UNITED STATES
SECURITIES AND EXCHANGE COMMISSION
Washington, D.C. 20549
FORM N-CSR
CERTIFIED SHAREHOLDER REPORT OF REGISTERED
MANAGEMENT INVESTMENT COMPANIES
Investment Company Act file number 811-2546
Fidelity Commonwealth Trust
(Exact name of registrant as specified in charter)
245 Summer St., Boston, Massachusetts 02210
(Address of principal executive offices) (Zip code)
Scott C. Goebel, Secretary
245 Summer St.
Boston, Massachusetts 02210
(Name and address of agent for service)
Registrant's telephone number, including area code: 617-563-7000
Date of fiscal year end: | April 30 |
|
|
Date of reporting period: | April 30, 2013 |
Item 1. Reports to Stockholders
Fidelity®
Small Cap Discovery
Fund
Annual Report
April 30, 2013
(Fidelity Cover Art)
Contents
Performance | How the fund has done over time. | |
Management's Discussion of Fund Performance | The Portfolio Manager's review of fund performance and strategy. | |
Shareholder Expense Example | An example of shareholder expenses. | |
Investment Changes | A summary of major shifts in the fund's investments over the past six months. | |
Investments | A complete list of the fund's investments with their market values. | |
Financial Statements | Statements of assets and liabilities, operations, and changes in net assets, as well as financial highlights. | |
Notes | Notes to the financial statements. | |
Report of Independent Registered Public Accounting Firm |
| |
Trustees and Officers |
| |
Distributions |
|
To view a fund's proxy voting guidelines and proxy voting record for the 12-month period ended June 30, visit http://www.fidelity.com/proxyvotingresults or visit the Securities and Exchange Commission's (SEC) web site at http://www.sec.gov. You may also call 1-800-544-8544 to request a free copy of the proxy voting guidelines.
Standard & Poor's, S&P and S&P 500 are registered service marks of The McGraw-Hill Companies, Inc. and have been licensed for use by Fidelity Distributors Corporation.
Other third-party marks appearing herein are the property of their respective owners.
All other marks appearing herein are registered or unregistered trademarks or service marks of FMR LLC or an affiliated company. © 2013 FMR LLC. All rights reserved.
This report and the financial statements contained herein are submitted for the general information of the shareholders of the fund. This report is not authorized for distribution to prospective investors in the fund unless preceded or accompanied by an effective prospectus.
A fund files its complete schedule of portfolio holdings with the SEC for the first and third quarters of each fiscal year on Form N-Q. Forms N-Q are available on the SEC's web site at http://www.sec.gov. A fund's Forms N-Q may be reviewed and copied at the SEC's Public Reference Room in Washington, DC. Information regarding the operation of the SEC's Public Reference Room may be obtained by calling 1-800-SEC-0330. For a complete list of a fund's portfolio holdings, view the most recent holdings listing, semiannual report, or annual report on Fidelity's web site at http://www.fidelity.com, http://www.advisor.fidelity.com, or http://www.401k.com, as applicable.
NOT FDIC INSURED • MAY LOSE VALUE • NO BANK GUARANTEE
Neither the fund nor Fidelity Distributors Corporation is a bank.
Annual Report
Performance: The Bottom Line
Average annual total return reflects the change in the value of an investment, assuming reinvestment of the fund's distributions from dividend income and capital gains (the profits earned upon the sale of securities that have grown in value, if any) and assuming a constant rate of performance each year. The $10,000 table and the fund's returns do not reflect the deduction of taxes that a shareholder would pay on fund distributions or the redemption of fund shares. During periods of reimbursement by Fidelity, a fund's total return will be greater than it would be had the reimbursement not occurred. How a fund did yesterday is no guarantee of how it will do tomorrow.
Average Annual Total Returns
Periods ended April 30, 2013 | Past 1 | Past 5 | Past 10 |
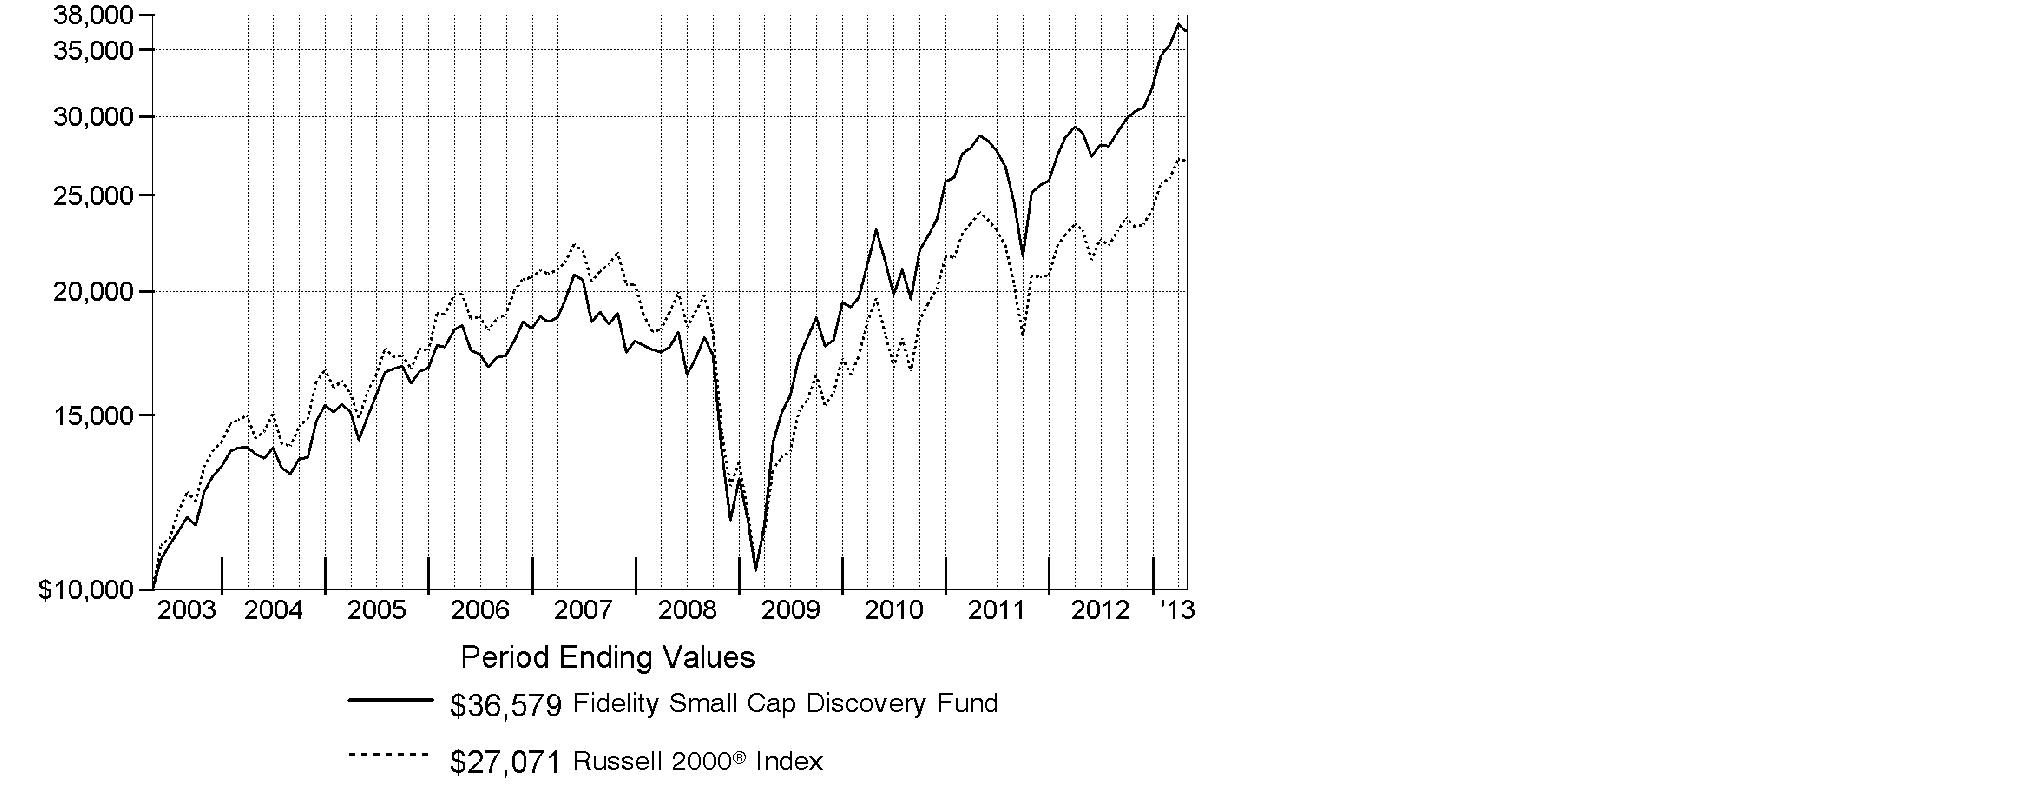
Fidelity® Small Cap Discovery Fund | 26.69% | 15.81% | 13.85% |
$10,000 Over 10 Years
Let's say hypothetically that $10,000 was invested in Fidelity® Small Cap Discovery Fund on April 30, 2003. The chart shows how the value of your investment would have changed, and also shows how the Russell 2000® Index performed over the same period.
Annual Report
Management's Discussion of Fund Performance
Market Recap: The bull run in U.S. stocks entered its fifth year and two major equity benchmarks reached record territory during the 12 months ending April 30, 2013, as gains in the global economy and more monetary stimulus from the U.S. Federal Reserve kept markets on the upswing for much of the period. Optimism over the nation's jobs picture and housing market teamed up with solid corporate earnings to make stocks a favorite with investors during the 12-month period. The broad-based S&P 500® Index finished the year up 16.89%, closing at a new all-time high, while the blue-chip-laden Dow Jones Industrial AverageSM - which broke its own record in early March - gained 15.39% for the full 12 months. The growth- oriented Nasdaq Composite Index® advanced a more modest 10.78%, curtailed by the weak performance of consumer electronics giant Apple, a large index component. During the year, markets shrugged off an early decline brought on by debt woes in Europe, and another dip later in the period amid pre-election jitters and Congressional gridlock over the federal budget. The year's gains were broad-based, with nine of the 10 sectors in the S&P 500® posting a double-digit increase, led by health care and telecommunication services, while information technology added only about 2%. Despite the headwind of a stronger U.S. dollar, foreign developed-markets stocks rose strongly, with the MSCI® EAFE® Index returning 19.53%.
Comments from Charles Myers, Portfolio Manager of Fidelity® Small Cap Discovery Fund: For the year, the fund gained 26.69%, significantly outpacing the 17.69% rise in the benchmark Russell 2000® Index. Stock picking was very strong in a number of sectors, especially consumer discretionary, where homebuilders such as KB Home and M.D.C. Holdings - the latter of which I sold before period end - did very well. Also in this group, Hanesbrands, a maker of undergarments and an out-of-benchmark stock, added value. We also had particularly good results in health care, consumer staples and information technology. The top individual contributor by a wide margin was private prison operator GEO Group, which benefited from investors' enthusiasm about the company's decision to convert to a real estate investment trust (REIT) corporate structure. Meanwhile, stock selection was negative - and only modestly so - in just two groups, materials and telecommunication services. In the industrials sector, GrafTech International, a maker of high-end graphite electrodes used in steel production, was a notable non-index detractor. The biggest individual source of underperformance was Knight Capital, whose shares I sold after the "market maker" made an ill-advised and, ultimately, costly change to its trading software.
Note to shareholders: The fund was closed to new accounts on January 31, 2013.
The views expressed above reflect those of the portfolio manager(s) only through the end of the period as stated on the cover of this report and do not necessarily represent the views of Fidelity or any other person in the Fidelity organization. Any such views are subject to change at any time based upon market or other conditions and Fidelity disclaims any responsibility to update such views. These views may not be relied on as investment advice and, because investment decisions for a Fidelity fund are based on numerous factors, may not be relied on as an indication of trading intent on behalf of any Fidelity fund.
Annual Report
Shareholder Expense Example
As a shareholder of the Fund, you incur two types of costs: (1) transaction costs, including redemption fees and (2) ongoing costs, including management fees and other Fund expenses. This Example is intended to help you understand your ongoing costs (in dollars) of investing in the Fund and to compare these costs with the ongoing costs of investing in other mutual funds.
The Example is based on an investment of $1,000 invested at the beginning of the period and held for the entire period (November 1, 2012 to April 30, 2013).
Actual Expenses
The first line of the accompanying table provides information about actual account values and actual expenses. You may use the information in this line, together with the amount you invested, to estimate the expenses that you paid over the period. Simply divide your account value by $1,000.00 (for example, an $8,600 account value divided by $1,000.00 = 8.6), then multiply the result by the number in the first line under the heading entitled "Expenses Paid During Period" to estimate the expenses you paid on your account during this period. A small balance maintenance fee of $12.00 that is charged once a year may apply for certain accounts with a value of less than $2,000. This fee is not included in the table below. If it was, the estimate of expenses you paid during the period would be higher, and your ending account value lower, by this amount. In addition, the Fund, as a shareholder in the underlying Fidelity Central Funds, will indirectly bear its pro-rata share of the fees and expenses incurred by the underlying Fidelity Central Funds. These fees and expenses are not included in the Fund's annualized expense ratio used to calculate the expense estimate in the table below.
Hypothetical Example for Comparison Purposes
The second line of the accompanying table provides information about hypothetical account values and hypothetical expenses based on the Fund's actual expense ratio and an assumed rate of return of 5% per year before expenses, which is not the Fund's actual return. The hypothetical account values and expenses may not be used to estimate the actual ending account balance or expenses you paid for the period. You may use this information to compare the ongoing costs of investing in the Fund and other funds. To do so, compare this 5% hypothetical example with the 5% hypothetical examples that appear in the shareholder reports of the other funds. A small balance maintenance fee of $12.00 that is charged once a year may apply for certain accounts with a value of less than $2,000. This fee is not included in the table below. If it was, the estimate of expenses you paid during the period would be higher, and your ending account value lower, by this amount. In addition, the Fund, as a shareholder in the underlying Fidelity Central Funds, will indirectly bear its pro-rata share of the fees and expenses incurred by the underlying Fidelity Central Funds. These fees and expenses are not included in the Fund's annualized expense ratio used to calculate the expense estimate in the table below.
Please note that the expenses shown in the table are meant to highlight your ongoing costs only and do not reflect any transaction costs. Therefore, the second line of the table is useful in comparing ongoing costs only, and will not help you determine the relative total costs of owning different funds. In addition, if these transactional costs were included, your costs would have been higher.
Annual Report
Shareholder Expense Example - continued
| Annualized Expense RatioB | Beginning | Ending | Expenses Paid |
Actual | 1.03% | $ 1,000.00 | $ 1,206.20 | $ 5.63 |
HypotheticalA |
| $ 1,000.00 | $ 1,019.69 | $ 5.16 |
A 5% return per year before expenses
B Annualized expense ratio reflects expenses net of applicable fee waivers.
* Expenses are equal to the Fund's annualized expense ratio, multiplied by the average account value over the period, multiplied by 181/365 (to reflect the one-half year period).
Annual Report
Investment Changes (Unaudited)
Top Ten Stocks as of April 30, 2013 | ||
| % of fund's | % of fund's net assets |
Berry Petroleum Co. Class A | 2.9 | 2.7 |
j2 Global, Inc. | 2.9 | 1.4 |
TCF Financial Corp. | 2.8 | 2.8 |
Superior Energy Services, Inc. | 2.7 | 2.8 |
Hanesbrands, Inc. | 2.6 | 2.6 |
Tech Data Corp. | 2.3 | 2.4 |
FTI Consulting, Inc. | 2.3 | 1.6 |
Chemed Corp. | 2.2 | 2.2 |
Rent-A-Center, Inc. | 2.2 | 0.0 |
Polycom, Inc. | 2.1 | 1.1 |
| 25.0 | |
Top Five Market Sectors as of April 30, 2013 | ||
| % of fund's | % of fund's net assets |
Financials | 23.0 | 21.4 |
Information Technology | 18.3 | 17.9 |
Consumer Discretionary | 15.5 | 15.3 |
Health Care | 14.4 | 11.2 |
Industrials | 12.4 | 16.6 |
Asset Allocation (% of fund's net assets) | |||||||
As of April 30, 2013 * | As of October 31, 2012 ** | ||||||
 | Stocks 99.8% |
| | Stocks 99.3% |
| ||
 | Short-Term |
| | Short-Term |
| ||
* Foreign investments | 3.5% |
| ** Foreign investments | 4.8% |
| ||

Annual Report
Investments April 30, 2013
Showing Percentage of Net Assets
Common Stocks - 99.8% | |||
Shares | Value | ||
CONSUMER DISCRETIONARY - 15.5% | |||
Diversified Consumer Services - 1.5% | |||
Regis Corp. (e) | 4,500,000 | $ 84,375,000 | |
Household Durables - 2.5% | |||
KB Home (d) | 2,400,000 | 54,096,000 | |
Tempur-Pedic International, Inc. (a) | 1,775,000 | 86,087,500 | |
| 140,183,500 | ||
Leisure Equipment & Products - 1.9% | |||
Brunswick Corp. | 3,330,000 | 105,427,800 | |
Media - 1.2% | |||
Valassis Communications, Inc. (d)(e) | 2,705,000 | 69,329,150 | |
Specialty Retail - 5.8% | |||
Asbury Automotive Group, Inc. (a)(e) | 1,882,000 | 75,449,380 | |
Genesco, Inc. (a)(e) | 1,700,000 | 104,635,000 | |
Rent-A-Center, Inc. (e) | 3,594,850 | 125,568,110 | |
Tsutsumi Jewelry Co. Ltd. | 664,800 | 20,759,469 | |
| 326,411,959 | ||
Textiles, Apparel & Luxury Goods - 2.6% | |||
Hanesbrands, Inc. | 3,000,000 | 150,480,000 | |
TOTAL CONSUMER DISCRETIONARY | 876,207,409 | ||
CONSUMER STAPLES - 3.3% | |||
Food Products - 2.7% | |||
Chiquita Brands International, Inc. (a)(e) | 3,571,000 | 30,817,730 | |
Dean Foods Co. (a) | 2,400,000 | 45,936,000 | |
Post Holdings, Inc. (a)(e) | 1,795,571 | 78,628,054 | |
| 155,381,784 | ||
Household Products - 0.6% | |||
Spectrum Brands Holdings, Inc. | 570,535 | 31,949,960 | |
TOTAL CONSUMER STAPLES | 187,331,744 | ||
ENERGY - 5.6% | |||
Energy Equipment & Services - 2.7% | |||
Superior Energy Services, Inc. (a) | 5,600,000 | 154,504,000 | |
Oil, Gas & Consumable Fuels - 2.9% | |||
Berry Petroleum Co. Class A (e) | 3,430,000 | 164,331,299 | |
TOTAL ENERGY | 318,835,299 | ||
Common Stocks - continued | |||
Shares | Value | ||
FINANCIALS - 23.0% | |||
Capital Markets - 4.1% | |||
Federated Investors, Inc. Class B (non-vtg.) (d) | 5,220,000 | $ 119,851,200 | |
Monex Group, Inc. (d) | 13,118 | 5,918,772 | |
Waddell & Reed Financial, Inc. Class A | 2,450,000 | 105,031,500 | |
| 230,801,472 | ||
Commercial Banks - 8.2% | |||
Associated Banc-Corp. | 5,300,000 | 75,631,000 | |
CapitalSource, Inc. | 9,700,000 | 86,815,000 | |
Cathay General Bancorp | 2,450,000 | 48,289,500 | |
First Citizen Bancshares, Inc. | 89,262 | 16,640,222 | |
First Citizen Bancshares, Inc. (f) | 200,000 | 33,555,600 | |
National Penn Bancshares, Inc. | 4,300,000 | 42,097,000 | |
TCF Financial Corp. (e) | 11,000,000 | 160,050,000 | |
| 463,078,322 | ||
Consumer Finance - 2.5% | |||
Cash America International, Inc. (d) | 1,112,743 | 48,548,977 | |
EZCORP, Inc. (non-vtg.) Class A (a) | 2,413,944 | 40,795,654 | |
World Acceptance Corp. (a)(d) | 589,900 | 52,418,514 | |
| 141,763,145 | ||
Insurance - 1.9% | |||
Amerisafe, Inc. (e) | 1,160,000 | 37,885,600 | |
Platinum Underwriters Holdings Ltd. | 1,247,590 | 70,800,733 | |
| 108,686,333 | ||
Real Estate Investment Trusts - 3.9% | |||
Franklin Street Properties Corp. (e) | 5,800,000 | 88,566,000 | |
Highwoods Properties, Inc. (SBI) | 735,000 | 30,157,050 | |
The Geo Group, Inc. | 2,700,000 | 101,115,000 | |
| 219,838,050 | ||
Thrifts & Mortgage Finance - 2.4% | |||
Astoria Financial Corp. | 4,475,000 | 42,915,250 | |
Washington Federal, Inc. (e) | 5,305,000 | 91,086,850 | |
| 134,002,100 | ||
TOTAL FINANCIALS | 1,298,169,422 | ||
Common Stocks - continued | |||
Shares | Value | ||
HEALTH CARE - 14.4% | |||
Health Care Equipment & Supplies - 1.8% | |||
Hill-Rom Holdings, Inc. | 809,038 | $ 27,563,925 | |
Integra LifeSciences Holdings Corp. (a)(e) | 2,140,000 | 74,964,200 | |
| 102,528,125 | ||
Health Care Providers & Services - 11.8% | |||
AmSurg Corp. (a) | 1,445,190 | 48,500,576 | |
Centene Corp. (a) | 2,200,000 | 101,640,000 | |
Chemed Corp. (e) | 1,550,000 | 126,511,000 | |
MEDNAX, Inc. (a) | 800,000 | 70,984,000 | |
Owens & Minor, Inc. (d)(e) | 3,400,000 | 110,738,000 | |
Team Health Holdings, Inc. (a) | 2,500,000 | 93,200,000 | |
VCA Antech, Inc. (a)(e) | 4,700,000 | 113,270,000 | |
| 664,843,576 | ||
Pharmaceuticals - 0.8% | |||
Hi-Tech Pharmacal Co., Inc. (e) | 1,357,100 | 44,865,726 | |
TOTAL HEALTH CARE | 812,237,427 | ||
INDUSTRIALS - 12.4% | |||
Commercial Services & Supplies - 3.7% | |||
HNI Corp. (e) | 3,000,000 | 103,290,000 | |
Quad/Graphics, Inc. (d)(e) | 3,664,200 | 76,581,780 | |
United Stationers, Inc. | 865,702 | 28,109,344 | |
| 207,981,124 | ||
Electrical Equipment - 3.8% | |||
EnerSys (a) | 1,700,000 | 77,928,000 | |
GrafTech International Ltd. (a)(d)(e) | 11,494,898 | 82,533,368 | |
Powell Industries, Inc. (a)(e) | 1,150,000 | 56,626,000 | |
| 217,087,368 | ||
Machinery - 1.3% | |||
Blount International, Inc. (a)(e) | 2,565,062 | 35,628,711 | |
Columbus McKinnon Corp. (NY Shares) (a)(e) | 1,870,000 | 35,118,600 | |
| 70,747,311 | ||
Professional Services - 2.3% | |||
FTI Consulting, Inc. (a)(e) | 4,000,000 | 132,480,000 | |
Trading Companies & Distributors - 1.3% | |||
WESCO International, Inc. (a) | 1,015,322 | 72,788,434 | |
TOTAL INDUSTRIALS | 701,084,237 | ||
Common Stocks - continued | |||
Shares | Value | ||
INFORMATION TECHNOLOGY - 18.3% | |||
Communications Equipment - 2.8% | |||
Polycom, Inc. (a)(e) | 11,500,000 | $ 120,750,000 | |
ViaSat, Inc. (a) | 773,069 | 37,470,654 | |
| 158,220,654 | ||
Electronic Equipment & Components - 5.5% | |||
Diploma PLC | 3,000,000 | 26,585,585 | |
Ingram Micro, Inc. Class A (a) | 6,250,000 | 111,312,500 | |
Ryoyo Electro Corp. (e) | 1,512,400 | 13,657,729 | |
SYNNEX Corp. (a) | 804,000 | 27,818,400 | |
Tech Data Corp. (a)(e) | 2,849,237 | 133,144,845 | |
| 312,519,059 | ||
Internet Software & Services - 3.9% | |||
Blucora, Inc. (a) | 2,033,100 | 30,028,887 | |
j2 Global, Inc. (d)(e) | 4,000,000 | 162,800,000 | |
QuinStreet, Inc. (a)(e) | 4,275,746 | 27,963,379 | |
| 220,792,266 | ||
IT Services - 3.0% | |||
CACI International, Inc. Class A (a)(d)(e) | 1,745,972 | 102,121,902 | |
WEX, Inc. (a) | 865,875 | 65,616,008 | |
| 167,737,910 | ||
Software - 3.1% | |||
Monotype Imaging Holdings, Inc. (e) | 2,857,353 | 66,262,016 | |
SS&C Technologies Holdings, Inc. (a) | 3,500,000 | 107,415,000 | |
| 173,677,016 | ||
TOTAL INFORMATION TECHNOLOGY | 1,032,946,905 | ||
MATERIALS - 4.3% | |||
Chemicals - 0.9% | |||
PolyOne Corp. | 2,300,000 | 51,819,000 | |
Metals & Mining - 3.4% | |||
Carpenter Technology Corp. | 1,600,000 | 71,936,000 | |
Haynes International, Inc. (e) | 840,000 | 40,832,400 | |
RTI International Metals, Inc. (a)(e) | 2,685,000 | 77,918,700 | |
| 190,687,100 | ||
TOTAL MATERIALS | 242,506,100 | ||
Common Stocks - continued | |||
Shares | Value | ||
TELECOMMUNICATION SERVICES - 1.1% | |||
Diversified Telecommunication Services - 1.1% | |||
Intelsat SA | 3,200,000 | $ 64,480,000 | |
UTILITIES - 1.9% | |||
Electric Utilities - 1.9% | |||
UIL Holdings Corp. (e) | 2,600,000 | 108,264,000 | |
TOTAL COMMON STOCKS (Cost $4,636,700,955) |
| ||
Nonconvertible Preferred Stocks - 0.0% | |||
|
|
|
|
CONSUMER DISCRETIONARY - 0.0% | |||
Household Durables - 0.0% | |||
M/I Homes, Inc. Series A, 9.75% (a) | 6,597 | 165,915 | |
TOTAL NONCONVERTIBLE PREFERRED STOCKS (Cost $49,825) |
| ||
Money Market Funds - 4.1% | |||
|
|
|
|
Fidelity Cash Central Fund, 0.13% (b) | 4,941,599 | 4,941,599 | |
Fidelity Securities Lending Cash Central Fund, 0.12% (b)(c) | 226,142,643 | 226,142,643 | |
TOTAL MONEY MARKET FUNDS (Cost $231,084,242) |
| ||
TOTAL INVESTMENT PORTFOLIO - 103.9% (Cost $4,867,835,022) | 5,873,312,700 | ||
NET OTHER ASSETS (LIABILITIES) - (3.9)% | (221,750,092) | ||
NET ASSETS - 100% | $ 5,651,562,608 | ||
Legend |
(a) Non-income producing |
(b) Affiliated fund that is generally available only to investment companies and other accounts managed by Fidelity Investments. The rate quoted is the annualized seven-day yield of the fund at period end. A complete unaudited listing of the fund's holdings as of its most recent quarter end is available upon request. In addition, each Fidelity Central Fund's financial statements, which are not covered by the Fund's Report of Independent Registered Public Accounting Firm, are available on the SEC's website or upon request. |
(c) Investment made with cash collateral received from securities on loan. |
(d) Security or a portion of the security is on loan at period end. |
(e) Affiliated company |
(f) Restricted securities - Investment in securities not registered under the Securities Act of 1933 (excluding 144A issues). At the end of the period, the value of restricted securities (excluding 144A issues) amounted to $33,555,600 or 0.6% of net assets. |
Additional information on each restricted holding is as follows: |
Security | Acquisition Date | Acquisition Cost |
First Citizen Bancshares, Inc. | 12/21/12 | $ 28,000,000 |
Affiliated Central Funds |
Information regarding fiscal year to date income earned by the Fund from investments in Fidelity Central Funds is as follows: |
Fund | Income earned |
Fidelity Cash Central Fund | $ 48,677 |
Fidelity Securities Lending Cash Central Fund | 1,315,446 |
Total | $ 1,364,123 |
Other Affiliated Issuers |
An affiliated company is a company in which the Fund has ownership of at least 5% of the voting securities. Fiscal year to date transactions with companies which are or were affiliates are as follows: |
Affiliate | Value, beginning of period | Purchases | Sales Proceeds | Dividend Income | Value, |
Amerisafe, Inc. | $ 30,111,008 | $ 853,779 | $ - | $ 92,800 | $ 37,885,600 |
Asbury Automotive Group, Inc. | 26,752,665 | 35,359,351 | 2,587,453 | - | 75,449,380 |
Berry Petroleum Co. Class A | 68,584,635 | 72,907,383 | 4,527,689 | 784,856 | 164,331,299 |
Blount International, Inc. | 29,653,694 | 9,624,988 | - | - | 35,628,711 |
CACI International, Inc. Class A | - | 97,508,713 | - | - | 102,121,902 |
Chemed Corp. | 64,376,746 | 34,725,048 | - | 844,246 | 126,511,000 |
Affiliate | Value, beginning of period | Purchases | Sales Proceeds | Dividend Income | Value, |
Chiquita Brands International, Inc. | $ 26,574,324 | $ 2,521,850 | $ - | $ - | $ 30,817,730 |
Columbus McKinnon Corp. (NY Shares) | 27,630,915 | 104,261 | - | - | 35,118,600 |
Ethan Allen Interiors, Inc. | 50,025,093 | 887,399 | 59,596,048 | 952,063 | - |
Franklin Street Properties Corp. | 25,863,657 | 36,366,096 | - | 3,627,607 | 88,566,000 |
FTI Consulting, Inc. | 26,891,600 | 99,991,558 | - | - | 132,480,000 |
Genesco, Inc. | - | 98,440,617 | - | - | 104,635,000 |
GrafTech International Ltd. | 19,243,269 | 93,845,680 | - | - | 82,533,368 |
Haynes International, Inc. | 37,197,842 | 12,207,879 | - | 632,019 | 40,832,400 |
Hi-Tech Pharmacal Co., Inc. | - | 43,625,923 | - | 1,897,500 | 44,865,726 |
HNI Corp. | 61,445,700 | 13,781,477 | - | 2,554,200 | 103,290,000 |
Integra LifeSciences Holdings Corp. | 25,333,377 | 57,495,020 | - | - | 74,964,200 |
Interline Brands, Inc. | 53,227,939 | - | 63,717,138 | - | - |
j2 Global, Inc. | 36,032,850 | 81,589,579 | - | 1,942,425 | 162,800,000 |
Monotype Imaging Holdings, Inc. | 38,662,670 | 2,471,162 | - | 393,209 | 66,262,016 |
Owens & Minor, Inc. | - | 98,570,805 | - | 1,322,000 | 110,738,000 |
Polycom, Inc. | - | 127,433,982 | - | - | 120,750,000 |
Post Holdings, Inc. | - | 58,115,394 | - | - | 78,628,054 |
Powell Industries, Inc. | 35,676,384 | 2,191,749 | - | - | 56,626,000 |
Quad/Graphics, Inc. | 19,526,855 | 38,259,456 | - | 9,714,485 | 76,581,780 |
QuinStreet, Inc. | 23,240,195 | 17,431,995 | - | - | 27,963,379 |
Regis Corp. | 60,252,170 | 27,212,517 | 7,662,351 | 881,005 | 84,375,000 |
Rent-A-Center, Inc. | - | 127,710,972 | - | 754,919 | 125,568,110 |
RTI International Metals, Inc. | 65,180,987 | 833,347 | - | - | 77,918,700 |
Ryoyo Electro Corp. | 15,767,618 | 3,332,829 | 2,070,170 | 542,182 | 13,657,729 |
TCF Financial Corp. | 82,516,327 | 49,997,006 | 2,286,329 | 1,290,000 | 160,050,000 |
Team Health Holdings, Inc. | 82,800,660 | - | 35,188,121 | - | - |
Tech Data Corp. | 40,611,450 | 104,527,591 | 5,117,055 | - | 133,144,845 |
The Geo Group, Inc. | 66,230,311 | 13,822,921 | 36,577,988 | 21,299,201 | - |
UIL Holdings Corp. | - | 94,651,159 | - | 1,597,407 | 108,264,000 |
Valassis Communications, Inc. | 50,000,000 | 11,896,337 | 6,450,563 | 1,677,100 | 69,329,150 |
VCA Antech, Inc. | 30,166,500 | 72,799,578 | 2,170,356 | - | 113,270,000 |
Washington Federal, Inc. | 59,506,853 | 32,671,773 | 240,520 | 1,473,261 | 91,086,850 |
Total | $ 1,279,084,294 | $ 1,675,767,174 | $ 228,191,781 | $ 54,272,485 | $ 2,957,044,529 |
Other Information |
The following is a summary of the inputs used, as of April 30, 2013, involving the Fund's assets and liabilities carried at fair value. The inputs or methodology used for valuing securities may not be an indication of the risk associated with investing in those securities. For more information on valuation inputs, and their aggregation into the levels used in the table below, please refer to the Investment Valuation section in the accompanying Notes to Financial Statements. |
Valuation Inputs at Reporting Date: | ||||
Description | Total | Level 1 | Level 2 | Level 3 |
Investments in Securities: | ||||
Equities: | ||||
Consumer Discretionary | $ 876,373,324 | $ 855,613,855 | $ 20,759,469 | $ - |
Consumer Staples | 187,331,744 | 187,331,744 | - | - |
Energy | 318,835,299 | 318,835,299 | - | - |
Financials | 1,298,169,422 | 1,258,695,050 | 39,474,372 | - |
Health Care | 812,237,427 | 812,237,427 | - | - |
Industrials | 701,084,237 | 701,084,237 | - | - |
Information Technology | 1,032,946,905 | 1,019,289,176 | 13,657,729 | - |
Materials | 242,506,100 | 242,506,100 | - | - |
Telecommunication Services | 64,480,000 | 64,480,000 | - | - |
Utilities | 108,264,000 | 108,264,000 | - | - |
Money Market Funds | 231,084,242 | 231,084,242 | - | - |
Total Investments in Securities: | $ 5,873,312,700 | $ 5,799,421,130 | $ 73,891,570 | $ - |
See accompanying notes which are an integral part of the financial statements.
Annual Report
Financial Statements
Statement of Assets and Liabilities
| April 30, 2013 | |
|
|
|
Assets | ||
Investment in securities, at value (including securities loaned of $220,844,081) - See accompanying schedule: Unaffiliated issuers (cost $2,030,359,845) | $ 2,685,183,929 |
|
Fidelity Central Funds (cost $231,084,242) | 231,084,242 |
|
Other affiliated issuers (cost $2,606,390,935) | 2,957,044,529 |
|
Total Investments (cost $4,867,835,022) |
| $ 5,873,312,700 |
Cash |
| 1 |
Receivable for investments sold | 33,397,473 | |
Receivable for fund shares sold | 7,433,275 | |
Dividends receivable | 2,590,216 | |
Distributions receivable from Fidelity Central Funds | 141,973 | |
Prepaid expenses | 3,131 | |
Receivable from investment adviser for expense reductions | 20,042 | |
Other receivables | 169,356 | |
Total assets | 5,917,068,167 | |
|
|
|
Liabilities | ||
Payable for investments purchased | $ 14,171,122 | |
Payable for fund shares redeemed | 20,475,639 | |
Accrued management fee | 3,647,084 | |
Other affiliated payables | 1,007,426 | |
Other payables and accrued expenses | 61,645 | |
Collateral on securities loaned, at value | 226,142,643 | |
Total liabilities | 265,505,559 | |
|
|
|
Net Assets | $ 5,651,562,608 | |
Net Assets consist of: |
| |
Paid in capital | $ 4,446,320,290 | |
Undistributed net investment income | 1,965,455 | |
Accumulated undistributed net realized gain (loss) on investments and foreign currency transactions | 197,823,135 | |
Net unrealized appreciation (depreciation) on investments and assets and liabilities in foreign currencies | 1,005,453,728 | |
Net Assets, for 205,833,033 shares outstanding | $ 5,651,562,608 | |
Net Asset Value, offering price and redemption price per share ($5,651,562,608 ÷ 205,833,033 shares) | $ 27.46 | |
See accompanying notes which are an integral part of the financial statements.
Annual Report
Financial Statements - continued
Statement of Operations
| Year ended April 30, 2013 | |
|
|
|
Investment Income |
|
|
Dividends (including $54,272,485 earned from other affiliated issuers) |
| $ 75,677,513 |
Interest |
| 239 |
Income from Fidelity Central Funds |
| 1,364,123 |
Total income |
| 77,041,875 |
|
|
|
Expenses | ||
Management fee | $ 26,467,400 | |
Performance adjustment | 3,368,623 | |
Transfer agent fees | 8,116,050 | |
Accounting and security lending fees | 978,904 | |
Custodian fees and expenses | 75,220 | |
Independent trustees' compensation | 23,248 | |
Registration fees | 248,006 | |
Audit | 59,229 | |
Legal | 10,176 | |
Interest | 468 | |
Miscellaneous | 27,536 | |
Total expenses before reductions | 39,374,860 | |
Expense reductions | (382,913) | 38,991,947 |
Net investment income (loss) | 38,049,928 | |
Realized and Unrealized Gain (Loss) Net realized gain (loss) on: | ||
Investment securities: |
|
|
Unaffiliated issuers | 193,906,425 | |
Other affiliated issuers | 56,213,161 |
|
Foreign currency transactions | 81,555 | |
Total net realized gain (loss) |
| 250,201,141 |
Change in net unrealized appreciation (depreciation) on: Investment securities | 685,211,474 | |
Assets and liabilities in foreign currencies | (38,849) | |
Total change in net unrealized appreciation (depreciation) |
| 685,172,625 |
Net gain (loss) | 935,373,766 | |
Net increase (decrease) in net assets resulting from operations | $ 973,423,694 | |
See accompanying notes which are an integral part of the financial statements.
Annual Report
Statement of Changes in Net Assets
| Year ended | Year ended |
Increase (Decrease) in Net Assets |
|
|
Operations |
|
|
Net investment income (loss) | $ 38,049,928 | $ (2,464,730) |
Net realized gain (loss) | 250,201,141 | 56,355,403 |
Change in net unrealized appreciation (depreciation) | 685,172,625 | (34,716,212) |
Net increase (decrease) in net assets resulting | 973,423,694 | 19,174,461 |
Distributions to shareholders from net investment income | (35,052,646) | - |
Distributions to shareholders from net realized gain | (68,024,851) | (49,903,097) |
Total distributions | (103,077,497) | (49,903,097) |
Share transactions | 2,813,664,819 | 1,544,635,138 |
Reinvestment of distributions | 97,348,365 | 47,974,009 |
Cost of shares redeemed | (911,856,116) | (885,423,562) |
Net increase (decrease) in net assets resulting from share transactions | 1,999,157,068 | 707,185,585 |
Redemption fees | 1,128,048 | 1,236,897 |
Total increase (decrease) in net assets | 2,870,631,313 | 677,693,846 |
|
|
|
Net Assets | ||
Beginning of period | 2,780,931,295 | 2,103,237,449 |
End of period (including undistributed net investment income of $1,965,455 and accumulated net investment loss of $1,241,280, respectively) | $ 5,651,562,608 | $ 2,780,931,295 |
Other Information Shares | ||
Sold | 115,528,295 | 73,376,317 |
Issued in reinvestment of distributions | 4,296,405 | 2,380,856 |
Redeemed | (38,317,979) | (43,742,640) |
Net increase (decrease) | 81,506,721 | 32,014,533 |
See accompanying notes which are an integral part of the financial statements.
Annual Report
Financial Highlights
Years ended April 30, | 2013 | 2012 | 2011 | 2010 | 2009 |
Selected Per-Share Data |
|
|
|
|
|
Net asset value, beginning of period | $ 22.37 | $ 22.78 | $ 18.43 | $ 11.27 | $ 14.20 |
Income from Investment Operations |
|
|
|
|
|
Net investment income (loss) B | .25 | (.02) | - E,H | .02 | .11 |
Net realized and unrealized gain (loss) | 5.55 | .11 | 4.43 | 7.18 | (2.96) |
Total from investment operations | 5.80 | .09 | 4.43 | 7.20 | (2.85) |
Distributions from net investment income | (.22) | - | - F | (.05) | (.09) |
Distributions from net realized gain | (.49) | (.51) | (.10) F | - | - |
Total distributions | (.72) I | (.51) | (.10) | (.05) | (.09) |
Redemption fees added to paid in capital | .01 | .01 | .02 | .01 | .01 |
Net asset value, end of period | $ 27.46 | $ 22.37 | $ 22.78 | $ 18.43 | $ 11.27 |
Total Return A | 26.69% | .72% | 24.22% | 64.12% | (19.91)% |
Ratios to Average Net Assets C,G |
|
|
|
|
|
Expenses before reductions | 1.06% | 1.07% | 1.08% | 1.26% | 1.13% |
Expenses net of fee waivers, if any | 1.06% | 1.07% | 1.05% | 1.05% | 1.05% |
Expenses net of all reductions | 1.05% | 1.07% | 1.04% | 1.04% | 1.05% |
Net investment income (loss) | 1.02% | (.12)% | (.01)% E | .10% | .91% |
Supplemental Data |
|
|
|
|
|
Net assets, end of period (000 omitted) | $ 5,651,563 | $ 2,780,931 | $ 2,103,237 | $ 576,632 | $ 142,097 |
Portfolio turnover rate D | 26% | 20% | 11% | 37% | 114% |
A Total returns would have been lower if certain expenses had not been reduced during the applicable periods shown.
B Calculated based on average shares outstanding during the period.
C Fees and expenses of any underlying Fidelity Central Funds are not included in the Fund's expense ratio. The Fund indirectly bears its proportionate share of the expenses of any underlying Fidelity Central Funds.
D Amount does not include the portfolio activity of any underlying Fidelity Central Funds.
E Investment income per share reflects a large, non-recurring dividend which amounted to $.06 per share. Excluding this non-recurring dividend, the ratio of net investment income (loss) to average net assets would have been (.34)%.
F The amounts shown reflect certain reclassifications related to book to tax differences that were made in the year shown.
G Expense ratios reflect operating expenses of the Fund. Expenses before reductions do not reflect amounts reimbursed by the investment adviser or reductions from brokerage service arrangements or reductions from other expense offset arrangements and do not represent the amount paid by the Fund during periods when reimbursements or reductions occur. Expenses net of fee waivers reflect expenses after reimbursement by the investment adviser but prior to reductions from brokerage service arrangements or other expense offset arrangements. Expenses net of all reductions represent the net expenses paid by the Fund.
H Amount represents less than $.01 per share.
I Total distributions of $.72 per share is comprised of distributions from net investment income of $.223 and distributions from net realized gain of $.493 per share.
See accompanying notes which are an integral part of the financial statements.
Annual Report
Notes to Financial Statements
For the period ended April 30, 2013
1. Organization.
Fidelity Small Cap Discovery Fund (the Fund) is a fund of Fidelity Commonwealth Trust (the Trust) and is authorized to issue an unlimited number of shares. The Trust is registered under the Investment Company Act of 1940, as amended (the 1940 Act), as an open-end management investment company organized as a Massachusetts business trust. Effective after the close of business on January 31, 2013, the Fund was closed to new accounts with certain exceptions.
2. Investments in Fidelity Central Funds.
The Fund invests in Fidelity Central Funds, which are open-end investment companies generally available only to other investment companies and accounts managed by Fidelity Management & Research Company (FMR) and its affiliates. The Fund's Schedule of Investments lists each of the Fidelity Central Funds held as of period end, if any, as an investment of the Fund, but does not include the underlying holdings of each Fidelity Central Fund. As an Investing Fund, the Fund indirectly bears its proportionate share of the expenses of the underlying Fidelity Central Funds.
The Money Market Central Funds seek preservation of capital and current income and are managed by Fidelity Investments Money Management, Inc. (FIMM), an affiliate of FMR.
A complete unaudited list of holdings for each Fidelity Central Fund is available upon request or at the Securities and Exchange Commission (the SEC) website at www.sec.gov. In addition, the financial statements of the Fidelity Central Funds, which are not covered by the Fund's Report of Independent Registered Public Accounting Firm, are available on the SEC website or upon request.
3. Significant Accounting Policies.
The financial statements have been prepared in conformity with accounting principles generally accepted in the United States of America (GAAP), which require management to make certain estimates and assumptions at the date of the financial statements. Actual results could differ from those estimates. Subsequent events, if any, through the date that the financial statements were issued have been evaluated in the preparation of the financial statements. The following summarizes the significant accounting policies of the Fund:
Annual Report
3. Significant Accounting Policies - continued
Investment Valuation. Investments are valued as of 4:00 p.m. Eastern time on the last calendar day of the period. In accordance with valuation policies and procedures approved by the Board of Trustees (the Board), the Fund attempts to obtain prices from one or more third party pricing vendors or brokers to value its investments. When current market prices, quotations or currency exchange rates are not readily available or reliable, investments will be fair valued in good faith by the FMR Fair Value Committee (the Committee), in accordance with procedures adopted by the Fund's Board. Factors used in determining fair value vary by investment type and may include market or investment specific events. The frequency with which these procedures are used cannot be predicted and they may be utilized to a significant extent. The Committee oversees the Fund's valuation policies and procedures and is responsible for approving and reporting to the Board all fair value determinations.
The Fund categorizes the inputs to valuation techniques used to value its investments into a disclosure hierarchy consisting of three levels as shown below:
Level 1 - quoted prices in active markets for identical investments
Level 2 - other significant observable inputs (including quoted prices for similar investments, interest rates, prepayment speeds, etc.)
Level 3 - unobservable inputs (including the Fund's own assumptions based on the best information available)
Valuation techniques used to value the Fund's investments by major category are as follows:
Equity securities, including restricted securities, for which market quotations are readily available, are valued at the last reported sale price or official closing price as reported by a third party pricing vendor on the primary market or exchange on which they are traded and are categorized as Level 1 in the hierarchy. In the event there were no sales during the day or closing prices are not available, securities are valued at the last quoted bid price or may be valued using the last available price and are generally categorized as Level 2 in the hierarchy. For foreign equity securities, when market or security specific events arise, comparisons to the valuation of American Depositary Receipts (ADRs), futures contracts, Exchange- Traded Funds (ETFs) and certain indexes as well as quoted prices for similar securities may be used and would be categorized as Level 2 in the hierarchy. Utilizing these techniques may result in transfers between Level 1 and Level 2.
Investments in open-end mutual funds, including the Fidelity Central Funds, are valued at their closing net asset value (NAV) each business day and are categorized as Level 1 in the hierarchy.
Changes in valuation techniques may result in transfers in or out of an assigned level within the disclosure hierarchy.
Annual Report
Notes to Financial Statements - continued
3. Significant Accounting Policies - continued
Foreign Currency. The Fund may use foreign currency contracts to facilitate transactions in foreign-denominated securities. Gains and losses from these transactions may arise from changes in the value of the foreign currency or if the counterparties do not perform under the contracts' terms.
Foreign-denominated assets, including investment securities, and liabilities are translated into U.S. dollars at the exchange rates at period end. Purchases and sales of investment securities, income and dividends received and expenses denominated in foreign currencies are translated into U.S. dollars at the exchange rate in effect on the transaction date.
The effects of exchange rate fluctuations on investments are included with the net realized and unrealized gain (loss) on investment securities. Other foreign currency transactions resulting in realized and unrealized gain (loss) are disclosed separately.
Investment Transactions and Income. For financial reporting purposes, the Fund's investment holdings and NAV include trades executed through the end of the last business day of the period. The NAV per share for processing shareholder transactions is calculated as of the close of business of the New York Stock Exchange (NYSE) normally 4:00 p.m. Eastern time and includes trades executed through the end of the prior business day. Gains and losses on securities sold are determined on the basis of identified cost and may include proceeds received from litigation. Dividend income is recorded on the ex-dividend date, except for certain dividends from foreign securities where the ex-dividend date may have passed, which are recorded as soon as the Fund is informed of the ex-dividend date. Non-cash dividends included in dividend income, if any, are recorded at the fair market value of the securities received. Distributions received on securities that represent a return of capital or capital gain are recorded as a reduction of cost of investments and/or as a realized gain. The Fund estimates the components of distributions received that may be considered return of capital distributions or capital gain distributions. Interest income and distributions from the Fidelity Central Funds are accrued as earned. Interest income includes coupon interest and amortization of premium and accretion of discount on debt securities. Investment income is recorded net of foreign taxes withheld where recovery of such taxes is uncertain.
Expenses. Expenses directly attributable to a fund are charged to that fund. Expenses attributable to more than one fund are allocated among the respective funds on the basis of relative net assets or other appropriate methods. Expense estimates are accrued in the period to which they relate and adjustments are made when actual amounts are known.
Annual Report
3. Significant Accounting Policies - continued
Income Tax Information and Distributions to Shareholders. Each year, the Fund intends to qualify as a regulated investment company under Subchapter M of the Internal Revenue Code, including distributing substantially all of its taxable income and realized gains. As a result, no provision for income taxes is required. As of April 30, 2013, the Fund did not have any unrecognized tax benefits in the financial statements; nor is the Fund aware of any tax positions for which it is reasonably possible that the total amounts of unrecognized tax benefits will significantly change in the next twelve months. The Fund files a U.S. federal tax return, in addition to state and local tax returns as required. A fund's federal income tax returns are subject to examination by the Internal Revenue Service (IRS) for a period of three fiscal years after they are filed. State and local tax returns may be subject to examination for an additional fiscal year depending on the jurisdiction. Foreign taxes are provided for based on the Fund's understanding of the tax rules and rates that exist in the foreign markets in which it invests.
Distributions are declared and recorded on the ex-dividend date. Income and capital gain distributions are determined in accordance with income tax regulations, which may differ from GAAP. The fund will claim a portion of the payment made to redeeming shareholders as a distribution for income tax purposes.
Capital accounts within the financial statements are adjusted for permanent book-tax differences. These adjustments have no impact on net assets or the results of operations. Temporary book-tax differences will reverse in a subsequent period.
Book-tax differences are primarily due to foreign currency transactions, losses deferred due to wash sales and excise tax regulations.
The federal tax cost of investment securities and unrealized appreciation (depreciation) as of period end were as follows:
Gross unrealized appreciation | $ 1,130,101,832 |
Gross unrealized depreciation | (128,516,720) |
Net unrealized appreciation (depreciation) on securities and other investments | $ 1,001,585,112 |
Tax Cost | $ 4,871,727,588 |
The tax-based components of distributable earnings as of period end were as follows:
Undistributed tax-exempt income | $ - |
Undistributed ordinary income | $ 1,965,455 |
Undistributed long-term capital gain | $ 201,715,701 |
Net unrealized appreciation (depreciation) | $ 1,001,561,162 |
Annual Report
Notes to Financial Statements - continued
3. Significant Accounting Policies - continued
Income Tax Information and Distributions to Shareholders - continued
The tax character of distributions paid was as follows:
| April 30, 2013 | April 30, 2012 |
Ordinary Income | $ 35,052,646 | $ 770,172 |
Long-term Capital Gains | 68,024,851 | 49,132,925 |
Total | $ 103,077,497 | $ 49,903,097 |
Short-Term Trading (Redemption) Fees. Shares held by investors in the Fund less than 90 days are subject to a redemption fee equal to 1.50% of the net asset value of shares redeemed. All redemption fees, which reduce the proceeds of the shareholder redemption, are retained by the Fund and accounted for as an addition to paid in capital.
Restricted Securities. The Fund may invest in securities that are subject to legal or contractual restrictions on resale. These securities generally may be resold in transactions exempt from registration or to the public if the securities are registered. Disposal of these securities may involve time-consuming negotiations and expense, and prompt sale at an acceptable price may be difficult. Information regarding restricted securities is included at the end of the Fund's Schedule of Investments.
4. Purchases and Sales of Investments.
Purchases and sales of securities other than short-term securities, aggregated $2,941,065,444 and $996,105,390, respectively.
5. Fees and Other Transactions with Affiliates.
Management Fee. FMR and its affiliates provide the Fund with investment management related services for which the Fund pays a monthly management fee. The management fee is the sum of an individual fund fee rate that is based on an annual rate of .45% of the Fund's average net assets and an annualized group fee rate that averaged .26% during the period. The group fee rate is based upon the average net assets of all the mutual funds advised by FMR. The group fee rate decreases as assets under management increase and increases as assets under management decrease. In addition, the management fee is subject to a performance adjustment (up to a maximum of ± .20% of the Fund's average net assets over a 36 month performance period). The upward or downward adjustment to the management fee is based on the Fund's relative investment performance as compared to an appropriate benchmark index. For the period, the total annual management fee rate, including the performance adjustment, was .80% of the Fund's average net assets.
Annual Report
5. Fees and Other Transactions with Affiliates - continued
Transfer Agent Fees. Fidelity Investments Institutional Operations Company, Inc. (FIIOC), an affiliate of FMR, is the Fund's transfer, dividend disbursing and shareholder servicing agent. FIIOC receives account fees and asset-based fees that vary according to account size and type of account. FIIOC pays for typesetting, printing and mailing of shareholder reports, except proxy statements. For the period, the transfer agent fees were equivalent to an annual rate of .22% of average net assets.
Accounting and Security Lending Fees. Fidelity Service Company, Inc. (FSC), an affiliate of FMR, maintains the Fund's accounting records. The accounting fee is based on the level of average net assets for each month. Under a separate contract, FSC administers the security lending program. The security lending fee is based on the number and duration of lending transactions.
Brokerage Commissions. The Fund placed a portion of its portfolio transactions with brokerage firms which are affiliates of the investment adviser. The commissions paid to these affiliated firms were $47,414 for the period.
Interfund Lending Program. Pursuant to an Exemptive Order issued by the SEC, the Fund, along with other registered investment companies having management contracts with FMR, may participate in an interfund lending program. This program provides an alternative credit facility allowing the funds to borrow from, or lend money to, other participating affiliated funds. At period end, there were no interfund loans outstanding. The Fund's activity in this program during the period for which loans were outstanding was as follows:
Borrower or Lender | Average Loan | Weighted Average Interest Rate | Interest |
Borrower | $ 5,085,375 | .41% | $ 468 |
6. Committed Line of Credit.
The Fund participates with other funds managed by FMR or an affiliate in a $4.25 billion credit facility (the "line of credit") to be utilized for temporary or emergency purposes to fund shareholder redemptions or for other short-term liquidity purposes. The Fund has agreed to pay commitment fees on its pro-rata portion of the line of credit, which amounted to $8,954 and is reflected in Miscellaneous expenses on the Statement of Operations. During the period, there were no borrowings on this line of credit.
Annual Report
Notes to Financial Statements - continued
7. Security Lending.
The Fund lends portfolio securities through a lending agent from time to time in order to earn additional income. For equity securities, a lending agent is used and may loan securities to certain qualified borrowers, including Fidelity Capital Markets (FCM), a broker-dealer affiliated with the Fund. On the settlement date of the loan, the Fund receives collateral (in the form of U.S. Treasury obligations, letters of credit and/or cash) against the loaned securities and maintains collateral in an amount not less than 100% of the market value of the loaned securities during the period of the loan. The market value of the loaned securities is determined at the close of business of the Fund and any additional required collateral is delivered to the Fund on the next business day. If the borrower defaults on its obligation to return the securities loaned because of insolvency or other reasons, a fund could experience delays and costs in recovering the securities loaned or in gaining access to the collateral. Any cash collateral received is invested in the Fidelity Securities Lending Cash Central Fund. The value of loaned securities and cash collateral at period end are disclosed on the Fund's Statement of Assets and Liabilities. The value of securities loaned to FCM at period end was $15,678,260. Security lending income represents the income earned on investing cash collateral, less rebates paid to borrowers and any lending agent fees associated with the loan, plus any premium payments received for lending certain types of securities. Security lending income is presented in the Statement of Operations as a component of income from Fidelity Central Funds. Total security lending income during the period amounted to $1,315,446, including $278,974 from securities loaned to FCM.
8. Expense Reductions.
Many of the brokers with whom FMR places trades on behalf of the Fund provided services to the Fund in addition to trade execution. These services included payments of certain expenses on behalf of the Fund totaling $362,871 for the period.
In addition, FMR reimbursed a portion of the Fund's operating expenses during the period in the amount of $ 20,042.
9. Other.
The Fund's organizational documents provide former and current trustees and officers with a limited indemnification against liabilities arising in connection with the performance of their duties to the Fund. In the normal course of business, the Fund may also enter into contracts that provide general indemnifications. The Fund's maximum exposure under these arrangements is unknown as this would be dependent on future claims that may be made against the Fund. The risk of material loss from such claims is considered remote.
Annual Report
Report of Independent Registered Public Accounting Firm
To the Trustees of Fidelity Commonwealth Trust and Shareholders of Fidelity Small Cap Discovery Fund:
We have audited the accompanying statement of assets and liabilities of Fidelity Small Cap Discovery Fund (the Fund), a fund of Fidelity Commonwealth Trust, including the schedule of investments, as of April 30, 2013, and the related statement of operations for the year then ended, the statement of changes in net assets for each of the two years in the period then ended, and the financial highlights for each of the five years in the period then ended. These financial statements and financial highlights are the responsibility of the Fund's management. Our responsibility is to express an opinion on these financial statements and financial highlights based on our audits.
We conducted our audits in accordance with the standards of the Public Company Accounting Oversight Board (United States). Those standards require that we plan and perform the audit to obtain reasonable assurance about whether the financial statements and financial highlights are free of material misstatement. The Fund is not required to have, nor were we engaged to perform, an audit of its internal control over financial reporting. Our audits included consideration of internal control over financial reporting as a basis for designing audit procedures that are appropriate in the circumstances, but not for the purpose of expressing an opinion on the effectiveness of the Fund's internal control over financial reporting. Accordingly, we express no such opinion. An audit also includes examining, on a test basis, evidence supporting the amounts and disclosures in the financial statements, assessing the accounting principles used and significant estimates made by management, as well as evaluating the overall financial statement presentation. Our procedures included confirmation of securities owned as of April 30, 2013, by correspondence with the custodians and brokers; where replies were not received from brokers, we performed other auditing procedures. We believe that our audits provide a reasonable basis for our opinion.
In our opinion, the financial statements and financial highlights referred to above present fairly, in all material respects, the financial position of Fidelity Small Cap Discovery Fund as of April 30, 2013, the results of its operations for the year then ended, the changes in its net assets for each of the two years in the period then ended, and the financial highlights for each of the five years in the period then ended, in conformity with accounting principles generally accepted in the United States of America.
DELOITTE & TOUCHE LLP
Boston, Massachusetts
June 11, 2013
Annual Report
Trustees and Officers
The Trustees, Members of the Advisory Board, and executive officers of the trust and fund, as applicable, are listed below. The Board of Trustees governs the fund and is responsible for protecting the interests of shareholders. The Trustees are experienced executives who meet periodically throughout the year to oversee the fund's activities, review contractual arrangements with companies that provide services to the fund, oversee management of the risks associated with such activities and contractual arrangements, and review the fund's performance. Except for James C. Curvey, each of the Trustees oversees 234 Fidelity funds. Mr. Curvey oversees 453 Fidelity funds.
The Trustees hold office without limit in time except that (a) any Trustee may resign; (b) any Trustee may be removed by written instrument, signed by at least two-thirds of the number of Trustees prior to such removal; (c) any Trustee who requests to be retired or who has become incapacitated by illness or injury may be retired by written instrument signed by a majority of the other Trustees; and (d) any Trustee may be removed at any special meeting of shareholders by a two-thirds vote of the outstanding voting securities of the trust. Each Trustee who is not an interested person of the trust and the fund (as defined in the 1940 Act) (Independent Trustee), shall retire not later than the last day of the calendar year in which his or her 75th birthday occurs. The Independent Trustees may waive this mandatory retirement age policy with respect to individual Trustees. The executive officers and Advisory Board Members hold office without limit in time, except that any officer and Advisory Board Member may resign or may be removed by a vote of a majority of the Trustees at any regular meeting or any special meeting of the Trustees. Except as indicated, each individual has held the office shown or other offices in the same company for the past five years.
Experience, Skills, Attributes, and Qualifications of the Fund's Trustees. The Governance and Nominating Committee has adopted a statement of policy that describes the experience, qualifications, attributes, and skills that are necessary and desirable for potential Independent Trustee candidates (Statement of Policy). The Board believes that each Trustee satisfied at the time he or she was initially elected or appointed a Trustee, and continues to satisfy, the standards contemplated by the Statement of Policy. The Governance and Nominating Committee also engages professional search firms to help identify potential Independent Trustee candidates who have the experience, qualifications, attributes, and skills consistent with the Statement of Policy. From time to time, additional criteria based on the composition and skills of the current Independent Trustees, as well as experience or skills that may be appropriate in light of future changes to board composition, business conditions, and regulatory or other developments, have also been considered by the professional search firms and the Governance and Nominating Committee. In addition, the Board takes into account the Trustees' commitment and participation in Board and committee meetings, as well as their leadership of standing and ad hoc committees throughout their tenure.
In determining that a particular Trustee was and continues to be qualified to serve as a Trustee, the Board has considered a variety of criteria, none of which, in isolation, was controlling. The Board believes that, collectively, the Trustees have balanced and diverse experience, qualifications, attributes, and skills, which allow the Board to operate effectively in governing the fund and protecting the interests of shareholders. Information about the specific experience, skills, attributes, and qualifications of each Trustee, which in each case led to the Board's conclusion that the Trustee should serve (or continue to serve) as a trustee of the fund, is provided below.
Annual Report
Trustees and Officers - continued
Board Structure and Oversight Function. James C. Curvey is an interested person (as defined in the 1940 Act) and currently serves as Chairman. The Trustees have determined that an interested Chairman is appropriate and benefits shareholders because an interested Chairman has a personal and professional stake in the quality and continuity of services provided to the fund. Independent Trustees exercise their informed business judgment to appoint an individual of their choosing to serve as Chairman, regardless of whether the Trustee happens to be independent or a member of management. The Independent Trustees have determined that they can act independently and effectively without having an Independent Trustee serve as Chairman and that a key structural component for assuring that they are in a position to do so is for the Independent Trustees to constitute a substantial majority for the Board. The Independent Trustees also regularly meet in executive session. Ned C. Lautenbach serves as Chairman of the Independent Trustees and as such (i) acts as a liaison between the Independent Trustees and management with respect to matters important to the Independent Trustees and (ii) with management prepares agendas for Board meetings.
Fidelity funds are overseen by different Boards of Trustees. The fund's Board oversees Fidelity's equity and high income funds and another Board oversees Fidelity's investment-grade bond, money market, and asset allocation funds. The asset allocation funds may invest in Fidelity funds overseen by the fund's Board. The use of separate Boards, each with its own committee structure, allows the Trustees of each group of Fidelity funds to focus on the unique issues of the funds they oversee, including common research, investment, and operational issues. On occasion, the separate Boards establish joint committees to address issues of overlapping consequences for the Fidelity funds overseen by each Board.
The Trustees operate using a system of committees to facilitate the timely and efficient consideration of all matters of importance to the Trustees, the fund, and fund shareholders and to facilitate compliance with legal and regulatory requirements and oversight of the fund's activities and associated risks. The Board, acting through its committees, has charged FMR and its affiliates with (i) identifying events or circumstances the occurrence of which could have demonstrably adverse effects on the fund's business and/or reputation; (ii) implementing processes and controls to lessen the possibility that such events or circumstances occur or to mitigate the effects of such events or circumstances if they do occur; and (iii) creating and maintaining a system designed to evaluate continuously business and market conditions in order to facilitate the identification and implementation processes described in (i) and (ii) above. Because the day-to-day operations and activities of the fund are carried out by or through FMR, its affiliates and other service providers, the fund's exposure to risks is mitigated but not eliminated by the processes overseen by the Trustees. While each of the Board's committees has responsibility for overseeing different aspects of the fund's activities, oversight is exercised primarily through the Operations, Audit, and Compliance Committees. In addition, the Independent Trustees have worked with FMR to enhance the Board's oversight of investment and financial risks, legal and regulatory risks, technology risks, and operational risks, including the development of additional risk reporting to the Board. For example, a working group comprised of Independent Trustees and FMR has worked and continues to work to review the Fidelity funds' valuation-related activities, reporting and risk management. Appropriate personnel, including but not limited to the fund's Chief Compliance Officer (CCO), FMR's internal auditor, the independent accountants, the fund's Treasurer and portfolio management personnel, make periodic reports to the Board's committees, as appropriate, including an annual review of FMR's risk management program for the Fidelity funds. The responsibilities of each standing committee, including their oversight responsibilities, are described further under "Standing Committees of the Fund's Trustees."
Annual Report
The fund's Statement of Additional Information (SAI) includes more information about the Trustees. To request a free copy, call Fidelity at 1-800-544-8544.
Interested Trustees*:
Correspondence intended for each Trustee who is an interested person may be sent to Fidelity Investments, 245 Summer Street, Boston, Massachusetts 02210.
Name, Year of Birth; Principal Occupations and Other Relevant Experience+ | |
James C. Curvey (1935) | |
| Year of Election or Appointment: 2007 Mr. Curvey is Trustee and Chairman of the Board of Trustees of certain Trusts. Mr. Curvey also serves as Trustee (2007-present) of other investment companies advised by FMR. Mr. Curvey is a Director of Fidelity Investments Money Management, Inc. (2009-present), Director of Fidelity Research & Analysis Co. (2009-present) and Director of FMR and FMR Co., Inc. (2007-present). Mr. Curvey is also Vice Chairman (2007-present) and Director of FMR LLC. In addition, Mr. Curvey serves as an Overseer for the Boston Symphony Orchestra and a member of the Trustees of Villanova University. Previously, Mr. Curvey was the Vice Chairman (2006-2007) and Director (2000-2007) of FMR Corp. |
Ronald P. O'Hanley (1957) | |
| Year of Election or Appointment: 2011 Mr. O'Hanley is Director of FMR Co., Inc. (2010-present), Director of Fidelity Investments Money Management, Inc. (2010-present), Director of Fidelity Research & Analysis Company (2010-present), President of Fidelity Asset Management and Corporate Services and a member of Fidelity's Executive Committee (2010-present). Previously, Mr. O'Hanley served as President and Chief Executive Officer of BNY Mellon Asset Management (2007-2010). Mr. O'Hanley also served as Vice Chairman of Bank New York Mellon Corp. and a member of that firm's Executive Committee. Prior to the 2007 merger of The Bank of New York and Mellon Financial Corporation, he was Vice Chairman of Mellon Financial Corporation and President and Chief Executive Officer of Mellon Asset Management. He joined Mellon in February 1997. Mr. O'Hanley currently serves as Chairman of the Boston Public Library Foundation Board of Directors and sits on the Board of Directors of Beth Israel Deaconess Medical Center, the Board of Trustees of the Marine Biological Laboratory and the Advisory Board of the Maxwell School of Citizenship and Public Administration at Syracuse University. Mr. O'Hanley also chairs the Council on Asset Management for the Financial Services Roundtable and is a member of the Board of Directors of Institutional Investor's U.S. Institute. |
* Trustees have been determined to be "Interested Trustees" by virtue of, among other things, their affiliation with the trust or various entities under common control with FMR.
+ The information above includes each Trustee's principal occupation during the last five years and other information relating to the experience, attributes, and skills relevant to each Trustee's qualifications to serve as a Trustee, which led to the conclusion that each Trustee should serve as a Trustee for the fund.
Annual Report
Independent Trustees:
Correspondence intended for each Independent Trustee (that is, the Trustees other than the Interested Trustees) may be sent to Fidelity Investments, P.O. Box 55235, Boston, Massachusetts 02205-5235.
Name, Year of Birth; Principal Occupations and Other Relevant Experience+ | |
Dennis J. Dirks (1948) | |
| Year of Election or Appointment: 2005 Prior to his retirement in May 2003, Mr. Dirks was Chief Operating Officer and a member of the Board of The Depository Trust & Clearing Corporation (DTCC). He also served as President, Chief Operating Officer, and Board member of The Depository Trust Company (DTC) and President and Board member of the National Securities Clearing Corporation (NSCC). In addition, Mr. Dirks served as Chief Executive Officer and Board member of the Government Securities Clearing Corporation, Chief Executive Officer and Board member of the Mortgage-Backed Securities Clearing Corporation, as a Trustee and a member of the Finance Committee of Manhattan College (2005-2008), and as a Trustee and a member of the Finance Committee of AHRC of Nassau County (2006-2008). Mr. Dirks is a member of the Independent Directors Council (IDC) Governing Council (2010-present) and Board of Directors for The Brookville Center for Children's Services, Inc. (2009-present). |
Alan J. Lacy (1953) | |
| Year of Election or Appointment: 2008 Mr. Lacy serves as Senior Adviser (2007-present) of Oak Hill Capital Partners, L.P. (private equity). Mr. Lacy also served as Chief Executive Officer (2000-2005) and Vice Chairman (2005-2006) of Sears Holdings Corporation and Sears, Roebuck and Co. (retail). In addition, Mr. Lacy serves as a member of the Board of Directors of Dave & Buster's Entertainment, Inc. (restaurant and entertainment complexes, 2010-present), Earth Fare, Inc. (retail grocery, 2012-present), The Hillman Companies, Inc. (hardware wholesalers, 2010-present), and Bristol-Myers Squibb Company (global pharmaceuticals, 2008-present). Mr. Lacy is a member of the Board of Trustees of The National Parks Conservation Association (2006-present). Previously, Mr. Lacy served as Chairman of the Board of Trustees of the National Parks Conservation Association (2008-2011) and as a member of the Board of Directors for the Western Union Company (global money transfer, 2006-2011). |
Ned C. Lautenbach (1944) | |
| Year of Election or Appointment: 2000 Mr. Lautenbach is Chairman of the Independent Trustees of the Equity and High Income Funds (2006-present). Mr. Lautenbach currently serves as the Lead Director of the Eaton Corporation Board of Directors (diversified industrial, 1997-present). Mr. Lautenbach is Chairman of the Board of Directors of the Philharmonic Center for the Arts in Naples, Florida (2012-present) and a member of the Council on Foreign Relations (1994-present). Previously, Mr. Lautenbach was a Partner/Advisory Partner at Clayton, Dubilier & Rice, LLC (private equity investment, 1998-2010), as well as a Director of Sony Corporation (2006-2007). |
Joseph Mauriello (1944) | |
| Year of Election or Appointment: 2008 Prior to his retirement in January 2006, Mr. Mauriello served in numerous senior management positions including Deputy Chairman and Chief Operating Officer (2004-2005), and Vice Chairman of Financial Services (2002-2004) of KPMG LLP US (professional services, 1965-2005). Mr. Mauriello currently serves as a member of the Board of Directors of XL Group plc. (global insurance and re-insurance, 2006-present). Previously, Mr. Mauriello served as a Director of the Hamilton Funds of the Bank of New York (2006-2007) and of Arcadia Resources Inc. (health care services and products, 2007-2012). |
Robert W. Selander (1950) | |
| Year of Election or Appointment: 2011 Previously, Mr. Selander served as a Member of the Advisory Board of Fidelity's Equity and High Income Funds (2011), Executive Vice Chairman (2010), Chief Executive Officer (2009-2010), and President and Chief Executive Officer (1997-2009) of Mastercard, Inc. |
Cornelia M. Small (1944) | |
| Year of Election or Appointment: 2005 Ms. Small is a member of the Board of Directors (2009-present) and Chair of the Investment Committee (2010-present) of the Teagle Foundation. Ms. Small also serves on the Investment Committee of the Berkshire Taconic Community Foundation (2008-present). Previously, Ms. Small served as Chairperson (2002-2008) and a member of the Investment Committee and Chairperson (2008-2012) and a member of the Board of Trustees of Smith College. In addition, Ms. Small served as Chief Investment Officer, Director of Global Equity Investments, and a member of the Board of Directors of Scudder, Stevens & Clark and Scudder Kemper Investments. |
William S. Stavropoulos (1939) | |
| Year of Election or Appointment: 2002 Mr. Stavropoulos is Vice Chairman of the Independent Trustees of the Equity and High Income Funds (2006-present). Mr. Stavropoulos serves as President and Founder of the Michigan Baseball Foundation, the Great Lakes Loons (2007-present). Mr. Stavropoulos is Chairman Emeritus of the Board of Directors of The Dow Chemical Company, where he previously served in numerous senior management positions, including President, CEO (1995-2000; 2002-2004), Chairman of the Executive Committee (2000-2006), and as a member of the Board of Directors (1990-2006). Currently, Mr. Stavropoulos is Chairman of the Board of Directors of Univar Inc. (global distributor of commodity and specialty chemicals), a Director of Teradata Corporation (data warehousing and technology solutions), and Maersk Inc. (industrial conglomerate), and a member of the Advisory Board for Metalmark Capital LLC (private equity investment, 2005-present). Mr. Stavropoulos is an operating advisor to Clayton, Dubilier & Rice, LLC (private equity investment). In addition, Mr. Stavropoulos is a member of the University of Notre Dame Advisory Council for the College of Science, a Trustee of the Rollin L. Gerstacker Foundation, and a Director of the Naples Philharmonic Center for the Arts. Previously, Mr. Stavropoulos served as a Director of Chemical Financial Corporation (bank holding company, 1993-2012) and Tyco International, Ltd. (multinational manufacturing and services, 2007-2012). |
David M. Thomas (1949) | |
| Year of Election or Appointment: 2008 Previously, Mr. Thomas served as Executive Chairman (2005-2006) and Chairman and Chief Executive Officer (2000-2005) of IMS Health, Inc. (pharmaceutical and healthcare information solutions), and a Director of Fortune Brands, Inc. (consumer products, 2000-2011). In addition, Mr. Thomas serves as Non-Executive Chairman of the Board of Directors of Fortune Brands Home and Security (home and security products, 2011-present), and as a member of the Board of Directors of Interpublic Group of Companies, Inc. (marketing communication, 2004-present). |
Michael E. Wiley (1950) | |
| Year of Election or Appointment: 2008 Mr. Wiley also serves as a Director of Asia Pacific Exploration Consolidated (international oil and gas exploration and production, 2008-present). Mr. Wiley serves as a Director of Tesoro Corporation (independent oil refiner and marketer, 2005-present), and a Director of Bill Barrett Corporation (exploration and production, 2005-present). In addition, Mr. Wiley also serves as a Director of Post Oak Bank (privately-held bank, 2004-present). Previously, Mr. Wiley served as a member of the Board of Trustees of the University of Tulsa (2000-2006; 2007-2010), as a Senior Energy Advisor of Katzenbach Partners, LLC (consulting, 2006-2007), as an Advisory Director of Riverstone Holdings (private investment), Chairman, President, and CEO of Baker Hughes, Inc. (oilfield services, 2000-2004), and as Director of Spinnaker Exploration Company (exploration and production, 2001-2005). |
+ The information above includes each Trustee's principal occupation during the last five years and other information relating to the experience, attributes, and skills relevant to each Trustee's qualifications to serve as a Trustee, which led to the conclusion that each Trustee should serve as a Trustee for the fund.
Advisory Board Members and Executive Officers:
Correspondence intended for David A. Rosow and Garnett A. Smith may be sent to Fidelity Investments, P.O. Box 55235, Boston, Massachusetts 02205-5235. Correspondence intended for each executive officer and Peter S. Lynch may be sent to Fidelity Investments, 245 Summer Street, Boston, Massachusetts 02210.
Name, Year of Birth; Principal Occupation | |
Peter S. Lynch (1944) | |
| Year of Election or Appointment: 2003 Member of the Advisory Board of Fidelity's Equity and High Income Funds. Mr. Lynch is Vice Chairman and a Director of FMR and FMR Co., Inc. In addition, Mr. Lynch serves as a Trustee of Boston College and as the Chairman of the Inner-City Scholarship Fund. Previously, Mr. Lynch served on the Special Olympics International Board of Directors (1997-2006). |
David A. Rosow (1942) | |
| Year of Election or Appointment: 2012 Member of the Advisory Board of Fidelity's Equity and High Income Funds. Chairman and Chief Executive Officer of International Golf Group, Inc. (golf course development, 1989-present). Previously, Mr. Rosow served as Chairman and Chief Executive Officer of Rosow & Company, Inc. (private investment company, 1989-2011), a Lead Director of Hudson United Bancorp (2001-2006) and as a Director of TD Banknorth (1996-2006). In addition, Mr. Rosow is a member (2008-present) and President (2009-present) of the Town Council of Palm Beach, Florida. |
Garnett A. Smith (1947) | |
| Year of Election or Appointment: 2012 Member of the Advisory Board of Fidelity's Equity and High Income Funds. Prior to Mr. Smith's retirement, he served as Chairman and Chief Executive Officer of Inbrand Corp. (manufacturer of personal absorbent products, 1990-1997). He also served as President (1986-1990) of Inbrand Corp. Prior to his employment with Inbrand Corp., he was employed by a retail fabric chain and North Carolina National Bank. In addition, Mr. Smith is a board member of the Jackson Hole Land Trust (2009-present). |
Kenneth B. Robins (1969) | |
| Year of Election or Appointment: 2008 President and Treasurer of Fidelity's Equity and High Income Funds. Mr. Robins also serves as President and Treasurer (2010-present) and Assistant Treasurer (2009-present) of other Fidelity funds and is an employee of Fidelity Investments (2004-present). Previously, Mr. Robins served as Deputy Treasurer of the Fidelity funds (2005-2008) and Treasurer and Chief Financial Officer of The North Carolina Capital Management Trust: Cash and Term Portfolios (2006-2008). |
Brian B. Hogan (1964) | |
| Year of Election or Appointment: 2009 Vice President of Equity and High Income Funds. Mr. Hogan also serves as President of FMR's Equity Division (2009-present). Previously, Mr. Hogan served as Senior Vice President, Equity Research of FMR (2006-2009) and as a portfolio manager. |
Thomas C. Hense (1964) | |
| Year of Election or Appointment: 2008 or 2010 Vice President of Fidelity's High Income (2008), Small Cap (2008), and Value (2010) Funds. Previously, Mr. Hense served as a portfolio manager for Fidelity's Institutional Money Management Group (Pyramis) (2003-2008). |
Scott C. Goebel (1968) | |
| Year of Election or Appointment: 2008 Secretary and Chief Legal Officer (CLO) of the Fidelity funds. Mr. Goebel also serves as Secretary of Fidelity Investments Money Management, Inc. (FIMM) (2010-present) and Fidelity Research and Analysis Company (FRAC) (2010-present); Secretary and CLO of The North Carolina Capital Management Trust: Cash and Term Portfolios (2008-present); General Counsel, Secretary, and Senior Vice President of FMR (2008-present) and FMR Co., Inc. (2008-present); employed by FMR LLC or an affiliate (2001-present); Chief Legal Officer of Fidelity Management & Research (Hong Kong) Limited (2008-present) and Assistant Secretary of Fidelity Management & Research (Japan) Inc. (2008-present), and Fidelity Management & Research (U.K.) Inc. (2008-present). Previously, Mr. Goebel served as Assistant Secretary of FIMM (2008-2010), FRAC (2008-2010), and the Funds (2007-2008) and as Vice President and Secretary of Fidelity Distributors Corporation (FDC) (2005-2007). |
William C. Coffey (1969) | |
| Year of Election or Appointment: 2009 Assistant Secretary of Fidelity's Equity and High Income Funds. Mr. Coffey also serves as Senior Vice President and Deputy General Counsel of FMR LLC (2010-present), and is an employee of Fidelity Investments. Previously, Mr. Coffey served as Vice President and Associate General Counsel of FMR LLC (2005-2009). |
Elizabeth Paige Baumann (1968) | |
| Year of Election or Appointment: 2012 Anti-Money Laundering (AML) Officer of the Fidelity funds. Ms. Baumann also serves as AML Officer of The North Carolina Capital Management Trust: Cash and Term Portfolios (2012-present), Chief AML Officer of FMR LLC (2012-present), and is an employee of Fidelity Investments. Previously, Ms. Baumann served as Vice President and Deputy Anti-Money Laundering Officer (2007-2012). |
Christine Reynolds (1958) | |
| Year of Election or Appointment: 2008 Chief Financial Officer of the Fidelity funds. Ms. Reynolds became President of Fidelity Pricing and Cash Management Services (FPCMS) in August 2008. Ms. Reynolds served as Chief Operating Officer of FPCMS (2007-2008). Previously, Ms. Reynolds served as President, Treasurer, and Anti-Money Laundering officer of the Fidelity funds (2004-2007). |
Joseph A. Hanlon (1968) | |
| Year of Election or Appointment: 2012 Chief Compliance Officer of Fidelity's Equity and High Income Funds. Mr. Hanlon serves as Compliance Officer of FMR, FMR Co., Inc., Fidelity Investments Money Management, Inc. (FIMM), Fidelity Research and Analysis Company (FRAC), Fidelity Management & Research (U.K.) Inc., Fidelity Management & Research (Hong Kong), and Strategic Advisers, Inc. (2009-present), as Senior Vice President of the Fidelity Asset Management Division (2009-present), and is an employee of Fidelity Investments. Previously, Mr. Hanlon served as Compliance Officer of Fidelity Management & Research (Japan) Inc. (2009-2013). |
Joseph F. Zambello (1957) | |
| Year of Election or Appointment: 2011 Deputy Treasurer of the Fidelity funds. Mr. Zambello is an employee of Fidelity Investments. Previously, Mr. Zambello served as Vice President of FMR's Program Management Group (2009-2011) and Vice President of the Transfer Agent Oversight Group (2005-2009). |
Adrien E. Deberghes (1967) | |
| Year of Election or Appointment: 2008 Deputy Treasurer of Fidelity's Equity and High Income Funds. Mr. Deberghes also serves as Vice President (2011-present) and Assistant Treasurer (2010-present) of other Fidelity funds, and is an employee of Fidelity Investments (2008-present). Previously, Mr. Deberghes served as Senior Vice President of Mutual Fund Administration at State Street Corporation (2007-2008), Senior Director of Mutual Fund Administration at Investors Bank & Trust (2005-2007), and Director of Finance for Dunkin' Brands (2000-2005). |
Stephen Sadoski (1971) | |
| Year of Election or Appointment: 2012 Deputy Treasurer of Fidelity's Equity and High Income Funds. Mr. Sadoski also serves as Deputy Treasurer of other Fidelity funds (2013-present) and is an employee of Fidelity Investments (2012-present). Previously, Mr. Sadoski served as Assistant Treasurer of Fidelity's Fixed Income and Asset Allocation Funds (2012-2013), an assistant chief accountant in the Division of Investment Management of the Securities and Exchange Commission (SEC) (2009-2012) and as a senior manager at Deloitte & Touche (1997-2009). |
Stacie Smith (1974) | |
| Year of Election or Appointment: 2013 Deputy Treasurer of Fidelity's Equity and High Income Funds. Ms. Smith is an employee of Fidelity Investments (2009-present). Previously, Ms. Smith served as Senior Audit Manager of Ernst & Young LLP (1996-2009). |
Stephanie J. Dorsey (1969) | |
| Year of Election or Appointment: 2010 Assistant Treasurer of Fidelity's Equity and High Income Funds. Ms. Dorsey also serves as President and Treasurer (2013-present) and Assistant Treasurer (2012-present) of other Fidelity funds, Treasurer and Chief Financial Officer of The North Carolina Capital Management Trust: Cash and Term Portfolios (2013-present), and is an employee of Fidelity Investments (2008-present). Previously, Ms. Dorsey served as Deputy Treasurer of Fidelity's Fixed Income and Asset Allocation Funds (2008-2013), Treasurer (2004-2008) of the JPMorgan Mutual Funds and Vice President (2004-2008) of JPMorgan Chase Bank. |
Gary W. Ryan (1958) | |
| Year of Election or Appointment: 2005 Assistant Treasurer of the Fidelity funds. Mr. Ryan is an employee of Fidelity Investments. Previously, Mr. Ryan served as Vice President of Fund Reporting in Fidelity Pricing and Cash Management Services (FPCMS) (1999-2005). |
Jonathan Davis (1968) | |
| Year of Election or Appointment: 2010 Assistant Treasurer of the Fidelity funds. Mr. Davis is also Assistant Treasurer of Fidelity Rutland Square Trust II and Fidelity Commonwealth Trust II. Mr. Davis is an employee of Fidelity Investments. Previously, Mr. Davis served as Vice President and Associate General Counsel of FMR LLC (2003-2010). |
Annual Report
Distributions (Unaudited)
The Board of Trustees of Fidelity Small Cap Discovery Fund voted to pay on June 10, 2013, to shareholders of record at the opening of business on June 07, 2013, a distribution of $0.974 per share derived from capital gains realized from sales of portfolio securities and a dividend of $0.010 per share from net investment income.
The fund hereby designates as a capital gain dividend with respect to the taxable year ended April 30, 2013 $249,844,351, or, if subsequently determined to be different, the net capital gain of such year.
The fund designates 100% of the dividends distributed during the fiscal year as qualifying for the dividends-received deduction for corporate shareholders.
The fund designates 100% of the dividend distributed during the fiscal year as amounts which may be taken into account as a dividend for the purposes of the maximum rate under section 1(h)(11) of the Internal Revenue Code.
The fund will notify shareholders in January 2014 of amounts for use in preparing 2013 income tax returns.
Annual Report
Investment Adviser
Fidelity Management & Research Company
Boston, MA
Investment Sub-Advisers
FMR Co., Inc.
Fidelity Management & Research
(U.K.) Inc.
Fidelity Management & Research
(Japan) Inc.
Fidelity Management & Research
(Hong Kong) Limited
General Distributor
Fidelity Distributors Corporation
Smithfield, RI
Transfer and Service Agents
Fidelity Investments Institutional
Operations Company, Inc.
Boston, MA
Fidelity Service Company, Inc.
Boston, MA
Custodian
State Street Bank and Trust Company
Quincy, MA
The Fidelity Telephone Connection
Mutual Fund 24-Hour Service
Exchanges/Redemptions
and Account Assistance 1-800-544-6666
Product Information 1-800-544-6666
Retirement Accounts 1-800-544-4774
(8 a.m. - 9 p.m.)
TDD Service 1-800-544-0118
for the deaf and hearing impaired
(9 a.m. - 9 p.m. Eastern time)
Fidelity Automated Service
Telephone (FAST®)
1-800-544-5555
Automated line for quickest service
(Fidelity Investment logo)(registered trademark)
Corporate Headquarters
245 Summer St., Boston, MA 02210
www.fidelity.com
SMR-UANN-0613
1.784729.110
Fidelity®
Small Cap Stock
Fund
Annual Report
April 30, 2013
(Fidelity Cover Art)
Contents
Performance | How the fund has done over time. | |
Management's Discussion of Fund Performance | The Portfolio Manager's review of fund performance and strategy. | |
Shareholder Expense Example | An example of shareholder expenses. | |
Investment Changes | A summary of major shifts in the fund's investments over the past six months. | |
Investments | A complete list of the fund's investments with their market values. | |
Financial Statements | Statements of assets and liabilities, operations, and changes in net assets, as well as financial highlights. | |
Notes | Notes to the financial statements. | |
Report of Independent Registered Public Accounting Firm |
| |
Trustees and Officers |
| |
Distributions |
|
To view a fund's proxy voting guidelines and proxy voting record for the 12-month period ended June 30, visit http://www.fidelity.com/proxyvotingresults or visit the Securities and Exchange Commission's (SEC) web site at http://www.sec.gov. You may also call 1-800-544-8544 to request a free copy of the proxy voting guidelines.
Standard & Poor's, S&P and S&P 500 are registered service marks of The McGraw-Hill Companies, Inc. and have been licensed for use by Fidelity Distributors Corporation.
Other third-party marks appearing herein are the property of their respective owners.
All other marks appearing herein are registered or unregistered trademarks or service marks of FMR LLC or an affiliated company. © 2013 FMR LLC. All rights reserved.
Annual Report
This report and the financial statements contained herein are submitted for the general information of the shareholders of the fund. This report is not authorized for distribution to prospective investors in the fund unless preceded or accompanied by an effective prospectus.
A fund files its complete schedule of portfolio holdings with the SEC for the first and third quarters of each fiscal year on Form N-Q. Forms N-Q are available on the SEC's web site at http://www.sec.gov. A fund's Forms N-Q may be reviewed and copied at the SEC's Public Reference Room in Washington, DC. Information regarding the operation of the SEC's Public Reference Room may be obtained by calling 1-800-SEC-0330. For a complete list of a fund's portfolio holdings, view the most recent holdings listing, semiannual report, or annual report on Fidelity's web site at http://www.fidelity.com, http://www.advisor.fidelity.com, or http://www.401k.com, as applicable.
NOT FDIC INSURED • MAY LOSE VALUE • NO BANK GUARANTEE
Neither the fund nor Fidelity Distributors Corporation is a bank.
Annual Report
Performance: The Bottom Line
Average annual total return reflects the change in the value of an investment, assuming reinvestment of the fund's distributions from dividend income and capital gains (the profits earned upon the sale of securities that have grown in value, if any) and assuming a constant rate of performance each year. The $10,000 table and the fund's returns do not reflect the deduction of taxes that a shareholder would pay on fund distributions or the redemption of fund shares. During periods of reimbursement by Fidelity, a fund's total return will be greater than it would be had the reimbursement not occurred. How a fund did yesterday is no guarantee of how it will do tomorrow.
Average Annual Total Returns
Periods ended April 30, 2013 | Past 1 | Past 5 | Past 10 |
Fidelity® Small Cap Stock Fund | 10.52% | 5.29% | 9.96% |
$10,000 Over 10 Years
Let's say hypothetically that $10,000 was invested in Fidelity® Small Cap Stock Fund on April 30, 2003. The chart shows how the value of your investment would have changed, and also shows how the Russell 2000® Index performed over the same period.
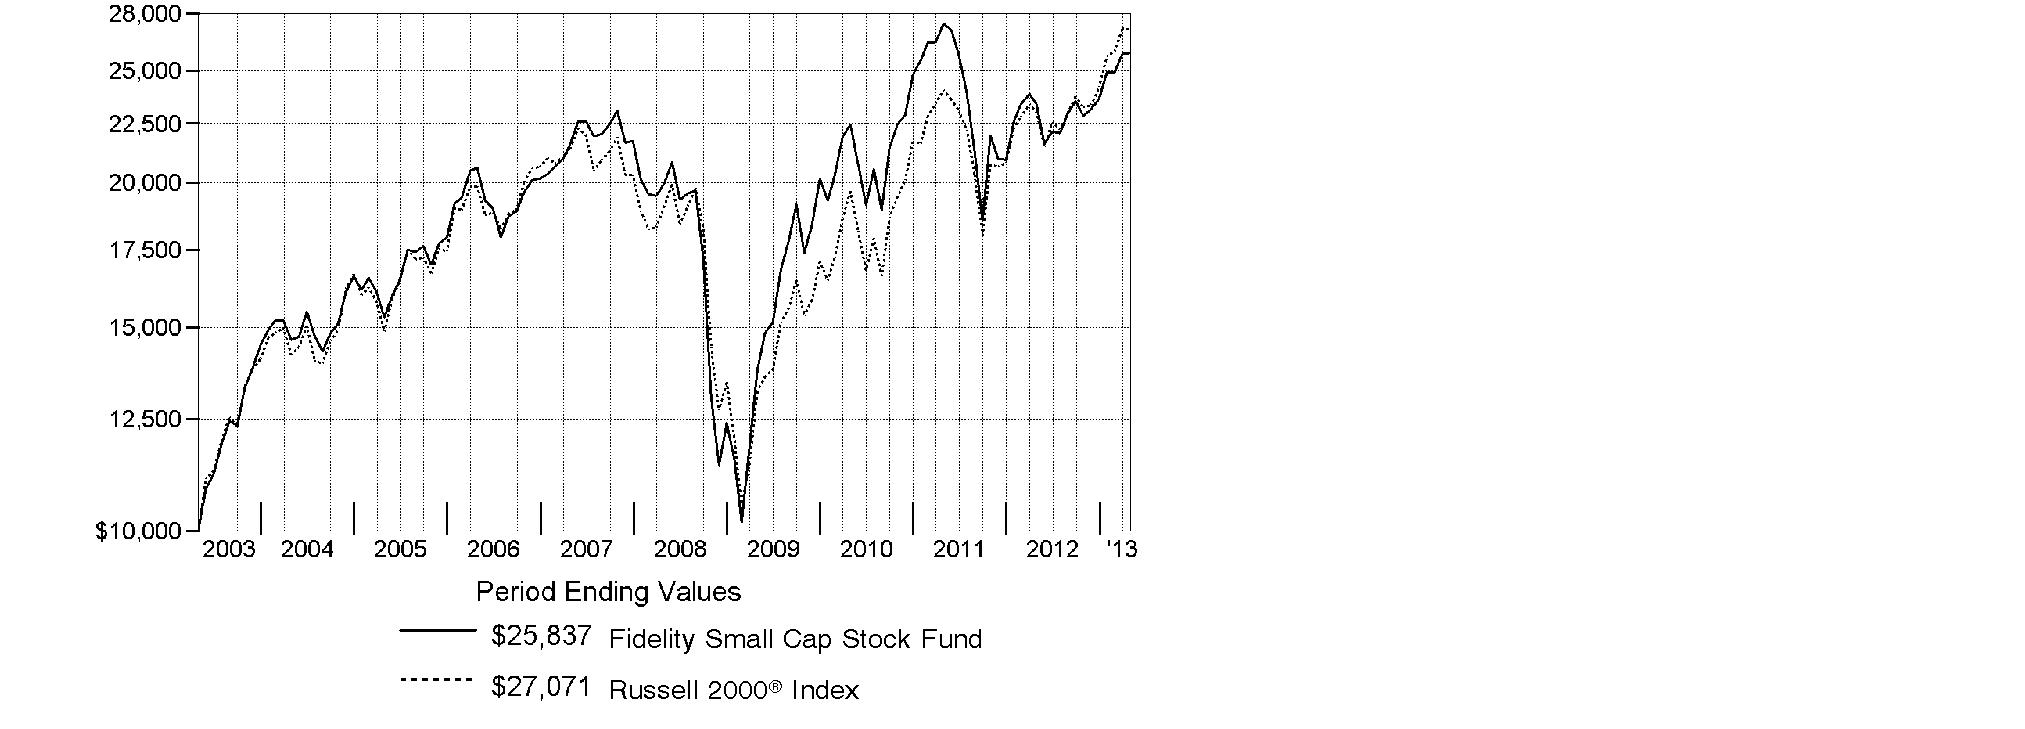
Annual Report
Management's Discussion of Fund Performance
Market Recap: The bull run in U.S. stocks entered its fifth year and two major equity benchmarks reached record territory during the 12 months ending April 30, 2013, as gains in the global economy and more monetary stimulus from the U.S. Federal Reserve kept markets on the upswing for much of the period. Optimism over the nation's jobs picture and housing market teamed up with solid corporate earnings to make stocks a favorite with investors during the 12-month period. The broad-based S&P 500® Index finished the year up 16.89%, closing at a new all-time high, while the blue-chip-laden Dow Jones Industrial AverageSM - which broke its own record in early March - gained 15.39% for the full 12 months. The growth- oriented Nasdaq Composite Index® advanced a more modest 10.78%, curtailed by the weak performance of consumer electronics giant Apple, a large index component. During the year, markets shrugged off an early decline brought on by debt woes in Europe, and another dip later in the period amid pre-election jitters and Congressional gridlock over the federal budget. The year's gains were broad-based, with nine of the 10 sectors in the S&P 500® posting a double-digit increase, led by health care and telecommunication services, while information technology added only about 2%. Despite the headwind of a stronger U.S. dollar, foreign developed-markets stocks rose strongly, with the MSCI® EAFE® Index returning 19.53%.
Comments from Lionel Harris, Portfolio Manager of Fidelity® Small Cap Stock Fund: For the year, the fund returned 10.52%, versus 17.69% for the Russell 2000® Index. Poor stock picking in the retail, consumer services and technology hardware/equipment industries and in the industrials sector were big negatives, as was the fund's modest cash weighting, which further hampered performance in a rising market. However, the financials and materials sectors were sources of relative strength. In information technology, Acme Packet - an out-of-benchmark stock whose software helps companies complete voice calls routed over the Internet - and Bankrate, an online publisher of financial information, both hurt. (Acme was not in the fund at period end.) The fund's biggest individual detractor was specialty apparel retailer Body Central, whose shares I liquidated after two weaker-than-expected earnings forecasts during the first half of the period. In contrast, JDA Software Group, a maker of supply-chain management software, and semiconductor company Standard Microsystems benefited from being acquired by competitors for a premium price during the period. Neither stock was in the portfolio at period end.
The views expressed above reflect those of the portfolio manager(s) only through the end of the period as stated on the cover of this report and do not necessarily represent the views of Fidelity or any other person in the Fidelity organization. Any such views are subject to change at any time based upon market or other conditions and Fidelity disclaims any responsibility to update such views. These views may not be relied on as investment advice and, because investment decisions for a Fidelity fund are based on numerous factors, may not be relied on as an indication of trading intent on behalf of any Fidelity fund.
Annual Report
Shareholder Expense Example
As a shareholder of the Fund, you incur two types of costs: (1) transaction costs, including redemption fees and (2) ongoing costs, including management fees and other Fund expenses. This Example is intended to help you understand your ongoing costs (in dollars) of investing in the Fund and to compare these costs with the ongoing costs of investing in other mutual funds.
The Example is based on an investment of $1,000 invested at the beginning of the period and held for the entire period (November 1, 2012 to April 30, 2013).
Actual Expenses
The first line of the accompanying table provides information about actual account values and actual expenses. You may use the information in this line, together with the amount you invested, to estimate the expenses that you paid over the period. Simply divide your account value by $1,000.00 (for example, an $8,600 account value divided by $1,000.00 = 8.6), then multiply the result by the number in the first line under the heading entitled "Expenses Paid During Period" to estimate the expenses you paid on your account during this period. A small balance maintenance fee of $12.00 that is charged once a year may apply for certain accounts with a value of less than $2,000. This fee is not included in the table below. If it was, the estimate of expenses you paid during the period would be higher, and your ending account value lower, by this amount. In addition, the Fund, as a shareholder in the underlying Fidelity Central Funds, will indirectly bear its pro-rata share of the fees and expenses incurred by the underlying Fidelity Central Funds. These fees and expenses are not included in the Fund's annualized expense ratio used to calculate the expense estimate in the table below.
Hypothetical Example for Comparison Purposes
The second line of the accompanying table provides information about hypothetical account values and hypothetical expenses based on the Fund's actual expense ratio and an assumed rate of return of 5% per year before expenses, which is not the Fund's actual return. The hypothetical account values and expenses may not be used to estimate the actual ending account balance or expenses you paid for the period. You may use this information to compare the ongoing costs of investing in the Fund and other funds. To do so, compare this 5% hypothetical example with the 5% hypothetical examples that appear in the shareholder reports of the other funds. A small balance maintenance fee of $12.00 that is charged once a year may apply for certain accounts with a value of less than $2,000. This fee is not included in the table below. If it was, the estimate of expenses you paid during the period would be higher, and your ending account value lower, by this amount. In addition, the Fund, as a shareholder in the underlying Fidelity Central Funds, will indirectly bear its pro-rata share of the fees and expenses incurred by the underlying Fidelity Central Funds. These fees and expenses are not included in the Fund's annualized expense ratio used to calculate the expense estimate in the table below.
Please note that the expenses shown in the table are meant to highlight your ongoing costs only and do not reflect any transaction costs. Therefore, the second line of the table is useful in comparing ongoing costs only, and will not help you determine the relative total costs of owning different funds. In addition, if these transactional costs were included, your costs would have been higher.
Annual Report
Shareholder Expense Example - continued
| Annualized | Beginning | Ending | Expenses Paid |
Actual | .71% | $ 1,000.00 | $ 1,132.80 | $ 3.75 |
HypotheticalA |
| $ 1,000.00 | $ 1,021.27 | $ 3.56 |
A 5% return per year before expenses
B Annualized expense ratio reflects expenses net of applicable fee waivers.
* Expenses are equal to the Fund's annualized expense ratio, multiplied by the average account value over the period, multiplied by 181/365 (to reflect the one-half year period).
Annual Report
Investment Changes (Unaudited)
Top Ten Stocks as of April 30, 2013 | ||
| % of fund's | % of fund's net assets |
Cleco Corp. | 1.6 | 1.2 |
Esterline Technologies Corp. | 1.5 | 0.7 |
UMB Financial Corp. | 1.4 | 1.0 |
City National Corp. | 1.4 | 1.1 |
Silgan Holdings, Inc. | 1.4 | 1.1 |
Allied World Assurance Co. Holdings Ltd. | 1.4 | 1.1 |
Texas Capital Bancshares, Inc. | 1.4 | 1.0 |
Tenneco, Inc. | 1.3 | 0.7 |
Rosetta Resources, Inc. | 1.3 | 0.6 |
Watsco, Inc. | 1.3 | 0.5 |
| 14.0 | |
Top Five Market Sectors as of April 30, 2013 | ||
| % of fund's | % of fund's net assets |
Financials | 19.8 | 18.7 |
Information Technology | 17.3 | 17.9 |
Industrials | 15.9 | 18.4 |
Health Care | 15.0 | 15.1 |
Consumer Discretionary | 12.9 | 12.5 |
Asset Allocation (% of fund's net assets) | |||||||
As of April 30, 2013* | As of October 31, 2012** | ||||||
| Stocks 95.3% |
| | Stocks and |
| ||
| Short-Term |
| | Short-Term |
| ||
* Foreign investments | 13.5% |
| ** Foreign investments | 13.2% |
| ||

Annual Report
Investments April 30, 2013
Showing Percentage of Net Assets
Common Stocks - 94.3% | |||
Shares | Value (000s) | ||
CONSUMER DISCRETIONARY - 12.9% | |||
Auto Components - 1.3% | |||
Tenneco, Inc. (a) | 868,692 | $ 33,592 | |
Hotels, Restaurants & Leisure - 2.5% | |||
Buffalo Wild Wings, Inc. (a) | 215,000 | 19,350 | |
Icahn Enterprises LP rights | 1,235,000 | 0* | |
Life Time Fitness, Inc. (a) | 325,000 | 15,009 | |
Paddy Power PLC (Ireland) | 144,000 | 12,128 | |
Penn National Gaming, Inc. (a) | 260,000 | 15,223 | |
| 61,710 | ||
Household Durables - 1.6% | |||
Cyrela Brazil Realty SA | 2,265,000 | 20,423 | |
KB Home (d) | 870,000 | 19,610 | |
| 40,033 | ||
Internet & Catalog Retail - 0.8% | |||
HSN, Inc. | 405,000 | 21,295 | |
Leisure Equipment & Products - 0.7% | |||
Brunswick Corp. | 550,000 | 17,413 | |
Specialty Retail - 5.1% | |||
Ascena Retail Group, Inc. (a) | 705,000 | 13,043 | |
Citi Trends, Inc. (a) | 330,745 | 3,893 | |
DSW, Inc. Class A | 192,457 | 12,725 | |
Guess?, Inc. | 470,900 | 13,035 | |
OfficeMax, Inc. | 665,000 | 7,654 | |
Penske Automotive Group, Inc. | 660,803 | 20,432 | |
USS Co. Ltd. | 219,000 | 28,094 | |
Vitamin Shoppe, Inc. (a) | 570,000 | 28,016 | |
| 126,892 | ||
Textiles, Apparel & Luxury Goods - 0.9% | |||
Steven Madden Ltd. (a) | 429,955 | 20,909 | |
Tod's SpA (d) | 9,657 | 1,402 | |
| 22,311 | ||
TOTAL CONSUMER DISCRETIONARY | 323,246 | ||
CONSUMER STAPLES - 0.5% | |||
Food & Staples Retailing - 0.5% | |||
Cosmos Pharmaceutical Corp. | 117,000 | 13,048 | |
ENERGY - 6.5% | |||
Energy Equipment & Services - 2.7% | |||
Helix Energy Solutions Group, Inc. (a) | 881,049 | 20,299 | |
Common Stocks - continued | |||
Shares | Value (000s) | ||
ENERGY - continued | |||
Energy Equipment & Services - continued | |||
McDermott International, Inc. (a) | 2,446,700 | $ 26,131 | |
Western Energy Services Corp. (d) | 2,925,000 | 20,411 | |
| 66,841 | ||
Oil, Gas & Consumable Fuels - 3.8% | |||
Alpha Natural Resources, Inc. (a) | 1,299,000 | 9,639 | |
Petrominerales Ltd. (d) | 1,080,000 | 5,960 | |
Rosetta Resources, Inc. (a) | 747,000 | 32,054 | |
Targa Resources Corp. | 390,000 | 25,646 | |
World Fuel Services Corp. | 555,000 | 22,505 | |
| 95,804 | ||
TOTAL ENERGY | 162,645 | ||
FINANCIALS - 18.8% | |||
Capital Markets - 1.6% | |||
AllianceBernstein Holding LP | 820,000 | 19,426 | |
HFF, Inc. | 982,287 | 20,579 | |
| 40,005 | ||
Commercial Banks - 7.4% | |||
Aozora Bank Ltd. | 4,439,000 | 13,908 | |
Bank of the Ozarks, Inc. | 305,500 | 12,504 | |
City National Corp. | 615,000 | 35,196 | |
Cullen/Frost Bankers, Inc. | 381,000 | 23,016 | |
FirstMerit Corp. | 1,725,000 | 29,549 | |
Spar Nord Bank A/S (a) | 128,932 | 829 | |
Texas Capital Bancshares, Inc. (a) | 818,000 | 34,078 | |
UMB Financial Corp. | 705,900 | 35,535 | |
| 184,615 | ||
Insurance - 3.4% | |||
Allied World Assurance Co. Holdings Ltd. | 376,000 | 34,145 | |
Primerica, Inc. | 600,000 | 20,376 | |
Validus Holdings Ltd. | 800,000 | 30,888 | |
| 85,409 | ||
Real Estate Investment Trusts - 5.7% | |||
CBL & Associates Properties, Inc. | 751,900 | 18,151 | |
Coresite Realty Corp. | 681,704 | 24,664 | |
Equity Lifestyle Properties, Inc. | 266,500 | 21,653 | |
Glimcher Realty Trust | 1,200,000 | 15,048 | |
Highwoods Properties, Inc. (SBI) | 337,462 | 13,846 | |
Common Stocks - continued | |||
Shares | Value (000s) | ||
FINANCIALS - continued | |||
Real Estate Investment Trusts - continued | |||
Home Properties, Inc. | 473,988 | $ 30,553 | |
Piedmont Office Realty Trust, Inc. Class A | 900,000 | 18,468 | |
| 142,383 | ||
Real Estate Management & Development - 0.7% | |||
Altisource Portfolio Solutions SA | 201,250 | 16,611 | |
TOTAL FINANCIALS | 469,023 | ||
HEALTH CARE - 15.0% | |||
Biotechnology - 5.4% | |||
Acorda Therapeutics, Inc. (a) | 10,000 | 396 | |
Affymax, Inc. (a)(d) | 460,479 | 414 | |
Alkermes PLC (a) | 782,000 | 23,937 | |
ARIAD Pharmaceuticals, Inc. (a) | 913,446 | 16,323 | |
ArQule, Inc. (a) | 539,138 | 1,590 | |
Astex Pharmaceuticals, Inc. (a) | 162,500 | 1,118 | |
AVEO Pharmaceuticals, Inc. (a) | 95,000 | 485 | |
Biota Pharmaceuticals, Inc. | 14,952 | 63 | |
Codexis, Inc. (a) | 439,796 | 985 | |
Cubist Pharmaceuticals, Inc. (a) | 44,300 | 2,034 | |
Dynavax Technologies Corp. (a)(d) | 3,227,200 | 7,584 | |
Emergent BioSolutions, Inc. (a) | 129,754 | 1,990 | |
Enzon Pharmaceuticals, Inc. | 452,969 | 1,495 | |
Genomic Health, Inc. (a) | 3,234 | 98 | |
ImmunoGen, Inc. (a)(d) | 1,000,000 | 16,020 | |
Mast Therapeutics, Inc. (a)(d) | 181,694 | 122 | |
Maxygen, Inc. | 422,997 | 1,015 | |
Momenta Pharmaceuticals, Inc. (a) | 74,479 | 918 | |
Nanosphere, Inc. (a)(d) | 143,440 | 397 | |
Novavax, Inc. (a) | 2,334,209 | 5,485 | |
NPS Pharmaceuticals, Inc. (a) | 500,000 | 6,715 | |
OncoGenex Pharmaceuticals, Inc. (a) | 83,086 | 842 | |
Rigel Pharmaceuticals, Inc. (a) | 750,000 | 3,593 | |
Spectrum Pharmaceuticals, Inc. | 182,200 | 1,350 | |
Targacept, Inc. (a) | 417,142 | 1,923 | |
Theravance, Inc. (a) | 394,157 | 13,303 | |
United Therapeutics Corp. (a) | 370,000 | 24,709 | |
| 134,904 | ||
Health Care Equipment & Supplies - 2.8% | |||
Align Technology, Inc. (a) | 570,000 | 18,878 | |
Common Stocks - continued | |||
Shares | Value (000s) | ||
HEALTH CARE - continued | |||
Health Care Equipment & Supplies - continued | |||
Cyberonics, Inc. (a) | 429,300 | $ 18,640 | |
ICU Medical, Inc. (a) | 237,190 | 14,291 | |
Integra LifeSciences Holdings Corp. (a) | 488,264 | 17,104 | |
| 68,913 | ||
Health Care Providers & Services - 3.8% | |||
Centene Corp. (a) | 495,000 | 22,869 | |
Chemed Corp. | 218,000 | 17,793 | |
MWI Veterinary Supply, Inc. (a) | 225,000 | 26,485 | |
Team Health Holdings, Inc. (a) | 743,080 | 27,702 | |
| 94,849 | ||
Health Care Technology - 0.6% | |||
HMS Holdings Corp. (a) | 620,000 | 15,630 | |
Pharmaceuticals - 2.4% | |||
Auxilium Pharmaceuticals, Inc. (a) | 25,000 | 373 | |
Dechra Pharmaceuticals PLC | 2,694,059 | 30,047 | |
Impax Laboratories, Inc. (a) | 660,000 | 11,550 | |
ViroPharma, Inc. (a) | 655,000 | 17,849 | |
| 59,819 | ||
TOTAL HEALTH CARE | 374,115 | ||
INDUSTRIALS - 15.9% | |||
Aerospace & Defense - 2.6% | |||
Esterline Technologies Corp. (a) | 503,000 | 37,745 | |
Teledyne Technologies, Inc. (a) | 372,318 | 27,946 | |
| 65,691 | ||
Building Products - 1.1% | |||
Armstrong World Industries, Inc. | 551,072 | 28,127 | |
Commercial Services & Supplies - 1.7% | |||
InnerWorkings, Inc. (a)(d) | 1,600,000 | 16,112 | |
Tetra Tech, Inc. (a) | 1,025,000 | 26,947 | |
| 43,059 | ||
Construction & Engineering - 1.1% | |||
AECOM Technology Corp. (a) | 910,063 | 26,456 | |
Electrical Equipment - 1.8% | |||
Brady Corp. Class A | 574,100 | 19,451 | |
Prysmian SpA | 1,284,300 | 25,929 | |
| 45,380 | ||
Common Stocks - continued | |||
Shares | Value (000s) | ||
INDUSTRIALS - continued | |||
Machinery - 3.4% | |||
Actuant Corp. Class A | 948,026 | $ 29,673 | |
Graco, Inc. | 236,559 | 14,319 | |
Snap-On, Inc. | 254,000 | 21,895 | |
Wabtec Corp. | 182,000 | 19,099 | |
| 84,986 | ||
Professional Services - 1.5% | |||
Dun & Bradstreet Corp. | 246,444 | 21,798 | |
Kforce, Inc. | 954,978 | 14,439 | |
| 36,237 | ||
Trading Companies & Distributors - 2.7% | |||
MRC Global, Inc. | 430,500 | 12,893 | |
Watsco, Inc. | 370,000 | 31,221 | |
WESCO International, Inc. (a) | 319,900 | 22,934 | |
| 67,048 | ||
TOTAL INDUSTRIALS | 396,984 | ||
INFORMATION TECHNOLOGY - 17.3% | |||
Communications Equipment - 3.5% | |||
Brocade Communications Systems, Inc. (a) | 3,948,600 | 22,981 | |
Finisar Corp. (a)(d) | 1,741,000 | 22,354 | |
Polycom, Inc. (a) | 2,278,800 | 23,927 | |
Riverbed Technology, Inc. (a) | 1,286,000 | 19,110 | |
| 88,372 | ||
Electronic Equipment & Components - 0.6% | |||
ScanSource, Inc. (a) | 512,100 | 14,836 | |
Internet Software & Services - 2.0% | |||
Bankrate, Inc. (a) | 1,630,000 | 21,972 | |
SciQuest, Inc. (a) | 623,605 | 14,256 | |
SPS Commerce, Inc. (a) | 284,900 | 13,427 | |
| 49,655 | ||
IT Services - 3.2% | |||
Broadridge Financial Solutions, Inc. | 1,018,000 | 25,633 | |
ExlService Holdings, Inc. (a) | 634,000 | 20,681 | |
Maximus, Inc. | 262,500 | 20,919 | |
Total System Services, Inc. | 545,000 | 12,873 | |
| 80,106 | ||
Semiconductors & Semiconductor Equipment - 3.2% | |||
Cypress Semiconductor Corp. | 1,300,176 | 13,119 | |
Common Stocks - continued | |||
Shares | Value (000s) | ||
INFORMATION TECHNOLOGY - continued | |||
Semiconductors & Semiconductor Equipment - continued | |||
Entegris, Inc. (a) | 2,580,000 | $ 24,458 | |
ON Semiconductor Corp. (a) | 1,840,000 | 14,462 | |
Skyworks Solutions, Inc. (a) | 1,298,000 | 28,647 | |
| 80,686 | ||
Software - 4.8% | |||
BroadSoft, Inc. (a) | 540,000 | 13,802 | |
Diligent Board Member Services, Inc. (a) | 680,578 | 4,399 | |
Mentor Graphics Corp. | 1,388,170 | 25,348 | |
Parametric Technology Corp. (a) | 1,085,000 | 26,051 | |
Solera Holdings, Inc. | 429,900 | 24,754 | |
Synchronoss Technologies, Inc. (a) | 861,895 | 24,426 | |
| 118,780 | ||
TOTAL INFORMATION TECHNOLOGY | 432,435 | ||
MATERIALS - 5.8% | |||
Chemicals - 1.7% | |||
Chemtura Corp. (a) | 1,234,500 | 26,245 | |
Innospec, Inc. | 390,000 | 17,164 | |
| 43,409 | ||
Containers & Packaging - 1.4% | |||
Silgan Holdings, Inc. | 725,000 | 34,706 | |
Metals & Mining - 1.2% | |||
Commercial Metals Co. | 1,955,800 | 28,594 | |
Paper & Forest Products - 1.5% | |||
P.H. Glatfelter Co. | 834,223 | 20,021 | |
Schweitzer-Mauduit International, Inc. | 443,586 | 17,872 | |
| 37,893 | ||
TOTAL MATERIALS | 144,602 | ||
UTILITIES - 1.6% | |||
Electric Utilities - 1.6% | |||
Cleco Corp. | 822,000 | 40,704 | |
TOTAL COMMON STOCKS (Cost $1,998,288) |
| ||
Nonconvertible Preferred Stocks - 1.0% | |||
Shares | Value (000s) | ||
FINANCIALS - 1.0% | |||
Commercial Banks - 1.0% | |||
Banco ABC Brasil SA (Cost $20,855) | 3,100,769 | $ 24,363 | |
Money Market Funds - 6.0% | |||
|
|
|
|
Fidelity Cash Central Fund, 0.13% (b) | 111,129,340 | 111,129 | |
Fidelity Securities Lending Cash Central Fund, 0.12% (b)(c) | 39,090,450 | 39,090 | |
TOTAL MONEY MARKET FUNDS (Cost $150,219) |
| ||
TOTAL INVESTMENT PORTFOLIO - 101.3% (Cost $2,169,362) | 2,531,384 | ||
NET OTHER ASSETS (LIABILITIES) - (1.3)% | (31,775) | ||
NET ASSETS - 100% | $ 2,499,609 | ||
Legend |
(a) Non-income producing |
(b) Affiliated fund that is generally available only to investment companies and other accounts managed by Fidelity Investments. The rate quoted is the annualized seven-day yield of the fund at period end. A complete unaudited listing of the fund's holdings as of its most recent quarter end is available upon request. In addition, each Fidelity Central Fund's financial statements, which are not covered by the Fund's Report of Independent Registered Public Accounting Firm, are available on the SEC's website or upon request. |
(c) Investment made with cash collateral received from securities on loan. |
(d) Security or a portion of the security is on loan at period end. |
* Amount represents less than $1,000. |
Affiliated Central Funds |
Information regarding fiscal year to date income earned by the Fund from investments in Fidelity Central Funds is as follows: |
Fund | Income earned |
Fidelity Cash Central Fund | $ 174 |
Fidelity Securities Lending Cash Central Fund | 611 |
Total | $ 785 |
Other Affiliated Issuers |
An affiliated company is a company in which the Fund has ownership of at least 5% of the voting securities. Fiscal year to date transactions with companies which are or were affiliates are as follows: |
Affiliate | Value, | Purchases | Sales | Dividend | Value, |
Altra Holdings, Inc. | $ 23,490 | $ 1,559 | $ 23,981 | $ 134 | $ - |
Body Central Corp. | 25,025 | - | 9,156 | - | - |
Coresite Realty Corp. | 23,743 | 7,363 | 18,637 | 887 | - |
Inter Parfums, Inc. | 25,988 | - | 27,854 | 113 | - |
Kforce, Inc. | 27,854 | 2,843 | 16,352 | 1,774 | - |
Total | $ 126,100 | $ 11,765 | $ 95,980 | $ 2,908 | $ - |
Other Information |
The following is a summary of the inputs used, as of April 30, 2013, involving the Fund's assets and liabilities carried at fair value. The inputs or methodology used for valuing securities may not be an indication of the risk associated with investing in those securities. For more information on valuation inputs, and their aggregation into the levels used in the table below, please refer to the Investment Valuation section in the accompanying Notes to Financial Statements. |
Valuation Inputs at Reporting Date: | ||||
Description | Total | Level 1 | Level 2 | Level 3 |
Investments in Securities: | ||||
Equities: | ||||
Consumer Discretionary | $ 323,246 | $ 295,152 | $ 28,094 | $ - |
Consumer Staples | 13,048 | - | 13,048 | - |
Energy | 162,645 | 162,645 | - | - |
Financials | 493,386 | 479,478 | 13,908 | - |
Health Care | 374,115 | 374,115 | - | - |
Industrials | 396,984 | 396,984 | - | - |
Information Technology | 432,435 | 432,435 | - | - |
Materials | 144,602 | 144,602 | - | - |
Utilities | 40,704 | 40,704 | - | - |
Money Market Funds | 150,219 | 150,219 | - | - |
Total Investments in Securities: | $ 2,531,384 | $ 2,476,334 | $ 55,050 | $ - |
Distribution of investments by country or territory of incorporation, as a percentage of total net assets, is as follows. (Unaudited) |
United States of America | 86.5% |
Japan | 2.3% |
Brazil | 1.8% |
Ireland | 1.5% |
Switzerland | 1.4% |
Bermuda | 1.2% |
United Kingdom | 1.2% |
Italy | 1.1% |
Panama | 1.1% |
Canada | 1.0% |
Others (Individually Less Than 1%) | 0.9% |
| 100.0% |
See accompanying notes which are an integral part of the financial statements.
Annual Report
Financial Statements
Statement of Assets and Liabilities
Amounts in thousands (except per-share amount) | April 30, 2013 | |
|
|
|
Assets | ||
Investment in securities, at value (including securities loaned of $37,365) - See accompanying schedule: Unaffiliated issuers (cost $2,019,143) | $ 2,381,165 |
|
Fidelity Central Funds (cost $150,219) | 150,219 |
|
Total Investments (cost $2,169,362) |
| $ 2,531,384 |
Cash |
| 128 |
Receivable for investments sold | 33,063 | |
Receivable for fund shares sold | 1,306 | |
Dividends receivable | 1,830 | |
Distributions receivable from Fidelity Central Funds | 71 | |
Prepaid expenses | 2 | |
Receivable from investment adviser for expense reductions | 7 | |
Other receivables | 114 | |
Total assets | 2,567,905 | |
|
|
|
Liabilities | ||
Payable for investments purchased | $ 24,496 | |
Payable for fund shares redeemed | 3,212 | |
Accrued management fee | 887 | |
Other affiliated payables | 543 | |
Other payables and accrued expenses | 68 | |
Collateral on securities loaned, at value | 39,090 | |
Total liabilities | 68,296 | |
|
|
|
Net Assets | $ 2,499,609 | |
Net Assets consist of: |
| |
Paid in capital | $ 2,002,375 | |
Undistributed net investment income | 2,091 | |
Accumulated undistributed net realized gain (loss) on investments and foreign currency transactions | 133,163 | |
Net unrealized appreciation (depreciation) on investments and assets and liabilities in foreign currencies | 361,980 | |
Net Assets, for 126,378 shares outstanding | $ 2,499,609 | |
Net Asset Value, offering price and redemption price per share ($2,499,609 ÷ 126,378 shares) | $ 19.78 | |
See accompanying notes which are an integral part of the financial statements.
Annual Report
Statement of Operations
Amounts in thousands | Year ended April 30, 2013 | |
|
|
|
Investment Income |
|
|
Dividends (including $2,908 earned from other affiliated issuers) |
| $ 32,920 |
Interest |
| 3 |
Income from Fidelity Central Funds |
| 785 |
Total income |
| 33,708 |
|
|
|
Expenses | ||
Management fee | $ 19,771 | |
Performance adjustment | (7,152) | |
Transfer agent fees | 6,462 | |
Accounting and security lending fees | 845 | |
Custodian fees and expenses | 83 | |
Independent trustees' compensation | 19 | |
Registration fees | 31 | |
Audit | 58 | |
Legal | 12 | |
Interest | 1 | |
Miscellaneous | 32 | |
Total expenses before reductions | 20,162 | |
Expense reductions | (730) | 19,432 |
Net investment income (loss) | 14,276 | |
Realized and Unrealized Gain (Loss) Net realized gain (loss) on: | ||
Investment securities: |
|
|
Unaffiliated issuers | 142,757 | |
Other affiliated issuers | (1,457) |
|
Foreign currency transactions | 94 | |
Futures contracts | 777 | |
Total net realized gain (loss) |
| 142,171 |
Change in net unrealized appreciation (depreciation) on: Investment securities | 94,787 | |
Assets and liabilities in foreign currencies | (92) | |
Futures contracts | (1,620) | |
Total change in net unrealized appreciation (depreciation) |
| 93,075 |
Net gain (loss) | 235,246 | |
Net increase (decrease) in net assets resulting from operations | $ 249,522 | |
See accompanying notes which are an integral part of the financial statements.
Annual Report
Financial Statements - continued
Statement of Changes in Net Assets
Amounts in thousands | Year ended | Year ended |
Increase (Decrease) in Net Assets |
|
|
Operations |
|
|
Net investment income (loss) | $ 14,276 | $ (9,106) |
Net realized gain (loss) | 142,171 | 393,893 |
Change in net unrealized appreciation (depreciation) | 93,075 | (1,093,617) |
Net increase (decrease) in net assets resulting | 249,522 | (708,830) |
Distributions to shareholders from net investment income | (12,422) | - |
Distributions to shareholders from net realized gain | (81,391) | (630) |
Total distributions | (93,813) | (630) |
Share transactions | 215,929 | 404,028 |
Reinvestment of distributions | 91,621 | 615 |
Cost of shares redeemed | (1,183,185) | (1,120,023) |
Net increase (decrease) in net assets resulting from share transactions | (875,635) | (715,380) |
Redemption fees | 241 | 589 |
Total increase (decrease) in net assets | (719,685) | (1,424,251) |
|
|
|
Net Assets | ||
Beginning of period | 3,219,294 | 4,643,545 |
End of period (including undistributed net investment income of $2,091 and $0, respectively) | $ 2,499,609 | $ 3,219,294 |
Other Information Shares | ||
Sold | 11,917 | 22,544 |
Issued in reinvestment of distributions | 5,438 | 32 |
Redeemed | (65,118) | (62,471) |
Net increase (decrease) | (47,763) | (39,895) |
See accompanying notes which are an integral part of the financial statements.
Annual Report
Financial Highlights
Years ended April 30, | 2013 | 2012 | 2011 | 2010 | 2009 |
Selected Per-Share Data |
|
|
|
|
|
Net asset value, beginning of period | $ 18.49 | $ 21.70 | $ 17.74 | $ 10.88 | $ 16.04 |
Income from Investment Operations |
|
|
|
|
|
Net investment income (loss) B | .09 | (.05) E | (.03) F | (.07) | - I |
Net realized and unrealized gain (loss) | 1.76 | (3.16) | 3.98 | 6.93 | (4.92) |
Total from investment operations | 1.85 | (3.21) | 3.95 | 6.86 | (4.92) |
Distributions from net investment income | (.08) | - | - | - | - G,I |
Distributions from net realized gain | (.48) | - I | - | - | (.24) G |
Total distributions | (.56) | - I | - | - | (.24) |
Redemption fees added to paid in capital B | - I | - I | .01 | - I | - I |
Net asset value, end of period | $ 19.78 | $ 18.49 | $ 21.70 | $ 17.74 | $ 10.88 |
Total Return A | 10.52% | (14.78)% | 22.32% | 63.05% | (31.13)% |
Ratios to Average Net Assets C,H |
|
|
|
|
|
Expenses before reductions | .72% | 1.12% | 1.13% | 1.24% | .96% |
Expenses net of fee waivers, if any | .72% | 1.12% | 1.13% | 1.24% | .96% |
Expenses net of all reductions | .69% | 1.10% | 1.12% | 1.23% | .95% |
Net investment income (loss) | .51% | (.26)% E | (.17)% F | (.49)% | .04% |
Supplemental Data |
|
|
|
|
|
Net assets, end of period (in millions) | $ 2,500 | $ 3,219 | $ 4,644 | $ 4,204 | $ 2,401 |
Portfolio turnover rate D | 75% | 104% | 47% | 60% | 92% |
A Total returns would have been lower if certain expenses had not been reduced during the applicable periods shown.
B Calculated based on average shares outstanding during the period.
C Fees and expenses of any underlying Fidelity Central Funds are not included in the Fund's expense ratio. The Fund indirectly bears its proportionate share of the expenses of any underlying Fidelity Central Funds.
D Amount does not include the portfolio activity of any underlying Fidelity Central Funds.
E Investment income per share reflects a large, non-recurring dividend which amounted to $.02 per share. Excluding this non-recurring dividend, the ratio of net investment income (loss) to average net assets would have been (.35)%.
F Investment income per share reflects a large, non-recurring dividend which amounted to $.05 per share. Excluding this non-recurring dividend, the ratio of net investment income (loss) to average net assets would have been (.46)%.
G The amounts shown reflect certain reclassifications related to book to tax differences that were made in the year shown.
H Expense ratios reflect operating expenses of the Fund. Expenses before reductions do not reflect amounts reimbursed by the investment adviser or reductions from brokerage service arrangements or reductions from other expense offset arrangements and do not represent the amount paid by the Fund during periods when reimbursements or reductions occur. Expenses net of fee waivers reflect expenses after reimbursement by the investment adviser but prior to reductions from brokerage service arrangements or other expense offset arrangements. Expenses net of all reductions represent the net expenses paid by the Fund.
I Amount represents less than $.01 per share.
See accompanying notes which are an integral part of the financial statements.
Annual Report
Notes to Financial Statements
For the period ended April 30, 2013
(Amounts in thousands except percentages)
1. Organization.
Fidelity Small Cap Stock Fund (the Fund) is a fund of Fidelity Commonwealth Trust (the Trust) and is authorized to issue an unlimited number of shares. The Trust is registered under the Investment Company Act of 1940, as amended (the 1940 Act), as an open-end management investment company organized as a Massachusetts business trust.
2. Investments in Fidelity Central Funds.
The Fund invests in Fidelity Central Funds, which are open-end investment companies generally available only to other investment companies and accounts managed by Fidelity Management & Research Company (FMR) and its affiliates. The Fund's Schedule of Investments lists each of the Fidelity Central Funds held as of period end, if any, as an investment of the Fund, but does not include the underlying holdings of each Fidelity Central Fund. As an Investing Fund, the Fund indirectly bears its proportionate share of the expenses of the underlying Fidelity Central Funds.
The Money Market Central Funds seek preservation of capital and current income and are managed by Fidelity Investments Money Management, Inc. (FIMM), an affiliate of FMR.
A complete unaudited list of holdings for each Fidelity Central Fund is available upon request or at the Securities and Exchange Commission (the SEC) website at www.sec.gov. In addition, the financial statements of the Fidelity Central Funds, which are not covered by the Fund's Report of Independent Registered Public Accounting Firm, are available on the SEC website or upon request.
3. Significant Accounting Policies.
The financial statements have been prepared in conformity with accounting principles generally accepted in the United States of America (GAAP), which require management to make certain estimates and assumptions at the date of the financial statements. Actual results could differ from those estimates. Subsequent events, if any, through the date that the financial statements were issued have been evaluated in the preparation of the financial statements. The following summarizes the significant accounting policies of the Fund:
Investment Valuation. Investments are valued as of 4:00 p.m. Eastern time on the last calendar day of the period. In accordance with valuation policies and procedures approved by the Board of Trustees (the Board), the Fund attempts to obtain prices from one or more third party pricing vendors or brokers to value its investments. When current market prices, quotations or currency exchange rates are not readily available or reliable, investments will be fair valued in good faith by the FMR Fair Value Committee
Annual Report
3. Significant Accounting Policies - continued
Investment Valuation - continued
(the Committee), in accordance with procedures adopted by the Board. Factors used in determining fair value vary by investment type and may include market or investment specific events. The frequency with which these procedures are used cannot be predicted and they may be utilized to a significant extent. The Committee oversees the Fund's valuation policies and procedures and is responsible for approving and reporting to the Board all fair value determinations.
The Fund categorizes the inputs to valuation techniques used to value its investments into a disclosure hierarchy consisting of three levels as shown below:
Level 1 - quoted prices in active markets for identical investments
Level 2 - other significant observable inputs (including quoted prices for similar investments, interest rates, prepayment speeds, etc.)
Level 3 - unobservable inputs (including the Fund's own assumptions based on the best information available)
Valuation techniques used to value the Fund's investments by major category are as follows:
Equity securities, including restricted securities, for which market quotations are readily available, are valued at the last reported sale price or official closing price as reported by a third party pricing vendor on the primary market or exchange on which they are traded and are categorized as Level 1 in the hierarchy. In the event there were no sales during the day or closing prices are not available, securities are valued at the last quoted bid price or may be valued using the last available price and are generally categorized as Level 2 in the hierarchy. For foreign equity securities, when market or security specific events arise, comparisons to the valuation of American Depositary Receipts (ADRs), futures contracts, Exchange- Traded Funds (ETFs) and certain indexes as well as quoted prices for similar securities may be used and would be categorized as Level 2 in the hierarchy. Utilizing these techniques may result in transfers between Level 1 and Level 2.
Investments in open-end mutual funds, including the Fidelity Central Funds, are valued at their closing net asset value (NAV) each business day and are categorized as Level 1 in the hierarchy.
Changes in valuation techniques may result in transfers in or out of an assigned level within the disclosure hierarchy. The aggregate value of investments by input level, as of April 30, 2013 is included at the end of the Fund's Schedule of Investments.
Annual Report
Notes to Financial Statements - continued
(Amounts in thousands except percentages)
3. Significant Accounting Policies - continued
Foreign Currency. The Fund may use foreign currency contracts to facilitate transactions in foreign-denominated securities. Gains and losses from these transactions may arise from changes in the value of the foreign currency or if the counterparties do not perform under the contracts' terms.
Foreign-denominated assets, including investment securities, and liabilities are translated into U.S. dollars at the exchange rates at period end. Purchases and sales of investment securities, income and dividends received and expenses denominated in foreign currencies are translated into U.S. dollars at the exchange rate in effect on the transaction date.
The effects of exchange rate fluctuations on investments are included with the net realized and unrealized gain (loss) on investment securities. Other foreign currency transactions resulting in realized and unrealized gain (loss) are disclosed separately.
Investment Transactions and Income. For financial reporting purposes, the Fund's investment holdings and NAV include trades executed through the end of the last business day of the period. The NAV per share for processing shareholder transactions is calculated as of the close of business of the New York Stock Exchange (NYSE), normally 4:00 p.m. Eastern time and includes trades executed through the end of the prior business day. Gains and losses on securities sold are determined on the basis of identified cost and may include proceeds received from litigation. Dividend income is recorded on the ex-dividend date, except for certain dividends from foreign securities where the ex-dividend date may have passed, which are recorded as soon as the Fund is informed of the ex-dividend date. Non-cash dividends included in dividend income, if any, are recorded at the fair market value of the securities received. Distributions received on securities that represent a return of capital or capital gain are recorded as a reduction of cost of investments and/or as a realized gain. The Fund estimates the components of distributions received that may be considered return of capital distributions or capital gain distributions. Interest income and distributions from the Fidelity Central Funds are accrued as earned. Interest income includes coupon interest and amortization of premium and accretion of discount on debt securities. Investment income is recorded net of foreign taxes withheld where recovery of such taxes is uncertain.
Expenses. Expenses directly attributable to a fund are charged to that fund. Expenses attributable to more than one fund are allocated among the respective funds on the basis of relative net assets or other appropriate methods. Expense estimates are accrued in the period to which they relate and adjustments are made when actual amounts are known.
Income Tax Information and Distributions to Shareholders. Each year, the Fund intends to qualify as a regulated investment company under Subchapter M of the Internal Revenue Code, including distributing substantially all of its taxable income and
Annual Report
3. Significant Accounting Policies - continued
Income Tax Information and Distributions to Shareholders - continued
realized gains. As a result, no provision for income taxes is required. As of April 30, 2013, the Fund did not have any unrecognized tax benefits in the financial statements; nor is the Fund aware of any tax positions for which it is reasonably possible that the total amounts of unrecognized tax benefits will significantly change in the next twelve months. The Fund files a U.S. federal tax return, in addition to state and local tax returns as required. A fund's federal income tax returns are subject to examination by the Internal Revenue Service (IRS) for a period of three fiscal years after they are filed. State and local tax returns may be subject to examination for an additional fiscal year depending on the jurisdiction. Foreign taxes are provided for based on the Fund's understanding of the tax rules and rates that exist in the foreign markets in which it invests.
Distributions are declared and recorded on the ex-dividend date. Income and capital gain distributions are determined in accordance with income tax regulations, which may differ from GAAP. In addition, the Fund claimed a portion of the payment made to redeeming shareholders as a distribution for income tax purposes.
Capital accounts within the financial statements are adjusted for permanent book-tax differences. These adjustments have no impact on net assets or the results of operations. Temporary book-tax differences will reverse in a subsequent period.
Book-tax differences are primarily due to futures contracts, foreign currency transactions, partnerships and losses deferred due to wash sales and excise tax regulations.
The federal tax cost of investment securities and unrealized appreciation (depreciation) as of period end were as follows:
Gross unrealized appreciation | $ 419,356 |
Gross unrealized depreciation | (63,581) |
Net unrealized appreciation (depreciation) on securities and other investments | $ 355,775 |
|
|
Tax Cost | $ 2,175,609 |
The tax-based components of distributable earnings as of period end were as follows:
Undistributed ordinary income | $ 2,091 |
Undistributed long-term capital gain | $ 139,410 |
Net unrealized appreciation (depreciation) | $ 355,733 |
Annual Report
Notes to Financial Statements - continued
(Amounts in thousands except percentages)
3. Significant Accounting Policies - continued
Income Tax Information and Distributions to Shareholders - continued
The tax character of distributions paid was as follows:
| April 30, 2013 | April 30, 2012 |
Ordinary Income | $ 12,422 | $ 630 |
Long-term Capital Gains | 81,391 | - |
Total | $ 93,813 | $ 630 |
Short-Term Trading (Redemption) Fees. Shares held by investors in the Fund less than 90 days are subject to a redemption fee equal to 2.00% of the net asset value of shares redeemed. All redemption fees, which reduce the proceeds of the shareholder redemption, are retained by the Fund and accounted for as an addition to paid in capital.
New Accounting Pronouncement. The Financial Accounting Standards Board issued in December 2011, Accounting Standard Update No. 2011-11, Disclosures about Offsetting Assets and Liabilities, and in January 2013, Accounting Standards Update No. 2013-1 Clarifying the Scope of Disclosures about Offsetting Assets and Liabilities. These updates create new disclosure requirements requiring entities to disclose both gross and net information for derivatives and other financial instruments that are either offset in the Statement of Assets and Liabilities or subject to an enforceable master netting arrangement or similar agreement. The disclosure requirements are effective for annual reporting periods beginning on or after January 1, 2013, and interim periods within those annual periods. Management is currently evaluating the impact of the update's adoption on the Fund's financial statement disclosures.
4. Derivative Instruments.
Risk Exposures and the Use of Derivative Instruments. The Fund's investment objective allows the Fund to enter into various types of derivative contracts, including futures contracts. Derivatives are investments whose value is primarily derived from underlying assets, indices or reference rates and may be transacted on an exchange or over-the-counter (OTC). Derivatives may involve a future commitment to buy or sell a specified asset based on specified terms, to exchange future cash flows at periodic intervals based on a notional principal amount, or for one party to make one or more payments upon the occurrence of specified events in exchange for periodic payments from the other party.
The Fund used derivatives to increase returns and to manage exposure to certain risks as defined below. The success of any strategy involving derivatives depends on analysis of numerous economic factors, and if the strategies for investment do not work as intended, the Fund may not achieve its objectives.
Annual Report
4. Derivative Instruments - continued
Risk Exposures and the Use of Derivative Instruments - continued
The Fund's use of derivatives increased or decreased its exposure to the following risk:
Equity Risk | Equity risk relates to the fluctuations in the value of financial instruments as a result of changes in market prices (other than those arising from interest rate risk or foreign exchange risk), whether caused by factors specific to an individual investment, its issuer, or all factors affecting all instruments traded in a market or market segment. |
The Fund is also exposed to additional risks from investing in derivatives, such as liquidity risk and counterparty credit risk. Liquidity risk is the risk that the Fund will be unable to close out the derivative in the open market in a timely manner. Counterparty credit risk is the risk that the counterparty will not be able to fulfill its obligation to the Fund. Counterparty credit risk related to exchange-traded futures contracts is mitigated by the protection provided by the exchange on which they trade.
Investing in derivatives may involve greater risks than investing in the underlying assets directly and, to varying degrees, may involve risk of loss in excess of any initial investment and collateral received and amounts recognized in the Statement of Assets and Liabilities. In addition, there may be the risk that the change in value of the derivative contract does not correspond to the change in value of the underlying instrument.
Futures Contracts. A futures contract is an agreement between two parties to buy or sell a specified underlying instrument for a fixed price at a specified future date. The Fund used futures contracts to manage its exposure to the stock market.
Upon entering into a futures contract, a fund is required to deposit either cash or securities (initial margin) with a clearing broker in an amount equal to a certain percentage of the face value of the contract. Futures contracts are marked-to-market daily and subsequent payments (variation margin) are made or received by a fund depending on the daily fluctuations in the value of the futures contracts and are recorded as unrealized appreciation or (depreciation). This receivable and/or payable, if any, is included in daily variation margin on futures contracts in the Statement of Assets and Liabilities. Realized gain or (loss) is recorded upon the expiration or closing of a futures contract.
Any open futures contracts at period end are presented in the Schedule of Investments under the caption "Futures Contracts." The underlying face amount at value reflects each contract's exposure to the underlying instrument or index at period end.
During the period the Fund recognized net realized gain (loss) of $777 and a change in net unrealized appreciation (depreciation) of $(1,620) related to its investment in futures contracts. These amounts are included in the Statement of Operations.
Annual Report
Notes to Financial Statements - continued
(Amounts in thousands except percentages)
5. Purchases and Sales of Investments.
Purchases and sales of securities, other than short-term securities, aggregated $2,012,571 and $2,955,573, respectively.
6. Fees and Other Transactions with Affiliates.
Management Fee. FMR and its affiliates provide the Fund with investment management related services for which the Fund pays a monthly management fee. The management fee is the sum of an individual fund fee rate that is based on an annual rate of .45% of the Fund's average net assets and an annualized group fee rate that averaged .26% during the period. The group fee rate is based upon the average net assets of all the mutual funds advised by FMR. The group fee rate decreases as assets under management increase and increases as assets under management decrease. In addition, the management fee is subject to a performance adjustment (up to a maximum of ± .20% of the Fund's average net assets over a 36 month performance period). The upward or downward adjustment to the management fee is based on the Fund's relative investment performance as compared to an appropriate benchmark index. For the period, the total annual management fee rate, including the performance adjustment, was .45% of the Fund's average net assets.
Transfer Agent Fees. Fidelity Investments Institutional Operations Company, Inc. (FIIOC), an affiliate of FMR, is the Fund's transfer, dividend disbursing and shareholder servicing agent. FIIOC receives account fees and asset-based fees that vary according to account size and type of account. FIIOC pays for typesetting, printing and mailing of shareholder reports, except proxy statements. For the period, the transfer agent fees were equivalent to an annual rate of .23% of average net assets.
Accounting and Security Lending Fees. Fidelity Service Company, Inc. (FSC), an affiliate of FMR, maintains the Fund's accounting records. The accounting fee is based on the level of average net assets for each month. Under a separate contract, FSC administers the security lending program. The security lending fee is based on the number and duration of lending transactions.
Brokerage Commissions. The Fund placed a portion of its portfolio transactions with brokerage firms which are affiliates of the investment adviser. Brokerage commissions are included in net realized gain (loss) and change in net unrealized appreciation (depreciation) in the Statement of Operations. The commissions paid to these affiliated firms were $101 for the period.
Interfund Lending Program. Pursuant to an Exemptive Order issued by the SEC, the Fund, along with other registered investment companies having management contracts with FMR, may participate in an interfund lending program. This program provides an alternative credit facility allowing the funds to borrow from, or lend money to, other
Annual Report
6. Fees and Other Transactions with Affiliates - continued
Interfund Lending Program - continued
participating affiliated funds. At period end, there were no interfund loans outstanding. The Fund's activity in this program during the period for which loans were outstanding was as follows:
Borrower or Lender | Average Loan | Weighted Average | Interest |
Borrower | $ 48,983 | .43% | $ 1 |
7. Committed Line of Credit.
The Fund participates with other funds managed by FMR or an affiliate in a $4.25 billion credit facility (the "line of credit") to be utilized for temporary or emergency purposes to fund shareholder redemptions or for other short-term liquidity purposes. The Fund has agreed to pay commitment fees on its pro-rata portion of the line of credit, which amounted to $7 and is reflected in Miscellaneous expenses on the Statement of Operations. During the period, there were no borrowings on this line of credit.
8. Security Lending.
The Fund lends portfolio securities through a lending agent from time to time in order to earn additional income. For equity securities, a lending agent is used and may loan securities to certain qualified borrowers, including Fidelity Capital Markets (FCM), a broker-dealer affiliated with the Fund. On the settlement date of the loan, the Fund receives collateral (in the form of U.S. Treasury obligations, letters of credit and/or cash) against the loaned securities and maintains collateral in an amount not less than 100% of the market value of the loaned securities during the period of the loan. The market value of the loaned securities is determined at the close of business of the Fund and any additional required collateral is delivered to the Fund on the next business day. If the borrower defaults on its obligation to return the securities loaned because of insolvency or other reasons, a fund could experience delays and costs in recovering the securities loaned or in gaining access to the collateral. Any cash collateral received is invested in the Fidelity Securities Lending Cash Central Fund. The value of loaned securities and cash collateral at period end are disclosed on the Fund's Statement of Assets and Liabilities. The value of securities loaned to FCM at period end was $93. Security lending income represents the income earned on investing cash collateral, less rebates paid to borrowers and any lending agent fees associated with the loan, plus any premium payments received for lending certain types of securities. Security lending income is presented in the Statement of Operations as a component of income from Fidelity Central Funds. Total security lending income during the period amounted to $611, including $73 from securities loaned to FCM.
Annual Report
Notes to Financial Statements - continued
(Amounts in thousands except percentages)
9. Expense Reductions.
Many of the brokers with whom FMR places trades on behalf of the Fund provided services to the Fund in addition to trade execution. These services included payments of certain expenses on behalf of the Fund totaling $723 for the period. In addition, through arrangements with the Fund's custodian, credits realized as a result of uninvested cash balances were used to reduce the Fund's expenses. During the period, these credits reduced the Fund's custody expense by one hundred and thirty-six dollars.
In addition, FMR reimbursed a portion of the Fund's operating expenses during the period in the amount of $7.
10. Other.
The Fund's organizational documents provide former and current trustees and officers with a limited indemnification against liabilities arising in connection with the performance of their duties to the Fund. In the normal course of business, the Fund may also enter into contracts that provide general indemnifications. The Fund's maximum exposure under these arrangements is unknown as this would be dependent on future claims that may be made against the Fund. The risk of material loss from such claims is considered remote.
Annual Report
Report of Independent Registered Public Accounting Firm
To the Trustees of Fidelity Commonwealth Trust and Shareholders of Fidelity Small Cap Stock Fund:
We have audited the accompanying statement of assets and liabilities of Fidelity Small Cap Stock Fund (the Fund), a fund of Fidelity Commonwealth Trust, including the schedule of investments, as of April 30, 2013, and the related statement of operations for the year then ended, the statement of changes in net assets for each of the two years in the period then ended, and the financial highlights for each of the five years in the period then ended. These financial statements and financial highlights are the responsibility of the Fund's management. Our responsibility is to express an opinion on these financial statements and financial highlights based on our audits.
We conducted our audits in accordance with the standards of the Public Company Accounting Oversight Board (United States). Those standards require that we plan and perform the audit to obtain reasonable assurance about whether the financial statements and financial highlights are free of material misstatement. The Fund is not required to have, nor were we engaged to perform, an audit of its internal control over financial reporting. Our audits included consideration of internal control over financial reporting as a basis for designing audit procedures that are appropriate in the circumstances, but not for the purpose of expressing an opinion on the effectiveness of the Fund's internal control over financial reporting. Accordingly, we express no such opinion. An audit also includes examining, on a test basis, evidence supporting the amounts and disclosures in the financial statements, assessing the accounting principles used and significant estimates made by management, as well as evaluating the overall financial statement presentation. Our procedures included confirmation of securities owned as of April 30, 2013, by correspondence with the custodians and brokers; where replies were not received from brokers, we performed other auditing procedures. We believe that our audits provide a reasonable basis for our opinion.
In our opinion, the financial statements and financial highlights referred to above present fairly, in all material respects, the financial position of Fidelity Small Cap Stock Fund as of April 30, 2013, the results of its operations for the year then ended, the changes in its net assets for each of the two years in the period then ended, and the financial highlights for each of the five years in the period then ended, in conformity with accounting principles generally accepted in the United States of America.
DELOITTE & TOUCHE LLP
Boston, Massachusetts
June 12, 2013
Annual Report
Trustees and Officers
The Trustees, Members of the Advisory Board, and executive officers of the trust and fund, as applicable, are listed below. The Board of Trustees governs the fund and is responsible for protecting the interests of shareholders. The Trustees are experienced executives who meet periodically throughout the year to oversee the fund's activities, review contractual arrangements with companies that provide services to the fund, oversee management of the risks associated with such activities and contractual arrangements, and review the fund's performance. Except for James C. Curvey, each of the Trustees oversees 234 Fidelity funds. Mr. Curvey oversees 453 Fidelity funds.
The Trustees hold office without limit in time except that (a) any Trustee may resign; (b) any Trustee may be removed by written instrument, signed by at least two-thirds of the number of Trustees prior to such removal; (c) any Trustee who requests to be retired or who has become incapacitated by illness or injury may be retired by written instrument signed by a majority of the other Trustees; and (d) any Trustee may be removed at any special meeting of shareholders by a two-thirds vote of the outstanding voting securities of the trust. Each Trustee who is not an interested person of the trust and the fund (as defined in the 1940 Act) (Independent Trustee), shall retire not later than the last day of the calendar year in which his or her 75th birthday occurs. The Independent Trustees may waive this mandatory retirement age policy with respect to individual Trustees. The executive officers and Advisory Board Members hold office without limit in time, except that any officer and Advisory Board Member may resign or may be removed by a vote of a majority of the Trustees at any regular meeting or any special meeting of the Trustees. Except as indicated, each individual has held the office shown or other offices in the same company for the past five years.
Experience, Skills, Attributes, and Qualifications of the Fund's Trustees. The Governance and Nominating Committee has adopted a statement of policy that describes the experience, qualifications, attributes, and skills that are necessary and desirable for potential Independent Trustee candidates (Statement of Policy). The Board believes that each Trustee satisfied at the time he or she was initially elected or appointed a Trustee, and continues to satisfy, the standards contemplated by the Statement of Policy. The Governance and Nominating Committee also engages professional search firms to help identify potential Independent Trustee candidates who have the experience, qualifications, attributes, and skills consistent with the Statement of Policy. From time to time, additional criteria based on the composition and skills of the current Independent Trustees, as well as experience or skills that may be appropriate in light of future changes to board composition, business conditions, and regulatory or other developments, have also been considered by the professional search firms and the Governance and Nominating Committee. In addition, the Board takes into account the Trustees' commitment and participation in Board and committee meetings, as well as their leadership of standing and ad hoc committees throughout their tenure.
In determining that a particular Trustee was and continues to be qualified to serve as a Trustee, the Board has considered a variety of criteria, none of which, in isolation, was controlling. The Board believes that, collectively, the Trustees have balanced and diverse experience, qualifications, attributes, and skills, which allow the Board to operate effectively in governing the fund and protecting the interests of shareholders. Information about the specific experience, skills, attributes, and qualifications of each Trustee, which in each case led to the Board's conclusion that the Trustee should serve (or continue to serve) as a trustee of the fund, is provided below.
Annual Report
Trustees and Officers - continued
Board Structure and Oversight Function. James C. Curvey is an interested person (as defined in the 1940 Act) and currently serves as Chairman. The Trustees have determined that an interested Chairman is appropriate and benefits shareholders because an interested Chairman has a personal and professional stake in the quality and continuity of services provided to the fund. Independent Trustees exercise their informed business judgment to appoint an individual of their choosing to serve as Chairman, regardless of whether the Trustee happens to be independent or a member of management. The Independent Trustees have determined that they can act independently and effectively without having an Independent Trustee serve as Chairman and that a key structural component for assuring that they are in a position to do so is for the Independent Trustees to constitute a substantial majority for the Board. The Independent Trustees also regularly meet in executive session. Ned C. Lautenbach serves as Chairman of the Independent Trustees and as such (i) acts as a liaison between the Independent Trustees and management with respect to matters important to the Independent Trustees and (ii) with management prepares agendas for Board meetings.
Fidelity funds are overseen by different Boards of Trustees. The fund's Board oversees Fidelity's equity and high income funds and another Board oversees Fidelity's investment-grade bond, money market, and asset allocation funds. The asset allocation funds may invest in Fidelity funds overseen by the fund's Board. The use of separate Boards, each with its own committee structure, allows the Trustees of each group of Fidelity funds to focus on the unique issues of the funds they oversee, including common research, investment, and operational issues. On occasion, the separate Boards establish joint committees to address issues of overlapping consequences for the Fidelity funds overseen by each Board.
The Trustees operate using a system of committees to facilitate the timely and efficient consideration of all matters of importance to the Trustees, the fund, and fund shareholders and to facilitate compliance with legal and regulatory requirements and oversight of the fund's activities and associated risks. The Board, acting through its committees, has charged FMR and its affiliates with (i) identifying events or circumstances the occurrence of which could have demonstrably adverse effects on the fund's business and/or reputation; (ii) implementing processes and controls to lessen the possibility that such events or circumstances occur or to mitigate the effects of such events or circumstances if they do occur; and (iii) creating and maintaining a system designed to evaluate continuously business and market conditions in order to facilitate the identification and implementation processes described in (i) and (ii) above. Because the day-to-day operations and activities of the fund are carried out by or through FMR, its affiliates and other service providers, the fund's exposure to risks is mitigated but not eliminated by the processes overseen by the Trustees. While each of the Board's committees has responsibility for overseeing different aspects of the fund's activities, oversight is exercised primarily through the Operations, Audit, and Compliance Committees. In addition, the Independent Trustees have worked with FMR to enhance the Board's oversight of investment and financial risks, legal and regulatory risks, technology risks, and operational risks, including the development of additional risk reporting to the Board. For example, a working group comprised of Independent Trustees and FMR has worked and continues to work to review the Fidelity funds' valuation-related activities, reporting and risk management. Appropriate personnel, including but not limited to the fund's Chief Compliance Officer (CCO), FMR's internal auditor, the independent accountants, the fund's Treasurer and portfolio management personnel, make periodic reports to the Board's committees, as appropriate, including an annual review of FMR's risk management program for the Fidelity funds. The responsibilities of each standing committee, including their oversight responsibilities, are described further under "Standing Committees of the Fund's Trustees."
Annual Report
The fund's Statement of Additional Information (SAI) includes more information about the Trustees. To request a free copy, call Fidelity at 1-800-544-8544.
Interested Trustees*:
Correspondence intended for each Trustee who is an interested person may be sent to Fidelity Investments, 245 Summer Street, Boston, Massachusetts 02210.
Name, Year of Birth; Principal Occupations and Other Relevant Experience+ | |
James C. Curvey (1935) | |
| Year of Election or Appointment: 2007 Mr. Curvey is Trustee and Chairman of the Board of Trustees of certain Trusts. Mr. Curvey also serves as Trustee (2007-present) of other investment companies advised by FMR. Mr. Curvey is a Director of Fidelity Investments Money Management, Inc. (2009-present), Director of Fidelity Research & Analysis Co. (2009-present) and Director of FMR and FMR Co., Inc. (2007-present). Mr. Curvey is also Vice Chairman (2007-present) and Director of FMR LLC. In addition, Mr. Curvey serves as an Overseer for the Boston Symphony Orchestra and a member of the Trustees of Villanova University. Previously, Mr. Curvey was the Vice Chairman (2006-2007) and Director (2000-2007) of FMR Corp. |
Ronald P. O'Hanley (1957) | |
| Year of Election or Appointment: 2011 Mr. O'Hanley is Director of FMR Co., Inc. (2010-present), Director of Fidelity Investments Money Management, Inc. (2010-present), Director of Fidelity Research & Analysis Company (2010-present), President of Fidelity Asset Management and Corporate Services and a member of Fidelity's Executive Committee (2010-present). Previously, Mr. O'Hanley served as President and Chief Executive Officer of BNY Mellon Asset Management (2007-2010). Mr. O'Hanley also served as Vice Chairman of Bank New York Mellon Corp. and a member of that firm's Executive Committee. Prior to the 2007 merger of The Bank of New York and Mellon Financial Corporation, he was Vice Chairman of Mellon Financial Corporation and President and Chief Executive Officer of Mellon Asset Management. He joined Mellon in February 1997. Mr. O'Hanley currently serves as Chairman of the Boston Public Library Foundation Board of Directors and sits on the Board of Directors of Beth Israel Deaconess Medical Center, the Board of Trustees of the Marine Biological Laboratory and the Advisory Board of the Maxwell School of Citizenship and Public Administration at Syracuse University. Mr. O'Hanley also chairs the Council on Asset Management for the Financial Services Roundtable and is a member of the Board of Directors of Institutional Investor's U.S. Institute. |
* Trustees have been determined to be "Interested Trustees" by virtue of, among other things, their affiliation with the trust or various entities under common control with FMR.
+ The information above includes each Trustee's principal occupation during the last five years and other information relating to the experience, attributes, and skills relevant to each Trustee's qualifications to serve as a Trustee, which led to the conclusion that each Trustee should serve as a Trustee for the fund.
Annual Report
Independent Trustees:
Correspondence intended for each Independent Trustee (that is, the Trustees other than the Interested Trustees) may be sent to Fidelity Investments, P.O. Box 55235, Boston, Massachusetts 02205-5235.
Name, Year of Birth; Principal Occupations and Other Relevant Experience+ | |
Dennis J. Dirks (1948) | |
| Year of Election or Appointment: 2005 Prior to his retirement in May 2003, Mr. Dirks was Chief Operating Officer and a member of the Board of The Depository Trust & Clearing Corporation (DTCC). He also served as President, Chief Operating Officer, and Board member of The Depository Trust Company (DTC) and President and Board member of the National Securities Clearing Corporation (NSCC). In addition, Mr. Dirks served as Chief Executive Officer and Board member of the Government Securities Clearing Corporation, Chief Executive Officer and Board member of the Mortgage-Backed Securities Clearing Corporation, as a Trustee and a member of the Finance Committee of Manhattan College (2005-2008), and as a Trustee and a member of the Finance Committee of AHRC of Nassau County (2006-2008). Mr. Dirks is a member of the Independent Directors Council (IDC) Governing Council (2010-present) and Board of Directors for The Brookville Center for Children's Services, Inc. (2009-present). |
Alan J. Lacy (1953) | |
| Year of Election or Appointment: 2008 Mr. Lacy serves as Senior Adviser (2007-present) of Oak Hill Capital Partners, L.P. (private equity). Mr. Lacy also served as Chief Executive Officer (2000-2005) and Vice Chairman (2005-2006) of Sears Holdings Corporation and Sears, Roebuck and Co. (retail). In addition, Mr. Lacy serves as a member of the Board of Directors of Dave & Buster's Entertainment, Inc. (restaurant and entertainment complexes, 2010-present), Earth Fare, Inc. (retail grocery, 2012-present), The Hillman Companies, Inc. (hardware wholesalers, 2010-present), and Bristol-Myers Squibb Company (global pharmaceuticals, 2008-present). Mr. Lacy is a member of the Board of Trustees of The National Parks Conservation Association (2006-present). Previously, Mr. Lacy served as Chairman of the Board of Trustees of the National Parks Conservation Association (2008-2011) and as a member of the Board of Directors for the Western Union Company (global money transfer, 2006-2011). |
Ned C. Lautenbach (1944) | |
| Year of Election or Appointment: 2000 Mr. Lautenbach is Chairman of the Independent Trustees of the Equity and High Income Funds (2006-present). Mr. Lautenbach currently serves as the Lead Director of the Eaton Corporation Board of Directors (diversified industrial, 1997-present). Mr. Lautenbach is Chairman of the Board of Directors of the Philharmonic Center for the Arts in Naples, Florida (2012-present) and a member of the Council on Foreign Relations (1994-present). Previously, Mr. Lautenbach was a Partner/Advisory Partner at Clayton, Dubilier & Rice, LLC (private equity investment, 1998-2010), as well as a Director of Sony Corporation (2006-2007). |
Joseph Mauriello (1944) | |
| Year of Election or Appointment: 2008 Prior to his retirement in January 2006, Mr. Mauriello served in numerous senior management positions including Deputy Chairman and Chief Operating Officer (2004-2005), and Vice Chairman of Financial Services (2002-2004) of KPMG LLP US (professional services, 1965-2005). Mr. Mauriello currently serves as a member of the Board of Directors of XL Group plc. (global insurance and re-insurance, 2006-present). Previously, Mr. Mauriello served as a Director of the Hamilton Funds of the Bank of New York (2006-2007) and of Arcadia Resources Inc. (health care services and products, 2007-2012). |
Robert W. Selander (1950) | |
| Year of Election or Appointment: 2011 Previously, Mr. Selander served as a Member of the Advisory Board of Fidelity's Equity and High Income Funds (2011), Executive Vice Chairman (2010), Chief Executive Officer (2009-2010), and President and Chief Executive Officer (1997-2009) of Mastercard, Inc. |
Cornelia M. Small (1944) | |
| Year of Election or Appointment: 2005 Ms. Small is a member of the Board of Directors (2009-present) and Chair of the Investment Committee (2010-present) of the Teagle Foundation. Ms. Small also serves on the Investment Committee of the Berkshire Taconic Community Foundation (2008-present). Previously, Ms. Small served as Chairperson (2002-2008) and a member of the Investment Committee and Chairperson (2008-2012) and a member of the Board of Trustees of Smith College. In addition, Ms. Small served as Chief Investment Officer, Director of Global Equity Investments, and a member of the Board of Directors of Scudder, Stevens & Clark and Scudder Kemper Investments. |
William S. Stavropoulos (1939) | |
| Year of Election or Appointment: 2002 Mr. Stavropoulos is Vice Chairman of the Independent Trustees of the Equity and High Income Funds (2006-present). Mr. Stavropoulos serves as President and Founder of the Michigan Baseball Foundation, the Great Lakes Loons (2007-present). Mr. Stavropoulos is Chairman Emeritus of the Board of Directors of The Dow Chemical Company, where he previously served in numerous senior management positions, including President, CEO (1995-2000; 2002-2004), Chairman of the Executive Committee (2000-2006), and as a member of the Board of Directors (1990-2006). Currently, Mr. Stavropoulos is Chairman of the Board of Directors of Univar Inc. (global distributor of commodity and specialty chemicals), a Director of Teradata Corporation (data warehousing and technology solutions), and Maersk Inc. (industrial conglomerate), and a member of the Advisory Board for Metalmark Capital LLC (private equity investment, 2005-present). Mr. Stavropoulos is an operating advisor to Clayton, Dubilier & Rice, LLC (private equity investment). In addition, Mr. Stavropoulos is a member of the University of Notre Dame Advisory Council for the College of Science, a Trustee of the Rollin L. Gerstacker Foundation, and a Director of the Naples Philharmonic Center for the Arts. Previously, Mr. Stavropoulos served as a Director of Chemical Financial Corporation (bank holding company, 1993-2012) and Tyco International, Ltd. (multinational manufacturing and services, 2007-2012). |
David M. Thomas (1949) | |
| Year of Election or Appointment: 2008 Previously, Mr. Thomas served as Executive Chairman (2005-2006) and Chairman and Chief Executive Officer (2000-2005) of IMS Health, Inc. (pharmaceutical and healthcare information solutions), and a Director of Fortune Brands, Inc. (consumer products, 2000-2011). In addition, Mr. Thomas serves as Non-Executive Chairman of the Board of Directors of Fortune Brands Home and Security (home and security products, 2011-present), and as a member of the Board of Directors of Interpublic Group of Companies, Inc. (marketing communication, 2004-present). |
Michael E. Wiley (1950) | |
| Year of Election or Appointment: 2008 Mr. Wiley also serves as a Director of Asia Pacific Exploration Consolidated (international oil and gas exploration and production, 2008-present). Mr. Wiley serves as a Director of Tesoro Corporation (independent oil refiner and marketer, 2005-present), and a Director of Bill Barrett Corporation (exploration and production, 2005-present). In addition, Mr. Wiley also serves as a Director of Post Oak Bank (privately-held bank, 2004-present). Previously, Mr. Wiley served as a member of the Board of Trustees of the University of Tulsa (2000-2006; 2007-2010), as a Senior Energy Advisor of Katzenbach Partners, LLC (consulting, 2006-2007), as an Advisory Director of Riverstone Holdings (private investment), Chairman, President, and CEO of Baker Hughes, Inc. (oilfield services, 2000-2004), and as Director of Spinnaker Exploration Company (exploration and production, 2001-2005). |
+ The information above includes each Trustee's principal occupation during the last five years and other information relating to the experience, attributes, and skills relevant to each Trustee's qualifications to serve as a Trustee, which led to the conclusion that each Trustee should serve as a Trustee for the fund.
Advisory Board Members and Executive Officers:
Correspondence intended for David A. Rosow and Garnett A. Smith may be sent to Fidelity Investments, P.O. Box 55235, Boston, Massachusetts 02205-5235. Correspondence intended for each executive officer and Peter S. Lynch may be sent to Fidelity Investments, 245 Summer Street, Boston, Massachusetts 02210.
Name, Year of Birth; Principal Occupation | |
Peter S. Lynch (1944) | |
| Year of Election or Appointment: 2003 Member of the Advisory Board of Fidelity's Equity and High Income Funds. Mr. Lynch is Vice Chairman and a Director of FMR and FMR Co., Inc. In addition, Mr. Lynch serves as a Trustee of Boston College and as the Chairman of the Inner-City Scholarship Fund. Previously, Mr. Lynch served on the Special Olympics International Board of Directors (1997-2006). |
David A. Rosow (1942) | |
| Year of Election or Appointment: 2012 Member of the Advisory Board of Fidelity's Equity and High Income Funds. Chairman and Chief Executive Officer of International Golf Group, Inc. (golf course development, 1989-present). Previously, Mr. Rosow served as Chairman and Chief Executive Officer of Rosow & Company, Inc. (private investment company, 1989-2011), a Lead Director of Hudson United Bancorp (2001-2006) and as a Director of TD Banknorth (1996-2006). In addition, Mr. Rosow is a member (2008-present) and President (2009-present) of the Town Council of Palm Beach, Florida. |
Garnett A. Smith (1947) | |
| Year of Election or Appointment: 2012 Member of the Advisory Board of Fidelity's Equity and High Income Funds. Prior to Mr. Smith's retirement, he served as Chairman and Chief Executive Officer of Inbrand Corp. (manufacturer of personal absorbent products, 1990-1997). He also served as President (1986-1990) of Inbrand Corp. Prior to his employment with Inbrand Corp., he was employed by a retail fabric chain and North Carolina National Bank. In addition, Mr. Smith is a board member of the Jackson Hole Land Trust (2009-present). |
Kenneth B. Robins (1969) | |
| Year of Election or Appointment: 2008 President and Treasurer of Fidelity's Equity and High Income Funds. Mr. Robins also serves as President and Treasurer (2010-present) and Assistant Treasurer (2009-present) of other Fidelity funds and is an employee of Fidelity Investments (2004-present). Previously, Mr. Robins served as Deputy Treasurer of the Fidelity funds (2005-2008) and Treasurer and Chief Financial Officer of The North Carolina Capital Management Trust: Cash and Term Portfolios (2006-2008). |
Brian B. Hogan (1964) | |
| Year of Election or Appointment: 2009 Vice President of Equity and High Income Funds. Mr. Hogan also serves as President of FMR's Equity Division (2009-present). Previously, Mr. Hogan served as Senior Vice President, Equity Research of FMR (2006-2009) and as a portfolio manager. |
Thomas C. Hense (1964) | |
| Year of Election or Appointment: 2008 or 2010 Vice President of Fidelity's High Income (2008), Small Cap (2008), and Value (2010) Funds. Previously, Mr. Hense served as a portfolio manager for Fidelity's Institutional Money Management Group (Pyramis) (2003-2008). |
Scott C. Goebel (1968) | |
| Year of Election or Appointment: 2008 Secretary and Chief Legal Officer (CLO) of the Fidelity funds. Mr. Goebel also serves as Secretary of Fidelity Investments Money Management, Inc. (FIMM) (2010-present) and Fidelity Research and Analysis Company (FRAC) (2010-present); Secretary and CLO of The North Carolina Capital Management Trust: Cash and Term Portfolios (2008-present); General Counsel, Secretary, and Senior Vice President of FMR (2008-present) and FMR Co., Inc. (2008-present); employed by FMR LLC or an affiliate (2001-present); Chief Legal Officer of Fidelity Management & Research (Hong Kong) Limited (2008-present) and Assistant Secretary of Fidelity Management & Research (Japan) Inc. (2008-present), and Fidelity Management & Research (U.K.) Inc. (2008-present). Previously, Mr. Goebel served as Assistant Secretary of FIMM (2008-2010), FRAC (2008-2010), and the Funds (2007-2008) and as Vice President and Secretary of Fidelity Distributors Corporation (FDC) (2005-2007). |
William C. Coffey (1969) | |
| Year of Election or Appointment: 2009 Assistant Secretary of Fidelity's Equity and High Income Funds. Mr. Coffey also serves as Senior Vice President and Deputy General Counsel of FMR LLC (2010-present), and is an employee of Fidelity Investments. Previously, Mr. Coffey served as Vice President and Associate General Counsel of FMR LLC (2005-2009). |
Elizabeth Paige Baumann (1968) | |
| Year of Election or Appointment: 2012 Anti-Money Laundering (AML) Officer of the Fidelity funds. Ms. Baumann also serves as AML Officer of The North Carolina Capital Management Trust: Cash and Term Portfolios (2012-present), Chief AML Officer of FMR LLC (2012-present), and is an employee of Fidelity Investments. Previously, Ms. Baumann served as Vice President and Deputy Anti-Money Laundering Officer (2007-2012). |
Christine Reynolds (1958) | |
| Year of Election or Appointment: 2008 Chief Financial Officer of the Fidelity funds. Ms. Reynolds became President of Fidelity Pricing and Cash Management Services (FPCMS) in August 2008. Ms. Reynolds served as Chief Operating Officer of FPCMS (2007-2008). Previously, Ms. Reynolds served as President, Treasurer, and Anti-Money Laundering officer of the Fidelity funds (2004-2007). |
Joseph A. Hanlon (1968) | |
| Year of Election or Appointment: 2012 Chief Compliance Officer of Fidelity's Equity and High Income Funds. Mr. Hanlon serves as Compliance Officer of FMR, FMR Co., Inc., Fidelity Investments Money Management, Inc. (FIMM), Fidelity Research and Analysis Company (FRAC), Fidelity Management & Research (U.K.) Inc., Fidelity Management & Research (Hong Kong), and Strategic Advisers, Inc. (2009-present), as Senior Vice President of the Fidelity Asset Management Division (2009-present), and is an employee of Fidelity Investments. Previously, Mr. Hanlon served as Compliance Officer of Fidelity Management & Research (Japan) Inc. (2009-2013). |
Joseph F. Zambello (1957) | |
| Year of Election or Appointment: 2011 Deputy Treasurer of the Fidelity funds. Mr. Zambello is an employee of Fidelity Investments. Previously, Mr. Zambello served as Vice President of FMR's Program Management Group (2009-2011) and Vice President of the Transfer Agent Oversight Group (2005-2009). |
Adrien E. Deberghes (1967) | |
| Year of Election or Appointment: 2008 Deputy Treasurer of Fidelity's Equity and High Income Funds. Mr. Deberghes also serves as Vice President (2011-present) and Assistant Treasurer (2010-present) of other Fidelity funds, and is an employee of Fidelity Investments (2008-present). Previously, Mr. Deberghes served as Senior Vice President of Mutual Fund Administration at State Street Corporation (2007-2008), Senior Director of Mutual Fund Administration at Investors Bank & Trust (2005-2007), and Director of Finance for Dunkin' Brands (2000-2005). |
Stephen Sadoski (1971) | |
| Year of Election or Appointment: 2012 Deputy Treasurer of Fidelity's Equity and High Income Funds. Mr. Sadoski also serves as Deputy Treasurer of other Fidelity funds (2013-present) and is an employee of Fidelity Investments (2012-present). Previously, Mr. Sadoski served as Assistant Treasurer of Fidelity's Fixed Income and Asset Allocation Funds (2012-2013), an assistant chief accountant in the Division of Investment Management of the Securities and Exchange Commission (SEC) (2009-2012) and as a senior manager at Deloitte & Touche (1997-2009). |
Stacie Smith (1974) | |
| Year of Election or Appointment: 2013 Deputy Treasurer of Fidelity's Equity and High Income Funds. Ms. Smith is an employee of Fidelity Investments (2009-present). Previously, Ms. Smith served as Senior Audit Manager of Ernst & Young LLP (1996-2009). |
Stephanie J. Dorsey (1969) | |
| Year of Election or Appointment: 2010 Assistant Treasurer of Fidelity's Equity and High Income Funds. Ms. Dorsey also serves as President and Treasurer (2013-present) and Assistant Treasurer (2012-present) of other Fidelity funds, Treasurer and Chief Financial Officer of The North Carolina Capital Management Trust: Cash and Term Portfolios (2013-present), and is an employee of Fidelity Investments (2008-present). Previously, Ms. Dorsey served as Deputy Treasurer of Fidelity's Fixed Income and Asset Allocation Funds (2008-2013), Treasurer (2004-2008) of the JPMorgan Mutual Funds and Vice President (2004-2008) of JPMorgan Chase Bank. |
Gary W. Ryan (1958) | |
| Year of Election or Appointment: 2005 Assistant Treasurer of the Fidelity funds. Mr. Ryan is an employee of Fidelity Investments. Previously, Mr. Ryan served as Vice President of Fund Reporting in Fidelity Pricing and Cash Management Services (FPCMS) (1999-2005). |
Jonathan Davis (1968) | |
| Year of Election or Appointment: 2010 Assistant Treasurer of the Fidelity funds. Mr. Davis is also Assistant Treasurer of Fidelity Rutland Square Trust II and Fidelity Commonwealth Trust II. Mr. Davis is an employee of Fidelity Investments. Previously, Mr. Davis served as Vice President and Associate General Counsel of FMR LLC (2003-2010). |
Annual Report
Distributions (Unaudited)
The Board of Trustees of Fidelity Small Cap Stock Fund voted to pay on June 10, 2013, to shareholders of record at the opening of business on June 07, 2013, a distribution of $1.137 per share derived from capital gains realized from sales of portfolio securities and a dividend of $0.018 per share from net investment income.
The fund hereby designates as a capital gain dividend with respect to the taxable year ended April 30, 2013 $145,572,506 or, if subsequently determined to be different, the net capital gain of such year.
The fund designates 100% of the dividends distributed during the fiscal year as qualifying for the dividends-received deduction for corporate shareholders.
The fund designates 100% of the dividend distributed during the fiscal year as amounts which may be taken into account as a dividend for the purposes of the maximum rate under section 1(h)(11) of the Internal Revenue Code.
The fund will notify shareholders in January 2014 of amounts for use in preparing 2013 income tax returns.
Semiannual Report
Annual Report
Investment Adviser
Fidelity Management & Research Company
Boston, MA
Investment Sub-Advisers
FMR Co., Inc.
Fidelity Management & Research
(U.K.) Inc.
Fidelity Management & Research
(Hong Kong) Limited
Fidelity Management & Research
(Japan) Inc.
General Distributor
Fidelity Distributors Corporation
Smithfield, RI
Transfer and Service Agents
Fidelity Investments Institutional
Operations Company, Inc.
Boston, MA
Fidelity Service Company, Inc.
Boston, MA
Custodian
Brown Brothers Harriman & Co.
Boston, MA
The Fidelity Telephone Connection
Mutual Fund 24-Hour Service
Exchanges/Redemptions
and Account Assistance 1-800-544-6666
Product Information 1-800-544-6666
Retirement Accounts 1-800-544-4774
(8 a.m. - 9 p.m.)
TDD Service 1-800-544-0118
for the deaf and hearing impaired
(9 a.m. - 9 p.m. Eastern time)
Fidelity Automated Service
Telephone (FAST®)
1-800-544-5555
Automated line for quickest service
(Fidelity Investment logo)(registered trademark)
Corporate Headquarters
245 Summer St., Boston, MA 02210
www.fidelity.com
SLCX-UANN-0613
1.784727.110
Fidelity®
Large Cap Stock
Fund
Annual Report
April 30, 2013
(Fidelity Cover Art)
Contents
Performance | How the fund has done over time. | |
Management's Discussion of Fund Performance | The Portfolio Manager's review of fund performance and strategy. | |
Shareholder Expense Example | An example of shareholder expenses. | |
Investment Changes | A summary of major shifts in the fund's investments over the past six months. | |
Investments | A complete list of the fund's investments with their market values. | |
Financial Statements | Statements of assets and liabilities, operations, and changes in net assets, as well as financial highlights. | |
Notes | Notes to the financial statements. | |
Report of Independent Registered Public Accounting Firm |
| |
Trustees and Officers |
| |
Distributions |
|
To view a fund's proxy voting guidelines and proxy voting record for the 12-month period ended June 30, visit http://www.fidelity.com/proxyvotingresults or visit the Securities and Exchange Commission's (SEC) web site at http://www.sec.gov. You may also call 1-800-544-8544 to request a free copy of the proxy voting guidelines.
Standard & Poor's, S&P and S&P 500 are registered service marks of The McGraw-Hill Companies, Inc. and have been licensed for use by Fidelity Distributors Corporation.
Other third-party marks appearing herein are the property of their respective owners.
All other marks appearing herein are registered or unregistered trademarks or service marks of FMR LLC or an affiliated company. © 2013 FMR LLC. All rights reserved.
This report and the financial statements contained herein are submitted for the general information of the shareholders of the fund. This report is not authorized for distribution to prospective investors in the fund unless preceded or accompanied by an effective prospectus.
A fund files its complete schedule of portfolio holdings with the SEC for the first and third quarters of each fiscal year on Form N-Q. Forms N-Q are available on the SEC's web site at http://www.sec.gov. A fund's Forms N-Q may be reviewed and copied at the SEC's Public Reference Room in Washington, DC. Information regarding the operation of the SEC's Public Reference Room may be obtained by calling 1-800-SEC-0330. For a complete list of a fund's portfolio holdings, view the most recent holdings listing, semiannual report, or annual report on Fidelity's web site at http://www.fidelity.com, http://www.advisor.fidelity.com, or http://www.401k.com, as applicable.
NOT FDIC INSURED • MAY LOSE VALUE • NO BANK GUARANTEE
Neither the fund nor Fidelity Distributors Corporation is a bank.
Annual Report
Performance: The Bottom Line
Average annual total return reflects the change in the value of an investment, assuming reinvestment of the fund's distributions from dividend income and capital gains (the profits earned upon the sale of securities that have grown in value, if any) and assuming a constant rate of performance each year. The $10,000 table and the fund's returns do not reflect the deduction of taxes that a shareholder would pay on fund distributions or the redemption of fund shares. During periods of reimbursement by Fidelity, a fund's total return will be greater than it would be had the reimbursement not occurred. How a fund did yesterday is no guarantee of how it will do tomorrow.
Average Annual Total Returns
Periods ended April 30, 2013 | Past 1 | Past 5 | Past 10 |
Fidelity® Large Cap Stock Fund | 19.74% | 6.27% | 8.22% |
$10,000 Over 10 Years
Let's say hypothetically that $10,000 was invested in Fidelity® Large Cap Stock Fund on April 30, 2003. The chart shows how the value of your investment would have changed, and also shows how the S&P 500® Index performed over the same period.
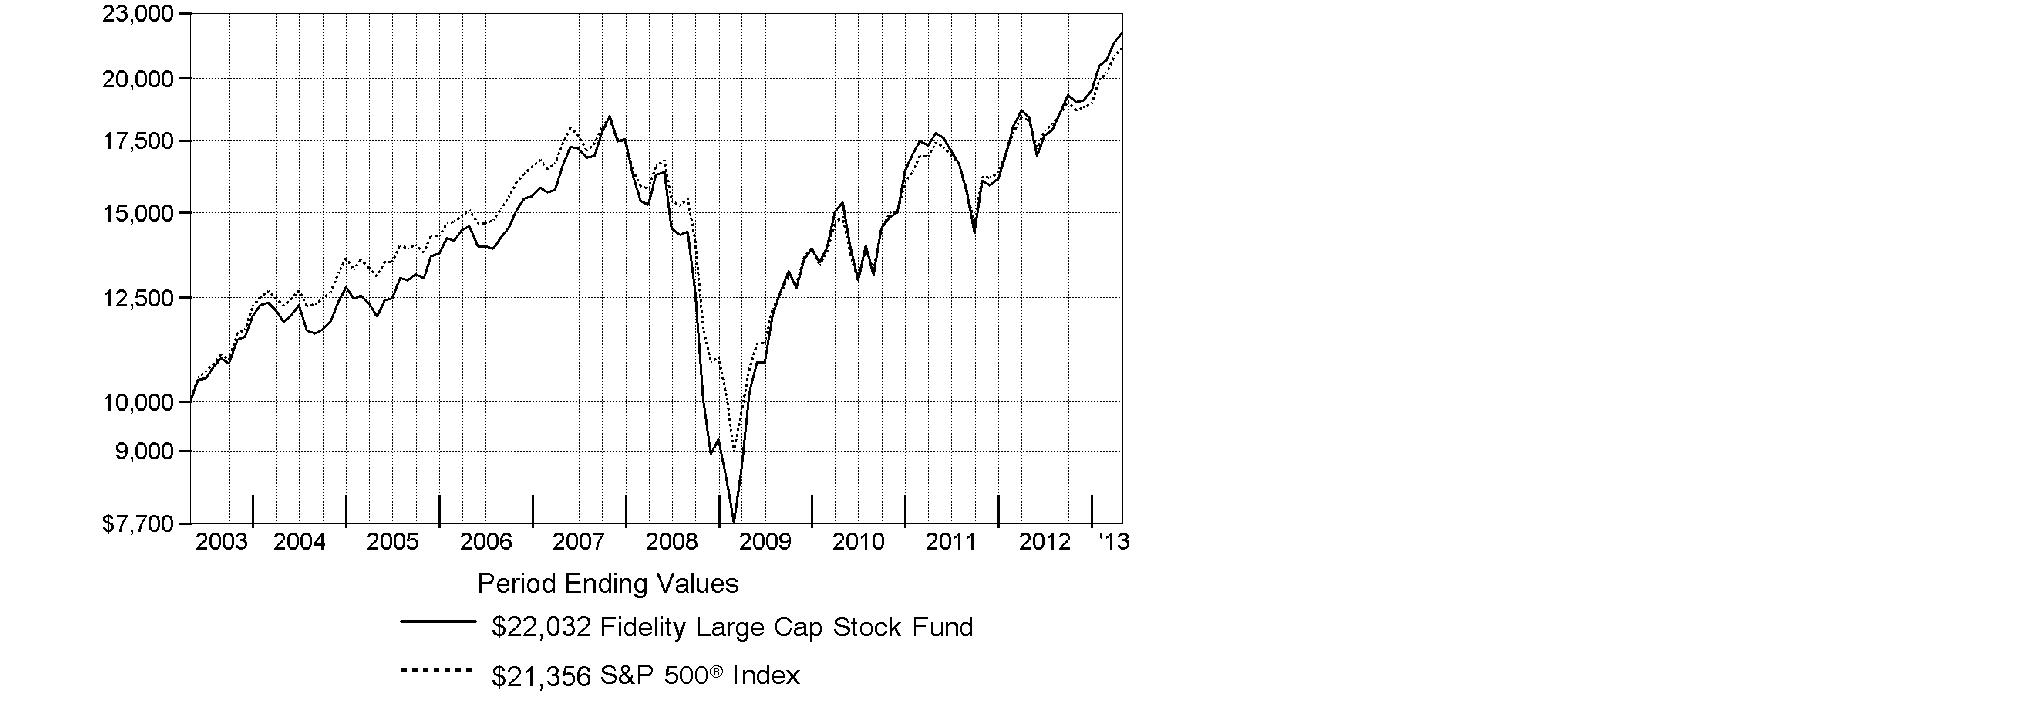
Annual Report
Management's Discussion of Fund Performance
Market Recap: The bull run in U.S. stocks entered its fifth year and two major equity benchmarks reached record territory during the 12 months ending April 30, 2013, as gains in the global economy and more monetary stimulus from the U.S. Federal Reserve kept markets on the upswing for much of the period. Optimism over the nation's jobs picture and housing market teamed up with solid corporate earnings to make stocks a favorite with investors during the 12-month period. The broad-based S&P 500® Index finished the year up 16.89%, closing at a new all-time high, while the blue-chip-laden Dow Jones Industrial AverageSM - which broke its own record in early March - gained 15.39% for the full 12 months. The growth- oriented Nasdaq Composite Index® advanced a more modest 10.78%, curtailed by the weak performance of consumer electronics giant Apple, a large index component. During the year, markets shrugged off an early decline brought on by debt woes in Europe, and another dip later in the period amid pre-election jitters and Congressional gridlock over the federal budget. The year's gains were broad-based, with nine of the 10 sectors in the S&P 500® posting a double-digit increase, led by health care and telecommunication services, while information technology added only about 2%. Despite the headwind of a stronger U.S. dollar, foreign developed-markets stocks rose strongly, with the MSCI® EAFE® Index returning 19.53%.
Comments from Matthew Fruhan, Portfolio Manager of Fidelity® Large Cap Stock Fund: For the year, the fund gained 19.74%, handily topping the S&P 500®. Relative performance was driven by strong security selection, especially within consumer discretionary. Here, the media industry easily outpaced the index overall, due in part to a healthier-than-expected advertising market, which led to strong results for Time Warner, which was overweight. Time Warner saw its earnings estimates increase and valuation expand. The top individual contributor was an out-of-index stake in mortgage insurer Radian Group, which saw its stock soar because investors started to appreciate the relative strength of the company's capital position versus its peers. Conversely, we were hurt by an out-of-index stake in Acacia Research, which assists patent owners with the protection and development of their intellectual property. The stock declined on concern about some inconsistency in earnings and cash flow. Avoiding biopharmaceuticals firm and index component Gilead Sciences was detrimental. The stock performed well due to significant valuation expansion, as investors become comfortable that the firm could replace its revenue and earnings derived from drugs that go off patent in 2017.
The views expressed above reflect those of the portfolio manager(s) only through the end of the period as stated on the cover of this report and do not necessarily represent the views of Fidelity or any other person in the Fidelity organization. Any such views are subject to change at any time based upon market or other conditions and Fidelity disclaims any responsibility to update such views. These views may not be relied on as investment advice and, because investment decisions for a Fidelity fund are based on numerous factors, may not be relied on as an indication of trading intent on behalf of any Fidelity fund.
Annual Report
Shareholder Expense Example
As a shareholder of the Fund, you incur two types of costs: (1) transaction costs, and (2) ongoing costs, including management fees and other Fund expenses. This Example is intended to help you understand your ongoing costs (in dollars) of investing in the Fund and to compare these costs with the ongoing costs of investing in other mutual funds.
The Example is based on an investment of $1,000 invested at the beginning of the period and held for the entire period (November 1, 2012 to April 30, 2013).
Actual Expenses
The first line of the accompanying table provides information about actual account values and actual expenses. You may use the information in this line, together with the amount you invested, to estimate the expenses that you paid over the period. Simply divide your account value by $1,000.00 (for example, an $8,600 account value divided by $1,000.00 = 8.6), then multiply the result by the number in the first line under the heading entitled "Expenses Paid During Period" to estimate the expenses you paid on your account during this period. A small balance maintenance fee of $12.00 that is charged once a year may apply for certain accounts with a value of less than $2,000. This fee is not included in the table below. If it was, the estimate of expenses you paid during the period would be higher, and your ending account value lower, by this amount. In addition, the Fund, as a shareholder in the underlying Fidelity Central Funds, will indirectly bear its pro-rata share of the fees and expenses incurred by the underlying Fidelity Central Funds. These fees and expenses are not included in the Fund's annualized expense ratio used to calculate the expense estimate in the table below.
Hypothetical Example for Comparison Purposes
The second line of the accompanying table provides information about hypothetical account values and hypothetical expenses based on the Fund's actual expense ratio and an assumed rate of return of 5% per year before expenses, which is not the Fund's actual return. The hypothetical account values and expenses may not be used to estimate the actual ending account balance or expenses you paid for the period. You may use this information to compare the ongoing costs of investing in the Fund and other funds. To do so, compare this 5% hypothetical example with the 5% hypothetical examples that appear in the shareholder reports of the other funds. A small balance maintenance fee of $12.00 that is charged once a year may apply for certain accounts with a value of less than $2,000. This fee is not included in the table below. If it was, the estimate of expenses you paid during the period would be higher, and your ending account value lower, by this amount. In addition, the Fund, as a shareholder in the underlying Fidelity Central Funds, will indirectly bear its pro-rata share of the fees and expenses incurred by the underlying Fidelity Central Funds. These fees and expenses are not included in the Fund's annualized expense ratio used to calculate the expense estimate in the table below.
Please note that the expenses shown in the table are meant to highlight your ongoing costs only and do not reflect any transaction costs. Therefore, the second line of the table is useful in comparing ongoing costs only, and will not help you determine the relative total costs of owning different funds.
Annual Report
Shareholder Expense Example - continued
| Annualized | Beginning | Ending | Expenses Paid |
Actual | .84% | $ 1,000.00 | $ 1,159.90 | $ 4.50 |
Hypothetical A |
| $ 1,000.00 | $ 1,020.63 | $ 4.21 |
A 5% return per year before expenses
B Annualized expense ratio reflects expenses net of applicable fee waivers.
* Expenses are equal to the Fund's annualized expense ratio, multiplied by the average account value over the period, multiplied by 181/365 (to reflect the one-half year period).
Annual Report
Investment Changes (Unaudited)
Top Ten Stocks as of April 30, 2013 | ||
| % of fund's | % of fund's net assets |
JPMorgan Chase & Co. | 3.8 | 3.9 |
Apple, Inc. | 3.5 | 4.7 |
Wells Fargo & Co. | 2.8 | 3.3 |
General Electric Co. | 2.6 | 2.3 |
Chevron Corp. | 2.6 | 2.9 |
Google, Inc. Class A | 2.3 | 2.3 |
Microsoft Corp. | 2.2 | 1.9 |
Citigroup, Inc. | 2.1 | 1.8 |
Target Corp. | 1.9 | 1.6 |
Occidental Petroleum Corp. | 1.9 | 0.7 |
| 25.7 | |
Top Five Market Sectors as of April 30, 2013 | ||
| % of fund's | % of fund's net assets |
Financials | 21.7 | 18.5 |
Information Technology | 18.7 | 20.2 |
Health Care | 16.0 | 14.5 |
Energy | 12.8 | 12.5 |
Industrials | 10.2 | 11.0 |
Asset Allocation (% of fund's net assets) | |||||||
As of April 30, 2013* | As of October 31, 2012** | ||||||
| Stocks 99.9% |
| | Stocks 98.5% |
| ||
 | Convertible |
| | Convertible |
| ||
| Short-Term |
| | Short-Term |
| ||
* Foreign investments | 8.9% |
| ** Foreign investments | 8.2% |
| ||

† Amount represents less than 0.1% |
Annual Report
Investments April 30, 2013
Showing Percentage of Net Assets
Common Stocks - 99.9% | |||
Shares | Value (000s) | ||
CONSUMER DISCRETIONARY - 10.2% | |||
Auto Components - 0.3% | |||
Gentex Corp. | 199,234 | $ 4,483 | |
Automobiles - 0.6% | |||
Ford Motor Co. | 668,460 | 9,165 | |
Distributors - 0.3% | |||
Li & Fung Ltd. | 978,000 | 1,265 | |
LKQ Corp. (a) | 112,500 | 2,709 | |
| 3,974 | ||
Hotels, Restaurants & Leisure - 0.5% | |||
Wyndham Worldwide Corp. | 47,100 | 2,830 | |
Yum! Brands, Inc. | 62,000 | 4,223 | |
| 7,053 | ||
Household Durables - 0.4% | |||
KB Home | 238,685 | 5,380 | |
Media - 3.6% | |||
Comcast Corp. Class A (special) (non-vtg.) | 683,413 | 26,851 | |
Discovery Communications, Inc. (a) | 26,723 | 2,106 | |
Time Warner, Inc. | 334,741 | 20,011 | |
Viacom, Inc. Class B (non-vtg.) | 80,509 | 5,152 | |
| 54,120 | ||
Multiline Retail - 2.0% | |||
Kohl's Corp. | 30,900 | 1,454 | |
Target Corp. | 408,448 | 28,820 | |
| 30,274 | ||
Specialty Retail - 2.4% | |||
Bed Bath & Beyond, Inc. (a) | 38,400 | 2,642 | |
Citi Trends, Inc. (a) | 139,967 | 1,647 | |
Lowe's Companies, Inc. | 584,505 | 22,457 | |
Select Comfort Corp. (a) | 156,594 | 3,323 | |
Staples, Inc. | 373,775 | 4,949 | |
| 35,018 | ||
Textiles, Apparel & Luxury Goods - 0.1% | |||
Coach, Inc. | 28,000 | 1,648 | |
TOTAL CONSUMER DISCRETIONARY | 151,115 | ||
Common Stocks - continued | |||
Shares | Value (000s) | ||
CONSUMER STAPLES - 8.1% | |||
Beverages - 1.7% | |||
PepsiCo, Inc. | 171,856 | $ 14,173 | |
The Coca-Cola Co. | 248,835 | 10,533 | |
| 24,706 | ||
Food & Staples Retailing - 2.0% | |||
CVS Caremark Corp. | 138,089 | 8,034 | |
Walgreen Co. | 434,120 | 21,493 | |
| 29,527 | ||
Food Products - 0.7% | |||
Danone SA | 54,397 | 4,156 | |
Kellogg Co. | 108,024 | 7,026 | |
| 11,182 | ||
Household Products - 2.4% | |||
Kimberly-Clark Corp. | 78,114 | 8,061 | |
Procter & Gamble Co. | 353,768 | 27,159 | |
Svenska Cellulosa AB (SCA) (B Shares) | 28,800 | 748 | |
| 35,968 | ||
Tobacco - 1.3% | |||
British American Tobacco PLC sponsored ADR | 87,006 | 9,659 | |
Lorillard, Inc. | 234,967 | 10,078 | |
| 19,737 | ||
TOTAL CONSUMER STAPLES | 121,120 | ||
ENERGY - 12.8% | |||
Energy Equipment & Services - 2.7% | |||
Baker Hughes, Inc. | 22,848 | 1,037 | |
Cameron International Corp. (a) | 80,675 | 4,966 | |
Dresser-Rand Group, Inc. (a) | 61,698 | 3,431 | |
Ensco PLC Class A | 52,550 | 3,031 | |
Halliburton Co. | 350,733 | 15,001 | |
Helmerich & Payne, Inc. | 54,370 | 3,187 | |
National Oilwell Varco, Inc. | 52,918 | 3,451 | |
Schlumberger Ltd. | 75,908 | 5,650 | |
| 39,754 | ||
Oil, Gas & Consumable Fuels - 10.1% | |||
Amyris, Inc. (a)(d) | 1,025,717 | 2,790 | |
Apache Corp. | 158,004 | 11,673 | |
BG Group PLC | 126,200 | 2,126 | |
BP PLC sponsored ADR | 142,324 | 6,205 | |
Common Stocks - continued | |||
Shares | Value (000s) | ||
ENERGY - continued | |||
Oil, Gas & Consumable Fuels - continued | |||
Canadian Natural Resources Ltd. | 464,300 | $ 13,619 | |
Chevron Corp. | 311,345 | 37,987 | |
ENI SpA | 67,300 | 1,606 | |
Exxon Mobil Corp. | 150,852 | 13,424 | |
Occidental Petroleum Corp. | 322,182 | 28,758 | |
Peabody Energy Corp. | 81,122 | 1,627 | |
Royal Dutch Shell PLC Class A (United Kingdom) | 278,334 | 9,476 | |
Suncor Energy, Inc. | 524,600 | 16,356 | |
The Williams Companies, Inc. | 127,100 | 4,846 | |
| 150,493 | ||
TOTAL ENERGY | 190,247 | ||
FINANCIALS - 21.7% | |||
Capital Markets - 3.3% | |||
Charles Schwab Corp. | 771,076 | 13,077 | |
KKR & Co. LP | 162,720 | 3,417 | |
Morgan Stanley | 923,303 | 20,451 | |
Northern Trust Corp. | 86,612 | 4,670 | |
State Street Corp. | 134,437 | 7,861 | |
| 49,476 | ||
Commercial Banks - 5.5% | |||
BNP Paribas SA | 16,600 | 925 | |
CIT Group, Inc. (a) | 141,695 | 6,023 | |
Comerica, Inc. | 154,626 | 5,605 | |
PNC Financial Services Group, Inc. | 119,120 | 8,086 | |
Standard Chartered PLC (United Kingdom) | 133,035 | 3,342 | |
SunTrust Banks, Inc. | 175,892 | 5,145 | |
U.S. Bancorp | 337,024 | 11,216 | |
Wells Fargo & Co. | 1,095,075 | 41,591 | |
| 81,933 | ||
Consumer Finance - 0.1% | |||
SLM Corp. | 67,245 | 1,389 | |
Diversified Financial Services - 8.2% | |||
Bank of America Corp. | 2,081,150 | 25,619 | |
Citigroup, Inc. | 673,120 | 31,408 | |
IntercontinentalExchange, Inc. (a) | 7,300 | 1,189 | |
Common Stocks - continued | |||
Shares | Value (000s) | ||
FINANCIALS - continued | |||
Diversified Financial Services - continued | |||
JPMorgan Chase & Co. | 1,149,874 | $ 56,352 | |
KKR Financial Holdings LLC | 630,375 | 6,739 | |
| 121,307 | ||
Insurance - 3.4% | |||
American International Group, Inc. (a) | 246,350 | 10,204 | |
Genworth Financial, Inc. Class A (a) | 706,549 | 7,087 | |
Lincoln National Corp. | 242,864 | 8,260 | |
MetLife, Inc. | 560,810 | 21,866 | |
Prudential Financial, Inc. | 64,934 | 3,923 | |
| 51,340 | ||
Thrifts & Mortgage Finance - 1.2% | |||
MGIC Investment Corp. (a) | 601,492 | 3,248 | |
Radian Group, Inc. | 1,202,890 | 14,375 | |
| 17,623 | ||
TOTAL FINANCIALS | 323,068 | ||
HEALTH CARE - 16.0% | |||
Biotechnology - 2.6% | |||
Achillion Pharmaceuticals, Inc. (a) | 229,000 | 1,727 | |
Amgen, Inc. | 139,503 | 14,538 | |
ARIAD Pharmaceuticals, Inc. (a) | 48,305 | 863 | |
Clovis Oncology, Inc. (a) | 35,800 | 1,340 | |
Discovery Laboratories, Inc. (a) | 103,000 | 174 | |
Dynavax Technologies Corp. (a) | 308,062 | 724 | |
Elan Corp. PLC sponsored ADR (a) | 382,979 | 4,481 | |
Gentium SpA sponsored ADR (a) | 272,350 | 2,236 | |
Infinity Pharmaceuticals, Inc. (a) | 93,947 | 4,048 | |
Insmed, Inc. (a) | 11,144 | 102 | |
Intercept Pharmaceuticals, Inc. | 28,577 | 973 | |
MEI Pharma, Inc. (a) | 335,500 | 2,993 | |
Merrimack Pharmaceuticals, Inc. (a) | 116,599 | 574 | |
Neurocrine Biosciences, Inc. (a) | 30,014 | 346 | |
Synageva BioPharma Corp. (a) | 52,136 | 2,695 | |
Theravance, Inc. (a) | 47,200 | 1,593 | |
| 39,407 | ||
Health Care Equipment & Supplies - 3.5% | |||
Abbott Laboratories | 96,175 | 3,551 | |
Alere, Inc. (a) | 887,043 | 22,779 | |
Common Stocks - continued | |||
Shares | Value (000s) | ||
HEALTH CARE - continued | |||
Health Care Equipment & Supplies - continued | |||
Align Technology, Inc. (a) | 210,458 | $ 6,970 | |
Boston Scientific Corp. (a) | 942,705 | 7,061 | |
CareFusion Corp. (a) | 82,933 | 2,773 | |
Insulet Corp. (a) | 55,443 | 1,399 | |
NxStage Medical, Inc. (a) | 129,802 | 1,450 | |
Sirona Dental Systems, Inc. (a) | 1,968 | 145 | |
St. Jude Medical, Inc. | 119,000 | 4,905 | |
Stryker Corp. | 17,100 | 1,121 | |
| 52,154 | ||
Health Care Providers & Services - 4.3% | |||
Aetna, Inc. | 191,466 | 10,998 | |
Express Scripts Holding Co. (a) | 76,295 | 4,530 | |
Health Management Associates, Inc. Class A (a) | 160,994 | 1,850 | |
Humana, Inc. | 21,900 | 1,623 | |
McKesson Corp. | 131,969 | 13,965 | |
Quest Diagnostics, Inc. | 74,345 | 4,188 | |
UnitedHealth Group, Inc. | 228,822 | 13,713 | |
WellPoint, Inc. | 173,803 | 12,674 | |
| 63,541 | ||
Health Care Technology - 0.1% | |||
HMS Holdings Corp. (a) | 46,300 | 1,167 | |
Life Sciences Tools & Services - 0.7% | |||
Illumina, Inc. (a)(d) | 82,117 | 5,312 | |
QIAGEN NV (a) | 199,615 | 3,968 | |
Thermo Fisher Scientific, Inc. | 17,800 | 1,436 | |
| 10,716 | ||
Pharmaceuticals - 4.8% | |||
AbbVie, Inc. | 194,875 | 8,974 | |
Cardiome Pharma Corp. (a) | 111,345 | 241 | |
Endo Health Solutions, Inc. (a) | 103,160 | 3,780 | |
GlaxoSmithKline PLC sponsored ADR | 169,911 | 8,774 | |
Hospira, Inc. (a) | 4,841 | 160 | |
Jazz Pharmaceuticals PLC (a) | 42,275 | 2,467 | |
Johnson & Johnson | 144,087 | 12,281 | |
Merck & Co., Inc. | 553,594 | 26,019 | |
Optimer Pharmaceuticals, Inc. (a) | 58,700 | 906 | |
Teva Pharmaceutical Industries Ltd. sponsored ADR | 32,700 | 1,252 | |
ViroPharma, Inc. (a) | 185,100 | 5,044 | |
Common Stocks - continued | |||
Shares | Value (000s) | ||
HEALTH CARE - continued | |||
Pharmaceuticals - continued | |||
Warner Chilcott PLC | 74,100 | $ 1,066 | |
XenoPort, Inc. (a) | 106,920 | 664 | |
| 71,628 | ||
TOTAL HEALTH CARE | 238,613 | ||
INDUSTRIALS - 10.2% | |||
Aerospace & Defense - 2.2% | |||
Esterline Technologies Corp. (a) | 39,604 | 2,972 | |
Honeywell International, Inc. | 80,220 | 5,899 | |
KEYW Holding Corp. (a) | 160,918 | 2,187 | |
Rockwell Collins, Inc. | 88,785 | 5,586 | |
The Boeing Co. | 139,837 | 12,783 | |
United Technologies Corp. | 28,378 | 2,591 | |
| 32,018 | ||
Air Freight & Logistics - 1.2% | |||
C.H. Robinson Worldwide, Inc. | 53,842 | 3,198 | |
United Parcel Service, Inc. Class B | 178,875 | 15,355 | |
| 18,553 | ||
Commercial Services & Supplies - 0.1% | |||
Interface, Inc. | 60,812 | 1,018 | |
Electrical Equipment - 0.6% | |||
AMETEK, Inc. | 90,870 | 3,699 | |
Hubbell, Inc. Class B | 7,500 | 720 | |
Roper Industries, Inc. | 33,565 | 4,016 | |
| 8,435 | ||
Industrial Conglomerates - 2.6% | |||
General Electric Co. | 1,722,508 | 38,395 | |
Machinery - 1.1% | |||
Illinois Tool Works, Inc. | 51,679 | 3,336 | |
Ingersoll-Rand PLC | 234,732 | 12,629 | |
| 15,965 | ||
Professional Services - 0.9% | |||
Acacia Research Corp. | 360,418 | 8,585 | |
Acacia Research Corp. (a)(e) | 24,000 | 572 | |
Michael Page International PLC | 501,844 | 2,905 | |
Verisk Analytics, Inc. (a) | 29,400 | 1,802 | |
| 13,864 | ||
Common Stocks - continued | |||
Shares | Value (000s) | ||
INDUSTRIALS - continued | |||
Road & Rail - 1.5% | |||
Con-way, Inc. | 89,306 | $ 3,019 | |
CSX Corp. | 428,586 | 10,539 | |
Hertz Global Holdings, Inc. (a) | 110,800 | 2,668 | |
Norfolk Southern Corp. | 87,142 | 6,747 | |
| 22,973 | ||
TOTAL INDUSTRIALS | 151,221 | ||
INFORMATION TECHNOLOGY - 18.7% | |||
Communications Equipment - 2.2% | |||
Brocade Communications Systems, Inc. (a) | 415,105 | 2,416 | |
Cisco Systems, Inc. | 1,068,661 | 22,356 | |
QUALCOMM, Inc. | 132,150 | 8,143 | |
| 32,915 | ||
Computers & Peripherals - 3.6% | |||
Apple, Inc. | 116,485 | 51,574 | |
Fusion-io, Inc. (a) | 22,200 | 417 | |
Stratasys Ltd. (a) | 21,600 | 1,794 | |
| 53,785 | ||
Internet Software & Services - 2.5% | |||
Cornerstone OnDemand, Inc. (a) | 24,419 | 886 | |
Demandware, Inc. (a) | 67,526 | 1,843 | |
Google, Inc. Class A (a) | 41,187 | 33,962 | |
| 36,691 | ||
IT Services - 5.6% | |||
Cognizant Technology Solutions Corp. Class A (a) | 136,408 | 8,839 | |
Fidelity National Information Services, Inc. | 136,776 | 5,751 | |
Gartner, Inc. Class A (a) | 37,467 | 2,167 | |
IBM Corp. | 34,769 | 7,042 | |
MasterCard, Inc. Class A | 33,000 | 18,247 | |
Paychex, Inc. | 462,512 | 16,840 | |
The Western Union Co. | 415,765 | 6,157 | |
Unisys Corp. (a) | 99,438 | 1,902 | |
Visa, Inc. Class A | 92,070 | 15,510 | |
| 82,455 | ||
Semiconductors & Semiconductor Equipment - 1.1% | |||
Applied Materials, Inc. | 462,139 | 6,706 | |
Broadcom Corp. Class A | 58,566 | 2,108 | |
Common Stocks - continued | |||
Shares | Value (000s) | ||
INFORMATION TECHNOLOGY - continued | |||
Semiconductors & Semiconductor Equipment - continued | |||
Lam Research Corp. (a) | 124,766 | $ 5,767 | |
NXP Semiconductors NV (a) | 85,868 | 2,366 | |
| 16,947 | ||
Software - 3.7% | |||
Adobe Systems, Inc. (a) | 112,790 | 5,085 | |
Citrix Systems, Inc. (a) | 57,004 | 3,544 | |
Concur Technologies, Inc. (a) | 50,176 | 3,668 | |
Electronic Arts, Inc. (a) | 188,091 | 3,312 | |
Microsoft Corp. | 974,955 | 32,271 | |
Oracle Corp. | 46,000 | 1,508 | |
salesforce.com, Inc. (a) | 71,200 | 2,927 | |
VMware, Inc. Class A (a) | 38,295 | 2,700 | |
Workday, Inc. Class A | 6,300 | 395 | |
| 55,410 | ||
TOTAL INFORMATION TECHNOLOGY | 278,203 | ||
MATERIALS - 0.7% | |||
Chemicals - 0.7% | |||
Airgas, Inc. | 43,952 | 4,248 | |
E.I. du Pont de Nemours & Co. | 66,712 | 3,636 | |
Syngenta AG (Switzerland) | 1,755 | 750 | |
W.R. Grace & Co. (a) | 24,703 | 1,905 | |
| 10,539 | ||
Metals & Mining - 0.0% | |||
Freeport-McMoRan Copper & Gold, Inc. | 20,500 | 624 | |
TOTAL MATERIALS | 11,163 | ||
TELECOMMUNICATION SERVICES - 1.5% | |||
Diversified Telecommunication Services - 1.1% | |||
Verizon Communications, Inc. | 320,303 | 17,268 | |
Wireless Telecommunication Services - 0.4% | |||
Vodafone Group PLC sponsored ADR | 178,741 | 5,468 | |
TOTAL TELECOMMUNICATION SERVICES | 22,736 | ||
TOTAL COMMON STOCKS (Cost $1,214,221) |
| ||
Convertible Bonds - 0.0% | ||||
| Principal Amount (000s) | Value (000s) | ||
ENERGY - 0.0% | ||||
Oil, Gas & Consumable Fuels - 0.0% | ||||
Amyris, Inc. 3% 2/27/17 (e) (Cost $395) | $ 395 | $ 276 | ||
Money Market Funds - 0.3% | |||
Shares |
| ||
Fidelity Cash Central Fund, 0.13% (b) | 794,952 | 795 | |
Fidelity Securities Lending Cash Central Fund, 0.12% (b)(c) | 3,238,274 | 3,238 | |
TOTAL MONEY MARKET FUNDS (Cost $4,033) |
| ||
TOTAL INVESTMENT PORTFOLIO - 100.2% (Cost $1,218,649) | 1,491,795 | ||
NET OTHER ASSETS (LIABILITIES) - (0.2)% | (3,454) | ||
NET ASSETS - 100% | $ 1,488,341 | ||
Legend |
(a) Non-income producing |
(b) Affiliated fund that is generally available only to investment companies and other accounts managed by Fidelity Investments. The rate quoted is the annualized seven-day yield of the fund at period end. A complete unaudited listing of the fund's holdings as of its most recent quarter end is available upon request. In addition, each Fidelity Central Fund's financial statements, which are not covered by the Fund's Report of Independent Registered Public Accounting Firm, are available on the SEC's website or upon request. |
(c) Investment made with cash collateral received from securities on loan. |
(d) Security or a portion of the security is on loan at period end. |
(e) Restricted securities - Investment in securities not registered under the Securities Act of 1933 (excluding 144A issues). At the end of the period, the value of restricted securities (excluding 144A issues) amounted to $848,000 or 0.1% of net assets. |
Additional information on each restricted holding is as follows: |
Security | Acquisition Date | Acquisition Cost (000s) |
Acacia Research Corp. | 2/16/12 | $ 882 |
Amyris, Inc. 3% 2/27/17 | 2/27/12 | $ 395 |
Affiliated Central Funds |
Information regarding fiscal year to date income earned by the Fund from investments in Fidelity Central Funds is as follows: |
Fund | Income earned |
Fidelity Cash Central Fund | $ 17 |
Fidelity Securities Lending Cash Central Fund | 251 |
Total | $ 268 |
Other Information |
The following is a summary of the inputs used, as of April 30, 2013, involving the Fund's assets and liabilities carried at fair value. The inputs or methodology used for valuing securities may not be an indication of the risk associated with investing in those securities. For more information on valuation inputs, and their aggregation into the levels used in the table below, please refer to the Investment Valuation section in the accompanying Notes to Financial Statements. |
Valuation Inputs at Reporting Date: | ||||
Description | Total | Level 1 | Level 2 | Level 3 |
Investments in Securities: | ||||
Equities: | ||||
Consumer Discretionary | $ 151,115 | $ 151,115 | $ - | $ - |
Consumer Staples | 121,120 | 121,120 | - | - |
Energy | 190,247 | 179,165 | 11,082 | - |
Financials | 323,068 | 323,068 | - | - |
Health Care | 238,613 | 238,613 | - | - |
Industrials | 151,221 | 151,221 | - | - |
Information Technology | 278,203 | 278,203 | - | - |
Materials | 11,163 | 10,413 | 750 | - |
Telecommunication Services | 22,736 | 22,736 | - | - |
Corporate Bonds | 276 | - | 276 | - |
Money Market Funds | 4,033 | 4,033 | - | - |
Total Investments in Securities: | $ 1,491,795 | $ 1,479,687 | $ 12,108 | $ - |
See accompanying notes which are an integral part of the financial statements.
Annual Report
Financial Statements
Statement of Assets and Liabilities
Amounts in thousands (except per-share amount) | April 30, 2013 | |
|
|
|
Assets | ||
Investment in securities, at value (including securities loaned of $3,051) - See accompanying schedule: Unaffiliated issuers (cost $1,214,616) | $ 1,487,762 |
|
Fidelity Central Funds (cost $4,033) | 4,033 |
|
Total Investments (cost $1,218,649) |
| $ 1,491,795 |
Foreign currency held at value (cost $310) | 313 | |
Receivable for investments sold | 5,655 | |
Receivable for fund shares sold | 1,419 | |
Dividends receivable | 1,073 | |
Interest receivable | 2 | |
Distributions receivable from Fidelity Central Funds | 14 | |
Prepaid expenses | 1 | |
Receivable from investment adviser for expense reductions | 3 | |
Other receivables | 46 | |
Total assets | 1,500,321 | |
|
|
|
Liabilities | ||
Payable for investments purchased | $ 5,776 | |
Payable for fund shares redeemed | 1,953 | |
Accrued management fee | 675 | |
Other affiliated payables | 277 | |
Other payables and accrued expenses | 61 | |
Collateral on securities loaned, at value | 3,238 | |
Total liabilities | 11,980 | |
|
|
|
Net Assets | $ 1,488,341 | |
Net Assets consist of: |
| |
Paid in capital | $ 1,181,611 | |
Undistributed net investment income | 4,254 | |
Accumulated undistributed net realized gain (loss) on investments and foreign currency transactions | 29,327 | |
Net unrealized appreciation (depreciation) on investments and assets and liabilities in foreign currencies | 273,149 | |
Net Assets, for 64,238 shares outstanding | $ 1,488,341 | |
Net Asset Value, offering price and redemption price per share ($1,488,341 ÷ 64,238 shares) | $ 23.17 | |
See accompanying notes which are an integral part of the financial statements.
Annual Report
Statement of Operations
Amounts in thousands | Year ended April 30, 2013 | |
|
|
|
Investment Income |
|
|
Dividends |
| $ 24,507 |
Interest |
| 12 |
Income from Fidelity Central Funds |
| 268 |
Total income |
| 24,787 |
|
|
|
Expenses | ||
Management fee | $ 6,741 | |
Performance adjustment | 438 | |
Transfer agent fees | 2,548 | |
Accounting and security lending fees | 393 | |
Custodian fees and expenses | 69 | |
Independent trustees' compensation | 8 | |
Registration fees | 49 | |
Audit | 58 | |
Legal | 4 | |
Miscellaneous | 10 | |
Total expenses before reductions | 10,318 | |
Expense reductions | (145) | 10,173 |
Net investment income (loss) | 14,614 | |
Realized and Unrealized Gain (Loss) Net realized gain (loss) on: | ||
Investment securities: |
|
|
Unaffiliated issuers | 73,593 | |
Foreign currency transactions | (29) | |
Total net realized gain (loss) |
| 73,564 |
Change in net unrealized appreciation (depreciation) on: Investment securities | 157,495 | |
Assets and liabilities in foreign currencies | 3 | |
Total change in net unrealized appreciation (depreciation) |
| 157,498 |
Net gain (loss) | 231,062 | |
Net increase (decrease) in net assets resulting from operations | $ 245,676 | |
See accompanying notes which are an integral part of the financial statements.
Annual Report
Financial Statements - continued
Statement of Changes in Net Assets
Amounts in thousands | Year ended | Year ended |
Increase (Decrease) in Net Assets |
|
|
Operations |
|
|
Net investment income (loss) | $ 14,614 | $ 7,737 |
Net realized gain (loss) | 73,564 | (15,258) |
Change in net unrealized appreciation (depreciation) | 157,498 | 18,117 |
Net increase (decrease) in net assets resulting | 245,676 | 10,596 |
Distributions to shareholders from net investment income | (11,530) | (7,156) |
Distributions to shareholders from net realized gain | (611) | (1,333) |
Total distributions | (12,141) | (8,489) |
Share transactions | 586,821 | 213,397 |
Reinvestment of distributions | 11,813 | 8,243 |
Cost of shares redeemed | (295,278) | (331,011) |
Net increase (decrease) in net assets resulting from share transactions | 303,356 | (109,371) |
Total increase (decrease) in net assets | 536,891 | (107,264) |
|
|
|
Net Assets | ||
Beginning of period | 951,450 | 1,058,714 |
End of period (including undistributed net investment income of $4,254 and undistributed net investment income of $1,332, respectively) | $ 1,488,341 | $ 951,450 |
Other Information Shares | ||
Sold | 29,502 | 11,864 |
Issued in reinvestment of distributions | 594 | 481 |
Redeemed | (14,526) | (19,098) |
Net increase (decrease) | 15,570 | (6,753) |
See accompanying notes which are an integral part of the financial statements.
Annual Report
Financial Highlights
Years ended April 30, | 2013 | 2012 | 2011 | 2010 | 2009 |
Selected Per-Share Data |
|
|
|
|
|
Net asset value, beginning of period | $ 19.55 | $ 19.10 | $ 16.55 | $ 11.06 | $ 17.90 |
Income from Investment Operations |
|
|
|
|
|
Net investment income (loss) B | .25 | .16 | .11 | .05 | .15 |
Net realized and unrealized gain (loss) | 3.58 | .46 | 2.55 | 5.52 | (6.84) |
Total from investment operations | 3.83 | .62 | 2.66 | 5.57 | (6.69) |
Distributions from net investment income | (.20) | (.15) | (.09) | (.08) | (.15) |
Distributions from net realized gain | (.01) | (.03) | (.02) | - | - |
Total distributions | (.21) | (.17) F | (.11) | (.08) | (.15) |
Net asset value, end of period | $ 23.17 | $ 19.55 | $ 19.10 | $ 16.55 | $ 11.06 |
Total Return A | 19.74% | 3.40% | 16.14% | 50.48% | (37.37)% |
Ratios to Average Net Assets C, E |
|
|
|
|
|
Expenses before reductions | .85% | 1.03% | .94% | 1.04% | .84% |
Expenses net of fee waivers, if any | .85% | 1.03% | .94% | 1.04% | .84% |
Expenses net of all reductions | .84% | 1.02% | .93% | 1.02% | .83% |
Net investment income (loss) | 1.21% | .88% | .66% | .32% | 1.19% |
Supplemental Data |
|
|
|
|
|
Net assets, end of period (in millions) | $ 1,488 | $ 951 | $ 1,059 | $ 1,088 | $ 587 |
Portfolio turnover rate D | 53% | 64% | 108% | 186% | 159% |
A Total returns would have been lower if certain expenses had not been reduced during the applicable periods shown.
B Calculated based on average shares outstanding during the period.
C Fees and expenses of any underlying Fidelity Central Funds are not included in the Fund's expense ratio. The Fund indirectly bears its proportionate share of the expenses of any underlying Fidelity Central Funds.
D Amount does not include the portfolio activity of any underlying Fidelity Central Funds.
E Expense ratios reflect operating expenses of the Fund. Expenses before reductions do not reflect amounts reimbursed by the investment adviser or reductions from brokerage service arrangements or reductions from other expense offset arrangements and do not represent the amount paid by the Fund during periods when reimbursements or reductions occur. Expenses net of fee waivers reflect expenses after reimbursement by the investment adviser but prior to reductions from brokerage service arrangements or other expense offset arrangements. Expenses net of all reductions represent the net expenses paid by the Fund.
F Total distributions of $.17 per share is comprised of distributions from net investment income of $.147 and distributions from net realized gain of $.027 per share.
See accompanying notes which are an integral part of the financial statements.
Annual Report
Notes to Financial Statements
For the period ended April 30, 2013
(Amounts in thousands except percentages)
1. Organization.
Fidelity Large Cap Stock Fund (the Fund) is a fund of Fidelity Commonwealth Trust (the Trust) and is authorized to issue an unlimited number of shares. The Trust is registered under the Investment Company Act of 1940, as amended (the 1940 Act), as an open-end management investment company organized as a Massachusetts business trust.
2. Investments in Fidelity Central Funds.
The Fund invests in Fidelity Central Funds, which are open-end investment companies generally available only to other investment companies and accounts managed by Fidelity Management & Research Company (FMR) and its affiliates. The Fund's Schedule of Investments lists each of the Fidelity Central Funds held as of period end, if any, as an investment of the Fund, but does not include the underlying holdings of each Fidelity Central Fund. As an Investing Fund, the Fund indirectly bears its proportionate share of the expenses of the underlying Fidelity Central Funds.
The Money Market Central Funds seek preservation of capital and current income and are managed by Fidelity Investments Money Management, Inc. (FIMM), an affiliate of FMR.
A complete unaudited list of holdings for each Fidelity Central Fund is available upon request or at the Securities and Exchange Commission (the SEC) website at www.sec.gov. In addition, the financial statements of the Fidelity Central Funds, which are not covered by the Fund's Report of Independent Registered Public Accounting Firm, are available on the SEC website or upon request.
3. Significant Accounting Policies.
The financial statements have been prepared in conformity with accounting principles generally accepted in the United States of America (GAAP), which require management to make certain estimates and assumptions at the date of the financial statements. Actual results could differ from those estimates. Subsequent events, if any, through the date that the financial statements were issued have been evaluated in the preparation of the financial statements. The following summarizes the significant accounting policies of the Fund:
Investment Valuation. Investments are valued as of 4:00 p.m. Eastern time on the last calendar day of the period. In accordance with valuation policies and procedures approved by the Board of Trustees (the Board), the Fund attempts to obtain prices from one or more third party pricing vendors or brokers to value its investments. When current market prices, quotations or currency exchange rates are not readily available or reliable, investments will be fair valued in good faith by the FMR Fair Value Committee (the Committee), in accordance with procedures adopted by the Fund's Board. Factors
Annual Report
Notes to Financial Statements - continued
(Amounts in thousands except percentages)
3. Significant Accounting Policies - continued
Investment Valuation - continued
used in determining fair value vary by investment type and may include market or investment specific events, changes in interest rates and credit quality. The frequency with which these procedures are used cannot be predicted and they may be utilized to a significant extent. The Committee oversees the Fund's valuation policies and procedures and is responsible for approving and reporting to the Board all fair value determinations.
The Fund categorizes the inputs to valuation techniques used to value its investments into a disclosure hierarchy consisting of three levels as shown below:
Level 1 - quoted prices in active markets for identical investments
Level 2 - other significant observable inputs (including quoted prices for similar investments, interest rates, prepayment speeds, etc.)
Level 3 - unobservable inputs (including the Fund's own assumptions based on the best information available)
Valuation techniques used to value the Fund's investments by major category are as follows:
Equity securities, including restricted securities, for which market quotations are readily available, are valued at the last reported sale price or official closing price as reported by a third party pricing vendor on the primary market or exchange on which they are traded and are categorized as Level 1 in the hierarchy. In the event there were no sales during the day or closing prices are not available, securities are valued at the last quoted bid price or may be valued using the last available price and are generally categorized as Level 2 in the hierarchy. For foreign equity securities, when market or security specific events arise, comparisons to the valuation of American Depositary Receipts (ADRs), futures contracts, Exchange- Traded Funds (ETFs) and certain indexes as well as quoted prices for similar securities may be used and would be categorized as Level 2 in the hierarchy. Utilizing these techniques may result in transfers between Level 1 and Level 2. For restricted equity securities and private placements where observable inputs are limited, assumptions about market activity and risk are used and these securities are generally categorized as Level 3 in the hierarchy.
Debt securities, including restricted securities, are valued based on evaluated prices received from third party pricing vendors or from brokers who make markets in such securities. For corporate bonds, pricing vendors utilize matrix pricing which considers yield or price of bonds of comparable quality, coupon, maturity and type as well as broker-supplied prices. When independent prices are unavailable or unreliable, debt
Annual Report
3. Significant Accounting Policies - continued
Investment Valuation - continued
securities may be valued utilizing pricing methodologies which consider similar factors that would be used by third party pricing vendors. Debt securities are generally categorized as Level 2 in the hierarchy but may be Level 3 depending on the circumstances.
Investments in open-end mutual funds, including the Fidelity Central Funds, are valued at their closing net asset value (NAV) each business day and are categorized as Level 1 in the hierarchy.
Changes in valuation techniques may result in transfers in or out of an assigned level within the disclosure hierarchy. The aggregate value of investments by input level, as of April 30, 2013 is included at the end of the Fund's Schedule of Investments.
Foreign Currency. The Fund may use foreign currency contracts to facilitate transactions in foreign-denominated securities. Gains and losses from these transactions may arise from changes in the value of the foreign currency or if the counterparties do not perform under the contracts' terms.
Foreign-denominated assets, including investment securities, and liabilities are translated into U.S. dollars at the exchange rates at period end. Purchases and sales of investment securities, income and dividends received and expenses denominated in foreign currencies are translated into U.S. dollars at the exchange rate in effect on the transaction date.
The effects of exchange rate fluctuations on investments are included with the net realized and unrealized gain (loss) on investment securities. Other foreign currency transactions resulting in realized and unrealized gain (loss) are disclosed separately.
Investment Transactions and Income. For financial reporting purposes, the Fund's investment holdings and NAV include trades executed through the end of the last business day of the period. The NAV per share for processing shareholder transactions is calculated as of the close of business of the New York Stock Exchange (NYSE), normally 4:00 p.m. Eastern time and includes trades executed through the end of the prior business day. Gains and losses on securities sold are determined on the basis of identified cost and may include proceeds received from litigation. Dividend income is recorded on the ex-dividend date, except for certain dividends from foreign securities where the ex-dividend date may have passed, which are recorded as soon as the Fund is informed of the ex-dividend date. Non-cash dividends included in dividend income, if any, are recorded at the fair market value of the securities received. Distributions received on securities that represent a return of capital or capital gain are recorded as a reduction of cost of investments and/or as a realized gain. The Fund estimates the components of distributions received that may be considered return of capital distributions or capital
Annual Report
Notes to Financial Statements - continued
(Amounts in thousands except percentages)
3. Significant Accounting Policies - continued
Investment Transactions and Income - continued
gain distributions. Interest income and distributions from the Fidelity Central Funds are accrued as earned. Interest income includes coupon interest and amortization of premium and accretion of discount on debt securities. Investment income is recorded net of foreign taxes withheld where recovery of such taxes is uncertain.
Expenses. Expenses directly attributable to a fund are charged to that fund. Expenses attributable to more than one fund are allocated among the respective funds on the basis of relative net assets or other appropriate methods. Expense estimates are accrued in the period to which they relate and adjustments are made when actual amounts are known.
Income Tax Information and Distributions to Shareholders. Each year, the Fund intends to qualify as a regulated investment company under Subchapter M of the Internal Revenue Code, including distributing substantially all of its taxable income and realized gains. As a result, no provision for income taxes is required. As of April 30, 2013, the Fund did not have any unrecognized tax benefits in the financial statements; nor is the Fund aware of any tax positions for which it is reasonably possible that the total amounts of unrecognized tax benefits will significantly change in the next twelve months. The Fund files a U.S. federal tax return, in addition to state and local tax returns as required. A fund's federal income tax returns are subject to examination by the Internal Revenue Service (IRS) for a period of three fiscal years after they are filed. State and local tax returns may be subject to examination for an additional fiscal year depending on the jurisdiction. Foreign taxes are provided for based on the Fund's understanding of the tax rules and rates that exist in the foreign markets in which it invests.
Distributions are declared and recorded on the ex-dividend date. Income and capital gain distributions are determined in accordance with income tax regulations, which may differ from GAAP. In addition, the Fund claimed a portion of the payment made to redeeming shareholders as a distribution for income tax purposes.
Capital accounts within the financial statements are adjusted for permanent book-tax differences. These adjustments have no impact on net assets or the results of operations. Temporary book-tax differences will reverse in a subsequent period.
Book-tax differences are primarily due to foreign currency transactions, partnerships, capital loss carryforwards, losses deferred due to wash sales and excise tax regulations.
Annual Report
3. Significant Accounting Policies - continued
Income Tax Information and Distributions to Shareholders - continued
The federal tax cost of investment securities and unrealized appreciation (depreciation) as of period end were as follows:
Gross unrealized appreciation | $ 299,544 |
Gross unrealized depreciation | (34,088) |
Net unrealized appreciation (depreciation) on securities and other investments | $ 265,456 |
|
|
Tax Cost | $ 1,226,339 |
The tax-based components of distributable earnings as of period end were as follows:
Undistributed tax-exempt income | $ - |
Undistributed ordinary income | $ 4,430 |
Undistributed long-term capital gain | $ 36,842 |
Net unrealized appreciation (depreciation) | $ 265,459 |
The tax character of distributions paid was as follows:
| April 30, 2013 | April 30, 2012 |
Ordinary Income | $ 12,141 | $ 8,489 |
Restricted Securities. The Fund may invest in securities that are subject to legal or contractual restrictions on resale. These securities generally may be resold in transactions exempt from registration or to the public if the securities are registered. Disposal of these securities may involve time-consuming negotiations and expense, and prompt sale at an acceptable price may be difficult. Information regarding restricted securities is included at the end of the Fund's Schedule of Investments.
4. Purchases and Sales of Investments.
Purchases and sales of securities, other than short-term securities, aggregated $940,872 and $633,296, respectively.
5. Fees and Other Transactions with Affiliates.
Management Fee. FMR and its affiliates provide the Fund with investment management related services for which the Fund pays a monthly management fee. The management fee is the sum of an individual fund fee rate that is based on an annual rate of .30% of the Fund's average net assets and an annualized group fee rate that averaged .26%
Annual Report
Notes to Financial Statements - continued
(Amounts in thousands except percentages)
5. Fees and Other Transactions with Affiliates - continued
Management Fee - continued
during the period. The group fee rate is based upon the average net assets of all the mutual funds advised by FMR. The group fee rate decreases as assets under management increase and increases as assets under management decrease. In addition, the management fee is subject to a performance adjustment (up to a maximum of ± .20% of the Fund's average net assets over a 36 month performance period). The upward or downward adjustment to the management fee is based on the Fund's relative investment performance as compared to an appropriate benchmark index. For the period, the total annual management fee rate, including the performance adjustment, was .59% of the Fund's average net assets.
Transfer Agent Fees. Fidelity Investments Institutional Operations Company, Inc. (FIIOC), an affiliate of FMR, is the Fund's transfer, dividend disbursing and shareholder servicing agent. FIIOC receives account fees and asset-based fees that vary according to account size and type of account. FIIOC pays for typesetting, printing and mailing of shareholder reports, except proxy statements. For the period, the transfer agent fees were equivalent to an annual rate of .21% of average net assets.
Accounting and Security Lending Fees. Fidelity Service Company, Inc. (FSC), an affiliate of FMR, maintains the Fund's accounting records. The accounting fee is based on the level of average net assets for each month. Under a separate contract, FSC administers the security lending program. The security lending fee is based on the number and duration of lending transactions.
Brokerage Commissions. The Fund placed a portion of its portfolio transactions with brokerage firms which are affiliates of the investment adviser. Brokerage commissions are included in net realized gain (loss) and change in net unrealized appreciation (depreciation) in the Statement of Operations. The commissions paid to these affiliated firms were $33 for the period.
6. Committed Line of Credit.
The Fund participates with other funds managed by FMR or an affiliate in a $4.25 billion credit facility (the "line of credit") to be utilized for temporary or emergency purposes to fund shareholder redemptions or for other short-term liquidity purposes. The Fund has agreed to pay commitment fees on its pro-rata portion of the line of credit, which amounted to $3 and is reflected in Miscellaneous expenses on the Statement of Operations. During the period, there were no borrowings on this line of credit.
Annual Report
7. Security Lending.
The Fund lends portfolio securities through a lending agent from time to time in order to earn additional income. For equity securities, a lending agent is used and may loan securities to certain qualified borrowers, including Fidelity Capital Markets (FCM), a broker-dealer affiliated with the Fund. On the settlement date of the loan, the Fund receives collateral (in the form of U.S. Treasury obligations, letters of credit and/or cash) against the loaned securities and maintains collateral in an amount not less than 100% of the market value of the loaned securities during the period of the loan. The market value of the loaned securities is determined at the close of business of the Fund and any additional required collateral is delivered to the Fund on the next business day. If the borrower defaults on its obligation to return the securities loaned because of insolvency or other reasons, a fund could experience delays and costs in recovering the securities loaned or in gaining access to the collateral. Any cash collateral received is invested in the Fidelity Securities Lending Cash Central Fund. The value of loaned securities and cash collateral at period end are disclosed on the Fund's Statement of Assets and Liabilities. At period end, there were no security loans outstanding with FCM. Security lending income represents the income earned on investing cash collateral, less rebates paid to borrowers and any lending agent fees associated with the loan, plus any premium payments received for lending certain types of securities. Security lending income is presented in the Statement of Operations as a component of income from Fidelity Central Funds. Total security lending income during the period amounted to $251, including $4 from securities loaned to FCM.
8. Expense Reductions.
Many of the brokers with whom FMR places trades on behalf of the Fund provided services to the Fund in addition to trade execution. These services included payments of certain expenses on behalf of the Fund totaling $142 for the period.
In addition, FMR reimbursed a portion of the Fund's operating expenses during the period in the amount of $3.
9. Other.
The Fund's organizational documents provide former and current trustees and officers with a limited indemnification against liabilities arising in connection with the performance of their duties to the Fund. In the normal course of business, the Fund may also enter into contracts that provide general indemnifications. The Fund's maximum exposure under these arrangements is unknown as this would be dependent on future claims that may be made against the Fund. The risk of material loss from such claims is considered remote.
Annual Report
Report of Independent Registered Public Accounting Firm
To the Trustees of Fidelity Commonwealth Trust and Shareholders of Fidelity Large Cap Stock Fund:
We have audited the accompanying statement of assets and liabilities of Fidelity Large Cap Stock Fund (the Fund), a fund of Fidelity Commonwealth Trust, including the schedule of investments, as of April 30, 2013, and the related statement of operations for the year then ended, the statement of changes in net assets for each of the two years in the period then ended, and the financial highlights for each of the five years in the period then ended. These financial statements and financial highlights are the responsibility of the Fund's management. Our responsibility is to express an opinion on these financial statements and financial highlights based on our audits.
We conducted our audits in accordance with the standards of the Public Company Accounting Oversight Board (United States). Those standards require that we plan and perform the audit to obtain reasonable assurance about whether the financial statements and financial highlights are free of material misstatement. The Fund is not required to have, nor were we engaged to perform, an audit of its internal control over financial reporting. Our audits included consideration of internal control over financial reporting as a basis for designing audit procedures that are appropriate in the circumstances, but not for the purpose of expressing an opinion on the effectiveness of the Fund's internal control over financial reporting. Accordingly, we express no such opinion. An audit also includes examining, on a test basis, evidence supporting the amounts and disclosures in the financial statements, assessing the accounting principles used and significant estimates made by management, as well as evaluating the overall financial statement presentation. Our procedures included confirmation of securities owned as of April 30, 2013, by correspondence with the custodian and brokers; where replies were not received from brokers, we performed other auditing procedures. We believe that our audits provide a reasonable basis for our opinion.
In our opinion, the financial statements and financial highlights referred to above present fairly, in all material respects, the financial position of Fidelity Large Cap Stock Fund as of April 30, 2013, the results of its operations for the year then ended, the changes in its net assets for each of the two years in the period then ended, and the financial highlights for each of the five years in the period then ended, in conformity with accounting principles generally accepted in the United States of America.
DELOITTE & TOUCHE LLP
Boston, Massachusetts
June 13, 2013
Annual Report
Trustees and Officers
The Trustees, Members of the Advisory Board, and executive officers of the trust and fund, as applicable, are listed below. The Board of Trustees governs the fund and is responsible for protecting the interests of shareholders. The Trustees are experienced executives who meet periodically throughout the year to oversee the fund's activities, review contractual arrangements with companies that provide services to the fund, oversee management of the risks associated with such activities and contractual arrangements, and review the fund's performance. Except for James C. Curvey, each of the Trustees oversees 234 Fidelity funds. Mr. Curvey oversees 453 Fidelity funds.
The Trustees hold office without limit in time except that (a) any Trustee may resign; (b) any Trustee may be removed by written instrument, signed by at least two-thirds of the number of Trustees prior to such removal; (c) any Trustee who requests to be retired or who has become incapacitated by illness or injury may be retired by written instrument signed by a majority of the other Trustees; and (d) any Trustee may be removed at any special meeting of shareholders by a two-thirds vote of the outstanding voting securities of the trust. Each Trustee who is not an interested person of the trust and the fund (as defined in the 1940 Act) (Independent Trustee), shall retire not later than the last day of the calendar year in which his or her 75th birthday occurs. The Independent Trustees may waive this mandatory retirement age policy with respect to individual Trustees. The executive officers and Advisory Board Members hold office without limit in time, except that any officer and Advisory Board Member may resign or may be removed by a vote of a majority of the Trustees at any regular meeting or any special meeting of the Trustees. Except as indicated, each individual has held the office shown or other offices in the same company for the past five years.
Experience, Skills, Attributes, and Qualifications of the Fund's Trustees. The Governance and Nominating Committee has adopted a statement of policy that describes the experience, qualifications, attributes, and skills that are necessary and desirable for potential Independent Trustee candidates (Statement of Policy). The Board believes that each Trustee satisfied at the time he or she was initially elected or appointed a Trustee, and continues to satisfy, the standards contemplated by the Statement of Policy. The Governance and Nominating Committee also engages professional search firms to help identify potential Independent Trustee candidates who have the experience, qualifications, attributes, and skills consistent with the Statement of Policy. From time to time, additional criteria based on the composition and skills of the current Independent Trustees, as well as experience or skills that may be appropriate in light of future changes to board composition, business conditions, and regulatory or other developments, have also been considered by the professional search firms and the Governance and Nominating Committee. In addition, the Board takes into account the Trustees' commitment and participation in Board and committee meetings, as well as their leadership of standing and ad hoc committees throughout their tenure.
In determining that a particular Trustee was and continues to be qualified to serve as a Trustee, the Board has considered a variety of criteria, none of which, in isolation, was controlling. The Board believes that, collectively, the Trustees have balanced and diverse experience, qualifications, attributes, and skills, which allow the Board to operate effectively in governing the fund and protecting the interests of shareholders. Information about the specific experience, skills, attributes, and qualifications of each Trustee, which in each case led to the Board's conclusion that the Trustee should serve (or continue to serve) as a trustee of the fund, is provided below.
Annual Report
Trustees and Officers - continued
Board Structure and Oversight Function. James C. Curvey is an interested person (as defined in the 1940 Act) and currently serves as Chairman. The Trustees have determined that an interested Chairman is appropriate and benefits shareholders because an interested Chairman has a personal and professional stake in the quality and continuity of services provided to the fund. Independent Trustees exercise their informed business judgment to appoint an individual of their choosing to serve as Chairman, regardless of whether the Trustee happens to be independent or a member of management. The Independent Trustees have determined that they can act independently and effectively without having an Independent Trustee serve as Chairman and that a key structural component for assuring that they are in a position to do so is for the Independent Trustees to constitute a substantial majority for the Board. The Independent Trustees also regularly meet in executive session. Ned C. Lautenbach serves as Chairman of the Independent Trustees and as such (i) acts as a liaison between the Independent Trustees and management with respect to matters important to the Independent Trustees and (ii) with management prepares agendas for Board meetings.
Fidelity funds are overseen by different Boards of Trustees. The fund's Board oversees Fidelity's equity and high income funds and another Board oversees Fidelity's investment-grade bond, money market, and asset allocation funds. The asset allocation funds may invest in Fidelity funds overseen by the fund's Board. The use of separate Boards, each with its own committee structure, allows the Trustees of each group of Fidelity funds to focus on the unique issues of the funds they oversee, including common research, investment, and operational issues. On occasion, the separate Boards establish joint committees to address issues of overlapping consequences for the Fidelity funds overseen by each Board.
The Trustees operate using a system of committees to facilitate the timely and efficient consideration of all matters of importance to the Trustees, the fund, and fund shareholders and to facilitate compliance with legal and regulatory requirements and oversight of the fund's activities and associated risks. The Board, acting through its committees, has charged FMR and its affiliates with (i) identifying events or circumstances the occurrence of which could have demonstrably adverse effects on the fund's business and/or reputation; (ii) implementing processes and controls to lessen the possibility that such events or circumstances occur or to mitigate the effects of such events or circumstances if they do occur; and (iii) creating and maintaining a system designed to evaluate continuously business and market conditions in order to facilitate the identification and implementation processes described in (i) and (ii) above. Because the day-to-day operations and activities of the fund are carried out by or through FMR, its affiliates and other service providers, the fund's exposure to risks is mitigated but not eliminated by the processes overseen by the Trustees. While each of the Board's committees has responsibility for overseeing different aspects of the fund's activities, oversight is exercised primarily through the Operations, Audit, and Compliance Committees. In addition, the Independent Trustees have worked with FMR to enhance the Board's oversight of investment and financial risks, legal and regulatory risks, technology risks, and operational risks, including the development of additional risk reporting to the Board. For example, a working group comprised of Independent Trustees and FMR has worked and continues to work to review the Fidelity funds' valuation-related activities, reporting and risk management. Appropriate personnel, including but not limited to the fund's Chief Compliance Officer (CCO), FMR's internal auditor, the independent accountants, the fund's Treasurer and portfolio management personnel, make periodic reports to the Board's committees, as appropriate, including an annual review of FMR's risk management program for the Fidelity funds. The responsibilities of each standing committee, including their oversight responsibilities, are described further under "Standing Committees of the Fund's Trustees."
Annual Report
The fund's Statement of Additional Information (SAI) includes more information about the Trustees. To request a free copy, call Fidelity at 1-800-544-8544.
Interested Trustees*:
Correspondence intended for each Trustee who is an interested person may be sent to Fidelity Investments, 245 Summer Street, Boston, Massachusetts 02210.
Name, Year of Birth; Principal Occupations and Other Relevant Experience+ | |
James C. Curvey (1935) | |
| Year of Election or Appointment: 2007 Mr. Curvey is Trustee and Chairman of the Board of Trustees of certain Trusts. Mr. Curvey also serves as Trustee (2007-present) of other investment companies advised by FMR. Mr. Curvey is a Director of Fidelity Investments Money Management, Inc. (2009-present), Director of Fidelity Research & Analysis Co. (2009-present) and Director of FMR and FMR Co., Inc. (2007-present). Mr. Curvey is also Vice Chairman (2007-present) and Director of FMR LLC. In addition, Mr. Curvey serves as an Overseer for the Boston Symphony Orchestra and a member of the Trustees of Villanova University. Previously, Mr. Curvey was the Vice Chairman (2006-2007) and Director (2000-2007) of FMR Corp. |
Ronald P. O'Hanley (1957) | |
| Year of Election or Appointment: 2011 Mr. O'Hanley is Director of FMR Co., Inc. (2010-present), Director of Fidelity Investments Money Management, Inc. (2010-present), Director of Fidelity Research & Analysis Company (2010-present), President of Fidelity Asset Management and Corporate Services and a member of Fidelity's Executive Committee (2010-present). Previously, Mr. O'Hanley served as President and Chief Executive Officer of BNY Mellon Asset Management (2007-2010). Mr. O'Hanley also served as Vice Chairman of Bank New York Mellon Corp. and a member of that firm's Executive Committee. Prior to the 2007 merger of The Bank of New York and Mellon Financial Corporation, he was Vice Chairman of Mellon Financial Corporation and President and Chief Executive Officer of Mellon Asset Management. He joined Mellon in February 1997. Mr. O'Hanley currently serves as Chairman of the Boston Public Library Foundation Board of Directors and sits on the Board of Directors of Beth Israel Deaconess Medical Center, the Board of Trustees of the Marine Biological Laboratory and the Advisory Board of the Maxwell School of Citizenship and Public Administration at Syracuse University. Mr. O'Hanley also chairs the Council on Asset Management for the Financial Services Roundtable and is a member of the Board of Directors of Institutional Investor's U.S. Institute. |
* Trustees have been determined to be "Interested Trustees" by virtue of, among other things, their affiliation with the trust or various entities under common control with FMR.
+ The information above includes each Trustee's principal occupation during the last five years and other information relating to the experience, attributes, and skills relevant to each Trustee's qualifications to serve as a Trustee, which led to the conclusion that each Trustee should serve as a Trustee for the fund.
Annual Report
Independent Trustees:
Correspondence intended for each Independent Trustee (that is, the Trustees other than the Interested Trustees) may be sent to Fidelity Investments, P.O. Box 55235, Boston, Massachusetts 02205-5235.
Name, Year of Birth; Principal Occupations and Other Relevant Experience+ | |
Dennis J. Dirks (1948) | |
| Year of Election or Appointment: 2005 Prior to his retirement in May 2003, Mr. Dirks was Chief Operating Officer and a member of the Board of The Depository Trust & Clearing Corporation (DTCC). He also served as President, Chief Operating Officer, and Board member of The Depository Trust Company (DTC) and President and Board member of the National Securities Clearing Corporation (NSCC). In addition, Mr. Dirks served as Chief Executive Officer and Board member of the Government Securities Clearing Corporation, Chief Executive Officer and Board member of the Mortgage-Backed Securities Clearing Corporation, as a Trustee and a member of the Finance Committee of Manhattan College (2005-2008), and as a Trustee and a member of the Finance Committee of AHRC of Nassau County (2006-2008). Mr. Dirks is a member of the Independent Directors Council (IDC) Governing Council (2010-present) and Board of Directors for The Brookville Center for Children's Services, Inc. (2009-present). |
Alan J. Lacy (1953) | |
| Year of Election or Appointment: 2008 Mr. Lacy serves as Senior Adviser (2007-present) of Oak Hill Capital Partners, L.P. (private equity). Mr. Lacy also served as Chief Executive Officer (2000-2005) and Vice Chairman (2005-2006) of Sears Holdings Corporation and Sears, Roebuck and Co. (retail). In addition, Mr. Lacy serves as a member of the Board of Directors of Dave & Buster's Entertainment, Inc. (restaurant and entertainment complexes, 2010-present), Earth Fare, Inc. (retail grocery, 2012-present), The Hillman Companies, Inc. (hardware wholesalers, 2010-present), and Bristol-Myers Squibb Company (global pharmaceuticals, 2008-present). Mr. Lacy is a member of the Board of Trustees of The National Parks Conservation Association (2006-present). Previously, Mr. Lacy served as Chairman of the Board of Trustees of the National Parks Conservation Association (2008-2011) and as a member of the Board of Directors for the Western Union Company (global money transfer, 2006-2011). |
Ned C. Lautenbach (1944) | |
| Year of Election or Appointment: 2000 Mr. Lautenbach is Chairman of the Independent Trustees of the Equity and High Income Funds (2006-present). Mr. Lautenbach currently serves as the Lead Director of the Eaton Corporation Board of Directors (diversified industrial, 1997-present). Mr. Lautenbach is Chairman of the Board of Directors of the Philharmonic Center for the Arts in Naples, Florida (2012-present) and a member of the Council on Foreign Relations (1994-present). Previously, Mr. Lautenbach was a Partner/Advisory Partner at Clayton, Dubilier & Rice, LLC (private equity investment, 1998-2010), as well as a Director of Sony Corporation (2006-2007). |
Joseph Mauriello (1944) | |
| Year of Election or Appointment: 2008 Prior to his retirement in January 2006, Mr. Mauriello served in numerous senior management positions including Deputy Chairman and Chief Operating Officer (2004-2005), and Vice Chairman of Financial Services (2002-2004) of KPMG LLP US (professional services, 1965-2005). Mr. Mauriello currently serves as a member of the Board of Directors of XL Group plc. (global insurance and re-insurance, 2006-present). Previously, Mr. Mauriello served as a Director of the Hamilton Funds of the Bank of New York (2006-2007) and of Arcadia Resources Inc. (health care services and products, 2007-2012). |
Robert W. Selander (1950) | |
| Year of Election or Appointment: 2011 Previously, Mr. Selander served as a Member of the Advisory Board of Fidelity's Equity and High Income Funds (2011), Executive Vice Chairman (2010), Chief Executive Officer (2009-2010), and President and Chief Executive Officer (1997-2009) of Mastercard, Inc. |
Cornelia M. Small (1944) | |
| Year of Election or Appointment: 2005 Ms. Small is a member of the Board of Directors (2009-present) and Chair of the Investment Committee (2010-present) of the Teagle Foundation. Ms. Small also serves on the Investment Committee of the Berkshire Taconic Community Foundation (2008-present). Previously, Ms. Small served as Chairperson (2002-2008) and a member of the Investment Committee and Chairperson (2008-2012) and a member of the Board of Trustees of Smith College. In addition, Ms. Small served as Chief Investment Officer, Director of Global Equity Investments, and a member of the Board of Directors of Scudder, Stevens & Clark and Scudder Kemper Investments. |
William S. Stavropoulos (1939) | |
| Year of Election or Appointment: 2002 Mr. Stavropoulos is Vice Chairman of the Independent Trustees of the Equity and High Income Funds (2006-present). Mr. Stavropoulos serves as President and Founder of the Michigan Baseball Foundation, the Great Lakes Loons (2007-present). Mr. Stavropoulos is Chairman Emeritus of the Board of Directors of The Dow Chemical Company, where he previously served in numerous senior management positions, including President, CEO (1995-2000; 2002-2004), Chairman of the Executive Committee (2000-2006), and as a member of the Board of Directors (1990-2006). Currently, Mr. Stavropoulos is Chairman of the Board of Directors of Univar Inc. (global distributor of commodity and specialty chemicals), a Director of Teradata Corporation (data warehousing and technology solutions), and Maersk Inc. (industrial conglomerate), and a member of the Advisory Board for Metalmark Capital LLC (private equity investment, 2005-present). Mr. Stavropoulos is an operating advisor to Clayton, Dubilier & Rice, LLC (private equity investment). In addition, Mr. Stavropoulos is a member of the University of Notre Dame Advisory Council for the College of Science, a Trustee of the Rollin L. Gerstacker Foundation, and a Director of the Naples Philharmonic Center for the Arts. Previously, Mr. Stavropoulos served as a Director of Chemical Financial Corporation (bank holding company, 1993-2012) and Tyco International, Ltd. (multinational manufacturing and services, 2007-2012). |
David M. Thomas (1949) | |
| Year of Election or Appointment: 2008 Previously, Mr. Thomas served as Executive Chairman (2005-2006) and Chairman and Chief Executive Officer (2000-2005) of IMS Health, Inc. (pharmaceutical and healthcare information solutions), and a Director of Fortune Brands, Inc. (consumer products, 2000-2011). In addition, Mr. Thomas serves as Non-Executive Chairman of the Board of Directors of Fortune Brands Home and Security (home and security products, 2011-present), and as a member of the Board of Directors of Interpublic Group of Companies, Inc. (marketing communication, 2004-present). |
Michael E. Wiley (1950) | |
| Year of Election or Appointment: 2008 Mr. Wiley also serves as a Director of Asia Pacific Exploration Consolidated (international oil and gas exploration and production, 2008-present). Mr. Wiley serves as a Director of Tesoro Corporation (independent oil refiner and marketer, 2005-present), and a Director of Bill Barrett Corporation (exploration and production, 2005-present). In addition, Mr. Wiley also serves as a Director of Post Oak Bank (privately-held bank, 2004-present). Previously, Mr. Wiley served as a member of the Board of Trustees of the University of Tulsa (2000-2006; 2007-2010), as a Senior Energy Advisor of Katzenbach Partners, LLC (consulting, 2006-2007), as an Advisory Director of Riverstone Holdings (private investment), Chairman, President, and CEO of Baker Hughes, Inc. (oilfield services, 2000-2004), and as Director of Spinnaker Exploration Company (exploration and production, 2001-2005). |
+ The information above includes each Trustee's principal occupation during the last five years and other information relating to the experience, attributes, and skills relevant to each Trustee's qualifications to serve as a Trustee, which led to the conclusion that each Trustee should serve as a Trustee for the fund.
Advisory Board Members and Executive Officers:
Correspondence intended for David A. Rosow and Garnett A. Smith may be sent to Fidelity Investments, P.O. Box 55235, Boston, Massachusetts 02205-5235. Correspondence intended for each executive officer and Peter S. Lynch may be sent to Fidelity Investments, 245 Summer Street, Boston, Massachusetts 02210.
Name, Year of Birth; Principal Occupation | |
Peter S. Lynch (1944) | |
| Year of Election or Appointment: 2003 Member of the Advisory Board of Fidelity's Equity and High Income Funds. Mr. Lynch is Vice Chairman and a Director of FMR and FMR Co., Inc. In addition, Mr. Lynch serves as a Trustee of Boston College and as the Chairman of the Inner-City Scholarship Fund. Previously, Mr. Lynch served on the Special Olympics International Board of Directors (1997-2006). |
David A. Rosow (1942) | |
| Year of Election or Appointment: 2012 Member of the Advisory Board of Fidelity's Equity and High Income Funds. Chairman and Chief Executive Officer of International Golf Group, Inc. (golf course development, 1989-present). Previously, Mr. Rosow served as Chairman and Chief Executive Officer of Rosow & Company, Inc. (private investment company, 1989-2011), a Lead Director of Hudson United Bancorp (2001-2006) and as a Director of TD Banknorth (1996-2006). In addition, Mr. Rosow is a member (2008-present) and President (2009-present) of the Town Council of Palm Beach, Florida. |
Garnett A. Smith (1947) | |
| Year of Election or Appointment: 2012 Member of the Advisory Board of Fidelity's Equity and High Income Funds. Prior to Mr. Smith's retirement, he served as Chairman and Chief Executive Officer of Inbrand Corp. (manufacturer of personal absorbent products, 1990-1997). He also served as President (1986-1990) of Inbrand Corp. Prior to his employment with Inbrand Corp., he was employed by a retail fabric chain and North Carolina National Bank. In addition, Mr. Smith is a board member of the Jackson Hole Land Trust (2009-present). |
Kenneth B. Robins (1969) | |
| Year of Election or Appointment: 2008 President and Treasurer of Fidelity's Equity and High Income Funds. Mr. Robins also serves as President and Treasurer (2010-present) and Assistant Treasurer (2009-present) of other Fidelity funds and is an employee of Fidelity Investments (2004-present). Previously, Mr. Robins served as Deputy Treasurer of the Fidelity funds (2005-2008) and Treasurer and Chief Financial Officer of The North Carolina Capital Management Trust: Cash and Term Portfolios (2006-2008). |
Bruce T. Herring (1965) | |
| Year of Election or Appointment: 2006 Vice President of certain Equity Funds. Mr. Herring also serves as Chief Investment Officer of Fidelity Global Asset Allocation (GAA) (2013-present), Chief Investment Officer and Director of Fidelity Management & Research (U.K.) Inc. (2010-present), Group Chief Investment Officer of FMR, and President of Fidelity Research & Analysis Company (2010-present). Previously, Mr. Herring served as Vice President (2005-2006) and Senior Vice President (2006-2007) of Fidelity Management & Research Company, Vice President of FMR Co., Inc. (2001-2007) and as a portfolio manager for Fidelity U.S. Equity Funds. |
Brian B. Hogan (1964) | |
| Year of Election or Appointment: 2009 Vice President of Equity and High Income Funds. Mr. Hogan also serves as President of FMR's Equity Division (2009-present). Previously, Mr. Hogan served as Senior Vice President, Equity Research of FMR (2006-2009) and as a portfolio manager. |
Scott C. Goebel (1968) | |
| Year of Election or Appointment: 2008 Secretary and Chief Legal Officer (CLO) of the Fidelity funds. Mr. Goebel also serves as Secretary of Fidelity Investments Money Management, Inc. (FIMM) (2010-present) and Fidelity Research and Analysis Company (FRAC) (2010-present); Secretary and CLO of The North Carolina Capital Management Trust: Cash and Term Portfolios (2008-present); General Counsel, Secretary, and Senior Vice President of FMR (2008-present) and FMR Co., Inc. (2008-present); employed by FMR LLC or an affiliate (2001-present); Chief Legal Officer of Fidelity Management & Research (Hong Kong) Limited (2008-present) and Assistant Secretary of Fidelity Management & Research (Japan) Inc. (2008-present), and Fidelity Management & Research (U.K.) Inc. (2008-present). Previously, Mr. Goebel served as Assistant Secretary of FIMM (2008-2010), FRAC (2008-2010), and the Funds (2007-2008) and as Vice President and Secretary of Fidelity Distributors Corporation (FDC) (2005-2007). |
William C. Coffey (1969) | |
| Year of Election or Appointment: 2009 Assistant Secretary of Fidelity's Equity and High Income Funds. Mr. Coffey also serves as Senior Vice President and Deputy General Counsel of FMR LLC (2010-present), and is an employee of Fidelity Investments. Previously, Mr. Coffey served as Vice President and Associate General Counsel of FMR LLC (2005-2009). |
Elizabeth Paige Baumann (1968) | |
| Year of Election or Appointment: 2012 Anti-Money Laundering (AML) Officer of the Fidelity funds. Ms. Baumann also serves as AML Officer of The North Carolina Capital Management Trust: Cash and Term Portfolios (2012-present), Chief AML Officer of FMR LLC (2012-present), and is an employee of Fidelity Investments. Previously, Ms. Baumann served as Vice President and Deputy Anti-Money Laundering Officer (2007-2012). |
Christine Reynolds (1958) | |
| Year of Election or Appointment: 2008 Chief Financial Officer of the Fidelity funds. Ms. Reynolds became President of Fidelity Pricing and Cash Management Services (FPCMS) in August 2008. Ms. Reynolds served as Chief Operating Officer of FPCMS (2007-2008). Previously, Ms. Reynolds served as President, Treasurer, and Anti-Money Laundering officer of the Fidelity funds (2004-2007). |
Joseph A. Hanlon (1968) | |
| Year of Election or Appointment: 2012 Chief Compliance Officer of Fidelity's Equity and High Income Funds. Mr. Hanlon serves as Compliance Officer of FMR, FMR Co., Inc., Fidelity Investments Money Management, Inc. (FIMM), Fidelity Research and Analysis Company (FRAC), Fidelity Management & Research (U.K.) Inc., Fidelity Management & Research (Hong Kong), and Strategic Advisers, Inc. (2009-present), as Senior Vice President of the Fidelity Asset Management Division (2009-present), and is an employee of Fidelity Investments. Previously, Mr. Hanlon served as Compliance Officer of Fidelity Management & Research (Japan) Inc. (2009-2013). |
Joseph F. Zambello (1957) | |
| Year of Election or Appointment: 2011 Deputy Treasurer of the Fidelity funds. Mr. Zambello is an employee of Fidelity Investments. Previously, Mr. Zambello served as Vice President of FMR's Program Management Group (2009-2011) and Vice President of the Transfer Agent Oversight Group (2005-2009). |
Adrien E. Deberghes (1967) | |
| Year of Election or Appointment: 2008 Deputy Treasurer of Fidelity's Equity and High Income Funds. Mr. Deberghes also serves as Vice President (2011-present) and Assistant Treasurer (2010-present) of other Fidelity funds, and is an employee of Fidelity Investments (2008-present). Previously, Mr. Deberghes served as Senior Vice President of Mutual Fund Administration at State Street Corporation (2007-2008), Senior Director of Mutual Fund Administration at Investors Bank & Trust (2005-2007), and Director of Finance for Dunkin' Brands (2000-2005). |
Stephen Sadoski (1971) | |
| Year of Election or Appointment: 2012 Deputy Treasurer of Fidelity's Equity and High Income Funds. Mr. Sadoski also serves as Deputy Treasurer of other Fidelity funds (2013-present) and is an employee of Fidelity Investments (2012-present). Previously, Mr. Sadoski served as Assistant Treasurer of Fidelity's Fixed Income and Asset Allocation Funds (2012-2013), an assistant chief accountant in the Division of Investment Management of the Securities and Exchange Commission (SEC) (2009-2012) and as a senior manager at Deloitte & Touche (1997-2009). |
Stacie Smith (1974) | |
| Year of Election or Appointment: 2013 Deputy Treasurer of Fidelity's Equity and High Income Funds. Ms. Smith is an employee of Fidelity Investments (2009-present). Previously, Ms. Smith served as Senior Audit Manager of Ernst & Young LLP (1996-2009). |
Stephanie J. Dorsey (1969) | |
| Year of Election or Appointment: 2010 Assistant Treasurer of Fidelity's Equity and High Income Funds. Ms. Dorsey also serves as President and Treasurer (2013-present) and Assistant Treasurer (2012-present) of other Fidelity funds, Treasurer and Chief Financial Officer of The North Carolina Capital Management Trust: Cash and Term Portfolios (2013-present), and is an employee of Fidelity Investments (2008-present). Previously, Ms. Dorsey served as Deputy Treasurer of Fidelity's Fixed Income and Asset Allocation Funds (2008-2013), Treasurer (2004-2008) of the JPMorgan Mutual Funds and Vice President (2004-2008) of JPMorgan Chase Bank. |
Gary W. Ryan (1958) | |
| Year of Election or Appointment: 2005 Assistant Treasurer of the Fidelity funds. Mr. Ryan is an employee of Fidelity Investments. Previously, Mr. Ryan served as Vice President of Fund Reporting in Fidelity Pricing and Cash Management Services (FPCMS) (1999-2005). |
Jonathan Davis (1968) | |
| Year of Election or Appointment: 2010 Assistant Treasurer of the Fidelity funds. Mr. Davis is also Assistant Treasurer of Fidelity Rutland Square Trust II and Fidelity Commonwealth Trust II. Mr. Davis is an employee of Fidelity Investments. Previously, Mr. Davis served as Vice President and Associate General Counsel of FMR LLC (2003-2010). |
Annual Report
Distributions (Unaudited)
The Board of Trustees of Fidelity Large Cap Stock fund voted to pay on June 10, 2013, to shareholders of record at the opening of business on June 7, 2013 a distribution of $0.567 per share derived from capital gains realized from sales of portfolio securities and a dividend of $0.065 per share from net investment income.
The fund hereby designates as a capital gain dividend with respect to the taxable year ended April 30, 2013, $36,841,937, or, if subsequently determined to be different, the net capital gain of such year.
The fund designates 100% of the dividends distributed during the fiscal year as qualifying for the dividends-received deduction for corporate shareholders.
The fund designates 100% of the dividends distributed during the fiscal year as amounts which may be taken into account as a dividend for the purposes of the maximum rate under section 1(h)(11) of the Internal Revenue Code.
The fund will notify shareholders in January 2014 of amounts for use in preparing 2013 income tax returns.
Annual Report
Investment Adviser
Fidelity Management & Research Company
Boston, MA
Investment Sub-Advisers
FMR Co., Inc.
Fidelity Management & Research
(U.K.) Inc.
Fidelity Management & Research
(Hong Kong) Limited
Fidelity Management & Research
(Japan) Inc.
General Distributor
Fidelity Distributors Corporation
Smithfield, RI
Transfer and Service Agents
Fidelity Investments Institutional
Operations Company, Inc.
Boston, MA
Fidelity Service Company, Inc.
Boston, MA
Custodian
Brown Brothers Harriman & Co.
Boston, MA
The Fidelity Telephone Connection
Mutual Fund 24-Hour Service
Exchanges/Redemptions
and Account Assistance 1-800-544-6666
Product Information 1-800-544-6666
Retirement Accounts 1-800-544-4774
(8 a.m. - 9 p.m.)
TDD Service 1-800-544-0118
for the deaf and hearing impaired
(9 a.m. - 9 p.m. Eastern time)
Fidelity Automated Service
Telephone (FAST®)
1-800-544-5555
Automated line for quickest service
(Fidelity Investment logo)(registered trademark)
Corporate Headquarters
245 Summer St., Boston, MA 02210
www.fidelity.com
LCS-UANN-0613
1.784725.110
Fidelity®
Mid-Cap Stock
Fund
Annual Report
April 30, 2013
(Fidelity Cover Art)
Contents
Performance | How the fund has done over time. | |
Management's Discussion of Fund Performance | The Portfolio Manager's review of fund performance and strategy. | |
Shareholder Expense Example | An example of shareholder expenses. | |
Investment Changes | A summary of major shifts in the fund's investments over the past six months. | |
Investments | A complete list of the fund's investments with their market values. | |
Financial Statements | Statements of assets and liabilities, operations, and changes in net assets, as well as financial highlights. | |
Notes | Notes to the financial statements. | |
Report of Independent Registered Public Accounting Firm |
| |
Trustees and Officers |
| |
Distributions |
|
To view a fund's proxy voting guidelines and proxy voting record for the 12-month period ended June 30, visit http://www.fidelity.com/proxyvotingresults or visit the Securities and Exchange Commission's (SEC) web site at http://www.sec.gov. You may also call 1-800-544-8544 to request a free copy of the proxy voting guidelines.
Standard & Poor's, S&P and S&P 500 are registered service marks of The McGraw-Hill Companies, Inc. and have been licensed for use by Fidelity Distributors Corporation.
Other third-party marks appearing herein are the property of their respective owners.
All other marks appearing herein are registered or unregistered trademarks or service marks of FMR LLC or an affiliated company. © 2013 FMR LLC. All rights reserved.
This report and the financial statements contained herein are submitted for the general information of the shareholders of the fund. This report is not authorized for distribution to prospective investors in the fund unless preceded or accompanied by an effective prospectus.
A fund files its complete schedule of portfolio holdings with the SEC for the first and third quarters of each fiscal year on Form N-Q. Forms N-Q are available on the SEC's web site at http://www.sec.gov. A fund's Forms N-Q may be reviewed and copied at the SEC's Public Reference Room in Washington, DC. Information regarding the operation of the SEC's Public Reference Room may be obtained by calling 1-800-SEC-0330. For a complete list of a fund's portfolio holdings, view the most recent holdings listing, semiannual report, or annual report on Fidelity's web site at http://www.fidelity.com, http://www.advisor.fidelity.com, or http://www.401k.com, as applicable.
NOT FDIC INSURED • MAY LOSE VALUE • NO BANK GUARANTEE
Neither the fund nor Fidelity Distributors Corporation is a bank.
Annual Report
Performance: The Bottom Line
Average annual total return reflects the change in the value of an investment, assuming reinvestment of the class' distributions from dividend income and capital gains (the profits earned upon the sale of securities that have grown in value, if any) and assuming a constant rate of performance each year. The $10,000 table and the fund's returns do not reflect the deduction of taxes that a shareholder would pay on fund distributions or the redemption of fund shares. During periods of reimbursement by Fidelity, a fund's total return will be greater than it would be had the reimbursement not occurred. How a fund did yesterday is no guarantee of how it will do tomorrow.
Average Annual Total Returns
Periods ended April 30, 2013 | Past 1 | Past 5 | Past 10 |
Fidelity® Mid-Cap Stock Fund | 16.54% | 6.54% | 10.11% |
$10,000 Over 10 Years
Let's say hypothetically that $10,000 was invested in Fidelity® Mid-Cap Stock Fund, a class of the fund, on April 30, 2003. The chart shows how the value of your investment would have changed, and also shows how the S&P MidCap 400® Index performed over the same period.
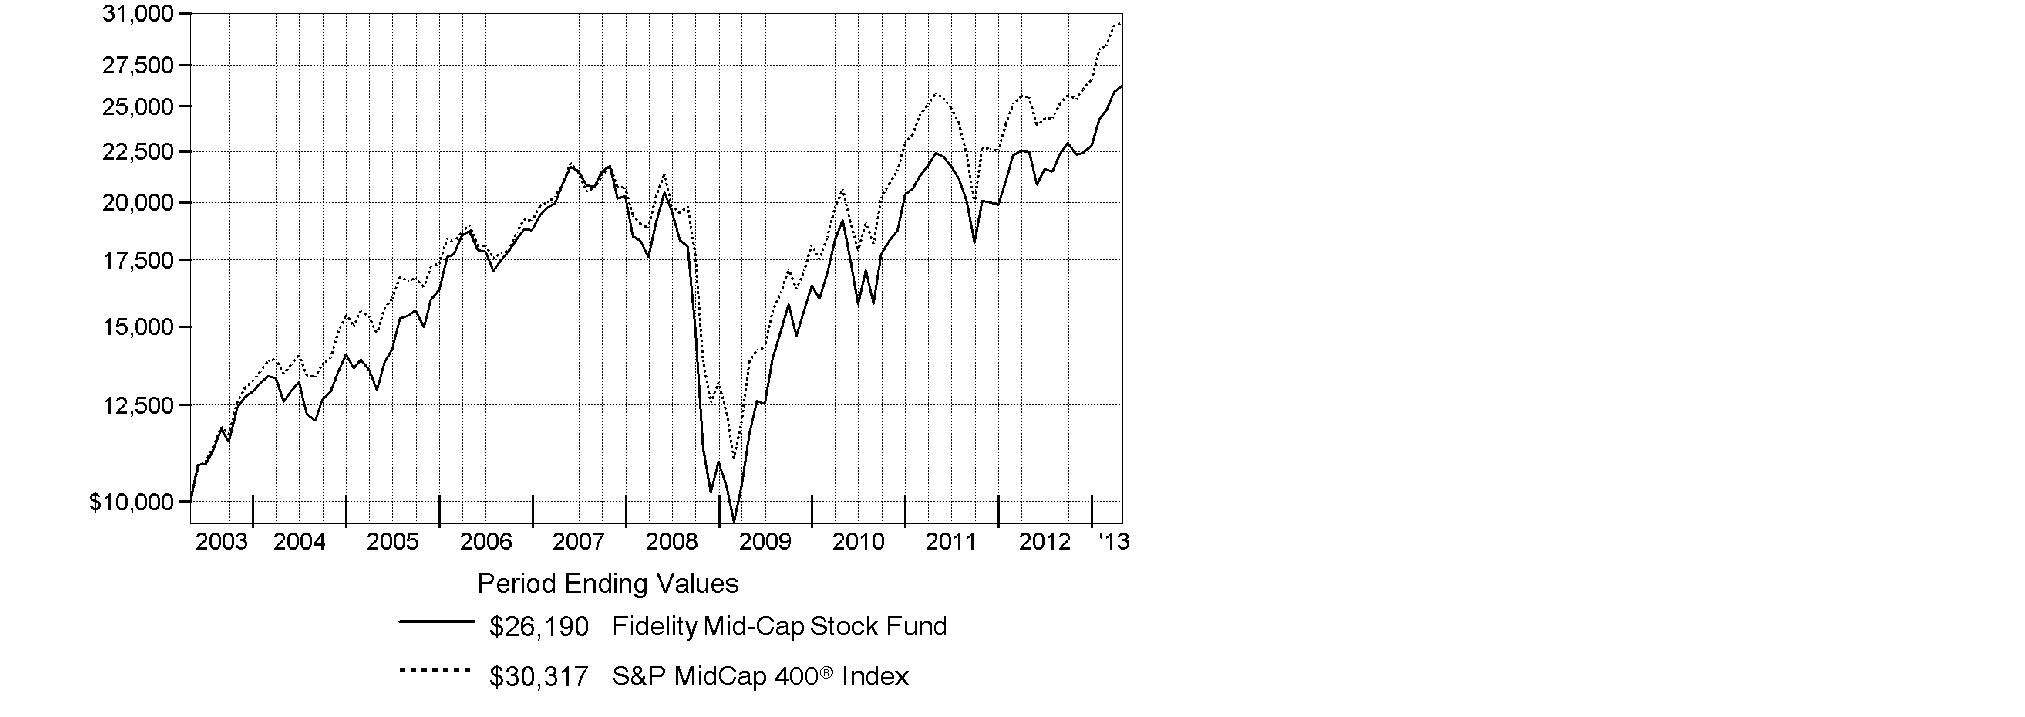
Annual Report
Management's Discussion of Fund Performance
Market Recap: The bull run in U.S. stocks entered its fifth year and two major equity benchmarks reached record territory during the 12 months ending April 30, 2013, as gains in the global economy and more monetary stimulus from the U.S. Federal Reserve kept markets on the upswing for much of the period. Optimism over the nation's jobs picture and housing market teamed up with solid corporate earnings to make stocks a favorite with investors during the 12-month period. The broad-based S&P 500® Index finished the year up 16.89%, closing at a new all-time high, while the blue-chip-laden Dow Jones Industrial AverageSM - which broke its own record in early March - gained 15.39% for the full 12 months. The growth- oriented Nasdaq Composite Index® advanced a more modest 10.78%, curtailed by the weak performance of consumer electronics giant Apple, a large index component. During the year, markets shrugged off an early decline brought on by debt woes in Europe, and another dip later in the period amid pre-election jitters and Congressional gridlock over the federal budget. The year's gains were broad-based, with nine of the 10 sectors in the S&P 500® posting a double-digit increase, led by health care and telecommunication services, while information technology added only about 2%. Despite the headwind of a stronger U.S. dollar, foreign developed-markets stocks rose strongly, with the MSCI® EAFE® Index returning 19.53%.
Comments from John Roth, Portfolio Manager of Fidelity® Mid-Cap Stock Fund: For the year, the fund's Retail Class shares advanced 16.54%, falling short of the 18.84% gain of the S&P MidCap 400® Index. Untimely exposure to Green Mountain Coffee Roasters hurt the most. The fund was overweighted in the stock earlier in the period when the company overestimated demand for its products and reduced its capital expenditure program, which caused shares to plunge, and did not own it when it began to rally after the firm reported better-than-expected fourth-quarter financial results. An underweighting, on average, in Vertex Pharmaceuticals also hurt. The fund did not own the stock in April when it spiked on positive trials for the firm's cystic fibrosis drug. The fund's non-index stake in Acacia Research, which purchases and protects patent rights for its clients, also hurt. Conversely, Ocwen Financial, one of the largest independent providers of special servicing for troubled mortgages, was the top relative contributor. The non-index stock staged two sharp rallies and its share price more than doubled during the period.
The views expressed above reflect those of the portfolio manager(s) only through the end of the period as stated on the cover of this report and do not necessarily represent the views of Fidelity or any other person in the Fidelity organization. Any such views are subject to change at any time based upon market or other conditions and Fidelity disclaims any responsibility to update such views. These views may not be relied on as investment advice and, because investment decisions for a Fidelity fund are based on numerous factors, may not be relied on as an indication of trading intent on behalf of any Fidelity fund.
Annual Report
Shareholder Expense Example
As a shareholder of the Fund, you incur two types of costs: (1) transaction costs, including redemption fees and (2) ongoing costs, including management fees and other Fund expenses. This Example is intended to help you understand your ongoing costs (in dollars) of investing in the Fund and to compare these costs with the ongoing costs of investing in other mutual funds.
The Example is based on an investment of $1,000 invested at the beginning of the period and held for the entire period (November 1, 2012 to April 30, 2013).
Actual Expenses
The first line of the accompanying table for each class of the Fund provides information about actual account values and actual expenses. You may use the information in this line, together with the amount you invested, to estimate the expenses that you paid over the period. Simply divide your account value by $1,000.00 (for example, an $8,600 account value divided by $1,000.00 = 8.6), then multiply the result by the number in the first line for a class of the Fund under the heading entitled "Expenses Paid During Period" to estimate the expenses you paid on your account during this period. A small balance maintenance fee of $12.00 that is charged once a year may apply for certain accounts with a value of less than $2,000. This fee is not included in the table below. If it was, the estimate of expenses you paid during the period would be higher, and your ending account value lower, by this amount. In addition, the Fund, as a shareholder in the underlying Fidelity Central Funds, will indirectly bear its pro-rata share of the fees and expenses incurred by the underlying Fidelity Central Funds. These fees and expenses are not included in the Fund's annualized expense ratio used to calculate the expense estimate in the table below.
Hypothetical Example for Comparison Purposes
The second line of the accompanying table for each class of the Fund provides information about hypothetical account values and hypothetical expenses based on a Class' actual expense ratio and an assumed rate of return of 5% per year before expenses, which is not the Class' actual return. The hypothetical account values and expenses may not be used to estimate the actual ending account balance or expenses you paid for the period. You may use this information to compare the ongoing costs of investing in the Fund and other funds. To do so, compare this 5% hypothetical example with the 5% hypothetical examples that appear in the shareholder reports of the other funds. A small balance maintenance fee of $12.00 that is charged once a year may apply for certain accounts with a value of less than $2,000. This fee is not included in the table below. If it was, the estimate of expenses you paid during the period would be higher, and your ending account value lower, by this amount. In addition, the Fund, as a shareholder in the underlying Fidelity Central Funds, will indirectly bear its pro-rata share of the fees and expenses incurred by the underlying Fidelity Central Funds. These fees and expenses are not included in the Fund's annualized expense ratio used to calculate the expense estimate in the table below.
Please note that the expenses shown in the table are meant to highlight your ongoing costs only and do not reflect any transaction costs. Therefore, the second line of the table is useful in comparing ongoing costs only, and will not help you determine the relative total costs of owning different funds. In addition, if these transactional costs were included, your costs would have been higher.
Annual Report
| Annualized | Beginning | Ending | Expenses Paid |
Mid-Cap Stock | .57% |
|
|
|
Actual |
| $ 1,000.00 | $ 1,173.30 | $ 3.07 |
HypotheticalA |
| $ 1,000.00 | $ 1,021.97 | $ 2.86 |
Class K | .44% |
|
|
|
Actual |
| $ 1,000.00 | $ 1,174.50 | $ 2.37 |
HypotheticalA |
| $ 1,000.00 | $ 1,022.61 | $ 2.21 |
A 5% return per year before expenses
B Annualized expense ratio reflects expenses net of applicable fee waivers.
* Expenses are equal to each Class' annualized expense ratio, multiplied by the average account value over the period, multiplied by 181/365 (to reflect the one-half year period).
Annual Report
Investment Changes (Unaudited)
Top Ten Stocks as of April 30, 2013 | ||
| % of fund's | % of fund's net assets |
Gartner, Inc. Class A | 1.5 | 1.3 |
Henry Schein, Inc. | 1.4 | 1.3 |
Brookdale Senior Living, Inc. | 1.4 | 1.4 |
Regeneron Pharmaceuticals, Inc. | 1.4 | 0.0 |
Kansas City Southern | 1.3 | 1.2 |
SL Green Realty Corp. | 1.3 | 1.2 |
The Macerich Co. | 1.2 | 1.1 |
Oceaneering International, Inc. | 1.2 | 1.1 |
ANSYS, Inc. | 1.1 | 1.1 |
United Rentals, Inc. | 1.1 | 0.5 |
| 12.9 | |
Top Five Market Sectors as of April 30, 2013 | ||
| % of fund's | % of fund's net assets |
Financials | 23.1 | 20.7 |
Consumer Discretionary | 15.3 | 11.5 |
Health Care | 15.2 | 14.5 |
Information Technology | 14.4 | 14.5 |
Industrials | 13.3 | 10.4 |
Asset Allocation (% of fund's net assets) | |||||||
As of April 30, 2013 * | As of October 31, 2012 ** | ||||||
| Stocks 99.2% |
| | Stocks 94.1% |
| ||
 | Other 0.4% |
|  | Other 0.0% |
| ||
| Short-Term |
| | Short-Term |
| ||
* Foreign investments | 8.0% |
| ** Foreign investments | 7.1% |
| ||

Annual Report
Investments April 30, 2013
Showing Percentage of Net Assets
Common Stocks - 99.2% | |||
Shares | Value (000s) | ||
CONSUMER DISCRETIONARY - 15.3% | |||
Auto Components - 0.3% | |||
Tenneco, Inc. (a) | 550,000 | $ 21,269 | |
Automobiles - 0.9% | |||
Tesla Motors, Inc. (a)(d) | 1,135,536 | 61,308 | |
Distributors - 0.4% | |||
Pool Corp. | 628,500 | 30,809 | |
Hotels, Restaurants & Leisure - 2.1% | |||
Arcos Dorados Holdings, Inc. Class A (d) | 2,076,129 | 28,277 | |
Domino's Pizza, Inc. | 924,500 | 51,032 | |
Jubilant Foodworks Ltd. (a) | 768,388 | 15,881 | |
Panera Bread Co. Class A (a) | 200,000 | 35,446 | |
Wyndham Worldwide Corp. | 376,300 | 22,608 | |
| 153,244 | ||
Household Durables - 2.7% | |||
D.R. Horton, Inc. | 1,060,933 | 27,669 | |
Lennar Corp. Class A | 447,600 | 18,450 | |
NVR, Inc. (a) | 56,900 | 58,607 | |
Toll Brothers, Inc. (a) | 1,212,187 | 41,590 | |
Tupperware Brands Corp. | 578,800 | 46,478 | |
| 192,794 | ||
Internet & Catalog Retail - 0.2% | |||
Liberty Media Corp. Interactive Series A (a) | 825,000 | 17,564 | |
Leisure Equipment & Products - 1.0% | |||
Brunswick Corp. | 675,000 | 21,371 | |
New Academy Holding Co. LLC unit (a)(g)(i) | 294,000 | 47,793 | |
| 69,164 | ||
Media - 1.4% | |||
Discovery Communications, Inc. (a) | 542,800 | 42,783 | |
Scripps Networks Interactive, Inc. Class A | 520,200 | 34,635 | |
Shutterstock, Inc. | 608,200 | 25,362 | |
| 102,780 | ||
Specialty Retail - 3.5% | |||
Cabela's, Inc. Class A (a) | 807,400 | 51,835 | |
Chico's FAS, Inc. | 913,700 | 16,693 | |
Fast Retailing Co. Ltd. | 85,200 | 31,244 | |
PT ACE Hardware Indonesia Tbk | 212,521,000 | 21,421 | |
Ross Stores, Inc. | 324,500 | 21,440 | |
Sally Beauty Holdings, Inc. (a) | 1,274,000 | 38,296 | |
Common Stocks - continued | |||
Shares | Value (000s) | ||
CONSUMER DISCRETIONARY - continued | |||
Specialty Retail - continued | |||
Tractor Supply Co. | 504,300 | $ 54,046 | |
Ulta Salon, Cosmetics & Fragrance, Inc. | 227,000 | 19,897 | |
| 254,872 | ||
Textiles, Apparel & Luxury Goods - 2.8% | |||
Brunello Cucinelli SpA | 1,522,000 | 32,592 | |
Hanesbrands, Inc. | 1,060,200 | 53,180 | |
PVH Corp. | 574,600 | 66,315 | |
Under Armour, Inc. Class A (sub. vtg.) (a) | 841,100 | 48,010 | |
| 200,097 | ||
TOTAL CONSUMER DISCRETIONARY | 1,103,901 | ||
CONSUMER STAPLES - 4.1% | |||
Beverages - 1.3% | |||
Beam, Inc. | 652,200 | 42,204 | |
Constellation Brands, Inc. Class A (sub. vtg.) (a) | 1,069,500 | 52,780 | |
| 94,984 | ||
Food & Staples Retailing - 0.7% | |||
Masan Consumer Corp. unit (g)(i) | 125,000 | 12,500 | |
Safeway, Inc. | 842,900 | 18,982 | |
United Natural Foods, Inc. (a) | 348,426 | 17,400 | |
| 48,882 | ||
Food Products - 1.1% | |||
Ingredion, Inc. | 718,000 | 51,703 | |
The Hershey Co. | 339,600 | 30,279 | |
| 81,982 | ||
Household Products - 1.0% | |||
Church & Dwight Co., Inc. | 1,092,800 | 69,819 | |
TOTAL CONSUMER STAPLES | 295,667 | ||
ENERGY - 6.5% | |||
Energy Equipment & Services - 2.0% | |||
Diamond Offshore Drilling, Inc. (d) | 452,900 | 31,295 | |
Helmerich & Payne, Inc. | 454,000 | 26,613 | |
Oceaneering International, Inc. | 1,172,200 | 82,253 | |
| 140,161 | ||
Oil, Gas & Consumable Fuels - 4.5% | |||
Cabot Oil & Gas Corp. | 925,200 | 62,960 | |
Common Stocks - continued | |||
Shares | Value (000s) | ||
ENERGY - continued | |||
Oil, Gas & Consumable Fuels - continued | |||
Concho Resources, Inc. (a) | 225,600 | $ 19,431 | |
EQT Corp. | 397,600 | 29,868 | |
EV Energy Partners LP | 676,900 | 31,516 | |
Holly Energy Partners LP | 914,400 | 35,936 | |
HollyFrontier Corp. | 553,300 | 27,361 | |
Oasis Petroleum, Inc. (a) | 696,300 | 23,834 | |
Range Resources Corp. | 450,000 | 33,084 | |
SM Energy Co. | 700,600 | 42,737 | |
Southwestern Energy Co. (a) | 500,000 | 18,710 | |
| 325,437 | ||
TOTAL ENERGY | 465,598 | ||
FINANCIALS - 23.1% | |||
Capital Markets - 1.0% | |||
Apollo Investment Corp. | 2,047,773 | 18,041 | |
Artisan Partners Asset Management, Inc. | 449,754 | 16,776 | |
KKR & Co. LP | 1,554,600 | 32,647 | |
| 67,464 | ||
Commercial Banks - 5.5% | |||
Bank of the Ozarks, Inc. | 474,996 | 19,442 | |
CIT Group, Inc. (a) | 824,300 | 35,041 | |
City National Corp. | 641,700 | 36,724 | |
Cullen/Frost Bankers, Inc. | 833,400 | 50,346 | |
First Niagara Financial Group, Inc. | 2,565,000 | 24,393 | |
First Republic Bank | 1,287,200 | 48,888 | |
FirstMerit Corp. | 1,942,500 | 33,275 | |
FNB Corp., Pennsylvania | 2,502,500 | 28,503 | |
Huntington Bancshares, Inc. | 3,646,900 | 26,148 | |
M&T Bank Corp. | 250,200 | 25,070 | |
Texas Capital Bancshares, Inc. (a) | 425,000 | 17,706 | |
UMB Financial Corp. | 405,000 | 20,388 | |
Webster Financial Corp. | 1,372,600 | 32,078 | |
| 398,002 | ||
Diversified Financial Services - 1.2% | |||
KKR Financial Holdings LLC | 4,948,009 | 52,894 | |
MSCI, Inc. Class A (a) | 1,028,247 | 35,063 | |
| 87,957 | ||
Common Stocks - continued | |||
Shares | Value (000s) | ||
FINANCIALS - continued | |||
Insurance - 5.0% | |||
Arch Capital Group Ltd. (a) | 815,600 | $ 43,276 | |
Assured Guaranty Ltd. | 2,273,900 | 46,911 | |
Direct Line Insurance Group PLC | 12,425,000 | 39,083 | |
Fairfax Financial Holdings Ltd. (sub. vtg.) | 134,900 | 54,117 | |
Fidelity National Financial, Inc. Class A | 2,914,400 | 78,252 | |
First American Financial Corp. | 1,561,400 | 41,799 | |
Genworth Financial, Inc. Class A (a) | 3,172,700 | 31,822 | |
Jardine Lloyd Thompson Group PLC | 1,754,594 | 23,099 | |
| 358,359 | ||
Real Estate Investment Trusts - 7.8% | |||
Apartment Investment & Management Co. Class A | 695,700 | 21,643 | |
Cys Investments, Inc. | 1,281,500 | 15,929 | |
Digital Realty Trust, Inc. (d) | 484,700 | 34,181 | |
Essex Property Trust, Inc. | 360,800 | 56,664 | |
Kimco Realty Corp. | 2,264,800 | 53,857 | |
MFA Financial, Inc. | 2,301,000 | 21,330 | |
Rayonier, Inc. | 1,000,000 | 59,420 | |
Retail Properties America, Inc. | 1,500,000 | 22,965 | |
Silver Bay Realty Trust Corp. (d) | 106,669 | 2,035 | |
SL Green Realty Corp. | 1,007,400 | 91,371 | |
The Geo Group, Inc. | 473,742 | 17,742 | |
The Macerich Co. | 1,223,100 | 85,678 | |
Two Harbors Investment Corp. | 2,184,700 | 26,173 | |
Ventas, Inc. | 642,175 | 51,136 | |
| 560,124 | ||
Real Estate Management & Development - 1.0% | |||
CBRE Group, Inc. (a) | 1,127,600 | 27,310 | |
Realogy Holdings Corp. | 956,900 | 45,931 | |
| 73,241 | ||
Thrifts & Mortgage Finance - 1.6% | |||
MGIC Investment Corp. (a) | 4,334,824 | 23,408 | |
Ocwen Financial Corp. (a) | 755,500 | 27,636 | |
Radian Group, Inc. (d) | 5,303,544 | 63,377 | |
| 114,421 | ||
TOTAL FINANCIALS | 1,659,568 | ||
Common Stocks - continued | |||
Shares | Value (000s) | ||
HEALTH CARE - 15.2% | |||
Biotechnology - 3.8% | |||
Achillion Pharmaceuticals, Inc. (a) | 2,717,800 | $ 20,492 | |
ARIAD Pharmaceuticals, Inc. (a) | 797,500 | 14,251 | |
BioMarin Pharmaceutical, Inc. (a) | 874,700 | 57,380 | |
Dynavax Technologies Corp. (a) | 1,991,667 | 4,680 | |
Infinity Pharmaceuticals, Inc. (a) | 239,000 | 10,299 | |
Regeneron Pharmaceuticals, Inc. (a) | 462,000 | 99,395 | |
Synageva BioPharma Corp. (a) | 564,366 | 29,172 | |
Theravance, Inc. (a) | 1,035,400 | 34,945 | |
| 270,614 | ||
Health Care Equipment & Supplies - 2.5% | |||
Align Technology, Inc. (a) | 1,515,800 | 50,203 | |
DENTSPLY International, Inc. | 649,500 | 27,506 | |
HeartWare International, Inc. (a) | 709,100 | 68,925 | |
The Cooper Companies, Inc. | 201,165 | 22,209 | |
Volcano Corp. (a) | 653,000 | 13,249 | |
| 182,092 | ||
Health Care Providers & Services - 4.6% | |||
Air Methods Corp. | 640,500 | 23,436 | |
Amplifon SpA | 1,425,582 | 7,341 | |
Brookdale Senior Living, Inc. (a) | 3,893,300 | 100,408 | |
Corvel Corp. (a) | 350,000 | 16,615 | |
Emeritus Corp. (a) | 950,000 | 24,415 | |
Henry Schein, Inc. (a) | 1,120,700 | 101,311 | |
MEDNAX, Inc. (a) | 475,500 | 42,191 | |
Qualicorp SA (a) | 1,618,000 | 15,753 | |
| 331,470 | ||
Health Care Technology - 0.2% | |||
HealthStream, Inc. (a) | 650,000 | 14,924 | |
Life Sciences Tools & Services - 1.7% | |||
Eurofins Scientific SA | 331,100 | 71,947 | |
Illumina, Inc. (a)(d) | 789,908 | 51,099 | |
| 123,046 | ||
Pharmaceuticals - 2.4% | |||
Endo Health Solutions, Inc. (a) | 1,614,100 | 59,141 | |
Impax Laboratories, Inc. (a) | 1,101,400 | 19,275 | |
Optimer Pharmaceuticals, Inc. (a)(d) | 1,550,600 | 23,941 | |
Common Stocks - continued | |||
Shares | Value (000s) | ||
HEALTH CARE - continued | |||
Pharmaceuticals - continued | |||
Perrigo Co. | 397,000 | $ 47,406 | |
ViroPharma, Inc. (a) | 805,000 | 21,936 | |
| 171,699 | ||
TOTAL HEALTH CARE | 1,093,845 | ||
INDUSTRIALS - 13.3% | |||
Aerospace & Defense - 2.6% | |||
Esterline Technologies Corp. (a) | 300,000 | 22,512 | |
KEYW Holding Corp. (a)(d)(e) | 3,652,436 | 49,637 | |
Teledyne Technologies, Inc. (a) | 300,000 | 22,518 | |
Textron, Inc. | 1,159,800 | 29,865 | |
TransDigm Group, Inc. | 441,800 | 64,856 | |
| 189,388 | ||
Air Freight & Logistics - 0.5% | |||
C.H. Robinson Worldwide, Inc. | 265,300 | 15,756 | |
Hub Group, Inc. Class A (a) | 600,000 | 21,990 | |
| 37,746 | ||
Commercial Services & Supplies - 1.3% | |||
Clean Harbors, Inc. (a) | 616,000 | 35,094 | |
Interface, Inc. | 3,114,900 | 52,143 | |
US Ecology, Inc. | 275,581 | 7,496 | |
| 94,733 | ||
Construction & Engineering - 0.6% | |||
Jacobs Engineering Group, Inc. (a) | 489,900 | 24,730 | |
MasTec, Inc. (a) | 717,333 | 19,942 | |
| 44,672 | ||
Electrical Equipment - 2.1% | |||
AMETEK, Inc. | 1,142,392 | 46,507 | |
Regal-Beloit Corp. | 400,000 | 31,448 | |
Rockwell Automation, Inc. | 500,000 | 42,390 | |
Roper Industries, Inc. | 274,500 | 32,844 | |
| 153,189 | ||
Machinery - 0.7% | |||
Donaldson Co., Inc. | 1,288,800 | 46,887 | |
Professional Services - 1.9% | |||
Acacia Research Corp. | 1,698,480 | 40,458 | |
Bureau Veritas SA | 219,900 | 26,947 | |
Common Stocks - continued | |||
Shares | Value (000s) | ||
INDUSTRIALS - continued | |||
Professional Services - continued | |||
Michael Page International PLC | 3,212,360 | $ 18,592 | |
Towers Watson & Co. | 729,700 | 53,210 | |
| 139,207 | ||
Road & Rail - 2.0% | |||
J.B. Hunt Transport Services, Inc. | 657,600 | 46,736 | |
Kansas City Southern | 884,500 | 96,472 | |
| 143,208 | ||
Trading Companies & Distributors - 1.6% | |||
Beacon Roofing Supply, Inc. (a) | 378,800 | 14,444 | |
Rush Enterprises, Inc. Class A (a) | 775,000 | 17,740 | |
United Rentals, Inc. (a) | 1,500,473 | 78,940 | |
| 111,124 | ||
TOTAL INDUSTRIALS | 960,154 | ||
INFORMATION TECHNOLOGY - 14.4% | |||
Communications Equipment - 0.5% | |||
Brocade Communications Systems, Inc. (a) | 3,800,200 | 22,117 | |
Juniper Networks, Inc. (a) | 850,000 | 14,068 | |
| 36,185 | ||
Computers & Peripherals - 0.5% | |||
3D Systems Corp. (a)(d) | 357,900 | 13,686 | |
Fusion-io, Inc. (a) | 621,400 | 11,670 | |
Stratasys Ltd. (a) | 160,000 | 13,288 | |
| 38,644 | ||
Electronic Equipment & Components - 1.2% | |||
Amphenol Corp. Class A | 337,000 | 25,450 | |
Arrow Electronics, Inc. (a) | 1,156,600 | 45,373 | |
Fabrinet (a) | 1,172,331 | 16,096 | |
| 86,919 | ||
Internet Software & Services - 2.9% | |||
Akamai Technologies, Inc. (a) | 1,006,600 | 44,200 | |
Cornerstone OnDemand, Inc. (a) | 1,050,400 | 38,109 | |
CoStar Group, Inc. (a) | 373,600 | 40,502 | |
Demandware, Inc. (a) | 690,285 | 18,845 | |
Equinix, Inc. (a) | 301,500 | 64,551 | |
| 206,207 | ||
Common Stocks - continued | |||
Shares | Value (000s) | ||
INFORMATION TECHNOLOGY - continued | |||
IT Services - 3.9% | |||
Fidelity National Information Services, Inc. | 1,274,386 | $ 53,588 | |
FleetCor Technologies, Inc. (a) | 585,800 | 45,048 | |
Gartner, Inc. Class A (a) | 1,832,100 | 105,985 | |
Teradata Corp. (a) | 325,000 | 16,598 | |
Total System Services, Inc. | 1,200,000 | 28,344 | |
WNS Holdings Ltd. sponsored ADR (a) | 2,200,000 | 32,868 | |
| 282,431 | ||
Semiconductors & Semiconductor Equipment - 1.0% | |||
Applied Materials, Inc. | 1,400,000 | 20,314 | |
Linear Technology Corp. | 769,600 | 28,090 | |
Siliconware Precision Industries Co. Ltd. sponsored ADR (d) | 3,903,800 | 23,774 | |
| 72,178 | ||
Software - 4.4% | |||
ANSYS, Inc. (a) | 977,700 | 79,057 | |
Aspen Technology, Inc. (a) | 1,382,200 | 42,129 | |
Citrix Systems, Inc. (a) | 301,100 | 18,719 | |
Concur Technologies, Inc. (a)(d) | 991,800 | 72,510 | |
Nuance Communications, Inc. (a) | 2,211,000 | 42,097 | |
Red Hat, Inc. (a) | 512,300 | 24,555 | |
ServiceNow, Inc. | 841,400 | 34,464 | |
| 313,531 | ||
TOTAL INFORMATION TECHNOLOGY | 1,036,095 | ||
MATERIALS - 2.4% | |||
Chemicals - 1.5% | |||
Airgas, Inc. | 528,400 | 51,070 | |
Cytec Industries, Inc. | 772,400 | 56,277 | |
| 107,347 | ||
Containers & Packaging - 0.9% | |||
Rock-Tenn Co. Class A | 616,000 | 61,686 | |
Metals & Mining - 0.0% | |||
Ivanplats Ltd. (f) | 1,025,536 | 3,054 | |
TOTAL MATERIALS | 172,087 | ||
Common Stocks - continued | |||
Shares | Value (000s) | ||
TELECOMMUNICATION SERVICES - 0.9% | |||
Diversified Telecommunication Services - 0.9% | |||
tw telecom, inc. (a) | 2,451,300 | $ 66,381 | |
UTILITIES - 4.0% | |||
Electric Utilities - 2.1% | |||
Cleco Corp. | 620,200 | 30,712 | |
Northeast Utilities | 814,900 | 36,939 | |
OGE Energy Corp. | 684,400 | 49,571 | |
PNM Resources, Inc. | 1,294,200 | 31,074 | |
| 148,296 | ||
Gas Utilities - 1.2% | |||
Atmos Energy Corp. | 1,000,000 | 44,370 | |
National Fuel Gas Co. | 707,600 | 44,381 | |
| 88,751 | ||
Multi-Utilities - 0.7% | |||
Alliant Energy Corp. | 948,800 | 50,770 | |
TOTAL UTILITIES | 287,817 | ||
TOTAL COMMON STOCKS (Cost $5,493,230) |
| ||
Other - 0.4% | |||
Principal |
| ||
ENERGY - 0.4% | |||
Oil, Gas & Consumable Fuels - 0.4% | |||
EQTY ER Holdings, LLC 12% 1/28/18(e)(h)(i) | $ 18,813 | 18,813 | |
Shares |
| ||
EQTY ER Holdings, LLC(e)(h)(i) | 9,406,667 | 9,407 | |
TOTAL OTHER (Cost $28,220) |
| ||
Money Market Funds - 4.2% | |||
Shares | Value (000s) | ||
Fidelity Cash Central Fund, 0.13% (b) | 32,009,208 | $ 32,009 | |
Fidelity Securities Lending Cash Central Fund, 0.12% (b)(c) | 272,325,194 | 272,325 | |
TOTAL MONEY MARKET FUNDS (Cost $304,334) |
| ||
TOTAL INVESTMENT PORTFOLIO - 103.8% (Cost $5,825,784) | 7,473,667 | ||
NET OTHER ASSETS (LIABILITIES) - (3.8)% | (276,913) | ||
NET ASSETS - 100% | $ 7,196,754 | ||
Legend |
(a) Non-income producing |
(b) Affiliated fund that is generally available only to investment companies and other accounts managed by Fidelity Investments. The rate quoted is the annualized seven-day yield of the fund at period end. A complete unaudited listing of the fund's holdings as of its most recent quarter end is available upon request. In addition, each Fidelity Central Fund's financial statements, which are not covered by the Fund's Report of Independent Registered Public Accounting Firm, are available on the SEC's website or upon request. |
(c) Investment made with cash collateral received from securities on loan. |
(d) Security or a portion of the security is on loan at period end. |
(e) Affiliated company |
(f) Security exempt from registration under Rule 144A of the Securities Act of 1933. These securities may be resold in transactions exempt from registration, normally to qualified institutional buyers. At the end of the period, the value of these securities amounted to $3,054,000 or 0.0% of net assets. |
(g) Investment is owned by an entity that is treated as a corporation for U.S. tax purposes and is owned by the Fund. |
(h) Investments represent a non-operating interest in oil and gas wells through an entity owned by the fund that is treated as a corporation for U.S. tax purposes. |
(i) Restricted securities - Investment in securities not registered under the Securities Act of 1933 (excluding 144A issues). At the end of the period, the value of restricted securities (excluding 144A issues) amounted to $88,513,000 or 1.2% of net assets. |
Additional information on each restricted holding is as follows: |
Security | Acquisition Date | Acquisition Cost (000s) |
EQTY ER Holdings, LLC 12% 1/28/18 | 1/29/13 | $ 18,813 |
EQTY ER Holdings, LLC | 1/29/13 | $ 9,407 |
Masan Consumer Corp. unit | 4/3/13 | $ 12,620 |
New Academy Holding Co. LLC unit | 8/1/11 | $ 30,988 |
Affiliated Central Funds |
Information regarding fiscal year to date income earned by the Fund from investments in Fidelity Central Funds is as follows: |
Fund | Income earned |
Fidelity Cash Central Fund | $ 267 |
Fidelity Securities Lending Cash Central Fund | 1,575 |
Total | $ 1,842 |
Other Affiliated Issuers |
An affiliated company is a company in which the Fund has ownership of at least 5% of the voting securities. Fiscal year to date transactions with companies which are or were affiliates are as follows: |
Affiliates | Value, | Purchases | Sales | Dividend | Value, |
Blinkx PLC | $ 16,826 | $ - | $ 20,921 | $ - | $ - |
Brunello Cucinelli SpA | - | 27,446 | - | - | - |
EQTY ER Holdings, LLC 12% 1/28/18 | - | 18,813 | - | - | 18,813 |
EQTY ER Holdings, LLC | - | 9,407 | - | - | 9,407 |
HeartWare International, Inc. | 61,970 | 18,243 | 24,521 | - | - |
KEYW Holding Corp. | - | 49,053 | - | - | 49,637 |
SciQuest, Inc. | 22,277 | - | 22,508 | - | - |
Sunrise Senior Living, Inc. | 20,410 | - | 46,474 | - | - |
Total | $ 121,483 | $ 122,962 | $ 114,424 | $ - | $ 77,857 |
Other Information |
The following is a summary of the inputs used, as of April 30, 2013, involving the Fund's assets and liabilities carried at fair value. The inputs or methodology used for valuing securities may not be an indication of the risk associated with investing in those securities. For more information on valuation inputs, and their aggregation into the levels used in the tables below, please refer to the Investment Valuation section in the accompanying Notes to Financial Statements. |
Valuation Inputs at Reporting Date: | ||||
Description | Total | Level 1 | Level 2 | Level 3 |
Investments in Securities: | ||||
Equities: | ||||
Consumer Discretionary | $ 1,103,901 | $ 1,024,864 | $ 31,244 | $ 47,793 |
Consumer Staples | 295,667 | 283,167 | - | 12,500 |
Energy | 465,598 | 465,598 | - | - |
Financials | 1,659,568 | 1,659,568 | - | - |
Health Care | 1,093,845 | 1,093,845 | - | - |
Industrials | 960,154 | 960,154 | - | - |
Information Technology | 1,036,095 | 1,036,095 | - | - |
Materials | 172,087 | 172,087 | - | - |
Telecommunication Services | 66,381 | 66,381 | - | - |
Utilities | 287,817 | 287,817 | - | - |
Other: | ||||
Energy | 28,220 | - | - | 28,220 |
Money Market Funds | 304,334 | 304,334 | - | - |
Total Investments in Securities: | $ 7,473,667 | $ 7,353,910 | $ 31,244 | $ 88,513 |
Valuation Inputs at Reporting Date: | ||||
The following is a reconciliation of Investments in Securities for which level 3 inputs were used in determining value: |
(Amounts in thousands) |
|
Investments in Securities: | |
Beginning Balance | $ 36,797 |
Total Realized Gain (Loss) | 333 |
Total Unrealized Gain (Loss) | 15,192 |
Cost of Purchases | 40,840 |
Proceeds of Sales | (4,649) |
Amortization/Accretion | - |
Transfers in to Level 3 | - |
Transfers out of Level 3 | - |
Ending Balance | $ 88,513 |
The change in unrealized gain (loss) for the period attributable to Level 3 securities held at April 30, 2013 | $ 15,192 |
The information used in the above reconciliation represents fiscal year to date activity for any Investments in Securities identified as using Level 3 inputs at either the beginning or the end of the current fiscal period. Transfers in or out of Level 3 represent the beginning value of any Security or Instrument where a change in the pricing level occurred from the beginning to the end of the period. The cost of purchases and the proceeds of sales may include securities received or delivered through corporate actions or exchanges. Realized and unrealized gains (losses) disclosed in the reconciliation are included in Net Gain (Loss) on the Fund's Statement of Operations. |
See accompanying notes which are an integral part of the financial statements.
Annual Report
Financial Statements
Statement of Assets and Liabilities
Amounts in thousands (except per-share amounts) | April 30, 2013 | |
|
|
|
Assets | ||
Investment in securities, at value (including securities loaned of $266,693) - See accompanying schedule: Unaffiliated issuers (cost $5,444,177) | $ 7,091,476 |
|
Fidelity Central Funds (cost $304,334) | 304,334 |
|
Other affiliated issuers (cost $77,273) | 77,857 |
|
Total Investments (cost $5,825,784) |
| $ 7,473,667 |
Receivable for fund shares sold | 3,964 | |
Dividends receivable | 3,136 | |
Distributions receivable from Fidelity Central Funds | 584 | |
Prepaid expenses | 5 | |
Receivable from investment adviser for expense reductions | 10 | |
Other receivables | 493 | |
Total assets | 7,481,859 | |
|
|
|
Liabilities | ||
Payable for investments purchased | $ 1,045 | |
Payable for fund shares redeemed | 8,361 | |
Accrued management fee | 2,056 | |
Other affiliated payables | 969 | |
Other payables and accrued expenses | 349 | |
Collateral on securities loaned, at value | 272,325 | |
Total liabilities | 285,105 | |
|
|
|
Net Assets | $ 7,196,754 | |
Net Assets consist of: |
| |
Paid in capital | $ 5,527,730 | |
Distributions in excess of net investment income | (5,318) | |
Accumulated undistributed net realized gain (loss) on investments and foreign currency transactions | 26,414 | |
Net unrealized appreciation (depreciation) on investments and assets and liabilities in foreign currencies | 1,647,928 | |
Net Assets | $ 7,196,754 | |
See accompanying notes which are an integral part of the financial statements.
Annual Report
Financial Statements - continued
Statement of Assets and Liabilities - continued
Amounts in thousands (except per-share amounts) | April 30, 2013 | |
|
|
|
Mid-Cap Stock: | $ 33.69 | |
|
|
|
Class K: | $ 33.68 | |
See accompanying notes which are an integral part of the financial statements.
Annual Report
Statement of Operations
Amounts in thousands | Year ended April 30, 2013 | |
|
|
|
Investment Income |
|
|
Dividends |
| $ 102,306 |
Interest |
| 160 |
Income from Fidelity Central Funds |
| 1,842 |
Total income |
| 104,308 |
|
|
|
Expenses | ||
Management fee | $ 36,565 | |
Performance adjustment | (8,608) | |
Transfer agent fees | 10,371 | |
Accounting and security lending fees | 1,178 | |
Custodian fees and expenses | 172 | |
Independent trustees' compensation | 45 | |
Registration fees | 95 | |
Audit | 74 | |
Legal | 32 | |
Miscellaneous | 70 | |
Total expenses before reductions | 39,994 | |
Expense reductions | (1,211) | 38,783 |
Net investment income (loss) | 65,525 | |
Realized and Unrealized Gain (Loss) Net realized gain (loss) on: | ||
Investment securities: |
|
|
Unaffiliated issuers | 111,954 | |
Other affiliated issuers | 21,121 |
|
Foreign currency transactions | (44) | |
Total net realized gain (loss) |
| 133,031 |
Change in net unrealized appreciation (depreciation) on: Investment securities | 822,333 | |
Assets and liabilities in foreign currencies | 27 | |
Total change in net unrealized appreciation (depreciation) |
| 822,360 |
Net gain (loss) | 955,391 | |
Net increase (decrease) in net assets resulting from operations | $ 1,020,916 | |
See accompanying notes which are an integral part of the financial statements.
Annual Report
Financial Statements - continued
Statement of Changes in Net Assets
Amounts in thousands | Year ended | Year ended |
Increase (Decrease) in Net Assets |
|
|
Operations |
|
|
Net investment income (loss) | $ 65,525 | $ 27,945 |
Net realized gain (loss) | 133,031 | 125,326 |
Change in net unrealized appreciation (depreciation) | 822,360 | (344,865) |
Net increase (decrease) in net assets resulting | 1,020,916 | (191,594) |
Distributions to shareholders from net investment income | (73,928) | (13,303) |
Distributions to shareholders from net realized gain | (190,685) | (413,018) |
Total distributions | (264,613) | (426,321) |
Share transactions - net increase (decrease) | (373,065) | (1,509,888) |
Redemption fees | 70 | 270 |
Total increase (decrease) in net assets | 383,308 | (2,127,533) |
|
|
|
Net Assets | ||
Beginning of period | 6,813,446 | 8,940,979 |
End of period (including distributions in excess of net investment income of $5,318 and undistributed net investment income of $8,318, respectively) | $ 7,196,754 | $ 6,813,446 |
See accompanying notes which are an integral part of the financial statements.
Annual Report
Financial Highlights - Mid-Cap Stock
Years ended April 30, | 2013 | 2012 | 2011 | 2010 | 2009 |
Selected Per-Share Data |
|
|
|
| |
Net asset value, beginning of period | $ 30.15 | $ 31.78 | $ 27.26 | $ 16.65 | $ 27.52 |
Income from Investment Operations |
|
|
|
|
|
Net investment income (loss) B | .29 | .10 | .01 | .08 | .02 |
Net realized and unrealized gain (loss) | 4.45 | (.18) | 4.59 | 10.59 | (10.58) |
Total from investment operations | 4.74 | (.08) | 4.60 | 10.67 | (10.56) |
Distributions from net investment income | (.33) | (.05) | (.04) E | (.06) | (.02) E |
Distributions from net realized gain | (.87) | (1.50) | (.04) E | - | (.29) E |
Total distributions | (1.20) | (1.55) | (.08) | (.06) | (.31) |
Redemption fees added to paid in capital B, G | - | - | - | - | - |
Net asset value, end of period | $ 33.69 | $ 30.15 | $ 31.78 | $ 27.26 | $ 16.65 |
Total Return A | 16.54% | .19% | 16.95% | 64.11% | (38.76)% |
Ratios to Average Net Assets C, F |
|
|
|
| |
Expenses before reductions | .65% | .86% | .61% | .65% | .73% |
Expenses net of fee waivers, if any | .65% | .86% | .61% | .65% | .73% |
Expenses net of all reductions | .63% | .85% | .59% | .64% | .72% |
Net investment income (loss) | .95% | .36% | .04% | .38% | .11% |
Supplemental Data |
|
|
|
| |
Net assets, end of period (in millions) | $ 4,750 | $ 5,170 | $ 7,120 | $ 7,475 | $ 4,763 |
Portfolio turnover rate D | 46% | 52% | 131% | 85% | 73% |
A Total returns would have been lower if certain expenses had not been reduced during the applicable periods shown.
B Calculated based on average shares outstanding during the period.
C Fees and expenses of any underlying Fidelity Central Funds are not included in the Fund's expense ratio. The Fund indirectly bears its proportionate share of the expenses of any underlying Fidelity Central Funds.
D Amount does not include the portfolio activity of any underlying Fidelity Central Funds.
E The amounts shown reflect certain reclassifications related to book to tax differences that were made in the year shown.
F Expense ratios reflect operating expenses of the class. Expenses before reductions do not reflect amounts reimbursed by the investment adviser or reductions from brokerage service arrangements or reductions from other expense offset arrangements and do not represent the amount paid by the class during periods when reimbursements or reductions occur. Expenses net of fee waivers reflect expenses after reimbursement by the investment adviser but prior to reductions from brokerage service arrangements or other expense offset arrangements. Expenses net of all reductions represent the net expenses paid by the class.
G Amount represents less than $.01 per share.
See accompanying notes which are an integral part of the financial statements.
Annual Report
Financial Highlights - Class K
Years ended April 30, | 2013 | 2012 | 2011 | 2010 | 2009 G |
Selected Per-Share Data |
|
|
|
| |
Net asset value, beginning of period | $ 30.15 | $ 31.77 | $ 27.26 | $ 16.63 | $ 28.33 |
Income from Investment Operations |
|
|
|
|
|
Net investment income (loss) D | .33 | .15 | .06 | .14 | .05 |
Net realized and unrealized gain (loss) | 4.45 | (.19) | 4.58 | 10.58 | (11.39) |
Total from investment operations | 4.78 | (.04) | 4.64 | 10.72 | (11.34) |
Distributions from net investment income | (.38) | (.08) | (.09) H | (.09) | (.07) H |
Distributions from net realized gain | (.87) | (1.50) | (.04) H | - | (.29) H |
Total distributions | (1.25) | (1.58) | (.13) | (.09) | (.36) |
Redemption fees added to paid in capital D, J | - | - | - | - | - |
Net asset value, end of period | $ 33.68 | $ 30.15 | $ 31.77 | $ 27.26 | $ 16.63 |
Total Return B, C | 16.72% | .35% | 17.13% | 64.55% | (40.38)% |
Ratios to Average Net Assets E, I |
|
|
|
| |
Expenses before reductions | .50% | .69% | .43% | .43% | .52% A |
Expenses net of fee waivers, if any | .50% | .69% | .43% | .43% | .52% A |
Expenses net of all reductions | .48% | .68% | .42% | .41% | .52% A |
Net investment income (loss) | 1.11% | .52% | .22% | .61% | .31% A |
Supplemental Data |
|
|
|
| |
Net assets, end of period (in millions) | $ 2,447 | $ 1,643 | $ 1,821 | $ 1,127 | $ 412 |
Portfolio turnover rate F | 46% | 52% | 131% | 85% | 73% |
A Annualized
B Total returns for periods of less than one year are not annualized.
C Total returns would have been lower if certain expenses had not been reduced during the applicable periods shown.
D Calculated based on average shares outstanding during the period.
E Fees and expenses of any underlying Fidelity Central Funds are not included in the Fund's expense ratio. The Fund indirectly bears its proportionate share of the expenses of any underlying Fidelity Central Funds.
F Amount does not include the portfolio activity of any underlying Fidelity Central Funds.
G For the period May 9, 2008 (commencement of sale of shares) to April 30, 2009.
H The amounts shown reflect certain reclassifications related to book to tax differences that were made in the year shown.
I Expense ratios reflect operating expenses of the class. Expenses before reductions do not reflect amounts reimbursed by the investment adviser or reductions from brokerage service arrangements or reductions from other expense offset arrangements and do not represent the amount paid by the class during periods when reimbursements or reductions occur. Expense ratios before reductions for start-up periods may not be representative of longer-term operating periods. Expenses net of fee waivers reflect expenses after reimbursement by the investment adviser but prior to reductions from brokerage service arrangements or other expense offset arrangements. Expenses net of all reductions represent the net expenses paid by the class.
J Amount represents less than $.01 per share.
See accompanying notes which are an integral part of the financial statements.
Annual Report
Notes to Financial Statements
For the period ended April 30, 2013
(Amounts in thousands except percentages)
1. Organization.
Fidelity Mid-Cap Stock Fund (the Fund) is a fund of Fidelity Commonwealth Trust (the Trust) and is authorized to issue an unlimited number of shares. The Trust is registered under the Investment Company Act of 1940, as amended (the 1940 Act), as an open-end management investment company organized as a Massachusetts business trust. The Fund offers Mid-Cap Stock and Class K shares, each of which has equal rights as to assets and voting privileges. Each class has exclusive voting rights with respect to matters that affect that class.
2. Investments in Fidelity Central Funds.
The Fund invests in Fidelity Central Funds, which are open-end investment companies generally available only to other investment companies and accounts managed by Fidelity Management & Research Company (FMR) and its affiliates. The Fund's Schedule of Investments lists each of the Fidelity Central Funds held as of period end, if any, as an investment of the Fund, but does not include the underlying holdings of each Fidelity Central Fund. As an Investing Fund, the Fund indirectly bears its proportionate share of the expenses of the underlying Fidelity Central Funds.
The Money Market Central Funds seek preservation of capital and current income and are managed by Fidelity Investments Money Management, Inc. (FIMM), an affiliate of FMR.
A complete unaudited list of holdings for each Fidelity Central Fund is available upon request or at the Securities and Exchange Commission (the SEC) website at www.sec.gov. In addition, the financial statements of the Fidelity Central Funds, which are not covered by the Fund's Report of Independent Registered Public Accounting Firm, are available on the SEC website or upon request.
3. Significant Accounting Policies.
The financial statements have been prepared in conformity with accounting principles generally accepted in the United States of America (GAAP), which require management to make certain estimates and assumptions at the date of the financial statements. Actual results could differ from those estimates. Subsequent events, if any, through the date that the financial statements were issued have been evaluated in the preparation of the financial statements. The following summarizes the significant accounting policies of the Fund:
Investment Valuation. Investments are valued as of 4:00 p.m. Eastern time on the last calendar day of the period. In accordance with valuation policies and procedures approved by the Board of Trustees (the Board), the Fund attempts to obtain prices from one or more third party pricing vendors or brokers to value its investments. When
Annual Report
3. Significant Accounting Policies - continued
Investment Valuation - continued
current market prices, quotations or currency exchange rates are not readily available or reliable, investments will be fair valued in good faith by the FMR Fair Value Committee (the Committee), in accordance with procedures adopted by the Fund's Board. Factors used in determining fair value vary by investment type and may include market or investment specific events. The frequency with which these procedures are used cannot be predicted and they may be utilized to a significant extent. The Committee oversees the Fund's valuation policies and procedures and is responsible for approving and reporting to the Board all fair value determinations.
The Fund categorizes the inputs to valuation techniques used to value its investments into a disclosure hierarchy consisting of three levels as shown below:
Level 1 - quoted prices in active markets for identical investments
Level 2 - other significant observable inputs (including quoted prices for similar investments, interest rates, prepayment speeds, etc.)
Level 3 - unobservable inputs (including the Fund's own assumptions based on the best information available)
Valuation techniques used to value the Fund's investments by major category are as follows:
Equity securities, including restricted securities, for which market quotations are readily available, are valued at the last reported sale price or official closing price as reported by a third party pricing vendor on the primary market or exchange on which they are traded and are categorized as Level 1 in the hierarchy. In the event there were no sales during the day or closing prices are not available, securities are valued at the last quoted bid price or may be valued using the last available price and are generally categorized as Level 2 in the hierarchy. For foreign equity securities, when market or security specific events arise, comparisons to the valuation of American Depositary Receipts (ADRs), futures contracts, Exchange- Traded Funds (ETFs) and certain indexes as well as quoted prices for similar securities may be used and would be categorized as Level 2 in the hierarchy. Utilizing these techniques may result in transfers between Level 1 and Level 2. Restricted equity securities and private placements for which observable inputs are not available are valued using alternate valuation approaches, including the market approach and the income approach and are categorized as Level 3 in the hierarchy. The market approach generally consists of using comparable market transactions while the income approach generally consists of using the net present value of estimated future cash flows, adjusted as appropriate for liquidity, credit, market and/or other risk factors.
Annual Report
Notes to Financial Statements - continued
(Amounts in thousands except percentages)
3. Significant Accounting Policies - continued
Investment Valuation - continued
Investments in open-end mutual funds, including the Fidelity Central Funds, are valued at their closing net asset value (NAV) each business day and are categorized as Level 1 in the hierarchy.
The following provides information on Level 3 securities held by the Fund that were valued at period end based on unobservable inputs. These amounts exclude valuations provided by a broker.
Asset Type | Fair Value at | Valuation | Unobservable | Amount or Range/ | Impact to |
Common | $ 88,513 | Discounted | Discount rate | 20.0% | Decrease |
|
| Market | Transaction price | $1.00 - $100.00/ | Increase |
|
|
| EV/EBITDA multiple | 9.0 | Increase |
* Represents the expected directional change in the fair value of the Level 3 investments that would result from an increase in the corresponding
input. A decrease to the unobservable input would have the opposite effect. Significant changes in these inputs could result in significantly higher
or lower fair value measurements.
Changes in valuation techniques may result in transfers in or out of an assigned level within the disclosure hierarchy. The aggregate value of investments by input level, as of April 30, 2013, as well as a roll forward of Level 3 investments, is included at the end of the Fund's Schedule of Investments.
Foreign Currency. The Fund may use foreign currency contracts to facilitate transactions in foreign-denominated securities. Gains and losses from these transactions may arise from changes in the value of the foreign currency or if the counterparties do not perform under the contracts' terms.
Foreign-denominated assets, including investment securities, and liabilities are translated into U.S. dollars at the exchange rates at period end. Purchases and sales of investment securities, income and dividends received and expenses denominated in foreign currencies are translated into U.S. dollars at the exchange rate in effect on the transaction date.
The effects of exchange rate fluctuations on investments are included with the net realized and unrealized gain (loss) on investment securities. Other foreign currency transactions resulting in realized and unrealized gain (loss) are disclosed separately.
Annual Report
3. Significant Accounting Policies - continued
Investment Transactions and Income. For financial reporting purposes, the Fund's investment holdings and NAV include trades executed through the end of the last business day of the period. The NAV per share for processing shareholder transactions is calculated as of the close of business of the New York Stock Exchange (NYSE), normally 4:00 p.m. Eastern time and includes trades executed through the end of the prior business day. Gains and losses on securities sold are determined on the basis of identified cost and may include proceeds received from litigation. Dividend income is recorded on the ex-dividend date, except for certain dividends from foreign securities where the ex-dividend date may have passed, which are recorded as soon as the Fund is informed of the ex-dividend date. Non-cash dividends included in dividend income, if any, are recorded at the fair market value of the securities received. Distributions received on securities that represent a return of capital or capital gain are recorded as a reduction of cost of investments and/or as a realized gain. The Fund estimates the components of distributions received that may be considered return of capital distributions or capital gain distributions. Interest income and distributions from the Fidelity Central Funds are accrued as earned. Interest income includes coupon interest and amortization of premium and accretion of discount on debt securities. Investment income is recorded net of foreign taxes withheld where recovery of such taxes is uncertain.
Class Allocations and Expenses. Investment income, realized and unrealized capital gains and losses, common expenses of the Fund and certain fund-level expense reductions, if any, are allocated on a pro-rata basis to each class based on the relative net assets of each class to the total net assets of the Fund. Each class differs with respect to transfer agent fees incurred. Certain expense reductions may also differ by class. Expenses directly attributable to a fund are charged to that fund. Expenses attributable to more than one fund are allocated among the respective funds on the basis of relative net assets or other appropriate methods. Expense estimates are accrued in the period to which they relate and adjustments are made when actual amounts are known.
Deferred Trustee Compensation. Under a Deferred Compensation Plan (the Plan), independent Trustees may elect to defer receipt of a portion of their annual compensation. Deferred amounts are invested in a cross-section of Fidelity funds, are marked-to-market and remain in the Fund until distributed in accordance with the Plan. The investment of deferred amounts and the offsetting payable to the Trustees are included in the accompanying Statement of Assets and Liabilities.
Income Tax Information and Distributions to Shareholders. Each year, the Fund intends to qualify as a regulated investment company under Subchapter M of the Internal Revenue Code, including distributing substantially all of its taxable income and realized gains. As a result, no provision for income taxes is required. As of April 30, 2013, the Fund did not have any unrecognized tax benefits in the financial statements; nor is
Annual Report
Notes to Financial Statements - continued
(Amounts in thousands except percentages)
3. Significant Accounting Policies - continued
Income Tax Information and Distributions to Shareholders - continued
the Fund aware of any tax positions for which it is reasonably possible that the total amounts of unrecognized tax benefits will significantly change in the next twelve months. The Fund files a U.S. federal tax return, in addition to state and local tax returns as required. A fund's federal income tax returns are subject to examination by the Internal Revenue Service (IRS) for a period of three fiscal years after they are filed. State and local tax returns may be subject to examination for an additional fiscal year depending on the jurisdiction. Foreign taxes are provided for based on the Fund's understanding of the tax rules and rates that exist in the foreign markets in which it invests.
Distributions are declared and recorded on the ex-dividend date. Income dividends and capital gain distributions are declared separately for each class. Income and capital gain distributions are determined in accordance with income tax regulations, which may differ from GAAP. These differences resulted in distribution reclassifications. In addition, the Fund claimed a portion of the payment made to redeeming shareholders as a distribution for income tax purposes.
Capital accounts within the financial statements are adjusted for permanent book-tax differences. These adjustments have no impact on net assets or the results of operations. Temporary book-tax differences will reverse in a subsequent period.
Book-tax differences are primarily due to foreign currency transactions, contingent interest, certain foreign taxes, passive foreign investment companies (PFIC), partnerships, deferred trustees compensation and losses deferred due to wash sales and excise tax regulations.
The federal tax cost of investment securities and unrealized appreciation (depreciation) as of period end were as follows:
Gross unrealized appreciation | $ 1,740,603 |
Gross unrealized depreciation | (132,385) |
Net unrealized appreciation (depreciation) on securities and other investments | $ 1,608,218 |
|
|
Tax Cost | $ 5,865,449 |
The tax-based components of distributable earnings as of period end were as follows:
Undistributed long-term capital gain | $ 66,079 |
Net unrealized appreciation (depreciation) | $ 1,608,264 |
Annual Report
3. Significant Accounting Policies - continued
Income Tax Information and Distributions to Shareholders - continued
The tax character of distributions paid was as follows:
| April 30, 2013 | April 30, 2012 |
Ordinary Income | $ 78,920 | $ 18,660 |
Long-term Capital Gains | 185,693 | 407,661 |
Total | $ 264,613 | $ 426,321 |
Short-Term Trading (Redemption) Fees. Shares held by investors in the Fund less than 30 days are subject to a redemption fee equal to .75% of the net asset value of shares redeemed. All redemption fees, which reduce the proceeds of the shareholder redemption, are retained by the Fund and accounted for as an addition to paid in capital.
Restricted Securities. The Fund may invest in securities that are subject to legal or contractual restrictions on resale. These securities generally may be resold in transactions exempt from registration or to the public if the securities are registered. Disposal of these securities may involve time-consuming negotiations and expense, and prompt sale at an acceptable price may be difficult. Information regarding restricted securities is included at the end of the Fund's Schedule of Investments.
4. Purchases and Sales of Investments.
Purchases and sales of securities, other than short-term securities, aggregated $2,989,098 and $3,503,826, respectively.
5. Fees and Other Transactions with Affiliates.
Management Fee. FMR and its affiliates provide the Fund with investment management related services for which the Fund pays a monthly management fee. The management fee is the sum of an individual fund fee rate that is based on an annual rate of .30% of the Fund's average net assets and an annualized group fee rate that averaged .26% during the period. The group fee rate is based upon the average net assets of all the mutual funds advised by FMR. The group fee rate decreases as assets under management increase and increases as assets under management decrease. In addition, the management fee is subject to a performance adjustment (up to a maximum of ± .20% of the Fund's average net assets over a 36 month performance period). The upward or downward adjustment to the management fee is based on the relative investment performance of Mid-Cap Stock as compared to an appropriate benchmark index. For the period, the total annual management fee rate, including the performance adjustment, was .43% of the Fund's average net assets.
Annual Report
Notes to Financial Statements - continued
(Amounts in thousands except percentages)
5. Fees and Other Transactions with Affiliates - continued
Transfer Agent Fees. Fidelity Investments Institutional Operations Company, Inc., (FIIOC), an affiliate of FMR, is the transfer, dividend disbursing and shareholder servicing agent for each class of the Fund. FIIOC receives account fees and asset-based fees that vary according to the account size and type of account of the shareholders of Mid-Cap Stock. FIIOC receives an asset-based fee of Class K's average net assets. FIIOC pays for typesetting, printing and mailing of shareholder reports, except proxy statements.
For the period, transfer agent fees for each class were as follows:
| Amount | % of |
Mid-Cap Stock | $ 9,435 | .20 |
Class K | 936 | .05 |
| $ 10,371 |
|
Accounting and Security Lending Fees. Fidelity Service Company, Inc. (FSC), an affiliate of FMR, maintains the Fund's accounting records. The accounting fee is based on the level of average net assets for each month. Under a separate contract, FSC administers the security lending program. The security lending fee is based on the number and duration of lending transactions.
Brokerage Commissions. The Fund placed a portion of its portfolio transactions with brokerage firms which are affiliates of the investment adviser. Brokerage commissions are included in net realized gain (loss) and change in net unrealized appreciation (depreciation) in the Statement of Operations. The commissions paid to these affiliated firms were $49 for the period.
6. Committed Line of Credit.
The Fund participates with other funds managed by FMR or an affiliate in a $4.25 billion credit facility (the "line of credit") to be utilized for temporary or emergency purposes to fund shareholder redemptions or for other short-term liquidity purposes. The Fund has agreed to pay commitment fees on its pro-rata portion of the line of credit, which amounted to $17 and is reflected in Miscellaneous expenses on the Statement of Operations. During the period, there were no borrowings on this line of credit.
7. Security Lending.
The Fund lends portfolio securities through a lending agent from time to time in order to earn additional income. For equity securities, a lending agent is used and may loan securities to certain qualified borrowers, including Fidelity Capital Markets (FCM), a broker-dealer affiliated with the Fund. On the settlement date of the loan, the Fund
Annual Report
7. Security Lending - continued
receives collateral (in the form of U.S. Treasury obligations, letters of credit and/or cash) against the loaned securities and maintains collateral in an amount not less than 100% of the market value of the loaned securities during the period of the loan. The market value of the loaned securities is determined at the close of business of the Fund and any additional required collateral is delivered to the Fund on the next business day. If the borrower defaults on its obligation to return the securities loaned because of insolvency or other reasons, a fund could experience delays and costs in recovering the securities loaned or in gaining access to the collateral. Any cash collateral received is invested in the Fidelity Securities Lending Cash Central Fund. The value of loaned securities and cash collateral at period end are disclosed on the Fund's Statement of Assets and Liabilities. The value of securities loaned to FCM at period end was $630. Security lending income represents the income earned on investing cash collateral, less rebates paid to borrowers and any lending agent fees associated with the loan, plus any premium payments received for lending certain types of securities. Security lending income is presented in the Statement of Operations as a component of income from Fidelity Central Funds. Total security lending income during the period amounted to $1,575, including $64 from securities loaned to FCM.
8. Expense Reductions.
Many of the brokers with whom FMR places trades on behalf of the Fund provided services to the Fund in addition to trade execution. These services included payments of certain expenses on behalf of the Fund totaling $1,201 for the period.
In addition, FMR reimbursed a portion of the Fund's operating expenses during the period in the amount of $10.
9. Distributions to Shareholders.
Distributions to shareholders of each class were as follows:
Years ended April 30, | 2013 | 2012 |
From net investment income |
|
|
Mid-Cap Stock | $ 48,097 | $ 9,342 |
Class K | 25,831 | 3,961 |
Total | $ 73,928 | $ 13,303 |
From net realized gain |
|
|
Mid-Cap Stock | $ 137,838 | $ 325,810 |
Class K | 52,847 | 87,208 |
Total | $ 190,685 | $ 413,018 |
Annual Report
Notes to Financial Statements - continued
(Amounts in thousands except percentages)
10. Share Transactions.
Transactions for each class of shares were as follows:
| Shares | Dollars | ||
Years ended April 30, | 2013 | 2012 | 2013 | 2012 |
Mid-Cap Stock |
|
|
|
|
Shares sold | 14,240 | 17,828 | $ 432,641 | $ 499,432 |
Reinvestment of distributions | 6,392 | 11,764 | 180,000 | 326,527 |
Shares redeemed | (51,115) | (82,143) | (1,519,331) | (2,288,341) |
Net increase (decrease) | (30,483) | (52,551) | $ (906,690) | $ (1,462,382) |
Class K |
|
|
|
|
Shares sold | 29,861 | 27,136 | $ 891,057 | $ 760,031 |
Reinvestment of distributions | 2,783 | 3,288 | 78,678 | 91,169 |
Shares redeemed | (14,484) | (33,243) | (436,110) | (898,706) |
Net increase (decrease) | 18,160 | (2,819) | $ 533,625 | $ (47,506) |
11. Other.
The Fund's organizational documents provide former and current trustees and officers with a limited indemnification against liabilities arising in connection with the performance of their duties to the Fund. In the normal course of business, the Fund may also enter into contracts that provide general indemnifications. The Fund's maximum exposure under these arrangements is unknown as this would be dependent on future claims that may be made against the Fund. The risk of material loss from such claims is considered remote.
Annual Report
Report of Independent Registered Public Accounting Firm
To the Trustees of Fidelity Commonwealth Trust and Shareholders of Fidelity Mid-Cap Stock Fund:
We have audited the accompanying statement of assets and liabilities of Fidelity Mid-Cap Stock Fund (the Fund), a fund of Fidelity Commonwealth Trust, including the schedule of investments, as of April 30, 2013, and the related statement of operations for the year then ended, the statement of changes in net assets for each of the two years in the period then ended, and the financial highlights for each of the periods presented. These financial statements and financial highlights are the responsibility of the Fund's management. Our responsibility is to express an opinion on these financial statements and financial highlights based on our audits.
We conducted our audits in accordance with the standards of the Public Company Accounting Oversight Board (United States). Those standards require that we plan and perform the audit to obtain reasonable assurance about whether the financial statements and financial highlights are free of material misstatement. The Fund is not required to have, nor were we engaged to perform, an audit of its internal control over financial reporting. Our audits included consideration of internal control over financial reporting as a basis for designing audit procedures that are appropriate in the circumstances, but not for the purpose of expressing an opinion on the effectiveness of the Fund's internal control over financial reporting. Accordingly, we express no such opinion. An audit also includes examining, on a test basis, evidence supporting the amounts and disclosures in the financial statements, assessing the accounting principles used and significant estimates made by management, as well as evaluating the overall financial statement presentation. Our procedures included confirmation of securities owned as of April 30, 2013, by correspondence with the custodian and brokers; where replies were not received from brokers, we performed other auditing procedures. We believe that our audits provide a reasonable basis for our opinion.
In our opinion, the financial statements and financial highlights referred to above present fairly, in all material respects, the financial position of Fidelity Mid-Cap Stock Fund as of April 30, 2013, the results of its operations for the year then ended, the changes in its net assets for each of the two years in the period then ended, and the financial highlights for each of the periods presented, in conformity with accounting principles generally accepted in the United States of America.
DELOITTE & TOUCHE LLP
Boston, Massachusetts
June 24, 2013
Annual Report
Trustees and Officers
The Trustees, Members of the Advisory Board, and executive officers of the trust and fund, as applicable, are listed below. The Board of Trustees governs the fund and is responsible for protecting the interests of shareholders. The Trustees are experienced executives who meet periodically throughout the year to oversee the fund's activities, review contractual arrangements with companies that provide services to the fund, oversee management of the risks associated with such activities and contractual arrangements, and review the fund's performance. Except for James C. Curvey, each of the Trustees oversees 234 Fidelity funds. Mr. Curvey oversees 453 Fidelity funds.
The Trustees hold office without limit in time except that (a) any Trustee may resign; (b) any Trustee may be removed by written instrument, signed by at least two-thirds of the number of Trustees prior to such removal; (c) any Trustee who requests to be retired or who has become incapacitated by illness or injury may be retired by written instrument signed by a majority of the other Trustees; and (d) any Trustee may be removed at any special meeting of shareholders by a two-thirds vote of the outstanding voting securities of the trust. Each Trustee who is not an interested person of the trust and the fund (as defined in the 1940 Act) (Independent Trustee), shall retire not later than the last day of the calendar year in which his or her 75th birthday occurs. The Independent Trustees may waive this mandatory retirement age policy with respect to individual Trustees. The executive officers and Advisory Board Members hold office without limit in time, except that any officer and Advisory Board Member may resign or may be removed by a vote of a majority of the Trustees at any regular meeting or any special meeting of the Trustees. Except as indicated, each individual has held the office shown or other offices in the same company for the past five years.
Experience, Skills, Attributes, and Qualifications of the Fund's Trustees. The Governance and Nominating Committee has adopted a statement of policy that describes the experience, qualifications, attributes, and skills that are necessary and desirable for potential Independent Trustee candidates (Statement of Policy). The Board believes that each Trustee satisfied at the time he or she was initially elected or appointed a Trustee, and continues to satisfy, the standards contemplated by the Statement of Policy. The Governance and Nominating Committee also engages professional search firms to help identify potential Independent Trustee candidates who have the experience, qualifications, attributes, and skills consistent with the Statement of Policy. From time to time, additional criteria based on the composition and skills of the current Independent Trustees, as well as experience or skills that may be appropriate in light of future changes to board composition, business conditions, and regulatory or other developments, have also been considered by the professional search firms and the Governance and Nominating Committee. In addition, the Board takes into account the Trustees' commitment and participation in Board and committee meetings, as well as their leadership of standing and ad hoc committees throughout their tenure.
In determining that a particular Trustee was and continues to be qualified to serve as a Trustee, the Board has considered a variety of criteria, none of which, in isolation, was controlling. The Board believes that, collectively, the Trustees have balanced and diverse experience, qualifications, attributes, and skills, which allow the Board to operate effectively in governing the fund and protecting the interests of shareholders. Information about the specific experience, skills, attributes, and qualifications of each Trustee, which in each case led to the Board's conclusion that the Trustee should serve (or continue to serve) as a trustee of the fund, is provided below.
Annual Report
Trustees and Officers - continued
Board Structure and Oversight Function. James C. Curvey is an interested person (as defined in the 1940 Act) and currently serves as Chairman. The Trustees have determined that an interested Chairman is appropriate and benefits shareholders because an interested Chairman has a personal and professional stake in the quality and continuity of services provided to the fund. Independent Trustees exercise their informed business judgment to appoint an individual of their choosing to serve as Chairman, regardless of whether the Trustee happens to be independent or a member of management. The Independent Trustees have determined that they can act independently and effectively without having an Independent Trustee serve as Chairman and that a key structural component for assuring that they are in a position to do so is for the Independent Trustees to constitute a substantial majority for the Board. The Independent Trustees also regularly meet in executive session. Ned C. Lautenbach serves as Chairman of the Independent Trustees and as such (i) acts as a liaison between the Independent Trustees and management with respect to matters important to the Independent Trustees and (ii) with management prepares agendas for Board meetings.
Fidelity funds are overseen by different Boards of Trustees. The fund's Board oversees Fidelity's equity and high income funds and another Board oversees Fidelity's investment-grade bond, money market, and asset allocation funds. The asset allocation funds may invest in Fidelity funds overseen by the fund's Board. The use of separate Boards, each with its own committee structure, allows the Trustees of each group of Fidelity funds to focus on the unique issues of the funds they oversee, including common research, investment, and operational issues. On occasion, the separate Boards establish joint committees to address issues of overlapping consequences for the Fidelity funds overseen by each Board.
The Trustees operate using a system of committees to facilitate the timely and efficient consideration of all matters of importance to the Trustees, the fund, and fund shareholders and to facilitate compliance with legal and regulatory requirements and oversight of the fund's activities and associated risks. The Board, acting through its committees, has charged FMR and its affiliates with (i) identifying events or circumstances the occurrence of which could have demonstrably adverse effects on the fund's business and/or reputation; (ii) implementing processes and controls to lessen the possibility that such events or circumstances occur or to mitigate the effects of such events or circumstances if they do occur; and (iii) creating and maintaining a system designed to evaluate continuously business and market conditions in order to facilitate the identification and implementation processes described in (i) and (ii) above. Because the day-to-day operations and activities of the fund are carried out by or through FMR, its affiliates and other service providers, the fund's exposure to risks is mitigated but not eliminated by the processes overseen by the Trustees. While each of the Board's committees has responsibility for overseeing different aspects of the fund's activities, oversight is exercised primarily through the Operations, Audit, and Compliance Committees. In addition, the Independent Trustees have worked with FMR to enhance the Board's oversight of investment and financial risks, legal and regulatory risks, technology risks, and operational risks, including the development of additional risk reporting to the Board. For example, a working group comprised of Independent Trustees and FMR has worked and continues to work to review the Fidelity funds' valuation-related activities, reporting and risk management. Appropriate personnel, including but not limited to the fund's Chief Compliance Officer (CCO), FMR's internal auditor, the independent accountants, the fund's Treasurer and portfolio management personnel, make periodic reports to the Board's committees, as appropriate, including an annual review of FMR's risk management program for the Fidelity funds. The responsibilities of each standing committee, including their oversight responsibilities, are described further under "Standing Committees of the Fund's Trustees."
Annual Report
The fund's Statement of Additional Information (SAI) includes more information about the Trustees. To request a free copy, call Fidelity at 1-800-544-8544.
Interested Trustees*:
Correspondence intended for each Trustee who is an interested person may be sent to Fidelity Investments, 245 Summer Street, Boston, Massachusetts 02210.
Name, Year of Birth; Principal Occupations and Other Relevant Experience+ | |
James C. Curvey (1935) | |
| Year of Election or Appointment: 2007 Mr. Curvey is Trustee and Chairman of the Board of Trustees of certain Trusts. Mr. Curvey also serves as Trustee (2007-present) of other investment companies advised by FMR. Mr. Curvey is a Director of Fidelity Investments Money Management, Inc. (2009-present), Director of Fidelity Research & Analysis Co. (2009-present) and Director of FMR and FMR Co., Inc. (2007-present). Mr. Curvey is also Vice Chairman (2007-present) and Director of FMR LLC. In addition, Mr. Curvey serves as an Overseer for the Boston Symphony Orchestra and a member of the Trustees of Villanova University. Previously, Mr. Curvey was the Vice Chairman (2006-2007) and Director (2000-2007) of FMR Corp. |
Ronald P. O'Hanley (1957) | |
| Year of Election or Appointment: 2011 Mr. O'Hanley is Director of FMR Co., Inc. (2010-present), Director of Fidelity Investments Money Management, Inc. (2010-present), Director of Fidelity Research & Analysis Company (2010-present), President of Fidelity Asset Management and Corporate Services and a member of Fidelity's Executive Committee (2010-present). Previously, Mr. O'Hanley served as President and Chief Executive Officer of BNY Mellon Asset Management (2007-2010). Mr. O'Hanley also served as Vice Chairman of Bank New York Mellon Corp. and a member of that firm's Executive Committee. Prior to the 2007 merger of The Bank of New York and Mellon Financial Corporation, he was Vice Chairman of Mellon Financial Corporation and President and Chief Executive Officer of Mellon Asset Management. He joined Mellon in February 1997. Mr. O'Hanley currently serves as Chairman of the Boston Public Library Foundation Board of Directors and sits on the Board of Directors of Beth Israel Deaconess Medical Center, the Board of Trustees of the Marine Biological Laboratory and the Advisory Board of the Maxwell School of Citizenship and Public Administration at Syracuse University. Mr. O'Hanley also chairs the Council on Asset Management for the Financial Services Roundtable and is a member of the Board of Directors of Institutional Investor's U.S. Institute. |
* Trustees have been determined to be "Interested Trustees" by virtue of, among other things, their affiliation with the trust or various entities under common control with FMR.
+ The information above includes each Trustee's principal occupation during the last five years and other information relating to the experience, attributes, and skills relevant to each Trustee's qualifications to serve as a Trustee, which led to the conclusion that each Trustee should serve as a Trustee for the fund.
Annual Report
Independent Trustees:
Correspondence intended for each Independent Trustee (that is, the Trustees other than the Interested Trustees) may be sent to Fidelity Investments, P.O. Box 55235, Boston, Massachusetts 02205-5235.
Name, Year of Birth; Principal Occupations and Other Relevant Experience+ | |
Dennis J. Dirks (1948) | |
| Year of Election or Appointment: 2005 Prior to his retirement in May 2003, Mr. Dirks was Chief Operating Officer and a member of the Board of The Depository Trust & Clearing Corporation (DTCC). He also served as President, Chief Operating Officer, and Board member of The Depository Trust Company (DTC) and President and Board member of the National Securities Clearing Corporation (NSCC). In addition, Mr. Dirks served as Chief Executive Officer and Board member of the Government Securities Clearing Corporation, Chief Executive Officer and Board member of the Mortgage-Backed Securities Clearing Corporation, as a Trustee and a member of the Finance Committee of Manhattan College (2005-2008), and as a Trustee and a member of the Finance Committee of AHRC of Nassau County (2006-2008). Mr. Dirks is a member of the Independent Directors Council (IDC) Governing Council (2010-present) and Board of Directors for The Brookville Center for Children's Services, Inc. (2009-present). |
Alan J. Lacy (1953) | |
| Year of Election or Appointment: 2008 Mr. Lacy serves as Senior Adviser (2007-present) of Oak Hill Capital Partners, L.P. (private equity). Mr. Lacy also served as Chief Executive Officer (2000-2005) and Vice Chairman (2005-2006) of Sears Holdings Corporation and Sears, Roebuck and Co. (retail). In addition, Mr. Lacy serves as a member of the Board of Directors of Dave & Buster's Entertainment, Inc. (restaurant and entertainment complexes, 2010-present), Earth Fare, Inc. (retail grocery, 2012-present), The Hillman Companies, Inc. (hardware wholesalers, 2010-present), and Bristol-Myers Squibb Company (global pharmaceuticals, 2008-present). Mr. Lacy is a member of the Board of Trustees of The National Parks Conservation Association (2006-present). Previously, Mr. Lacy served as Chairman of the Board of Trustees of the National Parks Conservation Association (2008-2011) and as a member of the Board of Directors for the Western Union Company (global money transfer, 2006-2011). |
Ned C. Lautenbach (1944) | |
| Year of Election or Appointment: 2000 Mr. Lautenbach is Chairman of the Independent Trustees of the Equity and High Income Funds (2006-present). Mr. Lautenbach currently serves as the Lead Director of the Eaton Corporation Board of Directors (diversified industrial, 1997-present). Mr. Lautenbach is Chairman of the Board of Directors of the Philharmonic Center for the Arts in Naples, Florida (2012-present) and a member of the Council on Foreign Relations (1994-present). Previously, Mr. Lautenbach was a Partner/Advisory Partner at Clayton, Dubilier & Rice, LLC (private equity investment, 1998-2010), as well as a Director of Sony Corporation (2006-2007). |
Joseph Mauriello (1944) | |
| Year of Election or Appointment: 2008 Prior to his retirement in January 2006, Mr. Mauriello served in numerous senior management positions including Deputy Chairman and Chief Operating Officer (2004-2005), and Vice Chairman of Financial Services (2002-2004) of KPMG LLP US (professional services, 1965-2005). Mr. Mauriello currently serves as a member of the Board of Directors of XL Group plc. (global insurance and re-insurance, 2006-present). Previously, Mr. Mauriello served as a Director of the Hamilton Funds of the Bank of New York (2006-2007) and of Arcadia Resources Inc. (health care services and products, 2007-2012). |
Robert W. Selander (1950) | |
| Year of Election or Appointment: 2011 Previously, Mr. Selander served as a Member of the Advisory Board of Fidelity's Equity and High Income Funds (2011), Executive Vice Chairman (2010), Chief Executive Officer (2009-2010), and President and Chief Executive Officer (1997-2009) of Mastercard, Inc. |
Cornelia M. Small (1944) | |
| Year of Election or Appointment: 2005 Ms. Small is a member of the Board of Directors (2009-present) and Chair of the Investment Committee (2010-present) of the Teagle Foundation. Ms. Small also serves on the Investment Committee of the Berkshire Taconic Community Foundation (2008-present). Previously, Ms. Small served as Chairperson (2002-2008) and a member of the Investment Committee and Chairperson (2008-2012) and a member of the Board of Trustees of Smith College. In addition, Ms. Small served as Chief Investment Officer, Director of Global Equity Investments, and a member of the Board of Directors of Scudder, Stevens & Clark and Scudder Kemper Investments. |
William S. Stavropoulos (1939) | |
| Year of Election or Appointment: 2002 Mr. Stavropoulos is Vice Chairman of the Independent Trustees of the Equity and High Income Funds (2006-present). Mr. Stavropoulos serves as President and Founder of the Michigan Baseball Foundation, the Great Lakes Loons (2007-present). Mr. Stavropoulos is Chairman Emeritus of the Board of Directors of The Dow Chemical Company, where he previously served in numerous senior management positions, including President, CEO (1995-2000; 2002-2004), Chairman of the Executive Committee (2000-2006), and as a member of the Board of Directors (1990-2006). Currently, Mr. Stavropoulos is Chairman of the Board of Directors of Univar Inc. (global distributor of commodity and specialty chemicals), a Director of Teradata Corporation (data warehousing and technology solutions), and Maersk Inc. (industrial conglomerate), and a member of the Advisory Board for Metalmark Capital LLC (private equity investment, 2005-present). Mr. Stavropoulos is an operating advisor to Clayton, Dubilier & Rice, LLC (private equity investment). In addition, Mr. Stavropoulos is a member of the University of Notre Dame Advisory Council for the College of Science, a Trustee of the Rollin L. Gerstacker Foundation, and a Director of the Naples Philharmonic Center for the Arts. Previously, Mr. Stavropoulos served as a Director of Chemical Financial Corporation (bank holding company, 1993-2012) and Tyco International, Ltd. (multinational manufacturing and services, 2007-2012). |
David M. Thomas (1949) | |
| Year of Election or Appointment: 2008 Previously, Mr. Thomas served as Executive Chairman (2005-2006) and Chairman and Chief Executive Officer (2000-2005) of IMS Health, Inc. (pharmaceutical and healthcare information solutions), and a Director of Fortune Brands, Inc. (consumer products, 2000-2011). In addition, Mr. Thomas serves as Non-Executive Chairman of the Board of Directors of Fortune Brands Home and Security (home and security products, 2011-present), and as a member of the Board of Directors of Interpublic Group of Companies, Inc. (marketing communication, 2004-present). |
Michael E. Wiley (1950) | |
| Year of Election or Appointment: 2008 Mr. Wiley also serves as a Director of Asia Pacific Exploration Consolidated (international oil and gas exploration and production, 2008-present). Mr. Wiley serves as a Director of Tesoro Corporation (independent oil refiner and marketer, 2005-present), and a Director of Bill Barrett Corporation (exploration and production, 2005-present). In addition, Mr. Wiley also serves as a Director of Post Oak Bank (privately-held bank, 2004-present). Previously, Mr. Wiley served as a member of the Board of Trustees of the University of Tulsa (2000-2006; 2007-2010), as a Senior Energy Advisor of Katzenbach Partners, LLC (consulting, 2006-2007), as an Advisory Director of Riverstone Holdings (private investment), Chairman, President, and CEO of Baker Hughes, Inc. (oilfield services, 2000-2004), and as Director of Spinnaker Exploration Company (exploration and production, 2001-2005). |
+ The information above includes each Trustee's principal occupation during the last five years and other information relating to the experience, attributes, and skills relevant to each Trustee's qualifications to serve as a Trustee, which led to the conclusion that each Trustee should serve as a Trustee for the fund.
Advisory Board Members and Executive Officers:
Correspondence intended for David A. Rosow and Garnett A. Smith may be sent to Fidelity Investments, P.O. Box 55235, Boston, Massachusetts 02205-5235. Correspondence intended for each executive officer and Peter S. Lynch may be sent to Fidelity Investments, 245 Summer Street, Boston, Massachusetts 02210.
Name, Year of Birth; Principal Occupation | |
Peter S. Lynch (1944) | |
| Year of Election or Appointment: 2003 Member of the Advisory Board of Fidelity's Equity and High Income Funds. Mr. Lynch is Vice Chairman and a Director of FMR and FMR Co., Inc. In addition, Mr. Lynch serves as a Trustee of Boston College and as the Chairman of the Inner-City Scholarship Fund. Previously, Mr. Lynch served on the Special Olympics International Board of Directors (1997-2006). |
David A. Rosow (1942) | |
| Year of Election or Appointment: 2012 Member of the Advisory Board of Fidelity's Equity and High Income Funds. Chairman and Chief Executive Officer of International Golf Group, Inc. (golf course development, 1989-present). Previously, Mr. Rosow served as Chairman and Chief Executive Officer of Rosow & Company, Inc. (private investment company, 1989-2011), a Lead Director of Hudson United Bancorp (2001-2006) and as a Director of TD Banknorth (1996-2006). In addition, Mr. Rosow is a member (2008-present) and President (2009-present) of the Town Council of Palm Beach, Florida. |
Garnett A. Smith (1947) | |
| Year of Election or Appointment: 2012 Member of the Advisory Board of Fidelity's Equity and High Income Funds. Prior to Mr. Smith's retirement, he served as Chairman and Chief Executive Officer of Inbrand Corp. (manufacturer of personal absorbent products, 1990-1997). He also served as President (1986-1990) of Inbrand Corp. Prior to his employment with Inbrand Corp., he was employed by a retail fabric chain and North Carolina National Bank. In addition, Mr. Smith is a board member of the Jackson Hole Land Trust (2009-present). |
Kenneth B. Robins (1969) | |
| Year of Election or Appointment: 2008 President and Treasurer of Fidelity's Equity and High Income Funds. Mr. Robins also serves as President and Treasurer (2010-present) and Assistant Treasurer (2009-present) of other Fidelity funds and is an employee of Fidelity Investments (2004-present). Previously, Mr. Robins served as Deputy Treasurer of the Fidelity funds (2005-2008) and Treasurer and Chief Financial Officer of The North Carolina Capital Management Trust: Cash and Term Portfolios (2006-2008). |
Bruce T. Herring (1965) | |
| Year of Election or Appointment: 2006 Vice President of certain Equity Funds. Mr. Herring also serves as Chief Investment Officer of Fidelity Global Asset Allocation (GAA) (2013-present), Chief Investment Officer and Director of Fidelity Management & Research (U.K.) Inc. (2010-present), Group Chief Investment Officer of FMR, and President of Fidelity Research & Analysis Company (2010-present). Previously, Mr. Herring served as Vice President (2005-2006) and Senior Vice President (2006-2007) of Fidelity Management & Research Company, Vice President of FMR Co., Inc. (2001-2007) and as a portfolio manager for Fidelity U.S. Equity Funds. |
Brian B. Hogan (1964) | |
| Year of Election or Appointment: 2009 Vice President of Equity and High Income Funds. Mr. Hogan also serves as President of FMR's Equity Division (2009-present). Previously, Mr. Hogan served as Senior Vice President, Equity Research of FMR (2006-2009) and as a portfolio manager. |
Scott C. Goebel (1968) | |
| Year of Election or Appointment: 2008 Secretary and Chief Legal Officer (CLO) of the Fidelity funds. Mr. Goebel also serves as Secretary of Fidelity Investments Money Management, Inc. (FIMM) (2010-present) and Fidelity Research and Analysis Company (FRAC) (2010-present); Secretary and CLO of The North Carolina Capital Management Trust: Cash and Term Portfolios (2008-present); General Counsel, Secretary, and Senior Vice President of FMR (2008-present) and FMR Co., Inc. (2008-present); employed by FMR LLC or an affiliate (2001-present); Chief Legal Officer of Fidelity Management & Research (Hong Kong) Limited (2008-present) and Assistant Secretary of Fidelity Management & Research (Japan) Inc. (2008-present), and Fidelity Management & Research (U.K.) Inc. (2008-present). Previously, Mr. Goebel served as Assistant Secretary of FIMM (2008-2010), FRAC (2008-2010), and the Funds (2007-2008) and as Vice President and Secretary of Fidelity Distributors Corporation (FDC) (2005-2007). |
William C. Coffey (1969) | |
| Year of Election or Appointment: 2009 Assistant Secretary of Fidelity's Equity and High Income Funds. Mr. Coffey also serves as Senior Vice President and Deputy General Counsel of FMR LLC (2010-present), and is an employee of Fidelity Investments. Previously, Mr. Coffey served as Vice President and Associate General Counsel of FMR LLC (2005-2009). |
Elizabeth Paige Baumann (1968) | |
| Year of Election or Appointment: 2012 Anti-Money Laundering (AML) Officer of the Fidelity funds. Ms. Baumann also serves as AML Officer of The North Carolina Capital Management Trust: Cash and Term Portfolios (2012-present), Chief AML Officer of FMR LLC (2012-present), and is an employee of Fidelity Investments. Previously, Ms. Baumann served as Vice President and Deputy Anti-Money Laundering Officer (2007-2012). |
Christine Reynolds (1958) | |
| Year of Election or Appointment: 2008 Chief Financial Officer of the Fidelity funds. Ms. Reynolds became President of Fidelity Pricing and Cash Management Services (FPCMS) in August 2008. Ms. Reynolds served as Chief Operating Officer of FPCMS (2007-2008). Previously, Ms. Reynolds served as President, Treasurer, and Anti-Money Laundering officer of the Fidelity funds (2004-2007). |
Joseph A. Hanlon (1968) | |
| Year of Election or Appointment: 2012 Chief Compliance Officer of Fidelity's Equity and High Income Funds. Mr. Hanlon serves as Compliance Officer of FMR, FMR Co., Inc., Fidelity Investments Money Management, Inc. (FIMM), Fidelity Research and Analysis Company (FRAC), Fidelity Management & Research (U.K.) Inc., Fidelity Management & Research (Hong Kong), and Strategic Advisers, Inc. (2009-present), as Senior Vice President of the Fidelity Asset Management Division (2009-present), and is an employee of Fidelity Investments. Previously, Mr. Hanlon served as Compliance Officer of Fidelity Management & Research (Japan) Inc. (2009-2013). |
Joseph F. Zambello (1957) | |
| Year of Election or Appointment: 2011 Deputy Treasurer of the Fidelity funds. Mr. Zambello is an employee of Fidelity Investments. Previously, Mr. Zambello served as Vice President of FMR's Program Management Group (2009-2011) and Vice President of the Transfer Agent Oversight Group (2005-2009). |
Adrien E. Deberghes (1967) | |
| Year of Election or Appointment: 2008 Deputy Treasurer of Fidelity's Equity and High Income Funds. Mr. Deberghes also serves as Vice President (2011-present) and Assistant Treasurer (2010-present) of other Fidelity funds, and is an employee of Fidelity Investments (2008-present). Previously, Mr. Deberghes served as Senior Vice President of Mutual Fund Administration at State Street Corporation (2007-2008), Senior Director of Mutual Fund Administration at Investors Bank & Trust (2005-2007), and Director of Finance for Dunkin' Brands (2000-2005). |
Stephen Sadoski (1971) | |
| Year of Election or Appointment: 2012 Deputy Treasurer of Fidelity's Equity and High Income Funds. Mr. Sadoski also serves as Deputy Treasurer of other Fidelity funds (2013-present) and is an employee of Fidelity Investments (2012-present). Previously, Mr. Sadoski served as Assistant Treasurer of Fidelity's Fixed Income and Asset Allocation Funds (2012-2013), an assistant chief accountant in the Division of Investment Management of the Securities and Exchange Commission (SEC) (2009-2012) and as a senior manager at Deloitte & Touche (1997-2009). |
Stacie Smith (1974) | |
| Year of Election or Appointment: 2013 Deputy Treasurer of Fidelity's Equity and High Income Funds. Ms. Smith is an employee of Fidelity Investments (2009-present). Previously, Ms. Smith served as Senior Audit Manager of Ernst & Young LLP (1996-2009). |
Stephanie J. Dorsey (1969) | |
| Year of Election or Appointment: 2010 Assistant Treasurer of Fidelity's Equity and High Income Funds. Ms. Dorsey also serves as President and Treasurer (2013-present) and Assistant Treasurer (2012-present) of other Fidelity funds, Treasurer and Chief Financial Officer of The North Carolina Capital Management Trust: Cash and Term Portfolios (2013-present), and is an employee of Fidelity Investments (2008-present). Previously, Ms. Dorsey served as Deputy Treasurer of Fidelity's Fixed Income and Asset Allocation Funds (2008-2013), Treasurer (2004-2008) of the JPMorgan Mutual Funds and Vice President (2004-2008) of JPMorgan Chase Bank. |
Gary W. Ryan (1958) | |
| Year of Election or Appointment: 2005 Assistant Treasurer of the Fidelity funds. Mr. Ryan is an employee of Fidelity Investments. Previously, Mr. Ryan served as Vice President of Fund Reporting in Fidelity Pricing and Cash Management Services (FPCMS) (1999-2005). |
Jonathan Davis (1968) | |
| Year of Election or Appointment: 2010 Assistant Treasurer of the Fidelity funds. Mr. Davis is also Assistant Treasurer of Fidelity Rutland Square Trust II and Fidelity Commonwealth Trust II. Mr. Davis is an employee of Fidelity Investments. Previously, Mr. Davis served as Vice President and Associate General Counsel of FMR LLC (2003-2010). |
Annual Report
Distributions (Unaudited)
The Board of Trustees of Fidelity Mid-Cap Stock Fund voted to pay shareholders of record at the opening of business on record date, the following distributions per share derived from capital gains realized from sales of portfolio securities:
| Pay Date | Record Date | Capital Gains |
Mid-Cap Stock Fund | 06/10/13 | 06/07/13 | $0.312 |
The fund hereby designates as a capital gain dividend with respect to the taxable year ended April 30, 2013 $135,415,544 or, if subsequently determined to be different, the net capital gain of such year.
Mid-Cap Stock Fund designates 100%, 83% and 80% of the dividends distributed in June 2012, December 14, 2012, and December 27, 2012, respectively, during the fiscal year as qualifying for the dividends-received deduction for corporate shareholders.
Mid-Cap Stock Fund designates 100% of the dividend distributed during the fiscal year as amounts which may be taken into account as a dividend for the purposes of the maximum rate under section 1(h)(11) of the Internal Revenue Code.
The fund will notify shareholders in January 2014 of amounts for use in preparing 2013 income tax returns.
Annual Report
Investment Adviser
Fidelity Management & Research Company
Boston, MA
Investment Sub-Advisers
FMR Co., Inc.
Fidelity Management & Research
(U.K.) Inc.
Fidelity Management & Research
(Japan) Inc.
Fidelity Management & Research
(Hong Kong) Limited
General Distributor
Fidelity Distributors Corporation
Smithfield, RI
Transfer and Service Agents
Fidelity Investments Institutional
Operations Company, Inc.
Boston, MA
Fidelity Service Company, Inc.
Boston, MA
Custodian
The Northern Trust Company
Chicago, IL
The Fidelity Telephone Connection
Mutual Fund 24-Hour Service
Exchanges/Redemptions
and Account Assistance 1-800-544-6666
Product Information 1-800-544-6666
Retirement Accounts 1-800-544-4774
(8 a.m. - 9 p.m.)
TDD Service 1-800-544-0118
for the deaf and hearing impaired
(9 a.m. - 9 p.m. Eastern time)
Fidelity Automated Service
Telephone (FAST®)
1-800-544-5555
Automated line for quickest service
(Fidelity Investment logo)(registered trademark)
Corporate Headquarters
245 Summer St., Boston, MA 02210
www.fidelity.com
MCS-UANN-0613
1.784726.110
Fidelity®
Mid-Cap Stock
Fund -
Class K
Annual Report
April 30, 2013
(Fidelity Cover Art)
Contents
Performance | How the fund has done over time. | |
Management's Discussion of Fund Performance | The Portfolio Manager's review of fund performance and strategy. | |
Shareholder Expense Example | An example of shareholder expenses. | |
Investment Changes | A summary of major shifts in the fund's investments over the past six months. | |
Investments | A complete list of the fund's investments with their market values. | |
Financial Statements | Statements of assets and liabilities, operations, and changes in net assets, as well as financial highlights. | |
Notes | Notes to the financial statements. | |
Report of Independent Registered Public Accounting Firm |
| |
Trustees and Officers |
| |
Distributions |
|
To view a fund's proxy voting guidelines and proxy voting record for the 12-month period ended June 30, visit http://www.fidelity.com/proxyvotingresults or visit the Securities and Exchange Commission's (SEC) web site at http://www.sec.gov. You may also call 1-800-835-5092 to request a free copy of the proxy voting guidelines.
Standard & Poor's, S&P and S&P 500 are registered service marks of The McGraw-Hill Companies, Inc. and have been licensed for use by Fidelity Distributors Corporation.
Other third-party marks appearing herein are the property of their respective owners.
All other marks appearing herein are registered or unregistered trademarks or service marks of FMR LLC or an affiliated company. © 2013 FMR LLC. All rights reserved.
This report and the financial statements contained herein are submitted for the general information of the shareholders of the fund. This report is not authorized for distribution to prospective investors in the fund unless preceded or accompanied by an effective prospectus.
A fund files its complete schedule of portfolio holdings with the SEC for the first and third quarters of each fiscal year on Form N-Q. Forms N-Q are available on the SEC's web site at http://www.sec.gov. A fund's Forms N-Q may be reviewed and copied at the SEC's Public Reference Room in Washington, DC. Information regarding the operation of the SEC's Public Reference Room may be obtained by calling 1-800-SEC-0330. For a complete list of a fund's portfolio holdings, view the most recent holdings listing, semiannual report, or annual report on Fidelity's web site at http://www.fidelity.com, http://www.advisor.fidelity.com, or http://www.401k.com, as applicable.
NOT FDIC INSURED • MAY LOSE VALUE • NO BANK GUARANTEE
Neither the fund nor Fidelity Distributors Corporation is a bank.
Annual Report
Performance: The Bottom Line
Average annual total return reflects the change in the value of an investment, assuming reinvestment of the class' distributions from dividend income and capital gains (the profits earned upon the sale of securities that have grown in value, if any) and assuming a constant rate of performance each year. The $10,000 table and the fund's returns do not reflect the deduction of taxes that a shareholder would pay on fund distributions or the redemption of fund shares. During periods of reimbursement by Fidelity, a fund's total return will be greater than it would be had the reimbursement not occurred. How a fund did yesterday is no guarantee of how it will do tomorrow.
Average Annual Total Returns
Periods ended April 30, 2013 | Past 1 | Past 5 | Past 10 |
Class KA | 16.72% | 6.74% | 10.21% |
A The initial offering of Class K shares took place on May 9, 2008. Returns prior to May 9, 2008 are those of Fidelity Mid-Cap Stock Fund, the original class of the fund.
$10,000 Over 10 Years
Let's say hypothetically that $10,000 was invested in Fidelity® Mid-Cap Stock Fund - Class K on April 30, 2003. The chart shows how the value of your investment would have changed, and also shows how the S&P MidCap 400® Index performed over the same period. The initial offering of Class K took place on May 9, 2008. See above for additional information regarding the performance of Class K.
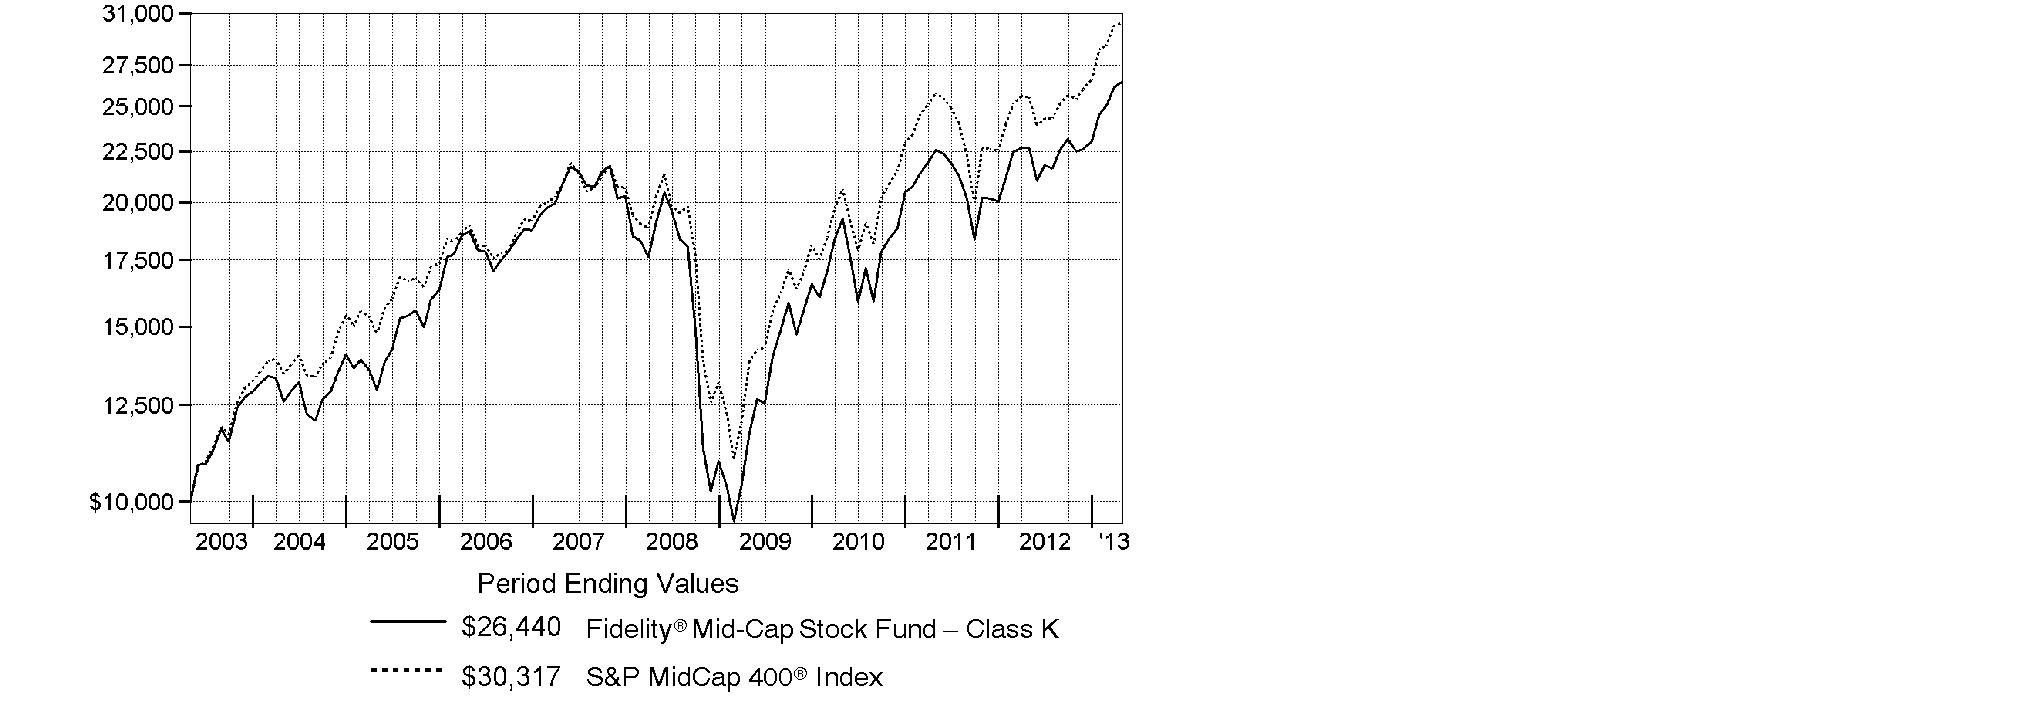
Annual Report
Management's Discussion of Fund Performance
Market Recap: The bull run in U.S. stocks entered its fifth year and two major equity benchmarks reached record territory during the 12 months ending April 30, 2013, as gains in the global economy and more monetary stimulus from the U.S. Federal Reserve kept markets on the upswing for much of the period. Optimism over the nation's jobs picture and housing market teamed up with solid corporate earnings to make stocks a favorite with investors during the 12-month period. The broad-based S&P 500® Index finished the year up 16.89%, closing at a new all-time high, while the blue-chip-laden Dow Jones Industrial AverageSM - which broke its own record in early March - gained 15.39% for the full 12 months. The growth- oriented Nasdaq Composite Index® advanced a more modest 10.78%, curtailed by the weak performance of consumer electronics giant Apple, a large index component. During the year, markets shrugged off an early decline brought on by debt woes in Europe, and another dip later in the period amid pre-election jitters and Congressional gridlock over the federal budget. The year's gains were broad-based, with nine of the 10 sectors in the S&P 500® posting a double-digit increase, led by health care and telecommunication services, while information technology added only about 2%. Despite the headwind of a stronger U.S. dollar, foreign developed-markets stocks rose strongly, with the MSCI® EAFE® Index returning 19.53%.
Comments from John Roth, Portfolio Manager of Fidelity® Mid-Cap Stock Fund: For the year, the fund's Class K shares advanced 16.72%, falling short of the 18.84% gain of the S&P MidCap 400® Index. Untimely exposure to Green Mountain Coffee Roasters hurt the most. The fund was overweighted in the stock earlier in the period when the company overestimated demand for its products and reduced its capital expenditure program, which caused shares to plunge, and did not own it when it began to rally after the firm reported better-than-expected fourth-quarter financial results. An underweighting, on average, in Vertex Pharmaceuticals also hurt. The fund did not own the stock in April when it spiked on positive trials for the firm's cystic fibrosis drug. Conversely, Ocwen Financial, one of the largest independent providers of special servicing for troubled mortgages, was the top relative contributor. The non-index stock staged two sharp rallies and its share price more than doubled during the period.
The views expressed above reflect those of the portfolio manager(s) only through the end of the period as stated on the cover of this report and do not necessarily represent the views of Fidelity or any other person in the Fidelity organization. Any such views are subject to change at any time based upon market or other conditions and Fidelity disclaims any responsibility to update such views. These views may not be relied on as investment advice and, because investment decisions for a Fidelity fund are based on numerous factors, may not be relied on as an indication of trading intent on behalf of any Fidelity fund.
Annual Report
Shareholder Expense Example
As a shareholder of the Fund, you incur two types of costs: (1) transaction costs, including redemption fees and (2) ongoing costs, including management fees and other Fund expenses. This Example is intended to help you understand your ongoing costs (in dollars) of investing in the Fund and to compare these costs with the ongoing costs of investing in other mutual funds.
The Example is based on an investment of $1,000 invested at the beginning of the period and held for the entire period (November 1, 2012 to April 30, 2013).
Actual Expenses
The first line of the accompanying table for each class of the Fund provides information about actual account values and actual expenses. You may use the information in this line, together with the amount you invested, to estimate the expenses that you paid over the period. Simply divide your account value by $1,000.00 (for example, an $8,600 account value divided by $1,000.00 = 8.6), then multiply the result by the number in the first line for a class of the Fund under the heading entitled "Expenses Paid During Period" to estimate the expenses you paid on your account during this period. A small balance maintenance fee of $12.00 that is charged once a year may apply for certain accounts with a value of less than $2,000. This fee is not included in the table below. If it was, the estimate of expenses you paid during the period would be higher, and your ending account value lower, by this amount. In addition, the Fund, as a shareholder in the underlying Fidelity Central Funds, will indirectly bear its pro-rata share of the fees and expenses incurred by the underlying Fidelity Central Funds. These fees and expenses are not included in the Fund's annualized expense ratio used to calculate the expense estimate in the table below.
Hypothetical Example for Comparison Purposes
The second line of the accompanying table for each class of the Fund provides information about hypothetical account values and hypothetical expenses based on a Class' actual expense ratio and an assumed rate of return of 5% per year before expenses, which is not the Class' actual return. The hypothetical account values and expenses may not be used to estimate the actual ending account balance or expenses you paid for the period. You may use this information to compare the ongoing costs of investing in the Fund and other funds. To do so, compare this 5% hypothetical example with the 5% hypothetical examples that appear in the shareholder reports of the other funds. A small balance maintenance fee of $12.00 that is charged once a year may apply for certain accounts with a value of less than $2,000. This fee is not included in the table below. If it was, the estimate of expenses you paid during the period would be higher, and your ending account value lower, by this amount. In addition, the Fund, as a shareholder in the underlying Fidelity Central Funds, will indirectly bear its pro-rata share of the fees and expenses incurred by the underlying Fidelity Central Funds. These fees and expenses are not included in the Fund's annualized expense ratio used to calculate the expense estimate in the table below.
Please note that the expenses shown in the table are meant to highlight your ongoing costs only and do not reflect any transaction costs. Therefore, the second line of the table is useful in comparing ongoing costs only, and will not help you determine the relative total costs of owning different funds. In addition, if these transactional costs were included, your costs would have been higher.
Annual Report
Shareholder Expense Example - continued
| Annualized | Beginning | Ending | Expenses Paid |
Mid-Cap Stock | .57% |
|
|
|
Actual |
| $ 1,000.00 | $ 1,173.30 | $ 3.07 |
HypotheticalA |
| $ 1,000.00 | $ 1,021.97 | $ 2.86 |
Class K | .44% |
|
|
|
Actual |
| $ 1,000.00 | $ 1,174.50 | $ 2.37 |
HypotheticalA |
| $ 1,000.00 | $ 1,022.61 | $ 2.21 |
A 5% return per year before expenses
B Annualized expense ratio reflects expenses net of applicable fee waivers.
* Expenses are equal to each Class' annualized expense ratio, multiplied by the average account value over the period, multiplied by 181/365 (to reflect the one-half year period).
Annual Report
Investment Changes (Unaudited)
Top Ten Stocks as of April 30, 2013 | ||
| % of fund's | % of fund's net assets |
Gartner, Inc. Class A | 1.5 | 1.3 |
Henry Schein, Inc. | 1.4 | 1.3 |
Brookdale Senior Living, Inc. | 1.4 | 1.4 |
Regeneron Pharmaceuticals, Inc. | 1.4 | 0.0 |
Kansas City Southern | 1.3 | 1.2 |
SL Green Realty Corp. | 1.3 | 1.2 |
The Macerich Co. | 1.2 | 1.1 |
Oceaneering International, Inc. | 1.2 | 1.1 |
ANSYS, Inc. | 1.1 | 1.1 |
United Rentals, Inc. | 1.1 | 0.5 |
| 12.9 | |
Top Five Market Sectors as of April 30, 2013 | ||
| % of fund's | % of fund's net assets |
Financials | 23.1 | 20.7 |
Consumer Discretionary | 15.3 | 11.5 |
Health Care | 15.2 | 14.5 |
Information Technology | 14.4 | 14.5 |
Industrials | 13.3 | 10.4 |
Asset Allocation (% of fund's net assets) | |||||||
As of April 30, 2013 * | As of October 31, 2012 ** | ||||||
| Stocks 99.2% |
| | Stocks 94.1% |
| ||
| Other 0.4% |
| | Other 0.0% |
| ||
| Short-Term |
| | Short-Term |
| ||
* Foreign investments | 8.0% |
| ** Foreign investments | 7.1% |
| ||

Annual Report
Investments April 30, 2013
Showing Percentage of Net Assets
Common Stocks - 99.2% | |||
Shares | Value (000s) | ||
CONSUMER DISCRETIONARY - 15.3% | |||
Auto Components - 0.3% | |||
Tenneco, Inc. (a) | 550,000 | $ 21,269 | |
Automobiles - 0.9% | |||
Tesla Motors, Inc. (a)(d) | 1,135,536 | 61,308 | |
Distributors - 0.4% | |||
Pool Corp. | 628,500 | 30,809 | |
Hotels, Restaurants & Leisure - 2.1% | |||
Arcos Dorados Holdings, Inc. Class A (d) | 2,076,129 | 28,277 | |
Domino's Pizza, Inc. | 924,500 | 51,032 | |
Jubilant Foodworks Ltd. (a) | 768,388 | 15,881 | |
Panera Bread Co. Class A (a) | 200,000 | 35,446 | |
Wyndham Worldwide Corp. | 376,300 | 22,608 | |
| 153,244 | ||
Household Durables - 2.7% | |||
D.R. Horton, Inc. | 1,060,933 | 27,669 | |
Lennar Corp. Class A | 447,600 | 18,450 | |
NVR, Inc. (a) | 56,900 | 58,607 | |
Toll Brothers, Inc. (a) | 1,212,187 | 41,590 | |
Tupperware Brands Corp. | 578,800 | 46,478 | |
| 192,794 | ||
Internet & Catalog Retail - 0.2% | |||
Liberty Media Corp. Interactive Series A (a) | 825,000 | 17,564 | |
Leisure Equipment & Products - 1.0% | |||
Brunswick Corp. | 675,000 | 21,371 | |
New Academy Holding Co. LLC unit (a)(g)(i) | 294,000 | 47,793 | |
| 69,164 | ||
Media - 1.4% | |||
Discovery Communications, Inc. (a) | 542,800 | 42,783 | |
Scripps Networks Interactive, Inc. Class A | 520,200 | 34,635 | |
Shutterstock, Inc. | 608,200 | 25,362 | |
| 102,780 | ||
Specialty Retail - 3.5% | |||
Cabela's, Inc. Class A (a) | 807,400 | 51,835 | |
Chico's FAS, Inc. | 913,700 | 16,693 | |
Fast Retailing Co. Ltd. | 85,200 | 31,244 | |
PT ACE Hardware Indonesia Tbk | 212,521,000 | 21,421 | |
Ross Stores, Inc. | 324,500 | 21,440 | |
Sally Beauty Holdings, Inc. (a) | 1,274,000 | 38,296 | |
Common Stocks - continued | |||
Shares | Value (000s) | ||
CONSUMER DISCRETIONARY - continued | |||
Specialty Retail - continued | |||
Tractor Supply Co. | 504,300 | $ 54,046 | |
Ulta Salon, Cosmetics & Fragrance, Inc. | 227,000 | 19,897 | |
| 254,872 | ||
Textiles, Apparel & Luxury Goods - 2.8% | |||
Brunello Cucinelli SpA | 1,522,000 | 32,592 | |
Hanesbrands, Inc. | 1,060,200 | 53,180 | |
PVH Corp. | 574,600 | 66,315 | |
Under Armour, Inc. Class A (sub. vtg.) (a) | 841,100 | 48,010 | |
| 200,097 | ||
TOTAL CONSUMER DISCRETIONARY | 1,103,901 | ||
CONSUMER STAPLES - 4.1% | |||
Beverages - 1.3% | |||
Beam, Inc. | 652,200 | 42,204 | |
Constellation Brands, Inc. Class A (sub. vtg.) (a) | 1,069,500 | 52,780 | |
| 94,984 | ||
Food & Staples Retailing - 0.7% | |||
Masan Consumer Corp. unit (g)(i) | 125,000 | 12,500 | |
Safeway, Inc. | 842,900 | 18,982 | |
United Natural Foods, Inc. (a) | 348,426 | 17,400 | |
| 48,882 | ||
Food Products - 1.1% | |||
Ingredion, Inc. | 718,000 | 51,703 | |
The Hershey Co. | 339,600 | 30,279 | |
| 81,982 | ||
Household Products - 1.0% | |||
Church & Dwight Co., Inc. | 1,092,800 | 69,819 | |
TOTAL CONSUMER STAPLES | 295,667 | ||
ENERGY - 6.5% | |||
Energy Equipment & Services - 2.0% | |||
Diamond Offshore Drilling, Inc. (d) | 452,900 | 31,295 | |
Helmerich & Payne, Inc. | 454,000 | 26,613 | |
Oceaneering International, Inc. | 1,172,200 | 82,253 | |
| 140,161 | ||
Oil, Gas & Consumable Fuels - 4.5% | |||
Cabot Oil & Gas Corp. | 925,200 | 62,960 | |
Common Stocks - continued | |||
Shares | Value (000s) | ||
ENERGY - continued | |||
Oil, Gas & Consumable Fuels - continued | |||
Concho Resources, Inc. (a) | 225,600 | $ 19,431 | |
EQT Corp. | 397,600 | 29,868 | |
EV Energy Partners LP | 676,900 | 31,516 | |
Holly Energy Partners LP | 914,400 | 35,936 | |
HollyFrontier Corp. | 553,300 | 27,361 | |
Oasis Petroleum, Inc. (a) | 696,300 | 23,834 | |
Range Resources Corp. | 450,000 | 33,084 | |
SM Energy Co. | 700,600 | 42,737 | |
Southwestern Energy Co. (a) | 500,000 | 18,710 | |
| 325,437 | ||
TOTAL ENERGY | 465,598 | ||
FINANCIALS - 23.1% | |||
Capital Markets - 1.0% | |||
Apollo Investment Corp. | 2,047,773 | 18,041 | |
Artisan Partners Asset Management, Inc. | 449,754 | 16,776 | |
KKR & Co. LP | 1,554,600 | 32,647 | |
| 67,464 | ||
Commercial Banks - 5.5% | |||
Bank of the Ozarks, Inc. | 474,996 | 19,442 | |
CIT Group, Inc. (a) | 824,300 | 35,041 | |
City National Corp. | 641,700 | 36,724 | |
Cullen/Frost Bankers, Inc. | 833,400 | 50,346 | |
First Niagara Financial Group, Inc. | 2,565,000 | 24,393 | |
First Republic Bank | 1,287,200 | 48,888 | |
FirstMerit Corp. | 1,942,500 | 33,275 | |
FNB Corp., Pennsylvania | 2,502,500 | 28,503 | |
Huntington Bancshares, Inc. | 3,646,900 | 26,148 | |
M&T Bank Corp. | 250,200 | 25,070 | |
Texas Capital Bancshares, Inc. (a) | 425,000 | 17,706 | |
UMB Financial Corp. | 405,000 | 20,388 | |
Webster Financial Corp. | 1,372,600 | 32,078 | |
| 398,002 | ||
Diversified Financial Services - 1.2% | |||
KKR Financial Holdings LLC | 4,948,009 | 52,894 | |
MSCI, Inc. Class A (a) | 1,028,247 | 35,063 | |
| 87,957 | ||
Common Stocks - continued | |||
Shares | Value (000s) | ||
FINANCIALS - continued | |||
Insurance - 5.0% | |||
Arch Capital Group Ltd. (a) | 815,600 | $ 43,276 | |
Assured Guaranty Ltd. | 2,273,900 | 46,911 | |
Direct Line Insurance Group PLC | 12,425,000 | 39,083 | |
Fairfax Financial Holdings Ltd. (sub. vtg.) | 134,900 | 54,117 | |
Fidelity National Financial, Inc. Class A | 2,914,400 | 78,252 | |
First American Financial Corp. | 1,561,400 | 41,799 | |
Genworth Financial, Inc. Class A (a) | 3,172,700 | 31,822 | |
Jardine Lloyd Thompson Group PLC | 1,754,594 | 23,099 | |
| 358,359 | ||
Real Estate Investment Trusts - 7.8% | |||
Apartment Investment & Management Co. Class A | 695,700 | 21,643 | |
Cys Investments, Inc. | 1,281,500 | 15,929 | |
Digital Realty Trust, Inc. (d) | 484,700 | 34,181 | |
Essex Property Trust, Inc. | 360,800 | 56,664 | |
Kimco Realty Corp. | 2,264,800 | 53,857 | |
MFA Financial, Inc. | 2,301,000 | 21,330 | |
Rayonier, Inc. | 1,000,000 | 59,420 | |
Retail Properties America, Inc. | 1,500,000 | 22,965 | |
Silver Bay Realty Trust Corp. (d) | 106,669 | 2,035 | |
SL Green Realty Corp. | 1,007,400 | 91,371 | |
The Geo Group, Inc. | 473,742 | 17,742 | |
The Macerich Co. | 1,223,100 | 85,678 | |
Two Harbors Investment Corp. | 2,184,700 | 26,173 | |
Ventas, Inc. | 642,175 | 51,136 | |
| 560,124 | ||
Real Estate Management & Development - 1.0% | |||
CBRE Group, Inc. (a) | 1,127,600 | 27,310 | |
Realogy Holdings Corp. | 956,900 | 45,931 | |
| 73,241 | ||
Thrifts & Mortgage Finance - 1.6% | |||
MGIC Investment Corp. (a) | 4,334,824 | 23,408 | |
Ocwen Financial Corp. (a) | 755,500 | 27,636 | |
Radian Group, Inc. (d) | 5,303,544 | 63,377 | |
| 114,421 | ||
TOTAL FINANCIALS | 1,659,568 | ||
Common Stocks - continued | |||
Shares | Value (000s) | ||
HEALTH CARE - 15.2% | |||
Biotechnology - 3.8% | |||
Achillion Pharmaceuticals, Inc. (a) | 2,717,800 | $ 20,492 | |
ARIAD Pharmaceuticals, Inc. (a) | 797,500 | 14,251 | |
BioMarin Pharmaceutical, Inc. (a) | 874,700 | 57,380 | |
Dynavax Technologies Corp. (a) | 1,991,667 | 4,680 | |
Infinity Pharmaceuticals, Inc. (a) | 239,000 | 10,299 | |
Regeneron Pharmaceuticals, Inc. (a) | 462,000 | 99,395 | |
Synageva BioPharma Corp. (a) | 564,366 | 29,172 | |
Theravance, Inc. (a) | 1,035,400 | 34,945 | |
| 270,614 | ||
Health Care Equipment & Supplies - 2.5% | |||
Align Technology, Inc. (a) | 1,515,800 | 50,203 | |
DENTSPLY International, Inc. | 649,500 | 27,506 | |
HeartWare International, Inc. (a) | 709,100 | 68,925 | |
The Cooper Companies, Inc. | 201,165 | 22,209 | |
Volcano Corp. (a) | 653,000 | 13,249 | |
| 182,092 | ||
Health Care Providers & Services - 4.6% | |||
Air Methods Corp. | 640,500 | 23,436 | |
Amplifon SpA | 1,425,582 | 7,341 | |
Brookdale Senior Living, Inc. (a) | 3,893,300 | 100,408 | |
Corvel Corp. (a) | 350,000 | 16,615 | |
Emeritus Corp. (a) | 950,000 | 24,415 | |
Henry Schein, Inc. (a) | 1,120,700 | 101,311 | |
MEDNAX, Inc. (a) | 475,500 | 42,191 | |
Qualicorp SA (a) | 1,618,000 | 15,753 | |
| 331,470 | ||
Health Care Technology - 0.2% | |||
HealthStream, Inc. (a) | 650,000 | 14,924 | |
Life Sciences Tools & Services - 1.7% | |||
Eurofins Scientific SA | 331,100 | 71,947 | |
Illumina, Inc. (a)(d) | 789,908 | 51,099 | |
| 123,046 | ||
Pharmaceuticals - 2.4% | |||
Endo Health Solutions, Inc. (a) | 1,614,100 | 59,141 | |
Impax Laboratories, Inc. (a) | 1,101,400 | 19,275 | |
Optimer Pharmaceuticals, Inc. (a)(d) | 1,550,600 | 23,941 | |
Common Stocks - continued | |||
Shares | Value (000s) | ||
HEALTH CARE - continued | |||
Pharmaceuticals - continued | |||
Perrigo Co. | 397,000 | $ 47,406 | |
ViroPharma, Inc. (a) | 805,000 | 21,936 | |
| 171,699 | ||
TOTAL HEALTH CARE | 1,093,845 | ||
INDUSTRIALS - 13.3% | |||
Aerospace & Defense - 2.6% | |||
Esterline Technologies Corp. (a) | 300,000 | 22,512 | |
KEYW Holding Corp. (a)(d)(e) | 3,652,436 | 49,637 | |
Teledyne Technologies, Inc. (a) | 300,000 | 22,518 | |
Textron, Inc. | 1,159,800 | 29,865 | |
TransDigm Group, Inc. | 441,800 | 64,856 | |
| 189,388 | ||
Air Freight & Logistics - 0.5% | |||
C.H. Robinson Worldwide, Inc. | 265,300 | 15,756 | |
Hub Group, Inc. Class A (a) | 600,000 | 21,990 | |
| 37,746 | ||
Commercial Services & Supplies - 1.3% | |||
Clean Harbors, Inc. (a) | 616,000 | 35,094 | |
Interface, Inc. | 3,114,900 | 52,143 | |
US Ecology, Inc. | 275,581 | 7,496 | |
| 94,733 | ||
Construction & Engineering - 0.6% | |||
Jacobs Engineering Group, Inc. (a) | 489,900 | 24,730 | |
MasTec, Inc. (a) | 717,333 | 19,942 | |
| 44,672 | ||
Electrical Equipment - 2.1% | |||
AMETEK, Inc. | 1,142,392 | 46,507 | |
Regal-Beloit Corp. | 400,000 | 31,448 | |
Rockwell Automation, Inc. | 500,000 | 42,390 | |
Roper Industries, Inc. | 274,500 | 32,844 | |
| 153,189 | ||
Machinery - 0.7% | |||
Donaldson Co., Inc. | 1,288,800 | 46,887 | |
Professional Services - 1.9% | |||
Acacia Research Corp. | 1,698,480 | 40,458 | |
Bureau Veritas SA | 219,900 | 26,947 | |
Common Stocks - continued | |||
Shares | Value (000s) | ||
INDUSTRIALS - continued | |||
Professional Services - continued | |||
Michael Page International PLC | 3,212,360 | $ 18,592 | |
Towers Watson & Co. | 729,700 | 53,210 | |
| 139,207 | ||
Road & Rail - 2.0% | |||
J.B. Hunt Transport Services, Inc. | 657,600 | 46,736 | |
Kansas City Southern | 884,500 | 96,472 | |
| 143,208 | ||
Trading Companies & Distributors - 1.6% | |||
Beacon Roofing Supply, Inc. (a) | 378,800 | 14,444 | |
Rush Enterprises, Inc. Class A (a) | 775,000 | 17,740 | |
United Rentals, Inc. (a) | 1,500,473 | 78,940 | |
| 111,124 | ||
TOTAL INDUSTRIALS | 960,154 | ||
INFORMATION TECHNOLOGY - 14.4% | |||
Communications Equipment - 0.5% | |||
Brocade Communications Systems, Inc. (a) | 3,800,200 | 22,117 | |
Juniper Networks, Inc. (a) | 850,000 | 14,068 | |
| 36,185 | ||
Computers & Peripherals - 0.5% | |||
3D Systems Corp. (a)(d) | 357,900 | 13,686 | |
Fusion-io, Inc. (a) | 621,400 | 11,670 | |
Stratasys Ltd. (a) | 160,000 | 13,288 | |
| 38,644 | ||
Electronic Equipment & Components - 1.2% | |||
Amphenol Corp. Class A | 337,000 | 25,450 | |
Arrow Electronics, Inc. (a) | 1,156,600 | 45,373 | |
Fabrinet (a) | 1,172,331 | 16,096 | |
| 86,919 | ||
Internet Software & Services - 2.9% | |||
Akamai Technologies, Inc. (a) | 1,006,600 | 44,200 | |
Cornerstone OnDemand, Inc. (a) | 1,050,400 | 38,109 | |
CoStar Group, Inc. (a) | 373,600 | 40,502 | |
Demandware, Inc. (a) | 690,285 | 18,845 | |
Equinix, Inc. (a) | 301,500 | 64,551 | |
| 206,207 | ||
Common Stocks - continued | |||
Shares | Value (000s) | ||
INFORMATION TECHNOLOGY - continued | |||
IT Services - 3.9% | |||
Fidelity National Information Services, Inc. | 1,274,386 | $ 53,588 | |
FleetCor Technologies, Inc. (a) | 585,800 | 45,048 | |
Gartner, Inc. Class A (a) | 1,832,100 | 105,985 | |
Teradata Corp. (a) | 325,000 | 16,598 | |
Total System Services, Inc. | 1,200,000 | 28,344 | |
WNS Holdings Ltd. sponsored ADR (a) | 2,200,000 | 32,868 | |
| 282,431 | ||
Semiconductors & Semiconductor Equipment - 1.0% | |||
Applied Materials, Inc. | 1,400,000 | 20,314 | |
Linear Technology Corp. | 769,600 | 28,090 | |
Siliconware Precision Industries Co. Ltd. sponsored ADR (d) | 3,903,800 | 23,774 | |
| 72,178 | ||
Software - 4.4% | |||
ANSYS, Inc. (a) | 977,700 | 79,057 | |
Aspen Technology, Inc. (a) | 1,382,200 | 42,129 | |
Citrix Systems, Inc. (a) | 301,100 | 18,719 | |
Concur Technologies, Inc. (a)(d) | 991,800 | 72,510 | |
Nuance Communications, Inc. (a) | 2,211,000 | 42,097 | |
Red Hat, Inc. (a) | 512,300 | 24,555 | |
ServiceNow, Inc. | 841,400 | 34,464 | |
| 313,531 | ||
TOTAL INFORMATION TECHNOLOGY | 1,036,095 | ||
MATERIALS - 2.4% | |||
Chemicals - 1.5% | |||
Airgas, Inc. | 528,400 | 51,070 | |
Cytec Industries, Inc. | 772,400 | 56,277 | |
| 107,347 | ||
Containers & Packaging - 0.9% | |||
Rock-Tenn Co. Class A | 616,000 | 61,686 | |
Metals & Mining - 0.0% | |||
Ivanplats Ltd. (f) | 1,025,536 | 3,054 | |
TOTAL MATERIALS | 172,087 | ||
Common Stocks - continued | |||
Shares | Value (000s) | ||
TELECOMMUNICATION SERVICES - 0.9% | |||
Diversified Telecommunication Services - 0.9% | |||
tw telecom, inc. (a) | 2,451,300 | $ 66,381 | |
UTILITIES - 4.0% | |||
Electric Utilities - 2.1% | |||
Cleco Corp. | 620,200 | 30,712 | |
Northeast Utilities | 814,900 | 36,939 | |
OGE Energy Corp. | 684,400 | 49,571 | |
PNM Resources, Inc. | 1,294,200 | 31,074 | |
| 148,296 | ||
Gas Utilities - 1.2% | |||
Atmos Energy Corp. | 1,000,000 | 44,370 | |
National Fuel Gas Co. | 707,600 | 44,381 | |
| 88,751 | ||
Multi-Utilities - 0.7% | |||
Alliant Energy Corp. | 948,800 | 50,770 | |
TOTAL UTILITIES | 287,817 | ||
TOTAL COMMON STOCKS (Cost $5,493,230) |
| ||
Other - 0.4% | |||
Principal |
| ||
ENERGY - 0.4% | |||
Oil, Gas & Consumable Fuels - 0.4% | |||
EQTY ER Holdings, LLC 12% 1/28/18(e)(h)(i) | $ 18,813 | 18,813 | |
Shares |
| ||
EQTY ER Holdings, LLC(e)(h)(i) | 9,406,667 | 9,407 | |
TOTAL OTHER (Cost $28,220) |
| ||
Money Market Funds - 4.2% | |||
Shares | Value (000s) | ||
Fidelity Cash Central Fund, 0.13% (b) | 32,009,208 | $ 32,009 | |
Fidelity Securities Lending Cash Central Fund, 0.12% (b)(c) | 272,325,194 | 272,325 | |
TOTAL MONEY MARKET FUNDS (Cost $304,334) |
| ||
TOTAL INVESTMENT PORTFOLIO - 103.8% (Cost $5,825,784) | 7,473,667 | ||
NET OTHER ASSETS (LIABILITIES) - (3.8)% | (276,913) | ||
NET ASSETS - 100% | $ 7,196,754 | ||
Legend |
(a) Non-income producing |
(b) Affiliated fund that is generally available only to investment companies and other accounts managed by Fidelity Investments. The rate quoted is the annualized seven-day yield of the fund at period end. A complete unaudited listing of the fund's holdings as of its most recent quarter end is available upon request. In addition, each Fidelity Central Fund's financial statements, which are not covered by the Fund's Report of Independent Registered Public Accounting Firm, are available on the SEC's website or upon request. |
(c) Investment made with cash collateral received from securities on loan. |
(d) Security or a portion of the security is on loan at period end. |
(e) Affiliated company |
(f) Security exempt from registration under Rule 144A of the Securities Act of 1933. These securities may be resold in transactions exempt from registration, normally to qualified institutional buyers. At the end of the period, the value of these securities amounted to $3,054,000 or 0.0% of net assets. |
(g) Investment is owned by an entity that is treated as a corporation for U.S. tax purposes and is owned by the Fund. |
(h) Investments represent a non-operating interest in oil and gas wells through an entity owned by the fund that is treated as a corporation for U.S. tax purposes. |
(i) Restricted securities - Investment in securities not registered under the Securities Act of 1933 (excluding 144A issues). At the end of the period, the value of restricted securities (excluding 144A issues) amounted to $88,513,000 or 1.2% of net assets. |
Additional information on each restricted holding is as follows: |
Security | Acquisition Date | Acquisition Cost (000s) |
EQTY ER Holdings, LLC 12% 1/28/18 | 1/29/13 | $ 18,813 |
EQTY ER Holdings, LLC | 1/29/13 | $ 9,407 |
Masan Consumer Corp. unit | 4/3/13 | $ 12,620 |
New Academy Holding Co. LLC unit | 8/1/11 | $ 30,988 |
Affiliated Central Funds |
Information regarding fiscal year to date income earned by the Fund from investments in Fidelity Central Funds is as follows: |
Fund | Income earned |
Fidelity Cash Central Fund | $ 267 |
Fidelity Securities Lending Cash Central Fund | 1,575 |
Total | $ 1,842 |
Other Affiliated Issuers |
An affiliated company is a company in which the Fund has ownership of at least 5% of the voting securities. Fiscal year to date transactions with companies which are or were affiliates are as follows: |
Affiliates | Value, | Purchases | Sales | Dividend | Value, |
Blinkx PLC | $ 16,826 | $ - | $ 20,921 | $ - | $ - |
Brunello Cucinelli SpA | - | 27,446 | - | - | - |
EQTY ER Holdings, LLC 12% 1/28/18 | - | 18,813 | - | - | 18,813 |
EQTY ER Holdings, LLC | - | 9,407 | - | - | 9,407 |
HeartWare International, Inc. | 61,970 | 18,243 | 24,521 | - | - |
KEYW Holding Corp. | - | 49,053 | - | - | 49,637 |
SciQuest, Inc. | 22,277 | - | 22,508 | - | - |
Sunrise Senior Living, Inc. | 20,410 | - | 46,474 | - | - |
Total | $ 121,483 | $ 122,962 | $ 114,424 | $ - | $ 77,857 |
Other Information |
The following is a summary of the inputs used, as of April 30, 2013, involving the Fund's assets and liabilities carried at fair value. The inputs or methodology used for valuing securities may not be an indication of the risk associated with investing in those securities. For more information on valuation inputs, and their aggregation into the levels used in the tables below, please refer to the Investment Valuation section in the accompanying Notes to Financial Statements. |
Valuation Inputs at Reporting Date: | ||||
Description | Total | Level 1 | Level 2 | Level 3 |
Investments in Securities: | ||||
Equities: | ||||
Consumer Discretionary | $ 1,103,901 | $ 1,024,864 | $ 31,244 | $ 47,793 |
Consumer Staples | 295,667 | 283,167 | - | 12,500 |
Energy | 465,598 | 465,598 | - | - |
Financials | 1,659,568 | 1,659,568 | - | - |
Health Care | 1,093,845 | 1,093,845 | - | - |
Industrials | 960,154 | 960,154 | - | - |
Information Technology | 1,036,095 | 1,036,095 | - | - |
Materials | 172,087 | 172,087 | - | - |
Telecommunication Services | 66,381 | 66,381 | - | - |
Utilities | 287,817 | 287,817 | - | - |
Other: | ||||
Energy | 28,220 | - | - | 28,220 |
Money Market Funds | 304,334 | 304,334 | - | - |
Total Investments in Securities: | $ 7,473,667 | $ 7,353,910 | $ 31,244 | $ 88,513 |
Valuation Inputs at Reporting Date: | ||||
The following is a reconciliation of Investments in Securities for which level 3 inputs were used in determining value: |
(Amounts in thousands) |
|
Investments in Securities: | |
Beginning Balance | $ 36,797 |
Total Realized Gain (Loss) | 333 |
Total Unrealized Gain (Loss) | 15,192 |
Cost of Purchases | 40,840 |
Proceeds of Sales | (4,649) |
Amortization/Accretion | - |
Transfers in to Level 3 | - |
Transfers out of Level 3 | - |
Ending Balance | $ 88,513 |
The change in unrealized gain (loss) for the period attributable to Level 3 securities held at April 30, 2013 | $ 15,192 |
The information used in the above reconciliation represents fiscal year to date activity for any Investments in Securities identified as using Level 3 inputs at either the beginning or the end of the current fiscal period. Transfers in or out of Level 3 represent the beginning value of any Security or Instrument where a change in the pricing level occurred from the beginning to the end of the period. The cost of purchases and the proceeds of sales may include securities received or delivered through corporate actions or exchanges. Realized and unrealized gains (losses) disclosed in the reconciliation are included in Net Gain (Loss) on the Fund's Statement of Operations. |
See accompanying notes which are an integral part of the financial statements.
Annual Report
Financial Statements
Statement of Assets and Liabilities
Amounts in thousands (except per-share amounts) | April 30, 2013 | |
|
|
|
Assets | ||
Investment in securities, at value (including securities loaned of $266,693) - See accompanying schedule: Unaffiliated issuers (cost $5,444,177) | $ 7,091,476 |
|
Fidelity Central Funds (cost $304,334) | 304,334 |
|
Other affiliated issuers (cost $77,273) | 77,857 |
|
Total Investments (cost $5,825,784) |
| $ 7,473,667 |
Receivable for fund shares sold | 3,964 | |
Dividends receivable | 3,136 | |
Distributions receivable from Fidelity Central Funds | 584 | |
Prepaid expenses | 5 | |
Receivable from investment adviser for expense reductions | 10 | |
Other receivables | 493 | |
Total assets | 7,481,859 | |
|
|
|
Liabilities | ||
Payable for investments purchased | $ 1,045 | |
Payable for fund shares redeemed | 8,361 | |
Accrued management fee | 2,056 | |
Other affiliated payables | 969 | |
Other payables and accrued expenses | 349 | |
Collateral on securities loaned, at value | 272,325 | |
Total liabilities | 285,105 | |
|
|
|
Net Assets | $ 7,196,754 | |
Net Assets consist of: |
| |
Paid in capital | $ 5,527,730 | |
Distributions in excess of net investment income | (5,318) | |
Accumulated undistributed net realized gain (loss) on investments and foreign currency transactions | 26,414 | |
Net unrealized appreciation (depreciation) on investments and assets and liabilities in foreign currencies | 1,647,928 | |
Net Assets | $ 7,196,754 | |
See accompanying notes which are an integral part of the financial statements.
Annual Report
Statement of Assets and Liabilities - continued
Amounts in thousands (except per-share amounts) | April 30, 2013 | |
|
|
|
Mid-Cap Stock: | $ 33.69 | |
|
|
|
Class K: | $ 33.68 | |
See accompanying notes which are an integral part of the financial statements.
Annual Report
Financial Statements - continued
Statement of Operations
Amounts in thousands | Year ended April 30, 2013 | |
|
|
|
Investment Income |
|
|
Dividends |
| $ 102,306 |
Interest |
| 160 |
Income from Fidelity Central Funds |
| 1,842 |
Total income |
| 104,308 |
|
|
|
Expenses | ||
Management fee | $ 36,565 | |
Performance adjustment | (8,608) | |
Transfer agent fees | 10,371 | |
Accounting and security lending fees | 1,178 | |
Custodian fees and expenses | 172 | |
Independent trustees' compensation | 45 | |
Registration fees | 95 | |
Audit | 74 | |
Legal | 32 | |
Miscellaneous | 70 | |
Total expenses before reductions | 39,994 | |
Expense reductions | (1,211) | 38,783 |
Net investment income (loss) | 65,525 | |
Realized and Unrealized Gain (Loss) Net realized gain (loss) on: | ||
Investment securities: |
|
|
Unaffiliated issuers | 111,954 | |
Other affiliated issuers | 21,121 |
|
Foreign currency transactions | (44) | |
Total net realized gain (loss) |
| 133,031 |
Change in net unrealized appreciation (depreciation) on: Investment securities | 822,333 | |
Assets and liabilities in foreign currencies | 27 | |
Total change in net unrealized appreciation (depreciation) |
| 822,360 |
Net gain (loss) | 955,391 | |
Net increase (decrease) in net assets resulting from operations | $ 1,020,916 | |
See accompanying notes which are an integral part of the financial statements.
Annual Report
Statement of Changes in Net Assets
Amounts in thousands | Year ended | Year ended |
Increase (Decrease) in Net Assets |
|
|
Operations |
|
|
Net investment income (loss) | $ 65,525 | $ 27,945 |
Net realized gain (loss) | 133,031 | 125,326 |
Change in net unrealized appreciation (depreciation) | 822,360 | (344,865) |
Net increase (decrease) in net assets resulting | 1,020,916 | (191,594) |
Distributions to shareholders from net investment income | (73,928) | (13,303) |
Distributions to shareholders from net realized gain | (190,685) | (413,018) |
Total distributions | (264,613) | (426,321) |
Share transactions - net increase (decrease) | (373,065) | (1,509,888) |
Redemption fees | 70 | 270 |
Total increase (decrease) in net assets | 383,308 | (2,127,533) |
|
|
|
Net Assets | ||
Beginning of period | 6,813,446 | 8,940,979 |
End of period (including distributions in excess of net investment income of $5,318 and undistributed net investment income of $8,318, respectively) | $ 7,196,754 | $ 6,813,446 |
See accompanying notes which are an integral part of the financial statements.
Annual Report
Financial Highlights - Mid-Cap Stock
Years ended April 30, | 2013 | 2012 | 2011 | 2010 | 2009 |
Selected Per-Share Data |
|
|
|
| |
Net asset value, beginning of period | $ 30.15 | $ 31.78 | $ 27.26 | $ 16.65 | $ 27.52 |
Income from Investment Operations |
|
|
|
|
|
Net investment income (loss) B | .29 | .10 | .01 | .08 | .02 |
Net realized and unrealized gain (loss) | 4.45 | (.18) | 4.59 | 10.59 | (10.58) |
Total from investment operations | 4.74 | (.08) | 4.60 | 10.67 | (10.56) |
Distributions from net investment income | (.33) | (.05) | (.04) E | (.06) | (.02) E |
Distributions from net realized gain | (.87) | (1.50) | (.04) E | - | (.29) E |
Total distributions | (1.20) | (1.55) | (.08) | (.06) | (.31) |
Redemption fees added to paid in capital B, G | - | - | - | - | - |
Net asset value, end of period | $ 33.69 | $ 30.15 | $ 31.78 | $ 27.26 | $ 16.65 |
Total Return A | 16.54% | .19% | 16.95% | 64.11% | (38.76)% |
Ratios to Average Net Assets C, F |
|
|
|
| |
Expenses before reductions | .65% | .86% | .61% | .65% | .73% |
Expenses net of fee waivers, if any | .65% | .86% | .61% | .65% | .73% |
Expenses net of all reductions | .63% | .85% | .59% | .64% | .72% |
Net investment income (loss) | .95% | .36% | .04% | .38% | .11% |
Supplemental Data |
|
|
|
| |
Net assets, end of period (in millions) | $ 4,750 | $ 5,170 | $ 7,120 | $ 7,475 | $ 4,763 |
Portfolio turnover rate D | 46% | 52% | 131% | 85% | 73% |
A Total returns would have been lower if certain expenses had not been reduced during the applicable periods shown.
B Calculated based on average shares outstanding during the period.
C Fees and expenses of any underlying Fidelity Central Funds are not included in the Fund's expense ratio. The Fund indirectly bears its proportionate share of the expenses of any underlying Fidelity Central Funds.
D Amount does not include the portfolio activity of any underlying Fidelity Central Funds.
E The amounts shown reflect certain reclassifications related to book to tax differences that were made in the year shown.
F Expense ratios reflect operating expenses of the class. Expenses before reductions do not reflect amounts reimbursed by the investment adviser or reductions from brokerage service arrangements or reductions from other expense offset arrangements and do not represent the amount paid by the class during periods when reimbursements or reductions occur. Expenses net of fee waivers reflect expenses after reimbursement by the investment adviser but prior to reductions from brokerage service arrangements or other expense offset arrangements. Expenses net of all reductions represent the net expenses paid by the class.
G Amount represents less than $.01 per share.
See accompanying notes which are an integral part of the financial statements.
Annual Report
Financial Highlights - Class K
Years ended April 30, | 2013 | 2012 | 2011 | 2010 | 2009 G |
Selected Per-Share Data |
|
|
|
| |
Net asset value, beginning of period | $ 30.15 | $ 31.77 | $ 27.26 | $ 16.63 | $ 28.33 |
Income from Investment Operations |
|
|
|
|
|
Net investment income (loss) D | .33 | .15 | .06 | .14 | .05 |
Net realized and unrealized gain (loss) | 4.45 | (.19) | 4.58 | 10.58 | (11.39) |
Total from investment operations | 4.78 | (.04) | 4.64 | 10.72 | (11.34) |
Distributions from net investment income | (.38) | (.08) | (.09) H | (.09) | (.07) H |
Distributions from net realized gain | (.87) | (1.50) | (.04) H | - | (.29) H |
Total distributions | (1.25) | (1.58) | (.13) | (.09) | (.36) |
Redemption fees added to paid in capital D, J | - | - | - | - | - |
Net asset value, end of period | $ 33.68 | $ 30.15 | $ 31.77 | $ 27.26 | $ 16.63 |
Total Return B, C | 16.72% | .35% | 17.13% | 64.55% | (40.38)% |
Ratios to Average Net Assets E, I |
|
|
|
| |
Expenses before reductions | .50% | .69% | .43% | .43% | .52% A |
Expenses net of fee waivers, if any | .50% | .69% | .43% | .43% | .52% A |
Expenses net of all reductions | .48% | .68% | .42% | .41% | .52% A |
Net investment income (loss) | 1.11% | .52% | .22% | .61% | .31% A |
Supplemental Data |
|
|
|
| |
Net assets, end of period (in millions) | $ 2,447 | $ 1,643 | $ 1,821 | $ 1,127 | $ 412 |
Portfolio turnover rate F | 46% | 52% | 131% | 85% | 73% |
A Annualized
B Total returns for periods of less than one year are not annualized.
C Total returns would have been lower if certain expenses had not been reduced during the applicable periods shown.
D Calculated based on average shares outstanding during the period.
E Fees and expenses of any underlying Fidelity Central Funds are not included in the Fund's expense ratio. The Fund indirectly bears its proportionate share of the expenses of any underlying Fidelity Central Funds.
F Amount does not include the portfolio activity of any underlying Fidelity Central Funds.
G For the period May 9, 2008 (commencement of sale of shares) to April 30, 2009.
H The amounts shown reflect certain reclassifications related to book to tax differences that were made in the year shown.
I Expense ratios reflect operating expenses of the class. Expenses before reductions do not reflect amounts reimbursed by the investment adviser or reductions from brokerage service arrangements or reductions from other expense offset arrangements and do not represent the amount paid by the class during periods when reimbursements or reductions occur. Expense ratios before reductions for start-up periods may not be representative of longer-term operating periods. Expenses net of fee waivers reflect expenses after reimbursement by the investment adviser but prior to reductions from brokerage service arrangements or other expense offset arrangements. Expenses net of all reductions represent the net expenses paid by the class.
J Amount represents less than $.01 per share.
See accompanying notes which are an integral part of the financial statements.
Annual Report
Notes to Financial Statements
For the period ended April 30, 2013
(Amounts in thousands except percentages)
1. Organization.
Fidelity Mid-Cap Stock Fund (the Fund) is a fund of Fidelity Commonwealth Trust (the Trust) and is authorized to issue an unlimited number of shares. The Trust is registered under the Investment Company Act of 1940, as amended (the 1940 Act), as an open-end management investment company organized as a Massachusetts business trust. The Fund offers Mid-Cap Stock and Class K shares, each of which has equal rights as to assets and voting privileges. Each class has exclusive voting rights with respect to matters that affect that class.
2. Investments in Fidelity Central Funds.
The Fund invests in Fidelity Central Funds, which are open-end investment companies generally available only to other investment companies and accounts managed by Fidelity Management & Research Company (FMR) and its affiliates. The Fund's Schedule of Investments lists each of the Fidelity Central Funds held as of period end, if any, as an investment of the Fund, but does not include the underlying holdings of each Fidelity Central Fund. As an Investing Fund, the Fund indirectly bears its proportionate share of the expenses of the underlying Fidelity Central Funds.
The Money Market Central Funds seek preservation of capital and current income and are managed by Fidelity Investments Money Management, Inc. (FIMM), an affiliate of FMR.
A complete unaudited list of holdings for each Fidelity Central Fund is available upon request or at the Securities and Exchange Commission (the SEC) website at www.sec.gov. In addition, the financial statements of the Fidelity Central Funds, which are not covered by the Fund's Report of Independent Registered Public Accounting Firm, are available on the SEC website or upon request.
3. Significant Accounting Policies.
The financial statements have been prepared in conformity with accounting principles generally accepted in the United States of America (GAAP), which require management to make certain estimates and assumptions at the date of the financial statements. Actual results could differ from those estimates. Subsequent events, if any, through the date that the financial statements were issued have been evaluated in the preparation of the financial statements. The following summarizes the significant accounting policies of the Fund:
Investment Valuation. Investments are valued as of 4:00 p.m. Eastern time on the last calendar day of the period. In accordance with valuation policies and procedures approved by the Board of Trustees (the Board), the Fund attempts to obtain prices from one or more third party pricing vendors or brokers to value its investments. When
Annual Report
Notes to Financial Statements - continued
(Amounts in thousands except percentages)
3. Significant Accounting Policies - continued
Investment Valuation - continued
current market prices, quotations or currency exchange rates are not readily available or reliable, investments will be fair valued in good faith by the FMR Fair Value Committee (the Committee), in accordance with procedures adopted by the Fund's Board. Factors used in determining fair value vary by investment type and may include market or investment specific events. The frequency with which these procedures are used cannot be predicted and they may be utilized to a significant extent. The Committee oversees the Fund's valuation policies and procedures and is responsible for approving and reporting to the Board all fair value determinations.
The Fund categorizes the inputs to valuation techniques used to value its investments into a disclosure hierarchy consisting of three levels as shown below:
Level 1 - quoted prices in active markets for identical investments
Level 2 - other significant observable inputs (including quoted prices for similar investments, interest rates, prepayment speeds, etc.)
Level 3 - unobservable inputs (including the Fund's own assumptions based on the best information available)
Valuation techniques used to value the Fund's investments by major category are as follows:
Equity securities, including restricted securities, for which market quotations are readily available, are valued at the last reported sale price or official closing price as reported by a third party pricing vendor on the primary market or exchange on which they are traded and are categorized as Level 1 in the hierarchy. In the event there were no sales during the day or closing prices are not available, securities are valued at the last quoted bid price or may be valued using the last available price and are generally categorized as Level 2 in the hierarchy. For foreign equity securities, when market or security specific events arise, comparisons to the valuation of American Depositary Receipts (ADRs), futures contracts, Exchange- Traded Funds (ETFs) and certain indexes as well as quoted prices for similar securities may be used and would be categorized as Level 2 in the hierarchy. Utilizing these techniques may result in transfers between Level 1 and Level 2. Restricted equity securities and private placements for which observable inputs are not available are valued using alternate valuation approaches, including the market approach and the income approach and are categorized as Level 3 in the hierarchy. The market approach generally consists of using comparable market transactions while the income approach generally consists of using the net present value of estimated future cash flows, adjusted as appropriate for liquidity, credit, market and/or other risk factors.
Annual Report
3. Significant Accounting Policies - continued
Investment Valuation - continued
Investments in open-end mutual funds, including the Fidelity Central Funds, are valued at their closing net asset value (NAV) each business day and are categorized as Level 1 in the hierarchy.
The following provides information on Level 3 securities held by the Fund that were valued at period end based on unobservable inputs. These amounts exclude valuations provided by a broker.
Asset Type | Fair Value at | Valuation | Unobservable | Amount or Range/ | Impact to |
Common | $ 88,513 | Discounted | Discount rate | 20.0% | Decrease |
|
| Market | Transaction price | $1.00 - $100.00/ | Increase |
|
|
| EV/EBITDA multiple | 9.0 | Increase |
* Represents the expected directional change in the fair value of the Level 3 investments that would result from an increase in the corresponding
input. A decrease to the unobservable input would have the opposite effect. Significant changes in these inputs could result in significantly higher
or lower fair value measurements.
Changes in valuation techniques may result in transfers in or out of an assigned level within the disclosure hierarchy. The aggregate value of investments by input level, as of April 30, 2013, as well as a roll forward of Level 3 investments, is included at the end of the Fund's Schedule of Investments.
Foreign Currency. The Fund may use foreign currency contracts to facilitate transactions in foreign-denominated securities. Gains and losses from these transactions may arise from changes in the value of the foreign currency or if the counterparties do not perform under the contracts' terms.
Foreign-denominated assets, including investment securities, and liabilities are translated into U.S. dollars at the exchange rates at period end. Purchases and sales of investment securities, income and dividends received and expenses denominated in foreign currencies are translated into U.S. dollars at the exchange rate in effect on the transaction date.
The effects of exchange rate fluctuations on investments are included with the net realized and unrealized gain (loss) on investment securities. Other foreign currency transactions resulting in realized and unrealized gain (loss) are disclosed separately.
Annual Report
Notes to Financial Statements - continued
(Amounts in thousands except percentages)
3. Significant Accounting Policies - continued
Investment Transactions and Income. For financial reporting purposes, the Fund's investment holdings and NAV include trades executed through the end of the last business day of the period. The NAV per share for processing shareholder transactions is calculated as of the close of business of the New York Stock Exchange (NYSE), normally 4:00 p.m. Eastern time and includes trades executed through the end of the prior business day. Gains and losses on securities sold are determined on the basis of identified cost and may include proceeds received from litigation. Dividend income is recorded on the ex-dividend date, except for certain dividends from foreign securities where the ex-dividend date may have passed, which are recorded as soon as the Fund is informed of the ex-dividend date. Non-cash dividends included in dividend income, if any, are recorded at the fair market value of the securities received. Distributions received on securities that represent a return of capital or capital gain are recorded as a reduction of cost of investments and/or as a realized gain. The Fund estimates the components of distributions received that may be considered return of capital distributions or capital gain distributions. Interest income and distributions from the Fidelity Central Funds are accrued as earned. Interest income includes coupon interest and amortization of premium and accretion of discount on debt securities. Investment income is recorded net of foreign taxes withheld where recovery of such taxes is uncertain.
Class Allocations and Expenses. Investment income, realized and unrealized capital gains and losses, common expenses of the Fund and certain fund-level expense reductions, if any, are allocated on a pro-rata basis to each class based on the relative net assets of each class to the total net assets of the Fund. Each class differs with respect to transfer agent fees incurred. Certain expense reductions may also differ by class. Expenses directly attributable to a fund are charged to that fund. Expenses attributable to more than one fund are allocated among the respective funds on the basis of relative net assets or other appropriate methods. Expense estimates are accrued in the period to which they relate and adjustments are made when actual amounts are known.
Deferred Trustee Compensation. Under a Deferred Compensation Plan (the Plan), independent Trustees may elect to defer receipt of a portion of their annual compensation. Deferred amounts are invested in a cross-section of Fidelity funds, are marked-to-market and remain in the Fund until distributed in accordance with the Plan. The investment of deferred amounts and the offsetting payable to the Trustees are included in the accompanying Statement of Assets and Liabilities.
Income Tax Information and Distributions to Shareholders. Each year, the Fund intends to qualify as a regulated investment company under Subchapter M of the Internal Revenue Code, including distributing substantially all of its taxable income and realized gains. As a result, no provision for income taxes is required. As of April 30, 2013, the Fund did not have any unrecognized tax benefits in the financial statements; nor is
Annual Report
3. Significant Accounting Policies - continued
Income Tax Information and Distributions to Shareholders - continued
the Fund aware of any tax positions for which it is reasonably possible that the total amounts of unrecognized tax benefits will significantly change in the next twelve months. The Fund files a U.S. federal tax return, in addition to state and local tax returns as required. A fund's federal income tax returns are subject to examination by the Internal Revenue Service (IRS) for a period of three fiscal years after they are filed. State and local tax returns may be subject to examination for an additional fiscal year depending on the jurisdiction. Foreign taxes are provided for based on the Fund's understanding of the tax rules and rates that exist in the foreign markets in which it invests.
Distributions are declared and recorded on the ex-dividend date. Income dividends and capital gain distributions are declared separately for each class. Income and capital gain distributions are determined in accordance with income tax regulations, which may differ from GAAP. These differences resulted in distribution reclassifications. In addition, the Fund claimed a portion of the payment made to redeeming shareholders as a distribution for income tax purposes.
Capital accounts within the financial statements are adjusted for permanent book-tax differences. These adjustments have no impact on net assets or the results of operations. Temporary book-tax differences will reverse in a subsequent period.
Book-tax differences are primarily due to foreign currency transactions, contingent interest, certain foreign taxes, passive foreign investment companies (PFIC), partnerships, deferred trustees compensation and losses deferred due to wash sales and excise tax regulations.
The federal tax cost of investment securities and unrealized appreciation (depreciation) as of period end were as follows:
Gross unrealized appreciation | $ 1,740,603 |
Gross unrealized depreciation | (132,385) |
Net unrealized appreciation (depreciation) on securities and other investments | $ 1,608,218 |
|
|
Tax Cost | $ 5,865,449 |
The tax-based components of distributable earnings as of period end were as follows:
Undistributed long-term capital gain | $ 66,079 |
Net unrealized appreciation (depreciation) | $ 1,608,264 |
Annual Report
Notes to Financial Statements - continued
(Amounts in thousands except percentages)
3. Significant Accounting Policies - continued
Income Tax Information and Distributions to Shareholders - continued
The tax character of distributions paid was as follows:
| April 30, 2013 | April 30, 2012 |
Ordinary Income | $ 78,920 | $ 18,660 |
Long-term Capital Gains | 185,693 | 407,661 |
Total | $ 264,613 | $ 426,321 |
Short-Term Trading (Redemption) Fees. Shares held by investors in the Fund less than 30 days are subject to a redemption fee equal to .75% of the net asset value of shares redeemed. All redemption fees, which reduce the proceeds of the shareholder redemption, are retained by the Fund and accounted for as an addition to paid in capital.
Restricted Securities. The Fund may invest in securities that are subject to legal or contractual restrictions on resale. These securities generally may be resold in transactions exempt from registration or to the public if the securities are registered. Disposal of these securities may involve time-consuming negotiations and expense, and prompt sale at an acceptable price may be difficult. Information regarding restricted securities is included at the end of the Fund's Schedule of Investments.
4. Purchases and Sales of Investments.
Purchases and sales of securities, other than short-term securities, aggregated $2,989,098 and $3,503,826, respectively.
5. Fees and Other Transactions with Affiliates.
Management Fee. FMR and its affiliates provide the Fund with investment management related services for which the Fund pays a monthly management fee. The management fee is the sum of an individual fund fee rate that is based on an annual rate of .30% of the Fund's average net assets and an annualized group fee rate that averaged .26% during the period. The group fee rate is based upon the average net assets of all the mutual funds advised by FMR. The group fee rate decreases as assets under management increase and increases as assets under management decrease. In addition, the management fee is subject to a performance adjustment (up to a maximum of ± .20% of the Fund's average net assets over a 36 month performance period). The upward or downward adjustment to the management fee is based on the relative investment performance of Mid-Cap Stock as compared to an appropriate benchmark index. For the period, the total annual management fee rate, including the performance adjustment, was .43% of the Fund's average net assets.
Annual Report
5. Fees and Other Transactions with Affiliates - continued
Transfer Agent Fees. Fidelity Investments Institutional Operations Company, Inc., (FIIOC), an affiliate of FMR, is the transfer, dividend disbursing and shareholder servicing agent for each class of the Fund. FIIOC receives account fees and asset-based fees that vary according to the account size and type of account of the shareholders of Mid-Cap Stock. FIIOC receives an asset-based fee of Class K's average net assets. FIIOC pays for typesetting, printing and mailing of shareholder reports, except proxy statements.
For the period, transfer agent fees for each class were as follows:
| Amount | % of |
Mid-Cap Stock | $ 9,435 | .20 |
Class K | 936 | .05 |
| $ 10,371 |
|
Accounting and Security Lending Fees. Fidelity Service Company, Inc. (FSC), an affiliate of FMR, maintains the Fund's accounting records. The accounting fee is based on the level of average net assets for each month. Under a separate contract, FSC administers the security lending program. The security lending fee is based on the number and duration of lending transactions.
Brokerage Commissions. The Fund placed a portion of its portfolio transactions with brokerage firms which are affiliates of the investment adviser. Brokerage commissions are included in net realized gain (loss) and change in net unrealized appreciation (depreciation) in the Statement of Operations. The commissions paid to these affiliated firms were $49 for the period.
6. Committed Line of Credit.
The Fund participates with other funds managed by FMR or an affiliate in a $4.25 billion credit facility (the "line of credit") to be utilized for temporary or emergency purposes to fund shareholder redemptions or for other short-term liquidity purposes. The Fund has agreed to pay commitment fees on its pro-rata portion of the line of credit, which amounted to $17 and is reflected in Miscellaneous expenses on the Statement of Operations. During the period, there were no borrowings on this line of credit.
7. Security Lending.
The Fund lends portfolio securities through a lending agent from time to time in order to earn additional income. For equity securities, a lending agent is used and may loan securities to certain qualified borrowers, including Fidelity Capital Markets (FCM), a broker-dealer affiliated with the Fund. On the settlement date of the loan, the Fund
Annual Report
Notes to Financial Statements - continued
(Amounts in thousands except percentages)
7. Security Lending - continued
receives collateral (in the form of U.S. Treasury obligations, letters of credit and/or cash) against the loaned securities and maintains collateral in an amount not less than 100% of the market value of the loaned securities during the period of the loan. The market value of the loaned securities is determined at the close of business of the Fund and any additional required collateral is delivered to the Fund on the next business day. If the borrower defaults on its obligation to return the securities loaned because of insolvency or other reasons, a fund could experience delays and costs in recovering the securities loaned or in gaining access to the collateral. Any cash collateral received is invested in the Fidelity Securities Lending Cash Central Fund. The value of loaned securities and cash collateral at period end are disclosed on the Fund's Statement of Assets and Liabilities. The value of securities loaned to FCM at period end was $630. Security lending income represents the income earned on investing cash collateral, less rebates paid to borrowers and any lending agent fees associated with the loan, plus any premium payments received for lending certain types of securities. Security lending income is presented in the Statement of Operations as a component of income from Fidelity Central Funds. Total security lending income during the period amounted to $1,575, including $64 from securities loaned to FCM.
8. Expense Reductions.
Many of the brokers with whom FMR places trades on behalf of the Fund provided services to the Fund in addition to trade execution. These services included payments of certain expenses on behalf of the Fund totaling $1,201 for the period.
In addition, FMR reimbursed a portion of the Fund's operating expenses during the period in the amount of $10.
9. Distributions to Shareholders.
Distributions to shareholders of each class were as follows:
Years ended April 30, | 2013 | 2012 |
From net investment income |
|
|
Mid-Cap Stock | $ 48,097 | $ 9,342 |
Class K | 25,831 | 3,961 |
Total | $ 73,928 | $ 13,303 |
From net realized gain |
|
|
Mid-Cap Stock | $ 137,838 | $ 325,810 |
Class K | 52,847 | 87,208 |
Total | $ 190,685 | $ 413,018 |
Annual Report
10. Share Transactions.
Transactions for each class of shares were as follows:
| Shares | Dollars | ||
Years ended April 30, | 2013 | 2012 | 2013 | 2012 |
Mid-Cap Stock |
|
|
|
|
Shares sold | 14,240 | 17,828 | $ 432,641 | $ 499,432 |
Reinvestment of distributions | 6,392 | 11,764 | 180,000 | 326,527 |
Shares redeemed | (51,115) | (82,143) | (1,519,331) | (2,288,341) |
Net increase (decrease) | (30,483) | (52,551) | $ (906,690) | $ (1,462,382) |
Class K |
|
|
|
|
Shares sold | 29,861 | 27,136 | $ 891,057 | $ 760,031 |
Reinvestment of distributions | 2,783 | 3,288 | 78,678 | 91,169 |
Shares redeemed | (14,484) | (33,243) | (436,110) | (898,706) |
Net increase (decrease) | 18,160 | (2,819) | $ 533,625 | $ (47,506) |
11. Other.
The Fund's organizational documents provide former and current trustees and officers with a limited indemnification against liabilities arising in connection with the performance of their duties to the Fund. In the normal course of business, the Fund may also enter into contracts that provide general indemnifications. The Fund's maximum exposure under these arrangements is unknown as this would be dependent on future claims that may be made against the Fund. The risk of material loss from such claims is considered remote.
Annual Report
Report of Independent Registered Public Accounting Firm
To the Trustees of Fidelity Commonwealth Trust and Shareholders of Fidelity Mid-Cap Stock Fund:
We have audited the accompanying statement of assets and liabilities of Fidelity Mid-Cap Stock Fund (the Fund), a fund of Fidelity Commonwealth Trust, including the schedule of investments, as of April 30, 2013, and the related statement of operations for the year then ended, the statement of changes in net assets for each of the two years in the period then ended, and the financial highlights for each of the periods presented. These financial statements and financial highlights are the responsibility of the Fund's management. Our responsibility is to express an opinion on these financial statements and financial highlights based on our audits.
We conducted our audits in accordance with the standards of the Public Company Accounting Oversight Board (United States). Those standards require that we plan and perform the audit to obtain reasonable assurance about whether the financial statements and financial highlights are free of material misstatement. The Fund is not required to have, nor were we engaged to perform, an audit of its internal control over financial reporting. Our audits included consideration of internal control over financial reporting as a basis for designing audit procedures that are appropriate in the circumstances, but not for the purpose of expressing an opinion on the effectiveness of the Fund's internal control over financial reporting. Accordingly, we express no such opinion. An audit also includes examining, on a test basis, evidence supporting the amounts and disclosures in the financial statements, assessing the accounting principles used and significant estimates made by management, as well as evaluating the overall financial statement presentation. Our procedures included confirmation of securities owned as of April 30, 2013, by correspondence with the custodian and brokers; where replies were not received from brokers, we performed other auditing procedures. We believe that our audits provide a reasonable basis for our opinion.
In our opinion, the financial statements and financial highlights referred to above present fairly, in all material respects, the financial position of Fidelity Mid-Cap Stock Fund as of April 30, 2013, the results of its operations for the year then ended, the changes in its net assets for each of the two years in the period then ended, and the financial highlights for each of the periods presented, in conformity with accounting principles generally accepted in the United States of America.
DELOITTE & TOUCHE LLP
Boston, Massachusetts
June 24, 2013
Annual Report
Trustees and Officers
The Trustees, Members of the Advisory Board, and executive officers of the trust and fund, as applicable, are listed below. The Board of Trustees governs the fund and is responsible for protecting the interests of shareholders. The Trustees are experienced executives who meet periodically throughout the year to oversee the fund's activities, review contractual arrangements with companies that provide services to the fund, oversee management of the risks associated with such activities and contractual arrangements, and review the fund's performance. Except for James C. Curvey, each of the Trustees oversees 234 Fidelity funds. Mr. Curvey oversees 453 Fidelity funds.
The Trustees hold office without limit in time except that (a) any Trustee may resign; (b) any Trustee may be removed by written instrument, signed by at least two-thirds of the number of Trustees prior to such removal; (c) any Trustee who requests to be retired or who has become incapacitated by illness or injury may be retired by written instrument signed by a majority of the other Trustees; and (d) any Trustee may be removed at any special meeting of shareholders by a two-thirds vote of the outstanding voting securities of the trust. Each Trustee who is not an interested person of the trust and the fund (as defined in the 1940 Act) (Independent Trustee), shall retire not later than the last day of the calendar year in which his or her 75th birthday occurs. The Independent Trustees may waive this mandatory retirement age policy with respect to individual Trustees. The executive officers and Advisory Board Members hold office without limit in time, except that any officer and Advisory Board Member may resign or may be removed by a vote of a majority of the Trustees at any regular meeting or any special meeting of the Trustees. Except as indicated, each individual has held the office shown or other offices in the same company for the past five years.
Experience, Skills, Attributes, and Qualifications of the Fund's Trustees. The Governance and Nominating Committee has adopted a statement of policy that describes the experience, qualifications, attributes, and skills that are necessary and desirable for potential Independent Trustee candidates (Statement of Policy). The Board believes that each Trustee satisfied at the time he or she was initially elected or appointed a Trustee, and continues to satisfy, the standards contemplated by the Statement of Policy. The Governance and Nominating Committee also engages professional search firms to help identify potential Independent Trustee candidates who have the experience, qualifications, attributes, and skills consistent with the Statement of Policy. From time to time, additional criteria based on the composition and skills of the current Independent Trustees, as well as experience or skills that may be appropriate in light of future changes to board composition, business conditions, and regulatory or other developments, have also been considered by the professional search firms and the Governance and Nominating Committee. In addition, the Board takes into account the Trustees' commitment and participation in Board and committee meetings, as well as their leadership of standing and ad hoc committees throughout their tenure.
In determining that a particular Trustee was and continues to be qualified to serve as a Trustee, the Board has considered a variety of criteria, none of which, in isolation, was controlling. The Board believes that, collectively, the Trustees have balanced and diverse experience, qualifications, attributes, and skills, which allow the Board to operate effectively in governing the fund and protecting the interests of shareholders. Information about the specific experience, skills, attributes, and qualifications of each Trustee, which in each case led to the Board's conclusion that the Trustee should serve (or continue to serve) as a trustee of the fund, is provided below.
Annual Report
Trustees and Officers - continued
Board Structure and Oversight Function. James C. Curvey is an interested person (as defined in the 1940 Act) and currently serves as Chairman. The Trustees have determined that an interested Chairman is appropriate and benefits shareholders because an interested Chairman has a personal and professional stake in the quality and continuity of services provided to the fund. Independent Trustees exercise their informed business judgment to appoint an individual of their choosing to serve as Chairman, regardless of whether the Trustee happens to be independent or a member of management. The Independent Trustees have determined that they can act independently and effectively without having an Independent Trustee serve as Chairman and that a key structural component for assuring that they are in a position to do so is for the Independent Trustees to constitute a substantial majority for the Board. The Independent Trustees also regularly meet in executive session. Ned C. Lautenbach serves as Chairman of the Independent Trustees and as such (i) acts as a liaison between the Independent Trustees and management with respect to matters important to the Independent Trustees and (ii) with management prepares agendas for Board meetings.
Fidelity funds are overseen by different Boards of Trustees. The fund's Board oversees Fidelity's equity and high income funds and another Board oversees Fidelity's investment-grade bond, money market, and asset allocation funds. The asset allocation funds may invest in Fidelity funds overseen by the fund's Board. The use of separate Boards, each with its own committee structure, allows the Trustees of each group of Fidelity funds to focus on the unique issues of the funds they oversee, including common research, investment, and operational issues. On occasion, the separate Boards establish joint committees to address issues of overlapping consequences for the Fidelity funds overseen by each Board.
The Trustees operate using a system of committees to facilitate the timely and efficient consideration of all matters of importance to the Trustees, the fund, and fund shareholders and to facilitate compliance with legal and regulatory requirements and oversight of the fund's activities and associated risks. The Board, acting through its committees, has charged FMR and its affiliates with (i) identifying events or circumstances the occurrence of which could have demonstrably adverse effects on the fund's business and/or reputation; (ii) implementing processes and controls to lessen the possibility that such events or circumstances occur or to mitigate the effects of such events or circumstances if they do occur; and (iii) creating and maintaining a system designed to evaluate continuously business and market conditions in order to facilitate the identification and implementation processes described in (i) and (ii) above. Because the day-to-day operations and activities of the fund are carried out by or through FMR, its affiliates and other service providers, the fund's exposure to risks is mitigated but not eliminated by the processes overseen by the Trustees. While each of the Board's committees has responsibility for overseeing different aspects of the fund's activities, oversight is exercised primarily through the Operations, Audit, and Compliance Committees. In addition, the Independent Trustees have worked with FMR to enhance the Board's oversight of investment and financial risks, legal and regulatory risks, technology risks, and operational risks, including the development of additional risk reporting to the Board. For example, a working group comprised of Independent Trustees and FMR has worked and continues to work to review the Fidelity funds' valuation-related activities, reporting and risk management. Appropriate personnel, including but not limited to the fund's Chief Compliance Officer (CCO), FMR's internal auditor, the independent accountants, the fund's Treasurer and portfolio management personnel, make periodic reports to the Board's committees, as appropriate, including an annual review of FMR's risk management program for the Fidelity funds. The responsibilities of each standing committee, including their oversight responsibilities, are described further under "Standing Committees of the Fund's Trustees."
Annual Report
The fund's Statement of Additional Information (SAI) includes more information about the Trustees. To request a free copy, call Fidelity at 1-800-835-5092.
Interested Trustees*:
Correspondence intended for each Trustee who is an interested person may be sent to Fidelity Investments, 245 Summer Street, Boston, Massachusetts 02210.
Name, Year of Birth; Principal Occupations and Other Relevant Experience+ | |
James C. Curvey (1935) | |
| Year of Election or Appointment: 2007 Mr. Curvey is Trustee and Chairman of the Board of Trustees of certain Trusts. Mr. Curvey also serves as Trustee (2007-present) of other investment companies advised by FMR. Mr. Curvey is a Director of Fidelity Investments Money Management, Inc. (2009-present), Director of Fidelity Research & Analysis Co. (2009-present) and Director of FMR and FMR Co., Inc. (2007-present). Mr. Curvey is also Vice Chairman (2007-present) and Director of FMR LLC. In addition, Mr. Curvey serves as an Overseer for the Boston Symphony Orchestra and a member of the Trustees of Villanova University. Previously, Mr. Curvey was the Vice Chairman (2006-2007) and Director (2000-2007) of FMR Corp. |
Ronald P. O'Hanley (1957) | |
| Year of Election or Appointment: 2011 Mr. O'Hanley is Director of FMR Co., Inc. (2010-present), Director of Fidelity Investments Money Management, Inc. (2010-present), Director of Fidelity Research & Analysis Company (2010-present), President of Fidelity Asset Management and Corporate Services and a member of Fidelity's Executive Committee (2010-present). Previously, Mr. O'Hanley served as President and Chief Executive Officer of BNY Mellon Asset Management (2007-2010). Mr. O'Hanley also served as Vice Chairman of Bank New York Mellon Corp. and a member of that firm's Executive Committee. Prior to the 2007 merger of The Bank of New York and Mellon Financial Corporation, he was Vice Chairman of Mellon Financial Corporation and President and Chief Executive Officer of Mellon Asset Management. He joined Mellon in February 1997. Mr. O'Hanley currently serves as Chairman of the Boston Public Library Foundation Board of Directors and sits on the Board of Directors of Beth Israel Deaconess Medical Center, the Board of Trustees of the Marine Biological Laboratory and the Advisory Board of the Maxwell School of Citizenship and Public Administration at Syracuse University. Mr. O'Hanley also chairs the Council on Asset Management for the Financial Services Roundtable and is a member of the Board of Directors of Institutional Investor's U.S. Institute. |
* Trustees have been determined to be "Interested Trustees" by virtue of, among other things, their affiliation with the trust or various entities under common control with FMR.
+ The information above includes each Trustee's principal occupation during the last five years and other information relating to the experience, attributes, and skills relevant to each Trustee's qualifications to serve as a Trustee, which led to the conclusion that each Trustee should serve as a Trustee for the fund.
Annual Report
Independent Trustees:
Correspondence intended for each Independent Trustee (that is, the Trustees other than the Interested Trustees) may be sent to Fidelity Investments, P.O. Box 55235, Boston, Massachusetts 02205-5235.
Name, Year of Birth; Principal Occupations and Other Relevant Experience+ | |
Dennis J. Dirks (1948) | |
| Year of Election or Appointment: 2005 Prior to his retirement in May 2003, Mr. Dirks was Chief Operating Officer and a member of the Board of The Depository Trust & Clearing Corporation (DTCC). He also served as President, Chief Operating Officer, and Board member of The Depository Trust Company (DTC) and President and Board member of the National Securities Clearing Corporation (NSCC). In addition, Mr. Dirks served as Chief Executive Officer and Board member of the Government Securities Clearing Corporation, Chief Executive Officer and Board member of the Mortgage-Backed Securities Clearing Corporation, as a Trustee and a member of the Finance Committee of Manhattan College (2005-2008), and as a Trustee and a member of the Finance Committee of AHRC of Nassau County (2006-2008). Mr. Dirks is a member of the Independent Directors Council (IDC) Governing Council (2010-present) and Board of Directors for The Brookville Center for Children's Services, Inc. (2009-present). |
Alan J. Lacy (1953) | |
| Year of Election or Appointment: 2008 Mr. Lacy serves as Senior Adviser (2007-present) of Oak Hill Capital Partners, L.P. (private equity). Mr. Lacy also served as Chief Executive Officer (2000-2005) and Vice Chairman (2005-2006) of Sears Holdings Corporation and Sears, Roebuck and Co. (retail). In addition, Mr. Lacy serves as a member of the Board of Directors of Dave & Buster's Entertainment, Inc. (restaurant and entertainment complexes, 2010-present), Earth Fare, Inc. (retail grocery, 2012-present), The Hillman Companies, Inc. (hardware wholesalers, 2010-present), and Bristol-Myers Squibb Company (global pharmaceuticals, 2008-present). Mr. Lacy is a member of the Board of Trustees of The National Parks Conservation Association (2006-present). Previously, Mr. Lacy served as Chairman of the Board of Trustees of the National Parks Conservation Association (2008-2011) and as a member of the Board of Directors for the Western Union Company (global money transfer, 2006-2011). |
Ned C. Lautenbach (1944) | |
| Year of Election or Appointment: 2000 Mr. Lautenbach is Chairman of the Independent Trustees of the Equity and High Income Funds (2006-present). Mr. Lautenbach currently serves as the Lead Director of the Eaton Corporation Board of Directors (diversified industrial, 1997-present). Mr. Lautenbach is Chairman of the Board of Directors of the Philharmonic Center for the Arts in Naples, Florida (2012-present) and a member of the Council on Foreign Relations (1994-present). Previously, Mr. Lautenbach was a Partner/Advisory Partner at Clayton, Dubilier & Rice, LLC (private equity investment, 1998-2010), as well as a Director of Sony Corporation (2006-2007). |
Joseph Mauriello (1944) | |
| Year of Election or Appointment: 2008 Prior to his retirement in January 2006, Mr. Mauriello served in numerous senior management positions including Deputy Chairman and Chief Operating Officer (2004-2005), and Vice Chairman of Financial Services (2002-2004) of KPMG LLP US (professional services, 1965-2005). Mr. Mauriello currently serves as a member of the Board of Directors of XL Group plc. (global insurance and re-insurance, 2006-present). Previously, Mr. Mauriello served as a Director of the Hamilton Funds of the Bank of New York (2006-2007) and of Arcadia Resources Inc. (health care services and products, 2007-2012). |
Robert W. Selander (1950) | |
| Year of Election or Appointment: 2011 Previously, Mr. Selander served as a Member of the Advisory Board of Fidelity's Equity and High Income Funds (2011), Executive Vice Chairman (2010), Chief Executive Officer (2009-2010), and President and Chief Executive Officer (1997-2009) of Mastercard, Inc. |
Cornelia M. Small (1944) | |
| Year of Election or Appointment: 2005 Ms. Small is a member of the Board of Directors (2009-present) and Chair of the Investment Committee (2010-present) of the Teagle Foundation. Ms. Small also serves on the Investment Committee of the Berkshire Taconic Community Foundation (2008-present). Previously, Ms. Small served as Chairperson (2002-2008) and a member of the Investment Committee and Chairperson (2008-2012) and a member of the Board of Trustees of Smith College. In addition, Ms. Small served as Chief Investment Officer, Director of Global Equity Investments, and a member of the Board of Directors of Scudder, Stevens & Clark and Scudder Kemper Investments. |
William S. Stavropoulos (1939) | |
| Year of Election or Appointment: 2002 Mr. Stavropoulos is Vice Chairman of the Independent Trustees of the Equity and High Income Funds (2006-present). Mr. Stavropoulos serves as President and Founder of the Michigan Baseball Foundation, the Great Lakes Loons (2007-present). Mr. Stavropoulos is Chairman Emeritus of the Board of Directors of The Dow Chemical Company, where he previously served in numerous senior management positions, including President, CEO (1995-2000; 2002-2004), Chairman of the Executive Committee (2000-2006), and as a member of the Board of Directors (1990-2006). Currently, Mr. Stavropoulos is Chairman of the Board of Directors of Univar Inc. (global distributor of commodity and specialty chemicals), a Director of Teradata Corporation (data warehousing and technology solutions), and Maersk Inc. (industrial conglomerate), and a member of the Advisory Board for Metalmark Capital LLC (private equity investment, 2005-present). Mr. Stavropoulos is an operating advisor to Clayton, Dubilier & Rice, LLC (private equity investment). In addition, Mr. Stavropoulos is a member of the University of Notre Dame Advisory Council for the College of Science, a Trustee of the Rollin L. Gerstacker Foundation, and a Director of the Naples Philharmonic Center for the Arts. Previously, Mr. Stavropoulos served as a Director of Chemical Financial Corporation (bank holding company, 1993-2012) and Tyco International, Ltd. (multinational manufacturing and services, 2007-2012). |
David M. Thomas (1949) | |
| Year of Election or Appointment: 2008 Previously, Mr. Thomas served as Executive Chairman (2005-2006) and Chairman and Chief Executive Officer (2000-2005) of IMS Health, Inc. (pharmaceutical and healthcare information solutions), and a Director of Fortune Brands, Inc. (consumer products, 2000-2011). In addition, Mr. Thomas serves as Non-Executive Chairman of the Board of Directors of Fortune Brands Home and Security (home and security products, 2011-present), and as a member of the Board of Directors of Interpublic Group of Companies, Inc. (marketing communication, 2004-present). |
Michael E. Wiley (1950) | |
| Year of Election or Appointment: 2008 Mr. Wiley also serves as a Director of Asia Pacific Exploration Consolidated (international oil and gas exploration and production, 2008-present). Mr. Wiley serves as a Director of Tesoro Corporation (independent oil refiner and marketer, 2005-present), and a Director of Bill Barrett Corporation (exploration and production, 2005-present). In addition, Mr. Wiley also serves as a Director of Post Oak Bank (privately-held bank, 2004-present). Previously, Mr. Wiley served as a member of the Board of Trustees of the University of Tulsa (2000-2006; 2007-2010), as a Senior Energy Advisor of Katzenbach Partners, LLC (consulting, 2006-2007), as an Advisory Director of Riverstone Holdings (private investment), Chairman, President, and CEO of Baker Hughes, Inc. (oilfield services, 2000-2004), and as Director of Spinnaker Exploration Company (exploration and production, 2001-2005). |
+ The information above includes each Trustee's principal occupation during the last five years and other information relating to the experience, attributes, and skills relevant to each Trustee's qualifications to serve as a Trustee, which led to the conclusion that each Trustee should serve as a Trustee for the fund.
Advisory Board Members and Executive Officers:
Correspondence intended for David A. Rosow and Garnett A. Smith may be sent to Fidelity Investments, P.O. Box 55235, Boston, Massachusetts 02205-5235. Correspondence intended for each executive officer and Peter S. Lynch may be sent to Fidelity Investments, 245 Summer Street, Boston, Massachusetts 02210.
Name, Year of Birth; Principal Occupation | |
Peter S. Lynch (1944) | |
| Year of Election or Appointment: 2003 Member of the Advisory Board of Fidelity's Equity and High Income Funds. Mr. Lynch is Vice Chairman and a Director of FMR and FMR Co., Inc. In addition, Mr. Lynch serves as a Trustee of Boston College and as the Chairman of the Inner-City Scholarship Fund. Previously, Mr. Lynch served on the Special Olympics International Board of Directors (1997-2006). |
David A. Rosow (1942) | |
| Year of Election or Appointment: 2012 Member of the Advisory Board of Fidelity's Equity and High Income Funds. Chairman and Chief Executive Officer of International Golf Group, Inc. (golf course development, 1989-present). Previously, Mr. Rosow served as Chairman and Chief Executive Officer of Rosow & Company, Inc. (private investment company, 1989-2011), a Lead Director of Hudson United Bancorp (2001-2006) and as a Director of TD Banknorth (1996-2006). In addition, Mr. Rosow is a member (2008-present) and President (2009-present) of the Town Council of Palm Beach, Florida. |
Garnett A. Smith (1947) | |
| Year of Election or Appointment: 2012 Member of the Advisory Board of Fidelity's Equity and High Income Funds. Prior to Mr. Smith's retirement, he served as Chairman and Chief Executive Officer of Inbrand Corp. (manufacturer of personal absorbent products, 1990-1997). He also served as President (1986-1990) of Inbrand Corp. Prior to his employment with Inbrand Corp., he was employed by a retail fabric chain and North Carolina National Bank. In addition, Mr. Smith is a board member of the Jackson Hole Land Trust (2009-present). |
Kenneth B. Robins (1969) | |
| Year of Election or Appointment: 2008 President and Treasurer of Fidelity's Equity and High Income Funds. Mr. Robins also serves as President and Treasurer (2010-present) and Assistant Treasurer (2009-present) of other Fidelity funds and is an employee of Fidelity Investments (2004-present). Previously, Mr. Robins served as Deputy Treasurer of the Fidelity funds (2005-2008) and Treasurer and Chief Financial Officer of The North Carolina Capital Management Trust: Cash and Term Portfolios (2006-2008). |
Bruce T. Herring (1965) | |
| Year of Election or Appointment: 2006 Vice President of certain Equity Funds. Mr. Herring also serves as Chief Investment Officer of Fidelity Global Asset Allocation (GAA) (2013-present), Chief Investment Officer and Director of Fidelity Management & Research (U.K.) Inc. (2010-present), Group Chief Investment Officer of FMR, and President of Fidelity Research & Analysis Company (2010-present). Previously, Mr. Herring served as Vice President (2005-2006) and Senior Vice President (2006-2007) of Fidelity Management & Research Company, Vice President of FMR Co., Inc. (2001-2007) and as a portfolio manager for Fidelity U.S. Equity Funds. |
Brian B. Hogan (1964) | |
| Year of Election or Appointment: 2009 Vice President of Equity and High Income Funds. Mr. Hogan also serves as President of FMR's Equity Division (2009-present). Previously, Mr. Hogan served as Senior Vice President, Equity Research of FMR (2006-2009) and as a portfolio manager. |
Scott C. Goebel (1968) | |
| Year of Election or Appointment: 2008 Secretary and Chief Legal Officer (CLO) of the Fidelity funds. Mr. Goebel also serves as Secretary of Fidelity Investments Money Management, Inc. (FIMM) (2010-present) and Fidelity Research and Analysis Company (FRAC) (2010-present); Secretary and CLO of The North Carolina Capital Management Trust: Cash and Term Portfolios (2008-present); General Counsel, Secretary, and Senior Vice President of FMR (2008-present) and FMR Co., Inc. (2008-present); employed by FMR LLC or an affiliate (2001-present); Chief Legal Officer of Fidelity Management & Research (Hong Kong) Limited (2008-present) and Assistant Secretary of Fidelity Management & Research (Japan) Inc. (2008-present), and Fidelity Management & Research (U.K.) Inc. (2008-present). Previously, Mr. Goebel served as Assistant Secretary of FIMM (2008-2010), FRAC (2008-2010), and the Funds (2007-2008) and as Vice President and Secretary of Fidelity Distributors Corporation (FDC) (2005-2007). |
William C. Coffey (1969) | |
| Year of Election or Appointment: 2009 Assistant Secretary of Fidelity's Equity and High Income Funds. Mr. Coffey also serves as Senior Vice President and Deputy General Counsel of FMR LLC (2010-present), and is an employee of Fidelity Investments. Previously, Mr. Coffey served as Vice President and Associate General Counsel of FMR LLC (2005-2009). |
Elizabeth Paige Baumann (1968) | |
| Year of Election or Appointment: 2012 Anti-Money Laundering (AML) Officer of the Fidelity funds. Ms. Baumann also serves as AML Officer of The North Carolina Capital Management Trust: Cash and Term Portfolios (2012-present), Chief AML Officer of FMR LLC (2012-present), and is an employee of Fidelity Investments. Previously, Ms. Baumann served as Vice President and Deputy Anti-Money Laundering Officer (2007-2012). |
Christine Reynolds (1958) | |
| Year of Election or Appointment: 2008 Chief Financial Officer of the Fidelity funds. Ms. Reynolds became President of Fidelity Pricing and Cash Management Services (FPCMS) in August 2008. Ms. Reynolds served as Chief Operating Officer of FPCMS (2007-2008). Previously, Ms. Reynolds served as President, Treasurer, and Anti-Money Laundering officer of the Fidelity funds (2004-2007). |
Joseph A. Hanlon (1968) | |
| Year of Election or Appointment: 2012 Chief Compliance Officer of Fidelity's Equity and High Income Funds. Mr. Hanlon serves as Compliance Officer of FMR, FMR Co., Inc., Fidelity Investments Money Management, Inc. (FIMM), Fidelity Research and Analysis Company (FRAC), Fidelity Management & Research (U.K.) Inc., Fidelity Management & Research (Hong Kong), and Strategic Advisers, Inc. (2009-present), as Senior Vice President of the Fidelity Asset Management Division (2009-present), and is an employee of Fidelity Investments. Previously, Mr. Hanlon served as Compliance Officer of Fidelity Management & Research (Japan) Inc. (2009-2013). |
Joseph F. Zambello (1957) | |
| Year of Election or Appointment: 2011 Deputy Treasurer of the Fidelity funds. Mr. Zambello is an employee of Fidelity Investments. Previously, Mr. Zambello served as Vice President of FMR's Program Management Group (2009-2011) and Vice President of the Transfer Agent Oversight Group (2005-2009). |
Adrien E. Deberghes (1967) | |
| Year of Election or Appointment: 2008 Deputy Treasurer of Fidelity's Equity and High Income Funds. Mr. Deberghes also serves as Vice President (2011-present) and Assistant Treasurer (2010-present) of other Fidelity funds, and is an employee of Fidelity Investments (2008-present). Previously, Mr. Deberghes served as Senior Vice President of Mutual Fund Administration at State Street Corporation (2007-2008), Senior Director of Mutual Fund Administration at Investors Bank & Trust (2005-2007), and Director of Finance for Dunkin' Brands (2000-2005). |
Stephen Sadoski (1971) | |
| Year of Election or Appointment: 2012 Deputy Treasurer of Fidelity's Equity and High Income Funds. Mr. Sadoski also serves as Deputy Treasurer of other Fidelity funds (2013-present) and is an employee of Fidelity Investments (2012-present). Previously, Mr. Sadoski served as Assistant Treasurer of Fidelity's Fixed Income and Asset Allocation Funds (2012-2013), an assistant chief accountant in the Division of Investment Management of the Securities and Exchange Commission (SEC) (2009-2012) and as a senior manager at Deloitte & Touche (1997-2009). |
Stacie Smith (1974) | |
| Year of Election or Appointment: 2013 Deputy Treasurer of Fidelity's Equity and High Income Funds. Ms. Smith is an employee of Fidelity Investments (2009-present). Previously, Ms. Smith served as Senior Audit Manager of Ernst & Young LLP (1996-2009). |
Stephanie J. Dorsey (1969) | |
| Year of Election or Appointment: 2010 Assistant Treasurer of Fidelity's Equity and High Income Funds. Ms. Dorsey also serves as President and Treasurer (2013-present) and Assistant Treasurer (2012-present) of other Fidelity funds, Treasurer and Chief Financial Officer of The North Carolina Capital Management Trust: Cash and Term Portfolios (2013-present), and is an employee of Fidelity Investments (2008-present). Previously, Ms. Dorsey served as Deputy Treasurer of Fidelity's Fixed Income and Asset Allocation Funds (2008-2013), Treasurer (2004-2008) of the JPMorgan Mutual Funds and Vice President (2004-2008) of JPMorgan Chase Bank. |
Gary W. Ryan (1958) | |
| Year of Election or Appointment: 2005 Assistant Treasurer of the Fidelity funds. Mr. Ryan is an employee of Fidelity Investments. Previously, Mr. Ryan served as Vice President of Fund Reporting in Fidelity Pricing and Cash Management Services (FPCMS) (1999-2005). |
Jonathan Davis (1968) | |
| Year of Election or Appointment: 2010 Assistant Treasurer of the Fidelity funds. Mr. Davis is also Assistant Treasurer of Fidelity Rutland Square Trust II and Fidelity Commonwealth Trust II. Mr. Davis is an employee of Fidelity Investments. Previously, Mr. Davis served as Vice President and Associate General Counsel of FMR LLC (2003-2010). |
Annual Report
Distributions (Unaudited)
The Board of Trustees of Fidelity Mid-Cap Stock Fund voted to pay shareholders of record at the opening of business on record date, the following distributions per share derived from capital gains realized from sales of portfolio securities:
| Pay Date | Record Date | Capital Gains |
Class K | 06/10/13 | 06/07/13 | $0.312 |
The fund hereby designates as a capital gain dividend with respect to the taxable year ended April 30, 2013 $135,415,544 or, if subsequently determined to be different, the net capital gain of such year.
Class K designates 98%, 73% and 80% of the dividends distributed in June 2012, December 14, 2012, and December 27, 2012, respectively, during the fiscal year as qualifying for the dividends-received deduction for corporate shareholders.
Class K designates 100% of the dividends distributed during the fiscal year as amounts which may be taken into account as a dividend for the purposes of the maximum rate under section 1(h)(11) of the Internal Revenue Code.
The fund will notify shareholders in January 2014 of amounts for use in preparing 2013 income tax returns.
Annual Report
Investment Adviser
Fidelity Management & Research Company
Boston, MA
Investment Sub-Advisers
FMR Co., Inc.
Fidelity Management & Research
(U.K.) Inc.
Fidelity Management & Research
(Hong Kong) Limited
Fidelity Management & Research
(Japan) Inc.
General Distributor
Fidelity Distributors Corporation
Smithfield, RI
Transfer and Service Agents
Fidelity Investments Institutional
Operations Company, Inc.
Boston, MA
Fidelity Service Company, Inc.
Boston, MA
Custodian
The Northern Trust Company
Chicago, IL
(Fidelity Investment logo)(registered trademark)
Corporate Headquarters
245 Summer St., Boston, MA 02210
www.fidelity.com
MCS-K-UANN-0613
1.863346.104
Item 2. Code of Ethics
As of the end of the period, April 30, 2013, Fidelity Commonwealth Trust (the trust) has adopted a code of ethics, as defined in Item 2 of Form N-CSR, that applies to its President and Treasurer and its Chief Financial Officer. A copy of the code of ethics is filed as an exhibit to this Form N-CSR.
Item 3. Audit Committee Financial Expert
The Board of Trustees of the trust has determined that Joseph Mauriello is an audit committee financial expert, as defined in Item 3 of Form N-CSR. Mr. Mauriello is independent for purposes of Item 3 of Form N-CSR.
Item 4. Principal Accountant Fees and Services
Fees and Services
The following table presents fees billed by Deloitte & Touche LLP, the member firms of Deloitte Touche Tohmatsu, and their respective affiliates (collectively, "Deloitte Entities") in each of the last two fiscal years for services rendered to Fidelity Large Cap Stock Fund, Fidelity Mid-Cap Stock Fund, Fidelity Small Cap Discovery Fund, Fidelity and Small Cap Stock Fund (the "Funds"):
Services Billed by Deloitte Entities
April 30, 2013 FeesA
| Audit Fees | Audit-Related Fees | Tax Fees | All Other Fees |
Fidelity Large Cap Stock Fund | $41,000 | $- | $4,700 | $600 |
Fidelity Mid-Cap Stock Fund | $40,000 | $- | $4,700 | $1,400 |
Fidelity Small Cap Discovery Fund | $44,000 | $- | $4,700 | $1,000 |
Fidelity Small Cap Stock Fund | $43,000 | $- | $4,700 | $800 |
April 30, 2012 FeesA
| Audit Fees | Audit-Related Fees | Tax Fees | All Other Fees |
Fidelity Large Cap Stock Fund | $38,000 | $- | $4,900 | $500 |
Fidelity Mid-Cap Stock Fund | $37,000 | $- | $5,600 | $1,300 |
Fidelity Small Cap Discovery Fund | $42,000 | $- | $4,600 | $600 |
Fidelity Small Cap Stock Fund | $42,000 | $- | $6,400 | $800 |
A Amounts may reflect rounding.
The following table presents fees billed by Deloitte Entities that were required to be approved by the Audit Committee for services that relate directly to the operations and financial reporting of the Funds and that are rendered on behalf of Fidelity Management & Research Company ("FMR") and entities controlling, controlled by, or under common control with FMR (not including any sub-adviser whose role is primarily portfolio management and is subcontracted with or overseen by another investment adviser) that provide ongoing services to the Funds ("Fund Service Providers"):
Services Billed by Deloitte Entities
| April 30, 2013A | April 30, 2012A |
Audit-Related Fees | $910,000 | $410,000 |
Tax Fees | $- | $- |
All Other Fees | $1,270,000 | $610,000 |
A Amounts may reflect rounding.
"Audit-Related Fees" represent fees billed for assurance and related services that are reasonably related to the performance of the fund audit or the review of the fund's financial statements and that are not reported under Audit Fees.
"Tax Fees" represent fees billed for tax compliance, tax advice or tax planning that relate directly to the operations and financial reporting of the fund.
"All Other Fees" represent fees billed for services provided to the fund or Fund Service Provider, a significant portion of which are assurance related, that relate directly to the operations and financial reporting of the fund, excluding those services that are reported under Audit Fees, Audit-Related Fees or Tax Fees.
Assurance services must be performed by an independent public accountant.
* * *
The aggregate non-audit fees billed by Deloitte Entities for services rendered to the Funds, FMR (not including any sub-adviser whose role is primarily portfolio management and is subcontracted with or overseen by another investment adviser), and any Fund Service Provider for each of the last two fiscal years of the Funds are as follows:
Billed By | April 30, 2013 A | April 30, 2012 A |
Deloitte Entities | $2,295,000 | $1,150,000 |
A Amounts may reflect rounding.
The trust's Audit Committee has considered non-audit services that were not pre-approved that were provided by Deloitte Entities to Fund Service Providers to be compatible with maintaining the independence of Deloitte Entities in its audit of the Funds, taking into account representations from Deloitte Entities, in accordance with Public Company Accounting Oversight Board rules, regarding its independence from the Funds and their related entities and FMR's review of the appropriateness and permissibility under applicable law of such non-audit services prior to their provision to the Fund Service Providers.
Audit Committee Pre-Approval Policies and Procedures
The trust's Audit Committee must pre-approve all audit and non-audit services provided by a fund's independent registered public accounting firm relating to the operations or financial reporting of the fund. Prior to the commencement of any audit or non-audit services to a fund, the Audit Committee reviews the services to determine whether they are appropriate and permissible under applicable law.
The Audit Committee has adopted policies and procedures to, among other purposes, provide a framework for the Committee's consideration of non-audit services by the audit firms that audit the Fidelity funds. The policies and procedures require that any non-audit service provided by a fund audit firm to a Fidelity fund and any non-audit service provided by a fund auditor to a Fund Service Provider that relates directly to the operations and financial reporting of a Fidelity fund ("Covered Service") are subject to approval by the Audit Committee before such service is provided.
All Covered Services must be approved in advance of provision of the service either: (i) by formal resolution of the Audit Committee, or (ii) by oral or written approval of the service by the Chair of the Audit Committee (or if the Chair is unavailable, such other member of the Audit Committee as may be designated by the Chair to act in the Chair's absence). The approval contemplated by (ii) above is permitted where the Treasurer determines that action on such an engagement is necessary before the next meeting of the Audit Committee.
Non-audit services provided by a fund audit firm to a Fund Service Provider that do not relate directly to the operations and financial reporting of a Fidelity fund are reported to the Audit Committee on a periodic basis.
Non-Audit Services Approved Pursuant to Rule 2-01(c)(7)(i)(C) and (ii) of Regulation S-X ("De Minimis Exception")
There were no non-audit services approved or required to be approved by the Audit Committee pursuant to the De Minimis Exception during the Funds' last two fiscal years relating to services provided to (i) the Funds or (ii) any Fund Service Provider that relate directly to the operations and financial reporting of the Funds.
Item 5. Audit Committee of Listed Registrants
Not applicable.
Item 6. Investments
(a) Not applicable.
(b) Not applicable
Item 7. Disclosure of Proxy Voting Policies and Procedures for Closed-End Management Investment Companies
Not applicable.
Item 8. Portfolio Managers of Closed-End Management Investment Companies
Not applicable.
Item 9. Purchase of Equity Securities by Closed-End Management Investment Company and Affiliated Purchasers
Not applicable.
Item 10. Submission of Matters to a Vote of Security Holders
There were no material changes to the procedures by which shareholders may recommend nominees to the trust's Board of Trustees.
Item 11. Controls and Procedures
(a)(i) The President and Treasurer and the Chief Financial Officer have concluded that the trust's disclosure controls and procedures (as defined in Rule 30a-3(c) under the Investment Company Act) provide reasonable assurances that material information relating to the trust is made known to them by the appropriate persons, based on their evaluation of these controls and procedures as of a date within 90 days of the filing date of this report.
(a)(ii) There was no change in the trust's internal control over financial reporting (as defined in Rule 30a-3(d) under the Investment Company Act) that occurred during the second fiscal quarter of the period covered by this report that has materially affected, or is reasonably likely to materially affect, the trust's internal control over financial reporting.
Item 12. Exhibits
(a) | (1) | Code of Ethics pursuant to Item 2 of Form N-CSR is filed and attached hereto as EX-99.CODE ETH. |
(a) | (2) | Certification pursuant to Rule 30a-2(a) under the Investment Company Act of 1940 (17 CFR 270.30a-2(a)) is filed and attached hereto as Exhibit 99.CERT. |
(a) | (3) | Not applicable. |
(b) |
| Certification pursuant to Rule 30a-2(b) under the Investment Company Act of 1940 (17 CFR 270.30a-2(b)) is furnished and attached hereto as Exhibit 99.906CERT. |
SIGNATURES
Pursuant to the requirements of the Securities Exchange Act of 1934 and the Investment Company Act of 1940, the registrant has duly caused this report to be signed on its behalf by the undersigned, thereunto duly authorized.
Fidelity Commonwealth Trust
By: | /s/Kenneth B. Robins |
| Kenneth B. Robins |
| President and Treasurer |
|
|
Date: | June 26, 2013 |
Pursuant to the requirements of the Securities Exchange Act of 1934 and the Investment Company Act of 1940, this report has been signed below by the following persons on behalf of the registrant and in the capacities and on the dates indicated.
By: | /s/Kenneth B. Robins |
| Kenneth B. Robins |
| President and Treasurer |
|
|
Date: | June 26, 2013 |
By: | /s/Christine Reynolds |
| Christine Reynolds |
| Chief Financial Officer |
|
|
Date: | June 26, 2013 |