As filed with the Securities and Exchange Commission on July 24, 2003
Registration No. 333-106916
SECURITIES AND EXCHANGE COMMISSION
WASHINGTON, D.C. 20549
AMENDMENT NO. 1
TO
FORM S-4
REGISTRATION STATEMENT
UNDER THE SECURITIES ACT OF 1933
The Premcor Refining Group Inc.
(Exact Name of Registrant as Specified in Its Charter)
| Delaware | | 2911 | | 43-1491230 |
(State or Other Jurisdiction of Incorporation or Organization) | | (Primary Standard Industrial Classification Code Number) | | (I.R.S. Employer Identification Number) |
Michael D. Gayda, Esq.
1700 East Putnam Avenue
Suite 400
Old Greenwich, Connecticut 06870
(203) 698-7500
(Name, Address, Including Zip Code, and Telephone Number, Including Area Code, of Agent For Service)
With a copy to:
Martin H. Neidell, Esq.
Stroock & Stroock & Lavan LLP
180 Maiden Lane
New York, New York 10038
(212) 806-5836
Facsimile: (212) 806-7836
Approximate date of commencement of proposed sale to the public: As soon as practicable after this Registration Statement becomes effective.
If the securities being registered on this form are being offered in connection with the formation of a holding company and there is compliance with General Instruction G, check the following box. ¨
If this form is filed to register additional securities for an offering pursuant to Rule 462(b) under the Securities Act, check the following box and list the Securities Act Registration number of the earlier effective Registration Statement for the same offering. ¨ _________
If this form is a post-effective amendment filed pursuant to Rule 462(d) under the Securities Act, check the following box and list the Securities Act Registration number of the earlier effective Registration Statement for the same offering. ¨ __________
The Registrant hereby amends this Registration Statement on such date or dates as may be necessary to delay its effective date until the Registrant shall file a further amendment which specifically states that this Registration Statement shall thereafter become effective in accordance with Section 8(a) of the Securities Act of 1933, as amended, or until this Registration Statement shall become effective on such date as the Commission, acting pursuant to said Section 8(a), may determine.
The information in this prospectus is not complete and may be changed. We may not sell these securities until the registration statement filed with the Securities and Exchange Commission is effective. This prospectus is not an offer to sell securities and we are not soliciting offers to buy these securities in any state where the offer or sale is not permitted.
SUBJECT TO COMPLETION, DATED JULY 24, 2003
Prospectus
$300,000,000

The Premcor Refining Group Inc.
Offer to exchange all outstanding 7 1/2% Senior Notes due 2015 for 7 1/2% Senior Notes due 2015, which have been registered under the Securities Act of 1933.
| The Exchange Offer | | Broker Dealers |
| |
• We will exchange all outstanding notes that are validly tendered and not validly withdrawn for an equal principal amount of exchange notes that are freely tradeable. • You may withdraw tenders of outstanding notes at any time prior to the expiration of the exchange offer. • The exchange offer expires at 5:00 p.m., New
York City time, August 28, 2003, unless extended. We do not currently intend to extend the expiration date. The Exchange Notes • The terms of the exchange notes to be issued in the exchange offer are substantially identical to the outstanding notes, except that the exchange notes will be freely tradeable. | | • Each broker-dealer that receives exchange notes for its own account in the exchange offer must acknowledge that it will deliver a prospectus in connection with any resale of those exchange notes. The letter of transmittal states that, by so acknowledging and delivering a prospectus, a broker-dealer will not be deemed to admit that it is an “underwriter” within the meaning of the Securities Act. • This prospectus, as it may be amended or supplemented from time to time, may be used by a broker-dealer in connection with resales of exchange notes received in exchange for outstanding notes where the outstanding notes were acquired by the broker-dealer as a result of market-making activities or other trading activities. • We have agreed that, for a period of 90 days after the consummation of this exchange offer, we will make this prospectus available to any broker-dealer for use in connection with the resale of exchange notes. See “Plan of Distribution.” |
You should consider carefully the risk factors beginning on page 13 of this prospectus before participating in the exchange offer.
Neither the Securities and Exchange Commission nor any state securities commission has approved or disapproved of these securities or determined if this prospectus is truthful or complete. Any representation to the contrary is a criminal offense.
The date of this prospectus is , 2003.
WHERE YOU CAN FIND ADDITIONAL INFORMATION
We have filed with the Securities and Exchange Commission, or SEC, a registration statement on Form S-4 with respect to the exchange notes offered in this prospectus. This prospectus is a part of the registration statement and, as permitted by the SEC’s rules, does not contain all of the information presented in the registration statement. Whenever a reference is made in this prospectus to one of our contracts or other documents, please be aware that this reference is not necessarily complete and that you should refer to the exhibits that are a part of the registration statement for a copy of the contract or other document. You may review a copy of the registration statement, including exhibits to the registration statement, at the SEC’s public reference rooms referred to below. Please call the SEC at 1-800-SEC-0330 for further information on the operation of the public reference room. Our filings with the SEC are also available to the public through the SEC’s internet site athttp://www.sec.gov.
We are subject to the informational requirements of the Securities Exchange Act of 1934, and in accordance with the Exchange Act have filed annual, quarterly and current reports with the SEC. The Exchange Act file number for our SEC filings is 1-11392. You may read and copy any document we file at the following SEC public reference room:
| Judiciary Plaza |
| 450 Fifth Street, N.W. |
| Rm. 1200 |
| Washington D.C. 20549 |
You may request copies of the filings, at no cost, by telephone at (203) 698-7500 or by mail at: The Premcor Refining Group Inc., 1700 East Putnam Avenue, Suite 400, Old Greenwich, Connecticut 06870, Attention: Investor Relations.
In order to obtain timely delivery, you must request documents from us no later than August 22, 2003.
Our investor relations website iswww.premcor.com. We make available, free of charge, under “Investor Relations—SEC Filings,” via a link to a third-party website at www.corporate-ir.net, our annual reports on Form 10-K, our quarterly reports on Form 10-Q, our current reports on Form 8-K, Forms 3, 4 and 5 filed via Edgar by our directors and executive officers and various other SEC filings, including amendments to these reports, as soon as reasonably practicable after we electronically file or furnish such reports to the SEC. The information on our website, or on the site of our third-party service provider, is not incorporated by reference into this report.
We have agreed that, if we are subject to the informational requirements of Sections 13 or 15(d) of the Exchange Act, we will furnish to holders and beneficial owners of the notes and to prospective purchasers designated by such holders the information required to be delivered pursuant to Rule 144(A)(d)(4) under the Securities Act to permit compliance with Rule 144A in connection with resales of the notes.
i
TABLE OF CONTENTS
You should rely only on the information contained in this document or to which we have referred you. We have not authorized anyone to provide you with information that is different from that contained in this document. This document may be used only where it is legal to sell these securities. The information in this document may be accurate only on the date of this document.
ii
PROSPECTUS SUMMARY
This summary may not contain all the information that may be important to you. You should read the entire prospectus, including the “Risk Factors” section and our financial statements and notes to those statements, before deciding whether to invest in the notes. As used in this prospectus, the terms “we,” “our,” or “us” refer to The Premcor Refining Group Inc. and its consolidated subsidiaries, including Sabine River Holding Corp., Sabine River LLC, Neches River Holding Corp., Port Arthur Coker Company L.P. and Port Arthur Finance Corp., taken as a whole, and its predecessors, unless the context otherwise indicates. Because of the technical nature of our industry, we have included a Glossary of Selected Terms that explains many of the terms we use in this prospectus.
The Premcor Refining Group Inc.
Overview
We are one of the largest independent petroleum refiners and suppliers of unbranded transportation fuels, heating oil, petrochemical feedstocks, petroleum coke and other petroleum products in the United States. We currently own and operate three refineries, which are located in Port Arthur, Texas; Memphis, Tennessee; and Lima, Ohio, with a combined crude oil volume processing capacity, known as throughput capacity, of approximately 610,000 barrels per day, or bpd. In late September 2002, we ceased refining operations at our Hartford, Illinois refinery. In the first quarter of 2003, we signed a memorandum of understanding with ConocoPhillips for a sale of refining assets and certain storage and distribution assets related to the Hartford refinery for $40 million. We sell petroleum products in the Midwest, the Gulf Coast, Eastern and Southeastern United States. We sell our products on an unbranded basis to approximately 1,200 distributors and chain retailers through our own product distribution system and an extensive third-party owned product distribution system, as well as in the spot market.
For the twelve months ended March 31, 2003, highly refined products, known as light products, such as transportation fuels, petrochemical feedstocks and heating oil, accounted for approximately 91% of our total product volume. For the same period, high-value, premium product grades, such as high octane and reformulated gasoline, low sulfur diesel and jet fuel, which are the most valuable types of light products, accounted for approximately 38% of our total product volume.
We source our crude oil on a global basis through a combination of long-term crude oil purchase contracts, short-term purchase contracts and spot market purchases. The long-term contracts provide us with a steady supply of crude oil, while the short-term contracts and spot market purchases give us flexibility in obtaining crude oil. Since all of our refineries have access, either directly or through pipeline connections, to deepwater terminals, we have the flexibility to purchase foreign crude oils via waterborne delivery or domestic crude oils via pipeline delivery. Our Port Arthur refinery, which possesses one of the world’s largest coking units, can process 80% heavy sour crude oil. Approximately 80% of the crude oil supply to our Port Arthur refinery is lower cost heavy sour crude oil from Mexico, called Maya.
Recent Developments
In May 2003, we announced plans to expand our Port Arthur refinery. The plans include increasing the refinery’s crude oil throughput capacity from its current rate of 250,000 bpd to approximately 325,000 bpd. In addition, the refinery’s coker unit, already one of the largest in the world, will be expanded from its current rated capacity of 80,000 bpd to 105,000 bpd, which will further increase our ability to process lower cost, heavy sour crude oil. The project, which is estimated to cost between $200 million and $220 million, is expected to be completed in the fourth quarter of 2005.
1
In June 2003, we completed a private placement offering of $300 million in senior notes, due 2015, bearing interest at 7.5% per annum. The proceeds from this offering will be used for capital expenditures, including the plans to expand our Port Arthur, Texas refinery, for acquisitions and for working capital and general corporate purposes.
The Transformation of Premcor Inc.
Beginning in early 1995 and continuing after Blackstone Capital Partners III Merchant Banking Fund L.P. and its affiliates, or Blackstone, acquired its controlling interest in Premcor Inc., our ultimate parent company, in 1997, we completed several strategic initiatives that have significantly enhanced our competitive position, the quality of our assets, and our financial and operating performance. For example:
| | • | | We divested non-core assets during 1998 and 1999, generating net proceeds of approximately $325 million, which we reinvested into our refining business. |
| | • | | We increased our crude oil throughput capacity from approximately 130,000 bpd to 610,000 bpd after closing two refineries, by acquiring our Port Arthur, Lima and Memphis refineries and subsequently upgrading our Port Arthur refinery. |
| | • | | We implemented capital projects to increase throughput and premium product yields and to reduce operating expenses within our refining asset base. These projects, together with our acquisitions, increased our coking capacity from 18,000 bpd to 113,000 bpd, increased our cracking capacity from 70,000 bpd to 246,000 bpd, and increased our capacity to process heavy sour crude oil from 45,000 bpd to 200,000 bpd. |
| | • | | We expanded and enhanced our capabilities to supply fuels, on an unbranded basis, to include the Midwest, Gulf Coast, eastern and southeastern United States. |
In February 2002, Premcor Inc. recruited Mr. Thomas D. O’Malley, a chief executive officer with a proven track record of successfully operating businesses and growing and enhancing shareholder value. Since then, Mr. O’Malley has assembled a management team of energy and refining industry veterans to lead Premcor Inc. and our competitive position has continued to improve as a result of the following:
| | • | | Premcor Inc. raised $481.7 million in an initial public offering of 20.7 million shares of common stock and a concurrent private placement of 850,000 shares of common stock in May 2002. |
| | • | | We completed an internal restructuring in June 2002, which resulted in Sabine River Holding Corp. becoming our wholly-owned subsidiary. |
| | • | | We ceased refining operations at our Hartford, Illinois refinery in late September 2002 after concluding it was uneconomical to reconfigure the refinery to meet new federally mandated fuel specification standards. |
| | • | | Premcor Inc. raised $305.9 million in a public offering of 13.1 million of its shares of common stock and a concurrent private placement of 2.9 million shares of common stock in January and February 2003. |
| | • | | We raised $825 million in two private offerings of senior notes in February 2003 and June 2003. |
| | • | | We completed the acquisition of a Memphis, Tennessee refinery and related supply and distribution assets from The Williams Companies, Inc. and certain of its subsidiaries in the beginning of March 2003. |
2
| | • | | We have taken, and are continuing to take, steps to reduce our cost structure. |
For further detail on our transformation, see “Business—The Transformation of Premcor Inc.”
Market Trends
Industry refining margins and crude oil differentials have declined in the second quarter of 2003 compared to the first quarter of 2003, and prices for natural gas, an important component of our refining cost structure, have increased. However, we believe that the longer term outlook for the United States refining industry is attractive due to certain significant trends that we have identified. We believe that:
| | • | | The supply and demand fundamentals for refined petroleum products have improved since the late 1990s and will continue to improve. |
| | • | | Increasing worldwide supplies of lower-cost sour and heavy sour crude oil will provide an increasing cost advantage to those refineries with complex configurations that are able to process these crude oils. |
| | • | | Products meeting new and evolving fuel specifications will account for an increasing share of total fuel demand, which will benefit refiners possessing the capabilities to blend and process these fuels. |
| | • | | The continuing consolidation in the refining industry will create attractive opportunities to acquire competitive refining capacity. |
See, however, “Risk Factors—Risks Related to our Business and our Industry—Volatile margins in the refining industry may negatively affect our future operating results and decrease our cash flow.”
For further detail on market trends, see “Business—Market Trends.”
Competitive Strengths
As a result of our transformation, we have developed the following strengths:
| | • | | As a “pure-play” refiner, which is a refiner without crude oil exploration and production or retail sales operations, we are free to supply our products to markets having the greatest profit potential and focus our management attention and capital solely on refining. |
| | • | | Our three refineries are logistically well-located modern facilities of significant size and scope with access to a wide variety of crude oils and product distribution systems. |
| | • | | Our Port Arthur, Texas refinery has significant heavy sour crude oil processing capacity, giving us a cost advantage over other refiners that are not able to process high volumes of these less expensive crude oils. |
| | • | | We have a long-term heavy sour crude oil supply agreement with an affiliate of Petroleos Mexicanos, or PEMEX, the Mexican state oil company, that provides a stable and secure supply of Maya crude oil. |
| | • | | We have an experienced and committed management team led by Mr. Thomas D. O’Malley, a refining industry veteran with a proven track record of growing businesses and shareholder value through acquisitions. |
For further detail on our competitive strengths, see “Business—Competitive Strengths.”
3
Business Strategies
Our goal is to be a premier independent refiner and supplier of unbranded petroleum products in the United States and to be an industry leader in growing shareholder value. We intend to accomplish this goal, grow our business, enhance earnings and improve our return on capital by executing the following strategies:
| | • | | We intend to grow through timely and cost-effective acquisitions and by undertaking discretionary capital projects to improve, upgrade and potentially expand our refineries. |
| | • | | We will continue to promote excellence in safety and reliability at our operations. |
| | • | | We intend to create an organization in which employees are highly motivated to enhance earnings and improve return on capital. |
For further detail on our business strategies, see “Business—Business Strategies.”
Risks Relating to Our Business
As part of your evaluation of our company, you should take into account the risks we face in our business and not solely our outlook for the refining industry, our competitive strengths and our business strategies. For example, our position as a “pure-play” refiner exposes us to volatility in refining industry margins; our long-term heavy sour crude oil supply agreement renders us highly dependent upon that supply, which could be interrupted by events beyond our control or that of the supplier; and our strategy of growing through acquisitions and by undertaking discretionary capital projects involves many factors beyond our control. See “Risk Factors” for a more detailed discussion of factors you should carefully consider before deciding to invest in the notes.
* * * *
Our principal executive offices are located at 1700 E. Putnam Avenue, Suite 400, Old Greenwich, CT 06870 and our telephone number is (203) 698-7500.
4
Summary of Terms of the Exchange Offer
References to “notes” in this prospectus are references to both the outstanding notes and the exchange notes.
In connection with the issuance of the notes, we entered into a registration rights agreement with the initial purchasers in which we agreed to deliver to you this prospectus and complete the exchange offer. If the exchange offer is not consummated within 270 days following June 10, 2003, then the per annum interest rate on the notes will increase. In the exchange offer, you are entitled to exchange your outstanding notes for exchange notes which are identical in all material respects to the outstanding notes except that:
| | • | | the exchange notes have been registered under the Securities Act, |
| | • | | the exchange notes are not entitled to all registration rights under the registration rights agreement, and |
| | • | | some of the contingent interest rate provisions of the registration rights agreement are no longer applicable. |
The Exchange Offer | | We are offering to exchange up to $300 million aggregate principal amount of exchange 7 1/2% senior notes due 2015 for up to $300 million aggregate principal amount of outstanding 7 1/2% senior notes due 2015. Outstanding notes may be exchanged only in integral multiples of $1,000. |
Resale | | Based on an interpretation by the staff of the SEC set forth in no-action letters issued to third parties, we believe that the exchange notes issued in the exchange offer in exchange for outstanding notes may be offered for resale, resold and otherwise transferred by you without compliance with the registration and prospectus delivery provisions of the Securities Act, provided that: |
| | | • you are acquiring the exchange notes in the ordinary course of your business; • you have not engaged in, do not intend to engage in, and have no arrangement or understanding with any person to participate in the distribution of exchange notes; and • you are not an “affiliate” of ours within the meaning of Rule 405 of the Securities Act. |
| | | Each participating broker-dealer that receives exchange notes for its own account during the exchange offer in exchange for shares of outstanding notes that were acquired as a result of market-making or other trading activity must acknowledge that it will deliver a prospectus in connection with any resale of the exchange notes. Prospectus delivery requirements are discussed in greater detail in the section captioned “Plan of Distribution.” |
5
| | | Any holder of outstanding notes who: |
| |
| | | • is an affiliate of ours, |
| |
| | | • does not acquire exchange notes in the ordinary course of its business, or |
| |
| | | • tenders in the exchange offer with the intention to participate, or for the purpose of participating, in a distribution of exchange notes, cannot rely on the position of the staff of the SEC enunciated in Exxon Capital Holdings Corporation, Morgan Stanley & Co. Incorporated or similar no-action letters and, in the absence of an exemption, must comply with the registration and prospectus delivery requirements of the Securities Act in connection with the resale of the exchange notes. |
| |
Expiration Date; Withdrawal of
Tenders | |
The expiration date of the exchange offer will be at 5:00 p.m., New York City time, on August 28, 2003, or such later date and time to which we extend it. A tender of outstanding notes in connection with the exchange offer may be withdrawn at any time prior to the expiration date. Any outstanding notes not accepted for exchange for any reason will be returned without expense to the tendering holder promptly after the expiration or termination of the exchange offer. |
| |
Conditions to the Exchange Offer | | The exchange offer is subject to customary conditions, which we may waive. Please read the section captioned “The Exchange Offer—Conditions to the Exchange Offer” of this prospectus for more information regarding the conditions to the exchange offer. |
| |
Procedures for Tendering Outstanding Notes | |
If you wish to accept the exchange offer, you must complete, sign and date the accompanying letter of transmittal, or a facsimile of the letter of transmittal, according to the instructions contained in this prospectus and the letter of transmittal. You must also mail or otherwise deliver the letter of transmittal, or a facsimile of the letter of transmittal, together with the outstanding notes and any other required documents to the exchange agent at the address set forth on the cover page of the letter of transmittal. If you hold outstanding notes through The Depository Trust Company, or DTC, and wish to participate in the exchange offer, you must comply with the Automated Tender Offer Program procedures of DTC, by which you will agree to be bound by the letter of transmittal. By signing, or agreeing to be bound by, the letter of transmittal, you will represent to us that, among other things: |
| |
| | | • any exchange notes that you receive will be acquired in the ordinary course of your business; |
| |
| | | • you have no arrangement or understanding with any person or entity to participate in the distribution of the exchange notes; |
| |
| | | • if you are a broker-dealer that will receive exchange notes for your own account in exchange for outstanding notes that were acquired as |
6
| | | a result of market-making activities, that you will deliver a prospectus, as required by law, in connection with any resale of the exchange notes; and |
| |
| | | • you are not an “affiliate,” as defined in Rule 405 of the Securities Act, of ours or, if you are an affiliate, you will comply with any applicable registration and prospectus delivery requirements of the Securities Act. |
| |
Special Procedures for Beneficial
Owners | |
If you are a beneficial owner of outstanding notes which are not registered in your name, and you wish to tender outstanding notes in the exchange offer, you should contact the registered holder promptly and instruct the registered holder to tender on your behalf. If you wish to tender on your own behalf, you must, prior to completing and executing the letter of transmittal and delivering your outstanding notes, either make appropriate arrangements to register ownership of the outstanding notes in your name or obtain a properly completed bond power from the registered holder. |
| |
Guaranteed Delivery Procedures | | If you wish to tender your outstanding notes and your outstanding notes are not immediately available or you cannot deliver your outstanding notes, the letter of transmittal or any other documents required by the letter of transmittal or comply with the applicable procedures under DTC’s Automated Tender Offer Program prior to the expiration date, you must tender your outstanding notes according to the guaranteed delivery procedures set forth in this prospectus under “The Exchange Offer—Guaranteed Delivery Procedures.” |
| |
Consequences of Failure to
Exchange | |
All untendered outstanding notes will continue to be subject to the restrictions on transfer provided for in the outstanding notes and in the indenture. In general, the outstanding notes may not be offered or sold, unless registered under the Securities Act, except in compliance with an exemption from, or in a transaction not subject to, the Securities Act and applicable state securities laws. Other than in connection with the exchange offer, we do not currently anticipate that we will register the outstanding notes under the Securities Act. |
| |
U.S. Federal Income Tax
Considerations | |
The exchange of outstanding notes for exchange notes in the exchange offer will not be a taxable event for U.S. federal income tax purposes. Please read the section of this prospectus captioned “U.S. Federal Income Tax Consequences of the Exchange Offer” for more information on tax consequences of the exchange offer. |
| |
Use of Proceeds | | We will not receive any cash proceeds from the issuance of exchange notes in the exchange offer. |
| |
Shelf Registration Statement | | Under certain circumstances, certain holders of outstanding notes (including holders who are not permitted to participate in the exchange offer or who may not freely resell registered notes received in the |
7
| |
| | | exchange offer) may, by giving us written notice, require us to file, and cause to become effective, a shelf registration statement under the Securities Act, which would cover resales of outstanding notes by these holders. See “Description of Notes—Registration Rights Agreement”. |
| |
Exchange Agent | | Deutsche Bank Trust Company Americas is the exchange agent for the exchange offer. The address and telephone number of the exchange agent are set forth in the section captioned “Exchange Offer—Exchange Agent” of this prospectus. |
8
Summary of Terms of the Exchange Notes
Issuer | The Premcor Refining Group Inc. |
Securities Offered | $300 million in principal amount of 7 1/2% senior notes due 2015. As of the date of this prospectus, $300 million aggregate principal amount of the notes are outstanding. |
Maturity Date | June 15, 2015. |
Interest Payment Dates | June 15 and December 15 of each year, beginning December 15, 2003. |
Optional Redemption | We may redeem any of the notes beginning on June 15, 2008. The redemption price for the notes will decline each year after June 15, 2008 and will be 100% of their principal amount, plus accrued interest, beginning on June 15, 2011. See “Description of Notes—Optional Redemption.” |
| | In addition, until June 15, 2006, we may redeem up to 35% of the aggregate principal amount of the notes with the net proceeds of certain public offerings of common stock by us, Premcor USA Inc., our direct parent, or Premcor Inc. at a redemption price equal to 107.500% of the principal amount, plus accrued and unpaid interest, of the notes being redeemed. We may make such redemption only if, after any such redemption, at least 65% of the aggregate principal amount of notes originally issued remains outstanding. |
Change of Control | Upon a change of control that results in a rating decline with respect to the notes (as defined under “Description of Notes”), we will be required to make an offer to purchase the notes at a purchase price of 101% of the principal amount of the notes on the date of purchase plus accrued interest. We may not have sufficient funds available at that time to make any required debt repayment (including purchases of the notes), and certain provisions of our other debt agreements (including our credit agreement) may further limit our ability to make these purchases. |
Ranking | The notes are our senior unsecured obligations. They rank equal in right of payment with any of our existing and future senior unsecured indebtedness and other liabilities and senior in right of payment to any of our future subordinated indebtedness. Because the notes are unsecured, obligations under our credit agreement effectively rank senior to the senior notes offered hereby. The notes are structurally subordinated to all indebtedness and other liabilities of our subsidiaries. We and our subsidiaries may incur additional debt, subject to the limits of the indenture, and our subsidiaries may incur other liabilities without limit by the indenture. |
9
Certain Covenants Before an Investment Grade Rating Event | The terms of the notes restrict our ability and the ability of certain of our subsidiaries (as described in “Description of Notes”) to: |
| | • | | incur or guarantee additional indebtedness; |
| | • | | pay dividends on and redeem capital stock; |
| | • | | sell assets and capital stock; |
| | • | | enter into transactions with affiliates; |
| | • | | engage in mergers and consolidations; and |
| | • | | transfer substantially all of our assets to another person. |
| | However, these limitations are subject to a number of important qualifications and exceptions. |
Certain Covenants After an Investment Grade Rating Event | After an investment grade rating event (as defined under “Description of Notes”), certain of the covenants described in the preceding paragraph will cease to exist or will be modified. The terms of the notes will then restrict our ability and the ability of certain of our subsidiaries to: |
| | • | | create liens with respect to certain assets; |
| | • | | enter into sale-leaseback transactions; and |
| | • | | engage in certain mergers and consolidations. |
Registration Rights | Upon consummation of the exchange offer, holders of notes will no longer have any rights under the registration rights agreement, except to the extent that we have continuing obligations to file a shelf registration statement. |
10
Summary Financial Information
The following table presents summary financial and other data about us. The summary statement of earnings and cash flow data for the years ended December 31, 2000, 2001 and 2002 are derived from our audited consolidated financial statements, including the notes thereto, appearing elsewhere in this prospectus. The summary statement of earnings and cash flow data set forth below for the three months ended March 31, 2002 and 2003 and the balance sheet data as of March 31, 2003 are derived from our unaudited condensed consolidated financial statements, including the notes thereto, appearing elsewhere in this prospectus. The interim information was prepared on a basis consistent with that used in preparing our audited financial statements with only such recurring adjustments as are necessary, in management’s opinion, for a fair statement of the results for the periods presented. The as adjusted balance sheet data give effect to the private offering of the notes and the use of proceeds as if it had occurred on March 31, 2003. The historical earnings, cash flow and balance sheet data referred to above have been restated to give retroactive effect to the contribution by Premcor Inc. of the common stock of Sabine River Holding Corp. to us. This table should be read in conjunction with “Management’s Discussion and Analysis of Financial Condition and Results of Operations” and our financial statements, including the notes thereto, appearing elsewhere in this prospectus. We have provided selected operating and other data under the heading “Key operating statistics”.
| | | Year Ended December 31,
| | | Three Months Ended March 31,
| |
| | | 2000
| | | 2001
| | | 2002
| | | 2002
| | | 2003
| |
| | | | | | (unaudited) | |
| | | (in millions, except as noted) | |
Statements of operations data: | | | | | | | | | | | | | | | | | | | | |
Net sales and operating revenues | | $ | 7,301.7 | | | $ | 6,417.5 | | | $ | 6,772.6 | | | $ | 1,228.3 | | | $ | 2,375.8 | |
Cost of sales | | | 6,564.1 | | | | 5,253.2 | | | | 6,106.0 | | | | 1,062.0 | | | | 2,109.6 | |
| | |
|
|
| |
|
|
| |
|
|
| |
|
|
| |
|
|
|
Gross margin | | | 737.6 | | | | 1,164.3 | | | | 666.6 | | | | 166.3 | | | | 266.2 | |
Operating expenses (1) | | | 466.7 | | | | 466.9 | | | | 431.5 | | | | 114.4 | | | | 116.7 | |
General and administrative expenses (1) | | | 52.7 | | | | 63.1 | | | | 51.5 | | | | 14.4 | | | | 11.7 | |
Stock-based compensation | | | — | | | | — | | | | 14.0 | | | | 1.9 | | | | 4.3 | |
Depreciation and amortization (2) | | | 71.7 | | | | 91.9 | | | | 88.9 | | | | 22.2 | | | | 24.0 | |
Refinery restructuring and other charges | | | — | | | | 176.2 | | | | 168.7 | | | | 142.0 | | | | 15.0 | |
| | |
|
|
| |
|
|
| |
|
|
| |
|
|
| |
|
|
|
Operating income (loss) | | $ | 146.5 | | | $ | 366.2 | | | $ | (88.0 | ) | | $ | (128.6 | ) | | $ | 94.5 | |
| | |
|
|
| |
|
|
| |
|
|
| |
|
|
| |
|
|
|
Net income (loss) | | $ | 83.8 | | | $ | 140.9 | | | $ | (114.4 | ) | | $ | (95.5 | ) | | $ | 38.8 | |
| | |
|
|
| |
|
|
| |
|
|
| |
|
|
| |
|
|
|
Cash flow and other data: | | | | | | | | | | | | | | | | | | | | |
Cash flow from operating activities | | $ | 141.4 | | | $ | 440.0 | | | $ | 30.9 | | | $ | 11.2 | | | $ | 117.4 | |
Cash flow from investing activities | | | (375.3 | ) | | | (153.4 | ) | | | (141.3 | ) | | | (39.1 | ) | | | (503.0 | ) |
Cash flow from financing activities | | | 200.1 | | | | (55.3 | ) | | | (252.4 | ) | | | (94.6 | ) | | | 521.7 | |
EBITDA (3) | | | 218.2 | | | | 458.1 | | | | 0.9 | | | | (106.4 | ) | | | 118.5 | |
Interest expense and finance income, net (4) | | | (64.3 | ) | | | (122.3 | ) | | | (92.1 | ) | | | (28.3 | ) | | | (25.1 | ) |
Capital expenditures for property, plant and equipment | | | 390.7 | | | | 94.5 | | | | 114.3 | | | | 14.8 | | | | 22.0 | |
Capital expenditures for turnaround | | | 31.5 | | | | 49.2 | | | | 34.3 | | | | 27.5 | | | | 8.8 | |
Refinery acquisition expenditures | | | — | | | | — | | | | — | | | | — | | | | 474.8 | |
Key operating statistics: | | | | | | | | | | | | | | | | | | | | |
Production (000 barrels per day) | | | 477.3 | | | | 463.4 | | | | 438.2 | | | | 444.2 | | | | 455.3 | |
Crude oil throughput (000 barrels per day) | | | 468.0 | | | | 439.7 | | | | 412.8 | | | | 434.2 | | | | 430.1 | |
Total crude oil throughput (in millions of barrels) | | | 171.3 | | | | 160.5 | | | | 150.7 | | | | 39.1 | | | | 38.7 | |
Per barrel of crude oil throughput ($ per barrel) | | | | | | | | | | | | | | | | | | | | |
Gross margin | | $ | 4.31 | | | $ | 7.25 | | | $ | 4.42 | | | $ | 4.25 | | | $ | 6.88 | |
Operating expenses | | | 2.72 | | | | 2.91 | | | | 2.86 | | | | 2.93 | | | | 3.02 | |
| | | As of March 31, 2003
|
| | | Actual
| | As Adjusted
|
| | | (unaudited) |
| | | (in millions) |
Balance sheet data: | | | | | | |
Cash, cash equivalents and short-term investments (5) | | $ | 311.3 | | $ | 606.3 |
Working capital | | | 530.5 | | | 825.5 |
Total assets | | | 3,129.3 | | | 3,429.3 |
Total debt | | | 1,165.2 | | | 1,465.2 |
Stockholder’s equity | | | 931.9 | | | 931.9 |
11
| (1) | | Certain reclassifications have been made to our prior period amounts to conform them to current period presentation. |
| (2) | | Amortization includes amortization of turnaround costs. However, this may not be permitted under generally accepted accounting principles, or GAAP, in future periods. |
| (3) | | EBITDA is earnings before interest, taxes, depreciation and amortization. EBITDA is a commonly used non-GAAP financial measure but should not be construed as an alternative to operating income or net income as an indicator of our performance, or as an alternative to cash flow from operating activities, investing activities or financing activities as a measure of liquidity, in each case as such measures are determined in accordance with GAAP. EBITDA is presented because we believe that it is a useful indicator of a company’s ability to incur and service debt. EBITDA, as we calculate it, may not be comparable to similarly-titled measures reported by other companies. Our calculations are as follows: |
| | | Year Ended December 31,
| | | Three Months
Ended March 31,
|
| | | 2000
| | 2001
| | 2002
| | | 2002
| | | 2003
|
| | | (in millions, unaudited) |
Operating income (loss) | | $ | 146.5 | | $ | 366.2 | | $ | (88.0 | ) | | $ | (128.6 | ) | | $ | 94.5 |
Depreciation and amortization | | | 71.7 | | | 91.9 | | | 88.9 | | | | 22.2 | | | | 24.0 |
| | |
|
| |
|
| |
|
|
| |
|
|
| |
|
|
EBITDA | | $ | 218.2 | | $ | 458.1 | | $ | 0.9 | | | $ | (106.4 | ) | | $ | 118.5 |
| | |
|
| |
|
| |
|
|
| |
|
|
| |
|
|
| (4) | | Interest expense and finance income, net, includes amortization of debt issuance costs of $11.8 million, $14.3 million, $12.1 million, $3.5 million and $2.4 million for the years ended December 31, 2000, 2001, and 2002, and for the three months ended March 31, 2002 and 2003, respectively. Interest expense and finance income, net, also includes interest on all indebtedness, net of capitalized interest and interest income. |
| (5) | | Cash, cash equivalents and short-term investments includes $53.8 million of cash and cash equivalents restricted for debt service as of March 31, 2003. |
12
RISK FACTORS
An investment in our notes involves risk. You should consider carefully, in addition to the other information contained in this prospectus, the following risk factors before deciding to invest in the notes.
Risks Related to our Business and our Industry
Volatile margins in the refining industry may negatively affect our future operating results and decrease our cash flow.
Our financial results are primarily affected by the relationship, or margin, between refined product prices and the prices for crude oil and other feedstocks. The cost to acquire our feedstocks and the price at which we can ultimately sell refined products depend upon a variety of factors beyond our control. Historically, refining margins have been volatile, and they are likely to continue to be volatile in the future. Future volatility may negatively affect our results of operations, since the margin between refined product prices and feedstock prices may decrease below the amount needed for us to generate net cash flow sufficient for our needs.
Specific factors, in no particular order, that may affect our refining margins include:
| | • | | accidents, interruptions in transportation, inclement weather or other events that cause unscheduled shutdowns or otherwise adversely affect our plants, machinery, pipelines or equipment, or those of our suppliers or customers; |
| | • | | changes in the cost or availability to us of transportation for feedstocks and refined products; |
| | • | | failure to successfully implement our planned capital projects or to realize the benefits expected for those projects; |
| | • | | changes in fuel specifications required by environmental and other laws, particularly with respect to oxygenates and sulfur content; |
| | • | | rulings, judgments or settlements in litigation or other legal matters, including unexpected environmental remediation or compliance costs at our facilities in excess of any reserves, and claims of product liability or personal injury; and |
| | • | | aggregate refinery capacity in our industry to convert heavy sour crude oil into refined products. |
Other factors that may affect our margins, as well as the margins in our industry in general, include, in no particular order:
| | • | | domestic and worldwide refinery overcapacity or undercapacity; |
| | • | | aggregate demand for crude oil and refined products, which is influenced by factors such as weather patterns, including seasonal fluctuations, and demand for specific products such as jet fuel, which may themselves be influenced by acts of God, nature and acts of terrorism; |
| | • | | domestic and foreign supplies of crude oil and other feedstocks and domestic supply of refined products, including from imports; |
| | • | | price fluctuations between the time we enter into domestic crude oil purchase commitments and the time we actually process the crude oil into refined products (approximately one month) and the effect of any related hedging transactions; |
| | • | | the ability of the members of the Organization of Petroleum Exporting Countries, or OPEC, to maintain oil price and production controls; |
| | • | | political conditions in oil producing regions, including the Middle East, Africa and Latin America; |
| | • | | refining industry utilization rates; |
| | • | | pricing and other actions taken by competitors that impact the market; |
| | • | | price, availability and acceptance of alternative fuels; |
13
| | • | | adoption of or modifications to federal, state or foreign environmental, taxation and other laws and regulations; |
| | • | | price fluctuations in natural gas, as our refineries purchase and consume significant amounts of natural gas to fuel their operations; and |
| | • | | general economic conditions. |
A significant interruption or casualty loss at any of our refineries could reduce our production, particularly if not fully covered by our insurance.
Our business currently consists of owning and operating three refineries. As a result, our operations could be subject to significant interruption if any of our refineries were to experience a major accident, be damaged by severe weather or other natural disaster, or otherwise be forced to shut down or curtail production due to unforeseen events, such as acts of God, nature and acts of terrorism. Any such shutdown would reduce the production from that refinery. For example, our Port Arthur refinery is located in the Gulf Coast region of the United States, which is susceptible to seasonal hurricanes and other weather related problems. There is also risk of mechanical failure and equipment shutdowns both in general and following unforeseen events. Further, in such situations, undamaged refinery processing units may be dependent on or interact with damaged sections of our refineries and, accordingly, are also subject to being shut down. In the event any of our refineries is forced to shut down for a significant period of time, it would have a material adverse effect on our earnings, our other results of operations and our financial condition as a whole. Furthermore, if any of the above events were not fully covered by our insurance, it could have a material adverse effect on our earnings, our other results of operations and our financial condition.
Disruption of our ability to obtain crude oil could reduce our margins and our other results of operations.
Although we have one long-term crude oil supply contract, the majority of our crude oil supply is acquired under short-term contractual arrangements or in the spot market. Our short-term crude oil supply contracts are terminable on one to three months’ notice. Further, a significant portion of our feedstock requirements is supplied from Latin America, Africa and the Middle East (including Iraq), and we are subject to the political, geographic and economic risks attendant to doing business with suppliers located in those regions. For example, on April 8, 2002 Iraq announced that it was halting all oil exports for a 30-day period. In the event that one or more of our supply contracts is terminated, we may not be able to find alternative sources of supply. If we are unable to obtain adequate crude oil volumes or are only able to obtain such volumes at unfavorable prices, our margins and our other results of operations could be materially adversely affected.
Our Port Arthur refinery is highly dependent upon a PEMEX affiliate for its supply of heavy sour crude oil, which could be interrupted by events beyond the control of PEMEX.
During 2002, we sourced approximately 83% of our Port Arthur refinery’s crude oil from P.M.I. Comercio Internacional, S.A. de C.V., or PMI, an affiliate of PEMEX. Therefore, a large proportion of our crude oil needs is influenced by the adequacy of PEMEX’s crude oil reserves, the estimates of which are not precise and are subject to revision at any time. In addition, in connection with our recently announced plans to expand our Port Arthur refinery, we will require additional heavy sour crude oil. We intend to seek an increase in our heavy sour crude oil supply agreement with the PEMEX affiliate and/or alternative supply sources to provide for our incremental requirements. There are no assurances that the PEMEX affiliate will agree to an increase in our crude oil supply agreement or that alternative sources can be obtained at terms as favorable as those negotiated with PEMEX’s affiliate. In the event that PEMEX’s affiliate were to terminate our crude oil supply agreement or default on its supply obligations, we would need to obtain heavy sour crude oil from another supplier and would lose the potential benefits of the coker gross margin support mechanism contained in the supply agreement. Alternative supplies of crude oil may not be available or may not be on terms as favorable as those negotiated
14
with PEMEX’s affiliate. In addition, the processing of oil supplied by a third party may require changes to the configuration of our Port Arthur refinery, which could require significant unbudgeted capital expenditures.
Furthermore, the obligation of PEMEX’s affiliate to deliver heavy sour crude oil under the agreement may be delayed or excused by the occurrence of conditions and events beyond the reasonable control of PEMEX, such as:
| | • | | extreme weather-related conditions; |
| | • | | production or operational difficulties and blockades; |
| | • | | embargoes or interruptions, declines or shortages of supply available for export from Mexico, including shortages due to increased domestic demand and other national or international political events; and |
| | • | | certain laws, changes in laws, decrees, directives or actions of the government of Mexico. |
The government of Mexico may direct a reduction in our supply of crude oil, so long as that action is taken in common with proportionately equal supply reductions under its long-term crude oil supply agreements with other parties and the amount by which it reduces the quantity of crude oil to be sold to us shall first be applied to reduce quantities of crude oil scheduled for sale and delivery to our Port Arthur refinery under any other crude oil supply agreement with us or any of our affiliates. Mexico is not a member of OPEC, but in 1998 it agreed with the governments of Saudi Arabia and Venezuela to reduce Mexico’s exports of crude oil by 200,000 bpd. In March 1999, Mexico further agreed to cut exports of crude oil by an additional 125,000 bpd. As a consequence, during 1999, PEMEX reduced its supply of oil under some oil supply contracts by invoking an excuse clause based on governmental action similar to one contained in our long-term crude oil supply agreement. It is possible that PEMEX could reduce our supply of crude oil by similarly invoking the excuse provisions in the future.
Competitors who produce their own supply of feedstocks, have extensive retail outlets, make alternative fuels or have greater financial resources than we do may have a competitive advantage over us.
The refining industry is highly competitive with respect to both feedstock supply and refined product markets. We compete with numerous other companies for available supplies of crude oil and other feedstocks and for outlets for our refined products. We are not engaged in the petroleum exploration and production business and therefore do not produce any of our crude oil feedstocks. We do not have a retail business and therefore are dependent upon others for outlets for our refined products. We do not have any long term arrangements for much of our production, and our contracts to supply jet fuel to Federal Express in Memphis will expire in 2004. Many of our competitors, however, obtain a significant portion of their feedstocks from company-owned production and have extensive retail outlets. Competitors that have their own production or extensive retail outlets, with brand-name recognition, are at times able to offset losses from refining operations with profits from producing or retailing operations, and may be better positioned to withstand periods of depressed refining margins or feedstock shortages. A number of our competitors also have materially greater financial and other resources than we possess. These competitors have a greater ability to bear the economic risks inherent in all phases of the refining industry. In addition, we compete with other industries that provide alternative means to satisfy the energy and fuel requirements of our industrial, commercial and individual consumers. If we are unable to compete effectively with these competitors, both within and outside of our industry, our financial condition and results of operations, as well as our business prospects, could be materially adversely affected.
Our substantial indebtedness may limit our financial flexibility.
Our substantial indebtedness has significantly affected our financial flexibility historically and may significantly affect our financial flexibility in the future. As of March 31, 2003, after giving effect to the
15
June 2003 private notes offering, we would have had total consolidated long-term debt, including current maturities, of $1,465.2 million, cash, short-term investments and cash restricted for debt service of $606.3 million, and stockholder’s equity of $931.9 million, resulting in a total debt to total capitalization ratio of 61.1%. We may also incur additional indebtedness in the future, although our ability to do so will be restricted by the terms of our existing indebtedness. The indenture governing the notes will permit us to incur significant additional indebtedness. We are continually evaluating all available refinery acquisitions, some of which may be significant. Any significant acquisition would require us to incur additional indebtedness in order to finance all or a portion of such acquisition. The level of our indebtedness has several important consequences for our future operations, including that:
| | • | | a significant portion of our cash flow from operations will be dedicated to the payment of principal of, and interest on, our indebtedness and will not be available for other purposes; |
| | • | | covenants contained in our existing debt arrangements require us to meet or maintain certain financial tests, which may affect our flexibility in planning for, and reacting to, changes in our industry, such as being able to take advantage of acquisition opportunities when they arise; |
| | • | | our ability to obtain additional financing for working capital, capital expenditures, acquisitions, general corporate and other purposes may be limited; |
| | • | | we may be at a competitive disadvantage to those of our competitors that are less leveraged; and |
| | • | | we may be more vulnerable to adverse economic and industry conditions. |
We have significant principal payments due under our debt instruments. As of March 31, 2003, after giving effect to the June 2003 private notes offering, we are required to make the following principal payments on our long-term debt: $10.4 million in 2003; $25.8 million in 2004; $38.5 million in 2005; $46.4 million in 2006; $318.4 million in 2007; and $1,026.8 million in the aggregate thereafter. Our ability to meet our principal obligations will be dependent upon our future performance, which in turn will be subject to general economic conditions, industry cycles and financial, business and other factors affecting our operations, many of which are beyond our control. Our business may not continue to generate sufficient cash flow from operations to repay our substantial indebtedness. If we are unable to generate sufficient cash flow from operations, we may be required to sell assets, to refinance all or a portion of our indebtedness or to obtain additional financing. Refinancing may not be possible and additional financing may not be available on commercially acceptable terms, or at all.
Restrictive covenants in our debt instruments limit our ability to move funds and assets among our subsidiaries and may limit our ability to undertake certain types of transactions.
Various covenants in our and our subsidiaries’ debt instruments and other financing arrangements may restrict our and our subsidiaries’ financial flexibility in a number of ways. Our indebtedness subjects us to significant financial and other restrictive covenants, including restrictions on our ability to incur additional indebtedness, place liens upon assets, pay dividends or make certain other restricted payments and investments, consummate certain asset sales or asset swaps, enter into certain transactions with affiliates, make certain payments to Premcor Inc. or Premcor USA, enter into sale and leaseback transactions, conduct businesses other than our current businesses, merge or consolidate with any other person or sell, assign, transfer, lease, convey or otherwise dispose of all or substantially all of our assets. Some of the debt instruments also require us and our subsidiaries to satisfy or maintain certain financial condition tests. Our credit agreement only allows us to incur $15 million of additional debt after the June 2003 private notes offering. Our ability and the ability of our subsidiaries to meet these financial condition tests can be affected by events beyond our control and we may not meet such tests.
16
Compliance with, and changes in, environmental laws could adversely affect our results of operations and our financial condition.
We are subject to extensive federal, state and local environmental laws and regulations, including those relating to the discharge of materials into the environment, waste management, pollution prevention, remediation of contaminated sites and the characteristics and composition of gasoline and diesel fuels. In addition, some of these laws and regulations require our facilities to operate under permits that are subject to renewal or modification. These laws and regulations and permits can often require expensive pollution control equipment or operational changes to limit the impact or potential impact on the environment and/or human health. Violations of these laws and regulations or permit conditions can result in substantial fines, criminal sanctions, permit revocations and/or facility shutdowns. Compliance with environmental laws and regulations significantly contributes to our operating costs. In addition, we have made and expect to make substantial capital expenditures on an ongoing basis to comply with environmental laws and regulations.
In addition, new laws, new interpretations of existing laws, increased governmental enforcement of environmental laws or other developments could require us to make additional unforeseen expenditures. These expenditures or costs for environmental compliance could have a material adverse effect on our financial condition, results of operations and cash flow. For example, the United States Environmental Protection Agency, or EPA, has promulgated new regulations under the federal Clean Air Act described below that establish stringent sulfur content specifications for gasoline and low-sulfur highway, or “on-road” diesel fuel designed to reduce air emissions from the use of these products.
In February 2000, the EPA promulgated the Tier 2 Motor Vehicle Emission Standards Final Rule for all passenger vehicles, establishing standards for sulfur content in gasoline. These regulations mandate that the average sulfur content of gasoline for highway use produced at any refinery not exceed 30 ppm during any calendar year by January 1, 2006, phasing in beginning on January 1, 2004. We currently expect to produce gasoline under the new sulfur standards at our Port Arthur refinery prior to January 1, 2004 and at our Memphis refinery in the first quarter of 2004. As a result of the corporate pool averaging provisions of the regulations, we believe that we will be able to defer a significant portion of the investment required for compliance for our Lima refinery until the end of 2005 through the purchase of sulfur allotments and credits which arise from a refiner producing gasoline with a sulfur content below specified levels prior to the end of 2005, the end of the phase-in period. There is no assurance that the averaging provisions of the regulations will allow for a deferral of compliance at our Lima refinery or that sufficient allotments or credits to defer investment at our Lima refinery will be available, or if available, that they will be cost effective. We believe, based on current estimates and on a January 1, 2004 compliance date for all three refineries, that compliance with the new Tier 2 gasoline specifications will require capital expenditures in the aggregate through 2004 of approximately $335 million. This estimate reflects an increase from 2001 year-end estimates of $80 million for the newly acquired Memphis refinery and $79 million for revised cost estimates at our Lima and Port Arthur refineries based on completed detailed engineering studies and refined implementation plans. Future revisions to these cost estimates may be necessary. We are reviewing the current plans for Tier 2 compliance at the Memphis refinery and believe there may be opportunities for significant cost savings based on a revised project design. We have entered into contracts totaling $126 million related to the design and construction activity at our Port Arthur and Lima refineries for the Tier 2 gasoline compliance.
In January 2001, the EPA promulgated its on-road diesel regulations, which will require a 97% reduction in the sulfur content of diesel fuel sold for highway use by June 1, 2006, with full compliance by January 1, 2010. We estimate that capital expenditures required to comply with the on-road diesel standards at all three of our refineries in the aggregate through 2006 is approximately $347 million, an increase from previous estimates of $100 million for the newly acquired Memphis refinery and of $20 million for revised cost estimates at our Lima and Port Arthur refineries. The revised estimate is based on additional engineering studies and may be revised further as we move towards finalization of our implementation strategy. More than 95% of the projected investment is expected to be incurred during 2004 through 2006 with the greatest concentration of spending
17
occurring in 2005. Since the Lima refinery does not currently produce diesel fuel to on-road specifications, we are considering an acceleration of the low-sulfur diesel investment at the Lima refinery in order to capture this incremental product value. If the investment is accelerated, production of the low-sulfur fuel is possible by the first half of 2005.
In April 2002, the EPA promulgated regulations to implement Phase II of the petroleum refinery Maximum Achievable Control Technology rule under the federal Clean Air Act, referred to as MACT II, which regulates emissions of hazardous air pollutants from certain refinery units. We expect to spend approximately $25 million in the next two years related to these new regulations.
We have additional capital needs for which our internally generated cash flow may not be adequate; we may have insufficient liquidity to meet those needs.
In addition to the capital expenditures we will make to comply with Tier 2 gasoline standards, on-road diesel regulations and MACT II regulations, we have additional short-term and long-term capital needs. Our short-term working capital needs are primarily crude oil purchase requirements, which fluctuate with the pricing and sourcing of crude oil. Our internally generated cash flow and availability under our working capital facilities may not be sufficient to meet these needs. We also have significant long-term needs for cash. We estimate that mandatory capital and turnaround expenditures, excluding the non-recurring capital expenditures required to comply with Tier 2 gasoline standards, on-road diesel regulations and MACT II regulations described above, will average approximately $150 million per year from 2003 through 2006. Our internally generated cash flow may not be sufficient to support such capital expenditures.
We may not be able to implement successfully our discretionary capital expenditure projects.
We could undertake a number of discretionary capital expenditure projects designed to increase the productivity and profitability of our refineries such as our recently announced plans to expand our Port Arthur refinery. Many factors beyond our control may prevent or hinder our undertaking of some or all of these projects, including compliance with or liability under environmental regulations, a downturn in refining margins, technical or mechanical problems, lack of availability of capital and other factors. Failure to successfully implement these profit-enhancing strategies may adversely affect our business prospects and competitive position in the industry.
Environmental clean-up and remediation costs of our sites and environmental litigation could decrease our net cash flow, reduce our results of operations and impair our financial condition.
We are subject to liability for the investigation and clean-up of environmental contamination with respect to each of the properties that we own or operate, certain properties we formerly owned or operated and at off-site locations where we arranged for the disposal of hazardous substances. We are involved in several proceedings or other projects relating to our liability for the investigation and clean-up of such sites. We may become involved in further litigation or other proceedings. If we were to be held responsible for damages in any existing or future litigation or proceedings, such costs may not be covered by insurance and may be material. For example, there is extensive contamination at our Port Arthur refinery site and contamination at our Lima refinery site. Chevron Products Company, the former owner of the Port Arthur refinery, has retained environmental remediation obligations regarding pre-closing contamination for all areas of the refinery except those under or within 100 feet of active processing units, and BP has retained liability for certain environmental costs relating to operations of, or associated with, the Lima refinery site prior to our acquisition of that facility. However, if either of these parties fails to satisfy its obligations for any reason, or if significant liabilities arise in the areas in which we assumed liability, we may become responsible for the remediation. In addition, in May 2003, the State of Illinois filed a lawsuit against us and a prior owner of the Hartford refinery seeking injunctive relief, recovery of removal costs and monetary penalties with regard to subsurface contamination in the village of Hartford, Illinois. If we are forced to assume liability for the cost of this remediation or other remediation relating to our current or former facilities, such liability could have a material adverse effect on our financial condition. As a result, in
18
addition to making capital expenditures or incurring other costs to comply with environmental laws, we also may be liable for significant environmental litigation or remediation costs and other liabilities arising from the ownership or operation of these assets by prior owners, which could materially adversely affect our financial condition, results of operations and cash flow.
In addition, at the closed Blue Island, Illinois and Hartford, Illinois refineries, we are required to conduct environmental assessment and remediation. We are currently assessing our remedial obligations at these closed facilities and have an aggregate reserve of $49.0 million as of March 31, 2003. Also, in connection with our sale of certain retail properties and product terminals in 1999, we agreed to indemnify the purchasers for certain environmental conditions arising during our ownership and operation of these assets. Clean-up costs may exceed our estimates, which could, in turn, have a material adverse effect on our financial condition, results of operations and cash flow.
We may also face liability arising from current or future claims alleging personal injury or property damage due to exposure to chemicals or other hazardous substances, such as asbestos and benzene and petroleum hydrocarbon, at or from our facilities. We may also face liability for personal injury, property damage, natural resource damage or clean-up costs for the alleged release or migration of contamination or hazardous substances from our currently or formerly owned properties. In June 2003, approximately 700 residents of Port Arthur, Texas filed a lawsuit against us and five other companies alleging personal injuries and property damage from emissions from refining and chemical facilities in the area. The plaintiffs are seeking class certification, unspecified damages and the establishment of a trust fund for health concerns. A significant increase in the number or success of these claims could materially adversely affect our financial condition, results of operations and cash flow.
We may assume significant lease and environmental clean-up obligations as a result of the bankruptcy filing of the purchaser of our former retail properties.
In 1999, we sold the majority of our former retail properties to Clark Retail Enterprises, Inc., or CRE, which, together with its parent company, Clark Retail Group, Inc. filed for Chapter 11 bankruptcy protection in October 2002. In addition to our obligations under the environmental indemnities discussed above, we may be jointly and severally liable for CRE’s obligations under approximately 150 retail leases that were assigned to CRE as part of the sale, including payment of rent and taxes. We may also incur other significant liabilities for environmental obligations at these sites. CRE rejected approximately 30 of these leases in connection with bankruptcy hearings held in January, February and March 2003. We recorded an after-tax charge of $4.3 million in the first quarter of 2003 representing the estimated net present value of our remaining liability under these leases, net of estimated sub-lease income. In May 2003, CRE announced that it would conduct an orderly sale of its retail assets, including the lease sites which have not been rejected. We are participating with CRE in the sale process. The remaining future lease payments on these properties is currently estimated as follows: 2003—$9.8 million; 2004—$10.1 million; 2005—$10.5 million; 2006—$10.9 million; 2007—$11.3 million; and in the aggregate thereafter—$84.2 million. It is possible that we may incur additional liability for CRE lease obligations or other costs as CRE finalizes the disposition of the properties; however, the amounts are not estimable at this time and could be material.
A substantial portion of our workforce is unionized and we may face labor disruptions that would interfere with our refinery operations.
As of March 31, 2003, we employed approximately 1,700 people, approximately 59% of whom were covered by collective bargaining agreements. The collective bargaining agreements covering employees at our Port Arthur and Memphis refineries expire in January 2006 and the agreement covering employees at our Lima refinery expires in April 2006. Our relationships with the relevant unions at our current facilities have been good and we have never experienced a work stoppage as a result of labor disagreement. However, we cannot assure you that this situation will continue. A labor disturbance at any of our refineries could have a material adverse effect on that refinery’s operations.
19
We have not fully developed or implemented a disaster recovery plan for our information systems, which could adversely affect business operations should a major physical disaster occur.
We are dependent upon functioning information systems to conduct business. A system failure or malfunction may result in an inability to process transactions or lead to a disruption of operations. Although we regularly backup our programs and data, we do not currently have a comprehensive disaster recovery plan providing a hot site facility for immediate system recovery should a major physical disaster occur at our general office, our executive office or at one of our refineries. A comprehensive disaster recovery plan is currently being developed, with completion targeted in the fourth quarter of 2003.
Our federal income tax carryforward attributes could be substantially limited if our parent, Premcor Inc., experiences an ownership change as defined in the Internal Revenue Code.
Our consolidated group had federal income tax net operating loss carryforwards of approximately $478.5 million, and we had net operating loss carryforwards of $372.1 million, at December 31, 2002. These net operating loss carryforwards will begin to terminate with the year ending December 31, 2011, to the extent they have not been used to reduce taxable income prior to such time. Our consolidated group’s ability to use these net operating loss carryforwards to reduce taxable income and to utilize other losses and certain tax credits is dependent upon, among other things, our parent, Premcor Inc., not experiencing an ownership change of more than 50% during any three-year testing period as defined in the Internal Revenue Code. Premcor Inc. has had significant changes in the ownership of its common stock in the three-year period immediately prior to this exchange offer. Accordingly, future changes, even slight changes, in the ownership of Premcor Inc.’s common stock (including, among other things, the exercise of compensatory options) could result in an aggregate change in ownership of more than 50% as defined in the Internal Revenue Code, which could substantially limit the availability of these net operating loss carryforwards, other losses and tax credits.
Risks Related to Future Acquisitions
We may not be able to consummate future acquisitions.
A substantial portion of our growth over the last several years has been attributed to acquisitions. A principal component of our strategy going forward is to continue to selectively acquire refining assets in order to increase cash flow and earnings. Our ability to do so will be dependent upon a number of factors, including our ability to identify acceptable acquisition candidates, consummate acquisitions on favorable terms, successfully integrate acquired businesses and obtain financing to support our growth and many other factors beyond our control. We may not be successful in implementing our acquisition strategy and, even if implemented, such strategy may not improve our operating results. In addition, the financing of future acquisitions may require us to incur additional indebtedness, which could limit our financial flexibility.
We may not be able to successfully integrate future acquisitions into our business.
In connection with future acquisitions, we may experience unforeseen operating difficulties as we integrate the acquired assets into our existing operations. These difficulties may require significant management attention and financial resources that would otherwise be available for the ongoing development or expansion of existing operations. Any future acquisitions involve risks, including:
| | • | | unexpected losses of key employees, customers and suppliers of the acquired operations; |
| | • | | difficulties in integrating the financial, technological and management standards, processes, procedures and controls of the acquired business with those of our existing operations; |
| | • | | challenges in managing the increased scope, geographic diversity and complexity of our operations; and |
| | • | | mitigating contingent liabilities. |
20
Risks Related to this Offering
There is no existing market for the exchange notes, and we cannot assure you that an active trading market will develop for the exchange notes or that you will be able to sell your exchange notes.
There is no existing market for the exchange notes, and there can be no assurance as to the liquidity of any markets that may develop for the exchange notes, your ability to sell your exchange notes or the prices at which you would be able to sell your exchange notes. Future trading prices of the exchange notes will depend on many factors, including, among other things, prevailing interest rates, our operating results and the market for similar securities. The initial purchasers of the outstanding notes are not obligated to make a market in the exchange notes and any market making by them may be discontinued at any time without notice. We do not intend to apply for a listing of the exchange notes on any securities exchange or on any automated dealer quotation system.
Historically, the market for non-investment grade debt has been subject to disruptions that have caused volatility in prices. It is possible that the market for the exchange notes will be subject to disruptions. Any such disruptions may have a negative effect on you, as a holder of the exchange notes, regardless of our prospects and financial performance.
Despite our level of indebtedness, we and our subsidiaries may be able to incur substantially more debt, which could exacerbate the risks described above.
We and our subsidiaries may be able to incur substantial additional indebtedness in the future. Although the indenture governing the notes and our other debt instruments and financing arrangements contain restrictions on the incurrence of additional indebtedness, these restrictions are subject to a number of qualifications and exceptions, and the indebtedness incurred in compliance with these restrictions could be substantial. To the extent new debt is added to our currently anticipated debt levels, the substantial leverage risks described above would increase. Also, these restrictions do not prevent us from incurring obligations that do not constitute indebtedness. See “Description of Indebtedness” and “Description of Notes.”
The notes are not secured.
The notes are not secured by any of our assets or those of our subsidiaries. Our obligations under our credit facility are secured by substantially all of our personal property and certain of our other assets and those of our subsidiaries, and the Port Arthur Finance Corp. notes are secured by certain of the assets of Port Arthur Finance Corp. and Port Arthur Coker Company. See “Description of Indebtedness.” If we become insolvent or are liquidated, or if payment under our credit facility or any other secured senior indebtedness is accelerated, the lenders under the credit facility or holders of any other secured senior indebtedness will be entitled to exercise the remedies available to a secured lender under applicable law (in addition to any remedies that may be available under documents pertaining to the credit facility or any other senior indebtedness) and will be paid out of the assets pledged as collateral before these assets are made available to other debt holders, including you.
If you choose not to exchange your outstanding notes, the present transfer restrictions will remain in force and the market price of your outstanding notes could decline.
If you do not exchange your outstanding notes for exchange notes under the exchange offer, then you will continue to be subject to the existing transfer restrictions on the outstanding notes. In general, the outstanding notes may not be offered or sold unless they are registered or exempt from registration under the Securities Act and applicable state securities laws. Except as required by the registration rights agreement, we do not intend to register resales of the outstanding notes under the Securities Act. You should refer to “Prospectus Summary—Summary of the Exchange Offer” and “The Exchange Offer” for information about how to tender your outstanding notes.
The tender of outstanding notes under the exchange offer will reduce the principal amount of the notes outstanding, which may have an adverse effect upon, and increase the volatility of, the market price of the outstanding notes due to a reduction in liquidity.
21
FORWARD-LOOKING STATEMENTS
Some of the matters discussed under the captions “Prospectus Summary,” “Risk Factors,” “Management’s Discussion and Analysis of Financial Condition and Results of Operations,” “Business” and elsewhere in this prospectus include forward-looking statements based on current expectations, estimates, forecasts and projections, beliefs and assumptions made by management. You can identify these forward-looking statements by the use of words like “strategy,” “expect,” “plan,” “believe,” “will,” “estimate,” “intend,” “project,” “goal,” “target” and other words of similar meaning. You can also identify them by the fact that they do not relate strictly to historical or current facts.
Even though we believe our expectations regarding future events are based on reasonable assumptions, forward-looking statements are not guarantees of future performance. Important factors that could cause actual results to differ materially from those contained in our forward-looking statements include those discussed under “Risk Factors—Risks Related to our Business and our Industry.” Because of these uncertainties and others, you should not place undue reliance on our forward-looking statements.
22
USE OF PROCEEDS
We will not receive any cash proceeds from the issuance of the exchange notes. In consideration for issuing the exchange notes as contemplated in this prospectus, we will receive in exchange a like principal amount of outstanding notes, the terms of which are identical in all material respects to the exchange notes. The outstanding notes surrendered in exchange for the exchange notes will be retired and canceled and cannot be reissued. Accordingly, issuance of the exchange notes will not result in any change in our capitalization.
The gross proceeds from the June 2003 private notes offering were $300 million. We intend to use the proceeds from the outstanding notes for capital expenditures, including for the recently announced plans to expand our Port Arthur refinery, for acquisitions, and for working capital and general corporate purposes. We retain broad discretion as to the use of the net proceeds.
23
CAPITALIZATION
The following table sets forth our cash, cash equivalents and short-term investments and capitalization as of March 31, 2003:
| | • | | on an actual basis; and |
| | • | | on an as adjusted basis to reflect our receipt of the net proceeds from the sale of $300 million of notes in the June 2003 private offering. |
The table below should be read in conjunction with “Summary Financial Information,” “Selected Financial Data,” “Management’s Discussion and Analysis of Financial Condition and Results of Operations” and our condensed consolidated financial statements and the notes to those statements appearing elsewhere in this prospectus.
| | | As of
March 31, 2003
|
| | | Actual
| | As
Adjusted
|
| | | (in millions) |
Cash, cash equivalents and short-term investments(1) | | $ | 311.3 | | $ | 606.3 |
| | |
|
| |
|
|
Debt (2): | | | | | | |
Port Arthur Finance Corp.: | | | | | | |
12 1/2% Senior Secured Notes due 2009 | | $ | 246.3 | | $ | 246.3 |
Premcor Refining Group Inc.: | | | | | | |
8 3/8% Senior Notes due 2007 | | | 99.7 | | | 99.7 |
8 5/8% Senior Notes due 2008 | | | 109.8 | | | 109.8 |
9 1/4% Senior Notes due 2010 | | | 175.0 | | | 175.0 |
9 1/2% Senior Notes due 2013 | | | 350.0 | | | 350.0 |
7 1/2% Senior Notes due 2015 | | | — | | | 300.0 |
8 7/8% Senior Subordinated Notes due 2007 | | | 174.4 | | | 174.4 |
Ohio Water Development Authority | | | | | | |
Environmental and Facilities Revenue Bonds | | | 10.0 | | | 10.0 |
| | |
|
| |
|
|
Total debt | | | 1,165.2 | | | 1,465.2 |
| | |
|
| |
|
|
Stockholder’s equity: | | | | | | |
Common stock, $0.01 par value (100 shares issued and outstanding) | | | — | | | — |
Paid-in capital | | | 806.7 | | | 806.7 |
Retained earnings | | | 125.2 | | | 125.2 |
| | |
|
| |
|
|
Total stockholder’s equity | | | 931.9 | | | 931.9 |
| | |
|
| |
|
|
Total capitalization | | $ | 2,097.1 | | $ | 2,397.1 |
| | |
|
| |
|
|
| (1) | | Includes $53.8 million of cash restricted for debt service. |
| (2) | | We also have a credit agreement that provides for the issuance of letters of credit and revolving loan borrowings of up to the lesser of $750 million or the amount available under a borrowing base calculation. As of March 31, 2003, $575.0 million of the line of credit was utilized for the issuance of letters of credit primarily to secure purchases of crude oil. Utilization can vary over time depending on our working capital needs. Direct cash borrowings under the credit facility are limited to $200 million subject to certain limitations. There were no direct cash borrowings under the facility as of March 31, 2003. See “Description of Indebtedness—Our Credit Agreement.” |
24
SELECTED FINANCIAL DATA
The selected consolidated financial data set forth below as of December 31, 2001 and 2002 and for the years ended December 31, 2000, 2001 and 2002 were derived from our audited consolidated financial statements, including the notes thereto, appearing elsewhere in this prospectus, which were audited by Deloitte & Touche LLP, independent accountants. The selected financial data set forth below as of December 31, 1998,1999 and 2000 and for the years ended December 31, 1998 and 1999 are derived from our audited consolidated financial statements, not included in this prospectus, which were audited by Deloitte & Touche LLP, independent auditors. The selected financial data set forth below as of March 31, 2002 and 2003 and for the three months then ended are derived from our unaudited consolidated condensed financial statements, including the notes thereto, appearing elsewhere in this prospectus. The interim information was prepared on a basis consistent with that used in preparing our audited financial statements with only such recurring adjustments as are necessary, in management’s opinion, for a fair statement of the results for the periods presented. The financial data referred to above has been restated to give retroactive effect to the contribution of the common stock of Sabine River Holding Corp. owned by Premcor Inc. to us. This table should be read in conjunction with “Management’s Discussion and Analysis of Financial Condition and Results of Operations” and our consolidated financial statements, including the notes thereto, appearing elsewhere in this prospectus. We have provided selected operating and other data under the heading “Key operating statistics.”
| | | Year Ended December 31,
| | | Three Months Ended March 31,
| |
| | | 1998
| | | 1999
| | | 2000
| | | 2001
| | | 2002
| | | 2002
| | | 2003
| |
| | | | | | (in millions, except as noted) | | | | | | (unaudited) | |
Statement of earnings data: | | | | | | | | | | | | | | | | | | | | | | | | | | | | |
Net sales and operating revenues | | $ | 3,580.5 | | | $ | 4,520.3 | | | $ | 7,301.7 | | | $ | 6,417.5 | | | $ | 6,772.6 | | | $ | 1,228.3 | | | $ | 2,375.8 | |
Cost of sales | | | 3,115.1 | | | | 4,102.0 | | | | 6,564.1 | | | | 5,253.2 | | | | 6,106.0 | | | | 1,062.0 | | | | 2,109.6 | |
| | |
|
|
| |
|
|
| |
|
|
| |
|
|
| |
|
|
| |
|
|
| |
|
|
|
Gross margin | | | 465.4 | | | | 418.3 | | | | 737.6 | | | | 1,164.3 | | | | 666.6 | | | | 166.3 | | | | 266.2 | |
Operating expenses (1) | | | 341.6 | | | | 402.0 | | | | 466.7 | | | | 466.9 | | | | 431.5 | | | | 114.4 | | | | 116.7 | |
General and administrative expenses (1) | | | 50.0 | | | | 51.4 | | | | 52.7 | | | | 63.1 | | | | 51.5 | | | | 14.4 | | | | 11.7 | |
Stock-based compensation | | | — | | | | — | | | | — | | | | — | | | | 14.0 | | | | 1.9 | | | | 4.3 | |
Depreciation and amortization (2) | | | 54.4 | | | | 63.0 | | | | 71.7 | | | | 91.9 | | | | 88.9 | | | | 22.2 | | | | 24.0 | |
Inventory write-down (recovery) to market value | | | 86.6 | | | | (105.8 | ) | | | — | | | | — | | | | — | | | | — | | | | — | |
Gain on sale of pipeline interests | | | (69.3 | ) | | | — | | | | — | | | | — | | | | — | | | | — | | | | — | |
Refinery restructuring, recapitalization, asset writeoffs and other charges | | | — | | | | — | | | | — | | | | 176.2 | | | | 168.7 | | | | 142.0 | | | | 15.0 | |
| | |
|
|
| |
|
|
| |
|
|
| |
|
|
| |
|
|
| |
|
|
| |
|
|
|
Operating income (loss) | | | 2.1 | | | | 7.7 | | | | 146.5 | | | | 366.2 | | | | (88.0 | ) | | | (128.6 | ) | | | 94.5 | |
Interest expense and finance income, net (4) | | | (51.0 | ) | | | (72.3 | ) | | | (64.3 | ) | | | (122.3 | ) | | | (92.1 | ) | | | (28.3 | ) | | | (25.1 | ) |
Gain (loss) on extinguishment of long-term
debt (4) | | | — | | | | — | | | | — | | | | 0.8 | | | | (9.3 | ) | | | — | | | | (4.7 | ) |
Income tax (provision) benefit | | | 12.9 | | | | 16.2 | | | | 2.2 | | | | (73.0 | ) | | | 73.3 | | | | 60.6 | | | | (21.6 | ) |
Minority interest | | | — | | | | 1.4 | | | | (0.6 | ) | | | (12.8 | ) | | | 1.7 | | | | 0.8 | | | | — | |
| | |
|
|
| |
|
|
| |
|
|
| |
|
|
| |
|
|
| |
|
|
| |
|
|
|
Income (loss) from continuing operations | | | (36.0 | ) | | | (47.0 | ) | | | 83.8 | | | | 158.9 | | | | (114.4 | ) | | | (95.5 | ) | | | 43.1 | |
Discontinued operations, net of taxes (5) | | | 15.1 | | | | 32.3 | | | | — | | | | (18.0 | ) | | | — | | | | — | | | | (4.3 | ) |
| | |
|
|
| |
|
|
| |
|
|
| |
|
|
| |
|
|
| |
|
|
| |
|
|
|
Net income (loss) | | $ | (20.9 | ) | | $ | (14.7 | ) | | $ | 83.8 | | | $ | 140.9 | | | $ | (114.4 | ) | | $ | (95.5 | ) | | $ | 38.8 | |
| | |
|
|
| |
|
|
| |
|
|
| |
|
|
| |
|
|
| |
|
|
| |
|
|
|
Cash flow and other data: | | | | | | | | | | | | | | | | | | | | | | | | | | | | |
Cash flow from operating activities | | $ | (44.7 | ) | | $ | 105.4 | | | $ | 141.4 | | | $ | 440.0 | | | $ | 30.9 | | | $ | 11.2 | | | $ | 117.4 | |
Cash flow from investing activities | | | (229.9 | ) | | | (316.3 | ) | | | (375.3 | ) | | | (153.4 | ) | | | (141.3 | ) | | | (39.1 | ) | | | (503.0 | ) |
Cash flow from financing activities | | | 194.0 | | | | 348.4 | | | | 200.1 | | | | (55.3 | ) | | | (252.4 | ) | | | (94.6 | ) | | | 521.7 | |
EBITDA (3) | | | 56.5 | | | | 70.7 | | | | 218.2 | | | | 458.1 | | | | 0.9 | | | | (106.4 | ) | | | 118.5 | |
Ratio of earnings to fixed charges (5) | | | — | | | | — | | | | 1.14 | | | | 2.58 | | | | — | | | | — | | | | 2.95 | |
Capital expenditures for property, plant and equipment | | $ | 101.3 | | | $ | 438.2 | | | $ | 390.7 | | | $ | 94.5 | | | $ | 114.3 | | | $ | 14.8 | | | $ | 22.0 | |
Capital expenditures for turnaround | | | 28.3 | | | | 77.9 | | | | 31.5 | | | | 49.2 | | | | 34.3 | | | | 27.5 | | | | 8.8 | |
Refinery acquisition expenditures | | | 175.0 | | | | — | | | | — | | | | — | | | | — | | | | — | | | | 474.8 | |
| | | | | | | |
Key operating statistics: | | | | | | | | | | | | | | | | | | | | | | | | | | | | |
Production (000 bbls per day) | | | 403.8 | | | | 460.5 | | | | 477.3 | | | | 463.4 | | | | 438.2 | | | | 444.2 | | | | 455.3 | |
Crude oil throughput (000 bbls per day) | | | 400.9 | | | | 451.7 | | | | 468.0 | | | | 439.7 | | | | 412.8 | | | | 434.2 | | | | 430.1 | |
Total crude oil throughput (in millions of barrels) | | | 146.3 | | | | 164.9 | | | | 171.3 | | | | 160.5 | | | | 150.7 | | | | 39.1 | | | | 38.7 | |
Per barrel of crude oil throughput ($ per barrel) | | | | | | | | | | | | | | | | | | | | | | | | | | | | |
Gross margin | | $ | 3.18 | | | $ | 2.54 | | | $ | 4.31 | | | $ | 7.25 | | | $ | 4.42 | | | $ | 4.25 | | | $ | 6.88 | |
Operating expenses | | | 2.33 | | | | 2.44 | | | | 2.72 | | | | 2.91 | | | | 2.86 | | | | 2.93 | | | | 3.02 | |
25
| | | As of December 31,
| | As of March 31,
2003
|
| | | 1998
| | 1999
| | 2000
| | 2001
| | 2002
| |
| | | (in millions, except as noted) | | (unaudited) |
Balance sheet data: | | | | | | | | | | | | | | | | | | |
Cash, cash equivalents and short-term investments(6) | | $ | 152.0 | | $ | 286.4 | | $ | 252.9 | | $ | 484.2 | | $ | 183.1 | | $ | 311.3 |
Working capital | | | 361.8 | | | 267.0 | | | 261.1 | | | 429.2 | | | 243.2 | | | 530.5 |
Total assets | | | 1,447.0 | | | 1,960.4 | | | 2,414.0 | | | 2,477.9 | | | 2,246.3 | | | 3,129.3 |
Long-term debt | | | 808.4 | | | 1,165.4 | | | 1,341.0 | | | 1,328.4 | | | 884.8 | | | 1,165.2 |
Stockholder’s equity | | | 225.0 | | | 222.3 | | | 328.7 | | | 443.8 | | | 627.8 | | | 931.9 |
| (1) | | Certain reclassifications have been made to our prior period amounts to conform them to current period presentation. |
| (2) | | Amortization includes amortization of turnaround costs. However, this may not be permitted under GAAP in future periods. |
| (3) | | EBITDA is earnings before interest, taxes, depreciation and amortization. EBITDA is a commonly used non-GAAP financial measure but should not be construed as an alternative to operating income or net income as an indicator of our performance, or as an alternative to cash flow from operating activities, investing activities or financing activities as a measure of liquidity, in each case as such measures are determined in accordance with GAAP. EBITDA is presented because we believe that it is a useful indicator of a company’s ability to incur and service debt. EBITDA, as we calculate it, may not be comparable to similarly-titled measures reported by other companies. Our calculations are as follows: |
| | | Year Ended December 31,
| | | Three Months
Ended March 31,
|
| | | 1998
| | 1999
| | 2000
| | 2001
| | 2002
| | | 2002
| | | 2003
|
| | | (in millions, unaudited) |
Operating income (loss) | | $ | 2.1 | | $ | 7.7 | | $ | 146.5 | | $ | 366.2 | | $ | (88.0 | ) | | $ | (128.6 | ) | | $ | 94.5 |
Depreciation and amortization | | | 54.4 | | | 63.0 | | | 71.7 | | | 91.9 | | | 88.9 | | | | 22.2 | | | | 24.0 |
| | |
|
| |
|
| |
|
| |
|
| |
|
|
| |
|
|
| |
|
|
EBITDA | | $ | 56.5 | | $ | 70.7 | | $ | 218.2 | | $ | 458.1 | | $ | 0.9 | | | $ | (106.4 | ) | | $ | 118.5 |
| | |
|
| |
|
| |
|
| |
|
| |
|
|
| |
|
|
| |
|
|
| (4) | | Interest expense and finance income, net, includes amortization of debt issuance costs of $2.2 million, $7.3 million, $11.8 million, $14.3 million, $12.1 million, $3.5 million and $2.4 million for the years ended December 31, 1998, 1999, 2000, 2001, and 2002, and for the three months ended March 31, 2002 and 2003, respectively. Interest expense and finance income, net, also includes interest on all indebtedness, net of capitalized interest and interest income. |
| (5) | | The ratio of earnings to fixed charges is calculated by dividing earnings from continuing operations before income taxes and minority interest, as adjusted, by fixed charges. Earnings from continuing operations before income taxes and minority interest is adjusted to reflect only distributed earnings of investments accounted for under the equity method, plus fixed charges and amortization of capitalized interest, less capitalized interest. Fixed charges consist of interest on indebtedness, including capitalized interest and amortization of discount and debt issuance costs, and one-third of rental and lease expense, the approximate portion representing interest. As a result of losses, earnings were insufficient to cover fixed charges by $51.3 million, $87.2 million and $193.0 million for the years ended December 31, 1998, 1999 and 2002 and $157.8 million for the three months ended March 31, 2002. |
| (6) | | Cash, cash equivalents and short-term investments included $30.8 million, $61.7 million and $53.8 million of cash and cash equivalents restricted for debt service as of December 31, 2001 and 2002 and as of March 31, 2003. |
26
MANAGEMENT’S DISCUSSION AND ANALYSIS OF FINANCIAL CONDITION
AND RESULTS OF OPERATIONS
Overview
The Premcor Refining Group Inc. is 100% owned by Premcor USA Inc., or Premcor USA, which in turn is 100% owned by Premcor Inc. We are an independent petroleum refiner and supplier of unbranded transportation fuels, heating oil, petrochemical feedstocks, petroleum coke and other petroleum products in the United States. We own and operate three refineries with a combined crude oil throughput capacity of approximately 610,000 barrels per day, or bpd. Our refineries are located in Port Arthur, Texas, Memphis, Tennessee and Lima, Ohio. We acquired our Memphis refinery in March 2003. We sell petroleum products in the Midwest, the Gulf Coast and the Eastern and Southeastern United States. We sell our products on an unbranded basis to approximately 1,200 distributors and chain retailers through a combination of our own product distribution system and an extensive third-party owned product distribution system, as well as in the spot market.
Recent Developments
Acquisition of the Memphis refinery and related financings
Effective March 3, 2003, we completed the acquisition of our Memphis, Tennessee refinery and related supply and distribution assets from The Williams Companies, Inc. and certain of its subsidiaries, or Williams, at an adjusted purchase price of $310 million plus approximately $159 million for crude and product inventories. The Memphis refinery has a rated crude oil throughput capacity of 190,000 bpd but typically processes approximately 170,000 bpd. The related assets include two truck-loading racks; three petroleum terminals in the area; supporting pipeline infrastructure that transports both crude oil and refined products; crude oil tankage at St. James, Louisiana; and an 80 megawatt power plant adjacent to the refinery. The transfer of certain of these assets remains subject to obtaining certain third party consents. No portion of the purchase price was held back relative to this delayed transfer and we are able to utilize these assets based on interim agreements.
The acquisition of the Memphis refinery and related supply and distribution assets was accounted for using the purchase method, and the results of operations of these assets have been included in our first quarter results from the date of acquisition. The preliminary purchase price allocation, which is subject to change pending finalization of the crude and product inventory settlement with Williams, completion of independent appraisals, and completion of other evaluations including the assessment of any asset retirement obligations, is as follows (in millions):
Current assets | | $ | 174.3 | |
Property, plant, and equipment | | | 321.9 | |
Accrued liabilities (including current portion of long-term debt) | | | (11.2 | ) |
Long-term debt (capital leases) | | | (10.2 | ) |
| | |
|
|
|
| | | $ | 474.8 | |
| | |
|
|
|
As part of the purchase agreement, we assumed liabilities of $11.2 million that primarily related to cancellation fees for contracts entered into by Williams for Tier II technology that will not be utilized by us and environmental remediation of a recently closed land farm. Williams assigned several leases to us including two capitalized leases that relate to the leasing of crude oil and product pipelines that are within the Memphis refinery system connecting the refinery to storage facilities and other third party pipelines. Both capital leases have 15-year terms with approximately 14 years of the term remaining.
The purchase agreement also provides for contingent participation, or earn-out, payments up to a maximum aggregate of $75 million to Williams over the next seven years, depending on the level of industry refining margins during that period. See “—Outlook—Earn-out Payments,” for a further discussion.
27
We acquired the refinery and related assets utilizing a portion of the proceeds from the issuance of $525 million in senior notes and utilizing capital contributions from Premcor Inc., which were funded from the proceeds of a public and private offering of common stock. We also amended and restated our credit agreement to allow for the acquisition. See “—Liquidity and Capital Resources—Cash Flows from Financing Activities” for additional details of the financings.
Announced Expansion Plans at Port Arthur Refinery
In May 2003, we announced plans to expand our Port Arthur, Texas refinery. The plans include increasing Port Arthur’s crude oil throughput capacity from its current rate of 250,000 bpd to approximately 325,000 bpd, and expanding the coker unit capacity from its current rated capacity of 80,000 bpd to 105,000 bpd, which will further increase our ability to process lower cost, heavy sour crude oil. The project is estimated to cost between $200 million and $220 million and is expected to be completed in the fourth quarter of 2005.
In June 2003, we completed a private placement offering of $300 million in senior notes, due 2015, bearing interest at 7.5% per annum. The proceeds from this offering will be used for capital expenditures, including the plans to expand our Port Arthur, Texas refinery, for acquisitions and for working capital and general corporate purposes.
Crude Oil Purchase Commitment
In June 2003, we purchased the 2.7 million barrels of crude oil in the pipeline system supplying our Lima refinery at then current market prices from Morgan Stanley Capital Group Inc., or MSCG. We had an agreement with MSCG to purchase these barrels in October 2003, but settled the agreement at a net cost to us of approximately $80 million in late June 2003.
Proposed sale of the Hartford refinery
In April 2003, we announced that we had signed a memorandum of understanding with ConocoPhillips to sell the Hartford refining assets and certain storage and distribution assets for $40 million. The sale is subject to execution of a definitive purchase and sale agreement and other conditions. In the first quarter of 2003, we recorded a $16.6 million refinery restructuring charge related to this proposed transaction, which included the write-down of refining assets held for sale and certain storage and distribution assets included in property, plant and equipment and certain other costs of the sale.
St. Louis office restructuring
As of December 31, 2002, we had a $4.9 million reserve for plans announced in the third quarter of 2002 to reduce additional staff at the St. Louis administrative office in early 2003. Due to the Memphis refinery acquisition, the number of positions to be eliminated has been reduced by 25. As a result, we recorded a reduction in the restructuring reserve of $1.6 million in the first quarter of 2003. In May 2003, we announced that we would be closing the St. Louis office and moving the administrative functions to the Connecticut office over the next six to twelve months. The office move is expected to cost approximately $12.8 million, which includes $6.9 million of severance related benefits and $5.9 million of other costs such as training, relocation, and the movement of physical assets. The severance related costs will be amortized over the future service period of the affected employees and the other costs will be expensed as incurred. We expect to record a $0.7 million charge in June 2003 related to this restructuring activity.
Discontinued Operations
In connection with the 1999 sale of our retail assets to Clark Retail Enterprises, Inc., or CRE, we assigned approximately 170 leases and subleases of retail stores to CRE. We remain jointly and severally liable for
28
approximately 150 of these leases, including payment of rent and taxes. We may also be contingently liable for environmental obligations at these sites. CRE and its parent company, Clark Retail Group, Inc., filed for voluntary bankruptcy in October 2002. In bankruptcy hearings in January, February and March 2003, CRE rejected approximately 30 of these leases. We recorded an after-tax charge of $4.3 million in the first quarter of 2003 representing the estimated net present value of our remaining liability under these rejected leases, net of estimated sub-lease income. In May 2003, CRE announced that it would conduct an orderly sale of its retail assets, including the lease sites which have not been rejected. The remaining future lease payments on these properties is currently estimated as follows: (in millions) 2003—$9.8, 2004—$10.1, 2005—$10.5, 2006—$10.9, 2007—$11.3, and in the aggregate thereafter—$84.2. In an effort to mitigate any losses we might incur as a result of the CRE bankruptcy, we are participating in the marketing of CRE’s subleases and discussing alternatives with representatives of CRE’s interests and with certain landlords. It is possible that we may incur additional liability for CRE lease obligations or other costs as CRE finalizes the disposition of the properties; however, the amounts are not estimable at this time and could be material. Should any additional leases revert to us, we will attempt to reduce the potential liability by subletting or reassigning the leases.
Factors Affecting Comparability
In addition to the recent developments discussed above, our results over the past three years and over the three months ended March 31, 2003 and 2002 have been affected by the following events, which must be understood in order to assess the comparability of our period to period financial performance.
Refinery Restructuring and Other Charges
In the first quarter of 2003, we recorded net refinery restructuring and other charges of $15.0 million, which consisted of a pretax charge of $16.6 million related to the proposed disposition of the Hartford refining assets and pretax income of $1.6 million related to a reduction in the St. Louis office restructuring reserve.
In the first quarter of 2002, we recorded net refinery restructuring and other charges of $142.0 million, which consisted of a $131.2 million charge related to the then planned shutdown of refining operations at our Hartford, Illinois refinery, a $15.8 million charge related to the restructuring of management and administrative functions, and income of $5.0 million related to the unanticipated sale of a portion of the Blue Island refinery assets previously written off.
In 2002, we recorded net refinery restructuring and other charges of $168.7 million, which consisted of the following:
| | • | | a $137.4 million charge related to the shutdown of refining operations at our Hartford, Illinois refinery, |
| | • | | a $32.4 million charge related to the restructuring of our management team, refinery operations and administrative functions, |
| | • | | income of $5.0 million related to the unanticipated sale of a portion of the Blue Island refinery assets previously written off, |
| | • | | a $2.5 million charge related to the termination of certain guarantees at PACC as part of the Sabine restructuring, and |
| | • | | a $1.4 million loss related to the sale of idled assets. |
In 2001, we recorded refinery restructuring and other charges of $176.2 million, which consisted of a $167.2 million charge related to the closure of our Blue Island, Illinois refinery and a $9.0 million charge related to the write-off of idled coker units at our Port Arthur refinery. The write-off of the Port Arthur coker units included a charge of $5.8 million related to the net asset value of the idled cokers and a charge of $3.2 million for future environmental clean-up costs related to the coker unit site.
Below are further discussions of the Hartford and Blue Island refinery closures and the management team, refinery, and administrative function restructuring.
Hartford Refinery Closure and Proposed Sale. In late September 2002, we ceased refining operations at our Hartford refinery after concluding there was no economically viable method of reconfiguring the refinery to produce fuels meeting new gasoline and diesel fuel specifications mandated by the federal government. A pretax charge of $137.4 million was recorded in 2002, which included $70.7 million of non-cash long-lived asset write-offs to reduce the refinery assets to their estimated net realizable value of $61.0 million and $4.8 million of non-
29
cash current asset write-offs. The net realizable value was determined by estimating the value of the assets in a sale or operating lease transaction and was recorded as a current asset on the balance sheet. In October 2002, we announced that we would continue to operate our storage and distribution facility at the refinery site to accommodate our wholesale operations. As a result of this decision, we reclassified the net book value of the storage and distribution facility assets from assets held for sale to property, plant and equipment. This reduced the estimated fair value of the remaining refinery assets to $49.0 million.
In April 2003, we announced that we had signed a memorandum of understanding with ConocoPhillips to sell the Hartford refining assets and certain storage and distribution assets for $40 million. We recorded a $16.6 million pretax restructuring charge in the first quarter of 2003 in connection with this proposed transaction. The sale is subject to execution of a definitive purchase and sale agreement and other conditions.
The total charge also included a reserve for future costs of $60.6 million. The following schedule summarizes the activity and balance of the closure reserve as of March 31, 2003:
| | | Reserve as of
December 31, 2002
| | Net Cash
Outlay
| | | Reserve as of
March 31, 2003
|
| | | (in millions) |
Employee severance | | $ 0.6 | | $ | (0.6 | ) | | $ — |
Plant closure/equipment remediation | | 0.4 | | | (0.4 | ) | | — |
Site clean-up/environmental matters | | 29.6 | | | 0.2 | | | 29.8 |
| | |
| |
|
|
| |
|
| | | $30.6 | | $ | (0.8 | ) | | $29.8 |
| | |
| |
|
|
| |
|
In the fourth quarter of 2002, we completed the process unit shutdown and hydrocarbon purging and terminated all employee positions, which approximated 310 hourly (covered by collective bargaining agreements) and salaried positions. The site clean-up and environmental reserve takes into account costs that are reasonably foreseeable at this time. As the final disposition of the refinery assets is determined and a site remediation plan refined, further adjustments of the reserve may be necessary, and such adjustments may be material.
Since the Hartford refinery operation had been only marginally profitable over the last 10 years and since substantial investment would be required to meet new required product specifications in the future, our reduced refining capacity resulting from the shutdown is not expected to have a significant negative impact on net income or cash flow. The only anticipated effect on net income and cash flow in the future will result from the final disposition of the assets and subsequent environmental site remediation. Unless there is a need to adjust the estimated fair value or the reserve in the future as discussed above, there should be no significant effect on net income beyond 2002.
Finally, the total charge included a $1.0 million reserve related to post-retirement benefits that were extended to certain employees who were nearing the retirement requirements. This liability was recorded in long-term liabilities on the balance sheet together with our other post-retirement liabilities.
Blue Island Refinery Closure. In January 2001, we ceased refining operations at our Blue Island, Illinois refinery due to economic factors and a decision that the capital expenditures necessary to produce low sulfur transportation fuels required by new regulations could not produce acceptable returns on our investment. This closure resulted in a pretax charge of $167.2 million in 2001, which included $98.1 million of non-cash asset write-offs in excess of realizable value and a $69.1 million reserve for closure activities. We continue to utilize our storage and distribution facility at our refinery site to supply selected products to the Chicago and other Midwest markets from our operating refineries. Since our Blue Island refinery operation had been only marginally profitable in recent years and since we will continue to operate a petroleum products storage and distribution business from the Blue Island site, our reduced refining capacity resulting from the closure is not expected to have a significant negative impact on net income or cash flow from operations. The only significant effect on cash flow will result from the environmental site remediation as discussed below. Unless there is a need to adjust the site remediation reserve in the future, there should be no significant effect on net income beyond 2001.
30
As of March 31, 2003, we had a $19.2 million reserve for future costs associated with the site clean-up and environmental matters. We are currently in discussions with governmental agencies concerning a remediation program, which we believe will likely lead to a final remediation plan before the end of 2003. Our site clean-up and environmental reserve takes into account costs that are reasonably foreseeable at this time, based on studies performed in conjunction with obtaining the insurance policy discussed below. As the site remediation plan is finalized and work is performed, further adjustments of the reserve may be necessary.
In 2002, environmental risk insurance policies covering the Blue Island refinery site were procured and bound, with final policies issued in the second quarter of 2003. This insurance program will allow us to quantify and, within the limits of the policy, cap our cost to remediate the site, and provide insurance coverage from future third party claims arising from past or future environmental releases. The remediation cost overrun policy has a term of ten years and, subject to certain exceptions and exclusions, provides $25 million in coverage in excess of a self-insured retention amount of $26 million. The pollution legal liability policy provides for $25 million in aggregate coverage and per incident coverage in excess of a $100,000 deductible. We believe this program also provides governmental agencies financial assurance that, once begun, remediation of the site will be completed in a timely and prudent manner.
Management, Refinery Operations and Administrative Restructuring.In February 2002, we began the restructuring of our executive management team and subsequently our administrative functions with the hiring of Thomas D. O’Malley as chairman, chief executive officer and president and William E. Hantke as executive vice president and chief financial officer. In the first quarter of 2002, as a result of the resignation of the officers who previously held these positions, we recognized severance expense of $5.0 million and non-cash compensation expense of $5.8 million resulting from modifications of stock option terms. In addition, we incurred a charge of $5.0 million for the cancellation of a monitoring agreement with an affiliate of Blackstone.
In the second quarter of 2002, we commenced a restructuring of our St. Louis-based general and administrative operations and recorded a charge of $6.5 million for severance, outplacement and other restructuring expenses relating to the elimination of 107 hourly and salaried positions. In the third quarter of 2002, we announced plans to reduce our non-represented workforce at our Port Arthur, Texas and Lima, Ohio refineries and make additional staff reductions at our St. Louis administrative office. We recorded a charge of $10.1 million for severance, outplacement, and other restructuring expenses relating to the elimination of 140 hourly and salaried positions. Included in this charge is $1.3 million related to post-retirement benefits that were extended to certain employees who were nearing the retirement requirements. This liability was recorded in long-term liabilities on the balance sheet together with our other post-retirement liabilities. Reductions at the refineries occurred in October 2002 and those at the St. Louis office are scheduled to take place in 2003. As a result of the Memphis refinery acquisition, the number of positions to be eliminated at the St. Louis office had been reduced by 25 and we recorded a reduction in the restructuring reserve of $1.6 million in the first quarter of 2003. In May 2003, we announced that we would be closing the St. Louis office and moving the administrative functions to the Connecticut office over the next six to twelve months. The office move is expected to cost approximately $12.8 million, which includes $6.9 million of severance related benefits and $5.9 million of other costs such as training, relocation, and the movement of physical assets. The severance related costs will be amortized over the future service period of the affected employees and the other costs will be expensed as incurred. We expect to record a $0.7 million charge in June 2003 related to this restructuring activity. The reserve related to the St. Louis restructuring was as follows:
| | | Reserve as of
December 31,
2002
| | Adjustment to Reserve
| | | Net Cash Outlay
| | | Reserve as of
March 31,
2003
|
| | | (in millions) |
St. Louis restructuring | | $ | 4.9 | | $ | (1.6 | ) | | $ | (1.5 | ) | | $ | 1.8 |
| | |
|
| |
|
|
| |
|
|
| |
|
|
Gain (Loss) on Extinguishment of Long-term Debt
In the first quarter of 2003, we recorded a pretax loss of $4.7 million, which included a write-off of unamortized deferred financing costs related to the repayment of the floating rate loan and the amendment of our credit agreement.
31
In 2002, we redeemed the outstanding balances of our 9½% senior notes and senior secured bank loan. We recorded a pretax loss on extinguishment of long-term debt of $9.3 million related to these early repayments. The loss included premiums associated with the early repayment of long-term debt of $0.9 million, a write-off of unamortized deferred financing costs related to this debt of $7.8 million, and the write-off of a prepaid premium for an insurance policy guaranteeing the interest and principal payments on Sabine’s long-term debt of $0.6 million.
In 2001, we repurchased in the open market portions of our 9½% senior notes and as a result, recorded a pretax gain of $0.8 million, which included a discount of $1.0 million offset by the write-off of deferred financing costs.
Discontinued Operations
In connection with the 1999 sale of retail assets to CRE, we assigned approximately 170 leases and subleases of retail stores to CRE. We remain jointly and severally liable for CRE’s obligations under approximately 150 of these leases, including payment of rent and taxes. We may also be contingently liable for environmental obligations at these sites. In October 2002, CRE and its parent company, Clark Retail Group, Inc., filed a voluntary petition for reorganization under Chapter 11 of the U.S. Bankruptcy Code. In bankruptcy hearings held in the first quarter of 2003, CRE rejected approximately 30 of these leases. We recorded an after-tax charge of $4.3 million in the first quarter of 2003 representing the estimated net present value of our remaining liability under these rejected leases, net of estimated sub-lease income. In May 2003, CRE announced that it would conduct an orderly sale of its retail assets, including the lease sites which have not been rejected. The remaining future lease payments on these properties is currently estimated as follows: (in millions) 2003 —$9.8, 2004—$10.1, 2005—$10.5, 2006—$10.9, 2007—$11.3, and in the aggregate thereafter—$84.2. In an effort to mitigate any losses we might incur as a result of the CRE bankruptcy, we are participating in the marketing of CRE’s subleases and discussing alternatives with representatives of CRE’s interests and with certain landlords. It is possible that we may incur additional liability for CRE lease obligations or other costs as CRE finalizes the disposition of the properties; however, the amounts are not estimable at this time and could be material. Should any additional leases revert to us, we will attempt to reduce the potential liability by subletting or reassigning the leases.
In 2001, we recorded a pretax charge of $29.5 million, or $18.0 million net of income taxes, related to the environmental and other liabilities of some of our previously owned retail sites. This charge represented an increase in estimate regarding our environmental clean up obligation and workers compensation liability and a decrease in the amount of reimbursements for environmental expenditures that are collectible from state agencies under various programs. The changes in estimates were prompted by the availability of new information concerning site by site clean up plans, changing postures of state regulatory agencies, and fluctuations in the amounts available under state reimbursement programs.
Sabine Restructuring
On June 6, 2002, we completed a series of transactions, referred to as the Sabine restructuring, which resulted in Sabine River Holding Corp. and its subsidiaries, or Sabine, becoming our wholly owned subsidiaries. Sabine, through its subsidiary, Port Arthur Coker Company, or PACC, owns and operates a heavy oil processing facility, which is operated in conjunction with our Port Arthur, Texas refinery. PACC owns all of the outstanding common stock of Port Arthur Finance Corp., or PAFC. Prior to the Sabine restructuring, Sabine was 90% owned by Premcor Inc. and 10% owned by Occidental.
Operation of the Port Arthur Heavy Oil Upgrade Project
In January 2001, we began operating our heavy oil upgrade project at our Port Arthur refinery. The project, which began construction in 1998, included the construction of a new 80,000 bpd delayed coking unit, a 35,000 bpd hydrocracker unit, a 417 ton per day sulfur removal unit and the expansion of the existing crude unit capacity to 250,000 bpd.
32
As a result of the heavy oil upgrade project, our Port Arthur refinery is able to process significant quantities of sour and heavy sour crude oil, increasing from 43,400 bpd in 2000 to 181,500 bpd in 2001. Sour and heavy sour crude oils have historically traded at a discount to West Texas Intermediate crude oil. Accordingly, our Port Arthur crude oil costs were reduced as a result of the heavy oil upgrade project. Although the heavy oil upgrade project has enabled us to process a less costly crude oil slate, the overall value of the resulting product slate is lower due to increased production of petroleum coke and other lower-valued products. In addition, the operating cost structure is higher under the new configuration of the Port Arthur refinery. Our operating results for 2002 and 2001 demonstrate that the benefit of the lower cost crude oil slate exceeds the lower production values and higher operating costs. See “Management’s Discussion and Analysis of Financial Condition and Results of Operations—2001 Compared to 2000 and 2002 Compared to 2001.”
Factors Affecting Operating Results
Our earnings and cash flow from operations are primarily affected by the relationship between refined product prices and the prices for crude oil and other feedstocks. The cost to acquire feedstocks and the price of refined products ultimately sold depends on numerous factors beyond our control, including the supply of, and demand for, crude oil, gasoline and other refined products which, in turn, depend on, among other factors, changes in domestic and foreign economies, weather conditions, domestic and foreign political affairs, production levels, the availability of imports, the marketing of competitive fuels, product pipeline capacity, and the extent of government regulation. While our net sales and operating revenues fluctuate significantly with movements in industry refined product prices, such prices do not generally have a direct long-term relationship to net earnings. Crude oil price movements may impact net earnings in the short-term because of fixed price crude oil purchase commitments. The effect of changes in crude oil prices on our operating results is influenced by how the prices of refined products adjust to reflect such changes.
Crude oil and other feedstock costs and the price of refined products have historically been subject to wide fluctuation. Expansion of existing facilities and installation of additional refinery crude distillation and upgrading facilities, price volatility, international political and economic developments and other factors beyond our control are likely to continue to play an important role in refining industry economics. These factors can impact, among other things, the level of inventories in the market resulting in price volatility and a reduction in product margins. Moreover, the industry typically experiences seasonal fluctuations in demand for refined products, such as for gasoline during the summer driving season and for home heating oil during the winter, primarily in the Northeast.
In order to assess our operating performance, we compare our gross margin (net sales and operating revenue less cost of sales) against an industry gross margin benchmark. The industry gross margin is based on a crack spread. For example, one such crack spread is calculated by assuming that two barrels of benchmark light sweet crude oil is converted, or cracked, into one barrel of conventional gasoline and one barrel of high sulfur diesel fuel. This is referred to as the 2/1/1 crack spread. We calculate the benchmark margin using the market value of U.S. Gulf Coast gasoline and diesel fuel against the market value of West Texas Intermediate crude oil and refer to that benchmark as the Gulf Coast 2/1/1 crack spread, or simply, the Gulf Coast crack spread. The Gulf Coast crack spread is expressed in dollars per barrel and is a proxy for the per barrel margin that a sweet crude oil refinery situated on the Gulf Coast would earn assuming it produced and sold the benchmark production of conventional gasoline and high sulfur diesel fuel. We also use the Gulf Coast 2/1/1 crack spread as a benchmark for our Memphis refinery operations. We utilize the Chicago 3/2/1 crack spread as a benchmark for our Lima refinery operations. As explained below, each of our refineries, depending on market conditions, has certain feedstock cost and/or product value advantages and disadvantages as compared to the benchmark.
Our Port Arthur refinery is able to process significant quantities of sour and heavy sour crude oil that has historically cost less than West Texas Intermediate crude oil. We measure the cost advantage of heavy sour crude oil by calculating the spread between the value of Maya crude oil, a heavy crude oil produced in Mexico, to the value of West Texas Intermediate crude oil, a light crude oil. We use Maya crude oil for this measurement because a significant amount of our heavy sour crude oil throughput is Maya. We measure the cost advantage of
33
sour crude oil by calculating the spread between the throughput value of West Texas Sour crude oil to the value of West Texas Intermediate crude oil. In addition, since we are able to source both domestic pipeline crude oil and foreign tanker crude oil to each of our refineries, the value of foreign crude oil relative to domestic crude oil is also an important factor affecting our operating results. Since many foreign crude oils other than Maya are priced relative to the market value of a benchmark North Sea crude oil known as Dated Brent, we also measure the cost advantage of foreign crude oil by calculating the spread between the value of Dated Brent crude oil to the value of West Texas Intermediate crude oil.
We have crude oil supply contracts that provide for our purchase of up to approximately 370,000 bpd of crude oil from PMI Comercio Internacional, S.A. de C.V., an affiliate of Petroleos Mexicanos, the Mexican state oil company, or PEMEX, and Morgan Stanley Capital Group Inc., or MSCG. The affiliate of PEMEX provides for our purchase of approximately 200,000 bpd of crude oil under two separate contracts. One of these contracts is a long-term agreement, under which we currently purchase approximately 162,000 bpd of Maya crude oil, designed to provide us with a stable and secure supply of Maya crude oil. An important feature of this agreement is a price adjustment mechanism designed to minimize the effect of adverse refining margin cycles and to moderate the fluctuations of the coker gross margin, a benchmark measure of the value of coker production over the cost of coker feedstocks. This price adjustment mechanism contains a formula that represents an approximation of the coker gross margin and provides for a minimum average coker margin of $15 per barrel over the first eight years of the agreement, which began on April 1, 2001. The agreement expires in 2011. For purposes of comparison, the $15 per barrel minimum average coker gross margin support amount equates to a WTI/Maya crude oil differential of approximately $6 per barrel using market prices from 1988 to 2002, which slightly exceeds actual market differentials during that period.
On a monthly basis, the coker gross margin, as defined under this agreement, is calculated and compared to the minimum. Coker gross margins exceeding the minimum are considered a “surplus” while coker gross margins that fall short of the minimum are considered a “shortfall.” On a quarterly basis, the surplus and shortfall determinations since the beginning of the contract are aggregated. Pricing adjustments to the crude oil we purchase is only made when there exists a cumulative shortfall. When this quarterly aggregation first reveals that a cumulative shortfall exists, we receive a discount on our crude oil purchases in the next quarter in the amount of the cumulative shortfall. If thereafter, the cumulative shortfall incrementally increases, we receive additional discounts on our crude oil purchases in the succeeding quarter equal to the incremental increase. Conversely, if thereafter, the cumulative shortfall incrementally decreases, we repay discounts previously received, or a premium, on our crude oil purchases in the succeeding quarter equal to the incremental decrease. Cash crude oil discounts received by us in any one quarter are limited to $30 million, while our repayment of previous crude oil discounts, or premiums, is limited to $20 million in any one quarter. Any amounts subject to the quarterly payment limitations are carried forward and applied in subsequent quarters.
As of March 31, 2003, a cumulative quarterly surplus of $137.7 million existed under the contract. As a result, to the extent that we experience quarterly shortfalls in coker gross margins going forward, the price we pay for Maya crude oil in succeeding quarters will not be discounted until this cumulative surplus is offset by future shortfalls.
We acquire directly or through MSCG the majority of the remainder of our crude oil supply on the spot market from unaffiliated foreign and domestic sources, allowing us to be flexible in our crude oil supply source.
The sales value of our production is also an important consideration in understanding our results. We produce a high volume of premium products, such as premium and reformulated gasoline, low sulfur diesel fuel, jet fuel, and petrochemical products that carry a sales value significantly greater than that for the products used to calculate the Gulf Coast crack spread. In addition, products produced by our Lima refinery are generally of higher value than similar products produced on the Gulf Coast due to the fact that the Midwest consumes more product than it produces, thereby creating a competitive advantage for Midwest refiners that can produce and deliver refined products at a cost lower than importers of refined product into the region. This advantage is measured by the excess of the Chicago crack spread over the Gulf Coast crack spread.
34
Another important factor affecting operating results is the relative quantity of higher value transportation fuels and petrochemical products compared to the production of residual fuel oil and other by-products such as petroleum coke and sulfur. Our Lima refinery produces a product slate that is of significantly higher value than the products used to calculate the Gulf Coast crack spread. Our Lima refinery also benefits from its mid-continental location, in addition to the fact that it produces a greater percentage of high value transportation fuels as a result of processing a predominantly sweet crude oil slate. In contrast to our Lima refinery, our Port Arthur refinery produces a product slate that approximates the value of the products used to calculate the Gulf Coast crack spread. Although the significant shift to heavy sour crude oil resulting from the completion of the heavy oil upgrade project has slightly lowered the overall value of the products produced at the refinery, the lower crude oil cost has greatly exceeded the decline in product value.
Our operating cost structure is also important to our profitability. Major operating costs include costs relating to energy, employee and contract labor, maintenance, and environmental compliance. The predominant variable cost is energy and the most important benchmark for energy costs is the value of natural gas. Because the complexity of the Port Arthur refinery and its ability to process greater volumes of heavy sour crude oil increased significantly as a result of the heavy oil upgrade project, the refinery now has a higher operating cost structure, primarily related to energy and labor.
Safety, reliability and the environmental performance of our refinery operations are critical to our financial performance. Unplanned downtime of our refinery assets generally results in lost margin opportunity, increased maintenance expense and a temporary increase in working capital investment and related inventory position. If we choose to hedge the incremental inventory position, we are subject to market and other risks normally associated with hedging activities. The financial impact of planned downtime, such as major turnaround maintenance, is mitigated through a diligent planning process that considers such things as margin environment, availability of resources to perform the needed maintenance and feedstock logistics.
The nature of our business leads us to maintain a substantial investment in petroleum inventories. Since petroleum feedstocks and products are essentially commodities, we have no control over the changing market value of our investment. Our inventory investment includes both titled inventory and fixed price purchase and sale commitments. In 2003, with the acquisition of our Memphis refinery, our average fixed price purchase commitments when offset by our fixed price sale commitments increased to a net long inventory position of approximately eight million barrels. We are generally leaving the titled portion of our inventory position fully exposed to price fluctuation; however, beginning in the second quarter of 2002, we began to actively mitigate some or all of the price risk related to our fixed price purchase and sale commitments. These risk management decisions are based on the relative level of absolute hydrocarbon prices. We generally conduct risk mitigation activities through the purchase or sale of futures contracts on the New York Mercantile Exchange, or NYMEX. Our price risk mitigation activities carry all of the usual time, location and product grade basis risks generally associated with these activities. Because our titled inventory is valued under the last-in, first-out costing method, price fluctuations on our titled inventory have very little effect on our financial results unless the market value of our inventory is reduced below cost. However, since the current cost of our inventory purchases and sales are generally charged to our statement of operations, our financial results are affected by price movements on the portion of our fixed price purchase and sale commitments that are not price protected.
35
Results of Operations
The following table provides supplementary income statement and operating data.
| | | Year Ended December 31,
| | | Three Months Ended March 31
| |
| Financial Results | | 2000
| | | 2001
| | | 2002
| | | 2002
| | | 2003
| |
| | | (in millions) | |
Net sales and operating revenues | | $ | 7,301.7 | | | $ | 6,417.5 | | | $ | 6,772.6 | | | $ | 1,228.3 | | | $ | 2,375.8 | |
Cost of sales | | | 6,564.1 | | | | 5,253.2 | | | | 6,106.0 | | | | 1,062.0 | | | | 2,109.6 | |
| | |
|
|
| |
|
|
| |
|
|
| |
|
|
| |
|
|
|
Gross margin | | | 737.6 | | | | 1,164.3 | | | | 666.6 | | | | 166.3 | | | | 266.2 | |
Operating expenses | | | 466.7 | | | | 466.9 | | | | 431.5 | | | | 114.4 | | | | 116.7 | |
General and administrative expenses | | | 52.7 | | | | 63.1 | | | | 51.5 | | | | 14.4 | | | | 11.7 | |
Stock-based compensation | | | — | | | | — | | | | 14.0 | | | | 1.9 | | | | 4.3 | |
Depreciation and amortization | | | 71.7 | | | | 91.9 | | | | 88.9 | | | | 22.2 | | | | 24.0 | |
Refinery restructuring and other charges | | | — | | | | 176.2 | | | | 168.7 | | | | 142.0 | | | | 15.0 | |
| | |
|
|
| |
|
|
| |
|
|
| |
|
|
| |
|
|
|
Operating income (loss) | | | 146.5 | | | | 366.2 | | | | (88.0 | ) | | | (128.6 | ) | | | 94.5 | |
Interest expense and finance income, net | | | (64.3 | ) | | | (122.3 | ) | | | (92.1 | ) | | | (28.3 | ) | | | (25.1 | ) |
Gain (loss) on extinguishment of long-term debt | | | — | | | | 0.8 | | | | (9.3 | ) | | | — | | | | (4.7 | ) |
Income tax (provision) benefit | | | 2.2 | | | | (73.0 | ) | | | 73.3 | | | | 60.6 | | | | (21.6 | ) |
Minority interest | | | (0.6 | ) | | | (12.8 | ) | | | 1.7 | | | | 0.8 | | | | — | |
| | |
|
|
| |
|
|
| |
|
|
| |
|
|
| |
|
|
|
Income (loss) from continuing operations | | | 83.8 | | | | 158.9 | | | | (114.4 | ) | | | (95.5 | ) | | | 43.1 | |
Discontinued operations | | | — | | | | (18.0 | ) | | | — | | | | — | | | | (4.3 | ) |
| | |
|
|
| |
|
|
| |
|
|
| |
|
|
| |
|
|
|
Net income (loss) | | $ | 83.8 | | | $ | 140.9 | | | $ | (114.4 | ) | | $ | (95.5 | ) | | $ | 38.8 | |
| | |
|
|
| |
|
|
| |
|
|
| |
|
|
| |
|
|
|
| | |
| | | Year Ended December 31,
| | | Three Months Ended March 31,
| |
| Market Indicators | | 2000
| | | 2001
| | | 2002
| | | 2002
| | | 2003
| |
| | | (dollars per barrel, except as noted) | |
West Texas Intermediate (WTI) crude oil | | $ | 30.37 | | | $ | 25.96 | | | $ | 26.13 | | | $ | 21.59 | | | $ | 34.13 | |
Crack Spreads | | | | | | | | | | | | | | | | | | | | |
Gulf Coast 2/1/1 | | | 4.02 | | | | 3.92 | | | | 2.72 | | | | 2.44 | | | | 5.51 | |
Chicago 3/2/1 | | | 5.84 | | | | 7.90 | | | | 5.00 | | | | 3.68 | | | | 6.42 | |
Crude Oil Differentials: | | | | | | | | | | | | | | | | | | | | |
WTI less Maya (heavy sour) | | | 7.29 | | | | 8.76 | | | | 5.21 | | | | 5.43 | | | | 7.62 | |
WTI less WTS (sour) | | | 2.17 | | | | 2.81 | | | | 1.38 | | | | 1.32 | | | | 3.61 | |
WTI less Dated Brent (foreign) | | | 1.92 | | | | 1.48 | | | | 1.12 | | | | 0.42 | | | | 2.60 | |
Natural gas (dollars per million btu) | | | 3.94 | | | | 4.22 | | | | 3.17 | | | | 2.20 | | | | 6.05 | |
| | |
| | | Year Ended December 31,
| | | Three Months Ended March 31,
| |
| Selected Operational Data | | 2000
| | | 2001
| | | 2002
| | | 2002
| | | 2003
| |
| | | (in thousands of barrels per day, except as noted) | |
Crude oil throughput by refinery: | | | | | | | | | | | | | | | | | | | | |
Port Arthur | | | 202.1 | | | | 229.8 | | | | 224.7 | | | | 231.7 | | | | 244.4 | |
Lima | | | 136.4 | | | | 140.5 | | | | 141.5 | | | | 139.7 | | | | 132.8 | |
Memphis | | | — | | | | — | | | | — | | | | — | | | | 52.9 | |
Hartford | | | 64.2 | | | | 65.5 | | | | 46.6 | | | | 62.8 | | | | — | |
Blue Island | | | 65.3 | | | | 3.9 | | | | — | | | | — | | | | — | |
| | |
|
|
| |
|
|
| |
|
|
| |
|
|
| |
|
|
|
Total crude oil throughput | | | 468.0 | | | | 439.7 | | | | 412.8 | | | | 434.2 | | | | 430.1 | |
Total crude oil throughput (in millions of barrels) | | | 171.3 | | | | 160.5 | | | | 150.7 | | | | 39.1 | | | | 38.7 | |
Per barrel of crude oil throughput (in dollars): | | | | | | | | | | | | | | | | | | | | |
Gross margin | | $ | 4.31 | | | $ | 7.25 | | | $ | 4.42 | | | $ | 4.25 | | | $ | 6.88 | |
Operating expenses | | | 2.72 | | | | 2.91 | | | | 2.86 | | | | 2.93 | | | | 3.02 | |
36
| | | Year Ended December 31,
| | | Three Months Ended March 31,
| |
| | | 2000
| | | 2001
| | | 2002
| | | 2002
| | | 2003(1)
| |
| Selected Volumetric Data | | bpd (thousands)
| | Percent of
Total
| | | bpd (thousands)
| | Percent of
Total
| | | bpd (thousands)
| | Percent of
Total
| | | bpd (thousands)
| | | Percent of
Total
| | | bpd (thousands)
| | | Percent of
Total
| |
Feedstocks: | | | | | | | | | | | | | | | | | | | | | | | | | | | |
Crude oil throughput: | | | | | | | | | | | | | | | | | | | | | | | | | | | |
Sweet | | 201.5 | | 42.6 | % | | 143.6 | | 31.9 | % | | 138.0 | | 32.9 | % | | 134.4 | | | 32.0 | % | | 180.3 | | | 40.8 | % |
Light/medium sour | | 207.4 | | 44.0 | | | 107.7 | | 23.9 | | | 82.0 | | 19.5 | | | 109.3 | | | 25.9 | | | 38.8 | | | 8.7 | |
Heavy sour | | 59.1 | | 12.4 | | | 188.4 | | 41.8 | | | 192.8 | | 45.9 | | | 190.5 | | | 45.2 | | | 211.0 | | | 47.7 | |
| | |
| |
|
| |
| |
|
| |
| |
|
| |
|
| |
|
| |
|
| |
|
|
Total crude oil | | 468.0 | | 99.0 | | | 439.7 | | 97.6 | | | 412.8 | | 98.3 | | | 434.2 | | | 103.1 | | | 430.1 | | | 97.2 | |
Unfinished and blendstocks | | 4.6 | | 1.0 | | | 10.6 | | 2.4 | | | 7.0 | | 1.7 | | | (13.0 | ) | | (3.1 | ) | | 12.2 | | | 2.8 | |
| | |
| |
|
| |
| |
|
| |
| |
|
| |
|
| |
|
| |
|
| |
|
|
Total feedstocks | | 472.6 | | 100.0 | % | | 450.3 | | 100.0 | % | | 419.8 | | 100.0 | % | | 421.2 | | | 100.0 | % | | 442.3 | | | 100.0 | % |
| | |
| |
|
| |
| |
|
| |
| |
|
| |
|
| |
|
| |
|
| |
|
|
Production: | | | | | | | | | | | | | | | | | | | | | | | | | | | |
Light Products: | | | | | | | | | | | | | | | | | | | | | | | | | | | |
Conventional gasoline | | 193.0 | | 40.4 | % | | 184.8 | | 39.9 | % | | 178.0 | | 40.6 | % | | 183.5 | | | 41.3 | % | | 174.8 | | | 38.4 | % |
Premium and reformulated gasoline | | 57.8 | | 12.1 | | | 44.9 | | 9.7 | | | 39.2 | | 9.0 | | | 28.9 | | | 6.5 | | | 47.2 | | | 10.4 | |
Diesel fuel | | 117.8 | | 24.7 | | | 121.7 | | 26.3 | | | 100.5 | | 22.9 | | | 101.8 | | | 22.9 | | | 114.1 | | | 25.1 | |
Jet fuel | | 38.0 | | 8.0 | | | 42.4 | | 9.1 | | | 48.7 | | 11.1 | | | 49.6 | | | 11.2 | | | 53.6 | | | 11.8 | |
Petrochemical feedstocks | | 36.2 | | 7.6 | | | 28.5 | | 6.2 | | | 27.5 | | 6.3 | | | 27.3 | | | 6.2 | | | 26.3 | | | 5.7 | |
| | |
| |
|
| |
| |
|
| |
| |
|
| |
|
| |
|
| |
|
| |
|
|
Subtotal light products | | 442.8 | | 92.8 | | | 422.3 | | 91.2 | | | 393.9 | | 89.9 | | | 391.1 | | | 88.1 | | | 416.0 | | | 91.4 | |
Petroleum coke and sulfur(2) | | 19.0 | | 4.0 | | | 33.1 | | 7.1 | | | 34.6 | | 7.9 | | | 41.0 | | | 9.2 | | | 30.3 | | | 6.6 | |
Residual oil | | 15.5 | | 3.2 | | | 8.0 | | 1.7 | | | 9.7 | | 2.2 | | | 12.1 | | | 2.7 | | | 9.0 | | | 2.0 | |
| | |
| |
|
| |
| |
|
| |
| |
|
| |
|
| |
|
| |
|
| |
|
|
Total production | | 477.3 | | 100.0 | % | | 463.4 | | 100.0 | % | | 438.2 | | 100.0 | % | | 444.2 | | | 100.0 | % | | 455.3 | | | 100.0 | % |
| | |
| |
|
| |
| |
|
| |
| |
|
| |
|
| |
|
| |
|
| |
|
|
| (1) | | We purchased Memphis effective March 3, 2003 and the crude oil throughput reflects 29 days of operations averaged over the first quarter of 2003. Average throughput during the 29 days of operations was 163,972 bpd. |
| (2) | | Volumes are per barrel equivalents |
Three Months Ended March 31, 2003 Compared to Three Months Ended March 31, 2002
Overview. Net income was $38.8 million in the first quarter of 2003 as compared to a net loss of $95.5 million in the corresponding period in 2002. Our operating income was $94.5 million in the first quarter of 2003 as compared to an operating loss of $128.6 million in the corresponding period in 2002. This increase was principally attributable to stronger refining market conditions and a lower restructuring charge in the first quarter of 2003 compared to the corresponding period in 2002.
Our first quarter 2003 results include the operations of our Memphis refinery beginning March 3, 2003, the date of acquisition. Our first quarter 2002 results include the operations of our Hartford refinery. We ceased refining operations at our Hartford refinery in September 2002.
Net Sales and Operating Revenues. Net sales and operating revenues increased $1,147.5 million, or 93%, to $2,375.8 million in the first quarter of 2003 from $1,228.3 million in the corresponding period in 2002. This increase was principally due to higher overall product and crude oil prices in the first quarter of 2003, which was characterized by particularly volatile market conditions. Crude oil and product prices increased significantly in December 2002, with crude prices remaining well over $30 per barrel through most of the first quarter of 2003. Crude oil prices dropped by $6-$8 per barrel for a short period of time in March, only to increase again in late March. There were many factors during the quarter that we believe contributed to the first quarter’s volatile market conditions including: the looming specter of war with Iraq followed by the commencement of the war; production disruptions caused by the Venezuelan oil workers’ strike; and political turmoil in Nigeria that significantly reduced sweet crude oil production exports to the U.S., among others. The high price scenario of 2003 was in sharp contrast to the first quarter of 2002, when overall prices were at more historical levels.
37
Gross Margin. Gross margin increased $99.9 million to $266.2 million in the first quarter of 2003 from $166.3 million in the corresponding period in 2002. The increase in gross margin in 2003 over 2002 was principally driven by significantly stronger market conditions including stronger crack spreads and crude oil differentials, and less scheduled maintenance in 2003 than in 2002. The increase in gross margin was partially offset by losses in price risk management activities.
It is common practice in our industry to look to benchmark market indicators, such as the Gulf Coast 2/1/1 and Chicago 3/2/1 crack spreads, as a predictor of actual refining margins. We utilize the Gulf Coast 2/1/1 as an indicator of refining margins at our Port Arthur and Memphis refineries and the Chicago 3/2/1 as an indicator of refining margins at our Lima refinery. Our actual results will vary as our crude oil and product slates differ from the benchmarks and for other ancillary costs that are not included in the benchmarks, such as transportation costs, storage and credit fees, inventory fluctuations and price risk management activities.
Average crack spreads and crude oil differentials were significantly stronger in the first quarter of 2003 as compared to the first quarter of 2002. The Gulf Coast 2/1/1 and Chicago 3/2/1 crack spreads were approximately 126% and 75% higher, respectively, in the first quarter of 2003 than in the corresponding period in 2002. The crack spreads were weak entering into the first quarter of 2003 but increased significantly as product inventories remained at low levels in a period when they normally build for the spring and summer driving season. Factors we believe impacted product inventory levels in the first quarter of 2003 include: heavy refinery maintenance schedules; product exports to South America; and the cold winter weather, which diverted marginal production from gasoline to distillates used for heating. The strong margin conditions experienced in the first quarter of 2003 were in sharp contrast to the poor market conditions experienced in the first quarter of 2002, when the winter was unseasonably warm and the economic downturn and significant demand declines resulting from the 2001 terrorist attacks plagued the refining market.
The WTI less Maya and WTI less WTS crude oil differentials were approximately 40% and 173% higher, respectively, in the first quarter of 2003 than in the corresponding period in 2002. We believe the strong recovery of crude oil differentials was partially driven by the increase in sour crude oil shipments from OPEC and other producers in answer to crude supply concerns related to the war with Iraq and by the increase in heavy sour crude oil supply from Venezuela as operations resumed in February following the workers’ strikes. Also contributing to the wide crude oil differentials was the rise in light sweet crude oil prices resulting from the reduced Nigerian production. These strong heavy sour and sour crude oil differentials had a significant positive impact on Port Arthur’s gross margin because its crude oil throughput is approximately 80% heavy sour crude oil and approximately 20% light and medium sour crude oils. Both our Lima and Memphis refineries process primarily light sweet crude oils and accordingly, do not require an adjustment for crude oil differentials except to the extent to which their crude oil is purchased in a foreign market versus a domestic market. Our Lima and Memphis refineries partially benefited from the stronger WTI less Brent crude oil differential as a portion of their crude oil supply in the first quarter was purchased in the foreign market.
Approximately 10% to 15% of Port Arthur’s product slate is lower value petroleum coke and residual oils which negatively impacted the refinery’s gross margin against the benchmark crack spread. On a normal basis the price of petroleum coke and residuals does not track crude oil prices; therefore, the negative impact was higher in the first quarter of 2003 during a high crude oil price environment than in the first quarter of 2002 in a more average crude oil price environment. Less than 5% of the product slate at Lima and Memphis is the lower value residual oils or petroleum coke.
Although benchmark market indicators such as the Gulf Coast 2/1/1 and Chicago 3/2/1 are useful in predicting refining gross margin, changes in absolute hydrocarbon prices, the “structure” of the hydrocarbon futures market and our specific price risk mitigation activities have an effect on our results that do not correlate with the benchmark market indicators. In order to supply our refineries with crude oil on a timely basis, we enter into purchase contracts that fix the price of crude oil from one to several weeks in advance of receiving and processing that crude oil. In addition, it is common as part of our marketing activities to fix the price of a portion of our product sales in advance of producing and delivering that refined product. Prior to delivery of the related
38
crude oil and production of the related refined products, these fixed price purchase and sale commitments will change in value as prices rise and fall. Our results are measured by recording these commitments at market value at the end of each accounting period. With the acquisition of our Memphis refinery and the related increase in our domestic crude oil requirements, the average level of our open fixed price purchase commitments is approximately 10 million barrels. Since the average level of our open fixed price sale commitments is approximately 2 million barrels, on a net basis, we carry an average level of open fixed price purchase commitments of 8 million barrels. As a result, a $1 per barrel increase in absolute price levels increases the value of our net fixed price purchase commitments and our pretax operating results by approximately $8 million. A $1 per barrel decline in absolute price levels would produce the opposite effect.
To mitigate the absolute price risk while holding these fixed price purchase and sale commitments, we may purchase futures contracts on the New York Mercantile Exchange, or NYMEX, that correspond volumetrically with all or a portion of our fixed price purchase and sale commitments. These futures contracts are normally held in the current, or prompt, contract month on the NYMEX in order to achieve the best correlation with the change in the value of the fixed price commitment. As prices change, the effect of the change on the value of the futures contract tends to offset the effect of the change on the value of the fixed price commitment. However, since the volumetric level of our fixed price commitments is a net purchase and is relatively constant, to mitigate price risk it is typical to carry an offsetting net short futures position. Since this net short futures position is held in the prompt contract month on the NYMEX, it is necessary to exchange the prompt month NYMEX futures contract for the following month contract prior to its expiration. When the contract price of the following month contract is less than the contract price of the prompt month contract (a “backwardated” market structure), a loss is realized on the exchange as the prompt month contract is “purchased” at a value higher than the following month contract is “sold.” When the contract price of the following month contract is greater than the contract price of the prompt month contract (a “contango” market structure), the converse is true and a gain is realized on the exchange.
During the first quarter of 2003, absolute hydrocarbon prices were at historically high levels, but the market structure for crude oil was significantly backwardated. In order to protect against the negative valuation effects of a possible precipitous decline in absolute price levels, we chose to carry net short NYMEX futures contracts to offset a large portion of our net fixed purchase commitment price risk. Due to the backwardated crude oil market structure, this price risk mitigation strategy carried a cost as discussed above which essentially offset the benefits of the strategy measured on a prompt month contract basis. As a result of our neutral price risk mitigation activities, our operating results in the first quarter of 2003 were negatively affected by approximately $16 million from a decline in the value of our net fixed price purchase commitments. By comparison, in the first quarter of 2002, operating results benefited by approximately $24 million from having our fixed price purchase commitments fully exposed to price risk in a rising absolute price environment. See “Quantitative and Qualitative Disclosures about Market Risk—Commodity Risk” for a description of our price risk management strategies and policies.
Refinery Operations
In the first quarter of 2003, the average crude oil throughput rate at our Port Arthur refinery was only slightly lower than the refinery’s rated capacity of 250,000 bpd. Early in the first quarter of 2003, our Port Arthur refinery restricted its crude oil throughput in order to maintain a more conservative crude oil inventory position in a relatively weak refining margin environment but a high outright crude oil price environment. As the crack spreads and crude oil differentials strengthened, the refinery increased crude oil runs to at or above capacity and ran well. In the first quarter of 2002, crude oil throughput was restricted primarily for operational reasons, including a ten day shutdown of the coker unit for unplanned maintenance. We took advantage of the coker outage to make repairs to the distillate and naphtha hydrotreaters, including turnaround maintenance that was originally planned for later in the year. Crude oil throughput rates were restricted by approximately 18,000 barrels per day, or bpd, during this time, but returned to near capacity of 250,000 bpd following the maintenance. We also shut down the fluid catalytic cracking (FCC) unit, gas oil hydrotreating unit and sulfur plant for approximately 39 days at our Port Arthur refinery for planned turnaround maintenance in the first quarter of
39
2002. This turnaround maintenance did not affect crude oil throughput rates but did lower gasoline production. We sold more unfinished products during the first quarter of 2002 due to this shutdown.
In the first quarter of 2003, the crude oil throughput rate at our Lima refinery was slightly lower than the corresponding period in 2002. The restricted crude oil throughput rate in 2003 related to an 18-day planned turnaround maintenance of the FCC unit and maintenance on the coker and reformer units. The maintenance on the FCC unit was estimated at 14 days, however, severe winter weather slowed the maintenance activity. The maintenance turnaround at our Lima refinery restricted our crude oil throughput rates by an average of approximately 25,000 bpd during the maintenance period. The crude oil throughput rate in both the first quarter of 2003 and 2002 was restricted due to weak market conditions at certain times during those periods.
In the first quarter of 2003, our newly acquired Memphis refinery operated at an average crude oil throughput rate of 163,972 bpd for 29 days in March.
Operating Expenses. Operating expenses increased $2.3 million to $116.7 million in the first quarter of 2003 from $114.4 million in the corresponding period of 2002. Operating expenses for the first quarter of 2003 as compared to 2002 increased approximately $22 million due to significantly higher natural gas prices and approximately $9 million due to the inclusion of Memphis refinery operations for one month in the first quarter of 2003. Natural gas prices were approximately 175% higher in the first quarter of 2003 than in the corresponding period in 2002. These increases were almost completely offset by a decrease of approximately $19 million due to the absence of Hartford refinery operations in 2003 and a decrease of approximately $9 million of which a significant portion related to lower repair and maintenance costs at our Port Arthur refinery in 2003.
General and Administrative Expenses. General and administrative expenses decreased $2.7 million to $11.7 million in the first quarter of 2003 from $14.4 million in the corresponding period in 2002. The decrease in general and administrative expenses was due to the restructuring of our St. Louis office activities and other cost reduction measures initiated in 2002, partially offset by an accrual for incentive compensation and the addition of Memphis refinery operations for one month.
Stock-based Compensation Expense. Stock-based compensation expense increased $2.4 million to $4.3 million in the first quarter of 2003 from $1.9 million in the corresponding period in 2002. The increase related to the grant of additional options in the second quarter of 2002 and the first quarter of 2003.
Depreciation and Amortization. Depreciation and amortization expenses increased $1.8 million to $24.0 million in the first quarter of 2003 from $22.2 million in the corresponding period in 2002. This increase was principally due to capital expenditure activity and the Memphis refinery acquisition.
Interest Expense and Finance Income, net. Interest expense and finance income, net decreased by $3.2 million to $25.1 million in the first quarter of 2003 from $28.3 million in the corresponding period in 2002. The decrease was primarily related to lower interest expense due to the repurchase of certain debt securities in 2002 and 2003, partially offset by additional interest expense related to the issuance of $525 million senior notes in February 2003.
Income Tax (Provision) Benefit. We recorded a $21.6 million income tax provision in the first quarter of 2003 compared to an income tax benefit of $60.6 million in the corresponding period in 2002. Our effective tax rate was 33.4% in the first quarter of 2003 versus 38.6% in the first quarter of 2002. Our subsidiaries are subject to different statutory tax rates. These differing tax rates and the differing amount of taxable income or loss recognized by each subsidiary impacts our consolidated effective tax rate. The decrease in our consolidated effective tax rate from the 2002 first quarter to the 2003 first quarter resulted from a higher percentage of our 2003 first quarter consolidated income being recognized by Sabine, which has a lower effective tax rate than other subsidiaries.
40
2002 Compared to 2001
Overview. Our net loss was $114.4 million in 2002 as compared to net income of $140.9 million in 2001. Our operating loss was $88.0 million in 2002 as compared to operating income of $366.2 million in the corresponding period in 2001. Operating income (loss) included pretax refinery restructuring and other charges of $168.7 million and $176.2 million in 2002 and 2001, respectively. Operating income decreased in 2002 compared to 2001 principally due to significantly weaker market conditions in 2002 than in 2001.
Net Sales and Operating Revenues. Net sales and operating revenues increased $355.1 million, or 6%, to $6,772.6 million in 2002 from $6,417.5 million in 2001. This increase is primarily attributable to an increase in the volume of crude oil sales in 2002 as compared to 2001. We periodically sell crude oil to take advantage of substitute crude slate opportunities particularly in relation to the crude oil supply to our Lima refinery.
Gross Margin. Gross margin decreased $497.7 million to $666.6 million in 2002 from $1,164.3 million in 2001. The decrease in gross margin in 2002 as compared to 2001 was principally driven by significantly weaker market conditions in 2002 than in 2001.
Market
These weak market conditions consisted of significantly weaker crack spreads and crude oil differentials. Beginning in late 2001 and continuing into the third quarter of 2002, crack spreads were poor due to weak demand and high levels of distillate and gasoline inventories. This margin environment has been principally driven by a sluggish world economy, significant declines in air travel following the events of September 11, 2001, and an extremely mild 2001/2002 winter. The Gulf Coast and Chicago crack spreads were approximately 31% and 37% lower, respectively, in 2002 than in 2001.
The crude oil differentials were also significantly lower in 2002 as compared to 2001. The crude oil differential between WTI and Maya heavy sour crude oil was approximately 41% lower in 2002 than in 2001. The crude oil differential between WTI and WTS sour crude oil was approximately 51% lower in 2002 than in 2001. We believe these narrowed differentials were attributable to OPEC production cutbacks during 2002, which were concentrated in heavy sour and light/medium sour crude oils. This had a significant negative impact on our gross margin because heavy sour and light/medium sour crude oils accounted for between 60% and 65% of our crude oil throughput. The overall decrease in the sour and heavy sour crude oil differentials reduced our gross margin by approximately $290 million in 2002 as compared to 2001.
Refinery Operations
In 2002, our Port Arthur refinery experienced reduced crude oil throughput for approximately 17 days in November due to repairs on the reformer unit resulting from October’s hurricane shutdown. The refinery also experienced reduced crude oil throughput rates in late September and early October due to planned delays in crude oil supply resulting from anticipated repairs at the coker unit, which proved to be minimal, and during the remainder of October due to unplanned delays in crude oil supply resulting from the impact of production and transportation interruptions caused by hurricanes Isidore and Lili. The Port Arthur refinery operations were also affected by the February shutdown of our coker unit for ten days for unplanned maintenance. We took advantage of the coker outage to make repairs to the distillate and naphtha hydrotreaters, including turnaround maintenance that was originally planned for later in the year. In January 2002, we shut down the fluid catalytic cracking (FCC) unit, gas oil hydrotreating unit and sulfur plant for approximately 39 days at our Port Arthur refinery for planned turnaround maintenance. This turnaround maintenance did not affect crude oil throughput rates but did lower gasoline production. We sold more unfinished products during the first quarter of 2002 due to this shutdown.
In 2002, the average crude oil throughput rate at our Lima refinery was basically the same as its 2001 rate and reflected its economic capacity. Crude oil throughput at higher rates produces additional high sulfur diesel for which there is only a limited market. Our Lima refinery had slightly reduced crude oil throughput rates in late
41
September and early October due to delays in crude oil delivery caused by the hurricanes, in May and December due to mechanical problems with downstream units, and in several months throughout the year due to poor refining market conditions. The Lima refinery’s results for 2002 were also affected by a new crude oil supply agreement which provided approximately $0.20 per barrel of cost savings in the fourth quarter of 2002.
In 2001, crude oil throughput rates at our Port Arthur refinery were below capacity because units downstream were in start-up operations during the first quarter and a lightning strike in early May limited the crude unit rate until the crude unit was shut down in early July for ten days to repair the damage caused by the lightning strike. The Port Arthur refinery also experienced a slightly reduced crude oil throughput rate late in the fourth quarter due to minor repairs of the coker and crude units. In March 2001, the Lima refinery performed a planned month-long maintenance turnaround on its coker and isocracker units, and in November 2001 it performed a planned seven-day maintenance turnaround on its crude and other units. The Lima refinery also experienced crude oil supply delays caused by bad weather in the Gulf Coast early in 2001. Our Hartford refinery experienced ten days of unplanned downtime for coker unit repairs early in the year and planned restricted utilization of the coker unit late in the year due to a minor repairs and a shutdown of a third party sulfur plant utilized by Hartford.
We continuously aim to achieve excellent safety and health performance. We believe that a superior safety record is inherently tied to achieving our productivity and financial goals. We measure our success in this area primarily through the use of injury frequency rates administered by the Occupational Safety and Health Administration, or OSHA. Our safety performance as measured by OSHA’s injury recording methods have improved over the past several years; however, our performance in the past year has declined. Accordingly, we are implementing several actions, including extensive reviews of our safe work practices and increased awareness communication, to change this trend. Despite our best efforts to achieve excellence in our safety and health performance, there can be no assurance that there will not be accidents resulting in injuries or even fatalities.
Operating Expenses. Operating expenses decreased $35.4 million, or 8%, to $431.5 million in 2002 from $466.9 million in 2001. This decrease in 2002 was principally due to significantly lower natural gas prices, lower repair and maintenance costs particularly at Port Arthur, and the closure of the Hartford refinery in the fourth quarter of 2002. This decrease was partially offset by higher insurance and employee expenses. The higher insurance expenses related to the overall insurance environment after the events of September 11, 2001, and the higher employee expenses related primarily to new benefit plans and higher medical benefit costs for both current and post retirement plans.
General and Administrative Expenses. General and administrative expenses decreased $11.6 million, or 18%, to $51.5 million in 2002 from $63.1 million in 2001. This decrease was principally due to lower wages and benefits, partially offset by relocation costs associated with our new Connecticut office. The lower wages related to the elimination of administrative positions, primarily at our St. Louis based office, as part of the restructuring. The lower benefits principally related to lower incentive compensation under our annual incentive program partially offset by higher costs associated with new pension and retirement plans and both current and post retirement employee medical benefit plans.
Stock-based Compensation Expense. Premcor Inc. has three stock-based employee compensation plans. Prior to 2002, we accounted for stock based compensation under the recognition and measurement provisions of APB Opinion No. 25,Accounting for Stock Issued to Employees, and related Interpretations. No stock-based employee compensation cost is reflected in 2001 or 2000 net income, as all options granted in those years had an exercise price equal to the market value of the underlying common stock on the date of grant. Effective January 1, 2002, we adopted the fair value recognition provisions of SFAS No. 123,Accounting for Stock-Based Compensation, prospectively, for all employee awards granted and modified after January 1, 2002. Awards under our plans typically vest over periods ranging from three to five years. Therefore, the cost related to stock-based employee compensation included in the determination of net income for 2002 is lower than that which would have been recognized if the fair value based method had been applied to all awards since the original effective
42
date of SFAS No. 123. The following table, provided in accordance with SFAS No. 148,Accounting for Stock Based Compensation—Transition and Disclosure, illustrates the effect on net income and earnings per share if the fair value based method had been applied to all outstanding awards in each period.
| | | Year Ended December 31,
| |
| | | 2000
| | | 2001
| | | 2002
| |
| | | (in millions) | |
Net income (loss), as reported | | $ | 83.8 | | | $ | 140.9 | | | $ | (114.4 | ) |
Add: Stock-based compensation expense included in reported net
income, net of tax effect | | | — | | | | — | | | | 11.9 | |
Deduct: Stock-based compensation expense determined under fair
value based method for all options, net of tax effect | | | (0.5 | ) | | | (0.6 | ) | | | (12.5 | ) |
| | |
|
|
| |
|
|
| |
|
|
|
Pro forma net income (loss) | | $ | 83.3 | | | $ | 140.3 | | | $ | (115.0 | ) |
| | |
|
|
| |
|
|
| |
|
|
|
With respect to stock option grants outstanding as of December 31, 2002, we will record future non-cash stock-based compensation expense and additional paid-in capital of $35.9 million over the applicable vesting periods of the grants.
Depreciation and Amortization. Depreciation and amortization expenses decreased $3.0 million, or 3%, to $88.9 million in 2002 from $91.9 million in 2001. This decrease was principally due to ceasing the recording of depreciation and amortization expense for the Hartford refinery assets beginning in March 2002. This decrease was partially offset by higher amortization expenses in 2002 at our Lima refinery due to the completion of turnarounds performed in 2001, and higher amortization in 2002 at our Port Arthur refinery due to the completion of turnaround activity in early 2002.
Interest Expense and Finance Income, net. Interest expense and finance income, net decreased $30.2 million, or 25%, to $92.1 million in 2002 from $122.3 million in 2001. This decrease related primarily to lower interest expense due to the repurchase of certain debt securities in the third quarter of 2001 and in the second quarter of 2002 and lower interest rates on our floating rate debt. This decrease was partially offset by lower interest income as cash balances declined.
Income Tax (Provision) Benefit. We recorded a $73.3 million income tax benefit in 2002 compared to an income tax provision of $73.0 million in the corresponding period in 2001. The income tax benefit for 2002 included an increase of $2.8 million to the deferred tax valuation allowance, which was recorded to reflect the likelihood of not realizing the future benefit of a portion of our federal business credits and a portion of our state tax loss carryforwards. The income tax provision for 2001 included the reversal of a $12.4 million deferred tax valuation allowance as a result of the analysis of the likelihood of realizing the future tax benefit of our federal and state tax loss carryforwards, alternative minimum tax credits and federal and state business tax credits.
As of December 31, 2002, we had a net deferred tax asset of $19.8 million. SFAS No. 109,Accounting for Income Taxes, requires that deferred tax assets be reduced by a valuation allowance if, based on the weight of available evidence, it is more likely than not (a likelihood of more than 50 percent) that some portion or all of the deferred tax assets will not be realized. When applicable a valuation allowance should be recorded to reduce the deferred tax asset to the amount that is more likely than not to be realized. As a result of the analysis of the likelihood of realizing the future tax benefit of a portion of our state tax loss carryforwards and a portion of our federal business tax credits, we provided a valuation allowance of $2.8 million related to the net deferred tax asset. The likelihood of realizing the net deferred tax asset is analyzed on a regular basis and should it be determined that it is more likely than not that an additional portion or all of the net deferred tax asset will not be realized, an increase to the tax valuation allowance and a corresponding income tax provision would be required at that time.
43
Our pretax earnings for financial reporting purposes in the future will generally be fully subject to income taxes, although our actual cash payment of taxes is expected to benefit from regular tax and alternative minimum tax net operating loss carryforwards available at December 31, 2002 of approximately $372 million and $157 million, respectively. Our net operating loss carryforwards will begin to terminate with the year ending December 31, 2011, to the extent they have not been used to reduce taxable income prior to such time. Our ability to use our net operating loss carryforwards to reduce taxable income and to utilize other losses and certain tax credits is dependent upon, among other things, our parent, Premcor Inc., not experiencing an ownership change of more than 50% during any three-year testing period as defined in the Internal Revenue Code. Premcor Inc. has had significant changes in the ownership of its common stock in the past three years. Accordingly, future changes, even slight changes, in the ownership of Premcor Inc.’s common stock (including, among other things, the exercise of compensatory options) could result in an aggregate change in ownership of more than 50% for purposes of Section 382 of the Internal Revenue Code, which could substantially limit the availability of our net operating loss carryforwards, other losses and tax credits.
2001 Compared to 2000
Overview. Net income increased $57.1 million, or 68%, to $140.9 million in 2001 from $83.8 million in 2000. Operating income increased $219.7 million to $366.2 million in 2001 from $146.5 million in 2000. Excluding non-recurring restructuring and other charges of $176.2 million in 2001, operating income increased $395.9 million in 2001 compared to 2000. This increase was principally due to the completion and operation of the heavy oil upgrade project at our Port Arthur refinery, combined with continued strong market conditions.
Net Sales and Operating Revenues. Net sales and operating revenues decreased by $884.2 million, or 12%, to $6,417.5 million in 2001 from $7,301.7 million in 2000. This decrease was principally attributable to steep declines in petroleum product prices in the second half of the year, particularly after the September 11th terrorist attacks, and to our shutdown of the Blue Island, Illinois refinery in January 2001.
Gross Margin. Gross margin increased by $426.7 million, or 58%, to $1,164.3 million in 2001 from $737.6 million in 2000. This increase was principally due to the processing of a greater quantity of less expensive heavy sour crude oil at our Port Arthur refinery, significant discounts on sour and heavy sour crude oil, strong gasoline and distillate market conditions, especially in the first half of the year, as well as solid performance by our refineries. These gains were partially offset by poor market conditions in the fourth quarter and plant downtime and operational issues as described below.
The improvement in crude oil discounts was reflected in the increase in the average sour and heavy sour crude oil differentials to West Texas Intermediate. The completion of the heavy oil upgrade project at our Port Arthur refinery has positioned us to maximize the improved crude oil differentials, having processed heavy sour crude oil equal to 43% of total crude oil throughput in 2001 compared to 13% of heavy sour crude oil in 2000. The improved crude oil differentials and the increase in usage of heavy sour crude oil together contributed over $450 million to gross margin in 2001. Margins for light products such as gasoline and distillates remained strong in the first six months of 2001 due to the continued tight supply and demand balance. Industry inventories remained at low levels through most of the first six months of 2001 and were further lowered by industry-wide maintenance turnarounds performed in the first quarter. The improvement in gasoline and distillate margins was reflected by increases in the Gulf Coast and Chicago crack spreads. In the second half of the year, the Gulf Coast and Chicago crack spreads weakened as gasoline and distillate inventory levels increased due to high refinery utilization rates, high import levels, and unseasonably low demand. The lower demand was driven by decreases in air travel after the September 11th terrorist attacks, a weak industrial sector, a general downturn in the economy, and mild winter weather. Due primarily to significant unplanned downtime experienced by other Midwest refiners, the Chicago crack spread did not weaken in proportion to the Gulf Coast crack spread through the third quarter. The Chicago crack spread decreased significantly during the fourth quarter as product was imported into the region due to the higher margins. Overall, crack spreads in 2001 remained above prior year levels.
44
Excluding the Blue Island refinery’s results, our crude oil throughput rate was higher in 2001 as compared to 2000. Overall, our refineries ran well in 2001 with some planned maintenance shutdowns and restrictions and a few unplanned restrictions of our crude and other units. The crude oil throughput rate at our Port Arthur refinery of 229,800 bpd was below capacity of 250,000 bpd in 2001 because units downstream were in start-up operations during the first quarter and a lightning strike in early May 2001 limited the crude unit rate until the crude unit was shut down in early July for ten days to repair the damage caused by the lightning strike. The Port Arthur refinery also experienced a slightly reduced crude oil throughput rate late in the fourth quarter due to minor repairs of the coker and crude units. In March 2001, the Lima refinery performed a planned month-long maintenance turnaround on its coker and isocracker units, and in November 2001 it performed a planned seven-day maintenance turnaround on its crude and other units. The Lima refinery also experienced crude oil supply delays caused by bad weather in the Gulf Coast. Our Hartford refinery experienced ten days of unplanned downtime for coker unit repairs early in the year and planned restricted utilization of the coker unit late in the year due to minor repairs and a shutdown of a third party sulfur plant utilized by Hartford.
Operations in 2000 were affected by the planned month-long maintenance turnaround and subsequent 11-day unscheduled downtime of the Port Arthur refinery crude unit, planned restrictions at all refineries due to weak margin conditions early in the year, unplanned downtime at the Lima refinery due to two electrical outages and a failed compressor, unplanned downtime at the Blue Island refinery requiring maintenance on its vacuum and crude unit, and crude oil supply disruptions to all of the plants late in the year.
Operating Expenses. Operating expenses remained the same at $467 million for both 2001 and 2000. Operating expenses benefited significantly in 2001 from the lack of eleven months of operating expenses for the Blue Island refinery in 2001 due to its closure in late January. Offsetting this decrease, however, were higher costs at our Port Arthur refinery for the operation of the new heavy oil processing units, higher energy costs at our Port Arthur refinery, and additional repair and maintenance costs at our Hartford refinery.
General and Administrative Expenses. General and administrative expenses increased $10.4 million, or 20%, to $63.1 million in 2001 from $52.7 million in 2000. This increase was principally due to higher incentive compensation under our annual incentive plan, expenses related to the planning, design and implementation of a new financial and commercial information system, and new support services for the heavy oil processing facility.
Depreciation and Amortization. Depreciation and amortization expenses increased $20.2 million, or 28%, to $91.9 million in 2001 from $71.7 million in the corresponding period in 2000. This increase was principally due to depreciation on the new units associated with the heavy oil upgrade project. We began depreciating these assets in accordance with our property, plant and equipment policy during the first quarter of 2001 following substantial completion of the heavy oil upgrade project and commencement of operations. Amortization contributed to the increase due to a major 2000 Port Arthur refinery turnaround and a first quarter 2001 Lima refinery turnaround.
Interest Expense and Finance Income, net. Interest expense and finance income, net increased by $58.0 million, or 90%, to $122.3 million in 2001 from $64.3 million in 2000. In 2000, the majority of the interest costs on the 12 1/2% senior notes and the senior secured bank loan of our subsidiary, PAFC, were capitalized as part of the heavy oil upgrade project. These costs are now expensed as a result of the commencement of operations in early 2001. Offsetting a portion of this increase were lower interest rates on our floating rate loans.
Income Tax (Provision) Benefit. The income tax provision increased $75.2 million to $73.0 million in 2001 from a tax benefit of $2.2 million in the corresponding period in 2000. The income tax provision of $73.0 million in 2001 consisted of a provision on income from continuing operations partially offset by the complete reversal of the remaining tax valuation allowance of $12.4 million. The income tax benefit of $2.2 million in 2000 included a reversal of a portion of our tax valuation allowance of $33.9 million partially offset by a provision on income. In September 2001, we made a federal estimated income tax payment of $13.0 million.
45
Outlook
This Outlook section contains forward-looking statements that reflect our current judgment regarding the direction of our business. Even though we believe our expectations regarding future events are reasonable assumptions, forward-looking statements are not guarantees of future performance. Factors beyond our control could cause our actual results to vary materially from our expectations and are discussed in “Risk Factors” and “Forward-Looking Statements.”
Market. Market conditions for the second quarter of 2003 through the middle of June have been strong. However in mid-June the crack spreads weakened considerably. In the second quarter of 2003, the Gulf Coast 2/1/1 crack spread averaged $3.10 per barrel and the Chicago 3/2/1 averaged $6.45 per barrel. The WTI/Maya crude oil differential averaged $7.21 per barrel. Natural gas remained significantly higher than more normalized rates averaging over $5.58 per million btu in the second quarter.
Refinery Operations. It is common practice in our industry to look to benchmark market indicators as a predictor of actual refining margins, such as the Gulf Coast 2/1/1 and Chicago 3/2/1. To improve the reliability of this benchmark as a predictor of actual refining margins, it must first be adjusted for a crude oil slate that is not 100% light and sweet. Secondly, it must be adjusted to reflect variances from the benchmark product slate to the actual, or anticipated, product slate. Lastly, it must be adjusted for any other factors not anticipated in the benchmark, including ancillary crude and product costs such as transportation, storage and credit fees, inventory fluctuations and price risk management activities.
Our Port Arthur refinery has historically produced roughly equal parts gasoline and distillate. For this reason, we believe the Gulf Coast 2/1/1 crack spread appropriately reflects our product slate. However, approximately 15% of Port Arthur’s product slate is lower value petroleum coke and residual oils which will negatively impact the refinery’s performance against the benchmark crack spread. Port Arthur’s crude oil slate is approximately 80% heavy sour crude oil and 20% medium sour crude oil. Accordingly, the WTI/Maya and WTI/WTS crude oil differentials can be used as an adjustment to the benchmark crack spread. We do not expect to receive discounts on our purchases of Maya crude oil in 2003 under our long-term crude oil supply agreement. Ancillary crude costs, primarily transportation, at Port Arthur averaged $0.94 per barrel of crude oil throughput in the first quarter of 2003. No significant downtime has occurred at the Port Arthur refinery during the second quarter of 2003 and crude oil throughput rates should meet the first quarter average of approximately 245,000 bpd.
Our Lima refinery has a product slate of approximately 60% gasoline and 30% distillate and we believe the Chicago 3/2/1 is an appropriate benchmark crack spread. This refinery consumes approximately 95% light sweet crude oil with the balance being light sour crude oils. We opportunistically buy a mix of domestic and foreign sweet crude oils. The foreign crude oils consumed at Lima are priced relative to Brent and the WTI/Brent differential can be used to adjust the benchmark. Ancillary crude costs for Lima averaged $1.62 per barrel of crude throughput in the first quarter of 2003. The crude oil throughput rates in the second quarter of 2003 should approximate 134,000 bpd, which factors in repair work to certain downstream units that was performed during the quarter.
Our Memphis refinery was acquired effective March 3, 2003 and averaged 164,000 bpd in March 2003. The crude oil throughput rate should approximate 170,000 bpd in the second quarter of 2003. We also expect that the operating results will track a Gulf Coast 2/1/1 benchmark crack spread and that we will be able to realize a gross margin benefit over the Gulf Coast 2/1/1 crack spread resulting from location premiums for refined products, partially offset by crude oil transportation costs. We expect that this location premium will approximate $0.63 per barrel in normalized market conditions.
Operating Expenses. Natural gas is the most variable component of our operating expenses. On an annual basis, our Port Arthur, Memphis and Lima refineries purchase approximately 29 million mmbtu of natural gas, with most of these purchases relating to our Port Arthur refinery. In a $3.00 per million btu natural gas pricing
46
environment and assuming average crude oil throughput levels, our annual operating expenses should range between $470 million and $500 million. However, natural gas prices for the first and second quarters of 2003 have been significantly higher than this rate. It is also important to note that we contract for the purchase of natural gas on a calendar month basis and set the price at the beginning of the month. Therefore, our natural gas costs will reflect the price of natural gas on the day the contract is set, and not the average price for the period.
General and Administrative Expenses. With the acquisition of the Memphis refinery, we expect our 2003 general and administrative expenses to be approximately $52 million, excluding incentive compensation. Based on a strong earnings outlook in the first quarter of 2003, we began accruing for incentive compensation in the first quarter of 2003.
Stock-based Compensation Expense. We recognize non-cash, stock-based compensation expense computed under SFAS No. 123 for all stock options granted beginning in 2002. During the first quarter of 2003, an additional 562,500 options were granted to employees and directors. Stock-based compensation expense for 2003, for options granted in 2002 and 2003, will approximate $17 million to $18 million.
Depreciation and Amortization. Depreciation and amortization expense for the first quarter of 2003 was $24.1 million. This includes approximately one month of depreciation on the Memphis refinery. Had we owned the Memphis refinery for all of the first quarter, our depreciation and amortization expense would have been approximately $27 million. This amount will increase in future periods based upon capital expenditure activity. Depreciation and amortization expense includes amortization of our turnaround costs, generally over four years.
Interest Expense. Based on our outstanding long-term debt as of March 31, 2003, our annual gross interest expense will be approximately $114 million. In the second quarter of 2003, we issued $300 million of new senior notes at a 7½% interest rate per annum. All of our outstanding debt is at fixed rates with the exception of $10 million in floating rate notes tied to LIBOR. Reported interest expense is reduced by capitalized interest.
Income Taxes. We expect our effective income tax rate for 2003 will range from approximately 35% to 38%.
Capital Expenditures and Turnarounds. Capital expenditures and turnarounds for the first quarter of 2003 totaled $30.8 million. We plan to expend approximately $200 million to $230 million for capital expenditures and turnarounds for the remainder of 2003. This amount includes expenditures at our Memphis refinery, excluding the original purchase price. We plan to fund capital expenditures with internally generated funds. If internally generated funds are insufficient, we will reduce our capital expenditure plans accordingly.
Earn-out Payments. The Memphis refinery purchase agreement provides for contingent participation, or earn-out, payments up to a maximum aggregate of $75 million over the next seven years. Earn-out payments will be calculated annually at the end of the seven 12-month periods beginning on March 3, 2003. The annual earn-out calculation will be equal to one-half of the excess of the actual daily value of the Gulf Coast 2/1/1 crack spread over a stipulated margin, at a crude oil throughput rate of 167,123 bpd. The stipulated margin is $3.25 per barrel for the first year and increases by $0.10 per barrel for each year thereafter. Any amounts we pay to Williams as a result of the earn-out agreement will be recorded as additional refinery purchase price, and depreciated or amortized accordingly.
Liquidity and Capital Resources
Cash Balances
We had a cash and short-term investment balance of $257.5 million and $121.4 million as of March 31, 2003 and December 31, 2002, respectively. In addition, under an amended and restated common security agreement related to PACC’s long-term debt, PACC is required to maintain $45.0 million of cash for debt service at all times and restrict an amount equal to the next scheduled principal and interest payment, prorated based on
47
the number of months remaining until that payment is due. As of March 31, 2003 and December 31, 2002, cash of $53.8 million and $61.7 million, respectively, was restricted under these requirements. The amended and restated common security agreement was a result of the Sabine restructuring and eliminated the requirements of a secured cash account structure, which restricted PACC’s cash distribution to its partners. Except for the PACC cash restrictions mentioned above, there are no restrictions limiting dividends from PACC to us and, under a credit agreement, PACC is required to dividend to us all excess cash over $20 million, excluding the restricted debt service amounts. Also, pursuant to the credit agreement, if an aggregate intercompany payable from us to PACC exceeds $40 million at any time, PACC shall forgive us such excess amount, which would take the form of a non-cash dividend. No such dividends have been made as of March 31, 2003.
Cash Flow from Operating Activities
Net cash provided by operating activities for the three months ended March 31, 2003 was $117.4 million compared to net cash provided from operations of $11.2 million in the corresponding period in 2002. The increase in the provision of cash from operating activities in 2003 as compared to 2002 is mainly attributable to strong market conditions, which resulted in strong operating results. Working capital as of March 31, 2003 was $530.5 million, a 1.58-to-1 current ratio, versus $243.2 million as of December 31, 2002, a 1.40-to-1 current ratio. The increase in working capital during the first quarter of 2003 was due primarily to strong operating results and the Memphis refinery acquisition.
Net cash flow provided by operating activities was $30.9 million for the year ended December 31, 2002 as compared to net cash flow provided by operating activities of $440.0 million for the year ended December 31, 2001 and $141.4 million for the year ended December 31, 2000. The significantly lower cash provided from operating activities in 2002 as compared to 2001 and 2000 is mainly attributable to weak market conditions, which resulted in poor operating results. Cash flow from operating activities was mainly impacted by strong cash earnings for the years ended December 31, 2001 and 2000.
Restructuring Reserves. As of December 31, 2002, we had a $4.9 million reserve for plans announced in the third quarter of 2002 to reduce additional staff at our St. Louis administrative office in early 2003. As a result of the Memphis refinery acquisition, the number of positions to be eliminated has been reduced by 25 and we recorded a reduction in the restructuring reserve of $1.6 million in the first quarter of 2003. We also had a $1.0 million reserve for employee severance and plant closure/equipment remediation related to shutdown of the refining operations at our Hartford refinery. The activities related to the Hartford closure were completed in the first quarter of 2003. The following schedule summarizes the activity and balance of these restructuring reserves as of March 31, 2003:
| | | Reserve as of
December 31,
2002
| | Adjustment
to Reserve
| | | Net Cash
Outlay
| | | Reserve as of
March 31,
2003
|
St. Louis restructuring | | $ | 4.9 | | $ | (1.6 | ) | | $ | (1.5 | ) | | $ | 1.8 |
Hartford closure: | | | | | | | | | | | | | | |
Employee severance | | | 0.6 | | | — | | | | (0.6 | ) | | | — |
Plant closure/equipment remediation | | | 0.4 | | | — | | | | (0.4 | ) | | | — |
| | |
|
| |
|
|
| |
|
|
| |
|
|
| | | $ | 5.9 | | $ | (1.6 | ) | | $ | (2.5 | ) | | $ | 1.8 |
| | |
|
| |
|
|
| |
|
|
| |
|
|
48
Environmental, Discontinued Operations and Legal Reserves. As a result of our normal course of business, we are party to a number of legal proceedings and environmental-related obligations. We have also incurred liabilities related to leases of previously operated retail sites as discussed above. In relation to these matters and obligations we have accrued, on an undiscounted basis unless otherwise noted, the following:
| | | March 31, 2003
| | December 31, 2002
|
Refinery environmental obligations: | | | | | | |
Hartford | | $ | 29.8 | | $ | 29.6 |
Blue Island | | | 19.2 | | | 19.7 |
Port Arthur | | | 11.8 | | | 11.9 |
Memphis | | | 1.0 | | | — |
Discontinued retail marketing: | | | | | | |
Environmental obligations | | | 23.2 | | | 23.0 |
Lease obligations (discounted) | | | 6.8 | | | — |
Other legal and environmental | | | 8.4 | | | 9.0 |
| | |
|
| |
|
|
| | | $ | 100.2 | | $ | 93.2 |
| | |
|
| |
|
|
In January 2001, we ceased refining operations at our Blue Island, Illinois refinery, and in September 2002, we ceased refining operations at our Hartford, Illinois refinery. We continue to utilize storage and distribution facilities at both sites. Upon closure of these refineries we recorded reserves for environmental obligations associated with their closure. The environmental obligations take into account costs that are reasonably foreseeable at this time. In relation to the Blue Island reserve, we are currently in discussions with governmental agencies concerning a remediation program and expect to have a final plan in place before the end of 2003. In relation to the Hartford reserve, we are in preliminary stages of producing a final remediation plan. As the remediation plans are finalized and as work is performed, adjustments of the reserves may be necessary. We expect to spend approximately $3 million to $5 million in 2003 related to the Hartford and Blue Island reserves.
Crude Oil Purchase Commitment. On October 1, 2002, we entered into a crude oil linefill agreement with MSCG which obligated us to purchase 2.7 million barrels of crude oil in the pipeline system supplying our Lima refinery from MSCG. We were obligated to purchase the 2.7 million barrels of crude oil upon termination of the agreement with MSCG, at then current market prices as adjusted by certain predetermined contract provisions. The agreement with MSCG was terminated in June 2003, and we purchased the 2.7 million barrels of linefill from MSCG at a net cost to us of approximately $80 million. We had hedged the economic price risk related to the repurchase obligation through the purchase of exchange-traded futures contracts.
As of December 31, 2002, our future minimum lease payments under non-cancelable operating leases are as follows (in millions): 2003—$34.8, 2004—$30.3, 2005—$30.0, 2006—$29.1, 2007—$27.5, and in the aggregate thereafter—$75.7. The annual lease payments increased significantly due to an eight year lease, beginning in late 2002, of three crude oil tankers that are utilized solely to transport a major portion of our crude oil requirements to our Port Arthur refinery.
Cash Flow from Investing Activities
Cash flows used in investing activities for the first quarter of 2003 were $503.0 million as compared to $39.1 million in the first quarter of 2002. The first quarter of 2003 reflected the acquisition of the Memphis refinery. Aside from this acquisition, activity in 2003 and 2002 primarily reflected capital expenditures. Cash flow used in investing activities was $141.3 million for the year ended December 31, 2002 as compared to $153.4 million for the year ended December 31, 2001 and $375.3 million for the year ended December 31, 2000. Activity in 2002, 2001, and 2000 primarily reflected capital expenditures.
49
We classify our capital expenditures into two main categories, mandatory and discretionary. Mandatory capital expenditures, such as for turnarounds and maintenance, are required to maintain safe and reliable operations or to comply with regulations pertaining to soil, water and air contamination or pollution and occupational, safety and health issues. Our total mandatory capital and refinery maintenance turnaround expenditures were $16.8 million, $33.3 million, $63.5 million, $86.6 million, and $64.7 million for the first quarter of 2003 and 2002 and the years ended December 31, 2002, 2001, and 2000, respectively. We estimate that total mandatory capital and turnaround expenditures for all three refineries will average $150 million per year over the next four years and the budget for these expenditures is approximately $105 million for 2003. We plan to fund mandatory capital expenditures with available cash and cash flow from operations and will adjust our annual expenditures accordingly.
The Environmental Protection Agency, or EPA, has promulgated new regulations under the Clean Air Act that establish stringent sulfur content specifications for gasoline and on-road diesel fuel designed to reduce air emissions from the use of these products. In addition to the mandatory capital expenditures discussed above, we expect to incur a total of approximately $707 million, including $637 million that we expect to expend through 2006, in order to comply with environmental regulations related to the new stringent sulfur content specifications and MACT II regulations as discussed below.
Tier 2 Motor Vehicle Emission Standards. In February 2000, the EPA promulgated the Tier 2 Motor Vehicle Emission Standards Final Rule for all passenger vehicles, establishing standards for sulfur content in gasoline. These regulations mandate that the average sulfur content of gasoline for highway use produced at any refinery not exceed 30 ppm during any calendar year by January 1, 2006, phasing in beginning on January 1, 2004. We currently expect to produce gasoline under the new sulfur standards at our Port Arthur refinery prior to January 1, 2004 and at our Memphis refinery in the first quarter of 2004. As a result of the corporate pool averaging provisions of the regulations, we believe that we will be able to defer a significant portion of the investment required for compliance for our Lima refinery until the end of 2005 through the purchase of sulfur allotments and credits which arise from a refiner producing gasoline with a sulfur content below specified levels prior to the end of 2005, the end of the phase-in period. There is no assurance that the averaging provisions of the regulations will allow for a deferral of compliance at our Lima refinery or that sufficient allotments or credits to defer investment at our Lima refinery will be available, or if available, that they will be cost effective. We believe, based on current estimates and on a January 1, 2004 compliance date for all three refineries, that compliance with the new Tier 2 gasoline specifications will require capital expenditures in the aggregate through 2004 of approximately $335 million. This estimate reflects an increase from 2001 year-end estimates of $80 million for the newly acquired Memphis refinery and $79 million for revised cost estimates at Lima and Port Arthur based on completed detailed engineering studies and refined implementation plans. Future revisions to these cost estimates may be necessary. We are reviewing the current plans for Tier 2 compliance at the Memphis refinery and believe there may be opportunities for significant cost savings based on a revised project design. We have entered into contracts totaling $126 million related to the design and construction activity at our Port Arthur and Lima refineries for the Tier 2 gasoline compliance.
Low Sulfur Diesel Standards. In January 2001, the EPA promulgated its on-road diesel regulations, which will require a 97% reduction in the sulfur content of diesel fuel sold for highway use by June 1, 2006, with full compliance by January 1, 2010. We estimate that capital expenditures required to comply with the on-road diesel standards at all three refineries in the aggregate through 2006 is approximately $347 million, an increase from previous estimates of $100 million for the newly acquired Memphis refinery and of $20 million for revised cost estimates at our Lima and Port Arthur refineries. The revised estimate is based on additional engineering studies and may be revised further as we move towards finalization of our implementation strategy. More than 95% of the projected investment is expected to be incurred during 2004 through 2006 with the greatest concentration of spending occurring in 2005. Since the Lima refinery does not currently produce diesel fuel to on-road specifications, we are considering an acceleration of the low-sulfur diesel investment at the Lima refinery in order to capture this incremental product value. If the investment is accelerated, production of the low-sulfur fuel is possible by the first half of 2005.
50
Maximum Achievable Control Technology. On April 11, 2002, the EPA promulgated regulations to implement Phase II of the petroleum refinery Maximum Achievable Control Technology rule under the federal Clean Air Act, referred to as MACT II, which regulates emissions of hazardous air pollutants from certain refinery units. We expect to spend approximately $25 million in the next two years related to these new regulations. We performed some tests at our Lima refinery that determined that we currently meet the MACT II standards, which reduced our original estimate for MACT II expenditures by $20 million.
Our budget for complying with Tier 2 gasoline standards, on-road diesel regulations and the MACT II regulations is approximately $120 million in 2003. We spent $12.6 million and $1.4 million in the first quarters of 2003 and 2002, respectively, and $56.7 million in 2002 related to these regulations. It is our intention to fund expenditures necessary to comply with these new environmental standards with cash flow from operations. Due to the volatile economic nature of our business we are organizing our plans and associated expenditures for compliance with these regulations into “modules” that can be shifted based on available funding. This will allow us to expedite or slow down the major portions of the project without compromising compliance dates but allowing us to take advantage of phase-in periods if necessary.
Discretionary capital expenditures are undertaken by us on a voluntary basis after thorough analytical review and screening of projects based on the expected return on incremental capital employed. Discretionary capital projects generally involve an expansion of existing capacity, improvement in product yields and/or a reduction in operating costs. Accordingly, total discretionary capital expenditures may be less than budget if cash flow is lower than expected and higher than budget if cash flow is better than expected. Our discretionary capital expenditures were $1.4 million and $7.6 million, $28.4 million, $57.1 million, and $357.5 million for the first quarter of 2003 and 2002 and the years ended December 31, 2002, 2001, and 2000, respectively. Discretionary spending in 2001 and 2000 reflected capital expenditures of $19.0 million and $346.0 million, respectively, related to the heavy oil upgrade project at Port Arthur. Our budget for discretionary capital expenditures is approximately $5 million for 2003. We plan to fund our discretionary capital expenditures for 2003 with available cash and cash flow from operations.
The cash and cash equivalents restricted for investment in capital additions for the first quarter of 2003 and 2002 and the years ended December 31, 2002 and 2001 reflected receipt of proceeds of $10.0 million in Ohio state revenue bonds that were restricted for solid waste and wastewater capital projects at the Lima refinery and the subsequent use of those proceeds. The cash and cash equivalents restricted for investment in capital additions for the year ended December 31, 2000 reflected the use of proceeds that were restricted for the heavy oil upgrade project.
Cash Flow from Financing Activities
Cash flows provided by financing activities was $521.7 million for the first quarter of 2003 compared to cash flows used in financing activities of $94.6 million in the corresponding period in 2002. In February 2003, we completed an offering of $525 million in senior notes, of which $350 million, due in 2013, bear interest at 9½% per annum and $175 million, due in 2010, bear interest at 9¼% per annum. The net proceeds from this transaction and the contribution from Premcor Inc. described below were used to fund the acquisition of the Memphis refinery as well as to repay our $240 million floating rate loan. In the first quarter of 2002, PACC repaid $66.2 million of its outstanding balance under a bank senior loan agreement.
In the first quarter of 2003, Premcor Inc. completed a public offering of 13.1 million shares of common stock and a private placement of 2.9 million shares of common stock with Blackstone Capital Partners III Merchant Banking Fund L.P. and its affiliates, or Blackstone, Occidental, and certain Premcor executives. Premcor Inc. received net proceeds of approximately $306 million from these transactions, and contributed $260.6 million of the proceeds to us through our parent company, Premcor USA Inc.
51
In the first quarter of 2003, we incurred $19.6 million of deferred financing costs in relation to the amendment of the credit agreement and the issuance of the $525 million senior notes. In the first quarter of 2002, we incurred $1.1 million of deferred financing costs for fees necessary to obtain a waiver related to insurance coverage required under the common security agreement.
Cash flow used in financing activities was $252.4 million for the year ended December 31, 2002 as compared to $55.3 million for the year ended December 31, 2001 and cash flow provided by financing activities of $200.1 million for the year ended December 31, 2000. Cash flow used in financing activities in 2002 was principally related to the redemption of long-term debt substantially offset by capital contributions received from Premcor Inc. related to the initial public offering of Premcor Inc.’s common stock. Cash flow used in financing activities in 2001 was principally related to the repurchase of a portion of our long-term debt. Cash flow provided by financing activity in 2000 was primarily related to the issuance of debt and equity to fund the heavy oil upgrade project at Port Arthur.
In 2002, Premcor Inc. received total net proceeds of $482.0 million from the sale of its common stock, which consisted of net proceeds of $462.6 million from an initial public offering of 20.7 million shares of its common stock, $19.1 million from the concurrent sales of 850,000 shares of common stock in the aggregate to Mr. O’Malley and two of its directors, and $6.3 million from the exercise of stock options under its stock incentive plans. The proceeds from the initial public offering and concurrent sales, or IPO proceeds, were committed to reducing the long-term debt of Premcor Inc.’s subsidiaries.
In 2002, we redeemed in the aggregate, $443.9 million in principal amount of long-term debt using a portion of Premcor Inc.’s initial public offering proceeds and approximately $205 million from available cash. We redeemed the remaining $150.4 million of our 9½% senior notes at par value. PACC repaid its senior secured bank loan balance of $287.6 million at a $0.9 million premium. PACC also made a scheduled $4.3 million principal payment of its 12½% Senior Notes.
In 2001, we repurchased in the open market $21.3 million in face value of our 9½% senior notes for an aggregate purchase price of $20.3 million.
In 2002, cash and cash equivalents restricted for debt service increased by $30.9 million, of which an increase of $45.2 million related to future principal payments and is included in cash flow from financing activity and a decrease of $14.3 million related to future interest payments and is included in cash flow from operating activities. The increase in the amount restricted for principal payments mainly reflected the new requirement under the amended and restated common security agreement to maintain a $45.0 million debt service reserve at all times. In 2001, cash and cash equivalents restricted for debt service increased by $30.8 million, of which an increase of $6.5 million related to future principal payments and is included in cash flow from financing activity and an increase of $24.3 million related to future interest payments and is included in cash flow from operating activities.
In 2002, Premcor USA made capital contributions of $248.1 million to us, all primarily for the repayment of long-term debt. In 2001, we returned capital of $25.8 million to Premcor USA of which $25.0 million was utilized by Premcor USA to repurchase a portion of its long-term debt and exchangeable preferred stock and $0.8 million was for its interest payment obligations. In 2000, we returned capital of $35.5 million to Premcor USA to meet future interest payment obligations.
In 2002, we incurred deferred financing costs of $11.4 million related to the consent process that permitted the Sabine restructuring, the registration of the 12½% senior notes with the SEC following the restructuring, and the waiver related to insurance coverage required under the common security agreement. In 2001, we incurred deferred financing costs of $10.2 million principally associated with the amendment of our working capital facility.
52
In 2001, we borrowed $10.0 million in Ohio state revenue bonds, the proceeds of which are restricted for solid waste and wastewater capital projects.
The scheduled maturities of our long-term debt as of March 31, 2003, after giving effect for the newly issued $300 million of senior notes, are: (in millions) 2003—$10.4; 2004—$25.8; 2005—$38.5; 2006—$46.4; 2007—$318.4; 2008 and thereafter—$1,026.8. In May 2003, we purchased $14.7 million of PACC’s 12 1/2% senior notes in the open market at a $2.6 million premium. We continue to evaluate the most efficient use of capital and, from time to time, depending upon market conditions, may seek to purchase certain of our outstanding debt securities in the open market or by other means, in each case to the extent permitted by existing covenant restrictions.
Our long-term debt instruments subject us to significant financial and other restrictive covenants. Covenants contained in various indentures, credit agreements, and term loan agreements place restrictions on, among other things, our subsidiaries’ ability to incur additional indebtedness, place liens upon our subsidiaries’ assets, pay dividends or make certain restricted payments and investments.
Credit Agreements
In February 2003, we amended and restated our credit agreement, which included extending its maturity date to February 2006; increasing the capacity under the agreement to the lesser of $750 million, with the ability to increase to $800 million, or the amount available under the borrowing base; increasing the sub-limit for cash borrowings to $200 million, subject to certain limitations discussed below; and modifying certain covenant requirements. This credit agreement provides for the issuance of letters of credit of up to the amounts described above less outstanding borrowings. The borrowing base includes our cash and eligible cash equivalents, eligible investments, eligible receivables, eligible petroleum inventories, paid but unexpired letters of credit, and net obligations on swap contracts. We use this facility primarily for the issuance of letters of credit to secure crude oil purchase obligations. In May 2002, the credit agreement was amended to allow for the PACC crude oil purchase obligations and thus incorporated PACC’s hydrocarbon inventory into the borrowing base calculation. As of March 31, 2003, the borrowing base was $1,090.8 million (December 31, 2002—$815.3 million), with $575.0 million (December 31, 2002—$597.1 million) of the facility utilized for letters of credit.
The credit agreement provides for direct cash borrowings of up to, but not exceeding in the aggregate, $200 million, subject to a sublimit of $75 million for working capital and general corporate purposes and a sublimit of $150 million for acquisition-related working capital. Acquisition related borrowings are subject to a defined repayment provision. Borrowings under the credit agreement are secured by a lien on substantially all of our cash and cash equivalents, receivables, crude oil and refined product inventories and trademarks. Our interest rate for any borrowings under this agreement would bear interest at a rate based on either the U.S. prime lending rate or the Eurodollar plus a defined margin at our option based on certain restrictions. As of March 31, 2003 and December 31, 2002, there were no direct cash borrowings under the credit agreement.
The credit agreement contains covenants and conditions that, among other things, limit our dividends, indebtedness, liens, investments and contingent obligations. We are also required to comply with certain financial covenants, including the maintenance of working capital of at least $150 million and the maintenance of tangible net worth of at least $650 million, as amended. The covenants also provide for a cumulative cash flow test that from January 1, 2003 to February 10, 2006, must not be less than zero. As amended, we are no longer required to maintain minimum levels of balance sheet cash.
PRG also has a $40 million cash-collateralized credit facility expiring May 31, 2004. This facility was arranged in support of lower interest rates on the Series 2001 Ohio Bonds. In addition, this facility can be utilized for other non-hydrocarbon purposes. As of March 31, 2003, $19.7 million (December 31, 2002—$10.1 million) of the line of credit was utilized for letters of credit.
53
We currently expect that funds generated from operating activities together with existing cash, cash equivalents and short-term investments and availability under our working capital facility will be adequate to fund our ongoing operating requirements.
Accounting Standards
Critical Accounting Standards
The process of preparing financial statements in accordance with generally accepted accounting principles requires that we make estimates and judgments regarding certain items and transactions. It is possible that materially different amounts could be recorded if these estimates and judgments change or if the actual results differ from our estimates and judgments. We consider the following to be our most critical accounting policies involving management judgment.
Contingencies.We account for contingencies in accordance with the Financial Accounting Standards Board (“FASB”) Statement of Financial Accounting Standards, or SFAS, No. 5,Accounting for Contingencies.SFAS No. 5 requires that we record an estimated loss from a loss contingency when information available prior to the issuance of our financial statements indicates that it is probable that an asset has been impaired or a liability has been incurred at the date of the financial statements and the amount of the loss can be reasonably estimated. Accounting for contingencies such as environmental, legal and other reserves requires us to use our judgment. While we believe that our accruals for these matters are adequate, if the actual loss from a loss contingency is significantly different than the estimated loss, our results of operations may be over or understated.
Major Maintenance Turnarounds. A turnaround is a periodically required standard procedure for maintenance of a refinery that involves the shutdown and inspection of major processing units which occurs approximately every three to five years. Turnaround costs include actual direct and contract labor, and material costs incurred for the overhaul, inspection, and replacement of major components of refinery processing and support units performed during turnaround. Turnaround costs, which are included in other assets on our balance sheet, are currently amortized on a straight-line basis over the period until the next scheduled turnaround, beginning the month following completion. The amortization of the turnaround costs is presented as “Amortization” in the consolidated statements of operations.
The Accounting Standards Executive Committee of the American Institute of Certified Public Accountants, or AcSEC, issued an exposure draft of a proposed statement of position, or SOP, entitledAccounting for Certain Costs and Activities Related to Property, Plant and Equipment. This SOP required companies, among other things, to expense as incurred turnaround costs. Adoption of the proposed SOP would have required that any existing unamortized turnaround costs be expensed immediately. If this proposed change were in effect at December 31, 2002, we would have been required to write-off unamortized turnaround costs of approximately $86 million. In December 2002, AcSEC discontinued discussions concerning this SOP and handed over the responsibility for any further action to the Financial Accounting Standards Board, or FASB. At its February 2003 meeting, AcSEC indefinitely suspended action on the proposed SOP. Whether there will be new accounting guidance on turnaround costs and when it would become effective is currently unclear.
Inventories. Our inventories are stated at the lower of cost or market. Cost is determined under the last-in, first-out, or LIFO, method for hydrocarbon inventories including crude oil, refined products, and blendstocks. The cost of warehouse stock and other inventories is determined under the first-in, first-out method. Any reserve for inventory cost in excess of market value is reversed if physical inventories turn and prices recover above cost. As of December 31, 2002, the replacement cost (market value) of our crude oil and refined product inventories exceeded its carrying value by approximately $188 million, or approximately $12 per barrel over cost. The market value of these inventories would have had to been lower by over $12 per barrel as of December 31, 2002, in order for us to have had to write-down the value of our inventory. If prices significantly decline from year-end 2002 levels, we may be required to write-down the value of our inventories in future periods.
54
Long-lived Assets. We account for property, plant and equipment at cost and depreciate these assets over their estimated useful lives, which range from 3 to 40 years. We review long-lived assets for impairment whenever events or changes in circumstances indicate that the carrying amount of an asset may not be recoverable. In 2001, we closed our Blue Island refinery and in 2002 we ceased refining operations at our Hartford refinery. Significant management judgment was required in determining the fair market value of these non-productive assets and in establishing associated environmental remediation and other reserves. As of December 31, 2002, the carrying value of the Blue Island refinery had been reduced to zero and the Hartford refinery was recorded at $49.0 million. As of March 31, 2003, the Hartford refinery was written down to $40 million based on the proposed sale. While we believe this represents the fair market value of the Hartford refinery assets, the amount we actually realize may differ from our estimate and further adjustments may be required.
Income Taxes. In preparing our consolidated financial statements, we must assess the likelihood that our deferred income tax assets will be recovered through future taxable income. To the extent we believe that recovery is not likely, a valuation allowance must be established. Significant management judgment is required in making this determination. At December 31, 2002, we recorded a valuation allowance of $2.8 million due to uncertainties related to our ability to realize the future benefit of a portion of our federal business credits and a portion of our state tax loss carryforwards. The valuation allowance is based on our estimates of taxable income in the various jurisdictions in which we operate and the period over which the deferred income tax assets will be recoverable. In the event actual results differ from our estimates, we may need to adjust the valuation allowance in the future.
Stock-based Compensation. Effective January 1, 2002, we adopted the fair value recognition provisions of SFAS No. 123,Accounting for Stock-Based Compensation for all employee awards granted and modified after January 1, 2002. SFAS No. 123 states that the adoption of the fair value based method is a change to a preferable method of accounting.
Pension Plans and Postretirement Employee Benefit Plans.We have three pension plans and a postretirement health care and life insurance benefit plan that require us to use judgment in selecting the actuarial assumptions used to estimate our expense and liability for these plans. The actuarial assumptions impacting our pension plans include estimates of compensation increases, discount rates, and the expected return on plan assets. Our pension plans were initiated in 2002 and will be funded for the first time in 2003. The actuarial assumptions impacting our postretirement employee benefit plans include estimates of compensation increases, discount rates and health care cost trend rates. Our postretirement expenses increased in 2001 and 2002, principally due to the low interest rate environment that is a basis for setting the plan’s discount rate and due to increases in our assumptions for health care cost trend rates. The impact of these changes has been significant and will be recognized over the service period of the employees covered by the plans. Future changes to the actuarial assumptions impacting our pension plans and postretirement employee benefit plans could have a significant impact on our costs for these plans.
New Accounting Standards
On July 20, 2001 the FASB issued SFAS No. 141Business Combinations and SFAS No. 142Goodwill and Other Intangible Assets. SFAS No. 141, effective on issuance, requires business combinations initiated after June 30, 2001 to be accounted for using the purchase method of accounting and addresses the initial recording of intangible assets separate from goodwill. SFAS No. 142 requires that goodwill and intangible assets with indefinite lives will not be amortized, but will be tested at least annually for impairment. Intangible assets with finite lives will continue to be amortized. SFAS No. 142 is effective for fiscal years beginning after December 15, 2001. The implementation of SFAS No. 141 and SFAS No. 142 did not have a material impact on our financial position and results of operations.
In July 2001, the FASB issued SFAS No. 143,Accounting for Asset Retirement Obligations. SFAS No. 143 requires fair value recognition of legal obligations to retire long-lived assets at the time the obligations are
55
incurred. The initial recording of a liability for an asset retirement obligation will require the recording of a corresponding asset. The liability will be adjusted for accretion due to the passage of time and the asset will be depreciated. We have asset retirement obligations based on our legal obligations at our refinery sites. We consider the settlement date of the obligations indeterminable at this time due to uncertainty about the timing of the retirement of the long-lived assets. Accordingly, we cannot calculate an associated asset retirement liability at this time. We adopted this standard in the first quarter of 2003, but the initial adoption did not have a material impact on our financial position or results of operations. We will measure and recognize the fair value of our asset retirement obligations at such time as a settlement date is determinable.
In August 2001, the FASB issued SFAS No. 144,Accounting for the Impairment or Disposal of Long-Lived Assets. This statement addresses financial accounting and reporting for the impairment disposal of long-lived assets and supersedes SFAS No. 121,Accounting for the Impairment of Long-Lived Assets and for Long-Lived Assets to Be Disposed Of,and the accounting and reporting provisions of APB Opinion No. 30,Reporting theResults of Operations—Reporting the Effects of Disposal of a Segment of a Business, and Extraordinary, Unusual and Infrequently Occurring Events and Transactions, for the disposal of a segment of a business (as previously defined in that Opinion). The provisions of this statement are effective for financial statements issued for fiscal years beginning after December 15, 2001 and interim periods within those fiscal years, with early application encouraged. The implementation of SFAS No. 144 did not have a material impact on our financial position or results of operations.
In April 2002, the FASB issued SFAS No. 145,Rescission of FASB Statements No. 4, 44, and 64, Amendment of FASB Statement No. 13 and Technical Corrections. SFAS 145 rescinds SFAS No. 4,Reporting Gains and Losses from the Extinguishment of Debt; SFAS No. 44,Accounting for Intangible Assets of Motor Carriers; and SFAS No. 64,Extinguishment of Debt Made to Satisfy Sinking-Fund Requirements. SFAS No. 145 also amends SFAS No. 13,Accounting for Leases, as it relates to sale-leaseback transactions and other transactions structured similar to a sale-leaseback as well as amends other pronouncements to make various technical corrections. The provisions of SFAS No. 145 as they relate to the rescission of SFAS No. 4 shall be applied in fiscal years beginning after May 15, 2002. The provision of this statement related to the amendment to SFAS No. 13 shall be effective for transactions occurring after May 15, 2002. All other provisions of this statement shall be effective for financial statements issued on or after May 15, 2002. As permitted by the statement, we elected early adoption of SFAS No. 145 and, accordingly, have included gains or losses on extinguishment of debt in “Income from continuing operations” as opposed to as an extraordinary item, net of taxes, below “Income from continuing operations” in our Statement of Operations.
In June 2002, the FASB issued SFAS No. 146,Accounting for Costs Associated with Exit or Disposal Activities. SFAS No. 146 requires the recognition of liabilities at fair value that are associated with exit or disposal activities when they are incurred rather than at the date of a commitment to an exit or disposal plan. Such liabilities include lease termination costs and certain employee severance costs that are associated with a restructuring, discontinued operations, plant closing or other exit or disposal activities. SFAS No. 146 is to be applied prospectively to exit or disposal activities initiated after December 31, 2002. We adopted SFAS No. 146 for all restructuring, discontinued operations, plant closings or other exit or disposal activities initiated after December 31, 2002.
In October 2002, the Emerging Issues Task Force, or EITF, of the FASB reached a consensus on certain issues in EITF 02-3:Issues Involved in Accounting for Derivative Contracts Held for Trading Purposes and Contracts Involved in Energy Trading and Risk Management Activities including:
| | • | | precluding mark-to-market accounting for energy trading contracts that are not derivatives pursuant to SFAS No. 133; and |
| | • | | requiring that gains and losses on all derivative instruments within the scope of SFAS No. 133 be shown net in the income statement, whether or not settled physically, if the derivative instruments are held for trading purposes. |
56
Implementation of EITF 02-3 did not have a material effect on our financial statements because we mark-to-market only financial instruments and forward purchase and sale contracts considered derivatives pursuant to SFAS No. 133 and do not hold or issue derivative instruments for trading purposes.
In November 2002, the FASB issued Interpretation No. 45,Guarantor’s Accounting and Disclosure Requirements for Guarantees, Including Indirect Guarantees of Indebtedness of Others. This interpretation requires expanded disclosure of a guarantor’s obligation under certain guarantees that it has issued. It also requires that a guarantor recognize, at the inception of certain guarantees, a liability for the fair value of the obligation undertaken in issuing the guarantee. The disclosure requirements are effective for interim and annual financial statements issued for periods ending after December 15, 2002. The provisions for the recognition of a liability are effective prospectively for guarantees issued or modified after December 31, 2002 and we adopted these recognition provisions in the first quarter of 2003. The adoption of this interpretation did not have a material impact on our financial statements.
In January 2003, the FASB issued Interpretation No. 46,Consolidation of Variable Interest Entities, an interpretation of ARB. No. 51. This interpretation clarifies consolidation requirements for variable interest entities. It establishes additional factors beyond ownership of a majority voting interest to indicate that a company has a controlling financing interest in an entity (or a relationship sufficiently similar to a controlling financial interest that it requires consolidation). This interpretation applies immediately to variable interest entities created or obtained after January 31, 2003 and must be retroactively applied to holdings in variable interest entities acquired before February 1, 2003 in interim and annual financial statements issued for periods beginning after June 15, 2003. The adoption of this interpretation did not have a material impact on our financial statements.
In April 2003, the FASB issued SFAS No. 149,Amendment of Statement 133 on Derivative Instruments and Hedging Activities. SFAS No. 149 amends and clarifies financial accounting and reporting for derivative instruments, including certain derivative instruments embedded in other contracts. More specifically, SFAS No. 149, among other things, clarifies under what circumstances a contract with an initial net investment meets the characteristics of a derivative, clarifies when a derivative contains a financing component, and amends the definition of an “underlying” to conform to recently issued standards. SFAS No. 149 is effective for contracts entered into or modified after June 30, 2003, except for certain aspects of the standard that relate to previously issued guidance, which should continue to be applied in accordance with the previously set effective dates. Also, this standard is effective for existing and new contracts entered into after June 30, 2003 as they relate to forward purchases or sales of when-issued securities or other securities that do not yet exist. We do not expect the adoption of this standard will have a material impact on our financial statements.
In May 2003, the FASB issued SFAS No. 150,Accounting for Certain Financial Instruments with Characteristics of both Liabilities and Equity. SFAS No. 150 establishes standards for how an issuer classifies and measures certain financial instruments with characteristics of both liabilities and equity. SFAS No. 150 requires classification of a financial instrument that is within its scope as a liability, or an asset in some circumstances. SFAS No. 150 is effective for financial instruments entered into or modified after May 31, 2003, and shall otherwise be effective at the beginning of the first interim period beginning after June 15, 2003, except for mandatorily redeemable financial instruments of a nonpublic entity. For instruments created before the issuance of SFAS No. 150 and still existing at the beginning of the interim period of adoption, this standard shall be implemented by reporting the cumulative effect of a change in an accounting principle. The adoption of this standard did not have a material impact on our financial statements.
Quantitative and Qualitative Disclosures About Market Risk
The risk inherent in our market risk sensitive instruments and positions is the potential loss from adverse changes in commodity prices and interest rates. None of our market risk sensitive instruments are held for trading.
57
Commodity Risk
Our earnings, cash flow and liquidity are significantly affected by a variety of factors beyond our control, including the supply of, and demand for, commodities such as crude oil, other feedstocks, gasoline, other refined products and natural gas. The demand for these refined products depends on, among other factors, changes in domestic and foreign economies, weather conditions, domestic and foreign political affairs, planned and unplanned downtime in refineries, pipelines and production facilities, production levels, the availability of imports, the marketing of competitive fuels and the extent of government regulation. As a result, the prices of these commodities fluctuate significantly. The movement in petroleum prices does not necessarily have a direct long term relationship to net income. The effect of changes in crude oil prices on our operating results is determined more by the rate at which the prices of refined products adjust to reflect such changes.
We fix the price on our crude oil purchases from one to several weeks prior to the time when the crude oil is processed and sold. As a result, we are exposed to crude oil price movements relative to refined product price movements during this period. In 2003, with the acquisition of our Memphis refinery, our average fixed price purchase commitments when offset by our fixed price sale commitments increased to a net long inventory position of approximately eight million barrels. As of March 31, 2003, if the market price of these net fixed price commitments had been lower by $1 per barrel, we would have recorded additional cost of sales of approximately $8 million, based on our treatment of these contracts as derivatives. An increase in the market price would reduce cost of sales by a like amount. We may actively mitigate some or all of the price risk related to our fixed price purchase and sale commitments. These risk management decisions are based on many factors including the relative level of absolute hydrocarbon prices and the extent to which the futures market is in backwardation or contango. When the contract price of the following month futures contract is less than the contract price of the current, or prompt, month contract, a “backwardated” market structure exists, and when the contract price of the following month futures contract is greater than the contract price of the prompt month contract, a “contango” market structure exists.
We use several strategies to minimize the impact on profitability of volatility in feedstock costs and refined product prices. These strategies generally involve the purchase and sale of exchange traded, energy related futures and options with a duration of six months or less. To a lesser extent we use energy swap agreements similar to those traded on the exchanges, such as crack spreads and crude oil options, to better match the specific price movements in our markets. These strategies are designed to minimize, on a short term basis, our exposure to the risk of fluctuations in crude oil prices and refined product margins. The number of barrels of crude oil and refined products covered by such contracts varies from time to time. Such purchases and sales are closely managed and subject to internally established risk policies. The results of these price risk mitigation activities affect refining cost of sales and inventory costs. We do not engage in speculative futures or derivative transactions.
We prepared a sensitivity analysis to estimate our exposure to market risk associated with derivative commodity positions. This analysis may differ from actual results. The fair value of each derivative commodity position was based on quoted futures prices. As of March 31, 2003, a 10% change in quoted futures prices would result in an approximate $2 million change to the fair market value of the derivative commodity position and correspondingly the same change in operating income. As of December 31, 2002, a 10% change in quoted futures prices would result in an approximately $8 million change to the fair market value of the derivative commodity position and correspondingly the same change in operating income.
In addition, earnings may be impacted by the write down of our LIFO based inventory cost to market value when market prices drop dramatically compared to our LIFO inventory cost. These potential write downs may be recovered in subsequent periods as our inventories turn and market prices rise. As of December 31, 2002 the replacement cost (market value) of our crude oil and refined product inventories exceeded the carrying value by $188 million, or approximately $12 per barrel over cost. The market value of these inventories would have had to been lower by over $12 per barrel as of December 31, 2002, in order for us to have had to write-down the value of our inventory. By contrast, as of December 31, 2001, the replacement cost (market value) of our crude oil and
58
refined product inventories exceeded the carrying value by only $5 million, or approximately $0.32 per barrel over cost. If the market value of these inventories had been lower by $1 per barrel as of December 31, 2001, we would have been required to write-down the value of our inventory by approximately $10 million. As of January 1, 2002, all of our hydrocarbon inventories are valued using the LIFO method, which are more susceptible to a material write-down when prices decline dramatically. If prices decline significantly from year-end 2002 levels, we may be required to write-down the value of our LIFO inventories in future periods.
Our results are also sensitive to the fluctuations in natural gas prices due to the use of natural gas to fuel our refinery operations. Based on our average annual consumption of approximately 29 million mmbtu of natural gas, a $1 change per million btu in the price of natural gas would generally change our natural gas costs by $29 million. Our sensitivity to a change in the price of natural gas would also be impacted by our method of purchasing natural gas. We contract for the purchase of natural gas on a calendar month basis and set the price at the beginning of the month. Therefore, our natural gas costs will reflect the price of natural gas on the day the contract is set, and not the average price for the period.
Interest Rate Risk
Our primary interest rate risk is associated with our long term debt. We manage this interest rate risk by maintaining a high percentage of our long term debt with fixed rates. As of March 31, 2003 we have an outstanding balance, including current maturities, of $1,165.2 million. In the second quarter of 2003, we issued $300 million of new senior notes and purchased $14.7 million of our subsidiary’s, PACC, long-term debt. Giving effect for the second quarter transactions our weighted average interest rate on our fixed rate long term debt is 9.3%. We are subject to interest rate risk on our Ohio bonds and any direct borrowings under our credit agreement. As of March 31, 2003, a 1% change in interest rates on our floating rate loans, which totaled $10 million, would result in a $0.1 million change in pretax income on an annual basis. In the first quarter of 2003, we refinanced our $240 of floating rate loans with fixed rate debt. As of December 31, 2002, a 1% change in interest rate on our floating rate loans, which totaled $250 million, would result in a $2.5 million change in pretax income on an annual basis. As of March 31, 2003 and December 31, 2002, there were no direct borrowings under our credit agreement.
59
INDUSTRY OVERVIEW
Oil refining is the process of separating hydrocarbon atoms present in crude oil and converting them into usable finished petroleum products. There are approximately 150 oil refineries operating in the United States. The refining industry is characterized by capacity shortage, high utilization, and reliance on imported products to meet demand for finished petroleum products. This overview explains the basics of the refining process and certain factors that influence our industry.
Refining Basics
Refineries are uniquely designed to process specific crude oils into selected products. In general, the different process units inside a refinery perform one of three functions:
| | • | | separate the many types of hydrocarbons present in crude oil; |
| | • | | chemically convert the separated hydrocarbons into more desirable products; and |
| | • | | treat the products by removing unwanted elements and compounds. |
Each step in the refining process is designed to maximize the value of the feedstocks, particularly the raw crude oil.
The first refinery units to process raw crude oil are typically the atmospheric and vacuum distillation units. Crude oil is separated by boiling point in the distillation units under high heat and low pressure and recovered as hydrocarbon fractions. The lowest boiling fractions, including gasoline and liquefied petroleum gas, vaporize and exit the top of the atmospheric distillation unit. Medium boiling liquids, including jet fuel, kerosene and distillates such as home heating oil and diesel fuel, are drawn from the middle. Higher boiling liquids, called gas oils and the highest boiling liquids, called residuum, are drawn together from the bottom and separated in the vacuum distillation unit. The various fractions are then pumped to the next appropriate unit in the refinery for further processing into higher-value products.
The next step in the refining process is to convert the hydrocarbon fractions into distinct products. One of the ways of accomplishing this is through “cracking,” a process that breaks or cracks higher boiling fractions into more valuable products such as gasoline, distillate and gas oil. The most important conversion units are the coker, the FCC unit, and the hydrocracker. Thermal cracking is accomplished in the coker, which upgrades residuum into naphtha, which is a low-octane gasoline fraction, distillate, and gas oil. The FCC unit converts gas oil from the crude distillation units and coker into liquefied petroleum gas, gasoline, and distillate by applying heat in the presence of a catalyst. The hydrocracker receives feedstocks from the coker, FCC and crude distillation units. This unit converts lower value intermediate products into gasoline, naphtha, kerosene, and distillates under very high pressure in the presence of hydrogen and a catalyst.
Finally, the intermediate products from the distillation and conversion processes are treated to remove impurities such as sulfur, nitrogen and heavy metals, and are processed to enhance octane, reduce vapor pressure, and meet other product specifications. Treatment is accomplished in hydrotreating units by heating the intermediates under high pressure in the presence of hydrogen and catalysts. Octane enhancement is accomplished primarily in a reformer. The reformer converts naphtha, or low-octane gasoline fractions, into higher octane gasoline blendstocks used in increasing the overall octane level of the gasoline pool. Vapor pressure reduction is accomplished primarily in an alkylation unit. The alkylation unit decreases the vapor pressure of gasoline blendstocks produced by the FCC and coker units through the conversion of light olefins to heavier, high-octane paraffins.
60
Refinery Products
Major refinery products include:
Gasoline. The most significant refinery product is motor gasoline. Various gasoline blendstocks are blended to achieve specifications for regular and premium grades in both summer and winter gasoline formulations. Refiners must also produce many grades of reformulated gasoline. Reformulated gasolines are special blends containing oxygenates, such as ethers or alcohols, that are tailored to areas of the country with severe ozone pollution. Additives are often used to enhance performance and provide protection against oxidation and rust formation.
Distillate Fuels. Distillates are diesel fuels and domestic heating oils.
Kerosene. Kerosene is a refined middle-distillate petroleum product that is used for jet fuel, cooking and space heating, lighting, solvents and for blending into diesel fuel.
Petrochemicals. Many products derived from crude oil refining, such as ethylene, propylene, butylene and isobutylene, are primarily intended for use as petrochemical feedstock in the production of plastics, synthetic fibers, synthetic rubbers and other products. A variety of products are produced for use as solvents, including benzene, toluene and xylene.
Liquefied Petroleum Gas. Liquefied petroleum gases, consisting primarily of propane and butane, are produced for use as a fuel and an intermediate material in the manufacture of petrochemicals.
Residual Fuels. Many marine vessels, power plants, commercial buildings and industrial facilities use residual fuels or combinations of residual and distillate fuels for heating and processing. Asphalts are also made from residual fuels and are used primarily for roads and roofing materials.
Petroleum Coke. Petroleum coke, a by-product of the coking process, is almost pure carbon and has a variety of uses. Fuel grade coke is used primarily by power plants as fuel for producing electricity. Premium grades of coke low in sulfur and metal content are used as anodes for the manufacture of aluminum.
Crude Oil
The quality of crude oil dictates the level of processing and conversion necessary to achieve the optimal mix of finished products. Crude oils are classified by their density (light to heavy) and sulfur content (sweet to sour). Light sweet crude oils are more expensive than heavy sour crude oils because they require less treatment and produce a slate of products with a greater percentage of high-priced, light, refined products such as gasoline, kerosene and jet fuel. The heavy sour crude oils typically sell at a discount to the lighter, sweet crude oils because they produce a greater percentage of lower-value products with simple distillation and require additional processing to produce the higher-value light products. Consequently, refiners strive to process the optimal mix, or slate, of crude oils through their refineries, depending on each refinery’s conversion and treating equipment, the desired product output, and the relative price of available crude oils.
Refinery Complexity
Refinery complexity refers to a refinery’s ability to process less-expensive feedstock, such as heavier and higher-sulfur content crude oils, into value-added products. Generally, the higher the complexity and more flexible the feedstock slate, the better positioned the refinery is to take advantage of the more cost-effective crude oils, resulting in incremental gross margin opportunities for the refinery.
Refinery Locations
A refinery’s location can have an important impact on its refining margins since a refinery’s location can influence its ability to access feedstocks and distribute its products efficiently. There are five regions in the
61
United States, as defined by the Petroleum Administration for Defense Districts, or PADDs, that have historically experienced varying levels of refining profitability due to regional market conditions. For example, refiners located in the Gulf Coast operate in a highly competitive market due to the fact that this region (PADD III) accounts for approximately 37% of the total number of United States refineries and approximately 46% of the country’s refining capacity. Alternatively, demand for gasoline and distillates has historically exceeded refining production by approximately 35% in the Midwest (PADD II). PADD I represents the East Coast, PADD IV the Rocky Mountains and PADD V is the West Coast.
Structure of Refining Companies
Refiners typically are structured as part of an integrated oil company or as an independent entity. Integrated oil companies have upstream operations, which are concerned with the exploration and production of crude oil, combined with downstream, or refining, operations. An independent refiner has no source of proprietary crude oil production.
Refiners primarily distribute their products as either wholesalers or retailers. Refiners who operate as wholesalers principally sell their refined products under spot and term contracts to bulk and truck rack customers. Wholesalers who sell their products on an unbranded basis are called “merchant refiners.” Many refiners, both integrated and independent, distribute their refined products through their own retail outlets.
Economics of Refining
Refining is primarily a margin-based business where both the feedstocks and refined finished products are commodities. Because operating expenses are relatively fixed, the refiners’ goal is to maximize the yields of high-value products and to minimize feedstock costs.
The industry uses a number of benchmarks to measure market values and margins:
West Texas Intermediate. In the United States, West Texas Intermediate crude oil is the reference quality crude oil. West Texas Intermediate is a light sweet crude oil and the West Texas Intermediate benchmark is used in both the spot and futures markets.
3/2/1 crack spread. Crack spreads are a proxy for refining margins and refer to the margin that would accrue from the simultaneous purchase of crude oil and the sale of refined petroleum products, in each case at the then prevailing price. The 3/2/1 crack spread assumes three barrels of West Texas Intermediate crude oil will produce two barrels of regular unleaded gasoline and one barrel of high-sulfur diesel fuel. Average 3/2/1 crack spreads vary from region to region depending on the supply and demand balances of crude oils and refined products.
Actual refinery margins vary from the 3/2/1 crack spread due to the actual crude oil used and products produced, transportation costs, regional differences, and the timing of the purchase of the feedstock and sale of the light products.
High complexity refineries are able to utilize crude oils lower in cost than West Texas Intermediate. The economic advantage of these refineries is estimated by using the heavy/light and the sweet/sour differentials.
Heavy/light differential. The heavy/light differential is the price differential between Maya, a heavy, sour crude oil, and West Texas Intermediate crude oil. Maya crude oil typically trades at a discount to West Texas Intermediate crude oil.
Sweet/sour differential. The sweet/sour differential is the price differential between West Texas Sour, a medium sour crude oil and West Texas Intermediate crude oil. West Texas Sour crude oil trades at a discount to West Texas Intermediate crude oil. Typically, the sweet/sour differential is less than the heavy/light differential.
62
Product differentials. Because refineries produce many other products that are not reflected in the crack spread, product differentials to regular unleaded gasoline and high-sulfur diesel are calculated to analyze the product mix advantage of a given refinery. Those refineries that produce relatively high volumes of premium products such as premium and reformulated gasoline, low-sulfur diesel fuel and jet fuel and relatively low volumes of by-products such as liquefied petroleum gas, residual fuel oil, petroleum coke, and sulfur have an economic advantage.
Operating expenses. Major operating costs include employee labor, repairs and maintenance, and energy. Employee labor and repairs and maintenance are relatively fixed costs that generally increase proportional to inflation. By far, the predominant variable cost is energy and the most reliable price indicator for energy costs is the cost of natural gas.
63
BUSINESS
Overview
We are one of the largest independent petroleum refiners and suppliers of unbranded transportation fuels, heating oil, petrochemical feedstocks, petroleum coke and other petroleum products in the United States. We currently own and operate three refineries, which are located in Port Arthur, Texas; Memphis, Tennessee; and Lima, Ohio, with a combined crude oil volume processing capacity, known as throughput capacity, of approximately 610,000 barrels per day, or bpd. In late September 2002, we ceased refining operations at our Hartford, Illinois refinery. In the first quarter of 2003, we signed a memorandum of understanding with ConocoPhillips for a sale of refining assets and certain storage and distribution assets related to the Hartford refinery for $40 million. We sell petroleum products in the Midwest, the Gulf Coast, Eastern and Southeastern United States. We sell our products on an unbranded basis to approximately 1,200 distributors and chain retailers through our own product distribution system and an extensive third-party owned product distribution system, as well as in the spot market.
For the twelve months ended March 31, 2003, highly refined products, known as light products, such as transportation fuels, petrochemical feedstocks and heating oil, accounted for approximately 91% of our total product volume. For the same period, high-value, premium product grades, such as high octane and reformulated gasoline, low sulfur diesel and jet fuel, which are the most valuable types of light products, accounted for approximately 38% of our total product volume.
We source our crude oil on a global basis through a combination of long-term crude oil purchase contracts, short-term purchase contracts and spot market purchases. The long-term contracts provide us with a steady supply of crude oil, while the short-term contracts and spot market purchases give us flexibility in obtaining crude oil. Since all of our refineries have access, either directly or through pipeline connections, to deepwater terminals, we have the flexibility to purchase foreign crude oils via waterborne delivery or domestic crude oils via pipeline delivery. Our Port Arthur refinery, which possesses one of the world’s largest coking units, can process 80% heavy sour crude oil. Approximately 80% of the crude oil supply to our Port Arthur refinery is lower cost heavy sour crude oil from Mexico, called Maya.
Our Predecessors and Corporate Structure
Clark USA, Inc., the predecessor of our ultimate parent company, Premcor Inc., was formed by TrizecHahn Corporation, or TrizecHahn, in 1988 to acquire a controlling interest in certain refining, distribution and marketing assets from the bankruptcy estate of Clark Oil & Refining Corporation. Those assets, which included the Hartford refinery, a Blue Island, Illinois refinery and certain Clark USA retail operations and product terminals, were acquired by our predecessor, Clark Refining & Marketing, Inc., a wholly owned subsidiary of Clark USA. In November 1997, Blackstone acquired a majority interest in Clark USA from TrizecHahn. In 1999, Premcor Inc. was formed as Clark Refining Holdings, Inc., a holding company for 100% of the capital stock of Clark USA. In 2000, Clark Refining Holdings changed its name to Premcor Inc., Clark USA changed its name to Premcor USA Inc. and Clark Refining & Marketing, Inc. changed its name to The Premcor Refining Group Inc.
In 1999, in connection with the financing of the heavy oil upgrade project at our Port Arthur refinery, Premcor Inc. acquired 90% of the capital stock of Sabine River Holding Corp., a new entity formed to be the general partner of PACC, the entity created to own and lease the assets comprising the heavy oil processing facility. Sabine also owns 100% of the capital stock of Neches River Holding Corp., which was formed to be the 99% limited partner of PACC. PACC entered into product purchase, service and supply agreements and facility, site and ground leases, and other arm’s length arrangements with us as part of the heavy oil upgrade project.
In connection with the Sabine restructuring, on June 6, 2002, Premcor Inc. consummated a share exchange with Occidental Petroleum Corporation whereby it received the remaining 10% of the common stock of Sabine. For a discussion of our relationship with Occidental, see “Related Party Transactions—Our Relationship with Occidental.” Upon consummation of the share exchange with Occidental, Premcor Inc. contributed its ownership interest in Sabine to us and Sabine became our direct, wholly owned subsidiary.
64
The following chart summarizes the current corporate structure of Premcor Inc.
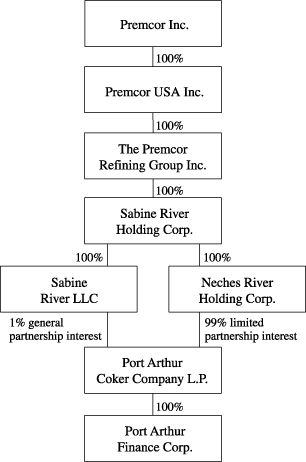
The Transformation of Premcor Inc.
Beginning in early 1995 and continuing after Blackstone acquired its controlling interest in Premcor Inc.’s predecessor in 1997, we completed several strategic initiatives that have significantly enhanced our competitive position, the quality of our assets, and our financial and operating performance. The following statements regarding our transformation exclude our Hartford refinery at which we ceased refining operations in late September 2002. For example, we:
Divested our Non-core Assets to Focus on Refining. We divested our non-core assets during 1998 and 1999, generating net proceeds of approximately $325 million, which we reinvested into our refining business. In 1998, we sold minority interests in several crude oil and product pipelines. In July 1999, we sold our retail business, which included 672 company-operated, and over 200 franchised, gas convenience stores. Also in 1999, we sold the majority of our product distribution terminals.
Acquired Additional Competitive Refining Capacity. We increased our net crude oil throughput capacity from approximately 130,000 bpd to 610,000 bpd after closing two refineries, by acquiring our Port Arthur, Lima and Memphis refineries and subsequently upgrading our Port Arthur refinery. In 1995, we significantly changed the character of our asset base by acquiring the Port Arthur refinery, which was then operating at a capacity of 178,000 bpd. In August 1998, we further expanded our refining capacity by acquiring the 170,000 bpd Lima refinery and in March 2003 we acquired our 190,000 bpd Memphis refinery as further discussed below.
65
Invested in Improving the Productivity of our Asset Base. We implemented capital projects to increase throughput and premium product yields and to reduce operating expenses within our refining asset base. Upon the acquisition of our Port Arthur refinery in 1995, we initially upgraded the facility to a capacity of 232,000 bpd. In January 2001, we completed construction and commenced operation of a heavy oil upgrade project at Port Arthur, further increasing its capacity to 250,000 bpd and significantly expanding its ability to process heavy sour crude oil. Since the acquisition of the Lima refinery in 1998, we have improved the product distribution logistics surrounding the refinery to allow the refinery to increase its throughput and more fully utilize that facility’s 170,000 bpd capacity. We allocate capital to these projects based on a rigorous analysis of the expected return on capital. Based upon such a review of our 80,000 bpd Blue Island, Illinois refinery, we determined that, due to its poor competitive position as a relatively small refinery configured to process primarily light sweet crude oil, it would not have been able to meet our return on capital and free cash flow targets. As a result, we closed the Blue Island refinery in January 2001. In September 2002, we ceased refining operations at our Hartford refinery for the same reasons. These productivity improvements, together with the acquisitions of our Port Arthur, Lima and Memphis refineries, and the closure of non-competitive capacity strengthened our asset base, increased our coking capacity from 18,000 bpd to 113,000 bpd, increased our cracking capacity from 70,000 bpd to 246,000 bpd and increased our capacity to process sour and heavy sour crude oil from 45,000 bpd in 1994 to 200,000 bpd, an approximate 340% increase.
Expanded our Unbranded Petroleum Product Distribution Capabilities. We expanded and enhanced our capabilities to supply fuels on an unbranded basis to include the Midwest, Gulf Coast, Southeastern and Eastern United States. As part of the sale of our terminal operations, we gained access, subject to availability, to an extensive pipeline and terminal network for the distribution of products from each of our refineries.
In February 2002, we recruited a new chairman, chief executive officer and president with a proven track record of successfully operating, growing and enhancing shareholder value, Thomas D. O’Malley, the former chairman and chief executive officer of Tosco Corporation and former vice chairman and director of Phillips Petroleum Corporation. Mr. O’Malley has over 25 years of industry experience and a proven track record of successfully operating, growing and enhancing shareholder value. Since then, we have improved our competitive position as a result of the following:
Recruited and Developed an Experienced Management Team. Mr. O’Malley has assembled an executive management team, consisting of Henry M. Kuchta, president and chief operating officer who joined us in April 2002, William E. Hantke, executive vice president and chief financial officer, who joined us in February 2002, Joseph D. Watson, who joined us in March 2002 as senior vice president and chief administrative officer and currently serves as our senior vice president—corporate development, and Michael D. Gayda as senior vice president, general counsel and secretary, who joined us in October 2002. These executive officers have an average of almost twenty years experience in the energy and refining industry. In addition, our operational management team has an average of 26 years of energy industry experience.
Premcor Inc. Completed its IPO. On May 3, 2002, Premcor Inc. completed an initial public offering of 20.7 million shares of its common stock. The initial public offering, plus the concurrent purchases of 850,000 shares of its common stock in the aggregate by Mr. O’Malley and two of Premcor Inc.’s independent directors, netted proceeds to Premcor of approximately $482 million. The proceeds from the offering were committed to retire certain indebtedness of its subsidiaries.
Completed our Sabine Restructuring. On June 6, 2002, we completed a series of transactions, referred to herein as the Sabine restructuring, that resulted in, among other things, all the senior secured debt of Sabine and its subsidiaries, other than the 12 1/2% senior secured notes, being paid in full, all commitments under the working capital facility and certain insurance policies being terminated and Sabine and its subsidiaries becoming wholly owned subsidiaries of us. In connection with the Sabine restructuring, we fully and unconditionally guaranteed, on a senior unsecured basis, the payment obligations under the notes. The Sabine restructuring was permitted by the successful consent solicitation of holders of the notes.
66
Closed our Hartford, Illinois Refinery. In late September 2002, we ceased refining operations at our Hartford refinery after concluding there was no economically viable method of reconfiguring the refinery to produce fuels meeting new gasoline and diesel fuel specifications mandated by the federal government. In the first quarter of 2003, we signed a memorandum of understanding with ConocoPhillips for a sale of refining assets and certain storage and distribution assets for $40 million.
Obtained Additional Financing. On January 30, 2003, Premcor Inc. completed a public offering of 12.5 million shares of common stock and a private placement of 2.9 million shares of common stock with Blackstone, subsidiaries of Occidental and certain Premcor executives. On February 5, 2003, Premcor Inc. sold an additional 0.6 million shares of common stock pursuant to the underwriters’ over-allotment option. Premcor Inc. received net proceeds of approximately $306 million from these transactions, of which $260.6 million was contributed to us. In February and June 2003, we completed offerings of $825 million of senior notes. Concurrently with the February 2003 notes offering, we amended and restated our credit agreement, which included extending its maturity date to February 2006; increasing the capacity under the agreement to the lesser of $750 million or the amount available under the defined borrowing base; increasing the sub-limit for cash borrowings to $200 million, subject to certain limitations; and modifying certain covenant requirements. In addition to the Memphis refinery acquisition, a portion of the proceeds from the February 2003 notes offering was used to repay our $240 million floating rate loan at par.
Acquisition of the Memphis Refinery. In March 2003, we completed the acquisition of our Memphis, Tennessee refinery and related supply and distribution assets from Williams at an adjusted purchase price of $310 million plus approximately $145 million for crude and product inventories subject to volumetric and pricing verification. The Memphis refinery has a rated crude oil throughput capacity of 190,000 bpd but typically processes approximately 170,000 bpd. The related assets include two truck-loading racks; three petroleum terminals in the area; supporting pipeline infrastructure that transports both crude oil and refined products; crude oil tankage at St. James, Louisiana; and an 80 megawatt power plant adjacent to the refinery.
Actions to Reduce Operating and General and Administrative Costs. We have taken and are continuing to take steps to reduce our cost structure, including:
| | • | | reducing our St. Louis-based administrative workforce by 107 positions, or approximately one-third of the total St. Louis administrative workforce in April 2002; |
| | • | | eliminating approximately 80 of our non-represented refinery positions in October 2002; and |
| | • | | renegotiating our contracts related to our crude acquisition costs at our Lima refinery. |
Market Trends
We believe that the outlook for the United States refining industry is attractive due to the following trends:
Favorable Supply and Demand Fundamentals. We believe that the supply and demand fundamentals for refined petroleum products have improved since the late 1990s and will continue to improve. Decreasing petroleum product demand and deregulation of the domestic refining industry in the 1980s, along with new fuel standards introduced in the early 1990s, contributed to years of decreasing domestic refining capacity. According to the Department of Energy’s Energy Information Administration, or EIA, the number of United States refineries has decreased from a peak of 324 in 1981 to 145 in January 2003. The EIA projects that capacity additions at existing refineries will increase total domestic refining capacity at an annual rate of only 0.5% per year over the next two decades and that utilization will remain high relative to historic levels, ranging from 91% to 95% of design capacity. We believe that impending regulatory requirements will result in the rationalization of non-competitive refineries, further reducing refining supply.
Net imports of petroleum products, largely from northwest Europe and Asia, have historically supplemented domestic refining supply shortfalls, accounting for a relatively consistent amount of approximately 7% of total United States supply over the last 15 years. We expect that imports will continue to occur primarily during periods when refined product prices in the United States are materially higher than in Europe and Asia.
67
While refining capacity growth is expected by the EIA to be nominal, the EIA expects demand for petroleum products to continue to grow steadily at 1.7% per year over the next two decades. Almost 96% of the projected growth is expected to come from the increased consumption of light products including gasoline, diesel, jet fuel and liquefied petroleum gas.
Increasing Supplies of Lower Cost Sour and Heavy Sour Crude Oil. We believe that increasing worldwide supplies of lower-cost sour and heavy sour crude oil will provide an increasing cost advantage to those refineries with complex configurations that are able to process these crude oils. Purvin & Gertz, an independent engineering firm, estimates that the total worldwide heavy sour crude oil production will increase by approximately 39% from 9.7 million bpd in 2000 to 13.5 million bpd in 2010, resulting in a continuation of the downward price pressure on these crude oils relative to benchmark West Texas Intermediate crude oil. Over the next several years, significant volumes of sour and heavy sour crude oils are expected to be imported into the United States, primarily from Latin America and Canada. Purvin & Gertz expects domestic imports of this production to increase from 3.0 million bpd presently to 5.3 million bpd by 2010.
Increasing Demand for Specialized Refined Petroleum Products. We expect that products meeting new and evolving fuel specifications will account for an increasing share of total fuel demand, which may benefit refiners possessing the capabilities to blend and process these fuels. As part of the Clean Air Act of 1990 and subsequent amendments, several major metropolitan areas in the United States with air pollution problems are required to use reformulated gasoline meeting certain environmental standards. According to the EIA, demand for reformulated gasoline and the oxygenates used in its production will increase from approximately 3.3 million bpd in 2000 to approximately 4 million bpd in 2010, accounting for approximately 40% of all annual gasoline sales. According to officials of the United States Department of Energy, the trend toward banning MTBE as a blendstock in reformulated gasoline will result in an annual reduction of the gasoline supply by 3% to 4%.
Continued Consolidation of the Refining Sector. We believe that the continuing consolidation in the refining industry may create attractive opportunities to acquire competitive refining capacity. During the period from 1990 to 2001, the percentage of refining capacity owned by major integrated oil companies decreased from 66% to 62%. Many integrated oil companies divested refining assets rather than making costly investments to meet increasingly strict product specifications. During this same period, the percentage of refining capacity owned by the top ten owners of refining assets increased from 57% to 69% and the share held by independent refiners increased from 16% to 33%. New environmental regulations will require the refining sector to make substantial investments in refining assets and pollution control technologies. We believe these substantial costs will likely force many smaller inefficient refiners out of the market.
Competitive Strengths
As a result of our transformation, we have developed the following strengths:
Refining Focus. We are a “pure-play” refiner, without the obligation to supply our own retail outlets or the cost of supporting our own retail brand. As a result, we are free to supply our products into the distribution channel or market that we believe will maximize profit. We do not own any other assets or businesses, such as petroleum exploration and production or retail distribution assets, that compete for capital or management attention. Therefore, our capital and attention are focused on improving our existing refineries and acquiring additional competitive refining capacity. Although many of our competitors are integrated oil companies that are better positioned to withstand market volatility, such competitors are not fully able to capitalize on periods of strong refining margins. See “—Competition.”
Significant Refineries Located in Key Geographic Regions. Our three refineries are logistically well located modern facilities of significant size and scope with access to a wide variety of crude oils and product distribution systems. Our access to key port locations on the Gulf Coast enables us to ship waterborne crude oil to our Midwest refineries via major pipeline systems. Our Lima and Memphis refineries provide us with a strong
68
presence in the attractive PADD II market. These refineries also benefit from the fact that the Midwest region is dependent upon the import of supplies from outside the region and that the pipelines available to deliver products to the region are fully utilized, which effectively places a ceiling on external supply into the region, giving local refineries such as ours a logistical advantage. Therefore, any disruption in local refinery production or pipeline supply magnifies this supply shortage.
Significant Capacity to Process Low-Cost Heavy Sour Crude Oil. Our Port Arthur refinery, which possesses one of the largest coking units in the world, can process 80% heavy sour crude oil which gives us a cost advantage over other refiners that are not able to process high volumes of these less expensive crude oils.
Favorable Crude Oil Supply Contract with PEMEX Affiliate. We have a long-term heavy sour crude oil supply agreement with an affiliate of PEMEX that provides a stable and secure supply of Maya crude oil. This contract, which currently covers approximately one-third of our company-wide crude oil requirements, contains a mechanism intended to provide us with a minimum average coker gross margin and to moderate fluctuations in coker gross margins during an eight-year period beginning April 1, 2001. Essentially, if the formula-based coker gross margin set forth in the contract, which is calculated on a cumulative quarterly basis, results in a shortfall from the support amount of $15 per barrel, we receive discounts from the PEMEX affiliate. In the event that there is a recovery of a prior shortfall upon which we received a discount from the PEMEX affiliate, we would reimburse the PEMEX affiliate in the form of a crude oil premium. Since we are not required to pay premiums in excess of accumulated net shortfalls, we retain the benefit of net cumulative surpluses in our coker gross margins as compared to the support amount of $15 per barrel. For purpose of comparison, the $15 per barrel minimum average coker gross margin support amount equates to a WTI/Maya crude oil price differential of approximately $6 per barrel using market prices during the period from 1988 to 2003, which slightly exceeds actual market differentials during that period. See “—Refinery Operations—Gulf Coast Operations—Port Arthur Refinery” for a further discussion of this contract.
Experienced and Committed Growth-Oriented Management Team. Our chairman and chief executive officer, Thomas D. O’Malley, has a proven track record in the refining industry. From 1990 to 2001 Mr. O’Malley was chairman and chief executive officer of Tosco Corporation. During that period, Mr. O’Malley led Tosco Corporation through a period of significant growth in operations and shareholder returns through acquisitions. At Premcor Inc., Mr. O’Malley has assembled an experienced and committed management team consisting of executives who have held management positions in growth-oriented organizations in the energy sector.
Business Strategies
Our goal is to be a premier independent refiner and supplier of unbranded petroleum products in the United States and to be an industry leader in growing shareholder value. We intend to accomplish this goal, grow our business, enhance earnings and improve our return on capital by executing the following strategies, which we believe capitalize on our existing competitive strengths.
Grow Through Acquisitions and Discretionary Capital Expenditure Projects at Our Existing Refineries. We intend to pursue timely and cost-effective acquisitions of crude oil refining capacity and undertake discretionary capital expenditure projects to improve, upgrade, and potentially expand our refineries. We will pursue opportunities that we believe will be promptly accretive to earnings and improve our return on capital, assuming historic average margins and crude oil differentials.
We believe that the continuing consolidation in our industry, the strategic divestitures by major integrated oil companies and the rationalization of specific refinery assets by merging companies will present us with attractive acquisition opportunities. We are continually evaluating all available refinery acquisitions, some of which may be significant. In addition, based upon our engineering and financial analysis, we have identified discretionary capital projects at our Port Arthur and Lima refineries that we believe should, if undertaken, be
69
accretive to earnings and generate an attractive return on capital. The management team assembled by Mr. O’Malley has a proven track record of growing businesses via acquisitions, which we believe complements an existing strength of our organization. Since 1995, we have demonstrated our expertise in evaluating, structuring, implementing and integrating projects, as well as our acquisition and technical abilities by transforming our asset base through the acquisition of, and subsequent performance enhancement at, our Port Arthur, Lima and Memphis refineries. We believe we are well situated to capitalize on these acquisitions and discretionary capital project opportunities.
In executing the strategies outlined above, we want to own and operate refineries, whether they be our existing refineries or refineries we may acquire in the future, which not only prosper in good market conditions, but are resilient during downturns in the market. We believe this resiliency can be created by, among other things:
| | • | | being a low-cost operator of safe and reliable refineries with a continuous focus on controlling costs; |
| | • | | having an inherent cost advantage due to lower feedstock costs, such as the cost advantage which comes from having significant sour and heavy sour crude oil processing capabilities; |
| | • | | owning refineries in strategic geographic locations; and |
| | • | | having the capability to produce and distribute a variety of the fuels required by varying regional fuel specifications. |
Promote Operational Excellence in Safety and Reliability. We will continue to devote significant time and resources toward improving the safety and reliability of our operations. We will seek to increase operating performance through our commitment to our preventative maintenance program and to training and development programs such as our current “proactive manufacturing” and “defect elimination” programs. We will continue to emphasize safety in all aspects of our operations. We believe that a superior safety record is inherently tied to profitability and that safety can be measured and managed like all other aspects of our business. We have identified several projects designed to increase our operational excellence. For example, at our Port Arthur refinery we are pursuing a portfolio of projects designed to increase reliability. At Lima, we have identified and are implementing a number of projects designed to decrease energy consumption and improve safety.
Create an Organization Highly Motivated to Enhance Earnings and Improve Return on Capital. We intend to create an organization in which employees are highly motivated to enhance earnings and improve return on capital. In order to create this motivation, we have adopted a new annual incentive program under which the annual bonus award for every employee in the organization is dependent to a substantial degree upon earnings. The primary parameter for determining bonus awards under the program for our executive officers and our senior level management team members is earnings. The program allows our executive officers and other senior management team members to earn annual bonus awards only if certain predetermined earnings levels are met, but provides significant bonus opportunities if those levels are exceeded. For the remainder of our employees, earnings is a substantial factor which determines whether a bonus pool is available for annual rewards. In approving annual awards under the program, the compensation committee of our board of directors will also consider our return on capital, and our environmental, health and safety performance.
Refinery Operations
We currently own and operate three refineries: our Port Arthur, Texas refinery comprises our Gulf Coast operations, and our Lima, Ohio and Memphis, Tennessee refineries comprise our Midwest operations.
The aggregate crude oil throughput capacity at our refineries is 610,000 bpd. The configuration at our Port Arthur and Lima refineries is that of a single-train coking refinery, which means that each of these refineries has a single crude unit and a coker unit. The configuration at our Memphis refinery includes two crude units, which can be operated independently, and one cracking unit. The following table provides a summary of key data for our three refineries.
70
Refinery Overview
| | | Port Arthur,
Texas
| | | Lima,
Ohio
| | | Memphis,
Tennessee
| | | Combined
| |
Crude distillation capacity (bpd) | | 250,000 | | | 170,000 | | | 190,000 | | | 610,000 | |
Crude slate capability: | | | | | | | | | | | | |
Heavy sour | | 80 | % | | — | % | | — | % | | 33 | % |
Medium and light sour | | 20 | | | 10 | | | — | | | 11 | |
Sweet | | — | | | 90 | | | 100 | | | 56 | |
| | |
|
| |
|
| |
|
| |
|
|
Total | | 100 | % | | 100 | % | | 100 | % | | 100 | % |
| | |
|
| |
|
| |
|
| |
|
|
| | | | |
Production For the Three Months Ended March 31, 2003 (1) | | | | | | | | | | | | |
Light products: | | | | | | | | | | | | |
Conventional gasoline | | 31.8 | % | | 50.4 | % | | 41.8 | % | | 38.4 | % |
Premium and reformulated gasoline | | 12.0 | | | 9.1 | | | 5.7 | | | 10.4 | |
Diesel fuel | | 27.5 | | | 18.2 | | | 29.4 | | | 25.1 | |
Jet fuel | | 10.0 | | | 13.6 | | | 16.1 | | | 11.8 | |
Petrochemical feedstocks | | 6.4 | | | 4.9 | | | 4.8 | | | 5.7 | |
| | |
|
| |
|
| |
|
| |
|
|
Subtotal light products | | 87.7 | | | 96.2 | | | 97.8 | | | 91.4 | |
Petroleum coke and sulfur | | 10.4 | | | 1.7 | | | 0.2 | | | 6.6 | |
Residual oil | | 1.9 | | | 2.1 | | | 2.0 | | | 2.0 | |
| | |
|
| |
|
| |
|
| |
|
|
Total production | | 100.0 | % | | 100.0 | % | | 100.0 | % | | 100.0 | % |
| | |
|
| |
|
| |
|
| |
|
|
| (1) | | Production rates for the Memphis refinery reflect 29 days of operations in the first quarter of 2003. |
Products
Our principal refined products are gasoline, on and off-road diesel fuel, jet fuel, liquefied petroleum gas, petroleum coke and residual oil. Gasoline, on-road (low sulfur) diesel fuel and jet fuel are primarily transportation fuels. Off-road (high-sulfur) diesel fuel is used mainly in agriculture and as railroad fuel. Liquefied petroleum gas is used mostly for home heating and as chemical and refining feedstocks. Petroleum coke, a by-product of the coking process, can be burned for power generation or used to process metals. Residual oil (slurry oil and vacuum tower bottoms) is used mainly as heavy industrial fuel, such as for power generation, or to manufacture roofing materials or create asphalt for highway paving. We also produce many unfinished petrochemical feedstocks that are sold to neighboring chemical plants at our Port Arthur and Lima refineries.
Gulf Coast Operations
The Gulf Coast, or PADD III, region of the United States, which is the largest PADD in the United States in terms of crude oil throughput capacity, is comprised of Alabama, Arkansas, Louisiana, Mississippi, New Mexico and Texas. According to the National Petrochemical and Refiners Association, or NPRA, 52 refineries were operating in PADD III as of December 31, 2002, with a total crude oil throughput capacity of approximately 7.6 million bpd.
The market has historically had an excess supply of products, with the Department of Energy’s Energy Information Administration, or EIA, estimating light product demand, as of December 31, 2002, at approximately 2.2 million bpd and light product production at approximately 6.0 million bpd. Approximately 61%, or 3.6 million bpd, of light product production is exported to other regions in the United States, mainly to the eastern seaboard or Midwest markets.
71
Explorer, TEPPCO, Seaway, Centennial and Phillips pipelines transport Gulf Coast products to markets located in the Midwest region, and the Colonial and Plantation pipelines transport products to markets located in the northeast and southeast United States. In addition to the product pipeline system, product can be shipped by barge and tanker to the eastern seaboard, west coast markets and the Caribbean basin.
Port Arthur Refinery
Our Port Arthur refinery is located on the Gulf Coast. The Gulf Coast region accounts for 47% of total domestic refining capacity and is one of the most competitive markets in the United States. We acquired the refinery from Chevron Products Company in 1995. This refinery is in Port Arthur, Texas, approximately 90 miles east of Houston located on a 4,000-acre site, of which less than 1,500 acres are occupied by refinery assets. Since acquiring the refinery, we have increased the crude oil throughput capacity from approximately 178,000 bpd to its current 250,000 bpd and expanded the refinery’s ability to process heavy sour crude oil. The refinery now has the ability to process 100% sour crude oil, including up to 80% heavy sour crude oil. The refinery includes a crude unit, a catalytic reformer, a hydrocracker, a fluid catalytic cracking unit, a delayed coker, and an alkylation unit. It produces conventional gasoline, reformulated gasoline, low sulfur diesel fuel and jet fuel, petrochemical feedstocks and fuel grade petroleum coke.
In May 2003, we announced plans to expand our Port Arthur, Texas refinery. The plans include increasing Port Arthur’s crude oil throughput capacity from its current rate of 250,000 bpd to approximately 325,000 bpd, and expanding the coker unit capacity from its current rated capacity of 80,000 bpd to 105,000 bpd, which will further increase our ability to process lower cost, heavy sour crude oil. The project is estimated to cost between $200 million and $220 million and is expected to be completed in the fourth quarter of 2005.
The heavy oil upgrade project at our Port Arthur refinery increased the refinery’s capability of processing heavy sour crude oil from 20% to 80%. The project achieved mechanical completion in December 2000 and became fully operational in the first quarter of 2001. Both milestones were achieved on time and under budget. Final completion was achieved on December 28, 2001.
The project, which cost approximately $830 million, involved the construction of new coking, hydrocracking and sulfur removal capabilities and upgrades to existing units and infrastructure. According to Purvin & Gertz, the 80,000 bpd coker unit at the refinery is one of the largest in the world. The upgrades completed in 2000 included improvements to the crude unit, which increased crude oil throughput capacity from 232,000 bpd to 250,000 bpd. Our Port Arthur refinery is now particularly well suited to process significantly greater quantities of lower-cost heavy sour crude oil. The heavy oil upgrade project has significantly improved the financial performance of the refinery. Our subsidiary, PACC, which owns the coker, the hydrocracker, the sulfur removal unit and related assets and equipment and leases the crude unit and the hydrotreater from us, sells the refined products and intermediate products produced by the heavy oil processing facility to us pursuant to arm’s length pricing formulas based on public market benchmark prices. We then sell these products to third parties. In June 2002, we and Premcor Inc. completed a series of transactions, which resulted in Sabine River Holding Corp. and its subsidiaries, including PACC, becoming wholly owned subsidiaries of ours. Prior to this date, Sabine was 90% owned by Premcor Inc. See “Management’s Discussion and Analysis of Financial Condition and Results of Operations—Major Developments—Sabine Restructuring” for more detail of these transactions.
72
Feedstocks and Production at Port Arthur Refinery
| | | For the Year Ended December 31,
| | | For the Three Months
Ended March 31,
| |
| | | 2000
| | | 2001
| | | 2002
| | | 2003
| |
| | | bpd (thousands)
| | Percent of Total
| | | bpd (thousands)
| | Percent of Total
| | | bpd (thousands)
| | Percent of Total
| | | bpd
(thousands)
| | Percent of
Total
| |
Feedstocks | | | | | | | | | | | | | | | | | | | | |
Crude oil throughput: | | | | | | | | | | | | | | | | | | | | |
Sweet crude oil | | 3.6 | | 1.7 | % | | — | | — | % | | — | | — | % | | — | | — | % |
Medium and light sour crude oil | | 155.1 | | 74.9 | | | 48.3 | | 20.0 | | | 34.3 | | 14.7 | | | 33.4 | | 12.9 | |
Heavy sour crude oil | | 43.4 | | 21.0 | | | 181.5 | | 75.2 | | | 190.4 | | 81.6 | | | 211.0 | | 81.8 | |
| | |
| |
|
| |
| |
|
| |
| |
|
| |
| |
|
|
Total crude oil | | 202.1 | | 97.6 | | | 229.8 | | 95.2 | | | 224.7 | | 96.3 | | | 244.4 | | 94.7 | |
Unfinished and blendstocks | | 5.0 | | 2.4 | | | 11.4 | | 4.8 | | | 8.7 | | 3.7 | | | 13.6 | | 5.3 | |
| | |
| |
|
| |
| |
|
| |
| |
|
| |
| |
|
|
Total feedstocks | | 207.1 | | 100.0 | % | | 241.2 | | 100.0 | % | | 233.4 | | 100.0 | % | | 258.0 | | 100.0 | % |
| | |
| |
|
| |
| |
|
| |
| |
|
| |
| |
|
|
Production | | | | | | | | | | | | | | | | | | | | |
Light Products: | | | | | | | | | | | | | | | | | | | | |
Conventional gasoline | | 73.4 | | 34.9 | % | | 82.9 | | 32.7 | % | | 82.4 | | 32.9 | % | | 85.8 | | 31.8 | |
Premium and reformulated gasoline | | 18.1 | | 8.6 | | | 24.4 | | 9.6 | | | 23.0 | | 9.2 | | | 32.2 | | 12.0 | |
Diesel fuel | | 58.0 | | 27.5 | | | 77.2 | | 30.4 | | | 65.4 | | 26.1 | | | 74.2 | | 27.5 | |
Jet fuel | | 16.6 | | 7.9 | | | 19.7 | | 7.8 | | | 26.5 | | 10.5 | | | 27.0 | | 10.0 | |
Petrochemical feedstocks | | 23.7 | | 11.3 | | | 18.3 | | 7.2 | | | 17.8 | | 7.1 | | | 17.3 | | 6.4 | |
| | |
| |
|
| |
| |
|
| |
| |
|
| |
| |
|
|
Total light products | | 189.8 | | 90.2 | | | 222.5 | | 87.7 | | | 215.1 | | 85.8 | | | 236.5 | | 87.7 | |
Petroleum coke and sulfur | | 11.3 | | 5.3 | | | 26.5 | | 10.4 | | | 28.7 | | 11.5 | | | 27.9 | | 10.4 | |
Residual oil | | 9.5 | | 4.5 | | | 4.8 | | 1.9 | | | 6.8 | | 2.7 | | | 5.2 | | 1.9 | |
| | |
| |
|
| |
| |
|
| |
| |
|
| |
| |
|
|
Total production | | 210.6 | | 100.0 | % | | 253.8 | | 100.0 | % | | 250.6 | | 100.0 | % | | 269.6 | | 100.0 | % |
| | |
| |
|
| |
| |
|
| |
| |
|
| |
| |
|
|
Feedstock and Other Supply Arrangements.The refinery’s Texas Gulf Coast location is close to the major heavy sour crude oil producers and permits access to many cost-effective domestic and international crude oil sources via waterborne and pipeline delivery. Waterborne crude oil is delivered to the refinery docks or via the Sun terminal or the Oiltanking Beaumont terminal, both of which are connected by pipeline to our Lucas tank farm for redelivery to the refinery. Pipeline crude oil can also be received from Equilon Enterprises LLC dba Shell Oil Products U.S.’s, or Shell’s, pipeline originating in Clovelly, Louisiana. We purchase approximately 200,000 bpd of heavy sour crude oil, or 80% of the refinery’s daily crude oil processing capacity, via waterborne delivery from P.M.I. Comercio Internacional, S.A. de C.V., an affiliate of Petroleos Mexicanos, or PEMEX, the Mexican state oil company under two crude oil supply agreements, one of which is a long-term agreement with PACC expiring in 2011. Under this long-term agreement, PEMEX guarantees its affiliate’s obligations to us. The remaining 20% of processing capacity utilizes a medium sour crude oil, the sourcing of which is optimally allocated between foreign waterborne crude oil and domestic offshore Gulf Coast sour crude oil delivered by pipeline.
The long-term crude oil supply agreement with the PEMEX affiliate provides PACC with a stable and secure supply of Maya crude oil. The long-term crude oil supply agreement includes a price adjustment mechanism designed to minimize the effect of adverse refining margin cycles and to moderate the fluctuations of the coker gross margin, a benchmark measure of the value of coker production over the cost of coker feedstock. This price adjustment mechanism contains a formula that represents an approximation of the coker gross margin and provides for a minimum average coker gross margin of $15 per barrel over the first eight years of the agreement, which began on April 1, 2001. The agreement expires in 2011.
On a monthly basis, the coker gross margin, as defined in the agreement, is calculated and compared to the minimum. Coker gross margins exceeding the minimum are considered a “surplus” while coker gross margins that fall short of the minimum are considered a “shortfall.” On a quarterly basis, the surplus and shortfall determinations since the beginning of the contract are aggregated. Pricing adjustments to the crude oil we
73
purchase are only made when there exists a cumulative shortfall. When this quarterly aggregation first reveals that a cumulative shortfall exists, we receive a discount on our crude oil purchases in the next quarter in the amount of the cumulative shortfall. If, thereafter, the cumulative shortfall incrementally increases, we receive additional discounts on our crude oil purchases in the succeeding quarter equal to the incremental increase, and conversely, if, thereafter, the cumulative shortfall incrementally decreases, we repay discounts previously received, or a premium, on our crude oil purchases in the succeeding quarter equal to the incremental decrease. Cash crude oil discounts received by us in any one quarter are limited to $30 million, while our repayment of previous crude oil discounts, or premiums, are limited to $20 million in any one quarter. Any amounts subject to the quarterly payment limitations are carried forward and applied in subsequent quarters.
As of March 31, 2003, a cumulative quarterly surplus of $137.7 million existed under the agreement. As a result, to the extent we experience quarterly shortfalls in coker gross margins going forward, the price we pay for Maya crude oil in succeeding quarters will not be discounted until this cumulative surplus is offset by future shortfalls.
In May 2001, we entered into marine charter agreements with The Sanko Steamship Co., Ltd. of Tokyo, Japan, for three tankers custom designed for delivery to our docks. The charter agreements have an eight-year term from the date of delivery of each ship and are renewable for two one-year periods. All three ships were delivered in late 2002. We use the ships solely to transport Maya crude oil from the loading port in Mexico to our refinery dock in Port Arthur. Because of the custom design of the tankers, our dock is accessible 24 hours a day by the tankers, unlike the daylight-only transit requirement applicable to ships approaching all other terminals in the Port Arthur area. In addition, the size of the custom-designed tankers allows our crude oil requirements to be satisfied with fewer trips to the docks. We believe our marine charter arrangement will improve delivery reliability of crude oil to the Port Arthur refinery and will save approximately $10 million per year due to reduced third party terminal costs and the benefit of fewer trips.
Hydrogen is supplied to the refinery under a 20-year contract with Air Products and Chemicals Inc., or Air Products. Air Products has constructed, on property leased from us, a new steam methane reformer and two hydrogen purification units. Air Products also supplies steam and electricity to our Port Arthur refinery. If our requirements exceed the daily amount provided for under the contract, we may purchase additional hydrogen from Air Products. Certain bonuses and penalties are applicable for various performance targets under the contract.
Mixed butylenes from the FCC unit and the coker unit are processed for a fee by Huntsman Petrochemical Corporation, or Huntsman, to produce MTBE for sale or refinery consumption. The unused portion of the mixed butylene stream and incremental purchases are returned to our refinery for use as alkylation feedstock. Methanol required to produce the MTBE is purchased by us and delivered to Huntsman. The butylenes are transported to and from Huntsman by dedicated pipelines owned by Huntsman. This is a one-year renewable agreement between Huntsman and us, which may be cancelled upon 90 days’ notice.
We purchase Huntsman’s entire production of pyrolysis gasoline, or pygas, produced from its Port Arthur ethylene cracker. Pygas is transported by dedicated pipeline from Huntsman to the refinery for use as a refinery gasoline blendstock. This agreement is for five years ending December 31, 2004, but can be cancelled by us, if desired, as a result of gasoline specification changes due to Tier 2 gasoline standards, since the sulfur content of pygas may exceed that which is permitted by the regulations.
Energy.We generate most of the electricity for our Port Arthur refinery in our own cogeneration plants. The remainder of our electricity needs is supplied under a long-term agreement with Air Products, which has a cogeneration plant as part of its on-site hydrogen plant. In addition, we buy power from Entergy Gulf States, Inc., or Entergy, under peak load conditions, or if a generator experiences a mechanical failure. During times when we have excess power, we sell the excess to Entergy. Entergy has exercised its right to terminate the agreement because of impending deregulation, which deregulation is expected to occur in late-2003. The agreement will
74
stay in effect on a month-to-month basis until deregulation occurs. We are in the process of making alternative arrangements to replace the Entergy agreement.
Our Port Arthur refinery purchases natural gas at a price based on a monthly index, pursuant to a contract with CenterPoint Energy Gas Resources Corporation, a subsidiary of CenterPoint Energy Inc., that terminated in June 2003. Our contract with CenterPoint Energy Inc. was extended to September 2003 and we are in the process of making new arrangements for a natural gas supply. The contract provides for 60,000 million btu of natural gas per day on a firm, uninterruptible basis, which is the amount of natural gas consumed by us each day at the refinery. The contract also allows for wide flexibility in volumes at a specified pricing formula. We believe there are many alternative sources of natural gas available upon expiration of this contract.
Product Offtake.The gasoline, low-sulfur diesel and jet fuel produced at our Port Arthur refinery are distributed into the Colonial pipeline, Explorer pipeline, TEPPCO pipeline or through the refinery dock into ships or barges. The TEPPCO pipeline also provides access to the Centennial pipeline. The advantage of a variety of distribution channels is that it gives us the flexibility to direct our product into the most profitable market. The TEPPCO pipeline is fed directly out of the refinery tankage, through pipelines we own and operate. The Colonial and Explorer pipelines are fed from our Port Arthur Products Station tank farm, which we partly own through a joint venture with Motiva Enterprises LLC and Unocal Pipeline Company, operated by Shell. We also own the pipelines which distribute products from the refinery to the Port Arthur Products Station tank farm. Products loaded at the refinery docks come directly out of our Port Arthur refinery tankage. A pipeline also runs from our refinery to Shell’s Beaumont light products terminal. We supply all the products to the Shell terminal. The petroleum coke produced is moved through the refinery dock by third-party shiploaders. The petroleum coke is sold to five customers under term agreements, for periods of one to four years.
Other Arrangements. Within our Port Arthur refinery, Chevron Phillips Chemical Company, L.P. operates a 164-acre petrochemical facility to manufacture olefins, benzene, cumene and cyclohexane. This facility is well integrated with the refinery and relies heavily on the refinery infrastructure for utility, operating and support services. We provide these services at cost. In addition to these services, Chevron Phillips Chemical Company L.P. purchases feedstock from the refinery for use in its olefin cracker, aromatic extraction unit and propylene fractionator. By-products from the petrochemical facility are sold to the refinery for use as gasoline and diesel blendstock, saturate gas plant feedstock, hydrogen and fuel gas. Chevron Phillips Chemical Company, L.P has expressed intent to discontinue operation of the aromatic extraction unit. We are currently evaluating the impact of this discontinued operation on our refinery operations.
Chevron Products Company also operates a distribution facility on 102 acres within our Port Arthur refinery. The distribution center is operated by Chevron Products Company to blend, package, and distribute lubricants and grease. This facility also relies heavily on the refinery infrastructure for utility, operating and support services, which are provided by us at cost.
Other Gulf Coast Assets
We own other assets associated with our Port Arthur refinery, including:
| | • | | a crude oil terminal and a liquefied petroleum gas terminal, with a combined capacity of approximately 5.0 million barrels; |
| | • | | an interest in a jointly held product terminal operated by Shell; |
| | • | | proprietary refined product pipelines that connect our Port Arthur refinery to our liquefied petroleum gas terminal; |
| | • | | refined product common carrier pipelines that connect our Port Arthur refinery to several other terminals; and |
| | • | | crude oil common carrier pipelines that connect our Port Arthur refinery to several other terminals and third party pipeline systems. |
75
Midwest Operations
The Midwest, or PADD II, region of the United States, which is the second largest PADD in the United States in terms of crude oil throughput capacity, is comprised of North Dakota, South Dakota, Minnesota, Iowa, Nebraska, Kansas, Missouri, Oklahoma, Wisconsin, Illinois, Michigan, Indiana, Ohio, Kentucky and Tennessee. According to the NPRA, 25 refineries were operating in PADD II as of December 31, 2002, with a total crude oil throughput capacity of approximately 3.5 million bpd.
Production of light, or premium, petroleum product by refiners located in PADD II has historically been less than the demand for such product within that region, resulting in product being supplied from surrounding regions. According to the EIA, total light product demand in PADD II, as of December 31, 2002, is approximately 4.5 million bpd, with refinery production of light products in PADD II estimated at approximately 3.0 million bpd. Net imports have supplemented PADD II refining in satisfying product demand and are currently estimated by the EIA at approximately 1.0 million bpd, with the Gulf Coast continuing to be the largest area for sourcing product, accounting for approximately 890,000 bpd.
The Explorer, TEPPCO, Seaway, Orion, Colonial and Plantation product pipelines are the primary pipeline systems for transporting Gulf Coast refinery output to PADD II. In addition, product began shipping via the Centennial product pipeline in April of 2002. Supply is also available via barge transport up the Mississippi River with significant deliveries into markets along the Ohio River. Barge transport serves a role in supplying inland markets that are remote from product pipeline access and in supplementing pipeline supply when they are bottlenecked or short of product.
Lima Refinery
Our Lima refinery, which we acquired from British Petroleum, or BP, in August 1998, is located on a 650-acre site in Lima, Ohio, about halfway between Toledo and Dayton. The refinery, with a crude oil throughput capacity of approximately 170,000 bpd, processes primarily light, sweet crude oil, although 22,500 bpd of coking capability allows the refinery to upgrade lower-valued products. Our Lima refinery is highly automated and modern and includes a crude unit, a hydrocracker unit, a reformer unit, an isomerization unit, a fluid catalytic cracking unit, a coker unit, a trolumen unit, an aromatic extraction unit and a sulfur recovery unit. We also own a 1.1 million-barrel crude oil terminal associated with our Lima refinery. The refinery can produce conventional gasoline, reformulated gasoline, jet fuel, high-sulfur diesel fuel, anode grade petroleum coke, benzene and toluene.
76
Feedstocks and Production at Lima Refinery
| | | For the Year Ended December 31,
| | | | | | | |
| | | 2000
| | | 2001
| | | 2002
| | |
| | | For the Three
Months Ended March 31, 2003
| |
| | | bpd
(thousands)
| | | Percent of
Total
| | | bpd
(thousands)
| | | Percent of
Total
| | | bpd (thousands)
| | | Percent of
Total
| | | bpd
(thousands)
| | | Percent
of
Total
| |
Feedstocks | | | | | | | | | | | | | | | | | | | | | | | | |
Crude oil throughput: | | | | | | | | | | | | | | | | | | | | | | | | |
Sweet crude oil | | 130.5 | | | 99.5 | % | | 136.5 | | | 99.7 | % | | 138.0 | | | 101.0 | % | | 128.2 | | | 98.4 | % |
Light sour crude oil | | 5.9 | | | 4.5 | | | 4.0 | | | 2.9 | | | 3.5 | | | 2.6 | | | 4.6 | | | 3.5 | |
| | |
|
| |
|
| |
|
| |
|
| |
|
| |
|
| |
|
| |
|
|
Total crude oil | | 136.4 | | | 104.0 | | | 140.5 | | | 102.6 | | | 141.5 | | | 103.6 | | | 132.8 | | | 101.9 | |
Unfinished and blendstocks | | (5.3 | ) | | (4.0 | ) | | (3.6 | ) | | (2.6 | ) | | (4.9 | ) | | (3.6 | ) | | (2.5 | ) | | (1.9 | ) |
| | |
|
| |
|
| |
|
| |
|
| |
|
| |
|
| |
|
| |
|
|
Total feedstocks | | 131.1 | | | 100.0 | % | | 136.9 | | | 100.0 | % | | 136.6 | | | 100.0 | % | | 130.3 | | | 100.0 | % |
| | |
|
| |
|
| |
|
| |
|
| |
|
| |
|
| |
|
| |
|
|
Production | | | | | | | | | | | | | | | | | | | | | | | | |
Light Products: | | | | | | | | | | | | | | | | | | | | | | | | |
Conventional gasoline | | 67.5 | | | 50.8 | % | | 71.2 | | | 51.4 | % | | 73.3 | | | 53.0 | % | | 66.2 | | | 50.4 | % |
Premium and reformulated gasoline | | 11.3 | | | 8.5 | | | 11.5 | | | 8.3 | | | 11.5 | | | 8.3 | | | 11.9 | | | 9.1 | |
Diesel fuel | | 21.1 | | | 15.9 | | | 21.3 | | | 15.4 | | | 19.3 | | | 13.9 | | | 23.9 | | | 18.2 | |
Jet fuel | | 21.4 | | | 16.1 | | | 22.7 | | | 16.4 | | | 22.2 | | | 16.0 | | | 17.8 | | | 13.6 | |
Petrochemical feedstocks | | 7.1 | | | 5.3 | | | 7.0 | | | 5.1 | | | 7.5 | | | 5.4 | | | 6.4 | | | 4.9 | |
| | |
|
| |
|
| |
|
| |
|
| |
|
| |
|
| |
|
| |
|
|
Total light products | | 128.4 | | | 96.6 | | | 133.7 | | | 96.6 | | | 133.8 | | | 96.6 | | | 126.2 | | | 96.2 | |
Petroleum coke and sulfur | | 2.5 | | | 1.9 | | | 2.8 | | | 2.0 | | | 2.8 | | | 2.0 | | | 2.3 | | | 1.7 | |
Residual oil | | 2.0 | | | 1.5 | | | 2.0 | | | 1.4 | | | 1.9 | | | 1.4 | | | 2.7 | | | 2.1 | |
| | |
|
| |
|
| |
|
| |
|
| |
|
| |
|
| |
|
| |
|
|
Total production | | 132.9 | | | 100.0 | % | | 138.5 | | | 100.0 | % | | 138.5 | | | 100.0 | % | | 131.2 | | | 100.0 | % |
| | |
|
| |
|
| |
|
| |
|
| |
|
| |
|
| |
|
| |
|
|
Our Lima refinery crude oil throughput has typically not exceeded an annual average of 140,000 bpd over the last several years despite having a throughput capacity of approximately 170,000 bpd. This is largely due to the inability to market the incremental product, mainly high-sulfur diesel fuel, which is produced at throughput rates in excess of 140,000 bpd. A new pipeline connection between the Buckeye pipeline, which transports products out of Lima, and the TEPPCO pipeline, which delivers products into Chicago, was completed in August 2001. This connection in Indianapolis allows for the transportation of light products, specifically high-sulfur diesel fuel, to be transported into the Chicago market from our Lima refinery. The ability to transport reformulated gasoline on this TEPPCO interconnection from our Lima refinery to the Chicago market was made available in late 2002. We may utilize this connection for light products in the future to increase throughput rates closer to the 170,000 bpd capacity when economically justifiable.
Feedstock and Other Supply Arrangements. The crude oil supplied to our refinery is purchased on a spot basis and delivered via the Marathon pipeline and the Mid-Valley pipeline. The reactivation and reversal of the Millennium pipeline in June 2000 allows the delivery of up to 65,000 bpd of foreign waterborne crude oil to the Mid-Valley pipeline at Longview, Texas. The Mid-Valley pipeline is also supplied with West Texas Intermediate domestic crude oil via the West Texas Gulf pipeline. The Marathon pipeline is supplied via the Capline, Ozark, Platte, ExxonMobil and Mustang pipelines. The refinery’s current crude oil slate includes foreign waterborne crude oil ranging from heavy sweet to light sweet, domestic West Texas Intermediate and a small amount of light sour crude oil in order to maximize the sulfur plant capacity. This flexibility in crude oil supply helps to assure availability and allows us to minimize the cost of crude oil delivered into our refinery. All deliveries to Lima, whether domestic or foreign, are accomplished on a daily ratable basis.
In March 1999, we entered into an agreement with Koch Petroleum Group L.P., or Koch, as a means of minimizing our working capital investment. Pursuant to the agreement, we sold Koch our crude oil linefill in the Mid-Valley pipeline and the West Texas Gulf pipeline that is required for the delivery of crude oil to our Lima refinery, which amounted to 2.7 million barrels. As part of the agreement with Koch, we were required to
77
repurchase these barrels of crude oil in September 2002. On October 1, 2002, Morgan Stanley Capital Group Inc., or MSCG, purchased the 2.7 million barrels of crude oil from Koch in lieu of our purchase obligation. We are obligated to purchase the linefill from MSCG upon termination of our agreement with them. The agreement with MSCG was terminated in June 2003, and we purchased the 2.7 million barrels of crude oil linefill from MSCG at a net cost to us of approximately $80 million.
Energy. Electricity is supplied to our refinery at a competitive rate pursuant to an agreement with Ohio Power Company, which is terminable by either party on twelve months notice. We believe this is a stable, long-term energy supply; however, there are alternative sources of electricity in the area if necessary. We purchase natural gas at a price based on a monthly index, pursuant to a contract with BP. The contract was renewed in August 2002 and renews automatically in August of each year, unless terminated by us on 120 days notice. If necessary, alternative sources of natural gas supply are available, although probably at higher prices.
Product Offtake. Our Lima refinery’s products are distributed through the Buckeye and Inland pipeline systems and by rail, truck or third party-owned terminals. The Buckeye system provides access to markets in northern/central Ohio, Indiana, Michigan and western Pennsylvania. The Inland pipeline system is a private intra-state system through which products from our Lima refinery can be delivered to the pipeline’s owners. A high percentage of our Lima refinery’s production supplies the wholesale business through direct movements or exchanges. Gasoline and diesel fuel are sold or exchanged to the Chicago market under term arrangements. Jet fuel production is sold primarily under annual contracts to commercial airlines and delivered via pipelines. Propane products are sold by truck or, during the summer, transported via the TEPPCO pipeline to caverns for winter sale. The mixed butylenes and isobutane products are transported by rail to customers throughout the country. The anode grade petroleum coke production, which commands a higher price than fuel grade petroleum coke, is transported by rail to customers in West Virginia and Illinois.
Other Arrangements. Adjacent to our Lima refinery is a chemical complex owned and operated by BP Chemical, a plant owned by PCS Nitrogen and operated by BP Chemical, and a plant owned by Akzo Nobel that processes by-products from the BP Chemical plant. The chemical complex relies heavily on our Lima refinery’s infrastructure for utility, operating and support services. We provide these services at cost; however, costs for the replacement of capital are shared based on the proportion each party uses the equipment. In addition to services, BP Chemical purchases chemical-grade propylene and normal butane for its plants.
We process BP’s Toledo refinery production of low purity propylene. The low purity propylene is transported by pipeline to the refinery for purification. High purity propylene is purchased by BP Chemical and is received by rail or truck and commingled with high-purity propylene production from the refinery to provide feed to the adjacent BP Chemical plant. This agreement has a seven-year term ending September 30, 2006, and continues year to year thereafter, unless terminated upon three years’ notice.
Memphis Refinery
Our Memphis refinery, which we acquired from Williams in March 2003, is located on a 223-acre site along the Mississippi River’s Lake McKellar in Memphis, Tennessee. The refinery, with a crude oil throughput capacity of approximately 190,000 bpd, primarily processes light, sweet crude oil. The refinery typically processes closer to 170,000 bpd of crude oil throughput based on the markets that are economically available for distribution of its production. While the Memphis refinery was originally constructed in 1941, due to significant investment particularly over the last four years, we believe the refinery is a modern and highly efficient refinery. The Memphis refinery includes two crude units, a fluid catalytic cracking unit, a reformer unit, an alkylation unit, an isomerization unit, two naphtha desulfurizers, a distillate desulfurizer, and a sulfur recovery unit. The refinery can produce conventional gasoline, jet fuel, low sulfur diesel fuel, refinery grade propylene, propane, and heavy fuel oil.
78
Feedstocks and Production at Memphis Refinery
| | | For the Three Months
Ended March 31, 2003
| |
| | | bpd
(thousands)(1)
| | Percent of
Total
| |
Feedstocks: | | | | | |
Crude oil throughput: | | | | | |
Sweet crude oil | | 52.1 | | 96.5 | |
Medium and light sour crude oil | | 0.8 | | 1.5 | |
| | |
| |
|
|
Total crude oil | | 52.9 | | 98.0 | |
Unfinished and blendstocks | | 1.1 | | 2.0 | |
| | |
| |
|
|
Total feedstocks | | 54.0 | | 100.0 | % |
| | |
| |
|
|
Production: | | | | | |
Light products: | | | | | |
Conventional gasoline | | 22.8 | | 41.8 | |
Premium and reformulated gasoline | | 3.1 | | 5.7 | |
Diesel fuel | | 16.0 | | 29.4 | |
Jet fuel | | 8.8 | | 16.1 | |
Petrochemical feedstocks | | 2.6 | | 4.8 | |
| | |
| |
|
|
Subtotal light products | | 53.3 | | 97.8 | |
Petroleum coke and sulfur | | 0.1 | | 0.2 | |
Residual oil | | 1.1 | | 2.0 | |
| | |
| |
|
|
Total production | | 54.5 | | 100.0 | % |
| | |
| |
|
|
| (1) | | Feedstocks and production reflect 29 days of operations averaged over the first quarter of 2003. |
The refinery’s location along the Mississippi River provides it with a cost advantage in serving numerous upriver markets due to the economic benefits of shipping crude oil for refining and subsequent product distribution versus shipping refined products from the Gulf Coast to Memphis. The refinery is also well situated to meet demand for refined products in Nashville, Tennessee, which the Gulf Coast market cannot economically satisfy. The refinery’s close proximity to several major electric power plants also provides access to increased distillate demand associated with peaking plants and fuel switching.
Feedstock and Other Supply Arrangements. Crude oil supplied to our refinery is purchased on the spot market and delivered via the Capline pipeline, which originates in St. James, Louisiana and terminates in Patoka, Illinois. We can also receive crude oil and other feedstocks by barge. We have entered into a crude oil supply agreement with MSCG through which we can arrange to purchase foreign or domestic crude oils in quantities sufficient to fulfill the crude oil requirements of the refinery. Under terms of this supply agreement, we must either cash fund crude oil purchases one week in advance of delivery or provide security to MSCG in the form of a letter of credit. This supply agreement expires in March 2005, and can be renewed based on certain notification requirements.
Energy. We purchase our electricity from the Tennessee Valley Authority, or TVA, and Memphis Light, Gas & Water, or MLG&W, under a contract that currently provides for interruptible supplies of electricity. Williams recently completed an 80-megawatt power plant that is adjacent to the refinery. This plant is designed to provide a reliable, secondary source of power and allow us to reduce our power costs by purchasing electrical power at interruptible rates. The turbine is permitted to operate under a variance, pending completion of final environmental emissions tests.
Product Offtake. The principal market for the refinery’s production is the local Memphis market and secondarily the Nashville, Tennessee market. Products are distributed primarily via truck loading racks at our
79
two product terminals, a pipeline directly to the Memphis airport, and barges. We also have the ability to deliver production to eastern, southern, and northern markets, given opportunistic market conditions, principally via barge and subsequently connecting into pipelines such as Colonial and TEPPCO.
The Memphis refinery is the sole supplier of jet fuel to the Memphis International Airport, a major air cargo thoroughfare and central hub for Federal Express. The Memphis refinery supplies Federal Express pursuant to supply agreements, which expire in 2004 and in the past have represented approximately 12% of the refinery’s production. In addition to the Federal Express supply agreement, we have a number of other supply agreements with terms in excess of one year.
Other Memphis Related Assets. Assets, other than the refinery units, that are associated with our Memphis refinery include:
| | • | | a crude oil terminal located in Mississippi just south of Collierville, Tennessee with storage capacity of 975,000 barrels and pipeline connections (a portion owned and a portion leased from MLG&W, but all operated by us) from the Capline pipeline to the refinery; |
| | • | | crude oil storage tanks in St. James, Louisiana, through lease and throughput agreements, with storage capacity totaling approximately 740,000 barrels; |
| | • | | a 120,000 bpd truck loading rack adjacent to the refinery; |
| | • | | a river dock adjacent to the refinery; |
| | • | | a products terminal in West Memphis, Arkansas with storage capacity of 964,000 barrels, a 50,000 bpd truck loading rack, a river dock, and a pipeline connecting the terminal facilities to the refinery; |
| | • | | a products terminal in Memphis, Tennessee, known as Riverside, with storage capacity of 169,000 barrels. |
Hartford Refinery
Our Hartford refinery is located on a 400-acre site on the Mississippi River in Hartford, Illinois, approximately 17 miles northeast of St. Louis, Missouri. The refinery, which has a crude oil throughput capacity of approximately 70,000 bpd, is designed to process primarily sour crude oil into higher-value products such as gasoline and diesel fuel. The refinery includes a coker unit and can therefore process a wide variety of crude oil slates, including approximately 60% heavy sour crude oil and 40% medium and light sour crude oil or up to 100% medium sour crude oil. The refinery can produce conventional gasoline, reformulated gasoline, high-sulfur diesel fuel, residual fuel and petroleum coke. The refinery includes a crude unit, a hydrogen plant, an isomerization unit, a fluid catalytic cracking unit, a coker unit and an alkylation unit.
In late September 2002, we ceased refining operations at our Hartford, Illinois refinery. We concluded that there was no economically viable manner of reconfiguring the refinery to produce fuels which meet new gasoline and diesel fuel specifications mandated by the federal government. We are continuing to operate the storage and distribution facility at the Hartford refinery site. In April 2003, we announced that we had signed a memorandum of understanding with ConocoPhillips to sell the Hartford refining assets and certain storage and distribution assets for $40 million. We recorded a $16.6 million pretax restructuring charge in the first quarter of 2003 in connection with this proposed transaction. The sale is subject to execution of a definitive purchase and sale agreement and other conditions. For a discussion of the pretax charge to earnings that we recorded in 2002 as a result of the closure of our Hartford refinery, see “Management’s Discussion and Analysis of Financial Condition and Results of Operations—Factors Affecting Comparability—Refinery Restructuring and Other Charges—Hartford Refinery Closure and Proposed Sale.”
80
Product Marketing
Our product marketing group sells approximately 4.1 billion gallons per year of gasoline, diesel fuel, and jet fuel to a diverse group of approximately 1,200 distributors and chain retailers and another 3.9 billion gallons per year to bulk customers. We believe we are one of the largest suppliers of unbranded refined petroleum products in the United States. We sell the majority of our products through an extensive third-party owned terminal system in the midwest, southeast and eastern United States. We also sell our products to end-users in the transportation and commercial sectors, including airlines, railroads and utilities.
In 1999, we sold our network of distribution terminals, with the exception of our Alsip terminal and two terminals affiliated with our Port Arthur refinery, to a group composed of Equiva Trading Company, Shell and Motiva Enterprises LLC. As part of the transaction, we entered into a ten-year agreement with the group under which we have the right to distribute our refined products from all our refineries through all of the group’s extensive network of approximately 113 terminals, including the terminals we sold to the group. Our right to use the terminals is subject to availability, and, as a result, our use of the terminals is sometimes limited.
Our Alsip terminal, located approximately 17 miles from Chicago, is adjacent to our former Blue Island refinery, which we closed in January 2001. We also own a dedicated pipeline that runs from the Alsip terminal to a Hammond, Indiana terminal owned by Shell. The terminal distributes primarily reformulated gasoline and distillates. We supply the terminal with products from our Port Arthur refinery via barge and via the Shell terminal and from our Lima refinery via the Buckeye/TEPPCO pipeline.
A one million barrel refinery tank farm formerly associated with our Blue Island refinery is currently used to store crude oil, light products, ethanol, and heavy oils. An adjacent facility leases and operates some tanks in the tank farm to store liquefied petroleum gas. Our refinery tank farm can receive products via Kinder Morgan, Capline and TEPPCO pipelines, barge, rail and through our proprietary pipeline from Shell’s Hammond terminal. Products can be shipped out of our refinery tank farm into the Kinder Morgan and Westshore pipelines, barges, railcars, trucks and via our pipeline back to Hammond where it can access the Wolverine pipeline, Badger pipeline and Buckeye pipeline. The location and variety of transportation into and out of the facility positions us well to supply the Chicago market or to lease our refinery tank farm to third parties.
Our Hartford storage and distribution facility is located on our Hartford refinery site and has total storage capacity of approximately 1.5 million barrels. We supply the petroleum product storage facility with products via barge and via the Marathon/Wabash and Explorer pipelines. Product is also distributed via these means or moved through our pipeline between the facility and the Shell terminal in Hartford and then further distributed by trucks.
Our distribution network is an integral part of our refining business. However, due to ordinary course logistical issues concerning production schedules and product sales commitments, it is common for us to purchase refined products from third parties in order to balance the requirements of our product marketing activities. Less than 20% of net sales and operating revenues in 2002 were represented by sales of products purchased from third parties. This percentage was higher in 2002 than previous years because we purchased refined products in order to cover shortfalls resulting from the closure of our Blue Island and Hartford refineries. We believe that a portion of the production from our Memphis refinery will contribute to meeting these commitments in the future. Although third party purchases are essential to effectively market our production, the effects from these activities on our operating results are not significant.
Crude Oil Supply
We have crude oil supply contracts that provide for our purchase of up to approximately 370,000 bpd of crude oil from an affiliate of PEMEX and MSCG. The affiliate of PEMEX provides for our purchase of approximately 200,000 bpd of crude oil under two separate contracts. One of these contracts is a long-term agreement, under which we currently purchase approximately 162,000 bpd, designed to provide our Port Arthur refinery with a stable and secure supply of Maya heavy sour crude oil. We acquire directly or through MSCG the
81
remainder of our crude oil supply on the spot market from unaffiliated foreign and domestic sources, allowing us to be flexible in our crude oil supply source.
The following table shows our average daily sources of crude oil for the three months ended March 31, 2003:
Sources of Crude Oil Supply
| |
| | | bpd
(thousands)
| | | Percent of Total
| |
Latin America | | | | | | |
Mexico | | 198.0 | | | 46.0 | % |
Rest of Latin America | | 30.3 | | | 7.1 | |
United States | | 127.3 | | | 29.6 | |
Middle East | | 32.3 | | | 7.5 | |
North Sea | | 19.3 | | | 4.5 | |
Africa | | 22.8 | | | 5.3 | |
| | |
|
| |
|
|
Total | | 430.0 | | | 100.0 | % |
| | |
|
| |
|
|
In both of our operating regions, we have the flexibility to receive feedstocks from several suppliers using either pipelines or waterborne delivery. Our Port Arthur refinery receives Maya crude oil and light sour crude oil, which is delivered primarily through waterborne delivery via our docks and also through third-party terminals. In the Midwest, our Lima refinery receives crude oil largely through the Mid-Valley pipeline, and our Memphis refinery primarily receives crude oil through the Capline pipeline.
Competition
Many of our competitors are fully integrated national or multinational oil companies engaged in various segments of the petroleum business, including exploration, production, transportation, refining and marketing. Because of their geographic diversity, integrated operations, larger capitalization and greater resources, these competitors may be better able to withstand volatile market conditions, compete more effectively on the basis of price, and obtain crude oil more readily in times of shortage.
The refining industry is highly competitive. Among the principal competitive factors are feedstock supply and product distribution. We compete with other companies for supplies of feedstocks and for outlets for our refined products. Many of our competitors produce their own feedstocks and have extensive retail outlets. We do not produce any of our own feedstocks and have sold our retail outlets. The constant supply of feedstocks and ready market and distribution channels of such competitors places us at a competitive disadvantage in periods of feedstock shortage, high feedstock prices, low refined product prices or unfavorable distribution channel market conditions. In addition, competitors with their own production or retail outlets may be better able to withstand such periods of depressed refining margins or feedstock shortages because they can offset refining losses with profits from their production or retail operations.
Our industry is subject to extensive environmental regulations, including new standards governing sulfur content in gasoline and diesel fuel. These regulations will have a significant impact on the refining industry and will require substantial capital outlays by us and our competitors in order to upgrade our facilities to comply with the new standards. For further information on environmental compliance, see “—Environmental Matters —Environmental Compliance.” Competitors who have more modern plants than we do may not spend as much to comply with the regulations and may be better able to afford the upgrade costs.
Several significant merger transactions have recently closed between several of our refining industry competitors. We expect this trend toward industry consolidation and restructuring through a variety of transaction structures to continue. As a result of this consolidation, we believe, as has already been the case, that regulators will require merging parties to divest themselves of certain assets. In addition, other assets may also
82
become available as the merged entities go through the process of rationalization regarding overlapping assets and production capability. As such, we believe that the continued consolidation and rationalization within the refining market may present us with attractive acquisition opportunities.
Office Properties
As of December 31, 2002, we leased approximately 84,000 square feet of office space in our Old Greenwich, Connecticut executive offices and our St. Louis, Missouri general offices. Our office space is generally suitable and adequate for its purposes. If we require additional or alternative office space, we believe we will be able to secure space on commercially reasonable terms without undue disruption of our operations.
Employees
As of March 31, 2003, we employed approximately 1,700 people, approximately 59% of whom are covered by collective bargaining agreements at our Lima, Memphis and Port Arthur refineries. The collective bargaining agreements covering employees at our Port Arthur and Memphis refinery expire in January 2006 and the agreement covering employees at our Lima refinery expires in April 2006. Our relationships with the relevant unions have been good and we have never experienced a work stoppage as a result of labor disagreements.
Environmental Matters
We are subject to extensive federal, state and local laws and regulations relating to the protection of the environment. These laws and the accompanying regulatory programs and enforcement initiatives, some of which are described below, impact our business and operations by imposing, among other things:
| | • | | restrictions or permit requirements on our on-going operations; |
| | • | | liability in certain cases for the remediation of contaminated soil and groundwater at our current or former facilities and at facilities where we have disposed of hazardous materials; and |
| | • | | specifications on the petroleum products we market, primarily gasoline and diesel fuel. |
The laws and regulations we are subject to often change and may become more stringent. The ultimate impact of complying with existing laws and regulations is not always clearly known or determinable due in part to the fact that our operations may change over time and certain implementation guidelines of the regulations for laws such as the Resource Conservation and Recovery Act and the Clean Air Act have not yet been finalized, are under governmental or judicial review or are being revised. These regulations and other new air and water quality standards and stricter fuel regulations could result in increased capital, operating and compliance costs. See “Management’s Discussion and Analysis of Financial Condition and Results of Operations—Liquidity and Capital Resources—Cash Flow from Investing Activities.”
In addition, we are currently a party to a number of enforcement actions filed by federal, state and local agencies alleging violations of environmental laws and regulations and party to a number of third-party claims alleging exposure to hazardous substances, including asbestos. See “—Environmental Matters—Certain Environmental Contingencies; Legal and Environmental Reserves” and “—Legal Proceedings.”
Environmental Compliance
The principal environmental risks associated with our refinery operations are air emissions, releases into soil and groundwater, wastewater excursions, and compliance with specifications for fuels mandated by environmental regulations. The primary legislative and regulatory programs that affect these areas are outlined below.
83
The Clean Air Act
The federal Clean Air Act and the corresponding state laws that regulate emissions of materials into the air affect refining operations both directly and indirectly. Direct impacts on refining operations may occur through Clean Air Act permitting requirements and/or emission control requirements relating to specific air pollutants. For example, fugitive dust, including fine particulate matter measuring ten micrometers in diameter or smaller, may be subject to future regulation. The Clean Air Act indirectly affects refining operations by extensively regulating the air emissions of sulfur dioxide and other compounds, including nitrogen oxides, emitted by automobiles, utility plants and mobile sources, which are direct or indirect users of our products.
The Clean Air Act imposes stringent limits on air emissions, establishes a federally mandated operating permit program and allows for civil and criminal enforcement sanctions. The Clean Air Act also establishes attainment deadlines and control requirements based on the severity of air pollution in a geographical area.
In July 1997, the EPA promulgated more stringent National Ambient Air Quality Standards for ground-level ozone and fine particulate matter. In May 1999, a federal appeals court overturned the new standards. In February 2001, the United States Supreme Court affirmed in part, reversed in part, and remanded the case to the EPA to develop a reasonable interpretation of the nonattainment implementation provisions insofar as they relate to the revised ozone standards. Additionally, in 1998, the EPA published a final rule addressing the regional transport of ground-level ozone across state boundaries to the eastern United States through nitrogen oxide emissions reduction from various emissions sources, including refineries. The rule requires nineteen states and the District of Columbia to revise their state implementation plans to reduce nitrogen oxide emissions. In a related action in December 1999, the EPA granted a petition from several northeastern states seeking the adoption of stricter nitrogen oxide standards by midwestern states. The impact of the revised ozone and nitrogen oxide standards could be significant to us, but the potential financial effects cannot be reasonably estimated until the EPA takes further action on the revised ozone National Ambient Air Quality Standards, or any further judicial review occurs, and the states, as necessary, develop and implement revised state implementation plans in response to the revised ozone and nitrogen oxide standards.
At the Port Arthur refinery, we have committed to acquire permits for “grandfathered” emissions sources under the Governor’s Clean Air Responsibility Enterprise program. To date, we have permitted 99% of the emissions from the refinery. We have been granted a flexible operating use permit for the refinery that allows us greater operational flexibility than we previously had, including the ability to increase throughput capacities, provided we do not exceed emissions thresholds set forth in the permit. In return for the flexible operating use permit, we agreed to install advanced pollution control technology at the refinery. We will begin our ninth year of an eleven year schedule to install such technology.
The Memphis refinery notified the EPA that it will sample waste streams at the refinery to determine the applicable provisions of the National Emission Standards for Hazardous Air Pollutants, or Benzene Waste NESHAP. Depending on the results of the sampling and the applicable provisions of the Benzene Waste NESHAP, additional control equipment will need to be installed to upgrade the wastewater treatment system. Under the purchase agreement for the Memphis refinery, we have assumed the liability for any costs to upgrade the wastewater treatment system, and Williams retains responsibility for any penalties imposed for any non-compliance of the refinery with Benzene Waste NESHAP. We currently estimate the cost of the wastewater treatment system upgrade to be approximately $15 million.
Williams has requested an applicability determination from the EPA regarding the barge loading facility located at the West Memphis terminal. If the terminal is deemed to be contiguous to the refinery by virtue of the completion of a pipeline connecting the refinery to the terminal in 2001, the barge loading facility will be subject to 40 CFR Subpart Y—National Emission Standards for Marine Tank Vessel Loading Operations. If the regulations are deemed applicable, a vapor control system will need to be installed at the terminal barge loading facility, which is expected to cost approximately $4 million.
84
The Clean Water Act
The federal Clean Water Act of 1972 affects refining operations by imposing restrictions on effluent discharge into, or impacting, navigable water. Regular monitoring, reporting requirements and performance standards are preconditions for the issuance and renewal of permits governing the discharge of pollutants into water. We maintain numerous discharge permits as required under the National Pollutant Discharge Elimination System program of the Clean Water Act and have implemented internal programs to oversee our compliance efforts. In addition, we are regulated under the Oil Pollution Act, which amended the Clean Water Act. Among other requirements, the Oil Pollution Act requires the owner or operator of a tank vessel or a facility to maintain an emergency oil response plan to respond to releases of oil or hazardous substances. We have developed and implemented such a plan for each of our facilities covered by the Oil Pollution Act. Also, in case of such releases, the Oil Pollution Act requires responsible companies to pay resulting removal costs and damages, provides for substantial civil penalties, and imposes criminal sanctions for violations of this law. The State of Texas, in which we operate, has passed laws similar to the Oil Pollution Act.
Ethanol and MTBE are the essential blendstocks for producing cleaner-burning gasoline. However, the presence of MTBE in some water supplies, resulting from gasoline leaks primarily from underground and aboveground storage tanks, has led to public concern that MTBE has contaminated drinking water supplies, thus posing a health risk, or has adversely affected the taste and odor of drinking water supplies. The federal legislature and certain states have either passed or proposed or are considering proposals to restrict or ban the use of MTBE. We have primarily used ethanol as the blendstock for the reformulated gasoline we produce. We have, however, produced gasoline containing MTBE at our refineries, and we have sold MTBE to third parties for use as a blendstock for gasoline.
Solid Waste Disposal
Our refining operations are subject to the federal Solid Waste Disposal Act, which imposes requirements for the treatment, management, storage and disposal of solid and hazardous wastes. When feasible, waste materials are recycled through our coking operations instead of being disposed of on-site or off-site. The Solid Waste Disposal Act, including the Resource Conservation and Recovery Act of 1976 and subsequent amendments, governs current waste disposal practices, as well as the environmental effects of certain past waste disposal operations, the recycling of wastes, and the regulation of underground storage tanks containing regulated substances. In addition, new laws are being enacted and regulations are being adopted by various regulatory agencies on a continuing basis, and the costs of compliance with these new rules can only be broadly appraised when their implementation becomes more accurately defined.
Fuel Regulations
Reformulated Fuels. EPA regulations also require that reformulated gasoline and low sulfur diesel intended for all on-road consumers be produced for ozone non-attainment areas, including Chicago, Milwaukee and Houston, which are in our direct market areas. In addition, St. Louis, another of our direct market areas, has been recently designated as serious non-attainment for ozone, requiring reformulated gasoline and low sulfur diesel in this market area. Expenditures necessary to comply with existing reformulated fuels regulations are primarily discretionary. Our decision of whether or not to make these expenditures is driven by market conditions and economic factors. The reformulated fuels programs impose restrictions on properties of fuels to be refined and marketed, including those pertaining to gasoline volatility, oxygenate content, detergent addition and sulfur content. The restrictions on fuel properties vary in markets in which we operate, depending on attainment of air quality standards and the time of year. Our Port Arthur refinery can produce up to approximately 60% of its gasoline production in reformulated gasoline. Its maximum reformulated gasoline production may be limited by the clean fuels attainment of our total refining system. Our Port Arthur refinery’s diesel production complies with the current on-road sulfur specification of 500 ppm.
85
Tier 2 Motor Vehicle Emission Standards. In February 2000, the EPA promulgated the Tier 2 Motor Vehicle Emission Standards Final Rule for all passenger vehicles, establishing standards for sulfur content in gasoline. These regulations mandate that the average sulfur content of gasoline for highway use produced at any refinery not exceed 30 ppm during any calendar year by January 1, 2006, phasing in beginning on January 1, 2004. We currently expect to produce gasoline under the new sulfur standards at our Port Arthur refinery prior to January 1, 2004 and at our Memphis refinery in the first quarter of 2004. As a result of the corporate pool averaging provisions of the regulations, we believe that we will be able to defer a significant portion of the investment required for compliance for our Lima refinery until the end of 2005 through the purchase of sulfur allotments and credits which arise from a refiner producing gasoline with a sulfur content below specified levels prior to the end of 2005, the end of the phase-in period. There is no assurance that the averaging provisions of the regulations will allow for a deferral of compliance at our Lima refinery or that sufficient allotments or credits to defer investment at our Lima refinery will be available, or if available, that they will be cost effective. We believe, based on current estimates and on a January 1, 2004 compliance date for all three refineries, that compliance with the new Tier 2 gasoline specifications will require capital expenditures in the aggregate through 2004 of approximately $335 million, of which $53 million had been incurred as of December 31, 2002.
Low Sulfur Diesel Standards. In January 2001, the EPA promulgated its on-road diesel regulations, which will require a 97% reduction in the sulfur content of diesel fuel sold for highway use by June 1, 2006, with full compliance by January 1, 2010. We estimate that capital expenditures required to comply with the on-road diesel standards at all three refineries in the aggregate through 2006 is approximately $347 million. More than 95% of the projected investment is expected to be incurred during 2004 through 2006 with the greatest concentration of spending occurring in 2005. Since the Lima refinery does not currently produce diesel fuel to on-road specifications, we are considering an acceleration of the low-sulfur diesel investment at the Lima refinery in order to capture this incremental product value. If the investment is accelerated, production of the low-sulfur fuel is possible by the first half of 2005.
Maximum Achievable Control Technology. On April 11, 2002, the EPA promulgated regulations to implement Phase II of the petroleum refinery Maximum Achievable Control Technology rule under the federal Clean Air Act, referred to as MACT II, which regulates emissions of hazardous air pollutants from certain refinery units. We expect to spend approximately $25 million in the next two years related to these new regulations.
Permits
Refining companies must obtain numerous permits that impose strict regulations on various environmental and safety matters in connection with oil refining. Once a permit application is prepared and submitted to the regulatory agency, it is subject to a completeness review, technical review and public notice and comment period before it can be approved. Depending on the size and complexity of the refining operation, some refining permits can take considerable time to prepare and often take six months to sometimes two years to be approved. Regulatory authorities have considerable discretion in the timing of the permit issuance and the public has rights to comment on and otherwise engage in the permitting process, including through intervention in the courts. Certain pending proceedings involving our Port Arthur refinery allege permit violations. See “—Legal Proceedings.”
Environmental Remediation
Under the Comprehensive Environmental Response, Compensation and Liability Act, or CERCLA, and the Solid Waste Disposal Act and related state laws, certain persons may be liable for the release or threatened release of hazardous substances and solid wastes including petroleum and its derivatives into the environment. These persons include the current owner or operator of property where the release or threatened release occurred, any persons who owned or operated the property when the release occurred, and any persons who arranged for the disposal of hazardous substances at the property. Liability under CERCLA is strict, retroactive and in most
86
cases involving the government as plaintiff is joint and several, so that any responsible party may be liable for the entire cost of investigating and remediating the release of hazardous substances. As a practical matter, however, liability at most CERCLA and similar sites is shared among all solvent potentially responsible parties. The liability of a party is determined by the cost of investigation and remediation, the portion of the hazardous substance(s) the party contributed to the site, and the number of solvent potentially responsible parties.
The release or discharge of crude oil, petroleum products or hazardous materials can occur at refineries and terminals. We have identified a variety of potential environmental issues at our refineries, terminals, and previously owned retail stores. In addition, each refinery has areas on-site that may contain hazardous waste or hazardous substance contamination that may need to be addressed in the future at substantial cost. The terminal sites may also require remediation as a result of past activities at the terminal properties including several significant spills and on-site waste disposal practices.
Port Arthur, Lima and Memphis Refineries
The original refineries on the sites of our Port Arthur and Lima refineries began operating in the late 1800s and early 1900s, prior to modern environmental laws and methods of operation. There is contamination at these sites, which we believe will be required to be remediated. Under the terms of the 1995 purchase of our Port Arthur refinery, Chevron Products Company, the former owner, retained liability for all required investigation and remediation relating to pre-purchase contamination discovered by June 1997, except with respect to certain areas on or around which active processing units are located, which are our responsibility. Less than 200 acres of the 4,000-acre refinery site are occupied by active processing units. Extensive due diligence efforts prior to our acquisition and additional investigation after our acquisition documented contamination for which Chevron is responsible. In June 1997, we entered into an agreed order with Chevron and the Texas Commission on Environmental Quality, or TCEQ, that incorporates the contractual division of the remediation responsibilities for certain assets into an agreed order. We have accrued $11.8 million for our portion of the Port Arthur remediation as of March 31, 2003.
Under the terms of the purchase of our Lima refinery, BP, the former owner, indemnified us, subject to certain time and dollar limits, for all pre-existing environmental liabilities, except for contamination resulting from releases of hazardous substances in or on sewers, process units, storage tanks and other equipment at the refinery as of the closing date, but only to the extent the presence of these hazardous substances was as a result of normal operations of the refinery and does not constitute a violation of any environmental law. Although we are not primarily responsible for the majority of the currently required remediation of these sites, we may become jointly and severally liable for the cost of investigating and remediating a portion of these sites in the event that Chevron or BP fails to perform the remediation. In such an event, however, we believe we would have a contractual right of recovery from these entities. The cost of any such remediation could be substantial and could have a material adverse effect on our financial position.
The Memphis refinery was constructed during World War II and also has contamination on the property. An order was originally issued in 1998 by the Tennessee Department of Environment and Conservation (TDEC) Division of Solid Waste Management to MAPCO Petroleum, Inc. (the owner of the refinery prior to Williams). This order addresses groundwater remediation of light non-aqueous phase liquids and dissolved phase hydrocarbons underlying the refinery. Williams has agreed, subject to the limitations described below, to indemnify us against all environmental liabilities incurred by us as a result of a breach of their environmental representations and as a result of environmental related matters (1) known by them prior to the closing but not disclosed to us and (2) not known by them prior to the closing. We are responsible for all other environmental liabilities, including various pending clean-up and compliance matters that we estimate will cost between $9 million and $16 million. Any claims made by us against Williams for environmental liabilities must be made within seven years. Williams was required to obtain, at their expense, a ten-year fully pre-paid $50 million environmental insurance policy in support of this obligation covering unknown and undisclosed liabilities for the period of time prior to the acquisition. The insurance policy provides for a $25 million (with a $5 million limit for
87
third party claims for offsite non-owned locations) limit per incident, with a $25 million aggregate limit per incident and a self-insured retention of $250,000 per incident. The maximum amount we can recover for environmental liabilities is limited to $50 million from Williams plus any amounts provided under the insurance policy. Williams has also agreed to indemnify us against breaches of their representations and from liabilities arising from the ownership and operation of the assets (other than environmental liabilities) prior to the closing, but the liability of the sellers will be subject to a $5 million deductible and a maximum liability of $50 million. In addition, Williams has agreed to indemnify us for any fines and penalties that result from William’s operations or ownership prior to the closing.
Blue Island Refinery Decommissioning and Closure
In January 2001, we ceased refining operations at our Blue Island refinery. The decommissioning of the facility is complete. The dismantling and tear down of the above-ground assets of the former refinery is the responsibility of a third party that purchased the assets for resale. At this time that company has failed to perform and we have notified them of their failure to comply with the contract. We are currently in discussions with state and local governmental agencies concerning remediation of the site. Related to the closure of the facility, we accrued $54.4 million for decommissioning and remediation of the site. As of March 31, 2003, we had spent $35.2 million and had a remaining reserve balance of $19.2 million. In 2002, environmental risk insurance policies covering the Blue Island refinery site have been procured and bound, with final policies issued in 2003. This insurance program will allow us to quantify and, within the limits of the policy, cap our cost to remediate the site, and provide insurance coverage from future third party claims arising from past or future environmental releases. The remediation cost overrun policy has a term of ten years and, subject to certain exceptions and exclusions, provides $25 million in coverage in excess of a self-insured retention amount of $26 million. The pollution legal liability policy provides for $25 million in aggregate coverage and per incident coverage in excess of a $100,000 deductible per incident. For further discussion of the closure of our Blue Island refinery, see “Management’s Discussion and Analysis of Financial Condition and Results of Operations—Factors Affecting Comparability—Refinery Restructuring and Other Charges—Blue Island Refinery Closure.”
Hartford Refinery Closure
In September 2002, we ceased refining operations at our Hartford refinery. In the fourth quarter of 2002, we completed the removal of hydrocarbons, catalyst and chemicals from the refinery processing units. We are also currently in discussions with state governmental agencies concerning environmental remediation of the site. Related to the closure of the refinery, we have accrued $47.4 million for decommissioning, remediation of the site and asbestos abatement. As of March 31, 2003, we spent a net $17.6 million related primarily to the decommissioning of the facility and have a remaining reserve balance of $29.8 million. The accrual of $47.4 million assumes that a portion of the refinery will be operated on an on-going basis as part of a lease or sale transaction and that remediation will occur only in non-operating portions of the refinery. In addition, state governmental agencies are investigating a large petroleum hydrocarbon plume underlying a portion of the Village of Hartford. Responsibility for the plume has not been determined. Nonetheless, since the mid-1990s we have operated, on a voluntary basis, a vapor recovery system designed to prevent gasoline odors from rising into the homes in that area of Hartford overlying the plume. The final disposition of the refinery assets and the final outcome of our discussions with the governmental agencies will have a significant bearing on any necessary adjustments to this accrual. For further discussion of the closure of our Hartford Refinery see “Management’s Discussion and Analysis of Financial Condition and Results of Operations—Factors Affecting Comparability—Refinery Restructuring and Other Charges—Hartford Refinery Closure and Proposed Sale.”
Former Retail Sites
In 1999, we sold our former retail marketing business, which we operated from time to time on a total of 1,150 sites. During the course of operations of these sites, releases of petroleum products from underground storage tanks have occurred. Federal and state laws require that contamination caused by such releases at these sites be assessed
88
and remediated to meet applicable standards. The enforcement of the underground storage tank regulations under the Resource Conservation and Recovery Act has been delegated to the states that administer their own underground storage tank programs. Our obligation to remediate such contamination varies, depending upon the extent of the releases and the stringency of the laws and regulations of the states in which the releases were made. A portion of these remediation costs may be recoverable from the appropriate state underground storage tank reimbursement fund once the applicable deductible has been satisfied. The 1999 sale included 672 sites, 225 of which had no known preclosure contamination, 365 of which had known pre-closure contamination of varying extent, and 80 of which had been previously remediated. The purchaser of our retail division assumed pre-closure environmental liabilities of up to $50,000 per site at the sites on which there was no known contamination. We are responsible for any liability above that amount per site for pre-closure liabilities, subject to certain time limitations. With respect to the sites on which there was known pre-closing contamination, we retained liability for 50% of the first $5 million in remediation costs and 100% of remediation costs over that amount. We retained any remaining pre-closing liability for sites that had been previously remediated.
Of the remaining 478 former retail sites not sold in the 1999 transaction described above, we have sold all but 6 in open market sales and auction sales. We generally retain the remediation obligations for sites sold in open market sales with identified contamination. Of the retail sites sold in auctions, we agreed to retain liability for all of these sites until an appropriate state regulatory agency issues a letter indicating that no further remedial action is necessary. However, these letters are subject to revocation if it is later determined that contamination exists at the properties and we would remain liable for the remediation of any property at which such a letter was received but subsequently revoked. We are currently involved in the active remediation of approximately 140 of the retail sites sold in open market and auction sales. We are actively seeking to sell the remaining 6 properties. During the period from the beginning of 1999 through March 31, 2003, we expended approximately $20 million to satisfy all the environmental cleanup obligations of our former retail marketing business and, as of March 31, 2003, had $23.2 million accrued to satisfy those obligations in the future.
In relation to the 1999 sale, we assigned approximately 170 leases and subleases of retail stores to the purchaser of our retail division, Clark Retail Enterprises, Inc., or CRE. We remain jointly and severally liable for CRE’s obligations under approximately 150 of these leases, including payment of rent and taxes. We may also be contingently liable for environmental cleanup responsibilities for releases of petroleum occurring during the term of the leases. In October 2002, CRE and its parent company, Clark Retail Group, Inc., filed a voluntary petition for reorganization under Chapter 11 of the U.S. Bankruptcy Code. Should CRE reject some or all of these leases in connection with bankruptcy proceedings, we would likely assume responsibility for these obligations. CRE rejected approximately 30 of these leases in connection with bankruptcy hearings held in January, February and March 2003. We recorded an after-tax charge of $4.3 million in the first quarter of 2003 representing the estimated net present value of our remaining liability under these leases, net of estimated sub-lease income. In May 2003, CRE announced that it would conduct an orderly sale of its retail assets, including the lease sites which have not been rejected. In an effort to mitigate any losses we might incur as a result of the CRE bankruptcy, we are participating in the marketing of CRE’s subleases and discussing alternatives with representatives of CRE’s interests and with certain landlords. It is possible that we may incur additional liability for CRE lease obligations or other costs as CRE finalizes the disposition of the properties; however, the amounts are not estimable at this time and could be material. Should any additional leases revert to us, we will attempt to reduce the potential liability by subletting or reassigning the leases.
Former Terminals
In December 1999, we sold 15 refined product terminals to a third party, but retained liability for environmental matters at four terminals and, with respect to the remaining eleven terminals, the first $250,000 per year of environmental liabilities for a period of six years up to a maximum of $1.5 million. As of March 31, 2003, we had expended $1.1 million on these obligations and have accrued $2.3 million for these obligations in the future.
89
Other Memphis Related Assets
On February 18, 1998, TDEC Division of Solid Waste Management issued an order to Truman Arnold Company Memphis Terminal (prior owner) to address increasing levels of petroleum in groundwater underlying the Riverside Terminal facility. Wells have been installed and recent monitoring indicated increased levels in some wells. TDEQ has requested a work plan to address the problem, which is believed to be due to a release of gasoline from a line fueling a vapor control unit located at the truck rack.
A non-hazardous land farm was operated at the Memphis Refinery up until February 2002, most recently for disposal of catalyst from the Poly Unit. The permit for the land farm allows us to begin closure twelve months after it receives its last application. The cost for closing the land farm in accordance with the permit’s closure procedures is not expected to exceed $1 million.
Certain Environmental Contingencies, Discontinued Operations, Legal and Environmental Reserves
As a result of our activities, we and our subsidiaries are party to a number of environmental proceedings. Those that could have a material effect on our operations, or involve potential monetary sanctions of $100,000 or more and to which a governmental authority is a party, are described below under “—Legal Proceedings.” We accrued a total of $100 million, primarily on an undiscounted basis, as of March 31, 2003, for all discontinued operations, legal and environmental contingencies and obligations, including those items described under “—Environmental Matters—Environmental Remediation” and “—Legal Proceedings.” We believe that the ultimate resolution of these claims, to the extent not previously provided for, will not have a material adverse effect on our consolidated financial condition, results of operations or liquidity. However, an adverse outcome of any one or more of these matters could have a material effect on quarterly or annual operating results or cash flow when resolved in a future period.
Environmental Outlook
We have incurred and will continue to incur substantial capital, operating and maintenance, and remediation expenditures as a result of environmental laws and regulations. To the extent these expenditures are not ultimately reflected in the prices of the products and services we offer, our operating results will be adversely affected. We believe that substantially all of our competitors are subject to similar environmental laws and regulations. However, the specific impact on each competitor may vary depending on a number of factors, including the age and location of its operating facilities, marketing areas, production processes and whether or not it is engaged in the petrochemical business or the marine transportation of crude oil or refined products.
Safety and Health Matters
We aim to achieve excellent safety and health performance. We measure our success in this area primarily through the use of injury frequency rates administrated by OSHA. We believe that a superior safety record is inherently tied to our productivity and financial goals. We seek to implement this goal by:
| | • | | training employees in safe work practices; |
| | • | | encouraging an atmosphere of open communication; |
| | • | | involving employees in establishing safety standards; and |
| | • | | recording, reporting and investigating all accidents to avoid reoccurrence. |
Our safety performance, as measured by OSHA’s injury recording methods, has improved over the past several years. Our performance in the past year, however, has declined over the previous year and we are implementing several actions, including extensive reviews of our safe work practices and increased awareness communication, to change the trend. The Memphis refinery has had injury rates higher than the Port Arthur and
90
Lima refineries. We intend to implement programs and provide onsite medical staff in order to improve the Memphis refinery’s safety record.
Legal Proceedings
The following is a summary of material pending legal proceedings to which we or any of our subsidiaries are a party or to which any of our or their property is subject, and environmental proceedings that involve potential monetary sanctions of $100,000 or more and to which a governmental authority is a party.
In addition to the specific matters discussed below, we also have been named in various other suits and claims. We believe that the ultimate resolution of these claims, to the extent not previously provided for, will not have a material adverse effect on our consolidated financial condition, results of operations or liquidity. However, an adverse outcome of any one or more of these matters could have a material effect on quarterly or annual operating results or cash flow.
Village of Hartford, Illinois Litigation.In May 2003, the Attorney General’s office for the State of Illinois filed a lawsuit against us and a former owner of the Hartford refinery for injunctive relief, cost recovery and penalties related to subsurface contamination in the area of the refinery and facilities owned by other companies. The Attorney General’s office also sent notices to other companies with current or former operations in the area of the state’s intent to sue those companies as well. We have met with representatives of the state regarding issues at the Village of Hartford and those discussions are ongoing.
Lawsuit by Residents of Port Arthur, Texas.In June 2003, approximately 700 residents of Port Arthur, Texas filed a lawsuit against us and five other companies alleging personal injuries and property damage from emissions from refining and chemical facilities in the area. The plaintiffs are seeking class certification, unspecified damages and the establishment of a trust fund for health concerns.
Port Arthur: Enforcement.The TNRCC conducted a site inspection of our Port Arthur refinery in the spring of 1998. In August 1998, we received a notice of enforcement alleging 47 air-related violations and 13 hazardous waste-related violations. The number of allegations was significantly reduced in an enforcement determination response from the TNRCC in April 1999. A follow-up inspection of the refinery in June 1999 concluded that only two items remained outstanding, namely that the refinery failed to maintain the temperature required by our air permit at one of its incinerators and that five process wastewater sump vents did not meet applicable air emission control requirements. The TNRCC also conducted a complete refinery inspection in the second quarter of 1999, resulting in another notice of enforcement in August 1999. This notice alleged nine air-related violations, relating primarily to deficiencies in our upset reports and emissions monitoring program, and one hazardous waste-related violation concerning spills. The 1998 and 1999 notices were combined and referred to the TNRCC’s litigation division. On September 7, 2000 the TNRCC issued a notice of enforcement regarding our alleged failure to maintain emission rates at permitted levels. In May 2001, the TNRCC proposed an order covering some of the 1998 hazardous waste allegations (i.e. the incinerator temperature deficiency and the process wastewater sumps) and all of the 1999 and 2000 allegations, and proposing the payment of a fine of $562,675 and the implementation of a series of technical provisions requiring corrective actions. Negotiations with the TNRCC are ongoing.
Blue Island: Class Action Matters.In October 1994, our Blue Island refinery experienced an accidental release of used catalyst into the air. In October 1995, a class action,Rosolowski v. Clark Refining & Marketing, Inc., et al.,was filed against us seeking to recover damages in an unspecified amount for alleged property damage and personal injury resulting from that catalyst release. The complaint underlying this action was later amended to add allegations of subsequent events that allegedly diminished property values. In June 2000, our Blue Island refinery experienced an electrical malfunction that resulted in another accidental release of used catalyst into the air. Following the 2000 catalyst release, two cases were filed purporting to be class actions,Madrigal et al. v. The Premcor Refining Group Inc.andMason et al. v. The Premcor Refining Group Inc.Both cases seek damages in an unspecified amount for alleged property damage and personal injury resulting from that catalyst release. These cases have been consolidated for the purpose of conducting discovery, which is currently proceeding.
91
Alleged Asbestos Exposure. We, along with numerous other defendants, have been named in certain individual lawsuits alleging personal injury resulting from exposure to asbestos. A majority of the claims have been filed by employees of third party independent contractors who purportedly were exposed to asbestos while performing services at our Hartford refinery. The cases remain in the early stages of litigation. Substantive discovery has not yet been concluded. It is impossible at this time for us to quantify our exposure from these claims, but, based on currently available information, we do not believe that any liability resulting from the resolution of these matters will have a material adverse effect on our financial condition, results of operations and cash flow.
New Source Review Permit Issues.New Source Review requirements under the Clean Air Act apply to newly constructed facilities, significant expansions of existing facilities, and significant process modifications and require new major stationary sources and major modifications at existing major stationary sources to obtain permits, perform air quality analysis and install stringent air pollution control equipment at affected facilities. The EPA has commenced an industry-wide enforcement initiative regarding New Source Review. The current EPA initiative, which includes sending numerous refineries information requests pursuant to Section 114 of the Clean Air Act, appears to target many items that the industry has historically considered routine repair, replacement, maintenance or other activity exempted from the New Source Review requirements.
We have responded to an information request from the EPA regarding New Source Review compliance at our Port Arthur and Lima refineries, both of which were purchased within the last seven years. We believe that any costs to respond to New Source Review issues at those refineries prior to our purchase are the responsibility of the prior owners and operators of those facilities. We responded to the request in late 2000, providing information relating to our period of ownership, and are awaiting a response. We are also providing information concerning the time periods prior to our ownership.
At Memphis, under the purchase agreement, Williams is not responsible for any costs we incur arising out of EPA Section 114 proceedings. The Memphis refinery has installed advanced pollution controls that reduced the amount of additional control equipment that may be required. Williams has retained responsibility for any penalties that may arise due to non-compliance of capital improvements completed under their ownership. The EPA recently issued a new Section 114 information request to the Memphis refinery, which is in the process of being responded to by us and Williams.
92
MANAGEMENT
Directors and Executive Officers
Our directors, executive officers, certain key employees, their ages as of March 31, 2003 and their positions with us are set forth in the table below.
Name
| | Age
| | Position
|
Thomas D. O’Malley | | 61 | | Chairman of the Board and Chief Executive Officer |
Henry M. Kuchta | | 46 | | Director, President and Chief Operating Officer |
William E. Hantke | | 55 | | Director, Executive Vice President and Chief Financial Officer |
Dennis R. Eichholz | | 49 | | Senior Vice President—Finance and Controller |
Michael D. Gayda | | 48 | | Director, Senior Vice President, General Counsel and Secretary |
James R. Voss | | 36 | | Senior Vice President and Chief Administrative Officer |
Joseph D. Watson | | 38 | | Director, Senior Vice President—Corporate Development |
Gregory R. Bram | | 38 | | Refinery Manager—Memphis Refinery |
Donovan J. Kuenzli | | 63 | | Refinery Manager—Port Arthur Refinery |
Timothy J. Murphy | | 50 | | Refinery Manager—Lima Refinery |
Thomas D. O’Malley has served as chairman of the board of directors and chief executive officer of our company and of Premcor Inc. since February 2002 and served as president from February 2002 until January 2003. Mr. O’Malley served as vice chairman of the board of Phillips Petroleum Company from the consummation of that company’s acquisition of Tosco Corporation in September 2001 until January 2002. Mr. O’Malley served as chairman and chief executive officer of Tosco from January 1990 to September 2001 and president of Tosco from May 1993 to May 1997 and from October 1989 to May 1990. He currently serves on the board of directors of Lowe’s Companies, Inc. and PETsMART, Inc.
Henry M. Kuchta has served as director of our company since January 2003 and as president of our company and of Premcor Inc. since January 2003 and chief operating officer since April 2002. From April 2002 to December 2002, Mr. Kuchta served as executive vice president—refining. Prior to this position he served as business development manager for Phillips 66 Company, since Phillips’ acquisition of Tosco Corporation in September 2001. Prior to joining Phillips, Mr. Kuchta served in various corporate, commercial and refining positions at Tosco from 1993 to 2001. Prior to joining Tosco, Mr. Kuchta spent 12 years at Exxon Corporation in various refining, engineering and financial positions, including assignments overseas.
William E. Hantke has served as director of our company since January 2003 and as executive vice president and chief financial officer of our company and of Premcor Inc. since February 2002. From 1990 to January 2002, Mr. Hantke served in various positions with Tosco Corporation, most recently serving as Tosco’s vice president of corporate development. He has held various finance and accounting positions in the oil industry and other commodity industries since 1975.
Dennis R. Eichholz has served as senior vice president—finance and controller of our company and of Premcor Inc. since February 2001. Since joining us in 1988, Mr. Eichholz has held various financial positions, including vice president—treasurer and director of tax. Prior to joining us, Mr. Eichholz held various corporate finance positions and began his career with Arthur Andersen & Co. in 1975.
Michael D. Gayda has served as director of our company since January 2003 and as senior vice president, general counsel and secretary of our company and of Premcor Inc. since October 2002. Prior to this position he served as general counsel—refining for Phillips Petroleum Company, since Phillips’ acquisition of Tosco Corporation in September 2001. Prior to joining Phillips, Mr. Gayda served as vice president and associate general counsel at Tosco Refining Company, a division of Tosco Corporation, from 1990 to 2001. Prior to joining Tosco, Mr. Gayda spent 11 years at Pacific Enterprises, predecessor of Sempra Energy, in various positions, including special counsel.
93
James R. Voss has served as senior vice president and chief administrative officer of our company and of Premcor Inc. since September 2002. From December 2000 to September 2002, Mr. Voss served as vice president and director of human resources of our company and Premcor Inc. From June 1999 to December 2000, Mr. Voss served as the director of human resources for Swank Audio Visuals, Inc., a nationally recognized audio visual service provider, and from October 1996 to June 1999, he served as a human resource manager of Foodmaker, Inc., a $1 billion food distribution and restaurant company. Prior to joining Foodmaker, Inc., he spent 10 years in human resources management, operations and labor relations with United Parcel Service (UPS).
Joseph D. Watson has served as director of our company since January 2003 and as senior vice president —corporate development of our company and of Premcor Inc. since September 2002. Mr. Watson served as senior vice president and chief administrative officer of our company and of Premcor Inc. from March 2002 to September 2002. He served as president of The e-Place.com, Ltd., a wholly owned subsidiary of Tosco Corporation, and a vice president of Tosco Shared Services from November 2000 to February 2002. He previously held various financial positions with Tosco from 1993 to 2000. From 1991 to 1993, he served as vice president of Argus Investments, Inc., a private investment company.
Gregory R. Bram has served as the refinery manager of our Memphis refinery since March 2003 and had served as the refinery manager of our Lima refinery since October 1999. From 1996 to September 1999, Mr. Bram held several senior positions in our corporate office, including manager of planning and development and optimization manager. Prior to joining us, Mr. Bram held various engineering and operations positions with Amoco. Mr. Bram has more than 15 years of experience within the refining industry.
Donovan J. Kuenzli has served as the refinery manager of our Port Arthur refinery since October 1998. Prior to joining us, Mr. Kuenzli held various positions with BP, including refinery manager of the Lima refinery (then owned by BP), plant manager of a Texas chemicals facility, operations manager at BP’s Alliance refinery and a corporate position in BP’s London corporate office. Mr. Kuenzli has more than 36 years of experience within the refining and petrochemical industry.
Timothy J. Murphy has served as the refinery manager of our Lima refinery since April 2003. Prior to joining us, Mr. Murphy held various positions with ConocoPhillips and with Tosco, prior to its merger with ConocoPhillips, including production manager at ConocoPhillips’ Bayway refinery and various engineering and operations positions at the Ferndale refinery. Mr. Murphy has more than 26 years of experience within the refining industry.
Our board of directors is currently composed of the five directors listed above, each of whom will serve until the next annual meeting of stockholders or until a successor is duly elected. Our directors do not receive any compensation for their services as directors.
94
Executive Compensation
The following table sets forth certain information regarding compensation we paid to our chief executive officer, to each of our four other most highly compensated executive officers whose salary and bonus for 2002 exceeded $100,000 and to our former chief executive officer and former executive vice president and general counsel. For information about the future compensation for each of Messrs. O’Malley and Hantke see “—Executive Officer Agreements—Employment Agreement with Thomas D. O’Malley” and “—Employment Agreement with William E. Hantke.”
Summary Compensation Table
| | | | | Annual Compensation
| | Long Term
Compensation
| | | |
Name and Principal Position
| | Year
| | Salary $
| | Bonus $
| | Other Annual Compensation(3) $
| | Stock
Options(4) #
| | | All Other Compensation(5) $
|
Thomas D. O’Malley Chief Executive Officer | | 2002 | | 404,616 | | — | | 1,125,000 | | 2,950,000 | | | 12,000 |
| | | | | | |
William E. Hantke Executive Vice President and Chief Financial Officer | | 2002 | | 226,924 | | — | | — | | 125,000 | | | — |
| | | | | | |
Dennis R. Eichholz Senior Vice President—Finance and Controller | | 2002 2001 2000 | | 206,924 167,693 148,443 | | — 151,500 100,000 | | 19,114 31,125 7,875 | | 20,000 30,000
— | | | 12,000 9,928 9,033 |
| | | | | | |
Donovan J. Kuenzli Refinery Manager—Port Arthur Refinery | | 2002 2001 2000 | | 225,002 223,732 212,846 | | — 202,600 200,000 | | 13,652 9,543
400 | | 10,000 20,000
— | | | 12,000 10,200 10,200 |
| | | | | | |
Gregory R. Bram Refinery Manager—Lima Refinery | | 2002 2001 2000 | | 178,463 158,686 141,393 | | — 165,100 90,000 | | 29,112 11,186 200 | | 10,000 — — | | | 11,446 9,521 20,004 |
| | | | | | |
William C. Rusnack(1) Former President, Chief Executive Officer and Chief Operating Officer | | 2002 2001 2000 | | 84,616 497,693 477,694 | | — 746,800 610,000 | | 38,750 18,679 — | | — — — | | | 3,398,283 10,200 10,200 |
| | | | | | |
Jeffry N. Quinn(2) Former Executive Vice President and General Counsel | | 2002 2001 2000 | | 234,616 297,981 236,867 | | — 344,500 232,000 | | 28,324 13,901 — | | 50,000 — 120,000 | | | 1,287,635 10,200 130,215 |
| (1) | | Mr. Rusnack resigned in January 2002. See “—Executive Officer Agreements—Termination Agreement with William C. Rusnack” for a discussion of the terms of Mr. Rusnack’s termination agreement with us. |
| (2) | | Mr. Quinn resigned in November 2002. See “—Executive Officer Agreements—Termination Agreement with Jeffry N. Quinn” for a discussion of the terms of Mr. Quinn’s termination agreement with us. |
| (3) | | Represents (i) for 2002, amounts for financial planning services for Messrs. Eichholz, Kuenzli, Bram, Rusnack and Quinn, amounts for unused vacation for Messrs. Bram, Rusnack and Quinn and amounts for safety and environmental awards for Messrs. Kuenzli and Bram, as well as an amount for Mr. O’Malley equal to the discount he received on 750,000 shares of our common stock he acquired in connection with our initial public offering, (ii) for 2001, amounts for financial planning services for Messrs. Eichholz, Bram, Rusnack and Quinn, amounts for unused vacation for Messrs. Kuenzli and Eichholz and amounts for safety |
95
| | awards for Messrs. Kuenzli and Bram, and (iii) for 2000, an amount for safety awards for Messrs. Kuenzli and Bram and an amount for unused vacation for Mr. Eichholz. |
| (4) | | Represents (i) for 2002, 2,200,000 options granted to Mr. O’Malley at an exercise price of $10.00 per share, 750,000 options granted to Mr. O’Malley at an exercise price of $22.50 per share, 100,000 options granted to Mr. Hantke at an exercise price of $10.00 per share, 25,000 options granted to Mr. Hantke at an exercise price of $22.50 per share, options granted to Messrs. Eichholz, Kuenzli and Bram at an exercise price of $24.00 per share and options granted to Mr. Quinn at an exercise price of $22.50 per share, (ii) for 2001, options granted to Messrs. Eichholz and Kuenzli at an exercise price of $9.90 per share, and (iii) for 2000, options granted to Mr. Quinn at an exercise price of $9.90 per share. |
| (5) | | Represents (i) for 2002, amounts accrued for the accounts of such individuals under the Premcor Retirement Savings Plan, termination payments for Messrs. Rusnack and Quinn and relocation expenses for Mr. Quinn, and (ii) for 2001, amounts accrued for the accounts of such individuals under the Premcor Retirement Savings Plan, and (iii) for 2000, amounts accrued for the accounts of such individuals under the Premcor Retirement Savings Plan, as well as an amount for relocation expenses for Mr. Bram and a starting bonus paid to Mr. Quinn. |
Stock Option Grants
The following table sets forth information concerning grants of each of time vesting and performance vesting stock options to purchase Premcor Inc.’s common stock made during the year ended December 31, 2002, to each of the executive officers named in the Summary Compensation Table.
Option Grants in Last Fiscal Year
| | | Individual Grants
|
Name
| | Number
Granted(1)
| | % Grants
to All Employees
| | | Exercise
Price
per ($/
Share)
| | Market Price
at Grant Date
($/Share)
| | Expiration
Date
| | Grant Date
Present
Value ($)(3)
|
Thomas D. O’Malley | | 2,200,000 | | 54.6 | % | | 10.00 | | 22.00 | | 2/2/12 | | 30,171,012 |
| | | 750,000 | | 18.6 | % | | 22.50 | | 24.00 | | 4/29/12 | | 7,996,865 |
William E. Hantke | | 100,000 | | 2.5 | % | | 10.00 | | 22.00 | | 2/1/12 | | 1,371,410 |
| | | 25,000 | | 0.6 | % | | 22.50 | | 24.00 | | 4/29/12 | | 266,562 |
Dennis R. Eichholz | | 20,000 | | 0.5 | % | | 24.00 | | 24.00 | | 4/29/12 | | 202,591 |
Donovan J. Kuenzli | | 10,000 | | 0.2 | % | | 24.00 | | 24.00 | | 4/29/12 | | 101,295 |
Gregory R. Bram | | 10,000 | | 0.2 | % | | 24.00 | | 24.00 | | 4/29/12 | | 101,295 |
William C. Rusnack | | — | | — | | | — | | — | | — | | — |
Jeffry N. Quinn | | 50,000 | | 1.2 | % | | 22.50 | | 24.00 | | (2) | | 533,124 |
| (1) | | All options granted during 2002 vest in equal annual installments over three years. |
| (2) | | The 50,000 options granted to Mr. Quinn were forfeited upon his termination of employment. |
| (3) | | The grant date present value was estimated using the Black-Scholes option-pricing model with the following weighted average assumptions: |
Assumed risk free rate of return | | 5.04% |
Expected average option life | | 3.76 years |
Volatility rate | | 38.87% |
Expected dividend yield | | None |
The actual value of the stock options is dependent on actual future performance of our common stock, the continued employment of the option holder throughout the vesting period and the timing of the exercise of the options. Accordingly, the actual values achieved may differ from the values set forth in this table. As of December 31, 2002, our three stock-based employee compensation plans, which allow for the issuance of Premcor Inc. common stock, were approved by Premcor Inc.’s shareholders.
96
Exercises of Stock Options
The following table shows aggregate exercises of options to purchase Premcor Inc.’s common stock and the number and value of securities underlying unexercised stock options of Premcor Inc. held by the named executive officers named in the Summary Compensation Table as of December 31, 2002.
Name
| | Shares Acquired on Exercise(#)
| | Value Realized($)
| | Number of Securities Underlying Unexercised Options/SARs at December 31, 2002
| | Value of Unexercised in-the- Money Options/SARs at December 31, 2002($)*
|
| | | | | | | Exercisable
| | Unexercisable
| | Exercisable
| | Unexercisable
|
Thomas D. O’Malley | | — | | — | | — | | 2,950,000 | | — | | 26,906,000 |
William E. Hantke | | — | | — | | — | | 125,000 | | — | | 1,223,000 |
Dennis R. Eichholz | | — | | — | | 40,000 | | 40,000 | | 493,200 | | 246,600 |
Donovan J. Kuenzli | | — | | — | | 40,000 | | 50,000 | | 493,200 | | 493,200 |
Gregory R. Bram | | — | | — | | 30,000 | | 40,000 | | 369,900 | | 369,900 |
William C. Rusnack | | 450,000 | | 2,750,031 | | — | | — | | — | | — |
Jeffry N. Quinn | | 45,000 | | 381,437 | | 45,000 | | — | | 554,850 | | — |
| * | | Calculated based on the closing price of Premcor Inc.’s common stock of $22.23 on December 31, 2002. |
Executive Officer Agreements
Employment Agreement with Thomas D. O’Malley
Premcor Inc. entered into an employment agreement with Thomas D. O’Malley, dated January 30, 2002, which has been amended from time to time. The agreement provides that Mr. O’Malley will serve as the full-time chairman of the board of directors of our company and of Premcor Inc. and as the chief executive officer of our company and of Premcor Inc. The agreement has a term of three years but is subject to automatic one-year extensions thereafter, unless either party gives the other 60 days prior written notice of its intention not to extend the term. The agreement provides for an annual base salary (with increases, if any, to be determined by Premcor Inc.’s board of directors) of $500,000. In addition, the employment agreement provides that Mr. O’Malley will be eligible to earn an annual bonus if net earnings per share to Premcor Inc.’s common shareholders, calculated on a fully diluted basis and in accordance with GAAP, excluding the after-tax impact of any extraordinary or special items that Premcor Inc.’s board of directors determines in good faith are not appropriately includable in such calculation because such items do not accurately reflect Premcor Inc.’s operating performance, is at least equal to $2.00. Upon achievement of such $2.00 earnings per share, the annual bonus for Mr. O’Malley shall equal his base salary (his “base bonus”). Mr. O’Malley shall have an opportunity to earn a larger bonus for increases in such earnings per share over $2.00, subject to a cap of six times his base salary.
Pursuant to the employment agreement, if Mr. O’Malley’s employment is terminated by Premcor Inc. without cause, by Mr. O’Malley for good reason or upon Premcor Inc.’s election not to extend the employment term, Mr. O’Malley will be entitled to receive (i) any accrued but unpaid base salary and annual bonus, (ii) subject to Mr. O’Malley’s continued compliance with non-competition, non-solicitation, no-hire and confidentiality covenants, three times the sum of Mr. O’Malley’s base salary plus base bonus, (iii) any accrued retirement benefit to which he is entitled, whether or not vested, and (iv) full vesting of any outstanding stock options. Mr. O’Malley is also entitled to be grossed up, on an after-tax basis, for any excise taxes imposed under the Internal Revenue Code on any excess parachute payment that he receives in connection with benefits and payments provided to him in connection with any “change in control” (as such term is defined under the Internal Revenue Code) of Premcor Inc. In addition, upon a change in control, Mr. O’Malley will be entitled to receive a percentage of his annual bonus.
Employment Agreement with William E. Hantke
Premcor Inc. entered into an employment agreement with William E. Hantke, dated as of June 1, 2002, which has been amended from time to time. The agreement provides that Mr. Hantke will serve as executive vice
97
president and chief financial officer of our company and of Premcor Inc. The agreement has a term of three years but is subject to automatic one-year extensions thereafter, unless either party gives the other 60 days prior written notice of its intention not to extend the term. The agreement provides for an annual base salary (with increases, if any, to be determined by Premcor Inc.’s board of directors) of $250,000. In addition, the employment agreement provides that Mr. Hantke will be eligible to earn an annual bonus if net earnings per share to Premcor Inc.’s common shareholders, calculated on a fully diluted basis and according to GAAP, excluding the after-tax impact of any extraordinary or special items that Premcor Inc.’s board of directors determines in good faith are not appropriately includable in such calculation because such items do not accurately reflect Premcor Inc.’s operating performance, is at least equal to $2.00. Upon achievement of such $2.00 earnings per share, the annual bonus for Mr. Hantke shall be equal to 50% of his annual base salary (his “base bonus”). Mr. Hantke shall have an opportunity to earn a larger bonus for increases in such earnings per share over $2.00, subject to a cap of three times his base salary.
In accordance with his employment agreement, in 2003 Premcor Inc. granted Mr. Hantke an option to purchase 40,000 shares of its common stock at an exercise price of $19.20 per share. The employment agreement also provides that Mr. Hantke will be granted options to purchase 25,000 shares of Premcor Inc.’s common stock in each of the years 2004 and 2005, at an exercise price equal to fair market value on the date of grant. Pursuant to the employment agreement, if Mr. Hantke’s employment is terminated by Premcor Inc. without cause, by Mr. Hantke for good reason or upon Premcor Inc.’s election not to extend the employment term, Mr. Hantke will be entitled to receive (i) any accrued but unpaid base salary and annual bonus attributable to a prior fiscal year and (ii) subject to Mr. Hantke’s continued compliance with non-competition, non-solicitation, no-hire and confidentiality covenants, three times the sum of Mr. Hantke’s base salary plus base bonus. Mr. Hantke is also entitled to be grossed up, on an after-tax basis, for any excise taxes imposed under the Internal Revenue Code on any excess parachute payment that he receives in connection with benefits and payments provided to him in connection with any “change in control” (as such term is defined under the Internal Revenue Code) of Premcor Inc. In addition, upon a change in control, Mr. Hantke will be entitled to receive a percentage of his annual bonus.
Termination Agreement with William C. Rusnack
William C. Rusnack served as the chief executive officer and president of our company and Premcor Inc. from April 1998 to January 2002. On January 31, 2002, Premcor Inc. entered into a termination agreement with Mr. Rusnack pursuant to which he resigned from all executive officer and board positions with Premcor Inc. and its affiliates (including us). Mr. Rusnack agreed to release Premcor Inc. and its affiliates from any claims he may have against Premcor Inc. and its affiliates, and Premcor Inc. agreed to provide certain severance payments and benefits. Upon the termination of his employment, Mr. Rusnack received a lump sum severance payment of $3,375,000. Of the 600,000 options granted to Mr. Rusnack, 450,000 were vested as of his termination date. As of March 1, 2003, Mr. Rusnack had exercised all 450,000 options. For more detail on Mr. Rusnack’s stock options, see “—Other Employee Benefits—1999 Stock Incentive Plan.” Mr. Rusnack is entitled to receive job relocation counseling services for up to 18 months. Mr. Rusnack is also entitled to have his salary grossed up, on an after-tax basis, for excise taxes imposed under the Internal Revenue Code on any excess parachute payment as set forth in his original employment agreement. Mr. Rusnack has agreed to certain post-termination confidentiality covenants.
Termination Agreement with Jeffry N. Quinn
Mr. Quinn served as executive vice president and general counsel of our company and Premcor Inc. from March 2000 to November 2002. On November 1, 2002, Premcor Inc. entered into a termination agreement with Mr. Quinn, pursuant to which he resigned from all executive officer and board positions with Premcor Inc. and its affiliates (including us). Mr. Quinn agreed to release Premcor Inc. and its affiliates from any claims he may have against Premcor Inc. and its affiliates, and Premcor Inc. agreed to provide certain severance payments and benefits. Under the agreement, on January 2, 2003, Mr. Quinn received a lump sum severance payment of $1,165,000. Of the 120,000 nonqualified stock options granted to Mr. Quinn 90,000 options were vested as of his
98
termination date. Mr. Quinn has exercised all of his 90,000 options. Mr. Quinn is entitled to receive job relocation counseling services up to $35,000. He is also entitled to have his salary grossed up, on an after-tax basis, for excise taxes imposed under the Internal Revenue Code on any excess parachute payment as set forth in his original employment agreement. Mr. Quinn has agreed to certain post-termination confidentiality covenants.
Compensation
Principles
Our compensation program for executive officers is designed to attract, retain and motivate these officers to enhance long-term stockholder value. The program consists of the following three key elements:
| | • | | a performance-based annual bonus; and |
| | • | | long-term equity incentive programs. |
Our compensation philosophy:
| | • | | emphasizes variable, incentive-oriented pay that rewards executive officers for achievement of predetermined operating and financial objectives; |
| | • | | places increased emphasis on variable pay and long-term incentives at higher levels in the organization; |
| | • | | balances the focus on short-term and long-term performance; and |
| | • | | utilizes plans which are fair and understandable so that the plans drive performance and do not simply follow performance. |
Annual Base Salary
Annual salary is designed to compensate our executive officers for enhancing earnings per share and the creation of shareholder value. Salaries for the executive officers and certain other officers who report directly to the chief executive officer are established on an annual basis by the compensation committee, typically at the first committee meeting of the year. Individual and/or corporate performance is considered in determining salary amounts.
Annual Bonuses for Calendar Year 2002
In February 2002, the Premcor Executive Recognition Plan was renamed the Premcor Incentive Compensation Plan and was expanded to include all of our salaried employees, except for employees whose bonus terms are provided in their employment agreements with us. For 2002, bonus awards for participants were earned solely on the basis of Premcor Inc.’s achievement of earnings per share results. The earnings per share measure had a threshold, target and maximum performance level and a corresponding payout level. For participants in the plan, the threshold performance level was earnings per share of $2.00, the target performance level was earnings per share of $3.50 and the maximum performance level was earnings per share of $5.00. The maximum bonus for participants was equal to 150% of annual base salary. No bonuses were paid in 2002. For information regarding bonus award opportunities for each of Messrs. O’Malley and Hantke, see “—Executive Officer Agreements—Employment Agreement with Thomas D. O’Malley” and “—Employment Agreement with William E. Hantke.”
Other Employee Benefits
2002 Special Stock Incentive Plan
In connection with the employment of Mr. O’Malley, Premcor Inc. established the 2002 Special Stock Incentive Plan, which was adopted and approved by its board of directors and stockholders. The total number of shares of Premcor Inc.’s common stock available for issuance under the 2002 Special Stock Incentive Plan is
99
3,400,000 shares. As of March 31, 2003, Premcor Inc. had granted Mr. O’Malley 2,200,000 options at an exercise price of $10.00 per share and 750,000 options at an exercise price of $22.50 per share. In addition, pursuant to the terms of Mr. O’Malley’s employment agreement, Premcor Inc. has committed to grant him 150,000 options a year from 2003 through 2005 at an exercise price equal to the fair market value of a share of its common stock on the date of the grant. Mr. O’Malley has waived his 2003 option grant.
2002 Equity Incentive Plan
Premcor Inc.’s board of directors adopted and its stockholders approved the Premcor 2002 Equity Incentive Plan which is designed to permit Premcor Inc. to grant to its and our key employees, directors and consultants incentive stock options, non-qualified stock options, stock appreciation rights, restricted stock, performance-based awards and other awards based on its common stock.
The total number of shares of Premcor Inc.’s common stock available for issuance under the 2002 Equity Incentive Plan is 1,500,000 shares. As of March 31, 2003, there were 1,291,000 options outstanding under the plan, 121,669 of which had vested. The outstanding options were granted at an exercise price ranging from $10.00 to $24.00 per share and vest in equal annual installments over three or five years. Premcor Inc. has committed to granting options to purchase an aggregate of 220,000 shares of its common stock to certain officers during 2004 and 2005 at an exercise price equal to the fair market value of a share of its common stock on the date of the grant. These options may be granted under either the 2002 Equity Incentive Plan or the 1999 Stock Incentive Plan or, in certain instances, under the 2002 Equity Incentive Plan only.
1999 Stock Incentive Plan
Premcor Inc.’s board of directors adopted and its stockholders approved the Premcor 1999 Stock Incentive Plan which is designed to attract and retain executive officers and other selected employees whose skills and talents are important to us. Under the 1999 Stock Incentive Plan, its and our executive officers and other employees are eligible to receive awards of options to purchase shares of Premcor Inc.’s common stock.
The total number of shares of Premcor Inc.’s common stock available for issuance under the 1999 Stock Incentive Plan is 2,215,250. As of March 31, 2003, there were 802,650 options outstanding under the 1999 Stock Incentive Plan, of which 316,750 had vested. The outstanding options were granted at an exercise price ranging from $9.90 to $22.40 per share.
Options granted under the 1999 Stock Incentive Plan to executive officers and other employees are either time vesting or performance vesting options. The time vesting options vest in equal annual installments over three or five years. The performance vesting options vest on the seventh anniversary of their date of grant, provided, however, that upon a change in control of Premcor Inc., the vesting is accelerated based on the achievement of certain per share prices of its common stock.
Long Term Incentive Plan
In 2000, the compensation committee of Premcor Inc.’s board of directors adopted a Long Term Incentive Plan which was designed to provide certain of its and our key management employees the opportunity to receive grants of performance units or awards, the value of which is measured based on the performance of Premcor Inc.’s common stock. This plan was designed to reward participants for achieving pre-defined operating and financial performance goals over a three-year performance cycle. The first three-year performance cycle under the plan began on January 1, 2001. For such performance period, 87,300 performance units are currently outstanding. Messrs. Bram, Eichholz and Kuenzli are the only named executive officers to participate in the plan for that performance cycle. The board of directors of Premcor Inc. terminated the Long Term Incentive Plan in February 2002. As a result, there will be no future grants under the plan.
100
Senior Executive Retirement Plan
Premcor Inc. adopted a Senior Executive Retirement Plan, or SERP, covering certain executive officers. Messrs. O’Malley and Hantke are the only named executive officers to participate in the SERP. Benefits under the plan vest after three years of continuous service. The annual retirement benefit payable under the SERP at a normal retirement date (as defined by the plan) will be a single life annuity for the life of the participant which is equal to the lesser of:
| | • | | The sum of six percent (6%) of average earnings times years of service less than or equal to five (5), plus three percent (3%) of average earnings times years of service greater than five (5); or |
| | • | | Sixty percent (60%) of average earnings. |
Average earnings are defined as the average of the participant’s annual earnings (generally, annual base compensation plus bonus paid under an annual incentive plan) during the three consecutive calendar year period of employment in which the participant has the highest aggregate earnings.
Any benefit payable under the SERP will be offset by benefits, if any, payable to the participant under Premcor Inc.’s pension plan. Further, a SERP participant will not accrue a benefit under Premcor Inc.’s non-qualified pension restoration plan during the period in which he participates in the SERP. The plan also provides death, disability and post-employment medical benefits.
Premcor Inc.’s board of directors suspended the SERP effective June 30, 2002. On April 22, 2003, Premcor Inc.’s board reactivated the plan retroactive to June 30, 2002. As a result, benefits under the SERP will be accrued as if the plan had never been suspended.
Pension Plans
Premcor Inc. implemented a cash balance pension plan for its and our salaried workforce, including the named executive officers, effective January 1, 2002. Benefits under the plan vest after five years of continuous service. The plan recognizes existing service with Premcor Inc. or its predecessors for purposes of vesting.
On an annual basis each participant’s account will be credited with the following:
| | • | | Contribution credit equal to seven percent (7%) of pensionable earnings plus seven percent (7%) of pensionable earnings in excess of the Social Security Wage Base; and |
| | • | | Interest credit equal to the average yield for one-year treasury bonds for the previous October, plus one percent (1%). |
For the purposes of the plan, “pensionable earnings” are defined as regular annual salary, overtime pay, annual incentive payments and contributions to 401(k) plans.
Premcor Inc. also adopted a non-qualified restoration plan which restores the benefits lost by any employee, including any executive officer during any period in which he is not participating in the SERP, under the qualified pension plan as a result of Internal Revenue Code imposed limitations on pensionable income.
101
As of December 31, 2002, the estimated annual annuities payable at age sixty-five (65) to Messrs. O’Malley, Hantke, Eichholz, Kuenzli and Bram are as follows:
Name
| | Current
Age
| | Estimated Annual
Payments (1)
|
Thomas D. O’Malley | | 61 | | $472,395 |
William E. Hantke | | 55 | | 372,096 |
Dennis R. Eichholz | | 49 | | 121,171 |
Donovan J. Kuenzli | | 63 | | 12,345 |
Gregory R. Bram | | 38 | | 192,924 |
| (1) | | Assumes the executive officer works until age sixty-five (65), annual base compensation remains unchanged from his current salary and that future incentive compensation awards are equal to 250% of base pay for Mr. O’Malley, 100% of base pay for Mr. Hantke and 50% of base pay for Messrs. Eichholz, Kuenzli and Bram. Amounts include estimated benefits under Premcor Inc.’s qualified cash balance pension plan and SERP for Messrs. O’Malley and Hantke and Premcor Inc.’s qualified cash balance pension plan and non-qualified pension restoration plan for Messrs. Eichholz, Kuenzli and Bram. The above amounts for Messrs. O’Malley and Hantke reflect that the SERP has been reactivated retroactively and assume that benefits accrued for such individuals since the original adoption of the plan. The interest rate used for determining the annuity was 7%. The interest credit for 2003 was 4.0% and future years was assumed to be 5.5%. For further discussion regarding the SERP, see “—Other Employee Benefits—Senior Executive Retirement Plan.” |
Change-In-Control, Retention and Severance Agreements
Premcor Inc. entered into change-in-control, retention and severance agreements with certain of its and our key employees, including Messrs. Bram, Eichholz and Kuenzli. Each agreement has an initial term of three years, provided that if neither us nor the employee gives 12 months’ notice of termination prior to the expiration of the initial term or any extension thereof, then the agreement shall automatically extend for an additional two-year period. In the event of a change in control of Premcor Inc., each agreement shall remain in effect until at least the second anniversary of the change in control. In the event that, prior to the occurrence of a change in control, an employee’s employment is terminated by us without cause or is terminated by the employee for good reason, then we shall continue to pay the employee his base salary and to provide medical and welfare benefits during the one-year period following such termination, plus a pro-rata portion of the employee’s annual target bonus for the year in which the termination occurs. In the event such termination occurs in connection with or after a change in control, the employee will receive a lump sum cash payment within 10 business days of the termination equal to two times the sum of his base salary amount and target bonus amount plus a pro-rata portion of his annual target bonus for the year in which the termination occurs. If the employee’s employment is terminated in connection with or after a change in control, the employee will also receive up to two years of continued medical and other welfare benefits, as well as up to one year of outplacement services.
The agreements also provide that upon a change in control, all stock options and other equity awards immediately vest and become exercisable (performance-vesting options only vest if the applicable performance goals are satisfied). In addition, the agreements provide that each covered employee is entitled to have his salary grossed up, on an after-tax basis, for any excise taxes imposed under the Internal Revenue Code on any excess parachute payment that he or she receives in connection with benefits and payments provided to him or her in connection with any change in control (as such term is defined under the Internal Revenue Code).
Premcor Inc. Retirement Savings Plan
Premcor Inc.’s Retirement Savings Plan permits its and our employees to make before-tax and after-tax contributions and provides for employer incentive matching contributions. Executive officers participate in the plan on the same terms as other eligible employees, subject to any legal limits on the amounts that may be contributed or paid to executive officers.
102
PRINCIPAL STOCKHOLDERS
All of our common stock is owned by Premcor USA, which is wholly owned by Premcor Inc.
103
RELATED PARTY TRANSACTIONS
Each of the related party transactions described below was negotiated on an arm’s length basis. We believe that the terms of each such agreement are as favorable as those we could have obtained from parties not related to us.
Our Relationship with Blackstone
The Blackstone Group L.P. is a private investment firm based in New York, founded in 1985. Its main businesses include private equity investing, merger and acquisition advisory services, restructuring advisory services, real estate investing, mezzanine debt investing, collateralized debt obligation investing and asset management. Blackstone Capital Partners III Merchant Banking Fund L.P. and its affiliates, or Blackstone, acquired its interest in Premcor Inc. in November 1997 and, as of March 15, 2003, beneficially owned 39.3% of its common stock.
Under a Monitoring Agreement, dated November 14, 1997, among us, Premcor USA and Blackstone, we have paid a monitoring fee equal to $2 million per annum to an affiliate of Blackstone. In return, Blackstone provided financial advisory services to us including advice on the structure and timing of our entry into financial arrangements, relationships with key lenders, property dispositions and acquisitions, and other ancillary financial advisory services. Financial advisory services rendered by Blackstone relating to specific acquisitions and divestitures are expressly excluded from the agreement. As of December 31, 2001, we have paid in full all amounts due and payable under this agreement. Over the past four years, we have paid fees to Blackstone totaling approximately $17 million, consisting of $6.0 million in monitoring fees, a $2.4 million fee paid in connection with our purchase of the Lima refinery, an $8.0 million fee in connection with structuring of the heavy oil upgrade project, and an amount for reimbursed expenses. We have terminated this monitoring agreement effective as of March 31, 2002. To terminate such agreement, we have paid Blackstone $500,000 for services rendered during 2002 and a $5 million termination fee.
Under a Stockholder Agreement dated March 9, 1999 among Premcor Inc., Blackstone and Marshall A. Cohen, one of Premcor Inc.’s directors and stockholders, if Blackstone transfers 25% or more of its holdings of Premcor Inc.’s common stock to a third party, Mr. Cohen or any of his permitted affiliates may require the transferee to purchase a similar percentage of his shares. Conversely, if Blackstone receives and accepts an offer from a third party to purchase 25% or more of its holdings of Premcor Inc.’s common stock, Mr. Cohen must transfer a similar percentage of his shares to the third party. This agreement terminates when Blackstone ceases to beneficially own at least 5% of Premcor Inc’s common stock on a fully diluted basis.
Pursuant to a Registration Rights Agreement, dated April 26, 2002, between Premcor Inc. and Blackstone, Blackstone has the right, on up to three occasions, to request that Premcor Inc. effect the registration of all or part of Blackstone’s shares. Premcor Inc. is obligated to use its best efforts to effect the registration of all of the shares of which Blackstone requests except when in the opinion of the underwriter the number of securities requested to be registered is likely to adversely impact such offering. Blackstone also has the right to include its shares in certain registered public offerings by Premcor Inc. Premcor Inc. is obligated to use its efforts to effect the registration of the Blackstone shares along with the other shares, absent a determination by the underwriter that such registration exceeds the largest number of securities which can be sold without adversely impacting the offering.
Blackstone is also a party to a Capital Contribution Agreement, dated as of August 19, 1999, with Sabine, Neches, PACC, PAFC and Premcor Inc. Under that agreement, Blackstone agreed to make certain capital investments in Sabine in connection with the heavy oil upgrade project. Blackstone made $109.6 million of contributions under the agreement.
From time to time in the past, we have retained Blackstone to act as our financial advisor with respect to potential transactions. Blackstone is not currently acting as our financial advisor with respect to any such transaction.
104
Our Relationship with Occidental
Occidental Petroleum Corporation explores for, develops, produces and markets crude oil and natural gas and manufactures and markets a variety of basic chemicals. Occidental acquired its interest in Premcor Inc. in 1995 and, as of March 15, 2003, beneficially owned 12.2% of its common stock. Occidental also acquired an approximately 10% equity interest in Sabine pursuant to a Subscription Agreement, dated as of August 4, 1999, among Occidental, Sabine, Neches and PACC, in connection with the heavy oil upgrade project at the Port Arthur refinery.
Pursuant to a Share Exchange Agreement dated April 27, 1999, Premcor Inc. succeeded to, and Premcor USA ceased to be a party to, the Second Amended and Restated Stockholders’ Agreement dated November 3, 1997, originally between Premcor USA and Occidental C.O.B. Partners. That stockholders’ agreement entitles Occidental to designate one director to Premcor Inc.’s board of directors for as long as it holds at least 10% of Premcor Inc.’s fully diluted shares. Premcor Inc. has the right of first refusal on any of its shares held by Occidental or a transferee of Occidental intended by such holder to be sold to a third party. Occidental has the right, on one occasion, to request that Premcor Inc. effect the registration of all or part of Occidental’s holdings of Premcor Inc.’s common stock. In addition, Occidental has the right to include its holding of Premcor Inc.’s common stock in any registered public offering by Premcor Inc. Premcor Inc. is required to use its best efforts to effect the registration of the shares of its common stock held by Occidental along with its other shares of common stock, unless the underwriters of the offering determine that the registration of the shares of Premcor Inc.’s common stock held by Occidental will adversely impact the offering of Premcor Inc.’s other shares of common stock.
Under an Advisory Agreement, dated November 14, 1997, among us, Premcor USA, and Occidental, Occidental may provide us with consulting services related to crude supplier decisions and related purchase and hedging strategies. In return, Occidental received 101,010 shares of Premcor Inc.’s Class F Common Stock. Pursuant to a Warrant Exercise and Share Exchange Agreement, dated as of June 6, 2002, among Blackstone, Occidental, Sabine and Premcor Inc., Occidental’s 101,010 shares of Premcor Inc.’s Class F Common Stock were converted into shares of Premcor Inc.’s common stock upon completion of the Premcor IPO and, in connection with the Sabine restructuring, Premcor Inc. consummated a share exchange with Occidental whereby we received the remaining 10% of the common stock of Sabine in exchange for shares of Premcor Inc.’s common stock.
Our Relationship with PACC
Prior to the Sabine restructuring, PACC was our affiliate because our ultimate parent company, Premcor Inc., owned 90% of the capital stock of Sabine, the entity formed to be the general partner of PACC, and 100% of Neches, the entity formed to be the 99% limited partner of PACC. In connection with the Sabine restructuring, on June 6, 2002 Premcor Inc. consummated a share exchange with Occidental whereby it received the remaining 10% of the common stock of Sabine and Premcor Inc. then contributed its 100% ownership interest in Sabine to us. As a result, Sabine and its wholly owned subsidiaries, including PACC, became our wholly-owned subsidiaries.
Consulting Agreement with Fuel Strategies International
Pursuant to a consulting agreement, Fuel Strategies International, Inc., the principal of which is James P. O’Malley, the brother of Thomas O’Malley, our chairman and chief executive officer, provides us with monthly consulting services relating to our petroleum coke operations. The initial term of the agreement runs from June 1, 2002 through May 30, 2003, and shall be automatically renewed for additional one-year periods unless terminated by either party upon 90 days notice prior to the expiration of the initial term or any renewal term. The agreement provides that Fuel Strategies will be paid a fixed fee of $12,000 per month for eight working days and $1,500 per day for each additional day thereafter. Fuel Strategies also is entitled to be reimbursed for its expenses and to be paid an additional $450 per day for expenses it may incur on business trips outside of Boca Raton, Florida. Effective October 2002, Fuel Strategies voluntarily agreed to work 10 days per month for its fixed monthly fee of $12,000 and to reduce its per diem fee for additional days to $1,200, which will be capped at a maximum rate of 12 days per month regardless of the actual number of days worked. For the year ended December 31, 2002, we paid $168,198 to Fuel Strategies under this agreement.
105
DESCRIPTION OF INDEBTEDNESS
The following are summaries of the terms of our principal long-term debt other than the notes.
The Premcor Refining Group
8 3/8% Senior Notes. In November 1997, we issued $100 million of unsecured 8 3/8% senior notes. The notes mature on November 15, 2007, with interest payable semi-annually in arrears on May 15th and November 15th. We may redeem the notes on or after November 15, 2002, at a redemption price equal to 104.187% of the principal amount of the notes in the first year. The redemption prices decline yearly to par on November 15, 2004, plus accrued and unpaid interest to the date of redemption.
8 7/8% Senior Subordinated Notes. In November 1997, we issued $175 million of unsecured 8 7/8% senior subordinated notes. The notes mature on November 15, 2007, with interest payable semi-annually in arrears on May 15th and November 15th. We may redeem the notes on or after November 15, 2002, at a redemption price equal to 104.437% of the principal amount of the notes in the first year. The redemption prices decline yearly to par on November 15, 2005, plus accrued and unpaid interest to the date of redemption. The notes are our senior subordinated obligations, subordinated in right of payment to all of our senior debt.
8 5/8% Senior Notes. In August 1998, we issued $110 million of unsecured 8 5/8% senior notes. The notes mature on August 15, 2008, with interest payable semi-annually in arrears on February 15th and August 15th. We may redeem the notes on or after August 15, 2003, at a redemption price equal to 104.312% of the principal amount of the notes in the first year. The redemption prices decline yearly to par on August 15, 2005, plus accrued and unpaid interest to the date of redemption.
9 1/4% Senior Notes. In February 2003, we issued $175 million of unsecured 9 1/4% senior notes. The notes mature on February 1, 2010, with interest payable semi-annually in arrears on February 1st and August 1st. We may redeem the notes on or after February 1, 2007, at a redemption price equal to 104.625% of the principal amount of the notes in the first year. The redemption prices decline yearly to par on February 1, 2009, plus accrued and unpaid interest to the date of redemption.
9 1/2% Senior Notes. In February 2003, we issued $350 million of unsecured 9 1/2% senior notes. The notes mature on February 1, 2013, with interest payable semi-annually in arrears on February 1st and August 1st. We may redeem the notes on or after February 1, 2008, at a redemption price equal to 104.750% of the principal amount of the notes in the first year. The redemption prices decline yearly to par on February 1, 2011, plus accrued and unpaid interest to the date of redemption.
Change of Control Provisions
Holders of each of the notes described above have the right, upon the occurrence of a change of control accompanied by a ratings downgrade, to require us to repurchase that holder’s notes at a price equal to 101% of their principal amount, plus accrued and unpaid interest to the repurchase date.
Restrictive Covenants
The indentures governing each of the notes contain covenants that, among other things, limit our ability to:
| | • | | lease, convey or otherwise dispose of substantially all of our assets or those of our subsidiaries or merge or consolidate; |
| | • | | pay dividends or make other distributions on our capital stock, repay subordinated obligations, repurchase capital stock or make specified types of investments, unless we either have the requisite adjusted net worth or can incur an additional $1 of new debt under the operating cash flow to fixed charge ratio mentioned below and unless the aggregate amount of specified restricted repayments and investments does not exceed a customary formula based on 50% of net operating income accrued since a specified date at or near the date of the applicable instrument, plus capital contributions; exceptions in all of the notes include dividends up to $75 million for investments and up to $50 million for other restricted payments; |
106
| | • | | incur debt unless, after giving effect to the incurrence of the new debt and the application of the proceeds therefrom, the ratio of operating cash flow to fixed charges would be greater than 2 to 1; exceptions include bank borrowings up to a borrowing base; junior subordinated debt and debt equal to twice capital contributions; and other debt not to exceed $75 million; |
| | • | | permit our subsidiaries to issue guarantees of indebtedness; |
| | • | | sell assets without receiving fair market value, 75% of the consideration in cash or cash equivalents or through the assumption by the buyer of debt and without having to apply the net proceeds to repay debt or reinvest in its business; |
| | • | | issue capital stock of certain subsidiaries; |
| | • | | restrict our subsidiaries’ ability to make dividend payments; |
| | • | | enter into transactions with affiliates; and |
| | • | | enter into sale leaseback transactions. |
If the notes are assigned an investment grade rating, certain of these covenants cease to apply to us and less restrictive covenants that limit only secured indebtedness and sale and leaseback transactions apply instead.
Our Credit Agreement
Our credit agreement, which was amended and restated in February 2003, provides for letter of credit issuances and revolving loan borrowings of up to the lesser of $750 million (which amount may be increased by up to $50 million under certain circumstances) and the amount of the borrowing base, calculated, on the date of determination, as the sum of 100% of eligible cash (less certain intercompany payables) and eligible cash equivalents, 95% of eligible investments, 90% of major oil company receivables, 85% of eligible receivables, 80% of eligible petroleum inventory, 80% of eligible petroleum inventory-not-received, and 100% of paid but unexpired standby letters of creditminus the greater of (i) the aggregate of all of our net obligations to any bank swap party under any swap contracts on such date of determination and (ii) zero. PACC’s hydro-carbon inventories may be included in the calculation of the borrowing base on the same basis as our assets. Revolving loans are limited to the principal amount of $200 million, subject to a sublimit of $75 million for working capital and general corporate purposes and a sublimit of $150 million for acquisition-related working capital. The letters of credit and the proceeds of revolving loans may be used for working capital and general corporate purposes.
Our credit agreement is structured in two tranches, Tranche 1 of $230 million and Tranche 2 of $520 million. The Tranche 1 commitments are considered fully utilized at all times, while Tranche 2 commitments are considered utilized in an amount equal to the result of subtracting the Tranche 1 commitments from the total letters of credit outstanding at any time.
Borrowings and other obligations under the credit agreement and certain hedging agreements are secured by a lien on substantially all of our and our subsidiaries’ personal property, including inventory, accounts, contracts, cash and cash equivalents, general intangibles, including security and deposit accounts, intellectual property, books and records, futures and forwards accounts, commodities accounts, supporting obligations and after-acquired property and proceeds of the foregoing, other than in each case general intangibles arising from or related to our real property, buildings, structures, and other improvements, fixtures, apparatus, machinery, appliances and other equipment, and all extensions, renewals, improvements, substitutions and replacements thereto whether owned or leased, together with rents, income, revenues, issues and profits from and in respect of such property.
107
Outstanding loans under the credit agreement bear interest at annual floating rates equal to LIBOR plus marginal rates between 2.00% and 3.25% or the agent bank’s prime rate plus marginal rates between 1.00% and 2.00%. Unused commitments under the credit agreement are subject to a per annum commitment fee ranging from 0.75% to 1.25%. The marginal rates are subject to adjustment based upon our senior unsecured debt rating.
Fees payable for outstanding letters of credit under the credit agreement are determined by applying marginal rates between 2.00% and 3.25% to the average daily maximum amount available to be drawn under such outstanding letters of credit. In the event that we fail to reimburse the issuing bank for a drawing under a letter of credit, the administrative agent shall reimburse the issuing bank and we will pay a fee in the amount of LIBOR less 0.03% plus marginal rates between 2.25% and 3.25% to the administrative agent. We will also pay a fronting fee of 0.15% per year of the average daily maximum amount available to be drawn under the outstanding letters of credit and certain other administrative fees in relation to letters of credit that have been issued. The marginal rates applicable to letters of credit are also subject to adjustment based upon our senior unsecured debt rating.
The credit agreement terminates, and all amounts outstanding thereunder are due and payable, on February 10, 2006. The credit agreement contains representations and warranties, funding and yield protection provisions, borrowing conditions precedent, financial and other covenants and restrictions, events of default and other provisions customary for bank credit agreements of this type.
Covenants and provisions contained in the credit agreement restrict (with certain exceptions), among other things, the ability of us and our restricted subsidiaries, in each case subject to certain exceptions:
| | • | | to create or incur liens; |
| | • | | to engage in certain asset sales; |
| | • | | to engage in mergers, consolidations, and sales of substantially all assets; |
| | • | | to make loans and investments; |
| | • | | (covers all subsidiaries) to incur additional indebtedness; |
| | • | | to engage in certain transactions with affiliates; |
| | • | | (covers all subsidiaries) to use loan proceeds to acquire or carry margin stock, or to acquire securities in violation of certain sections of the Exchange Act; |
| | • | | to create or become or remain liable with respect to certain contingent liabilities; |
| | • | | to enter into certain joint ventures; |
| | • | | to enter into certain lease obligations; |
| | • | | to make certain dividend, debt and other restricted payments; |
| | • | | to engage in different businesses; |
| | • | | (covers all subsidiaries) to make any significant change in our accounting practices; |
| | • | | (covers certain affiliates) to incur certain liabilities or engage in certain prohibited transactions under the Employee Retirement Income Security Act of 1974, or ERISA; |
| | • | | to maintain deposit accounts not under the control of the banks that are parties to the credit agreement, or to take certain other action with respect to its bank accounts; |
| | • | | (covers all subsidiaries) to engage in speculative trading; |
| | • | | (covers all subsidiaries) to amend, modify or terminate certain material agreements; and |
| | • | | to enter into contracts limiting the ability of restricted subsidiaries to pay dividends and make payments to restricted subsidiaries. |
108
We are required to cause Sabine and its subsidiaries to forgive certain intercompany indebtedness owed by us to them under certain circumstances. We are also required to comply with certain financial covenants. The current financial covenants are:
| | • | | maintenance of working capital of at least $150 million at all times; and |
| | • | | maintenance of tangible net worth of at least $650 million. |
The covenants also provide for a cumulative cash flow test, as defined in the credit agreement, that, from January 1, 2003 to February 10, 2006, shall not be less than or equal to zero. The credit agreement also limits the amount of future additional indebtedness that may be incurred by us and our subsidiaries, subject to certain exceptions, including a general exception for up to $75 million of indebtedness (which amount may be increased to up to $300 million if our consolidated debt to capitalization ratio (after giving pro forma effect to the incurrence of such indebtedness) is less than or equal to 0.60), no more than $25 million of which may mature before or concurrently with the credit agreement. We have remaining only a $15 million general exception for indebtedness.
Events of default under the credit agreement include, among other things:
| | • | | any failure by us to pay principal thereunder when due, or to pay interest or any other amount due within three days after the date due; |
| | • | | material inaccuracy of any representation or warranty given by us or any restricted subsidiary therein or in any document delivered pursuant thereto; |
| | • | | breach by us of certain covenants contained therein; |
| | • | | the continuance of a default by us or a subsidiary in the performance of or the compliance with other covenants and agreements for a period of 3 or 20 days depending on the covenant, in each case after the earlier of (x) the date upon which a responsible officer knew or reasonably should have known of such failure and (y) the date upon which written notice thereof is given to us by the administrative agent or any bank; |
| | • | | breach of or default under any indebtedness in excess of $5 million and continuance beyond any applicable grace period; |
| | • | | certain acts of bankruptcy or insolvency; |
| | • | | the occurrence of certain events under ERISA; |
| | • | | certain judgments, writs or warrants of attachment of similar process equal to or greater than $5 million remaining undischarged, unvacated, unbonded, or unstayed for a period of 10 days or non-monetary judgments, orders or decrees which do or would reasonably be expected to have a material adverse effect; |
| | • | | the occurrence of a change of control; |
| | • | | the revocation of or failure to renew licenses or permits where such revocation or failure to renew could reasonably be expected to have a material adverse effect; |
| | • | | the failure of the liens of the banks to be first priority perfected liens, subject to certain permitted liens or unenforceability or written assertion of limitation or unenforceability by us or any subsidiary, of any collateral document; or |
Port Arthur Finance Corp.
12 1/2% Senior Secured Notes. In August 1999, Port Arthur Finance Corp. issued $255 million of 12 1/2% senior secured notes, of which $8.6 million has been repaid through March 31, 2003. Additionally, in May 2003,
109
we purchased, and continue to hold, $14.7 million in principal amount of the notes. The notes were purchased by us in an open market transaction for $17.4 million. The notes are secured by certain of the assets of Port Arthur Finance Corp. and Port Arthur Coker Company. The collateral does not include PACC’s crude oil inventory, refined or intermediate products or any proceeds of the foregoing that are cash or cash equivalents and is shared ratably among the senior lenders pursuant to a common security agreement. Each of Port Arthur Coker Company, Sabine River Holding, Neches River Holding and us have unconditionally guaranteed, on a joint and several basis, all the obligations of Port Arthur Finance Corp. under the notes. The notes amortize over time, with principal payments due semi-annually on January 15th and July 15th until January 15, 2009. We may redeem all of the notes at any time at a redemption price equal to par plus accrued and unpaid interest plus a make-whole premium which is based on the rates of treasury securities with average lives comparable to the average life of the remaining scheduled payments plus 75 basis points.
Restrictive Covenants
The 12 1/2% senior secured notes contain covenants which, among other things, limit the ability of Port Arthur Coker Company, Port Arthur Finance Corp., Sabine River Holding, Neches River Holdings and us to:
| | • | | amend or modify their constitutive or governing documents; |
| | • | | conduct any business other than the business of the heavy oil upgrade project; |
| | • | | sell, assign, lease, transfer or otherwise dispose of project property without the consent of the lenders (and where applicable secured parties), with certain exceptions; |
| | • | | make investments or advances or loans. |
Port Arthur Coker Company is subject to restrictions on the making of distributions to its general partner Sabine River Holding and its limited partner Neches River Holding. Port Arthur Coker Company is required to fund certain restricted cash accounts to be used for future capital expenditures, tax payments, major maintenance, and debt repayments.
110
DESCRIPTION OF NOTES
You can find the definitions of certain terms used in this description under the subheading “Certain Definitions”. In this description, the terms “we”, “our” or “us” refer only to The Premcor Refining Group Inc. and not to any of its subsidiaries.
The terms of the notes will include those stated in the indenture as it relates to the notes and those made part of the indenture by reference to the Trust Indenture Act. Our 9 1/4% senior notes and 9 1/2% senior notes were also issued under this indenture.
Subject to the covenant described below under “Limitations on Indebtedness,” the indenture does not limit the aggregate principal amount of debt securities that we may issue and we may issue as many distinct series of debt securities under the indenture as we wish.
The following description is a summary of the material provisions of the indenture. It does not restate the indenture in its entirety and does not contain all the information that may be important to you. We urge you to read the indenture, including the definitions in the indenture of certain terms used below and the registration rights agreement, because they, and not this description, define your rights as holders of the notes. Copies of the indenture and the registration rights agreement will be available from us upon written request as described under “Where You Can Find Additional Information.”
As of the date of the indenture, each of our Subsidiaries will be a Restricted Subsidiary and the notes will not be assigned an Investment Grade Rating. However, under certain circumstances, we will be able to designate current or future Subsidiaries as Unrestricted Subsidiaries. Unrestricted Subsidiaries will not be subject to many of the restrictive covenants set forth in the indenture. In addition, upon an Investment Grade Rating Event, we will not be subject to certain restrictive covenants set forth in the indenture with respect to the notes.
The Notes
The notes will be:
| | • | | our general unsecured obligations; |
| | • | | equal in right of payment to all of our existing and future unsecured obligations that are not, by their terms, expressly subordinated in right of payment to the notes; |
| | • | | senior in right of payment to all of our existing and future obligations that are, by their terms, expressly subordinated in right of payment to the notes; |
| | • | | effectively junior in right of payment to all of our secured Indebtedness and other obligations to the extent of the value of the assets securing such Indebtedness and other obligations; and |
| | • | | structurally subordinated to all Indebtedness and other liabilities of our Subsidiaries. |
Principal, Maturity and Interest
We will issue $300.0 million aggregate principal amount of notes. The notes will mature on June 15, 2015.
Notes will be issued in denominations of $1,000 and integral multiples of $1,000.
Interest on the notes will accrue at the rate of 7 1/2% per annum. Interest on the notes will be payable semi-annually in arrears on June 15 and December 15, commencing on December 15, 2003. We will make each interest payment to the holders of record of the notes on the immediately preceding June 1 and December 1.
Interest on the notes will accrue from June 10, 2003 or, if interest has already been paid, from the date it was most recently paid. Interest will be computed on the basis of a 360-day year comprised of twelve 30-day months.
111
Methods for Receiving Payments on the Notes
All payments on the notes will be made at the office or agency of the trustee unless we elect to make interest payments by check mailed to the holders at their addresses set forth in the register of holders.
Methods for Settlement of the Notes
Settlement for the notes will be made in immediately available funds. We will pay the notes (including principal, premium, if any, and interest and Additional Interest, if any) in immediately available funds. Secondary trading in long-term notes and debentures of corporate issuers is generally settled in clearing-house or next-day funds. In contrast, the notes are expected to trade in the Same-Day Funds Settlement System of the Depository Trust Company, or DTC, and any secondary market trading activity in the notes will, therefore, be required by DTC to be settled in immediately available funds. No assurance can be given as to the effect, if any, of such settlement arrangements on trading activity in the notes.
Mandatory Redemption
The notes are not subject to any mandatory redemption.
Optional Redemption
The notes will not be redeemable at our option prior to June 15, 2008. On or after June 15, 2008, we may redeem all or a part of the notes, upon not less than 30 nor more than 60 days’ notice mailed to each holder of such notes to be redeemed at such holder’s address appearing in our security register, in principal amounts of $1,000 or an integral multiple of $1,000, at the redemption prices (expressed as percentages of principal amount) set forth below, plus accrued and unpaid interest on the notes to be redeemed, if any, to, but excluding, the redemption date, if redeemed during the 12-month period beginning on June 15 in the years indicated below:
Year
| | Redemption
Price
| |
2008 | | 103.750 | % |
2009 | | 102.500 | % |
2010 | | 101.250 | % |
2011 and thereafter | | 100.000 | % |
We may acquire notes by means other than a redemption, whether by tender offer, open market purchases, negotiated transactions or otherwise, so long as such acquisition does not otherwise violate the terms of the indenture.
In addition, we may, at our option, use the net cash proceeds of one or more Equity Offerings to the extent the net cash proceeds are contributed to our equity capital to redeem for cash up to 35% in aggregate principal amount of the notes originally issued under the indenture at any time prior to June 15, 2006 at a redemption price equal to 107.500% of the aggregate principal amount, plus accrued and unpaid interest;provided that at least 65% of the principal amount of notes originally issued remains outstanding immediately after such redemption. Any such redemption will be required to occur on or prior to 120 days after our receipt of the net cash proceeds of such Equity Offering and upon not less than 30 nor more than 60 days’ notice mailed to each holder of notes to be redeemed at such holder’s address appearing in our security register, in principal amounts of $1,000 or an integral multiple of $1,000.
112
Change of Control
If a Change of Control occurs resulting in a Rating Decline, each holder of notes will have the right to require us to purchase all or any part (equal to $1,000 or an integral multiple thereof) of that holder’s notes pursuant to an Offer (as described under “—Procedures for Offers”). In the Offer, we will offer a payment in cash equal to 101% of the aggregate principal amount of the notes purchased, plus accrued and unpaid interest on such notes, if any, including Additional Interest to the date of purchase (the “Purchase Date”). This right to require the repurchase of notes will not continue after the discharge from our obligations with respect to the notes (see “—Defeasance”).
The Change of Control purchase feature of the notes may, in certain circumstances, make more difficult or discourage a takeover of us and, as a result, may make removal of incumbent management more difficult. The Change of Control purchase feature, however, is not the result of our knowledge of any specific effort to accumulate our stock or to obtain control of us by means of a merger, tender offer, solicitation or otherwise, or part of a plan by management to adopt a series of anti-takeover provisions. Instead, the Change of Control purchase feature is a result of our negotiations with the initial purchasers. We have no present intention to engage in a transaction involving a Change of Control, although it is possible that we could decide to do so in the future.
Most of our debt instruments contain “change of control” provisions similar to the Change of Control provision in the indenture. In addition, under the Credit Agreement a “change of control” is an event of default. If a Change of Control were to occur, it is likely that we would not have sufficient assets to satisfy our obligation to purchase all of the notes that might be delivered by holders seeking to exercise the purchase right and any repurchase or prepayment obligations pursuant to other instruments governing its debt obligations.
In addition, pursuant to the terms of the indenture and our other debt instruments, other than the Credit Agreement, we are only required to offer to repurchase our notes in the event that a Change of Control results in a Rating Decline. Consequently, if a Change of Control were to occur which does not result in a Rating Decline, we would be required to make prepayments under the Credit Agreement but would not be required to offer to repurchase the notes offered hereby or the notes offered pursuant to our other debt instruments.
The provisions of the indenture would not necessarily afford holders of the notes protection in the event of a highly leveraged transaction, reorganization, restructuring, merger or similar transaction that may adversely affect such holders.
Provision of Financial Information
So long as any of the notes are outstanding, we will file with the SEC the annual reports, quarterly reports and other documents that we would have been required to file with the SEC pursuant to Section 13(a) or 15(d) of the Exchange Act if we were subject to those sections, and we will provide to all holders copies of such reports and documents. In addition, we will, so long as any notes remain outstanding, furnish to all holders and to prospective investors, upon request, the information required to be delivered pursuant to Rule 144A(d)(4) under the Securities Act.
Covenants
If an Investment Grade Rating Event occurs, the covenants that the indenture imposes on us with respect to the notes will change. See “—Certain Investment Grade Covenants”.
An “Investment Grade Rating Event” with respect to the notes will be deemed to have occurred when the notes receive the following rating:
| | (1) | | a Moody’s Rating of Baa3 or higher and an S&P Rating of at least BB+; or |
| | (2) | | a Moody’s Rating of Ba1 or higher and an S&P Rating of at least BBB–; |
or, in each case, if either Moody’s or S&P changes its rating system, equivalent ratings.
113
Certain Non-Investment Grade Covenants
Set forth below are summaries of certain covenants contained in the indenture that will apply with respect to the notes unless and until an Investment Grade Rating Event occurs.
Limitation on Indebtedness. We will not, and will not permit any of our Subsidiaries to, directly or indirectly, incur any Indebtedness (including Acquired Debt) other than the notes and the obligations outstanding on the Issue Date under the Amended and Restated Term Loan Agreement and Permitted Indebtedness, unless after giving effect to the incurrence of such Indebtedness, our Consolidated Operating Cash Flow Ratio is greater than 2 to 1.
Notwithstanding the above, our Unrestricted Subsidiaries may incur Non-Recourse Debt,provided, however, that if any such Indebtedness ceases to be Non-Recourse Debt of an Unrestricted Subsidiary, it shall be deemed to constitute an incurrence of Indebtedness by our Restricted Subsidiary.
Other than the limitations on incurrence of Indebtedness contained in this covenant, there are no provisions in the indenture that would protect the holders of the notes in the event of a highly leveraged transaction.
Limitation on Restricted Payments. We will not, and will not permit any of our Restricted Subsidiaries to, directly or indirectly, make any Restricted Payment, unless:
| | (A) | | at the time of and immediately after giving effect to the proposed Restricted Payment, no Default or Event of Default has occurred and is continuing, or would occur as a consequence of it; |
| | (B) | | we would be permitted to incur at least $1.00 of additional Indebtedness pursuant to the Consolidated Operating Cash Flow Ratio test set forth in the first paragraph of the covenant described under “—Limitation on Indebtedness;” and |
| | (C) | | at the time of and immediately after giving effect to the proposed Restricted Payment (the value of any such payment, if other than cash, as determined in good faith by our board of directors and evidenced by a board resolution), the aggregate amount of all Restricted Payments (including Restricted Payments permitted by clauses (2) and (5) of the next succeeding paragraph and excluding the other Restricted Payments permitted by such paragraph) declared or made subsequent to April 1, 1998 will not exceed the sum of: |
| | (1) | | 50% of our aggregate Consolidated Net Operating Income (or, if such aggregate Consolidated Net Operating Income is a deficit, minus 100% of such deficit) for the period (taken as one accounting period) from April 1, 1998 to the end of our most recently ended fiscal quarter for which internal financial statements are available at the time of such Restricted Payment;plus |
| | (2) | | 100% of the aggregate net proceeds, including cash and the fair market value of property other than cash (as determined in good faith by our board of directors and evidenced by a board resolution), that we have received since April 1, 1998 from any Person other than any of our Subsidiaries as a result of the issuance of Capital Stock (other than any Disqualified Capital Stock) including such Capital Stock issued upon conversion of Indebtedness or upon exercise of warrants and any contributions to our capital (other than Excluded Contributions) from any such Person;plus |
| | (3) | | to the extent that any Restricted Investment that was made after April 1, 1998, is sold for cash or otherwise liquidated or repaid for cash, the cash return of capital with respect to such Restricted Investment (less the cost of disposition, if any). |
For purposes of any calculation pursuant to the preceding sentence which is required to be made within 60 days after the declaration of a dividend by us, such dividend shall be deemed to be paid at the date of declaration.
Notwithstanding the foregoing, the provisions set forth in the immediately preceding paragraph do not prohibit:
| | (1) | | the payment of any dividends or distributions payable solely in shares of our Capital Stock (other than Disqualified Capital Stock) or in options, warrants or other rights to acquire our Capital Stock (other than Disqualified Capital Stock); |
114
| | (2) | | the payment of any dividend within 60 days after the date of declaration if, at such date of declaration, such payment complied with the provisions described above; |
| | (3) | | the retirement of any shares of our Capital Stock in exchange for, or out of the proceeds of, the substantially concurrent sale (other than to any of our Subsidiaries) of, other shares of our Capital Stock (other than Disqualified Capital Stock) or options, warrants or other rights to purchase our Capital Stock (other than Disqualified Capital Stock) and the declaration and payment of dividends on such new Capital Stock in an aggregate amount no greater than the amount of dividends declarable and payable on such retired Capital Stock immediately prior to such retirement; |
| | (4) | | other Restricted Payments in an aggregate amount not to exceed $50 million; |
| | (5) | | the making of any payment in redemption of our Capital Stock or the Capital Stock of Premcor USA or Premcor Inc. or options to purchase such Capital Stock granted to our officers or employees or the officers or employees of Premcor USA or Premcor Inc. pursuant to any stock option, stock purchase or other stock plan approved by our board of directors or the board of directors of Premcor USA or Premcor Inc. in connection with the severance or termination of officers or employees not to exceed $8 million per annum or the payment of cash dividends or the making of loans or advances to Premcor USA or Premcor Inc. to permit them to make such payments; |
| | (6) | | the declaration and payment of dividends to holders of any class or series of our preferred stock and that of our Restricted Subsidiaries issued in accordance with the “Limitation on Indebtedness” covenant; |
| | (7) | | the payment of dividends or the making of loans or advances by us to Premcor USA in an amount not to exceed $2 million in any fiscal year for costs and expenses incurred by Premcor USA in its capacity as a holding company or for services rendered to us; |
| | (8) | | Restricted Investments not to exceed at any one time an aggregate of $75 million; and |
| | (9) | | Restricted Investments made with Excluded Contributions. |
Our board of directors may designate any Restricted Subsidiary to be an Unrestricted Subsidiary if such designation would not cause a Default or Event of Default. For purposes of making such determination, all outstanding Investments by us and our Restricted Subsidiaries (except to the extent repaid in cash) in the Subsidiary so designated will be deemed to be Restricted Payments at the time of such designation and will reduce the amount available for Restricted Payments under the first paragraph of this “Limitation on Restricted Payments” covenant. All such outstanding Investments will be deemed to constitute Investments in an amount equal to the greatest of:
| | • | | the net book value of such Investments at the time of such designation; |
| | • | | the fair market value of such Investments at the time of such designation; and |
| | • | | the original fair market value of such Investments at the time they were made. |
Such designation will be permitted only if such Restricted Payment would be permitted at such time and if such Restricted Subsidiary otherwise meets the definition of an Unrestricted Subsidiary.
For purposes of this covenant, any payment made on or after April 1,1998 but prior to the Issue Date shall be deemed to be a “Restricted Payment” to the extent such payment would have been a Restricted Payment had the Indenture been in effect at the time of such payment (and, to the extent that any such Restricted Payment was permitted by clauses (1) through (9) above, such Restricted Payment may be deemed by the Company to have been made pursuant to such clause).
115
Limitation on Certain Asset Dispositions. We will not, and will not permit any of our Restricted Subsidiaries to, make any Asset Disposition unless:
| | (1) | | we receive or the applicable Restricted Subsidiary receives consideration at the time of the disposition (or, in the case of a lease, over the term of the lease) at least equal to the fair market value of the shares or assets that are disposed of, as determined by us in good faith; and |
| | (2) | | at least 75% of the consideration for the disposition is in the form of cash or Cash Equivalents;provided that the following will be deemed to be cash for purposes of this covenant: |
| | (A) | | the amount of any liabilities (as shown on our or such Restricted Subsidiary’s most recent balance sheet or in the notes thereto) of ours or such Restricted Subsidiary (other than liabilities that are by their terms subordinated to the notes) that are assumed by the transferee of any such assets; and |
| | (B) | | any notes or other obligations received by us or such Restricted Subsidiary from a transferee that are converted by us or such Restricted Subsidiary into cash within 180 days after such Asset Disposition; |
provided,further, that the 75% limitation referred to above in clause (2) will not apply to:
| | • | | any disposition of assets in which the cash portion of such consideration received on an after-tax basis, determined in accordance with the foregoing proviso, is equal to or greater than what the after-tax net proceeds would have been had such transaction complied with the 75% limitation described above; |
| | • | | any disposition of assets (other than the Port Arthur Refinery) in exchange for assets of comparable fair market value related to our Principal Business,provided that in any such exchange of our or a Restricted Subsidiary’s assets with a fair market value in excess of $20 million occurring when Blackstone fails to hold, directly or indirectly, 30% or more of the total voting power of all classes of our stock, we will obtain an opinion or report from a nationally recognized investment banking firm, valuation expert or accounting firm confirming that the assets we and such Restricted Subsidiary received in such exchange have a fair market value at least equal to the assets so exchanged; or |
| | • | | any disposition of Securitization Program Assets to any Securitization Special Purpose Entity in exchange for Indebtedness of, procurement of letters of credit and similar instruments by, or equity or other interests in, such Securitization Special Purpose Entity. |
Within 360 days of the later of (a) the receipt of the Net Available Proceeds and (b) the date of such applicable Asset Disposition, we may elect to:
| | (1) | | apply the Net Available Proceeds from the Asset Disposition to permanently redeem or repay our Indebtedness or that of any Restricted Subsidiary, other than our Indebtedness which is subordinated to the notes; or |
| | (2) | | apply the Net Available Proceeds from such Asset Disposition to invest in assets related to our Principal Business or Capital Stock of any Person primarily engaged in the Principal Business if, as a result of such acquisition, such Person becomes a Restricted Subsidiary. |
Pending the final application of any such Net Available Proceeds, we may temporarily invest such Net Available Proceeds in any manner permitted by the indenture. Any Net Available Proceeds from an Asset Disposition not applied or invested as provided in the first or second sentence of this paragraph will be deemed to constitute “Excess Proceeds.”
As soon as practical, but in no event later than 10 Business Days after any date (an “Asset Disposition Trigger Date”) that the aggregate amount of Excess Proceeds exceeds $25 million, we will commence an Offer (as described below under “—Procedures for Offers”) to purchase the maximum principal amount of notes and
116
other securities issued under the indenture that may be purchased out of the Excess Proceeds and to purchase or prepay the maximum amount of our other Indebtedness or that of Premcor USA having similar rights to be purchased out of such Excess Proceeds, in each case at an Offer price in cash in an amount equal to 100% of the principal amount thereof, plus accrued and unpaid interest, including Additional Interest, to the date of purchase. To the extent that any Excess Proceeds remain after completion of an Offer, we may use the remaining amount for general corporate purposes. Upon completion of such Offer, the amount of Excess Proceeds will be reset to zero.
Limitation on Dividend and Other Payment Restrictions Affecting our Restricted Subsidiaries. We will not, and will not permit any of our Restricted Subsidiaries (other than a Securitization Special Purpose Entity) to, create or otherwise cause or permit to exist or become effective any consensual encumbrance or restriction on the ability of any Restricted Subsidiary (other than a Securitization Special Purpose Entity) to:
| | (A) | | pay dividends or make any other distributions on or in respect of the Capital Stock of any of our Restricted Subsidiaries or pay any Indebtedness owed to us or any Restricted Subsidiary; |
| | (B) | | make loans or advances to us or any of our Restricted Subsidiaries; or |
| | (C) | | transfer any of its property or assets to us or any of our Restricted Subsidiaries; |
except for, in the case of clauses (A), (B) and (C), any restrictions:
| | (1) | | existing under the indenture and any restrictions existing on the Issue Date pursuant to an agreement relating to our Existing Indebtedness or that of any of our Restricted Subsidiaries; |
| | (2) | | pursuant to an agreement relating to Indebtedness incurred by a Restricted Subsidiary prior to the date on which we acquired such Restricted Subsidiary and outstanding on such date and not incurred in anticipation of becoming a Restricted Subsidiary; |
| | (3) | | imposed by virtue of applicable corporate law or regulation and relating solely to the payment of dividends or distributions to stockholders; |
| | (4) | | with respect to any restrictions of the nature described in clause (C) above, included in a contract entered into in the ordinary course of business and consistent with past practices that contains provisions restricting the assignment of such contract; |
| | (5) | | pursuant to an agreement effecting a renewal, extension, refinancing, refunding or replacement of Indebtedness referred to in (1) or (2) above;provided, however, that the provisions contained in such renewal, extension, refinancing, refunding or replacement agreement relating to such encumbrance or restriction, taken as a whole, are not materially more restrictive than the provisions contained in the agreement the subject thereof, as determined in good faith by our board of directors; or |
| | (6) | | which will not in the aggregate cause us not to have the funds necessary to pay the principal of, premium, if any, or interest, including Additional Interest, on the notes at their stated maturity. |
Limitation on Transactions with Shareholders and Affiliates. We will not, and will not permit any of our Restricted Subsidiaries to, directly or indirectly, conduct any business or enter into any transaction or series of similar transactions (including, without limitation, the purchase, sale, transfer, lease or exchange of any property or the rendering of any service) with:
| | (1) | | any direct or indirect holder of more than 5% of any class of our Capital Stock or that of any of our Restricted Subsidiaries (other than transactions between or among us and/or our Restricted Subsidiaries) or |
| | (2) | | any Affiliate of ours (other than transactions between or among us and/or our Restricted Subsidiaries) (each, a “Shareholder/Affiliate Transaction”) unless the terms of such business, transaction or series of transactions are as favorable to us or such Restricted Subsidiary in all material respects as terms that |
117
| | would be obtainable at the time for a comparable transaction or series of similar transactions in arm’s-length dealings with a Person which is not such a stockholder or Affiliate and, if such transaction or series of transactions involves payment for services of such a stockholder or Affiliate, |
| | (A) | | for amounts greater than $10 million and less than $25 million per annum, we will deliver an Officers’ Certificate to the trustee certifying that such Shareholder/Affiliate Transaction complies with this clause (2) or |
| | (B) | | for amounts equal to or greater than $25 million per annum, then |
| | • | | a majority of the disinterested members of our board of directors must in good faith determine that such payments are fair consideration for the services performed or to be performed (evidenced by a board resolution) or |
| | • | | we must receive a favorable opinion from a nationally recognized investment banking firm of our choice or, if no such investment banking firm is in a position to provide such opinion, a similar firm of our choice (having expertise in the specific area which is the subject of the opinion), that such payments are fair consideration for the services performed or to be performed (a copy of which will be delivered to the trustee); |
provided that the foregoing requirements will not apply to:
| | (A) | | Shareholder/Affiliate Transactions involving the purchase or sale of crude oil, vacuum tower bottoms, refined products or other inventory, so long as: |
| | • | | in the case of such transactions involving crude oil, such transactions are priced in line with the market price of a crude benchmark; and |
| | • | | the pricing of each of such transactions are equivalent to the pricing of comparable transactions with unrelated third parties; |
| | (B) | | Restricted Payments permitted by the provisions of the indenture described under “—Limitation on Restricted Payments”; |
| | (C) | | payment of annual management, consulting, monitoring and advisory fees and related expenses to Blackstone and its affiliates; |
| | (D) | | payment of reasonable and customary fees paid to, and indemnity provided on behalf of, our officers, directors, employees or consultants or those of any Restricted Subsidiary; |
| | (E) | | payments by us or any of our Restricted Subsidiaries to Blackstone and its Affiliates made for any financial advisory, financing, underwriting or placement services or in respect of other investment banking activities, including, without limitation, in connection with acquisitions or divestitures, which payments are approved by a majority of our board of directors in good faith; |
| | (F) | | payments or loans to employees or consultants which are approved by a majority of our board of directors in good faith; |
| | (G) | | any agreement in effect on the Issue Date and any amendment thereto (so long as any such amendment is not disadvantageous to the holders of the notes in any material respect) or any transaction contemplated thereby; or |
| | (H) | | any stockholder agreement or registration rights agreement to which we are a party on the Issue Date and any similar agreements which we may enter into thereafter;provided that our performance or that of any of our Restricted Subsidiaries of obligations under any future amendment or under such a similar agreement entered into after the Issue Date shall only be permitted by this clause (H) to the extent that the terms of any such amendment or new agreement are not disadvantageous to the holders of the notes in any material respect. |
118
Limitation on Liens. We will not, directly or indirectly, create, incur, assume or suffer to exist any Lien on any asset now owned or hereafter acquired, or on any income or profits therefrom, or assign or convey any right to receive income therefrom to secure any Indebtedness which ispari passu with or subordinate in right of payment to the notes (in each case except for Permitted Liens), unless the notes and the other securities issued under the indenture are secured equally and ratably simultaneously with or prior to the creation, incurrence or assumption of such Lien for so long as such Lien exists;provided, that in any case involving a Lien securing Indebtedness which is subordinated in right of payment to the notes, such Lien is subordinated to the Lien securing the notes to the same extent that such subordinated debt is subordinated to the notes.
Limitation on Merger, Consolidation and Sale of Assets. We will not consolidate or merge with or into (whether or not we are the Surviving Person), or sell, assign, transfer, lease, convey, or otherwise dispose of all or substantially all of our properties or assets in one or more related transactions to another Person unless:
| | (1) | | the Surviving Person is a corporation organized and existing under the laws of the United States, any state thereof or the District of Columbia; |
| | (2) | | the Surviving Person (if other than us) assumes all of our obligations under the notes and the indenture pursuant to a supplemental indenture in a form reasonably satisfactory to the trustee; |
| | (3) | | at the time of and immediately after such transaction, no Default or Event of Default has occurred and is continuing; and |
| | (4) | | except with respect to a merger of us with or into Premcor USA that does not result in a Rating Decline with respect to the notes, after giving pro forma effect to the transaction, either |
| | • | | the Surviving Person would be permitted to incur at least $1.00 of additional Indebtedness pursuant to the Consolidated Operating Cash Flow Ratio test set forth in the first paragraph of the covenant described under “—Limitations on Indebtedness” or |
| | • | | the Consolidated Operating Cash Flow Ratio of the Surviving Person would be no less than such ratio for us immediately prior to such transaction. |
Limitation on Issuance of Guarantees of Indebtedness. We will not permit any of our Restricted Subsidiaries, directly or indirectly, to guarantee or secure the payment of any of our Indebtedness unless such Restricted Subsidiary simultaneously executes and delivers a supplemental indenture to the indenture providing for the guarantee or security of the payment of the notes and the other securities issued under the indenture by such Restricted Subsidiary (other than the grant of security interests in cash and cash equivalents, receivables and product inventories to secure obligations under the Credit Agreement). If the Indebtedness to be guaranteed is subordinated to the notes, the guarantee or security of such Indebtedness will be subordinated to the guarantee or security of the notes to the same extent as the Indebtedness to be guaranteed is subordinated to the notes. Notwithstanding the foregoing, any such guarantee or security by a Restricted Subsidiary of the notes will provide by its terms that it will be automatically and unconditionally released and discharged upon either:
| | • | | the release or discharge of such guarantee or security of payment of such other Indebtedness, except a discharge by or as a result of payment under such guarantee or security, or |
| | • | | any sale, exchange or transfer, to any Person not an Affiliate of ours, of all of our Capital Stock in, or all or substantially all the assets of, such Restricted Subsidiary, which sale, exchange or transfer is made in compliance with the applicable provisions of the indenture. |
Certain Investment Grade Covenants
If an Investment Grade Rating Event occurs with respect to the notes, each of the covenants (except for “—Limitation on Issuance of Guarantees of Indebtedness” and clauses (1), (2), and (3) of “—Limitation on Merger, Consolidation and Sale of Assets”) described above under “—Certain Non-Investment Grade Covenants” ceases to apply to us and our Restricted Subsidiaries with respect to the notes.
119
In addition, the indenture contains, among other things, the following covenants, each of which will apply to us with respect to the notes only upon and after the occurrence of an Investment Grade Rating Event.
Restrictions on Secured Indebtedness. If we incur, issue, assume or guarantee any Indebtedness secured by a Lien on any Principal Property or on any share of stock or Indebtedness of any Restricted Subsidiary (other than a Securitization Special Purpose Entity), we will secure the notes and the other securities issued under the indenture equally and ratably with (or, at our option, prior to) such secured Indebtedness so long as such Indebtedness is so secured, unless the aggregate amount of all such secured Indebtedness, together with all our Attributable Indebtedness with respect to any sale and leaseback transactions involving Principal Properties (with the exception of such transactions which are excluded as described in clauses (1) through (5) under “—Restrictions on Sales and Leasebacks” below), would not exceed 10% of Consolidated Net Tangible Assets. The above restriction does not apply to, and there will be excluded from secured Indebtedness in any computation under such restriction, Indebtedness secured by:
| | (1) | | Liens on property of, or on any share of stock or Indebtedness of, any corporation existing at the time such corporation becomes a Restricted Subsidiary and Liens on any property acquired from a corporation which is merged with or into us or a Subsidiary; |
| | (2) | | Liens in favor of us; |
| | (3) | | Liens in favor of governmental bodies to secure progress, advance or other payments; |
| | (4) | | Liens upon any property acquired after the date of the indenture, securing the purchase price thereof or created or incurred simultaneously with (or within 270 days after) such acquisition to finance the acquisition of such property or existing on such property at the time of such acquisition, or Liens on improvements after such date, in each case subject to certain conditions and provided that the principal amount of the obligation or indebtedness secured by such Lien shall not exceed 100% of the cost or fair value (as determined in good faith by us), whichever shall be lower, of the property at the time of the acquisition, construction or improvement thereof; |
| | (5) | | Liens securing industrial revenue or pollution control bonds; |
| | (6) | | Liens arising out of any final judgment for the payment of money aggregating not in excess of $25 million which remains unstayed, in effect and unpaid for a period of 60 consecutive days or Liens arising out of any judgments which are being contested in good faith; |
| | (7) | | Permitted Liens in existence on the date of the Investment Grade Rating Event; |
| | (8) | | Liens to secure obligations arising from time to time under the Credit Agreement, including Guaranties thereof, and Interest Swap Obligations owed by us or a Subsidiary to any lender under the Credit Agreement or an Affiliate of any such lender; or |
| | (9) | | any extension, renewal, or replacement of any Lien referred to in the foregoing clauses (1) through (8) inclusive. |
Restrictions on Sales and Leasebacks. We may not enter into any sale and leaseback transaction involving any Principal Property, unless the aggregate amount of all our Attributable Indebtedness with respect to such transaction plus all secured Indebtedness (with the exception of secured Indebtedness which is excluded as described in clauses (1) through (9) under “—Restrictions on Secured Indebtedness” above) would not exceed 10% of Consolidated Net Tangible Assets. This restriction does not apply to, and there shall be excluded from Attributable Indebtedness in any computation under such restriction, any sale and leaseback transaction if:
| | (1) | | the lease is for a period, including renewal rights, not in excess of three years; |
| | (2) | | the sale of the Principal Property is made within 270 days after its acquisition, construction or improvements; |
| | (3) | | the lease secures or relates to industrial revenue or pollution control bonds; |
| | (4) | | the transaction is between us and a Restricted Subsidiary; or |
120
| | (5) | | we, within 270 days after the sale is completed, apply to the retirement of our Indebtedness or that of a Restricted Subsidiary, or to the purchase of other property which will constitute a Principal Property, an amount not less than the greater of: |
| | (A) | | the net proceeds of the sale of the Principal Property leased or |
| | (B) | | the fair market value (as determined by us in good faith) of the Principal Property leased. |
The amount to be applied to the retirement of Indebtedness shall be reduced by:
| | • | | the principal amount of any of our debentures or notes (including the notes) or those of a Restricted Subsidiary surrendered within 270 days after such sale to the trustee for retirement and cancellation; |
| | • | | the principal amount of Indebtedness, other than the items referred to in the preceding bullet point paragraph, voluntarily retired by us or a Restricted Subsidiary within 270 days after such sale; and |
| | • | | associated transaction expenses. |
Procedures for Offers
Within 30 days following a Change of Control resulting in a Rating Decline and on any Asset Disposition Trigger Date, we will mail to each holder of notes, at such holder’s registered address, a notice stating:
| | • | | that the offer (the “Offer”) is being made as a result of a Change of Control or one or more Asset Dispositions, the length of time the Offer will remain open, and the maximum aggregate principal amount of notes that will be accepted for payment pursuant to such Offer; |
| | • | | the purchase price, the amount of accrued and unpaid interest, including Additional Interest, as of the Purchase Date, and the Purchase Date; |
| | • | | in the case of a Change of Control, the circumstances and material facts regarding such Change of Control, to the extent known to us (including, but not limited to, information with respect to pro forma and historical financial information after giving effect to such Change of Control, and information regarding the Person or Persons acquiring control); and |
| | • | | any other information required by the indenture and applicable laws and regulations. |
On the Purchase Date for any Offer, we will:
| | • | | in the case of an Offer resulting from a Change of Control, accept for payment all notes tendered pursuant to the Offer and, in the case of an Offer resulting from one or more Asset Dispositions, accept for payment the maximum principal amount of notes tendered pursuant to the Offer that can be purchased out of Excess Proceeds from the Asset Dispositions, which amount shall equal the product of (a) the amount of such Excess Proceeds and (b) a fraction whose numerator is the aggregate amount of all obligations owing under notes tendered pursuant to such offering and whose denominator is the sum of the aggregate amount of all obligations owing under notes tendered pursuant to the Offer and the aggregate amount of all obligations owing under other of our Indebtedness or that of Premcor USA tendered pursuant to similar rights to repayment or repurchase; |
| | • | | deposit with the Paying Agent the aggregate purchase price of all notes accepted for payment and any accrued and unpaid interest, including Additional Interest, on such notes as of the Purchase Date; and |
| | • | | deliver or cause to be delivered to the trustee all notes tendered pursuant to the Offer. |
If less than all notes tendered pursuant to any Offer are accepted for payment by us for any reason, selection of the notes to be purchased will be in compliance with the requirements of the principal national securities exchange, if any, on which the notes are listed or, if the notes are not so listed, by lot or by such method as the trustee deems fair and appropriate;provided that notes accepted for payment in part will only be purchased for
121
payment in integral multiples of $1,000. The Paying Agent will promptly mail to each holder of notes accepted for payment an amount equal to the purchase price for such notes plus any accrued and unpaid interest, including Additional Interest thereon. The trustee will promptly authenticate and mail to such holder of notes accepted for payment in part new notes equal in principal amount to any unpurchased portion of the notes, and any notes not accepted for payment in whole or in part shall be promptly returned to the holder thereof. On and after a Purchase Date, interest will cease to accrue on the notes accepted for payment. We will announce the results of the Offer to holders of the notes on or as soon as practicable after the Purchase Date.
We will comply with all applicable requirements of Rule 14e-1 under the Exchange Act and all other applicable securities laws and regulations thereunder, to the extent applicable, in connection with any Offer.
Events of Default
The following will be Events of Default with respect to the notes:
| | (1) | | our failure to pay any interest on any note when due or within 30 days thereafter; |
| | (2) | | our failure to pay principal of (or premium, if any, on) any note when due; |
| | (3) | | our failure to observe or comply with any provisions described under “—Covenants—Limitation on Merger, Consolidation and Sale of Assets”; |
| | (4) | | our breach any of our other covenants or warranties in the indenture and such breach continues for a period of 30 days after written notice as provided in the indenture; |
| | (5) | | our failure to pay, at final maturity, in excess of $25 million in principal amount of any of our Indebtedness or that of any of our Restricted Subsidiaries, or acceleration of any of such Indebtedness or that of any of our Restricted Subsidiaries in an aggregate principal amount in excess of $25 million; |
| | (6) | | the rendering of a final judgment or judgments (not subject to appeal and not covered by insurance) against us or any of our Restricted Subsidiaries in an aggregate principal amount in excess of $50 million which remains unstayed, in effect and unpaid for a period of 60 consecutive days thereafter; and |
| | (7) | | certain events in bankruptcy, insolvency or reorganization affecting us or any of our Significant Subsidiaries which, in the case of an involuntary proceeding, remains unstayed and in effect for a period of 60 consecutive days. |
If an Event of Default shall occur and be continuing, either the trustee or the holders of at least 25% of the principal amount of the outstanding notes may accelerate the maturity of all of the notes;provided, however, that after such acceleration, but before a judgment or decree based on acceleration, the holders of a majority in principal amount of outstanding notes may, under certain circumstances, rescind and annul such acceleration if all Events of Default, other than the nonpayment of accelerated principal, have been cured or waived as provided in the indenture. For information as to waiver of defaults, see “—Modification and Waiver.”
No holder of any note will have any right to institute any proceeding with respect to the indenture or for any remedy thereunder, unless such holder has previously given to the trustee written notice of a continuing Event of Default and unless the holders of at least 25% in aggregate principal amount of the outstanding notes have made written request, and offered reasonable indemnity, to the trustee to institute such proceeding as trustee, and the trustee has not received from the holders of a majority in aggregate principal amount of the outstanding notes a direction inconsistent with such request and has failed to institute such proceeding within 60 days. However, such limitations do not apply to a suit instituted by a holder of a note for enforcement of payment of the principal of (and premium, if any) or interest on such note on or after the due date expressed in such note.
Subject to the provisions of the indenture relating to the duties of the trustee in case an Event of Default occurs and is continuing, the trustee will be under no obligation to exercise any of its rights or powers under the
122
indenture at the request or direction of any of the holders, unless such holders shall have offered to the trustee reasonable indemnity. Subject to such provisions for the indemnification of the trustee, the holders of a majority in aggregate principal amount of the outstanding notes will have the right to direct the time, method and place of conducting any proceeding for any remedy available to the trustee or exercising any trust or power conferred on the trustee with respect to the notes.
We will be required to furnish to the trustee annually a statement as to our performance of certain of our obligations under the indenture and as to any default in such performance.
No Personal Liability of Directors, Officers, Employees and Stockholders
None of our directors, officers, employees, incorporators or stockholders or any of our Restricted Subsidiaries, as such, will have any liability for any of our obligations under the notes, the indenture, or of any claim based on, in respect of, or by reason of, such obligations or their creation. Each Holder of notes by accepting a note waives and releases all such liability. The waiver and release are part of the consideration for issuance of the notes. The waiver may not be effective to waive liabilities under the federal securities laws.
Defeasance
We may, at our option and at any time, elect to have our obligations discharged with respect to the outstanding notes (“legal defeasance”). Legal defeasance with respect to the notes means that we will be discharged from any and all obligations in respect of the outstanding notes.
In addition, we may, at our option and at any time, elect to omit to comply with certain restrictive covenants, and that omission will not be deemed to be an Event of Default under the indenture and the notes issued (“covenant defeasance”). With respect to the covenant defeasance, the obligations under the indenture other than with respect to such covenants and the Events of Default other than the Events of Default relating to such covenants above will remain in full force and effect.
We may exercise our legal defeasance option or our covenant defeasance option with respect to the notes only if we have irrevocably deposited with the trustee, in trust, money and/or U.S. government obligations which will provide money in an amount sufficient in the opinion of a nationally recognized accounting firm to pay the principal of and premium, if any, and each installment of interest, if any, on the outstanding notes.
The trust referred to above may be established only if, among other things:
| | (1) | | (a) with respect to legal defeasance, we have received from, or there has been published by, the Internal Revenue Service a ruling or there has been a change in law, which in the Opinion of Counsel provides that holders of the notes will not recognize gain or loss for federal income tax purposes as a result of such deposit, defeasance and discharge and will be subject to federal income tax on the same amount, in the same manner and at the same times as would have been the case if such deposit, defeasance and discharge had not occurred; or |
| | | | (b) with respect to covenant defeasance, we have delivered to the trustee an Opinion of Counsel to the effect that the holders of the notes will not recognize gain or loss for federal income tax purposes as a result of such deposit and defeasance and will be subject to federal income tax on the same amount, in the same manner and at the same times as would have been the case if such deposit and defeasance had not occurred; |
| | (2) | | no Event of Default or event that, with the passing of time or the giving of notice, or both, shall constitute an Event of Default has occurred or is continuing; |
| | (3) | | We have delivered to the trustee an Opinion of Counsel to the effect that such deposit shall not cause the trustee or the trust so created to be subject to the Investment Company Act of 1940; and |
123
| | (4) | | certain other customary conditions precedent are met. |
Modification and Waiver
We, when authorized by a board resolution, and the trustee may enter into supplemental indentures to amend the indenture or the securities issued under the indenture without the consent of any holder of securities:
| | (1) | | to evidence the succession of another Person to us and the assumption by any such successor of our covenants in the indenture and in the securities; or |
| | (2) | | to add to our covenants for the benefit of the holders of all or any series of securities issued under the indenture (and if such covenants are to be for the benefit of less than all series of securities issued under the indenture, stating that such covenants are expressly being included solely for the benefit of such series) or to surrender any right or power in the indenture conferred upon us; or |
| | (3) | | to add any additional Events of Default; or |
| | (4) | | to secure the securities issued under the indenture; or |
| | (5) | | to establish the form or terms of securities of any series as permitted by the indenture; or |
| | (6) | | to evidence and provide for the acceptance of appointment in the indenture by a successor trustee with respect to the securities of one or more series and to add to or change any of the provisions of this indenture as shall be necessary to provide for or facilitate the administration of the trusts by more than one trustee; or |
| | (7) | | to cure any ambiguity, to correct or supplement any provision in the indenture which is inconsistent with any other provision in the indenture, or to make any other provisions with respect to matters or questions arising under the indenture,provided that it does not adversely affect the interests of the holders of any series in any material respect; or |
| | (8) | | to comply with the requirements of the SEC in order to effect or maintain the qualification of the indenture under the Trust Indenture Act; or |
| | (9) | | to add to, change or eliminate any of the provisions of the indenture in respect of one or more series of securities issued under the indenture,provided that any such addition, change or elimination (A) shall neither (i) apply to any securities of any series created prior to the execution of such supplemental indenture and entitled to the benefit of such provision nor (ii) modify the rights of the holder of any such securities with respect to such provision or (B) shall become effective only when there is no such security outstanding. |
We and the trustee, with the consent of the holders of a majority in aggregate principal amount of the outstanding securities issued under the indenture of each affected series, may enter into an indenture or indentures supplemental to the indenture to modify or amend the indenture;provided, however, that no such modification or amendment may, without the consent of the holder of each outstanding security issued under the indenture affected thereby,
| | (1) | | change the stated maturity of the principal of, or any installment of interest on, any such security; |
| | (2) | | reduce the principal amount of (or the premium), or interest on, any such security; |
| | (3) | | reduce the amount of the principal of an original issue discount security or any other security under the indenture which would be due and payable upon a declaration of acceleration of the Maturity (as described under “—Events of Default”); |
| | (4) | | change the place or currency of payment of principal of (or premium), or interest on, any such security; |
| | (5) | | impair the right to institute suit for the enforcement of any payment on or with respect to any such security; |
124
| | (6) | | reduce the above-stated percentage of outstanding securities of a series necessary to modify or amend the indenture; |
| | (7) | | reduce the percentage of aggregate principal amount of outstanding securities of a series necessary for waiver of compliance with certain provisions of the indenture or for waiver of certain defaults; or |
| | (8) | | modify any provisions of the indenture relating to the modification and amendment of the indenture or the waiver of past defaults or covenants, except as otherwise specified. |
The holders of a majority in aggregate principal amount of the outstanding notes may waive our compliance with certain restrictive provisions of the indenture with respect to the notes. The holders of a majority in aggregate principal amount of the outstanding notes may waive any past default under the indenture with respect to the notes, except a default in the payment of principal of (or premium, if any) or interest on any note, or in respect of any covenant which cannot be modified or waived without the consent of each such holder.
Satisfaction and Discharge
The indenture will be discharged and will cease to be of further effect as to all securities issued thereunder, when:
| | (a) | | all such securities that have been authenticated, except lost, stolen or destroyed securities that have been replaced or paid and securities for whose payment money has been deposited in trust and thereafter repaid to us, have been delivered to the trustee for cancellation; or |
| | (b) | | all such securities that have not been delivered to the trustee for cancellation have become due and payable by reason of the mailing of a notice of redemption or otherwise or will become due and payable within one year and we have irrevocably deposited or caused to be deposited with the trustee as trust funds in trust solely for the benefit of the holders, in amounts sufficient to pay and discharge the entire indebtedness on such securities not delivered to the trustee for cancellation for principal, premium, and interest to the date of maturity or redemption; |
| | (2) | | we have paid or caused to be paid all sums payable by us under the indenture; |
| | (3) | | we have delivered an Officers’ Certificate and an Opinion of Counsel to the trustee stating that all conditions precedent to satisfaction and discharge have been satisfied; and |
| | (4) | | the trustee has received such other documents and assurances as the trustee has reasonably requested. |
The Trustee
The indenture provides that, except during the continuance of an Event of Default, the trustee will perform only such duties as are specifically set forth in the indenture. During the existence of an Event of Default, the trustee will exercise such rights and powers vested in it under the indenture and use the same degree of care and skill in its exercise as a prudent person would exercise under the circumstances in the conduct of such person’s own affairs.
The indenture and the provisions of the Trust Indenture Act incorporated by reference therein contain limitations on the rights of the trustee, should it become a creditor of ours, to obtain payment of claims in certain cases or to realize on certain property received by it in respect of any such claim as security or otherwise. The trustee is permitted to engage in other transactions with us or any Affiliate;provided, however, that if it acquires any conflicting interest (as defined in the indenture or in the Trust Indenture Act), it must eliminate such conflict or resign.
125
Certain Definitions
Set forth below is a summary of certain of the defined terms used in the indenture. Reference is made to the indenture for the full definition of all such terms, as well as any other terms used herein for which no definition is provided.
“8 3/8% Notes” means our 8 3/8% Senior Notes due 2007.
“8 5/8% Notes” means our 8 5/8% Senior Notes due 2008.
“8 7/8% Senior Subordinated Notes” means our 8 7/8% Senior Subordinated Notes due 2007.
“Acquired Debt” means, with respect to any specified Person, (i) Indebtedness of any other Person existing at the time such other Person is merged with or into or became a Subsidiary of such specified Person, including, without limitation, Indebtedness incurred in connection with, or in contemplation of, such other Person merging with or into or becoming a Subsidiary of such specified Person, and (ii) Indebtedness secured by a Lien encumbering any asset acquired by such specified Person.
“Additional Interest” means the additional interest, in addition to the Interest of the notes, that shall accrue and be payable at a per annum rate as described under “Registration Covenant; Exchange Offer.”
“Affiliate” of any specified Person means any other Person directly or indirectly controlling or controlled by or under direct or indirect common control with such specified Person. For the purposes of this definition, “control” when used with respect to any specified Person means the power to direct the management and policies of such Person, directly or indirectly, whether through the ownership of voting securities, by contract or otherwise; and the terms “controlling” and “controlled” have meanings correlative to the foregoing.
“Amended and Restated Term Loan Agreement” means the amended and restated term loan agreement, dated as of August 10, 1998, among us, certain lenders, Goldman Sachs Credit Partners L.P., as agent, as amended from time to time.
“Asset Disposition” by any Person means any transfer, conveyance, sale, lease or other disposition by such Person or any of its Restricted Subsidiaries (including a consolidation or merger or other sale of any such Restricted Subsidiary in a transaction in which such Restricted Subsidiary ceases to be a Restricted Subsidiary, but excluding a disposition by a Restricted Subsidiary of such Person to such Person or a Restricted Subsidiary of such Person or by such Person to a Restricted Subsidiary of such Person) of:
| | • | | shares of Capital Stock (other than directors’ qualifying shares) or other ownership interests of a Restricted Subsidiary of such Person; |
| | • | | substantially all of the assets of such Person or any of its Restricted Subsidiaries representing a division or line of business; or |
| | • | | other assets or rights of such Person or any of its Restricted Subsidiaries outside of the ordinary course of business, which in the case of this clause or either clause above, whether in a single transaction or a series of related transactions, results in Net Available Proceeds in excess of $10.0 million;provided that (i) any transfer, conveyance, sale, lease or other disposition of assets securing the Credit Agreement in connection with the enforcement of the security interests therein and (ii) any sale of crude oil, vacuum tower bottoms, refined products, or other inventory shall not be deemed an Asset Disposition hereunder. |
“Attributable Indebtedness” means the total net amount of rent required to be paid during the remaining primary term of any particular lease under which any Person is at the time liable, discounted at the rate per annum equal to the weighted average interest rate borne by the notes and the other securities issued under the indenture.
“Blackstone” means Blackstone Capital Partners III Merchant Banking Fund L.P. and its affiliates.
126
“Borrowing Base” means, as of any date, an amount equal to the sum of:
| | • | | 95% of the accounts receivable owned by us and our Restricted Subsidiaries (excluding any accounts receivable from Restricted Subsidiaries and any accounts receivable that are more than 90 days past due) as of such date, plus |
| | • | | 90% of the market value of inventory owned by us and our Restricted Subsidiaries as of such date, plus |
| | • | | 100% of the cash and Cash Equivalents owned by us and our Restricted Subsidiaries as of such date that are, as of such date, held in one or more accounts under the direct control of the agent banks or lenders under the Credit Agreement and that are as of such date pledged to secure borrowings and other extensions of credit under the Credit Agreement. |
“Capital Lease” means, at the time any determination thereof is to be made, any lease of property, real or personal or mixed, in respect of which the present value of the minimum rental commitment would be capitalized on a balance sheet of the lessee in accordance with GAAP.
“Capitalized Lease Obligation” of any Person means any lease of any property (whether real, personal or mixed) by such Person as lessee which, in conformity with GAAP, is required to be accounted for as a Capital Lease on the balance sheet of that Person.
“Capital Stock” means:
| | • | | in the case of a corporation, corporate stock; |
| | • | | in the case of any association or business entity, any and all shares, interests, participations, rights or other equivalents (however designated) of corporate stock; and |
| | • | | in the case of a partnership, partnership interests (whether general or limited). |
“Cash Equivalents” means:
| | (1) | | United States dollars; |
| | (2) | | securities issued or directly and fully guaranteed or insured by the United States government or any agency or instrumentality thereof; |
| | (3) | | certificates of deposit and eurodollar time deposits with maturities of six months or less from the date of acquisition, bankers’ acceptances with maturities not exceeding six months and overnight bank deposits, in each case with any domestic commercial bank having capital and surplus in excess of $500 million and a Keefe Bank Watch Rating of “B” or better; |
| | (4) | | repurchase obligations with a term of not more than seven days for underlying securities of the types described in clauses (2) and (3) entered into with any financial institution meeting the qualifications specified in clause (3) above; and |
| | (5) | | commercial paper having the highest rating obtainable from Moody’s or S&P and, in each case, maturing within six months after the date of acquisition. |
“Change of Control” means any transaction the result of which is that any Person (an “Acquiring Person”) other than Blackstone, or a Person, a majority of whose voting equity is owned by Blackstone, becomes the Beneficial Owner, directly or indirectly, of shares of our stock or that of Premcor USA or Premcor Inc. entitling such Acquiring Person to exercise 50% or more of the total voting power of all classes of our stock or that of Premcor USA or Premcor Inc., as the case may be, entitled to vote in elections of directors. The term “Beneficial Owner” shall be determined in accordance with Rule 13d-3 under the Exchange Act.
127
“Common Security Agreement” means that certain Amended and Restated Common Security Agreement, dated as of June 6, 2002, among us, PAFC, PACC, Neches River, Sabine River LLC, Sabine River, Deutsche Bank Trust Company Americas, as collateral trustee for the secured parties, HSBC Bank USA, as capital markets trustee for the capital markets senior lenders, and Deutsche Bank Trust Company Americas, as depositary bank, as the same may be amended or supplemented in accordance with its terms and in effect from time to time.
“Consolidated Net Operating Income” means, when used with reference to any Person, for any period, the aggregate of the Net Income of such Person and its Restricted Subsidiaries for such period, on a consolidated basis, determined in accordance with GAAP,provided that
| | (1) | | the Net Income of any Person which is not a Subsidiary of such Person or is accounted for by the equity method of accounting shall be included only to the extent of the amount of dividends or distributions paid to such Person or its Restricted Subsidiaries, |
| | (2) | | the Net Income of any Unrestricted Subsidiary shall be excluded (except to the extent distributed to us or one of our Subsidiaries), |
| | (3) | | the Net Income of any Person acquired in a pooling of interests transaction for any period prior to the date of such acquisition shall be excluded, |
| | (4) | | extraordinary gains and losses and gains and losses from the sale of assets outside the ordinary course of such Person’s business shall be excluded, |
| | (5) | | the cumulative effect of changes in accounting principles in the year of adoption of such changes shall be excluded, and |
| | (6) | | the tax effect of any of the items described in clauses (1) through (5) above shall be excluded. |
“Consolidated Net Tangible Assets” of a Person means the consolidated total assets of such Person and its Restricted Subsidiaries determined in accordance with GAAP, less the sum of
| | • | | all current liabilities and current liability items, and |
| | • | | all goodwill, trade names, trademarks, patents, organization expense, unamortized debt discount and expense and other similar intangibles properly classified as intangibles in accordance with GAAP. |
“Consolidated Operating Cash Flow” means with respect to any Person, Consolidated Net Operating Income of such Person and its Restricted Subsidiaries without giving effect to gains and losses on securities transactions (net of related taxes) for the period described below, increased by the sum of:
| | (1) | | consolidated Fixed Charges of such Person and its Restricted Subsidiaries which reduced Consolidated Net Operating Income for such period; |
| | (2) | | consolidated income tax expense (net of taxes relating to gains and losses on securities transactions) of such Person and its Restricted Subsidiaries which reduced Consolidated Net Operating Income for such period; |
| | (3) | | consolidated depreciation and amortization expense (including amortization of purchase accounting adjustments) of such Person and its Restricted Subsidiaries and other non-cash items to the extent any of which reduced Consolidated Net Operating Income for such period; and |
| | (4) | | any annual management, monitoring, consulting and advisory fees and related expenses paid to Blackstone and its affiliates in an amount not to exceed $2.0 million, less non-cash items which increased Consolidated Net Operating Income for such period, all as determined for such Person and its consolidated Restricted Subsidiaries in accordance with GAAP for the four full Quarters for which financial information in respect thereof is available immediately prior to the Transaction Date. |
128
“Consolidated Operating Cash Flow Ratio” means, with respect to any Person, the ratio of:
| | (1) | | Consolidated Operating Cash Flow of such Person and its Restricted Subsidiaries for the four Quarters for which financial information in respect thereof is available immediately prior to the Transaction Date to |
| | (2) | | the aggregate Fixed Charges of such Person and its Restricted Subsidiaries for such four Quarters, such Fixed Charges to be calculated on the basis of the amount of the Indebtedness, Capitalized Lease Obligations and Preferred Stock of such Person and its Restricted Subsidiaries outstanding on the Transaction Date and assuming the continuation of market interest rate levels prevailing on the Transaction Date in any calculation of interest rates in respect of floating interest rate obligations; |
provided,however, that if such Person or any Restricted Subsidiary of such Person shall have acquired, sold or otherwise disposed of any Material Asset or engaged in an Equity Offering during the four full Quarters for which financial information in respect thereof is available immediately prior to the Transaction Date or during the period from the end of such fourth full Quarter to and including the Transaction Date, the calculation required in clause (1) above will be made giving effect to such acquisition, sale or disposition or the other investment of the Net Available Proceeds of such Equity Offering on apro forma basis as if such acquisition, sale, disposition or investment had occurred at the beginning of such four full Quarter period without giving effect to clause (3) of the definition of “Consolidated Net Operating Income” (that is, including in such calculation the Net Income for the relevant prior period of any Person acquired in a pooling of interests transaction, notwithstanding the provisions of said clause (3));provided, further, that Fixed Charges of such Person during the applicable period shall not include the amount of consolidated Interest Expense which is directly attributable to Indebtedness to the extent such Indebtedness is reduced by the proceeds of the incurrence of the Indebtedness which gave rise to the need to calculate the Consolidated Operating Cash Flow Ratio. Any such pro forma calculation may include adjustments appropriate, in our reasonable determination as set forth in an Officers’ Certificate, to
| | • | | reflect operating expense reductions reasonably expected to result from our acquisition of such Material Asset, or |
| | • | | eliminate the effect of any extraordinary accounting event with respect to any acquired Person on Consolidated Net Operating Income. |
“Credit Agreement” means that certain Amended and Restated Credit Agreement, dated as of February 11, 2003, by and among us and the financial institutions party thereto, and each other credit agreement or reimbursement agreement to which we are a party from time to time, including any related notes, guarantees, collateral documents, instruments and agreements executed in connection therewith, and in each case as amended, restated, modified, extended, renewed, refunded, replaced, increased or refinanced from time to time.
“Default” means any event which is, or after notice or passage of time or both would be, an Event of Default.
“Disposition” means, with respect to any Person, any merger, consolidation or other business combination involving such Person (whether or not such Person is the Surviving Person) or the sale, assignment, transfer, lease, conveyance or other disposition of all or substantially all of such Person’s assets.
“Disqualified Capital Stock” means, with respect to any of the notes issued under the indenture, any of our Capital Stock that, either by its terms or by the terms of any security into which it is convertible or exchangeable, is, or upon the happening of any event or passage of time would be, required to be redeemed or purchased (other than pursuant to an offer to repurchase such Capital Stock following a change of control, which offer may not be completed until 45 days after completion of the Offer described under “—Change of Control”), including at the option of the holder, in whole or in part, or has, or upon the happening of an event or passage of time would have, a redemption, sinking fund or similar payment due, on or prior to the stated maturity of the notes of such series.
129
“Equity Offering” means any public or private sale of our Capital Stock (including options, warrants or rights with respect thereto) or that of Premcor USA or Premcor Inc.
“Excluded Contribution” means the net cash proceeds received by us after the Issue Date from
| | • | | contributions to its common equity capital, and |
| | • | | the sale (other than to a Subsidiary or to any Company or Subsidiary management equity plan or stock option plan or any other management or employee benefit plan or agreement) of our Capital Stock (other than Disqualified Stock), |
in each case, designated as Excluded Contributions pursuant to an Officers’ Certificate.
“Existing Indebtedness” means any of our Indebtedness or that of our Subsidiaries incurred on or outstanding as of the Issue Date and in any event Indebtedness evidenced by the Credit Agreement, the 8 3/8% Notes, the 8 7/8% Senior Subordinated Notes, the 8 5/8% Notes, the Port Arthur Notes, the Guaranty by PACC, Sabine River, Neches River and us of the Port Arthur Notes and of PAFC’s obligations under the Common Security Agreement and any Financing Documents (as defined in the Common Security Agreement), and the Ohio Water Bonds, whether or not outstanding on the Issue Date.
“Fixed Charges” of any Person means, for any period, the sum of
| | (1) | | consolidated Interest Expense of such Person and its Restricted Subsidiaries, plus |
| | (2) | | all but the principal component of rentals in respect of consolidated Capitalized Lease Obligations of such Person and its Restricted Subsidiaries paid, accrued or scheduled to be paid or accrued by such Person and its Restricted Subsidiaries during such period, and determined in accordance with GAAP, plus |
| | (3) | | all cash dividend payments (excluding items eliminated in consolidation) on any series of preferred stock of such Person. |
For purposes of this definition:
| | • | | interest on Indebtedness which accrues on a fluctuating basis for periods succeeding the date of determination shall be deemed to accrue at a rate equal to the average daily rate of interest in effect during such immediately preceding Quarter; and |
| | • | | interest on a Capitalized Lease Obligation shall be deemed to accrue at an interest rate reasonably determined in good faith by the chief financial officer, treasurer or controller of such Person to be the rate of interest implicit in such Capitalized Lease Obligation in accordance with GAAP (including Statement of Financial Accounting Standards No. 13 of the Financial Accounting Standards Board). |
“GAAP” means generally accepted accounting principles set forth in the opinions and pronouncements of the Accounting Principles Board of the American Institute of Certified Public Accountants and statements and pronouncements of the Financial Accounting Standards Board or in such other statements by such other entities as have been approved by a significant segment of the accounting profession, as in effect on the Issue Date.
“Guaranty” means a guaranty (other than by endorsement of negotiable instruments for collection in the ordinary course of business), direct or indirect, in any manner (including, without limitation, letters of credit and reimbursement agreements in respect thereof), of all or any part of any Indebtedness.
“lndebtedness” with respect to any Person, means any indebtedness, including, in our case, the indebtedness evidenced by the notes, whether or not contingent, in respect of borrowed money or evidenced by bonds, notes, debentures or similar instruments or letters of credit (or reimbursement agreements in respect thereof) or
130
representing the balance deferred and unpaid of the purchase price of any property (including pursuant to Capital Leases) (except any such balance that constitutes a trade payable in the ordinary course of business that is not overdue by more than 90 days from the invoice date or is being contested in good faith), if and to the extent any of the foregoing indebtedness would appear as a liability upon a balance sheet of such Person prepared on a consolidated basis in accordance with GAAP, and shall also include, to the extent not otherwise included, the Guaranty of Indebtedness of other Persons not included in our financial statements, the maximum fixed redemption or repurchase price of Disqualified Capital Stock (or if not redeemable or subject to repurchase, the issue price) and the maximum fixed redemption or repurchase price (or if not redeemable or subject to repurchase, the issue price) of Preferred Stock issued by any of our Restricted Subsidiaries to any Person other than to us or a Restricted Subsidiary.
“Interest Expense” of any Person means, for any period, the aggregate amount of interest expense in respect of Indebtedness (excluding the amortization of debt issuance expense relating to the notes issued from time to time under the Indenture, the 8 3/8% Notes, the 8 7/8% Senior Subordinated Notes, the 8 5/8% Notes, and the Port Arthur Notes, but including without limitation or duplication:
| | • | | amortization of debt issuance expense with respect to other Indebtedness; |
| | • | | amortization of original issue discount on any Indebtedness; and |
| | • | | the interest portion of any deferred payment obligation, all commissions, discounts and other fees and charges owed with respect to letters of credit and bankers’ acceptance financings and the net cost associated with Interest Swap Obligations) |
paid, accrued or scheduled to be paid or accrued by such Person during such period, determined in accordance with GAAP.
“Interest Swap Obligations” means, when used with reference to any Person, the obligations of such person under
| | • | | interest rate swap agreements, interest rate exchange agreements, interest rate cap agreements, and interest rate collar agreements; |
| | • | | commodity swap agreements and commodity exchange agreements; |
| | • | | currency swap agreements and currency exchange agreements; and |
| | • | | other similar agreements or arrangements, which are, in each such case, designed solely to protect such Person against fluctuations in interest rates, currency or commodity exchange rates. |
“Investment” means, when used with reference to any Person, any direct or indirect advances, loans or other extensions of credit or capital contributions by such Person to (by means of transfers of property to others or payments for property or services for the account or use of others, or otherwise), or purchases or acquisitions by such Person of Capital Stock, bonds, notes, debentures or other securities issued by, any other Person or any Guaranty or assumption of any liability (contingent or otherwise) by such Person of any Indebtedness or Obligations of any other Person and all other items that are or would be classified as investments on a balance sheet prepared in accordance with GAAP.
“Investment Grade Rating” means:
| | • | | a Moody’s Rating of Baa3 or higher and an S&P Rating of at least BB+ or |
| | • | | a Moody’s Rating of Ba1 or higher and an S&P Rating of at least BBB- or, in each case, if either Moody’s or S&P shall change its rating system, equivalent ratings. |
“Investment Grade Rating Event” means the first day on which the notes are assigned an Investment Grade Rating.
131
“Issue Date” means, with respect to any series, the first date on which the notes of such series are initially issued.
“Lien” means, with respect to any asset, any mortgage, lien, pledge, charge, security interest or encumbrance of any kind (except for taxes not yet owing) in respect of such asset, whether or not filed, retention agreement, any lease in the nature thereof, any option or other agreement to sell and, with respect to which, any filing of or agreement to give any financing statement under the Uniform Commercial Code (or equivalent statutes) of any jurisdiction.
“Material Asset” means, with respect to us or any of our Restricted Subsidiaries, any asset, related group of assets, business or division of ours or any of our Restricted Subsidiaries (including any Capital Stock of any Restricted Subsidiary) which:
| | (1) | | for our most recent fiscal year, accounted or would have accounted for more than 3% of our consolidated revenues, or |
| | (2) | | as at the end of such fiscal year, represented or would have represented more than 3% of our consolidated assets or had a fair market value in excess of $10 million, all as shown |
| | • | | with respect to any sale or disposition, on our consolidated financial statements for such fiscal year or such shorter period as such assets, business or division were owned by us or any of our Restricted Subsidiaries and |
| | • | | with respect to any acquisition, on our consolidated pro forma financial statements for the four full Quarters for which financial information in respect thereof is available immediately prior to such acquisition, giving effect thereto on a pro forma basis as if such acquisition had occurred at the beginning of such four full Quarters. |
“Maturity” means, when used with respect to either series of the notes, the date on which the principal of such notes becomes due and payable as provided in the indenture, whether at the stated maturity or by declaration of acceleration, call for redemption or otherwise.
“Moody’s” means Moody’s Investors Service, Inc. and its successors.
“MSCG Arrangements” means the crude oil supply arrangement that may be entered into by Morgan Stanley Capital Group Inc. and Premcor Inc., or one of Premcor Inc.’s Affiliates, in connection with our acquisition of the Memphis refinery and the related supply and distribution assets from The Williams Companies, Inc. and certain of its Subsidiaries.
“Net Available Proceeds” means cash or readily marketable cash equivalents received by any Person (including by way of sale or discounting of a note, installment receivable or other receivable, but excluding any other consideration received in the form of assumption by the acquiree of Indebtedness or other obligations relating to such properties or assets or received in any other non-cash form) net of:
| | • | | all legal and accounting expenses, commissions and other fees and expenses incurred and all federal, state, provincial, foreign and local taxes required to be accrued as a liability as a consequence of such issuance, and |
| | • | | all payments made by such Person or its Subsidiaries on any Indebtedness which must, in order to obtain a necessary consent to such issuance or by applicable law, be repaid out of the proceeds from such issuance. |
“Neches River” means Neches River Holding Corp., a Delaware corporation and our indirect Subsidiary.
“Net Income” of any Person for any period, means the net income (loss) from continuing operations of such Person for such period, determined in accordance with GAAP.
132
“Non-Recourse Debt” means Indebtedness as to which neither we nor any of our Restricted Subsidiaries
| | • | | provides credit support of any kind (including any undertaking, agreement or instrument that would constitute Indebtedness); |
| | • | | is directly or indirectly liable (as a guarantor or otherwise); or |
| | • | | constitutes the lender. |
“Obligations” means any principal (and premium, if any), interest, penalties, fees, indemnifications, reimbursements, damages and other liabilities payable under the documentation governing any Indebtedness.
“Offer” means the offer that is being made to holders of notes as a result of a Change of Control resulting in a Rating Decline or one or more Asset Dispositions (as described further under “—Procedures for Offers”).
“Officers’ Certificate” means a certificate signed by at least two of our officers, one of which must be the Chairman of the board, a Vice-Chairman of the board, the Chief Executive Officer, the President or a Vice-President, and the other of which must be the Treasurer, an Assistant Treasurer, the Secretary or an Assistant Secretary and delivered to the trustee.
“Ohio Water Bonds” means our Ohio Water Development Authority Environmental Facilities Revenue Bonds due 2031.
“Opinion of Counsel” means a written opinion of counsel, who may be counsel for us, and whose opinion is reasonably acceptable to the trustee.
“PACC” means Port Arthur Coker Company L.P., a Delaware limited partnership and our indirect Subsidiary.
“PAFC” means Port Arthur Finance Corp., a Delaware corporation and our indirect Subsidiary.
“Paying Agent” means any Person authorized by us to pay the principal of or any premium or interest on any notes on our behalf. We initially appoint the trustee as Paying Agent.
“Permitted Indebtedness” means Indebtedness incurred by us or our Restricted Subsidiaries:
| | (1) | | to renew, extend, refinance or refund Indebtedness that is permitted to be incurred pursuant to the Consolidated Operating Cash Flow Ratio test set forth in the covenant described under “—Limitation on Indebtedness” and clauses (2) through (4) and (10) below;provided,however, that such Indebtedness does not exceed the principal amount of the Indebtedness so renewed, extended, refinanced or refunded plus the amount of any premium required to be paid in connection with such refinancing pursuant to the terms of the Indebtedness refinanced or the amount of any premium reasonably determined by us or such Restricted Subsidiary as necessary to accomplish such refinancing by means of a tender offer or privately negotiated repurchase, plus our expenses or those of such Restricted Subsidiary incurred in connection with such refinancing; andprovided,however, that Indebtedness the proceeds of which are used to refinance or refund such Indebtedness shall only be permitted if: |
| | • | | in the case of any refinancing or refunding of Indebtedness that ispari passu with the notes, the refinancing or refunding Indebtedness is madepari passu with the notes or subordinated to the notes; |
| | • | | in the case of any refinancing or refunding of Indebtedness that is subordinated to the notes, the refinancing or refunding Indebtedness is made subordinated to the notes at least to the same extent as such Indebtedness being refinanced or refunded was subordinated to the notes; and |
133
| | • | | in the case of the refinancing or refunding of Indebtedness that is subordinated to the notes, the refinancing or refunding Indebtedness by its terms, or by the terms of any agreement or instrument pursuant to which such Indebtedness is issued, (x) does not provide for payments of principal of such Indebtedness at the stated maturity thereof or by way of a sinking fund applicable thereto or by way of any mandatory redemption, defeasance, retirement or repurchase thereof by us or such Restricted Subsidiary (including any redemption, retirement or repurchase which is contingent upon events or circumstances, but excluding any retirement required by virtue of acceleration of such Indebtedness upon an event of default thereunder), in each case prior to the final stated maturity of the Indebtedness being refinanced or refunded and (y) does not permit redemption or other retirement (including pursuant to an offer to purchase made by us or such Restricted Subsidiary) of such Indebtedness at the option of the holder thereof prior to the final stated maturity of the Indebtedness being refinanced or refunded, other than a redemption or other retirement at the option of the holder of such Indebtedness (including pursuant to an offer to purchase made by us or such Restricted Subsidiary), which is conditioned upon the change of control of us or such Restricted Subsidiary; |
| | (2) | | arising from time to time under the Credit Agreement in an aggregate principal amount which, together with the principal component of any obligations under clause (10) below, do not exceed the greater of: |
| | • | | $850 million at any one time outstanding less the aggregate amount of all proceeds of all Asset Dispositions that have been applied since the Issue Date to permanently reduce the outstanding amount of such Indebtedness and |
| | • | | the amount of the Borrowing Base as of such date (calculated on a pro forma basis after giving effect to such borrowing and the application of the proceeds therefrom); |
| | (3) | | outstanding or incurred on the Issue Date; |
| | (4) | | evidenced by trade letters of credit incurred in the ordinary course of business not to exceed $20 million in the aggregate at any time; |
| | (5) | | between or among us and/or our Restricted Subsidiaries; |
| | (6) | | which is Subordinated Indebtedness in an amount not to exceed $200 million; |
| | (7) | | arising out of Sale and Leaseback Transactions or Capitalized Lease Obligations relating to computers and other office equipment and elements, catalysts or other chemicals used in connection with the refining of petroleum or petroleum by-products; |
| | (8) | | arising out of Interest Swap Obligations; |
| | (9) | | in connection with capital projects qualifying under Section 142(a) (or any successor provision) of the Internal Revenue Code of 1986, as amended, in an amount not to exceed $75 million in the aggregate at any time; |
| | (10) | | obligations of us or any Restricted Subsidiary in connection with any Qualified Securitization Transaction in a principal amount which, together with any principal amount under clause (2) above, does not exceed the greater of |
| | • | | $700 million at any one time outstanding less the aggregate amount of all proceeds of all Asset Dispositions that have been applied since the Issue Date to permanently reduce the outstanding amount of such Indebtedness and |
| | • | | the amount of the Borrowing Base as of such date (calculated on a pro forma basis after giving effect to such borrowing and the application of the proceeds therefrom); |
| | (11) | | any guarantee by us of Indebtedness of any of our Restricted Subsidiaries so long as the incurrence of such Indebtedness is permitted to be incurred under the covenant “Limitation on Indebtedness”; |
134
| | (12) | | or preferred stock of Persons that are acquired by us or any of our Restricted Subsidiaries or merged into us or a Restricted Subsidiary in accordance with the terms of the indenture;provided that such Indebtedness or preferred stock is not incurred in contemplation of such acquisition or merger; andprovided further that after giving effect to such acquisition or merger either: |
| | • | | we would be permitted to incur at least $1.00 of additional Indebtedness under the Consolidated Operating Cash Flow Ratio test set forth in the first paragraph of “—Limitation on Indebtedness” or |
| | • | | our Consolidated Operating Cash Flow Ratio is equal to or greater than such ratio immediately prior to such acquisition or merger; |
| | (13) | | in an amount not greater than twice the aggregate amount of cash contributions made to our capital; |
| | (14) | | that may arise out of, or in connection with, the MSCG Arrangements to the extent that such Indebtedness is reflected as a liability on our balance sheet; |
| | (15) | | permitted under Sections 4.01(s) and 4.02(g) of the Common Security Agreement; and |
| | (16) | | in addition to Indebtedness permitted by clauses (1) through (15) above, Indebtedness not to exceed on a consolidated basis for us and our Restricted Subsidiaries at any time $75 million. |
“Permitted Liens” means
| | (1) | | Liens in favor of us; |
| | (2) | | Liens on the property of a Person existing at the time such Person is merged into or consolidated with us,provided that such Liens were in existence prior to the contemplation of such merger or consolidation and do not extend to any assets other than those of the Person merged into or consolidated with us; |
| | (3) | | Liens on property existing at the time of our acquisition thereof,provided that such Liens were in existence prior to the contemplation of such acquisition; |
| | (4) | | Liens to secure the performance of statutory obligations, surety or appeal bonds, performance bonds or other obligations of a like nature incurred in the ordinary course of business; |
| | (5) | | Liens existing on the Issue Date; |
| | (6) | | Liens for taxes, assessments or governmental charges or claims that are not yet delinquent or that are being contested in good faith by appropriate proceedings promptly instituted and diligently concluded,provided that any reserve or other appropriate provision as shall be required in conformity with GAAP shall have been made therefor; |
| | (7) | | Liens imposed by law, such as mechanics’, carriers’, warehousemen’s, material men’s, and vendors’ Liens, incurred in good faith in the ordinary course of business with respect to amounts not yet delinquent or being contested in good faith by appropriate proceedings if a reserve or other appropriate provisions, if any, as shall be required by GAAP shall have been made therefor; |
| | (8) | | zoning restrictions, easements, licenses, covenants, reservations, restrictions on the use of real property or minor irregularities of title incident thereto that do not, in the aggregate, materially detract from the value of our property or assets or impair the use of such property in the operation of our business; |
| | (9) | | judgment Liens to the extent that such judgments do not cause or constitute a Default or an Event of Default; |
135
| | (10) | | Liens to secure the payment of all or a part of the purchase price of property or assets acquired or the construction costs of property or assets constructed in the ordinary course of business on or after the Issue Date,provided that |
| | • | | such property or assets are used in our Principal Business, |
| | • | | at the time of incurrence of any such Lien, the aggregate principal amount of the obligations secured by such Lien shall not exceed the lesser of the cost or fair market value of the assets or property (or portions thereof) so acquired or constructed, |
| | • | | each such Lien shall encumber only the assets or property (or portions thereof) so acquired or constructed and shall attach to such assets or property within 180 days of the purchase or construction thereof and |
| | • | | any Indebtedness secured by such Lien shall have been permitted to be incurred under the covenant entitled “Limitation on Indebtedness”; |
| | (11) | | Liens incurred in the ordinary course of our business with respect to obligations that do not exceed 5% of Consolidated Net Tangible Assets at any one time outstanding; |
| | (12) | | Liens incurred in connection with Interest Swap Obligations; |
| | (13) | | Liens on any Securitization Program Assets in connection with any Qualified Securitization Transaction; |
| | (14) | | Liens of PAFC or PACC that are Permitted Liens within the meaning of the Common Security Agreement; and |
| | (15) | | Liens to secure obligations owing from time to time under the Credit Agreement and Guaranties thereof. |
“Person” means any individual, corporation, partnership, joint venture, association, joint stock company, trust, estate, unincorporated organization or government or any agency or political subdivision thereof.
“Port Arthur Notes” means the 12 1/2% Senior Secured Notes due 2009 of PAFC.
“Preferred Stock” means any share of Capital Stock of any Person in respect of which the holder thereof is entitled to receive payment before any other payment is made with respect to any other Capital Stock of such Person.
“Premcor Inc.” means Premcor Inc., a Delaware corporation and the direct parent of Premcor USA.
“Premcor USA” means Premcor USA Inc., a Delaware corporation and our direct parent.
“Principal Business” means, with respect to us and our Restricted Subsidiaries,
| | (1) | | the business of the acquisition, processing, marketing, refining, storage and/or transportation of hydrocarbons and/or royalty or other interests in crude oil or associated products related thereto; |
| | (2) | | the acquisition, operation, improvement, leasing and other use of convenience stores, retail service stations, truck stops and other public accommodations in connection therewith; |
| | (3) | | any business in which we or our Restricted Subsidiaries engage on the Issue Date; and |
| | (4) | | any activity or business that is a reasonable extension, development or expansion of, or reasonably related to, any of the foregoing. |
“Principal Property” means:
| | • | | any refinery and related pipelines, terminalling and processing equipment or |
| | • | | any other real property or marketing assets or related group of our assets having a fair market value in excess of $20.0 million. |
136
“Qualified Securitization Transaction” means any transaction or series of transactions that we or any Subsidiary may enter into pursuant to which we or any Subsidiary may sell, convey, grant a security interest in or otherwise transfer to a Securitization Special Purpose Entity, and such Securitization Special Purpose Entity may sell, convey, grant a security interest in, or otherwise transfer to any other Person, any Securitization Program Assets (whether now existing or arising in the future).
“Quarter” means one of our fiscal quarterly periods.
“Rating Agencies” means:
| | • | | if S&P or Moody’s or both of them are not making ratings of the notes publicly available, a nationally recognized U.S. rating agency or agencies, as the case may be, selected by us, which will be substituted for S&P or Moody’s or both, as the case may be. |
“Rating Decline” means that at any time within 90 days (which period shall be extended so long as the rating of the notes of such series is under publicly announced consideration for possible down grade by any Rating Agency) after the date of public notice of a Change of Control, or of our intention or that of any Person to effect a Change of Control, the rating of the notes is decreased by both Rating Agencies by one or more categories and the ratings on such notes following such downgrade are below Investment Grade.
“Receivables” means all of our rights and the rights of any of our Subsidiaries to payments (whether constituting accounts, chattel paper, instruments, general intangibles or otherwise, and including the right to payment of any interest or finance charges), which rights are identified in our accounting records or those of such Subsidiary as accounts receivable.
“Redemption Date,” when used with respect to any note to be redeemed, means the date fixed for such redemption by or pursuant to the indenture.
“Redemption Price,” when used with respect to any note to be redeemed, means the price at which it is to be redeemed pursuant to the indenture.
“Restricted Debt Prepayment” means any purchase, redemption, defeasance (including, but not limited to, covenant or legal defeasance) or other acquisition or retirement for value (collectively a “prepayment”) (other than in connection with a concurrent issuance ofpari passu or Subordinated Indebtedness) directly or indirectly, by us or a Restricted Subsidiary, prior to the scheduled maturity on or prior to any scheduled repayment of principal (and premium, if any) or sinking fund payment, in respect of our Indebtedness (other than the securities of any series issued under the indenture) which is subordinate in right of payment to the securities of any series issued under the indenture.
“Restricted Investment” means any direct or indirect Investment by us or any of our Restricted Subsidiaries in:
| | (1) | | any Affiliate of ours which is not a Restricted Subsidiary of ours; and |
| | (2) | | any Unrestricted Subsidiary of ours, |
other than direct or indirect investments in any pipeline company in which we or any of our Restricted Subsidiaries now own or hereafter acquire any interest;provided that the aggregate amount of Investments we or any of our Restricted Subsidiaries make in any such pipeline company shall not exceed $25 million in the aggregate at any one time outstanding;provided further, that any Investment in a Securitization Special Purpose Entity in connection with a Qualified Securitization Transaction shall not be a Restricted Investment.
“Restricted Payment” means:
| | (2) | | any Restricted Investment; or |
137
| | (3) | | any Restricted Debt Prepayment. |
Notwithstanding the foregoing, Restricted Payments shall not include
| | • | | payments by us to any Restricted Subsidiary of ours, and |
| | • | | payments by any Restricted Subsidiary of ours to us or any other Restricted Subsidiary of ours. |
“Restricted Subsidiary” of a Person, means any Subsidiary of the referent Person that is not:
| | • | | an Unrestricted Subsidiary; or |
| | • | | a direct or indirect Subsidiary of an Unrestricted Subsidiary. |
“S&P” means Standard & Poor’s Rating Services and its successors.
“Sabine River” means Sabine River Holding Corp., a Delaware corporation and our direct Subsidiary.
“Sabine River LLC” means Sabine River LLC, a Delaware limited liability company.
“Sale and Leaseback Transaction” of any Person, means an arrangement with any lender or investor or to which such lender or investor is a party providing for the leasing by such Person of any property or asset of such Person which has been or is being sold or transferred by such Person more than 365 days after the acquisition thereof or the completion of construction or commencement of operation thereof to such lender or investor or to any Person to whom funds have been or are to be advanced by such lender or investor on the security of such property or asset. The stated maturity of such arrangement shall be the date of the last payment of rent or any other amount due under such arrangement prior to the first date on which such arrangement may be terminated by the lessee without payment of a penalty.
“Securitization Program Assets” means:
| | • | | all Receivables and inventory which are described as being transferred by us or any Subsidiary of ours pursuant to documents relating to any Qualified Securitization Transaction; |
| | • | | all Securitization Related Assets; and |
| | • | | all collections (including recoveries) and other proceeds of the assets described in the foregoing clauses. |
“Securitization Related Assets” means:
| | (1) | | any rights arising under the documentation governing or relating to Receivables (including rights in respect of Liens securing such Receivables and other credit support in respect of such Receivables) or to inventory; |
| | (2) | | any proceeds of such Receivables or inventory and any lockboxes or accounts in which such proceeds are deposited; |
| | (3) | | spread accounts and other similar accounts (and any amounts on deposit therein) established in connection with a Qualified Securitization Transaction; |
| | (4) | | any warranty, indemnity, dilution and other intercompany claim arising out of the documents relating to such Qualified Securitization Transaction; and |
| | (5) | | other assets which are customarily transferred or in respect of which security interests are customarily granted in connection with asset securitization transactions involving accounts receivable or inventory. |
“Securitization Special Purpose Entity” means a Person (including, without limitation, a Subsidiary of ours) created in connection with the transactions contemplated by a Qualified Securitization Transaction, which Person engages in no activities other than those incidental to such Qualified Securitization Transaction.
“Significant Subsidiary” means any Restricted Subsidiary that would be a “significant subsidiary” as defined in Article 1, Rule 1-02 of Regulation S-X, promulgated pursuant to the Securities Act, as such Regulation is in effect on the date of the indenture.
“Stock Payment” means, with respect to us, any dividend, either in cash or in property (except dividends payable in our Capital Stock which is not convertible into Indebtedness), on, or the making by us of any other
138
distribution in respect of, our Capital Stock, now or hereafter outstanding, or the redemption, repurchase, retirement, defeasance or any acquisition for value by us, directly or indirectly, of our Capital Stock or any warrants, rights or options to purchase or acquire shares of any class of our Capital Stock, now or hereafter outstanding (other than in exchange for our Capital Stock (other than Disqualified Capital Stock) or options, warrants or other rights to purchase our Capital Stock (other than Disqualified Capital Stock)).
“Subordinated Indebtedness” means, with respect to the notes, any of our Indebtedness which is subordinated in right of payment to the notes and with respect to which no payments of principal (by way of sinking fund, mandatory redemption, maturity or otherwise) including, without limitation, at the option of the holder thereof (other than pursuant to an offer to repurchase such Subordinated Indebtedness following a change of control, which offer may not be completed until 45 days after completion of the Offer described under “—Change of Control”) are required to be made by us at any time prior to the stated maturity of the notes.
“Subsidiary” of any Person means:
| | • | | a corporation more than 50% of the total voting power of all classes of the outstanding voting stock of which is owned, directly or indirectly, by such Person or by one or more other Subsidiaries of such Person or by such Person and one or more Subsidiaries thereof or |
| | • | | any other Person (other than a corporation) in which such Person, or one or more other Subsidiaries of such Person or such Person and one or more other Subsidiaries thereof, directly or indirectly, has at least a majority ownership and the power to direct the policies, management and affairs thereof. |
“Surviving Person” means, with respect to any Person involved in or that makes any Disposition, the Person formed by or surviving such Disposition or the Person to which such Disposition is made.
“Transaction Date” means the date on which the Indebtedness giving rise to the need to calculate the Consolidated Operating Cash Flow Ratio was incurred or the date on which, pursuant to the terms of this indenture, the transaction giving rise to the need to calculate the Consolidated Operating Cash Flow Ratio occurred.
“Trust Indenture Act” means the Trust Indenture Act of 1939 as in force at the Issue Date;provided, however, that in the event the Trust Indenture Act of 1939 is amended after such date, “Trust Indenture Act” means, to the extent required by any such amendment, the Trust Indenture Act of 1939 as so amended.
“Unrestricted Subsidiary” means any Subsidiary that is designated by our board of directors of as an Unrestricted Subsidiary pursuant to a Board Resolution; but only to the extent that such Subsidiary:
| | (1) | | has no Indebtedness other than Non-Recourse Debt; and |
| | (2) | | is a Person with respect to which neither we nor any of our Restricted Subsidiaries has any direct or indirect obligation: |
| | • | | to subscribe for additional Capital Stock (including options, warrants or other rights to acquire Capital Stock), or |
| | • | | to maintain or preserve such Person’s financial condition or to cause such Person to achieve any specified levels of operating results. |
Our board of directors may at any time designate any Unrestricted Subsidiary to be a Restricted Subsidiary;provided that such designation shall be deemed to be an incurrence of Indebtedness by a Restricted Subsidiary of ours of any outstanding Indebtedness of such Unrestricted Subsidiary and such designation shall only be permitted if (i) such Indebtedness is permitted under “—Certain Covenants—Limitation on Indebtedness,” and (ii) no Default or Event of Default would be in existence following such designation.
Registration Rights Agreement
You can find the definitions of certain terms used in this description and not defined herein under “Description of Notes—Certain Definitions.”
139
We entered into a registration rights agreement pursuant to which we agreed, for the benefit of the holders of the notes:
| | (1) | | to use our reasonable best efforts to file with the SEC, within 90 days following June 10, 2003, a registration statement under the Securities Act with respect to a registered offer pursuant to which exchange notes would be offered in exchange for the outstanding notes tendered at the option of the holders thereof; and |
| | (2) | | to use our reasonable best efforts to cause the registration statement to become effective as soon as practicable thereafter. |
We have further agreed to commence the exchange offer promptly after the registration statement has become effective, hold the offer open for at least 20 business days, and exchange the exchange notes for all notes validly tendered and not withdrawn before the expiration of the exchange offer.
For each note tendered pursuant to the exchange offer, we will issue to the holder of such note an exchange note having a principal amount equal to that of the surrendered note. Interest on each exchange note will accrue from the last interest payment date on which interest was paid on the note surrendered in exchange therefor, or, if no interest has been paid on such note, from the date of its original issue.
In the event that any of the following occurs:
| | (1) | | We have (a) not filed a registration statement within 90 days following June 10, 2003, and (b) not filed a resale registration statement within 45 days following the date the obligation to file such resale registration statement arose; or |
| | (2) | | the registration statement has not become effective or been declared effective by the SEC within 180 days of June 10, 2003; or |
| | (3) | | a resale registration statement has not become effective within 105 days of the date on which the obligation to file the resale registration statement arose; or |
| | (4) | | the exchange offer has not been completed within 30 business days after the effectiveness deadline of the exchange offer (if the exchange offer is then required to be made); or |
| | (5) | | any registration statement or resale registration statement is filed and declared effective but thereafter ceases to be effective without being succeeded within 30 days by an additional registration statement filed and declared effective, |
then the per annum interest rate on the notes will increase by 0.25% for the period from the occurrence of any of the above events until such time as such event is no longer in effect (at which time the interest rate will be reduced to its initial rate). If we have not consummated the exchange offer within 270 days following June 10, 2003 (or, if applicable, the resale registration statement has not become effective by the 150th day after the obligation to file it arose), then the per annum interest rate on the notes will increase by an additional 0.25%, to 0.50% for so long as we have not consummated the exchange offer (or until a resale registration statement becomes effective).
The summary herein of certain provisions of the registration rights agreement does not purport to be complete and is subject to, and is qualified in its entirety by reference to, all the provisions of the registration rights agreement, a copy of which is filed as an exhibit to the registration statement to which this prospectus is a part.
140
THE EXCHANGE OFFER
Purpose and Effect of the Exchange Offer
We have entered into a registration rights agreement with the indenture trustee in which we agreed to file a registration statement relating to an offer to exchange the outstanding notes for exchange notes. We agreed to pay additional interest on the outstanding notes if, among other situations, the registration statement does not become effective within 180 days following the issuance of the outstanding notes or the exchange offer is not consummated within 270 days following the issuance of the outstanding notes. The exchange notes will have terms substantially identical to the outstanding notes; except that the exchange notes will not contain terms with respect to transfer restrictions, registration rights and additional interest for failure to observe specified obligations in the registration rights agreement. The outstanding notes were issued on June 10, 2003.
Under the circumstances set forth below, we will use our reasonable best efforts to cause the SEC to declare effective a shelf registration statement with respect to the resale of the outstanding notes and keep the shelf registration statement continuously effective. These circumstances include:
| | • | | if, on or before the date of the consummation of the exchange offer, the existing interpretations of the SEC staff discussed below under “—Resale of Exchange Notes,” are changed such that the exchange notes are not freely tradeable as contemplated below; or |
| | • | | if the exchange offer is not consummated within 225 days following the issuance of the outstanding notes. |
If we fail to comply with specified obligations under the registration rights agreement, we will be required to pay additional interest to holders of the outstanding notes. Please read the section captioned “Description of Notes—Registration Rights Agreement” for more details regarding the registration rights agreement and the circumstances under which we will be required to pay additional interest.
Each holder of outstanding notes that wishes to exchange such outstanding notes for transferable exchange notes in the exchange offer will be required to make the following representations:
| | • | | any exchange notes will be acquired in the ordinary course of its business; |
| | • | | such holder has no arrangement with any person to participate in the distribution of the exchange notes; and |
| | • | | such holder is not our “affiliate,” as defined in Rule 405 of the Securities Act, or if it is our affiliate, that it will comply with applicable registration and prospectus delivery requirements of the Securities Act. |
Resale of Exchange Notes
Based on interpretations of the SEC staff set forth in no action letters issued to unrelated third parties, we believe that exchange notes issued under the exchange offer in exchange for outstanding notes may be offered for resale, resold and otherwise transferred by any exchange note holder without compliance with the registration and prospectus delivery provisions of the Securities Act, if:
| | • | | such holder is not an “affiliate” of ours within the meaning of Rule 405 under the Securities Act; |
| | • | | such exchange notes are acquired in the ordinary course of the holder’s business; and |
| | • | | the holder does not intend to participate in the distribution of such exchange notes. |
Any holder who tenders in the exchange offer with the intention of participating in any manner in a distribution of the exchange notes;
| | • | | cannot rely on the position of the staff of the SEC enunciated in “Exxon Capital Holdings Corporation” or similar interpretive letters; and |
| | • | | must comply with the registration and prospectus delivery requirements of the Securities Act in connection with a secondary resale transaction. |
141
This prospectus may be used for an offer to resell, resale or other retransfer of exchange notes only as specifically set forth in this prospectus. With regard to broker-dealers, only broker-dealers that acquired the outstanding notes as a result of market-making activities or other trading activities may participate in the exchange offer. Each broker-dealer that receives exchange notes for its own account in exchange for outstanding notes, where such outstanding notes were acquired by such broker-dealer as a result of market-making activities or other trading activities, must acknowledge that it will deliver a prospectus in connection with any resale of the exchange notes. Please read the section captioned “Plan of Distribution” for more details regarding the transfer of exchange notes.
Terms of the Exchange Offer
Upon the terms and subject to the conditions set forth in this prospectus and in the letter of transmittal, we will accept for exchange any outstanding notes properly tendered and not withdrawn prior to the expiration date. We will issue $1,000 principal amount of exchange notes in exchange for each $1,000 principal amount of outstanding notes surrendered under the exchange offer. Outstanding notes may be tendered only in integral multiples of $1,000.
The form and terms of the exchange notes will be substantially identical to the form and terms of the outstanding notes except the exchange notes will be registered under the Securities Act, will not bear legends restricting their transfer and will not provide for any additional interest upon our failure to fulfill our obligations under the registration rights agreement to file, and cause to be effective, a registration statement. The exchange notes will evidence the same debt as the outstanding notes. The exchange notes will be issued under and entitled to the benefits of the same indenture that authorized the issuance of the outstanding notes. Consequently, both series will be treated as a single class of debt securities under that indenture. For a description of the indenture, see “Description of Notes” above.
The exchange offer is not conditioned upon any minimum aggregate principal amount of outstanding notes being tendered for exchange.
As of the date of this prospectus, $300 million aggregate principal amount of the outstanding notes are outstanding. This prospectus and the letter of transmittal are being sent to all registered holders of outstanding notes. There will be no fixed record date for determining registered holders of outstanding notes entitled to participate in the exchange offer.
We intend to conduct the exchange offer in accordance with the provisions of the registration rights agreement, the applicable requirements of the Securities Act and the Securities Exchange Act of 1934 and the rules and regulations of the SEC. Outstanding notes that are not tendered for exchange in the exchange offer will remain outstanding and continue to accrue interest and will be entitled to the rights and benefits such holders have under the indenture relating to the outstanding notes and the registration rights agreement.
We will be deemed to have accepted for exchange properly tendered outstanding notes when we have given oral or written notice of the acceptance to the exchange agent. The exchange agent will act as agent for the tendering holders for the purposes of receiving, and delivering to the tendering holders, the exchange notes. Subject to the terms of the registration rights agreement, we expressly reserve the right to amend or terminate the exchange offer, and not to accept for exchange any outstanding notes not previously accepted for exchange, upon the occurrence of any of the conditions specified below under the caption “—Certain Conditions to the Exchange Offer.”
Holders who tender outstanding notes in the exchange offer will not be required to pay brokerage commissions or fees or, subject to the instructions in the letter of transmittal, transfer taxes with respect to the exchange of outstanding notes. We will pay all charges and expenses, other than the applicable taxes described below under “—Fees and Expenses”, in connection with the exchange offer. It is important that you read the section labeled “—Fees and Expenses” below for more details regarding fees and expenses incurred in the exchange offer.
142
Expiration Date; Extensions; Amendments
The exchange offer will expire at 5:00 p.m., New York City time on August 28, 2003, unless in our sole discretion, we extend it.
In order to extend the exchange offer, we will notify the exchange agent orally or in writing of any extension. We will notify the registered holders of outstanding notes of the extension no later than 9:00 a.m., New York City time, on the business day after the previously scheduled expiration date.
We reserve the right, in our sole discretion:
| | • | | to delay accepting for exchange any outstanding notes; |
| | • | | to extend the exchange offer or to terminate the exchange offer and to refuse to accept outstanding notes not previously accepted if any of the conditions set forth below under “—Conditions to the Exchange Offer” have not been satisfied, by giving oral or written notice of such delay, extension or termination to the exchange agent; or |
| | • | | subject to the terms of the registration rights agreement, to amend the terms of the exchange offer in any manner. |
Any such delay in acceptance, extension, termination or amendment will be followed as promptly as practicable by oral or written notice thereof to the registered holders of outstanding notes. If we amend the exchange offer in a manner that we determine to constitute a material change, we will promptly disclose such amendment in a manner reasonably calculated to inform the holders of outstanding notes of such amendment.
Without limiting the manner in which we may choose to make public announcements of any delay in acceptance, extension, termination or amendment of the exchange offer, we shall have no obligation to publish, advertise, or otherwise communicate any such public announcement, other than by making a timely release to a financial news service.
Conditions to the Exchange Offer
Despite any other term of the exchange offer, we will not be required to accept for exchange, or exchange any exchange notes for, any outstanding notes, and we may terminate the exchange offer as provided in this prospectus before accepting any outstanding notes for exchange if in our reasonable judgment:
| | • | | the exchange notes to be received will not be tradeable by the holder, without restriction under the Securities Act, the Securities Exchange Act of 1934 and without material restrictions under the blue sky or securities laws of substantially all of the states of the United States; |
| | • | | the exchange offer, or the making any exchange by a holder of outstanding notes, would violate applicable law or any applicable interpretation of the staff of the SEC; or |
| | • | | any action or proceeding has been instituted or threatened in any court or by or before any governmental agency with respect to the exchange offer that, in our judgment, would reasonably be expected to impair our ability to proceed with the exchange offer. |
In addition, we will not be obligated to accept for exchange the outstanding notes of any holder that has not made to us:
| | • | | the representations described under “—Purpose and Effect of the Exchange Offer,” “—Procedures for Tendering” and “Plan of Distribution”; and |
| | • | | such other representations as may be reasonably necessary under applicable SEC rules, regulations or interpretations to make available to an appropriate form for registration of the exchange notes under the Securities Act. |
We expressly reserve the right, at any time or at various times, to extend the period of time during which the exchange offer is open. Consequently, we may delay acceptance of any outstanding notes by giving oral or
143
written notice of such extension to the holders. During any such extensions, all outstanding notes previously tendered will remain subject to the exchange offer, and we may accept them for exchange. We will return any outstanding notes that we do not accept for exchange for any reason without expense to the tendering holder as promptly as practicable after the expiration or termination of the exchange offer.
We expressly reserve the right to amend or terminate the exchange offer, and to reject for exchange any outstanding notes not previously accepted for exchange, upon the occurrence of any of the conditions of the exchange offer specified above. We will give oral or written notice of any extension, amendment, non-acceptance or termination to the holders of the outstanding notes as promptly as practicable. In the case of any extension, such notice will be issued no later than 9:00 a.m., New York City time, on the business day after the previously scheduled expiration date.
These conditions are for our sole benefit and we may assert them regardless of the circumstances that may give rise to them or waive them in whole or in part at any or at various times in our sole discretion. If we fail at any time to exercise any of the foregoing rights, this failure will not constitute a waiver of such right. Each such right will be deemed an ongoing right that we may assert at any time or at various times.
In addition, we will not accept for exchange any outstanding notes tendered, and will not issue exchange notes in exchange for any such outstanding notes, if at such time any stop order will be threatened or in effect with respect to the registration statement of which this prospectus constitutes a part or the qualification of the indenture under the Trust Indenture Act of 1939.
Procedures for Tendering
Only a holder of outstanding notes may tender such outstanding notes in the exchange offer. To tender in the exchange offer, a holder must:
| | • | | complete, sign and date the letter of transmittal, or a facsimile of the letter of transmittal; have the signature on the letter of transmittal guaranteed if the letter of transmittal so requires; and mail or deliver such letter of transmittal or facsimile to the exchange agent prior to the expiration date; or |
| | • | | comply with DTC’s Automated Tender Offer Program procedures described below. |
In addition, either:
| | • | | the exchange agent must receive outstanding notes along with the letter of transmittal; or |
| | • | | the exchange agent must receive, prior to the expiration date, a timely confirmation of book-entry transfer of such outstanding notes into the exchange agent’s account at DTC according to the procedure for book-entry transfer described below or a properly transmitted agent’s message; or |
| | • | | the holder must comply with the guaranteed delivery procedures described below. |
To be tendered effectively, the exchange agent must receive any physical delivery of the letter of transmittal and other required documents at the address set forth below under “—Exchange Agent” prior to the expiration date.
The tender by a holder that is not withdrawn prior to the expiration date will constitute an agreement between such holder and us in accordance with the terms and subject to the conditions set forth in this prospectus and in the letter of transmittal.
The method of delivery of outstanding notes, the letter of transmittal and all other required documents to the exchange agent is at the holder’s election and risk. Rather than mail these items, we recommend that holders use an overnight or hand delivery service. In all cases, holders should allow sufficient time to assure delivery to the exchange agent before the expiration date. Holders should not send the letter of transmittal or outstanding notes to us. Holders may request their respective brokers, dealers, commercial banks, trust companies or other nominees to effect the above transactions for them.
144
Any beneficial owner whose outstanding notes are registered in the name of a broker, dealer, commercial bank, trust company or other nominee and who wishes to tender should contact the registered holder promptly and instruct it to tender on the owner’s behalf. If such beneficial owner wishes to tender on its own behalf, it must, prior to completing and executing the letter of transmittal and delivering its outstanding notes, either:
| | • | | make appropriate arrangements to register ownership of the outstanding notes in such owner’s name; or |
| | • | | obtain a properly completed bond power from the registered holder of outstanding notes. |
The transfer of registered ownership may take considerable time and may not be completed prior to the expiration date.
Signatures on a letter of transmittal or a notice of withdrawal described below must be guaranteed by a member firm of a registered national securities exchange or of the National Association of Securities Dealers, Inc., a commercial bank or trust company having an office or correspondent in the United States or another “eligible guarantor institution” within the meaning of Rule 17Ad-15 under the Exchange Act, unless the outstanding notes tendered pursuant thereto are tendered:
| | • | | by a registered holder who has not competed the box entitled “Special Issuance Instructions” or “Special Delivery Instructions” on the letter of transmittal; or |
| | • | | for the account of an eligible guarantor institution. |
If the letter of transmittal is signed by a person other than the registered holder of any outstanding notes listed on the outstanding notes, such outstanding notes must be endorsed or accompanied by a properly completed bond power. The bond power must be signed by the registered holder as the registered holder’s name appears on the outstanding notes and an eligible institution must guarantee the signature on the bond power.
If the letter of transmittal or any outstanding notes or bond powers are signed by trustees, executors, administrators, guardians, attorneys-in-fact, officers of corporations or others acting in a fiduciary or representative capacity, such persons should so indicate when signing. Unless waived by us, they should also submit evidence satisfactory to us of their authority to deliver the letter of transmittal.
The exchange agent and DTC have confirmed that any financial institution that is a participant in DTC’s system may use DTC’s Automated Tender Offer Program to tender. Participants in the program may, instead of physically completing and signing the letter of transmittal and delivering it to the exchange agent, transmit their acceptance of the exchange offer electronically. They may do so by causing DTC to transfer the outstanding notes to the exchange agent in accordance with its procedures for transfer. DTC will then send an agent’s message to the exchange agent. The term “agent’s message” means a message transmitted by DTC, received by the exchange agent and forming part of the book-entry confirmation, to the effect that:
| | • | | DTC has received an express acknowledgment from a participant in its Automated Tender Offer Program that is tendering outstanding notes that are the subject of such book-entry confirmation; |
| | • | | such participant has received and agrees to be bound by the terms of the letter of transmittal, or, in the case of an agent’s message relating to guaranteed delivery, that such participant has received and agrees to be bound by the applicable notice of guaranteed delivery; and |
| | • | | the agreement may be enforced against such participant. |
We will determine in our sole discretion all questions as to the validity, form, eligibility, including time of receipt, acceptance of tendered outstanding notes and withdrawal of tendered outstanding notes. Our determination will be final and binding. We reserve the absolute right to reject any outstanding notes not properly tendered or any outstanding notes our acceptance of which would, in the opinion of our counsel, be unlawful. We also reserve the right to waive any defects, irregularities or conditions of tender as to particular outstanding notes. Our interpretation of the terms and conditions of the exchange offer, including the instructions in the letter of
145
transmittal, will be final and binding on all parties. Unless waived, any defects or irregularities in connection with tenders of outstanding notes must be cured within such time as we shall determine. Although we intend to notify holders of defects or irregularities with respect to tenders of outstanding notes, neither us, the exchange agent nor any other person will incur any liability for failure to give such notification. Tenders of outstanding notes will not be deemed made until such defects or irregularities have been cured or waived. Any outstanding notes received by the exchange agent that are not properly tendered and as to which the defects or irregularities have not been cured or waived will be returned to the exchange agent without cost to the tendering holder, unless otherwise provided in the letter of transmittal, as soon as practicable following the expiration date.
In all cases, we will issue exchange notes for outstanding notes that we have accepted for exchange under the exchange offer only after the exchange agent timely receives:
| | • | | outstanding notes or a timely book-entry confirmation of such outstanding notes into the exchange agent’s account at DTC; and |
| | • | | a properly completed and duly executed letter of transmittal and all other required documents or a properly transmitted agent’s message. |
By signing the letter of transmittal, each tendering holder of outstanding notes will represent to us that, among other things:
| | • | | any exchange notes that the holder receives will be acquired in the ordinary course of its business; |
| | • | | the holder has no arrangement or understanding with any person or entity to participate in the distribution of the exchange notes; |
| | • | | if the holder is not a broker-dealer, that it is not engaged in and does not intend to engage in the distribution of the exchange notes; |
| | • | | if the holder is a broker-dealer that will receive exchange notes for its own account in exchange for outstanding notes that were acquired as a result of market-making activities, that it will deliver a prospectus, as required by law, in connection with any resale of such exchange notes; and |
| | • | | the holder is not an “affiliate,” as defined in Rule 405 of the Securities Act, of ours or, if the holder is an affiliate, it will comply with any applicable registration and prospectus delivery requirements of the Securities Act. |
Book-Entry Transfer
The exchange agent will make a request to establish an account with respect to the outstanding notes at DTC for purposes of the exchange offer promptly after the date of this prospectus; and any financial institution participating in DTC’s system may make book-entry delivery of outstanding notes by causing DTC to transfer such outstanding notes into the exchange agent’s account at DTC in accordance with DTC’s procedures for transfer. Holders of outstanding notes who are unable to deliver confirmation of the book-entry tender of their outstanding notes into the exchange agent’s account at DTC or all other documents required by the letter of transmittal to the exchange agent on or prior to the expiration date must tender their outstanding notes according to the guaranteed delivery procedures described below.
Guaranteed Delivery Procedures
Holders wishing to tender their outstanding notes but whose outstanding notes are not immediately available or who cannot deliver their outstanding notes, the letter of transmittal or any other required documents to the exchange agent or comply with the applicable procedures under DTC’s Automated Tender Offer Program prior to the expiration date may tender if:
| | • | | the tender is made through an eligible institution; |
146
| | • | | prior to the expiration date, the exchange agent receives from such eligible guarantor institution either a properly completed and duly executed notice of guaranteed delivery, by hand, mail or overnight mail or courier, or a properly transmitted agent’s message and notice of guaranteed delivery: |
| | • | | setting forth the name and address of the holder, the registered number(s) of such outstanding notes and the principal amount of outstanding notes tendered; |
| | • | | stating that the tender is being made thereby; and |
| | • | | guaranteeing that, within three (3) New York Stock Exchange trading days after the expiration date, the letter of transmittal, or facsimile of the letter of transmittal, together with the outstanding notes or a book-entry confirmation, and any other documents required by the letter of transmittal will be deposited by the Eligible Institution with the exchange agent; and |
| | • | | the exchange agent receives such properly completed and executed letter of transmittal, or facsimile of the letter of transmittal, as well as all tendered outstanding notes in proper form for transfer or a book-entry confirmation, and all other documents required by the letter of transmittal, within three (3) New York Stock Exchange trading days after the expiration date. |
Upon request to the exchange agent, a notice of guaranteed delivery will be sent to holders who wish to tender their outstanding notes according to the guaranteed delivery procedures set forth above.
Withdrawal of Tenders
Except as otherwise provided in this prospectus, holders of outstanding notes may withdraw their tenders at any time prior to the expiration date.
For a withdrawal to be effective:
| | • | | the exchange agent must receive a written notice, which may be by telegram, telex, facsimile transmission or letter, of withdrawal at one of the addresses set forth below under “—Exchange Agent”; or |
| | • | | holders must comply with the appropriate procedures of DTC’s Automated Tender Offer Program system. |
Any such notice of withdrawal must:
| | • | | specify the name of the person who tendered the outstanding notes to be withdrawn; |
| | • | | identify the outstanding notes to be withdrawn, including the principal amount of such outstanding notes; and |
| | • | | where certificates for outstanding notes have been transmitted, specify the name in which such outstanding notes were registered, if different from that of the withdrawing holder. |
If certificates for outstanding notes have been delivered or otherwise identified to the exchange agent, then, prior to the release of such certificates, the withdrawing holder must also submit:
| | • | | the serial numbers of the particular certificates to be withdrawn; and |
| | • | | a signed notice of withdrawal with signatures guaranteed by an eligible institution unless such holder is an eligible institution. |
If outstanding notes have been tendered pursuant to the procedure for book-entry transfer described above, any notice of withdrawal must specify the name and number of the account at DTC to be credited with the withdrawn outstanding notes and otherwise comply with the procedures of such facility. We will determine all questions as to the validity, form and eligibility, including time of receipt, of such notices, and our determination shall be final and binding on all parties. We will deem any outstanding notes so withdrawn not to have been validity tendered for exchange for purposes of the exchange offer. Any outstanding notes that have been tendered for exchange but that are not exchanged for any reason will be returned to their holder without cost to the holder,
147
or, in the case of outstanding notes tendered by book-entry transfer into the exchange agent’s account at DTC according to the procedures described above, such outstanding notes will be credited to an account maintained with DTC for outstanding notes, as soon as practicable after withdrawal, rejection of tender or termination of the exchange offer. Properly withdrawn outstanding notes may be retendered by following one of the procedures described under “—Procedures for Tendering” above at any time on or prior to the expiration date.
Exchange Agent
Deutsche Bank Trust Company Americas has been appointed as exchange agent for the exchange offer. You should direct questions and requests for assistance, requests for additional copies of this prospectus or of the letter of transmittal and requests for the notice of guaranteed delivery to the exchange agent addressed as follows:
By Hand Delivery:
Deutsche Bank Trust Company Americas
C/O The Depository Trust Clearing Corporation
55 Water Street, 1st floor
Jeanette Park Entrance
New York, NY 10041
By Mail:
DB Services Tennessee, Inc.
Reorganization Unit
P.O. Box 292737
Nashville, TN 37229-2737
By Overnight Mail or Courier:
DB Services Tennessee, Inc.
Corporate Trust & Agency Services
Reorganization Unit
648 Grassmere Park Road
Nashville, TN 37211
Attn: Karl Shepherd
Confirm by Telephone
(615) 835-3572
For Information Call (800) 735-7777
Delivery of the letter of transmittal to an address other than as set forth above does not constitute a valid delivery of such letter of transmittal.
Fees, Expenses and Transfer Taxes
We will bear the expenses of soliciting tenders. The principal solicitation is being made by mail; however, we may make additional solicitation by telegraph, telephone or in person by our officers and regular employees and those of our affiliates.
We have not retained any dealer-manager in connection with the exchange offer and will not make any payments to broker-dealers or others soliciting acceptances of the exchange offer. We will, however, pay the exchange agent reasonable and customary fees for its services and reimburse it for its related reasonable out-of-pocket expenses.
148
We will pay the cash expenses to be incurred in connection with the exchange offer. The expenses are estimated in the aggregate to be approximately $500,000. They include:
| | • | | fees and expenses of the exchange agent and trustee; |
| | • | | accounting and legal fees and printing costs; and |
| | • | | related fees and expenses. |
We will pay all transfer taxes, if any, applicable to the exchange of outstanding notes under the exchange offer. The tendering holder, however, will be required to pay any transfer taxes, whether imposed on the registered holder or any other person, if:
| | • | | certificates representing outstanding notes for principal amounts not tendered or accepted for exchange are to be delivered to, or are to be issued in the name of, any person other than the registered holder of outstanding notes tendered; |
| | • | | tendered outstanding notes are registered in the name of any person other than the person signing the letter of transmittal; or |
| | • | | a transfer tax is imposed for any reason other than the exchange of outstanding notes under the exchange offer. |
If satisfactory evidence of payment of such taxes is not submitted with the letter of transmittal, the amount of such transfer taxes will be billed to that tendering holder.
Consequences of Failure to Exchange
Holders of outstanding notes who do not exchange their outstanding notes for exchange notes under the exchange offer will remain subject to the restrictions on transfer of such outstanding notes:
| | • | | as set forth in the legend printed on the notes as a consequence of the issuance of the outstanding notes pursuant to the exemptions from, or in transactions not subject to, the registration requirements of the Securities Act and applicable state securities laws; and |
| | • | | otherwise set forth in the offering memorandum distributed in connection with the private offering of the outstanding notes. |
In general, you may not offer or sell the outstanding notes unless they are registered under the Securities Act, or if the offer or sale is exempt from registration under the Securities Act and applicable state securities laws. Except as required by the registration rights agreement, we do not intend to register resales of the outstanding notes under the Securities Act. Based on interpretations of the SEC staff, exchange notes issued pursuant to the exchange offer may be offered for resale, resold or otherwise transferred by their holders, other than any such holder that is our “affiliate” within the meaning of Rule 405 under the Securities Act, without compliance with the registration and prospectus delivery provisions of the Securities Act, provided that the holders acquired the exchange notes in the ordinary course of the holders’ business and the holders have no arrangement or understanding with respect to the distribution of the exchange notes to be acquired in the exchange offer. Any holder who tenders in the exchange offer for the purpose of participating in a distribution of the exchange notes:
| | • | | could not rely on the applicable interpretations of the SEC; and |
| | • | | must comply with the registration and prospectus delivery requirements of the Securities Act in connection with a secondary resale transaction. |
Upon completion of the exchange offer, holders of the outstanding notes will not be entitled to any further registration rights under the registration rights agreements, except under limited circumstances.
149
Accounting Treatment
We will record the exchange notes in our accounting records at the same carrying value as the outstanding notes, which is the aggregate principal amount, as reflected in our accounting records on the date of exchange. Accordingly, we will not recognize any gain or loss for accounting purposes in connection with the exchange offer. We will record the expenses of the exchange offer as incurred.
Other
Participation in the exchange offer is voluntary, and you should carefully consider whether to accept. You are urged to consult your financial and tax advisors in making your own decision on what action to take.
We may in the future seek to acquire untendered outstanding notes in open market or privately negotiated transactions, through subsequent exchange offers or otherwise. We have no present plans to acquire any outstanding notes that are not tendered in the exchange offer or to file a registration statement to permit resales of any untendered outstanding notes.
150
U.S. FEDERAL INCOME TAX
CONSEQUENCES OF THE EXCHANGE OFFER
Exchange of Notes
The following summary describes the material U.S. federal income tax consequences of the exchange offer. The exchange of outstanding notes for exchange notes in the exchange offer will not constitute a taxable event to holders. Consequently, no gain or loss will be recognized by a holder upon receipt of an exchange note, the holding period of the exchange note will include the holding period of the outstanding note exchanged therefor and the basis of the exchange note will be the same as the basis of the outstanding note immediately before the exchange.
In any event, persons considering the exchange of outstanding notes for exchange notes should consult their own tax advisors concerning the United States federal income tax consequences in light of their particular situations as well as any consequences arising under the laws of any other taxing jurisdiction.
PLAN OF DISTRIBUTION
Each broker-dealer that receives exchange notes for its own account pursuant to the exchange offer must acknowledge that it will deliver a prospectus in connection with any resale of such exchange notes. This prospectus, as it may be amended or supplemented, may be used by a broker-dealer in connection with resales of exchange notes received in exchange for outstanding notes where such outstanding notes were acquired as a result of market-making activities or other trading activities. We have agreed that we will make this prospectus, as amended or supplemented, available to any broker-dealer for use in connection with any such resale for a period of 90 days from the date on which the exchange offer is consummated, or such shorter period as will terminate when all outstanding notes acquired by broker-dealers for their own accounts as a result of market-making activities or other trading activities have been exchanged for exchange notes and such exchange notes have been resold by such broker-dealers. In addition, dealers effecting transactions in the exchange notes may be required to deliver a prospectus.
We will not receive any proceeds from any sale of exchange notes by broker-dealers. Exchange notes received by broker-dealers for their own account pursuant to the exchange offer may be sold from time to time in one or more transactions in the over-the-counter market, in negotiated transactions, through the writing of options on the exchange notes or a combination of such methods of resale, at market prices prevailing at the time of resale, at prices related to such prevailing market prices or negotiated prices. Any such resale may be made directly to purchasers or to or through brokers or dealers who may receive compensation in the form of commissions or concessions from any such broker-dealer or the purchasers of any exchange notes. Any broker-dealer that resells exchange notes that were received by it for its own account pursuant to the exchange offer and any broker or dealer that participates in a distribution of such exchange notes may be deemed to be an “underwriter” within the meaning of the Securities Act and any profit on any such resale of exchange notes and any commissions or concessions received by any such persons may be deemed to be underwriting compensation under the Securities Act. The letter of transmittal states that by acknowledging that it will deliver and by delivering a prospectus, a broker-dealer will not be deemed to admit that it is an “underwriter” within the meaning of the Securities Act.
For a period of 90 days from the date on which the exchange offer is consummated, or such shorter period as will terminate when all outstanding notes acquired by broker-dealers for their own accounts as a result of market-making activities or other trading activities have been exchanged for exchange notes and such exchange notes have been resold by such broker-dealers, we will promptly send additional copies of this prospectus and any amendment or supplement to this prospectus to any broker-dealer that requests such documents in the letter of transmittal. We have agreed to pay all expenses incident to the exchange offer other than commissions or
151
concessions of any brokers or dealers and the fees of any counsel or other advisors or experts retained by the holders of outstanding notes, except as expressly set forth in the registration rights agreement, and will indemnify the holders of outstanding notes, including any broker-dealers, against specified liabilities, including liabilities under the Securities Act. We note, however, that in the opinion of the SEC, indemnification against liabilities arising under federal securities laws is against public policy and may be unenforceable. In the event of a shelf registration, we have agreed to pay the expenses of one firm of counsel designated by the holders of notes covered by the shelf registration.
If you are an affiliate of ours or are engaged in, or intend to engage in, or have an agreement or understanding to participate in, a distribution of the exchange notes, you cannot rely on the applicable interpretations of the SEC and you must comply with the registration requirements of the Securities Act in connection with any resale transaction.
LEGAL MATTERS
Our counsel, Stroock & Stroock & Lavan LLP, New York, New York, will issue an opinion regarding the validity of the exchange notes.
EXPERTS
The financial statements as of December 31, 2002 and 2001, and for each of the three years in the period ended December 31, 2002, included in this prospectus and the related financial statement schedules included elsewhere in the registration statement have been audited by Deloitte & Touche LLP, independent auditors, as stated in their report (which report expresses an unqualified opinion and includes an explanatory paragraph relating to the Company’s change in its method of accounting for stock based compensation issued to employees and the restatement of the consolidated financial statements to give effect to the contribution of Sabine River Holding Corp. common stock owned by Premcor Inc. (the Company’s Parent company) to the Company, which was accounted for in a manner similar to a pooling of interests as described in Notes 2 and 3 to the consolidated financial statements) appearing herein and elsewhere in the registration statement, and have been so included in reliance upon the report of such firm given upon their authority as experts in accounting and auditing.
With respect to the unaudited interim financial information for the periods ended March 31, 2003 and 2002 included in this prospectus, Deloitte & Touche LLP have applied limited procedures in accordance with professional standards for a review of such information. However, as stated in their report in our Quarterly Report on Form 10-Q for the three months ended March 31, 2003 and included in this prospectus, they did not audit and they do not express an opinion on that interim financial information. Accordingly, the degree of reliance on their report on such information should be restricted in light of the limited nature of the review procedures applied. Deloitte & Touche LLP are not subject to the liability provisions of Section 11 of the Securities Act for their report on the unaudited interim financial information because this report is not a “report” or a “part” of the registration statement prepared or certified by an accountant within the meaning of Sections 7 and 11 of the Securities Act.
152
GLOSSARY OF SELECTED TERMS
The following are definitions of certain terms used in this prospectus.
alkylation | | A polymerization process uniting olefins and isoparaffins; particularly the reacting of butylene and isobutane, with sulfuric acid or hydrofluoric acid as a catalyst, to produce a high-octane, low-sensitivity blending agent for gasoline. |
anode | | A positively charged conductor that influences the flow of current in another conducting medium. |
| |
| barrel | | Common unit of measure in the oil industry which equates to 42 gallons. |
blendstocks | | Various compounds that are combined with gasoline from the crude oil refining process to make finished gasoline and diesel fuel; these may include natural gasoline, FCC unit gasoline, ethanol, reformate or butane, among others. |
bpd | | Abbreviation for barrels per day. |
btu | | British thermal units: a measure of energy. One btu of heat is required to raise the temperature of one pound of water one degree fahrenheit. |
| by-products | | Products that result from extracting high value products such as gasoline and diesel fuel from crude oil; these include black oil, sulfur, propane, petroleum coke and other products. |
catalyst | | A substance that alters, accelerates, or instigates chemical changes, but is neither produced, consumed nor altered in the process. |
coker gross margin | | The value of refined products derived from coker feedstocks less the cost of such coker feedstocks. |
coker unit | | A refinery unit that utilizes the lowest value component of crude oil remaining after all higher value products are removed, further breaks down the component into more valuable products and converts the rest into petroleum coke. |
crack spread | | A simplified model that measures the difference between the price for light products and crude oil. A 3/2/1 crack spread is often referenced and represents the approximate gross margin resulting from processing one barrel of crude oil, being three barrels of crude oil to produce two barrels of gasoline and one barrel of diesel fuel. |
crude unit | | The initial refinery unit to process crude oil by separating the crude oil according to boiling point under high heat and low pressure to recover various hydrocarbon fractions. |
distillates | | Primarily diesel fuel, kerosene and jet fuel. |
feedstocks | | Hydrocarbon compounds, such as crude oil and natural gas liquids, that are processed and blended into refined products. |
fluid catalytic cracking unit | | Converts gas oil from the crude unit or coker unit into liquefied petroleum gas, distillate and gasoline blendstocks by applying heat in the presence of a catalyst. |
fractionator | | A cylindrical vessel designed to distill or separate compounds that have different vapor pressures at any given temperature. Also called stabilizer column, fractionating tower or bubble tower. |
153
heavy crude oil | | A relatively inexpensive crude oil characterized by high relative density and viscosity. Heavy crude oils require greater levels of processing to produce high value products such as gasoline and diesel fuel. |
hydrocracker unit | | A refinery unit that converts low-value intermediates into gasoline, naphtha, kerosene and distillates under very high pressure in the presence of hydrogen and a catalyst. |
independent refiner | | A refiner that does not have crude oil exploration or production operations. An independent refiner purchases the crude oil used as feedstock in its refinery operations from third parties. |
light crude oil | | A relatively expensive crude oil characterized by low relative density and viscosity. Light crude oils require lower levels of processing to produce high value products such as gasoline and diesel fuel. |
liquefied petroleum gas | | Light hydrocarbon material gaseous at atmospheric temperature and pressure, held in the liquid state by pressure to facilitate storage, transport and handling. |
lost time | | see “lost work day.” |
lost time injury | | Any injury that results in one or more lost work days. |
| lost time injury rate | | The number of lost time injuries per 200,000 hours worked. |
lost work day | | The number of workdays (consecutive or not) beyond the day of injury or onset of illness the employee was away from work or limited to restricted work activity because of an occupational injury or illness. |
| | | (1) lost workdays—away from work. The number of workdays (consecutive or not) on which the employee would have worked but could not because of occupational injury or illness. |
| | | (2) lost workdays—restricted work activity. The number of workdays (consecutive or not) on which, because of injury or illness: (i) the employee was assigned to another job on a temporary basis; or (ii) the employee worked at a permanent job less than full time; or (iii) the employee worked at a permanently assigned job but could not perform all duties normally connected with it. |
| | | The number of days away from work or days of restricted work activity does not include the day of injury or onset of illness or any days on which the employee would not have worked even though able to work. |
MTBE | | Methyl Tertiary Butyl Ether, an ether produced from the reaction of isobutylene and methanol specifically for use as a gasoline blendstock. The EPA requires MTBE or other oxygenates to be blended into reformulated gasoline. |
Maya | | A heavy, sour crude oil from Mexico characterized by an API gravity of approximately 21.5 and a sulfur content of approximately 3.6 weight percent. |
merchant refiner | | A refiner that is not vertically integrated to distribute its refinery products through branded retail outlets. |
naphtha | | The major constituent of gasoline fractionated from crude oil during the refining process, which is later processed in the reformer unit to increase octane. |
154
olefin cracker | | A chemical processing plant designed to produce predominantly ethylene and propylene for use in the production of plastics and other chemicals. |
PADD I | | East Coast Petroleum Area for Defense District. |
PADD II | | Midwest Petroleum Area for Defense District. |
PADD III | | Gulf Coast Petroleum Area for Defense District. |
PADD IV | | Rocky Mountains Petroleum Area for Defense District. |
PADD V | | West Coast Petroleum Area for Defense District. |
particulate matter | | Material suspended in the air in the form of minute solid particles or liquid droplets, especially when considered as an atmospheric pollutant. |
petroleum coke | | A coal-like substance that can be burned to generate electricity or used as a hardener in concrete. |
ppm | | Parts per million. |
propylene | | A commodity chemical, derived from petroleum hydrocarbon cracking processes, which is used in the production of plastics and other chemicals. |
pure-play refiner | | A refiner without either crude oil production operations or retail distribution operations (that is, both an independent and a merchant refiner). |
pyrolysis gasoline or pygas | | A high octane blendstock produced as a by-product from an olefin cracker. |
rated crude oil throughput capacity | | The crude oil processing capacity of a refinery that is established by engineering design. |
recordable injury | | An injury, as defined by OSHA. All work-related deaths and illnesses, and those work-related injuries which result in loss of consciousness, restriction of work or motion, transfer to another job, or require medical treatment beyond first aid. |
recordable injury rate | | The number of recordable injuries per 200,000 hours worked. |
refined products | | Hydrocarbon compounds, such as gasoline, diesel fuel, jet fuel and residual fuel, that are produced by a refinery. |
refinery conversion | | The ability of a refinery to produce high-value lighter refined products such as gasoline, diesel fuel and jet fuel from crude oil and other feedstocks. |
reformer unit | | A refinery unit that processes naphtha and converts it to high-octane gasoline by using a platinum/rhenium catalyst. Also known as a platformer. |
reformulated gasoline | | The composition and properties of which meet the requirements of the reformulated gasoline regulations. |
single train | | A refinery processing configuration consisting of only one crude unit and several downstream conversion units with no significant amount of redundancy in such units. |
sour crude oil | | A crude oil that is relatively high in sulfur content, requiring additional processing to remove the sulfur. Sour crude oil is typically less expensive than sweet crude oil. |
| spot market | | A market in which commodities are bought and sold for cash and delivered immediately. |
155
sweet crude oil | | A crude oil that is relatively low in sulfur content, requiring less processing to remove the sulfur. Sweet crude oil is typically more expensive than sour crude oil. |
throughput | | The volume per day processed through a unit or a refinery. |
turnaround | | A periodically required standard procedure to refurbish and maintain a refinery that involves the shutdown and inspection of major processing units and occurs every three to four years. |
unbranded | | A term used in connection with fuel or the sale of fuel into the spot or wholesale markets, rather than fuel or the sale of fuel directly to retail outlets. |
utilization | | Ratio of total refinery throughput to the rated capacity of the refinery. |
WTI | | West Texas Intermediate crude oil, a light, sweet crude oil, characterized by an API gravity between 38 and 40 and a sulfur content of approximately 0.3 weight percent that is used as a benchmark for other crude oils. |
yield | | The percentage of refined products that are produced from feedstocks. |
156
THE PREMCOR REFINING GROUP INC. AND SUBSIDIARIES
INDEX TO FINANCIAL STATEMENTS
| | | Page
|
Annual Financial Statements: | | |
Independent Auditors’ Report | | F-2 |
Consolidated Balance Sheets as of December 31, 2001 and 2002 | | F-3 |
Consolidated Statements of Operations for the Years Ended December 31, 2000, 2001 and 2002 | | F-4 |
Consolidated Statements of Cash Flows for the Years Ended December 31, 2000, 2001 and 2002 | | F-5 |
Consolidated Statements of Stockholder’s Equity for the Years Ended December 31, 2000, 2001 and 2002 | | F-6 |
Notes to Consolidated Financial Statements | | F-7 |
Financial Statement Schedule | | |
Schedule II—Valuation and Qualifying Accounts | | F-45 |
Interim Financial Statements: | | |
Independent Accountants’ Report | | F-46 |
Condensed Consolidated Balance Sheets as of December 31, 2002 and March 31, 2003 | | F-47 |
Condensed Consolidated Statements of Operations for the Three Months Ended March 31, 2002 and 2003 | | F-48 |
Condensed Consolidated Statements of Cash Flows for the Three Months Ended March 31, 2002 and 2003 | | F-49 |
Notes to Condensed Consolidated Financial Statements | | F-50 |
F-1
INDEPENDENT AUDITORS’ REPORT
To the Board of Directors of The Premcor Refining Group Inc.:
We have audited the accompanying consolidated balance sheets of The Premcor Refining Group Inc. and subsidiaries (the “Company”) as of December 31, 2002 and 2001 and the related consolidated statements of operations, stockholder’s equity, and cash flows for each of the three years in the period ended December 31, 2002. Our audits also included the financial statement schedule listed in the Index at Item 21. These financial statements and financial statement schedule are the responsibility of the Company’s management. Our responsibility is to express an opinion on these financial statements and financial statement schedule based on our audits.
We conducted our audits in accordance with auditing standards generally accepted in the United States of America. Those standards require that we plan and perform the audit to obtain reasonable assurance about whether the financial statements are free of material misstatement. An audit includes examining, on a test basis, evidence supporting the amounts and disclosures in the financial statements. An audit also includes assessing the accounting principles used and significant estimates made by management, as well as evaluating the overall financial statement presentation. We believe that our audits provide a reasonable basis for our opinion.
In our opinion, such consolidated financial statements present fairly, in all material respects, the financial position of the Company at December 31, 2002 and 2001, and the results of its operations and its cash flows for each of the three years in the period ended December 31, 2002, in conformity with accounting principles generally accepted in the United States of America. Also, in our opinion, such financial statement schedule, when considered in relation to the basic consolidated financial statements taken as a whole, present fairly in all material respects the information set forth therein.
As discussed in Note 2 to the consolidated financial statements, the Company changed its method of accounting for stock based compensation issued to employees. Additionally, the consolidated financial statements have been restated to give retroactive effect to the contribution of Sabine River Holding Corp. common stock owned by Premcor Inc. to The Premcor Refining Group Inc. (the “Sabine Restructuring”), which has been accounted for in a manner similar to a pooling of interests as described in Notes 2 and 3 to the consolidated financial statements.
DELOITTE & TOUCHE LLP
St. Louis, Missouri
February 14, 2003 (March 6, 2003 as to Note 20)
F-2
THE PREMCOR REFINING GROUP INC. AND SUBSIDIARIES
CONSOLIDATED BALANCE SHEETS
(in millions, except share data)
| | | December 31,
|
| | | 2001
| | 2002
|
| | | (as restated, see Note 2) | | |
ASSETS | | | | | | |
| | |
CURRENT ASSETS: | | | | | | |
Cash and cash equivalents | | $ | 482.5 | | $ | 119.7 |
Short-term investments | | | 1.7 | | | 1.7 |
Cash and cash equivalents restricted for debt service | | | 30.8 | | | 61.7 |
Accounts receivable, net of allowance of $1.3 and $3.2 | | | 148.3 | | | 269.0 |
Receivables from affiliates | | | 12.1 | | | 13.1 |
Inventories | | | 318.3 | | | 287.3 |
Prepaid expenses | | | 42.7 | | | 45.7 |
Assets held for sale | | | — | | | 49.3 |
| | |
|
| |
|
|
Total current assets | | | 1,036.4 | | | 847.5 |
PROPERTY, PLANT AND EQUIPMENT, NET | | | 1,298.7 | | | 1,261.7 |
DEFERRED INCOME TAXES | | | — | | | 19.8 |
OTHER ASSETS | | | 142.8 | | | 117.3 |
| | |
|
| |
|
|
| | | $ | 2,477.9 | | $ | 2,246.3 |
| | |
|
| |
|
|
| | |
LIABILITIES AND STOCKHOLDER’S EQUITY | | | | | | |
| | |
CURRENT LIABILITIES: | | | | | | |
Accounts payable | | $ | 366.4 | | $ | 466.2 |
Payable to affiliates | | | 30.6 | | | 41.0 |
Accrued expenses and other | | | 93.1 | | | 55.7 |
Accrued taxes other than income | | | 35.7 | | | 26.4 |
Current portion of long-term debt | | | 81.4 | | | 15.0 |
| | |
|
| |
|
|
Total current liabilities | | | 607.2 | | | 604.3 |
LONG-TERM DEBT | | | 1,247.0 | | | 869.8 |
DEFERRED INCOME TAXES | | | 46.6 | | | — |
OTHER LONG-TERM LIABILITIES | | | 109.1 | | | 144.4 |
COMMITMENTS AND CONTINGENCIES | | | — | | | — |
| | |
MINORITY INTEREST | | | 24.2 | | | — |
| | |
COMMON STOCKHOLDER’S EQUITY: | | | | | | |
Common, $0.01 par value per share, 100 authorized, issued and outstanding | | | — | | | — |
Paid-in capital | | | 243.0 | | | 541.4 |
Retained earnings | | | 200.8 | | | 86.4 |
| | |
|
| |
|
|
Total common stockholder’s equity | | | 443.8 | | | 627.8 |
| | |
|
| |
|
|
| | | $ | 2,477.9 | | $ | 2,246.3 |
| | |
|
| |
|
|
The accompanying notes are an integral part of these statements.
F-3
THE PREMCOR REFINING GROUP INC. AND SUBSIDIARIES
CONSOLIDATED STATEMENTS OF OPERATIONS
(in millions)
| | | For the Year Ended December 31,
| |
| | | 2000
| | | 2001
| | | 2002
| |
| | | (as restated, see Note 2)
| | | | |
| | | |
NET SALES AND OPERATING REVENUES | | $ | 7,301.7 | | | $ | 6,417.5 | | | $ | 6,772.6 | |
| | | |
EXPENSES: | | | | | | | | | | | | |
Cost of sales | | | 6,564.1 | | | | 5,253.2 | | | | 6,106.0 | |
Operating expenses | | | 466.7 | | | | 466.9 | | | | 431.5 | |
General and administrative expenses | | | 52.7 | | | | 63.1 | | | | 51.5 | |
Stock-based compensation | | | — | | | | — | | | | 14.0 | |
Depreciation | | | 37.0 | | | | 53.2 | | | | 48.8 | |
Amortization | | | 34.7 | | | | 38.7 | | | | 40.1 | |
Refinery restructuring and other charges | | | — | | | | 176.2 | | | | 168.7 | |
| | |
|
|
| |
|
|
| |
|
|
|
| | | | 7,155.2 | | | | 6,051.3 | | | | 6,860.6 | |
| | |
|
|
| |
|
|
| |
|
|
|
OPERATING INCOME (LOSS) | | | 146.5 | | | | 366.2 | | | | (88.0 | ) |
Interest and finance expense | | | (79.9 | ) | | | (139.9 | ) | | | (98.8 | ) |
Gain (loss) on extinguishment of long-term debt | | | — | | | | 0.8 | | | | (9.3 | ) |
Interest income | | | 15.6 | | | | 17.6 | | | | 6.7 | |
| | |
|
|
| |
|
|
| |
|
|
|
INCOME (LOSS) FROM CONTINUING OPERATIONS BEFORE INCOME TAXES AND MINORITY INTEREST | | | 82.2 | | | | 244.7 | | | | (189.4 | ) |
Income tax (provision) benefit | | | 2.2 | | | | (73.0 | ) | | | 73.3 | |
Minority interest in subsidiary | | | (0.6 | ) | | | (12.8 | ) | | | 1.7 | |
| | |
|
|
| |
|
|
| |
|
|
|
INCOME (LOSS) FROM CONTINUING OPERATIONS | | | 83.8 | | | | 158.9 | | | | (114.4 | ) |
Loss from discontinued operations, net of income tax benefit of $11.5 | | | — | | | | (18.0 | ) | | | — | |
| | |
|
|
| |
|
|
| |
|
|
|
NET INCOME (LOSS) | | $ | 83.8 | | | $ | 140.9 | | | $ | (114.4 | ) |
| | |
|
|
| |
|
|
| |
|
|
|
The accompanying notes are an integral part of these statements.
F-4
THE PREMCOR REFINING GROUP INC. AND SUBSIDIARIES
CONSOLIDATED STATEMENTS OF CASH FLOWS
(in millions)
| | | For the Year Ended December 31,
| |
| | | 2000
| | | 2001
| | | 2002
| |
| | | (as restated, see Note 2) | | | | |
CASH FLOWS FROM OPERATING ACTIVITIES: | | | | | | | | | | | | |
Net income (loss) | | $ | 83.8 | | | $ | 140.9 | | | $ | (114.4 | ) |
Discontinued operations | | | — | | | | 18.0 | | | | — | |
Adjustments: | | | | | | | | | | | | |
Depreciation | | | 37.0 | | | | 53.2 | | | | 48.8 | |
Amortization | | | 45.5 | | | | 49.8 | | | | 50.5 | |
Deferred income taxes | | | (7.1 | ) | | | 64.9 | | | | (71.4 | ) |
Stock-based compensation | | | — | | | | — | | | | 14.0 | |
Minority interest | | | 0.6 | | | | 12.8 | | | | (1.7 | ) |
Refinery restructuring and other charges | | | — | | | | 118.5 | | | | 110.3 | |
Write-off of deferred financing costs | | | — | | | | 0.2 | | | | 7.9 | |
Other, net | | | (1.9 | ) | | | 1.0 | | | | 6.2 | |
Cash provided by (reinvested in) working capital: | | | | | | | | | | | | |
Accounts receivable, prepaid expenses and other | | | (54.5 | ) | | | 98.5 | | | | (123.7 | ) |
Inventories | | | (126.1 | ) | | | 60.0 | | | | 31.0 | |
Accounts payable, accrued expenses, taxes other than income, and other | | | 153.1 | | | | (132.7 | ) | | | 53.1 | |
Affiliate receivables and payables | | | 11.0 | | | | (12.4 | ) | | | 14.3 | |
Cash and cash equivalents restricted for debt service | | | — | | | | (24.3 | ) | | | 9.4 | |
| | |
|
|
| |
|
|
| |
|
|
|
Net cash provided by operating activities of continuing operations | | | 141.4 | | | | 448.4 | | | | 34.3 | |
Net cash used in operating activities of discontinued operations | | | — | | | | (8.4 | ) | | | (3.4 | ) |
| | |
|
|
| |
|
|
| |
|
|
|
Net cash provided by operating activities | | | 141.4 | | | | 440.0 | | | | 30.9 | |
| | |
|
|
| |
|
|
| |
|
|
|
CASH FLOWS FROM INVESTING ACTIVITIES: | | | | | | | | | | | | |
Expenditures for property, plant and equipment | | | (390.7 | ) | | | (94.5 | ) | | | (114.3 | ) |
Expenditures for turnaround | | | (31.5 | ) | | | (49.2 | ) | | | (34.3 | ) |
Cash and cash equivalents restricted for investment in capital additions | | | 46.6 | | | | (9.9 | ) | | | 7.3 | |
Proceeds from sale of assets | | | 0.5 | | | | 0.2 | | | | — | |
Other | | | (0.2 | ) | | | — | | | | — | |
| | |
|
|
| |
|
|
| |
|
|
|
Net cash used in investing activities | | | (375.3 | ) | | | (153.4 | ) | | | (141.3 | ) |
| | |
|
|
| |
|
|
| |
|
|
|
CASH FLOWS FROM FINANCING ACTIVITIES: | | | | | | | | | | | | |
Proceeds from issuance of long-term debt | | | 182.6 | | | | 10.0 | | | | — | |
Long-term debt and capital lease payments | | | (7.3 | ) | | | (22.8 | ) | | | (443.9 | ) |
Cash and cash equivalents restricted for debt repayment | | | — | | | | (6.5 | ) | | | (45.2 | ) |
Proceeds from issuance of common stock | | | 58.1 | | | | — | | | | — | |
Contribution from minority interest | | | 6.5 | | | | — | | | | — | |
Capital contributions, net | | | (35.5 | ) | | | (25.8 | ) | | | 248.1 | |
Deferred financing costs | | | (4.3 | ) | | | (10.2 | ) | | | (11.4 | ) |
| | |
|
|
| |
|
|
| |
|
|
|
Net cash provided by (used in) financing activities | | | 200.1 | | | | (55.3 | ) | | | (252.4 | ) |
| | |
|
|
| |
|
|
| |
|
|
|
NET INCREASE (DECREASE) IN CASH AND CASH EQUIVALENTS | | | (33.8 | ) | | | 231.3 | | | | (362.8 | ) |
CASH AND CASH EQUIVALENTS, beginning of period | | | 285.0 | | | | 251.2 | | | | 482.5 | |
| | |
|
|
| |
|
|
| |
|
|
|
CASH AND CASH EQUIVALENTS, end of period | | $ | 251.2 | | | $ | 482.5 | | | $ | 119.7 | |
| | |
|
|
| |
|
|
| |
|
|
|
The accompanying notes are an integral part of these statements.
F-5
THE PREMCOR REFINING GROUP INC. AND SUBSIDIARIES
CONSOLIDATED STATEMENTS OF STOCKHOLDER’S EQUITY
(in millions, except share data)
| | | Number of
Common
Shares
| | Common
Stock
| | Paid-in
Capital
| | | Retained
Earnings
| | | Total
| |
| | | (as restated for years ended
December 31, 2001 and 2000, see Note 2) | |
| | | | | |
BALANCE, December 31, 1999 | | 100 | | $ | — | | $ | 246.2 | | | $ | (23.9 | ) | | $ | 222.3 | |
Stock issuance | | — | | | — | | | 58.1 | | | | — | | | | 58.1 | |
Capital contribution returned | | — | | | — | | | (35.5 | ) | | | — | | | | (35.5 | ) |
Net income | | — | | | — | | | — | | | | 83.8 | | | | 83.8 | |
| | |
| |
|
| |
|
|
| |
|
|
| |
|
|
|
BALANCE, December 31, 2000 | | 100 | | | — | | | 268.8 | | | | 59.9 | | | | 328.7 | |
Capital contribution returned | | — | | | — | | | (25.8 | ) | | | — | | | | (25.8 | ) |
Net income | | — | | | — | | | — | | | | 140.9 | | | | 140.9 | |
| | |
| |
|
| |
|
|
| |
|
|
| |
|
|
|
BALANCE, December 31, 2001 | | 100 | | | — | | | 243.0 | | | | 200.8 | | | | 443.8 | |
Capital contributions, net | | — | | | — | | | 278.3 | | | | — | | | | 278.3 | |
Stock-based compensation | | — | | | — | | | 19.7 | | | | — | | | | 19.7 | |
Tax benefit on stock options exercised | | — | | | — | | | 0.4 | | | | — | | | | 0.4 | |
Net loss | | — | | | — | | | — | | | | (114.4 | ) | | | (114.4 | ) |
| | |
| |
|
| |
|
|
| |
|
|
| |
|
|
|
BALANCE, December 31, 2002 | | 100 | | $ | — | | $ | 541.4 | | | $ | 86.4 | | | $ | 627.8 | |
| | |
| |
|
| |
|
|
| |
|
|
| |
|
|
|
The accompanying notes are an integral part of these statements.
F-6
THE PREMCOR REFINING GROUP INC. AND SUBSIDIARIES
NOTES TO CONSOLIDATED FINANCIAL STATEMENTS
For the years ended December 31, 2002, 2001 and 2000
(Tabular amounts in millions, except per share data)
1. NATURE OF BUSINESS
The Premcor Refining Group Inc., a Delaware corporation, incorporated in 1988, (“PRG” on a stand-alone basis and the “Company” on a consolidated basis) is 100% owned by Premcor USA Inc., a Delaware corporation, also incorporated in 1988 (“Premcor USA”), which in turn is 100% owned by Premcor Inc., a Delaware corporation incorporated in April 1999. Following the completion of the restructuring described in Note 3, referred to as the Sabine Restructuring, Sabine River Holding Corp. (“Sabine”), a Delaware corporation, incorporated in May 1999, became a wholly owned subsidiary of PRG.
The Company is an independent petroleum refiner and supplier of unbranded transportation fuels, heating oil, petrochemical feedstocks, petroleum coke and other petroleum products in the United States. As of December 31, 2002, the Company owned and operated two refineries with a combined crude oil throughput capacity of 420,000 barrels per day (“bpd”). The refineries are located in Port Arthur, Texas and Lima, Ohio. In September 2002, the Company ceased refining operations at its 70,000 bpd Hartford, Illinois refinery. In March 2003, the Company acquired a 190,000 bpd refinery in Memphis, Tennessee bringing its combined crude oil throughput capacity to 610,000 bpd. See Note 20, Subsequent Events for more details of the acquisition.
All of the operations of the Company are in the United States. These operations are related to the refining of crude oil and other petroleum feedstocks into petroleum products and are all considered part of one business segment. The Company’s earnings and cash flows from operations are primarily dependent upon processing crude oil and selling quantities of refined petroleum products at margins sufficient to cover operating expenses. Crude oil and refined petroleum products are commodities, and factors largely out of the Company’s control can cause prices to vary, in a wide range, over a short period of time. This potential margin volatility can have a material effect on the financial position, current period earnings, and cash flows.
2. SUMMARY OF SIGNIFICANT ACCOUNTING POLICIES
Principles of Consolidation
The accompanying consolidated financial statements of the Company include the accounts of PRG and its subsidiaries, Sabine and its subsidiaries, The Premcor P.A. Pipeline Company, and Premcor Investments Inc. The Company consolidates the assets, liabilities, and results of operations of the subsidiaries in which the Company has a controlling interest. All significant intercompany accounts and transactions have been eliminated. The investment in a company in which the Company owned 20 percent to 50 percent voting control was accounted for by the equity method.
Following the completion of the Sabine restructuring, PRG owns all of the outstanding common stock of Sabine. The restructuring of Sabine as a wholly owned subsidiary of PRG constituted an exchange of ownership interest between entities under common control, and therefore was accounted for similar to a pooling of interests. Accordingly, the Company’s historical financial statements have been restated to include the consolidated financial position, results of operations, and cash flows of Sabine for all periods presented.
F-7
Use of Estimates
The preparation of financial statements in conformity with accounting principles generally accepted in the United States of America requires management to make estimates and assumptions that affect the reported amounts of assets and liabilities, the disclosure of contingent assets and liabilities at the dates of financial statements, and the reported amounts of revenues and expenses during the reporting periods. Actual results could differ from those estimates.
Cash and Cash Equivalents
The Company considers all highly liquid investments, such as time deposits, money market instruments, commercial paper and United States and foreign government securities, purchased with an original maturity of three months or less, to be cash equivalents. Cash and cash equivalents exclude cash that is contractually restricted for non-operational purposes such as debt service and capital expenditures. Restricted cash and cash equivalents is classified as a current or noncurrent asset based on its designated purpose.
Revenue Recognition
Revenue from sales of products is recognized upon transfer of title, based upon the terms of delivery.
Supply and Marketing Activities
The Company engages in the buying and selling of crude oil to supply its refineries. Purchases of crude oil are recorded in cost of sales. Sales of crude oil where the Company bears risk on market price, timing, and other non-controllable factors are recorded in net sales and operating revenue; otherwise, the sales of crude oil are recorded against cost of sales. The Company also engages in the buying and selling of refined products to facilitate the marketing of its refined products. The results of this activity are recorded in cost of sales and net sales and operating revenue. The Company’s distribution network is an integral part of its refining business. However, due to ordinary course logistical issues concerning production schedules and product sales commitments, it is common for the Company to purchase refined products from third parties in order to balance the requirements of its product marketing activities. Although third party purchases are essential to effectively market the Company’s production, the effects from these activities on the Company’s results are not significant.
Refined product exchange transactions that do not involve the payment or receipt of cash are not accounted for as purchases or sales. Any resulting volumetric exchange balances are accounted for as inventory in accordance with the Last-in, First-out (“LIFO”) inventory method. Exchanges that are settled through payment or receipt of cash are accounted for as purchases or sales.
Excise Taxes
The Company collects excise taxes on sales of gasoline and other motor fuels. Excise taxes of approximately $347.4 million, $451.0 million, and $471.1 million were collected from customers and paid to various governmental entities in 2002, 2001, and 2000, respectively. Excise taxes are not included in sales.
Inventories
Inventories for the Company are stated at the lower of cost or market. Cost is determined under the LIFO inventory method for hydrocarbon inventories including crude oil, refined products, and blendstocks. The cost of warehouse stock and other inventories for the Company is determined under the First-in First-out (“FIFO”) inventory method. Any reserve for inventory cost in excess of market value is reversed if physical inventories turn and prices recover above cost.
Hedging Activity
The Company adopted Statement of Financial Accounting Standards (“SFAS”) No. 133,Accounting for Derivative Instruments and Hedge Activities, as amended by SFAS No. 138, effective January 1, 2001. The adoption of SFAS No. 133 did not have a material impact on the Company’s financial position or results of
F-8
operations because the Company has historically marked to market all financial instruments, including futures and options contracts, used in the implementation of the Company’s price risk mitigation strategies. The Company enters into crude oil, refined products, and natural gas exchange traded futures and options contracts as well as over-the-counter swaps to limit risk related to hydrocarbon price fluctuations created by a potentially volatile market. Forward purchase and sale contracts are also considered derivatives. As of December 31, 2002 and 2001, the Company has not designated hedge accounting for any of its derivative positions, and accordingly, records unrealized gains and losses on open contracts in current cost of sales. The Company does not hold or issue derivative instruments for trading purposes.
Property, Plant, and Equipment
Property, plant, and equipment additions are recorded at cost. Depreciation of property, plant, and equipment is computed using the straight-line method over the estimated useful lives of the assets or group of assets, beginning for all Company-constructed assets in the month following the date in which the asset first achieves its design performance. The Company capitalizes the interest cost associated with major construction projects based on the effective interest rate on aggregate borrowings.
Expenditures for maintenance and repairs are expensed as incurred. Expenditures for major replacements and additions are capitalized. Upon disposal of assets depreciated on an individual basis, the gains and losses are reflected in current operating income. Upon disposal of assets depreciated on a group basis, unless unusual in nature or amount, residual cost less salvage is charged against accumulated depreciation.
The Company reviews long-lived assets for impairment whenever events or changes in circumstances indicate that the carrying amount of an asset may not be recoverable. If the undiscounted future cash flows of an asset to be held and used in operations is less than the carrying value, the Company would recognize a loss for the difference between the carrying value and fair market value.
Deferred Turnaround Costs
A turnaround is a periodically required standard procedure for maintenance of a refinery that involves the shutdown and inspection of major processing units which occurs approximately every three to five years. Turnaround costs include actual direct and contract labor, and material costs incurred for the overhaul, inspection, and replacement of major components of refinery processing and support units performed during turnaround. Turnaround costs, which are included in the Company’s balance sheet in “Other Assets,” are currently amortized on a straight-line basis over the period until the next scheduled turnaround, beginning the month following completion. The amortization of the turnaround costs is presented as amortization in the consolidated statements of operations.
The Accounting Standards Executive Committee of the American Institute of Certified Public Accountants (“AcSEC”) issued an exposure draft of a proposed statement of position (“SOP”) entitledAccounting for Certain Costs and Activities Related to Property, Plant and Equipment. This SOP required companies, among other things, to expense as incurred turnaround costs. Adoption of the proposed SOP would have required that any existing unamortized turnaround costs be expensed immediately. If this proposed change were in effect at December 31, 2002, the Company would have been required to write-off unamortized turnaround costs of approximately $86 million. In December 2002, AcSEC discontinued discussions concerning this SOP and delegated responsibility for any further action to the Financial Accounting Standards Board (“FASB”). At its February 2003 meeting, AcSEC indefinitely suspended action on the proposed SOP. Whether there will be new accounting guidance on turnaround costs and when it would become effective is currently unclear.
Environmental Costs
Environmental liabilities and reimbursements for underground storage remediation are recorded on an undiscounted basis when environmental assessments and/or remedial efforts are probable and can be reasonably estimated. Environmental expenditures that relate to current or future operations are expensed or capitalized as
F-9
appropriate. Expenditures that relate to an existing condition caused by past operations and that do not contribute to current or future revenue generation are expensed. Subsequent adjustments to estimates, to the extent required, may be made as more refined information becomes available.
Income Taxes
The Company provides for deferred taxes under the asset and liability approach, which requires the recognition of deferred tax assets and liabilities for the expected future tax consequences of temporary differences between the carrying amounts and the tax bases of assets and liabilities. Deferred taxes are classified as current or noncurrent depending on the classification of the assets and liabilities to which the temporary differences relate. Deferred taxes arising from temporary differences that are not related to a specific asset or liability are classified as current or noncurrent depending on the periods in which the temporary differences are expected to reverse. The Company records a valuation allowance if it is more likely than not that some portion or all of net deferred tax assets will not be realized by the Company.
All of the Company’s subsidiaries, except for Port Arthur Coker Company L.P. (“PACC”) and PAFC, are included in the consolidated U.S. federal income tax return filed by Premcor Inc. Each subsidiary computes its provision on a separate company basis with adjustments necessary to reflect the effect of consolidated tax return allocations and limitations. PACC is classified as a partnership for U.S. federal income tax purposes and, accordingly, does not pay federal income tax. PACC files a U.S. partnership return of income and its taxable income or loss flows through to its partners who report and are taxed on their distributive shares of such taxable income or loss. Accordingly, no federal income taxes have been provided by PACC. PAFC files a separate U.S. federal income tax return and computes its provision on a separate company basis.
Stock Based Compensation
As of December 31, 2002, Premcor Inc. has three stock-based employee compensation plans, which are described more fully in Note 17, Stock Option Plans. Prior to 2002, the Company accounted for stock based compensation under the recognition and measurement provisions of APB Opinion No. 25,Accounting for Stock Issued to Employees, and related Interpretations. No stock-based employee compensation cost is reflected in 2001 or 2000 net income, as all options granted in those years had an exercise price equal to the market value of the underlying common stock on the date of grant. Effective January 1, 2002, the Company adopted the fair value recognition provisions of SFAS No. 123,Accounting for Stock-Based Compensation, prospectively, for all employee awards granted and modified after January 1, 2002. Awards under the Company’s plans typically vest over periods ranging from three to five years. Therefore, the cost related to stock-based employee compensation included in the determination of net income for 2002 is lower than that which would have been recognized if the fair value based method had been applied to all awards since the original effective date of SFAS No. 123. The following table, provided in accordance with SFAS No. 148,Accounting for Stock Based Compensation—Transition and Disclosure, illustrates the effect on net income and earnings per share if the fair value based method had been applied to all outstanding awards in each period.
| | | Year Ended December 31,
| |
| | | 2000
| | | 2001
| | | 2002
| |
Net income (loss), as reported | | $ | 83.8 | | | $ | 140.9 | | | $ | (114.4 | ) |
Add: Stock-based compensation expense included in reported net income, net of tax effect | | | — | | | | — | | | | 11.9 | |
Deduct: Stock-based compensation expense determined under fair value based method for all options, net of tax effect | | | (0.5 | ) | | | (0.6 | ) | | | (12.5 | ) |
| | |
|
|
| |
|
|
| |
|
|
|
Pro forma net income (loss) | | $ | 83.3 | | | $ | 140.3 | | | $ | (115.0 | ) |
| | |
|
|
| |
|
|
| |
|
|
|
F-10
With respect to stock option grants outstanding as of December 31, 2002, the Company will record future non-cash stock-based compensation expense and additional paid-in capital of $35.9 million over the applicable vesting periods of the grants. The stock-based compensation expense principally relates to employees whose costs are classified as general and administrative expenses.
New Accounting Standards
In July 2001, the FASB issued SFAS No. 143, Accounting for Asset Retirement Obligations. SFAS No. 143 requires fair value recognition of legal obligations to retire long-lived assets at the time the obligations are incurred. The initial recording of a liability for an asset retirement obligation will require the recording of a corresponding asset. The liability will be adjusted for accretion due to the passage of time and the asset will be depreciated. The Company has asset retirement obligations based on its legal obligations to remediate its refinery sites. These obligations principally relate to the removal of solid waste, hazardous waste and asbestos as well as the remediation of soil and groundwater in and around the operating units of the refineries, wastewater treatment facilities, storage tanks, and pipelines. The Company is not required to perform these obligations until it permanently ceases operations of the long-lived assets and therefore, considers the settlement date of the obligations to be indeterminable. Accordingly, the Company cannot calculate an associated asset retirement liability at this time. The Company will adopt this standard in the first quarter of 2003, but the initial adoption will not have a material impact on the Company’s financial position or results of operations. The Company will measure and recognize the fair value of its asset retirement obligations at such time as a settlement date is determinable.
On January 1, 2002, the Company adopted SFAS No. 142,Goodwill and Other Intangible Assets, and SFAS No. 144,Accounting for the Impairment or Disposal of Long-Lived Assets. The adoption of these standards did not have a material impact on the Company’s financial position and results of operations; however, SFAS No. 144 was utilized in the accounting for the Company’s closure of the Hartford, Illinois refinery. See Note 4, Refinery Restructuring and Other Charges for details of the Hartford refinery closure.
In April 2002, the FASB issued SFAS No. 145,Rescission of FASB Statements No. 4, 44, and 64, Amendment of FASB Statement No. 13 and Technical Corrections. SFAS 145 rescinds SFAS No. 4,Reporting Gains and Losses from the Extinguishment of Debt; SFAS No. 44,Accounting for Intangible Assets of Motor Carriers; and SFAS No. 64,Extinguishment of Debt Made to Satisfy Sinking-Fund Requirements. SFAS No. 145 also amends SFAS No. 13, Accounting for Leases, as it relates to sale-leaseback transactions and other transactions structured similar to a sale-leaseback, as well as amends other pronouncements to make various technical corrections. The provisions of SFAS No. 145 as they relate to the rescission of SFAS No. 4 shall be applied in fiscal years beginning after May 15, 2002. The provision of this statement related to the amendment to SFAS No. 13 shall be effective for transactions occurring after May 15, 2002. All other provisions of this statement shall be effective for financial statements issued on or after May 15, 2002. As permitted by SFAS No. 145, the Company elected early adoption of the rescission of SFAS No. 4. Accordingly, the Company has included the gain or loss on extinguishment of long-term debt as a component of “Income (loss) from continuing operations” as opposed to as an extraordinary item, net of taxes, in its Statement of Operations. The Company reclassified a pretax gain of $0.8 million in 2001 to conform to the new classification.
In June 2002, the FASB issued SFAS No. 146,Accounting for Costs Associated with Exit or Disposal Activities. SFAS No. 146 requires the recognition of liabilities at fair value that are associated with exit or disposal activities when they are incurred rather than at the date of a commitment to an exit or disposal plan. Such liabilities include lease termination costs and certain employee severance costs that are associated with a restructuring, discontinued operation, plant closing or other exit or disposal activities. SFAS No. 146 is to be applied prospectively to exit or disposal activities initiated after December 31, 2002. The Company will adopt SFAS No. 146 for all restructuring, discontinued operations, plant closings or other exit or disposal activities initiated after December 31, 2002.
F-11
In October 2002, the Emerging Issues Task Force (“EITF”) of the FASB reached a consensus on certain issues in EITF 02-3:Issues Involved in Accounting for Derivative Contracts Held for Trading Purposes and Contracts Involved in Energy Trading and Risk Management Activities including:
| | • | | precluding mark-to-market accounting for energy trading contracts that are not derivatives pursuant to SFAS No. 133; and |
| | • | | requiring that gains and losses on all derivative instruments within the scope of SFAS No. 133 be shown net in the income statement, whether or not settled physically, if the derivative instruments are held for trading purposes. |
Implementation of EITF 02-3 did not have a material effect on the Company’s financial statements because it marks-to-market only financial instruments and forward purchase and sale contracts considered derivatives pursuant to SFAS No. 133 and does not hold or issue derivative instruments for trading purposes.
In November 2002, the FASB issued Interpretation No. 45,Guarantor’s Accounting and Disclosure Requirements for Guarantees, Including Indirect Guarantees of Indebtedness of Others. This interpretation requires expanded disclosure of a guarantor’s obligation under certain guarantees that it has issued. It also requires that a guarantor recognize, at the inception of certain guarantees, a liability for the fair value of the obligation undertaken in issuing the guarantee. The disclosure requirements are effective for interim and annual financial statements issued for periods ending after December 15, 2002. The provisions for the recognition of a liability are effective prospectively for guarantees issued or modified after December 31, 2002 and the Company will adopt these recognition provisions in the first quarter of 2003.
In January 2003, the FASB issued Interpretation No. 46,Consolidation of Variable Interest Entities, an interpretation of ARB. No. 51. This interpretation clarifies consolidation requirements for variable interest entities. It establishes additional factors beyond ownership of a majority voting interest to indicate that a company has a controlling financing interest in an entity (or a relationship sufficiently similar to a controlling financial interest that it requires consolidation). This interpretation applies immediately to variable interest entities created or obtained after January 31, 2003 and must be retroactively applied to holdings in variable interest entities acquired before February 1, 2003 in interim and annual financial statements issued for periods beginning after June 15, 2003. The Company does not expect that adoption of this interpretation will have a material impact on its financial statements.
Reclassifications
Certain reclassifications have been made to prior years’ financial statements to conform to classifications used in the current year.
3. SABINE RESTRUCTURING
On June 6, 2002, Premcor Inc., PRG and Sabine completed a series of transactions (“the Sabine restructuring”) that resulted in Sabine and its subsidiaries becoming wholly owned subsidiaries of PRG. Sabine, through its principal operating subsidiary, PACC, owns and operates a heavy oil processing facility, which is operated in conjunction with PRG’s Port Arthur refinery. Prior to the Sabine restructuring, Sabine was 90% owned by Premcor Inc. and 10% owned by a subsidiary of Occidental Petroleum Corporation (“Occidental”). The Sabine restructuring was permitted by the successful consent solicitation of the holders of the PAFC 12½% Senior Notes. The Sabine restructuring was accomplished according to the following steps, among others:
| | • | | Premcor Inc. contributed $225.6 million in proceeds from its initial public offering of common stock to Sabine. Sabine used the proceeds from the equity contribution, plus cash on hand, to prepay $221.4 million of its Senior Secured Bank Loan and to pay a dividend of $141.4 million to Premcor Inc.; |
| | • | | Commitments under Sabine’s Senior Secured Bank Loan, working capital facility, and certain insurance policies were terminated and related guarantees were released; |
F-12
| | • | | PRG’s existing working capital facility was amended and restated to, among other things, permit letters of credit to be issued on behalf of Sabine; |
| | • | | Occidental exchanged its 10% interest in Sabine for 1,363,636 newly issued shares of Premcor Inc. common stock; |
| | • | | Premcor Inc. contributed its 100% ownership interest in Sabine to Premcor USA and Premcor USA, in turn, contributed its 100% ownership interest in Sabine to PRG; and |
| | • | | PRG fully and unconditionally guaranteed, on a senior unsecured basis, the payment obligations under the PAFC 12½% Senior Notes. |
Premcor Inc.’s acquisition of Occidental’s 10% ownership in Sabine was accounted for under the purchase method. The purchase price was based on the exchange of 1,363,636 shares of Premcor Inc. common stock for the 10% interest in Sabine and was valued at $30.5 million or approximately $22 per share. The purchase price of the 10% minority interest in Sabine exceeded the book value by $8.0 million. Based on an appraisal of the Sabine assets, the excess of the purchase price over the book value of the minority interest, along with a $5.0 million deferred income tax adjustment, was recorded as an investment in property, plant and equipment and will be depreciated over the remaining useful lives of the related Sabine assets. The income tax adjustment reflected the temporary difference between the book and tax basis of property, plant and equipment related to the excess of the purchase price over book value. Because the purchase price did not exceed the fair value of the underlying assets, no goodwill was recognized.
As discussed in Note 2, the contribution of Premcor Inc.’s 100% ownership interest in Sabine to PRG was an exchange of ownership interest between entities under common control, and therefore was accounted for similar to a pooling of interests. Accordingly, the Company’s historical financial statements have been restated to include the consolidated results of operations, financial position, and cash flows of Sabine for all periods presented.
4. REFINERY RESTRUCTURING AND OTHER CHARGES
In 2002, the Company recorded refinery restructuring and other charges of $168.7 million as follows:
| | • | | a $137.4 million charge related to the shutdown of refining operations at the Hartford refinery, |
| | • | | a $32.4 million charge related to the restructuring of the Company’s management team, refinery operations and administrative functions, |
| | • | | income of $5.0 million related to the unanticipated sale of a portion of the Blue Island refinery assets previously written off, |
| | • | | a $2.5 million charge related to the termination of certain guarantees at PACC as part of the Sabine restructuring and, |
| | • | | a $1.4 million loss related to idled assets held for sale. |
In 2001, refinery restructuring and other charges of $176.2 million consisted of a $167.2 million charge related to the January 2001 closure of the Blue Island, Illinois refinery and a $9.0 million charge related to the write-off of idled coker units at the Port Arthur refinery. The write-off of the Port Arthur coker units included a charge of $5.8 million related to the net asset value of the idled cokers and a charge of $3.2 million for future environmental clean-up costs related to the coker unit site.
Below are further discussions of the Hartford and Blue Island refinery closures and the management team, refinery, and administrative function restructuring.
F-13
Hartford Refinery Closure
In late September 2002, the Company ceased refining operations at its Hartford refinery after concluding there was no economically viable method of reconfiguring the refinery to produce fuels meeting new gasoline and diesel fuel specifications mandated by the federal government. A pretax charge of $137.4 million was recorded in 2002, which included $70.7 million of non-cash long-lived asset write-offs to reduce the refinery assets to their estimated net realizable value of $61.0 million and $4.8 million of non-cash current asset write-offs. The net realizable value was determined by estimating the value of the assets in a sale or operating lease transaction and was recorded as a current asset on the balance sheet. In October 2002, the Company announced that it would continue to operate its storage and distribution facility at the refinery site to accommodate its wholesale operations. As a result of this decision, the Company reclassified the net book value of the storage and distribution facility assets from assets held for sale to property, plant and equipment. This reduced the estimated net realizable value of the remaining refinery assets to $49.0 million.
Despite ceasing operations, the Company continues to pursue all strategic options including the sale or lease of the refinery. The Company has had preliminary discussions with third parties regarding a transaction for the refinery assets, but there can be no assurance that a transaction will be completed. When the final disposition of the assets is determined, the net realizable value may be less than $49.0 million and a further write-down may be required.
The total charge also included a reserve for future costs of $60.6 million, which included an initial reserve of $62.5 million and a decrease in the fourth quarter of $1.9 million. The following schedule summarizes the activity and balance of the closure reserve as of December 31, 2002:
| | | Initial Reserve
| | Adjustment to Reserve
| | | Net Cash Outlay
| | Reserve as of December 31, 2002
|
Employee severance | | $ | 16.6 | | $ | (3.4 | ) | | $ | 12.6 | | $ | 0.6 |
Plant closure/equipment remediation | | | 12.9 | | | 4.6 | | | | 17.1 | | | 0.4 |
Site clean-up/environmental matters | | | 33.0 | | | (3.1 | ) | | | 0.3 | | | 29.6 |
| | |
|
| |
|
|
| |
|
| |
|
|
| | | $ | 62.5 | | $ | (1.9 | ) | | $ | 30.0 | | $ | 30.6 |
| | |
|
| |
|
|
| |
|
| |
|
|
In the fourth quarter of 2002, the Company completed the process unit shutdown and hydrocarbon purging and terminated all employee positions, which approximated 310 hourly (covered by collective bargaining agreements) and salaried positions. In the fourth quarter of 2002, the Company lowered the reserve by $1.6 million, which reflected a decrease of the site clean-up costs partially offset by a net increase for actual costs incurred for employee severance and the plant shutdown. The lower site clean-up costs reflected less work that will need to be performed since the storage and distribution facility will remain in operation. Additionally, the Company reclassified $0.3 million of the reserve to the Company’s pension related long-term liability. The site clean-up and environmental reserve takes into account costs that are reasonably foreseeable at this time. As the final disposition of the refinery assets is determined and a site remediation plan refined, further adjustments of the reserve may be necessary, and such adjustments may be material. Also in the fourth quarter of 2002, the Company increased its non-cash current asset write-off from $3.2 million to $4.8 million as a result of losses on the disposition of warehouse inventories and other supplies.
Since the Hartford refinery operation had been only marginally profitable over the last 10 years and since substantial investment would be required to meet new required product specifications in the future, the Company’s reduced refining capacity resulting from the shutdown is not expected to have a significant negative impact on net income or cash flow. The only anticipated effect on net income and cash flow in the future will result from the final disposition of the assets and subsequent environmental site remediation. Unless there is a need to adjust the estimated net realizable value or the reserve in the future as discussed above, there should be no significant effect on net income beyond 2002.
F-14
Finally, the total charge included a $1.0 million reserve related to post-retirement benefits that were extended to certain employees who were nearing the retirement requirements. This liability was recorded in long-term liabilities on the balance sheet together with the Company’s other post-retirement liabilities.
Management, Refinery Operations and Administrative Restructuring
In February 2002, the Company began the restructuring of its executive management team and subsequently its administrative functions with the hiring of Thomas D. O’Malley as chairman, chief executive officer, and president and William E. Hantke as executive vice president and chief financial officer. In the first quarter of 2002, as a result of the resignation of the officers who previously held these positions, the Company recognized severance expense of $5.0 million and non-cash compensation expense of $5.8 million resulting from modifications of stock option terms. In addition, the Company incurred a charge of $5.0 million for the cancellation of a monitoring agreement with an affiliate of one of Premcor Inc.’s major shareholders.
In the second quarter of 2002, the Company commenced a restructuring of its St. Louis-based general and administrative operations and recorded a charge of $6.5 million for severance, outplacement and other restructuring expenses relating to the elimination of 107 hourly and salaried positions. In the third quarter of 2002, the Company announced plans to reduce its non-represented workforce at its Port Arthur and Lima refineries and make additional staff reductions at its St. Louis administrative office. The Company recorded a charge of $10.1 million for severance, outplacement, and other restructuring expenses relating to the elimination of 140 hourly and salaried positions. Included in this charge was $1.3 million related to post-retirement benefits that were extended to certain employees who were nearing the retirement requirements. This liability was recorded in long-term liabilities on the balance sheet together with the Company’s other post-retirement liabilities. Reductions at the refineries occurred in October 2002 and those at the St. Louis office will take place in early 2003. The reserve relating to the refineries and St. Louis restructuring was as follows:
| | | Initial Reserve
| | Adjustment to Reserve
| | Net Cash Outlay
| | Reserve as of December 31, 2002
|
Refineries and St. Louis restructuring | | $ | 6.5 | | $ | 8.8 | | $ | 10.4 | | $ | 4.9 |
| | |
|
| |
|
| |
|
| |
|
|
Blue Island Refinery Closure
In January 2001, the Company ceased refining operations at its Blue Island refinery due to economic factors and a decision that the capital expenditures necessary to produce low sulfur transportation fuels required by new regulations could not produce acceptable returns on investment. This closure resulted in a pretax charge of $167.2 million in 2001, which included $98.1 of non-cash asset write-offs in excess of realizable value and a $69.1 million reserve for closure activities. The Company continues to utilize its storage and distribution facility at the refinery site to supply selected products to the Chicago and other Midwest markets from its operating refineries. Since the Blue Island refinery operation had been only marginally profitable in recent years the reduced refining capacity resulting from the closure is not expected to have a significant negative impact on future net income or cash flow from operations. The only significant effect of the refinery closure on cash flow will result from the environmental site remediation as discussed below. Unless there is a need to adjust the site remediation reserve in the future, there should be no significant effect on net income beyond 2001.
The shutdown of the process units was completed during the first quarter of 2001 and all 297 employee positions were terminated by the end of 2002. The following schedule summarizes the activity and balance of the closure reserve as of December 31, 2002:
| | | Reserve as of December 31, 2001
| | Adjustment to Reserve
| | | Net Cash Outlay
| | Reserve as of December 31, 2002
|
Employee severance | | $ | 2.1 | | $ | — | | | $ | 2.1 | | $ | — |
Plant closure/equipment remediation | | | 13.9 | | | (5.2 | ) | | | 8.7 | | | — |
Site clean-up/environmental matters | | | 20.5 | | | 3.2 | | | | 4.0 | | | 19.7 |
| | |
|
| |
|
|
| |
|
| |
|
|
| | | $ | 36.5 | | $ | (2.0 | ) | | $ | 14.8 | | $ | 19.7 |
| | |
|
| |
|
|
| |
|
| |
|
|
F-15
The Company is currently in discussions with governmental agencies concerning a remediation program, which it believes will likely lead to a final consent order and remediation plan. The Company does not expect these discussions to be concluded until mid-2003 at the earliest. The site clean-up and environmental reserve takes into account costs that are reasonably foreseeable at this time, based on studies performed in conjunction with obtaining the insurance policy discussed below. In 2002, the Company decreased the reserve for site remediation by an aggregate $2.0 million and concurrently wrote-off an asset previously recorded for the sale of emission credits. The adjustments reflected further refinement of plant closure and remediation activities relating to the continuing operations of the storage and distribution facility. As the site remediation plan is finalized and work is performed, further adjustments to the reserve may be necessary.
In 2002, environmental risk insurance policies covering the Blue Island refinery site were procured and bound, with final policies expected to be issued within the first quarter of 2003. This insurance program will allow the Company to quantify and, within the limits of the policy, cap the cost to remediate the site, and provide insurance coverage from future third party claims arising from past or future environmental releases. The remediation cost overrun policy has a term of ten years and, subject to certain exceptions and exclusions, provides $25 million in coverage in excess of a self-insured retention amount of $26 million. The pollution legal liability policy provides for $25 million in aggregate coverage and per incident coverage in excess of a $100,000 deductible.
5. DISCONTINUED OPERATIONS
In 2001, the Company recorded a pretax charge of $29.5 million, $18.0 million net of income taxes, related primarily to environmental liabilities of discontinued retail operations. This pretax charge consisted of $14.0 million representing a change in estimate relative to the Company’s clean up obligation regarding the previously discontinued retail operations, a charge of $14.0 million representing a change in estimate concerning the amount collectible from state agencies under various reimbursement programs, and a charge of $1.5 million representing workers compensation and general liability claims related to the discontinued retail operations. More complete information concerning site by site clean up plans, changing postures of state regulatory agencies, and fluctuations in the amounts available under the state reimbursement programs prompted the change in estimates.
6. FINANCIAL INSTRUMENTS
Short-term Investments
Short-term investments include United States government security funds, maturing between three and twelve months from date of purchase. The Company invests only in AA-rated or better fixed income marketable securities or the short-term rated equivalent. All of these investments are considered available-for-sale and carried at fair value. Realized gains and losses are presented in “Interest income” and are computed using the specific identification method.
At December 31, 2002, the Company maintained short-term investments totaling $1.7 million, which were pledged as collateral for self-insured workers’ compensation programs (2001—$1.7 million). The cost of short-term investments approximates fair value. Accordingly, unrealized gains and losses are not material.
Fair Value Financial Instruments
The carrying amount of cash and cash equivalents, accounts receivable and accounts payable approximate fair value due to the short-term nature of these items. See Note 11, Long-term Debt for the disclosure of the fair value of long-term debt.
Derivative Financial Instruments
As of December 31, 2002, the Company had open contracts of futures, swaps, and forward purchases and sales, all related to commodity derivative activity, which resulted in a net unrealized gain of $1.8 million. As of
F-16
December 31, 2001, the Company had open contracts of futures and options, all related to commodity derivative activity, which resulted in a net unrealized loss of $6.9 million.
Concentration of Credit Risk
Financial instruments that potentially subject the Company to concentration of credit risk consist primarily of trade receivables. Credit risk on trade receivables is minimized as a result of the credit quality of the Company’s customer base and industry collateralization practices. The Company conducts ongoing evaluations of its customers and requires letters of credit or other collateral as appropriate. Trade receivable credit losses for the three years ended December 31, 2001 were not material. As of December 31, 2002, the Company increased its reserve for uncollectible accounts receivable to $3.2 million primarily in response to increased risk with respect to our wholesale customers caused by the continued downturn of the U.S. economy.
The Company does not believe that it has a significant credit risk on its derivative instruments, which are transacted through the New York Mercantile Exchange or with counterparties meeting established collateral and credit criteria.
7. INVENTORIES
The carrying value of inventories consisted of the following:
| | | December 31,
|
| | | 2001
| | 2002
|
Crude oil | | $ | 77.0 | | $ | 63.8 |
Refined products and blendstocks | | | 218.7 | | | 204.5 |
Warehouse stock and other | | | 22.6 | | | 19.0 |
| | |
|
| |
|
|
| | | $ | 318.3 | | $ | 287.3 |
| | |
|
| |
|
|
As of December 31, 2002, the market value of crude oil, refined product, and blendstock inventories was approximately $188.3 million above carrying value (2001—$5.0 million).
As of January 1, 2002, PACC changed its method of inventory valuation from FIFO to LIFO for crude oil and blendstock inventories. Management believes this change is preferable in that it achieves a more appropriate matching of revenues and expenses. The adoption of this inventory accounting method on January 1, 2002 did not have a material impact on prior periods and accordingly, prior periods have not been restated. The adoption of the LIFO method resulted in approximately $11 million less net income for the year ended December 31, 2002 than if the FIFO method had been used for the same period.
Inventories recorded under LIFO include crude oil, refined products, and blendstocks of $262.6 million and $252.6 million for the years ended December 31, 2002 and 2001, respectively. A LIFO liquidation reduced the Company’s pretax earnings by $1.5 million in 2002 (2001—$19.3 million). The 2002 liquidation was due to the closure of the Hartford refinery. The 2001 liquidation was due to the closure of the Blue Island refinery and a decrease in the amount of crude oil processed by PRG at the Port Arthur refinery as PACC became the predominant crude oil processor at the refinery.
8. PROPERTY, PLANT, AND EQUIPMENT
Property, plant, and equipment consisted of the following:
| | | December 31,
| |
| | | 2001
| | | 2002
| |
Real property | | $ | 8.3 | | | $ | 8.3 | |
Process units, buildings, and oil storage and movement | | | 1,343.0 | | | | 1,227.0 | |
Office equipment, furniture, and autos | | | 24.4 | | | | 46.4 | |
Construction in progress | | | 121.8 | | | | 146.6 | |
Accumulated depreciation | | | (198.8 | ) | | | (166.6 | ) |
| | |
|
|
| |
|
|
|
| | | $ | 1,298.7 | | | $ | 1,261.7 | |
| | |
|
|
| |
|
|
|
F-17
The useful lives on depreciable assets used to determine depreciation were as follows:
Process units, buildings, and oil storage and movement | | 15 to 40 years; average 27 years |
Office equipment, furniture and autos | | 3 to 12 years; average 7 years |
Construction in progress included approximately $64 million related to expenditures to conform to new federally mandated fuel specifications as discussed more fully in Note 19, Commitments and Contingencies.
Sabine and its subsidiaries were formed to develop, construct, own, operate and finance a heavy oil processing facility that includes an 80,000 barrel per stream day delayed coking unit, a 35,000 barrel per stream day hydrocracker, a 417 long tons per day sulfur complex and related assets at the Port Arthur refinery (the “heavy oil upgrade project”). The heavy oil upgrade project became fully operational in January of 2001 and final completion of this project was achieved on December 28, 2001. Construction in progress included $33 million related to the heavy oil upgrade project as of December 31, 2001.
9. OTHER ASSETS
Other assets consisted of the following:
| | | December 31,
|
| | | 2001
| | 2002
|
Deferred turnaround costs | | $ | 97.9 | | $ | 86.3 |
Deferred financing costs | | | 30.9 | | | 24.2 |
Cash restricted for investment in capital additions | | | 9.9 | | | 2.6 |
Other | | | 4.1 | | | 4.2 |
| | |
|
| |
|
|
| | | $ | 142.8 | | $ | 117.3 |
| | |
|
| |
|
|
In 2002, the Company incurred deferred financing costs of $11.4 million related to the consent process that permitted the Sabine restructuring, the registration of the PAFC 12½% Senior Notes with the Securities and Exchange Commission following the restructuring, and a waiver related to insurance coverage required under the indenture for the PAFC 12½% Senior Notes. In 2002, the Company wrote-off $7.8 million of deferred financing costs as a result of the early repayment of long-term debt.
In 2001, the Company incurred deferred financing costs of $10.2 million associated with the amendment of its working capital facility issued at PRG and the issuance of tax exempt bonds through the state of Ohio. In 2001, the Company wrote-off $0.2 million of deferred financing costs related to the repurchase of a portion of its long-term debt. In 2001, related to the adoption of SFAS No. 133, PACC recorded its interest rate cap on its Senior Secured Bank Loan at fair market value resulting in the write-down of deferred financing costs of $0.7 million.
Amortization of deferred financing costs for the year ended December 31, 2002 was $10.2 million (2001—$10.9 million, 2000—$10.5 million). Amortization of deferred financing costs was included in “Interest and finance expense”.
Cash restricted for investment in capital additions is related to the outstanding proceeds from the Series 2001 Ohio Bonds. These proceeds are restricted to fund capital expenditure projects for solid waste and wastewater facilities at the Lima refinery.
10. WORKING CAPITAL FACILITIES
The Company’s amended and restated credit agreement, which expires in August 2003, provides a facility for the issuance of letters of credit of up to the lesser of $650 million or the amount of a borrowing base
F-18
calculated with respect to the Company’s cash and eligible cash equivalents, eligible investments, eligible receivables, eligible petroleum inventories, paid but unexpired letters of credit, and net obligations on swap contracts. The Company uses this facility primarily for the issuance of letters of credit to secure crude oil purchase obligations. In May 2002, the credit agreement was amended to allow for the PACC crude oil purchase obligations and thus incorporated PACC’s hydrocarbon inventory into the borrowing base calculation. Also, as amended, the $650 million limit can be increased by $50 million at the request of the Company upon securing additional commitments. As of December 31, 2002, the borrowing base was $815.3 million (2001—$620.7 million), with $597.1 million (2001—$295.3 million) of the facility utilized for letters of credit. As of December 31, 2002, $239.3 million (2001—$139.9 million) of the total letters of credit utilized under this facility supported deliveries that PRG and PACC had not taken delivery of but had made a purchase commitment. The remaining $357.8 (2001—$155.4 million) related to deliveries in which the Company had taken title and accordingly recorded purchases and accounts payable.
The credit agreement provides for direct cash borrowings up to $50 million. Borrowings under the credit agreement are secured by a lien on substantially all of our cash and cash equivalents, receivables, crude oil and refined product inventories and trademarks. As of December 31, 2002 and 2001, there were no direct cash borrowings under the credit agreement.
The credit agreement contains covenants and conditions that, among other things, limit the Company’s dividends, indebtedness, liens, investments and contingent obligations. The Company is also required to comply with certain financial covenants, including the maintenance of working capital of at least $150 million, the maintenance of tangible net worth of at least $400 million, as amended, and the maintenance of minimum levels of balance sheet cash (as defined therein) of $75 million at all times. The covenants also provide for a cumulative cash flow test that from July 1, 2001 must not be less than zero. In March 2002, the Company received a waiver regarding the maintenance of the tangible net worth covenant, which allows for the exclusion of $120 million for the pretax restructuring charge related to the closure of the Hartford refinery.
In February 2003, the Company’s credit agreement was amended and restated to, among other things, increase the facility size to $750 million and extend the maturity date to February 2006. See Note 20, Subsequent Events.
As part of the Sabine restructuring, PACC terminated its Winterthur International Insurance Company Limited oil payment guaranty insurance policy, which had guaranteed Maya crude oil purchase obligations made under the long-term agreement with the affiliate of PEMEX. PACC also terminated its $35 million bank working capital facility, which primarily supported non-Maya crude oil purchase obligations. As such, all PACC crude oil purchase obligations are now supported under an amended and restated PRG credit agreement.
In December 2001, PRG entered into a $20 million cash-collateralized credit facility expiring August 23, 2003. In October 2002, PRG expanded the facility to $40 million. This facility was arranged for required guarantees related to the Series 2001 Ohio Bonds. In addition, this facility can be utilized for other non-hydrocarbon purposes. As of December 31, 2002, $10.1 million (2001—$10.1 million) of the line of credit was utilized for letters of credit.
F-19
11. LONG-TERM DEBT
Long-term debt consisted of the following:
| | | December 31,
|
| | | 2001
| | 2002
|
8 5/8% Senior Notes due August 15, 2008 (“8 5/8% Senior Notes”)(1) | | $ | 109.8 | | $ | 109.8 |
8 3/8% Senior Notes due November 15, 2007 (“8 3/8% Senior Notes”)(1) | | | 99.6 | | | 99.7 |
8 7/8% Senior Subordinated Notes due November 15, 2007 (“8 7/8% Senior Subordinated Notes”)(1) | | | 174.2 | | | 174.4 |
Floating Rate Term Loan due November 15, 2003 and 2004 (“Floating Rate Loan”)(1) | | | 240.0 | | | 240.0 |
9½% Senior Notes due September 15, 2004 (“9½% Senior Notes”)(1) | | | 150.4 | | | — |
12½% Senior Notes due January 15, 2009 (“12½% Senior Notes”)(2) | | | 255.0 | | | 250.7 |
Senior Secured Bank Loan(2) | | | 287.6 | | | — |
Ohio Water Development Authority Environmental Facilities Revenue Bonds due December 01, 2031 (“Series 2001 Ohio Bonds”)(1) | | | 10.0 | | | 10.0 |
Obligations under capital leases(1) | | | 1.8 | | | 0.2 |
| | |
|
| |
|
|
| | | | 1,328.4 | | | 884.8 |
Less current portion | | | 81.4 | | | 15.0 |
| | |
|
| |
|
|
Total long-term debt | | $ | 1,247.0 | | $ | 869.8 |
| | |
|
| |
|
|
| (1) | | Issued or borrowed by PRG |
| (2) | | Issued or borrowed by PAFC |
The estimated fair value of the Company’s long-term debt at December 31, 2002 was $884.6 million (2001—$1,215.8 million). Estimated fair value was determined using quoted market prices for each debt issue.
In 2002, the Company redeemed in the aggregate $443.9 million in principal amount of long-term debt from Premcor Inc.’s initial public offering proceeds and approximately $205 million of available cash. PRG redeemed the remaining $150.4 million of its 9½% Senior Notes at par value. PAFC repaid its Senior Secured Bank Loan balance of $287.6 million at a $0.9 million premium. PAFC also made a scheduled $4.3 million principal payment of its 12 ½% Senior Notes.
The 8 3/8% Senior Notes and 8 7/8% Senior Subordinated Notes were issued by PRG in November 1997, at a discount of 0.734% and 0.719%, respectively. These notes are unsecured, with the 8 7/8% Senior Subordinated Notes subordinated in right of payment to all unsubordinated indebtedness of PRG. The 8 3/8% Senior Notes and 8 7/8% Senior Subordinated Notes are redeemable at the option of PRG beginning November 2002, at a redemption price of 104.187% of principal and 104.437% of principal, respectively, which decreases to 100% of principal in 2004 and 2005, respectively.
The 8 5/8% Senior Notes were issued by PRG in August 1998, at a discount of 0.234% and are unsecured. The 8 5/8% Senior Notes are redeemable at the option of the Company beginning August 2003, at a redemption price of 104.312% of principal, which decreases to 100% of principal amount in 2005.
F-20
PRG borrowed $125.0 million in November 1997, and an additional $115.0 million in August 1998, under a floating rate term loan agreement expiring in 2004. In 2003, $31.3 million of the outstanding principal amount is due with the remainder of the outstanding principal due in 2004. The Floating Rate Loan is a senior unsecured obligation of the Company and bears interest at the London Interbank Offer Rate (“LIBOR”) plus a margin of 2.75%. The loan may be repaid subject to certain restrictive covenants as stated in the amended and restated credit agreement. The average LIBOR rate for years 2002, 2001 and 2000 was 1.79%, 3.78% and 6.54%, respectively. The Floating Rate Loan was repaid in February 2003, as described in Note 20 Subsequent Events.
The 12½% Senior Notes were issued by PAFC in August 1999 on behalf of PACC at par and are secured by substantially all of the assets of PACC. The 12½% Senior Notes are redeemable at the Company’s option at any time at a redemption price equal to 100% of principal plus accrued and unpaid interest plus a make-whole premium which is based on the rates of treasury securities with average lives comparable to the average life of the remaining scheduled payments plus 0.75%. The current portion of the 12½% Senior Notes was $14.8 million as of December 31, 2002.
In December 2001, PRG borrowed $10 million through the state of Ohio, which had issued Ohio Water Development Authority Environmental Facilities Revenue Bonds. PRG is the sole guarantor on the principal and interest payments of these bonds. PRG is subject to a variable interest rate determined by the Trustee Bank not to exceed the maximum interest rate as defined under the indentures. For 2002 and 2003, the interest rate is 2%. PRG has the option to redeem the bonds prior to maturity during a window from April 1st to November 30th of any year at a redemption price of 100% of principal plus accrued interest. PRG has the option of converting from a variable interest rate to a 30-year fixed interest rate. If PRG decides to convert the bonds to a 30-year fixed interest rate, PRG has the option to redeem the bonds at a redemption price of 101%, declining to 100% the next year, of the principal plus accrued interest if the length of the fixed rate period is greater than 10 years. If the fixed rate period on the bonds is less than 10 years, there is no call provision.
The aggregate stated maturities of long-term debt for the Company are (in millions): 2003—$15.0; 2004—$265.8; 2005—$38.5; 2006—$46.4; 2007—$318.4; 2008 and thereafter—$201.8. These stated maturities do not reflect the impact of PRG’s $525 million Senior Notes offering, which was completed in February 2003, as described in Note 20, Subsequent Events.
PRG note indentures contain certain restrictive covenants including limitations on the payment of dividends, limitations on the payment of amounts to related parties, limitations on the incurrence of debt, and limitations on the incurrence of liens. In order to make dividend payments, PRG must maintain a net worth, as defined, of $200 million or be permitted to incur at least $1 of additional debt as defined in the indentures, possess a cumulative earnings calculation, as defined, of greater than zero after a dividend payment is made, and not be in default of any covenants. In the event of a change of control of PRG, as defined in the indentures, the respective company is required to tender an offer to redeem its outstanding notes and Floating Rate Loans at 101% and 100% of face value, respectively, plus accrued interest.
An amended and restated common security agreement contains common covenants, representations, defaults and other terms with respect to the long-term debt obligations of PAFC. The original common security agreement was amended and restated as a result of the Sabine restructuring. Under the amended and restated common security agreement, PRG fully and unconditionally guaranteed, on a senior secured basis, the payment obligations under the 12½% Senior Notes. Also, under the amended and restated common security agreement, PACC is required to maintain $45.0 million of cash for debt service at all times plus an amount equal to the next scheduled principal and interest payment on its 12½% Senior Notes, prorated based on the number of months remaining until that payment is due. As of December 31, 2002, cash of $61.7 million was restricted under these requirements and classified as cash and cash equivalents restricted for debt service on the balance sheet. The amended and restated common security agreement eliminated the requirements of a secured cash account structure, which had placed significant restrictions on PACC’s cash balances. As of December 31, 2001, cash of $30.8 million was restricted for debt service under the secured cash account structure.
F-21
Except for the PACC debt service cash restrictions discussed above, there are no restrictions limiting dividends from PACC to PRG and, under the amended and restated working capital facility, PACC is required to dividend to PRG all excess cash over $20 million, excluding the restricted debt service amounts. Also, pursuant to the amended working capital facility, if an aggregate intercompany payable from PRG to PACC exceeds $40 million at any time, PACC shall forgive PRG such excess amount, which would take the form of a non-cash dividend. No such dividends have been made as of December 31, 2002.
The original common security agreement required that PACC carry insurance coverage with specified terms. Due to the effects of the events of September 11, 2001 on the insurance market, coverage meeting such terms was not available on commercially reasonable terms, and as a result, PACC’s insurance program was not in full compliance with the required insurance coverage at December 31, 2001. PACC received a waiver from the requisite parties, and the amended and restated common security agreement takes into consideration a changing economic environment and its effects on the insurance markets in general. Under the amended and restated common security agreement, PACC has some specific insurance requirements, but principally must ensure that coverage is consistent with customary standards in its industry. There is also a provision that allows for thirty days notice to requisite parties of any inability to comply with the specific terms without any event of a default. As of December 31, 2002, PACC was in compliance with the insurance coverage requirements of the amended and restated common security agreement.
Interest and finance expense
Interest and finance expense included in the Company’s statements of operations consisted of the following:
| | | For The Year Ended December 31,
| |
| | | 2000
| | | 2001
| | | 2002
| |
Interest expense | | $ | 129.9 | | | $ | 129.8 | | | $ | 92.2 | |
Finance costs | | | 12.1 | | | | 15.4 | | | | 13.3 | |
Capitalized interest | | | (62.1 | ) | | | (5.3 | ) | | | (6.7 | ) |
| | |
|
|
| |
|
|
| |
|
|
|
Interest and finance expense | | $ | 79.9 | | | $ | 139.9 | | | $ | 98.8 | |
| | |
|
|
| |
|
|
| |
|
|
|
Cash paid for interest expense in 2002 for the Company was $103.9 million (2001—$133.9 million; 2000—$122.7 million)
Gain (loss) on extinguishment of long-term debt
As a result of the early extinguishment of debt in 2002, as noted above, the Company recorded a loss on extinguishment of long-term debt of $9.3 million of which $0.9 million related to premiums, $7.8 million related to the write-off of unamortized deferred financing costs, and $0.6 million related to the write-off of a prepaid premium for an insurance policy guaranteeing Sabine’s long-term debt obligations.
In 2001, the Company repurchased in the open market $21.3 million in face value of its 9½% Senior Notes for an aggregate price of $20.3 million. As a result of these transactions, the Company recorded a gain of $0.8 million, which included the write-off of deferred financing costs related to the notes.
12. LEASE COMMITMENTS
The Company leases refinery equipment, crude oil tankers, catalyst, tank cars, office space, and office equipment from unrelated third parties with lease terms ranging from 1 to 8 years with the option to purchase some of the equipment at the end of the lease term at fair market value. The leases generally provide that the Company pay taxes, insurance, and maintenance expenses related to the leased assets. As of December 31, 2002, net future minimum lease payments under non-cancelable operating leases were as follows (in millions): 2003—$34.8; 2004—$30.3; 2005—$30.0; 2006—$29.1; 2007—$27.5; 2008 and thereafter—$75.7. Rental expense during 2002 was $31.5 million (2001—$26.8 million; 2000—$9.9 million).
F-22
13. RELATED PARTY TRANSACTIONS
The following related party transactions are not discussed elsewhere in the footnotes. See Note 16, Income Taxes for a discussion of intercompany transactions and balances related to a tax sharing agreement between Premcor Inc. and certain of its subsidiaries.
Blackstone
The Company had an agreement with an affiliate of one of Premcor Inc.’s major shareholders, Blackstone Capital Partners III Merchant Banking Fund L.P. and its affiliates (“Blackstone”), under which it incurred a monitoring fee equal to $2.0 million per annum subject to increases relating to inflation. The Company recorded expenses related to the annual monitoring fee and the reimbursement of out-of-pocket costs of $0.3 million, $2.5 million and $2.0 million for the years ended December 31, 2002, 2001 and 2000, respectively. As of December 31, 2001, the Company had a payable to the affiliate of Blackstone of $0.3 million.
Premcor Inc.
As of December 31, 2002, the Company had a payable to Premcor Inc. for management fees paid by Premcor Inc. on the Company’s behalf of $8.3 million (December 31, 2001—$8.8 million). As of December 31, 2002, the Company also had a loan receivable from Premcor Inc. for $8.1 million (December 31, 2001—$7.2 million) which included both principal and interest. The Company’s subsidiary, Premcor Investments Inc., loaned these proceeds to Premcor Inc. to allow Premcor Inc. to pay certain fees. The loan bears interest at 12% per annum.
Premcor USA
In 2002, the Company received capital contributions from Premcor USA totaling $278.3 million, which included cash contributions of $248.1 million, which were used primarily for the early repayment of long-term debt, and a non-cash contribution of the 10% equity interest in Sabine that Premcor Inc. acquired from Occidental. In 2001 and 2000, the Company returned capital to Premcor USA of $25.8 million and $35.5 million, respectively. The capital returned in 2001 included $25.0 million that was used by Premcor USA to repurchase a portion of its long-term debt and exchangeable preferred stock. The remaining $0.8 million in 2001 and $35.5 million in 2000 were returned to Premcor USA to permit it to pay interest obligations.
Fuel Strategies International, Inc.
The Company has an agreement with Fuel Strategies International (“FSI”) with an initial term from June 2002 to May 2003. The principal of FSI is the brother of the Company’s chairman and chief executive officer. For the year ended December 31, 2002, the Company incurred fees of $0.2 million related to this agreement. The agreement will automatically renew for additional one-year periods unless terminated by either party upon 90 days notice prior to expiration.
14. EMPLOYEE BENEFIT PLANS
Pension and Other Postretirement Benefit Plans
The Company has two qualified non-contributory cash balance defined benefit pension plans which were adopted in 2002 and cover most full-time employees. Neither of the two plans provided benefits for years prior to 2002. The Company also has a non-qualified cash balance defined benefit restoration plan, which provides benefits in excess of government limits placed on a qualified defined benefit plan. The two qualified plans are funded and contributions will meet or exceed the Employee Retirement Income Security Act of 1974, as amended (“ERISA”) minimum funding requirements. The cash balance defined benefit restoration plan is not funded. The Company also sponsors post-retirement health care and life insurance benefit plans, which are not funded and cover most retired employees. The health care benefits are contributory. The life insurance benefits are non-contributory to a base amount and contributory for coverage over that base.
F-23
The tables which follow provide a reconciliation of the changes in the plans’ benefit obligations and fair value of assets for the year ended December 31, 2002 and also for the year ended December 31, 2001 for other postretirement benefits. Since the defined benefit pension plans were adopted in 2002, information for 2001 is not applicable.
| | | Other Postretirement
Benefits
| | | Pension
Benefits
| |
| | | 2001
| | | 2002
| | | 2002
| |
CHANGE IN BENEFIT OBLIGATION: | | | | | | | | | | | | |
Benefit obligation at beginning of year | | $ | 42.1 | | | $ | 61.7 | | | $ | — | |
Service costs | | | 1.3 | | | | 2.1 | | | | 6.1 | |
Interest costs | | | 3.4 | | | | 4.8 | | | | — | |
Participants’ contribution | | | 0.7 | | | | 0.8 | | | | — | |
Plan amendments | | | 0.7 | | | | — | | | | — | |
Curtailment gain | | | (1.6 | ) | | | (4.0 | ) | | | — | |
Actuarial loss | | | 17.9 | | | | 12.4 | | | | 0.3 | |
Special termination benefits | | | — | | | | 2.5 | | | | — | |
Benefits paid | | | (2.8 | ) | | | (3.5 | ) | | | (0.4 | ) |
| | |
|
|
| |
|
|
| |
|
|
|
Benefit obligation at end of year | | | 61.7 | | | | 76.8 | | | | 6.0 | |
| | | |
CHANGE IN PLAN ASSETS: | | | | | | | | | | | | |
Fair value of plan assets at beginning of year | | | — | | | | — | | | | — | |
Employer contributions | | | 2.1 | | | | 2.7 | | | | 0.5 | |
Participant contributions | | | 0.7 | | | | 0.8 | | | | — | |
Benefits paid | | | (2.8 | ) | | | (3.5 | ) | | | (0.4 | ) |
| | |
|
|
| |
|
|
| |
|
|
|
Fair value of plan assets at end of year | | | — | | | | — | | | | 0.1 | |
| | | |
RECONCILIATION OF FUNDED STATUS: | | | | | | | | | | | | |
Funded status | | | (61.7 | ) | | | (76.8 | ) | | | (5.9 | ) |
Unrecognized actuarial loss | | | 17.7 | | | | 25.0 | | | | 0.3 | |
Unrecognized prior service cost | | | 0.6 | | | | 0.5 | | | | — | |
| | |
|
|
| |
|
|
| |
|
|
|
Accrued benefit liability | | $ | (43.4 | ) | | $ | (51.3 | ) | | $ | (5.6 | ) |
| | |
|
|
| |
|
|
| |
|
|
|
| | | |
WEIGHTED AVERAGE ASSUMPTIONS: | | | | | | | | | | | | |
Discount rate | | | 7.25 | % | | | 6.75 | % | | | 6.75 | % |
Expected return on plan assets | | | N/A | | | | N/A | | | | 8.50 | % |
Rate of compensation increase | | | 4.00 | % | | | 4.00 | % | | | 4.00 | % |
The components of net periodic benefit costs were as follows for the years ended December 31:
| | | Other Postretirement Benefits
| | Pension
Benefits
|
| | | 2000
| | 2001
| | 2002
| | 2002
|
Service costs | | $1.3 | | $1.3 | | $ | 2.1 | | $ | 5.6 |
Interest costs | | 2.9 | | 3.4 | | | 4.8 | | | — |
Recognized actuarial loss | | — | | — | | | 1.0 | | | — |
| | |
| |
| |
|
| |
|
|
Net periodic benefit cost . | | $4.2 | | $4.7 | | $ | 7.9 | | $ | 5.6 |
| | |
| |
| |
|
| |
|
|
F-24
In measuring the expected postretirement benefit obligation and expense, the Company assumed a rate of 12% in 2002, declining by 1% per year to an ultimate rate of 5% for the increase in the per capita cost of covered health care benefits. Assumed health care cost trend rates have a significant effect on the amounts reported for the health care plan. A one-percentage-point change in assumed health care cost trend rates would have the following effects:
| | | 1% Increase
| | 1% Decrease
|
Effect on total service and interest costs | | $ 1.2 | | $(0.8) |
Effect on postretirement benefit obligation | | $12.4 | | $(9.9) |
Employee Savings Plan
The Premcor Refining Group Retirement Savings Plan and separate Trust (the “Plan”), a defined contribution plan, covers substantially all employees of the Company. This Plan, which is subject to the provisions of ERISA, permits employees to make before-tax and after-tax contributions and provides for employer incentive matching contributions. The Company contributions to the Plan during 2002 were $8.3 million (2001—$8.4 million; 2000—$8.7 million).
15. INCOME TAXES
The Company’s income tax (provision) benefit is summarized as follows:
| | | For the Year Ended December 31,
| |
| | | 2000
| | | 2001
| | | 2002
| |
Income (loss) from continuing operations before income taxes and minority interest | | $ | 82.2 | | | $ | 244.7 | | | $ | (189.4 | ) |
| | |
|
|
| |
|
|
| |
|
|
|
Income tax (provision) benefit: | | | | | | | | | | | | |
Current (provision) benefit—Federal | | $ | (5.5 | ) | | $ | (7.5 | ) | | $ | 2.7 | |
| —State | | | 0.6 | | | | (0.6 | ) | | | (0.3 | ) |
| | |
|
|
| |
|
|
| |
|
|
|
| | | | (4.9 | ) | | | (8.1 | ) | | | 2.4 | |
| | |
|
|
| |
|
|
| |
|
|
|
Deferred (provision) benefit—Federal | | | 7.1 | | | | (65.9 | ) | | | 58.4 | |
| —State | | | — | | | | 1.0 | | | | 12.5 | |
| | |
|
|
| |
|
|
| |
|
|
|
| | | | 7.1 | | | | (64.9 | ) | | | 70.9 | |
| | |
|
|
| |
|
|
| |
|
|
|
Income tax (provision) benefit | | $ | 2.2 | | | $ | (73.0 | ) | | $ | 73.3 | |
| | |
|
|
| |
|
|
| |
|
|
|
A reconciliation between the income tax (provision) benefit computed on pretax income at the statutory federal rate and the actual (provision) benefit for income taxes is as follows:
| | | For the Year Ended December 31,
| |
| | | 2000
| | | 2001
| | | 2002
| |
Federal taxes computed at 35% | | $ | (28.8 | ) | | $ | (85.6 | ) | | $ | 66.3 | |
State taxes, net of federal effect | | | (3.0 | ) | | | (2.9 | ) | | | 7.9 | |
Valuation allowance | | | 33.9 | | | | 12.4 | | | | (2.8 | ) |
Other items, net | | | 0.1 | | | | 3.1 | | | | 1.9 | |
| | |
|
|
| |
|
|
| |
|
|
|
Income tax (provision) benefit | | $ | 2.2 | | | $ | (73.0 | ) | | $ | 73.3 | |
| | |
|
|
| |
|
|
| |
|
|
|
F-25
The following represents the approximate tax effect of each significant temporary difference giving rise to deferred tax liabilities and assets:
| | | December 31,
| |
| | | 2001
| | | 2002
| |
Deferred tax liabilities: | | | | | | | | |
Property, plant and equipment | | $ | 154.6 | | | $ | 189.5 | |
Turnaround costs | | | 34.1 | | | | 31.3 | |
Inventory | | | 4.3 | | | | 3.9 | |
Other | | | 1.7 | | | | 2.1 | |
| | |
|
|
| |
|
|
|
| | | | 194.7 | | | | 226.8 | |
| | |
|
|
| |
|
|
|
Deferred tax assets: | | | | | | | | |
Alternative minimum tax credit | | | 23.4 | | | | 23.2 | |
Environmental and other future costs | | | 43.3 | | | | 54.8 | |
Tax loss carryforwards | | | 67.6 | | | | 145.8 | |
Federal business tax credits | | | 5.4 | | | | 8.3 | |
Stock-based compensation expense | | | — | | | | 5.6 | |
Organizational and working capital costs | | | 2.4 | | | | 1.6 | |
Other | | | 6.0 | | | | 10.1 | |
| | |
|
|
| |
|
|
|
| | | | 148.1 | | | | 249.4 | |
| | |
|
|
| |
|
|
|
Valuation allowance | | | — | | | | (2.8 | ) |
| | |
|
|
| |
|
|
|
Net deferred tax asset (liability) | | $ | (46.6 | ) | | $ | 19.8 | |
| | |
|
|
| |
|
|
|
As of December 31, 2002, the Company has made net cumulative payments of $23.2 million under the federal alternative minimum tax system which are available to reduce future regular income tax payments. As of December 31, 2002, the Company had a federal net operating loss carryforward of $372.1 million. As of December 31, 2002, the Company had federal business tax credit carryforwards in the amount of $8.3 million. Such operating losses and tax credit carryforwards have carryover periods of 15 years (20 years for losses and credits originating in 1998 and years thereafter) and are available to reduce future tax liabilities through the year ending December 31, 2022. The tax credit carryover periods will begin to terminate with the year ending December 31, 2003 and the net operating loss carryover periods will begin to terminate with the year ending December 31, 2011.
The valuation allowance of the Company as of December 31, 2002 was $2.8 million (2001—nil). The increase of the deferred tax valuation allowance in 2002 is primarily the result of the Company’s analysis of the likelihood of realizing the future benefit of a portion of its federal business credits and a portion of its state tax loss carryforwards. As of December 31, 2000, the Company provided a valuation allowance to reduce its deferred tax assets to amounts that were more likely than not to be realized. During the first quarter of 2001, the Company reversed its remaining deferred tax valuation allowance. In calculating the reversal of its deferred tax valuation allowance in 2001, the Company assumed as future taxable income future reversals of existing taxable temporary differences, future taxable income exclusive of reversing temporary differences and available tax planning strategies. The reversal of its remaining deferred tax valuation allowance in 2001 was primarily the result of the Company’s analysis of the likelihood of realizing the future tax benefit of its federal and state tax loss carryforwards, alternative minimum tax credits and federal and state business tax credits.
During 2002, the Company received net federal cash refunds of $12.6 million (2001—$14.5 million net federal cash payments; 2000—$0.6 million net federal cash refunds). The Company provides for its portion of consolidated refunds and liability under its tax sharing agreement with Premcor Inc. As of December 31, 2002,
F-26
the Company had an amount due to Premcor Inc. of $12.7 million and an amount due to Premcor USA of $11.8 million related to income taxes. During 2002, the Company made net state cash payments of $0.3 million (2001—$1.7 million; 2000—$1.8 million).
The Company’s income tax benefit of $73.3 million for 2002 reflected the effect of the increase in the deferred tax valuation allowance of $2.8 million. The Company’s income tax provision of $73.0 million for 2001 reflected the effect of the decrease in the deferred tax valuation allowance of $12.4 million. The income tax benefit of $2.2 million for 2000 reflected the effect of the decrease in the deferred tax valuation allowance of $33.9 million.
16. STOCKHOLDER’S EQUITY
As a result of the Sabine restructuring on June 6, 2002, as discussed in Note 3, Premcor Inc. acquired Occidental’s 10% ownership interest in Sabine and subsequently contributed its entire 100% ownership interest in Sabine to Premcor USA and Premcor USA, in turn, contributed its 100% ownership interest in Sabine to PRG.
In August 1999, Blackstone and Occidental signed capital contribution agreements related to the financing of the heavy oil upgrade project totaling $135.0 million. Blackstone agreed to contribute $121.5 million, and Occidental agreed to contribute $13.5 million. Funding of the capital contributions occurred on a pro-rata basis as proceeds were received from borrowings under the senior loan agreement. In the third quarter of 2001, PACC decided not to borrow the remaining loan commitment under the bank senior loan agreement, and consequently forfeited the remaining $13.2 million outstanding capital contributions. The ability to draw any remaining funds under the bank senior loan agreement and receive the remaining capital contributions expired in September of 2001 upon the achievement of substantial reliability of the heavy oil upgrade project. As of December 31, 2001, Blackstone and Occidental contributed $109.6 million and $12.2 million, respectively, of their commitments. Occidental’s contributions under the capital contribution agreement and subsequent 10% equity interest in earnings in Sabine were reflected as minority interest in the financial statements.
17. STOCK OPTION PLANS
As of December 31, 2002, Premcor Inc. had three stock-based employee compensation plans. In connection with the employment of Thomas D. O’Malley in 2002, Premcor Inc. adopted the 2002 Special Stock Incentive Plan, which allows for the issuance of options for the purchase of Premcor Inc. common stock. Under this plan, options on 3,400,000 shares of Premcor Inc. common stock may be awarded. Options granted under this plan vest 1/3 on each of the first three anniversaries of the date of grant. Also in 2002, Premcor Inc. adopted the 2002 Equity Incentive Plan to award key employees, directors, and consultants with various stock options, stock appreciation rights, restricted stock, performance-based awards and other common stock based awards of Premcor Inc. common stock. Under this plan, options for 1,500,000 shares of Premcor Inc. common stock may be awarded and these options vest 1/3 on each of the first three anniversaries of the date of grant.
In 1999, the Company adopted the Premcor 1999 Stock Incentive Plan. Under this plan, employees are eligible to receive awards of options to purchase shares of the common stock of Premcor Inc. Options in an aggregate amount of 2,215,250 shares of Premcor Inc.’s common stock may be awarded under this plan. Options granted under this plan were either time vesting or performance vesting options. Time vesting options typically vest over three to five years. As of December 31, 2002, 50% of the outstanding performance vesting options vested based on the Company’s stock price following the initial public offering of common stock.
F-27
Information regarding stock option plans as of December 31, 2000, 2001 and 2002 is as follows:
| | | 2000
| | 2001
| | 2002
|
| | | Shares
| | | Weighted
Average
Exercise
Price
| | Shares
| | | Weighted
Average
Exercise
Price
| | Shares
| | | Weighted
Average
Exercise
Price
|
Options outstanding, beginning of period | | 1,955,505 | | | $ | 10.31 | | 1,832,805 | | | $ | 10.25 | | 1,856,555 | | | $ | 10.24 |
Granted | | 207,300 | | | | 9.90 | | 200,000 | | | | 9.90 | | 4,031,000 | | | | 14.38 |
Exercised | | — | | | | — | | — | | | | — | | (608,700 | ) | | | 10.40 |
Forfeited | | (330,000 | ) | | | 10.36 | | (176,250 | ) | | | 9.90 | | (689,375 | ) | | | 11.59 |
| | |
|
| | | | |
|
| | | | |
|
| | | |
Options outstanding, end of period | | 1,832,805 | | | | 10.25 | | 1,856,555 | | | | 10.25 | | 4,589,480 | | | | 13.66 |
| | |
|
| | | | |
|
| | | | |
|
| | | |
| | | | | | |
Exercisable at end of period | | 458,500 | | | $ | 11.26 | | 560,500 | | | $ | 11.01 | | 430,080 | | | $ | 10.81 |
Information regarding stock options granted during 2000, 2001, and 2002 is as follows:
| | | 2000
| | 2001
| | 2002
|
Options granted at an exercise price less than market price on grant date | | | — | | | | | — | | | | | 3,625,000 | | |
Weighted average exercise price | | | — | | | | | — | | | | $ | 13.41 | | |
Weighted average fair value | | | — | | | | | — | | | | $ | 12.92 | | |
Options granted at an exercise price equal to market price on grant date | | | 207,300 | | | | | 200,000 | | | | | 406,000 | | |
Weighted average exercise price | | $ | 9.90 | | | | $ | 9.90 | | | | $ | 22.98 | | |
Weighted average fair value | | $ | 3.65 | | | | $ | 3.10 | | | | $ | 9.65 | | |
Information regarding stock options outstanding as of December 31, 2002 is as follows:
| | | Options Outstanding
| | Options Exercisable
|
Exercise Price
| | Options
Outstanding
| | Weighted
Average
Exercise
Price
| | Remaining
Contractual Life (in years)
| | Options
Exercisable
| | Weighted
Average
Exercise
Price
|
$ 9.90–$12.90 | | 3,213,480 | | $ | 9.98 | | 8.4 | | 362,580 | | $ | 9.90 |
$15.00–$15.92 | | 87,500 | | | 14.38 | | 6.0 | | 62,500 | | | 15.00 |
$15.93–$18.93 | | 12,500 | | | 18.50 | | 9.7 | | — | | | — |
$18.94–$23.34 | | 960,000 | | | 22.44 | | 6.4 | | — | | | — |
$23.35–$25.00 | | 316,000 | | | 24.02 | | 9.3 | | 5,000 | | | 24.00 |
| | |
| | | | | | |
| | | |
| | | 4,589,480 | | | 13.66 | | 8.6 | | 430,080 | | | 10.81 |
| | |
| | | | | | |
| | | |
The fair value of these options was estimated on the grant date using the Black-Scholes option-pricing model with the following weighted average assumptions:
| | | 2000
| | 2001
| | 2002
|
Assumed risk-free rate | | 5.82% | | 4.95% | | 5.04% |
Expected life | | 7.9 years | | 7.6 years | | 3.76 years |
Volatility rate | | 1.0% | | 1.0% | | 38.87% |
Expected dividend yields | | 0% | | 0% | | 0% |
F-28
| 18. | CONSOLIDATING FINANCIAL STATEMENTS OF PRG AS CO-GUARANTOR OF PAFC’S 12½% SENIOR NOTES |
Presented below are the PRG consolidating balance sheets, statement of operations, and cash flows as required by Rule 3-10 of the Securities Exchange Act of 1934, as amended. Under Rule 3-10, the consolidating balance sheets, statement of operations, and cash flows presented below meet the requirements for financial statements of the issuer and each guarantor of the 12½% Senior Notes since the issuer and guarantors are all direct or indirect subsidiaries of PRG as well as full and unconditional guarantors.
In addition to the relationships related to the 12½% Senior Notes, there are several intercompany agreements between PACC (included in Other Guarantor Subsidiaries) and PRG that dictate their operational relationships due to the full integration of their respective Port Arthur facilities. Principally, PACC leases the crude unit and the hydrotreater from PRG and then sells to PRG the refined products and intermediate products produced by its heavy oil processing facility. PRG then sells these products to third parties. The net receivables and payables related to these transactions are shown by each company and eliminated in consolidation of PRG.
F-29
THE PREMCOR REFINING GROUP INC. AND SUBSIDIARIES
CONSOLIDATING BALANCE SHEET
As of December 31, 2002
| | | PRG
| | PAFC
| | Other
Guarantor
Subsidiaries
| | Eliminations
| | | Consolidated
PRG
|
| ASSETS | | (in millions) |
| | | | | |
CURRENT ASSETS: | | | | | | | | | | | | | | | | |
Cash and cash equivalents | | $ | 119.7 | | $ | — | | $ | — | | $ | — | | | $ | 119.7 |
Short-term investments | | | 1.7 | | | — | | | — | | | — | | | | 1.7 |
Cash and cash equivalents restricted for debt service | | | — | | | — | | | 61.7 | | | — | | | | 61.7 |
Accounts receivable | | | 268.7 | | | — | | | 0.3 | | | — | | | | 269.0 |
Receivable from affiliates | | | 32.9 | | | 29.2 | | | 50.7 | | | (99.7 | ) | | | 13.1 |
Inventories | | | 259.7 | | | — | | | 27.6 | | | — | | | | 287.3 |
Prepaid expenses and other | | | 43.7 | | | — | | | 2.0 | | | — | | | | 45.7 |
Assets held for sale | | | 49.3 | | | — | | | — | | | — | | | | 49.3 |
| | |
|
| |
|
| |
|
| |
|
|
| |
|
|
Total current assets | | | 775.7 | | | 29.2 | | | 142.3 | | | (99.7 | ) | | | 847.5 |
| | | | | |
PROPERTY, PLANT AND EQUIPMENT, NET | | | 651.3 | | | — | | | 610.4 | | | — | | | | 1,261.7 |
DEFERRED INCOME TAXES | | | 67.0 | | | — | | | — | | | (47.2 | ) | | | 19.8 |
INVESTMENT IN AFFILIATE | | | 330.9 | | | — | | | — | | | (330.9 | ) | | | — |
OTHER ASSETS | | | 101.4 | | | — | | | 15.9 | | | — | | | | 117.3 |
NOTE RECEIVABLE FROM AFFILIATE | | | 2.3 | | | 235.9 | | | — | | | (238.2 | ) | | | — |
| | |
|
| |
|
| |
|
| |
|
|
| |
|
|
| | | $ | 1,928.6 | | $ | 265.1 | | $ | 768.6 | | $ | (716.0 | ) | | $ | 2,246.3 |
| | |
|
| |
|
| |
|
| |
|
|
| |
|
|
| | | | |
| LIABILITIES AND STOCKHOLDER’S EQUITY | | | | | | | | | |
| | | | | |
CURRENT LIABILITIES: | | | | | | | | | | | | | | | | |
Accounts payable | | $ | 342.9 | | $ | — | | $ | 123.3 | | $ | — | | | $ | 466.2 |
Payable to affiliates | | | 117.7 | | | — | | | 20.1 | | | (96.8 | ) | | | 41.0 |
Accrued expenses and other | | | 40.9 | | | 14.4 | | | 0.4 | | | — | | | | 55.7 |
Accrued taxes other than income | | | 21.1 | | | — | | | 5.3 | | | — | | | | 26.4 |
Current portion of long-term debt | | | 0.2 | | | 14.8 | | | — | | | — | | | | 15.0 |
Current portion of notes payable to affiliate | | | — | | | — | | | 2.9 | | | (2.9 | ) | | | — |
| | |
|
| |
|
| |
|
| |
|
|
| |
|
|
Total current liabilities | | | 522.8 | | | 29.2 | | | 152.0 | | | (99.7 | ) | | | 604.3 |
| | | | | |
LONG-TERM DEBT | | | 633.9 | | | 235.9 | | | — | | | — | | | | 869.8 |
DEFERRED INCOME TAXES | | | — | | | — | | | 47.2 | | | (47.2 | ) | | | — |
OTHER LONG-TERM LIABILITIES | | | 144.1 | | | — | | | 0.3 | | | — | | | | 144.4 |
NOTE PAYABLE TO AFFILIATE | | | — | | | — | | | 238.2 | | | (238.2 | ) | | | — |
COMMITMENTS AND CONTINGENCIES | | | — | | | — | | | — | | | — | | | | — |
| | | | | |
COMMON STOCKHOLDER’S EQUITY: | | | | | | | | | | | | | | | | |
Common stock | | | — | | | — | | | 0.1 | | | (0.1 | ) | | | — |
Paid-in capital | | | 541.4 | | | — | | | 206.0 | | | (206.0 | ) | | | 541.4 |
Retained earnings | | | 86.4 | | | — | | | 124.8 | | | (124.8 | ) | | | 86.4 |
| | |
|
| |
|
| |
|
| |
|
|
| |
|
|
Total common stockholder’s equity | | | 627.8 | | | — | | | 330.9 | | | (330.9 | ) | | | 627.8 |
| | |
|
| |
|
| |
|
| |
|
|
| |
|
|
| | | $ | 1,928.6 | | $ | 265.1 | | $ | 768.6 | | $ | (716.0 | ) | | $ | 2,246.3 |
| | |
|
| |
|
| |
|
| |
|
|
| |
|
|
F-30
THE PREMCOR REFINING GROUP INC. AND SUBSIDIARIES
CONSOLIDATING STATEMENT OF OPERATIONS
For the year ended December 31, 2002
| | | PRG
| | | PAFC
| | | Other Guarantor
Subsidiaries
| | | Eliminations and Minority
Interest
| | | Consolidated
PRG
| |
| | | | | | | | | (in millions) | | | | | | | |
NET SALES AND OPERATING REVENUES | | $ | 7,134.3 | | | $ | — | | | $ | 1,950.9 | | | $ | (2,312.6 | ) | | $ | 6,772.6 | |
| | | | | |
EQUITY IN EARNINGS OF AFFILIATE | | | 2.6 | | | | — | | | | — | | | | (2.6 | ) | | | — | |
| | | | | |
EXPENSES: | | | | | | | | | | | | | | | | | | | | |
Cost of sales | | | 6,650.3 | | | | — | | | | 1,736.6 | | | | (2,280.9 | ) | | | 6,106.0 | |
Operating expenses | | | 334.6 | | | | — | | | | 128.6 | | | | (31.7 | ) | | | 431.5 | |
General and administrative expenses | | | 47.2 | | | | — | | | | 4.3 | | | | — | | | | 51.5 | |
Stock-based compensation | | | 14.0 | | | | — | | | | — | | | | — | | | | 14.0 | |
Depreciation | | | 27.5 | | | | — | | | | 21.3 | | | | — | | | | 48.8 | |
Amortization | | | 40.1 | | | | — | | | | — | | | | — | | | | 40.1 | |
Refinery restructuring and other charges | | | 166.1 | | | | — | | | | 2.6 | | | | — | | | | 168.7 | |
| | |
|
|
| |
|
|
| |
|
|
| |
|
|
| |
|
|
|
| | | | 7,279.8 | | | | — | | | | 1,893.4 | | | | (2,312.6 | ) | | | 6,860.6 | |
| | |
|
|
| |
|
|
| |
|
|
| |
|
|
| |
|
|
|
OPERATING INCOME (LOSS) | | | (142.9 | ) | | | — | | | | 57.5 | | | | (2.6 | ) | | | (88.0 | ) |
Interest and finance expense | | | (56.1 | ) | | | (38.5 | ) | | | (44.6 | ) | | | 40.4 | | | | (98.8 | ) |
Loss on extinguishment of long-term debt | | | (1.0 | ) | | | — | | | | (8.3 | ) | | | — | | | | (9.3 | ) |
Interest income | | | 6.4 | | | | 38.5 | | | | 2.2 | | | | (40.4 | ) | | | 6.7 | |
| | |
|
|
| |
|
|
| |
|
|
| |
|
|
| |
|
|
|
INCOME (LOSS) BEFORE INCOME TAXES AND MINORITY INTEREST | | | (193.6 | ) | | | — | | | | 6.8 | | | | (2.6 | ) | | | (189.4 | ) |
Income tax (provision) benefit | | | 75.8 | | | | — | | | | (2.5 | ) | | | — | | | | 73.3 | |
Minority interest | | | — | | | | — | | | | — | | | | 1.7 | | | | 1.7 | |
| | |
|
|
| |
|
|
| |
|
|
| |
|
|
| |
|
|
|
NET INCOME (LOSS) | | $ | (117.8 | ) | | $ | — | | | $ | 4.3 | | | $ | (0.9 | ) | | $ | (114.4 | ) |
| | |
|
|
| |
|
|
| |
|
|
| |
|
|
| |
|
|
|
F-31
THE PREMCOR REFINING GROUP INC. AND SUBSIDIARIES
CONSOLIDATING STATEMENT OF CASH FLOWS
For the year ended December 31, 2002
| | | PRG
| | | PAFC
| | | Other Guarantor
Subsidiaries
| | | Eliminations and Minority
Interest
| | | Consolidated
PRG
| |
| | | | | | | | | (in millions) | | | | | | | |
CASH FLOWS FROM OPERATING ACTIVITIES: | | | | | | | | | | | | | | | | | | | | |
Net income (loss) | | $ | (117.8 | ) | | $ | — | | | $ | 4.3 | | | $ | (0.9 | ) | | $ | (114.4 | ) |
Adjustments: | | | | | | | | | | | | | | | | | | | | |
Depreciation | | | 27.5 | | | | — | | | | 21.3 | | | | — | | | | 48.8 | |
Amortization | | | 47.0 | | | | — | | | | 3.5 | | | | — | | | | 50.5 | |
Deferred income taxes | | | (78.0 | ) | | | — | | | | 6.6 | | | | — | | | | (71.4 | ) |
Stock-based compensation | | | 14.0 | | | | — | | | | — | | | | — | | | | 14.0 | |
Minority interest | | | — | | | | — | | | | — | | | | (1.7 | ) | | | (1.7 | ) |
Refinery restructuring and other charges | | | 110.3 | | | | — | | | | — | | | | — | | | | 110.3 | |
Write-off of deferred financing costs | | | 1.1 | | | | — | | | | 6.8 | | | | — | | | | 7.9 | |
Equity in earnings of affiliate | | | (2.6 | ) | | | — | | | | — | | | | 2.6 | | | | — | |
Other, net | | | 5.7 | | | | — | | | | 0.5 | | | | — | | | | 6.2 | |
Cash provided by (reinvested in) working capital: | | | | | | | | | | | | | | | | | | | | |
Accounts receivable, prepaid expenses and other | | | (132.9 | ) | | | — | | | | 9.2 | | | | — | | | | (123.7 | ) |
Inventories | | | 18.5 | | | | — | | | | 12.5 | | | | — | | | | 31.0 | |
Accounts payable, accrued expenses, and taxes other than income, and other | | | 17.4 | | | | (5.0 | ) | | | 40.7 | | | | — | | | | 53.1 | |
Cash and cash equivalents restricted for debt service | | | — | | | | — | | | | 14.3 | | | | — | | | | 14.3 | |
Affiliate receivables and payables | | | 84.7 | | | | 296.9 | | | | (372.2 | ) | | | — | | | | 9.4 | |
| | |
|
|
| |
|
|
| |
|
|
| |
|
|
| |
|
|
|
Net cash provided by operating activities of continued operations | | | (5.1 | ) | | | 291.9 | | | | (252.5 | ) | | | — | | | | 34.3 | |
Net cash used in operating activities of discontinued operations | | | (3.4 | ) | | | — | | | | — | | | | — | | | | (3.4 | ) |
| | |
|
|
| |
|
|
| |
|
|
| |
|
|
| |
|
|
|
Net cash provided by operating activities | | | (8.5 | ) | | | 291.9 | | | | (252.5 | ) | | | — | | | | 30.9 | |
| | |
|
|
| |
|
|
| |
|
|
| |
|
|
| |
|
|
|
CASH FLOWS FROM INVESTING ACTIVITIES: | | | | | | | | | | | | | | | | | | | | |
Expenditures for property, plant and equipment | | | (115.0 | ) | | | — | | | | 0.7 | | | | — | | | | (114.3 | ) |
Expenditures for turnaround | | | (34.1 | ) | | | — | | | | (0.2 | ) | | | — | | | | (34.3 | ) |
Cash and cash equivalents restricted for investment in capital additions | | | 7.3 | | | | — | | | | — | | | | — | | | | 7.3 | |
| | |
|
|
| |
|
|
| |
|
|
| |
|
|
| |
|
|
|
Net cash provided by (used in) investing activities | | | (141.8 | ) | | | — | | | | 0.5 | | | | — | | | | (141.3 | ) |
| | |
|
|
| |
|
|
| |
|
|
| |
|
|
| |
|
|
|
CASH FLOWS FROM FINANCING ACTIVITIES: | | | | | | | | | | | | | | | | | | | | |
Long-term debt and capital lease payments | | | (152.0 | ) | | | (291.9 | ) | | | — | | | | — | | | | (443.9 | ) |
Cash and cash equivalents restricted for debt repayment | | | — | | | | — | | | | (45.2 | ) | | | — | | | | (45.2 | ) |
Capital contribution received | | | 163.9 | | | | — | | | | 84.2 | | | | — | | | | 248.1 | |
Deferred financing costs | | | (1.6 | ) | | | — | | | | (9.8 | ) | | | — | | | | (11.4 | ) |
| | |
|
|
| |
|
|
| |
|
|
| |
|
|
| |
|
|
|
Net cash provided by (used in) financing activities | | | 10.3 | | | | (291.9 | ) | | | 29.2 | | | | — | | | | (252.4 | ) |
| | |
|
|
| |
|
|
| |
|
|
| |
|
|
| |
|
|
|
NET INCREASE (DECREASE) IN CASH AND CASH EQUIVALENTS | | | (140.0 | ) | | | — | | | | (222.8 | ) | | | — | | | | (362.8 | ) |
CASH AND CASH EQUIVALENTS, beginning of period | | | 259.7 | | | | — | | | | 222.8 | | | | — | | | | 482.5 | |
| | |
|
|
| |
|
|
| |
|
|
| |
|
|
| |
|
|
|
CASH AND CASH EQUIVALENTS, end of period | | $ | 119.7 | | | $ | — | | | $ | — | | | $ | — | | | $ | 119.7 | |
| | |
|
|
| |
|
|
| |
|
|
| |
|
|
| |
|
|
|
F-32
THE PREMCOR REFINING GROUP INC. AND SUBSIDIARIES
CONSOLIDATING BALANCE SHEET
As of December 31, 2001
| | | PRG
| | PAFC
| | Other Guarantor
Subsidiaries
| | Eliminations
and Minority
Interest
| | | Consolidated
PRG
|
| | | | | | | (in millions) | | | | | |
ASSETS | | | | | | | | | | | | | | | | |
CURRENT ASSETS: | | | | | | | | | | | | | | | | |
Cash and cash equivalents | | $ | 259.7 | | $ | — | | $ | 222.8 | | $ | — | | | $ | 482.5 |
Short-term investments | | | 1.7 | | | — | | | — | | | — | | | | 1.7 |
Cash and cash equivalents restricted for debt service | | | — | | | — | | | 30.8 | | | — | | | | 30.8 |
Accounts receivable | | | 148.3 | | | — | | | — | | | — | | | | 148.3 |
Receivable from affiliates | | | 60.8 | | | 99.0 | | | 25.1 | | | (172.8 | ) | | | 12.1 |
Inventories | | | 278.2 | | | — | | | 40.1 | | | — | | | | 318.3 |
Prepaid expenses and other | | | 31.2 | | | — | | | 11.5 | | | — | | | | 42.7 |
| | |
|
| |
|
| |
|
| |
|
|
| |
|
|
Total current assets | | | 779.9 | | | 99.0 | | | 330.3 | | | (172.8 | ) | | | 1,036.4 |
| | | | | |
PROPERTY, PLANT AND EQUIPMENT, NET | | | 666.3 | | | — | | | 632.4 | | | — | | | | 1,298.7 |
INVESTMENT IN AFFILIATE | | | 218.1 | | | — | | | — | | | (218.1 | ) | | | — |
OTHER ASSETS | | | 126.4 | | | — | | | 16.4 | | | — | | | | 142.8 |
NOTE RECEIVABLE FROM AFFILIATE | | | 4.9 | | | 463.0 | | | — | | | (467.9 | ) | | | — |
| | |
|
| |
|
| |
|
| |
|
|
| |
|
|
| | | $ | 1,795.6 | | $ | 562.0 | | $ | 979.1 | | $ | (858.8 | ) | | $ | 2,477.9 |
| | |
|
| |
|
| |
|
| |
|
|
| |
|
|
LIABILITIES AND STOCKHOLDER’S EQUITY | | | | | | | | | | | | | | | | |
| | | | | |
CURRENT LIABILITIES: | | | | | | | | | | | | | | | | |
Accounts payable | | $ | 284.1 | | $ | — | | $ | 82.3 | | $ | — | | | $ | 366.4 |
Payable to affiliates | | | 63.4 | | | — | | | 137.2 | | | (170.0 | ) | | | 30.6 |
Accrued expenses and other | | | 72.6 | | | 19.4 | | | 1.1 | | | — | | | | 93.1 |
Accrued taxes other than income | | | 30.8 | | | — | | | 4.9 | | | — | | | | 35.7 |
Current portion of long-term debt | | | 1.8 | | | 79.6 | | | — | | | — | | | | 81.4 |
Current portion of notes payable to affiliate | | | — | | | — | | | 2.8 | | | (2.8 | ) | | | — |
| | |
|
| |
|
| |
|
| |
|
|
| |
|
|
Total current liabilities | | | 452.7 | | | 99.0 | | | 228.3 | | | (172.8 | ) | | | 607.2 |
LONG-TERM DEBT | | | 784.0 | | | 463.0 | | | — | | | — | | | | 1,247.0 |
DEFERRED INCOME TAXES | | | 6.0 | | | — | | | 40.6 | | | — | | | | 46.6 |
OTHER LONG-TERM LIABILITIES | | | 109.1 | | | — | | | — | | | — | | | | 109.1 |
NOTE PAYABLE TO AFFILIATE | | | — | | | — | | | 467.9 | | | (467.9 | ) | | | — |
COMMITMENTS AND CONTINGENCIES | | | — | | | — | | | — | | | — | | | | — |
| | | | | |
MINORITY INTEREST | | | — | | | — | | | — | | | 24.2 | | | | 24.2 |
| | | | | |
COMMON STOCKHOLDER’S EQUITY: | | | | | | | | | | | | | | | | |
Common stock | | | — | | | — | | | 0.1 | | | (0.1 | ) | | | — |
Paid-in capital | | | 243.0 | | | — | | | 121.7 | | | (121.7 | ) | | | 243.0 |
Retained earnings (deficit) | | | 200.8 | | | — | | | 120.5 | | | (120.5 | ) | | | 200.8 |
| | |
|
| |
|
| |
|
| |
|
|
| |
|
|
Total common stockholder’s equity | | | 443.8 | | | — | | | 242.3 | | | (242.3 | ) | | | 443.8 |
| | |
|
| |
|
| |
|
| |
|
|
| |
|
|
| | | $ | 1,795.6 | | $ | 562.0 | | $ | 979.1 | | $ | (858.8 | ) | | $ | 2,477.9 |
| | |
|
| |
|
| |
|
| |
|
|
| |
|
|
F-33
THE PREMCOR REFINING GROUP INC. AND SUBSIDIARIES
CONSOLIDATING STATEMENT OF OPERATIONS
For the year ended December 31, 2001
| | | PRG
| | | PAFC
| | | Other Guarantor
Subsidiaries
| | | Eliminations
and Minority
Interest
| | | Consolidated
PRG
| |
| | | | | | | | | (in millions) | | | | | | | |
NET SALES AND OPERATING REVENUES | | $ | 6,532.8 | | | $ | — | | | $ | 1,882.4 | | | $ | (1,997.7 | ) | | $ | 6,417.5 | |
| | | | | |
EQUITY IN EARNINGS OF AFFILIATE | | | 115.3 | | | | — | | | | — | | | | (115.3 | ) | | | — | |
| | | | | |
EXPENSES: | | | | | | | | | | | | | | | | | | | | |
Cost of sales | | | 5,759.9 | | | | — | | | | 1,460.2 | | | $ | (1,966.9 | ) | | | 5,253.2 | |
Operating expenses | | | 358.9 | | | | — | | | | 140.4 | | | | (32.4 | ) | | | 466.9 | |
General and administrative expenses | | | 59.0 | | | | — | | | | 4.1 | | | | — | | | | 63.1 | |
Depreciation | | | 32.7 | | | | — | | | | 20.5 | | | | — | | | | 53.2 | |
Amortization | | | 38.7 | | | | — | | | | — | | | | — | | | | 38.7 | |
Refinery restructuring and other charges | | | 176.2 | | | | — | | | | — | | | | — | | | | 176.2 | |
| | |
|
|
| |
|
|
| |
|
|
| |
|
|
| |
|
|
|
| | | | 6,425.4 | | | | — | | | | 1,625.2 | | | | (1,999.3 | ) | | | 6,051.3 | |
| | |
|
|
| |
|
|
| |
|
|
| |
|
|
| |
|
|
|
OPERATING INCOME | | | 222.7 | | | | — | | | | 257.2 | | | | (113.7 | ) | | | 366.2 | |
Interest and finance expense | | | (73.9 | ) | | | (59.5 | ) | | | (66.5 | ) | | | 60.0 | | | | (139.9 | ) |
Gain on extinguishment of long-term debt | | | 0.8 | | | | — | | | | — | | | | — | | | | 0.8 | |
Interest income | | | 11.7 | | | | 59.5 | | | | 6.4 | | | | (60.0 | ) | | | 17.6 | |
| | |
|
|
| |
|
|
| |
|
|
| |
|
|
| |
|
|
|
INCOME FROM CONTINUING OPERATIONS BEFORE INCOME TAXES AND MINORITY INTEREST | | | 161.3 | | | | — | | | | 197.1 | | | | (113.7 | ) | | | 244.7 | |
Income tax provision | | | (4.0 | ) | | | — | | | | (69.0 | ) | | | — | | | | (73.0 | ) |
Minority interest | | | — | | | | — | | | | — | | | | (12.8 | ) | | | (12.8 | ) |
| | |
|
|
| |
|
|
| |
|
|
| |
|
|
| |
|
|
|
INCOME FROM CONTINUING OPERATIONS | | | 157.3 | | | | — | | | | 128.1 | | | | (126.5 | ) | | | 158.9 | |
Loss from discontinued operations, net of tax benefit of $11.5 | | | (18.0 | ) | | | — | | | | — | | | | — | | | | (18.0 | ) |
| | |
|
|
| |
|
|
| |
|
|
| |
|
|
| |
|
|
|
NET INCOME | | $ | 139.3 | | | $ | — | | | $ | 128.1 | | | $ | (126.5 | ) | | $ | 140.9 | |
| | |
|
|
| |
|
|
| |
|
|
| |
|
|
| |
|
|
|
F-34
THE PREMCOR REFINING GROUP INC. AND SUBSIDIARIES
CONSOLIDATING STATEMENT OF CASH FLOWS
For the year ended December 31, 2001
| | | PRG
| | | PAFC
| | | Other Guarantor
Subsidiaries
| | | Eliminations and Minority
Interest
| | | Consolidated
PRG
| |
| | | | | | | | | (in millions) | | | | | | | |
CASH FLOWS FROM OPERATING ACTIVITIES: | | | | | | | | | | | | | | | | | | | | |
Net income (loss) | | $ | 139.3 | | | $ | — | | | $ | 128.1 | | | $ | (126.5 | ) | | $ | 140.9 | |
Discontinued operations | | | 18.0 | | | | — | | | | — | | | | — | | | | 18.0 | |
Adjustments: | | | | | | | | | | | | | | | | | | | | |
Depreciation | | | 32.7 | | | | — | | | | 20.5 | | | | — | | | | 53.2 | |
Amortization | | | 46.7 | | | | — | | | | 3.1 | | | | — | | | | 49.8 | |
Deferred income taxes | | | 24.7 | | | | — | | | | 40.2 | | | | — | | | | 64.9 | |
Minority interest | | | — | | | | — | | | | — | | | | 12.8 | | | | 12.8 | |
Refinery restructuring and other charges | | | 118.5 | | | | — | | | | — | | | | — | | | | 118.5 | |
Equity in earnings of affiliate | | | (115.3 | ) | | | — | | | | — | | | | 115.3 | | | | — | |
Other, net | | | 0.4 | | | | — | | | | 0.8 | | | | — | | | | 1.2 | |
Cash provided by (reinvested in) working capital: | | | | | | | | | | | | | | | | | | | | |
Accounts receivable, prepaid expenses and other | | | 105.0 | | | | — | | | | (6.5 | ) | | | — | | | | 98.5 | |
Inventories | | | 56.5 | | | | — | | | | 5.1 | | | | (1.6 | ) | | | 60.0 | |
Accounts payable, accrued expenses, and taxes other than income, and other | | | (132.0 | ) | | | (2.1 | ) | | | 1.4 | | | | — | | | | (132.7 | ) |
Affiliate receivables and payables | | | (51.1 | ) | | | 2.1 | | | | 36.6 | | | | — | | | | (12.4 | ) |
Cash and cash equivalents restricted for debt service | | | — | | | | — | | | | (24.3 | ) | | | — | | | | (24.3 | ) |
| | |
|
|
| |
|
|
| |
|
|
| |
|
|
| |
|
|
|
Net cash provided by operating activities of continued operations | | | 243.4 | | | | — | | | | 205.0 | | | | — | | | | 448.4 | |
Net cash used in operating activities of discontinued operations | | | (8.4 | ) | | | — | | | | — | | | | — | | | | (8.4 | ) |
| | |
|
|
| |
|
|
| |
|
|
| |
|
|
| |
|
|
|
Net cash provided by operating activities | | | 235.0 | | | | — | | | | 205.0 | | | | — | | | | 440.0 | |
| | |
|
|
| |
|
|
| |
|
|
| |
|
|
| |
|
|
|
CASH FLOWS FROM INVESTING ACTIVITIES: | | | | | | | | | | | | | | | | | | | | |
Expenditures for property, plant and equipment | | | (82.4 | ) | | | — | | | | (12.1 | ) | | | — | | | | (94.5 | ) |
Expenditures for turnaround | | | (49.2 | ) | | | — | | | | — | | | | — | | | | (49.2 | ) |
Cash and cash equivalents restricted for investment in capital additions | | | (9.9 | ) | | | — | | | | — | | | | — | | | | (9.9 | ) |
Proceeds from sale of assets | | | 0.2 | | | | — | | | | — | | | | — | | | | 0.2 | |
| | |
|
|
| |
|
|
| |
|
|
| |
|
|
| |
|
|
|
Net cash used in investing activities | | | (141.3 | ) | | | — | | | | (12.1 | ) | | | — | | | | (153.4 | ) |
| | |
|
|
| |
|
|
| |
|
|
| |
|
|
| |
|
|
|
CASH FLOWS FROM FINANCING ACTIVITIES: | | | | | | | | | | | | | | | | | | | | |
Proceeds from issuance of long-term debt | | | 10.0 | | | | — | | | | — | | | | — | | | | 10.0 | |
Long-term debt and capital lease payments | | | (22.8 | ) | | | — | | | | — | | | | — | | | | (22.8 | ) |
Cash and cash equivalents restricted for debt repayment | | | — | | | | — | | | | (6.5 | ) | | | — | | | | (6.5 | ) |
Capital contribution returned | | | (25.8 | ) | | | — | | | | — | | | | — | | | | (25.8 | ) |
Deferred financing costs | | | (10.2 | ) | | | — | | | | — | | | | — | | | | (10.2 | ) |
| | |
|
|
| |
|
|
| |
|
|
| |
|
|
| |
|
|
|
Net cash used in financing activities | | | (48.8 | ) | | | — | | | | (6.5 | ) | | | — | | | | (55.3 | ) |
| | |
|
|
| |
|
|
| |
|
|
| |
|
|
| |
|
|
|
NET INCREASE IN CASH AND CASH EQUIVALENTS | | | 44.9 | | | | — | | | | 186.4 | | | | — | | | | 231.3 | |
CASH AND CASH EQUIVALENTS, beginning of period | | | 214.8 | | | | — | | | | 36.4 | | | | — | | | | 251.2 | |
| | |
|
|
| |
|
|
| |
|
|
| |
|
|
| |
|
|
|
CASH AND CASH EQUIVALENTS, end of period | | $ | 259.7 | | | $ | — | | | $ | 222.8 | | | $ | — | | | $ | 482.5 | |
| | |
|
|
| |
|
|
| |
|
|
| |
|
|
| |
|
|
|
F-35
THE PREMCOR REFINING GROUP INC. AND SUBSIDIARIES
CONSOLIDATING STATEMENT OF OPERATIONS
For the year ended December 31, 2000
| | | PRG
| | | PAFC
| | | Other Guarantor
Subsidiaries
| | | Eliminations and Minority
Interest
| | | Consolidated
PRG
| |
| | | | | | | | | (in millions) | | | | | | | |
NET SALES AND OPERATING REVENUES | | $ | 7,311.8 | | | $ | — | | | $ | 100.3 | | | $ | (110.4 | ) | | $ | 7,301.7 | |
| | | | | |
EQUITY IN EARNINGS OF AFFILIATE | | | 5.7 | | | | — | | | | — | | | | (5.7 | ) | | | — | |
| | | | | |
EXPENSES: | | | | | | | | | | | | | | | | | | | | |
Cost of sales | | | 6,586.5 | | | | — | | | | 83.6 | | | $ | (106.0 | ) | | | 6,564.1 | |
Operating expenses | | | 459.3 | | | | — | | | | 10.2 | | | | (2.8 | ) | | | 466.7 | |
General and administrative expenses | | | 51.6 | | | | — | | | | 1.1 | | | | — | | | | 52.7 | |
Depreciation | | | 37.0 | | | | — | | | | — | | | | — | | | | 37.0 | |
Amortization | | | 34.7 | | | | — | | | | — | | | | — | | | | 34.7 | |
| | |
|
|
| |
|
|
| |
|
|
| |
|
|
| |
|
|
|
| | | | 7,169.1 | | | | — | | | | 94.9 | | | | (108.8 | ) | | | 7,155.2 | |
| | |
|
|
| |
|
|
| |
|
|
| |
|
|
| |
|
|
|
OPERATING INCOME | | | 148.4 | | | | — | | | | 5.4 | | | | (7.3 | ) | | | 146.5 | |
Interest and finance expense | | | (76.0 | ) | | | (56.1 | ) | | | (4.0 | ) | | | 56.2 | | | | (79.9 | ) |
Interest income | | | 14.9 | | | | 56.1 | | | | 0.8 | | | | (56.2 | ) | | | 15.6 | |
| | |
|
|
| |
|
|
| |
|
|
| |
|
|
| |
|
|
|
INCOME BEFORE INCOME TAXES AND MINORITY INTEREST | | | 87.3 | | | | — | | | | 2.2 | | | | (7.3 | ) | | | 82.2 | |
Income tax (provision) benefit | | | (1.9 | ) | | | — | | | | 4.1 | | | | — | | | | 2.2 | |
Minority interest | | | — | | | | — | | | | — | | | | (0.6 | ) | | | (0.6 | ) |
| | |
|
|
| |
|
|
| |
|
|
| |
|
|
| |
|
|
|
NET INCOME | | $ | 85.4 | | | $ | — | | | $ | 6.3 | | | $ | (7.9 | ) | | $ | 83.8 | |
| | |
|
|
| |
|
|
| |
|
|
| |
|
|
| |
|
|
|
F-36
THE PREMCOR REFINING GROUP INC. AND SUBSIDIARIES
CONSOLIDATING STATEMENT OF CASH FLOWS
For the year ended December 31, 2000
| | | PRG
| | | PAFC
| | | Other Guarantor
Subsidiaries
| | | Eliminations and Minority
Interest
| | | Consolidated
PRG
| |
| | | | | | | | | (in millions) | | | | | | | |
CASH FLOWS FROM OPERATING ACTIVITIES: | | | | | | | | | | | | | | | | | | | | |
Net income (loss) | | $ | 85.4 | | | $ | — | | | $ | 6.3 | | | $ | (7.9 | ) | | $ | 83.8 | |
Adjustments: | | | | | | | | | | | | | | | | | | | | |
Depreciation | | | 37.0 | | | | — | | | | — | | | | — | | | | 37.0 | |
Amortization | | | 42.8 | | | | — | | | | 2.7 | | | | — | | | | 45.5 | |
Deferred income taxes | | | (7.5 | ) | | | — | | | | 0.4 | | | | — | | | | (7.1 | ) |
Minority interest | | | — | | | | — | | | | — | | | | 0.6 | | | | 0.6 | |
Equity in earnings of affiliate | | | (5.7 | ) | | | — | | | | — | | | | 5.7 | | | | — | |
Affiliate note receivables/payables | | | (4.9 | ) | | | — | | | | — | | | | 4.9 | | | | — | |
Other, net | | | (1.8 | ) | | | — | | | | — | | | | (0.1 | ) | | | (1.9 | ) |
Cash provided by (reinvested in) working capital: | | | | | | | | | | | | | | | | | | | | |
Accounts receivable, prepaid expenses and other | | | (50.3 | ) | | | — | | | | (4.2 | ) | | | — | | | | (54.5 | ) |
Inventories | | | (82.5 | ) | | | — | | | | (45.3 | ) | | | 1.7 | | | | (126.1 | ) |
Accounts payable, accrued expenses, and taxes other than income, and other | | | 85.4 | | | | 7.4 | | | | 60.3 | | | | — | | | | 153.1 | |
Affiliate receivables and payables | | | 36.3 | | | | (190.0 | ) | | | 164.7 | | | | — | | | | 11.0 | |
| | |
|
|
| |
|
|
| |
|
|
| |
|
|
| |
|
|
|
Net cash provided by (used in) operating activities | | | 134.2 | | | | (182.6 | ) | | | 184.9 | | | | 4.9 | | | | 141.4 | |
| | |
|
|
| |
|
|
| |
|
|
| |
|
|
| |
|
|
|
| | | | | |
CASH FLOWS FROM INVESTING ACTIVITIES: | | | | | | | | | | | | | | | | | | | | |
Expenditures for property, plant and equipment | | | (128.3 | ) | | | — | | | | (262.4 | ) | | | — | | | | (390.7 | ) |
Expenditures for turnaround | | | (31.5 | ) | | | — | | | | — | | | | — | | | | (31.5 | ) |
Cash and cash equivalents restricted for investment in capital additions | | | — | | | | — | | | | 46.6 | | | | — | | | | 46.6 | |
Proceeds from sale of assets | | | 0.5 | | | | — | | | | — | | | | — | | | | 0.5 | |
Other | | | (0.2 | ) | | | — | | | | — | | | | — | | | | (0.2 | ) |
| | |
|
|
| |
|
|
| |
|
|
| |
|
|
| |
|
|
|
Net cash used in investing activities | | | (159.5 | ) | | | — | | | | (215.8 | ) | | | — | | | | (375.3 | ) |
| | |
|
|
| |
|
|
| |
|
|
| |
|
|
| |
|
|
|
| | | | | |
CASH FLOWS FROM FINANCING ACTIVITIES: | | | | | | | | | | | | | | | | | | | | |
Proceeds from issuance of long-term debt | | | — | | | | 182.6 | | | | — | | | | — | | | | 182.6 | |
Capital lease payments | | | (7.3 | ) | | | — | | | | — | | | | — | | | | (7.3 | ) |
Proceeds from issuance of common stock | | | — | | | | — | | | | 58.1 | | | | — | | | | 58.1 | |
Contribution from minority interest | | | — | | | | — | | | | 6.5 | | | | — | | | | 6.5 | |
Affiliates receivables/payables | | | — | | | | — | | | | 4.9 | | | | (4.9 | ) | | | — | |
Capital contribution returned | | | (35.5 | ) | | | — | | | | — | | | | — | | | | (35.5 | ) |
Deferred financing costs | | | (2.0 | ) | | | — | | | | (2.3 | ) | | | — | | | | (4.3 | ) |
| | |
|
|
| |
|
|
| |
|
|
| |
|
|
| |
|
|
|
Net cash provided by (used in) financing activities | | | (44.8 | ) | | | 182.6 | | | | 67.2 | | | | (4.9 | ) | | | 200.1 | |
| | |
|
|
| |
|
|
| |
|
|
| |
|
|
| |
|
|
|
NET INCREASE (DECREASE) IN CASH AND CASH EQUIVALENTS | | | (70.1 | ) | | | — | | | | 36.3 | | | | — | | | | (33.8 | ) |
CASH AND CASH EQUIVALENTS, beginning of period | | | 284.9 | | | | — | | | | 0.1 | | | | — | | | | 285.0 | |
| | |
|
|
| |
|
|
| |
|
|
| |
|
|
| |
|
|
|
CASH AND CASH EQUIVALENTS, end of period | | $ | 214.8 | | | $ | — | | | $ | 36.4 | | | $ | — | | | $ | 251.2 | |
| | |
|
|
| |
|
|
| |
|
|
| |
|
|
| |
|
|
|
F-37
19. COMMITMENTS AND CONTINGENCIES
Legal and Environmental
As a result of its activities, the Company is the subject of a number of material pending legal proceedings, including proceedings related to environmental matters. Set forth below is an update of developments during the year ended December 31, 2002 with respect to any such proceedings and with respect to any environmental proceedings that involve monetary sanctions of $100,000 or more and to which a governmental authority is a party.
Port Arthur: Enforcement. The Texas Commission on Environmental Quality (“TCEQ,” formerly the TNRCC) conducted a site inspection of the Port Arthur refinery in the spring of 1998. In August 1998, the Company received a notice of enforcement alleging 47 air-related violations and 13 hazardous waste-related violations. The number of allegations was significantly reduced in an enforcement determination response from the TCEQ in April 1999. A follow-up inspection of the refinery in June 1999 concluded that only two items remained outstanding, namely that the refinery failed to maintain the temperature required by the air permit at one of its incinerators and that five process wastewater sump vents did not meet applicable air emission control requirements. The TCEQ also conducted a complete refinery inspection in the second quarter of 1999, resulting in another notice of enforcement in August 1999. This notice alleged nine air-related violations, relating primarily to deficiencies in the Company’s upset reports and emissions monitoring program, and one hazardous waste-related violation concerning spills. The 1998 and 1999 notices were combined and referred to the TCEQ’s litigation division. On September 7, 2000 the TCEQ issued a notice of enforcement regarding the Company’s alleged failure to maintain emission rates at permitted levels. In May 2001, the TCEQ proposed an order covering some of the 1998 hazardous waste allegations, the incinerator temperature deficiency, the process wastewater sumps, and all of the 1999 and 2000 allegations, and proposing the payment of a fine of $562,675 and the implementation of a series of technical provisions requiring corrective actions. Negotiations with the TCEQ are ongoing.
Blue Island: Class Action Matters. In October 1994, the Company’s Blue Island refinery experienced an accidental release of used catalyst into the air. In October 1995, a class action,Rosolowski v. Clark Refining & Marketing, Inc., et al., was filed against the Company seeking to recover damages in an unspecified amount for alleged property damage and personal injury resulting from that catalyst release. The complaint underlying this action was later amended to add allegations of subsequent events that allegedly diminished property values. In June 2000, the Company’s Blue Island refinery experienced an electrical malfunction that resulted in another accidental release of used catalyst into the air. Following the 2000 catalyst release, two cases were filed purporting to be class actions,Madrigal et al. v. The Premcor Refining Group Inc. andMason et al. v. The Premcor Refining Group Inc. Both cases seek damages in an unspecified amount for alleged property damage and personal injury resulting from that catalyst release. These cases have been consolidated for the purpose of conducting discovery, which is currently proceeding.
Sashabaw Road Retail Location: State Enforcement. In July 1994, the Michigan Department of Natural Resources brought an action alleging that one of the Company’s retail locations caused groundwater contamination, necessitating the installation of a new $600,000 drinking water system. The Michigan Department of Natural Resources sought reimbursement of this cost. Although the Company’s site may have contributed to contamination in the area, the Company maintained that numerous other sources were responsible and that a total reimbursement demand from it would be excessive. Mediation resulted in a $200,000 finding against the Company. The Company made an offer of judgment equal to the mediation finding. The Michigan Department of Natural Resources rejected the offer and the matter was tried in November 1999, resulting in a judgment against the Company of $110,000 plus interest. Since the judgment was over 20% below the previous settlement offer, under applicable state law the Company is entitled to recover its legal fees. Both the Michigan Department of Natural Resources and the Company appealed the decision. The appellate court rendered its decision on January 10, 2003 and affirmed the trial court’s ruling in all respects. The Michigan Department of Natural Resources
F-38
elected not to file an appeal with the Michigan Supreme Court. As a result, the judgment became final. The Michigan Department of Natural Resources will owe the Company mediation sanctions, which should net approximately $100,000 to the Company.
Environmental matters are as follows:
Port Arthur and Lima Refineries. The original refineries on the sites of the Port Arthur and Lima refineries began operating in the late 1800s and early 1900s, prior to modern environmental laws and methods of operation. There is contamination at these sites, which the Company believes will be required to be remediated. Under the terms of the Company’s 1995 purchase of the Port Arthur refinery, Chevron Products Company, the former owner, retained liability for all required investigation and remediation relating to pre-purchase contamination discovered by June 1997, except with respect to certain areas on or around which active processing units are located, which are the Company’s responsibility. Less than 200 acres of the 4,000-acre refinery site are occupied by active operating units. Extensive due diligence efforts prior to the acquisition and additional investigation after the acquisition documented contamination for which Chevron is responsible. In June 1997, the Company entered into an agreed order with Chevron and the TCEQ, that incorporates this contractual division of the remediation responsibilities into an agreed order. The Company has accrued $11.9 million (December 31, 2001—$11.4 million) for the Port Arthur remediation as of December 31, 2002. Under the terms of the purchase of the Lima refinery, BP PLC (“BP”), the former owner, indemnified the Company for all pre-existing environmental liabilities, except for contamination resulting from releases of hazardous substances in or on sewers, process units and other equipment at the refinery as of the closing date, but only to the extent the presence of these hazardous substances was as a result of normal operations of the refinery and does not constitute a violation of any environmental law. Although the Company is not primarily responsible for the majority of the currently required remediation of these sites, the Company may become jointly and severally liable for the cost of investigating and remediating a portion of these sites in the event that Chevron or BP fails to perform the remediation. In such event, however, the Company believes it would have a contractual right of recovery from these entities. The cost of any such remediation could be substantial and could have a material adverse effect on the Company’s financial position.
Hartford Refinery Closure. In September 2002, the Company ceased refining operations at its Hartford refinery. In the fourth quarter of 2002, the Company completed the removal of hydrocarbons, catalyst and chemicals from the refinery processing units. The Company is also currently in preliminary discussions with state governmental agencies concerning environmental remediation of the site. Related to the closure of the refinery, the Company has accrued $47.4 million for decommissioning, remediation of the site and asbestos abatement. As of December 31, 2002, the Company spent $17.4 million related primarily to the decommissioning of the facility and had a remaining reserve balance of $30.0 million. The accrual of $47.4 million assumes that a portion of the refinery will be operated on an on-going basis as part of a lease or sale transaction and that remediation will occur only in non-operating portions of the refinery. In addition, state governmental agencies are investigating a large petroleum hydrocarbon plume underlying a portion of the Village of Hartford. Responsibility for the plume has not been determined and no enforcement action has been taken. Nonetheless, since the mid-1990s the Company has operated, on a voluntary basis, a vapor recovery system designed to prevent gasoline odors from rising into the homes in that area of Hartford overlying the plume. The final disposition of the refinery assets and the final outcome of the discussions with the governmental agencies will have a significant bearing on any necessary adjustments to this accrual.
Blue Island Refinery Decommissioning and Closure.In January 2001, the Company ceased operations at its Blue Island, Illinois refinery although the Company continues to operate the adjacent Alsip terminal. The decommissioning, dismantling and tear down of the facility is underway. The Company is currently in discussions with federal, state and local governmental agencies concerning remediation of the site. The governmental agencies have proposed a remediation process patterned after national contingency plan provisions of the Comprehensive Environmental Response, Compensation, and Liability Act (“CERCLA”). The Company has proposed to the agencies a site investigation and remediation that incorporates certain elements of the
F-39
CERCLA process and the State of Illinois’ site remediation program. Related to the closure of the facility, we accrued $54.4 million for decommissioning, remediation of the site and asbestos abatement. As of December 31, 2002, the Company had spent $34.7 million and had a remaining reserve balance of $19.7 million. In 2002, environmental risk insurance policies covering the Blue Island refinery site were procured and bound, with final policies expected to be issued within the first quarter of 2003. This insurance program will allow us to quantify and, within the limits of the policy, cap our cost to remediate the site, and provide insurance coverage from future third party claims arising from past or future environmental releases. The remediation cost overrun policy has a term of ten years and, subject to certain exceptions and exclusions, provides $25 million in coverage in excess of a self-insured retention amount of $26 million. The pollution legal liability policy provides for $25 million in aggregate coverage and per incident coverage in excess of a $100,000 deductible per incident.
Former Retail Sites.In 1999, the Company sold its former retail marketing business, which the Company operated from time to time on a total of 1,150 sites. During the course of operations of these sites, releases of petroleum products from underground storage tanks have occurred. Federal and state laws require that contamination caused by such releases at these sites be assessed and remediated to meet applicable standards. The enforcement of the underground storage tank regulations under the Resource Conservation and Recovery Act has been delegated to the states that administer their own underground storage tank programs. The Company’s obligation to remediate such contamination varies, depending upon the extent of the releases and the stringency of the laws and regulations of the states in which the releases were made. A portion of these remediation costs may be recoverable from the appropriate state underground storage tank reimbursement fund once the applicable deductible has been satisfied. The 1999 sale included 672 sites, 225 of which had no known pre-closure contamination, 365 of which had known pre-closure contamination of varying extent, and 80 of which had been previously remediated. The purchaser of the retail division assumed pre-closure environmental liabilities of up to $50,000 per site at the sites on which there was no known contamination. The Company is responsible for any liability above that amount per site for pre-closure liabilities, subject to certain time limitations. With respect to the sites on which there was known pre-closing contamination, the Company retained liability for 50% of the first $5 million in remediation costs and 100% of remediation costs over that amount. The Company retained any remaining pre-closing liability for sites that had been previously remediated.
Of the remaining 478 former retail sites not sold in the 1999 transaction described above, the Company has sold all but 8 in open market sales and auction sales. The Company generally retains the remediation obligations for sites sold in open market sales with identified contamination. Of the retail sites sold in auctions, the Company agreed to retain liability for all of these sites until an appropriate state regulatory agency issues a letter indicating that no further remedial action is necessary. However, these letters are subject to revocation if it is later determined that contamination exists at the properties and the Company would remain liable for the remediation of any property at which such a letter was received but subsequently revoked. The Company is currently involved in the active remediation of 140 of the retail sites sold in open market and auction sales and is actively seeking to sell the remaining 8 properties. During the period from the beginning of 1999 through 2002, the Company had expended $20 million to satisfy all the environmental cleanup obligations of our former retail marketing business and as of December 31, 2002, had $23.0 million (December 31, 2001—$26.6 million) accrued, net of reimbursements of $8.6 million (December 31, 2001—$12.2 million), to satisfy those obligations in the future.
In relation to the 1999 sale, PRG assigned approximately 170 leases and subleases of retail stores to the purchaser of the retail division, CRE. PRG remains jointly and severally liable for CRE’s obligations under approximately 150 of these leases, including payment of rent and taxes representing future payments as of December 31, 2002 currently estimated as follows (in millions): 2003—$11.0, 2004—$11.3, 2005—$11.7, 2006—$12.0, 2007—$12.4, and in the aggregate thereafter—$90.8. PRG may also be contingently liable for environmental cleanup responsibilities for releases of petroleum occurring during the term of the CRE leases. The potential costs, if any, of environmental remediation related to these leases cannot be determined at this time. Should any of these leases revert to PRG, PRG will attempt to reduce the potential liability by subletting or reassigning the leases. On October 15, 2002, CRE and its parent company, Clark Retail Group, Inc., filed a
F-40
voluntary petition for reorganization under Chapter 11 of the U.S. Bankruptcy Code. Should CRE reject some or all of these leases, PRG may become responsible for these obligations. Subsequent to December 31, 2002, CRE rejected 25 leases in bankruptcy hearings held in late January 2003 and February 2003. See Note 20, Subsequent Events.
Former Terminals.In December 1999, the Company sold 15 refined product terminals to a third party, but retained liability for environmental matters at four terminals and, with respect to the remaining eleven terminals, the first $250,000 per year of environmental liabilities for a period of six years up to a maximum of $1.5 million. As of December 31, 2002, the Company had expended $0.9 million on these obligations and has accrued $2.5 million (December 31, 2001—$2.9 million) for these obligations in the future including additional investigative and administrative costs.
Legal and Environmental Reserves. As a result of its normal course of business, the Company is a party to a number of legal and environmental proceedings. As of December 31, 2002, the Company had accrued a total of approximately $93 million (December 31, 2001—$77 million), on an undiscounted basis, for legal and environmental-related obligations that may result from the matters noted above and other legal and environmental matters. As of December 31, 2002, this accrual included approximately $72 million (December 31, 2001—$53 million) for site clean-up and environmental matters associated with the Hartford and Blue Island refinery closures and retail sites. The Company is of the opinion that the ultimate resolution of these claims, to the extent not previously provided for, will not have a material adverse effect on the consolidated financial condition, results of operations or liquidity of the Company. However, an adverse outcome of any one or more of these matters could have a material effect on quarterly or annual operating results or cash flows when resolved in a future period.
Environmental Product Standards
The Company expects to incur in the aggregate approximately $727 million in order to comply with environmental regulations related to the new stringent sulfur content specifications and MACT II regulations as discussed below.
Tier 2 Motor Vehicle Emission Standards. In February 2000, the EPA promulgated the Tier 2 Motor Vehicle Emission Standards Final Rule for all passenger vehicles, establishing standards for sulfur content in gasoline. These regulations mandate that the average sulfur content of gasoline for highway use produced at any refinery not exceed 30 ppm during any calendar year by January 1, 2006, phasing in beginning on January 1, 2004. The Company currently expects to produce gasoline under the new sulfur standards at the Port Arthur refinery prior to January 1, 2004. As a result of the corporate pool averaging provisions of the regulations, the Company believes that it will be able to defer a significant portion of the investment required for compliance for one or both of the Lima and Memphis refineries until the end of 2005. In addition, delay in the requirement to meet the new sulfur standards at the Lima and Memphis refinery through 2005 may also be possible through the purchase of sulfur allotments and credits which arise from a refiner producing gasoline with a sulfur content below specified levels prior to the end of 2005, the end of the phase-in period. There is no assurance that the averaging provisions of the regulations will allow for a deferral of compliance at one or both of the Lima and Memphis refineries or that sufficient allotments or credits to defer investment at our Lima and Memphis refinery will be available, or if available, that they will be cost effective. The Company believes, based on current estimates and on a January 1, 2004 compliance date for all three refineries, that compliance with the new Tier 2 gasoline specifications will require capital expenditures in the aggregate through 2004 of approximately $335 million, of which $53 million had been incurred as of December 31, 2002. The Company has entered into contracts totaling $126 million related to the design and construction activity at the Port Arthur and Lima refineries for the Tier 2 gasoline compliance.
Low Sulfur Diesel Standards. In January 2001, the EPA promulgated its on-road diesel regulations, which will require a 97% reduction in the sulfur content of diesel fuel sold for highway use by June 1, 2006, with full
F-41
compliance by January 1, 2010. The Company estimates that capital expenditures required to comply with the on-road diesel standards at all three refineries in the aggregate through 2006 is approximately $347 million. More than 95% of the projected investment is expected to be incurred during 2004 through 2006 with the greatest concentration of spending occurring in 2005. Since the Lima refinery does not currently produce diesel fuel to on-road specifications, the Company is considering an acceleration of the low-sulfur diesel investment at the Lima refinery in order to capture this incremental product value. If the investment is accelerated, production of the low-sulfur fuel is possible by the first half of 2005.
Maximum Achievable Control Technology. On April 11, 2002, the EPA promulgated regulations to implement Phase II of the petroleum refinery Maximum Achievable Control Technology rule under the federal Clean Air Act, referred to as MACT II, which regulates emissions of hazardous air pollutants from certain refinery units. The Company expects to spend approximately $45 million in the next two years related to these new regulations.
Other Commitments
Crude Oil Purchase Commitment. In 1999, the Company sold crude oil linefill in the pipeline system supplying the Lima refinery to Koch Supply and Trading L.P. or Koch. As part of the agreement with Koch, the Company was required to repurchase approximately 2.7 million barrels of crude oil in this pipeline system in September 2002. On October 1, 2002, Morgan Stanley Capital Group Inc. (“MSCG’), purchased the 2.7 million barrels of crude oil from Koch in lieu of the Company’s purchase obligation. The Company has agreed to purchase those barrels of crude oil from MSCG upon termination of the agreement with them, at then current market prices as adjusted by certain predetermined contract provisions. The initial term of the contract continues until October 1, 2003, and, thereafter, automatically renews for additional 30-day periods unless terminated by either party. The Company has hedged the economic price risk related to the repurchase obligation through the purchase of exchange-traded futures contracts.
Long-Term Crude Oil Contract. PACC is party to a long-term crude oil supply agreement with PMI Comercio Internacional, S.A. de C.V., an affiliate of Petroleos Mexicanos (“PEMEX”), the Mexican state oil company, which supplies approximately 162,000 barrels per day of Maya crude oil. Under the terms of this agreement, PACC is obligated to buy Maya crude oil from the affiliate of PEMEX, and the affiliate of PEMEX is obligated to sell Maya crude oil to PACC. An important feature of this agreement is a price adjustment mechanism designed to minimize the effect of adverse refining margin cycles and to moderate the fluctuations of the coker gross margin, a benchmark measure of the value of coker production over the cost of coker feedstocks. This price adjustment mechanism contains a formula that represents an approximation of the coker gross margin and provides for a minimum average coker margin of $15 per barrel over the first eight years of the agreement, which began on April 1, 2001. The agreement expires in 2011.
On a monthly basis, the coker gross margin, as defined under this agreement, is calculated and compared to the minimum. Coker gross margins exceeding the minimum are considered a “surplus” while coker gross margins that fall short of the minimum are considered a “shortfall.” On a quarterly basis, the surplus and shortfall determinations since the beginning of the contract are aggregated. Pricing adjustments to the crude oil the Company purchases are only made when there exists a cumulative shortfall. When this quarterly aggregation first reveals that a cumulative shortfall exists, the Company receives a discount on its crude oil purchases in the next quarter in the amount of the cumulative shortfall. If thereafter, the cumulative shortfall incrementally increases, the Company receives additional discounts on its crude oil purchases in the succeeding quarter equal to the incremental increase. Conversely, if thereafter, the cumulative shortfall incrementally decreases, the Company repays discounts previously received, or a premium, on its crude oil purchases in the succeeding quarter equal to the incremental decrease. Cash crude oil discounts received by the Company in any one quarter are limited to $30 million, while the Company’s repayment of previous crude oil discounts, or premiums, are limited to $20 million in any one quarter. Any amounts subject to the quarterly payment limitations are carried forward and applied in subsequent quarters.
F-42
As of December 31, 2002, a cumulative quarterly surplus of $79.6 million (2001—$110.0 million) existed under the contract. As a result, to the extent the Company experiences quarterly shortfalls in coker gross margins going forward, the price it pays for Maya crude oil in succeeding quarters will not be discounted until this cumulative surplus is offset by future shortfalls.
Insurance Expenses. The Company purchases insurance intending to protect against risk of loss from a variety of exposures common to the refining industry, including property damage, business interruptions, third party liabilities, workers compensation, marine activities, and directors and officers legal liability, among others. The Company employs internal risk management measurements, actuarial analysis, and peer benchmarking to assist in determining the appropriate limits, deductibles, and coverage terms for the Company. The Company believes the insurance coverages it currently purchases are consistent with customary insurance standards in the industry. The Company’s major insurance policies renewed on October 1, 2002 with a one-year term. Due primarily to the continuing effects of the events of September 11, 2001 on the insurance market, certain coverage terms, including terrorism coverage, were restricted or eliminated at renewal, certain deductibles were raised, certain coverage limits were lowered, and overall premium rates increased by 23%. While the Company intends to continue purchasing insurance coverages consistent with customary insurance standards in the industry, future losses could exceed insurance policy limits or, under adverse interpretations, be excluded from coverage.
20. SUBSEQUENT EVENTS
Effective March 3, 2003, the Company completed the acquisition of a Memphis, Tennessee refinery and related supply and distribution assets from The Williams Companies, Inc. and certain of its subsidiaries (“Williams”) at an adjusted purchase price of $310 million plus approximately $145 million for crude and product inventories subject to volumetric and pricing verification. The Memphis refinery has a rated crude oil throughput capacity of 190,000 bpd but typically processes approximately 170,000 bpd. The related assets include two truck-loading racks; three petroleum terminals in the area; supporting pipeline infrastructure that transports both crude oil and refined products; crude oil tankage at St. James, Louisiana; and an 80 megawatt power plant adjacent to the refinery. The transfer of certain of these assets remains subject to obtaining third party consents. No portion of the purchase price was held back relative to this delayed ownership transfer. The purchase agreement also provides for contingent participation, or earn-out, payments that could result in additional payments of up to $75 million to Williams over the next seven years, depending on the level of industry refining margins during that period. PRG acquired the refinery and related assets utilizing a portion of the proceeds from the issuance of $525 million in senior notes and utilizing capital contributions from Premcor Inc., which were funded from the proceeds from a public and private offering of common stock.
On January 30, 2003, Premcor Inc. completed a public offering of 12.5 million shares of common stock and a private placement of 2.9 million shares of common stock with Blackstone, Occidental, and certain Premcor executives. On February 5, 2003, Premcor Inc. sold an additional 0.6 million shares of common stock pursuant to the underwriters’ over-allotment option. Premcor Inc. received net proceeds of approximately $306 million from these transactions. On February 11, 2003, PRG completed an offering of $525 million in senior notes, of which $350 million, due in 2013, bear interest at 9½% per annum and $175 million, due in 2010, bear interest at 9¼% per annum. Concurrently, PRG amended and restated its credit agreement, which included extending its maturity date to February 2006; increasing the capacity under the agreement to the lesser of $750 million or the amount available under the defined borrowing base; increasing the sub-limit for cash borrowings to $200 million, subject to certain limitations; and modifying certain covenant requirements.
In addition to the refinery acquisition, the proceeds from these transactions were also used to repay PRG’s $240 million floating rate loan at par. The Company will recognize a pretax loss in the first quarter of 2003 of approximately $4.7 million, in relation to these early repayments and the amendment of the credit facility.
F-43
The following pro forma information regarding the Company’s long-term debt gives effect to the February 2003 Senior Notes offering and the subsequent use of proceeds to retire the PRG Floating Rate Loans, as if each had happened on December 31, 2002:
| | | As
reported,
December
31, 2002
| | Adjustments
| | | As
adjusted,
December
31, 2002
|
8 5/8% Senior Notes | | $ | 109.8 | | $ | — | | | $ | 109.8 |
8 3/8% Senior Notes | | | 99.7 | | | — | | | | 99.7 |
8 7/8% Senior Subordinated Notes | | | 174.4 | | | — | | | | 174.4 |
Floating Rate Loan | | | 240.0 | | | (240.0 | ) | | | — |
12½% Senior Notes | | | 250.7 | | | — | | | | 250.7 |
9¼% Senior Notes | | | — | | | 175.0 | | | | 175.0 |
9½% Senior Notes | | | — | | | 350.0 | | | | 350.0 |
Series 2001 Ohio Bonds | | | 10.0 | | | — | | | | 10.0 |
Obligations under capital leases | | | 0.2 | | | — | | | | 0.2 |
| | |
|
| |
|
|
| |
|
|
| | | | 884.8 | | | 285.0 | | | | 1,169.8 |
Less current portion | | | 15.0 | | | — | | | | 15.0 |
| | |
|
| |
|
|
| |
|
|
Total long-term debt at PRG | | $ | 869.8 | | $ | 285.0 | | | $ | 1,154.8 |
| | |
|
| |
|
|
| |
|
|
The aggregate stated maturities of long-term debt for the Company based on the effects of the above transactions are (in millions): 2003—$15.0; 2004—$25.8; 2005—$38.5; 2006—$46.4; 2007—$318.4; 2008 and thereafter—$726.9.
Subsequent to December 31, 2002, CRE rejected 25 leases in connection with bankruptcy hearings held in late January and February 2003. The Company will record an after-tax charge of approximately $3.5 million in the first quarter of 2003 representing the estimated net present value of the remaining liability under these leases, net of estimated sub-lease income. The Company is currently in discussions with CRE regarding their reorganization plans, the status of environmental remediation agreements, and other matters. While it is possible that the Company may incur additional liability for CRE lease obligations or other costs as CRE finalizes its reorganization plans, the amounts are not estimable at this time.
F-44
THE PREMCOR REFINING GROUP INC. AND SUBSIDIARIES
SCHEDULE II—VALUATION AND QUALIFYING ACCOUNTS
(in millions)
| | | | | | Liability Reserves
| |
| | | Accounts
Receivable
Reserve
| | | Blue
Island
Refinery
Closure
| | | Hartford
Refinery
Closure
| | | Refinery and
Administrative
Restructuring
| |
Balance, December 31, 1999 | | $ | 1.9 | | | $ | — | | | $ | — | | | $ | — | |
Write-off of uncollectible receivables | | | (0.6 | ) | | | — | | | | — | | | | — | |
| | |
|
|
| |
|
|
| |
|
|
| |
|
|
|
Balance, December 31, 2000 | | | 1.3 | | | | — | | | | — | | | | — | |
Adjustments | | | — | | | | 69.1 | | | | — | | | | — | |
Net cash outlays | | | — | | | | (32.6 | ) | | | — | | | | — | |
| | |
|
|
| |
|
|
| |
|
|
| |
|
|
|
Balance, December 31, 2001 | | | 1.3 | | | | 36.5 | | | | — | | | | — | |
Adjustments | | | 2.0 | | | | (2.0 | ) | | | 60.6 | | | | 15.3 | |
Write-off of uncollectible receivables | | | (0.1 | ) | | | — | | | | — | | | | — | |
Net cash outlays | | | — | | | | (14.8 | ) | | | (30.0 | ) | | | (10.4 | ) |
| | |
|
|
| |
|
|
| |
|
|
| |
|
|
|
Balance, December 31, 2002 | | $ | 3.2 | | | $ | 19.7 | | | $ | 30.6 | | | $ | 4.9 | |
| | |
|
|
| |
|
|
| |
|
|
| |
|
|
|
F-45
INDEPENDENT ACCOUNTANTS’ REPORT
To the Board of Directors of The Premcor Refining Group Inc.:
We have reviewed the accompanying condensed consolidated balance sheet of The Premcor Refining Group Inc. and subsidiaries (the “Company”) as of March 31, 2003 and the related condensed consolidated statements of operations and cash flows for the three-month periods ended March 31, 2003 and 2002. These financial statements are the responsibility of the Company’s management.
We conducted our review in accordance with standards established by the American Institute of Certified Public Accountants. A review of interim financial information consists principally of applying analytical procedures to financial data and making inquiries of persons responsible for financial and accounting matters. It is substantially less in scope than an audit conducted in accordance with auditing standards generally accepted in the United States of America, the objective of which is the expression of an opinion regarding the financial statements taken as a whole. Accordingly, we do not express such an opinion.
Based on our review, we are not aware of any material modifications that should be made to such condensed consolidated financial statements for them to be in conformity with accounting principles generally accepted in the United States of America.
We have previously audited, in accordance with auditing standards generally accepted in the United States of America, the consolidated balance sheet of the Company as of December 31, 2002, and the related consolidated statements of operations, stockholder’s equity, and cash flows for the year then ended (not presented herein). In our report dated February 14, 2003 (March 6, 2003 as to Note 20) (which report includes an explanatory paragraph relating to the Company’s change in its method of accounting for stock based compensation issued to employees and the restatement of the consolidated financial statements to give effect to the contribution of Sabine River Holding Corp. common stock owned by Premcor Inc. (the Company’s parent company) to the Company, which was accounted for in a manner similar to a pooling of interests as described in Notes 2 and 3), we expressed an unqualified opinion on those consolidated financial statements. In our opinion, the information set forth in the accompanying condensed consolidated balance sheet as of December 31, 2002 is fairly stated, in all material respects, in relation to the consolidated balance sheet from which it has been derived.
DELOITTE & TOUCHE LLP
St. Louis, Missouri
April 28, 2003
F-46
THE PREMCOR REFINING GROUP INC. AND SUBSIDIARIES
CONDENSED CONSOLIDATED BALANCE SHEETS
(in millions, except share data)
| | | December 31,
2002
| | March 31,
2003
|
| | | | | (unaudited) |
ASSETS | | | | | | |
CURRENT ASSETS: | | | | | | |
Cash and cash equivalents | | $ | 119.7 | | $ | 255.8 |
Short-term investments | | | 1.7 | | | 1.7 |
Cash and cash equivalents restricted for debt service | | | 61.7 | | | 53.8 |
Accounts receivable, net of allowance of $3.2 and $3.3 | | | 269.0 | | | 520.0 |
Receivables from affiliates | | | 13.1 | | | 26.4 |
Inventories | | | 287.3 | | | 463.4 |
Prepaid expenses and other | | | 45.7 | | | 77.9 |
Assets held for sale | | | 49.3 | | | 40.2 |
| | |
|
| |
|
|
Total current assets | | | 847.5 | | | 1,439.2 |
PROPERTY, PLANT AND EQUIPMENT, NET | | | 1,261.7 | | | 1,560.9 |
DEFERRED INCOME TAXES | | | 19.8 | | | 4.6 |
OTHER ASSETS | | | 117.3 | | | 124.6 |
| | |
|
| |
|
|
| | | $ | 2,246.3 | | $ | 3,129.3 |
| | |
|
| |
|
|
| | |
LIABILITIES AND STOCKHOLDER’S EQUITY | | | | | | |
| | |
CURRENT LIABILITIES: | | | | | | |
Accounts payable | | $ | 466.2 | | $ | 720.4 |
Payables to affiliates | | | 41.0 | | | 42.1 |
Accrued expenses and other | | | 55.7 | | | 83.4 |
Accrued taxes other than income | | | 26.4 | | | 41.9 |
Current portion of long-term debt | | | 15.0 | | | 20.9 |
| | |
|
| |
|
|
Total current liabilities | | | 604.3 | | | 908.7 |
LONG-TERM DEBT | | | 869.8 | | | 1,144.3 |
OTHER LONG-TERM LIABILITIES | | | 144.4 | | | 144.4 |
COMMITMENTS AND CONTINGENCIES | | | — | | | — |
| | |
COMMON STOCKHOLDER’S EQUITY: | | | | | | |
Common, $0.01 par value per share, 100 issued and outstanding | | | — | | | — |
Paid-in capital | | | 541.4 | | | 806.7 |
Retained earnings | | | 86.4 | | | 125.2 |
| | |
|
| |
|
|
Total common stockholder’s equity | | | 627.8 | | | 931.9 |
| | |
|
| |
|
|
| | | $ | 2,246.3 | | $ | 3,129.3 |
| | |
|
| |
|
|
The accompanying notes are an integral part of these financial statements.
F-47
THE PREMCOR REFINING GROUP INC. AND SUBSIDIARIES
CONDENSED CONSOLIDATED STATEMENTS OF OPERATIONS
(unaudited, in millions)
| | | For the Three Months Ended March 31,
| |
| | | 2002
| | | 2003
| |
| | | (as restated, see Note 1) | | | | |
NET SALES AND OPERATING REVENUES | | $ | 1,228.3 | | | $ | 2,375.8 | |
| | |
EXPENSES: | | | | | | | | |
Cost of sales | | | 1,062.0 | | | | 2,109.6 | |
Operating expenses | | | 114.4 | | | | 116.7 | |
General and administrative expenses | | | 14.4 | | | | 11.7 | |
Stock-based compensation | | | 1.9 | | | | 4.3 | |
Depreciation | | | 12.4 | | | | 14.5 | |
Amortization | | | 9.8 | | | | 9.5 | |
Refinery restructuring and other charges | | | 142.0 | | | | 15.0 | |
| | |
|
|
| |
|
|
|
| | | | 1,356.9 | | | | 2,281.3 | |
| | |
|
|
| |
|
|
|
OPERATING INCOME (LOSS) | | | (128.6 | ) | | | 94.5 | |
Interest and finance expense | | | (30.5 | ) | | | (26.2 | ) |
Loss on extinguishment of long-term debt | | | — | | | | (4.7 | ) |
Interest income | | | 2.2 | | | | 1.1 | |
| | |
|
|
| |
|
|
|
INCOME (LOSS) FROM CONTINUING OPERATIONS BEFORE INCOME TAXES AND MINORITY INTEREST | | | (156.9 | ) | | | 64.7 | |
Income tax (provision) benefit | | | 60.6 | | | | (21.6 | ) |
Minority interest | | | 0.8 | | | | — | |
| | |
|
|
| |
|
|
|
INCOME (LOSS) FROM CONTINUING OPERATIONS | | | (95.5 | ) | | | 43.1 | |
Loss from discontinued operations, net of income tax benefit of $2.7 | | | — | | | | (4.3 | ) |
| | |
|
|
| |
|
|
|
NET INCOME (LOSS) | | $ | (95.5 | ) | | $ | 38.8 | |
| | |
|
|
| |
|
|
|
The accompanying notes are an integral part of these financial statements.
F-48
THE PREMCOR REFINING GROUP INC. AND SUBSIDIARIES
CONDENSED CONSOLIDATED STATEMENTS OF CASH FLOWS
(unaudited, in millions)
| | | For the Three Months Ended March 31,
| |
| | | 2002
| | | 2003
| |
| | | (as restated, see Note 1) | | | | |
CASH FLOWS FROM OPERATING ACTIVITIES: | | | | | | | | |
Net income (loss) | | $ | (95.5 | ) | | $ | 38.8 | |
Adjustments: | | | | | | | | |
Loss on discontinued operations | | | — | | | | 7.0 | |
Depreciation | | | 12.4 | | | | 14.5 | |
Amortization | | | 12.4 | | | | 12.0 | |
Deferred income taxes | | | (60.9 | ) | | | 15.2 | |
Stock-based compensation | | | 1.9 | | | | 4.3 | |
Minority interest | | | (0.8 | ) | | | — | |
Refinery restructuring and other charges | | | 101.2 | | | | 13.6 | |
Write-off of deferred financing costs | | | — | | | | 4.7 | |
Other, net | | | 8.6 | | | | 2.5 | |
Cash provided by (reinvested in) working capital— | | | | | | | | |
Accounts receivable, prepaid expenses and other | | | (70.3 | ) | | | (274.2 | ) |
Inventories | | | (13.8 | ) | | | (10.8 | ) |
Accounts payable, accrued expenses, taxes other than income, and other | | | 99.9 | | | | 279.6 | |
Affiliate receivables and payables | | | 13.3 | | | | 2.8 | |
Cash and cash equivalents restricted for debt service | | | 4.3 | | | | 7.7 | |
| | |
|
|
| |
|
|
|
Net cash provided by operating activities of continuing operations | | | 12.7 | | | | 117.7 | |
Net cash used in operating activities of discontinued operations | | | (1.5 | ) | | | (0.3 | ) |
| | |
|
|
| |
|
|
|
Net cash provided by operating activities | | | 11.2 | | | | 117.4 | |
| | |
|
|
| |
|
|
|
CASH FLOWS FROM INVESTING ACTIVITIES: | | | | | | | | |
Expenditures for property, plant and equipment | | | (14.8 | ) | | | (22.0 | ) |
Expenditures for turnaround | | | (27.5 | ) | | | (8.8 | ) |
Expenditures for refinery acquisition | | | — | | | | (474.8 | ) |
Cash and cash equivalents restricted for investment in capital additions | | | 3.2 | | | | 2.6 | |
| | |
|
|
| |
|
|
|
Net cash used in investing activities | | | (39.1 | ) | | | (503.0 | ) |
| | |
|
|
| |
|
|
|
CASH FLOWS FROM FINANCING ACTIVITIES: | | | | | | | | |
Proceeds from issuance of long-term debt | | | — | | | | 525.0 | |
Long-term debt and capital lease payments | | | (66.6 | ) | | | (244.5 | ) |
Capital contributions, net | | | — | | | | 260.6 | |
Cash and cash equivalents restricted for debt repayment | | | (26.9 | ) | | | 0.2 | |
Deferred financing costs | | | (1.1 | ) | | | (19.6 | ) |
| | |
|
|
| |
|
|
|
Net cash provided by (used in) financing activities | | | (94.6 | ) | | | 521.7 | |
| | |
|
|
| |
|
|
|
NET INCREASE (DECREASE) IN CASH AND CASH EQUIVALENTS | | | (122.5 | ) | | | 136.1 | |
CASH AND CASH EQUIVALENTS, beginning of period | | | 482.5 | | | | 119.7 | |
| | |
|
|
| |
|
|
|
CASH AND CASH EQUIVALENTS, end of period | | $ | 360.0 | | | $ | 255.8 | |
| | |
|
|
| |
|
|
|
The accompanying notes are an integral part of these financial statements.
F-49
THE PREMCOR REFINING GROUP INC. AND SUBSIDIARIES
NOTES TO CONDENSED CONSOLIDATED FINANCIAL STATEMENTS
March 31, 2003
(Unaudited)
(Tabular amounts in millions)
1. Nature of Business and Basis of Preparation
The Premcor Refining Group Inc., a Delaware corporation incorporated in 1988, (“PRG” on a stand-alone basis and the “Company” on a consolidated basis) is 100% owned by Premcor USA Inc., a Delaware corporation also incorporated in 1988 (“Premcor USA”). Premcor USA is 100% owned by Premcor Inc., a Delaware corporation incorporated in April 1999. The Company is an independent petroleum refiner and supplier of unbranded transportation fuels, heating oil, petrochemical feedstocks, petroleum coke and other petroleum products in the United States. As of March 31, 2003, the Company owned and operated three refineries with a combined crude oil throughput capacity of 610,000 barrels per day (“bpd”). The refineries are located in Port Arthur, Texas; Memphis, Tennessee; and Lima, Ohio.
All of the operations of the Company are in the United States. These operations are related to the refining of crude oil and other petroleum feedstocks into petroleum products and are all considered part of one business segment. The Company’s earnings and cash flows from operations are primarily dependent upon processing crude oil and selling quantities of refined petroleum products at margins sufficient to cover operating expenses. Crude oil and refined petroleum products are commodities, and factors largely out of the Company’s control can cause prices to vary, in a wide range, over a short period of time. This potential margin volatility can have a material effect on the financial position, current period earnings, and cash flows.
The accompanying unaudited condensed consolidated financial statements of the Company are presented pursuant to the rules and regulations of the United States Securities and Exchange Commission in accordance with the disclosure requirements for the Quarterly Report on Form 10-Q. In the opinion of the management of the Company, the unaudited condensed consolidated financial statements reflect all adjustments (consisting of normal recurring adjustments) necessary to fairly state the results for the interim periods presented. Operating results for the three months ended March 31, 2003 are not necessarily indicative of the results that may be expected for the year ending December 31, 2003. These unaudited condensed financial statements should be read in conjunction with the audited financial statements and notes included in the Company’s Annual Report on Form 10-K for the year ended December 31, 2002.
In the second quarter of 2002, the Company adopted the recognition and measurement provisions of Statement of Financial Accounting Standard (“SFAS”) No. 123,Accounting for Stock-Based Compensation,and effective January 1, 2002 recognized stock-based compensation expense using the fair value recognition provisions of SFAS No. 123 for all employee awards granted or modified after January 1, 2002. SFAS No. 123 requires the restatement of previously reported interim financial statements within the year of adoption, and accordingly, the Company restated the financial statements for the first quarter of 2002. For the three months ended March 31, 2002, the adoption of the fair value recognition provisions of SFAS No. 123 increased the Company’s net loss available to common stockholders by $0.2 million from amounts originally reported.
On June 6, 2002, Premcor Inc. and PRG completed a series of transactions, which resulted in Sabine River Holding Corp. and its subsidiaries (“Sabine”), becoming wholly owned subsidiaries of PRG. Prior to this date, Premcor Inc. held a 90% interest in Sabine and a subsidiary of Occidental Petroleum Corporation (“Occidental”) held a 10% interest. Sabine, through Port Arthur Coker Company L.P. (“PACC”), owns and operates a heavy oil processing facility, which is operated in conjunction with PRG’s Port Arthur refinery. The restructuring of Sabine as a wholly owned subsidiary of PRG constituted an exchange of ownership interest between entities under common control, and therefore was accounted for in a manner similar to a pooling of interests. Accordingly, the Company’s historical financial statements have been restated to include the consolidated financial position, results of operations, and cash flows of Sabine for all periods presented.
F-50
Certain reclassifications have been made to the prior year’s financial statements to conform to classifications used in the current year.
2. New Accounting Standards
In July 2001, the Financial Accounting Standards Board (“FASB”) issued SFAS No. 143, Accounting for Asset Retirement Obligations. SFAS No. 143 requires fair value recognition of legal obligations to retire long-lived assets at the time the obligations are incurred. The initial recording of a liability for an asset retirement obligation will require the recording of a corresponding asset. The liability will be adjusted for accretion due to the passage of time and the asset will be depreciated. The Company has asset retirement obligations based on its legal obligations at its refinery sites. The Company considers the settlement date of the obligations indeterminable at this time due to uncertainty about the timing of the retirement of the long-lived assets. Accordingly, the Company cannot calculate an associated asset retirement liability at this time. The Company adopted this standard in the first quarter of 2003, but the initial adoption did not have a material impact on the Company’s financial position or results of operations. The Company will measure and recognize the fair value of its asset retirement obligations at such time as a settlement date is determinable.
In November 2002, the FASB issued Interpretation No. 45,Guarantor’s Accounting and Disclosure Requirements for Guarantees, Including Indirect Guarantees of Indebtedness of Others. This interpretation requires expanded disclosure of a guarantor’s obligation under certain guarantees that it has issued. It also requires that a guarantor recognize, at the inception of certain guarantees, a liability for the fair value of the obligation undertaken in issuing the guarantee. The disclosure requirements are effective for interim and annual financial statements issued for periods ending after December 15, 2002. The provisions for the recognition of a liability are effective prospectively for guarantees issued or modified after December 31, 2002. The Company has adopted the recognition provisions in the first quarter of 2003 with no material impact on its financial statements.
In January 2003, the FASB issued Interpretation No. 46,Consolidation of Variable Interest Entities, an interpretation of ARB No. 51. This interpretation clarifies consolidation requirements for variable interest entities. It establishes additional factors beyond ownership of a majority voting interest to indicate that a company has a controlling financial interest in an entity (or a relationship sufficiently similar to a controlling financial interest that it requires consolidation). This interpretation applies immediately to variable interest entities created or obtained after January 31, 2003 and must be retroactively applied to holdings in variable interest entities acquired before February 1, 2003 in interim and annual financial statements issued for periods beginning after June 15, 2003. The adoption of this interpretation did not have a material impact on the Company’s financial statements.
In April 2003, the agenda committee of the Emerging Issues Task Force (“EITF”) of the FASB placed the discussion of Issue No. 02-L,Reporting Gains and Losses on Derivative Instruments That are Subject to SFAS No. 133, Accounting for Derivative Instruments and Hedging Activities, and Not Held for Trading Purposes,on its agenda for future meetings. It is anticipated the EITF will address Issue No. 02-L which deals with certain aspects of EITF 02-3,Issues Involved in Accounting for Derivative Contracts Held for Trading Purposes and Contracts Involved in Energy Trading and Risk Management Activities. EITF 02-3 currently requires that gains and losses on all derivative instruments within the scope of SFAS No. 133 be shown net in the income statement, whether or not settled physically, if the derivative instruments are held for trading purposes. The EITF is expected to address the income statement classification of gains and losses on energy contracts within the scope of SFAS No. 133 that are not held for trading purposes and the applicability of EITF 99-19 to such transactions. Energy contract arrangements that are settled physically qualify for “gross” reporting pursuant to EITF 99-19. Any consensus reached by the EITF on this issue may require changes in the Company’s presentation of revenue and cost of sales. The Company does not expect that any such changes will have an impact on its gross margin.
3. Memphis Refinery Acquisition and Related Financing Transactions
Effective March 3, 2003, Premcor Inc. completed the acquisition of the Memphis, Tennessee refinery and related supply and distribution assets from The Williams Companies, Inc. and certain of its subsidiaries
F-51
(“Williams”) at a purchase price of $310 million plus approximately $159 million for crude and product inventories, which is subject to finalization, and approximately $6 million in transaction fees. The Memphis refinery has a rated crude oil throughput capacity of 190,000 bpd but typically processes approximately 170,000 bpd. The related assets include two truck-loading racks; three petroleum terminals in the area; supporting pipeline infrastructure that transports both crude oil and refined products; crude oil tankage at St. James, Louisiana; and an 80-megawatt power plant adjacent to the refinery. The transfer of certain of these assets remains subject to obtaining certain third party consents. No portion of the purchase price was held back relative to this delayed transfer, and the Company is able to utilize the assets based on interim agreements.
The acquisition of the Memphis refinery and related supply and distribution assets was accounted for using the purchase method, and the results of operations of these assets have been included in the Company’s first quarter results from the date of acquisition. The preliminary purchase price allocation, which is subject to change pending finalization of the crude and product inventory settlement with Williams, completion of independent appraisals, and completion of other evaluations including the assessment of any asset retirement obligations, is as follows:
Current assets | | $ | 174.3 | |
Property, plant, and equipment | | | 321.9 | |
Accrued liabilities (including current portion of long-term debt) | | | (11.2 | ) |
Long-term debt (capital leases) | | | (10.2 | ) |
| | |
|
|
|
| | | $ | 474.8 | |
| | |
|
|
|
As part of the purchase agreement, the Company assumed liabilities of $11.2 million that primarily related to cancellation fees for contracts entered into by Williams for Tier II technology that will not be utilized by the Company and environmental remediation of a recently closed land farm. Williams assigned several leases to the Company including two capitalized leases that relate to the leasing of crude oil and product pipelines that are within the Memphis refinery system connecting the refinery to storage facilities and other third party pipelines. Both capital leases have 15-year terms with approximately 14 years of the term remaining.
The purchase agreement also provides for contingent participation, or earn-out, payments up to a maximum aggregate of $75 million to Williams over the next seven years, depending on the level of industry refining margins during that period. The earn-out payments will be calculated annually at the end of the seven 12-month periods beginning on March 3, 2003. The annual earn-out calculation will be equal to one-half of the excess of the actual daily value of the Gulf Coast 2/1/1 crack spread over a stipulated margin, at a crude oil throughput rate of 167,123 bpd. The stipulated margin is $3.25 per barrel for the first year and increases by $0.10 per barrel for each year thereafter. Any amounts the Company pays to Williams as a result of the earn-out agreement will be recorded as additional refinery purchase price on the calculation date, and depreciated or amortized accordingly.
Related Financing Transactions
PRG acquired the refinery and related assets utilizing a portion of the proceeds from the issuance of $525 million in senior notes and utilizing capital contributions from Premcor Inc., which were funded from the proceeds of a public and private offering of common stock.
On January 30, 2003, Premcor Inc. completed a public offering of 12.5 million shares of common stock and a private placement of 2.9 million shares of common stock with Blackstone Capital Partners III Merchant Banking Fund L.P. and its affiliates (“Blackstone”), Occidental, and certain Premcor executives. On February 5, 2003, Premcor Inc. sold an additional 0.6 million shares of common stock pursuant to the underwriters’ over-allotment option. Premcor Inc. received net proceeds of approximately $306 million from these transactions. On February 11, 2003, PRG completed an offering of $525 million in senior notes, of which $350 million, due in 2013, bear interest at 9½% per annum and $175 million, due in 2010, bear interest at 9¼% per annum. Concurrently, PRG amended and restated its credit agreement as described in Note 7, Credit Agreement.
F-52
In addition to the refinery acquisition, the proceeds from these transactions were also used to repay PRG’s $240 million floating rate loan at par.
Loss on Extinguishment of Long-term Debt
As a result of the early extinguishment of long-term debt and credit agreement restructuring, the Company recorded a loss of $4.7 million in the first quarter of 2003 which included a write-off of unamortized deferred financing costs related to the repayment of the floating rate loan and the amendment of the credit agreement.
4. Refinery Restructuring and Other Charges
In September 2002, the Company ceased refining operations at its Hartford, Illinois refinery and as of December 31, 2002, had written down the long-lived refining assets to their estimated net realizable value of $49.0 million in anticipation of a sale or lease of the refining assets. The Company continued to operate the storage and distribution facility at the refinery site. In the first quarter of 2003, the Company signed a memorandum of understanding with ConocoPhillips for a sale of refining assets and certain storage and distribution assets for $40 million. In the first quarter of 2003, the Company recorded refinery restructuring and other charges of $16.6 million related to the transaction, which included the write-down of the refining assets held for sale and certain storage and distribution assets included in property, plant and equipment.
In the first quarter of 2002, the Company recorded refinery restructuring and other charges of $142.0 million, which consisted of a $131.2 million charge related to the then planned shutdown of refining operations at the Hartford, Illinois refinery, a $15.8 million charge related to the restructuring of management and administrative functions; and income of $5.0 million related to the unanticipated sale of a portion of the Blue Island refinery assets previously written off.
As of December 31, 2002, the Company had a $4.9 million reserve for plans announced in the third quarter of 2002 to reduce additional staff at the St. Louis administrative office in early 2003. As a result of the Memphis refinery acquisition, the number of positions to be eliminated has been reduced by 25 and the Company recorded a reduction in the restructuring reserve of $1.6 million in the first quarter of 2003. The Company expects to complete the restructuring of its St. Louis administrative functions by the end of the year. The Company also had a $1.0 million reserve for employee severance and plant closure/equipment remediation related to shutdown of the refining operations at the Hartford refinery. The activities related to the Hartford closure were completed in the first quarter of 2003. The following schedule summarizes the activity and balance of these restructuring reserves as of March 31, 2003:
| | | Reserve as of
December 31,
2002
| | Adjustment
to Reserve
| | | Net Cash
Outlay
| | | Reserve as of
March 31,
2003
|
St. Louis restructuring | | $ | 4.9 | | $ | (1.6 | ) | | $ | (1.5 | ) | | $ | 1.8 |
Hartford closure: | | | | | | | | | | | | | | |
Employee severance | | | 0.6 | | | — | | | | (0.6 | ) | | | — |
Plant closure/equipment remediation | | | 0.4 | | | — | | | | (0.4 | ) | | | — |
| | |
|
| |
|
|
| |
|
|
| |
|
|
| | | $ | 5.9 | | $ | (1.6 | ) | | $ | (2.5 | ) | | $ | 1.8 |
| | |
|
| |
|
|
| |
|
|
| |
|
|
5. Inventories
The carrying value of inventories consisted of the following:
| | | December 31,
2002
| | March 31,
2003
|
Crude oil | | $ | 63.8 | | $ | 151.4 |
Refined products and blendstocks | | | 204.5 | | | 286.5 |
Warehouse stock and other | | | 19.0 | | | 25.5 |
| | |
|
| |
|
|
| | | $ | 287.3 | | $ | 463.4 |
| | |
|
| |
|
|
F-53
The market value of crude oil, refined products and blendstock inventories at March 31, 2003 was approximately $159 million (December 31, 2002—$188 million) above carrying value.
6. Other Assets
Other assets consisted of the following:
| | | December 31,
2002
| | March 31,
2003
|
Deferred turnaround costs | | $ | 86.3 | | $ | 85.6 |
Deferred financing costs | | | 24.2 | | | 36.8 |
Cash restricted for investment in capital additions | | | 2.6 | | | — |
Other | | | 4.2 | | | 2.2 |
| | |
|
| |
|
|
| | | $ | 117.3 | | $ | 124.6 |
| | |
|
| |
|
|
Amortization of deferred financing costs for the three months ended March 31, 2003 was $2.3 million for the Company (2002—$2.4 million), and was included in “Interest and finance expense”. In the first quarter of 2003, the Company incurred deferred financing costs of $19.6 million related to the amendment of its credit agreement and the issuance of $525 million in senior notes. In the first quarter of 2003, the Company wrote-off $4.7 million of unamortized deferred financing costs as a result of the early repayment of portions of its long-term debt and the amendment of its credit agreement.
7. Credit Agreement
PRG’s credit agreement, which was amended and restated in February 2003, provides for letter of credit issuances of up to the lesser of $750 million or an amount available under a defined borrowing base, less outstanding borrowings. The facility may be increased to $800 million under certain circumstances. PRG utilizes this facility primarily for the issuance of letters of credit to secure crude oil purchase obligations. The borrowing base includes PRG’s unrestricted cash and eligible cash equivalents, eligible investments, eligible receivables, eligible petroleum inventories, paid but unexpired letters of credit, net obligations on swap contracts and PACC’s eligible hydrocarbon inventory. The credit agreement expires in February 2006. As of March 31, 2003, the borrowing base was $1,090.8 million (December 31, 2002—$815.3 million), with $575.0 million (December 31, 2002—$597.1 million) of the facility utilized for letters of credit.
The credit agreement provides for direct cash borrowings of up to, but not exceeding in the aggregate, $200 million, subject to sublimits of $75 million for working capital and general corporate purposes and $150 million for acquisition-related working capital. Acquisition-related borrowings are subject to a defined repayment provision. Borrowings under the credit agreement are secured by a lien on substantially all of PRG’s unrestricted cash and cash equivalents, receivables, crude oil and refined product inventories and trademarks and PACC’s hydrocarbon inventory. PRG’s interest rate for any borrowings under this agreement would bear interest at a rate based on either the U.S. prime lending rate or the Eurodollar rate plus a defined margin, at PRG’s option, based on certain restrictions. As of December 31, 2002 and March 31, 2003, there were no direct cash borrowings under the credit agreement.
The credit agreement contains covenants and conditions that, among other things, limit PRG’s dividends, indebtedness, liens, investments and contingent obligations. PRG is also required to comply with certain financial covenants, including the maintenance of minimum working capital of $150 million and the maintenance of minimum tangible net worth of $650 million. The covenants also provide for a cumulative cash flow test that from January 1, 2003 must not be less than zero.
F-54
8. Long-term Debt
Significant transactions affecting long-term debt were discussed in Note 3. Long-term debt consisted of the following:
| | | December 31,
2002
| | March 31,
2003
|
8 5/8% Senior Notes due August 15, 2008 (“8 3/8% Senior Notes”) (1) | | $ | 109.8 | | $ | 109.8 |
8 7/8% Senior Notes due November 15, 2007 (“8 3/8% Senior Notes”) (1) | | | 99.7 | | | 99.7 |
8 7/8% Senior Subordinated Notes due November 15, 2007 (“8 7/8% Senior Subordinated Notes”) (1) | | | 174.4 | | | 174.4 |
Floating Rate Term Loan due November 15, 2003 and 2004 (“Floating Rate Loan”) (1) | | | 240.0 | | | — |
12½% Senior Notes due January 15, 2009 (“12 ½% Senior Notes”) (2) | | | 250.7 | | | 246.3 |
9¼% Senior Notes due February 01, 2010 (“9¼% Senior Notes”) (1) | | | — | | | 175.0 |
9½% Senior Notes due February 01, 2013 (“9½% Senior Notes”) (1) | | | — | | | 350.0 |
Ohio Water Development Authority Environmental Facilities Revenue Bonds due December 01, 2031 (“Series 2001 Ohio Bonds”) (1) | | | 10.0 | | | 10.0 |
Obligation under capital leases | | | 0.2 | | | — |
| | |
|
| |
|
|
| | | | 884.8 | | | 1,165.2 |
Less current portion | | | 15.0 | | | 20.9 |
| | |
|
| |
|
|
Total long-term debt | | $ | 869.8 | | $ | 1,144.3 |
| | |
|
| |
|
|
| (1) | | Issued or borrowed by PRG |
| (2) | | Issued or borrowed by Port Arthur Finance Corp. (“PAFC”) |
9. Stock-based Compensation Expense
As of March 31, 2003, the Company had outstanding stock awards accounted for under the intrinsic value method of APB Opinion No. 25,Accounting for Stock Issued to Employee(awards granted prior to January 1, 2002). The following table illustrates the effect on net income if the fair value based method of SFAS No. 123 had been applied to all outstanding awards in each period as opposed to only the awards granted or modified after January 1, 2002.
| | | For the Three Months
Ended March 31,
| |
| | | 2002
| | | 2003
| |
Net income (loss), as reported | | $ | (95.5 | ) | | $ | 38.8 | |
Add: Stock-based compensation expense included in reported net income, net of tax effect | | | 4.8 | | | | 2.7 | |
Deduct: Stock-based compensation expense determined under fair value based method for all options, net of tax effect | | | (4.9 | ) | | | (2.7 | ) |
| | |
|
|
| |
|
|
|
Pro forma net income (loss) | | $ | (95.6 | ) | | $ | 38.8 | |
| | |
|
|
| |
|
|
|
F-55
10. Interest and Finance Expense
Interest and finance expense included in the statements of operations consisted of the following:
| | | For the Three Months
Ended March 31,
| |
| | | 2002
| | | 2003
| |
Interest expense | | $ | 28.2 | | | $ | 26.1 | |
Financing costs | | | 4.1 | | | | 2.4 | |
Capitalized interest | | | (1.8 | ) | | | (2.3 | ) |
| | |
|
|
| |
|
|
|
| | | $ | 30.5 | | | $ | 26.2 | |
| | |
|
|
| |
|
|
|
The Company’s cash paid for interest expense for the three months ended March 31, 2003 was $23.1 million (2002—$37.9 million).
11. Income Taxes
The Company made no net cash income tax payments nor received any net cash income tax refunds during the first quarter of 2003 (2002—no income tax payment or refunds).
12. Discontinued Operations
In connection with the 1999 sale of the Company’s retail assets to Clark Retail Enterprises, Inc. (“CRE”), the Company assigned approximately 170 leases and subleases of retail stores to CRE. The Company remains jointly and severally liable for CRE’s obligations under approximately 150 of these leases, including payment of rent and taxes. The Company may also be contingently liable for environmental cleanup responsibilities for releases of petroleum occurring during the term of the CRE leases. On October 15, 2002, CRE and its parent company, Clark Retail Group, Inc., filed a voluntary petition for reorganization under Chapter 11 of the U.S. Bankruptcy Code. As CRE rejects some or all of these leases from its reorganization plan, the Company may become responsible for these obligations. In bankruptcy hearings held in the first quarter of 2003, CRE rejected 30 of these leases. The Company recorded an after-tax charge of $4.3 million in the first quarter of 2003 representing the estimated net present value of our remaining liability under these rejected leases, net of estimated sub-lease income. The Company is currently in discussions with CRE regarding their reorganization plans, the status of environmental remediation agreements, and other matters. While it is possible that the Company may incur additional liability for CRE lease obligations or other costs as CRE finalizes its reorganization plans, the amounts are not estimable at this time.
13. Consolidating Financial Statements of PRG as Co-guarantor of PAFC’s Senior Notes
Presented below are the consolidating balance sheets, statement of operations, and cash flows as required by Rule 3-10 of the Securities Exchange Act of 1934. PRG along with PACC, Sabine, and various other subsidiaries of Sabine are full and unconditional guarantors of PAFC’s 12½% Senior Notes. PAFC is a wholly owned subsidiary of PACC. Under Rule 3-10, the consolidating balance sheets, statement of operations, and cash flows presented below meet the requirements for financial statements of the issuer and each guarantor of the notes since the issuer and guarantors are all direct or indirect wholly owned subsidiaries of PRG, and all guarantees are full and unconditional and joint and several.
F-56
THE PREMCOR REFINING GROUP INC. AND SUBSIDIARIES
CONSOLIDATING BALANCE SHEET
As of March 31, 2003
(unaudited, in millions)
| | | PRG
| | PAFC
| | Other
Guarantor
Subsidiaries
| | Eliminations
| | | Consolidated
PRG
|
ASSETS | | | | | | | | | | | | | | | | |
CURRENT ASSETS: | | | | | | | | | | | | | | | | |
Cash and cash equivalents | | $ | 250.8 | | $ | — | | $ | 5.0 | | $ | — | | | $ | 255.8 |
Short-term investments | | | 1.7 | | | — | | | — | | | — | | | | 1.7 |
Cash and cash equivalents restricted for debt service | | | — | | | — | | | 53.8 | | | — | | | | 53.8 |
Accounts receivable | | | 517.6 | | | — | | | 2.4 | | | — | | | | 520.0 |
Receivable from affiliates | | | 71.4 | | | 27.4 | | | 139.5 | | | (211.9 | ) | | | 26.4 |
Inventories | | | 431.7 | | | — | | | 31.7 | | | — | | | | 463.4 |
Prepaid expenses and other | | | 76.9 | | | — | | | 1.0 | | | — | | | | 77.9 |
Assets held for sale | | | 40.2 | | | — | | | — | | | — | | | | 40.2 |
| | |
|
| |
|
| |
|
| |
|
|
| |
|
|
Total current assets | | | 1,390.3 | | | 27.4 | | | 233.4 | | | (211.9 | ) | | | 1,439.2 |
PROPERTY, PLANT AND EQUIPMENT, NET | | | 955.9 | | | — | | | 605.0 | | | — | | | | 1,560.9 |
DEFERRED INCOME TAXES | | | 56.5 | | | — | | | — | | | (51.9 | ) | | | 4.6 |
INVESTMENT IN AFFILIATE | | | 393.2 | | | — | | | — | | | (393.2 | ) | | | — |
OTHER ASSETS | | | 109.6 | | | — | | | 15.0 | | | — | | | | 124.6 |
NOTE RECEIVABLE FROM AFFILIATE | | | — | | | 225.4 | | | — | | | (225.4 | ) | | | — |
| | |
|
| |
|
| |
|
| |
|
|
| |
|
|
| | | $ | 2,905.5 | | $ | 252.8 | | $ | 853.4 | | $ | (882.4 | ) | | $ | 3,129.3 |
| | |
|
| |
|
| |
|
| |
|
|
| |
|
|
LIABILITIES AND STOCKHOLDER’S EQUITY | | | | | | | | | | | | | | | | |
CURRENT LIABILITIES: | | | | | | | | | | | | | | | | |
Accounts payable | | $ | 619.0 | | $ | — | | $ | 101.4 | | $ | — | | | $ | 720.4 |
Payable to affiliates | | | 175.3 | | | — | | | 55.4 | | | (188.6 | ) | | | 42.1 |
Accrued expenses and other | | | 76.4 | | | 6.5 | | | 0.5 | | | — | | | | 83.4 |
Accrued taxes other than income | | | 40.1 | | | — | | | 1.8 | | | — | | | | 41.9 |
Current portion of long-term debt | | | — | | | 20.9 | | | — | | | — | | | | 20.9 |
Current portion of notes payable to affiliate | | | — | | | — | | | 23.3 | | | (23.3 | ) | | | — |
| | |
|
| |
|
| |
|
| |
|
|
| |
|
|
Total current liabilities | | | 910.8 | | | 27.4 | | | 182.4 | | | (211.9 | ) | | | 908.7 |
LONG-TERM DEBT | | | 918.9 | | | 225.4 | | | — | | | — | | | | 1,144.3 |
DEFERRED INCOME TAXES | | | — | | | — | | | 51.9 | | | (51.9 | ) | | | — |
OTHER LONG-TERM LIABILITIES | | | 143.9 | | | — | | | 0.5 | | | — | | | | 144.4 |
NOTE PAYABLE TO AFFILIATE | | | — | | | — | | | 225.4 | | | (225.4 | ) | | | — |
| | | | | |
COMMON STOCKHOLDER’S EQUITY: | | | | | | | | | | | | | | | | |
Common stock | | | — | | | — | | | 0.1 | | | (0.1 | ) | | | — |
Paid-in capital | | | 806.7 | | | — | | | 206.0 | | | (206.0 | ) | | | 806.7 |
Retained earnings | | | 125.2 | | | — | | | 187.1 | | | (187.1 | ) | | | 125.2 |
| | |
|
| |
|
| |
|
| |
|
|
| |
|
|
Total common stockholder’s equity | | | 931.9 | | | — | | | 393.2 | | | (393.2 | ) | | | 931.9 |
| | |
|
| |
|
| |
|
| |
|
|
| |
|
|
| | | $ | 2,905.5 | | $ | 252.8 | | $ | 853.4 | | $ | (882.4 | ) | | $ | 3,129.3 |
| | |
|
| |
|
| |
|
| |
|
|
| |
|
|
F-57
THE PREMCOR REFINING GROUP INC. AND SUBSIDIARIES
CONSOLIDATING STATEMENT OF OPERATIONS
For the three months ended March 31, 2003
(unaudited, in millions)
| | | PRG
| | | PAFC
| | | Other Guarantor
Subsidiaries
| | | Eliminations
| | | Consolidated
PRG
| |
NET SALES AND OPERATING REVENUES | | $ | 2,513.8 | | | $ | — | | | $ | 704.3 | | | $ | (842.3 | ) | | $ | 2,375.8 | |
EQUITY IN EARNINGS OF AFFILIATE | | | 62.3 | | | | — | | | | — | | | | (62.3 | ) | | | — | |
| | | | | |
EXPENSES: | | | | | | | | | | | | | | | | | | | | |
Cost of sales | | | 2,392.7 | | | | — | | | | 550.9 | | | | (834.0 | ) | | | 2,109.6 | |
Operating expenses | | | 82.4 | | | | — | | | | 42.6 | | | | (8.3 | ) | | | 116.7 | |
General and administrative expenses | | | 10.7 | | | | — | | | | 1.0 | | | | — | | | | 11.7 | |
Stock-based compensation | | | 4.3 | | | | — | | | | — | | | | — | | | | 4.3 | |
Depreciation | | | 9.1 | | | | — | | | | 5.4 | | | | — | | | | 14.5 | |
Amortization | | | 9.5 | | | | — | | | | — | | | | — | | | | 9.5 | |
Refinery restructuring and other charges | | | 15.0 | | | | — | | | | — | | | | — | | | | 15.0 | |
| | |
|
|
| |
|
|
| |
|
|
| |
|
|
| |
|
|
|
| | | | 2,523.7 | | | | — | | | | 599.9 | | | | (842.3 | ) | | | 2,281.3 | |
| | |
|
|
| |
|
|
| |
|
|
| |
|
|
| |
|
|
|
| | | | | |
OPERATING INCOME | | | 52.4 | | | | — | | | | 104.4 | | | | (62.3 | ) | | | 94.5 | |
| | | | | |
Interest and finance expense | | | (17.5 | ) | | | (7.7 | ) | | | (8.7 | ) | | | 7.7 | | | | (26.2 | ) |
Loss on extinguishment of long-term debt | | | (4.7 | ) | | | — | | | | — | | | | — | | | | (4.7 | ) |
Interest income | | | 1.0 | | | | 7.7 | | | | 0.1 | | | | (7.7 | ) | | | 1.1 | |
| | |
|
|
| |
|
|
| |
|
|
| |
|
|
| |
|
|
|
| | | | | |
INCOME FROM CONTINUING OPERATIONS BEFORE INCOME TAXES | | | 31.2 | | | | — | | | | 95.8 | | | | (62.3 | ) | | | 64.7 | |
| | | | | |
Income tax (provision) benefit | | | 11.9 | | | | — | | | | (33.5 | ) | | | — | | | | (21.6 | ) |
| | |
|
|
| |
|
|
| |
|
|
| |
|
|
| |
|
|
|
| | | | | |
INCOME FROM CONTINUING OPERATIONS | | | 43.1 | | | | — | | | | 62.3 | | | | (62.3 | ) | | | 43.1 | |
| | | | | |
Loss from discontinued operations, net of income tax benefit of $2.7 | | | (4.3 | ) | | | — | | | | — | | | | — | | | | (4.3 | ) |
| | |
|
|
| |
|
|
| |
|
|
| |
|
|
| |
|
|
|
| | | | | |
NET INCOME | | $ | 38.8 | | | $ | — | | | $ | 62.3 | | | $ | (62.3 | ) | | $ | 38.8 | |
| | |
|
|
| |
|
|
| |
|
|
| |
|
|
| |
|
|
|
F-58
THE PREMCOR REFINING GROUP INC. AND SUBSIDIARIES
CONSOLIDATING STATEMENT OF CASH FLOWS
For the three months ended March 31, 2003
(unaudited, in millions)
| | | PRG
| | | PAFC
| | | Other
Guarantor
Subsidiaries
| | | Eliminations
| | | Consolidated
PRG
| |
CASH FLOWS FROM OPERATING ACTIVITIES: | | | | | | | | | | | | | | | | | | | | |
Net income | | $ | 38.8 | | | $ | — | | | $ | 62.3 | | | $ | (62.3 | ) | | $ | 38.8 | |
Adjustments: | | | | | | | | | | | | | | | | | | | | |
Loss on discontinued operations | | | 7.0 | | | | — | | | | — | | | | — | | | | 7.0 | |
Depreciation | | | 9.1 | | | | — | | | | 5.4 | | | | — | | | | 14.5 | |
Amortization | | | 11.1 | | | | — | | | | 0.9 | | | | — | | | | 12.0 | |
Deferred income taxes | | | 10.5 | | | | — | | | | 4.7 | | | | — | | | | 15.2 | |
Stock-based compensation | | | 4.3 | | | | — | | | | — | | | | — | | | | 4.3 | |
Refinery restructuring and other charges | | | 13.6 | | | | — | | | | — | | | | — | | | | 13.6 | |
Write-off of deferred financing costs | | | 4.7 | | | | — | | | | — | | | | — | | | | 4.7 | |
Equity in earnings of affiliate | | | (62.3 | ) | | | — | | | | — | | | | 62.3 | | | | — | |
Other, net | | | 2.3 | | | | — | | | | 0.2 | | | | — | | | | 2.5 | |
Cash provided by (reinvested in) working capital: | | | | | | | | | | | | | | | | | | | | |
Accounts receivable, prepaid expenses and other | | | (273.1 | ) | | | — | | | �� | (1.1 | ) | | | — | | | | (274.2 | ) |
Inventories | | | (6.7 | ) | | | — | | | | (4.1 | ) | | | — | | | | (10.8 | ) |
Accounts payable, accrued expenses, taxes other than income, and other | | | 312.9 | | | | (7.9 | ) | | | (25.4 | ) | | | — | | | | 279.6 | |
Affiliate receivables and payables | | | 36.4 | | | | 12.2 | | | | (45.8 | ) | | | — | | | | 2.8 | |
Cash and cash equivalents restricted for debt service | | | — | | | | — | | | | 7.7 | | | | — | | | | 7.7 | |
| | |
|
|
| |
|
|
| |
|
|
| |
|
|
| |
|
|
|
Net cash provided by operating activities of continuing operations | | | 108.6 | | | | 4.3 | | | | 4.8 | | | | — | | | | 117.7 | |
Net cash used in operating activities of discontinued operations | | | (0.3 | ) | | | — | | | | — | | | | — | | | | (0.3 | ) |
| | |
|
|
| |
|
|
| |
|
|
| |
|
|
| |
|
|
|
Net cash provided by operating activities | | | 108.3 | | | | 4.3 | | | | 4.8 | | | | — | | | | 117.4 | |
| | |
|
|
| |
|
|
| |
|
|
| |
|
|
| |
|
|
|
CASH FLOWS FROM INVESTING ACTIVITIES: | | | | | | | | | | | | | | | | | | | | |
Expenditures for property, plant and equipment | | | (22.0 | ) | | | — | | | | — | | | | — | | | | (22.0 | ) |
Expenditures for turnaround | | | (8.8 | ) | | | — | | | | — | | | | — | | | | (8.8 | ) |
Expenditures for refinery acquisition | | | (474.8 | ) | | | — | | | | — | | | | — | | | | (474.8 | ) |
Cash and cash equivalents restricted for investment in capital additions | | | 2.6 | | | | — | | | | — | | | | — | | | | 2.6 | |
| | |
|
|
| |
|
|
| |
|
|
| |
|
|
| |
|
|
|
Net cash used in investing activities | | | (503.0 | ) | | | — | | | | — | | | | — | | | | (503.0 | ) |
| | |
|
|
| |
|
|
| |
|
|
| |
|
|
| |
|
|
|
CASH FLOWS FROM FINANCING ACTIVITIES: | | | | | | | | | | | | | | | | | | | | |
Proceeds from issuance of long-term debt. | | | 525.0 | | | | — | | | | — | | | | — | | | | 525.0 | |
Long-term debt and capital lease payments | | | (240.2 | ) | | | (4.3 | ) | | | — | | | | — | | | | (244.5 | ) |
Capital contributions, net | | | 260.6 | | | | — | | | | — | | | | — | | | | 260.6 | |
Cash and cash equivalents restricted for debt repayment | | | — | | | | — | | | | 0.2 | | | | — | | | | 0.2 | |
Deferred financing costs | | | (19.6 | ) | | | — | | | | — | | | | — | | | | (19.6 | ) |
| | |
|
|
| |
|
|
| |
|
|
| |
|
|
| |
|
|
|
Net cash provided by (used in) financing activities | | | 525.8 | | | | (4.3 | ) | | | 0.2 | | | | — | | | | 521.7 | |
| | |
|
|
| |
|
|
| |
|
|
| |
|
|
| |
|
|
|
NET INCREASE IN CASH AND CASH EQUIVALENTS | | | 131.1 | | | | — | | | | 5.0 | | | | — | | | | 136.1 | |
CASH AND CASH EQUIVALENTS, Beginning of period | | | 119.7 | | | | — | | | | — | | | | — | | | | 119.7 | |
| | |
|
|
| |
|
|
| |
|
|
| |
|
|
| |
|
|
|
CASH AND CASH EQUIVALENTS, end of period | | $ | 250.8 | | | $ | — | | | $ | 5.0 | | | $ | — | | | $ | 255.8 | |
| | |
|
|
| |
|
|
| |
|
|
| |
|
|
| |
|
|
|
F-59
THE PREMCOR REFINING GROUP INC. AND SUBSIDIARIES
CONSOLIDATING BALANCE SHEET
As of December 31, 2002
(in millions)
| | | PRG
| | PAFC
| | Other Guarantor
Subsidiaries
| | Eliminations
| | | Consolidated
PRG
|
ASSETS | | | | | | | | | | | | | | | | |
| | | | | |
CURRENT ASSETS: | | | | | | | | | | | | | | | | |
Cash and cash equivalents | | $ | 119.7 | | $ | — | | $ | — | | $ | — | | | $ | 119.7 |
Short-term investments | | | 1.7 | | | — | | | — | | | — | | | | 1.7 |
Cash and cash equivalents restricted for debt service | | | — | | | — | | | 61.7 | | | — | | | | 61.7 |
Accounts receivable | | | 268.7 | | | — | | | 0.3 | | | — | | | | 269.0 |
Receivable from affiliates | | | 32.9 | | | 29.2 | | | 50.7 | | | (99.7 | ) | | | 13.1 |
Inventories | | | 259.7 | | | — | | | 27.6 | | | — | | | | 287.3 |
Prepaid expenses and other | | | 43.7 | | | — | | | 2.0 | | | — | | | | 45.7 |
Assets held for sale | | | 49.3 | | | — | | | — | | | — | | | | 49.3 |
| | |
|
| |
|
| |
|
| |
|
|
| |
|
|
Total current assets | | | 775.7 | | | 29.2 | | | 142.3 | | | (99.7 | ) | | | 847.5 |
| | | | | |
PROPERTY, PLANT AND EQUIPMENT, NET | | | 651.3 | | | — | | | 610.4 | | | — | | | | 1,261.7 |
DEFERRED INCOME TAXES | | | 67.0 | | | — | | | — | | | (47.2 | ) | | | 19.8 |
INVESTMENT IN AFFILIATE | | | 330.9 | | | — | | | — | | | (330.9 | ) | | | — |
OTHER ASSETS | | | 101.4 | | | — | | | 15.9 | | | — | | | | 117.3 |
NOTE RECEIVABLE FROM AFFILIATE | | | 2.3 | | | 235.9 | | | — | | | (238.2 | ) | | | — |
| | |
|
| |
|
| |
|
| |
|
|
| |
|
|
| | | $ | 1,928.6 | | $ | 265.1 | | $ | 768.6 | | $ | (716.0 | ) | | $ | 2,246.3 |
| | |
|
| |
|
| |
|
| |
|
|
| |
|
|
| | | | |
LIABILITIES AND STOCKHOLDER’S EQUITY | | | | | | | | | | | | | |
| | | | | |
CURRENT LIABILITIES: | | | | | | | | | | | | | | | | |
Accounts payable | | $ | 342.9 | | $ | — | | $ | 123.3 | | $ | — | | | $ | 466.2 |
Payable to affiliates | | | 117.7 | | | — | | | 20.1 | | | (96.8 | ) | | | 41.0 |
Accrued expenses and other | | | 40.9 | | | 14.4 | | | 0.4 | | | — | | | | 55.7 |
Accrued taxes other than income | | | 21.1 | | | — | | | 5.3 | | | — | | | | 26.4 |
Current portion of long-term debt | | | 0.2 | | | 14.8 | | | — | | | — | | | | 15.0 |
Current portion of notes payable to affiliate | | | — | | | — | | | 2.9 | | | (2.9 | ) | | | — |
| | |
|
| |
|
| |
|
| |
|
|
| |
|
|
Total current liabilities | | | 522.8 | | | 29.2 | | | 152.0 | | | (99.7 | ) | | | 604.3 |
| | | | | |
LONG-TERM DEBT | | | 633.9 | | | 235.9 | | | — | | | — | | | | 869.8 |
DEFERRED INCOME TAXES | | | — | | | — | | | 47.2 | | | (47.2 | ) | | | — |
OTHER LONG-TERM LIABILITIES | | | 144.1 | | | — | | | 0.3 | | | — | | | | 144.4 |
NOTE PAYABLE TO AFFILIATE | | | — | | | — | | | 238.2 | | | (238.2 | ) | | | — |
COMMITMENTS AND CONTINGENCIES | | | — | | | — | | | — | | | — | | | | — |
COMMON STOCKHOLDER’S EQUITY: | | | | | | | | | | | | | | | | |
Common stock | | | — | | | — | | | 0.1 | | | (0.1 | ) | | | — |
Paid-in capital | | | 541.4 | | | — | | | 206.0 | | | (206.0 | ) | | | 541.4 |
Retained earnings | | | 86.4 | | | — | | | 124.8 | | | (124.8 | ) | | | 86.4 |
| | |
|
| |
|
| |
|
| |
|
|
| |
|
|
Total common stockholder’s equity | | | 627.8 | | | — | | | 330.9 | | | (330.9 | ) | | | 627.8 |
| | |
|
| |
|
| |
|
| |
|
|
| |
|
|
| | | $ | 1,928.6 | | $ | 265.1 | | $ | 768.6 | | $ | (716.0 | ) | | $ | 2,246.3 |
| | |
|
| |
|
| |
|
| |
|
|
| |
|
|
F-60
THE PREMCOR REFINING GROUP INC. AND SUBSIDIARIES
CONSOLIDATING STATEMENT OF OPERATIONS
For the three months ended March 31, 2002
(unaudited, in millions)
| | | PRG
| | | PAFC
| | | Other
Guarantor
Subsidiaries
| | | Eliminations and
Minority
Interest
| | | Consolidated
PRG
| |
NET SALES AND OPERATING REVENUES | | $ | 1,255.9 | | | $ | — | | | $ | 420.7 | | | $ | (448.3 | ) | | $ | 1,228.3 | |
EQUITY IN EARNINGS OF AFFILIATE | | | (7.3 | ) | | | — | | | | — | | | | 7.3 | | | | — | |
| | | | | |
EXPENSES: | | | | | | | | | | | | | | | | | | | | |
Cost of sales | | | 1,123.1 | | | | — | | | | 379.6 | | | | (440.7 | ) | | | 1,062.0 | |
Operating expenses | | | 88.3 | | | | — | | | | 33.7 | | | | (7.6 | ) | | | 114.4 | |
General and administrative expenses | | | 13.3 | | | | — | | | | 1.1 | | | | — | | | | 14.4 | |
Stock-based compensation | | | 1.9 | | | | — | | | | — | | | | — | | | | 1.9 | |
Depreciation | | | 7.2 | | | | — | | | | 5.2 | | | | — | | | | 12.4 | |
Amortization | | | 9.8 | | | | — | | | | — | | | | — | | | | 9.8 | |
Refinery restructuring and other charges | | | 142.0 | | | | — | | | | — | | | | — | | | | 142.0 | |
| | |
|
|
| |
|
|
| |
|
|
| |
|
|
| |
|
|
|
| | | | 1,385.6 | | | | — | | | | 419.6 | | | | (448.3 | ) | | | 1,356.9 | |
| | |
|
|
| |
|
|
| |
|
|
| |
|
|
| |
|
|
|
| | | | | |
OPERATING INCOME (LOSS) | | | (137.0 | ) | | | — | | | | 1.1 | | | | 7.3 | | | | (128.6 | ) |
Interest and finance expense | | | (16.0 | ) | | | (12.0 | ) | | | (14.6 | ) | | | 12.1 | | | | (30.5 | ) |
Interest income | | | 1.4 | | | | 12.0 | | | | 0.9 | | | | (12.1 | ) | | | 2.2 | |
| | |
|
|
| |
|
|
| |
|
|
| |
|
|
| |
|
|
|
| | | | | |
LOSS BEFORE INCOME TAXES AND MINORITY INTEREST | | | (151.6 | ) | | | — | | | | (12.6 | ) | | | 7.3 | | | | (156.9 | ) |
Income tax benefit | | | 56.1 | | | | — | | | | 4.5 | | | | — | | | | 60.6 | |
Minority interest | | | — | | | | — | | | | — | | | | 0.8 | | | | 0.8 | |
| | |
|
|
| |
|
|
| |
|
|
| |
|
|
| |
|
|
|
| | | | | |
NET LOSS | | $ | (95.5 | ) | | $ | — | | | $ | (8.1 | ) | | $ | 8.1 | | | $ | (95.5 | ) |
| | |
|
|
| |
|
|
| |
|
|
| |
|
|
| |
|
|
|
F-61
THE PREMCOR REFINING GROUP INC. AND SUBSIDIARIES
CONSOLIDATING STATEMENT OF CASH FLOWS
For the three months ended March 31, 2002
(unaudited, in millions)
| | | PRG
| | | PAFC
| | | Other
Guarantor
Subsidiaries
| | | Eliminations And Minority
Interest
| | | Consolidated
PRG
| |
CASH FLOWS FROM OPERATING ACTIVITIES: | | | | | | | | | | | | | | | | | | | | |
Net loss | | $ | (95.5 | ) | | $ | — | | | $ | (8.1 | ) | | $ | 8.1 | | | $ | (95.5 | ) |
Adjustments: | | | | | | | | | | | | | | | | | | | | |
Depreciation | | | 7.2 | | | | — | | | | 5.2 | | | | — | | | | 12.4 | |
Amortization | | | 11.6 | | | | — | | | | 0.8 | | | | — | | | | 12.4 | |
Deferred income taxes | | | (56.3 | ) | | | — | | | | (4.6 | ) | | | — | | | | (60.9 | ) |
Stock-based compensation | | | 1.9 | | | | — | | | | — | | | | — | | | | 1.9 | |
Minority interest | | | — | | | | — | | | | — | | | | (0.8 | ) | | | (0.8 | ) |
Refinery restructuring and other charges | | | 101.2 | | | | — | | | | — | | | | — | | | | 101.2 | |
Equity in earnings of affiliate | | | 7.3 | | | | — | | | | — | | | | (7.3 | ) | | | — | |
Other, net | | | 8.4 | | | | — | | | | 0.2 | | | | — | | | | 8.6 | |
| | | | | |
Cash provided by (reinvested in) working capital: | | | | | | | | | | | | | | | | | | | | |
Accounts receivable, prepaid expenses and other | | | (73.0 | ) | | | — | | | | 2.7 | | | | — | | | | (70.3 | ) |
Inventories | | | (38.1 | ) | | | — | | | | 24.3 | | | | — | | | | (13.8 | ) |
Accounts payable, accrued expenses, taxes other than income, and other | | | 64.6 | | | | (9.5 | ) | | | 44.8 | | | | — | | | | 99.9 | |
Affiliate receivables and payables | | | 49.1 | | | | 75.7 | | | | (111.5 | ) | | | — | | | | 13.3 | |
Cash and cash equivalents restricted for debt service | | | — | | | | — | | | | 4.3 | | | | — | | | | 4.3 | |
| | |
|
|
| |
|
|
| |
|
|
| |
|
|
| |
|
|
|
Net cash provided by (used in) operating activities of continued operations | | | (11.6 | ) | | | 66.2 | | | | (41.9 | ) | | | — | | | | 12.7 | |
Net cash used in operating activities of discontinued operations | | | (1.5 | ) | | | — | | | | — | | | | — | | | | (1.5 | ) |
| | |
|
|
| |
|
|
| |
|
|
| |
|
|
| |
|
|
|
Net cash provided by (used in) operating activities | | | (13.1 | ) | | | 66.2 | | | | (41.9 | ) | | | — | | | | 11.2 | |
| | |
|
|
| |
|
|
| |
|
|
| |
|
|
| |
|
|
|
| | | | | |
CASH FLOWS FROM INVESTING ACTIVITIES: | | | | | | | | | | | | | | | | | | | | |
Expenditures for property, plant and equipment | | | (14.4 | ) | | | — | | | | (0.4 | ) | | | — | | | | (14.8 | ) |
Expenditures for turnaround | | | (27.5 | ) | | | — | | | | — | | | | — | | | | (27.5 | ) |
Cash and cash equivalents restricted for investment in capital additions | | | 3.2 | | | | — | | | | — | | | | — | | | | 3.2 | |
| | |
|
|
| |
|
|
| |
|
|
| |
|
|
| |
|
|
|
Net cash used in investing activities | | | (38.7 | ) | | | — | | | | (0.4 | ) | | | — | | | | (39.1 | ) |
| | |
|
|
| |
|
|
| |
|
|
| |
|
|
| |
|
|
|
| | | | | |
CASH FLOWS FROM FINANCING ACTIVITIES: | | | | | | | | | | | | | | | | | | | | |
Long-term debt and capital lease payments | | | (0.4 | ) | | | (66.2 | ) | | | — | | | | — | | | | (66.6 | ) |
Cash and cash equivalents restricted for debt repayment | | | — | | | | — | | | | (26.9 | ) | | | — | | | | (26.9 | ) |
Deferred financing costs | | | — | | | | — | | | | (1.1 | ) | | | — | | | | (1.1 | ) |
| | |
|
|
| |
|
|
| |
|
|
| |
|
|
| |
|
|
|
Net cash used in financing activities | | | (0.4 | ) | | | (66.2 | ) | | | (28.0 | ) | | | — | | | | (94.6 | ) |
| | |
|
|
| |
|
|
| |
|
|
| |
|
|
| |
|
|
|
| | | | | |
NET DECREASE IN CASH AND CASH EQUIVALENTS | | | (52.2 | ) | | | — | | | | (70.3 | ) | | | — | | | | (122.5 | ) |
CASH AND CASH EQUIVALENTS, beginning of period | | | 259.7 | | | | — | | | | 222.8 | | | | — | | | | 482.5 | |
| | |
|
|
| |
|
|
| |
|
|
| |
|
|
| |
|
|
|
CASH AND CASH EQUIVALENTS, end of period | | $ | 207.5 | | | $ | — | | | $ | 152.5 | | | $ | — | | | $ | 360.0 | |
| | |
|
|
| |
|
|
| |
|
|
| |
|
|
| |
|
|
|
F-62
15. Commitments and Contingencies
Environmental, Discontinued Operations and Legal Reserves
As a result of its normal course of business, the Company is a party to a number of legal proceedings and environmental-related obligations. The Company has also incurred liabilities related to leases of previously operated retail sites as discussed in Note 12, Discontinued Operations. In relation to these matters and obligations the Company has accrued, on an undiscounted basis unless otherwise noted, the following:
| | | December 31, 2002
| | March 31, 2003
|
Refinery environmental obligations: | | | | | | |
Hartford | | $ | 29.6 | | $ | 29.8 |
Blue Island | | | 19.7 | | | 19.2 |
Port Arthur | | | 11.9 | | | 11.8 |
Memphis | | | — | | | 1.0 |
Discontinued retail marketing: | | | | | | |
Environmental obligations | | | 23.0 | | | 23.2 |
Lease obligations (discounted) | | | — | | | 6.8 |
Other legal and environmental | | | 9.0 | | | 8.4 |
| | |
|
| |
|
|
| | | $ | 93.2 | | $ | 100.2 |
| | |
|
| |
|
|
The Company is of the opinion that the ultimate resolution of these claims and obligations, to the extent not previously provided for, will not have a material adverse effect on the consolidated financial condition, results of operations or liquidity of the Company. However, an adverse outcome of any one or more of these matters could have a material effect on quarterly or annual operating results or cash flows when resolved in a future period.
Environmental Product Standards and MACT II
The Environmental Protection Agency, or EPA, has promulgated regulations under the Clean Air Act that establish stringent sulfur content specifications for gasoline and on-road diesel fuel designed to reduce air emissions from the use of these products. The Company expects to incur in the aggregate approximately $727 million, including $657 million that it expects to expend through 2006, in order to comply with environmental regulations related to the new stringent sulfur content specifications and MACT II regulations. Future revisions to these current cost estimates may be necessary as the Company continues to finalize its plans. Information related to the expected expenditures in relation to these new regulations is shown below.
| | | Total
Estimated
Expenditures
| | Total
Expenditures
Incurred To-Date
| | Remaining
Expenditures at March 31,
2003
| | Contract
Commitments
| | Year of
Concentration of
Expenditures
|
Gasoline Low sulfur standards | | $ | 335 | | $ | 66 | | $ | 269 | | $ | 126 | | 2003/2004 |
Diesel low sulfur standards | | | 347 | | | 4 | | | 343 | | | — | | 2005 |
MACT II | | | 45 | | | — | | | 45 | | | — | | 2003/2004 |
| | |
|
| |
|
| |
|
| |
|
| | |
Total | | $ | 727 | | $ | 70 | | $ | 657 | | $ | 126 | | |
| | |
|
| |
|
| |
|
| |
|
| | |
Other Commitments
Crude Oil Purchase Commitment. On October 1, 2002, the Company entered into a crude oil linefill agreement with Morgan Stanley Capital Group Inc. (“MSCG”), which obligated it to purchase 2.7 million barrels of crude oil in the pipeline system supplying the Lima refinery from MSCG. The Company will purchase the 2.7 million barrels of crude oil upon termination of the agreement with MSCG, at then current market prices as adjusted by certain predetermined contract provisions. The initial term of the contract continues until October 1, 2003, and thereafter, automatically renews for additional 30-day periods unless terminated by either party. The Company has hedged the economic price risk related to the repurchase obligation through the purchase of exchange-traded futures contracts.
F-63
Long-Term Crude Oil Agreement. PACC has a long-term crude oil supply agreement with PMI Comercio Internacional, S.A. de C.V., an affiliate of Petroleos Mexicanos or PEMEX, the Mexican state oil company, which supplies approximately 162,000 barrels per day of Maya crude oil to the Port Arthur refinery. Under the terms of this agreement, PACC is obligated to buy Maya crude oil from the affiliate of PEMEX, and the affiliate of PEMEX is obligated to sell Maya crude oil to PACC. The agreement also provides a price adjustment mechanism designed to minimize the effect of adverse refining margin cycles and more specifically to moderate the fluctuations of the coker gross margin, a benchmark measure of the value of coker production over the cost of coker feedstocks. This price adjustment mechanism contains a formula that represents an approximation of the coker gross margin and provides for a minimum average coker margin of $15 per barrel over the first eight years of the agreement, which began on April 1, 2001. The cumulative difference, calculated on a monthly basis, between the actual coker gross margin and the defined minimum coker margin is referred to as a surplus or shortfall, and as of March 31, 2003, a cumulative quarterly surplus of $137.7 million existed under the agreement. As a result, the price the Company pays for Maya crude oil purchased under this agreement in succeeding quarters will not be discounted until this cumulative surplus is offset by future shortfalls.
F-64
$300,000,000

The Premcor Refining Group Inc.
Offer to exchange all outstanding 7 1/2% Senior Notes due 2015 for 7 1/2% Senior Notes due 2015, which have been registered under the Securities Act of 1933.
PART II
INFORMATION NOT REQUIRED IN THE PROSPECTUS
Item 20. Indemnification of Directors and Officers.
Section 145 of the Delaware General Corporation Law provides that a corporation may indemnify directors and officers as well as other employees and individuals against expenses (including attorneys’ fees), judgments, fines and amounts paid in settlement actually and reasonably incurred by such person in connection with any threatened, pending or completed actions, suits or proceedings in which such person is made a party by reason of such person being or having been a director, officer, employee or agent to the Registrant. The Delaware General Corporation Law provides that Section 145 is not exclusive of other rights to which those seeking indemnification may be entitled under any bylaw, agreement, vote of stockholders or disinterested directors or otherwise. Article VI of the Registrant’s bylaws provides for indemnification by the Registrant of its directors, officers and employees to the fullest extent permitted by the Delaware General Corporation Law.
Section 102(b)(7) of the Delaware General Corporation Law permits a corporation to provide in its certificate of incorporation that a director of the corporation shall not be personally liable to the corporation or its stockholders for monetary damages for breach of fiduciary duty as a director, except for liability (i) for any breach of the director’s duty of loyalty to the corporation or its stockholders, (ii) for acts or omissions not in good faith or which involve intentional misconduct or a knowing violation of law, (iii) for unlawful payments of dividends or unlawful stock repurchases, redemptions or other distributions or (iv) for any transaction from which the director derived an improper personal benefit. The Registrant’s Restated Certificate of Incorporation provides for such limitation of liability to the fullest extent permitted by the Delaware General Corporation Law.
The Registrant expects to maintain standard policies of insurance under which coverage is provided (a) to its directors and officers against loss arising from claims made by reason of breach of duty or other wrongful act, and (b) to the Registrant with respect to payments that may be made by the Registrant to such officers and directors pursuant to the above indemnification provision or otherwise as a matter of law. Pursuant to indemnity agreements between Premcor Inc. and each of the directors and officers of the Registrant and its subsidiaries, Premcor Inc. has formed a captive insurance company to provide additional insurance coverage for such liability.
Item 21. Exhibits and Financial Statement Schedules
(a) Exhibits
Exhibit
Number
| | Description
|
| |
| 3.01 | | Restated Certificate of Incorporation of The Premcor Refining Group Inc. (“PRG”) (f/k/a Clark Refining and Marketing, Inc. and Clark Oil & Refining Corporation) effective as of February 1, 1993 (Incorporated by reference to Exhibit 3.1 filed with PRG’s Annual Report on Form 10-K for the year ended December 31, 2000 (File No. 1-11392)). |
| |
| 3.02 | | Certificate of Amendment to Certificate of Incorporation of PRG (f/k/a Clark Refining & Marketing, Inc. and Clark Oil & Refining Corporation) effective as of September 30, 1993 (Incorporated by reference to Exhibit 3.2 filed with PRG’s Annual Report on Form 10-K for the year ended December 31, 2000 (File No. 1-11392)). |
| |
| 3.03 | | Certificate of Amendment of Restated Certificate of Incorporation of PRG (f/k/a Clark Refining & Marketing, Inc. and Clark Oil & Refining Corporation) effective as of May 9, 2000 (Incorporated by reference to Exhibit 3.3 filed with PRG’s Annual Report on Form 10-K for the year ended December 31, 2000 (File No. 1-11392)). |
| |
| 3.04 | | By Laws of PRG (f/k/a Clark Refining & Marketing, Inc. and Clark Oil & Refining Corporation) (Incorporated by reference to Exhibit 3.2 filed with PRG’s Registration Statement on Form S-1 (Registration No. 33-28146)). |
II-1
Exhibit
Number
| | Description
|
| |
4.01 | | Indenture dated as of November 21, 1997, between PRG (f/k/a Clark Refining & Marketing, Inc.) and Bankers Trust Company, as Trustee, including the form of 8 3/8% Senior Notes due 2007 (Incorporated by reference to Exhibit 4.5 filed with PRG’s Registration Statement on Form S-4 (Registration No. 333-42431)). |
| |
4.02 | | Indenture dated as of November 21, 1997, between PRG (f/k/a Clark Refining & Marketing, Inc.) and Marine Midland Bank, including the form of 8 7/8% Senior Subordinated Notes due 2007 (Incorporated by reference to Exhibit 4.6 filed with PRG’s Registration Statement on Form S-4 (Registration No. 333-42431)). |
| |
4.03 | | Supplemental Indenture dated as of November 21, 1997, between PRG (f/k/a Clark Refining & Marketing, Inc.) and Marine Midland Bank (Incorporated by reference to Exhibit 6.1 filed with PRG’s Registration Statement on Form S-4 (Registration No. 333-42431)). |
| |
4.04 | | Indenture, dated as of August 10, 1998, between PRG (f/k/a Clark Refining & Marketing, Inc.) and Bankers Trust Company, as Trustee, including the form of the 8 5/8% Senior Notes due 2008 (Incorporated by reference to Exhibit 4.1 filed with PRG’s Registration Statement on Form S-4 (Registration No. 333-64387)). |
| |
4.05 | | Indenture, dated as of August 19, 1999, among Sabine, Neches River Holding Corp. (“Neches”), Port Arthur Finance Corp. (“PAFC”), Port Arthur Coker Company L.P. (“PACC”), HSBC Bank USA, the Capital Markets Trustee, and Bankers Trust Company, as Collateral Trustee (Incorporated by reference to Exhibit 4.01 filed with PAFC’s Registration Statement on Form S-4
(Registration No. 333-92871)). |
| |
4.06 | | First Supplemental Indenture, dated as of June 6, 2002, among PRG, Sabine, Neches, PACC, PAFC, Deutsche Bank Trust Company Americas, as Collateral Trustee, and HSBC Bank USA, as Capital Markets Trustee, including the Form of 12½% Senior Secured Notes due 2009 (Incorporated by reference to Exhibit 4.1 filed with PRG’s Current Report on Form 8-K dated June 6, 2002
(File No. 1-11392)). |
| |
4.07 | | Amended and Restated Common Security Agreement, dated as of June 6, 2002, among Sabine, PRG, PAFC, PACC, Neches, Deutsche Bank Trust Company Americas, as Collateral Trustee and Depositary Bank, and HSBC Bank USA, as Capital Markets Trustee (Incorporated by reference to Exhibit 4.2 filed with PRG’s Current Report on Form 8-K dated June 6, 2002 (File No. 1-11392)). |
| |
4.08 | | Amended and Restated Transfer Restrictions Agreement, dated as of June 6, 2002, among Premcor Inc., Sabine, Neches, PACC, PAFC, Deutsche Bank Trust Company Americas, as Collateral Trustee, and HSBC Bank USA, as Capital Markets Trustee (Incorporated by reference to Exhibit 4.4 filed with PRG’s Current Report on Form 8-K dated June 6, 2002 (File No. 1-11392)). |
| |
4.09 | | Indenture, dated as of February 11, 2003, between PRG and Deutsche Bank Trust Company Americas, as Trustee, including the Form of 9¼% Senior Notes due 2010 and 9½% Senior Notes due 2013 (Incorporated by reference to Exhibit 4.13 filed with PRG’s Annual Report on Form 10-K for the year ended December 31, 2002 (File No. 1-11392)). |
| |
4.10* | | Registration Rights Agreement, dated as of June 10, 2003, among PRG and the purchasers set forth therein. |
| |
4.11* | | Form of 7 1/2% Senior Exchange Note due 2015. |
| |
5* | | Opinion of Stroock & Stroock & Lavan LLP as to the legality of the securities being registered. |
| |
10.01 | | Hydrogen Supply Agreement, dated as of August 1, 1999, between PACC and Air Products and Chemicals, Inc. (Incorporated by reference to Exhibit 10.10 filed with PAFC’s Registration Statement on Form S-4 (Registration No. 333-92871)). |
II-2
Exhibit
Number
| | Description
|
| |
10.02 | | First Amendment, dated March 1, 2000, to the Hydrogen Supply Agreement, dated as of August 1, 1999, between PACC and Air Products and Chemicals, Inc. (Incorporated by reference to Exhibit 10.1 filed with Sabine River’s Quarterly Report on Form 10-Q for the quarter ended June 30, 2001 (File No. 333-92871)). |
| |
10.03 | | Second Amendment, dated June 1, 2001, to the Hydrogen Supply Agreement, dated as of August 1, 1999, between PACC and Air Products and Chemicals, Inc. (Incorporated by reference to Exhibit 10.2 filed with Sabine River’s Quarterly Report on Form 10-Q for the quarter ended June 30, 2001 (File No. 333-92871)). |
| |
10.04 | | Assignment and Assumption Agreement, dated as of August 19, 1999, between PACC and PRG
(f/k/a Clark Refining & Marketing, Inc.) (Incorporated by Reference to Exhibit 10.13 filed with Sabine River’s Registration Statement on Form S-4 (Registration No. 333-92871)). |
| |
10.05 | | Maya Crude Oil Sale Agreement, dated as of March 10, 1998, between PRG (f/k/a Clark Refining & Marketing, Inc.) and P.M.I. Comercio Internacional, S.A. de C.V., as amended by the First Amendment and Supplement to the Maya Crued Oil Sales Agreement, dated as of August 19, 1999 (included as Exhibit 10.06 hereto), and as assigned by PRG to PACC pursuant to the Assignment and Assumption Agreement, dated as of August 19, 1999 (included as Exhibit 10.04 hereto) (Incorporated by Reference to Exhibit 10.14 filed with PAFC’s Registration Statement on Form S-4 (Registration No. 333-92871)). |
| |
10.06 | | First Amendment and Supplement to the Maya Crude Oil Sales Agreement, dated as of August 19, 1999 (Incorporated by Reference to Exhibit 10.15 filed with PAFC’s Registration Statement on Form S-4 (Registration No. 333-92871)). |
| |
10.07 | | Guarantee Agreement, dated as of March 10, 1998, between PRG (f/k/a Clark Refining & Marketing, Inc.) and Petroleos Mexicanos, as assigned by PRG to PACC as of August 19, 1999 pursuant to the Assignment and Assumption Agreement, dated as of August 19, 1999 (included as Exhibit 10.04 hereto) (Incorporated by Reference to Exhibit 10.16 filed with PAFC’s Registration Statement on Form S-4 (Registration No. 333-92871)). |
| |
10.08 | | Supply and Terminalling Agreement, dated November 8, 1999, by and among PRG, Equiva Trading Company, Equilon Enterprises LLC and Motiva Enterprises LLC. (Incorporated by reference to Exhibit 10.31 filed with Premcor Inc.’s Registration Statement on Form S-1
(Registration No. 333-70314)). |
| |
10.09 | | Terminal Services Agreement, dated as of January 14, 2000, between PRG and Millennium Terminal Company, L.P. (Incorporated by reference to Exhibit 10.26 filed with Premcor Inc.’s Registration Statement on Form S-1 (Registration No. 333-70314)). |
| |
10.10 | | Crude Oil Sale and Supply Agreement effective as of September 13, 2002 by and between PRG and Morgan Stanley Capital Group Inc. (Incorporated by reference to Exhibit 10.4 filed with PRG’s Quarterly Report on Form 10-Q for the quarter ended September 30, 2002 (File No. 1-11392)). |
| |
10.11 | | Amendment to Crude Oil Sale and Supply Agreement, dated September 13, 2002 by and between PRG and Morgan Stanley Capital Group Inc. (Incorporated by reference to Exhibit 10.5 filed with PRG’s Quarterly Report on Form 10-Q for the quarter ended September 30, 2002
(File No. 1-11392)). |
| |
10.12 | | Asset Purchase and Sale Agreement, dated as of November 25, 2002, among Williams Refining & Marketing, L.L.C., Williams Generating Memphis, L.L.C., Williams Memphis Terminal, Inc., Williams Petroleum Pipeline Systems, Inc., Williams Mid-South Pipelines, LLC, as Sellers, The Williams Companies, Inc., as Sellers’ Guarantor, PRG, as Purchaser, and Premcor Inc., as Purchaser’s Guarantor (Incorporated by reference to Exhibit 2.01 filed with PAFC’s Registration Statement on Form S-4 (Registration No. 333-99981)). |
II-3
Exhibit
Number
| | Description
|
| |
| 10.13 | | First Amendment to the Asset Purchase and Sale Agreement, dated as of January 16, 2003, among Williams Refining & Marketing, L.L.C., Williams Generating Memphis, L.L.C., Williams Memphis Terminal, Inc., Williams Petroleum Pipeline Systems, Inc., Williams Mid-South Pipelines, LLC, as Sellers, The Williams Companies, Inc., as Sellers’ Guarantor, PRG, as Purchaser, and Premcor Inc., as Purchaser’s Guarantor (Incorporated by reference to Exhibit 10.13 filed with PRG’s Annual Report on Form 10-K for the year ended December 31, 2002 (File No. 1-11392)). |
| |
10.14 | | Second Amendment to the Asset Purchase and Sale Agreement, dated as of February 28, 2003, among Williams Refining & Marketing, L.L.C., Williams Generating Memphis, L.L.C., Williams Memphis Terminal, Inc., Williams Petroleum Pipeline Systems, Inc., Williams Mid-South Pipelines, LLC, as Sellers, The Williams Companies, Inc., as Sellers’ Guarantor, PRG, as Purchaser, and Premcor Inc., as Purchaser’s Guarantor (Incorporated by reference to Exhibit 10.14 filed with PRG’s Annual Report on Form 10-K for the year ended December 31, 2002 (File No. 1-11392)). |
| |
10.15 | | Crack Spread Retained Interest Agreement, dated as of November 25, 2002, between Williams Refining & Marketing, L.L.C. and PRG (Incorporated by reference to Exhibit 2.02 filed with PAFC’s Registration Statement on Form S-4 (Registration No. 333-99981)). |
| |
10.16 | | Amended and Restated Credit Agreement, dated as of February 11, 2003, among PRG, Deutsche Bank Securities Inc., as Lead Arranger, Deutsche Bank Trust Company Americas, as Administrative Agent and Collateral Agent, Fleet National Bank, as Syndication Agent, and the other financial institutions party thereto (Incorporated by reference to Exhibit 10.16 filed with PRG’s Annual Report on Form 10-K for the year ended December 31, 2002 (File No. 1-11392)). |
| |
10.17 | | Form of Change-In-Control, Severance and Retention Agreement between Premcor Inc. and six of its officers and other key employees (other than its executive officers) (Incorporated by reference to Exhibit 10.12 filed with the PRG Annual Report on Form 10-K for the year ended December 31, 2000 (File No. 1-11392)). |
| |
10.18 | | Premcor Inc. Senior Executive Retirement Plan (Incorporated by reference to Exhibit 10.15 filed with the PRG Quarterly Report on Form 10-Q for the quarter ended June 30, 2002
(File No. 1-11392)). |
| |
10.19 | | Amendment to the Premcor Inc. Senior Executive Retirement Plan dated as of February 28, 2003 (Incorporated by reference to Exhibit 10.19 filed with PRG’s Annual Report on Form 10-K for the year ended December 31, 2002 (File No. 1-11392)). |
| |
10.20 | | Termination Agreement, dated as of January 31, 2002, between Premcor Inc. and William C. Rusnack (Incorporated by reference to Exhibit 10.39 filed with Premcor Inc’s Registration Statement on Form S-1 (Registration No. 333-70314)). |
| |
10.21 | | Termination Agreement, dated as of January 31, 2002, between Premcor Inc. and Ezra C. Hunt (Incorporated by reference to Exhibit 10.40 filed with Premcor Inc’s Registration Statement on
Form S-1 (Registration No. 333-70314)). |
| |
10.22 | | Premcor Inc. 2002 Special Stock Incentive Plan (Incorporated by reference to Exhibit 10.20 filed with PRG’s Annual Report on Form 10-K for the year ended December 31, 2001
(File No. 1-11392)). |
| |
10.23 | | Employment Agreement, dated as of January 30, 2002, of Thomas D. O’Malley (Incorporated by reference to Exhibit 10.13 filed with PRG’s Annual Report on Form 10-K for the year ended December 31, 2001 (File No. 1-11392)). |
| |
10.24 | | First Amendment to Employment Agreement, dated March 18, 2002, of Thomas D. O’Malley (Incorporated by reference to Exhibit 10.14 filed with PRG’s Annual Report on Form 10-K for the year ended December 31, 2001 (File No. 1-11392)). |
| |
10.25 | | Letter Agreement, dated November 13, 2002, amending Employment Agreement of Thomas D. O’Malley (Incorporated by reference to Exhibit 10.26 filed with PAFC’s Registration Statement on Form S-4 (Registration No. 333-99981)). |
| |
10.26** | | Amendment to Employment Agreement, dated May 20, 2003, of Thomas D. O’Malley. |
| |
10.27 | | Amended and Restated Employment Agreement, dated as of June 1, 2002, of William E. Hantke (Incorporated by reference to Exhibit 10.3 filed with PRG’s Quarterly Report on Form 10-Q for the quarter ended June 30, 2002 (File No. 1-11392)). |
II-4
Exhibit
Number
| | Description
|
| |
10.28 | | Amended and Restated Employment Agreement, dated as of June 1, 2002, of Henry M. Kuchta (Incorporated by reference to Exhibit 10.4 filed with PRG’s Quarterly Report on Form 10-Q for the quarter ended June 30, 2002 (File No. 1-11392)). |
| |
10.29 | | Amended and Restated Employment Agreement, dated as of June 1, 2002, of Joseph D. Watson (Incorporated by reference to Exhibit 10.6 filed with PRG’s Quarterly Report on Form 10-Q for the quarter ended June 30, 2002 (File No. 1-11392)). |
| |
10.30 | | Form of Indemnity Agreement (Incorporated by reference to Exhibit 10.36 filed with PAFC’s Registration Statement on Form S-4 (Registration No. 333-99981)). |
| |
10.31 | | Employment Agreement, dated as of September 16, 2002, of James R. Voss (Incorporated by reference to Exhibit 10.37 filed with PAFC’s Registration Statement on Form S-4
(Registration No. 333-99981)). |
| |
10.33 | | Employment Agreement, dated as of October 1, 2002, of Michael D. Gayda (Incorporated by reference to Exhibit 10.38 filed with PAFC’s Registration Statement on Form S-4
(Registration No. 333-99981)). |
| |
10.34 | | Separation Agreement and General Release, dated as of November 1, 2002, between Premcor Inc. and Jeffry N. Quinn (Incorporated by reference to Exhibit 10.39 filed with PAFC’s Registration Statement on Form S-4 (Registration No. 333-99981)). |
| |
10.35 | | Form of Letter Agreement, dated as of October 28, 2002, amending Employment Agreements of James R. Voss and Michael D. Gayda and Amended and Restated Employment Agreements of William E. Hantke, Henry M. Kuchta and Joseph D. Watson (Incorporated by reference to Exhibit 10.40 filed with PAFC’s Registration Statement on Form S-4 (Registration No. 333-99981)). |
| |
10.36 | | Form of Letter Agreement, dated as of November 13, 2002, amending Employment Agreements of Thomas D. O’Malley, James R. Voss and Michael D. Gayda and Amended and Restated Employment Agreements of William E. Hantke, Henry M. Kuchta and Joseph D. Watson (Incorporated by reference to Exhibit 10.41 filed with PAFC’s Registration Statement on Form S-4 (Registration No. 333-99981)). |
| |
10.37 | | Second Amendment to the Premcor Pension Plan, dated as of December 27, 2002 (Incorporated by reference to Exhibit 10.35 filed with PRG’s Annual Report on Form 10-K for the year ended December 31, 2002 (File No. 1-11392)). |
| |
10.38 | | Third Amendment to the Premcor Pension Plan, dated as of February 28, 2003 (Incorporated by reference to Exhibit 10.36 filed with PRG’s Annual Report on Form 10-K for the year ended December 31, 2002 (File No. 1-11392)). |
| |
10.39 | | Third Amendment to the Premcor Retirement Savings Plan, dated December 30, 2002 (Incorporated by reference to Exhibit 10.37 filed with PRG’s Annual Report on Form 10-K for the year ended December 31, 2002 (File No. 1-11392)). |
| |
10.40 | | Fourth Amendment to the Premcor Retirement Savings Plan, dated as of February 28, 2003 (Incorporated by reference to Exhibit 10.38 filed with PRG’s Annual Report on Form 10-K for the year ended December 31, 2002 (File No. 1-11392)). |
| |
10.41 | | Fifth Amendment to the Premcor Retirement Savings Plan, dated as of February 28, 2003 (Incorporated by reference to Exhibit 10.39 filed with PRG’s Annual Report on Form 10-K for the year ended December 31, 2002 (File No. 1-11392)). |
| |
10.42 | | Amended and Restated Letter Agreement, dated as of November 6, 2002, between Premcor Inc. and Wilkes McClave III (Incorporated by reference to Exhibit 10.40 filed with PRG’s Annual Report on Form 10-K for the year ended December 31, 2002 (File No. 1-11392)). |
II-5
Exhibit
Number
| | Description
|
| |
10.43 | | Amended and Restated Letter Agreement, dated as of November 6, 2002, between Premcor Inc. and Jefferson F. Allen (Incorporated by reference to Exhibit 10.41 filed with PRG’s Annual Report on Form 10-K for the year ended December 31, 2002 (File No. 1-11392)). |
| |
10.44*** | | Crude Oil Supply Agreement, dated March 3, 2003, between Morgan Stanley Capital Group Inc. and PRG (Incorporated by reference to Exhibit 10.1 filed with PRG’s Quarterly Report on Form 10-Q for the quarter ended March 31, 2003 (File No. 1-11392)). |
| |
10.45 | | Form of Letter Agreement, dated as of January 22, 2003, amending Employment Agreements of James R. Voss and Michael D. Gayda and Amended and Restated Employment Agreements of William E. Hantke, Henry M. Kuchta and Joseph D. Watson (Incorporated by reference to Exhibit 10.2 filed with PRG’s Quarterly Report on Form 10-Q for the quarter ended March 31, 2003 (File No. 1-11392)). |
| |
| 12* | | Statement re computation of earnings to fixed charges. |
| |
| 15** | | Awareness letter dated July 24, 2003, from Deloitte & Touche LLP regarding the unaudited interim financial information for March 31, 2003 and 2002. |
| |
18 | | Preferability letter, dated May 8, 2002, from Deloitte & Touche LLP concerning PACC’s change in method of accounting for crude oil and blendstock inventories from first-in first-out to last-in first-out (Incorporated by reference to Exhibit 18 filed with PRG’s Quarterly Report on Form 10-Q for the quarter ended March 31, 2002 (File No. 1-11392)). |
| |
| 21 | | Subsidiaries of the Registrant (Incorporated by reference to Exhibit 21 filed with PRG’s Registration Statement on Form S-4 (File No. 333-104682)). |
| |
| 23.01* | | Consent of Stroock & Stroock & Lavan LLP (contained in Exhibit 5). |
| |
| 23.02** | | Consent of Deloitte & Touche LLP. |
| |
| 24* | | Power of Attorney. |
| |
| 25 | | Form T-1 Statement of Eligibility under the Trust Indenture Act of 1939 of Deutsche Bank Trust Company Americas, as Trustee (Incorporated by reference to Exhibit 25 filed with PRG’s Registration Statement on Form S-4 (File No. 333-104682)). |
| |
| 99.01* | | Form of Letter of Transmittal. |
| |
| 99.02* | | Form of Notice of Guaranteed Delivery. |
* Previously filed
** Filed herewith.
*** Confidential treatment has been requested as to certain portions, which portions have been omitted and filed separately with the Securities and Exchange Commission.
(b) Financial Statement Schedules
See Schedule II—“Valuation and Qualifying Accounts” contained on page F-45. All other schedules are omitted as the information is not required or is included in the Registrant’s financial statements and related notes.
Item 22. Undertakings
The undersigned registrant hereby undertakes:
Insofar as indemnification for liabilities arising under Securities Act of 1933 may be permitted to directors, officers and controlling persons of the registrant pursuant to the foregoing provisions, or otherwise, the registrant has been advised that in the opinion of the Securities and Exchange Commission such indemnification is against public policy as expressed in the Act and is, therefore, unenforceable. In the event that a claim for indemnification against such liabilities (other than the payment by the registrant of expenses incurred or paid by a director, officer or controlling person of the registrant in the successful defense of any action, suit or proceeding) is asserted by such director, officer or controlling person in connection with the securities being registered, the registrant will, unless in the opinion of its counsel the matter has been settled by controlling precedent, submit to a court of appropriate jurisdiction the question whether such indemnification by it is against public policy as expressed in the Act and will be governed by the final adjudication of such issue.
II-6
SIGNATURES
Pursuant to the requirements of the Securities Act of 1933, as amended, the registrant issuer has duly caused this registration statement to be signed on its behalf by the undersigned, thereunto duly authorized, in St. Louis, Missouri, on July 24, 2003.
| THE PREMCOR REFINING GROUP INC. |
| |
By: | | /S/ DENNIS R. EICHHOLZ
|
| Name: | | Dennis R. Eichholz |
| Title: | | Senior Vice President – Finance and Controller |
Pursuant to the requirements of the Securities Act of 1933, this Registration Statement or amendment thereto has been signed below by the following persons in the capacities and on the dates indicated.
Signature
| | Title
| | Date
|
| | |
*
Thomas D. O’Malley | | Chairman of the Board and Chief Executive Officer (principal executive officer) | | July 24, 2003 |
| | |
*
William E. Hantke | | Executive Vice President, Chief Financial Officer, and Director (principal financial officer) | | July 24, 2003 |
| | |
*
Dennis R. Eichholz | | Senior Vice President—Finance and Controller (principal accounting officer) | | July 24, 2003 |
| | |
*
Henry M. Kuchta | | President, Chief Operating Officer and Director | | July 24, 2003 |
| | |
/S/ MICHAEL D. GAYDA
Michael D. Gayda | | Senior Vice President, General Counsel, Secretary, and Director | | July 24, 2003 |
| | |
*
Joseph D. Watson | | Senior Vice President—Corporate Development and Director | | July 24, 2003 |
| |
*By: | | /S/ MICHAEL D. GAYDA
|
| | | Michael D. Gayda Attorney-in-fact |
II-7