UNITED STATES
SECURITIES AND EXCHANGE COMMISSION
Washington, D.C. 20549
FORM N-CSR
CERTIFIED SHAREHOLDER REPORT OF REGISTERED MANAGEMENT INVESTMENT COMPANIES
Investment Company Act file number 811-02809 and 811-10095
Name of Fund: BlackRock Value Opportunities Fund, Inc. and Master Value Opportunities LLC
Fund Address: 100 Bellevue Parkway, Wilmington, DE 19809
Name and address of agent for service: John M. Perlowski, Chief Executive Officer, BlackRock Value Opportunities Fund, Inc. and Master Value Opportunities LLC, 55 East 52nd Street, New York, NY 10055
Registrants’ telephone number, including area code: (800) 441-7762
Date of fiscal year end: 03/31/2012
Date of reporting period: 03/31/2012
Item 1 – Report to Stockholders
|
|
| March 31, 2012 |

|
|
| Annual Report |
|
|
| BlackRock Value Opportunities Fund, Inc. |
|
Not FDIC Insured § No Bank Guarantee § May Lose Value |
|
|
| |
Table of Contents | |
|
|
|
|
| Page |
|
|
|
| 3 | |
Annual Report: |
|
|
| 4 | |
| 6 | |
| 6 | |
Fund Financial Statements: |
|
|
| 7 | |
| 8 | |
| 9 | |
| 10 | |
| 13 | |
Fund Report of Independent Registered Public Accounting Firm |
| 16 |
| 17 | |
Master LLC Financial Statements: |
|
|
| 18 | |
| 22 | |
| 23 | |
| 24 | |
| 24 | |
| 25 | |
Master Report of Independent Registered Public Accounting Firm |
| 28 |
| 29 | |
| 33 | |
| 35 |
|
|
|
|
|
|
2 | BLACKROCK VALUE OPPORTUNITIES FUND, INC. | MARCH 31, 2012 |
|
Twelve months ago, risk assets were charging forward, only to be met with a sharp reversal in May 2011 when escalating political strife in Greece rekindled fears about sovereign debt problems spreading across Europe. Concurrently, global economic indicators signaled that the recovery had slowed. Confidence was further shaken by the prolonged debt ceiling debate in Washington, DC. On August 5, 2011, Standard & Poor’s made history by downgrading the US government’s credit rating, and turmoil erupted in financial markets around the world. Extraordinary levels of volatility persisted in the months that followed as the European debt crisis intensified. Macro news flow became a greater influence on trading decisions than the fundamentals of the securities traded, resulting in high correlations between asset prices. By the end of the third quarter, equity markets had fallen nearly 20% from their April peak while safe-haven assets such as US Treasuries and gold had rallied to historic highs.
October brought enough positive economic data to assuage fears of a global double-dip recession. Additionally, European leaders began to show progress toward stemming the region’s debt crisis. Investors began to reenter the markets, putting risk assets on the road to recovery. Improving investor sentiment carried over into the first several months of 2012. Debt problems in Europe stabilized as policymakers secured a bailout plan for Greece and completed the nation’s debt restructuring without significant market disruptions. While concerns about slowing growth in China and a European recession weighed on the outlook for the global economy, an acceleration of the US recovery lifted sentiment. Several consecutive months of stronger jobs data signaled solid improvement in the US labor market, a pivotal factor for economic growth. Meanwhile, the European Central Bank revived financial markets with additional liquidity through its long-term refinancing operations. The improving market conditions and generally better-than-expected economic news lured investors still holding cash on the sidelines back to risk assets. Stocks, commodities and high yield bonds rallied through the first two months of the year while rising Treasury yields pressured higher-quality fixed income assets. The rally softened in late March, however, as concerns about slowing growth in China were refueled by negative signals from the world’s second-largest economy. Additionally, concerns over the European debt crisis resurfaced given uncertainty around policies for sovereign debt financing in peripheral countries and rising yields in Portugal and Spain.
Thanks in large part to an exceptionally strong first quarter of 2012, risk assets, including equities and high yield bonds, posted solid returns for the 6-month period ended March 31, 2012. On a 12-month basis, US large-cap stocks and high yield bonds delivered positive results, while small-cap stocks finished in slightly negative territory. International and emerging markets, which experienced significant downturns in 2011, lagged the broader rebound. Fixed income securities experienced mixed results, given recent volatility in yields. US Treasury bonds performed particularly well for the 12-month period; however, an early-2012 sell-off resulted in a negative return for the 6–month period. Municipal bonds staged a solid advance over the past year. Continued low short-term interest rates kept yields on money market securities near their all-time lows.
While markets have improved in recent months, considerable headwinds remain. Europe faces a prolonged recession and the financial situations in Italy, Portugal and Spain remain worrisome. Higher oil and gasoline prices along with slowing growth in China and other emerging-market countries weigh heavily on the future of the global economy. But, we believe that with these challenges come opportu-nities. We remain committed to working with you and your financial professional to identify actionable ideas for your portfolio. We encourage you to visit www.blackrock.com/newworld for more information.
|
Sincerely, |
|
|
Rob Kapito |
President, BlackRock Advisors, LLC |
|
|
|
“While markets have improved in recent months, considerable headwinds remain.” |
|
Rob Kapito |
|
President, BlackRock Advisors, LLC |


|
|
|
|
|
|
|
|
|
|
|
|
|
|
|
|
Total Returns as of March 31, 2012 |
|
|
|
|
|
|
|
|
| 6-month |
| 12-month |
| ||
US large cap equities |
|
| 25.89 | % |
| 8.54 | % |
(S&P 500® Index) |
|
|
|
|
|
|
|
US small cap equities |
|
| 29.83 |
|
| (0.18 | ) |
(Russell 2000® Index) |
|
|
|
|
|
|
|
International equities |
|
| 14.56 |
|
| (5.77 | ) |
(MSCI Europe, Australasia, |
|
|
|
|
|
|
|
Far East Index) |
|
|
|
|
|
|
|
Emerging market |
|
| 19.12 |
|
| (8.81 | ) |
equities (MSCI Emerging |
|
|
|
|
|
|
|
Markets Index) |
|
|
|
|
|
|
|
3-month Treasury |
|
| 0.01 |
|
| 0.06 |
|
bill (BofA Merrill Lynch |
|
|
|
|
|
|
|
3-Month Treasury |
|
|
|
|
|
|
|
Bill Index) |
|
|
|
|
|
|
|
US Treasury securities |
|
| (1.05 | ) |
| 14.92 |
|
(BofA Merrill Lynch 10- |
|
|
|
|
|
|
|
Year US Treasury Index) |
|
|
|
|
|
|
|
US investment grade |
|
| 1.43 |
|
| 7.71 |
|
bonds (Barclays US |
|
|
|
|
|
|
|
Aggregate Bond Index) |
|
|
|
|
|
|
|
Tax-exempt municipal |
|
| 4.16 |
|
| 12.56 |
|
bonds (S&P Municipal |
|
|
|
|
|
|
|
Bond Index) |
|
|
|
|
|
|
|
US high yield bonds |
|
| 12.17 |
|
| 6.43 |
|
(Barclays US Corporate |
|
|
|
|
|
|
|
High Yield 2% Issuer |
|
|
|
|
|
|
|
Capped Index) |
|
|
|
|
|
|
|
|
Past performance is no guarantee of future results. Index performance is shown for illustrative purposes only. You cannot invest directly in an index. |
|
|
|
|
| ||
| THIS PAGE NOT PART OF YOUR FUND REPORT | 3 |
|
|
|
|
Investment Objective |
|
BlackRock Value Opportunities Fund, Inc.’s (the “Fund”) investment objective is to seek long term growth of capital by investing in a diversified portfolio of securities, primarily common stock, of relatively small companies that management of the Fund believes have special investment value and emerging growth companies regardless of size. |
|
|
Portfolio Management Commentary |
|
|
| How did the Fund perform? |
|
|
• | For the 12-month period ended March 31, 2012, the Fund, through its investment in Master Value Opportunities LLC (the “Master LLC”), underperformed the benchmark S&P SmallCap 600® Value Index. |
|
|
| What factors influenced performance? |
|
|
• | The Master LLC’s sector positioning relative to the benchmark index detracted significantly from performance during this 12-month period in which the disparity between sector returns was especially wide. The Master LLC’s overweight in the energy sector hurt performance, as did stock selection within the space. An overweight in health care also detracted, although good stock selection in the sector more than compensated. The Master LLC’s underweights in financials and consumer staples and stock selection within those sectors had a negative impact on returns. An underweight in utilities also detracted. Additionally, stock selection in industrials dragged on returns, particularly within the machinery, professional services and road & rail industries. |
|
|
• | Contributing positively to performance for the period was stock selection in the health care sector, particularly within health care equipment & supplies, where OraSure Technologies, Inc. was a strong performer, and within the biotechnology industry. Stock selection in information technology (“IT”) was beneficial as well, with notable contributions from the Master LLC’s computer and software holdings. Sector underweights in industrials and materials also had a positive impact on performance. |
|
|
| Describe recent portfolio activity. |
|
|
• | During the 12-month period, the Master LLC increased exposure to consumer discretionary and IT, most notably within the computers & peripherals and software industries, while decreasing exposure to energy and utilities. Also during the period, the Master LLC added to positions in financials, especially banks. |
|
|
| Describe portfolio positioning at period end. |
|
|
• | At the end of the period, the Master LLC’s most significant sector positions relative to the S&P SmallCap 600® Value Index were overweights in health care and IT, and underweights in consumer discretionary, consumer staples, financials and industrials. |
|
|
| The views expressed reflect the opinions of BlackRock as of the date of this report and are subject to change based on changes in market, economic or other conditions. These views are not intended to be a forecast of future events and are no guarantee of future results. |
|
|
|
| ||
4 | BLACKROCK VALUE OPPORTUNITIES FUND, INC. | MARCH 31, 2012 |
|
|
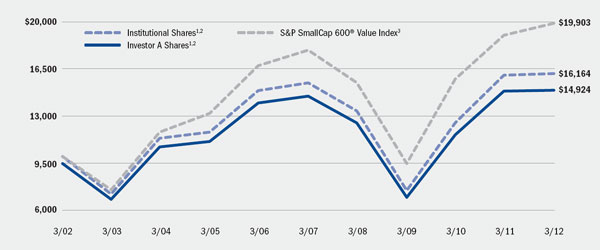
Total Return Based on a $10,000 Investment |
|
|
|
|
|
|
|
|
|
| 1 | Assuming maximum sales charges, if any, transaction costs and other operating expenses, including administration fees. Institutional Shares do not have a sales charge. |
|
|
|
| 2 | The Fund invests all of its assets in the Master LLC. The Master LLC invests in a diversified portfolio of securities, primarily common stocks, of relatively small companies that the Master LLC’s management believes have special investment value and emerging growth companies regardless of size. |
|
|
|
| 3 | This unmanaged index measures performance of the small-capitalization value sector of the US equity market. |
|
Performance Summary for the Period Ended March 31, 2012 |
|
|
|
|
|
|
|
|
|
|
|
|
|
|
|
|
|
|
|
|
|
|
|
|
|
|
| Average Annual Total Returns4 |
| |||||||||||||||||
|
|
|
| 1 Year |
| 5 Years |
| 10 Years |
| |||||||||||||
|
| 6-Month |
| w/o sales |
| w/sales |
| w/o sales |
| w/sales |
| w/o sales |
| w/sales |
| |||||||
Institutional |
| 30.50 | % |
| 0.75 | % |
| N/A |
|
| 0.88 | % |
| N/A |
|
| 4.92 | % |
| N/A |
|
|
Investor A |
| 30.28 |
|
| 0.43 |
|
| (4.84 | )% |
| 0.60 |
|
| (0.48 | )% |
| 4.65 |
|
| 4.08 | % |
|
Investor B |
| 29.63 |
|
| (0.62 | ) |
| (5.10 | ) |
| (0.36 | ) |
| (0.68 | ) |
| 3.95 |
|
| 3.95 |
|
|
Investor C |
| 29.73 |
|
| (0.54 | ) |
| (1.53 | ) |
| (0.38 | ) |
| (0.38 | ) |
| 3.73 |
|
| 3.73 |
|
|
Class R |
| 30.08 |
|
| 0.06 |
|
| N/A |
|
| 0.20 |
|
| N/A |
|
| 4.35 |
|
| N/A |
|
|
S&P SmallCap 600® Value Index |
| 33.83 |
|
| 4.68 |
|
| N/A |
|
| 2.14 |
|
| N/A |
|
| 7.13 |
|
| N/A |
|
|
|
|
4 | Assuming maximum sales charges, if any. Average annual total returns with and without sales charges reflect reductions for distribution and service fees. See “About Fund Performance” on page 6 for a detailed description of share classes, including any related sales charges and fees. |
|
|
| N/A — Not applicable as share class and index do not have a sales charge. |
|
|
| Past performance is not indicative of future results. |
|
Expense Example |
|
|
|
|
|
|
|
|
|
|
|
|
|
|
|
|
|
|
|
|
| Actual |
| Hypothetical6 |
|
|
| |||||||||||
|
| Beginning |
| Ending |
| Expenses Paid |
| Beginning |
| Ending |
| Expenses Paid |
| Annualized |
| |||
Institutional |
| $1,000.00 |
| $1,305.00 |
| $ 5.88 |
| $1,000.00 |
| $1,019.90 |
|
| $ | 5.15 |
|
| 1.02% |
|
Investor A |
| $1,000.00 |
| $1,302.80 |
| $ 7.54 |
| $1,000.00 |
| $1,018.45 |
|
| $ | 6.61 |
|
| 1.31% |
|
Investor B |
| $1,000.00 |
| $1,296.30 |
| $13.32 |
| $1,000.00 |
| $1,013.40 |
|
| $ | 11.68 |
|
| 2.32% |
|
Investor C |
| $1,000.00 |
| $1,297.30 |
| $12.98 |
| $1,000.00 |
| $1,013.70 |
|
| $ | 11.38 |
|
| 2.26% |
|
Class R |
| $1,000.00 |
| $1,300.80 |
| $ 9.55 |
| $1,000.00 |
| $1,016.70 |
|
| $ | 8.37 |
|
| 1.66% |
|
|
|
5 | For each class of the Fund, expenses are equal to the annualized expense ratio for the class, multiplied by the average account value over the period, multiplied by 183/366 (to reflect the one-half year period shown). Because the Fund invests significantly in the Master LLC, the expense table example reflects the net expenses of both the Fund and the Master LLC in which it invests. |
|
|
6 | Hypothetical 5% annual return before expenses is calculated by pro rating the number of days in the most recent fiscal half year divided by 366. See “Disclosure of Expenses” on page 6 for further information on how expenses were calculated. |
|
|
|
|
|
|
|
|
| BLACKROCK VALUE OPPORTUNITIES FUND, INC. | MARCH 31, 2012 | 5 |
|
|
|
|
• | Institutional Shares are not subject to any sales charge. These shares bear no ongoing distribution or service fees and are available only to eligible investors. |
|
|
• | Investor A Shares incur a maximum initial sales charge (front-end load) of 5.25% and a service fee of 0.25% per year (but no distribution fee). |
|
|
• | Investor B Shares are subject to a maximum contingent deferred sales charge (“CDSC”) of 4.50% declining to 0% after six years. In addition, these shares are subject to a distribution fee of 0.75% per year and a service fee of 0.25% per year. These shares automatically convert to Investor A Shares after approximately eight years. (There is no initial sales charge for automatic share conversions.) All returns for periods greater than eight years reflect this conversion. These shares are only available through exchanges, dividend reinvestment by existing shareholders or for purchase by certain qualified employee benefit plans. |
|
|
• | Investor C Shares are subject to a 1.00% CDSC if redeemed within one year of purchase. In addition, these shares are subject to a distribution fee of 0.75% per year and a service fee of 0.25% per year. |
|
|
• | Class R Shares do not incur a maximum initial sales charge (front-end load) or CDSC. These shares are subject to a distribution fee of 0.25% per year and a service fee of 0.25% per year. These shares are available only to certain retirement plans. Prior to February 4, 2003, Class R Share performance results are those of Institutional Shares (which have no distribution or service fees) restated to reflect Class R Share fees. |
|
|
| Performance information reflects past performance and does not guarantee future results. Current performance may be lower or higher than the performance data quoted. Refer to www.blackrock.com/funds to obtain performance data current to the most recent month end. Performance results do not reflect the deduction of taxes that a shareholder would pay on fund distributions or the redemption of fund shares. Figures shown in the performance table on the previous page assume reinvestment of all dividends and capital gain distributions, if any, at net asset value on the ex-dividend date. Investment return and principal value of shares will fluctuate so that shares, when redeemed, may be worth more or less than their original cost. Dividends paid to each class of shares will vary because of the different levels of service, distribution and transfer agency fees applicable to each class, which are deducted from the income available to be paid to shareholders. |
|
|
Shareholders of the Fund may incur the following charges: (a) expenses related to transactions, including sales charges and exchange fees; and (b) operating expenses, including administration fees, service and distribution fees, including 12b-1 fees, and other Fund expenses. The expense examples shown below (which are based on a hypothetical investment of $1,000 invested on October 1, 2011 and held through March 31, 2012) are intended to assist shareholders both in calculating expenses based on an investment in the Fund and in comparing these expenses with similar costs of investing in other mutual funds.
The table provides information about actual account values and actual expenses. In order to estimate the expenses a shareholder paid during the period covered by this report, shareholders can divide their account value by $1,000 and then multiply the result by the number corresponding to their share class under the heading entitled “Expenses Paid During the Period.”
The table also provides information about hypothetical account values and hypothetical expenses based on the Fund’s actual expense ratio and an assumed rate of return of 5% per year before expenses. In order to assist shareholders in comparing the ongoing expenses of investing in this Fund and other funds, compare the 5% hypothetical example with the 5% hypothetical examples that appear in other funds’ shareholder reports.
The expenses shown in the table are intended to highlight shareholders’ ongoing costs only and do not reflect any transactional expenses, such as sales charges or exchange fees, if any. Therefore, the hypothetical example is useful in comparing ongoing expenses only, and will not help shareholders determine the relative total expenses of owning different funds. If these transactional expenses were included, shareholder expenses would have been higher.
|
|
|
|
|
|
6 | BLACKROCK VALUE OPPORTUNITIES FUND, INC. | MARCH 31, 2012 |
|
|
|
|
BlackRock Value Opportunities Fund, Inc. |
|
|
|
|
|
March 31, 2012 |
|
|
|
|
Assets |
|
|
|
|
Investments at value — Master Value Opportunities LLC (the “Master LLC”) (cost — $738,555,156) |
| $ | 923,111,416 |
|
Withdrawals receivable from the Master LLC |
|
| 851,292 |
|
Capital shares sold receivable |
|
| 705,967 |
|
Prepaid expenses |
|
| 19,563 |
|
Total assets |
|
| 924,688,238 |
|
|
|
|
|
|
Liabilities |
|
|
|
|
Capital shares redeemed payable |
|
| 1,557,259 |
|
Service and distribution fees payable |
|
| 299,450 |
|
Administration fees payable |
|
| 207,847 |
|
Officer’s fees payable |
|
| 218 |
|
Other accrued expenses payable |
|
| 752,581 |
|
Total liabilities |
|
| 2,817,355 |
|
Net Assets |
| $ | 921,870,883 |
|
|
|
|
|
|
Net Assets Consist of |
|
|
|
|
Paid-in capital |
| $ | 1,207,321,588 |
|
Distributions in excess of net investment income |
|
| (2,009,334 | ) |
Accumulated net realized loss allocated from the Master LLC |
|
| (467,997,631 | ) |
Net unrealized appreciation/depreciation allocated from the Master LLC |
|
| 184,556,260 |
|
Net Assets |
| $ | 921,870,883 |
|
|
|
|
|
|
Net Asset Value |
|
|
|
|
Institutional — Based on net assets of $249,011,508 and 11,573,262 shares outstanding, 100 million shares authorized, $0.10 par value |
| $ | 21.52 |
|
Investor A — Based on net assets of $397,590,932 and 18,862,115 shares outstanding, 100 million shares authorized, $0.10 par value |
| $ | 21.08 |
|
Investor B — Based on net assets of $54,590,171 and 3,119,193 shares outstanding, 100 million shares authorized, $0.10 par value |
| $ | 17.50 |
|
Investor C — Based on net assets of $190,058,684 and 11,403,721 shares outstanding, 100 million shares authorized, $0.10 par value |
| $ | 16.67 |
|
Class R — Based on net assets of $30,619,588 and 1,726,699 shares outstanding, 100 million shares authorized, $0.10 par value |
| $ | 17.73 |
|
|
|
|
|
See Notes to Financial Statements. | |||
|
|
|
|
| BLACKROCK VALUE OPPORTUNITIES FUND, INC. | MARCH 31, 2012 | 7 |
|
|
|
|
BlackRock Value Opportunities Fund, Inc. |
|
|
|
|
|
Year Ended March 31, 2012 |
|
|
|
|
Investment Income |
|
|
|
|
Net investment income allocated from the Master LLC: |
|
|
|
|
Dividends — unaffiliated |
| $ | 11,359,901 |
|
Securities lending — affiliated |
|
| 790,941 |
|
Dividends — affiliated |
|
| 12,531 |
|
Expenses |
|
| (5,635,599 | ) |
Fees waived |
|
| 7,908 |
|
Total income |
|
| 6,535,682 |
|
|
|
|
|
|
Expenses |
|
|
|
|
Administration |
|
| 2,609,659 |
|
Service — Investor A |
|
| 972,560 |
|
Service and distribution — Investor B |
|
| 656,516 |
|
Service and distribution — Investor C |
|
| 1,949,364 |
|
Service and distribution — Class R |
|
| 163,328 |
|
Transfer agent — Institutional |
|
| 669,119 |
|
Transfer agent — Investor A |
|
| 895,197 |
|
Transfer agent — Investor B |
|
| 320,525 |
|
Transfer agent — Investor C |
|
| 841,621 |
|
Transfer agent — Class R |
|
| 110,057 |
|
Printing |
|
| 96,910 |
|
Professional |
|
| 83,595 |
|
Registration |
|
| 78,064 |
|
Officer |
|
| 942 |
|
Miscellaneous |
|
| 17,962 |
|
Total expenses |
|
| 9,465,419 |
|
Net investment loss |
|
| (2,929,737 | ) |
|
|
|
|
|
Realized and Unrealized Gain (Loss) Allocated from the Master LLC |
|
|
|
|
Net realized gain from investments |
|
| 138,398,237 |
|
Net change in unrealized appreciation/depreciation on investments |
|
| (147,360,026 | ) |
Total realized and unrealized loss |
|
| (8,961,789 | ) |
Net Decrease in Net Assets Resulting from Operations |
| $ | (11,891,526 | ) |
|
|
|
See Notes to Financial Statements. | ||
|
|
|
8 | BLACKROCK VALUE OPPORTUNITIES FUND, INC. | MARCH 31, 2012 |
|
|
|
|
BlackRock Value Opportunities Fund, Inc. |
|
|
|
|
|
|
|
|
|
| Year Ended March 31, |
| ||||
Increase (Decrease) in Net Assets: |
| 2012 |
| 2011 |
| ||
Operations |
|
|
|
|
|
|
|
Net investment loss |
| $ | (2,929,737 | ) | $ | (1,879,470 | ) |
Net realized gain |
|
| 138,398,237 |
|
| 101,199,105 |
|
Net change in unrealized appreciation/depreciation |
|
| (147,360,026 | ) |
| 169,640,781 |
|
Net increase (decrease) in net assets resulting from operations |
|
| (11,891,526 | ) |
| 268,960,416 |
|
|
|
|
|
|
|
|
|
Dividends to Shareholders From |
|
|
|
|
|
|
|
Net investment income: |
|
|
|
|
|
|
|
Institutional |
|
| — |
|
| (725,833 | ) |
Investor A |
|
| — |
|
| (25,817 | ) |
Decrease in net assets resulting from dividends to shareholders |
|
| — |
|
| (751,650 | ) |
|
|
|
|
|
|
|
|
Capital Share Transactions |
|
|
|
|
|
|
|
Net decrease in net assets derived from capital share transactions |
|
| (293,751,362 | ) |
| (96,268,088 | ) |
|
|
|
|
|
|
|
|
Redemption fee |
|
|
|
|
|
|
|
Redemption fee |
|
| — |
|
| 33,657 |
|
|
|
|
|
|
|
|
|
Net Assets |
|
|
|
|
|
|
|
Total increase (decrease) in net assets |
|
| (305,642,888 | ) |
| 171,974,335 |
|
Beginning of year |
|
| 1,227,513,771 |
|
| 1,055,539,436 |
|
End of year |
| $ | 921,870,883 |
| $ | 1,227,513,771 |
|
Distributions in excess of net investment income |
| $ | (2,009,334 | ) | $ | (2,358 | ) |
|
|
|
|
See Notes to Financial Statements. | |||
|
|
|
|
| BLACKROCK VALUE OPPORTUNITIES FUND, INC. | MARCH 31, 2012 | 9 |
|
|
BlackRock Value Opportunities Fund, Inc. |
|
|
|
|
|
|
|
|
|
|
|
|
|
|
|
|
|
|
|
|
|
|
|
|
|
|
|
|
|
|
|
|
|
|
| Institutional |
|
| Investor A |
| ||||||||||||||||||||||||||
|
| Year Ended March 31, |
|
| Year Ended March 31, |
| ||||||||||||||||||||||||||
|
| 2012 |
| 2011 |
| 2010 |
| 2009 |
| 2008 |
|
| 2012 |
| 2011 |
| 2010 |
| 2009 |
| 2008 |
| ||||||||||
Per Share Operating Performance |
|
|
|
|
|
|
|
|
|
|
|
|
|
|
|
|
|
|
|
|
|
|
|
|
|
|
|
|
| |||
Net asset value, beginning of year |
| $ | 21.36 |
| $ | 16.70 |
| $ | 10.01 |
| $ | 18.24 |
| $ | 24.95 |
|
| $ | 20.99 |
| $ | 16.41 |
| $ | 9.85 |
| $ | 17.98 |
| $ | 24.65 |
|
Net investment income (loss)1 |
|
| 0.04 |
|
| 0.05 |
|
| 0.09 |
|
| 0.11 |
|
| 0.05 |
|
|
| (0.03 | ) |
| 0.00 | 2 |
| 0.04 |
|
| 0.06 |
|
| (0.01 | ) |
Net realized and unrealized gain (loss) |
|
| 0.12 |
|
| 4.65 | 3 |
| 6.65 | 3 |
| (8.03 | )3 |
| (2.82 | )3 |
|
| 0.12 |
|
| 4.58 | 3 |
| 6.54 | 3 |
| (7.88 | )3 |
| (2.79 | )3 |
Net increase (decrease) from |
|
| 0.16 |
|
| 4.70 |
|
| 6.74 |
|
| (7.92 | ) |
| (2.77 | ) |
|
| 0.09 |
|
| 4.58 |
|
| 6.58 |
|
| (7.82 | ) |
| (2.80 | ) |
Dividends and distributions from: |
|
|
|
|
|
|
|
|
|
|
|
|
|
|
|
|
|
|
|
|
|
|
|
|
|
|
|
|
|
|
|
|
Net investment income |
|
| — |
|
| (0.04 | ) |
| (0.05 | ) |
| — |
|
| — |
|
|
| — |
|
| (0.00 | )4 |
| (0.02 | ) |
| — |
|
| — |
|
Net realized gain |
|
| — |
|
| — |
|
| — |
|
| (0.31 | ) |
| (3.94 | ) |
|
| — |
|
| — |
|
| — |
|
| (0.31 | ) |
| (3.87 | ) |
Total dividends and distributions |
|
| — |
|
| (0.04 | ) |
| (0.05 | ) |
| (0.31 | ) |
| (3.94 | ) |
|
| — |
|
| (0.00 | )4 |
| (0.02 | ) |
| (0.31 | ) |
| (3.87 | ) |
Net asset value, end of year |
| $ | 21.52 |
| $ | 21.36 |
| $ | 16.70 |
| $ | 10.01 |
| $ | 18.24 |
|
| $ | 21.08 |
| $ | 20.99 |
| $ | 16.41 |
| $ | 9.85 |
| $ | 17.98 |
|
|
|
|
|
|
|
|
|
|
|
|
|
|
|
|
|
|
|
|
|
|
|
|
|
|
|
|
|
|
|
|
|
|
Total Investment Return5 |
|
|
|
|
|
|
|
|
|
|
|
|
|
|
|
|
|
|
|
|
|
|
|
|
|
|
|
|
|
|
|
|
Based on net asset value |
|
| 0.75 | % |
| 28.24 | % |
| 67.43 | %6 |
| (44.18 | )% |
| (13.48 | )% |
|
| 0.43 | % |
| 27.92 | % |
| 66.80 | %7 |
| (44.27 | )% |
| (13.74 | )% |
|
|
|
|
|
|
|
|
|
|
|
|
|
|
|
|
|
|
|
|
|
|
|
|
|
|
|
|
|
|
|
|
|
Ratios to Average Net Assets8 |
|
|
|
|
|
|
|
|
|
|
|
|
|
|
|
|
|
|
|
|
|
|
|
|
|
|
|
|
|
| ||
Total expenses |
|
| 1.00 | %9 |
| 1.01 | % |
| 1.07 | % |
| 1.09 | % |
| 0.97 | % |
|
| 1.30 | %9 |
| 1.29 | % |
| 1.35 | % |
| 1.34 | % |
| 1.23 | % |
Net investment income (loss) |
|
| 0.19 | %9 |
| 0.30 | % |
| 0.63 | % |
| 0.68 | % |
| 0.20 | % |
|
| (0.14 | )%9 |
| 0.02 | % |
| 0.33 | % |
| 0.39 | % |
| (0.06 | )% |
|
|
|
|
|
|
|
|
|
|
|
|
|
|
|
|
|
|
|
|
|
|
|
|
|
|
|
|
|
|
|
|
|
Supplemental Data |
|
|
|
|
|
|
|
|
|
|
|
|
|
|
|
|
|
|
|
|
|
|
|
|
|
|
|
|
|
|
|
|
Net assets, end of year (000) |
| $ | 249,012 |
| $ | 418,333 |
| $ | 288,028 |
| $ | 206,966 |
| $ | 521,653 |
|
| $ | 397,591 |
| $ | 445,797 |
| $ | 403,008 |
| $ | 264,870 |
| $ | 499,605 |
|
Portfolio turnover of the Master LLC |
|
| 45 | % |
| 52 | % |
| 79 | % |
| 147 | % |
| 109 | % |
|
| 45 | % |
| 52 | % |
| 79 | % |
| 147 | % |
| 109 | % |
|
|
1 | Based on average shares outstanding. |
|
|
2 | Amount is less than $0.01 per share. |
|
|
3 | Includes a redemption fee, which is less than $0.01 per share. |
|
|
4 | Amount is less than $(0.01) per share. |
|
|
5 | Where applicable, total investment returns exclude the effects of any sales charges and include the reinvestment of dividends and distributions. |
|
|
6 | Includes proceeds received from a settlement of litigation, through its investment in the Master LLC, which impacted the Fund’s total investment return. Not including these proceeds, the total investment return would have been 67.13%. |
|
|
7 | Includes proceeds received from a settlement of litigation, through its investment in the Master LLC, which impacted the Fund’s total investment return. Not including these proceeds, the total investment return would have been 66.49%. |
|
|
8 | Includes the Fund’s share of the Master LLC’s allocated expenses and/or net investment income. |
|
|
9 | Includes the Fund’s share of the Master LLC’s allocated fees waived of less than 0.01%. |
|
|
|
|
See Notes to Financial Statements. |
|
| |
| |||
10 | BLACKROCK VALUE OPPORTUNITIES FUND, INC. |
| MARCH 31, 2012 |
|
|
Financial Highlights (continued) | BlackRock Value Opportunities Fund, Inc. |
|
|
|
|
|
|
|
|
|
|
|
|
|
|
|
|
|
|
|
|
|
|
|
|
|
|
|
|
|
|
|
|
|
|
| Investor B |
|
| Investor C |
| ||||||||||||||||||||||||||
|
| Year Ended March 31, |
|
| Year Ended March 31, |
| ||||||||||||||||||||||||||
|
| 2012 |
| 2011 |
| 2010 |
| 2009 |
| 2008 |
|
| 2012 |
| 2011 |
| 2010 |
| 2009 |
| 2008 |
| ||||||||||
Per Share Operating Performance |
|
|
|
|
|
|
|
|
|
|
|
|
|
|
|
|
|
|
|
|
|
|
|
|
|
|
|
|
| |||
Net asset value, beginning of year |
| $ | 17.61 |
| $ | 13.89 |
| $ | 8.41 |
| $ | 15.54 |
| $ | 21.82 |
|
| $ | 16.76 |
| $ | 13.23 |
| $ | 8.01 |
| $ | 14.83 |
| $ | 21.01 |
|
Net investment loss1 |
|
| (0.18 | ) |
| (0.13 | ) |
| (0.07 | ) |
| (0.06 | ) |
| (0.18 | ) |
|
| (0.17 | ) |
| (0.13 | ) |
| (0.08 | ) |
| (0.07 | ) |
| (0.19 | ) |
Net realized and unrealized gain (loss) |
|
| 0.07 |
|
| 3.85 | 2 |
| 5.55 | 2 |
| (6.76 | )2 |
| (2.41 | )2 |
|
| 0.08 |
|
| 3.66 | 2 |
| 5.30 | 2 |
| (6.44 | )2 |
| (2.28 | )2 |
Net increase (decrease) from |
|
| (0.11 | ) |
| 3.72 |
|
| 5.48 |
|
| (6.82 | ) |
| (2.59 | ) |
|
| (0.09 | ) |
| 3.53 |
|
| 5.22 |
|
| (6.51 | ) |
| (2.47 | ) |
Distributions from net realized gain |
|
| — |
|
| — |
|
| — |
|
| (0.31 | ) |
| (3.69 | ) |
|
| — |
|
| — |
|
| — |
|
| (0.31 | ) |
| (3.71 | ) |
Net asset value, end of year |
| $ | 17.50 |
| $ | 17.61 |
| $ | 13.89 |
| $ | 8.41 |
| $ | 15.54 |
|
| $ | 16.67 |
| $ | 16.76 |
| $ | 13.23 |
| $ | 8.01 |
| $ | 14.83 |
|
|
|
|
|
|
|
|
|
|
|
|
|
|
|
|
|
|
|
|
|
|
|
|
|
|
|
|
|
|
|
|
|
|
Total Investment Return3 |
|
|
|
|
|
|
|
|
|
|
|
|
|
|
|
|
|
|
|
|
|
|
|
|
|
|
|
|
|
| ||
Based on net asset value |
|
| (0.62 | )% |
| 26.78 | % |
| 65.16 | %4 |
| (44.79 | )% |
| (14.49 | )% |
|
| (0.54 | )% |
| 26.68 | % |
| 65.17 | %4 |
| (44.85 | )% |
| (14.51 | )% |
|
|
|
|
|
|
|
|
|
|
|
|
|
|
|
|
|
|
|
|
|
|
|
|
|
|
|
|
|
|
|
|
|
Ratios to Average Net Assets5 |
|
|
|
|
|
|
|
|
|
|
|
|
|
|
|
|
|
|
|
|
|
|
|
|
|
|
|
|
| |||
Total expenses |
|
| 2.30 | %6 |
| 2.25 | % |
| 2.34 | % |
| 2.25 | % |
| 2.08 | % |
|
| 2.25 | %6 |
| 2.26 | % |
| 2.40 | % |
| 2.34 | % |
| 2.13 | % |
Net investment loss |
|
| (1.14 | )%6 |
| (0.93 | )% |
| (0.64 | )% |
| (0.46 | )% |
| (0.89 | )% |
|
| (1.09 | )%6 |
| (0.94 | )% |
| (0.71 | )% |
| (0.58 | )% |
| (0.96 | )% |
|
|
|
|
|
|
|
|
|
|
|
|
|
|
|
|
|
|
|
|
|
|
|
|
|
|
|
|
|
|
|
|
|
Supplemental Data |
|
|
|
|
|
|
|
|
|
|
|
|
|
|
|
|
|
|
|
|
|
|
|
|
|
|
|
|
|
|
|
|
Net assets, end of year (000) |
| $ | 54,590 |
| $ | 88,310 |
| $ | 109,461 |
| $ | 110,538 |
| $ | 311,312 |
|
| $ | 190,059 |
| $ | 232,996 |
| $ | 215,916 |
| $ | 155,267 |
| $ | 355,755 |
|
Portfolio turnover of the Master LLC |
|
| 45 | % |
| 52 | % |
| 79 | % |
| 147 | % |
| 109 | % |
|
| 45 | % |
| 52 | % |
| 79 | % |
| 147 | % |
| 109 | % |
|
|
1 | Based on average shares outstanding. |
|
|
2 | Includes a redemption fee, which is less than $0.01 per share. |
|
|
3 | Where applicable, total investment returns exclude the effects of any sales charges and include the reinvestment of dividends and distributions. |
|
|
4 | Includes proceeds received from a settlement of litigation, through its investment in the Master LLC, which impacted the Fund’s total investment return. Not including these proceeds, the total investment return would have been 64.92%. |
|
|
5 | Includes the Fund’s share of the Master LLC’s allocated expenses and/or net investment income. |
|
|
6 | Includes the Fund’s share of the Master LLC’s allocated fees waived of less than 0.01%. |
|
|
|
|
See Notes to Financial Statements. |
|
| |
|
|
|
|
| BLACKROCK VALUE OPPORTUNITIES FUND, INC. | MARCH 31, 2012 | 11 |
|
|
|
|
Financial Highlights (concluded) | BlackRock Value Opportunities Fund, Inc. |
|
|
|
|
|
|
|
|
|
|
|
|
|
|
|
|
|
|
| Class R |
| |||||||||||||
|
| Year Ended March 31, |
| |||||||||||||
|
| 2012 |
| 2011 |
| 2010 |
| 2009 |
| 2008 |
| |||||
Per Share Operating Performance |
|
|
|
|
|
|
|
|
|
|
|
|
|
|
|
|
Net asset value, beginning of year |
| $ | 17.72 |
| $ | 13.90 |
| $ | 8.36 |
| $ | 15.38 |
| $ | 21.69 |
|
Net investment loss1 |
|
| (0.08 | ) |
| (0.05 | ) |
| (0.01 | ) |
| (0.00 | )2 |
| (0.10 | ) |
Net realized and unrealized gain (loss) |
|
| 0.09 |
|
| 3.87 | 3 |
| 5.55 | 3 |
| (6.71 | )3 |
| (2.38 | )3 |
Net increase (decrease) from investment operations |
|
| 0.01 |
|
| 3.82 |
|
| 5.54 |
|
| (6.71 | ) |
| (2.48 | ) |
Distribution from net realized gain |
|
| — |
|
| — |
|
| — |
|
| (0.31 | ) |
| (3.83 | ) |
Net asset value, end of year |
| $ | 17.73 |
| $ | 17.72 |
| $ | 13.90 |
| $ | 8.36 |
| $ | 15.38 |
|
|
|
|
|
|
|
|
|
|
|
|
|
|
|
|
|
|
Total Investment Return4 |
|
|
|
|
|
|
|
|
|
|
|
|
|
|
|
|
Based on net asset value |
|
| 0.06 | % |
| 27.48 | % |
| 66.27 | %5 |
| (44.54 | )% |
| (14.13 | )% |
|
|
|
|
|
|
|
|
|
|
|
|
|
|
|
|
|
Ratios to Average Net Assets6 |
|
|
|
|
|
|
|
|
|
|
|
|
|
|
|
|
Total expenses |
|
| 1.65 | %7 |
| 1.65 | % |
| 1.75 | % |
| 1.76 | % |
| 1.65 | % |
Net investment loss |
|
| (0.50 | )%7 |
| (0.33 | )% |
| (0.05 | )% |
| (0.02 | )% |
| (0.52 | )% |
|
|
|
|
|
|
|
|
|
|
|
|
|
|
|
|
|
Supplemental Data |
|
|
|
|
|
|
|
|
|
|
|
|
|
|
|
|
Net assets, end of year (000) |
| $ | 30,620 |
| $ | 42,078 |
| $ | 39,126 |
| $ | 31,767 |
| $ | 60,194 |
|
Portfolio turnover of the Master LLC |
|
| 45 | % |
| 52 | % |
| 79 | % |
| 147 | % |
| 109 | % |
|
|
1 | Based on average shares outstanding. |
|
|
2 | Amount is less than $(0.01) per share. |
|
|
3 | Includes a redemption fee, which is less than $0.01 per share. |
|
|
4 | Where applicable, total investment returns include the reinvestment of dividends and distributions. |
|
|
5 | Includes proceeds received from a settlement of litigation, through its investment in the Master LLC, which impacted the Fund’s total investment return. Not including these proceeds, the total investment return would have been 66.03%. |
|
|
6 | Includes the Fund’s share of the Master LLC’s allocated expenses and/or net investment income. |
|
|
7 | Includes the Fund’s share of the Master LLC’s allocated fees waived of less than 0.01%. |
|
|
|
See Notes to Financial Statements. | ||
| ||
12 | BLACKROCK VALUE OPPORTUNITIES FUND, INC. | MARCH 31, 2012 |
|
|
|
|
BlackRock Value Opportunities Fund, Inc. |
1. Organization and Significant Accounting Policies:
BlackRock Value Opportunities Fund, Inc. (the “Fund”) is registered under the Investment Company Act of 1940, as amended (the “1940 Act”), as a diversified, open-end management investment company. The Fund is organized as a Maryland corporation. The Fund seeks to achieve its investment objective by investing all of its assets in Master Value Opportunities LLC (the “Master LLC”), which has the same investment objective and strategies as the Fund. The value of the Fund’s investment in the Master LLC reflects the Fund’s proportionate interest in the net assets of the Master LLC. The performance of the Fund is directly affected by the performance of the Master LLC. The percentage of the Master LLC owned by the Fund at March 31, 2012 was 99.4%.The financial statements of the Master LLC, including the Schedule of Investments, are included elsewhere in this report and should be read in conjunction with the Fund’s financial statements. The Fund’s financial statements are prepared in conformity with accounting principles generally accepted in the United States of America (“US GAAP”), which may require management to make estimates and assumptions that affect the reported amounts and disclosures in the financial statements. Actual results could differ from those estimates. The Fund offers multiple classes of shares. Institutional Shares are sold without a sales charge and only to certain eligible investors. Investor A Shares are generally sold with a front-end sales charge. Investor B and Investor C Shares may be subject to a CDSC. Class R Shares are sold without a sales charge and only to certain retirement and other similar plans. All classes of shares have identical voting, dividend, liquidation and other rights and the same terms and conditions, except that Investor A, Investor B, Investor C and Class R Shares bear certain expenses related to the shareholder servicing of such shares, and Investor B, Investor C and Class R Shares also bear certain expenses related to the distribution of such shares. Investor B Shares automatically convert to Investor A Shares after approximately eight years. Investor B Shares are only available through exchanges, dividend reinvestment by existing shareholders or for purchase by certain qualified employee benefit plans. Each class has exclusive voting rights with respect to matters relating to its shareholder servicing and distribution expenditures (except that Investor B shareholders may vote on material changes to the Investor A distribution and service plan).
The following is a summary of significant accounting policies followed by the Fund:
Valuation: US GAAP defines fair value as the price the Fund would receive to sell an asset or pay to transfer a liability in an orderly transaction between market participants at the measurement date. The Fund’s policy is to fair value its financial instruments at market value. The Fund records its investment in the Master LLC at fair value based on the Fund’s proportionate interest in the net assets of the Master LLC. Valuation of securities held by the Master LLC is discussed in Note 1 of the Master LLC’s Notes to Financial Statements, which are included elsewhere in this report.
Investment Transactions and Investment Income: For financial reporting purposes, contributions to and withdrawals from the Master LLC are accounted for on a trade date basis. The Fund records daily its proportionate share of the Master LCC’s income, expenses and realized and unrealized gains and losses. Realized and unrealized gains and losses are adjusted for utilizing partnership tax allocation rules. In addition, the Fund accrues its own expenses. Income, expenses and realized and unrealized gains and losses are allocated daily to each class based on its relative net assets.
Dividends and Distributions: Dividends and distributions paid by the Fund are recorded on the ex-dividend dates. The amount and timing of dividends and distributions are determined in accordance with federal income tax regulations, which may differ from US GAAP.
Income Taxes: It is the Fund’s policy to comply with the requirements of the Internal Revenue Code of 1986, as amended, applicable to regulated investment companies and to distribute substantially all of its taxable income to its shareholders. Therefore, no federal income tax provision is required.
The Fund files US federal and various state and local tax returns. No income tax returns are currently under examination. The statute of limitations on the Fund’s US federal tax returns remains open for each of the four years ended March 31, 2012. The statutes of limitations on the Fund’s state and local tax returns may remain open for an additional year depending upon the jurisdiction. Management does not believe there are any uncertain tax positions that require recognition of a tax liability.
Other: Expenses directly related to the Fund or its classes are charged to the Fund or class. Other operating expenses shared by several funds are pro rated among those funds on the basis of relative net assets or other appropriate methods. Expenses directly related to the Fund and other shared expenses pro rated to the Fund are allocated daily to each class based on its relative net assets or other appropriate methods.
2. Administration Agreement and Other Transactions with Affiliates:
The PNC Financial Services Group, Inc. (“PNC”) and Barclays Bank PLC (“Barclays”) are the largest stockholders of BlackRock, Inc. (“BlackRock”). Due to the ownership structure, PNC is an affiliate for 1940 Act purposes, but Barclays is not.
The Fund entered into an Administration Agreement with BlackRock Advisors, LLC (the “Administrator”), an indirect, wholly owned subsidiary of BlackRock, to provide administrative services (other than investment advice and related portfolio activities). For such services, the Fund pays the Administrator a monthly fee at an annual rate of 0.25% of the average daily value of the Fund’s net assets. The Fund does not pay an investment advisory fee or investment management fee.
|
|
|
|
|
|
|
|
| BLACKROCK VALUE OPPORTUNITIES FUND, INC. | MARCH 31, 2012 | 13 |
|
|
|
|
Notes to Financial Statements (continued) | BlackRock Value Opportunities Fund, Inc. |
The Fund entered into a Distribution Agreement and Distribution and Service Plan with BlackRock Investments, LLC (“BRIL”), an affiliate of the Administrator. Pursuant to the Distribution and Service Plan and in accordance with Rule 12b-1 under the 1940 Act, the Fund pays BRIL ongoing service and distribution fees. The fees are accrued daily and paid monthly at annual rates based upon the average daily net assets of the shares of the Fund as follows:
|
|
|
|
|
|
|
|
|
| Service |
| Distribution |
| ||
Investor A |
|
| 0.25 | % |
| — |
|
Investor B |
|
| 0.25 | % |
| 0.75 | % |
Investor C |
|
| 0.25 | % |
| 0.75 | % |
Class R |
|
| 0.25 | % |
| 0.25 | % |
Pursuant to sub-agreements with BRIL, broker-dealers and BRIL provide shareholder servicing and distribution services to the Fund. The ongoing service and/or distribution fee compensates BRIL and each broker-dealer for providing shareholder servicing and/or distribution related services to Investor A, Investor B, Investor C and Class R shareholders.
For the year ended March 31, 2012, affiliates earned underwriting discounts, direct commissions and dealer concessions on sales of the Fund’s Investor A Shares, which totaled $5,526.
For the year ended March 31, 2012, affiliates received the following CDSCs relating to transactions in Investor A, Investor B and Investor C Shares as follows:
|
|
|
|
|
Investor A |
| $ | 92 |
|
Investor B |
| $ | 6,953 |
|
Investor C |
| $ | 6,946 |
|
Pursuant to written agreements, certain financial intermediaries, some of which may be affiliates, provide the Fund with sub-accounting, recordkeeping, sub-transfer agency and other administrative services with respect to sub-accounts they service. For these services, these entities receive an annual fee per shareholder account, which will vary depending on share class and/or net assets. For the year ended March 31, 2012, the Fund paid the following to affiliates in return for these services, which is included in transfer agent in the Statement of Operations:
|
|
|
|
|
Institutional |
| $ | 5 |
|
Investor A |
| $ | 43 |
|
Investor B |
| $ | 18 |
|
Investor C |
| $ | 16 |
|
The Administrator maintains a call center, which is responsible for providing certain shareholder services to the Fund, such as responding to shareholder inquiries and processing transactions based upon instructions from shareholders with respect to the subscription and redemption of Fund shares. For the year ended March 31, 2012, the Fund reimbursed the Administrator the following amounts for costs incurred in running the call center, which are included in transfer agent — class specific in the Statement of Operations:
|
|
|
|
|
Institutional |
| $ | 5,040 |
|
Investor A |
| $ | 5,175 |
|
Investor B |
| $ | 757 |
|
Investor C |
| $ | 3,707 |
|
Class R |
| $ | 450 |
|
Certain officers and/or directors of the Fund are officers and/or directors of BlackRock or its affiliates. The Fund reimburses the Administrator for compensation paid to the Fund’s Chief Compliance Officer.
3. Income Tax Information:
US GAAP requires that certain components of net assets be adjusted to reflect permanent differences between financial and tax reporting. These reclassifications have no effect on net assets or net asset values per share. The following permanent difference as of March 31, 2012 attributable to net operating losses was reclassified to the following accounts:
|
|
|
|
|
Paid-in capital |
| $ | (922,761 | ) |
Distributions in excess of net investment income |
| $ | 922,761 |
|
The tax character of distributions paid during the fiscal years ended March 31, 2012 and March 31, 2011 was as follows:
|
|
|
|
|
|
|
|
|
| 3/31/12 |
| 3/31/11 |
| ||
Ordinary Income |
|
| — |
| $ | 751,650 |
|
Total |
|
| — |
| $ | 751,650 |
|
As of March 31, 2012, the tax components of accumulated net losses were as follows:
|
|
|
|
|
Capital loss carryforwards |
| $ | (455,091,100 | ) |
Net unrealized gains1 |
|
| 171,647,371 |
|
Qualified late-year losses2 |
|
| (2,006,976 | ) |
Total |
| $ | (285,450,705 | ) |
|
|
|
| 1 | The difference between book-basis and tax-basis net unrealized gains was attributable primarily to the tax deferral of losses on wash sales. |
| ||
| 2 | The Fund has elected to defer certain qualified late-year losses and recognize such losses in the year ended March 31, 2013. |
As of March 31, 2012, the Fund had a capital loss carryforward of $455,091,100 available to offset future realized capital gains, all of which expires March 31, 2018.
|
|
|
|
|
|
14 | BLACKROCK VALUE OPPORTUNITIES FUND, INC. | MARCH 31, 2012 |
|
|
|
|
Notes to Financial Statements (concluded) | BlackRock Value Opportunities Fund, Inc. |
4. Capital Share Transactions:
Transactions in capital shares for each class were as follows:
|
|
|
|
|
|
|
|
|
|
|
|
|
|
|
|
| Year Ended |
| Year Ended |
| |||||||||
|
| Shares |
| Amount |
|
| Shares |
| Amount |
| ||||
Institutional |
|
|
|
|
|
|
|
|
|
|
|
|
|
|
Shares sold |
|
| 2,841,087 |
| $ | 57,039,677 |
|
|
| 6,795,248 |
| $ | 118,791,797 |
|
Shares issued to shareholders in reinvestment of dividends |
|
| — |
|
| — |
|
|
| 41,632 |
|
| 652,154 |
|
Shares redeemed |
|
| (10,849,660 | ) |
| (223,552,762 | ) |
|
| (4,506,287 | ) |
| (80,094,504 | ) |
Net increase (decrease) |
|
| (8,008,573 | ) | $ | (166,513,085 | ) |
|
| 2,330,593 |
| $ | 39,349,447 |
|
|
|
|
|
|
|
|
|
|
|
|
|
|
|
|
Investor A |
|
|
|
|
|
|
|
|
|
|
|
|
|
|
Shares sold and automatic conversion of shares |
|
| 3,486,773 |
| $ | 66,350,628 |
|
|
| 3,870,752 |
| $ | 68,391,605 |
|
Shares issued to shareholders in reinvestment of dividends |
|
| — |
|
| — |
|
|
| 1,587 |
|
| 24,466 |
|
Shares redeemed |
|
| (5,860,845 | ) |
| (113,839,538 | ) |
|
| (7,195,118 | ) |
| (122,337,827 | ) |
Net decrease |
|
| (2,374,072 | ) | $ | (47,488,910 | ) |
|
| (3,322,779 | ) | $ | (53,921,756 | ) |
|
|
|
|
|
|
|
|
|
|
|
|
|
|
|
Investor B |
|
|
|
|
|
|
|
|
|
|
|
|
|
|
Shares sold |
|
| 579,222 |
| $ | 9,371,713 |
|
|
| 996,090 |
| $ | 14,629,658 |
|
Shares redeemed and automatic conversion of shares |
|
| (2,475,819 | ) |
| (40,119,371 | ) |
|
| (3,858,322 | ) |
| (56,662,763 | ) |
Net decrease |
|
| (1,896,597 | ) | $ | (30,747,658 | ) |
|
| (2,862,232 | ) | $ | (42,033,105 | ) |
|
|
|
|
|
|
|
|
|
|
|
|
|
|
|
Investor C |
|
|
|
|
|
|
|
|
|
|
|
|
|
|
Shares sold |
|
| 1,480,057 |
| $ | 22,919,456 |
|
|
| 2,199,943 |
| $ | 31,095,245 |
|
Shares redeemed |
|
| (3,980,857 | ) |
| (61,111,596 | ) |
|
| (4,621,404 | ) |
| (64,282,355 | ) |
Net decrease |
|
| (2,500,800 | ) | $ | (38,192,140 | ) |
|
| (2,421,461 | ) | $ | (33,187,110 | ) |
|
|
|
|
|
|
|
|
|
|
|
|
|
|
|
Class R |
|
|
|
|
|
|
|
|
|
|
|
|
|
|
Shares sold |
|
| 593,645 |
| $ | 9,807,192 |
|
|
| 983,474 |
| $ | 14,675,725 |
|
Shares redeemed |
|
| (1,241,126 | ) |
| (20,616,761 | ) |
|
| (1,423,451 | ) |
| (21,151,289 | ) |
Net decrease |
|
| (647,481 | ) | $ | (10,809,569 | ) |
|
| (439,977 | ) | $ | (6,475,564 | ) |
Total Net Decrease |
|
| (15,427,523 | ) | $ | (293,751,362 | ) |
|
| (6,715,856 | ) | $ | (96,268,088 | ) |
Prior to April 1, 2011, there was a 2% redemption fee on shares redeemed or exchanged that have been held 30 days or less. The redemption fees were collected and retained by the Fund for the benefit of the remaining shareholders. The redemption fees were recorded as a credit to paid-in capital. Effective April 1, 2011, the redemption fee was terminated and is no longer charged by the Fund.
5. Subsequent Events:
Management has evaluated the impact of all subsequent events on the Fund through the date the financial statements were issued and has determined that there were no subsequent events requiring adjustment or additional disclosure in the financial statements.
|
|
|
|
|
|
|
|
| BLACKROCK VALUE OPPORTUNITIES FUND, INC. | MARCH 31, 2012 | 15 |
|
|
|
|
BlackRock Value Opportunities Fund, Inc. |
To the Shareholders and Board of Directors of BlackRock Value Opportunities Fund, Inc.:
We have audited the accompanying statement of assets and liabilities of BlackRock Value Opportunities Fund, Inc. (the “Fund”) as of March 31, 2012, and the related statement of operations for the year then ended, the statements of changes in net assets for each of the two years in the period then ended, and the financial highlights for each of the five years in the period then ended. These financial statements and financial highlights are the responsibility of the Fund’s management. Our responsibility is to express an opinion on these financial statements and financial highlights based on our audits.
We conducted our audits in accordance with the standards of the Public Company Accounting Oversight Board (United States). Those standards require that we plan and perform the audit to obtain reasonable assurance about whether the financial statements and financial highlights are free of material misstatement. The Fund is not required to have, nor were we engaged to perform, an audit of its internal control over financial reporting. Our audits included consideration of internal control over financial reporting as a basis for designing audit procedures that are appropriate in the circumstances, but not for the purpose of expressing an opinion on the effectiveness of the Fund’s internal control over financial reporting. Accordingly, we express no such opinion. An audit also includes examining, on a test basis, evidence supporting the amounts and disclosures in the financial statements, assessing the accounting principles used and significant estimates made by management, as well as evaluating the overall financial statement presentation. We believe that our audits provide a reasonable basis for our opinion.
In our opinion, the financial statements and financial highlights referred to above present fairly, in all material respects, the financial position of BlackRock Value Opportunities Fund, Inc. as of March 31, 2012, the results of its operations for the year then ended, the changes in its net assets for each of the two years in the period then ended, and the financial highlights for each of the five years in the period then ended, in conformity with accounting principles generally accepted in the United States of America.
Deloitte & Touche LLP
Boston, Massachusetts
May 24, 2012
|
|
|
|
|
|
16 | BLACKROCK VALUE OPPORTUNITIES FUND, INC. | MARCH 31, 2012 |
|
|
|
|
Master Value Opportunities LLC |
|
|
|
|
|
|
|
|
|
|
As of March 31, 2012 |
|
|
|
|
|
|
|
|
|
|
|
Ten Largest Holdings |
| Percent of |
| |||
Coventry Health Care, Inc. |
|
|
| 2 | % |
|
Dupont Fabros Technology, Inc. |
|
|
| 1 |
|
|
SM Energy Co. |
|
|
| 1 |
|
|
Tenet Healthcare Corp. |
|
|
| 1 |
|
|
Ascena Retail Group, Inc. |
|
|
| 1 |
|
|
Rockwood Holdings, Inc. |
|
|
| 1 |
|
|
NuVasive, Inc. |
|
|
| 1 |
|
|
Spirit AeroSystems Holdings, Inc., Class A |
|
|
| 1 |
|
|
Umpqua Holdings Corp. |
|
|
| 1 |
|
|
Carpenter Technology Corp. |
|
|
| 1 |
|
|
|
|
|
|
|
|
|
Sector Allocations |
|
| Percent of |
| ||
Financials |
|
|
| 23 | % |
|
Industrials |
|
|
| 17 |
|
|
Information Technology |
|
|
| 17 |
|
|
Health Care |
|
|
| 13 |
|
|
Consumer Discretionary |
|
|
| 13 |
|
|
Energy |
|
|
| 7 |
|
|
Materials |
|
|
| 6 |
|
|
Utilities |
|
|
| 4 |
|
|
|
|
|
|
|
|
|
|
| BLACKROCK VALUE OPPORTUNITIES FUND, INC. | MARCH 31, 2012 | 17 |
|
|
|
|
Master Value Opportunities LLC | |
(Percentages shown are based on Net Assets) |
|
|
|
|
|
|
|
|
Common Stocks |
| Shares |
| Value |
| ||
Aerospace & Defense — 4.2% |
|
|
|
|
|
|
|
Ceradyne, Inc. |
|
| 93,600 |
| $ | 3,047,616 |
|
Curtiss-Wright Corp. |
|
| 132,100 |
|
| 4,889,021 |
|
Esterline Technologies Corp. (a)(b) |
|
| 125,900 |
|
| 8,996,814 |
|
The KEYW Holding Corp. (a) |
|
| 380,600 |
|
| 2,949,650 |
|
Moog, Inc., Class A (a) |
|
| 187,500 |
|
| 8,041,875 |
|
Spirit AeroSystems Holdings, Inc., Class A (a)(b) |
|
| 431,600 |
|
| 10,556,936 |
|
|
|
|
|
|
| 38,481,912 |
|
Automobiles — 0.4% |
|
|
|
|
|
|
|
Thor Industries, Inc. |
|
| 125,600 |
|
| 3,963,936 |
|
Beverages — 0.5% |
|
|
|
|
|
|
|
Cott Corp. (a) |
|
| 687,300 |
|
| 4,529,307 |
|
Biotechnology — 0.8% |
|
|
|
|
|
|
|
Arena Pharmaceuticals, Inc. (a)(b) |
|
| 1,045,000 |
|
| 3,208,150 |
|
MannKind Corp. (a)(b) |
|
| 769,700 |
|
| 1,901,159 |
|
Pacific Biosciences of California, Inc. (a)(b) |
|
| 353,000 |
|
| 1,207,260 |
|
XOMA Corp. (a) |
|
| 526,400 |
|
| 1,458,128 |
|
|
|
|
|
|
| 7,774,697 |
|
Capital Markets — 0.4% |
|
|
|
|
|
|
|
Investment Technology Group, Inc. (a)(b) |
|
| 315,400 |
|
| 3,772,184 |
|
Chemicals — 2.8% |
|
|
|
|
|
|
|
Ferro Corp. (a)(b) |
|
| 251,300 |
|
| 1,492,722 |
|
Huntsman Corp. |
|
| 566,900 |
|
| 7,942,269 |
|
OM Group, Inc. (a)(b) |
|
| 131,900 |
|
| 3,628,569 |
|
Rockwood Holdings, Inc. (a) |
|
| 214,800 |
|
| 11,201,820 |
|
Spartech Corp. (a) |
|
| 317,300 |
|
| 1,548,424 |
|
|
|
|
|
|
| 25,813,804 |
|
Commercial Banks — 12.6% |
|
|
|
|
|
|
|
Banner Corp. |
|
| 259,499 |
|
| 5,716,763 |
|
BBCN Bancorp, Inc. (a) |
|
| 886,000 |
|
| 9,861,180 |
|
Boston Private Financial Holdings, Inc. |
|
| 854,576 |
|
| 8,468,848 |
|
Columbia Banking System, Inc. |
|
| 343,600 |
|
| 7,827,208 |
|
First Financial Bankshares, Inc. |
|
| 124,250 |
|
| 4,374,843 |
|
First Midwest Bancorp, Inc. |
|
| 470,600 |
|
| 5,637,788 |
|
F.N.B Corp. |
|
| 802,200 |
|
| 9,690,576 |
|
Glacier Bancorp, Inc. |
|
| 421,800 |
|
| 6,301,692 |
|
National Penn Bancshares, Inc. |
|
| 816,900 |
|
| 7,229,565 |
|
NBT Bancorp, Inc. |
|
| 237,200 |
|
| 5,237,376 |
|
Old National Bancorp |
|
| 642,100 |
|
| 8,437,194 |
|
Pinnacle Financial Partners, Inc. (a)(b) |
|
| 426,833 |
|
| 7,832,386 |
|
PrivateBancorp, Inc. |
|
| 342,400 |
|
| 5,194,208 |
|
Susquehanna Bancshares, Inc. |
|
| 964,100 |
|
| 9,525,308 |
|
UMB Financial Corp. |
|
| 116,100 |
|
| 5,193,733 |
|
Umpqua Holdings Corp. |
|
| 769,000 |
|
| 10,427,640 |
|
|
|
|
|
|
| 116,956,308 |
|
Communications Equipment — 3.1% |
|
|
|
|
|
|
|
Arris Group, Inc. (a) |
|
| 814,600 |
|
| 9,204,980 |
|
Finisar Corp. (a)(b) |
|
| 285,500 |
|
| 5,752,825 |
|
Harmonic, Inc. (a) |
|
| 909,600 |
|
| 4,975,512 |
|
Plantronics, Inc. |
|
| 50,700 |
|
| 2,041,182 |
|
Polycom, Inc. (a) |
|
| 365,200 |
|
| 6,964,364 |
|
|
|
|
|
|
| 28,938,863 |
|
Computers & Peripherals — 1.8% |
|
|
|
|
|
|
|
NCR Corp. (a) |
|
| 423,000 |
|
| 9,183,330 |
|
QLogic Corp. (a)(b) |
|
| 416,900 |
|
| 7,404,144 |
|
|
|
|
|
|
| 16,587,474 |
|
|
|
|
|
|
|
|
|
Common Stocks |
| Shares |
| Value |
| ||
Construction & Engineering — 1.1% |
|
|
|
|
|
|
|
KBR, Inc. |
|
| 222,500 |
| $ | 7,909,875 |
|
URS Corp. |
|
| 54,000 |
|
| 2,296,080 |
|
|
|
|
|
|
| 10,205,955 |
|
Containers & Packaging — 0.8% |
|
|
|
|
|
|
|
Packaging Corp. of America |
|
| 72,000 |
|
| 2,130,480 |
|
Rock-Tenn Co., Class A |
|
| 70,580 |
|
| 4,768,385 |
|
|
|
|
|
|
| 6,898,865 |
|
Diversified Financial Services — 0.7% |
|
|
|
|
|
|
|
Interactive Brokers Group, Inc., Class A |
|
| 263,200 |
|
| 4,474,400 |
|
Stifel Financial Corp. (a)(b) |
|
| 54,100 |
|
| 2,047,144 |
|
|
|
|
|
|
| 6,521,544 |
|
Electric Utilities — 1.5% |
|
|
|
|
|
|
|
Allete, Inc. |
|
| 186,400 |
|
| 7,733,736 |
|
UIL Holdings Corp. |
|
| 188,900 |
|
| 6,566,164 |
|
|
|
|
|
|
| 14,299,900 |
|
Electronic Equipment, Instruments & |
|
|
|
|
|
|
|
Checkpoint Systems, Inc. (a) |
|
| 333,700 |
|
| 3,764,136 |
|
Ingram Micro, Inc., Class A (a) |
|
| 392,500 |
|
| 7,284,800 |
|
Rofin-Sinar Technologies, Inc. (a)(b) |
|
| 213,600 |
|
| 5,632,632 |
|
ScanSource, Inc. (a)(b) |
|
| 202,500 |
|
| 7,557,300 |
|
|
|
|
|
|
| 24,238,868 |
|
Energy Equipment & Services — 1.7% |
|
|
|
|
|
|
|
Oil States International, Inc. (a)(b) |
|
| 63,000 |
|
| 4,917,780 |
|
Pioneer Drilling Co. (a) |
|
| 588,057 |
|
| 5,174,902 |
|
Tetra Technologies, Inc. (a)(b) |
|
| 619,500 |
|
| 5,835,690 |
|
|
|
|
|
|
| 15,928,372 |
|
Food & Staples Retailing — 0.1% |
|
|
|
|
|
|
|
The Fresh Market, Inc. (a) |
|
| 12,100 |
|
| 580,195 |
|
Gas Utilities — 0.7% |
|
|
|
|
|
|
|
Southwest Gas Corp. |
|
| 158,200 |
|
| 6,761,468 |
|
Health Care Equipment & Supplies — 4.9% |
|
|
|
|
|
|
|
CONMED Corp. |
|
| 175,200 |
|
| 5,233,224 |
|
Hansen Medical, Inc. (a)(b) |
|
| 1,408,000 |
|
| 4,224,000 |
|
Invacare Corp. |
|
| 490,800 |
|
| 8,132,556 |
|
NuVasive, Inc. (a) |
|
| 636,900 |
|
| 10,725,396 |
|
OraSure Technologies, Inc. (a) |
|
| 771,241 |
|
| 8,861,559 |
|
Wright Medical Group, Inc. (a)(b) |
|
| 421,700 |
|
| 8,147,244 |
|
|
|
|
|
|
| 45,323,979 |
|
Health Care Providers & Services — 6.2% |
|
|
|
|
|
|
|
Brookdale Senior Living, Inc. (a) |
|
| 498,600 |
|
| 9,333,792 |
|
Coventry Health Care, Inc. |
|
| 442,200 |
|
| 15,729,054 |
|
Gentiva Health Services, Inc. (a)(b) |
|
| 566,700 |
|
| 4,952,958 |
|
Health Net, Inc. (a) |
|
| 125,050 |
|
| 4,966,986 |
|
Healthways, Inc. (a) |
|
| 700,700 |
|
| 5,157,152 |
|
LCA-Vision, Inc. (a) |
|
| 701,800 |
|
| 4,407,304 |
|
Tenet Healthcare Corp. (a)(b) |
|
| 2,432,900 |
|
| 12,918,699 |
|
|
|
|
|
|
| 57,465,945 |
|
Hotels, Restaurants & Leisure — 1.9% |
|
|
|
|
|
|
|
Gaylord Entertainment Co. (a) |
|
| 242,600 |
|
| 7,472,080 |
|
Papa John’s International, Inc. (a) |
|
| 137,689 |
|
| 5,185,368 |
|
Ruby Tuesday, Inc. (a)(b) |
|
| 585,500 |
|
| 5,345,615 |
|
|
|
|
|
|
| 18,003,063 |
|
|
|
|
See Notes to Financial Statements. | ||
|
|
|
18 | BLACKROCK VALUE OPPORTUNITIES FUND, INC. | MARCH 31, 2012 |
|
|
|
|
Schedule of Investments (continued) | Master Value Opportunities LLC |
(Percentages shown are based on Net Assets) |
|
|
|
|
|
|
|
|
Common Stocks |
| Shares |
| Value |
| ||
Household Durables — 0.7% |
|
|
|
|
|
|
|
KB Home |
|
| 419,000 |
| $ | 3,729,100 |
|
MDC Holdings, Inc. |
|
| 94,939 |
|
| 2,448,477 |
|
|
|
|
|
|
| 6,177,577 |
|
Insurance — 2.0% |
|
|
|
|
|
|
|
Delphi Financial Group, Inc., Class A |
|
| 119,700 |
|
| 5,358,969 |
|
National Financial Partners Corp. (a) |
|
| 467,500 |
|
| 7,077,950 |
|
Selective Insurance Group, Inc. |
|
| 347,400 |
|
| 6,117,714 |
|
|
|
|
|
|
| 18,554,633 |
|
Internet & Catalog Retail — 0.2% |
|
|
|
|
|
|
|
CafePress, Inc. (a) |
|
| 95,600 |
|
| 1,830,740 |
|
Internet Software & Services — 0.8% |
|
|
|
|
|
|
|
IAC/InterActiveCorp. |
|
| 46,802 |
|
| 2,297,510 |
|
Monster Worldwide, Inc. (a)(b) |
|
| 501,000 |
|
| 4,884,750 |
|
|
|
|
|
|
| 7,182,260 |
|
IT Services — 1.5% |
|
|
|
|
|
|
|
Acxiom Corp. (a) |
|
| 451,500 |
|
| 6,628,020 |
|
Convergys Corp. (a)(b) |
|
| 535,000 |
|
| 7,142,250 |
|
|
|
|
|
|
| 13,770,270 |
|
Leisure Equipment & Products — 0.4% |
|
|
|
|
|
|
|
Leapfrog Enterprises, Inc. (a) |
|
| 478,530 |
|
| 4,000,511 |
|
Life Sciences Tools & Services — 1.0% |
|
|
|
|
|
|
|
Affymetrix, Inc. (a)(b) |
|
| 2,104,200 |
|
| 8,984,934 |
|
Machinery — 8.6% |
|
|
|
|
|
|
|
AGCO Corp. (a) |
|
| 206,700 |
|
| 9,758,307 |
|
Altra Holdings, Inc. (a)(b) |
|
| 498,378 |
|
| 9,568,857 |
|
Briggs & Stratton Corp. |
|
| 410,100 |
|
| 7,353,093 |
|
CIRCOR International, Inc. |
|
| 172,900 |
|
| 5,752,383 |
|
EnPro Industries, Inc. (a)(b) |
|
| 239,700 |
|
| 9,851,670 |
|
IDEX Corp. |
|
| 233,800 |
|
| 9,849,994 |
|
Kennametal, Inc. |
|
| 149,200 |
|
| 6,643,876 |
|
RBC Bearings, Inc. (a) |
|
| 188,800 |
|
| 8,709,344 |
|
Robbins & Myers, Inc. |
|
| 127,600 |
|
| 6,641,580 |
|
Terex Corp. (a) |
|
| 266,900 |
|
| 6,005,250 |
|
|
|
|
|
|
| 80,134,354 |
|
Metals & Mining — 1.1% |
|
|
|
|
|
|
|
Carpenter Technology Corp. |
|
| 190,900 |
|
| 9,970,707 |
|
Multi-Utilities — 1.6% |
|
|
|
|
|
|
|
NorthWestern Corp. |
|
| 256,100 |
|
| 9,081,306 |
|
OGE Energy Corp. |
|
| 114,600 |
|
| 6,131,100 |
|
|
|
|
|
|
| 15,212,406 |
|
Multiline Retail — 1.4% |
|
|
|
|
|
|
|
Big Lots, Inc. (a) |
|
| 161,200 |
|
| 6,934,824 |
|
Fred’s, Inc. |
|
| 379,114 |
|
| 5,538,855 |
|
|
|
|
|
|
| 12,473,679 |
|
Oil, Gas & Consumable Fuels — 5.3% |
|
|
|
|
|
|
|
Bill Barrett Corp. (a)(b) |
|
| 154,400 |
|
| 4,015,944 |
|
Cabot Oil & Gas Corp. |
|
| 116,698 |
|
| 3,637,477 |
|
Carrizo Oil & Gas, Inc. (a)(b) |
|
| 219,900 |
|
| 6,214,374 |
|
Gastar Exploration Ltd. (a) |
|
| 1,230,343 |
|
| 3,678,725 |
|
Goodrich Petroleum Corp. (a)(b) |
|
| 224,100 |
|
| 4,262,382 |
|
HollyFrontier Corp. |
|
| 34,880 |
|
| 1,121,392 |
|
Oasis Petroleum, Inc. (a) |
|
| 293,300 |
|
| 9,042,439 |
|
SM Energy Co. |
|
| 184,600 |
|
| 13,064,142 |
|
Whiting Petroleum Corp. (a) |
|
| 82,500 |
|
| 4,479,750 |
|
|
|
|
|
|
| 49,516,625 |
|
|
|
|
|
|
|
|
|
Common Stocks |
| Shares |
| Value |
| ||
Paper & Forest Products — 0.9% |
|
|
|
|
|
|
|
Schweitzer-Mauduit International, Inc. |
|
| 57,020 |
| $ | 3,937,801 |
|
Wausau Paper Corp. |
|
| 496,300 |
|
| 4,655,294 |
|
|
|
|
|
|
| 8,593,095 |
|
Pharmaceuticals — 0.2% |
|
|
|
|
|
|
|
K-V Pharmaceutical Co., Class A (a)(b) |
|
| 1,543,300 |
|
| 2,037,156 |
|
Professional Services — 1.5% |
|
|
|
|
|
|
|
Kelly Services, Inc., Class A |
|
| 308,500 |
|
| 4,932,915 |
|
Kforce, Inc. (a) |
|
| 375,300 |
|
| 5,591,970 |
|
Resources Connection, Inc. |
|
| 267,800 |
|
| 3,762,590 |
|
|
|
|
|
|
| 14,287,475 |
|
Real Estate Investment Trusts (REITs) — 6.8% |
|
|
|
|
|
|
|
Acadia Realty Trust (b) |
|
| 420,500 |
|
| 9,478,070 |
|
BioMed Realty Trust, Inc. |
|
| 243,000 |
|
| 4,612,140 |
|
CommonWealth REIT |
|
| 250,975 |
|
| 4,673,155 |
|
Corporate Office Properties Trust (b) |
|
| 192,500 |
|
| 4,467,925 |
|
Cousins Properties, Inc. (b) |
|
| 981,667 |
|
| 7,441,036 |
|
Dupont Fabros Technology, Inc. (b) |
|
| 544,000 |
|
| 13,300,800 |
|
Kilroy Realty Corp. (b) |
|
| 105,100 |
|
| 4,898,711 |
|
Lexington Corporate Properties Trust (b) |
|
| 695,150 |
|
| 6,249,398 |
|
Omega Healthcare Investors, Inc. (b) |
|
| 376,800 |
|
| 8,010,768 |
|
|
|
|
|
|
| 63,132,003 |
|
Road & Rail — 1.4% |
|
|
|
|
|
|
|
Marten Transport Ltd. |
|
| 271,848 |
|
| 5,999,685 |
|
Vitran Corp., Inc. (a) |
|
| 815,227 |
|
| 6,505,512 |
|
|
|
|
|
|
| 12,505,197 |
|
Semiconductors & Semiconductor |
|
|
|
|
|
|
|
Equipment — 3.2% |
|
|
|
|
|
|
|
Cymer, Inc. (a)(b) |
|
| 88,600 |
|
| 4,430,000 |
|
DSP Group, Inc. (a) |
|
| 821,037 |
|
| 5,468,106 |
|
MKS Instruments, Inc. |
|
| 100,100 |
|
| 2,955,953 |
|
PMC-Sierra, Inc. (a) |
|
| 945,100 |
|
| 6,833,073 |
|
Standard Microsystems Corp. (a) |
|
| 231,500 |
|
| 5,988,905 |
|
Teradyne, Inc. (a)(b) |
|
| 255,600 |
|
| 4,317,084 |
|
|
|
|
|
|
| 29,993,121 |
|
Software — 3.5% |
|
|
|
|
|
|
|
Bottomline Technologies, Inc. (a)(b) |
|
| 333,997 |
|
| 9,331,876 |
|
Compuware Corp. (a) |
|
| 897,800 |
|
| 8,250,782 |
|
Progress Software Corp. (a)(b) |
|
| 237,200 |
|
| 5,602,664 |
|
Take-Two Interactive Software, Inc. (a) |
|
| 591,400 |
|
| 9,098,689 |
|
|
|
|
|
|
| 32,284,011 |
|
Specialty Retail — 5.7% |
|
|
|
|
|
|
|
Ascena Retail Group, Inc. (a) |
|
| 286,015 |
|
| 12,676,185 |
|
Chico’s FAS, Inc. |
|
| 150,300 |
|
| 2,269,530 |
|
The Children’s Place Retail Stores, Inc. (a)(b) |
|
| 116,500 |
|
| 6,019,555 |
|
Collective Brands, Inc. (a) |
|
| 210,126 |
|
| 4,131,077 |
|
Express, Inc. (a) |
|
| 384,500 |
|
| 9,604,810 |
|
Genesco, Inc. (a) |
|
| 102,900 |
|
| 7,372,785 |
|
The Men’s Wearhouse, Inc. |
|
| 139,087 |
|
| 5,392,403 |
|
Penske Automotive Group, Inc. |
|
| 192,300 |
|
| 4,736,349 |
|
The Pep Boys — Manny, Moe & Jack |
|
| 62,399 |
|
| 930,993 |
|
|
|
|
|
|
| 53,133,687 |
|
|
|
|
|
See Notes to Financial Statements. | |||
|
|
|
|
| BLACKROCK VALUE OPPORTUNITIES FUND, INC. | MARCH 31, 2012 | 19 |
|
|
|
|
Schedule of Investments (continued) | Master Value Opportunities LLC |
| (Percentages shown are based on Net Assets) |
|
|
|
|
|
|
|
|
Common Stocks |
| Shares |
| Value |
| ||
Textiles, Apparel & Luxury Goods — 2.1% |
|
|
|
|
|
|
|
G-III Apparel Group Ltd. (a)(b) |
|
| 192,392 |
| $ | 5,467,781 |
|
The Jones Group, Inc. |
|
| 493,216 |
|
| 6,194,793 |
|
Perry Ellis International, Inc. (a)(b) |
|
| 135,448 |
|
| 2,528,814 |
|
The Warnaco Group, Inc. (a) |
|
| 90,300 |
|
| 5,273,520 |
|
|
|
|
|
|
| 19,464,908 |
|
Thrifts & Mortgage Finance — 0.2% |
|
|
|
|
|
|
|
Provident Financial Services, Inc. |
|
| 134,700 |
|
| 1,957,191 |
|
Total Common Stocks — 98.9% |
|
|
|
|
| 918,243,179 |
|
|
|
|
|
|
|
|
|
|
|
|
|
|
|
|
|
Warrants (c) |
|
|
|
|
|
|
|
Biotechnology — 0.0% |
|
|
|
|
|
|
|
MannKind Corp. (Expires 2/08/16) |
|
| 221,800 |
|
| 133,080 |
|
XOMA Corp. (Expires 3/09/17) |
|
| 202,350 |
|
| 102,187 |
|
Total Warrants — 0.0% |
|
|
|
|
| 235,267 |
|
Total Long-Term Investments |
|
|
|
|
| 918,478,446 |
|
|
|
|
|
|
|
|
|
Short-Term Securities |
| Shares |
| Value |
| ||
BlackRock Liquidity Funds, TempFund, |
|
| 12,877,033 |
| $ | 12,877,033 |
|
|
|
|
|
|
|
|
|
|
| Beneficial |
|
|
|
| |
BlackRock Liquidity Series, LLC |
| $ | 157,156 |
|
| 157,155,871 |
|
Total Short-Term Securities |
|
|
|
|
| 170,032,904 |
|
Total Investments (Cost — $902,819,082*) — 117.2% |
|
|
|
|
| 1,088,511,350 |
|
Liabilities in Excess of Other Assets — (17.2)% |
|
|
|
|
| (159,918,295 | ) |
Net Assets — 100.0% |
|
|
|
| $ | 928,593,055 |
|
|
|
| |
* | As of March 31, 2012, gross unrealized appreciation and gross unrealized depreciation based on cost for federal income tax purposes were as follows: |
|
|
|
|
|
Tax cost |
| $ | 915,984,704 |
|
Gross unrealized appreciation |
| $ | 221,544,014 |
|
Gross unrealized depreciation |
|
| (49,017,368 | ) |
Net unrealized appreciation |
| $ | 172,526,646 |
|
|
|
(a) | Non-income producing security. |
|
|
(b) | Security, or a portion of security, is on loan. |
|
|
(c) | Warrants entitle the Master LLC to purchase a predetermined number of shares of common stock and are non-income producing. The purchase price and number of shares are subject to adjustment under certain conditions until the expiration date, if any. |
|
|
(d) | Investments in companies considered to be an affiliate of the Master LLC during the year, for purposes of Section 2(a)(3) of the Investment Company Act of 1940, as amended, were as follows: |
|
|
|
|
|
|
|
|
|
|
|
|
|
|
|
|
|
Affiliate |
| Shares/Beneficial |
| Net Activity |
| Shares/Beneficial |
| Income |
| Realized |
| |||||
BlackRock Liquidity Funds, TempFund, Institutional Class |
|
| 20,440,783 |
|
| (7,563,750 | ) |
| 12,877,033 |
| $ | 12,594 |
| $ | 2 |
|
BlackRock Liquidity Series, LLC Money Market Series |
| $ | 25,810,450 |
| $ | 131,345,421 |
| $ | 157,155,871 |
| $ | 794,919 |
|
| — |
|
|
|
(e) | Represents the current yield as of report date. |
|
|
(f) | Security was purchased with the cash collateral from loaned securities. |
|
|
• | Investments in companies (whereby the Master LLC held 5% or more of the companies’ outstanding securities) that were considered to be an affiliate during the year, for purposes of Section 2(a)(3) of the Investment Company Act of 1940, as amended, were as follows: |
|
|
|
|
|
|
|
|
|
|
|
|
|
|
|
|
|
|
|
|
Affiliate |
| Shares Held at |
| Shares |
| Shares |
| Shares Held at |
| Value at |
| Realized |
| ||||||
OraSure Technologies, Inc.1 |
|
| 2,616,100 |
|
| 9,087 |
|
| (1,853,946 | ) |
| 771,241 |
| $ | 8,861,559 |
| $ | 2,783,220 |
|
|
|
|
|
|
| 1 | No longer an affiliated company as of report date. |
|
|
|
|
• | For Master LLC compliance purposes, the Master LLC’s industry classifications refer to any one or more of the industry sub-classifications used by one or more widely recognized market indexes or rating group indexes, and/or as defined by Master LLC management. These definitions may not apply for purposes of this report, which may combine such industry sub-classifications for reporting ease. | ||
|
|
|
|
See Notes to Financial Statements. | |||
|
|
|
|
20 |
| BLACKROCK VALUE OPPORTUNITIES FUND, INC. | MARCH 31, 2012 |
|
|
|
|
Schedule of Investments (concluded) | Master Value Opportunities LLC |
|
|
|
• | Fair Value Measurements — Various inputs are used in determining the fair value of investments. These inputs are categorized into a disclosure hierarchy consisting of three broad levels for financial statement purposes as follows: | |
|
|
|
| • | Level 1 — unadjusted price quotations in active markets/exchanges for identical assets and liabilities |
|
|
|
| • | Level 2 — other observable inputs (including, but not limited to: quoted prices for similar assets or liabilities in markets that are active, quoted prices for identical or similar assets or liabilities in markets that are not active, inputs other than quoted prices that are observable for the assets or liabilities (such as interest rates, yield curves, volatilities, prepayment speeds, loss severities, credit risks and default rates) or other market-corroborated inputs) |
|
|
|
| • | Level 3 — unobservable inputs based on the best information available in the circumstances, to the extent observable inputs are not available (including the Master LLC’s own assumptions used in determining the fair value of investments) |
|
|
|
| Changes in valuation techniques may result in transfers into or out of an assigned level within the disclosure hierarchy. The categorization of a value determined for investments is based on the pricing transparency of the investment and is not necessarily an indication of the risks associated with investing in those securities. For information about the Master LLC’s policy regarding valuation of investments and other significant accounting policies, please refer to Note 1 of the Notes to Financial Statements. | |
|
|
|
| The following table summarizes the inputs used as of March 31, 2012 in determining the fair valuation of the Master LLC’s investments: | |
|
|
|
|
|
|
|
|
|
|
|
|
|
|
Valuation Inputs |
| Level 1 |
| Level 2 |
| Level 3 |
| Total |
| ||||
Assets: |
|
|
|
|
|
|
|
|
|
|
|
|
|
Investments: |
|
|
|
|
|
|
|
|
|
|
|
|
|
Long-Term Investments1 |
| $ | 918,376,259 |
| $ | 102,187 |
|
| — |
| $ | 918,478,446 |
|
Short-Term Securities |
|
| 12,877,033 |
|
| 157,155,871 |
|
| — |
|
| 170,032,904 |
|
Total |
| $ | 931,253,292 |
| $ | 157,258,058 |
|
| — |
| $ | 1,088,511,350 |
|
|
|
|
| 1 | See above Schedule of Investments for values in each industry. |
|
|
|
|
See Notes to Financial Statements. |
|
|
|
|
|
|
|
| BLACKROCK VALUE OPPORTUNITIES FUND, INC. | MARCH 31, 2012 | 21 |
|
|
|
|
Master Value Opportunities LLC |
|
|
|
|
|
March 31, 2012 |
|
|
|
|
Assets |
|
|
|
|
Investments at value — unaffiliated (including securities loaned of $151,604,816) (cost — $732,786,178) |
| $ | 918,478,446 |
|
Investments at value — affiliated (cost — $170,032,904) |
|
| 170,032,904 |
|
Investments sold receivable |
|
| 4,963,740 |
|
Dividends receivable |
|
| 862,482 |
|
Securities lending income receivable — affiliated |
|
| 67,774 |
|
Prepaid expenses |
|
| 22,425 |
|
Total assets |
|
| 1,094,427,771 |
|
|
|
|
|
|
Liabilities |
|
|
|
|
Collateral on securities loaned at value |
|
| 157,155,871 |
|
Investments purchased payable |
|
| 7,238,424 |
|
Withdrawals payable to investors |
|
| 851,292 |
|
Investment advisory fees payable |
|
| 431,841 |
|
Other affiliates payable |
|
| 5,300 |
|
Directors’ fees payable |
|
| 1,273 |
|
Other accrued expenses payable |
|
| 150,715 |
|
Total liabilities |
|
| 165,834,716 |
|
Net Assets |
| $ | 928,593,055 |
|
|
|
|
|
|
Net Assets Consist of |
|
|
|
|
Investors’ capital |
| $ | 742,900,787 |
|
Net unrealized appreciation/depreciation |
|
| 185,692,268 |
|
Net Assets |
| $ | 928,593,055 |
|
|
|
|
|
See Notes to Financial Statements. | |||
|
|
|
|
22 |
| BLACKROCK VALUE OPPORTUNITIES FUND, INC. | MARCH 31, 2012 |
|
|
|
|
Master Value Opportunities LLC |
|
|
|
|
|
Year Ended March 31, 2012 |
|
|
|
|
Investment Income |
|
|
|
|
Dividends — unaffiliated |
| $ | 11,416,215 |
|
Securities lending — affiliated |
|
| 794,919 |
|
Dividends — affiliated |
|
| 12,594 |
|
Total income |
|
| 12,223,728 |
|
|
|
|
|
|
Expenses |
|
|
|
|
Investment advisory |
|
| 5,233,517 |
|
Accounting services |
|
| 217,501 |
|
Custodian |
|
| 79,879 |
|
Professional |
|
| 50,458 |
|
Directors |
|
| 36,459 |
|
Printing |
|
| 14,747 |
|
Miscellaneous |
|
| 31,701 |
|
Total expenses |
|
| 5,664,262 |
|
Less fees waived by advisor |
|
| (7,947 | ) |
Total expenses after fees waived |
|
| 5,656,315 |
|
Net investment income |
|
| 6,567,413 |
|
|
|
|
|
|
Realized and Unrealized Gain (Loss) |
|
|
|
|
Net realized gain from investments, including $2,783,222 gain from affiliates |
|
| 138,038,067 |
|
Net change in unrealized appreciation/depreciation on investments |
|
| (147,040,478 | ) |
Total realized and unrealized loss |
|
| (9,002,411 | ) |
Net Decrease in Net Assets Resulting from Operations |
| $ | (2,434,998 | ) |
|
|
|
|
See Notes to Financial Statements. |
|
|
|
|
|
|
|
| BLACKROCK VALUE OPPORTUNITIES FUND, INC. | MARCH 31, 2012 | 23 |
|
|
|
|
Master Value Opportunities LLC |
|
|
|
|
|
|
|
|
|
| Year Ended March 31, |
| ||||
Increase (Decrease) in Net Assets: |
| 2012 |
| 2011 |
| ||
Operations |
|
|
|
|
|
|
|
Net investment income |
| $ | 6,567,413 |
| $ | 8,230,507 |
|
Net realized gain |
|
| 138,038,067 |
|
| 101,477,883 |
|
Net change in unrealized appreciation/depreciation |
|
| (147,040,478 | ) |
| 170,244,774 |
|
Net increase (decrease) in net assets resulting from operations |
|
| (2,434,998 | ) |
| 279,953,164 |
|
|
|
|
|
|
|
|
|
Capital Transactions |
|
|
|
|
|
|
|
Proceeds from contributions |
|
| 166,429,563 |
|
| 254,535,746 |
|
Value of withdrawals |
|
| (471,023,813 | ) |
| (355,618,017 | ) |
Net decrease in net assets derived from capital transactions |
|
| (304,594,250 | ) |
| (101,082,271 | ) |
|
|
|
|
|
|
|
|
Net Assets |
|
|
|
|
|
|
|
Total increase (decrease) in net assets |
|
| (307,029,248 | ) |
| 178,870,893 |
|
Beginning of year |
|
| 1,235,622,303 |
|
| 1,056,751,410 |
|
End of year |
| $ | 928,593,055 |
| $ | 1,235,622,303 |
|
|
|
|
|
Master Value Opportunities LLC |
|
|
|
|
|
|
|
|
|
|
|
|
|
|
|
|
|
|
| Year Ended March 31, |
| |||||||||||||
|
| 2012 |
| 2011 |
| 2010 |
| 2009 |
| 2008 |
| |||||
Total Investment Return |
|
|
|
|
|
|
|
|
|
|
|
|
|
|
|
|
Total investment return |
|
| 1.17 | % |
| 28.70 | % |
| 68.13 | %1 |
| (43.58 | )% |
| (13.02 | )% |
|
|
|
|
|
|
|
|
|
|
|
|
|
|
|
|
|
Ratios to Average Net Assets |
|
|
|
|
|
|
|
|
|
|
|
|
|
|
|
|
Total expenses |
|
| 0.54 | % |
| 0.54 | % |
| 0.55 | % |
| 0.54 | % |
| 0.51 | % |
Total expenses after fees waived |
|
| 0.54 | % |
| 0.54 | % |
| 0.55 | % |
| 0.54 | % |
| 0.51 | % |
Net investment income |
|
| 0.62 | % |
| 0.78 | % |
| 1.14 | % |
| 1.21 | % |
| 0.66 | % |
|
|
|
|
|
|
|
|
|
|
|
|
|
|
|
|
|
Supplemental Data |
|
|
|
|
|
|
|
|
|
|
|
|
|
|
|
|
Net assets, end of year (000) |
| $ | 928,593 |
| $ | 1,235,622 |
| $ | 1,056,751 |
| $ | 770,616 |
| $ | 1,750,575 |
|
Portfolio turnover |
|
| 45 | % |
| 52 | % |
| 79 | % |
| 147 | % |
| 109 | % |
|
|
|
| 1 | Includes proceeds received from a settlement of litigation, which impacted the Master LLC’s total investment return. Not including these proceeds, the total investment return would have been 67.83%. |
|
|
|
|
See Notes to Financial Statements. | |||
|
|
|
|
24 |
| BLACKROCK VALUE OPPORTUNITIES FUND, INC. | MARCH 31, 2012 |
| |
|
|
Master Value Opportunities LLC | |
1. Organization and Significant Accounting Policies:
Master Value Opportunities LLC (the “Master LLC”) is registered under the Investment Company Act of 1940, as amended (the “1940 Act”), as a diversified, open-end management investment company and is organized as a Delaware limited liability company. The Limited Liability Company Agreement permits the Board of Directors of the Master LLC (the “Board”) to issue nontransferable interests in the Master LLC, subject to certain limitations. The Master LLC’s financial statements are prepared in conformity with accounting principles generally accepted in the United States of America (“US GAAP”), which may require management to make estimates and assumptions that affect the reported amounts and disclosures in the financial statements. Actual results could differ from those estimates.
The following is a summary of significant accounting policies followed by the Master LLC:
Valuation: US GAAP defines fair value as the price the Master LLC would receive to sell an asset or pay to transfer a liability in an orderly transaction between market participants at the measurement date. The Master LLC fair values its financial instruments at market value using independent dealers or pricing services under policies approved by the Board. Equity investments traded on a recognized securities exchange or the NASDAQ Global Market System (“NASDAQ”) are valued at the last reported sale price that day or the NASDAQ official closing price, if applicable. For equity investments traded on more than one exchange, the last reported sale price on the exchange where the stock is primarily traded is used. Equity investments traded on a recognized exchange for which there were no sales on that day are valued at the last available bid (long positions) or ask (short positions) price. If no bid or ask price is available, the prior day’s price will be used, unless it is determined that such prior day’s price no longer reflects the fair value of the security. Investments in open-end registered investment companies are valued at NAV each business day. Short-term securities with remaining maturities of 60 days or less may be valued at amortized cost, which approximates fair value.
The Master LLC values its investments in BlackRock Liquidity Series, LLC Money Market Series (the “Money Market Series”) at fair value, which is ordinarily based upon its pro rata ownership in the underlying fund’s net assets. The Money Market Series seeks current income consistent with maintaining liquidity and preserving capital. Although the Money Market Series is not registered under the 1940 Act, its investments will follow the parameters of investments by a money market fund that is subject to Rule 2a-7 under the 1940 Act. The Master LLC may withdraw up to 25% of its investment daily, although the manager of the Money Market Series, in its sole discretion, may permit an investor to withdraw more than 25% on any one day.
In the event that application of these methods of valuation results in a price for an investment which is deemed not to be representative of the market value of such investment or if a price is not available, the investment will be valued in accordance with a policy approved by the Board as reflecting fair value (“Fair Value Assets”). When determining the price for Fair Value Assets, the investment advisor and/or the sub-advisor seeks to determine the price that the Master LLC might reasonably expect to receive from the current sale of that asset in an arm’s-length transaction. Fair value determinations shall be based upon all available factors that the investment advisor and/or sub-advisor deems relevant. The pricing of all Fair Value Assets is subsequently reported to the Board or a committee thereof.
Investment Transactions and Investment Income: For financial reporting purposes, investment transactions are recorded on the dates the transactions are entered into (the trade dates). Realized gains and losses on investment transactions are determined on the identified cost basis. Dividend income is recorded on the ex-dividend dates. Dividends from foreign securities where the ex-dividend date may have passed are subsequently recorded when the Master LLC is informed of the ex-dividend date. Upon notification from issuers, some of the dividend income received from a real estate investment trust may be redesignated as a reduction of cost of the related investment and/or realized gain.
Securities Lending: The Master LLC may lend securities to approved borrowers, such as banks, brokers and other financial institutions. The borrower pledges cash, securities issued or guaranteed by the US government or irrevocable letters of credit issued by a bank as collateral, which will be maintained at all times in an amount equal to at least 100% of the current market value of the loaned securities. The market value of the loaned securities is determined at the close of business of the Master LLC and any additional required collateral is delivered to the Master LLC on the next business day. Securities lending income, as disclosed in the Statement of Operations, represents the income earned from the investment of the cash collateral, net of rebates paid to, or fees paid by, borrowers and less the fees paid to the securities lending agent. During the term of the loan, the Master LLC earns dividend or interest income on the securities loaned but does not receive interest income on the securities received as collateral. Loans of securities are terminable at any time and the borrower, after notice, is required to return borrowed securities within the standard time period for settlement of securities transactions. In the event that the borrower defaults on its obligation to return borrowed securities because of insolvency or for any other reason, the Master LLC could experience delays and costs in gaining access to the collateral. The Master LLC also could suffer a loss if the value of an investment purchased with cash collateral falls below the market value of loaned securities or if the value of an investment purchased with cash collateral falls below the value of the original cash collateral received. During the year ended March 31, 2012, any securities on loan were collateralized by cash.
|
|
|
|
|
|
|
|
| BLACKROCK VALUE OPPORTUNITIES FUND, INC. | MARCH 31, 2012 | 25 |
| |
|
|
Notes to Financial Statements (continued) | Master Value Opportunities LLC |
Income Taxes: The Master LLC is classified as a partnership for federal income tax purposes. As such, each investor in the Master LLC is treated as the owner of its proportionate share of net assets, income, expenses and realized and unrealized gains and losses of the Master LLC. Therefore, no federal income tax provision is required. It is intended that the Master LLC’s assets will be managed so an investor in the Master LLC can satisfy the requirements of Subchapter M of the Internal Revenue Code of 1986, as amended.
The Master LLC files US federal and various state and local tax returns. No income tax returns are currently under examination. The statute of limitations on the Master LLC’s US federal tax returns remains open for each of the four years ended March 31, 2012. The statutes of limitations on the Master LLC’s state and local tax returns may remain open for an additional year depending upon the jurisdiction. Management does not believe there are any uncertain tax positions that require recognition of a tax liability.
Recent Accounting Standards: In May 2011, the Financial Accounting Standards Board (the “FASB”) issued amended guidance to improve disclosure about fair value measurements which will require the following disclosures for fair value measurements categorized as Level 3: quantitative information about the unobservable inputs and assumptions used in the fair value measurement, a description of the valuation policies and procedures and a narrative description of the sensitivity of the fair value measurement to changes in unobservable inputs and the interrelationships between those unobservable inputs. In addition, the amounts and reasons for all transfers in and out of Level 1 and Level 2 will be required to be disclosed as well as disclosure of the level in the fair value hierarchy of assets and liabilities not recorded at fair value but where fair value is disclosed. The amended guidance is effective for financial statements for fiscal years beginning after December 15, 2011, and interim periods within those fiscal years. Management is evaluating the impact of this guidance on the Master LLC’s financial statement disclosures.
In December 2011, the FASB issued guidance that will expand current disclosure requirements on the offsetting of certain assets and liabilities. The new disclosures will be required for investments and derivative financial instruments subject to master netting or similar agreements which are eligible for offset in the Statement of Assets and Liabilities and will require an entity to disclose both gross and net information about such investments and transactions in the financial statements. The guidance is effective for financial statements with fiscal years beginning on or after January 1, 2013, and interim periods within those fiscal years. Management is evaluating the impact of this guidance on the Master LLC’s financial statement disclosures.
Other: Expenses directly related to the Master LLC are charged to the Master LLC. Other operating expenses shared by several funds are pro rated among those funds on the basis of relative net assets or other appropriate methods.
The Master LLC has an arrangement with the custodian whereby fees may be reduced by credits earned on uninvested cash balances, which, if applicable, are shown as fees paid indirectly in the Statement of Operations. The custodian imposes fees on overdrawn cash balances, which can be offset by accumulated credits earned or may result in additional custody charges.
2. Investment Advisory Agreement and Other Transactions with Affiliates:
The PNC Financial Services Group, Inc. (“PNC”) and Barclays Bank PLC (“Barclays”) are the largest stockholders of BlackRock, Inc. (“BlackRock”). Due to the ownership structure, PNC is an affiliate for 1940 Act purposes, but Barclays is not.
The Master LLC entered into an Investment Advisory Agreement with BlackRock Advisors, LLC (the “Manager”), the Master LLC’s investment advisor, an indirect, wholly owned subsidiary of BlackRock, to provide investment advisory and administration services. The Manager is responsible for the management of the Master LLC’s portfolio and provides the necessary personnel, facilities, equipment and certain other services necessary to the operations of the Master LLC. For such services, the Master LLC pays the Manager a monthly fee based on a percentage of the Master LLC’s average daily net assets at the following annual rates:
|
|
|
|
|
Average Daily Net Assets |
| Investment |
| |
First $1 billion |
|
| 0.500% |
|
$1 billion – $1.5 billion |
|
| 0.475% |
|
Greater than $1.5 billion |
|
| 0.450% |
|
The Manager voluntarily agreed to waive its investment advisory fees by the amount of investment advisory fees the Master LLC pays to the Manager indirectly through its investment in affiliated money market funds. However, the Manager does not waive its investment advisory fees by the amount of investment advisory fees paid in connection with the Master LLC’s investment in other affiliated investment companies, if any. This amount is shown as, or included in, fees waived by advisor in the Statement of Operations.
The Manager entered into a sub-advisory agreement with BlackRock Investment Management, LLC (“BIM”), an affiliate of the Manager. The Manager pays BIM, for services it provides, a monthly fee that is a percentage of the investment advisory fees paid by the Master LLC to the Manager.
For the year ended March 31, 2012, the Master LLC reimbursed the Manager $9,052 for certain accounting services, which is included in accounting services in the Statement of Operations.
|
|
|
|
|
|
26 | BLACKROCK VALUE OPPORTUNITIES FUND, INC. | MARCH 31, 2012 |
| |
|
|
Notes to Financial Statements (concluded) | Master Value Opportunities LLC |
The Master LLC received an exemptive order from the SEC permitting it, among other things, to pay an affiliated securities lending agent a fee based on a share of the income derived from the securities lending activities and has retained BIM as the securities lending agent. BIM may, on behalf of the Master LLC, invest cash collateral received by the Master LLC for such loans, among other things, in a private investment company managed by the Manager or in registered money market funds advised by the Manager or its affiliates. As securities lending agent, BIM is responsible for all transaction fees and all other operational costs relating to securities lending activities, other than extraordinary expenses. BIM does not receive any fees for managing the cash collateral. The market value of securities on loan and the value of the related collateral, if applicable, are shown in the Statement of Assets and Liabilities as securities loaned at value and collateral on securities loaned at value, respectively. The cash collateral invested by BIM is disclosed in the Schedule of Investments, if any. Securities lending income is equal to the total of income earned from the reinvestment of cash collateral, net of rebates paid to, or fees paid by, borrowers of securities. The Master LLC retains 65% of securities lending income and pays a fee to BIM equal to 35% of such income. The share of income earned by the Master LLC on the reinvestment of cash collateral is shown as securities lending — affiliated in the Statement of Operations. For the year ended March 31, 2012, BIM received $413,856 in securities lending agent fees related to securities lending activities for the Master LLC.
Certain officers and/or directors of the Master LLC are officers and/or directors of BlackRock or its affiliates.
3. Investments:
Purchases and sales of investments, excluding short-term securities for the year ended March 31, 2012, were $466,666,969 and $738,590,955, respectively.
4. Borrowings:
The Master LLC, along with certain other funds managed by the Manager and its affiliates, is a party to a $500 million credit agreement with a group of lenders. The Master LLC may borrow under the credit agreement to fund shareholder redemptions. Effective November 2010 to November 2011, the credit agreement had the following terms: a commitment fee of 0.08% per annum based on the Master LLC’s pro rata share of the unused portion of the credit agreement and interest at a rate equal to the higher of (a) the one-month LIBOR plus 1.00% per annum or (b) the Fed Funds rate plus 1.00% per annum on amounts borrowed. In addition, the Master LLC paid administration and arrangement fees which were allocated to the Master LLC based on its net assets as of October 31, 2010. The credit agreement, which expired in November 2011, was renewed until November 2012. Effective November 2011 to November 2012, the credit agreement has the following terms: a commitment fee of 0.065% per annum based on the Master LLC’s pro rata share of the unused portion of the credit agreement and interest at a rate equal to the higher of (a) the one-month LIBOR plus 0.80% per annum or (b) the Fed Funds rate plus 0.80% per annum on amounts borrowed. In addition, the Master LLC paid administration and arrangement fees which were allocated to the Master LLC based on its net assets as of October 31, 2011. The Master LLC did not borrow under the credit agreement during the year ended March 31, 2012.
5. Concentration, Market and Credit Risk:
In the normal course of business, the Master LLC invests in securities and enters into transactions where risks exist due to fluctuations in the market (market risk) or failure of the issuer of a security to meet all its obligations (issuer credit risk). The value of securities held by the Master LLC may decline in response to certain events, including those directly involving the issuers whose securities are owned by the Master LLC; conditions affecting the general economy; overall market changes; local, regional or global political, social or economic instability; and currency and interest rate and price fluctuations. Similar to issuer credit risk, the Master LLC may be exposed to counterparty credit risk, or the risk that an entity with which the Master LLC has unsettled or open transactions may fail to or be unable to perform on its commitments. The Master LLC manages counterparty credit risk by entering into transactions only with counterparties that it believes have the financial resources to honor their obligations and by monitoring the financial stability of those counterparties. Financial assets, which potentially expose the Master LLC to market, issuer and counterparty credit risks, consist principally of financial instruments and receivables due from counterparties. The extent of the Master LLC’s exposure to market, issuer and counterparty credit risks with respect to these financial assets is generally approximated by their value recorded in the Master LLC’s Statement of Assets and Liabilities, less any collateral held by the Master LLC.
As of March 31, 2012, the Master LLC invested a significant portion of its assets in securities in the financials sector. Changes in economic conditions affecting the financials sector would have a greater impact on the Master LLC and could affect the value, income and/or liquidity of positions in such securities.
6. Subsequent Events:
Management has evaluated the impact of all subsequent events on the Master LLC through the date the financial statements were issued and has determined that there were no subsequent events requiring adjustment or additional disclosure in the financial statements.
|
|
|
|
|
|
|
|
| BLACKROCK VALUE OPPORTUNITIES FUND, INC. | MARCH 31, 2012 | 27 |
| |
|
|
Master Value Opportunities LLC | |
To the Investor and Board of Directors of Master Value Opportunities LLC:
We have audited the accompanying statement of assets and liabilities of Master Value Opportunities LLC (the “Master LLC”), including the schedule of investments, as of March 31, 2012, and the related statement of operations for the year then ended, the statements of changes in net assets for each of the two years in the period then ended, and the financial highlights for each of the five years in the period then ended. These financial statements and financial highlights are the responsibility of the Master LLC’s management. Our responsibility is to express an opinion on these financial statements and financial highlights based on our audits.
We conducted our audits in accordance with the standards of the Public Company Accounting Oversight Board (United States). Those standards require that we plan and perform the audit to obtain reasonable assurance about whether the financial statements and financial highlights are free from material misstatement. The Master LLC is not required to have, nor were we engaged to perform, an audit of its internal control over financial reporting. Our audits included consideration of internal control over financial reporting as a basis for designing audit procedures that are appropriate in the circumstances, but not for the purpose of expressing an opinion on the effectiveness of the Master LLC’s internal control over financial reporting. Accordingly, we express no such opinion. An audit also includes examining, on a test basis, evidence supporting the amounts and disclosures in the financial statements, assessing the accounting principles used and significant estimates made by management, as well as evaluating the overall financial statement presentation. Our procedures included confirmation of securities owned as of March 31, 2012, by correspondence with the custodian and brokers; where replies were not received from brokers, we performed other auditing procedures. We believe that our audits provide a reasonable basis for our opinion.
In our opinion, the financial statements and financial highlights referred to above present fairly, in all material respects, the financial position of Master Value Opportunities LLC as of March 31, 2012, the results of its operations for the year then ended, the changes in its net assets for each of the two years in the period then ended, and the financial highlights for each of the five years in the period then ended, in conformity with accounting principles generally accepted in the United States of America.
Deloitte & Touche LLP
Boston, Massachusetts
May 24, 2012
|
|
|
|
|
|
28 | BLACKROCK VALUE OPPORTUNITIES FUND, INC. | MARCH 31, 2012 |
|
|
|
|
|
|
|
|
|
|
|
|
|
Name, Address |
| Position(s) |
| Length |
| Principal Occupation(s) During Past Five Years |
| Number of BlackRock- |
| Public |
Independent Directors1 | ||||||||||
Robert M. Hernandez |
| Chairman of |
| Since |
| Director, Vice Chairman and Chief Financial Officer of USX Corporation (energy and steel business) from 1991 to 2001; Director, TE Connectivity (electronics) from 2006 to 2012. |
| 29 RICs consisting of |
| ACE Limited (insurance company); Eastman Chemical Company (chemicals); RTI International Metals, Inc. (metals) |
Fred G. Weiss |
| Vice Chairman |
| Since |
| Managing Director, FGW Associates (consulting and investment company) since 1997; Director and Treasurer, Michael J. Fox Foundation for Parkinson’s Research since 2000; Director, BTG International Plc (medical technology commercialization company) from 2001 to 2007. |
| 29 RICs consisting of |
| Watson Pharmaceuticals, Inc. |
James H. Bodurtha |
| Director |
| Since |
| Director, The China Business Group, Inc. (consulting firm) since 1996 and Executive Vice President thereof from 1996 to 2003; Chairman of the Board, Berkshire Holding Corporation since 1980. |
| 29 RICs consisting of |
| None |
Bruce R. Bond |
| Director |
| Since |
| Trustee and Member of the Governance Committee, State Street Research Mutual Funds from 1997 to 2005; Board Member of Governance, Audit and Finance Committee, Avaya Inc. (computer equipment) from 2003 to 2007. |
| 29 RICs consisting of |
| None |
Donald W. Burton |
| Director |
| Since |
| Managing General Partner, The Burton Partnership, LP (an investment partnership) since 1979; Managing General Partner, The South Atlantic Venture Funds since 1983; Director, Lifestyle Family Fitness (fitness industry) since 2006; Director, IDology, Inc. (technology solutions) since 2006; Member of the Investment Advisory Council of the Florida State Board of Administration from 2001 to 2007. |
| 29 RICs consisting of |
| Knology, Inc. (telecommunications); Capital Southwest (financial) |
Honorable |
| Director |
| Since |
| Partner and Head of International Practice, Covington and Burling LLP (law firm) since 2001; International Advisory Board Member, The Coca-Cola Company from 2002 to 2011; Advisory Board Member, Veracity Worldwide, LLC (risk management) since 2007; Member of the International Advisory Board GML (energy) since 2003; Advisory Board Member, BT Americas (telecommunications) from 2004 to 2010. |
| 29 RICs consisting of |
| Alcatel-Lucent (telecommunications); Global Specialty Metallurgical (metallurgical industry); UPS Corporation (delivery service) |
Kenneth A. Froot |
| Director |
| Since |
| Professor, Harvard University since 1992. |
| 29 RICs consisting of |
| None |
|
|
|
|
|
|
|
|
|
|
|
|
| BLACKROCK VALUE OPPORTUNITIES FUND, INC. | MARCH 31, 2012 | 29 |
|
|
Officers and Directors (continued) |
|
|
|
|
|
|
|
|
|
|
|
|
Name, Address |
| Position(s) |
| Length |
| Principal Occupation(s) During Past Five Years |
| Number of BlackRock- |
| Public | |
Independent Directors1 (concluded) | |||||||||||
John F. O’Brien |
| Director |
| Since |
| Chairman and Director, Woods Hole Oceanographic Institute since 2009 and Trustee thereof from 2003 to 2009; Director, Ameresco, Inc. (energy solutions company) from 2006 to 2007. |
| 29 RICs consisting of |
| Cabot Corporation (chemicals); LKQ Corporation (auto parts manufacturing); TJX Companies, Inc. (retailer) | |
Roberta Cooper Ramo |
| Director |
| Since |
| Shareholder, Modrall, Sperling, Roehl, Harris & Sisk, P.A. (law firm) since 1993; Chairman of the Board, Cooper’s Inc. (retail) since 2000; Director, ECMC Group (service provider to students, schools and lenders) since 2001; President, The American Law Institute (non-profit) since 2008; President, American Bar Association from 1995 to 1996. |
| 29 RICs consisting of |
| None | |
David H. Walsh |
| Director |
| Since |
| Director, National Museum of Wildlife Art since 2007; Trustee, University of Wyoming Foundation since 2008; Director, Ruckelshaus Institute and Haub School of Natural Resources at the University of Wyoming from 2006 to 2008; Director, The American Museum of Fly Fishing since 1997; Director, The National Audubon Society from 1998 to 2005. |
| 29 RICs consisting of |
| None | |
|
| 1 | Directors serve until their resignation, removal or death, or until December 31 of the year in which they turn 72. | ||||||||
|
|
|
|
|
|
|
|
|
|
|
|
|
| 2 | Date shown is the earliest date a person has served for the Fund/Master LLC covered by this annual report. Following the combination of Merrill Lynch Investment Managers, L.P. (“MLIM”) and BlackRock, Inc. (“BlackRock”) in September 2006, the various legacy MLIM and legacy BlackRock Fund boards were realigned and consolidated into three new Fund boards in 2007. As a result, although the chart shows certain Directors as joining the Fund’s/Master LLC’s board in 2007, each Director first became a member of the board of other legacy MLIM or legacy BlackRock Funds as follows: James H. Bodurtha since 1995; Bruce R. Bond since 2005; Donald W. Burton since 2002; Stuart E. Eizenstat since 2001; Kenneth A. Froot since 2005; Robert M. Hernandez since 1996; John F. O’Brien since 2004; Roberta Cooper Ramo since 2000; David H. Walsh since 2003; and Fred G. Weiss since 1998. | ||||||||
|
|
|
|
|
|
|
|
|
|
|
|
30 |
| BLACKROCK VALUE OPPORTUNITIES FUND, INC. | MARCH 31, 2012 |
|
|
Officers and Directors (continued) |
|
|
|
|
|
|
|
|
|
|
|
|
Name, Address |
| Position(s) |
| Length |
| Principal Occupation(s) During Past Five Years |
| Number of BlackRock- |
| Public | |
Interested Directors1 | |||||||||||
Paul L. Audet |
| Director |
| Since |
| Senior Managing Director of BlackRock and Head of US Mutual Funds since 2011; Chair of the US Mutual Funds Committee reporting to the Global Executive Committee since 2011; Head of BlackRock’s Real Estate business from 2008 to 2011; Member of BlackRock’s Global Operating and Corporate Risk Management Committees and of the BlackRock Alternative Investors Executive Committee and Investment Committee for the Private Equity Fund of Funds business since 2008; Head of BlackRock’s Global Cash Management business from 2005 to 2010; Acting Chief Financial Officer of BlackRock from 2007 to 2008; Chief Financial Officer of BlackRock from 1998 to 2005. |
| 157 RICs consisting of |
| None | |
Laurence D. Fink |
| Director |
| Since |
| Chairman and Chief Executive Officer of BlackRock since its formation in 1998 and of BlackRock��s predecessor entities since 1988 and Chairman of the Executive and Management Committees; Formerly Managing Director, The First Boston Corporation, Member of its Management Committee, Co-head of its Taxable Fixed Income Division and Head of its Mortgage and Real Estate Products Group; Chairman of the Board of several of BlackRock’s alternative investment vehicles; Director of several of BlackRock’s offshore funds; Member of the Board of Trustees of New York University, Chair of the Financial Affairs Committee and a member of the Executive Committee, the Ad Hoc Committee on Board Governance, and the Committee on Trustees; Co-Chairman of the NYU Hospitals Center Board of Trustees, Chairman of the Development/Trustee Stewardship Committee and Chairman of the Finance Committee; Trustee, The Boys’ Club of New York. |
| 29 RICs consisting of |
| BlackRock | |
Henry Gabbay |
| Director |
| Since |
| Consultant, BlackRock from 2007 to 2008; Managing Director, BlackRock from 1989 to 2007; Chief Administrative Officer, BlackRock Advisors, LLC from 1998 to 2007; President of BlackRock Funds and BlackRock Bond Allocation Target Shares from 2005 to 2007 and Treasurer of certain closed-end funds in the BlackRock fund complex from 1989 to 2006. |
| 157 RICs consisting of |
| None | |
|
| 1 | Messrs. Audet and Fink are both “interested persons,” as defined in the 1940 Act, of the Fund/Master LLC based on their positions with BlackRock and its affiliates. Mr. Gabbay is an “interested person” of the Fund/Master LLC based on his former positions with BlackRock and its affiliates as well as his ownership of BlackRock and The PNC Financial Services Group, Inc. securities. Mr. Audet and Mr. Gabbay are also Directors of the BlackRock registered closed-end funds and Directors of other BlackRock registered open-end funds. Directors serve until their resignation, removal or death, or until December 31 of the year in which they turn 72. | ||||||||
|
|
|
|
|
|
|
|
|
|
|
|
| BLACKROCK VALUE OPPORTUNITIES FUND, INC. | MARCH 31, 2012 | 31 |
|
|
Officers and Directors (concluded) |
|
|
|
|
|
|
| |
Name, Address |
| Position(s) |
| Length |
| Principal Occupation(s) During Past Five Years | |
Officers1 | |||||||
John M. Perlowski |
| President and |
| Since |
| Managing Director of BlackRock since 2009; Global Head of BlackRock Fund Administration since 2009; Managing Director and Chief Operating Officer of the Global Product Group at Goldman Sachs Asset Management, L.P. from 2003 to 2009; Treasurer of Goldman Sachs Mutual Funds from 2003 to 2009 and Senior Vice President thereof from 2007 to 2009; Director of Goldman Sachs Offshore Funds from 2002 to 2009; Director of Family Resource Network (charitable foundation) since 2009. | |
Brendan Kyne |
| Vice |
| Since |
| Managing Director of BlackRock since 2010; Director of BlackRock from 2008 to 2009; Head of Product Development and Management for BlackRock’s U.S. Retail Group since 2009 and Co-head thereof from 2007 to 2009; Vice President of BlackRock from 2005 to 2008. | |
Neal Andrews |
| Chief |
| Since |
| Managing Director of BlackRock since 2006; Senior Vice President and Line of Business Head of Fund Accounting and Administration at PNC Global Investment Servicing (U.S.) Inc. from 1992 to 2006. | |
Jay Fife |
| Treasurer |
| Since |
| Managing Director of BlackRock since 2007; Director of BlackRock in 2006; Assistant Treasurer of the MLIM and Fund Asset Management, L.P. advised Funds from 2005 to 2006; Director of MLIM Fund Services Group from 2001 to 2006. | |
Brian Kindelan |
| Chief Compliance |
| Since |
| Chief Compliance Officer of the BlackRock-advised Funds since 2007; Managing Director and Senior Counsel of BlackRock since 2005. | |
Ira P. Shapiro |
| Secretary |
| Since |
| Managing Director of BlackRock since 2009; Managing Director and Associate General Counsel of Barclays Global Investors from 2008 to 2009 and Principal thereof from 2004 to 2008. | |
|
| 1 Officers of the Fund/Master LLC serve at the pleasure of the Board. | |||||
|
| Further information about the Officers and Directors is available in the Fund’s/Master LLC’s Statement of Additional Information, which can be obtained without charge by calling (800) 441-7762. | |||||
|
Investment Advisor |
BlackRock Advisors, LLC |
Wilmington, DE 19809 |
|
Sub-Advisor |
BlackRock Investment |
Management, LLC |
Princeton, NJ 08540 |
|
Custodian |
The Bank of New York Mellon |
New York, NY 10286 |
|
Transfer Agent |
BNY Mellon Investment |
Servicing (US) Inc. |
Wilmington, DE 19809 |
|
Accounting Agent |
State Street Bank and |
Trust Company |
Boston, MA 02110 |
|
Distributor |
BlackRock Investments, LLC |
New York, NY 10022 |
|
Independent Registered Public Accounting Firm |
Deloitte & Touche LLP |
Boston, MA 02116 |
|
Legal Counsel |
Willkie Farr & Gallagher LLP |
New York, NY 10019 |
|
Address of the Fund |
100 Bellevue Parkway |
Wilmington, DE 19809 |
|
|
|
|
|
|
|
|
|
|
|
|
32 |
| BLACKROCK VALUE OPPORTUNITIES FUND, INC. | MARCH 31, 2012 |
|
|
|
General Information |
Electronic Delivery
Electronic copies of most financial reports and prospectuses are available on the Fund’s website or shareholders can sign up for e-mail notifications of quarterly statements, annual and semi-annual reports and prospectuses by enrolling in the Fund’s electronic delivery program.
To enroll:
Shareholders Who Hold Accounts with Investment Advisors, Banks or Brokerages:
Please contact your financial advisor. Please note that not all investment advisors, banks or brokerages may offer this service.
Shareholders Who Hold Accounts Directly with BlackRock:
|
|
1) | Access the BlackRock website at http://www.blackrock.com/edelivery |
| |
2) | Select “eDelivery” under the “More Information” section |
| |
3) | Log into your account |
Householding
The Fund will mail only one copy of shareholder documents, including prospectuses, annual and semi-annual reports and proxy statements, to shareholders with multiple accounts at the same address. This practice is commonly called “householding” and is intended to reduce expenses and eliminate duplicate mailings of shareholder documents. Mailings of your shareholder documents may be householded indefinitely unless you instruct us otherwise. If you do not want the mailing of these documents to be combined with those for other members of your household, please call the Fund at (800) 441-7762.
Availability of Quarterly Schedule of Investments
The Fund/Master LLC file their complete schedule of portfolio holdings with the SEC for the first and third quarters of each fiscal year on Form N-Q. The Fund’s/Master LLC’s Forms N-Q are available on the SEC’s website at http://www.sec.gov and may also be reviewed and copied at the SEC’s Public Reference Room in Washington, D.C. Information on how to access documents on the SEC’s website without charge may be obtained by calling (800) SEC-0330. The Fund’s/Master LLC’s Forms N-Q may also be obtained upon request and without charge by calling (800) 441-7762.
Availability of Proxy Voting Policies and Procedures
A description of the policies and procedures that the Fund/Master LLC use to determine how to vote proxies relating to portfolio securities is available (1) without charge, upon request, by calling (800) 441-7762; (2) at http://www.blackrock.com; and (3) on the SEC’s website at http://www.sec.gov.
Availability of Proxy Voting Record
Information about how the Fund/Master LLC voted proxies relating to securities held in the Fund’s/Master LLC’s portfolio during the most recent 12-month period ended June 30 is available upon request and without charge (1) at http://www.blackrock.com or by calling (800) 441-7762 and (2) on the SEC’s website at http://www.sec.gov.
|
Shareholder Privileges |
Account Information
Call us at (800) 441-7762 from 8:00 AM to 6:00 PM EST on any business day to get information about your account balances, recent transactions and share prices. You can also reach us on the Web at http://www.blackrock.com/funds.
Automatic Investment Plans
Investor Class shareholders who want to invest regularly can arrange to have $50 or more automatically deducted from their checking or savings account and invested in any of the BlackRock funds.
Systematic Withdrawal Plans
Investor Class shareholders can establish a systematic withdrawal plan and receive periodic payments of $50 or more from their BlackRock funds, as long as their account balance is at least $10,000.
Retirement Plans
Shareholders may make investments in conjunction with Traditional, Rollover, Roth, Coverdell, Simple IRAs, SEP IRAs and 403(b) Plans.
|
|
|
|
|
|
|
|
|
|
|
|
| BLACKROCK VALUE OPPORTUNITIES FUND, INC. | MARCH 31, 2012 | 33 |
|
|
Additional Information (concluded) |
|
BlackRock Privacy Principles |
BlackRock is committed to maintaining the privacy of its current and former fund investors and individual clients (collectively, “Clients”) and to safeguarding their non-public personal information. The following information is provided to help you understand what personal information BlackRock collects, how we protect that information and why in certain cases we share such information with select parties.
If you are located in a jurisdiction where specific laws, rules or regulations require BlackRock to provide you with additional or different privacy-related rights beyond what is set forth below, then BlackRock will comply with those specific laws, rules or regulations.
BlackRock obtains or verifies personal non-public information from and about you from different sources, including the following: (i) information we receive from you or, if applicable, your financial intermediary, on applications, forms or other documents; (ii) information about your transactions with us, our affiliates, or others; (iii) information we receive from a consumer reporting agency; and (iv) from visits to our websites.
BlackRock does not sell or disclose to non-affiliated third parties any non-public personal information about its Clients, except as permitted by law or as is necessary to respond to regulatory requests or to service Client accounts. These non-affiliated third parties are required to protect the confidentiality and security of this information and to use it only for its intended purpose.
We may share information with our affiliates to service your account or to provide you with information about other BlackRock products or services that may be of interest to you. In addition, BlackRock restricts access to non-public personal information about its Clients to those BlackRock employees with a legitimate business need for the information. BlackRock maintains physical, electronic and procedural safeguards that are designed to protect the non-public personal information of its Clients, including procedures relating to the proper storage and disposal of such information.
|
|
|
|
|
|
|
|
|
|
|
|
34 |
| BLACKROCK VALUE OPPORTUNITIES FUND, INC. | MARCH 31, 2012 |
|
|
BlackRock offers a diverse lineup of open-end mutual funds crossing all investment styles and managed by experts in equity, fixed income and tax-exempt investing.
|
|
Equity Funds |
|
BlackRock ACWI ex-US Index Fund |
BlackRock All-Cap Energy & Resources Portfolio |
BlackRock Balanced Capital Fund† |
BlackRock Basic Value Fund |
BlackRock Capital Appreciation Fund |
BlackRock China Fund |
BlackRock Commodity Strategies Fund |
BlackRock Emerging Markets Fund |
BlackRock Emerging Markets Long/Short Equity Fund |
BlackRock Energy & Resources Portfolio |
BlackRock Equity Dividend Fund |
BlackRock EuroFund |
BlackRock Focus Growth Fund |
BlackRock Global Allocation Fund† |
BlackRock Global Dividend Income Portfolio |
BlackRock Global Dynamic Equity Fund |
BlackRock Global Opportunities Portfolio |
BlackRock Global SmallCap Fund |
BlackRock Health Sciences Opportunities Portfolio |
BlackRock Index Equity Portfolio |
BlackRock India Fund |
BlackRock International Fund |
BlackRock International Index Fund |
BlackRock International Opportunities Portfolio |
BlackRock Large Cap Core Fund |
BlackRock Large Cap Core Plus Fund |
BlackRock Large Cap Growth Fund |
BlackRock Large Cap Value Fund |
BlackRock Latin America Fund |
BlackRock Managed Volatility Portfolio† |
BlackRock Mid-Cap Growth Equity Portfolio |
BlackRock Mid-Cap Value Equity Portfolio |
BlackRock Mid Cap Value Opportunities Fund |
BlackRock Natural Resources Trust |
BlackRock Pacific Fund |
BlackRock Russell 1000 Index Fund |
BlackRock Science & Technology Opportunities Portfolio |
BlackRock Small Cap Growth Equity Portfolio |
BlackRock Small Cap Growth Fund II |
BlackRock Small Cap Index Fund |
BlackRock S&P 500 Index Fund |
BlackRock S&P 500 Stock Fund |
BlackRock U.S. Opportunities Portfolio |
BlackRock Value Opportunities Fund |
BlackRock World Gold Fund |
|
Fixed Income Funds |
BlackRock Bond Index Fund |
BlackRock Core Bond Portfolio |
BlackRock CoreAlpha Bond Fund |
BlackRock Emerging Market Debt Portfolio |
BlackRock Floating Rate Income Portfolio |
BlackRock Global Long/Short Credit Fund |
BlackRock GNMA Portfolio |
BlackRock High Yield Bond Portfolio |
BlackRock Inflation Protected Bond Portfolio |
BlackRock International Bond Portfolio |
BlackRock Long Duration Bond Portfolio |
BlackRock Low Duration Bond Portfolio |
BlackRock Multi-Asset Income Portfolio† |
BlackRock Multi-Sector Bond Portfolio |
BlackRock Strategic Income Opportunities Portfolio |
BlackRock Total Return Fund |
BlackRock US Government Bond Portfolio |
BlackRock US Mortgage Portfolio |
BlackRock World Income Fund |
|
Municipal Bond Funds |
BlackRock California Municipal Bond Fund |
BlackRock High Yield Municipal Fund |
BlackRock Intermediate Municipal Fund |
BlackRock National Municipal Fund |
BlackRock New Jersey Municipal Bond Fund |
BlackRock New York Municipal Bond Fund |
BlackRock Pennsylvania Municipal Bond Fund |
BlackRock Short-Term Municipal Fund |
|
Target Risk & Target Date Funds† |
|
BlackRock Prepared Portfolios |
Conservative Prepared Portfolio |
Moderate Prepared Portfolio |
Growth Prepared Portfolio |
Aggressive Growth Prepared Portfolio |
| |
BlackRock Lifecycle Prepared Portfolios | |
2015 | |
2020 | |
2025 | |
2030 | |
2035 | |
2040 | |
2045 | |
2050 | |
| |
LifePath Portfolios | |
Retirement | |
2020 | |
2025 | |
2030 | |
2035 | |
2040 | |
2045 | |
2050 | |
2055 | |
| |
LifePath Index Portfolios | |
Retirement | |
2020 | |
2025 | |
2030 | |
2035 | |
2040 | |
2045 | |
2050 | |
2055 | |
† Mixed asset fund.
BlackRock mutual funds are currently distributed by BlackRock Investments, LLC. You should consider the investment objectives, risks, charges and expenses of the funds under consideration carefully before investing. Each fund’s prospectus contains this and other information and is available at www.blackrock.com or by calling (800) 441-7762 or from your financial advisor. The prospectus should be read carefully before investing.
|
|
|
|
|
|
|
|
|
|
|
|
| BLACKROCK VALUE OPPORTUNITIES FUND, INC. | MARCH 31, 2012 | 35 |
This report is not authorized for use as an offer of sale or a solicitation of an offer to buy shares of the Fund unless accompanied or preceded by the Fund’s current prospectus. Past performance results shown in this report should not be considered a representation of future performance. Investment returns and principal value of shares will fluctuate so that shares, when redeemed, may be worth more or less than their original cost. Statements and other information herein are as dated and are subject to change.
|
|
|
|

|
|
#10253-3/12-AR |
|

Item 2 – | Code of Ethics – Each registrant (or “Fund”) has adopted a code of ethics, as of the end of the period covered by this report, applicable to the registrant’s principal executive officer, principal financial officer, principal accounting officer or controller, or persons performing similar functions. During the period covered by this report, there have been no amendments to or waivers granted under the code of ethics. A copy of the code of ethics is available without charge at www.blackrock.com. |
|
|
Item 3 – | Audit Committee Financial Expert – Each registrant’s board of trustees (the “board of trustees”), has determined that (i) the registrant has the following audit committee financial experts serving on its audit committee and (ii) each audit committee financial expert is independent: |
| Robert M. Hernandez |
| Fred G. Weiss |
| Stuart E. Eizenstat |
|
|
| Under applicable securities laws, a person determined to be an audit committee financial expert will not be deemed an “expert” for any purpose, including without limitation for the purposes of Section 11 of the Securities Act of 1933, as a result of being designated or identified as an audit committee financial expert. The designation or identification of a person as an audit committee financial expert does not impose on such person any duties, obligations, or liabilities greater than the duties, obligations, and liabilities imposed on such person as a member of the audit committee and board of directors in the absence of such designation or identification. |
|
|
Item 4 – | Principal Accountant Fees and Services |
|
|
| The following table presents fees billed by Deloitte & Touche LLP (“D&T”) in each of the last two fiscal years for the services rendered to the Funds: |
| (a) Audit Fees | (b) Audit-Related Fees1 | (c) Tax Fees2 | (d) All Other Fees3 | ||||
Entity Name | Current | Previous | Current | Previous | Current | Previous | Current | Previous |
BlackRock Value Opportunities Fund, Inc. | $7,100 | $7,000 | $0 | $0 | $12,350 | $12,350 | $0 | $0 |
Master Value Opportunities LLC | $36,500 | $32,500 | $0 | $0 | $13,000 | $0 | $0 | $0 |
| The following table presents fees billed by D&T that were required to be approved by each registrant’s audit committee (each a “Committee”) for services that relate directly to the operations or financial reporting of the Fund and that are rendered on behalf of BlackRock Advisors, LLC (“Investment Adviser” or “BlackRock”) and entities controlling, controlled by, or under common control with BlackRock (not including any sub-adviser whose role is primarily portfolio management and is subcontracted with or overseen by another investment adviser) that provide ongoing services to the Fund (“Fund Service Providers”): |
| Current Fiscal Year End | Previous Fiscal Year End |
(b) Audit-Related Fees1 | $0 | $0 |
(c) Tax Fees2 | $0 | $0 |
(d) All Other Fees3 | $2,970,000 | $3,030,000 |
1 The nature of the services includes assurance and related services reasonably related to the performance of the audit of financial statements not included in Audit Fees.
2 The nature of the services includes tax compliance, tax advice and tax planning.
3 Aggregate fees borne by BlackRock in connection with the review of compliance procedures and attestation thereto performed by D&T with respect to all of the registered closed-end funds and some of the registered open-end funds advised by BlackRock.
| (e)(1) Audit Committee Pre-Approval Policies and Procedures: |
|
|
| Each Committee has adopted policies and procedures with regard to the pre-approval of services. Audit, audit-related and tax compliance services provided to the registrants on an annual basis require specific pre-approval by the registrant’s Committee. The Committee also must approve other non-audit services provided to the registrant and those non-audit services provided to the Investment Adviser and Fund Service Providers that relate directly to the operations and the financial reporting of the registrant. Certain of these non-audit services that the Committee believes are (a) consistent with the SEC’s auditor independence rules and (b) routine and recurring services that will not impair the independence of the independent accountants may be approved by the Committee without consideration on a specific case-by-case basis (“general pre-approval”). The term of any general pre-approval is 12 months from the date of the pre-approval, unless the Committee provides for a different period. Tax or other non-audit services provided to a registrant which have a direct impact on the operations or financial reporting of the registrant will only be deemed pre-approved provided that any individual project does not exceed $10,000 attributable to the registrant or $50,000 per project. For this purpose, multiple projects will be aggregated to determine if they exceed the previously mentioned cost levels. |
|
|
| Any proposed services exceeding the pre-approved cost levels will require specific pre-approval by the registrant’s Committee, as will any other services not subject to general pre-approval (e.g., unanticipated but permissible services). The Committee is informed of each service approved subject to general pre-approval at the next regularly scheduled in-person board meeting. At this meeting, an analysis of such services is presented to the Committee for ratification. The Committee may delegate to the Committee Chairman the authority to approve the provision of and fees for any specific engagement of permitted non-audit services, including services exceeding pre-approved cost levels. |
|
|
| (e)(2) None of the services described in each of Items 4(b) through (d) were approved by either Committee pursuant to the de minimus exception in paragraph (c)(7)(i)(C) of Rule 2-01 of Regulation S-X. |
|
|
| (f) Not Applicable |
|
|
| (g) The aggregate non-audit fees paid to the accountant for services rendered by the accountant to the registrants, the Investment Adviser and the Fund Service Providers were: |
Entity Name | Current Fiscal Year End | Previous Fiscal Year End |
BlackRock Value Opportunities Fund, Inc. | $12,350 | $12,350 |
Master Value Opportunities LLC | $13,000 | $0 |
| Additionally, SSAE 16 Review (Formerly, SAS No. 70) fees for the current and previous fiscal years of $2,970,000 and $3,030,000, respectively, were billed by D&T to the Investment Adviser. |
|
|
| (h) Each Committee has considered and determined that the provision of non-audit services that were rendered to the Investment Adviser, and the Fund Service Providers that were not pre-approved pursuant to paragraph (c)(7)(ii) of Rule 2-01 of Regulation S-X is compatible with maintaining the principal accountant’s independence. |
|
|
Item 5 – | Audit Committee of Listed Registrants – Not Applicable |
Item 6 – | Investments |
| (a) The registrants’ Schedules of Investments are included as part of the Report to Stockholders filed under Item 1 of this Form. |
| (b) Not Applicable due to no such divestments during the semi-annual period covered since the previous Form N-CSR filing. |
Item 7 – | Disclosure of Proxy Voting Policies and Procedures for Closed-End Management Investment Companies – Not Applicable |
|
|
Item 8 – | Portfolio Managers of Closed-End Management Investment Companies – Not Applicable |
|
|
Item 9 – | Purchases of Equity Securities by Closed-End Management Investment Company and Affiliated Purchasers – Not Applicable |
|
|
Item 10 – | Submission of Matters to a Vote of Security Holders – There have been no material changes to these procedures. |
|
|
Item 11 – | Controls and Procedures |
|
|
11(a) – | The registrant’s principal executive and principal financial officers, or persons performing similar functions, have concluded that the registrant’s disclosure controls and procedures (as defined in Rule 30a-3(c) under the Investment Company Act of 1940, as amended (the “1940 Act”)) are effective as of a date within 90 days of the filing of this report based on the evaluation of these controls and procedures required by Rule 30a-3(b) under the 1940 Act and Rule 15d-15(b) under the Securities Exchange Act of 1934, as amended. |
|
|
11(b) – | There were no changes in the registrant’s internal control over financial reporting (as defined in Rule 30a-3(d) under the 1940 Act) that occurred during the second fiscal quarter of the period covered by this report that have materially affected, or are reasonably likely to materially affect, the registrants’s internal control over financial reporting. |
|
|
Item 12 – | Exhibits attached hereto |
|
|
12(a)(1) – | Code of Ethics – See Item 2 |
|
|
12(a)(2) – | Certifications – Attached hereto |
|
|
12(a)(3) – | Not Applicable |
|
|
12(b) – | Certifications – Attached hereto |
| Pursuant to the requirements of the Securities Exchange Act of 1934 and the Investment Company Act of 1940, each registrant has duly caused this report to be signed on its behalf by the undersigned, thereunto duly authorized. | ||
|
| ||
| BlackRock Value Opportunities Fund, Inc. and Master Value Opportunities LLC | ||
|
| ||
| By: | /s/ John M. Perlowski |
|
|
| John M. Perlowski | |
|
| Chief Executive Officer (principal executive officer) of | |
|
| BlackRock Value Opportunities Fund, Inc. and Master Value Opportunities LLC | |
|
| ||
| Date: June 4, 2012 | ||
|
| ||
| Pursuant to the requirements of the Securities Exchange Act of 1934 and the Investment Company Act of 1940, this report has been signed below by the following persons on behalf of each registrant and in the capacities and on the dates indicated. | ||
|
| ||
| By: | /s/ John M. Perlowski |
|
|
| John M. Perlowski | |
|
| Chief Executive Officer (principal executive officer) of | |
|
| BlackRock Value Opportunities Fund, Inc. and Master Value Opportunities LLC | |
|
| ||
| Date: June 4, 2012 | ||
|
| ||
| By: | /s/ Neal J. Andrews |
|
|
| Neal J. Andrews | |
|
| Chief Financial Officer (principal financial officer) of | |
|
| BlackRock Value Opportunities Fund, Inc. and Master Value Opportunities LLC | |
|
|
| |
| Date: June 4, 2012 | ||