UNITED STATES
SECURITIES AND EXCHANGE COMMISSION
Washington, D.C. 20549
FORM N-CSR
CERTIFIED SHAREHOLDER REPORT OF REGISTERED
MANAGEMENT INVESTMENT COMPANIES
Investment Company Act file number 811-02841
Fidelity Capital Trust
(Exact name of registrant as specified in charter)
245 Summer St., Boston, Massachusetts 02210
(Address of principal executive offices) (Zip code)
Cynthia Lo Bessette, Secretary
245 Summer St.
Boston, Massachusetts 02210
(Name and address of agent for service)
Registrant's telephone number, including area code:
617-563-7000
Date of fiscal year end: | October 31 |
Date of reporting period: | October 31, 2022 |
Item 1.
Reports to Stockholders


Contents
Board Approval of Investment Advisory Contracts and Management Fees |
| Average Annual Total Returns | |||
Periods ended October 31, 2022 | Past 1 year | Past 5 years | Past 10 years |
| Class A (incl.5.75% sales charge) | -21.71% | 7.36% | 9.96% |
| Class M (incl.3.50% sales charge) | -20.09% | 7.54% | 9.87% |
Class C (incl. contingent deferred sales charge) | -18.34% | 7.77% | 9.90% |
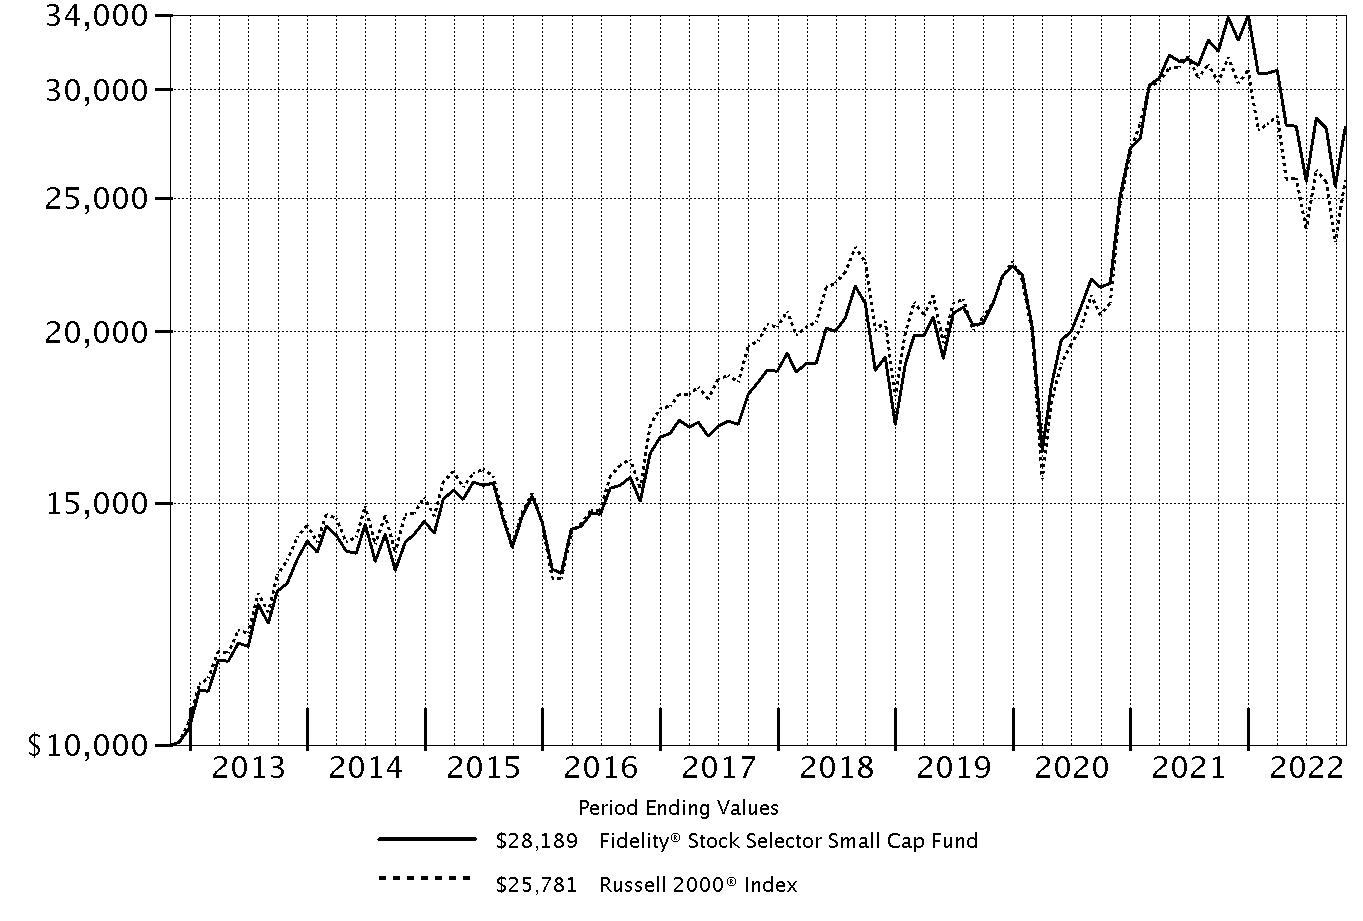
| Fidelity® Stock Selector Small Cap Fund | -16.73% | 8.95% | 10.92% |
| Class I | -16.72% | 8.94% | 10.92% |
| Class Z | -16.62% | 9.09% | 11.01% |
| $10,000 Over 10 Years |
Let's say hypothetically that $10,000 was invested in Fidelity® Stock Selector Small Cap Fund, a class of the fund, on October 31, 2012. The chart shows how the value of your investment would have changed, and also shows how the Russell 2000® Index performed over the same period. |
 |
Top Holdings (% of Fund's net assets) | ||
| Antero Resources Corp. | 1.7 | |
| ExlService Holdings, Inc. | 1.7 | |
| Denbury, Inc. | 1.6 | |
| HF Sinclair Corp. | 1.5 | |
| Commercial Metals Co. | 1.5 | |
| Northern Oil & Gas, Inc. | 1.4 | |
| Atkore, Inc. | 1.3 | |
| Murphy U.S.A., Inc. | 1.3 | |
| SPX Technologies, Inc. | 1.2 | |
| Academy Sports & Outdoors, Inc. | 1.2 | |
| 14.4 | ||
| Market Sectors (% of Fund's net assets) | ||
| Industrials | 16.8 | |
| Financials | 15.2 | |
| Health Care | 14.9 | |
| Information Technology | 11.9 | |
| Consumer Discretionary | 11.8 | |
| Energy | 8.7 | |
| Materials | 5.6 | |
| Real Estate | 5.3 | |
| Consumer Staples | 4.1 | |
| Utilities | 2.1 | |
| Communication Services | 1.8 | |
Asset Allocation (% of Fund's net assets) |
 |
Foreign investments - 11.9% |
Geographic Diversification (% of Fund's net assets) |
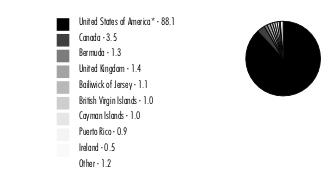 |
* Includes Short-Term investments and Net Other Assets (Liabilities). Percentages are based on country or territory of incorporation and are adjusted for the effect of futures contracts, if applicable. |
| Common Stocks - 98.0% | |||
| Shares | Value ($) (000s) | ||
| COMMUNICATION SERVICES - 1.8% | |||
| Interactive Media & Services - 0.4% | |||
| Ziff Davis, Inc. (a) | 90,000 | 6,965 | |
| Media - 1.3% | |||
| Nexstar Broadcasting Group, Inc. Class A | 78,500 | 13,447 | |
| TechTarget, Inc. (a) | 108,798 | 7,023 | |
| Thryv Holdings, Inc. (a) | 275,800 | 5,643 | |
| 26,113 | |||
| Wireless Telecommunication Services - 0.1% | |||
| Gogo, Inc. (a) | 155,800 | 2,215 | |
TOTAL COMMUNICATION SERVICES | 35,293 | ||
| CONSUMER DISCRETIONARY - 11.8% | |||
| Auto Components - 1.8% | |||
| Adient PLC (a) | 313,700 | 10,973 | |
| Fox Factory Holding Corp. (a) | 108,800 | 9,558 | |
| Gentherm, Inc. (a) | 76,400 | 4,463 | |
| LCI Industries | 57,300 | 6,080 | |
| Patrick Industries, Inc. | 123,700 | 5,654 | |
| 36,728 | |||
| Diversified Consumer Services - 0.4% | |||
| Laureate Education, Inc. Class A | 584,900 | 7,393 | |
| Hotels, Restaurants & Leisure - 2.4% | |||
| Brinker International, Inc. (a) | 316,500 | 10,568 | |
| Churchill Downs, Inc. | 80,900 | 16,820 | |
| Everi Holdings, Inc. (a) | 270,800 | 5,140 | |
| Hilton Grand Vacations, Inc. (a) | 167,600 | 6,577 | |
| Jack in the Box, Inc. | 75,500 | 6,661 | |
| Lindblad Expeditions Holdings (a) | 150,700 | 1,264 | |
| 47,030 | |||
| Household Durables - 1.3% | |||
| M.D.C. Holdings, Inc. (b) | 165,104 | 5,029 | |
| Skyline Champion Corp. (a) | 260,500 | 15,164 | |
| Tempur Sealy International, Inc. | 213,500 | 5,741 | |
| 25,934 | |||
| Internet & Direct Marketing Retail - 0.2% | |||
| Vivid Seats, Inc. Class A (b) | 581,967 | 4,772 | |
| Leisure Products - 0.6% | |||
| Acushnet Holdings Corp. (b) | 133,700 | 6,226 | |
| Clarus Corp. (b) | 442,137 | 5,354 | |
| 11,580 | |||
| Specialty Retail - 3.1% | |||
| Academy Sports & Outdoors, Inc. (b) | 528,400 | 23,265 | |
| Dick's Sporting Goods, Inc. | 77,500 | 8,816 | |
| Murphy U.S.A., Inc. | 83,050 | 26,120 | |
| Rent-A-Center, Inc. | 179,300 | 3,738 | |
| 61,939 | |||
| Textiles, Apparel & Luxury Goods - 2.0% | |||
| Capri Holdings Ltd. (a) | 143,200 | 6,541 | |
| Crocs, Inc. (a) | 198,300 | 14,030 | |
| Deckers Outdoor Corp. (a) | 25,400 | 8,888 | |
| Kontoor Brands, Inc. (b) | 278,800 | 9,953 | |
| 39,412 | |||
TOTAL CONSUMER DISCRETIONARY | 234,788 | ||
| CONSUMER STAPLES - 4.1% | |||
| Beverages - 0.5% | |||
| Primo Water Corp. | 713,600 | 10,411 | |
| Food & Staples Retailing - 2.0% | |||
| BJ's Wholesale Club Holdings, Inc. (a) | 286,600 | 22,183 | |
| Performance Food Group Co. (a) | 224,800 | 11,699 | |
| Sprouts Farmers Market LLC (a) | 183,700 | 5,419 | |
| 39,301 | |||
| Food Products - 1.3% | |||
| Darling Ingredients, Inc. (a) | 72,500 | 5,690 | |
| Nomad Foods Ltd. (a) | 887,900 | 13,674 | |
| The Simply Good Foods Co. (a) | 180,900 | 6,928 | |
| 26,292 | |||
| Personal Products - 0.3% | |||
| BellRing Brands, Inc. (a) | 262,600 | 6,360 | |
TOTAL CONSUMER STAPLES | 82,364 | ||
| ENERGY - 8.7% | |||
| Energy Equipment & Services - 1.5% | |||
| Liberty Oilfield Services, Inc. Class A | 1,201,048 | 20,310 | |
| TechnipFMC PLC (a) | 862,700 | 9,136 | |
| 29,446 | |||
| Oil, Gas & Consumable Fuels - 7.2% | |||
| Antero Resources Corp. (a) | 958,188 | 35,133 | |
| Denbury, Inc. (a) | 349,209 | 31,921 | |
| Enviva, Inc. (b) | 121,300 | 7,259 | |
| HF Sinclair Corp. | 480,200 | 29,374 | |
| Magnolia Oil & Gas Corp. Class A | 517,100 | 13,279 | |
| Northern Oil & Gas, Inc. | 800,722 | 27,337 | |
| 144,303 | |||
TOTAL ENERGY | 173,749 | ||
| FINANCIALS - 15.2% | |||
| Banks - 8.9% | |||
| East West Bancorp, Inc. | 129,300 | 9,254 | |
| First Bancorp, Puerto Rico | 1,121,900 | 17,715 | |
| Glacier Bancorp, Inc. (b) | 196,200 | 11,238 | |
| Independent Bank Group, Inc. | 152,800 | 9,640 | |
| Metropolitan Bank Holding Corp. (a) | 83,700 | 5,524 | |
| PacWest Bancorp | 573,400 | 14,255 | |
| Pathward Financial, Inc. | 287,400 | 12,079 | |
| Pinnacle Financial Partners, Inc. | 101,800 | 8,448 | |
| Preferred Bank, Los Angeles | 131,500 | 10,108 | |
| ServisFirst Bancshares, Inc. | 109,800 | 8,271 | |
| Synovus Financial Corp. | 449,100 | 17,897 | |
| Trico Bancshares | 327,317 | 18,955 | |
| United Community Bank, Inc. (b) | 551,500 | 21,233 | |
| Webster Financial Corp. | 141,464 | 7,676 | |
| Western Alliance Bancorp. | 77,000 | 5,172 | |
| 177,465 | |||
| Capital Markets - 2.4% | |||
| Focus Financial Partners, Inc. Class A (a) | 154,200 | 5,365 | |
| Houlihan Lokey | 103,600 | 9,254 | |
| Lazard Ltd. Class A | 332,400 | 12,535 | |
| LPL Financial | 32,200 | 8,232 | |
| TMX Group Ltd. | 131,900 | 12,681 | |
| 48,067 | |||
| Consumer Finance - 0.7% | |||
| FirstCash Holdings, Inc. | 133,500 | 13,143 | |
| Insurance - 1.7% | |||
| Assurant, Inc. | 58,600 | 7,961 | |
| Primerica, Inc. | 100,200 | 14,499 | |
| Selective Insurance Group, Inc. | 127,270 | 12,483 | |
| 34,943 | |||
| Thrifts & Mortgage Finance - 1.5% | |||
| Essent Group Ltd. | 370,300 | 14,656 | |
| Walker & Dunlop, Inc. | 163,642 | 14,721 | |
| 29,377 | |||
TOTAL FINANCIALS | 302,995 | ||
| HEALTH CARE - 14.7% | |||
| Biotechnology - 7.3% | |||
| ADC Therapeutics SA (a) | 103,581 | 460 | |
| ALX Oncology Holdings, Inc. (a) | 149,800 | 1,819 | |
| Arcutis Biotherapeutics, Inc. (a) | 221,100 | 3,909 | |
| Argenx SE ADR (a) | 25,131 | 9,749 | |
| Ascendis Pharma A/S sponsored ADR (a) | 32,406 | 3,727 | |
| Blueprint Medicines Corp. (a) | 172,600 | 8,948 | |
| Celldex Therapeutics, Inc. (a) | 128,600 | 4,518 | |
| Cerevel Therapeutics Holdings (a) | 219,300 | 6,132 | |
| Cytokinetics, Inc. (a) | 258,300 | 11,277 | |
| Day One Biopharmaceuticals, Inc. (a) | 337,100 | 7,126 | |
| Erasca, Inc. (a) | 470,800 | 3,846 | |
| Exelixis, Inc. (a) | 350,300 | 5,808 | |
| Imago BioSciences, Inc. (a) | 241,600 | 4,107 | |
| Instil Bio, Inc. (a)(b) | 468,725 | 1,547 | |
| Janux Therapeutics, Inc. (a)(b) | 266,500 | 4,818 | |
| Keros Therapeutics, Inc. (a) | 185,100 | 9,318 | |
| Mirati Therapeutics, Inc. (a) | 69,600 | 4,685 | |
| Morphic Holding, Inc. (a) | 104,238 | 2,920 | |
| PTC Therapeutics, Inc. (a) | 135,800 | 5,136 | |
| Relay Therapeutics, Inc. (a)(b) | 213,100 | 4,735 | |
| Scholar Rock Holding Corp. warrants 12/31/25 (a)(c) | 7,350 | 35 | |
| Tango Therapeutics, Inc. (a) | 620,500 | 4,989 | |
| Tyra Biosciences, Inc. (a) | 457,100 | 3,163 | |
| Vaxcyte, Inc. (a) | 133,739 | 5,832 | |
| Vera Therapeutics, Inc. (a) | 206,100 | 3,842 | |
| Verve Therapeutics, Inc. (a)(b) | 286,439 | 10,799 | |
| Xenon Pharmaceuticals, Inc. (a) | 193,871 | 7,090 | |
| Zentalis Pharmaceuticals, Inc. (a) | 196,548 | 4,931 | |
| 145,266 | |||
| Health Care Equipment & Supplies - 1.8% | |||
| Envista Holdings Corp. (a) | 225,900 | 7,457 | |
| Figs, Inc. Class A (a)(b) | 618,900 | 4,567 | |
| Globus Medical, Inc. (a) | 42,200 | 2,827 | |
| Inspire Medical Systems, Inc. (a) | 30,300 | 5,907 | |
| Integer Holdings Corp. (a) | 46,563 | 2,902 | |
| Omnicell, Inc. (a) | 46,800 | 3,619 | |
| TransMedics Group, Inc. (a) | 188,200 | 9,075 | |
| 36,354 | |||
| Health Care Providers & Services - 3.2% | |||
| Acadia Healthcare Co., Inc. (a) | 192,300 | 15,634 | |
| agilon health, Inc. (a) | 391,400 | 7,769 | |
| Molina Healthcare, Inc. (a) | 50,100 | 17,979 | |
| Owens & Minor, Inc. | 245,560 | 4,175 | |
| R1 Rcm, Inc. (a) | 431,500 | 7,620 | |
| Surgery Partners, Inc. (a) | 167,800 | 4,562 | |
| Tenet Healthcare Corp. (a) | 91,400 | 4,055 | |
| The Oncology Institute, Inc. (a)(c) | 373,842 | 1,697 | |
| 63,491 | |||
| Health Care Technology - 0.6% | |||
| Evolent Health, Inc. (a) | 385,540 | 12,264 | |
| Life Sciences Tools & Services - 0.5% | |||
| Olink Holding AB ADR (a) | 231,373 | 4,241 | |
| Syneos Health, Inc. (a) | 88,500 | 4,459 | |
| 8,700 | |||
| Pharmaceuticals - 1.3% | |||
| Arvinas Holding Co. LLC (a) | 147,200 | 7,317 | |
| DICE Therapeutics, Inc. (a) | 138,700 | 4,925 | |
| Edgewise Therapeutics, Inc. (a) | 552,500 | 5,254 | |
| Enliven Therapeutics, Inc. (d) | 378,877 | 1,514 | |
| Fulcrum Therapeutics, Inc. (a) | 253,100 | 1,407 | |
| Theseus Pharmaceuticals, Inc. | 137,146 | 738 | |
| Ventyx Biosciences, Inc. (b) | 155,000 | 5,017 | |
| 26,172 | |||
TOTAL HEALTH CARE | 292,247 | ||
| INDUSTRIALS - 16.8% | |||
| Aerospace & Defense - 0.3% | |||
| V2X, Inc. (a) | 120,500 | 4,939 | |
| Building Products - 1.7% | |||
| Builders FirstSource, Inc. (a) | 226,837 | 13,987 | |
| Masonite International Corp. (a) | 110,800 | 7,926 | |
| Simpson Manufacturing Co. Ltd. | 136,210 | 11,643 | |
| 33,556 | |||
| Commercial Services & Supplies - 0.7% | |||
| Casella Waste Systems, Inc. Class A (a) | 112,500 | 9,204 | |
| The Brink's Co. | 92,400 | 5,510 | |
| 14,714 | |||
| Construction & Engineering - 4.1% | |||
| Comfort Systems U.S.A., Inc. | 100,476 | 12,387 | |
| Construction Partners, Inc. Class A (a) | 327,200 | 10,189 | |
| Dycom Industries, Inc. (a) | 86,600 | 10,234 | |
| EMCOR Group, Inc. | 139,040 | 19,619 | |
| Granite Construction, Inc. | 232,600 | 7,846 | |
| IES Holdings, Inc. (a) | 295,215 | 9,754 | |
| NV5 Global, Inc. (a) | 86,000 | 12,466 | |
| 82,495 | |||
| Electrical Equipment - 1.7% | |||
| Atkore, Inc. (a) | 278,470 | 26,538 | |
| Regal Rexnord Corp. | 29,700 | 3,758 | |
| Thermon Group Holdings, Inc. (a) | 157,855 | 2,804 | |
| 33,100 | |||
| Machinery - 3.4% | |||
| Federal Signal Corp. | 372,900 | 17,396 | |
| ITT, Inc. | 86,020 | 6,571 | |
| Kadant, Inc. | 40,500 | 7,207 | |
| Oshkosh Corp. | 77,900 | 6,855 | |
| SPX Technologies, Inc. (a) | 360,300 | 23,722 | |
| Timken Co. | 91,000 | 6,487 | |
| 68,238 | |||
| Professional Services - 2.6% | |||
| ASGN, Inc. (a) | 200,300 | 16,981 | |
| CACI International, Inc. Class A (a) | 24,600 | 7,479 | |
| CRA International, Inc. | 67,100 | 6,894 | |
| KBR, Inc. | 189,700 | 9,441 | |
| TriNet Group, Inc. (a) | 168,274 | 10,934 | |
| 51,729 | |||
| Trading Companies & Distributors - 2.3% | |||
| Beacon Roofing Supply, Inc. (a) | 177,200 | 9,985 | |
| Finning International, Inc. | 177,000 | 3,764 | |
| GMS, Inc. (a) | 162,800 | 7,684 | |
| Rush Enterprises, Inc. Class A | 396,088 | 19,761 | |
| Univar Solutions, Inc. (a) | 197,600 | 5,035 | |
| 46,229 | |||
TOTAL INDUSTRIALS | 335,000 | ||
| INFORMATION TECHNOLOGY - 11.9% | |||
| Communications Equipment - 0.5% | |||
| Extreme Networks, Inc. (a) | 502,200 | 9,009 | |
| Electronic Equipment & Components - 3.4% | |||
| Advanced Energy Industries, Inc. | 231,200 | 18,184 | |
| Fabrinet (a) | 168,340 | 19,258 | |
| Insight Enterprises, Inc. (a) | 157,900 | 14,923 | |
| Napco Security Technologies, Inc. | 252,300 | 7,170 | |
| TD SYNNEX Corp. | 88,500 | 8,099 | |
| 67,634 | |||
| IT Services - 3.8% | |||
| Cyxtera Technologies, Inc. Class A (a) | 1,085,727 | 2,627 | |
| Endava PLC ADR (a) | 101,000 | 7,700 | |
| ExlService Holdings, Inc. (a) | 189,133 | 34,394 | |
| Perficient, Inc. (a) | 138,600 | 9,282 | |
| WNS Holdings Ltd. sponsored ADR (a) | 259,850 | 22,368 | |
| 76,371 | |||
| Semiconductors & Semiconductor Equipment - 1.4% | |||
| FormFactor, Inc. (a) | 127,200 | 2,571 | |
| MACOM Technology Solutions Holdings, Inc. (a) | 170,300 | 9,855 | |
| Onto Innovation, Inc. (a) | 122,450 | 8,185 | |
| SiTime Corp. (a) | 29,800 | 2,676 | |
| Synaptics, Inc. (a) | 51,000 | 4,519 | |
| 27,806 | |||
| Software - 2.6% | |||
| Five9, Inc. (a) | 46,600 | 2,808 | |
| Intapp, Inc. (a) | 233,448 | 5,243 | |
| Manhattan Associates, Inc. (a) | 55,200 | 6,716 | |
| NCR Corp. (a) | 137,200 | 2,917 | |
| Qualys, Inc. (a) | 34,400 | 4,904 | |
| Rapid7, Inc. (a) | 175,300 | 7,936 | |
| SPS Commerce, Inc. (a) | 54,700 | 6,921 | |
| Tenable Holdings, Inc. (a) | 334,100 | 13,578 | |
| 51,023 | |||
| Technology Hardware, Storage & Peripherals - 0.2% | |||
| Avid Technology, Inc. (a) | 177,369 | 4,876 | |
TOTAL INFORMATION TECHNOLOGY | 236,719 | ||
| MATERIALS - 5.6% | |||
| Chemicals - 1.3% | |||
| Element Solutions, Inc. | 490,500 | 8,437 | |
| Huntsman Corp. | 475,800 | 12,732 | |
| Tronox Holdings PLC | 407,400 | 4,889 | |
| 26,058 | |||
| Construction Materials - 0.7% | |||
| Eagle Materials, Inc. | 118,900 | 14,543 | |
| Containers & Packaging - 0.5% | |||
| O-I Glass, Inc. (a) | 549,400 | 8,961 | |
| Metals & Mining - 2.5% | |||
| Arconic Corp. (a) | 210,700 | 4,374 | |
| Commercial Metals Co. | 641,800 | 29,202 | |
| Constellium NV (a) | 527,800 | 5,816 | |
| Warrior Metropolitan Coal, Inc. | 163,090 | 6,057 | |
| Yamana Gold, Inc. | 1,148,500 | 5,030 | |
| 50,479 | |||
| Paper & Forest Products - 0.6% | |||
| Louisiana-Pacific Corp. | 115,500 | 6,543 | |
| Sylvamo Corp. | 102,200 | 4,923 | |
| 11,466 | |||
TOTAL MATERIALS | 111,507 | ||
| REAL ESTATE - 5.3% | |||
| Equity Real Estate Investment Trusts (REITs) - 4.6% | |||
| EastGroup Properties, Inc. | 56,100 | 8,790 | |
| Elme Communities (SBI) | 599,800 | 11,450 | |
| Equity Commonwealth | 346,700 | 9,070 | |
| Essential Properties Realty Trust, Inc. | 388,400 | 8,358 | |
| Lamar Advertising Co. Class A | 77,500 | 7,148 | |
| LXP Industrial Trust (REIT) | 1,360,800 | 13,173 | |
| Sunstone Hotel Investors, Inc. | 936,800 | 10,445 | |
| Terreno Realty Corp. | 388,800 | 22,216 | |
| 90,650 | |||
| Real Estate Management & Development - 0.7% | |||
| Cushman & Wakefield PLC (a) | 408,300 | 4,716 | |
| Jones Lang LaSalle, Inc. (a) | 59,400 | 9,450 | |
| 14,166 | |||
TOTAL REAL ESTATE | 104,816 | ||
| UTILITIES - 2.1% | |||
| Gas Utilities - 1.8% | |||
| Brookfield Infrastructure Corp. A Shares | 538,200 | 23,207 | |
| ONE Gas, Inc. (b) | 150,500 | 11,661 | |
| 34,868 | |||
| Independent Power and Renewable Electricity Producers - 0.3% | |||
| Clearway Energy, Inc. Class C | 189,300 | 6,576 | |
TOTAL UTILITIES | 41,444 | ||
| TOTAL COMMON STOCKS (Cost $1,667,747) | 1,950,922 | ||
| Convertible Preferred Stocks - 0.2% | |||
| Shares | Value ($) (000s) | ||
| HEALTH CARE - 0.2% | |||
| Biotechnology - 0.1% | |||
| Dianthus Therapeutics, Inc. Series A (c)(e) | 422,467 | 1,577 | |
| ValenzaBio, Inc. Series A (a)(c)(e) | 125,214 | 743 | |
| 2,320 | |||
| Pharmaceuticals - 0.1% | |||
| Aristea Therapeutics, Inc. Series B (a)(c)(e) | 186,831 | 1,465 | |
| TOTAL CONVERTIBLE PREFERRED STOCKS (Cost $3,980) | 3,785 | ||
| U.S. Treasury Obligations - 0.1% | |||
Principal Amount (f) (000s) | Value ($) (000s) | ||
U.S. Treasury Bills, yield at date of purchase 2.59% to 2.89% 11/17/22 to 12/1/22 (g) (Cost $1,618) | 1,620 | 1,617 | |
| Money Market Funds - 4.6% | |||
| Shares | Value ($) (000s) | ||
| Fidelity Cash Central Fund 3.10% (h) | 34,188,569 | 34,195 | |
| Fidelity Securities Lending Cash Central Fund 3.10% (h)(i) | 57,123,293 | 57,129 | |
| TOTAL MONEY MARKET FUNDS (Cost $91,324) | 91,324 | ||
| TOTAL INVESTMENT IN SECURITIES - 102.9% (Cost $1,764,669) | 2,047,648 |
NET OTHER ASSETS (LIABILITIES) - (2.9)% | (57,466) |
| NET ASSETS - 100.0% | 1,990,182 |
| Futures Contracts | |||||
Number of contracts | Expiration Date | Notional Amount ($) (000s) | Value ($) (000s) | Unrealized Appreciation/ (Depreciation) ($) (000s) | |
| Purchased | |||||
| Equity Index Contracts | |||||
| CME E-mini Russell 2000 Index Contracts (United States) | 51 | Dec 2022 | 4,725 | 332 | 332 |
| The notional amount of futures purchased as a percentage of Net Assets is 0.2% | |||||
| (a) | Non-income producing |
| (b) | Security or a portion of the security is on loan at period end. |
| (c) | Restricted securities (including private placements) - Investment in securities not registered under the Securities Act of 1933 (excluding 144A issues). At the end of the period, the value of restricted securities (excluding 144A issues) amounted to $5,517,000 or 0.3% of net assets. |
| (d) | Security or a portion of the security purchased on a delayed delivery or when-issued basis. |
| (e) | Level 3 security |
| (f) | Amount is stated in United States dollars unless otherwise noted. |
| (g) | Security or a portion of the security was pledged to cover margin requirements for futures contracts. At period end, the value of securities pledged amounted to $446,000. |
| (h) | Affiliated fund that is generally available only to investment companies and other accounts managed by Fidelity Investments. The rate quoted is the annualized seven-day yield of the fund at period end. A complete unaudited listing of the fund's holdings as of its most recent quarter end is available upon request. In addition, each Fidelity Central Fund's financial statements, which are not covered by the Fund's Report of Independent Registered Public Accounting Firm, are available on the SEC's website or upon request. |
| (i) | Investment made with cash collateral received from securities on loan. |
| Additional information on each restricted holding is as follows: | ||
| Security | Acquisition Date | Acquisition Cost ($) (000s) |
| Aristea Therapeutics, Inc. Series B | 10/06/20 - 7/27/21 | 1,030 |
| Dianthus Therapeutics, Inc. Series A | 4/06/22 | 1,836 |
| Scholar Rock Holding Corp. warrants 12/31/25 | 6/17/22 | 0 |
| The Oncology Institute, Inc. | 6/28/21 | 3,738 |
| ValenzaBio, Inc. Series A | 3/25/21 | 1,114 |
| Affiliate (Amounts in thousands) | Value, beginning of period ($) | Purchases ($) | Sales Proceeds ($) | Dividend Income ($) | Realized Gain (loss) ($) | Change in Unrealized appreciation (depreciation) ($) | Value, end of period ($) | % ownership, end of period |
| Fidelity Cash Central Fund 3.10% | 57,248 | 747,091 | 770,144 | 375 | - | - | 34,195 | 0.1% |
| Fidelity Securities Lending Cash Central Fund 3.10% | 49,434 | 660,730 | 653,035 | 249 | - | - | 57,129 | 0.2% |
| Total | 106,682 | 1,407,821 | 1,423,179 | 624 | - | - | 91,324 | |
| Valuation Inputs at Reporting Date: | ||||
Description (Amounts in thousands) | Total ($) | Level 1 ($) | Level 2 ($) | Level 3 ($) |
Investments in Securities: | ||||
| Equities: | ||||
Communication Services | 35,293 | 35,293 | - | - |
Consumer Discretionary | 234,788 | 234,788 | - | - |
Consumer Staples | 82,364 | 82,364 | - | - |
Energy | 173,749 | 173,749 | - | - |
Financials | 302,995 | 302,995 | - | - |
Health Care | 296,032 | 290,698 | 1,549 | 3,785 |
Industrials | 335,000 | 335,000 | - | - |
Information Technology | 236,719 | 236,719 | - | - |
Materials | 111,507 | 111,507 | - | - |
Real Estate | 104,816 | 104,816 | - | - |
Utilities | 41,444 | 41,444 | - | - |
| U.S. Government and Government Agency Obligations | 1,617 | - | 1,617 | - |
| Money Market Funds | 91,324 | 91,324 | - | - |
| Total Investments in Securities: | 2,047,648 | 2,040,697 | 3,166 | 3,785 |
Derivative Instruments: | ||||
| Assets | ||||
Futures Contracts | 332 | 332 | - | - |
| Total Assets | 332 | 332 | - | - |
| Total Derivative Instruments: | 332 | 332 | - | - |
Primary Risk Exposure / Derivative Type | Value | |
| (Amounts in thousands) | Asset ($) | Liability ($) |
| Equity Risk | ||
Futures Contracts (a) | 332 | 0 |
| Total Equity Risk | 332 | 0 |
| Total Value of Derivatives | 332 | 0 |
| Statement of Assets and Liabilities | ||||
| Amounts in thousands (except per-share amounts) | October 31, 2022 | |||
| Assets | ||||
| Investment in securities, at value (including securities loaned of $53,893) - See accompanying schedule: | ||||
Unaffiliated issuers (cost $1,673,345) | $1,956,324 | |||
Fidelity Central Funds (cost $91,324) | 91,324 | |||
| Total Investment in Securities (cost $1,764,669) | $ | 2,047,648 | ||
| Receivable for investments sold | 3,192 | |||
| Receivable for fund shares sold | 1,317 | |||
| Dividends receivable | 167 | |||
| Distributions receivable from Fidelity Central Funds | 72 | |||
| Receivable for daily variation margin on futures contracts | 4 | |||
| Prepaid expenses | 3 | |||
Total assets | 2,052,403 | |||
| Liabilities | ||||
| Payable for investments purchased | ||||
Regular delivery | $838 | |||
Delayed delivery | 1,455 | |||
| Payable for fund shares redeemed | 1,223 | |||
| Accrued management fee | 1,195 | |||
| Distribution and service plan fees payable | 38 | |||
| Other affiliated payables | 300 | |||
| Other payables and accrued expenses | 48 | |||
| Collateral on securities loaned | 57,124 | |||
| Total Liabilities | 62,221 | |||
| Net Assets | $ | 1,990,182 | ||
| Net Assets consist of: | ||||
| Paid in capital | $ | 1,730,440 | ||
| Total accumulated earnings (loss) | 259,742 | |||
| Net Assets | $ | 1,990,182 | ||
| Net Asset Value and Maximum Offering Price | ||||
| Class A : | ||||
Net Asset Value and redemption price per share ($98,903 ÷ 3,596 shares) (a)(b) | $ | 27.51 | ||
| Maximum offering price per share (100/94.25 of $27.51) | $ | 29.19 | ||
| Class M : | ||||
Net Asset Value and redemption price per share ($14,222 ÷ 541 shares) (a)(b) | $ | 26.28 | ||
| Maximum offering price per share (100/96.50 of $26.28) | $ | 27.23 | ||
| Class C : | ||||
Net Asset Value and offering price per share ($15,666 ÷ 655 shares) (a)(b) | $ | 23.91 | ||
| Stock Selector Small Cap : | ||||
Net Asset Value , offering price and redemption price per share ($1,339,623 ÷ 47,041 shares) | $ | 28.48 | ||
| Class I : | ||||
Net Asset Value , offering price and redemption price per share ($296,360 ÷ 10,338 shares) | $ | 28.67 | ||
| Class Z : | ||||
Net Asset Value , offering price and redemption price per share ($225,408 ÷ 7,879 shares) | $ | 28.61 | ||
(a)Redemption price per share is equal to net asset value less any applicable contingent deferred sales charge. | ||||
(b)Corresponding Net Asset Value does not calculate due to rounding of fractional net assets and/or units | ||||
| Statement of Operations | ||||
| Amounts in thousands | Year ended October 31, 2022 | |||
| Investment Income | ||||
| Dividends | $ | 18,328 | ||
| Special dividends | 3,994 | |||
| Interest | 13 | |||
| Income from Fidelity Central Funds (including $249 from security lending) | 624 | |||
| Total Income | 22,959 | |||
| Expenses | ||||
| Management fee | ||||
| Basic fee | $ | 11,904 | ||
| Performance adjustment | 3,115 | |||
| Transfer agent fees | 3,207 | |||
| Distribution and service plan fees | 498 | |||
| Accounting fees | 597 | |||
| Custodian fees and expenses | 35 | |||
| Independent trustees' fees and expenses | 7 | |||
| Registration fees | 163 | |||
| Audit | 56 | |||
| Legal | 5 | |||
| Miscellaneous | 8 | |||
| Total expenses before reductions | 19,595 | |||
| Expense reductions | (67) | |||
| Total expenses after reductions | 19,528 | |||
| Net Investment income (loss) | 3,431 | |||
| Realized and Unrealized Gain (Loss) | ||||
| Net realized gain (loss) on: | ||||
| Investment Securities: | ||||
| Unaffiliated issuers | (15,631) | |||
| Foreign currency transactions | 4 | |||
| Futures contracts | (4,477) | |||
| Total net realized gain (loss) | (20,104) | |||
| Change in net unrealized appreciation (depreciation) on: | ||||
| Investment Securities: | ||||
| Unaffiliated issuers | (379,148) | |||
| Unfunded commitments | 374 | |||
| Futures contracts | (611) | |||
| Total change in net unrealized appreciation (depreciation) | (379,385) | |||
| Net gain (loss) | (399,489) | |||
| Net increase (decrease) in net assets resulting from operations | $ | (396,058) | ||
| Statement of Changes in Net Assets | ||||
| Amount in thousands | Year ended October 31, 2022 | Year ended October 31, 2021 | ||
| Increase (Decrease) in Net Assets | ||||
| Operations | ||||
| Net investment income (loss) | $ | 3,431 | $ | (3,430) |
| Net realized gain (loss) | (20,104) | 255,965 | ||
| Change in net unrealized appreciation (depreciation) | (379,385) | 464,504 | ||
| Net increase (decrease) in net assets resulting from operations | (396,058) | 717,039 | ||
| Distributions to shareholders | (226,161) | (21,097) | ||
| Share transactions - net increase (decrease) | 339,216 | 417,871 | ||
| Total increase (decrease) in net assets | (283,003) | 1,113,813 | ||
| Net Assets | ||||
| Beginning of period | 2,273,185 | 1,159,372 | ||
| End of period | $ | 1,990,182 | $ | 2,273,185 |
| Fidelity Advisor® Stock Selector Small Cap Fund Class A |
| Years ended October 31, | 2022 | 2021 | 2020 | 2019 | 2018 | |||||
Selected Per-Share Data | ||||||||||
| Net asset value, beginning of period | $ | 36.93 | $ | 24.09 | $ | 23.82 | $ | 25.94 | $ | 28.16 |
| Income from Investment Operations | ||||||||||
Net investment income (loss) A,B | (.03) C | (.15) | (.07) | .01 | .04 D | |||||
| Net realized and unrealized gain (loss) | (5.76) | 13.42 | .83 | 2.30 | .43 | |||||
| Total from investment operations | (5.79) | 13.27 | .76 | 2.31 | .47 | |||||
| Distributions from net investment income | - | - | (.02) E | (.01) | (.03) | |||||
| Distributions from net realized gain | (3.63) | (.43) | (.47) E | (4.42) | (2.65) | |||||
| Total distributions | (3.63) | (.43) | (.49) | (4.43) | (2.69) F | |||||
Redemption fees added to paid in capital A | - | - | - | - | - G | |||||
| Net asset value, end of period | $ | 27.51 | $ | 36.93 | $ | 24.09 | $ | 23.82 | $ | 25.94 |
Total Return H,I | (16.94)% | 55.62% | 3.15% | 11.55% | 1.73% | |||||
Ratios to Average Net Assets B,J,K | ||||||||||
| Expenses before reductions | 1.21% | 1.19% | 1.32% | 1.04% | .97% | |||||
| Expenses net of fee waivers, if any | 1.21% | 1.19% | 1.32% | 1.04% | .97% | |||||
| Expenses net of all reductions | 1.21% | 1.19% | 1.31% | 1.04% | .95% | |||||
| Net investment income (loss) | (.10)% C | (.45)% | (.29)% | .06% | .14% D | |||||
| Supplemental Data | ||||||||||
| Net assets, end of period (in millions) | $ | 99 | $ | 108 | $ | 52 | $ | 37 | $ | 23 |
Portfolio turnover rate L | 38% | 59% | 70% | 56% M | 68% |
| Fidelity Advisor® Stock Selector Small Cap Fund Class M |
| Years ended October 31, | 2022 | 2021 | 2020 | 2019 | 2018 | |||||
Selected Per-Share Data | ||||||||||
| Net asset value, beginning of period | $ | 35.46 | $ | 23.20 | $ | 23.00 | $ | 25.21 | $ | 27.49 |
| Income from Investment Operations | ||||||||||
Net investment income (loss) A,B | (.10) C | (.23) | (.13) | (.05) | (.06) D | |||||
| Net realized and unrealized gain (loss) | (5.53) | 12.92 | .80 | 2.21 | .43 | |||||
| Total from investment operations | (5.63) | 12.69 | .67 | 2.16 | .37 | |||||
| Distributions from net realized gain | (3.55) | (.43) | (.46) E | (4.37) | (2.65) | |||||
| Total distributions | (3.55) | (.43) | (.46) | (4.37) | (2.65) | |||||
Redemption fees added to paid in capital A | - | - | - | - | - F | |||||
| Net asset value, end of period | $ | 26.28 | $ | 35.46 | $ | 23.20 | $ | 23.00 | $ | 25.21 |
Total Return G,H | (17.19)% | 55.24% | 2.83% | 11.20% | 1.40% | |||||
Ratios to Average Net Assets B,I,J | ||||||||||
| Expenses before reductions | 1.48% | 1.46% | 1.61% | 1.35% | 1.33% | |||||
| Expenses net of fee waivers, if any | 1.48% | 1.45% | 1.60% | 1.35% | 1.33% | |||||
| Expenses net of all reductions | 1.48% | 1.45% | 1.60% | 1.35% | 1.32% | |||||
| Net investment income (loss) | (.37)% C | (.71)% | (.58)% | (.24)% | (.22)% D | |||||
| Supplemental Data | ||||||||||
| Net assets, end of period (in millions) | $ | 14 | $ | 17 | $ | 8 | $ | 7 | $ | 5 |
Portfolio turnover rate K | 38% | 59% | 70% | 56% L | 68% |
| Fidelity Advisor® Stock Selector Small Cap Fund Class C |
| Years ended October 31, | 2022 | 2021 | 2020 | 2019 | 2018 | |||||
Selected Per-Share Data | ||||||||||
| Net asset value, beginning of period | $ | 32.61 | $ | 21.48 | $ | 21.43 | $ | 23.79 | $ | 26.20 |
| Income from Investment Operations | ||||||||||
Net investment income (loss) A,B | (.23) C | (.36) | (.23) | (.16) | (.17) D | |||||
| Net realized and unrealized gain (loss) | (5.05) | 11.92 | .75 | 2.06 | .41 | |||||
| Total from investment operations | (5.28) | 11.56 | .52 | 1.90 | .24 | |||||
| Distributions from net realized gain | (3.42) | (.43) | (.46) E | (4.26) | (2.65) | |||||
| Total distributions | (3.42) | (.43) | (.46) | (4.26) | (2.65) | |||||
Redemption fees added to paid in capital A | - | - | - | - | - F | |||||
| Net asset value, end of period | $ | 23.91 | $ | 32.61 | $ | 21.48 | $ | 21.43 | $ | 23.79 |
Total Return G,H | (17.61)% | 54.40% | 2.33% | 10.64% | .94% | |||||
Ratios to Average Net Assets B,I,J | ||||||||||
| Expenses before reductions | 2.00% | 1.98% | 2.13% | 1.86% | 1.79% | |||||
| Expenses net of fee waivers, if any | 1.99% | 1.97% | 2.13% | 1.86% | 1.79% | |||||
| Expenses net of all reductions | 1.99% | 1.97% | 2.12% | 1.86% | 1.78% | |||||
| Net investment income (loss) | (.88)% C | (1.23)% | (1.10)% | (.76)% | (.68)% D | |||||
| Supplemental Data | ||||||||||
| Net assets, end of period (in millions) | $ | 16 | $ | 19 | $ | 8 | $ | 8 | $ | 6 |
Portfolio turnover rate K | 38% | 59% | 70% | 56% L | 68% |
| Fidelity® Stock Selector Small Cap Fund |
| Years ended October 31, | 2022 | 2021 | 2020 | 2019 | 2018 | |||||
Selected Per-Share Data | ||||||||||
| Net asset value, beginning of period | $ | 38.11 | $ | 24.77 | $ | 24.47 | $ | 26.50 | $ | 28.71 |
| Income from Investment Operations | ||||||||||
Net investment income (loss) A,B | .06 C | (.05) | - D | .08 | .12 E | |||||
| Net realized and unrealized gain (loss) | (5.96) | 13.82 | .84 | 2.36 | .43 | |||||
| Total from investment operations | (5.90) | 13.77 | .84 | 2.44 | .55 | |||||
| Distributions from net investment income | (.06) | - | (.07) F | (.06) | (.11) | |||||
| Distributions from net realized gain | (3.67) | (.43) | (.47) F | (4.42) | (2.65) | |||||
| Total distributions | (3.73) | (.43) | (.54) | (4.47) G | (2.76) | |||||
Redemption fees added to paid in capital A | - | - | - | - | - D | |||||
| Net asset value, end of period | $ | 28.48 | $ | 38.11 | $ | 24.77 | $ | 24.47 | $ | 26.50 |
Total Return H | (16.73)% | 56.11% | 3.42% | 11.90% | 2.04% | |||||
Ratios to Average Net Assets B,I,J | ||||||||||
| Expenses before reductions | .93% | .90% | 1.02% | .75% | .68% | |||||
| Expenses net of fee waivers, if any | .93% | .90% | 1.02% | .75% | .68% | |||||
| Expenses net of all reductions | .93% | .90% | 1.01% | .75% | .67% | |||||
| Net investment income (loss) | .18% C | (.16)% | -% K | .36% | .43% E | |||||
| Supplemental Data | ||||||||||
| Net assets, end of period (in millions) | $ | 1,340 | $ | 1,654 | $ | 960 | $ | 938 | $ | 1,035 |
Portfolio turnover rate L | 38% | 59% | 70% | 56% M | 68% |
| Fidelity Advisor® Stock Selector Small Cap Fund Class I |
| Years ended October 31, | 2022 | 2021 | 2020 | 2019 | 2018 | |||||
Selected Per-Share Data | ||||||||||
| Net asset value, beginning of period | $ | 38.34 | $ | 24.93 | $ | 24.54 | $ | 26.57 | $ | 28.78 |
| Income from Investment Operations | ||||||||||
Net investment income (loss) A,B | .05 C | (.06) | - D | .08 | .12 E | |||||
| Net realized and unrealized gain (loss) | (5.99) | 13.90 | .86 | 2.37 | .43 | |||||
| Total from investment operations | (5.94) | 13.84 | .86 | 2.45 | .55 | |||||
| Distributions from net investment income | (.06) | - | - D,F | (.06) | (.11) | |||||
| Distributions from net realized gain | (3.67) | (.43) | (.47) F | (4.42) | (2.65) | |||||
| Total distributions | (3.73) | (.43) | (.47) | (4.48) | (2.76) | |||||
Redemption fees added to paid in capital A | - | - | - | - | - D | |||||
| Net asset value, end of period | $ | 28.67 | $ | 38.34 | $ | 24.93 | $ | 24.54 | $ | 26.57 |
Total Return G | (16.72)% | 56.03% | 3.49% | 11.87% | 2.02% | |||||
Ratios to Average Net Assets B,H,I | ||||||||||
| Expenses before reductions | .94% | .92% | 1.01% | .76% | .69% | |||||
| Expenses net of fee waivers, if any | .94% | .91% | 1.00% | .76% | .69% | |||||
| Expenses net of all reductions | .94% | .91% | 1.00% | .75% | .68% | |||||
| Net investment income (loss) | .17% C | (.17)% | .02% | .35% | .42% E | |||||
| Supplemental Data | ||||||||||
| Net assets, end of period (in millions) | $ | 296 | $ | 308 | $ | 79 | $ | 9 | $ | 40 |
Portfolio turnover rate J | 38% | 59% | 70% | 56% K | 68% |
| Fidelity Advisor® Stock Selector Small Cap Fund Class Z |
| Years ended October 31, | 2022 | 2021 | 2020 | 2019 | 2018 | |||||
Selected Per-Share Data | ||||||||||
| Net asset value, beginning of period | $ | 38.27 | $ | 24.85 | $ | 24.55 | $ | 26.59 | $ | 28.81 |
| Income from Investment Operations | ||||||||||
Net investment income (loss) A,B | .09 C | (.02) | .03 | .12 | .16 D | |||||
| Net realized and unrealized gain (loss) | (5.98) | 13.87 | .86 | 2.36 | .43 | |||||
| Total from investment operations | (5.89) | 13.85 | .89 | 2.48 | .59 | |||||
| Distributions from net investment income | (.11) | - | (.12) E | (.10) | (.16) | |||||
| Distributions from net realized gain | (3.67) | (.43) | (.47) E | (4.42) | (2.65) | |||||
| Total distributions | (3.77) F | (.43) | (.59) | (4.52) | (2.81) | |||||
Redemption fees added to paid in capital A | - | - | - | - | - G | |||||
| Net asset value, end of period | $ | 28.61 | $ | 38.27 | $ | 24.85 | $ | 24.55 | $ | 26.59 |
Total Return H | (16.62)% | 56.26% | 3.58% | 12.05% | 2.17% | |||||
Ratios to Average Net Assets B,I,J | ||||||||||
| Expenses before reductions | .81% | .79% | .89% | .61% | .55% | |||||
| Expenses net of fee waivers, if any | .81% | .79% | .88% | .61% | .55% | |||||
| Expenses net of all reductions | .81% | .79% | .88% | .61% | .54% | |||||
| Net investment income (loss) | .30% C | (.04)% | .14% | .49% | .56% D | |||||
| Supplemental Data | ||||||||||
| Net assets, end of period (in millions) | $ | 225 | $ | 167 | $ | 53 | $ | 30 | $ | 6 |
Portfolio turnover rate K | 38% | 59% | 70% | 56% L | 68% |
| Fidelity Central Fund | Investment Manager | Investment Objective | Investment Practices | Expense Ratio A |
| Fidelity Money Market Central Funds | Fidelity Management & Research Company LLC (FMR) | Each fund seeks to obtain a high level of current income consistent with the preservation of capital and liquidity. | Short-term Investments | Less than .005% |
| Gross unrealized appreciation | $495,478 |
| Gross unrealized depreciation | (215,738) |
| Net unrealized appreciation (depreciation) | $279,740 |
| Tax Cost | $1,767,908 |
| Capital loss carryforward | $(19,028) |
| Net unrealized appreciation (depreciation) on securities and other investments | $279,082 |
| Short-term | $(19,028) |
| October 31, 2022 | October 31, 2021 | |
| Ordinary Income | $43,104 | $- |
| Long-term Capital Gains | 183,057 | 21,097 |
| Total | $226,161 | $21,097 |
| Equity Risk | Equity risk relates to the fluctuations in the value of financial instruments as a result of changes in market prices (other than those arising from interest rate risk or foreign exchange risk), whether caused by factors specific to an individual investment, its issuer, or all factors affecting all instruments traded in a market or market segment. |
| Purchases ($) | Sales ($) | |
| Fidelity Stock Selector Small Cap Fund | 907,317 | 779,802 |
| Distribution Fee | Service Fee | Total Fees | Retained by FDC | |
| Class A | - % | .25% | $256 | $15 |
| Class M | .25% | .25% | 75 | - |
| Class C | .75% | .25% | 167 | 54 |
| $498 | $69 |
| Retained by FDC | |
| Class A | $59 |
| Class M | 5 |
Class C (a) | - (b) |
| $64 |
| Amount | % of Class-Level Average Net Assets | |
| Class A | $199 | .19 |
| Class M | 32 | .22 |
| Class C | 38 | .23 |
| Stock Selector Small Cap | 2,346 | .16 |
| Class I | 511 | .17 |
| Class Z | 81 | .04 |
| $3,207 |
| % of Average Net Assets | |
| Fidelity Stock Selector Small Cap Fund | .03 |
| Amount | |
| Fidelity Stock Selector Small Cap Fund | $33 |
| Purchases ($) | Sales ($) | Realized Gain (Loss) ($) | |
| Fidelity Stock Selector Small Cap Fund | 70,965 | 56,623 | 691 |
| Amount | |
| Fidelity Stock Selector Small Cap Fund | $4 |
| Total Security Lending Fees Paid to NFS | Security Lending Income From Securities Loaned to NFS | Value of Securities Loaned to NFS at Period End | |
| Fidelity Stock Selector Small Cap Fund | $26 | $- (a) | $- |
Year ended October 31, 2022 | Year ended October 31, 2021 | |
| Fidelity Stock Selector Small Cap Fund | ||
| Distributions to shareholders | ||
| Class A | $10,910 | $931 |
| Class M | 1,718 | 148 |
| Class C | 2,017 | 166 |
| Stock Selector Small Cap | 163,524 | 16,978 |
| Class I | 30,970 | 1,721 |
| Class Z | 17,022 | 1,153 |
Total | $226,161 | $21,097 |
| Shares | Shares | Dollars | Dollars | |
| Year ended October 31, 2022 | Year ended October 31, 2021 | Year ended October 31, 2022 | Year ended October 31, 2021 | |
| Fidelity Stock Selector Small Cap Fund | ||||
| Class A | ||||
| Shares sold | 1,133 | 1,228 | $34,122 | $40,693 |
| Reinvestment of distributions | 335 | 31 | 10,563 | 885 |
| Shares redeemed | (787) | (483) | (22,689) | (16,024) |
| Net increase (decrease) | 681 | 776 | $21,996 | $25,554 |
| Class M | ||||
| Shares sold | 105 | 183 | $3,024 | $5,810 |
| Reinvestment of distributions | 57 | 5 | 1,718 | 148 |
| Shares redeemed | (101) | (54) | (2,857) | (1,685) |
| Net increase (decrease) | 61 | 134 | $1,885 | $4,273 |
| Class C | ||||
| Shares sold | 188 | 320 | $4,875 | $9,363 |
| Reinvestment of distributions | 73 | 7 | 2,015 | 166 |
| Shares redeemed | (186) | (102) | (4,677) | (3,021) |
| Net increase (decrease) | 75 | 225 | $2,213 | $6,508 |
| Stock Selector Small Cap | ||||
| Shares sold | 8,023 | 13,890 | $252,902 | $464,016 |
| Reinvestment of distributions | 4,730 | 557 | 154,140 | 16,281 |
| Shares redeemed | (9,125) | (9,792) | (276,721) | (333,526) |
| Net increase (decrease) | 3,628 | 4,655 | $130,321 | $146,771 |
| Class I | ||||
| Shares sold | 5,918 | 6,912 | $182,536 | $230,376 |
| Reinvestment of distributions | 921 | 56 | 30,204 | 1,648 |
| Shares redeemed | (4,531) | (2,098) | (138,056) | (70,410) |
| Net increase (decrease) | 2,308 | 4,870 | $74,684 | $161,614 |
| Class Z | ||||
| Shares sold | 5,266 | 2,962 | $158,315 | $99,043 |
| Reinvestment of distributions | 462 | 37 | 15,122 | 1,098 |
| Shares redeemed | (2,223) | (770) | (65,320) | (26,990) |
| Net increase (decrease) | 3,505 | 2,229 | $108,117 | $73,151 |
| The Example is based on an investment of $1,000 invested at the beginning of the period and held for the entire period (May 1, 2022 to October 31, 2022). |
Annualized Expense Ratio- A | Beginning Account Value May 1, 2022 | Ending Account Value October 31, 2022 | Expenses Paid During Period- C May 1, 2022 to October 31, 2022 | |||||||
| Fidelity® Stock Selector Small Cap Fund | ||||||||||
| Class A | 1.22% | |||||||||
| Actual | $ 1,000 | $ 996.40 | $ 6.14 | |||||||
Hypothetical- B | $ 1,000 | $ 1,019.06 | $ 6.21 | |||||||
| Class M | 1.50% | |||||||||
| Actual | $ 1,000 | $ 994.70 | $ 7.54 | |||||||
Hypothetical- B | $ 1,000 | $ 1,017.64 | $ 7.63 | |||||||
| Class C | 2.01% | |||||||||
| Actual | $ 1,000 | $ 992.10 | $ 10.09 | |||||||
Hypothetical- B | $ 1,000 | $ 1,015.07 | $ 10.21 | |||||||
| Fidelity® Stock Selector Small Cap Fund | .95% | |||||||||
| Actual | $ 1,000 | $ 997.50 | $ 4.78 | |||||||
Hypothetical- B | $ 1,000 | $ 1,020.42 | $ 4.84 | |||||||
| Class I | .95% | |||||||||
| Actual | $ 1,000 | $ 997.60 | $ 4.78 | |||||||
Hypothetical- B | $ 1,000 | $ 1,020.42 | $ 4.84 | |||||||
| Class Z | .82% | |||||||||
| Actual | $ 1,000 | $ 998.30 | $ 4.13 | |||||||
Hypothetical- B | $ 1,000 | $ 1,021.07 | $ 4.18 | |||||||
|


Contents
Board Approval of Investment Advisory Contracts and Management Fees |
| Average Annual Total Returns | |||
Periods ended October 31, 2022 | Past 1 year | Past 5 years | Past 10 years |
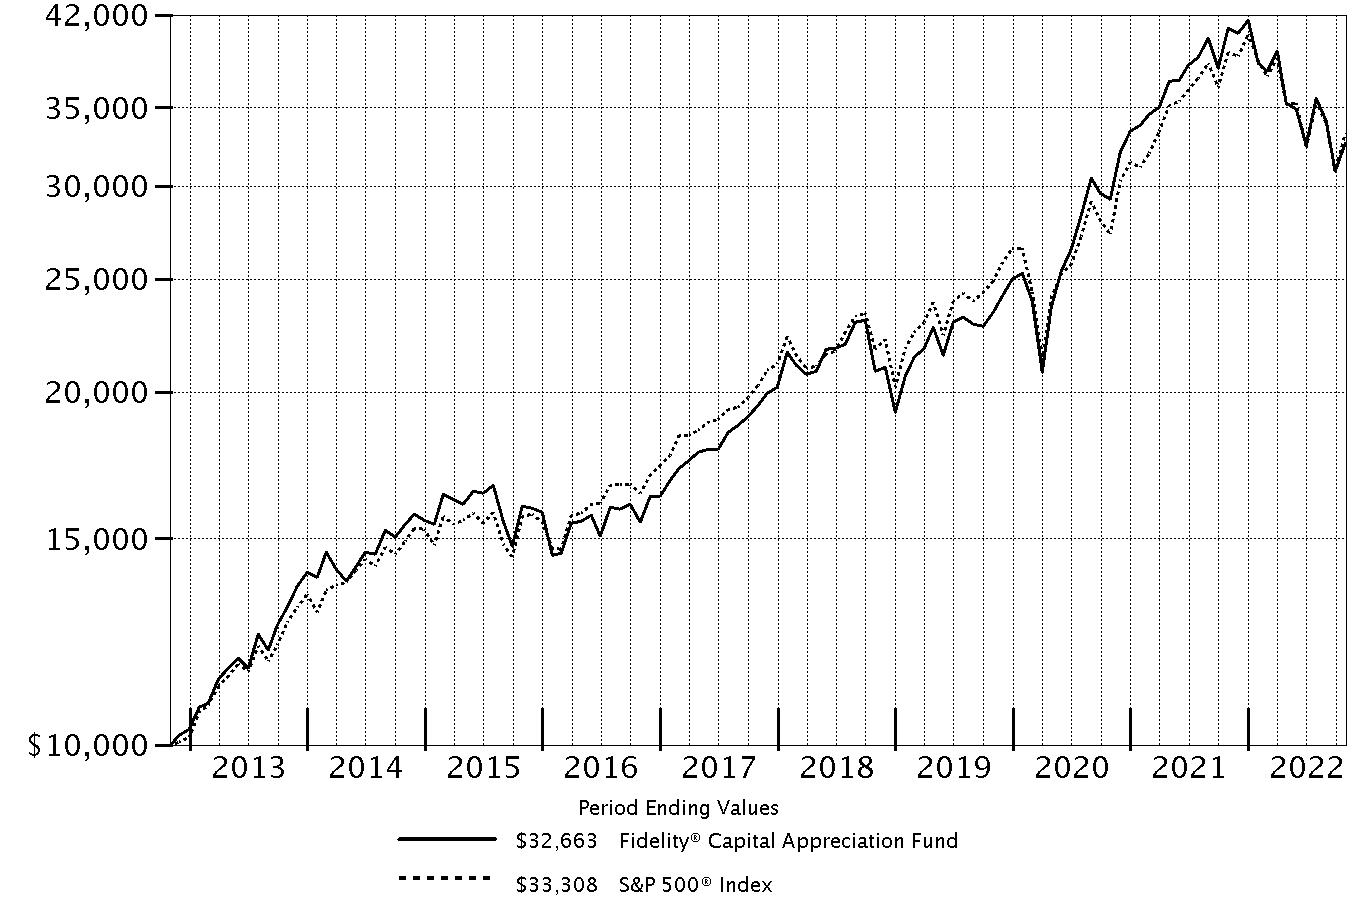
| Fidelity® Capital Appreciation Fund | -20.14% | 10.85% | 12.57% |
| Class K | -20.08% | 10.95% | 12.68% |
| $10,000 Over 10 Years |
Let's say hypothetically that $10,000 was invested in Fidelity® Capital Appreciation Fund, a class of the fund, on October 31, 2012. The chart shows how the value of your investment would have changed, and also shows how the S&P 500® Index performed over the same period. |
 |
Top Holdings (% of Fund's net assets) | ||
| Microsoft Corp. | 8.1 | |
| UnitedHealth Group, Inc. | 5.1 | |
| Amazon.com, Inc. | 4.1 | |
| JPMorgan Chase & Co. | 2.6 | |
| Apple, Inc. | 2.6 | |
| Vertex Pharmaceuticals, Inc. | 2.4 | |
| Bank of America Corp. | 2.3 | |
| Alphabet, Inc. Class A | 2.2 | |
| TJX Companies, Inc. | 2.0 | |
| The Coca-Cola Co. | 1.8 | |
| 33.2 | ||
| Market Sectors (% of Fund's net assets) | ||
| Information Technology | 22.8 | |
| Health Care | 18.5 | |
| Financials | 12.5 | |
| Consumer Discretionary | 12.2 | |
| Communication Services | 10.4 | |
| Industrials | 9.7 | |
| Energy | 4.9 | |
| Consumer Staples | 4.7 | |
| Materials | 3.5 | |
| Utilities | 0.4 | |
| Real Estate | 0.1 | |
Asset Allocation (% of Fund's net assets) |
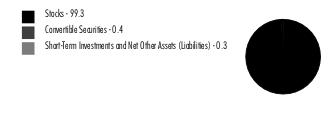 |
Foreign investments - 8.3% |
| Common Stocks - 99.3% | |||
| Shares | Value ($) (000s) | ||
| COMMUNICATION SERVICES - 10.4% | |||
| Entertainment - 3.3% | |||
| Netflix, Inc. (a) | 30,100 | 8,786 | |
| Universal Music Group NV | 4,453,321 | 87,443 | |
| Warner Music Group Corp. Class A | 2,753,200 | 71,638 | |
| 167,867 | |||
| Interactive Media & Services - 5.6% | |||
| Alphabet, Inc.: | |||
| Class A (a) | 1,217,840 | 115,098 | |
| Class C (a) | 860,220 | 81,428 | |
| Bumble, Inc. (a)(b) | 529,600 | 13,452 | |
| Eventbrite, Inc. (a) | 363,300 | 2,387 | |
| Meta Platforms, Inc. Class A (a) | 796,902 | 74,239 | |
| 286,604 | |||
| Media - 1.5% | |||
| Charter Communications, Inc. Class A (a) | 137,800 | 50,658 | |
| Innovid Corp. (a)(c) | 337,444 | 1,262 | |
| Liberty Media Corp. Liberty Formula One Group Series C (a) | 461,481 | 26,641 | |
| 78,561 | |||
TOTAL COMMUNICATION SERVICES | 533,032 | ||
| CONSUMER DISCRETIONARY - 12.2% | |||
| Hotels, Restaurants & Leisure - 1.8% | |||
| Airbnb, Inc. Class A (a) | 274,900 | 29,390 | |
| Chipotle Mexican Grill, Inc. (a) | 8,600 | 12,886 | |
| Flutter Entertainment PLC (a) | 220,800 | 29,322 | |
| Wingstop, Inc. (b) | 130,900 | 20,733 | |
| 92,331 | |||
| Internet & Direct Marketing Retail - 5.5% | |||
| Amazon.com, Inc. (a) | 2,052,460 | 210,254 | |
| Uber Technologies, Inc. (a) | 2,772,200 | 73,657 | |
| 283,911 | |||
| Multiline Retail - 0.3% | |||
| Dollarama, Inc. | 291,500 | 17,321 | |
| Specialty Retail - 3.2% | |||
| Five Below, Inc. (a) | 231,900 | 33,939 | |
| TJX Companies, Inc. | 1,394,400 | 100,536 | |
| Victoria's Secret & Co. (a) | 724,900 | 27,256 | |
| 161,731 | |||
| Textiles, Apparel & Luxury Goods - 1.4% | |||
| LVMH Moet Hennessy Louis Vuitton SE | 52,104 | 32,877 | |
| LVMH Moet Hennessy Louis Vuitton SE | 23,738 | 15,584 | |
| Samsonite International SA (a)(d) | 11,419,200 | 24,556 | |
| 73,017 | |||
TOTAL CONSUMER DISCRETIONARY | 628,311 | ||
| CONSUMER STAPLES - 4.7% | |||
| Beverages - 4.7% | |||
| Boston Beer Co., Inc. Class A (a) | 62,983 | 23,511 | |
| Constellation Brands, Inc. Class A (sub. vtg.) | 160,500 | 39,656 | |
| Keurig Dr. Pepper, Inc. | 827,100 | 32,125 | |
| Monster Beverage Corp. (a) | 562,238 | 52,693 | |
| The Coca-Cola Co. | 1,528,700 | 91,493 | |
| 239,478 | |||
| ENERGY - 4.9% | |||
| Energy Equipment & Services - 1.3% | |||
| Baker Hughes Co. Class A | 1,600,500 | 44,270 | |
| Cactus, Inc. | 142,000 | 7,344 | |
| Championx Corp. | 298,700 | 8,549 | |
| Helmerich & Payne, Inc. | 143,500 | 7,105 | |
| 67,268 | |||
| Oil, Gas & Consumable Fuels - 3.6% | |||
| Canadian Natural Resources Ltd. | 790,300 | 47,371 | |
| Cheniere Energy, Inc. | 454,000 | 80,090 | |
| Denbury, Inc. (a) | 190,400 | 17,404 | |
| New Fortress Energy, Inc. | 333,700 | 18,377 | |
| Range Resources Corp. | 663,400 | 18,894 | |
| 182,136 | |||
TOTAL ENERGY | 249,404 | ||
| FINANCIALS - 12.5% | |||
| Banks - 6.0% | |||
| Bank of America Corp. | 3,290,100 | 118,575 | |
| JPMorgan Chase & Co. | 1,067,500 | 134,377 | |
| M&T Bank Corp. | 277,526 | 46,727 | |
| Signature Bank | 53,300 | 8,450 | |
| 308,129 | |||
| Capital Markets - 2.5% | |||
| CME Group, Inc. | 420,138 | 72,810 | |
| Morgan Stanley | 659,700 | 54,208 | |
| 127,018 | |||
| Insurance - 3.9% | |||
| American Financial Group, Inc. | 256,900 | 37,279 | |
| Arthur J. Gallagher & Co. | 453,741 | 84,886 | |
| BRP Group, Inc. (a) | 438,000 | 12,417 | |
| Marsh & McLennan Companies, Inc. | 421,800 | 68,116 | |
| 202,698 | |||
| Thrifts & Mortgage Finance - 0.1% | |||
| Rocket Companies, Inc. (b) | 397,000 | 2,739 | |
TOTAL FINANCIALS | 640,584 | ||
| HEALTH CARE - 18.5% | |||
| Biotechnology - 6.1% | |||
| 2seventy bio, Inc. (a) | 34,200 | 543 | |
| Adamas Pharmaceuticals, Inc.: | |||
| rights (a)(e) | 1,379,600 | 83 | |
| rights (a)(e) | 1,379,600 | 83 | |
| Alnylam Pharmaceuticals, Inc. (a) | 100,500 | 20,830 | |
| Applied Therapeutics, Inc. (a) | 92,111 | 71 | |
| Arcellx, Inc. | 25,600 | 601 | |
| Beam Therapeutics, Inc. (a)(b) | 61,100 | 2,692 | |
| Cytokinetics, Inc. (a) | 159,800 | 6,977 | |
| EQRx, Inc. (a) | 334,595 | 1,720 | |
| Erasca, Inc. (a) | 139,673 | 1,141 | |
| Evelo Biosciences, Inc. (a) | 379,400 | 774 | |
| Galapagos NV sponsored ADR (a) | 329,500 | 15,005 | |
| Gamida Cell Ltd. (a) | 1,811,763 | 3,243 | |
| Gilead Sciences, Inc. | 366,700 | 28,771 | |
| Hookipa Pharma, Inc. (a) | 916,200 | 1,182 | |
| Prelude Therapeutics, Inc. (a) | 24,000 | 161 | |
| Regeneron Pharmaceuticals, Inc. (a) | 87,022 | 65,158 | |
| Seagen, Inc. (a) | 232,800 | 29,603 | |
| Seres Therapeutics, Inc. (a) | 330,500 | 2,928 | |
| Synlogic, Inc. (a) | 951,200 | 797 | |
| Vertex Pharmaceuticals, Inc. (a) | 396,600 | 123,739 | |
| Vor Biopharma, Inc. (a) | 367,505 | 1,768 | |
| XOMA Corp. (a)(b) | 296,000 | 4,902 | |
| 312,772 | |||
| Health Care Equipment & Supplies - 0.9% | |||
| Edwards Lifesciences Corp. (a) | 405,500 | 29,370 | |
| Insulet Corp. (a) | 6,400 | 1,656 | |
| Nevro Corp. (a) | 53,907 | 2,067 | |
| Penumbra, Inc. (a) | 74,461 | 12,768 | |
| 45,861 | |||
| Health Care Providers & Services - 7.1% | |||
| Guardant Health, Inc. (a) | 354,788 | 17,562 | |
| HealthEquity, Inc. (a) | 879,200 | 68,498 | |
| Option Care Health, Inc. (a) | 583,100 | 17,645 | |
| UnitedHealth Group, Inc. | 469,092 | 260,416 | |
| 364,121 | |||
| Health Care Technology - 0.2% | |||
| Certara, Inc. (a) | 564,300 | 6,901 | |
| Doximity, Inc. (a)(b) | 98,200 | 2,599 | |
| Simulations Plus, Inc. (b) | 75,200 | 3,121 | |
| 12,621 | |||
| Life Sciences Tools & Services - 3.3% | |||
| Bio-Techne Corp. | 47,800 | 14,161 | |
| Bruker Corp. | 472,048 | 29,191 | |
| Charles River Laboratories International, Inc. (a) | 7,300 | 1,549 | |
| Codexis, Inc. (a) | 380,840 | 2,140 | |
| Danaher Corp. | 191,639 | 48,230 | |
| Nanostring Technologies, Inc. (a) | 39,503 | 413 | |
| Thermo Fisher Scientific, Inc. | 139,900 | 71,904 | |
| 167,588 | |||
| Pharmaceuticals - 0.9% | |||
| Aclaris Therapeutics, Inc. (a) | 218,000 | 3,403 | |
| AstraZeneca PLC sponsored ADR | 584,900 | 34,398 | |
| Revance Therapeutics, Inc. (a) | 371,300 | 8,284 | |
| 46,085 | |||
TOTAL HEALTH CARE | 949,048 | ||
| INDUSTRIALS - 9.7% | |||
| Aerospace & Defense - 2.4% | |||
| Axon Enterprise, Inc. (a) | 57,400 | 8,348 | |
| Northrop Grumman Corp. | 131,700 | 72,305 | |
| The Boeing Co. (a) | 286,100 | 40,772 | |
| 121,425 | |||
| Electrical Equipment - 1.2% | |||
| AMETEK, Inc. | 126,300 | 16,376 | |
| Bloom Energy Corp. Class A (a) | 123,200 | 2,305 | |
| Hubbell, Inc. Class B | 53,200 | 12,634 | |
| Rockwell Automation, Inc. | 116,700 | 29,794 | |
| 61,109 | |||
| Machinery - 3.0% | |||
| Chart Industries, Inc. (a)(b) | 58,900 | 13,128 | |
| Ingersoll Rand, Inc. | 1,782,545 | 90,019 | |
| Parker Hannifin Corp. | 80,800 | 23,482 | |
| Westinghouse Air Brake Tech Co. | 321,600 | 29,999 | |
| 156,628 | |||
| Professional Services - 1.9% | |||
| ASGN, Inc. (a) | 125,500 | 10,640 | |
| KBR, Inc. | 1,589,200 | 79,094 | |
| Kforce, Inc. | 57,400 | 3,632 | |
| Upwork, Inc. (a) | 451,456 | 6,072 | |
| 99,438 | |||
| Road & Rail - 0.3% | |||
| Old Dominion Freight Lines, Inc. | 47,200 | 12,961 | |
| Trading Companies & Distributors - 0.9% | |||
| Ferguson PLC | 441,800 | 48,183 | |
TOTAL INDUSTRIALS | 499,744 | ||
| INFORMATION TECHNOLOGY - 22.7% | |||
| Electronic Equipment & Components - 0.0% | |||
| Mobileye Global, Inc. (a) | 46,600 | 1,229 | |
| IT Services - 2.1% | |||
| Cloudflare, Inc. (a) | 182,000 | 10,250 | |
| MasterCard, Inc. Class A | 229,100 | 75,186 | |
| MongoDB, Inc. Class A (a) | 89,319 | 16,348 | |
| Snowflake, Inc. (a) | 23,900 | 3,831 | |
| 105,615 | |||
| Semiconductors & Semiconductor Equipment - 3.8% | |||
| Aixtron AG | 594,500 | 14,623 | |
| Allegro MicroSystems LLC (a) | 180,400 | 4,584 | |
| Analog Devices, Inc. | 245,800 | 35,056 | |
| ASML Holding NV | 44,299 | 20,928 | |
| Enphase Energy, Inc. (a) | 148,995 | 45,741 | |
| NVIDIA Corp. | 137,436 | 18,550 | |
| NXP Semiconductors NV | 4,400 | 643 | |
| Qualcomm, Inc. | 249,947 | 29,409 | |
| SiTime Corp. (a) | 98,277 | 8,826 | |
| Universal Display Corp. | 189,428 | 18,037 | |
| 196,397 | |||
| Software - 14.2% | |||
| Adobe, Inc. (a) | 224,424 | 71,479 | |
| Confluent, Inc. (a)(b) | 296,600 | 7,973 | |
| Epic Games, Inc. (a)(c)(e) | 4,584 | 4,079 | |
| HashiCorp, Inc. (b) | 224,300 | 6,893 | |
| Intuit, Inc. | 105,500 | 45,101 | |
| Manhattan Associates, Inc. (a) | 181,448 | 22,077 | |
| Microsoft Corp. | 1,797,410 | 417,234 | |
| Oracle Corp. | 1,026,400 | 80,131 | |
| Palo Alto Networks, Inc. (a) | 206,700 | 35,468 | |
| Synopsys, Inc. (a) | 123,100 | 36,013 | |
| Volue A/S (a) | 1,407,500 | 3,655 | |
| 730,103 | |||
| Technology Hardware, Storage & Peripherals - 2.6% | |||
| Apple, Inc. | 863,308 | 132,380 | |
TOTAL INFORMATION TECHNOLOGY | 1,165,724 | ||
| MATERIALS - 3.2% | |||
| Chemicals - 2.8% | |||
| Albemarle Corp. | 158,800 | 44,443 | |
| CF Industries Holdings, Inc. | 348,900 | 37,074 | |
| Sherwin-Williams Co. | 272,835 | 61,396 | |
| 142,913 | |||
| Metals & Mining - 0.4% | |||
| Lynas Rare Earths Ltd. (a) | 2,375,566 | 12,658 | |
| MP Materials Corp. (a)(b) | 385,500 | 11,580 | |
| 24,238 | |||
TOTAL MATERIALS | 167,151 | ||
| REAL ESTATE - 0.1% | |||
| Real Estate Management & Development - 0.1% | |||
| Doma Holdings, Inc. (a)(c) | 673,925 | 366 | |
| WeWork, Inc. (a)(b) | 2,795,500 | 7,184 | |
| 7,550 | |||
| UTILITIES - 0.4% | |||
| Independent Power and Renewable Electricity Producers - 0.4% | |||
| Brookfield Renewable Corp. (b) | 551,700 | 17,119 | |
| Brookfield Renewable Partners LP | 114,500 | 3,341 | |
| 20,460 | |||
| TOTAL COMMON STOCKS (Cost $4,256,166) | 5,100,486 | ||
| Convertible Preferred Stocks - 0.4% | |||
| Shares | Value ($) (000s) | ||
| HEALTH CARE - 0.0% | |||
| Biotechnology - 0.0% | |||
| ElevateBio LLC Series C (a)(c)(e) | 153,900 | 704 | |
| INFORMATION TECHNOLOGY - 0.1% | |||
| Software - 0.1% | |||
| ASAPP, Inc. Series C (a)(c)(e) | 513,013 | 1,888 | |
| MATERIALS - 0.3% | |||
| Metals & Mining - 0.3% | |||
| Illuminated Holdings, Inc.: | |||
| Series C2 (a)(c)(e) | 110,923 | 5,207 | |
| Series C3 (a)(c)(e) | 138,654 | 6,508 | |
| Series C4 (a)(c)(e) | 37,518 | 1,761 | |
| Series C5 (a)(c)(e) | 75,216 | 3,531 | |
| 17,007 | |||
| TOTAL CONVERTIBLE PREFERRED STOCKS (Cost $15,563) | 19,599 | ||
| Money Market Funds - 2.7% | |||
| Shares | Value ($) (000s) | ||
| Fidelity Cash Central Fund 3.10% (f) | 62,116,632 | 62,129 | |
| Fidelity Securities Lending Cash Central Fund 3.10% (f)(g) | 76,243,110 | 76,251 | |
| TOTAL MONEY MARKET FUNDS (Cost $138,380) | 138,380 | ||
| TOTAL INVESTMENT IN SECURITIES - 102.4% (Cost $4,410,109) | 5,258,465 |
NET OTHER ASSETS (LIABILITIES) - (2.4)% | (123,133) |
| NET ASSETS - 100.0% | 5,135,332 |
| (a) | Non-income producing |
| (b) | Security or a portion of the security is on loan at period end. |
| (c) | Restricted securities (including private placements) - Investment in securities not registered under the Securities Act of 1933 (excluding 144A issues). At the end of the period, the value of restricted securities (excluding 144A issues) amounted to $25,306,000 or 0.5% of net assets. |
| (d) | Security exempt from registration under Rule 144A of the Securities Act of 1933. These securities may be resold in transactions exempt from registration, normally to qualified institutional buyers. At the end of the period, the value of these securities amounted to $24,556,000 or 0.5% of net assets. |
| (e) | Level 3 security |
| (f) | Affiliated fund that is generally available only to investment companies and other accounts managed by Fidelity Investments. The rate quoted is the annualized seven-day yield of the fund at period end. A complete unaudited listing of the fund's holdings as of its most recent quarter end is available upon request. In addition, each Fidelity Central Fund's financial statements, which are not covered by the Fund's Report of Independent Registered Public Accounting Firm, are available on the SEC's website or upon request. |
| (g) | Investment made with cash collateral received from securities on loan. |
| Additional information on each restricted holding is as follows: | ||
| Security | Acquisition Date | Acquisition Cost ($) (000s) |
| ASAPP, Inc. Series C | 4/30/21 | 3,384 |
| Doma Holdings, Inc. | 3/02/21 | 6,739 |
| ElevateBio LLC Series C | 3/09/21 | 646 |
| Epic Games, Inc. | 3/29/21 | 4,057 |
| Illuminated Holdings, Inc. Series C2 | 7/07/20 | 2,773 |
| Illuminated Holdings, Inc. Series C3 | 7/07/20 | 4,160 |
| Illuminated Holdings, Inc. Series C4 | 1/08/21 | 1,351 |
| Illuminated Holdings, Inc. Series C5 | 6/16/21 | 3,249 |
| Innovid Corp. | 6/24/21 | 3,374 |
| Affiliate (Amounts in thousands) | Value, beginning of period ($) | Purchases ($) | Sales Proceeds ($) | Dividend Income ($) | Realized Gain (loss) ($) | Change in Unrealized appreciation (depreciation) ($) | Value, end of period ($) | % ownership, end of period |
| Fidelity Cash Central Fund 3.10% | 150,736 | 1,211,695 | 1,300,302 | 208 | - | - | 62,129 | 0.1% |
| Fidelity Securities Lending Cash Central Fund 3.10% | 8,109 | 776,406 | 708,264 | 438 | - | - | 76,251 | 0.2% |
| Total | 158,845 | 1,988,101 | 2,008,566 | 646 | - | - | 138,380 | |
| Valuation Inputs at Reporting Date: | ||||
Description (Amounts in thousands) | Total ($) | Level 1 ($) | Level 2 ($) | Level 3 ($) |
Investments in Securities: | ||||
| Equities: | ||||
Communication Services | 533,032 | 445,589 | 87,443 | - |
Consumer Discretionary | 628,311 | 595,434 | 32,877 | - |
Consumer Staples | 239,478 | 239,478 | - | - |
Energy | 249,404 | 249,404 | - | - |
Financials | 640,584 | 640,584 | - | - |
Health Care | 949,752 | 948,882 | - | 870 |
Industrials | 499,744 | 499,744 | - | - |
Information Technology | 1,167,612 | 1,161,645 | - | 5,967 |
Materials | 184,158 | 167,151 | - | 17,007 |
Real Estate | 7,550 | 7,550 | - | - |
Utilities | 20,460 | 20,460 | - | - |
| Money Market Funds | 138,380 | 138,380 | - | - |
| Total Investments in Securities: | 5,258,465 | 5,114,301 | 120,320 | 23,844 |
| Statement of Assets and Liabilities | ||||
| Amounts in thousands (except per-share amounts) | October 31, 2022 | |||
| Assets | ||||
| Investment in securities, at value (including securities loaned of $73,572) - See accompanying schedule: | ||||
Unaffiliated issuers (cost $4,271,729) | $5,120,085 | |||
Fidelity Central Funds (cost $138,380) | 138,380 | |||
| Total Investment in Securities (cost $4,410,109) | $ | 5,258,465 | ||
| Cash | 750 | |||
| Receivable for investments sold | 4,088 | |||
| Receivable for fund shares sold | 1,299 | |||
| Dividends receivable | 1,948 | |||
| Distributions receivable from Fidelity Central Funds | 70 | |||
| Prepaid expenses | 9 | |||
| Other receivables | 27 | |||
Total assets | 5,266,656 | |||
| Liabilities | ||||
| Payable for investments purchased | $49,442 | |||
| Payable for fund shares redeemed | 2,158 | |||
| Accrued management fee | 2,776 | |||
| Other affiliated payables | 595 | |||
| Other payables and accrued expenses | 91 | |||
| Collateral on securities loaned | 76,262 | |||
| Total Liabilities | 131,324 | |||
| Net Assets | $ | 5,135,332 | ||
| Net Assets consist of: | ||||
| Paid in capital | $ | 3,867,142 | ||
| Total accumulated earnings (loss) | 1,268,190 | |||
| Net Assets | $ | 5,135,332 | ||
| Net Asset Value and Maximum Offering Price | ||||
| Capital Appreciation : | ||||
Net Asset Value , offering price and redemption price per share ($4,809,269 ÷ 138,570 shares) | $ | 34.71 | ||
| Class K : | ||||
Net Asset Value , offering price and redemption price per share ($326,063 ÷ 9,357 shares) | $ | 34.85 | ||
| Statement of Operations | ||||
| Amounts in thousands | Year ended October 31, 2022 | |||
| Investment Income | ||||
| Dividends | $ | 62,225 | ||
| Special dividends | 23,086 | |||
| Income from Fidelity Central Funds (including $438 from security lending) | 646 | |||
| Total Income | 85,957 | |||
| Expenses | ||||
| Management fee | ||||
| Basic fee | $ | 31,907 | ||
| Performance adjustment | 9,747 | |||
| Transfer agent fees | 6,707 | |||
| Accounting fees | 1,074 | |||
| Custodian fees and expenses | 75 | |||
| Independent trustees' fees and expenses | 21 | |||
| Registration fees | 115 | |||
| Audit | 59 | |||
| Legal | 11 | |||
| Interest | 54 | |||
| Miscellaneous | 27 | |||
| Total expenses before reductions | 49,797 | |||
| Expense reductions | (199) | |||
| Total expenses after reductions | 49,598 | |||
| Net Investment income (loss) | 36,359 | |||
| Realized and Unrealized Gain (Loss) | ||||
| Net realized gain (loss) on: | ||||
| Investment Securities: | ||||
| Unaffiliated issuers | 471,928 | |||
| Foreign currency transactions | 61 | |||
| Total net realized gain (loss) | 471,989 | |||
| Change in net unrealized appreciation (depreciation) on: | ||||
| Investment Securities: | ||||
| Unaffiliated issuers | (1,860,587) | |||
| Unfunded commitments | 1,033 | |||
| Assets and liabilities in foreign currencies | (18) | |||
| Total change in net unrealized appreciation (depreciation) | (1,859,572) | |||
| Net gain (loss) | (1,387,583) | |||
| Net increase (decrease) in net assets resulting from operations | $ | (1,351,224) | ||
| Statement of Changes in Net Assets | ||||
| Amount in thousands | Year ended October 31, 2022 | Year ended October 31, 2021 | ||
| Increase (Decrease) in Net Assets | ||||
| Operations | ||||
| Net investment income (loss) | $ | 36,359 | $ | (1,132) |
| Net realized gain (loss) | 471,989 | 1,062,802 | ||
| Change in net unrealized appreciation (depreciation) | (1,859,572) | 1,063,302 | ||
| Net increase (decrease) in net assets resulting from operations | (1,351,224) | 2,124,972 | ||
| Distributions to shareholders | (1,022,382) | (480,925) | ||
| Share transactions - net increase (decrease) | 416,815 | (75,008) | ||
| Total increase (decrease) in net assets | (1,956,791) | 1,569,039 | ||
| Net Assets | ||||
| Beginning of period | 7,092,123 | 5,523,084 | ||
| End of period | $ | 5,135,332 | $ | 7,092,123 |
| Fidelity® Capital Appreciation Fund |
| Years ended October 31, | 2022 | 2021 | 2020 | 2019 | 2018 | |||||
Selected Per-Share Data | ||||||||||
| Net asset value, beginning of period | $ | 51.06 | $ | 39.58 | $ | 36.16 | $ | 36.33 | $ | 37.90 |
| Income from Investment Operations | ||||||||||
Net investment income (loss) A,B | .23 C | (.01) | .04 | .24 | .29 | |||||
| Net realized and unrealized gain (loss) | (9.18) | 14.99 | 7.95 | 3.53 | 2.15 | |||||
| Total from investment operations | (8.95) | 14.98 | 7.99 | 3.77 | 2.44 | |||||
| Distributions from net investment income | (.17) | (.01) | (.24) | (.27) | (.34) | |||||
| Distributions from net realized gain | (7.23) | (3.49) | (4.34) | (3.67) | (3.67) | |||||
| Total distributions | (7.40) | (3.50) | (4.57) D | (3.94) | (4.01) | |||||
| Net asset value, end of period | $ | 34.71 | $ | 51.06 | $ | 39.58 | $ | 36.16 | $ | 36.33 |
Total Return E | (20.14)% | 40.02% | 24.73% | 12.24% | 6.93% | |||||
Ratios to Average Net Assets B,F,G | ||||||||||
| Expenses before reductions | .83% | .84% | .82% | .62% | .54% | |||||
| Expenses net of fee waivers, if any | .82% | .84% | .82% | .62% | .54% | |||||
| Expenses net of all reductions | .82% | .84% | .82% | .61% | .53% | |||||
| Net investment income (loss) | .59% C | (.02)% | .12% | .69% | .77% | |||||
| Supplemental Data | ||||||||||
| Net assets, end of period (in millions) | $ | 4,809 | $ | 6,549 | $ | 5,023 | $ | 4,668 | $ | 4,792 |
Portfolio turnover rate H | 69% | 51% | 61% I | 122% | 101% |
| Fidelity® Capital Appreciation Fund Class K |
| Years ended October 31, | 2022 | 2021 | 2020 | 2019 | 2018 | |||||
Selected Per-Share Data | ||||||||||
| Net asset value, beginning of period | $ | 51.24 | $ | 39.70 | $ | 36.25 | $ | 36.42 | $ | 37.99 |
| Income from Investment Operations | ||||||||||
Net investment income (loss) A,B | .26 C | .02 | .07 | .27 | .33 | |||||
| Net realized and unrealized gain (loss) | (9.21) | 15.04 | 7.98 | 3.54 | 2.15 | |||||
| Total from investment operations | (8.95) | 15.06 | 8.05 | 3.81 | 2.48 | |||||
| Distributions from net investment income | (.21) | (.03) | (.26) | (.31) | (.37) | |||||
| Distributions from net realized gain | (7.23) | (3.49) | (4.34) | (3.67) | (3.67) | |||||
| Total distributions | (7.44) | (3.52) | (4.60) | (3.98) | (4.05) D | |||||
| Net asset value, end of period | $ | 34.85 | $ | 51.24 | $ | 39.70 | $ | 36.25 | $ | 36.42 |
Total Return E | (20.08)% | 40.12% | 24.85% | 12.33% | 7.03% | |||||
Ratios to Average Net Assets B,F,G | ||||||||||
| Expenses before reductions | .75% | .76% | .74% | .52% | .45% | |||||
| Expenses net of fee waivers, if any | .75% | .76% | .74% | .52% | .44% | |||||
| Expenses net of all reductions | .75% | .76% | .73% | .52% | .43% | |||||
| Net investment income (loss) | .67% C | .05% | .21% | .79% | .86% | |||||
| Supplemental Data | ||||||||||
| Net assets, end of period (in millions) | $ | 326 | $ | 543 | $ | 500 | $ | 864 | $ | 1,702 |
Portfolio turnover rate H | 69% | 51% | 61% I | 122% | 101% |
| Fidelity Central Fund | Investment Manager | Investment Objective | Investment Practices | Expense Ratio A |
| Fidelity Money Market Central Funds | Fidelity Management & Research Company LLC (FMR) | Each fund seeks to obtain a high level of current income consistent with the preservation of capital and liquidity. | Short-term Investments | Less than .005% |
| Fidelity Capital Appreciation Fund | $26 |
| Gross unrealized appreciation | $1,278,123 |
| Gross unrealized depreciation | (437,665) |
| Net unrealized appreciation (depreciation) | $840,458 |
| Tax Cost | $4,418,007 |
| Undistributed ordinary income | $13,743 |
| Undistributed long-term capital gain | $414,009 |
| Net unrealized appreciation (depreciation) on securities and other investments | $840,438 |
| October 31, 2022 | October 31, 2021 | |
| Ordinary Income | $198,377 | $6,834 |
| Long-term Capital Gains | 824,005 | 474,091 |
| Total | $1,022,382 | $480,925 |
| Purchases ($) | Sales ($) | |
| Fidelity Capital Appreciation Fund | 4,210,775 | 4,589,957 |
| Amount | % of Class-Level Average Net Assets | |
| Capital Appreciation | $6,503 | .12 |
| Class K | 204 | .04 |
| $6,707 |
| % of Average Net Assets | |
| Fidelity Capital Appreciation Fund | .02 |
| Amount | |
| Fidelity Capital Appreciation Fund | $65 |
| Borrower or Lender | Average Loan Balance | Weighted Average Interest Rate | Interest Expense | |
| Fidelity Capital Appreciation Fund | Borrower | $15,617 | 1.49% | $53 |
| Purchases ($) | Sales ($) | Realized Gain (Loss) ($) | |
| Fidelity Capital Appreciation Fund | 151,438 | 260,627 | 14,416 |
| Amount ($) | |
| Fidelity Capital Appreciation Fund | 3 |
| Amount | |
| Fidelity Capital Appreciation Fund | $11 |
| Total Security Lending Fees Paid to NFS | Security Lending Income From Securities Loaned to NFS | Value of Securities Loaned to NFS at Period End | |
| Fidelity Capital Appreciation Fund | $46 | $- A | $148 |
| Average Loan Balance | Weighted Average Interest Rate | Interest Expense | |
| Fidelity Capital Appreciation Fund | $11,581 | 1.33% | $- A |
Year ended October 31, 2022 | Year ended October 31, 2021 | |
| Fidelity Capital Appreciation Fund | ||
| Distributions to shareholders | ||
| Capital Appreciation | $943,863 | $440,699 |
| Class K | 78,519 | 40,226 |
Total | $1,022,382 | $480,925 |
| Shares | Shares | Dollars | Dollars | |
| Year ended October 31, 2022 | Year ended October 31, 2021 | Year ended October 31, 2022 | Year ended October 31, 2021 | |
| Fidelity Capital Appreciation Fund | ||||
| Capital Appreciation | ||||
| Shares sold | 4,490 | 4,762 | $178,854 | $213,800 |
| Reinvestment of distributions | 21,042 | 10,190 | 890,712 | 417,572 |
| Shares redeemed | (15,220) | (13,606) | (597,446) | (616,358) |
| Net increase (decrease) | 10,312 | 1,346 | $472,120 | $15,014 |
| Class K | ||||
| Shares sold | 9,368 | 2,161 | $337,499 | $97,913 |
| Reinvestment of distributions | 1,849 | 979 | 78,519 | 40,226 |
| Shares redeemed | (12,465) | (5,138) | (471,323) | (228,161) |
| Net increase (decrease) | (1,248) | (1,998) | $(55,305) | $(90,022) |
| The Example is based on an investment of $1,000 invested at the beginning of the period and held for the entire period (May 1, 2022 to October 31, 2022). |
Annualized Expense Ratio- A | Beginning Account Value May 1, 2022 | Ending Account Value October 31, 2022 | Expenses Paid During Period- C May 1, 2022 to October 31, 2022 | |||||||
| Fidelity® Capital Appreciation Fund | ||||||||||
| Fidelity® Capital Appreciation Fund | .82% | |||||||||
| Actual | $ 1,000 | $ 925.60 | $ 3.98 | |||||||
Hypothetical- B | $ 1,000 | $ 1,021.07 | $ 4.18 | |||||||
| Class K | .74% | |||||||||
| Actual | $ 1,000 | $ 925.90 | $ 3.59 | |||||||
Hypothetical- B | $ 1,000 | $ 1,021.48 | $ 3.77 | |||||||
|


Contents
Board Approval of Investment Advisory Contracts and Management Fees |
| Average Annual Total Returns | |||
Periods ended October 31, 2022 | Past 1 year | Past 5 years | Past 10 years |
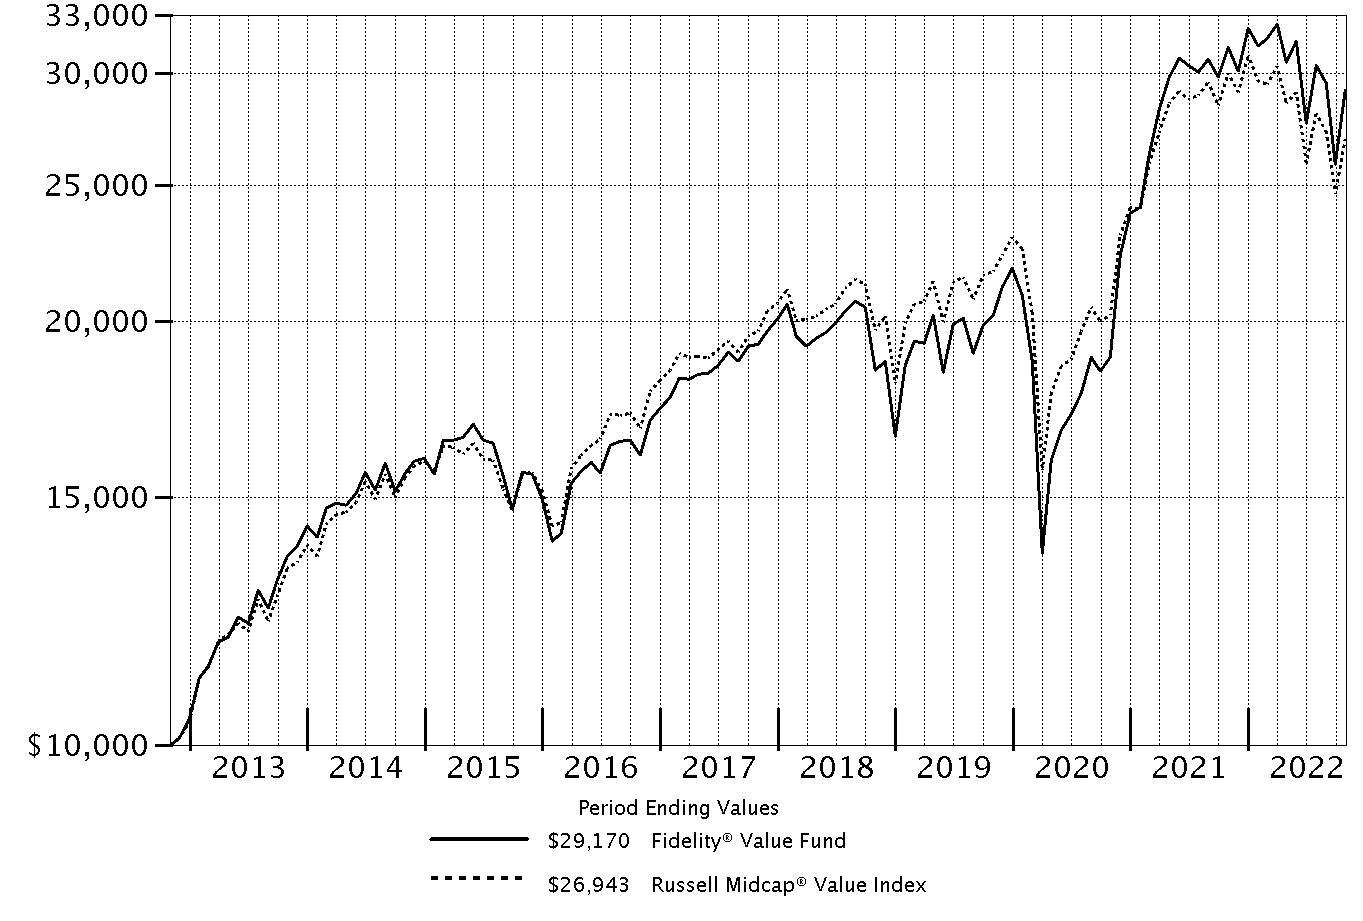
| Fidelity® Value Fund | -6.80% | 8.66% | 11.30% |
| Class K | -6.63% | 8.77% | 11.42% |
| $10,000 Over 10 Years |
Let's say hypothetically that $10,000 was invested in Fidelity® Value Fund, a class of the fund, on October 31, 2012. The chart shows how the value of your investment would have changed, and also shows how the Russell Midcap® Value Index performed over the same period. |
 |
Top Holdings (% of Fund's net assets) | ||
| Antero Resources Corp. | 1.6 | |
| Hess Corp. | 1.5 | |
| Edison International | 1.3 | |
| PG&E Corp. | 1.2 | |
| The AES Corp. | 1.1 | |
| CubeSmart | 1.1 | |
| Denbury, Inc. | 1.0 | |
| The Travelers Companies, Inc. | 1.0 | |
| Entergy Corp. | 1.0 | |
| Cenovus Energy, Inc. (Canada) | 0.9 | |
| 11.7 | ||
| Market Sectors (% of Fund's net assets) | ||
| Consumer Discretionary | 15.4 | |
| Industrials | 15.0 | |
| Financials | 14.0 | |
| Energy | 13.6 | |
| Materials | 12.4 | |
| Health Care | 6.7 | |
| Utilities | 6.4 | |
| Real Estate | 5.4 | |
| Information Technology | 5.1 | |
| Communication Services | 2.8 | |
| Consumer Staples | 2.6 | |
Asset Allocation (% of Fund's net assets) |
 |
Foreign investments - 15.1% |
Geographic Diversification (% of Fund's net assets) |
 |
* Includes Short-Term investments and Net Other Assets (Liabilities). Percentages are based on country or territory of incorporation and are adjusted for the effect of futures contracts, if applicable. |
| Common Stocks - 99.4% | |||
| Shares | Value ($) (000s) | ||
| COMMUNICATION SERVICES - 2.8% | |||
| Diversified Telecommunication Services - 0.4% | |||
| Cellnex Telecom SA (a) | 902,000 | 29,523 | |
| Interactive Media & Services - 0.2% | |||
| Ziff Davis, Inc. (b) | 265,800 | 20,570 | |
| Media - 2.2% | |||
| DISH Network Corp. Class A (b) | 727,068 | 10,841 | |
| Interpublic Group of Companies, Inc. | 1,366,500 | 40,708 | |
| Liberty Broadband Corp. Class C (b) | 362,100 | 30,572 | |
| News Corp. Class A | 1,104,300 | 18,630 | |
| Nexstar Broadcasting Group, Inc. Class A | 176,100 | 30,166 | |
| Scholastic Corp. | 749,500 | 28,586 | |
| Thryv Holdings, Inc. (b) | 1,345,400 | 27,527 | |
| 187,030 | |||
TOTAL COMMUNICATION SERVICES | 237,123 | ||
| CONSUMER DISCRETIONARY - 15.4% | |||
| Auto Components - 1.3% | |||
| Adient PLC (b) | 1,471,700 | 51,480 | |
| Autoliv, Inc. | 555,400 | 44,626 | |
| Cie Automotive SA | 560,200 | 14,250 | |
| 110,356 | |||
| Automobiles - 0.7% | |||
| Harley-Davidson, Inc. | 1,259,400 | 54,154 | |
| Diversified Consumer Services - 1.0% | |||
| Adtalem Global Education, Inc. (b) | 1,512,428 | 63,068 | |
| Frontdoor, Inc. (b) | 983,000 | 21,685 | |
| 84,753 | |||
| Hotels, Restaurants & Leisure - 2.8% | |||
| ARAMARK Holdings Corp. | 1,191,006 | 43,472 | |
| Brinker International, Inc. (b) | 447,557 | 14,944 | |
| Caesars Entertainment, Inc. (b) | 1,116,004 | 48,803 | |
| Hilton Grand Vacations, Inc. (b) | 593,000 | 23,269 | |
| Hyatt Hotels Corp. Class A (b)(c) | 310,346 | 29,238 | |
| Light & Wonder, Inc. Class A (b) | 546,342 | 30,672 | |
| Red Rock Resorts, Inc. (c) | 1,126,800 | 46,931 | |
| 237,329 | |||
| Household Durables - 1.3% | |||
| KB Home | 1,065,200 | 30,699 | |
| Mohawk Industries, Inc. (b) | 352,800 | 33,428 | |
| Tempur Sealy International, Inc. | 1,684,700 | 45,302 | |
| 109,429 | |||
| Internet & Direct Marketing Retail - 0.5% | |||
| eBay, Inc. | 1,044,664 | 41,619 | |
| Leisure Products - 0.5% | |||
| Mattel, Inc. (b) | 2,375,892 | 45,047 | |
| Multiline Retail - 2.1% | |||
| Dollar Tree, Inc. (b) | 371,000 | 58,804 | |
| Franchise Group, Inc. | 1,460,450 | 44,325 | |
| Kohl's Corp. | 1,598,400 | 47,872 | |
| Nordstrom, Inc. (c) | 1,310,108 | 26,648 | |
| 177,649 | |||
| Specialty Retail - 4.5% | |||
| Academy Sports & Outdoors, Inc. | 465,279 | 20,486 | |
| American Eagle Outfitters, Inc. (c) | 5,151,600 | 58,522 | |
| Bath & Body Works, Inc. | 1,306,400 | 43,608 | |
| Camping World Holdings, Inc. (c) | 1,191,200 | 33,151 | |
| Lithia Motors, Inc. Class A (sub. vtg.) | 158,700 | 31,446 | |
| Rent-A-Center, Inc. | 1,784,920 | 37,216 | |
| Sally Beauty Holdings, Inc. (b) | 2,386,646 | 30,334 | |
| Signet Jewelers Ltd. (c) | 593,777 | 38,738 | |
| Victoria's Secret & Co. (b) | 1,744,533 | 65,594 | |
| Williams-Sonoma, Inc. (c) | 106,800 | 13,225 | |
| 372,320 | |||
| Textiles, Apparel & Luxury Goods - 0.7% | |||
| Capri Holdings Ltd. (b) | 1,205,066 | 55,047 | |
TOTAL CONSUMER DISCRETIONARY | 1,287,703 | ||
| CONSUMER STAPLES - 2.6% | |||
| Beverages - 0.4% | |||
| Primo Water Corp. | 2,293,100 | 33,456 | |
| Food & Staples Retailing - 0.8% | |||
| U.S. Foods Holding Corp. (b) | 2,216,800 | 65,972 | |
| Food Products - 0.8% | |||
| Darling Ingredients, Inc. (b) | 823,894 | 64,659 | |
| Household Products - 0.3% | |||
| Energizer Holdings, Inc. | 850,400 | 24,568 | |
| Personal Products - 0.3% | |||
| Herbalife Nutrition Ltd. (b) | 1,108,100 | 23,558 | |
TOTAL CONSUMER STAPLES | 212,213 | ||
| ENERGY - 13.6% | |||
| Energy Equipment & Services - 2.8% | |||
| Halliburton Co. | 1,600,300 | 58,283 | |
| Liberty Oilfield Services, Inc. Class A | 2,115,133 | 35,767 | |
| TechnipFMC PLC (b) | 6,863,540 | 72,685 | |
| Tenaris SA | 3,166,800 | 49,564 | |
| Valaris Ltd. (b) | 266,900 | 17,864 | |
| 234,163 | |||
| Oil, Gas & Consumable Fuels - 10.8% | |||
| Antero Resources Corp. (b) | 3,688,300 | 135,213 | |
| APA Corp. | 282,000 | 12,820 | |
| Canadian Natural Resources Ltd. | 921,600 | 55,275 | |
| Cenovus Energy, Inc. (Canada) | 3,642,281 | 73,629 | |
| Chesapeake Energy Corp. | 187,200 | 19,145 | |
| Denbury, Inc. (b) | 891,927 | 81,531 | |
| Devon Energy Corp. | 310,901 | 24,048 | |
| Diamondback Energy, Inc. | 85,636 | 13,454 | |
| Energy Transfer LP | 3,722,397 | 47,535 | |
| EQT Corp. | 387,642 | 16,219 | |
| Genesis Energy LP | 3,782,595 | 43,462 | |
| Hess Corp. | 902,277 | 127,293 | |
| HF Sinclair Corp. | 962,700 | 58,888 | |
| Imperial Oil Ltd. | 855,400 | 46,533 | |
| Kosmos Energy Ltd. (b) | 6,520,128 | 42,316 | |
| Targa Resources Corp. | 508,380 | 34,758 | |
| The Williams Companies, Inc. | 301,333 | 9,863 | |
| Tourmaline Oil Corp. | 740,300 | 41,711 | |
| Valero Energy Corp. | 162,812 | 20,441 | |
| 904,134 | |||
TOTAL ENERGY | 1,138,297 | ||
| FINANCIALS - 14.0% | |||
| Banks - 3.8% | |||
| Bank of Kyoto Ltd. | 363,800 | 13,114 | |
| East West Bancorp, Inc. | 909,666 | 65,105 | |
| First Citizens Bancshares, Inc. | 56,792 | 46,690 | |
| First Citizens Bancshares, Inc. Class B | 5,400 | 3,818 | |
| M&T Bank Corp. | 404,572 | 68,118 | |
| PacWest Bancorp | 1,165,140 | 28,965 | |
| Signature Bank | 419,400 | 66,487 | |
| Wintrust Financial Corp. | 254,600 | 23,836 | |
| 316,133 | |||
| Capital Markets - 2.4% | |||
| Ameriprise Financial, Inc. | 182,500 | 56,414 | |
| Lazard Ltd. Class A | 812,300 | 30,632 | |
| LPL Financial | 272,700 | 69,716 | |
| Northern Trust Corp. | 27,900 | 2,353 | |
| Petershill Partners PLC (a) | 7,977,800 | 18,133 | |
| State Street Corp. | 257,700 | 19,070 | |
| 196,318 | |||
| Consumer Finance - 1.3% | |||
| OneMain Holdings, Inc. | 1,262,780 | 48,693 | |
| SLM Corp. | 3,803,342 | 63,097 | |
| 111,790 | |||
| Diversified Financial Services - 1.5% | |||
| Apollo Global Management, Inc. | 1,213,502 | 67,179 | |
| Corebridge Financial, Inc. | 322,700 | 7,316 | |
| ECN Capital Corp. | 3,148,069 | 9,497 | |
| Equitable Holdings, Inc. | 1,338,757 | 40,993 | |
| 124,985 | |||
| Insurance - 3.6% | |||
| AMBAC Financial Group, Inc. (b) | 1,971,059 | 27,693 | |
| American Financial Group, Inc. | 273,400 | 39,673 | |
| Arch Capital Group Ltd. (b) | 747,151 | 42,961 | |
| Assurant, Inc. | 311,179 | 42,277 | |
| First American Financial Corp. | 438,800 | 22,116 | |
| Reinsurance Group of America, Inc. | 311,449 | 45,836 | |
| The Travelers Companies, Inc. | 441,400 | 81,421 | |
| 301,977 | |||
| Thrifts & Mortgage Finance - 1.4% | |||
| Axos Financial, Inc. (b) | 1,275,969 | 49,712 | |
| Essent Group Ltd. | 832,700 | 32,958 | |
| Walker & Dunlop, Inc. | 393,100 | 35,363 | |
| 118,033 | |||
TOTAL FINANCIALS | 1,169,236 | ||
| HEALTH CARE - 6.7% | |||
| Biotechnology - 0.7% | |||
| Biogen, Inc. (b) | 35,899 | 10,175 | |
| BioMarin Pharmaceutical, Inc. (b) | 39,900 | 3,457 | |
| Horizon Therapeutics PLC (b) | 33,931 | 2,115 | |
| Poseida Therapeutics, Inc. (b) | 179,120 | 734 | |
| United Therapeutics Corp. (b) | 173,945 | 40,100 | |
| 56,581 | |||
| Health Care Equipment & Supplies - 0.5% | |||
| Dentsply Sirona, Inc. | 298,800 | 9,209 | |
| STERIS PLC | 45,893 | 7,920 | |
| Teleflex, Inc. | 34,620 | 7,428 | |
| The Cooper Companies, Inc. | 33,635 | 9,195 | |
| Zimmer Biomet Holdings, Inc. | 40,931 | 4,640 | |
| 38,392 | |||
| Health Care Providers & Services - 3.6% | |||
| AdaptHealth Corp. (b)(d) | 2,418,996 | 55,153 | |
| agilon health, Inc. (b) | 85,200 | 1,691 | |
| AmerisourceBergen Corp. | 79,732 | 12,535 | |
| Centene Corp. (b) | 612,700 | 52,159 | |
| Cigna Corp. | 190,349 | 61,494 | |
| Laboratory Corp. of America Holdings | 221,255 | 49,088 | |
| Molina Healthcare, Inc. (b) | 32,160 | 11,541 | |
| Oak Street Health, Inc. (b) | 116,600 | 2,359 | |
| Owens & Minor, Inc. | 460,836 | 7,834 | |
| Quest Diagnostics, Inc. | 27,800 | 3,993 | |
| R1 Rcm, Inc. (b) | 186,000 | 3,285 | |
| Tenet Healthcare Corp. (b) | 838,007 | 37,174 | |
| 298,306 | |||
| Health Care Technology - 0.0% | |||
| Evolent Health, Inc. (b) | 58,000 | 1,845 | |
| Life Sciences Tools & Services - 0.9% | |||
| Agilent Technologies, Inc. | 61,827 | 8,554 | |
| Avantor, Inc. (b) | 148,320 | 2,992 | |
| Bio-Rad Laboratories, Inc. Class A (b) | 23,562 | 8,287 | |
| Charles River Laboratories International, Inc. (b) | 12,800 | 2,717 | |
| IQVIA Holdings, Inc. (b) | 27,084 | 5,679 | |
| PerkinElmer, Inc. (c) | 59,531 | 7,952 | |
| Syneos Health, Inc. (b) | 867,900 | 43,725 | |
| 79,906 | |||
| Pharmaceuticals - 1.0% | |||
| Catalent, Inc. (b) | 81,693 | 5,370 | |
| Elanco Animal Health, Inc. (b) | 906,000 | 11,950 | |
| Jazz Pharmaceuticals PLC (b) | 375,397 | 53,978 | |
| Royalty Pharma PLC | 269,787 | 11,417 | |
| 82,715 | |||
TOTAL HEALTH CARE | 557,745 | ||
| INDUSTRIALS - 15.0% | |||
| Air Freight & Logistics - 0.6% | |||
| Deutsche Post AG | 129,100 | 4,564 | |
| FedEx Corp. | 282,600 | 45,295 | |
| 49,859 | |||
| Building Products - 0.9% | |||
| Builders FirstSource, Inc. (b) | 876,750 | 54,060 | |
| UFP Industries, Inc. | 244,800 | 17,437 | |
| 71,497 | |||
| Commercial Services & Supplies - 0.9% | |||
| HNI Corp. (c) | 737,824 | 21,390 | |
| The Brink's Co. | 886,900 | 52,886 | |
| 74,276 | |||
| Construction & Engineering - 3.0% | |||
| API Group Corp. (b) | 2,596,263 | 42,812 | |
| Fluor Corp. (b) | 2,140,400 | 64,769 | |
| Granite Construction, Inc. | 1,432,600 | 48,322 | |
| MDU Resources Group, Inc. | 1,410,800 | 40,180 | |
| Willscot Mobile Mini Holdings (b) | 1,301,600 | 55,357 | |
| 251,440 | |||
| Electrical Equipment - 1.9% | |||
| Array Technologies, Inc. (b)(c) | 2,501,000 | 45,268 | |
| GrafTech International Ltd. | 5,637,700 | 28,696 | |
| Regal Rexnord Corp. | 460,456 | 58,266 | |
| Sensata Technologies, Inc. PLC | 652,306 | 26,229 | |
| 158,459 | |||
| Machinery - 3.4% | |||
| Allison Transmission Holdings, Inc. | 1,154,129 | 48,762 | |
| Crane Holdings Co. | 507,400 | 50,913 | |
| Flowserve Corp. | 1,774,809 | 50,902 | |
| Kennametal, Inc. | 1,967,997 | 52,565 | |
| Oshkosh Corp. | 381,700 | 33,590 | |
| Timken Co. | 705,636 | 50,305 | |
| 287,037 | |||
| Professional Services - 0.6% | |||
| Manpower, Inc. | 657,000 | 51,469 | |
| Road & Rail - 2.1% | |||
| AMERCO | 69,100 | 39,746 | |
| FTAI Infrastructure LLC | 1,204,031 | 3,311 | |
| Ryder System, Inc. | 559,370 | 45,035 | |
| TFI International, Inc. (Canada) | 369,300 | 33,616 | |
| XPO Logistics, Inc. (b) | 1,026,000 | 53,085 | |
| 174,793 | |||
| Trading Companies & Distributors - 1.6% | |||
| Beacon Roofing Supply, Inc. (b) | 944,800 | 53,239 | |
| Custom Truck One Source, Inc. Class A (b) | 3,803,100 | 26,355 | |
| GMS, Inc. (b) | 336,798 | 15,897 | |
| Herc Holdings, Inc. | 348,300 | 40,964 | |
| 136,455 | |||
TOTAL INDUSTRIALS | 1,255,285 | ||
| INFORMATION TECHNOLOGY - 5.1% | |||
| Communications Equipment - 0.4% | |||
| Lumentum Holdings, Inc. (b) | 448,194 | 33,368 | |
| Electronic Equipment & Components - 1.2% | |||
| Flex Ltd. (b) | 3,529,500 | 69,108 | |
| Vontier Corp. | 1,671,808 | 31,932 | |
| 101,040 | |||
| IT Services - 2.3% | |||
| Concentrix Corp. | 306,600 | 37,476 | |
| Cyxtera Technologies, Inc. Class A (b) | 2,970,392 | 7,188 | |
| DXC Technology Co. (b) | 640,400 | 18,412 | |
| Fidelity National Information Services, Inc. | 557,600 | 46,275 | |
| SS&C Technologies Holdings, Inc. | 955,100 | 49,111 | |
| Unisys Corp. (b)(d) | 3,400,472 | 28,904 | |
| 187,366 | |||
| Semiconductors & Semiconductor Equipment - 0.1% | |||
| Micron Technology, Inc. | 167,700 | 9,073 | |
| Software - 1.1% | |||
| NCR Corp. (b) | 2,235,500 | 47,527 | |
| NortonLifeLock, Inc. | 2,028,200 | 45,695 | |
| 93,222 | |||
TOTAL INFORMATION TECHNOLOGY | 424,069 | ||
| MATERIALS - 12.4% | |||
| Chemicals - 5.4% | |||
| Axalta Coating Systems Ltd. (b)(c) | 1,904,337 | 44,409 | |
| Cabot Corp. | 535,600 | 39,356 | |
| Celanese Corp. Class A | 493,911 | 47,475 | |
| Corteva, Inc. | 592,223 | 38,696 | |
| Eastman Chemical Co. | 522,900 | 40,164 | |
| Huntsman Corp. | 528,080 | 14,131 | |
| Methanex Corp. (c) | 1,429,200 | 49,865 | |
| Olin Corp. | 901,300 | 47,724 | |
| The Chemours Co. LLC | 1,401,345 | 40,121 | |
| Trinseo PLC | 374,726 | 7,052 | |
| Tronox Holdings PLC | 2,351,374 | 28,216 | |
| Westlake Corp. (c) | 570,700 | 55,158 | |
| 452,367 | |||
| Construction Materials - 1.4% | |||
| Eagle Materials, Inc. | 283,800 | 34,712 | |
| GCC S.A.B. de CV | 3,358,400 | 20,852 | |
| Martin Marietta Materials, Inc. | 69,749 | 23,434 | |
| Summit Materials, Inc. (b) | 1,508,484 | 39,749 | |
| 118,747 | |||
| Containers & Packaging - 1.5% | |||
| Berry Global Group, Inc. (b) | 1,003,167 | 47,470 | |
| Crown Holdings, Inc. | 531,600 | 36,462 | |
| O-I Glass, Inc. (b) | 2,602,884 | 42,453 | |
| 126,385 | |||
| Metals & Mining - 3.6% | |||
| Alcoa Corp. | 704,500 | 27,497 | |
| ArcelorMittal SA Class A unit GDR | 1,324,984 | 29,746 | |
| Arconic Corp. (b) | 2,699,824 | 56,048 | |
| ATI, Inc. (b)(c) | 1,045,800 | 31,123 | |
| Carpenter Technology Corp. | 602,200 | 22,522 | |
| Constellium NV (b) | 4,162,914 | 45,875 | |
| First Quantum Minerals Ltd. | 949,107 | 16,741 | |
| Freeport-McMoRan, Inc. | 1,209,600 | 38,332 | |
| Steel Dynamics, Inc. | 285,711 | 26,871 | |
| 294,755 | |||
| Paper & Forest Products - 0.5% | |||
| Louisiana-Pacific Corp. | 742,120 | 42,041 | |
TOTAL MATERIALS | 1,034,295 | ||
| REAL ESTATE - 5.4% | |||
| Equity Real Estate Investment Trusts (REITs) - 3.7% | |||
| CubeSmart | 2,133,637 | 89,335 | |
| Equinix, Inc. | 43,700 | 24,753 | |
| Equity Lifestyle Properties, Inc. | 486,022 | 31,086 | |
| Lamar Advertising Co. Class A | 135,500 | 12,497 | |
| Outfront Media, Inc. | 517,300 | 9,337 | |
| Prologis (REIT), Inc. | 547,902 | 60,680 | |
| Ventas, Inc. | 655,586 | 25,653 | |
| Welltower Op | 913,600 | 55,766 | |
| 309,107 | |||
| Real Estate Management & Development - 1.7% | |||
| Anywhere Real Estate, Inc. (b) | 3,739,895 | 27,787 | |
| Cushman & Wakefield PLC (b) | 4,076,666 | 47,085 | |
| Jones Lang LaSalle, Inc. (b) | 302,300 | 48,093 | |
| WeWork, Inc. (b)(c) | 6,491,247 | 16,683 | |
| 139,648 | |||
TOTAL REAL ESTATE | 448,755 | ||
| UTILITIES - 6.4% | |||
| Electric Utilities - 4.3% | |||
| Constellation Energy Corp. | 685,469 | 64,804 | |
| Edison International | 1,859,784 | 111,661 | |
| Entergy Corp. | 750,300 | 80,387 | |
| PG&E Corp. (b) | 6,703,300 | 100,080 | |
| 356,932 | |||
| Independent Power and Renewable Electricity Producers - 1.5% | |||
| The AES Corp. | 3,595,700 | 94,064 | |
| Vistra Corp. | 1,554,500 | 35,707 | |
| 129,771 | |||
| Multi-Utilities - 0.6% | |||
| Sempra Energy | 332,300 | 50,157 | |
TOTAL UTILITIES | 536,860 | ||
| TOTAL COMMON STOCKS (Cost $7,271,565) | 8,301,581 | ||
| U.S. Treasury Obligations - 0.1% | |||
Principal Amount (e) (000s) | Value ($) (000s) | ||
U.S. Treasury Bills, yield at date of purchase 2.59% to 2.88% 11/17/22 to 12/1/22 (Cost $2,764) | 2,770 | 2,763 | |
| Money Market Funds - 2.5% | |||
| Shares | Value ($) (000s) | ||
| Fidelity Cash Central Fund 3.10% (f) | 16,301,497 | 16,305 | |
| Fidelity Securities Lending Cash Central Fund 3.10% (f)(g) | 192,967,688 | 192,987 | |
| TOTAL MONEY MARKET FUNDS (Cost $209,291) | 209,292 | ||
| TOTAL INVESTMENT IN SECURITIES - 102.0% (Cost $7,483,620) | 8,513,636 |
NET OTHER ASSETS (LIABILITIES) - (2.0)% | (164,386) |
| NET ASSETS - 100.0% | 8,349,250 |
| (a) | Security exempt from registration under Rule 144A of the Securities Act of 1933. These securities may be resold in transactions exempt from registration, normally to qualified institutional buyers. At the end of the period, the value of these securities amounted to $47,656,000 or 0.6% of net assets. |
| (b) | Non-income producing |
| (c) | Security or a portion of the security is on loan at period end. |
| (d) | Affiliated company |
| (e) | Amount is stated in United States dollars unless otherwise noted. |
| (f) | Affiliated fund that is generally available only to investment companies and other accounts managed by Fidelity Investments. The rate quoted is the annualized seven-day yield of the fund at period end. A complete unaudited listing of the fund's holdings as of its most recent quarter end is available upon request. In addition, each Fidelity Central Fund's financial statements, which are not covered by the Fund's Report of Independent Registered Public Accounting Firm, are available on the SEC's website or upon request. |
| (g) | Investment made with cash collateral received from securities on loan. |
| Affiliate (Amounts in thousands) | Value, beginning of period ($) | Purchases ($) | Sales Proceeds ($) | Dividend Income ($) | Realized Gain (loss) ($) | Change in Unrealized appreciation (depreciation) ($) | Value, end of period ($) | % ownership, end of period |
| Fidelity Cash Central Fund 3.10% | 44,445 | 2,806,407 | 2,834,547 | 768 | - | - | 16,305 | 0.0% |
| Fidelity Securities Lending Cash Central Fund 3.10% | 192,078 | 1,571,899 | 1,570,990 | 1,887 | - | - | 192,987 | 0.5% |
| Total | 236,523 | 4,378,306 | 4,405,537 | 2,655 | - | - | 209,292 | |
| Affiliate (Amounts in thousands) | Value, beginning of period ($) | Purchases ($) | Sales Proceeds ($) | Dividend Income ($) | Realized Gain (loss) ($) | Change in Unrealized appreciation (depreciation) ($) | Value, end of period ($) |
| AdaptHealth Corp. | - | 72,900 | 35,192 | - | 785 | 16,660 | 55,153 |
| Unisys Corp. | 76,788 | 7,423 | - | - | - | (55,307) | 28,904 |
| Total | 76,788 | 80,323 | 35,192 | - | 785 | (38,647) | 84,057 |
| Valuation Inputs at Reporting Date: | ||||
Description (Amounts in thousands) | Total ($) | Level 1 ($) | Level 2 ($) | Level 3 ($) |
Investments in Securities: | ||||
| Equities: | ||||
Communication Services | 237,123 | 207,600 | 29,523 | - |
Consumer Discretionary | 1,287,703 | 1,287,703 | - | - |
Consumer Staples | 212,213 | 212,213 | - | - |
Energy | 1,138,297 | 1,088,733 | 49,564 | - |
Financials | 1,169,236 | 1,169,236 | - | - |
Health Care | 557,745 | 557,745 | - | - |
Industrials | 1,255,285 | 1,250,721 | 4,564 | - |
Information Technology | 424,069 | 424,069 | - | - |
Materials | 1,034,295 | 1,034,295 | - | - |
Real Estate | 448,755 | 448,755 | - | - |
Utilities | 536,860 | 536,860 | - | - |
| U.S. Government and Government Agency Obligations | 2,763 | - | 2,763 | - |
| Money Market Funds | 209,292 | 209,292 | - | - |
| Total Investments in Securities: | 8,513,636 | 8,427,222 | 86,414 | - |
| Statement of Assets and Liabilities | ||||
| Amounts in thousands (except per-share amounts) | October 31, 2022 | |||
| Assets | ||||
| Investment in securities, at value (including securities loaned of $186,611) - See accompanying schedule: | ||||
Unaffiliated issuers (cost $7,183,112) | $8,220,287 | |||
Fidelity Central Funds (cost $209,291) | 209,292 | |||
Other affiliated issuers (cost $91,217) | 84,057 | |||
| Total Investment in Securities (cost $7,483,620) | $ | 8,513,636 | ||
| Cash | 898 | |||
| Foreign currency held at value (cost $2,826) | 2,830 | |||
| Receivable for investments sold | 59,253 | |||
| Receivable for fund shares sold | 3,240 | |||
| Dividends receivable | 3,898 | |||
| Distributions receivable from Fidelity Central Funds | 281 | |||
| Prepaid expenses | 13 | |||
| Other receivables | 470 | |||
Total assets | 8,584,519 | |||
| Liabilities | ||||
| Payable for investments purchased | $31,202 | |||
| Payable for fund shares redeemed | 4,951 | |||
| Accrued management fee | 4,777 | |||
| Payable for daily variation margin on futures contracts | 19 | |||
| Other affiliated payables | 903 | |||
| Other payables and accrued expenses | 448 | |||
| Collateral on securities loaned | 192,969 | |||
| Total Liabilities | 235,269 | |||
| Net Assets | $ | 8,349,250 | ||
| Net Assets consist of: | ||||
| Paid in capital | $ | 6,860,975 | ||
| Total accumulated earnings (loss) | 1,488,275 | |||
| Net Assets | $ | 8,349,250 | ||
| Net Asset Value and Maximum Offering Price | ||||
| Value : | ||||
Net Asset Value , offering price and redemption price per share ($7,189,566 ÷ 541,614 shares) | $ | 13.27 | ||
| Class K : | ||||
Net Asset Value , offering price and redemption price per share ($1,159,684 ÷ 87,197 shares) | $ | 13.30 | ||
| Statement of Operations | ||||
| Amounts in thousands | Year ended October 31, 2022 | |||
| Investment Income | ||||
| Dividends | $ | 180,541 | ||
| Interest | 46 | |||
| Income from Fidelity Central Funds (including $1,887 from security lending) | 2,655 | |||
| Total Income | 183,242 | |||
| Expenses | ||||
| Management fee | ||||
| Basic fee | $ | 47,931 | ||
| Performance adjustment | 14,713 | |||
| Transfer agent fees | 10,452 | |||
| Accounting fees | 1,199 | |||
| Custodian fees and expenses | 69 | |||
| Independent trustees' fees and expenses | 31 | |||
| Registration fees | 172 | |||
| Audit | 64 | |||
| Legal | 16 | |||
| Interest | 40 | |||
| Miscellaneous | 40 | |||
| Total expenses before reductions | 74,727 | |||
| Expense reductions | (295) | |||
| Total expenses after reductions | 74,432 | |||
| Net Investment income (loss) | 108,810 | |||
| Realized and Unrealized Gain (Loss) | ||||
| Net realized gain (loss) on: | ||||
| Investment Securities: | ||||
| Unaffiliated issuers | 560,422 | |||
| Affiliated issuers | 785 | |||
| Foreign currency transactions | (80) | |||
| Futures contracts | (21,896) | |||
| Total net realized gain (loss) | 539,231 | |||
| Change in net unrealized appreciation (depreciation) on: | ||||
| Investment Securities: | ||||
| Unaffiliated issuers | (1,264,121) | |||
| Affiliated issuers | (38,647) | |||
| Assets and liabilities in foreign currencies | (82) | |||
| Futures contracts | (423) | |||
| Total change in net unrealized appreciation (depreciation) | (1,303,273) | |||
| Net gain (loss) | (764,042) | |||
| Net increase (decrease) in net assets resulting from operations | $ | (655,232) | ||
| Statement of Changes in Net Assets | ||||
| Amount in thousands | Year ended October 31, 2022 | Year ended October 31, 2021 | ||
| Increase (Decrease) in Net Assets | ||||
| Operations | ||||
| Net investment income (loss) | $ | 108,810 | $ | 68,102 |
| Net realized gain (loss) | 539,231 | 1,487,674 | ||
| Change in net unrealized appreciation (depreciation) | (1,303,273) | 1,892,801 | ||
| Net increase (decrease) in net assets resulting from operations | (655,232) | 3,448,577 | ||
| Distributions to shareholders | (871,432) | (64,718) | ||
| Share transactions - net increase (decrease) | 346,721 | 892,433 | ||
| Total increase (decrease) in net assets | (1,179,943) | 4,276,292 | ||
| Net Assets | ||||
| Beginning of period | 9,529,193 | 5,252,901 | ||
| End of period | $ | 8,349,250 | $ | 9,529,193 |
| Fidelity® Value Fund |
| Years ended October 31, | 2022 | 2021 | 2020 | 2019 | 2018 A | |||||
Selected Per-Share Data | ||||||||||
| Net asset value, beginning of period | $ | 15.72 | $ | 9.57 | $ | 10.59 | $ | 11.15 | $ | 12.19 |
| Income from Investment Operations | ||||||||||
Net investment income (loss) B,C | .17 | .12 | .12 | .14 | .15 | |||||
| Net realized and unrealized gain (loss) | (1.18) | 6.15 | (.77) | .71 | (.62) | |||||
| Total from investment operations | (1.01) | 6.27 | (.65) | .85 | (.47) | |||||
| Distributions from net investment income | (.20) | (.12) | (.14) D | (.12) | (.17) | |||||
| Distributions from net realized gain | (1.24) | - | (.23) D | (1.29) | (.41) | |||||
| Total distributions | (1.44) | (.12) | (.37) | (1.41) | (.57) E | |||||
| Net asset value, end of period | $ | 13.27 | $ | 15.72 | $ | 9.57 | $ | 10.59 | $ | 11.15 |
Total Return F | (6.80)% | 65.91% | (6.52)% | 9.31% | (4.14)% | |||||
Ratios to Average Net Assets B,G,H | ||||||||||
| Expenses before reductions | .83% | .79% | .57% | .58% | .58% | |||||
| Expenses net of fee waivers, if any | .83% | .79% | .57% | .58% | .58% | |||||
| Expenses net of all reductions | .83% | .79% | .55% | .58% | .56% | |||||
| Net investment income (loss) | 1.18% | .82% | 1.30% | 1.38% | 1.25% | |||||
| Supplemental Data | ||||||||||
| Net assets, end of period (in millions) | $ | 7,190 | $ | 8,361 | $ | 4,760 | $ | 6,112 | $ | 6,181 |
Portfolio turnover rate I | 74% | 77% | 90% | 75% | 100% |
| Fidelity® Value Fund Class K |
| Years ended October 31, | 2022 | 2021 | 2020 | 2019 | 2018 A | |||||
Selected Per-Share Data | ||||||||||
| Net asset value, beginning of period | $ | 15.74 | $ | 9.59 | $ | 10.60 | $ | 11.16 | $ | 12.21 |
| Income from Investment Operations | ||||||||||
Net investment income (loss) B,C | .18 | .13 | .13 | .15 | .16 | |||||
| Net realized and unrealized gain (loss) | (1.17) | 6.15 | (.76) | .72 | (.62) | |||||
| Total from investment operations | (.99) | 6.28 | (.63) | .87 | (.46) | |||||
| Distributions from net investment income | (.21) | (.13) | (.15) D | (.13) | (.18) | |||||
| Distributions from net realized gain | (1.24) | - | (.23) D | (1.29) | (.41) | |||||
| Total distributions | (1.45) | (.13) | (.38) | (1.43) E | (.59) | |||||
| Net asset value, end of period | $ | 13.30 | $ | 15.74 | $ | 9.59 | $ | 10.60 | $ | 11.16 |
Total Return F | (6.63)% | 65.90% | (6.33)% | 9.43% | (4.11)% | |||||
Ratios to Average Net Assets C,G,H | ||||||||||
| Expenses before reductions | .75% | .71% | .47% | .49% | .48% | |||||
| Expenses net of fee waivers, if any | .74% | .71% | .47% | .49% | .48% | |||||
| Expenses net of all reductions | .74% | .71% | .45% | .48% | .46% | |||||
| Net investment income (loss) | 1.27% | .91% | 1.40% | 1.48% | 1.34% | |||||
| Supplemental Data | ||||||||||
| Net assets, end of period (in millions) | $ | 1,160 | $ | 1,168 | $ | 493 | $ | 740 | $ | 844 |
Portfolio turnover rate I | 74% | 77% | 90% | 75% | 100% |
| Fidelity Central Fund | Investment Manager | Investment Objective | Investment Practices | Expense Ratio A |
| Fidelity Money Market Central Funds | Fidelity Management & Research Company LLC (FMR) | Each fund seeks to obtain a high level of current income consistent with the preservation of capital and liquidity. | Short-term Investments | Less than .005% |
| Fidelity Value Fund | $370 |
| Gross unrealized appreciation | $1,750,047 |
| Gross unrealized depreciation | (786,556) |
| Net unrealized appreciation (depreciation) | $ 963,491 |
| Tax Cost | $7,550,145 |
| Undistributed ordinary income | $30,144 |
| Undistributed long-term capital gain | $494,720 |
| Net unrealized appreciation (depreciation) on securities and other investments | $963,412 |
| October 31, 2022 | October 31, 2021 | |
| Ordinary Income | $358,482 | $64,718 |
| Long-term Capital Gains | 512,950 | - |
| Total | $871,432 | $64,718 |
| Equity Risk | Equity risk relates to the fluctuations in the value of financial instruments as a result of changes in market prices (other than those arising from interest rate risk or foreign exchange risk), whether caused by factors specific to an individual investment, its issuer, or all factors affecting all instruments traded in a market or market segment. |
| Purchases ($) | Sales ($) | |
| Fidelity Value Fund | 6,628,180 | 7,019,386 |
| Amount | % of Class-Level Average Net Assets | |
| Value | $9,959 | .13 |
| Class K | 493 | .04 |
| $10,452 |
| % of Average Net Assets | |
| Fidelity Value Fund | .01 |
| Amount | |
| Fidelity Value Fund | $233 |
| Borrower or Lender | Average Loan Balance | Weighted Average Interest Rate | Interest Expense | |
| Fidelity Value Fund | Borrower | $28,618 | 1.75% | $38 |
| Purchases ($) | Sales ($) | Realized Gain (Loss) ($) | |
| Fidelity Value Fund | 693,452 | 557,190 | 56,462 |
| Amount ($) | |
| Fidelity Value Fund | 59 |
| Amount | |
| Fidelity Value Fund | $16 |
| Total Security Lending Fees Paid to NFS | Security Lending Income From Securities Loaned to NFS | Value of Securities Loaned to NFS at Period End | |
| Fidelity Value Fund | $197 | $10 | $- |
| Average Loan Balance | Weighted Average Interest Rate | Interest Expense | |
| Fidelity Value Fund | $25,296 | 2.83% | $2 |
Year ended October 31, 2022 | Year ended October 31, 2021 | |
| Fidelity Value Fund | ||
| Distributions to shareholders | ||
| Value | $764,386 | $58,303 |
| Class K | 107,046 | 6,415 |
Total | $871,432 | $64,718 |
| Shares | Shares | Dollars | Dollars | |
| Year ended October 31, 2022 | Year ended October 31, 2021 | Year ended October 31, 2022 | Year ended October 31, 2021 | |
| Fidelity Value Fund | ||||
| Value | ||||
| Shares sold | 66,565 | 108,639 | $955,112 | $1,570,378 |
| Reinvestment of distributions | 50,898 | 4,594 | 704,841 | 54,026 |
| Shares redeemed | (107,837) | (78,502) | (1,496,833) | (1,105,911) |
| Net increase (decrease) | 9,626 | 34,731 | $163,120 | $518,493 |
| Class K | ||||
| Shares sold | 27,089 | 45,765 | $383,456 | $690,373 |
| Reinvestment of distributions | 7,724 | 545 | 107,046 | 6,415 |
| Shares redeemed | (21,814) | (23,501) | (306,902) | (322,848) |
| Net increase (decrease) | 12,999 | 22,809 | $183,600 | $373,940 |
| The Example is based on an investment of $1,000 invested at the beginning of the period and held for the entire period (May 1, 2022 to October 31, 2022). |
Annualized Expense Ratio- A | Beginning Account Value May 1, 2022 | Ending Account Value October 31, 2022 | Expenses Paid During Period- C May 1, 2022 to October 31, 2022 | |||||||
| Fidelity® Value Fund | ||||||||||
| Fidelity® Value Fund | .85% | |||||||||
| Actual | $ 1,000 | $ 954.70 | $ 4.19 | |||||||
Hypothetical- B | $ 1,000 | $ 1,020.92 | $ 4.33 | |||||||
| Class K | .76% | |||||||||
| Actual | $ 1,000 | $ 955.50 | $ 3.75 | |||||||
Hypothetical- B | $ 1,000 | $ 1,021.37 | $ 3.87 | |||||||

|


Contents
Board Approval of Investment Advisory Contracts and Management Fees |
| Average Annual Total Returns | |||
Periods ended October 31, 2022 | Past 1 year | Past 5 years | Past 10 years |
| Fidelity® Focused Stock Fund | -24.13% | 12.51% | 13.56% |
| $10,000 Over 10 Years |
Let's say hypothetically that $10,000 was invested in Fidelity® Focused Stock Fund on October 31, 2012. The chart shows how the value of your investment would have changed, and also shows how the S&P 500® Index performed over the same period. |
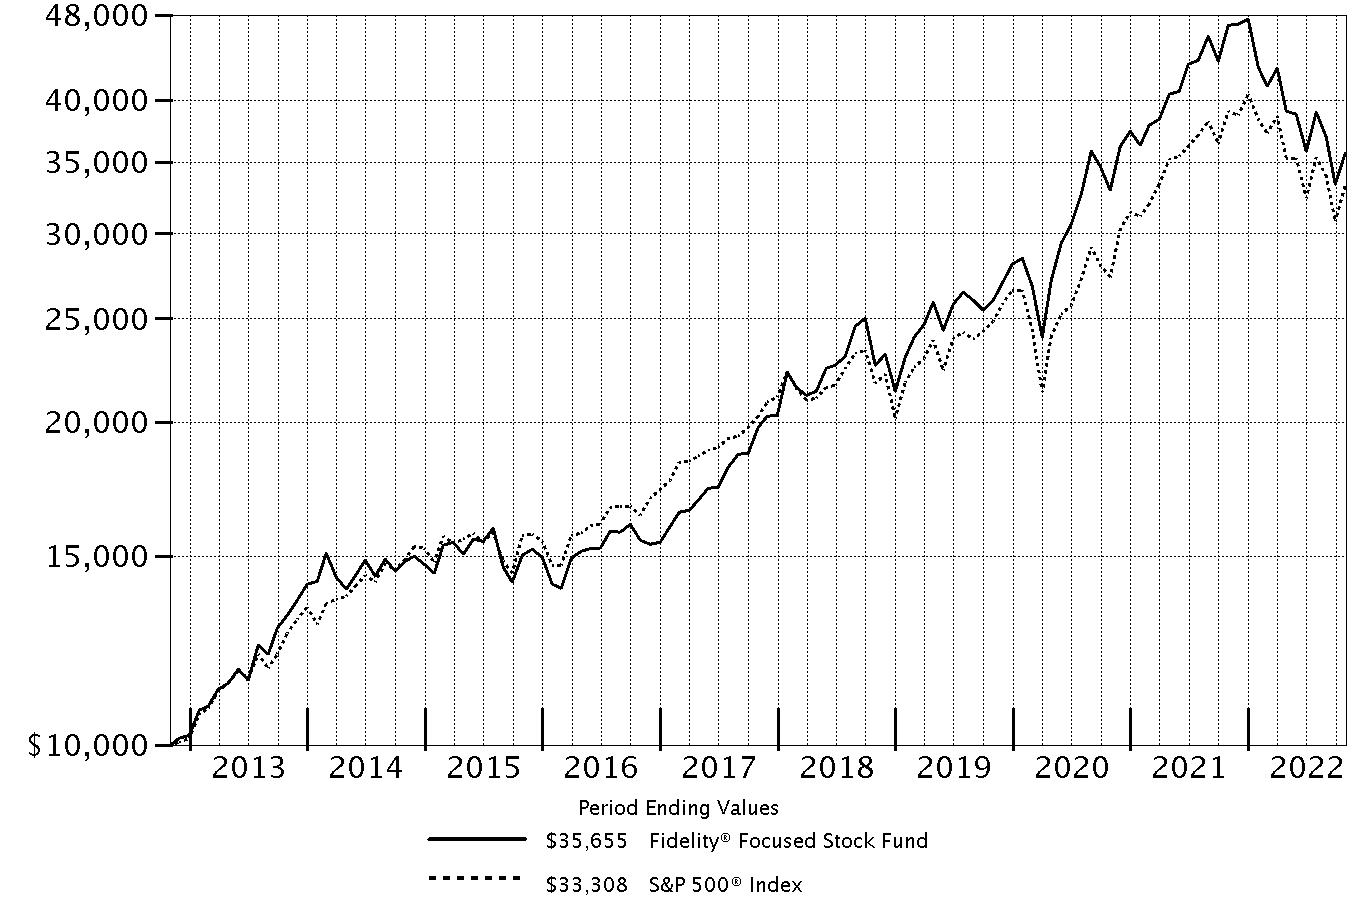 |
Top Holdings (% of Fund's net assets) | ||
| UnitedHealth Group, Inc. | 7.8 | |
| Microsoft Corp. | 6.1 | |
| Apple, Inc. | 5.7 | |
| Alphabet, Inc. Class A | 5.2 | |
| Constellation Energy Corp. | 4.6 | |
| Eli Lilly & Co. | 4.3 | |
| Amazon.com, Inc. | 4.2 | |
| The Travelers Companies, Inc. | 3.8 | |
| Estee Lauder Companies, Inc. Class A | 3.6 | |
| Northrop Grumman Corp. | 3.4 | |
| 48.7 | ||
| Market Sectors (% of Fund's net assets) | ||
| Information Technology | 25.2 | |
| Health Care | 23.5 | |
| Financials | 13.8 | |
| Consumer Discretionary | 12.4 | |
| Industrials | 7.2 | |
| Communication Services | 5.2 | |
| Utilities | 4.6 | |
| Consumer Staples | 3.6 | |
| Energy | 3.4 | |
Asset Allocation (% of Fund's net assets) |
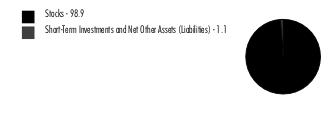 |
Foreign investments - 3.7% |
| Common Stocks - 98.9% | |||
| Shares | Value ($) | ||
| COMMUNICATION SERVICES - 5.2% | |||
| Interactive Media & Services - 5.2% | |||
| Alphabet, Inc. Class A (a) | 1,412,000 | 133,448,120 | |
| CONSUMER DISCRETIONARY - 12.4% | |||
| Automobiles - 2.5% | |||
| Tesla, Inc. (a) | 278,000 | 63,256,120 | |
| Internet & Direct Marketing Retail - 4.2% | |||
| Amazon.com, Inc. (a) | 1,049,000 | 107,459,560 | |
| Specialty Retail - 2.4% | |||
| TJX Companies, Inc. | 873,000 | 62,943,300 | |
| Textiles, Apparel & Luxury Goods - 3.3% | |||
| Deckers Outdoor Corp. (a) | 65,827 | 23,034,842 | |
| lululemon athletica, Inc. (a) | 50,000 | 16,452,000 | |
| LVMH Moet Hennessy Louis Vuitton SE | 71,741 | 45,268,205 | |
| 84,755,047 | |||
TOTAL CONSUMER DISCRETIONARY | 318,414,027 | ||
| CONSUMER STAPLES - 3.6% | |||
| Personal Products - 3.6% | |||
| Estee Lauder Companies, Inc. Class A | 465,000 | 93,227,850 | |
| ENERGY - 3.4% | |||
| Oil, Gas & Consumable Fuels - 3.4% | |||
| PrairieSky Royalty Ltd. (b) | 2,705,000 | 42,014,020 | |
| Range Resources Corp. | 1,601,000 | 45,596,480 | |
| 87,610,500 | |||
| FINANCIALS - 13.8% | |||
| Banks - 3.2% | |||
| JPMorgan Chase & Co. | 656,000 | 82,577,280 | |
| Capital Markets - 6.5% | |||
| Moody's Corp. | 38,810 | 10,279,605 | |
| MSCI, Inc. | 171,000 | 80,175,060 | |
| S&P Global, Inc. | 239,294 | 76,873,198 | |
| 167,327,863 | |||
| Insurance - 4.1% | |||
| Chubb Ltd. | 36,029 | 7,742,272 | |
| The Travelers Companies, Inc. | 525,100 | 96,859,946 | |
| 104,602,218 | |||
TOTAL FINANCIALS | 354,507,361 | ||
| HEALTH CARE - 23.5% | |||
| Biotechnology - 3.1% | |||
| Regeneron Pharmaceuticals, Inc. (a) | 35,408 | 26,511,740 | |
| Vertex Pharmaceuticals, Inc. (a) | 168,000 | 52,416,000 | |
| 78,927,740 | |||
| Health Care Providers & Services - 9.9% | |||
| Humana, Inc. | 99,000 | 55,249,920 | |
| UnitedHealth Group, Inc. | 362,000 | 200,964,298 | |
| 256,214,218 | |||
| Life Sciences Tools & Services - 3.3% | |||
| Danaher Corp. | 165,000 | 41,525,550 | |
| Thermo Fisher Scientific, Inc. | 83,000 | 42,659,510 | |
| 84,185,060 | |||
| Pharmaceuticals - 7.2% | |||
| Eli Lilly & Co. | 310,000 | 112,247,900 | |
| Royalty Pharma PLC | 1,754,000 | 74,229,280 | |
| 186,477,180 | |||
TOTAL HEALTH CARE | 605,804,198 | ||
| INDUSTRIALS - 7.2% | |||
| Aerospace & Defense - 3.4% | |||
| Northrop Grumman Corp. | 161,000 | 88,390,610 | |
| Machinery - 1.8% | |||
| Cummins, Inc. | 188,127 | 45,998,933 | |
| Road & Rail - 2.0% | |||
| Union Pacific Corp. | 259,000 | 51,059,260 | |
TOTAL INDUSTRIALS | 185,448,803 | ||
| INFORMATION TECHNOLOGY - 25.2% | |||
| IT Services - 6.7% | |||
| Fiserv, Inc. (a) | 526,971 | 54,141,001 | |
| MasterCard, Inc. Class A | 166,000 | 54,477,880 | |
| Visa, Inc. Class A | 303,000 | 62,769,480 | |
| 171,388,361 | |||
| Semiconductors & Semiconductor Equipment - 3.8% | |||
| Marvell Technology, Inc. | 328,320 | 13,027,738 | |
| NVIDIA Corp. | 629,000 | 84,896,130 | |
| 97,923,868 | |||
| Software - 9.0% | |||
| Adobe, Inc. (a) | 60,000 | 19,110,000 | |
| Intuit, Inc. | 106,000 | 45,315,000 | |
| Microsoft Corp. | 682,000 | 158,312,660 | |
| Oracle Corp. | 133,000 | 10,383,310 | |
| 233,120,970 | |||
| Technology Hardware, Storage & Peripherals - 5.7% | |||
| Apple, Inc. | 962,000 | 147,513,080 | |
TOTAL INFORMATION TECHNOLOGY | 649,946,279 | ||
| UTILITIES - 4.6% | |||
| Electric Utilities - 4.6% | |||
| Constellation Energy Corp. | 1,253,000 | 118,458,620 | |
| TOTAL COMMON STOCKS (Cost $2,140,406,887) | 2,546,865,758 | ||
| Money Market Funds - 0.4% | |||
| Shares | Value ($) | ||
| Fidelity Cash Central Fund 3.10% (c) | 6,944,698 | 6,946,087 | |
| Fidelity Securities Lending Cash Central Fund 3.10% (c)(d) | 2,265,724 | 2,265,950 | |
| TOTAL MONEY MARKET FUNDS (Cost $9,212,037) | 9,212,037 | ||
| TOTAL INVESTMENT IN SECURITIES - 99.3% (Cost $2,149,618,924) | 2,556,077,795 |
NET OTHER ASSETS (LIABILITIES) - 0.7% | 17,914,737 |
| NET ASSETS - 100.0% | 2,573,992,532 |
| (a) | Non-income producing |
| (b) | Security or a portion of the security is on loan at period end. |
| (c) | Affiliated fund that is generally available only to investment companies and other accounts managed by Fidelity Investments. The rate quoted is the annualized seven-day yield of the fund at period end. A complete unaudited listing of the fund's holdings as of its most recent quarter end is available upon request. In addition, each Fidelity Central Fund's financial statements, which are not covered by the Fund's Report of Independent Registered Public Accounting Firm, are available on the SEC's website or upon request. |
| (d) | Investment made with cash collateral received from securities on loan. |
| Affiliate | Value, beginning of period ($) | Purchases ($) | Sales Proceeds ($) | Dividend Income ($) | Realized Gain (loss) ($) | Change in Unrealized appreciation (depreciation) ($) | Value, end of period ($) | % ownership, end of period |
| Fidelity Cash Central Fund 3.10% | 6,535,025 | 1,596,319,261 | 1,595,908,199 | 437,355 | - | - | 6,946,087 | 0.0% |
| Fidelity Securities Lending Cash Central Fund 3.10% | 44,138,069 | 662,782,964 | 704,655,083 | 273,134 | - | - | 2,265,950 | 0.0% |
| Total | 50,673,094 | 2,259,102,225 | 2,300,563,282 | 710,489 | - | - | 9,212,037 | |
| Valuation Inputs at Reporting Date: | ||||
| Description | Total ($) | Level 1 ($) | Level 2 ($) | Level 3 ($) |
Investments in Securities: | ||||
| Equities: | ||||
Communication Services | 133,448,120 | 133,448,120 | - | - |
Consumer Discretionary | 318,414,027 | 273,145,822 | 45,268,205 | - |
Consumer Staples | 93,227,850 | 93,227,850 | - | - |
Energy | 87,610,500 | 87,610,500 | - | - |
Financials | 354,507,361 | 354,507,361 | - | - |
Health Care | 605,804,198 | 605,804,198 | - | - |
Industrials | 185,448,803 | 185,448,803 | - | - |
Information Technology | 649,946,279 | 649,946,279 | - | - |
Utilities | 118,458,620 | 118,458,620 | - | - |
| Money Market Funds | 9,212,037 | 9,212,037 | - | - |
| Total Investments in Securities: | 2,556,077,795 | 2,510,809,590 | 45,268,205 | - |
| Statement of Assets and Liabilities | ||||
| October 31, 2022 | ||||
| Assets | ||||
| Investment in securities, at value (including securities loaned of $2,127,774) - See accompanying schedule: | ||||
Unaffiliated issuers (cost $2,140,406,887) | $2,546,865,758 | |||
Fidelity Central Funds (cost $9,212,037) | 9,212,037 | |||
| Total Investment in Securities (cost $2,149,618,924) | $ | 2,556,077,795 | ||
| Cash | 32,152 | |||
| Foreign currency held at value (cost $2,047) | 2,007 | |||
| Receivable for investments sold | 64,128,961 | |||
| Receivable for fund shares sold | 201,277 | |||
| Dividends receivable | 203,038 | |||
| Distributions receivable from Fidelity Central Funds | 103,824 | |||
| Prepaid expenses | 4,417 | |||
| Other receivables | 1,531 | |||
Total assets | 2,620,755,002 | |||
| Liabilities | ||||
| Payable for investments purchased | $41,676,039 | |||
| Payable for fund shares redeemed | 1,124,055 | |||
| Accrued management fee | 1,276,806 | |||
| Other affiliated payables | 379,712 | |||
| Other payables and accrued expenses | 42,652 | |||
| Collateral on securities loaned | 2,263,206 | |||
| Total Liabilities | 46,762,470 | |||
| Net Assets | $ | 2,573,992,532 | ||
| Net Assets consist of: | ||||
| Paid in capital | $ | 2,003,323,760 | ||
| Total accumulated earnings (loss) | 570,668,772 | |||
| Net Assets | $ | 2,573,992,532 | ||
Net Asset Value , offering price and redemption price per share ($2,573,992,532 ÷ 98,879,772 shares) | $ | 26.03 | ||
| Statement of Operations | ||||
Year ended October 31, 2022 | ||||
| Investment Income | ||||
| Dividends | $ | 30,570,122 | ||
| Interest | 498 | |||
| Income from Fidelity Central Funds (including $273,134 from security lending) | 710,489 | |||
| Total Income | 31,281,109 | |||
| Expenses | ||||
| Management fee | ||||
| Basic fee | $ | 17,047,526 | ||
| Performance adjustment | 3,188,846 | |||
| Transfer agent fees | 4,502,002 | |||
| Accounting fees | 887,148 | |||
| Custodian fees and expenses | 56,565 | |||
| Independent trustees' fees and expenses | 11,333 | |||
| Registration fees | 70,713 | |||
| Audit | 39,575 | |||
| Legal | 9,137 | |||
| Miscellaneous | 14,872 | |||
| Total expenses before reductions | 25,827,717 | |||
| Expense reductions | (106,736) | |||
| Total expenses after reductions | 25,720,981 | |||
| Net Investment income (loss) | 5,560,128 | |||
| Realized and Unrealized Gain (Loss) | ||||
| Net realized gain (loss) on: | ||||
| Investment Securities: | ||||
| Unaffiliated issuers | 232,159,784 | |||
| Foreign currency transactions | 21,018 | |||
| Total net realized gain (loss) | 232,180,802 | |||
| Change in net unrealized appreciation (depreciation) on: | ||||
| Investment Securities: | ||||
| Unaffiliated issuers | (1,170,313,998) | |||
| Assets and liabilities in foreign currencies | (36,016) | |||
| Total change in net unrealized appreciation (depreciation) | (1,170,350,014) | |||
| Net gain (loss) | (938,169,212) | |||
| Net increase (decrease) in net assets resulting from operations | $ | (932,609,084) | ||
| Statement of Changes in Net Assets | ||||
Year ended October 31, 2022 | Year ended October 31, 2021 | |||
| Increase (Decrease) in Net Assets | ||||
| Operations | ||||
| Net investment income (loss) | $ | 5,560,128 | $ | (10,310,440) |
| Net realized gain (loss) | 232,180,802 | 539,785,834 | ||
| Change in net unrealized appreciation (depreciation) | (1,170,350,014) | 737,238,783 | ||
| Net increase (decrease) in net assets resulting from operations | (932,609,084) | 1,266,714,177 | ||
| Distributions to shareholders | (473,470,909) | (368,627,790) | ||
| Share transactions | ||||
| Proceeds from sales of shares | 318,891,655 | 371,384,461 | ||
| Reinvestment of distributions | 444,595,520 | 349,597,290 | ||
| Cost of shares redeemed | (736,064,445) | (856,975,720) | ||
Net increase (decrease) in net assets resulting from share transactions | 27,422,730 | (135,993,969) | ||
| Total increase (decrease) in net assets | (1,378,657,263) | 762,092,418 | ||
| Net Assets | ||||
| Beginning of period | 3,952,649,795 | 3,190,557,377 | ||
| End of period | $ | 2,573,992,532 | $ | 3,952,649,795 |
| Other Information | ||||
| Shares | ||||
| Sold | 10,448,913 | 11,211,690 | ||
| Issued in reinvestment of distributions | 13,184,921 | 11,477,259 | ||
| Redeemed | (25,861,227) | (26,001,483) | ||
| Net increase (decrease) | (2,227,393) | (3,312,534) | ||
| Fidelity® Focused Stock Fund |
| Years ended October 31, | 2022 | 2021 | 2020 | 2019 | 2018 | |||||
Selected Per-Share Data | ||||||||||
| Net asset value, beginning of period | $ | 39.09 | $ | 30.56 | $ | 25.42 | $ | 25.23 | $ | 23.48 |
| Income from Investment Operations | ||||||||||
Net investment income (loss) A,B | .05 | (.10) | .01 | .03 | .02 | |||||
| Net realized and unrealized gain (loss) | (8.41) | 12.18 | 6.45 | 3.23 | 3.17 | |||||
| Total from investment operations | (8.36) | 12.08 | 6.46 | 3.26 | 3.19 | |||||
| Distributions from net investment income | - | (.01) | (.02) | (.03) | (.09) C | |||||
| Distributions from net realized gain | (4.70) | (3.54) | (1.30) | (3.04) | (1.35) C | |||||
| Total distributions | (4.70) | (3.55) | (1.32) | (3.07) | (1.44) | |||||
| Net asset value, end of period | $ | 26.03 | $ | 39.09 | $ | 30.56 | $ | 25.42 | $ | 25.23 |
Total Return D | (24.13)% | 42.82% | 26.56% | 15.05% | 14.30% | |||||
Ratios to Average Net Assets B,E,F | ||||||||||
| Expenses before reductions | .80% | .86% | .88% | .89% | .82% | |||||
| Expenses net of fee waivers, if any | .79% | .86% | .88% | .89% | .82% | |||||
| Expenses net of all reductions | .79% | .86% | .87% | .89% | .81% | |||||
| Net investment income (loss) | .17% | (.29)% | .05% | .12% | .07% | |||||
| Supplemental Data | ||||||||||
| Net assets, end of period (000 omitted) | $ | 2,573,993 | $ | 3,952,650 | $ | 3,190,557 | $ | 2,953,108 | $ | 2,262,100 |
Portfolio turnover rate G | 142% | 107% | 140% | 152% | 138% |
| Fidelity Central Fund | Investment Manager | Investment Objective | Investment Practices | Expense Ratio A |
| Fidelity Money Market Central Funds | Fidelity Management & Research Company LLC (FMR) | Each fund seeks to obtain a high level of current income consistent with the preservation of capital and liquidity. | Short-term Investments | Less than .005% |
| Gross unrealized appreciation | $509,782,075 |
| Gross unrealized depreciation | (119,134,801) |
| Net unrealized appreciation (depreciation) | $390,647,274 |
| Tax Cost | $2,165,430,521 |
| Undistributed ordinary income | $16,083,380 |
| Undistributed long-term capital gain | $163,970,933 |
| Net unrealized appreciation (depreciation) on securities and other investments | $390,614,456 |
| October 31, 2022 | October 31, 2021 | |
| Ordinary Income | $112,899,173 | $623,037 |
| Long-term Capital Gains | 360,571,736 | 368,004,753 |
| Total | $473,470,909 | $368,627,790 |
| Purchases ($) | Sales ($) | |
| Fidelity Focused Stock Fund | 4,543,825,031 | 5,000,564,123 |
| % of Average Net Assets | |
| Fidelity Focused Stock Fund | .03 |
| Amount | |
| Fidelity Focused Stock Fund | $50,233 |
| Purchases ($) | Sales ($) | Realized Gain (Loss) ($) | |
| Fidelity Focused Stock Fund | 368,326,002 | 499,907,470 | 65,398,880 |
| Amount ($) | |
| Fidelity Focused Stock Fund | 74,946 |
| Amount | |
| Fidelity Focused Stock Fund | $5,726 |
| Total Security Lending Fees Paid to NFS | Security Lending Income From Securities Loaned to NFS | Value of Securities Loaned to NFS at Period End | |
| Fidelity Focused Stock Fund | $29,624 | $- | $- |
| The Example is based on an investment of $1,000 invested at the beginning of the period and held for the entire period (May 1, 2022 to October 31, 2022). |
Annualized Expense Ratio- A | Beginning Account Value May 1, 2022 | Ending Account Value October 31, 2022 | Expenses Paid During Period- C May 1, 2022 to October 31, 2022 | |||||||
| Fidelity® Focused Stock Fund | .75% | |||||||||
| Actual | $ 1,000 | $ 913.00 | $ 3.62 | |||||||
Hypothetical- B | $ 1,000 | $ 1,021.42 | $ 3.82 | |||||||
|


Contents
Board Approval of Investment Advisory Contracts and Management Fees |
| Average Annual Total Returns | |||
Periods ended October 31, 2022 | Past 1 year | Past 5 years | Past 10 years |
| Fidelity® Disciplined Equity Fund | -25.71% | 8.28% | 11.22% |
| Class K | -25.65% | 8.38% | 11.33% |
| $10,000 Over 10 Years |
Let's say hypothetically that $10,000 was invested in Fidelity® Disciplined Equity Fund, a class of the fund, on October 31, 2012. The chart shows how the value of your investment would have changed, and also shows how the S&P 500® Index performed over the same period. |
 |
Top Holdings (% of Fund's net assets) | ||
| Microsoft Corp. | 7.3 | |
| Apple, Inc. | 6.9 | |
| UnitedHealth Group, Inc. | 3.5 | |
| Amazon.com, Inc. | 3.4 | |
| Visa, Inc. Class A | 2.5 | |
| Alphabet, Inc. Class A | 2.2 | |
| MasterCard, Inc. Class A | 2.1 | |
| Danaher Corp. | 1.9 | |
| Alphabet, Inc. Class C | 1.6 | |
| JPMorgan Chase & Co. | 1.5 | |
| 32.9 | ||
| Market Sectors (% of Fund's net assets) | ||
| Information Technology | 36.5 | |
| Health Care | 15.0 | |
| Consumer Discretionary | 9.8 | |
| Industrials | 8.3 | |
| Financials | 7.1 | |
| Energy | 6.9 | |
| Communication Services | 5.6 | |
| Consumer Staples | 5.0 | |
| Materials | 1.6 | |
| Real Estate | 1.4 | |
| Utilities | 0.8 | |
Asset Allocation (% of Fund's net assets) |
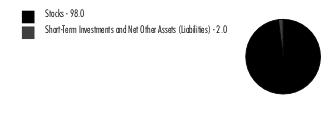 |
Foreign investments - 2% |
| Common Stocks - 98.0% | |||
| Shares | Value ($) (000s) | ||
| COMMUNICATION SERVICES - 5.6% | |||
| Entertainment - 1.3% | |||
| Live Nation Entertainment, Inc. (a) | 33,800 | 2,691 | |
| Netflix, Inc. (a) | 55,334 | 16,151 | |
| 18,842 | |||
| Interactive Media & Services - 4.3% | |||
| Alphabet, Inc.: | |||
| Class A (a) | 346,100 | 32,710 | |
| Class C (a) | 258,600 | 24,479 | |
| Meta Platforms, Inc. Class A (a) | 75,877 | 7,069 | |
| 64,258 | |||
TOTAL COMMUNICATION SERVICES | 83,100 | ||
| CONSUMER DISCRETIONARY - 9.8% | |||
| Automobiles - 0.5% | |||
| Tesla, Inc. (a) | 29,000 | 6,599 | |
| Distributors - 0.2% | |||
| Pool Corp. | 9,200 | 2,799 | |
| Hotels, Restaurants & Leisure - 1.6% | |||
| Domino's Pizza, Inc. | 18,700 | 6,213 | |
| Hilton Worldwide Holdings, Inc. | 59,866 | 8,097 | |
| Marriott International, Inc. Class A | 61,800 | 9,895 | |
| 24,205 | |||
| Household Durables - 0.3% | |||
| NVR, Inc. (a) | 1,055 | 4,471 | |
| Internet & Direct Marketing Retail - 3.4% | |||
| Amazon.com, Inc. (a) | 489,760 | 50,171 | |
| Multiline Retail - 0.7% | |||
| Dollar General Corp. | 40,800 | 10,406 | |
| Specialty Retail - 2.1% | |||
| Floor & Decor Holdings, Inc. Class A (a) | 11,352 | 833 | |
| Ross Stores, Inc. | 31,800 | 3,043 | |
| The Home Depot, Inc. | 62,444 | 18,492 | |
| TJX Companies, Inc. | 125,300 | 9,034 | |
| 31,402 | |||
| Textiles, Apparel & Luxury Goods - 1.0% | |||
| lululemon athletica, Inc. (a) | 13,900 | 4,574 | |
| NIKE, Inc. Class B | 106,510 | 9,871 | |
| 14,445 | |||
TOTAL CONSUMER DISCRETIONARY | 144,498 | ||
| CONSUMER STAPLES - 5.0% | |||
| Beverages - 2.2% | |||
| Constellation Brands, Inc. Class A (sub. vtg.) | 17,600 | 4,349 | |
| Monster Beverage Corp. (a) | 105,600 | 9,897 | |
| The Coca-Cola Co. | 295,000 | 17,656 | |
| 31,902 | |||
| Food & Staples Retailing - 1.5% | |||
| Costco Wholesale Corp. | 43,515 | 21,823 | |
| Food Products - 0.7% | |||
| Lamb Weston Holdings, Inc. | 57,000 | 4,915 | |
| Mondelez International, Inc. | 79,100 | 4,863 | |
| 9,778 | |||
| Personal Products - 0.6% | |||
| Estee Lauder Companies, Inc. Class A | 47,919 | 9,607 | |
TOTAL CONSUMER STAPLES | 73,110 | ||
| ENERGY - 6.9% | |||
| Oil, Gas & Consumable Fuels - 6.9% | |||
| ConocoPhillips Co. | 130,500 | 16,455 | |
| Continental Resources, Inc. | 67,500 | 4,993 | |
| Coterra Energy, Inc. | 89,700 | 2,792 | |
| Devon Energy Corp. | 234,396 | 18,131 | |
| EOG Resources, Inc. | 110,667 | 15,108 | |
| EQT Corp. | 98,500 | 4,121 | |
| Hess Corp. | 83,800 | 11,823 | |
| Occidental Petroleum Corp. | 136,400 | 9,903 | |
| Pioneer Natural Resources Co. | 36,500 | 9,359 | |
| Valero Energy Corp. | 73,900 | 9,278 | |
| 101,963 | |||
| FINANCIALS - 7.1% | |||
| Banks - 3.4% | |||
| Bank of America Corp. | 489,283 | 17,634 | |
| Comerica, Inc. | 63,400 | 4,470 | |
| Cullen/Frost Bankers, Inc. | 35,600 | 5,520 | |
| JPMorgan Chase & Co. | 183,314 | 23,076 | |
| 50,700 | |||
| Capital Markets - 2.5% | |||
| Moody's Corp. | 40,439 | 10,711 | |
| MSCI, Inc. | 34,344 | 16,103 | |
| S&P Global, Inc. | 29,558 | 9,496 | |
| 36,310 | |||
| Insurance - 1.2% | |||
| American Financial Group, Inc. | 9,300 | 1,350 | |
| Arthur J. Gallagher & Co. | 56,800 | 10,626 | |
| The Travelers Companies, Inc. | 31,100 | 5,737 | |
| 17,713 | |||
TOTAL FINANCIALS | 104,723 | ||
| HEALTH CARE - 15.0% | |||
| Biotechnology - 0.4% | |||
| Horizon Therapeutics PLC (a) | 22,284 | 1,389 | |
| Neurocrine Biosciences, Inc. (a) | 12,500 | 1,439 | |
| Vertex Pharmaceuticals, Inc. (a) | 9,600 | 2,995 | |
| 5,823 | |||
| Health Care Equipment & Supplies - 2.6% | |||
| Boston Scientific Corp. (a) | 168,429 | 7,261 | |
| DexCom, Inc. (a) | 38,700 | 4,674 | |
| IDEXX Laboratories, Inc. (a) | 9,093 | 3,271 | |
| Intuitive Surgical, Inc. (a) | 27,814 | 6,855 | |
| Masimo Corp. (a) | 21,384 | 2,814 | |
| ResMed, Inc. | 34,620 | 7,744 | |
| Stryker Corp. | 26,335 | 6,037 | |
| 38,656 | |||
| Health Care Providers & Services - 5.6% | |||
| Cigna Corp. | 33,400 | 10,790 | |
| Elevance Health, Inc. | 27,300 | 14,927 | |
| Guardant Health, Inc. (a) | 29,400 | 1,455 | |
| HCA Holdings, Inc. | 20,500 | 4,458 | |
| UnitedHealth Group, Inc. | 92,075 | 51,115 | |
| 82,745 | |||
| Health Care Technology - 0.1% | |||
| Veeva Systems, Inc. Class A (a) | 9,185 | 1,543 | |
| Life Sciences Tools & Services - 4.6% | |||
| Agilent Technologies, Inc. | 34,900 | 4,828 | |
| Avantor, Inc. (a) | 72,073 | 1,454 | |
| Bio-Rad Laboratories, Inc. Class A (a) | 4,854 | 1,707 | |
| Danaher Corp. | 111,545 | 28,073 | |
| Maravai LifeSciences Holdings, Inc. (a) | 55,200 | 916 | |
| Mettler-Toledo International, Inc. (a) | 4,764 | 6,026 | |
| Thermo Fisher Scientific, Inc. | 38,900 | 19,993 | |
| West Pharmaceutical Services, Inc. | 21,236 | 4,886 | |
| 67,883 | |||
| Pharmaceuticals - 1.7% | |||
| Eli Lilly & Co. | 25,700 | 9,306 | |
| Zoetis, Inc. Class A | 104,544 | 15,763 | |
| 25,069 | |||
TOTAL HEALTH CARE | 221,719 | ||
| INDUSTRIALS - 8.3% | |||
| Aerospace & Defense - 2.6% | |||
| HEICO Corp. Class A | 81,847 | 10,419 | |
| L3Harris Technologies, Inc. | 28,100 | 6,926 | |
| Lockheed Martin Corp. | 22,137 | 10,774 | |
| Northrop Grumman Corp. | 17,000 | 9,333 | |
| 37,452 | |||
| Commercial Services & Supplies - 1.5% | |||
| Cintas Corp. | 28,263 | 12,084 | |
| Copart, Inc. (a) | 80,288 | 9,235 | |
| 21,319 | |||
| Electrical Equipment - 0.7% | |||
| AMETEK, Inc. | 75,838 | 9,833 | |
| Generac Holdings, Inc. (a) | 8,806 | 1,021 | |
| 10,854 | |||
| Machinery - 1.8% | |||
| Fortive Corp. | 92,300 | 5,898 | |
| IDEX Corp. | 39,300 | 8,737 | |
| ITT, Inc. | 73,839 | 5,641 | |
| Snap-On, Inc. | 30,200 | 6,706 | |
| 26,982 | |||
| Professional Services - 0.5% | |||
| CoStar Group, Inc. (a) | 93,500 | 7,734 | |
| Road & Rail - 1.2% | |||
| Norfolk Southern Corp. | 41,703 | 9,511 | |
| Old Dominion Freight Lines, Inc. | 29,950 | 8,224 | |
| 17,735 | |||
TOTAL INDUSTRIALS | 122,076 | ||
| INFORMATION TECHNOLOGY - 36.5% | |||
| Electronic Equipment & Components - 2.4% | |||
| Amphenol Corp. Class A | 142,940 | 10,839 | |
| CDW Corp. | 33,873 | 5,854 | |
| Keysight Technologies, Inc. (a) | 51,102 | 8,899 | |
| Teledyne Technologies, Inc. (a) | 19,897 | 7,919 | |
| Zebra Technologies Corp. Class A (a) | 4,941 | 1,399 | |
| 34,910 | |||
| IT Services - 7.5% | |||
| Accenture PLC Class A | 78,708 | 22,345 | |
| EPAM Systems, Inc. (a) | 26,000 | 9,100 | |
| Global Payments, Inc. | 38,872 | 4,442 | |
| MasterCard, Inc. Class A | 92,811 | 30,459 | |
| Okta, Inc. (a) | 5,100 | 286 | |
| PayPal Holdings, Inc. (a) | 89,300 | 7,464 | |
| Visa, Inc. Class A | 175,034 | 36,260 | |
| 110,356 | |||
| Semiconductors & Semiconductor Equipment - 3.1% | |||
| Lam Research Corp. | 25,767 | 10,430 | |
| Monolithic Power Systems, Inc. | 9,500 | 3,225 | |
| NVIDIA Corp. | 160,598 | 21,676 | |
| NXP Semiconductors NV | 39,000 | 5,697 | |
| onsemi (a) | 74,600 | 4,583 | |
| 45,611 | |||
| Software - 16.6% | |||
| Adobe, Inc. (a) | 61,459 | 19,575 | |
| ANSYS, Inc. (a) | 51,700 | 11,434 | |
| Atlassian Corp. PLC (a) | 4,041 | 819 | |
| Autodesk, Inc. (a) | 40,500 | 8,679 | |
| Bill.Com Holdings, Inc. (a) | 2,200 | 293 | |
| Cadence Design Systems, Inc. (a) | 85,647 | 12,966 | |
| Ceridian HCM Holding, Inc. (a) | 12,100 | 801 | |
| Datadog, Inc. Class A (a) | 3,500 | 282 | |
| Dynatrace, Inc. (a) | 138,903 | 4,895 | |
| Elastic NV (a) | 4,400 | 281 | |
| Fortinet, Inc. (a) | 193,760 | 11,075 | |
| HubSpot, Inc. (a) | 4,962 | 1,472 | |
| Intuit, Inc. | 51,126 | 21,856 | |
| Microsoft Corp. | 466,738 | 108,340 | |
| New Relic, Inc. (a) | 4,800 | 284 | |
| Paycom Software, Inc. (a) | 23,396 | 8,095 | |
| Roper Technologies, Inc. | 17,275 | 7,161 | |
| Salesforce.com, Inc. (a) | 59,194 | 9,624 | |
| ServiceNow, Inc. (a) | 20,052 | 8,437 | |
| Splunk, Inc. (a) | 3,600 | 299 | |
| Synopsys, Inc. (a) | 27,100 | 7,928 | |
| Zendesk, Inc. (a) | 3,800 | 291 | |
| 244,887 | |||
| Technology Hardware, Storage & Peripherals - 6.9% | |||
| Apple, Inc. | 664,807 | 101,942 | |
TOTAL INFORMATION TECHNOLOGY | 537,706 | ||
| MATERIALS - 1.6% | |||
| Chemicals - 1.4% | |||
| CF Industries Holdings, Inc. | 90,100 | 9,574 | |
| Sherwin-Williams Co. | 39,383 | 8,862 | |
| Westlake Corp. | 22,800 | 2,204 | |
| 20,640 | |||
| Metals & Mining - 0.2% | |||
| Freeport-McMoRan, Inc. | 112,700 | 3,571 | |
TOTAL MATERIALS | 24,211 | ||
| REAL ESTATE - 1.4% | |||
| Equity Real Estate Investment Trusts (REITs) - 1.4% | |||
| American Tower Corp. | 70,700 | 14,648 | |
| SBA Communications Corp. Class A | 24,300 | 6,559 | |
| 21,207 | |||
| UTILITIES - 0.8% | |||
| Electric Utilities - 0.8% | |||
| NextEra Energy, Inc. | 158,400 | 12,276 | |
| TOTAL COMMON STOCKS (Cost $936,423) | 1,446,589 | ||
| Money Market Funds - 1.2% | |||
| Shares | Value ($) (000s) | ||
Fidelity Cash Central Fund 3.10% (b) (Cost $17,319) | 17,315,333 | 17,319 | |
| TOTAL INVESTMENT IN SECURITIES - 99.2% (Cost $953,742) | 1,463,908 |
NET OTHER ASSETS (LIABILITIES) - 0.8% | 11,095 |
| NET ASSETS - 100.0% | 1,475,003 |
| (a) | Non-income producing |
| (b) | Affiliated fund that is generally available only to investment companies and other accounts managed by Fidelity Investments. The rate quoted is the annualized seven-day yield of the fund at period end. A complete unaudited listing of the fund's holdings as of its most recent quarter end is available upon request. In addition, each Fidelity Central Fund's financial statements, which are not covered by the Fund's Report of Independent Registered Public Accounting Firm, are available on the SEC's website or upon request. |
| Affiliate (Amounts in thousands) | Value, beginning of period ($) | Purchases ($) | Sales Proceeds ($) | Dividend Income ($) | Realized Gain (loss) ($) | Change in Unrealized appreciation (depreciation) ($) | Value, end of period ($) | % ownership, end of period |
| Fidelity Cash Central Fund 3.10% | 872 | 339,337 | 322,890 | 259 | - | - | 17,319 | 0.0% |
| Fidelity Securities Lending Cash Central Fund 3.10% | 1,673 | 113,763 | 115,436 | 3 | - | - | - | 0.0% |
| Total | 2,545 | 453,100 | 438,326 | 262 | - | - | 17,319 | |
| Valuation Inputs at Reporting Date: | ||||
Description (Amounts in thousands) | Total ($) | Level 1 ($) | Level 2 ($) | Level 3 ($) |
Investments in Securities: | ||||
| Equities: | ||||
Communication Services | 83,100 | 83,100 | - | - |
Consumer Discretionary | 144,498 | 144,498 | - | - |
Consumer Staples | 73,110 | 73,110 | - | - |
Energy | 101,963 | 101,963 | - | - |
Financials | 104,723 | 104,723 | - | - |
Health Care | 221,719 | 221,719 | - | - |
Industrials | 122,076 | 122,076 | - | - |
Information Technology | 537,706 | 537,706 | - | - |
Materials | 24,211 | 24,211 | - | - |
Real Estate | 21,207 | 21,207 | - | - |
Utilities | 12,276 | 12,276 | - | - |
| Money Market Funds | 17,319 | 17,319 | - | - |
| Total Investments in Securities: | 1,463,908 | 1,463,908 | - | - |
| Statement of Assets and Liabilities | ||||
| Amounts in thousands (except per-share amounts) | October 31, 2022 | |||
| Assets | ||||
| Investment in securities, at value - See accompanying schedule: | ||||
Unaffiliated issuers (cost $936,423) | $1,446,589 | |||
Fidelity Central Funds (cost $17,319) | 17,319 | |||
| Total Investment in Securities (cost $953,742) | $ | 1,463,908 | ||
| Receivable for investments sold | 15,604 | |||
| Receivable for fund shares sold | 134 | |||
| Dividends receivable | 228 | |||
| Distributions receivable from Fidelity Central Funds | 113 | |||
| Prepaid expenses | 2 | |||
Total assets | 1,479,989 | |||
| Liabilities | ||||
| Payable for investments purchased | $3,746 | |||
| Payable for fund shares redeemed | 478 | |||
| Accrued management fee | 516 | |||
| Other affiliated payables | 195 | |||
| Other payables and accrued expenses | 51 | |||
| Total Liabilities | 4,986 | |||
| Net Assets | $ | 1,475,003 | ||
| Net Assets consist of: | ||||
| Paid in capital | $ | 933,064 | ||
| Total accumulated earnings (loss) | 541,939 | |||
| Net Assets | $ | 1,475,003 | ||
| Net Asset Value and Maximum Offering Price | ||||
| Disciplined Equity : | ||||
Net Asset Value , offering price and redemption price per share ($1,422,066 ÷ 29,807 shares) | $ | 47.71 | ||
| Class K : | ||||
Net Asset Value , offering price and redemption price per share ($52,937 ÷ 1,109 shares) (a) | $ | 47.72 | ||
(a)Corresponding Net Asset Value does not calculate due to rounding of fractional net assets and/or shares | ||||
| Statement of Operations | ||||
| Amounts in thousands | Year ended October 31, 2022 | |||
| Investment Income | ||||
| Dividends | $ | 15,847 | ||
| Income from Fidelity Central Funds (including $3 from security lending) | 262 | |||
| Total Income | 16,109 | |||
| Expenses | ||||
| Management fee | ||||
| Basic fee | $ | 9,359 | ||
| Performance adjustment | 353 | |||
| Transfer agent fees | 2,154 | |||
| Accounting fees | 524 | |||
| Custodian fees and expenses | 24 | |||
| Independent trustees' fees and expenses | 6 | |||
| Registration fees | 48 | |||
| Audit | 52 | |||
| Legal | 6 | |||
| Miscellaneous | 9 | |||
| Total expenses before reductions | 12,535 | |||
| Expense reductions | (59) | |||
| Total expenses after reductions | 12,476 | |||
| Net Investment income (loss) | 3,633 | |||
| Realized and Unrealized Gain (Loss) | ||||
| Net realized gain (loss) on: | ||||
| Investment Securities: | ||||
| Unaffiliated issuers | 34,685 | |||
| Total net realized gain (loss) | 34,685 | |||
| Change in net unrealized appreciation (depreciation) on investment securities | (583,180) | |||
| Net gain (loss) | (548,495) | |||
| Net increase (decrease) in net assets resulting from operations | $ | (544,862) | ||
| Statement of Changes in Net Assets | ||||
| Amount in thousands | Year ended October 31, 2022 | Year ended October 31, 2021 | ||
| Increase (Decrease) in Net Assets | ||||
| Operations | ||||
| Net investment income (loss) | $ | 3,633 | $ | (1,823) |
| Net realized gain (loss) | 34,685 | 68,874 | ||
| Change in net unrealized appreciation (depreciation) | (583,180) | 615,412 | ||
| Net increase (decrease) in net assets resulting from operations | (544,862) | 682,463 | ||
| Distributions to shareholders | (31,288) | (438) | ||
| Share transactions - net increase (decrease) | (152,553) | (42,002) | ||
| Total increase (decrease) in net assets | (728,703) | 640,023 | ||
| Net Assets | ||||
| Beginning of period | 2,203,706 | 1,563,683 | ||
| End of period | $ | 1,475,003 | $ | 2,203,706 |
| Fidelity® Disciplined Equity Fund |
| Years ended October 31, | 2022 | 2021 | 2020 | 2019 | 2018 | |||||
Selected Per-Share Data | ||||||||||
| Net asset value, beginning of period | $ | 65.18 | $ | 45.48 | $ | 37.51 | $ | 38.32 | $ | 38.96 |
| Income from Investment Operations | ||||||||||
Net investment income (loss) A,B | .11 | (.06) | .03 | .32 | .52 | |||||
| Net realized and unrealized gain (loss) | (16.65) | 19.77 | 8.16 | 3.53 | .41 | |||||
| Total from investment operations | (16.54) | 19.71 | 8.19 | 3.85 | .93 | |||||
| Distributions from net investment income | - | (.01) | (.22) | (.53) | (.45) | |||||
| Distributions from net realized gain | (.93) | - | - | (4.13) | (1.12) | |||||
| Total distributions | (.93) | (.01) | (.22) | (4.66) | (1.57) | |||||
| Net asset value, end of period | $ | 47.71 | $ | 65.18 | $ | 45.48 | $ | 37.51 | $ | 38.32 |
Total Return C | (25.71)% | 43.35% | 21.92% | 12.01% | 2.37% | |||||
Ratios to Average Net Assets B,D,E | ||||||||||
| Expenses before reductions | .71% | .79% | .71% | .51% | .53% | |||||
| Expenses net of fee waivers, if any | .70% | .78% | .71% | .51% | .53% | |||||
| Expenses net of all reductions | .70% | .78% | .71% | .51% | .53% | |||||
| Net investment income (loss) | .20% | (.10)% | .07% | .90% | 1.32% | |||||
| Supplemental Data | ||||||||||
| Net assets, end of period (in millions) | $ | 1,422 | $ | 2,091 | $ | 1,469 | $ | 1,190 | $ | 1,182 |
Portfolio turnover rate F | 28% | 19% | 35% | 108% | 181% |
| Fidelity® Disciplined Equity Fund Class K |
| Years ended October 31, | 2022 | 2021 | 2020 | 2019 | 2018 | |||||
Selected Per-Share Data | ||||||||||
| Net asset value, beginning of period | $ | 65.14 | $ | 45.42 | $ | 37.47 | $ | 38.29 | $ | 38.93 |
| Income from Investment Operations | ||||||||||
Net investment income (loss) A,B | .16 | (.01) | .06 | .35 | .56 | |||||
| Net realized and unrealized gain (loss) | (16.65) | 19.75 | 8.14 | 3.53 | .41 | |||||
| Total from investment operations | (16.49) | 19.74 | 8.20 | 3.88 | .97 | |||||
| Distributions from net investment income | - | (.02) | (.25) | (.57) | (.49) | |||||
| Distributions from net realized gain | (.93) | - | - | (4.13) | (1.12) | |||||
| Total distributions | (.93) | (.02) | (.25) | (4.70) | (1.61) | |||||
| Net asset value, end of period | $ | 47.72 | $ | 65.14 | $ | 45.42 | $ | 37.47 | $ | 38.29 |
Total Return C | (25.65)% | 43.47% | 21.99% | 12.12% | 2.48% | |||||
Ratios to Average Net Assets B,D,E | ||||||||||
| Expenses before reductions | .62% | .70% | .62% | .42% | .43% | |||||
| Expenses net of fee waivers, if any | .62% | .70% | .62% | .42% | .43% | |||||
| Expenses net of all reductions | .62% | .70% | .62% | .42% | .43% | |||||
| Net investment income (loss) | .28% | (.01)% | .16% | .99% | 1.41% | |||||
| Supplemental Data | ||||||||||
| Net assets, end of period (in millions) | $ | 53 | $ | 113 | $ | 95 | $ | 91 | $ | 99 |
Portfolio turnover rate F | 28% | 19% | 35% | 108% | 181% |
| Fidelity Central Fund | Investment Manager | Investment Objective | Investment Practices | Expense Ratio A |
| Fidelity Money Market Central Funds | Fidelity Management & Research Company LLC (FMR) | Each fund seeks to obtain a high level of current income consistent with the preservation of capital and liquidity. | Short-term Investments | Less than .005% |
| Gross unrealized appreciation | $532,551 |
| Gross unrealized depreciation | (28,575) |
| Net unrealized appreciation (depreciation) | $503,976 |
| Tax Cost | $959,932 |
| Undistributed ordinary income | $1,250 |
| Undistributed long-term capital gain | $36,712 |
| Net unrealized appreciation (depreciation) on securities and other investments | $503,976 |
| October 31, 2022 | October 31, 2021 | |
| Ordinary Income | $- | $438 |
| Long-term Capital Gains | 31,288 | - |
| Total | $31,288 | $438 |
| Purchases ($) | Sales ($) | |
| Fidelity Disciplined Equity Fund | 505,235 | 700,274 |
| Amount | % of Class-Level Average Net Assets | |
| Disciplined Equity | $2,121 | .12 |
| Class K | 33 | .04 |
| $2,154 |
| % of Average Net Assets | |
| Fidelity Disciplined Equity Fund | .03 |
| Amount | |
| Fidelity Disciplined Equity Fund | $10 |
| Purchases ($) | Sales ($) | Realized Gain (Loss) ($) | |
| Fidelity Disciplined Equity Fund | 41,853 | 43,114 | 206 |
| Amount | |
| Fidelity Disciplined Equity Fund | $3 |
| Total Security Lending Fees Paid to NFS | Security Lending Income From Securities Loaned to NFS | Value of Securities Loaned to NFS at Period End | |
| Fidelity Disciplined Equity Fund | $- A | $- | $- |
| Year ended October 31, 2022 | Year ended October 31, 2021 | |
| Fidelity Disciplined Equity Fund | ||
| Distributions to shareholders | ||
| Disciplined Equity | $29,805 | $396 |
| Class K | 1,483 | 42 |
Total | $31,288 | $438 |
| Shares | Shares | Dollars | Dollars | |
| Year ended October 31, 2022 | Year ended October 31, 2021 | Year ended October 31, 2022 | Year ended October 31, 2021 | |
| Fidelity Disciplined Equity Fund | ||||
| Disciplined Equity | ||||
| Shares sold | 884 | 4,022 | $49,965 | $213,553 |
| Reinvestment of distributions | 441 | 7 | 27,553 | 367 |
| Shares redeemed | (3,600) | (4,245) | (197,919) | (236,063) |
| Net increase (decrease) | (2,275) | (216) | $(120,401) | $(22,143) |
| Class K | ||||
| Shares sold | 125 | 171 | $7,128 | $9,204 |
| Reinvestment of distributions | 24 | 1 | 1,483 | 42 |
| Shares redeemed | (768) | (533) | (40,763) | (29,105) |
| Net increase (decrease) | (619) | (361) | $(32,152) | $(19,859) |
| The Example is based on an investment of $1,000 invested at the beginning of the period and held for the entire period (May 1, 2022 to October 31, 2022). |
Annualized Expense Ratio- A | Beginning Account Value May 1, 2022 | Ending Account Value October 31, 2022 | Expenses Paid During Period- C May 1, 2022 to October 31, 2022 | |||||||
| Fidelity® Disciplined Equity Fund | ||||||||||
| Fidelity® Disciplined Equity Fund | .62% | |||||||||
| Actual | $ 1,000 | $ 921.60 | $ 3.00 | |||||||
Hypothetical- B | $ 1,000 | $ 1,022.08 | $ 3.16 | |||||||
| Class K | .52% | |||||||||
| Actual | $ 1,000 | $ 921.90 | $ 2.52 | |||||||
Hypothetical- B | $ 1,000 | $ 1,022.58 | $ 2.65 | |||||||
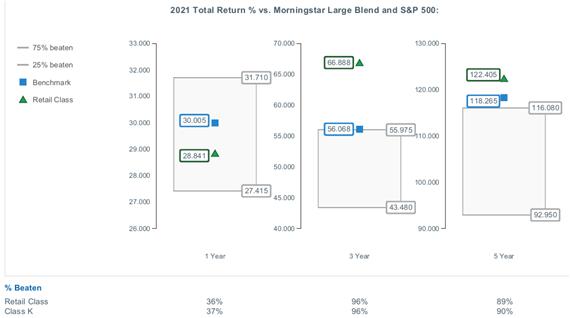
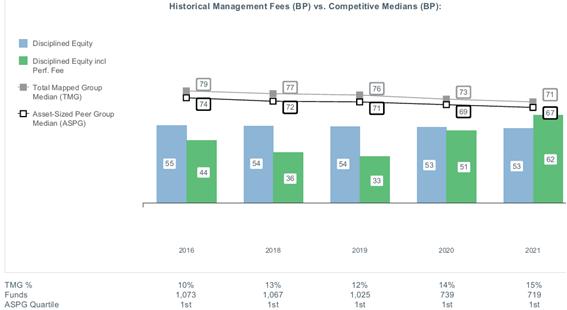
|
Item 2.
Code of Ethics
As of the end of the period, October 31, 2022, Fidelity Capital Trust (the trust) has adopted a code of ethics, as defined in Item 2 of Form N-CSR, that applies to its President and Treasurer and its Chief Financial Officer. A copy of the code of ethics is filed as an exhibit to this Form N-CSR.
Item 3.
Audit Committee Financial Expert
The Board of Trustees of the trust has determined that Donald F. Donahue is an audit committee financial expert, as defined in Item 3 of Form N-CSR. Mr. Donahue is independent for purposes of Item 3 of Form N-CSR.
Item 4.
Principal Accountant Fees and Services
Fees and Services
The following table presents fees billed by Deloitte & Touche LLP, the member firms of Deloitte Touche Tohmatsu, and their respective affiliates (collectively, “Deloitte Entities ”) in each of the last two fiscal years for services rendered to Fidelity Stock Selector Small Cap Fund (the “Fund(s) ”):
Services Billed by Deloitte Entities
October 31, 2022 Fees A
Audit Fees | Audit-Related Fees | Tax Fees | All Other Fees | |
Fidelity Stock Selector Small Cap Fund | $44,100 | $- | $6,900 | $1,000 |
October 31, 2021 Fees A
Audit Fees | Audit-Related Fees | Tax Fees | All Other Fees | |
Fidelity Stock Selector Small Cap Fund | $42,200 | $- | $7,200 | $1,000 |
A Amounts may reflect rounding.
The following table presents fees billed by PricewaterhouseCoopers LLP ( “PwC ”) in each of the last two fiscal years for services rendered to Fidelity Capital Appreciation Fund, Fidelity Disciplined Equity Fund, Fidelity Focused Stock Fund and Fidelity Value Fund (the “Fund(s) ”):
Services Billed by PwC
October 31, 2022 Fees A
Audit Fees | Audit-Related Fees | Tax Fees | All Other Fees | |
Fidelity Capital Appreciation Fund | $45,100 | $4,000 | $8,800 | $1,400 |
Fidelity Disciplined Equity Fund | $42,700 | $3,800 | $7,800 | $1,300 |
Fidelity Focused Stock Fund | $28,000 | $2,700 | $8,600 | $900 |
Fidelity Value Fund | $49,900 | $4,700 | $14,400 | $1,600 |
October 31, 2021 Fees A
Audit Fees | Audit-Related Fees | Tax Fees | All Other Fees | |
Fidelity Capital Appreciation Fund | $46,300 | $4,200 | $10,900 | $1,400 |
Fidelity Disciplined Equity Fund | $41,500 | $4,000 | $7,600 | $1,400 |
Fidelity Focused Stock Fund | $27,200 | $2,800 | $8,400 | $1,000 |
Fidelity Value Fund | $48,500 | $5,000 | $14,000 | $1,700 |
A Amounts may reflect rounding.
The following table(s) present(s) fees billed by Deloitte Entities and PwC that were required to be approved by the Audit Committee for services that relate directly to the operations and financial reporting of the Fund(s) and that are rendered on behalf of Fidelity Management & Research Company LLC ("FMR") and entities controlling, controlled by, or under common control with FMR (not including any sub-adviser whose role is primarily portfolio management and is subcontracted with or overseen by another investment adviser) that provide ongoing services to the Fund(s) ( “Fund Service Providers ”):
Services Billed by Deloitte Entities
October 31, 2022 A | October 31, 2021 A | |
Audit-Related Fees | $- | $- |
Tax Fees | $- | $- |
All Other Fees | $- | $- |
A Amounts may reflect rounding.
Services Billed by PwC
October 31, 2022 A | October 31, 2021 A | |
Audit-Related Fees | $7,914,600 | $8,830,600 |
Tax Fees | $1,000 | $354,200 |
All Other Fees | $- | $- |
A Amounts may reflect rounding.
“Audit-Related Fees ” represent fees billed for assurance and related services that are reasonably related to the performance of the fund audit or the review of the fund's financial statements and that are not reported under Audit Fees.
“Tax Fees ” represent fees billed for tax compliance, tax advice or tax planning that relate directly to the operations and financial reporting of the fund.
“All Other Fees ” represent fees billed for services provided to the fund or Fund Service Provider, a significant portion of which are assurance related, that relate directly to the operations and financial reporting of the fund, excluding those services that are reported under Audit Fees, Audit-Related Fees or Tax Fees.
Assurance services must be performed by an independent public accountant.
* * *
The aggregate non-audit fees billed by Deloitte Entities and PwC for services rendered to the Fund(s), FMR (not including any sub-adviser whose role is primarily portfolio management and is subcontracted with or overseen by another investment adviser), and any Fund Service Provider for each of the last two fiscal years of the Fund(s) are as follows:
Billed By | October 31, 2022 A | October 31, 2021 A |
Deloitte Entities | $473,000 | $537,900 |
PwC | $12,943,000 | $14,549,900 |
A Amounts may reflect rounding.
The trust's Audit Committee has considered non-audit services that were not pre-approved that were provided by Deloitte Entities and PwC to Fund Service Providers to be compatible with maintaining the independence of Deloitte Entities and PwC in its(their) audit of the Fund(s), taking into account representations from Deloitte Entities and PwC, in accordance with Public Company Accounting Oversight Board rules, regarding its independence from the Fund(s) and its(their) related entities and FMR ’s review of the appropriateness and permissibility under applicable law of such non-audit services prior to their provision to the Fund(s) Service Providers.
Audit Committee Pre-Approval Policies and Procedures
The trust ’s Audit Committee must pre-approve all audit and non-audit services provided by a fund ’s independent registered public accounting firm relating to the operations or financial reporting of the fund. Prior to the commencement of any audit or non-audit services to a fund, the Audit Committee reviews the services to determine whether they are appropriate and permissible under applicable law.
The Audit Committee has adopted policies and procedures to, among other purposes, provide a framework for the Committee ’s consideration of non-audit services by the audit firms that audit the Fidelity funds. The policies and procedures require that any non-audit service provided by a fund audit firm to a Fidelity fund and any non-audit service provided by a fund auditor to a Fund Service Provider that relates directly to the operations and financial reporting of a Fidelity fund ( “Covered Service ”) are subject to approval by the Audit Committee before such service is provided.
All Covered Services must be approved in advance of provision of the service either: (i) by formal resolution of the Audit Committee, or (ii) by oral or written approval of the service by the Chair of the Audit Committee (or if the Chair is unavailable, such other member of the Audit Committee as may be designated by the Chair to act in the Chair ’s absence). The approval contemplated by (ii) above is permitted where the Treasurer determines that action on such an engagement is necessary before the next meeting of the Audit Committee.
Non-audit services provided by a fund audit firm to a Fund Service Provider that do not relate directly to the operations and financial reporting of a Fidelity fund are reported to the Audit Committee periodically.
Non-Audit Services Approved Pursuant to Rule 2-01(c)(7)(i)(C) and (ii) of Regulation S-X ( “De Minimis Exception ”)
There were no non-audit services approved or required to be approved by the Audit Committee pursuant to the De Minimis Exception during the Fund ’s(s ’) last two fiscal years relating to services provided to (i) the Fund(s) or (ii) any Fund Service Provider that relate directly to the operations and financial reporting of the Fund(s).
Item 5.
Audit Committee of Listed Registrants
Not applicable.
Item 6.
Investments
(a)
Not applicable.
(b)
Not applicable.
Item 7.
Disclosure of Proxy Voting Policies and Procedures for Closed-End Management Investment Companies
Not applicable.
Item 8.
Portfolio Managers of Closed-End Management Investment Companies
Not applicable.
Item 9.
Purchase of Equity Securities by Closed-End Management Investment Company and Affiliated Purchasers
Not applicable.
Item 10.
Submission of Matters to a Vote of Security Holders
There were no material changes to the procedures by which shareholders may recommend nominees to the trust ’s Board of Trustees.
Item 11.
Controls and Procedures
(a)(i) The President and Treasurer and the Chief Financial Officer have concluded that the trust ’s disclosure controls and procedures (as defined in Rule 30a-3(c) under the Investment Company Act) provide reasonable assurances that material information relating to the trust is made known to them by the appropriate persons, based on their evaluation of these controls and procedures as of a date within 90 days of the filing date of this report.
(a)(ii) There was no change in the trust ’s internal control over financial reporting (as defined in Rule 30a-3(d) under the Investment Company Act) that occurred during the period covered by this report that has materially affected, or is reasonably likely to materially affect, the trust ’s internal control over financial reporting.
Item 12.
Disclosure of Securities Lending Activities for Closed-End Management
Investment Companies
Not applicable.
Item 13.
Exhibits
(a) | (1) | Code of Ethics pursuant to Item 2 of Form N-CSR is filed and attached hereto as EX-99.CODE ETH. |
(a) | (2) | |
(a) | (3) | Not applicable. |
(b) |
SIGNATURES
Pursuant to the requirements of the Securities Exchange Act of 1934 and the Investment Company Act of 1940, the registrant has duly caused this report to be signed on its behalf by the undersigned, thereunto duly authorized.
Fidelity Capital Trust
By: | /s/Stacie M. Smith |
Stacie M. Smith | |
President and Treasurer | |
Date: | December 21, 2022 |
Pursuant to the requirements of the Securities Exchange Act of 1934 and the Investment Company Act of 1940, this report has been signed below by the following persons on behalf of the registrant and in the capacities and on the dates indicated.
By: | /s/Stacie M. Smith |
Stacie M. Smith | |
President and Treasurer | |
Date: | December 21, 2022 |
By: | /s/John J. Burke III |
John J. Burke III | |
Chief Financial Officer | |
Date: | December 21, 2022 |