Comerica Incorporated First Quarter 2013 Financial ReviewApril 16, 2013 Safe Harbor Statement 2 Any statements in this presentation that are not historical facts are forward-looking statements as defined in the Private Securities LitigationReform Act of 1995. Words such as “anticipates,” “believes,” “contemplates,” “feels,” “expects,” “estimates,” “seeks,” “strives,” “plans,” “intends,”“outlook,” “forecast,” “position,” “target,” “mission,” “assume,” “achievable,” “potential,” “strategy,” “goal,” “aspiration,” “opportunity,” “initiative,”“outcome,” “continue,” “remain,” “maintain,” “on course,” “trend,” “objective,” “looks forward” and variations of such words and similar expressions,or future or conditional verbs such as “will,” “would,” “should,” “could,” “might,” “can,” “may” or similar expressions, as they relate to Comerica or itsmanagement, are intended to identify forward-looking statements. These forward-looking statements are predicated on the beliefs andassumptions of Comerica's management based on information known to Comerica's management as of the date of this presentation and do notpurport to speak as of any other date. Forward-looking statements may include descriptions of plans and objectives of Comerica's managementfor future or past operations, products or services, and forecasts of Comerica's revenue, earnings or other measures of economic performance,including statements of profitability, business segments and subsidiaries, estimates of credit trends and global stability. Such statements reflectthe view of Comerica's management as of this date with respect to future events and are subject to risks and uncertainties. Should one or more ofthese risks materialize or should underlying beliefs or assumptions prove incorrect, Comerica's actual results could differ materially from thosediscussed. Factors that could cause or contribute to such differences are changes in general economic, political or industry conditions; changes inmonetary and fiscal policies, including the interest rate policies of the Federal Reserve Board; volatility and disruptions in global capital and creditmarkets; changes in Comerica's credit rating; the interdependence of financial service companies; changes in regulation or oversight; unfavorabledevelopments concerning credit quality; any future acquisitions or divestitures; the effects of more stringent capital or liquidity requirements;declines or other changes in the businesses or industries of Comerica's customers; the implementation of Comerica's strategies and businessmodels; Comerica's ability to utilize technology to efficiently and effectively develop, market and deliver new products and services; operationaldifficulties, failure of technology infrastructure or information security incidents; changes in the financial markets, including fluctuations in interestrates and their impact on deposit pricing; competitive product and pricing pressures among financial institutions within Comerica's markets;changes in customer behavior; management's ability to maintain and expand customer relationships; management's ability to retain key officersand employees; the impact of legal and regulatory proceedings or determinations; the effectiveness of methods of reducing risk exposures; theeffects of terrorist activities and other hostilities; the effects of catastrophic events including, but not limited to, hurricanes, tornadoes, earthquakes,fires, droughts and floods; changes in accounting standards and the critical nature of Comerica's accounting policies. Comerica cautions that theforegoing list of factors is not exclusive. For discussion of factors that may cause actual results to differ from expectations, please refer to ourfilings with the Securities and Exchange Commission. In particular, please refer to “Item 1A. Risk Factors” beginning on page 13 of Comerica'sAnnual Report on Form 10-K for the year ended December 31, 2012. Forward-looking statements speak only as of the date they are made.Comerica does not undertake to update forward-looking statements to reflect facts, circumstances, assumptions or events that occur after the datethe forward-looking statements are made. For any forward-looking statements made in this presentation or in any documents, Comerica claimsthe protection of the safe harbor for forward-looking statements contained in the Private Securities Litigation Reform Act of 1995.
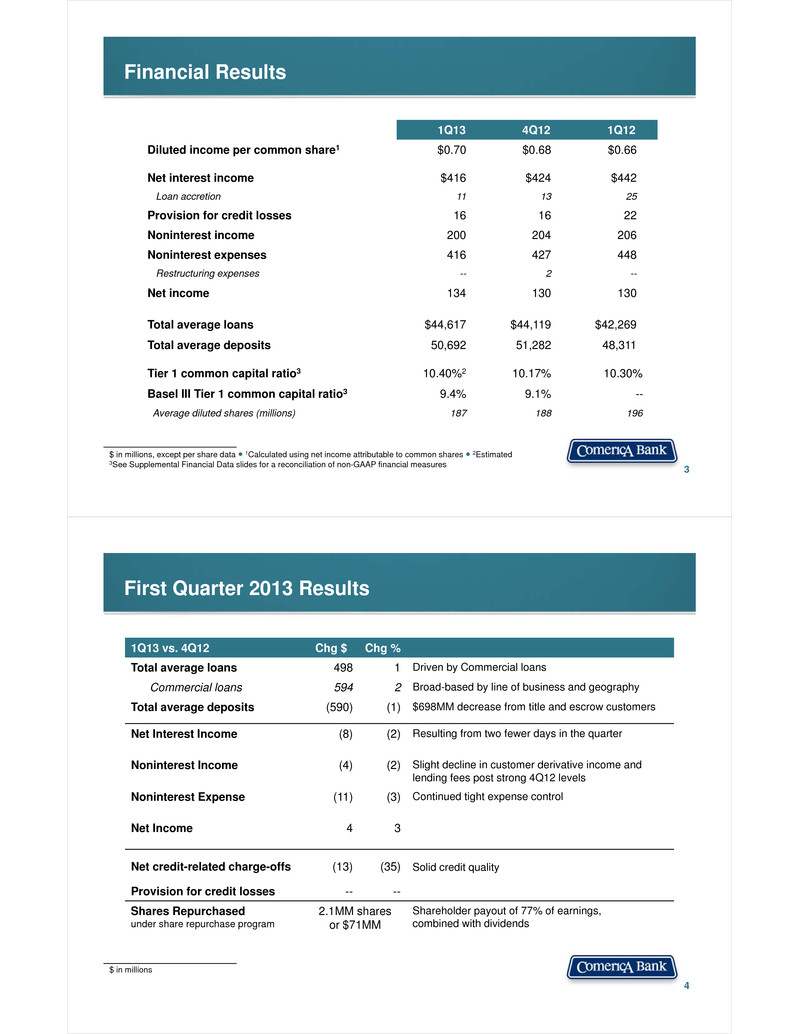
Financial Results 3 1Q13 4Q12 1Q12 Diluted income per common share1 $0.70 $0.68 $0.66 Net interest income $416 $424 $442 Loan accretion 11 13 25 Provision for credit losses 16 16 22 Noninterest income 200 204 206 Noninterest expenses 416 427 448 Restructuring expenses -- 2 -- Net income 134 130 130 Total average loans $44,617 $44,119 $42,269 Total average deposits 50,692 51,282 48,311 Tier 1 common capital ratio3 10.40%2 10.17% 10.30% Basel III Tier 1 common capital ratio3 9.4% 9.1% -- Average diluted shares (millions) 187 188 196 $ in millions, except per share data ● 1Calculated using net income attributable to common shares ● 2Estimated 3See Supplemental Financial Data slides for a reconciliation of non-GAAP financial measures First Quarter 2013 Results 4 $ in millions 1Q13 vs. 4Q12 Chg $ Chg % Total average loans 498 1 Driven by Commercial loans Commercial loans 594 2 Broad-based by line of business and geography Total average deposits (590) (1) $698MM decrease from title and escrow customers Net Interest Income (8) (2) Resulting from two fewer days in the quarter Noninterest Income (4) (2) Slight decline in customer derivative income and lending fees post strong 4Q12 levels Noninterest Expense (11) (3) Continued tight expense control Net Income 4 3 Net credit-related charge-offs (13) (35) Solid credit quality Provision for credit losses -- -- Shares Repurchasedunder share repurchase program 2.1MM sharesor $71MM Shareholder payout of 77% of earnings, combined with dividends
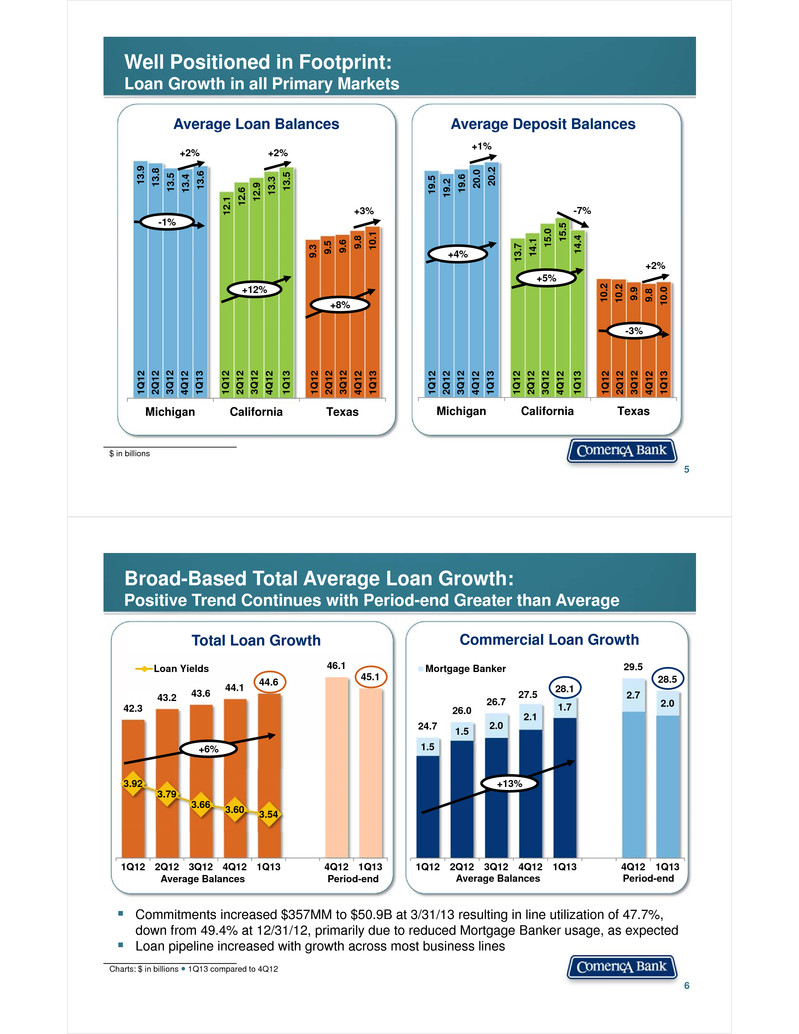
Well Positioned in Footprint:Loan Growth in all Primary Markets 5 19.5 13.7 10.2 19.2 14.1 10.2 19.6 15.0 9.9 20.0 15.5 9.8 20.2 14.4 10.0 Michigan California Texas +5% 13.9 12.1 9.3 13.8 12.6 9.5 13.5 12.9 9.6 13.4 13.3 9.8 13.6 13.5 10.1 Michigan California Texas +2% +12% 2Q1 2 3Q1 2 1Q1 3 1Q1 2 4Q1 2 +8% 2Q1 2 3Q1 2 1Q1 3 1Q1 2 4Q1 2 2Q1 2 3Q1 2 1Q1 3 1Q1 2 4Q1 2 -3% $ in billions Average Loan Balances Average Deposit Balances 2Q1 2 3Q1 2 1Q1 3 1Q1 2 4Q1 2 2Q1 2 3Q1 2 1Q1 3 1Q1 2 4Q1 2 2Q1 2 3Q1 2 1Q1 3 1Q1 2 4Q1 2 +4% +2% +3%-1% +1% -7% +2% Broad-Based Total Average Loan Growth:Positive Trend Continues with Period-end Greater than Average 1.5 1.5 2.0 2.1 1.7 2.7 2.0 24.7 26.0 26.7 27.5 28.1 29.5 28.5 1Q12 2Q12 3Q12 4Q12 1Q13 4Q12 1Q13 Mortgage Banker 42.3 43.2 43.6 44.1 44.6 46.1 45.1 3.92 3.79 3.66 3.60 3.54 1Q12 2Q12 3Q12 4Q12 1Q13 4Q12 1Q13 Loan Yields 6 Charts: $ in billions ● 1Q13 compared to 4Q12 +6% +13% Commitments increased $357MM to $50.9B at 3/31/13 resulting in line utilization of 47.7%, down from 49.4% at 12/31/12, primarily due to reduced Mortgage Banker usage, as expected Loan pipeline increased with growth across most business lines Total Loan Growth Commercial Loan Growth Average Balances Period-end Average Balances Period-end
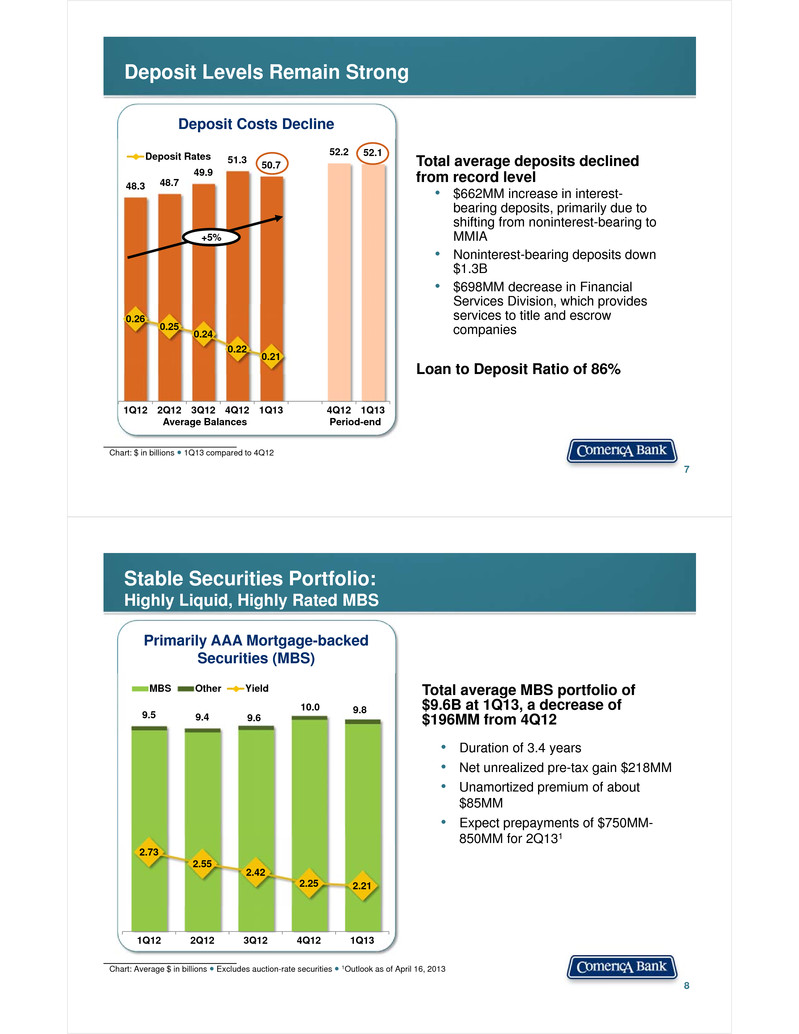
48.3 48.7 49.9 51.3 50.7 52.2 52.1 0.26 0.25 0.24 0.22 0.21 1Q12 2Q12 3Q12 4Q12 1Q13 4Q12 1Q13 Deposit Rates Deposit Levels Remain Strong 7 Chart: $ in billions ● 1Q13 compared to 4Q12 +5% Total average deposits declined from record level• $662MM increase in interest-bearing deposits, primarily due to shifting from noninterest-bearing to MMIA• Noninterest-bearing deposits down $1.3B• $698MM decrease in Financial Services Division, which provides services to title and escrow companies Loan to Deposit Ratio of 86% Deposit Costs Decline Average Balances Period-end Stable Securities Portfolio: Highly Liquid, Highly Rated MBS 8 Chart: Average $ in billions ● Excludes auction-rate securities ● 1Outlook as of April 16, 2013 Primarily AAA Mortgage-backed Securities (MBS) 9.5 9.4 9.6 10.0 9.8 2.73 2.55 2.42 2.25 2.21 1Q12 2Q12 3Q12 4Q12 1Q13 MBS Other Yield Total average MBS portfolio of $9.6B at 1Q13, a decrease of $196MM from 4Q12 • Duration of 3.4 years • Net unrealized pre-tax gain $218MM• Unamortized premium of about $85MM• Expect prepayments of $750MM-850MM for 2Q131
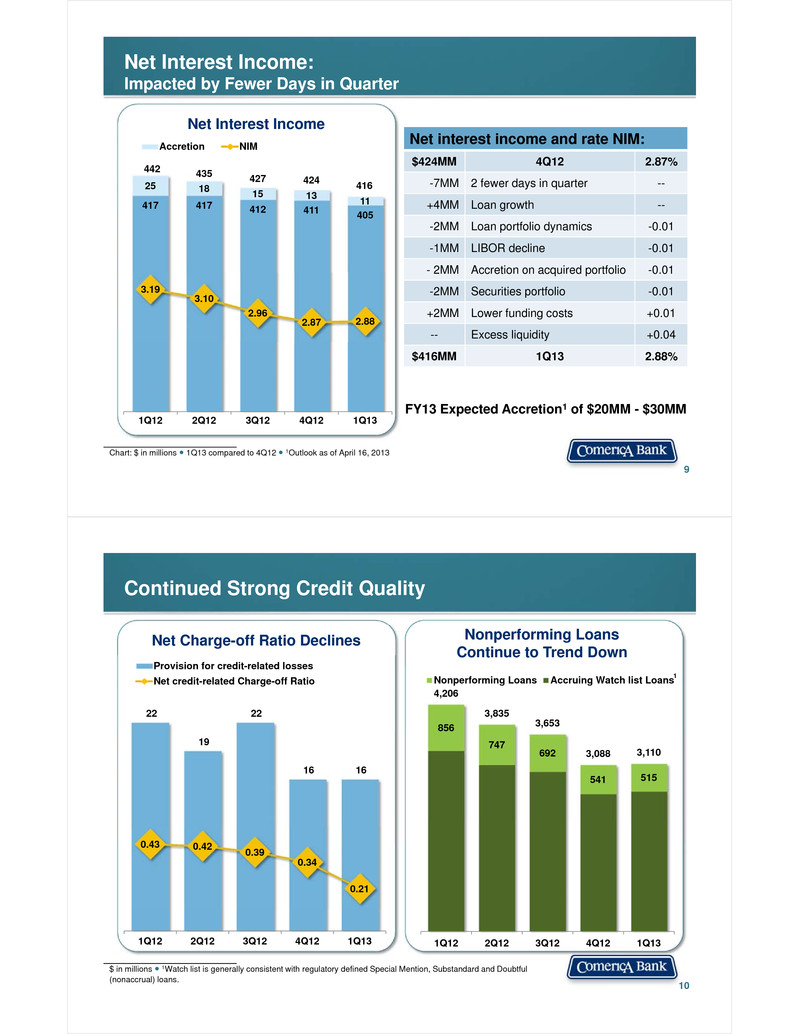
Net Interest Income:Impacted by Fewer Days in Quarter 9 Chart: $ in millions ● 1Q13 compared to 4Q12 ● 1Outlook as of April 16, 2013 Net Interest Income Net interest income and rate NIM: $424MM 4Q12 2.87% -7MM 2 fewer days in quarter -- +4MM Loan growth -- -2MM Loan portfolio dynamics -0.01 -1MM LIBOR decline -0.01 - 2MM Accretion on acquired portfolio -0.01 -2MM Securities portfolio -0.01 +2MM Lower funding costs +0.01 -- Excess liquidity +0.04 $416MM 1Q13 2.88% FY13 Expected Accretion1 of $20MM - $30MM 417 417 412 411 405 25 18 15 13 11 442 435 427 424 416 3.19 3.10 2.96 2.87 2.88 1Q12 2Q12 3Q12 4Q12 1Q13 Accretion NIM 22 19 22 16 16 0.43 0.42 0.39 0.34 0.21 1Q12 2Q12 3Q12 4Q12 1Q13 Provision for credit-related lossesNet credit-related Charge-off Ratio Continued Strong Credit Quality 10 $ in millions ● 1Watch list is generally consistent with regulatory defined Special Mention, Substandard and Doubtful (nonaccrual) loans. Net Charge-off Ratio Declines 856 747 692 541 515 4,206 3,835 3,653 3,088 3,110 1Q12 2Q12 3Q12 4Q12 1Q13 Nonperforming Loans Accruing Watch list Loans Nonperforming Loans Continue to Trend Down 1
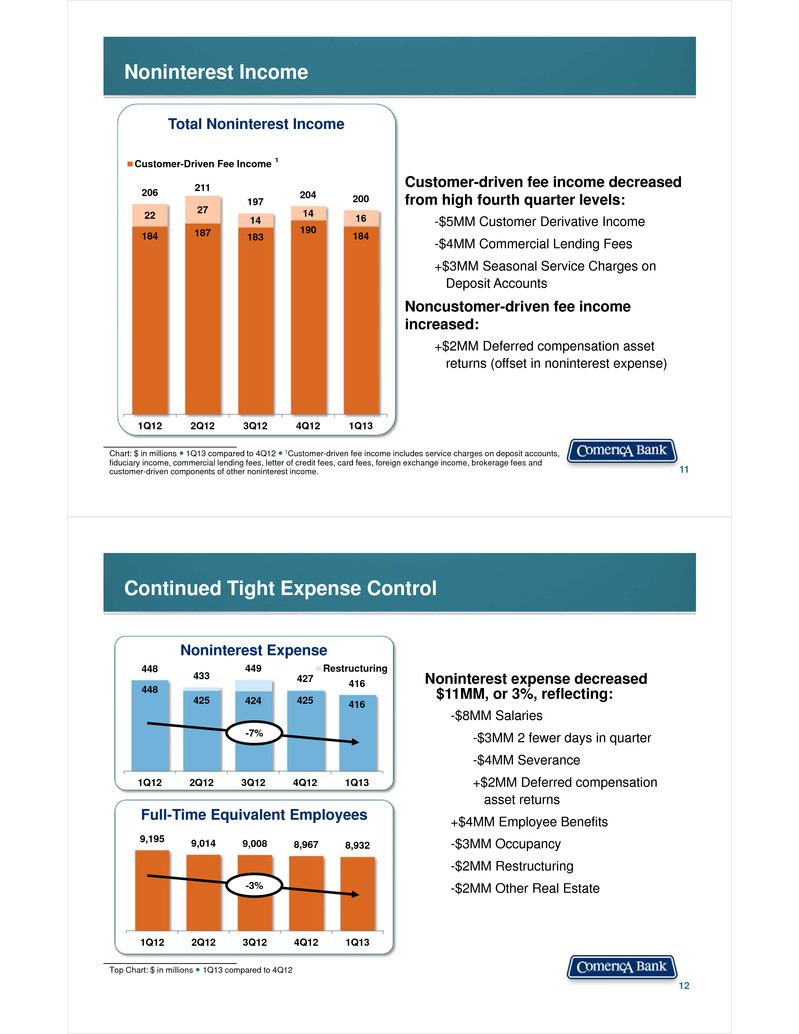
Noninterest Income 11 Total Noninterest Income Chart: $ in millions ● 1Q13 compared to 4Q12 ● 1Customer-driven fee income includes service charges on deposit accounts, fiduciary income, commercial lending fees, letter of credit fees, card fees, foreign exchange income, brokerage fees and customer-driven components of other noninterest income. 184 187 183 190 184 22 27 14 14 16 206 211 197 204 200 1Q12 2Q12 3Q12 4Q12 1Q13 Customer-Driven Fee Income Customer-driven fee income decreased from high fourth quarter levels: -$5MM Customer Derivative Income -$4MM Commercial Lending Fees +$3MM Seasonal Service Charges on Deposit Accounts Noncustomer-driven fee income increased: +$2MM Deferred compensation asset returns (offset in noninterest expense) 1 Continued Tight Expense Control 12 Noninterest Expense Full-Time Equivalent Employees 9,195 9,014 9,008 8,967 8,932 1Q12 2Q12 3Q12 4Q12 1Q13 448 425 424 425 416 448 433 449 427 416 1Q12 2Q12 3Q12 4Q12 1Q13 Restructuring Noninterest expense decreased $11MM, or 3%, reflecting: -$8MM Salaries -$3MM 2 fewer days in quarter -$4MM Severance +$2MM Deferred compensation asset returns +$4MM Employee Benefits -$3MM Occupancy -$2MM Restructuring -$2MM Other Real Estate-3% Top Chart: $ in millions ● 1Q13 compared to 4Q12 -7%
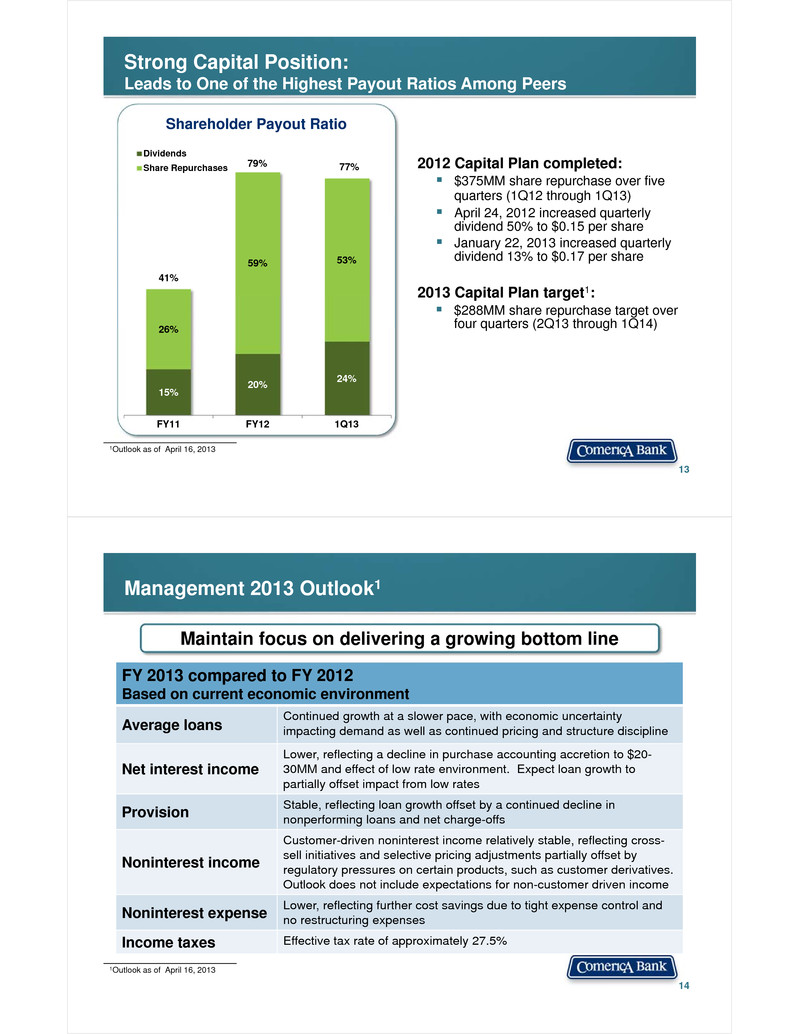
Strong Capital Position: Leads to One of the Highest Payout Ratios Among Peers 13 Shareholder Payout Ratio 15% 20% 24% 26% 59% 53%41% 79% 77% FY11 FY12 1Q13 Dividends Share Repurchases 1Outlook as of April 16, 2013 2012 Capital Plan completed: $375MM share repurchase over five quarters (1Q12 through 1Q13) April 24, 2012 increased quarterly dividend 50% to $0.15 per share January 22, 2013 increased quarterly dividend 13% to $0.17 per share 2013 Capital Plan target1: $288MM share repurchase target over four quarters (2Q13 through 1Q14) Management 2013 Outlook1 14 FY 2013 compared to FY 2012Based on current economic environment Average loans Continued growth at a slower pace, with economic uncertainty impacting demand as well as continued pricing and structure discipline Net interest income Lower, reflecting a decline in purchase accounting accretion to $20-30MM and effect of low rate environment. Expect loan growth to partially offset impact from low rates Provision Stable, reflecting loan growth offset by a continued decline in nonperforming loans and net charge-offs Noninterest income Customer-driven noninterest income relatively stable, reflecting cross-sell initiatives and selective pricing adjustments partially offset by regulatory pressures on certain products, such as customer derivatives. Outlook does not include expectations for non-customer driven income Noninterest expense Lower, reflecting further cost savings due to tight expense control and no restructuring expensesIncome taxes Effective tax rate of approximately 27.5% 1Outlook as of April 16, 2013 Maintain focus on delivering a growing bottom line
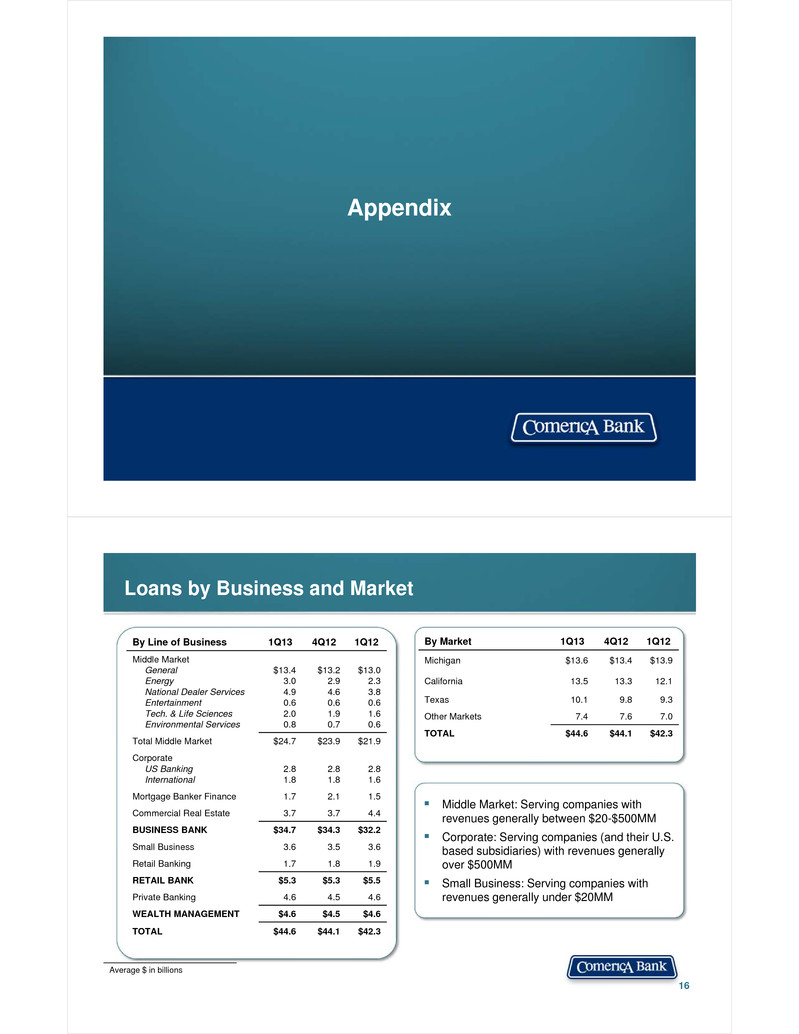
Appendix Loans by Business and Market 16 Middle Market: Serving companies with revenues generally between $20-$500MM Corporate: Serving companies (and their U.S. based subsidiaries) with revenues generally over $500MM Small Business: Serving companies with revenues generally under $20MM Average $ in billions By Line of Business 1Q13 4Q12 1Q12 Middle MarketGeneralEnergyNational Dealer ServicesEntertainmentTech. & Life SciencesEnvironmental Services $13.43.04.90.62.00.8 $13.22.94.60.61.90.7 $13.02.33.80.61.60.6 Total Middle Market $24.7 $23.9 $21.9 CorporateUS BankingInternational 2.81.8 2.81.8 2.81.6 Mortgage Banker Finance 1.7 2.1 1.5 Commercial Real Estate 3.7 3.7 4.4 BUSINESS BANK $34.7 $34.3 $32.2 Small Business 3.6 3.5 3.6 Retail Banking 1.7 1.8 1.9 RETAIL BANK $5.3 $5.3 $5.5 Private Banking 4.6 4.5 4.6 WEALTH MANAGEMENT $4.6 $4.5 $4.6 TOTAL $44.6 $44.1 $42.3 By Market 1Q13 4Q12 1Q12 Michigan $13.6 $13.4 $13.9 California 13.5 13.3 12.1 Texas 10.1 9.8 9.3 Other Markets 7.4 7.6 7.0 TOTAL $44.6 $44.1 $42.3
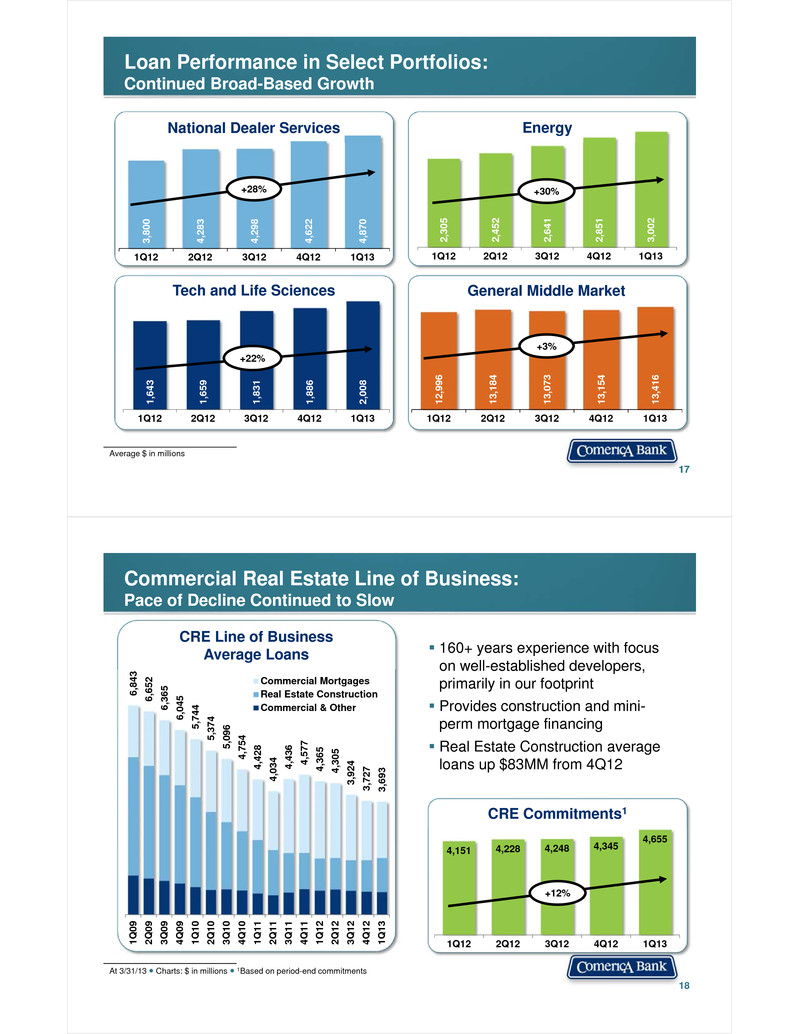
2,30 5 2,45 2 2,64 1 2,85 1 3,00 2 1Q12 2Q12 3Q12 4Q12 1Q13 Loan Performance in Select Portfolios:Continued Broad-Based Growth Average $ in millions 1,64 3 1,65 9 1,83 1 1,88 6 2,00 8 1Q12 2Q12 3Q12 4Q12 1Q13 +22% 17 3,80 0 4,28 3 4,29 8 4,62 2 4,87 0 1Q12 2Q12 3Q12 4Q12 1Q13 +28% National Dealer Services +30% Energy Tech and Life Sciences General Middle Market 12,9 96 13,1 84 13,0 73 13,1 54 13,4 16 1Q12 2Q12 3Q12 4Q12 1Q13 +3% 18 6,84 3 6,65 2 6,36 5 6,04 5 5,74 4 5,37 4 5,09 6 4,75 4 4,42 8 4,03 4 4,43 6 4,57 7 4,36 5 4,30 5 3,92 4 3,72 7 3,69 3 1Q0 9 2Q0 9 3Q0 9 4Q0 9 1Q1 0 2Q1 0 3Q1 0 4Q1 0 1Q1 1 2Q1 1 3Q1 1 4Q1 1 1Q1 2 2Q1 2 3Q1 2 4Q1 2 1Q1 3 Commercial MortgagesReal Estate ConstructionCommercial & Other 160+ years experience with focus on well-established developers, primarily in our footprint Provides construction and mini-perm mortgage financing Real Estate Construction average loans up $83MM from 4Q12 4,151 4,228 4,248 4,345 4,655 1Q12 2Q12 3Q12 4Q12 1Q13 +12% At 3/31/13 ● Charts: $ in millions ● 1Based on period-end commitments CRE Line of BusinessAverage Loans CRE Commitments1 Commercial Real Estate Line of Business:Pace of Decline Continued to Slow
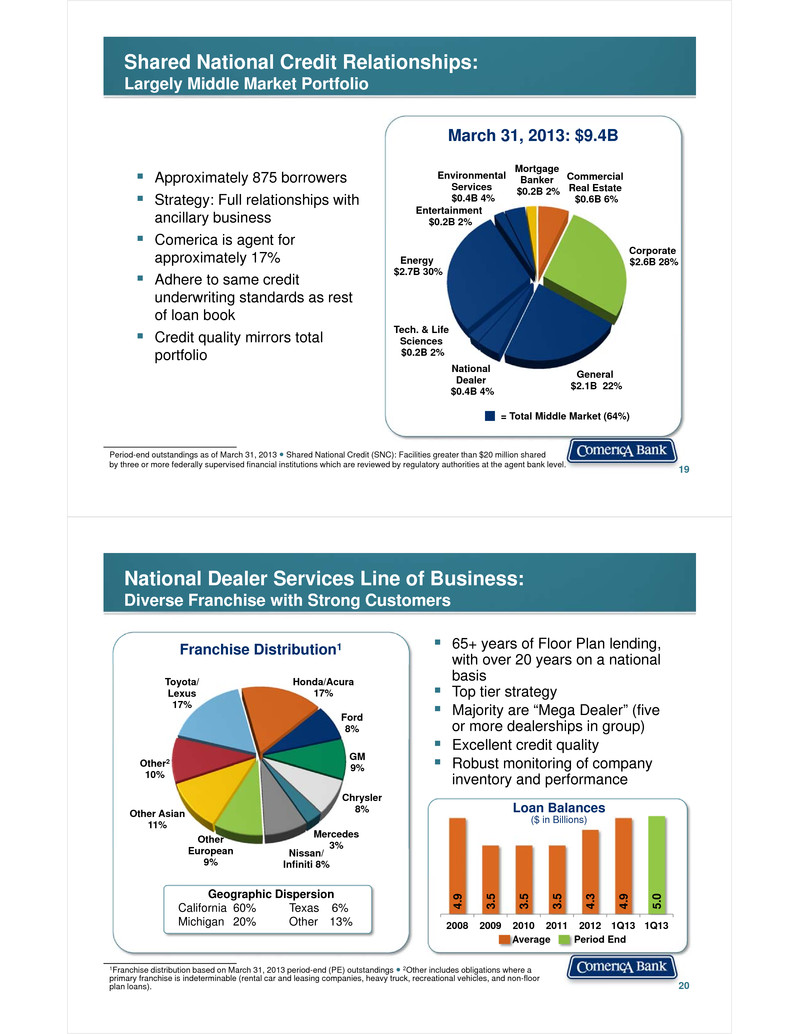
Shared National Credit Relationships:Largely Middle Market Portfolio 19 Approximately 875 borrowers Strategy: Full relationships with ancillary business Comerica is agent for approximately 17% Adhere to same credit underwriting standards as rest of loan book Credit quality mirrors total portfolio Commercial Real Estate$0.6B 6% Corporate $2.6B 28% General$2.1B 22% National Dealer $0.4B 4% Energy$2.7B 30% Entertainment$0.2B 2% Tech. & Life Sciences$0.2B 2% Environmental Services $0.4B 4% Mortgage Banker$0.2B 2% March 31, 2013: $9.4B Period-end outstandings as of March 31, 2013 ● Shared National Credit (SNC): Facilities greater than $20 million shared by three or more federally supervised financial institutions which are reviewed by regulatory authorities at the agent bank level. = Total Middle Market (64%) National Dealer Services Line of Business:Diverse Franchise with Strong Customers 20 Toyota/Lexus17% Honda/Acura 17% Ford 8% GM 9% Chrysler 8% Mercedes 3%Nissan/ Infiniti 8% Other European 9% Other Asian 11% Other210% 65+ years of Floor Plan lending, with over 20 years on a national basis Top tier strategy Majority are “Mega Dealer” (five or more dealerships in group) Excellent credit quality Robust monitoring of company inventory and performance Geographic DispersionCalifornia 60% Texas 6%Michigan 20% Other 13% 4 .9 3.5 3.5 3.5 4.3 4.9 5.0 2008 2009 2010 2011 2012 1Q13 1Q13 Loan Balances ($ in Billions) Average Period End 1Franchise distribution based on March 31, 2013 period-end (PE) outstandings ● 2Other includes obligations where a primary franchise is indeterminable (rental car and leasing companies, heavy truck, recreational vehicles, and non-floor plan loans). Franchise Distribution1
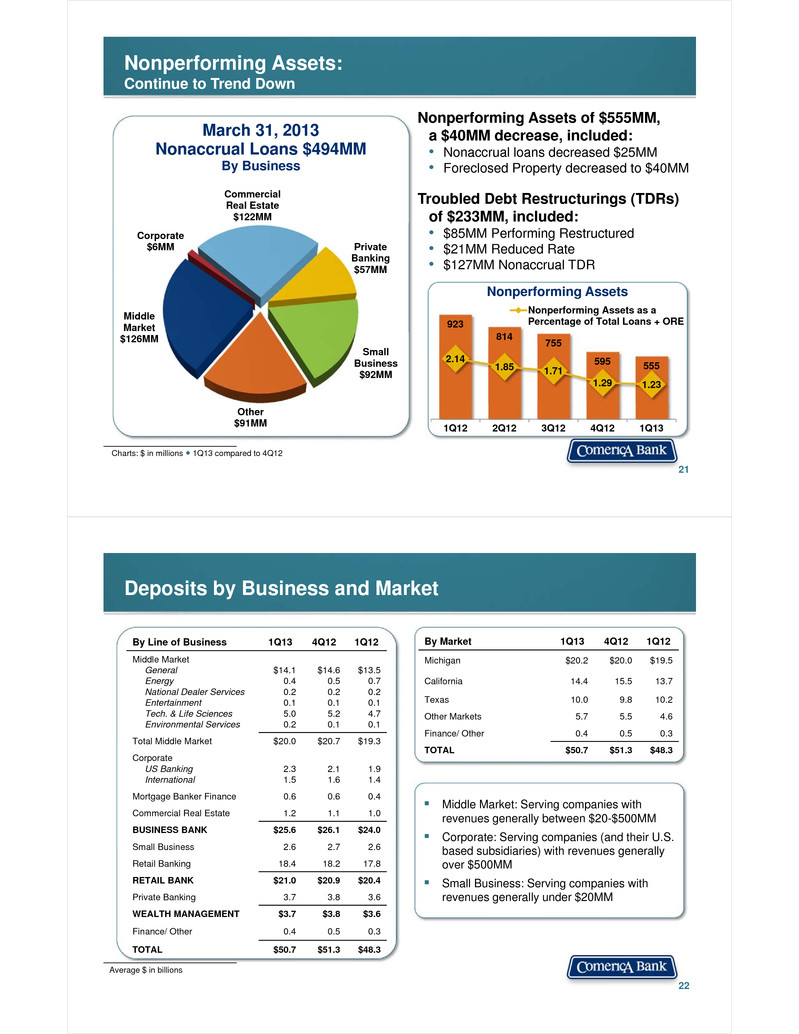
Charts: $ in millions ● 1Q13 compared to 4Q12 Nonperforming Assets of $555MM, a $40MM decrease, included:• Nonaccrual loans decreased $25MM • Foreclosed Property decreased to $40MM Troubled Debt Restructurings (TDRs) of $233MM, included:• $85MM Performing Restructured• $21MM Reduced Rate • $127MM Nonaccrual TDR March 31, 2013Nonaccrual Loans $494MMBy Business Middle Market$126MM Corporate $6MM Commercial Real Estate$122MM Private Banking$57MM Small Business$92MM Other$91MM 21 Nonperforming Assets:Continue to Trend Down Nonperforming Assets 923 814 755 595 5552.14 1.85 1.71 1.29 1.23 1Q12 2Q12 3Q12 4Q12 1Q13 Nonperforming Assets as aPercentage of Total Loans + ORE Deposits by Business and Market 22 Middle Market: Serving companies with revenues generally between $20-$500MM Corporate: Serving companies (and their U.S. based subsidiaries) with revenues generally over $500MM Small Business: Serving companies with revenues generally under $20MM Average $ in billions By Line of Business 1Q13 4Q12 1Q12 Middle MarketGeneralEnergyNational Dealer ServicesEntertainmentTech. & Life SciencesEnvironmental Services $14.10.40.20.15.00.2 $14.60.50.20.15.20.1 $13.50.70.20.14.70.1 Total Middle Market $20.0 $20.7 $19.3 CorporateUS BankingInternational 2.31.5 2.11.6 1.91.4 Mortgage Banker Finance 0.6 0.6 0.4 Commercial Real Estate 1.2 1.1 1.0 BUSINESS BANK $25.6 $26.1 $24.0 Small Business 2.6 2.7 2.6 Retail Banking 18.4 18.2 17.8 RETAIL BANK $21.0 $20.9 $20.4 Private Banking 3.7 3.8 3.6 WEALTH MANAGEMENT $3.7 $3.8 $3.6 Finance/ Other 0.4 0.5 0.3 TOTAL $50.7 $51.3 $48.3 By Market 1Q13 4Q12 1Q12 Michigan $20.2 $20.0 $19.5 California 14.4 15.5 13.7 Texas 10.0 9.8 10.2 Other Markets 5.7 5.5 4.6 Finance/ Other 0.4 0.5 0.3 TOTAL $50.7 $51.3 $48.3
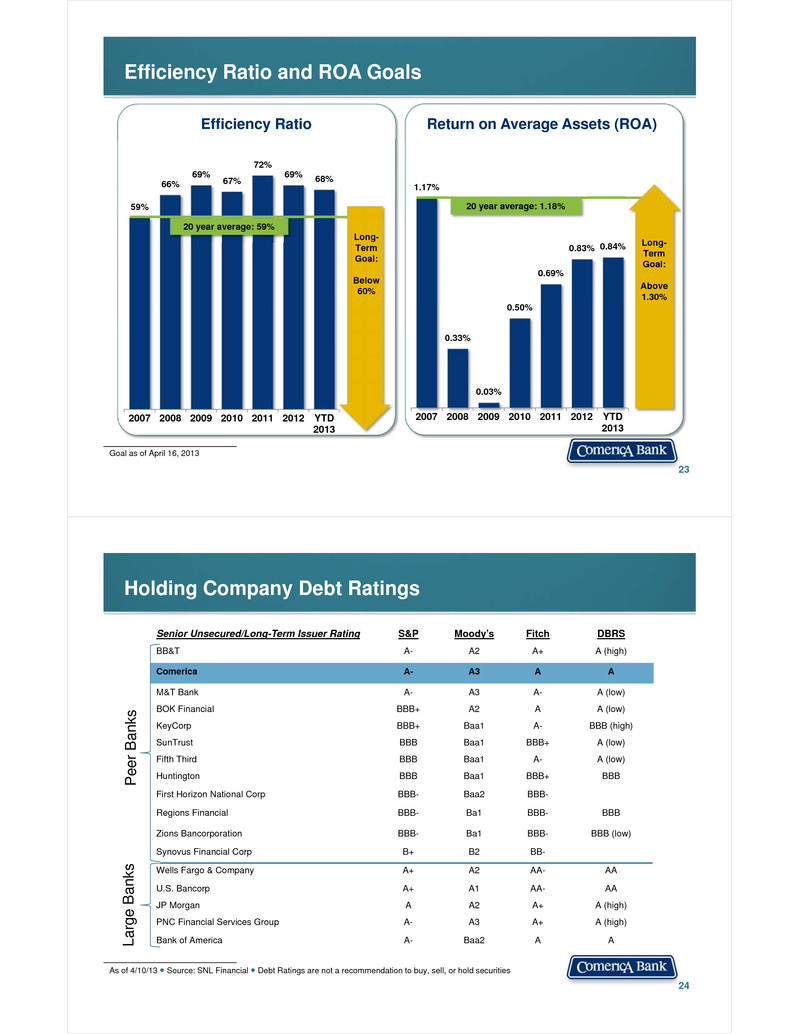
Efficiency Ratio and ROA Goals 23 Goal as of April 16, 2013 Efficiency Ratio Return on Average Assets (ROA) 59% 66% 69% 67% 72% 69% 68% 2007 2008 2009 2010 2011 2012 YTD2013 20 year average: 59% 1.17% 0.33% 0.03% 0.50% 0.69% 0.83% 0.84% 2007 2008 2009 2010 2011 2012 YTD2013 20 year average: 1.18% Long-TermGoal: Above 1.30% Long-TermGoal: Below 60% Senior Unsecured/Long-Term Issuer Rating S&P Moody’s Fitch DBRS BB&T A- A2 A+ A (high) Comerica A- A3 A A M&T Bank A- A3 A- A (low) BOK Financial BBB+ A2 A A (low) KeyCorp BBB+ Baa1 A- BBB (high) SunTrust BBB Baa1 BBB+ A (low) Fifth Third BBB Baa1 A- A (low) Huntington BBB Baa1 BBB+ BBB First Horizon National Corp BBB- Baa2 BBB- Regions Financial BBB- Ba1 BBB- BBB Zions Bancorporation BBB- Ba1 BBB- BBB (low) Synovus Financial Corp B+ B2 BB- Wells Fargo & Company A+ A2 AA- AA U.S. Bancorp A+ A1 AA- AA JP Morgan A A2 A+ A (high) PNC Financial Services Group A- A3 A+ A (high) Bank of America A- Baa2 A A Holding Company Debt Ratings 24 Pee r Ba nks Larg e Ba nks As of 4/10/13 ● Source: SNL Financial ● Debt Ratings are not a recommendation to buy, sell, or hold securities
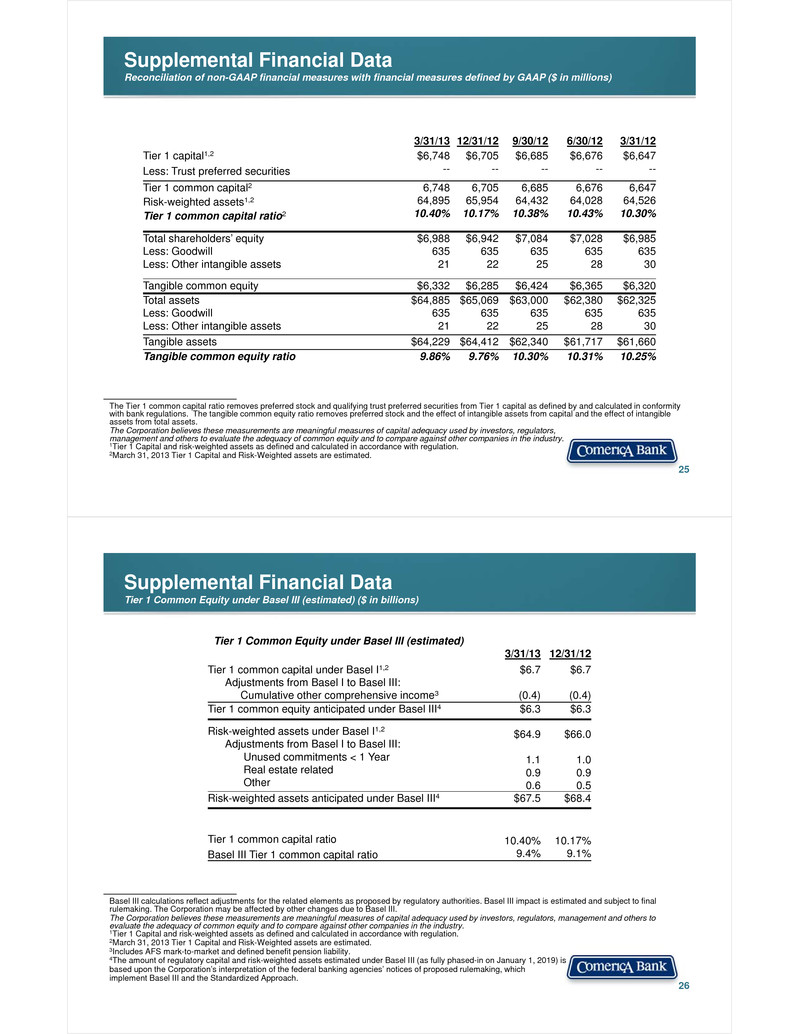
Supplemental Financial DataReconciliation of non-GAAP financial measures with financial measures defined by GAAP ($ in millions) 25 3/31/13 12/31/12 9/30/12 6/30/12 3/31/12Tier 1 capital1,2Less: Trust preferred securities $6,748-- $6,705-- $6,685-- $6,676-- $6,647--Tier 1 common capital2Risk-weighted assets1,2Tier 1 common capital ratio2 6,74864,89510.40% 6,70565,95410.17% 6,68564,43210.38% 6,67664,02810.43% 6,64764,52610.30% Total shareholders’ equityLess: GoodwillLess: Other intangible assets $6,98863521 $6,94263522 $7,08463525 $7,02863528 $6,98563530 Tangible common equity $6,332 $6,285 $6,424 $6,365 $6,320Total assetsLess: GoodwillLess: Other intangible assets $64,88563521 $65,06963522 $63,00063525 $62,38063528 $62,32563530Tangible assets $64,229 $64,412 $62,340 $61,717 $61,660Tangible common equity ratio 9.86% 9.76% 10.30% 10.31% 10.25% The Tier 1 common capital ratio removes preferred stock and qualifying trust preferred securities from Tier 1 capital as defined by and calculated in conformity with bank regulations. The tangible common equity ratio removes preferred stock and the effect of intangible assets from capital and the effect of intangible assets from total assets.The Corporation believes these measurements are meaningful measures of capital adequacy used by investors, regulators, management and others to evaluate the adequacy of common equity and to compare against other companies in the industry.1Tier 1 Capital and risk-weighted assets as defined and calculated in accordance with regulation.2March 31, 2013 Tier 1 Capital and Risk-Weighted assets are estimated. Supplemental Financial DataTier 1 Common Equity under Basel III (estimated) ($ in billions) 26 Basel III calculations reflect adjustments for the related elements as proposed by regulatory authorities. Basel III impact is estimated and subject to final rulemaking. The Corporation may be affected by other changes due to Basel III. The Corporation believes these measurements are meaningful measures of capital adequacy used by investors, regulators, management and others to evaluate the adequacy of common equity and to compare against other companies in the industry.1Tier 1 Capital and risk-weighted assets as defined and calculated in accordance with regulation.2March 31, 2013 Tier 1 Capital and Risk-Weighted assets are estimated.3Includes AFS mark-to-market and defined benefit pension liability.4The amount of regulatory capital and risk-weighted assets estimated under Basel III (as fully phased-in on January 1, 2019) is based upon the Corporation’s interpretation of the federal banking agencies’ notices of proposed rulemaking, which implement Basel III and the Standardized Approach. Tier 1 Common Equity under Basel III (estimated) 3/31/13 12/31/12Tier 1 common capital under Basel I1,2Adjustments from Basel I to Basel III:Cumulative other comprehensive income3 $6.7 (0.4) $6.7 (0.4)Tier 1 common equity anticipated under Basel III4 $6.3 $6.3 Risk-weighted assets under Basel I1,2Adjustments from Basel I to Basel III:Unused commitments < 1 YearReal estate relatedOther $64.9 1.10.90.6 $66.0 1.00.90.5Risk-weighted assets anticipated under Basel III4 $67.5 $68.4 Tier 1 common capital ratioBasel III Tier 1 common capital ratio 10.40%9.4% 10.17%9.1%


