Comerica Incorporated Second Quarter 2013 Financial ReviewJuly 16, 2013 Safe Harbor Statement 2 Any statements in this presentation that are not historical facts are forward-looking statements as defined in the Private Securities LitigationReform Act of 1995. Words such as “anticipates,” “believes,” “contemplates,” “feels,” “expects,” “estimates,” “seeks,” “strives,” “plans,” “intends,”“outlook,” “forecast,” “position,” “target,” “mission,” “assume,” “achievable,” “potential,” “strategy,” “goal,” “aspiration,” “opportunity,” “initiative,”“outcome,” “continue,” “remain,” “maintain,” “on course,” “trend,” “objective,” “looks forward” and variations of such words and similar expressions,or future or conditional verbs such as “will,” “would,” “should,” “could,” “might,” “can,” “may” or similar expressions, as they relate to Comerica or itsmanagement, are intended to identify forward-looking statements. These forward-looking statements are predicated on the beliefs andassumptions of Comerica's management based on information known to Comerica's management as of the date of this presentation and do notpurport to speak as of any other date. Forward-looking statements may include descriptions of plans and objectives of Comerica's managementfor future or past operations, products or services, and forecasts of Comerica's revenue, earnings or other measures of economic performance,including statements of profitability, business segments and subsidiaries, estimates of credit trends and global stability. Such statements reflectthe view of Comerica's management as of this date with respect to future events and are subject to risks and uncertainties. Should one or more ofthese risks materialize or should underlying beliefs or assumptions prove incorrect, Comerica's actual results could differ materially from thosediscussed. Factors that could cause or contribute to such differences are changes in general economic, political or industry conditions; changes inmonetary and fiscal policies, including the interest rate policies of the Federal Reserve Board; volatility and disruptions in global capital and creditmarkets; changes in Comerica's credit rating; the interdependence of financial service companies; changes in regulation or oversight; unfavorabledevelopments concerning credit quality; any future acquisitions or divestitures; the effects of more stringent capital or liquidity requirements;declines or other changes in the businesses or industries of Comerica's customers; the implementation of Comerica's strategies and businessmodels; Comerica's ability to utilize technology to efficiently and effectively develop, market and deliver new products and services; operationaldifficulties, failure of technology infrastructure or information security incidents; changes in the financial markets, including fluctuations in interestrates and their impact on deposit pricing; competitive product and pricing pressures among financial institutions within Comerica's markets;changes in customer behavior; management's ability to maintain and expand customer relationships; management's ability to retain key officersand employees; the impact of legal and regulatory proceedings or determinations; the effectiveness of methods of reducing risk exposures; theeffects of terrorist activities and other hostilities; the effects of catastrophic events including, but not limited to, hurricanes, tornadoes, earthquakes,fires, droughts and floods; changes in accounting standards and the critical nature of Comerica's accounting policies. Comerica cautions that theforegoing list of factors is not exclusive. For discussion of factors that may cause actual results to differ from expectations, please refer to ourfilings with the Securities and Exchange Commission. In particular, please refer to “Item 1A. Risk Factors” beginning on page 13 of Comerica'sAnnual Report on Form 10-K for the year ended December 31, 2012. Forward-looking statements speak only as of the date they are made.Comerica does not undertake to update forward-looking statements to reflect facts, circumstances, assumptions or events that occur after the datethe forward-looking statements are made. For any forward-looking statements made in this presentation or in any documents, Comerica claimsthe protection of the safe harbor for forward-looking statements contained in the Private Securities Litigation Reform Act of 1995.
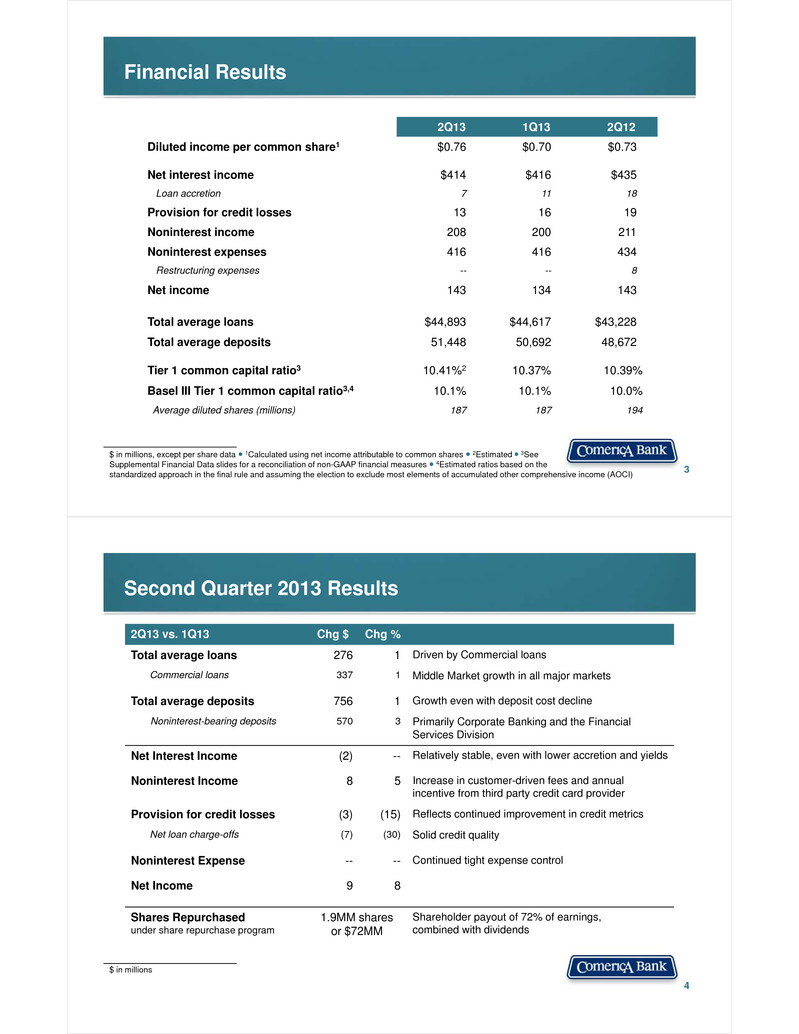
Financial Results 3 2Q13 1Q13 2Q12 Diluted income per common share1 $0.76 $0.70 $0.73 Net interest income $414 $416 $435 Loan accretion 7 11 18 Provision for credit losses 13 16 19 Noninterest income 208 200 211 Noninterest expenses 416 416 434 Restructuring expenses -- -- 8 Net income 143 134 143 Total average loans $44,893 $44,617 $43,228 Total average deposits 51,448 50,692 48,672 Tier 1 common capital ratio3 10.41%2 10.37% 10.39% Basel III Tier 1 common capital ratio3,4 10.1% 10.1% 10.0% Average diluted shares (millions) 187 187 194 $ in millions, except per share data ● 1Calculated using net income attributable to common shares ● 2Estimated ● 3See Supplemental Financial Data slides for a reconciliation of non-GAAP financial measures ● 4Estimated ratios based on the standardized approach in the final rule and assuming the election to exclude most elements of accumulated other comprehensive income (AOCI) Second Quarter 2013 Results 4 $ in millions 2Q13 vs. 1Q13 Chg $ Chg % Total average loans 276 1 Driven by Commercial loans Commercial loans 337 1 Middle Market growth in all major markets Total average deposits 756 1 Growth even with deposit cost decline Noninterest-bearing deposits 570 3 Primarily Corporate Banking and the Financial Services Division Net Interest Income (2) -- Relatively stable, even with lower accretion and yields Noninterest Income 8 5 Increase in customer-driven fees and annual incentive from third party credit card provider Provision for credit losses (3) (15) Reflects continued improvement in credit metrics Net loan charge-offs (7) (30) Solid credit quality Noninterest Expense -- -- Continued tight expense control Net Income 9 8 Shares Repurchasedunder share repurchase program 1.9MM sharesor $72MM Shareholder payout of 72% of earnings, combined with dividends
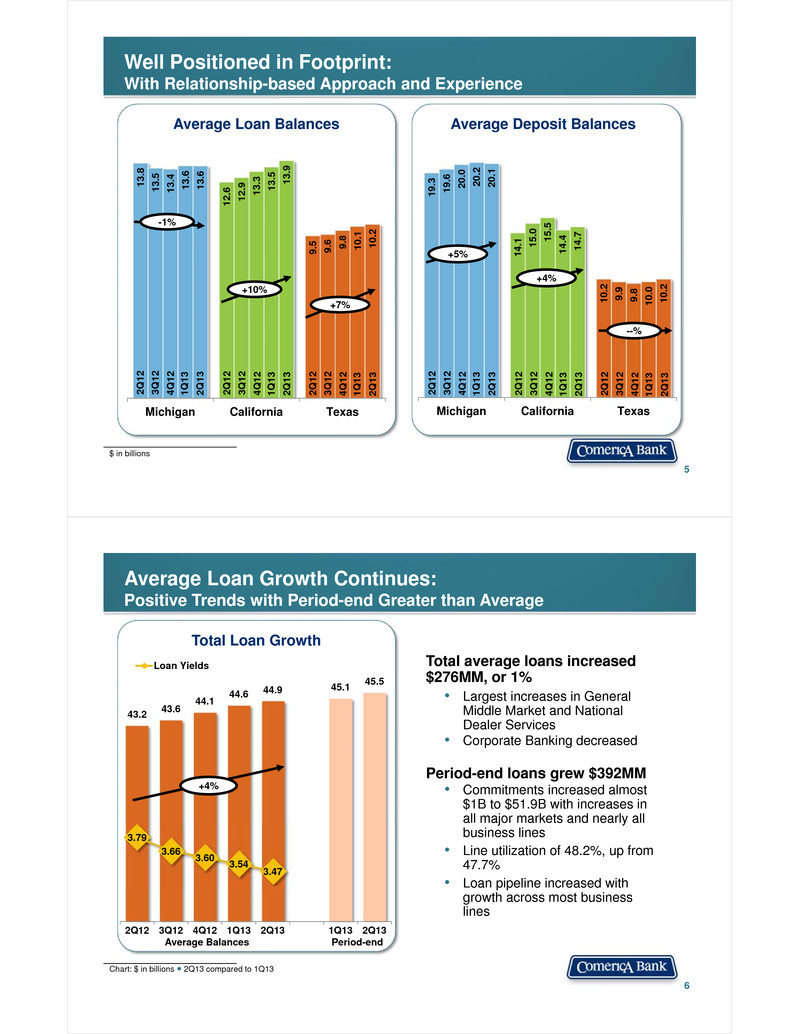
Well Positioned in Footprint:With Relationship-based Approach and Experience 5 19.3 14.1 10.2 19.6 15.0 9.9 20.0 15.5 9.8 20.2 14.4 10.0 20.1 14.7 10.2 Michigan California Texas +4% 13.8 12.6 9.5 13.5 12.9 9.6 13.4 13.3 9.8 13.6 13.5 10.1 13.6 13 .9 10.2 Michigan California Texas +10% 3Q1 2 4Q1 2 2Q1 3 2Q1 2 1Q1 3 +7% --% $ in billions Average Loan Balances Average Deposit Balances +5% -1% 3Q1 2 4Q1 2 2Q1 3 2Q1 2 1Q1 3 3Q1 2 4Q1 2 2Q1 3 2Q1 2 1Q1 3 3Q1 2 4Q1 2 2Q1 3 2Q1 2 1Q1 3 3Q1 2 4Q1 2 2Q1 3 2Q1 2 1Q1 3 3Q1 2 4Q1 2 2Q1 3 2Q1 2 1Q1 3 Average Loan Growth Continues:Positive Trends with Period-end Greater than Average 43.2 43.6 44.1 44.6 44.9 45.1 45.5 3.79 3.66 3.60 3.54 3.47 2Q12 3Q12 4Q12 1Q13 2Q13 1Q13 2Q13 Loan Yields 6 Chart: $ in billions ● 2Q13 compared to 1Q13 +4% Total average loans increased $276MM, or 1%• Largest increases in General Middle Market and National Dealer Services• Corporate Banking decreased Period-end loans grew $392MM• Commitments increased almost $1B to $51.9B with increases in all major markets and nearly all business lines• Line utilization of 48.2%, up from 47.7%• Loan pipeline increased with growth across most business lines Total Loan Growth Average Balances Period-end
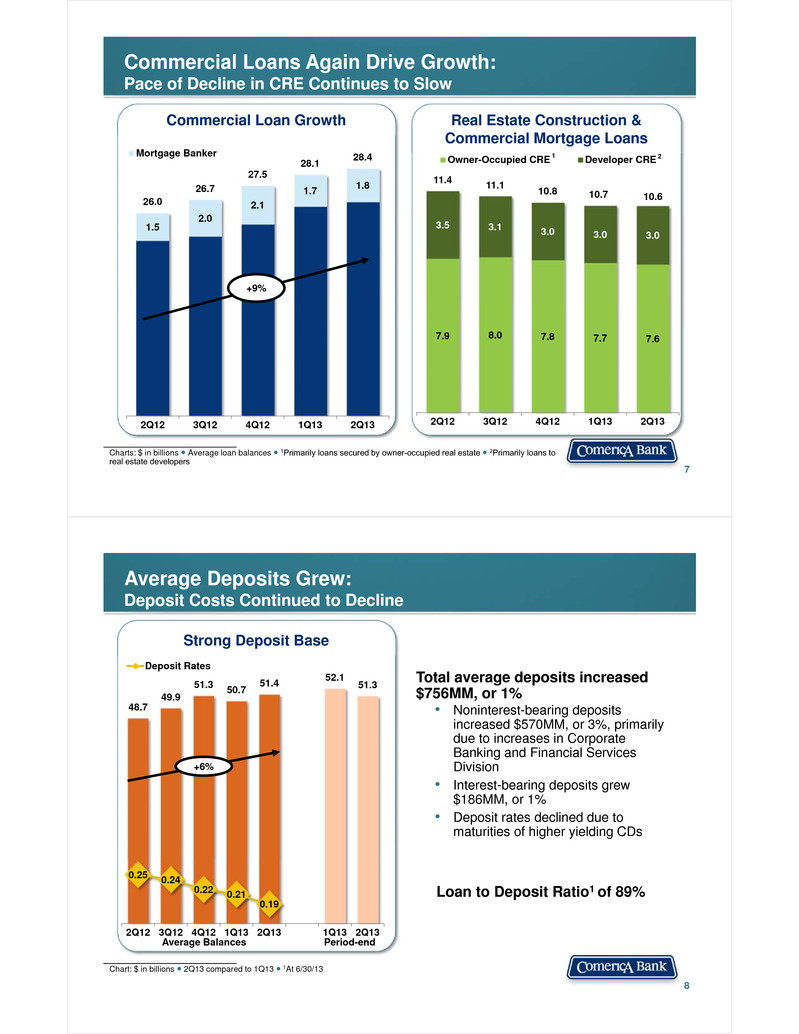
Commercial Loans Again Drive Growth:Pace of Decline in CRE Continues to Slow 1.5 2.0 2.1 1.7 1.8 26.0 26.7 27.5 28.1 28.4 2Q12 3Q12 4Q12 1Q13 2Q13 Mortgage Banker 7 Charts: $ in billions ● Average loan balances ● 1Primarily loans secured by owner-occupied real estate ● 2Primarily loans to real estate developers +9% Commercial Loan Growth Real Estate Construction & Commercial Mortgage Loans 7.9 8.0 7.8 7.7 7.6 3.5 3.1 3.0 3.0 3.0 11.4 11.1 10.8 10.7 10.6 2Q12 3Q12 4Q12 1Q13 2Q13 Owner-Occupied CRE Developer CRE1 2 48.7 49.9 51.3 50.7 51.4 52.1 51.3 0.25 0.24 0.22 0.21 0.19 2Q12 3Q12 4Q12 1Q13 2Q13 1Q13 2Q13 Deposit Rates Average Deposits Grew:Deposit Costs Continued to Decline 8 Chart: $ in billions ● 2Q13 compared to 1Q13 ● 1At 6/30/13 +6% Total average deposits increased $756MM, or 1%• Noninterest-bearing deposits increased $570MM, or 3%, primarily due to increases in Corporate Banking and Financial Services Division• Interest-bearing deposits grew $186MM, or 1%• Deposit rates declined due to maturities of higher yielding CDs Loan to Deposit Ratio1 of 89% Strong Deposit Base Average Balances Period-end
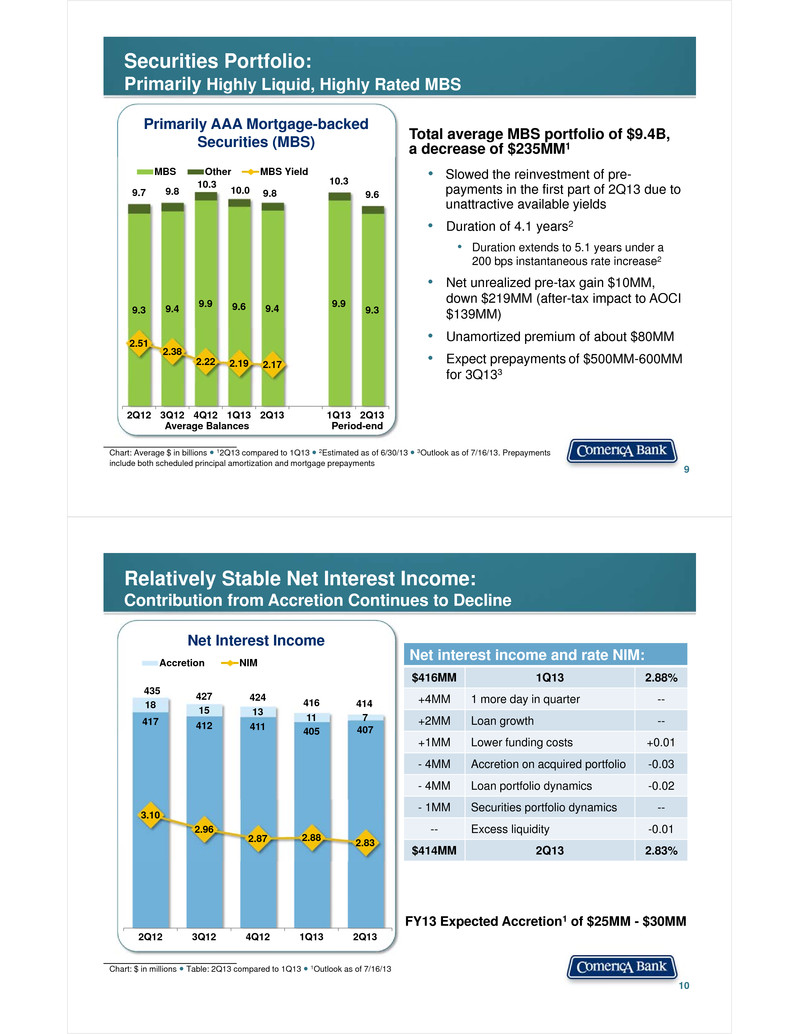
Securities Portfolio: Primarily Highly Liquid, Highly Rated MBS 9 Chart: Average $ in billions ● 12Q13 compared to 1Q13 ● 2Estimated as of 6/30/13 ● 3Outlook as of 7/16/13. Prepayments include both scheduled principal amortization and mortgage prepayments Primarily AAA Mortgage-backed Securities (MBS) 9.3 9.4 9.9 9.6 9.4 9.9 9.3 9.7 9.8 10.3 10.0 9.8 10.3 9.6 2.51 2.38 2.22 2.19 2.17 2Q12 3Q12 4Q12 1Q13 2Q13 1Q13 2Q13 MBS Other MBS Yield Total average MBS portfolio of $9.4B, a decrease of $235MM1• Slowed the reinvestment of pre-payments in the first part of 2Q13 due to unattractive available yields • Duration of 4.1 years2 • Duration extends to 5.1 years under a 200 bps instantaneous rate increase2• Net unrealized pre-tax gain $10MM, down $219MM (after-tax impact to AOCI $139MM) • Unamortized premium of about $80MM• Expect prepayments of $500MM-600MM for 3Q133 Average Balances Period-end Relatively Stable Net Interest Income:Contribution from Accretion Continues to Decline 10 Chart: $ in millions ● Table: 2Q13 compared to 1Q13 ● 1Outlook as of 7/16/13 Net Interest Income Net interest income and rate NIM: $416MM 1Q13 2.88% +4MM 1 more day in quarter -- +2MM Loan growth -- +1MM Lower funding costs +0.01 - 4MM Accretion on acquired portfolio -0.03 - 4MM Loan portfolio dynamics -0.02 - 1MM Securities portfolio dynamics -- -- Excess liquidity -0.01 $414MM 2Q13 2.83% FY13 Expected Accretion1 of $25MM - $30MM 417 412 411 405 407 18 15 13 11 7 435 427 424 416 414 3.10 2.96 2.87 2.88 2.83 2Q12 3Q12 4Q12 1Q13 2Q13 Accretion NIM
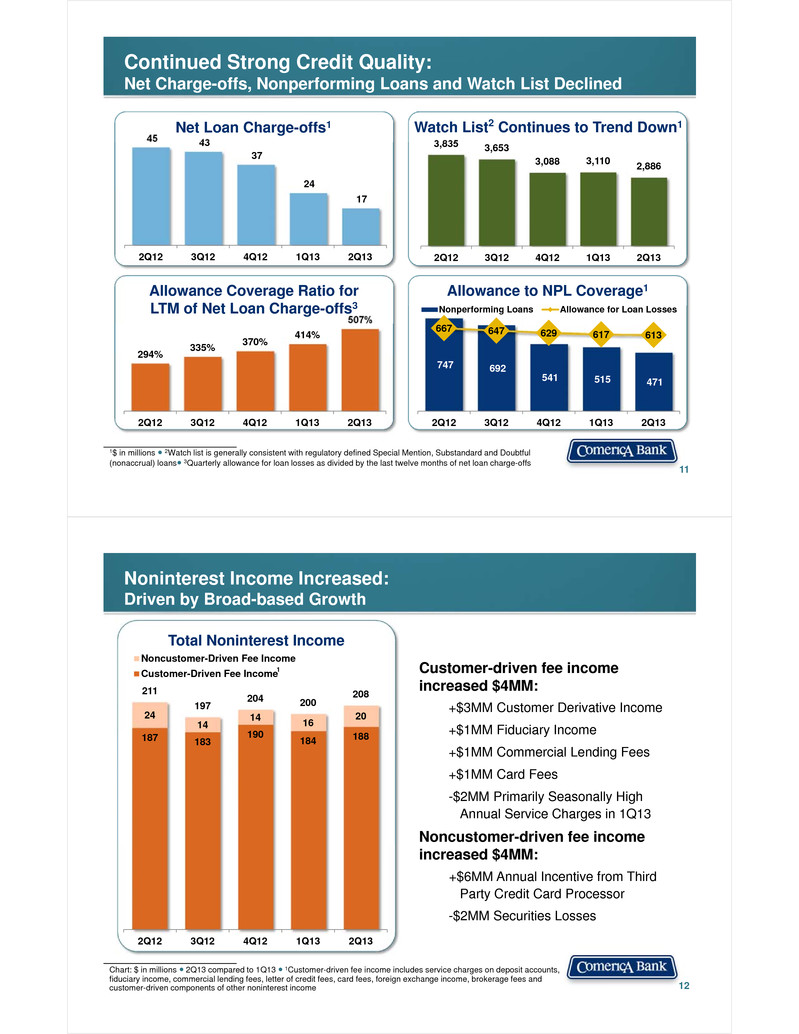
747 692 541 515 471 667 647 629 617 613 2Q12 3Q12 4Q12 1Q13 2Q13 Nonperforming Loans Allowance for Loan Losses 45 43 37 24 17 2Q12 3Q12 4Q12 1Q13 2Q13 Continued Strong Credit Quality:Net Charge-offs, Nonperforming Loans and Watch List Declined 11 1$ in millions ● 2Watch list is generally consistent with regulatory defined Special Mention, Substandard and Doubtful (nonaccrual) loans● 3Quarterly allowance for loan losses as divided by the last twelve months of net loan charge-offs Allowance to NPL Coverage1 3,835 3,653 3,088 3,110 2,886 2Q12 3Q12 4Q12 1Q13 2Q13 Net Loan Charge-offs1 294% 335% 370% 414% 507% 2Q12 3Q12 4Q12 1Q13 2Q13 Allowance Coverage Ratio for LTM of Net Loan Charge-offs3 Watch List2 Continues to Trend Down1 Noninterest Income Increased:Driven by Broad-based Growth 12 Total Noninterest Income Chart: $ in millions ● 2Q13 compared to 1Q13 ● 1Customer-driven fee income includes service charges on deposit accounts, fiduciary income, commercial lending fees, letter of credit fees, card fees, foreign exchange income, brokerage fees and customer-driven components of other noninterest income 187 183 190 184 188 24 14 14 16 20 211 197 204 200 208 2Q12 3Q12 4Q12 1Q13 2Q13 Noncustomer-Driven Fee IncomeCustomer-Driven Fee Income Customer-driven fee income increased $4MM: +$3MM Customer Derivative Income +$1MM Fiduciary Income +$1MM Commercial Lending Fees +$1MM Card Fees -$2MM Primarily Seasonally High Annual Service Charges in 1Q13 Noncustomer-driven fee income increased $4MM: +$6MM Annual Incentive from Third Party Credit Card Processor -$2MM Securities Losses 1
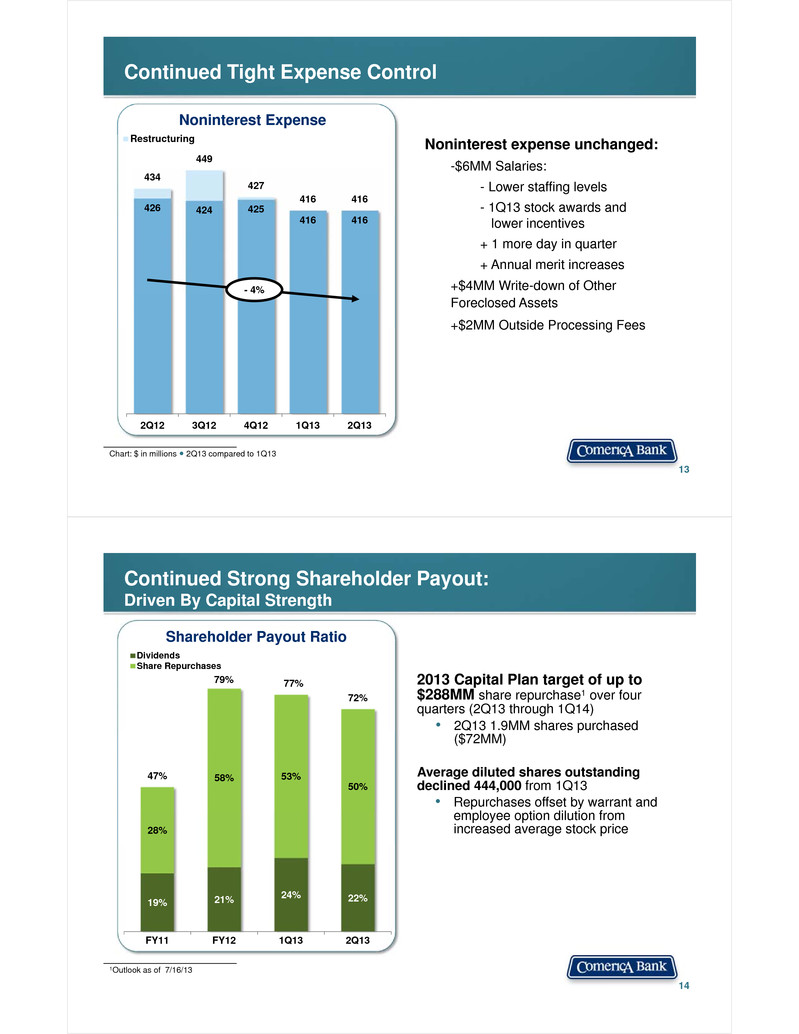
Continued Tight Expense Control 13 Noninterest Expense 426 424 425 416 416 434 449 427 416 416 2Q12 3Q12 4Q12 1Q13 2Q13 Restructuring Noninterest expense unchanged: -$6MM Salaries:- Lower staffing levels- 1Q13 stock awards and lower incentives+ 1 more day in quarter+ Annual merit increases +$4MM Write-down of Other Foreclosed Assets +$2MM Outside Processing Fees Chart: $ in millions ● 2Q13 compared to 1Q13 - 4% Continued Strong Shareholder Payout: Driven By Capital Strength 14 Shareholder Payout Ratio 19% 21% 24% 22% 28% 58% 53% 50%47% 79% 77% 72% FY11 FY12 1Q13 2Q13 DividendsShare Repurchases 1Outlook as of 7/16/13 2013 Capital Plan target of up to $288MM share repurchase1 over four quarters (2Q13 through 1Q14)• 2Q13 1.9MM shares purchased ($72MM) Average diluted shares outstanding declined 444,000 from 1Q13• Repurchases offset by warrant and employee option dilution from increased average stock price
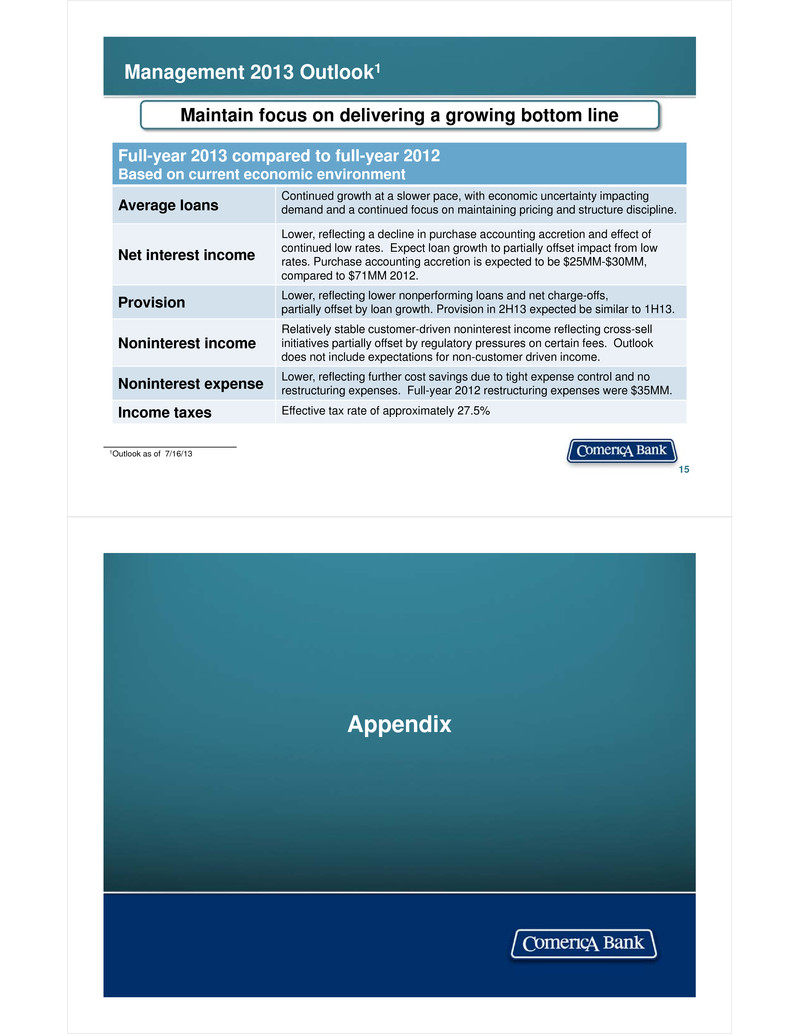
Management 2013 Outlook1 15 Full-year 2013 compared to full-year 2012Based on current economic environment Average loans Continued growth at a slower pace, with economic uncertainty impacting demand and a continued focus on maintaining pricing and structure discipline. Net interest income Lower, reflecting a decline in purchase accounting accretion and effect of continued low rates. Expect loan growth to partially offset impact from low rates. Purchase accounting accretion is expected to be $25MM-$30MM, compared to $71MM 2012. Provision Lower, reflecting lower nonperforming loans and net charge-offs,partially offset by loan growth. Provision in 2H13 expected be similar to 1H13. Noninterest income Relatively stable customer-driven noninterest income reflecting cross-sell initiatives partially offset by regulatory pressures on certain fees. Outlook does not include expectations for non-customer driven income. Noninterest expense Lower, reflecting further cost savings due to tight expense control and no restructuring expenses. Full-year 2012 restructuring expenses were $35MM.Income taxes Effective tax rate of approximately 27.5% 1Outlook as of 7/16/13 Maintain focus on delivering a growing bottom line Appendix
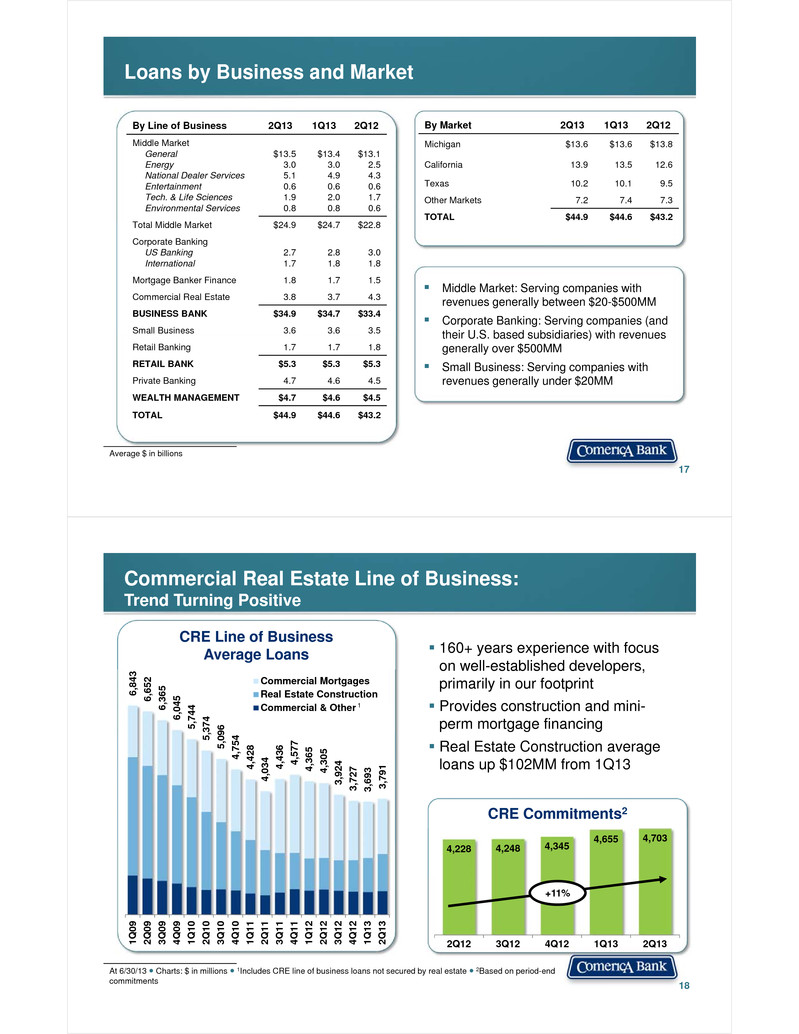
Loans by Business and Market 17 Middle Market: Serving companies with revenues generally between $20-$500MM Corporate Banking: Serving companies (and their U.S. based subsidiaries) with revenues generally over $500MM Small Business: Serving companies with revenues generally under $20MM Average $ in billions By Line of Business 2Q13 1Q13 2Q12 Middle MarketGeneralEnergyNational Dealer ServicesEntertainmentTech. & Life SciencesEnvironmental Services $13.53.05.10.61.90.8 $13.43.04.90.62.00.8 $13.12.54.30.61.70.6 Total Middle Market $24.9 $24.7 $22.8 Corporate BankingUS BankingInternational 2.71.7 2.81.8 3.01.8 Mortgage Banker Finance 1.8 1.7 1.5 Commercial Real Estate 3.8 3.7 4.3 BUSINESS BANK $34.9 $34.7 $33.4 Small Business 3.6 3.6 3.5 Retail Banking 1.7 1.7 1.8 RETAIL BANK $5.3 $5.3 $5.3 Private Banking 4.7 4.6 4.5 WEALTH MANAGEMENT $4.7 $4.6 $4.5 TOTAL $44.9 $44.6 $43.2 By Market 2Q13 1Q13 2Q12 Michigan $13.6 $13.6 $13.8 California 13.9 13.5 12.6 Texas 10.2 10.1 9.5 Other Markets 7.2 7.4 7.3 TOTAL $44.9 $44.6 $43.2 18 6,84 3 6,65 2 6,36 5 6,04 5 5,74 4 5,37 4 5,09 6 4,75 4 4,42 8 4,03 4 4,43 6 4,57 7 4,36 5 4,30 5 3,92 4 3,72 7 3,69 3 3,79 1 1Q0 9 2Q0 9 3Q0 9 4Q0 9 1Q1 0 2Q1 0 3Q1 0 4Q1 0 1Q1 1 2Q1 1 3Q1 1 4Q1 1 1Q1 2 2Q1 2 3Q1 2 4Q1 2 1Q1 3 2Q1 3 Commercial MortgagesReal Estate ConstructionCommercial & Other 160+ years experience with focus on well-established developers, primarily in our footprint Provides construction and mini-perm mortgage financing Real Estate Construction average loans up $102MM from 1Q13 4,228 4,248 4,345 4,655 4,703 2Q12 3Q12 4Q12 1Q13 2Q13 +11% At 6/30/13 ● Charts: $ in millions ● 1Includes CRE line of business loans not secured by real estate ● 2Based on period-end commitments CRE Line of BusinessAverage Loans CRE Commitments2 Commercial Real Estate Line of Business:Trend Turning Positive 1
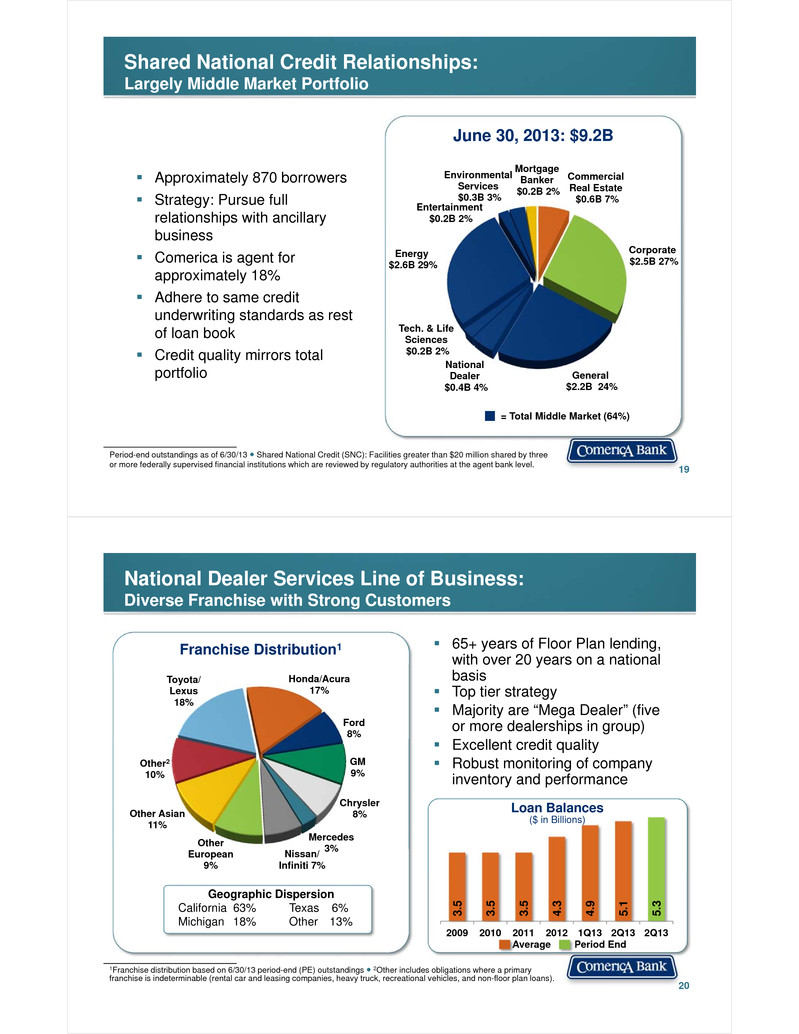
Shared National Credit Relationships:Largely Middle Market Portfolio 19 Approximately 870 borrowers Strategy: Pursue full relationships with ancillary business Comerica is agent for approximately 18% Adhere to same credit underwriting standards as rest of loan book Credit quality mirrors total portfolio Commercial Real Estate$0.6B 7% Corporate $2.5B 27% General$2.2B 24% National Dealer $0.4B 4% Energy$2.6B 29% Entertainment$0.2B 2% Tech. & Life Sciences$0.2B 2% Environmental Services $0.3B 3% Mortgage Banker$0.2B 2% June 30, 2013: $9.2B Period-end outstandings as of 6/30/13 ● Shared National Credit (SNC): Facilities greater than $20 million shared by three or more federally supervised financial institutions which are reviewed by regulatory authorities at the agent bank level. = Total Middle Market (64%) National Dealer Services Line of Business:Diverse Franchise with Strong Customers 20 Toyota/Lexus18% Honda/Acura 17% Ford 8% GM 9% Chrysler 8% Mercedes 3%Nissan/ Infiniti 7% Other European 9% Other Asian 11% Other210% 65+ years of Floor Plan lending, with over 20 years on a national basis Top tier strategy Majority are “Mega Dealer” (five or more dealerships in group) Excellent credit quality Robust monitoring of company inventory and performance Geographic DispersionCalifornia 63% Texas 6%Michigan 18% Other 13% 3. 5 3.5 3.5 4.3 4.9 5.1 5.3 2009 2010 2011 2012 1Q13 2Q13 2Q13 Loan Balances ($ in Billions) Average Period End 1Franchise distribution based on 6/30/13 period-end (PE) outstandings ● 2Other includes obligations where a primary franchise is indeterminable (rental car and leasing companies, heavy truck, recreational vehicles, and non-floor plan loans). Franchise Distribution1
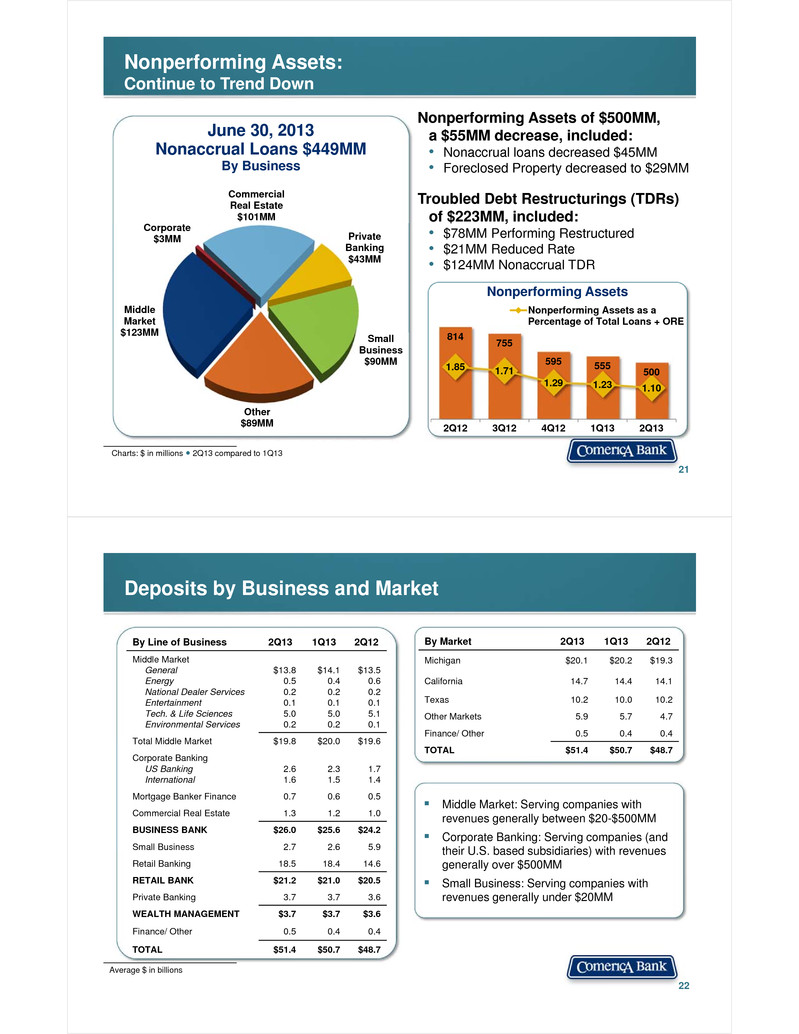
Charts: $ in millions ● 2Q13 compared to 1Q13 Nonperforming Assets of $500MM, a $55MM decrease, included:• Nonaccrual loans decreased $45MM • Foreclosed Property decreased to $29MM Troubled Debt Restructurings (TDRs) of $223MM, included:• $78MM Performing Restructured• $21MM Reduced Rate • $124MM Nonaccrual TDR June 30, 2013Nonaccrual Loans $449MMBy Business Middle Market$123MM Corporate $3MM Commercial Real Estate$101MM Private Banking$43MM Small Business$90MM Other$89MM 21 Nonperforming Assets:Continue to Trend Down Nonperforming Assets 814 755 595 555 5001.85 1.71 1.29 1.23 1.10 2Q12 3Q12 4Q12 1Q13 2Q13 Nonperforming Assets as aPercentage of Total Loans + ORE Deposits by Business and Market 22 Middle Market: Serving companies with revenues generally between $20-$500MM Corporate Banking: Serving companies (and their U.S. based subsidiaries) with revenues generally over $500MM Small Business: Serving companies with revenues generally under $20MM Average $ in billions By Line of Business 2Q13 1Q13 2Q12 Middle MarketGeneralEnergyNational Dealer ServicesEntertainmentTech. & Life SciencesEnvironmental Services $13.80.50.20.15.00.2 $14.10.40.20.15.00.2 $13.50.60.20.15.10.1 Total Middle Market $19.8 $20.0 $19.6 Corporate BankingUS BankingInternational 2.61.6 2.31.5 1.71.4 Mortgage Banker Finance 0.7 0.6 0.5 Commercial Real Estate 1.3 1.2 1.0 BUSINESS BANK $26.0 $25.6 $24.2 Small Business 2.7 2.6 5.9 Retail Banking 18.5 18.4 14.6 RETAIL BANK $21.2 $21.0 $20.5 Private Banking 3.7 3.7 3.6 WEALTH MANAGEMENT $3.7 $3.7 $3.6 Finance/ Other 0.5 0.4 0.4 TOTAL $51.4 $50.7 $48.7 By Market 2Q13 1Q13 2Q12 Michigan $20.1 $20.2 $19.3 California 14.7 14.4 14.1 Texas 10.2 10.0 10.2 Other Markets 5.9 5.7 4.7 Finance/ Other 0.5 0.4 0.4 TOTAL $51.4 $50.7 $48.7
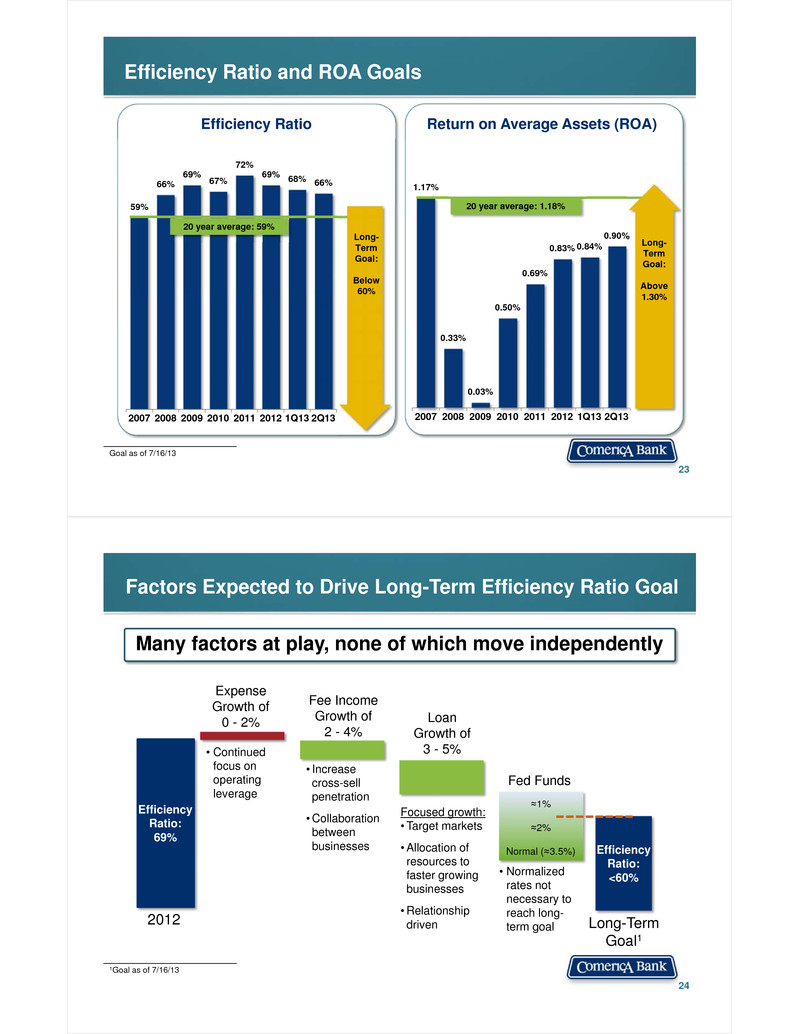
Efficiency Ratio and ROA Goals 23 Goal as of 7/16/13 Efficiency Ratio Return on Average Assets (ROA) 59% 66% 69% 67% 72% 69% 68% 66% 2007 2008 2009 2010 2011 2012 1Q13 2Q13 20 year average: 59% 1.17% 0.33% 0.03% 0.50% 0.69% 0.83% 0.84% 0.90% 2007 2008 2009 2010 2011 2012 1Q13 2Q13 20 year average: 1.18% Long-TermGoal: Above 1.30% Long-TermGoal: Below 60% 24 2012 Long-Term Goal1 Efficiency Ratio:69% Efficiency Ratio:<60% Expense Growth of 0 - 2% Fee Income Growth of 2 - 4% Loan Growth of 3 - 5% • Increase cross-sell penetration • Collaboration between businesses Focused growth:• Target markets • Allocation of resources to faster growing businesses • Relationship driven • Normalized rates not necessary to reach long-term goal • Continued focus on operating leverage 1Goal as of 7/16/13 ≈1% ≈2% Normal (≈3.5%) Fed Funds Many factors at play, none of which move independently Factors Expected to Drive Long-Term Efficiency Ratio Goal
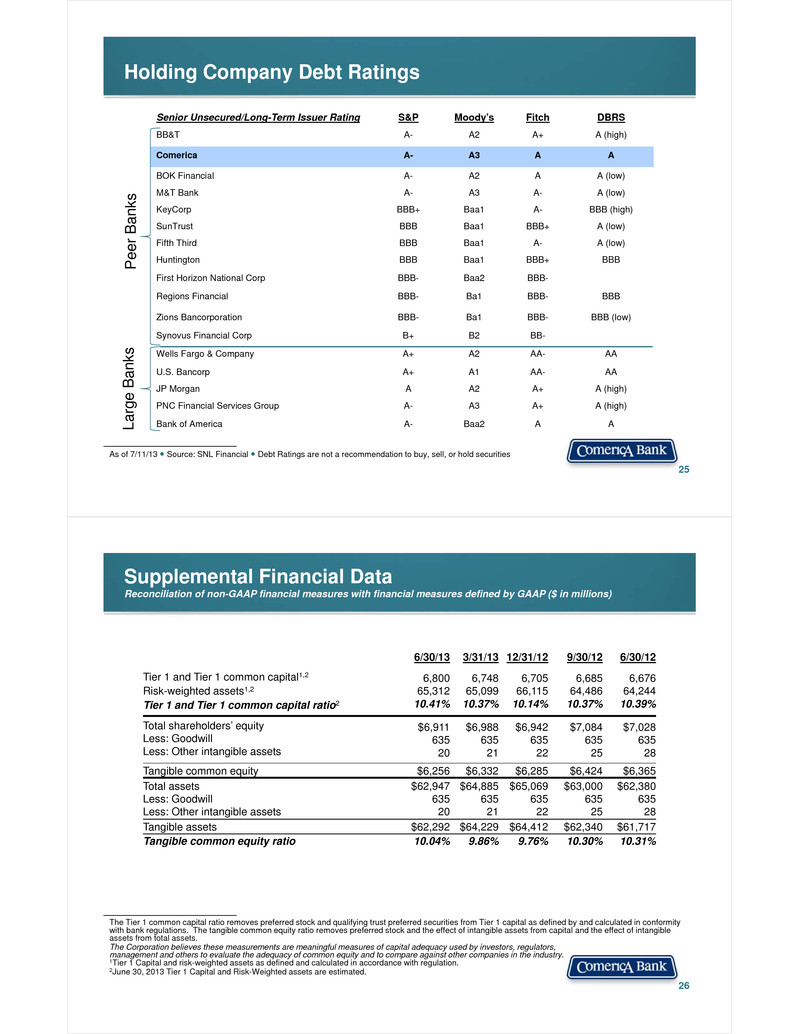
Senior Unsecured/Long-Term Issuer Rating S&P Moody’s Fitch DBRS BB&T A- A2 A+ A (high) Comerica A- A3 A A BOK Financial A- A2 A A (low) M&T Bank A- A3 A- A (low) KeyCorp BBB+ Baa1 A- BBB (high) SunTrust BBB Baa1 BBB+ A (low) Fifth Third BBB Baa1 A- A (low) Huntington BBB Baa1 BBB+ BBB First Horizon National Corp BBB- Baa2 BBB- Regions Financial BBB- Ba1 BBB- BBB Zions Bancorporation BBB- Ba1 BBB- BBB (low) Synovus Financial Corp B+ B2 BB- Wells Fargo & Company A+ A2 AA- AA U.S. Bancorp A+ A1 AA- AA JP Morgan A A2 A+ A (high) PNC Financial Services Group A- A3 A+ A (high) Bank of America A- Baa2 A A Holding Company Debt Ratings 25 Pee r Ba nks Larg e Ba nks As of 7/11/13 ● Source: SNL Financial ● Debt Ratings are not a recommendation to buy, sell, or hold securities Supplemental Financial DataReconciliation of non-GAAP financial measures with financial measures defined by GAAP ($ in millions) 26 6/30/13 3/31/13 12/31/12 9/30/12 6/30/12 Tier 1 and Tier 1 common capital1,2Risk-weighted assets1,2Tier 1 and Tier 1 common capital ratio2 6,80065,31210.41% 6,74865,09910.37% 6,70566,11510.14% 6,68564,48610.37% 6,67664,24410.39% Total shareholders’ equityLess: GoodwillLess: Other intangible assets $6,91163520 $6,98863521 $6,94263522 $7,08463525 $7,02863528 Tangible common equity $6,256 $6,332 $6,285 $6,424 $6,365Total assetsLess: GoodwillLess: Other intangible assets $62,94763520 $64,88563521 $65,06963522 $63,00063525 $62,38063528Tangible assets $62,292 $64,229 $64,412 $62,340 $61,717Tangible common equity ratio 10.04% 9.86% 9.76% 10.30% 10.31% The Tier 1 common capital ratio removes preferred stock and qualifying trust preferred securities from Tier 1 capital as defined by and calculated in conformity with bank regulations. The tangible common equity ratio removes preferred stock and the effect of intangible assets from capital and the effect of intangible assets from total assets.The Corporation believes these measurements are meaningful measures of capital adequacy used by investors, regulators, management and others to evaluate the adequacy of common equity and to compare against other companies in the industry.1Tier 1 Capital and risk-weighted assets as defined and calculated in accordance with regulation.2June 30, 2013 Tier 1 Capital and Risk-Weighted assets are estimated.
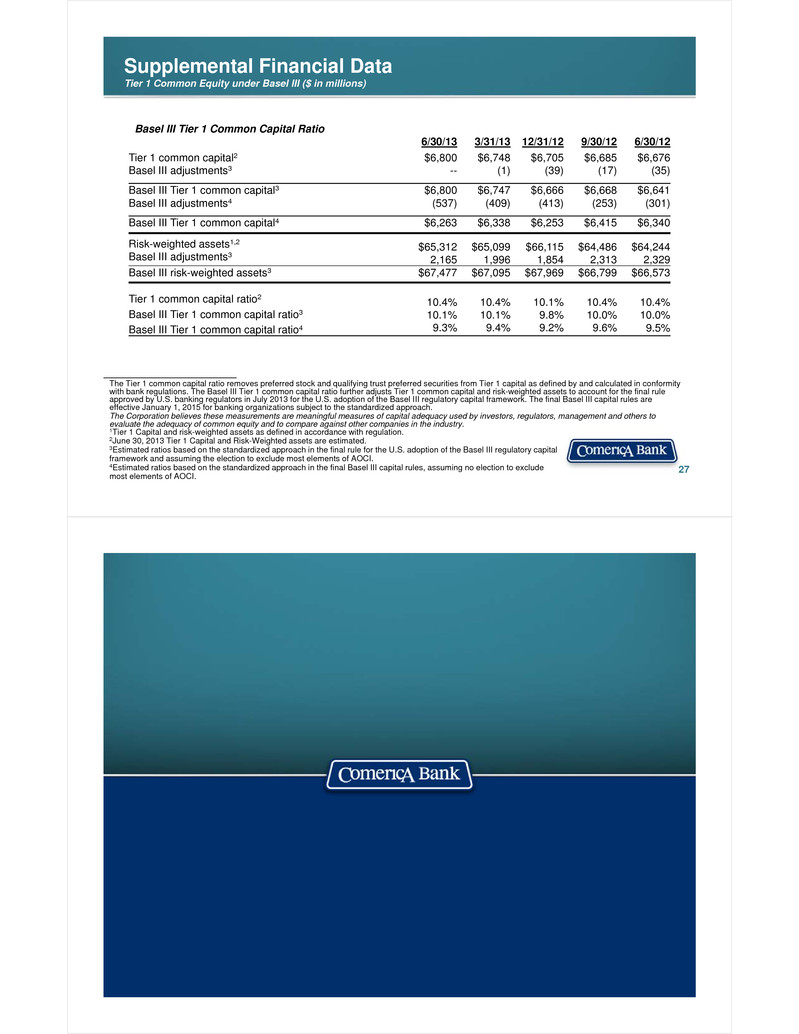
Supplemental Financial DataTier 1 Common Equity under Basel III ($ in millions) 27 The Tier 1 common capital ratio removes preferred stock and qualifying trust preferred securities from Tier 1 capital as defined by and calculated in conformity with bank regulations. The Basel III Tier 1 common capital ratio further adjusts Tier 1 common capital and risk-weighted assets to account for the final rule approved by U.S. banking regulators in July 2013 for the U.S. adoption of the Basel III regulatory capital framework. The final Basel III capital rules are effective January 1, 2015 for banking organizations subject to the standardized approach. The Corporation believes these measurements are meaningful measures of capital adequacy used by investors, regulators, management and others to evaluate the adequacy of common equity and to compare against other companies in the industry.1Tier 1 Capital and risk-weighted assets as defined in accordance with regulation.2June 30, 2013 Tier 1 Capital and Risk-Weighted assets are estimated.3Estimated ratios based on the standardized approach in the final rule for the U.S. adoption of the Basel III regulatory capital framework and assuming the election to exclude most elements of AOCI. 4Estimated ratios based on the standardized approach in the final Basel III capital rules, assuming no election to exclude most elements of AOCI. Basel III Tier 1 Common Capital Ratio 6/30/13 3/31/13 12/31/12 9/30/12 6/30/12Tier 1 common capital2Basel III adjustments3 $6,800-- $6,748(1) $6,705(39) $6,685(17) $6,676(35) Basel III Tier 1 common capital3Basel III adjustments4 $6,800(537) $6,747(409) $6,666(413) $6,668(253) $6,641(301) Basel III Tier 1 common capital4 $6,263 $6,338 $6,253 $6,415 $6,340 Risk-weighted assets1,2Basel III adjustments3 $65,3122,165 $65,0991,996 $66,1151,854 $64,4862,313 $64,2442,329Basel III risk-weighted assets3 $67,477 $67,095 $67,969 $66,799 $66,573 Tier 1 common capital ratio2Basel III Tier 1 common capital ratio3Basel III Tier 1 common capital ratio4 10.4%10.1% 9.3% 10.4%10.1% 9.4% 10.1%9.8% 9.2% 10.4%10.0% 9.6% 10.4%10.0% 9.5%


