- CMA Dashboard
- Financials
- Filings
-
Holdings
- Transcripts
- ETFs
- Insider
- Institutional
- Shorts
-
8-K Filing
Comerica (CMA) 8-KRegulation FD Disclosure
Filed: 17 Sep 07, 12:00am
| Beth Acton Chief Financial Officer Bank of America 2007 Annual Investment Conference September 19, 2007 |
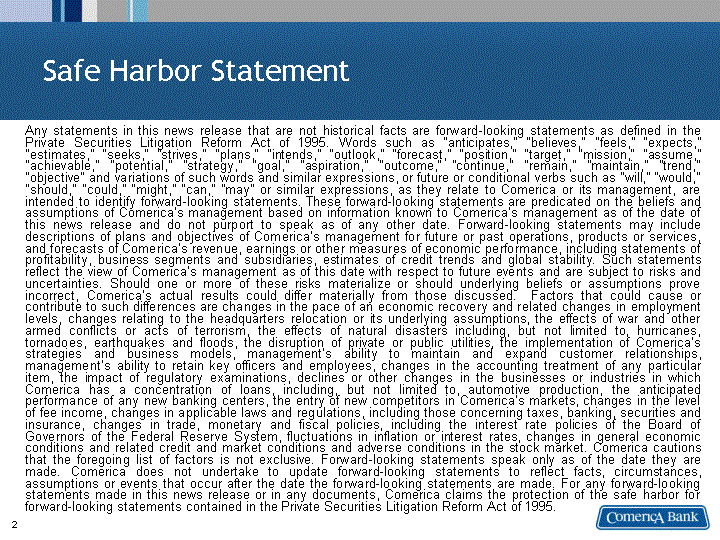
| Safe Harbor Statement Any statements in this news release that are not historical facts are forward-looking statements as defined in the Private Securities Litigation Reform Act of 1995. Words such as "anticipates," "believes," "feels," "expects," "estimates," "seeks," "strives," "plans," "intends," "outlook," "forecast," "position," "target," "mission," "assume," "achievable," "potential," "strategy," "goal," "aspiration," "outcome," "continue," "remain," "maintain," "trend," "objective" and variations of such words and similar expressions, or future or conditional verbs such as "will," "would," "should," "could," "might," "can," "may" or similar expressions, as they relate to Comerica or its management, are intended to identify forward-looking statements. These forward-looking statements are predicated on the beliefs and assumptions of Comerica's management based on information known to Comerica's management as of the date of this news release and do not purport to speak as of any other date. Forward-looking statements may include descriptions of plans and objectives of Comerica's management for future or past operations, products or services, and forecasts of Comerica's revenue, earnings or other measures of economic performance, including statements of profitability, business segments and subsidiaries, estimates of credit trends and global stability. Such statements reflect the view of Comerica's management as of this date with respect to future events and are subject to risks and uncertainties. Should one or more of these risks materialize or should underlying beliefs or assumptions prove incorrect, Comerica's actual results could differ materially from those discussed. Factors that could cause or contribute to such differences are changes in the pace of an economic recovery and related changes in employment levels, changes relating to the headquarters relocation or its underlying assumptions, the effects of war and other armed conflicts or acts of terrorism, the effects of natural disasters including, but not limited to, hurricanes, tornadoes, earthquakes and floods, the disruption of private or public utilities, the implementation of Comerica's strategies and business models, management's ability to maintain and expand customer relationships, management's ability to retain key officers and employees, changes in the accounting treatment of any particular item, the impact of regulatory examinations, declines or other changes in the businesses or industries in which Comerica has a concentration of loans, including, but not limited to, automotive production, the anticipated performance of any new banking centers, the entry of new competitors in Comerica's markets, changes in the level of fee income, changes in applicable laws and regulations, including those concerning taxes, banking, securities and insurance, changes in trade, monetary and fiscal policies, including the interest rate policies of the Board of Governors of the Federal Reserve System, fluctuations in inflation or interest rates, changes in general economic conditions and related credit and market conditions and adverse conditions in the stock market. Comerica cautions that the foregoing list of factors is not exclusive. Forward-looking statements speak only as of the date they are made. Comerica does not undertake to update forward-looking statements to reflect facts, circumstances, assumptions or events that occur after the date the forward-looking statements are made. For any forward-looking statements made in this news release or in any documents, Comerica claims the protection of the safe harbor for forward- looking statements contained in the Private Securities Litigation Reform Act of 1995. |
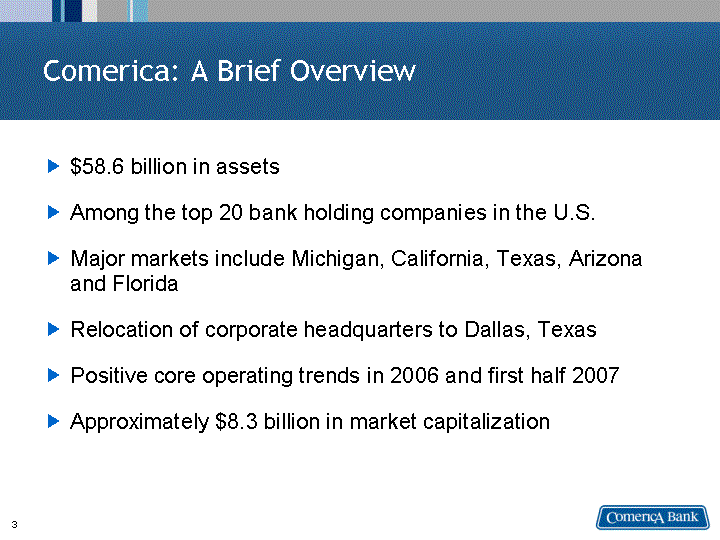
| Comerica: A Brief Overview $58.6 billion in assets Among the top 20 bank holding companies in the U.S. Major markets include Michigan, California, Texas, Arizona and Florida Relocation of corporate headquarters to Dallas, Texas Positive core operating trends in 2006 and first half 2007 Approximately $8.3 billion in market capitalization |
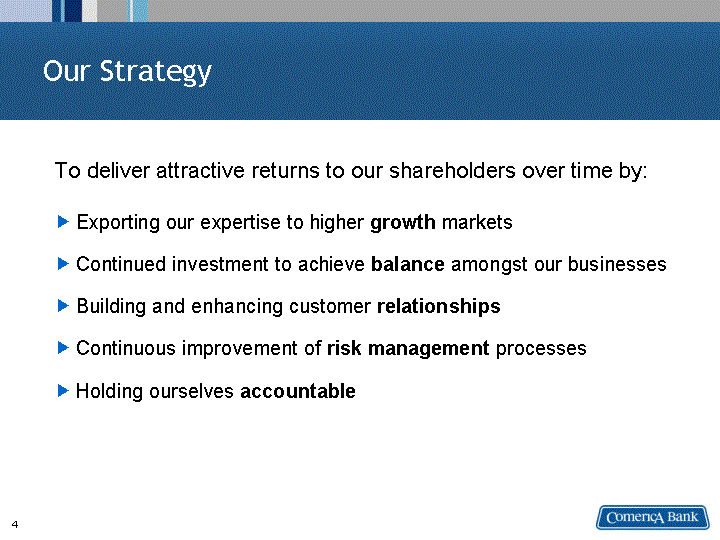
| Our Strategy To deliver attractive returns to our shareholders over time by: Exporting our expertise to higher growth markets Continued investment to achieve balance amongst our businesses Building and enhancing customer relationships Continuous improvement of risk management processes Holding ourselves accountable |
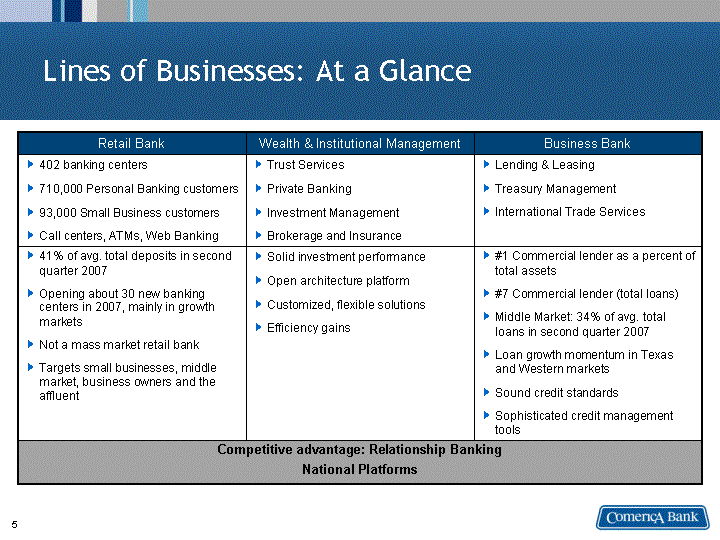
| Lines of Businesses: At a Glance Retail Bank Wealth & Institutional Management Business Bank 402 banking centers 710,000 Personal Banking customers 93,000 Small Business customers Call centers, ATMs, Web Banking Trust Services Private Banking Investment Management Brokerage and Insurance Lending & Leasing Treasury Management International Trade Services 41% of avg. total deposits in second quarter 2007 Opening about 30 new banking centers in 2007, mainly in growth markets Not a mass market retail bank Targets small businesses, middle market, business owners and the affluent Solid investment performance Open architecture platform Customized, flexible solutions Efficiency gains #1 Commercial lender as a percent of total assets #7 Commercial lender (total loans) Middle Market: 34% of avg. total loans in second quarter 2007 Loan growth momentum in Texas and Western markets Sound credit standards Sophisticated credit management tools Competitive advantage: Relationship Banking National Platforms Competitive advantage: Relationship Banking National Platforms Competitive advantage: Relationship Banking National Platforms |
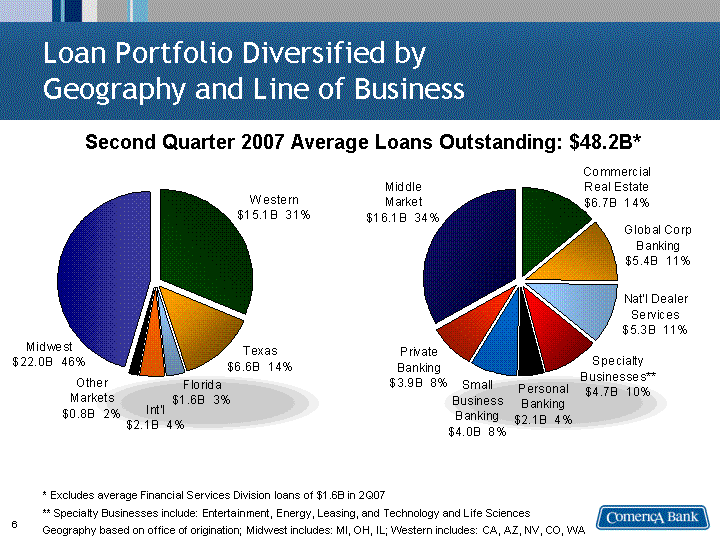
| Midwest Western Texas Florida International Other Markets 2Q07 Avg Loans Outstanding 22 15.1 6.6 1.6 2.1 0.8 Loan Portfolio Diversified by Geography and Line of Business * Excludes average Financial Services Division loans of $1.6B in 2Q07 ** Specialty Businesses include: Entertainment, Energy, Leasing, and Technology and Life Sciences Geography based on office of origination; Midwest includes: MI, OH, IL; Western includes: CA, AZ, NV, CO, WA Second Quarter 2007 Average Loans Outstanding: $48.2B* Middle Market Commercial Real Estate Global Corporate Banking National Dealer Services Specialty Businesses Personal Banking Small Business Banking Private Banking 2Q07 Average Loans Outstanding 16.1 6.7 5.4 5.3 4.7 2.1 4 3.9 |

| Solid Credit Quality 2Q06 3Q06 4Q06 1Q07 2Q07 NPA's / Total Loans and ORE 0.0037 0.0042 0.0049 0.0049 0.0053 2Q06 3Q06 4Q06 1Q07 2Q07 Net Credit-Related Charge-offs to Average Total Loans * 0.0016 0.0006 0.0019 0.0016 0.0024 2Q06 3Q06 4Q06 1Q07 2Q07 ALLL / Total Loans 0.0104 0.0106 0.0104 0.0104 0.0104 2Q06 3Q06 4Q06 1Q07 2Q07 Net loan charge-offs to total average loans 2.78 2.51 2.13 2.14 1.95 *Includes net loan charge-offs and net charge-offs on lending related commitments |
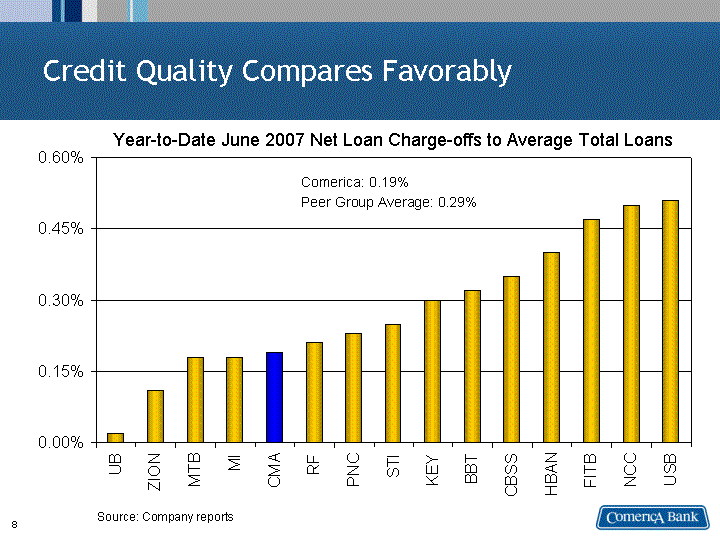
| Credit Quality Compares Favorably UB ZION MTB MI CMA RF PNC STI KEY BBT CBSS HBAN FITB NCC USB 0.0002 0.0011 0.0018 0.0018 0.0019 0.0021 0.0023 0.0025 0.003 0.0032 0.0035 0.004 0.0047 0.005 0.0051 Comerica: 0.19% Peer Group Average: 0.29% Year-to-Date June 2007 Net Loan Charge-offs to Average Total Loans Source: Company reports |
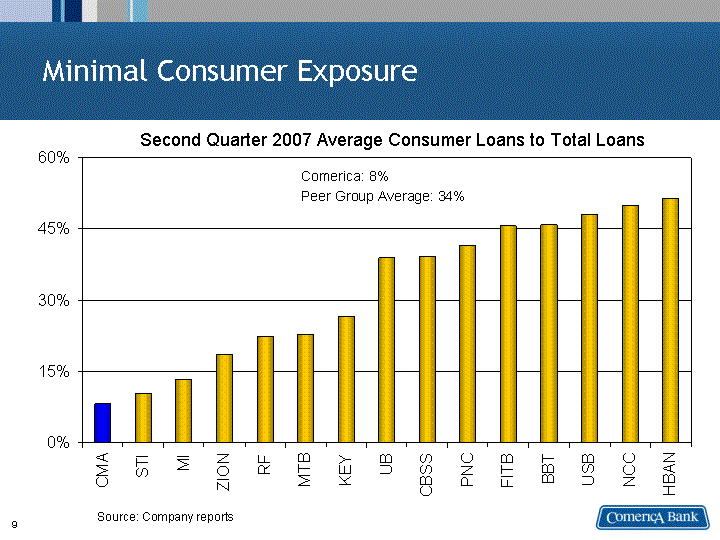
| Minimal Consumer Exposure CMA STI MI ZION RF MTB KEY UB CBSS PNC FITB BBT USB NCC HBAN 0.0828 0.105 0.1337 0.1858 0.2241 0.2287 0.2647 0.39 0.3922 0.4156 0.4563 0.459 0.4803 0.4997 0.5152 Comerica: 8% Peer Group Average: 34% Second Quarter 2007 Average Consumer Loans to Total Loans Source: Company reports |
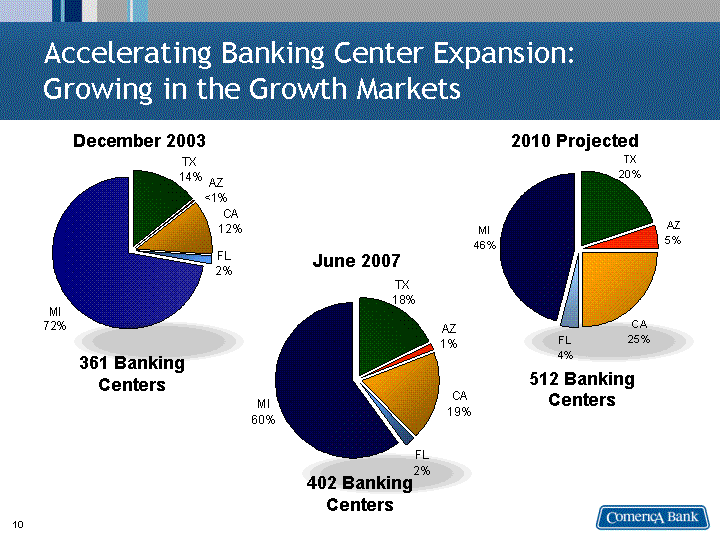
| MI TX AZ CA FL Banking Centers 261 51 1 42 6 MI TX AZ CA FL Banking Centers 0.46 0.2 0.05 0.25 0.04 Accelerating Banking Center Expansion: Growing in the Growth Markets December 2003 2010 Projected 361 Banking Centers 512 Banking Centers MI TX AZ CA FL Banking Centers 241 72 5 75 9 June 2007 402 Banking Centers |
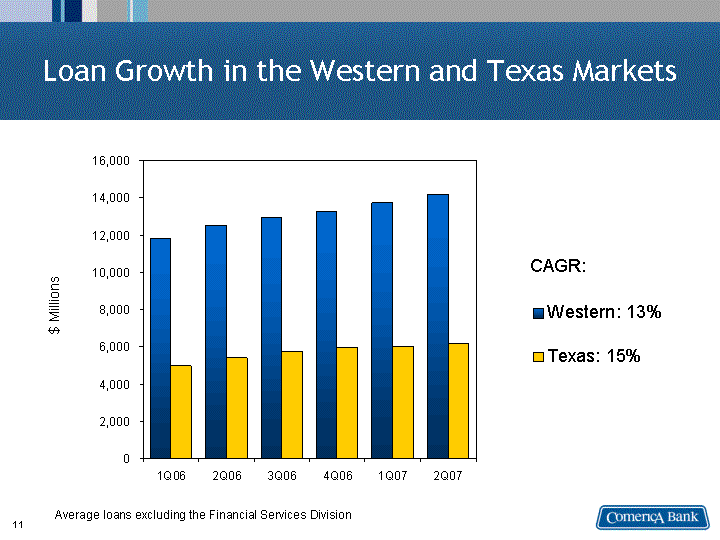
| Loan Growth in the Western and Texas Markets 1Q06 2Q06 3Q06 4Q06 1Q07 2Q07 Western: 13% 11810 12494 12905 13221 13744 14188 Texas: 15% 4965 5402 5709 5936 6020 6144 $ Millions Average loans excluding the Financial Services Division CAGR: |
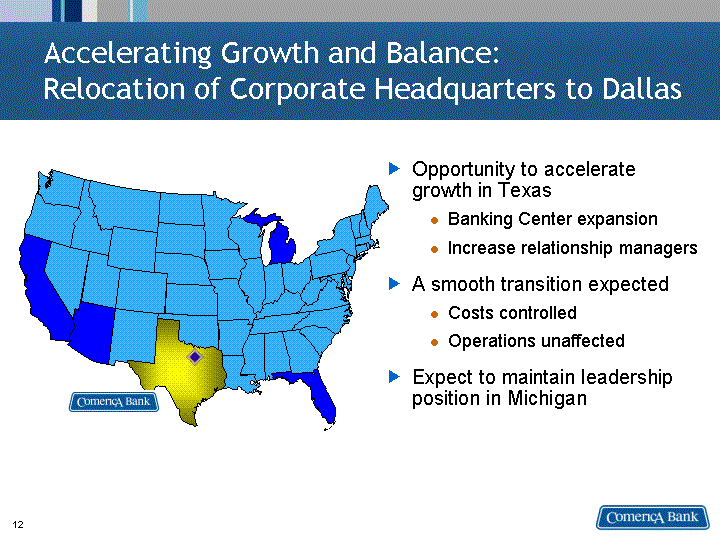
| Accelerating Growth and Balance: Relocation of Corporate Headquarters to Dallas Opportunity to accelerate growth in Texas Banking Center expansion Increase relationship managers A smooth transition expected Costs controlled Operations unaffected Expect to maintain leadership position in Michigan |

| Total Payout Ratio * Excluding Framlington gain ** Excluding Munder Capital Management gain Buyback Dividend '02 0.9147 0.557 '03 0.576 0.53 '04 0.9656 0.48 '05* 1.076 0.4472 '06** 0.9772 0.4896 Historical Total Payout Average (2002-2006) = 90% Dividends = 50% Buyback = 40% |
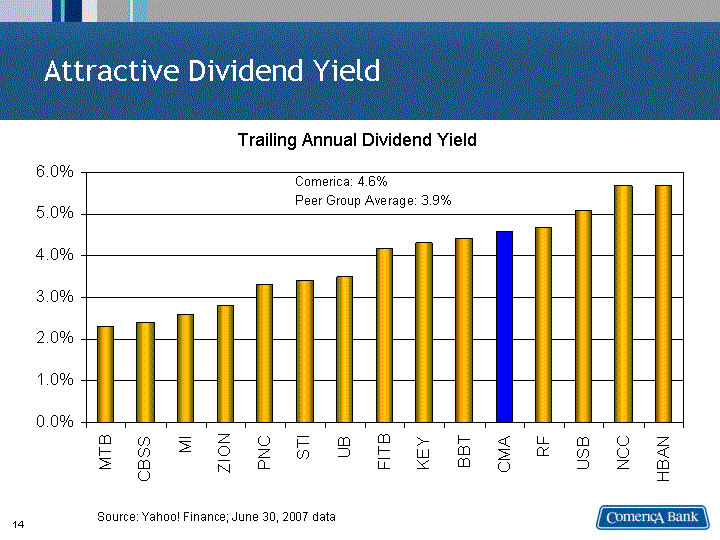
| Attractive Dividend Yield Comerica: 4.6% Peer Group Average: 3.9% Trailing Annual Dividend Yield Source: Yahoo! Finance; June 30, 2007 data |
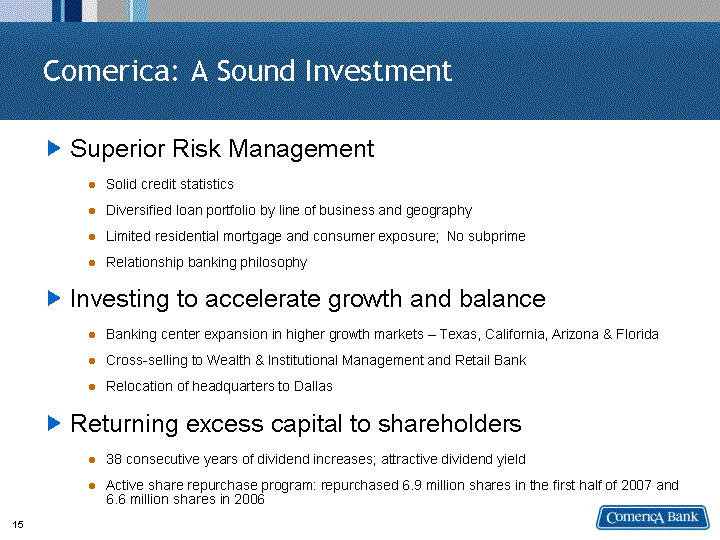
| Comerica: A Sound Investment Superior Risk Management Solid credit statistics Diversified loan portfolio by line of business and geography Limited residential mortgage and consumer exposure; No subprime Relationship banking philosophy Investing to accelerate growth and balance Banking center expansion in higher growth markets - Texas, California, Arizona & Florida Cross-selling to Wealth & Institutional Management and Retail Bank Relocation of headquarters to Dallas Returning excess capital to shareholders 38 consecutive years of dividend increases; attractive dividend yield Active share repurchase program: repurchased 6.9 million shares in the first half of 2007 and 6.6 million shares in 2006 |
| Appendix |
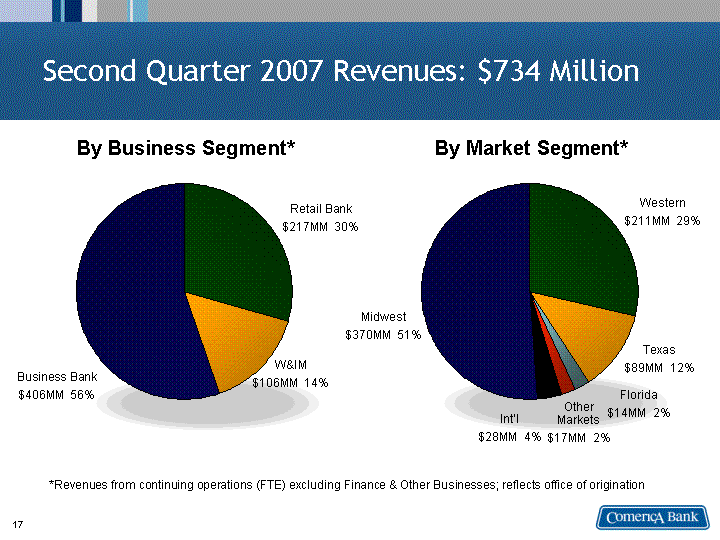
| By Business Segment Midwest Western Texas Florida Other Markets International Revenue 360 203 86 15 16 25 By Business Segment Business Bank Retail Bank W&IM Revenues 390 208 107 Second Quarter 2007 Revenues: $734 Million By Business Segment* By Market Segment* Business Bank $406MM 56% Retail Bank $217MM 30% W&IM $106MM 14% Midwest $370MM 51% Western $211MM 29% Texas $89MM 12% Florida $14MM 2% *Revenues from continuing operations (FTE) excluding Finance & Other Businesses; reflects office of origination Other Markets $17MM 2% Int'l $28MM 4% |
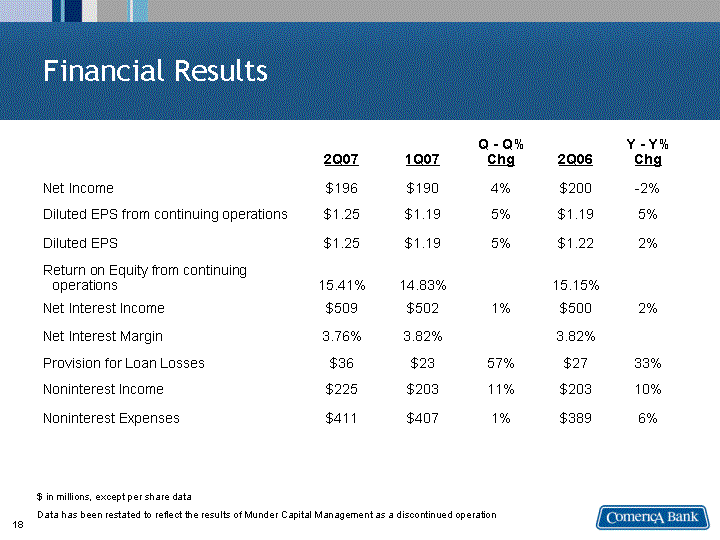
| Financial Results 2Q07 1Q07 Q - Q% Chg 2Q06 Y - Y% Chg Net Income $196 $190 4% $200 -2% Diluted EPS from continuing operations Diluted EPS $1.25 $1.25 $1.19 $1.19 5% 5% $1.19 $1.22 5% 2% Return on Equity from continuing operations 15.41% 14.83% 15.15% Net Interest Income $509 $502 1% $500 2% Net Interest Margin 3.76% 3.82% 3.82% Provision for Loan Losses $36 $23 57% $27 33% Noninterest Income $225 $203 11% $203 10% Noninterest Expenses $411 $407 1% $389 6% $ in millions, except per share data Data has been restated to reflect the results of Munder Capital Management as a discontinued operation |
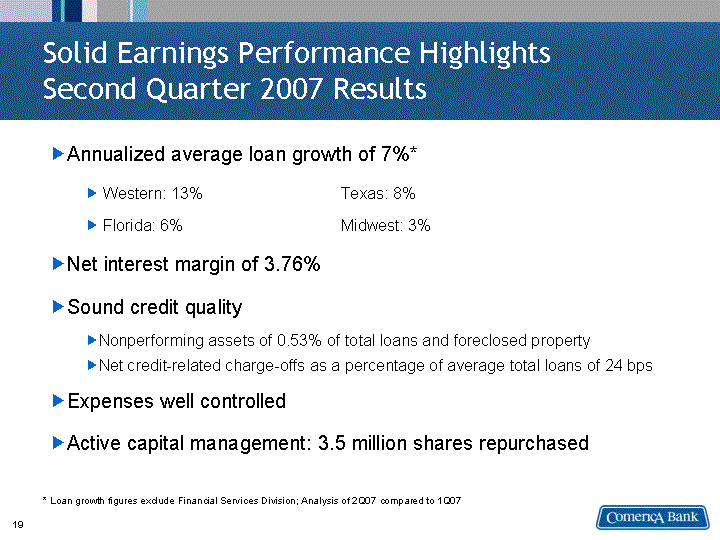
| Solid Earnings Performance Highlights Second Quarter 2007 Results * Loan growth figures exclude Financial Services Division; Analysis of 2Q07 compared to 1Q07 Annualized average loan growth of 7%* Western: 13% Texas: 8% Florida: 6% Midwest: 3% Net interest margin of 3.76% Sound credit quality Nonperforming assets of 0.53% of total loans and foreclosed property Net credit-related charge-offs as a percentage of average total loans of 24 bps Expenses well controlled Active capital management: 3.5 million shares repurchased |
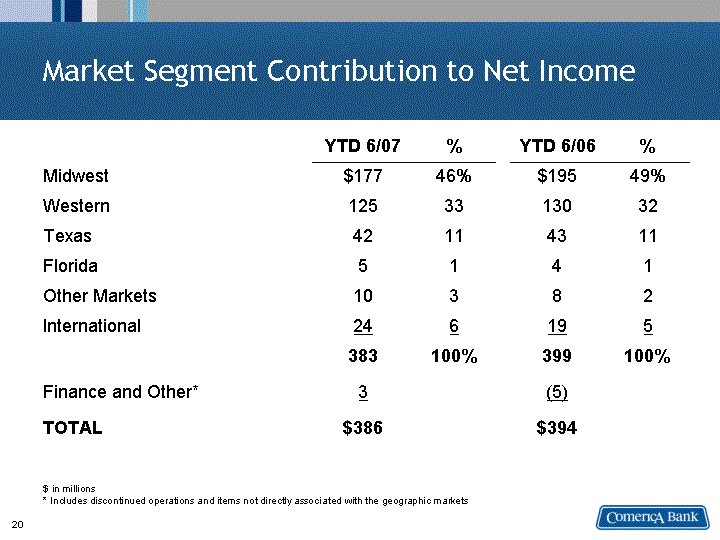
| Market Segment Contribution to Net Income YTD 6/07 % YTD 6/06 % Midwest $177 46% $195 49% Western 125 33 130 32 Texas 42 11 43 11 Florida 5 1 4 1 Other Markets 10 3 8 2 International 24 6 19 5 383 100% 399 100% Finance and Other* 3 (5) TOTAL $386 $394 $ in millions * Includes discontinued operations and items not directly associated with the geographic markets |
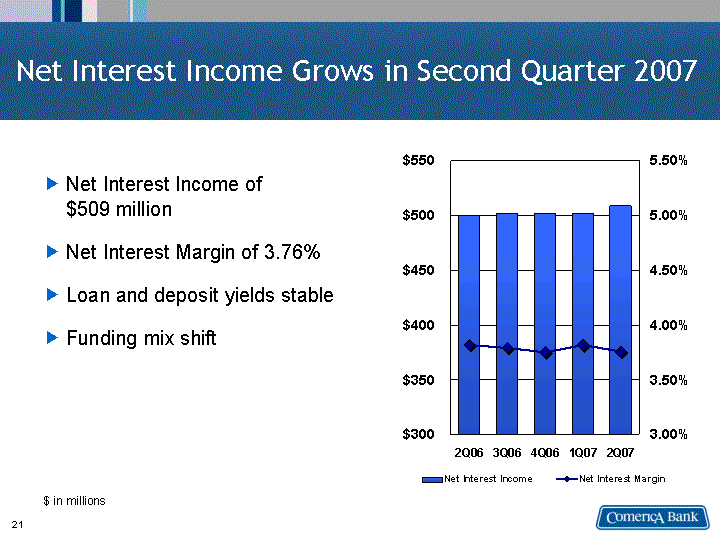
| 2Q06 3Q06 4Q06 1Q07 2Q07 Net Interest Income 500 502 502 502 509 Net Interest Margin 0.0382 0.0379 0.0375 0.0382 0.0376 Warrant Accounting Net Interest Margin Net Interest Income Grows in Second Quarter 2007 Net Interest Income of $509 million Net Interest Margin of 3.76% Loan and deposit yields stable Funding mix shift $ in millions |
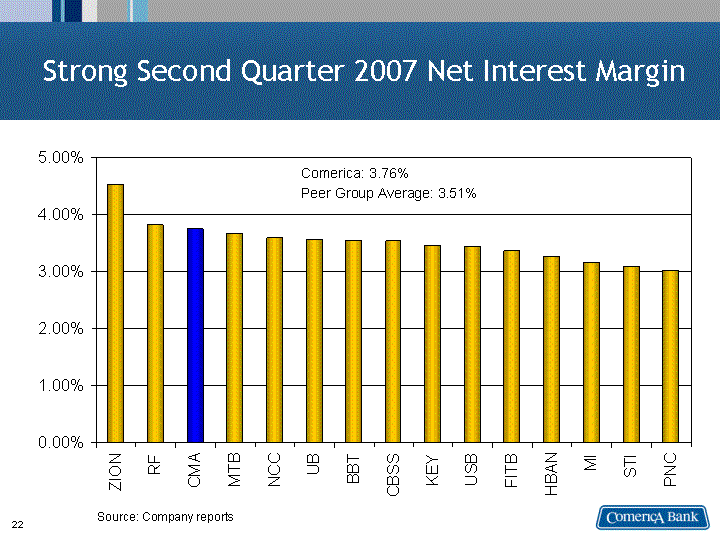
| ZION RF CMA MTB NCC UB BBT CBSS KEY USB FITB HBAN MI STI PNC 0.0453 0.0382 0.0376 0.0367 0.0359 0.0356 0.0355 0.0354 0.0346 0.0344 0.0337 0.0327 0.0317 0.031 0.0303 Comerica: 3.76% Peer Group Average: 3.51% Source: Company reports Strong Second Quarter 2007 Net Interest Margin |

| Midwest Western Texas Florida International Other Markets 2Q07 Avg Loans Outstanding 22 15.1 6.6 1.6 2.1 0.8 Midwest Western Texas Florida International Other Markets 2Q06 Average Loans Outstanding 21.7 13.4 5.8 1.5 2.1 0.7 Achieving Geographic Loan Growth 2Q07: $48.2 billion* 2Q06: $45.2 billion* *Excludes average Financial Services Division loans of $2.6B in 2Q06 and $1.6B in 2Q07 Geography based on office of origination; Midwest includes: MI, OH, IL; Western includes: CA, AZ, NV, CO, WA Year-over-Year Average Loan Outstandings up 7%* |
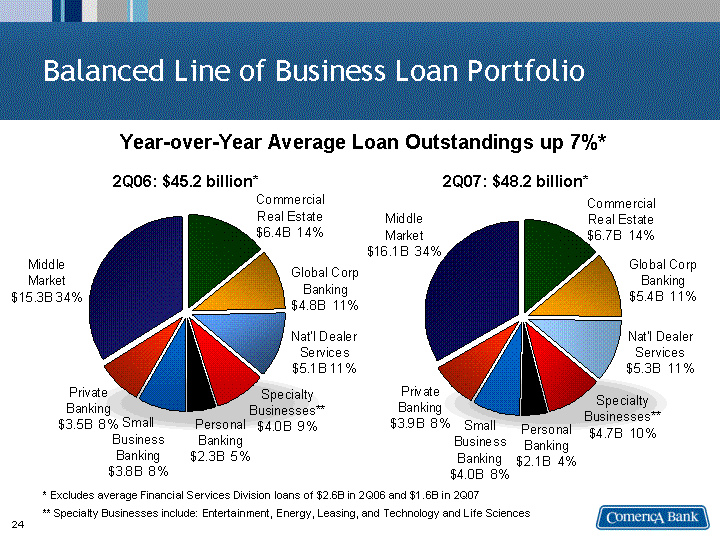
| Middle Market CRE Global Corp Bankings National Dealer Specialty Businesses* Personal Banking Small Business Banking Private Banking 2Q06 Avg Loans Outstanding 15.3 6.4 4.8 5.1 4 2.3 3.8 3.5 Middle Market Commercial Real Estate Global Corporate Banking National Dealer Services Specialty Businesses Personal Banking Small Business Banking Private Banking 2Q07 Average Loans Outstanding 16.1 6.7 5.4 5.3 4.7 2.1 4 3.9 Balanced Line of Business Loan Portfolio Year-over-Year Average Loan Outstandings up 7%* * Excludes average Financial Services Division loans of $2.6B in 2Q06 and $1.6B in 2Q07 ** Specialty Businesses include: Entertainment, Energy, Leasing, and Technology and Life Sciences 2Q07: $48.2 billion* 2Q06: $45.2 billion* |
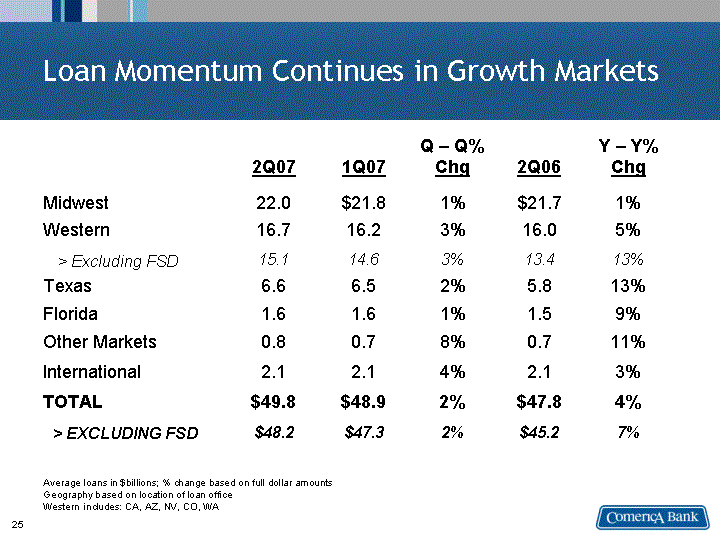
| Loan Momentum Continues in Growth Markets 2Q07 1Q07 Q - Q% Chg 2Q06 Y - Y% Chg Midwest 22.0 $21.8 1% $21.7 1% Western > Excluding FSD 16.7 15.1 16.2 14.6 3% 3% 16.0 13.4 5% 13% Texas 6.6 6.5 2% 5.8 13% Florida 1.6 1.6 1% 1.5 9% Other Markets 0.8 0.7 8% 0.7 11% International 2.1 2.1 4% 2.1 3% TOTAL $49.8 $48.9 2% $47.8 4% > EXCLUDING FSD $48.2 $47.3 2% $45.2 7% Average loans in $billions; % change based on full dollar amounts Geography based on location of loan office Western includes: CA, AZ, NV, CO, WA |
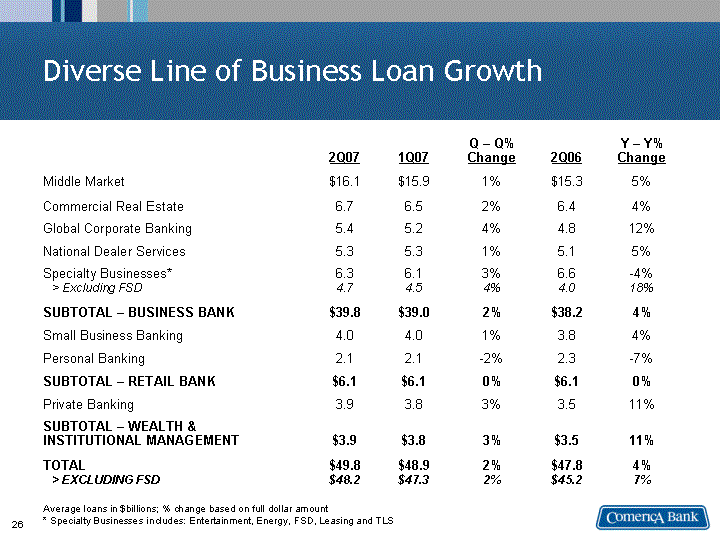
| Diverse Line of Business Loan Growth 2Q07 1Q07 Q - Q% Change 2Q06 Y - Y% Change Middle Market $16.1 $15.9 1% $15.3 5% Commercial Real Estate 6.7 6.5 2% 6.4 4% Global Corporate Banking 5.4 5.2 4% 4.8 12% National Dealer Services 5.3 5.3 1% 5.1 5% Specialty Businesses* > Excluding FSD 6.3 4.7 6.1 4.5 3% 4% 6.6 4.0 -4% 18% SUBTOTAL - BUSINESS BANK $39.8 $39.0 2% $38.2 4% Small Business Banking 4.0 4.0 1% 3.8 4% Personal Banking 2.1 2.1 -2% 2.3 -7% SUBTOTAL - RETAIL BANK $6.1 $6.1 0% $6.1 0% Private Banking 3.9 3.8 3% 3.5 11% SUBTOTAL - WEALTH & INSTITUTIONAL MANAGEMENT $3.9 $3.8 3% $3.5 11% TOTAL > EXCLUDING FSD $49.8 $48.2 $48.9 $47.3 2% 2% $47.8 $45.2 4% 7% Average loans in $billions; % change based on full dollar amount * Specialty Businesses includes: Entertainment, Energy, FSD, Leasing and TLS |
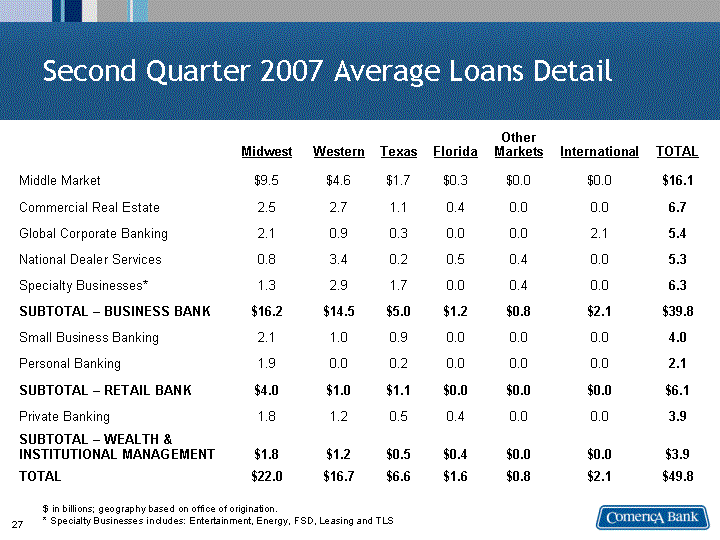
| Second Quarter 2007 Average Loans Detail Midwest Western Texas Florida Other Markets International TOTAL Middle Market $9.5 $4.6 $1.7 $0.3 $0.0 $0.0 $16.1 Commercial Real Estate 2.5 2.7 1.1 0.4 0.0 0.0 6.7 Global Corporate Banking 2.1 0.9 0.3 0.0 0.0 2.1 5.4 National Dealer Services 0.8 3.4 0.2 0.5 0.4 0.0 5.3 Specialty Businesses* 1.3 2.9 1.7 0.0 0.4 0.0 6.3 SUBTOTAL - BUSINESS BANK $16.2 $14.5 $5.0 $1.2 $0.8 $2.1 $39.8 Small Business Banking 2.1 1.0 0.9 0.0 0.0 0.0 4.0 Personal Banking 1.9 0.0 0.2 0.0 0.0 0.0 2.1 SUBTOTAL - RETAIL BANK $4.0 $1.0 $1.1 $0.0 $0.0 $0.0 $6.1 Private Banking 1.8 1.2 0.5 0.4 0.0 0.0 3.9 SUBTOTAL - WEALTH & INSTITUTIONAL MANAGEMENT $1.8 $1.2 $0.5 $0.4 $0.0 $0.0 $3.9 TOTAL $22.0 $16.7 $6.6 $1.6 $0.8 $2.1 $49.8 $ in billions; geography based on office of origination. * Specialty Businesses includes: Entertainment, Energy, FSD, Leasing and TLS |
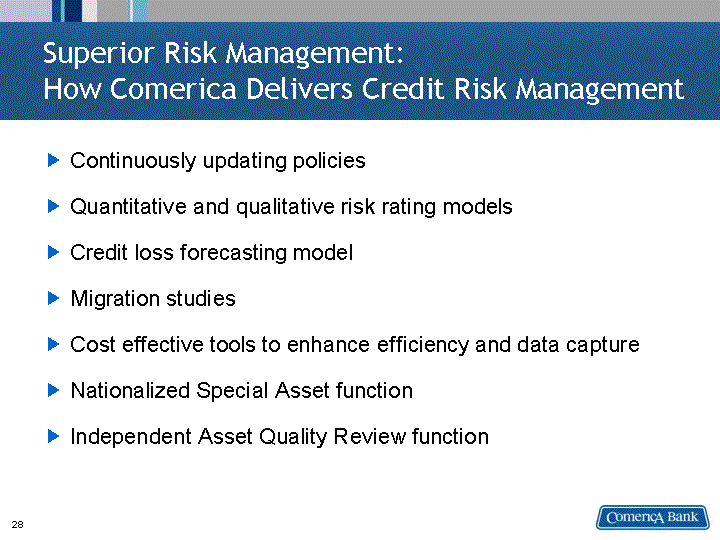
| Superior Risk Management: How Comerica Delivers Credit Risk Management Continuously updating policies Quantitative and qualitative risk rating models Credit loss forecasting model Migration studies Cost effective tools to enhance efficiency and data capture Nationalized Special Asset function Independent Asset Quality Review function |
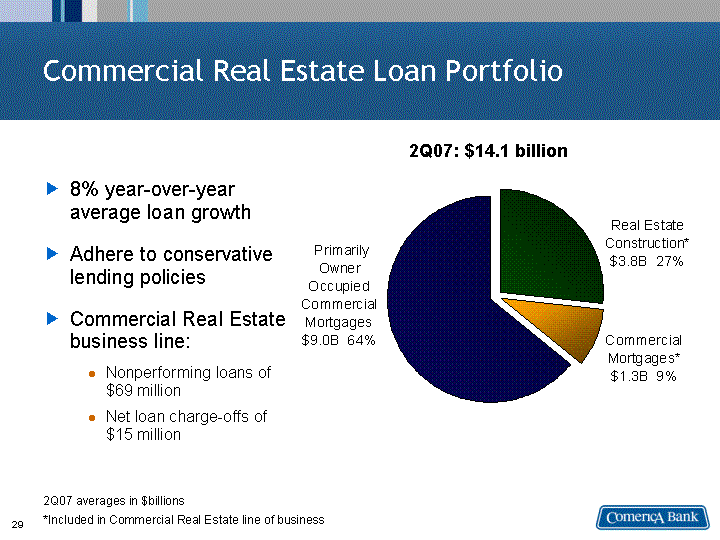
| Commercial Real Estate Loan Portfolio 8% year-over-year average loan growth Adhere to conservative lending policies Commercial Real Estate business line: Nonperforming loans of $69 million Net loan charge-offs of $15 million Owner Occupied/Other* Real Estate Construction Commercial Mortgage 2Q07 9075 3755 1305 2Q07: $14.1 billion 2Q07 averages in $billions *Included in Commercial Real Estate line of business |
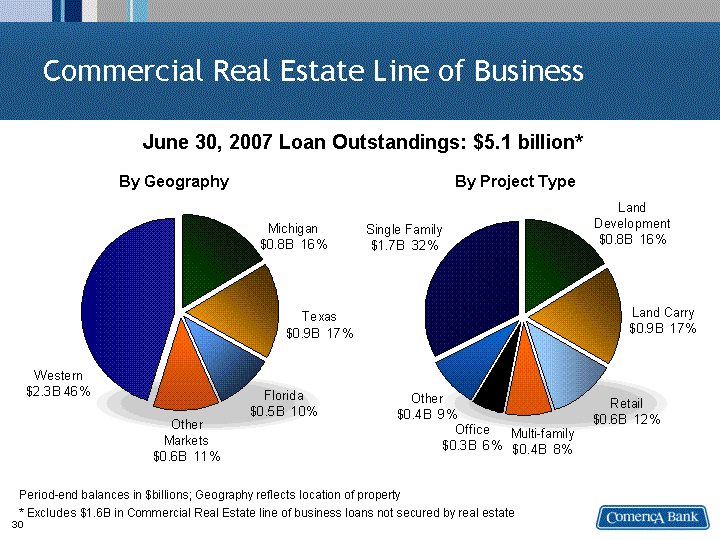
| Western Michigan Texas Florida Other Markets 1Q06 Loans Outstanding 2.325 0.834 0.849 0.533 0.579 Single Family Land Development Land Carry Retail Multi-family Office Other 2Q07 Loans Outstanding 1.667 0.816 0.893 0.595 0.41 0.287 0.451 Commercial Real Estate Line of Business June 30, 2007 Loan Outstandings: $5.1 billion* By Project Type By Geography Period-end balances in $billions; Geography reflects location of property * Excludes $1.6B in Commercial Real Estate line of business loans not secured by real estate |
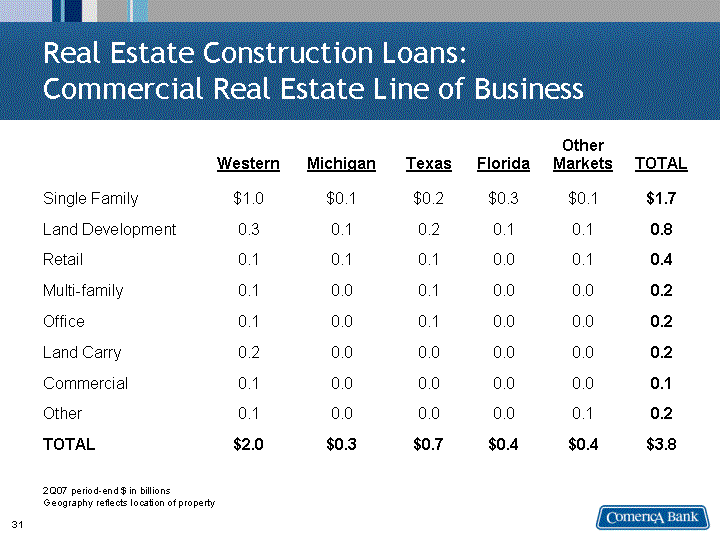
| Real Estate Construction Loans: Commercial Real Estate Line of Business Western Michigan Texas Florida Other Markets TOTAL Single Family $1.0 $0.1 $0.2 $0.3 $0.1 $1.7 Land Development 0.3 0.1 0.2 0.1 0.1 0.8 Retail 0.1 0.1 0.1 0.0 0.1 0.4 Multi-family 0.1 0.0 0.1 0.0 0.0 0.2 Office 0.1 0.0 0.1 0.0 0.0 0.2 Land Carry 0.2 0.0 0.0 0.0 0.0 0.2 Commercial 0.1 0.0 0.0 0.0 0.0 0.1 Other 0.1 0.0 0.0 0.0 0.1 0.2 TOTAL $2.0 $0.3 $0.7 $0.4 $0.4 $3.8 2Q07 period-end $ in billions Geography reflects location of property |
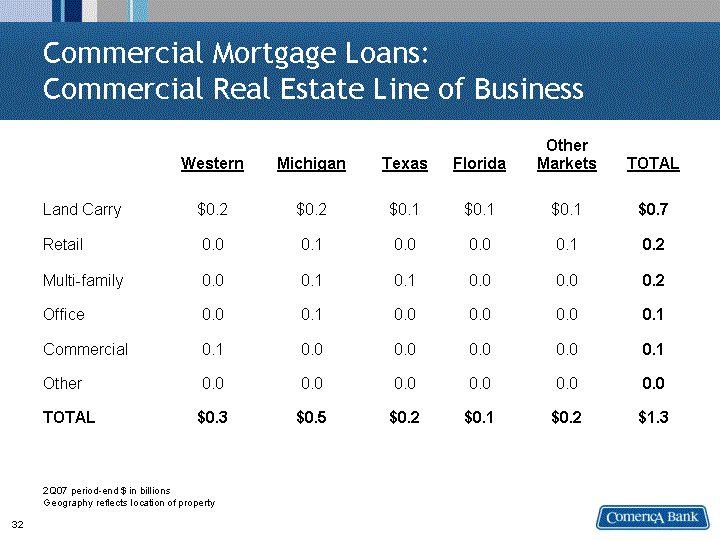
| Commercial Mortgage Loans: Commercial Real Estate Line of Business Western Michigan Texas Florida Other Markets TOTAL Land Carry $0.2 $0.2 $0.1 $0.1 $0.1 $0.7 Retail 0.0 0.1 0.0 0.0 0.1 0.2 Multi-family 0.0 0.1 0.1 0.0 0.0 0.2 Office 0.0 0.1 0.0 0.0 0.0 0.1 Commercial 0.1 0.0 0.0 0.0 0.0 0.1 Other 0.0 0.0 0.0 0.0 0.0 0.0 TOTAL $0.3 $0.5 $0.2 $0.1 $0.2 $1.3 2Q07 period-end $ in billions Geography reflects location of property |
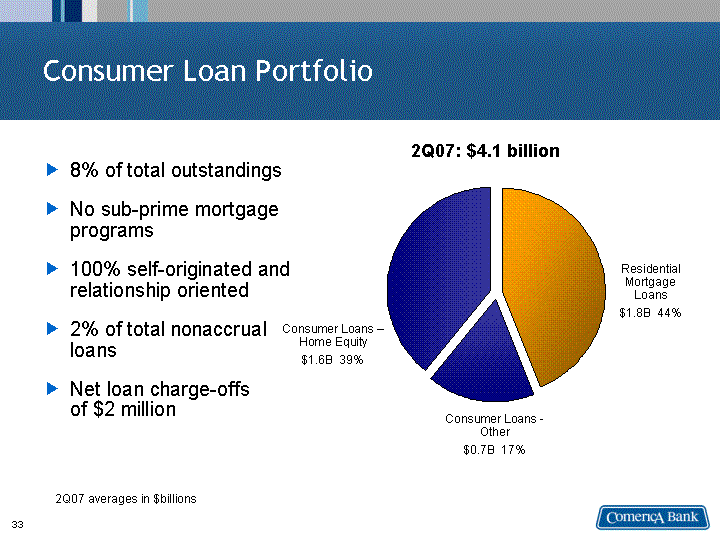
| Consumer Loan Portfolio 8% of total outstandings No sub-prime mortgage programs 100% self-originated and relationship oriented 2% of total nonaccrual loans Net loan charge-offs of $2 million Consumer loans-Other Consumer Loans-HELOC Residential Mortgages 17 39 44 2Q07: $4.1 billion 2Q07 averages in $billions Consumer Loans - Home Equity $1.6B 39% Consumer Loans - Other $0.7B 17% Residential Mortgage Loans $1.8B 44% |
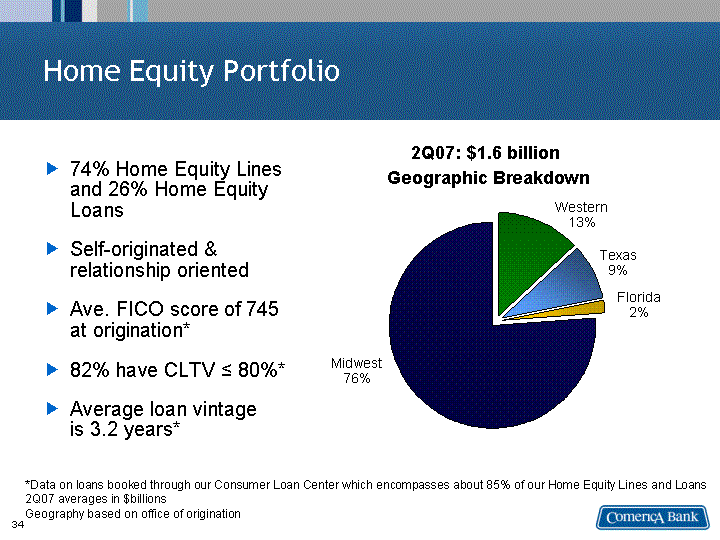
| Home Equity Portfolio Florida Midwest Western Texas 2 76 13 9 74% Home Equity Lines and 26% Home Equity Loans Self-originated & relationship oriented Ave. FICO score of 745 at origination* 82% have CLTV ^ 80%* Average loan vintage is 3.2 years* Geographic Breakdown Midwest 76% Texas 9% Western 13% *Data on loans booked through our Consumer Loan Center which encompasses about 85% of our Home Equity Lines and Loans 2Q07 averages in $billions Geography based on office of origination Florida 2% 2Q07: $1.6 billion |
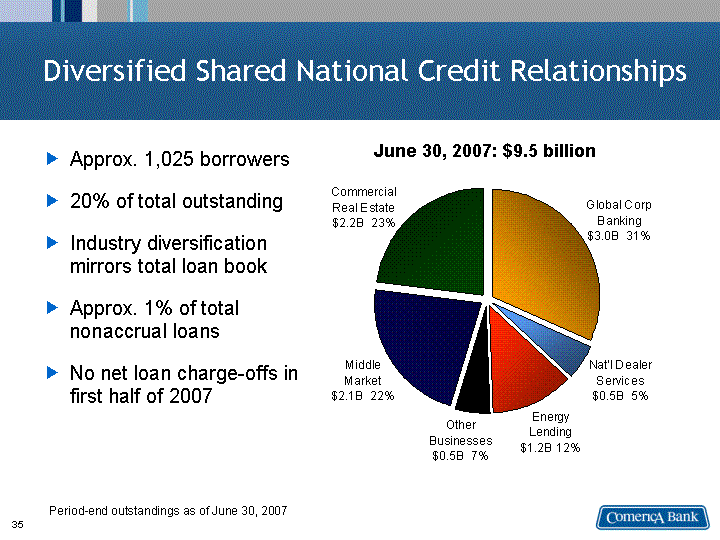
| Diversified Shared National Credit Relationships Approx. 1,025 borrowers 20% of total outstanding Industry diversification mirrors total loan book Approx. 1% of total nonaccrual loans No net loan charge-offs in first half of 2007 Middle Market Commercial Real Estate Global Corporate Banking National Dealer Services Energy Other 39172 2.1 2.2 3 0.5 1.2 0.5 June 30, 2007: $9.5 billion Period-end outstandings as of June 30, 2007 |
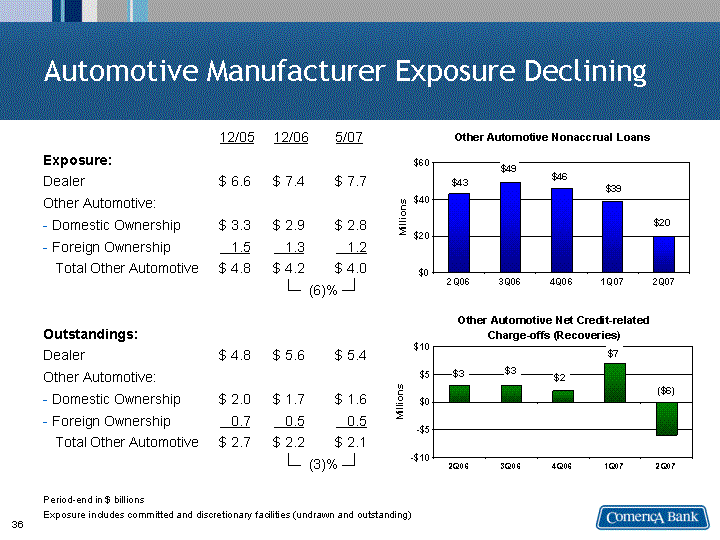
| Automotive Manufacturer Exposure Declining 12/05 12/06 5/07 Exposure: Dealer $ 6.6 $ 7.4 $ 7.7 Other Automotive: Domestic Ownership $ 3.3 $ 2.9 $ 2.8 Foreign Ownership 1.5 1.3 1.2 Total Other Automotive $ 4.8 $ 4.2 $ 4.0 (6)% Outstandings: Dealer $ 4.8 $ 5.6 $ 5.4 Other Automotive: Domestic Ownership $ 2.0 $ 1.7 $ 1.6 Foreign Ownership 0.7 0.5 0.5 Total Other Automotive $ 2.7 $ 2.2 $ 2.1 (3)% 2Q06 3Q06 4Q06 1Q07 2Q07 NPA's 43 49 46 39 20 2Q06 3Q06 4Q06 1Q07 2Q07 Net Loan Charge-offs 3 3 2 7 -6 Period-end in $ billions Exposure includes committed and discretionary facilities (undrawn and outstanding) |
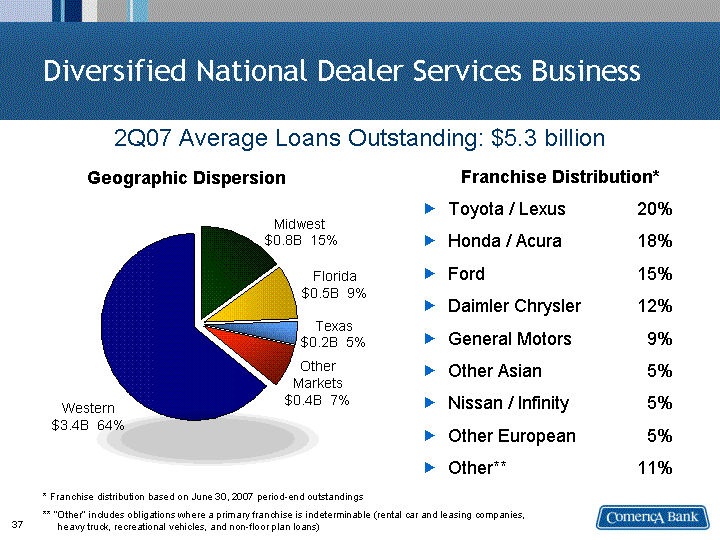
| Western Midwest Florida Texas Other 3.4 0.8 0.5 0.2 0.4 Franchise Distribution* Toyota / Lexus 20% Honda / Acura 18% Ford 15% Daimler Chrysler 12% General Motors 9% Other Asian 5% Nissan / Infinity 5% Other European 5% Other** 11% 2Q07 Average Loans Outstanding: $5.3 billion Midwest $0.8B 15% Western $3.4B 64% Texas $0.2B 5% Florida $0.5B 9% Geographic Dispersion * Franchise distribution based on June 30, 2007 period-end outstandings ** "Other" includes obligations where a primary franchise is indeterminable (rental car and leasing companies, heavy truck, recreational vehicles, and non-floor plan loans) Diversified National Dealer Services Business Other Markets $0.4B 7% |
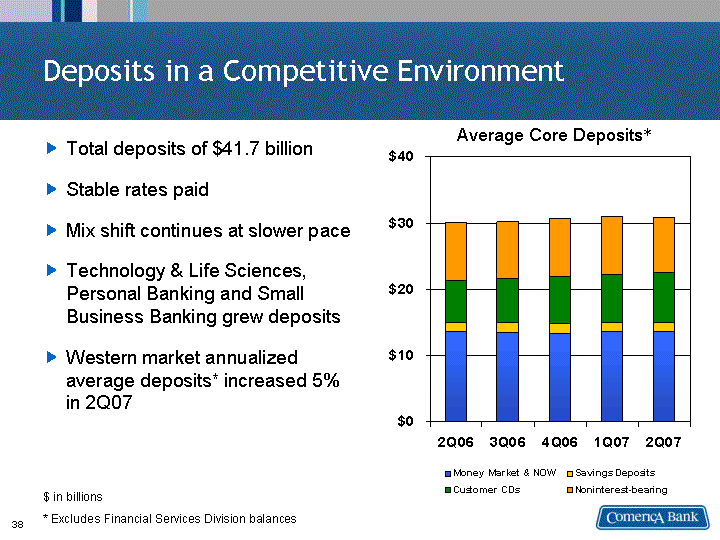
| Deposits in a Competitive Environment Total deposits of $41.7 billion Stable rates paid Mix shift continues at slower pace Technology & Life Sciences, Personal Banking and Small Business Banking grew deposits Western market annualized average deposits* increased 5% in 2Q07 $ in billions * Excludes Financial Services Division balances 2Q06 3Q06 4Q06 1Q07 2Q07 Money Market & NOW 13.583 13.447 13.383 13.517 13.614 Savings Deposits 1.479 1.433 1.375 1.38 1.419 Customer CDs 6.199 6.685 7.175 7.329 7.447 Noninterest-bearing 8.782 8.644 8.696 8.712 8.355 Average Core Deposits* |
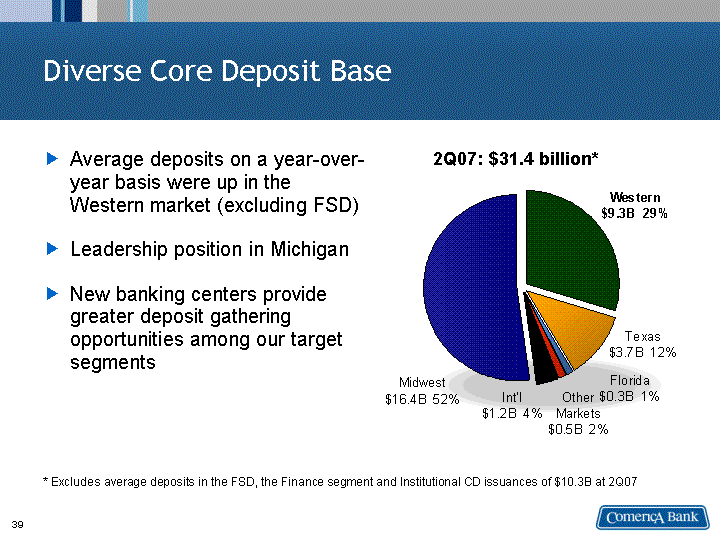
| Midwest Western Texas Florida Other Markets International 16.4 9.3 3.7 0.3 0.5 1.2 Diverse Core Deposit Base 2Q07: $31.4 billion* * Excludes average deposits in the FSD, the Finance segment and Institutional CD issuances of $10.3B at 2Q07 Average deposits on a year-over- year basis were up in the Western market (excluding FSD) Leadership position in Michigan New banking centers provide greater deposit gathering opportunities among our target segments |

| Line of Business Deposits 2Q07 1Q07 Q - Q% Change 2Q06 Y - Y% Change Middle Market $4.0 $4.3 -5% $4.0 0% Commercial Real Estate 1.0 1.0 -6% 1.1 -12% Global Corporate Banking 3.3 3.3 0% 3.2 6% National Dealer Services 0.1 0.1 -1% 0.1 10% Specialty Businesses1 > Excluding FSD 8.0 3.5 8.1 3.3 0% 5% 9.5 2.9 -16% 17% SUBTOTAL - BUSINESS BANK >Excluding FSD $16.4 $11.9 $16.7 $12.0 -2% -1% $17.9 $11.3 -8% 5% Small Business Banking 3.9 3.9 1% 3.9 1% Personal Banking 13.3 13.2 1% 12.9 3% SUBTOTAL - RETAIL BANK $17.2 $17.1 1% $16.8 3% Private Banking 2.3 2.3 -1% 2.5 -7% SUBTOTAL - WEALTH & INSTITUTIONAL MANAGEMENT $2.3 $2.3 -1% $2.5 -7% Finance/Other2 5.8 6.5 -12% 4.8 19% TOTAL > EXCLUDING FSD $41.7 $37.2 $42.6 $37.9 -2% -2% $42.0 $35.4 -1% 5% Average deposits in $billions; % change based on full dollar amount 1 Specialty Businesses includes: Entertainment, Energy, FSD, Leasing and TLS 2 Finance/Other includes Institutional CD's: 2Q07 - $5.5B; 1Q07 - $5.8B; 2Q06 - $4.3B |
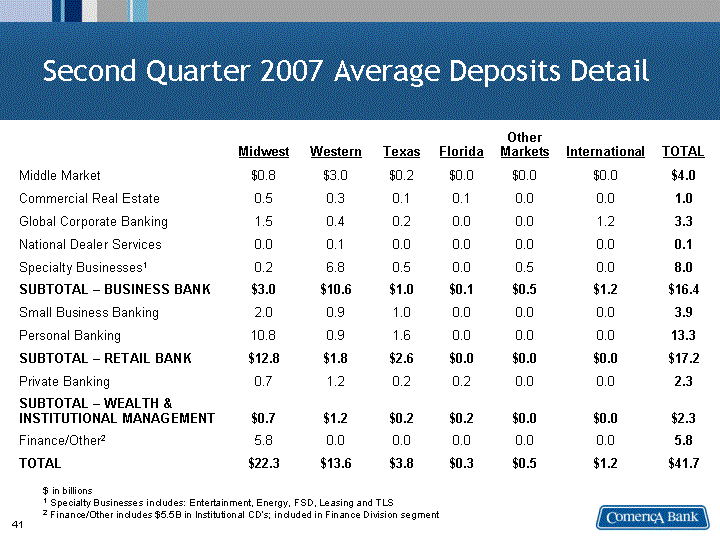
| Second Quarter 2007 Average Deposits Detail Midwest Western Texas Florida Other Markets International TOTAL Middle Market $0.8 $3.0 $0.2 $0.0 $0.0 $0.0 $4.0 Commercial Real Estate 0.5 0.3 0.1 0.1 0.0 0.0 1.0 Global Corporate Banking 1.5 0.4 0.2 0.0 0.0 1.2 3.3 National Dealer Services 0.0 0.1 0.0 0.0 0.0 0.0 0.1 Specialty Businesses1 0.2 6.8 0.5 0.0 0.5 0.0 8.0 SUBTOTAL - BUSINESS BANK $3.0 $10.6 $1.0 $0.1 $0.5 $1.2 $16.4 Small Business Banking 2.0 0.9 1.0 0.0 0.0 0.0 3.9 Personal Banking 10.8 0.9 1.6 0.0 0.0 0.0 13.3 SUBTOTAL - RETAIL BANK $12.8 $1.8 $2.6 $0.0 $0.0 $0.0 $17.2 Private Banking 0.7 1.2 0.2 0.2 0.0 0.0 2.3 SUBTOTAL - WEALTH & INSTITUTIONAL MANAGEMENT $0.7 $1.2 $0.2 $0.2 $0.0 $0.0 $2.3 Finance/Other2 5.8 0.0 0.0 0.0 0.0 0.0 5.8 TOTAL $22.3 $13.6 $3.8 $0.3 $0.5 $1.2 $41.7 $ in billions 1 Specialty Businesses includes: Entertainment, Energy, FSD, Leasing and TLS 2 Finance/Other includes $5.5B in Institutional CD's; included in Finance Division segment |
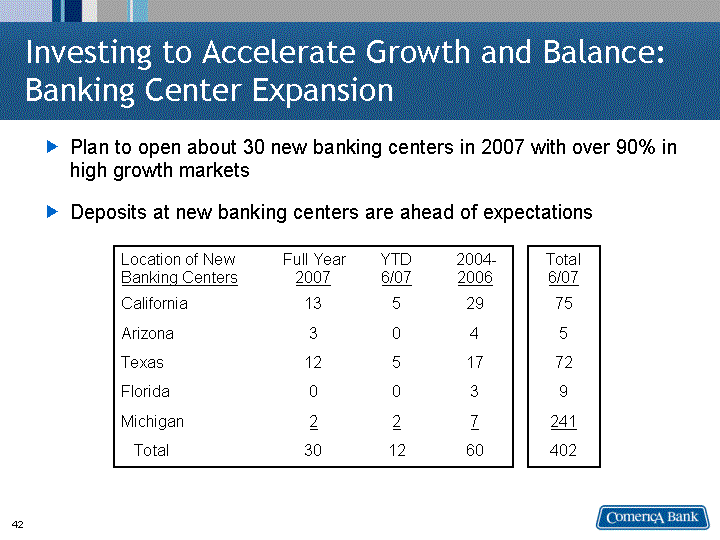
| Investing to Accelerate Growth and Balance: Banking Center Expansion Plan to open about 30 new banking centers in 2007 with over 90% in high growth markets Deposits at new banking centers are ahead of expectations Location of New Banking Centers Full Year 2007 YTD 6/07 2004- 2006 Total 6/07 California 13 5 29 75 Arizona 3 0 4 5 Texas 12 5 17 72 Florida 0 0 3 9 Michigan 2 2 7 241 Total 30 12 60 402 |
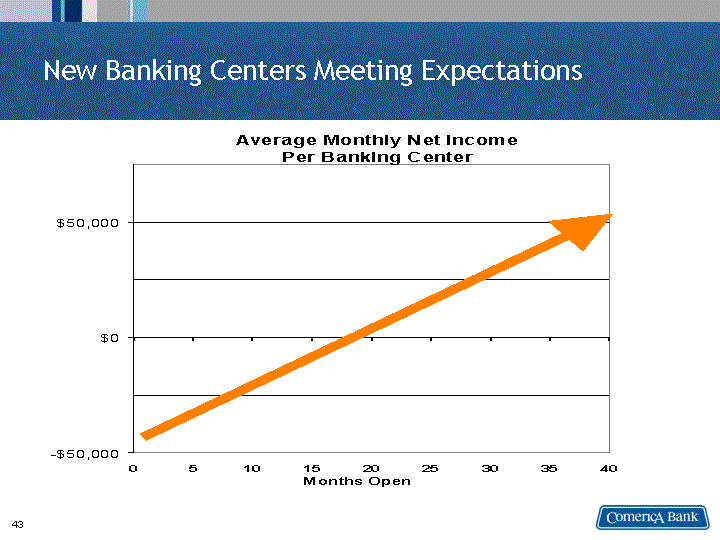
| New Banking Centers Meeting Expectations |

| New Banking Center Deposits 1Q05 2Q05 3Q05 4Q05 1Q06 2Q06 3Q06 4Q06 1Q07 2Q07 Deposits ($) 196924351 329328727 399063830 442418991 489342051 519562757 584415916 768889962 846113023 403058176.56 341049226.32 155022375.6 134352725.52 Quarter End CAGR: 18% Personal Bkg - 39% Business Bank - 33% Small Business - 15% WIM - 13% |
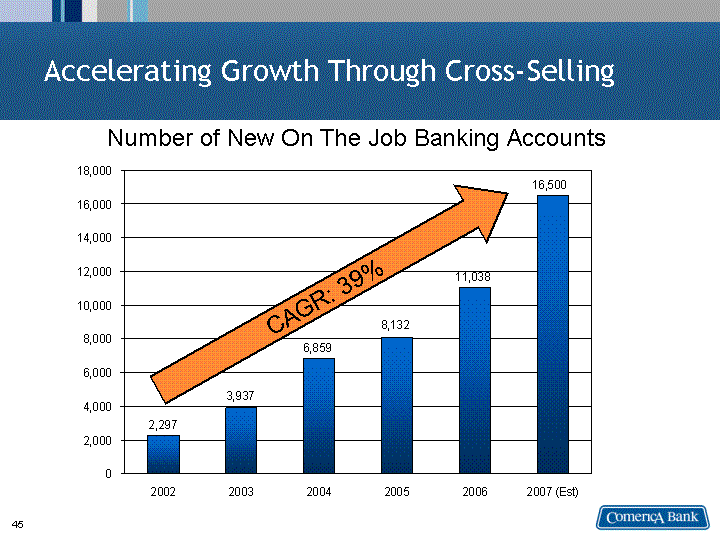
| Accelerating Growth Through Cross-Selling 2002 2003 2004 2005 2006 2007 (Est) Number of Accounts Opened 2297 3937 6859 8132 11038 16500 Number of New On The Job Banking Accounts CAGR: 39% |
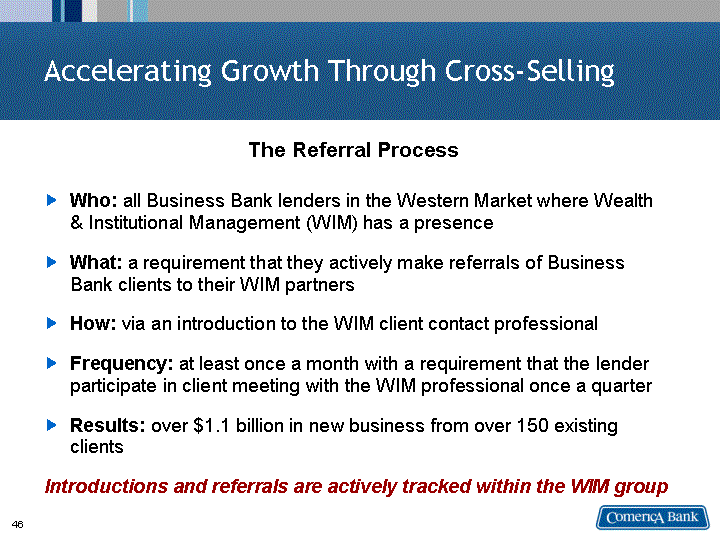
| Accelerating Growth Through Cross-Selling Who: all Business Bank lenders in the Western Market where Wealth & Institutional Management (WIM) has a presence What: a requirement that they actively make referrals of Business Bank clients to their WIM partners How: via an introduction to the WIM client contact professional Frequency: at least once a month with a requirement that the lender participate in client meeting with the WIM professional once a quarter Results: over $1.1 billion in new business from over 150 existing clients Introductions and referrals are actively tracked within the WIM group The Referral Process |

| Accelerating Our Strategy of Growth and Balance Comerica 2006 Western/Texas/Florida: Loans 50% Deposits 45% Revenue 44% Net Income 46% Banking Centers 152 Comerica 1997 Western/Texas/Florida: Loans 27% Deposits 27% Revenue 27% Net Income 30% Banking Centers 90 Percent of Total Comerica |
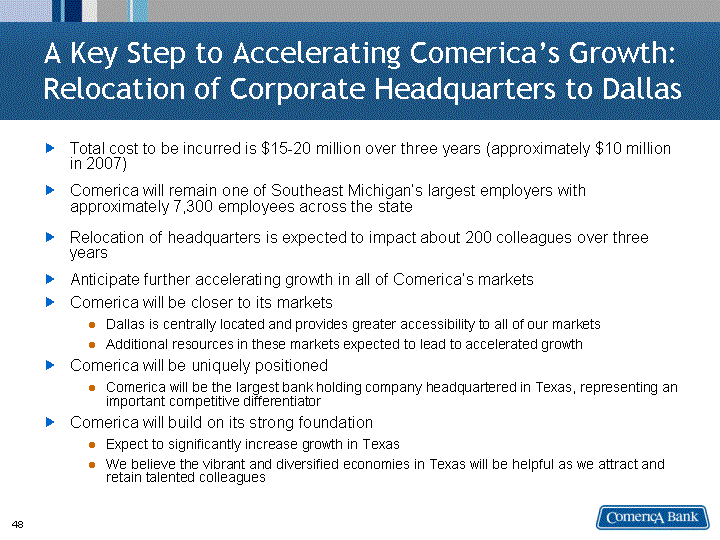
| A Key Step to Accelerating Comerica's Growth: Relocation of Corporate Headquarters to Dallas Total cost to be incurred is $15-20 million over three years (approximately $10 million in 2007) Comerica will remain one of Southeast Michigan's largest employers with approximately 7,300 employees across the state Relocation of headquarters is expected to impact about 200 colleagues over three years Anticipate further accelerating growth in all of Comerica's markets Comerica will be closer to its markets Dallas is centrally located and provides greater accessibility to all of our markets Additional resources in these markets expected to lead to accelerated growth Comerica will be uniquely positioned Comerica will be the largest bank holding company headquartered in Texas, representing an important competitive differentiator Comerica will build on its strong foundation Expect to significantly increase growth in Texas We believe the vibrant and diversified economies in Texas will be helpful as we attract and retain talented colleagues |
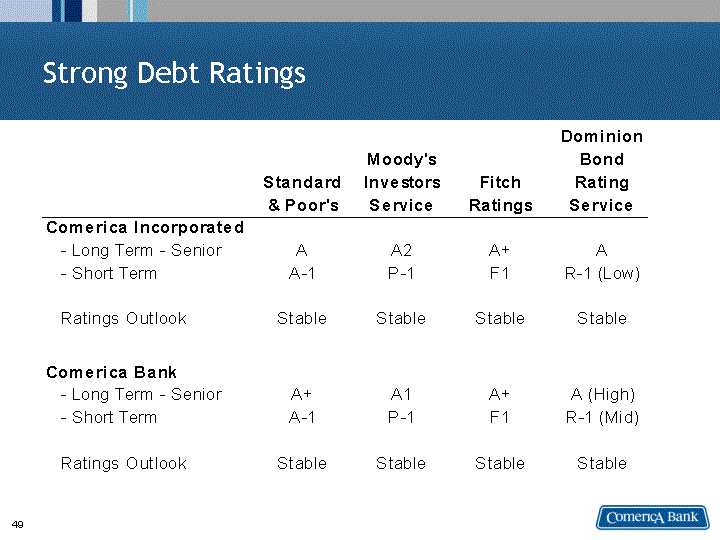
| Strong Debt Ratings |

| Investor Relations Contacts Darlene Persons Director of Investor Relations (313) 222-2840 DPPersons@Comerica.com Paul Jaremski Vice President (214) 969-6476 PJaremski@Comerica.com |
