Free signup for more
- Track your favorite companies
- Receive email alerts for new filings
- Personalized dashboard of news and more
- Access all data and search results
Filing tables
Filing exhibits
SXT similar filings
- 20 Dec 22 Entry into a Material Definitive Agreement
- 9 Dec 22 Announces Retirement of Dr. Elaine R. Wedral
- 8 Nov 22 Entry into a Material Definitive Agreement
- 8 Nov 22 Regulation FD Disclosure
- 21 Oct 22 Results of Operations and Financial Condition
- 21 Sep 22 Regulation FD Disclosure
- 6 Sep 22 Entry into a Material Definitive Agreement
Filing view
External links
Exhibit 99.1

2022 Baird Global Industrial Conference Wednesday, November 9, 2022 Paul Manning Chairman of the Board, President and Chief Executive Officer Steve Rolfs Senior Vice President and Chief Financial Officer
FORWARD-LOOKING STATEMENTS 2 This document contains statements that may constitute “forward-looking statements” within the meaning of Federal securities laws. Such forward-looking statements are not guarantees of future performance and involve known and unknown risks, uncertainties and other factors concerning the Company’s operations and business environment. Important factors that could cause actual results to differ materially from those sugges ted by these forward-looking statements and that could adversely affect the Company’s future financial performance include the following: the impact and uncertainty created by the COVID- 19 pandemic, including, but not limited to, its effects on our employees, facilities, customers, and suppliers, the availability and cost of raw materials, energy, and other supplies, the availability and cost of labor, logistics, and transportation, governmental regulations and restrictions, and general economic conditions, including inflation; the uncertain impacts of the ongoing conflict between Russia and Ukraine on our supply chain, input costs, including energy and transportation, and on general economic conditions; the pace and nature of new product introductions by the Company and the Company’s customers; the Company’s ability to anticipate and respond to changing consumer preferences and changing technologies; the Company’s ability to successfully implement its growth strategies; the outcome of the Company’s various productivity-improvement and cost-reduction efforts, acquisition and divestiture activities, and operational improvement plan; changes in costs of raw materials, including energy; industry, regulatory, legal, and economic factors related to the Company’s domestic and international business; the effects of tariffs, trade barriers, and disputes; growth in markets for products in which the Company competes; industry and customer acceptance of price increases; actions by competitors; currency exchange rate fluctuations; and other factors included in “Risk Factors” in the Company's Annual Report on Form 10-K for the year ended December 31, 2021, as updated and supplemented by the Company’s Quarterly Report on Form 10-Q for the quarter ended March 31, 2022, and in other documents that the Company files with the SEC. The risks and uncertainties identified above are not the only risks the Company faces. Additional risks and uncertainties not presently known to the Company or that it currently believes to be immaterial also may adversely affect the Company. Should any known or unknown risks and uncertainties develop into actual events, these developments could have material adverse effects on our business, financial condition, and results of operations. This presentation contains time-sensitive information that reflects management’s best analysis only as of the date of this presentation. Except to the extent required by applicable laws, the Company does not undertake to publicly update or revise its forward-looking statements even if experience or future changes make it clear that any projected results expressed or implied herein will not be realized.
NON-GAAP FINANCIAL MEASURES 2 Within this document, the Company reports certain non-GAAP financial measures, including: (1) adjusted revenue, adjusted operating income, and adjusted operating margin (which exclude divestiture & other related costs, the results of the divested product lines, and restructuring and other costs, which include operational improvement plan costs and income), (2) adjusted results by segment (which exclude divestiture & other related costs, operational improvement plan costs and income, and the results of the divested operations), and (3) percentage changes in revenue and operating income on an adjusted local currency basis (which eliminate the effects that result from translating its international operations into U.S. dollars and revenue and operating income of the divested product lines). The Company has included each of these non-GAAP measures in order to provide additional information regarding the underlying operating results and comparable period-over-period performance. Such information is supplemental to information presented in accordance with GAAP and is not intended to represent a presentation in accordance with GAAP. These non-GAAP measures should not be considered in isolation. Rather, they should be considered together with GAAP measures and the rest of the information included in this presentation and the Company’s SEC filings. Management internally reviews each of these non-GAAP measures to evaluate performance on a comparative period-to-period basis and to gain additional insight into underlying operating and performance trends. The Company believes this information can be beneficial to investors for these same purposes. These non-GAAP measures may not be comparable to similarly titled measures used by other companies. Refer to “Non-GAAP Financial Measures” at the end of this presentation for reconciliations and additional information.

Sensient Technologies Corporation 2 Provider of customized solutions for the food and beverage, pharmaceutical, and personal care markets Global market leader offering an extensive portfolio of natural flavor and color technology platforms and solutions Exceptional innovation & applications expertise with unique ability to service global, regional, and local customers Technically-driven products deliver high impact relative to cost
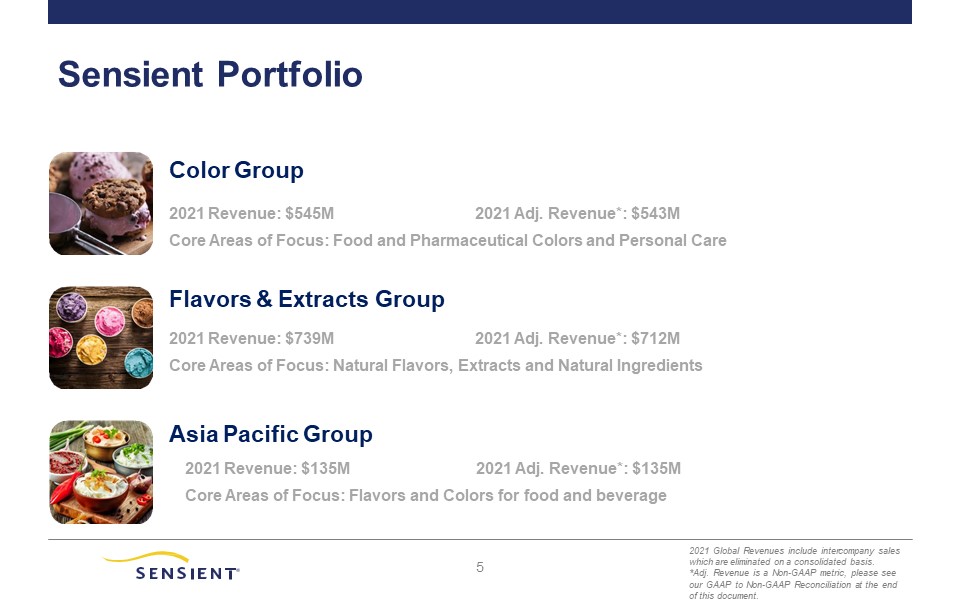
5 Sensient Portfolio 2021 Global Revenues include intercompany sales which are eliminated on a consolidated basis. *Adj. Revenue is a Non-GAAP metric, please see our GAAP to Non-GAAP Reconciliation at the end of this document. Color Group 2021 Revenue: $545M 2021 Adj. Revenue*: $543M Core Areas of Focus: Food and Pharmaceutical Colors and Personal Care Flavors & Extracts Group 2021 Revenue: $739M 2021 Adj. Revenue*: $712M Core Areas of Focus: Natural Flavors, Extracts and Natural Ingredients Asia Pacific Group 2021 Revenue: $135M 2021 Adj. Revenue*: $135M Core Areas of Focus: Flavors and Colors for food and beverage

6 2022 September YTD Performance Local Currency Adjusted Revenue* Local Currency Adjusted Operating Income* Adjusted Operating Margin* Color +16.0% +17.3% Flat Flavors & Extracts +6.9% +14.6% +120 bps Asia Pacific +17.2% +29.6% +180 bps Consolidated +11.0% +16.7% +60 bps * Local-currency (LC) adjusted revenue, local-currency adjusted operating income and adjusted operating margin are Non-GAAP metrics. Please see our GAAP to Non- GAAP Reconciliation at the end of this document.
7 Why Invest? Strong competitive position ‘Sticky’ business (& low portion of customer costs) Global presence Exposure to stable and growing markets Focused on improving returns and on growth

APPENDIX *Amounts in thousands, except percentages
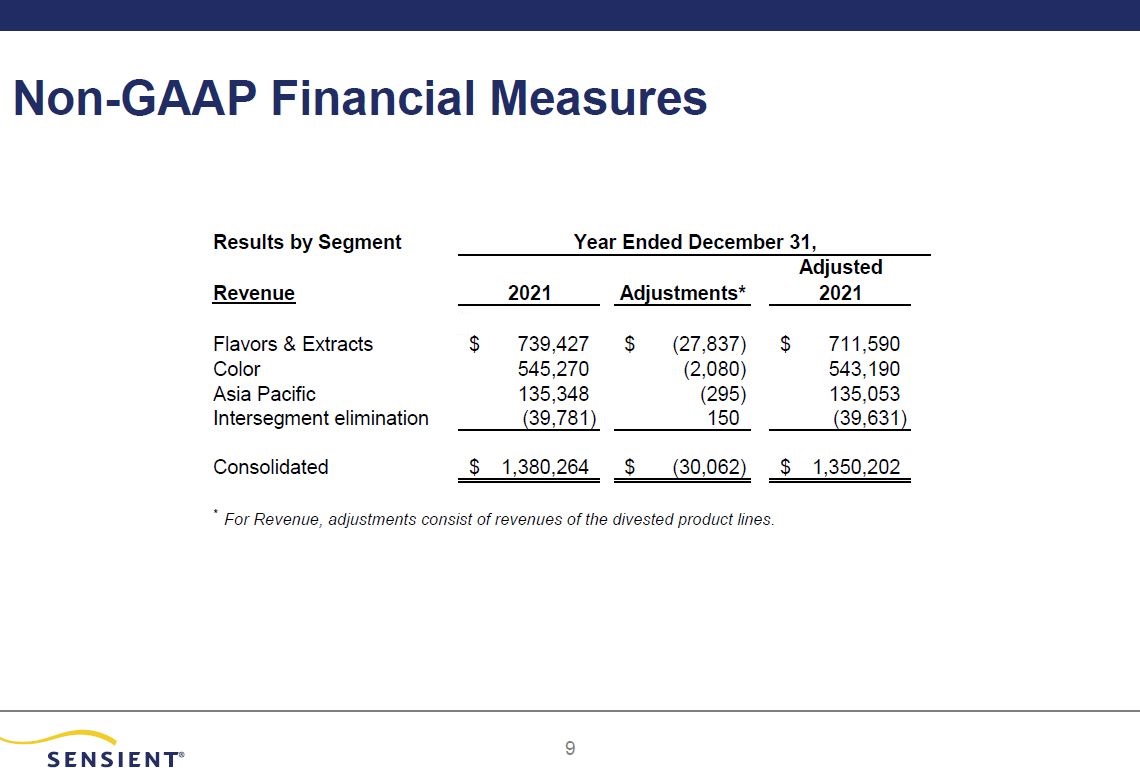
Non-GAAP Financial Measures Results by Segment Revenue 2021 Adjustments* 2021 Flavors & Extracts $ 739,427 $ (27,837) $ 711,590 Color 545,270 (2,080) 543,190 Asia Pacific 135,348 (295) 135,053 Intersegment elimination (39,781) 150 (39,631) Consolidated $ 1,380,264 $ (30,062) $ 1,350,202 Year Ended December 31, Adjusted * For Revenue, adjustments consist of revenues of the divested product lines. 12
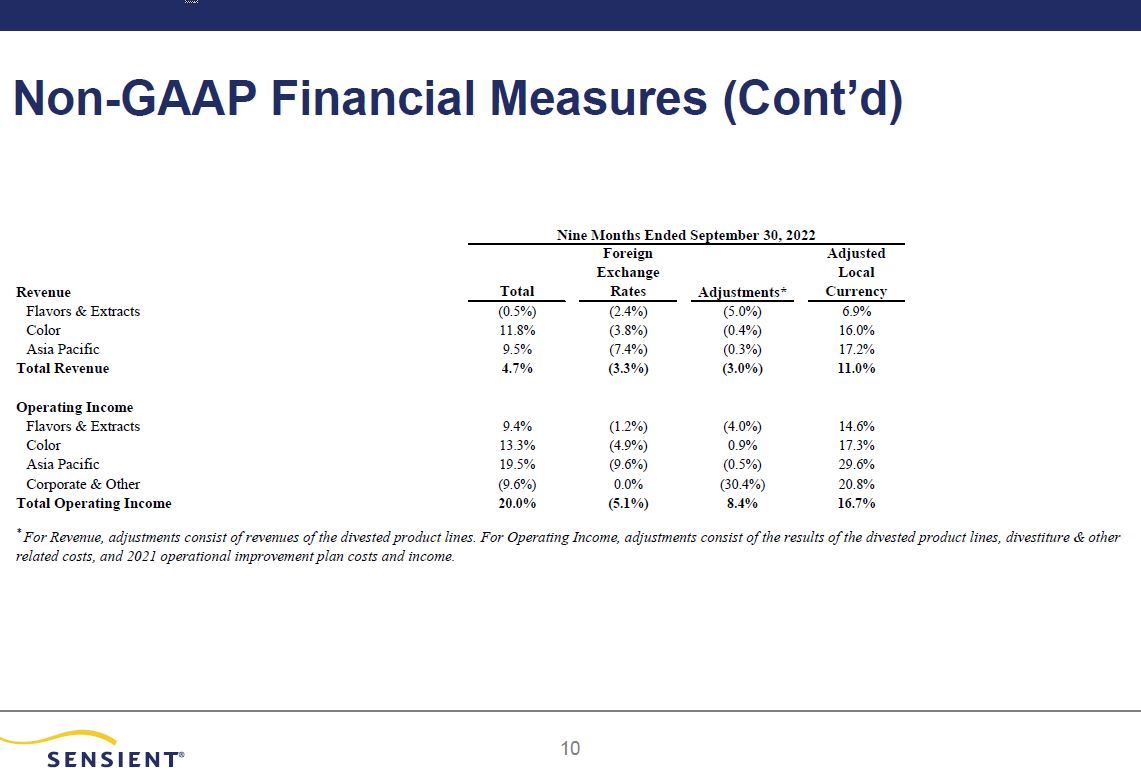
Non-GAAP Financial Measures (Cont’d) 12 Revenue Total Foreign Exchange Rates Adjustments* Adjusted Local Currency Flavors & Extracts (0.5%) (2.4%) (5.0%) 6 Color 11.8% (3.8%) (0.4%) Asia Pacific 9.5% (7.4%) Total Revenue 4.7% (3.3%) Operating Income Flavors & Extracts Color Asia Pacific Corporate & Other Total Operating Income * For Revenue, relate Nine Months Ended September 30, 2022

Non-GAAP Financial Measures (Cont’d) Results by Segment Nine Months Ended September 30, * For Revenue, adjustments consist of revenues of the divested product lines. For Operating Income, adjustments consist of the results of the divested product lines, divestiture & other related costs, and 2021 operational improvement plan costs and income. Adjusted Adjusted Revenue 2022 Adjustments* 2022 2021 Adjustments* 2021 Flavors & Extracts $ 559,110 - $ 559,110 $ 561,979 $ (27,616) $ 534,363 Color 456,175 - 456,175 408,166 (1,638) 406,528 Asia Pacific 109,014 - 109,014 99,599 (295) 99,304 Intersegment elimination (35,996) - (35,996) (29,928) 150 (29,778) Consolidated $ 1,088,303 $ - $ 1,088,303 $ 1,039,816 $ (29,399) $ 1,010,417 Operating Income Flavors & Extracts $ 83,929 - $ 83,929 $ 76,718 $ (2,859) $ 73,859 Color 90,035 - 90,035 79,462 548 80,010 Asia Pacific 22,877 - 22,877 19,146 (87) 19,059 Corporate & Other (41,315) - (41,315) (45,718) 11,491 (34,227) Consolidated $ 155,526 $ - $ 155,526 $ 129,608 $ 9,093 $ 138,701 Operating Margin Flavors & Extracts 15.0% - 15.0% 13.7% 0.1% 13.8% Color 19.7% - 19.7% 19.5% 0.2% 19.7% Asia Pacific 21.0% - 21.0% 19.2% - 19.2% Consolidated 14.3% - 14.3% 12.5% 1.2% 13.7% 12

12