Contact: Pete Bakel Resource Center: 1-800-232-6643
202-752-2034 Exhibit 99.1
Date: October 31, 2023
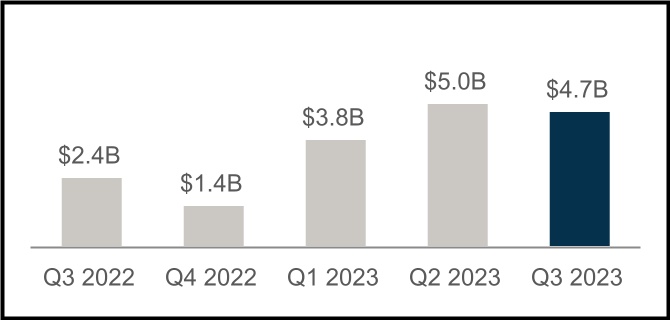
Fannie Mae Reports Net Income of $4.7 Billion for Third Quarter 2023
| | | | | | | | | | | | | | |
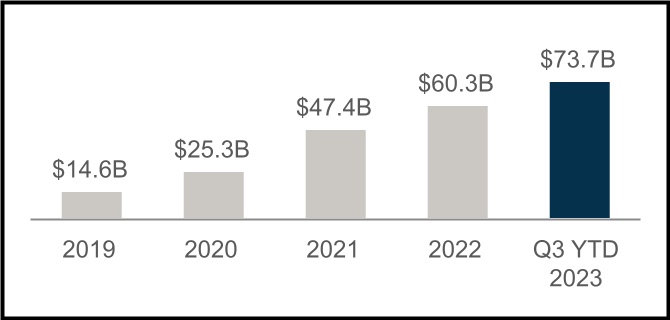
| • | $4.7 billion net income for the third quarter of 2023, with net worth reaching $73.7 billion as of September 30, 2023 | | “The third quarter remained challenging for housing – with higher mortgage rates, high home prices, and a limited inventory of homes for sale. Renters, too, continued to face all-time high rents. Against this economic backdrop, Fannie Mae delivered strong third quarter results and remained a reliable source of liquidity and stability for America’s housing market. This quarter, we helped 428,000 households purchase, refinance, or rent a home, many of whom are low- to moderate-income borrowers or renters.”
Priscilla Almodovar, Chief Executive Officer |
| | |
| • | Net income decreased $295 million in the third quarter of 2023 compared with the second quarter of 2023, primarily driven by a decrease in benefit for credit losses, partially offset by an increase in fair value gains | |
| | |
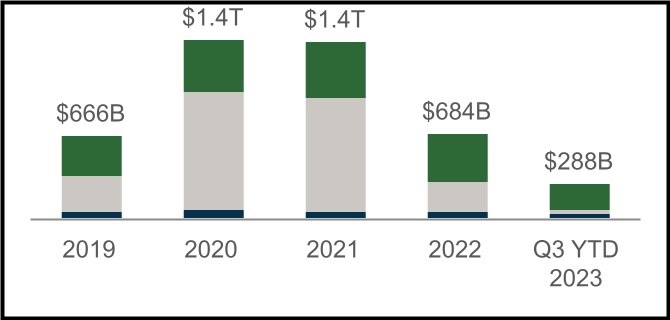
| • | $106 billion in liquidity provided to the mortgage market in the third quarter of 2023 | |
| | |
| • | Acquired approximately 224,000 single-family purchase loans, of which more than 45% were for first-time homebuyers, and approximately 45,000 single-family refinance loans during the third quarter of 2023 | |
| | |
| • | Financed approximately 159,000 units of multifamily rental housing in the third quarter of 2023, a significant majority of which were affordable to households earning at or below 120% of area median income, providing support for both workforce and affordable housing | |
| | |
| • | Home prices grew 1.7% on a national basis in the third quarter of 2023, compared with a 3.8% increase in the second quarter of 2023 | |
| | |
| • | The U.S. weekly average 30-year fixed-rate mortgage rate increased from 6.71% as of the end of the second quarter of 2023 to 7.31% as of the end of the third quarter of 2023 | |
| | |
| | |
| | |
| | |
| | | | |
| | | | |
| | | | |
| |
| | | | |
| | | | | | | | | | | | | | | | | | | | | | | | | | | | | | | | | | | |
| Q3 2023 Key Results |
|
| $73.7 Billion Net Worth | $288 Billion Supporting Housing Activity |
| | | | | | | | | | | |
| Increase of $4.7 billion in the third quarter of 2023 | | SF Home Purchases | | | SF Refinancings | | | MF Rental Units |
| | | | |
| | | | | | | | | | | | | | | | | | | | |
| | | | | | |
| $4.7 Billion Net Income for Q3 2023 | Serious Delinquency Rates |
| | | | | | |
| Decrease of $295 million compared with second quarter 2023 | | Single-Family SDQ Rate | | Multifamily SDQ Rate |
| |

| | | | | | | | |
| Third Quarter 2023 Results | 1 |
| | | | | | | | | | | | | | | | | | | | | | | | | | | | | | | | | | | | | | | | | | | | | | |
| Summary of Financial Results |
| | | | | | | | | | | | | | | | |
| (Dollars in millions) | | Q323 | | Q223 | | Variance | | % Change | | Q322 | | | | Variance | | % Change |
| Net interest income | | $ | 7,220 | | | $ | 7,035 | | | $ | 185 | | | 3 | % | | $ | 7,124 | | | | | $ | 96 | | | 1 | % |
| Fee and other income | | 76 | | | 70 | | | 6 | | | 9 | % | | 105 | | | | | (29) | | | (28) | % |
| Net revenues | | 7,296 | | | 7,105 | | | 191 | | | 3 | % | | 7,229 | | | | | 67 | | | 1 | % |
| Investment gains (losses), net | | 8 | | | 25 | | | (17) | | | (68) | % | | (172) | | | | | 180 | | | NM |
| Fair value gains, net | | 795 | | | 404 | | | 391 | | | 97 | % | | 292 | | | | | 503 | | | 172 | % |
| Administrative expenses | | (897) | | | (864) | | | (33) | | | (4) | % | | (870) | | | | | (27) | | | (3) | % |
| Benefit (provision) for credit losses | | 652 | | | 1,266 | | | (614) | | | (48) | % | | (2,536) | | | | | 3,188 | | | NM |
| TCCA fees | | (860) | | | (856) | | | (4) | | | — | % | | (850) | | | | | (10) | | | (1) | % |
Credit enhancement expense(1) | | (390) | | | (384) | | | (6) | | | (2) | % | | (364) | | | | | (26) | | | (7) | % |
| Change in expected credit enhancement recoveries | | (128) | | | (160) | | | 32 | | | 20 | % | | 290 | | | | | (418) | | | NM |
Other expenses, net(2) | | (535) | | | (257) | | | (278) | | | (108) | % | | (154) | | | | | (381) | | | NM |
| Income before federal income taxes | | 5,941 | | | 6,279 | | | (338) | | | (5) | % | | 2,865 | | | | | 3,076 | | | 107 | % |
| Provision for federal income taxes | | (1,242) | | | (1,285) | | | 43 | | | 3 | % | | (429) | | | | | (813) | | | (190) | % |
| Net income | | $ | 4,699 | | | $ | 4,994 | | | $ | (295) | | | (6) | % | | $ | 2,436 | | | | | $ | 2,263 | | | 93 | % |
| | | | | | | | | | | | | | | | |
| Total comprehensive income | | $ | 4,681 | | | $ | 4,995 | | | $ | (314) | | | (6) | % | | $ | 2,433 | | | | | $ | 2,248 | | | 92 | % |
| Net worth | | $ | 73,725 | | | $ | 69,044 | | | $ | 4,681 | | | 7 | % | | $ | 58,840 | | | | | $ | 14,885 | | | 25 | % |
| | | | | | | | | | | | | | | | |
| | | | | | | | | | | | | | | | |
| NM - Not meaningful | | | | | | | | | | | | | | | | |
(1) Consists of costs associated with freestanding credit enhancements, which primarily include Connecticut Avenue Securities® and Credit Insurance Risk TransferTM programs, enterprise-paid mortgage insurance, and certain lender risk-sharing programs. |
| | | | | | | | | | | | | | | | |
(2) Consists of debt extinguishment gains (losses), expenses associated with legal claims, foreclosed property income (expense), gains (losses) from partnership investments, housing trust fund expenses, loan subservicing costs, and servicer fees paid in connection with certain loss mitigation activities. |
| | | | | | | | | | | | | | | | |
|
| | | | | | | | | |
| Financial Highlights | |
| | | |
| | | |
| Net income decreased $295 million in the third quarter of 2023, compared with the second quarter of 2023, primarily driven by a decrease in benefit for credit losses, partially offset by an increase in fair value gains. | |
| | | |
| • | | Net interest income remained strong in the third quarter of 2023 primarily driven by base guaranty fee income. | |
| | | |
| • | | Benefit for credit losses was $652 million in the third quarter of 2023, compared with $1.3 billion in the second quarter of 2023. The benefit for credit losses for the third quarter of 2023 was primarily driven by increases in actual and forecasted single-family home prices. This was partially offset by write-offs relating to the redesignation of certain single-family loans from held for investment to held for sale. | |
| | | |
| • | | Fair value gains were $795 million in the third quarter of 2023, compared with $404 million in the second quarter of 2023. Fair value gains in the third quarter of 2023 were primarily due to increases in interest rates during the period. | |
| | | |
| • | | Other expenses, net includes $491 million of expense in the third quarter of 2023 relating to a jury verdict and an award of prejudgment interest for Fannie Mae preferred shareholders. | |
| | | | | | | | |
| Third Quarter 2023 Results | 2 |
| | | | | | | | | | | | | | | | | | | | | | | | | | | | | | | | | | | | | | | | | | | | | | | | |
| Single-Family Business Financial Results |
|
| (Dollars in millions) | | Q323 | | Q223 | | Variance | | % Change | | | | Q322 | | | | Variance | | % Change |
| Net interest income | | $ | 6,074 | | | $ | 5,917 | | | $ | 157 | | | 3 | % | | | | $ | 5,918 | | | | | $ | 156 | | | 3 | % |
| Fee and other income | | 56 | | | 52 | | | 4 | | | 8 | % | | | | 83 | | | | | (27) | | | (33) | % |
| Net revenues | | 6,130 | | | 5,969 | | | 161 | | | 3 | % | | | | 6,001 | | | | | 129 | | | 2 | % |
| Investment gains (losses), net | | 9 | | | 27 | | | (18) | | | (67) | % | | | | (178) | | | | | 187 | | | NM |
| Fair value gains, net | | 742 | | | 460 | | | 282 | | | 61 | % | | | | 309 | | | | | 433 | | | 140 | % |
| Administrative expenses | | (745) | | | (718) | | | (27) | | | (4) | % | | | | (730) | | | | | (15) | | | (2) | % |
| Benefit (provision) for credit losses | | 736 | | | 1,418 | | | (682) | | | (48) | % | | | | (2,361) | | | | | 3,097 | | | NM |
| TCCA fees | | (860) | | | (856) | | | (4) | | | — | % | | | | (850) | | | | | (10) | | | (1) | % |
| Credit enhancement expense | | (335) | | | (327) | | | (8) | | | (2) | % | | | | (298) | | | | | (37) | | | (12) | % |
| Change in expected credit enhancement recoveries | | (170) | | | (223) | | | 53 | | | 24 | % | | | | 245 | | | | | (415) | | | NM |
| Other expenses, net | | (411) | | | (203) | | | (208) | | | (102) | % | | | | (165) | | | | | (246) | | | (149) | % |
| Income before federal income taxes | | 5,096 | | | 5,547 | | | (451) | | | (8) | % | | | | 1,973 | | | | | 3,123 | | | 158 | % |
| Provision for federal income taxes | | (1,071) | | | (1,153) | | | 82 | | | 7 | % | | | | (276) | | | | | (795) | | | NM |
| Net income | | $ | 4,025 | | | $ | 4,394 | | | $ | (369) | | | (8) | % | | | | $ | 1,697 | | | | | $ | 2,328 | | | 137 | % |
| | | | | | | | | | | | | | | | | | |
| Average charged guaranty fee on new conventional acquisitions, net of TCCA fees* | | 54.3 bps | | 52.2 bps | | 2.1 bps | | 4 | % | | | | 52.1 bps | | | | 2.2 bps | | 4 | % |
| Average charged guaranty fee on conventional guaranty book of business, net of TCCA fees* | | 47.0 bps | | 46.8 bps | | 0.2 bps | | — | % | | | | 46.3 bps | | | | 0.7 bps | | 2 | % |
| NM - Not meaningful | | | | | | | | | | | | | | | | | | |
| * In Q4 2022, the company enhanced the method it uses to estimate average loan life at acquisition. Charged fees reported for prior periods have been updated in this release to reflect this updated methodology. |
| | | | | | | | | | | | | | | | | | |
| | | | | | | | | | | | | | | | | | |
| | | | | | | | | | | | | | | | | | |
| | | | | | |
|
| | |
| | |
| | |
| Key Business Highlights |
| | |
| | |
| • | Single-family conventional acquisition volume was $89.2 billion in the third quarter of 2023, consistent with the second quarter of 2023. Purchase acquisition volume, of which more than 45% was for first-time homebuyers, increased to $78.2 billion in the third quarter of 2023 from $76.4 billion in the second quarter of 2023. Refinance acquisition volume was $11.0 billion in the third quarter of 2023, a decrease from $12.8 billion in the second quarter of 2023. | |
| | |
| • | Average single-family conventional guaranty book of business in the third quarter of 2023 increased by $5.5 billion from the second quarter of 2023 driven by an increase in the average loan size of the book. Overall credit characteristics of the single-family conventional guaranty book of business remained strong, with a weighted-average mark-to-market loan-to-value ratio of 51% and a weighted-average FICO credit score at origination of 753 as of September 30, 2023. | |
| | |
| • | Average charged guaranty fee, net of TCCA fees, on the single-family conventional guaranty book remained relatively flat at 47.0 basis points as of September 30, 2023, compared with 46.8 basis points as of June 30, 2023. Average charged guaranty fee on newly acquired single-family conventional loans, net of TCCA fees, increased to 54.3 basis points for the third quarter of 2023, compared with 52.2 basis points for the second quarter of 2023. | |
| | |
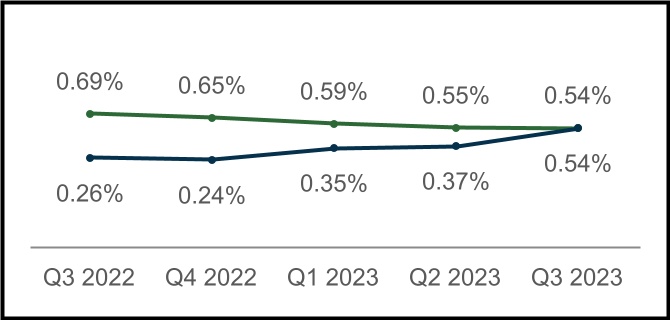
| • | Single-family serious delinquency rate decreased to 0.54% as of September 30, 2023 from 0.55% as of June 30, 2023. Single-family seriously delinquent loans are loans that are 90 days or more past due or in the foreclosure process. | |
| | | | | | | | |
| Third Quarter 2023 Results | 3 |
| | | | | | | | | | | | | | | | | | | | | | | | | | | | | | | | | | | | | | | | | | | | | | | | |
| Multifamily Business Financial Results |
|
| (Dollars in millions) | | Q323 | | Q223 | | Variance | | % Change | | | | Q322 | | | | Variance | | % Change |
| Net interest income | | $ | 1,146 | | | $ | 1,118 | | | $ | 28 | | | 3 | % | | | | $ | 1,206 | | | | | $ | (60) | | | (5) | % |
| Fee and other income | | 20 | | | 18 | | | 2 | | | 11 | % | | | | 22 | | | | | (2) | | | (9) | % |
| Net revenues | | 1,166 | | | 1,136 | | | 30 | | | 3 | % | | | | 1,228 | | | | | (62) | | | (5) | % |
| | | | | | | | | | | | | | | | | | |
| Fair value gains (losses), net | | 53 | | | (56) | | | 109 | | | NM | | | | (17) | | | | | 70 | | | NM |
| Administrative expenses | | (152) | | | (146) | | | (6) | | | (4) | % | | | | (140) | | | | | (12) | | | (9) | % |
| Provision for credit losses | | (84) | | | (152) | | | 68 | | | 45 | % | | | | (175) | | | | | 91 | | | 52 | % |
| Credit enhancement expense | | (55) | | | (57) | | | 2 | | | 4 | % | | | | (66) | | | | | 11 | | | 17 | % |
| Change in expected credit enhancement recoveries | | 42 | | | 63 | | | (21) | | | (33) | % | | | | 45 | | | | | (3) | | | (7) | % |
| Other income (expenses), net* | | (125) | | | (56) | | | (69) | | | (123) | % | | | | 17 | | | | | (142) | | | NM |
| Income before federal income taxes | | 845 | | | 732 | | | 113 | | | 15 | % | | | | 892 | | | | | (47) | | | (5) | % |
| Provision for federal income taxes | | (171) | | | (132) | | | (39) | | | (30) | % | | | | (153) | | | | | (18) | | | (12) | % |
| Net income | | $ | 674 | | | $ | 600 | | | $ | 74 | | | 12 | % | | | | $ | 739 | | | | | $ | (65) | | | (9) | % |
| | | | | | | | | | | | | | | | | | |
| Average charged guaranty fee rate on multifamily guaranty book of business, at period end | | 76.8 bps | | 77.4 bps | | (0.6) bps | | (1) | % | | | | 79.0 bps | | | | (2.2) bps | | (3) | % |
| | | | | | | | | | | | | | | | | | |
| NM - Not meaningful | | | | | | | | | | | | | | | | | | |
| | | | | | | | | | | | | | | | | | |
| * Includes investment gains or losses and other income or expenses. |
| | | | | | | | | | | | | | | | | | |
| | | | | | | | | | | | | | | | | | |
| | | | | | | | | | | | | | | | | | |
| | | | | | |
| | |
| Key Business Highlights |
| | |
| | |
| • | New multifamily business volume was $16.4 billion in the third quarter of 2023, compared with $15.1 billion in the second quarter of 2023. During the first nine months of 2023, new multifamily business volume was $41.7 billion. FHFA has capped the company’s multifamily loan purchases for 2023 at $75 billion. FHFA requires that a minimum of 50% of the company’s multifamily loan purchases must be mission-driven, focused on specified affordable and underserved market segments. | |
| | |
| • | The multifamily guaranty book of business grew by approximately 2% in the third quarter of 2023 to $464.7 billion. The average charged guaranty fee on the multifamily book declined slightly to 76.8 basis points as of September 30, 2023, compared with 77.4 basis points as of June 30, 2023. | |
| | |
| | |
| | |
| • | The multifamily serious delinquency rate increased to 0.54% as of September 30, 2023, compared with 0.37% as of June 30, 2023, largely driven by seniors housing portfolios. Multifamily seriously delinquent loans are loans that are 60 days or more past due. | |
| | |
| | | | | | | | |
| Third Quarter 2023 Results | 4 |
Fannie Mae’s Condensed Consolidated Balance Sheets and Condensed Consolidated Statements of Operations and Comprehensive Income for the third quarter of 2023 are available in the accompanying Annex; however, investors and interested parties should read the company’s Third Quarter 2023 Form 10-Q, which was filed today with the Securities and Exchange Commission and is available on Fannie Mae’s website, www.fanniemae.com. The company provides further discussion of its financial results and condition, credit performance, and other matters in its Third Quarter 2023 Form 10-Q. Additional information about the company’s financial and credit performance is contained in Fannie Mae’s “Q3 2023 Financial Supplement” at www.fanniemae.com.
# # #
Fannie Mae provides website addresses in its news releases solely for readers’ information. Other content or information appearing on these websites is not part of this release.
Fannie Mae advances equitable and sustainable access to homeownership and quality, affordable rental housing for millions of people across America. We enable the 30-year fixed-rate mortgage and drive responsible innovation to make homebuying and renting easier, fairer, and more accessible. To learn more, visit fanniemae.com.
| | | | | | | | |
| Third Quarter 2023 Results | 5 |
ANNEX
FANNIE MAE
(In conservatorship)
Condensed Consolidated Balance Sheets — (Unaudited)
(Dollars in millions)
| | | | | | | | | | | | | | | | | | | | | | | |
| As of |
| September 30, 2023 | | December 31, 2022 |
| ASSETS | |
| Cash and cash equivalents | | $ | 48,604 | | | | | $ | 57,987 | | |
| Restricted cash and cash equivalents (includes $26,993 and $23,348, respectively, related to consolidated trusts) | | 33,195 | | | | | 29,854 | | |
| Securities purchased under agreements to resell (includes $900 and $3,475, respectively, related to consolidated trusts) | | 22,850 | | | | | 14,565 | | |
| Investments in securities, at fair value | | 51,872 | | | | | 50,825 | | |
| Mortgage loans: | | | | | | | |
| Loans held for sale, at lower of cost or fair value | | 2,587 | | | | | 2,033 | | |
| Loans held for investment, at amortized cost: | | | | | | | |
| Of Fannie Mae | | 49,767 | | | | | 52,081 | | |
| Of consolidated trusts | | 4,090,205 | | | | | 4,071,669 | | |
| Total loans held for investment (includes $3,207 and $3,645, respectively, at fair value) | | 4,139,972 | | | | | 4,123,750 | | |
| Allowance for loan losses | | (8,671) | | | | | (11,347) | | |
| Total loans held for investment, net of allowance | | 4,131,301 | | | | | 4,112,403 | | |
| Total mortgage loans | | 4,133,888 | | | | | 4,114,436 | | |
| Advances to lenders | | 3,384 | | | | | 1,502 | | |
| Deferred tax assets, net | | 11,885 | | | | | 12,911 | | |
| Accrued interest receivable, net (includes $9,861 and $9,241 related to consolidated trusts and net of allowance of $33 and $111, respectively) | | 10,462 | | | | | 9,821 | | |
| Other assets | | 13,240 | | | | | 13,387 | | |
| Total assets | | $ | 4,329,380 | | | | | $ | 4,305,288 | | |
| LIABILITIES AND EQUITY | |
| Liabilities: | | | | | | | |
| Accrued interest payable (includes $9,998 and $9,347, respectively, related to consolidated trusts) | | $ | 10,758 | | | | | $ | 9,917 | | |
| Debt: | | | | | | | |
| Of Fannie Mae (includes $833 and $1,161, respectively, at fair value) | | 125,652 | | | | | 134,168 | | |
| Of consolidated trusts (includes $14,210 and $16,260, respectively, at fair value) | | 4,106,110 | | | | | 4,087,720 | | |
| Other liabilities (includes $1,715 and $1,748, respectively, related to consolidated trusts) | | 13,135 | | | | | 13,206 | | |
| Total liabilities | | 4,255,655 | | | | | 4,245,011 | | |
| Commitments and contingencies (Note 13) | | — | | | | | — | | |
| Fannie Mae stockholders’ equity: | | | | | | | |
| Senior preferred stock (liquidation preference of $190,543 and $180,339, respectively) | | 120,836 | | | | | 120,836 | | |
| Preferred stock, 700,000,000 shares are authorized—555,374,922 shares issued and outstanding | | 19,130 | | | | | 19,130 | | |
| Common stock, no par value, no maximum authorization—1,308,762,703 shares issued and 1,158,087,567 shares outstanding | | 687 | | | | | 687 | | |
| Accumulated deficit | | (59,546) | | | | | (73,011) | | |
| Accumulated other comprehensive income | | 18 | | | | | 35 | | |
| Treasury stock, at cost, 150,675,136 shares | | (7,400) | | | | | (7,400) | | |
| Total stockholders’ equity (See Note 1: Senior Preferred Stock Purchase Agreement and Senior Preferred Stock for information on the related dividend obligation and liquidation preference) | | 73,725 | | | | | 60,277 | | |
| Total liabilities and equity | | $ | 4,329,380 | | | | | $ | 4,305,288 | | |
See Notes to Condensed Consolidated Financial Statements in the Third Quarter 2023 Form 10-Q
| | | | | | | | |
| Third Quarter 2023 Results | 6 |
FANNIE MAE
(In conservatorship)
Condensed Consolidated Statements of Operations and Comprehensive Income — (Unaudited)
(Dollars in millions, except per share amounts)
| | | | | | | | | | | | | | | | | | | | | | | | | | | | | | | | | | | | | | | | | | | | | | | |
| For the Three Months Ended September 30, | | For the Nine Months Ended September 30, |
| |
| 2023 | | 2022 | | 2023 | | 2022 |
| Interest income: | | | | | | | | | | | | | | | |
| Investments in securities | | $ | 1,075 | | | | | $ | 525 | | | | | $ | 3,157 | | | | | $ | 1,009 | | |
| Mortgage loans | | 33,711 | | | | | 30,114 | | | | | 98,503 | | | | | 86,338 | | |
| Other | | 629 | | | | | 211 | | | | | 1,665 | | | | | 298 | | |
| Total interest income | | 35,415 | | | | | 30,850 | | | | | 103,325 | | | | | 87,645 | | |
| Interest expense: | | | | | | | | | | | | | | | |
| Short-term debt | | (201) | | | | | (17) | | | | | (503) | | | | | (23) | | |
| Long-term debt | | (27,994) | | | | | (23,709) | | | | | (81,781) | | | | | (65,291) | | |
| Total interest expense | | (28,195) | | | | | (23,726) | | | | | (82,284) | | | | | (65,314) | | |
| Net interest income | | 7,220 | | | | | 7,124 | | | | | 21,041 | | | | | 22,331 | | |
| Benefit (provision) for credit losses | | 652 | | | | | (2,536) | | | | | 1,786 | | | | | (2,994) | | |
| Net interest income after benefit (provision) for credit losses | | 7,872 | | | | | 4,588 | | | | | 22,827 | | | | | 19,337 | | |
| Investment gains (losses), net | | 8 | | | | | (172) | | | | | (34) | | | | | (323) | | |
| Fair value gains, net | | 795 | | | | | 292 | | | | | 1,403 | | | | | 1,301 | | |
| Fee and other income | | 76 | | | | | 105 | | | | | 209 | | | | | 269 | | |
| Non-interest income | | 879 | | | | | 225 | | | | | 1,578 | | | | | 1,247 | | |
| Administrative expenses: | | | | | | | | | | | | | | | |
| Salaries and employee benefits | | (477) | | | | | (439) | | | | | (1,424) | | | | | (1,244) | | |
| Professional services | | (211) | | | | | (229) | | | | | (587) | | | | | (636) | | |
| | | | | | | | | | | | | | | |
| Other administrative expenses | | (209) | | | | | (202) | | | | | (618) | | | | | (593) | | |
| Total administrative expenses | | (897) | | | | | (870) | | | | | (2,629) | | | | | (2,473) | | |
| TCCA fees | | (860) | | | | | (850) | | | | | (2,571) | | | | | (2,515) | | |
| Credit enhancement expense | | (390) | | | | | (364) | | | | | (1,115) | | | | | (974) | | |
| Change in expected credit enhancement recoveries | | (128) | | | | | 290 | | | | | (168) | | | | | 303 | | |
| Other expenses, net | | (535) | | | | | (154) | | | | | (922) | | | | | (612) | | |
| Total expenses | | (2,810) | | | | | (1,948) | | | | | (7,405) | | | | | (6,271) | | |
| Income before federal income taxes | | 5,941 | | | | | 2,865 | | | | | 17,000 | | | | | 14,313 | | |
| Provision for federal income taxes | | (1,242) | | | | | (429) | | | | | (3,535) | | | | | (2,816) | | |
| Net income | | 4,699 | | | | | 2,436 | | | | | 13,465 | | | | | 11,497 | | |
| Other comprehensive loss | | (18) | | | | | (3) | | | | | (17) | | | | | (14) | | |
| Total comprehensive income | | $ | 4,681 | | | | | $ | 2,433 | | | | | $ | 13,448 | | | | | $ | 11,483 | | |
| Net income | | $ | 4,699 | | | | | $ | 2,436 | | | | | $ | 13,465 | | | | | $ | 11,497 | | |
| Dividends distributed or amounts attributable to senior preferred stock | | (4,681) | | | | | (2,433) | | | | | (13,448) | | | | | (11,483) | | |
| Net income attributable to common stockholders | | $ | 18 | | | | | $ | 3 | | | | | $ | 17 | | | | | $ | 14 | | |
| Earnings per share: | | | | | | | | | | | | | | | |
| Basic | | $ | 0.00 | | | | | $ | 0.00 | | | | | $ | 0.00 | | | | | $ | 0.00 | | |
| Diluted | | 0.00 | | | | | 0.00 | | | | | 0.00 | | | | | 0.00 | | |
| Weighted-average common shares outstanding: | | | | | | | | | | | | | | | |
| Basic | | 5,867 | | | | | 5,867 | | | | | 5,867 | | | | | 5,867 | | |
| Diluted | | 5,893 | | | | | 5,893 | | | | | 5,893 | | | | | 5,893 | | |
See Notes to Condensed Consolidated Financial Statements in the Third Quarter 2023 Form 10-Q
| | | | | | | | |
| Third Quarter 2023 Results | 7 |