QuickLinks -- Click here to rapidly navigate through this document
Management's Discussion and Analysis for the fiscal year ended December 31, 2015,
dated February 25, 2016
MANAGEMENT'S DISCUSSION AND ANALYSIS February 25, 2016 | |
This Management's Discussion and Analysis (this MD&A) should be read in conjunction with Suncor's December 31, 2015 audited Consolidated Financial Statements and the accompanying notes. Additional information about Suncor filed with Canadian securities regulatory authorities and the United States Securities and Exchange Commission (SEC), including quarterly and annual reports and the Annual Information Form dated February 25, 2016 (the 2015 AIF), which is also filed with the SEC under cover of Form 40-F, is available online at www.sedar.com, www.sec.gov and our website, www.suncor.com. Information on or connected to our website, even if referred to in this MD&A, does not constitute part of this MD&A.
References to "we", "our", "Suncor", or "the company" mean Suncor Energy Inc., its subsidiaries, partnerships and joint arrangements, unless the context requires otherwise. For a list of abbreviations that may be used in this MD&A, refer to the Advisories – Common Abbreviations section of this MD&A.
SUNCOR ENERGY INC. ANNUAL REPORT 2015 11
| MD&A – Table of Contents | ||
| 13 | Financial and Operating Summary | |
| 15 | Suncor Overview | |
| 17 | Financial Information | |
| 21 | Segment Results and Analysis | |
| 33 | Fourth Quarter 2015 Analysis | |
| 35 | Quarterly Financial Data | |
| 38 | Capital Investment Update | |
| 41 | Financial Condition and Liquidity | |
| 47 | Accounting Policies and Critical Accounting Estimates | |
| 51 | Risk Factors | |
| 57 | Other Items | |
| 58 | Advisories | |
Basis of Presentation
Unless otherwise noted, all financial information has been prepared in accordance with International Financial Reporting Standards (IFRS) as issued by the International Accounting Standards Board (IASB) and Canadian generally accepted accounting principles (GAAP) as contained within Part 1 of the Canadian Institute of Chartered Professional Accountants Handbook.
All financial information is reported in Canadian dollars, unless otherwise noted. Production volumes are presented on a working-interest basis, before royalties, unless otherwise noted.
Non-GAAP Financial Measures
Certain financial measures in this MD&A – namely operating earnings, cash flow from operations, return on capital employed (ROCE), Oil Sands cash operating costs, free cash flow, and last-in, first-out (LIFO) – are not prescribed by GAAP. Operating earnings, Oil Sands cash operating costs and LIFO are defined in the Advisories – Non-GAAP Financial Measures section of this MD&A and reconciled to GAAP measures in the Financial Information and Segment Results and Analysis sections of this MD&A. Cash flow from operations, ROCE and free cash flow are defined and reconciled to GAAP measures in the Advisories – Non-GAAP Financial Measures section of this MD&A.
Measurement Conversions
Crude oil and natural gas liquids volumes have been converted to mcfe on the basis of one bbl to six mcf in this MD&A. Also, certain natural gas volumes have been converted to boe or mboe on the same basis. Refer to the Advisories – Measurement Conversions section of this MD&A.
Common Abbreviations
For a list of abbreviations that may be used in this MD&A, refer to the Advisories – Common Abbreviations section of this MD&A.
Risks and Forward-Looking Information
The company's financial and operational performance is potentially affected by a number of factors, including, but not limited to, the factors described in the Risk Factors section of this MD&A.
This MD&A contains forward-looking information based on Suncor's current expectations, estimates, projections and assumptions. This information is subject to a number of risks and uncertainties, including those discussed in this MD&A and Suncor's other disclosure documents, many of which are beyond the company's control. Users of this information are cautioned that actual results may differ materially. Refer to the Advisories – Forward-Looking Information section of this MD&A for information on the material risk factors and assumptions underlying our forward-looking information.
12 SUNCOR ENERGY INC. ANNUAL REPORT 2015
1. FINANCIAL AND OPERATING SUMMARY
Financial Summary
| Year ended December 31 ($ millions, except per share amounts) | 2015 | 2014 | 2013 | |||||
| Operating revenues, net of royalties | 29 208 | 39 862 | 39 593 | |||||
| Net (loss) earnings | (1 995 | ) | 2 699 | 3 911 | ||||
| per common share – basic | (1.38 | ) | 1.84 | 2.61 | ||||
| per common share – diluted | (1.38 | ) | 1.84 | 2.60 | ||||
| Operating earnings(1) | 1 465 | 4 620 | 4 700 | |||||
| per common share – basic | 1.01 | 3.15 | 3.13 | |||||
| Cash flow from operations(1) | 6 806 | 9 058 | 9 412 | |||||
| per common share – basic | 4.71 | 6.19 | 6.27 | |||||
| Dividends paid on common shares | 1 648 | 1 490 | 1 095 | |||||
| per common share – basic | 1.14 | 1.02 | 0.73 | |||||
| Weighted average number of common shares in millions – basic | 1 446 | 1 462 | 1 501 | |||||
| Weighted average number of common shares in millions – diluted | 1 447 | 1 465 | 1 502 | |||||
| ROCE(1)(2) (%) | 0.6 | 8.6 | 11.5 | |||||
| Capital Expenditures(3) | 6 220 | 6 530 | 6 380 | |||||
| Sustaining | 2 602 | 3 014 | 3 725 | |||||
| Growth | 3 618 | 3 516 | 2 655 | |||||
| Free cash flow(1) | 139 | 2 097 | 2 635 | |||||
| Balance Sheet (at December 31) | ||||||||
| Total assets | 77 527 | 79 671 | 78 315 | |||||
| Long-term debt(4) | 14 556 | 12 523 | 10 660 | |||||
| Net debt | 11 254 | 7 834 | 6 256 | |||||
| Total liabilities | 38 488 | 38 068 | 37 135 | |||||
- (1)
- Non-GAAP financial measures. See the Advisories – Non-GAAP Financial Measures section of this MD&A.
- (2)
- ROCE excludes capitalized costs related to major projects in progress.
- (3)
- Excludes capitalized interest.
- (4)
- Includes current portion of long-term debt.
SUNCOR ENERGY INC. ANNUAL REPORT 2015 13
Operating Summary
| Year ended December 31 | 2015 | 2014 | 2013 | |||||
| Production Volumes (mboe/d) | ||||||||
| Oil Sands | 463.4 | 421.9 | 392.5 | |||||
| Exploration and Production | 114.4 | 113.0 | 169.9 | |||||
| Total | 577.8 | 534.9 | 562.4 | |||||
| Production Mix | ||||||||
| Crude oil and liquids / natural gas (%) | 99/1 | 99/1 | 94/6 | |||||
| Average Price Realizations ($/boe) | ||||||||
| Oil Sands operations | 49.46 | 87.46 | 82.83 | |||||
| Exploration and Production | 60.53 | 103.05 | 91.44 | |||||
| Refinery crude oil processed (mbbls/d) | 432.1 | 427.5 | 431.3 | |||||
| Refinery Utilization(1)(2) (%) | ||||||||
| Eastern North America | 94 | 90 | 91 | |||||
| Western North America | 93 | 95 | 96 | |||||
| 94 | 93 | 94 | ||||||
- (1)
- Refinery utilization is the amount of crude oil run through crude distillation units, expressed as a percentage of the nameplate capacity of these units.
- (2)
- Refinery nameplate capacity increases:
- •
- Effective January 1, 2014, Edmonton refinery from 140,000 bbls/d to 142,000 bbls/d;
- •
- Effective January 1, 2013, Edmonton refinery from 135,000 bbls/d to 140,000 bbls/d;
- •
- Prior years' utilization rates have not been recalculated and reflect the lower nameplate capacities.
Segment Summary
| Year ended December 31 ($ millions) | 2015 | 2014 | 2013 | ||||||
| Net (loss) earnings | |||||||||
| Oil Sands | (856 | ) | 1 776 | 2 040 | |||||
| Exploration and Production | (758 | ) | 653 | 1 000 | |||||
| Refining and Marketing | 2 266 | 1 692 | 2 022 | ||||||
| Corporate, Energy Trading and Eliminations | (2 647 | ) | (1 422 | ) | (1 151 | ) | |||
| Total | (1 995 | ) | 2 699 | 3 911 | |||||
| Operating (loss) earnings(1) | |||||||||
| Oil Sands | (111 | ) | 2 771 | 2 098 | |||||
| Exploration and Production | 7 | 857 | 1 210 | ||||||
| Refining and Marketing | 2 234 | 1 692 | 2 022 | ||||||
| Corporate, Energy Trading and Eliminations | (665 | ) | (700 | ) | (630 | ) | |||
| Total | 1 465 | 4 620 | 4 700 | ||||||
| Cash flow from (used in) operations(1) | |||||||||
| Oil Sands | 2 835 | 5 400 | 4 556 | ||||||
| Exploration and Production | 1 386 | 1 909 | 2 316 | ||||||
| Refining and Marketing | 2 872 | 2 178 | 2 618 | ||||||
| Corporate, Energy Trading and Eliminations | (287 | ) | (429 | ) | (78 | ) | |||
| Total | 6 806 | 9 058 | 9 412 | ||||||
- (1)
- Non-GAAP financial measures. See the Advisories – Non-GAAP Financial Measures section of this MD&A.
14 SUNCOR ENERGY INC. ANNUAL REPORT 2015
Suncor is an integrated energy company headquartered in Calgary, Alberta, Canada. We are strategically focused on developing one of the world's largest petroleum resource basins – Canada's Athabasca oil sands. In addition, we explore for, acquire, develop, produce and market crude oil and natural gas in Canada and internationally; we transport and refine crude oil, and we market petroleum and petrochemical products primarily in Canada. Periodically, we market third-party petroleum products. We also conduct energy trading activities focused principally on the marketing and trading of crude oil, natural gas and byproducts.
For a description of Suncor's business segments, refer to the Segment Results and Analysis section of this MD&A.
Suncor's Strategy
We are committed to delivering competitive and sustainable returns to shareholders by focusing on capital discipline, operational excellence and long-term profitable growth, and by leveraging our competitive differentiators: an industry-leading oil sands reserves base, a proven integrated model, financial strength, industry expertise and a commitment to sustainability. Key components of Suncor's strategy include:
- •
- Profitably operate and develop our reserves – Suncor's growth plan is focused on projects, such as Fort Hills and the Canadian Oil Sands Limited (COS) acquisition, that are expected to provide long-term profitability for the company. The company's significant reserves base and industry expertise in oil sands has laid the groundwork for achieving this growth. Suncor's economies of scale have also allowed us to focus on near-term oil sands growth through low-cost debottlenecking and expansion projects.
- •
- Optimize value through integration – From the ground to the gas station, Suncor optimizes its profit through each step of the value chain. As upstream production grows, securing access to global pricing through the company's refining operations and midstream logistics network helps to maximize profit on each upstream barrel.
- •
- Achieve industry-leading unit costs in each business segment – Through a focus on operational excellence, Suncor is aiming to get the most out of our operations. Driving down costs and a continued focus on improved productivity and reliability will help to achieve this.
- •
- Industry leader in sustainable development – Suncor is focused on triple bottom line sustainability, which means leadership and industry collaboration in environmental performance, social responsibility and creating a strong economy.
2015 Highlights
Financial results summary
- •
- Net loss for 2015 was $1.995 billion, compared to net earnings of $2.699 billion in 2014.
- •
- Operating earnings(1) for 2015 were $1.465 billion, compared to $4.620 billion in 2014.
- •
- Cash flow from operations(1) for 2015 was $6.806 billion, compared to $9.058 billion in 2014.
- •
- ROCE(1) (excluding major projects in progress) decreased to 0.6% for the twelve months ended December 31, 2015, compared to 8.6% for the twelve months ended December 31, 2014. ROCE for the twelve months ended December 31, 2015 improves to 4.2% (2014 – 11.5%) when removing the impacts of impairment charges.
Suncor's commitment to capital discipline, operational excellence, and improved reliability generated cash flow from operations which fully funded sustaining capital and dividends in the year.
- •
- Suncor's approach to prudent capital management resulted in the company finishing 2015 with $6.220 billion in capital expenditures, which is within its revised capital guidance range of $5.8 to $6.4 billion, and $1.0 billion below the lower end of initial 2015 guidance.
- •
- In response to the continuing low crude oil price environment, Suncor announced a $750 million reduction to its 2016 capital program, including the deferral of planned Firebag maintenance into 2017. The reduction is not expected to impact the company's safety, reliability, environmental performance, or production targets.
- •
- Continuous improvement and demonstrated reliability of the company's refining facilities resulted in 94% overall refinery utilization while performing planned maintenance.
- (1)
- Operating earnings, cash flow from operations and ROCE, are non-GAAP financial measures. See the Advisories – Non-GAAP Financial Measures section of this MD&A
SUNCOR ENERGY INC. ANNUAL REPORT 2015 15
- •
- The company continues to focus on improving facility utilization and workforce productivity, achieving Oil Sands upgrading reliability in excess of 90% more than a year ahead of our original plan to upgrade 315,000 bbls/d by 2017.
Continued focus on cost management enabled Suncor to decrease Oil Sands cash operating costs per barrel by 18%.
- •
- Suncor reduced annual cash operating costs per barrel(1) from $33.80/bbl in 2014 to $27.85/bbl in 2015, the lowest since 2007.
- •
- Suncor delivered on the reliability targets and cost reduction measures announced in early 2015 by decreasing companywide operating costs by almost $1 billion. The current pricing environment has reinforced the importance of Suncor's disciplined approach to cost management.
Suncor's strong balance sheet has effectively positioned the company to pursue profitable long-term growth opportunities.
- •
- The company ended the year with $4.0 billion in cash and cash equivalents and had $7.0 billion of credit facilities available at December 31, 2015.
- •
- Suncor acquired an additional 10% working interest in the Fort Hills oil sands project in 2015. The project continues to be on schedule and all critical milestones set for 2015 were achieved, with construction more than 50% complete at the end of the year. First oil is expected in the fourth quarter of 2017, ramping up to 90% of its planned gross production capacity of 180,000 bbls/d within twelve months.
- •
- Construction of the Hebron project continued in 2015, with first oil expected in late 2017.
- •
- Subsequent to year end, Suncor acquired 84.2% of the shares of COS for consideration of 0.28 of a Suncor share for each COS share. Suncor plans to acquire the remaining 15.8% of COS' shares by the end of the first quarter. The transaction valued COS at $6.9 billion at the time of the acquisition.
Continued investment in integration and market access strategies.
- •
- The Refining and Marketing segment continues to reinforce the value of the company's integrated model by generating $2.234 billion of operating earnings, an increase of 32% from the prior year.
- •
- Suncor began shipments of crude oil to the Montreal refinery on Enbridge's Line 9 in the fourth quarter of 2015. The reversal of Enbridge's Line 9 will provide Suncor with the flexibility to supply its Montreal refinery with a full slate of inland-priced crude.
- •
- The company completed a non-cash asset exchange and lease with TransAlta Corporation (TransAlta) in the third quarter of 2015 where Suncor assumed operating control of the Poplar Creek cogeneration facilities, which provide steam and power to the company's Oil Sands operations, in exchange for Suncor's Kent Breeze and its share of the Wintering Hills wind power facilities. Bringing the Poplar Creek assets in-house is expected to improve Suncor's overall Oil Sands operations reliability and profitability.
- •
- The company's integrated model and strong market access position resulted in Suncor capturing global-based pricing on volumes equivalent to 98% of its upstream production in 2015, compared to 97% in 2014.
Oil Sands operations grows production by 11% with strong Oil Sands reliability and record In Situ performance.
- •
- Firebag nameplate capacity increased from 180,000 bbls/d to 203,000 bbls/d as a result of cost-effective debottlenecking activities and sub surface optimizations, and record Firebag production achieved in 2015.
- •
- Strong infill well performance and optimized reservoir management strategies contributed to a record low steam-to-oil ratio (SOR) of 2.6 at Firebag for the year.
- •
- Production at MacKay River increased 14% as a result of the debottlenecking project.
Return of cash to shareholders through dividends, which increased by more than 10%.
- •
- The company paid $1.648 billion in dividends in 2015, reflecting an increase to Suncor's quarterly dividend compared to the prior year, demonstrating our dedication to returning value to shareholders.
- (1)
- Cash operating costs per barrel is a non-GAAP financial measure. See the Advisories – Non-GAAP Financial Measures section of this MD&A.
16 SUNCOR ENERGY INC. ANNUAL REPORT 2015
Net Earnings
Suncor's net loss in 2015 was $1.995 billion, compared to net earnings of $2.699 billion in 2014. The net loss was impacted by the same factors that influenced operating earnings, which are described below. Other items affecting the net loss in 2015 and net earnings in 2014 included:
- •
- In 2015, the company recorded after-tax impairment charges against property, plant and equipment and exploration and evaluation assets of $359 million on White Rose, $331 million on Golden Eagle and $54 million on Terra Nova, primarily as a result of impacts of a decline in the crude oil price forecast. In addition, impairment charges of $290 million were recorded against the Joslyn mining project and $54 million on the Ballicatters well, due to uncertainty on the timing and likelihood of development plans, and $96 million in Oil Sands following a review of certain assets that no longer fit with Suncor's growth strategies, and which could not be repurposed or otherwise deployed.
- •
- In 2015, as a result of shut-in production due to the continued closure of certain Libyan export terminals, escalating political unrest, and increased uncertainty with respect to the company's return to normal operations in the country, the company recorded an after-tax impairment charge of $415 million against property, plant and equipment and exploration and evaluation assets.
- •
- The after-tax unrealized foreign exchange losses on the revaluation of U.S. dollar denominated debt were $1.930 billion for 2015, compared to $722 million for 2014.
- •
- In 2015, the company recorded an after-tax gain of $68 million on the disposal of the company's share of certain assets and liabilities of Pioneer Energy in the Refining and Marketing segment.
- •
- The company recorded a $423 million deferred income tax charge in 2015 related to a 2% increase in the Alberta corporate income tax rate.
- •
- The company recorded a $406 million income tax recovery in 2015 in the Exploration and Production (E&P) segment related to a 12% decrease in the U.K. tax rate.
- •
- Suncor recorded after-tax insurance proceeds of $75 million in 2015 related to a claim on the Terra Nova asset in the E&P segment.
- •
- In 2015, the company recorded after-tax restructuring charges of $57 million related to cost reduction initiatives in the Corporate segment.
- •
- The company recorded an after-tax gain of $61 million in 2014 relating to the sale of its Wilson Creek natural gas assets in the E&P segment.
- •
- Suncor recorded a current income tax expense adjustment and associated interest expense of $54 million in 2014 related to the timing of tax depreciation deductions taken on certain capital expenditures incurred in a prior period in the Oil Sands segment.
- •
- In 2014, Joslyn mining project development activities were scaled back in order to focus on engineering studies to further optimize the Joslyn resource. As a result of Suncor's assessment of expected future net cash flows and the uncertainty of the project, including the timing of the development plans, Suncor recorded an after-tax charge to net earnings of $718 million against property, plant and equipment and exploration and evaluation assets.
- •
- In 2014, as a result of the continued closure of certain Libyan export terminals and the company's view on production plans during the remaining term of the production sharing agreements, the company recorded an after-tax impairment charge of $297 million against property, plant and equipment and exploration and evaluation assets.
- •
- The company recorded after-tax impairment charges of $223 million in the Oil Sands segment in 2014 following a review of certain assets that no longer fit with Suncor's previously revised growth strategies and which could not be repurposed or otherwise deployed. Such assets included a pipeline and related compressor, as well as steam generator components.
- •
- The company recorded after-tax earnings of $32 million in 2014 related to an agreement reached for Suncor to receive a reserves redetermination of 1.2 million barrels of oil related to an interest in a Norwegian asset that Suncor previously owned.
SUNCOR ENERGY INC. ANNUAL REPORT 2015 17
Operating Earnings
Consolidated Operating Earnings Reconciliation(1)
| Year ended December 31 ($ millions) | 2015 | 2014 | 2013 | |||||
| Net (loss) earnings as reported | (1 995 | ) | 2 699 | 3 911 | ||||
| Unrealized foreign exchange loss on U.S. dollar denominated debt | 1 930 | 722 | 521 | |||||
| Impairments net of reversals and provisions(2) | 1 599 | 1 238 | 563 | |||||
| Restructuring charges | 57 | — | — | |||||
| Recognition of risk mitigation proceeds(2) | (75 | ) | — | (223 | ) | |||
| Net impact of not proceeding with the Voyageur upgrader project(3) | — | — | 58 | |||||
| Gain on significant disposals(4) | (68 | ) | (61 | ) | (130 | ) | ||
| Impact of income tax adjustments on deferred income taxes | 17 | 54 | — | |||||
| Reserves redetermination | — | (32 | ) | — | ||||
| Operating earnings(1) | 1 465 | 4 620 | 4 700 | |||||
- (1)
- Non-GAAP financial measure. See the Advisories – Non-GAAP Financial Measures section of this MD&A.
- (2)
- In 2013, the company recorded after-tax impairment charges of $563 million in the Exploration and Production segment against its assets in Syria, Libya and North America Onshore. Concurrent with the impairment of its Syrian assets, the company recognized after-tax risk mitigation proceeds of $223 million, previously recorded as a long-term provision.
- (3)
- In 2013, the company recorded an after-tax charge of $58 million as a result of not proceeding with the Voyageur upgrader project.
- (4)
- In 2013, the company recorded an after-tax gain of $130 million relating to the sale of the company's conventional natural gas business.
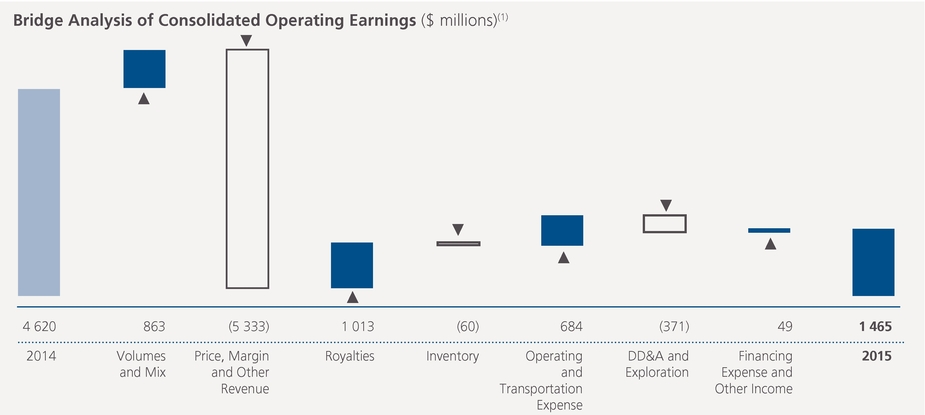
- (1)
- For an explanation of the construction of this bridge analysis, see the Advisories – Non-GAAP Financial Measures section of this MD&A.
Suncor's consolidated operating earnings for 2015 were $1.465 billion, compared to $4.620 billion in 2014. The decrease was primarily due to lower operating earnings in the Oil Sands and E&P segments as a result of significantly lower upstream price realizations consistent with the decline in benchmark crude oil prices, partially offset by increased Oil Sands operations production due to improved reliability, record Refining and Marketing operating earnings due to a strong downstream pricing environment and lower operating costs companywide.
Cash Flow from Operations
Consolidated cash flow from operations for 2015 was $6.806 billion, compared to $9.058 billion in 2014. Cash flow from operations was impacted by the same factors as operating earnings.
18 SUNCOR ENERGY INC. ANNUAL REPORT 2015
Results for 2014 compared with 2013
Net earnings for 2014 were $2.699 billion, compared to $3.911 billion in 2013. The decrease in net earnings was mainly due to the same factors impacting operating earnings described below and by the net earnings adjustments described above.
Operating earnings for 2014 were $4.620 billion, compared to $4.700 billion in 2013. The decrease was primarily due to lower operating earnings from the E&P segment as a result of volume decreases at Buzzard, the sale of the company's conventional natural gas business which took place in 2013, lower price realizations, and lower contributions from Libya. In addition, the Refining and Marketing segment earnings decreased due to the lower downstream pricing environment. These factors were partially offset by higher production from the Oil Sands segment and higher price realizations for Oil Sands sales which benefited from favourable foreign exchange rates.
Consolidated cash flow from operations for 2014 was $9.058 billion, compared to $9.412 billion in 2013. Cash flow from operations decreased primarily due to lower production and price realizations in E&P and lower margins in Refining and Marketing as well as the impacts of settling trading positions in Energy Trading, partially offset by higher production and higher average price realizations from Oil Sands operations.
Business Environment
Commodity prices, refining crack spreads and foreign exchange rates are important factors that affect the results of Suncor's operations.
| Average for the year ended December 31 | 2015 | 2014 | 2013 | ||||
| WTI crude oil at Cushing (US$/bbl) | 48.75 | 93.00 | 97.95 | ||||
| Brent crude oil at Sullom Voe (US$/bbl) | 53.60 | 99.50 | 108.75 | ||||
| Dated Brent/Maya FOB price differential (US$/bbl) | 9.50 | 13.70 | 11.65 | ||||
| MSW at Edmonton (Cdn$/bbl) | 57.60 | 94.85 | 96.80 | ||||
| WCS at Hardisty (US$/bbl) | 35.25 | 73.60 | 72.75 | ||||
| Light/heavy differential for WTI at Cushing less WCS at Hardisty (US$/bbl) | 13.50 | 19.40 | 25.20 | ||||
| Condensate at Edmonton (US$/bbl) | 47.35 | 92.95 | 101.70 | ||||
| Natural gas (Alberta spot) at AECO (Cdn$/mcf) | 2.65 | 4.50 | 3.15 | ||||
| Alberta Power Pool Price (Cdn$/MWh) | 33.40 | 49.65 | 79.95 | ||||
| New York Harbor 3-2-1 crack(1) (US$/bbl) | 19.70 | 19.65 | 23.90 | ||||
| Chicago 3-2-1 crack(1) (US$/bbl) | 18.50 | 17.40 | 21.40 | ||||
| Portland 3-2-1 crack(1) (US$/bbl) | 25.15 | 20.15 | 24.00 | ||||
| Gulf Coast 3-2-1 crack(1) (US$/bbl) | 18.35 | 16.50 | 20.55 | ||||
| Exchange rate (US$/Cdn$) | 0.78 | 0.91 | 0.97 | ||||
| Exchange rate (end of period) (US$/Cdn$) | 0.72 | 0.86 | 0.94 | ||||
- (1)
- 3-2-1 crack spreads are indicators of the refining margin generated by converting three barrels of WTI into two barrels of gasoline and one barrel of diesel. The crack spreads presented here generally approximate the regions into which the company sells refined products through retail and wholesale channels.
Suncor's sweet SCO price realizations are influenced primarily by the price of WTI at Cushing and by the supply and demand of sweet SCO from Western Canada. WTI decreased to US$48.75/bbl in 2015, compared to US$93.00/bbl in 2014.
Suncor produces a specific grade of sour SCO, the price realizations for which are influenced by various crude benchmarks including, but not limited to: MSW at Edmonton and WCS at Hardisty, and which can also be affected by prices negotiated for spot sales. Prices for both MSW at Edmonton and WCS at Hardisty decreased in 2015 compared to 2014, resulting in lower realizations for sour SCO.
Bitumen production that Suncor does not upgrade is blended with diluent to facilitate delivery on pipeline systems. Net bitumen price realizations are therefore influenced by both prices for Canadian heavy crude oil (WCS at Hardisty is a common reference) and prices for diluent (Condensate at Edmonton and SCO). Bitumen price realizations can also be affected by bitumen quality and
SUNCOR ENERGY INC. ANNUAL REPORT 2015 19
spot sales. Average prices for WCS at Hardisty and Condensate at Edmonton decreased significantly in 2015 compared to 2014, resulting in lower realizations for bitumen.
Suncor's price realizations for production from East Coast Canada and E&P International assets are influenced primarily by the price for Brent crude. Brent crude pricing decreased over the prior year and averaged US$53.60/bbl in 2015, compared to US$99.50/bbl in 2014.
Suncor's price realizations for E&P Canada natural gas production are primarily referenced to Alberta spot at AECO. Natural gas is also used in the company's Oil Sands and Refining operations. The average AECO benchmark decreased to $2.65/mcf in 2015, from $4.50/mcf in 2014.
Suncor's refining margins are influenced by 3-2-1 crack spreads, which are industry indicators approximating the gross margin on a barrel of crude oil that is refined to produce gasoline and distillate, and by light/heavy and light/sour crude differentials. More complex refineries can earn greater margins by processing less expensive, heavier crudes. Crack spreads do not necessarily reflect the margins of a specific refinery. Crack spreads are based on current crude feedstock prices whereas actual refining margins are based on first-in, first-out inventory accounting (FIFO), where a delay exists between the time that feedstock is purchased and when it is processed and sold to a third party. Specific refinery margins are further impacted by actual crude purchase costs, refinery configuration and refined products sales markets unique to that refinery. Average market crack spreads increased in 2015 compared to 2014, resulting in a positive impact to refining margins.
Excess electricity produced in Suncor's Oil Sands business is sold to the Alberta Electric System Operator (AESO), with the proceeds netted against the cash operating costs per barrel metric. The Alberta power pool price decreased to an average of $33.40/MWh in 2015 from $49.65/MWh in the prior year.
The majority of Suncor's revenues from the sale of oil and natural gas commodities are based on prices that are determined by or referenced to U.S. dollar benchmark prices. The majority of Suncor's expenditures are realized in Canadian dollars. A decrease in the value of the Canadian dollar relative to the U.S. dollar will increase the revenues received from the sale of commodities. An increase in the value of the Canadian dollar relative to the U.S. dollar will decrease revenue received from the sale of commodities. In 2015, the Canadian dollar weakened in relation to the U.S. dollar as the average exchange rate decreased to 0.78 from 0.91, which had a positive impact on price realizations for the company in 2015.
Conversely, many of Suncor's assets and liabilities, notably the majority of the company's debt, are denominated in U.S. dollars and translated to Suncor's reporting currency (Canadian dollars) at each balance sheet date. A decrease in the value of the Canadian dollar relative to the U.S. dollar from the previous balance sheet date increases the amount of Canadian dollars required to settle U.S. dollar denominated obligations.
Economic Sensitivities(1)(2)
The following table illustrates the estimated effects that changes in certain factors would have had on 2015 net earnings and cash flow from operations if the listed changes had occurred.
| (Estimated change, in $ millions) | Net Earnings | Cash Flow From Operations | ||||
| Crude oil +US$1.00/bbl | 165 | 165 | ||||
| Natural gas +Cdn$0.10/mcf | (15 | ) | (15 | ) | ||
| Light/heavy differential +US$1.00/bbl | 5 | 5 | ||||
| 3-2-1 crack spreads +US$1.00/bbl | 120 | 120 | ||||
| Foreign exchange +$0.01 US$/Cdn$(3) related to operating activities | (135 | ) | (135 | ) | ||
| Foreign exchange on U.S. denominated debt +$0.01 US$/Cdn$(3) | 140 | — | ||||
- (1)
- Each line item in this table shows the effects of a change in that variable only, with other variables being held consistent.
- (2)
- Changes for a variable imply that all such similar variables are impacted, such that Suncor's average price realizations increase uniformly. For instance, "Crude oil +US$1.00/bbl" implies that price realizations influenced by WTI, Brent, SCO, WCS, par crude at Edmonton and condensate all increase by US$1.00/bbl.
- (3)
- The difference between estimates for net earnings and cash flow from operations are due primarily to the revaluation of U.S. dollar denominated debt that is included within net earnings but not within cash flow from operations.
20 SUNCOR ENERGY INC. ANNUAL REPORT 2015
4. SEGMENT RESULTS AND ANALYSIS
Suncor has classified its operations into the following segments:
OIL SANDS
Suncor's Oil Sands segment, with assets located in the Athabasca oil sands of northeast Alberta, recovers bitumen from mining and in situ operations and either upgrades this production into SCO for refinery feedstock and diesel fuel, or blends the bitumen with diluent for direct sale to market. The Oil Sands segment includes:
- •
- Oil Sands operations refer to Suncor's wholly owned and operated mining, extraction, upgrading, in situ and related logistics and storage assets in the Athabasca oil sands region. Oil Sands operations consist of:
- •
- Oil Sands Base operations include the Millennium and North Steepbank mining and extraction operations, integrated upgrading facilities known as Upgrader 1 and Upgrader 2, and the associated infrastructure for these assets – including utilities, energy and reclamation facilities, such as Suncor's Tailings Reduction Operations process (TROTM) assets.
- •
- In Situ operations include oil sands bitumen production from Firebag and MacKay River and supporting infrastructure, such as central processing facilities, cogeneration units and hot bitumen infrastructure, including insulated pipelines, diluent import capabilities and a cooling and blending facility, and related storage assets. In Situ production is either upgraded by Oil Sands Base, or blended with diluent and marketed directly to customers.
- •
- Oil Sands ventures includes Suncor's 50.8% interest in the Fort Hills mining project, where Suncor is the operator, and its 36.75% non-operated interest in the Joslyn North mining project. The company also holds a 12.0% interest in the Syncrude oil sands mining and upgrading joint arrangement and currently holds an additional 30.9% indirectly through its 84.2% ownership of COS, which owns a 36.74% interest in the Syncrude joint venture.
EXPLORATION AND PRODUCTION
Suncor's E&P segment consists of offshore operations off the east coast of Canada and in the North Sea, and onshore assets in North America, Libya and Syria.
- •
- E&P Canada operations include Suncor's 37.675% working interest in Terra Nova, which Suncor operates. Suncor also holds a 20.0% interest in the Hibernia base project and a 19.13% interest in the Hibernia Southern Extension Unit (HSEU) (reset from 19.51%, effective December 1, 2015). Suncor holds a 27.5% interest in the White Rose base project and a 26.125% interest in the White Rose Extensions. Effective January 1, 2016, Suncor's working interest in the Hebron project has been reset from 22.729% to 21.034%. Other than Terra Nova, all of the projects are operated by other companies. Suncor also holds interests in several exploration licences offshore Newfoundland and Labrador and Nova Scotia. E&P Canada also includes Suncor's working interests in unconventional natural gas properties in northeast B.C.
- •
- E&P International operations include Suncor's 29.89% working interest in Buzzard and its 26.69% interest in Golden Eagle. Both operations are located in the U.K. sector of the North Sea and are operated by another company. Suncor also holds interests in several exploration licences offshore the U.K. and Norway. Suncor owns, pursuant to Exploration and Production Sharing Agreements (EPSAs), working interests in the exploration and development of oilfields in the Sirte Basin in Libya. Production in Libya remained impacted by political unrest at the end of 2015, with the timing of a return to normal operations remaining uncertain. Suncor also owns, pursuant to a Production Sharing Contract (PSC), an interest in the Ebla gas development in the Ash Shaer and Cherrife areas in Syria. Suncor's operations in Syria were suspended indefinitely in 2011, due to political unrest in the country.
SUNCOR ENERGY INC. ANNUAL REPORT 2015 21
REFINING AND MARKETING
Suncor's Refining and Marketing segment consists of two primary operations:
- •
- Refining and Supply operations refine crude oil and intermediate feedstock into a broad range of petroleum and petrochemical products. Refining and Supply consists of:
- •
- Eastern North America operations which include a refinery located in Montreal, Quebec, a refinery located in Sarnia, Ontario, and a lubricants business located in Mississauga, Ontario that manufactures and blends products which are marketed worldwide.
- •
- Western North America operations which include refineries located in Edmonton, Alberta and Commerce City, Colorado.
- •
- Other Refining and Supply assets include interests in a sulphur plant, a petrochemical plant, pipelines and product terminals in Canada and the U.S.
- •
- Downstream Marketing operations sell refined petroleum products to retail, commercial and industrial customers through a combination of company-owned, Petro-Canada branded-dealer and other retail stations in Canada and Colorado, a nationwide commercial road transport network in Canada, and a bulk sales channel in Canada. Lubricant products are marketed worldwide through company-operated locations and distributor networks.
CORPORATE, ENERGY TRADING AND ELIMINATIONS
The groupingCorporate, Energy Trading and Eliminations includes the company's investments in renewable energy projects, results related to energy marketing, supply and trading activities, and other activities not directly attributable to any other operating segment.
- •
- Renewable Energy interests include six wind facilities across Canada, including Cedar Point which is the most recent addition to the portfolio, and the St. Clair ethanol plant in Ontario.
- •
- Energy Trading activities primarily involve the marketing, supply and trading of crude oil, natural gas, power and byproducts, and the use of midstream infrastructure and financial derivatives to optimize related trading strategies.
- •
- Corporate activities include stewardship of Suncor's debt and borrowing costs, expenses not allocated to the company's businesses, and the company's captive insurance activities that self-insure a portion of the company's asset base.
- •
- Intersegment revenues and expenses are removed from consolidated results inEliminations. Intersegment activity includes the sale of product between the company's segments and insurance for a portion of the company's operations by theCorporate captive insurance entity.
22 SUNCOR ENERGY INC. ANNUAL REPORT 2015
2015 Highlights
- •
- Oil Sands operations production increased to 433,600 bbls/d, an increase of 11% compared to 2014, driven by strong reliability across all assets and record In Situ production of 217,600 bbls/d.
- •
- The company's continued focus on cost management, combined with increased production, enabled Suncor to decrease its cash operating costs per barrel by 18% to $27.85/bbl in 2015, compared to $33.80/bbl in the prior year and is the lowest achieved since 2007.
- •
- Fort Hills construction continued to ramp up and was more than 50% complete by the end of the year. First oil is expected the fourth quarter of 2017.
- •
- Suncor continues to deliver on its commitment to invest in long-term profitable growth in its core asset areas. The company acquired an additional 10% of the Fort Hills mining project and, subsequent to year end, acquired 84.2% of COS.
- •
- Suncor continues to focus on safely and reliably operating our assets, and optimizing the value chain through integration. The company completed a non-cash asset exchange and lease with TransAlta where Suncor assumed operating control of the Poplar Creek cogeneration facilities, which provide steam and power to the company's Oil Sands operations. Bringing the Poplar Creek assets in-house is expected to improve Suncor's overall Oil Sands operations reliability and profitability.
- •
- Increase to nameplate capacity of Firebag from 180,000 bbls/d to 203,000 bbls/d as a result of cost-effective debottlenecking activities and record Firebag production achieved in 2015. Record low SOR of 2.6 was achieved at Firebag in 2015, primarily due to optimized reservoir management strategies and strong infill well performance.
Strategy and Investment Update
Suncor continues to deliver on its commitment to add shareholder value and invest in long-term profitable growth in its core asset areas. The company acquired an additional 10% working interest in the Fort Hills oil sands project from Total E&P Canada Ltd. (Total E&P) for $360 million. Suncor's share in the project is now 50.8%. In addition, subsequent to December 31, 2015, Suncor acquired 84.2% of COS and plans to acquire the remaining shares by March 21, 2016 at a COS special shareholders meeting to approve the acquisition.
Oil Sands operations has established a large physical asset base providing the opportunity for production growth through low cost debottlenecks, expansions and increased reliability. In 2015, Oil Sands upgrading achieved reliability in excess of 90%, more than a year ahead of our original plan to upgrade 315,000 bbls/d by 2017. Transactions, including the non-cash asset exchange with TransAlta and planned termination of the wastewater treatment facilities operating agreement and lease with a third party to allow for in-house management of those operations, will provide Suncor with increased control over asset reliability.
Oil Sands continues to focus on safe, reliable and sustainable operations. The company's operational excellence initiatives target improving facility utilization and workforce productivity, including a continued focus on upgrader reliability, which are expected to achieve steady production growth while reducing operating costs. Sustaining capital for Oil Sands operations in 2016 is expected to include a turnaround on Upgrader 2.
The primary focus for both cost management and capital discipline in 2016 will be to continue efforts to sustainably reduce controllable operating costs through elimination of non-critical work and close collaboration with suppliers and business partners. Capital discipline continues to focus on managing investment opportunities, including sustainability priorities, through a robust asset development process and realizing turnaround productivity improvements.
Suncor continues to work closely with the Fort Hills mining project co-owners on engineering, procurement and construction activities. As operator of the Fort Hills project, Suncor is developing the mine using traditional open-pit truck and shovel techniques, and paraffinic froth treatment-based extraction technology that will allow the mine to produce a bitumen product that can be sold directly to the market.
SUNCOR ENERGY INC. ANNUAL REPORT 2015 23
Financial Highlights
| Year ended December 31 ($ millions) | 2015 | 2014 | 2013 | ||||||
| Gross revenues | 9 332 | 14 561 | 13 089 | ||||||
| Less: Royalties | (114 | ) | (982 | ) | (859 | ) | |||
| Operating revenues, net of royalties | 9 218 | 13 579 | 12 230 | ||||||
| Net (loss) earnings | (856 | ) | 1 776 | 2 040 | |||||
| Adjusted for: | |||||||||
| Net impact of not proceeding with the Voyageur upgrader project | — | — | 58 | ||||||
| Impairments | 386 | 941 | — | ||||||
| Impact of income tax adjustments on deferred income taxes | 359 | 54 | — | ||||||
| Operating (loss) earnings(1) | (111 | ) | 2 771 | 2 098 | |||||
| Oil Sands operations | (33 | ) | 2 696 | 1 870 | |||||
| Oil Sands ventures | (78 | ) | 75 | 228 | |||||
| Cash flow from operations(1) | 2 835 | 5 400 | 4 556 | ||||||
- (1)
- Non-GAAP financial measures. See the Advisories – Non-GAAP Financial Measures section of this MD&A.
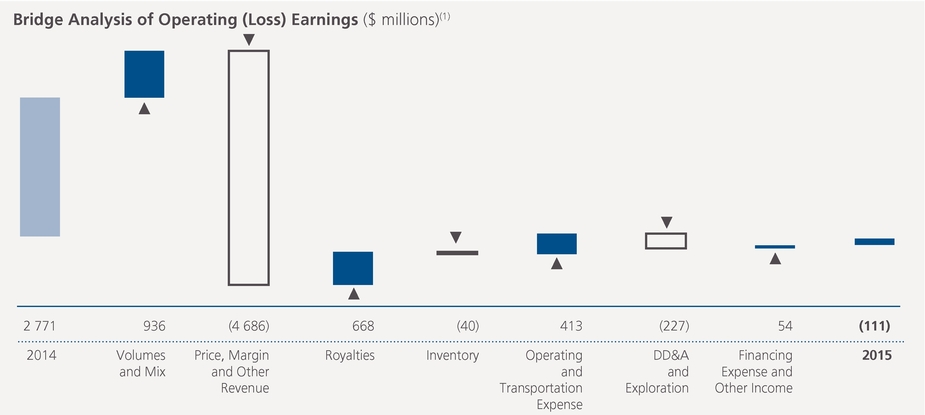
- (1)
- For an explanation of the construction of this bridge analysis, see the Advisories – Non-GAAP Financial Measures section of this MD&A.
Operating losses for Oil Sands operations were $33 million in 2015, compared to operating earnings of $2.696 billion in 2014. The decrease was primarily due to significantly lower price realizations as a result of lower crude oil benchmark prices, partially offset by increased production, lower royalties, and lower operating and transportation expenses as a result of the impact of cost reduction initiatives, lower natural gas prices and lower unplanned maintenance activities.
Operating losses for Oil Sands ventures were $78 million in 2015, compared to operating earnings of $75 million in 2014. The decrease was primarily due to lower price realizations as a result of lower crude oil benchmark prices and lower production, partially offset by lower royalties and operating costs as a result of cost reduction initiatives for Syncrude and the decision to scale back activities at the Joslyn mining project.
Cash flow from operations for the Oil Sands segment was $2.835 billion in 2015, compared to $5.400 billion in 2014. The decrease was largely due to the same factors that impacted operating earnings.
24 SUNCOR ENERGY INC. ANNUAL REPORT 2015
Production Volumes(1)
| Year ended December 31 (mbbls/d) | 2015 | 2014 | 2013 | ||||
| Upgraded product (SCO) | 320.1 | 289.1 | 282.6 | ||||
| Non-upgraded bitumen | 113.5 | 101.8 | 77.9 | ||||
| Oil Sands operations | 433.6 | 390.9 | 360.5 | ||||
| Oil Sands ventures – Syncrude | 29.8 | 31.0 | 32.0 | ||||
| Total | 463.4 | 421.9 | 392.5 | ||||
- (1)
- Bitumen from Oil Sands Base operations is upgraded, while bitumen from In Situ operations is upgraded or sold directly to customers. Yields of SCO from Suncor's upgrading processes are approximately 79% of bitumen feedstock input.
Sales Volumes and Mix
| Year ended December 31 (mbbls/d) | 2015 | 2014 | 2013 | |||||
| Oil Sands operations sales volumes | ||||||||
| Sweet SCO | 107.0 | 99.7 | 91.5 | |||||
| Diesel | 31.3 | 30.7 | 23.5 | |||||
| Sour SCO | 182.5 | 158.9 | 166.0 | |||||
| Upgraded product (SCO) | 320.8 | 289.3 | 281.0 | |||||
| Non-upgraded bitumen | 107.7 | 101.4 | 76.0 | |||||
| Oil Sands operations | 428.5 | 390.7 | 357.0 | |||||
| Oil Sands ventures | 29.8 | 31.0 | 32.0 | |||||
| Total | 458.3 | 421.7 | 389.0 | |||||
Production in Oil Sands operations increased to 433,600 bbls/d in 2015 from 390,900 bbls/d in 2014, due primarily to reliable operations across all assets, with record SCO and In Situ production for 2015. Production in both years was impacted by planned coker maintenance in the spring and fall, while 2014 was also impacted by unplanned maintenance in upgrading and extraction during the third and fourth quarters of 2014, and a weather-related site-wide power outage in the third quarter of 2014. Sweet SCO production in 2015 was impacted by unplanned hydrotreater maintenance in the first half of the year.
Sales volumes for Oil Sands operations increased to 428,500 bbls/d in 2015, compared to 390,700 bbls/d in 2014, reflecting the same factors that led to the overall increase in production volumes. The sales mix improved in 2015, compared to 2014, primarily due to lower unplanned upgrader maintenance activities in the current year.
Sales volumes of non-upgraded bitumen increased in 2015, compared to 2014, mainly due to higher production at Firebag.
The inventory variance factor decreased operating earnings, primarily due to a larger inventory build in 2015 as compared to 2014. Inventory levels in 2015 increased compared to 2014 due to increased production levels and expanded use of midstream assets necessary to access new sales markets.
Suncor's share of Syncrude production and sales volumes averaged 29,800 bbls/d in 2015, compared to 31,000 bbls/d in 2014. Production in both years was impacted by planned and unplanned maintenance events.
Bitumen Production from Operations
| Year ended December 31 | 2015 | 2014 | 2013 | |||||
| Oil Sands Base | ||||||||
| Bitumen production (mbbls/d) | 307.3 | 274.4 | 269.8 | |||||
| Bitumen ore mined (thousands of tonnes/day) | 461.3 | 408.5 | 413.6 | |||||
| Bitumen ore grade quality (bbls/tonne) | 0.67 | 0.67 | 0.65 | |||||
| In Situ bitumen production (mbbls/d) | ||||||||
| Firebag | 186.9 | 172.0 | 143.4 | |||||
| MacKay River | 30.7 | 27.0 | 28.5 | |||||
| Total In Situ production | 217.6 | 199.0 | 171.9 | |||||
| In Situ steam-to-oil ratio | ||||||||
| Firebag | 2.6 | 2.8 | 3.3 | |||||
| MacKay River | 2.9 | 2.9 | 2.6 | |||||
Bitumen production from Oil Sands Base operations increased to an average of 307,300 bbls/d in 2015, compared to 274,400 bbls/d in 2014. The increase was primarily due to reliable operations across all assets, compared to the prior year which was impacted by unplanned extraction, upgrading, and utilities maintenance in the third and fourth quarters that constrained mine production.
In Situ achieved record bitumen production in 2015, increasing to 217,600 bbls/d from 199,000 bbls/d in 2014. The increase was driven by strong production from both Firebag and MacKay River primarily as a result of cost-effective de-bottlenecking and strong infill well performance. Production at Firebag increased to 186,900 bbls/d in 2015 from 172,000 bbls/d in 2014, with nameplate capacity for Firebag increasing to 203,000 bbls/d from 180,000 bbls/d due to sustained production levels in 2015. Production at MacKay River increased to 30,700 bbls/d in 2015 from 27,000 bbls/d in 2014 due to additional production associated with the debottlenecking project.
SUNCOR ENERGY INC. ANNUAL REPORT 2015 25
Firebag attained a record low SOR of 2.6 in 2015, down from 2.8 in 2014, primarily due to strong infill well performance and optimized reservoir management strategies, while SOR at MacKay River remained comparable to 2014.
Price Realizations
| Year ended December 31 Net of transportation costs, but before royalties ($/bbl) | 2015 | 2014 | 2013 | ||||||
| Oil Sands operations | |||||||||
| Sweet SCO and diesel | 66.00 | 109.02 | 104.22 | ||||||
| Sour SCO and non-upgraded bitumen | 41.58 | 76.66 | 72.67 | ||||||
| Crude sales basket (all products) | 49.46 | 87.46 | 82.83 | ||||||
| Crude sales basket, relative to WTI | (12.91 | ) | (15.28 | ) | (18.09 | ) | |||
| Oil Sands ventures | |||||||||
| Syncrude – Sweet SCO | 61.55 | 99.32 | 99.82 | ||||||
| Syncrude, relative to WTI | (0.83 | ) | (3.42 | ) | (1.10 | ) | |||
Price realizations were negatively impacted by the decrease in WTI benchmark prices, partially offset by the weaker Canadian dollar in 2015 and resulted in average price realizations for Oil Sands operations of $49.46/bbl in 2015, compared to $87.46/bbl in 2014.
Suncor's average price realization for Syncrude sales decreased in 2015 to $61.55/bbl, compared to $99.32/bbl in 2014, as the impacts of the decrease in WTI benchmark prices were partially offset by the weaker Canadian dollar in 2015.
Royalties
Royalties were lower in 2015 relative to 2014, primarily due to lower bitumen prices, partially offset by higher production.
Expenses and Other Factors
Operating expenses for 2015 were lower relative to 2014. Factors contributing to the change in operating expenses included:
- •
- A decrease in cash operating costs for Oil Sands operations. See the Cash Operating Costs Reconciliation for further details.
- •
- Operating expenses at Syncrude were lower for 2015 than 2014 as a result of cost reduction initiatives and lower natural gas prices.
- •
- Non-production costs were lower in 2015 compared to 2014, primarily due to cost reduction initiatives, including reductions to discretionary spending, lower expenses related to a gas swap arrangement with a third-party processor, and a decrease in costs associated with future growth activities, partially offset by higher share-based compensation expense.
Transportation expense increased in 2015, relative to 2014, primarily due to the costs related to increased sales volumes.
DD&A expense for 2015 was higher than 2014, mainly due to a larger asset base primarily as a result of assets commissioned in 2015, including well pads and infill wells, as well as the higher production from In Situ in 2015 as compared to 2014.
Cash Operating Costs Reconciliation(1)
| Year ended December 31 | 2015 | 2014 | 2013 | ||||||
| Operating, selling and general expense (OS&G) | 5 220 | 5 940 | 5 852 | ||||||
| Syncrude OS&G | (471 | ) | (593 | ) | (536 | ) | |||
| Non-production costs(2) | (279 | ) | (340 | ) | (282 | ) | |||
| Other items(3) | (63 | ) | (187 | ) | (165 | ) | |||
| Oil Sands cash operating costs ($ millions) | 4 407 | 4 820 | 4 869 | ||||||
| Oil Sands cash operating costs ($/bbl) | 27.85 | 33.80 | 37.00 | ||||||
- (1)
- Cash operating costs and cash operating costs per barrel are non-GAAP financial measures. See the Advisories – Non-GAAP Financial Measures section of this MD&A.
- (2)
- Significant non-production costs include share-based compensation adjustments, research and the expense recorded as part of a gas swap arrangement involving a third-party processor.
- (3)
- Other items includes the impacts of changes in inventory valuation and operating revenues associated with excess capacity, primarily power from cogeneration units that was deducted from total cash operating costs.
Oil Sands cash operating costs per barrel averaged $27.85/bbl in 2015, compared to $33.80/bbl in 2014, primarily due to higher production volumes combined with lower cash operating costs in 2015. Total cash operating costs decreased in 2015, primarily due to cost reduction initiatives, lower natural gas input costs and lower unplanned maintenance activities, partially offset by changes in inventory and a decrease in power cogeneration revenues due to the decrease in power price.
Planned Maintenance
The company plans to complete a turnaround on Upgrader 2 commencing at the end of the first quarter of 2016. The impact of this maintenance has been reflected in the company's 2016 guidance.
26 SUNCOR ENERGY INC. ANNUAL REPORT 2015
EXPLORATION AND PRODUCTION
2015 Highlights
- •
- Golden Eagle achieved production of 14,800 boe/d during its first full year of production, and was operating at its peak production rate of approximately 18,000 boe/d by the fourth quarter.
- •
- Construction of the gravity-based structure and topsides at the Hebron project continued with first oil expected in late 2017.
- •
- Exploration drilling at the deepwater Shelburne Basin offshore Nova Scotia commenced in the fourth quarter, and will continue into 2016.
Strategy and Investment Update
The Exploration and Production segment focuses primarily on low-cost projects that deliver significant returns, cash flow and long-term value. Suncor is currently evaluating exploration and development opportunities off the east coast of Canada, offshore Norway and in the U.K. North Sea to provide diverse and lower cost conventional production.
Construction activities continue at the Hebron project, with first oil expected in late 2017. Effective January 1, 2016, Suncor's working interest in the Hebron project has been reset. As a result, the company's working interest in the project decreased from 22.729% to 21.034%, with Suncor to be reimbursed for costs incurred to December 31, 2015.
At Golden Eagle, development drilling activities are planned to continue through 2016. The company also has field extension projects underway which leverage existing facilities and infrastructure. The HSEU and South White Rose Extension (SWRX) projects are expected to provide incremental production and extend the productive life of the existing fields. Drilling activities on both extension projects are planned to continue in 2016. Exploration drilling activities in the Shelburne Basin are also continuing in 2016, along with ongoing appraisal of Norwegian discoveries at Beta and Butch.
Financial Highlights
| Year ended December 31 ($ millions) | 2015 | 2014 | 2013 | ||||||
| Gross revenues | 2 612 | 4 715 | 6 363 | ||||||
| Less: Royalties | (267 | ) | (672 | ) | (1 146 | ) | |||
| Operating revenues, net of royalties | 2 345 | 4 043 | 5 217 | ||||||
| Net (loss) earnings | (758 | ) | 653 | 1 000 | |||||
| Adjusted for: | |||||||||
| Impairments | 1 213 | 297 | 563 | ||||||
| Recognition of risk mitigation proceeds | (75 | ) | — | (223 | ) | ||||
| Gain on significant disposals | — | (61 | ) | (130 | ) | ||||
| Impact of income tax rate adjustments on deferred income taxes | (373 | ) | — | — | |||||
| Reserves redetermination | — | (32 | ) | — | |||||
| Operating earnings (loss)(1) | 7 | 857 | 1 210 | ||||||
| E&P Canada | (14 | ) | 502 | 643 | |||||
| E&P International | 21 | 355 | 567 | ||||||
| Cash flow from operations(1) | 1 386 | 1 909 | 2 316 | ||||||
- (1)
- Non-GAAP financial measures. See the Advisories – Non-GAAP Financial Measures section of this MD&A.
SUNCOR ENERGY INC. ANNUAL REPORT 2015 27
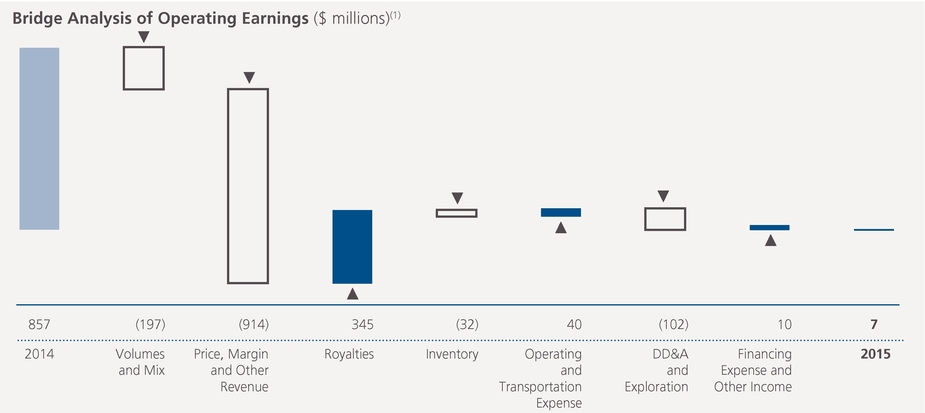
- (1)
- For an explanation of the construction of this bridge analysis, see the Advisories – Non-GAAP Financial Measures section of this MD&A.
E&P operating earnings were $7 million in 2015, compared to operating earnings of $857 million in 2014.
Operating losses in 2015 for E&P Canada were $14 million, compared to operating earnings of $502 million for 2014, with the decrease primarily due to lower price realizations and a decrease in production, partially offset by lower royalties and operating costs. Operating earnings for E&P International were $21 million for 2015, compared to $355 million for 2014, and were lower primarily due to lower price realizations, partially offset by the additional production from Golden Eagle and increased production from Buzzard.
Cash flow from operations was $1.386 billion in 2015, compared to $1.909 billion in 2014. The decrease was largely due to the same factors that impacted operating earnings.
Production Volumes
| Year ended December 31 | 2015 | 2014 | 2013 | |||||
| E&P Canada | ||||||||
| Terra Nova (mbbls/d) | 13.5 | 17.3 | 14.2 | |||||
| Hibernia (mbbls/d) | 18.1 | 23.1 | 27.1 | |||||
| White Rose (mbbls/d) | 12.2 | 14.6 | 14.9 | |||||
| North America Onshore (mboe/d) | 3.2 | 3.6 | 37.3 | |||||
| 47.0 | 58.6 | 93.5 | ||||||
| E&P International | ||||||||
| Buzzard (mboe/d) | 49.8 | 47.1 | 55.8 | |||||
| Golden Eagle (mboe/d) | 14.8 | 0.6 | — | |||||
| Libya (mbbls/d) | 2.8 | 6.7 | 20.6 | |||||
| 67.4 | 54.4 | 76.4 | ||||||
| Total Production (mboe/d) | 114.4 | 113.0 | 169.9 | |||||
| Production Mix (liquids/gas) (%) | 96/4 | 97/3 | 80/20 | |||||
E&P Canada production averaged 47,000 boe/d in 2015, compared to 58,600 boe/d in 2014.
- •
- Production from Terra Nova averaged 13,500 bbls/d in 2015, compared to 17,300 bbls/d in 2014. Production decreased primarily due to higher unplanned maintenance activity in 2015. Production from 2015 was also impacted by natural declines.
- •
- Production from Hibernia averaged 18,100 bbls/d in 2015, compared to 23,100 bbls/d in 2014, with the decrease in 2015 primarily due to natural declines, and the impact of a five-week planned maintenance program in the second half of 2015.
28 SUNCOR ENERGY INC. ANNUAL REPORT 2015
- •
- Production from White Rose averaged 12,200 bbls/d in 2015, compared to 14,600 bbls/d in 2014. Production decreased in 2015 primarily due to natural declines.
- •
- Production from North America Onshore averaged 3,200 boe/d in 2015, compared to 3,600 boe/d in 2014. Production decreased primarily due to the sale of the Wilson Creek assets in the third quarter of 2014.
E&P International production averaged 67,400 boe/d in 2015, compared to 54,400 boe/d in 2014.
- •
- Production from Buzzard averaged 49,800 boe/d in 2015, compared to 47,100 boe/d in 2014. Production increased primarily due to lower maintenance activity in 2015, offset by natural declines.
- •
- Production from Golden Eagle averaged 14,800 boe/d in 2015, compared to 600 boe/d in 2014, as first oil was achieved in the fourth quarter of 2014 and production continued to ramp up throughout 2015.
- •
- Production from Libya averaged 2,800 bbls/d in 2015, compared to 6,700 bbls/d in 2014. Production in Libya remains substantially shut in due to political unrest, with the timing of a return to normal operations remaining uncertain.
Price Realizations
| Twelve months ended December 31 | ||||||||
| Net of transportation costs, but before royalties | 2015 | 2014 | 2013 | |||||
| Exploration and Production | ||||||||
| E&P Canada – Crude oil and natural gas liquids ($/bbl) | 61.78 | 105.98 | 109.71 | |||||
| E&P Canada – Natural gas ($/mcf) | 1.78 | 4.49 | 3.42 | |||||
| E&P International ($/boe) | 61.44 | 104.12 | 107.57 | |||||
| E&P average price ($/boe) | 60.53 | 103.05 | 91.44 | |||||
Average price realizations for crude oil from E&P Canada and E&P International were lower than 2014, consistent with the decrease in benchmark prices for Brent crude in 2015, partially offset by favourable foreign exchange rates.
Royalties
Royalties were lower in 2015, compared with 2014, primarily due to lower price realizations and lower production in East Coast Canada.
Inventory
Inventory movements due to the timing of shuttle tankers in East Coast Canada positively impacted earnings in both years. However, in the decreasing crude oil price environment, the earnings impact was lower than in 2014.
Expenses and Other Factors
Operating expenses were lower in 2015 compared to 2014, primarily due to lower expenses in Libya, lower expenses in North America Onshore following the sale of the Wilson Creek assets in the third quarter of 2014, cost reduction initiatives, and lower maintenance costs in East Coast Canada, partially offset by incremental costs associated with Golden Eagle production, which achieved first oil in the fourth quarter of 2014.
DD&A and exploration expenses were higher in 2015, primarily due to increased production associated with Golden Eagle and Buzzard, partially offset by lower production from East Coast Canada and Libya.
Planned Maintenance of Operated Assets
A planned four-week maintenance event at Terra Nova has been scheduled to commence in the second quarter of 2016. The impact of this maintenance has been reflected in the company's 2016 guidance.
REFINING AND MARKETING
2015 Highlights
- •
- The Refining and Marketing segment continues to be a key component of the company's integrated business model, generating $2.234 billion in operating earnings in 2015.
- •
- Strong refinery utilizations allowed Suncor to reduce the impact of the declining crude price environment by optimizing the profit realized on a portion of Suncor's upstream production.
- •
- Suncor lowered feedstock costs at the Montreal refinery through increased rail shipments of inland crudes and marine shipments of lower priced crudes from the U.S. Gulf Coast when market conditions were favourable.
- •
- Suncor completed the sale of its 50% interest in certain assets and liabilities of Pioneer Energy for $183 million, highlighting the company's continued focus on core assets that are aligned with Suncor's long-term strategy.
- •
- Enbridge's Line 9 reversal was commissioned during the fourth quarter of 2015 and became operational by the end of the year. The reversal will provide Suncor the flexibility of supplying its Montreal refinery with a full slate of inland priced crude.
Strategy and Investment Update
Suncor's downstream is a key component of the integrated business model. The Refining and Marketing network serves to maximize the value of Suncor's oil sands
SUNCOR ENERGY INC. ANNUAL REPORT 2015 29
production by extending the value chain to the end customer. The company operates its refineries at or near maximum capacity to provide reliable offtake and secure international pricing for oil sands production. The strategy also includes selling more volumes than refinery capacity to minimize per unit operating costs and provide a reliable product supply to customers. Feedstock intended for the refineries and finished products that are not expected to be sold by Refining and Marketing are sold at market prices by Suncor's Energy Trading group.
Suncor's Petro-Canada branded outlets maintained their position as a leading retailer by market share in major urban areas of Canada. Suncor will continue to leverage the strong brand to increase non-petroleum revenues through the company's network of convenience stores and car washes, and expand the lubricants product offering, including global expansion in the U.S., Europe and China.
Financial Highlights
| Year ended December 31 ($ millions) | 2015 | 2014 | 2013 | |||||
| Operating revenues | 19 826 | 26 627 | 26 658 | |||||
| Net earnings | 2 266 | 1 692 | 2 022 | |||||
| Adjusted for: | ||||||||
| Impact of income tax rate adjustments on deferred taxes | 36 | — | — | |||||
| Gain on significant disposal | (68 | ) | — | — | ||||
| Operating earnings(1) | 2 234 | 1 692 | 2 022 | |||||
| Refining and Product Supply | 1 864 | 1 385 | 1 758 | |||||
| Marketing | 370 | 307 | 264 | |||||
| Cash flow from operations(1) | 2 872 | 2 178 | 2 618 | |||||
- (1)
- Non-GAAP financial measures. See the Advisories – Non-GAAP Financial Measures section of this MD&A.
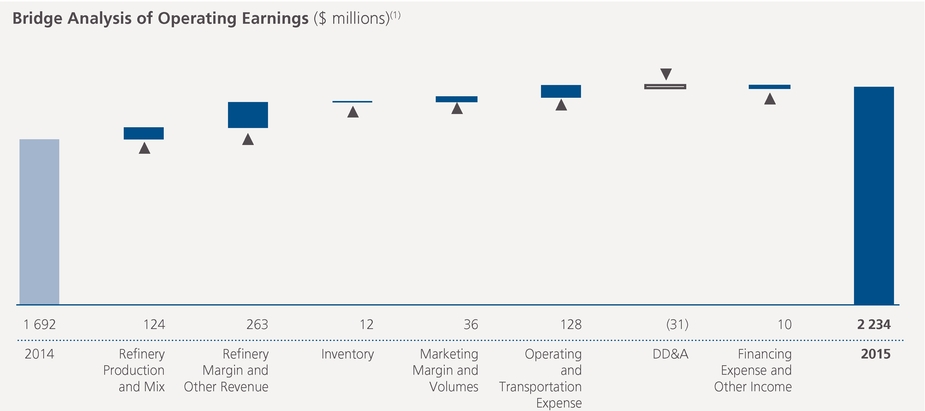
- (1)
- For an explanation of the construction of this bridge analysis, see the Advisories – Non-GAAP Financial Measures section of this MD&A.
Refining and Product Supply contributed operating earnings of $1.864 billion in 2015, compared with $1.385 billion in 2014. The increase was primarily due to an increase in benchmark gasoline cracking margins and higher refinery production bolstered by the positive impacts of the weaker Canadian dollar, slightly offset by weaker distillate benchmark cracking margins. In addition, 2015 included lower operating expenses driven by lower energy expenses, the impact of cost reduction initiatives, lower environmental expense and lower maintenance activity, partially offset by higher share-based compensation expense.
30 SUNCOR ENERGY INC. ANNUAL REPORT 2015
Marketing operations contributed $370 million to operating earnings in 2015, compared to $307 million in 2014, due mainly to stronger retail and lubricant margins.
Cash flow from operations was $2.872 billion in 2015, compared to $2.178 billion in 2014, due primarily to the same factors that impacted operating earnings.
Volumes
| Year ended December 31 | 2015 | 2014 | 2013 | |||||
| Crude oil processed (mbbls/d) | ||||||||
| Eastern North America | 208.1 | 199.2 | 201.7 | |||||
| Western North America | 224.0 | 228.3 | 229.6 | |||||
| Total | 432.1 | 427.5 | 431.3 | |||||
| Refinery utilization(1)(2) (%) | ||||||||
| Eastern North America | 94 | 90 | 91 | |||||
| Western North America | 93 | 95 | 96 | |||||
| Total | 94 | 93 | 94 | |||||
| Refined Product Sales (mbbls/d) | ||||||||
| Gasoline | 246.2 | 243.4 | 247.4 | |||||
| Distillate | 198.0 | 199.7 | 209.8 | |||||
| Other | 79.1 | 88.6 | 85.7 | |||||
| 523.3 | 531.7 | 542.9 | ||||||
- (1)
- Effective January 1, 2014, the company increased the nameplate capacity of the Edmonton refinery from 140,000 bbls/d to 142,000 bbls/d. Prior year utilization rates have not been recalculated and reflect the lower nameplate capacity.
- (2)
- Refinery utilization is the amount of crude oil run through crude distillation units, expressed as a percentage of the capacity of these units.
Refinery utilization in Eastern North America averaged 94% in 2015, compared with 90% in 2014. The increase from the prior year was primarily due to fewer planned maintenance events at Montreal and Sarnia.
Refinery utilization in Western North America averaged 93% in 2015, compared to 95% in 2014. The decrease from the prior year was primarily due to increased maintenance events in 2015 at the Edmonton refinery and lower demand for refined products in Western North America.
Total sales of refined petroleum products decreased to an average of 523,300 bbls/d in 2015, compared to 531,700 bbls/d in 2014, primarily due to lower demand in Western North America.
Prices and Margins
Refining and Product Supply prices and margins for refined products were higher in 2015 compared to 2014.
- •
- In 2015, the impact of FIFO inventory accounting, as used by the company, relative to an estimated LIFO basis of accounting, had a negative impact on net earnings of approximately $286 million after-tax, compared to $290 million after-tax in 2014.
- •
- Refining margins were also higher due to strong location differentials, the positive impact of the weaker Canadian dollar, partially offset by the impacts of narrower inland crude differentials, relative to WTI, and weaker distillate benchmark margins in 2015.
Marketing margins increased primarily due to higher margins for retail and lubricants channels.
Expenses and Other Factors
Operating expenses were lower in 2015 compared to 2014, primarily due to lower energy costs as a result of lower natural gas prices, the impact of cost reduction initiatives, lower maintenance costs, and lower environmental remediation expense. DD&A expense increased due to a larger asset base, while transportation expense was relatively unchanged between years.
Planned Maintenance
The company has scheduled two planned maintenance events at the Commerce City refinery, both with an expected duration of two weeks in each of the first and second quarters of 2016. The Sarnia refinery has a seven-week planned maintenance event in the second quarter of 2016, a four-week planned maintenance event in the third quarter and a one-week planned maintenance event in the fourth quarter of 2016. The Montreal refinery has a six-week planned maintenance event in the second quarter of 2016. The impacts of this planned maintenance are included in the company's guidance.
CORPORATE, ENERGY TRADING AND ELIMINATIONS
2015 Highlights
- •
- The company completed construction of the 100 MW Cedar Point wind farm in the fourth quarter of 2015.
- •
- The company entered into partnership agreements whereby the Aamjiwnaang First Nation acquired a 25% interest in the 40 MW Adelaide wind facility, and NextEra Energy Canada acquired a 50% interest in the Cedar Point wind facility, which began commercial operations in 2015.
Strategy and Investment Update
The Energy Trading business supports the company's production by securing market access, optimizing price realizations, managing inventory levels and managing the
SUNCOR ENERGY INC. ANNUAL REPORT 2015 31
impacts of external market factors, such as pipeline disruptions or outages at refining customers, while generating trading earnings through established strategies. The Energy Trading business continues to evaluate additional pipeline agreements to support planned production growth.
The Renewables business added 100 MW of gross installed capacity in 2015 through completion of the Cedar Point wind farm and also exchanged its interests in the Kent Breeze and Wintering Hills wind farms with TransAlta for the Poplar Creek cogeneration facilities, which support Oil Sands Base operations. Suncor also invested in a biodiesel plant, which is expected to be producing by the end of the first quarter of 2016.
Financial Highlights
| Year ended December 31 ($ millions) | 2015 | 2014 | 2013 | ||||||
| Net loss | (2 647 | ) | (1 422 | ) | (1 151 | ) | |||
| Adjusted for: | |||||||||
| Unrealized foreign exchange loss (gain) on U.S. dollar denominated debt | 1 930 | 722 | 521 | ||||||
| Restructuring charges | 57 | — | — | ||||||
| Impact of income tax rate adjustments on deferred income taxes | (5 | ) | — | — | |||||
| Operating (loss) earnings(1) | (665 | ) | (700 | ) | (630 | ) | |||
| Renewable Energy | 56 | 78 | 72 | ||||||
| Energy Trading | 36 | 66 | 116 | ||||||
| Corporate | (799 | ) | (850 | ) | (785 | ) | |||
| Eliminations | 42 | 6 | (33 | ) | |||||
| Cash flow used in operations(1) | (287 | ) | (429 | ) | (78 | ) | |||
- (1)
- Non-GAAP financial measures. See the Advisories – Non-GAAP Financial Measures section of this MD&A.
Renewable Energy
| Year ended December 31 | 2015 | 2014 | 2013 | ||||
| Power generation marketed (net gigawatt hours) | 407 | 411 | 430 | ||||
| Ethanol production (thousands of m3) | 418 | 412 | 415 | ||||
Suncor's Renewable Energy assets contributed operating earnings of $56 million in 2015, compared to $78 million in 2014. The decrease was primarily due to narrower margins on ethanol sales driven by lower ethanol fuel prices and higher feedstock costs, partially offset by higher ethanol production.
Energy Trading
Energy Trading activities contributed operating earnings of $36 million in 2015, compared to $66 million in 2014. The decrease in operating earnings was primarily due to lower gains on natural gas strategies due to weaker natural gas prices, lower gains on crude trading strategies as a result of weaker location spreads and the recording of an onerous contract related to the company's rail transportation strategy in 2015.
Corporate
Corporate incurred an operating loss of $799 million in 2015, compared with an operating loss of $850 million in 2014. The decrease in the operating loss was primarily a result of cost reduction initiatives, partially offset by increased share-based compensation expense. Suncor capitalized $447 million of its borrowing costs in 2015 as part of the cost of major development assets and construction projects in progress, compared to $431 million in the prior year. The increase was driven by the ramp up of construction at Fort Hills and the acquisition of an additional 10% working interest in the project.
Eliminations
Eliminations reflect the elimination or realization of profit on crude oil sales from Oil Sands and East Coast Canada to Refining and Marketing. Consolidated profits are only realized when the company sells the products produced from intersegment purchases of crude feedstock to third parties. In 2015, $42 million of after-tax intersegment profit was realized, compared to $6 million of after-tax intersegment profit realized in 2014.
32 SUNCOR ENERGY INC. ANNUAL REPORT 2015
5. FOURTH QUARTER 2015 ANALYSIS
Financial and Operational Highlights
| Three months ended December 31 ($ millions, except as noted) | 2015 | 2014 | |||||
| Net (loss) earnings | |||||||
| Oil Sands | (616 | ) | 180 | ||||
| Exploration and Production | (1 263 | ) | 198 | ||||
| Refining and Marketing | 498 | 173 | |||||
| Corporate, Energy Trading and Eliminations | (626 | ) | (467 | ) | |||
| Total | (2 007 | ) | 84 | ||||
| Operating (loss) earnings(1) | |||||||
| Oil Sands | (230 | ) | 180 | ||||
| Exploration and Production | (50 | ) | 198 | ||||
| Refining and Marketing | 498 | 173 | |||||
| Corporate, Energy Trading and Eliminations | (244 | ) | (165 | ) | |||
| Total | (26 | ) | 386 | ||||
| Cash flow from (used in) operations(1) | |||||||
| Oil Sands | 467 | 875 | |||||
| Exploration and Production | 257 | 401 | |||||
| Refining and Marketing | 596 | 240 | |||||
| Corporate, Energy Trading and Eliminations | (26 | ) | (24 | ) | |||
| Total | 1 294 | 1 492 | |||||
| Production volumes (mboe/d) | |||||||
| Oil Sands | 470.6 | 419.3 | |||||
| Exploration and Production | 112.3 | 138.3 | |||||
| Total | 582.9 | 557.6 | |||||
- (1)
- Non-GAAP financial measures. Operating earnings and cash flow from operations are reconciled below. See the Advisories – Non-GAAP Financial Measures section of this MD&A.
Net Earnings
Suncor's consolidated net loss for the fourth quarter of 2015 was $2.007 billion, compared with net earnings of $84 million for the prior year quarter. Net earnings were primarily affected by the same factors that influenced operating earnings described in the segmented analysis below. Other items affecting net earnings over these periods included:
- •
- In the fourth quarter of 2015, the company recorded after-tax impairment charges against property, plant and equipment and exploration and evaluation assets of $359 million on White Rose, $331 million on Golden Eagle and $54 million on Terra Nova, as a result of impacts of a decline in the crude oil price forecast. In addition, impairment charges of $290 million were recorded against the Joslyn mining project and $54 million on the Ballicatters well, due to uncertainty on the timing and likelihood of development plans and $96 million in Oil Sands following a review of certain assets that no longer fit with Suncor's growth strategies and which could not be repurposed or otherwise deployed.
- •
- In the fourth quarter of 2015, as a result of shut-in production due to the continued closure of certain Libyan export terminals, escalating political unrest, and increased uncertainty with respect to the company's return to normal operations in the country, the company recorded an after-tax impairment charge of $415 million against property, plant and equipment and exploration and evaluation assets.
- •
- The after-tax unrealized foreign exchange losses on the revaluation of U.S. dollar denominated debt were $382 million for the fourth quarter of 2015, compared to $302 million for the fourth quarter of 2014.
Cash Flow from Operations
Consolidated cash flow from operations was $1.294 billion for the fourth quarter of 2015 compared to $1.492 billion for the prior year quarter. Cash flow from operations was impacted by the same factors that affected operating earnings in the segmented analysis described below.
Segmented Analysis
Oil Sands
Operating losses for the fourth quarter of 2015 were $230 million, compared to operating earnings of $180 million in the prior year quarter. The decrease was primarily due to lower price realizations as a result of lower crude oil benchmark prices, partially offset by increased production from Oil Sands operations, lower operating and transportation expenses as a result of the impact of cost reduction initiatives, lower unplanned maintenance activities, lower natural gas prices and lower royalties.
Production volumes for Oil Sands operations increased to 439,700 bbls/d in the fourth quarter of 2015, compared to 384,200 bbls/d in the prior year quarter. The increase was primarily due to reliable operations across all assets, compared to the prior year quarter that was impacted by unplanned maintenance at Upgrader 2 and on certain utility assets impacting upgrading and extraction.
SUNCOR ENERGY INC. ANNUAL REPORT 2015 33
Suncor's share of Syncrude production decreased to 30,900 bbls/d in the fourth quarter of 2015, compared to 35,100 bbls/d in the prior year quarter. The decrease was primarily due to unplanned maintenance activities associated with sulphur removal and water treatment assets, and an unplanned coker maintenance event that began late in the quarter.
Exploration and Production
Exploration and Production operating losses were $50 million in the fourth quarter of 2015, compared to operating earnings of $198 million in the fourth quarter of 2014. Operating earnings decreased primarily due to lower price realizations and lower East Coast Canada and Buzzard production, partially offset by additional production from Golden Eagle.
Production volumes were 112,300 boe/d in the fourth quarter of 2015, compared to 138,300 boe/d in the fourth quarter of 2014. The decrease was primarily due to expected natural declines at Terra Nova and Hibernia, a planned turnaround at Hibernia, unplanned maintenance at Terra Nova, Libyan production being substantially shut in and decreased production at Buzzard, partially offset by increased production at Golden Eagle.
Refining and Marketing
Refining and Marketing operating earnings were $498 million in the fourth quarter of 2015, compared to operating earnings of $173 million for the fourth quarter of 2014. The increase was primarily due to higher gasoline benchmark cracking margins, and higher location differentials supported by the positive impact of the weaker Canadian dollar, partially offset by lower distillate cracking margins, lower throughput and the impact of narrower inland crude differentials. In addition, the fourth quarter of 2015 included lower operating expenses driven by lower maintenance costs, lower environmental expenses and the impact of cost reduction initiatives, partially offset by higher share-based compensation expense.
Refinery crude throughput decreased in the fourth quarter of 2015, resulting in an average refinery utilization of 93%, compared to 95% in the prior year quarter. The decrease was primarily due to planned and unplanned maintenance work at the Edmonton refinery and a four-week planned maintenance event at the Montreal refinery that was completed at the beginning of the fourth quarter of 2015, partially offset by an eight-week planned maintenance event at the Sarnia refinery in the prior year quarter.
Corporate, Energy Trading and Eliminations
Operating loss for Corporate, Energy Trading and Eliminations in the fourth quarter of 2015 was $244 million, compared to a $165 million loss in the fourth quarter of 2014. The increase in operating loss was due primarily to increased share-based compensation expense and lower realization of previously eliminated after-tax intersegment profit, partially offset by lower overall spending as a result of cost reduction initiatives.
34 SUNCOR ENERGY INC. ANNUAL REPORT 2015
Financial Summary
| Three months ended ($ millions, unless otherwise noted) | Dec 31 2015 | Sept 30 2015 | June 30 2015 | Mar 31 2015 | Dec 31 2014 | Sept 30 2014 | June 30 2014 | Mar 31 2014 | ||||||||||||
| Total production (mboe/d) | ||||||||||||||||||||
| Oil Sands | 470.6 | 458.4 | 448.7 | 475.6 | 419.3 | 441.1 | 403.1 | 424.4 | ||||||||||||
| Exploration and Production | 112.3 | 107.7 | 111.2 | 126.8 | 138.3 | 78.2 | 115.3 | 120.9 | ||||||||||||
| 582.9 | 566.1 | 559.9 | 602.4 | 557.6 | 519.3 | 518.4 | 545.3 | |||||||||||||
| Revenues and other income | ||||||||||||||||||||
| Operating revenues, net of royalties | 6 499 | 7 485 | 8 095 | 7 129 | 8 899 | 10 175 | 10 446 | 10 342 | ||||||||||||
| Other income | 94 | 72 | 49 | 257 | 192 | 98 | 203 | 135 | ||||||||||||
| 6 593 | 7 557 | 8 144 | 7 386 | 9 091 | 10 273 | 10 649 | 10 477 | |||||||||||||
| Net (loss) earnings | (2 007 | ) | (376 | ) | 729 | (341 | ) | 84 | 919 | 211 | 1 485 | |||||||||
| per common share – basic (dollars) | (1.38 | ) | (0.26 | ) | 0.50 | (0.24 | ) | 0.06 | 0.63 | 0.14 | 1.01 | |||||||||
| per common share – diluted (dollars) | (1.38 | ) | (0.26 | ) | 0.50 | (0.24 | ) | 0.06 | 0.62 | 0.14 | 1.01 | |||||||||
| Operating (loss) earnings(1) | (26 | ) | 410 | 906 | 175 | 386 | 1 306 | 1 135 | 1 793 | |||||||||||
| per common share – basic(1) (dollars) | (0.02 | ) | 0.28 | 0.63 | 0.12 | 0.27 | 0.89 | 0.77 | 1.22 | |||||||||||
| Cash flow from operations(1) | 1 294 | 1 882 | 2 155 | 1 475 | 1 492 | 2 280 | 2 406 | 2 880 | ||||||||||||
| per common share – basic(1) (dollars) | 0.90 | 1.30 | 1.49 | 1.02 | 1.03 | 1.56 | 1.64 | 1.96 | ||||||||||||
| ROCE(1) (%) for the twelve months ended | 0.6 | 5.1 | 7.2 | 5.8 | 8.6 | 9.4 | 10.1 | 12.6 | ||||||||||||
| After-tax unrealized foreign exchange (loss) gain on U.S. dollar denominated debt | (382 | ) | (786 | ) | 178 | (940 | ) | (302 | ) | (394 | ) | 282 | (308 | ) | ||||||
| Common share information (dollars) | ||||||||||||||||||||
| Dividend per common share | 0.29 | 0.29 | 0.28 | 0.28 | 0.28 | 0.28 | 0.23 | 0.23 | ||||||||||||
| Share price at the end of trading | ||||||||||||||||||||
| Toronto Stock Exchange (Cdn$) | 35.72 | 35.69 | 34.40 | 37.01 | 36.90 | 40.53 | 45.50 | 38.61 | ||||||||||||
| New York Stock Exchange (US$) | 25.80 | 26.72 | 27.52 | 29.25 | 31.78 | 36.15 | 42.63 | 34.96 | ||||||||||||
- (1)
- Non-GAAP financial measures. See the Advisories – Non-GAAP Financial Measures section of this MD&A. ROCE excludes capitalized costs related to major projects in progress. Operating earnings for each quarter are defined in the Non-GAAP Financial Measures Advisory section and reconciled to GAAP measures in the consolidated Financial Information and Segment Results and Analysis sections of each quarterly Report to Shareholders issued by Suncor (Quarterly Reports) in respect of the relevant quarter of 2015. Cash flow from operations and ROCE for each quarter are defined and reconciled to GAAP measures in the Advisories – Non-GAAP Financial Measures section of each Quarterly Report issued by Suncor in respect of the relevant quarter for 2015.
SUNCOR ENERGY INC. ANNUAL REPORT 2015 35
Business Environment
| Three months ended (average for the period ended, except as noted) | Dec 31 2015 | Sept 30 2015 | June 30 2015 | Mar 31 2015 | Dec 31 2014 | Sept 30 2014 | June 30 2014 | Mar 31 2014 | |||||||||||
| WTI crude oil at Cushing | US$/bbl | 42.15 | 46.45 | 57.95 | 48.65 | 73.15 | 97.20 | 103.00 | 98.70 | ||||||||||
| Brent crude oil at Sullom Voe | US$/bbl | 44.70 | 51.20 | 63.50 | 55.15 | 77.00 | 103.40 | 109.75 | 107.80 | ||||||||||
| Dated Brent/Maya FOB price differential | US$/bbl | 10.35 | 8.50 | 8.15 | 11.05 | 10.05 | 12.50 | 13.85 | 18.45 | ||||||||||
| MSW at Edmonton | Cdn$/bbl | 53.55 | 52.35 | 68.05 | 52.25 | 75.95 | 97.45 | 105.90 | 100.10 | ||||||||||
| WCS at Hardisty | US$/bbl | 27.70 | 33.25 | 46.35 | 33.90 | 58.90 | 77.00 | 82.95 | 75.55 | ||||||||||
| Light/heavy crude oil differential for WTI at Cushing less WCS at Hardisty | US$/bbl | 14.50 | 13.20 | 11.60 | 14.75 | 14.25 | 20.20 | 20.05 | 23.15 | ||||||||||
| Condensate at Edmonton | US$/bbl | 41.65 | 44.20 | 57.95 | 45.60 | 70.55 | 93.45 | 105.15 | 102.65 | ||||||||||
| Natural gas (Alberta spot) at AECO | Cdn$/mcf | 2.45 | 2.90 | 2.55 | 2.75 | 3.60 | 4.00 | 4.65 | 5.70 | ||||||||||
| Alberta Power Pool Price | Cdn$/MWh | 21.20 | 26.05 | 57.25 | 29.15 | 30.55 | 63.90 | 42.30 | 61.75 | ||||||||||
| New York Harbor 3-2-1 crack(1) | US$/bbl | 13.60 | 22.25 | 23.85 | 19.20 | 16.15 | 20.50 | 21.55 | 20.40 | ||||||||||
| Chicago 3-2-1 crack(1) | US$/bbl | 13.90 | 23.95 | 20.30 | 16.00 | 14.40 | 17.50 | 19.40 | 18.35 | ||||||||||
| Portland 3-2-1 crack(1) | US$/bbl | 17.90 | 28.75 | 32.55 | 21.50 | 12.45 | 24.60 | 26.10 | 17.40 | ||||||||||
| Gulf Coast 3-2-1 crack(1) | US$/bbl | 11.05 | 21.55 | 22.90 | 18.00 | 10.15 | 19.10 | 19.55 | 17.15 | ||||||||||
| Exchange rate | US$/Cdn$ | 0.75 | 0.76 | 0.81 | 0.81 | 0.88 | 0.92 | 0.92 | 0.91 | ||||||||||
| Exchange rate (end of period) | US$/Cdn$ | 0.72 | 0.75 | 0.80 | 0.79 | 0.86 | 0.89 | 0.94 | 0.90 | ||||||||||
- (1)
- 3-2-1 crack spreads are indicators of the refining margin generated by converting three barrels of WTI into two barrels of gasoline and one barrel of diesel. The crack spreads presented here generally approximate the regions into which the company sells refined products through retail and wholesale channels.
36 SUNCOR ENERGY INC. ANNUAL REPORT 2015
Significant or Unusual Items Impacting Net Earnings
Trends in Suncor's quarterly earnings and cash flow from operations are driven primarily by production volumes, which can be significantly impacted by major maintenance events – such as planned coker maintenance in the spring and fall of 2015 and 2014, planned maintenance that occurred at Terra Nova in 2015, unplanned maintenance in upgrading and extraction during the second and fourth quarters of 2014, and a weather-related site-wide power outage in the third quarter of 2014.
Trends in Suncor's quarterly earnings and cash flow from operations are also affected by changes in commodity prices, price differentials, refining crack spreads and foreign exchange rates, as described in the Financial Information section of this MD&A.
In addition to the impacts of changes in production volumes and business environment, net earnings over the last eight quarters were affected by the following events or significant adjustments:
- •
- In the fourth quarter of 2015, the company recorded after-tax impairment charges against property, plant and equipment and exploration and evaluation assets of $359 million on White Rose, $331 million on Golden Eagle and $54 million on Terra Nova as a result of impacts of a decline in the crude oil price forecast. In addition, impairment charges of $290 million were recorded on the company's interest in the Joslyn mining project and $54 million on the Ballicatters well, due to uncertainty in the timing and likelihood of development plans, and $96 million in Oil Sands following a review of certain assets that no longer fit with Suncor's growth strategies and which could not be repurposed or otherwise deployed.
- •
- In the fourth quarter of 2015, as a result of shut-in production due to the continued closure of certain Libyan export terminals, escalating political unrest, and increased uncertainty with respect to the company's return to normal operations in the country, the company recorded an after-tax impairment charge of $415 million against property, plant and equipment and exploration and evaluation assets.
- •
- In the second quarter of 2015, the company recorded an after-tax gain of $68 million on the disposal of the company's share of certain assets and liabilities of Pioneer Energy in the Refining and Marketing segment.
- •
- In the second quarter of 2015, the company recorded a $423 million deferred income tax charge related to a 2% increase in the Alberta corporate income tax rate.
- •
- The company recorded a $406 million income tax recovery in 2015 in the E&P segment related to a 12% decrease in the U.K. tax rate.
- •
- In the first quarter of 2015, the company recorded after-tax insurance proceeds of $75 million related to a claim on the Terra Nova asset in the E&P segment.
- •
- In the first quarter of 2015, the company recorded after-tax restructuring charges of $57 million related to cost reduction initiatives in the Corporate segment.
- •
- In the third quarter of 2014, the company recorded an after-tax gain of $61 million relating to the sale of its Wilson Creek natural gas assets in the E&P segment.
- •
- In the third quarter of 2014, the company recorded a current income tax expense adjustment and associated interest expense of $54 million related to the timing of tax depreciation deductions taken on certain capital expenditures incurred in a prior period in the Oil Sands segment.
- •
- In the second quarter of 2014, Joslyn mining project development activities were scaled back to focus on engineering studies to further optimize the Joslyn resource. As a result of Suncor's assessment of expected future net cash flows and the uncertainty of the project, including the timing of the development plans, Suncor recorded an after-tax charge to net earnings of $718 million against property, plant and equipment and exploration and evaluation assets.
- •
- In the second quarter of 2014, as a result of the continued closure of certain Libyan export terminals and the company's view on production plans during the remaining term of the production sharing agreements, the company recorded an after-tax impairment charge of $297 million against property, plant and equipment and exploration and evaluation assets.
- •
- In the second quarter of 2014, the company recorded after-tax impairment charges of $223 million in Oil Sands following a review of certain assets that no longer fit with Suncor's previously revised growth strategies and which could not be repurposed or otherwise deployed. Such assets included a pipeline and related compressor, as well as steam generator components.
- •
- In the second quarter of 2014, the company recorded after-tax earnings of $32 million related to an agreement reached for Suncor to receive a reserves redetermination of 1.2 million barrels of oil related to an interest in a Norwegian asset that Suncor previously owned.
SUNCOR ENERGY INC. ANNUAL REPORT 2015 37
Capital and Exploration Expenditures by Segment
| Year ended December 31 ($ millions) | 2015 | 2014 | 2013 | |||||
| Oil Sands | 4 181 | 3 826 | 4 311 | |||||
| Exploration and Production | 1 459 | 1 819 | 1 483 | |||||
| Refining and Marketing | 821 | 1 021 | 890 | |||||
| Corporate, Energy Trading and Eliminations | 206 | 295 | 93 | |||||
| Total | 6 667 | 6 961 | 6 777 | |||||
| Less: capitalized interest on debt | (447 | ) | (431 | ) | (397 | ) | ||
| 6 220 | 6 530 | 6 380 | ||||||
Capital and Exploration Expenditures by Type(1)(2)(3)
| Year ended December 31, 2015 ($ millions) | Sustaining | Growth | Total | |||||
| Oil Sands Base | 1 056 | 261 | 1 317 | |||||
| In Situ | 603 | 19 | 622 | |||||
| Oil Sands Ventures | 98 | 1 844 | 1 942 | |||||
| Oil Sands | 1 757 | 2 124 | 3 881 | |||||
| Exploration and Production | 20 | 1 305 | 1 325 | |||||
| Refining and Marketing | 766 | 44 | 810 | |||||
| Corporate, Energy Trading and Eliminations | 59 | 145 | 204 | |||||
| 2 602 | 3 618 | 6 220 | ||||||
- (1)
- Capital expenditures in this table exclude capitalized interest on debt.
- (2)
- Growth capital expenditures include capital investments that result in i) an increase in production levels at existing Oil Sands operations and Refining and Marketing operations; ii) new facilities or operations that increase overall production; iii) new infrastructure and logistics that are required to support higher production levels; iv) new reserves or a positive change in the company's reserves profile in Exploration and Production operations; or v) margin improvement, by increasing revenues or reducing costs.
- (3)
- Sustaining capital expenditures include capital investments that i) ensure compliance or maintain relations with regulators and other stakeholders; ii) improve efficiency and reliability of operations or maintain productive capacity by replacing component assets at the end of their useful lives; iii) deliver existing proved developed reserves for Exploration and Production operations; or iv) maintain current production capacities at existing Oil Sands operations and Refining and Marketing operations.
In 2015, Suncor spent $6.220 billion on property, plant and equipment and exploration activities, and capitalized $447 million of interest on debt towards major development assets and construction projects. Activity in 2015 included the following:
Oil Sands Base
Oil Sands Base capital expenditures were $1.317 billion, of which $1.056 billion was directed towards sustaining activities as the company continued to progress reliability, safety and environmental sustainment projects. Sustaining capital expenditures were primarily related to planned maintenance in the spring and fall of 2015, purchases of mine haul trucks, and a number of reliability and sustainment projects across the operations.
During 2015, the company reached an agreement with TransAlta to exchange Suncor's Kent Breeze and its 51% share of the Wintering Hills wind power facilities for TransAlta's Poplar Creek cogeneration facilities, which provide steam and power for Suncor's Oil Sands operations. As part of the agreement, Suncor has entered into a 15-year lease to acquire two gas turbine generators and heat recovery steam generators at Poplar Creek, for $303 million. This transaction has been accounted for as a business combination and no cash was exchanged on transfer.
Oil Sands Base growth capital of $261 million was focused on logistical and storage assets which will support market access for Fort Hills' bitumen.
38 SUNCOR ENERGY INC. ANNUAL REPORT 2015
In Situ
In Situ capital expenditures were $622 million, of which $603 million was directed towards sustaining capital expenditures. Sustaining capital in 2015 was focused on the ongoing design and construction of well pads that are expected to maintain existing production levels at Firebag and MacKay River in future years as production from existing well pads decline, and planned Firebag maintenance activities.
Growth capital of $19 million in 2015 related to MacKay River debottlenecking activities.
Oil Sands Ventures
Oil Sands ventures growth capital expenditures were $1.844 billion in 2015, primarily related to the Fort Hills mining project expenditures, which were directed towards engineering, procurement, module fabrication and site construction. All critical milestones were substantially achieved on the Fort Hills project in 2015. Detailed engineering is 96% complete, while construction is more than 50% complete. Suncor completed the purchase of an additional 10% working interest in the Fort Hills project from Total E&P for $360 million, which increases the company's working interest in the project to 50.8%. Following closing, Suncor spent an additional $62 million of capital expenditures as a result of the increase in working interest.
Suncor's share of capital expenditures for the Syncrude joint operation in 2015 was $98 million of sustaining capital, which included expenditures for the spring 2015 turnaround and for a centrifuge to process mature fine tailings.
Exploration and Production
Exploration and Production capital and exploration expenditures were $1.325 billion in 2015, of which $1.305 billion was directed towards growth and exploration.
Growth spending included $545 million for Hebron, as construction of the project continued throughout 2015, with first oil expected in late 2017. Effective January 1, 2016, Suncor's working interest in the Hebron project has been reset. As a result, Suncor's working interest in the project decreased from 22.729% to 21.034%, with Suncor to be reimbursed for costs incurred to December 31, 2015.
Growth spending also related to continued development drilling at Golden Eagle, the HSEU and SWRX projects, which leverage existing facilities and infrastructure. Spending also related to exploration drilling at the deepwater Shelburne Basin offshore Nova Scotia, appraisal drilling on the operated Beta prospect in Norway as well as other exploration drilling in the North Sea.
Refining and Marketing
Refining and Marketing spent $810 million on capital expenditures in 2015, of which $766 million was directed to sustaining activities focused on planned maintenance events at the company's refineries and in its retail business on the ongoing sustainment of operations, as well as improvements to an existing pipeline to connect the Denver refinery with crude supply.
Growth spending of $44 million was primarily spent on modifications made to the Montreal refinery in support of the Enbridge Line 9 reversal.
Significant Growth Projects Update(1)(2)
| At December 31, 2015 | Working Interest (%) | Description | Cost Estimate ($ millions) | Project Spend to Date ($ millions) | Expected First Oil Date(3) | |||||||
| Operated | ||||||||||||
| Fort Hills(4) | 50.80 | 91.4 mbbls/d | 6 500 | 3 159 | Q4 2017 | |||||||
| Non-operated(5)(6) | ||||||||||||
| Hebron | 22.73 | 34.2 mboe/d | 2 800 (+/-10%) | 1 774 | Q4 2017 | |||||||
- (1)
- Cost Estimate and Project Spend to Date figures reflect post-sanction estimates and expenditures, excluding capitalized interest.
- (2)
- The Capital Investment Update section contains forward-looking information. See the Advisories – Forward-Looking Information section of this MD&A for the material risks and assumptions underlying this forward-looking information.
- (3)
- Expenditures to complete the project may extend beyond the first oil date.
- (4)
- Fort Hills cost estimate increase is due to acquisition of additional 10% in the fourth quarter of 2015.
- (5)
- Cost and first oil estimates are provided by the operator.
- (6)
- Effective January 1, 2016, working interests in the Hebron project have been reset. As a result, Suncor's working interest in the project decreased from 22.729% to 21.034%, reducing Suncor's share of estimated production to 31.6 mboe/d.
SUNCOR ENERGY INC. ANNUAL REPORT 2015 39
The table above summarizes major growth projects that have been sanctioned for development by the company. Other potential material growth projects have not yet received a final investment decision by the company or its Board of Directors.
The Fort Hills mining project will be developed using traditional open-pit truck and shovel techniques, and solvent-based extraction technology that will allow the mine to produce bitumen product that is sold directly to market. The project is scheduled to produce first oil as early as the fourth quarter of 2017 and achieve 90% of its planned gross production capacity of 180,000 bbls/d within twelve months. Project activities in 2016 are expected to focus on completing procurement for all areas except mining and completing construction in the ore processing plant, extraction and infrastructure areas. In the fourth quarter of 2015, Suncor acquired an additional 10% working interest in the Fort Hills oil sands project from Total E&P for $360 million.
The co-owners for the Hebron project sanctioned development on December 31, 2012. The Hebron field includes a gravity-based structure design supporting an expected gross oil production rate of 150,000 bbls/d. Project activity in 2016 is expected to focus on construction of the gravity-based structure and topsides.
Other Capital Projects
Suncor also anticipates 2016 capital expenditures to be directed to the following projects and initiatives:
Oil Sands Operations
For 2016, plans for sustaining capital continue to focus on planned maintenance, which includes a turnaround on Upgrader 2, maintaining production capacity at existing facilities, primarily related to new well pads for In Situ assets to offset natural production declines, and tailings management operations.
Growth capital will continue to focus on logistical and storage assets which will support market access for Fort Hills' bitumen.
Oil Sands Ventures
Sustaining capital expenditures in 2016 for Syncrude are expected to focus on planned maintenance, development of tailings management facilities and maintaining production capacity.
Exploration and Production
For 2016, growth capital will continue to focus on development drilling at Hibernia, HSEU and White Rose within E&P Canada as well as focus on the continuation of Golden Eagle development drilling. E&P Canada growth capital also includes exploration drilling in the Shelburne Basin.
Refining and Marketing
The company expects that sustaining capital will focus on planned maintenance events and routine asset replacement.
40 SUNCOR ENERGY INC. ANNUAL REPORT 2015
8. FINANCIAL CONDITION AND LIQUIDITY
Liquidity and Capital Resources
| At December 31 ($ millions, except as noted) | 2015 | 2014 | 2013 | ||||||
| Net cash from (used in) | |||||||||
| Operating activities | 6 884 | 8 936 | 10 100 | ||||||
| Investing activities | (6 771 | ) | (6 863 | ) | (6 533 | ) | |||
| Financing activities | (1 854 | ) | (1 872 | ) | (2 832 | ) | |||
| Foreign exchange gain on cash and cash equivalents | 295 | 92 | 82 | ||||||
| (Decrease) increase in cash and cash equivalents | (1 446 | ) | 293 | 817 | |||||
| Cash and Cash equivalents, end of year | 4 049 | 5 495 | 5 202 | ||||||
| Return on Capital Employed (%)(1)(2) | |||||||||
| Excluding major projects in progress | 0.6 | 8.6 | 11.5 | ||||||
| Including major projects in progress | 0.5 | 7.5 | 9.9 | ||||||
| Net debt to cash flow from operations(2) (times) | 1.7 | 0.9 | 0.7 | ||||||
| Interest coverage on long-term debt (times) | |||||||||
| Earnings basis(3) | (1.8 | ) | 6.6 | 9.5 | |||||
| Cash flow from operations basis(2)(4) | 9.3 | 15.5 | 16.8 | ||||||
- (1)
- Non-GAAP financial measure. ROCE is reconciled in the Advisories – Non-GAAP Financial Measures section of this MD&A.
- (2)
- Cash flow from operations and metrics that use cash flow from operations are non-GAAP financial measures. See the Advisories – Non-GAAP Financial Measures section of this MD&A.
- (3)
- Net earnings plus income taxes and interest expense, divided by the sum of interest expense and capitalized interest on debt.
- (4)
- Cash flow from operations plus current income taxes and interest expense, divided by the sum of interest expense and capitalized interest on debt.
Cash Flow from Operating Activities
Cash flow from operating activities was $6.884 billion in 2015 compared to $8.936 billion in 2014. The decrease was primarily due to significantly lower upstream price realizations consistent with the decline in benchmark crude oil prices, partially offset by strong Oil Sands operations production due to improved reliability, a strong downstream pricing environment and lower operating costs companywide.
Cash Flow used in Investment Activities
Cash flow used in investing activities was $6.771 billion in 2015 compared to $6.863 billion in 2014. The decrease in net cash flow used in 2015 was primarily due to a reduction in the capital spending program in response to the declining commodity price environment. This was partially offset by the acquisition of an additional 10% working interest in the Fort Hills oil sands project from Total E&P for $360 million.
Cash Flow used in Financing Activities
Cash flow used in financing activities was $1.854 billion in 2015 compared to $1.872 billion in 2014. The decrease in cash flow used in 2015 was primarily due to a decrease in the share buyback program that was suspended, partially offset by no new debt issuances in 2015 and an increase in dividends paid.
Capital Resources
Suncor's capital resources consist primarily of cash flow provided by operating activities, cash and cash equivalents, and available lines of credit. Management believes the company will have the capital resources to fund its planned 2016 capital spending program of $6.0 to $6.5 billion, which includes the incremental 10% share of the Fort Hills project acquired in 2015, the sustaining capital costs and dividend requirements associated with the acquisition of COS, detailed below, and meet current and future working capital requirements through existing cash balances and short-term investments, cash flow provided by operating activities, available committed credit facilities, issuing commercial paper and/or by the issuance of long-term notes or debentures. The company's cash flow provided by operating activities depends on a number of factors, including commodity prices, production and sales volumes, refining and marketing margins, operating expenses, taxes, royalties and foreign exchange rates. If additional capital is required, Suncor's management believes adequate additional financing will be available in debt capital markets at commercial terms and rates.
SUNCOR ENERGY INC. ANNUAL REPORT 2015 41
The company has invested excess cash in short-term financial instruments that are presented as cash and cash equivalents. The objectives of the company's short-term investment portfolio are to ensure the preservation of capital, maintain adequate liquidity to meet Suncor's cash flow requirements and deliver competitive returns derived from the quality and diversification of investments within acceptable risk parameters. The maximum weighted average term to maturity of the short-term investment portfolio is not expected to exceed six months, and all investments will be with counterparties with investment grade debt ratings.
On October 5, 2015, Suncor made an offer to acquire all of the outstanding common shares of COS for 0.25 of a common share of Suncor for each common share of COS. COS has a 36.74% interest in Syncrude and had an estimated 485 million shares outstanding at December 31, 2015. In February 2016, Suncor acquired 84.2% of the shares of COS for consideration of 0.28 of a Suncor share for each COS share. The transaction valued COS at $6.9 billion at the time of the acquisition, which represented the market value of Suncor common shares exchanged and $2.6 billion of COS net debt. COS subsequently called a shareholder meeting for March 21, 2016, at which time the remaining COS shares can be acquired by Suncor pursuant to a subsequent acquisition transaction.
The acquisition, and subsequent planned acquisition, of the shares of COS will impact Suncor's liquidity and capital resources. At January 31, 2016, COS had approximately $1.5 billion of U.S. dollar denominated debt and $550 million drawn on a credit facility. The first scheduled debt repayment is US$500 million in 2019. The acquisition, when complete, is anticipated to result in Suncor issuing a total of 136 million common shares in February and March of 2016, which at the current dividend payment would result in an annual incremental $157 million of dividends paid by Suncor. The incremental ownership is expected to provide additional cash flow from operating activities and result in increased sustaining capital expenditures of approximately $250 million for 2016. Suncor's ultimate net cash flows will depend on the performance of the underlying Syncrude asset as well as other factors, such as prices received for SCO.
Available Sources of Liquidity
Cash and Cash Equivalents
Included in cash and cash equivalents of $4.049 billion at December 31, 2015 are short-term investments with weighted average terms to maturity of approximately 10.5 days. In 2015, the company earned approximately $30.2 million of interest income on this portfolio.
Financing Activities
Management of debt levels continues to be a priority for Suncor given the company's long-term growth plans and pricing environment. Suncor believes a phased and flexible approach to existing and future growth projects should assist the company in maintaining its ability to manage project costs and debt levels.
Suncor's interest on debt (before capitalized interest) in 2015 was $870 million, an increase from $739 million in 2014 primarily due to the weakening of the Canadian dollar.
Available lines of credit at December 31, 2015 increased to $7.034 billion, compared to $4.136 billion at December 31, 2014, primarily due to a new US$2.0 billion credit facility added in the first quarter of 2015 that matures in the second quarter of 2019.
A summary of total and unutilized credit facilities is as follows:
| ($ millions) | 2015 | |||
| Fully revolving for a period of one year after term-out date (April 2016) | 2 000 | |||
| Fully revolving and expires in 2017 | 1 600 | |||
| Fully revolving for a period of four years and expires in April 2019 | 5 768 | |||
| Can be terminated at any time at the option of the lenders | 165 | |||
| Total credit facilities | 9 533 | |||
| Credit facilities supporting outstanding commercial paper | (748 | ) | ||
| Credit facilities supporting standby letters of credit | (1 569 | ) | ||
| Total unutilized credit facilities(1) | 7 216 | |||
- (1)
- Available credit facilities for general purposes were $7 034 million at December 31, 2015 (December 31, 2014 – $4 136 million).
Total Debt to Total Debt Plus Shareholders' Equity
Suncor is subject to financial and operating covenants related to its bank debt and public market debt. Failure to meet the terms of one or more of these covenants may constitute an Event of Default as defined in the respective debt agreements, potentially resulting in accelerated repayment of one or more of the debt obligations. The company is in compliance with its financial covenant that requires total debt to not exceed 65% of its total debt plus shareholders' equity. At December 31, 2015, total debt to total debt plus shareholders' equity was 28% (December 31, 2014 – 24%). The company is currently in
42 SUNCOR ENERGY INC. ANNUAL REPORT 2015
compliance with all operating covenants as at December 31, 2015.
| At December 31 ($ millions, except as noted) | 2015 | 2014 | ||||
| Short-term debt | 747 | 806 | ||||
| Current portion of long-term debt | 70 | 34 | ||||
| Long-term debt | 14 486 | 12 489 | ||||
| Total debt | 15 303 | 13 329 | ||||
| Less: Cash and cash equivalents | 4 049 | 5 495 | ||||
| Net debt | 11 254 | 7 834 | ||||
| Shareholders' equity | 39 039 | 41 603 | ||||
| Total debt plus shareholders' equity | 54 342 | 54 932 | ||||
| Total debt to total debt plus shareholders' equity (%) | 28 | 24 | ||||
Change in Net Debt
| ($ millions) | |||||
| Net debt – December 31, 2014 | 7 834 | ||||
| Increase in net debt | 3 420 | ||||
| Net debt – December 31, 2015 | 11 254 | ||||
| Change in net debt | |||||
| Cash flow from operations | 6 806 | ||||
| Capital and exploration expenditures and other investments | (6 685 | ) | |||
| Proceeds from disposal of assets | 277 | ||||
| Acquisitions | (360 | ) | |||
| Dividends less proceeds from exercise of share options | (1 553 | ) | |||
| Change in non-cash working capital | 75 | ||||
| Foreign exchange on cash, debt and other balances | (1 980 | ) | |||
| (3 420 | ) | ||||
At December 31, 2015, Suncor's net debt was $11.254 billion, compared to $7.834 billion at December 31, 2014. During 2015, net debt increased by $3.420 billion, largely due to the impact of the weaker Canadian dollar relative to the U.S. dollar on the valuation of U.S. denominated debt and dividend payments, partially offset by cash flow from operations that exceeded capital and exploration expenditures.
For the year ended December 31, 2015, the company's net debt to cash flow from operations measure was 1.7 times, which met management's target of less than 2.0 times.
Credit Ratings
The company's credit ratings impact its cost of funds and liquidity. In particular, the company's ability to access unsecured funding markets and to engage in certain activities on a cost-effective basis is primarily dependent upon maintaining a strong credit rating. A lowering of the company's credit rating may also have potentially adverse consequences for the company's funding capacity or access to the capital markets, may affect the company's ability, and the cost, to enter into normal course derivative or hedging transactions, and may require the company to post additional collateral under certain contracts.
In the first quarter of 2016, Moody's Investors Service downgraded the company's long-term senior debt rating from A3 (negative outlook) to Baa1 (stable outlook), and confirmed the company's short-term U.S. commercial paper program at P2.
As at February 25, 2016, the company's long-term senior debt ratings are:
| Long-Term Senior Debt | Rating | Long-Term Outlook | |||
| Standard & Poor's | A- | Credit Watch | |||
| Dominion Bond Rating Service | A (low | ) | Review | ||
| Moody's Investors Service | Baa1 | Stable | |||
The company's commercial paper ratings are:
| Commercial Paper | Cdn Program Rating | U.S. Program Rating | |||
| Standard & Poor's | A-1 (low | ) | A-2 | ||
| Dominion Bond Rating Service | R-1 (low | ) | Not rated | ||
| Moody's Investors Service | Not rated | P2 | |||
Refer to the Description of Capital Structure – Credit Ratings section of Suncor's 2015 AIF for a description of credit ratings listed above.
Common Shares
Outstanding Shares
| December 31, 2015 (thousands) | |||
| Common shares | 1 446 013 | ||
| Common share options – exercisable and non-exercisable | 17 527 | ||
| Common share options – exercisable | 11 563 | ||
As at February 22, 2016, the total number of common shares outstanding was 1,544,964,541 and the total
SUNCOR ENERGY INC. ANNUAL REPORT 2015 43
number of exercisable and non-exercisable common share options outstanding was 35,835,232. Once exercisable, each outstanding common share option is convertible into one common share. Suncor expects to issue an additional 21.4 million shares to COS shareholders in March 2016 pursuant to a subsequent acquisition transaction.
Share Repurchases
The company may repurchase shares pursuant to a normal course issuer bid (NCIB) through the facilities of the Toronto Stock Exchange, New York Stock Exchange and/or alternative trading platforms. Under its current NCIB, the company may purchase for cancellation up to approximately $500 million worth of its common shares beginning August 5, 2015 and ending August 4, 2016. In accordance with applicable securities laws, repurchases under the program were suspended on October 5, 2015.
During 2015, the company repurchased 1,229,579 common shares at an average price of $34.94 per share, for a total repurchase cost of $43 million.
Pursuant to the NCIB, Suncor has agreed that it will not purchase more than 43,375,481 common shares, which is equal to approximately 3% of Suncor's issued and outstanding common shares. Shareholders may obtain a copy of the company's Notice of Intention to make a Normal Course Issuer Bid in relation to the 2015 NCIB, without charge, by contacting Investor Relations.
Since commencing its share buyback program in 2011, Suncor has purchased 156.7 million common shares for a total return to shareholders of $5.340 billion under this program.
| At December 31 ($ millions, except as noted) | 2015 | 2014 | 2013 | 2012 | |||||||
| Share repurchase activities (thousands of common shares) | |||||||||||
| Shares repurchased | 1 230 | 42 027 | 49 492 | 46 862 | |||||||
| Share repurchase cost ($ millions) | |||||||||||
| Repurchase cost | 43 | 1 671 | 1 675 | 1 452 | |||||||
| Option premiums received | — | — | — | (1 | ) | ||||||
| 43 | 1 671 | 1 675 | 1 451 | ||||||||
| Weighted average repurchase price per share, net of option premiums (dollars per share) | 34.93 | 39.76 | 33.84 | 30.96 | |||||||
Contractual Obligations, Commitments, Guarantees, and Off-Balance Sheet Arrangements
In addition to the enforceable and legally binding obligations in the table below, Suncor has other obligations for goods and services that were entered into in the normal course of business, which may terminate on short notice, including commitments for the purchase of commodities for which an active, highly liquid market exists, and which are expected to be re-sold shortly after purchase.
The company does not believe it has any guarantees or off-balance sheet arrangements that have, or are reasonably likely to have, a current or future material effect on the company's financial condition or financial performance, including liquidity and capital resources.
In the normal course of business, the company is obligated to make future payments, including contractual obligations and non-cancellable commitments.
44 SUNCOR ENERGY INC. ANNUAL REPORT 2015
| Payment due by period | |||||||||||||||
| ($ millions) | 2016 | 2017 | 2018 | 2019 | 2020 | 2021 and beyond | Total | ||||||||
| Fixed and revolving term debt(1) | 1 467 | 707 | 3 876 | 551 | 551 | 17 277 | 24 429 | ||||||||
| Finance lease obligations | 57 | 58 | 62 | 28 | 31 | 1 028 | 1 264 | ||||||||
| Decommissioning and restoration costs(2) | 388 | 429 | 520 | 601 | 535 | 7 395 | 9 868 | ||||||||
| Operating lease agreements, pipeline capacity and energy services commitments(3) | 2 337 | 1 653 | 1 479 | 1 288 | 1 180 | 10 253 | 18 190 | ||||||||
| Exploration work commitments | 1 | 83 | 145 | 128 | 125 | 112 | 594 | ||||||||
| Other long-term obligations(4) | 3 | 20 | 10 | 19 | 19 | 19 | 90 | ||||||||
| Total | 4 253 | 2 950 | 6 092 | 2 615 | 2 441 | 36 084 | 54 435 | ||||||||
- (1)
- Includes debt that is redeemable at Suncor's option and interest payments on fixed-term debt.
- (2)
- Represents the undiscounted amount of decommissioning and restoration costs.
- (3)
- The company has also entered into various pipeline commitments which are awaiting regulatory approval. In the event regulatory approval is not obtained, Suncor has committed to reimburse certain costs to the service provider.
- (4)
- Includes the Libya ESPA signature bonus and merger consent. See the Other Long-Term Liabilities note to the audited Consolidated Financial Statements.
Transactions with Related Parties
The company enters into transactions with related parties in the normal course of business. These transactions primarily include sales to associated entities in the company's Refining and Marketing segment. For more information on these transactions and for a summary of Compensation of Key Management Personnel, refer to note 30 to the 2015 audited Consolidated Financial Statements.
Financial Instruments
Suncor periodically enters into derivative contracts for risk management purposes. The derivative contracts hedge risks related to purchases and sales of commodities, to manage exposure to interest rates and to hedge risks specific to individual transactions. For the year ended December 31, 2015, the pre-tax earnings impact for risk management activities was a gain of $93 million (2014 – pre-tax gain of $176 million).
The company's Energy Trading business uses crude oil, natural gas, refined products and other derivative contracts to generate net earnings. For the year ended December 31, 2015, the pre-tax earnings impact for Energy Trading activities was a gain of $28 million (2014 – pre-tax gain of $173 million).
Assets Available for Sale relate to the company's investment in Pioneer Energy. As a result of an agreement to sell the company's share of its assets of Pioneer Energy, Suncor increased the fair value of its investment in Pioneer Energy by $98 million to $183 million in the third quarter of 2014 based on the agreed upon selling price. This transaction was completed in 2015.
Gains or losses related to derivatives are recorded as Other Income in the Consolidated Statements of Comprehensive Income.
SUNCOR ENERGY INC. ANNUAL REPORT 2015 45
| ($ millions) | Energy Trading | Risk Management | Total | |||||
| Fair value of contracts, outstanding – January 1, 2014 | (138 | ) | (1 | ) | (139 | ) | ||
| Fair value of contracts realized during the year | (15 | ) | (65 | ) | (80 | ) | ||
| Changes in fair value during the year | 173 | 176 | 349 | |||||
| Fair value of contracts, outstanding – December 31, 2014 | 20 | 110 | 130 | |||||
| Fair value of contracts realized during the year | (66 | ) | (183 | ) | (249 | ) | ||
| Changes in fair value during the year | 28 | 93 | 121 | |||||
| Fair value outstanding – December 31, 2015 | (18 | ) | 20 | 2 | ||||
The fair value of derivative contracts are recorded in the Consolidated Balance Sheets.
| Fair value of derivative contracts at December 31 ($ millions) | 2015 | 2014 | ||||
| Accounts receivable | 90 | 211 | ||||
| Accounts payable | (88 | ) | (81 | ) | ||
| 2 | 130 | |||||
Risks Associated with Derivative Financial Instruments
Suncor may be exposed to certain losses in the event that counterparties to derivative financial instruments are unable to fulfil their obligations under these contracts. The company minimizes this risk by entering into agreements with investment grade counterparties. Risk is also minimized through regular management review of the potential exposure to and credit ratings of such counterparties. Suncor's exposure is limited to those counterparties holding derivative contracts with net positive fair values at a reporting date.
Suncor's risk management activities are subject to periodic reviews by management to determine appropriate hedging requirements based on the company's tolerance for exposure to market volatility, as well as the need for stable cash flow to finance future growth. Energy Trading activities are governed by a separate risk management group that reviews and monitors practices and policies and provides independent verification and valuation of these activities.
For further details on our derivative financial instruments, including assumptions made in the calculation of fair value, a sensitivity analysis of the effect of changes in commodity prices on our derivative financial instruments, and additional discussion of exposure to risks and mitigation activities, see the Financial Instruments and Risk Management note in the company's 2015 audited Consolidated Financial Statements.
46 SUNCOR ENERGY INC. ANNUAL REPORT 2015
9. ACCOUNTING POLICIES AND CRITICAL ACCOUNTING ESTIMATES
Suncor's significant accounting policies are described in note 3 to the audited Consolidated Financial Statements for the year ended December 31, 2015.
Recently Announced Accounting Pronouncements
The standards and interpretations that are issued, but not yet effective up to the date of issuance of the company's consolidated financial statements, and that may have an impact on the disclosures and financial position of the company, are disclosed below. The company intends to adopt these standards and interpretations, if applicable, when they become effective.
Accounting for Acquisitions of Interests in Joint Operations
In May 2014, the IASB issued amendments to IFRS 11Joint Arrangements to clarify that the acquirer of an interest in a joint operation in which the activity constitutes a business is required to apply all of the principles of business combinations accounting in IFRS 3Business Combinations. Prospective application of this interpretation is effective for annual periods beginning on or after January 1, 2016, with earlier application permitted. The adoption of this amendment could impact the company in the event it increases or decreases its ownership share in an existing joint operation or invests in a new joint operation.
Sale or Contribution of Assets between an Investor and its Associate or Joint Venture
In September 2014, the IASB issued amendments to address an inconsistency between the requirements in IFRS 10Consolidated Financial Statements and those in International Accounting Standard (IAS) 28Investments in Associates and Joint Ventures regarding the sale or contribution of assets between an investor and its associate or joint venture. The amendment clarified that a full gain or loss is recognized when a transaction involves a business. A partial gain or loss is recognized when a transaction involves assets that do not constitute a business. Prospective application of this interpretation is effective for annual periods beginning on or after January 1, 2016, with earlier application permitted. The adoption of this amendment could impact the company in the event that it has transactions with Associates or Joint Ventures.
Disclosure Initiative
In December 2014, the IASB issued amendments to IAS 1Presentation of Financial Statements to clarify existing requirements related to materiality, order of notes, subtotals, accounting policies and disaggregation. Retrospective application of this standard is effective for fiscal years beginning on or after January 1, 2016, with earlier application permitted. The adoption of this amended standard is not expected to have a material impact on the company's disclosure.
Revenue from Contracts with Customers
In May 2014, the IASB issued IFRS 15Revenue from Contracts with Customers. It replaces existing revenue recognition guidance and provides a single, principles-based five-step model to be applied to all contracts with customers. Retrospective application of this standard is effective for fiscal years beginning on or after January 1, 2018, with earlier application permitted. The company is currently assessing the impact of this standard.
Financial Instruments: Recognition and Measurement
In July 2014, IFRS 9Financial Instruments was issued as a complete standard, including the requirements previously issued related to classification and measurement of financial assets and liabilities, and additional amendments to introduce a new expected loss impairment model for financial assets including credit losses. Retrospective application of this standard with certain exemptions is effective for fiscal years beginning on or after January 1, 2018, with earlier application permitted. The company is currently assessing the impact of this standard.
Leases
In January 2016, the IASB issued IFRS 16Leases which replaces the existing leasing standard (IAS 17Leases) and requires the recognition of most leases as finance leases on the balance sheet. IFRS 16 effectively treats all leases as finance leases for lessees by removing the classification of leases as either finance or operating leases. Finance lease exemptions exist for short-term leases where the term is twelve months or less and for leases of low value items. The accounting treatment for lessors remains the same, which provides the choice of classifying a lease as either a finance or operating lease. IFRS 16 is effective January 1, 2019, with earlier application permitted. The company is currently assessing the impact of this standard.
Significant Accounting Estimates and Judgments
The preparation of financial statements in accordance with GAAP requires management to make estimates, judgments and assumptions that affect reported assets, liabilities, revenues, expenses, gains, losses, and disclosures of contingencies. These estimates and judgments are subject to change based on experience and new information.
Significant accounting estimates are those estimates that require management to make assumptions about matters
SUNCOR ENERGY INC. ANNUAL REPORT 2015 47
that are highly uncertain at the time the estimate is made, and those estimates where changes in significant assumptions that are within a range of reasonably possible outcomes would have a material impact on the company's financial condition, changes in financial condition or financial performance.
Significant judgments are those judgments made by management in the process of applying the company's accounting policies and that have the most significant impact on the amounts recognized in the audited Consolidated Financial Statements.
Significant accounting estimates and judgments are reviewed annually by the Audit Committee of the Board of Directors. The following are the significant accounting estimates used in the preparation of Suncor's December 31, 2015 audited Consolidated Financial Statements.
Oil and Gas Reserves and Resources
Measurements of depletion, depreciation, impairment and decommissioning and restoration obligations are determined in part based on the company's estimate of oil and gas reserves and resources. The estimation of reserves and resources is an inherently complex process and involves the exercise of professional judgment. All reserves have been evaluated at December 31, 2015 by independent qualified reserves evaluators. Oil and gas reserves and resources estimates are based on a range of geological, technical and economic factors, including projected future rates of production, projected future commodity prices, engineering data, and the timing and amount of future expenditures, all of which are subject to uncertainty. Estimates reflect market and regulatory conditions existing at December 31, 2015, which could differ significantly from other points in time throughout the year, or future periods. Changes in market and regulatory conditions and assumptions can materially impact the estimation of reserves.
Oil and Gas Activities
The company is required to apply judgment when designating the nature of oil and gas activities as exploration, evaluation, development or production, and when determining whether the costs of these activities shall be expensed or capitalized.
Exploration and Evaluation Costs
Certain exploration and evaluation costs are initially capitalized with the intent to establish commercially viable reserves. The company is required to make judgments about future events and circumstances and applies estimates to assess the economic viability of extracting the underlying reserves. The costs are subject to technical, commercial and management review to confirm the continued intent to develop the project. Level of drilling success or changes to project economics, reserves quantities, expected production techniques, production costs and required capital expenditures are important judgments when making this determination. Management uses judgment to determine when these costs are reclassified to Property, Plant and Equipment based on several factors including the existence of reserves, appropriate approvals from regulatory bodies and the company's internal project approval process.
Project Development
Management uses judgment to determine when exploration and evaluation assets are reclassified to Property, Plant and Equipment. This decision considers several factors, including the existence of reserves, appropriate approvals from regulatory bodies and the company's internal project approval processes.
Determination of Cash Generating Units (CGU)
A CGU is the lowest grouping of integrated assets that generate identifiable cash inflows that are largely independent of the cash inflows of other assets or groups of assets. The allocation of assets into CGUs requires significant judgment and interpretations with respect to the integration between assets, the existence of active markets, similar exposure to market risks, shared infrastructures, and the way in which management monitors the operations.
Asset Impairment and Reversals
Management applies judgment in assessing the existence of impairment and impairment reversal indicators based on various internal and external factors.
The recoverable amount of CGUs and individual assets is determined based on the higher of fair value less costs of disposal or value-in-use calculations. The key estimates the company applies in determining the recoverable amount normally include estimated future commodity prices, expected production volumes, future operating and development costs, discount rates, tax rates, and refining margins. In determining the recoverable amount, management may also be required to make judgments regarding the likelihood of occurrence of a future event. Changes to these estimates and judgments will affect the recoverable amounts of CGUs and individual assets and may then require a material adjustment to their related carrying value.
Regardless of any indication of impairment, the company must complete an annual impairment assessment for any CGU, or group of CGUs, whose net carrying value includes indefinite-life intangible assets or an allocation of goodwill. For Suncor, this includes impairment assessments of the Oil Sands segment as at December 31, 2015 and the Refining
48 SUNCOR ENERGY INC. ANNUAL REPORT 2015
and Marketing segment as at October 31, 2015, which determined that the underlying CGUs were not impaired.
During 2015, an impairment indicator existed due to a significant decline in benchmark crude prices, and as such, the company completed impairment assessments for its CGUs in the Oil Sands and Exploration and Production segments as at December 31, 2015. Impairments were recorded on both Oil Sands and Exploration and Production assets.
Refer to note 9 to the 2015 audited Consolidated Financial Statements for impairments recorded during 2015.
Decommissioning and Restoration Costs
The company recognizes liabilities for the future decommissioning and restoration of Exploration and Evaluation assets and Property, Plant and Equipment. Management applies judgment in assessing the existence and extent as well as the expected method of reclamation of the company's decommissioning and restoration obligations at the end of each reporting period. Management also uses judgment to determine whether the nature of the activities performed is related to decommissioning and restoration activities or normal operating activities.
In addition, these provisions are based on estimated costs, which take into account the anticipated method and extent of restoration, technological advances, possible future use of the site, and reclamation projects and processes such as the TROTM process and the water treatment facility. Actual costs are uncertain and estimates can vary as a result of changes to relevant laws and regulations related to the use of certain technologies, the emergence of new technology, operating experience, prices and closure plans. The estimated timing of future decommissioning and restoration may change due to certain factors, including reserves life. Changes to estimates related to future expected costs, discount rates, inflation assumptions, and timing may have a material impact on the amounts presented.
Suncor's provision for decommissioning and restoration costs increased by $1.0 billion in 2015 to $9.9 billion on an undiscounted basis and increased by $0.4 billion to $5.5 billion on a discounted basis. The most significant change in the provision is related to a change in the discount rate, increased disturbance and an increase in certain cost estimates in the Oil Sands and Exploration and Production segments. The provision also increased due to a decrease in the average credit-adjusted discount rate (2015 – 4.37%; 2014 – 3.93%).
Employee Future Benefits
The company provides benefits to employees, including pensions and other post-retirement benefits. The cost of defined benefit pension plans and other post-retirement benefits received by employees is estimated based on actuarial valuation methods that require professional judgment. Estimates typically used in determining these amounts include, as applicable, rates of employee turnover, future claim costs, discount rates, future salary and benefit levels, the return on plan assets, mortality rates and future medical costs. Changes to these estimates may have a material impact on the amounts presented.
The fair value of plan assets is determined using market values. The estimated rate of return on plan assets in the portfolio considers the current level of returns on fixed income assets, the historical level of risk premium associated with other asset classes and the expected future returns on all asset classes. The discount rate assumption is based on the year-end interest rates for high-quality bonds that mature at times concurrent with the company's benefit obligations. The estimated rate for compensation increases is based on management's judgment.
Actuarial valuations are subject to management's judgment. Actuarial gains and losses comprise changes to assumptions related to discount rates, expected return on plan assets and annual rates for compensation increases. They are accounted for on a prospective basis and may have a material impact on the amounts presented.
Other Provisions
The determination of other provisions, including, but not limited to, provisions for royalty disputes, onerous contracts, litigation and constructive obligations, is a complex process that involves judgments about the outcomes of future events, the interpretation of laws and regulations, and estimates on timing and amount of expected future cash flows and discount rates.
The company is involved in litigation and claims in the normal course of operations. As at December 31, 2015, management believes the result of any settlements related to such litigation or claims would not materially affect the financial position of the company.
Income Taxes
Management evaluates tax positions, annually or when circumstances require, which involves judgment and could be subject to differing interpretations of applicable tax legislation. The company recognizes a tax provision when a payment to tax authorities is considered probable. However, the results of audits and reassessments and changes in the interpretations of standards may result in changes to those positions and potentially a material increase or decrease in the company's assets, liabilities and net earnings.
SUNCOR ENERGY INC. ANNUAL REPORT 2015 49
Deferred Income Taxes
Deferred tax assets are recognized when it is considered probable that deductible temporary differences will be recovered in the foreseeable future. To the extent that future taxable income and the application of existing tax laws in each jurisdiction differ significantly from the company's estimate, the ability of the company to realize the deferred tax assets could be impacted.
Deferred tax liabilities are recognized when there are taxable temporary differences that will reverse and result in a future outflow of funds to a taxation authority. The company records a provision for the amount that is expected to be settled, which requires judgment as to the ultimate outcome. Deferred tax liabilities could be impacted by changes in the company's judgment of the likelihood of a future outflow and estimates of the expected settlement amount, timing of reversals, and the tax laws in the jurisdictions in which the company operates.
Control and Significant Influence
Control is defined as the power to govern the financial and operating decisions of an entity so as to obtain benefits from its activities, and significant influence is defined as the power to participate in the financial and operating decisions of the investee. The assessment of whether the company has control, joint control, or significant influence over another entity requires judgment of the impact it has over the financial and operating decisions of the entity and the extent of the benefits it obtains.
Joint Arrangements
Joint arrangements represent arrangements in which two or more parties have joint control established by a contractual agreement. Joint control requires unanimous consent for financial and operational decisions. Joint arrangements can be classified as either a joint operation or a joint venture. The classification depends on the contractual rights and obligations of each investor, rather than the legal structure of the joint arrangement.
Where the company has a direct ownership interest in jointly controlled assets and obligations for the liabilities of a joint arrangement, such joint arrangement is classified as a joint operation and the company's share of the assets, liabilities, revenue and expenses is included in the consolidated financial statements.
Interests in joint ventures are accounted for using the equity method of accounting. Under the equity method, the company's initial investment is recognized at cost and subsequently adjusted for the company's share of the joint venture's income or loss, less distributions received.
Fair Value of Financial Instruments
The fair value of a financial instrument is determined, whenever possible, based on observable market data. If not available, the company uses third-party models and valuation methodologies that utilize observable market data including forward commodity prices, foreign exchange rates and interest rates to estimate the fair value of financial instruments, including derivatives. In addition to market information, the company incorporates transaction-specific details that market participants would utilize in a fair value measurement, including the impact of non-performance risk.
Functional Currency
The designation of the functional currency of the company and each of its subsidiaries is a management judgment based on the composition of revenue and costs in the locations in which it operates.
Fair Value of Share-Based Compensation
The fair values of equity-settled and cash-settled share-based payment awards are estimated using the Black-Scholes options pricing model. These estimates depend on certain assumptions, including share price, volatility, risk-free interest rate, the term of the awards, the forfeiture rate and the annual dividend yield, which, by their nature, are subject to measurement uncertainty.
50 SUNCOR ENERGY INC. ANNUAL REPORT 2015
Suncor is committed to a proactive program of enterprise risk management intended to enable decision-making through consistent identification of risks inherent to its assets, activities and operations. Some of these risks are common to operations in the oil and gas industry as a whole, while some are unique to Suncor. The company's enterprise risk committee (ERC), comprised of senior representatives from business and functional groups across Suncor, oversees entity-wide processes to identify, assess and report on the company's principal risks.
Volatility of Commodity Prices
Our financial performance is closely linked to prices for crude oil in our upstream business and prices for refined petroleum products in our downstream business, and, to a lesser extent, to natural gas prices in our upstream business, where natural gas is both an input and output of production processes. The prices for all of these commodities can be influenced by global and regional supply and demand factors, which are factors that are beyond our control and can result in a high degree of price volatility.
Crude oil prices are also affected by, among other things, global economic health and global economic growth (particularly in emerging markets), pipeline constraints, regional and international supply and demand imbalances, political developments, compliance or non-compliance with quotas agreed upon by the Organization of Petroleum Export Countries (OPEC) members, decisions by OPEC not to impose quotas on its members, access to markets for crude oil, and weather. These factors impact the various types of crude oil and refined products differently and can impact differentials between light and heavy grades of crude oil (including blended bitumen), and between conventional and synthetic crude oil.
Refined petroleum product prices and refining margins are also affected by, among other things, crude oil prices, the availability of crude oil and other feedstock, levels of refined product inventories, regional refinery availability, marketplace competitiveness, and other local market factors. Natural gas prices in North America are affected primarily by supply and demand, and by prices for alternative energy sources. Decreases in refined product margins or increases in natural gas prices could have a material adverse effect on Suncor's financial condition and reserves.
In addition, oil and natural gas producers in North America, and particularly in Canada, may receive discounted prices for their production relative to certain international prices, due to constraints on the ability to transport and sell such products to international markets. A failure to resolve such constraints may result in continued discounted or reduced commodity prices realized by oil and natural gas producers such as Suncor. Suncor's reserves include significant quantities of bitumen and synthetic crude oil that trade at a discount to light and medium crude oil. Bitumen and synthetic crude oil are typically more expensive to produce and process. In addition, the market prices for these products may differ from the established market indices for light and medium grades of crude oil. As a result, the price received for bitumen and synthetic crude oil may differ from the benchmark they are priced against. Future quality differentials are uncertain and a significant increase could have a material adverse effect on Suncor's financial condition.
Through the latter half of 2014 and into 2016, world oil prices have declined significantly. A prolonged period of low and/or volatile prices could affect the value of our upstream and downstream assets and the level of spending on growth projects, and could result in the curtailment of production from some properties and/or the impairment of that property's carrying value. Accordingly, low commodity prices, particularly for crude oil, could have a material adverse effect on Suncor's business, financial condition, reserves, and may also lead to the impairment of assets, or the cancellation or deferral of Suncor's growth projects.
Government Policy
Suncor operates under federal, provincial, state and municipal legislation in numerous countries. The company is also subject to regulation and intervention by governments in oil and gas industry matters, such as land tenure, royalties, taxes (including income taxes), government fees, production rates, environmental protection controls, safety performance, the reduction of greenhouse gas (GHG) and other emissions, the export of crude oil, natural gas and other products, the company's interactions with foreign governments, the awarding or acquisition of exploration and production rights, oil sands leases or other interests, the imposition of specific drilling obligations, control over the development and abandonment of fields and mine sites (including restrictions on production) and possibly expropriation or cancellation of contract rights.
Changes in government policy or regulation, or interpretation thereof, could impact Suncor's existing and planned projects as well as impose costs on compliance resulting in increased capital expenditures and operating expenses. Changes in government policy or regulation or third party opposition to projects, including Northern Gateway and Energy East proposals, could also have an adverse impact on Suncor's operations. The result of such
SUNCOR ENERGY INC. ANNUAL REPORT 2015 51
changes can also lead to additional compliance costs and staffing and resource levels, and also increase exposure to other risks to Suncor's business, including environmental or safety non-compliance and permit approvals.
Income Taxes
Increases in income taxes, such as the increase in the second quarter of 2015 in the Alberta provincial corporate income tax rate from 10% to 12% effective July 1, 2015, could have a material adverse effect on Suncor's financial condition. Pursuant to the previously disclosed 2013 proposal letter from the Canada Revenue Agency (CRA), the company received a Notice of Reassessment (NOR) from the CRA during the second quarter of 2014, regarding the income tax treatment of realized losses in 2007 on the settlement of certain derivative contracts. The total amount of the NOR, including tax, penalty and interest, was approximately $920 million. The company strongly disagrees with the CRA's position and continues to firmly believe it will be able to successfully defend its original filing position and will take the appropriate actions to resolve this matter. In addition to the above, the company has:
- •
- Received NORs related to the derivative contracts from the Provinces of Alberta, Ontario and Quebec for approximately $124 million, $100 million and $42 million, respectively;
- •
- Provided security to the CRA and the Provinces of Quebec and Ontario for approximately $642 million;
- •
- Filed Notices of Objection with the CRA and the Provinces of Alberta, Ontario and Quebec; and
- •
- Filed a Notice of Appeal with the Tax Court of Canada in November 2014 and is now pursuing its Appeal to that Court.
If the company is unsuccessful in defending its tax filing position, it could be subject to an earnings and cash impact of up to $1.2 billion.
Royalties
Royalties can be impacted by changes in crude oil and natural gas pricing, production volumes, and capital and operating costs by changes to existing legislation or PSCs, and by results of regulatory audits of prior year filings and other unexpected events. The final determination of these events may have a material impact on the company's royalties expense.
The occurrence of any of the foregoing could have a material adverse effect on Suncor's business, financial condition, reserves, results of operations and cash flow.
Operational Outages and Major Environmental or Safety Incidents
Each of Suncor's primary operating businesses – Oil Sands, E&P, and Refining and Marketing – requires significant levels of investment in the design, operation and maintenance of facilities and, therefore, carries the additional economic risk associated with operating reliably or enduring a protracted operational outage.
The company's businesses also carry the risks associated with environmental and safety performance, which is closely scrutinized by governments, the public and the media, and could result in a suspension of or inability to obtain regulatory approvals and permits, or, in the case of a major environmental or safety incident, fines, civil suits or criminal charges against the company.
Generally, Suncor's operations are subject to operational hazards and risks such as fires, explosions, blow-outs, power outages, severe winter climate conditions and other extreme weather conditions, railcar incidents or derailment and the migration of harmful substances such as oil spills, gaseous leaks or a release of tailings into water systems, any of which can interrupt operations or cause personal injury or death, or damage to property, equipment, the environment, and information technology systems and related data and control systems.
The reliable operation of production and processing facilities at planned levels and Suncor's ability to produce higher value products can also be impacted by failure to follow operating procedures or operate within established operating parameters, equipment failure through inadequate maintenance, unanticipated erosion or corrosion of facilities, manufacturing and engineering flaws, and labour shortage or interruption. The company is also subject to operational risks such as sabotage, terrorism, trespass, theft and malicious software or network attacks.
In addition to the foregoing factors that affect Suncor's business generally, each business unit is susceptible to additional risks due to the nature of its business, as follows:
- •
- Oil Sands operations are susceptible to loss of production, slowdowns, shutdowns or restrictions on our ability to produce higher value products, due to the failure of any one or more of its interdependent component systems;
- •
- For Suncor's upstream businesses, there are risks and uncertainties associated with drilling for oil and natural gas, the operation and development of such properties and wells (including encountering unexpected formations, pressures, ore grade qualities, or the presence of hydrogen sulphide), premature declines of reservoirs, sour gas releases,
52 SUNCOR ENERGY INC. ANNUAL REPORT 2015
- •
- E&P offshore operations occur in areas subject to hurricanes and other extreme weather conditions, such as winter storms, pack ice, icebergs and fog. The occurrence of any of these events could result in production shut-ins, the suspension of drilling operations, damage to or destruction of the equipment involved and injury or death of rig personnel. Suncor's offshore operations could also be affected by the actions of Suncor's contractors, joint venture operators and agents that could result in similar catastrophic events at their facilities, or could be indirectly affected by catastrophic events occurring at other third-party offshore operations. In either case, this could give rise to liability, damage to the company's equipment, harm to individuals, force a shutdown of our facilities or operations, or result in a shortage of appropriate equipment or specialists required to perform our planned operations; and
- •
- Suncor's Refining and Marketing operations are also subject to all of the risks normally inherent in the operation of refineries, terminals, pipelines and other distribution facilities and service stations, including loss of product, slowdowns due to equipment failures, unavailability of feedstock, price and quality of feedstock or other incidents.
uncontrollable flows of crude oil, natural gas or well fluids, other accidents, and pollution and other environmental risks. Refer also to Significant Risk Factors and Uncertainties Affecting Reserves Data in the 2015 AIF;
Although the company maintains a risk management program, which includes an insurance component, such insurance may not provide adequate coverage in all circumstances, nor are all such risks insurable. It is possible that our insurance coverage will not be sufficient to address the costs arising out of the allocation of liabilities and risk of loss arising from Suncor operations.
The occurrence of any of the foregoing could have a material adverse effect on Suncor's business, financial condition, results of operations and cash flow.
Regulatory Approval and Compliance
Before proceeding with most major projects, including significant changes to existing operations, Suncor must obtain various federal, provincial or state permits and regulatory approvals. Suncor must also obtain licences to operate certain assets. These processes can involve, among other things, stakeholder consultation, environmental impact assessments and public hearings, and may be subject to conditions, including security deposit obligations and other commitments. Suncor can also be indirectly impacted by a third party's inability to obtain regulatory approval for a shared infrastructure project. Compliance can also be affected by the loss of skilled staff, inadequate internal processes and compliance auditing.
As part of ongoing operations, the company is also required to comply with a large number of environmental, health and safety regulations under a variety of Canadian, U.S., U.K. and other foreign, federal, provincial, territorial, state and municipal laws and regulations. Failure to comply with these regulations may result in the imposition of fines and penalties, production constraints, reputational damage, operating and growth permit applications, censure, liability for cleanup costs and damages, and the loss of important licences and permits.
Failure to obtain, comply with or maintain regulatory permits and approvals, or failure to obtain them on a timely basis or on satisfactory terms, could result in delays, abandonment or restructuring of projects and increased costs, all of which could have a material adverse effect on Suncor's business, financial condition, reserves, results of operations and cash flow.
Project Execution
There are certain risks associated with the execution of our major projects and the commissioning and integration of new facilities within our existing asset base.
Project execution risk consists of three related primary risks:
- •
- Engineering – a failure in the specification, design or technology selection;
- •
- Construction – a failure to build the project in the approved time, in accordance with design, and at the agreed cost; and
- •
- Commissioning and startup – a failure of the facility to meet agreed performance targets, including operating costs, efficiency, yield and maintenance costs.
Project execution can also be impacted by:
- •
- Failure to comply with Suncor's project implementation model;
- •
- The availability, scheduling and cost of materials, equipment and qualified personnel;
- •
- The complexities associated with integrating and managing contractor staff and suppliers in a confined construction area;
- •
- Our ability to obtain the necessary environmental and other regulatory approvals;
- •
- The impact of general economic, business and market conditions and our ability to finance growth, including major growth projects in progress, if commodity prices were to decline and stay at low levels for an extended period;
- •
- The impact of weather conditions;
SUNCOR ENERGY INC. ANNUAL REPORT 2015 53
- •
- Risks relating to restarting projects placed in safe mode, including increased capital costs;
- •
- The effect of changing government regulation and public expectations in relation to the impact of oil sands development on the environment;
- •
- Risks associated with offshore fabrication and logistics;
- •
- Risks relating to scheduling, resources and costs, including the availability and cost of materials, equipment and qualified personnel;
- •
- The accuracy of project cost estimates, as actual costs for major projects can vary from estimates, and these differences can be material;
- •
- Our ability to complete strategic transactions; and
- •
- The commissioning and integration of new facilities within our existing asset base could cause delays in achieving guidance, targets and objectives.
The occurrence of any of the foregoing could have a material adverse effect on Suncor's business, financial condition, reserves, results of operations and cash flow.
Fossil Fuel Industry Reputation
Suncor works within an environment characterized by concerns over climate change, with environmental limits seen as a legitimate constraint on economic growth and increased activism and public opposition to fossil fuels. In addition, the social value proposition of resource deployment is being challenged.
Future laws and regulations may impose significant liabilities on a failure to comply with their requirements. Concerns over climate change and fossil fuel extraction could lead governments to enact additional or more stringent laws and regulations applicable to Suncor and other companies in the energy industry.
Changes in environmental regulation could impact the demand, formulation or quality of our products, or by requiring increased capital expenditures or distribution costs, which may or may not be recoverable in the marketplace. The complexity and breadth of changes in environmental regulation make it extremely difficult to predict the potential impact to Suncor.
Climate Change
Suncor continues to actively monitor the international and domestic efforts to address climate change. While it currently appears that GHG regulations and targets will continue to become more stringent, and while Suncor will continue efforts to reduce the intensity of its GHG emissions, the absolute GHG emissions of our company are expected to rise as we pursue a growth strategy. Increases in GHG emissions may impact the profitability of our projects, as Suncor may be subject to incremental levies and taxes.
Land Reclamation
There are risks associated specifically with the company's ability to reclaim mature fine tailings, with TROTM or other methods and technologies. Suncor expects that TROTM will help the company reclaim existing tailings ponds by reducing the volumes of fluid fine tailings. The inability of TROTM or any other methods of technology and/or the increase in time to reclaim tailings ponds could increase Suncor's decommissioning and restoration cost estimates.
Alberta's Land-Use Framework (LARP)
The implementation of, and compliance with, the terms of the LARP may adversely impact our current properties and projects in northern Alberta due to, among other things, environmental limits and thresholds. Due to the cumulative nature of the plan development, the impact of the LARP on Suncor's operations may be outside of the control of the company, as Suncor's operations could be impacted as a result of restrictions imposed due to the cumulative impact of development, by the other operators in the area and not solely in relation to Suncor's direct impact.
Alberta Environment Water Licences
We currently rely on fresh water, which is obtained under licences from Alberta Environment, to provide domestic and utility water at our Oil Sands operations. Water licences, like all regulatory approvals, contain conditions to be met in order to maintain compliance with the licence. There can be no assurance that the licences to withdraw water will not be rescinded or that additional conditions will not be added to these licences. There can be no assurance that the company will not have to pay a fee for the use of water in the future or that any such fees will be reasonable. In addition, the expansion of the company's projects may rely on securing licences for additional water withdrawal, and there can be no assurance that these licences will be granted or that they will be granted on terms favourable to Suncor.
There is a risk that future laws or changes to existing laws or regulations could cause capital expenditures and operating expenses to increase or the demand for our products to decrease. There is also a risk that Suncor could face litigation initiated by third parties relating to climate change.
The occurrence of any of the foregoing could have a material adverse effect on Suncor's business, financial condition, results of operations and cash flow.
54 SUNCOR ENERGY INC. ANNUAL REPORT 2015
Change Capacity
In order to achieve Suncor's business objectives, the company must operate efficiently, reliably and safely, and, at the same time, deliver growth and sustaining projects safely, on budget and on schedule. The ability to achieve these two sets of objectives is critically important to Suncor to deliver value to shareholders and stakeholders. These objectives also demand a large number of improvement initiatives that compete for resources, and may negatively impact the company should there be inadequate consideration of the cumulative impacts of prior and parallel initiatives on people, processes and systems. There is also a risk that these objectives may exceed Suncor's capacity to adopt and implement change. The occurrence of any of the foregoing could have a material adverse effect on Suncor's business, financial condition, results of operations and cash flow.
Cost Management
Suncor is exposed to the risk of escalating operating costs. Suncor's inability to successfully manage costs may constrain its ability to execute high-quality projects that deliver lower operating costs. Factors contributing to these risks include, but are not limited to, the skills and resource shortage and the long-term success of existing and new in situ technologies. The risk of escalating operating costs could have a material adverse effect on Suncor's business, financial condition, reserves, results of operations and cash flow.
Market Access
Suncor anticipates higher production of bitumen in future years, due mainly to production growth from Fort Hills. The markets for bitumen blends or heavy crude are more limited than those for light crude, making them more susceptible to supply and demand changes and imbalances (whether as a result of the availability, proximity, and capacity of pipeline facilities, railcars, or otherwise). Heavy crude oil generally receives lower market prices than light crude, due principally to the lower quality and value of the refined product yield and the higher cost to transport the more viscous product on pipelines, and this price differential can be amplified due to supply and demand imbalances. A shortage of condensate to transport bitumen may cause Suncor's cost to increase due to the need to purchase alternative diluent supplies, thereby increasing the cost to transport bitumen to market and increasing Suncor's operating cost, as well as affecting Suncor's bitumen blend marketing strategy.
There is a risk that constrained market access for oil sands production, due to insufficient pipeline takeaway capacity, growing inland production and refinery outages creates risk of widening differentials that could impact the profitability of product sales, which could have a material adverse effect on our business, financial condition, reserves, results of operations and cash flow.
Information Security
The efficient operation of Suncor's business is dependent on computer hardware and software systems. Information systems are vulnerable to security breaches by computer hackers and cyberterrorists. We rely on industry-accepted security measures and technology to securely maintain confidential and proprietary information stored on our information systems. However, these measures and technology may not adequately prevent security breaches. There is a risk that any significant interruption or the failure of these systems to perform as anticipated for any reason could disrupt our business and could result in decreased performance, production, or increased costs, and could have a material adverse effect on Suncor's business, financial condition, results of operations and cash flow.
In the ordinary course of Suncor's business, Suncor collects and stores sensitive data, including intellectual property, proprietary business information and personally identifiable information of our employees and retail customers. Despite Suncor's security measures, Suncor's information technology and infrastructure may be vulnerable to attacks by hackers and cyberterrorists or breached due to employee error, malfeasance or other disruptions. Any such breach could compromise Suncor's networks and the information Suncor stores could be accessed, publicly disclosed, lost or stolen. Any such access, disclosure or other loss of information could result in legal claims or proceedings, liability under laws that protect the privacy of personal information, regulatory penalties, disrupt Suncor's operations and damage Suncor's reputation, which could have a material adverse effect on Suncor's business, financial condition, results of operations and cash flow.
Financial Risks
Energy Trading and Risk Management Activities and the Exposure to Counterparties
The nature of Suncor's energy trading and risk management activities, which may make use of derivative financial instruments to hedge its commodity price and other market risks, creates exposure to significant financial risks, which include, but are not limited to, the following:
- •
- Unfavourable movements in commodity prices, interest rates or foreign exchange could result in a financial or opportunity loss to the company;
- •
- A lack of counterparties, due to market conditions or other circumstances, could leave us unable to liquidate or offset a position, or unable to do so at or near the previous market price;
- •
- We may not receive funds or instruments from our counterparty at the expected time or at all;
SUNCOR ENERGY INC. ANNUAL REPORT 2015 55
- •
- The counterparty could fail to perform an obligation owed to us;
- •
- Loss as a result of human error or deficiency in our systems or controls; and
- •
- Loss as a result of contracts being unenforceable or transactions being inadequately documented.
The occurrence of any of the foregoing could have a material adverse effect on Suncor's business, financial condition, results of operations and cash flow.
Exchange Rate Fluctuations
Our audited Consolidated Financial Statements are presented in Canadian dollars. The majority of Suncor's revenues from the sale of oil and natural gas are based on prices that are determined by, or referenced to, U.S. dollar benchmark prices, while the majority of Suncor's expenditures are realized in Canadian dollars. The company also holds substantial amounts of U.S. dollar debt. Suncor's results, therefore, can be affected significantly by the exchange rates between the Canadian dollar and the U.S. dollar. The company also undertakes operations administered through international subsidiaries and, so, to a lesser extent, Suncor's results can be affected by the exchange rates between the Canadian dollar and the euro, and the Canadian dollar and the British pound. These exchange rates may vary substantially and may give rise to favourable or unfavourable foreign currency exposure. A decrease in the value of the Canadian dollar relative to the U.S. dollar will increase the revenues received from the sale of commodities. An increase in the value of the Canadian dollar relative to the U.S. dollar will decrease revenue received from the sale of commodities. A decrease in the value of the Canadian dollar relative to the U.S. dollar from the previous balance sheet date increases the amount of Canadian dollars required to settle U.S. dollar denominated obligations. In 2015, the Canadian dollar weakened in relation to the U.S. dollar to 0.72 from 0.86.
The occurrence of any of the foregoing could have a material adverse effect on Suncor's business, financial condition, results of operations and cash flow.
Interest Rate Risk
We are exposed to fluctuations in short-term Canadian and U.S. interest rates as Suncor maintains a portion of its debt capacity in revolving and floating rate bank facilities and commercial paper, and invests surplus cash in short-term debt instruments. We are also exposed to interest rate risk when debt instruments are maturing and require refinancing, or when new debt capital needs to be raised. Unfavourable changes in interest rates could have a material adverse effect on Suncor's business, financial condition, results of operations and cash flow.
Issuance of Debt and Debt Covenants
Suncor expects that future capital expenditures will be financed out of cash generated from operations and borrowings. This ability is dependent on, among other factors, commodity prices, the overall state of the capital markets and investor appetite for investments in the energy industry generally and our securities in particular. To the extent that external sources of capital become limited or unavailable or available on unfavourable terms, our ability to make capital investments and maintain existing properties may be constrained.
If we finance capital expenditures in whole or in part with debt, that may increase our debt levels above industry standards for oil and gas companies of similar size. Depending on future development plans, we may require additional debt financing that may not be available or, if available, may not be available on favourable terms, including higher interest rates and fees. Neither the articles of Suncor (the Articles) nor its bylaws limit the amount of indebtedness that we may incur; however, we are subject to covenants in our existing bank facilities and seek to avoid an unfavourable cost of debt. The level of our indebtedness, from time to time, could impair our ability to obtain additional financing on a timely basis to take advantage of business opportunities that may arise and could negatively affect our credit ratings.
We are required to comply with financial and operating covenants under existing credit facilities and debt securities. We routinely review the covenants based on actual and forecast results and have the ability to make changes to our development plans, capital structure and/or dividend policy to comply with covenants under the credit facilities. If Suncor does not comply with the covenants under its credit facilities and debt securities, there is a risk that repayment could be accelerated and/or the company's access to capital could be restricted or only be available on unfavourable terms.
Rating agencies regularly evaluate the company and our subsidiaries. Their ratings of our long-term and short-term debt are based on a number of factors, including our financial strength, as well as factors not entirely within our control, including conditions affecting the oil and gas industry generally, and the wider state of the economy. Credit ratings may be important to customers or counterparties when we compete in certain markets and when we seek to engage in certain transactions, including transactions involving over-the-counter derivatives. There is a risk that one or more of our credit ratings could be downgraded, which could potentially limit our access to private and public credit markets and increase the company's cost of borrowing. On February 12, 2016, Moody's Investors Service downgraded Suncor's senior unsecured debt from A3 to Baa1. In addition, Suncor's
56 SUNCOR ENERGY INC. ANNUAL REPORT 2015
outlook has been placed under credit watch by Standard & Poor's and under review by Dominion Bond Rating Service.
Dividends
Our payment of future dividends on our common shares will be dependent on, among other things, our financial condition, results of operations, cash flow, the need for funds to finance ongoing operations, debt covenants and other business considerations as the company's Board considers relevant. There can be no assurance that Suncor will continue to pay dividends in the future.
The occurrence of any of the foregoing could have a material adverse effect on Suncor's business, financial condition, reserves, results of operations and cash flow.
Other Risk Factors
A detailed discussion of additional risk factors is presented in our most recent Annual Information Form / Form 40-F, filed with the Canadian and U.S. securities regulators, respectively.
11. OTHER ITEMS
Control Environment
Based on their evaluation as of December 31, 2015, Suncor's Chief Executive Officer and Chief Financial Officer concluded that the company's disclosure controls and procedures (as defined in Rules 13a-15(e) and 15d-15(e) under the United States Securities Exchange Act of 1934, as amended (the Exchange Act)), are effective to ensure that information required to be disclosed by the company in reports that are filed or submitted to Canadian and U.S. securities authorities is recorded, processed, summarized and reported within the time periods specified in Canadian and U.S. securities laws. In addition, as of December 31, 2015, there were no changes in the internal control over financial reporting (as defined in Exchange Act Rules 13a-15(f) and 15d-15(f)) that occurred during the year ended December 31, 2015 that have materially affected, or are reasonably likely to materially affect, the company's internal control over financial reporting. Management will continue to periodically evaluate the company's disclosure controls and procedures and internal control over financial reporting and will make any modifications from time to time as deemed necessary.
As a result of political unrest in Libya and Syria, Suncor is not able to monitor the status of in-country assets. Suncor is continually assessing the control environment in Libya and Syria to the extent possible and does not consider the changes in the countries to have had a material impact on the company's overall internal control over financial reporting.
The effectiveness of our internal control over financial reporting as at December 31, 2015 was audited by PricewaterhouseCoopers LLP, an independent registered public accounting firm, as stated in their report, which is included in our audited Consolidated Financial Statements for the year ended December 31, 2015.
Based on their inherent limitations, disclosure controls and procedures and internal control over financial reporting may not prevent or detect misstatements, and even those controls determined to be effective can provide only reasonable assurance with respect to financial statement preparation and presentation.
Corporate Guidance
In response to a declining crude price outlook, Suncor issued an update to its 2016 corporate guidance. Suncor's press release dated February 3, 2016, which is also available on suncor.com and sedar.com, provides further details and advisories regarding this update to its corporate guidance.
SUNCOR ENERGY INC. ANNUAL REPORT 2015 57
Non-GAAP Financial Measures
Certain financial measures in this MD&A – namely operating earnings, ROCE, cash flow from operations, free cash flow, Oil Sands cash operating costs and LIFO – are not prescribed by GAAP. These non-GAAP financial measures are included because management uses the information to analyze business performance, leverage and liquidity. These non-GAAP financial measures do not have any standardized meaning and, therefore, are unlikely to be comparable to similar measures presented by other companies. Therefore, these non-GAAP financial measures should not be considered in isolation or as a substitute for measures of performance prepared in accordance with GAAP. Except as otherwise indicated, these non-GAAP measures are calculated and disclosed on a consistent basis from period to period. Specific adjusting items may only be relevant in certain periods.
Operating Earnings
Operating earnings is a non-GAAP financial measure that adjusts net earnings for significant items that are not indicative of operating performance. Management uses operating earnings to evaluate operating performance, because management believes it provides better comparability between periods. Operating earnings for each segment are reconciled to net earnings in the Financial Information section of the MD&A.
Bridge Analyses of Operating Earnings
Throughout this MD&A, the company presents charts that illustrate the change in operating earnings from the comparative period through key variance factors. These factors are analyzed in the Operating Earnings narratives following the bridge analyses in that particular section of the MD&A. These bridge analyses are presented because management uses this presentation to analyze performance.
- •
- The factor for Volumes and Mix is calculated based on production volumes and mix for the Oil Sands and Exploration and Production segments and throughput volumes and mix for the Refining and Marketing segment.
- •
- The factor for Price, Margin and Other Revenue includes upstream price realizations before royalties, refining and marketing margins, other operating revenues, and the net impacts of sales and purchases of third-party crude, including product purchased for use as diluent in the company's Oil Sands operations and subsequently sold as part of diluted bitumen.
- •
- The factor for Royalties includes royalties in Libya that represent the difference between gross revenues, which is based on the company's working-interest share of production, and the net revenue attributable to Suncor under the terms of the respective contracts.
- •
- The factor for Inventory reflects the opportunity cost of building production volumes in inventory or the additional margin earned by drawing down inventory produced in previous periods. The calculation of the Inventory factor in a bridge analysis permits the company to present the factor for Volumes and Mix based on production volumes, rather than based on sales volumes.
- •
- The factor for Operating and Transportation Expense includes project startup costs, operating, selling and general expense (adjusted for impacts of changes in inventory), and transportation expense.
- •
- The factor for Financing Expense and Other Income includes financing expenses, other income, operational foreign exchange gains and losses, changes in gains and losses on disposal of assets that are not operating earnings adjustments, changes in statutory income tax rates, and other income tax adjustments.
Return on Capital Employed (ROCE)
ROCE is a non-GAAP financial measure that management uses to analyze operating performance and the efficiency of Suncor's capital allocation process. Average capital employed is calculated as a twelve-month average of the capital employed balance at the beginning of the twelve-month period and the month-end capital employed balances throughout the remainder of the twelve-month period. Figures for capital employed at the beginning and end of the twelve-month period are presented to show the changes in the components of the calculation over the twelve-month period.
58 SUNCOR ENERGY INC. ANNUAL REPORT 2015
The company presents two ROCE calculations – one including and one excluding the impacts on capital employed of major projects in progress. Major projects in progress includes accumulated capital expenditures and capitalized interest for significant projects still under construction or in the process of being commissioned, and acquired assets that are still being evaluated. Management uses ROCE excluding the impacts of major projects in progress on capital employed to assess performance of operating assets.
| Year ended December 31 ($ millions, except as noted) | 2015 | 2014 | 2013 | ||||||||
| Adjustments to net earnings | |||||||||||
| Net earnings | (1 995 | ) | 2 699 | 3 911 | |||||||
| Add after-tax amounts for: | |||||||||||
| Unrealized foreign exchange loss (gain) on U.S. dollar denominated debt | 1 930 | 722 | 521 | ||||||||
| Net interest expense | 312 | 229 | 228 | ||||||||
| A | 247 | 3 650 | 4 660 | ||||||||
| Capital employed – beginning of twelve-month period | |||||||||||
| Net debt | 7 834 | 6 256 | 6 639 | ||||||||
| Shareholders' equity | 41 603 | 41 180 | 39 215 | ||||||||
| 49 437 | 47 436 | 45 854 | |||||||||
| Capital employed – end of twelve-month period | |||||||||||
| Net debt | 11 254 | 7 834 | 6 256 | ||||||||
| Shareholders' equity | 39 039 | 41 603 | 41 180 | ||||||||
| 50 293 | 49 437 | 47 436 | |||||||||
| Average capital employed | B | 50 565 | 48 797 | 46 981 | |||||||
| ROCE – including major projects in progress (%) | A/B | 0.5 | 7.5 | 9.9 | |||||||
| Average capitalized costs related to major projects in progress | C | 7 195 | 6 203 | 6 502 | |||||||
| ROCE – excluding major projects in progress (%) | A/(B-C) | 0.6 | 8.6 | 11.5 | |||||||
SUNCOR ENERGY INC. ANNUAL REPORT 2015 59
Cash Flow from Operations and Free Cash Flow
Cash flow from operations is a non-GAAP financial measure that adjusts a GAAP measure – cash flow provided by operating activities – for changes in non-cash working capital, which management uses to analyze operating performance and liquidity. Changes to non-cash working capital can include, among other factors, the timing of offshore feedstock purchases and payments for fuel and income taxes, and the timing of cash flows related to accounts receivable and accounts payable, which reduces comparability between periods.
| Oil Sands | Exploration and Production | Refining and Marketing | |||||||||||||||||||
| Year ended December 31 ($ millions) | 2015 | 2014 | 2013 | 2015 | 2014 | 2013 | 2015 | 2014 | 2013 | ||||||||||||
| Net earnings (loss) | (856 | ) | 1 776 | 2 040 | (758 | ) | 653 | 1 000 | 2 266 | 1 692 | 2 022 | ||||||||||
| Adjustments for: | |||||||||||||||||||||
| Depreciation, depletion, amortization and impairment | 3 583 | 4 035 | 2 439 | 3 106 | 1 349 | 1 804 | 676 | 635 | 530 | ||||||||||||
| Deferred income taxes | 172 | (139 | ) | 358 | (1 235 | ) | (115 | ) | (130 | ) | (21 | ) | (43 | ) | 64 | ||||||
| Accretion of liabilities | 144 | 140 | 114 | 50 | 44 | 60 | 7 | 7 | 6 | ||||||||||||
| Unrealized foreign exchange (gain) loss on U.S. dollar denominated debt | — | — | — | — | — | — | — | — | — | ||||||||||||
| Change in fair value of derivative contracts | 20 | (34 | ) | — | — | — | — | 60 | (82 | ) | 1 | ||||||||||
| Loss (gain) on disposal of assets | 8 | 3 | — | (5 | ) | (82 | ) | (130 | ) | (109 | ) | (11 | ) | (7 | ) | ||||||
| Share-based compensation | 13 | 22 | 7 | 9 | 8 | 28 | 2 | 4 | 19 | ||||||||||||
| Exploration expenses | — | — | — | 255 | 104 | 82 | — | — | — | ||||||||||||
| Settlement of decommissioning and restoration liabilities | (277 | ) | (324 | ) | (388 | ) | (5 | ) | (20 | ) | (15 | ) | (20 | ) | (20 | ) | (20 | ) | |||
| Other | 28 | (79 | ) | (14 | ) | (31 | ) | (32 | ) | (383 | ) | 11 | (4 | ) | 3 | ||||||
| Cash flow from (used in) operations | 2 835 | 5 400 | 4 556 | 1 386 | 1 909 | 2 316 | 2 872 | 2 178 | 2 618 | ||||||||||||
| (Increase) decrease in non-cash working capital | (27 | ) | 1 252 | 1 225 | 322 | 201 | 656 | 521 | (278 | ) | 566 | ||||||||||
| Cash flow provided by (used in) operating activities | 2 808 | 6 652 | 5 781 | 1 708 | 2 110 | 2 972 | 3 393 | 1 900 | 3 184 | ||||||||||||
60 SUNCOR ENERGY INC. ANNUAL REPORT 2015
| Corporate, Energy Trading and Eliminations | Total | ||||||||||||||
| Year ended December 31 ($ millions) | 2015 | 2014 | 2013 | 2015 | 2014 | 2013 | |||||||||
| Net (loss) earnings | (2 647 | ) | (1 422 | ) | (1 151 | ) | (1 995 | ) | 2 699 | 3 911 | |||||
| Adjustments for: | |||||||||||||||
| Depreciation, depletion, amortization and impairment | 135 | 121 | 119 | 7 500 | 6 140 | 4 892 | |||||||||
| Deferred income taxes | 160 | 73 | 90 | (924 | ) | (224 | ) | 382 | |||||||
| Accretion of liabilities | (4 | ) | 7 | 12 | 197 | 198 | 192 | ||||||||
| Unrealized foreign exchange loss (gain) on U.S. dollar denominated debt | 1 967 | 839 | 605 | 1 967 | 839 | 605 | |||||||||
| Change in fair value of derivative contracts | 50 | (154 | ) | 94 | 130 | (270 | ) | 95 | |||||||
| Gain on disposal of assets | (4 | ) | — | — | (110 | ) | (90 | ) | (137 | ) | |||||
| Share-based compensation | (6 | ) | 72 | 160 | 18 | 106 | 214 | ||||||||
| Exploration expenses | — | — | — | 255 | 104 | 82 | |||||||||
| Settlement of decommissioning and restoration liabilities | — | — | — | (302 | ) | (364 | ) | (423 | ) | ||||||
| Other | 62 | 35 | (7 | ) | 70 | (80 | ) | (401 | ) | ||||||
| Cash flow (used in) from operations | (287 | ) | (429 | ) | (78 | ) | 6 806 | 9 058 | 9 412 | ||||||
| (Increase) decrease in non-cash working capital | (738 | ) | (1 297 | ) | (1 759 | ) | 78 | (122 | ) | 688 | |||||
| Cash flow (used in) provided by operating activities | (1 025 | ) | (1 726 | ) | (1 837 | ) | 6 884 | 8 936 | 10 100 | ||||||
Free cash flow is a non-GAAP financial measure that is calculated by deducting capital and exploration expenditures from cash flow from operations. Free cash flow reflects cash available for distribution to shareholders and to fund financing activities. Management uses free cash flow to measure financial performance and liquidity. The following is a reconciliation of free cash flow for Suncor's last three years of operations.
| ($ millions) | 2015 | 2014 | 2013 | |||||
| Cash flow from operations | 6 806 | 9 058 | 9 412 | |||||
| Capital and exploration expenditures | (6 667 | ) | (6 961 | ) | (6 777 | ) | ||
| Free Cash Flow | 139 | 2 097 | 2 635 | |||||
Oil Sands Cash Operating Costs
Oil Sands cash operating costs and cash operating costs per barrel are non-GAAP financial measures, which are calculated by adjusting Oil Sands segment OS&G expense (a GAAP measure based on sales volumes) for i) costs pertaining to Syncrude operations; ii) non-production costs that management believes do not relate to the production performance of Oil Sands operations, including, but not limited to, share-based compensation adjustments, research, and the expense recorded as part of a non-monetary arrangement involving a third-party processor; iii) revenues associated with excess capacity, including excess power generated and sold that is recorded in operating revenue; iv) project startup costs; and v) the impacts of changes in inventory levels, such that the company is able to present cost information based on production volumes. Oil Sands cash operating costs are reconciled in the Segment Results and Analysis – Oil Sands section of this MD&A. Management uses cash operating costs to measure Oil Sands operating performance on a production barrel basis.
Impact of First-in, First-out Inventory Valuation on Refining and Marketing Net Earnings
GAAP requires the use of a FIFO valuation methodology. For Suncor, this results in a lag between the sales prices for refined products, which reflects current market conditions, and the amount recorded as the cost of sale for the related refinery feedstock, which reflects market conditions at the time when the feedstock was purchased.
SUNCOR ENERGY INC. ANNUAL REPORT 2015 61
Suncor prepares and presents an estimate of the impact of using a FIFO inventory valuation methodology compared to a LIFO methodology, because management uses the information to analyze operating performance and compare itself against refining peers that are permitted to use LIFO inventory valuation under United States GAAP (U.S. GAAP).
The company's estimate is not derived from a standardized calculation and, therefore, may not be directly comparable to similar measures presented by other companies, and should not be considered in isolation or as a substitute for measures of performance prepared in accordance with GAAP or U.S. GAAP.
Measurement Conversions
Certain crude oil and natural gas liquids volumes have been converted to mcfe or mmcfe on the basis of one bbl to six mcf. Also, certain natural gas volumes have been converted to boe or mboe on the same basis. Any figure presented in mcfe, mmcfe, boe or mboe may be misleading, particularly if used in isolation. A conversion ratio of one bbl of crude oil or natural gas liquids to six mcf of natural gas is based on an energy equivalency conversion method primarily applicable at the burner tip and does not necessarily represent value equivalency at the wellhead. Given that the value ratio based on the current price of crude oil as compared to natural gas is significantly different from the energy equivalency of 6:1, conversion on a 6:1 basis may be misleading as an indication of value.
Operating Earnings Reconciliations – Fourth Quarter 2015 and 2014
| Three months ended December 31 | Oil Sands | Exploration and Production | Refining and Marketing | Corporate, Energy Trading and Eliminations | Total | ||||||||||||||||
| ($ millions) | 2015 | 2014 | 2015 | 2014 | 2015 | 2014 | 2015 | 2014 | 2015 | 2014 | |||||||||||
| Net (loss) earnings as reported | (616 | ) | 180 | (1 263 | ) | 198 | 498 | 173 | (626 | ) | (467 | ) | (2 007 | ) | 84 | ||||||
| Unrealized foreign exchange loss on U.S. dollar denominated debt | — | — | — | — | — | — | 382 | 302 | 382 | 302 | |||||||||||
| Impairments | 386 | — | 1 213 | — | — | — | — | 1 599 | — | ||||||||||||
| Operating (loss) earnings | (230 | ) | 180 | (50 | ) | 198 | 498 | 173 | (244 | ) | (165 | ) | (26 | ) | 386 | ||||||
62 SUNCOR ENERGY INC. ANNUAL REPORT 2015
Cash Flow from Operations Reconciliations – Fourth Quarter 2015 and 2014
| Three months ended December 31 | Oil Sands | Exploration and Production | Refining and Marketing | Corporate, Energy Trading and Eliminations | Total | ||||||||||||||||||
| ($ millions) | 2015 | 2014 | 2015 | 2014 | 2015 | 2014 | 2015 | 2014 | 2015 | 2014 | |||||||||||||
| Net (loss) earnings | (616 | ) | 180 | (1 263 | ) | 198 | 498 | 173 | (626 | ) | (467 | ) | (2 007 | ) | 84 | ||||||||
| Adjustments for: | |||||||||||||||||||||||
| Depreciation, depletion, amortization and impairment | 1 260 | 709 | 2 063 | 297 | 174 | 162 | 32 | 32 | 3 529 | 1 200 | |||||||||||||
| Deferred income taxes | (174 | ) | 84 | (579 | ) | (83 | ) | (36 | ) | (10 | ) | 54 | 60 | (735 | ) | 51 | |||||||
| Accretion of liabilities | 38 | 34 | 13 | 11 | 2 | 2 | (2 | ) | — | 51 | 47 | ||||||||||||
| Unrealized foreign exchange loss on U.S. dollar denominated debt | — | — | — | — | — | — | 386 | 352 | 386 | 352 | |||||||||||||
| Change in fair value of derivative contracts | (14 | ) | (32 | ) | — | (2 | ) | (32 | ) | (68 | ) | 56 | (54 | ) | 10 | (156 | ) | ||||||
| Gain on disposal of assets | — | — | — | — | (4 | ) | (10 | ) | (1 | ) | — | (5 | ) | (10 | ) | ||||||||
| Share-based compensation | 21 | (5 | ) | 3 | (1 | ) | 11 | (2 | ) | 35 | (4 | ) | 70 | (12 | ) | ||||||||
| Exploration expenses | — | — | 41 | 8 | — | — | — | — | 41 | 8 | |||||||||||||
| Settlement of decommissioning and restoration liabilities | (37 | ) | (70 | ) | (3 | ) | (3 | ) | (7 | ) | (10 | ) | — | — | (47 | ) | (83 | ) | |||||
| Other | (11 | ) | (25 | ) | (18 | ) | (24 | ) | (10 | ) | 3 | 40 | 57 | 1 | 11 | ||||||||
| Cash flow from (used in) operations | 467 | 875 | 257 | 401 | 596 | 240 | (26 | ) | (24 | ) | 1 294 | 1 492 | |||||||||||
| (Increase) decrease in non-cash working capital | (2 | ) | 1 542 | 45 | 137 | 436 | 317 | (330 | ) | (1 473 | ) | 149 | 523 | ||||||||||
| Cash flow provided by (used in) operating activities | 465 | 2 417 | 302 | 538 | 1 032 | 557 | (356 | ) | (1 497 | ) | 1 443 | 2 015 | |||||||||||
SUNCOR ENERGY INC. ANNUAL REPORT 2015 63
The following is a list of abbreviations that may be used in this MD&A:
| Measurement | ||
| bbl | barrel | |
| bbls/d | barrels per day | |
| mbbls/d | thousands of barrels per day | |
| boe | barrels of oil equivalent | |
| boe/d | barrels of oil equivalent per day | |
| mboe | thousands of barrels of oil equivalent | |
| mboe/d | thousands of barrels of oil equivalent per day | |
| mcf | thousands of cubic feet of natural gas | |
| mcfe | thousands of cubic feet of natural gas equivalent | |
| mmcf | millions of cubic feet of natural gas | |
| mmcf/d | millions of cubic feet of natural gas per day | |
| mmcfe | millions of cubic feet of natural gas equivalent | |
| mmcfe/d | millions of cubic feet of natural gas equivalent per day | |
| m3 | cubic metres | |
| MW | Megawatts | |
| MWh | Megawatt hour | |
Places and Currencies | ||
| U.S. | United States | |
| U.K. | United Kingdom | |
| B.C. | British Columbia | |
| $ or Cdn$ | Canadian dollars | |
| US$ | United States dollars | |
| £ | Pounds sterling | |
| € | Euros | |
Financial and Business Environment | ||
| DD&A | Depreciation, depletion and amortization | |
| WTI | West Texas Intermediate | |
| WCS | Western Canadian Select | |
| SCO | Synthetic crude oil | |
| MSW | Mixed Sweet Blend | |
| NYMEX | New York Mercantile Exchange | |
| ICE | Intercontinental Exchange | |
Forward-Looking Information
The MD&A contains certain forward-looking statements and forward-looking information (collectively, forward-looking statements) within the meaning of applicable Canadian and U.S. securities laws and other information based on Suncor's current expectations, estimates, projections and assumptions that were made by the company in light of information available at the time the statement was made and consider Suncor's experience and its perception of historical trends, including expectations and assumptions concerning: the accuracy of reserves and resources estimates; commodity prices and interest and foreign exchange rates; capital efficiencies and cost-savings; applicable royalty rates and tax laws; future production rates; the sufficiency of budgeted capital expenditures in carrying out planned activities; the availability and cost of labour and services; and the receipt, in a timely manner, of regulatory and third-party approvals. In addition, all other statements and other information that address expectations or projections about the future, and other statements and information about Suncor's strategy for growth, expected and future expenditures or investment decisions, commodity prices, costs, schedules, production volumes, operating and financial results, future financing and capital activities, and the expected impact of future commitments are forward-looking statements. Some of the forward-looking statements and information may be identified by words like "expects", "anticipates", "will", "estimates", "plans", "scheduled", "intends", "believes", "projects", "indicates", "could", "focus", "vision", "goal", "outlook", "proposed", "target", "objective", "continue", "should", "may", "aiming" and similar expressions.
Forward-looking statements in this MD&A include references to:
Suncor's expectations about production volumes and the performance and costs of its assets, including that:
- •
- The Fort Hills mining project will be developed using traditional open-pit truck and shovel techniques, and solvent-based extraction technology that will allow the mine to produce a bitumen product that can be sold directly to market. The project is scheduled to produce first oil as early as the fourth quarter of 2017 with a ramp up to 90% of its planned gross production capacity of 180,000 bbls/d within twelve months. Project activities in 2016 are expected to focus on completing procurement for all areas except mining and completing construction in the ore processing plant, extraction and infrastructure areas. Suncor's share of the estimated post-sanction project cost is $6.5 billion;
- •
- The Hebron field includes a gravity-based structure design supporting a gross oil production rate of 150,000 bbls/d (that effective January 1, 2016 decreased from 34,200 boe/d to 31,600 boe/d net to Suncor). Project activity in 2016 is expected to focus on construction of the gravity-based structure and topsides. At sanction, Suncor's share of the post-sanction project cost estimate provided by the project operator was approximately $2.8 billion (+/- 10%). First oil at the Hebron project is expected in late 2017; and
- •
- The effects of the acquisition of COS.
64 SUNCOR ENERGY INC. ANNUAL REPORT 2015
The anticipated duration and impact of planned maintenance events, including that:
- •
- A planned turnaround at Upgrader 2, commencing at the end of the first quarter of 2016;
- •
- A planned four-week maintenance event at Terra Nova has been scheduled for the second quarter of 2016; and
- •
- The company has scheduled two planned maintenance events at the Commerce City refinery, both with an expected duration of two weeks in each of the first and second quarters of 2016. The Sarnia refinery has a seven-week planned maintenance event in the second quarter of 2016, a four-week planned maintenance event in the third quarter and a one-week planned maintenance event in the fourth quarter of 2016. The Montreal refinery has a six-week planned maintenance event in the second quarter of 2016.
Suncor's expectations about capital expenditures, and growth and other projects, including:
- •
- The HSEU and SWRX projects are expected to provide incremental production and extend the productive life of the existing fields;
- •
- The company's operational excellence initiatives target improving facility utilization and workforce productivity, including a continued focus on upgrader reliability, which are expected to achieve steady production growth while reducing operating costs;
- •
- For 2016, Oil Sands operations plans to focus on planned maintenance, which includes a turnaround on Upgrader 2, maintaining production capacity at existing facilities, primarily related to new well pads for In Situ assets to offset natural production declines, and tailings management operations. Growth capital will continue to focus on logistical and storage assets which will support market access for Fort Hills' bitumen;
- •
- Oil Sands ventures sustaining capital expenditures in 2016 for Syncrude are expected to focus on planned maintenance, development of tailings management facilities and maintaining production capacity;
- •
- For E&P, and for 2016, growth capital will continue to focus on development drilling at Hibernia, HSEU and White Rose as well as focus on the continuation of Golden Eagle development drilling in the North Sea. E&P also includes exploration drilling in the Shelburne Basin, along with ongoing appraisal of Norwegian discoveries at Beta and Butch; and
- •
- Sustaining capital for Refining and Marketing will focus on planned maintenance events and routine asset replacement.
Also:
- •
- Suncor's strategies and commitments, including to delivering competitive and sustainable returns to shareholders by focusing on capital discipline, operational excellence and long-term profitable growth, and by leveraging its competitive differentiators and achieving industry-leading unit costs;
- •
- Suncor's projects, such as Fort Hills and the COS acquisition, are expected to provide long-term profitability for the company;
- •
- Bringing the Poplar Creek assets in-house is expected to improve Suncor's overall Oil Sands operations' reliability and profitability;
- •
- Suncor's expectation that it will drive down costs and focus on improved productivity and reliability, which is expected to help Suncor get the most out of its operations;
- •
- The company's reductions in its 2016 capital program of $750 million, including the deferral of maintenance at Firebag, which is not expected to impact the company's continued safety, reliability and environmental performance;
- •
- The company's belief that it does not have any guarantees or off-balance sheet arrangements that have, or are reasonably likely to have, a current or future material effect on the company's financial condition or financial performance, including liquidity and capital resources;
- •
- Suncor's management believes the company will have the capital resources to fund its planned 2016 capital spending program of $6.0 to $6.5 billion, the sustaining capital costs and dividend requirements associated with the acquisition of COS, and meet working capital requirements through existing cash balances and short-term investments, cash flow from operations, available committed credit facilities, issuing commercial paper and issuing long-term notes or debentures;
- •
- If additional capital is required, the company believes adequate additional financing will be available in debt capital markets at commercial terms and rates;
- •
- Our belief that a phased and flexible approach to existing and future growth projects should assist Suncor in maintaining its ability to manage project costs and debt levels; and
- •
- The company's position in respect of the NOR received from the CRA (and consequentially from the Provinces of Alberta, Ontario and Quebec) regarding the income tax treatment of realized losses in 2007 on the settlement of certain derivative contracts continues to be that it will be able to successfully defend its original
SUNCOR ENERGY INC. ANNUAL REPORT 2015 65
position and it will take the appropriate actions to resolve this matter. The company has provided security to the CRA and the Provinces in the approximate amount of $642 million, but the company may be required to post cash instead of security in relation to the NORs.
Forward-looking statements and information are not guarantees of future performance and involve a number of risks and uncertainties, some that are similar to other oil and gas companies and some that are unique to Suncor. Suncor's actual results may differ materially from those expressed or implied by its forward-looking statements, so readers are cautioned not to place undue reliance on them.
The financial and operating performance of the company's reportable operating segments, specifically Oil Sands, Exploration and Production, and Refining and Marketing, may be affected by a number of factors.
Factors that affect our Oil Sands segment include, but are not limited to, volatility in the prices for crude oil and other production, and the related impacts of fluctuating light/heavy and sweet/sour crude oil differentials; changes in the demand for refinery feedstock and diesel fuel, including the possibility that refiners that process our proprietary production will be closed, experience equipment failure or other accidents; our ability to operate our Oil Sands facilities reliably in order to meet production targets; the output of newly commissioned facilities, the performance of which may be difficult to predict during initial operations; the possibility that completed maintenance activities may not improve operational performance or the output of related facilities; our dependence on pipeline capacity and other logistical constraints, which may affect our ability to distribute our products to market; our ability to finance Oil Sands growth and sustaining capital expenditures; the availability of bitumen feedstock for upgrading operations, which can be negatively affected by poor ore grade quality, unplanned mine equipment and extraction plant maintenance, tailings storage, and in situ reservoir and equipment performance, or the unavailability of third-party bitumen; inflationary pressures on operating costs, including labour, natural gas and other energy sources used in oil sands processes; our ability to complete projects, including planned maintenance events, both on time and on budget, which could be impacted by competition from other projects (including other oil sands projects) for goods and services and demands on infrastructure in Alberta's Wood Buffalo region and the surrounding area (including housing, roads and schools); risks and uncertainties associated with obtaining regulatory and stakeholder approval for exploration and development activities; changes to royalty and tax legislation and related agreements that could impact our business; the potential for disruptions to operations and construction projects as a result of our relationships with labour unions that represent employees at our facilities; and changes to environmental regulations or legislation.
Factors that affect our Exploration and Production segment include, but are not limited to, volatility in crude oil and natural gas prices; operational risks and uncertainties associated with oil and gas activities, including unexpected formations or pressures, premature declines of reservoirs, fires, blow-outs, equipment failures and other accidents, uncontrollable flows of crude oil, natural gas or well fluids, and pollution and other environmental risks; the possibility that completed maintenance activities may not improve operational performance or the output of related facilities; adverse weather conditions, which could disrupt output from producing assets or impact drilling programs, resulting in increased costs and/or delays in bringing on new production; political, economic and socio-economic risks associated with Suncor's foreign operations, including the unpredictability of operating in Libya and that operations in Syria continue to be impacted by sanctions or political unrest; risks and uncertainties associated with obtaining regulatory and stakeholder approval for exploration and development activities; the potential for disruptions to operations and construction projects as a result of our relationships with labour unions that represent employees at our facilities; and market demand for mineral rights and producing properties, potentially leading to losses on disposition or increased property acquisition costs.
Factors that affect our Refining and Marketing segment include, but are not limited to, fluctuations in demand and supply for refined products that impact the company's margins; market competition, including potential new market entrants; our ability to reliably operate refining and marketing facilities in order to meet production or sales targets; the possibility that completed maintenance activities may not improve operational performance or the output of related facilities; risks and uncertainties affecting construction or planned maintenance schedules, including the availability of labour and other impacts of competing projects drawing on the same resources during the same time period; and the potential for disruptions to operations and construction projects as a result of our relationships with labour unions or employee associations that represent employees at our refineries and distribution facilities.
Additional risks, uncertainties and other factors that could influence the financial and operating performance of all of Suncor's operating segments and activities include, but are not limited to, changes in general economic, market and business conditions, such as commodity prices, interest rates and currency exchange rates; fluctuations in supply and demand for Suncor's products; the successful and
66 SUNCOR ENERGY INC. ANNUAL REPORT 2015
timely implementation of capital projects, including growth projects and regulatory projects; competitive actions of other companies, including increased competition from other oil and gas companies or from companies that provide alternative sources of energy; labour and material shortages; actions by government authorities, including the imposition or reassessment of taxes or changes to fees and royalties, such as the NORs received by Suncor from the CRA, Ontario, Alberta and Quebec, relating to the settlement of certain derivative contracts, including the risk that: (i) Suncor may not be able to successfully defend its original filing position and ultimately be required to pay increased taxes, interest and penalty as a result; or (ii) Suncor may be required to post cash instead of security in relation to the NORs; changes in environmental and other regulations; the ability and willingness of parties with whom we have material relationships to perform their obligations to us; outages to third-party infrastructure that could cause disruptions to production; the occurrence of unexpected events such as fires, equipment failures and other similar events affecting Suncor or other parties whose operations or assets directly or indirectly affect Suncor; the potential for security breaches of Suncor's information systems by computer hackers or cyberterrorists, and the unavailability or failure of such systems to perform as anticipated as a result of such breaches; our ability to find new oil and gas reserves that can be developed economically; the accuracy of Suncor's reserves, resources and future production estimates; market instability affecting Suncor's ability to borrow in the capital debt markets at acceptable rates; maintaining an optimal debt to cash flow ratio; the success of the company's risk management activities using derivatives and other financial instruments; the cost of compliance with current and future environmental laws; risks and uncertainties associated with closing a transaction for the purchase or sale of an oil and gas property, including estimates of the final consideration to be paid or received, the ability of counterparties to comply with their obligations in a timely manner and the receipt of any required regulatory or other third-party approvals outside of Suncor's control that are customary to transactions of this nature; and the accuracy of cost estimates, some of which are provided at the conceptual or other preliminary stage of projects and prior to commencement or conception of the detailed engineering that is needed to reduce the margin of error and increase the level of accuracy. The foregoing important factors are not exhaustive.
Many of these risk factors and other assumptions related to Suncor's forward-looking statements and information are discussed in further detail throughout this MD&A, including under the heading Risk Factors, and the company's 2015 AIF dated February 25, 2016 and Form 40-F on file with Canadian securities commissions at www.sedar.com and the United States Securities and Exchange Commission at www.sec.gov. Readers are also referred to the risk factors and assumptions described in other documents that Suncor files from time to time with securities regulatory authorities. Copies of these documents are available without charge from the company.
SUNCOR ENERGY INC. ANNUAL REPORT 2015 67
Management's Discussion and Analysis for the fiscal year ended December 31, 2015, dated February 25, 2016