FORM 6-K
SECURITIES AND EXCHANGE COMMISSION
Washington, D.C. 20549
October 23, 2007
Report of Foreign issuer
Pursuant to Rule 13a-16 or 15d-16 of
The Securities Exchange Act of 1934
(Commission file number) 0 - 017444
Akzo Nobel N.V.
(Translation of registrant’s name into English)
2555, Strawinskylaan, 1070 AS Amsterdam, the Netherlands
(Address of principal executive offices)

| 2 | Report for the 3rd quarter of 2007 |
| Highlights |
| Strong operational quarter | |||
| • | 5% autonomous growth | ||
| • | EBIT up 11%; EBITDA margin further improved to 12.8% | ||
| • | 16% higher net income before incidentals from continuing operations | ||
| • | Chemicals driving performance | ||
| • | Decorative Coatings – significantly improved results | ||
| • | Good quarter for Organon and Intervet | ||
| • | Recommended cash offer for ICI | ||
| • | EUR 1.6 billion share buyback program completed – further EUR 3 billion | ||
| capital reduction planned for 2008/2009 | |||
| • | Interim dividend increased to EUR 0.40 per common share | ||
| • | Akzo Nobel tops DJSI sustainability ranking | ||
| 3rd quarter | Millions of euros (EUR) or % | January-September | ||||||||||
| 2007 | 2006 | Δ% | 2007 | 2006 | Δ% | |||||||
| Continuing operations (Coatings and Chemicals) before incidentals: | ||||||||||||
| 2,600 | 2,553 | 2 | Revenues | 7,786 | 7,649 | 2 | ||||||
| 333 | 312 | 7 | EBITDA | 1,007 | 887 | 14 | ||||||
| 12.8 | 12.2 | EBITDA margin | 12.9 | 11.6 | ||||||||
| 244 | 219 | 11 | EBIT | 742 | 611 | 21 | ||||||
| 9.4 | 8.6 | EBIT margin | 9.5 | 8.0 | ||||||||
| 156 | 135 | 16 | Net income from continuing operations | 455 | 372 | 22 | ||||||
| 0.58 | 0.47 | 23 | – per share, in EUR | 1.62 | 1.30 | 25 | ||||||
| Moving average ROI | 15.6 | 13.5 | ||||||||||
| 145 | 105 | 38 | Net income from discontinued operations (Organon BioSciences) | 402 | 328 | 23 | ||||||
| 281 | 313 | (10 | ) | Net income1 (attributable to equity holders) | 797 | 923 | (14 | ) | ||||
| 1.04 | 1.09 | (5 | ) | – per share, in EUR | 2.84 | 3.22 | (12 | ) | ||||
| Invested capital | 7,992 | 8,060 | 2 | |||||||||
| Net interest-bearing borrowings | 2,190 | 1,090 | 2 | |||||||||
![]()
| Akzo Nobel | 3 |
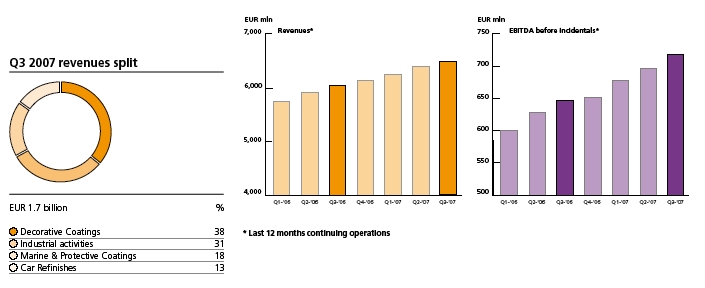
Revenues – 5% autonomous growth
Revenues from continuing operations of EUR 2.6 billion were up 2% on last year. Autonomous growth was 5%. Volumes increased 1%, attributable to Chemicals. Average selling prices were 4% higher, with both segments contributing. Currency translation had a 2% negative effect in the quarter, mainly due to the weaker U.S. dollar and Asian currencies. Acquisitions (mainly Chemcraft) and divestments (the 2005 Chemicals divestment program) on balance had a 1% negative impact. The changes in revenues of Akzo Nobel compare as follows with the third quarter of 2006:
| In % | Total | Volume | Price | Currency | Acquisitions/ | |||||
| translation | divestments | |||||||||
| Coatings | 3 | – | 3 | (2 | ) | 2 | ||||
| Chemicals | 5 | 4 | 5 | (2 | ) | (2 | ) | |||
| Akzo Nobel | 2 | 1 | 4 | (2 | ) | (1 | ) 1 | |||
| 1 Included is the effect of the divestment of certain activities in Other. | ||||||||||
EBIT up 11%; EBITDA improved 7%
Operating income before incidentals rose 11% from EUR 219 million to EUR 244 million. The EBIT margin was 9.4%, against 8.6% in the third quarter of 2006. Both Coatings and Chemicals realized strong autonomous growth and cost savings.
EBITDA before incidentals in the third quarter grew 7% to EUR 333 million. Both Coatings and Chemicals contributed to this increase. The EBITDA margin rose to 12.8% (2006: 12.2%). Coatings achieved an EBITDA margin of 12.4% compared with 12.0% in 2006. Chemicals’ EBITDA margin increased from 15.6% to 16.7% in 2007.
Including incidentals, operating income decreased 25% to EUR 213 million, with an EBIT margin of 8.2 (2006: 11.1%). Incidentals in 2007 were a net loss of EUR 31 million, compared with a gain of EUR 65 million in the third quarter of 2006. The 2007 losses mainly related to restructuring and impairment charges at several Coatings and Chemicals sites. 2006 included gains for several divestments at Chemicals and special benefits in respect of the U.S. postretirement benefit schemes. See the table on page 9 for further details.
Net financing charges increased from EUR 25 million to EUR 39 million, mainly due to higher net interest-bearing borrowings as a result of the share buyback program. Interest coverage in the third quarter was 5.5 (2006: 11.4).
The share in profit of associates was EUR 7 million, compared with EUR 15 million in 2006. Earnings decreased after the divestment of Flexsys on May 1, 2007.
The income tax charge in the third quarter of 2007 was 21%, compared with 25% in 2006. The 2007 tax charge was favorably influenced by one-off releases of tax provisions of EUR 8 million.
Operational net income substantially up
Operational net income from continuing operations increased 16% to EUR 156 million. Organon BioSciences’ net income was up 38%, partially due to the effect of the nonrecognition of depreciation. Including lower incidentals, total net income for the company declined 10% to EUR 281 million. Earnings per share were down 5% to EUR 1.04 (2006: EUR 1.09). The decrease of earnings per share was less than the net income decrease, as the share buyback program reduced the number of shares outstanding. Net income breaks down as follows:
| 3rd quarter | Millions of euros or % | January-September | ||||||||||||||||||||||
| Net income before incidentals | Net income | Net income before incidentals | Net income | |||||||||||||||||||||
| 2007 | 2006 | Δ% | 2007 | 2006 | Δ% | 2007 | 2006 | Δ% | 2007 | 2006 | Δ% | |||||||||||||
| 156 | 135 | 16 | 136 | 194 | (30 | ) | Continuing operations | 455 | 372 | 22 | 394 | 578 | (32 | ) | ||||||||||
| 145 | 105 | 38 | 145 | 119 | 22 | Discontinued operations | 402 | 328 | 23 | 403 | 345 | 17 | ||||||||||||
| 301 | 240 | 25 | 281 | 313 | (10 | ) | Akzo Nobel | 857 | 700 | 22 | 797 | 923 | (14 | ) | ||||||||||
Workforce
Akzo Nobel’s workforce at Coatings and Chemicals totaled 43,510 employees, up compared with the 42,690 employees at year-end 2006. The number of employees at Organon BioSciences was 18,710, down from 19,190 at December 31, 2006.
Interim dividend increased to EUR 0.40
Akzo Nobel recently announced an increase in the minimum pay-out ratio to 45% of net income before incidentals, up from a range of 35–40%. We decided to increase the interim dividend for 2007 to EUR 0.40 per common share
(2006: EUR 0.30). Starting October 24, 2007, Akzo Nobel shares will trade ex-dividend. The interim dividend will be made payable on October 31, 2007.
Trading conditions in 2007
Akzo Nobel’s portfolio is well-positioned for profitable growth. Assuming that no significant changes in the major economies of the world occur, Akzo Nobel believes that it is well placed to deliver on the objectives to outgrow its markets and further improve the financial returns in Coatings and Chemicals compared with 2006.
| Highlights 3rd quarter | ||
| Report for the 3rd quarter of 2007 |
| 4 | Report for the 3rd quarter of 2007 |
| Coatings – solid performance; EBITDA margin up to 12.4% |
| • | Revenue growth 3% – autonomous growth and acquisitions | |
| • | Strong EBIT margin of 10.3% (before incidentals) | |
| • | Decorative Coatings – significantly improved profitability | |
| • | Marine & Protective Coatings – excellent performance continued | |
| • | Industrial activities – sustained performance despite slow demand | |
| • | Car Refinishes – on track | |
| • | Acquisition of Chemcraft completed |
| 3rd quarter | Millions of euros or % | January-September | ||||||||||
| 2007 | 2006 | 1 | Δ% | 2007 | 2006 | 1 | Δ% | |||||
| Revenues | ||||||||||||
| 640 | 642 | Decorative Coatings | 1,898 | 1,753 | ||||||||
| 529 | 512 | Industrial activities | 1,546 | 1,492 | ||||||||
| 308 | 279 | Marine & Protective Coatings | 940 | 840 | ||||||||
| 226 | 225 | Car Refinishes | 693 | 697 | ||||||||
| (17 | ) | (20 | ) | Intragroup revenues/other | (62 | ) | (67 | ) | ||||
| 1,686 | 1,638 | 3 | Total | 5,015 | 4,715 | 6 | ||||||
| 209 | 196 | 7 | EBITDA before incidentals | 594 | 544 | 9 | ||||||
| 12.4 | 12.0 | EBITDA margin | 11.8 | 11.5 | ||||||||
| 174 | 161 | 8 | EBIT before incidentals | 490 | 440 | 11 | ||||||
| 10.3 | 9.8 | EBIT margin | 9.8 | 9.3 | ||||||||
| 156 | 155 | 1 | EBIT (operating income) | 466 | 526 | (11 | ) | |||||
| 9.3 | 9.5 | EBIT margin | 9.3 | 11.2 | ||||||||
| 37 | 30 | Capital expenditures | 102 | 77 | ||||||||
| Invested capital | 2,998 | 2,653 | 2 | |||||||||
| Moving average ROI | 20.3 | 20.5 | ||||||||||
| Number of employees | 33,130 | 31,660 | 2 | |||||||||
| 1 The 2006 figures have been restated for minor changes in the business unit structure. |
| 2 At December 31. |
| Akzo Nobel | 5 |
Overview
Coatings had a strong third quarter with revenue growth of 3% on last year to EUR 1.7 billion. Autonomous growth was 3%, mainly driven by Marine & Protective Coatings. Acquisitions added 2%, predominantly in Industrial Finishes. The currency impact was negative at 2%, mainly affecting the industrial activities and Marine & Protective Coatings.
EBITDA before incidentals amounted to EUR 209 million, up 7%. The EBITDA margin improved to 12.4%. Before incidentals, EBIT grew 8% to EUR 174 million, with an EBIT margin of 10.3%. The moving average ROI was 20.3%.
Decorative Coatings
The bottom-line performance of Decorative Coatings clearly improved, despite the stable top-line. The business successfully implemented restructuring programs in mature markets, which supported the earnings improvement. Almost all countries are supporting this upswing. Management changes in Morocco were implemented to boost the performance. In Turkey, results were negatively influenced by weaker market conditions. Programs on complexity reduction and brand clustering are being implemented worldwide, resulting in brand synergies, improved sharing of best practices, stronger market impact, and efficiency improvements.
Industrial activities
Industrial Finishes successfully completed the acquisition of Chemcraft in the United States. The prolonged correction in the North American residential construction industry leads to soft demand in the North American-based and the Asian export-driven businesses. Nevertheless, all key financial measures remained sound, albeit weaker in comparison to the exceptionally strong performance of 2006. The major economies in Western Europe appear healthy and offered modest growth opportunities in 2007. Autonomous growth in China, India, Vietnam, and Russia remains encouraging. Powder Coatings performed well in Europe and Asia, but was flat in the Americas.
Marine & Protective Coatings
Marine & Protective Coatings again achieved double-digit revenue growth, driven by both volume and price improvement. The Marine New Building volume is in line with the same quarter last year, but behind this year’s very strong second quarter due to a slow down in the new build program in Korea. The Marine Maintenance and Repair activity shows strong revenue growth, especially in the Americas and Asia. Top line growth in Protective Coatings is driven by China, India, and Eastern Europe as well as the successful integration of the Ceilcote business. Yacht continues its recovery from the slow start to the year with a strong quarter for the super yacht new construction in Europe. Aerospace Coatings continues its upward trend, with good volume for OEM and growth in Asia Pacific, seeing profits well ahead of last year and the strong second quarter result.
Car Refinishes
Revenues were in line with the previous year. Contributions from higher selling prices were offset by somewhat lower volumes and a small negative currency effect. The implementation of the new contract with the Royal Bank of Scotland – the largest car insurer in the United Kingdom – under which Car Refinishes will be the exclusive paint supplier for their U.K. repair network, has almost been finalized. In order to improve operational excellence the Pontiac North Brush operation was closed down and all production and logistics moved to the recently opened, state of the art production facility for Automotive Plastics Components in Pontiac South Brush, Michigan. Early in October 2007, our share in the automotive passenger car coatings activities of Kemipol in Turkey was divested to Kansai Paint. The joint venture Kemipol will continue to be active in the car repair, wood, and coil activities.
Akzo Nobel’s revolutionary automotive clearcoat Sikkens® Autoclear® UV recently picked up another award when it received first prize in the Garage category of the Grands Prix Internationaux de l’Innovation Automobile at France’s Equip Auto 2007 event.
Developed by the company’s Car Refinishes business as an industry first, the product harnesses the power of ultra-violet to dry in just six minutes and has the potential to radically improve bodyshop capability.
| Akzo Nobel Coatings | ||
| Report for the 3rd quarter of 2007 |
| 6 | Report for the 3rd quarter of 2007 |
| Chemicals – strong performance; record ROI of 21.1% |
| • | 9% autonomous growth – 5% price and 4% volume increase | |
| • | Operational result up 26% | |
| • | EBITDA margin of 16.7%; moving average ROI of 21.1% | |
| • | Raw material and energy price pressure being managed | |
| • | Base and Functional Chemicals lead improvement on previous | |
| year’s third quarter | ||
| • | Surfactants making progress on road map |
| 3rd quarter | Millions of euros or % | January-September | ||||||||||
| 2007 | 2006 | 1 | Δ% | 2007 | 2006 | 1 | Δ% | |||||
| Revenues | ||||||||||||
| 243 | 241 | Pulp & Paper Chemicals | 735 | 730 | ||||||||
| 222 | 217 | Base Chemicals | 658 | 677 | ||||||||
| 199 | 178 | Functional Chemicals | 596 | 563 | ||||||||
| 139 | 128 | Surfactants | 419 | 404 | ||||||||
| 130 | 130 | Polymer Chemicals | 398 | 391 | ||||||||
| (22 | ) | (26 | ) | Intragroup revenues/other | (74 | ) | (90 | ) | ||||
| 911 | 868 | 5 | Total | 2,732 | 2,675 | 2 | ||||||
| 152 | 135 | 13 | EBITDA before incidentals | 473 | 427 | 11 | ||||||
| 16.7 | 15.6 | EBITDA margin | 17.3 | 16.0 | ||||||||
| 102 | 81 | 26 | EBIT before incidentals | 321 | 264 | 22 | ||||||
| 11.2 | 9.3 | EBIT margin | 11.7 | 9.9 | ||||||||
| 96 | 62 | 55 | EBIT (operating income) | 296 | 211 | 40 | ||||||
| 10.5 | 7.1 | EBIT margin | 10.8 | 7.9 | ||||||||
| 40 | 53 | Capital expenditures | 129 | 149 | ||||||||
| Invested capital | 1,889 | 1,960 | 2 | |||||||||
| Moving average ROI | 21.1 | 18.5 | ||||||||||
| Number of employees | 8,940 | 9,300 | 2 | |||||||||
| 1 The 2006 figures have been restated for minor changes in the business unit structure. In addition, the activities (to be) divested have now been included under Other at company level. This includes the results on divestments for these activities |
| 2 At December 31. |

| Akzo Nobel | 7 |
Chemicals reported a strong third quarter with revenues up 5% on the previous year to EUR 911 million. Autonomous growth was 9% (volume growth of 4% and price increases of 5%). The negative currency impact of 2% was primarily attributable to the U.S. dollar. In addition, there was a 2% negative divestment effect. Before incidentals, EBITDA increased 13% to EUR 152 mln. The EBITDA margin was 16.7%, compared with 15.6% in the third quarter of 2006. Especially Base Chemicals, Functional Chemicals, and Surfactants are operating at a significantly improved level.
Pulp & Paper Chemicals
Pulp & Paper Chemicals’ autonomous revenue growth in the third quarter was 4%, mainly driven by improved pricing. This favorable development for the top line was, however, to a significant extent offset by the negative currency impact (weaker U.S. dollar) and the transfer of the U.S. hydrogen peroxide business to the OCI joint venture. Europe and the Americas have made good progress during 2007, but are faced with high energy (Europe) and currency headwinds (Americas). Results in Asia continue to improve, aided by the successful startup of new facilities, especially in China.
Base Chemicals
Base Chemicals reported strong quarterly results due to higher selling prices and increased demand compared to the third quarter of 2006. During the quarter caustic prices remained at good levels, while Energy benefited from high plant availability and favorable summer gas prices. The woodchip plant in Mariager (Denmark) started up successfully.
Functional Chemicals
Functional Chemicals turned in good performances in most of its businesses. Cellulosic Specialties achieved profitable growth especially in the Building segment. Salt Specialties increased its performance through restructuring and efficiency projects. Sulfur Products realized overall higher prices while volumes also increased in Europe. Ethylene Amines benefited from the combination of higher prices and high utilization of its Stenungsund plants. Both Chelates and Polysulfides are still confronted with margin pressure, despite recently announced price increases. The China investment projects showed good progress on the technical side. In addition, several license and engineering (EPCM) agreements were concluded.
Surfactants
Market demand for surfactants was robust in the third quarter and plant utilization remained high. The business unit recorded healthy demand in most markets, especially Agro, Asphalt, and Mining. Volumes were up 9% on the previous year (of which 4% stemmed from the Feixiang exports). Margin pressure continued to be an issue, as the increases in sales prices were still lagging raw material cost increases. Production at the McCook site was terminated in June, leading to a positive effect on Surfactants’ results.
Polymer Chemicals
Polymer Chemicals’ revenues for the quarter were on the same level as in 2006. Proceeds from higher selling prices were offset by negative effects from weaker currencies (mainly the U.S. dollar) and somewhat lower volumes. The lower volumes were caused by a slightly stronger seasonal slowdown in Europe and lower shipments in Organometallic Specialties, partly of a one-off nature. Margins were negatively impacted by product mix and lower selling prices in the Asia Pacific region due to competition with local suppliers.

China is preparing for a huge increase in traffic levels due to the 2008 Olympic Games and major improvements are being made to allow the athletes to travel quickly and easily to each venue. But the current amount of traffic means that work on the roads is not possible during the day.
A vital contribution has come from Akzo Nobel. The company’s Surfactants business has supplied a quick-setting micro-surfacing emulsifier which enables roads to be resurfaced in double quick time during the night.
| Akzo Nobel Chemicals | ||
| Report for the 3rd quarter of 2007 |
| 8 | Report for the 3rd quarter of 2007 |
| Consolidated statement of income |
| 3rd quarter | Millions of euros | January-September | ||||||||||
| 2007 | 2006 | Δ% | 2007 | 2006 | Δ% | |||||||
| Continuing operations | ||||||||||||
| 2,600 | 2,553 | 2 | Revenues | 7,786 | 7,649 | 2 | ||||||
| (1,599 | ) | (1,571 | ) | Cost of sales | (4,759 | ) | (4,789 | ) | ||||
| 1,001 | 982 | Gross profit | 3,027 | 2,860 | ||||||||
| (554 | ) | (525 | ) | Selling expenses | (1,671 | ) | (1,655 | ) | ||||
| (70 | ) | (67 | ) | Research and development expenses | (210 | ) | (212 | ) | ||||
| (172 | ) | (160 | ) | General and administrative expenses | (499 | ) | (464 | ) | ||||
| 8 | 54 | Other operating income | 29 | 177 | ||||||||
| 213 | 284 | (25 | ) | Operating income (EBIT) | 676 | 706 | (4 | ) | ||||
| 17 | 30 | Financing income | 87 | 87 | ||||||||
| (56 | ) | (55 | ) | Financing expenses | (178 | ) | (181 | ) | ||||
| 174 | 259 | Operating income less financing income and expenses | 585 | 612 | ||||||||
| 7 | 15 | Share in profit of associates | (24 | ) | 42 | |||||||
| 181 | 274 | Profit before tax | 561 | 654 | ||||||||
| (38 | ) | (69 | ) | Income taxes | (141 | ) | (51 | ) | ||||
| 143 | 205 | (30 | ) | Profit for the period from continuing operations | 420 | 603 | (30 | ) | ||||
| Discontinued operations (Organon BioSciences) | ||||||||||||
| 145 | 119 | Profit for the period from discontinued operations | 403 | 345 | ||||||||
| 288 | 324 | (11 | ) | Profit for the period | 823 | 948 | (13 | ) | ||||
| Attributable to: | ||||||||||||
| 281 | 313 | (10 | ) | Equity holders of the company (net income) | 797 | 923 | (14 | ) | ||||
| 7 | 11 | Minority interest | 26 | 25 | ||||||||
| 288 | 324 | Profit for the period | 823 | 948 | ||||||||
| 5.5 | 11.4 | Interest coverage | 7.4 | 7.5 | ||||||||
| Earnings per share, in EUR | ||||||||||||
| Net income before incidentals from continuing operations | ||||||||||||
| 0.58 | 0.47 | 23 | – basic | 1.62 | 1.30 | 25 | ||||||
| 0.58 | 0.47 | – diluted | 1.61 | 1.29 | ||||||||
| Net income from continuing operations | ||||||||||||
| 0.50 | 0.68 | (25 | ) | – basic | 1.40 | 2.02 | (30 | ) | ||||
| 0.50 | 0.67 | – diluted | 1.39 | 2.00 | ||||||||
| Net income from discontinued operations | ||||||||||||
| 0.54 | 0.41 | 30 | – basic | 1.44 | 1.20 | 19 | ||||||
| 0.54 | 0.41 | – diluted | 1.43 | 1.20 | ||||||||
| Net income | ||||||||||||
| 1.04 | 1.09 | (5 | ) | – basic | 2.84 | 3.22 | (12 | ) | ||||
| 1.04 | 1.08 | – diluted | 2.82 | 3.20 | ||||||||
| In accordance with IFRS, incidentals are reported on the applicable income and expense lines in the statement of income. | ||||||||||||
| Akzo Nobel | 9 |
| Information on segments and incidentals |
| 3rd quarter | Millions of euros or % | January-September | ||||||||||
| 2007 | 2006 | 1 | Δ% | 2007 | 2006 | 1 | Δ% | |||||
| Revenues | ||||||||||||
| 1,686 | 1,638 | 3 | Coatings | 5,015 | 4,715 | 6 | ||||||
| 911 | 868 | 5 | Chemicals | 2,732 | 2,675 | 2 | ||||||
| 3 | 47 | Other/eliminations | 39 | 259 | ||||||||
| 2,600 | 2,553 | 2 | Total | 7,786 | 7,649 | 2 | ||||||
| EBITDA before incidentals | ||||||||||||
| 209 | 196 | 7 | Coatings | 594 | 544 | 9 | ||||||
| 152 | 135 | 13 | Chemicals | 473 | 427 | 11 | ||||||
| (28 | ) | (19 | ) | Other | (60 | ) | (84 | ) | ||||
| 333 | 312 | 7 | Total | 1,007 | 887 | 14 | ||||||
| 12.8 | 12.2 | EBITDA margin | 12.9 | 11.6 | ||||||||
| EBIT (operating income) before incidentals | ||||||||||||
| 174 | 161 | 8 | Coatings | 490 | 440 | 11 | ||||||
| 102 | 81 | 26 | Chemicals | 321 | 264 | 22 | ||||||
| (32 | ) | (23 | ) | Other | (69 | ) | (93 | ) | ||||
| 244 | 219 | 11 | Total | 742 | 611 | 21 | ||||||
| 9.4 | 8.6 | EBIT margin | 9.5 | 8.0 | ||||||||
| EBIT (operating income) | ||||||||||||
| 156 | 155 | 1 | Coatings | 466 | 526 | (11 | ) | |||||
| 96 | 62 | 55 | Chemicals | 296 | 211 | 40 | ||||||
| (39 | ) | 67 | Other | (86 | ) | (31 | ) | |||||
| 213 | 284 | (25 | ) | Total | 676 | 706 | (4 | ) | ||||
| 8.2 | 11.1 | EBIT margin | 8.7 | 9.2 | ||||||||
| Incidentals included in EBIT: | ||||||||||||
| 38 | Special benefits | 38 | ||||||||||
| (2 | ) | 41 | Results on divestments | (12 | ) | 169 | ||||||
| (29 | ) | (14 | ) | Restructuring and impairment charges | (52 | ) | (66 | ) | ||||
| Charges related to major legal, antitrust, and environmental cases | (2 | ) | (46 | ) | ||||||||
| (31 | ) | 65 | Total incidentals | (66 | ) | 95 | ||||||
| 1 | The figures for 2006 have been restated because the Chemicals’ “activities (to be) divested” have now been included under Other at company level. This includes the results on divestments for these activities. |
| Consolidated statement of income Information on segments and incidentals | ||
| Report for the 3rd quarter of 2007 |
| 10 | Report for the 3rd quarter of 2007 |
| Condensed consolidated balance sheet |
| Millions of euros | September 30, 2007 | December 31, 2006 pro forma | December 31, 2006 | ||||
| Property, plant and equipment | 2,205 | 2,249 | 3,346 | ||||
| Intangible assets | 637 | 536 | 682 | ||||
| Financial noncurrent assets | 1,273 | 1,351 | 1,706 | ||||
| Total noncurrent assets | 4,115 | 4,136 | 5,734 | ||||
| Inventories | 1,211 | 1,190 | 2,042 | ||||
| Receivables | 2,467 | 2,111 | 2,919 | ||||
| Cash and cash equivalents | 1,103 | 1,871 | 1,871 | ||||
| Assets held for sale | 3,339 | 3,477 | 219 | ||||
| Total current assets | 8,120 | 8,649 | 7,051 | ||||
| Total assets | 12,235 | 12,785 | 12,785 | ||||
| Akzo Nobel N.V. shareholders’ equity | 2,967 | 4,144 | 4,144 | ||||
| Minority interest | 108 | 119 | 119 | ||||
| Total equity | 3,075 | 4,263 | 4,263 | ||||
| Provisions | 1,806 | 1,910 | 2,132 | ||||
| Deferred income | 7 | ||||||
| Deferred tax liabilities | 115 | 149 | 174 | ||||
| Long-term borrowings | 2,475 | 2,505 | 2,551 | ||||
| Total noncurrent liabilities | 4,396 | 4,564 | 4,864 | ||||
| Short-term borrowings | 818 | 304 | 410 | ||||
| Current payables | 2,747 | 2,486 | 3,223 | ||||
| Liabilities held for sale | 1,199 | 1,168 | 25 | ||||
| Total current liabilities | 4,764 | 3,958 | 3,658 | ||||
| Total equity and liabilities | 12,235 | 12,785 | 12,785 | ||||
| Shareholders’ equity per share, in EUR | 11.31 | 14.44 | |||||
| Number of shares outstanding, in millions | 262.3 | 287.0 | |||||
| Gearing | 0.71 | 0.26 | |||||
| Invested capital | 7,992 | 8,060 | |||||
| In the December 31, 2006 pro forma column, Organon BioSciences has been treated as if it would qualify as discontinued operation as of that date. |
| Akzo Nobel | 11 |
| Condensed consolidated statement of cash flows |
| Millions of euros | January-September | |||||||
2007 | 2006 | 1 | ||||||
| Profit for the period | 823 | 948 | ||||||
| Income discontinued operations | (403 | ) | (345 | ) | ||||
| Adjustments to reconcile earnings to cash generated from operating activities: | ||||||||
| Depreciation and amortization | 265 | 276 | ||||||
| Impairment losses | 15 | 13 | ||||||
| Financing income and expenses | 91 | 94 | ||||||
| Share in profit of associates | (26 | ) | (42 | ) | ||||
| Income taxes | 141 | 51 | ||||||
| Operating profit before changes in working capital and provisions | 906 | 995 | ||||||
| Changes in working capital | (259 | ) | 15 | |||||
| Changes in provisions | (169 | ) | (112 | ) | ||||
| Other | 2 | 9 | ||||||
| (426 | ) | (88 | ) | |||||
| Cash generated from operating activities | 480 | 907 | ||||||
| Interest paid | (150 | ) | (155 | ) | ||||
| Income taxes paid | (111 | ) | (191 | ) | ||||
| Pre-tax loss/(gain) on divestments | 62 | (169 | ) | |||||
| (199 | ) | (515 | ) | |||||
| Net cash from operating activities | 281 | 392 | ||||||
| Capital expenditures | (240 | ) | (235 | ) | ||||
| Interest received | 105 | 85 | ||||||
| Repayments from associates | 15 | 5 | ||||||
| Dividends from associates | 10 | 31 | ||||||
| Acquisition of consolidated companies2 | (154 | ) | (318 | ) | ||||
| Proceeds from sale of interests2 | 150 | 304 | ||||||
| Other changes in noncurrent assets | (80 | ) | 28 | |||||
| Net cash from investing activities | (194 | ) | (100 | ) | ||||
| Changes in borrowings | 518 | 7 | ||||||
| Issue of shares for stock option plan | 74 | 39 | ||||||
| Buyback of shares | (1,600 | ) | ||||||
| Termination of currency swap | 68 | 21 | ||||||
| Dividends | (286 | ) | (278 | ) | ||||
| Net cash from financing activities | (1,226 | ) | (211 | ) | ||||
| Net cash used for continuing operations | (1,139 | ) | 81 | |||||
| Cash flows from discontinued operations | ||||||||
| Net cash from operating activities | 500 | 376 | ||||||
| Net cash from investing activities | (152 | ) | (113 | ) | ||||
| Net cash from financing activities | 40 | (7 | ) | |||||
388 | 256 | |||||||
| Net change in cash and cash equivalents of continued | ||||||||
| and discontinued operations | (751 | ) | 337 | |||||
| Cash and cash equivalents at January 1 | 1,871 | 1,486 | ||||||
| Effect of exchange rate changes on cash and cash equivalents | (17 | ) | (20 | ) | ||||
| Cash and cash equivalents at September 30 | 1,103 | 1,803 | ||||||
| 1 Reclassified for comparative purposes. |
| 2 Net of cash acquired or disposed of. |
| Condensed consolidated balance sheet Condensed consolidated statement of cash flows | ||
| Report for the 3rd quarter of 2007 |
| 12 | Report for the 3rd quarter of 2007 |
| Changes in equity |
| Millions of euros | Subscribed share capital | Additional paid-in capital | Change in fair value of derivatives | Cumulative translation reserves | Other (statutory) reserves and undistributed profits | Shareholders’ equity | Minority interest | Total equity | ||||||||
| Balance at December 31, 2005 | 572 | 1,803 | 22 | 142 | 876 | 3,415 | 161 | 3,576 | ||||||||
| Changes in fair value of derivatives | 7 | 7 | 7 | |||||||||||||
| Changes in exchange rates in respect of | ||||||||||||||||
| subsidiaries, associates, and joint ventures | (68 | ) | (68 | ) | (9 | ) | (77 | ) | ||||||||
| Income/(expense) directly recognized in equity | 7 | (68 | ) | (61 | ) | (9 | ) | (70 | ) | |||||||
| Profit for the period | 923 | 923 | 25 | 948 | ||||||||||||
| Total income/(expenses) | 7 | (68 | ) | 923 | 862 | 16 | 878 | |||||||||
| Dividend paid | (258 | ) | (258 | ) | (20 | ) | (278 | ) | ||||||||
| Equity-settled transactions | 12 | 12 | 12 | |||||||||||||
| Issue of common shares | 2 | 37 | 39 | 39 | ||||||||||||
| Changes in minority interest in subsidiaries | (30 | ) | (30 | ) | ||||||||||||
| Balance at September 30, 2006 | 574 | 1,840 | 29 | 74 | 1,553 | 4,070 | 127 | 4,197 | ||||||||
| Balance at December 31, 2006 | 574 | 1,841 | (2 | ) | 30 | 1,701 | 4,144 | 119 | 4,263 | |||||||
| Changes in fair value of derivatives | (165 | ) | (165 | ) | (165 | ) | ||||||||||
| Changes in exchange rates in respect of | ||||||||||||||||
| subsidiaries, associates, and joint ventures | (39 | ) | (39 | ) | – | (39 | ) | |||||||||
| Income/(expenses) directly recognized in equity | (165 | ) | (39 | ) | (204 | ) | – | (204 | ) | |||||||
| Profit for the period | 797 | 797 | 26 | 823 | ||||||||||||
| Total income/(expenses) | (165 | ) | (39 | ) | 797 | 593 | 26 | 619 | ||||||||
| Dividend paid | (259 | ) | (259 | ) | (27 | ) | (286 | ) | ||||||||
| Equity-settled transactions | 15 | 15 | 15 | |||||||||||||
| Issue of common shares | 4 | 70 | 74 | 74 | ||||||||||||
| Buyback of shares | (1,600 | ) | (1,600 | ) | (1,600 | ) | ||||||||||
| Changes in minority interests in subsidiaries | (10 | ) | (10 | ) | ||||||||||||
| Balance at September 30, 2007 | 578 | 1,911 | (167 | ) | (9 | ) | 654 | 2,967 | 108 | 3,075 | ||||||
Good quarter for Organon and Intervet
On March 12, 2007, the company announced its intention to divest Organon BioSciences (OBS) to Schering-Plough, following their binding cash offer of EUR 11 billion. As a consequence, in accordance with IFRS 5, the OBS activities qualify as so-called discontinued operations. As a result, going forward depreciation or amortization will no longer be recognized for the OBS activities, as a result of which pre-tax results increased by EUR 53 million, of which EUR 21 million was recognized in the third quarter of 2007. This also affects the statement of income lines for S&D and R&D expenses.
The consultation procedures with the relevant employee representative bodies have been completed and the related sale and purchase agreement has been signed. On October 11, 2007, Schering-Plough Corporation received approval from the European Commission for its planned acquisition of OBS. It is expected that the transaction with Schering-Plough will be completed no later than at the end of 2007.
Organon
Organon reported continued strong performance of its key products. At EUR 615 million, third-quarter revenues were 2% below 2006, due to negative currency translation effects, mainly
attributable to the U.S. dollar and the Japanese yen. Contraceptives realized the strongest revenue growth (up 13%), due primarily to NuvaRing® and Cerazette®, for which volume increases of EUR 15 million and EUR 5 million were realized, respectively.
Contributions from volume growth in contraception and fertility, and higher royalties were offset by decreased sales of Remeron® and Anzemet®, and the loss of Avinza®.
Operating income before incidentals grew 27% to EUR 117 million (2006: EUR 92 million). The effect of lower revenues and higher R&D expenses was more than offset by the effects of a favorable product mix, lower marketing expenses, and the nonrecognition of depreciation and amortization. If depreciation and amortization had been recognized, EBIT would have amounted to EUR 101 million, up 10% on 2006.
For further details on the development of sales of Organon’s key products, see the Akzo Nobel website at www.akzonobel.com/ investorrelations/financialfaq.
Intervet
Building on strong growth performance of previous quarters, Intervet achieved a double-digit revenue increase, leading to record
| Akzo Nobel | 13 |
sales and a sharp EBIT rise. Growth was realized in all geographical areas, despite currency losses of 2%. Cost control and profitable new product introductions drove up gross margins. More than 50% of our revenues are generated in Europe, where a continuous stream of new product introductions boosted revenues by 10%.
Also the North American business benefited from important product introductions. This resulted in revenue growth of 20% in a region which accounts for about 18% of Intervet’s global sales.
The business in the remaining parts of the world grew 8%, despite significant losses incurred by currency translation. Continued outbreaks of avian influenza in many Asian countries limit livestock export and agricultural growth.
Lower cash position due to share buyback program
Cash and cash equivalents decreased EUR 751 million in the first nine months of 2007, compared with an increase of EUR 337 million in 2006. The difference was mainly attributable to the share buyback program. The seasonal increase of working capital was higher than in the corresponding period of 2006, predominantly due to autonomous revenue growth and lower other current liabilities.
Capital expenditures amounted to EUR 240 million, up EUR 5 million on the comparable 2006 level. Capital expenditures were 97% of depreciation (2006: 90%). Expenditures were up at Coatings, but down at Chemicals.
Proceeds from the sale of interests, both in 2007 and 2006, related to installment payments for the divestment of a Coatings plant near Barcelona, Spain (divested in 2006), and to the sale of several Chemicals activities under the divestment program initiated in 2005, including Flexsys. 2007 acquisition expenditures predominantly related to Chemcraft, while last year’s expenditures mainly concerned Sico.
Included in “Other changes in noncurrent assets” is a payment into an escrow account of the Akzo Nobel U.K. pension fund for an amount of EUR 68 million.
Strong financial position
Invested capital at September 30, 2007, amounted to EUR 8.0 billion, unchanged from December 31, 2006.
Equity decreased EUR 1.2 billion, because the share buyback and dividend payments exceeded the result of the first nine months. The company started a share buyback program for EUR 1.6 billion on May 3, 2007, which was completed on August 27, 2007. The total number of shares repurchased under this program is 26,736,674 common shares, for which cancellation is expected before the end of 2007. These shares were repurchased at an average price of EUR 59.84. Under the performance-related share plan 53,520 common shares were issued and 1,943,769 stock options were exercised. These options were fulfilled by 1,703,859 new common shares being issued and 239,910 common shares already held by the company.
Akzo Nobel intends to return an additional EUR 3 billion to its shareholders, commencing in 2008, subject to shareholder approval, completion of the sale of Organon BioSciences, and completion of the on-sale of certain ICI activities to Henkel. This intended return comprises a EUR 2 billion share buyback and a return of paid-in capital of EUR 1 billion upon completion of this share buyback.
In the context of intended acquisition of ICI, the company has concluded forward exchange contracts to hedge the currency risk on the transaction. Per September 30, 2007, contracts had been concluded for GBP 5.3 billion. These contracts are accounted for as cash flow hedge.
Net interest-bearing borrowings were EUR 2.2 billion, up EUR 1.1 billion on year-end 2006, mainly due to the EUR 1.6 billion share buyback program. Gearing was 0.71 (December 31, 2006: 0.26). Recently, Akzo Nobel announced that it will maintain a solid investment grade in the single A– to BBB+ range.
Recommended cash offer for ICI
On August 13, 2007, the Board of Management and the Supervisory Board of Akzo Nobel N.V. and the Board of Imperial Chemical Industries PLC announced that they had reached agreement on the terms of a recommended cash offer by Akzo Nobel for ICI. Under the terms of the transaction, ICI shareholders will receive GBP 6.70 in cash for each ICI share. This acquisition provides the opportunity to create a global leader in coatings and one of the largest specialty chemicals companies in the world with complementary brands, assets, and skills, and leading positions in attractive specialty chemicals markets. The enlarged Akzo Nobel group will benefit from a diversified and broad geographic presence, a significantly strengthened Decorative Coatings business, and highly attractive platforms for growth in emerging markets.
In connection with the acquisition of ICI, Akzo Nobel has entered into an agreement with Henkel to sell all assets and liabilities comprising the business divisions known within the ICI Group as the “Adhesives Division” and the “Electronic Materials Division”, both of which form part of the “National Starch” business of ICI, for GBP 2.7 billion (EUR 4.0 billion) in cash (calculated on a debt and cash free basis and subject to certain adjustments).
Subject to the approval of the shareholders of Akzo Nobel (EGM on November 5, 2007) and ICI (EGM on November 6, 2007), and certain other conditions precedent, completion of the ICI transaction is currently expected to take place on January 2, 2008.
Arnhem, October 23, 2007
The Board of Management
| Changes in equity | ||
| Report for the 3rd quarter of 2007 |
| 14 | Report for the 3rd quarter of 2007 |
| Information on discontinued operations – Organon BioSciences |
| Millions of euros or % | Organon | Intervet | Organon BioSciences | |||||||||||||||
| 2007 | 2006 | Δ% | 2007 | 2006 | Δ% | 2007 | 2006 | Δ% | ||||||||||
| Third quarter | ||||||||||||||||||
| Revenues | 615 | 626 | (2 | ) | 306 | 276 | 11 | 918 | 896 | 2 | ||||||||
| EBIT before incidentals | 117 | 92 | 27 | 80 | 54 | 48 | 205 | 147 | 39 | |||||||||
| EBIT margin | 19.0 | 14.7 | 26.1 | 19.6 | 22.3 | 16.4 | ||||||||||||
| EBIT (operating income) | 117 | 115 | 2 | 80 | 62 | 29 | 205 | 177 | 16 | |||||||||
| EBIT margin | 19.0 | 18.4 | 26.1 | 22.5 | 22.3 | 19.8 | ||||||||||||
| S&D expenses as % of revenues | 29.8 | 31.5 | 22.2 | 23.9 | 27.3 | 29.3 | ||||||||||||
| R&D expenses as % of revenues | 19.5 | 18.2 | 7.8 | 9.1 | 15.7 | 15.5 | ||||||||||||
| Capital expenditures | 27 | 23 | 11 | 18 | 38 | 41 | ||||||||||||
| January-September | ||||||||||||||||||
| Revenues | 1,879 | 1,948 | (4 | ) | 912 | 838 | 9 | 2,774 | 2,766 | – | ||||||||
| EBIT before incidentals | 330 | 278 | 19 | 214 | 163 | 31 | 543 | 442 | 23 | |||||||||
| EBIT margin | 17.6 | 14.3 | 23.5 | 19.5 | 19.6 | 16.0 | ||||||||||||
| EBIT (operating income) | 333 | 296 | 13 | 215 | 177 | 21 | 547 | 473 | 16 | |||||||||
| EBIT margin | 17.7 | 15.2 | 23.6 | 21.1 | 19.7 | 17.1 | ||||||||||||
| S&D expenses as % of revenues | 30.8 | 31.5 | 22.9 | 24.6 | 28.4 | 29.6 | ||||||||||||
| R&D expenses as % of revenues | 18.7 | 18.8 | 8.4 | 9.8 | 15.4 | 16.2 | ||||||||||||
| Capital expenditures | 98 | 63 | 34 | 40 | 132 | 104 | ||||||||||||
| Invested capital | 1,630 | 1,593 | 1 | 947 | 949 | 1 | 2,592 | 2,556 | 1 | |||||||||
| Number of employees | 13,270 | 13,760 | 1 | 5,390 | 5,370 | 1 | 18,710 | 19,190 | 1 | |||||||||
| The minor differences between the Organon BioSciences figures and the sum of the Organon and Intervet amounts relate to other activities and eliminations. |
| The Organon figures include the Nobilon (human vaccines) activity. |
| 1 At December 31. |
Statement of income of discontinued operation | |||||||||||
| 3rd quarter | Millions of euros | January-September | |||||||||
| 2007 | 2006 | Δ% | 2007 | 2006 | Δ% | ||||||
| 918 | 896 | 2 | Revenues | 2,774 | 2,766 | – | |||||
| (715 | ) | (718 | ) | Expenses | (2,232 | ) | (2,287 | ) | |||
| 203 | 178 | Profit before tax | 542 | 479 | |||||||
| (58 | ) | (59 | ) | Income taxes | (139 | ) | (134 | ) | |||
| Income from | |||||||||||
| 145 | 119 | 22 | discontinued operations | 403 | 345 | 17 | |||||
Assets and liabilities held for sale of Organon BioSciences
| Millions of euros | September 30, 2007 | ||
| Property, plant and equipment | 1,144 | ||
| Intangible assets | 160 | ||
| Financial noncurrent assets | 361 | ||
| Inventories | 875 | ||
| Receivables | 761 | ||
| Assets held for sale | 3,301 | ||
| Noncurrent liabilities | 291 | ||
| Short-term borrowings | 149 | ||
| Current payables | 738 | ||
| Liabilities held for sale | 1,178 | ||
Note: Cash and cash equivalents reported for Organon BioSciences are not included in assets held for sale as these will be settled with the purchase price at the closing of the deal.
| Akzo Nobel | 15 |
| Contact details | |||
| Akzo Nobel NV | Akzo Nobel Corporate Communications | ||
| Strawinskylaan 2555 | Tel: | +31 20 502 7833 | |
| P.O. Box 75730 | Fax: | +31 20 502 7604 | |
| 1070 AS Amsterdam, the Netherlands | E-mail: | info@akzonobel.com | |
| Tel: | +31 20 502 7555 | ||
| Fax: | +31 20 502 7666 | Akzo Nobel Investor Relations | |
| Internet: | www.akzonobel.com | Tel: | +31 20 502 7854 |
| Fax: | +31 20 502 7605 | ||
| For more information: | E-mail: | investor.relations@akzonobel.com | |
| The explanatory sheets used by the CFO during the press | |||
| conference can be viewed on Akzo Nobel’s corporate website | |||
| www.akzonobel.com. | |||
Notes
The data in this report are unaudited.
This interim financial report is in compliance with IAS 34 – Interim Financial Reporting. The same accounting policies and methods of computation have been applied as in the 2006 financial statements, a copy of which can be found on the company’s website: www.akzonobel.com.
As a consequence of the intention to divest Organon BioSciences (OBS) to Schering-Plough, in accordance with IFRS 5, the OBS activities qualify as so-called discontinued operations. As a result, going forward no depreciation or amortization is recognized anymore for the OBS activities, as a result of which pre-tax results increased by EUR 53 million. Of this amount, EUR 21 million was recognized in the third quarter of 2007.
Revenues consist of sales of goods and services, and royalty income.
Autonomous growth is defined as the change in revenues attributable to changed volumes and selling prices. It excludes currency, acquisition, and divestment effects.
Incidentals are special benefits, results on divestments, restructuring and impairment charges, and charges related to major legal, antitrust, and environmental cases. Operating income excluding incidentals is one of the key figures management uses to assess the company’s performance, as this figure better reflects the underlying trends in the results of the activities.
EBIT margin is operating income (EBIT) as a percentage of revenues.
EBITDA is EBIT before depreciation and amortization.
Invested capital is total assets less cash and cash equivalents, less current liabilities.
Moving average ROI is EBIT before incidentals of the last four quarters divided by the average invested capital of those four quarters.
Safe Harbor Statement*
This report contains statements which address such key issues as Akzo Nobel’s growth strategy, future financial results, market positions, product development, pharmaceutical products in the pipeline, and product approvals. Such statements should be carefully considered, and it should be understood that many factors could cause forecasted and actual results to differ from these statements. These factors include, but are not limited to, price fluctuations, currency fluctuations, progress of drug development, clinical testing and regulatory approval, developments in raw material and personnel costs, pensions, physical and environmental risks, legal issues, and legislative, fiscal, and other regulatory measures. Stated competitive positions are based on management estimates supported by information provided by specialized external agencies. For a more comprehensive discussion of the risk factors affecting our business please see our Annual Report on Form 20-F filed with the United States Securities and Exchange Commission, a copy of which can be found on the company’s corporate website www.akzonobel.com.
* Pursuant to the U.S. Private Securities Litigation Reform Act 1995.
| Information on the discontinued operations – Organon BioSciences Contact details and notes | ||
| Report for the 3rd quarter of 2007 |
![]()
SIGNATURES
Pursuant to the requirements of Section 12 of the Securities Exchange Act of
1934 the registrant has duly caused this report to be signed on its behalf of
the undersigned, thereto duly authorized.
Akzo Nobel N.V.
| Name : | R.J. Frohn | Name : | M. Potter |
| Title : | Chief Financial Officer | Title : | Director Corporate Control |
Dated : October 23, 2007