UNITED STATES
SECURITIES AND EXCHANGE COMMISSION
Washington, D.C. 20549
Form N-CSR
CERTIFIED SHAREHOLDER REPORT OF REGISTERED
MANAGEMENT INVESTMENT COMPANIES
Investment Company Act File Number: 811-01545
Eaton Vance Special Investment Trust
(Exact Name of Registrant as Specified in Charter)
Two International Place, Boston, Massachusetts 02110
(Address of Principal Executive Offices)
Deidre E. Walsh
Two International Place, Boston, Massachusetts 02110
(Name and Address of Agent for Services)
(617) 482-8260
(Registrant’s Telephone Number)
December 31
Date of Fiscal Year End
December 31, 2021
Date of Reporting Period
Item 1. Reports to Stockholders

Eaton Vance
Greater India Fund
Annual Report
December 31, 2021

Commodity Futures Trading Commission Registration. The Commodity Futures Trading Commission (“CFTC”) has adopted regulations that subject registered investment companies and advisers to regulation by the CFTC if a fund invests more than a prescribed level of its assets in certain CFTC-regulated instruments (including futures, certain options and swap agreements) or markets itself as providing investment exposure to such instruments. The investment adviser has claimed an exclusion from the definition of “commodity pool operator” under the Commodity Exchange Act with respect to its management of the Fund. Accordingly, neither the Fund nor the adviser with respect to the operation of the Fund is subject to CFTC regulation. Because of its management of other strategies, the Fund’s adviser and Goldman Sachs Asset Management, L.P. (GSAM), sub-adviser to the Fund, are registered with the CFTC as commodity pool operators. The adviser and GSAM are also registered as commodity trading advisors.
Fund shares are not insured by the FDIC and are not deposits or other obligations of, or guaranteed by, any depository institution. Shares are subject to investment risks, including possible loss of principal invested.
This report must be preceded or accompanied by a current summary prospectus or prospectus. Before investing, investors should consider carefully the investment objective, risks, and charges and expenses of a mutual fund. This and other important information is contained in the summary prospectus and prospectus, which can be obtained from a financial intermediary. Prospective investors should read the prospectus carefully before investing. For further information, please call 1-800-262-1122.
Annual Report December 31, 2021
Eaton Vance
Greater India Fund
| 2 | ||||
| 3 | ||||
| 4 | ||||
| 5 | ||||
| 6 | ||||
| 7 | ||||
| 19 and 34 | ||||
| 20 | ||||
| 35 | ||||
| 38 | ||||
| 40 |
Eaton Vance
Greater India Fund
December 31, 2021
Management’s Discussion of Fund Performance1
Economic and Market Conditions
The 12-month period starting January 1, 2021, was notable for a global equity rally that lasted most of the period. Except for temporary market retreats in September and November influenced by new outbreaks of COVID-19, stock indexes worldwide generally posted strong returns during the period as investors cheered the reopening of businesses that had been affected by the pandemic and the rollout of several highly effective COVID-19 vaccines.
Against this backdrop, India was among the best-performing major equity markets worldwide in 2021. After reaching an all-time high in mid-October, the MSCI India Index (the Index) finished the year returning 26.23%.
During the year, India’s response to the pandemic — in terms of a faster pace of vaccinations and no national-level lockdowns being imposed — helped the economic recovery from the impact of a second COVID-19 wave. The economy was also supported by the Reserve Bank of India’s monetary policy, which maintained an accommodative stance to ensure inexpensive credit availability and to sustain demand for economic growth. Additionally, factors like the listing of new-age technology start-ups and the government’s continued focus on kick starting the investment cycle — through policies intended to boost the country’s manufacturing sector — helped grow investors’ confidence. Market participants were also enthused by the government’s intent and progress on privatizing a number of state-owned enterprises, which is expected to improve the economy’s efficiency.
During the period, the best-performing market sectors were materials, utilities, and information technology, with no sectors in negative performance territory.
For the period as a whole, the MSCI World Index, a broad measure of global equities, returned 21.82%; while the S&P 500® Index returned 28.71%; and the Nasdaq Composite Index rose 22.18%. The MSCI EAFE Index of developed-market international equities returned 11.26%; while the MSCI Emerging Markets Index returned -2.54%; and the MSCI Frontier Markets Index returned 19.73%.
Fund Performance
For the 12-month period ended December 31, 2021, Eaton Vance Greater India Fund (the Fund) returned 24.04% for Class A shares at net asset value (NAV), underperforming its benchmark, the Index, which returned 26.23%.
At the sector level, the Fund’s underweight exposure to materials detracted from Fund performance relative to the Index during the period. In contrast, positions in the information technology (IT) and consumer staples sectors were the largest contributors to relative returns.
Within the consumer discretionary sector, an overweight position in Maruti Suzuki India, Ltd. (Maruti Suzuki), India’s largest passenger car company, was the largest detractor at the stock level. Maruti Suzuki had reported weaker-than-expected quarterly results due to the impact of a second COVID-19 wave in India as well as rising production costs. To compound challenges, a pandemic-induced global microchip shortage had been hindering a recovery in the passenger vehicle market. In addition, the car firm had already been losing market share to competition in the SUV segment. By period-end, the Fund reduced its position in Maruti Suzuki.
Within the financials sector, the Fund’s overweight position initiated in early 2021 in the State Bank of India, the country’s largest state-owned bank, also detracted from relative performance at the stock level. In contrast, an underweight position in the Housing Development Finance Corp., Ltd., India’s largest mortgage financier, was the largest contributor to relative returns during the period.
Within the IT sector, an overweight position in Infosys, Ltd. (Infosys), a global IT consultant, contributed to relative returns during the period. Infosys derives a major part of its revenues by providing business process outsourcing services to developed markets, especially to firms in the U.S. and Europe. In recent years, Indian IT companies have benefited from structural tailwinds, including growing global demand for offshore digital capabilities and strong management execution among vendors.
See Endnotes and Additional Disclosures in this report.
Past performance is no guarantee of future results. Returns are historical and are calculated by determining the percentage change in net asset value (NAV) or offering price (as applicable) with all distributions reinvested. Investment return and principal value will fluctuate so that shares, when redeemed, may be worth more or less than their original cost. Performance for periods less than or equal to one year is cumulative. Performance is for the stated time period only; due to market volatility, current Fund performance may be lower or higher than the quoted return. For performance as of the most recent month-end, please refer to eatonvance.com.
| 2 |
Eaton Vance
Greater India Fund
December 31, 2021
Portfolio Manager(s) Hiren Dasani, CFA, of Goldman Sachs Asset Management, L.P. (GSAM)
| % Average Annual Total Returns | Class Inception Date | Performance Inception Date | One Year | Five Years | Ten Years | |||||||||||||||
Class A at NAV | 05/02/1994 | 05/02/1994 | 24.04 | % | 14.60 | % | 12.02 | % | ||||||||||||
Class A with 5.75% Maximum Sales Charge | — | — | 16.90 | 13.25 | 11.36 | |||||||||||||||
Class C at NAV | 07/07/2006 | 05/02/1994 | 23.17 | 13.80 | 11.39 | |||||||||||||||
Class C with 1% Maximum Sales Charge | — | — | 22.17 | 13.80 | 11.39 | |||||||||||||||
Class I at NAV | 10/01/2009 | 05/02/1994 | 24.31 | 14.92 | 12.34 | |||||||||||||||
| ||||||||||||||||||||
MSCI India Index | — | — | 26.23 | % | 15.07 | % | 10.84 | % | ||||||||||||
| % Total Annual Operating Expense Ratios4 | Class A | Class C | Class I | |||||||||||||||||
| 1.56 | % | 2.26 | % | 1.26 | % | |||||||||||||||
Growth of $10,000
This graph shows the change in value of a hypothetical investment of $10,000 in Class A of the Fund for the period indicated. For comparison, the same investment is shown in the indicated index.
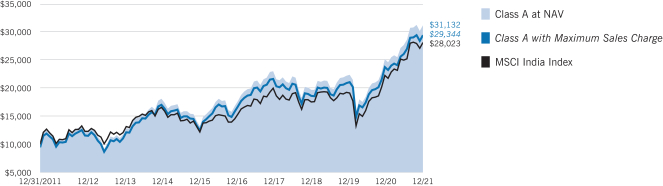
| Growth of Investment | Amount Invested | Period Beginning | At NAV | With Maximum Sales Charge | ||||||||||||
Class C | $10,000 | 12/31/2011 | $29,443 | N.A. | ||||||||||||
Class I | $250,000 | 12/31/2011 | $801,475 | N.A. | ||||||||||||
See Endnotes and Additional Disclosures in this report.
Past performance is no guarantee of future results. Returns are historical and are calculated by determining the percentage change in net asset value (NAV) or offering price (as applicable) with all distributions reinvested. Investment return and principal value will fluctuate so that shares, when redeemed, may be worth more or less than their original cost. Performance for periods less than or equal to one year is cumulative. Performance is for the stated time period only; due to market volatility, current Fund performance may be lower or higher than the quoted return. For performance as of the most recent month-end, please refer to eatonvance.com.
| 3 |
Eaton Vance
Greater India Fund
December 31, 2021
Sector Allocation (% of net assets)6

Top 10 Holdings (% of net assets)6
Infosys, Ltd. | 13.1 | % | ||
ICICI Bank, Ltd. | 9.7 | |||
Reliance Industries, Ltd. | 5.0 | |||
Axis Bank, Ltd. | 4.6 | |||
HCL Technologies, Ltd. | 3.2 | |||
UltraTech Cement, Ltd. | 2.7 | |||
Wipro, Ltd. | 2.6 | |||
State Bank of India | 2.6 | |||
Avenue Supermarts, Ltd. | 2.5 | |||
Bajaj Finserv, Ltd. | 2.3 | |||
Total | 48.3 | % | ||
See Endnotes and Additional Disclosures in this report.
| 4 |
Eaton Vance
Greater India Fund
December 31, 2021
Endnotes and Additional Disclosures
| 1 | The views expressed in this report are those of the portfolio manager(s) and are current only through the date stated at the top of this page. These views are subject to change at any time based upon market or other conditions, and Eaton Vance and the Fund(s) disclaim any responsibility to update such views. These views may not be relied upon as investment advice and, because investment decisions are based on many factors, may not be relied upon as an indication of trading intent on behalf of any Eaton Vance fund. This commentary may contain statements that are not historical facts, referred to as “forward-looking statements.” The Fund’s actual future results may differ significantly from those stated in any forward-looking statement, depending on factors such as changes in securities or financial markets or general economic conditions, the volume of sales and purchases of Fund shares, the continuation of investment advisory, administrative and service contracts, and other risks discussed from time to time in the Fund’s filings with the Securities and Exchange Commission. |
| 2 | MSCI India Index is an unmanaged index of common stocks traded in the India market. MSCI indexes are net of foreign withholding taxes. Source: MSCI. MSCI data may not be reproduced or used for any other purpose. MSCI provides no warranties, has not prepared or approved this report, and has no liability hereunder. Unless otherwise stated, index returns do not reflect the effect of any applicable sales charges, commissions, expenses, taxes or leverage, as applicable. It is not possible to invest directly in an index. |
| 3 | Total Returns at NAV do not include applicable sales charges. If sales charges were deducted, the returns would be lower. Total Returns shown with maximum sales charge reflect the stated maximum sales charge. Unless otherwise stated, performance does not reflect the deduction of taxes on Fund distributions or redemptions of Fund shares. |
Effective November 5, 2020, Class C shares automatically convert to Class A shares eight years after purchase. The average annual total returns listed for Class C reflect conversion to Class A shares after eight years. Prior to November 5, 2020, Class C shares automatically converted to Class A shares ten years after purchase.
Effective September 15, 2016, Goldman Sachs Asset Management International (GSAM beginning October 19, 2017) began sub- advising the Fund. Performance prior to September 15, 2016, reflects the Fund’s performance under a former sub-adviser.
| 4 | Source: Fund prospectus. The expense ratios for the current reporting period can be found in the Financial Highlights section of this report. |
| 5 | Fund primarily invests in an affiliated investment company (Portfolio) with the same objective(s) and policies as the Fund and may also invest directly. Unless otherwise noted, references to investments are to the aggregate holdings of the Fund and the Portfolio. |
| 6 | Excludes cash and cash equivalents. |
Fund profile subject to change due to active management.
Additional Information
MSCI World Index is an unmanaged index of equity securities in the developed markets. MSCI EAFE Index is an unmanaged index of equities in the developed markets, excluding the U.S. and Canada. MSCI Emerging Markets Index is an unmanaged index of emerging markets common stocks. MSCI Frontier Markets Index is an unmanaged index that measures the performance of stock markets with less-developed economies and financial markets than emerging markets, and that typically have more restrictions on foreign stock ownership. S&P 500® Index is an unmanaged index of large-cap stocks commonly used as a measure of U.S. stock market performance. S&P Dow Jones Indices are a product of S&P Dow Jones Indices LLC (“S&P DJI”) and have been licensed for use. S&P® and S&P 500® are registered trademarks of S&P DJI; Dow Jones® is a registered trademark of Dow Jones Trademark Holdings LLC (“Dow Jones”); S&P DJI, Dow Jones and their respective affiliates do not sponsor, endorse, sell or promote the Fund, will not have any liability with respect thereto and do not have any liability for any errors, omissions, or interruptions of the S&P Dow Jones Indices. Nasdaq Composite Index is a market capitalization-weighted index of all domestic and international securities listed on Nasdaq. Source: Nasdaq, Inc. The information is provided by Nasdaq (with its affiliates, are referred to as the “Corporations”) and Nasdaq’s third party licensors on an “as is” basis and the Corporations make no guarantees and bear no liability of any kind with respect to the information or the Fund.
| 5 |
Eaton Vance
Greater India Fund
December 31, 2021
Example: As a Fund shareholder, you incur two types of costs: (1) transaction costs, including sales charges (loads) on purchases and redemption fees (if applicable); and (2) ongoing costs, including management fees; distribution and/or service fees; and other Fund expenses. This Example is intended to help you understand your ongoing costs (in dollars) of Fund investing and to compare these costs with the ongoing costs of investing in other mutual funds. The Example is based on an investment of $1,000 invested at the beginning of the period and held for the entire period (July 1, 2021 – December 31, 2021).
Actual Expenses: The first section of the table below provides information about actual account values and actual expenses. You may use the information in this section, together with the amount you invested, to estimate the expenses that you paid over the period. Simply divide your account value by $1,000 (for example, an $8,600 account value divided by $1,000 = 8.6), then multiply the result by the number in the first section under the heading entitled “Expenses Paid During Period” to estimate the expenses you paid on your account during this period.
Hypothetical Example for Comparison Purposes: The second section of the table below provides information about hypothetical account values and hypothetical expenses based on the actual Fund expense ratio and an assumed rate of return of 5% per year (before expenses), which is not the actual Fund return. The hypothetical account values and expenses may not be used to estimate the actual ending account balance or expenses you paid for the period. You may use this information to compare the ongoing costs of investing in your Fund and other funds. To do so, compare this 5% hypothetical example with the 5% hypothetical examples that appear in the shareholder reports of the other funds.
Please note that the expenses shown in the table are meant to highlight your ongoing costs only and do not reflect any transactional costs, such as sales charges (loads) or redemption fees (if applicable). Therefore, the second section of the table is useful in comparing ongoing costs only, and will not help you determine the relative total costs of owning different funds. In addition, if these transactional costs were included, your costs would be higher.
| Beginning Account Value (7/1/21) | Ending Account Value (12/31/21) | Expenses Paid During Period* (7/1/21 – 12/31/21) | Annualized Expense Ratio | |||||||||||||
Actual | ||||||||||||||||
Class A | $ | 1,000.00 | $ | 1,127.90 | $ | 8.26 | 1.54 | % | ||||||||
Class C | $ | 1,000.00 | $ | 1,123.80 | $ | 12.04 | 2.25 | % | ||||||||
Class I | $ | 1,000.00 | $ | 1,129.90 | $ | 6.66 | 1.24 | % | ||||||||
Hypothetical | ||||||||||||||||
(5% return per year before expenses) | ||||||||||||||||
Class A | $ | 1,000.00 | $ | 1,017.44 | $ | 7.83 | 1.54 | % | ||||||||
Class C | $ | 1,000.00 | $ | 1,013.86 | $ | 11.42 | 2.25 | % | ||||||||
Class I | $ | 1,000.00 | $ | 1,018.95 | $ | 6.31 | 1.24 | % | ||||||||
| * | Expenses are equal to the Fund’s annualized expense ratio for the indicated Class, multiplied by the average account value over the period, multiplied by 184/365 (to reflect the one-half year period). The Example assumes that the $1,000 was invested at the net asset value per share determined at the close of business on June 30, 2021. The Example reflects the expenses of both the Fund and the Portfolio. |
| 6 |
Eaton Vance
Greater India Fund
December 31, 2021
Statement of Assets and Liabilities
| Assets | December 31, 2021 | |||
Investment in Greater India Portfolio, at value (identified cost, $182,946,419) | $ | 284,150,152 | ||
Receivable for Fund shares sold | 138,503 | |||
Due from affiliate | 3,250,133 | |||
Total assets | $ | 287,538,788 | ||
| Liabilities |
| |||
Payable for Fund shares redeemed | $ | 594,729 | ||
Payable to affiliates: | ||||
Administration fee | 37,458 | |||
Distribution and service fees | 55,026 | |||
Trustees’ fees | 125 | |||
Accrued expenses | 82,294 | |||
Total liabilities | $ | 769,632 | ||
Net Assets | $ | 286,769,156 | ||
| Sources of Net Assets |
| |||
Paid-in capital | $ | 169,166,119 | ||
Distributable earnings | 117,603,037 | |||
Net Assets | $ | 286,769,156 | ||
| Class A Shares |
| |||
Net Assets | $ | 181,367,909 | ||
Shares Outstanding | 4,113,916 | |||
Net Asset Value and Redemption Price Per Share | ||||
(net assets ÷ shares of beneficial interest outstanding) | $ | 44.09 | ||
Maximum Offering Price Per Share | ||||
(100 ÷ 94.25 of net asset value per share) | $ | 46.78 | ||
| Class C Shares |
| |||
Net Assets | $ | 9,181,139 | ||
Shares Outstanding | 252,317 | |||
Net Asset Value and Offering Price Per Share* | ||||
(net assets ÷ shares of beneficial interest outstanding) | $ | 36.39 | ||
| Class I Shares |
| |||
Net Assets | $ | 96,220,108 | ||
Shares Outstanding | 2,109,959 | |||
Net Asset Value, Offering Price and Redemption Price Per Share | ||||
(net assets ÷ shares of beneficial interest outstanding) | $ | 45.60 | ||
On sales of $50,000 or more, the offering price of Class A shares is reduced.
| * | Redemption price per share is equal to the net asset value less any applicable contingent deferred sales charge. |
| 7 | See Notes to Financial Statements. |
Eaton Vance
Greater India Fund
December 31, 2021
Statement of Operations
| Investment Income | Year Ended December 31, 2021 | |||
Dividends allocated from Portfolio (net of foreign taxes, $460,167) | $ | 1,545,523 | ||
Expenses allocated from Portfolio | (2,608,830 | ) | ||
Total investment loss from Portfolio | $ | (1,063,307 | ) | |
| Expenses | ||||
Administration fee | $ | 410,752 | ||
Distribution and service fees | ||||
Class A | 512,984 | |||
Class C | 83,846 | |||
Trustees’ fees and expenses | 500 | |||
Custodian fee | 26,446 | |||
Transfer and dividend disbursing agent fees | 232,622 | |||
Legal and accounting services | 24,471 | |||
Printing and postage | 21,635 | |||
Registration fees | 51,852 | |||
Miscellaneous | 11,432 | |||
Total expenses | $ | 1,376,540 | ||
Net investment loss | $ | (2,439,847 | ) | |
| Realized and Unrealized Gain (Loss) from Portfolio | ||||
Net realized gain (loss) — | ||||
Investment transactions (net of foreign capital gains taxes of $2,732,902) | $ | 38,901,935 | ||
Financial futures contracts | 2,064,320 | |||
Foreign currency transactions | (195,920 | ) | ||
Net realized gain | $ | 40,770,335 | ||
Change in unrealized appreciation (depreciation) — | ||||
Investments (including net increase in accrued foreign capital gains taxes of $6,153,223) | $ | 20,392,336 | ||
Financial futures contracts | 7,921 | |||
Foreign currency | (1,399 | ) | ||
Net change in unrealized appreciation (depreciation) | $ | 20,398,858 | ||
Net realized and unrealized gain | $ | 61,169,193 | ||
Net increase in net assets from operations | $ | 58,729,346 | ||
| 8 | See Notes to Financial Statements. |
Eaton Vance
Greater India Fund
December 31, 2021
Statements of Changes in Net Assets
| Year Ended December 31, | ||||||||
| Increase (Decrease) in Net Assets | 2021 | 2020 (as restated) | ||||||
From operations — | ||||||||
Net investment loss | $ | (2,439,847 | ) | $ | (1,343,407 | ) | ||
Net realized gain | 40,770,335 | 6,347,851 | ||||||
Net change in unrealized appreciation (depreciation) | 20,398,858 | 20,452,421 | ||||||
Net increase in net assets from operations | $ | 58,729,346 | $ | 25,456,865 | ||||
Distributions to shareholders — | ||||||||
Class A | $ | (15,279,756 | ) | $ | (400,539 | ) | ||
Class C | (903,171 | ) | (26,074 | ) | ||||
Class I | (7,991,474 | ) | (138,011 | ) | ||||
Total distributions to shareholders | $ | (24,174,401 | ) | $ | (564,624 | ) | ||
Transactions in shares of beneficial interest — | ||||||||
Proceeds from sale of shares | ||||||||
Class A | $ | 10,423,509 | $ | 8,791,552 | ||||
Class C | 1,751,246 | 1,151,209 | ||||||
Class I | 43,052,707 | 50,142,961 | ||||||
Net asset value of shares issued to shareholders in payment of distributions declared | ||||||||
Class A | 13,799,306 | 356,690 | ||||||
Class C | 900,899 | 25,905 | ||||||
Class I | 7,234,565 | 118,877 | ||||||
Cost of shares redeemed | ||||||||
Class A | (19,820,692 | ) | (33,527,366 | ) | ||||
Class C | (1,793,996 | ) | (4,199,233 | ) | ||||
Class I | (35,389,983 | ) | (34,902,284 | ) | ||||
Net asset value of shares converted | ||||||||
Class A | 115,111 | 1,561,672 | ||||||
Class C | (115,111 | ) | (1,561,672 | ) | ||||
Contributed capital from affiliate for shares redeemed | ||||||||
Class A | 881,304 | 307,994 | ||||||
Class C | 86,067 | 60,717 | ||||||
Class I | 1,786,810 | 89,019 | ||||||
Net increase (decrease) in net assets from Fund share transactions | $ | 22,911,742 | $ | (11,583,959 | ) | |||
Net increase in net assets | $ | 57,466,687 | $ | 13,308,282 | ||||
| Net Assets |
| |||||||
At beginning of year | $ | 229,302,469 | $ | 215,994,187 | ||||
At end of year | $ | 286,769,156 | $ | 229,302,469 | ||||
| 9 | See Notes to Financial Statements. |
Eaton Vance
Greater India Fund
December 31, 2021
Financial Highlights
| Class A | ||||||||||||||||||||
| Year Ended December 31, | ||||||||||||||||||||
| 2021 | 2020 (as restated) | 2019 | 2018 | 2017 | ||||||||||||||||
Net asset value — Beginning of year | $ | 38.790 | $ | 34.300 | $ | 32.020 | $ | 36.830 | $ | 26.300 | ||||||||||
| Income (Loss) From Operations | ||||||||||||||||||||
Net investment income (loss)(1) | $ | (0.425 | ) | $ | (0.237 | ) | $ | (0.188 | ) | $ | (0.150 | ) | $ | 0.016 | ||||||
Net realized and unrealized gain (loss) | 9.728 | 4.823 | 3.424 | (4.284 | ) | 11.737 | ||||||||||||||
Total income (loss) from operations | $ | 9.303 | $ | 4.586 | $ | 3.236 | $ | (4.434 | ) | $ | 11.753 | |||||||||
| Less Distributions | ||||||||||||||||||||
From net investment income | $ | — | $ | — | $ | — | $ | (0.376 | ) | $ | (1.223 | ) | ||||||||
From net realized gain | (4.003 | ) | (0.096 | ) | (0.956 | ) | — | — | ||||||||||||
Total distributions | $ | (4.003 | ) | $ | (0.096 | ) | $ | (0.956 | ) | $ | (0.376 | ) | $ | (1.223 | ) | |||||
Net asset value — End of year | $ | 44.090 | $ | 38.790 | $ | 34.300 | $ | 32.020 | $ | 36.830 | ||||||||||
Total Return(2) | 24.04 | % | 13.42 | % | 10.46 | % | (12.13 | )% | 44.80 | % | ||||||||||
Net assets, end of year (000’s omitted) | $ | 181,368 | $ | 155,011 | $ | 163,335 | $ | 152,967 | $ | 192,016 | ||||||||||
Ratios (as a percentage of average daily net assets):(3) | ||||||||||||||||||||
Expenses | 1.54 | % | 1.56 | % | 1.63 | % | 1.62 | % | 1.68 | % | ||||||||||
Net investment income (loss) | (0.98 | )% | (0.75 | )% | (0.58 | )% | (0.44 | )% | 0.05 | % | ||||||||||
Portfolio Turnover of the Portfolio | 33 | % | 26 | % | 21 | % | 29 | % | 25 | % | ||||||||||
| (1) | Computed using average shares outstanding. |
| (2) | Returns are historical and are calculated by determining the percentage change in net asset value with all distributions reinvested and do not reflect the effect of sales charges. |
| (3) | Includes the Fund’s share of the Portfolio’s allocated expenses. |
| 10 | See Notes to Financial Statements. |
Eaton Vance
Greater India Fund
December 31, 2021
Financial Highlights — continued
| Class C | ||||||||||||||||||||
| Year Ended December 31, | ||||||||||||||||||||
| 2021 | 2020 (as restated) | 2019 | 2018 | 2017 | ||||||||||||||||
Net asset value — Beginning of year | $ | 32.810 | $ | 29.230 | $ | 27.620 | $ | 32.050 | $ | 23.020 | ||||||||||
| Income (Loss) From Operations | ||||||||||||||||||||
Net investment loss(1) | $ | (0.616 | ) | $ | (0.385 | ) | $ | (0.363 | ) | $ | (0.334 | ) | $ | (0.186 | ) | |||||
Net realized and unrealized gain (loss) | 8.199 | 4.061 | 2.929 | (3.720 | ) | 10.247 | ||||||||||||||
Total income (loss) from operations | $ | 7.583 | $ | 3.676 | $ | 2.566 | $ | (4.054 | ) | $ | 10.061 | |||||||||
| Less Distributions | ||||||||||||||||||||
From net investment income | $ | — | $ | — | $ | — | $ | (0.376 | ) | $ | (1.031 | ) | ||||||||
From net realized gain | (4.003 | ) | (0.096 | ) | (0.956 | ) | — | — | ||||||||||||
Total distributions | $ | (4.003 | ) | $ | (0.096 | ) | $ | (0.956 | ) | $ | (0.376 | ) | $ | (1.031 | ) | |||||
Net asset value — End of year | $ | 36.390 | $ | 32.810 | $ | 29.230 | $ | 27.620 | $ | 32.050 | ||||||||||
Total Return(2) | 23.17 | % | 12.64 | % | 9.69 | % | (12.76 | )% | 43.81 | % | ||||||||||
| Ratios/Supplemental Data |
| |||||||||||||||||||
Net assets, end of year (000’s omitted) | $ | 9,181 | $ | 7,548 | $ | 11,898 | $ | 21,891 | $ | 30,195 | ||||||||||
Ratios (as a percentage of average daily net assets):(3) | ||||||||||||||||||||
Expenses | 2.24 | % | 2.26 | % | 2.33 | % | 2.32 | % | 2.38 | % | ||||||||||
Net investment loss | (1.69 | )% | (1.44 | )% | (1.30 | )% | (1.14 | )% | (0.65 | )% | ||||||||||
Portfolio Turnover of the Portfolio | 33 | % | 26 | % | 21 | % | 29 | % | 25 | % | ||||||||||
| (1) | Computed using average shares outstanding. |
| (2) | Returns are historical and are calculated by determining the percentage change in net asset value with all distributions reinvested and do not reflect the effect of sales charges. |
| (3) | Includes the Fund’s share of the Portfolio’s allocated expenses. |
| 11 | See Notes to Financial Statements. |
Eaton Vance
Greater India Fund
December 31, 2021
Financial Highlights — continued
| Class I | ||||||||||||||||||||
| Year Ended December 31, | ||||||||||||||||||||
| 2021 | 2020 (as restated) | 2019 | 2018 | 2017 | ||||||||||||||||
Net asset value — Beginning of year | $ | 39.920 | $ | 35.190 | $ | 32.730 | $ | 37.520 | $ | 26.770 | ||||||||||
| Income (Loss) From Operations | ||||||||||||||||||||
Net investment income (loss)(1) | $ | (0.298 | ) | $ | (0.148 | ) | $ | (0.092 | ) | $ | (0.047 | ) | $ | 0.140 | ||||||
Net realized and unrealized gain (loss) | 9.981 | 4.974 | 3.508 | (4.367 | ) | 11.936 | ||||||||||||||
Total income (loss) from operations | $ | 9.683 | $ | 4.826 | $ | 3.416 | $ | (4.414 | ) | $ | 12.076 | |||||||||
| Less Distributions | ||||||||||||||||||||
From net investment income | $ | — | $ | — | $ | — | $ | (0.376 | ) | $ | (1.326 | ) | ||||||||
From net realized gain | (4.003 | ) | (0.096 | ) | (0.956 | ) | — | — | ||||||||||||
Total distributions | $ | (4.003 | ) | $ | (0.096 | ) | $ | (0.956 | ) | $ | (0.376 | ) | $ | (1.326 | ) | |||||
Net asset value — End of year | $ | 45.600 | $ | 39.920 | $ | 35.190 | $ | 32.730 | $ | 37.520 | ||||||||||
Total Return(2) | 24.31 | % | 13.77 | % | 10.79 | % | (11.85 | )% | 45.22 | % | ||||||||||
| Ratios/Supplemental Data |
| |||||||||||||||||||
Net assets, end of year (000’s omitted) | $ | 96,220 | $ | 66,744 | $ | 40,761 | $ | 37,330 | $ | 48,595 | ||||||||||
Ratios (as a percentage of average daily net assets):(3) | ||||||||||||||||||||
Expenses | 1.24 | % | 1.26 | % | 1.33 | % | 1.32 | % | 1.38 | % | ||||||||||
Net investment income (loss) | (0.66 | )% | (0.45 | )% | (0.27 | )% | (0.14 | )% | 0.41 | % | ||||||||||
Portfolio Turnover of the Portfolio | 33 | % | 26 | % | 21 | % | 29 | % | 25 | % | ||||||||||
| (1) | Computed using average shares outstanding. |
| (2) | Returns are historical and are calculated by determining the percentage change in net asset value with all distributions reinvested. |
| (3) | Includes the Fund’s share of the Portfolio’s allocated expenses. |
| 12 | See Notes to Financial Statements. |
Eaton Vance
Greater India Fund
December 31, 2021
Notes to Financial Statements
1 Significant Accounting Policies
Eaton Vance Greater India Fund (the Fund) is a non-diversified series of Eaton Vance Special Investment Trust (the Trust). The Trust is a Massachusetts business trust registered under the Investment Company Act of 1940, as amended (the 1940 Act), as an open-end management investment company. The Fund offers three classes of shares. Class A shares are generally sold subject to a sales charge imposed at time of purchase. Class C shares are sold at net asset value and are generally subject to a contingent deferred sales charge (see Note 5). Effective January 25, 2019, Class C shares generally automatically convert to Class A shares ten years after their purchase and, effective November 5, 2020, automatically convert to Class A shares eight years after their purchase as described in the Fund’s prospectus. Class I shares are sold at net asset value and are not subject to a sales charge. Each class represents a pro-rata interest in the Fund, but votes separately on class-specific matters and (as noted below) is subject to different expenses. Realized and unrealized gains and losses and net investment income and losses, other than class-specific expenses, are allocated daily to each class of shares based on the relative net assets of each class to the total net assets of the Fund. Each class of shares differs in its distribution plan and certain other class-specific expenses. The Fund invests all of its investable assets in interests in Greater India Portfolio (the Portfolio), a Massachusetts business trust, having the same investment objective and policies as the Fund. The value of the Fund’s investment in the Portfolio reflects the Fund’s proportionate interest in the net assets of the Portfolio (99.9% at December 31, 2021). The performance of the Fund is directly affected by the performance of the Portfolio. The financial statements of the Portfolio, including the portfolio of investments, are included elsewhere in this report and should be read in conjunction with the Fund’s financial statements.
The following is a summary of significant accounting policies of the Fund. The policies are in conformity with accounting principles generally accepted in the United States of America (U.S. GAAP). The Fund is an investment company and follows accounting and reporting guidance in the Financial Accounting Standards Board (FASB) Accounting Standards Codification Topic 946.
A Investment Valuation — Valuation of securities by the Portfolio is discussed in Note 1A of the Portfolio’s Notes to Financial Statements, which are included elsewhere in this report.
B Income — The Fund’s net investment income or loss consists of the Fund’s pro-rata share of the net investment income or loss of the Portfolio, less all actual and accrued expenses of the Fund.
C Federal and Other Taxes — The Fund’s policy is to comply with the provisions of the Internal Revenue Code applicable to regulated investment companies and to distribute to shareholders each year substantially all of its net investment income, and all or substantially all of its net realized capital gains. Accordingly, no provision for federal income or excise tax is necessary.
In addition to the requirements of the Internal Revenue Code, the Fund may also be required to recognize its pro-rata share of the capital gains taxes incurred by the Portfolio. In doing so, the daily net asset value would reflect the Fund’s pro-rata share of the estimated reserve for such taxes incurred by the Portfolio.
As of December 31, 2021, the Fund had no uncertain tax positions that would require financial statement recognition, de-recognition, or disclosure. The Fund files a U.S. federal income tax return annually after its fiscal year-end, which is subject to examination by the Internal Revenue Service for a period of three years from the date of filing.
D Expenses — The majority of expenses of the Trust are directly identifiable to an individual fund. Expenses which are not readily identifiable to a specific fund are allocated taking into consideration, among other things, the nature and type of expense and the relative size of the funds.
E Use of Estimates — The preparation of the financial statements in conformity with U.S. GAAP requires management to make estimates and assumptions that affect the reported amounts of assets and liabilities at the date of the financial statements and the reported amounts of income and expense during the reporting period. Actual results could differ from those estimates.
F Indemnifications — Under the Trust’s organizational documents, its officers and Trustees may be indemnified against certain liabilities and expenses arising out of the performance of their duties to the Fund. Under Massachusetts law, if certain conditions prevail, shareholders of a Massachusetts business trust (such as the Trust) could be deemed to have personal liability for the obligations of the Trust. However, the Trust’s Declaration of Trust contains an express disclaimer of liability on the part of Fund shareholders and the By-laws provide that the Trust shall assume, upon request by the shareholder, the defense on behalf of any Fund shareholders. Moreover, the By-laws also provide for indemnification out of Fund property of any shareholder held personally liable solely by reason of being or having been a shareholder for all loss or expense arising from such liability. Additionally, in the normal course of business, the Fund enters into agreements with service providers that may contain indemnification clauses. The Fund’s maximum exposure under these arrangements is unknown as this would involve future claims that may be made against the Fund that have not yet occurred.
G Other — Investment transactions are accounted for on a trade date basis.
2 Distributions to Shareholders and Income Tax Information
It is the present policy of the Fund to make at least one distribution annually (normally in December) of all or substantially all of its net investment income and to distribute annually all or substantially all of its net realized capital gains. Distributions to shareholders are recorded on the ex-dividend date. Distributions are declared separately for each class of shares. Shareholders may reinvest income and capital gain distributions in additional shares of the
| 13 |
Eaton Vance
Greater India Fund
December 31, 2021
Notes to Financial Statements — continued
same class of the Fund at the net asset value as of the ex-dividend date or, at the election of the shareholder, receive distributions in cash. Distributions to shareholders are determined in accordance with income tax regulations, which may differ from U.S. GAAP. As required by U.S. GAAP, only distributions in excess of tax basis earnings and profits are reported in the financial statements as a return of capital. Permanent differences between book and tax accounting relating to distributions are reclassified to paid-in capital. For tax purposes, distributions from short-term capital gains are considered to be from ordinary income.
The tax character of distributions declared for the years ended December 31, 2021 and December 31, 2020 was as follows:
| Year Ended December 31, | ||||||||
| 2021 | 2020 | |||||||
Ordinary income | $ | 3,002,551 | $ | — | ||||
Long-term capital gains | $ | 21,171,850 | $ | 564,624 | ||||
During the year ended December 31, 2021, distributable earnings was increased by $494,483 and paid-in capital was decreased by $494,483 due to the Fund’s use of equalization accounting. Tax equalization accounting allows the Fund to treat as a distribution that portion of redemption proceeds representing a redeeming shareholder’s portion of undistributed taxable income and net capital gains. These reclassifications had no effect on the net assets or net asset value per share of the Fund.
As of December 31, 2021, the components of distributable earnings (accumulated loss) on a tax basis were as follows:
Undistributed ordinary income | $ | 1,901,044 | ||
Undistributed long-term capital gains | 13,225,789 | |||
Net unrealized appreciation | 102,476,204 | |||
Distributable earnings | $ | 117,603,037 | ||
3 Investment Adviser Fee and Other Transactions with Affiliates
The investment adviser fee is earned by Boston Management and Research (BMR) as compensation for investment advisory services rendered to the Fund. On March 1, 2021, Morgan Stanley acquired Eaton Vance Corp. (the “Transaction”) and BMR became an indirect, wholly-owned subsidiary of Morgan Stanley. In connection with the Transaction, the Fund entered into a new investment advisory agreement (the “New Agreement”) with BMR, which took effect on March 1, 2021. Pursuant to the New Agreement (and the Fund’s investment advisory agreement with BMR in effect prior to March 1, 2021), the investment adviser fee is computed at an annual rate as a percentage of the Fund’s average daily net assets that are not invested in other investment companies for which BMR or its affiliates serve as investment adviser and receive an advisory fee as follows and is payable monthly:
| Average Daily Net Assets | Annual Fee Rate | |||
Up to $500 million | 0.850 | % | ||
$500 million but less than $1 billion | 0.800 | % | ||
$1 billion but less than $2.5 billion | 0.775 | % | ||
$2.5 billion but less than $5 billion | 0.750 | % | ||
$5 billion and over | 0.730 | % | ||
For the year ended December 31, 2021, the Fund incurred no investment adviser fee on such assets. Pursuant to an investment sub-advisory agreement, BMR has delegated the investment management of the Fund to Goldman Sachs Asset Management, L.P. (GSAM). In connection with the Transaction, BMR entered into a new investment sub-advisory agreement with GSAM, which took effect on March 1, 2021. BMR pays GSAM a portion of its investment adviser fee for sub-advisory services provided to the Fund. To the extent the Fund’s assets are invested in the Portfolio, the Fund is allocated its pro rata share of the Portfolio’s investment adviser fee. The Portfolio has engaged BMR to render investment advisory services. See Note 2 of the Portfolio’s Notes to Financial Statements which are included elsewhere in this report. The administration fee is earned by Eaton Vance Management (EVM), an affiliate of BMR and effective March 1, 2021, an indirect, wholly-owned subsidiary of Morgan Stanley, for administering the business affairs of the Fund and is computed at an annual rate of 0.15% of the Fund’s average daily net assets. For the year ended December 31, 2021, the administration fee amounted to $410,752.
| 14 |
Eaton Vance
Greater India Fund
December 31, 2021
Notes to Financial Statements — continued
EVM provides sub-transfer agency and related services to the Fund pursuant to a Sub-Transfer Agency Support Services Agreement. For the year ended December 31, 2021, EVM earned $30,631 from the Fund pursuant to such agreement, which is included in transfer and dividend disbursing agent fees on the Statement of Operations. The Fund was informed that Eaton Vance Distributors, Inc. (EVD), an affiliate of EVM and the Fund’s principal underwriter, received $10,101 as its portion of the sales charge on sales of Class A shares for the year ended December 31, 2021. The Fund was informed that Morgan Stanley affiliated broker-dealers, which may be deemed to be affiliates of BMR, EVM and EVD, also received a portion of the sales charge on sales of Class A shares from March 1, 2021 through December 31, 2021 in the amount of $3,750. EVD also received distribution and service fees from Class A and Class C shares (see Note 4) and contingent deferred sales charges (see Note 5).
Trustees and officers of the Fund who are members of EVM’s or BMR’s organizations receive remuneration for their services to the Fund out of the investment adviser fee and administration fee. Certain officers and Trustees of the Fund and the Portfolio are officers of the above organizations.
4 Distribution Plans
The Fund has in effect a distribution plan for Class A shares (Class A Plan) pursuant to Rule 12b-1 under the 1940 Act. Pursuant to the Class A Plan, the Fund pays EVD a distribution and service fee of 0.30% per annum of its average daily net assets attributable to Class A shares for distribution services and facilities provided to the Fund by EVD, as well as for personal services and/or the maintenance of shareholder accounts. Distribution and service fees paid or accrued to EVD for the year ended December 31, 2021 amounted to $512,984 for Class A shares.
The Fund also has in effect a distribution plan for Class C shares (Class C Plan) pursuant to Rule 12b-1 under the 1940 Act. Pursuant to the Class C Plan, the Fund pays EVD amounts equal to 0.75% per annum of its average daily net assets attributable to Class C shares for providing ongoing distribution services and facilities to the Fund. For the year ended December 31, 2021, the Fund paid or accrued to EVD $62,885 for Class C shares.
Pursuant to the Class C Plan, the Fund also makes payments of service fees to EVD, financial intermediaries and other persons in amounts equal to 0.25% per annum of its average daily net assets attributable to that class. Service fees paid or accrued are for personal services and/or the maintenance of shareholder accounts. They are separate and distinct from the sales commissions and distribution fees payable to EVD. Service fees paid or accrued for the year ended December 31, 2021 amounted to $20,961 for Class C shares.
Distribution and service fees are subject to the limitations contained in the Financial Industry Regulatory Authority Rule 2341(d).
5 Contingent Deferred Sales Charges
A contingent deferred sales charge (CDSC) of 1% generally is imposed on redemptions of Class C shares made within 12 months of purchase. Class A shares may be subject to a 1% CDSC if redeemed within 18 months of purchase (depending on the circumstances of purchase). Generally, the CDSC is based upon the lower of the net asset value at date of redemption or date of purchase. No charge is levied on shares acquired by reinvestment of dividends or capital gain distributions. For the year ended December 31, 2021, the Fund was informed that EVD received approximately $5,000 of CDSCs paid by Class C shareholders and no CDSCs paid by Class A shareholders.
6 Investment Transactions
For the year ended December 31, 2021, increases and decreases in the Fund’s investment in the Portfolio aggregated $31,649,737 and $36,627,830, respectively.
7 Shares of Beneficial Interest
The Fund’s Declaration of Trust permits the Trustees to issue an unlimited number of full and fractional shares of beneficial interest (without par value). Such shares may be issued in a number of different series (such as the Fund) and classes. Transactions in Fund shares were as follows:
| Year Ended December 31, | ||||||||
| Class A | 2021 | 2020 (as restated) | ||||||
Sales | 235,749 | 283,007 | ||||||
Issued to shareholders electing to receive payments of distributions in Fund shares | 318,323 | 11,192 | ||||||
Redemptions | (438,592 | ) | (1,107,484 | ) | ||||
Converted from Class C shares | 2,456 | 47,626 | ||||||
Net increase (decrease) | 117,936 | (765,659 | ) | |||||
| 15 |
Eaton Vance
Greater India Fund
December 31, 2021
Notes to Financial Statements — continued
| Year Ended December 31, | ||||||||
| Class C | 2021 | 2020 (as restated) | ||||||
Sales | 47,927 | 40,805 | ||||||
Issued to shareholders electing to receive payments of distributions in Fund shares | 25,165 | 959 | ||||||
Redemptions | (47,907 | ) | (162,624 | ) | ||||
Converted to Class A shares | (2,915 | ) | (56,121 | ) | ||||
Net increase (decrease) | 22,270 | (176,981 | ) | |||||
| Year Ended December 31, | ||||||||
| Class I | 2021 | 2020 (as restated) | ||||||
Sales | 996,118 | 1,760,185 | ||||||
Issued to shareholders electing to receive payments of distributions in Fund shares | 161,306 | 3,629 | ||||||
Redemptions | (719,500 | ) | (1,249,965 | ) | ||||
Net increase | 437,924 | 513,849 | ||||||
8 Restatement
Prior to the issuance of the Fund’s December 31, 2021 financial statements, it was determined that the Fund’s investment in the Portfolio was overstated, thereby resulting in an overstatement of the Fund’s net assets and net asset value (NAV) per share for each class, because the Portfolio’s accrual for foreign capital gains taxes had been understated since June 2, 2020. Since the amount of the misstatement was concluded to be material, the Fund’s daily net assets and NAV per share for each class were revised from June 2, 2020 through December 31, 2021 and through the date of correction on March 7, 2022 (the error period), to reflect the correct accrual for foreign capital gains taxes. In accordance with the Fund’s NAV correction policy, the Fund will reprocess shareholder transactions where shareholders were negatively impacted during the error period and EVM will reimburse the Fund for overpayments made to redeeming shareholders. The financial statements as of and for the year ended December 31, 2021 and the restated financial statements as of December 31, 2020 reflect an estimate by share class of the additional shares to be issued for the reprocessing of shareholder transactions through December 31, 2021 and December 31, 2020, respectively. The overpayment to redeeming shareholders as of December 31, 2021 for which EVM will reimburse the Fund is estimated to be $3,211,911 and is included in Due from affiliate in the Statement of Assets and Liabilities. Such amount includes $457,730 as of December 31, 2020, which is included in the restated Statement of Assets and Liabilities as of December 31, 2020. Also included in the Due from affiliate balance at December 31, 2021 is $38,222, for the reimbursement to the Fund from EVM of excess asset-based administration and distribution fees paid by the Fund through December 31, 2021, as a result of overstated net assets.
As a result of the foregoing, the Fund has restated its Statement of Assets and Liabilities as of December 31, 2020 and its Statement of Operations, Statement of Changes in Net Assets and Financial Highlights for the year then ended. In addition, share activity in Note 7 has been restated for the year ended December 31, 2020 to reflect the increase in shares for the reprocessing of certain share activity at the revised NAVs per share, which is expected to occur at a later date. A component of distributable earnings on a tax basis in Note 2 at December 31, 2020 has also been restated.
| 16 |
Eaton Vance
Greater India Fund
December 31, 2021
Notes to Financial Statements — continued
The following table presents previously reported balances and restated balances and excludes balances that were not restated. See Note 9 at the Portfolio’s financial statements included herein for the restatement of the Portfolio’s previously reported balances as of and for the year ended December 31, 2020.
| Statement of Assets and Liabilities | As Previously Reported | As Restated | ||||||
Assets: | ||||||||
Investment in Greater India Portfolio, at value | $ | 237,414,299 | $ | 229,022,359 | ||||
Due from affiliate | — | 457,730 | ||||||
Total assets | 237,586,908 | 229,652,698 | ||||||
Net Assets | 237,236,679 | 229,302,469 | ||||||
Sources of Net Assets: | ||||||||
Paid-in capital | 146,291,130 | 146,748,860 | ||||||
Distributable earnings | 90,945,549 | 82,553,609 | ||||||
Net Assets | 237,236,679 | 229,302,469 | ||||||
Class A Shares | ||||||||
Net Assets | $ | 160,570,243 | $ | 155,010,926 | ||||
Shares Outstanding | 3,991,502 | 3,995,980 | ||||||
Net Asset Value and Redemption Price Per Share | $ | 40.23 | $ | 38.79 | ||||
Maximum Offering Price Per Share | $ | 42.68 | $ | 41.16 | ||||
Class C Shares | ||||||||
Net Assets | $ | 7,803,832 | $ | 7,547,789 | ||||
Shares Outstanding | 229,336 | 230,047 | ||||||
Net Asset Value and Offering Price Per Share | $ | 34.03 | $ | 32.81 | ||||
Class I Shares | ||||||||
Net Assets | $ | 68,862,604 | $ | 66,743,754 | ||||
Shares Outstanding | 1,663,335 | 1,672,035 | ||||||
Net Asset Value, Offering Price and Redemption Price Per Share | $ | 41.40 | $ | 39.92 | ||||
| Statement of Operations | ||||||||
Change in unrealized appreciation (depreciation) — | ||||||||
Investments (including net increase in accrued foreign capital gains taxes of $0 and $8,391,940, respectively) | $ | 28,840,800 | $ | 20,448,860 | ||||
Net change in unrealized appreciation (depreciation) | 28,844,361 | 20,452,421 | ||||||
Net realized and unrealized gain | 35,192,212 | 26,800,272 | ||||||
Net increase in net assets from operations | 33,848,805 | 25,456,865 | ||||||
| Statement of Changes in Net Assets | ||||||||
Net change in unrealized appreciation (depreciation) | $ | 28,844,361 | $ | 20,452,421 | ||||
Net increase in net assets from operations | 33,848,805 | 25,456,865 | ||||||
Contributed capital from affiliate for shares redeemed: | ||||||||
Class A | — | 307,994 | ||||||
Class C | — | 60,717 | ||||||
Class I | — | 89,019 | ||||||
Net decrease in net assets from Fund share transactions | (12,041,689 | ) | (11,583,959 | ) | ||||
Net increase in net assets | 21,242,492 | 13,308,282 | ||||||
Net Assets at end of year | 237,236,679 | 229,302,469 | ||||||
| 17 |
Eaton Vance
Greater India Fund
December 31, 2021
Notes to Financial Statements — continued
| Financial Highlights — Class A | As Previously Reported | As Restated | ||||||
Net realized and unrealized gain (loss) | $ | 6.263 | $ | 4.823 | ||||
Total income (loss) from operations | 6.026 | 4.586 | ||||||
Net asset value—end of year | 40.230 | 38.790 | ||||||
Total Return | 17.64 | % | 13.42 | % | ||||
Net assets, end of year (000’s omitted) | $ | 160,570 | $ | 155,011 | ||||
| Financial Highlights — Class C | ||||||||
Net realized and unrealized gain (loss) | $ | 5.281 | $ | 4.061 | ||||
Total income (loss) from operations | 4.896 | 3.676 | ||||||
Net asset value—end of year | 34.030 | 32.810 | ||||||
Total Return | 16.82 | % | 12.64 | % | ||||
Net assets, end of year (000’s omitted) | $ | 7,804 | $ | 7,548 | ||||
| Financial Highlights — Class I | ||||||||
Net realized and unrealized gain (loss) | $ | 6.454 | $ | 4.974 | ||||
Total income (loss) from operations | 6.306 | 4.826 | ||||||
Net asset value—end of year | 41.400 | 39.920 | ||||||
Total Return | 17.99 | % | 13.77 | % | ||||
Net assets, end of year (000’s omitted) | $ | 68,863 | $ | 66,744 | ||||
| Note 2 — Distributions to Shareholders and Income Tax Information | ||||||||
Net unrealized appreciation | $ | 90,130,968 | $ | 81,739,028 | ||||
| Note 7 — Shares of Beneficial Interest | ||||||||
Class A: | ||||||||
Sales | 278,715 | 283,007 | ||||||
Issued to shareholders electing to receive payments of distributions in Fund shares | 11,006 | 11,192 | ||||||
Net decrease | (770,137 | ) | (765,659 | ) | ||||
Class C: | ||||||||
Sales | 40,110 | 40,805 | ||||||
Issued to shareholders electing to receive payments of distributions in Fund shares | 943 | 959 | ||||||
Net decrease | (177,692 | ) | (176,981 | ) | ||||
Class I: | ||||||||
Sales | 1,751,546 | 1,760,185 | ||||||
Issued to shareholders electing to receive payments of distributions in Fund shares | 3,568 | 3,629 | ||||||
Net increase | 505,149 | 513,849 | ||||||
| 18 |
Eaton Vance
Greater India Fund
December 31, 2021
Report of Independent Registered Public Accounting Firm
To the Trustees of Eaton Vance Special Investment Trust and Shareholders of Eaton Vance Greater India Fund:
Opinion on the Financial Statements and Financial Highlights
We have audited the accompanying statement of assets and liabilities of Eaton Vance Greater India Fund (the “Fund”) (one of the funds constituting Eaton Vance Special Investment Trust), as of December 31, 2021, the related statement of operations for the year then ended, the statements of changes in net assets for each of the two years in the period then ended, the financial highlights for each of the five years in the period then ended, and the related notes. In our opinion, the financial statements and financial highlights present fairly, in all material respects, the financial position of the Fund as of December 31, 2021, and the results of its operations for the year then ended, the changes in its net assets for each of the two years in the period then ended, and the financial highlights for each of the five years in the period then ended, in conformity with accounting principles generally accepted in the United States of America.
Restatement of the 2020 Financial Statements and Financial Highlights
As discussed in Note 8 to the financial statements, the accompanying 2020 financial statements and financial highlights have been restated to correct a misstatement.
Basis for Opinion
These financial statements and financial highlights are the responsibility of the Fund’s management. Our responsibility is to express an opinion on the Fund’s financial statements and financial highlights based on our audits. We are a public accounting firm registered with the Public Company Accounting Oversight Board (United States) (PCAOB) and are required to be independent with respect to the Fund in accordance with the U.S. federal securities laws and the applicable rules and regulations of the Securities and Exchange Commission and the PCAOB.
We conducted our audits in accordance with the standards of the PCAOB. Those standards require that we plan and perform the audit to obtain reasonable assurance about whether the financial statements and financial highlights are free of material misstatement, whether due to error or fraud. The Fund is not required to have, nor were we engaged to perform, an audit of its internal control over financial reporting. As part of our audits, we are required to obtain an understanding of internal control over financial reporting but not for the purpose of expressing an opinion on the effectiveness of the Fund’s internal control over financial reporting. Accordingly, we express no such opinion.
Our audits included performing procedures to assess the risks of material misstatement of the financial statements and financial highlights, whether due to error or fraud, and performing procedures that respond to those risks. Such procedures included examining, on a test basis, evidence regarding the amounts and disclosures in the financial statements and financial highlights. Our audits also included evaluating the accounting principles used and significant estimates made by management, as well as evaluating the overall presentation of the financial statements and financial highlights. We believe that our audits provide a reasonable basis for our opinion.
/s/ Deloitte & Touche LLP
Boston, Massachusetts
March 10, 2022
We have served as the auditor of one or more Eaton Vance investment companies since 1959.
| 19 |
Eaton Vance
Greater India Fund
December 31, 2021
Federal Tax Information (Unaudited)
The Form 1099-DIV you received in February 2022 showed the tax status of all distributions paid to your account in calendar year 2021. Shareholders are advised to consult their own tax adviser with respect to the tax consequences of their investment in the Fund. As required by the Internal Revenue Code and/or regulations, shareholders must be notified regarding the status of qualified dividend income for individuals, the foreign tax credit and capital gains dividends.
Qualified Dividend Income. For the fiscal year ended December 31, 2021, the Fund designates approximately $2,005,690, or up to the maximum amount of such dividends allowable pursuant to the Internal Revenue Code, as qualified dividend income eligible for the reduced tax rate of 15%.
Foreign Tax Credit. For the fiscal year ended December 31, 2021, the Fund paid foreign taxes of $3,193,069 and recognized foreign source income of $42,776,178.
Capital Gains Dividends. The Fund hereby designates as a capital gain dividend with respect to the taxable year ended December 31, 2021, $35,851,760 or, if subsequently determined to be different, the net capital gain of such year.
| 20 |
Greater India Portfolio
December 31, 2021
Portfolio of Investments
| Common Stocks — 104.2% |
| |||||||
| Security | Shares | Value | ||||||
| India — 104.2% | ||||||||
| Auto Components — 2.6% | ||||||||
Sona BLW Precision Forgings, Ltd.(1)(2) | 415,081 | $ | 4,102,068 | |||||
Sundram Fasteners, Ltd. | 131,433 | 1,599,376 | ||||||
Tube Investments of India, Ltd. | 77,320 | 1,812,713 | ||||||
| $ | 7,514,157 | |||||||
| Automobiles — 4.2% | ||||||||
Maruti Suzuki India, Ltd. | 62,212 | $ | 6,188,318 | |||||
Tata Motors, Ltd.(1) | 894,315 | 5,769,753 | ||||||
| $ | 11,958,071 | |||||||
| Banks — 19.8% | ||||||||
Axis Bank, Ltd.(1) | 1,444,036 | $ | 13,147,471 | |||||
Federal Bank, Ltd. | 1,650,418 | 1,836,587 | ||||||
ICICI Bank, Ltd. | 2,774,975 | 27,610,123 | ||||||
Kotak Mahindra Bank, Ltd. | 260,217 | 6,269,564 | ||||||
State Bank of India | 1,175,326 | 7,248,211 | ||||||
| $ | 56,111,956 | |||||||
| Beverages — 1.6% | ||||||||
United Spirits, Ltd.(1) | 379,718 | $ | 4,578,148 | |||||
| $ | 4,578,148 | |||||||
| Building Products — 0.5% | ||||||||
Kajaria Ceramics, Ltd. | 85,334 | $ | 1,472,966 | |||||
| $ | 1,472,966 | |||||||
| Chemicals — 1.4% | ||||||||
Atul, Ltd. | 11,387 | $ | 1,382,409 | |||||
Navin Fluorine International, Ltd. | 46,183 | 2,590,000 | ||||||
| $ | 3,972,409 | |||||||
| Construction & Engineering — 1.4% | ||||||||
Voltas, Ltd. | 241,374 | $ | 3,954,460 | |||||
| $ | 3,954,460 | |||||||
| Construction Materials — 3.2% | ||||||||
JK Cement, Ltd. | 32,085 | $ | 1,450,710 | |||||
UltraTech Cement, Ltd. | 76,049 | 7,758,499 | ||||||
| $ | 9,209,209 | |||||||
| Security | Shares | Value | ||||||
| Consumer Finance — 1.0% | ||||||||
Mahindra & Mahindra Financial Services, Ltd. | 594,130 | $ | 1,187,886 | |||||
SBI Cards & Payment Services, Ltd.(1) | 139,222 | 1,735,098 | ||||||
| $ | 2,922,984 | |||||||
| Diversified Financial Services — 2.3% | ||||||||
Bajaj Finserv, Ltd. | 29,338 | $ | 6,467,048 | |||||
| $ | 6,467,048 | |||||||
| Diversified Telecommunication Services — 1.0% | ||||||||
Tata Communications, Ltd. | 144,613 | $ | 2,841,877 | |||||
| $ | 2,841,877 | |||||||
| Electric Utilities — 1.2% | ||||||||
Tata Power Co., Ltd. (The) | 1,143,921 | $ | 3,387,893 | |||||
| $ | 3,387,893 | |||||||
| Electronic Equipment, Instruments & Components — 0.6% | ||||||||
Honeywell Automation India, Ltd. | 3,034 | $ | 1,709,922 | |||||
| $ | 1,709,922 | |||||||
| Food & Staples Retailing — 3.1% | ||||||||
Avenue Supermarts, Ltd.(1)(2) | 114,303 | $ | 7,160,117 | |||||
Medplus Health Services, Ltd.(1) | 109,235 | 1,516,360 | ||||||
| $ | 8,676,477 | |||||||
| Food Products — 1.6% | ||||||||
Tata Consumer Products, Ltd. | 467,358 | $ | 4,663,400 | |||||
| $ | 4,663,400 | |||||||
| Gas Utilities — 0.7% | ||||||||
Gujarat Gas, Ltd. | 225,147 | $ | 1,917,049 | |||||
| $ | 1,917,049 | |||||||
| Health Care Providers & Services — 1.3% | ||||||||
Apollo Hospitals Enterprise, Ltd. | 56,116 | $ | 3,786,037 | |||||
| $ | 3,786,037 | |||||||
| Hotels, Restaurants & Leisure — 1.9% | ||||||||
Devyani International, Ltd.(1) | 578,588 | $ | 1,277,847 | |||||
Jubilant FoodWorks, Ltd. | 88,553 | 4,260,265 | ||||||
| $ | 5,538,112 | |||||||
| 21 | See Notes to Financial Statements. |
Greater India Portfolio
December 31, 2021
Portfolio of Investments — continued
| Security | Shares | Value | ||||||
| Household Durables — 2.0% | ||||||||
Crompton Greaves Consumer Electricals, Ltd. | 641,357 | $ | 3,759,376 | |||||
Dixon Technologies India, Ltd. | 26,438 | 1,954,800 | ||||||
| $ | 5,714,176 | |||||||
| Insurance — 3.3% | ||||||||
ICICI Lombard General Insurance Co., Ltd.(2) | 165,875 | $ | 3,117,268 | |||||
SBI Life Insurance Co., Ltd.(2) | 394,005 | 6,312,612 | ||||||
| $ | 9,429,880 | |||||||
| Interactive Media & Services — 2.2% | ||||||||
Info Edge India, Ltd. | 84,034 | $ | 6,273,757 | |||||
| $ | 6,273,757 | |||||||
| Internet & Direct Marketing Retail — 2.9% | ||||||||
FSN E-Commerce Ventures, Ltd.(1) | 69,630 | $ | 1,973,621 | |||||
PB Fintech, Ltd.(1) | 114,698 | 1,473,386 | ||||||
Zomato, Ltd.(1) | 2,661,297 | 4,889,161 | ||||||
| $ | 8,336,168 | |||||||
| IT Services — 21.8% | ||||||||
Coforge, Ltd. | 53,741 | $ | 4,230,925 | |||||
HCL Technologies, Ltd. | 509,908 | 9,022,620 | ||||||
Infosys, Ltd. | 1,461,059 | 37,105,281 | ||||||
Persistent Systems, Ltd. | 62,010 | 4,070,596 | ||||||
Wipro, Ltd. | 775,628 | 7,431,822 | ||||||
| $ | 61,861,244 | |||||||
| Machinery — 0.8% | ||||||||
Grindwell Norton, Ltd. | 86,000 | $ | 2,193,797 | |||||
| $ | 2,193,797 | |||||||
| Metals & Mining — 3.3% | ||||||||
APL Apollo Tubes, Ltd.(1) | 156,608 | $ | 2,095,060 | |||||
Hindalco Industries, Ltd. | 792,877 | 5,033,470 | ||||||
Jindal Steel & Power, Ltd.(1) | 455,205 | 2,298,566 | ||||||
| $ | 9,427,096 | |||||||
| Multiline Retail — 0.6% | ||||||||
Trent, Ltd. | 113,576 | $ | 1,620,002 | |||||
| $ | 1,620,002 | |||||||
| Oil, Gas & Consumable Fuels — 5.0% | ||||||||
Reliance Industries, Ltd. | 445,629 | $ | 14,158,199 | |||||
| $ | 14,158,199 | |||||||
| Security | Shares | Value | ||||||
| Personal Products — 2.1% | ||||||||
Emami, Ltd. | 308,764 | $ | 2,150,263 | |||||
Marico, Ltd. | 538,582 | 3,714,297 | ||||||
| $ | 5,864,560 | |||||||
| Pharmaceuticals — 5.2% | ||||||||
Gland Pharma, Ltd.(1)(2) | 50,542 | $ | 2,612,514 | |||||
Ipca Laboratories, Ltd. | 71,998 | 2,095,523 | ||||||
Lupin, Ltd. | 197,697 | 2,520,504 | ||||||
Sun Pharmaceutical Industries, Ltd. | 430,716 | 4,889,763 | ||||||
Torrent Pharmaceuticals, Ltd. | 58,307 | 2,571,556 | ||||||
| $ | 14,689,860 | |||||||
| Professional Services — 1.8% | ||||||||
L&T Technology Services, Ltd.(2) | 40,740 | $ | 3,060,628 | |||||
Quess Corp, Ltd.(2) | 182,207 | 2,081,226 | ||||||
| $ | 5,141,854 | |||||||
| Real Estate Management & Development — 1.9% | ||||||||
Godrej Properties, Ltd.(1) | 117,693 | $ | 2,957,375 | |||||
Oberoi Realty, Ltd.(1) | 214,170 | 2,470,363 | ||||||
| $ | 5,427,738 | |||||||
| Software — 1.0% | ||||||||
Zensar Technologies, Ltd. | 395,433 | $ | 2,774,876 | |||||
| $ | 2,774,876 | |||||||
| Thrifts & Mortgage Finance — 0.9% | ||||||||
Housing Development Finance Corp., Ltd. | 71,657 | $ | 2,479,793 | |||||
| $ | 2,479,793 | |||||||
Total India |
| $ | 296,075,175 | |||||
Total Common Stocks |
| $ | 296,075,175 | |||||
Total Investments — 104.2% |
| $ | 296,075,175 | |||||
Other Assets, Less Liabilities — (4.2)% |
| $ | (11,922,086 | ) | ||||
Net Assets — 100.0% |
| $ | 284,153,089 | |||||
The percentage shown for each investment category in the Portfolio of Investments is based on net assets.
| 22 | See Notes to Financial Statements. |
Greater India Portfolio
December 31, 2021
Portfolio of Investments — continued
| (1) | Non-income producing security. |
| (2) | Security exempt from registration under Rule 144A of the Securities Act of 1933, as amended. These securities may be sold in certain transactions in reliance on an exemption from registration (normally to qualified institutional buyers). At December 31, 2021, the aggregate value of these securities is $28,446,433 or 10.0% of the Portfolio’s net assets. |
| Futures Contracts | ||||||||||||||||||||
| Description | Number of Contracts | Position | Expiration Date | Notional Amount | Value/Unrealized (Depreciation) | |||||||||||||||
Equity Futures | ||||||||||||||||||||
| SGX CNX Nifty Index | 47 | Long | 1/27/22 | $ | 1,639,313 | $ | 13,640 | |||||||||||||
| $ | 13,640 | |||||||||||||||||||
| 23 | See Notes to Financial Statements. |
Greater India Portfolio
December 31, 2021
Statement of Assets and Liabilities
| Assets | December 31, 2021 | |||
Unaffiliated investments, at value (identified cost, $180,401,041) | $ | 296,075,175 | ||
Cash | 2,730,644 | |||
Deposits for derivatives collateral — financial futures contracts | 77,550 | |||
Receivable for variation margin on open financial futures contracts | 13,631 | |||
Due from affiliate | 82,873 | |||
Receivable for foreign taxes | 39,624 | |||
Total assets | $ | 299,019,497 | ||
| Liabilities |
| |||
Payable to affiliates: | ||||
Investment adviser fee | $ | 214,294 | ||
Trustees’ fees | 3,458 | |||
Accrued foreign capital gains taxes | 14,545,163 | |||
Accrued expenses | 103,493 | |||
Total liabilities | $ | 14,866,408 | ||
Net Assets applicable to investors’ interest in Portfolio | $ | 284,153,089 | ||
| 24 | See Notes to Financial Statements. |
Greater India Portfolio
December 31, 2021
Statement of Operations
| Investment Income | Year Ended December 31, 2021 | |||
Dividends (net of foreign taxes, $460,171) | $ | 1,545,537 | ||
Total investment income | $ | 1,545,537 | ||
| Expenses | ||||
Investment adviser fee | $ | 2,340,522 | ||
Trustees’ fees and expenses | 14,180 | |||
Custodian fee | 155,466 | |||
Legal and accounting services | 86,261 | |||
Miscellaneous | 12,426 | |||
Total expenses | $ | 2,608,855 | ||
Net investment loss | $ | (1,063,318 | ) | |
| Realized and Unrealized Gain (Loss) | ||||
Net realized gain (loss) — | ||||
Investment transactions (net of foreign capital gains taxes of $2,732,928) | $ | 38,902,299 | ||
Financial futures contracts | 2,064,339 | |||
Foreign currency transactions | (195,920 | ) | ||
Net realized gain | $ | 40,770,718 | ||
Change in unrealized appreciation (depreciation) — | ||||
Investments (including net increase in accrued foreign capital gains taxes of $6,153,223) | $ | 20,392,578 | ||
Financial futures contracts | 7,921 | |||
Foreign currency | (1,399 | ) | ||
Net change in unrealized appreciation (depreciation) | $ | 20,399,100 | ||
Net realized and unrealized gain | $ | 61,169,818 | ||
Net increase in net assets from operations | $ | 60,106,500 | ||
| 25 | See Notes to Financial Statements. |
Greater India Portfolio
December 31, 2021
Statements of Changes in Net Assets
| Year Ended December 31, | ||||||||
| Increase (Decrease) in Net Assets | 2021 | 2020 (as restated) | ||||||
From operations — | ||||||||
Net investment loss | $ | (1,063,318 | ) | $ | (231,832 | ) | ||
Net realized gain | 40,770,718 | 6,347,912 | ||||||
Net change in unrealized appreciation (depreciation) | 20,399,100 | 20,452,727 | ||||||
Net increase in net assets from operations | $ | 60,106,500 | $ | 26,568,807 | ||||
Capital transactions — | ||||||||
Contributions | $ | 31,649,737 | $ | 42,906,129 | ||||
Withdrawals | (36,627,830 | ) | (57,262,729 | ) | ||||
Net decrease in net assets from capital transactions | $ | (4,978,093 | ) | $ | (14,356,600 | ) | ||
Net increase in net assets | $ | 55,128,407 | $ | 12,212,207 | ||||
| Net Assets |
| |||||||
At beginning of year | $ | 229,024,682 | $ | 216,812,475 | ||||
At end of year | $ | 284,153,089 | $ | 229,024,682 | ||||
| 26 | See Notes to Financial Statements. |
Greater India Portfolio
December 31, 2021
Financial Highlights
| Year Ended December 31, | ||||||||||||||||||||
| 2021 | 2020 (as restated) | 2019 | 2018 | 2017 | ||||||||||||||||
Ratios (as a percentage of average daily net assets): | ||||||||||||||||||||
Expenses | 0.95 | % | 0.93 | % | 0.98 | % | 0.98 | % | 0.98 | % | ||||||||||
Net investment income (loss) | (0.39 | )% | (0.12 | )% | 0.07 | % | 0.19 | % | 0.76 | % | ||||||||||
Portfolio Turnover | 33 | % | 26 | % | 21 | % | 29 | % | 25 | % | ||||||||||
Total Return | 24.76 | % | 14.14 | % | 11.17 | % | (11.57 | )% | 45.78 | % | ||||||||||
Net assets, end of year (000’s omitted) | $ | 284,153 | $ | 229,025 | $ | 216,812 | $ | 213,186 | $ | 273,437 | ||||||||||
| 27 | See Notes to Financial Statements. |
Greater India Portfolio
December 31, 2021
Notes to Financial Statements
1 Significant Accounting Policies
Greater India Portfolio (the Portfolio) is a Massachusetts business trust registered under the Investment Company Act of 1940, as amended (the 1940 Act), as a non-diversified, open-end management investment company. The Portfolio’s investment objective is to seek long-term capital appreciation. The Declaration of Trust permits the Trustees to issue interests in the Portfolio. At December 31, 2021, Eaton Vance Greater India Fund held a 99.9% interest in the Portfolio.
The following is a summary of significant accounting policies of the Portfolio. The policies are in conformity with accounting principles generally accepted in the United States of America (U.S. GAAP). The Portfolio is an investment company and follows accounting and reporting guidance in the Financial Accounting Standards Board (FASB) Accounting Standards Codification Topic 946.
A Investment Valuation — The following methodologies are used to determine the market value or fair value of investments.
Equity Securities. Equity securities listed on a U.S. securities exchange generally are valued at the last sale or closing price on the day of valuation or, if no sales took place on such date, at the mean between the closing bid and ask prices on the exchange where such securities are principally traded. Equity securities listed on the NASDAQ National Market System are valued at the NASDAQ official closing price. Unlisted or listed securities for which closing sales prices or closing quotations are not available are valued at the mean between the latest available bid and ask prices.
Derivatives. Financial futures contracts are valued at the closing settlement price established by the board of trade or exchange on which they are traded, with adjustments for fair valuation for certain foreign financial futures contracts as described below.
Foreign Securities, Financial Futures Contracts and Currencies. Foreign securities, financial futures contracts and currencies are valued in U.S. dollars, based on foreign currency exchange rate quotations supplied by a third party pricing service. The pricing service uses a proprietary model to determine the exchange rate. Inputs to the model include reported trades and implied bid/ask spreads. The daily valuation of exchange-traded foreign securities and certain exchange-traded foreign financial futures contracts generally is determined as of the close of trading on the principal exchange on which such securities and contracts trade. Foreign ownership of shares of certain Indian companies may be subject to limitations. When foreign ownership of such an Indian company’s shares approaches the limitation, foreign investors may be willing to pay a premium to the local share price to acquire shares from other foreign investors. Such shares are valued at the closing price for foreign investors as provided by the exchange on which they trade. Events occurring after the close of trading on foreign exchanges may result in adjustments to the valuation of foreign securities and certain foreign financial futures contracts to more accurately reflect their fair value as of the close of regular trading on the New York Stock Exchange. When valuing foreign equity securities and foreign financial futures contracts that meet certain criteria, the Portfolio’s Trustees have approved the use of a fair value service that values such securities and foreign financial futures contracts to reflect market trading that occurs after the close of the applicable foreign markets of comparable securities or other instruments that have a strong correlation to the fair-valued securities and foreign financial futures contracts.
Fair Valuation. Investments for which valuations or market quotations are not readily available or are deemed unreliable are valued at fair value using methods determined in good faith by or at the direction of the Trustees of the Portfolio in a manner that most fairly reflects the security’s “fair value”, which is the amount that the Portfolio might reasonably expect to receive for the security upon its current sale in the ordinary course. Each such determination is based on a consideration of relevant factors, which are likely to vary from one pricing context to another. These factors may include, but are not limited to, the type of security, the existence of any contractual restrictions on the security’s disposition, the price and extent of public trading in similar securities of the issuer or of comparable companies or entities, quotations or relevant information obtained from broker/dealers or other market participants, information obtained from the issuer, analysts, and/or the appropriate stock exchange (for exchange-traded securities), an analysis of the company’s or entity’s financial statements, and an evaluation of the forces that influence the issuer and the market(s) in which the security is purchased and sold.
B Investment Transactions — Investment transactions for financial statement purposes are accounted for on a trade date basis. Realized gains and losses on investments sold are determined on the basis of identified cost.
C Income — Dividend income is recorded on the ex-dividend date for dividends received in cash and/or securities. However, if the ex-dividend date has passed, certain dividends from foreign securities are recorded as the Portfolio is informed of the ex-dividend date. Non-cash dividends are recorded at the fair value of the securities received. Withholding taxes on foreign dividends and capital gains have been provided for in accordance with the Portfolio’s understanding of the applicable countries’ tax rules and rates.
D Federal and Other Taxes — The Portfolio has elected to be treated as a partnership for federal tax purposes. No provision is made by the Portfolio for federal or state taxes on any taxable income of the Portfolio because each investor in the Portfolio is ultimately responsible for the payment of any taxes on its share of taxable income. Since at least one of the Portfolio’s investors is a regulated investment company that invests all or substantially all of its assets in the Portfolio, the Portfolio normally must satisfy the applicable source of income and diversification requirements (under the Internal Revenue Code) in order for its investors to satisfy them. The Portfolio will allocate, at least annually among its investors, each investor’s distributive share of the Portfolio’s net investment income, net realized capital gains and losses and any other items of income, gain, loss, deduction or credit.
In addition to the requirements of the Internal Revenue Code, the Portfolio may also be subject to local taxes on the recognition of capital gains in India. In determining the daily net asset value, the Portfolio estimates the accrual for such taxes, if any, based on the unrealized appreciation on certain portfolio securities, historical effective tax rates on securities sold, and the availability of any realized losses in excess of gains that may be carried forward to offset future gains. Taxes attributable to unrealized appreciation are included in the change in unrealized appreciation (depreciation) on investments. Capital
| 28 |
Greater India Portfolio
December 31, 2021
Notes to Financial Statements — continued
gains taxes on certain Indian securities sold at a gain are included in net realized gain (loss) on investments. As of December 31, 2021, the Portfolio for tax reporting in India had no accumulated losses available to be carried forward to offset future realized gains from the sale of Indian securities.
As of December 31, 2021, the Portfolio had no uncertain tax positions that would require financial statement recognition, de-recognition, or disclosure. The Portfolio files a U.S. federal income tax return annually after its fiscal year-end, which is subject to examination by the Internal Revenue Service for a period of three years from the date of filing. The Portfolio also files a tax return in India annually as of March 31st. Such tax returns are subject to examination by the Indian tax authorities for open years as determined by the statute of limitations, which is generally a period of up to 7 years after a tax return is filed.
E Foreign Currency Translation — Investment valuations, other assets, and liabilities initially expressed in foreign currencies are translated each business day into U.S. dollars based upon current exchange rates. Purchases and sales of foreign investment securities and income and expenses denominated in foreign currencies are translated into U.S. dollars based upon currency exchange rates in effect on the respective dates of such transactions. Recognized gains or losses on investment transactions attributable to changes in foreign currency exchange rates are recorded for financial statement purposes as net realized gains and losses on investments. That portion of unrealized gains and losses on investments that results from fluctuations in foreign currency exchange rates is not separately disclosed.
F Use of Estimates — The preparation of the financial statements in conformity with U.S. GAAP requires management to make estimates and assumptions that affect the reported amounts of assets and liabilities at the date of the financial statements and the reported amounts of income and expense during the reporting period. Actual results could differ from those estimates.
G Indemnifications — Under the Portfolio’s organizational documents, its officers and Trustees may be indemnified against certain liabilities and expenses arising out of the performance of their duties to the Portfolio. Under Massachusetts law, if certain conditions prevail, interestholders in the Portfolio could be deemed to have personal liability for the obligations of the Portfolio. However, the Portfolio’s Declaration of Trust contains an express disclaimer of liability on the part of Portfolio interestholders. Additionally, in the normal course of business, the Portfolio enters into agreements with service providers that may contain indemnification clauses. The Portfolio’s maximum exposure under these arrangements is unknown as this would involve future claims that may be made against the Portfolio that have not yet occurred.
H Financial Futures Contracts — Upon entering into a financial futures contract, the Portfolio is required to deposit with the broker, either in cash or securities, an amount equal to a certain percentage of the contract amount (initial margin). Subsequent payments, known as variation margin, are made or received by the Portfolio each business day, depending on the daily fluctuations in the value of the underlying security or index, and are recorded as unrealized gains or losses by the Portfolio. Gains (losses) are realized upon the expiration or closing of the financial futures contracts. Should market conditions change unexpectedly, the Portfolio may not achieve the anticipated benefits of the financial futures contracts and may realize a loss. Futures contracts have minimal counterparty risk as they are exchange traded and the clearinghouse for the exchange is substituted as the counterparty, guaranteeing counterparty performance.
2 Investment Adviser Fee and Other Transactions with Affiliates
The investment adviser fee is earned by Boston Management and Research (BMR) as compensation for investment advisory services rendered to the Portfolio. On March 1, 2021, Morgan Stanley acquired Eaton Vance Corp. (the “Transaction”) and BMR became an indirect, wholly-owned subsidiary of Morgan Stanley. In connection with the Transaction, the Portfolio entered into a new investment advisory agreement (the “New Agreement”) with BMR, which took effect on March 1, 2021. The Portfolio’s prior fee reduction agreement was incorporated into the New Agreement. Pursuant to the New Agreement (and the Portfolio’s investment advisory agreement and related fee reduction agreement with BMR in effect prior to March 1, 2021), the fee is computed at an annual rate as a percentage of average daily net assets as follows and is payable monthly:
| Average Daily Net Assets | Annual Fee Rate | |||
Up to $500 million | 0.850 | % | ||
$500 million but less than $1 billion | 0.800 | % | ||
$1 billion but less than $2.5 billion | 0.775 | % | ||
$2.5 billion but less than $5 billion | 0.750 | % | ||
$5 billion and over | 0.730 | % | ||
For the year ended December 31, 2021, the investment adviser fee amounted to $2,340,522 or 0.85% of the Portfolio’s average daily net assets. Included in Due from affiliate on the Statement of Assets and Liabilities is $82,873, representing a reimbursement from BMR for the overpayment of advisory fees during the period from June 2, 2020 to December 31, 2021. The overpayment of advisory fees resulted from the overstatement of net assets during the same period because accrued foreign capital gains taxes during the period were misstated. See also Note 9 for further explanation. Pursuant to an investment sub-advisory agreement, BMR has delegated the investment management of the Portfolio to Goldman Sachs Asset Management, L.P. (GSAM). In connection with the Transaction, BMR entered into a new investment sub-advisory agreement with GSAM, which took effect on March 1, 2021. BMR pays GSAM a portion of its investment adviser fee for sub-advisory services provided to the Portfolio.
| 29 |
Greater India Portfolio
December 31, 2021
Notes to Financial Statements — continued
Trustees and officers of the Portfolio who are members of EVM’s or BMR’s organizations receive remuneration for their services to the Portfolio out of the investment adviser fee. Trustees of the Portfolio who are not affiliated with the investment adviser may elect to defer receipt of all or a percentage of their annual fees in accordance with the terms of the Trustees Deferred Compensation Plan. For the year ended December 31, 2021, no significant amounts have been deferred. Certain officers and Trustees of the Portfolio are officers of the above organizations.
3 Purchases and Sales of Investments
Purchases and sales of investments, other than short-term obligations, aggregated $90,034,446 and $92,095,525, respectively, for the year ended December 31, 2021.
4 Federal Income Tax Basis of Investments
The cost and unrealized appreciation (depreciation) of investments, including open derivative contracts, of the Portfolio at December 31, 2021, as determined on a federal income tax basis, were as follows:
Aggregate cost | $ | 182,055,476 | ||
Gross unrealized appreciation | $ | 115,447,564 | ||
Gross unrealized depreciation | (1,414,225 | ) | ||
Net unrealized appreciation | $ | 114,033,339 | ||
5 Financial Instruments
The Portfolio may trade in financial instruments with off-balance sheet risk in the normal course of its investing activities. These financial instruments may include financial futures contracts and may involve, to a varying degree, elements of risk in excess of the amounts recognized for financial statement purposes. The notional or contractual amounts of these instruments represent the investment the Portfolio has in particular classes of financial instruments and do not necessarily represent the amounts potentially subject to risk. The measurement of the risks associated with these instruments is meaningful only when all related and offsetting transactions are considered. A summary of obligations under these financial instruments at December 31, 2021 is included in the Portfolio of Investments. At December 31, 2021, the Portfolio had sufficient cash and/or securities to cover commitments under these contracts.
The Portfolio is subject to equity price risk in the normal course of pursuing its investment objective. The Portfolio enters into equity index futures contracts to manage cash flows.
The fair value of open derivative instruments (not considered to be hedging instruments for accounting disclosure purposes) and whose primary underlying risk exposure is equity price risk at December 31, 2021 was as follows:
| Fair Value | ||||||||
| Derivative | Asset Derivative(1) | Liability Derivative | ||||||
Financial futures contracts | $ | 13,640 | $ | — | ||||
| (1) | Only the current day’s variation margin on open futures contracts is reported within the Statement of Assets and Liabilities as Receivable or Payable for variation margin on open financial futures contracts, as applicable. |
The effect of derivative instruments (not considered to be hedging instruments for accounting disclosure purposes) on the Statement of Operations and whose primary underlying risk exposure is equity price risk for the year ended December 31, 2021 was as follows:
| Derivative | Realized Gain (Loss) on Derivatives Recognized in Income(1) | Change in Unrealized Appreciation (Depreciation) on Derivatives Recognized in Income(2) | ||||||
Financial futures contracts | $ | 2,064,339 | $ | 7,921 | ||||
| (1) | Statement of Operations location: Net realized gain (loss) – Financial futures contracts. |
| 30 |
Greater India Portfolio
December 31, 2021
Notes to Financial Statements — continued
| (2) | Statement of Operations location: Change in unrealized appreciation (depreciation) – Financial futures contracts. |
The average notional cost of futures contracts (long) outstanding during the year ended December 31, 2021, which is indicative of the volume of this derivative type, was approximately $7,821,000.
6 Line of Credit
The Portfolio participates with other portfolios and funds managed by EVM and its affiliates in an $800 million unsecured line of credit agreement with a group of banks, which is in effect through October 25, 2022. Borrowings are made by the Portfolio solely for temporary purposes related to redemptions and other short-term cash needs. Interest is charged to the Portfolio based on its borrowings at an amount above either the Secured Overnight Financing Rate (SOFR) or Federal Funds rate. In addition, a fee computed at an annual rate of 0.15% on the daily unused portion of the line of credit is allocated among the participating portfolios and funds at the end of each quarter. In connection with the renewal of the agreement in October 2021, an arrangement fee totaling $150,000 was incurred that was allocated to the participating portfolios and funds. Because the line of credit is not available exclusively to the Portfolio, it may be unable to borrow some or all of its requested amounts at any particular time. The Portfolio did not have any significant borrowings or allocated fees during the year ended December 31, 2021.
7 Fair Value Measurements
Under generally accepted accounting principles for fair value measurements, a three-tier hierarchy to prioritize the assumptions, referred to as inputs, is used in valuation techniques to measure fair value. The three-tier hierarchy of inputs is summarized in the three broad levels listed below.
| • | Level 1 – quoted prices in active markets for identical investments |
| • | Level 2 – other significant observable inputs (including quoted prices for similar investments, interest rates, prepayment speeds, credit risk, etc.) |
| • | Level 3 – significant unobservable inputs (including a fund’s own assumptions in determining the fair value of investments) |
In cases where the inputs used to measure fair value fall in different levels of the fair value hierarchy, the level disclosed is determined based on the lowest level input that is significant to the fair value measurement in its entirety. The inputs or methodology used for valuing securities are not necessarily an indication of the risk associated with investing in those securities.
At December 31, 2021, the hierarchy of inputs used in valuing the Portfolio’s investments and open derivative instruments, which are carried at value, were as follows:
| Asset Description | Level 1 | Level 2 | Level 3 | Total | ||||||||||||
Common Stocks | ||||||||||||||||
Communication Services | $ | — | $ | 9,115,634 | $ | — | $ | 9,115,634 | ||||||||
Consumer Discretionary | 3,447,007 | 37,233,679 | — | 40,680,686 | ||||||||||||
Consumer Staples | 1,516,360 | 22,266,225 | — | 23,782,585 | ||||||||||||
Energy | — | 14,158,199 | — | 14,158,199 | ||||||||||||
Financials | — | 77,411,661 | — | 77,411,661 | ||||||||||||
Health Care | — | 18,475,897 | — | 18,475,897 | ||||||||||||
Industrials | — | 12,763,077 | — | 12,763,077 | ||||||||||||
Information Technology | — | 66,346,042 | — | 66,346,042 | ||||||||||||
Materials | — | 22,608,714 | — | 22,608,714 | ||||||||||||
Real Estate | — | 5,427,738 | — | 5,427,738 | ||||||||||||
Utilities | — | 5,304,942 | — | 5,304,942 | ||||||||||||
Total Common Stocks | $ | 4,963,367 | $ | 291,111,808 | * | $ | — | $ | 296,075,175 | |||||||
Total Investments | $ | 4,963,367 | $ | 291,111,808 | $ | — | $ | 296,075,175 | ||||||||
Futures Contracts | $ | — | $ | 13,640 | $ | — | $ | 13,640 | ||||||||
Total | $ | 4,963,367 | $ | 291,125,448 | $ | — | $ | 296,088,815 | ||||||||
| * | Includes foreign equity securities whose values were adjusted to reflect market trading of comparable securities or other correlated instruments that occurred after the close of trading in their applicable foreign markets. |
| 31 |
Greater India Portfolio
December 31, 2021
Notes to Financial Statements — continued
8 Risks and Uncertainties
Risks Associated with Foreign Investments
Foreign investments can be adversely affected by political, economic and market developments abroad, including the imposition of economic and other sanctions by the United States or another country. There may be less publicly available information about foreign issuers because they may not be subject to reporting practices, requirements or regulations comparable to those to which United States companies are subject. Foreign markets may be smaller, less liquid and more volatile than the major markets in the United States. Trading in foreign markets typically involves higher expense than trading in the United States. The Fund may have difficulties enforcing its legal or contractual rights in a foreign country. Securities that trade or are denominated in currencies other than the U.S. dollar may be adversely affected by fluctuations in currency exchange rates.
Countries within the Indian sub-continent region are considered emerging market countries. The securities markets within the Indian sub-continent are undergoing a period of growth and change, which may result in trading or price volatility and difficulties in the settlement and recording of transactions, and in interpreting and applying relevant laws and regulations. The securities markets in these countries are comparatively underdeveloped and may be concentrated in certain sectors. In addition, governmental actions can have a significant effect on the economic conditions in the India region, which could adversely affect the value and liquidity of investments.
Pandemic Risk
An outbreak of respiratory disease caused by a novel coronavirus was first detected in China in late 2019 and subsequently spread internationally. This coronavirus has resulted in closing borders, enhanced health screenings, changes to healthcare service preparation and delivery, quarantines, cancellations, disruptions to supply chains and customer activity, as well as general concern and uncertainty. Health crises caused by outbreaks, such as the coronavirus outbreak, may exacerbate other pre-existing political, social and economic risks and disrupt normal market conditions and operations. The impact of this outbreak has negatively affected the worldwide economy, the economies of individual countries, individual companies, and the market in general, and may continue to do so in significant and unforeseen ways, as may other epidemics and pandemics that may arise in the future. Any such impact could adversely affect the Portfolio’s performance, or the performance of the securities in which the Portfolio invests.
9 Restatement
Prior to the issuance of the Portfolio’s December 31, 2021 financial statements, it was determined that the accrual for foreign capital gains taxes had been understated since June 2, 2020.
As a result, the Portfolio has restated its Statement of Assets and Liabilities as of December 31, 2020 and its Statement of Operations, Statement of Changes in Net Assets and Financial Highlights for the year then ended. There was no change to the amounts for cost and value of investments as presented in the Portfolio of Investments as of December 31, 2020, although the percentages therein for each investment category based on net assets would change due to the change in net assets. The adjustment for excess asset-based investment advisory fees for the year ended December 31, 2020 was less than $15,000 and was recorded as an adjustment to expense in the year ended December 31, 2021.
The following table presents previously reported balances and restated balances after the adjustment for accrued foreign capital gains taxes and excludes balances that were not restated.
| Statement of Assets and Liabilities | As Previously Reported | As Restated | ||||||
Liabilities: | ||||||||
Accrued foreign capital gains taxes | $ | — | $ | 8,391,940 | ||||
Total liabilities | 294,636 | 8,686,576 | ||||||
Net Assets applicable to investors’ interest in the Portfolio | 237,416,622 | 229,024,682 | ||||||
| Statement of Operations | ||||||||
Change in unrealized appreciation (depreciation) — | ||||||||
Investments (including net increase in accrued foreign capital gains taxes of $0 and $8,391,940, respectively) | $ | 28,841,106 | $ | 20,449,166 | ||||
Net change in unrealized appreciation (depreciation) | 28,844,667 | 20,452,727 | ||||||
Net realized and unrealized gain | 35,192,579 | 26,800,639 | ||||||
Net increase in net assets from operations | 34,960,747 | 26,568,807 | ||||||
| 32 |
Greater India Portfolio
December 31, 2021
Notes to Financial Statements — continued
| Statement of Changes in Net Assets | As Previously Reported | As Restated | ||||||
Net change in unrealized appreciation (depreciation) | $ | 28,844,667 | $ | 20,452,727 | ||||
Net increase in net assets from operations | 34,960,747 | 26,568,807 | ||||||
Net increase in net assets | 20,604,147 | 12,212,207 | ||||||
Net Assets at end of year | 237,416,622 | 229,024,682 | ||||||
| Financial Highlights | ||||||||
Total Return | 18.38 | % | 14.14 | % | ||||
Net assets, end of year (000’s omitted) | $ | 237,417 | $ | 229,025 | ||||
| 33 |
Greater India Portfolio
December 31, 2021
Report of Independent Registered Public Accounting Firm
To the Trustees and Investors of Greater India Portfolio:
Opinion on the Financial Statements and Financial Highlights
We have audited the accompanying statement of assets and liabilities of Greater India Portfolio (the “Portfolio”), including the portfolio of investments, as of December 31, 2021, the related statement of operations for the year then ended, the statements of changes in net assets for each of the two years in the period then ended, the financial highlights for each of the five years in the period then ended, and the related notes. In our opinion, the financial statements and financial highlights present fairly, in all material respects, the financial position of the Portfolio as of December 31, 2021, and the results of its operations for the year then ended, the changes in its net assets for each of the two years in the period then ended, and the financial highlights for each of the five years in the period then ended, in conformity with accounting principles generally accepted in the United States of America.
Restatement of the 2020 Financial Statements and Financial Highlights
As discussed in Note 9 to the financial statements, the accompanying 2020 financial statements and financial highlights have been restated to correct a misstatement.
Basis for Opinion
These financial statements and financial highlights are the responsibility of the Portfolio’s management. Our responsibility is to express an opinion on the Portfolio’s financial statements and financial highlights based on our audits. We are a public accounting firm registered with the Public Company Accounting Oversight Board (United States) (PCAOB) and are required to be independent with respect to the Portfolio in accordance with the U.S. federal securities laws and the applicable rules and regulations of the Securities and Exchange Commission and the PCAOB.
We conducted our audits in accordance with the standards of the PCAOB. Those standards require that we plan and perform the audit to obtain reasonable assurance about whether the financial statements and financial highlights are free of material misstatement, whether due to error or fraud. The Portfolio is not required to have, nor were we engaged to perform, an audit of its internal control over financial reporting. As part of our audits, we are required to obtain an understanding of internal control over financial reporting but not for the purpose of expressing an opinion on the effectiveness of the Portfolio’s internal control over financial reporting. Accordingly, we express no such opinion.
Our audits included performing procedures to assess the risks of material misstatement of the financial statements and financial highlights, whether due to error or fraud, and performing procedures that respond to those risks. Such procedures included examining, on a test basis, evidence regarding the amounts and disclosures in the financial statements and financial highlights. Our audits also included evaluating the accounting principles used and significant estimates made by management, as well as evaluating the overall presentation of the financial statements and financial highlights. Our procedures included confirmation of securities owned as of December 31, 2021, by correspondence with the custodian and brokers; when replies were not received from brokers, we performed other auditing procedures. We believe that our audits provide a reasonable basis for our opinion.
/s/ Deloitte & Touche LLP
Boston, Massachusetts
March 10, 2022
We have served as the auditor of one or more Eaton Vance investment companies since 1959.
| 34 |
Eaton Vance
Greater India Fund
December 31, 2021
Fund Management. The Trustees of Eaton Vance Special Investment Trust (the Trust) and Greater India Portfolio (the Portfolio) are responsible for the overall management and supervision of the Trust and the Portfolio’s affairs. The Board members and officers of the Trust and the Portfolio are listed below. Except as indicated, each individual has held the office shown or other offices in the same company for the last five years. Board members hold indefinite terms of office. Each Trustee holds office until his or her successor is elected and qualified, subject to a prior death, resignation, retirement, disqualification or removal. Under the terms of the Fund’s and the Portfolio’s current Trustee retirement policy, an Independent Trustee must retire and resign as a Trustee on the earlier of: (i) the first day of July following his or her 74th birthday; or (ii), with limited exception, December 31st of the 20th year in which he or she has served as a Trustee. However, if such retirement and resignation would cause the Fund or Portfolio to be out of compliance with Section 16 of the 1940 Act or any other regulations or guidance of the SEC, then such retirement and resignation will not become effective until such time as action has been taken for the Fund or Portfolio to be in compliance therewith. The “noninterested Trustees” consist of those Trustees who are not “interested persons” of the Trust and the Portfolio, as that term is defined under the 1940 Act. The business address of each Board member and officer is Two International Place, Boston, Massachusetts 02110. As used below, “BMR” refers to Boston Management and Research, “EVC” refers to Eaton Vance Corp., “EV” refers to EV LLC, “EVM” refers to Eaton Vance Management and “EVD” refers to Eaton Vance Distributors, Inc. EV is the trustee of each of EVM and BMR. Effective March 1, 2021, each of EVM, BMR, EVD and EV are indirect, wholly owned subsidiaries of Morgan Stanley. Each officer affiliated with EVM may hold a position with other EVM affiliates that is comparable to his or her position with EVM listed below. Each Trustee oversees 138 funds (with the exception of Messrs. Faust and Wennerholm and Ms. Frost who oversee 137 funds) in the Eaton Vance fund complex (including both funds and portfolios in a hub and spoke structure).
| Name and Year of Birth | Trust/Portfolio Position(s) | Length of Service | Principal Occupation(s) and Other Directorships During Past Five Years and Other Relevant Experience | |||
| Interested Trustee | ||||||
Thomas E. Faust Jr. 1958 | Trustee | Since 2007 | Chairman of Morgan Stanley Investment Management, Inc. (MSIM), member of the Board of Managers and President of EV, Chief Executive Officer of EVM and BMR, and Director of EVD. Formerly, Chairman, Chief Executive Officer and President of EVC. Mr. Faust is an interested person because of his positions with MSIM, BMR, EVM, EVD, and EV, which are affiliates of the Trust and the Portfolio, and his former position with EVC, which was an affiliate of the Trust and the Portfolio prior to March 1, 2021. Other Directorships. Formerly, Director of EVC (2007-2021) and Hexavest Inc. (investment management firm) (2012-2021). | |||
| Noninterested Trustees | ||||||
Mark R. Fetting 1954 | Trustee | Since 2016 | Private investor. Formerly held various positions at Legg Mason, Inc. (investment management firm) (2000-2012), including President, Chief Executive Officer, Director and Chairman (2008-2012), Senior Executive Vice President (2004-2008) and Executive Vice President (2001-2004). Formerly, President of Legg Mason family of funds (2001-2008). Formerly, Division President and Senior Officer of Prudential Financial Group, Inc. and related companies (investment management firm) (1991-2000). Other Directorships. None. | |||
Cynthia E. Frost 1961 | Trustee | Since 2014 | Private investor. Formerly, Chief Investment Officer of Brown University (university endowment) (2000-2012). Formerly, Portfolio Strategist for Duke Management Company (university endowment manager) (1995-2000). Formerly, Managing Director, Cambridge Associates (investment consulting company) (1989-1995). Formerly, Consultant, Bain and Company (management consulting firm) (1987-1989). Formerly, Senior Equity Analyst, BA Investment Management Company (1983-1985). Other Directorships. None. | |||
George J. Gorman 1952 | Chairperson of the Board and Trustee | Since 2021 (Chairperson) and 2014 (Trustee) | Principal at George J. Gorman LLC (consulting firm). Formerly, Senior Partner at Ernst & Young LLP (a registered public accounting firm) (1974-2009). Other Directorships. None. | |||
Valerie A. Mosley 1960 | Trustee | Since 2014 | Chairwoman and Chief Executive Officer of Valmo Ventures (a consulting and investment firm). Founder of Upward Wealth, Inc., dba BrightUP, a fintech platform. Formerly, Partner and Senior Vice President, Portfolio Manager and Investment Strategist at Wellington Management Company, LLP (investment management firm) (1992-2012). Formerly, Chief Investment Officer, PG Corbin Asset Management (1990-1992). Formerly worked in institutional corporate bond sales at Kidder Peabody (1986-1990). Other Directorships. Director of DraftKings, Inc. (digital sports entertainment and gaming company) (since September 2020). Director of Groupon, Inc. (e-commerce provider) (since April 2020). Director of Envestnet, Inc. (provider of intelligent systems for wealth management and financial wellness) (since 2018). Formerly, Director of Dynex Capital, Inc. (mortgage REIT) (2013-2020). | |||
| 35 |
Eaton Vance
Greater India Fund
December 31, 2021
Management and Organization — continued
| Name and Year of Birth | Trust/Portfolio Position(s) | Length of Service | Principal Occupation(s) and Other Directorships During Past Five Years and Other Relevant Experience | |||
| Noninterested Trustees (continued) | ||||||
William H. Park 1947 | Trustee | Since 2003 | Private investor. Formerly, Consultant (management and transactional) (2012-2014). Formerly, Chief Financial Officer, Aveon Group L.P. (investment management firm) (2010-2011). Formerly, Vice Chairman, Commercial Industrial Finance Corp. (specialty finance company) (2006-2010). Formerly, President and Chief Executive Officer, Prizm Capital Management, LLC (investment management firm) (2002-2005). Formerly, Executive Vice President and Chief Financial Officer, United Asset Management Corporation (investment management firm) (1982-2001). Formerly, Senior Manager, Price Waterhouse (now PricewaterhouseCoopers) (a registered public accounting firm) (1972-1981). Other Directorships. None. | |||
Helen Frame Peters 1948 | Trustee | Since 2008 | Professor of Finance, Carroll School of Management, Boston College. Formerly, Dean, Carroll School of Management, Boston College (2000-2002). Formerly, Chief Investment Officer, Fixed Income, Scudder Kemper Investments (investment management firm) (1998-1999). Formerly, Chief Investment Officer, Equity and Fixed Income, Colonial Management Associates (investment management firm) (1991-1998). Other Directorships. None. | |||
Keith Quinton 1958 | Trustee | Since 2018 | Private investor, researcher and lecturer. Formerly, Independent Investment Committee Member at New Hampshire Retirement System (2017-2021). Formerly, Portfolio Manager and Senior Quantitative Analyst at Fidelity Investments (investment management firm) (2001-2014). Other Directorships. Formerly, Director (2016-2021) and Chairman (2019-2021) of New Hampshire Municipal Bond Bank. | |||
Marcus L. Smith 1966 | Trustee | Since 2018 | Private investor. Formerly, Portfolio Manager at MFS Investment Management (investment management firm) (1994-2017). Other Directorships. Director of First Industrial Realty Trust, Inc. (an industrial REIT) (since 2021). Director of MSCI Inc. (global provider of investment decision support tools) (since 2017). Formerly, Director of DCT Industrial Trust Inc. (logistics real estate company) (2017-2018). | |||
Susan J. Sutherland 1957 | Trustee | Since 2015 | Private investor. Director of Ascot Group Limited and certain of its subsidiaries (insurance and reinsurance) (since 2017). Formerly, Director of Hagerty Holding Corp. (insurance) (2015-2018) and Montpelier Re Holdings Ltd. (insurance and reinsurance) (2013-2015). Formerly, Associate, Counsel and Partner at Skadden, Arps, Slate, Meagher & Flom LLP (law firm) (1982-2013). Other Directorships. Director of Kairos Acquisition Corp. (insurance/InsurTech acquisition company) (since 2021). | |||
Scott E. Wennerholm 1959 | Trustee | Since 2016 | Private investor. Formerly, Trustee at Wheelock College (postsecondary institution) (2012-2018). Formerly, Consultant at GF Parish Group (executive recruiting firm) (2016-2017). Formerly, Chief Operating Officer and Executive Vice President at BNY Mellon Asset Management (investment management firm) (2005-2011). Formerly, Chief Operating Officer and Chief Financial Officer at Natixis Global Asset Management (investment management firm) (1997-2004). Formerly, Vice President at Fidelity Investments Institutional Services (investment management firm) (1994-1997). Other Directorships. None. | |||
| Name and Year of Birth | Trust/Portfolio Position(s) | Length of Service | Principal Occupation(s) During Past Five Years | |||
| Principal Officers who are not Trustees | ||||||
Eric A. Stein 1980 | President of the Trust | Since 2020 | Vice President and Chief Investment Officer, Fixed Income of EVM and BMR. Prior to November 1, 2020, Mr. Stein was a co-Director of Eaton Vance’s Global Income Investments. Also Vice President of Calvert Research and Management (“CRM”). | |||
Edward J. Perkin 1972 | President of the Portfolio | Since 2014 | Chief Equity Investment Officer and Vice President of EVM and BMR since 2014. Also Vice President of CRM. | |||
| 36 |
Eaton Vance
Greater India Fund
December 31, 2021
Management and Organization — continued
| Name and Year of Birth | Trust/Portfolio Position(s) | Length of Service | Principal Occupation(s) During Past Five Years | |||
| Principal Officers who are not Trustees (continued) | ||||||
Deidre E. Walsh 1971 | Vice President and Chief Legal Officer | Since 2009 | Vice President of EVM and BMR. Also Vice President of CRM. | |||
James F. Kirchner 1967 | Treasurer | Since 2007 | Vice President of EVM and BMR. Also Vice President of CRM. | |||
Jill R. Damon 1984 | Secretary | Since 2022 | Vice President of EVM and BMR since 2017. Formerly, associate at Dechert LLP (2009-2017). | |||
Richard F. Froio 1968 | Chief Compliance Officer | Since 2017 | Vice President of EVM and BMR since 2017. Formerly, Deputy Chief Compliance Officer (Adviser/Funds) and Chief Compliance Officer (Distribution) at PIMCO (2012-2017) and Managing Director at BlackRock/Barclays Global Investors (2009-2012). | |||
The SAI for the Fund includes additional information about the Trustees and officers of the Trust and the Portfolio and can be obtained without charge on Eaton Vance’s website at www.eatonvance.com or by calling 1-800-262-1122.
| 37 |
Eaton Vance Funds
| Privacy Notice | April 2021 |
| FACTS | WHAT DOES EATON VANCE DO WITH YOUR PERSONAL INFORMATION? | |
| Why? | Financial companies choose how they share your personal information. Federal law gives consumers the right to limit some but not all sharing. Federal law also requires us to tell you how we collect, share, and protect your personal information. Please read this notice carefully to understand what we do. | |
| What? | The types of personal information we collect and share depend on the product or service you have with us. This information can include:
∎ Social Security number and income ∎ investment experience and risk tolerance ∎ checking account number and wire transfer instructions | |
| How? | All financial companies need to share customers’ personal information to run their everyday business. In the section below, we list the reasons financial companies can share their customers’ personal information; the reasons Eaton Vance chooses to share; and whether you can limit this sharing. | |
| Reasons we can share your personal information | Does Eaton Vance share? | Can you limit this sharing? | ||
| For our everyday business purposes — such as to process your transactions, maintain your account(s), respond to court orders and legal investigations, or report to credit bureaus | Yes | No | ||
| For our marketing purposes — to offer our products and services to you | Yes | No | ||
| For joint marketing with other financial companies | No | We don’t share | ||
| For our investment management affiliates’ everyday business purposes — information about your transactions, experiences, and creditworthiness | Yes | Yes | ||
| For our affiliates’ everyday business purposes — information about your transactions and experiences | Yes | No | ||
| For our affiliates’ everyday business purposes — information about your creditworthiness | No | We don’t share | ||
| For our investment management affiliates to market to you | Yes | Yes | ||
| For our affiliates to market to you | No | We don’t share | ||
| For nonaffiliates to market to you | No | We don’t share |
| To limit our sharing | Call toll-free 1-800-262-1122 or email: EVPrivacy@eatonvance.com
Please note:
If you are a new customer, we can begin sharing your information 30 days from the date we sent this notice. When you are no longer our customer, we continue to share your information as described in this notice. However, you can contact us at any time to limit our sharing. | |
| Questions? | Call toll-free 1-800-262-1122 or email: EVPrivacy@eatonvance.com | |
| 38 |
Eaton Vance Funds
| Privacy Notice — continued | April 2021 |
| Page 2 |
| Who we are | ||
| Who is providing this notice? | Eaton Vance Management, Eaton Vance Distributors, Inc., Eaton Vance Trust Company, Eaton Vance Management (International) Limited, Eaton Vance Advisers International Ltd., Eaton Vance Global Advisors Limited, Eaton Vance Management’s Real Estate Investment Group, Boston Management and Research, Calvert Research and Management, Eaton Vance and Calvert Fund Families and our investment advisory affiliates (“Eaton Vance”) (see Investment Management Affiliates definition below) | |
| What we do | ||
| How does Eaton Vance protect my personal information? | To protect your personal information from unauthorized access and use, we use security measures that comply with federal law. These measures include computer safeguards and secured files and buildings. We have policies governing the proper handling of customer information by personnel and requiring third parties that provide support to adhere to appropriate security standards with respect to such information. | |
| How does Eaton Vance collect my personal information? | We collect your personal information, for example, when you
∎ open an account or make deposits or withdrawals from your account ∎ buy securities from us or make a wire transfer ∎ give us your contact information
We also collect your personal information from others, such as credit bureaus, affiliates, or other companies. | |
| Why can’t I limit all sharing? | Federal law gives you the right to limit only
∎ sharing for affiliates’ everyday business purposes — information about your creditworthiness ∎ affiliates from using your information to market to you ∎ sharing for nonaffiliates to market to you
State laws and individual companies may give you additional rights to limit sharing. See below for more on your rights under state law. | |
| Definitions | ||
| Investment Management Affiliates | Eaton Vance Investment Management Affiliates include registered investment advisers, registered broker-dealers, and registered and unregistered funds. Investment Management Affiliates does not include entities associated with Morgan Stanley Wealth Management, such as Morgan Stanley Smith Barney LLC and Morgan Stanley & Co. | |
| Affiliates | Companies related by common ownership or control. They can be financial and nonfinancial companies.
∎ Our affiliates include companies with a Morgan Stanley name and financial companies such as Morgan Stanley Smith Barney LLC and Morgan Stanley & Co. | |
| Nonaffiliates | Companies not related by common ownership or control. They can be financial and nonfinancial companies.
∎ Eaton Vance does not share with nonaffiliates so they can market to you. | |
| Joint marketing | A formal agreement between nonaffiliated financial companies that together market financial products or services to you.
∎ Eaton Vance doesn’t jointly market. | |
| Other important information | ||
Vermont: Except as permitted by law, we will not share personal information we collect about Vermont residents with Nonaffiliates unless you provide us with your written consent to share such information.
California: Except as permitted by law, we will not share personal information we collect about California residents with Nonaffiliates and we will limit sharing such personal information with our Affiliates to comply with California privacy laws that apply to us. | ||
| 39 |
Eaton Vance Funds
Delivery of Shareholder Documents. The Securities and Exchange Commission (SEC) permits funds to deliver only one copy of shareholder documents, including prospectuses, proxy statements and shareholder reports, to fund investors with multiple accounts at the same residential or post office box address. This practice is often called “householding” and it helps eliminate duplicate mailings to shareholders. Eaton Vance, or your financial intermediary, may household the mailing of your documents indefinitely unless you instruct Eaton Vance, or your financial intermediary, otherwise. If you would prefer that your Eaton Vance documents not be householded, please contact Eaton Vance at 1-800-262-1122, or contact your financial intermediary. Your instructions that householding not apply to delivery of your Eaton Vance documents will typically be effective within 30 days of receipt by Eaton Vance or your financial intermediary.
Portfolio Holdings. Each Eaton Vance Fund and its underlying Portfolio(s) (if applicable) files a schedule of portfolio holdings on Part F to Form N-PORT with the SEC. Certain information filed on Form N-PORT may be viewed on the Eaton Vance website at www.eatonvance.com, by calling Eaton Vance at 1-800-262-1122 or in the EDGAR database on the SEC’s website at www.sec.gov.
Proxy Voting. From time to time, funds are required to vote proxies related to the securities held by the funds. The Eaton Vance Funds or their underlying Portfolios (if applicable) vote proxies according to a set of policies and procedures approved by the Funds’ and Portfolios’ Boards. You may obtain a description of these policies and procedures and information on how the Funds or Portfolios voted proxies relating to portfolio securities during the most recent 12-month period ended June 30, without charge, upon request, by calling 1-800-262-1122 and by accessing the SEC’s website at www.sec.gov.
| 40 |
Investment Adviser of Eaton Vance Greater India Fund and Greater India Portfolio
Boston Management and Research
Two International Place
Boston, MA 02110
Investment Sub-Adviser of Eaton Vance Greater India Fund and Greater India Portfolio
Goldman Sachs Asset Management, L.P.
200 West Street
New York, NY 10282
Administrator of Eaton Vance Greater India Fund
Eaton Vance Management
Two International Place
Boston, MA 02110
Principal Underwriter*
Eaton Vance Distributors, Inc.
Two International Place
Boston, MA 02110
(617) 482-8260
Custodian
State Street Bank and Trust Company
State Street Financial Center, One Lincoln Street
Boston, MA 02111
Transfer Agent
BNY Mellon Investment Servicing (US) Inc.
Attn: Eaton Vance Funds
P.O. Box 9653
Providence, RI 02940-9653
(800) 262-1122
Independent Registered Public Accounting Firm
Deloitte & Touche LLP
200 Berkeley Street
Boston, MA 02116-5022
Fund Offices
Two International Place
Boston, MA 02110
| * | FINRA BrokerCheck. Investors may check the background of their Investment Professional by contacting the Financial Industry Regulatory Authority (FINRA). FINRA BrokerCheck is a free tool to help investors check the professional background of current and former FINRA-registered securities firms and brokers. FINRA BrokerCheck is available by calling 1-800-289-9999 and at www.FINRA.org. The FINRA BrokerCheck brochure describing this program is available to investors at www.FINRA.org. |
142 12.31.21
Item 2. Code of Ethics
The registrant (sometimes referred to as the “Fund”) has adopted a code of ethics applicable to its Principal Executive Officer, Principal Financial Officer and Principal Accounting Officer. The registrant undertakes to provide a copy of such code of ethics to any person upon request, without charge, by calling 1-800-262-1122. The registrant has not amended the code of ethics as described in Form N-CSR during the period covered by this report. The registrant has not granted any waiver, including an implicit waiver, from a provision of the code of ethics as described in Form N-CSR during the period covered by this report.
Item 3. Audit Committee Financial Expert
The registrant’s Board of Trustees (the “Board”) has designated George J. Gorman, William H. Park and Scott E. Wennerholm, each an independent trustee, as audit committee financial experts. Mr. Gorman is a certified public accountant who is the Principal at George J. Gorman LLC (a consulting firm). Previously, Mr. Gorman served in various capacities at Ernst & Young LLP (a registered public accounting firm), including as Senior Partner. Mr. Gorman also has experience serving as an independent trustee and audit committee financial expert of other mutual fund complexes. Mr. Park is a certified public accountant who is a private investor. Previously, he served as a consultant, as the Chief Financial Officer of Aveon Group, L.P. (an investment management firm), as the Vice Chairman of Commercial Industrial Finance Corp. (specialty finance company), as President and Chief Executive Officer of Prizm Capital Management, LLC (investment management firm), as Executive Vice President and Chief Financial Officer of United Asset Management Corporation (an institutional investment management firm) and as a Senior Manager at Price Waterhouse (now PricewaterhouseCoopers) (a registered public accounting firm). Mr. Wennerholm is a private investor. Previously, Mr. Wennerholm served as a Trustee at Wheelock College (postsecondary institution), as a Consultant at GF Parish Group (executive recruiting firm), Chief Operating Officer and Executive Vice President at BNY Mellon Asset Management (investment management firm), Chief Operating Officer and Chief Financial Officer at Natixis Global Asset Management (investment management firm), and Vice President at Fidelity Investments Institutional Services (investment management firm).
Item 4. Principal Accountant Fees and Services
Eaton Vance Greater India Fund, (the “Fund”), is a series of Eaton Vance Special Investment Trust (the “Trust”), a Massachusetts business trust, which, including the Fund, contains a total of 9 series (the “Series”). The Trust is registered under the Investment Company Act of 1940 as an open-end management investment company. This Form N-CSR relates to the Fund’s annual report.
(a)-(d)
The following table presents the aggregate fees billed to the Fund for the Fund’s fiscal years ended December 31, 2020 and December 31, 2021 by the registrant’s principal accountant, Deloitte & Touche LLP (“D&T”), for professional services rendered for the audit of the Fund’s annual financial statements and fees billed for other services rendered by D&T during such periods.
Eaton Vance Greater India Fund
Fiscal Years Ended | 12/31/20 | 12/31/21 | ||||||
Audit Fees | $ | 16,350 | $ | 16,350 | ||||
Audit-Related Fees(1) | $ | 0 | $ | 0 | ||||
Tax Fees(2) | $ | 6,706 | $ | 7,056 | ||||
All Other Fees(3) | $ | 0 | $ | 0 | ||||
|
|
|
| |||||
Total | $ | 23,056 | $ | 23,406 | ||||
|
|
|
| |||||
| (1) | Audit-related fees consist of the aggregate fees billed for assurance and related services that are reasonably related to the performance of the audit of financial statements and are not reported under the category of audit fees. |
| (2) | Tax fees consist of the aggregate fees billed for professional services rendered by the principal accountant relating to tax compliance, tax advice, and tax planning and specifically include fees for tax return preparation and other related tax compliance/planning matters. |
| (3) | All other fees consist of the aggregate fees billed for products and services provided by the principal accountant other than audit, audit-related, and tax services. |
The various Series comprising the Trust have differing fiscal year ends (October 31 and December 31). The following table presents the aggregate audit, audit-related, tax, and other fees billed to all of the Series in the Trust by D&T for the last two fiscal years of each Series.
Fiscal Years Ended | 10/31/20 | 12/31/20 | 10/31/21 | 12/31/21 | ||||||||||||
Audit Fees | $ | 39,350 | $ | 283,450 | $ | 40,350 | $ | 214,800 | ||||||||
Audit-Related Fees(1) | $ | 0 | $ | 0 | $ | 0 | $ | 0 | ||||||||
Tax Fees(2) | $ | 8,572 | $ | 113,037 | $ | 8,922 | $ | 101,882 | ||||||||
All Other Fees(3) | $ | 0 | $ | 0 | $ | 0 | $ | 0 | ||||||||
|
|
|
|
|
|
|
| |||||||||
Total | $ | 47,922 | $ | 396,487 | $ | 49,272 | $ | 316,682 | ||||||||
|
|
|
|
|
|
|
| |||||||||
| (1) | Audit-related fees consist of the aggregate fees billed for assurance and related services that are reasonably related to the performance of the audit of financial statements and are not reported under the category of audit fees. |
| (2) | Tax fees consist of the aggregate fees billed for professional services rendered by the principal accountant relating to tax compliance, tax advice, and tax planning and specifically include fees for tax return preparation and other related tax compliance/planning matters. |
| (3) | All other fees consist of the aggregate fees billed for products and services provided by the principal accountant other than audit, audit-related, and tax services. |
(e)(1) The registrant’s audit committee has adopted policies and procedures relating to the pre-approval of services provided by the registrant’s principal accountant (the “Pre-Approval Policies”). The Pre-Approval Policies establish a framework intended to assist the audit committee in the proper discharge of its pre-approval responsibilities. As a general matter, the Pre-Approval Policies (i) specify certain types of audit, audit-related, tax, and other services determined to be pre-approved by the audit committee; and (ii) delineate specific procedures governing the mechanics of the pre-approval process, including the approval and monitoring of audit and non-audit service fees. Unless a service is specifically pre-approved under the Pre-Approval Policies, it must be separately pre-approved by the audit committee.
The Pre-Approval Policies and the types of audit and non-audit services pre-approved therein must be reviewed and ratified by the registrant’s audit committee at least annually. The registrant’s audit committee maintains full responsibility for the appointment, compensation, and oversight of the work of the registrant’s principal accountant.
(e)(2) No services described in paragraphs (b)-(d) above were approved by the registrant’s audit committee pursuant to the “de minimis exception” set forth in Rule 2-01 (c)(7)(i)(C) of Regulation S-X.
(f) Not applicable.
(g) The following table presents (i) the aggregate non-audit fees (i.e., fees for audit-related, tax, and other services) billed for services rendered to all of the Series in the Trust by D&T for the last two fiscal years of each Series; and (ii) the aggregate non-audit fees (i.e., fees for audit-related, tax, and other services) billed to the Eaton Vance organization by D&T for the last two fiscal years of each Series.
Fiscal Years Ended | 10/31/20 | 12/31/20 | 10/31/21 | 12/31/21 | ||||||||||||
Registrant(1) | $ | 8,572 | $ | 113,037 | $ | 8,922 | $ | 101,882 | ||||||||
Eaton Vance(2) | $ | 51,800 | $ | 150,300 | $ | 51,800 | $ | 51,800 | ||||||||
| (1) | Includes all of the Series of the Trust. During the fiscal years reported above, certain of the Funds were “feeder” funds in a “master-feeder” fund structure or funds of funds. |
| (2) | Various subsidiaries of Morgan Stanley act in either an investment advisory and/or service provider capacity with respect to the Series and/or their respective “master” funds (if applicable). |
(h) The registrant’s audit committee has considered whether the provision by the registrant’s principal accountant of non-audit services to the registrant’s investment adviser and any entity controlling, controlled by, or under common control with the adviser that provides ongoing services to the registrant that were not pre-approved pursuant to Rule 2-01(c)(7)(ii) of Regulation S-X is compatible with maintaining the principal accountant’s independence.
Item 5. Audit Committee of Listed Registrants
Not applicable.
Item 6. Schedule of Investments
Please see schedule of investments contained in the Report to Stockholders included under Item 1 of this Form N-CSR.
Item 7. Disclosure of Proxy Voting Policies and Procedures for Closed-End Management Investment Companies
Not applicable.
Item 8. Portfolio Managers of Closed-End Management Investment Companies
Not applicable.
Item 9. Purchases of Equity Securities by Closed-End Management Investment Company and Affiliated Purchasers
Not applicable.
Item 10. Submission of Matters to a Vote of Security Holders
No material changes.
Item 11. Controls and Procedures
(a) The registrant maintains disclosure controls and procedures to provide reasonable assurance that the information required to be disclosed by the registrant has been recorded, processed, summarized and reported within the time period specified in the Commission’s rules and forms and that the information required to be disclosed by the registrant has been accumulated and communicated to the registrant’s principal executive officer and principal financial officer in order to allow timely decisions regarding required disclosure. Within 90 days prior to the filing date of the annual report on Form N-CSR, management carried out an evaluation of the effectiveness of the design and operation of the registrant’s disclosure controls and procedures. Based on such evaluation, the principal executive officer and principal financial officer concluded that the registrant’s disclosure controls and procedures were not effective due to a material weakness. The registrant holds a 99.9% interest in Greater India Portfolio (the Portfolio). Due to the nature of the registrant being a feeder fund of the Portfolio, the performance of the registrant is directly affected by the performance of the Portfolio. A material weakness exists in the design of controls for the registrant over the Portfolio’s calculation of accrued foreign capital gains taxes because the registrant is reliant on the Portfolio to provide accurate information to the registrant regarding its investment in the Portfolio. The understatement of the Portfolio’s accrual for foreign capital gains taxes resulted in the registrant overstating the amount of unrealized appreciation on investments allocated to it by the Portfolio, resulting in a material error in the 2020 financial statements of the registrant requiring restatement and a material corrected adjustment to the 2021 financial statements of the registrant.
The registrant is implementing enhancements to its disclosure controls and procedures to remediate the material weakness described above. Management has clarified with the fund administration team the process to be used in the calculation of accrued foreign capital gains taxes and adopted review procedures surrounding the calculation.
(b) Other than the enhancements to controls noted above that were implemented subsequent to December 31, 2021, there have been no changes in the registrant’s internal controls over financial reporting during the period covered by this report and subsequent to the date of their evaluation in connection with the preparation of this Form N-CSR that materially affected, or are reasonably likely to materially affect, the registrant’s internal control over financial reporting.
Item 12. Disclosure of Securities Lending Activities for Closed-End Management Investment Companies
Not applicable.
Item 13. Exhibits
(a)(1) | Registrant’s Code of Ethics – Not applicable (please see Item 2). | |
(a)(2)(i) | ||
(a)(2)(ii) | ||
(b) | ||
Signatures
Pursuant to the requirements of the Securities Exchange Act of 1934 and the Investment Company Act of 1940, the registrant has duly caused this report to be signed on its behalf by the undersigned, thereunto duly authorized.
| Eaton Vance Special Investment Trust | ||
| By: | /s/ Eric A. Stein | |
| Eric A. Stein | ||
| President | ||
Date: March 10, 2022
Pursuant to the requirements of the Securities Exchange Act of 1934 and the Investment Company Act of 1940, this report has been signed below by the following persons on behalf of the registrant and in the capacities and on the dates indicated.
| By: | /s/ James F. Kirchner | |
| James F. Kirchner | ||
| Treasurer | ||
Date: March 10, 2022
| By: | /s/ Eric A. Stein | |
| Eric A. Stein | ||
| President | ||
Date: March 10, 2022