UNITED STATES
SECURITIES AND EXCHANGE COMMISSION
Washington, D.C. 20549
Form N-CSR
CERTIFIED SHAREHOLDER REPORT OF REGISTERED
MANAGEMENT INVESTMENT COMPANIES
Investment Company Act File Number: 811-01545
Eaton Vance Special Investment Trust
(Exact Name of Registrant as Specified in Charter)
Two International Place, Boston, Massachusetts 02110
(Address of Principal Executive Offices)
Deidre E. Walsh
Two International Place, Boston, Massachusetts 02110
(Name and Address of Agent for Services)
(617) 482-8260
(Registrant’s Telephone Number)
December 31
Date of Fiscal Year End
June 30, 2022
Date of Reporting Period
Item 1. Reports to Stockholders


| % Average Annual Total Returns1,2 | Class Inception Date | Performance Inception Date | Six Months | One Year | Five Years | Ten Years |
| Class A at NAV | 04/01/1932 | 04/01/1932 | (15.71)% | (11.32)% | 6.92% | 8.32% |
| Class A with 5.25% Maximum Sales Charge | — | — | (20.16) | (15.96) | 5.77 | 7.74 |
| Class C at NAV | 11/02/1993 | 04/01/1932 | (15.98) | (11.94) | 6.11 | 7.67 |
| Class C with 1% Maximum Sales Charge | — | — | (16.82) | (12.76) | 6.11 | 7.67 |
| Class I at NAV | 09/28/2012 | 04/01/1932 | (15.52) | (11.09) | 7.20 | 8.59 |
| Class R at NAV | 05/02/2016 | 04/01/1932 | (15.80) | (11.57) | 6.65 | 8.16 |
| Class R6 at NAV | 05/02/2016 | 04/01/1932 | (15.57) | (11.05) | 7.23 | 8.62 |
| S&P 500® Index | — | — | (19.96)% | (10.62)% | 11.30% | 12.95% |
| Bloomberg U.S. Aggregate Bond Index | — | — | (10.35) | (10.29) | 0.88 | 1.54 |
| Blended Index | — | — | (16.11) | (10.24) | 7.37 | 8.49 |
| % Total Annual Operating Expense Ratios3 | Class A | Class C | Class I | Class R | Class R6 |
| 0.95% | 1.70% | 0.70% | 1.20% | 0.66% |
| Asset Allocation (% of total investments) |
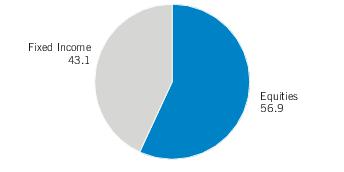
| * | Fund invests in one or more affiliated investment companies (Portfolios). References to investments are to the aggregate holdings of the Fund, including its pro rata share of each Portfolio in which it invests. |
| Equity Investments Sector Allocation (% of total investments) |

| Fixed-Income Allocation (% of total investments) |

| 1 | S&P 500® Index is an unmanaged index of large-cap stocks commonly used as a measure of U.S. stock market performance. S&P Dow Jones Indices are a product of S&P Dow Jones Indices LLC (“S&P DJI”) and have been licensed for use. S&P® and S&P 500® are registered trademarks of S&P DJI; Dow Jones® is a registered trademark of Dow Jones Trademark Holdings LLC (“Dow Jones”); S&P DJI, Dow Jones and their respective affiliates do not sponsor, endorse, sell or promote the Fund, will not have any liability with respect thereto and do not have any liability for any errors, omissions, or interruptions of the S&P Dow Jones Indices. Bloomberg U.S. Aggregate Bond Index is an unmanaged index of domestic investment-grade bonds, including corporate, government and mortgage-backed securities. The Blended Index consists of 60% S&P 500® Index and 40% Bloomberg U.S. Aggregate Bond Index, rebalanced monthly. Unless otherwise stated, index returns do not reflect the effect of any applicable sales charges, commissions, expenses, taxes or leverage, as applicable. It is not possible to invest directly in an index. |
| 2 | Total Returns at NAV do not include applicable sales charges. If sales charges were deducted, the returns would be lower. Total Returns shown with maximum sales charge reflect the stated maximum sales charge. Unless otherwise stated, performance does not reflect the deduction of taxes on Fund distributions or redemptions of Fund shares.Effective November 5, 2020, Class C shares automatically convert to Class A shares eight years after purchase. The average annual total returns listed for Class C reflect conversion to Class A shares after eight years. Prior to November 5, 2020, Class C shares automatically converted to Class A shares ten years after purchase.Performance prior to the inception date of a class may be linked to the performance of an older class of the Fund. This linked performance is adjusted for any applicable sales charge, but is not adjusted for class expense differences. If adjusted for such differences, the performance would be different. The performance of Class I and Class R is linked to Class A and the performance of Class R6 is linked to Class I. Performance presented in the Financial Highlights included in the financial statements is not linked. |
| 3 | Source: Fund prospectus. The expense ratios for the current reporting period can be found in the Financial Highlights section of this report. Performance reflects expenses waived and/or reimbursed, if applicable. Without such waivers and/or reimbursements, performance would have been lower. |
| Beginning Account Value (1/1/22) | Ending Account Value (6/30/22) | Expenses Paid During Period* (1/1/22 – 6/30/22) | Annualized Expense Ratio | |
| Actual | ||||
| Class A | $1,000.00 | $ 842.90 | $4.39 | 0.96% |
| Class C | $1,000.00 | $ 840.20 | $7.80 | 1.71% |
| Class I | $1,000.00 | $ 844.80 | $3.25 | 0.71% |
| Class R | $1,000.00 | $ 842.00 | $5.53 | 1.21% |
| Class R6 | $1,000.00 | $ 844.30 | $3.06 | 0.67% |
| Hypothetical | ||||
| (5% return per year before expenses) | ||||
| Class A | $1,000.00 | $1,020.03 | $4.81 | 0.96% |
| Class C | $1,000.00 | $1,016.32 | $8.55 | 1.71% |
| Class I | $1,000.00 | $1,021.27 | $3.56 | 0.71% |
| Class R | $1,000.00 | $1,018.79 | $6.06 | 1.21% |
| Class R6 | $1,000.00 | $1,021.47 | $3.36 | 0.67% |
| * | Expenses are equal to the Fund's annualized expense ratio for the indicated Class, multiplied by the average account value over the period, multiplied by 181/365 (to reflect the one-half year period). The Example assumes that the $1,000 was invested at the net asset value per share determined at the close of business on December 31, 2021. The Example reflects the expenses of both the Fund and the Portfolios. |
| June 30, 2022 | |
| Assets | |
| Investment in Core Bond Portfolio, at value (identified cost, $415,002,506) | $ 374,859,957 |
| Investment in Stock Portfolio, at value (identified cost, $397,003,142) | 515,353,714 |
| Receivable for Fund shares sold | 609,755 |
| Total assets | $890,823,426 |
| Liabilities | |
| Payable for Fund shares redeemed | $ 1,157,799 |
| Payable to affiliates: | |
| Administration fee | 29,854 |
| Distribution and service fees | 251,872 |
| Trustees' fees | 125 |
| Accrued expenses | 186,035 |
| Total liabilities | $ 1,625,685 |
| Net Assets | $889,197,741 |
| Sources of Net Assets | |
| Paid-in capital | $ 754,407,638 |
| Distributable earnings | 134,790,103 |
| Net Assets | $889,197,741 |
| Class A Shares | |
| Net Assets | $ 363,818,306 |
| Shares Outstanding | 37,737,883 |
| Net Asset Value and Redemption Price Per Share (net assets ÷ shares of beneficial interest outstanding) | $ 9.64 |
| Maximum Offering Price Per Share (100 ÷ 94.75 of net asset value per share) | $ 10.17 |
| Class C Shares | |
| Net Assets | $ 202,517,211 |
| Shares Outstanding | 20,903,760 |
| Net Asset Value and Offering Price Per Share* (net assets ÷ shares of beneficial interest outstanding) | $ 9.69 |
| Class I Shares | |
| Net Assets | $ 305,104,612 |
| Shares Outstanding | 31,631,712 |
| Net Asset Value, Offering Price and Redemption Price Per Share (net assets ÷ shares of beneficial interest outstanding) | $ 9.65 |
| Class R Shares | |
| Net Assets | $ 13,463,224 |
| Shares Outstanding | 1,402,311 |
| Net Asset Value, Offering Price and Redemption Price Per Share (net assets ÷ shares of beneficial interest outstanding) | $ 9.60 |
| June 30, 2022 | |
| Class R6 Shares | |
| Net Assets | $4,294,388 |
| Shares Outstanding | 445,151 |
| Net Asset Value, Offering Price and Redemption Price Per Share (net assets ÷ shares of beneficial interest outstanding) | $ 9.65 |
| On sales of $50,000 or more, the offering price of Class A shares is reduced. | |
| * | Redemption price per share is equal to the net asset value less any applicable contingent deferred sales charge. |
| Six Months Ended | |
| June 30, 2022 | |
| Investment Income | |
| Dividend income allocated from Portfolios (net of foreign taxes withheld of $6,461) | $ 4,475,903 |
| Interest income allocated from Portfolios (net of foreign taxes withheld of $1,187) | 4,981,345 |
| Expenses allocated from Portfolios | (2,892,477) |
| Total investment income from Portfolios | $ 6,564,771 |
| Expenses | |
| Administration fee | $ 197,272 |
| Distribution and service fees: | |
| Class A | 503,013 |
| Class C | 1,137,420 |
| Class R | 36,206 |
| Trustees’ fees and expenses | 250 |
| Custodian fee | 30,140 |
| Transfer and dividend disbursing agent fees | 316,687 |
| Legal and accounting services | 24,144 |
| Printing and postage | 42,616 |
| Registration fees | 45,406 |
| Miscellaneous | 9,150 |
| Total expenses | $ 2,342,304 |
| Deduct: | |
| Waiver and/or reimbursement of expenses by affiliate | $ (3,261) |
| Total expense reductions | $ (3,261) |
| Net expenses | $ 2,345,565 |
| Net investment income | $ 4,219,206 |
| Realized and Unrealized Gain (Loss) from Portfolios | |
| Net realized gain (loss): | |
| Investment transactions | $ 7,486,985 |
| Futures contracts | (1,775,463) |
| Foreign currency transactions | (1,030) |
| Net realized gain | $ 5,710,492 |
| Change in unrealized appreciation (depreciation): | |
| Investments | $ (183,775,224) |
| Futures contracts | (175,508) |
| Foreign currency | (6,676) |
| Net change in unrealized appreciation (depreciation) | $(183,957,408) |
| Net realized and unrealized loss | $(178,246,916) |
| Net decrease in net assets from operations | $(174,027,710) |
| Six Months Ended June 30, 2022 (Unaudited) | Year Ended December 31, 2021 | |
| Increase (Decrease) in Net Assets | ||
| From operations: | ||
| Net investment income | $ 4,219,206 | $ 7,539,421 |
| Net realized gain | 5,710,492 | 113,049,941 (1) |
| Net change in unrealized appreciation (depreciation) | (183,957,408) | 27,978,321 |
| Net increase (decrease) in net assets from operations | $ (174,027,710) | $ 148,567,683 |
| Distributions to shareholders: | ||
| Class A | $ (2,136,073) | $ (34,488,656) |
| Class C | (314,731) | (18,132,108) |
| Class I | (2,284,955) | (32,432,173) |
| Class R | (60,601) | (1,117,168) |
| Class R6 | (32,703) | (5,018,451) |
| Total distributions to shareholders | $ (4,829,063) | $ (91,188,556) |
| Transactions in shares of beneficial interest: | ||
| Class A | $ (13,157,873) | $ 36,091,509 |
| Class C | (15,205,007) | (3,270,357) |
| Class I | (41,654,239) | (9,824,338) |
| Class R | 463,827 | 6,272,222 |
| Class R6 | (4,200) | (52,360,733) |
| Net decrease in net assets from Fund share transactions | $ (69,557,492) | $ (23,091,697) |
| Other capital: | ||
| Portfolio transaction fee contributed to Portfolio | $ (531,978) | $ (502,642) |
| Portfolio transaction fee allocated from Portfolio | 532,748 | 494,318 |
| Net increase (decrease) in net assets from other capital | $ 770 | $ (8,324) |
| Net increase (decrease) in net assets | $ (248,413,495) | $ 34,279,106 |
| Net Assets | ||
| At beginning of period | $1,137,611,236 | $ 1,103,332,130 |
| At end of period | $ 889,197,741 | $1,137,611,236 |
| (1) | Includes $2,669,216 of net realized gains from redemptions in-kind. |
| Class A | ||||||
| Six Months Ended June 30, 2022 (Unaudited) | Year Ended December 31, | |||||
| 2021 | 2020 | 2019 | 2018 | 2017 | ||
| Net asset value — Beginning of period | $ 11.500 | $ 10.930 | $ 9.850 | $ 8.280 | $ 9.110 | $ 8.410 |
| Income (Loss) From Operations | ||||||
| Net investment income(1) | $ 0.049 | $ 0.085 | $ 0.110 | $ 0.125 | $ 0.132 | $ 0.124 |
| Net realized and unrealized gain (loss) | (1.853) | 1.430 | 1.266 | 1.819 | (0.424) | 1.003 |
| Total income (loss) from operations | $ (1.804) | $ 1.515 | $ 1.376 | $ 1.944 | $ (0.292) | $ 1.127 |
| Less Distributions | ||||||
| From net investment income | $ (0.056) | $ (0.127) | $ (0.118) | $ (0.127) | $ (0.146) | $ (0.139) |
| From net realized gain | — | (0.818) | (0.178) | (0.247) | (0.392) | (0.288) |
| Total distributions | $ (0.056) | $ (0.945) | $ (0.296) | $ (0.374) | $ (0.538) | $ (0.427) |
| Portfolio transaction fee, net(1) | $ 0.000(2) | $ (0.000)(2) | $ 0.000(2) | $ (0.000)(2) | $ (0.000)(2) | $ 0.000(2) |
| Net asset value — End of period | $ 9.640 | $ 11.500 | $ 10.930 | $ 9.850 | $ 8.280 | $ 9.110 |
| Total Return(3) | (15.71)% (4) | 14.01% | 14.20% (5) | 23.63% | (3.43)% (5) | 13.53% (5) |
| Ratios/Supplemental Data | ||||||
| Net assets, end of period (000’s omitted) | $363,818 | $448,684 | $391,745 | $353,169 | $294,742 | $333,860 |
| Ratios (as a percentage of average daily net assets):(6) | ||||||
| Expenses | 0.96% (7)(8) | 0.95% | 0.96% (5) | 0.98% | 0.98% (5) | 0.98% (5) |
| Net investment income | 0.93% (7) | 0.73% | 1.10% | 1.34% | 1.45% | 1.41% |
| Portfolio Turnover of the Fund(9) | 4% (4) | 7% | 11% | 12% | 7% | 4% |
| (1) | Computed using average shares outstanding. |
| (2) | Amount is less than $0.0005 or $(0.0005), as applicable. |
| (3) | Returns are historical and are calculated by determining the percentage change in net asset value with all distributions reinvested and do not reflect the effect of sales charges. |
| (4) | Not annualized. |
| (5) | The administrator of the Fund reimbursed certain operating expenses (equal to less than 0.005%, 0.03% and 0.01% of average daily net assets for the years ended December 31, 2020, 2018 and 2017, respectively). Absent this reimbursement, total return would be lower. |
| (6) | Includes the Fund’s share of the Portfolios’ allocated expenses. |
| (7) | Annualized. |
| (8) | The investment adviser reduced a portion of its adviser fee (equal to less than 0.005% of average daily net assets for the six months ended June 30, 2022). |
| (9) | Percentage is based on the Fund’s contributions to and withdrawals from the Portfolios and excludes the investment activity of the Portfolios. |
| Class C | ||||||
| Six Months Ended June 30, 2022 (Unaudited) | Year Ended December 31, | |||||
| 2021 | 2020 | 2019 | 2018 | 2017 | ||
| Net asset value — Beginning of period | $ 11.550 | $ 10.970 | $ 9.900 | $ 8.310 | $ 9.140 | $ 8.440 |
| Income (Loss) From Operations | ||||||
| Net investment income (loss)(1) | $ 0.009 | $ (0.002) | $ 0.036 | $ 0.055 | $ 0.064 | $ 0.058 |
| Net realized and unrealized gain (loss) | (1.854) | 1.442 | 1.257 | 1.837 | (0.426) | 1.001 |
| Total income (loss) from operations | $ (1.845) | $ 1.440 | $ 1.293 | $ 1.892 | $ (0.362) | $ 1.059 |
| Less Distributions | ||||||
| From net investment income | $ (0.015) | $ (0.042) | $ (0.045) | $ (0.055) | $ (0.076) | $ (0.071) |
| From net realized gain | — | (0.818) | (0.178) | (0.247) | (0.392) | (0.288) |
| Total distributions | $ (0.015) | $ (0.860) | $ (0.223) | $ (0.302) | $ (0.468) | $ (0.359) |
| Portfolio transaction fee, net(1) | $ 0.000(2) | $ (0.000)(2) | $ 0.000(2) | $ (0.000)(2) | $ (0.000)(2) | $ 0.000(2) |
| Net asset value — End of period | $ 9.690 | $ 11.550 | $ 10.970 | $ 9.900 | $ 8.310 | $ 9.140 |
| Total Return(3) | (15.98)% (4) | 13.21% | 13.21% (5) | 22.71% | (4.03)% (5) | 12.63% (5) |
| Ratios/Supplemental Data | ||||||
| Net assets, end of period (000’s omitted) | $202,517 | $258,309 | $248,249 | $236,215 | $221,669 | $258,844 |
| Ratios (as a percentage of average daily net assets):(6) | ||||||
| Expenses | 1.71% (7)(8) | 1.70% | 1.71% (5) | 1.73% | 1.73% (5) | 1.73% (5) |
| Net investment income (loss) | 0.18% (7) | (0.02)% | 0.36% | 0.59% | 0.70% | 0.65% |
| Portfolio Turnover of the Portfolio(9) | 4% (4) | 7% | 11% | 12% | 7% | 4% |
| (1) | Computed using average shares outstanding. |
| (2) | Amount is less than $0.0005 or $(0.0005), as applicable. |
| (3) | Returns are historical and are calculated by determining the percentage change in net asset value with all distributions reinvested and do not reflect the effect of sales charges. |
| (4) | Not annualized. |
| (5) | The administrator of the Fund reimbursed certain operating expenses (equal to less than 0.005%, 0.03% and 0.01% of average daily net assets for the years ended December 31, 2020, 2018 and 2017, respectively). Absent this reimbursement, total return would be lower. |
| (6) | Includes the Fund’s share of the Portfolios’ allocated expenses. |
| (7) | Annualized. |
| (8) | The investment adviser reduced a portion of its adviser fee (equal to less than 0.005% of average daily net assets for the six months ended June 30, 2022). |
| (9) | Percentage is based on the Fund’s contributions to and withdrawals from the Portfolios and excludes the investment activity of the Portfolios. |
| Class I | ||||||
| Six Months Ended June 30, 2022 (Unaudited) | Year Ended December 31, | |||||
| 2021 | 2020 | 2019 | 2018 | 2017 | ||
| Net asset value — Beginning of period | $ 11.500 | $ 10.930 | $ 9.860 | $ 8.280 | $ 9.110 | $ 8.410 |
| Income (Loss) From Operations | ||||||
| Net investment income(1) | $ 0.061 | $ 0.114 | $ 0.134 | $ 0.149 | $ 0.156 | $ 0.147 |
| Net realized and unrealized gain (loss) | (1.842) | 1.430 | 1.257 | 1.830 | (0.425) | 1.002 |
| Total income (loss) from operations | $ (1.781) | $ 1.544 | $ 1.391 | $ 1.979 | $ (0.269) | $ 1.149 |
| Less Distributions | ||||||
| From net investment income | $ (0.069) | $ (0.156) | $ (0.143) | $ (0.152) | $ (0.169) | $ (0.161) |
| From net realized gain | — | (0.818) | (0.178) | (0.247) | (0.392) | (0.288) |
| Total distributions | $ (0.069) | $ (0.974) | $ (0.321) | $ (0.399) | $ (0.561) | $ (0.449) |
| Portfolio transaction fee, net(1) | $ 0.000(2) | $ (0.000)(2) | $ 0.000(2) | $ (0.000)(2) | $ (0.000)(2) | $ 0.000(2) |
| Net asset value — End of period | $ 9.650 | $ 11.500 | $ 10.930 | $ 9.860 | $ 8.280 | $ 9.110 |
| Total Return(3) | (15.52)% (4) | 14.28% | 14.36% (5) | 24.07% | (3.19)% (5) | 13.81% (5) |
| Ratios/Supplemental Data | ||||||
| Net assets, end of period (000’s omitted) | $305,105 | $409,900 | $399,991 | $322,436 | $208,740 | $220,522 |
| Ratios (as a percentage of average daily net assets):(6) | ||||||
| Expenses | 0.71% (7)(8) | 0.70% | 0.71% (5) | 0.73% | 0.73% (5) | 0.73% (5) |
| Net investment income | 1.18% (7) | 0.98% | 1.34% | 1.59% | 1.70% | 1.66% |
| Portfolio Turnover of the Portfolio(9) | 4% (4) | 7% | 11% | 12% | 7% | 4% |
| (1) | Computed using average shares outstanding. |
| (2) | Amount is less than $0.0005 or $(0.0005), as applicable. |
| (3) | Returns are historical and are calculated by determining the percentage change in net asset value with all distributions reinvested. |
| (4) | Not annualized. |
| (5) | The administrator of the Fund reimbursed certain operating expenses (equal to less than 0.005%, 0.03% and 0.01% of average daily net assets for the years ended December 31, 2020, 2018 and 2017, respectively). Absent this reimbursement, total return would be lower. |
| (6) | Includes the Fund’s share of the Portfolios’ allocated expenses. |
| (7) | Annualized. |
| (8) | The investment adviser reduced a portion of its adviser fee (equal to less than 0.005% of average daily net assets for the six months ended June 30, 2022). |
| (9) | Percentage is based on the Fund’s contributions to and withdrawals from the Portfolios and excludes the investment activity of the Portfolios. |
| Class R | ||||||
| Six Months Ended June 30, 2022 (Unaudited) | Year Ended December 31, | |||||
| 2021 | 2020 | 2019 | 2018 | 2017 | ||
| Net asset value — Beginning of period | $11.450 | $ 10.890 | $ 9.820 | $ 8.260 | $ 9.090 | $ 8.400 |
| Income (Loss) From Operations | ||||||
| Net investment income(1) | $ 0.039 | $ 0.055 | $ 0.083 | $ 0.102 | $ 0.115 | $ 0.104 |
| Net realized and unrealized gain (loss) | (1.846) | 1.425 | 1.261 | 1.812 | (0.423) | 0.996 |
| Total income (loss) from operations | $ (1.807) | $ 1.480 | $ 1.344 | $ 1.914 | $(0.308) | $ 1.100 |
| Less Distributions | ||||||
| From net investment income | $ (0.043) | $ (0.102) | $ (0.096) | $ (0.107) | $ (0.130) | $ (0.122) |
| From net realized gain | — | (0.818) | (0.178) | (0.247) | (0.392) | (0.288) |
| Total distributions | $ (0.043) | $ (0.920) | $ (0.274) | $(0.354) | $(0.522) | $(0.410) |
| Portfolio transaction fee, net(1) | $ 0.000(2) | $ (0.000)(2) | $ 0.000(2) | $(0.000) (2) | $(0.000) (2) | $ 0.000(2) |
| Net asset value — End of period | $ 9.600 | $11.450 | $10.890 | $ 9.820 | $ 8.260 | $ 9.090 |
| Total Return(3) | (15.80)% (4) | 13.71% | 13.89% (5) | 23.31% | (3.61)% (5) | 13.22% (5) |
| Ratios/Supplemental Data | ||||||
| Net assets, end of period (000’s omitted) | $13,463 | $ 15,587 | $ 8,958 | $ 5,905 | $ 2,514 | $ 561 |
| Ratios (as a percentage of average daily net assets):(6) | ||||||
| Expenses | 1.21% (7)(8) | 1.20% | 1.21% (5) | 1.23% | 1.23% (5) | 1.23% (5) |
| Net investment income | 0.76% (7) | 0.47% | 0.84% | 1.08% | 1.27% | 1.17% |
| Portfolio Turnover of the Portfolio(9) | 4% (4) | 7% | 11% | 12% | 7% | 4% |
| (1) | Computed using average shares outstanding. |
| (2) | Amount is less than $0.0005 or $(0.0005), as applicable. |
| (3) | Returns are historical and are calculated by determining the percentage change in net asset value with all distributions reinvested. |
| (4) | Not annualized. |
| (5) | The administrator of the Fund reimbursed certain operating expenses (equal to less than 0.005%, 0.03% and 0.01% of average daily net assets for the years ended December 31, 2020, 2018 and 2017, respectively). Absent this reimbursement, total return would be lower. |
| (6) | Includes the Fund’s share of the Portfolios’ allocated expenses. |
| (7) | Annualized. |
| (8) | The investment adviser reduced a portion of its adviser fee (equal to less than 0.005% of average daily net assets for the six months ended June 30, 2022). |
| (9) | Percentage is based on the Fund’s contributions to and withdrawals from the Portfolios and excludes the investment activity of the Portfolios. |
| Class R6 | ||||||
| Six Months Ended June 30, 2022 (Unaudited) | Year Ended December 31, | |||||
| 2021 | 2020 | 2019 | 2018 | 2017 | ||
| Net asset value — Beginning of period | $11.510 | $ 10.930 | $ 9.860 | $ 8.280 | $ 9.110 | $ 8.420 |
| Income (Loss) From Operations | ||||||
| Net investment income(1) | $ 0.053 | $ 0.119 | $ 0.139 | $ 0.153 | $ 0.160 | $ 0.146 |
| Net realized and unrealized gain (loss) | (1.841) | 1.440 | 1.256 | 1.829 | (0.423) | 0.999 |
| Total income (loss) from operations | $ (1.788) | $ 1.559 | $ 1.395 | $ 1.982 | $ (0.263) | $ 1.145 |
| Less Distributions | ||||||
| From net investment income | $ (0.072) | $ (0.161) | $ (0.147) | $ (0.155) | $ (0.175) | $ (0.167) |
| From net realized gain | — | (0.818) | (0.178) | (0.247) | (0.392) | (0.288) |
| Total distributions | $ (0.072) | $ (0.979) | $ (0.325) | $ (0.402) | $ (0.567) | $ (0.455) |
| Portfolio transaction fee, net(1) | $ 0.000(2) | $ (0.000)(2) | $ 0.000(2) | $ (0.000)(2) | $ (0.000)(2) | $ 0.000(2) |
| Net asset value — End of period | $ 9.650 | $11.510 | $10.930 | $ 9.860 | $ 8.280 | $ 9.110 |
| Total Return(3) | (15.57)% (4) | 14.42% | 14.41% (5) | 24.11% | (3.13)% (5) | 13.75% (5) |
| Ratios/Supplemental Data | ||||||
| Net assets, end of period (000’s omitted) | $ 4,294 | $ 5,131 | $ 54,388 | $42,255 | $28,215 | $27,492 |
| Ratios (as a percentage of average daily net assets):(6) | ||||||
| Expenses | 0.67% (7)(8) | 0.66% | 0.67% (5) | 0.68% | 0.69% (5) | 0.69% (5) |
| Net investment income | 1.02% (7) | 1.02% | 1.39% | 1.63% | 1.74% | 1.62% |
| Portfolio Turnover of the Portfolio(9) | 4% (4) | 7% | 11% | 12% | 7% | 4% |
| (1) | Computed using average shares outstanding. |
| (2) | Amount is less than $0.0005 or $(0.0005), as applicable. |
| (3) | Returns are historical and are calculated by determining the percentage change in net asset value with all distributions reinvested. |
| (4) | Not annualized. |
| (5) | The administrator of the Fund reimbursed certain operating expenses (equal to less than 0.005%, 0.03% and 0.01% of average daily net assets for the years ended December 31, 2020, 2018 and 2017, respectively). Absent this reimbursement, total return would be lower. |
| (6) | Includes the Fund’s share of the Portfolios’ allocated expenses. |
| (7) | Annualized. |
| (8) | The investment adviser reduced a portion of its adviser fee (equal to less than 0.005% of average daily net assets for the six months ended June 30, 2022). |
| (9) | Percentage is based on the Fund’s contributions to and withdrawals from the Portfolios and excludes the investment activity of the Portfolios. |
| Average Daily Net Assets | Annual Fee Rate |
| Up to $500 million | 0.600% |
| $500 million but less than $1 billion | 0.575% |
| $1 billion but less than $2.5 billion | 0.550% |
| $2.5 billion but less than $5 billion | 0.530% |
| $5 billion and over | 0.515% |
| Average Daily Net Assets | Annual Fee Rate |
| Less than $1 billion | 0.450% |
| $1 billion up to $2 billion | 0.425% |
| $2 billion up to $5 billion | 0.415% |
| $5 billion and over | 0.405% |
| Portfolio | Contributions | Withdrawals |
| Core Bond Portfolio | $39,803,039 | $ 54,225,699 |
| Stock Portfolio | 1,333,051 | 117,453,474 |
| Six Months Ended June 30, 2022 (Unaudited) | Year Ended December 31, 2021 | ||||
| Shares | Amount | Shares | Amount | ||
| Class A | |||||
| Sales | 1,250,080 | $ 13,330,033 | 4,176,035 | $ 48,400,186 | |
| Issued to shareholders electing to receive payments of distributions in Fund shares | 187,775 | 1,913,738 | 2,770,703 | 31,529,862 | |
| Redemptions | (2,921,778) | (30,492,460) | (4,184,607) | (48,517,965) | |
| Converted from Class C shares | 199,898 | 2,090,816 | 404,790 | 4,679,426 | |
| Net increase (decrease) | (1,284,025) | $(13,157,873) | 3,166,921 | $ 36,091,509 | |
| Class C | |||||
| Sales | 805,651 | $ 8,528,180 | 2,781,836 | $ 32,200,851 | |
| Issued to shareholders electing to receive payments of distributions in Fund shares | 30,355 | 308,610 | 1,550,042 | 17,713,688 | |
| Redemptions | (2,094,895) | (21,950,981) | (4,188,082) | (48,505,470) | |
| Converted to Class A shares | (199,038) | (2,090,816) | (403,119) | (4,679,426) | |
| Net decrease | (1,457,927) | $(15,205,007) | (259,323) | $ (3,270,357) | |
| Class I | |||||
| Sales | 2,232,187 | $ 23,705,206 | 6,952,216 | $ 80,302,215 | |
| Issued to shareholders electing to receive payments of distributions in Fund shares | 206,106 | 2,103,054 | 2,617,006 | 29,817,055 | |
| Redemptions | (6,435,597) | (67,462,499) | (10,534,372) | (119,943,608) | |
| Net decrease | (3,997,304) | $(41,654,239) | (965,150) | $ (9,824,338) | |
| Class R | |||||
| Sales | 179,846 | $ 1,900,231 | 682,829 | $ 7,932,531 | |
| Issued to shareholders electing to receive payments of distributions in Fund shares | 5,977 | 60,601 | 98,543 | 1,117,168 | |
| Redemptions | (144,715) | (1,497,005) | (243,016) | (2,777,477) | |
| Net increase | 41,108 | $ 463,827 | 538,356 | $ 6,272,222 | |
| Six Months Ended June 30, 2022 (Unaudited) | Year Ended December 31, 2021 | ||||
| Shares | Amount | Shares | Amount | ||
| Class R6 | |||||
| Sales | 100,208 | $ 1,057,634 | 1,253,295 | $ 14,450,535 | |
| Issued to shareholders electing to receive payments of distributions in Fund shares | 3,200 | 32,639 | 440,316 | 5,017,767 | |
| Redemptions | (104,165) | (1,094,473) | (6,222,460) | (71,829,035) | |
| Net decrease | (757) | $ (4,200) | (4,528,849) | $ (52,360,733) | |
| • | Level 1 – quoted prices in active markets for identical investments |
| • | Level 2 – other significant observable inputs (including quoted prices for similar investments, interest rates, prepayment speeds, credit risk, etc.) |
| • | Level 3 – significant unobservable inputs (including a fund's own assumptions in determining the fair value of investments) |
| Common Stocks — 99.0% |
| Security | Shares | Value | |
| Auto Components — 0.6% | |||
| Aptiv PLC(1) | 37,556 | $ 3,345,113 | |
| $ 3,345,113 | |||
| Banks — 3.4% | |||
| PNC Financial Services Group, Inc. (The) | 60,170 | $ 9,493,021 | |
| Wells Fargo & Co. | 278,210 | 10,897,486 | |
| $ 20,390,507 | |||
| Beverages — 4.1% | |||
| Coca-Cola Co. (The) | 261,546 | $ 16,453,859 | |
| Coca-Cola Europacific Partners PLC | 150,560 | 7,770,401 | |
| $ 24,224,260 | |||
| Biotechnology — 2.8% | |||
| AbbVie, Inc. | 109,716 | $ 16,804,103 | |
| $ 16,804,103 | |||
| Capital Markets — 4.3% | |||
| Intercontinental Exchange, Inc. | 115,304 | $ 10,843,188 | |
| S&P Global, Inc. | 24,536 | 8,270,104 | |
| Tradeweb Markets, Inc., Class A | 93,229 | 6,362,880 | |
| $ 25,476,172 | |||
| Chemicals — 2.7% | |||
| Ecolab, Inc. | 50,600 | $ 7,780,256 | |
| FMC Corp. | 77,500 | 8,293,275 | |
| $ 16,073,531 | |||
| Commercial Services & Supplies — 1.7% | |||
| Waste Management, Inc. | 66,178 | $ 10,123,910 | |
| $ 10,123,910 | |||
| Diversified Telecommunication Services — 2.1% | |||
| Verizon Communications, Inc. | 245,300 | $ 12,448,975 | |
| $ 12,448,975 | |||
| Electric Utilities — 2.3% | |||
| NextEra Energy, Inc. | 179,340 | $ 13,891,676 | |
| $ 13,891,676 | |||
| Security | Shares | Value | |
| Electrical Equipment — 1.2% | |||
| AMETEK, Inc. | 67,656 | $ 7,434,718 | |
| $ 7,434,718 | |||
| Electronic Equipment, Instruments & Components — 1.3% | |||
| TE Connectivity, Ltd. | 70,500 | $ 7,977,075 | |
| $ 7,977,075 | |||
| Energy Equipment & Services — 1.2% | |||
| Baker Hughes Co. | 245,800 | $ 7,096,246 | |
| $ 7,096,246 | |||
| Entertainment — 0.9% | |||
| Electronic Arts, Inc. | 46,000 | $ 5,595,900 | |
| $ 5,595,900 | |||
| Equity Real Estate Investment Trusts (REITs) — 3.9% | |||
| EastGroup Properties, Inc. | 75,322 | $ 11,624,444 | |
| Lamar Advertising Co., Class A | 129,590 | 11,400,033 | |
| $ 23,024,477 | |||
| Food & Staples Retailing — 4.0% | |||
| Sysco Corp. | 150,690 | $ 12,764,950 | |
| Walmart, Inc. | 88,400 | 10,747,672 | |
| $ 23,512,622 | |||
| Health Care Equipment & Supplies — 1.9% | |||
| Boston Scientific Corp.(1) | 227,036 | $ 8,461,632 | |
| Teleflex, Inc. | 11,600 | 2,851,860 | |
| $ 11,313,492 | |||
| Health Care Providers & Services — 2.4% | |||
| Elevance Health, Inc. | 29,024 | $ 14,006,402 | |
| $ 14,006,402 | |||
| Hotels, Restaurants & Leisure — 0.9% | |||
| Marriott International, Inc., Class A | 41,528 | $ 5,648,223 | |
| $ 5,648,223 | |||
| Insurance — 3.2% | |||
| Allstate Corp. (The) | 100,600 | $ 12,749,038 | |
| W.R. Berkley Corp. | 88,100 | 6,013,706 | |
| $ 18,762,744 | |||
| Security | Shares | Value | |
| Interactive Media & Services — 5.6% | |||
| Alphabet, Inc., Class C(1) | 15,189 | $ 33,225,178 | |
| $ 33,225,178 | |||
| Internet & Direct Marketing Retail — 3.8% | |||
| Amazon.com, Inc.(1) | 214,720 | $ 22,805,411 | |
| $ 22,805,411 | |||
| IT Services — 4.1% | |||
| Automatic Data Processing, Inc. | 51,096 | $ 10,732,204 | |
| Visa, Inc., Class A | 69,730 | 13,729,140 | |
| $ 24,461,344 | |||
| Life Sciences Tools & Services — 4.0% | |||
| Danaher Corp. | 47,992 | $ 12,166,932 | |
| Thermo Fisher Scientific, Inc. | 21,734 | 11,807,647 | |
| $ 23,974,579 | |||
| Machinery — 1.8% | |||
| Westinghouse Air Brake Technologies Corp. | 128,000 | $ 10,506,240 | |
| $ 10,506,240 | |||
| Multi-Utilities — 2.2% | |||
| Sempra Energy | 85,500 | $ 12,848,085 | |
| $ 12,848,085 | |||
| Oil, Gas & Consumable Fuels — 1.6% | |||
| ConocoPhillips | 106,456 | $ 9,560,813 | |
| $ 9,560,813 | |||
| Pharmaceuticals — 4.6% | |||
| Bristol-Myers Squibb Co. | 169,900 | $ 13,082,300 | |
| Eli Lilly & Co. | 28,900 | 9,370,247 | |
| Pfizer, Inc. | 94,100 | 4,933,663 | |
| $ 27,386,210 | |||
| Professional Services — 1.5% | |||
| Booz Allen Hamilton Holding Corp. | 97,290 | $ 8,791,124 | |
| $ 8,791,124 | |||
| Road & Rail — 1.5% | |||
| Union Pacific Corp. | 41,024 | $ 8,749,599 | |
| $ 8,749,599 | |||
| Semiconductors & Semiconductor Equipment — 4.4% | |||
| Analog Devices, Inc. | 70,386 | $ 10,282,691 | |
| Security | Shares | Value | |
| Semiconductors & Semiconductor Equipment (continued) | |||
| Lam Research Corp. | 16,000 | $ 6,818,400 | |
| Texas Instruments, Inc. | 57,847 | 8,888,191 | |
| $ 25,989,282 | |||
| Software — 10.4% | |||
| Black Knight, Inc.(1) | 94,000 | $ 6,146,660 | |
| Fair Isaac Corp.(1) | 15,200 | 6,093,680 | |
| Intuit, Inc. | 13,554 | 5,224,254 | |
| Microsoft Corp. | 151,398 | 38,883,548 | |
| VMware, Inc., Class A | 49,100 | 5,596,418 | |
| $ 61,944,560 | |||
| Specialty Retail — 1.2% | |||
| TJX Cos., Inc. (The) | 126,534 | $ 7,066,924 | |
| $ 7,066,924 | |||
| Technology Hardware, Storage & Peripherals — 6.1% | |||
| Apple, Inc. | 267,084 | $ 36,515,725 | |
| $ 36,515,725 | |||
| Wireless Telecommunication Services — 1.3% | |||
| T-Mobile US, Inc.(1) | 55,908 | $ 7,521,862 | |
| $ 7,521,862 | |||
| Total Common Stocks (identified cost $432,837,553) | $588,497,082 | ||
| Short-Term Investments — 0.1% |
| Security | Shares | Value | |
| Morgan Stanley Institutional Liquidity Funds - Government Portfolio, Institutional Class, 1.38%(2) | 452,518 | $ 452,518 | |
| Total Short-Term Investments (identified cost $452,518) | $ 452,518 | ||
| Total Investments — 99.1% (identified cost $433,290,071) | $588,949,600 | ||
| Other Assets, Less Liabilities — 0.9% | $ 5,542,635 | ||
| Net Assets — 100.0% | $594,492,235 | ||
| The percentage shown for each investment category in the Portfolio of Investments is based on net assets. | |
| (1) | Non-income producing security. |
| (2) | May be deemed to be an affiliated investment company. The rate shown is the annualized seven-day yield as of June 30, 2022. |
| June 30, 2022 | |
| Assets | |
| Unaffiliated investments, at value (identified cost $432,837,553) | $ 588,497,082 |
| Affiliated investment, at value (identified cost $452,518) | 452,518 |
| Dividends receivable | 747,053 |
| Dividends receivable from affiliated investment | 1,962 |
| Receivable for investments sold | 5,404,184 |
| Tax reclaims receivable | 88,523 |
| Total assets | $595,191,322 |
| Liabilities | |
| Payable for investments purchased | $ 304,045 |
| Payable to affiliates: | |
| Investment adviser fee | 299,050 |
| Trustees' fees | 10,185 |
| Accrued expenses | 85,807 |
| Total liabilities | $ 699,087 |
| Net Assets applicable to investors' interest in Portfolio | $594,492,235 |
| Six Months Ended | |
| June 30, 2022 | |
| Investment Income | |
| Dividend income (net of foreign taxes withheld of $7,008) | $ 4,994,859 |
| Dividend income from affiliated investments | 5,862 |
| Total investment income | $ 5,000,721 |
| Expenses | |
| Investment adviser fee | $ 2,081,739 |
| Trustees’ fees and expenses | 20,256 |
| Custodian fee | 86,878 |
| Legal and accounting services | 25,713 |
| Miscellaneous | 7,443 |
| Total expenses | $ 2,222,029 |
| Deduct: | |
| Waiver and/or reimbursement of expenses by affiliate | $ 948 |
| Total expense reductions | $ 948 |
| Net expenses | $ 2,221,081 |
| Net investment income | $ 2,779,640 |
| Realized and Unrealized Gain (Loss) | |
| Net realized gain (loss): | |
| Investment transactions | $ 14,807,244 |
| Investment transactions - affiliated investment | 2,363 |
| Foreign currency transactions | (1,188) |
| Net realized gain | $ 14,808,419 |
| Change in unrealized appreciation (depreciation): | |
| Investments | $ (163,408,810) |
| Foreign currency | (7,646) |
| Net change in unrealized appreciation (depreciation) | $(163,416,456) |
| Net realized and unrealized loss | $(148,608,037) |
| Net decrease in net assets from operations | $(145,828,397) |
| Six Months Ended June 30, 2022 (Unaudited) | Year Ended December 31, 2021 | |
| Increase (Decrease) in Net Assets | ||
| From operations: | ||
| Net investment income | $ 2,779,640 | $ 4,613,543 |
| Net realized gain | 14,808,419 | 123,837,212 (1) |
| Net change in unrealized appreciation (depreciation) | (163,416,456) | 46,443,015 |
| Net increase (decrease) in net assets from operations | $(145,828,397) | $ 174,893,770 |
| Capital transactions: | ||
| Contributions | $ 2,676,186 | $ 23,356,815 |
| Withdrawals | (134,275,537) | (131,961,931) |
| Portfolio transaction fee | 610,437 | 574,923 |
| Net decrease in net assets from capital transactions | $(130,988,914) | $(108,030,193) |
| Net increase (decrease) in net assets | $(276,817,311) | $ 66,863,577 |
| Net Assets | ||
| At beginning of period | $ 871,309,546 | $ 804,445,969 |
| At end of period | $ 594,492,235 | $ 871,309,546 |
| (1) | Includes $3,096,043 of net realized gains from redemptions in-kind. |
| Six Months Ended June 30, 2022 (Unaudited) | Year Ended December 31, | |||||
| Ratios/Supplemental Data | 2021 | 2020 | 2019 | 2018 | 2017 | |
| Ratios (as a percentage of average daily net assets): | ||||||
| Expenses | 0.63% (1)(2) | 0.63% | 0.64% | 0.63% | 0.64% | 0.64% |
| Net investment income | 0.79% (1) | 0.55% | 0.84% | 0.99% | 1.14% | 1.38% |
| Portfolio Turnover | 31% (3) | 44% | 70% | 55% | 90% | 101% |
| Total Return | (18.72)% (3) | 23.21% | 18.61% | 35.47% | (5.57)% | 20.31% |
| Net assets, end of period (000’s omitted) | $594,492 | $871,310 | $804,446 | $683,548 | $516,615 | $647,405 |
| (1) | Annualized. |
| (2) | The investment adviser reduced a portion of its adviser fee (equal to less than 0.005% of average daily net assets for the six months ended June 30, 2022). |
| (3) | Not annualized. |
| Average Daily Net Assets | Annual Fee Rate |
| Up to $500 million | 0.600% |
| $500 million but less than $1 billion | 0.575% |
| $1 billion but less than $2.5 billion | 0.550% |
| $2.5 billion but less than $5 billion | 0.530% |
| $5 billion and over | 0.515% |
| Aggregate cost | $ 434,925,680 |
| Gross unrealized appreciation | $ 172,737,860 |
| Gross unrealized depreciation | (18,713,940) |
| Net unrealized appreciation | $ 154,023,920 |
| Name | Value, beginning of period | Purchases | Sales proceeds | Net realized gain (loss) | Change in unrealized appreciation (depreciation) | Value, end of period | Dividend income | Units/Shares, end of period |
| Short-Term Investments | ||||||||
| Cash Reserves Fund | $2,248,476 | $51,152,522 | $(53,403,361) | $ 2,363 | $ — | $ — | $ 588 | — |
| Liquidity Fund | — | 20,631,636 | (20,179,118) | — | — | 452,518 | 5,274 | 452,518 |
| Total | $2,363 | $ — | $452,518 | $5,862 | ||||
| • | Level 1 – quoted prices in active markets for identical investments |
| • | Level 2 – other significant observable inputs (including quoted prices for similar investments, interest rates, prepayment speeds, credit risk, etc.) |
| • | Level 3 – significant unobservable inputs (including a fund's own assumptions in determining the fair value of investments) |
| Asset Description | Level 1 | Level 2 | Level 3 | Total |
| Common Stocks | $ 588,497,082* | $ — | $ — | $ 588,497,082 |
| Short-Term Investments | 452,518 | — | — | 452,518 |
| Total Investments | $588,949,600 | $ — | $ — | $588,949,600 |
| * | The level classification by major category of investments is the same as the category presentation in the Portfolio of Investments. |
| Officers of Eaton Vance Balanced Fund | |
| Eric A. Stein President | Jill R. Damon Secretary |
| Deidre E. Walsh Vice President and Chief Legal Officer | Richard F. Froio Chief Compliance Officer |
| James F. Kirchner Treasurer | |
| Officers of Stock Portfolio | |
| Edward J. Perkin President | Jill R. Damon Secretary |
| Deidre E. Walsh Vice President and Chief Legal Officer | Richard F. Froio Chief Compliance Officer |
| James F. Kirchner Treasurer | |
| Trustees of Eaton Vance Balanced Fund and Stock Portfolio |
| George J. Gorman Chairperson | |
| Alan C. Bowser** | |
| Thomas E. Faust Jr.* | |
| Mark R. Fetting | |
| Cynthia E. Frost | |
| Valerie A. Mosley |
| Keith Quinton | |
| Marcus L. Smith | |
| Susan J. Sutherland | |
| Scott E. Wennerholm | |
| Nancy A. Wiser** |
| * | Interested Trustee |
| ** | Mr. Bowser and Ms. Wiser began serving as Trustees effective April 4, 2022. |
| Privacy Notice | April 2021 |
| FACTS | WHAT DOES EATON VANCE DO WITH YOUR PERSONAL INFORMATION? |
| Why? | Financial companies choose how they share your personal information. Federal law gives consumers the right to limit some but not all sharing. Federal law also requires us to tell you how we collect, share, and protect your personal information. Please read this notice carefully to understand what we do. |
| What? | The types of personal information we collect and share depend on the product or service you have with us. This information can include:■ Social Security number and income ■ investment experience and risk tolerance ■ checking account number and wire transfer instructions |
| How? | All financial companies need to share customers’ personal information to run their everyday business. In the section below, we list the reasons financial companies can share their customers’ personal information; the reasons Eaton Vance chooses to share; and whether you can limit this sharing. |
| Reasons we can share your personal information | Does Eaton Vance share? | Can you limit this sharing? |
| For our everyday business purposes — such as to process your transactions, maintain your account(s), respond to court orders and legal investigations, or report to credit bureaus | Yes | No |
| For our marketing purposes — to offer our products and services to you | Yes | No |
| For joint marketing with other financial companies | No | We don’t share |
| For our investment management affiliates’ everyday business purposes — information about your transactions, experiences, and creditworthiness | Yes | Yes |
| For our affiliates’ everyday business purposes — information about your transactions and experiences | Yes | No |
| For our affiliates’ everyday business purposes — information about your creditworthiness | No | We don’t share |
| For our investment management affiliates to market to you | Yes | Yes |
| For our affiliates to market to you | No | We don’t share |
| For nonaffiliates to market to you | No | We don’t share |
| To limit our sharing | Call toll-free 1-800-262-1122 or email: EVPrivacy@eatonvance.comPlease note:If you are a new customer, we can begin sharing your information 30 days from the date we sent this notice. When you are no longer our customer, we continue to share your information as described in this notice. However, you can contact us at any time to limit our sharing. |
| Questions? | Call toll-free 1-800-262-1122 or email: EVPrivacy@eatonvance.com |
| Privacy Notice — continued | April 2021 |
| Who we are | |
| Who is providing this notice? | Eaton Vance Management, Eaton Vance Distributors, Inc., Eaton Vance Trust Company, Eaton Vance Management (International) Limited, Eaton Vance Advisers International Ltd., Eaton Vance Global Advisors Limited, Eaton Vance Management’s Real Estate Investment Group, Boston Management and Research, Calvert Research and Management, Eaton Vance and Calvert Fund Families and our investment advisory affiliates (“Eaton Vance”) (see Investment Management Affiliates definition below) |
| What we do | |
| How does Eaton Vance protect my personal information? | To protect your personal information from unauthorized access and use, we use security measures that comply with federal law. These measures include computer safeguards and secured files and buildings. We have policies governing the proper handling of customer information by personnel and requiring third parties that provide support to adhere to appropriate security standards with respect to such information. |
| How does Eaton Vance collect my personal information? | We collect your personal information, for example, when you■ open an account or make deposits or withdrawals from your account ■ buy securities from us or make a wire transfer ■ give us your contact informationWe also collect your personal information from others, such as credit bureaus, affiliates, or other companies. |
| Why can’t I limit all sharing? | Federal law gives you the right to limit only■ sharing for affiliates’ everyday business purposes — information about your creditworthiness ■ affiliates from using your information to market to you ■ sharing for nonaffiliates to market to youState laws and individual companies may give you additional rights to limit sharing. See below for more on your rights under state law. |
| Definitions | |
| Investment Management Affiliates | Eaton Vance Investment Management Affiliates include registered investment advisers, registered broker- dealers, and registered and unregistered funds. Investment Management Affiliates does not include entities associated with Morgan Stanley Wealth Management, such as Morgan Stanley Smith Barney LLC and Morgan Stanley & Co. |
| Affiliates | Companies related by common ownership or control. They can be financial and nonfinancial companies.■ Our affiliates include companies with a Morgan Stanley name and financial companies such as Morgan Stanley Smith Barney LLC and Morgan Stanley & Co. |
| Nonaffiliates | Companies not related by common ownership or control. They can be financial and nonfinancial companies.■ Eaton Vance does not share with nonaffiliates so they can market to you. |
| Joint marketing | A formal agreement between nonaffiliated financial companies that together market financial products or services to you.■ Eaton Vance doesn’t jointly market. |
| Other important information | |
| Vermont: Except as permitted by law, we will not share personal information we collect about Vermont residents with Nonaffiliates unless you provide us with your written consent to share such information.California: Except as permitted by law, we will not share personal information we collect about California residents with Nonaffiliates and we will limit sharing such personal information with our Affiliates to comply with California privacy laws that apply to us. | |
Two International Place
Boston, MA 02110
Two International Place
Boston, MA 02110
Two International Place
Boston, MA 02110
(617) 482-8260
State Street Financial Center, One Lincoln Street
Boston, MA 02111
Attn: Eaton Vance Funds
P.O. Box 9653
Providence, RI 02940-9653
(800) 262-1122
Boston, MA 02110


| % Average Annual Total Returns1,2 | Class Inception Date | Performance Inception Date | Six Months | One Year | Five Years | Ten Years |
| Class A at NAV | 01/05/2009 | 03/07/2000 | (10.75)% | (10.65)% | 1.22% | 1.69% |
| Class A with 3.25% Maximum Sales Charge | — | — | (13.61) | (13.54) | 0.55 | 1.35 |
| Class I at NAV | 03/21/2007 | 03/07/2000 | (10.66) | (10.36) | 1.47 | 1.94 |
| Bloomberg U.S. Aggregate Bond Index | — | — | (10.35)% | (10.29)% | 0.88% | 1.54% |
| % Total Annual Operating Expense Ratios3 | Class A | Class I |
| Gross | 0.86% | 0.61% |
| Net | 0.74 | 0.49 |
| Asset Allocation (% of total investments) |

| 1 | Bloomberg U.S. Aggregate Bond Index is an unmanaged index of domestic investment-grade bonds, including corporate, government and mortgage-backed securities. Unless otherwise stated, index returns do not reflect the effect of any applicable sales charges, commissions, expenses, taxes or leverage, as applicable. It is not possible to invest directly in an index. |
| 2 | Total Returns at NAV do not include applicable sales charges. If sales charges were deducted, the returns would be lower. Total Returns shown with maximum sales charge reflect the stated maximum sales charge. Unless otherwise stated, performance does not reflect the deduction of taxes on Fund distributions or redemptions of Fund shares. |
| 3 | Source: Fund prospectus. Net expense ratios reflect a contractual expense reimbursement that continues through 4/30/23. The expense ratios for the current reporting period can be found in the Financial Highlights section of this report. Performance reflects expenses waived and/or reimbursed, if applicable. Without such waivers and/or reimbursements, performance would have been lower. |
| Fund profile subject to change due to active management. |
| Beginning Account Value (1/1/22) | Ending Account Value (6/30/22) | Expenses Paid During Period* (1/1/22 – 6/30/22) | Annualized Expense Ratio | |
| Actual | ||||
| Class A | $1,000.00 | $ 892.50 | $3.47** | 0.74% |
| Class I | $1,000.00 | $ 893.40 | $2.30** | 0.49% |
| Hypothetical | ||||
| (5% return per year before expenses) | ||||
| Class A | $1,000.00 | $1,021.13 | $3.71** | 0.74% |
| Class I | $1,000.00 | $1,022.37 | $2.46** | 0.49% |
| * | Expenses are equal to the Fund's annualized expense ratio for the indicated Class, multiplied by the average account value over the period, multiplied by 181/365 (to reflect the one-half year period). The Example assumes that the $1,000 was invested at the net asset value per share determined at the close of business on December 31, 2021. The Example reflects the expenses of both the Fund and the Portfolio. |
| ** | Absent an allocation of certain expenses to affiliates, expenses would be higher. |
| June 30, 2022 | |
| Assets | |
| Investment in Core Bond Portfolio, at value (identified cost $167,821,738) | $ 153,267,512 |
| Receivable for Fund shares sold | 174,449 |
| Receivable from affiliate | 27,700 |
| Total assets | $153,469,661 |
| Liabilities | |
| Payable for Fund shares redeemed | $ 115,367 |
| Distributions payable | 1,628 |
| Payable to affiliates: | |
| Distribution and service fees | 2,784 |
| Trustees' fees | 125 |
| Accrued expenses | 31,715 |
| Total liabilities | $ 151,619 |
| Net Assets | $153,318,042 |
| Sources of Net Assets | |
| Paid-in capital | $ 172,581,304 |
| Accumulated loss | (19,263,262) |
| Net Assets | $153,318,042 |
| Class A Shares | |
| Net Assets | $ 13,377,840 |
| Shares Outstanding | 1,519,852 |
| Net Asset Value and Redemption Price Per Share (net assets ÷ shares of beneficial interest outstanding) | $ 8.80 |
| Maximum Offering Price Per Share (100 ÷ 96.75 of net asset value per share) | $ 9.10 |
| Class I Shares | |
| Net Assets | $ 139,940,202 |
| Shares Outstanding | 15,923,010 |
| Net Asset Value, Offering Price and Redemption Price Per Share (net assets ÷ shares of beneficial interest outstanding) | $ 8.79 |
| On sales of $100,000 or more, the offering price of Class A shares is reduced. |
| Six Months Ended | |
| June 30, 2022 | |
| Investment Income | |
| Dividend income allocated from Portfolio (net of foreign taxes withheld of $107) | $ 42,743 |
| Interest income allocated from Portfolio (net of foreign taxes withheld of $538) | 1,883,873 |
| Expenses allocated from Portfolio | (363,896) |
| Total investment income from Portfolio | $ 1,562,720 |
| Expenses | |
| Distribution and shareholder service fees: | |
| Class A | $ 18,926 |
| Trustees’ fees and expenses | 250 |
| Custodian fee | 9,697 |
| Transfer and dividend disbursing agent fees | 22,450 |
| Legal and accounting services | 16,199 |
| Printing and postage | 10,617 |
| Registration fees | 19,846 |
| Miscellaneous | 4,726 |
| Total expenses | $ 102,711 |
| Deduct: | |
| Allocation of expenses to affiliate | $ 83,753 |
| Total expense reductions | $ 83,753 |
| Net expenses | $ 18,958 |
| Net investment income | $ 1,543,762 |
| Realized and Unrealized Gain (Loss) from Portfolio | |
| Net realized gain (loss): | |
| Investment transactions | $ (2,315,238) |
| Futures contracts | (617,988) |
| Net realized loss | $ (2,933,226) |
| Change in unrealized appreciation (depreciation): | |
| Investments | $ (15,763,457) |
| Futures contracts | (89,586) |
| Net change in unrealized appreciation (depreciation) | $(15,853,043) |
| Net realized and unrealized loss | $(18,786,269) |
| Net decrease in net assets from operations | $(17,242,507) |
| Six Months Ended June 30, 2022 (Unaudited) | Year Ended December 31, 2021 | |
| Increase (Decrease) in Net Assets | ||
| From operations: | ||
| Net investment income | $ 1,543,762 | $ 2,987,064 |
| Net realized gain (loss) | (2,933,226) | 2,223,449 |
| Net change in unrealized appreciation (depreciation) | (15,853,043) | (4,167,035) |
| Net increase (decrease) in net assets from operations | $ (17,242,507) | $ 1,043,478 |
| Distributions to shareholders: | ||
| Class A | $ (167,219) | $ (604,619) |
| Class I | (1,652,892) | (4,330,652) |
| Total distributions to shareholders | $ (1,820,111) | $ (4,935,271) |
| Transactions in shares of beneficial interest: | ||
| Class A | $ (2,083,902) | $ (3,832,515) |
| Class I | 50,372,103 | (29,778,888) |
| Net increase (decrease) in net assets from Fund share transactions | $ 48,288,201 | $ (33,611,403) |
| Net increase (decrease) in net assets | $ 29,225,583 | $ (37,503,196) |
| Net Assets | ||
| At beginning of period | $ 124,092,459 | $ 161,595,655 |
| At end of period | $153,318,042 | $124,092,459 |
| Class A | ||||||
| Six Months Ended June 30, 2022 (Unaudited) | Year Ended December 31, | |||||
| 2021 | 2020 | 2019 | 2018 | 2017 | ||
| Net asset value — Beginning of period | $ 9.970 | $10.260 | $ 10.010 | $ 9.490 | $ 9.840 | $ 9.690 |
| Income (Loss) From Operations | ||||||
| Net investment income(1) | $ 0.085 | $ 0.184 | $ 0.226 | $ 0.260 | $ 0.273 | $ 0.217 |
| Net realized and unrealized gain (loss) | (1.153) | (0.148) | 0.550 | 0.587 | (0.338) | 0.187 |
| Total income (loss) from operations | $ (1.068) | $ 0.036 | $ 0.776 | $ 0.847 | $ (0.065) | $ 0.404 |
| Less Distributions | ||||||
| From net investment income | $ (0.102) | $ (0.205) | $ (0.249) | $ (0.278) | $ (0.285) | $ (0.254) |
| From net realized gain | — | (0.121) | (0.277) | (0.049) | — | — |
| Total distributions | $ (0.102) | $ (0.326) | $ (0.526) | $ (0.327) | $ (0.285) | $ (0.254) |
| Net asset value — End of period | $ 8.800 | $ 9.970 | $10.260 | $10.010 | $ 9.490 | $ 9.840 |
| Total Return(2)(3) | (10.75)% (4) | 0.36% | 7.88% | 9.00% | (0.64)% | 4.20% |
| Ratios/Supplemental Data | ||||||
| Net assets, end of period (000’s omitted) | $13,378 | $17,409 | $ 21,770 | $ 28,309 | $25,158 | $34,064 |
| Ratios (as a percentage of average daily net assets):(5) | ||||||
| Expenses (3) | 0.74% (6)(7) | 0.74% | 0.74% | 0.74% | 0.74% | 0.75% |
| Net investment income | 1.84% (6) | 1.81% | 2.23% | 2.63% | 2.85% | 2.21% |
| Portfolio Turnover of the Portfolio | 51% (4) | 122% | 93% | 89% | 65% | 123% |
| (1) | Computed using average shares outstanding. |
| (2) | Returns are historical and are calculated by determining the percentage change in net asset value with all distributions reinvested and do not reflect the effect of sales charges. |
| (3) | The investment adviser of the Portfolio and/or the administrator reimbursed certain operating expenses (equal to 0.12%, 0.12%, 0.12%, 0.11%, 0.11% and 0.11% of average daily net assets for the six months ended June 30, 2022 and the years ended December 31, 2021, 2020, 2019, 2018 and 2017, respectively). Absent this reimbursement, total return would be lower. |
| (4) | Not annualized. |
| (5) | Includes the Fund's share of the Portfolio's allocated expenses. |
| (6) | Annualized. |
| (7) | Includes a reduction by the investment adviser and administrator of a portion of the Portfolio's adviser fee due to the Portfolio's investment in the Liquidity Fund (equal to less than 0.005% of average daily net assets for the six months ended June 30, 2022). |
| Class I | ||||||
| Six Months Ended June 30, 2022 (Unaudited) | Year Ended December 31, | |||||
| 2021 | 2020 | 2019 | 2018 | 2017 | ||
| Net asset value — Beginning of period | $ 9.960 | $ 10.240 | $ 9.990 | $ 9.470 | $ 9.830 | $ 9.680 |
| Income (Loss) From Operations | ||||||
| Net investment income(1) | $ 0.096 | $ 0.209 | $ 0.251 | $ 0.283 | $ 0.282 | $ 0.241 |
| Net realized and unrealized gain (loss) | (1.153) | (0.138) | 0.550 | 0.588 | (0.333) | 0.187 |
| Total income (loss) from operations | $ (1.057) | $ 0.071 | $ 0.801 | $ 0.871 | $ (0.051) | $ 0.428 |
| Less Distributions | ||||||
| From net investment income | $ (0.113) | $ (0.230) | $ (0.274) | $ (0.302) | $ (0.309) | $ (0.278) |
| From net realized gain | — | (0.121) | (0.277) | (0.049) | — | — |
| Total distributions | $ (0.113) | $ (0.351) | $ (0.551) | $ (0.351) | $ (0.309) | $ (0.278) |
| Net asset value — End of period | $ 8.790 | $ 9.960 | $ 10.240 | $ 9.990 | $ 9.470 | $ 9.830 |
| Total Return(2)(3) | (10.66)% (4) | 0.71% | 8.16% | 9.29% | (0.50)% | 4.47% |
| Ratios/Supplemental Data | ||||||
| Net assets, end of period (000’s omitted) | $139,940 | $106,684 | $139,826 | $177,519 | $149,220 | $130,714 |
| Ratios (as a percentage of average daily net assets):(5) | ||||||
| Expenses (3) | 0.49% (6)(7) | 0.49% | 0.49% | 0.49% | 0.49% | 0.50% |
| Net investment income | 2.11% (6) | 2.06% | 2.47% | 2.87% | 2.95% | 2.46% |
| Portfolio Turnover of the Portfolio | 51% (4) | 122% | 93% | 89% | 65% | 123% |
| (1) | Computed using average shares outstanding. |
| (2) | Returns are historical and are calculated by determining the percentage change in net asset value with all distributions reinvested. |
| (3) | The investment adviser of the Portfolio and/or the administrator reimbursed certain operating expenses (equal to 0.12%, 0.12%, 0.12%, 0.11%, 0.11% and 0.11% of average daily net assets for the six months ended June 30, 2022 and the years ended December 31, 2021, 2020, 2019, 2018 and 2017, respectively). Absent this reimbursement, total return would be lower. |
| (4) | Not annualized. |
| (5) | Includes the Fund's share of the Portfolio's allocated expenses. |
| (6) | Annualized. |
| (7) | Includes a reduction by the investment adviser and administrator of a portion of the Portfolio's adviser fee due to the Portfolio's investment in the Liquidity Fund (equal to less than 0.005% of average daily net assets for the six months ended June 30, 2022). |
| Average Daily Net Assets | Annual Fee Rate |
| Up to $1 billion | 0.450% |
| $1 billion up to $2 billion | 0.425% |
| $2 billion up to $5 billion | 0.415% |
| $5 billion and over | 0.405% |
| Six Months Ended June 30, 2022 (Unaudited) | Year Ended December 31, 2021 | ||||
| Shares | Amount | Shares | Amount | ||
| Class A | |||||
| Sales | 47,919 | $ 446,135 | 170,928 | $ 1,738,879 | |
| Issued to shareholders electing to receive payments of distributions in Fund shares | 17,131 | 158,321 | 56,919 | 573,920 | |
| Redemptions | (290,536) | (2,688,358) | (605,106) | (6,145,314) | |
| Net decrease | (225,486) | $ (2,083,902) | (377,259) | $ (3,832,515) | |
| Class I | |||||
| Sales | 8,218,922 | $ 78,196,234 | 2,900,652 | $ 29,318,252 | |
| Issued to shareholders electing to receive payments of distributions in Fund shares | 180,059 | 1,649,241 | 428,735 | 4,318,831 | |
| Redemptions | (3,189,173) | (29,473,372) | (6,271,622) | (63,415,971) | |
| Net increase (decrease) | 5,209,808 | $ 50,372,103 | (2,942,235) | $(29,778,888) | |
| Asset-Backed Securities — 11.6% |
| Security | Principal Amount (000's omitted) | Value | |
| Adams Outdoor Advertising L.P., Series 2018-1, Class A, 4.81%, 11/15/48(1) | $ | 670 | $ 660,839 |
| Affirm Asset Securitization Trust, Series 2021-A, Class A, 0.88%, 8/15/25(1) | 505 | 498,779 | |
| Coinstar Funding, LLC, Series 2017-1A, Class A2, 5.216%, 4/25/47(1) | 1,220 | 1,183,769 | |
| Conn's Receivables Funding, LLC: | |||
| Series 2021-A, Class A, 1.05%, 5/15/26(1) | 976 | 970,065 | |
| Series 2021-A, Class B, 2.87%, 5/15/26(1) | 1,260 | 1,222,823 | |
| DataBank Issuer, Series 2021-2A, Class A2, 2.40%, 10/25/51(1) | 1,186 | 1,058,412 | |
| DB Master Finance, LLC, Series 2017-1A, Class A2II, 4.03%, 11/20/47(1) | 326 | 312,788 | |
| Diamond Infrastructure Funding, LLC: | |||
| Series 2021-1A, Class A, 1.76%, 4/15/49(1) | 3,760 | 3,236,781 | |
| Series 2021-1A, Class C, 3.475%, 4/15/49(1) | 313 | 267,287 | |
| Driven Brands Funding, LLC, Series 2018-1A, Class A2, 4.739%, 4/20/48(1) | 1,114 | 1,101,662 | |
| FMC GMSR Issuer Trust, Series 2021-GT2, Class A, 3.85%, 10/25/26(1)(2) | 1,225 | 1,096,665 | |
| FOCUS Brands Funding, LLC, Series 2017-1A, Class A2II, 5.093%, 4/30/47(1) | 950 | 917,954 | |
| Foundation Finance Trust, Series 2017-1A, Class A, 3.30%, 7/15/33(1) | 68 | 67,912 | |
| FREED ABS Trust, Series 2019-1, Class C, 5.39%, 6/18/26(1) | 1,647 | 1,648,182 | |
| Horizon Aircraft Finance III, Ltd., Series 2019-2, Class A, 3.425%, 11/15/39(1) | 1,458 | 1,270,651 | |
| Jersey Mike's Funding, Series 2019-1A, Class A2, 4.433%, 2/15/50(1) | 1,034 | 987,850 | |
| JPMorgan Chase Bank, NA: | |||
| Series 2021-2, Class B, 0.889%, 12/26/28(1) | 1,205 | 1,167,783 | |
| Series 2021-3, Class B, 0.76%, 2/26/29(1) | 1,006 | 972,858 | |
| Lendingpoint Asset Securitization Trust, Series 2022-A, Class A, 1.68%, 6/15/29(1) | 1,231 | 1,211,648 | |
| Lunar Aircraft, Ltd., Series 2020-1A, Class B, 4.335%, 2/15/45(1) | 318 | 250,217 | |
| Neighborly Issuer, LLC, Series 2021-1A, Class A2, 3.584%, 4/30/51(1) | 1,356 | 1,183,315 | |
| NRZ Excess Spread-Collateralized Notes, Series 2021-GNT1, Class A, 3.474%, 11/25/26(1) | 2,066 | 1,932,559 | |
| Oportun Funding XIV, LLC, Series 2021-A, Class B, 1.76%, 3/8/28(1) | 419 | 394,470 | |
| Oportun Issuance Trust: | |||
| Series 2021-B, Class A, 1.47%, 5/8/31(1) | 1,547 | 1,435,779 | |
| Series 2021-C, Class A, 2.18%, 10/8/31(1) | 4,685 | 4,337,765 | |
| Pagaya AI Debt Selection Trust: | |||
| Series 2021-2, 3.00%, 1/25/29(1) | 1,273 | 1,207,010 | |
| Security | Principal Amount (000's omitted) | Value | |
| Pagaya AI Debt Selection Trust: (continued) | |||
| Series 2021-3, Class A, 1.15%, 5/15/29(1) | $ | 2,277 | $ 2,215,503 |
| Series 2021-HG1, Class A, 1.22%, 1/16/29(1) | 772 | 734,305 | |
| Planet Fitness Master Issuer, LLC, Series 2019-1A, Class A2, 3.858%, 12/5/49(1) | 1,014 | 904,656 | |
| ServiceMaster Funding, LLC: | |||
| Series 2020-1, Class A2I, 2.841%, 1/30/51(1) | 553 | 478,396 | |
| Series 2020-1, Class A2II, 3.337%, 1/30/51(1) | 645 | 541,202 | |
| SERVPRO Master Issuer, LLC, Series 2019-1A, Class A2, 3.882%, 10/25/49(1) | 3,654 | 3,420,449 | |
| Sonic Capital, LLC, Series 2020-1A, Class A2I, 3.845%, 1/20/50(1) | 1,796 | 1,704,876 | |
| SpringCastle America Funding, LLC, Series 2020-AA, Class A, 1.97%, 9/25/37(1) | 1,249 | 1,161,127 | |
| Stack Infrastructure Issuer, LLC: | |||
| Series 2019-1A, Class A2, 4.54%, 2/25/44(1) | 8,618 | 8,555,537 | |
| Series 2019-2A, Class A2, 3.08%, 10/25/44(1) | 750 | 721,719 | |
| Sunnova Helios II Issuer, LLC, Series 2021-A, Class A, 1.80%, 2/20/48(1) | 250 | 218,811 | |
| Sunnova Sol II Issuer, LLC, Series 2020-2A, Class A, 2.73%, 11/1/55(1) | 2,442 | 2,100,910 | |
| Theorem Funding Trust, Series 2021-1A, Class A, 1.21%, 12/15/27(1) | 1,346 | 1,315,499 | |
| Towd Point Asset Trust, Series 2018-SL1, Class A, 2.224%, (1 mo. USD LIBOR + 0.60%), 1/25/46(1)(3) | 1,692 | 1,682,332 | |
| Vantage Data Centers Issuer, LLC: | |||
| Series 2019-1A, Class A2, 3.188%, 7/15/44(1) | 1,134 | 1,102,960 | |
| Series 2020-2A, Class A2, 1.992%, 9/15/45(1) | 2,220 | 1,936,360 | |
| Series 2021-1A, Class A2, 2.165%, 10/15/46(1) | 869 | 778,669 | |
| Willis Engine Structured Trust V: | |||
| Series 2020-A, Class B, 4.212%, 3/15/45(1) | 917 | 733,481 | |
| Series 2020-A, Class C, 6.657%, 3/15/45(1) | 253 | 166,786 | |
| Total Asset-Backed Securities (identified cost $65,375,178) | $ 61,069,401 | ||
| Collateralized Mortgage Obligations — 2.5% |
| Security | Principal Amount (000's omitted) | Value | |
| Bellemeade Re, Ltd.: | |||
| Series 2021-1A, Class M1A, 2.676%, (30-day average SOFR + 1.75%), 3/25/31(1)(3) | $ | 397 | $ 397,299 |
| Series 2021-1A, Class M1B, 3.126%, (30-day average SOFR + 2.20%), 3/25/31(1)(3) | 390 | 376,476 | |
| Series 2021-2A, Class M1A, 2.126%, (30-day average SOFR + 1.20%), 6/25/31(1)(3) | 1,870 | 1,842,290 | |
| Series 2021-3A, Class A2, 1.926%, (30-day average SOFR + 1.00%), 9/25/31(1)(3) | 830 | 820,084 | |
| Security | Principal Amount (000's omitted) | Value | |
| Federal Home Loan Mortgage Corp. Structured Agency Credit Risk Debt Notes: | |||
| Series 2018-DNA1, Class M2AT, 2.674%, (1 mo. USD LIBOR + 1.05%), 7/25/30(3) | $ | 404 | $ 404,404 |
| Series 2019-DNA3, Class M2, 3.674%, (1 mo. USD LIBOR + 2.05%), 7/25/49(1)(3) | 1,331 | 1,325,219 | |
| Series 2019-DNA4, Class M2, 3.574%, (1 mo. USD LIBOR + 1.95%), 10/25/49(1)(3) | 158 | 157,505 | |
| Series 2021-DNA3, Class M1, 1.676%, (30-day average SOFR + 0.75%), 10/25/33(1)(3) | 627 | 619,384 | |
| Series 2022-DNA2, Class M1A, 2.226%, (30-day average SOFR + 1.30%), 2/25/42(1)(3) | 1,282 | 1,255,092 | |
| Federal National Mortgage Association: | |||
| Series 2005-58, Class MA, 5.50%, 7/25/35 | 84 | 88,085 | |
| Series 2011-135, Class PK, 4.50%, 5/25/40 | 89 | 88,974 | |
| Series 2013-6, Class HD, 1.50%, 12/25/42 | 60 | 57,293 | |
| Series 2014-70, Class KP, 3.50%, 3/25/44 | 380 | 376,383 | |
| Federal National Mortgage Association Connecticut Avenue Securities: | |||
| Series 2013-C01, Class M2, 6.874%, (1 mo. USD LIBOR + 5.25%), 10/25/23(3) | 513 | 529,171 | |
| Series 2014-C02, Class 2M2, 4.224%, (1 mo. USD LIBOR + 2.60%), 5/25/24(3) | 215 | 217,695 | |
| Series 2014-C03, Class 2M2, 4.524%, (1 mo. USD LIBOR + 2.90%), 7/25/24(3) | 355 | 356,593 | |
| Series 2018-R07, Class 1M2, 4.024%, (1 mo. USD LIBOR + 2.40%), 4/25/31(1)(3) | 120 | 119,375 | |
| Series 2019-R06, Class 2B1, 5.374%, (1 mo. USD LIBOR + 3.75%), 9/25/39(1)(3) | 2,988 | 2,834,167 | |
| Home Re, Ltd., Series 2021-1, Class M1B, 3.174%, (1 mo. USD LIBOR + 1.55%), 7/25/33(1)(3) | 1,135 | 1,122,258 | |
| Total Collateralized Mortgage Obligations (identified cost $13,288,292) | $ 12,987,747 | ||
| Commercial Mortgage-Backed Securities — 11.9% |
| Security | Principal Amount (000's omitted) | Value | |
| BAMLL Commercial Mortgage Securities Trust: | |||
| Series 2019-BPR, Class DNM, 3.843%, 11/5/32(1)(2) | $ | 3,325 | $ 2,821,295 |
| Series 2019-BPR, Class FNM, 3.843%, 11/5/32(1)(2) | 1,635 | 1,350,488 | |
| BX Commercial Mortgage Trust: | |||
| Series 2019-XL, Class A, 2.244%, (1 mo. USD LIBOR + 0.92%), 10/15/36(1)(3) | 2,508 | 2,466,154 | |
| Series 2019-XL, Class B, 2.404%, (1 mo. USD LIBOR + 1.08%), 10/15/36(1)(3) | 1,122 | 1,095,087 | |
| Series 2021-VOLT, Class B, 2.274%, (1 mo. USD LIBOR + 0.95%), 9/15/36(1)(3) | 3,103 | 2,922,319 | |
| Series 2021-VOLT, Class C, 2.424%, (1 mo. USD LIBOR + 1.10%), 9/15/36(1)(3) | 1,461 | 1,362,938 | |
| Security | Principal Amount (000's omitted) | Value | |
| BX Commercial Mortgage Trust: (continued) | |||
| Series 2021-VOLT, Class D, 2.974%, (1 mo. USD LIBOR + 1.65%), 9/15/36(1)(3) | $ | 1,074 | $ 1,007,091 |
| CFCRE Commercial Mortgage Trust: | |||
| Series 2016-C7, Class C, 4.541%, 12/10/54(2) | 1,250 | 1,096,999 | |
| Series 2016-C7, Class D, 4.541%, 12/10/54(1)(2) | 2,000 | 1,592,168 | |
| CGMS Commercial Mortgage Trust, Series 2017-MDRB, Class C, 3.824%, (1 mo. USD LIBOR + 2.50%), 7/15/30(1)(3) | 3,000 | 2,997,968 | |
| COMM Mortgage Trust: | |||
| Series 2013-CR11, Class B, 5.276%, 8/10/50(2) | 1,000 | 992,900 | |
| Series 2014-CR21, Class C, 4.567%, 12/10/47(2) | 500 | 465,001 | |
| CSMC Trust, Series 2016-NXSR, Class C, 4.598%, 12/15/49(2) | 1,775 | 1,416,940 | |
| Extended Stay America Trust: | |||
| Series 2021-ESH, Class A, 2.405%, (1 mo. USD LIBOR + 1.08%), 7/15/38(1)(3) | 495 | 483,305 | |
| Series 2021-ESH, Class C, 3.025%, (1 mo. USD LIBOR + 1.70%), 7/15/38(1)(3) | 2,721 | 2,638,514 | |
| Federal National Mortgage Association: | |||
| Series 2018-M4, Class A2, 3.158%, 3/25/28(2) | 583 | 571,483 | |
| Series 2019-M1, Class A2, 3.671%, 9/25/28(2) | 2,757 | 2,764,189 | |
| Series 2020-M1, Class A2, 2.444%, 10/25/29 | 4,434 | 4,149,284 | |
| Federal National Mortgage Association Multifamily Connecticut Avenue Securities Trust, Series 2020-01, Class M10, 5.374%, (1 mo. USD LIBOR + 3.75%), 3/25/50(1)(3) | 1,260 | 1,136,932 | |
| Hawaii Hotel Trust, Series 2019-MAUI, Class A, 2.474%, (1 mo. USD LIBOR + 1.15%), 5/15/38(1)(3) | 4,033 | 3,928,626 | |
| JPMBB Commercial Mortgage Securities Trust: | |||
| Series 2014-C22, Class D, 4.702%, 9/15/47(1)(2) | 990 | 727,132 | |
| Series 2014-C23, Class D, 4.133%, 9/15/47(1)(2) | 2,000 | 1,820,778 | |
| Series 2014-C25, Class D, 4.086%, 11/15/47(1)(2) | 1,960 | 1,437,068 | |
| JPMorgan Chase Commercial Mortgage Securities Trust: | |||
| Series 2013-C13, Class D, 4.212%, 1/15/46(1)(2) | 2,000 | 1,931,887 | |
| Series 2021-MHC, Class C, 2.624%, (1 mo. USD LIBOR + 1.30%), 4/15/38(1)(3) | 2,425 | 2,308,495 | |
| Morgan Stanley Bank of America Merrill Lynch Trust, Series 2016-C29, Class C, 4.903%, 5/15/49(2)(4) | 993 | 919,038 | |
| Morgan Stanley Capital I Trust: | |||
| Series 2016-UBS12, Class D, 3.312%, 12/15/49(1)(4) | 1,745 | 990,889 | |
| Series 2019-BPR, Class A, 2.974%, (1 mo. USD LIBOR + 1.65%), 5/15/36(1)(3)(4) | 2,210 | 2,135,189 | |
| Natixis Commercial Mortgage Securities Trust, Series 2018-FL1, Class C, 3.524%, (1 mo. USD LIBOR + 2.20%), 6/15/35(1)(3) | 5,000 | 4,592,717 | |
| SLG Office Trust, Series 2021-OVA, Class A, 2.585%, 7/15/41(1) | 2,427 | 2,065,281 | |
| UBS-Barclays Commercial Mortgage Trust, Series 2012-C3, Class C, 5.186%, 8/10/49(1)(2) | 1,950 | 1,941,190 | |
| Security | Principal Amount (000's omitted) | Value | |
| VMC Finance, LLC: | |||
| Series 2021-HT1, Class A, 3.262%, (1 mo. USD LIBOR + 1.65%), 1/18/37(1)(3) | $ | 1,956 | $ 1,879,670 |
| Series 2021-HT1, Class B, 6.112%, (1 mo. USD LIBOR + 4.50%), 1/18/37(1)(3) | 2,000 | 1,873,259 | |
| Wells Fargo Commercial Mortgage Trust: | |||
| Series 2015-LC22, Class C, 4.706%, 9/15/58(2) | 900 | 847,467 | |
| Series 2016-C35, Class D, 3.142%, 7/15/48(1) | 500 | 380,716 | |
| Total Commercial Mortgage-Backed Securities (identified cost $67,692,667) | $ 63,110,457 | ||
| Corporate Bonds — 33.7% |
| Security | Principal Amount (000's omitted) | Value | |
| Aerospace & Defense — 0.3% | |||
| Delta Air Lines, Inc./SkyMiles IP, Ltd., 4.75%, 10/20/28(1) | $ | 1,436 | $ 1,357,584 |
| $ 1,357,584 | |||
| Auto Manufacturers — 0.3% | |||
| General Motors Financial Co., Inc., 4.30%, 4/6/29 | $ | 1,702 | $ 1,563,582 |
| $ 1,563,582 | |||
| Automotive & Auto Parts — 0.1% | |||
| Aptiv PLC/Aptiv Corp., 3.25%, 3/1/32 | $ | 526 | $ 447,491 |
| $ 447,491 | |||
| Banks — 13.6% | |||
| Australia & New Zealand Banking Group, Ltd., 2.95% to 7/22/25, 7/22/30(1)(5) | $ | 903 | $ 852,342 |
| Banco de Chile, 2.99%, 12/9/31(1) | 1,171 | 979,963 | |
| Banco Safra S.A., 4.125%, 2/8/23(1) | 1,210 | 1,211,591 | |
| Banco Santander S.A., 1.722% to 9/14/26, 9/14/27(5) | 1,200 | 1,042,420 | |
| Bank of America Corp.: | |||
| 1.734% to 7/22/26, 7/22/27(5) | 5,076 | 4,520,760 | |
| 1.898% to 7/23/30, 7/23/31(5) | 1,020 | 816,114 | |
| 1.922% to 10/24/30, 10/24/31(5) | 831 | 664,550 | |
| 2.087% to 6/14/28, 6/14/29(5) | 1,881 | 1,612,568 | |
| 2.299% to 7/21/31, 7/21/32(5) | 2,050 | 1,658,655 | |
| 2.456% to 10/22/24, 10/22/25(5) | 963 | 918,269 | |
| 3.824% to 1/20/27, 1/20/28(5) | 1,639 | 1,573,036 | |
| 3.846% to 3/8/32, 3/8/37(5) | 3,689 | 3,192,746 | |
| BankUnited, Inc., 5.125%, 6/11/30 | 490 | 475,099 | |
| Security | Principal Amount (000's omitted) | Value | |
| Banks (continued) | |||
| Barclays PLC: | |||
| 2.852% to 5/7/25, 5/7/26(5) | $ | 1,281 | $ 1,211,402 |
| 4.836%, 5/9/28 | 2,125 | 2,046,484 | |
| BBVA Bancomer S.A./Texas: | |||
| 1.875%, 9/18/25(1) | 1,165 | 1,057,902 | |
| 5.125% to 1/18/28, 1/18/33(1)(5) | 1,000 | 848,470 | |
| BPCE S.A., 3.648% to 1/14/32, 1/14/37(1)(5) | 1,452 | 1,218,822 | |
| Capital One Financial Corp.: | |||
| 3.273% to 3/1/29, 3/1/30(5) | 909 | 805,234 | |
| 3.30%, 10/30/24 | 1,759 | 1,718,103 | |
| 4.927% to 5/10/27, 5/10/28(5) | 1,352 | 1,340,098 | |
| Citigroup, Inc.: | |||
| 1.281% to 11/3/24, 11/3/25(5) | 451 | 419,103 | |
| 2.78%, (SOFR + 1.28%), 2/24/28(3) | 1,925 | 1,847,967 | |
| 3.106% to 4/8/25, 4/8/26(5) | 1,447 | 1,390,859 | |
| 3.70%, 1/12/26 | 1,524 | 1,495,811 | |
| 3.785% to 3/17/32, 3/17/33(5) | 1,685 | 1,519,658 | |
| 4.00% to 12/10/25(5)(6) | 1,090 | 945,575 | |
| Discover Bank, 4.682% to 8/9/23, 8/9/28(5) | 1,672 | 1,626,127 | |
| Goldman Sachs Group, Inc. (The): | |||
| 1.948% to 10/21/26, 10/21/27(5) | 2,188 | 1,937,912 | |
| 2.65% to 10/21/31, 10/21/32(5) | 1,493 | 1,231,932 | |
| 3.75%, 2/25/26 | 970 | 952,476 | |
| HSBC Holdings PLC: | |||
| 2.251% to 11/22/26, 11/22/27(5) | 1,552 | 1,383,965 | |
| 2.357% to 8/18/30, 8/18/31(5) | 982 | 796,858 | |
| International Bank for Reconstruction & Development, 1.63%, (SOFR + 0.13%), 1/13/23(3) | 2,756 | 2,756,315 | |
| JPMorgan Chase & Co.: | |||
| 1.47% to 9/22/26, 9/22/27(5) | 1,591 | 1,396,524 | |
| 2.08%, (SOFR + 0.58%), 3/16/24(3) | 482 | 476,367 | |
| 2.68%, (SOFR + 1.18%), 2/24/28(3) | 1,468 | 1,412,237 | |
| 2.739% to 10/15/29, 10/15/30(5) | 3,095 | 2,703,033 | |
| 2.82%, (SOFR + 1.32%), 4/26/26(3) | 1,219 | 1,200,347 | |
| 4.586% to 4/26/32, 4/26/33(5) | 512 | 503,440 | |
| Macquarie Bank, Ltd.: | |||
| 3.052% to 3/3/31, 3/3/36(1)(5) | 1,331 | 1,056,832 | |
| 3.624%, 6/3/30(1) | 762 | 665,307 | |
| National Bank of Canada, 0.55% to 11/15/23, 11/15/24(5) | 1,294 | 1,234,314 | |
| PPTT, 2006-A GS, Class A, 5.945%(1)(6)(7) | 259 | 224,954 | |
| Santander Holdings USA, Inc.: | |||
| 3.45%, 6/2/25 | 1,788 | 1,721,215 | |
| 4.50%, 7/17/25 | 712 | 706,046 | |
| Societe Generale S.A., 6.221% to 6/15/32, 6/15/33(1)(5) | 975 | 931,660 | |
| Security | Principal Amount (000's omitted) | Value | |
| Banks (continued) | |||
| Standard Chartered PLC: | |||
| 1.456% to 1/14/26, 1/14/27(1)(5) | $ | 808 | $ 713,514 |
| 1.822% to 11/23/24, 11/23/25(1)(5) | 929 | 861,037 | |
| Synovus Bank/Columbus, GA, 4.00% to 10/29/25, 10/29/30(5) | 940 | 912,199 | |
| Synovus Financial Corp., 3.125%, 11/1/22 | 622 | 621,214 | |
| Texas Capital Bancshares, Inc., 4.00% to 5/6/26, 5/6/31(5) | 655 | 603,675 | |
| Truist Financial Corp., 5.10% to 3/1/30(5)(6) | 1,427 | 1,298,570 | |
| UBS AG, 1.25%, 6/1/26(1) | 1,442 | 1,282,918 | |
| UBS Group AG, 2.095% to 2/11/31, 2/11/32(1)(5) | 1,652 | 1,313,332 | |
| United Overseas Bank, Ltd., 3.863% to 10/7/27, 10/7/32(1)(5) | 1,295 | 1,240,012 | |
| Westpac Banking Corp., 3.02% to 11/18/31, 11/18/36(5) | 867 | 699,119 | |
| $ 71,847,052 | |||
| Beverages — 0.1% | |||
| Coca-Cola Europacific Partners PLC, 1.50%, 1/15/27(1) | $ | 541 | $ 480,457 |
| $ 480,457 | |||
| Biotechnology — 0.2% | |||
| Royalty Pharma PLC, 3.55%, 9/2/50 | $ | 1,588 | $ 1,111,970 |
| $ 1,111,970 | |||
| Building Materials — 0.7% | |||
| Builders FirstSource, Inc., 5.00%, 3/1/30(1) | $ | 2,715 | $ 2,304,288 |
| Owens Corning, 3.95%, 8/15/29 | 1,441 | 1,338,071 | |
| $ 3,642,359 | |||
| Chemicals — 0.3% | |||
| Alpek SAB de CV: | |||
| 3.25%, 2/25/31(1) | $ | 1,200 | $ 964,458 |
| 4.25%, 9/18/29(1) | 920 | 828,699 | |
| $ 1,793,157 | |||
| Commercial Services — 0.9% | |||
| Ashtead Capital, Inc., 4.25%, 11/1/29(1) | $ | 1,752 | $ 1,543,037 |
| Block Financial, LLC, 3.875%, 8/15/30 | 1,362 | 1,226,274 | |
| Ford Foundation (The), 2.415%, 6/1/50 | 650 | 464,925 | |
| Western Union Co. (The), 6.20%, 11/17/36 | 1,275 | 1,297,600 | |
| $ 4,531,836 | |||
| Computers — 0.9% | |||
| DXC Technology Co., 2.375%, 9/15/28 | $ | 639 | $ 550,491 |
| Security | Principal Amount (000's omitted) | Value | |
| Computers (continued) | |||
| HP, Inc., 4.00%, 4/15/29 | $ | 1,017 | $ 953,721 |
| Kyndryl Holdings, Inc., 2.05%, 10/15/26(1) | 1,472 | 1,240,194 | |
| Seagate HDD Cayman: | |||
| 3.375%, 7/15/31 | 870 | 677,795 | |
| 4.091%, 6/1/29 | 332 | 286,144 | |
| 5.75%, 12/1/34 | 1,473 | 1,298,894 | |
| $ 5,007,239 | |||
| Consumer Products — 0.3% | |||
| Natura & Co. Luxembourg Holdings S.a.r.l., 6.00%, 4/19/29(1) | $ | 1,029 | $ 907,877 |
| Natura Cosmeticos S.A., 4.125%, 5/3/28(1) | 678 | 559,214 | |
| $ 1,467,091 | |||
| Diversified Financial Services — 2.2% | |||
| AerCap Ireland Capital DAC/AerCap Global Aviation Trust: | |||
| 1.65%, 10/29/24 | $ | 221 | $ 204,299 |
| 4.50%, 9/15/23 | 1,246 | 1,240,827 | |
| 6.50%, 7/15/25 | 742 | 760,279 | |
| Affiliated Managers Group, Inc., 3.30%, 6/15/30 | 1,136 | 1,027,680 | |
| Air Lease Corp., 2.875%, 1/15/26 | 700 | 643,678 | |
| Bread Financial Holdings, Inc., 4.75%, 12/15/24(1) | 1,140 | 1,047,073 | |
| CI Financial Corp.: | |||
| 3.20%, 12/17/30 | 1,403 | 1,098,460 | |
| 4.10%, 6/15/51 | 1,090 | 707,947 | |
| KKR Group Finance Co. VII, LLC, 3.625%, 2/25/50(1) | 1,350 | 1,040,915 | |
| KKR Group Finance Co. X, LLC, 3.25%, 12/15/51(1) | 420 | 298,140 | |
| Rocket Mortgage, LLC/Rocket Mortgage Co.-Issuer, Inc.: | |||
| 2.875%, 10/15/26(1) | 504 | 417,932 | |
| 3.875%, 3/1/31(1) | 1,507 | 1,133,482 | |
| Stifel Financial Corp., 4.00%, 5/15/30 | 1,408 | 1,309,618 | |
| UniCredit SpA, 5.459% to 6/30/30, 6/30/35(1)(5) | 611 | 494,300 | |
| $ 11,424,630 | |||
| Electric Utilities — 0.8% | |||
| AES Corp. (The), 2.45%, 1/15/31 | $ | 2,342 | $ 1,885,950 |
| Enel Finance International N.V., 1.375%, 7/12/26(1) | 873 | 767,107 | |
| ITC Holdings Corp., 4.05%, 7/1/23 | 680 | 683,715 | |
| NextEra Energy Capital Holdings, Inc., 1.90%, 6/15/28 | 1,240 | 1,079,418 | |
| NextEra Energy Operating Partners, L.P., 4.25%, 9/15/24(1) | 38 | 36,428 | |
| $ 4,452,618 | |||
| Security | Principal Amount (000's omitted) | Value | |
| Electrical and Electronic Equipment — 0.7% | |||
| Jabil, Inc.: | |||
| 3.00%, 1/15/31 | $ | 2,232 | $ 1,876,780 |
| 3.60%, 1/15/30 | 2,207 | 1,967,702 | |
| $ 3,844,482 | |||
| Entertainment — 0.2% | |||
| Magallanes, Inc., 5.141%, 3/15/52(1) | $ | 936 | $ 786,856 |
| $ 786,856 | |||
| Foods — 0.4% | |||
| JBS USA LUX S.A./JBS USA Food Co./JBS USA Finance, Inc., 3.75%, 12/1/31(1) | $ | 1,587 | $ 1,304,677 |
| Smithfield Foods, Inc.: | |||
| 2.625%, 9/13/31(1) | 1,120 | 885,651 | |
| 3.00%, 10/15/30(1) | 210 | 174,336 | |
| $ 2,364,664 | |||
| Health Care — 0.5% | |||
| Centene Corp.: | |||
| 2.50%, 3/1/31 | $ | 1,312 | $ 1,045,507 |
| 3.375%, 2/15/30 | 784 | 667,117 | |
| 4.25%, 12/15/27 | 798 | 747,383 | |
| $ 2,460,007 | |||
| Insurance — 1.5% | |||
| Athene Global Funding, 2.45%, 8/20/27(1) | $ | 1,294 | $ 1,134,312 |
| Brown & Brown, Inc.: | |||
| 2.375%, 3/15/31 | 157 | 124,442 | |
| 4.20%, 3/17/32 | 198 | 180,469 | |
| GA Global Funding Trust: | |||
| 2.25%, 1/6/27(1) | 2,595 | 2,323,303 | |
| 2.90%, 1/6/32(1) | 2,048 | 1,704,058 | |
| Liberty Mutual Group, Inc., 4.125% to 9/15/26, 12/15/51(1)(5) | 1,466 | 1,171,679 | |
| Stewart Information Services Corp., 3.60%, 11/15/31 | 1,286 | 1,068,170 | |
| $ 7,706,433 | |||
| Lodging and Gaming — 0.1% | |||
| Hyatt Hotels Corp.: | |||
| 1.30%, 10/1/23 | $ | 577 | $ 559,021 |
| 1.80%, 10/1/24 | 237 | 224,208 | |
| $ 783,229 | |||
| Security | Principal Amount (000's omitted) | Value | |
| Machinery — 0.3% | |||
| Valmont Industries, Inc., 5.25%, 10/1/54 | $ | 1,373 | $ 1,312,716 |
| $ 1,312,716 | |||
| Media — 1.3% | |||
| Charter Communications Operating, LLC/Charter Communications Operating Capital: | |||
| 2.80%, 4/1/31 | $ | 2,110 | $ 1,691,999 |
| 4.80%, 3/1/50 | 2,895 | 2,299,685 | |
| Comcast Corp.: | |||
| 2.887%, 11/1/51 | 2,930 | 2,096,960 | |
| 2.937%, 11/1/56 | 832 | 579,847 | |
| $ 6,668,491 | |||
| Oil and Gas — 0.5% | |||
| Patterson-UTI Energy, Inc., 5.15%, 11/15/29 | $ | 1,765 | $ 1,514,953 |
| South32 Treasury, Ltd., 4.35%, 4/14/32(1) | 1,003 | 938,116 | |
| $ 2,453,069 | |||
| Other Revenue — 0.7% | |||
| BlueHub Loan Fund, Inc., 3.099%, 1/1/30 | $ | 3,160 | $ 2,873,196 |
| OneMain Finance Corp., 3.50%, 1/15/27 | 1,146 | 918,421 | |
| $ 3,791,617 | |||
| Pharmaceuticals — 0.2% | |||
| Perrigo Finance Unlimited Co., 4.40%, 6/15/30 | $ | 1,214 | $ 1,085,050 |
| $ 1,085,050 | |||
| Real Estate Investment Trusts (REITs) — 3.4% | |||
| Agree, L.P., 2.00%, 6/15/28 | $ | 520 | $ 444,676 |
| American Assets Trust, L.P., 3.375%, 2/1/31 | 1,170 | 1,002,425 | |
| Corporate Office Properties, L.P., 2.90%, 12/1/33 | 872 | 676,800 | |
| Digital Realty Trust, L.P., 3.70%, 8/15/27 | 1,272 | 1,212,843 | |
| EPR Properties: | |||
| 3.75%, 8/15/29 | 1,474 | 1,228,153 | |
| 4.50%, 6/1/27 | 1,381 | 1,251,221 | |
| Extra Space Storage, L.P., 2.55%, 6/1/31 | 1,011 | 832,872 | |
| HAT Holdings I, LLC/HAT Holdings II, LLC: | |||
| 3.375%, 6/15/26(1) | 1,436 | 1,238,686 | |
| 3.75%, 9/15/30(1) | 597 | 477,251 | |
| Iron Mountain, Inc.: | |||
| 4.50%, 2/15/31(1) | 977 | 801,140 | |
| 5.00%, 7/15/28(1) | 339 | 300,878 | |
| Life Storage, L.P., 2.40%, 10/15/31 | 1,473 | 1,173,918 | |
| Newmark Group, Inc., 6.125%, 11/15/23 | 3,504 | 3,496,965 | |
| Security | Principal Amount (000's omitted) | Value | |
| Real Estate Investment Trusts (REITs) (continued) | |||
| Sabra Health Care, L.P., 3.20%, 12/1/31 | $ | 1,435 | $ 1,140,429 |
| SITE Centers Corp., 3.625%, 2/1/25 | 874 | 850,325 | |
| Sun Communities Operating, L.P.: | |||
| 2.30%, 11/1/28 | 543 | 464,968 | |
| 2.70%, 7/15/31 | 455 | 367,184 | |
| 4.20%, 4/15/32 | 1,276 | 1,161,733 | |
| $ 18,122,467 | |||
| Retail — 0.5% | |||
| Bath & Body Works, Inc.: | |||
| 6.625%, 10/1/30(1) | $ | 700 | $ 606,438 |
| 7.60%, 7/15/37 | 524 | 424,806 | |
| Dick's Sporting Goods, Inc., 4.10%, 1/15/52 | 2,609 | 1,738,019 | |
| $ 2,769,263 | |||
| Technology — 0.1% | |||
| CDW, LLC/CDW Finance Corp., 3.276%, 12/1/28 | $ | 731 | $ 631,935 |
| $ 631,935 | |||
| Telecommunications — 1.8% | |||
| AT&T, Inc.: | |||
| 3.55%, 9/15/55 | $ | 1,251 | $ 939,382 |
| 3.65%, 6/1/51 | 2,039 | 1,597,855 | |
| 3.65%, 9/15/59 | 372 | 279,434 | |
| 3.80%, 12/1/57 | 2,258 | 1,749,112 | |
| Nokia Oyj: | |||
| 4.375%, 6/12/27 | 981 | 928,087 | |
| 6.625%, 5/15/39 | 1,492 | 1,478,080 | |
| SES Global Americas Holdings GP, 5.30%, 3/25/44(1) | 661 | 564,678 | |
| SES S.A., 5.30%, 4/4/43(1) | 393 | 335,430 | |
| T-Mobile USA, Inc.: | |||
| 2.25%, 11/15/31 | 278 | 225,895 | |
| 2.55%, 2/15/31 | 646 | 544,254 | |
| 2.625%, 4/15/26 | 856 | 778,421 | |
| $ 9,420,628 | |||
| Transportation — 0.2% | |||
| SMBC Aviation Capital Finance DAC, 3.55%, 4/15/24(1) | $ | 1,200 | $ 1,168,542 |
| $ 1,168,542 | |||
| Utilities — 0.6% | |||
| American Water Capital Corp., 2.95%, 9/1/27 | $ | 745 | $ 699,710 |
| Security | Principal Amount (000's omitted) | Value | |
| Utilities (continued) | |||
| Southern Co. (The), Series B, 4.00% to 10/15/25, 1/15/51(5) | $ | 1,704 | $ 1,531,862 |
| Southern Co. Gas Capital Corp., 2.45%, 10/1/23 | 1,060 | 1,045,903 | |
| $ 3,277,475 | |||
| Total Corporate Bonds (identified cost $202,533,103) | $177,773,990 | ||
| Preferred Stocks — 0.7% |
| Security | Shares | Value | |
| Oil, Gas & Consumable Fuels — 0.1% | |||
| NuStar Energy, L.P., Series B, 7.673%, (3 mo. USD LIBOR + 5.643%)(3) | 24,632 | $ 507,173 | |
| $ 507,173 | |||
| Real Estate Management & Development — 0.3% | |||
| Brookfield Property Partners, L.P., Series A, 5.75% | 85,000 | $ 1,451,800 | |
| $ 1,451,800 | |||
| Telecommunications — 0.3% | |||
| United States Cellular Corp., 5.50% | 84,600 | $ 1,571,022 | |
| $ 1,571,022 | |||
| Total Preferred Stocks (identified cost $4,757,096) | $ 3,529,995 | ||
| Senior Floating-Rate Loans — 1.2%(8) |
| Borrower/Description | Principal Amount (000's omitted) | Value | |
| Automobiles — 0.1% | |||
| Bombardier Recreational Products, Inc., Term Loan, 3.666%, (1 mo. USD LIBOR + 2.00%), 5/24/27 | $ | 241 | $ 223,315 |
| $ 223,315 | |||
| Diversified Telecommunication Services — 0.3% | |||
| CenturyLink, Inc., Term Loan, 3.916%, (1 mo. USD LIBOR + 2.25%), 3/15/27 | $ | 488 | $ 449,211 |
| Borrower/Description | Principal Amount (000's omitted) | Value | |
| Diversified Telecommunication Services (continued) | |||
| Level 3 Financing, Inc., Term Loan, 3.416%, (1 mo. USD LIBOR + 1.75%), 3/1/27 | $ | 250 | $ 231,941 |
| Ziggo Financing Partnership, Term Loan, 3.824%, (1 mo. USD LIBOR + 2.50%), 4/30/28 | 1,000 | 934,375 | |
| $ 1,615,527 | |||
| Health Care Technology — 0.1% | |||
| Change Healthcare Holdings, LLC, Term Loan, 4.166%, (1 mo. USD LIBOR + 2.50%), 3/1/24 | $ | 397 | $ 386,920 |
| $ 386,920 | |||
| IT Services — 0.1% | |||
| Asurion, LLC: | |||
| Term Loan, 4.791%, (1 mo. USD LIBOR + 3.125%), 11/3/23 | $ | 432 | $ 415,483 |
| Term Loan, 4.916%, (1 mo. USD LIBOR + 3.25%), 12/23/26 | 246 | 223,934 | |
| $ 639,417 | |||
| Real Estate Management & Development — 0.2% | |||
| Cushman & Wakefield U.S. Borrower, LLC, Term Loan, 4.416%, (1 mo. USD LIBOR + 2.75%), 8/21/25 | $ | 1,207 | $ 1,137,598 |
| $ 1,137,598 | |||
| Software — 0.2% | |||
| Hyland Software, Inc., Term Loan, 5.166%, (1 mo. USD LIBOR + 3.50%), 7/1/24 | $ | 997 | $ 965,386 |
| Seattle Spinco, Inc., Term Loan, 4.416%, (1 mo. USD LIBOR + 2.75%), 6/21/24 | 291 | 277,923 | |
| $ 1,243,309 | |||
| Specialty Retail — 0.2% | |||
| PetSmart, Inc., Term Loan, 4.50%, (6 mo. USD LIBOR + 3.75%, Floor 0.75%), 2/11/28 | $ | 1,297 | $ 1,222,576 |
| $ 1,222,576 | |||
| Total Senior Floating-Rate Loans (identified cost $6,849,582) | $ 6,468,662 | ||
| Sovereign Government Bonds — 1.3% |
| Security | Principal Amount (000's omitted) | Value | |
| Germany — 1.3% | |||
| Kreditanstalt fuer Wiederaufbau, 2.00%, 9/29/22 | $ | 7,000 | $ 6,998,714 |
| Total Sovereign Government Bonds (identified cost $7,224,280) | $ 6,998,714 | ||
| Taxable Municipal Obligations — 1.8% |
| Security | Principal Amount (000's omitted) | Value | |
| Special Tax Revenue — 0.2% | |||
| California Health Facilities Financing Authority, (No Place Like Home Program), 3.034%, 6/1/34 | $ | 1,430 | $ 1,243,356 |
| $ 1,243,356 | |||
| Water and Sewer — 1.6% | |||
| Narragansett Bay Commission, RI, Wastewater System Revenue: | |||
| Green Bonds, 2.094%, 9/1/30 | $ | 820 | $ 711,448 |
| Green Bonds, 2.184%, 9/1/31 | 650 | 557,187 | |
| Green Bonds, 2.264%, 9/1/32 | 585 | 495,460 | |
| Green Bonds, 2.344%, 9/1/33 | 635 | 529,304 | |
| San Francisco City and County Public Utilities Commission, CA, Water Revenue, Green Bonds, 3.303%, 11/1/39 | 6,750 | 5,976,990 | |
| $ 8,270,389 | |||
| Total Taxable Municipal Obligations (identified cost $10,870,000) | $ 9,513,745 | ||
| U.S. Government Agency Mortgage-Backed Securities — 9.6% |
| Security | Principal Amount (000's omitted) | Value | |
| Federal Home Loan Mortgage Corp.: | |||
| Pool #A93547, 4.50%, 8/1/40 | $ | 355 | $ 368,488 |
| Pool #C03490, 4.50%, 8/1/40 | 187 | 193,783 | |
| Pool #C09031, 2.50%, 2/1/43 | 721 | 663,967 | |
| Pool #G07589, 5.50%, 6/1/41 | 1,175 | 1,264,493 | |
| Pool #G08596, 4.50%, 7/1/44 | 283 | 291,464 | |
| Pool #G08670, 3.00%, 10/1/45 | 419 | 398,897 | |
| Pool #G08701, 3.00%, 4/1/46 | 557 | 528,767 | |
| Pool #G60608, 4.00%, 5/1/46 | 1,207 | 1,214,183 | |
| Pool #G60761, 3.00%, 10/1/43 | 757 | 724,156 | |
| Security | Principal Amount (000's omitted) | Value | |
| Federal Home Loan Mortgage Corp.: (continued) | |||
| Pool #Q17453, 3.50%, 4/1/43 | $ | 728 | $ 716,420 |
| Pool #Q34310, 3.50%, 6/1/45 | 449 | 440,497 | |
| Pool #Q40264, 3.50%, 5/1/46 | 391 | 383,000 | |
| Pool #Q45051, 3.00%, 12/1/46 | 1,548 | 1,468,965 | |
| Pool #Q46889, 3.50%, 3/1/47 | 1,050 | 1,033,120 | |
| Pool #Q47999, 4.00%, 5/1/47 | 1,217 | 1,222,072 | |
| Pool #ZT0383, 3.50%, 3/1/48 | 445 | 434,181 | |
| Federal National Mortgage Association: | |||
| 3.50%, 30-Year, TBA(9) | 16,624 | 15,984,359 | |
| 4.00%, 30-Year, TBA(9) | 4,919 | 4,849,824 | |
| 4.50%, 30-Year, TBA(9) | 5,600 | 5,621,438 | |
| Pool #AB3678, 3.50%, 10/1/41 | 1,887 | 1,866,494 | |
| Pool #AL7524, 5.00%, 7/1/41 | 255 | 268,409 | |
| Pool #AS3892, 4.00%, 11/1/44 | 407 | 410,036 | |
| Pool #AS5332, 4.00%, 7/1/45 | 392 | 395,094 | |
| Pool #AS6014, 4.00%, 10/1/45 | 242 | 243,369 | |
| Pool #BA0891, 3.50%, 1/1/46 | 953 | 933,222 | |
| Pool #BA3938, 3.50%, 1/1/46 | 564 | 552,757 | |
| Pool #BD1183, 3.50%, 12/1/46 | 361 | 353,617 | |
| Pool #BE2316, 3.50%, 1/1/47 | 969 | 947,232 | |
| Pool #BM1144, 2.50%, 3/1/47 | 845 | 771,758 | |
| Pool #FM7023, 3.00%, 7/1/49 | 969 | 912,796 | |
| Pool #MA1789, 4.50%, 2/1/44 | 287 | 294,473 | |
| Pool #MA2653, 4.00%, 6/1/46 | 610 | 612,227 | |
| Government National Mortgage Association: | |||
| Pool #AQ1784, 3.50%, 12/20/45 | 1,076 | 1,058,298 | |
| Pool #CB2653, 2.50%, 3/20/51 | 1,353 | 1,233,125 | |
| Pool #CB8629, 2.50%, 4/20/51 | 2,024 | 1,843,948 | |
| Total U.S. Government Agency Mortgage-Backed Securities (identified cost $52,543,738) | $ 50,498,929 | ||
| U.S. Treasury Obligations — 28.4% |
| Security | Principal Amount (000's omitted) | Value | |
| U.S. Treasury Bonds: | |||
| 1.375%, 8/15/50 | $ | 2,806 | $ 1,848,288 |
| 1.625%, 11/15/50 | 8,674 | 6,104,356 | |
| 1.875%, 2/15/51 | 6,837 | 5,131,756 | |
| 1.875%, 11/15/51 | 1,318 | 989,324 | |
| 2.00%, 11/15/41 | 8,644 | 6,868,603 | |
| 2.00%, 8/15/51 | 347 | 268,342 | |
| 2.25%, 5/15/41 | 4,238 | 3,538,068 | |
| 2.25%, 2/15/52 | 3,332 | 2,743,173 | |
| 2.375%, 2/15/42 | 2,143 | 1,817,867 | |
| Security | Principal Amount (000's omitted) | Value | |
| U.S. Treasury Notes: | |||
| 0.25%, 5/31/25 | $ | 3,310 | $ 3,054,833 |
| 0.375%, 11/30/25 | 1,414 | 1,291,822 | |
| 0.375%, 12/31/25 | 10,941 | 9,972,337 | |
| 0.375%, 1/31/26 | 8,006 | 7,280,613 | |
| 0.50%, 2/28/26 | 3,144 | 2,866,321 | |
| 0.75%, 11/15/24 | 400 | 379,344 | |
| 0.75%, 4/30/26 | 4,821 | 4,420,066 | |
| 1.00%, 7/31/28 | 2,455 | 2,171,620 | |
| 1.125%, 2/29/28 | 3,680 | 3,309,700 | |
| 1.125%, 8/31/28 | 1,045 | 930,172 | |
| 1.25%, 3/31/28 | 2,415 | 2,182,179 | |
| 1.25%, 4/30/28 | 8,955 | 8,079,089 | |
| 1.25%, 6/30/28 | 1,455 | 1,309,102 | |
| 1.375%, 10/31/28 | 2,510 | 2,263,412 | |
| 1.50%, 2/29/24 | 13,624 | 13,304,155 | |
| 1.875%, 2/28/27 | 22,061 | 20,942,964 | |
| 2.125%, 3/31/24 | 14,939 | 14,722,501 | |
| 2.625%, 4/15/25 | 992 | 981,344 | |
| 2.75%, 4/30/27 | 18,000 | 17,758,828 | |
| 2.875%, 4/30/29 | 3,760 | 3,716,724 | |
| Total U.S. Treasury Obligations (identified cost $164,182,016) | $150,246,903 | ||
| Short-Term Investments — 1.3% |
| Security | Shares | Value | |
| Morgan Stanley Institutional Liquidity Funds - Government Portfolio, Institutional Class, 1.38%(10) | 7,133,022 | $ 7,133,022 | |
| Total Short-Term Investments (identified cost $7,133,022) | $ 7,133,022 | ||
| Total Investments — 104.0% (identified cost $602,448,974) | $549,331,565 | ||
| Other Assets, Less Liabilities — (4.0)% | $ (21,203,911) | ||
| Net Assets — 100.0% | $528,127,654 | ||
| The percentage shown for each investment category in the Portfolio of Investments is based on net assets. | |
| (1) | Security exempt from registration under Rule 144A of the Securities Act of 1933, as amended. These securities may be sold in certain transactions in reliance on an exemption from registration (normally to qualified institutional buyers). At June 30, 2022, the aggregate value of these securities is $167,621,578 or 31.7% of the Portfolio's net assets. |
| (2) | Weighted average fixed-rate coupon that changes/updates monthly. Rate shown is the rate at June 30, 2022. |
| (3) | Variable rate security. The stated interest rate represents the rate in effect at June 30, 2022. |
| (4) | Represents an investment in an issuer that may be deemed to be an affiliate (see Note 7). |
| (5) | Security converts to variable rate after the indicated fixed-rate coupon period. |
| (6) | Perpetual security with no stated maturity date but may be subject to calls by the issuer. |
| (7) | Variable rate security. The stated interest rate, which resets quarterly, is determined at auction and represents the rate in effect at June 30, 2022. |
| (8) | Senior floating-rate loans (Senior Loans) often require prepayments from excess cash flows or permit the borrowers to repay at their election. The degree to which borrowers repay, whether as a contractual requirement or at their election, cannot be predicted with accuracy. As a result, the actual remaining maturity may be substantially less than the stated maturities shown. However, Senior Loans will typically have an expected average life of approximately two to four years. Senior Loans typically have rates of interest which are redetermined periodically by reference to a base lending rate, plus a spread. These base lending rates are primarily the London Interbank Offered Rate ("LIBOR") or the Secured Overnight Financing Rate ("SOFR") and secondarily, the prime rate offered by one or more major United States banks (the "Prime Rate"). Base lending rates may be subject to a floor, or minimum rate. Rates for SOFR are generally 1 or 3-month tenors and may also be subject to a credit spread adjustment. Senior Loans are generally subject to contractual restrictions that must be satisfied before they can be bought or sold. |
| (9) | TBA (To Be Announced) securities are purchased on a forward commitment basis with an approximate principal amount and maturity date. The actual principal amount and maturity date are determined upon settlement. |
| (10) | May be deemed to be an affiliated investment company. The rate shown is the annualized seven-day yield as of June 30, 2022. |
| Futures Contracts | |||||
| Description | Number of Contracts | Position | Expiration Date | Notional Amount | Value/Unrealized Appreciation (Depreciation) |
| Interest Rate Futures | |||||
| U.S. 2-Year Treasury Note | 95 | Long | 9/30/22 | $ 19,951,484 | $ (118,153) |
| U.S. 5-Year Treasury Note | 43 | Long | 9/30/22 | 4,826,750 | (49,113) |
| U.S. 10-Year Treasury Note | 9 | Long | 9/21/22 | 1,066,782 | (15,060) |
| U.S. Long Treasury Bond | 40 | Long | 9/21/22 | 5,545,000 | (84,436) |
| U.S. Ultra-Long Treasury Bond | 130 | Long | 9/21/22 | 20,064,687 | (475,449) |
| U.S. Ultra 10-Year Treasury Note | (128) | Short | 9/21/22 | (16,304,000) | 247,640 |
| $ (494,571) | |||||
| Abbreviations: | |
| LIBOR | – London Interbank Offered Rate |
| PPTT | – Preferred Pass-Through Trust |
| SOFR | – Secured Overnight Financing Rate |
| TBA | – To Be Announced |
| Currency Abbreviations: | |
| USD | – United States Dollar |
| June 30, 2022 | |
| Assets | |
| Unaffiliated investments, at value (identified cost $590,711,264) | $ 538,153,427 |
| Affiliated investments, at value (identified cost $11,737,710) | 11,178,138 |
| Cash | 686,670 |
| Deposits for derivatives collateral — futures contracts | 1,110,178 |
| Deposits for forward commitment securities | 800,000 |
| Interest and dividends receivable | 2,945,953 |
| Interest and dividends receivable from affiliated investments | 18,480 |
| Receivable for variation margin on open futures contracts | 255,528 |
| Receivable from affiliate | 8,993 |
| Total assets | $555,157,367 |
| Liabilities | |
| Payable for when-issued/delayed delivery/forward commitment securities | $ 26,728,860 |
| Payable to affiliates: | |
| Investment adviser fee | 196,313 |
| Trustees' fees | 6,705 |
| Accrued expenses | 97,835 |
| Total liabilities | $ 27,029,713 |
| Net Assets applicable to investors' interest in Portfolio | $528,127,654 |
| Six Months Ended | |
| June 30, 2022 | |
| Investment Income | |
| Dividend income (net of foreign taxes withheld of $421) | $ 141,822 |
| Dividend income from affiliated investments | 21,223 |
| Interest income (net of foreign taxes withheld of $1,725) | 6,777,282 |
| Interest income from affiliated investments | 83,359 |
| Total investment income | $ 7,023,686 |
| Expenses | |
| Investment adviser fee | $ 1,213,698 |
| Trustees’ fees and expenses | 13,236 |
| Custodian fee | 75,834 |
| Legal and accounting services | 38,386 |
| Miscellaneous | 6,849 |
| Total expenses | $ 1,348,003 |
| Deduct: | |
| Waiver and/or reimbursement of expenses by affiliate | $ 29,597 |
| Total expense reductions | $ 29,597 |
| Net expenses | $ 1,318,406 |
| Net investment income | $ 5,705,280 |
| Realized and Unrealized Gain (Loss) | |
| Net realized gain (loss): | |
| Investment transactions | $ (7,813,756) |
| Investment transactions - affiliated investment | 1,326 |
| Futures contracts | (2,393,451) |
| Net realized loss | $(10,205,881) |
| Change in unrealized appreciation (depreciation): | |
| Investments | $ (56,945,390) |
| Investments - affiliated investments | (176,992) |
| Futures contracts | (265,091) |
| Net change in unrealized appreciation (depreciation) | $(57,387,473) |
| Net realized and unrealized loss | $(67,593,354) |
| Net decrease in net assets from operations | $(61,888,074) |
| Six Months Ended June 30, 2022 (Unaudited) | Year Ended December 31, 2021 | |
| Increase (Decrease) in Net Assets | ||
| From operations: | ||
| Net investment income | $ 5,705,280 | $ 11,649,278 |
| Net realized gain (loss) | (10,205,881) | 8,512,986 |
| Net change in unrealized appreciation (depreciation) | (57,387,473) | (16,032,763) |
| Net increase (decrease) in net assets from operations | $ (61,888,074) | $ 4,129,501 |
| Capital transactions: | ||
| Contributions | $ 110,766,338 | $ 73,755,473 |
| Withdrawals | (91,622,923) | (82,966,119) |
| Net increase (decrease) in net assets from capital transactions | $ 19,143,415 | $ (9,210,646) |
| Net decrease in net assets | $ (42,744,659) | $ (5,081,145) |
| Net Assets | ||
| At beginning of period | $ 570,872,313 | $ 575,953,458 |
| At end of period | $528,127,654 | $570,872,313 |
| Six Months Ended June 30, 2022 (Unaudited) | Year Ended December 31, | |||||
| 2021 | 2020 | 2019 | 2018 | 2017 | ||
| Ratios/Supplemental Data | ||||||
| Ratios (as a percentage of average daily net assets): | ||||||
| Expenses (1) | 0.49% (2)(3) | 0.49% | 0.49% | 0.49% | 0.49% | 0.49% |
| Net investment income | 2.12% (2) | 2.06% | 2.46% | 2.86% | 2.98% | 2.46% |
| Portfolio Turnover | 51% (4)(5) | 122% (5) | 93% (5) | 89% | 65% | 123% |
| Total Return(1) | (10.66)% (4) | 0.70% | 8.16% | 9.28% | (0.50)% | 4.48% |
| Net assets, end of period (000’s omitted) | $528,128 | $570,872 | $575,953 | $590,390 | $506,016 | $479,364 |
| (1) | The investment adviser reimbursed certain operating expenses (equal to 0.01%, 0.01%, 0.01%, 0.01%, 0.02% and 0.01% of average daily net assets for the six months ended June 30, 2022 and the years ended December 31, 2021, 2020, 2019, 2018 and 2017, respectively). Absent this reimbursement, total return would be lower. |
| (2) | Annualized. |
| (3) | The investment adviser reduced a portion of its adviser fee (equal to less than 0.005% of average daily net assets for the six months ended June 30, 2022). |
| (4) | Not annualized. |
| (5) | Includes the effect of To Be Announced (TBA) transactions. |
| Average Daily Net Assets | Annual Fee Rate |
| Up to $1 billion | 0.450% |
| $1 billion up to $2 billion | 0.425% |
| $2 billion up to $5 billion | 0.415% |
| $5 billion and over | 0.405% |
| Purchases | Sales | |
| Investments (non-U.S. Government) | $ 89,413,357 | $ 104,105,940 |
| U.S. Government and Agency Securities | 248,462,282 | 180,128,088 |
| $337,875,639 | $284,234,028 |
| Aggregate cost | $ 603,417,273 |
| Gross unrealized appreciation | $ 45,566 |
| Gross unrealized depreciation | (54,625,845) |
| Net unrealized depreciation | $ (54,580,279) |
| Fair Value | ||
| Derivative | Asset Derivative(1) | Liability Derivative(1) |
| Futures contracts | $247,640 | $(742,211) |
| (1) | Only the current day’s variation margin on open futures contracts is reported within the Statement of Assets and Liabilities as Receivable or Payable for variation margin on open futures contracts, as applicable. |
| Derivative | Realized Gain (Loss) on Derivatives Recognized in Income(1) | Change in Unrealized Appreciation (Depreciation) on Derivatives Recognized in Income(2) |
| Futures contracts | $(2,393,451) | $(265,091) |
| (1) | Statement of Operations location: Net realized gain (loss) - Futures contracts. |
| (2) | Statement of Operations location: Change in unrealized appreciation (depreciation) - Futures contracts. |
| Futures Contracts — Long | Futures Contracts — Short |
| $85,504,000 | $33,678,000 |
| Name | Value, beginning of period | Purchases | Sales proceeds | Net realized gain (loss) | Change in unrealized appreciation (depreciation) | Value, end of period | Interest/ Dividend income | Principal amount/ Units/Shares, end of period |
| Commercial Mortgage-Backed Securities | ||||||||
| Morgan Stanley Bank of America Merrill Lynch Trust, Series 2016-C29, Class C, 4.903%, 5/15/49 | $ 1,014,911 | $ — | $ — | $ — | $ (95,873) | $ 919,038 | $ 23,898 | $ 993,200 |
| Morgan Stanley Capital I Trust: | ||||||||
| Series 2016-UBS12, Class D, 3.312%, 12/15/49 | 1,017,226 | — | — | — | (33,552) | 990,889 | 36,112 | 1,745,000 |
| Name | Value, beginning of period | Purchases | Sales proceeds | Net realized gain (loss) | Change in unrealized appreciation (depreciation) | Value, end of period | Interest/ Dividend income | Principal amount/ Units/Shares, end of period |
| Morgan Stanley Capital I Trust: | ||||||||
| Series 2019-BPR, Class A, 2.974%, (1 mo. USD LIBOR + 1.65%), 5/15/36 | $ 2,493,382 | $ — | $ (310,621) | $ — | $ (47,567) | $ 2,135,189 | $ 23,349 | $2,210,379 |
| Short-Term Investments | ||||||||
| Cash Reserves Fund | 38,096,434 | 122,078,814 | (160,176,574) | 1,326 | — | — | 2,657 | — |
| Liquidity Fund | — | 52,611,935 | (45,478,913) | — | — | 7,133,022 | 18,566 | 7,133,022 |
| Total | $1,326 | $(176,992) | $11,178,138 | $104,582 | ||||
| • | Level 1 – quoted prices in active markets for identical investments |
| • | Level 2 – other significant observable inputs (including quoted prices for similar investments, interest rates, prepayment speeds, credit risk, etc.) |
| • | Level 3 – significant unobservable inputs (including a fund's own assumptions in determining the fair value of investments) |
| Asset Description | Level 1 | Level 2 | Level 3 | Total |
| Asset-Backed Securities | $ — | $ 61,069,401 | $ — | $ 61,069,401 |
| Collateralized Mortgage Obligations | — | 12,987,747 | — | 12,987,747 |
| Commercial Mortgage-Backed Securities | — | 63,110,457 | — | 63,110,457 |
| Corporate Bonds | — | 177,773,990 | — | 177,773,990 |
| Preferred Stocks | 3,529,995 | — | — | 3,529,995 |
| Senior Floating-Rate Loans | — | 6,468,662 | — | 6,468,662 |
| Sovereign Government Bonds | — | 6,998,714 | — | 6,998,714 |
| Taxable Municipal Obligations | — | 9,513,745 | — | 9,513,745 |
| U.S. Government Agency Mortgage-Backed Securities | — | 50,498,929 | — | 50,498,929 |
| U.S. Treasury Obligations | — | 150,246,903 | — | 150,246,903 |
| Short-Term Investments | 7,133,022 | — | — | 7,133,022 |
| Total Investments | $ 10,663,017 | $538,668,548 | $ — | $ 549,331,565 |
| Futures Contracts | $ 247,640 | $ — | $ — | $ 247,640 |
| Total | $ 10,910,657 | $538,668,548 | $ — | $ 549,579,205 |
| Liability Description | Level 1 | Level 2 | Level 3 | Total |
| Futures Contracts | $ (742,211) | $ — | $ — | $ (742,211) |
| Total | $ (742,211) | $ — | $ — | $ (742,211) |
| Officers of Eaton Vance Core Bond Fund | |
| Eric A. Stein President | Jill R. Damon Secretary |
| Deidre E. Walsh Vice President and Chief Legal Officer | Richard F. Froio Chief Compliance Officer |
| James F. Kirchner Treasurer | |
| Officers of Core Bond Portfolio | |
| Eric A. Stein President | Jill R. Damon Secretary |
| Deidre E. Walsh Vice President and Chief Legal Officer | Richard F. Froio Chief Compliance Officer |
| James F. Kirchner Treasurer | |
| Trustees of Eaton Vance Core Bond Fund and Core Bond Portfolio |
| George J. Gorman Chairperson | |
| Alan C. Bowser** | |
| Thomas E. Faust Jr.* | |
| Mark R. Fetting | |
| Cynthia E. Frost | |
| Valerie A. Mosley |
| Keith Quinton | |
| Marcus L. Smith | |
| Susan J. Sutherland | |
| Scott E. Wennerholm | |
| Nancy A. Wiser** |
| * | Interested Trustee |
| ** | Mr. Bowser and Ms. Wiser began serving as Trustees effective April 4, 2022. |
| Privacy Notice | April 2021 |
| FACTS | WHAT DOES EATON VANCE DO WITH YOUR PERSONAL INFORMATION? |
| Why? | Financial companies choose how they share your personal information. Federal law gives consumers the right to limit some but not all sharing. Federal law also requires us to tell you how we collect, share, and protect your personal information. Please read this notice carefully to understand what we do. |
| What? | The types of personal information we collect and share depend on the product or service you have with us. This information can include:■ Social Security number and income ■ investment experience and risk tolerance ■ checking account number and wire transfer instructions |
| How? | All financial companies need to share customers’ personal information to run their everyday business. In the section below, we list the reasons financial companies can share their customers’ personal information; the reasons Eaton Vance chooses to share; and whether you can limit this sharing. |
| Reasons we can share your personal information | Does Eaton Vance share? | Can you limit this sharing? |
| For our everyday business purposes — such as to process your transactions, maintain your account(s), respond to court orders and legal investigations, or report to credit bureaus | Yes | No |
| For our marketing purposes — to offer our products and services to you | Yes | No |
| For joint marketing with other financial companies | No | We don’t share |
| For our investment management affiliates’ everyday business purposes — information about your transactions, experiences, and creditworthiness | Yes | Yes |
| For our affiliates’ everyday business purposes — information about your transactions and experiences | Yes | No |
| For our affiliates’ everyday business purposes — information about your creditworthiness | No | We don’t share |
| For our investment management affiliates to market to you | Yes | Yes |
| For our affiliates to market to you | No | We don’t share |
| For nonaffiliates to market to you | No | We don’t share |
| To limit our sharing | Call toll-free 1-800-262-1122 or email: EVPrivacy@eatonvance.comPlease note:If you are a new customer, we can begin sharing your information 30 days from the date we sent this notice. When you are no longer our customer, we continue to share your information as described in this notice. However, you can contact us at any time to limit our sharing. |
| Questions? | Call toll-free 1-800-262-1122 or email: EVPrivacy@eatonvance.com |
| Privacy Notice — continued | April 2021 |
| Who we are | |
| Who is providing this notice? | Eaton Vance Management, Eaton Vance Distributors, Inc., Eaton Vance Trust Company, Eaton Vance Management (International) Limited, Eaton Vance Advisers International Ltd., Eaton Vance Global Advisors Limited, Eaton Vance Management’s Real Estate Investment Group, Boston Management and Research, Calvert Research and Management, Eaton Vance and Calvert Fund Families and our investment advisory affiliates (“Eaton Vance”) (see Investment Management Affiliates definition below) |
| What we do | |
| How does Eaton Vance protect my personal information? | To protect your personal information from unauthorized access and use, we use security measures that comply with federal law. These measures include computer safeguards and secured files and buildings. We have policies governing the proper handling of customer information by personnel and requiring third parties that provide support to adhere to appropriate security standards with respect to such information. |
| How does Eaton Vance collect my personal information? | We collect your personal information, for example, when you■ open an account or make deposits or withdrawals from your account ■ buy securities from us or make a wire transfer ■ give us your contact informationWe also collect your personal information from others, such as credit bureaus, affiliates, or other companies. |
| Why can’t I limit all sharing? | Federal law gives you the right to limit only■ sharing for affiliates’ everyday business purposes — information about your creditworthiness ■ affiliates from using your information to market to you ■ sharing for nonaffiliates to market to youState laws and individual companies may give you additional rights to limit sharing. See below for more on your rights under state law. |
| Definitions | |
| Investment Management Affiliates | Eaton Vance Investment Management Affiliates include registered investment advisers, registered broker- dealers, and registered and unregistered funds. Investment Management Affiliates does not include entities associated with Morgan Stanley Wealth Management, such as Morgan Stanley Smith Barney LLC and Morgan Stanley & Co. |
| Affiliates | Companies related by common ownership or control. They can be financial and nonfinancial companies.■ Our affiliates include companies with a Morgan Stanley name and financial companies such as Morgan Stanley Smith Barney LLC and Morgan Stanley & Co. |
| Nonaffiliates | Companies not related by common ownership or control. They can be financial and nonfinancial companies.■ Eaton Vance does not share with nonaffiliates so they can market to you. |
| Joint marketing | A formal agreement between nonaffiliated financial companies that together market financial products or services to you.■ Eaton Vance doesn’t jointly market. |
| Other important information | |
| Vermont: Except as permitted by law, we will not share personal information we collect about Vermont residents with Nonaffiliates unless you provide us with your written consent to share such information.California: Except as permitted by law, we will not share personal information we collect about California residents with Nonaffiliates and we will limit sharing such personal information with our Affiliates to comply with California privacy laws that apply to us. | |
Two International Place
Boston, MA 02110
Two International Place
Boston, MA 02110
Two International Place
Boston, MA 02110
(617) 482-8260
State Street Financial Center, One Lincoln Street
Boston, MA 02111
Attn: Eaton Vance Funds
P.O. Box 9653
Providence, RI 02940-9653
(800) 262-1122
Boston, MA 02110


| % Average Annual Total Returns1,2 | Class Inception Date | Performance Inception Date | Six Months | One Year | Five Years | Ten Years |
| Class A at NAV | 05/02/1994 | 05/02/1994 | (21.34)% | (11.29)% | 4.26% | 8.39% |
| Class A with 5.25% Maximum Sales Charge | — | — | (25.47) | (15.94) | 3.14 | 7.80 |
| Class C at NAV | 07/07/2006 | 05/02/1994 | (21.46) | (11.74) | 3.57 | 7.78 |
| Class C with 1% Maximum Sales Charge | — | — | (22.25) | (12.53) | 3.57 | 7.78 |
| Class I at NAV | 10/01/2009 | 05/02/1994 | (20.86) | (10.58) | 4.66 | 8.76 |
| MSCI India Index | — | — | (15.25)% | (4.80)% | 7.25% | 8.13% |
| % Total Annual Operating Expense Ratios3 | Class A | Class C | Class I |
| 1.49% | 2.24% | 1.24% |
| Sector Allocation (% of net assets)* |

| Top 10 Holdings (% of net assets)* | |
| ICICI Bank, Ltd. | 12.0% |
| Infosys, Ltd. | 11.2 |
| Reliance Industries, Ltd. | 8.3 |
| Axis Bank, Ltd. | 5.5 |
| State Bank of India | 3.1 |
| SBI Life Insurance Co., Ltd. | 2.7 |
| HCL Technologies, Ltd. | 2.6 |
| Sun Pharmaceutical Industries, Ltd. | 2.5 |
| Tata Consumer Products, Ltd. | 2.3 |
| Kotak Mahindra Bank, Ltd. | 2.3 |
| Total | 52.5% |
| * | Excludes cash and cash equivalents. |
| 1 | MSCI India Index is an unmanaged index of common stocks traded in the India market. MSCI indexes are net of foreign withholding taxes. Source: MSCI. MSCI data may not be reproduced or used for any other purpose. MSCI provides no warranties, has not prepared or approved this report, and has no liability hereunder. Unless otherwise stated, index returns do not reflect the effect of any applicable sales charges, commissions, expenses, taxes or leverage, as applicable. It is not possible to invest directly in an index. |
| 2 | Total Returns at NAV do not include applicable sales charges. If sales charges were deducted, the returns would be lower. Total Returns shown with maximum sales charge reflect the stated maximum sales charge. Unless otherwise stated, performance does not reflect the deduction of taxes on Fund distributions or redemptions of Fund shares.Effective November 5, 2020, Class C shares automatically convert to Class A shares eight years after purchase. The average annual total returns listed for Class C reflect conversion to Class A shares after eight years. Prior to November 5, 2020, Class C shares automatically converted to Class A shares ten years after purchase.Effective September 15, 2016, Goldman Sachs Asset Management International (GSAM beginning October 19, 2017) began sub-advising the Fund. Performance prior to September 15, 2016, reflects the Fund’s performance under a former sub-adviser. |
| 3 | Source: Fund prospectus. The expense ratios for the current reporting period can be found in the Financial Highlights section of this report. Performance reflects expenses waived and/or reimbursed, if applicable. Without such waivers and/or reimbursements, performance would have been lower. |
| Fund profile subject to change due to active management. |
| Beginning Account Value (1/1/22) | Ending Account Value (6/30/22) | Expenses Paid During Period* (1/1/22 – 6/30/22) | Annualized Expense Ratio | |
| Actual | ||||
| Class A | $1,000.00 | $ 786.60 | $6.87 | 1.55% |
| Class C | $1,000.00 | $ 785.40 | $9.96 | 2.25% |
| Class I | $1,000.00 | $ 791.40 | $5.51 | 1.24% |
| Hypothetical | ||||
| (5% return per year before expenses) | ||||
| Class A | $1,000.00 | $1,017.11 | $7.75 | 1.55% |
| Class C | $1,000.00 | $1,013.64 | $11.23 | 2.25% |
| Class I | $1,000.00 | $1,018.65 | $6.21 | 1.24% |
| * | Expenses are equal to the Fund’s annualized expense ratio for the indicated Class, multiplied by the average account value over the period, multiplied by 181/365 (to reflect the one-half year period). The Example assumes that the $1,000 was invested at the net asset value per share determined at the close of business on December 31, 2021. The Example reflects the expenses of both the Fund and the Portfolio. |
| June 30, 2022 | |
| Assets | |
| Investment in Greater India Portfolio, at value (identified cost $160,480,767) | $ 196,498,208 |
| Receivable for Fund shares sold | 41,038 |
| Total assets | $196,539,246 |
| Liabilities | |
| Payable for Fund shares redeemed | $ 122,523 |
| Payable to affiliates: | |
| Administration fee | 24,999 |
| Distribution and service fees | 38,927 |
| Trustees' fees | 125 |
| Other | 140,537 |
| Accrued expenses | 65,020 |
| Total liabilities | $ 392,131 |
| Net Assets | $196,147,115 |
| Sources of Net Assets | |
| Paid-in capital | $ 134,915,025 |
| Distributable earnings | 61,232,090 |
| Net Assets | $196,147,115 |
| Class A Shares | |
| Net Assets | $ 130,714,804 |
| Shares Outstanding | 3,768,830 |
| Net Asset Value and Redemption Price Per Share (net assets ÷ shares of beneficial interest outstanding) | $ 34.68 |
| Maximum Offering Price Per Share (100 ÷ 94.75 of net asset value per share) | $ 36.60 |
| Class C Shares | |
| Net Assets | $ 6,496,182 |
| Shares Outstanding | 227,265 |
| Net Asset Value and Offering Price Per Share* (net assets ÷ shares of beneficial interest outstanding) | $ 28.58 |
| Class I Shares | |
| Net Assets | $ 58,936,129 |
| Shares Outstanding | 1,633,083 |
| Net Asset Value, Offering Price and Redemption Price Per Share (net assets ÷ shares of beneficial interest outstanding) | $ 36.09 |
| On sales of $50,000 or more, the offering price of Class A shares is reduced. | |
| * | Redemption price per share is equal to the net asset value less any applicable contingent deferred sales charge. |
| Six Months Ended | |
| June 30, 2022 | |
| Investment Income | |
| Dividend income allocated from Portfolio (net of foreign taxes withheld of $187,527) | $ 701,785 |
| Expenses allocated from Portfolio | (1,138,059) |
| Total investment loss from Portfolio | $ (436,274) |
| Expenses | |
| Administration fee | $ 181,398 |
| Distribution and service fees: | |
| Class A | 238,775 |
| Class C | 40,685 |
| Trustees’ fees and expenses | 250 |
| Custodian fee | 12,036 |
| Transfer and dividend disbursing agent fees | 109,537 |
| Legal and accounting services | 14,497 |
| Printing and postage | 24,761 |
| Registration fees | 25,891 |
| Miscellaneous | 5,805 |
| Total expenses | $ 653,635 |
| Net investment loss | $ (1,089,909) |
| Realized and Unrealized Gain (Loss) from Portfolio | |
| Net realized gain (loss): | |
| Investment transactions (net of foreign capital gains taxes of $1,554,830) | $ 10,641,014 |
| Futures contracts | (739,028) |
| Foreign currency transactions | 3,268 |
| Net realized gain | $ 9,905,254 |
| Change in unrealized appreciation (depreciation): | |
| Investments (including net decrease in accrued foreign capital gains taxes of $8,174,808) | $ (65,170,703) |
| Futures contracts | (18,472) |
| Foreign currency | 2,883 |
| Net change in unrealized appreciation (depreciation) | $(65,186,292) |
| Net realized and unrealized loss | $(55,281,038) |
| Net decrease in net assets from operations | $(56,370,947) |
| Six Months Ended June 30, 2022 (Unaudited) | Year Ended December 31, 2021 | |
| Increase (Decrease) in Net Assets | ||
| From operations: | ||
| Net investment loss | $ (1,089,909) | $ (2,439,847) |
| Net realized gain | 9,905,254 | 40,770,335 |
| Net change in unrealized appreciation (depreciation) | (65,186,292) | 20,398,858 |
| Net increase (decrease) in net assets from operations | $ (56,370,947) | $ 58,729,346 |
| Distributions to shareholders: | ||
| Class A | $ — | $ (15,279,756) |
| Class C | — | (903,171) |
| Class I | — | (7,991,474) |
| Total distributions to shareholders | $ — | $ (24,174,401) |
| Transactions in shares of beneficial interest: | ||
| Class A | $ (13,766,483) | $ 4,517,234 |
| Class C | (759,896) | 743,038 |
| Class I | (20,693,614) | 14,897,289 |
| Contributed capital from affiliate for shares redeemed: | ||
| Class A | 175,361 | 881,304 |
| Class C | 22,064 | 86,067 |
| Class I | 771,474 | 1,786,810 |
| Net increase (decrease) in net assets from Fund share transactions | $ (34,251,094) | $ 22,911,742 |
| Net increase (decrease) in net assets | $ (90,622,041) | $ 57,466,687 |
| Net Assets | ||
| At beginning of period | $ 286,769,156 | $ 229,302,469 |
| At end of period | $196,147,115 | $286,769,156 |
| Class A | ||||||
| Six Months Ended June 30, 2022 (Unaudited) | Year Ended December 31, | |||||
| 2021 | 2020 (as restated) | 2019 | 2018 | 2017 | ||
| Net asset value — Beginning of period | $ 44.090 | $ 38.790 | $ 34.300 | $ 32.020 | $ 36.830 | $ 26.300 |
| Income (Loss) From Operations | ||||||
| Net investment income (loss)(1) | $ (0.193) | $ (0.425) | $ (0.237) | $ (0.188) | $ (0.150) | $ 0.016 |
| Net realized and unrealized gain (loss) | (9.217) | 9.728 | 4.823 | 3.424 | (4.284) | 11.737 |
| Total income (loss) from operations | $ (9.410) | $ 9.303 | $ 4.586 | $ 3.236 | $ (4.434) | $ 11.753 |
| Less Distributions | ||||||
| From net investment income | $ — | $ — | $ — | $ — | $ (0.376) | $ (1.223) |
| From net realized gain | — | (4.003) | (0.096) | (0.956) | — | — |
| Total distributions | $ — | $ (4.003) | $ (0.096) | $ (0.956) | $ (0.376) | $ (1.223) |
| Net asset value — End of period | $ 34.680 | $ 44.090 | $ 38.790 | $ 34.300 | $ 32.020 | $ 36.830 |
| Total Return(2) | (21.34)% (3) | 24.04% | 13.42% | 10.46% | (12.13)% | 44.80% |
| Ratios/Supplemental Data | ||||||
| Net assets, end of period (000’s omitted) | $130,715 | $181,368 | $155,011 | $163,335 | $152,967 | $192,016 |
| Ratios (as a percentage of average daily net assets):(4) | ||||||
| Expenses | 1.55% (5)(6) | 1.54% | 1.56% | 1.63% | 1.62% | 1.68% |
| Net investment income (loss) | (0.97)% (6) | (0.98)% | (0.75)% | (0.58)% | (0.44)% | 0.05% |
| Portfolio Turnover of the Portfolio | 6% (3) | 33% | 26% | 21% | 29% | 25% |
| (1) | Computed using average shares outstanding. |
| (2) | Returns are historical and are calculated by determining the percentage change in net asset value with all distributions reinvested and do not reflect the effect of sales charges. |
| (3) | Not annualized. |
| (4) | Includes the Fund's share of the Portfolio's allocated expenses. |
| (5) | Includes a reduction by the investment adviser of a portion of the Portfolio's adviser fee due to the Portfolio's investment in the Liquidity Fund (equal to less than 0.005% of average daily net assets for the six months ended June 30, 2022). |
| (6) | Annualized. |
| Class C | ||||||
| Six Months Ended June 30, 2022 (Unaudited) | Year Ended December 31, | |||||
| 2021 | 2020 (as restated) | 2019 | 2018 | 2017 | ||
| Net asset value — Beginning of period | $ 36.390 | $ 32.810 | $ 29.230 | $ 27.620 | $ 32.050 | $ 23.020 |
| Income (Loss) From Operations | ||||||
| Net investment loss(1) | $ (0.274) | $ (0.616) | $ (0.385) | $ (0.363) | $ (0.334) | $ (0.186) |
| Net realized and unrealized gain (loss) | (7.536) | 8.199 | 4.061 | 2.929 | (3.720) | 10.247 |
| Total income (loss) from operations | $ (7.810) | $ 7.583 | $ 3.676 | $ 2.566 | $ (4.054) | $10.061 |
| Less Distributions | ||||||
| From net investment income | $ — | $ — | $ — | $ — | $ (0.376) | $ (1.031) |
| From net realized gain | — | (4.003) | (0.096) | (0.956) | — | — |
| Total distributions | $ — | $ (4.003) | $ (0.096) | $ (0.956) | $ (0.376) | $ (1.031) |
| Net asset value — End of period | $28.580 | $36.390 | $32.810 | $29.230 | $27.620 | $32.050 |
| Total Return(2) | (21.46)% (3) | 23.17% | 12.64% | 9.69% | (12.76)% | 43.81% |
| Ratios/Supplemental Data | ||||||
| Net assets, end of period (000’s omitted) | $ 6,496 | $ 9,181 | $ 7,548 | $ 11,898 | $ 21,891 | $ 30,195 |
| Ratios (as a percentage of average daily net assets):(4) | ||||||
| Expenses | 2.25% (5)(6) | 2.24% | 2.26% | 2.33% | 2.32% | 2.38% |
| Net investment loss | (1.67)% (6) | (1.69)% | (1.44)% | (1.30)% | (1.14)% | (0.65)% |
| Portfolio Turnover of the Portfolio | 6% (3) | 33% | 26% | 21% | 29% | 25% |
| (1) | Computed using average shares outstanding. |
| (2) | Returns are historical and are calculated by determining the percentage change in net asset value with all distributions reinvested and do not reflect the effect of sales charges. |
| (3) | Not annualized. |
| (4) | Includes the Fund's share of the Portfolio's allocated expenses. |
| (5) | Includes a reduction by the investment adviser of a portion of the Portfolio's adviser fee due to the Portfolio's investment in the Liquidity Fund (equal to less than 0.005% of average daily net assets for the six months ended June 30, 2022). |
| (6) | Annualized. |
| Class I | ||||||
| Six Months Ended June 30, 2022 (Unaudited) | Year Ended December 31, | |||||
| 2021 | 2020 (as restated) | 2019 | 2018 | 2017 | ||
| Net asset value — Beginning of period | $ 45.600 | $ 39.920 | $ 35.190 | $ 32.730 | $ 37.520 | $ 26.770 |
| Income (Loss) From Operations | ||||||
| Net investment income (loss)(1) | $ (0.139) | $ (0.298) | $ (0.148) | $ (0.092) | $ (0.047) | $ 0.140 |
| Net realized and unrealized gain (loss) | (9.371) | 9.981 | 4.974 | 3.508 | (4.367) | 11.936 |
| Total income (loss) from operations | $ (9.510) | $ 9.683 | $ 4.826 | $ 3.416 | $ (4.414) | $12.076 |
| Less Distributions | ||||||
| From net investment income | $ — | $ — | $ — | $ — | $ (0.376) | $ (1.326) |
| From net realized gain | — | (4.003) | (0.096) | (0.956) | — | — |
| Total distributions | $ — | $ (4.003) | $ (0.096) | $ (0.956) | $ (0.376) | $ (1.326) |
| Net asset value — End of period | $36.090 | $45.600 | $39.920 | $35.190 | $32.730 | $37.520 |
| Total Return(2) | (20.86)% (3) | 24.31% | 13.77% | 10.79% | (11.85)% | 45.22% |
| Ratios/Supplemental Data | ||||||
| Net assets, end of period (000’s omitted) | $ 58,936 | $ 96,220 | $ 66,744 | $ 40,761 | $ 37,330 | $ 48,595 |
| Ratios (as a percentage of average daily net assets):(4) | ||||||
| Expenses | 1.24% (5)(6) | 1.24% | 1.26% | 1.33% | 1.32% | 1.38% |
| Net investment income (loss) | (0.67)% (6) | (0.66)% | (0.45)% | (0.27)% | (0.14)% | 0.41% |
| Portfolio Turnover of the Portfolio | 6% (3) | 33% | 26% | 21% | 29% | 25% |
| (1) | Computed using average shares outstanding. |
| (2) | Returns are historical and are calculated by determining the percentage change in net asset value with all distributions reinvested. |
| (3) | Not annualized. |
| (4) | Includes the Fund's share of the Portfolio's allocated expenses. |
| (5) | Includes a reduction by the investment adviser of a portion of the Portfolio's adviser fee due to the Portfolio's investment in the Liquidity Fund (equal to less than 0.005% of average daily net assets for the six months ended June 30, 2022). |
| (6) | Annualized. |
| Average Daily Net Assets | Annual Fee Rate |
| Up to $500 million | 0.850% |
| $500 million but less than $1 billion | 0.800% |
| $1 billion but less than $2.5 billion | 0.775% |
| $2.5 billion but less than $5 billion | 0.750% |
| $5 billion and over | 0.730% |
| Six Months Ended June 30, 2022 (Unaudited) | Year Ended December 31, 2021 | ||||
| Shares | Amount | Shares | Amount | ||
| Class A | |||||
| Sales | 87,942 | $ 3,633,546 | 235,749 | $ 10,423,509 | |
| Issued to shareholders electing to receive payments of distributions in Fund shares | — | — | 318,323 | 13,799,306 | |
| Redemptions | (441,561) | (17,722,761) | (438,592) | (19,820,692) | |
| Converted from Class C shares | 8,533 | 322,732 | 2,456 | 115,111 | |
| Net increase (decrease) | (345,086) | $(13,766,483) | 117,936 | $ 4,517,234 | |
| Class C | |||||
| Sales | 18,201 | $ 639,729 | 47,927 | $ 1,751,246 | |
| Issued to shareholders electing to receive payments of distributions in Fund shares | — | — | 25,165 | 900,899 | |
| Redemptions | (32,908) | (1,076,893) | (47,907) | (1,793,996) | |
| Converted to Class A shares | (10,345) | (322,732) | (2,915) | (115,111) | |
| Net increase (decrease) | (25,052) | $ (759,896) | 22,270 | $ 743,038 | |
| Class I | |||||
| Sales | 601,394 | $ 25,638,589 | 996,118 | $ 43,052,707 | |
| Issued to shareholders electing to receive payments of distributions in Fund shares | — | — | 161,306 | 7,234,565 | |
| Redemptions | (1,078,270) | (46,332,203) | (719,500) | (35,389,983) | |
| Net increase (decrease) | (476,876) | $(20,693,614) | 437,924 | $ 14,897,289 | |
| As Previously Reported | As Restated | |
| Financial Highlights — Class A | ||
| Net realized and unrealized gain (loss) | $ 6.263 | $ 4.823 |
| Total income (loss) from operations | 6.026 | 4.586 |
| Net Asset value—end of year | 40.230 | 38.790 |
| Total Return | 17.64% | 13.42% |
| Net assets, end of year (000's omitted) | $160,570 | $155,011 |
| Financial Highlights — Class C | ||
| Net realized and unrealized gain (loss) | $ 5.281 | $ 4.061 |
| Total income (loss) from operations | 4.896 | 3.676 |
| Net Asset value—end of year | 34.030 | 32.810 |
| Total Return | 16.82% | 12.64% |
| Net assets, end of year (000's omitted) | $ 7,804 | $ 7,548 |
| Financial Highlights — Class I | ||
| Net realized and unrealized gain (loss) | $ 6.454 | $ 4.974 |
| Total income (loss) from operations | 6.306 | 4.826 |
| Net Asset value—end of year | 41.400 | 39.920 |
| Total Return | 17.99% | 13.77% |
| Net assets, end of year (000's omitted) | $ 68,863 | $ 66,744 |
| Common Stocks — 101.9% |
| Security | Shares | Value | |
| India — 101.9% | |||
| Air Freight & Logistics — 0.3% | |||
| Delhivery, Ltd. (1) | 82,237 | $ 526,917 | |
| $ 526,917 | |||
| Auto Components — 2.6% | |||
| Sona BLW Precision Forgings, Ltd.(2) | 292,781 | $ 2,065,771 | |
| Sundram Fasteners, Ltd. | 131,433 | 1,198,643 | |
| Tube Investments of India, Ltd. | 77,320 | 1,815,849 | |
| $ 5,080,263 | |||
| Automobiles — 5.2% | |||
| Mahindra & Mahindra, Ltd. | 226,421 | $ 3,139,978 | |
| Maruti Suzuki India, Ltd. | 27,159 | 2,916,129 | |
| Tata Motors, Ltd.(1) | 807,986 | 4,203,834 | |
| $ 10,259,941 | |||
| Banks — 24.4% | |||
| Axis Bank, Ltd.(1) | 1,345,111 | $ 10,862,985 | |
| Federal Bank, Ltd. | 1,650,418 | 1,905,008 | |
| HDFC Bank, Ltd. | 59,356 | 1,013,699 | |
| ICICI Bank, Ltd. | 2,633,784 | 23,628,254 | |
| Kotak Mahindra Bank, Ltd. | 211,203 | 4,458,552 | |
| State Bank of India | 1,030,963 | 6,110,226 | |
| $ 47,978,724 | |||
| Beverages — 1.9% | |||
| United Spirits, Ltd.(1) | 379,718 | $ 3,668,765 | |
| $ 3,668,765 | |||
| Building Products — 0.5% | |||
| Kajaria Ceramics, Ltd. | 85,334 | $ 1,025,727 | |
| $ 1,025,727 | |||
| Chemicals — 1.7% | |||
| Atul, Ltd. | 11,387 | $ 1,156,356 | |
| Navin Fluorine International, Ltd. | 46,183 | 2,148,762 | |
| $ 3,305,118 | |||
| Construction & Engineering — 1.1% | |||
| Voltas, Ltd. | 169,824 | $ 2,095,957 | |
| $ 2,095,957 | |||
| Security | Shares | Value | |
| Construction Materials — 0.3% | |||
| JK Cement, Ltd. | 25,295 | $ 675,536 | |
| $ 675,536 | |||
| Consumer Finance — 0.7% | |||
| SBI Cards & Payment Services, Ltd. | 139,222 | $ 1,350,073 | |
| $ 1,350,073 | |||
| Diversified Financial Services — 1.8% | |||
| Bajaj Finserv, Ltd. | 24,865 | $ 3,458,295 | |
| $ 3,458,295 | |||
| Electronic Equipment, Instruments & Components — 0.7% | |||
| Honeywell Automation India, Ltd. | 3,034 | $ 1,301,859 | |
| $ 1,301,859 | |||
| Food & Staples Retailing — 2.3% | |||
| Avenue Supermarts, Ltd.(1)(2) | 82,169 | $ 3,536,027 | |
| Medplus Health Services, Ltd.(1) | 109,235 | 1,062,795 | |
| $ 4,598,822 | |||
| Food Products — 2.3% | |||
| Tata Consumer Products, Ltd. | 509,479 | $ 4,561,040 | |
| $ 4,561,040 | |||
| Gas Utilities — 0.4% | |||
| Gujarat Gas, Ltd. | 144,858 | $ 764,482 | |
| $ 764,482 | |||
| Health Care Providers & Services — 1.3% | |||
| Apollo Hospitals Enterprise, Ltd. | 56,116 | $ 2,615,158 | |
| $ 2,615,158 | |||
| Hotels, Restaurants & Leisure — 1.5% | |||
| Devyani International, Ltd.(1) | 578,588 | $ 1,145,741 | |
| Jubilant FoodWorks, Ltd. | 262,640 | 1,712,806 | |
| $ 2,858,547 | |||
| Household Durables — 1.7% | |||
| Crompton Greaves Consumer Electricals, Ltd. | 503,396 | $ 2,176,088 | |
| Dixon Technologies India, Ltd. | 26,438 | 1,197,753 | |
| $ 3,373,841 | |||
| Independent Power and Renewable Electricity Producers — 1.5% | |||
| NTPC, Ltd. | 1,585,859 | $ 2,867,553 | |
| $ 2,867,553 | |||
| Security | Shares | Value | |
| Insurance — 4.3% | |||
| ICICI Lombard General Insurance Co., Ltd.(2) | 165,875 | $ 2,342,983 | |
| PB Fintech, Ltd.(1) | 114,698 | 825,834 | |
| SBI Life Insurance Co., Ltd.(2) | 394,005 | 5,376,670 | |
| $ 8,545,487 | |||
| Interactive Media & Services — 1.6% | |||
| Info Edge India, Ltd. | 65,468 | $ 3,152,836 | |
| $ 3,152,836 | |||
| Internet & Direct Marketing Retail — 1.5% | |||
| FSN E-Commerce Ventures, Ltd.(1) | 69,630 | $ 1,234,891 | |
| Zomato, Ltd.(1) | 2,349,082 | 1,616,207 | |
| $ 2,851,098 | |||
| IT Services — 18.0% | |||
| Coforge, Ltd. | 53,741 | $ 2,416,522 | |
| HCL Technologies, Ltd. | 407,327 | 5,033,126 | |
| Infosys, Ltd. | 1,185,036 | 21,989,531 | |
| Persistent Systems, Ltd. | 59,363 | 2,574,975 | |
| Wipro, Ltd. | 647,152 | 3,421,594 | |
| $ 35,435,748 | |||
| Machinery — 0.9% | |||
| Grindwell Norton, Ltd. | 86,000 | $ 1,839,779 | |
| $ 1,839,779 | |||
| Metals & Mining — 3.1% | |||
| APL Apollo Tubes, Ltd.(1) | 156,608 | $ 1,692,160 | |
| Hindalco Industries, Ltd. | 792,877 | 3,409,608 | |
| Jindal Steel & Power, Ltd. | 227,782 | 945,465 | |
| $ 6,047,233 | |||
| Multiline Retail — 0.8% | |||
| Trent, Ltd. | 113,576 | $ 1,568,137 | |
| $ 1,568,137 | |||
| Oil, Gas & Consumable Fuels — 8.3% | |||
| Reliance Industries, Ltd. | 495,925 | $ 16,333,172 | |
| $ 16,333,172 | |||
| Personal Products — 2.7% | |||
| Emami, Ltd. | 308,764 | $ 1,657,440 | |
| Godrej Consumer Products, Ltd.(1) | 374,841 | 3,614,438 | |
| $ 5,271,878 | |||
| Security | Shares | Value | |
| Pharmaceuticals — 5.2% | |||
| Gland Pharma, Ltd.(1)(2) | 50,542 | $ 1,731,790 | |
| Ipca Laboratories, Ltd. | 118,255 | 1,336,195 | |
| Lupin, Ltd. | 1 | 8 | |
| Sun Pharmaceutical Industries, Ltd. | 477,353 | 5,030,212 | |
| Torrent Pharmaceuticals, Ltd. | 58,307 | 2,108,289 | |
| $ 10,206,494 | |||
| Real Estate Management & Development — 1.9% | |||
| Godrej Properties, Ltd.(1) | 117,693 | $ 1,765,160 | |
| Oberoi Realty, Ltd.(1) | 214,170 | 1,988,894 | |
| $ 3,754,054 | |||
| Software — 0.7% | |||
| Zensar Technologies, Ltd. | 395,433 | $ 1,376,807 | |
| $ 1,376,807 | |||
| Thrifts & Mortgage Finance — 0.7% | |||
| Housing Development Finance Corp., Ltd. | 49,704 | $ 1,364,535 | |
| $ 1,364,535 | |||
| Total India (identified cost $157,786,087) | $200,113,876 | ||
| Total Common Stocks (identified cost $157,786,087) | $200,113,876 | ||
| Short-Term Investments — 0.8% |
| Security | Shares | Value | |
| Morgan Stanley Institutional Liquidity Funds - Government Portfolio, Institutional Class, 1.38%(3) | 1,634,332 | $ 1,634,332 | |
| Total Short-Term Investments (identified cost $1,634,332) | $ 1,634,332 | ||
| Total Investments — 102.7% (identified cost $159,420,419) | $201,748,208 | ||
| Other Assets, Less Liabilities — (2.7)% | $ (5,247,796) | ||
| Net Assets — 100.0% | $196,500,412 | ||
| The percentage shown for each investment category in the Portfolio of Investments is based on net assets. | |
| (1) | Non-income producing security. |
| (2) | Security exempt from registration under Rule 144A of the Securities Act of 1933, as amended. These securities may be sold in certain transactions in reliance on an exemption from registration (normally to qualified institutional buyers). At June 30, 2022, the aggregate value of these securities is $15,053,241 or 7.7% of the Portfolio's net assets. |
| (3) | May be deemed to be an affiliated investment company. The rate shown is the annualized seven-day yield as of June 30, 2022. |
| Futures Contracts | |||||
| Description | Number of Contracts | Position | Expiration Date | Notional Amount | Value/Unrealized Appreciation (Depreciation) |
| Equity Futures | |||||
| SGX CNX Nifty Index | 82 | Long | 7/28/22 | $2,588,347 | $ (4,832) |
| $(4,832) | |||||
| June 30, 2022 | |
| Assets | |
| Unaffiliated investments, at value (identified cost $157,786,087) | $ 200,113,876 |
| Affiliated investment, at value (identified cost $1,634,332) | 1,634,332 |
| Deposits for derivatives collateral — futures contracts | 144,320 |
| Foreign currency, at value (identified cost $785,388) | 785,383 |
| Dividends receivable | 41,799 |
| Dividends receivable from affiliated investment | 4,274 |
| Receivable for investments sold | 641,193 |
| Receivable for variation margin on open futures contracts | 2,722 |
| Receivable for foreign taxes | 43,182 |
| Receivable from affiliate | 140,537 |
| Total assets | $203,551,618 |
| Liabilities | |
| Payable for investments purchased | $ 375,562 |
| Payable to affiliates: | |
| Investment adviser fee | 141,169 |
| Trustees' fees | 3,860 |
| Accrued foreign capital gains taxes | 6,370,355 |
| Accrued expenses | 160,260 |
| Total liabilities | $ 7,051,206 |
| Net Assets applicable to investors' interest in Portfolio | $196,500,412 |
| Six Months Ended | |
| June 30, 2022 | |
| Investment Income | |
| Dividend income (net of foreign taxes withheld of $187,529) | $ 696,788 |
| Dividend income from affiliated investment | 5,005 |
| Total investment income | $ 701,793 |
| Expenses | |
| Investment adviser fee | $ 1,025,104 |
| Trustees’ fees and expenses | 8,124 |
| Custodian fee | 70,725 |
| Legal and accounting services | 26,703 |
| Miscellaneous | 8,134 |
| Total expenses | $ 1,138,790 |
| Deduct: | |
| Waiver and/or reimbursement of expenses by affiliate | $ 722 |
| Total expense reductions | $ 722 |
| Net expenses | $ 1,138,068 |
| Net investment loss | $ (436,275) |
| Realized and Unrealized Gain (Loss) | |
| Net realized gain (loss): | |
| Investment transactions (net of foreign capital gains taxes of $1,554,847) | $ 10,641,124 |
| Futures contracts | (739,036) |
| Foreign currency transactions | 3,268 |
| Net realized gain | $ 9,905,356 |
| Change in unrealized appreciation (depreciation): | |
| Investments (including net decrease in accrued foreign capital gains taxes of $8,174,808) | $ (65,171,537) |
| Futures contracts | (18,472) |
| Foreign currency | 2,883 |
| Net change in unrealized appreciation (depreciation) | $(65,187,126) |
| Net realized and unrealized loss | $(55,281,770) |
| Net decrease in net assets from operations | $(55,718,045) |
| Six Months Ended June 30, 2022 (Unaudited) | Year Ended December 31, 2021 | |
| Increase (Decrease) in Net Assets | ||
| From operations: | ||
| Net investment loss | $ (436,275) | $ (1,063,318) |
| Net realized gain | 9,905,356 | 40,770,718 |
| Net change in unrealized appreciation (depreciation) | (65,187,126) | 20,399,100 |
| Net increase (decrease) in net assets from operations | $ (55,718,045) | $ 60,106,500 |
| Capital transactions: | ||
| Contributions | $ 15,590,038 | $ 31,649,737 |
| Withdrawals | (47,524,670) | (36,627,830) |
| Net decrease in net assets from capital transactions | $ (31,934,632) | $ (4,978,093) |
| Net increase (decrease) in net assets | $ (87,652,677) | $ 55,128,407 |
| Net Assets | ||
| At beginning of period | $ 284,153,089 | $ 229,024,682 |
| At end of period | $196,500,412 | $284,153,089 |
| Six Months Ended June 30, 2022 (Unaudited) | Year Ended December 31, | |||||
| Ratios/Supplemental Data | 2021 | 2020 (as restated) | 2019 | 2018 | 2017 | |
| Ratios (as a percentage of average daily net assets): | ||||||
| Expenses | 0.95% (1)(2) | 0.95% | 0.93% | 0.98% | 0.98% | 0.98% |
| Net investment income (loss) | (0.36)% (1) | (0.39)% | (0.12)% | 0.07% | 0.19% | 0.76% |
| Portfolio Turnover | 6% (3) | 33% | 26% | 21% | 29% | 25% |
| Total Return | (20.74)% (3) | 24.76% | 14.14% | 11.17% | (11.57)% | 45.78% |
| Net assets, end of period (000’s omitted) | $196,500 | $284,153 | $229,025 | $216,812 | $213,186 | $273,437 |
| (1) | Annualized. |
| (2) | The investment adviser reduced a portion of its adviser fee (equal to less than 0.005% of average daily net assets for the six months ended June 30, 2022). |
| (3) | Not annualized. |
| Average Daily Net Assets | Annual Fee Rate |
| Up to $500 million | 0.850% |
| $500 million but less than $1 billion | 0.800% |
| $1 billion but less than $2.5 billion | 0.775% |
| $2.5 billion but less than $5 billion | 0.750% |
| $5 billion and over | 0.730% |
| Aggregate cost | $ 161,074,854 |
| Gross unrealized appreciation | $ 52,825,971 |
| Gross unrealized depreciation | (12,157,449) |
| Net unrealized appreciation | $ 40,668,522 |
| Fair Value | ||
| Derivative | Asset Derivative | Liability Derivative(1) |
| Futures contracts | $ — | $(4,832) |
| (1) | Only the current day's variation margin on open futures contracts is reported within the Statement of Assets and Liabilities as Receivable or Payable for variation margin on open futures contracts, as applicable. |
| Derivative | Realized Gain (Loss) on Derivatives Recognized in Income(1) | Change in Unrealized Appreciation (Depreciation) on Derivatives Recognized in Income(2) |
| Futures contracts | $(739,036) | $(18,472) |
| (1) | Statement of Operations location: Net realized gain (loss): Futures contracts. |
| (2) | Statement of Operations location: Change in unrealized appreciation (depreciation): Futures contracts. |
| Name | Value, beginning of period | Purchases | Sales proceeds | Net realized gain (loss) | Change in unrealized appreciation (depreciation) | Value, end of period | Dividend income | Shares, end of period |
| Short-Term Investments | ||||||||
| Liquidity Fund | $ — | $15,770,786 | $(14,136,454) | $ — | $ — | $1,634,332 | $5,005 | 1,634,332 |
| • | Level 1 – quoted prices in active markets for identical investments |
| • | Level 2 – other significant observable inputs (including quoted prices for similar investments, interest rates, prepayment speeds, credit risk, etc.) |
| • | Level 3 – significant unobservable inputs (including a fund's own assumptions in determining the fair value of investments) |
| Asset Description | Level 1 | Level 2 | Level 3 | Total |
| Common Stocks: | ||||
| Communication Services | $ — | $ 3,152,836 | $ — | $ 3,152,836 |
| Consumer Discretionary | — | 25,991,827 | — | 25,991,827 |
| Consumer Staples | — | 18,100,505 | — | 18,100,505 |
| Energy | — | 16,333,172 | — | 16,333,172 |
| Financials | — | 62,697,114 | — | 62,697,114 |
| Health Care | — | 12,821,652 | — | 12,821,652 |
| Industrials | 526,917 | 4,961,463 | — | 5,488,380 |
| Information Technology | — | 38,114,414 | — | 38,114,414 |
| Materials | — | 10,027,887 | — | 10,027,887 |
| Real Estate | — | 3,754,054 | — | 3,754,054 |
| Utilities | — | 3,632,035 | — | 3,632,035 |
| Total Common Stocks | $ 526,917 | $ 199,586,959* | $ — | $ 200,113,876 |
| Short-Term Investments | $ 1,634,332 | $ — | $ — | $ 1,634,332 |
| Total Investments | $2,161,249 | $ 199,586,959 | $ — | $ 201,748,208 |
| Liability Description | ||||
| Futures Contracts | $ — | $ (4,832) | $ — | $ (4,832) |
| Total | $ — | $ (4,832) | $ — | $ (4,832) |
| * | Includes foreign equity securities whose values were adjusted to reflect market trading of comparable securities or other correlated instruments that occurred after the close of trading in their applicable foreign markets. |
| Financial Highlights | As Previously Reported | As Restated |
| Total Return | 18.38% | 14.14% |
| Net assets, end of year (000's omitted) | $237,417 | $229,025 |
| Officers of Eaton Vance Greater India Fund | |
| Eric A. Stein President | Jill R. Damon Secretary |
| Deidre E. Walsh Vice President and Chief Legal Officer | Richard F. Froio Chief Compliance Officer |
| James F. Kirchner Treasurer | |
| Officers of Greater India Portfolio | |
| Edward J. Perkin President | Jill R. Damon Secretary |
| Deidre E. Walsh Vice President and Chief Legal Officer | Richard F. Froio Chief Compliance Officer |
| James F. Kirchner Treasurer | |
| Trustees of Eaton Vance Greater India Fund and Greater India Portfolio |
| George J. Gorman Chairperson | |
| Alan C. Bowser** | |
| Thomas E. Faust Jr.* | |
| Mark R. Fetting | |
| Cynthia E. Frost | |
| Valerie A. Mosley |
| Keith Quinton | |
| Marcus L. Smith | |
| Susan J. Sutherland | |
| Scott E. Wennerholm | |
| Nancy A. Wiser** |
| * | Interested Trustee |
| ** | Mr. Bowser and Ms. Wiser began serving as Trustees effective April 4, 2022. |
| Privacy Notice | April 2021 |
| FACTS | WHAT DOES EATON VANCE DO WITH YOUR PERSONAL INFORMATION? |
| Why? | Financial companies choose how they share your personal information. Federal law gives consumers the right to limit some but not all sharing. Federal law also requires us to tell you how we collect, share, and protect your personal information. Please read this notice carefully to understand what we do. |
| What? | The types of personal information we collect and share depend on the product or service you have with us. This information can include:■ Social Security number and income ■ investment experience and risk tolerance ■ checking account number and wire transfer instructions |
| How? | All financial companies need to share customers’ personal information to run their everyday business. In the section below, we list the reasons financial companies can share their customers’ personal information; the reasons Eaton Vance chooses to share; and whether you can limit this sharing. |
| Reasons we can share your personal information | Does Eaton Vance share? | Can you limit this sharing? |
| For our everyday business purposes — such as to process your transactions, maintain your account(s), respond to court orders and legal investigations, or report to credit bureaus | Yes | No |
| For our marketing purposes — to offer our products and services to you | Yes | No |
| For joint marketing with other financial companies | No | We don’t share |
| For our investment management affiliates’ everyday business purposes — information about your transactions, experiences, and creditworthiness | Yes | Yes |
| For our affiliates’ everyday business purposes — information about your transactions and experiences | Yes | No |
| For our affiliates’ everyday business purposes — information about your creditworthiness | No | We don’t share |
| For our investment management affiliates to market to you | Yes | Yes |
| For our affiliates to market to you | No | We don’t share |
| For nonaffiliates to market to you | No | We don’t share |
| To limit our sharing | Call toll-free 1-800-262-1122 or email: EVPrivacy@eatonvance.comPlease note:If you are a new customer, we can begin sharing your information 30 days from the date we sent this notice. When you are no longer our customer, we continue to share your information as described in this notice. However, you can contact us at any time to limit our sharing. |
| Questions? | Call toll-free 1-800-262-1122 or email: EVPrivacy@eatonvance.com |
| Privacy Notice — continued | April 2021 |
| Who we are | |
| Who is providing this notice? | Eaton Vance Management, Eaton Vance Distributors, Inc., Eaton Vance Trust Company, Eaton Vance Management (International) Limited, Eaton Vance Advisers International Ltd., Eaton Vance Global Advisors Limited, Eaton Vance Management’s Real Estate Investment Group, Boston Management and Research, Calvert Research and Management, Eaton Vance and Calvert Fund Families and our investment advisory affiliates (“Eaton Vance”) (see Investment Management Affiliates definition below) |
| What we do | |
| How does Eaton Vance protect my personal information? | To protect your personal information from unauthorized access and use, we use security measures that comply with federal law. These measures include computer safeguards and secured files and buildings. We have policies governing the proper handling of customer information by personnel and requiring third parties that provide support to adhere to appropriate security standards with respect to such information. |
| How does Eaton Vance collect my personal information? | We collect your personal information, for example, when you■ open an account or make deposits or withdrawals from your account ■ buy securities from us or make a wire transfer ■ give us your contact informationWe also collect your personal information from others, such as credit bureaus, affiliates, or other companies. |
| Why can’t I limit all sharing? | Federal law gives you the right to limit only■ sharing for affiliates’ everyday business purposes — information about your creditworthiness ■ affiliates from using your information to market to you ■ sharing for nonaffiliates to market to youState laws and individual companies may give you additional rights to limit sharing. See below for more on your rights under state law. |
| Definitions | |
| Investment Management Affiliates | Eaton Vance Investment Management Affiliates include registered investment advisers, registered broker- dealers, and registered and unregistered funds. Investment Management Affiliates does not include entities associated with Morgan Stanley Wealth Management, such as Morgan Stanley Smith Barney LLC and Morgan Stanley & Co. |
| Affiliates | Companies related by common ownership or control. They can be financial and nonfinancial companies.■ Our affiliates include companies with a Morgan Stanley name and financial companies such as Morgan Stanley Smith Barney LLC and Morgan Stanley & Co. |
| Nonaffiliates | Companies not related by common ownership or control. They can be financial and nonfinancial companies.■ Eaton Vance does not share with nonaffiliates so they can market to you. |
| Joint marketing | A formal agreement between nonaffiliated financial companies that together market financial products or services to you.■ Eaton Vance doesn’t jointly market. |
| Other important information | |
| Vermont: Except as permitted by law, we will not share personal information we collect about Vermont residents with Nonaffiliates unless you provide us with your written consent to share such information.California: Except as permitted by law, we will not share personal information we collect about California residents with Nonaffiliates and we will limit sharing such personal information with our Affiliates to comply with California privacy laws that apply to us. | |
and Greater India Portfolio
Two International Place
Boston, MA 02110
and Greater India Portfolio
200 West Street
New York, NY 10282
Two International Place
Boston, MA 02110
Two International Place
Boston, MA 02110
(617) 482-8260
State Street Financial Center, One Lincoln Street
Boston, MA 02111
Attn: Eaton Vance Funds
P.O. Box 9653
Providence, RI 02940-9653
(800) 262-1122
Boston, MA 02110


| % Average Annual Total Returns1,2 | Class Inception Date | Performance Inception Date | Six Months | One Year | Five Years | Ten Years |
| Class A at NAV | 04/22/1968 | 04/22/1968 | (19.89)% | (15.46)% | 7.22% | 9.31% |
| Class A with 5.25% Maximum Sales Charge | — | — | (24.08) | (19.90) | 6.07 | 8.72 |
| Class C at NAV | 11/17/1994 | 04/22/1968 | (20.21) | (16.08) | 6.42 | 8.66 |
| Class C with 1% Maximum Sales Charge | — | — | (21.01) | (16.81) | 6.42 | 8.66 |
| Class I at NAV | 07/29/2011 | 04/22/1968 | (19.81) | (15.26) | 7.49 | 9.59 |
| Russell 2500™ Index | — | — | (21.81)% | (21.00)% | 7.04% | 10.48% |
| % Total Annual Operating Expense Ratios3 | Class A | Class C | Class I |
| 1.18% | 1.93% | 0.93% |
| Sector Allocation (% of net assets)* |

| * | Excludes cash and cash equivalents. |
| Top 10 Holdings (% of net assets)* | |
| Performance Food Group Co. | 3.2% |
| Dorman Products, Inc. | 2.7 |
| CBIZ, Inc. | 2.5 |
| Selective Insurance Group, Inc. | 2.4 |
| R1 RCM, Inc. | 2.4 |
| W.R. Berkley Corp. | 2.3 |
| SouthState Corp. | 2.2 |
| Valvoline, Inc. | 2.2 |
| Commerce Bancshares, Inc. | 2.1 |
| Ryan Specialty Holdings, Inc., Class A | 2.1 |
| Total | 24.1% |
| * | Excludes cash and cash equivalents. |
| 1 | Russell 2500™ Index is an unmanaged index of approximately 2,500 small-and mid-cap U.S. stocks. Unless otherwise stated, index returns do not reflect the effect of any applicable sales charges, commissions, expenses, taxes or leverage, as applicable. It is not possible to invest directly in an index. |
| 2 | Total Returns at NAV do not include applicable sales charges. If sales charges were deducted, the returns would be lower. Total Returns shown with maximum sales charge reflect the stated maximum sales charge. Unless otherwise stated, performance does not reflect the deduction of taxes on Fund distributions or redemptions of Fund shares.Effective November 5, 2020, Class C shares automatically convert to Class A shares eight years after purchase. The average annual total returns listed for Class C reflect conversion to Class A shares after eight years. Prior to November 5, 2020, Class C shares automatically converted to Class A shares ten years after purchase. |
| 3 | Source: Fund prospectus. The expense ratios for the current reporting period can be found in the Financial Highlights section of this report. Performance reflects expenses waived and/or reimbursed, if applicable. Without such waivers and/or reimbursements, performance would have been lower. |
| Fund profile subject to change due to active management. |
| Beginning Account Value (1/1/22) | Ending Account Value (6/30/22) | Expenses Paid During Period* (1/1/22 – 6/30/22) | Annualized Expense Ratio | |
| Actual | ||||
| Class A | $1,000.00 | $ 801.10 | $5.36** | 1.20% |
| Class C | $1,000.00 | $ 797.90 | $8.69** | 1.95% |
| Class I | $1,000.00 | $ 801.90 | $4.24** | 0.95% |
| Hypothetical | ||||
| (5% return per year before expenses) | ||||
| Class A | $1,000.00 | $1,018.84 | $6.01** | 1.20% |
| Class C | $1,000.00 | $1,015.13 | $9.74** | 1.95% |
| Class I | $1,000.00 | $1,020.08 | $4.76** | 0.95% |
| * | Expenses are equal to the Fund's annualized expense ratio for the indicated Class, multiplied by the average account value over the period, multiplied by 181/365 (to reflect the one-half year period). The Example assumes that the $1,000 was invested at the net asset value per share determined at the close of business on December 31, 2021. |
| ** | Absent an allocation of certain expenses to an affiliate, expenses would be higher. |
| Common Stocks — 98.6% |
| Security | Shares | Value | |
| Aerospace & Defense — 2.5% | |||
| Hexcel Corp. | 15,071 | $ 788,364 | |
| Woodward, Inc. | 5,565 | 514,707 | |
| $ 1,303,071 | |||
| Auto Components — 4.9% | |||
| Dana, Inc. | 37,025 | $ 520,942 | |
| Dorman Products, Inc.(1) | 12,410 | 1,361,501 | |
| Visteon Corp.(1) | 6,045 | 626,141 | |
| $ 2,508,584 | |||
| Automobiles — 1.0% | |||
| Harley-Davidson, Inc. | 15,615 | $ 494,371 | |
| $ 494,371 | |||
| Banks — 8.4% | |||
| Commerce Bancshares, Inc. | 16,574 | $ 1,088,083 | |
| CVB Financial Corp. | 22,285 | 552,891 | |
| M&T Bank Corp. | 6,430 | 1,024,878 | |
| SouthState Corp. | 15,015 | 1,158,407 | |
| Wintrust Financial Corp. | 6,370 | 510,555 | |
| $ 4,334,814 | |||
| Biotechnology — 1.2% | |||
| Neurocrine Biosciences, Inc.(1) | 6,535 | $ 637,032 | |
| $ 637,032 | |||
| Building Products — 4.1% | |||
| AAON, Inc. | 14,840 | $ 812,639 | |
| AZEK Co., Inc. (The)(1) | 48,464 | 811,287 | |
| Hayward Holdings, Inc.(1) | 32,310 | 464,941 | |
| $ 2,088,867 | |||
| Capital Markets — 2.5% | |||
| Cohen & Steers, Inc. | 5,024 | $ 319,476 | |
| MarketAxess Holdings, Inc. | 2,060 | 527,381 | |
| Tradeweb Markets, Inc., Class A | 6,425 | 438,506 | |
| $ 1,285,363 | |||
| Chemicals — 3.3% | |||
| Quaker Chemical Corp. | 3,815 | $ 570,419 | |
| Security | Shares | Value | |
| Chemicals (continued) | |||
| Valvoline, Inc. | 39,535 | $ 1,139,794 | |
| $ 1,710,213 | |||
| Commercial Services & Supplies — 1.7% | |||
| MillerKnoll, Inc. | 34,095 | $ 895,676 | |
| $ 895,676 | |||
| Communications Equipment — 1.8% | |||
| F5, Inc.(1) | 6,125 | $ 937,370 | |
| $ 937,370 | |||
| Containers & Packaging — 1.4% | |||
| AptarGroup, Inc. | 6,960 | $ 718,342 | |
| $ 718,342 | |||
| Diversified Consumer Services — 2.3% | |||
| Bright Horizons Family Solutions, Inc.(1) | 3,475 | $ 293,707 | |
| Terminix Global Holdings, Inc.(1) | 22,300 | 906,495 | |
| $ 1,200,202 | |||
| Electric Utilities — 1.2% | |||
| Alliant Energy Corp. | 10,944 | $ 641,428 | |
| $ 641,428 | |||
| Electrical Equipment — 0.5% | |||
| Generac Holdings, Inc.(1) | 1,110 | $ 233,744 | |
| $ 233,744 | |||
| Electronic Equipment, Instruments & Components — 1.1% | |||
| National Instruments Corp. | 17,480 | $ 545,900 | |
| $ 545,900 | |||
| Equity Real Estate Investment Trusts (REITs) — 7.0% | |||
| CubeSmart | 16,307 | $ 696,635 | |
| EastGroup Properties, Inc. | 5,470 | 844,185 | |
| Equity LifeStyle Properties, Inc. | 10,105 | 712,099 | |
| Rexford Industrial Realty, Inc. | 12,445 | 716,708 | |
| STORE Capital Corp. | 23,425 | 610,924 | |
| $ 3,580,551 | |||
| Food & Staples Retailing — 3.2% | |||
| Performance Food Group Co.(1) | 35,833 | $ 1,647,601 | |
| $ 1,647,601 | |||
| Security | Shares | Value | |
| Health Care Equipment & Supplies — 5.4% | |||
| Cooper Cos., Inc. (The) | 1,086 | $ 340,048 | |
| Envista Holdings Corp.(1) | 25,370 | 977,760 | |
| ICU Medical, Inc.(1) | 2,158 | 354,753 | |
| Tandem Diabetes Care, Inc.(1) | 5,330 | 315,483 | |
| Teleflex, Inc. | 3,249 | 798,767 | |
| $ 2,786,811 | |||
| Health Care Providers & Services — 7.3% | |||
| Addus HomeCare Corp.(1) | 4,595 | $ 382,672 | |
| Agiliti, Inc.(1) | 45,145 | 925,924 | |
| Amedisys, Inc.(1) | 1,905 | 200,254 | |
| Chemed Corp. | 2,145 | 1,006,841 | |
| R1 RCM, Inc.(1) | 57,725 | 1,209,916 | |
| $ 3,725,607 | |||
| Hotels, Restaurants & Leisure — 2.0% | |||
| Texas Roadhouse, Inc. | 6,240 | $ 456,768 | |
| Wyndham Hotels & Resorts, Inc. | 8,400 | 552,048 | |
| $ 1,008,816 | |||
| Insurance — 8.8% | |||
| RLI Corp. | 8,762 | $ 1,021,562 | |
| Ryan Specialty Holdings, Inc., Class A(1) | 26,891 | 1,053,858 | |
| Selective Insurance Group, Inc. | 14,435 | 1,254,979 | |
| W.R. Berkley Corp. | 17,555 | 1,198,304 | |
| $ 4,528,703 | |||
| Interactive Media & Services — 1.4% | |||
| CarGurus, Inc.(1) | 33,915 | $ 728,833 | |
| $ 728,833 | |||
| IT Services — 0.8% | |||
| Euronet Worldwide, Inc.(1) | 4,096 | $ 412,017 | |
| $ 412,017 | |||
| Machinery — 4.5% | |||
| Chart Industries, Inc.(1) | 3,435 | $ 574,950 | |
| Graco, Inc. | 14,145 | 840,355 | |
| Middleby Corp.(1) | 7,045 | 883,161 | |
| $ 2,298,466 | |||
| Multi-Utilities — 1.2% | |||
| CMS Energy Corp. | 9,495 | $ 640,912 | |
| $ 640,912 | |||
| Security | Shares | Value | |
| Oil, Gas & Consumable Fuels — 0.4% | |||
| Archaea Energy, Inc.(1) | 13,190 | $ 204,841 | |
| $ 204,841 | |||
| Pharmaceuticals — 1.3% | |||
| Jazz Pharmaceuticals PLC(1) | 4,355 | $ 679,423 | |
| $ 679,423 | |||
| Professional Services — 2.5% | |||
| CBIZ, Inc.(1) | 32,410 | $ 1,295,104 | |
| $ 1,295,104 | |||
| Road & Rail — 1.1% | |||
| Landstar System, Inc. | 3,815 | $ 554,777 | |
| $ 554,777 | |||
| Semiconductors & Semiconductor Equipment — 1.2% | |||
| Ambarella, Inc.(1) | 1,705 | $ 111,609 | |
| Silicon Laboratories, Inc.(1) | 3,650 | 511,803 | |
| $ 623,412 | |||
| Software — 7.2% | |||
| ACI Worldwide, Inc.(1) | 14,243 | $ 368,751 | |
| Altair Engineering, Inc., Class A(1) | 18,547 | 973,718 | |
| Ceridian HCM Holding, Inc.(1) | 5,715 | 269,062 | |
| Clearwater Analytics Holdings, Inc., Class A(1) | 24,735 | 297,809 | |
| Envestnet, Inc.(1) | 10,720 | 565,695 | |
| Fair Isaac Corp.(1) | 2,100 | 841,890 | |
| nCino, Inc.(1) | 11,784 | 364,361 | |
| $ 3,681,286 | |||
| Specialty Retail — 2.6% | |||
| Burlington Stores, Inc.(1) | 1,290 | $ 175,737 | |
| Five Below, Inc.(1) | 4,060 | 460,526 | |
| Floor & Decor Holdings, Inc., Class A(1) | 2,760 | 173,769 | |
| National Vision Holdings, Inc.(1) | 18,466 | 507,815 | |
| $ 1,317,847 | |||
| Trading Companies & Distributors — 2.8% | |||
| Core & Main, Inc., Class A(1) | 33,960 | $ 757,308 | |
| Herc Holdings, Inc. | 7,675 | 691,901 | |
| $ 1,449,209 | |||
| Total Common Stocks (identified cost $47,689,939) | $50,699,193 | ||
| Short-Term Investments — 1.4% |
| Security | Shares | Value | |
| Morgan Stanley Institutional Liquidity Funds - Government Portfolio, Institutional Class, 1.38%(2) | 710,151 | $ 710,151 | |
| Total Short-Term Investments (identified cost $710,151) | $ 710,151 | ||
| Total Investments — 100.0% (identified cost $48,400,090) | $51,409,344 | ||
| Other Assets, Less Liabilities — (0.0)%(3) | $ (12,327) | ||
| Net Assets — 100.0% | $51,397,017 | ||
| The percentage shown for each investment category in the Portfolio of Investments is based on net assets. | |
| (1) | Non-income producing security. |
| (2) | May be deemed to be an affiliated investment company. The rate shown is the annualized seven-day yield as of June 30, 2022. |
| (3) | Amount is less than (0.05)%. |
| June 30, 2022 | |
| Assets | |
| Unaffiliated investments, at value (identified cost $47,689,939) | $ 50,699,193 |
| Affiliated investment, at value (identified cost $710,151) | 710,151 |
| Dividends receivable | 54,089 |
| Dividends receivable from affiliated investment | 653 |
| Receivable for Fund shares sold | 6,984 |
| Receivable from affiliate | 7,345 |
| Total assets | $51,478,415 |
| Liabilities | |
| Payable for Fund shares redeemed | $ 9,343 |
| Payable to affiliates: | |
| Investment adviser fee | 26,929 |
| Distribution and service fees | 6,082 |
| Trustees' fees | 960 |
| Accrued expenses | 38,084 |
| Total liabilities | $ 81,398 |
| Net Assets | $51,397,017 |
| Sources of Net Assets | |
| Paid-in capital | $ 45,551,656 |
| Distributable earnings | 5,845,361 |
| Net Assets | $51,397,017 |
| Class A Shares | |
| Net Assets | $ 27,444,566 |
| Shares Outstanding | 1,229,867 |
| Net Asset Value and Redemption Price Per Share (net assets ÷ shares of beneficial interest outstanding) | $ 22.32 |
| Maximum Offering Price Per Share (100 ÷ 94.75 of net asset value per share) | $ 23.56 |
| Class C Shares | |
| Net Assets | $ 369,349 |
| Shares Outstanding | 20,164 |
| Net Asset Value and Offering Price Per Share* (net assets ÷ shares of beneficial interest outstanding) | $ 18.32 |
| Class I Shares | |
| Net Assets | $ 23,583,102 |
| Shares Outstanding | 1,016,986 |
| Net Asset Value, Offering Price and Redemption Price Per Share (net assets ÷ shares of beneficial interest outstanding) | $ 23.19 |
| On sales of $50,000 or more, the offering price of Class A shares is reduced. | |
| * | Redemption price per share is equal to the net asset value less any applicable contingent deferred sales charge. |
| Six Months Ended | |
| June 30, 2022 | |
| Investment Income | |
| Dividend income | $ 281,373 |
| Dividend income from affiliated investments | 1,106 |
| Total investment income | $ 282,479 |
| Expenses | |
| Investment adviser fee | $ 187,174 |
| Distribution and service fees: | |
| Class A | 39,047 |
| Class C | 2,443 |
| Trustees’ fees and expenses | 1,971 |
| Custodian fee | 13,848 |
| Transfer and dividend disbursing agent fees | 31,780 |
| Legal and accounting services | 18,964 |
| Printing and postage | 9,554 |
| Registration fees | 21,508 |
| Miscellaneous | 6,276 |
| Total expenses | $ 332,565 |
| Deduct: | |
| Waiver and/or reimbursement of expenses by affiliates | $ 7,623 |
| Total expense reductions | $ 7,623 |
| Net expenses | $ 324,942 |
| Net investment loss | $ (42,463) |
| Realized and Unrealized Gain (Loss) | |
| Net realized gain (loss): | |
| Investment transactions | $ 828,760 |
| Investment transactions - affiliated investment | 66 |
| Net realized gain | $ 828,826 |
| Change in unrealized appreciation (depreciation): | |
| Investments | $ (13,880,947) |
| Net change in unrealized appreciation (depreciation) | $(13,880,947) |
| Net realized and unrealized loss | $(13,052,121) |
| Net decrease in net assets from operations | $(13,094,584) |
| Six Months Ended June 30, 2022 (Unaudited) | Year Ended December 31, 2021 | |
| Increase (Decrease) in Net Assets | ||
| From operations: | ||
| Net investment loss | $ (42,463) | $ (114,183) |
| Net realized gain | 828,826 | 9,871,044 |
| Net change in unrealized appreciation (depreciation) | (13,880,947) | 423,395 |
| Net increase (decrease) in net assets from operations | $(13,094,584) | $10,180,256 |
| Distributions to shareholders: | ||
| Class A | $ — | $ (4,279,525) |
| Class C | — | (83,557) |
| Class I | — | (3,858,486) |
| Total distributions to shareholders | $ — | $ (8,221,568) |
| Transactions in shares of beneficial interest: | ||
| Class A | $ (1,106,033) | $ 401,547 |
| Class C | (115,183) | (72,289) |
| Class I | (2,860,974) | 15,326,516 |
| Net increase (decrease) in net assets from Fund share transactions | $ (4,082,190) | $15,655,774 |
| Net increase (decrease) in net assets | $(17,176,774) | $17,614,462 |
| Net Assets | ||
| At beginning of period | $ 68,573,791 | $ 50,959,329 |
| At end of period | $ 51,397,017 | $68,573,791 |
| Class A | ||||||
| Six Months Ended June 30, 2022 (Unaudited) | Year Ended December 31, | |||||
| 2021 | 2020 | 2019 | 2018 | 2017 | ||
| Net asset value — Beginning of period | $ 27.860 | $ 26.630 | $ 24.300 | $ 19.820 | $ 22.700 | $ 21.100 |
| Income (Loss) From Operations | ||||||
| Net investment loss(1) | $ (0.031) | $ (0.086) | $ (0.026) | $ (0.034) | $ (0.036) | $ (0.070) |
| Net realized and unrealized gain (loss) | (5.509) | 5.017 | 3.086 | 5.586 | (0.982) | 3.281 |
| Total income (loss) from operations | $ (5.540) | $ 4.931 | $ 3.060 | $ 5.552 | $ (1.018) | $ 3.211 |
| Less Distributions | ||||||
| From net realized gain | $ — | $ (3.701) | $ (0.730) | $ (1.072) | $ (1.862) | $ (1.611) |
| Total distributions | $ — | $ (3.701) | $ (0.730) | $ (1.072) | $ (1.862) | $ (1.611) |
| Net asset value — End of period | $22.320 | $27.860 | $26.630 | $24.300 | $19.820 | $22.700 |
| Total Return(2) | (19.89)% (3)(4) | 18.87% | 12.81% (4) | 28.12% (4) | (4.95)% (4) | 15.38% (4) |
| Ratios/Supplemental Data | ||||||
| Net assets, end of period (000’s omitted) | $ 27,445 | $ 35,483 | $ 33,253 | $ 32,825 | $ 28,419 | $ 32,397 |
| Ratios (as a percentage of average daily net assets): | ||||||
| Expenses | 1.20% (4)(5)(6) | 1.18% | 1.20% (4) | 1.29% (4) | 1.35% (4) | 1.36% (4) |
| Net investment loss | (0.25)% (6) | (0.29)% | (0.12)% | (0.14)% | (0.15)% | (0.32)% |
| Portfolio Turnover | 21% (3) | 58% | 41% | 39% | 41% | 65% |
| (1) | Computed using average shares outstanding. |
| (2) | Returns are historical and are calculated by determining the percentage change in net asset value with all distributions reinvested and do not reflect the effect of sales charges. |
| (3) | Not annualized. |
| (4) | The administrator reimbursed certain operating expenses (equal to 0.02%, 0.13%, 0.02%, 0.02% and 0.01% of average daily net assets for the six months ended June 30, 2022 and the years ended December 31, 2020, 2019, 2018 and 2017, respectively). Absent this reimbursement, total return would be lower. |
| (5) | Includes a reduction by the investment adviser of a portion of its adviser fee due to the Fund's investment in the Liquidity Fund (equal to less than 0.005% of average daily net assets for the six months ended June 30, 2022). |
| (6) | Annualized. |
| Class C | ||||||
| Six Months Ended June 30, 2022 (Unaudited) | Year Ended December 31, | |||||
| 2021 | 2020 | 2019 | 2018 | 2017 | ||
| Net asset value — Beginning of period | $ 22.960 | $ 22.670 | $ 20.940 | $ 17.330 | $ 20.230 | $ 19.110 |
| Income (Loss) From Operations | ||||||
| Net investment loss(1) | $ (0.105) | $ (0.259) | $ (0.169) | $ (0.191) | $ (0.195) | $ (0.215) |
| Net realized and unrealized gain (loss) | (4.535) | 4.250 | 2.629 | 4.873 | (0.843) | 2.946 |
| Total income (loss) from operations | $ (4.640) | $ 3.991 | $ 2.460 | $ 4.682 | $ (1.038) | $ 2.731 |
| Less Distributions | ||||||
| From net realized gain | $ — | $ (3.701) | $ (0.730) | $ (1.072) | $ (1.862) | $ (1.611) |
| Total distributions | $ — | $ (3.701) | $ (0.730) | $ (1.072) | $ (1.862) | $ (1.611) |
| Net asset value — End of period | $18.320 | $22.960 | $22.670 | $20.940 | $17.330 | $20.230 |
| Total Return(2) | (20.21)% (3)(4) | 18.02% | 12.00% (4) | 27.14% (4) | (5.66)% (4) | 14.46% (4) |
| Ratios/Supplemental Data | ||||||
| Net assets, end of period (000’s omitted) | $ 369 | $ 594 | $ 643 | $ 957 | $ 1,461 | $ 2,243 |
| Ratios (as a percentage of average daily net assets): | ||||||
| Expenses | 1.95% (4)(5)(6) | 1.93% | 1.95% (4) | 2.04% (4) | 2.10% (4) | 2.11% (4) |
| Net investment loss | (1.02)% (6) | (1.05)% | (0.88)% | (0.94)% | (0.93)% | (1.07)% |
| Portfolio Turnover | 21% (3) | 58% | 41% | 39% | 41% | 65% |
| (1) | Computed using average shares outstanding. |
| (2) | Returns are historical and are calculated by determining the percentage change in net asset value with all distributions reinvested and do not reflect the effect of sales charges. |
| (3) | Not annualized. |
| (4) | The administrator reimbursed certain operating expenses (equal to 0.02%, 0.13%, 0.02%, 0.02% and 0.01% of average daily net assets for the six months ended June 30, 2022 and the years ended December 31, 2020, 2019, 2018 and 2017, respectively). Absent this reimbursement, total return would be lower. |
| (5) | Includes a reduction by the investment adviser of a portion of its adviser fee due to the Fund's investment in the Liquidity Fund (equal to less than 0.005% of average daily net assets for the six months ended June 30, 2022). |
| (6) | Annualized. |
| Class I | ||||||
| Six Months Ended June 30, 2022 (Unaudited) | Year Ended December 31, | |||||
| 2021 | 2020 | 2019 | 2018 | 2017 | ||
| Net asset value — Beginning of period | $ 28.920 | $ 27.450 | $ 25.010 | $ 20.330 | $ 23.170 | $ 21.460 |
| Income (Loss) From Operations | ||||||
| Net investment income (loss)(1) | $ (0.001) | $ (0.004) | $ 0.029 | $ 0.032 | $ 0.028 | $ (0.010) |
| Net realized and unrealized gain (loss) | (5.729) | 5.175 | 3.193 | 5.720 | (1.006) | 3.331 |
| Total income (loss) from operations | $ (5.730) | $ 5.171 | $ 3.222 | $ 5.752 | $ (0.978) | $ 3.321 |
| Less Distributions | ||||||
| From net investment income | $ — | $ — | $ (0.052) | $ — | $ — | $ — |
| From net realized gain | — | (3.701) | (0.730) | (1.072) | (1.862) | (1.611) |
| Total distributions | $ — | $ (3.701) | $ (0.782) | $ (1.072) | $ (1.862) | $ (1.611) |
| Net asset value — End of period | $23.190 | $28.920 | $27.450 | $25.010 | $20.330 | $23.170 |
| Total Return(2) | (19.81)% (3)(4) | 19.19% | 13.10% (4) | 28.40% (4) | (4.67)% (4) | 15.63% (4) |
| Ratios/Supplemental Data | ||||||
| Net assets, end of period (000’s omitted) | $ 23,583 | $ 32,497 | $ 17,063 | $ 17,357 | $ 11,158 | $ 11,216 |
| Ratios (as a percentage of average daily net assets): | ||||||
| Expenses | 0.95% (4)(5)(6) | 0.93% | 0.95% (4) | 1.03% (4) | 1.10% (4) | 1.11% (4) |
| Net investment income (loss) | (0.01)% (6) | (0.01)% | 0.13% | 0.13% | 0.12% | (0.04)% |
| Portfolio Turnover | 21% (3) | 58% | 41% | 39% | 41% | 65% |
| (1) | Computed using average shares outstanding. |
| (2) | Returns are historical and are calculated by determining the percentage change in net asset value with all distributions reinvested. |
| (3) | Not annualized. |
| (4) | The administrator reimbursed certain operating expenses (equal to 0.02%, 0.13%, 0.02%, 0.02% and 0.01% of average daily net assets for the six months ended June 30, 2022 and the years ended December 31, 2020, 2019, 2018 and 2017, respectively). Absent this reimbursement, total return would be lower. |
| (5) | Includes a reduction by the investment adviser of a portion of its adviser fee due to the Fund's investment in the Liquidity Fund (equal to less than 0.005% of average daily net assets for the six months ended June 30, 2022). |
| (6) | Annualized. |
| Aggregate cost | $ 48,540,316 |
| Gross unrealized appreciation | $ 7,525,744 |
| Gross unrealized depreciation | (4,656,716) |
| Net unrealized appreciation | $ 2,869,028 |
| Six Months Ended June 30, 2022 (Unaudited) | Year Ended December 31, 2021 | ||||
| Shares | Amount | Shares | Amount | ||
| Class A | |||||
| Sales | 6,053 | $ 153,578 | 31,702 | $ 906,185 | |
| Issued to shareholders electing to receive payments of distributions in Fund shares | — | — | 133,492 | 3,625,656 | |
| Redemptions | (50,582) | (1,284,744) | (142,186) | (4,176,755) | |
| Converted from Class C shares | 998 | 25,133 | 1,662 | 46,461 | |
| Net increase (decrease) | (43,531) | $(1,106,033) | 24,670 | $ 401,547 | |
| Six Months Ended June 30, 2022 (Unaudited) | Year Ended December 31, 2021 | ||||
| Shares | Amount | Shares | Amount | ||
| Class C | |||||
| Sales | — | $ — | 393 | $ 9,563 | |
| Issued to shareholders electing to receive payments of distributions in Fund shares | — | — | 3,712 | 83,119 | |
| Redemptions | (4,475) | (90,050) | (4,646) | (118,510) | |
| Converted to Class A shares | (1,214) | (25,133) | (1,964) | (46,461) | |
| Net decrease | (5,689) | $ (115,183) | (2,505) | $ (72,289) | |
| Class I | |||||
| Sales | 63,624 | $ 1,758,511 | 597,217 | $ 18,272,454 | |
| Issued to shareholders electing to receive payments of distributions in Fund shares | — | — | 136,573 | 3,849,997 | |
| Redemptions | (170,354) | (4,619,485) | (231,670) | (6,795,935) | |
| Net increase (decrease) | (106,730) | $(2,860,974) | 502,120 | $15,326,516 | |
| Name | Value, beginning of period | Purchases | Sales proceeds | Net realized gain (loss) | Change in unrealized appreciation (depreciation) | Value, end of period | Dividend income | Units/Shares, end of period |
| Short-Term Investments | ||||||||
| Cash Reserves Fund | $1,463,016 | $7,535,347 | $(8,998,429) | $ 66 | $ — | $ — | $ 239 | — |
| Liquidity Fund | — | 2,777,502 | (2,067,351) | — | — | 710,151 | 867 | 710,151 |
| Total | $ 66 | $ — | $710,151 | $1,106 | ||||
| • | Level 1 – quoted prices in active markets for identical investments |
| • | Level 2 – other significant observable inputs (including quoted prices for similar investments, interest rates, prepayment speeds, credit risk, etc.) |
| • | Level 3 – significant unobservable inputs (including a fund's own assumptions in determining the fair value of investments) |
| Asset Description | Level 1 | Level 2 | Level 3 | Total |
| Common Stocks | $ 50,699,193* | $ — | $ — | $ 50,699,193 |
| Short-Term Investments | 710,151 | — | — | 710,151 |
| Total Investments | $51,409,344 | $ — | $ — | $51,409,344 |
| * | The level classification by major category of investments is the same as the category presentation in the Portfolio of Investments. |
| Officers | |
| Eric A. Stein President | Jill R. Damon Secretary |
| Deidre E. Walsh Vice President and Chief Legal Officer | Richard F. Froio Chief Compliance Officer |
| James F. Kirchner Treasurer | |
| Trustees |
| George J. Gorman Chairperson | |
| Alan C. Bowser** | |
| Thomas E. Faust Jr.* | |
| Mark R. Fetting | |
| Cynthia E. Frost | |
| Valerie A. Mosley |
| Keith Quinton | |
| Marcus L. Smith | |
| Susan J. Sutherland | |
| Scott E. Wennerholm | |
| Nancy A. Wiser** |
| * | Interested Trustee |
| ** | Mr. Bowser and Ms. Wiser began serving as Trustees effective April 4, 2022. |
| Privacy Notice | April 2021 |
| FACTS | WHAT DOES EATON VANCE DO WITH YOUR PERSONAL INFORMATION? |
| Why? | Financial companies choose how they share your personal information. Federal law gives consumers the right to limit some but not all sharing. Federal law also requires us to tell you how we collect, share, and protect your personal information. Please read this notice carefully to understand what we do. |
| What? | The types of personal information we collect and share depend on the product or service you have with us. This information can include:■ Social Security number and income ■ investment experience and risk tolerance ■ checking account number and wire transfer instructions |
| How? | All financial companies need to share customers’ personal information to run their everyday business. In the section below, we list the reasons financial companies can share their customers’ personal information; the reasons Eaton Vance chooses to share; and whether you can limit this sharing. |
| Reasons we can share your personal information | Does Eaton Vance share? | Can you limit this sharing? |
| For our everyday business purposes — such as to process your transactions, maintain your account(s), respond to court orders and legal investigations, or report to credit bureaus | Yes | No |
| For our marketing purposes — to offer our products and services to you | Yes | No |
| For joint marketing with other financial companies | No | We don’t share |
| For our investment management affiliates’ everyday business purposes — information about your transactions, experiences, and creditworthiness | Yes | Yes |
| For our affiliates’ everyday business purposes — information about your transactions and experiences | Yes | No |
| For our affiliates’ everyday business purposes — information about your creditworthiness | No | We don’t share |
| For our investment management affiliates to market to you | Yes | Yes |
| For our affiliates to market to you | No | We don’t share |
| For nonaffiliates to market to you | No | We don’t share |
| To limit our sharing | Call toll-free 1-800-262-1122 or email: EVPrivacy@eatonvance.comPlease note:If you are a new customer, we can begin sharing your information 30 days from the date we sent this notice. When you are no longer our customer, we continue to share your information as described in this notice. However, you can contact us at any time to limit our sharing. |
| Questions? | Call toll-free 1-800-262-1122 or email: EVPrivacy@eatonvance.com |
| Privacy Notice — continued | April 2021 |
| Who we are | |
| Who is providing this notice? | Eaton Vance Management, Eaton Vance Distributors, Inc., Eaton Vance Trust Company, Eaton Vance Management (International) Limited, Eaton Vance Advisers International Ltd., Eaton Vance Global Advisors Limited, Eaton Vance Management’s Real Estate Investment Group, Boston Management and Research, Calvert Research and Management, Eaton Vance and Calvert Fund Families and our investment advisory affiliates (“Eaton Vance”) (see Investment Management Affiliates definition below) |
| What we do | |
| How does Eaton Vance protect my personal information? | To protect your personal information from unauthorized access and use, we use security measures that comply with federal law. These measures include computer safeguards and secured files and buildings. We have policies governing the proper handling of customer information by personnel and requiring third parties that provide support to adhere to appropriate security standards with respect to such information. |
| How does Eaton Vance collect my personal information? | We collect your personal information, for example, when you■ open an account or make deposits or withdrawals from your account ■ buy securities from us or make a wire transfer ■ give us your contact informationWe also collect your personal information from others, such as credit bureaus, affiliates, or other companies. |
| Why can’t I limit all sharing? | Federal law gives you the right to limit only■ sharing for affiliates’ everyday business purposes — information about your creditworthiness ■ affiliates from using your information to market to you ■ sharing for nonaffiliates to market to youState laws and individual companies may give you additional rights to limit sharing. See below for more on your rights under state law. |
| Definitions | |
| Investment Management Affiliates | Eaton Vance Investment Management Affiliates include registered investment advisers, registered broker- dealers, and registered and unregistered funds. Investment Management Affiliates does not include entities associated with Morgan Stanley Wealth Management, such as Morgan Stanley Smith Barney LLC and Morgan Stanley & Co. |
| Affiliates | Companies related by common ownership or control. They can be financial and nonfinancial companies.■ Our affiliates include companies with a Morgan Stanley name and financial companies such as Morgan Stanley Smith Barney LLC and Morgan Stanley & Co. |
| Nonaffiliates | Companies not related by common ownership or control. They can be financial and nonfinancial companies.■ Eaton Vance does not share with nonaffiliates so they can market to you. |
| Joint marketing | A formal agreement between nonaffiliated financial companies that together market financial products or services to you.■ Eaton Vance doesn’t jointly market. |
| Other important information | |
| Vermont: Except as permitted by law, we will not share personal information we collect about Vermont residents with Nonaffiliates unless you provide us with your written consent to share such information.California: Except as permitted by law, we will not share personal information we collect about California residents with Nonaffiliates and we will limit sharing such personal information with our Affiliates to comply with California privacy laws that apply to us. | |
Two International Place
Boston, MA 02110
Two International Place
Boston, MA 02110
Two International Place
Boston, MA 02110
(617) 482-8260
State Street Financial Center, One Lincoln Street
Boston, MA 02111
Attn: Eaton Vance Funds
P.O. Box 9653
Providence, RI 02940-9653
(800) 262-1122
Boston, MA 02110


| % Average Annual Total Returns1,2 | Class Inception Date | Performance Inception Date | Six Months | One Year | Five Years | Ten Years |
| Class A at NAV | 12/18/1981 | 12/18/1981 | (13.70)% | (4.76)% | 10.84% | 11.53% |
| Class A with 5.25% Maximum Sales Charge | — | — | (18.23) | (9.78) | 9.65 | 10.93 |
| Class C at NAV | 11/01/1993 | 12/18/1981 | (13.98) | (5.45) | 10.01 | 10.85 |
| Class C with 1% Maximum Sales Charge | — | — | (14.83) | (6.34) | 10.01 | 10.85 |
| Class I at NAV | 06/20/2005 | 12/18/1981 | (13.60) | (4.53) | 11.11 | 11.80 |
| S&P 500® Index | — | — | (19.96)% | (10.62)% | 11.30% | 12.95% |
| NASDAQ US Broad Dividend AchieversTM Index | — | — | (12.08) | (2.38) | 10.25 | 11.10 |
| % Total Annual Operating Expense Ratios3 | Class A | Class C | Class I |
| 0.99% | 1.74% | 0.74% |
| Sector Allocation (% of net assets)* |

| * | Excludes cash and cash equivalents. |
| Top 10 Holdings (% of net assets)* | |
| AbbVie, Inc. | 3.2% |
| Verizon Communications, Inc. | 3.2 |
| Bristol-Myers Squibb Co. | 3.2 |
| Pfizer, Inc. | 3.1 |
| Baker Hughes Co. | 2.8 |
| American Financial Group, Inc. | 2.7 |
| Allstate Corp. (The) | 2.7 |
| JPMorgan Chase & Co. | 2.6 |
| Comcast Corp., Class A | 2.5 |
| Danaher Corp. | 2.4 |
| Total | 28.4% |
| * | Excludes cash and cash equivalents. |
| 1 | S&P 500® Index is an unmanaged index of large-cap stocks commonly used as a measure of U.S. stock market performance. S&P Dow Jones Indices are a product of S&P Dow Jones Indices LLC (“S&P DJI”) and have been licensed for use. S&P® and S&P 500® are registered trademarks of S&P DJI; Dow Jones® is a registered trademark of Dow Jones Trademark Holdings LLC (“Dow Jones”); S&P DJI, Dow Jones and their respective affiliates do not sponsor, endorse, sell or promote the Fund, will not have any liability with respect thereto and do not have any liability for any errors, omissions, or interruptions of the S&P Dow Jones Indices. NASDAQ US Broad Dividend AchieversTM Index is an unmanaged index of US stocks with at least ten consecutive years of increasing annual regular dividends. Source: Nasdaq, Inc. The information is provided by Nasdaq (with its affiliates, are referred to as the “Corporations”) and Nasdaq’s third party licensors on an “as is” basis and the Corporations make no guarantees and bear no liability of any kind with respect to the information or the Fund. Unless otherwise stated, index returns do not reflect the effect of any applicable sales charges, commissions, expenses, taxes or leverage, as applicable. It is not possible to invest directly in an index. |
| 2 | Total Returns at NAV do not include applicable sales charges. If sales charges were deducted, the returns would be lower. Total Returns shown with maximum sales charge reflect the stated maximum sales charge. Unless otherwise stated, performance does not reflect the deduction of taxes on Fund distributions or redemptions of Fund shares.Effective November 5, 2020, Class C shares automatically convert to Class A shares eight years after purchase. The average annual total returns listed for Class C reflect conversion to Class A shares after eight years. Prior to November 5, 2020, Class C shares automatically converted to Class A shares ten years after purchase. |
| 3 | Source: Fund prospectus. The expense ratios for the current reporting period can be found in the Financial Highlights section of this report. Performance reflects expenses waived and/or reimbursed, if applicable. Without such waivers and/or reimbursements, performance would have been lower. |
| Fund profile subject to change due to active management. |
| Beginning Account Value (1/1/22) | Ending Account Value (6/30/22) | Expenses Paid During Period* (1/1/22 – 6/30/22) | Annualized Expense Ratio | |
| Actual | ||||
| Class A | $1,000.00 | $ 863.00 | $4.62 | 1.00% |
| Class C | $1,000.00 | $ 860.20 | $8.07 | 1.75% |
| Class I | $1,000.00 | $ 864.00 | $3.47 | 0.75% |
| Hypothetical | ||||
| (5% return per year before expenses) | ||||
| Class A | $1,000.00 | $1,019.84 | $5.01 | 1.00% |
| Class C | $1,000.00 | $1,016.12 | $8.75 | 1.75% |
| Class I | $1,000.00 | $1,021.08 | $3.76 | 0.75% |
| * | Expenses are equal to the Fund's annualized expense ratio for the indicated Class, multiplied by the average account value over the period, multiplied by 181/365 (to reflect the one-half year period). The Example assumes that the $1,000 was invested at the net asset value per share determined at the close of business on December 31, 2021. |
| Common Stocks — 98.0% |
| Security | Shares | Value | |
| Banks — 7.0% | |||
| JPMorgan Chase & Co. | 212,200 | $ 23,895,842 | |
| PNC Financial Services Group, Inc. (The) | 124,900 | 19,705,473 | |
| Truist Financial Corp. | 438,100 | 20,779,083 | |
| $ 64,380,398 | |||
| Beverages — 4.5% | |||
| Coca-Cola Europacific Partners PLC | 396,500 | $ 20,463,365 | |
| PepsiCo, Inc. | 125,900 | 20,982,494 | |
| $ 41,445,859 | |||
| Biotechnology — 5.3% | |||
| AbbVie, Inc. | 190,800 | $ 29,222,928 | |
| Amgen, Inc. | 80,900 | 19,682,970 | |
| $ 48,905,898 | |||
| Capital Markets — 4.0% | |||
| BlackRock, Inc. | 23,600 | $ 14,373,344 | |
| CME Group, Inc. | 55,900 | 11,442,730 | |
| S&P Global, Inc. | 31,300 | 10,549,978 | |
| $ 36,366,052 | |||
| Chemicals — 1.7% | |||
| FMC Corp. | 146,800 | $ 15,709,068 | |
| $ 15,709,068 | |||
| Commercial Services & Supplies — 1.9% | |||
| Waste Management, Inc. | 115,400 | $ 17,653,892 | |
| $ 17,653,892 | |||
| Communications Equipment — 1.4% | |||
| Cisco Systems, Inc. | 294,800 | $ 12,570,272 | |
| $ 12,570,272 | |||
| Containers & Packaging — 1.6% | |||
| Packaging Corp. of America | 106,800 | $ 14,685,000 | |
| $ 14,685,000 | |||
| Diversified Telecommunication Services — 3.2% | |||
| Verizon Communications, Inc. | 572,100 | $ 29,034,075 | |
| $ 29,034,075 | |||
| Security | Shares | Value | |
| Electric Utilities — 2.7% | |||
| Constellation Energy Corp. | 89,400 | $ 5,119,044 | |
| Xcel Energy, Inc. | 280,500 | 19,848,180 | |
| $ 24,967,224 | |||
| Electrical Equipment — 1.9% | |||
| Emerson Electric Co. | 220,800 | $ 17,562,432 | |
| $ 17,562,432 | |||
| Energy Equipment & Services — 2.8% | |||
| Baker Hughes Co. | 876,100 | $ 25,293,007 | |
| $ 25,293,007 | |||
| Equity Real Estate Investment Trusts (REITs) — 3.6% | |||
| Healthpeak Properties, Inc. | 661,100 | $ 17,129,101 | |
| Lamar Advertising Co., Class A | 184,800 | 16,256,856 | |
| $ 33,385,957 | |||
| Food & Staples Retailing — 2.3% | |||
| Sysco Corp. | 246,500 | $ 20,881,015 | |
| $ 20,881,015 | |||
| Health Care Equipment & Supplies — 4.1% | |||
| Abbott Laboratories | 169,300 | $ 18,394,445 | |
| Medtronic PLC | 213,400 | 19,152,650 | |
| $ 37,547,095 | |||
| Health Care Providers & Services — 2.1% | |||
| Elevance Health, Inc. | 39,600 | $ 19,110,168 | |
| $ 19,110,168 | |||
| Household Products — 2.1% | |||
| Procter & Gamble Co. (The) | 131,000 | $ 18,836,490 | |
| $ 18,836,490 | |||
| Independent Power and Renewable Electricity Producers — 2.4% | |||
| NextEra Energy Partners, L.P. | 293,500 | $ 21,765,960 | |
| $ 21,765,960 | |||
| Insurance — 5.4% | |||
| Allstate Corp. (The) | 193,200 | $ 24,484,236 | |
| American Financial Group, Inc. | 176,800 | 24,541,608 | |
| $ 49,025,844 | |||
| Security | Shares | Value | |
| Interactive Media & Services — 0.8% | |||
| Alphabet, Inc., Class A(1) | 3,500 | $ 7,627,410 | |
| $ 7,627,410 | |||
| IT Services — 4.7% | |||
| Automatic Data Processing, Inc. | 84,700 | $ 17,790,388 | |
| Broadridge Financial Solutions, Inc. | 110,600 | 15,766,030 | |
| Fidelity National Information Services, Inc. | 100,300 | 9,194,501 | |
| $ 42,750,919 | |||
| Life Sciences Tools & Services — 2.4% | |||
| Danaher Corp. | 87,700 | $ 22,233,704 | |
| $ 22,233,704 | |||
| Machinery — 3.6% | |||
| Illinois Tool Works, Inc. | 101,000 | $ 18,407,250 | |
| Westinghouse Air Brake Technologies Corp. | 178,200 | 14,626,656 | |
| $ 33,033,906 | |||
| Media — 3.4% | |||
| Comcast Corp., Class A | 583,400 | $ 22,892,616 | |
| Interpublic Group of Cos., Inc. (The) | 297,300 | 8,184,669 | |
| $ 31,077,285 | |||
| Mortgage Real Estate Investment Trusts (REITs) — 0.4% | |||
| Hannon Armstrong Sustainable Infrastructure Capital, Inc.(2) | 109,900 | $ 4,160,814 | |
| $ 4,160,814 | |||
| Multi-Utilities — 2.0% | |||
| Sempra Energy | 121,900 | $ 18,317,913 | |
| $ 18,317,913 | |||
| Pharmaceuticals — 6.3% | |||
| Bristol-Myers Squibb Co. | 375,700 | $ 28,928,900 | |
| Pfizer, Inc. | 549,200 | 28,794,556 | |
| $ 57,723,456 | |||
| Professional Services — 2.0% | |||
| Booz Allen Hamilton Holding Corp. | 199,900 | $ 18,062,964 | |
| $ 18,062,964 | |||
| Road & Rail — 1.9% | |||
| Union Pacific Corp. | 80,800 | $ 17,233,024 | |
| $ 17,233,024 | |||
| Security | Shares | Value | |
| Semiconductors & Semiconductor Equipment — 5.4% | |||
| Broadcom, Inc. | 42,500 | $ 20,646,925 | |
| Lam Research Corp. | 32,100 | 13,679,415 | |
| Texas Instruments, Inc. | 96,000 | 14,750,400 | |
| $ 49,076,740 | |||
| Software — 1.4% | |||
| Microsoft Corp. | 50,467 | $ 12,961,439 | |
| $ 12,961,439 | |||
| Specialty Retail — 3.7% | |||
| Bath & Body Works, Inc. | 171,800 | $ 4,624,856 | |
| Best Buy Co., Inc. | 137,500 | 8,963,625 | |
| Home Depot, Inc. (The) | 73,500 | 20,158,845 | |
| $ 33,747,326 | |||
| Total Common Stocks (identified cost $865,960,380) | $897,132,606 | ||
| Short-Term Investments — 2.1% |
| Affiliated Fund — 2.0% |
| Security | Shares | Value | |
| Morgan Stanley Institutional Liquidity Funds - Government Portfolio, Institutional Class, 1.38%(3) | 17,610,612 | $ 17,610,612 | |
| Total Affiliated Fund (identified cost $17,610,612) | $ 17,610,612 | ||
| Securities Lending Collateral — 0.1% |
| Security | Shares | Value | |
| State Street Navigator Securities Lending Government Money Market Portfolio, 1.56%(4) | 1,100,888 | $ 1,100,888 | |
| Total Securities Lending Collateral (identified cost $1,100,888) | $ 1,100,888 | ||
| Total Short-Term Investments (identified cost $18,711,500) | $ 18,711,500 | ||
| Total Investments — 100.1% (identified cost $884,671,880) | $915,844,106 | ||
| Other Assets, Less Liabilities — (0.1)% | $ (812,653) | ||
| Net Assets — 100.0% | $915,031,453 | ||
| The percentage shown for each investment category in the Portfolio of Investments is based on net assets. | |
| (1) | Non-income producing security. |
| (2) | All or a portion of this security was on loan at June 30, 2022. The aggregate market value of securities on loan at June 30, 2022 was $4,119,206. |
| (3) | May be deemed to be an affiliated investment company. The rate shown is the annualized seven-day yield as of June 30, 2022. |
| (4) | Represents investment of cash collateral received in connection with securities lending. |
| June 30, 2022 | |
| Assets | |
| Unaffiliated investments, at value (identified cost $867,061,268) — including $4,119,206 of securities on loan | $ 898,233,494 |
| Affiliated investment, at value (identified cost $17,610,612) | 17,610,612 |
| Dividends receivable | 1,461,971 |
| Dividends receivable from affiliated investment | 10,641 |
| Receivable for investments sold | 2,777,490 |
| Receivable for Fund shares sold | 239,189 |
| Securities lending income receivable | 213 |
| Tax reclaims receivable | 112,302 |
| Total assets | $920,445,912 |
| Liabilities | |
| Collateral for securities loaned | $ 1,100,888 |
| Payable for investments purchased | 2,888,157 |
| Payable for Fund shares redeemed | 492,634 |
| Payable to affiliates: | |
| Investment adviser fee | 488,246 |
| Distribution and service fees | 163,111 |
| Trustees' fees | 8,460 |
| Accrued expenses | 272,963 |
| Total liabilities | $ 5,414,459 |
| Net Assets | $915,031,453 |
| Sources of Net Assets | |
| Paid-in capital | $ 623,470,398 |
| Distributable earnings | 291,561,055 |
| Net Assets | $915,031,453 |
| Class A Shares | |
| Net Assets | $ 685,745,565 |
| Shares Outstanding | 40,316,650 |
| Net Asset Value and Redemption Price Per Share (net assets ÷ shares of beneficial interest outstanding) | $ 17.01 |
| Maximum Offering Price Per Share (100 ÷ 94.75 of net asset value per share) | $ 17.95 |
| Class C Shares | |
| Net Assets | $ 22,807,948 |
| Shares Outstanding | 1,331,057 |
| Net Asset Value and Offering Price Per Share* (net assets ÷ shares of beneficial interest outstanding) | $ 17.14 |
| Class I Shares | |
| Net Assets | $ 206,477,940 |
| Shares Outstanding | 12,149,661 |
| Net Asset Value, Offering Price and Redemption Price Per Share (net assets ÷ shares of beneficial interest outstanding) | $ 16.99 |
| On sales of $50,000 or more, the offering price of Class A shares is reduced. | |
| * | Redemption price per share is equal to the net asset value less any applicable contingent deferred sales charge. |
| Six Months Ended | |
| June 30, 2022 | |
| Investment Income | |
| Dividend income (net of foreign taxes withheld of $1,617) | $ 14,290,129 |
| Dividend income from affiliated investments | 16,108 |
| Securities lending income, net | 794 |
| Total investment income | $ 14,307,031 |
| Expenses | |
| Investment adviser fee | $ 3,176,812 |
| Distribution and service fees: | |
| Class A | 938,240 |
| Class C | 124,804 |
| Trustees’ fees and expenses | 22,941 |
| Custodian fee | 123,934 |
| Transfer and dividend disbursing agent fees | 265,096 |
| Legal and accounting services | 34,795 |
| Printing and postage | 37,677 |
| Registration fees | 26,074 |
| Miscellaneous | 27,785 |
| Total expenses | $ 4,778,158 |
| Deduct: | |
| Waiver and/or reimbursement of expenses by affiliates | $ 2,140 |
| Total expense reductions | $ 2,140 |
| Net expenses | $ 4,776,018 |
| Net investment income | $ 9,531,013 |
| Realized and Unrealized Gain (Loss) | |
| Net realized gain (loss): | |
| Investment transactions | $ 156,336,443 |
| Investment transactions - affiliated investment | (168) |
| Net realized gain | $ 156,336,275 |
| Change in unrealized appreciation (depreciation): | |
| Investments | $ (312,606,979) |
| Foreign currency | (4,727) |
| Net change in unrealized appreciation (depreciation) | $(312,611,706) |
| Net realized and unrealized loss | $(156,275,431) |
| Net decrease in net assets from operations | $(146,744,418) |
| Six Months Ended June 30, 2022 (Unaudited) | Year Ended December 31, 2021 | |
| Increase (Decrease) in Net Assets | ||
| From operations: | ||
| Net investment income | $ 9,531,013 | $ 19,696,696 |
| Net realized gain | 156,336,275 | 168,744,483 |
| Net change in unrealized appreciation (depreciation) | (312,611,706) | 34,823,907 |
| Net increase (decrease) in net assets from operations | $ (146,744,418) | $ 223,265,086 |
| Distributions to shareholders: | ||
| Class A | $ (5,400,110) | $ (51,288,730) |
| Class C | (82,340) | (1,524,848) |
| Class I | (1,882,076) | (15,397,929) |
| Total distributions to shareholders | $ (7,364,526) | $ (68,211,507) |
| Transactions in shares of beneficial interest: | ||
| Class A | $ (19,803,088) | $ (21,722,994) |
| Class C | (712,870) | (6,037,273) |
| Class I | 1,397,938 | 9,304,894 |
| Net decrease in net assets from Fund share transactions | $ (19,118,020) | $ (18,455,373) |
| Net increase (decrease) in net assets | $ (173,226,964) | $ 136,598,206 |
| Net Assets | ||
| At beginning of period | $1,088,258,417 | $ 951,660,211 |
| At end of period | $ 915,031,453 | $1,088,258,417 |
| Class A | ||||||
| Six Months Ended June 30, 2022 (Unaudited) | Year Ended December 31, | |||||
| 2021 | 2020 | 2019 | 2018 | 2017 | ||
| Net asset value — Beginning of period | $ 19.850 | $ 17.030 | $ 15.610 | $ 12.510 | $ 14.550 | $ 13.510 |
| Income (Loss) From Operations | ||||||
| Net investment income(1) | $ 0.172 | $ 0.355 | $ 0.276 | $ 0.227 | $ 0.242 | $ 0.282 |
| Net realized and unrealized gain (loss) | (2.880) | 3.744 | 1.590 | 3.607 | (0.942) | 2.212 |
| Total income (loss) from operations | $ (2.708) | $ 4.099 | $ 1.866 | $ 3.834 | $ (0.700) | $ 2.494 |
| Less Distributions | ||||||
| From net investment income | $ (0.132) | $ (0.344) | $ (0.264) | $ (0.264) | $ (0.264) | $ (0.264) |
| From net realized gain | — | (0.935) | (0.182) | (0.470) | (1.076) | (1.190) |
| Total distributions | $ (0.132) | $ (1.279) | $ (0.446) | $ (0.734) | $ (1.340) | $ (1.454) |
| Net asset value — End of period | $ 17.010 | $ 19.850 | $ 17.030 | $ 15.610 | $ 12.510 | $ 14.550 |
| Total Return(2) | (13.70)% (3) | 24.42% | 12.32% | 31.09% | (5.40)% | 18.89% |
| Ratios/Supplemental Data | ||||||
| Net assets, end of period (000’s omitted) | $685,746 | $821,560 | $725,569 | $706,043 | $558,487 | $674,421 |
| Ratios (as a percentage of average daily net assets):(4) | ||||||
| Expenses | 1.00% (5)(6) | 0.99% | 1.01% | 1.01% | 1.02% | 1.03% |
| Net investment income | 1.88% (5) | 1.89% | 1.83% | 1.57% | 1.66% | 1.98% |
| Portfolio Turnover of the Portfolio(7) | — | — | — | — | 37% (3) | 86% |
| Portfolio Turnover of the Fund | 37% (3) | 74% | 81% | 55% | 41% (3)(8) | — |
| (1) | Computed using average shares outstanding. |
| (2) | Returns are historical and are calculated by determining the percentage change in net asset value with all distributions reinvested and do not reflect the effect of sales charges. |
| (3) | Not annualized. |
| (4) | Includes the Fund’s share of the Portfolio’s allocated expenses for the period while the Fund was investing in the Portfolio. |
| (5) | Annualized. |
| (6) | The investment adviser reduced a portion of its adviser fee (equal to less than 0.005% of average daily net assets for the six months ended June 30, 2022). |
| (7) | Portfolio turnover represents the rate of portfolio activity for the period while the Fund was investing in the Portfolio. |
| (8) | For the period from June 11, 2018 through December 31, 2018 when the Fund was making investments directly in securities. |
| References to Portfolio herein are to Dividend Builder Portfolio, a Massachusetts business trust having the same investment objective and policies as the Fund, in which the Fund invested all of its investable assets prior to June 11, 2018. | |
| Class C | ||||||
| Six Months Ended June 30, 2022 (Unaudited) | Year Ended December 31, | |||||
| 2021 | 2020 | 2019 | 2018 | 2017 | ||
| Net asset value — Beginning of period | $ 19.990 | $ 17.150 | $ 15.710 | $ 12.580 | $ 14.620 | $ 13.580 |
| Income (Loss) From Operations | ||||||
| Net investment income(1) | $ 0.104 | $ 0.218 | $ 0.166 | $ 0.115 | $ 0.133 | $ 0.177 |
| Net realized and unrealized gain (loss) | (2.893) | 3.758 | 1.602 | 3.636 | (0.945) | 2.209 |
| Total income (loss) from operations | $ (2.789) | $ 3.976 | $ 1.768 | $ 3.751 | $ (0.812) | $ 2.386 |
| Less Distributions | ||||||
| From net investment income | $ (0.061) | $ (0.201) | $ (0.146) | $ (0.151) | $ (0.152) | $ (0.156) |
| From net realized gain | — | (0.935) | (0.182) | (0.470) | (1.076) | (1.190) |
| Total distributions | $ (0.061) | $ (1.136) | $ (0.328) | $ (0.621) | $ (1.228) | $ (1.346) |
| Net asset value — End of period | $17.140 | $19.990 | $17.150 | $15.710 | $ 12.580 | $ 14.620 |
| Total Return(2) | (13.98)% (3) | 23.43% | 11.51% | 30.13% | (6.09)% | 17.89% |
| Ratios/Supplemental Data | ||||||
| Net assets, end of period (000’s omitted) | $ 22,808 | $ 27,405 | $ 29,195 | $ 56,585 | $107,495 | $149,298 |
| Ratios (as a percentage of average daily net assets):(4) | ||||||
| Expenses | 1.75% (5)(6) | 1.74% | 1.76% | 1.77% | 1.77% | 1.78% |
| Net investment income | 1.13% (5) | 1.15% | 1.10% | 0.80% | 0.91% | 1.24% |
| Portfolio Turnover of the Portfolio(7) | — | — | — | — | 37% (3) | 86% |
| Portfolio Turnover of the Fund | 37% (3) | 74% | 81% | 55% | 41% (3)(8) | — |
| (1) | Computed using average shares outstanding. |
| (2) | Returns are historical and are calculated by determining the percentage change in net asset value with all distributions reinvested and do not reflect the effect of sales charges. |
| (3) | Not annualized. |
| (4) | Includes the Fund’s share of the Portfolio’s allocated expenses for the period while the Fund was investing in the Portfolio. |
| (5) | Annualized. |
| (6) | The investment adviser reduced a portion of its adviser fee (equal to less than 0.005% of average daily net assets for the six months ended June 30, 2022). |
| (7) | Portfolio turnover represents the rate of portfolio activity for the period while the Fund was investing in the Portfolio. |
| (8) | For the period from June 11, 2018 through December 31, 2018 when the Fund was making investments directly in securities. |
| References to Portfolio herein are to Dividend Builder Portfolio, a Massachusetts business trust having the same investment objective and policies as the Fund, in which the Fund invested all of its investable assets prior to June 11, 2018. | |
| Class I | ||||||
| Six Months Ended June 30, 2022 (Unaudited) | Year Ended December 31, | |||||
| 2021 | 2020 | 2019 | 2018 | 2017 | ||
| Net asset value — Beginning of period | $ 19.830 | $ 17.020 | $ 15.600 | $ 12.500 | $ 14.530 | $ 13.500 |
| Income (Loss) From Operations | ||||||
| Net investment income(1) | $ 0.195 | $ 0.402 | $ 0.313 | $ 0.262 | $ 0.279 | $ 0.316 |
| Net realized and unrealized gain (loss) | (2.879) | 3.733 | 1.591 | 3.608 | (0.932) | 2.204 |
| Total income (loss) from operations | $ (2.684) | $ 4.135 | $ 1.904 | $ 3.870 | $ (0.653) | $ 2.520 |
| Less Distributions | ||||||
| From net investment income | $ (0.156) | $ (0.390) | $ (0.302) | $ (0.300) | $ (0.301) | $ (0.300) |
| From net realized gain | — | (0.935) | (0.182) | (0.470) | (1.076) | (1.190) |
| Total distributions | $ (0.156) | $ (1.325) | $ (0.484) | $ (0.770) | $ (1.377) | $ (1.490) |
| Net asset value — End of period | $ 16.990 | $ 19.830 | $ 17.020 | $ 15.600 | $ 12.500 | $ 14.530 |
| Total Return(2) | (13.60)% (3) | 24.68% | 12.61% | 31.44% | (5.10)% | 19.12% |
| Ratios/Supplemental Data | ||||||
| Net assets, end of period (000’s omitted) | $206,478 | $239,294 | $196,896 | $184,050 | $146,070 | $164,604 |
| Ratios (as a percentage of average daily net assets):(4) | ||||||
| Expenses | 0.75% (5)(6) | 0.74% | 0.76% | 0.76% | 0.77% | 0.78% |
| Net investment income | 2.13% (5) | 2.14% | 2.08% | 1.82% | 1.92% | 2.22% |
| Portfolio Turnover of the Portfolio(7) | — | — | — | — | 37% (3) | 86% |
| Portfolio Turnover of the Fund | 37% (3) | 74% | 81% | 55% | 41% (3)(8) | — |
| (1) | Computed using average shares outstanding. |
| (2) | Returns are historical and are calculated by determining the percentage change in net asset value with all distributions reinvested. |
| (3) | Not annualized. |
| (4) | Includes the Fund’s share of the Portfolio’s allocated expenses for the period while the Fund was investing in the Portfolio. |
| (5) | Annualized. |
| (6) | The investment adviser reduced a portion of its adviser fee (equal to less than 0.005% of average daily net assets for the six months ended June 30, 2022). |
| (7) | Portfolio turnover represents the rate of portfolio activity for the period while the Fund was investing in the Portfolio. |
| (8) | For the period from June 11, 2018 through December 31, 2018 when the Fund was making investments directly in securities. |
| References to Portfolio herein are to Dividend Builder Portfolio, a Massachusetts business trust having the same investment objective and policies as the Fund, in which the Fund invested all of its investable assets prior to June 11, 2018. | |
| Aggregate cost | $ 886,218,455 |
| Gross unrealized appreciation | $ 99,568,684 |
| Gross unrealized depreciation | (69,943,033) |
| Net unrealized appreciation | $ 29,625,651 |
| Average Daily Net Assets | Annual Fee Rate |
| Up to $500 million | 0.6500% |
| $500 million but less than $1 billion | 0.6250% |
| $1 billion but less than $1.5 billion | 0.6000% |
| $1.5 billion but less than $2 billion | 0.5500% |
| $2 billion but less than $3 billion | 0.5000% |
| $3 billion and over | 0.4375% |
| Six Months Ended June 30, 2022 (Unaudited) | Year Ended December 31, 2021 | ||||
| Shares | Amount | Shares | Amount | ||
| Class A | |||||
| Sales | 548,939 | $ 10,136,856 | 1,142,477 | $ 21,444,292 | |
| Issued to shareholders electing to receive payments of distributions in Fund shares | 246,605 | 4,586,222 | 2,282,140 | 43,779,123 | |
| Redemptions | (1,942,057) | (35,741,354) | (4,829,485) | (90,769,432) | |
| Converted from Class C shares | 65,795 | 1,215,188 | 206,437 | 3,823,023 | |
| Net decrease | (1,080,718) | $(19,803,088) | (1,198,431) | $(21,722,994) | |
| Class C | |||||
| Sales | 125,298 | $ 2,347,534 | 163,994 | $ 3,118,845 | |
| Issued to shareholders electing to receive payments of distributions in Fund shares | 4,260 | 79,593 | 76,214 | 1,476,883 | |
| Redemptions | (104,069) | (1,924,809) | (366,688) | (6,809,978) | |
| Converted to Class A shares | (65,295) | (1,215,188) | (204,962) | (3,823,023) | |
| Net decrease | (39,806) | $ (712,870) | (331,442) | $ (6,037,273) | |
| Class I | |||||
| Sales | 958,943 | $ 17,593,777 | 1,628,587 | $ 30,171,573 | |
| Issued to shareholders electing to receive payments of distributions in Fund shares | 94,621 | 1,758,305 | 750,764 | 14,380,481 | |
| Redemptions | (972,150) | (17,954,144) | (1,880,014) | (35,247,160) | |
| Net increase | 81,414 | $ 1,397,938 | 499,337 | $ 9,304,894 | |
| Remaining Contractual Maturity of the Transactions | |||||
| Overnight and Continuous | <30 days | 30 to 90 days | >90 days | Total | |
| Common Stocks | $1,100,888 | $ — | $ — | $ — | $1,100,888 |
| Name | Value, beginning of period | Purchases | Sales proceeds | Net realized gain (loss) | Change in unrealized appreciation (depreciation) | Value, end of period | Dividend income | Units/Shares, end of period |
| Short-Term Investments | ||||||||
| Cash Reserves Fund | $1,120,031 | $21,224,470 | $(22,344,333) | $ (168) | $ — | $ — | $ 1,033 | — |
| Liquidity Fund | — | 42,249,260 | (24,638,648) | — | — | 17,610,612 | 15,075 | 17,610,612 |
| Total | $(168) | $ — | $17,610,612 | $16,108 | ||||
| • | Level 1 – quoted prices in active markets for identical investments |
| • | Level 2 – other significant observable inputs (including quoted prices for similar investments, interest rates, prepayment speeds, credit risk, etc.) |
| • | Level 3 – significant unobservable inputs (including a fund's own assumptions in determining the fair value of investments) |
| Asset Description | Level 1 | Level 2 | Level 3 | Total |
| Common Stocks | $ 897,132,606* | $ — | $ — | $ 897,132,606 |
| Short-Term Investments: | ||||
| Affiliated Fund | 17,610,612 | — | — | 17,610,612 |
| Securities Lending Collateral | 1,100,888 | — | — | 1,100,888 |
| Total Investments | $915,844,106 | $ — | $ — | $915,844,106 |
| * | The level classification by major category of investments is the same as the category presentation in the Portfolio of Investments. |
| Officers | |
| Eric A. Stein President | Jill R. Damon Secretary |
| Deidre E. Walsh Vice President and Chief Legal Officer | Richard F. Froio Chief Compliance Officer |
| James F. Kirchner Treasurer | |
| Trustees |
| George J. Gorman Chairperson | |
| Alan C. Bowser** | |
| Thomas E. Faust Jr* | |
| Mark R. Fetting | |
| Cynthia E. Frost | |
| Valerie A. Mosley |
| Keith Quinton | |
| Marcus L. Smith | |
| Susan J. Sutherland | |
| Scott E. Wennerholm | |
| Nancy A. Wiser** |
| * | Interested Trustee |
| ** | Mr. Bowser and Ms. Wiser began serving as Trustees effective April 4, 2022. |
| Privacy Notice | April 2021 |
| FACTS | WHAT DOES EATON VANCE DO WITH YOUR PERSONAL INFORMATION? |
| Why? | Financial companies choose how they share your personal information. Federal law gives consumers the right to limit some but not all sharing. Federal law also requires us to tell you how we collect, share, and protect your personal information. Please read this notice carefully to understand what we do. |
| What? | The types of personal information we collect and share depend on the product or service you have with us. This information can include:■ Social Security number and income ■ investment experience and risk tolerance ■ checking account number and wire transfer instructions |
| How? | All financial companies need to share customers’ personal information to run their everyday business. In the section below, we list the reasons financial companies can share their customers’ personal information; the reasons Eaton Vance chooses to share; and whether you can limit this sharing. |
| Reasons we can share your personal information | Does Eaton Vance share? | Can you limit this sharing? |
| For our everyday business purposes — such as to process your transactions, maintain your account(s), respond to court orders and legal investigations, or report to credit bureaus | Yes | No |
| For our marketing purposes — to offer our products and services to you | Yes | No |
| For joint marketing with other financial companies | No | We don’t share |
| For our investment management affiliates’ everyday business purposes — information about your transactions, experiences, and creditworthiness | Yes | Yes |
| For our affiliates’ everyday business purposes — information about your transactions and experiences | Yes | No |
| For our affiliates’ everyday business purposes — information about your creditworthiness | No | We don’t share |
| For our investment management affiliates to market to you | Yes | Yes |
| For our affiliates to market to you | No | We don’t share |
| For nonaffiliates to market to you | No | We don’t share |
| To limit our sharing | Call toll-free 1-800-262-1122 or email: EVPrivacy@eatonvance.comPlease note:If you are a new customer, we can begin sharing your information 30 days from the date we sent this notice. When you are no longer our customer, we continue to share your information as described in this notice. However, you can contact us at any time to limit our sharing. |
| Questions? | Call toll-free 1-800-262-1122 or email: EVPrivacy@eatonvance.com |
| Privacy Notice — continued | April 2021 |
| Who we are | |
| Who is providing this notice? | Eaton Vance Management, Eaton Vance Distributors, Inc., Eaton Vance Trust Company, Eaton Vance Management (International) Limited, Eaton Vance Advisers International Ltd., Eaton Vance Global Advisors Limited, Eaton Vance Management’s Real Estate Investment Group, Boston Management and Research, Calvert Research and Management, Eaton Vance and Calvert Fund Families and our investment advisory affiliates (“Eaton Vance”) (see Investment Management Affiliates definition below) |
| What we do | |
| How does Eaton Vance protect my personal information? | To protect your personal information from unauthorized access and use, we use security measures that comply with federal law. These measures include computer safeguards and secured files and buildings. We have policies governing the proper handling of customer information by personnel and requiring third parties that provide support to adhere to appropriate security standards with respect to such information. |
| How does Eaton Vance collect my personal information? | We collect your personal information, for example, when you■ open an account or make deposits or withdrawals from your account ■ buy securities from us or make a wire transfer ■ give us your contact informationWe also collect your personal information from others, such as credit bureaus, affiliates, or other companies. |
| Why can’t I limit all sharing? | Federal law gives you the right to limit only■ sharing for affiliates’ everyday business purposes — information about your creditworthiness ■ affiliates from using your information to market to you ■ sharing for nonaffiliates to market to youState laws and individual companies may give you additional rights to limit sharing. See below for more on your rights under state law. |
| Definitions | |
| Investment Management Affiliates | Eaton Vance Investment Management Affiliates include registered investment advisers, registered broker- dealers, and registered and unregistered funds. Investment Management Affiliates does not include entities associated with Morgan Stanley Wealth Management, such as Morgan Stanley Smith Barney LLC and Morgan Stanley & Co. |
| Affiliates | Companies related by common ownership or control. They can be financial and nonfinancial companies.■ Our affiliates include companies with a Morgan Stanley name and financial companies such as Morgan Stanley Smith Barney LLC and Morgan Stanley & Co. |
| Nonaffiliates | Companies not related by common ownership or control. They can be financial and nonfinancial companies.■ Eaton Vance does not share with nonaffiliates so they can market to you. |
| Joint marketing | A formal agreement between nonaffiliated financial companies that together market financial products or services to you.■ Eaton Vance doesn’t jointly market. |
| Other important information | |
| Vermont: Except as permitted by law, we will not share personal information we collect about Vermont residents with Nonaffiliates unless you provide us with your written consent to share such information.California: Except as permitted by law, we will not share personal information we collect about California residents with Nonaffiliates and we will limit sharing such personal information with our Affiliates to comply with California privacy laws that apply to us. | |
Two International Place
Boston, MA 02110
Two International Place
Boston, MA 02110
Two International Place
Boston, MA 02110
(617) 482-8260
State Street Financial Center, One Lincoln Street
Boston, MA 02111
Attn: Eaton Vance Funds
P.O. Box 9653
Providence, RI 02940-9653
(800) 262-1122
Boston, MA 02110


| % Average Annual Total Returns1,2 | Class Inception Date | Performance Inception Date | Six Months | One Year | Five Years | Ten Years |
| Class A at NAV | 09/09/2002 | 09/09/2002 | (29.20)% | (24.79)% | 10.77% | 12.81% |
| Class A with 5.25% Maximum Sales Charge | — | — | (32.91) | (28.74) | 9.58 | 12.20 |
| Class C at NAV | 09/09/2002 | 09/09/2002 | (29.45) | (25.36) | 9.94 | 12.14 |
| Class C with 1% Maximum Sales Charge | — | — | (30.15) | (26.03) | 9.94 | 12.14 |
| Class I at NAV | 05/03/2007 | 09/09/2002 | (29.10) | (24.59) | 11.05 | 13.09 |
| Class R at NAV | 08/03/2009 | 09/09/2002 | (29.26) | (24.96) | 10.50 | 12.53 |
| Russell 1000® Growth Index | — | — | (28.07)% | (18.77)% | 14.28% | 14.79% |
| % Total Annual Operating Expense Ratios3 | Class A | Class C | Class I | Class R |
| 1.05% | 1.80% | 0.80% | 1.30% |
| Sector Allocation (% of net assets)* |
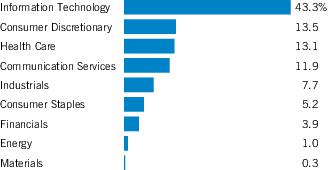
| * | Excludes cash and cash equivalents. |
| Top 10 Holdings (% of net assets)* | |
| Microsoft Corp. | 8.3% |
| Amazon.com, Inc. | 6.9 |
| Apple, Inc. | 6.2 |
| Alphabet, Inc., Class A | 5.9 |
| Visa, Inc., Class A | 5.7 |
| Adobe, Inc. | 3.0 |
| QUALCOMM, Inc. | 3.0 |
| Coca-Cola Co. (The) | 2.7 |
| Intuit, Inc. | 2.6 |
| Alphabet, Inc., Class C | 2.6 |
| Total | 46.9% |
| * | Excludes cash and cash equivalents. |
| 1 | Russell 1000® Growth Index is an unmanaged index of U.S. large-cap growth stocks. Unless otherwise stated, index returns do not reflect the effect of any applicable sales charges, commissions, expenses, taxes or leverage, as applicable. It is not possible to invest directly in an index. |
| 2 | Total Returns at NAV do not include applicable sales charges. If sales charges were deducted, the returns would be lower. Total Returns shown with maximum sales charge reflect the stated maximum sales charge. Unless otherwise stated, performance does not reflect the deduction of taxes on Fund distributions or redemptions of Fund shares.Effective November 5, 2020, Class C shares automatically convert to Class A shares eight years after purchase. The average annual total returns listed for Class C reflect conversion to Class A shares after eight years. Prior to November 5, 2020, Class C shares automatically converted to Class A shares ten years after purchase. |
| 3 | Source: Fund prospectus. Net expense ratios reflect a contractual expense reimbursement that continues through 4/30/23. The expense ratios for the current reporting period can be found in the Financial Highlights section of this report. Performance reflects expenses waived and/or reimbursed, if applicable. Without such waivers and/or reimbursements, performance would have been lower. |
| Fund profile subject to change due to active management. |
| Beginning Account Value (1/1/22) | Ending Account Value (6/30/22) | Expenses Paid During Period* (1/1/22 – 6/30/22) | Annualized Expense Ratio | |
| Actual | ||||
| Class A | $1,000.00 | $ 708.00 | $4.45** | 1.05% |
| Class C | $1,000.00 | $ 705.50 | $7.61** | 1.80% |
| Class I | $1,000.00 | $ 709.00 | $3.39** | 0.80% |
| Class R | $1,000.00 | $ 707.40 | $5.50** | 1.30% |
| Hypothetical | ||||
| (5% return per year before expenses) | ||||
| Class A | $1,000.00 | $1,019.59 | $5.26** | 1.05% |
| Class C | $1,000.00 | $1,015.87 | $9.00** | 1.80% |
| Class I | $1,000.00 | $1,020.83 | $4.01** | 0.80% |
| Class R | $1,000.00 | $1,018.35 | $6.51** | 1.30% |
| * | Expenses are equal to the Fund's annualized expense ratio for the indicated Class, multiplied by the average account value over the period, multiplied by 181/365 (to reflect the one-half year period). The Example assumes that the $1,000 was invested at the net asset value per share determined at the close of business on December 31, 2021. |
| ** | Absent an allocation of certain expenses to an affiliate, expenses would be higher. |
| Common Stocks — 99.9% |
| Security | Shares | Value | |
| Aerospace & Defense — 1.7% | |||
| Hexcel Corp. | 49,084 | $ 2,567,584 | |
| Raytheon Technologies Corp. | 25,585 | 2,458,974 | |
| $ 5,026,558 | |||
| Auto Components — 1.0% | |||
| Aptiv PLC(1) | 34,949 | $ 3,112,907 | |
| $ 3,112,907 | |||
| Beverages — 2.7% | |||
| Coca-Cola Co. (The) | 131,149 | $ 8,250,584 | |
| $ 8,250,584 | |||
| Biotechnology — 2.1% | |||
| AbbVie, Inc. | 41,436 | $ 6,346,338 | |
| $ 6,346,338 | |||
| Building Products — 0.7% | |||
| Trane Technologies PLC | 15,472 | $ 2,009,349 | |
| $ 2,009,349 | |||
| Capital Markets — 3.9% | |||
| Charles Schwab Corp. (The) | 61,175 | $ 3,865,037 | |
| Goldman Sachs Group, Inc. (The) | 19,736 | 5,861,987 | |
| Intercontinental Exchange, Inc. | 21,158 | 1,989,698 | |
| $ 11,716,722 | |||
| Chemicals — 0.3% | |||
| Ecolab, Inc. | 5,423 | $ 833,840 | |
| $ 833,840 | |||
| Commercial Services & Supplies — 1.6% | |||
| Copart, Inc.(1) | 16,029 | $ 1,741,711 | |
| Waste Connections, Inc. | 25,646 | 3,179,078 | |
| $ 4,920,789 | |||
| Electrical Equipment — 1.4% | |||
| AMETEK, Inc. | 37,368 | $ 4,106,369 | |
| $ 4,106,369 | |||
| Security | Shares | Value | |
| Electronic Equipment, Instruments & Components — 0.4% | |||
| Zebra Technologies Corp., Class A(1) | 4,600 | $ 1,352,170 | |
| $ 1,352,170 | |||
| Entertainment — 1.3% | |||
| Netflix, Inc.(1) | 11,469 | $ 2,005,584 | |
| Walt Disney Co. (The)(1) | 21,088 | 1,990,707 | |
| $ 3,996,291 | |||
| Food & Staples Retailing — 1.4% | |||
| Sysco Corp. | 51,200 | $ 4,337,152 | |
| $ 4,337,152 | |||
| Food Products — 1.1% | |||
| Mondelez International, Inc., Class A | 54,096 | $ 3,358,821 | |
| $ 3,358,821 | |||
| Health Care Equipment & Supplies — 3.4% | |||
| Abbott Laboratories | 34,968 | $ 3,799,273 | |
| Intuitive Surgical, Inc.(1) | 23,471 | 4,710,865 | |
| QuidelOrtho Corp.(1) | 7,606 | 739,151 | |
| Tandem Diabetes Care, Inc.(1) | 19,354 | 1,145,563 | |
| $ 10,394,852 | |||
| Health Care Providers & Services — 2.2% | |||
| UnitedHealth Group, Inc. | 12,877 | $ 6,614,013 | |
| $ 6,614,013 | |||
| Health Care Technology — 0.5% | |||
| Veeva Systems, Inc., Class A(1) | 8,460 | $ 1,675,418 | |
| $ 1,675,418 | |||
| Hotels, Restaurants & Leisure — 1.2% | |||
| Starbucks Corp. | 48,094 | $ 3,673,901 | |
| $ 3,673,901 | |||
| Interactive Media & Services — 10.6% | |||
| Alphabet, Inc., Class A(1) | 8,284 | $ 18,052,990 | |
| Alphabet, Inc., Class C(1) | 3,620 | 7,918,569 | |
| Meta Platforms, Inc., Class A(1) | 32,788 | 5,287,065 | |
| Twitter, Inc.(1) | 28,161 | 1,052,940 | |
| $ 32,311,564 | |||
| Internet & Direct Marketing Retail — 6.9% | |||
| Amazon.com, Inc.(1) | 197,804 | $ 21,008,763 | |
| $ 21,008,763 | |||
| Security | Shares | Value | |
| IT Services — 7.6% | |||
| Accenture PLC, Class A | 12,186 | $ 3,383,443 | |
| PayPal Holdings, Inc.(1) | 33,403 | 2,332,866 | |
| Visa, Inc., Class A | 87,662 | 17,259,771 | |
| $ 22,976,080 | |||
| Life Sciences Tools & Services — 2.7% | |||
| 10X Genomics, Inc., Class A(1) | 23,657 | $ 1,070,479 | |
| Agilent Technologies, Inc. | 18,184 | 2,159,714 | |
| Illumina, Inc.(1) | 6,209 | 1,144,691 | |
| Thermo Fisher Scientific, Inc. | 7,088 | 3,850,769 | |
| $ 8,225,653 | |||
| Machinery — 0.6% | |||
| Westinghouse Air Brake Technologies Corp. | 22,576 | $ 1,853,038 | |
| $ 1,853,038 | |||
| Oil, Gas & Consumable Fuels — 1.0% | |||
| EOG Resources, Inc. | 26,895 | $ 2,970,284 | |
| $ 2,970,284 | |||
| Pharmaceuticals — 2.2% | |||
| Eli Lilly & Co. | 20,378 | $ 6,607,159 | |
| $ 6,607,159 | |||
| Road & Rail — 1.7% | |||
| CSX Corp. | 117,069 | $ 3,402,025 | |
| Uber Technologies, Inc.(1) | 80,436 | 1,645,721 | |
| $ 5,047,746 | |||
| Semiconductors & Semiconductor Equipment — 9.9% | |||
| Ambarella, Inc.(1) | 15,281 | $ 1,000,294 | |
| Intel Corp. | 91,929 | 3,439,064 | |
| Micron Technology, Inc. | 124,632 | 6,889,657 | |
| NVIDIA Corp. | 13,688 | 2,074,964 | |
| QUALCOMM, Inc. | 70,336 | 8,984,720 | |
| Texas Instruments, Inc. | 50,572 | 7,770,388 | |
| $ 30,159,087 | |||
| Software — 18.4% | |||
| Adobe, Inc.(1) | 25,224 | $ 9,233,497 | |
| Altair Engineering, Inc., Class A(1) | 30,179 | 1,584,397 | |
| Intuit, Inc. | 20,608 | 7,943,148 | |
| Microsoft Corp. | 97,797 | 25,117,204 | |
| Palantir Technologies, Inc., Class A(1) | 228,683 | 2,074,155 | |
| Paycom Software, Inc.(1) | 11,446 | 3,206,254 | |
| Security | Shares | Value | |
| Software (continued) | |||
| Salesforce, Inc.(1) | 26,346 | $ 4,348,144 | |
| Zscaler, Inc.(1) | 15,691 | 2,345,961 | |
| $ 55,852,760 | |||
| Specialty Retail — 3.4% | |||
| Home Depot, Inc. (The) | 11,576 | $ 3,174,950 | |
| TJX Cos., Inc. (The) | 128,012 | 7,149,470 | |
| $ 10,324,420 | |||
| Technology Hardware, Storage & Peripherals — 7.0% | |||
| Apple, Inc. | 137,110 | $ 18,745,679 | |
| Logitech International S.A. | 50,264 | 2,616,744 | |
| $ 21,362,423 | |||
| Textiles, Apparel & Luxury Goods — 1.0% | |||
| NIKE, Inc., Class B | 29,417 | $ 3,006,417 | |
| $ 3,006,417 | |||
| Total Common Stocks (identified cost $166,913,033) | $303,431,468 | ||
| Short-Term Investments — 0.2% |
| Security | Shares | Value | |
| Morgan Stanley Institutional Liquidity Funds - Government Portfolio, Institutional Class, 1.38%(2) | 489,606 | $ 489,606 | |
| Total Short-Term Investments (identified cost $489,606) | $ 489,606 | ||
| Total Investments — 100.1% (identified cost $167,402,639) | $303,921,074 | ||
| Other Assets, Less Liabilities — (0.1)% | $ (365,981) | ||
| Net Assets — 100.0% | $303,555,093 | ||
| The percentage shown for each investment category in the Portfolio of Investments is based on net assets. | |
| (1) | Non-income producing security. |
| (2) | May be deemed to be an affiliated investment company. The rate shown is the annualized seven-day yield as of June 30, 2022. |
| June 30, 2022 | |
| Assets | |
| Unaffiliated investments, at value (identified cost $166,913,033) | $ 303,431,468 |
| Affiliated investment, at value (identified cost $489,606) | 489,606 |
| Cash | 10,366 |
| Dividends receivable | 116,292 |
| Dividends receivable from affiliated investment | 147 |
| Receivable for Fund shares sold | 34,747 |
| Securities lending income receivable | 866 |
| Tax reclaims receivable | 20,929 |
| Receivable from affiliate | 29,509 |
| Total assets | $304,133,930 |
| Liabilities | |
| Payable for Fund shares redeemed | $ 216,093 |
| Payable to affiliates: | |
| Investment adviser fee | 168,213 |
| Distribution and service fees | 56,504 |
| Trustees' fees | 5,500 |
| Accrued expenses | 132,527 |
| Total liabilities | $ 578,837 |
| Net Assets | $303,555,093 |
| Sources of Net Assets | |
| Paid-in capital | $ 153,322,803 |
| Distributable earnings | 150,232,290 |
| Net Assets | $303,555,093 |
| Class A Shares | |
| Net Assets | $ 226,507,962 |
| Shares Outstanding | 8,080,622 |
| Net Asset Value and Redemption Price Per Share (net assets ÷ shares of beneficial interest outstanding) | $ 28.03 |
| Maximum Offering Price Per Share (100 ÷ 94.75 of net asset value per share) | $ 29.58 |
| Class C Shares | |
| Net Assets | $ 8,667,402 |
| Shares Outstanding | 405,592 |
| Net Asset Value and Offering Price Per Share* (net assets ÷ shares of beneficial interest outstanding) | $ 21.37 |
| Class I Shares | |
| Net Assets | $ 66,316,212 |
| Shares Outstanding | 2,249,743 |
| Net Asset Value, Offering Price and Redemption Price Per Share (net assets ÷ shares of beneficial interest outstanding) | $ 29.48 |
| June 30, 2022 | |
| Class R Shares | |
| Net Assets | $2,063,517 |
| Shares Outstanding | 76,981 |
| Net Asset Value, Offering Price and Redemption Price Per Share (net assets ÷ shares of beneficial interest outstanding) | $ 26.81 |
| On sales of $50,000 or more, the offering price of Class A shares is reduced. | |
| * | Redemption price per share is equal to the net asset value less any applicable contingent deferred sales charge. |
| Six Months Ended | |
| June 30, 2022 | |
| Investment Income | |
| Dividend income (net of foreign taxes withheld of $1,766) | $ 1,657,698 |
| Dividend income from affiliated investments | 763 |
| Securities lending income, net | 5,753 |
| Total investment income | $ 1,664,214 |
| Expenses | |
| Investment adviser fee | $ 1,184,210 |
| Distribution and service fees: | |
| Class A | 337,039 |
| Class C | 55,632 |
| Class R | 6,004 |
| Trustees’ fees and expenses | 11,114 |
| Custodian fee | 44,481 |
| Transfer and dividend disbursing agent fees | 151,219 |
| Legal and accounting services | 24,516 |
| Printing and postage | 21,108 |
| Registration fees | 30,297 |
| Miscellaneous | 8,783 |
| Total expenses | $ 1,874,403 |
| Deduct: | |
| Waiver and/or reimbursement of expenses by affiliates | $ 31,287 |
| Total expense reductions | $ 31,287 |
| Net expenses | $ 1,843,116 |
| Net investment loss | $ (178,902) |
| Realized and Unrealized Gain (Loss) | |
| Net realized gain (loss): | |
| Investment transactions | $ 7,172,381 |
| Investment transactions - affiliated investments | (142) |
| Foreign currency transactions | 21 |
| Net realized gain | $ 7,172,260 |
| Change in unrealized appreciation (depreciation): | |
| Investments | $ (135,710,810) |
| Net change in unrealized appreciation (depreciation) | $(135,710,810) |
| Net realized and unrealized loss | $(128,538,550) |
| Net decrease in net assets from operations | $(128,717,452) |
| Six Months Ended June 30, 2022 (Unaudited) | Year Ended December 31, 2021 | |
| Increase (Decrease) in Net Assets | ||
| From operations: | ||
| Net investment loss | $ (178,902) | $ (1,207,036) |
| Net realized gain | 7,172,260 | 42,987,786 |
| Net change in unrealized appreciation (depreciation) | (135,710,810) | 35,102,108 |
| Net increase (decrease) in net assets from operations | $(128,717,452) | $ 76,882,858 |
| Distributions to shareholders: | ||
| Class A | $ — | $ (26,394,413) |
| Class C | — | (1,466,142) |
| Class I | — | (7,573,390) |
| Class R | — | (248,220) |
| Total distributions to shareholders | $ — | $ (35,682,165) |
| Transactions in shares of beneficial interest: | ||
| Class A | $ (8,586,857) | $ (358,309) |
| Class C | (1,699,340) | (2,760,102) |
| Class I | (5,420,671) | 8,559,140 |
| Class R | (102,012) | 192,726 |
| Net increase (decrease) in net assets from Fund share transactions | $ (15,808,880) | $ 5,633,455 |
| Net increase (decrease) in net assets | $(144,526,332) | $ 46,834,148 |
| Net Assets | ||
| At beginning of period | $ 448,081,425 | $ 401,247,277 |
| At end of period | $ 303,555,093 | $448,081,425 |
| Class A | ||||||
| Six Months Ended June 30, 2022 (Unaudited) | Year Ended December 31, | |||||
| 2021 | 2020 | 2019 | 2018 | 2017 | ||
| Net asset value — Beginning of period | $ 39.590 | $ 35.930 | $ 28.130 | $ 23.610 | $ 26.650 | $ 22.300 |
| Income (Loss) From Operations | ||||||
| Net investment loss(1) | $ (0.021) | $ (0.120) | $ (0.098) | $ (0.037) | $ (0.034) | $ (0.021) |
| Net realized and unrealized gain (loss) | (11.539) | 7.140 | 10.409 | 7.095 | 0.301 | 5.680 |
| Total income (loss) from operations | $ (11.560) | $ 7.020 | $ 10.311 | $ 7.058 | $ 0.267 | $ 5.659 |
| Less Distributions | ||||||
| From net investment income | $ — | $ — | $ — | $ — | $ — | $ (0.029) |
| From net realized gain | — | (3.360) | (2.511) | (2.538) | (3.307) | (1.280) |
| Total distributions | $ — | $ (3.360) | $ (2.511) | $ (2.538) | $ (3.307) | $ (1.309) |
| Net asset value — End of period | $ 28.030 | $ 39.590 | $ 35.930 | $ 28.130 | $ 23.610 | $ 26.650 |
| Total Return(2)(3) | (29.20)% (4) | 19.62% | 37.16% | 30.38% | 0.27% | 25.42% |
| Ratios/Supplemental Data | ||||||
| Net assets, end of period (000’s omitted) | $226,508 | $330,230 | $299,834 | $236,457 | $190,017 | $209,606 |
| Ratios (as a percentage of average daily net assets):(5) | ||||||
| Expenses (3) | 1.05% (6)(7) | 1.05% | 1.05% | 1.05% | 1.05% | 1.05% |
| Net investment loss | (0.13)% (7) | (0.30)% | (0.32)% | (0.14)% | (0.12)% | (0.08)% |
| Portfolio Turnover of the Portfolio(8) | — | — | — | — | 20% (4) | 50% |
| Portfolio Turnover of the Fund | 4% (4) | 21% | 37% | 40% | 28% (4)(9) | — |
| (1) | Computed using average shares outstanding. |
| (2) | Returns are historical and are calculated by determining the percentage change in net asset value with all distributions reinvested and do not reflect the effect of sales charges. |
| (3) | The administrator reimbursed certain operating expenses (equal to 0.02%, less than 0.005%, 0.04%, 0.04%, 0.04% and 0.06% of average daily net assets for the six months ended June 30, 2022 and the years ended December 31, 2021, 2020, 2019, 2018 and 2017, respectively). Absent this reimbursement, total return would be lower. |
| (4) | Not annualized. |
| (5) | Includes the Fund’s share of the Portfolio’s allocated expenses for the period while the Fund was investing in the Portfolio. |
| (6) | Includes a reduction by the investment adviser of a portion of its adviser fee due to the Fund's investment in the Liquidity Fund (equal to less than 0.005% of average daily net assets for the six months ended June 30, 2022). |
| (7) | Annualized. |
| (8) | Portfolio turnover represents the rate of portfolio activity for the period while the Fund was investing in the Portfolio. |
| (9) | For the period from May 14, 2018 through December 31, 2018 when the Fund was making investments directly in securities. |
| Class C | ||||||
| Six Months Ended June 30, 2022 (Unaudited) | Year Ended December 31, | |||||
| 2021 | 2020 | 2019 | 2018 | 2017 | ||
| Net asset value — Beginning of period | $ 30.290 | $ 28.370 | $ 22.790 | $ 19.660 | $ 22.870 | $ 19.410 |
| Income (Loss) From Operations | ||||||
| Net investment loss(1) | $ (0.111) | $ (0.326) | $ (0.261) | $ (0.206) | $ (0.214) | $ (0.183) |
| Net realized and unrealized gain (loss) | (8.809) | 5.606 | 8.352 | 5.874 | 0.311 | 4.923 |
| Total income (loss) from operations | $ (8.920) | $ 5.280 | $ 8.091 | $ 5.668 | $ 0.097 | $ 4.740 |
| Less Distributions | ||||||
| From net realized gain | $ — | $ (3.360) | $ (2.511) | $ (2.538) | $ (3.307) | $ (1.280) |
| Total distributions | $ — | $ (3.360) | $ (2.511) | $ (2.538) | $ (3.307) | $ (1.280) |
| Net asset value — End of period | $21.370 | $30.290 | $28.370 | $22.790 | $19.660 | $22.870 |
| Total Return(2)(3) | (29.45)% (4) | 18.70% | 36.17% | 29.35% | (0.43)% | 24.45% |
| Ratios/Supplemental Data | ||||||
| Net assets, end of period (000’s omitted) | $ 8,667 | $ 14,409 | $ 16,026 | $ 17,501 | $ 35,061 | $ 41,450 |
| Ratios (as a percentage of average daily net assets):(5) | ||||||
| Expenses (3) | 1.80% (6)(7) | 1.80% | 1.80% | 1.80% | 1.80% | 1.80% |
| Net investment loss | (0.88)% (7) | (1.05)% | (1.06)% | (0.91)% | (0.87)% | (0.83)% |
| Portfolio Turnover of the Portfolio(8) | — | — | — | — | 20% (4) | 50% |
| Portfolio Turnover of the Fund | 4% (4) | 21% | 37% | 40% | 28% (4)(9) | — |
| (1) | Computed using average shares outstanding. |
| (2) | Returns are historical and are calculated by determining the percentage change in net asset value with all distributions reinvested and do not reflect the effect of sales charges. |
| (3) | The administrator reimbursed certain operating expenses (equal to 0.02%, less than 0.005%, 0.04%, 0.04%, 0.04% and 0.06% of average daily net assets for the six months ended June 30, 2022 and the years ended December 31, 2021, 2020, 2019, 2018 and 2017, respectively). Absent this reimbursement, total return would be lower. |
| (4) | Not annualized. |
| (5) | Includes the Fund’s share of the Portfolio’s allocated expenses for the period while the Fund was investing in the Portfolio. |
| (6) | Includes a reduction by the investment adviser of a portion of its adviser fee due to the Fund's investment in the Liquidity Fund (equal to less than 0.005% of average daily net assets for the six months ended June 30, 2022). |
| (7) | Annualized. |
| (8) | Portfolio turnover represents the rate of portfolio activity for the period while the Fund was investing in the Portfolio. |
| (9) | For the period from May 14, 2018 through December 31, 2018 when the Fund was making investments directly in securities. |
| Class I | ||||||
| Six Months Ended June 30, 2022 (Unaudited) | Year Ended December 31, | |||||
| 2021 | 2020 | 2019 | 2018 | 2017 | ||
| Net asset value — Beginning of period | $ 41.580 | $ 37.500 | $ 29.200 | $ 24.380 | $ 27.340 | $ 22.850 |
| Income (Loss) From Operations | ||||||
| Net investment income (loss)(1) | $ 0.021 | $ (0.023) | $ (0.022) | $ 0.029 | $ 0.040 | $ 0.043 |
| Net realized and unrealized gain (loss) | (12.121) | 7.463 | 10.833 | 7.329 | 0.307 | 5.820 |
| Total income (loss) from operations | $(12.100) | $ 7.440 | $10.811 | $ 7.358 | $ 0.347 | $ 5.863 |
| Less Distributions | ||||||
| From net investment income | $ — | $ — | $ — | $ — | $ — | $ (0.093) |
| From net realized gain | — | (3.360) | (2.511) | (2.538) | (3.307) | (1.280) |
| Total distributions | $ — | $ (3.360) | $ (2.511) | $ (2.538) | $ (3.307) | $ (1.373) |
| Net asset value — End of period | $ 29.480 | $ 41.580 | $37.500 | $29.200 | $24.380 | $27.340 |
| Total Return(2)(3) | (29.10)% (4) | 19.92% | 37.51% | 30.65% | 0.56% | 25.72% |
| Ratios/Supplemental Data | ||||||
| Net assets, end of period (000’s omitted) | $ 66,316 | $100,423 | $ 82,887 | $ 65,646 | $ 78,812 | $ 78,775 |
| Ratios (as a percentage of average daily net assets):(5) | ||||||
| Expenses (3) | 0.80% (6)(7) | 0.80% | 0.80% | 0.80% | 0.80% | 0.80% |
| Net investment income (loss) | 0.12% (7) | (0.05)% | (0.07)% | 0.10% | 0.14% | 0.16% |
| Portfolio Turnover of the Portfolio(8) | — | — | — | — | 20% (4) | 50% |
| Portfolio Turnover of the Fund | 4% (4) | 21% | 37% | 40% | 28% (4)(9) | — |
| (1) | Computed using average shares outstanding. |
| (2) | Returns are historical and are calculated by determining the percentage change in net asset value with all distributions reinvested. |
| (3) | The administrator reimbursed certain operating expenses (equal to 0.02%, less than 0.005%, 0.04%, 0.04%, 0.04% and 0.06% of average daily net assets for the six months ended June 30, 2022 and the years ended December 31, 2021, 2020, 2019, 2018 and 2017, respectively). Absent this reimbursement, total return would be lower. |
| (4) | Not annualized. |
| (5) | Includes the Fund’s share of the Portfolio’s allocated expenses for the period while the Fund was investing in the Portfolio. |
| (6) | Includes a reduction by the investment adviser of a portion of its adviser fee due to the Fund's investment in the Liquidity Fund (equal to less than 0.005% of average daily net assets for the six months ended June 30, 2022). |
| (7) | Annualized. |
| (8) | Portfolio turnover represents the rate of portfolio activity for the period while the Fund was investing in the Portfolio. |
| (9) | For the period from May 14, 2018 through December 31, 2018 when the Fund was making investments directly in securities. |
| Class R | ||||||
| Six Months Ended June 30, 2022 (Unaudited) | Year Ended December 31, | |||||
| 2021 | 2020 | 2019 | 2018 | 2017 | ||
| Net asset value — Beginning of period | $ 37.900 | $ 34.610 | $ 27.230 | $ 22.980 | $ 26.090 | $ 21.880 |
| Income (Loss) From Operations | ||||||
| Net investment loss(1) | $ (0.060) | $ (0.214) | $ (0.166) | $ (0.105) | $ (0.104) | $ (0.082) |
| Net realized and unrealized gain (loss) | (11.030) | 6.864 | 10.057 | 6.893 | 0.301 | 5.572 |
| Total income (loss) from operations | $(11.090) | $ 6.650 | $ 9.891 | $ 6.788 | $ 0.197 | $ 5.490 |
| Less Distributions | ||||||
| From net realized gain | $ — | $ (3.360) | $ (2.511) | $ (2.538) | $ (3.307) | $ (1.280) |
| Total distributions | $ — | $ (3.360) | $ (2.511) | $ (2.538) | $ (3.307) | $ (1.280) |
| Net asset value — End of period | $ 26.810 | $37.900 | $34.610 | $27.230 | $22.980 | $26.090 |
| Total Return(2)(3) | (29.26)% (4) | 19.29% | 36.84% | 30.03% | 0.01% | 25.12% |
| Ratios/Supplemental Data | ||||||
| Net assets, end of period (000’s omitted) | $ 2,064 | $ 3,020 | $ 2,501 | $ 2,264 | $ 3,030 | $ 3,447 |
| Ratios (as a percentage of average daily net assets):(5) | ||||||
| Expenses (3) | 1.30% (6)(7) | 1.30% | 1.30% | 1.30% | 1.30% | 1.30% |
| Net investment loss | (0.38)% (7) | (0.56)% | (0.56)% | (0.39)% | (0.37)% | (0.33)% |
| Portfolio Turnover of the Portfolio(8) | — | — | — | — | 20% (4) | 50% |
| Portfolio Turnover of the Fund | 4% (4) | 21% | 37% | 40% | 28% (4)(9) | — |
| (1) | Computed using average shares outstanding. |
| (2) | Returns are historical and are calculated by determining the percentage change in net asset value with all distributions reinvested. |
| (3) | The administrator reimbursed certain operating expenses (equal to 0.02%, less than 0.005%, 0.04%, 0.04%, 0.04% and 0.06% of average daily net assets for the six months ended June 30, 2022 and the years ended December 31, 2021, 2020, 2019, 2018 and 2017, respectively). Absent this reimbursement, total return would be lower. |
| (4) | Not annualized. |
| (5) | Includes the Fund’s share of the Portfolio’s allocated expenses for the period while the Fund was investing in the Portfolio. |
| (6) | Includes a reduction by the investment adviser of a portion of its adviser fee due to the Fund's investment in the Liquidity Fund (equal to less than 0.005% of average daily net assets for the six months ended June 30, 2022). |
| (7) | Annualized. |
| (8) | Portfolio turnover represents the rate of portfolio activity for the period while the Fund was investing in the Portfolio. |
| (9) | For the period from May 14, 2018 through December 31, 2018 when the Fund was making investments directly in securities. |
| Aggregate cost | $ 167,432,360 |
| Gross unrealized appreciation | $ 153,534,564 |
| Gross unrealized depreciation | (17,045,850) |
| Net unrealized appreciation | $ 136,488,714 |
| Average Daily Net Assets | Annual Fee Rate |
| Up to $500 million | 0.650% |
| $500 million but less than $1 billion | 0.625% |
| $1 billion but less than $2.5 billion | 0.600% |
| $2.5 billion and over | 0.575% |
| Six Months Ended June 30, 2022 (Unaudited) | Year Ended December 31, 2021 | ||||
| Shares | Amount | Shares | Amount | ||
| Class A | |||||
| Sales | 124,461 | $ 4,198,569 | 268,420 | $ 10,435,549 | |
| Issued to shareholders electing to receive payments of distributions in Fund shares | — | — | 620,171 | 24,347,899 | |
| Redemptions | (404,685) | (13,403,922) | (939,982) | (37,087,351) | |
| Converted from Class C shares | 18,940 | 618,496 | 49,113 | 1,945,594 | |
| Net decrease | (261,284) | $ (8,586,857) | (2,278) | $ (358,309) | |
| Class C | |||||
| Sales | 20,581 | $ 546,223 | 50,396 | $ 1,557,588 | |
| Issued to shareholders electing to receive payments of distributions in Fund shares | — | — | 48,586 | 1,460,503 | |
| Redemptions | (65,851) | (1,627,067) | (125,730) | (3,832,599) | |
| Converted to Class A shares | (24,801) | (618,496) | (62,447) | (1,945,594) | |
| Net decrease | (70,071) | $ (1,699,340) | (89,195) | $ (2,760,102) | |
| Class I | |||||
| Sales | 102,688 | $ 3,572,140 | 357,444 | $ 14,743,302 | |
| Issued to shareholders electing to receive payments of distributions in Fund shares | — | — | 178,358 | 7,353,696 | |
| Redemptions | (268,260) | (8,992,811) | (330,540) | (13,537,858) | |
| Net increase (decrease) | (165,572) | $ (5,420,671) | 205,262 | $ 8,559,140 | |
| Class R | |||||
| Sales | 3,153 | $ 98,975 | 31,559 | $ 1,143,299 | |
| Issued to shareholders electing to receive payments of distributions in Fund shares | — | — | 6,342 | 238,448 | |
| Redemptions | (5,853) | (200,987) | (30,470) | (1,189,021) | |
| Net increase (decrease) | (2,700) | $ (102,012) | 7,431 | $ 192,726 | |
| Name | Value, beginning of period | Purchases | Sales proceeds | Net realized gain (loss) | Change in unrealized appreciation (depreciation) | Value, end of period | Dividend income | Units/Shares, end of period |
| Short-Term Investments | ||||||||
| Cash Reserves Fund | $45,076 | $8,001,032 | $(8,045,966) | $ (142) | $ — | $ — | $ 327 | — |
| Liquidity Fund | — | 5,778,206 | (5,288,600) | — | — | 489,606 | 436 | 489,606 |
| Total | $(142) | $ — | $489,606 | $763 | ||||
| • | Level 1 – quoted prices in active markets for identical investments |
| • | Level 2 – other significant observable inputs (including quoted prices for similar investments, interest rates, prepayment speeds, credit risk, etc.) |
| • | Level 3 – significant unobservable inputs (including a fund's own assumptions in determining the fair value of investments) |
| Asset Description | Level 1 | Level 2 | Level 3 | Total |
| Common Stocks | $ 303,431,468* | $ — | $ — | $ 303,431,468 |
| Short-Term Investments | 489,606 | — | — | 489,606 |
| Total Investments | $303,921,074 | $ — | $ — | $303,921,074 |
| * | The level classification by major category of investments is the same as the category presentation in the Portfolio of Investments. |
| Officers | |
| Eric A. Stein President | Jill R. Damon Secretary |
| Deidre E. Walsh Vice President and Chief Legal Officer | Richard F. Froio Chief Compliance Officer |
| James F. Kirchner Treasurer | |
| Trustees |
| George J. Gorman Chairperson | |
| Alan C. Bowser** | |
| Thomas E. Faust Jr.* | |
| Mark R. Fetting | |
| Cynthia E. Frost | |
| Valerie A. Mosley |
| Keith Quinton | |
| Marcus L. Smith | |
| Susan J. Sutherland | |
| Scott E. Wennerholm | |
| Nancy A. Wiser** |
| * | Interested Trustee |
| ** | Mr. Bowser and Ms. Wiser began serving as Trustees effective April 4, 2022. |
| Privacy Notice | April 2021 |
| FACTS | WHAT DOES EATON VANCE DO WITH YOUR PERSONAL INFORMATION? |
| Why? | Financial companies choose how they share your personal information. Federal law gives consumers the right to limit some but not all sharing. Federal law also requires us to tell you how we collect, share, and protect your personal information. Please read this notice carefully to understand what we do. |
| What? | The types of personal information we collect and share depend on the product or service you have with us. This information can include:■ Social Security number and income ■ investment experience and risk tolerance ■ checking account number and wire transfer instructions |
| How? | All financial companies need to share customers’ personal information to run their everyday business. In the section below, we list the reasons financial companies can share their customers’ personal information; the reasons Eaton Vance chooses to share; and whether you can limit this sharing. |
| Reasons we can share your personal information | Does Eaton Vance share? | Can you limit this sharing? |
| For our everyday business purposes — such as to process your transactions, maintain your account(s), respond to court orders and legal investigations, or report to credit bureaus | Yes | No |
| For our marketing purposes — to offer our products and services to you | Yes | No |
| For joint marketing with other financial companies | No | We don’t share |
| For our investment management affiliates’ everyday business purposes — information about your transactions, experiences, and creditworthiness | Yes | Yes |
| For our affiliates’ everyday business purposes — information about your transactions and experiences | Yes | No |
| For our affiliates’ everyday business purposes — information about your creditworthiness | No | We don’t share |
| For our investment management affiliates to market to you | Yes | Yes |
| For our affiliates to market to you | No | We don’t share |
| For nonaffiliates to market to you | No | We don’t share |
| To limit our sharing | Call toll-free 1-800-262-1122 or email: EVPrivacy@eatonvance.comPlease note:If you are a new customer, we can begin sharing your information 30 days from the date we sent this notice. When you are no longer our customer, we continue to share your information as described in this notice. However, you can contact us at any time to limit our sharing. |
| Questions? | Call toll-free 1-800-262-1122 or email: EVPrivacy@eatonvance.com |
| Privacy Notice — continued | April 2021 |
| Who we are | |
| Who is providing this notice? | Eaton Vance Management, Eaton Vance Distributors, Inc., Eaton Vance Trust Company, Eaton Vance Management (International) Limited, Eaton Vance Advisers International Ltd., Eaton Vance Global Advisors Limited, Eaton Vance Management’s Real Estate Investment Group, Boston Management and Research, Calvert Research and Management, Eaton Vance and Calvert Fund Families and our investment advisory affiliates (“Eaton Vance”) (see Investment Management Affiliates definition below) |
| What we do | |
| How does Eaton Vance protect my personal information? | To protect your personal information from unauthorized access and use, we use security measures that comply with federal law. These measures include computer safeguards and secured files and buildings. We have policies governing the proper handling of customer information by personnel and requiring third parties that provide support to adhere to appropriate security standards with respect to such information. |
| How does Eaton Vance collect my personal information? | We collect your personal information, for example, when you■ open an account or make deposits or withdrawals from your account ■ buy securities from us or make a wire transfer ■ give us your contact informationWe also collect your personal information from others, such as credit bureaus, affiliates, or other companies. |
| Why can’t I limit all sharing? | Federal law gives you the right to limit only■ sharing for affiliates’ everyday business purposes — information about your creditworthiness ■ affiliates from using your information to market to you ■ sharing for nonaffiliates to market to youState laws and individual companies may give you additional rights to limit sharing. See below for more on your rights under state law. |
| Definitions | |
| Investment Management Affiliates | Eaton Vance Investment Management Affiliates include registered investment advisers, registered broker- dealers, and registered and unregistered funds. Investment Management Affiliates does not include entities associated with Morgan Stanley Wealth Management, such as Morgan Stanley Smith Barney LLC and Morgan Stanley & Co. |
| Affiliates | Companies related by common ownership or control. They can be financial and nonfinancial companies.■ Our affiliates include companies with a Morgan Stanley name and financial companies such as Morgan Stanley Smith Barney LLC and Morgan Stanley & Co. |
| Nonaffiliates | Companies not related by common ownership or control. They can be financial and nonfinancial companies.■ Eaton Vance does not share with nonaffiliates so they can market to you. |
| Joint marketing | A formal agreement between nonaffiliated financial companies that together market financial products or services to you.■ Eaton Vance doesn’t jointly market. |
| Other important information | |
| Vermont: Except as permitted by law, we will not share personal information we collect about Vermont residents with Nonaffiliates unless you provide us with your written consent to share such information.California: Except as permitted by law, we will not share personal information we collect about California residents with Nonaffiliates and we will limit sharing such personal information with our Affiliates to comply with California privacy laws that apply to us. | |
Two International Place
Boston, MA 02110
Two International Place
Boston, MA 02110
Two International Place
Boston, MA 02110
(617) 482-8260
State Street Financial Center, One Lincoln Street
Boston, MA 02111
Attn: Eaton Vance Funds
P.O. Box 9653
Providence, RI 02940-9653
(800) 262-1122
Boston, MA 02110


| % Average Annual Total Returns1,2 | Class Inception Date | Performance Inception Date | Six Months | One Year | Five Years | Ten Years |
| Class A at NAV | 09/23/1931 | 09/23/1931 | (9.33)% | (2.86)% | 8.98% | 10.29% |
| Class A with 5.25% Maximum Sales Charge | — | — | (14.07) | (7.95) | 7.81 | 9.70 |
| Class C at NAV | 11/04/1994 | 09/23/1931 | (9.67) | (3.55) | 8.17 | 9.63 |
| Class C with 1% Maximum Sales Charge | — | — | (10.57) | (4.46) | 8.17 | 9.63 |
| Class I at NAV | 12/28/2004 | 09/23/1931 | (9.20) | (2.59) | 9.25 | 10.57 |
| Class R at NAV | 02/18/2004 | 09/23/1931 | (9.47) | (3.07) | 8.70 | 10.01 |
| Class R6 at NAV | 07/01/2014 | 09/23/1931 | (9.21) | (2.54) | 9.32 | 10.64 |
| Russell 1000® Value Index | — | — | (12.86)% | (6.82)% | 7.16% | 10.49% |
| % Total Annual Operating Expense Ratios3 | Class A | Class C | Class I | Class R | Class R6 |
| 1.01% | 1.76% | 0.76% | 1.26% | 0.70% |
| Sector Allocation (% of net assets)* |

| * | Excludes cash and cash equivalents. |
| Top 10 Holdings (% of net assets)* | |
| Johnson & Johnson | 3.4% |
| Wells Fargo & Co. | 3.0 |
| Verizon Communications, Inc. | 2.9 |
| NextEra Energy, Inc. | 2.7 |
| ConocoPhillips | 2.6 |
| Bristol-Myers Squibb Co. | 2.6 |
| M&T Bank Corp. | 2.5 |
| Chevron Corp. | 2.5 |
| Charles Schwab Corp. (The) | 2.5 |
| Alphabet, Inc., Class A | 2.4 |
| Total | 27.1% |
| * | Excludes cash and cash equivalents. |
| 1 | Russell 1000® Value Index is an unmanaged index of U.S. large-cap value stocks. Unless otherwise stated, index returns do not reflect the effect of any applicable sales charges, commissions, expenses, taxes or leverage, as applicable. It is not possible to invest directly in an index. |
| 2 | Total Returns at NAV do not include applicable sales charges. If sales charges were deducted, the returns would be lower. Total Returns shown with maximum sales charge reflect the stated maximum sales charge. Unless otherwise stated, performance does not reflect the deduction of taxes on Fund distributions or redemptions of Fund shares.Effective November 5, 2020, Class C shares automatically convert to Class A shares eight years after purchase. The average annual total returns listed for Class C reflect conversion to Class A shares after eight years. Prior to November 5, 2020, Class C shares automatically converted to Class A shares ten years after purchase.Performance prior to the inception date of a class may be linked to the performance of an older class of the Fund. This linked performance is adjusted for any applicable sales charge, but is not adjusted for class expense differences. If adjusted for such differences, the performance would be different. The performance of Class R6 is linked to Class I. Performance presented in the Financial Highlights included in the financial statements is not linked. |
| 3 | Source: Fund prospectus. The expense ratios for the current reporting period can be found in the Financial Highlights section of this report. Performance reflects expenses waived and/or reimbursed, if applicable. Without such waivers and/or reimbursements, performance would have been lower. |
| Fund profile subject to change due to active management. | |
| Important Notice to Shareholders | |
| Effective September 30, 2022, the portfolio management team of the Fund will be Aaron S. Dunn, CFA and Bradley T. Galko, CFA. |
| Beginning Account Value (1/1/22) | Ending Account Value (6/30/22) | Expenses Paid During Period* (1/1/22 – 6/30/22) | Annualized Expense Ratio | |
| Actual | ||||
| Class A | $1,000.00 | $ 906.70 | $4.82 | 1.02% |
| Class C | $1,000.00 | $ 903.30 | $8.35 | 1.77% |
| Class I | $1,000.00 | $ 908.00 | $3.64 | 0.77% |
| Class R | $1,000.00 | $ 905.30 | $6.00 | 1.27% |
| Class R6 | $1,000.00 | $ 907.90 | $3.36 | 0.71% |
| Hypothetical | ||||
| (5% return per year before expenses) | ||||
| Class A | $1,000.00 | $1,019.74 | $5.11 | 1.02% |
| Class C | $1,000.00 | $1,016.02 | $8.85 | 1.77% |
| Class I | $1,000.00 | $1,020.98 | $3.86 | 0.77% |
| Class R | $1,000.00 | $1,018.50 | $6.36 | 1.27% |
| Class R6 | $1,000.00 | $1,021.27 | $3.56 | 0.71% |
| * | Expenses are equal to the Fund's annualized expense ratio for the indicated Class, multiplied by the average account value over the period, multiplied by 181/365 (to reflect the one-half year period). The Example assumes that the $1,000 was invested at the net asset value per share determined at the close of business on December 31, 2021. |
| Common Stocks — 99.4% |
| Security | Shares | Value | |
| Aerospace & Defense — 3.3% | |||
| Hexcel Corp. | 322,631 | $ 16,876,828 | |
| Huntington Ingalls Industries, Inc. | 156,408 | 34,068,790 | |
| $ 50,945,618 | |||
| Air Freight & Logistics — 2.0% | |||
| C.H. Robinson Worldwide, Inc. | 303,621 | $ 30,778,061 | |
| $ 30,778,061 | |||
| Banks — 5.5% | |||
| M&T Bank Corp. | 241,152 | $ 38,437,217 | |
| Wells Fargo & Co. | 1,160,575 | 45,459,723 | |
| $ 83,896,940 | |||
| Beverages — 2.3% | |||
| Constellation Brands, Inc., Class A | 150,483 | $ 35,071,568 | |
| $ 35,071,568 | |||
| Biotechnology — 3.3% | |||
| AbbVie, Inc. | 185,131 | $ 28,354,664 | |
| Neurocrine Biosciences, Inc.(1) | 222,968 | 21,734,921 | |
| $ 50,089,585 | |||
| Building Products — 1.4% | |||
| Johnson Controls International PLC | 455,842 | $ 21,825,715 | |
| $ 21,825,715 | |||
| Capital Markets — 6.6% | |||
| Charles Schwab Corp. (The) | 592,463 | $ 37,431,812 | |
| Goldman Sachs Group, Inc. (The) | 121,810 | 36,180,006 | |
| Stifel Financial Corp. | 468,025 | 26,218,761 | |
| $ 99,830,579 | |||
| Chemicals — 1.6% | |||
| FMC Corp. | 228,068 | $ 24,405,557 | |
| $ 24,405,557 | |||
| Communications Equipment — 1.6% | |||
| Cisco Systems, Inc. | 560,258 | $ 23,889,401 | |
| $ 23,889,401 | |||
| Security | Shares | Value | |
| Containers & Packaging — 1.3% | |||
| Packaging Corp. of America | 143,476 | $ 19,727,950 | |
| $ 19,727,950 | |||
| Diversified Telecommunication Services — 2.9% | |||
| Verizon Communications, Inc. | 864,165 | $ 43,856,374 | |
| $ 43,856,374 | |||
| Electric Utilities — 4.1% | |||
| Edison International | 342,167 | $ 21,638,641 | |
| NextEra Energy, Inc. | 522,529 | 40,475,096 | |
| $ 62,113,737 | |||
| Electrical Equipment — 1.3% | |||
| Eaton Corp. PLC | 163,367 | $ 20,582,608 | |
| $ 20,582,608 | |||
| Entertainment — 1.5% | |||
| Walt Disney Co. (The)(1) | 246,844 | $ 23,302,074 | |
| $ 23,302,074 | |||
| Equity Real Estate Investment Trusts (REITs) — 5.2% | |||
| EastGroup Properties, Inc. | 106,928 | $ 16,502,198 | |
| Healthpeak Properties, Inc. | 509,403 | 13,198,632 | |
| Invitation Homes, Inc. | 562,684 | 20,020,297 | |
| Mid-America Apartment Communities, Inc. | 165,368 | 28,884,828 | |
| $ 78,605,955 | |||
| Food & Staples Retailing — 3.0% | |||
| BJ's Wholesale Club Holdings, Inc.(1) | 451,769 | $ 28,154,244 | |
| Performance Food Group Co.(1) | 378,241 | 17,391,521 | |
| $ 45,545,765 | |||
| Food Products — 2.3% | |||
| Hershey Co. (The) | 163,516 | $ 35,182,103 | |
| $ 35,182,103 | |||
| Health Care Equipment & Supplies — 3.1% | |||
| Teleflex, Inc. | 96,442 | $ 23,710,266 | |
| Zimmer Biomet Holdings, Inc. | 218,034 | 22,906,652 | |
| $ 46,616,918 | |||
| Hotels, Restaurants & Leisure — 2.2% | |||
| Hilton Worldwide Holdings, Inc. | 145,744 | $ 16,241,711 | |
| Papa John's International, Inc. | 205,645 | 17,175,471 | |
| $ 33,417,182 | |||
| Security | Shares | Value | |
| Insurance — 5.9% | |||
| Allstate Corp. (The) | 218,810 | $ 27,729,791 | |
| American International Group, Inc. | 596,212 | 30,484,320 | |
| Arch Capital Group, Ltd.(1) | 452,216 | 20,571,306 | |
| Reinsurance Group of America, Inc. | 97,459 | 11,430,966 | |
| $ 90,216,383 | |||
| Interactive Media & Services — 2.4% | |||
| Alphabet, Inc., Class A(1) | 17,078 | $ 37,217,402 | |
| $ 37,217,402 | |||
| IT Services — 2.8% | |||
| Euronet Worldwide, Inc.(1) | 139,048 | $ 13,986,838 | |
| Fidelity National Information Services, Inc. | 305,957 | 28,047,078 | |
| $ 42,033,916 | |||
| Life Sciences Tools & Services — 4.4% | |||
| Thermo Fisher Scientific, Inc. | 65,922 | $ 35,814,104 | |
| Waters Corp.(1) | 95,365 | 31,563,908 | |
| $ 67,378,012 | |||
| Machinery — 2.9% | |||
| PACCAR, Inc. | 218,949 | $ 18,028,261 | |
| Westinghouse Air Brake Technologies Corp. | 324,057 | 26,598,598 | |
| $ 44,626,859 | |||
| Media — 0.9% | |||
| Fox Corp., Class A | 410,750 | $ 13,209,720 | |
| $ 13,209,720 | |||
| Multiline Retail — 1.5% | |||
| Dollar Tree, Inc.(1) | 144,612 | $ 22,537,780 | |
| $ 22,537,780 | |||
| Multi-Utilities — 2.9% | |||
| CMS Energy Corp. | 335,770 | $ 22,664,475 | |
| Sempra Energy | 147,269 | 22,130,113 | |
| $ 44,794,588 | |||
| Oil, Gas & Consumable Fuels — 7.0% | |||
| Chevron Corp. | 262,447 | $ 37,997,077 | |
| ConocoPhillips | 446,790 | 40,126,210 | |
| EOG Resources, Inc. | 262,389 | 28,978,241 | |
| $ 107,101,528 | |||
| Security | Shares | Value | |
| Pharmaceuticals — 8.6% | |||
| Bristol-Myers Squibb Co. | 514,684 | $ 39,630,668 | |
| Johnson & Johnson | 293,431 | 52,086,937 | |
| Royalty Pharma PLC, Class A | 218,825 | 9,199,403 | |
| Sanofi | 300,760 | 30,330,450 | |
| $ 131,247,458 | |||
| Semiconductors & Semiconductor Equipment — 2.9% | |||
| Micron Technology, Inc. | 352,247 | $ 19,472,214 | |
| Texas Instruments, Inc. | 158,708 | 24,385,484 | |
| $ 43,857,698 | |||
| Software — 1.5% | |||
| VMware, Inc., Class A | 195,489 | $ 22,281,836 | |
| $ 22,281,836 | |||
| Specialty Retail — 1.2% | |||
| Lithia Motors, Inc. | 68,466 | $ 18,815,141 | |
| $ 18,815,141 | |||
| Total Common Stocks (identified cost $1,375,596,270) | $1,515,002,011 | ||
| Short-Term Investments — 0.6% |
| Security | Shares | Value | |
| Morgan Stanley Institutional Liquidity Funds - Government Portfolio, Institutional Class, 1.38%(2) | 9,341,835 | $ 9,341,835 | |
| Total Short-Term Investments (identified cost $9,341,835) | $ 9,341,835 | ||
| Total Investments — 100.0% (identified cost $1,384,938,105) | $1,524,343,846 | ||
| Other Assets, Less Liabilities — (0.0)%(3) | $ (753,080) | ||
| Net Assets — 100.0% | $1,523,590,766 | ||
| The percentage shown for each investment category in the Portfolio of Investments is based on net assets. | |
| (1) | Non-income producing security. |
| (2) | May be deemed to be an affiliated investment company. The rate shown is the annualized seven-day yield as of June 30, 2022. |
| (3) | Amount is less than (0.05)%. |
| June 30, 2022 | |
| Assets | |
| Unaffiliated investments, at value (identified cost $1,375,596,270) | $ 1,515,002,011 |
| Affiliated investment, at value (identified cost $9,341,835) | 9,341,835 |
| Dividends receivable | 1,595,554 |
| Dividends receivable from affiliated investment | 2,371 |
| Receivable for Fund shares sold | 963,123 |
| Securities lending income receivable | 46 |
| Tax reclaims receivable | 68,027 |
| Total assets | $1,526,972,967 |
| Liabilities | |
| Payable for Fund shares redeemed | $ 1,937,931 |
| Payable to affiliates: | |
| Investment adviser fee | 806,336 |
| Distribution and service fees | 162,209 |
| Trustees' fees | 21,365 |
| Accrued expenses | 454,360 |
| Total liabilities | $ 3,382,201 |
| Net Assets | $1,523,590,766 |
| Sources of Net Assets | |
| Paid-in capital | $ 1,293,609,156 |
| Distributable earnings | 229,981,610 |
| Net Assets | $1,523,590,766 |
| Class A Shares | |
| Net Assets | $ 606,304,364 |
| Shares Outstanding | 27,694,715 |
| Net Asset Value and Redemption Price Per Share (net assets ÷ shares of beneficial interest outstanding) | $ 21.89 |
| Maximum Offering Price Per Share (100 ÷ 94.75 of net asset value per share) | $ 23.10 |
| Class C Shares | |
| Net Assets | $ 17,178,863 |
| Shares Outstanding | 780,633 |
| Net Asset Value and Offering Price Per Share* (net assets ÷ shares of beneficial interest outstanding) | $ 22.01 |
| Class I Shares | |
| Net Assets | $ 761,222,898 |
| Shares Outstanding | 34,604,309 |
| Net Asset Value, Offering Price and Redemption Price Per Share (net assets ÷ shares of beneficial interest outstanding) | $ 22.00 |
| Class R Shares | |
| Net Assets | $ 44,328,711 |
| Shares Outstanding | 2,031,104 |
| Net Asset Value, Offering Price and Redemption Price Per Share (net assets ÷ shares of beneficial interest outstanding) | $ 21.82 |
| June 30, 2022 | |
| Class R6 Shares | |
| Net Assets | $94,555,930 |
| Shares Outstanding | 4,295,215 |
| Net Asset Value, Offering Price and Redemption Price Per Share (net assets ÷ shares of beneficial interest outstanding) | $ 22.01 |
| On sales of $50,000 or more, the offering price of Class A shares is reduced. | |
| * | Redemption price per share is equal to the net asset value less any applicable contingent deferred sales charge. |
| Six Months Ended | |
| June 30, 2022 | |
| Investment Income | |
| Dividend income (net of foreign taxes withheld of $185,344) | $ 17,104,995 |
| Dividend income from affiliated investments | 5,512 |
| Securities lending income, net | 10,541 |
| Total investment income | $ 17,121,048 |
| Expenses | |
| Investment adviser fee | $ 5,133,713 |
| Distribution and service fees: | |
| Class A | 836,685 |
| Class C | 98,014 |
| Class R | 121,174 |
| Trustees’ fees and expenses | 44,074 |
| Custodian fee | 183,403 |
| Transfer and dividend disbursing agent fees | 564,878 |
| Legal and accounting services | 38,593 |
| Printing and postage | 61,680 |
| Registration fees | 42,904 |
| ReFlow liquidity program fees | 149,695 |
| Miscellaneous | 34,381 |
| Total expenses | $ 7,309,194 |
| Deduct: | |
| Waiver and/or reimbursement of expenses by affiliate | $ 723 |
| Total expense reductions | $ 723 |
| Net expenses | $ 7,308,471 |
| Net investment income | $ 9,812,577 |
| Realized and Unrealized Gain (Loss) | |
| Net realized gain (loss): | |
| Investment transactions | $ 86,415,841(1) |
| Investment transactions - affiliated investment | 365 |
| Foreign currency transactions | (18,208) |
| Net realized gain | $ 86,397,998 |
| Change in unrealized appreciation (depreciation): | |
| Investments | $ (251,336,266) |
| Foreign currency | (1,267) |
| Net change in unrealized appreciation (depreciation) | $(251,337,533) |
| Net realized and unrealized loss | $(164,939,535) |
| Net decrease in net assets from operations | $(155,126,958) |
| (1) | Includes $18,165,269 of net realized gains from redemptions in-kind. |
| Six Months Ended June 30, 2022 (Unaudited) | Year Ended December 31, 2021 | |
| Increase (Decrease) in Net Assets | ||
| From operations: | ||
| Net investment income | $ 9,812,577 | $ 19,888,975 |
| Net realized gain | 86,397,998 (1) | 254,232,119 (2) |
| Net change in unrealized appreciation (depreciation) | (251,337,533) | 86,538,741 |
| Net increase (decrease) in net assets from operations | $ (155,126,958) | $ 360,659,835 |
| Distributions to shareholders: | ||
| Class A | $ (3,241,474) | $ (49,070,204) |
| Class C | (19,756) | (1,279,924) |
| Class I | (4,937,056) | (60,711,953) |
| Class R | (174,947) | (3,365,297) |
| Class R6 | (630,954) | (6,834,688) |
| Total distributions to shareholders | $ (9,004,187) | $ (121,262,066) |
| Transactions in shares of beneficial interest: | ||
| Class A | $ (26,457,011) | $ (28,510,581) |
| Class C | (1,496,747) | (3,645,096) |
| Class I | 891,856 | (48,148,635) |
| Class R | (334,777) | (5,676,395) |
| Class R6 | 8,325,372 | 16,717,425 |
| Net decrease in net assets from Fund share transactions | $ (19,071,307) | $ (69,263,282) |
| Net increase (decrease) in net assets | $ (183,202,452) | $ 170,134,487 |
| Net Assets | ||
| At beginning of period | $ 1,706,793,218 | $ 1,536,658,731 |
| At end of period | $1,523,590,766 | $1,706,793,218 |
| (1) | Includes $18,165,269 of net realized gains from redemptions in-kind. |
| (2) | Includes $59,907,056 of net realized gains from redemptions in-kind. |
| Class A | ||||||
| Six Months Ended June 30, 2022 (Unaudited) | Year Ended December 31, | |||||
| 2021 | 2020 | 2019 | 2018 | 2017 | ||
| Net asset value — Beginning of period | $ 24.260 | $ 21.000 | $ 20.980 | $ 16.500 | $ 19.520 | $ 18.030 |
| Income (Loss) From Operations | ||||||
| Net investment income(1) | $ 0.126 | $ 0.254 | $ 0.274 | $ 0.256 | $ 0.254 | $ 0.246 |
| Net realized and unrealized gain (loss) | (2.381) | 4.782 | 0.154 (2) | 4.638 | (1.470) | 2.393 |
| Total income (loss) from operations | $ (2.255) | $ 5.036 | $ 0.428 | $ 4.894 | $ (1.216) | $ 2.639 |
| Less Distributions | ||||||
| From net investment income | $ (0.115) | $ (0.244) | $ (0.259) | $ (0.248) | $ (0.240) | $ (0.240) |
| From net realized gain | — | (1.532) | (0.149) | (0.166) | (1.564) | (0.909) |
| Total distributions | $ (0.115) | $ (1.776) | $ (0.408) | $ (0.414) | $ (1.804) | $ (1.149) |
| Net asset value — End of period | $ 21.890 | $ 24.260 | $ 21.000 | $ 20.980 | $ 16.500 | $ 19.520 |
| Total Return(3) | (9.33)% (4) | 24.29% | 2.28% | 29.79% | (6.83)% | 14.80% |
| Ratios/Supplemental Data | ||||||
| Net assets, end of period (000’s omitted) | $606,304 | $699,076 | $630,544 | $711,972 | $549,515 | $741,193 |
| Ratios (as a percentage of average daily net assets):(5) | ||||||
| Expenses | 1.02% (6)(7) | 1.01% | 1.04% | 1.04% | 1.06% | 1.06% |
| Net investment income | 1.07% (6) | 1.07% | 1.48% | 1.33% | 1.30% | 1.31% |
| Portfolio Turnover of the Portfolio(8) | — | — | — | — | 34% (4) | 105% |
| Portfolio Turnover of the Fund | 25% (4) | 56% | 65% | 62% | 48% (4)(9) | — |
| (1) | Computed using average shares outstanding. |
| (2) | The per share amount is not in accord with the net realized and unrealized gain (loss) for the period because of the timing of Fund share transactions and the amount of the per share realized and unrealized gains and losses at such time. |
| (3) | Returns are historical and are calculated by determining the percentage change in net asset value with all distributions reinvested and do not reflect the effect of sales charges. |
| (4) | Not annualized. |
| (5) | Includes the Fund’s share of the Portfolio’s allocated expenses for the period while the Fund was investing in the Portfolio. |
| (6) | Annualized. |
| (7) | The investment adviser reduced a portion of its adviser fee (equal to less than 0.005% of average daily net assets for the six months ended June 30, 2022). |
| (8) | Portfolio turnover represents the rate of portfolio activity for the period while the Fund was investing in the Portfolio. |
| (9) | For the period from June 18, 2018 through December 31, 2018 when the Fund was making investments directly in securities. |
| References to Portfolio herein are to Large-Cap Value Portfolio, a Massachusetts business trust in which the Fund invested all of its investable assets prior to the close of business on June 15, 2018 and which had the same investment objective and policies as the Fund during such period. | |
| Class C | ||||||
| Six Months Ended June 30, 2022 (Unaudited) | Year Ended December 31, | |||||
| 2021 | 2020 | 2019 | 2018 | 2017 | ||
| Net asset value — Beginning of period | $ 24.390 | $ 21.100 | $ 21.050 | $ 16.520 | $ 19.540 | $ 18.040 |
| Income (Loss) From Operations | ||||||
| Net investment income(1) | $ 0.037 | $ 0.073 | $ 0.139 | $ 0.103 | $ 0.107 | $ 0.107 |
| Net realized and unrealized gain (loss) | (2.393) | 4.810 | 0.150 (2) | 4.655 | (1.473) | 2.394 |
| Total income (loss) from operations | $ (2.356) | $ 4.883 | $ 0.289 | $ 4.758 | $ (1.366) | $ 2.501 |
| Less Distributions | ||||||
| From net investment income | $ (0.024) | $ (0.061) | $ (0.090) | $ (0.062) | $ (0.090) | $ (0.092) |
| From net realized gain | — | (1.532) | (0.149) | (0.166) | (1.564) | (0.909) |
| Total distributions | $ (0.024) | $ (1.593) | $ (0.239) | $ (0.228) | $ (1.654) | $ (1.001) |
| Net asset value — End of period | $22.010 | $24.390 | $21.100 | $21.050 | $ 16.520 | $ 19.540 |
| Total Return(3) | (9.67)% (4) | 23.39% | 1.52% | 28.82% | (7.53)% | 13.96% |
| Ratios/Supplemental Data | ||||||
| Net assets, end of period (000’s omitted) | $ 17,179 | $ 20,594 | $ 21,069 | $ 56,344 | $168,783 | $241,192 |
| Ratios (as a percentage of average daily net assets):(5) | ||||||
| Expenses | 1.77% (6)(7) | 1.76% | 1.79% | 1.80% | 1.81% | 1.81% |
| Net investment income | 0.32% (6) | 0.30% | 0.75% | 0.54% | 0.55% | 0.57% |
| Portfolio Turnover of the Portfolio(8) | — | — | — | — | 34% (4) | 105% |
| Portfolio Turnover of the Fund | 25% (4) | 56% | 65% | 62% | 48% (4)(9) | — |
| (1) | Computed using average shares outstanding. |
| (2) | The per share amount is not in accord with the net realized and unrealized gain (loss) for the period because of the timing of Fund share transactions and the amount of the per share realized and unrealized gains and losses at such time. |
| (3) | Returns are historical and are calculated by determining the percentage change in net asset value with all distributions reinvested and do not reflect the effect of sales charges. |
| (4) | Not annualized. |
| (5) | Includes the Fund’s share of the Portfolio’s allocated expenses for the period while the Fund was investing in the Portfolio. |
| (6) | Annualized. |
| (7) | The investment adviser reduced a portion of its adviser fee (equal to less than 0.005% of average daily net assets for the six months ended June 30, 2022). |
| (8) | Portfolio turnover represents the rate of portfolio activity for the period while the Fund was investing in the Portfolio. |
| (9) | For the period from June 18, 2018 through December 31, 2018 when the Fund was making investments directly in securities. |
| References to Portfolio herein are to Large-Cap Value Portfolio, a Massachusetts business trust in which the Fund invested all of its investable assets prior to the close of business on June 15, 2018 and which had the same investment objective and policies as the Fund during such period. | |
| Class I | ||||||
| Six Months Ended June 30, 2022 (Unaudited) | Year Ended December 31, | |||||
| 2021 | 2020 | 2019 | 2018 | 2017 | ||
| Net asset value — Beginning of period | $ 24.380 | $ 21.090 | $ 21.070 | $ 16.570 | $ 19.590 | $ 18.090 |
| Income (Loss) From Operations | ||||||
| Net investment income(1) | $ 0.157 | $ 0.314 | $ 0.322 | $ 0.305 | $ 0.306 | $ 0.296 |
| Net realized and unrealized gain (loss) | (2.391) | 4.812 | 0.152 (2) | 4.658 | (1.472) | 2.401 |
| Total income (loss) from operations | $ (2.234) | $ 5.126 | $ 0.474 | $ 4.963 | $ (1.166) | $ 2.697 |
| Less Distributions | ||||||
| From net investment income | $ (0.146) | $ (0.304) | $ (0.305) | $ (0.297) | $ (0.290) | $ (0.288) |
| From net realized gain | — | (1.532) | (0.149) | (0.166) | (1.564) | (0.909) |
| Total distributions | $ (0.146) | $ (1.836) | $ (0.454) | $ (0.463) | $ (1.854) | $ (1.197) |
| Net asset value — End of period | $ 22.000 | $ 24.380 | $ 21.090 | $ 21.070 | $ 16.570 | $ 19.590 |
| Total Return(3) | (9.20)% (4) | 24.64% | 2.52% | 30.11% | (6.57)% | 15.10% |
| Ratios/Supplemental Data | ||||||
| Net assets, end of period (000’s omitted) | $761,223 | $841,350 | $768,930 | $819,292 | $736,581 | $1,032,300 |
| Ratios (as a percentage of average daily net assets):(5) | ||||||
| Expenses | 0.77% (6)(7) | 0.76% | 0.79% | 0.79% | 0.81% | 0.81% |
| Net investment income | 1.32% (6) | 1.31% | 1.72% | 1.58% | 1.56% | 1.57% |
| Portfolio Turnover of the Portfolio(8) | — | — | — | — | 34% (4) | 105% |
| Portfolio Turnover of the Fund | 25% (4) | 56% | 65% | 62% | 48% (4)(9) | — |
| (1) | Computed using average shares outstanding. |
| (2) | The per share amount is not in accord with the net realized and unrealized gain (loss) for the period because of the timing of Fund share transactions and the amount of the per share realized and unrealized gains and losses at such time. |
| (3) | Returns are historical and are calculated by determining the percentage change in net asset value with all distributions reinvested. |
| (4) | Not annualized. |
| (5) | Includes the Fund’s share of the Portfolio’s allocated expenses for the period while the Fund was investing in the Portfolio. |
| (6) | Annualized. |
| (7) | The investment adviser reduced a portion of its adviser fee (equal to less than 0.005% of average daily net assets for the six months ended June 30, 2022). |
| (8) | Portfolio turnover represents the rate of portfolio activity for the period while the Fund was investing in the Portfolio. |
| (9) | For the period from June 18, 2018 through December 31, 2018 when the Fund was making investments directly in securities. |
| References to Portfolio herein are to Large-Cap Value Portfolio, a Massachusetts business trust in which the Fund invested all of its investable assets prior to the close of business on June 15, 2018 and which had the same investment objective and policies as the Fund during such period. | |
| Class R | ||||||
| Six Months Ended June 30, 2022 (Unaudited) | Year Ended December 31, | |||||
| 2021 | 2020 | 2019 | 2018 | 2017 | ||
| Net asset value — Beginning of period | $ 24.190 | $ 20.940 | $ 20.920 | $ 16.450 | $ 19.460 | $ 17.980 |
| Income (Loss) From Operations | ||||||
| Net investment income(1) | $ 0.096 | $ 0.193 | $ 0.228 | $ 0.206 | $ 0.204 | $ 0.199 |
| Net realized and unrealized gain (loss) | (2.381) | 4.773 | 0.152 (2) | 4.626 | (1.460) | 2.382 |
| Total income (loss) from operations | $ (2.285) | $ 4.966 | $ 0.380 | $ 4.832 | $ (1.256) | $ 2.581 |
| Less Distributions | ||||||
| From net investment income | $ (0.085) | $ (0.184) | $ (0.211) | $ (0.196) | $ (0.190) | $ (0.192) |
| From net realized gain | — | (1.532) | (0.149) | (0.166) | (1.564) | (0.909) |
| Total distributions | $ (0.085) | $ (1.716) | $ (0.360) | $ (0.362) | $ (1.754) | $ (1.101) |
| Net asset value — End of period | $21.820 | $24.190 | $20.940 | $20.920 | $16.450 | $19.460 |
| Total Return(3) | (9.47)% (4) | 24.01% | 2.03% | 29.48% | (7.04)% | 14.50% |
| Ratios/Supplemental Data | ||||||
| Net assets, end of period (000’s omitted) | $ 44,329 | $ 49,462 | $ 47,772 | $ 59,473 | $ 60,984 | $ 86,706 |
| Ratios (as a percentage of average daily net assets):(5) | ||||||
| Expenses | 1.27% (6)(7) | 1.26% | 1.29% | 1.30% | 1.31% | 1.31% |
| Net investment income | 0.82% (6) | 0.81% | 1.23% | 1.08% | 1.05% | 1.06% |
| Portfolio Turnover of the Portfolio(8) | — | — | — | — | 34% (4) | 105% |
| Portfolio Turnover of the Fund | 25% (4) | 56% | 65% | 62% | 48% (4)(9) | — |
| (1) | Computed using average shares outstanding. |
| (2) | The per share amount is not in accord with the net realized and unrealized gain (loss) for the period because of the timing of Fund share transactions and the amount of the per share realized and unrealized gains and losses at such time. |
| (3) | Returns are historical and are calculated by determining the percentage change in net asset value with all distributions reinvested. |
| (4) | Not annualized. |
| (5) | Includes the Fund’s share of the Portfolio’s allocated expenses for the period while the Fund was investing in the Portfolio. |
| (6) | Annualized. |
| (7) | The investment adviser reduced a portion of its adviser fee (equal to less than 0.005% of average daily net assets for the six months ended June 30, 2022). |
| (8) | Portfolio turnover represents the rate of portfolio activity for the period while the Fund was investing in the Portfolio. |
| (9) | For the period from June 18, 2018 through December 31, 2018 when the Fund was making investments directly in securities. |
| References to Portfolio herein are to Large-Cap Value Portfolio, a Massachusetts business trust in which the Fund invested all of its investable assets prior to the close of business on June 15, 2018 and which had the same investment objective and policies as the Fund during such period. | |
| Class R6 | ||||||
| Six Months Ended June 30, 2022 (Unaudited) | Year Ended December 31, | |||||
| 2021 | 2020 | 2019 | 2018 | 2017 | ||
| Net asset value — Beginning of period | $ 24.400 | $ 21.110 | $ 21.080 | $ 16.580 | $ 19.610 | $ 18.100 |
| Income (Loss) From Operations | ||||||
| Net investment income(1) | $ 0.164 | $ 0.334 | $ 0.337 | $ 0.320 | $ 0.310 | $ 0.311 |
| Net realized and unrealized gain (loss) | (2.402) | 4.806 | 0.160 (2) | 4.656 | (1.470) | 2.413 |
| Total income (loss) from operations | $ (2.238) | $ 5.140 | $ 0.497 | $ 4.976 | $ (1.160) | $ 2.724 |
| Less Distributions | ||||||
| From net investment income | $ (0.152) | $ (0.318) | $ (0.318) | $ (0.310) | $ (0.306) | $ (0.305) |
| From net realized gain | — | (1.532) | (0.149) | (0.166) | (1.564) | (0.909) |
| Total distributions | $ (0.152) | $ (1.850) | $ (0.467) | $ (0.476) | $ (1.870) | $ (1.214) |
| Net asset value — End of period | $22.010 | $24.400 | $21.110 | $21.080 | $16.580 | $19.610 |
| Total Return(3) | (9.21)% (4) | 24.69% | 2.64% | 30.17% | (6.54)% | 15.25% |
| Ratios/Supplemental Data | ||||||
| Net assets, end of period (000’s omitted) | $ 94,556 | $ 96,311 | $ 68,343 | $ 76,714 | $ 73,019 | $ 86,742 |
| Ratios (as a percentage of average daily net assets):(5) | ||||||
| Expenses | 0.71% (6)(7) | 0.70% | 0.72% | 0.72% | 0.72% | 0.73% |
| Net investment income | 1.38% (6) | 1.39% | 1.80% | 1.66% | 1.57% | 1.64% |
| Portfolio Turnover of the Portfolio(8) | — | — | — | — | 34% (4) | 105% |
| Portfolio Turnover of the Fund | 25% (4) | 56% | 65% | 62% | 48% (4)(9) | — |
| (1) | Computed using average shares outstanding. |
| (2) | The per share amount is not in accord with the net realized and unrealized gain (loss) for the period because of the timing of Fund share transactions and the amount of the per share realized and unrealized gains and losses at such time. |
| (3) | Returns are historical and are calculated by determining the percentage change in net asset value with all distributions reinvested. |
| (4) | Not annualized. |
| (5) | Includes the Fund’s share of the Portfolio’s allocated expenses for the period while the Fund was investing in the Portfolio. |
| (6) | Annualized. |
| (7) | The investment adviser reduced a portion of its adviser fee (equal to less than 0.005% of average daily net assets for the six months ended June 30, 2022). |
| (8) | Portfolio turnover represents the rate of portfolio activity for the period while the Fund was investing in the Portfolio. |
| (9) | For the period from June 18, 2018 through December 31, 2018 when the Fund was making investments directly in securities. |
| References to Portfolio herein are to Large-Cap Value Portfolio, a Massachusetts business trust in which the Fund invested all of its investable assets prior to the close of business on June 15, 2018 and which had the same investment objective and policies as the Fund during such period. | |
| Aggregate cost | $1,394,414,804 |
| Gross unrealized appreciation | $ 193,504,231 |
| Gross unrealized depreciation | (63,575,189) |
| Net unrealized appreciation | $ 129,929,042 |
| Average Daily Net Assets | Annual Fee Rate |
| Up to $2 billion | 0.625% |
| $2 billion but less than $5 billion | 0.600% |
| $5 billion but less than $10 billion | 0.575% |
| $10 billion but less than $15 billion | 0.555% |
| $15 billion but less than $20 billion | 0.540% |
| $20 billion but less than $25 billion | 0.530% |
| $25 billion and over | 0.520% |
| Six Months Ended June 30, 2022 (Unaudited) | Year Ended December 31, 2021 | ||||
| Shares | Amount | Shares | Amount | ||
| Class A | |||||
| Sales | 1,040,031 | $ 24,868,648 | 2,067,434 | $ 49,290,623 | |
| Issued to shareholders electing to receive payments of distributions in Fund shares | 123,421 | 2,897,101 | 1,869,325 | 44,038,615 | |
| Redemptions | (2,332,745) | (55,451,031) | (5,267,155) | (124,586,539) | |
| Converted from Class C shares | 52,372 | 1,228,271 | 115,452 | 2,746,720 | |
| Net decrease | (1,116,921) | $ (26,457,011) | (1,214,944) | $ (28,510,581) | |
| Class C | |||||
| Sales | 95,010 | $ 2,289,542 | 194,103 | $ 4,641,660 | |
| Issued to shareholders electing to receive payments of distributions in Fund shares | 773 | 18,313 | 50,234 | 1,188,427 | |
| Redemptions | (107,554) | (2,576,331) | (283,521) | (6,728,463) | |
| Converted to Class A shares | (52,119) | (1,228,271) | (114,963) | (2,746,720) | |
| Net decrease | (63,890) | $ (1,496,747) | (154,147) | $ (3,645,096) | |
| Six Months Ended June 30, 2022 (Unaudited) | Year Ended December 31, 2021 | ||||
| Shares | Amount | Shares | Amount | ||
| Class I | |||||
| Sales | 7,129,475 | $ 170,180,410 | 12,148,514 | $ 289,525,969 | |
| Issued to shareholders electing to receive payments of distributions in Fund shares | 175,868 | 4,144,754 | 2,118,517 | 50,158,104 | |
| Redemptions | (7,209,210) | (173,433,308) | (16,212,717) | (387,832,708) | |
| Net increase (decrease) | 96,133 | $ 891,856 | (1,945,686) | $ (48,148,635) | |
| Class R | |||||
| Sales | 197,779 | $ 4,717,299 | 235,191 | $ 5,544,656 | |
| Issued to shareholders electing to receive payments of distributions in Fund shares | 7,450 | 174,383 | 142,734 | 3,350,945 | |
| Redemptions | (219,049) | (5,226,459) | (614,541) | (14,571,996) | |
| Net decrease | (13,820) | $ (334,777) | (236,616) | $ (5,676,395) | |
| Class R6 | |||||
| Sales | 740,052 | $ 17,712,189 | 1,230,661 | $ 29,415,674 | |
| Issued to shareholders electing to receive payments of distributions in Fund shares | 26,522 | 625,609 | 285,796 | 6,771,948 | |
| Redemptions | (418,696) | (10,012,426) | (806,934) | (19,470,197) | |
| Net increase | 347,878 | $ 8,325,372 | 709,523 | $ 16,717,425 | |
| Name | Value, beginning of period | Purchases | Sales proceeds | Net realized gain (loss) | Change in unrealized appreciation (depreciation) | Value, end of period | Dividend income | Units/Shares, end of period |
| Short-Term Investments | ||||||||
| Cash Reserves Fund | $6,681,683 | $73,592,438 | $(80,274,486) | $ 365 | $ — | $ — | $ 1,360 | — |
| Liquidity Fund | — | 62,127,433 | (52,785,598) | — | — | 9,341,835 | 4,152 | 9,341,835 |
| Total | $ 365 | $ — | $9,341,835 | $5,512 | ||||
| • | Level 1 – quoted prices in active markets for identical investments |
| • | Level 2 – other significant observable inputs (including quoted prices for similar investments, interest rates, prepayment speeds, credit risk, etc.) |
| • | Level 3 – significant unobservable inputs (including a fund's own assumptions in determining the fair value of investments) |
| Asset Description | Level 1 | Level 2 | Level 3 | Total |
| Common Stocks: | ||||
| Communication Services | $ 117,585,570 | $ — | $ — | $ 117,585,570 |
| Consumer Discretionary | 74,770,103 | — | — | 74,770,103 |
| Consumer Staples | 115,799,436 | — | — | 115,799,436 |
| Energy | 107,101,528 | — | — | 107,101,528 |
| Financials | 273,943,902 | — | — | 273,943,902 |
| Health Care | 265,001,523 | 30,330,450 | — | 295,331,973 |
| Industrials | 168,758,861 | — | — | 168,758,861 |
| Information Technology | 132,062,851 | — | — | 132,062,851 |
| Materials | 44,133,507 | — | — | 44,133,507 |
| Real Estate | 78,605,955 | — | — | 78,605,955 |
| Utilities | 106,908,325 | — | — | 106,908,325 |
| Total Common Stocks | $1,484,671,561 | $30,330,450* | $ — | $1,515,002,011 |
| Short-Term Investments | $ 9,341,835 | $ — | $ — | $ 9,341,835 |
| Total Investments | $1,494,013,396 | $30,330,450 | $ — | $1,524,343,846 |
| * | Includes foreign equity securities whose values were adjusted to reflect market trading of comparable securities or other correlated instruments that occurred after the close of trading in their applicable foreign markets. |
| Officers | |
| Eric A. Stein President | Jill R. Damon Secretary |
| Deidre E. Walsh Vice President and Chief Legal Officer | Richard F. Froio Chief Compliance Officer |
| James F. Kirchner Treasurer | |
| Trustees |
| George J. Gorman Chairperson | |
| Alan C. Bowser** | |
| Thomas E. Faust Jr.* | |
| Mark R. Fetting | |
| Cynthia E. Frost | |
| Valerie A. Mosley |
| Keith Quinton | |
| Marcus L. Smith | |
| Susan J. Sutherland | |
| Scott E. Wennerholm | |
| Nancy A. Wiser** |
| * | Interested Trustee |
| ** | Mr. Bowser and Ms. Wiser began serving as Trustees effective April 4, 2022. |
| Privacy Notice | April 2021 |
| FACTS | WHAT DOES EATON VANCE DO WITH YOUR PERSONAL INFORMATION? |
| Why? | Financial companies choose how they share your personal information. Federal law gives consumers the right to limit some but not all sharing. Federal law also requires us to tell you how we collect, share, and protect your personal information. Please read this notice carefully to understand what we do. |
| What? | The types of personal information we collect and share depend on the product or service you have with us. This information can include:■ Social Security number and income ■ investment experience and risk tolerance ■ checking account number and wire transfer instructions |
| How? | All financial companies need to share customers’ personal information to run their everyday business. In the section below, we list the reasons financial companies can share their customers’ personal information; the reasons Eaton Vance chooses to share; and whether you can limit this sharing. |
| Reasons we can share your personal information | Does Eaton Vance share? | Can you limit this sharing? |
| For our everyday business purposes — such as to process your transactions, maintain your account(s), respond to court orders and legal investigations, or report to credit bureaus | Yes | No |
| For our marketing purposes — to offer our products and services to you | Yes | No |
| For joint marketing with other financial companies | No | We don’t share |
| For our investment management affiliates’ everyday business purposes — information about your transactions, experiences, and creditworthiness | Yes | Yes |
| For our affiliates’ everyday business purposes — information about your transactions and experiences | Yes | No |
| For our affiliates’ everyday business purposes — information about your creditworthiness | No | We don’t share |
| For our investment management affiliates to market to you | Yes | Yes |
| For our affiliates to market to you | No | We don’t share |
| For nonaffiliates to market to you | No | We don’t share |
| To limit our sharing | Call toll-free 1-800-262-1122 or email: EVPrivacy@eatonvance.comPlease note:If you are a new customer, we can begin sharing your information 30 days from the date we sent this notice. When you are no longer our customer, we continue to share your information as described in this notice. However, you can contact us at any time to limit our sharing. |
| Questions? | Call toll-free 1-800-262-1122 or email: EVPrivacy@eatonvance.com |
| Privacy Notice — continued | April 2021 |
| Who we are | |
| Who is providing this notice? | Eaton Vance Management, Eaton Vance Distributors, Inc., Eaton Vance Trust Company, Eaton Vance Management (International) Limited, Eaton Vance Advisers International Ltd., Eaton Vance Global Advisors Limited, Eaton Vance Management’s Real Estate Investment Group, Boston Management and Research, Calvert Research and Management, Eaton Vance and Calvert Fund Families and our investment advisory affiliates (“Eaton Vance”) (see Investment Management Affiliates definition below) |
| What we do | |
| How does Eaton Vance protect my personal information? | To protect your personal information from unauthorized access and use, we use security measures that comply with federal law. These measures include computer safeguards and secured files and buildings. We have policies governing the proper handling of customer information by personnel and requiring third parties that provide support to adhere to appropriate security standards with respect to such information. |
| How does Eaton Vance collect my personal information? | We collect your personal information, for example, when you■ open an account or make deposits or withdrawals from your account ■ buy securities from us or make a wire transfer ■ give us your contact informationWe also collect your personal information from others, such as credit bureaus, affiliates, or other companies. |
| Why can’t I limit all sharing? | Federal law gives you the right to limit only■ sharing for affiliates’ everyday business purposes — information about your creditworthiness ■ affiliates from using your information to market to you ■ sharing for nonaffiliates to market to youState laws and individual companies may give you additional rights to limit sharing. See below for more on your rights under state law. |
| Definitions | |
| Investment Management Affiliates | Eaton Vance Investment Management Affiliates include registered investment advisers, registered broker- dealers, and registered and unregistered funds. Investment Management Affiliates does not include entities associated with Morgan Stanley Wealth Management, such as Morgan Stanley Smith Barney LLC and Morgan Stanley & Co. |
| Affiliates | Companies related by common ownership or control. They can be financial and nonfinancial companies.■ Our affiliates include companies with a Morgan Stanley name and financial companies such as Morgan Stanley Smith Barney LLC and Morgan Stanley & Co. |
| Nonaffiliates | Companies not related by common ownership or control. They can be financial and nonfinancial companies.■ Eaton Vance does not share with nonaffiliates so they can market to you. |
| Joint marketing | A formal agreement between nonaffiliated financial companies that together market financial products or services to you.■ Eaton Vance doesn’t jointly market. |
| Other important information | |
| Vermont: Except as permitted by law, we will not share personal information we collect about Vermont residents with Nonaffiliates unless you provide us with your written consent to share such information.California: Except as permitted by law, we will not share personal information we collect about California residents with Nonaffiliates and we will limit sharing such personal information with our Affiliates to comply with California privacy laws that apply to us. | |
Two International Place
Boston, MA 02110
Two International Place
Boston, MA 02110
Two International Place
Boston, MA 02110
(617) 482-8260
State Street Financial Center, One Lincoln Street
Boston, MA 02111
Attn: Eaton Vance Funds
P.O. Box 9653
Providence, RI 02940-9653
(800) 262-1122
Boston, MA 02110


| % Average Annual Total Returns1,2 | Class Inception Date | Performance Inception Date | Six Months | One Year | Five Years | Ten Years |
| Class A at NAV | 01/02/1997 | 01/02/1997 | (18.54)% | (13.16)% | 7.80% | 10.48% |
| Class A with 5.25% Maximum Sales Charge | — | — | (22.80) | (17.74) | 6.65 | 9.89 |
| Class C at NAV | 05/03/2002 | 01/02/1997 | (18.86) | (13.83) | 7.00 | 9.80 |
| Class C with 1% Maximum Sales Charge | — | — | (19.67) | (14.57) | 7.00 | 9.80 |
| Class I at NAV | 09/02/2008 | 01/02/1997 | (18.47) | (12.99) | 8.07 | 10.74 |
| Class R at NAV | 08/03/2009 | 01/02/1997 | (18.65) | (13.45) | 7.53 | 10.20 |
| Russell 2000® Index | — | — | (23.43)% | (25.20)% | 5.16% | 9.35% |
| % Total Annual Operating Expense Ratios3 | Class A | Class C | Class I | Class R |
| Gross | 1.38% | 2.13% | 1.13% | 1.63% |
| Net | 1.21 | 1.96 | 0.96 | 1.46 |
| Sector Allocation (% of net assets)* |

| * | Excludes cash and cash equivalents. |
| Top 10 Holdings (% of net assets)* | |
| Performance Food Group Co. | 3.3% |
| Dorman Products, Inc. | 2.7 |
| CBIZ, Inc. | 2.7 |
| Selective Insurance Group, Inc. | 2.5 |
| ONE Gas, Inc. | 2.4 |
| Chemed Corp. | 2.4 |
| SouthState Corp. | 2.4 |
| Commerce Bancshares, Inc. | 2.3 |
| Valvoline, Inc. | 2.3 |
| R1 RCM, Inc. | 2.3 |
| Total | 25.3% |
| * | Excludes cash and cash equivalents. |
| 1 | Russell 2000® Index is an unmanaged index of 2,000 U.S. small-cap stocks. Unless otherwise stated, index returns do not reflect the effect of any applicable sales charges, commissions, expenses, taxes or leverage, as applicable. It is not possible to invest directly in an index. |
| 2 | Total Returns at NAV do not include applicable sales charges. If sales charges were deducted, the returns would be lower. Total Returns shown with maximum sales charge reflect the stated maximum sales charge. Unless otherwise stated, performance does not reflect the deduction of taxes on Fund distributions or redemptions of Fund shares.Effective November 5, 2020, Class C shares automatically convert to Class A shares eight years after purchase. The average annual total returns listed for Class C reflect conversion to Class A shares after eight years. Prior to November 5, 2020, Class C shares automatically converted to Class A shares ten years after purchase. |
| 3 | Source: Fund prospectus. Net expense ratios reflect a contractual expense reimbursement that continues through 4/30/23. The expense ratios for the current reporting period can be found in the Financial Highlights section of this report. Performance reflects expenses waived and/or reimbursed, if applicable. Without such waivers and/or reimbursements, performance would have been lower. |
| Fund profile subject to change due to active management. |
| Beginning Account Value (1/1/22) | Ending Account Value (6/30/22) | Expenses Paid During Period* (1/1/22 – 6/30/22) | Annualized Expense Ratio | |
| Actual | ||||
| Class A | $1,000.00 | $ 814.60 | $5.44** | 1.21% |
| Class C | $1,000.00 | $ 811.40 | $8.80** | 1.96% |
| Class I | $1,000.00 | $ 815.30 | $4.32** | 0.96% |
| Class R | $1,000.00 | $ 813.50 | $6.56** | 1.46% |
| Hypothetical | ||||
| (5% return per year before expenses) | ||||
| Class A | $1,000.00 | $1,018.79 | $6.06** | 1.21% |
| Class C | $1,000.00 | $1,015.08 | $9.79** | 1.96% |
| Class I | $1,000.00 | $1,020.03 | $4.81** | 0.96% |
| Class R | $1,000.00 | $1,017.56 | $7.30** | 1.46% |
| * | Expenses are equal to the Fund's annualized expense ratio for the indicated Class, multiplied by the average account value over the period, multiplied by 181/365 (to reflect the one-half year period). The Example assumes that the $1,000 was invested at the net asset value per share determined at the close of business on December 31, 2021. |
| ** | Absent an allocation of certain expenses to an affiliate, expenses would be higher. |
| Common Stocks — 97.5% |
| Security | Shares | Value | |
| Aerospace & Defense — 2.8% | |||
| Hexcel Corp. | 35,498 | $ 1,856,900 | |
| Woodward, Inc. | 16,456 | 1,522,016 | |
| $ 3,378,916 | |||
| Auto Components — 5.1% | |||
| Dana, Inc. | 85,561 | $ 1,203,843 | |
| Dorman Products, Inc.(1) | 30,080 | 3,300,077 | |
| Visteon Corp.(1) | 15,574 | 1,613,155 | |
| $ 6,117,075 | |||
| Automobiles — 0.9% | |||
| Harley-Davidson, Inc. | 36,004 | $ 1,139,887 | |
| $ 1,139,887 | |||
| Banks — 11.4% | |||
| Commerce Bancshares, Inc. | 42,234 | $ 2,772,662 | |
| Community Bank System, Inc. | 22,710 | 1,437,089 | |
| CVB Financial Corp. | 55,628 | 1,380,131 | |
| Glacier Bancorp, Inc. | 25,461 | 1,207,361 | |
| Independent Bank Corp. | 20,182 | 1,603,056 | |
| SouthState Corp. | 36,910 | 2,847,606 | |
| Stock Yards Bancorp, Inc. | 17,917 | 1,071,795 | |
| Wintrust Financial Corp. | 18,607 | 1,491,351 | |
| $ 13,811,051 | |||
| Biotechnology — 1.3% | |||
| Neurocrine Biosciences, Inc.(1) | 15,892 | $ 1,549,152 | |
| $ 1,549,152 | |||
| Building Products — 5.6% | |||
| AAON, Inc. | 37,062 | $ 2,029,515 | |
| AZEK Co., Inc. (The)(1) | 120,119 | 2,010,792 | |
| CSW Industrials, Inc. | 15,951 | 1,643,432 | |
| Hayward Holdings, Inc.(1) | 75,300 | 1,083,567 | |
| $ 6,767,306 | |||
| Capital Markets — 0.8% | |||
| Cohen & Steers, Inc. | 15,493 | $ 985,200 | |
| $ 985,200 | |||
| Chemicals — 3.5% | |||
| Quaker Chemical Corp. | 9,662 | $ 1,444,662 | |
| Security | Shares | Value | |
| Chemicals (continued) | |||
| Valvoline, Inc. | 96,104 | $ 2,770,679 | |
| $ 4,215,341 | |||
| Commercial Services & Supplies — 1.8% | |||
| MillerKnoll, Inc. | 81,317 | $ 2,136,198 | |
| $ 2,136,198 | |||
| Diversified Consumer Services — 2.3% | |||
| Bright Horizons Family Solutions, Inc.(1) | 7,429 | $ 627,899 | |
| Terminix Global Holdings, Inc.(1) | 51,543 | 2,095,223 | |
| $ 2,723,122 | |||
| Electronic Equipment, Instruments & Components — 1.1% | |||
| National Instruments Corp. | 41,657 | $ 1,300,948 | |
| $ 1,300,948 | |||
| Equity Real Estate Investment Trusts (REITs) — 6.9% | |||
| CubeSmart | 45,373 | $ 1,938,335 | |
| EastGroup Properties, Inc. | 10,203 | 1,574,629 | |
| Essential Properties Realty Trust, Inc. | 91,215 | 1,960,210 | |
| Rexford Industrial Realty, Inc. | 20,699 | 1,192,056 | |
| STORE Capital Corp. | 62,040 | 1,618,003 | |
| $ 8,283,233 | |||
| Food & Staples Retailing — 4.2% | |||
| Chefs' Warehouse, Inc. (The)(1) | 26,084 | $ 1,014,407 | |
| Performance Food Group Co.(1) | 87,511 | 4,023,756 | |
| $ 5,038,163 | |||
| Food Products — 0.9% | |||
| J&J Snack Foods Corp. | 7,358 | $ 1,027,618 | |
| $ 1,027,618 | |||
| Gas Utilities — 2.4% | |||
| ONE Gas, Inc. | 36,086 | $ 2,929,822 | |
| $ 2,929,822 | |||
| Health Care Equipment & Supplies — 5.4% | |||
| Envista Holdings Corp.(1) | 59,325 | $ 2,286,386 | |
| ICU Medical, Inc.(1) | 9,532 | 1,566,965 | |
| Integra LifeSciences Holdings Corp.(1) | 36,697 | 1,982,739 | |
| Tandem Diabetes Care, Inc.(1) | 12,518 | 740,940 | |
| $ 6,577,030 | |||
| Security | Shares | Value | |
| Health Care Providers & Services — 10.3% | |||
| Addus HomeCare Corp.(1) | 27,753 | $ 2,311,270 | |
| Agiliti, Inc.(1) | 111,397 | 2,284,753 | |
| Chemed Corp. | 6,219 | 2,919,136 | |
| R1 RCM, Inc.(1) | 131,167 | 2,749,260 | |
| U.S. Physical Therapy, Inc. | 20,252 | 2,211,518 | |
| $ 12,475,937 | |||
| Hotels, Restaurants & Leisure — 1.9% | |||
| Texas Roadhouse, Inc. | 16,491 | $ 1,207,141 | |
| Wyndham Hotels & Resorts, Inc. | 16,691 | 1,096,933 | |
| $ 2,304,074 | |||
| Insurance — 6.5% | |||
| RLI Corp. | 20,817 | $ 2,427,054 | |
| Ryan Specialty Holdings, Inc., Class A(1) | 62,286 | 2,440,988 | |
| Selective Insurance Group, Inc. | 33,700 | 2,929,878 | |
| $ 7,797,920 | |||
| Interactive Media & Services — 1.4% | |||
| CarGurus, Inc.(1) | 80,131 | $ 1,722,015 | |
| $ 1,722,015 | |||
| IT Services — 0.8% | |||
| Euronet Worldwide, Inc.(1) | 9,498 | $ 955,404 | |
| $ 955,404 | |||
| Machinery — 2.5% | |||
| Chart Industries, Inc.(1) | 8,182 | $ 1,369,503 | |
| Middleby Corp.(1) | 13,458 | 1,687,095 | |
| $ 3,056,598 | |||
| Oil, Gas & Consumable Fuels — 0.5% | |||
| Archaea Energy, Inc.(1) | 37,133 | $ 576,675 | |
| $ 576,675 | |||
| Professional Services — 2.7% | |||
| CBIZ, Inc.(1) | 80,918 | $ 3,233,483 | |
| $ 3,233,483 | |||
| Road & Rail — 1.6% | |||
| Landstar System, Inc. | 13,588 | $ 1,975,967 | |
| $ 1,975,967 | |||
| Semiconductors & Semiconductor Equipment — 1.6% | |||
| Ambarella, Inc.(1) | 12,260 | $ 802,540 | |
| Security | Shares | Value | |
| Semiconductors & Semiconductor Equipment (continued) | |||
| Silicon Laboratories, Inc.(1) | 8,474 | $ 1,188,224 | |
| $ 1,990,764 | |||
| Software — 7.0% | |||
| ACI Worldwide, Inc.(1) | 37,616 | $ 973,878 | |
| Altair Engineering, Inc., Class A(1) | 47,124 | 2,474,010 | |
| Clearwater Analytics Holdings, Inc., Class A(1) | 57,162 | 688,230 | |
| Envestnet, Inc.(1) | 30,656 | 1,617,717 | |
| nCino, Inc.(1) | 30,937 | 956,572 | |
| Sps Commerce, Inc.(1) | 15,092 | 1,706,151 | |
| $ 8,416,558 | |||
| Specialty Retail — 1.4% | |||
| Five Below, Inc.(1) | 4,879 | $ 553,425 | |
| National Vision Holdings, Inc.(1) | 42,914 | 1,180,135 | |
| $ 1,733,560 | |||
| Trading Companies & Distributors — 2.9% | |||
| Core & Main, Inc., Class A(1) | 85,914 | $ 1,915,882 | |
| Herc Holdings, Inc. | 18,137 | 1,635,051 | |
| $ 3,550,933 | |||
| Total Common Stocks (identified cost $108,380,014) | $117,769,950 | ||
| Short-Term Investments — 2.4% |
| Security | Shares | Value | |
| Morgan Stanley Institutional Liquidity Funds - Government Portfolio, Institutional Class, 1.38%(2) | 2,904,334 | $ 2,904,334 | |
| Total Short-Term Investments (identified cost $2,904,334) | $ 2,904,334 | ||
| Total Investments — 99.9% (identified cost $111,284,348) | $120,674,284 | ||
| Other Assets, Less Liabilities — 0.1% | $ 150,756 | ||
| Net Assets — 100.0% | $120,825,040 | ||
| The percentage shown for each investment category in the Portfolio of Investments is based on net assets. | |
| (1) | Non-income producing security. |
| (2) | May be deemed to be an affiliated investment company. The rate shown is the annualized seven-day yield as of June 30, 2022. |
| June 30, 2022 | |
| Assets | |
| Unaffiliated investments, at value (identified cost $108,380,014) | $ 117,769,950 |
| Affiliated investment, at value (identified cost $2,904,334) | 2,904,334 |
| Dividends receivable | 147,044 |
| Dividends receivable from affiliated investment | 2,964 |
| Receivable for Fund shares sold | 186,509 |
| Receivable from affiliate | 51,752 |
| Total assets | $121,062,553 |
| Liabilities | |
| Payable for Fund shares redeemed | $ 78,007 |
| Payable to affiliate: | |
| Investment adviser fee | 74,436 |
| Administration fee | 14,978 |
| Distribution and service fees | 7,120 |
| Trustees' fees | 1,865 |
| Accrued expenses | 61,107 |
| Total liabilities | $ 237,513 |
| Net Assets | $120,825,040 |
| Sources of Net Assets | |
| Paid-in capital | $ 108,912,865 |
| Distributable earnings | 11,912,175 |
| Net Assets | $120,825,040 |
| Class A Shares | |
| Net Assets | $ 22,562,175 |
| Shares Outstanding | 1,777,213 |
| Net Asset Value and Redemption Price Per Share (net assets ÷ shares of beneficial interest outstanding) | $ 12.70 |
| Maximum Offering Price Per Share (100 ÷ 94.75 of net asset value per share) | $ 13.40 |
| Class C Shares | |
| Net Assets | $ 2,653,964 |
| Shares Outstanding | 275,340 |
| Net Asset Value and Offering Price Per Share* (net assets ÷ shares of beneficial interest outstanding) | $ 9.64 |
| Class I Shares | |
| Net Assets | $ 95,168,250 |
| Shares Outstanding | 6,530,804 |
| Net Asset Value, Offering Price and Redemption Price Per Share (net assets ÷ shares of beneficial interest outstanding) | $ 14.57 |
| Class R Shares | |
| Net Assets | $ 440,651 |
| Shares Outstanding | 36,865 |
| Net Asset Value, Offering Price and Redemption Price Per Share (net assets ÷ shares of beneficial interest outstanding) | $ 11.95 |
| On sales of $50,000 or more, the offering price of Class A shares is reduced. | |
| * | Redemption price per share is equal to the net asset value less any applicable contingent deferred sales charge. |
| Six Months Ended | |
| June 30, 2022 | |
| Investment Income | |
| Dividend income | $ 710,432 |
| Dividend income from affiliated investments | 4,832 |
| Total investment income | $ 715,264 |
| Expenses | |
| Investment adviser fee | $ 510,107 |
| Administration fee | 102,021 |
| Distribution and service fees: | |
| Class A | 31,850 |
| Class C | 14,596 |
| Class R | 1,111 |
| Trustees’ fees and expenses | 3,924 |
| Custodian fee | 23,386 |
| Transfer and dividend disbursing agent fees | 61,691 |
| Legal and accounting services | 15,102 |
| Printing and postage | 18,461 |
| Registration fees | 30,358 |
| Miscellaneous | 8,666 |
| Total expenses | $ 821,273 |
| Deduct: | |
| Waiver and/or reimbursement of expenses by affiliates | $ 120,730 |
| Total expense reductions | $ 120,730 |
| Net expenses | $ 700,543 |
| Net investment income | $ 14,721 |
| Realized and Unrealized Gain (Loss) | |
| Net realized gain (loss): | |
| Investment transactions | $ 1,899,634 |
| Investment transactions - affiliated investment | 494 |
| Net realized gain | $ 1,900,128 |
| Change in unrealized appreciation (depreciation): | |
| Investments | $ (29,913,924) |
| Net change in unrealized appreciation (depreciation) | $(29,913,924) |
| Net realized and unrealized loss | $(28,013,796) |
| Net decrease in net assets from operations | $(27,999,075) |
| Six Months Ended June 30, 2022 (Unaudited) | Year Ended December 31, 2021 | |
| Increase (Decrease) in Net Assets | ||
| From operations: | ||
| Net investment income (loss) | $ 14,721 | $ (95,977) |
| Net realized gain | 1,900,128 | 18,348,401 |
| Net change in unrealized appreciation (depreciation) | (29,913,924) | 6,733,999 |
| Net increase (decrease) in net assets from operations | $ (27,999,075) | $ 24,986,423 |
| Distributions to shareholders: | ||
| Class A | $ — | $ (3,568,657) |
| Class C | — | (485,866) |
| Class I | — | (12,370,274) |
| Class R | — | (56,381) |
| Total distributions to shareholders | $ — | $ (16,481,178) |
| Transactions in shares of beneficial interest: | ||
| Class A | $ (1,041,288) | $ 359,461 |
| Class C | 11,618 | (402,915) |
| Class I | 6,133,829 | 21,857,792 |
| Class R | 76,695 | (161,144) |
| Net increase in net assets from Fund share transactions | $ 5,180,854 | $ 21,653,194 |
| Net increase (decrease) in net assets | $ (22,818,221) | $ 30,158,439 |
| Net Assets | ||
| At beginning of period | $ 143,643,261 | $ 113,484,822 |
| At end of period | $120,825,040 | $143,643,261 |
| Class A | ||||||
| Six Months Ended June 30, 2022 (Unaudited) | Year Ended December 31, | |||||
| 2021 | 2020 | 2019 | 2018 | 2017 | ||
| Net asset value — Beginning of period | $ 15.590 | $ 14.690 | $ 13.190 | $ 11.100 | $ 13.150 | $ 12.740 |
| Income (Loss) From Operations | ||||||
| Net investment income (loss)(1) | $ (0.011) | $ (0.041) | $ 0.001 | $ (0.008) | $ (0.026) | $ (0.057) |
| Net realized and unrealized gain (loss) | (2.879) | 3.103 | 1.654 | 3.046 | (0.660) | 1.916 |
| Total income (loss) from operations | $ (2.890) | $ 3.062 | $ 1.655 | $ 3.038 | $ (0.686) | $ 1.859 |
| Less Distributions | ||||||
| From net realized gain | $ — | $ (2.162) | $ (0.155) | $ (0.948) | $ (1.364) | $ (1.449) |
| Total distributions | $ — | $ (2.162) | $ (0.155) | $ (0.948) | $ (1.364) | $ (1.449) |
| Net asset value — End of period | $12.700 | $15.590 | $14.690 | $13.190 | $11.100 | $13.150 |
| Total Return(2)(3) | (18.54)% (4) | 21.18% | 12.73% | 27.54% | (5.81)% | 14.91% |
| Ratios/Supplemental Data | ||||||
| Net assets, end of period (000’s omitted) | $ 22,562 | $ 28,882 | $ 26,683 | $ 24,530 | $ 19,329 | $ 24,865 |
| Ratios (as a percentage of average daily net assets): | ||||||
| Expenses (3) | 1.21% (5)(6) | 1.21% | 1.21% | 1.21% | 1.35% | 1.42% |
| Net investment income (loss) | (0.16)% (6) | (0.25)% | 0.01% | (0.06)% | (0.19)% | (0.43)% |
| Portfolio Turnover | 32% (4) | 55% | 71% | 54% | 44% | 50% |
| (1) | Computed using average shares outstanding. |
| (2) | Returns are historical and are calculated by determining the percentage change in net asset value with all distributions reinvested and do not reflect the effect of sales charges. |
| (3) | The administrator reimbursed certain operating expenses (equal to 0.18%, 0.17%, 0.25%, 0.29%, 0.17% and 0.10% of average daily net assets for the six months ended June 30, 2022 and the years ended December 31, 2021, 2020, 2019, 2018 and 2017, respectively). Absent this reimbursement, total return would be lower. |
| (4) | Not annualized. |
| (5) | Includes a reduction by the investment adviser of a portion of its adviser fee due to the Fund's investment in the Liquidity Fund (equal to less than 0.005% of average daily net assets for the six months ended June 30, 2022). |
| (6) | Annualized. |
| Class C | ||||||
| Six Months Ended June 30, 2022 (Unaudited) | Year Ended December 31, | |||||
| 2021 | 2020 | 2019 | 2018 | 2017 | ||
| Net asset value — Beginning of period | $11.880 | $ 11.630 | $ 10.550 | $ 9.100 | $11.110 | $ 11.040 |
| Income (Loss) From Operations | ||||||
| Net investment loss(1) | $ (0.048) | $ (0.131) | $ (0.074) | $ (0.092) | $ (0.108) | $ (0.133) |
| Net realized and unrealized gain (loss) | (2.192) | 2.440 | 1.309 | 2.490 | (0.538) | 1.652 |
| Total income (loss) from operations | $ (2.240) | $ 2.309 | $ 1.235 | $ 2.398 | $ (0.646) | $ 1.519 |
| Less Distributions | ||||||
| From net realized gain | $ — | $ (2.059) | $ (0.155) | $ (0.948) | $ (1.364) | $ (1.449) |
| Total distributions | $ — | $ (2.059) | $ (0.155) | $ (0.948) | $ (1.364) | $ (1.449) |
| Net asset value — End of period | $ 9.640 | $11.880 | $11.630 | $10.550 | $ 9.100 | $11.110 |
| Total Return(2)(3) | (18.86)% (4) | 20.25% | 11.93% | 26.54% | (6.52)% | 14.11% |
| Ratios/Supplemental Data | ||||||
| Net assets, end of period (000’s omitted) | $ 2,654 | $ 3,254 | $ 3,517 | $ 4,564 | $ 7,356 | $ 9,565 |
| Ratios (as a percentage of average daily net assets): | ||||||
| Expenses (3) | 1.96% (5)(6) | 1.96% | 1.96% | 1.96% | 2.10% | 2.17% |
| Net investment loss | (0.91)% (6) | (1.01)% | (0.76)% | (0.87)% | (0.94)% | (1.17)% |
| Portfolio Turnover | 32% (4) | 55% | 71% | 54% | 44% | 50% |
| (1) | Computed using average shares outstanding. |
| (2) | Returns are historical and are calculated by determining the percentage change in net asset value with all distributions reinvested and do not reflect the effect of sales charges. |
| (3) | The administrator reimbursed certain operating expenses (equal to 0.18%, 0.17%, 0.25%, 0.29%, 0.17% and 0.10% of average daily net assets for the six months ended June 30, 2022 and the years ended December 31, 2021, 2020, 2019, 2018 and 2017, respectively). Absent this reimbursement, total return would be lower. |
| (4) | Not annualized. |
| (5) | Includes a reduction by the investment adviser of a portion of its adviser fee due to the Fund's investment in the Liquidity Fund (equal to less than 0.005% of average daily net assets for the six months ended June 30, 2022). |
| (6) | Annualized. |
| Class I | ||||||
| Six Months Ended June 30, 2022 (Unaudited) | Year Ended December 31, | |||||
| 2021 | 2020 | 2019 | 2018 | 2017 | ||
| Net asset value — Beginning of period | $ 17.870 | $ 16.570 | $ 14.830 | $ 12.360 | $ 14.450 | $ 13.840 |
| Income (Loss) From Operations | ||||||
| Net investment income (loss)(1) | $ 0.007 | $ 0.003 | $ 0.037 | $ 0.029 | $ 0.010 | $ (0.022) |
| Net realized and unrealized gain (loss) | (3.307) | 3.502 | 1.873 | 3.389 | (0.736) | 2.081 |
| Total income (loss) from operations | $ (3.300) | $ 3.505 | $ 1.910 | $ 3.418 | $ (0.726) | $ 2.059 |
| Less Distributions | ||||||
| From net investment income | $ — | $ (0.017) | $ (0.015) | $ — | $ — | $ — |
| From net realized gain | — | (2.188) | (0.155) | (0.948) | (1.364) | (1.449) |
| Total distributions | $ — | $ (2.205) | $ (0.170) | $ (0.948) | $ (1.364) | $ (1.449) |
| Net asset value — End of period | $14.570 | $ 17.870 | $16.570 | $14.830 | $12.360 | $14.450 |
| Total Return(2)(3) | (18.47)% (4) | 21.46% | 13.05% | 27.81% | (5.57)% | 15.17% |
| Ratios/Supplemental Data | ||||||
| Net assets, end of period (000’s omitted) | $ 95,168 | $111,052 | $ 82,716 | $ 57,202 | $ 35,097 | $ 45,587 |
| Ratios (as a percentage of average daily net assets): | ||||||
| Expenses (3) | 0.96% (5)(6) | 0.96% | 0.96% | 0.96% | 1.10% | 1.16% |
| Net investment income (loss) | 0.09% (6) | 0.01% | 0.27% | 0.20% | 0.07% | (0.15)% |
| Portfolio Turnover | 32% (4) | 55% | 71% | 54% | 44% | 50% |
| (1) | Computed using average shares outstanding. |
| (2) | Returns are historical and are calculated by determining the percentage change in net asset value with all distributions reinvested. |
| (3) | The administrator reimbursed certain operating expenses (equal to 0.18%, 0.17%, 0.25%, 0.29%, 0.17% and 0.10% of average daily net assets for the six months ended June 30, 2022 and the years ended December 31, 2021, 2020, 2019, 2018 and 2017, respectively). Absent this reimbursement, total return would be lower. |
| (4) | Not annualized. |
| (5) | Includes a reduction by the investment adviser of a portion of its adviser fee due to the Fund's investment in the Liquidity Fund (equal to less than 0.005% of average daily net assets for the six months ended June 30, 2022). |
| (6) | Annualized. |
| Class R | ||||||
| Six Months Ended June 30, 2022 (Unaudited) | Year Ended December 31, | |||||
| 2021 | 2020 | 2019 | 2018 | 2017 | ||
| Net asset value — Beginning of period | $ 14.690 | $ 13.930 | $ 12.540 | $ 10.620 | $ 12.670 | $ 12.350 |
| Income (Loss) From Operations | ||||||
| Net investment loss(1) | $ (0.026) | $ (0.082) | $ (0.029) | $ (0.042) | $ (0.053) | $ (0.084) |
| Net realized and unrealized gain (loss) | (2.714) | 2.936 | 1.574 | 2.910 | (0.633) | 1.853 |
| Total income (loss) from operations | $ (2.740) | $ 2.854 | $ 1.545 | $ 2.868 | $ (0.686) | $ 1.769 |
| Less Distributions | ||||||
| From net realized gain | $ — | $ (2.094) | $ (0.155) | $ (0.948) | $ (1.364) | $ (1.449) |
| Total distributions | $ — | $ (2.094) | $ (0.155) | $ (0.948) | $ (1.364) | $ (1.449) |
| Net asset value — End of period | $11.950 | $14.690 | $13.930 | $12.540 | $10.620 | $12.670 |
| Total Return(2)(3) | (18.65)% (4) | 20.82% | 12.51% | 27.18% | (6.04)% | 14.64% |
| Ratios/Supplemental Data | ||||||
| Net assets, end of period (000’s omitted) | $ 441 | $ 455 | $ 569 | $ 595 | $ 799 | $ 722 |
| Ratios (as a percentage of average daily net assets): | ||||||
| Expenses (3) | 1.46% (5)(6) | 1.46% | 1.46% | 1.46% | 1.60% | 1.66% |
| Net investment loss | (0.39)% (6) | (0.53)% | (0.25)% | (0.34)% | (0.40)% | (0.66)% |
| Portfolio Turnover | 32% (4) | 55% | 71% | 54% | 44% | 50% |
| (1) | Computed using average shares outstanding. |
| (2) | Returns are historical and are calculated by determining the percentage change in net asset value with all distributions reinvested. |
| (3) | The administrator reimbursed certain operating expenses (equal to 0.18%, 0.17%, 0.25%, 0.29%, 0.17% and 0.10% of average daily net assets for the six months ended June 30, 2022 and the years ended December 31, 2021, 2020, 2019, 2018 and 2017, respectively). Absent this reimbursement, total return would be lower. |
| (4) | Not annualized. |
| (5) | Includes a reduction by the investment adviser of a portion of its adviser fee due to the Fund's investment in the Liquidity Fund (equal to less than 0.005% of average daily net assets for the six months ended June 30, 2022). |
| (6) | Annualized. |
| Aggregate cost | $113,307,543 |
| Gross unrealized appreciation | $ 15,278,173 |
| Gross unrealized depreciation | (7,911,432) |
| Net unrealized appreciation | $ 7,366,741 |
| Average Daily Net Assets | Annual Fee Rate |
| Up to $500 million | 0.7500% |
| $500 million but less than $1 billion | 0.6875% |
| $1 billion but less than $1.5 billion | 0.6250% |
| $1.5 billion but less than $2 billion | 0.5625% |
| $2 billion but less than $3 billion | 0.5000% |
| $3 billion and over | 0.4375% |
| Six Months Ended June 30, 2022 (Unaudited) | Year Ended December 31, 2021 | ||||
| Shares | Amount | Shares | Amount | ||
| Class A | |||||
| Sales | 37,820 | $ 526,230 | 124,193 | $ 2,045,106 | |
| Issued to shareholders electing to receive payments of distributions in Fund shares | — | — | 227,276 | 3,463,684 | |
| Redemptions | (118,112) | (1,624,393) | (334,602) | (5,468,835) | |
| Converted from Class C shares | 4,378 | 56,875 | 20,068 | 319,506 | |
| Net increase (decrease) | (75,914) | $ (1,041,288) | 36,935 | $ 359,461 | |
| Class C | |||||
| Sales | 15,606 | $ 161,246 | 61,246 | $ 801,257 | |
| Issued to shareholders electing to receive payments of distributions in Fund shares | — | — | 41,811 | 485,842 | |
| Redemptions | (8,475) | (92,753) | (106,034) | (1,370,508) | |
| Converted to Class A shares | (5,761) | (56,875) | (25,459) | (319,506) | |
| Net increase (decrease) | 1,370 | $ 11,618 | (28,436) | $ (402,915) | |
| Class I | |||||
| Sales | 2,004,530 | $ 32,964,989 | 2,046,359 | $ 37,317,290 | |
| Issued to shareholders electing to receive payments of distributions in Fund shares | — | — | 693,653 | 12,118,112 | |
| Redemptions | (1,688,926) | (26,831,160) | (1,516,312) | (27,577,610) | |
| Net increase | 315,604 | $ 6,133,829 | 1,223,700 | $ 21,857,792 | |
| Class R | |||||
| Sales | 6,156 | $ 79,820 | 15,360 | $ 240,208 | |
| Issued to shareholders electing to receive payments of distributions in Fund shares | — | — | 3,923 | 56,381 | |
| Redemptions | (257) | (3,125) | (29,146) | (457,733) | |
| Net increase (decrease) | 5,899 | $ 76,695 | (9,863) | $ (161,144) | |
| Name | Value, beginning of period | Purchases | Sales proceeds | Net realized gain (loss) | Change in unrealized appreciation (depreciation) | Value, end of period | Dividend income | Units/Shares, end of period |
| Short-Term Investments | ||||||||
| Cash Reserves Fund | $1,936,619 | $26,277,916 | $(28,215,029) | $ 494 | $ — | $ — | $ 915 | — |
| Liquidity Fund | — | 17,148,818 | (14,244,484) | — | — | 2,904,334 | 3,917 | 2,904,334 |
| Total | $ 494 | $ — | $2,904,334 | $4,832 | ||||
| • | Level 1 – quoted prices in active markets for identical investments |
| • | Level 2 – other significant observable inputs (including quoted prices for similar investments, interest rates, prepayment speeds, credit risk, etc.) |
| • | Level 3 – significant unobservable inputs (including a fund's own assumptions in determining the fair value of investments) |
| Asset Description | Level 1 | Level 2 | Level 3 | Total |
| Common Stocks | $ 117,769,950* | $ — | $ — | $ 117,769,950 |
| Short-Term Investments | 2,904,334 | — | — | 2,904,334 |
| Total Investments | $120,674,284 | $ — | $ — | $120,674,284 |
| * | The level classification by major category of investments is the same as the category presentation in the Portfolio of Investments. |
| Officers | |
| Eric A. Stein President | Jill R. Damon Secretary |
| Deidre E. Walsh Vice President and Chief Legal Officer | Richard F. Froio Chief Compliance Officer |
| James F. Kirchner Treasurer | |
| Trustees |
| George J. Gorman Chairperson | |
| Alan C. Bowser** | |
| Thomas E. Faust Jr.* | |
| Mark R. Fetting | |
| Cynthia E. Frost | |
| Valerie A. Mosley |
| Keith Quinton | |
| Marcus L. Smith | |
| Susan J. Sutherland | |
| Scott E. Wennerholm | |
| Nancy A. Wiser** |
| * | Interested Trustee |
| ** | Mr. Bowser and Ms. Wiser began serving as Trustees effective April 4, 2022. |
| Privacy Notice | April 2021 |
| FACTS | WHAT DOES EATON VANCE DO WITH YOUR PERSONAL INFORMATION? |
| Why? | Financial companies choose how they share your personal information. Federal law gives consumers the right to limit some but not all sharing. Federal law also requires us to tell you how we collect, share, and protect your personal information. Please read this notice carefully to understand what we do. |
| What? | The types of personal information we collect and share depend on the product or service you have with us. This information can include:■ Social Security number and income ■ investment experience and risk tolerance ■ checking account number and wire transfer instructions |
| How? | All financial companies need to share customers’ personal information to run their everyday business. In the section below, we list the reasons financial companies can share their customers’ personal information; the reasons Eaton Vance chooses to share; and whether you can limit this sharing. |
| Reasons we can share your personal information | Does Eaton Vance share? | Can you limit this sharing? |
| For our everyday business purposes — such as to process your transactions, maintain your account(s), respond to court orders and legal investigations, or report to credit bureaus | Yes | No |
| For our marketing purposes — to offer our products and services to you | Yes | No |
| For joint marketing with other financial companies | No | We don’t share |
| For our investment management affiliates’ everyday business purposes — information about your transactions, experiences, and creditworthiness | Yes | Yes |
| For our affiliates’ everyday business purposes — information about your transactions and experiences | Yes | No |
| For our affiliates’ everyday business purposes — information about your creditworthiness | No | We don’t share |
| For our investment management affiliates to market to you | Yes | Yes |
| For our affiliates to market to you | No | We don’t share |
| For nonaffiliates to market to you | No | We don’t share |
| To limit our sharing | Call toll-free 1-800-262-1122 or email: EVPrivacy@eatonvance.comPlease note:If you are a new customer, we can begin sharing your information 30 days from the date we sent this notice. When you are no longer our customer, we continue to share your information as described in this notice. However, you can contact us at any time to limit our sharing. |
| Questions? | Call toll-free 1-800-262-1122 or email: EVPrivacy@eatonvance.com |
| Privacy Notice — continued | April 2021 |
| Who we are | |
| Who is providing this notice? | Eaton Vance Management, Eaton Vance Distributors, Inc., Eaton Vance Trust Company, Eaton Vance Management (International) Limited, Eaton Vance Advisers International Ltd., Eaton Vance Global Advisors Limited, Eaton Vance Management’s Real Estate Investment Group, Boston Management and Research, Calvert Research and Management, Eaton Vance and Calvert Fund Families and our investment advisory affiliates (“Eaton Vance”) (see Investment Management Affiliates definition below) |
| What we do | |
| How does Eaton Vance protect my personal information? | To protect your personal information from unauthorized access and use, we use security measures that comply with federal law. These measures include computer safeguards and secured files and buildings. We have policies governing the proper handling of customer information by personnel and requiring third parties that provide support to adhere to appropriate security standards with respect to such information. |
| How does Eaton Vance collect my personal information? | We collect your personal information, for example, when you■ open an account or make deposits or withdrawals from your account ■ buy securities from us or make a wire transfer ■ give us your contact informationWe also collect your personal information from others, such as credit bureaus, affiliates, or other companies. |
| Why can’t I limit all sharing? | Federal law gives you the right to limit only■ sharing for affiliates’ everyday business purposes — information about your creditworthiness ■ affiliates from using your information to market to you ■ sharing for nonaffiliates to market to youState laws and individual companies may give you additional rights to limit sharing. See below for more on your rights under state law. |
| Definitions | |
| Investment Management Affiliates | Eaton Vance Investment Management Affiliates include registered investment advisers, registered broker- dealers, and registered and unregistered funds. Investment Management Affiliates does not include entities associated with Morgan Stanley Wealth Management, such as Morgan Stanley Smith Barney LLC and Morgan Stanley & Co. |
| Affiliates | Companies related by common ownership or control. They can be financial and nonfinancial companies.■ Our affiliates include companies with a Morgan Stanley name and financial companies such as Morgan Stanley Smith Barney LLC and Morgan Stanley & Co. |
| Nonaffiliates | Companies not related by common ownership or control. They can be financial and nonfinancial companies.■ Eaton Vance does not share with nonaffiliates so they can market to you. |
| Joint marketing | A formal agreement between nonaffiliated financial companies that together market financial products or services to you.■ Eaton Vance doesn’t jointly market. |
| Other important information | |
| Vermont: Except as permitted by law, we will not share personal information we collect about Vermont residents with Nonaffiliates unless you provide us with your written consent to share such information.California: Except as permitted by law, we will not share personal information we collect about California residents with Nonaffiliates and we will limit sharing such personal information with our Affiliates to comply with California privacy laws that apply to us. | |
Two International Place
Boston, MA 02110
Two International Place
Boston, MA 02110
Two International Place
Boston, MA 02110
(617) 482-8260
State Street Financial Center, One Lincoln Street
Boston, MA 02111
Attn: Eaton Vance Funds
P.O. Box 9653
Providence, RI 02940-9653
(800) 262-1122
Boston, MA 02110
Item 2. Code of Ethics
Not required in this filing.
Item 3. Audit Committee Financial Expert
Not required in this filing.
Item 4. Principal Accountant Fees and Services
Not required in this filing.
Item 5. Audit Committee of Listed Registrants
Not applicable.
Item 6. Schedule of Investments
Please see schedule of investments contained in the Report to Stockholders included under Item 1 of this Form N-CSR.
Item 7. Disclosure of Proxy Voting Policies and Procedures for Closed-End Management Investment Companies
Not applicable.
Item 8. Portfolio Managers of Closed-End Management Investment Companies
Not applicable.
Item 9. Purchases of Equity Securities by Closed-End Management Investment Company and Affiliated Purchasers
Not applicable.
Item 10. Submission of Matters to a Vote of Security Holders
No material changes.
Item 11. Controls and Procedures
(a) It is the conclusion of the registrant’s principal executive officer and principal financial officer that the effectiveness of the registrant’s current disclosure controls and procedures (such disclosure controls and procedures having been evaluated within 90 days of the date of this filing) provide reasonable assurance that the information required to be disclosed by the registrant has been recorded, processed, summarized and reported within the time period specified in the Commission’s rules and forms and that the information required to be disclosed by the registrant has been accumulated and communicated to the registrant’s principal executive officer and principal financial officer in order to allow timely decisions regarding required disclosure.
(b) There have been no changes in the registrant’s internal controls over financial reporting during the period covered by this report that has materially affected, or is reasonably likely to materially affect, the registrant’s internal control over financial reporting.
Item 12. Disclosure of Securities Lending Activities for Closed-End Management Investment Companies
Not applicable.
Item 13. Exhibits
| (a)(1) | Registrant’s Code of Ethics – Not applicable (please see Item 2). | |
| (a)(2)(i) | Treasurer’s Section 302 certification. | |
| (a)(2)(ii) | President’s Section 302 certification. | |
| (b) | Combined Section 906 certification. | |
Signatures
Pursuant to the requirements of the Securities Exchange Act of 1934 and the Investment Company Act of 1940, the registrant has duly caused this report to be signed on its behalf by the undersigned, thereunto duly authorized.
Eaton Vance Special Investment Trust | ||
| By: | /s/ Eric A. Stein | |
| Eric A. Stein | ||
| President | ||
| Date: | August 22, 2022 | |
Pursuant to the requirements of the Securities Exchange Act of 1934 and the Investment Company Act of 1940, this report has been signed below by the following persons on behalf of the registrant and in the capacities and on the dates indicated.
| By: | /s/ James F. Kirchner | |
| James F. Kirchner | ||
| Treasurer | ||
| Date: | August 22, 2022 | |
| By: | /s/ Eric A. Stein | |
| Eric A. Stein | ||
| President | ||
| Date: | August 22, 2022 | |