UNITED STATES
SECURITIES AND EXCHANGE COMMISSION
Washington, D.C. 20549
Form N-CSR
CERTIFIED SHAREHOLDER REPORT OF REGISTERED
MANAGEMENT INVESTMENT COMPANIES
Investment Company Act File Number: 811-01545
Eaton Vance Special Investment Trust
(Exact Name of Registrant as Specified in Charter)
Two International Place, Boston, Massachusetts 02110
(Address of Principal Executive Offices)
Deidre E. Walsh
Two International Place, Boston, Massachusetts 02110
(Name and Address of Agent for Services)
(617) 482-8260
(Registrant’s Telephone Number)
October 31
Date of Fiscal Year End
October 31, 2022
Date of Reporting Period
Item 1. Reports to Stockholders

Eaton Vance
Short Duration Inflation-Protected Income Fund
Annual Report
October 31, 2022

Commodity Futures Trading Commission Registration. The Commodity Futures Trading Commission (“CFTC”) has adopted regulations that subject registered investment companies and advisers to regulation by the CFTC if a fund invests more than a prescribed level of its assets in certain CFTC-regulated instruments (including futures, certain options and swap agreements) or markets itself as providing investment exposure to such instruments. The adviser is registered with the CFTC as a commodity pool operator with respect to its management of the Fund. As the commodity pool operator of the Fund, the adviser has claimed relief under the Commodity Exchange Act from certain reporting and recordkeeping requirements. The adviser is also registered as a commodity trading advisor.
Fund shares are not insured by the FDIC and are not deposits or other obligations of, or guaranteed by, any depository institution. Shares are subject to investment risks, including possible loss of principal invested.
This report must be preceded or accompanied by a current summary prospectus or prospectus. Before investing, investors should consider carefully the investment objective, risks, and charges and expenses of a mutual fund. This and other important information is contained in the summary prospectus and prospectus, which can be obtained from a financial intermediary. Prospective investors should read the prospectus carefully before investing. For further information, please call 1-800-262-1122.
Annual Report October 31, 2022
Eaton Vance
Short Duration Inflation-Protected Income Fund
| 2 | ||||
| 3 | ||||
| 4 | ||||
| 5 | ||||
| 6 | ||||
| 7 | ||||
| 19 and 33 | ||||
| 20 | ||||
| 34 | ||||
| 38 | ||||
| 39 | ||||
| 42 | ||||
| 44 |
Eaton Vance
Short Duration Inflation-Protected Income Fund
October 31, 2022
Management’s Discussion of Fund Performance†
Economic and Market Conditions
During the 12-month period ended October 31, 2022, short-term Treasury Inflation-Protected Securities (TIPS) returned –3.82%, as measured by the ICE BofA 1-5 Year U.S. Inflation-Linked Treasury Index (the Index).
The period was characterized by rising interest rates, widening credit spreads, and high levels of inflation. On a year-over-year basis, the Consumer Price Index (CPI) rose 7.7%, with price gains across a broad range of goods and services. Gasoline, airfares, and auto insurance were among those categories posting the largest price increases. Shelter, the biggest component of CPI, also posted a substantial price gain. Core CPI — excluding food and energy prices — rose 6.3% during the period, compared with 4.6% during the previous 12 months. Wage inflation climbed 4.7%, year over year, as measured by average hourly earnings.
Inflationary pressures were due, in part, to supply-demand imbalances in the economy. China’s zero-COVID policy led to shutdowns of Chinese ports and manufacturing facilities during the period, impacting U.S. supplies of electronics, furniture, apparel, and other products imported from China. In addition, the Russia-Ukraine war reduced energy and grain exports from these two countries. Labor was also in short supply, with the number of unfilled U.S. job openings touching a record high during the period. On the demand side, U.S. consumer spending was strong, supported by favorable labor-market conditions and household savings accumulated during the COVID-19 pandemic.
In an effort to control inflation, the U.S. Federal Reserve (the Fed) launched its most aggressive monetary tightening campaign in decades. The Fed rapidly increased the federal funds rate, raising it from 0.00%-0.25% at the start of the period to 3.00%-3.25% at period-end. The central bank also stopped purchasing U.S. Treasury and mortgage-backed securities in March 2022, then began decreasing its holdings of these assets a few months later.
During the period, a decline in TIPS breakeven rates — that is, inflation rates expected by the market — suggested that market participants believed the Fed’s actions would help reduce inflation. Five-year TIPS breakeven rates fell 0.28% during the period, finishing the period at 2.66%. In contrast, nominal interest rates and real interest rates — nominal rates adjusted for inflation — moved significantly higher due to Fed tightening. Both five-year nominal and real interest rates increased more than three percentage points during the period, settling at 4.24% and 1.58%, respectively, on October 31, 2022.
Fund Performance
For the 12-month period ended October 31, 2022, Eaton Vance Short Duration Inflation-Protected Income Fund (the Fund) returned –3.02% for Class A shares at net asset value (NAV), outperforming its benchmark, the Index, which returned –3.82%.
The Fund seeks to generate a real return — that is, total return less the estimated cost of inflation — by investing in a combination of “inflation-protected” instruments, including TIPS, and by combining floating-rate bank loans, asset-backed securities (ABS), and commercial mortgage-backed securities (CMBS) with CPI swaps and swaps based on other measures of inflation. Bank loans, ABS, CMBS, CPI swaps, and swaps based on other inflation measures are not represented in the Index.
During the period, the Fund’s strategy of swapping nominal interest payments for payments based on changes in the CPI and other measures of inflation generated a positive return. This was the primary driver of the Fund’s outperformance relative to the Index. In addition, the Fund’s overall duration was shorter than that of the Index, which contributed to relative performance in the rising rate environment.
The Fund’s out-of-Index allocation to floating-rate bank loans did not have a material impact on relative performance during the period, as the floating-rate bank loans held in the Fund posted a return that essentially matched the return of the Index. The Fund’s out-of-Index allocation to ABS also did not have a meaningful effect on performance, mainly due to the ABS allocation’s low weighting in the Fund.
TIPS accrued an 8.26% inflation rate during the period. However, the sharp increase in real interest rates and TIPS’ negative real yield offset the positive inflation accrual, producing a negative total return for the Index. The TIPS in the Fund had a longer duration than that of the Index. Consequently, the Fund’s TIPS slightly underperformed the TIPS in the Index during the period.
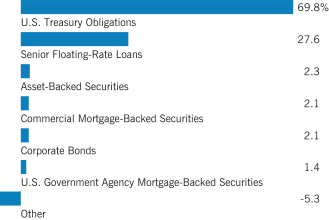
As of period-end, the Fund had a 69.9% allocation to TIPS, a 24.9% allocation to floating-rate bank loans, a 3.8% allocation to short-term and other investments, and a 1.4% allocation to ABS. In keeping with the Fund’s principal investment strategy of investing at least 80% of its net assets in “inflation-protected” instruments, interest rate payments on both bank loans and securitized credit, including ABS, were largely swapped for payments based on changes in the CPI and other measures of inflation.
See Endnotes and Additional Disclosures in this report.
Past performance is no guarantee of future results. Returns are historical and are calculated by determining the percentage change in net asset value (NAV) or offering price (as applicable) with all distributions reinvested. Furthermore, returns do not reflect the deduction of taxes that shareholders may have to pay on Fund distributions or upon the redemption of Fund shares. Investment return and principal value will fluctuate so that shares, when redeemed, may be worth more or less than their original cost. Performance for periods less than or equal to one year is cumulative. Performance is for the stated time period only; due to market volatility, current Fund performance may be lower or higher than the quoted return. For performance as of the most recent month-end, please refer to eatonvance.com.
| 2 |
Eaton Vance
Short Duration Inflation-Protected Income Fund
October 31, 2022
Portfolio Manager(s) Jason C. DesLauriers, CFA and Brian S. Ellis, CFA
| % Average Annual Total Returns1,2 | Class Inception Date | Performance Inception Date | One Year | Five Years | Ten Years | |||||||||||||||
Class A at NAV | 04/01/2010 | 04/01/2010 | (3.02 | )% | 2.75 | % | 1.79 | % | ||||||||||||
Class A with 3.25% Maximum Sales Charge | — | — | (6.15 | ) | 2.08 | 1.45 | ||||||||||||||
Class C at NAV | 04/01/2010 | 04/01/2010 | (3.78 | ) | 1.97 | 1.17 | ||||||||||||||
Class C with 1% Maximum Deferred Sales Charge | — | — | (4.71 | ) | 1.97 | 1.17 | ||||||||||||||
Class I at NAV | 04/01/2010 | 04/01/2010 | (2.79 | ) | 3.02 | 2.05 | ||||||||||||||
| ||||||||||||||||||||
ICE BofA 1–5 Year U.S. Inflation-Linked Treasury Index | — | — | (3.82 | )% | 2.40 | % | 1.30 | % | ||||||||||||
| % Total Annual Operating Expense Ratios3 | Class A | Class C | Class I | |||||||||||||||||
Gross | 0.94 | % | 1.69 | % | 0.69 | % | ||||||||||||||
Net | 0.84 | 1.59 | 0.59 | |||||||||||||||||
Growth of $10,000
This graph shows the change in value of a hypothetical investment of $10,000 in Class A of the Fund for the period indicated. For comparison, the same investment is shown in the indicated index.
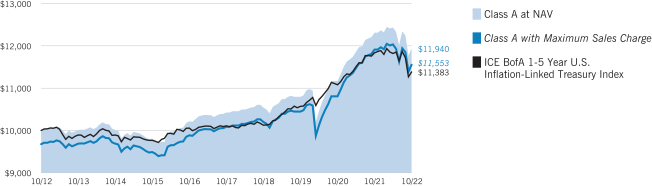
| Growth of Investment | Amount Invested | Period Beginning | At NAV | With Maximum Sales Charge | ||||||||||||
Class C | $10,000 | 10/31/2012 | $11,239 | N.A. | ||||||||||||
Class I, at minimum investment | $1,000,000 | 10/31/2012 | $1,224,816 | N.A. | ||||||||||||
See Endnotes and Additional Disclosures in this report.
Past performance is no guarantee of future results. Returns are historical and are calculated by determining the percentage change in net asset value (NAV) or offering price (as applicable) with all distributions reinvested. Furthermore, returns do not reflect the deduction of taxes that shareholders may have to pay on Fund distributions or upon the redemption of Fund shares. Investment return and principal value will fluctuate so that shares, when redeemed, may be worth more or less than their original cost. Performance for periods less than or equal to one year is cumulative. Performance is for the stated time period only; due to market volatility, current Fund performance may be lower or higher than the quoted return. For performance as of the most recent month-end, please refer to eatonvance.com.
| 3 |
Eaton Vance
Short Duration Inflation-Protected Income Fund
October 31, 2022
Asset Allocation (% of total investments)1,2
Footnotes:
| 1 | Fund invests in one or more affiliated investment companies (Portfolios). References to investments are to the aggregate holdings of the Fund, including its pro rata share of each Portfolio in which it invests. |
| 2 | Other represents other assets less liabilities and includes any investment type that represents less than 1% of net assets. |
| 4 |
Eaton Vance
Short Duration Inflation-Protected Income Fund
October 31, 2022
Endnotes and Additional Disclosures
| † | The views expressed in this report are those of the portfolio manager(s) and are current only through the date stated at the top of this page. These views are subject to change at any time based upon market or other conditions, and Eaton Vance and the Fund(s) disclaim any responsibility to update such views. These views may not be relied upon as investment advice and, because investment decisions are based on many factors, may not be relied upon as an indication of trading intent on behalf of any Eaton Vance fund. This commentary may contain statements that are not historical facts, referred to as “forward-looking statements.” The Fund’s actual future results may differ significantly from those stated in any forward-looking statement, depending on factors such as changes in securities or financial markets or general economic conditions, the volume of sales and purchases of Fund shares, the continuation of investment advisory, administrative and service contracts, and other risks discussed from time to time in the Fund’s filings with the Securities and Exchange Commission. |
| 1 | ICE BofA 1-5 Year U.S. Inflation-Linked Treasury Index is an unmanaged index comprised of U.S. Treasury Inflation-Protected Securities with at least $1 billion in outstanding face value and a remaining term to final maturity of at least 1 year and less than 5 years. ICE® BofA® indices are not for redistribution or other uses; provided “as is”, without warranties, and with no liability. Eaton Vance has prepared this report and ICE Data Indices, LLC does not endorse it, or guarantee, review, or endorse Eaton Vance’s products. BofA® is a licensed registered trademark of Bank of America Corporation in the United States and other countries. Unless otherwise stated, index returns do not reflect the effect of any applicable sales charges, commissions, expenses, taxes or leverage, as applicable. It is not possible to invest directly in an index. |
| 2 | Total Returns at NAV do not include applicable sales charges. If sales charges were deducted, the returns would be lower. Total Returns shown with maximum sales charge reflect the stated maximum sales charge. Unless otherwise stated, performance does not reflect the deduction of taxes on Fund distributions or redemptions of Fund shares. |
Effective November 5, 2020, Class C shares automatically convert to Class A shares eight years after purchase. The average annual total returns listed for Class C reflect conversion to Class A shares after eight years. Prior to November 5, 2020, Class C shares automatically converted to Class A shares ten years after purchase.
| 3 | Source: Fund prospectus. Net expense ratios reflect a contractual expense reimbursement that continues through 2/28/23. The expense ratios for the current reporting period can be found in the Financial Highlights section of this report. Performance reflects expenses waived and/or reimbursed, if applicable. Without such waivers and/or reimbursements, performance would have been lower. |
Fund profile subject to change due to active management.
Additional Information
Duration is a measure of the expected change in price of a bond — in percentage terms — given a one percent change in interest rates, all else being constant. Securities with lower durations tend to be less sensitive to interest rate changes.
Spread is the difference in yield between a U.S. Treasury bond and another debt security of the same maturity but different credit quality.
| 5 |
Eaton Vance
Short Duration Inflation-Protected Income Fund
October 31, 2022
Example
As a Fund shareholder, you incur two types of costs: (1) transaction costs, including sales charges (loads) on purchases and redemption fees (if applicable); and (2) ongoing costs, including management fees; distribution and/or service fees; and other Fund expenses. This Example is intended to help you understand your ongoing costs (in dollars) of Fund investing and to compare these costs with the ongoing costs of investing in other mutual funds. The Example is based on an investment of $1,000 invested at the beginning of the period and held for the entire period (May 1, 2022 to October 31, 2022).
Actual Expenses
The first section of the table below provides information about actual account values and actual expenses. You may use the information in this section, together with the amount you invested, to estimate the expenses that you paid over the period. Simply divide your account value by $1,000 (for example, an $8,600 account value divided by $1,000 = 8.6), then multiply the result by the number in the first section under the heading entitled “Expenses Paid During Period” to estimate the expenses you paid on your account during this period.
Hypothetical Example for Comparison Purposes
The second section of the table below provides information about hypothetical account values and hypothetical expenses based on the actual Fund expense ratio and an assumed rate of return of 5% per year (before expenses), which is not the actual Fund return. The hypothetical account values and expenses may not be used to estimate the actual ending account balance or expenses you paid for the period. You may use this information to compare the ongoing costs of investing in your Fund and other funds. To do so, compare this 5% hypothetical example with the 5% hypothetical examples that appear in the shareholder reports of the other funds.
Please note that the expenses shown in the table are meant to highlight your ongoing costs only and do not reflect any transactional costs, such as sales charges (loads) or redemption fees (if applicable). Therefore, the second section of the table is useful in comparing ongoing costs only, and will not help you determine the relative total costs of owning different funds. In addition, if these transactional costs were included, your costs would be higher.
| Beginning Account Value (5/1/22) | Ending Account Value (10/31/22) | Expenses Paid During Period* (5/1/22 – 10/31/22) | Annualized Expense Ratio% | |||||||||||||
Actual | ||||||||||||||||
Class A | $ | 1,000.00 | $ | 960.10 | $ | 4.55 | ** | 0.92 | % | |||||||
Class C | $ | 1,000.00 | $ | 956.30 | $ | 8.28 | ** | 1.68 | % | |||||||
Class I | $ | 1,000.00 | $ | 961.30 | $ | 3.36 | ** | 0.68 | % | |||||||
Hypothetical | ||||||||||||||||
(5% return per year before expenses) | ||||||||||||||||
Class A | $ | 1,000.00 | $ | 1,020.57 | $ | 4.69 | ** | 0.92 | % | |||||||
Class C | $ | 1,000.00 | $ | 1,016.74 | $ | 8.54 | ** | 1.68 | % | |||||||
Class I | $ | 1,000.00 | $ | 1,021.78 | $ | 3.47 | ** | 0.68 | % | |||||||
| * | Expenses are equal to the Fund’s annualized expense ratio for the indicated Class, multiplied by the average account value over the period, multiplied by 184/365 (to reflect the one-half year period). The Example assumes that the $1,000 was invested at the net asset value per share determined at the close of business on April 30, 2022. The Example reflects the expenses of both the Fund and the Portfolio. |
| ** | Absent an allocation of certain expenses to an affiliate, expenses would be higher. |
| 6 |
Eaton Vance
Short Duration Inflation-Protected Income Fund
October 31, 2022
Statement of Assets and Liabilities
| Assets | October 31, 2022 | |||
Investment in Short Duration Inflation-Protected Income Portfolio, at value | $ | 777,135,020 | ||
Investment in Senior Debt Portfolio, at value | 257,570,819 | |||
Receivable for Fund shares sold | 5,624,133 | |||
Receivable from affiliate | 166,485 | |||
Total assets | $ | 1,040,496,457 | ||
| Liabilities |
| |||
Payable for Fund shares redeemed | $ | 4,959,845 | ||
Payable to affiliates: | ||||
Distribution and service fees | 40,379 | |||
Trustees’ fees | 43 | |||
Accrued expenses | 229,306 | |||
Total liabilities | $ | 5,229,573 | ||
Net Assets | $ | 1,035,266,884 | ||
| Sources of Net Assets |
| |||
Paid-in capital | $ | 1,111,144,043 | ||
Accumulated loss | (75,877,159 | ) | ||
Net Assets | $ | 1,035,266,884 | ||
| Class A Shares | ||||
Net Assets | $ | 89,066,808 | ||
Shares Outstanding | 9,169,713 | |||
Net Asset Value and Redemption Price Per Share | ||||
(net assets ÷ shares of beneficial interest outstanding) | $ | 9.71 | ||
Maximum Offering Price Per Share | ||||
(100 ÷ 96.75 of net asset value per share) | $ | 10.04 | ||
| Class C Shares |
| |||
Net Assets | $ | 25,350,880 | ||
Shares Outstanding | 2,639,548 | |||
Net Asset Value and Offering Price Per Share* | ||||
(net assets ÷ shares of beneficial interest outstanding) | $ | 9.60 | ||
| Class I Shares |
| |||
Net Assets | $ | 920,849,196 | ||
Shares Outstanding | 94,716,031 | |||
Net Asset Value, Offering Price and Redemption Price Per Share | ||||
(net assets ÷ shares of beneficial interest outstanding) | $ | 9.72 | ||
On sales of $100,000 or more, the offering price of Class A shares is reduced. | ||||
| * | Redemption price per share is equal to the net asset value less any applicable contingent deferred sales charge. |
| 7 | See Notes to Financial Statements. |
Eaton Vance
Short Duration Inflation-Protected Income Fund
October 31, 2022
Statement of Operations
| Investment Income | Year Ended October 31, 2022 | |||
Dividend income allocated from affiliated Portfolios | $ | 245,448 | ||
Dividend income from affiliated investments | 23,872 | |||
Interest income | 15,384,529 | |||
Interest income from affiliated investment | 19,728 | |||
Interest and other income allocated from affiliated Portfolios | 33,942,325 | |||
Expenses, excluding interest expense and fees, allocated from affiliated Portfolios | (2,832,403 | ) | ||
Interest expense and fees allocated from affiliated Portfolios | (1,179,618 | ) | ||
Total investment income | $ | 45,603,881 | ||
| Expenses | ||||
Investment adviser fee | $ | 1,098,680 | ||
Distribution and service fees: | ||||
Class A | 196,895 | |||
Class C | 198,508 | |||
Trustees’ fees and expenses | 500 | |||
Custodian fee | 63,776 | |||
Transfer and dividend disbursing agent fees | 535,693 | |||
Legal and accounting services | 62,366 | |||
Printing and postage | 55,527 | |||
Registration fees | 153,366 | |||
Miscellaneous | 26,741 | |||
Total expenses | $ | 2,392,052 | ||
Deduct: | ||||
Waiver and/or reimbursement of expenses by affiliate | $ | 812,238 | ||
Total expense reductions | $ | 812,238 | ||
Net expenses | $ | 1,579,814 | ||
Net investment income | $ | 44,024,067 | ||
| Realized and Unrealized Gain (Loss) |
| |||
Net realized gain (loss): | ||||
Investment transactions | $ | (198,907 | ) | |
Investment transactions – affiliated investments | (23 | ) | ||
Swap contracts | 5,504,716 | |||
Net realized gain (loss) allocated from affiliated Portfolios: | ||||
Investment transactions | (5,840,480 | ) | ||
Swap contracts | (36,336 | ) | ||
Foreign currency transactions | 354,782 | |||
Forward foreign currency exchange contracts | 4,880,732 | |||
Net realized gain | $ | 4,664,484 | ||
Change in unrealized appreciation (depreciation): | ||||
Investments | $ | (19,709,002 | ) | |
Investments - affiliated investments | (49,744 | ) | ||
Swap contracts | 429,674 | |||
Change in unrealized appreciation (depreciation) allocated from affiliated Portfolios: | ||||
Investments | (65,335,219 | ) | ||
Swap contracts | 1,964,300 | |||
Foreign currency | (90,595 | ) | ||
Forward foreign currency exchange contracts | (731,282 | ) | ||
Net change in unrealized appreciation (depreciation) | $ | (83,521,868 | ) | |
Net realized and unrealized loss | $ | (78,857,384 | ) | |
Net decrease in net assets from operations | $ | (34,833,317 | ) | |
| 8 | See Notes to Financial Statements. |
Eaton Vance
Short Duration Inflation-Protected Income Fund
October 31, 2022
Statements of Changes in Net Assets
| Year Ended October 31, | ||||||||
| Increase (Decrease) in Net Assets | 2022 | 2021 | ||||||
From operations: | ||||||||
Net investment income | $ | 44,024,067 | $ | 10,246,848 | ||||
Net realized gain | 4,664,484 | 859,155 | ||||||
Net change in unrealized appreciation (depreciation) | (83,521,868 | ) | 13,630,212 | |||||
Net increase (decrease) in net assets from operations | $ | (34,833,317 | ) | $ | 24,736,215 | |||
Distributions to shareholders: | ||||||||
Class A | $ | (3,914,956 | ) | $ | (1,528,395 | ) | ||
Class C | (904,222 | ) | (203,009 | ) | ||||
Class I | (39,322,845 | ) | (8,833,344 | ) | ||||
Total distributions to shareholders | $ | (44,142,023 | ) | $ | (10,564,748 | ) | ||
Transactions in shares of beneficial interest: | ||||||||
Class A | $ | 37,212,555 | $ | 27,724,194 | ||||
Class C | 15,904,187 | 5,851,812 | ||||||
Class I | 644,754,406 | 187,818,020 | ||||||
Net increase in net assets from Fund share transactions | $ | 697,871,148 | $ | 221,394,026 | ||||
Net increase in net assets | $ | 618,895,808 | $ | 235,565,493 | ||||
| Net Assets |
| |||||||
At beginning of year | $ | 416,371,076 | $ | 180,805,583 | ||||
At end of year | $ | 1,035,266,884 | $ | 416,371,076 | ||||
| 9 | See Notes to Financial Statements. |
Eaton Vance
Short Duration Inflation-Protected Income Fund
October 31, 2022
Financial Highlights
| Class A | ||||||||||||||||||||
| Year Ended October 31, | ||||||||||||||||||||
| 2022 | 2021 | 2020 | 2019 | 2018 | ||||||||||||||||
Net asset value — Beginning of year | $ | 10.490 | $ | 9.850 | $ | 9.730 | $ | 9.720 | $ | 9.860 | ||||||||||
| Income (Loss) From Operations | ||||||||||||||||||||
Net investment income(1) | $ | 0.521 | $ | 0.366 | $ | 0.209 | $ | 0.240 | $ | 0.254 | ||||||||||
Net realized and unrealized gain (loss) | (0.832 | ) | 0.630 | 0.120 | (2) | (0.008 | ) | (0.142 | ) | |||||||||||
Total income (loss) from operations | $ | (0.311 | ) | $ | 0.996 | $ | 0.329 | $ | 0.232 | $ | 0.112 | |||||||||
| Less Distributions | ||||||||||||||||||||
From net investment income | $ | (0.469 | ) | $ | (0.356 | ) | $ | (0.209 | ) | $ | (0.222 | ) | $ | (0.252 | ) | |||||
Total distributions | $ | (0.469 | ) | $ | (0.356 | ) | $ | (0.209 | ) | $ | (0.222 | ) | $ | (0.252 | ) | |||||
Net asset value — End of year | $ | 9.710 | $ | 10.490 | $ | 9.850 | $ | 9.730 | $ | 9.720 | ||||||||||
Total Return(3)(4) | (3.02 | )% | 10.23 | % | 3.46 | % | 2.41 | % | 1.14 | % | ||||||||||
| Ratios/Supplemental Data | ||||||||||||||||||||
Net assets, end of year (000’s omitted) | $ | 89,067 | $ | 58,835 | $ | 28,768 | $ | 29,350 | $ | 37,919 | ||||||||||
Ratios (as a percentage of average daily net assets):(5) | ||||||||||||||||||||
Expenses(4)(6) | 0.88 | %(7) | 0.84 | % | 0.90 | % | 0.95 | % | 0.87 | % | ||||||||||
Net investment income | 5.09 | % | 3.54 | % | 2.16 | % | 2.46 | % | 2.59 | % | ||||||||||
Portfolio Turnover of the Fund(8) | 26 | % | 25 | % | 68 | % | 36 | % | 51 | % | ||||||||||
| (1) | Computed using average shares outstanding. |
| (2) | The per share amount is not in accord with the net realized and unrealized gain (loss) for the period because of the timing of Fund share transactions and the amount of the per share realized and unrealized gains and losses at such time. |
| (3) | Returns are historical and are calculated by determining the percentage change in net asset value with all distributions reinvested and do not reflect the effect of sales charges. |
| (4) | The investment adviser and the administrator of the Fund reimbursed expenses (equal to 0.10%, 0.10%, 0.11%, 0.14% and 0.11% of average daily net assets for the years ended October 31, 2022, 2021, 2020, 2019 and 2018, respectively). Absent this reimbursement, total return would be lower. |
| (5) | Includes the Fund’s share of the Portfolio’s/Portfolios’ allocated expenses. |
| (6) | Includes interest expense, including allocated from the Portfolio(s) of 0.13%, 0.09%, 0.15%, 0.20% and 0.12% of average daily net assets for the years ended October 31, 2022, 2021, 2020, 2019 and 2018, respectively. |
| (7) | Includes a reduction by the investment adviser of a portion of the Portfolios’ and Fund’s adviser fees due to the Portfolios’ and Fund’s investments in the Liquidity Fund (equal to less than 0.005% of average daily net assets for the year ended October 31, 2022). |
| (8) | Percentage includes both the Fund’s contributions to and withdrawals from the Portfolio(s) and purchases and sales of securities held directly by the Fund. |
| 10 | See Notes to Financial Statements. |
Eaton Vance
Short Duration Inflation-Protected Income Fund
October 31, 2022
Financial Highlights — continued
| Class C | ||||||||||||||||||||
| Year Ended October 31, | ||||||||||||||||||||
| 2022 | 2021 | 2020 | 2019 | 2018 | ||||||||||||||||
Net asset value — Beginning of year | $ | 10.390 | $ | 9.760 | $ | 9.660 | $ | 9.660 | $ | 9.810 | ||||||||||
| Income (Loss) From Operations | ||||||||||||||||||||
Net investment income(1) | $ | 0.447 | $ | 0.283 | $ | 0.134 | $ | 0.163 | $ | 0.179 | ||||||||||
Net realized and unrealized gain (loss) | (0.835 | ) | 0.632 | 0.116 | (2) | (0.002 | ) | (0.148 | ) | |||||||||||
Total income (loss) from operations | $ | (0.388 | ) | $ | 0.915 | $ | 0.250 | $ | 0.161 | $ | 0.031 | |||||||||
| Less Distributions | ||||||||||||||||||||
From net investment income | $ | (0.402 | ) | $ | (0.285 | ) | $ | (0.150 | ) | $ | (0.161 | ) | $ | (0.181 | ) | |||||
Total distributions | $ | (0.402 | ) | $ | (0.285 | ) | $ | (0.150 | ) | $ | (0.161 | ) | $ | (0.181 | ) | |||||
Net asset value — End of year | $ | 9.600 | $ | 10.390 | $ | 9.760 | $ | 9.660 | $ | 9.660 | ||||||||||
Total Return(3)(4) | (3.78 | )% | 9.46 | % | 2.74 | % | 1.58 | % | 0.31 | % | ||||||||||
| Ratios/Supplemental Data | ||||||||||||||||||||
Net assets, end of year (000’s omitted) | $ | 25,351 | $ | 11,322 | $ | 5,152 | $ | 7,118 | $ | 13,528 | ||||||||||
Ratios (as a percentage of average daily net assets):(5) | ||||||||||||||||||||
Expenses(4)(6) | 1.64 | %(7) | 1.59 | % | 1.65 | % | 1.70 | % | 1.62 | % | ||||||||||
Net investment income | 4.42 | % | 2.76 | % | 1.40 | % | 1.68 | % | 1.83 | % | ||||||||||
Portfolio Turnover of the Fund(8) | 26 | % | 25 | % | 68 | % | 36 | % | 51 | % | ||||||||||
| (1) | Computed using average shares outstanding. |
| (2) | The per share amount is not in accord with the net realized and unrealized gain (loss) for the period because of the timing of Fund share transactions and the amount of the per share realized and unrealized gains and losses at such time. |
| (3) | Returns are historical and are calculated by determining the percentage change in net asset value with all distributions reinvested and do not reflect the effect of sales charges. |
| (4) | The investment adviser and the administrator of the Fund reimbursed expenses (equal to 0.10%, 0.10%, 0.11%, 0.14% and 0.11% of average daily net assets for the years ended October 31, 2022, 2021, 2020, 2019 and 2018, respectively). Absent this reimbursement, total return would be lower. |
| (5) | Includes the Fund’s share of the Portfolio’s/Portfolios’ allocated expenses. |
| (6) | Includes interest expense, including allocated from the Portfolio(s) of 0.14%, 0.09%, 0.15%, 0.20% and 0.12% of average daily net assets for the years ended October 31, 2022, 2021, 2020, 2019 and 2018, respectively. |
| (7) | Includes a reduction by the investment adviser of a portion of the Portfolios’ and Fund’s adviser fees due to the Portfolios’ and Fund’s investment in the Liquidity Fund (equal to less than 0.005% of average daily net assets for the year ended October 31, 2022). |
| (8) | Percentage includes both the Fund’s contributions to and withdrawals from the Portfolio(s) and purchases and sales of securities held directly by the Fund. |
| 11 | See Notes to Financial Statements. |
Eaton Vance
Short Duration Inflation-Protected Income Fund
October 31, 2022
Financial Highlights — continued
| Class I | ||||||||||||||||||||
| Year Ended October 31, | ||||||||||||||||||||
| 2022 | 2021 | 2020 | 2019 | 2018 | ||||||||||||||||
Net asset value — Beginning of year | $ | 10.500 | $ | 9.850 | $ | 9.730 | $ | 9.710 | $ | 9.850 | ||||||||||
| Income (Loss) From Operations | ||||||||||||||||||||
Net investment income(1) | $ | 0.562 | $ | 0.401 | $ | 0.234 | $ | 0.265 | $ | 0.282 | ||||||||||
Net realized and unrealized gain (loss) | (0.850 | ) | 0.629 | 0.114 | (2) | (0.005 | ) | (0.147 | ) | |||||||||||
Total income (loss) from operations | $ | (0.288 | ) | $ | 1.030 | $ | 0.348 | $ | 0.260 | $ | 0.135 | |||||||||
| Less Distributions | ||||||||||||||||||||
From net investment income | $ | (0.492 | ) | $ | (0.380 | ) | $ | (0.228 | ) | $ | (0.240 | ) | $ | (0.275 | ) | |||||
Total distributions | $ | (0.492 | ) | $ | (0.380 | ) | $ | (0.228 | ) | $ | (0.240 | ) | $ | (0.275 | ) | |||||
Net asset value — End of year | $ | 9.720 | $ | 10.500 | $ | 9.850 | $ | 9.730 | $ | 9.710 | ||||||||||
Total Return(3)(4) | (2.79 | )% | 10.59 | % | 3.66 | % | 2.71 | % | 1.37 | % | ||||||||||
| Ratios/Supplemental Data | ||||||||||||||||||||
Net assets, end of year (000’s omitted) | $ | 920,849 | $ | 346,214 | $ | 146,885 | $ | 200,002 | $ | 273,458 | ||||||||||
Ratios (as a percentage of average daily net assets):(5) | ||||||||||||||||||||
Expenses(4)(6) | 0.64 | %(7) | 0.59 | % | 0.65 | % | 0.70 | % | 0.62 | % | ||||||||||
Net investment income | 5.50 | % | 3.88 | % | 2.42 | % | 2.72 | % | 2.87 | % | ||||||||||
Portfolio Turnover of the Fund(8) | 26 | % | 25 | % | 68 | % | 36 | % | 51 | % | ||||||||||
| (1) | Computed using average shares outstanding. |
| (2) | The per share amount is not in accord with the net realized and unrealized gain (loss) for the period because of the timing of Fund share transactions and the amount of the per share realized and unrealized gains and losses at such time. |
| (3) | Returns are historical and are calculated by determining the percentage change in net asset value with all distributions reinvested. |
| (4) | The investment adviser and the administrator of the Fund reimbursed expenses (equal to 0.10%, 0.10%, 0.11%, 0.14% and 0.11% of average daily net assets for the years ended October 31, 2022, 2021, 2020, 2019 and 2018, respectively). Absent this reimbursement, total return would be lower. |
| (5) | Includes the Fund’s share of the Portfolio’s/Portfolios’ allocated expenses. |
| (6) | Includes interest expense, including allocated from the Portfolio(s) of 0.14%, 0.09%, 0.15%, 0.20% and 0.12% of average daily net assets for the years ended October 31, 2022, 2021, 2020, 2019 and 2018, respectively. |
| (7) | Includes a reduction by the investment adviser of a portion of the Portfolios’ and Fund’s adviser fees due to the Portfolios’ and Fund’s investments in the Liquidity Fund (equal to less than 0.005% of average daily net assets for the year ended October 31, 2022). |
| (8) | Percentage includes both the Fund’s contributions to and withdrawals from the Portfolio(s) and purchases and sales of securities held directly by the Fund. |
| 12 | See Notes to Financial Statements. |
Eaton Vance
Short Duration Inflation-Protected Income Fund
October 31, 2022
Notes to Financial Statements
1 Significant Accounting Policies
Eaton Vance Short Duration Inflation-Protected Income Fund (the Fund) is a non-diversified series of Eaton Vance Special Investment Trust (the Trust). The Trust is a Massachusetts business trust registered under the Investment Company Act of 1940, as amended (the 1940 Act), as an open-end management investment company. The Fund offers three classes of shares. Class A shares are generally sold subject to a sales charge imposed at time of purchase. Class C shares are sold at net asset value and are generally subject to a contingent deferred sales charge (see Note 5). Effective November 5, 2020, Class C shares automatically convert to Class A shares eight years after their purchase as described in the Fund’s prospectus. Class I shares are sold at net asset value and are not subject to a sales charge. Each class represents a pro-rata interest in the Fund, but votes separately on class-specific matters and (as noted below) is subject to different expenses. Realized and unrealized gains and losses and net investment income and losses, other than class-specific expenses, are allocated daily to each class of shares based on the relative net assets of each class to the total net assets of the Fund. Each class of shares differs in its distribution plan and certain other class-specific expenses. The Fund’s investment objective is real return (real return is defined as total return less the estimated cost of inflation (typically measured by the change in an official inflation measure)). Effective May 23, 2022, the Fund seeks its investment objective by allocating its assets to certain registered investment companies (each a Portfolio, and collectively the Portfolios) sponsored by the Eaton Vance organization. The value of the Fund’s investments in the Portfolios reflects the Fund’s proportionate interest in their net assets. The Portfolios and the Fund’s proportionate interest in each of their net assets at October 31, 2022 were as follows: Short Duration Inflation-Protected Income Portfolio (99.9%) and Senior Debt Portfolio (3.5%). The performance of the Fund is directly affected by the performance of the Portfolios. The financial statements of Short Duration Inflation-Protected Income Portfolio, including the portfolio of investments, are included elsewhere in this report and should be read in conjunction with the Fund’s financial statements. A copy of Senior Debt Portfolio’s financial statements is available by calling Eaton Vance at 1-800-262-1122 or on the EDGAR database on the Securities and Exchange Commission’s website at www.sec.gov.
The following is a summary of significant accounting policies of the Fund. The policies are in conformity with accounting principles generally accepted in the United States of America (U.S. GAAP). The Fund is an investment company and follows accounting and reporting guidance in the Financial Accounting Standards Board (FASB) Accounting Standards Codification Topic 946. Prior to May 23, 2022, the Fund invested directly in securities and derivatives. The accounting policy followed by the Fund for inflation swaps was consistent with Short Duration Inflation-Protected Income Portfolio’s accounting policy.
A Investment Valuation — Valuation of securities by Short Duration Inflation-Protected Income Portfolio is discussed in Note 1A of such Portfolio’s Notes to Financial Statements, which are included elsewhere in this report. Such policies are consistent with those of Senior Debt Portfolio.
Additional valuation policies for Senior Debt Portfolio (the Portfolio) are as follows:
Senior Floating-Rate Loans. Interests in senior floating-rate loans (Senior Loans) are valued generally at the average mean of bid and ask quotations obtained from a third party pricing service. Senior Loans, for which a valuation is not available or deemed unreliable, are fair valued by the investment adviser utilizing one or more of the valuation techniques described below to assess the likelihood that the borrower will make a full repayment of the loan underlying such Senior Loan. If the investment adviser believes that there is a reasonable likelihood of full repayment, the investment adviser will determine fair value using a matrix pricing approach that considers the yield on the Senior Loan relative to yields on other Senior Loans issued by companies of comparable credit quality. If the investment adviser believes there is not a reasonable likelihood of full repayment, the investment adviser will determine fair value using analyses that include, but are not limited to: (i) a comparison of the value of the borrower’s outstanding equity and debt to that of comparable public companies; (ii) a discounted cash flow analysis; or (iii) when the investment adviser believes it is likely that a borrower will be liquidated or sold, an analysis of the terms of such liquidation or sale. In certain cases, the investment adviser will use a combination of analytical methods to determine fair value, such as when only a portion of a borrower’s assets are likely to be sold. In conducting its assessment and analyses for purposes of determining fair value of a Senior Loan, the investment adviser will use its discretion and judgment in considering and appraising relevant factors. Junior Loans (i.e., subordinated loans and second lien loans) are valued in the same manner as Senior Loans.
Equity Securities. Equity securities listed on a U.S. securities exchange generally are valued at the last sale or closing price on the day of valuation or, if no sales took place on such date, at the mean between the closing bid and ask prices on the exchange where such securities are principally traded. Equity securities listed on the NASDAQ National Market System are valued at the NASDAQ official closing price. Unlisted or listed securities for which closing sales prices or closing quotations are not available are valued at the mean between the latest available bid and ask prices or, in the case of preferred equity securities that are not listed or traded in the over-the-counter market, by a third party pricing service that uses various techniques that consider factors including, but not limited to, prices or yields of securities with similar characteristics, benchmark yields, broker/dealer quotes, quotes of underlying common stock, issuer spreads, as well as industry and economic events.
Derivatives. Forward foreign currency exchange contracts are generally valued at the mean of the average bid and average ask prices that are reported by currency dealers to a third party pricing service at the valuation time. Such third party pricing service valuations are supplied for specific settlement periods and the Portfolio’s forward foreign currency exchange contracts are valued at an interpolated rate between the closest preceding and subsequent settlement period reported by the third party pricing service.
Foreign Securities and Currencies. Foreign securities and currencies are valued in U.S. dollars, based on foreign currency exchange rate quotations supplied by a third party pricing service. The pricing service uses a proprietary model to determine the exchange rate. Inputs to the model include reported trades and implied bid/ask spreads.
B Income — The Fund’s net investment income or loss includes the Fund’s pro-rata share of the net investment income or loss of the Portfolios, less all actual and accrued expenses of the Fund. Prior to May 23, 2022, interest income on direct investments was recorded on the basis of interest accrued,
| 13 |
Eaton Vance
Short Duration Inflation-Protected Income Fund
October 31, 2022
Notes to Financial Statements — continued
adjusted for amortization of premium or accretion of discount. Inflation adjustments to the principal amount of inflation-adjusted bonds and notes were reflected as interest income. Deflation adjustments to the principal amount of an inflation-adjusted bond or note were reflected as reductions to interest income to the extent of interest income previously recorded on such bond or note. Dividend income on direct investments was recorded on the ex-dividend date for dividends received in cash and/or securities.
C Federal Taxes — The Fund’s policy is to comply with the provisions of the Internal Revenue Code applicable to regulated investment companies and to distribute to shareholders each year substantially all of its net investment income, and all or substantially all of its net realized capital gains. Accordingly, no provision for federal income or excise tax is necessary.
As of October 31, 2022, the Fund had no uncertain tax positions that would require financial statement recognition, de-recognition, or disclosure. The Fund files a U.S. federal income tax return annually after its fiscal year-end, which is subject to examination by the Internal Revenue Service for a period of three years from the date of filing.
D Expenses — The majority of expenses of the Trust are directly identifiable to an individual fund. Expenses which are not readily identifiable to a specific fund are allocated taking into consideration, among other things, the nature and type of expense and the relative size of the funds.
E Use of Estimates — The preparation of the financial statements in conformity with U.S. GAAP requires management to make estimates and assumptions that affect the reported amounts of assets and liabilities at the date of the financial statements and the reported amounts of income and expense during the reporting period. Actual results could differ from those estimates.
F Indemnifications — Under the Trust’s organizational documents, its officers and Trustees may be indemnified against certain liabilities and expenses arising out of the performance of their duties to the Fund. Under Massachusetts law, if certain conditions prevail, shareholders of a Massachusetts business trust (such as the Trust) could be deemed to have personal liability for the obligations of the Trust. However, the Trust’s Declaration of Trust contains an express disclaimer of liability on the part of Fund shareholders and the By-laws provide that the Trust shall assume, upon request by the shareholder, the defense on behalf of any Fund shareholders. Moreover, the By-laws also provide for indemnification out of Fund property of any shareholder held personally liable solely by reason of being or having been a shareholder for all loss or expense arising from such liability. Additionally, in the normal course of business, the Fund enters into agreements with service providers that may contain indemnification clauses. The Fund’s maximum exposure under these arrangements is unknown as this would involve future claims that may be made against the Fund that have not yet occurred.
G Other — Investment transactions are accounted for on a trade date basis. Prior to May 23, 2022, when the Fund primarily invested directly in securities and derivatives realized gains and losses on investments sold were determined on the basis of identified cost and the accounting for inflation swaps was consistent with Short Duration Inflation-Protected Income Portfolio’s accounting policy.
2 Distributions to Shareholders and Income Tax Information
It is the present policy of the Fund to declare and pay distributions quarterly of all or substantially all of its net investment income and to distribute annually all or substantially all of its net realized capital gains. Distributions of realized capital gains are made at least annually. Distributions are declared separately for each class of shares. Shareholders may reinvest income and capital gain distributions in additional shares of the same class of the Fund at the net asset value as of the reinvestment date or, at the election of the shareholder, receive distributions in cash. Distributions to shareholders are determined in accordance with income tax regulations, which may differ from U.S. GAAP. As required by U.S. GAAP, only distributions in excess of tax basis earnings and profits are reported in the financial statements as a return of capital. Permanent differences between book and tax accounting relating to distributions are reclassified to paid-in capital. For tax purposes, distributions from short-term capital gains are considered to be from ordinary income.
The tax character of distributions declared for the years ended October 31, 2022 and October 31, 2021 was as follows:
| Year Ended October 31, | ||||||||
| 2022 | 2021 | |||||||
Ordinary income | $ | 44,142,023 | $ | 10,564,748 | ||||
As of October 31, 2022, the components of distributable earnings (accumulated loss) on a tax basis were as follows:
Undistributed ordinary income | $ | 698,907 | | |||||
Deferred capital losses | (8,987,397 | ) | ||||||
Net unrealized depreciation | | (67,588,669 | ) | |||||
Accumulated loss | $ | (75,877,159 | ) | |||||
| 14 |
Eaton Vance
Short Duration Inflation-Protected Income Fund
October 31, 2022
Notes to Financial Statements — continued
At October 31, 2022, the Fund for federal income tax purposes, had deferred capital losses of $8,987,397 which would reduce its taxable income arising from future net realized gains on investment transactions, if any, to the extent permitted by the Internal Revenue Code, and thus would reduce the amount of distributions to shareholders, which would otherwise be necessary to relieve the Fund of any liability for federal income or excise tax. The deferred capital losses are treated as arising on the first day of the Fund’s next taxable year and retain the same short-term or long-term character as when originally deferred. Of the deferred capital losses at October 31, 2022, $3,588,149 are short-term and $5,399,248 are long-term.
3 Investment Adviser Fee and Other Transactions with Affiliates
The investment adviser fee is earned by Eaton Vance Management (EVM), an indirect, wholly-owned subsidiary of Morgan Stanley, as compensation for investment advisory services rendered to the Fund. The investment adviser fee is computed based on the Fund’s average daily net assets that are not invested in other investment companies for which EVM or its affiliates serve as investment adviser and receive an advisory fee at the following annual rates and is payable monthly:
| Average Daily Net Assets | Annual Fee Rate | |||
Up to $1 billion | 0.45 | % | ||
$1 billion but less than $2.5 billion | 0.43 | % | ||
$2.5 billion but less than $5 billion | 0.41 | % | ||
$5 billion and over | 0.40 | % | ||
To the extent the Fund’s assets are invested in the Portfolios, the Fund is allocated its share of the Portfolios’ investment adviser fees. The Portfolios have engaged Boston Management and Research (BMR) to render investment advisory services. Effective April 26, 2022, the Portfolios and Fund may invest in a money market fund, the Institutional Class of the Morgan Stanley Institutional Liquidity Funds - Government Portfolio (the Liquidity Fund), an open-end management investment company managed by Morgan Stanley Investment Management Inc., a wholly-owned subsidiary of Morgan Stanley. The investment adviser fee paid by the Portfolios and Fund is reduced by an amount equal to their pro-rata share of the advisory and administration fees paid by the Portfolios and Fund due to their investments in the Liquidity Fund. For the year ended October 31, 2022, the Fund’s allocated share of the reduction of the investment adviser fee paid by the Portfolios was reduced by $15,612 relating to the Portfolios’ investments in the Liquidity Fund and the investment adviser fee paid by the Fund was reduced by $2,745 relating to the Fund’s investment in the Liquidity Fund. Prior to April 26, 2022, Senior Debt Portfolio and the Fund may have invested their cash in Eaton Vance Cash Reserves Fund, LLC (Cash Reserves Fund), an affiliated investment company managed by EVM. EVM did not receive a fee for advisory services provided to Cash Reserves Fund. For the year ended October 31, 2022, the Fund’s investment adviser fee totaled $3,704,202, of which $2,605,522 was allocated from the Portfolios and $1,098,680 was paid or accrued directly by the Fund. For the year ended October 31, 2022, the Fund’s investment adviser fee, including the fees allocated from the Portfolios, was 0.45% of the Fund’s average daily net assets. EVM also serves as the administrator of the Fund, but currently receives no compensation.
EVM has agreed to reimburse the Fund’s expenses to the extent that total annual operating expenses (relating to ordinary operating expenses only and excluding such expenses as borrowing costs, taxes or litigation expenses) exceed 0.75%, 1.50% and 0.50% of the Fund’s average daily net assets for Class A, Class C and Class I, respectively. This agreement may be changed or terminated after February 28, 2023. Pursuant to this agreement, EVM was allocated $809,493 of the Fund’s operating expenses for the year ended October 31, 2022.
EVM provides sub-transfer agency and related services to the Fund pursuant to a Sub-Transfer Agency Support Services Agreement. For the year ended October 31, 2022, EVM earned $9,232 from the Fund pursuant to such agreement, which is included in transfer and dividend disbursing agent fees on the Statement of Operations. The Fund was informed that Eaton Vance Distributors, Inc. (EVD), an affiliate of EVM and the Fund’s principal underwriter, received $34,093 as its portion of the sales charge on sales of Class A shares for the year ended October 31, 2022. The Fund was informed that Morgan Stanley affiliated broker-dealers, which may be deemed to be affiliates of EVM, BMR and EVD, also received a portion of the sales charge on sales of Class A shares for the year ended October 31, 2022 in the amount of $10,824. EVD also received distribution and service fees from Class A and Class C shares (see Note 4) and contingent deferred sales charges (see Note 5).
Trustees and officers of the Fund and the Portfolios who are members of EVM’s or BMR’s organizations receive remuneration for their services to the Fund out of the investment adviser fee. Certain officers and Trustees of the Fund and the Portfolios are officers of the above organizations.
4 Distribution Plans
The Fund has in effect a distribution plan for Class A shares (Class A Plan) pursuant to Rule 12b-1 under the 1940 Act. Pursuant to the Class A Plan, the Fund pays EVD a distribution and service fee of 0.25% per annum of its average daily net assets attributable to Class A shares for distribution services and facilities provided to the Fund by EVD, as well as for personal services and/or the maintenance of shareholder accounts. Distribution and service fees paid or accrued to EVD for the year ended October 31, 2022 amounted to $196,895 for Class A shares.
| 15 |
Eaton Vance
Short Duration Inflation-Protected Income Fund
October 31, 2022
Notes to Financial Statements — continued
The Fund also has in effect a distribution plan for Class C shares (Class C Plan) pursuant to Rule 12b-1 under the 1940 Act. Pursuant to the Class C Plan, the Fund pays EVD amounts equal to 0.75% per annum of its average daily net assets attributable to Class C shares for providing ongoing distribution services and facilities to the Fund. For the year ended October 31, 2022, the Fund paid or accrued to EVD $148,881 for Class C shares.
Pursuant to the Class C Plan, the Fund also makes payments of service fees to EVD, financial intermediaries and other persons in amounts equal to 0.25% per annum of its average daily net assets attributable to Class C shares. Service fees paid or accrued are for personal services and/or the maintenance of shareholder accounts. They are separate and distinct from the sales commissions and distribution fees payable to EVD. Service fees paid or accrued for the year ended October 31, 2022 amounted to $49,627 for Class C shares.
Distribution and service fees are subject to the limitations contained in the Financial Industry Regulatory Authority Rule 2341(d).
5 Contingent Deferred Sales Charges
A contingent deferred sales charge (CDSC) of 1% generally is imposed on redemptions of Class C shares made within 12 months of purchase. Class A shares may be subject to a 0.75% (1% prior to April 29, 2022) CDSC if redeemed within 12 months (18 months prior to April 29, 2022) of purchase (depending on the circumstances of purchase). Generally, the CDSC is based upon the lower of the net asset value at date of redemption or date of purchase. No charge is levied on shares acquired by reinvestment of dividends or capital gain distributions. For the year ended October 31, 2022, the Fund was informed that EVD received approximately $46,000 and $3,000 of CDSCs paid by Class A and Class C shareholders, respectively.
6 Purchases and Sales of Investments
Purchases and sales of investments by the Fund, other than short-term obligations, and including maturities and paydowns, for the period from November 1, 2021 through May 22, 2022 when the Fund was making investments directly in securities were as follows:
| Purchases | Sales | |||||||
Investments (non-U.S. Government) | $ | 37,608,046 | $ | 3,791,519 | ||||
U.S. Government and Agency Securities | $ | 381,511,112 | $ | 56,559,183 | ||||
| $ | 419,119,158 | $ | 60,350,702 | |||||
7 Investment Transactions
Effective as of the opening of business on May 23, 2022, the Fund transferred a portion of its net assets (primarily its investment in securities, swap contracts and related assets and liabilities), with a value of $676,262,483, including unrealized depreciation of $6,205,769, to Short Duration Inflation-Protected Income Portfolio in exchange for a 99.9% interest therein.
For the year ended October 31, 2022, additional increases and decreases in the Fund’s investment in Short Duration Inflation-Protected Portfolio and increases and decreases in the Fund’s investment in Senior Debt Portfolio were as follows:
| Portfolio | Contributions | Withdrawals | ||||||
Short Duration Inflation-Protected Income Portfolio | $ | 193,391,379 | $ | 68,422,512 | ||||
Senior Debt Portfolio | $ | 226,090,209 | $ | 76,806,418 | ||||
| 16 |
Eaton Vance
Short Duration Inflation-Protected Income Fund
October 31, 2022
Notes to Financial Statements — continued
8 Shares of Beneficial Interest
The Fund’s Declaration of Trust permits the Trustees to issue an unlimited number of full and fractional shares of beneficial interest (without par value). Such shares may be issued in a number of different series (such as the Fund) and classes. Transactions in Fund shares, including direct exchanges pursuant to share class conversions for all periods presented, were as follows:
| Year Ended October 31, 2022 | Year Ended October 31, 2021 | |||||||||||||||
| Shares | Amount | Shares | Amount | |||||||||||||
Class A | ||||||||||||||||
Sales | 7,761,674 | $ | 80,380,065 | 4,015,371 | $ | 41,446,801 | ||||||||||
Issued to shareholders electing to receive payments of distributions in Fund shares | 388,953 | 3,865,351 | 145,514 | 1,499,890 | ||||||||||||
Redemptions | (4,586,923 | ) | (47,032,861 | ) | (1,476,121 | ) | (15,222,497 | ) | ||||||||
Net increase | 3,563,704 | $ | 37,212,555 | 2,684,764 | $ | 27,724,194 | ||||||||||
| Year Ended October 31, 2022 | Year Ended October 31, 2021 | |||||||||||||||
| Shares | Amount | Shares | Amount | |||||||||||||
Class C | ||||||||||||||||
Sales | 1,998,352 | $ | 20,402,219 | 758,124 | $ | 7,820,191 | ||||||||||
Issued to shareholders electing to receive payments of distributions in Fund shares | 91,961 | 901,192 | 19,750 | 202,273 | ||||||||||||
Redemptions | (540,313 | ) | (5,399,224 | ) | (216,213 | ) | (2,170,652 | ) | ||||||||
Net increase | 1,550,000 | $ | 15,904,187 | 561,661 | $ | 5,851,812 | ||||||||||
Class I | ||||||||||||||||
Sales | 106,317,172 | $ | 1,098,924,601 | 26,310,010 | $ | 272,611,215 | ||||||||||
Issued to shareholders electing to receive payments of distributions in Fund shares | 3,961,917 | 39,298,078 | 851,543 | 8,791,040 | ||||||||||||
Redemptions | (48,528,256 | ) | (493,468,273 | ) | (9,105,288 | ) | (93,584,235 | ) | ||||||||
Net increase | 61,750,833 | $ | 644,754,406 | 18,056,265 | $ | 187,818,020 | ||||||||||
9 Financial Instruments
During the year ended October 31, 2022, the Fund entered into inflation swap agreements to swap nominal interest payments with respect to its investments in certain fixed or floating-rate debt (including floating-rate loans) for payments based on changes in the U.S. Consumer Price Index or other measures of inflation.
The effect of derivative instruments (not considered to be hedging instruments for accounting disclosure purposes) on the Statement of Operations and whose primary underlying risk exposure is interest rate risk for the year ended October 31, 2022 was as follows:
| Derivative | Realized Gain (Loss) on Derivatives Recognized in Income | Change in Unrealized Appreciation (Depreciation) on Derivatives Recognized in Income | ||||||
Swap contracts | $ | 5,504,716 | (1) | $ | 429,674 | (2) | ||
| (1) | Statement of Operations location: Net realized gain (loss) – Swap contracts. |
| (2) | Statement of Operations location: Change in unrealized appreciation (depreciation) – Swap contracts. |
The average notional amount of swap contracts outstanding during the period ended May 22, 2022, which is indicative of the volume of this derivative type, was approximately $229,625,000.
| 17 |
Eaton Vance
Short Duration Inflation-Protected Income Fund
October 31, 2022
Notes to Financial Statements — continued
10 Investments in Affiliated Issuers and Funds
The Fund invested in issuers that may be deemed to be affiliated with Morgan Stanley. At October 31, 2022, the value of the Fund’s investment in affiliated issuers and funds was $0. Transactions in affiliated issuers and funds by the Fund for the year ended October 31, 2022 were as follows:
| Name | Value, beginning of period | Purchases | Sales proceeds | Net realized gain (loss) | Change in unrealized appreciation (depreciation) | Value, end of period | Interest/ Dividend income | Principal amount/ Units/Shares, end of period | ||||||||||||||||||||||||
| Commercial Mortgage-Backed Securities | ||||||||||||||||||||||||||||||||
Morgan Stanley Capital I Trust, Series 2017-CLS, Class A, 2.699%, (1 mo. USD LIBOR + 0.70%), 11/15/34 | $ | — | $ | 6,327,630 | $ | (6,278,071 | )(1) | $ | — | $ | (49,744 | ) | $ | — | $ | 19,728 | $ | — | ||||||||||||||
Short-Term Investments | ||||||||||||||||||||||||||||||||
Cash Reserves Fund | 9,713,035 | 232,876,303 | (242,589,315 | ) | (23 | ) | — | — | 4,215 | — | ||||||||||||||||||||||
Liquidity Fund | — | 94,544,817 | (94,544,817 | )(2) | — | — | — | 19,657 | — | |||||||||||||||||||||||
Total | $ | (23 | ) | $ | (49,744 | ) | $ | — | $ | 43,600 | ||||||||||||||||||||||
| (1) | Represents amount transferred to Short Duration Inflation-Protected Income Portfolio. |
| (2) | Included in sales is $30,694,290 representing the amount transferred to Short Duration Inflation-Protected Income Portfolio. |
11 Fair Value Measurements
Under generally accepted accounting principles for fair value measurements, a three-tier hierarchy to prioritize the assumptions, referred to as inputs, is used in valuation techniques to measure fair value. The three-tier hierarchy of inputs is summarized in the three broad levels listed below.
| • | Level 1 – quoted prices in active markets for identical investments |
| • | Level 2 – other significant observable inputs (including quoted prices for similar investments, interest rates, prepayment speeds, credit risk, etc.) |
| • | Level 3 – significant unobservable inputs (including a fund’s own assumptions in determining the fair value of investments) |
In cases where the inputs used to measure fair value fall in different levels of the fair value hierarchy, the level disclosed is determined based on the lowest level input that is significant to the fair value measurement in its entirety. The inputs or methodology used for valuing securities are not necessarily an indication of the risk associated with investing in those securities.
At October 31, 2022, the Fund’s investment in Senior Debt Portfolio, whose financial statements are not included but are available elsewhere as discussed in Note 1, and in Short Duration Inflation-Protected Income Portfolio were valued based on Level 1 inputs.
| 18 |
Eaton Vance
Short Duration Inflation-Protected Income Fund
October 31, 2022
Report of Independent Registered Public Accounting Firm
To the Trustees of Eaton Vance Special Investment Trust and Shareholders of Eaton Vance Short Duration Inflation-Protected Income Fund:
Opinion on the Financial Statements and Financial Highlights
We have audited the accompanying statement of assets and liabilities of Eaton Vance Short Duration Inflation-Protected Income Fund (the “Fund”) (one of the funds constituting Eaton Vance Special Investment Trust), the related statement of operations for the year then ended, the statements of changes in net assets for each of the two years in the period then ended, the financial highlights for each of the five years in the period then ended, and the related notes. In our opinion, the financial statements and financial highlights present fairly, in all material respects, the financial position of the Fund as of October 31, 2022, and the results of its operations for the year then ended, the changes in its net assets for each of the two years in the period then ended, and the financial highlights for each of the five years in the period then ended, in conformity with accounting principles generally accepted in the United States of America.
Basis for Opinion
These financial statements and financial highlights are the responsibility of the Fund’s management. Our responsibility is to express an opinion on the Fund’s financial statements and financial highlights based on our audits. We are a public accounting firm registered with the Public Company Accounting Oversight Board (United States) (PCAOB) and are required to be independent with respect to the Fund in accordance with the U.S. federal securities laws and the applicable rules and regulations of the Securities and Exchange Commission and the PCAOB.
We conducted our audits in accordance with the standards of the PCAOB. Those standards require that we plan and perform the audit to obtain reasonable assurance about whether the financial statements and financial highlights are free of material misstatement, whether due to error or fraud. The Fund is not required to have, nor were we engaged to perform, an audit of its internal control over financial reporting. As part of our audits, we are required to obtain an understanding of internal control over financial reporting but not for the purpose of expressing an opinion on the effectiveness of the Fund’s internal control over financial reporting. Accordingly, we express no such opinion.
Our audits included performing procedures to assess the risks of material misstatement of the financial statements and financial highlights, whether due to error or fraud, and performing procedures that respond to those risks. Such procedures included examining, on a test basis, evidence regarding the amounts and disclosures in the financial statements and financial highlights. Our audits also included evaluating the accounting principles used and significant estimates made by management, as well as evaluating the overall presentation of the financial statements and financial highlights. We believe that our audits provide a reasonable basis for our opinion.
/s/ Deloitte & Touche LLP
Boston, Massachusetts
December 29, 2022
We have served as the auditor of one or more Eaton Vance investment companies since 1959.
| 19 |
Eaton Vance
Short Duration Inflation-Protected Income Fund
October 31, 2022
Federal Tax Information (Unaudited)
The Form 1099-DIV you receive in February 2023 will show the tax status of all distributions paid to your account in calendar year 2022. Shareholders are advised to consult their own tax adviser with respect to the tax consequences of their investment in the Fund. As required by the Internal Revenue Code and/or regulations, shareholders must be notified regarding the status of 163(j) interest dividends.
163(j) Interest Dividends. For the fiscal year ended October 31, 2022, the Fund designates 77.14% of distributions from net investment income as a 163(j) interest dividend.
| 20 |
Short Duration Inflation-Protected Income Portfolio
October 31, 2022
Portfolio of Investments
| Asset-Backed Securities — 1.8% | ||||||||
| Security | Principal Amount (000’s omitted) | Value | ||||||
Coinstar Funding, LLC, Series 2017-1A, Class A2, 5.216%, 4/25/47(1) | $ | 728 | $ | 675,546 | ||||
LAD Auto Receivables Trust , Series 2022-1A, Class A, 5.21%, 6/15/27(1) | 1,732 | 1,700,564 | ||||||
LL ABS Trust, Series 2022-1A, Class A, 3.76%, 11/15/29(1) | 2,755 | 2,692,742 | ||||||
MVW, LLC, Series 2020-1A, Class A, 1.74%, 10/20/37(1) | 53 | 46,206 | ||||||
Oportun Funding, LLC, Series 2022-1, Class A, 3.25%, 6/15/29(1) | 2,992 | 2,919,942 | ||||||
Pagaya AI Debt Trust, Series 2022-1, Class A, 2.03%, 10/15/29(1) | 3,941 | 3,771,732 | ||||||
SpringCastle America Funding, LLC, Series 2020-AA, Class A, 1.97%, 9/25/37(1) | 795 | 714,338 | ||||||
Stack Infrastructure Issuer, LLC, Series 2019-1A, Class A2, 4.54%, 2/25/44(1) | 959 | 933,937 | ||||||
Vantage Data Centers, LLC, Series 2020-2A, Class A2, 1.992%, 9/15/45(1) | 1,105 | 885,742 | ||||||
Total Asset-Backed Securities |
| $ | 14,340,749 | |||||
| Commercial Mortgage-Backed Securities — 2.9% |
| |||||||
| Security | Principal Amount (000’s omitted) | Value | ||||||
BX Commercial Mortgage Trust: | ||||||||
Series 2019-XL, Class A, 4.332%, (1 mo. USD LIBOR + 0.92%), 10/15/36(1)(2) | $ | 4,930 | $ | 4,835,858 | ||||
Series 2021-VOLT, Class B, 4.362%, (1 mo. USD LIBOR + 0.95%), | 5,000 | 4,706,318 | ||||||
CAMB Commercial Mortgage Trust, Series 2019-LIFE, Class A, 4.482%, (1 mo. USD LIBOR + 1.07%), 12/15/37(1)(2) | 3,135 | 3,067,446 | ||||||
| COMM Mortgage Trust: | ||||||||
Series 2013-CR11, Class B, 5.111%, 8/10/50(1)(3) | 2,331 | 2,279,782 | ||||||
Series 2013-CR11, Class D, 5.118%, 8/10/50(1)(3) | 455 | 434,127 | ||||||
Series 2015-CR22, Class D, 4.071%, 3/10/48(1)(3) | 1,000 | 866,943 | ||||||
Extended Stay America Trust, Series 2021-ESH, Class A, 4.493%, (1 mo. USD LIBOR + 1.08%), 7/15/38(1)(2) | 3,162 | 3,040,879 | ||||||
Hawaii Hotel Trust, Series 2019-MAUI, Class A, 4.562%, (1 mo. USD LIBOR + 1.15%), 5/15/38(1)(2) | 3,000 | 2,892,886 | ||||||
Total Commercial Mortgage-Backed Securities |
| $ | 22,124,239 | |||||
| U.S. Government Agency Mortgage-Backed Securities — 1.8% |
| |||||||
| Security | Principal Amount (000’s omitted) | Value | ||||||
Federal National Mortgage Association, 4.50%, 30-Year, TBA(4) | $ | 15,000 | $ | 14,068,353 | ||||
Total U.S. Government Agency |
| $ | 14,068,353 | |||||
| U.S. Treasury Obligations — 93.0% |
| |||||||
| Security | Principal Amount (000’s omitted) | Value | ||||||
U.S. Treasury Inflation-Protected Bonds: | ||||||||
2.00%, 1/15/26(5) | $ | 44,767 | $ | 45,032,639 | ||||
2.375%, 1/15/25(5) | 39,281 | 39,724,257 | ||||||
2.375%, 1/15/27(5) | 44,060 | 45,174,298 | ||||||
U.S. Treasury Inflation-Protected Notes: | ||||||||
0.125%, 7/15/24(5) | 42,409 | 41,355,146 | ||||||
0.125%, 10/15/24(5) | 46,175 | 44,828,382 | ||||||
0.125%, 4/15/25(5) | 36,692 | 35,196,112 | ||||||
0.125%, 10/15/25(5) | 45,658 | 43,674,956 | ||||||
0.125%, 4/15/26(5) | 45,174 | 42,629,814 | ||||||
0.125%, 7/15/26(5) | 37,068 | 35,048,625 | ||||||
0.125%, 10/15/26(5) | 36,851 | 34,692,244 | ||||||
0.125%, 4/15/27(5) | 37,763 | 35,231,251 | ||||||
0.25%, 1/15/25(5) | 37,514 | 36,251,412 | ||||||
0.375%, 7/15/25(5) | 37,468 | 36,216,765 | ||||||
0.375%, 1/15/27(5) | 38,009 | 35,934,662 | ||||||
0.375%, 7/15/27(5) | 46,009 | 43,458,069 | ||||||
0.50%, 4/15/24(5) | 39,927 | 39,096,914 | ||||||
0.50%, 1/15/28(5) | 15,609 | 14,691,599 | ||||||
0.625%, 1/15/24(5) | 25,387 | 24,973,072 | ||||||
0.625%, 1/15/26(5) | 51,105 | 49,295,675 | ||||||
Total U.S. Treasury Obligations |
| $ | 722,505,892 | |||||
| 21 | See Notes to Financial Statements. |
Short Duration Inflation-Protected Income Portfolio
October 31, 2022
Portfolio of Investments — continued
| Short-Term Investments — 0.9% |
| |||||||
| Security | Shares | Value | ||||||
Morgan Stanley Institutional Liquidity Funds - Government Portfolio, Institutional Class, 2.88%(6) | 7,445,764 | $ | 7,445,764 | |||||
Total Short-Term Investments |
| $ | 7,445,764 | |||||
Total Investments — 100.4% |
| $ | 780,484,997 | |||||
Other Assets, Less Liabilities — (0.4)% |
| $ | (3,340,268 | ) | ||||
Net Assets — 100.0% |
| $ | 777,144,729 | |||||
The percentage shown for each investment category in the Portfolio of
Investments is based on net assets.
| (1) | Security exempt from registration under Rule 144A of the Securities Act of 1933, as amended. These securities may be sold in certain transactions in reliance on an exemption from registration (normally to qualified institutional buyers). At October 31, 2022, the aggregate value of these securities is $36,464,988 or 4.7% of the Portfolio’s net assets. |
| (2) | Variable rate security. The stated interest rate represents the rate in effect at October 31, 2022. |
| (3) | Weighted average fixed-rate coupon that changes/updates monthly. Rate shown is the rate at October 31, 2022. |
| (4) | TBA (To Be Announced) securities are purchased or sold on a forward commitment basis with an approximate principal amount and maturity date. The actual principal amount and maturity date are determined upon settlement. |
| (5) | Inflation-linked security whose principal is adjusted for inflation based on changes in the U.S. Consumer Price Index. Interest is calculated based on the inflation-adjusted principal. |
| (6) | May be deemed to be an affiliated investment company. The rate shown is the annualized seven-day yield as of October 31, 2022. |
| Inflation Swaps (Centrally Cleared) | ||||||||||||||||||||
| Notional Amount (000’s omitted) | Portfolio Pays/Receives Return on Reference Index | Reference Index | Portfolio Pays/Receives Rate | Annual Rate | Termination Date | Value/Unrealized Appreciation (Depreciation) | ||||||||||||||
| USD | 30,000 | Receives | Return on CPI-U (NSA) (pays upon termination) | Pays | 4.47% (pays upon termination) | 4/21/24 | $ | 27,063 | ||||||||||||
| USD | 7,000 | Receives | Return on CPI-U (NSA) (pays upon termination) | Pays | 2.34% (pays upon termination) | 3/2/25 | 725,699 | |||||||||||||
| USD | 5,000 | Receives | Return on CPI-U (NSA) (pays upon termination) | Pays | 1.40% (pays upon termination) | 3/6/25 | 703,061 | |||||||||||||
| USD | 4,000 | Receives | Return on CPI-U (NSA) (pays upon termination) | Pays | 0.66% (pays upon termination) | 3/27/25 | 702,749 | |||||||||||||
| USD | 25,000 | Receives | Return on CPI-U (NSA) (pays upon termination) | Pays | 4.27% (pays upon termination) | 3/28/25 | (129,102 | ) | ||||||||||||
| USD | 35,000 | Receives | Return on CPI-U (NSA) (pays upon termination) | Pays | 4.04% (pays upon termination) | 4/25/25 | (99,208 | ) | ||||||||||||
| USD | 6,000 | Receives | Return on CPI-U (NSA) (pays upon termination) | Pays | 1.92% (pays upon termination) | 9/2/25 | 807,345 | |||||||||||||
| USD | 4,000 | Receives | Return on CPI-U (NSA) (pays upon termination) | Pays | 0.45% (pays upon termination) | 3/24/26 | 815,453 | |||||||||||||
| USD | 25,000 | Receives | Return on CPI-U (NSA) (pays upon termination) | Pays | 3.76% (pays upon termination) | 4/1/26 | (17,152 | ) | ||||||||||||
| USD | 10,000 | Receives | Return on CPI-U (NSA) (pays upon termination) | Pays | 2.73% (pays upon termination) | 5/27/26 | 841,016 | |||||||||||||
| USD | 10,000 | Receives | Return on CPI-U (NSA) (pays upon termination) | Pays | 2.71% (pays upon termination) | 8/11/26 | 715,531 | |||||||||||||
| USD | 5,000 | Receives | Return on CPI-U (NSA) (pays upon termination) | Pays | 1.90% (pays upon termination) | 9/1/26 | 711,459 | |||||||||||||
| 22 | See Notes to Financial Statements. |
Short Duration Inflation-Protected Income Portfolio
October 31, 2022
Portfolio of Investments — continued
| Inflation Swaps (Centrally Cleared) (continued) | ||||||||||||||||||||
| Notional Amount (000’s omitted) | Portfolio Pays/Receives Return on Reference Index | Reference Index | Portfolio Pays/Receives Rate | Annual Rate | Termination Date | Value/Unrealized Appreciation (Depreciation) | ||||||||||||||
| USD | 15,000 | Receives | Return on CPI-U (NSA) (pays upon termination) | Pays | 3.16% (pays upon termination) | 10/28/26 | $ | 609,114 | ||||||||||||
| USD | 20,000 | Receives | Return on CPI-U (NSA) (pays upon termination) | Pays | 3.00% (pays upon termination) | 1/4/27 | 771,680 | |||||||||||||
| USD | 20,000 | Receives | Return on CPI-U (NSA) (pays upon termination) | Pays | 2.82% (pays upon termination) | 2/11/27 | 815,379 | |||||||||||||
| USD | 30,000 | Receives | Return on CPI-U (NSA) (pays upon termination) | Pays | 3.61% (pays upon termination) | 3/23/27 | (52,368 | ) | ||||||||||||
| USD | 10,000 | Receives | Return on CPI-U (NSA) (pays upon termination) | Pays | 2.55% (pays upon termination) | 4/19/27 | 966,721 | |||||||||||||
| USD | 10,000 | Receives | Return on CPI-U (NSA) (pays upon termination) | Pays | 2.81% (pays upon termination) | 10/12/27 | 563,759 | |||||||||||||
| USD | 15,000 | Receives | Return on CPI-U (NSA) (pays upon termination) | Pays | 3.24% (pays upon termination) | 11/19/27 | 466,601 | |||||||||||||
| USD | 50,000 | Receives | Return on CPI-U (NSA) (pays upon termination) | Pays | 3.37% (pays upon termination) | 3/10/28 | 261,999 | |||||||||||||
| $ | 10,206,799 | |||||||||||||||||||
Abbreviations:
| CPI-U (NSA) | – | Consumer Price Index All Urban Non-Seasonally Adjusted | ||
| LIBOR | – | London Interbank Offered Rate | ||
| OTC | – | Over-the-counter | ||
| TBA | – | To Be Announced | ||
Currency Abbreviations:
| USD | – | United States Dollar | ||
| 23 | See Notes to Financial Statements. |
Short Duration Inflation-Protected Income Portfolio
October 31, 2022
Statement of Assets and Liabilities
| Assets | October 31, 2022 | |||
Unaffiliated investments, at value (identified cost $830,584,581) | $ | 773,039,233 | ||
Affiliated investment, at value (identified cost $7,445,764) | 7,445,764 | |||
Cash | 11,729 | |||
Deposits for derivatives collateral - centrally cleared derivatives | 9,359,196 | |||
Interest receivable | 1,331,091 | |||
Dividends receivable from affiliated investment | 24,185 | |||
Receivable for variation margin on open centrally cleared derivatives | 492,433 | |||
Total assets | $ | 791,703,631 | ||
| Liabilities |
| |||
Payable for forward commitment securities | $ | 14,111,875 | ||
Payable to affiliates: | ||||
Investment adviser fee | 298,664 | |||
Trustees’ fees | 4,871 | |||
Accrued expenses | 143,492 | |||
Total liabilities | $ | 14,558,902 | ||
Net Assets applicable to investors’ interest in Portfolio | $ | 777,144,729 | ||
| 24 | See Notes to Financial Statements. |
Short Duration Inflation-Protected Income Portfolio
October 31, 2022
Statement of Operations
| Investment Income | Period Ended October 31, 2022(1) | |||
Dividend income from affiliated investment | $ | 126,909 | ||
Interest income | 20,087,466 | |||
Interest income from affiliated investment | 67,283 | |||
Total investment income | $ | 20,281,658 | ||
| Expenses | ||||
Investment adviser fee | $ | 1,551,576 | ||
Trustees’ fees and expenses | 33,528 | |||
Custodian fee | 82,403 | |||
Legal and accounting services | 63,225 | |||
Miscellaneous | 2,472 | |||
Total expenses | $ | 1,733,204 | ||
Deduct: | ||||
Waiver and/or reimbursement of expenses by affiliate | $ | 12,529 | ||
Total expense reductions | $ | 12,529 | ||
Net expenses | $ | 1,720,675 | ||
Net investment income | $ | 18,560,983 | ||
| Realized and Unrealized Gain (Loss) | ||||
Net realized gain (loss): | ||||
Investment transactions | $ | (1,497,626 | ) | |
Investment transactions - affiliated investments | 9,141 | |||
Swap contracts | (36,337 | ) | ||
Net realized loss | $ | (1,524,822 | ) | |
Change in unrealized appreciation (depreciation): | ||||
Investments | $ | (43,146,951 | ) | |
Investments - affiliated investments | 49,744 | |||
Swap contracts | 1,964,427 | |||
Net change in unrealized appreciation (depreciation) | $ | (41,132,780 | ) | |
Net realized and unrealized loss | $ | (42,657,602 | ) | |
Net decrease in net assets from operations | $ | (24,096,619 | ) | |
| (1) | For the period from the commencement of operations, May 23, 2022, to October 31, 2022. |
| 25 | See Notes to Financial Statements. |
Short Duration Inflation-Protected Income Portfolio
October 31, 2022
Statement of Changes in Net Assets
| Increase (Decrease) in Net Assets | Period Ended October 31, 2022(1) | |||
From operations: | ||||
Net investment income | $ | 18,560,983 | ||
Net realized loss | (1,524,822 | ) | ||
Net change in unrealized appreciation (depreciation) | (41,132,780 | ) | ||
Net decrease in net assets from operations | $ | (24,096,619 | ) | |
Capital transactions: | ||||
Contributions | $ | 193,401,377 | ||
Withdrawals | (68,422,512 | ) | ||
Assets contributed by Eaton Vance Short Duration Inflation-Protected Income Fund | 676,262,483 | |||
Net increase in net assets from capital transactions | $ | 801,241,348 | ||
Net increase in net assets | $ | 777,144,729 | ||
| Net Assets |
| |||
At beginning of period | $ | — | ||
At end of period | $ | 777,144,729 | ||
| (1) | For the period from the commencement of operations, May 23, 2022, to October 31, 2022. |
| 26 | See Notes to Financial Statements. |
Short Duration Inflation-Protected Income Portfolio
October 31, 2022
Financial Highlights
| Ratios/Supplemental Data | Period Ended October 31, 2022(1) | |||
Ratios (as a percentage of average daily net assets): | ||||
Expenses | 0.50 | %(2)(3) | ||
Net investment income | 5.38 | %(2) | ||
Portfolio Turnover | 9 | %(4)(5) | ||
Total Return | (2.95 | )%(4) | ||
Net assets, end of period (000’s omitted) | $ | 777,145 | ||
| (1) | For the period from the commencement of operations, May 23, 2022, to October 31, 2022. |
| (2) | Annualized. |
| (3) | Includes a reduction by the investment adviser of a portion of its adviser fee due to the Portfolio’s investment in the Liquidity Fund (equal to less than 0.005% of average daily net assets for the period ended October 31, 2022). |
| (4) | Not annualized. |
| (5) | Includes the effect of To Be Announced (TBA) transactions. |
| 27 |
Short Duration Inflation-Protected Income Portfolio
October 31, 2022
Notes to Financial Statements
1 Significant Accounting Policies
Short Duration Inflation-Protected Income Portfolio (the Portfolio) is a Massachusetts business trust registered under the Investment Company Act of 1940, as amended (the 1940 Act), as a non-diversified, open-end management investment company. The Portfolio commenced operations on May 23, 2022 with the transfer of a portion of the net assets (primarily its investment in securities, swap contracts and related assets and liabilities) of Eaton Vance Short Duration Inflation-Protected Income Fund (the Fund) in exchange for an interest in the Portfolio (see Note 3). The Portfolio’s investment objective is real return (real return is defined as total return less the estimated cost of inflation (typically measured by the change in an official inflation measure)). The Declaration of Trust permits the Trustees to issue interests in the Portfolio. At October 31, 2022, Eaton Vance Short Duration Inflation-Protected Income Fund held an interest of 99.9% in the Portfolio.
A Investment Valuation — The following methodologies are used to determine the market value or fair value of investments.
Debt Obligations. Debt obligations are generally valued on the basis of valuations provided by third party pricing services, as derived from such services’ pricing models. Inputs to the models may include, but are not limited to, reported trades, executable bid and ask prices, broker/dealer quotations, prices or yields of securities with similar characteristics, interest rates, anticipated prepayments, benchmark curves or information pertaining to the issuer, as well as industry and economic events. The pricing services may use a matrix approach, which considers information regarding securities with similar characteristics to determine the valuation for a security. Short-term debt obligations purchased with a remaining maturity of sixty days or less for which a valuation from a third party pricing service is not readily available may be valued at amortized cost, which approximates fair value.
Derivatives. Swaps are normally valued using valuations provided by a third party pricing service. Such pricing service valuations are based on the present value of fixed and projected floating rate cash flows over the term of the swap contract. Future cash flows on swaps are discounted to their present value using swap rates provided by electronic data services or by broker/dealers.
Other. Investments in management investment companies (including money market funds) that do not trade on an exchange are valued at the net asset value as of the close of each business day.
Fair Valuation. In connection with Rule 2a-5 of the 1940 Act, which became effective September 8, 2022, the Trustees have designated the Portfolio’s investment adviser as its valuation designee. Investments for which valuations or market quotations are not readily available or are deemed unreliable are valued by the investment adviser, as valuation designee, at fair value using methods that most fairly reflect the security’s “fair value”, which is the amount that the Portfolio might reasonably expect to receive for the security upon its current sale in the ordinary course. Each such determination is based on a consideration of relevant factors, which are likely to vary from one pricing context to another. These factors may include, but are not limited to, the type of security, the existence of any contractual restrictions on the security’s disposition, the price and extent of public trading in similar securities of the issuer or of comparable companies or entities, quotations or relevant information obtained from broker/dealers or other market participants, information obtained from the issuer, analysts, and/or the appropriate stock exchange (for exchange-traded securities), an analysis of the company’s or entity’s financial statements, and an evaluation of the forces that influence the issuer and the market(s) in which the security is purchased and sold.
B Investment Transactions — Investment transactions for financial statement purposes are accounted for on a trade date basis. Realized gains and losses on investments sold are determined on the basis of identified cost.
C Income — Interest income is recorded on the basis of interest accrued, adjusted for amortization of premium or accretion of discount. Inflation adjustments to the principal amount of inflation-adjusted bonds and notes are reflected as interest income. Deflation adjustments to the principal amount of an inflation-adjusted bond or note are reflected as reductions to interest income to the extent of interest income previously recorded on such bond or note. Dividend income is recorded on the ex-dividend date for dividends received in cash and/or securities.
D Federal Taxes — The Portfolio has elected to be treated as a partnership for federal tax purposes. No provision is made by the Portfolio for federal or state taxes on any taxable income of the Portfolio because each investor in the Portfolio is ultimately responsible for the payment of any taxes on its share of taxable income. Since at least one of the Portfolio’s investors is a regulated investment company that invests all or substantially all of its assets in the Portfolio, the Portfolio normally must satisfy the applicable source of income and diversification requirements (under the Internal Revenue Code) in order for its investors to satisfy them. The Portfolio will allocate, at least annually among its investors, each investor’s distributive share of the Portfolio’s net investment income, net realized capital gains and losses and any other items of income, gain, loss, deduction or credit.
As of October 31, 2022, the Portfolio had no uncertain tax positions that would require financial statement recognition, de-recognition, or disclosure. The Portfolio files a U.S. federal income tax return annually after its fiscal year-end, which is subject to examination by the Internal Revenue Service for a period of three years from the date of filing.
E Use of Estimates — The preparation of the financial statements in conformity with U.S. GAAP requires management to make estimates and assumptions that affect the reported amounts of assets and liabilities at the date of the financial statements and the reported amounts of income and expense during the reporting period. Actual results could differ from those estimates.
F Indemnifications — Under the Portfolio’s organizational documents, its officers and Trustees may be indemnified against certain liabilities and expenses arising out of the performance of their duties to the Portfolio. Under Massachusetts law, if certain conditions prevail, interestholders in the Portfolio could be deemed to have personal liability for the obligations of the Portfolio. However, the Portfolio’s Declaration of Trust contains an express disclaimer of liability on the part of Portfolio interestholders. Additionally, in the normal course of business, the Portfolio enters into agreements with service providers
| 28 |
Short Duration Inflation-Protected Income Portfolio
October 31, 2022
Notes to Financial Statements — continued
that may contain indemnification clauses. The Portfolio’s maximum exposure under these arrangements is unknown as this would involve future claims that may be made against the Portfolio that have not yet occurred.
G Inflation Swaps — Swap contracts are privately negotiated agreements between the Portfolio and a counterparty. Certain swap contracts may be centrally cleared (“centrally cleared swaps”), whereby all payments made or received by the Portfolio pursuant to the contract are with a central clearing party (CCP) rather than the original counterparty. The CCP guarantees the performance of the original parties to the contract. Upon entering into centrally cleared swaps, the Portfolio is required to deposit with the CCP, either in cash or securities, an amount of initial margin determined by the CCP, which is subject to adjustment. Pursuant to inflation swap agreements, the Portfolio either makes floating-rate payments to the counterparty (or CCP in the case of centrally cleared swaps) based on a benchmark index in exchange for fixed-rate payments or the Portfolio makes fixed-rate payments to the counterparty (or CCP in the case of centrally cleared swaps) in exchange for floating-rate payments based on the return of a benchmark index. By design, the benchmark index is an inflation index, such as the Consumer Price Index. Payments received or made are recorded as realized gains or losses. During the term of the outstanding swap agreement, changes in the underlying value of the swap are recorded as unrealized gains or losses. For centrally cleared swaps, the daily change in valuation is recorded as a receivable or payable for variation margin and settled in cash with the CCP daily. The value of the swap is determined by changes in the relationship between the rate of interest and the benchmark index. The Portfolio is exposed to credit loss in the event of nonperformance by the swap counterparty. In the case of centrally cleared swaps, counterparty risk is minimal due to protections provided by the CCP. Risk may also arise from the unanticipated movements in value of interest rates or the index.
H When-Issued Securities and Delayed Delivery Transactions — The Portfolio may purchase securities on a delayed delivery, when-issued or forward commitment basis, including TBA (To Be Announced) securities. Payment and delivery may take place after the customary settlement period for that security. At the time the transaction is negotiated, the price of the security that will be delivered is fixed. The Portfolio maintains cash and/or security positions for these commitments such that sufficient liquid assets will be available to make payments upon settlement. Securities purchased on a delayed delivery, when-issued or forward commitment basis are marked-to-market daily and begin earning interest on settlement date. Such security purchases are subject to the risk that when delivered they will be worth less than the agreed upon payment price. Losses may also arise if the counterparty does not perform under the contract. A forward purchase commitment may also be closed by entering into an offsetting commitment. If an offsetting commitment is entered into, the Portfolio will realize a gain or loss on investments based on the price established when the Portfolio entered into the commitment.
2 Investment Adviser Fee and Other Transactions with Affiliates
The investment adviser fee is earned by Boston Management and Research (BMR), an indirect, wholly-owned subsidiary of Morgan Stanley, as compensation for investment advisory services rendered to the Portfolio. The investment adviser fee is computed at an annual rate as a percentage of the Portfolio’s average daily net assets as follows and is payable monthly:
| Average Daily Net Assets | Annual Fee Rate | |||
Up to $1 billion | 0.45 | % | ||
$1 billion but less than $2.5 billion | 0.43 | % | ||
$2.5 billion but less than $5 billion | 0.41 | % | ||
$5 billion and over | 0.40 | % | ||
For the period ended October 31, 2022, the investment adviser fee amounted to $1,551,576 or 0.45% (annualized) of the Portfolio’s average daily net assets. The Portfolio may invest in a money market fund, the Institutional Class of the Morgan Stanley Institutional Liquidity Funds - Government Portfolio (the “Liquidity Fund”), an open-end management investment company managed by Morgan Stanley Investment Management Inc., a wholly-owned subsidiary of Morgan Stanley. The investment adviser fee paid by the Portfolio is reduced by an amount equal to its pro-rata share of the advisory and administration fees paid by the Portfolio due to its investment in the Liquidity Fund. For the period ended October 31, 2022, the investment adviser fee paid was reduced by $12,529 relating to the Portfolio’s investment in the Liquidity Fund.
Trustees and officers of the Portfolio who are members of EVM’s or BMR’s organizations receive remuneration for their services to the Portfolio out of the investment adviser fee. Trustees of the Portfolio who are not affiliated with the investment adviser may elect to defer receipt of all or a percentage of their annual fees in accordance with the terms of the Trustees Deferred Compensation Plan. For the period ended October 31, 2022, no significant amounts have been deferred. Certain officers and Trustees of the Portfolio are officers of the above organizations.
3 Transfer of Assets
The Portfolio commenced operations on May 23, 2022 with the transfer of a portion of the net assets (primarily its investment in securities, swap contracts and related assets and liabilities) of Eaton Vance Short Duration Inflation-Protected Income Fund with a value of $676,262,483, including net unrealized depreciation of $6,205,769, in exchange for an interest in the Portfolio. The transaction was structured for tax purposes as a tax-free exchange under the Internal Revenue Code.
| 29 |
Short Duration Inflation-Protected Income Portfolio
October 31, 2022
Notes to Financial Statements — continued
4 Purchases and Sales of Investments
Purchases and sales of investments, other than short-term obligations and investments acquired in the transfer of assets as described in Note 3, and including maturities and paydowns, for the period ended October 31, 2022 were as follows:
| Purchases | Sales | |||||||
Investments (non-U.S. Government) | $ | 10,604,408 | $ | 14,376,068 | ||||
U.S. Government and Agency Securities | 224,553,528 | 56,068,304 | ||||||
| $ | 235,157,936 | $ | 70,444,372 | |||||
5 Federal Income Tax Basis of Investments
The cost and unrealized appreciation (depreciation) of investments, including open derivative contracts, of the Portfolio at October 31, 2022, as determined on a federal income tax basis, were as follows:
Aggregate cost | $ | 838,030,483 | ||
Gross unrealized appreciation | $ | 10,206,799 | ||
Gross unrealized depreciation | (57,545,486 | ) | ||
Net unrealized depreciation | $ | (47,338,687 | ) | |
6 Financial Instruments
The Portfolio may trade in financial instruments with off-balance sheet risk in the normal course of its investing activities. These financial instruments may include swap contracts and may involve, to a varying degree, elements of risk in excess of the amounts recognized for financial statement purposes. The notional or contractual amounts of these instruments represent the investment the Portfolio has in particular classes of financial instruments and do not necessarily represent the amounts potentially subject to risk. The measurement of the risks associated with these instruments is meaningful only when all related and offsetting transactions are considered. A summary of obligations under these financial instruments at October 31, 2022 is included in the Portfolio of Investments. At October 31, 2022, the Portfolio had sufficient cash and/or securities to cover commitments under these contracts.
The Portfolio is subject to interest rate risk in the normal course of pursuing its investment objective and its use of derivatives. The Fund enters into interest rate and inflation swap agreements to swap nominal interest payments with respect to its investments in certain fixed or floating-rate debt (including floating-rate loans) for payments based on changes in the U.S. Consumer Price Index or other measures of inflation.
The fair value of open derivative instruments (not considered to be hedging instruments for accounting disclosure purposes) and whose primary underlying risk exposure is interest rate risk at October 31, 2022 was as follows:
| Fair Value | ||||||||
| Derivative | Asset Derivative | Liability Derivative | ||||||
Swap contracts (centrally cleared) | $ | 10,504,629 | (1) | $ | (297,830 | )(1) | ||
| (1) | Only the current day’s variation margin on centrally cleared swap contracts is reported within the Statement of Assets and Liabilities as Receivable or Payable for variation margin on centrally cleared derivatives, as applicable. |
| 30 |
Short Duration Inflation-Protected Income Portfolio
October 31, 2022
Notes to Financial Statements — continued
The effect of derivative instruments (not considered to be hedging instruments for accounting disclosure purposes) on the Statement of Operations and whose primary underlying risk exposure is interest rate risk for the period ended October 31, 2022 was as follows:
| Derivative | Realized Gain (Loss) on Derivatives Recognized in Income | Change in Unrealized Appreciation (Depreciation) on Derivatives Recognized in Income | ||||||
Swap contracts | $ | (36,337 | )(1) | $ | 1,964,427 | (2) | ||
| (1) | Statement of Operations location: Net realized gain (loss) – Swap contracts. |
| (2) | Statement of Operations location: Change in unrealized appreciation (depreciation) – Swap contracts. |
The average notional amount of swap contracts outstanding during the period ended October 31, 2022, which is indicative of the volume of this derivative type, was approximately $336,000,000.
7 Line of Credit
Effective October 25, 2022, the Portfolio participates with other portfolios and funds managed by EVM and its affiliates in a $725 million unsecured line of credit agreement with a group of banks, which is in effect through October 24, 2023. In connection with the renewal of the agreement on October 25, 2022, the borrowing limit was decreased from $800 million. Borrowings are made by the Portfolio solely for temporary purposes related to redemptions and other short-term cash needs. Interest is charged to the Portfolio based on its borrowings at an amount above either the Secured Overnight Financing Rate (SOFR) or Federal Funds rate. In addition, a fee computed at an annual rate of 0.15% on the daily unused portion of the line of credit is allocated among the participating portfolios and funds at the end of each quarter. Also in connection with the renewal of the agreement, an arrangement fee totaling $150,000 was incurred that was allocated to the participating portfolios and funds. Because the line of credit is not available exclusively to the Portfolio, it may be unable to borrow some or all of its requested amounts at any particular time. The Portfolio did not have any significant borrowings or allocated fees during the period ended October 31, 2022.
8 Investments in Affiliated Issuers and Funds
The Portfolio invested in issuers that may be deemed to be affiliated with Morgan Stanley. At October 31, 2022, the value of the Portfolio’s investment in affiliated issuers and funds was $7,445,764, which represents 0.9% of the Portfolio’s net assets. Transactions in affiliated issuers and funds by the Portfolio for the period ended October 31, 2022 were as follows:
| Name | Value, beginning of period | Purchases | Sales proceeds | Net realized gain (loss) | Change in unrealized appreciation (depreciation) | Value, end of period | Interest/ Dividend income | Principal amount/ Shares, end of period | ||||||||||||||||||||||||
Commercial Mortgage-Backed Securities | ||||||||||||||||||||||||||||||||
Morgan Stanley Capital I Trust, Series 2017-CLS, Class A, 3.518%, (1 mo. USD LIBOR + 0.70%), 11/15/34 | $ | — | $ | 6,278,071 | (1) | $ | (6,337,000 | ) | $ | 9,141 | $ | 49,744 | $ | — | $ | 67,283 | $ | — | ||||||||||||||
Short-Term Investments | ||||||||||||||||||||||||||||||||
Liquidity Fund | — | 214,610,901 | (2) | (207,165,137 | ) | — | — | 7,445,764 | 126,909 | 7,445,764 | ||||||||||||||||||||||
Total | $ | 9,141 | $ | 49,744 | $ | 7,445,764 | $ | 194,192 | ||||||||||||||||||||||||
| (1) | Represents the amount transferred from the Fund. |
| (2) | Included in purchases is $30,694,290 representing the amount transferred from the Fund. |
9 Fair Value Measurements
Under generally accepted accounting principles for fair value measurements, a three-tier hierarchy to prioritize the assumptions, referred to as inputs, is used in valuation techniques to measure fair value. The three-tier hierarchy of inputs is summarized in the three broad levels listed below.
| • | Level 1 – quoted prices in active markets for identical investments |
| • | Level 2 – other significant observable inputs (including quoted prices for similar investments, interest rates, prepayment speeds, credit risk, etc.) |
| 31 |
Short Duration Inflation-Protected Income Portfolio
October 31, 2022
Notes to Financial Statements — continued
| • | Level 3 – significant unobservable inputs (including a fund’s own assumptions in determining the fair value of investments) |
In cases where the inputs used to measure fair value fall in different levels of the fair value hierarchy, the level disclosed is determined based on the lowest level input that is significant to the fair value measurement in its entirety. The inputs or methodology used for valuing securities are not necessarily an indication of the risk associated with investing in those securities.
At October 31, 2022, the hierarchy of inputs used in valuing the Portfolio’s investments and open derivative instruments, which are carried at value, were as follows:
| Asset Description | Level 1 | Level 2 | Level 3 | Total | ||||||||||||
Asset-Backed Securities | $ | — | $ | 14,340,749 | $ | — | $ | 14,340,749 | ||||||||
Commercial Mortgage-Backed Securities | — | 22,124,239 | — | 22,124,239 | ||||||||||||
U.S. Government Agency Mortgage-Backed Securities | — | 14,068,353 | — | 14,068,353 | ||||||||||||
U.S. Treasury Obligations | — | 722,505,892 | — | 722,505,892 | ||||||||||||
Short-Term Investments | 7,445,764 | — | — | 7,445,764 | ||||||||||||
Total Investments | $ | 7,445,764 | $ | 773,039,233 | $ | — | $ | 780,484,997 | ||||||||
Swap Contracts | $ | — | $ | 10,504,629 | $ | — | $ | 10,504,629 | ||||||||
Total | $ | 7,445,764 | $ | 783,543,862 | $ | — | $ | 790,989,626 | ||||||||
Liability Description | ||||||||||||||||
Swap Contracts | $ | — | $ | (297,830 | ) | $ | — | $ | (297,830 | ) | ||||||
Total | $ | — | $ | (297,830 | ) | $ | — | $ | (297,830 | ) | ||||||
10 Risks and Uncertainties
LIBOR Transition Risk
Certain instruments held by the Portfolio may pay an interest rate based on the London Interbank Offered Rate (“LIBOR”), which is the average offered rate for various maturities of short-term loans between certain major international banks. LIBOR is used throughout global banking and financial industries to determine interest rates for a variety of financial instruments (such as debt instruments and derivatives) and borrowing arrangements. The ICE Benchmark Administration Limited, the administrator of LIBOR, ceased publishing certain LIBOR settings on December 31, 2021, and is expected to cease publishing the remaining LIBOR settings on June 30, 2023. Although the transition process away from LIBOR has become increasingly well-defined, the impact on certain debt securities, derivatives and other financial instruments that utilize LIBOR remains uncertain. The phase-out of LIBOR may result in, among other things, increased volatility or illiquidity in markets for instruments based on LIBOR and changes in the value of such instruments.
Pandemic Risk
An outbreak of respiratory disease caused by a novel coronavirus was first detected in China in late 2019 and subsequently spread internationally. This coronavirus has resulted in closing borders, enhanced health screenings, changes to healthcare service preparation and delivery, quarantines, cancellations, disruptions to supply chains and customer activity, as well as general concern and uncertainty. Health crises caused by outbreaks of disease, such as the coronavirus outbreak, may exacerbate other pre-existing political, social and economic risks and disrupt normal market conditions and operations. The impact of this outbreak has negatively affected the worldwide economy, as well as the economies of individual countries and industries, and could continue to affect the market in significant and unforeseen ways. Other epidemics and pandemics that may arise in the future may have similar effects. Any such impact could adversely affect the Portfolio’s performance, or the performance of the securities in which the Portfolio invests.
| 32 |
Short Duration Inflation-Protected Income Portfolio
October 31, 2022
Report of Independent Registered Public Accounting Firm
To the Trustees and Investors of Short Duration Inflation-Protected Income Portfolio:
Opinion on the Financial Statements and Financial Highlights
We have audited the accompanying statement of assets and liabilities of Short Duration Inflation-Protected Income Portfolio (the “Portfolio”), including the portfolio of investments, as of October 31, 2022, and the related statement of operations, the statement of changes in net assets, and the financial highlights for the period from the commencement of operations, May 23, 2022, to October 31, 2022, and the related notes. In our opinion, the financial statements and financial highlights present fairly, in all material respects, the financial position of the Portfolio as of October 31, 2022, and the results of its operations, the changes in its net assets, and the financial highlights for the period from the commencement of operations, May 23, 2022, to October 31, 2022, in conformity with accounting principles generally accepted in the United States of America.
Basis for Opinion
These financial statements and financial highlights are the responsibility of the Portfolio’s management. Our responsibility is to express an opinion on the Portfolio’s financial statements and financial highlights based on our audit. We are a public accounting firm registered with the Public Company Accounting Oversight Board (United States) (PCAOB) and are required to be independent with respect to the Portfolio in accordance with the U.S. federal securities laws and the applicable rules and regulations of the Securities and Exchange Commission and the PCAOB.
We conducted our audit in accordance with the standards of the PCAOB. Those standards require that we plan and perform the audit to obtain reasonable assurance about whether the financial statements and financial highlights are free of material misstatement, whether due to error or fraud. The Portfolio is not required to have, nor were we engaged to perform, an audit of its internal control over financial reporting. As part of our audit, we are required to obtain an understanding of internal control over financial reporting but not for the purpose of expressing an opinion on the effectiveness of the Portfolio’s internal control over financial reporting. Accordingly, we express no such opinion.
Our audit included performing procedures to assess the risks of material misstatement of the financial statements and financial highlights, whether due to error or fraud, and performing procedures that respond to those risks. Such procedures included examining, on a test basis, evidence regarding the amounts and disclosures in the financial statements and financial highlights. Our audit also included evaluating the accounting principles used and significant estimates made by management, as well as evaluating the overall presentation of the financial statements and financial highlights. Our procedures included confirmation of securities owned as of October 31, 2022, by correspondence with the custodian and brokers; when replies were not received from brokers, we performed other auditing procedures. We believe that our audit provides a reasonable basis for our opinion.
/s/ Deloitte & Touche LLP
Boston, Massachusetts
December 29, 2022
We have served as the auditor of one or more Eaton Vance investment companies since 1959.
| 33 |
Eaton Vance
Short Duration Inflation-Protected Income Fund
October 31, 2022
Board of Trustees’ Contract Approval
Overview of the Contract Review Process
The Investment Company Act of 1940, as amended (the “1940 Act”), provides, in substance, that the investment advisory agreement between a fund and its investment adviser will continue in effect from year-to-year only if its continuation is approved on an annual basis by a vote of the fund’s board of trustees, including a majority of the trustees who are not “interested persons” of the fund (“independent trustees”), cast in person at a meeting called for the purpose of considering such approval.
At a meeting held on June 8, 2022, the Boards of Trustees/Directors (collectively, the “Board”) that oversee the registered investment companies advised by Eaton Vance Management or its affiliate, Boston Management and Research (the “Eaton Vance Funds”), including a majority of the independent trustees (the “Independent Trustees”), voted to approve the continuation of existing investment advisory agreements and sub-advisory agreements1 for each of the Eaton Vance Funds for an additional one-year period. The Board relied upon the affirmative recommendation of its Contract Review Committee, which is a committee exclusively comprised of Independent Trustees. Prior to making its recommendation, the Contract Review Committee reviewed information furnished by the adviser and sub-adviser to each of the Eaton Vance Funds (including information specifically requested by the Board) for a series of formal meetings held between April and June 2022. Members of the Contract Review Committee also considered information received at prior meetings of the Board and its committees, to the extent such information was relevant to the Contract Review Committee’s annual evaluation of the investment advisory agreements and sub-advisory agreements.
In connection with its evaluation of the investment advisory agreements and sub-advisory agreements, the Board considered various information relating to the Eaton Vance Funds. This included information applicable to all or groups of Eaton Vance Funds, which is referenced immediately below, and information applicable to the particular Eaton Vance Fund covered by this report (additional fund-specific information is referenced below under “Results of the Contract Review Process”). (For funds that invest through one or more underlying portfolios, references to “each fund” in this section may include information that was considered at the portfolio-level.)
Information about Fees, Performance and Expenses
| • | A report from an independent data provider comparing advisory and other fees paid by each fund to such fees paid by comparable funds, as identified by the independent data provider (“comparable funds”); |
| • | A report from an independent data provider comparing each fund’s total expense ratio (and its components) to those of comparable funds; |
| • | A report from an independent data provider comparing the investment performance of each fund (including, as relevant, total return data, income data, Sharpe ratios and information ratios) to the investment performance of comparable funds and, as applicable, benchmark indices, over various time periods; |
| • | In certain instances, data regarding investment performance relative to customized groups of peer funds and blended indices identified by the adviser in consultation with the Portfolio Management Committee of the Board (a committee exclusively comprised of Independent Trustees); |
| • | Comparative information concerning the fees charged and services provided by the adviser and sub-adviser to each fund in managing other accounts (which may include other mutual funds, collective investment funds and institutional accounts) using investment strategies and techniques similar to those used in managing such fund(s), if any; |
| • | Profitability analyses with respect to the adviser and sub-adviser to each of the funds; |
Information about Portfolio Management and Trading
| • | Descriptions of the investment management services provided to each fund, as well as each of the funds’ investment strategies and policies; |
| • | The procedures and processes used to determine the value of fund assets, including, when necessary, the determination of “fair value” and actions taken to monitor and test the effectiveness of such procedures and processes; |
| • | Information about the policies and practices of each fund’s adviser and sub-adviser with respect to trading, including their processes for seeking best execution of portfolio transactions; |
| • | Information about the allocation of brokerage transactions and the benefits, if any, received by the adviser and sub-adviser to each fund as a result of brokerage allocation, including, as applicable, information concerning the acquisition of research through client commission arrangements and policies with respect to “soft dollars”; |
| • | Data relating to the portfolio turnover rate of each fund and related information regarding active management in the context of particular strategies; |
Information about each Adviser and Sub-adviser
| • | Reports detailing the financial results and condition of the adviser and sub-adviser to each fund; |
| 1 | Not all Eaton Vance Funds have entered into a sub-advisory agreement with a sub-adviser. Accordingly, references to “sub-adviser” or “sub-advisory agreement” in this “Overview” section may not be applicable to the particular Eaton Vance Fund covered by this report. Following the “Overview” section, further information regarding the Board’s evaluation of a fund’s contractual arrangements is included under the “Results of the Contract Review Process” section. |
| 34 |
Eaton Vance
Short Duration Inflation-Protected Income Fund
October 31, 2022
Board of Trustees’ Contract Approval — continued
| • | Information regarding the individual investment professionals whose responsibilities include portfolio management and investment research for the funds, and, for portfolio managers and certain other investment professionals, information relating to their responsibilities with respect to managing other mutual funds and investment accounts, as applicable; |
| • | Information regarding the adviser’s and its parent company’s (Morgan Stanley’s) efforts to retain and attract talented investment professionals, including in the context of a particularly competitive marketplace for talent, as well as the ongoing unique environment presented by hybrid, remote and other alternative work arrangements; |
| • | The Code of Ethics of the adviser and its affiliates and the sub-adviser of each fund, together with information relating to compliance with, and the administration of, such codes; |
| • | Policies and procedures relating to proxy voting, including regular reporting with respect to fund proxy voting activities; |
| • | Information regarding the handling of corporate actions and class actions, as well as information regarding litigation and other regulatory matters; |
| • | Information concerning the resources devoted to compliance efforts undertaken by the adviser and its affiliates and the sub-adviser of each fund, if any, including descriptions of their various compliance programs and their record of compliance; |
| • | Information concerning the business continuity and disaster recovery plans of the adviser and its affiliates and the sub-adviser of each fund, if any; |
| • | A description of Eaton Vance Management’s and Boston Management and Research’s oversight of sub-advisers, including with respect to regulatory and compliance issues, investment management and other matters; |
Other Relevant Information
| • | Information regarding ongoing initiatives to further integrate and harmonize, where applicable, the investment management and other departments of the adviser and its affiliates with the overall investment management infrastructure of Morgan Stanley, in light of Morgan Stanley’s acquisition of Eaton Vance on March 1, 2021; |
| • | Information concerning the nature, cost and character of the administrative and other non-investment advisory services provided by Eaton Vance Management and its affiliates; |
| • | Information concerning oversight of the relationship with the custodian, subcustodians, fund accountants, and other third-party service providers by the adviser and/or administrator to each of the funds; |
| • | Information concerning efforts to implement policies and procedures with respect to various new regulations applicable to the funds, including Rule 12d1-4 (the Fund-of-Funds Rule), Rule 18f-4 (the Derivatives Rule) and Rule 2a-5 (the Fair Valuation Rule); |
| • | For an Eaton Vance Fund structured as an exchange-listed closed-end fund, information concerning the benefits of the closed-end fund structure, as well as, where relevant, the closed-end fund’s market prices (including as compared to the closed-end fund’s net asset value (NAV)), trading volume data, continued use of auction preferred shares (where applicable), distribution rates and other relevant matters; |
| • | The risks which the adviser and/or its affiliates incur in connection with the management and operation of the funds, including, among others, litigation, regulatory, entrepreneurial, and other business risks (and the associated costs of such risks); and |
| • | The terms of each investment advisory agreement and sub-advisory agreement. |
During the various meetings of the Board and its committees over the course of the year leading up to the June 8, 2022 meeting, the Trustees received information from portfolio managers and other investment professionals of the advisers and sub-advisers of the funds regarding investment and performance matters, and considered various investment and trading strategies used in pursuing the funds’ investment objectives. The Trustees also received information regarding risk management techniques employed in connection with the management of the funds. The Board and its committees evaluated issues pertaining to industry and regulatory developments, compliance procedures, fund governance and other issues with respect to the funds, and received and participated in reports and presentations provided by Eaton Vance Management, Boston Management and Research and fund sub-advisers, with respect to such matters. In addition to the formal meetings of the Board and its committees, the Independent Trustees held regular teleconferences to discuss, among other topics, matters relating to the continuation of investment advisory agreements and sub-advisory agreements.
The Contract Review Committee was advised throughout the contract review process by Goodwin Procter LLP, independent legal counsel for the Independent Trustees. The members of the Contract Review Committee, with the advice of such counsel, exercised their own business judgment in determining the material factors to be considered in evaluating each investment advisory agreement and sub-advisory agreement and the weight to be given to each such factor. The conclusions reached with respect to each investment advisory agreement and sub-advisory agreement were based on a comprehensive evaluation of all the information provided and not any single factor. Moreover, each member of the Contract Review Committee may have placed varying emphasis on particular factors in reaching conclusions with respect to each investment advisory agreement and sub-advisory agreement. In evaluating each investment advisory agreement and sub-advisory agreement, including the fee structures and other terms contained in such agreements, the members of the Contract Review Committee were also informed by multiple years of analysis and discussion with the adviser and sub-adviser to each of the Eaton Vance Funds.
Results of the Contract Review Process
Based on its consideration of the foregoing, and such other information it deemed relevant, including the factors and conclusions described below, the Contract Review Committee concluded that the continuation of the investment advisory agreement between Eaton Vance Short Duration Inflation-Protected Income Fund (the “Fund”) and Eaton Vance Management (“EVM”), as well as an investment advisory agreement between each of Eaton Vance Floating
| 35 |
Eaton Vance
Short Duration Inflation-Protected Income Fund
October 31, 2022
Board of Trustees’ Contract Approval — continued
Rate Portfolio, Senior Debt Portfolio and Short Duration Inflation-Protected Income Portfolio (the “Portfolios”), which are portfolios in which the Fund is authorized to invest, and Boston Management and Research (“BMR”) (EVM, with respect to the Fund, and BMR, with respect to the Portfolios, are each referred to herein as the “Adviser”), including their respective fee structures, are in the interests of shareholders and, therefore, recommended to the Board approval of each agreement. Based on the recommendation of the Contract Review Committee, the Board, including a majority of the Independent Trustees, voted to approve continuation of the investment advisory agreements for the Fund and the Portfolios.
Nature, Extent and Quality of Services
In considering whether to approve the investment advisory agreements for the Fund and the Portfolios, the Board evaluated the nature, extent and quality of services provided to the Fund and to the Portfolios by the applicable Adviser. BMR manages the Portfolios, while EVM allocates the assets of the Fund among the Portfolios and is also authorized to cause the Fund to make direct investments consistent with its investment strategies.
The Board considered each Adviser’s management capabilities and investment processes in light of the types of investments held by the Fund and the Portfolios, including the education, experience and number of investment professionals and other personnel who provide portfolio management, investment research, and similar services to the Fund and the Portfolios. In particular, the Board considered the abilities and experience of each Adviser’s investment professionals in investing in income instruments, including, in the case of the Fund and Short Duration Inflation-Protected Income Portfolio, inflation protected instruments such as inflation-indexed securities. With respect to the Eaton Vance Floating Rate Portfolio and Senior Debt Portfolio, the Board considered the experience of BMR’s investment professionals in investing in senior floating rate loans. For all the Portfolios, the Board also took into account the resources dedicated to portfolio management and other services, the compensation methods of each Adviser and other factors, including the reputation and resources of each Adviser to recruit and retain highly qualified research, advisory and supervisory investment professionals. In addition, the Board considered the time and attention devoted to the Eaton Vance Funds, including the Fund and the Portfolios, by senior management, as well as the infrastructure, operational capabilities and support staff in place to assist in the portfolio management and operations of the Fund and the Portfolios, including the provision of administrative services. The Board also considered the business-related and other risks to which each Adviser or its affiliates may be subject in managing the Fund and the Portfolios.
The Board noted that, under the terms of the investment advisory agreement of the Fund, EVM may invest assets of the Fund directly in securities and other instruments, for which it would receive a fee, or in a Portfolio, for which it receives no separate fee but for which BMR receives an advisory fee from the Portfolio. The Trustees considered the potential benefits to the Fund of the ability to make direct investments, such as an improved ability to: gain exposure to sectors of the market EVM believes may not be represented or underrepresented by the Portfolios; to hedge certain Portfolio exposures; and/or to otherwise manage the exposures of the Fund.
The Board considered the compliance programs of each Adviser and relevant affiliates thereof. The Board considered compliance and reporting matters regarding, among other things, personal trading by investment professionals, disclosure of portfolio holdings, late trading, frequent trading, portfolio valuation, business continuity and the allocation of investment opportunities. The Board also considered the responses of each Adviser and its affiliates to requests in recent years from regulatory authorities, such as the Securities and Exchange Commission and the Financial Industry Regulatory Authority.
The Board considered other administrative services provided or overseen by Eaton Vance Management and its affiliates, including transfer agency and accounting services. The Board evaluated the benefits to shareholders of investing in a fund that is a part of a large fund complex offering exposure to a variety of asset classes and investment disciplines, as well as the ability, in many cases, to exchange an investment among different funds without incurring additional sales charges.
After consideration of the foregoing factors, among others, the Board concluded that the nature, extent and quality of services provided by each Adviser, taken as a whole, are appropriate and consistent with the terms of the applicable investment advisory agreement.
Fund Performance
The Board compared the Fund’s investment performance to that of comparable funds identified by an independent data provider (the peer group), as well as an appropriate benchmark index and a custom peer group of similarly managed funds. The Board’s review included comparative performance data with respect to the Fund for the one-, three-, five- and ten-year periods ended December 31, 2021. In this regard, the Board noted that the performance of the Fund was lower than the median performance of the Fund’s peer group and custom peer group for the three-year period. The Board also noted that the performance of the Fund was higher than its benchmark index for the three-year period. The Board also considered the performance of the underlying Portfolios. On the basis of the foregoing and other relevant information provided to the Board, the Board concluded that each Portfolio had achieved its performance objective. On the basis of the foregoing, the performance of the Fund over other periods, and other relevant information provided by the Adviser in response to inquiries from the Contract Review Committee, the Board concluded that the performance of the Fund was satisfactory.
Management Fees and Expenses
The Board considered contractual fee rates payable by the Portfolios and by the Fund for advisory and administrative services (referred to collectively as “management fees”). As part of its review, the Board considered the Fund’s management fees and total expense ratio for the one-year period ended December 31, 2021, as compared to those of comparable funds, before and after giving effect to any undertaking to waive fees or reimburse expenses.
| 36 |
Eaton Vance
Short Duration Inflation-Protected Income Fund
October 31, 2022
Board of Trustees’ Contract Approval — continued
The Board also considered certain factors identified by management in response to inquiries from the Contract Review Committee regarding the Fund’s total expense ratio relative to comparable funds.
After considering the foregoing information, and in light of the nature, extent and quality of the services provided by each Adviser, the Board concluded that the management fees charged for advisory and related services are reasonable.
Profitability and “Fall-Out” Benefits
The Board considered the level of profits realized by each Adviser and relevant affiliates thereof in providing investment advisory and administrative services to the Fund, to the Portfolios and to all Eaton Vance Funds as a group. The Board considered the level of profits realized without regard to marketing support or other payments by each Adviser and its affiliates to third parties in respect of distribution or other services.
The Board concluded that, in light of the foregoing factors and the nature, extent and quality of the services rendered, the profits realized by each Adviser and its affiliates are deemed not to be excessive.
The Board also considered direct or indirect fall-out benefits received by each Adviser and its affiliates in connection with their respective relationships with the Fund and the Portfolios, including the benefits of research services that may be available to each Adviser as a result of securities transactions effected for the Fund and the Portfolios and other investment advisory clients.
Economies of Scale
In reviewing management fees and profitability, the Board also considered the extent to which the applicable Adviser and its affiliates, on the one hand, and the Fund and the Portfolios, on the other hand, can expect to realize benefits from economies of scale as the assets of the Fund and the Portfolios increase. The Board acknowledged the difficulty in accurately measuring the benefits resulting from economies of scale, if any, with respect to the management of any specific fund or group of funds. The Board reviewed data summarizing the increases and decreases in the assets of the Fund and of all Eaton Vance Funds as a group over various time periods, and evaluated the extent to which the total expense ratio of the Fund and the profitability of each Adviser and its affiliates may have been affected by such increases or decreases. Based upon the foregoing, the Board concluded that the Fund currently shares in the benefits from economies of scale, if any, when they are realized by each Adviser. The Board also concluded that the structure of the advisory fees, some of which include breakpoints at several asset levels, will allow the Fund and the Portfolios to continue to benefit from any economies of scale in the future.
| 37 |
Eaton Vance
Short Duration Inflation-Protected Income Fund
October 31, 2022
Liquidity Risk Management Program
The Fund has implemented a written liquidity risk management program (Program) and related procedures to manage its liquidity in accordance with Rule 22e-4 under the Investment Company Act of 1940, as amended (Liquidity Rule). The Liquidity Rule defines “liquidity risk” as the risk that a fund could not meet requests to redeem shares issued by the fund without significant dilution of the remaining investors’ interests in the fund. The Fund’s Board of Trustees/Directors has designated the investment adviser to serve as the administrator of the Program and the related procedures. The administrator has established a Liquidity Risk Management Oversight Committee (Committee) to perform the functions necessary to administer the Program. As part of the Program, the administrator is responsible for identifying illiquid investments and categorizing the relative liquidity of the Fund’s investments in accordance with the Liquidity Rule. Under the Program, the administrator assesses, manages, and periodically reviews the Fund’s liquidity risk, and is responsible for making certain reports to the Fund’s Board of Trustees/Directors and the Securities and Exchange Commission (SEC) regarding the liquidity of the Fund’s investments, and to notify the Board of Trustees/Directors and the SEC of certain liquidity events specified in the Liquidity Rule. The liquidity of the Fund’s portfolio investments is determined based on a number of factors including, but not limited to, relevant market, trading and investment-specific considerations under the Program.
At a meeting of the Fund’s Board of Trustees/Directors on June 7, 2022, the Committee provided a written report to the Fund’s Board of Trustees/Directors pertaining to the operation, adequacy, and effectiveness of implementation of the Program, as well as the operation of the highly liquid investment minimum (if applicable) for the period January 1, 2021 through December 31, 2021 (Review Period). The Program operated effectively during the Review Period, supporting the administrator’s ability to assess, manage and monitor Fund liquidity risk, including during periods of market volatility and net redemptions. During the Review Period, the Fund met redemption requests on a timely basis.
There can be no assurance that the Program will achieve its objectives in the future. Please refer to the Fund’s prospectus for more information regarding the Fund’s exposure to liquidity risk and other principal risks to which an investment in the Fund may be subject.
| 38 |
Eaton Vance
Short Duration Inflation-Protected Income Fund
October 31, 2022
Fund Management. The Trustees of Eaton Vance Special Investment Trust (the Trust), Eaton Vance Floating Rate Portfolio, Senior Debt Portfolio and Short Duration Inflation-Protected Income Portfolio (collectively, the Portfolios) are responsible for the overall management and supervision of the Trust’s and Portfolios’ affairs. The Board members and officers of the Trust and the Portfolios are listed below. Except as indicated, each individual has held the office shown or other offices in the same company for the last five years. Board members hold indefinite terms of office. Each Trustee holds office until his or her successor is elected and qualified, subject to a prior death, resignation, retirement, disqualification or removal. Under the terms of the Fund’s and each Portfolio’s current Trustee retirement policy, an Independent Trustee must retire and resign as a Trustee on the earlier of: (i) the first day of July following his or her 74th birthday; or (ii), with limited exception, December 31st of the 20th year in which he or she has served as a Trustee. However, if such retirement and resignation would cause the Fund and each Portfolio to be out of compliance with Section 16 of the 1940 Act or any other regulations or guidance of the SEC, then such retirement and resignation will not become effective until such time as action has been taken for the Fund and each Portfolio to be in compliance therewith. The “noninterested Trustees” consist of those Trustees who are not “interested persons” of the the Trust and the Portfolios, as that term is defined under the 1940 Act. The business address of each Board member and officer is Two International Place, Boston, Massachusetts 02110. As used below, “BMR” refers to Boston Management and Research, “EVC” refers to Eaton Vance Corp., “EV” refers to EV LLC, “EVM” refers to Eaton Vance Management and “EVD” refers to Eaton Vance Distributors, Inc. EV is the trustee of each of EVM and BMR. Effective March 1, 2021, each of EVM, BMR, EVD and EV are indirect, wholly owned subsidiaries of Morgan Stanley. Each officer affiliated with EVM may hold a position with other EVM affiliates that is comparable to his or her position with EVM listed below. Each Trustee oversees 135 funds (with the exception of Mr. Bowser who oversees 110 funds) in the Eaton Vance fund complex (including both funds and portfolios in a hub and spoke structure).
| Name and Year of Birth | Trust/Portfolios Position(s) | Length of Service | Principal Occupation(s) and Other Directorships During Past Five Years and Other Relevant Experience | |||
| Interested Trustee | ||||||
Thomas E. Faust Jr. 1958 | Trustee | Since 2007 | Chairman of Morgan Stanley Investment Management, Inc. (MSIM), member of the Board of Managers and President of EV (since 2021), Chief Executive Officer of EVM and BMR. Formerly, Chairman, Chief Executive Officer (2007-2021) and President (2006-2021) of EVC and Director of EVD (2007-2022). Mr. Faust is an interested person because of his positions with MSIM, BMR, EVM and EV, which are affiliates of the Trust and the Portfolios. Other Directorships. Formerly, Director of EVC (2007-2021) and Hexavest Inc. (investment management firm) (2012-2021). | |||
| Noninterested Trustees | ||||||
Alan C. Bowser(1) 1962 | Trustee | Since 2022 | Chief Diversity Officer, Partner and a member of the Operating Committee, and formerly served as Senior Advisor on Diversity and Inclusion for the firm’s chief executive officer, Co-Head of the Americas Region, and Senior Client Advisor of Bridgewater Associates, an asset management firm (2011- present). Other Directorships. None. | |||
Mark R. Fetting 1954 | Trustee | Since 2016 | Private investor. Formerly held various positions at Legg Mason, Inc. (investment management firm) (2000-2012), including President, Chief Executive Officer, Director and Chairman (2008-2012), Senior Executive Vice President (2004-2008) and Executive Vice President (2001-2004). Formerly, President of Legg Mason family of funds (2001-2008). Formerly, Division President and Senior Officer of Prudential Financial Group, Inc. and related companies (investment management firm) (1991-2000). Other Directorships. None. | |||
Cynthia E. Frost 1961 | Trustee | Since 2014 | Private investor. Formerly, Chief Investment Officer of Brown University (university endowment) (2000-2012). Formerly, Portfolio Strategist for Duke Management Company (university endowment manager) (1995-2000). Formerly, Managing Director, Cambridge Associates (investment consulting company) (1989-1995). Formerly, Consultant, Bain and Company (management consulting firm) (1987-1989). Formerly, Senior Equity Analyst, BA Investment Management Company (1983-1985). Other Directorships. None. | |||
George J. Gorman 1952 | Chairperson of the Board and Trustee | Since 2021 (Chairperson) and 2014 (Trustee) | Principal at George J. Gorman LLC (consulting firm). Formerly, Senior Partner at Ernst & Young LLP (a registered public accounting firm) (1974-2009). Other Directorships. None. | |||
| 39 |
Eaton Vance
Short Duration Inflation-Protected Income Fund
October 31, 2022
Management and Organization — continued
| Name and Year of Birth | Trust/Portfolios Position(s) | Length of Service | Principal Occupation(s) and Other Directorships During Past Five Years and Other Relevant Experience | |||
| Noninterested Trustees (continued) | ||||||
Valerie A. Mosley 1960 | Trustee | Since 2014 | Chairwoman and Chief Executive Officer of Valmo Ventures (a consulting and investment firm). Founder of Upward Wealth, Inc., dba BrightUp, a fintech platform. Formerly, Partner and Senior Vice President, Portfolio Manager and Investment Strategist at Wellington Management Company, LLP (investment management firm) (1992-2012). Formerly, Chief Investment Officer, PG Corbin Asset Management (1990-1992). Formerly worked in institutional corporate bond sales at Kidder Peabody (1986-1990). Other Directorships. Director of DraftKings, Inc. (digital sports entertainment and gaming company) (since September 2020). Director of Envestnet, Inc. (provider of intelligent systems for wealth management and financial wellness) (since 2018). Formerly, Director of Dynex Capital, Inc. (mortgage REIT) (2013-2020) and Director of Groupon, Inc. (e-commerce provider) (2020-2022). | |||
Keith Quinton 1958 | Trustee | Since 2018 | Private investor, researcher and lecturer. Formerly, Independent Investment Committee Member at New Hampshire Retirement System (2017-2021). Formerly, Portfolio Manager and Senior Quantitative Analyst at Fidelity Investments (investment management firm) (2001-2014). Other Directorships. Formerly, Director (2016-2021) and Chairman (2019-2021) of New Hampshire Municipal Bond Bank. | |||
Marcus L. Smith 1966 | Trustee | Since 2018 | Private investor and independent corporate director. Formerly, Chief Investment Officer, Canada (2012-2017), Chief Investment Officer, Asia (2010-2012), Director of Asian Research (2004-2010) and portfolio manager (2001-2017) at MFS Investment Management (investment management firm). Other Directorships. Director of First Industrial Realty Trust, Inc. (an industrial REIT) (since 2021). Director of MSCI Inc. (global provider of investment decision support tools) (since 2017). Formerly, Director of DCT Industrial Trust Inc. (logistics real estate company) (2017-2018). | |||
Susan J. Sutherland 1957 | Trustee | Since 2015 | Private investor. Director of Ascot Group Limited and certain of its subsidiaries (insurance and reinsurance) (since 2017). Formerly, Director of Hagerty Holding Corp. (insurance) (2015-2018) and Montpelier Re Holdings Ltd. (insurance and reinsurance) (2013-2015). Formerly, Associate, Counsel and Partner at Skadden, Arps, Slate, Meagher & Flom LLP (law firm) (1982-2013). Other Directorships. Director of Kairos Acquisition Corp. (insurance/InsurTech acquisition company) (since 2021). | |||
Scott E. Wennerholm 1959 | Trustee | Since 2016 | Private investor. Formerly, Trustee at Wheelock College (postsecondary institution) (2012-2018). Formerly, Consultant at GF Parish Group (executive recruiting firm) (2016-2017). Formerly, Chief Operating Officer and Executive Vice President at BNY Mellon Asset Management (investment management firm) (2005-2011). Formerly, Chief Operating Officer and Chief Financial Officer at Natixis Global Asset Management (investment management firm) (1997-2004). Formerly, Vice President at Fidelity Investments Institutional Services (investment management firm) (1994-1997). Other Directorships. None. | |||
Nancy A. Wiser(1) 1967 | Trustee | Since 2022 | Formerly, Executive Vice President and the Global Head of Operations at Wells Fargo Asset Management (2011-2021). Other Directorships. None. | |||
| Name and Year of Birth | Trust/Portfolios Position(s) | Length of Service | Principal Occupation(s) During Past Five Years | |||
| Principal Officers who are not Trustees | ||||||
Eric A. Stein 1980 | President | Since 2020 | Vice President and Chief Investment Officer, Fixed Income of EVM and BMR. Prior to November 1, 2020, Mr. Stein was a co-Director of Eaton Vance’s Global Income Investments. Also Vice President of Calvert Research and Management (“CRM”). | |||
Deidre E. Walsh 1971 | Vice President and Chief Legal Officer | Since 2009 | Vice President of EVM and BMR. Also Vice President of CRM. | |||
| 40 |
Eaton Vance
Short Duration Inflation-Protected Income Fund
October 31, 2022
Management and Organization — continued
| Name and Year of Birth | Trust/Portfolios Position(s) | Length of Service | Principal Occupation(s) During Past Five Years | |||
| Principal Officers who are not Trustees (continued) | ||||||
James F. Kirchner 1967 | Treasurer | Since 2007 | Vice President of EVM and BMR. Also Vice President of CRM. | |||
Nicholas Di Lorenzo 1987 | Secretary | Since 2022 | Formerly, associate (2012-2021) and counsel (2022) at Dechert LLP. | |||
Richard F. Froio 1968 | Chief Compliance Officer | Since 2017 | Vice President of EVM and BMR since 2017. Formerly, Deputy Chief Compliance Officer (Adviser/Funds) and Chief Compliance Officer (Distribution) at PIMCO (2012-2017) and Managing Director at BlackRock/Barclays Global Investors (2009-2012). | |||
| (1) | Mr. Bowser and Ms. Wiser began serving as Trustees effective April 4, 2022. |
The SAI for the Fund includes additional information about the Trustees and officers of the Fund and each Portfolio and can be obtained without charge on Eaton Vance’s website at www.eatonvance.com or by calling 1-800-262-1122.
| 41 |
Eaton Vance Funds
| Privacy Notice | April 2021 |
| FACTS | WHAT DOES EATON VANCE DO WITH YOUR PERSONAL INFORMATION? | |
| Why? | Financial companies choose how they share your personal information. Federal law gives consumers the right to limit some but not all sharing. Federal law also requires us to tell you how we collect, share, and protect your personal information. Please read this notice carefully to understand what we do. | |
| What? | The types of personal information we collect and share depend on the product or service you have with us. This information can include:
∎ Social Security number and income ∎ investment experience and risk tolerance ∎ checking account number and wire transfer instructions | |
| How? | All financial companies need to share customers’ personal information to run their everyday business. In the section below, we list the reasons financial companies can share their customers’ personal information; the reasons Eaton Vance chooses to share; and whether you can limit this sharing. | |
| Reasons we can share your personal information | Does Eaton Vance share? | Can you limit this sharing? | ||
For our everyday business purposes — such as to process your transactions, maintain your account(s), respond to court orders and legal investigations, or report to credit bureaus |
Yes |
No | ||
| For our marketing purposes — to offer our products and services to you | Yes | No | ||
| For joint marketing with other financial companies | No | We don’t share | ||
| For our investment management affiliates’ everyday business purposes — information about your transactions, experiences, and creditworthiness | Yes | Yes | ||
| For our affiliates’ everyday business purposes — information about your transactions and experiences | Yes | No | ||
| For our affiliates’ everyday business purposes — information about your creditworthiness | No | We don’t share | ||
| For our investment management affiliates to market to you | Yes | Yes | ||
| For our affiliates to market to you | No | We don’t share | ||
| For nonaffiliates to market to you | No | We don’t share |
| To limit our sharing | Call toll-free 1-800-262-1122 or email: EVPrivacy@eatonvance.com
Please note:
If you are a new customer, we can begin sharing your information 30 days from the date we sent this notice. When you are no longer our customer, we continue to share your information as described in this notice. However, you can contact us at any time to limit our sharing. | |
| Questions? | Call toll-free 1-800-262-1122 or email: EVPrivacy@eatonvance.com | |
| 42 |
Eaton Vance Funds
| Privacy Notice — continued | April 2021 |
| Page 2 |
| Who we are | ||
| Who is providing this notice? | Eaton Vance Management, Eaton Vance Distributors, Inc., Eaton Vance Trust Company, Eaton Vance Management (International) Limited, Eaton Vance Advisers International Ltd., Eaton Vance Global Advisors Limited, Eaton Vance Management’s Real Estate Investment Group, Boston Management and Research, Calvert Research and Management, Eaton Vance and Calvert Fund Families and our investment advisory affiliates (“Eaton Vance”) (see Investment Management Affiliates definition below) | |
| What we do | ||
| How does Eaton Vance protect my personal information? | To protect your personal information from unauthorized access and use, we use security measures that comply with federal law. These measures include computer safeguards and secured files and buildings. We have policies governing the proper handling of customer information by personnel and requiring third parties that provide support to adhere to appropriate security standards with respect to such information. | |
| How does Eaton Vance collect my personal information? | We collect your personal information, for example, when you
∎ open an account or make deposits or withdrawals from your account ∎ buy securities from us or make a wire transfer ∎ give us your contact information
We also collect your personal information from others, such as credit bureaus, affiliates, or other companies. | |
| Why can’t I limit all sharing? | Federal law gives you the right to limit only
∎ sharing for affiliates’ everyday business purposes — information about your creditworthiness ∎ affiliates from using your information to market to you ∎ sharing for nonaffiliates to market to you
State laws and individual companies may give you additional rights to limit sharing. See below for more on your rights under state law. | |
| Definitions | ||
| Investment Management Affiliates | Eaton Vance Investment Management Affiliates include registered investment advisers, registered broker-dealers, and registered and unregistered funds. Investment Management Affiliates does not include entities associated with Morgan Stanley Wealth Management, such as Morgan Stanley Smith Barney LLC and Morgan Stanley & Co. | |
| Affiliates | Companies related by common ownership or control. They can be financial and nonfinancial companies.
∎ Our affiliates include companies with a Morgan Stanley name and financial companies such as Morgan Stanley Smith Barney LLC and Morgan Stanley & Co. | |
| Nonaffiliates | Companies not related by common ownership or control. They can be financial and nonfinancial companies.
∎ Eaton Vance does not share with nonaffiliates so they can market to you. | |
| Joint marketing | A formal agreement between nonaffiliated financial companies that together market financial products or services to you.
∎ Eaton Vance doesn’t jointly market. | |
| Other important information | ||
Vermont: Except as permitted by law, we will not share personal information we collect about Vermont residents with Nonaffiliates unless you provide us with your written consent to share such information.
California: Except as permitted by law, we will not share personal information we collect about California residents with Nonaffiliates and we will limit sharing such personal information with our Affiliates to comply with California privacy laws that apply to us. | ||
| 43 |
Eaton Vance Funds
Delivery of Shareholder Documents. The Securities and Exchange Commission (SEC) permits funds to deliver only one copy of shareholder documents, including prospectuses, proxy statements and shareholder reports, to fund investors with multiple accounts at the same residential or post office box address. This practice is often called “householding” and it helps eliminate duplicate mailings to shareholders. Eaton Vance, or your financial intermediary, may household the mailing of your documents indefinitely unless you instruct Eaton Vance, or your financial intermediary, otherwise. If you would prefer that your Eaton Vance documents not be householded, please contact Eaton Vance at 1-800-262-1122, or contact your financial intermediary. Your instructions that householding not apply to delivery of your Eaton Vance documents will typically be effective within 30 days of receipt by Eaton Vance or your financial intermediary.
Portfolio Holdings. Each Eaton Vance Fund and its underlying Portfolio(s) (if applicable) files a schedule of portfolio holdings on Part F to Form N-PORT with the SEC. Certain information filed on Form N-PORT may be viewed on the Eaton Vance website at www.eatonvance.com, by calling Eaton Vance at 1-800-262-1122 or in the EDGAR database on the SEC’s website at www.sec.gov.
Proxy Voting. From time to time, funds are required to vote proxies related to the securities held by the funds. The Eaton Vance Funds or their underlying Portfolios (if applicable) vote proxies according to a set of policies and procedures approved by the Funds’ and Portfolios’ Boards. You may obtain a description of these policies and procedures and information on how the Funds or Portfolios voted proxies relating to portfolio securities during the most recent 12-month period ended June 30, without charge, upon request, by calling 1-800-262-1122 and by accessing the SEC’s website at www.sec.gov.
| 44 |
Investment Adviser of Short Duration Inflation-Protected Income Portfolio
Boston Management and Research
Two International Place
Boston, MA 02110
Investment Adviser and Administrator of Eaton Vance Short Duration Inflation-Protected Income Fund
Eaton Vance Management
Two International Place
Boston, MA 02110
Principal Underwriter*
Eaton Vance Distributors, Inc.
Two International Place
Boston, MA 02110
(617) 482-8260
Custodian
State Street Bank and Trust Company
State Street Financial Center, One Lincoln Street
Boston, MA 02111
Transfer Agent
BNY Mellon Investment Servicing (US) Inc.
Attn: Eaton Vance Funds
P.O. Box 9653
Providence, RI 02940-9653
(800) 262-1122
Independent Registered Public Accounting Firm
Deloitte & Touche LLP
200 Berkeley Street
Boston, MA 02116-5022
Fund Offices
Two International Place
Boston, MA 02110
| * | FINRA BrokerCheck. Investors may check the background of their Investment Professional by contacting the Financial Industry Regulatory Authority (FINRA). FINRA BrokerCheck is a free tool to help investors check the professional background of current and former FINRA-registered securities firms and brokers. FINRA BrokerCheck is available by calling 1-800-289-9999 and at www.FINRA.org. The FINRA BrokerCheck brochure describing this program is available to investors at www.FINRA.org. |
4596 10.31.22
Item 2. Code of Ethics
The registrant (sometimes referred to as the “Fund”) has adopted a code of ethics applicable to its Principal Executive Officer, Principal Financial Officer and Principal Accounting Officer. The registrant undertakes to provide a copy of such code of ethics to any person upon request, without charge, by calling 1-800-262-1122. The registrant has not amended the code of ethics as described in Form N-CSR during the period covered by this report. The registrant has not granted any waiver, including an implicit waiver, from a provision of the code of ethics as described in Form N-CSR during the period covered by this report.
Item 3. Audit Committee Financial Expert
The registrant’s Board of Trustees (the “Board”) has designated George J. Gorman and Scott E. Wennerholm, each an independent trustee, as audit committee financial experts. Mr. Gorman is a certified public accountant who is the Principal at George J. Gorman LLC (a consulting firm). Previously, Mr. Gorman served in various capacities at Ernst & Young LLP (a registered public accounting firm), including as Senior Partner. Mr. Gorman also has experience serving as an independent trustee and audit committee financial expert of other
mutual fund complexes. Mr. Wennerholm is a private investor. Previously, Mr. Wennerholm served as a Trustee at Wheelock College (postsecondary institution), as a Consultant at GF Parish Group (executive recruiting firm), Chief Operating Officer and Executive Vice President at BNY Mellon Asset Management (investment management firm), Chief Operating Officer and Chief Financial Officer at Natixis Global Asset Management (investment management firm), and Vice President at Fidelity Investments Institutional Services (investment management firm).
Item 4. Principal Accountant Fees and Services
Eaton Vance Short Duration Inflation-Protected Income Fund (the “Fund”) is a series of Eaton Vance Special Investment Trust (the “Trust”), a Massachusetts business trust, which, including the Fund, contains a total of 9 series (the “Series”). The Trust is registered under the Investment Company Act of 1940 as an open-end management investment company. This Form N-CSR relates to the Fund’s annual report.
(a)-(d)
The following table presents the aggregate fees billed to the Fund for the Fund’s fiscal years ended October 31, 2021 and October 31, 2022 by the Fund’s principal accountant, Deloitte & Touche LLP (“D&T”), for professional services rendered for the audit of the Fund’s annual financial statements and fees billed for other services rendered by D&T during such periods.
Eaton Vance Short Duration Inflation-Protected Income Fund Fiscal Years Ended | 10/31/21 | 10/31/22 | ||||||
Audit Fees | $ | 40,350 | $ | 27,450 | ||||
Audit-Related Fees(1) | $ | 0 | $ | 0 | ||||
Tax Fees(2) | $ | 8,922 | $ | 350 | ||||
All Other Fees(3) | $ | 0 | $ | 0 | ||||
|
|
|
| |||||
Total | $ | 49,272 | $ | 27,800 | ||||
|
|
|
| |||||
| (1) | Audit-related fees consist of the aggregate fees billed for assurance and related services that are reasonably related to the performance of the audit of financial statements and are not reported under the category of audit fees. |
| (2) | Tax fees consist of the aggregate fees billed for professional services rendered by the principal accountant relating to tax compliance, tax advice, and tax planning and specifically include fees for tax return preparation. |
| (3) | All other fees consist of the aggregate fees billed for products and services provided by the principal accountant other than audit, audit-related, and tax services. |
The various Series comprising the Trust have differing fiscal year ends (October 31 or December 31). The following table presents the aggregate audit, audit-related, tax, and other fees billed to all of the Series in the Trust by D&T for the last two fiscal years of each Series.
Fiscal Years Ended | 12/31/20 | 10/31/21 | 12/31/21 | 10/31/22 | ||||||||||||
Audit Fees | $ | 283,450 | $ | 40,350 | $ | 214,800 | $ | 27,450 | ||||||||
Audit-Related Fees(1) | $ | 0 | $ | 0 | $ | 0 | $ | 0 | ||||||||
Tax Fees(2) | $ | 113,037 | $ | 8,922 | $ | 101,882 | $ | 350 | ||||||||
All Other Fees(3) | $ | 0 | $ | 0 | $ | 0 | $ | 0 | ||||||||
|
|
|
|
|
|
|
| |||||||||
Total | $ | 396,487 | $ | 49,272 | $ | 316,682 | $ | 27,800 | ||||||||
|
|
|
|
|
|
|
| |||||||||
| (1) | Audit-related fees consist of the aggregate fees billed for assurance and related services that are reasonably related to the performance of the audit of the registrant’s financial statements and are not reported under the category of audit fees. |
| (2) | Tax fees consist of the aggregate fees billed for professional services rendered by the principal accountant relating to tax compliance, tax advice, and tax planning and specifically include fees for tax return preparation and other tax related compliance/planning matters. |
| (3) | All other fees consist of the aggregate fees billed for products and services provided by the principal accountant other than audit, audit-related, and tax services. |
(e)(1) The registrant’s audit committee has adopted policies and procedures relating to the pre-approval of services provided by the registrant’s principal accountant (the “Pre-Approval Policies”). The Pre-Approval Policies establish a framework intended to assist the audit committee in the proper discharge of its pre-approval responsibilities. As a general matter, the Pre-Approval Policies (i) specify certain types of audit, audit-related, tax, and other services determined to be pre-approved by the audit committee; and (ii) delineate specific procedures governing the mechanics of the pre-approval process, including the approval and monitoring of audit and non-audit service fees. Unless a service is specifically pre-approved under the Pre-Approval Policies, it must be separately pre-approved by the audit committee.
The Pre-Approval Policies and the types of audit and non-audit services pre-approved therein must be reviewed and ratified by the registrant’s audit committee at least annually. The registrant’s audit committee maintains full responsibility for the appointment, compensation, and oversight of the work of the registrant’s principal accountant.
(e)(2) No services described in paragraphs (b)-(d) above were approved by the registrant’s audit committee pursuant to the “de minimis exception” set forth in Rule 2-01(c)(7)(i)(C) of Regulation S-X.
(f) Not applicable.
(g) The following table presents (i) the aggregate non-audit fees (i.e., fees for audit-related, tax, and other services) billed for services rendered to all of the Series in the Trust by D&T for the last two fiscal years of each Series; and (ii) the aggregate non-audit fees (i.e., fees for audit-related, tax, and other services) billed to the Eaton Vance organization by D&T for the last two fiscal years of each Series.
Fiscal Years Ended | 12/31/20 | 10/31/21 | 12/31/21 | 10/31/22 | ||||||||||||
Registrant(1) | $ | 113,037 | $ | 8,922 | $ | 101,882 | $ | 350 | ||||||||
Eaton Vance(2) | $ | 150,300 | $ | 51,800 | $ | 51,800 | $ | 52,836 | ||||||||
| (1) | Includes all of the Series of the Trust. During the fiscal years reported above, certain of the Series were “feeder” funds in a “master-feeder” fund structure or funds of funds. |
| (2) | Various subsidiaries of Morgan Stanley act in either an investment advisory and/or service provider capacity with respect to the Series and/or their respective “master” funds (if applicable). |
(h) The registrant’s audit committee has considered whether the provision by the registrant’s principal accountant of non-audit services to the registrant’s investment adviser and any entity controlling, controlled by, or under common control with the adviser that provides ongoing services to the registrant that were not pre-approved pursuant to Rule 2-01(c)(7)(ii) of Regulation S-X is compatible with maintaining the principal accountant’s independence.
Item 5. Audit Committee of Listed Registrants
Not applicable.
Item 6. Schedule of Investments
Please see schedule of investments contained in the Report to Stockholders included under Item 1 of this Form N-CSR.
Item 7. Disclosure of Proxy Voting Policies and Procedures for Closed-End Management Investment Companies
Not applicable.
Item 8. Portfolio Managers of Closed-End Management Investment Companies
Not applicable.
Item 9. Purchases of Equity Securities by Closed-End Management Investment Company and Affiliated Purchasers
Not applicable.
Item 10. Submission of Matters to a Vote of Security Holders
No material changes.
Item 11. Controls and Procedures
(a) It is the conclusion of the registrant’s principal executive officer and principal financial officer that the effectiveness of the registrant’s current disclosure controls and procedures (such disclosure controls and procedures having been evaluated within 90 days of the date of this filing) provide reasonable assurance that the information required to be disclosed by the registrant has been recorded, processed, summarized and reported within the time period specified in the Commission’s rules and forms and that the information required to be disclosed by the registrant has been accumulated and communicated to the registrant’s principal executive officer and principal financial officer in order to allow timely decisions regarding required disclosure.
(b) There have been no changes in the registrant’s internal controls over financial reporting during the period covered by this report that has materially affected, or is reasonably likely to materially affect, the registrant’s internal control over financial reporting.
Item 12. Disclosure of Securities Lending Activities for Closed-End Management Investment Companies
Not applicable.
Item 13. Exhibits
(a)(1) | Registrant’s Code of Ethics – Not applicable (please see Item 2). | |
(a)(2)(i) | Treasurer’s Section 302 certification. | |
(a)(2)(ii) | President’s Section 302 certification. | |
(b) | Combined Section 906 certification. | |
Signatures
Pursuant to the requirements of the Securities Exchange Act of 1934 and the Investment Company Act of 1940, the registrant has duly caused this report to be signed on its behalf by the undersigned, thereunto duly authorized.
| Eaton Vance Special Investment Trust | ||
| By: | /s/ Eric A. Stein | |
| Eric A. Stein | ||
| President | ||
| Date: | January 6, 2023 | |
Pursuant to the requirements of the Securities Exchange Act of 1934 and the Investment Company Act of 1940, this report has been signed below by the following persons on behalf of the registrant and in the capacities and on the dates indicated.
| By: | /s/ James F. Kirchner | |
| James F. Kirchner | ||
| Treasurer | ||
| Date: | January 6, 2023 | |
| By: | /s/ Eric A. Stein | |
| Eric A. Stein | ||
| President | ||
| Date: | January 6, 2023 | |