UNITED STATES
SECURITIES AND EXCHANGE COMMISSION
Washington, D.C. 20549
FORM N-CSR
CERTIFIED SHAREHOLDER REPORT OF REGISTERED
MANAGEMENT INVESTMENT COMPANIES
Investment Company Act File Number: 811-02958
| T. Rowe Price International Funds, Inc. |
|
| (Exact name of registrant as specified in charter) |
| |
| 100 East Pratt Street, Baltimore, MD 21202 |
|
| (Address of principal executive offices) |
| |
| David Oestreicher |
| 100 East Pratt Street, Baltimore, MD 21202 |
|
| (Name and address of agent for service) |
Registrant’s telephone number, including area code: (410) 345-2000
Date of fiscal year end: December 31
Date of reporting period: December 31, 2019
Item 1. Reports to Shareholders
(a) Report pursuant to Rule 30e-1.
Emerging Markets Local Currency
Bond Fund | December 31, 2019 |
| PRELX | Investor Class |
| PAELX | Advisor Class |
| TEIMX | I Class |
Beginning on January 1, 2021, as permitted by SEC regulations, paper copies of the T. Rowe Price funds’ annual and semiannual shareholder reports will no longer be mailed, unless you specifically request them. Instead, shareholder reports will be made available on the funds’ website (troweprice.com/prospectus), and you will be notified by mail with a website link to access the reports each time a report is posted to the site.
If you already elected to receive reports electronically, you will not be affected by this change and need not take any action. At any time, shareholders who invest directly in T. Rowe Price funds may generally elect to receive reports or other communications electronically by enrolling attroweprice.com/paperlessor, if you are a retirement plan sponsor or invest in the funds through a financial intermediary (such as an investment advisor, broker-dealer, insurance company, or bank), by contacting your representative or your financial intermediary.
You may elect to continue receiving paper copies of future shareholder reports free of charge. To do so, if you invest directly with T. Rowe Price, please call T. Rowe Price as follows: IRA, nonretirement account holders, and institutional investors,1-800-225-5132; small business retirement accounts,1-800-492-7670. If you are a retirement plan sponsor or invest in the T. Rowe Price funds through a financial intermediary, please contact your representative or financial intermediary or follow additional instructions if included with this document. Your election to receive paper copies of reports will apply to all funds held in your account with your financial intermediary or, if you invest directly in the T. Rowe Price funds, with T. Rowe Price. Your election can be changed at any time in the future.
| T. ROWE PRICE EMERGING MARKETS LOCAL CURRENCY BOND FUND |
|
HIGHLIGHTS
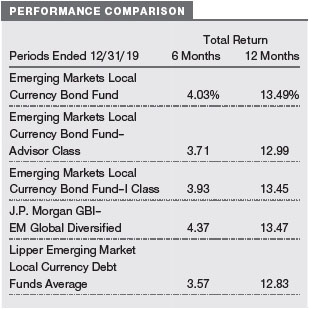
| ■ | The Emerging Markets Local Currency Bond Fund performed broadly in line with its benchmark index and outperformed the Lipper peer group average in the 12 months ended December 31, 2019. |
| | |
| ■ | Our active currency positioning as well as country allocation and exposure to interest rate changes helped the portfolio’s relative performance. |
| | |
| ■ | We increased the portfolio’s risk exposure mid-period to try to take advantage of bond and currency valuations that had reached attractive levels. |
| | |
| ■ | We expect to see investor sentiment toward emerging markets local currency bonds remain positive in 2020 amid an improving growth backdrop and strong technical conditions. |

Log in to your account attroweprice.comfor more information.
*Certain mutual fund accounts that are assessed an annual account service fee can also save money by switching to e-delivery.
CIO Market Commentary
Dear Shareholder
Stocks posted strong gains in 2019 as most major U.S. indexes hit record highs in a broad-based rally that more than offset 2018’s losses. Large- and mid-cap growth stocks were the strongest performers, with the S&P 500 and Nasdaq benchmarks recording their best year since 2013. U.S. shares outpaced their global counterparts, although most non-U.S. indexes also finished with solid double-digit gains.
Technology shares performed best within the S&P 500, helped by strong gains from industry giants Apple and Microsoft, and financial stocks also outperformed the broader market. Fixed income securities produced solid gains during the period as well—with corporate bonds leading the way—as longer-term Treasury yields fell to historic lows in late summer before partially rebounding.
In a sign that public markets have retained discipline, investors expressed skepticism about certain private-equity valuation levels when compared with their prospects for financial profitability. Relatively few initial public offerings (IPOs) saw their prices appreciate during the year, and one high-profile IPO candidate (WeWork) decided to withdraw its offering altogether after its valuation was dramatically reduced in the weeks before its proposed IPO.
Although the year opened with concerns that an escalating U.S.-China trade dispute could lead to a recession, global central banks played a key role in supporting markets. Fed policymakers delivered quarter-percentage-point rate cuts in July, September, and October and took steps to maintain liquidity in short-term lending markets. Other central banks also acted to address flagging growth, including the European Central Bank, which lowered its benchmark deposit rate deeper into negative territory and announced that it was restarting its quantitative easing program.
The pivot to a more accommodative monetary policy was a marked change from 2018, when the Fed raised rates four times, and appeared to be successful in reenergizing the economy. After contracting earlier in 2019, key U.S. manufacturing indicators showed signs of stabilizing by year-end, and the labor market remained strong, with solid payroll gains and an unemployment rate hovering near a 50-year low. With this more encouraging economic backdrop, it was not a surprise that in December Fed officials seemed satisfied that monetary policy was properly positioned to support continued growth and forecast no additional rate moves in 2020.
Besides central bank policy, investors also closely followed developments in the U.S.-China trade dispute. Stocks stumbled in May and August after the U.S. announced new tariffs on some Chinese imports and China retaliated with new tariffs of its own. However, investors generally took an optimistic view of trade negotiations, which limited the trade war’s toll on markets, and in December the two countries announced a “phase one” agreement to reduce some existing tariffs and cancel the imposition of new ones.
With monetary policy worldwide largely committed to ensuring market liquidity and some global economic indicators showing signs of improvement, there are reasons to be optimistic in 2020. However, we caution investors not to expect the outsized gains of the past year. If the post-World War II era is to be a guide, the S&P 500 has on average generated mid-single-digit returns in the fourth year of a presidential cycle.
Further market advances will likely hinge on a resumption in earnings growth, which stalled in 2019, and there is no shortage of global risks in the year ahead. Unresolved trade issues, tensions in the Middle East, and policy debates on taxes, health care, and wealth disparity leading up to the U.S. presidential election all have the potential to cause market volatility.
In addition to these risks, T. Rowe Price analysts will be closely following how disruptive forces such as innovation, technological change, and automation could impact a growing number of global industries. In an uncertain environment, with a wide dispersion of returns possible, we believe that in-depth fundamental research that integrates environmental, social, and governance considerations will be critical to successfully assess opportunities and risks. I am confident our strategic investing approach will continue to serve our shareholders well.
Thank you for your continued confidence in T. Rowe Price.
Sincerely,

Robert Sharps
Group Chief Investment Officer
Management’s Discussion of Fund Performance
INVESTMENT OBJECTIVE
The fund seeks to provide high income and capital appreciation.
FUND COMMENTARY
How did the fund perform in the past 12 months?
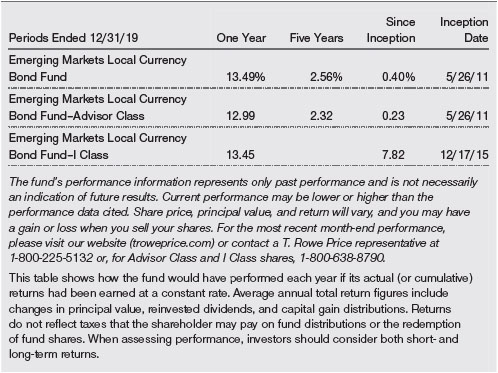
The T. Rowe Price Emerging Markets Local Currency Bond Fund posted a net return of 13.49% for the 12 months that ended December 31, 2019. The fund performed broadly in line with the benchmark J.P. Morgan Government Bond Index–Emerging Markets (GBI–EM) Global Diversified while outperforming the peer group average. (Results for Advisor and I Class shares variedslightly, reflecting their different fee structures.Past performance cannot guarantee future results.)
What factors influenced the fund’s performance?
Both our currency positioning and duration exposure made positive impacts on the portfolio’s relative performance during a strong year for emerging market (EM) assets overall. In terms of currencies, an off-benchmark exposure to the Egyptian pound stood out as the country’s fundamentals continue to improve. As partof its International Monetary Fund loan program, Egypt continued to work toward achieving a primary budget surplus. An overweight to the Mexican peso also aided relative performance. High real yields and a healthy current account, as well as an agreement on a U.S.-Mexico-Canada trade deal, boosted the peso in 2019.
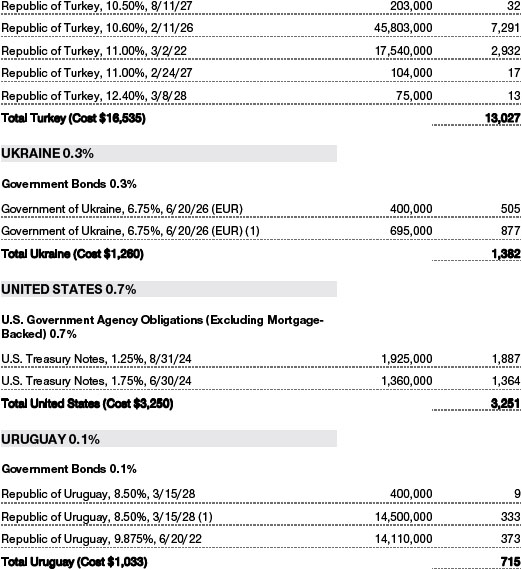
Conversely, an overweight position to the Turkish lira detracted as the currency came under selling pressure amid concerns over inflation and the Turkish central bank’s foreign currency reserves. The lira did retrace some of its losses at times in the second half of the year, but it still ended loweroverall. Our exposure to the Argentine peso made a negative impact on relative performance. The peso sold off in the wake of an early-August primary election that produced a surprise result when Alberto Fernández significantly outperformed incumbent President Mauricio Macri, who was viewed as the more market-friendly candidate.
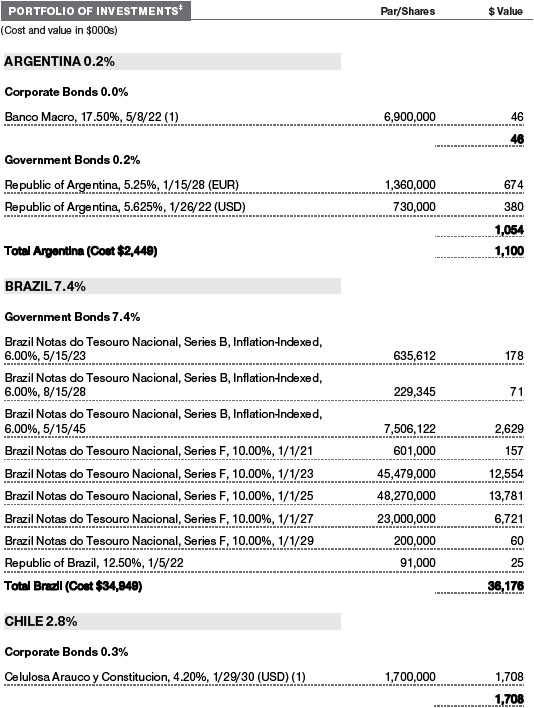
In terms of country exposure, an overweight to Brazilian bonds contributed favorably, helped by the country’s central bank cutting interest rates severaltimes in the second half of the year. Brazilian President Jair Bolsonaro’s progress on his planned pension reforms added further support to the country’s assets. Our off-benchmark exposure to Sri Lankan bonds delivered positive results as well.
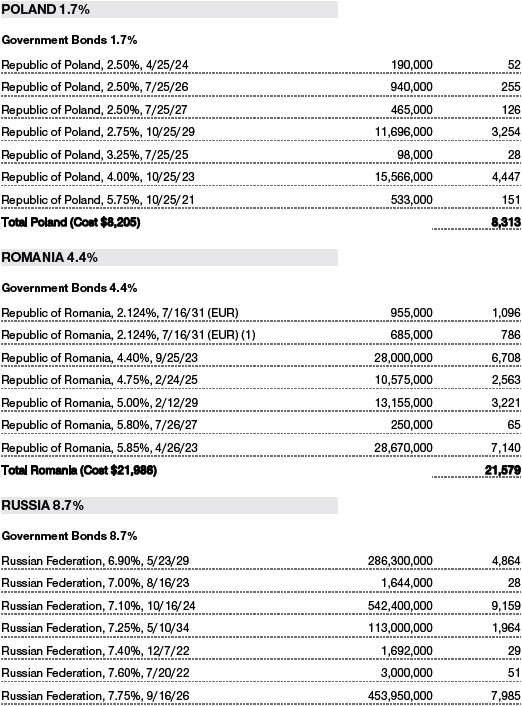
Underweights to the lower-yielding Polish, Czech, and Hungarian bond markets, however, held back performance. For much of the period, core developed market government bonds rallied amid weak growth, geopolitical concerns, and easing monetary policies. These moves carried over into the higher-qualitysectors of EMs, including central and Eastern European countries. Elsewhere, an underweight to Thailand detracted when the country’s assets joined the wider EM rally following the U.S-China trade agreement.
How is the fund positioned?
We built the portfolio’s risk exposure up mid-period to take advantage of an improving appetite for risk assets as central banks shifted to more dovish policy stances. However, following the broad EM rally at the end of the year, we moderately reduced our overall risk exposure, primarily by increasing underweights in markets where we see limited value going forward. In Asia, we are overweight to India, where we see the potential for monetary policyto support local bond markets. We increased our underweight to Thailand, however, toward the end of the year due to increasingly stretched valuations, which are vulnerable to shifts in the macro environment.
Within central and Eastern Europe (CEE) and Russia, we opened an overweight to Russia due to its healthy current account and fiscal policies. However, we are underweight CEE countries, including the Czech Republic, Hungary, and Poland, where government bond prices currently offer little value in our view.
In currencies, we began adding to our risk exposures mid-period as our outlook for the U.S. dollar peaked. We continued building our exposure to EM currencies through the end of the year due to attractive valuations in many EMs. We hold an overweight exposure to the Mexican peso as we see further potential in 2020 due to the country’s stable current account and healthy currency reserves.
We moderately increased overweight exposures to the Indonesian rupiah and Indian rupee during 2019. The potential for constructive reforms in both countries could help the currencies outperform amid a favorable EM backdrop. Conversely, we ended the year underweight to Asian currencies, including the South Korean won and the Taiwan dollar, both of which we use as funder currencies for our more favored positions.
Market liquidity is a key variable that we are closely monitoring due to persistent global macro risks. Market volatility can limit our ability to buy and sell EM bonds at efficient prices. EM debt, as one of the riskier and smaller fixed income asset classes, tends to have lower liquidity than high-quality government debt like U.S. Treasuries. We will continue to actively consider market depth and liquidity when evaluating bonds for purchase or sale.
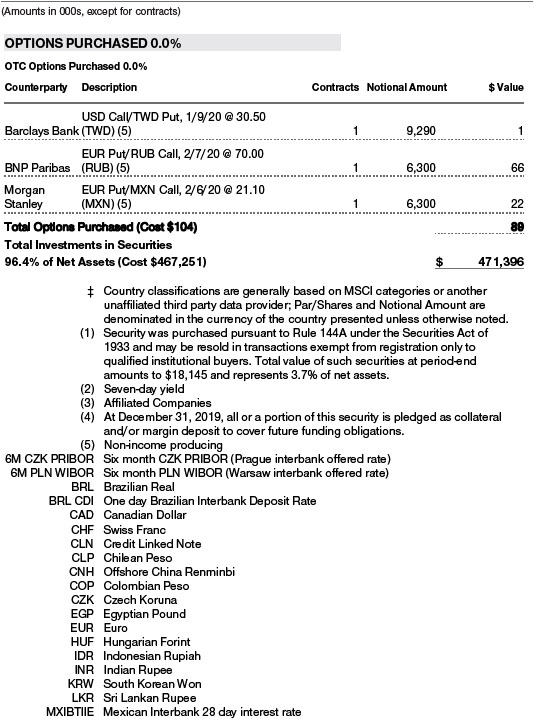
The portfolio maintains allocations to select types of derivatives for hedging purposes or to gain exposure to certain currencies or countries. The fund held currency forward contracts during the reporting period, but they did not have a meaningful impact on performance. The fund also held interest rate derivatives that did not meaningfully impact performance.
What is portfolio management’s outlook?
We remain constructive on the outlook for EM local currency bonds at the beginning of 2020. The asset class remains one of the highest-yielding opportunities in the fixed income market. Over the longer term, we also see the potential for the U.S. dollar to decline against global currencies following an extended period of strength. Therefore, we continue to hold a constructive view on EM currencies following the late rally in 2019.
We see the potential for EM growth to improve relative to growth in developed markets, which should help support inflows into EM assets. Inflation in EM remains relatively low and broadly contained, allowing central banks some flexibility and supporting real yield valuations. In this environment, fundamentals remain broadly stable, including disciplined government spending, largely balanced current accounts, and rational economic policy in most major EMs.
The technical and global interest rate backdrop should remain supportive of EM assets in the near term. The Federal Reserve is expected to keep interest rates on hold, and the European Central Bank maintains its quantitative easing program. Overall, the accommodative stances by major developed market central banks should keep global yields contained, propping up demand for EM bonds.
Valuations are still attractive versus EM fundamentals as well as other asset classes. However, the late rally in 2019 means they are not as cheap as they were earlier in 2019, and the market is susceptible to a geopolitical shock or a disappointment in growth data. Therefore, investors need to remain selective, even during risk rallies, and focus on countries displaying long-term reform momentum, decent value, and stable fundamentals. Bottom-up research and analysis are essential to maintaining consistent longer-term performance. We believe that the extended reach of T. Rowe Price’s global sovereign, credit, and equity research platforms, combined with our emphasis on collaboration across those platforms, gives us a critical edge in analyzing both risks and opportunities in emerging fixed income markets.
The views expressed reflect the opinions of T. Rowe Price as of the date of this report and are subject to change based on changes in market, economic, or other conditions. These views are not intended to be a forecast of future events and are no guarantee of future results.
RISKS OF INTERNATIONAL BOND INVESTING
Funds that invest overseas generally carry more risk than funds that invest strictly in U.S. assets, including unpredictable changes in currency values. Investments in EMs are subject to abrupt and severe price declines and should be regarded as speculative. The economic and political structures of developing nations, in most cases, do not compare favorably with the U.S. or other developed countries in terms of wealth and stability, and their financial markets often lack liquidity. Some countries also have legacies of hyperinflation, currency devaluations, and governmental interference in markets.
International investments are subject to currency risk, a decline in the value of a foreign currency versus the U.S. dollar, which reduces the dollar value of securities denominated in that currency. The overall impact on a fund’s holdings can be significant and long-lasting depending on the currencies represented in the portfolio, how each one appreciates or depreciates in relation to the U.S. dollar, and whether currency positions are hedged. Further, exchange rate movements are unpredictable, and it is not possible to effectively hedge the currency risks of many developing countries.
Bonds are also subject to interest rate risk, the decline in bond prices that usually accompanies a rise in interest rates, andcredit risk, the chance that any fund holding could have its credit rating downgraded, or that a bond issuer will default (fail to make timely payments of interest or principal), potentially reducing the fund’s income level and share price.
BENCHMARK INFORMATION
Note: Information has been obtained from sources believed to be reliable, but J.P. Morgan does not warrant its completeness or accuracy. The index is used with permission. The index may not be copied, used, or distributed without J.P. Morgan’s prior written approval. Copyright 2020, J.P. Morgan Chase & Co. All rights reserved.
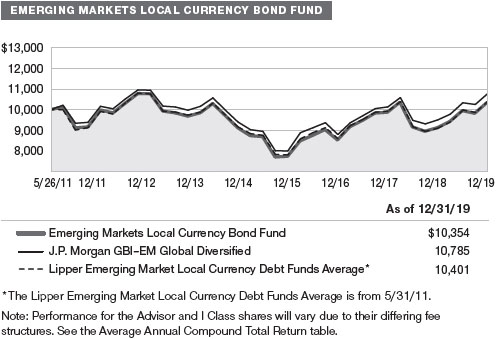
GROWTH OF $10,000
This chart shows the value of a hypothetical $10,000 investment in the fund over the past 10 fiscal year periods or since inception (for funds lacking 10-year records). The result is compared with benchmarks, which include a broad-based market index and may also include a peer group average or index. Market indexes do not include expenses, which are deducted from fund returns as well as mutual fund averages and indexes.
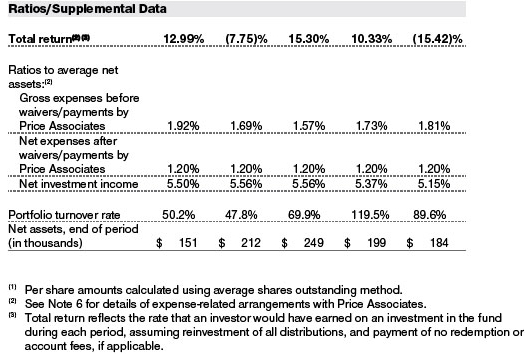
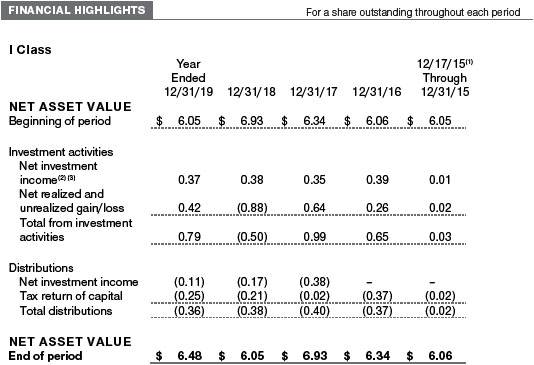
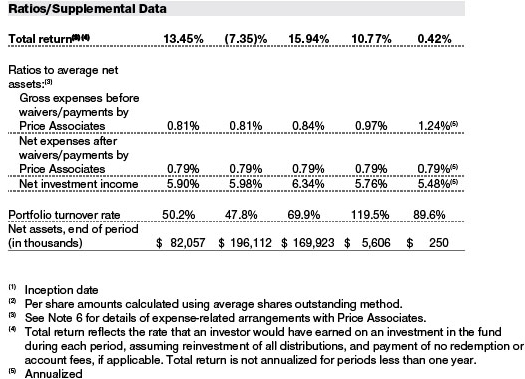
AVERAGE ANNUAL COMPOUND TOTAL RETURN
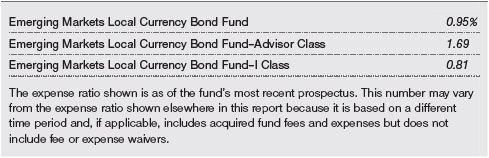
EXPENSE RATIO
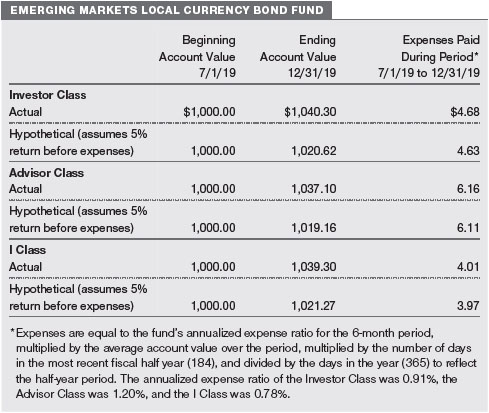
FUND EXPENSE EXAMPLE
As a mutual fund shareholder, you may incur two types of costs: (1) transaction costs, such as redemption fees or sales loads, and (2) ongoing costs, including management fees, distribution and service (12b-1) fees, and other fund expenses. The following example is intended to help you understand your ongoing costs (in dollars) of investing in the fund and to compare these costs with the ongoing costs of investing in other mutual funds. The example is based on an investment of $1,000 invested at the beginning of the most recent six-month period and held for the entire period.
Please note that the fund has three share classes: The original share class (Investor Class) charges no distribution and service (12b-1) fee, the Advisor Class shares are offered only through unaffiliated brokers and other financial intermediaries and charge a 0.25% 12b-1 fee, and the I Class shares are available to institutionally oriented clients and impose no 12b-1 or administrative fee payment. Each share class is presented separately in the table.
Actual Expenses
The first line of the following table (Actual) provides information about actual account values and expenses based on the fund’s actual returns. You may use the information on this line, together with your account balance, to estimate the expenses that you paid over the period. Simply divide your account value by $1,000 (for example, an $8,600 account value divided by $1,000 = 8.6), then multiply the result by the number on the first line under the heading “Expenses Paid During Period” to estimate the expenses you paid on your account during this period.
Hypothetical Example for Comparison Purposes
The information on the second line of the table (Hypothetical) is based on hypothetical account values and expenses derived from the fund’s actual expense ratio and an assumed 5% per year rate of return before expenses (not the fund’s actual return). You may compare the ongoing costs of investing in the fund with other funds by contrasting this 5% hypothetical example and the 5% hypothetical examples that appear in the shareholder reports of the other funds. The hypothetical account values and expenses may not be used to estimate the actual ending account balance or expenses you paid for the period.
Note:T. Rowe Price charges an annual account service fee of $20, generally for accounts with less than $10,000. The fee is waived for any investor whose T. Rowe Price mutual fund accounts total $50,000 or more; accounts electing to receive electronic delivery of account statements, transaction confirmations, prospectuses, and shareholder reports; or accounts of an investor who is a T. Rowe Price Personal Services or Enhanced Personal Services client (enrollment in these programs generally requires T. Rowe Price assets of at least $250,000). This fee is not included in the accompanying table. If you are subject to the fee, keep it in mind when you are estimating the ongoing expenses of investing in the fund and when comparing the expenses of this fund with other funds.
You should also be aware that the expenses shown in the table highlight only your ongoing costs and do not reflect any transaction costs, such as redemption fees or sales loads. Therefore, the second line of the table is useful in comparing ongoing costs only and will not help you determine the relative total costs of owning different funds. To the extent a fund charges transaction costs, however, the total cost of owning that fund is higher.

The accompanying notes are an integral part of these financial statements.
The accompanying notes are an integral part of these financial statements.
The accompanying notes are an integral part of these financial statements.


The accompanying notes are an integral part of these financial statements.
The accompanying notes are an integral part of these financial statements.
The accompanying notes are an integral part of these financial statements.
The accompanying notes are an integral part of these financial statements.
| NOTES TO FINANCIAL STATEMENTS |
T. Rowe Price International Funds, Inc. (the corporation) is registered under the Investment Company Act of 1940 (the 1940 Act). The Emerging Markets Local Currency Bond Fund (the fund) is a nondiversified, open-end management investment company established by the corporation. The fund seeks to provide high income and capital appreciation. The fund has three classes of shares: the Emerging Markets Local Currency Bond Fund (Investor Class), the Emerging Markets Local Currency Bond Fund–Advisor Class (Advisor Class), and the Emerging Markets Local Currency Bond Fund–I Class (I Class). Advisor Class shares are sold only through various brokers and other financial intermediaries. I Class shares require a $1 million initial investment minimum, although the minimum generally is waived for retirement plans, financial intermediaries, and certain other accounts. The Advisor Class operates under a Board-approved Rule 12b-1 plan pursuant to which the class compensates financial intermediaries for distribution, shareholder servicing, and/or certain administrative services; the Investor and I Classes do not pay Rule 12b-1 fees. Each class has exclusive voting rights on matters related solely to that class; separate voting rights on matters that relate to all classes; and, in all other respects, the same rights and obligations as the other classes.
NOTE 1 - SIGNIFICANT ACCOUNTING POLICIES
Basis of PreparationThe fund is an investment company and follows accounting and reporting guidance in the Financial Accounting Standards Board (FASB)Accounting Standards CodificationTopic 946 (ASC 946). The accompanying financial statements were prepared in accordance with accounting principles generally accepted in the United States of America (GAAP), including, but not limited to, ASC 946. GAAP requires the use of estimates made by management. Management believes that estimates and valuations are appropriate; however, actual results may differ from those estimates, and the valuations reflected in the accompanying financial statements may differ from the value ultimately realized upon sale or maturity. Certain prior year amounts in the accompanying financial statements and financial highlights have been restated to conform to current year presentation.
Investment Transactions, Investment Income, and Distributions Investment transactions are accounted for on the trade date basis. Income and expenses are recorded on the accrual basis. Realized gains and losses are reported on the identified cost basis. Premiums and discounts on debt securities are amortized for financial reporting purposes. Inflation adjustments to the principal amount of inflation-indexed bonds arereflected as interest income. Income tax-related interest and penalties, if incurred, are recorded as income tax expense. Dividends received from mutual fund investments are reflected as dividend income; capital gain distributions are reflected as realized gain/loss. Dividend income and capital gain distributions are recorded on the ex-dividend date. Non-cash dividends, if any, are recorded at the fair market value of the asset received. Distributions to shareholders are recorded on the ex-dividend date. Income distributions are declared by each class daily and paid monthly. A capital gain distribution may also be declared and paid by the fund annually.
Currency TranslationAssets, including investments, and liabilities denominated in foreign currencies are translated into U.S. dollar values each day at the prevailing exchange rate, using the mean of the bid and asked prices of such currencies against U.S. dollars as quoted by a major bank. Purchases and sales of securities, income, and expenses are translated into U.S. dollars at the prevailing exchange rate on the respective date of such transaction. The effect of changes in foreign currency exchange rates on realized and unrealized security gains and losses is not bifurcated from the portion attributable to changes in market prices.
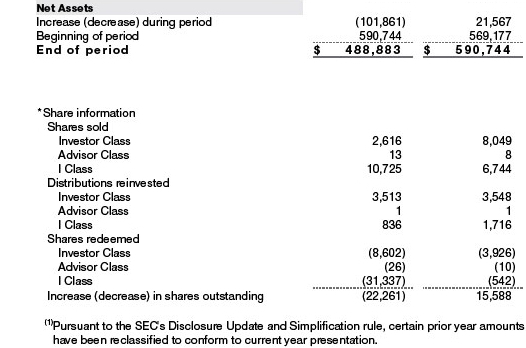
Class Accounting Shareholder servicing, prospectus, and shareholder report expenses incurred by each class are charged directly to the class to which they relate. Expenses common to all classes and investment income are allocated to the classes based upon the relative daily net assets of each class’s settled shares; realized and unrealized gains and losses are allocated based upon the relative daily net assets of each class’s outstanding shares. The Advisor Class pays Rule 12b-1 fees, in an amount not exceeding 0.25% of the class’s average daily net assets; during the year-ended December 31, 2019, the Advisor Class incurred less than $1,000 in these fees.
Redemption FeesPrior to April 1, 2019, a 2% fee was assessed on redemptions of fund shares held for 90 days or less or less than 365 days to deter short-term trading and to protect the interests of long-term shareholders. Redemption fees were withheld from proceeds that shareholders received from the sale or exchange of fund shares. The fees were paid to the fund and were recorded as an increase to paid-in capital. The fees may have caused the redemption price per share to differ from the net asset value per share.
New Accounting GuidanceEffective January 1, 2019, the fund adopted FASB guidance that shortened the amortization period for certain callable debt securities held at a premium. Adoption had no effect on the fund’s net assets or results of operations.
Indemnification In the normal course of business, the fund may provide indemnification in connection with its officers and directors, service providers, and/or private company investments. The fund’s maximum exposure under these arrangements is unknown; however, the risk of material loss is currently considered to be remote.
NOTE 2 - VALUATION
The fund’s financial instruments are valued and each class’s net asset value (NAV) per share is computed at the close of the New York Stock Exchange (NYSE), normally 4 p.m. ET, each day the NYSE is open for business. However, the NAV per share may be calculated at a time other than the normal close of the NYSE if trading on the NYSE is restricted, if the NYSE closes earlier, or as may be permitted by the SEC.
Fair Value The fund’s financial instruments are reported at fair value, which GAAP defines as the price that would be received to sell an asset or paid to transfer a liability in an orderly transaction between market participants at the measurement date. The T. Rowe Price Valuation Committee (the Valuation Committee) is an internal committee that has been delegated certain responsibilities by the fund’s Board of Directors (the Board) to ensure that financial instruments are appropriately priced at fair value in accordance with GAAP and the 1940 Act. Subject to oversight by the Board, the Valuation Committee develops and oversees pricing-related policies and procedures and approves all fair value determinations. Specifically, the Valuation Committee establishes procedures to value securities; determines pricing techniques, sources, and persons eligible to effect fair value pricing actions; oversees the selection, services, and performance of pricing vendors; oversees valuation-related business continuity practices; and provides guidance on internal controls and valuation-related matters. The Valuation Committee reports to the Board and has representation from legal, portfolio management and trading, operations, risk management, and the fund’s treasurer.
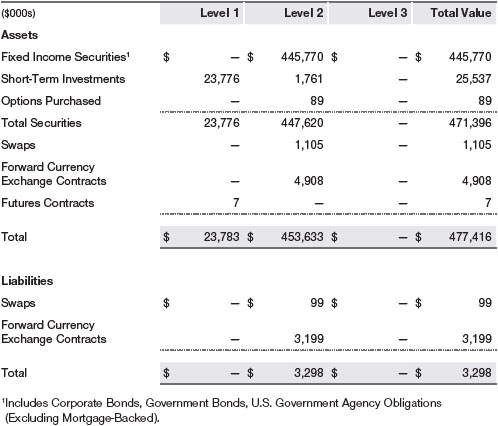
Various valuation techniques and inputs are used to determine the fair value of financial instruments. GAAP establishes the following fair value hierarchy that categorizes the inputs used to measure fair value:
Level 1 – quoted prices (unadjusted) in active markets for identical financial instruments that the fund can access at the reporting date
Level 2 – inputs other than Level 1 quoted prices that are observable, either directly or indirectly (including, but not limited to, quoted prices for similar financial instruments in active markets, quoted prices for identical or similar financial instruments in inactive markets, interest rates and yield curves, implied volatilities, and credit spreads)
Level 3 – unobservable inputs
Observable inputs are developed using market data, such as publicly available information about actual events or transactions, and reflect the assumptions that market participants would use to price the financial instrument. Unobservable inputs are those for which market data are not available and are developed using the best information available about the assumptions that market participants would use to price the financial instrument. GAAP requires valuation techniques to maximize the use of relevant observable inputs and minimize the use of unobservable inputs. When multiple inputs are used to derive fair value, the financial instrument is assigned to the level within the fair value hierarchy based on the lowest-level input that is significant to the fair value of the financial instrument. Input levels are not necessarily an indication of the risk or liquidity associated with financial instruments at that level but rather the degree of judgment used in determining those values.
Valuation TechniquesDebt securities generally are traded in the over-the-counter (OTC) market and are valued at prices furnished by independent pricing services or by broker dealers who make markets in such securities. When valuing securities, the independent pricing services consider the yield or price of bonds of comparable quality, coupon, maturity, and type, as well as prices quoted by dealers who make markets in such securities. Generally, debt securities are categorized in Level 2 of the fair value hierarchy; however, to the extent the valuations include significant unobservable inputs, the securities would be categorized in Level 3.
Investments in mutual funds are valued at the mutual fund’s closing NAV per share on the day of valuation and are categorized in Level 1 of the fair value hierarchy. Listed options, and OTC options with a listed equivalent, are valued at the mean of the closing bid and asked prices and generally are categorized in Level 2 of the fair value hierarchy. Financial futures contracts are valued at closing settlement prices and are categorized in Level 1 of the fair value hierarchy. Forward currency exchange contracts are valued using the prevailing forward exchange rate and are categorized in Level 2 of the fair value hierarchy. Swaps are valued at prices furnished by an independent pricing service or independent swap dealers and generally are categorized in Level 2 of the fair value hierarchy; however, if unobservable inputs are significant to the valuation, the swap would be categorized in Level 3. Assets and liabilities other than financial instruments, including short-term receivables and payables, are carried at cost, or estimated realizable value, if less, which approximates fair value.
Thinly traded financial instruments and those for which the above valuation procedures are inappropriate or are deemed not to reflect fair value are stated at fair value as determined in good faith by the Valuation Committee. The objective of any fair value pricing determination is to arrive at a price that could reasonably be expected from a current sale. Financial instruments fair valued by the Valuation Committee are primarily private placements, restricted securities, warrants, rights, and other securities that are not publicly traded.
Subject to oversight by the Board, the Valuation Committee regularly makes good faith judgments to establish and adjust the fair valuations of certain securities as events occur and circumstances warrant. For instance, in determining the fair value of troubled or thinly traded debt instruments, the Valuation Committee considers a variety of factors, which may include, but are not limited to, the issuer’s business prospects, its financial standing and performance, recent investment transactions in the issuer, strategic events affecting the company, market liquidity for the issuer, and general economic conditions and events. In consultation with the investment and pricing teams, the Valuation Committee will determine an appropriate valuation technique based on available information, which may include both observable and unobservable inputs. The Valuation Committee typically will afford greatest weight to actual prices in arm’s length transactions, to the extent they represent orderly transactions between market participants, transaction information can be reliably obtained, and prices are deemed representative of fair value. However, the Valuation Committee may also consider other valuation methods such as a discount or premium from market value of a similar, freely traded security of the same issuer; discounted cash flows; yield to maturity; or some combination. Fair value determinations are reviewed on a regular basis and updated as information becomes available, including actual purchase and sale transactions of the issue. Because any fair value determination involves a significant amount of judgment, there is a degree of subjectivity inherent in such pricing decisions, and fair value prices determined by the Valuation Committee could differ from those of other market participants. Depending on the relative significance of unobservable inputs, including the valuation technique(s) used, fair valued securities may be categorized in Level 2 or 3 of the fair value hierarchy.
Valuation InputsThe following table summarizes the fund’s financial instruments, based on the inputs used to determine their fair values on December 31, 2019 (for further detail by category, please refer to the accompanying Portfolio of Investments):
NOTE 3 - DERIVATIVE INSTRUMENTS
During the year ended December 31, 2019, the fund invested in derivative instruments. As defined by GAAP, a derivative is a financial instrument whose value is derived from an underlying security price, foreign exchange rate, interest rate, index of prices or rates, or other variable; it requires little or no initial investment and permits or requires net settlement. The fund invests in derivatives only if the expected risks and rewards are consistent with its investment objectives, policies, and overall risk profile, as described in its prospectus and Statement of Additional Information. The fund may use derivatives for a variety of purposes, such as seeking to hedge against declines in principal value, increase yield, invest in an asset with greater efficiency and at a lower cost than ispossible through direct investment, to enhance return, or to adjust portfolio duration and credit exposure. The risks associated with the use of derivatives are different from, and potentially much greater than, the risks associated with investing directly in the instruments on which the derivatives are based. The fund at all times maintains sufficient cash reserves, liquid assets, or other SEC-permitted asset types to cover its settlement obligations under open derivative contracts.
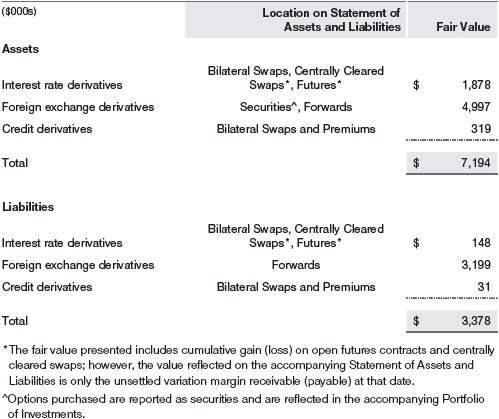
The fund values its derivatives at fair value and recognizes changes in fair value currently in its results of operations. Accordingly, the fund does not follow hedge accounting, even for derivatives employed as economic hedges. Generally, the fund accounts for its derivatives on a gross basis. It does not offset the fair value of derivative liabilities against the fair value of derivative assets on its financial statements, nor does it offset the fair value of derivative instruments against the right to reclaim or obligation to return collateral.
The following table summarizes the fair value of the fund’s derivative instruments held as of December 31, 2019, and the related location on the accompanying Statement of Assets and Liabilities, presented by primary underlying risk exposure:
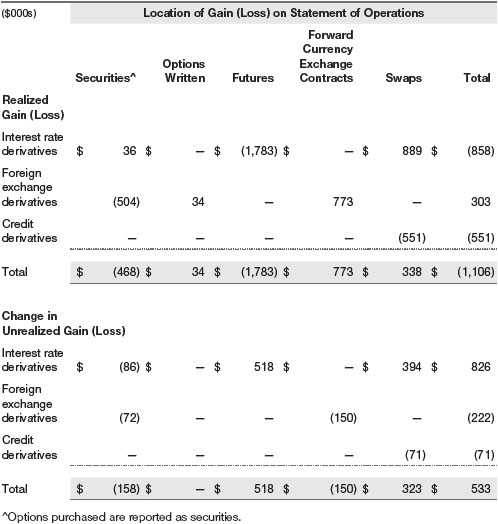
Additionally, the amount of gains and losses on derivative instruments recognized in fund earnings during the year ended December 31, 2019, and the related location on the accompanying Statement of Operations is summarized in the following table by primary underlying risk exposure:
Counterparty Risk and CollateralThe fund invests in derivatives in various markets, which expose it to differing levels of counterparty risk. Counterparty risk on exchange-traded and centrally cleared derivative contracts, such as futures, exchange-traded options, and centrally cleared swaps, is minimal because the clearinghouse provides protection against counterparty defaults. For futures and centrally cleared swaps, the fund is required to deposit collateral in an amount specified by the clearinghouse and the clearing firm (margin requirement), and the margin requirement must be maintained over the life of the contract. Each clearinghouse and clearing firm, in its sole discretion, may adjust the margin requirements applicable to the fund.
Derivatives, such as bilateral swaps, forward currency exchange contracts, and OTC options, that are transacted and settle directly with a counterparty (bilateral derivatives) may expose the fund to greater counterparty risk. To mitigate this risk, the fund has entered into master netting arrangements (MNAs) with certain counterparties that permit net settlement under specified conditions and, for certain counterparties, also require the exchange of collateral to cover mark-to-market exposure. MNAs may be in the form of International Swaps and Derivatives Association master agreements (ISDAs) or foreign exchange letter agreements (FX letters).
MNAs provide the ability to offset amounts the fund owes a counterparty against amounts the counterparty owes the fund (net settlement). Both ISDAs and FX letters generally allow termination of transactions and net settlement upon the occurrence of contractually specified events, such as failure to pay or bankruptcy. In addition, ISDAs specify other events, the occurrence of which would allow one of the parties to terminate. For example, a downgrade in credit rating of a counterparty below a specified rating would allow the fund to terminate, while a decline in the fund’s net assets of more than a specified percentage would allow the counterparty to terminate. Upon termination, all transactions with that counterparty would be liquidated and a net termination amount settled. ISDAs include collateral agreements whereas FX letters do not. Collateral requirements are determined daily based on the net aggregate unrealized gain or loss on all bilateral derivatives with a counterparty, subject to minimum transfer amounts that typically range from $100,000 to $250,000. Any additional collateral required due to changes in security values is typically transferred the next business day.
The following table summarizes the fund’s derivatives at the reporting date by loss exposure to each counterparty, clearinghouse or clearing firm after consideration of collateral, if any. Exchange-traded and centrally cleared derivatives that settle variation margin daily are presented at the variation margin receivable or payable on the reporting date, and exchange-traded options are presented at value.
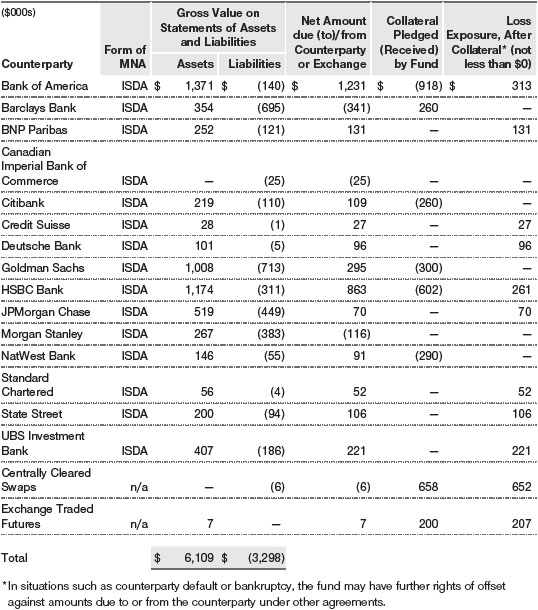
Collateral may be in the form of cash or debt securities issued by the U.S. government or related agencies. Cash posted by the fund is reflected as cash deposits in the accompanying financial statements and generally is restricted from withdrawal by the fund; securities posted by the fund are so noted in the accompanying Portfolio of Investments; both remain in the fund’s assets. Collateral pledged by counterparties is not included in the fund’s assets because the fund does not obtain effective control over those assets. For bilateral derivatives, collateral posted or received by the fund is held in a segregated account at the fund’s custodian.
While typically not sold in the same manner as equity or fixed income securities, exchange-traded or centrally cleared derivatives may be closed out only on the exchange or clearinghouse where the contracts were traded, and OTC and bilateral derivatives may be unwound with counterparties or transactions assigned to other counterparties to allow the fund to exit the transaction. This ability is subject to the liquidity of underlying positions.
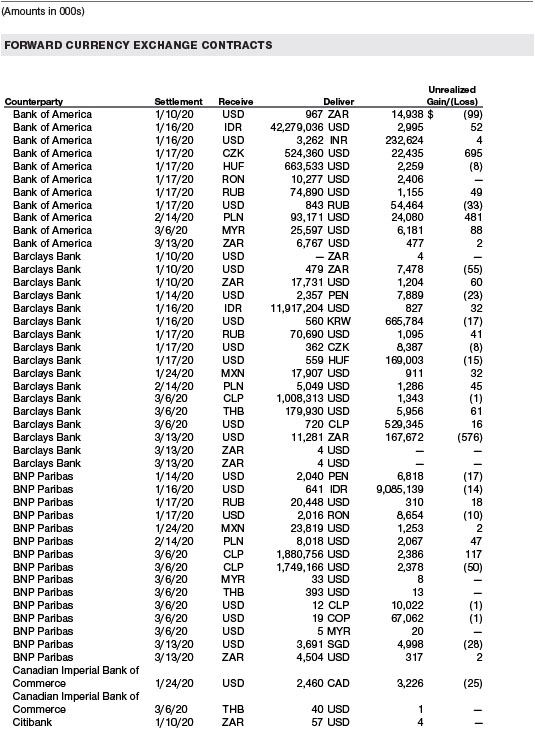
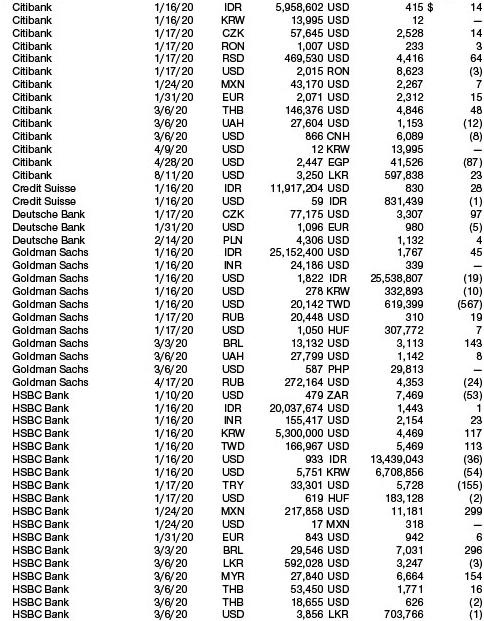
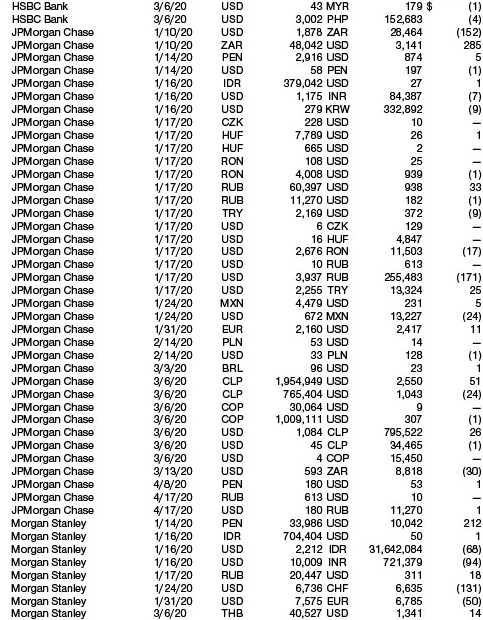
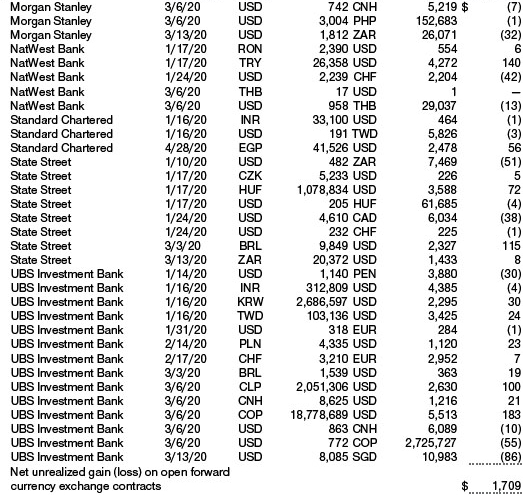
Forward Currency Exchange ContractsThe fund is subject to foreign currency exchange rate risk in the normal course of pursuing its investment objectives. It uses forward currency exchange contracts (forwards) primarily to protect its non-U.S. dollar-denominated securities from adverse currency movements and to increase exposure to a particular foreign currency, to shift the fund’s foreign currency exposure from one country to another, or to enhance the fund’s return. A forward involves an obligation to purchase or sell a fixed amount of a specific currency on a future date at a price set at the time of the contract. Although certain forwards may be settled by exchanging only the net gain or loss on the contract, most forwards are settled with the exchange of the underlying currencies in accordance with the specified terms. Forwards are valued at the unrealized gain or loss on the contract, which reflects the net amount the fund either is entitled to receive or obligated to deliver, as measured by the difference between the forward exchange rates at the date of entry into the contract and the forward rates at the reporting date. Appreciated forwards are reflected as assets and depreciated forwards are reflected as liabilities on the accompanying Statement of Assets and Liabilities. Risks related to the use of forwards include the possible failure of counterparties to meet the terms of the agreements; that anticipated currency movements will not occur, thereby reducing the fund’s total return; and the potential for losses in excess of the fund’s initial investment. During the year ended December 31, 2019, the volume of the fund’s activity in forwards, based on underlying notional amounts, was generally between 42% and 51% of net assets.
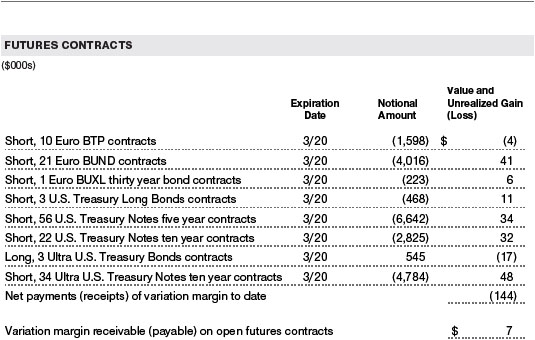
Futures ContractsThe fund is subject to interest rate risk in the normal course of pursuing its investment objectives and uses futures contracts to help manage such risk. The fund may enter into futures contracts to manage exposure to interest rate and yield curve movements, security prices, foreign currencies, credit quality, and mortgage prepayments; as an efficient means of adjusting exposure to all or part of a target market; to enhance income; as a cash management tool; or to adjust portfolio duration and credit exposure. A futures contract provides for the future sale by one party and purchase by another of a specified amount of a specific underlying financial instrument at an agreed upon price, date, time, and place. The fund currently invests only in exchange-traded futures, which generally are standardized as to maturity date, underlying financial instrument, and other contract terms. Payments are made or received by the fund each day to settle daily fluctuations in the value of the contract (variation margin), which reflect changes in the value of the underlying financial instrument. Variation margin is recorded as unrealized gain or loss until the contract is closed. The value of a futures contract included in net assets is the amount of unsettled variation margin; net variation margin receivable is reflected as an asset and net variation margin payable is reflected as a liability on the accompanying Statement of Assets and Liabilities. Risks related to the use of futures contracts include possible illiquidity of the futures markets, contract prices that can be highly volatile and imperfectly correlated to movements in hedged security values and/or interest rates, and potential losses in excess of the fund’s initial investment. During the year ended December 31, 2019, the volume of the fund’s activity in futures, based on underlying notional amounts, was generally between 3% and 4% of net assets.
OptionsThe fund is subject to interest rate risk and foreign currency exchange rate risk in the normal course of pursuing its investment objectives and uses options to help manage such risks. The fund may use options to manage exposure to security prices, interest rates, foreign currencies, and credit quality; as an efficient means of adjusting exposure to all or a part of a target market; to enhance income; as a cash management tool; or to adjust credit exposure. Options are included in net assets at fair value, options purchased are included in Investments in Securities, and Options written are separately reflected as a liability on the accompanying Statement of Assets and Liabilities. Premiums on unexercised, expired options are recorded as realized gains or losses; premiums on exercised options are recorded as an adjustment to the proceeds from the sale or cost of the purchase. The difference between the premium and the amount received or paid in a closing transaction is also treated as realized gain or loss. In return for a premium paid, currency options give the holder the right, but not the obligation, to buy and sell currency at a specified exchange rate. In return for a premium paid, call and put options on futures give the holder the right, but not the obligation, to purchase or sell, respectively, a position in a particular futures contract at a specified exercise price. Risks related to the use of options include possible illiquidity of the optionsmarkets; trading restrictions imposed by an exchange or counterparty; movements in the underlying asset values and interest rates, and currency values; and, for options written, potential losses in excess of the fund’s initial investment. During the year ended December 31, 2019, the volume of the fund’s activity in options, based on underlying notional amounts, was generally between 3% and 14% of net assets.
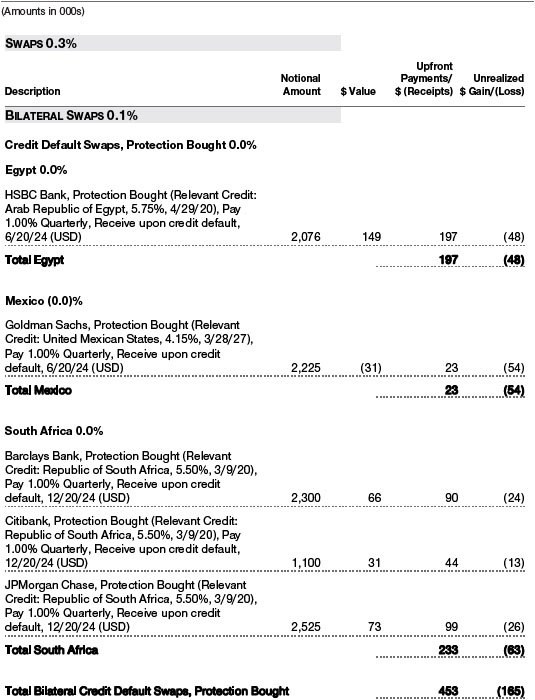
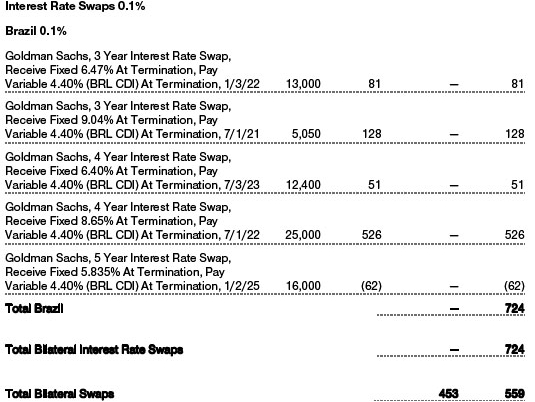
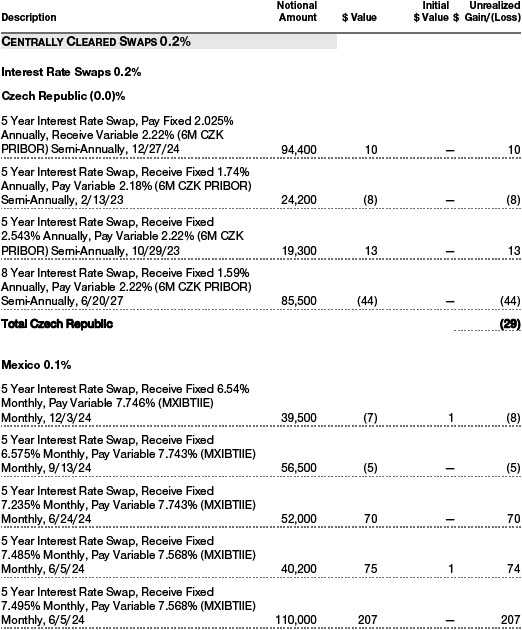
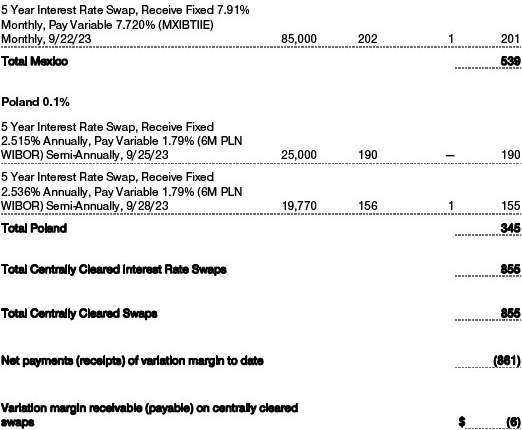
SwapsThe fund is subject to interest rate risk and credit risk in the normal course of pursuing its investment objectives and uses swap contracts to help manage such risks. The fund may use swaps in an effort to manage both long and short exposure to changes in interest rates, inflation rates, and credit quality; to adjust overall exposure to certain markets; to enhance total return or protect the value of portfolio securities; to serve as a cash management tool; or to adjust portfolio duration and credit exposure. Swap agreements can be settled either directly with the counterparty (bilateral swap) or through a central clearinghouse (centrally cleared swap). Fluctuations in the fair value of a contract are reflected in unrealized gain or loss and are reclassified to realized gain or loss upon contract termination or cash settlement. Net periodic receipts or payments required by a contract increase or decrease, respectively, the value of the contract until the contractual payment date, at which time such amounts are reclassified from unrealized to realized gain or loss. For bilateral swaps, cash payments are made or received by the fund on a periodic basis in accordance with contract terms; unrealized gain on contracts and premiums paid are reflected as assets and unrealized loss on contracts and premiums received are reflected as liabilities on the accompanying Statement of Assets and Liabilities. For bilateral swaps, premiums paid or received are amortized over the life of the swap and are recognized as realized gain or loss in the Statement of Operations. For centrally cleared swaps, payments are made or received by the fund each day to settle the daily fluctuation in the value of the contract (variation margin). Accordingly, the value of a centrally cleared swap included in net assets is the unsettled variation margin; net variation margin receivable is reflected as an asset and net variation margin payable is reflected as a liability on the accompanying Statement of Assets and Liabilities.
Interest rate swaps are agreements to exchange cash flows based on the difference between specified interest rates applied to a notional principal amount for a specified period of time. Risks related to the use of interest rate swaps include the potential for unanticipated movements in interest or currency rates, the possible failure of a counterparty to perform in accordance with the terms of the swap agreements, potential government regulation that could adversely affect the fund’s swap investments, and potential losses in excess of the fund’s initial investment.
Credit default swaps are agreements where one party (the protection buyer) agrees to make periodic payments to another party (the protection seller) in exchange for protection against specified credit events, such as certain defaults and bankruptciesrelated to an underlying credit instrument, or issuer or index of such instruments. Upon occurrence of a specified credit event, the protection seller is required to pay the buyer the difference between the notional amount of the swap and the value of the underlying credit, either in the form of a net cash settlement or by paying the gross notional amount and accepting delivery of the relevant underlying credit. For credit default swaps where the underlying credit is an index, a specified credit event may affect all or individual underlying securities included in the index and will be settled based upon the relative weighting of the affected underlying security(ies) within the index. Risks related to the use of credit default swaps include the possible inability of the fund to accurately assess the current and future creditworthiness of underlying issuers, the possible failure of a counterparty to perform in accordance with the terms of the swap agreements, potential government regulation that could adversely affect the fund’s swap investments, and potential losses in excess of the fund’s initial investment.
During the year ended December 31, 2019, the volume of the fund’s activity in swaps, based on underlying notional amounts, was generally between 13% and 16% of net assets.
NOTE 4 - OTHER INVESTMENT TRANSACTIONS
Consistent with its investment objective, the fund engages in the following practices to manage exposure to certain risks and/or to enhance performance. The investment objective, policies, program, and risk factors of the fund are described more fully in the fund’s prospectus and Statement of Additional Information.
Emerging and Frontier MarketsThe fund invests, either directly or through investments in other T. Rowe Price funds, in securities of companies located in, issued by governments of, or denominated in or linked to the currencies of emerging and frontier market countries. Emerging markets, and to a greater extent frontier markets, generally have economic structures that are less diverse and mature, and political systems that are less stable, than developed countries. These markets may be subject to greater political, economic, and social uncertainty and differing regulatory environments that may potentially impact the fund’s ability to buy or sell certain securities or repatriate proceeds to U.S. dollars. Such securities are often subject to greater price volatility, less liquidity, and higher rates of inflation than U.S. securities. Investing in frontier markets is significantly riskier than investing in other countries, including emerging markets.
Noninvestment-Grade DebtThe fund invests, either directly or through its investment in other T. Rowe Price funds, in noninvestment-grade debt, including “high yield” or “junk” bonds or leveraged loans. Noninvestment-grade debt issuers are more likely to suffer an adverse change in financial condition that would result in the inability to meet a financial obligation. The noninvestment-grade debt market may experience sudden and sharp price swings due to a variety of factors that may decrease the ability of issuers to make principal and interest payments and adversely affect the liquidity or value, or both, of such securities. Accordingly, securities issued by such companies carry a higher risk of default and should be considered speculative.
Restricted SecuritiesThe fund invests in securities that are subject to legal or contractual restrictions on resale. Prompt sale of such securities at an acceptable price may be difficult and may involve substantial delays and additional costs.
OtherPurchases and sales of portfolio securities other than short-term and U.S. government securities aggregated $223,431,000 and $384,078,000, respectively, for the year ended December 31, 2019.
NOTE 5 - FEDERAL INCOME TAXES
No provision for federal income taxes is required since the fund intends to continue to qualify as a regulated investment company under Subchapter M of the Internal Revenue Code and distribute to shareholders all of its taxable income and gains. Distributions determined in accordance with federal income tax regulations may differ in amount or character from net investment income and realized gains for financial reporting purposes.
The fund files U.S. federal, state, and local tax returns as required. The fund’s tax returns are subject to examination by the relevant tax authorities until expiration of the applicable statute of limitations, which is generally three years after the filing of the tax return but which can be extended to six years in certain circumstances. Tax returns for open years have incorporated no uncertain tax positions that require a provision for income taxes.
Financial reporting records are adjusted for permanent book/tax differences to reflect tax character but are not adjusted for temporary differences. The permanent book/tax adjustments have no impact on results of operations or net assets and relate primarily to the character of net currency losses.
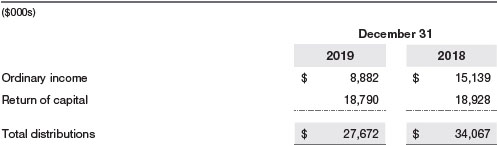
Distributions during the years ended December 31, 2019 and December 31, 2018, were characterized for tax purposes as follows:
At December 31, 2019, the tax-basis cost of investments, including derivatives, and components of net assets were as follows:
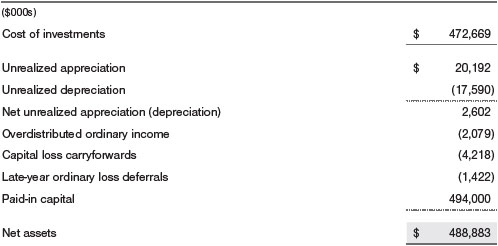
The difference between book-basis and tax-basis net unrealized appreciation (depreciation) is attributable to the deferral of losses from wash sales, and the realization of gains/losses on certain open derivative contracts, for tax purposes. The fund intends to retain realized gains to the extent of available capital loss carryforwards. Net realized capital losses may be carried forward indefinitely to offset future realized capital gains. In accordance with federal tax laws applicable to investment companies, net specified losses realized between November 1 and December 31 are not recognized for tax purposes until the subsequent year (late-year ordinary loss deferrals); however, such losses are recognized for financial reporting purposes in the year realized.
NOTE 6 - RELATED PARTY TRANSACTIONS
The fund is managed by T. Rowe Price Associates, Inc. (Price Associates), a wholly owned subsidiary of T. Rowe Price Group, Inc. (Price Group). The investment management agreement between the fund and Price Associates provides for an annual investment management fee, which is computed daily and paid monthly. The fee consists of an individual fund fee, equal to 0.45% of the fund’s average daily net assets, and a group fee. The group fee rate is calculated based on the combined net assets of certain mutual funds sponsored by Price Associates (the group) applied to a graduated fee schedule, with rates ranging from 0.48% for the first $1 billion of assets to 0.265% for assets in excess of $650 billion. The fund’s group fee is determined by applying the group fee rate to the fund’s average daily net assets. The fee is computed daily and paid monthly. At December 31, 2019, the effective annual group fee rate was 0.29%.
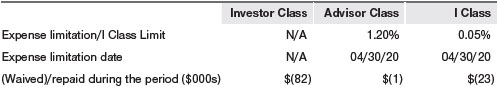
The Advisor Class is subject to a contractual expense limitation through the expense limitation date indicated in the table below. During the limitation period, Price Associates is required to waive its management fee or pay any expenses (excluding interest; expenses related to borrowings, taxes, and brokerage; and other non-recurring expenses permitted by the investment management agreement) that would otherwise cause the class’s ratio of annualized total expenses to average net assets (net expense ratio) to exceed its expense limitation. The class is required to repay Price Associates for expenses previously waived/paid to the extent the class’s net assets grow or expenses decline sufficiently to allow repayment without causing the class’s net expense ratio (after the repayment is taken into account) to exceed the lesser of: (1) the expense limitation in place at the time such amounts were waived; or (2) the class’s current expense limitation. However, no repayment will be made more than three years after the date of a payment or waiver.
The I Class is also subject to an operating expense limitation (I Class Limit) pursuant to which Price Associates is contractually required to pay all operating expenses of the I Class, excluding management fees; interest; expenses related to borrowings, taxes, and brokerage; and other non-recurring expenses permitted by the investment management agreement, to the extent such operating expenses, on an annualized basis, exceed the I Class Limit. This agreement will continue through the expense limitation date indicated in the table below, and may be renewed, revised, or revoked only with approval of the fund’s Board. The I Class is required to repay Price Associates for expenses previously paid to the extent the class’s net assets grow or expenses decline sufficiently to allow repayment without causing the class’s operating expenses (after the repayment is taken into account) to exceed the lesser of: (1) the I Class Limit in place at the time such amounts were paid; or (2) the current I Class Limit. However, no repayment will be made more than three years after the date of a payment or waiver.
Pursuant to these agreements, expenses were waived/paid by and/or repaid to Price Associates during the year ended December 31, 2019 as indicated in the table below. Including these amounts, expenses previously waived/paid by Price Associates in the amount of $15,000 remain subject to repayment by the fund at December 31, 2019. Any repayment of expenses previously waived/paid by Price Associates during the period would be included in the net investment income and expense ratios presented on the accompanying Financial Highlights.
In addition, the fund has entered into service agreements with Price Associates and two wholly owned subsidiaries of Price Associates, each an affiliate of the fund (collectively, Price). Price Associates provides certain accounting and administrative services to the fund. T. Rowe Price Services, Inc. provides shareholder and administrative services in its capacity as the fund’s transfer and dividend-disbursing agent. T. Rowe Price Retirement Plan Services, Inc. provides subaccounting and recordkeeping services for certain retirement accounts invested in the Investor Class and Advisor Class. For the year ended December 31, 2019, expenses incurred pursuant to these service agreements were $70,000 for Price Associates; $36,000 for T. Rowe Price Services, Inc.; and less than $1,000 for T. Rowe Price Retirement Plan Services, Inc. All amounts due to and due from Price, exclusive of investment management fees payable, are presented net on the accompanying Statement of Assets and Liabilities.
The fund is also one of several mutual funds sponsored by Price Associates (underlying Price Funds) in which the T. Rowe Price Spectrum Funds (Spectrum Funds) may invest. The Spectrum Funds do not invest in the underlying Price Funds for the purpose of exercising management or control. Pursuant to special servicing agreements, expenses associated with the operation of the Spectrum Funds are borne by each underlying Price Fund to the extent of estimated savings to it and in proportion to the average daily value of its shares owned by the Spectrum Funds. Expenses allocated under these special servicing agreements are reflected as shareholder servicing expense in the accompanying financial statements. For the year ended December 31, 2019, the fund was allocated $395,000 of Spectrum Funds’ expenses. Of these amounts, $272,000 related to services provided by Price. All amounts due to and due from Price, exclusive of investment management fees payable, are presented net on the accompanying Statement of Assets and Liabilities. At December 31, 2019, approximately 87% of the outstanding shares of the Investor Class were held by the Spectrum Funds.
In addition, other mutual funds, trusts, and other accounts managed by Price Associates or its affiliates (collectively, Price Funds and accounts) may invest in the fund and are not subject to the special servicing agreements disclosed above. No Price fund or account may invest for the purpose of exercising management or control over the fund. At December 31, 2019, approximately 5% of the Investor’s Class outstanding shares were held by Price Funds and accounts.
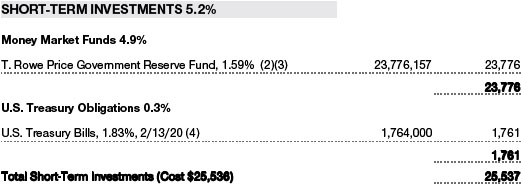
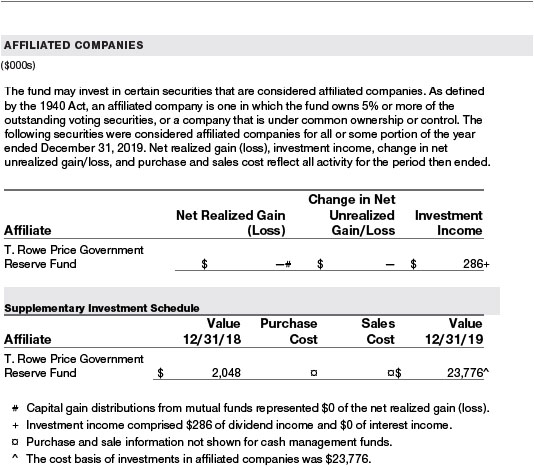
The fund may invest its cash reserves in certain open-end management investment companies managed by Price Associates and considered affiliates of the fund: the T. Rowe Price Government Reserve Fund or the T. Rowe Price Treasury Reserve Fund, organized as money market funds, or the T. Rowe Price Short-Term Fund, a short-term bond fund (collectively, the Price Reserve Funds). The Price Reserve Funds are offered as short-term investment options to mutual funds, trusts, and other accounts managed by Price Associates or its affiliates and are not available for direct purchase by members of the public. Cash collateral from securities lending is invested in the T. Rowe Price Short-Term Fund. The Price Reserve Funds pay no investment management fees.
The fund may participate in securities purchase and sale transactions with other funds or accounts advised by Price Associates (cross trades), in accordance with procedures adopted by the fund’s Board and Securities and Exchange Commission rules, which require, among other things, that such purchase and sale cross trades be effected at the independent current market price of the security. During the year ended December 31, 2019, the fund had no purchases or sales cross trades with other funds or accounts advised by Price Associates.
REPORT OF INDEPENDENT REGISTERED PUBLIC ACCOUNTING FIRM
To the Board of Directors of T. Rowe Price International Funds, Inc. and
Shareholders of T. Rowe Price Emerging Markets Local Currency Bond Fund
Opinion on the Financial Statements
We have audited the accompanying statement of assets and liabilities, including the portfolio of investments, of T. Rowe Price Emerging Markets Local Currency Bond Fund (one of the funds constituting T. Rowe Price International Funds, Inc., referred to hereafter as the “Fund”) as of December 31, 2019, the related statement of operations for the year ended December 31, 2019, the statement of changes in net assets for each of the two years in the period ended December 31, 2019, including the related notes, and the financial highlights for each of the periods indicated therein (collectively referred to as the “financial statements”). In our opinion, the financial statements present fairly, in all material respects, the financial position of the Fund as of December 31, 2019, the results of its operations for the year then ended, the changes in its net assets for each of the two years in the period ended December 31, 2019 and the financial highlights for each of the periods indicated therein, in conformity with accounting principles generally accepted in the United States of America.
Basis for Opinion
These financial statements are the responsibility of the Fund’s management. Our responsibility is to express an opinion on the Fund’s financial statements based on our audits. We are a public accounting firm registered with the Public Company Accounting Oversight Board (United States) (PCAOB) and are required to be independent with respect to the Fund in accordance with the U.S. federal securities laws and the applicable rules and regulations of the Securities and Exchange Commission and the PCAOB.
We conducted our audits of these financial statements in accordance with the standards of the PCAOB. Those standards require that we plan and perform the audit to obtain reasonable assurance about whether the financial statements are free of material misstatement, whether due to error or fraud.
Our audits included performing procedures to assess the risks of material misstatement of the financial statements, whether due to error or fraud, and performing procedures that respond to those risks. Such procedures included examining, on a test basis, evidence regarding the amounts and disclosures in the financial statements. Our audits also included evaluating the accounting principles used and significant estimates made by management, as well as evaluating the overall presentation of the financial statements. Our procedures included confirmation of securities owned as of December 31, 2019 by correspondence with the custodians, transfer agent and brokers; when replies were not received from brokers, we performed other auditing procedures. We believe that our audits provide a reasonable basis for our opinion.
PricewaterhouseCoopers LLP
Baltimore, Maryland
February 14, 2020
We have served as the auditor of one or more investment companies in the T. Rowe Price group of investment companies since 1973.
TAX INFORMATION (UNAUDITED) FOR THE TAX YEAR ENDED 12/31/19
We are providing this information as required by the Internal Revenue Code. The amounts shown may differ from those elsewhere in this report because of differences between tax and financial reporting requirements.
The fund will pass through foreign source income of $10,494,000 and foreign taxes paid of $721,000.
INFORMATION ON PROXY VOTING POLICIES, PROCEDURES, AND RECORDS
A description of the policies and procedures used by T. Rowe Price funds and portfolios to determine how to vote proxies relating to portfolio securities is available in each fund’s Statement of Additional Information. You may request this document by calling 1-800-225-5132 or by accessing the SEC’s website, sec.gov.
The description of our proxy voting policies and procedures is also available on our corporate website. To access it, please visit the following Web page:
https://www.troweprice.com/corporate/en/utility/policies.html
Scroll down to the section near the bottom of the page that says, “Proxy Voting Policies.” Click on the Proxy Voting Policies link in the shaded box.
Each fund’s most recent annual proxy voting record is available on our website and through the SEC’s website. To access it through T. Rowe Price, visit the website location shown above, and scroll down to the section near the bottom of the page that says, “Proxy Voting Records.” Click on the Proxy Voting Records link in the shaded box.
HOW TO OBTAIN QUARTERLY PORTFOLIO HOLDINGS
Effective for reporting periods on or after March 1, 2019, a fund, except a money market fund, files a complete schedule of portfolio holdings with the Securities and Exchange Commission (SEC) for the first and third quarters of each fiscal year as an exhibit to its reports on Form N-PORT. Prior to March 1, 2019, a fund, including a money market fund, filed a complete schedule of portfolio holdings with the SEC for the first and third quarters of each fiscal year on Form N-Q. A money market fund files detailed month-end portfolio holdings information on Form N-MFP with the SEC each month and posts a complete schedule of portfolio holdings on its website (troweprice.com) as of each month-end for the previous six months. A fund’s Forms N-PORT, N-MFP, and N-Q are available electronically on the SEC’s website (sec.gov).
ABOUT THE FUND’S DIRECTORS AND OFFICERS
Your fund is overseen by a Board of Directors (Board) that meets regularly to review a wide variety of matters affecting or potentially affecting the fund, including performance, investment programs, compliance matters, advisory fees and expenses, service providers, and business and regulatory affairs. The Board elects the fund’s officers, who are listed in the final table. At least 75% of the Board’s members are independent of the Boards of T. Rowe Price Associates, Inc. (T. Rowe Price), and its affiliates; “inside” or “interested” directors are employees or officers of T. Rowe Price. The business address of each director and officer is 100 East Pratt Street, Baltimore, Maryland 21202. The Statement of Additional Information includes additional information about the fund directors and is available without charge by calling a T. Rowe Price representative at 1-800-638-5660.
INDEPENDENT DIRECTORS(a)
Name
(Year of Birth)
Year Elected
[Number of T. Rowe Price
Portfolios Overseen] | | Principal Occupation(s) and Directorships of Public Companies and Other Investment Companies During the Past Five Years |
| | |
Teresa Bryce Bazemore
(1959)
2018
[189] | | President, Radian Guaranty (2008 to 2017); Chief Executive Officer, Bazemore Consulting LLC (2018 to present); Director, Chimera Investment Corporation (2017 to present); Director, Federal Home Loan Bank of Pittsburgh (2017 to present) |
| | | |
Ronald J. Daniels
(1959)
2018
[189] | | President, The Johns Hopkins University(b)and Professor, Political Science Department, The Johns Hopkins University (2009 to present); Director, Lyndhurst Holdings (2015 to present) |
| | | |
Bruce W. Duncan
(1951)
2013
[189] | | Chief Executive Officer and Director (January 2009 to December 2016), Chairman of the Board (January 2016 to present), and President (January 2009 to September 2016), First Industrial Realty Trust, an owner and operator of industrial properties; Chairman of the Board (2005 to September 2016) and Director (1999 to September 2016), Starwood Hotels & Resorts, a hotel and leisure company; Member, Investment Company Institute Board of Governors (2017 to present); Member, Independent Directors Council Governing Board (2017 to present); Senior Advisor, KKR (November 2018 to present); Director, Boston Properties (May 2016 to present); Director, Marriott International, Inc. (September 2016 to present) |
| | | |
Robert J. Gerrard, Jr.
(1952)
2012
[189] | | Advisory Board Member, Pipeline Crisis/Winning Strategies, a collaborative working to improve opportunities for young African Americans (1997 to January 2016); Chairman of the Board, all funds (July 2018 to present) |
| | | |
Paul F. McBride
(1956)
2013
[189] | | Advisory Board Member, Vizzia Technologies (2015 to present); Board Member, Dunbar Armored (2012 to 2018) |
| | | |
Cecilia E. Rouse, Ph.D.
(1963)
2012
[189] | | Dean, Woodrow Wilson School (2012 to present); Professor and Researcher, Princeton University (1992 to present); Director, MDRC, a nonprofit education and social policy research organization (2011 to present); Member, National Academy of Education (2010 to present); Research Associate of Labor Studies Program at the National Bureau of Economic Research (2011 to 2015); Board Member, National Bureau of Economic Research (2011 to present); Chair of Committee on the Status of Minority Groups in the Economic Profession of the American Economic Association (2012 to 2018); Vice President (2015 to 2016) and Board Member, American Economic Association (2018 to present) |
| | | |
John G. Schreiber
(1946)
2001
[189] | | Owner/President, Centaur Capital Partners, Inc., a real estate investment company (1991 to present); Cofounder, Partner, and Cochairman of the Investment Committee, Blackstone Real Estate Advisors, L.P. (1992 to 2015); Director, Blackstone Mortgage Trust, a real estate finance company (2012 to 2016); Director and Chairman of the Board, Brixmor Property Group, Inc. (2013 to present); Director, Hilton Worldwide (2007 to present); Director, Hudson Pacific Properties (2014 to 2016); Director, Invitation Homes (2014 to 2017); Director, JMB Realty Corporation (1980 to present) |
| | | |
Mark R. Tercek(c)
(1957)
2009
[0] | | President and Chief Executive Officer, The Nature Conservancy (2008 to present) |
| | | |
(a)All information about the independent directors was current as of February 19, 2019, unless otherwise indicated, except for the number of portfolios overseen, which is current as of the date of this report. |
(b)William J. Stromberg, president and chief executive officer of T. Rowe Price Group, Inc., the parent company of the Price Funds’ investment advisor, has served on the Board of Trustees of Johns Hopkins University since 2014 and is a member of the Johns Hopkins University Board’s Compensation Committee. |
(c)Effective February 15, 2019, Mr. Tercek resigned from his role as independent director of the Price Funds. |
INSIDE DIRECTORS
Name
(Year of Birth)
Year Elected*
[Number of T. Rowe Price
Portfolios Overseen] | | Principal Occupation(s) and Directorships of Public Companies and Other Investment Companies During the Past Five Years |
| | | |
David Oestreicher
(1967)
2018
[189] | | Chief Legal Officer, Vice President, and Secretary, T. Rowe Price Group, Inc.; Director, Vice President, and Secretary, T. Rowe Price Investment Services, Inc., T. Rowe Price Retirement Plan Services, Inc., T. Rowe Price Services, Inc., and T. Rowe Price Trust Company; Vice President and Secretary, T. Rowe Price, T. Rowe Price Hong Kong (Price Hong Kong), and T. Rowe Price International; Vice President, T. Rowe Price Japan (Price Japan) and T. Rowe Price Singapore (Price Singapore); Principal Executive Officer and Executive Vice President, all funds |
| | | |
Robert W. Sharps, CFA, CPA**
(1971)
2017
[189] | | Director and Vice President, T. Rowe Price; Vice President, T. Rowe Price Group, Inc., and T. Rowe Price Trust Company; Vice President, International Funds |
| | | |
*Each inside director serves until retirement, resignation, or election of a successor. |
**Mr. Sharps replaced Edward A. Wiese as director of the domestic fixed income Price Funds effective January 1, 2019. |
OFFICERS
Name (Year of Birth)
Position Held With International Funds | | Principal Occupation(s) |
| | | |
Mariel Abreu (1981)
Vice President | | Vice President, T. Rowe Price and T. Rowe Price Group, Inc. |
| | | |
Jason R. Adams (1979)
Vice President | | Vice President, T. Rowe Price and T. Rowe Price Group, Inc. |
| | | |
Ulle Adamson, CFA (1979)
Executive Vice President | | Vice President, T. Rowe Price Group, Inc., and T. Rowe Price International |
| | | |
Roy H. Adkins (1970)
Vice President | | Vice President, T. Rowe Price Group, Inc., and T. Rowe Price International |
| | | |
Christopher D. Alderson (1962)
President | | Director and Vice President, T. Rowe Price International; Vice President, Price Hong Kong, Price Singapore, and T. Rowe Price Group, Inc. |
| | | |
Syed H. Ali (1970)
Vice President | | Vice President, Price Singapore and T. Rowe Price Group, Inc. |
| | | |
Kennard W. Allen (1977)
Vice President | | Vice President, T. Rowe Price and T. Rowe Price Group, Inc. |
| | | |
Paulina Amieva (1981)
Vice President | | Vice President, T. Rowe Price and T. Rowe Price Group, Inc. |
| | | |
Malik S. Asif (1981)
Vice President | | Vice President, T. Rowe Price Group, Inc., and T. Rowe Price International |
| | | |
Ziad Bakri, M.D., CFA (1980)
Vice President | | Vice President, T. Rowe Price and T. Rowe Price Group, Inc. |
| | | |
Harishankar Balkrishna (1983)
Vice President | | Vice President, T. Rowe Price Group, Inc., and T. Rowe Price International |
| | | |
Sheena L. Barbosa (1983)
Vice President | | Vice President, Price Hong Kong and T. Rowe Price Group, Inc. |
| | | |
Peter J. Bates, CFA (1974)
Executive Vice President | | Vice President, T. Rowe Price and T. Rowe Price Group, Inc. |
| | | |
Jason A. Bauer (1979)
Vice President | | Vice President, T. Rowe Price and T. Rowe Price Group, Inc. |
| | | |
Luis M. Baylac (1982)
Vice President | | Vice President, T. Rowe Price Group, Inc., and T. Rowe Price International |
| | | |
Timothy Bei (1973)
Vice President | | Vice President, T. Rowe Price and T. Rowe Price Group, Inc. |
| | | |
Oliver D.M. Bell (1969)
Executive Vice President | | Vice President, T. Rowe Price Group, Inc., and T. Rowe Price International |
| | | |
R. Scott Berg, CFA (1972)
Executive Vice President | | Vice President, T. Rowe Price, T. Rowe Price Group, Inc., and T. Rowe Price Trust Company |
| | | |
Steve E. Boothe, CFA (1977)
Vice President | | Vice President, T. Rowe Price and T. Rowe Price Group, Inc. |
| | | |
Peter I. Botoucharov (1965)
Vice President | | Vice President, T. Rowe Price Group, Inc., and T. Rowe Price International |
| | | |
Tala Boulos (1984)
Vice President | | Vice President, T. Rowe Price Group, Inc., and T. Rowe Price International |
| | | |
Darrell N. Braman (1963)
Vice President and Secretary | | Vice President, Price Hong Kong, Price Singapore, T. Rowe Price, T. Rowe Price Group, Inc., T. Rowe Price International, T. Rowe Price Retirement Plan Services, Inc., and T. Rowe Price Services, Inc. |
| | | |
Christopher P. Brown, Jr., CFA (1977)
Vice President | | Vice President, T. Rowe Price and T. Rowe Price Group, Inc. |
| | | |
Sheldon Chan (1981)
Vice President | | Vice President, Price Hong Kong and T. Rowe Price Group, Inc. |
| | | |
Andrew Chang (1983)
Vice President | | Vice President, T. Rowe Price Group, Inc. |
| | | |
William Chen (1979)
Vice President | | Vice President, Price Hong Kong; formerly, Greater China TMT and Automation Analyst, J.P. Morgan Asset Management (to 2018) |
| | | |
Carolyn Hoi Che Chu (1974)
Vice President | | Vice President, Price Hong Kong and T. Rowe Price Group, Inc. |
| | | |
Archibald Ciganer Albeniz, CFA (1976)
Executive Vice President | | Director and Vice President, Price Japan; Vice President, T. Rowe Price Group, Inc. |
| | | |
Richard N. Clattenburg, CFA (1979)
Executive Vice President | | Vice President, Price Singapore, T. Rowe Price, T. Rowe Price Group, Inc., and T. Rowe Price International |
| | | |
Michael J. Conelius, CFA (1964)
Executive Vice President | | Vice President, T. Rowe Price, T. Rowe Price Group, Inc., T. Rowe Price International, and T. Rowe Price Trust Company |
| | | |
Michael F. Connelly, CFA (1977)
Vice President | | Vice President, T. Rowe Price and T. Rowe Price Group, Inc. |
| | | |
Andrew S. Davis (1978)
Vice President | | Vice President, T. Rowe Price and T. Rowe Price Group, Inc. |
| | | |
Richard de los Reyes (1975)
Vice President | | Vice President, T. Rowe Price, T. Rowe Price Group, Inc., and T. Rowe Price Trust Company |
| | | |
Michael Della Vedova (1969)
Executive Vice President | | Vice President, T. Rowe Price Group, Inc., and T. Rowe Price International |
| | | |
Iona Dent, CFA (1991)
Vice President | | Vice President, T. Rowe Price; formerly, Associate, Equity Research, Deutsche Bank (to 2018) |
| | | |
Maria Elena Drew (1973)
Vice President | | Vice President, T. Rowe Price Group, Inc., and T. Rowe Price International; formerly, Executive Director, Goldman Sachs Asset Management (to 2017) |
| | | |
Shawn T. Driscoll (1975)
Vice President | | Vice President, T. Rowe Price, T. Rowe Price Group, Inc., and T. Rowe Price Trust Company |
| | | |
Alan S. Dupski, CPA (1982)
Assistant Treasurer | | Vice President, T. Rowe Price and T. Rowe Price Group, Inc. |
| | | |
Bridget A. Ebner (1970)
Vice President | | Vice President, T. Rowe Price and T. Rowe Price Group, Inc. |
| | | |
David J. Eiswert, CFA (1972)
Executive Vice President | | Vice President, T. Rowe Price and T. Rowe Price Group, Inc. |
| | | |
Dawei Feng (1979)
Vice President | | Vice President, Price Hong Kong and T. Rowe Price Group, Inc.; formerly, Head of China Consumer in Equity Research, Credit Lyonnais Asia-Pacific (to 2018) |
| | | |
Ryan W. Ferro (1985)
Vice President | | Vice President, T. Rowe Price and T. Rowe Price Group, Inc. |
| | | |
Mark S. Finn, CFA, CPA (1963)
Vice President | | Vice President, T. Rowe Price, T. Rowe Price Group, Inc., and T. Rowe Price Trust Company |
| | | |
Quentin S. Fitzsimmons (1968)
Vice President | | Vice President, T. Rowe Price Group, Inc., and T. Rowe Price International; formerly, Portfolio Manager, Royal Bank of Scotland Group (to 2015) |
| | | |
Melissa C. Gallagher (1974)
Vice President | | Vice President, T. Rowe Price Group, Inc., and T. Rowe Price International |
| | | |
Justin T. Gerbereux, CFA (1975)
Vice President | | Vice President, T. Rowe Price, T. Rowe Price Group, Inc., and T. Rowe Price Trust Company |
| | | |
Aaron Gifford, CFA (1987)
Vice President | | Vice President, T. Rowe Price and T. Rowe Price Group, Inc.; formerly, Strategist, Morgan Stanley & Co. LLC (to 2017) |
| | | |
John R. Gilner (1961)
Chief Compliance Officer | | Chief Compliance Officer and Vice President, T. Rowe Price; Vice President, T. Rowe Price Group, Inc., and T. Rowe Price Investment Services, Inc. |
| | | |
Vishnu V. Gopal (1979)
Vice President | | Vice President, Price Hong Kong and T. Rowe Price Group, Inc. |
| | | |
Joel Grant (1978)
Vice President | | Vice President, T. Rowe Price and T. Rowe Price Group, Inc. |
| | | |
Gary J. Greb (1961)
Vice President | | Vice President, T. Rowe Price, T. Rowe Price International, and T. Rowe Price Trust Company |
| | | |
Paul D. Greene II (1978)
Vice President | | Vice President, T. Rowe Price and T. Rowe Price Group, Inc. |
| | | |
Benjamin Griffiths, CFA (1977)
Vice President | | Vice President, T. Rowe Price Group, Inc., and T. Rowe Price International |
| | | |
Gianluca Guicciardi (1983)
Vice President | | Vice President, T. Rowe Price Group, Inc., and T. Rowe Price International |
| | | |
Richard L. Hall (1979)
Vice President | | Vice President, T. Rowe Price and T. Rowe Price Group, Inc. |
| | | |
Nabil Hanano, CFA (1984)
Vice President | | Vice President, T. Rowe Price Group, Inc., and T. Rowe Price International |
| | | |
Daniel B. Hirsch, CFA (1985)
Vice President | | Vice President, T. Rowe Price |
| | | |
Jeffrey Holford, Ph.D., ACA (1972)
Vice President | | Vice President, T. Rowe Price and T. Rowe Price Group, Inc.; formerly, Managing Director, Jeffries Financial Group (to 2018) |
| | | |
Stefan Hubrich, Ph.D., CFA (1974)
Vice President | | Vice President, T. Rowe Price and T. Rowe Price Group, Inc. |
| | | |
Arif Husain, CFA (1972)
Executive Vice President | | Vice President, T. Rowe Price Group, Inc., and T. Rowe Price International |
| | | |
Hiromasa Ikeda (1971)
Vice President | | Vice President, Price Hong Kong and T. Rowe Price Group, Inc. |
| | | |
Tetsuji Inoue (1971)
Vice President | | Vice President, T. Rowe Price Group, Inc., and T. Rowe Price International |
| | | |
Michael D. Jacobs (1971)
Vice President | | Vice President, Price Japan, T. Rowe Price Group, Inc., and T. Rowe Price International |
| | | |
Randal S. Jenneke (1971)
Vice President | | Vice President, T. Rowe Price Group, Inc. |
| | | |
Prashant G. Jeyaganesh (1983)
Vice President | | Vice President, T. Rowe Price and T. Rowe Price Group, Inc. |
| | | |
Nina P. Jones, CPA (1980)
Vice President | | Vice President, T. Rowe Price and T. Rowe Price Group, Inc. |
| | | |
Yoichiro Kai (1973)
Vice President | | Vice President, T. Rowe Price Group, Inc., and T. Rowe Price International |
| | | |
Jacob H. Kann, CFA (1987)
Vice President | | Vice President, T. Rowe Price and T. Rowe Price Group, Inc. |
| | | |
Jai Kapadia (1982)
Vice President | | Vice President, Price Hong Kong and T. Rowe Price Group, Inc. |
| | | |
Andrew J. Keirle (1974)
Executive Vice President | | Vice President, T. Rowe Price Group, Inc., and T. Rowe Price International |
| | | |
Takanori Kobayashi (1981)
Vice President | | Vice President, Price Japan, T. Rowe Price Group, Inc., and T. Rowe Price International; formerly, Research Analyst, Allianz Global Investors (to 2017) |
| | | |
Paul J. Krug, CPA (1964)
Vice President | | Vice President, T. Rowe Price, T. Rowe Price Group, Inc., and T. Rowe Price Trust Company |
| | | |
Christopher J. Kushlis, CFA (1976)
Vice President | | Vice President, T. Rowe Price Group, Inc., and T. Rowe Price International |
| | | |
Shengrong Lau (1982)
Vice President | | Vice President, Price Singapore and T. Rowe Price Group, Inc. |
| | | |
Mark J. Lawrence (1970)
Vice President | | Vice President, T. Rowe Price Group, Inc., and T. Rowe Price International |
| | | |
Jacqueline L. Liu (1979)
Vice President | | Vice President, Price Hong Kong and T. Rowe Price Group, Inc. |
| | | |
Johannes Loefstrand (1988)
Vice President | | Vice President, T. Rowe Price International |
| | | |
Anh Lu (1968)
Executive Vice President | | Vice President, Price Hong Kong and T. Rowe Price Group, Inc. |
| | | |
Oxana Lyalina (1987)
Vice President | | Vice President, T. Rowe Price International |
| | | |
Sebastien Mallet (1974)
Vice President | | Vice President, T. Rowe Price Group, Inc., and T. Rowe Price International |
| | | |
Jennifer Martin (1972)
Vice President | | Vice President, T. Rowe Price and T. Rowe Price Group, Inc. |
| | | |
Ryan Martyn (1979)
Vice President | | Vice President, T. Rowe Price Group, Inc., and T. Rowe Price International |
| | | |
Catherine D. Mathews (1963)
Principal Financial Officer, Vice President,
and Treasurer | | Vice President, T. Rowe Price, T. Rowe Price Group, Inc., T. Rowe Price International, and T. Rowe Price Trust Company |
| | | |
Raymond A. Mills, Ph.D., CFA (1960)
Executive Vice President | | Vice President, T. Rowe Price, T. Rowe Price Group, Inc., and T. Rowe Price Trust Company |
| | | |
Jihong Min (1979)
Vice President | | Vice President, Price Singapore and T. Rowe Price Group, Inc. |
| | | |
Eric C. Moffett (1974)
Executive Vice President | | Vice President, Price Hong Kong and T. Rowe Price Group, Inc. |
| | | |
Ivan Morozov, CFA (1987)
Vice President | | Vice President, T. Rowe Price Group, Inc., and T. Rowe Price International |
| | | |
Samy B. Muaddi, CFA (1984)
Executive Vice President | | Vice President, T. Rowe Price and T. Rowe Price Group, Inc. |
| | | |
Tobias F. Mueller, CFA (1980)
Vice President | | Vice President, T. Rowe Price Group, Inc., and T. Rowe Price International |
| | | |
Joshua Nelson (1977)
Executive Vice President | | Vice President, T. Rowe Price, T. Rowe Price Group, Inc., T. Rowe Price International, and T. Rowe Price Trust Company |
| | | |
Philip A. Nestico (1976)
Vice President | | Vice President, T. Rowe Price and T. Rowe Price Group, Inc. |
| | | |
Michael Niedzielski (1979)
Vice President | | Vice President, T. Rowe Price Group, Inc., and T. Rowe Price International |
| | | |
Sridhar Nishtala (1975)
Vice President | | Director and Vice President, Price Singapore and T. Rowe Price Group, Inc. |
| | | |
Jason Nogueira, CFA (1974)
Executive Vice President | | Vice President, T. Rowe Price and T. Rowe Price Group, Inc. |
| | | |
Kenneth A. Orchard (1975)
Executive Vice President | | Vice President, T. Rowe Price Group, Inc., and T. Rowe Price International |
| | | |
Curt J. Organt, CFA (1968)
Vice President | | Vice President, T. Rowe Price and T. Rowe Price Group, Inc. |
| | | |
Paul T. O’Sullivan (1973)
Vice President | | Vice President, T. Rowe Price Group, Inc., and T. Rowe Price International |
| | | |
Oluwaseun A. Oyegunle, CFA (1984)
Vice President | | Vice President, T. Rowe Price Group, Inc., and T. Rowe Price International |
| | | |
Gonzalo Pángaro, CFA (1968)
Executive Vice President | | Vice President, T. Rowe Price Group, Inc., and T. Rowe Price International |
| | | |
Vivek Rajeswaran (1985)
Vice President | | Vice President, T. Rowe Price and T. Rowe Price Group, Inc. |
| | | |
John W. Ratzesberger (1975)
Vice President | | Vice President, T. Rowe Price, T. Rowe Price Group, Inc., and T. Rowe Price Trust Company |
| | | |
Shannon H. Rauser (1987)
Assistant Secretary | | Assistant Vice President, T. Rowe Price |
| | | |
Todd Reese (1990)
Vice President | | Employee, T. Rowe Price; formerly, Investment Analyst, Trian Fund Management (to 2016) |
| | | |
Melanie A. Rizzo (1982)
Vice President | | Vice President, T. Rowe Price and T. Rowe Price Group, Inc. |
| | | |
David L. Rowlett, CFA (1975)
Vice President | | Vice President, T. Rowe Price and T. Rowe Price Group, Inc. |
| | | |
Federico Santilli, CFA (1974)
Executive Vice President | | Vice President, T. Rowe Price Group, Inc., and T. Rowe Price International |
| | | |
Nikolaj Schmidt (1975)
Vice President | | Vice President, T. Rowe Price Group, Inc., and T. Rowe Price International |
| | | |
Sebastian Schrott (1977)
Vice President | | Vice President, T. Rowe Price Group, Inc., and T. Rowe Price International |
| | | |
Bin Shen, CFA (1987)
Vice President | | Employee, T. Rowe Price |
| | | |
John C.A. Sherman (1969)
Vice President | | Vice President, T. Rowe Price and T. Rowe Price Group, Inc. |
| | | |
Gabriel Solomon (1977)
Vice President | | Vice President, T. Rowe Price and T. Rowe Price Group, Inc. |
| | | |
Scott D. Solomon, CFA (1981)
Vice President | | Vice President, T. Rowe Price and T. Rowe Price Group, Inc. |
| | | |
Joshua K. Spencer, CFA (1973)
Vice President | | Vice President, T. Rowe Price, T. Rowe Price Group, Inc., and T. Rowe Price Trust Company |
| | | |
David Stanley (1963)
Vice President | | Vice President, T. Rowe Price Group, Inc., and T. Rowe Price International |
| | | |
Saurabh Sud, CFA (1985)
Executive Vice President | | Vice President, T. Rowe Price and T. Rowe Price Group, Inc.; formerly, Senior Vice President, PIMCO (to 2018) |
| | | |
Taymour R. Tamaddon, CFA (1976)
Vice President | | Vice President, T. Rowe Price, T. Rowe Price Group, Inc., and T. Rowe Price Trust Company |
| | | |
Ju Yen Tan (1972)
Vice President | | Vice President, T. Rowe Price Group, Inc., and T. Rowe Price International |
| | | |
Sin Dee Tan, CFA (1979)
Vice President | | Vice President, T. Rowe Price Group, Inc., and T. Rowe Price International |
| | | |
Dean Tenerelli (1964)
Executive Vice President | | Vice President, T. Rowe Price Group, Inc., and T. Rowe Price International |
| | | |
Siby Thomas (1979)
Vice President | | Vice President, T. Rowe Price and T. Rowe Price Group, Inc. |
| | | |
Justin Thomson (1968)
Executive Vice President | | Vice President, T. Rowe Price Group, Inc., and T. Rowe Price International |
| | | |
Mark J. Vaselkiv (1958)
Executive Vice President | | Vice President, T. Rowe Price, T. Rowe Price Group, Inc., and T. Rowe Price Trust Company |
| | | |
Rupinder Vig (1979)
Vice President | | Vice President, T. Rowe Price Group, Inc., and T. Rowe Price International; formerly, Partner, Egerton Capital (to 2016) |
| | | |
Willem Visser (1979)
Vice President | | Vice President, T. Rowe Price Group, Inc., and T. Rowe Price International; formerly, Investment Analyst, NN Investment Partners (to 2017) |
| | | |
Kes Visuvalingam, CFA (1968)
Vice President | | Vice President, T. Rowe Price Group, Inc., and T. Rowe Price International |
| | | |
Chris Vost (1989)
Vice President | | Vice President, T. Rowe Price International |
| | | |
Zenon Voyiatzis (1971)
Vice President | | Vice President, T. Rowe Price Group, Inc., and T. Rowe Price International |
| | | |
Verena E. Wachnitz, CFA (1978)
Executive Vice President | | Vice President, T. Rowe Price Group, Inc., and T. Rowe Price International |
| | | |
David J. Wallack (1960)
Vice President | | Vice President, T. Rowe Price, T. Rowe Price Group, Inc., and T. Rowe Price Trust Company |
| | | |
Dai Wang (1989)
Vice President | | Vice President, Price Hong Kong and T. Rowe Price Group, Inc. |
| | | |
Megan Warren (1968)
Vice President | | Vice President, T. Rowe Price, T. Rowe Price Group, Inc., T. Rowe Price Retirement Plan Services, Inc., T. Rowe Price Services, Inc., and T. Rowe Price Trust Company; formerly, Executive Director, JPMorgan Chase (to 2017) |
| | | |
Hiroshi Watanabe, CFA (1975)
Vice President | | Director and Vice President, Price Japan; Vice President, T. Rowe Price Group, Inc. |
| | | |
Clive M. Williams (1966)
Vice President | | Vice President, Price Hong Kong, Price Singapore, T. Rowe Price, T. Rowe Price Group, Inc., and T. Rowe Price International |
| | | |
J. Howard Woodward, CFA (1974)
Vice President | | Vice President, T. Rowe Price Group, Inc., and T. Rowe Price International |
| | | |
Marta Yago (1977)
Vice President | | Vice President, T. Rowe Price Group, Inc., and T. Rowe Price International |
| | | |
Benjamin T. Yeagle (1978)
Vice President | | Vice President, T. Rowe Price and T. Rowe Price Group, Inc. |
| | | |
Ernest C. Yeung, CFA (1979)
Executive Vice President | | Director and Vice President, Price Hong Kong; Vice President, T. Rowe Price Group, Inc. |
| | | |
Alison Mei Ling Yip (1966)
Vice President | | Vice President, Price Hong Kong and T. Rowe Price Group, Inc. |
| | | |
Eric Yuan (1984)
Vice President | | Vice President, Price Hong Kong and T. Rowe Price Group, Inc.; formerly, student, Columbia Business School (to 2016) |
| | | |
Wenli Zheng (1979)
Vice President | | Vice President, Price Hong Kong and T. Rowe Price Group, Inc. |
| | | |
Unless otherwise noted, officers have been employees of T. Rowe Price or T. Rowe Price International for at least 5 years. |
Item 1. (b) Notice pursuant to Rule 30e-3.
Not applicable.
Item 2. Code of Ethics.
The registrant has adopted a code of ethics, as defined in Item 2 of Form N-CSR, applicable to its principal executive officer, principal financial officer, principal accounting officer or controller, or persons performing similar functions. A copy of this code of ethics is filed as an exhibit to this Form N-CSR. No substantive amendments were approved or waivers were granted to this code of ethics during the period covered by this report.
Item 3. Audit Committee Financial Expert.
The registrant’s Board of Directors/Trustees has determined that Mr. Bruce W. Duncan qualifies as an audit committee financial expert, as defined in Item 3 of Form N-CSR. Mr. Duncan is considered independent for purposes of Item 3 of Form N-CSR.
Item 4. Principal Accountant Fees and Services.
(a) – (d) Aggregate fees billed for the last two fiscal years for professional services rendered to, or on behalf of, the registrant by the registrant’s principal accountant were as follows:
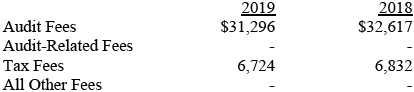
Audit fees include amounts related to the audit of the registrant’s annual financial statements and services normally provided by the accountant in connection with statutory and regulatory filings. Audit-related fees include amounts reasonably related to the performance of the audit of the registrant’s financial statements and specifically include the issuance of a report on internal controls and, if applicable, agreed-upon procedures related to fund acquisitions. Tax fees include amounts related to services for tax compliance, tax planning, and tax advice. The nature of these services specifically includes the review of distribution calculations and the preparation of Federal, state, and excise tax returns. All other fees include the registrant’s pro-rata share of amounts for agreed-upon procedures in conjunction with service contract approvals by the registrant’s Board of Directors/Trustees.
(e)(1) The registrant’s audit committee has adopted a policy whereby audit and non-audit services performed by the registrant’s principal accountant for the registrant, its investment adviser, and any entity controlling, controlled by, or under common control with the investment adviser that provides ongoing services to the registrant require pre-approval in advance at regularly scheduled audit committee meetings. If such a service is required between regularly scheduled audit committee meetings, pre-approval may be authorized by one audit committee member with ratification at the next scheduled audit committee meeting. Waiver of pre-approval for audit or non-audit services requiring fees of a de minimis amount is not permitted.
(2) No services included in (b) – (d) above were approved pursuant to paragraph (c)(7)(i)(C) of Rule 2-01 of Regulation S-X.
(f) Less than 50 percent of the hours expended on the principal accountant’s engagement to audit the registrant’s financial statements for the most recent fiscal year were attributed to work performed by persons other than the principal accountant’s full-time, permanent employees.
(g) The aggregate fees billed for the most recent fiscal year and the preceding fiscal year by the registrant’s principal accountant for non-audit services rendered to the registrant, its investment adviser, and any entity controlling, controlled by, or under common control with the investment adviser that provides ongoing services to the registrant were $3,227,000 and $2,544,000, respectively.
(h) All non-audit services rendered in (g) above were pre-approved by the registrant’s audit committee. Accordingly, these services were considered by the registrant’s audit committee in maintaining the principal accountant’s independence.
Item 5. Audit Committee of Listed Registrants.
Not applicable.
Item 6. Investments.
(a) Not applicable. The complete schedule of investments is included in Item 1 of this Form N-CSR.
(b) Not applicable.
Item 7. Disclosure of Proxy Voting Policies and Procedures for Closed-End Management Investment Companies.
Not applicable.
Item 8. Portfolio Managers of Closed-End Management Investment Companies.
Not applicable.
Item 9. Purchases of Equity Securities by Closed-End Management Investment Company and Affiliated Purchasers.
Not applicable.
Item 10. Submission of Matters to a Vote of Security Holders.
Not applicable.
Item 11. Controls and Procedures.
(a) The registrant’s principal executive officer and principal financial officer have evaluated the registrant’s disclosure controls and procedures within 90 days of this filing and have concluded that the registrant’s disclosure controls and procedures were effective, as of that date, in ensuring that information required to be disclosed by the registrant in this Form N-CSR was recorded, processed, summarized, and reported timely.
(b) The registrant’s principal executive officer and principal financial officer are aware of no change in the registrant’s internal control over financial reporting that occurred during the period covered by this report that has materially affected, or is reasonably likely to materially affect, the registrant’s internal control over financial reporting.
Item 12. Disclosure of Securities Lending Activities for Closed-End Management Investment Companies.
Not applicable.
Item 13. Exhibits.
(a)(1) The registrant’s code of ethics pursuant to Item 2 of Form N-CSR is attached.
(2) Separate certifications by the registrant's principal executive officer and principal financial officer, pursuant to Section 302 of the Sarbanes-Oxley Act of 2002 and required by Rule 30a-2(a) under the Investment Company Act of 1940, are attached.
(3) Written solicitation to repurchase securities issued by closed-end companies: not applicable.
(b) A certification by the registrant’s principal executive officer and principal financial officer, pursuant to Section 906 of the Sarbanes-Oxley Act of 2002 and required by Rule 30a-2(b) under the Investment Company Act of 1940, is attached.
SIGNATURES
Pursuant to the requirements of the Securities Exchange Act of 1934 and the Investment Company Act of 1940, the registrant has duly caused this report to be signed on its behalf by the undersigned, thereunto duly authorized.
T. Rowe Price International Funds, Inc.
| By | | /s/ David Oestreicher |
| | | David Oestreicher |
| | | Principal Executive Officer |
| |
| Date | | February 14, 2020 | | | | |
Pursuant to the requirements of the Securities Exchange Act of 1934 and the Investment Company Act of 1940, this report has been signed below by the following persons on behalf of the registrant and in the capacities and on the dates indicated.
| By | | /s/ David Oestreicher |
| | | David Oestreicher |
| | | Principal Executive Officer |
| |
| Date | | February 14, 2020 | | | | |
| |
| |
| By | | /s/ Alan S. Dupski |
| | | Alan S. Dupski |
| | | Principal Financial Officer |
| |
| Date | | February 14, 2020 | | | | |