UNITED STATES
SECURITIES AND EXCHANGE COMMISSION
Washington, D.C. 20549
FORM N-CSR
CERTIFIED SHAREHOLDER REPORT
OF
REGISTERED MANAGEMENT INVESTMENT COMPANIES
Investment Company Act file number: 811-02968-99
Name of Registrant: |
| Vanguard Trustees’ Equity Fund | ||
Address of Registrant: |
| P.O. Box 2600 | ||
|
| Valley Forge, PA 19482 | ||
|
|
| ||
Name and address of agent for service: |
| Anne E. Robinson, Esquire | ||
|
| P.O. Box 876 | ||
|
| Valley Forge, PA 19482 | ||
Registrant’s telephone number, including area code: (610) 669-1000
Date of fiscal year end: October 31
Date of reporting period: November 1, 2018—October 31, 2019
Item 1: Reports to Shareholders

Annual Report | October 31, 2019
Vanguard International Value Fund
|
See the inside front cover for important information about access to your fund’s annual and semiannual shareholder reports.
|
Important information about access to shareholder reports
Beginning on January 1, 2021, as permitted by regulations adopted by the Securities and Exchange Commission, paper copies of your fund’s annual and semiannual shareholder reports will no longer be sent to you by mail, unless you specifically request them. Instead, you will be notified by mail each time a report is posted on the website and will be provided with a link to access the report.
If you have already elected to receive shareholder reports electronically, you will not be affected by this change and do not need to take any action. You may elect to receive shareholder reports and other communications from the fund electronically by contacting your financial intermediary (such as a broker-dealer or bank) or, if you invest directly with the fund, by calling Vanguard at one of the phone numbers on the back cover of this report or by logging on to vanguard.com.
You may elect to receive paper copies of all future shareholder reports free of charge. If you invest through a financial intermediary, you can contact the intermediary to request that you continue to receive paper copies. If you invest directly with the fund, you can call Vanguard at one of the phone numbers on the back cover of this report or log on to vanguard.com. Your election to receive paper copies will apply to all the funds you hold through an intermediary or directly with Vanguard.
Contents |
|
|
|
A Note From Our Chairman | 1 |
Your Fund’s Performance at a Glance | 2 |
Advisors’ Report | 3 |
About Your Fund’s Expenses | 8 |
Performance Summary | 10 |
Financial Statements | 12 |
Please note: The opinions expressed in this report are just that—informed opinions. They should not be considered promises or advice. Also, please keep in mind that the information and opinions cover the period through the date on the front of this report. Of course, the risks of investing in your fund are spelled out in the prospectus.
A Note From Our Chairman

Tim Buckley
Chairman and Chief Executive Officer
Dear Shareholder,
Recent volatility in financial markets—affecting stocks, bonds, and commodities—has been a good reminder of the wise old adage, “Never keep all your eggs in one basket.” Maintaining balance and diversification in your investment portfolio can help to both limit risk and set you up for long-term success.
It’s understandable why some investors might become complacent after a long market run-up like the one that lifted stock prices, especially U.S. stock prices, in the years following the global financial crisis. But failing to rebalance regularly can leave a portfolio with a much different mix of assets than intended and, often, more risk than intended.
Balance across and diversification within asset classes are powerful tools for managing risk and achieving your investment goals. A portfolio’s allocation will determine a large portion of its long-term return and also the majority of its volatility risk. A well-diversified portfolio is less vulnerable to significant swings in the performance of any one segment of the asset classes in which it invests.
Balance and diversification will never eliminate the risk of loss, nor will they guarantee positive returns in a declining market. But they should reduce the chance that you’ll suffer disproportionate losses in one particular high-flying asset class or sector when it comes back to earth. And exposure to all key market components should give you at least some participation in the sectors that are performing best at any given time.
Vanguard is committed to helping you achieve balance and diversification in your portfolios to help meet your investment goals. We thank you for your continued loyalty.
Sincerely,

Mortimer J. Buckley
Chairman and Chief Executive Officer
November 18, 2019
Your Fund’s Performance at a Glance
· Vanguard International Value Fund returned 8.48% for the 12 months ended October 31, 2019. It lagged its benchmark, the MSCI AC World Index ex USA, which returned 11.27%.
· Using multiple managers, the fund seeks long-term capital appreciation through broadly diversified exposure to the major equity markets outside of the United States.
· Of the fund’s 11 sectors, only information technology, health care, and materials helped relative performance. Holdings in consumer discretionary, financials, energy, and communication services were the biggest laggards.
· Fund holdings in emerging markets and the Middle East outperformed relative to the benchmark, but positions in Europe and the Pacific detracted.
· The fund’s average annual return of 4.83% for the ten years ended October 31, 2019, surpassed the 4.50% average annual return of its Spliced International Index benchmark.
Market Barometer
|
| Average Annual Total Returns |
| ||||
|
| Periods Ended October 31, 2019 |
| ||||
|
| One Year |
| Three Years |
| Five Years |
|
Stocks |
|
|
|
|
|
|
|
Russell 1000 Index (Large-caps) |
| 14.15% |
| 14.73% |
| 10.55% |
|
Russell 2000 Index (Small-caps) |
| 4.90 |
| 10.96 |
| 7.37 |
|
Russell 3000 Index (Broad U.S. market) |
| 13.49 |
| 14.47 |
| 10.31 |
|
FTSE All-World ex US Index (International) |
| 11.52 |
| 8.21 |
| 4.16 |
|
|
|
|
|
|
|
|
|
Bonds |
|
|
|
|
|
|
|
Bloomberg Barclays U.S. Aggregate Bond Index (Broad taxable market) |
| 11.51% |
| 3.29% |
| 3.24% |
|
Bloomberg Barclays Municipal Bond Index (Broad tax-exempt market) |
| 9.42 |
| 3.62 |
| 3.55 |
|
FTSE Three-Month U.S. Treasury Bill Index |
| 2.35 |
| 1.57 |
| 0.98 |
|
|
|
|
|
|
|
|
|
CPI |
|
|
|
|
|
|
|
Consumer Price Index |
| 1.76% |
| 2.11% |
| 1.62% |
|
Advisors’ Report
For the 12 months ended October 31, 2019, Vanguard International Value Fund returned 8.48%. Your fund is managed by three independent advisors, a strategy that enhances diversification by providing exposure to distinct yet complementary investment approaches. It is not uncommon for different advisors to have different views about individual securities or the broader investment environment.
The table on page 7 presents the advisors, the percentage and amount of fund assets that each manages, and brief descriptions of their investment strategies. Each advisor has also prepared a discussion of the investment environment during the fiscal period and of how the portfolio’s positioning reflects this assessment. These reports were prepared on November 21, 2019.
Lazard Asset Management LLC
Portfolio Managers:
Michael G. Fry, Managing Director
Michael A. Bennett, CPA,
Managing Director
Developed international equities gained more than 11% during the period, and emerging markets stocks rose almost 12%. Investor uncertainty about global growth and trade weighed on sentiment, and central banks responded by loosening monetary policy. Governments in surplus were urged to implement fiscal stimulus, which sustained strong equity returns.
Trade tensions contributed to a slower economy. Global growth has declined 1.2 percentage points since President Donald Trump first ordered tariffs on steel and aluminum in early 2018. Germany, an export powerhouse, reported slightly negative GDP growth in the second quarter as manufacturing indexes deteriorated. China—the world’s second-largest economy and source of almost 20% of global growth—reported GDP growth of 6.2%, a 27-year low.
Although global manufacturing was weak, the global consumer was more resilient. The majority of consumer data was still relatively positive, and this helped drive modestly positive global growth.
Stock selection in the materials sector helped drive relative returns. Shin-Etsu Chemical, a Japanese chemical company, reported strong first-quarter results and quarter-over-quarter operating profit growth in all segments. Stock selection in the United Kingdom also contributed; global insurance broker Aon outperformed as cost reductions drove margins higher.
In contrast, stock selection in the consumer discretionary sector hurt relative returns. Japanese retailer Ryohin Keikaku, operator of Muji brand stores, underperformed on rising costs and some missteps in recruitment, which should correct itself through natural attrition. In the energy sector, shares of Canadian integrated oil sands and refinery company Suncor Energy lagged.
The global economy’s deceleration, in our view, is part of its progression through the late stages of the cycle. Ultimately, our outlook is mostly unchanged from previous periods. As the world’s central banks ease monetary policy and expectations of regional earnings remain similar, investors may focus on relatively cheap companies that can more reliably deliver earnings and cash flows.
In this environment, stock selection will be a main driver of returns. We believe high-quality, more defensive companies, with fortunes less geared to the economic cycle and inexpensive valuations, will lead for the foreseeable future.
Edinburgh Partners Limited
Portfolio Manager:
Sandy Nairn, Investment Partner,
Director and CEO
Asset markets staged a significant recovery over the period as weaker economic indicators softened the resolve of central banks. The reversal of normalizing the cost of money lay behind the markets’ moves, again inflating some valuations beyond what we believe is sustainable.
We see real issues caused by the sustained use of unconventional monetary policy to promote economic growth. Valuations in both private equity and private debt look highly vulnerable and can potentially undermine public equity and debt markets. We therefore continue to be cautious in our outlook.
Our portion of the portfolio retains a defensive orientation, with significant exposures to health care and communication services. During the fiscal year, health care stocks helped results. AstraZeneca in particular appreciated after good news about its drug pipeline. Roche and a new position in Astellas Pharma also added significantly.
Communication services holdings contributed, too. We increased our position in Vodafone when it fell sharply after a dividend cut before subsequently rebounding. Both Galaxy Entertainment and Lenovo boosted performance, but a backdrop of significant price movements emphasized the need for patience and a long-term view.
The reversal on interest rates had a negative impact on our financial holdings. A number of banks, most notably Commerzbank, fell because of reduced expectations on net interest income.
In information technology, Panasonic was weak as concerns over its relationship with Tesla mounted. But we regard its underlying business as well-positioned, and we are comfortable with the holding. Nokia, on the other hand, reduced future expectations and noted a shift toward lower-priced equipment in the 5G rollout. Although its current results are reasonable, this caused us to reevaluate the position.
Against this backdrop, the portfolio remains exposed to stocks with valuations less reliant on strong growth and balance sheets that are more robust or cash-flow rich.
Our caution has increased, and we are focused on researching potential holdings that could become attractive when market liquidity diminishes. In the meantime, we believe the portfolio has the correct mixture of defensive positions and those with economic exposure counterbalanced by very low valuations.
ARGA Investment Management, LP
Portfolio Managers:
A. Rama Krishna, CFA, Founder and
Chief Investment Officer
Steven Morrow, CFA, Director of Research
Favorable market factors drove strong international equity performance for the fiscal year ended October 31. Key drivers included welcome signs of bottoming global growth and progress in U.S.-China trade negotiations.
Our portion of the portfolio’s results and changes reflect unwavering commitment to our valuation approach. Our goal is to own undervalued stocks that are unpopular because of temporary stress but likely to recover in the long term on the strength of underlying franchises.
Our information technology holdings were a powerful example of this approach and the largest contributor to results. Stress on the sector early on enabled us to double our exposure to undervalued companies. These included leading semiconductor and semiconductor-manufacturing equipment providers that suffered from a cycle downturn, Apple supply chain weakness, and otherwise soft demand.
Our research suggested a deep short-term cycle downturn would set the stage for strong longer-term recovery as demand drivers took effect. By the end of the fiscal year, changing expectations and the bottoming of demand signaled eventual semiconductor recovery. Along with positive company developments, this drove technology’s strong performance.
Japan offers significant geographic valuation opportunity, and it represented our largest single country weighting. We added to our exposure at the start of the period, when Japanese equities became further depressed by trade tensions, technology sector weakness, and global macroeconomic uncertainty.
Our environmental, social, and governance (ESG) research suggested that these market concerns overshadowed impressive progress made by Japanese companies in corporate governance and balance sheet management. Over time, the market began rewarding Japan’s ESG improvements through unprecedented buyback programs, strong board governance,
restructuring measures, and prudent capital allocation. This contributed to results and future opportunities.
As value investing in general remains out of favor, many of our value-style equities are undervalued. This has provided many compelling regional and sector opportunities. We believe continued discipline and patience will generate strong future returns.
Vanguard International Value Fund Investment Advisors
| Fund Assets Managed |
|
| |
Investment Advisor | % | $ Million |
| Investment Strategy |
Lazard Asset Management LLC | 40 | 4,076 |
| The advisor uses a research-driven, bottom-up, relative-value approach in selecting stocks. The goal is to identify individual stocks that offer an appropriate trade-off between low relative valuation and high financial productivity. |
Edinburgh Partners Limited | 34 | 3,528 |
| The advisor employs a concentrated, low-turnover, value-oriented investment approach that results in a portfolio of companies with good long-term prospects and below-market price/earnings ratios. In-depth fundamental research on industries and companies is central to this investment process. |
ARGA Investment Management, LP | 24 | 2,532 |
| The advisor believes that investors overreact to short-term developments in companies, leading to opportunities to generate gains as the businesses recover. Its valuation-focused process uses a dividend discount model to select stocks that trade at a discount to intrinsic value based on the company’s long-term earnings power and dividend-paying capability. |
Cash Investments | 2 | 224 |
| These short-term reserves are invested by Vanguard in equity index products to simulate investments in stocks. Each advisor may also maintain a modest cash position. |
About Your Fund’s Expenses
As a shareholder of the fund, you incur ongoing costs, which include costs for portfolio management, administrative services, and shareholder reports (like this one), among others. Operating expenses, which are deducted from a fund’s gross income, directly reduce the investment return of the fund.
A fund’s expenses are expressed as a percentage of its average net assets. This figure is known as the expense ratio. The following examples are intended to help you understand the ongoing costs (in dollars) of investing in your fund and to compare these costs with those of other mutual funds. The examples are based on an investment of $1,000 made at the beginning of the period shown and held for the entire period.
The accompanying table illustrates your fund’s costs in two ways:
· Based on actual fund return. This section helps you to estimate the actual expenses that you paid over the period. The “Ending Account Value” shown is derived from the fund’s actual return, and the third column shows the dollar amount that would have been paid by an investor who started with $1,000 in the fund. You may use the information here, together with the amount you invested, to estimate the expenses that you paid over the period.
To do so, simply divide your account value by $1,000 (for example, an $8,600 account value divided by $1,000 = 8.6), then multiply the result by the number given for your fund under the heading “Expenses Paid During Period.”
· Based on hypothetical 5% yearly return. This section is intended to help you compare your fund’s costs with those of other mutual funds. It assumes that the fund had a yearly return of 5% before expenses, but that the expense ratio is unchanged. In this case—because the return used is not the fund’s actual return—the results do not apply to your investment. The example is useful in making comparisons because the Securities and Exchange Commission requires all mutual funds to calculate expenses based on a 5% return. You can assess your fund’s costs by comparing this hypothetical example with the hypothetical examples that appear in shareholder reports of other funds.
Note that the expenses shown in the table are meant to highlight and help you compare ongoing costs only and do not reflect transaction costs incurred by the fund for buying and selling securities. Further, the expenses do not include any purchase, redemption, or account service fees described in the fund prospectus. If such fees were applied to your account, your costs would be higher. Your fund does not carry a “sales load.”
The calculations assume no shares were bought or sold during the period. Your actual costs may have been higher or lower, depending on the amount of your investment and the timing of any purchases or redemptions.
You can find more information about the fund’s expenses, including annual expense ratios, in the Financial Statements section of this report. For additional information on operating expenses and other shareholder costs, please refer to your fund’s current prospectus.
Six Months Ended October 31, 2019
| Beginning | Ending | Expenses |
| Account Value | Account Value | Paid During |
International Value Fund | 4/30/2019 | 10/31/2019 | Period |
Based on Actual Fund Return | $1,000.00 | $1,010.48 | $1.82 |
Based on Hypothetical 5% Yearly Return | 1,000.00 | 1,023.39 | 1.84 |
The calculations are based on expenses incurred in the most recent six-month period. The fund’s annualized six-month expense ratio for that period is 0.36%. The dollar amounts shown as “Expenses Paid” are equal to the annualized expense ratio multiplied by the average account value over the period, multiplied by the number of days in the most recent six-month period, then divided by the number of days in the most recent 12-month period (184/365).
International Value Fund
Performance Summary
All of the returns in this report represent past performance, which is not a guarantee of future results that may be achieved by the fund. (Current performance may be lower or higher than the performance data cited. For performance data current to the most recent month-end, visit our website at vanguard.com/performance.) Note, too, that both investment returns and principal value can fluctuate widely, so an investor’s shares, when sold, could be worth more or less than their original cost. The returns shown do not reflect taxes that a shareholder would pay on fund distributions or on the sale of fund shares.
Cumulative Performance: October 31, 2009, Through October 31, 2019
Initial Investment of $10,000

|
|
|
| Average Annual Total Returns |
|
| ||||
|
|
|
| Periods Ended October 31, 2019 |
|
| ||||
|
|
|
|
|
|
|
|
|
| Final Value |
|
|
|
| One |
| Five |
| Ten |
| of a $10,000 |
|
|
|
| Year |
| Years |
| Years |
| Investment |
|
| International Value Fund |
| 8.48% |
| 2.91% |
| 4.83% |
| $16,026 |
|
| Spliced International Index |
| 11.27 |
| 3.82 |
| 4.50 |
| 15,528 |
Spliced International Index: MSCI EAFE Index through May 31, 2010; MSCI All Country World Index ex USA thereafter.
See Financial Highlights for dividend and capital gains information.
International Value Fund
Sector Diversification
As of October 31, 2019
Communication Services | 9.3% |
Consumer Discretionary | 9.5 |
Consumer Staples | 5.8 |
Energy | 7.1 |
Financials | 21.9 |
Health Care | 13.0 |
Industrials | 10.9 |
Information Technology | 14.6 |
Materials | 3.6 |
Real Estate | 1.7 |
Utilities | 2.6 |
The table reflects the fund’s equity exposure, based on its investments in stocks and stock index futures. Any holdings in short-term reserves are excluded. Sector categories are based on the Global Industry Classification Standard (“GICS”), except for the “Other” category (if applicable), which includes securities that have not been provided a GICS classification as of the effective reporting period.
The Global Industry Classification Standard (“GICS”) was developed by and is the exclusive property and a service mark of MSCI Inc. (“MSCI”) and Standard and Poor’s, a division of McGraw-Hill Companies, Inc. (“S&P”), and is licensed for use by Vanguard. Neither MSCI, S&P nor any third party involved in making or compiling the GICS or any GICS classification makes any express or implied warranties or representations with respect to such standard or classification (or the results to be obtained by the use thereof), and all such parties hereby expressly disclaim all warranties of originality, accuracy, completeness, merchantability or fitness for a particular purpose with respect to any such standard or classification. Without limiting any of the foregoing, in no event shall MSCI, S&P, any of its affiliates or any third party involved in making or compiling the GICS or any GICS classification have any liability for any direct, indirect, special, punitive, consequential or any other damages (including lost profits) even if notified of the possibility of such damages.
International Value Fund
Financial Statements
Statement of Net Assets
As of October 31, 2019
The fund files its complete schedule of portfolio holdings with the Securities and Exchange Commission (SEC) for the first and third quarters of each fiscal year as an exhibit to its reports on Form N-PORT. The fund’s Form N-PORT reports are available on the SEC’s website at www.sec.gov.
|
|
|
|
| Market |
|
|
|
|
|
| Value· |
|
|
|
| Shares |
| ($000 | ) |
Common Stocks (93.6%)1 |
|
|
|
|
| |
Australia (0.4%) |
|
|
|
|
| |
| BHP Group Ltd. |
| 1,827,914 |
| 44,807 |
|
|
|
|
|
|
|
|
Belgium (0.3%) |
|
|
|
|
| |
| Anheuser-Busch InBev SA/NV |
| 412,825 |
| 33,323 |
|
|
|
|
|
|
|
|
Brazil (1.2%) |
|
|
|
|
| |
| BB Seguridade Participacoes SA |
| 5,490,500 |
| 46,506 |
|
| IRB Brasil Resseguros S/A |
| 3,656,700 |
| 34,456 |
|
| Cia de Saneamento Basico do Estado de Sao Paulo |
| 1,988,900 |
| 27,087 |
|
| Cogna Educacao |
| 5,288,900 |
| 12,753 |
|
|
|
|
|
| 120,802 |
|
Canada (2.2%) |
|
|
|
|
| |
| Suncor Energy Inc. |
| 2,524,300 |
| 75,052 |
|
| Canadian Natural Resources Ltd. |
| 2,054,300 |
| 51,798 |
|
| Canadian National Railway Co. (Toronto Shares) |
| 431,600 |
| 38,602 |
|
| National Bank of Canada |
| 695,800 |
| 35,934 |
|
| Nutrien Ltd. |
| 537,600 |
| 25,719 |
|
|
|
|
|
| 227,105 |
|
China (4.4%) |
|
|
|
|
| |
| Ping An Insurance Group Co. of China Ltd. |
| 8,517,000 |
| 98,301 |
|
| China Mobile Ltd. |
| 10,597,500 |
| 86,123 |
|
| Tencent Holdings Ltd. |
| 2,087,000 |
| 84,655 |
|
| Lenovo Group Ltd. |
| 91,488,000 |
| 63,780 |
|
| Shanghai Fosun Pharmaceutical Group Co. Ltd. |
| 18,335,500 |
| 51,750 |
|
| ENN Energy Holdings Ltd. |
| 3,904,300 |
| 44,542 |
|
* | 58.com Inc. ADR |
| 563,415 |
| 29,754 |
|
|
|
|
|
| 458,905 |
|
Denmark (1.3%) |
|
|
|
|
| |
| Carlsberg A/S Class B |
| 351,121 |
| 49,446 |
|
| Pandora A/S |
| 805,516 |
| 39,636 |
|
* | Genmab A/S |
| 131,109 |
| 28,647 |
|
| Vestas Wind Systems A/S |
| 255,300 |
| 20,799 |
|
|
|
|
|
| 138,528 |
|
Finland (1.1%) |
|
|
|
|
| |
| Sampo Oyj Class A |
| 1,608,318 |
| 65,909 |
|
| Nokia Oyj |
| 14,016,858 |
| 51,457 |
|
|
|
|
|
| 117,366 |
|
France (11.4%) |
|
|
|
|
| |
| Sanofi |
| 2,589,897 |
| 238,758 |
|
| Safran SA |
| 743,834 |
| 117,817 |
|
| Orange SA |
| 6,635,477 |
| 106,796 |
|
| Credit Agricole SA |
| 8,047,344 |
| 105,006 |
|
| STMicroelectronics NV |
| 3,826,172 |
| 86,841 |
|
| TOTAL SA |
| 1,592,465 |
| 84,192 |
|
| Atos SE |
| 1,061,395 |
| 82,372 |
|
| Vivendi SA |
| 2,867,587 |
| 79,856 |
|
| BNP Paribas SA |
| 1,484,274 |
| 77,569 |
|
| Engie SA |
| 4,267,063 |
| 71,452 |
|
| Publicis Groupe SA |
| 1,049,698 |
| 45,178 |
|
^ | Vinci SA |
| 386,943 |
| 43,414 |
|
* | Ubisoft Entertainment SA |
| 381,004 |
| 22,517 |
|
| Natixis SA |
| 3,560,935 |
| 16,360 |
|
|
|
|
|
| 1,178,128 |
|
Germany (5.9%) |
|
|
|
|
| |
| SAP SE |
| 1,030,828 |
| 136,588 |
|
| Fresenius Medical Care AG & Co. KGaA |
| 1,655,733 |
| 119,512 |
|
| Volkswagen AG Preference Shares |
| 473,152 |
| 89,950 |
|
International Value Fund
|
|
|
|
| Market |
|
|
|
|
|
| Value· |
|
|
|
| Shares |
| ($000 | ) |
| E.ON SE |
| 8,097,730 |
| 81,662 |
|
| Bayer AG |
| 1,004,421 |
| 77,920 |
|
| Commerzbank AG |
| 10,692,541 |
| 63,982 |
|
| Beiersdorf AG |
| 339,700 |
| 40,190 |
|
|
|
|
|
| 609,804 |
|
Hong Kong (2.9%) |
|
|
|
|
| |
| CK Hutchison Holdings Ltd. |
| 15,222,192 |
| 140,548 |
|
| Galaxy Entertainment Group Ltd. |
| 10,278,000 |
| 70,770 |
|
| Swire Pacific Ltd. Class A |
| 7,221,350 |
| 68,836 |
|
*,2 | ESR Cayman Ltd. |
| 7,601,400 |
| 16,297 |
|
|
|
|
|
| 296,451 |
|
India (1.0%) |
|
|
|
|
| |
| ICICI Bank Ltd. ADR |
| 5,512,512 |
| 71,828 |
|
* | State Bank of India |
| 6,950,636 |
| 30,568 |
|
|
|
|
|
| 102,396 |
|
Indonesia (0.4%) |
|
|
|
|
| |
| Telekomunikasi Indonesia Persero Tbk PT ADR |
| 1,277,768 |
| 36,902 |
|
|
|
|
|
|
|
|
Ireland (0.4%) |
|
|
|
|
| |
* | Ryanair Holdings plc ADR |
| 585,914 |
| 43,733 |
|
|
|
|
|
|
|
|
Italy (1.2%) |
|
|
|
|
| |
| Eni SPA |
| 5,778,704 |
| 87,670 |
|
| CNH Industrial NV |
| 2,206,722 |
| 24,026 |
|
| UniCredit SPA |
| 1,135,386 |
| 14,405 |
|
|
|
|
|
| 126,101 |
|
Japan (16.1%) |
|
|
|
|
| |
| Sony Corp. |
| 2,339,900 |
| 142,428 |
|
| Sumitomo Mitsui Financial Group Inc. |
| 3,862,100 |
| 137,117 |
|
| Tokyo Electron Ltd. |
| 525,100 |
| 106,385 |
|
| Murata Manufacturing Co. Ltd. |
| 1,874,300 |
| 102,052 |
|
| Hitachi Ltd. |
| 2,669,600 |
| 99,636 |
|
| Panasonic Corp. |
| 11,760,200 |
| 98,837 |
|
| East Japan Railway Co. |
| 998,900 |
| 90,681 |
|
| Astellas Pharma Inc. |
| 4,871,400 |
| 83,606 |
|
| Sumitomo Mitsui Trust Holdings Inc. |
| 2,118,800 |
| 77,221 |
|
| Japan Tobacco Inc. |
| 3,172,800 |
| 71,714 |
|
| Kao Corp. |
| 845,900 |
| 68,009 |
|
| Daiwa House Industry Co. Ltd. |
| 1,952,800 |
| 67,225 |
|
| Sumitomo Electric Industries Ltd. |
| 4,439,000 |
| 60,875 |
|
| Shin-Etsu Chemical Co. Ltd. |
| 515,400 |
| 57,468 |
|
| Komatsu Ltd. |
| 2,218,300 |
| 51,941 |
|
| Ryohin Keikaku Co. Ltd. |
| 2,090,000 |
| 46,528 |
|
| Fujitsu Ltd. |
| 476,429 |
| 42,226 |
|
| Suzuki Motor Corp. |
| 859,600 |
| 40,585 |
|
| Ulvac Inc. |
| 903,909 |
| 39,546 |
|
| ITOCHU Corp. |
| 1,882,800 |
| 39,365 |
|
| Makita Corp. |
| 1,102,500 |
| 37,078 |
|
| Teijin Ltd. |
| 1,227,300 |
| 24,593 |
|
^ | ZOZO Inc. |
| 1,021,400 |
| 23,791 |
|
| Rohm Co. Ltd. |
| 201,100 |
| 15,933 |
|
| Daiwa Securities Group Inc. |
| 3,414,000 |
| 15,345 |
|
| Sumitomo Chemical Co. Ltd. |
| 2,747,800 |
| 12,570 |
|
| Kirin Holdings Co. Ltd. |
| 287,400 |
| 6,097 |
|
| Sumitomo Realty & Development Co. Ltd. |
| 163,777 |
| 5,945 |
|
| Nintendo Co. Ltd. |
| 1,300 |
| 477 |
|
|
|
|
|
| 1,665,274 |
|
Mexico (0.3%) |
|
|
|
|
| |
| Grupo Financiero Banorte SAB de CV |
| 6,585,700 |
| 35,947 |
|
|
|
|
|
|
|
|
Netherlands (2.6%) |
|
|
|
|
| |
| ING Groep NV |
| 6,952,978 |
| 78,733 |
|
| Wolters Kluwer NV |
| 876,437 |
| 64,553 |
|
| NXP Semiconductors NV |
| 488,675 |
| 55,553 |
|
| Koninklijke DSM NV |
| 339,537 |
| 40,299 |
|
2 | ABN AMRO Bank NV |
| 1,753,207 |
| 32,680 |
|
|
|
|
|
| 271,818 |
|
Norway (1.2%) |
|
|
|
|
| |
| Telenor ASA |
| 2,998,709 |
| 56,123 |
|
| Equinor ASA |
| 2,186,747 |
| 40,598 |
|
| Mowi ASA |
| 1,207,800 |
| 29,485 |
|
|
|
|
|
| 126,206 |
|
Other (0.4%) |
|
|
|
|
| |
3 | Vanguard FTSE All-World ex-US ETF |
| 718,406 |
| 37,084 |
|
|
|
|
|
|
|
|
Russia (0.5%) |
|
|
|
|
| |
| Gazprom PJSC ADR |
| 6,302,910 |
| 50,529 |
|
|
|
|
|
|
|
|
Singapore (2.3%) |
|
|
|
|
| |
| DBS Group Holdings Ltd. |
| 7,855,400 |
| 149,731 |
|
| Singapore Telecommunications Ltd. |
| 35,267,900 |
| 85,403 |
|
|
|
|
|
| 235,134 |
|
International Value Fund
|
|
|
|
| Market |
|
|
|
|
|
| Value· |
|
|
|
| Shares |
| ($000 | ) |
South Africa (0.5%) |
|
|
|
|
| |
| Sanlam Ltd. |
| 5,791,532 |
| 30,480 |
|
| Mr Price Group Ltd. |
| 1,575,589 |
| 16,660 |
|
|
|
|
|
| 47,140 |
|
South Korea (4.2%) |
|
|
|
|
| |
| Samsung Electronics Co. Ltd. |
| 4,794,811 |
| 207,231 |
|
| Samsung SDI Co. Ltd. |
| 390,650 |
| 76,234 |
|
| POSCO |
| 226,992 |
| 41,187 |
|
| Hana Financial Group Inc. |
| 984,207 |
| 28,495 |
|
| LG Chem Ltd. |
| 87,451 |
| 23,073 |
|
| KB Financial Group Inc. |
| 605,341 |
| 21,792 |
|
| Shinhan Financial Group Co. Ltd. |
| 561,096 |
| 20,444 |
|
| E-MART Inc. |
| 132,695 |
| 12,693 |
|
|
|
|
|
| 431,149 |
|
Spain (1.8%) |
|
|
|
|
| |
| Telefonica SA |
| 10,944,704 |
| 84,048 |
|
| Banco Bilbao Vizcaya Argentaria SA |
| 13,786,991 |
| 72,615 |
|
| Red Electrica Corp. SA |
| 1,496,078 |
| 30,068 |
|
|
|
|
|
| 186,731 |
|
Sweden (1.5%) |
|
|
|
|
| |
| Assa Abloy AB Class B |
| 2,816,980 |
| 66,899 |
|
| Nordea Bank Abp |
| 6,640,894 |
| 48,607 |
|
| Nordea Bank Abp (Finland Shares) |
| 5,704,472 |
| 41,750 |
|
|
|
|
|
| 157,256 |
|
Switzerland (7.0%) |
|
|
|
|
| |
| Novartis AG |
| 2,591,889 |
| 226,467 |
|
| Roche Holding AG |
| 419,124 |
| 126,138 |
|
| Credit Suisse Group AG |
| 6,226,274 |
| 77,068 |
|
| LafargeHolcim Ltd. |
| 1,492,952 |
| 77,064 |
|
| Adecco Group AG |
| 1,288,237 |
| 76,581 |
|
| ABB Ltd. |
| 2,596,688 |
| 54,530 |
|
| Lonza Group AG |
| 120,847 |
| 43,557 |
|
| Cie Financiere Richemont SA |
| 373,057 |
| 29,315 |
|
* | Alcon Inc. |
| 267,587 |
| 15,825 |
|
|
|
|
|
| 726,545 |
|
Taiwan (1.6%) |
|
|
|
|
| |
| Taiwan Semiconductor Manufacturing Co. Ltd. ADR |
| 1,728,168 |
| 89,225 |
|
| Taiwan Semiconductor Manufacturing Co. Ltd. |
| 6,213,404 |
| 60,890 |
|
| Silicon Motion Technology Corp. ADR |
| 371,881 |
| 15,638 |
|
|
|
|
|
| 165,753 |
|
Thailand (0.9%) |
|
|
|
|
| |
^ | Bangkok Bank PCL |
| 13,166,800 |
| 75,853 |
|
| Kasikornbank PCL (Foreign) |
| 4,682,900 |
| 21,625 |
|
|
|
|
|
| 97,478 |
|
United Kingdom (14.3%) |
|
|
|
|
| |
| Royal Dutch Shell plc Class A (Amsterdam Shares) |
| 5,973,285 |
| 173,509 |
|
| Tesco plc |
| 53,896,407 |
| 164,522 |
|
| Vodafone Group plc |
| 77,777,680 |
| 158,723 |
|
| AstraZeneca plc |
| 1,300,558 |
| 126,827 |
|
| Kingfisher plc |
| 35,412,787 |
| 94,999 |
|
| BP plc |
| 14,362,003 |
| 91,075 |
|
| Prudential plc |
| 5,154,060 |
| 90,025 |
|
| Unilever plc |
| 1,447,732 |
| 86,689 |
|
| RELX plc |
| 3,516,490 |
| 84,661 |
|
| Barclays plc |
| 37,214,250 |
| 80,721 |
|
| HSBC Holdings plc |
| 6,896,039 |
| 52,100 |
|
| Standard Life Aberdeen plc |
| 12,861,867 |
| 50,569 |
|
| Compass Group plc |
| 1,684,271 |
| 44,842 |
|
| Ferguson plc |
| 464,653 |
| 39,678 |
|
| Lloyds Banking Group plc |
| 45,017,214 |
| 33,115 |
|
| Aviva plc |
| 4,804,265 |
| 25,895 |
|
| ITV plc |
| 14,022,431 |
| 24,326 |
|
| Royal Dutch Shell plc Class A |
| 827,596 |
| 23,991 |
|
| Direct Line Insurance Group plc |
| 5,486,918 |
| 19,346 |
|
| Babcock International Group plc |
| 2,143,115 |
| 15,392 |
|
|
|
|
|
| 1,481,005 |
|
United States (4.3%) |
|
|
|
|
| |
| Medtronic plc |
| 1,105,185 |
| 120,354 |
|
* | Capri Holdings Ltd. |
| 3,470,498 |
| 107,828 |
|
| Aon plc |
| 551,455 |
| 106,519 |
|
| Accenture plc Class A |
| 432,190 |
| 80,137 |
|
| RenaissanceRe Holdings Ltd. |
| 180,525 |
| 33,791 |
|
|
|
|
|
| 448,629 |
|
Total Common Stocks |
|
|
|
|
| |
(Cost $9,160,805) |
|
|
| 9,698,029 |
| |
International Value Fund
|
|
|
|
| Market |
| |
|
|
|
|
| Value· |
| |
|
|
|
|
| ($000 | ) | |
Temporary Cash Investments (5.8%)1 |
|
|
|
|
| ||
Money Market Fund (5.7%) |
|
|
|
|
| ||
4,5 | Vanguard Market Liquidity Fund, 1.984% |
| 5,880,298 |
| 588,088 |
| |
|
|
|
|
|
|
| |
|
|
| Face |
|
|
| |
|
|
| Amount |
|
|
| |
|
|
| ($000 | ) |
|
|
|
U.S. Government and Agency Obligations (0.1%) |
|
|
|
|
| ||
| United States Treasury Bill, 1.954%, 11/7/19 |
| 2,300 |
| 2,300 |
| |
| United States Treasury Bill, 1.946%, 11/29/19 |
| 2,600 |
| 2,597 |
| |
6 | United States Treasury Bill, 1.997%, 12/26/19 |
| 3,300 |
| 3,292 |
| |
6 | United States Treasury Bill, 1.872%, 2/20/20 |
| 3,200 |
| 3,185 |
| |
|
|
|
|
| 11,374 |
| |
Total Temporary Cash Investments |
|
|
|
|
| ||
(Cost $599,420) |
|
|
| 599,462 |
| ||
Total Investments (99.4%) |
|
|
|
|
| ||
(Cost $9,760,225) |
|
|
| 10,297,491 |
| ||
Other Assets and Liabilities (0.6%) |
|
|
|
|
| ||
Other Assets |
|
|
| 261,218 |
| ||
Liabilities5 |
|
|
| (198,388 | ) | ||
|
|
|
| 62,830 |
| ||
Net Assets (100%) |
|
|
|
|
| ||
Applicable to 282,871,936 outstanding $.001 par value shares of beneficial interest (unlimited authorization) |
|
|
| 10,360,321 |
| ||
Net Asset Value Per Share |
|
|
| $36.63 |
| ||
|
|
|
| Amount |
|
|
|
|
| ($000 | ) |
Statement of Assets and Liabilities |
|
|
|
|
|
Assets |
|
|
|
|
|
Investments in Securities, at Value |
|
|
|
|
|
Unaffiliated Issuers |
|
|
| 9,672,319 |
|
Affiliated Issuers |
|
|
| 625,172 |
|
Total Investments in Securities |
|
|
| 10,297,491 |
|
Investment in Vanguard |
|
|
| 474 |
|
Receivables for Investment Securities Sold |
|
|
| 177,246 |
|
Receivables for Accrued Income |
|
|
| 42,818 |
|
Receivables for Capital Shares Issued |
|
|
| 5,618 |
|
Variation Margin Receivable—Futures Contracts |
|
|
| 208 |
|
Unrealized Appreciation—Forward Currency Contracts |
|
|
| 2,454 |
|
Other Assets |
|
|
| 32,400 |
|
Total Assets |
|
|
| 10,558,709 |
|
Liabilities |
|
|
|
|
|
Payables for Investment Securities Purchased |
|
|
| 47,340 |
|
Collateral for Securities on Loan |
|
|
| 82,370 |
|
Payables to Investment Advisor |
|
|
| 3,858 |
|
Payables for Capital Shares Redeemed |
|
|
| 37,971 |
|
Payables to Vanguard |
|
|
| 8,920 |
|
Variation Margin Payable—Futures Contracts |
|
|
| 388 |
|
Unrealized Depreciation—Forward Currency Contracts |
|
|
| 994 |
|
Other Liabilities |
|
|
| 16,547 |
|
Total Liabilities |
|
|
| 198,388 |
|
Net Assets |
|
|
| 10,360,321 |
|
International Value Fund
At October 31, 2019, net assets consisted of:
|
|
|
| Amount |
|
|
|
|
| ($000 | ) |
Paid-in Capital |
|
|
| 9,693,329 |
|
Total Distributable Earnings (Loss) |
|
|
| 666,992 |
|
Net Assets |
|
|
| 10,360,321 |
|
· See Note A in Notes to Financial Statements.
^ Includes partial security positions on loan to broker-dealers. The total value of securities on loan is $79,044,000.
* Non-income-producing security.
1 The fund invests a portion of its cash reserves in equity markets through the use of index futures contracts. After giving effect to futures investments, the fund’s effective common stock and temporary cash investment positions represent 95.7% and 3.7%, respectively, of net assets.
2 Security exempt from registration under Rule 144A of the Securities Act of 1933. Such securities may be sold in transactions exempt from registration, normally to qualified institutional buyers. At October 31, 2019, the aggregate value of these securities was $48,977,000, representing 0.5% of net assets.
3 Considered an affiliated company of the fund as the issuer is another member of The Vanguard Group.
4 Affiliated money market fund available only to Vanguard funds and certain trusts and accounts managed by Vanguard. Rate shown is the 7-day yield.
5 Collateral of $82,370,000 was received for securities on loan.
6 Securities with a value of $4,881,000 have been segregated as initial margin for open futures contracts.
ADR—American Depositary Receipt.
International Value Fund
Derivative Financial Instruments Outstanding as of Period End |
|
Futures Contracts |
|
|
|
|
|
|
|
| ($000 | ) |
|
|
|
|
|
|
|
|
|
|
|
|
|
|
|
|
|
|
|
|
|
|
|
|
|
|
|
| Value and |
|
|
|
|
| Number of |
|
|
| Unrealized |
|
|
|
|
| Long (Short | ) | Notional |
| Appreciation |
|
|
| Expiration |
| Contracts |
| Amount |
| (Depreciation | ) |
Long Futures Contracts |
|
|
|
|
|
|
|
|
|
Dow Jones EURO STOXX 50 Index |
| December 2019 |
| 2,027 |
| 81,590 |
| 933 |
|
Topix Index |
| December 2019 |
| 397 |
| 61,339 |
| 1,997 |
|
FTSE 100 Index |
| December 2019 |
| 428 |
| 40,173 |
| (92 | ) |
S&P ASX 200 Index |
| December 2019 |
| 327 |
| 37,414 |
| (28 | ) |
|
|
|
|
|
|
|
| 2,810 |
|
Forward Currency Contracts |
|
| Contract |
|
|
|
|
|
|
|
|
| Unrealized |
| Unrealized |
|
|
| Settlement |
| Contract Amount (000) |
| Appreciation |
| (Depreciation | ) | ||||||
Counterparty |
| Date |
|
|
| Receive |
|
|
| Deliver |
| ($000 | ) | ($000 | ) |
Bank of America, N.A. |
| 12/24/19 |
| EUR |
| 61,398 |
| USD |
| 68,061 |
| 694 |
| — |
|
Bank of America, N.A. |
| 12/16/19 |
| JPY |
| 5,993,536 |
| USD |
| 55,776 |
| — |
| (99 | ) |
Royal Bank of Canada |
| 12/24/19 |
| EUR |
| 42,213 |
| USD |
| 47,231 |
| 40 |
| — |
|
Bank of America, N.A. |
| 12/24/19 |
| GBP |
| 27,412 |
| USD |
| 34,174 |
| 1,405 |
| — |
|
Toronto-Dominion Bank |
| 12/24/19 |
| AUD |
| 46,192 |
| USD |
| 31,753 |
| 136 |
| — |
|
Royal Bank of Canada |
| 12/16/19 |
| JPY |
| 2,597,504 |
| USD |
| 24,109 |
| 21 |
| — |
|
Royal Bank of Canada |
| 12/24/19 |
| GBP |
| 17,391 |
| USD |
| 22,560 |
| 12 |
| — |
|
Royal Bank of Canada |
| 12/23/19 |
| AUD |
| 18,000 |
| USD |
| 12,425 |
| 2 |
| — |
|
Citibank, N.A. |
| 12/16/19 |
| JPY |
| 1,113,216 |
| USD |
| 10,332 |
| 9 |
| — |
|
Bank of America, N.A. |
| 12/23/19 |
| AUD |
| 13,182 |
| USD |
| 9,100 |
| — |
| — |
|
Goldman Sachs International |
| 12/16/19 |
| JPY |
| 494,760 |
| USD |
| 4,582 |
| 14 |
| — |
|
Goldman Sachs International |
| 12/23/19 |
| AUD |
| 4,607 |
| USD |
| 3,135 |
| 45 |
| — |
|
Goldman Sachs International |
| 12/24/19 |
| GBP |
| 1,363 |
| USD |
| 1,730 |
| 39 |
| — |
|
Goldman Sachs International |
| 12/24/19 |
| EUR |
| 558 |
| USD |
| 618 |
| 6 |
| — |
|
Royal Bank of Canada |
| 12/24/19 |
| USD |
| 30,512 |
| EUR |
| 27,351 |
| — |
| (117 | ) |
Bank of America, N.A. |
| 12/24/19 |
| USD |
| 21,690 |
| EUR |
| 19,533 |
| — |
| (183 | ) |
Royal Bank of Canada |
| 12/16/19 |
| USD |
| 13,829 |
| JPY |
| 1,492,550 |
| — |
| (36 | ) |
Royal Bank of Canada |
| 12/16/19 |
| USD |
| 13,362 |
| JPY |
| 1,436,515 |
| 17 |
| — |
|
Deutsche Bank AG |
| 12/16/19 |
| USD |
| 9,153 |
| JPY |
| 986,730 |
| — |
| (13 | ) |
Citibank, N.A. |
| 12/23/19 |
| USD |
| 9,049 |
| AUD |
| 13,182 |
| — |
| (51 | ) |
Royal Bank of Canada |
| 12/24/19 |
| USD |
| 8,576 |
| GBP |
| 6,617 |
| — |
| (12 | ) |
Bank of America, N.A. |
| 12/24/19 |
| USD |
| 8,368 |
| AUD |
| 12,169 |
| — |
| (33 | ) |
Royal Bank of Canada |
| 12/23/19 |
| USD |
| 8,123 |
| AUD |
| 11,788 |
| — |
| (15 | ) |
Goldman Sachs International |
| 12/16/19 |
| USD |
| 6,390 |
| JPY |
| 686,710 |
| 11 |
| — |
|
Goldman Sachs International |
| 12/24/19 |
| USD |
| 6,385 |
| GBP |
| 5,098 |
| — |
| (231 | ) |
UBS AG |
| 12/24/19 |
| USD |
| 6,142 |
| GBP |
| 4,735 |
| — |
| (4 | ) |
International Value Fund
Forward Currency Contracts (continued) |
|
| Contract |
|
|
|
|
|
|
|
|
| Unrealized |
| Unrealized |
|
|
| Settlement |
| Contract Amount (000) |
| Appreciation |
| (Depreciation | ) | ||||||
Counterparty |
| Date |
|
|
| Receive |
|
|
| Deliver |
| ($000 | ) | ($000 | ) |
Citibank, N.A. |
| 12/24/19 |
| USD |
| 5,318 |
| GBP |
| 4,241 |
| — |
| (186 | ) |
Royal Bank of Canada |
| 12/24/19 |
| USD |
| 2,775 |
| EUR |
| 2,476 |
| 3 |
| — |
|
Goldman Sachs International |
| 12/16/19 |
| USD |
| 2,096 |
| JPY |
| 226,450 |
| — |
| (8 | ) |
Bank of America, N.A. |
| 12/23/19 |
| USD |
| 1,136 |
| AUD |
| 1,654 |
| — |
| (6 | ) |
|
|
|
|
|
|
|
|
|
|
|
| 2,454 |
| (994 | ) |
AUD—Australian dollar.
EUR—Euro.
GBP—British pound.
JPY—Japanese yen.
USD—U.S. dollar.
At October 31, 2019, a counterparty had deposited in a segregated account cash of $750,000 in connection with open forward currency contracts.
After October 31, 2019, the counterparty posted additional collateral of $880,000 in connection with open forward currency contracts as of October 31, 2019.
See accompanying Notes, which are an integral part of the Financial Statements.
International Value Fund
Statement of Operations
|
| Year Ended |
|
|
| October 31, 2019 |
|
|
|
|
|
|
| ($000 | ) |
Investment Income |
|
|
|
Income |
|
|
|
Dividends—Unaffiliated Issuers1 |
| 328,100 |
|
Dividends—Affiliated Issuers |
| 1,100 |
|
Interest—Unaffiliated Issuers |
| 290 |
|
Interest—Affiliated Issuers |
| 11,998 |
|
Securities Lending—Net |
| 2,827 |
|
Total Income |
| 344,315 |
|
Expenses |
|
|
|
Investment Advisory Fees—Note B |
|
|
|
Basic Fee |
| 16,144 |
|
Performance Adjustment |
| (674 | ) |
The Vanguard Group—Note C |
|
|
|
Management and Administrative |
| 18,822 |
|
Marketing and Distribution |
| 1,029 |
|
Custodian Fees |
| 414 |
|
Auditing Fees |
| 46 |
|
Shareholders’ Reports |
| 109 |
|
Trustees’ Fees and Expenses |
| 12 |
|
Total Expenses |
| 35,902 |
|
Net Investment Income |
| 308,413 |
|
Realized Net Gain (Loss) |
|
|
|
Investment Securities Sold—Unaffiliated Issuers |
| (139,246 | ) |
Investment Securities Sold—Affiliated Issuers |
| 87 |
|
Futures Contracts |
| 8,759 |
|
Forward Currency Contracts |
| (9,938 | ) |
Foreign Currencies |
| (2,376 | ) |
Realized Net Gain (Loss) |
| (142,714 | ) |
Change in Unrealized Appreciation (Depreciation) |
|
|
|
Investment Securities—Unaffiliated Issuers |
| 617,463 |
|
Investment Securities—Affiliated Issuers |
| 2,806 |
|
Futures Contracts |
| 11,515 |
|
Forward Currency Contracts |
| 6,881 |
|
Foreign Currencies |
| 1,335 |
|
Change in Unrealized Appreciation (Depreciation) |
| 640,000 |
|
Net Increase (Decrease) in Net Assets Resulting from Operations |
| 805,699 |
|
1 Dividends are net of foreign withholding taxes of $32,298,000.
See accompanying Notes, which are an integral part of the Financial Statements.
International Value Fund
Statement of Changes in Net Assets
|
| Year Ended October 31, |
| ||
|
| 2019 |
| 2018 |
|
|
| ($000 | ) | ($000 | ) |
Increase (Decrease) in Net Assets |
|
|
|
|
|
Operations |
|
|
|
|
|
Net Investment Income |
| 308,413 |
| 248,079 |
|
Realized Net Gain (Loss) |
| (142,714 | ) | 301,312 |
|
Change in Unrealized Appreciation (Depreciation) |
| 640,000 |
| (1,265,501 | ) |
Net Increase (Decrease) in Net Assets Resulting from Operations |
| 805,699 |
| (716,110 | ) |
Distributions |
|
|
|
|
|
Net Investment Income |
| (248,443 | ) | (189,521 | ) |
Realized Capital Gain1 |
| (279,298 | ) | — |
|
Total Distributions |
| (527,741 | ) | (189,521 | ) |
Capital Share Transactions |
|
|
|
|
|
Issued |
| 1,467,177 |
| 1,541,114 |
|
Issued in Lieu of Cash Distributions |
| 490,069 |
| 175,732 |
|
Redeemed |
| (1,399,172 | ) | (1,251,235 | ) |
Net Increase (Decrease) from Capital Share Transactions |
| 558,074 |
| 465,611 |
|
Total Increase (Decrease) |
| 836,032 |
| (440,020 | ) |
Net Assets |
|
|
|
|
|
Beginning of Period |
| 9,524,289 |
| 9,964,309 |
|
End of Period |
| 10,360,321 |
| 9,524,289 |
|
1 Includes fiscal 2019 and 2018 short-term gain distributions totaling $31,092,000 and $0, respectively. Short-term gain distributions are treated as ordinary income dividends for tax purposes.
See accompanying Notes, which are an integral part of the Financial Statements.
International Value Fund
Financial Highlights
For a Share Outstanding |
| Year Ended October 31, |
| ||||||||
Throughout Each Period |
| 2019 |
| 2018 |
| 2017 |
| 2016 |
| 2015 |
|
Net Asset Value, Beginning of Period |
| $35.86 |
| $39.26 |
| $32.30 |
| $33.22 |
| $36.87 |
|
Investment Operations |
|
|
|
|
|
|
|
|
|
|
|
Net Investment Income |
| 1.104 | 1 | .950 | 1 | .781 | 1 | .721 |
| .669 |
|
Net Realized and Unrealized Gain (Loss) on Investments |
| 1.669 |
| (3.607 | ) | 6.905 |
| (.979 | ) | (3.373 | ) |
Total from Investment Operations |
| 2.773 |
| (2.657 | ) | 7.686 |
| (.258 | ) | (2.704 | ) |
Distributions |
|
|
|
|
|
|
|
|
|
|
|
Dividends from Net Investment Income |
| (.943 | ) | (.743 | ) | (.726 | ) | (.662 | ) | (.946 | ) |
Distributions from Realized Capital Gains |
| (1.060 | ) | — |
| — |
| — |
| — |
|
Total Distributions |
| (2.003 | ) | (.743 | ) | (.726 | ) | (.662 | ) | (.946 | ) |
Net Asset Value, End of Period |
| $36.63 |
| $35.86 |
| $39.26 |
| $32.30 |
| $33.22 |
|
|
|
|
|
|
|
|
|
|
|
|
|
Total Return2 |
| 8.48% |
| -6.95% |
| 24.33% |
| -0.67% |
| -7.43% |
|
|
|
|
|
|
|
|
|
|
|
|
|
Ratios/Supplemental Data |
|
|
|
|
|
|
|
|
|
|
|
Net Assets, End of Period (Millions) |
| $10,360 |
| $9,524 |
| $9,964 |
| $7,873 |
| $7,932 |
|
Ratio of Total Expenses to Average Net Assets3 |
| 0.37% |
| 0.38% |
| 0.40% |
| 0.43% |
| 0.46% |
|
Ratio of Net Investment Income to Average Net Assets |
| 3.15% |
| 2.41% |
| 2.21% |
| 2.29% |
| 1.95% |
|
Portfolio Turnover Rate |
| 38% |
| 28% |
| 34% |
| 30% |
| 36% |
|
1 Calculated based on average shares outstanding.
2 Total returns do not include account service fees that may have applied in the periods shown. Fund prospectuses provide information about any applicable account service fees.
3 Includes performance-based investment advisory fee increases (decreases) of (0.01%), (0.01%), 0.00%, 0.03%, and 0.04%.
See accompanying Notes, which are an integral part of the Financial Statements.
International Value Fund
Notes to Financial Statements
Vanguard International Value Fund is registered under the Investment Company Act of 1940 as an open-end investment company, or mutual fund. The fund invests in securities of foreign issuers, which may subject it to investment risks not normally associated with investing in securities of U.S. corporations.
A. The following significant accounting policies conform to generally accepted accounting principles for U.S. investment companies. The fund consistently follows such policies in preparing its financial statements.
1. Security Valuation: Securities are valued as of the close of trading on the New York Stock Exchange (generally 4 p.m., Eastern time) on the valuation date. Equity securities are valued at the latest quoted sales prices or official closing prices taken from the primary market in which each security trades; such securities not traded on the valuation date are valued at the mean of the latest quoted bid and asked prices. Securities for which market quotations are not readily available, or whose values have been affected by events occurring before the fund’s pricing time but after the close of the securities’ primary markets, are valued at their fair values calculated according to procedures adopted by the board of trustees. These procedures include obtaining quotations from an independent pricing service, monitoring news to identify significant market- or security-specific events, and evaluating changes in the values of foreign market proxies (for example, ADRs, futures contracts, or exchange-traded funds), between the time the foreign markets close and the fund’s pricing time. When fair-value pricing is employed, the prices of securities used by a fund to calculate its net asset value may differ from quoted or published prices for the same securities. Investments in Vanguard Market Liquidity Fund are valued at that fund’s net asset value. Temporary cash investments are valued using the latest bid prices or using valuations based on a matrix system (which considers such factors as security prices, yields, maturities, and ratings), both as furnished by independent pricing services.
2. Foreign Currency: Securities and other assets and liabilities denominated in foreign currencies are translated into U.S. dollars using exchange rates obtained from an independent third party as of the fund’s pricing time on the valuation date. Realized gains (losses) and unrealized appreciation (depreciation) on investment securities include the effects of changes in exchange rates since the securities were purchased, combined with the effects of changes in security prices. Fluctuations in the value of other assets and liabilities resulting from changes in exchange rates are recorded as unrealized foreign currency gains (losses) until the assets or liabilities are settled in cash, at which time they are recorded as realized foreign currency gains (losses).
3. Futures and Forward Currency Contracts: The fund uses index futures contracts to a limited extent, with the objective of maintaining full exposure to the stock market while maintaining liquidity. The fund may purchase or sell futures contracts to achieve a desired level of investment, whether to accommodate portfolio turnover or cash flows from capital share transactions. The primary risks associated with the use of futures contracts are imperfect correlation between changes in market values of stocks held by the fund and the prices of futures contracts, and the possibility of an illiquid market. Counterparty risk involving futures is mitigated because a regulated clearinghouse is the counterparty instead of the clearing broker. To further mitigate counterparty risk, the fund trades futures contracts on an exchange, monitors the financial strength of its clearing brokers and clearinghouse, and has entered into clearing agreements with its clearing brokers. The clearinghouse imposes initial margin requirements to secure the fund’s performance and requires daily settlement of variation margin representing changes in the market value of each contract. Any assets pledged as initial margin for open contracts are noted in the Statement of Net Assets.
International Value Fund
The fund enters into forward currency contracts to provide the appropriate currency exposure related to any open futures contracts or to protect the value of securities and related receivables and payables against changes in foreign exchange rates. The fund’s risks in using these contracts include movement in the values of the foreign currencies relative to the U.S. dollar and the ability of the counterparties to fulfill their obligations under the contracts. The fund mitigates its counterparty risk by entering into forward currency contracts only with a diverse group of prequalified counterparties, monitoring their financial strength, entering into master netting arrangements with its counterparties, and requiring its counterparties to transfer collateral as security for their performance. In the absence of a default, the collateral pledged or received by the fund cannot be repledged, resold, or rehypothecated. The master netting arrangements provide that, in the event of a counterparty’s default (including bankruptcy), the fund may terminate the forward currency contracts, determine the net amount owed by either party in accordance with its master netting arrangements, and sell or retain any collateral held up to the net amount owed to the fund under the master netting arrangements. The forward currency contracts contain provisions whereby a counterparty may terminate open contracts if the fund’s net assets decline below a certain level, triggering a payment by the fund if the fund is in a net liability position at the time of the termination. The payment amount would be reduced by any collateral the fund has pledged. Any assets pledged as collateral for open contracts are noted in the Statement of Net Assets. The value of collateral received or pledged is compared daily to the value of the forward currency contracts exposure with each counterparty, and any difference, if in excess of a specified minimum transfer amount, is adjusted and settled within two business days.
Futures contracts are valued at their quoted daily settlement prices. Forward currency contracts are valued at their quoted daily prices obtained from an independent third party, adjusted for currency risk based on the expiration date of each contract. The notional amounts of the contracts are not recorded in the Statement of Net Assets. Fluctuations in the value of the contracts are recorded in the Statement of Assets and Liabilities as an asset (liability) and in the Statement of Operations as unrealized appreciation (depreciation) until the contracts are closed, when they are recorded as realized gains (losses) on futures or forward currency contracts.
During the year ended October 31, 2019, the fund’s average investments in long and short futures contracts represented 2% and 0% of net assets, respectively, based on the average of the notional amounts at each quarter-end during the period. The fund’s average investment in forward currency contracts represented 3% of net assets, based on the average of the notional amounts at each quarter-end during the period.
4. Federal Income Taxes: The fund intends to continue to qualify as a regulated investment company and distribute all of its taxable income. Management has analyzed the fund’s tax positions taken for all open federal income tax years (October 31, 2016–2019), and has concluded that no provision for federal income tax is required in the fund’s financial statements.
5. Distributions: Distributions to shareholders are recorded on the ex-dividend date. Distributions are determined on a tax basis and may differ from net investment income and realized capital gains for financial reporting purposes.
6. Securities Lending: To earn additional income, the fund lends its securities to qualified institutional borrowers. Security loans are subject to termination by the fund at any time, and are required to be secured at all times by collateral in an amount at least equal to the market value of securities loaned.
International Value Fund
Daily market fluctuations could cause the value of loaned securities to be more or less than the value of the collateral received. When this occurs, the collateral is adjusted and settled before the opening of the market on the next business day. The fund further mitigates its counterparty risk by entering into securities lending transactions only with a diverse group of prequalified counterparties, monitoring their financial strength, and entering into master securities lending agreements with its counterparties. The master securities lending agreements provide that, in the event of a counterparty’s default (including bankruptcy), the fund may terminate any loans with that borrower, determine the net amount owed, and sell or retain the collateral up to the net amount owed to the fund; however, such actions may be subject to legal proceedings. While collateral mitigates counterparty risk, in the event of a default, the fund may experience delays and costs in recovering the securities loaned. The fund invests cash collateral received in Vanguard Market Liquidity Fund, and records a liability in the Statement of Assets and Liabilities for the return of the collateral, during the period the securities are on loan. Securities lending income represents fees charged to borrowers plus income earned on invested cash collateral, less expenses associated with the loan. During the term of the loan, the fund is entitled to all distributions made on or in respect of the loaned securities.
7. Credit Facility: The fund and certain other funds managed by The Vanguard Group (“Vanguard”) participate in a $4.3 billion committed credit facility provided by a syndicate of lenders pursuant to a credit agreement that may be renewed annually; each fund is individually liable for its borrowings, if any, under the credit facility. Borrowings may be utilized for temporary and emergency purposes, and are subject to the fund’s regulatory and contractual borrowing restrictions. The participating funds are charged administrative fees and an annual commitment fee of 0.10% of the undrawn amount of the facility; these fees are allocated to the funds based on a method approved by the fund’s board of trustees and included in Management and Administrative expenses on the fund’s Statement of Operations. Any borrowings under this facility bear interest at a rate based upon the higher of the one-month London Interbank Offered Rate, federal funds effective rate, or overnight bank funding rate plus an agreed-upon spread.
The fund had no borrowings outstanding at October 31, 2019, or at any time during the period then ended.
8. Other: Dividend income is recorded on the ex-dividend date. Interest income includes income distributions received from Vanguard Market Liquidity Fund and is accrued daily. Premiums and discounts on debt securities purchased are amortized and accreted, respectively, to interest income over the lives of the respective securities. Security transactions are accounted for on the date securities are bought or sold. Costs used to determine realized gains (losses) on the sale of investment securities are those of the specific securities sold.
Withholding taxes on foreign dividends and capital gains have been provided for in accordance with the fund’s understanding of the applicable countries’ tax rules and rates. The fund has filed tax reclaims for previously withheld taxes on dividends earned in certain European Union countries. These filings are subject to various administrative and judicial proceedings within these countries. Such tax reclaims received during the year, if any, are included in dividend income. No other amounts for additional tax reclaims are reflected in the financial statements due to the uncertainty as to the ultimate resolution of proceedings, the likelihood of receipt of these reclaims, and the potential timing of payment.
International Value Fund
B. The investment advisory firms Lazard Asset Management LLC, Edinburgh Partners Limited, and ARGA Investment Management, LP, each provide investment advisory services to a portion of the fund for a fee calculated at an annual percentage rate of average net assets managed by the advisor. The basic fee of Lazard Asset Management LLC and ARGA Investment Management, LP, is subject to quarterly adjustments based on performance relative to the MSCI All Country World Index ex US for the preceding five years. The basic fee of Edinburgh Partners Limited is subject to quarterly adjustments based on performance relative to the MSCI All Country World Index ex US for the preceding three years.
Vanguard manages the cash reserves of the fund as described below.
For the year ended October 31, 2019, the aggregate investment advisory fee represented an effective annual basic rate of 0.17% of the fund’s average net assets, before a decrease of $674,000 (0.01%) based on performance.
C. In accordance with the terms of a Funds’ Service Agreement (the “FSA”) between Vanguard and the fund, Vanguard furnishes to the fund corporate management, administrative, marketing, distribution, and cash management services at Vanguard’s cost of operations (as defined by the FSA). These costs of operations are allocated to the fund based on methods and guidelines approved by the board of trustees. Vanguard does not require reimbursement in the current period for certain costs of operations (such as deferred compensation/benefits and risk/insurance costs); the fund’s liability for these costs of operations is included in Payables to Vanguard on the Statement of Assets and Liabilities. All other costs of operations payable to Vanguard are generally settled twice a month.
Upon the request of Vanguard, the fund may invest up to 0.40% of its net assets as capital in Vanguard. At October 31, 2019, the fund had contributed to Vanguard capital in the amount of $474,000, representing less than 0.01% of the fund’s net assets and 0.19% of Vanguard’s capital received pursuant to the FSA. The fund’s trustees and officers are also directors and employees, respectively, of Vanguard.
D. Various inputs may be used to determine the value of the fund’s investments. These inputs are summarized in three broad levels for financial statement purposes. The inputs or methodologies used to value securities are not necessarily an indication of the risk associated with investing in those securities.
Level 1—Quoted prices in active markets for identical securities.
Level 2—Other significant observable inputs (including quoted prices for similar securities, interest rates, prepayment speeds, credit risk, etc.).
Level 3—Significant unobservable inputs (including the fund’s own assumptions used to determine the fair value of investments). Any investments valued with significant unobservable inputs are noted on the Statement of Net Assets.
International Value Fund
The following table summarizes the market value of the fund’s investments and derivatives as of October 31, 2019, based on the inputs used to value them:
|
| Level 1 |
| Level 2 |
| Level 3 |
|
Investments |
| ($000 | ) | ($000 | ) | ($000 | ) |
Common Stocks |
| 1,212,200 |
| 8,485,829 |
| — |
|
Temporary Cash Investments |
| 588,088 |
| 11,374 |
| — |
|
Futures Contracts—Assets1 |
| 208 |
| — |
| — |
|
Futures Contracts—Liabilities1 |
| (388 | ) | — |
| — |
|
Forward Currency Contracts—Assets |
| — |
| 2,454 |
| — |
|
Forward Currency Contracts—Liabilities |
| — |
| (994 | ) | — |
|
Total |
| 1,800,108 |
| 8,498,663 |
| — |
|
1 Represents variation margin on the last day of the reporting period.
E. At October 31, 2019, the fair values of derivatives were reflected in the Statement of Assets and Liabilities as follows:
|
|
|
| Foreign |
|
|
|
|
| Equity |
| Exchange |
|
|
|
|
| Contracts |
| Contracts |
| Total |
|
Statement of Assets and Liabilities Caption |
| ($000 | ) | ($000 | ) | ($000 | ) |
Variation Margin Receivable—Futures Contracts |
| 208 |
| — |
| 208 |
|
Unrealized Appreciation—Forward Currency Contracts |
| — |
| 2,454 |
| 2,454 |
|
Total Assets |
| 208 |
| 2,454 |
| 2,662 |
|
|
|
|
|
|
|
|
|
Variation Margin Payable—Futures Contracts |
| (388 | ) | — |
| (388 | ) |
Unrealized Depreciation—Forward Currency Contracts |
| — |
| (994 | ) | (994 | ) |
Total Liabilities |
| (388 | ) | (994 | ) | (1,382 | ) |
Realized net gain (loss) and the change in unrealized appreciation (depreciation) on derivatives for the year ended October 31, 2019, were:
|
|
|
| Foreign |
|
|
|
|
| Equity |
| Exchange |
|
|
|
|
| Contracts |
| Contracts |
| Total |
|
Realized Net Gain (Loss) on Derivatives |
| ($000 | ) | ($000 | ) | ($000 | ) |
Futures Contracts |
| 8,759 |
| — |
| 8,759 |
|
Forward Currency Contracts |
| — |
| (9,938 | ) | (9,938 | ) |
Realized Net Gain (Loss) on Derivatives |
| 8,759 |
| (9,938 | ) | (1,179 | ) |
|
|
|
|
|
|
|
|
Change in Unrealized Appreciation (Depreciation) on Derivatives |
|
|
|
|
|
|
|
Futures Contracts |
| 11,515 |
| — |
| 11,515 |
|
Forward Currency Contracts |
| — |
| 6,881 |
| 6,881 |
|
Change in Unrealized Appreciation (Depreciation) on Derivatives |
| 11,515 |
| 6,881 |
| 18,396 |
|
International Value Fund
F. Permanent differences between book-basis and tax-basis components of net assets are reclassified among capital accounts in the financial statements to reflect their tax character. These reclassifications have no effect on net assets or net asset value per share. As of period end, permanent differences primarily attributable to the accounting for foreign currency transactions, passive foreign investment companies, and tax expense on capital gains were reclassified between the individual components of total distributable earnings (loss):
|
| Amount |
|
|
| ($000 | ) |
Paid-in Capital |
| — |
|
Total Distributable Earnings (Loss) |
| — |
|
Temporary differences between book-basis and tax-basis components of total distributable earnings (loss) arise when certain items of income, gain, or loss are recognized in different periods for financial statement and tax purposes; these differences will reverse at some time in the future. The differences are primarily related to the tax deferral of losses on wash sales, the realization of unrealized gains or losses on certain futures contracts and forward currency contracts, and unrealized gains on passive foreign investment companies. As of period end, the tax-basis components of total distributable earnings (loss) are detailed in the table as follows:
|
| Amount |
|
|
| ($000 | ) |
Undistributed Ordinary Income |
| 276,358 |
|
Undistributed Long-Term Gains |
| — |
|
Capital Loss Carryforwards (Non-expiring) |
| (135,407 | ) |
Net Unrealized Gains (Losses) |
| 533,831 |
|
As of October 31, 2019, gross unrealized appreciation and depreciation for investments and derivatives based on cost for U.S. federal income tax purposes were as follows:
|
| Amount |
|
|
| ($000 | ) |
Tax Cost |
| 9,765,877 |
|
Gross Unrealized Appreciation |
| 1,375,092 |
|
Gross Unrealized Depreciation |
| (841,508 | ) |
Net Unrealized Appreciation (Depreciation) |
| 533,584 |
|
G. During the year ended October 31, 2019, the fund purchased $3,806,349,000 of investment securities and sold $3,539,847,000 of investment securities, other than temporary cash investments.
International Value Fund
H. Capital shares issued and redeemed were:
|
| Year Ended October 31, |
| ||
|
| 2019 |
| 2018 |
|
|
| Shares |
| Shares |
|
|
| (000 | ) | (000 | ) |
Issued |
| 42,273 |
| 39,096 |
|
Issued in Lieu of Cash Distributions |
| 15,158 |
| 4,439 |
|
Redeemed |
| (40,172 | ) | (31,720 | ) |
Net Increase (Decrease) in Shares Outstanding |
| 17,259 |
| 11,815 |
|
I. Transactions during the period in investments where the issuer is another member of The Vanguard Group were as follows:
|
|
|
| Current Period Transactions |
|
|
| ||||||||||
|
| Oct. 31, |
|
|
| Proceeds |
| Realized |
|
|
|
|
|
|
| Oct. 31, |
|
|
| 2018 |
|
|
| from |
| Net |
| Change in |
|
|
| Capital Gain |
| 2019 |
|
|
| Market |
| Purchases |
| Securities |
| Gain |
| Unrealized |
|
|
| Distributions |
| Market |
|
|
| Value |
| at Cost |
| Sold |
| (Loss | ) | App. (Dep. | ) | Income |
| Received |
| Value |
|
|
| ($000 | ) | ($000 | ) | ($000 | ) | ($000 | ) | ($000 | ) | ($000 | ) | ($000 | ) | ($000 | ) |
Vanguard FTSE All World ex-US ETF |
| 34,290 |
| — |
| — |
| — |
| 2,794 |
| 1,100 |
| — |
| 37,084 |
|
Vanguard Market Liquidity Fund |
| 568,331 |
| NA1 |
| NA1 |
| 87 |
| 12 |
| 11,998 |
| — |
| 588,088 |
|
Total |
| 602,621 |
|
|
|
|
| 87 |
| 2,806 |
| 13,098 |
| — |
| 625,172 |
|
1 Not applicable—purchases and sales are for temporary cash investment purposes.
J. Management has determined that no events or transactions occurred subsequent to October 31, 2019, that would require recognition or disclosure in these financial statements.
Report of Independent Registered Public Accounting Firm
To the Board of Trustees of Vanguard Trustees’ Equity Fund and Shareholders of Vanguard International Value Fund
Opinion on the Financial Statements
We have audited the accompanying statement of net assets and statement of assets and liabilities of Vanguard International Value Fund (one of the funds constituting Vanguard Trustees’ Equity Fund, referred to hereafter as the “Fund”) as of October 31, 2019, the related statement of operations for the year ended October 31, 2019, the statement of changes in net assets for each of the two years in the period ended October 31, 2019, including the related notes, and the financial highlights for each of the five years in the period ended October 31, 2019 (collectively referred to as the “financial statements”). In our opinion, the financial statements present fairly, in all material respects, the financial position of the Fund as of October 31, 2019, the results of its operations for the year then ended, the changes in its net assets for each of the two years in the period ended October 31, 2019 and the financial highlights for each of the five years in the period ended October 31, 2019 in conformity with accounting principles generally accepted in the United States of America.
Basis for Opinion
These financial statements are the responsibility of the Fund’s management. Our responsibility is to express an opinion on the Fund’s financial statements based on our audits. We are a public accounting firm registered with the Public Company Accounting Oversight Board (United States) (“PCAOB”) and are required to be independent with respect to the Fund in accordance with the U.S. federal securities laws and the applicable rules and regulations of the Securities and Exchange Commission and the PCAOB.
We conducted our audits of these financial statements in accordance with the standards of the PCAOB. Those standards require that we plan and perform the audit to obtain reasonable assurance about whether the financial statements are free of material misstatement, whether due to error or fraud.
Our audits included performing procedures to assess the risks of material misstatement of the financial statements, whether due to error or fraud, and performing procedures that respond to those risks. Such procedures included examining, on a test basis, evidence regarding the amounts and disclosures in the financial statements. Our audits also included evaluating the accounting principles used and significant estimates made by management, as well as evaluating the overall presentation of the financial statements. Our procedures included confirmation of securities owned as of October 31, 2019 by correspondence with the custodian and brokers and by agreement to the underlying ownership records of the transfer agent; when replies were not received from brokers, we performed other auditing procedures. We believe that our audits provide a reasonable basis for our opinion.
/s/PricewaterhouseCoopers LLP
Philadelphia, Pennsylvania
December 18, 2019
We have served as the auditor of one or more investment companies in The Vanguard Group of Funds since 1975.
Special 2019 tax information (unaudited) for Vanguard International Value Fund
This information for the fiscal year ended October 31, 2019, is included pursuant to provisions of the Internal Revenue Code.
The fund distributed $248,206,000 as capital gain dividends (20% rate gain distributions) to shareholders during the fiscal year.
For nonresident alien shareholders, 100% of short-term capital gain dividends distributed by the fund are qualified short-term capital gains.
The fund distributed $193,187,000 of qualified dividend income to shareholders during the fiscal year.
The fund designates to shareholders foreign source income of $360,512,000 and foreign taxes paid of $24,255,000. Shareholders will receive more detailed information with their Form 1099-DIV in January 2020 to determine the calendar-year amounts to be included on their 2019 tax returns.
The People Who Govern Your Fund
The trustees of your mutual fund are there to see that the fund is operated and managed in your best interests since, as a shareholder, you are a part owner of the fund. Your fund’s trustees also serve on the board of directors of The Vanguard Group, Inc., which is owned by the Vanguard funds and provides services to them.
A majority of Vanguard’s board members are independent, meaning that they have no affiliation with Vanguard or the funds they oversee, apart from the sizable personal investments they have made as private individuals. The independent board members have distinguished backgrounds in business, academia, and public service. Each of the trustees and executive officers oversees 213 Vanguard funds.
Information for each trustee and executive officer of the fund appears below. That information, as well as the Vanguard fund count, is as of the date on the cover of this fund report. The mailing address of the trustees and officers is P.O. Box 876, Valley Forge, PA 19482. More information about the trustees is in the Statement of Additional Information, which can be obtained, without charge, by contacting Vanguard at 800-662-7447, or online at vanguard.com.
Interested Trustee1
Mortimer J. Buckley
Born in 1969. Trustee since January 2018. Principal occupation(s) during the past five years and other experience: chairman of the board (January 2019–present) of Vanguard and of each of the investment companies served by Vanguard; chief executive officer (January 2018–present) of Vanguard; chief executive officer, president, and trustee (January 2018–present) of each of the investment companies served by Vanguard; president and director (2017–present) of Vanguard; and president (February 2018–present) of Vanguard Marketing Corporation. Chief investment officer (2013–2017), managing director (2002–2017), head of the Retail Investor Group (2006–2012), and chief information officer (2001–2006) of Vanguard. Chairman of the board (2011–2017) and trustee (2009–2017) of the Children’s Hospital of Philadelphia; trustee (2018–present) of The Shipley School.
Independent Trustees
Emerson U. Fullwood
Born in 1948. Trustee since January 2008. Principal occupation(s) during the past five years and other experience: executive chief staff and marketing officer for North America and corporate vice president (retired 2008) of Xerox Corporation (document management products and services). Former president of the Worldwide Channels Group, Latin America, and Worldwide Customer Service and executive chief staff officer of Developing Markets of Xerox. Executive in residence and 2009–2010 Distinguished Minett Professor at the Rochester Institute of Technology. Director of SPX FLOW, Inc. (multi-industry manufacturing). Director of the University of Rochester Medical Center, the Monroe Community College Foundation, the United Way of Rochester, North Carolina A&T University, and Roberts Wesleyan College. Trustee of the University of Rochester.
Amy Gutmann
Born in 1949. Trustee since June 2006. Principal occupation(s) during the past five years and other experience: president (2004–present) of the University of Pennsylvania. Christopher H. Browne Distinguished Professor of Political Science, School of Arts and Sciences, and professor of communication, Annenberg School for Communication, with secondary faculty appointments in the Department of Philosophy, School of Arts and Sciences, and at the Graduate School of Education, University of Pennsylvania. Trustee of the National Constitution Center.
F. Joseph Loughrey
Born in 1949. Trustee since October 2009. Principal occupation(s) during the past five years and other experience: president and chief operating officer (retired 2009) and vice chairman of the board (2008–2009) of Cummins Inc. (industrial machinery). Chairman of the board of Hillenbrand, Inc. (specialized consumer services), and the Lumina Foundation.
1 Mr. Buckley is considered an “interested person,” as defined in the Investment Company Act of 1940, because he is an officer of the Vanguard funds.
Director of the V Foundation and Oxfam America. Member of the advisory council for the College of Arts and Letters and chair of the advisory board to the Kellogg Institute for International Studies, both at the University of Notre Dame.
Mark Loughridge
Born in 1953. Trustee since March 2012. Principal occupation(s) during the past five years and other experience: senior vice president and chief financial officer (retired 2013) of IBM (information technology services). Fiduciary member of IBM’s Retirement Plan Committee (2004–2013), senior vice president and general manager (2002–2004) of IBM Global Financing, vice president and controller (1998–2002) of IBM, and a variety of other prior management roles at IBM. Member of the Council on Chicago Booth.
Scott C. Malpass
Born in 1962. Trustee since March 2012. Principal occupation(s) during the past five years and other experience: chief investment officer (1989–present) and vice president (1996–present) of the University of Notre Dame. Assistant professor of finance at the Mendoza College of Business, University of Notre Dame, and member of the Notre Dame 403(b) Investment Committee. Chairman of the board of TIFF Advisory Services, Inc. Member of the board of Catholic Investment Services, Inc. (investment advisors) and the board of superintendence of the Institute for the Works of Religion.
Deanna Mulligan
Born in 1963. Trustee since January 2018. Principal occupation(s) during the past five years and other experience: president (2010–present) and chief executive officer (2011–present) of The Guardian Life Insurance Company of America. Chief operating officer (2010–2011) and executive vice president (2008–2010) of Individual Life and Disability of The Guardian Life Insurance Company of America. Member of the board of The Guardian Life Insurance Company of America, the American Council of Life Insurers, the Partnership for New York City (business leadership), and the Committee Encouraging Corporate Philanthropy. Trustee of the Economic Club of New York and the Bruce Museum (arts and science). Member of the Advisory Council for the Stanford Graduate School of Business.
André F. Perold
Born in 1952. Trustee since December 2004. Principal occupation(s) during the past five years and other experience: George Gund Professor of Finance and Banking, Emeritus at the Harvard Business School (retired 2011). Chief investment officer and co-managing partner of HighVista Strategies (private investment firm). Board of advisors and investment committee member of the Museum of Fine Arts Boston. Board member (2018–present) of RIT Capital Partners (investment firm); investment committee member of Partners Health Care System.
Sarah Bloom Raskin
Born in 1961. Trustee since January 2018. Principal occupation(s) during the past five years and other experience: deputy secretary (2014–2017) of the United States Department of the Treasury. Governor (2010–2014) of the Federal Reserve Board. Commissioner (2007–2010) of financial regulation for the State of Maryland. Member of the board of directors (2012–2014) of Neighborhood Reinvestment Corporation. Director (2017–present) of i(x) Investments; director (2017–present) of Reserve Trust. Rubinstein Fellow (2017–present) of Duke University; trustee (2017–present) of Amherst College.
Peter F. Volanakis
Born in 1955. Trustee since July 2009. Principal occupation(s) during the past five years and other experience: president and chief operating officer (retired 2010) of Corning Incorporated (communications equipment) and director of Corning Incorporated (2000–2010) and Dow Corning (2001–2010). Director (2012) of SPX Corporation (multi-industry manufacturing). Overseer of the Amos Tuck School of Business Administration, Dartmouth College (2001–2013). Chairman of the board of trustees of Colby-Sawyer College. Member of the board of Hypertherm Inc. (industrial cutting systems, software, and consumables).
Executive Officers
John Bendl
Born in 1970. Principal occupation(s) during the past five years and other experience: principal of Vanguard. Chief financial officer (October 2019–present) of each of the investment companies served by Vanguard. Chief accounting officer, treasurer, and controller of Vanguard (2017–present). Partner (2003–2016) at KPMG (audit, tax, and advisory services).
Glenn Booraem
Born in 1967. Principal occupation(s) during the past five years and other experience: principal of Vanguard. Investment stewardship officer (2017–present), treasurer (2015–2017), controller (2010–2015), and assistant controller (2001–2010) of each of the investment companies served by Vanguard.
Christine M. Buchanan
Born in 1970. Principal occupation(s) during the past five years and other experience: principal of Vanguard. Treasurer (2017–present) of each of the investment companies served by Vanguard. Partner (2005–2017) at KPMG (audit, tax, and advisory services).
David Cermak
Born in 1960. Principal occupation(s) during the past five years and other experience: principal of Vanguard. Finance director (October 2019–present) of each of the investment companies served by Vanguard. Managing director and head (2017–present) of Vanguard Investments Singapore. Managing director and head (2017–2019) of Vanguard Investments Hong Kong. Representative director and head (2014–2017) of Vanguard Investments Japan.
Thomas J. Higgins
Born in 1957. Principal occupation(s) during the past five years and other experience: principal of Vanguard. Finance director (October 2019–present), chief financial officer (2008–2019), and treasurer (1998–2008) of each of the investment companies served by Vanguard.
Peter Mahoney
Born in 1974. Principal occupation(s) during the past five years and other experience: principal of Vanguard. Controller (2015–present) of each of the investment companies served by Vanguard. Head of International Fund Services (2008–2014) at Vanguard.
Anne E. Robinson
Born in 1970. Principal occupation(s) during the past five years and other experience: general counsel (2016–present) of Vanguard. Secretary (2016–present) of Vanguard and of each of the investment companies served by Vanguard. Managing director (2016–present) of Vanguard. Managing director and general counsel of Global Cards and Consumer Services (2014–2016) at Citigroup. Counsel (2003–2014) at American Express.
Michael Rollings
Born in 1963. Principal occupation(s) during the past five years and other experience: finance director (2017–present) and treasurer (2017) of each of the investment companies served by Vanguard. Managing director (2016–present) of Vanguard. Chief financial officer (2016–present) of Vanguard. Director (2016–present) of Vanguard Marketing Corporation. Executive vice president and chief financial officer (2006–2016) of MassMutual Financial Group.
John E. Schadl
Born in 1972. Principal occupation(s) during the past five years and other experience: principal of Vanguard. Chief compliance officer (2019–present) of Vanguard and of each of the investment companies served by Vanguard. Assistant vice president (May 2019–present) of Vanguard Marketing Corporation.
Vanguard Senior Management Team
Joseph Brennan |
| Chris D. McIsaac |
Mortimer J. Buckley |
| James M. Norris |
Gregory Davis |
| Thomas M. Rampulla |
John James |
| Karin A. Risi |
Martha G. King |
| Anne E. Robinson |
John T. Marcante |
| Michael Rollings |
|
|
|
|
| P.O. Box 2600 |
| Valley Forge, PA 19482-2600 |

Connect with Vanguard® > vanguard.com
Fund Information > 800-662-7447
Direct Investor Account Services > 800-662-2739
Institutional Investor Services > 800-523-1036
Text Telephone for People
Who Are Deaf or Hard of Hearing > 800-749-7273
This material may be used in conjunction with the offering of shares of any Vanguard fund only if preceded or accompanied by the fund’s current prospectus.
All comparative mutual fund data are from Morningstar, Inc., unless otherwise noted.
You can obtain a free copy of Vanguard’s proxy voting guidelines by visiting vanguard.com/proxyreporting or by calling Vanguard at 800-662-2739. The guidelines are also available from the SEC’s website, www.sec.gov. In addition, you may obtain a free report on how your fund voted the proxies for securities it owned during the 12 months ended June 30. To get the report, visit either vanguard.com/proxyreporting or www.sec.gov.
You can review information about your fund on the SEC’s website, and you can receive copies of this information, for a fee, by sending a request via email addressed to publicinfo@sec.gov.
Source for Bloomberg Barclays indexes: Bloomberg Index Services Limited. Copyright 2019, Bloomberg. All rights reserved.
CFA® is a registered trademark owned by CFA Institute.
| © 2019 The Vanguard Group, Inc. |
| All rights reserved. |
| Vanguard Marketing Corporation, Distributor. |
|
|
| Q460 122019 |

Annual Report | October 31, 2019
Vanguard Diversified Equity Fund
|
See the inside front cover for important information about access to your fund’s annual and semiannual shareholder reports.
|
Important information about access to shareholder reports
Beginning on January 1, 2021, as permitted by regulations adopted by the Securities and Exchange Commission, paper copies of your fund’s annual and semiannual shareholder reports will no longer be sent to you by mail, unless you specifically request them. Instead, you will be notified by mail each time a report is posted on the website and will be provided with a link to access the report.
If you have already elected to receive shareholder reports electronically, you will not be affected by this change and do not need to take any action. You may elect to receive shareholder reports and other communications from the fund electronically by contacting your financial intermediary (such as a broker-dealer or bank) or, if you invest directly with the fund, by calling Vanguard at one of the phone numbers on the back cover of this report or by logging on to vanguard.com.
You may elect to receive paper copies of all future shareholder reports free of charge. If you invest through a financial intermediary, you can contact the intermediary to request that you continue to receive paper copies. If you invest directly with the fund, you can call Vanguard at one of the phone numbers on the back cover of this report or log on to vanguard.com. Your election to receive paper copies will apply to all the funds you hold through an intermediary or directly with Vanguard.
Contents |
|
|
|
A Note From Our Chairman | 1 |
Your Fund’s Performance at a Glance | 2 |
About Your Fund’s Expenses | 3 |
Performance Summary | 5 |
Financial Statements | 7 |
Please note: The opinions expressed in this report are just that—informed opinions. They should not be considered promises or advice. Also, please keep in mind that the information and opinions cover the period through the date on the front of this report. Of course, the risks of investing in your fund are spelled out in the prospectus.
A Note From Our Chairman

Tim Buckley
Chairman and Chief Executive Officer
Dear Shareholder,
Recent volatility in financial markets—affecting stocks, bonds, and commodities—has been a good reminder of the wise old adage, “Never keep all your eggs in one basket.” Maintaining balance and diversification in your investment portfolio can help to both limit risk and set you up for long-term success.
It’s understandable why some investors might become complacent after a long market run-up like the one that lifted stock prices, especially U.S. stock prices, in the years following the global financial crisis. But failing to rebalance regularly can leave a portfolio with a much different mix of assets than intended and, often, more risk than intended.
Balance across and diversification within asset classes are powerful tools for managing risk and achieving your investment goals. A portfolio’s allocation will determine a large portion of its long-term return and also the majority of its volatility risk. A well-diversified portfolio is less vulnerable to significant swings in the performance of any one segment of the asset classes in which it invests.
Balance and diversification will never eliminate the risk of loss, nor will they guarantee positive returns in a declining market. But they should reduce the chance that you’ll suffer disproportionate losses in one particular high-flying asset class or sector when it comes back to earth. And exposure to all key market components should give you at least some participation in the sectors that are performing best at any given time.
Vanguard is committed to helping you achieve balance and diversification in your portfolios to help meet your investment goals. We thank you for your continued loyalty.
Sincerely,
![]()
Mortimer J. Buckley
Chairman and Chief Executive Officer
November 18, 2019
Your Fund’s Performance at a Glance
· For the 12 months ended October 31, 2019, Vanguard Diversified Equity Fund returned 12.82%, behind its benchmark, the MSCI US Broad Market Index.
· The broad U.S. stock market, as measured by the Russell 3000 Index, climbed more than 13% for the year, despite stretches of volatility at the end of 2018 and during the spring of 2019. The market’s 12-month performance was boosted by the Federal Reserve’s accommodative stance and corporate earnings that largely exceeded investor expectations.
· As a “fund of funds,” the Diversified Equity Fund invests in seven actively managed Vanguard funds selected to provide broad exposure to all segments of the U.S. equity market. Together, the funds cover the style and capitalization spectrum.
· Results for the underlying funds ranged from about 10% for Vanguard Explorer Fund to more than 15% for Vanguard U.S. Growth Fund.
· For the ten years ended October 31, 2019, the fund’s average annual return of 13.16% trailed that of its benchmark.
Market Barometer
|
| Average Annual Total Returns |
| ||||
|
| Periods Ended October 31, 2019 |
| ||||
|
| One Year |
| Three Years |
| Five Years |
|
Stocks |
|
|
|
|
|
|
|
Russell 1000 Index (Large-caps) |
| 14.15% |
| 14.73% |
| 10.55% |
|
Russell 2000 Index (Small-caps) |
| 4.90 |
| 10.96 |
| 7.37 |
|
Russell 3000 Index (Broad U.S. market) |
| 13.49 |
| 14.47 |
| 10.31 |
|
FTSE All-World ex US Index (International) |
| 11.52 |
| 8.21 |
| 4.16 |
|
|
|
|
|
|
|
|
|
Bonds |
|
|
|
|
|
|
|
Bloomberg Barclays U.S. Aggregate Bond Index (Broad taxable market) |
| 11.51% |
| 3.29% |
| 3.24% |
|
Bloomberg Barclays Municipal Bond Index (Broad tax-exempt market) |
| 9.42 |
| 3.62 |
| 3.55 |
|
FTSE Three-Month U.S. Treasury Bill Index |
| 2.35 |
| 1.57 |
| 0.98 |
|
|
|
|
|
|
|
|
|
CPI |
|
|
|
|
|
|
|
Consumer Price Index |
| 1.76% |
| 2.11% |
| 1.62% |
|
About Your Fund’s Expenses
As a shareholder of the fund, you incur ongoing costs, which include costs for portfolio management, administrative services, and shareholder reports (like this one), among others. Operating expenses, which are deducted from a fund’s gross income, directly reduce the investment return of the fund.
A typical fund’s expenses are expressed as a percentage of its average net assets. The Diversified Equity Fund has no direct expenses, but bears its proportionate share of the costs for the underlying funds in which it invests. These indirect expenses make up the acquired fund fees and expenses, also expressed as a percentage of average net assets.
The following examples are intended to help you understand the ongoing cost (in dollars) of investing in your fund and to compare these costs with those of other mutual funds. The examples are based on an investment of $1,000 made at the beginning of the period shown and held for the entire period. The costs were calculated using the acquired fund fees and expenses for the Diversified Equity Fund.
The accompanying table illustrates your fund’s costs in two ways:
· Based on actual fund return. This section helps you to estimate the actual expenses that you paid over the period. The “Ending Account Value” shown is derived from the fund’s actual return, and the third column shows the dollar amount that would have been paid by an investor who started with $1,000 in the fund. You may use the information here, together with the amount you invested, to estimate the expenses that you paid over the period.
To do so, simply divide your account value by $1,000 (for example, an $8,600 account value divided by $1,000 = 8.6), then multiply the result by the number given for your fund under the heading “Expenses Paid During Period.”
· Based on hypothetical 5% yearly return. This section is intended to help you compare your fund’s costs with those of other mutual funds. It assumes that the fund had a yearly return of 5% before expenses, but that the expense ratio is unchanged. In this case—because the return used is not the fund’s actual return—the results do not apply to your investment. The example is useful in making comparisons because the Securities and Exchange Commission requires all mutual funds to calculate expenses based on a 5% return. You can assess your fund’s costs by comparing this hypothetical example with the hypothetical examples that appear in shareholder reports of other funds.
Note that the expenses shown in the table are meant to highlight and help you compare ongoing costs only and do not reflect transaction costs incurred by the fund for buying and selling securities. Further, the expenses do not include any purchase, redemption, or account service fees described in the fund prospectus. If such fees were applied to your account, your costs would be higher. Your fund does not carry a “sales load.”
The calculations assume no shares were bought or sold during the period. Your actual costs may have been higher or lower, depending on the amount of your investment and the timing of any purchases or redemptions.
You can find more information about the fund’s expenses, including annual expense ratios, in the Financial Statements section of this report. For additional information on operating expenses and other shareholder costs, please refer to your fund’s current prospectus.
Six Months Ended October 31, 2019 |
|
|
|
| Beginning | Ending | Expenses |
| Account Value | Account Value | Paid During |
Diversified Equity Fund | 4/30/2019 | 10/31/2019 | Period |
Based on Actual Fund Return | $1,000.00 | $1,023.46 | $1.84 |
Based on Hypothetical 5% Yearly Return | 1,000.00 | 1,023.39 | 1.84 |
The calculations are based on acquired fund fees and expenses charged by the underlying mutual funds in which the Diversified Equity Fund invests. The Diversified Equity Fund’s annualized expense figure for the period is 0.36%. The dollar amounts shown as “Expenses Paid” are equal to the annualized average weighted expense ratio for the underlying funds multiplied by the average account value over the period, multiplied by the number of days in the most recent six-month period, then divided by the number of days in the most recent 12-month period (184/365).
Diversified Equity Fund
Performance Summary
All of the returns in this report represent past performance, which is not a guarantee of future results that may be achieved by the fund. (Current performance may be lower or higher than the performance data cited. For performance data current to the most recent month-end, visit our website at vanguard.com/performance.) Note, too, that both investment returns and principal value can fluctuate widely, so an investor’s shares, when sold, could be worth more or less than their original cost. The returns shown do not reflect taxes that a shareholder would pay on fund distributions or on the sale of fund shares.
Cumulative Performance: October 31, 2009, Through October 31, 2019
Initial Investment of $10,000
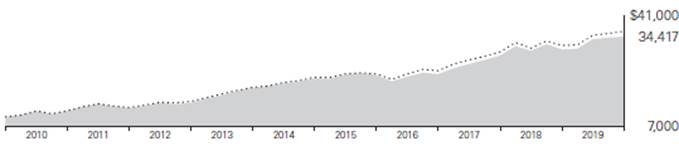
|
| Average Annual Total Returns |
| ||
|
| Periods Ended October 31, 2019 |
| ||
|
|
|
|
| Final Value |
|
| One | Five | Ten | of a $10,000 |
|
| Year | Years | Years | Investment |
| Diversified Equity Fund | 12.82% | 9.70% | 13.16% | $34,417 |
| MSCI US Broad Market Index | 13.48 | 10.34 | 13.68 | 36,048 |
See Financial Highlights for dividend and capital gains information.
Diversified Equity Fund
Underlying Vanguard Funds
As of October 31, 2019
Vanguard U.S. Growth Fund Investor Shares | 29.8% |
Vanguard Growth and Income Fund Investor Shares | 20.0 |
Vanguard Windsor™ II Fund Investor Shares | 15.1 |
Vanguard Windsor Fund Investor Shares | 15.1 |
Vanguard Explorer™ Fund Investor Shares | 10.0 |
Vanguard Capital Value Fund | 5.1 |
Vanguard Mid-Cap Growth Fund | 4.9 |
Diversified Equity Fund
Financial Statements
Statement of Net Assets
As of October 31, 2019
The fund files its complete schedule of portfolio holdings with the Securities and Exchange Commission (SEC) for the first and third quarters of each fiscal year as an exhibit to its reports on Form N-PORT. The fund’s Form N-PORT reports are available on the SEC’s website at www.sec.gov.
|
|
|
|
| Market |
|
|
|
|
|
| Value· |
|
|
|
| Shares |
| ($000 | ) |
Investment Companies (100.0%) |
|
|
|
|
| |
U.S. Stock Funds (100.0%) |
|
|
|
|
| |
| Vanguard U.S. Growth Fund Investor Shares |
| 12,848,736 |
| 533,865 |
|
| Vanguard Growth and Income Fund Investor Shares |
| 7,085,168 |
| 357,518 |
|
| Vanguard Windsor II Fund Investor Shares |
| 7,263,009 |
| 270,329 |
|
| Vanguard Windsor Fund Investor Shares |
| 12,379,687 |
| 269,382 |
|
| Vanguard Explorer Fund Investor Shares |
| 1,759,071 |
| 178,827 |
|
| Vanguard Capital Value Fund |
| 6,611,372 |
| 90,708 |
|
| Vanguard Mid-Cap Growth Fund |
| 3,141,453 |
| 87,741 |
|
Total Investment Companies (Cost $1,190,081) |
|
|
| 1,788,370 |
| |
Temporary Cash Investment (0.0%) |
|
|
|
|
| |
Money Market Fund (0.0%) |
|
|
|
|
| |
1 | Vanguard Market Liquidity Fund, 1.984% (Cost $7) |
| 71 |
| 7 |
|
Total Investments (100.0%) (Cost $1,190,088) |
|
|
| 1,788,377 |
| |
Other Assets and Liabilities (0.0%) |
|
|
|
|
| |
Other Assets |
|
|
| 749 |
| |
Liabilities |
|
|
| (607 | ) | |
|
|
|
|
| 142 |
|
Net Assets (100%) |
|
|
|
|
| |
Applicable to 47,127,983 outstanding $.001 par value shares of beneficial interest (unlimited authorization) |
|
|
| 1,788,519 |
| |
Net Asset Value Per Share |
|
|
| $37.95 |
| |
|
|
|
| Amount |
|
|
|
|
| ($000 | ) |
Statement of Assets and Liabilities |
|
|
|
|
|
Assets |
|
|
|
|
|
Investments in Securities, at Value—Affiliated Funds |
|
|
| 1,788,377 |
|
Receivables for Capital Shares Issued |
|
|
| 749 |
|
Total Assets |
|
|
| 1,789,126 |
|
Liabilities |
|
|
|
|
|
Payables for Investment Securities Purchased |
|
|
| 349 |
|
Payables for Capital Shares Redeemed |
|
|
| 258 |
|
Total Liabilities |
|
|
| 607 |
|
Net Assets |
|
|
| 1,788,519 |
|
Diversified Equity Fund
At October 31, 2019, net assets consisted of:
|
|
|
| Amount |
|
|
|
|
| ($000 | ) |
Paid-in Capital |
|
|
| 1,077,639 |
|
Total Distributable Earnings (Loss) |
|
|
| 710,880 |
|
Net Assets |
|
|
| 1,788,519 |
|
· See Note A in Notes to Financial Statements.
1 Affiliated money market fund available only to Vanguard funds and certain trusts and accounts managed by Vanguard. Rate shown is the 7-day yield.
See accompanying Notes, which are an integral part of the Financial Statements.
Diversified Equity Fund
Statement of Operations
|
| Year Ended |
|
|
| October 31, 2019 |
|
|
|
|
|
|
| ($000 | ) |
Investment Income |
|
|
|
Income |
|
|
|
Income Distributions Received from Affiliated Funds |
| 22,061 |
|
Net Investment Income—Note B |
| 22,061 |
|
Realized Net Gain (Loss) |
|
|
|
Capital Gain Distributions Received from Affiliated Funds |
| 149,529 |
|
Affiliated Funds Sold |
| (12,315 | ) |
Realized Net Gain (Loss) |
| 137,214 |
|
Change in Unrealized Appreciation (Depreciation) from Affiliated Funds |
| 48,896 |
|
Net Increase (Decrease) in Net Assets Resulting from Operations |
| 208,171 |
|
See accompanying Notes, which are an integral part of the Financial Statements.
Diversified Equity Fund
Statement of Changes in Net Assets
|
| Year Ended October 31, |
| ||
|
|
|
|
|
|
|
| 2019 |
| 2018 |
|
|
| ($000 | ) | ($000 | ) |
Increase (Decrease) in Net Assets |
|
|
|
|
|
Operations |
|
|
|
|
|
Net Investment Income |
| 22,061 |
| 17,250 |
|
Realized Net Gain (Loss) |
| 137,214 |
| 81,325 |
|
Change in Unrealized Appreciation (Depreciation) |
| 48,896 |
| (16,628 | ) |
Net Increase (Decrease) in Net Assets Resulting from Operations |
| 208,171 |
| 81,947 |
|
Distributions |
|
|
|
|
|
Net Investment Income |
| (17,961 | ) | (15,286 | ) |
Realized Capital Gain1 |
| (78,084 | ) | (69,091 | ) |
Total Distributions |
| (96,045 | ) | (84,377 | ) |
Capital Share Transactions |
|
|
|
|
|
Issued |
| 175,169 |
| 467,373 |
|
Issued in Lieu of Cash Distributions |
| 90,958 |
| 80,017 |
|
Redeemed |
| (298,471 | ) | (275,188 | ) |
Net Increase (Decrease) from Capital Share Transactions |
| (32,344 | ) | 272,202 |
|
Total Increase (Decrease) |
| 79,782 |
| 269,772 |
|
Net Assets |
|
|
|
|
|
Beginning of Period |
| 1,708,737 |
| 1,438,965 |
|
End of Period |
| 1,788,519 |
| 1,708,737 |
|
1 Includes fiscal 2019 and 2018 short-term gain distributions totaling $19,795,000 and $13,729,000, respectively. Short-term gain distributions are treated as ordinary income dividends for tax purposes.
See accompanying Notes, which are an integral part of the Financial Statements.
Diversified Equity Fund
Financial Highlights
For a Share Outstanding | Year Ended October 31, |
| ||||||||
Throughout Each Period | 2019 |
| 2018 |
| 2017 |
| 2016 |
| 2015 |
|
Net Asset Value, Beginning of Period | $35.88 |
| $35.57 |
| $30.76 |
| $33.15 |
| $33.18 |
|
Investment Operations |
|
|
|
|
|
|
|
|
|
|
Net Investment Income | .455 | 1 | .395 | 1 | .428 | 1 | .397 |
| .394 |
|
Capital Gain Distributions Received | 3.087 | 1 | 1.686 | 1 | 1.064 | 1 | .860 |
| 2.606 |
|
Net Realized and Unrealized Gain (Loss) on Investments | .575 |
| .206 |
| 5.627 |
| (.836 | ) | (1.453 | ) |
Total from Investment Operations | 4.117 |
| 2.287 |
| 7.119 |
| .421 |
| 1.547 |
|
Distributions |
|
|
|
|
|
|
|
|
|
|
Dividends from Net Investment Income | (.383 | ) | (.358 | ) | (.414 | ) | (.362 | ) | (.342 | ) |
Distributions from Realized Capital Gains | (1.664 | ) | (1.619 | ) | (1.895 | ) | (2.449 | ) | (1.235 | ) |
Total Distributions | (2.047 | ) | (1.977 | ) | (2.309 | ) | (2.811 | ) | (1.577 | ) |
Net Asset Value, End of Period | $37.95 |
| $35.88 |
| $35.57 |
| $30.76 |
| $33.15 |
|
|
|
|
|
|
|
|
|
|
|
|
Total Return2 | 12.82% |
| 6.55% |
| 24.47% |
| 1.39% |
| 4.71% |
|
|
|
|
|
|
|
|
|
|
|
|
Ratios/Supplemental Data |
|
|
|
|
|
|
|
|
|
|
Net Assets, End of Period (Millions) | $1,789 |
| $1,709 |
| $1,439 |
| $1,276 |
| $1,456 |
|
Ratio of Total Expenses to Average Net Assets | — |
| — |
| — |
| — |
| — |
|
Acquired Fund Fees and Expenses | 0.35% |
| 0.36% |
| 0.36% |
| 0.36% |
| 0.40% |
|
Ratio of Net Investment Income to Average Net Assets | 1.27% |
| 1.07% |
| 1.31% |
| 1.26% |
| 1.16% |
|
Portfolio Turnover Rate | 9% |
| 8% |
| 5% |
| 9% |
| 10% |
|
1 Calculated based on average shares outstanding.
2 Total returns do not include account service fees that may have applied in the periods shown. Fund prospectuses provide information about any applicable account service fees.
See accompanying Notes, which are an integral part of the Financial Statements.
Diversified Equity Fund
Notes to Financial Statements
Vanguard Diversified Equity Fund is registered under the Investment Company Act of 1940 as an open-end investment company, or mutual fund. The fund invests in selected Vanguard actively managed U.S. stock funds. Financial statements and other information about each underlying fund are available on vanguard.com.
A. The following significant accounting policies conform to generally accepted accounting principles for U.S. investment companies. The fund consistently follows such policies in preparing its financial statements.
1. Security Valuation: Investments are valued at the net asset value of each underlying Vanguard fund determined as of the close of the New York Stock Exchange (generally 4 p.m., Eastern time) on the valuation date.
2. Federal Income Taxes: The fund intends to continue to qualify as a regulated investment company and distribute all of its taxable income. Management has analyzed the fund’s tax positions taken for all open federal income tax years (October 31, 2016–2019), and has concluded that no provision for federal income tax is required in the fund’s financial statements.
3. Distributions: Distributions to shareholders are recorded on the ex-dividend date. Distributions are determined on a tax basis and may differ from net investment income and realized capital gains for financial reporting purposes.
4. Credit Facility: The fund and certain other funds managed by The Vanguard Group (“Vanguard”) participate in a $4.3 billion committed credit facility provided by a syndicate of lenders pursuant to a credit agreement that may be renewed annually; each fund is individually liable for its borrowings, if any, under the credit facility. Borrowings may be utilized for temporary and emergency purposes, and are subject to the fund’s regulatory and contractual borrowing restrictions. The participating funds are charged administrative fees and an annual commitment fee of 0.10% of the undrawn amount of the facility; these fees are allocated to the funds based on a method approved by the fund’s board of trustees and borne by the funds in which the fund invests (see Note B). Any borrowings under this facility bear interest at a rate based upon the higher of the one-month London Interbank Offered Rate, federal funds effective rate, or overnight bank funding rate plus an agreed-upon spread.
The fund had no borrowings outstanding at October 31, 2019, or at any time during the period then ended.
5. Other: Income and capital gain distributions received are recorded on the ex-dividend date. Security transactions are accounted for on the date securities are bought or sold. Costs used to determine realized gains (losses) on the sale of investment securities are those of the specific securities sold.
Diversified Equity Fund
B. In accordance with the terms of a Funds’ Service Agreement (the “FSA”) between Vanguard and the fund, Vanguard furnishes to the fund investment advisory, corporate management, administrative, marketing, and distribution services at Vanguard’s cost of operations (as defined by the FSA). These costs of operations are allocated to the fund based on methods and guidelines approved by the board of trustees. The FSA provides that expenses otherwise allocable to Vanguard funds-of-funds may be reduced or eliminated to the extent of savings realized by the underlying Vanguard funds by virtue of being part of a fund-of-funds. Accordingly, all expenses for services provided by Vanguard to the fund and all other expenses incurred by the fund during the period ended October 31, 2019, were borne by the underlying Vanguard funds in which the fund invests. The fund’s trustees and officers are also trustees and officers, respectively, of the underlying Vanguard funds, as well as directors and employees, respectively, of Vanguard.
C. Various inputs may be used to determine the value of the fund’s investments. These inputs are summarized in three broad levels for financial statement purposes. The inputs or methodologies used to value securities are not necessarily an indication of the risk associated with investing in those securities.
Level 1—Quoted prices in active markets for identical securities.
Level 2—Other significant observable inputs (including quoted prices for similar securities, interest rates, prepayment speeds, credit risk, etc.).
Level 3—Significant unobservable inputs (including the fund’s own assumptions used to determine the fair value of investments). Any investments valued with significant unobservable inputs are noted on the Statement of Net Assets.
At October 31, 2019, 100% of the market value of the fund’s investments was determined based on Level 1 inputs.
D. Permanent differences between book-basis and tax-basis components of net assets are reclassified among capital accounts in the financial statements to reflect their tax character. These reclassifications have no effect on net assets or net asset value per share. As of period end, permanent differences primarily attributable to the accounting for distributions in connection with fund share redemptions were reclassified between the following accounts:
| Amount |
| ($000) |
Paid-in Capital | 16,483 |
Total Distributable Earnings (Loss) | (16,483) |
Diversified Equity Fund
Temporary differences between book-basis and tax-basis components of total distributable earnings (loss) arise when certain items of income, gain, or loss are recognized in different periods for financial statement and tax purposes; these differences will reverse at some time in the future. The differences are primarily related to the tax deferral of losses on wash sales. As of period end, the tax-basis components of total distributable earnings (loss) are detailed in the table as follows:
| Amount |
| ($000) |
Undistributed Ordinary Income | 3,682 |
Undistributed Long-Term Gains | 108,909 |
Capital Loss Carryforwards (Non-expiring) | — |
Net Unrealized Gains (Losses) | 598,289 |
As of October 31, 2019, gross unrealized appreciation and depreciation for investments based on cost for U.S. federal income tax purposes were as follows:
| Amount ($000) |
Tax Cost | 1,190,088 |
Gross Unrealized Appreciation | 603,731 |
Gross Unrealized Depreciation | (5,442) |
Net Unrealized Appreciation (Depreciation) | 598,289 |
E. Capital shares issued and redeemed were:
| Year Ended October 31, | |
| 2019 | 2018 |
| Shares | Shares |
| (000) | (000) |
Issued | 4,941 | 12,393 |
Issued in Lieu of Cash Distributions | 2,961 | 2,279 |
Redeemed | (8,400) | (7,499) |
Net Increase (Decrease) in Shares Outstanding | (498) | 7,173 |
Diversified Equity Fund
F. Transactions during the period in affiliated underlying Vanguard funds were as follows:
|
|
|
| Current Period Transactions |
|
|
| ||||||||||
|
| Oct. 31, |
|
|
| Proceeds |
| Realized |
|
|
|
|
|
|
| Oct. 31, |
|
|
| 2018 |
|
|
| from |
| Net |
| Change in |
|
|
| Capital Gain |
| 2019 |
|
|
| Market |
| Purchases |
| Securities |
| Gain |
| Unrealized |
|
|
| Distributions |
| Market |
|
|
| Value |
| at Cost |
| Sold1 |
| (Loss | ) | App. (Dep. | ) | Income |
| Received |
| Value |
|
|
| ($000 | ) | ($000 | ) | ($000 | ) | ($000 | ) | ($000 | ) | ($000 | ) | ($000 | ) | ($000 | ) |
Vanguard Market Liquidity Fund |
| — |
| NA2 |
| NA2 |
| — |
| — |
| 2 |
| — |
| 7 |
|
Vanguard Capital Value Fund |
| 85,721 |
| 4,183 |
| 6,871 |
| (351 | ) | 8,026 |
| 2,000 |
| — |
| 90,708 |
|
Vanguard Explorer Fund |
| 169,410 |
| 20,640 |
| 12,607 |
| (959 | ) | 2,343 |
| 475 |
| 14,750 |
| 178,827 |
|
Vanguard Growth and Income Fund |
| 341,967 |
| 27,477 |
| 29,387 |
| (1,578 | ) | 19,039 |
| 5,487 |
| 17,896 |
| 357,518 |
|
Vanguard Mid-Cap Growth Fund |
| 84,689 |
| 11,852 |
| 9,971 |
| (1,066 | ) | 2,237 |
| 300 |
| 9,554 |
| 87,741 |
|
Vanguard Morgan™ Growth Fund3 |
| 256,583 |
| 52,580 |
| 16,020 |
| (1,285 | ) | (103,491 | ) | 1,850 |
| 49,554 |
| — |
|
Vanguard U.S. Growth Fund3 |
| 258,175 |
| 25,687 |
| 45,783 |
| (3,886 | ) | 114,195 |
| 841 |
| 16,873 |
| 533,865 |
|
Vanguard Windsor Fund |
| 256,091 |
| 33,544 |
| 21,472 |
| (1,860 | ) | 3,079 |
| 5,108 |
| 22,316 |
| 269,382 |
|
Vanguard Windsor II Fund |
| 256,309 |
| 30,089 |
| 18,207 |
| (1,330 | ) | 3,468 |
| 5,998 |
| 18,586 |
| 270,329 |
|
Total |
| 1,708,945 |
| 206,052 |
| 160,318 |
| (12,315 | ) | 48,896 |
| 22,061 |
| 149,529 |
| 1,788,377 |
|
1 Does not include adjustments related to return of capital.
2 Not applicable—purchases and sales are for temporary cash investment purposes.
3 In April 2019, Vanguard Morgan Growth Fund reorganized with and into Vanguard U.S. Growth Fund through a tax-free reorganization. As a result of the merger, the fund received shares of Vanguard U.S. Growth Fund valued at $267,850,000, which consisted of cost of $188,367,000, and unrealized appreciation of $79,483,000.
G. Management has determined that no events or transactions occurred subsequent to October 31, 2019, that would require recognition or disclosure in these financial statements.
Report of Independent Registered Public Accounting Firm
To the Board of Trustees of Vanguard Trustees’ Equity Fund and Shareholders of Vanguard Diversified Equity Fund
Opinion on the Financial Statements
We have audited the accompanying statement of net assets and statement of assets and liabilities of Vanguard Diversified Equity Fund (one of the funds constituting Vanguard Trustees’ Equity Fund, referred to hereafter as the “Fund”) as of October 31, 2019, the related statement of operations for the year ended October 31, 2019, the statement of changes in net assets for each of the two years in the period ended October 31, 2019, including the related notes, and the financial highlights for each of the five years in the period ended October 31, 2019 (collectively referred to as the “financial statements”). In our opinion, the financial statements present fairly, in all material respects, the financial position of the Fund as of October 31, 2019, the results of its operations for the year then ended, the changes in its net assets for each of the two years in the period ended October 31, 2019 and the financial highlights for each of the five years in the period ended October 31, 2019 in conformity with accounting principles generally accepted in the United States of America.
Basis for Opinion
These financial statements are the responsibility of the Fund’s management. Our responsibility is to express an opinion on the Fund’s financial statements based on our audits. We are a public accounting firm registered with the Public Company Accounting Oversight Board (United States) (“PCAOB”) and are required to be independent with respect to the Fund in accordance with the U.S. federal securities laws and the applicable rules and regulations of the Securities and Exchange Commission and the PCAOB.
We conducted our audits of these financial statements in accordance with the standards of the PCAOB. Those standards require that we plan and perform the audit to obtain reasonable assurance about whether the financial statements are free of material misstatement, whether due to error or fraud.
Our audits included performing procedures to assess the risks of material misstatement of the financial statements, whether due to error or fraud, and performing procedures that respond to those risks. Such procedures included examining, on a test basis, evidence regarding the amounts and disclosures in the financial statements. Our audits also included evaluating the accounting principles used and significant estimates made by management, as well as evaluating the overall presentation of the financial statements. Our procedures included confirmation of securities owned as of October 31, 2019 by correspondence with the transfer agent. We believe that our audits provide a reasonable basis for our opinion.
/s/PricewaterhouseCoopers LLP
Philadelphia, Pennsylvania
December 13, 2019
We have served as the auditor of one or more investment companies in The Vanguard Group of Funds since 1975.
Special 2019 tax information (unaudited) for Vanguard Diversified Equity Fund
This information for the fiscal year ended October 31, 2019, is included pursuant to provisions of the Internal Revenue Code.
The fund distributed $71,007,000 as capital gain dividends (20% rate gain distributions) to shareholders during the fiscal year.
For nonresident alien shareholders, 100% of short-term capital gain dividends distributed by the fund are qualified short-term capital gains.
The fund distributed $20,095,000 of qualified dividend income to shareholders during the fiscal year.
For corporate shareholders, 55.0% of investment income (dividend income plus short-term gains, if any) qualifies for the dividends-received deduction.
This page intentionally left blank.
The People Who Govern Your Fund
The trustees of your mutual fund are there to see that the fund is operated and managed in your best interests since, as a shareholder, you are a part owner of the fund. Your fund’s trustees also serve on the board of directors of The Vanguard Group, Inc., which is owned by the Vanguard funds and provides services to them.
A majority of Vanguard’s board members are independent, meaning that they have no affiliation with Vanguard or the funds they oversee, apart from the sizable personal investments they have made as private individuals. The independent board members have distinguished backgrounds in business, academia, and public service. Each of the trustees and executive officers oversees 213 Vanguard funds.
Information for each trustee and executive officer of the fund appears below. That information, as well as the Vanguard fund count, is as of the date on the cover of this fund report. The mailing address of the trustees and officers is P.O. Box 876, Valley Forge, PA 19482. More information about the trustees is in the Statement of Additional Information, which can be obtained, without charge, by contacting Vanguard at 800-662-7447, or online at vanguard.com.
Interested Trustee1
Mortimer J. Buckley
Born in 1969. Trustee since January 2018. Principal occupation(s) during the past five years and other experience: chairman of the board (January 2019–present) of Vanguard and of each of the investment companies served by Vanguard; chief executive officer (January 2018–present) of Vanguard; chief executive officer, president, and trustee (January 2018–present) of each of the investment companies served by Vanguard; president and director (2017–present) of Vanguard; and president (February 2018–present) of Vanguard Marketing Corporation. Chief investment officer (2013–2017), managing director (2002–2017), head of the Retail Investor Group (2006–2012), and chief information officer (2001–2006) of Vanguard. Chairman of the board (2011–2017) and trustee (2009–2017) of the Children’s Hospital of Philadelphia; trustee (2018–present) of The Shipley School.
Independent Trustees
Emerson U. Fullwood
Born in 1948. Trustee since January 2008. Principal occupation(s) during the past five years and other experience: executive chief staff and marketing officer for North America and corporate vice president (retired 2008) of Xerox Corporation (document management products and services). Former president of the Worldwide Channels Group, Latin America, and Worldwide Customer Service and executive chief staff officer of Developing Markets of Xerox. Executive in residence and 2009–2010 Distinguished Minett Professor at the Rochester Institute of Technology. Director of SPX FLOW, Inc. (multi-industry manufacturing). Director of the University of Rochester Medical Center, the Monroe Community College Foundation, the United Way of Rochester, North Carolina A&T University, and Roberts Wesleyan College. Trustee of the University of Rochester.
Amy Gutmann
Born in 1949. Trustee since June 2006. Principal occupation(s) during the past five years and other experience: president (2004–present) of the University of Pennsylvania. Christopher H. Browne Distinguished Professor of Political Science, School of Arts and Sciences, and professor of communication, Annenberg School for Communication, with secondary faculty appointments in the Department of Philosophy, School of Arts and Sciences, and at the Graduate School of Education, University of Pennsylvania. Trustee of the National Constitution Center.
F. Joseph Loughrey
Born in 1949. Trustee since October 2009. Principal occupation(s) during the past five years and other experience: president and chief operating officer (retired 2009) and vice chairman of the board (2008–2009) of Cummins Inc. (industrial machinery). Chairman of the board of Hillenbrand, Inc. (specialized consumer services), and the Lumina Foundation.
1 Mr. Buckley is considered an “interested person,” as defined in the Investment Company Act of 1940, because he is an officer of the Vanguard funds.
Director of the V Foundation and Oxfam America. Member of the advisory council for the College of Arts and Letters and chair of the advisory board to the Kellogg Institute for International Studies, both at the University of Notre Dame.
Mark Loughridge
Born in 1953. Trustee since March 2012. Principal occupation(s) during the past five years and other experience: senior vice president and chief financial officer (retired 2013) of IBM (information technology services). Fiduciary member of IBM’s Retirement Plan Committee (2004–2013), senior vice president and general manager (2002–2004) of IBM Global Financing, vice president and controller (1998–2002) of IBM, and a variety of other prior management roles at IBM. Member of the Council on Chicago Booth.
Scott C. Malpass
Born in 1962. Trustee since March 2012. Principal occupation(s) during the past five years and other experience: chief investment officer (1989–present) and vice president (1996–present) of the University of Notre Dame. Assistant professor of finance at the Mendoza College of Business, University of Notre Dame, and member of the Notre Dame 403(b) Investment Committee. Chairman of the board of TIFF Advisory Services, Inc. Member of the board of Catholic Investment Services, Inc. (investment advisors) and the board of superintendence of the Institute for the Works of Religion.
Deanna Mulligan
Born in 1963. Trustee since January 2018. Principal occupation(s) during the past five years and other experience: president (2010–present) and chief executive officer (2011–present) of The Guardian Life Insurance Company of America. Chief operating officer (2010–2011) and executive vice president (2008–2010) of Individual Life and Disability of The Guardian Life Insurance Company of America. Member of the board of The Guardian Life Insurance Company of America, the American Council of Life Insurers, the Partnership for New York City (business leadership), and the Committee Encouraging Corporate Philanthropy. Trustee of the Economic Club of New York and the Bruce Museum (arts and science). Member of the Advisory Council for the Stanford Graduate School of Business.
André F. Perold
Born in 1952. Trustee since December 2004. Principal occupation(s) during the past five years and other experience: George Gund Professor of Finance and Banking, Emeritus at the Harvard Business School (retired 2011). Chief investment officer and co-managing partner of HighVista Strategies (private investment firm). Board of advisors and investment committee member of the Museum of Fine Arts Boston. Board member (2018–present) of RIT Capital Partners (investment firm); investment committee member of Partners Health Care System.
Sarah Bloom Raskin
Born in 1961. Trustee since January 2018. Principal occupation(s) during the past five years and other experience: deputy secretary (2014–2017) of the United States Department of the Treasury. Governor (2010–2014) of the Federal Reserve Board. Commissioner (2007–2010) of financial regulation for the State of Maryland. Member of the board of directors (2012–2014) of Neighborhood Reinvestment Corporation. Director (2017–present) of i(x) Investments; director (2017–present) of Reserve Trust. Rubinstein Fellow (2017–present) of Duke University; trustee (2017–present) of Amherst College.
Peter F. Volanakis
Born in 1955. Trustee since July 2009. Principal occupation(s) during the past five years and other experience: president and chief operating officer (retired 2010) of Corning Incorporated (communications equipment) and director of Corning Incorporated (2000–2010) and Dow Corning (2001–2010). Director (2012) of SPX Corporation (multi-industry manufacturing). Overseer of the Amos Tuck School of Business Administration, Dartmouth College (2001–2013). Chairman of the board of trustees of Colby-Sawyer College. Member of the board of Hypertherm Inc. (industrial cutting systems, software, and consumables).
Executive Officers
John Bendl
Born in 1970. Principal occupation(s) during the past five years and other experience: principal of Vanguard. Chief financial officer (October 2019–present) of each of the investment companies served by Vanguard. Chief accounting officer, treasurer, and controller of Vanguard (2017–present). Partner (2003–2016) at KPMG (audit, tax, and advisory services).
Glenn Booraem
Born in 1967. Principal occupation(s) during the past five years and other experience: principal of Vanguard. Investment stewardship officer (2017–present), treasurer (2015–2017), controller (2010–2015), and assistant controller (2001–2010) of each of the investment companies served by Vanguard.
Christine M. Buchanan
Born in 1970. Principal occupation(s) during the past five years and other experience: principal of Vanguard. Treasurer (2017–present) of each of the investment companies served by Vanguard. Partner (2005–2017) at KPMG (audit, tax, and advisory services).
David Cermak
Born in 1960. Principal occupation(s) during the past five years and other experience: principal of Vanguard. Finance director (October 2019–present) of each of the investment companies served by Vanguard. Managing director and head (2017–present) of Vanguard Investments Singapore. Managing director and head (2017–2019) of Vanguard Investments Hong Kong. Representative director and head (2014–2017) of Vanguard Investments Japan.
Thomas J. Higgins
Born in 1957. Principal occupation(s) during the past five years and other experience: principal of Vanguard. Finance director (October 2019–present), chief financial officer (2008–2019), and treasurer (1998–2008) of each of the investment companies served by Vanguard.
Peter Mahoney
Born in 1974. Principal occupation(s) during the past five years and other experience: principal of Vanguard. Controller (2015–present) of each of the investment companies served by Vanguard. Head of International Fund Services (2008–2014) at Vanguard.
Anne E. Robinson
Born in 1970. Principal occupation(s) during the past five years and other experience: general counsel (2016–present) of Vanguard. Secretary (2016–present) of Vanguard and of each of the investment companies served by Vanguard. Managing director (2016–present) of Vanguard. Managing director and general counsel of Global Cards and Consumer Services (2014–2016) at Citigroup. Counsel (2003–2014) at American Express.
Michael Rollings
Born in 1963. Principal occupation(s) during the past five years and other experience: finance director (2017–present) and treasurer (2017) of each of the investment companies served by Vanguard. Managing director (2016–present) of Vanguard. Chief financial officer (2016–present) of Vanguard. Director (2016–present) of Vanguard Marketing Corporation. Executive vice president and chief financial officer (2006–2016) of MassMutual Financial Group.
John E. Schadl
Born in 1972. Principal occupation(s) during the past five years and other experience: principal of Vanguard. Chief compliance officer (2019–present) of Vanguard and of each of the investment companies served by Vanguard. Assistant vice president (May 2019–present) of Vanguard Marketing Corporation.
Vanguard Senior Management Team
Joseph Brennan | Chris D. McIsaac |
Mortimer J. Buckley | James M. Norris |
Gregory Davis | Thomas M. Rampulla |
John James | Karin A. Risi |
Martha G. King | Anne E. Robinson |
John T. Marcante | Michael Rollings |
|
|
|
|
|
|
|
| P.O. Box 2600 |
|
| Valley Forge, PA 19482-2600 |

Connect with Vanguard® > vanguard.com
Fund Information > 800-662-7447
Direct Investor Account Services > 800-662-2739
Institutional Investor Services > 800-523-1036
Text Telephone for People
Who Are Deaf or Hard of Hearing > 800-749-7273
This material may be used in conjunction with the offering of shares of any Vanguard fund only if preceded or accompanied by the fund’s current prospectus.
All comparative mutual fund data are from Morningstar, Inc., unless otherwise noted.
You can obtain a free copy of Vanguard’s proxy voting guidelines by visiting vanguard.com/proxyreporting or by calling Vanguard at 800-662-2739. The guidelines are also available from the SEC’s website, www.sec.gov. In addition, you may obtain a free report on how your fund voted the proxies for securities it owned during the 12 months ended June 30. To get the report, visit either vanguard.com/proxyreporting or www.sec.gov.
You can review information about your fund on the SEC’s website, and you can receive copies of this information, for a fee, by sending a request via email addressed to publicinfo@sec.gov.
Source for Bloomberg Barclays indexes: Bloomberg Index Services Limited. Copyright 2019, Bloomberg. All rights reserved.
| © 2019 The Vanguard Group, Inc. |
| All rights reserved. |
| Vanguard Marketing Corporation, Distributor. |
|
|
| Q6080 122019 |

Annual Report | October 31, 2019
Vanguard Emerging Markets Select Stock Fund
|
See the inside front cover for important information about access to your fund’s annual and semiannual shareholder reports.
|
Important information about access to shareholder reports
Beginning on January 1, 2021, as permitted by regulations adopted by the Securities and Exchange Commission, paper copies of your fund’s annual and semiannual shareholder reports will no longer be sent to you by mail, unless you specifically request them. Instead, you will be notified by mail each time a report is posted on the website and will be provided with a link to access the report.
If you have already elected to receive shareholder reports electronically, you will not be affected by this change and do not need to take any action. You may elect to receive shareholder reports and other communications from the fund electronically by contacting your financial intermediary (such as a broker-dealer or bank) or, if you invest directly with the fund, by calling Vanguard at one of the phone numbers on the back cover of this report or by logging on to vanguard.com.
You may elect to receive paper copies of all future shareholder reports free of charge. If you invest through a financial intermediary, you can contact the intermediary to request that you continue to receive paper copies. If you invest directly with the fund, you can call Vanguard at one of the phone numbers on the back cover of this report or log on to vanguard.com. Your election to receive paper copies will apply to all the funds you hold through an intermediary or directly with Vanguard.
Contents |
|
|
|
|
|
A Note From Our Chairman | 1 |
|
Your Fund’s Performance at a Glance | 2 |
|
Advisors’ Report | 3 |
|
About Your Fund’s Expenses | 9 |
|
Performance Summary | 11 |
|
Financial Statements | 13 |
|
Trustees Approve Advisory Arrangement | 31 |
|
Please note: The opinions expressed in this report are just that—informed opinions. They should not be considered promises or advice. Also, please keep in mind that the information and opinions cover the period through the date on the front of this report. Of course, the risks of investing in your fund are spelled out in the prospectus.
A Note From Our Chairman

Tim Buckley
Chairman and Chief Executive Officer
Dear Shareholder,
Recent volatility in financial markets—affecting stocks, bonds, and commodities—has been a good reminder of the wise old adage, “Never keep all your eggs in one basket.” Maintaining balance and diversification in your investment portfolio can help to both limit risk and set you up for long-term success.
It’s understandable why some investors might become complacent after a long market run-up like the one that lifted stock prices, especially U.S. stock prices, in the years following the global financial crisis. But failing to rebalance regularly can leave a portfolio with a much different mix of assets than intended and, often, more risk than intended.
Balance across and diversification within asset classes are powerful tools for managing risk and achieving your investment goals. A portfolio’s allocation will determine a large portion of its long-term return and also the majority of its volatility risk. A well-diversified portfolio is less vulnerable to significant swings in the performance of any one segment of the asset classes in which it invests.
Balance and diversification will never eliminate the risk of loss, nor will they guarantee positive returns in a declining market. But they should reduce the chance that you’ll suffer disproportionate losses in one particular high-flying asset class or sector when it comes back to earth. And exposure to all key market components should give you at least some participation in the sectors that are performing best at any given time.
Vanguard is committed to helping you achieve balance and diversification in your portfolios to help meet your investment goals. We thank you for your continued loyalty.
Sincerely,
![]()
Mortimer J. Buckley
Chairman and Chief Executive Officer
November 18, 2019
Your Fund’s Performance at a Glance
· For the 12 months ended October 31, 2019, Vanguard Emerging Markets Select Stock Fund returned 13.96%. That performance slightly outpaced the 13.66% return of its benchmark index, the FTSE Emerging Index.
· Global markets were volatile but made strong gains during the 12-month period, with emerging markets stocks performing best. With the global economy showing signs of slowing, many central banks around the world leaned toward more accommodative monetary policy. That boosted the appeal of riskier assets, including stocks.
· China, which accounts for more than one-quarter of the index, performed better than might have been expected given trade tensions with the United States and some softening in manufacturing. Stock selection in China and Taiwan helped relative performance, as did underweighting Malaysia, Chile, and Saudi Arabia, which all turned in negative performances for the index.
· Stock selection was positive in seven of the fund’s 11 industry sectors. Information technology, materials, and financial stocks drove relative performance. Detractors included energy, consumer discretionary, and utilities.
Market Barometer
| Average Annual Total Returns | ||
| One Year | Three Years | Five Years |
Stocks |
|
|
|
Russell 1000 Index (Large-caps) | 14.15% | 14.73% | 10.55% |
Russell 2000 Index (Small-caps) | 4.90 | 10.96 | 7.37 |
Russell 3000 Index (Broad U.S. market) | 13.49 | 14.47 | 10.31 |
FTSE All-World ex US Index (International) | 11.52 | 8.21 | 4.16 |
|
|
|
|
Bonds |
|
|
|
Bloomberg Barclays U.S. Aggregate Bond Index (Broad taxable market) | 11.51% | 3.29% | 3.24% |
Bloomberg Barclays Municipal Bond Index (Broad tax-exempt market) | 9.42 | 3.62 | 3.55 |
FTSE Three-Month U.S. Treasury Bill Index | 2.35 | 1.57 | 0.98 |
|
|
|
|
CPI |
|
|
|
Consumer Price Index | 1.76% | 2.11% | 1.62% |
Advisors’ Report
For the 12 months ended October 31, 2019, Vanguard Emerging Markets Select Stock Fund returned 13.96%. Your fund is managed by four independent advisors, a strategy that enhances the fund’s diversification by providing exposure to distinct yet complementary investment approaches. It’s not uncommon for different advisors to have different views about individual securities or the broader investment environment.
The advisors, the percentage of fund assets each manages, and brief descriptions of their investment strategies are presented in the accompanying table. The advisors have also prepared a discussion of the investment environment that existed during the fiscal year and of how portfolio positioning reflects this assessment.
These comments were prepared on November 20, 2019.
Baillie Gifford Overseas Ltd.
Portfolio Managers:
Richard Sneller,
Head of Emerging Markets Equities
Andrew Stobart
Mike Gush
We focus on companies’ long-term potential and take care not to be drawn into speculation on unpredictable political events that have dominated the headlines recently.
Over time, emerging-market equities tend to perform well when business conditions are improving, investor risk appetite is relatively high, interest rates are declining, and emerging-market currencies are holding up against the U.S. dollar. To varying degrees, these conditions exist today. This makes us optimistic, which is our natural inclination as growth investors.
Returns have been strong over the past year. In our sleeve of the portfolio, good operating results from several companies, such as MercadoLibre, Banco Bradesco, and Ping An, have driven performance. Your portfolio is positioned for strong growth.
We have exposure to many companies that use technology to facilitate innovation, such as Alibaba and Reliance Industries. Over the last decade, such companies have been very successful in raising capital. We now have to consider how close we are to the peak in this trend and whether returns in the sector will rise or fall. Either way, we suspect it is becoming more important to be selective, but we are encouraged by innovation in countries as disparate as China and Brazil.
Exposure to cyclical-growth companies has risen to make up about one-third of our holdings. In the case of resources such as copper and nickel, we continue to be optimistic that companies like Norilsk Nickel in Russia will prosper as demand grows and supply remains relatively constrained.
Stock research is the lifeblood of the team’s approach to investing. Within the broad opportunities that emerging markets provide, we are garnering plenty of good ideas that, over the long term, should provide further profitable investments.
Pzena Investment Management, LLC
Portfolio Managers:
Caroline Cai, CFA, Principal
Allison Fisch, Principal
John P. Goetz, Managing Principal and
Co-Chief Investment Officer
Emerging-market equities performed well for the 12-month period despite fears about the effects of tariffs and slower growth in China. Our holdings performed relatively well notwithstanding the anti-value climate.
Our sleeve’s performance was driven by Taiwanese and Russian holdings, led by Realtek Semiconductor and Norilsk Nickel. Realtek shares gained after the company beat earnings expectations and provided strong 2019 guidance. We have exited the position on valuation. Nickel producer Norilsk Nickel released strong production numbers, as management cited good weather in the Arctic, where the company has operations. Additionally, palladium prices are at all-time highs and Norilsk, as the dominant producer globally, increased its production. Following its run-up, the stock position has been trimmed.
Positions in South Africa and China detracted most, driven by weakness in holdings such as Sasol and Baidu. Sasol, an energy and chemical company, fell when it announced that the cost of its Lake Charles Chemical Project was coming in above estimates. We have factored the higher costs into our estimates and continue to hold the position. Internet search giant Baidu weakened on softer growth and margin expectations for the year in light of the economic environment, heightened competition, and the company’s increased investments. While the disappointment about growth is real, the company now trades at its lowest-ever multiples to sales and profits, with increased opportunities for shareholder return.
Our largest weightings remain to the financial and information technology sectors, and on a regional basis, we are most exposed to North Asia. In financials, we exited Bank Danamon Indonesia as it appreciated toward fair value. We held a position in Union National Bank, which last spring merged with Abu Dhabi Commercial Bank. We increased our exposure to information technology by purchasing two smaller Taiwanese parts suppliers that succumbed to the weakness of companies in the Apple supply chain: Catcher Technology and Lite-On Technology. In utilities (our largest relative overweight sector), we initiated positions in Brazilian electric utilities CEMIG and Light SA, which we partially paid for by exiting Brazilian water utility Sabesp after its strong run-up.
Oaktree Capital Management, L.P.
Portfolio Managers:
Frank J. Carroll III,
Managing Director and Co-Head of
Emerging Markets Equities
Timothy D. Jensen,
Managing Director and Co-Head of
Emerging Markets Equities
Emerging markets equities performed well during the 12 months ended October 31, 2019, although performance was volatile. Emerging markets rallied when U.S.-China trade tensions eased, but weakened when tensions escalated. Russia was the best performer among the larger markets on improving corporate governance and the distribution of strong free cash flow to investors. Taiwan was supported by strength in technology and semiconductor companies. China performed slightly better than the index, despite tariff escalations and other economic pressure. Argentina, a tiny index constituent, was the worst performer after its market-friendly president lost in primary elections.
Our sleeve’s relative performance during the period was largely driven by stock selection in China. Stock selection in Taiwan, Indonesia, and South Africa also helped, while stock selection in Mexico and Russia detracted. Our overweight allocation to Russia had a positive effect, along with our underweight exposures to Malaysia, Chile, and Saudi Arabia. Our out-of-benchmark exposure to South Korea and underweight allocation to Taiwan detracted.
By sector, selection in financial, consumer staples, materials, health care, information technology, industrial, communication services, and real estate stocks all drove relative performance. Stock selection in utilities had a negative effect, along with our underweight exposures to consumer discretionary and communication services. Our overweight allocation to consumer staples also detracted.
We have an optimistic view of the market and will be even more bullish when trade negotiations are concluded. Although we believe the U.S. and China will reach a trade deal, the process has been slow. It now appears that the two sides will pursue phased compromises rather than a single agreement.
On a positive note, although emerging markets have fallen when the trade conflict has escalated, the declines have diminished in severity. Central banks have continued to ease monetary policies, somewhat mitigating the trade war uncertainty. As in developed economies, interest rates in many emerging markets are approaching or hitting all-time lows, supporting equity valuations despite slower economic growth. Corporate governance is improving in a growing number of emerging-market companies. Finally, valuations are attractive in absolute terms and relative to developed markets.
Wellington Management Company LLP
Portfolio Manager:
Mary Pryshlak, CFA,
Senior Managing Director and Director,
Global Industry Research
Emerging-market equities rose in U.S. dollar terms, as measured by the FTSE Emerging Index, during the 12-month period. Ten of the 11 sectors in the index posted positive returns, led by the information technology, consumer discretionary, and real estate sectors. Materials was the one negative sector.
Positive security selection in communication services, consumer discretionary, and real estate contributed to relative results. Contributing most to relative returns were not owning Baidu, a Chinese internet search and technology company, and owning Longfor Group Holdings, a Chinese real estate development company, and Cia de Saneamento do Paraná Sanepar, a Brazilian water and waste management company.
Our decision not to own Baidu was the top contributor to relative results as the company’s stock declined roughly 46% during the period. The company reported losses for the first time since going public. The losses were driven by rising operating costs and slowing advertising sales that have been affected by the weakening Chinese economy.
Longfor shares rose after a series of positive earnings releases. Notably, the company reported a substantial increase in net profit for 2018 compared with the prior year, driven by stronger-than-expected sales.
Cia de Saneamento do Paraná Sanepar, a water and waste management company owned by Paraná state, was also a top contributor for the period. It delivered solid top- and bottom-line growth and showed impressive control of operating expenses. Brazilian utilities have performed well, as several key states (Minas Gerais, Sao Paulo, and Paraná) have newly elected governors who appear to be pro-market and open to privatization of state-owned utility entities.
Negative stock selection in materials and energy dampened results. Our underweight to Taiwan Semiconductor, which manufactures and designs integrated circuits and other semiconductor devices, detracted from relative results. Shares of the company, a supplier to China-based Huawei Technologies, rose after President Trump delayed trade restrictions against Huawei. The news boosted the outlook for Taiwan Semiconductor and eased one of the biggest headwinds facing the semiconductor industry.
Tenaris, a global manufacturer and supplier of tubular goods used to build oil and gas wells, detracted from relative results. Shares fell in November 2018 on news
that the chief executive officer and majority shareholder, Paolo Rocca, had been indicted by Argentine prosecutors in a graft scandal. (He was later cleared of the charges.) More recently, shares fell after Tenaris reported second-quarter earnings that missed on consensus EBITDA (earnings before interest, tax, depreciation, and amortization) estimates and provided a softer third-quarter outlook.
YPF, an Argentine energy company engaged in oil and gas exploration, detracted from relative results. Shares of the company declined over the period, as Argentine stocks fell broadly in mid-August after pro-business President Mauricio Macri suffered a setback in the primary election, creating uncertainty about political policy.
Vanguard Emerging Markets Select Stock Fund Investment Advisors
| Fund Assets Managed |
|
| |
Investment Advisor | % | $ Million |
| Investment Strategy |
Baillie Gifford Overseas Ltd. | 24 | 170 |
| Believes that companies that can sustainably grow their business and increase earnings faster than market average will perform best. Stock selection is driven by bottom-up, fundamental analysis, focusing on a company’s potential over a meaningful time period, typically three to five years and beyond. |
Pzena Investment Management, LLC | 24 | 169 |
| Uses a deep-value approach that focuses on the most undervalued companies based on price-to-normalized earnings. The firm believes that this value philosophy works well globally and is especially effective in emerging markets because of generally wider valuation spreads. |
Oaktree Capital Management, L.P. | 24 | 168 |
| Seeks securities that have been undervalued by investors. Oaktree’s investment process is driven by bottom-up research, which includes extensive travel to meet company management and maintaining in-house models focused on deriving reliable cash-flow projections. |
Wellington Management Company LLP | 24 | 166 |
| Allocates the assets in its portion of the fund to a team of global analysts who seek to add value through in-depth fundamental research and understanding of their industries. By covering the same companies over a period of many years, these investment professionals gain comprehensive insight to guide decisions for their subportfolios. |
Cash Investments | 4 | 29 |
| These short-term reserves are invested by Vanguard in equity index products to simulate investment in stocks. Each advisor may also maintain a modest cash position. |
About Your Fund’s Expenses
As a shareholder of the fund, you incur ongoing costs, which include costs for portfolio management, administrative services, and shareholder reports (like this one), among others. Operating expenses, which are deducted from a fund’s gross income, directly reduce the investment return of the fund.
A fund’s expenses are expressed as a percentage of its average net assets. This figure is known as the expense ratio. The following examples are intended to help you understand the ongoing costs (in dollars) of investing in your fund and to compare these costs with those of other mutual funds. The examples are based on an investment of $1,000 made at the beginning of the period shown and held for the entire period.
The accompanying table illustrates your fund’s costs in two ways:
· Based on actual fund return. This section helps you to estimate the actual expenses that you paid over the period. The “Ending Account Value” shown is derived from the fund’s actual return, and the third column shows the dollar amount that would have been paid by an investor who started with $1,000 in the fund. You may use the information here, together with the amount you invested, to estimate the expenses that you paid over the period.
To do so, simply divide your account value by $1,000 (for example, an $8,600 account value divided by $1,000 = 8.6), then multiply the result by the number given for your fund under the heading “Expenses Paid During Period.”
· Based on hypothetical 5% yearly return. This section is intended to help you compare your fund’s costs with those of other mutual funds. It assumes that the fund had a yearly return of 5% before expenses, but that the expense ratio is unchanged. In this case—because the return used is not the fund’s actual return—the results do not apply to your investment. The example is useful in making comparisons because the Securities and Exchange Commission requires all mutual funds to calculate expenses based on a 5% return. You can assess your fund’s costs by comparing this hypothetical example with the hypothetical examples that appear in shareholder reports of other funds.
Note that the expenses shown in the table are meant to highlight and help you compare ongoing costs only and do not reflect transaction costs incurred by the fund for buying and selling securities. Further, the expenses do not include any purchase, redemption, or account service fees described in the fund prospectus. If such fees were applied to your account, your costs would be higher. Your fund does not carry a “sales load.”
The calculations assume no shares were bought or sold during the period. Your actual costs may have been higher or lower, depending on the amount of your investment and the timing of any purchases or redemptions.
You can find more information about the fund’s expenses, including annual expense ratios, in the Financial Statements section of this report. For additional information on operating expenses and other shareholder costs, please refer to your fund’s current prospectus.
Six Months Ended October 31, 2019
| Beginning | Ending | Expenses |
| Account Value | Account Value | Paid During |
Emerging Markets Select Stock Fund | 4/30/2019 | 10/31/2019 | Period |
Based on Actual Fund Return | $1,000.00 | $983.81 | $4.50 |
Based on Hypothetical 5% Yearly Return | 1,000.00 | 1,020.67 | 4.58 |
The calculations are based on expenses incurred in the most recent six-month period. The fund’s annualized six-month expense ratio for that period is 0.90%. The dollar amounts shown as “Expenses Paid” are equal to the annualized expense ratio multiplied by the average account value over the period, multiplied by the number of days in the most recent six-month period, then divided by the number of days in the most recent 12-month period (184/365).
Emerging Markets Select Stock Fund
Performance Summary
All of the returns in this report represent past performance, which is not a guarantee of future results that may be achieved by the fund. (Current performance may be lower or higher than the performance data cited. For performance data current to the most recent month-end, visit our website at vanguard.com/performance.) Note, too, that both investment returns and principal value can fluctuate widely, so an investor’s shares, when sold, could be worth more or less than their original cost. The returns shown do not reflect taxes that a shareholder would pay on fund distributions or on the sale of fund shares.
Cumulative Performance: June 27, 2011, Through October 31, 2019
Initial Investment of $10,000

|
|
|
| Average Annual Total Returns |
|
| ||||
|
|
|
| Periods Ended October 31, 2019 |
|
| ||||
|
|
|
|
|
|
|
| Since |
| Final Value |
|
|
|
| One |
| Five |
| Inception |
| of a $10,000 |
|
|
|
| Year |
| Years |
| (6/27/2011) |
| Investment |
|
| Emerging Markets Select Stock Fund |
| 13.96% |
| 3.47% |
| 2.47% |
| $12,261 |
|
| FTSE Emerging Index |
| 13.66 |
| 3.02 |
| 1.99 |
| 11,789 |
|
| MSCI All Country World Index ex USA |
| 11.84 |
| 4.31 |
| 4.39 |
| 14,315 |
“Since Inception” performance is calculated from the inception date for both the fund and its comparative standards.
See Financial Highlights for dividend and capital gains information.
Emerging Markets Select Stock Fund
Sector Diversification
As of October 31, 2019
Communication Services | 7.7% |
Consumer Discretionary | 11.4 |
Consumer Staples | 5.0 |
Energy | 12.1 |
Financials | 28.1 |
Health Care | 1.5 |
Industrials | 3.3 |
Information Technology | 15.0 |
Materials | 9.2 |
Real Estate | 1.7 |
Utilities | 5.0 |
The table reflects the fund’s equity exposure, based on its investments in stocks and stock index futures. Any holdings in short-term reserves are excluded. Sector categories are based on the Global Industry Classification Standard (“GICS”), except for the “Other” category (if applicable), which includes securities that have not been provided a GICS classification as of the effective reporting period.
The Global Industry Classification Standard (“GICS”) was developed by and is the exclusive property and a service mark of MSCI Inc. (“MSCI”) and Standard and Poor’s, a division of McGraw-Hill Companies, Inc. (“S&P”), and is licensed for use by Vanguard. Neither MSCI, S&P nor any third party involved in making or compiling the GICS or any GICS classification makes any express or implied warranties or representations with respect to such standard or classification (or the results to be obtained by the use thereof), and all such parties hereby expressly disclaim all warranties of originality, accuracy, completeness, merchantability or fitness for a particular purpose with respect to any such standard or classification. Without limiting any of the foregoing, in no event shall MSCI, S&P, any of its affiliates or any third party involved in making or compiling the GICS or any GICS classification have any liability for any direct, indirect, special, punitive, consequential or any other damages (including lost profits) even if notified of the possibility of such damages.
Emerging Markets Select Stock Fund
Financial Statements
Statement of Net Assets
As of October 31, 2019
The fund files its complete schedule of portfolio holdings with the Securities and Exchange Commission (SEC) for the first and third quarters of each fiscal year as an exhibit to its reports on Form N-PORT. The fund’s Form N-PORT reports are available on the SEC’s website at www.sec.gov.
|
|
|
|
| Market |
|
|
|
|
|
| Value· |
|
|
|
| Shares |
| ($000 | ) |
Common Stocks (94.6%)1 |
|
|
|
|
| |
Argentina (0.5%) |
|
|
|
|
| |
| YPF SA ADR |
| 367,404 |
| 3,439 |
|
| Banco Macro SA ADR |
| 12,604 |
| 288 |
|
|
|
|
|
| 3,727 |
|
Austria (0.2%) |
|
|
|
|
| |
* | OMV AG ADR |
| 26,861 |
| 1,568 |
|
|
|
|
|
|
|
|
Brazil (8.1%) |
|
|
|
|
| |
| Petroleo Brasileiro SA Preference Shares |
| 473,133 |
| 7,139 |
|
| Petroleo Brasileiro SA |
| 426,380 |
| 6,924 |
|
| Itau Unibanco Holding SA ADR |
| 641,119 |
| 5,789 |
|
* | Vale SA Class B ADR |
| 448,870 |
| 5,270 |
|
| Light SA |
| 791,714 |
| 3,928 |
|
| Banco Bradesco SA ADR |
| 407,383 |
| 3,569 |
|
* | BRF SA ADR |
| 350,262 |
| 3,068 |
|
| Itau Unibanco Holding SA Preference Shares |
| 316,672 |
| 2,861 |
|
| Cia Energetica de Minas Gerais Preference Shares |
| 723,000 |
| 2,461 |
|
| Banco Bradesco SA Preference Shares |
| 223,440 |
| 1,959 |
|
| Petrobras Distribuidora SA |
| 269,406 |
| 1,900 |
|
| B3 SA - Brasil Bolsa Balcao |
| 134,700 |
| 1,625 |
|
| Lojas Renner SA |
| 114,183 |
| 1,445 |
|
| Cia de Saneamento do Parana |
| 60,606 |
| 1,378 |
|
| Ultrapar Participacoes SA |
| 268,600 |
| 1,264 |
|
| Localiza Rent a Car SA |
| 115,077 |
| 1,239 |
|
| Magazine Luiza SA |
| 104,360 |
| 1,162 |
|
| Suzano SA |
| 98,439 |
| 801 |
|
| Braskem SA Preference Shares |
| 108,000 |
| 746 |
|
| Cogna Educacao |
| 298,900 |
| 721 |
|
| Neoenergia SA |
| 126,419 |
| 661 |
|
| Gerdau SA Preference Shares |
| 147,500 |
| 494 |
|
| Raia Drogasil SA |
| 6,950 |
| 191 |
|
|
|
|
|
| 56,595 |
|
Canada (0.2%) |
|
|
|
|
| |
| Lundin Mining Corp. |
| 210,700 |
| 1,064 |
|
*,^ | Valeura Energy Inc. |
| 264,800 |
| 177 |
|
|
|
|
|
| 1,241 |
|
China (29.5%) |
|
|
|
|
| |
| Tencent Holdings Ltd. |
| 717,353 |
| 29,098 |
|
| Ping An Insurance Group Co. of China Ltd. |
| 1,666,514 |
| 19,235 |
|
* | Alibaba Group Holding Ltd. ADR |
| 101,843 |
| 17,993 |
|
| China Construction Bank Corp. |
| 16,111,312 |
| 12,910 |
|
| CNOOC Ltd. |
| 5,893,270 |
| 8,771 |
|
| China Merchants Bank Co. Ltd. |
| 1,615,367 |
| 7,704 |
|
| Industrial & Commercial Bank of China Ltd. |
| 9,668,172 |
| 6,926 |
|
| Lenovo Group Ltd |
| 7,326,000 |
| 5,107 |
|
| Dongfeng Motor Group Co. Ltd. |
| 4,862,000 |
| 4,877 |
|
| China Resources Power Holdings Co. Ltd. |
| 3,682,000 |
| 4,627 |
|
| China Oilfield Services Ltd. |
| 3,323,130 |
| 4,627 |
|
| China Shenhua Energy Co. Ltd. |
| 1,837,269 |
| 3,731 |
|
| China Agri-Industries Holdings Ltd. |
| 11,021,000 |
| 3,631 |
|
| CNOOC Ltd. ADR |
| 23,980 |
| 3,562 |
|
| Huadian Power International Corp. Ltd. |
| 8,466,000 |
| 3,172 |
|
| China Longyuan Power Group Corp. Ltd. |
| 5,840,957 |
| 3,155 |
|
* | Baidu Inc. ADR |
| 29,804 |
| 3,036 |
|
| China International Travel Service Corp. Ltd. Class A (XSSC) |
| 234,944 |
| 3,014 |
|
Emerging Markets Select Stock Fund
|
|
|
|
| Market |
|
|
|
|
|
| Value· |
|
|
|
| Shares |
| ($000 | ) |
| Shimao Property Holdings Ltd. |
| 865,113 |
| 2,898 |
|
| Geely Automobile Holdings Ltd. |
| 1,467,000 |
| 2,776 |
|
| China Mobile Ltd. |
| 289,500 |
| 2,353 |
|
| Anhui Conch Cement Co. Ltd. |
| 380,000 |
| 2,271 |
|
2 | Longfor Group Holdings Ltd. |
| 524,824 |
| 2,178 |
|
| PetroChina Co. Ltd. |
| 4,392,000 |
| 2,142 |
|
2 | China Tower Corp. Ltd. |
| 9,288,416 |
| 2,044 |
|
| Guangzhou R&F Properties Co. Ltd. |
| 1,300,800 |
| 2,016 |
|
| Brilliance China Automotive Holdings Ltd. |
| 1,807,351 |
| 1,993 |
|
| Ping An Bank Co. Ltd. Class A (XSEC) |
| 859,583 |
| 1,985 |
|
2 | WuXi AppTec Co. Ltd. |
| 150,716 |
| 1,817 |
|
| China Vanke Co. Ltd. |
| 439,400 |
| 1,602 |
|
* | Meituan Dianping Class B |
| 133,394 |
| 1,591 |
|
| Hangzhou Tigermed Consulting Co. Ltd. Class A |
| 146,474 |
| 1,421 |
|
| China Dongxiang Group Co. Ltd. |
| 12,254,000 |
| 1,375 |
|
* | Grand Baoxin Auto Group Ltd. |
| 6,831,000 |
| 1,370 |
|
| ENN Energy Holdings Ltd. |
| 118,905 |
| 1,357 |
|
* | Zai Lab Ltd. ADR |
| 39,617 |
| 1,339 |
|
| Sunny Optical Technology Group Co. Ltd. |
| 82,341 |
| 1,324 |
|
* | BeiGene Ltd. ADR |
| 9,386 |
| 1,298 |
|
| Shenzhou International Group Holdings Ltd. |
| 91,000 |
| 1,257 |
|
| Ping An Bank Co. Ltd. Class A (XSHE) |
| 522,891 |
| 1,207 |
|
| China Railway Group Ltd. |
| 1,902,000 |
| 1,146 |
|
* | Ctrip.com International Ltd. ADR |
| 34,007 |
| 1,122 |
|
| Jiangsu Hengrui Medicine Co. Ltd. Class A |
| 84,300 |
| 1,088 |
|
* | TAL Education Group ADR |
| 24,734 |
| 1,059 |
|
| Hangzhou Hikvision Digital Technology Co. Ltd. Class A (XSEC) |
| 229,500 |
| 1,052 |
|
| Haier Electronics Group Co. Ltd. |
| 352,000 |
| 1,005 |
|
| China Overseas Land & Investment Ltd. |
| 315,076 |
| 994 |
|
| China Pacific Insurance Group Co. Ltd. |
| 270,700 |
| 982 |
|
* | HUYA Inc. ADR |
| 42,900 |
| 954 |
|
| China Gas Holdings Ltd. |
| 216,147 |
| 921 |
|
| Baoshan Iron & Steel Co. Ltd. Class A |
| 1,073,091 |
| 884 |
|
| Wuliangye Yibin Co. Ltd. Class A (XSEC) |
| 44,000 |
| 824 |
|
| Suofeiya Home Collection Co. Ltd. Class A (XSEC) |
| 328,596 |
| 809 |
|
2 | Ganfeng Lithium Co. Ltd. |
| 435,189 |
| 790 |
|
| Midea Group Co. Ltd. Class A |
| 100,099 |
| 789 |
|
| Wuliangye Yibin Co. Ltd. Class A (XSHE) |
| 41,700 |
| 781 |
|
* | Kingsoft Corp. Ltd. |
| 338,000 |
| 778 |
|
* | Tencent Music Entertainment Group ADR |
| 52,801 |
| 731 |
|
| Sinopec Shanghai Petrochemical Co. Ltd. |
| 2,567,941 |
| 709 |
|
*,§,2 | Tianhe Chemicals Group Ltd. |
| 4,142,000 |
| 618 |
|
| Greentown Service Group Co. Ltd. |
| 438,000 |
| 497 |
|
| Kingboard Holdings Ltd. |
| 168,969 |
| 450 |
|
| Shengyi Technology Co. Ltd. Class A |
| 125,200 |
| 400 |
|
| Sinopharm Group Co. Ltd. |
| 108,000 |
| 387 |
|
| Kingdee International Software Group Co. Ltd. |
| 322,387 |
| 353 |
|
| SSY Group Ltd. |
| 357,000 |
| 298 |
|
| Shandong Weigao Group Medical Polymer Co. Ltd. |
| 245,800 |
| 282 |
|
| China National Accord Medicines Corp. Ltd. Class A |
| 39,300 |
| 260 |
|
*,2 | Innovent Biologics Inc. |
| 82,000 |
| 250 |
|
| China Traditional Chinese Medicine Holdings Co. Ltd. |
| 534,000 |
| 238 |
|
| Sinotrans Ltd. |
| 675,000 |
| 198 |
|
| China International Travel Service Corp. Ltd. Class A (XSHG) |
| 5,300 |
| 68 |
|
| Dah Chong Hong Holdings Ltd. |
| 53,000 |
| 24 |
|
| Hangzhou Hikvision Digital Technology Co. Ltd. Class A (XSHE) |
| 5,000 |
| 23 |
|
Emerging Markets Select Stock Fund
|
|
|
|
| Market |
|
|
|
|
|
| Value· |
|
|
|
| Shares |
| ($000 | ) |
| Suofeiya Home Collection Co. Ltd. Class A (XSHE) |
| 7,200 |
| 18 |
|
|
|
|
|
| 206,572 |
|
Czech Republic (0.7%) |
|
|
|
|
| |
| CEZ AS |
| 153,423 |
| 3,499 |
|
| Komercni banka as |
| 36,325 |
| 1,228 |
|
|
|
|
|
| 4,727 |
|
Greece (0.6%) |
|
|
|
|
| |
* | Alpha Bank AE |
| 1,220,263 |
| 2,604 |
|
| Hellenic Telecommunications Organization SA |
| 109,556 |
| 1,661 |
|
|
|
|
|
| 4,265 |
|
Hong Kong (2.7%) |
|
|
|
|
| |
| AIA Group Ltd. |
| 347,951 |
| 3,465 |
|
| Want Want China Holdings Ltd. |
| 3,207,000 |
| 2,702 |
|
| Pacific Basin Shipping Ltd. |
| 10,479,975 |
| 2,426 |
|
| Galaxy Entertainment Group Ltd. |
| 345,000 |
| 2,376 |
|
*,2 | Budweiser Brewing Co. APAC Ltd. |
| 482,541 |
| 1,764 |
|
| China Mengniu Dairy Co. Ltd. |
| 383,458 |
| 1,529 |
|
| MGM China Holdings Ltd. |
| 571,934 |
| 906 |
|
| Minth Group Ltd. |
| 232,000 |
| 821 |
|
* | MMG Ltd. |
| 3,498,500 |
| 728 |
|
| Singamas Container Holdings Ltd. |
| 5,719,473 |
| 642 |
|
| Man Wah Holdings Ltd. |
| 928,400 |
| 632 |
|
| AMVIG Holdings Ltd. |
| 2,172,040 |
| 560 |
|
| SITC International Holdings Co. Ltd. |
| 363,392 |
| 400 |
|
| Texwinca Holdings Ltd. |
| 811,000 |
| 184 |
|
|
|
|
|
| 19,135 |
|
Hungary (0.7%) |
|
|
|
|
| |
| OTP Bank Nyrt |
| 107,034 |
| 4,936 |
|
|
|
|
|
|
|
|
India (10.4%) |
|
|
|
|
| |
| Reliance Industries Ltd. |
| 646,114 |
| 13,317 |
|
| ICICI Bank Ltd. ADR |
| 521,348 |
| 6,793 |
|
| ICICI Bank Ltd. |
| 874,309 |
| 5,704 |
|
| Housing Development Finance Corp. Ltd. |
| 173,173 |
| 5,197 |
|
| NTPC Ltd. |
| 1,959,046 |
| 3,378 |
|
| UltraTech Cement Ltd. |
| 51,211 |
| 2,991 |
|
| Tata Consultancy Services Ltd. |
| 88,949 |
| 2,848 |
|
* | Punjab National Bank |
| 3,077,785 |
| 2,832 |
|
| Maruti Suzuki India Ltd. |
| 24,686 |
| 2,630 |
|
* | State Bank of India |
| 483,728 |
| 2,127 |
|
| HDFC Bank Ltd. ADR |
| 34,396 |
| 2,101 |
|
2 | ICICI Prudential Life Insurance Co. Ltd. |
| 274,811 |
| 1,976 |
|
| Godrej Consumer Products Ltd. |
| 177,377 |
| 1,852 |
|
| Mahindra & Mahindra Ltd. |
| 207,232 |
| 1,770 |
|
| NHPC Ltd. |
| 4,359,267 |
| 1,443 |
|
| Marico Ltd. |
| 265,577 |
| 1,370 |
|
| Tech Mahindra Ltd. |
| 129,260 |
| 1,346 |
|
| Asian Paints Ltd. |
| 45,349 |
| 1,156 |
|
| Indraprastha Gas Ltd. |
| 196,851 |
| 1,086 |
|
2 | ICICI Lombard General Insurance Co. Ltd. |
| 51,711 |
| 979 |
|
| Bharti Infratel Ltd. |
| 365,641 |
| 977 |
|
2 | HDFC Life Insurance Co. Ltd. |
| 106,051 |
| 935 |
|
| Power Grid Corp. of India Ltd. |
| 333,125 |
| 932 |
|
| PVR Ltd. |
| 32,711 |
| 819 |
|
| IndusInd Bank Ltd. |
| 43,489 |
| 804 |
|
* | Westlife Development Ltd. |
| 160,476 |
| 794 |
|
| UPL Ltd. |
| 79,533 | �� | 668 |
|
| Crompton Greaves Consumer Electricals Ltd. |
| 188,194 |
| 660 |
|
| Edelweiss Financial Services Ltd. |
| 494,586 |
| 642 |
|
| Ambuja Cements Ltd. |
| 191,393 |
| 545 |
|
| Ashok Leyland Ltd. |
| 503,628 |
| 544 |
|
| Oberoi Realty Ltd. |
| 65,678 |
| 469 |
|
| Glenmark Pharmaceuticals Ltd. |
| 87,948 |
| 391 |
|
| TAKE Solutions Ltd. |
| 240,567 |
| 381 |
|
2 | InterGlobe Aviation Ltd. |
| 16,050 |
| 329 |
|
* | Godrej Properties Ltd. |
| 19,235 |
| 270 |
|
| Tube Investments of India Ltd. |
| 29,864 |
| 168 |
|
|
|
|
|
| 73,224 |
|
Indonesia (2.1%) |
|
|
|
|
| |
| Bank Rakyat Indonesia Persero Tbk PT |
| 20,728,100 |
| 6,211 |
|
| Bank Mandiri Persero Tbk PT |
| 6,041,063 |
| 3,020 |
|
| Semen Indonesia Persero Tbk PT |
| 3,099,600 |
| 2,796 |
|
| Bank Central Asia Tbk PT |
| 649,335 |
| 1,453 |
|
| Astra International Tbk PT |
| 2,375,760 |
| 1,175 |
|
|
|
|
|
| 14,655 |
|
Emerging Markets Select Stock Fund
|
|
|
|
| Market |
|
|
|
|
|
| Value· |
|
|
|
| Shares |
| ($000 | ) |
Japan (0.2%) |
|
|
|
|
| |
* | Nexon Co. Ltd. |
| 95,134 |
| 1,102 |
|
|
|
|
|
|
|
|
Kazakhstan (0.2%) |
|
|
|
|
| |
2 | NAC Kazatomprom JSC GDR |
| 79,870 |
| 1,073 |
|
| JSC National Atomic Company Kazatomprom |
| 3,512 |
| 47 |
|
|
|
|
|
| 1,120 |
|
Kenya (0.1%) |
|
|
|
|
| |
| Equity Group Holdings PLC |
| 2,070,900 |
| 933 |
|
|
|
|
|
|
|
|
Luxembourg (0.4%) |
|
|
|
|
| |
| Millicom International Cellular SA |
| 34,386 |
| 1,568 |
|
| Tenaris SA ADR |
| 70,756 |
| 1,436 |
|
|
|
|
|
| 3,004 |
|
Malaysia (0.7%) |
|
|
|
|
| |
| CIMB Group Holdings Bhd. |
| 2,105,000 |
| 2,642 |
|
| Genting Malaysia Bhd. |
| 2,940,200 |
| 2,255 |
|
|
|
|
|
| 4,897 |
|
Mexico (1.6%) |
|
|
|
|
| |
| Grupo Financiero Banorte SAB de CV |
| 630,714 |
| 3,443 |
|
| Cemex SAB de CV ADR |
| 662,217 |
| 2,496 |
|
| Wal-Mart de Mexico SAB de CV |
| 532,700 |
| 1,599 |
|
| America Movil SAB de CV |
| 1,685,400 |
| 1,335 |
|
| Alpek SAB de CV |
| 773,454 |
| 833 |
|
| Alfa SAB de CV Class A |
| 918,500 |
| 796 |
|
| Orbia Advance Corp. SAB de CV |
| 257,488 |
| 556 |
|
| Grupo Mexico SAB de CV Class B |
| 160,056 |
| 422 |
|
|
|
|
|
| 11,480 |
|
Netherlands (0.1%) |
|
|
|
|
| |
* | Prosus NV |
| 12,875 |
| 888 |
|
|
|
|
|
|
|
|
Pakistan (0.1%) |
|
|
|
|
| |
| United Bank Ltd. |
| 1,047,705 |
| 926 |
|
|
|
|
|
|
|
|
Philippines (0.2%) |
|
|
|
|
| |
| Universal Robina Corp. |
| 380,458 |
| 1,130 |
|
|
|
|
|
|
|
|
Poland (0.1%) |
|
|
|
|
| |
* | KGHM Polska Miedz SA |
| 30,385 |
| 666 |
|
|
|
|
|
|
|
|
Portugal (0.2%) |
|
|
|
|
| |
| Galp Energia SGPS SA |
| 95,458 |
| 1,527 |
|
|
|
|
|
|
|
|
Russia (5.8%) |
|
|
|
|
| |
| Sberbank of Russia PJSC ADR |
| 791,691 |
| 11,640 |
|
| MMC Norilsk Nickel PJSC ADR |
| 381,249 |
| 10,577 |
|
| Lukoil PJSC ADR |
| 81,935 |
| 7,551 |
|
| Rosneft Oil Co. PJSC GDR |
| 666,000 |
| 4,426 |
|
| Gazprom PJSC ADR |
| 407,444 |
| 3,266 |
|
| Sberbank of Russia PJSC |
| 422,530 |
| 1,549 |
|
| Magnit PJSC GDR |
| 80,807 |
| 920 |
|
| Inter RAO UES PJSC |
| 12,601,519 |
| 849 |
|
|
|
|
|
| 40,778 |
|
Singapore (0.6%) |
|
|
|
|
| |
| Wilmar International Ltd. |
| 1,534,100 |
| 4,218 |
|
* | Ezion Holdings Ltd. Warrants Exp. 04/16/2023 |
| 2,242,476 |
| — |
|
|
|
|
|
| 4,218 |
|
South Africa (4.0%) |
|
|
|
|
| |
| FirstRand Ltd. |
| 1,063,938 |
| 4,599 |
|
| MTN Group Ltd. |
| 532,433 |
| 3,295 |
|
| Sasol Ltd. |
| 180,075 |
| 3,264 |
|
| AngloGold Ashanti Ltd. ADR |
| 141,157 |
| 3,117 |
|
| Reunert Ltd. |
| 607,574 |
| 2,873 |
|
| Foschini Group Ltd. |
| 211,334 |
| 2,437 |
|
| Naspers Ltd. |
| 12,875 |
| 1,822 |
|
| Old Mutual Ltd. |
| 1,296,072 |
| 1,704 |
|
| Shoprite Holdings Ltd. |
| 185,550 |
| 1,663 |
|
| Nedbank Group Ltd. |
| 65,720 |
| 997 |
|
| Gold Fields Ltd. |
| 139,561 |
| 867 |
|
* | PPC Ltd. |
| 2,784,175 |
| 710 |
|
* | Nampak Ltd. |
| 1,140,013 |
| 607 |
|
|
|
|
|
| 27,955 |
|
South Korea (6.8%) |
|
|
|
|
| |
| Samsung Electronics Co. Ltd. |
| 242,391 |
| 10,476 |
|
| SK Hynix Inc. |
| 71,060 |
| 4,997 |
|
| POSCO |
| 26,991 |
| 4,897 |
|
| DB Insurance Co. Ltd. |
| 90,730 |
| 3,934 |
|
* | Korea Shipbuilding & Offshore Engineering Co. Ltd. |
| 31,970 |
| 3,341 |
|
| Hyundai Motor Co. |
| 29,511 |
| 3,091 |
|
| Hana Financial Group Inc. |
| 99,288 |
| 2,874 |
|
| LG Chem Ltd. |
| 10,509 |
| 2,773 |
|
| Shinhan Financial Group Co. Ltd. |
| 66,550 |
| 2,425 |
|
| Samsung Electronics Co. Ltd. Preference Shares |
| 62,099 |
| 2,186 |
|
* | Samsung Heavy Industries Co. Ltd. |
| 273,425 |
| 1,698 |
|
Emerging Markets Select Stock Fund
|
|
|
|
| Market |
|
|
|
|
|
| Value· |
|
|
|
| Shares |
| ($000 | ) |
| KB Financial Group Inc. |
| 46,380 |
| 1,670 |
|
| NAVER Corp. |
| 6,234 |
| 879 |
|
| Doosan Bobcat Inc. |
| 31,650 |
| 853 |
|
| Orion Corp. |
| 8,849 |
| 804 |
|
| Samsung Fire & Marine Insurance Co. Ltd. |
| 3,646 |
| 678 |
|
* | Hugel Inc. |
| 838 |
| 262 |
|
|
|
|
|
| 47,838 |
|
Taiwan (9.1%) |
|
|
|
|
| |
| Taiwan Semiconductor Manufacturing Co. Ltd. |
| 1,850,352 |
| 18,133 |
|
| MediaTek Inc. |
| 735,032 |
| 9,816 |
|
| Taiwan Semiconductor Manufacturing Co. Ltd. ADR |
| 177,704 |
| 9,175 |
|
| Hon Hai Precision Industry Co. Ltd. |
| 1,622,685 |
| 4,286 |
|
| Lite-On Technology Corp. |
| 2,430,000 |
| 4,004 |
|
| Catcher Technology Co. Ltd. |
| 430,000 |
| 3,645 |
|
| Compal Electronics Inc. |
| 5,121,000 |
| 3,057 |
|
| E.Sun Financial Holding Co. Ltd. |
| 1,452,031 |
| 1,312 |
|
| Realtek Semiconductor Corp. |
| 155,000 |
| 1,150 |
|
| Largan Precision Co. Ltd. |
| 7,382 |
| 1,083 |
|
| King Yuan Electronics Co. Ltd. |
| 848,000 |
| 1,062 |
|
| ITEQ Corp. |
| 208,000 |
| 1,054 |
|
| Chroma ATE Inc. |
| 208,174 |
| 1,035 |
|
| Far Eastern New Century Corp. |
| 1,049,653 |
| 1,021 |
|
| Formosa Plastics Corp. |
| 228,000 |
| 732 |
|
| Uni-President Enterprises Corp. |
| 292,000 |
| 721 |
|
| Novatek Microelectronics Corp. |
| 106,915 |
| 685 |
|
| Eclat Textile Co. Ltd. |
| 46,000 |
| 617 |
|
| LandMark Optoelectronics Corp. |
| 63,464 |
| 534 |
|
| Walsin Technology Corp. |
| 67,987 |
| 407 |
|
| Airtac International Group |
| 12,738 |
| 173 |
|
| Globalwafers Co. Ltd. |
| 12,612 |
| 150 |
|
|
|
|
|
| 63,852 |
|
Thailand (2.5%) |
|
|
|
|
| |
| Siam Commercial Bank PCL |
| 1,588,600 |
| 5,888 |
|
| Charoen Pokphand Foods PCL (Foreign) |
| 3,601,500 |
| 3,013 |
|
| Kasikornbank PCL |
| 604,200 |
| 2,780 |
|
| Bangkok Bank PCL |
| 415,900 |
| 2,396 |
|
| Thai Oil PCL (Foreign) |
| 885,100 |
| 2,008 |
|
* | Precious Shipping PCL |
| 1,798,684 |
| 503 |
|
| Land & Houses PCL |
| 1,437,900 |
| 462 |
|
| PTT Global Chemical PCL |
| 143,600 |
| 242 |
|
| PTT PCL (Foreign) |
| 115,500 |
| 173 |
|
|
|
|
|
| 17,465 |
|
Turkey (1.0%) |
|
|
|
|
| |
* | Akbank T.A.S. |
| 2,428,837 |
| 2,935 |
|
| Ford Otomotiv Sanayi AS |
| 244,066 |
| 2,752 |
|
* | Turkiye Garanti Bankasi AS |
| 573,731 |
| 922 |
|
| KOC Holding AS |
| 103,336 |
| 339 |
|
|
|
|
|
| 6,948 |
|
United Arab Emirates (0.4%) |
|
|
|
|
| |
| Abu Dhabi Commercial Bank PJSC |
| 1,358,906 |
| 2,883 |
|
|
|
|
|
|
|
|
United Kingdom (2.0%) |
|
|
|
|
| |
| Standard Chartered plc |
| 525,613 |
| 4,769 |
|
| Antofagasta plc |
| 308,432 |
| 3,474 |
|
* | Premier Oil plc |
| 1,745,488 |
| 1,876 |
|
| Anglo American plc |
| 48,196 |
| 1,240 |
|
| Coca-Cola HBC AG |
| 32,544 |
| 991 |
|
* | Bank of Cyprus Holdings plc |
| 430,987 |
| 617 |
|
| Ferrexpo plc |
| 189,169 |
| 310 |
|
| Hikma Pharmaceuticals plc |
| 8,888 |
| 232 |
|
| NMC Health plc |
| 5,378 |
| 152 |
|
|
|
|
|
| 13,661 |
|
United States (2.8%) |
|
|
|
|
| |
3 | Vanguard FTSE Emerging Markets ETF |
| 93,241 |
| 3,902 |
|
* | Flex Ltd. |
| 321,783 |
| 3,781 |
|
* | Azul SA ADR |
| 62,033 |
| 2,418 |
|
| Cognizant Technology Solutions Corp. Class A |
| 37,641 |
| 2,294 |
|
| Genpact Ltd. |
| 51,966 |
| 2,035 |
|
* | MercadoLibre Inc. |
| 3,244 |
| 1,692 |
|
| Credicorp Ltd. |
| 5,685 |
| 1,217 |
|
* | Afya Ltd. Class A |
| 41,186 |
| 1,112 |
|
* | Yandex NV Class A |
| 33,176 |
| 1,108 |
|
|
|
|
|
| 19,559 |
|
Total Common Stocks |
|
|
|
|
| |
(Cost $615,266) |
|
|
| 663,475 |
| |
Temporary Cash Investments (5.1%)1 |
|
|
|
|
| |
Money Market Fund (4.9%) |
|
|
|
|
| |
4,5 | Vanguard Market Liquidity Fund, 1.984% |
| 341,770 |
| 34,181 |
|
Emerging Markets Select Stock Fund
|
|
| Face |
| Market |
|
|
|
| Amount |
| Value· |
|
|
|
| ($000 | ) | ($000 | ) |
U.S. Government and Agency Obligations (0.2%) |
|
|
|
|
| |
6 | United States Treasury Bill, 1.997%, 12/26/19 |
| 1,500 |
| 1,496 |
|
Total Temporary Cash Investments |
|
|
|
|
| |
(Cost $35,672) |
|
|
| 35,677 |
| |
Total Investments (99.7%) |
|
|
|
|
| |
(Cost $650,938) |
|
|
| 699,152 |
| |
Other Assets and Liabilities (0.3%) |
|
|
|
|
| |
Other Assets |
|
|
| 7,131 |
| |
Liabilities5 |
|
|
| (4,720 | ) | |
|
|
|
| 2,411 |
| |
Net Assets (100%) |
|
|
|
|
| |
Applicable to 32,082,094 outstanding $.001 par value shares of beneficial interest (unlimited authorization) |
|
|
| 701,563 |
| |
Net Asset Value Per Share |
|
|
| $21.87 |
| |
|
|
|
| Amount |
|
|
|
|
| ($000 | ) |
Statement of Assets and Liabilities |
|
|
|
|
|
Assets |
|
|
|
|
|
Investments in Securities, at Value |
|
|
|
|
|
Unaffiliated Issuers |
|
|
| 661,069 |
|
Affiliated Issuers |
|
|
| 38,083 |
|
Total Investments in Securities |
|
|
| 699,152 |
|
Investments in Vanguard |
|
|
| 33 |
|
Receivables for Investment Securities Sold |
|
|
| 2,704 |
|
Receivables for Capital Shares Issued |
|
|
| 685 |
|
Receivables for Accrued Income |
|
|
| 1,163 |
|
Other Assets |
|
|
| 2,546 |
|
Total Assets |
|
|
| 706,283 |
|
Liabilities |
|
|
|
|
|
Payables for Investment Securities Purchased |
|
|
| 1,854 |
|
Collateral for Securities on Loan |
|
|
| 200 |
|
Payables to Investment Advisor |
|
|
| 981 |
|
Payables for Capital Shares Redeemed |
|
|
| 1,055 |
|
Payables to Vanguard |
|
|
| 294 |
|
Variation Margin Payable—Futures Contracts |
|
|
| 207 |
|
Other Liabilities |
|
|
| 129 |
|
Total Liabilities |
|
|
| 4,720 |
|
Net Assets |
|
|
| 701,563 |
|
At October 31, 2019, net assets consisted of:
|
|
|
| Amount |
|
|
|
|
| ($000 | ) |
Paid-in Capital |
|
|
| 641,065 |
|
Total Distributable Earnings (Loss) |
|
|
| 60,498 |
|
Net Assets |
|
|
| 701,563 |
|
· See Note A in Notes to Financial Statements.
* Non-income-producing security.
^ Includes partial security positions on loan to broker-dealers.
The total value of securities on loan is $134,000.
§ Security value determined using significant unobservable inputs.
1 The fund invests a portion of its cash reserves in equity markets through the use of index futures contracts. After giving effect to futures investments, the fund’s effective common stock and temporary cash investment positions represent 98.5% and 1.2%, respectively, of net assets.
2 Security exempt from registration under Rule 144A of the Securities Act of 1933. Such securities may be sold in transactions exempt from registration, normally to qualified institutional buyers. At October 31, 2019, the aggregate value of these securities was $14,753,000, representing 2.1% of net assets.
3 Considered an affiliated company of the fund as the issuer is another member of The Vanguard Group.
4 Affiliated money market fund available only to Vanguard funds and certain trusts and accounts managed by Vanguard. Rate shown is the 7-day yield.
5 Collateral of $200,000 was received for securities on loan.
6 Securities with a value of $1,496,000 have been segregated as initial margin for open futures contracts.
ADR—American Depositary Receipt.
GDR—Global Depositary Receipt.
Emerging Markets Select Stock Fund
Derivative Financial Instruments Outstanding as of Period End
Futures Contracts |
|
|
|
|
|
|
|
|
|
|
|
|
|
|
|
|
|
|
|
|
|
|
|
|
|
|
| ($000 | ) |
|
|
|
|
|
|
|
|
|
|
|
|
|
|
|
|
|
|
|
|
|
|
|
|
|
|
|
| Value and |
|
|
|
|
| Number of |
|
|
| Unrealized |
|
|
|
|
| Long (Short | ) | Notional |
| Appreciation |
|
|
| Expiration |
| Contracts |
| Amount |
| (Depreciation | ) |
Long Futures Contracts |
|
|
|
|
|
|
|
|
|
MSCI Emerging Market Index |
| December 2019 |
| 524 |
| 27,285 |
| 600 |
|
See accompanying Notes, which are an integral part of the Financial Statements.
Emerging Markets Select Stock Fund
Statement of Operations
|
| Year Ended |
|
|
| October 31, 2019 |
|
|
|
|
|
|
| ($000 | ) |
Investment Income |
|
|
|
Income |
|
|
|
Dividends—Unaffiliated Issuers1 |
| 19,915 |
|
Dividends—Affiliated Issuers |
| 132 |
|
Interest—Unaffiliated Issuers |
| 45 |
|
Interest—Affiliated Issuers |
| 811 |
|
Securities Lending—Net |
| 44 |
|
Total Income |
| 20,947 |
|
Expenses |
|
|
|
Investment Advisory Fees—Note B |
|
|
|
Basic Fee |
| 3,402 |
|
Performance Adjustment |
| 459 |
|
The Vanguard Group—Note C |
|
|
|
Management and Administrative |
| 1,945 |
|
Marketing and Distribution |
| 90 |
|
Custodian Fees |
| 190 |
|
Auditing Fees |
| 39 |
|
Shareholders’ Reports |
| 9 |
|
Trustees’ Fees and Expenses |
| 1 |
|
Total Expenses |
| 6,135 |
|
Expenses Paid Indirectly |
| (13 | ) |
Net Expenses |
| 6,122 |
|
Net Investment Income |
| 14,825 |
|
Realized Net Gain (Loss) |
|
|
|
Investment Securities Sold—Unaffiliated Issuers |
| 700 |
|
Investment Securities Sold—Affiliated Issuers |
| (207 | ) |
Futures Contracts |
| 177 |
|
Foreign Currencies |
| (318 | ) |
Realized Net Gain (Loss) |
| 352 |
|
Change in Unrealized Appreciation (Depreciation) |
|
|
|
Investment Securities Sold—Unaffiliated Issuers2 |
| 61,799 |
|
Investment Securities Sold—Affiliated Issuers |
| 734 |
|
Futures Contracts |
| 1,915 |
|
Foreign Currencies |
| — |
|
Change in Unrealized Appreciation (Depreciation) |
| 64,448 |
|
Net Increase (Decrease) in Net Assets Resulting from Operations |
| 79,625 |
|
1 Dividends are net of foreign withholding taxes of $126,000.
2 The change in unrealized appreciation (depreciation) is net of deferred foreign capital gain taxes of $129,000.
See accompanying Notes, which are an integral part of the Financial Statements.
Emerging Markets Select Stock Fund
Statement of Changes in Net Assets
|
| Year Ended October 31, |
| ||
|
|
|
|
|
|
|
| 2019 |
| 2018 |
|
|
| ($000 | ) | ($000 | ) |
Increase (Decrease) in Net Assets |
|
|
|
|
|
Operations |
|
|
|
|
|
Net Investment Income |
| 14,825 |
| 12,688 |
|
Realized Net Gain (Loss) |
| 352 |
| 13,827 |
|
Change in Unrealized Appreciation (Depreciation) |
| 64,448 |
| (105,255 | ) |
Net Increase (Decrease) in Net Assets Resulting from Operations |
| 79,625 |
| (78,740 | ) |
Distributions |
|
|
|
|
|
Net Investment Income |
| (14,035 | ) | (10,297 | ) |
Realized Capital Gain |
| — |
| — |
|
Total Distributions |
| (14,035 | ) | (10,297 | ) |
Capital Share Transactions |
|
|
|
|
|
Issued |
| 240,400 |
| 303,890 |
|
Issued in Lieu of Cash Distributions |
| 12,484 |
| 9,303 |
|
Redeemed |
| (181,231 | ) | (305,679 | ) |
Net Increase (Decrease) from Capital Share Transactions |
| 71,653 |
| 7,514 |
|
Total Increase (Decrease) |
| 137,243 |
| (81,523 | ) |
Net Assets |
|
|
|
|
|
Beginning of Period |
| 564,320 |
| 645,843 |
|
End of Period |
| 701,563 |
| 564,320 |
|
See accompanying Notes, which are an integral part of the Financial Statements.
Emerging Markets Select Stock Fund
Financial Highlights
For a Share Outstanding | Year Ended October 31, |
| ||||||||
Throughout Each Period | 2019 |
| 2018 |
| 2017 |
| 2016 |
| 2015 |
|
Net Asset Value, Beginning of Period | $19.68 |
| $22.56 |
| $18.27 |
| $16.48 |
| $20.13 |
|
Investment Operations |
|
|
|
|
|
|
|
|
|
|
Net Investment Income | .474 | 1,2 | .414 | 1 | .413 | 1 | .234 |
| .290 |
|
Net Realized and Unrealized Gain (Loss) on Investments | 2.208 |
| (2.943 | ) | 4.129 |
| 1.840 |
| (3.685 | ) |
Total from Investment Operations | 2.682 |
| (2.529 | ) | 4.542 |
| 2.074 |
| (3.395 | ) |
Distributions |
|
|
|
|
|
|
|
|
|
|
Dividends from Net Investment Income | (.492 | ) | (.351 | ) | (.252 | ) | (.284 | ) | (.255 | ) |
Distributions from Realized Capital Gains | — |
| — |
| — |
| — |
| — |
|
Total Distributions | (.492 | ) | (.351 | ) | (.252 | ) | (.284 | ) | (.255 | ) |
Net Asset Value, End of Period | $21.87 |
| $19.68 |
| $22.56 |
| $18.27 |
| $16.48 |
|
|
|
|
|
|
|
|
|
|
|
|
Total Return3 | 13.96% |
| -11.39% |
| 25.28% |
| 12.95% |
| -16.99% |
|
|
|
|
|
|
|
|
|
|
|
|
Ratios/Supplemental Data |
|
|
|
|
|
|
|
|
|
|
Net Assets, End of Period (Millions) | $702 |
| $564 |
| $646 |
| $339 |
| $259 |
|
Ratio of Total Expenses to Average Net Assets4 | 0.93% |
| 0.94% |
| 0.92% |
| 0.90% |
| 0.93% |
|
Ratio of Net Investment Income to Average Net Assets | 2.25%2 |
| 1.85% |
| 2.04% |
| 1.57% |
| 1.59% |
|
Portfolio Turnover Rate | 46% |
| 76% |
| 44% |
| 46% |
| 49% |
|
1 Calculated based on average shares outstanding.
2 Net investment income per share and the ratio of net investment income to average net assets include $.071 and 0.34%, respectively, resulting from a special dividend from Naspers Ltd. in September 2019.
3 Total returns do not include account service fees that may have applied in the periods shown. Fund prospectuses provide information about any applicable account service fees.
4 Includes performance-based investment advisory fee increases (decreases) of 0.07%, 0.05%, (0.01%), (0.03%), and 0.00%.
See accompanying Notes, which are an integral part of the Financial Statements.
Emerging Markets Select Stock Fund
Notes to Financial Statements
Vanguard Emerging Markets Select Stock Fund is registered under the Investment Company Act of 1940 as an open-end investment company, or mutual fund. The fund invests in securities of foreign issuers, which may subject it to investment risks not normally associated with investing in securities of U.S. corporations. Further, at October 31, 2019, the fund had a concentration of its investments in securities issued in China, and the performance of such investments may be impacted by the country’s social, political, and economic conditions.
A. The following significant accounting policies conform to generally accepted accounting principles for U.S. investment companies. The fund consistently follows such policies in preparing its financial statements.
1. Security Valuation: Securities are valued as of the close of trading on the New York Stock Exchange (generally 4 p.m., Eastern time) on the valuation date. Equity securities are valued at the latest quoted sales prices or official closing prices taken from the primary market in which each security trades; such securities not traded on the valuation date are valued at the mean of the latest quoted bid and asked prices. Securities for which market quotations are not readily available, or whose values have been affected by events occurring before the fund’s pricing time but after the close of the securities’ primary markets, are valued at their fair values calculated according to procedures adopted by the board of trustees. These procedures include obtaining quotations from an independent pricing service, monitoring news to identify significant market- or security-specific events, and evaluating changes in the values of foreign market proxies (for example, ADRs, futures contracts, or exchange-traded funds), between the time the foreign markets close and the fund’s pricing time. When fair-value pricing is employed, the prices of securities used by a fund to calculate its net asset value may differ from quoted or published prices for the same securities. Investments in Vanguard Market Liquidity Fund are valued at that fund’s net asset value. Temporary cash investments are valued using the latest bid prices or using valuations based on a matrix system (which considers such factors as security prices, yields, maturities, and ratings), both as furnished by independent pricing services.
2. Foreign Currency: Securities and other assets and liabilities denominated in foreign currencies are translated into U.S. dollars using exchange rates obtained from an independent third party as of the fund’s pricing time on the valuation date. Realized gains (losses) and unrealized appreciation (depreciation) on investment securities include the effects of changes in exchange rates since the securities were purchased, combined with the effects of changes in security prices. Fluctuations in the value of other assets and liabilities resulting from changes in exchange rates are recorded as unrealized foreign currency gains (losses) until the assets or liabilities are settled in cash, at which time they are recorded as realized foreign currency gains (losses).
3. Futures Contracts: The fund uses index futures contracts to a limited extent, with the objective of maintaining full exposure to the stock market while maintaining liquidity. The fund may purchase or sell futures contracts to achieve a desired level of investment, whether to accommodate portfolio turnover or cash flows from capital share transactions. The primary risks associated with the use of futures contracts are imperfect correlation between changes in market values of stocks held by the fund and the prices of futures contracts, and the possibility of an illiquid market. Counterparty risk involving futures is mitigated because a regulated clearinghouse is the counterparty instead of the clearing broker. To further mitigate counterparty risk, the fund trades futures contracts on an exchange, monitors the financial strength of its clearing brokers and clearinghouse, and has entered into clearing agreements with its clearing brokers. The clearinghouse imposes initial margin
Emerging Markets Select Stock Fund
requirements to secure the fund’s performance and requires daily settlement of variation margin representing changes in the market value of each contract. Any assets pledged as initial margin for open contracts are noted in the Statement of Net Assets.
Futures contracts are valued at their quoted daily settlement prices. The notional amounts of the contracts are not recorded in the Statement of Net Assets. Fluctuations in the value of the contracts are recorded in the Statement of Assets and Liabilities as an asset (liability) and in the Statement of Operations as unrealized appreciation (depreciation) until the contracts are closed, when they are recorded as realized futures gains (losses).
During the year ended October 31, 2019, the fund’s average investments in long and short futures contracts represented 4% and 0% of net assets, respectively, based on the average of the notional amounts at each quarter-end during the period.
4. Federal Income Taxes: The fund intends to continue to qualify as a regulated investment company and distribute all of its taxable income. Management has analyzed the fund’s tax positions taken for all open federal income tax years (October 31, 2016–2019), and has concluded that no provision for federal income tax is required in the fund’s financial statements.
5. Distributions: Distributions to shareholders are recorded on the ex-dividend date. Distributions are determined on a tax basis and may differ from net investment income and realized capital gains for financial reporting purposes.
6. Securities Lending: To earn additional income, the fund lends its securities to qualified institutional borrowers. Security loans are subject to termination by the fund at any time, and are required to be secured at all times by collateral in an amount at least equal to the market value of securities loaned. Daily market fluctuations could cause the value of loaned securities to be more or less than the value of the collateral received. When this occurs, the collateral is adjusted and settled before the opening of the market on the next business day. The fund further mitigates its counterparty risk by entering into securities lending transactions only with a diverse group of prequalified counterparties, monitoring their financial strength, and entering into master securities lending agreements with its counterparties. The master securities lending agreements provide that, in the event of a counterparty’s default (including bankruptcy), the fund may terminate any loans with that borrower, determine the net amount owed, and sell or retain the collateral up to the net amount owed to the fund; however, such actions may be subject to legal proceedings. While collateral mitigates counterparty risk, in the event of a default, the fund may experience delays and costs in recovering the securities loaned. The fund invests cash collateral received in Vanguard Market Liquidity Fund, and records a liability in the Statement of Assets and Liabilities for the return of the collateral, during the period the securities are on loan. Securities lending income represents fees charged to borrowers plus income earned on invested cash collateral, less expenses associated with the loan. During the term of the loan, the fund is entitled to all distributions made on or in respect of the loaned securities.
7. Credit Facility: The fund and certain other funds managed by The Vanguard Group (“Vanguard”) participate in a $4.3 billion committed credit facility provided by a syndicate of lenders pursuant to a credit agreement that may be renewed annually; each fund is individually liable for its borrowings, if any, under the credit facility. Borrowings may be utilized for temporary and emergency purposes, and are subject to the fund’s regulatory and contractual borrowing restrictions. The participating funds are charged administrative fees and an annual commitment fee of 0.10% of the undrawn amount of
Emerging Markets Select Stock Fund
the facility; these fees are allocated to the funds based on a method approved by the fund’s board of trustees and included in Management and Administrative expenses on the fund’s Statement of Operations. Any borrowings under this facility bear interest at a rate based upon the higher of the one-month London Interbank Offered Rate, federal funds effective rate, or overnight bank funding rate plus an agreed-upon spread.
The fund had no borrowings outstanding at October 31, 2019, or at any time during the period then ended.
8. Other: Dividend income is recorded on the ex-dividend date. Interest income includes income distributions received from Vanguard Market Liquidity Fund and is accrued daily. Premiums and discounts on debt securities purchased are amortized and accreted, respectively, to interest income over the lives of the respective securities. Taxes on foreign dividends and capital gains have been provided for in accordance with the fund’s understanding of the applicable countries’ tax rules and rates. Foreign capital gains tax is accrued daily based upon net unrealized gains. Security transactions are accounted for on the date securities are bought or sold. Costs used to determine realized gains (losses) on the sale of investment securities are those of the specific securities sold.
B. The investment advisory firms Baillie Gifford Overseas Ltd., Pzena Investment Management, LLC, Oaktree Capital Management, L.P., and Wellington Management Company LLP each provide investment advisory services to a portion of the fund for a fee calculated at an annual percentage rate of average net assets managed by the advisor. The basic fees of Baillie Gifford Overseas Ltd., Pzena Investment Management, LLC, Oaktree Capital Management, L.P., and Wellington Management Company LLP are subject to quarterly adjustments based on performance relative to the FTSE Emerging Index for the preceding three years. In accordance with the advisory contract entered into with Baillie Gifford Overseas Ltd., beginning August 1, 2019, the investment advisory fee will be subject to quarterly adjustments based on performance relative to the FTSE Emerging Index since July 31, 2018.
Vanguard manages the cash reserves of the fund as described below.
For the year ended October 31, 2019, the aggregate investment advisory fee represented an effective annual basic rate of 0.52% of the fund’s average net assets, before an increase of $459,000 (0.07%) based on performance.
C. In accordance with the terms of a Funds’ Service Agreement (the “FSA”) between Vanguard and the fund, Vanguard furnishes to the fund corporate management, administrative, marketing, distribution, and cash management services at Vanguard’s cost of operations (as defined by the FSA). These costs of operations are allocated to the fund based on methods and guidelines approved by the board of trustees. Vanguard does not require reimbursement in the current period for certain costs of operations (such as deferred compensation/benefits and risk/insurance costs); the fund’s liability for these costs of operations is included in Payables to Vanguard on the Statement of Assets and Liabilities. All other costs of operations payable to Vanguard are generally settled twice a month.
Upon the request of Vanguard, the fund may invest up to 0.40% of its net assets as capital in Vanguard. At October 31, 2019, the fund had contributed to Vanguard capital in the amount of $33,000, representing less than 0.01% of the fund’s net assets and 0.01% of Vanguard’s capital received pursuant to the FSA. The fund’s trustees and officers are also directors and employees, respectively, of Vanguard.
Emerging Markets Select Stock Fund
D. The fund’s custodian bank has agreed to reduce its fees when the fund maintains cash on deposit in the non-interest-bearing custody account. For the year ended October 31, 2019, custodian fee offset arrangements reduced the fund’s expenses by $13,000 (an annual rate of 0.00% of average net assets).
E. Various inputs may be used to determine the value of the fund’s investments. These inputs are summarized in three broad levels for financial statement purposes. The inputs or methodologies used to value securities are not necessarily an indication of the risk associated with investing in those securities.
Level 1—Quoted prices in active markets for identical securities.
Level 2—Other significant observable inputs (including quoted prices for similar securities, interest rates, prepayment speeds, credit risk, etc.).
Level 3—Significant unobservable inputs (including the fund’s own assumptions used to determine the fair value of investments). Any investments valued with significant unobservable inputs are noted on the Statement of Net Assets.
The following table summarizes the market value of the fund’s investments and derivatives as of October 31, 2019, based on the inputs used to value them:
Investments | Level 1 | ) | Level 2 | ) | Level 3 | ) |
Common Stocks—North and South America | 92,602 |
| — |
| — |
|
Common Stocks—Other | 66,452 |
| 503,803 |
| 618 |
|
Temporary Cash Investments | 34,181 |
| 1,496 |
| — |
|
Futures Contracts—Liabilities1 | (207 | ) | — |
| — |
|
Total | 193,028 |
| 505,299 |
| 618 |
|
1 Represents variation margin on the last day of the reporting period.
F. Permanent differences between book-basis and tax-basis components of net assets, if any, are reclassified among capital accounts in the financial statements to reflect their tax character. These reclassifications have no effect on net assets or net asset value per share.
Emerging Markets Select Stock Fund
Temporary differences between book-basis and tax-basis components of total distributable earnings (loss) arise when certain items of income, gain, or loss are recognized in different periods for financial statement and tax purposes; these differences will reverse at some time in the future. The differences are primarily related to the tax deferral of losses on wash sales, the realization of unrealized gains or losses on certain futures contracts, and unrealized gains on passive foreign investment companies. As of period end, the tax-basis components of total distributable earnings (loss) are detailed in the table as follows:
| Amount ($000) |
Undistributed Ordinary Income | 13,644 |
Undistributed Long-Term Gains | — |
Capital Loss Carryforwards (Non-expiring)* | (760) |
Net Unrealized Gains (Losses) | 47,785 |
*The fund used capital loss carryforwards of $2,126,000 to offset taxable capital gains realized during the year ended October 31, 2019.
As of October 31, 2019, gross unrealized appreciation and depreciation for investments and derivatives based on cost for U.S. federal income tax purposes were as follows:
| Amount ($000) |
Tax Cost | 651,239 |
Gross Unrealized Appreciation | 109,415 |
Gross Unrealized Depreciation | (61,502) |
Net Unrealized Appreciation (Depreciation) | 47,913 |
G. During the year ended October 31, 2019, the fund purchased $349,515,000 of investment securities and sold $285,341,000 of investment securities, other than temporary cash investments.
H. Capital shares issued and redeemed were:
| Year Ended October 31, |
| ||
| 2019 | ) | 2018 | ) |
Issued | 11,415 |
| 13,294 |
|
Issued in Lieu of Cash Distributions | 646 |
| 417 |
|
Redeemed | (8,654 | ) | (13,666 | ) |
Net Increase (Decrease) in Shares Outstanding | 3,407 |
| 45 |
|
Emerging Markets Select Stock Fund
I. Transactions during the period in investments where the issuer is another member of The Vanguard Group were as follows:
|
|
|
| Current Period Transactions |
|
|
| ||||||||||
|
| Oct. 31, |
|
|
| Proceeds |
| Realized |
|
|
|
|
|
|
| Oct. 31, |
|
|
| 2018 |
|
|
| from |
| Net |
| Change in |
|
|
| Capital Gain |
| 2019 |
|
|
| Market |
| Purchases |
| Securities |
| Gain |
| Unrealized |
|
|
| Distributions |
| Market |
|
|
| Value |
| at Cost |
| Sold |
| (Loss | ) | App. (Dep. | ) | Income |
| Received |
| Value |
|
|
| ($000 | ) | ($000 | ) | ($000 | ) | ($000 | ) | ($000 | ) | ($000 | ) | ($000 | ) | ($000 | ) |
Vanguard Market Liquidity Fund |
| 26,414 |
| NA1 |
| NA1 |
| 3 |
| 2 |
| 811 |
| — |
| 34,181 |
|
Vanguard FTSE Emerging Markets ETF |
| 6,247 |
| 13,861 |
| 16,728 |
| (210 | ) | 732 |
| 132 |
| — |
| 3,902 |
|
Total |
| 32,661 |
|
|
|
|
| (207 | ) | 734 |
| 943 |
| — |
| 38,083 |
|
1 Not applicable—purchases and sales are for temporary cash investment purposes.
J. Management has determined that no events or transactions occurred subsequent to October 31, 2019, that would require recognition or disclosure in these financial statements.
Report of Independent Registered Public Accounting Firm
To the Board of Trustees of Vanguard Trustees’ Equity Fund and Shareholders of Vanguard Emerging Markets Select Stock Fund
Opinion on the Financial Statements
We have audited the accompanying statement of net assets and statement of assets and liabilities of Vanguard Emerging Markets Select Stock Fund (one of the funds constituting Vanguard Trustees’ Equity Fund, referred to hereafter as the “Fund”) as of October 31, 2019, the related statement of operations for the year ended October 31, 2019, the statement of changes in net assets for each of the two years in the period ended October 31, 2019, including the related notes, and the financial highlights for each of the five years in the period ended October 31, 2019 (collectively referred to as the “financial statements”). In our opinion, the financial statements present fairly, in all material respects, the financial position of the Fund as of October 31, 2019, the results of its operations for the year then ended, the changes in its net assets for each of the two years in the period ended October 31, 2019 and the financial highlights for each of the five years in the period ended October 31, 2019 in conformity with accounting principles generally accepted in the United States of America.
Basis for Opinion
These financial statements are the responsibility of the Fund’s management. Our responsibility is to express an opinion on the Fund’s financial statements based on our audits. We are a public accounting firm registered with the Public Company Accounting Oversight Board (United States) (“PCAOB”) and are required to be independent with respect to the Fund in accordance with the U.S. federal securities laws and the applicable rules and regulations of the Securities and Exchange Commission and the PCAOB.
We conducted our audits of these financial statements in accordance with the standards of the PCAOB. Those standards require that we plan and perform the audit to obtain reasonable assurance about whether the financial statements are free of material misstatement, whether due to error or fraud.
Our audits included performing procedures to assess the risks of material misstatement of the financial statements, whether due to error or fraud, and performing procedures that respond to those risks. Such procedures included examining, on a test basis, evidence regarding the amounts and disclosures in the financial statements. Our audits also included evaluating the accounting principles used and significant estimates made by management, as well as evaluating the overall presentation of the financial statements. Our procedures included confirmation of securities owned as of October 31, 2019 by correspondence with the custodian and brokers and by agreement to the underlying ownership records of the transfer agent; when replies were not received from brokers, we performed other auditing procedures. We believe that our audits provide a reasonable basis for our opinion.
/s/PricewaterhouseCoopers LLP
Philadelphia, Pennsylvania
December 13, 2019
We have served as the auditor of one or more investment companies in The Vanguard Group of Funds since 1975.
Special 2019 tax information (unaudited) for Vanguard Emerging Markets Select Stock Fund
This information for the fiscal year ended October 31, 2019, is included pursuant to provisions of the Internal Revenue Code.
The fund distributed $10,820,000 of qualified dividend income to shareholders during the fiscal year.
The fund designates to shareholders foreign source income of $21,762,000 and foreign taxes paid of $1,893,000. Shareholders will receive more detailed information with their Form 1099-DIV in January 2020 to determine the calendar-year amounts to be included on their 2019 tax returns.
Trustees Approve Advisory Arrangement
In September 2019, the parent company of Oaktree Capital Management, L.P. (“Oaktree”), was involved in a transaction with Brookfield Asset Management, Inc. (“Brookfield”), as a result of which Brookfield has acquired an indirect 62% economic interest in Oaktree. One of the closing conditions of the transaction was that the fund and Oaktree enter into a new advisory agreement.1 Accordingly, the board of trustees approved a new advisory agreement with Oaktree to allow for an uninterrupted advisory relationship between Oaktree and the fund. The new agreement is materially the same as the former agreement with Oaktree except for the date.
The board based its decision upon an evaluation of the advisor’s investment staff, portfolio management process, and performance. This evaluation included information provided to the board by Vanguard’s Portfolio Review Department, which is responsible for fund and advisor oversight and product management. The trustees considered the factors discussed below, among others. However, no single factor determined whether the board approved the arrangement. Rather, it was the totality of the circumstances that drove the board’s decision.
Nature, extent, and quality of services
The board reviewed the quality of the investment management services provided to the fund by Oaktree and took into account the organizational depth and stability of the advisor. The board considered that Oaktree, founded in 1995, is an investment advisory firm that focuses on certain specialized investment areas, including emerging markets. The portfolio managers each have over 20 years of investment experience and are supported by an analyst team focused only on emerging markets equity investing. The team’s fundamental research focuses on companies with strong cash flow generation and attractive returns on capital, seeking to purchase these companies at favorable valuations. The team emphasizes developing in-depth industry knowledge by traveling extensively to meet with company management. Oaktree has advised a portion of the fund since the fund’s inception in 2011.
The board concluded that Oaktree’s experience, stability, depth, and performance, among other factors, warranted approval of the advisory arrangement.
Investment performance
The board considered the short- and long-term performance of the fund and Oaktree since the fund’s inception, including any periods of outperformance or underperformance compared with a relevant benchmark index and peer group. The board concluded that the performance was such that the advisory arrangement should continue.
Cost
The board concluded that the fund’s expense ratio was well below the average expense ratio charged by funds in its peer group and that the fund’s advisory fee rate was also well below the peer-group average.
The board did not consider the profitability of Oaktree in determining whether to approve the advisory fee, because the firm is independent of Vanguard and the advisory fee is the result of arm’s-length negotiations.
1 The transaction did not result in a change in control of Oaktree and, therefore, approval of a new advisory agreement was not required under the Investment Company Act of 1940.
The benefit of economies of scale
The board concluded that the fund’s shareholders benefit from economies of scale because of breakpoints in the advisory fee schedule for Oaktree. The breakpoints reduce the effective rate of the fee as the fund’s assets managed by Oaktree increase.
The board will consider whether to renew the advisory arrangement again after no more than a one-year period.
This page intentionally left blank.
This page intentionally left blank.
The People Who Govern Your Fund
The trustees of your mutual fund are there to see that the fund is operated and managed in your best interests since, as a shareholder, you are a part owner of the fund. Your fund’s trustees also serve on the board of directors of The Vanguard Group, Inc., which is owned by the Vanguard funds and provides services to them.
A majority of Vanguard’s board members are independent, meaning that they have no affiliation with Vanguard or the funds they oversee, apart from the sizable personal investments they have made as private individuals. The independent board members have distinguished backgrounds in business, academia, and public service. Each of the trustees and executive officers oversees 213 Vanguard funds.
Information for each trustee and executive officer of the fund appears below. That information, as well as the Vanguard fund count, is as of the date on the cover of this fund report. The mailing address of the trustees and officers is P.O. Box 876, Valley Forge, PA 19482. More information about the trustees is in the Statement of Additional Information, which can be obtained, without charge, by contacting Vanguard at 800-662-7447, or online at vanguard.com.
Interested Trustee1
Mortimer J. Buckley
Born in 1969. Trustee since January 2018. Principal occupation(s) during the past five years and other experience: chairman of the board (January 2019–present) of Vanguard and of each of the investment companies served by Vanguard; chief executive officer (January 2018–present) of Vanguard; chief executive officer, president, and trustee (January 2018–present) of each of the investment companies served by Vanguard; president and director (2017–present) of Vanguard; and president (February 2018–present) of Vanguard Marketing Corporation. Chief investment officer (2013–2017), managing director (2002–2017), head of the Retail Investor Group (2006–2012), and chief information officer (2001–2006) of Vanguard. Chairman of the board (2011–2017) and trustee (2009–2017) of the Children’s Hospital of Philadelphia; trustee (2018–present) of The Shipley School.
Independent Trustees
Emerson U. Fullwood
Born in 1948. Trustee since January 2008. Principal occupation(s) during the past five years and other experience: executive chief staff and marketing officer for North America and corporate vice president (retired 2008) of Xerox Corporation (document management products and services). Former president of the Worldwide Channels Group, Latin America, and Worldwide Customer Service and executive chief staff officer of Developing Markets of Xerox. Executive in residence and 2009–2010 Distinguished Minett Professor at the Rochester Institute of Technology. Director of SPX FLOW, Inc. (multi-industry manufacturing). Director of the University of Rochester Medical Center, the Monroe Community College Foundation, the United Way of Rochester, North Carolina A&T University, and Roberts Wesleyan College. Trustee of the University of Rochester.
Amy Gutmann
Born in 1949. Trustee since June 2006. Principal occupation(s) during the past five years and other experience: president (2004–present) of the University of Pennsylvania. Christopher H. Browne Distinguished Professor of Political Science, School of Arts and Sciences, and professor of communication, Annenberg School for Communication, with secondary faculty appointments in the Department of Philosophy, School of Arts and Sciences, and at the Graduate School of Education, University of Pennsylvania. Trustee of the National Constitution Center.
F. Joseph Loughrey
Born in 1949. Trustee since October 2009. Principal occupation(s) during the past five years and other experience: president and chief operating officer (retired 2009) and vice chairman of the board (2008–2009) of Cummins Inc. (industrial machinery). Chairman of the board of Hillenbrand, Inc. (specialized consumer services), and the Lumina Foundation.
1 Mr. Buckley is considered an “interested person,” as defined in the Investment Company Act of 1940, because he is an officer of the Vanguard funds.
Director of the V Foundation and Oxfam America. Member of the advisory council for the College of Arts and Letters and chair of the advisory board to the Kellogg Institute for International Studies, both at the University of Notre Dame.
Mark Loughridge
Born in 1953. Trustee since March 2012. Principal occupation(s) during the past five years and other experience: senior vice president and chief financial officer (retired 2013) of IBM (information technology services). Fiduciary member of IBM’s Retirement Plan Committee (2004–2013), senior vice president and general manager (2002–2004) of IBM Global Financing, vice president and controller (1998–2002) of IBM, and a variety of other prior management roles at IBM. Member of the Council on Chicago Booth.
Scott C. Malpass
Born in 1962. Trustee since March 2012. Principal occupation(s) during the past five years and other experience: chief investment officer (1989–present) and vice president (1996–present) of the University of Notre Dame. Assistant professor of finance at the Mendoza College of Business, University of Notre Dame, and member of the Notre Dame 403(b) Investment Committee. Chairman of the board of TIFF Advisory Services, Inc. Member of the board of Catholic Investment Services, Inc. (investment advisors) and the board of superintendence of the Institute for the Works of Religion.
Deanna Mulligan
Born in 1963. Trustee since January 2018. Principal occupation(s) during the past five years and other experience: president (2010–present) and chief executive officer (2011–present) of The Guardian Life Insurance Company of America. Chief operating officer (2010–2011) and executive vice president (2008–2010) of Individual Life and Disability of The Guardian Life Insurance Company of America. Member of the board of The Guardian Life Insurance Company of America, the American Council of Life Insurers, the Partnership for New York City (business leadership), and the Committee Encouraging Corporate Philanthropy. Trustee of the Economic Club of New York and the Bruce Museum (arts and science). Member of the Advisory Council for the Stanford Graduate School of Business.
André F. Perold
Born in 1952. Trustee since December 2004. Principal occupation(s) during the past five years and other experience: George Gund Professor of Finance and Banking, Emeritus at the Harvard Business School (retired 2011). Chief investment officer and co-managing partner of HighVista Strategies (private investment firm). Board of advisors and investment committee member of the Museum of Fine Arts Boston. Board member (2018–present) of RIT Capital Partners (investment firm); investment committee member of Partners Health Care System.
Sarah Bloom Raskin
Born in 1961. Trustee since January 2018. Principal occupation(s) during the past five years and other experience: deputy secretary (2014–2017) of the United States Department of the Treasury. Governor (2010–2014) of the Federal Reserve Board. Commissioner (2007–2010) of financial regulation for the State of Maryland. Member of the board of directors (2012–2014) of Neighborhood Reinvestment Corporation. Director (2017–present) of i(x) Investments; director (2017–present) of Reserve Trust. Rubinstein Fellow (2017–present) of Duke University; trustee (2017–present) of Amherst College.
Peter F. Volanakis
Born in 1955. Trustee since July 2009. Principal occupation(s) during the past five years and other experience: president and chief operating officer (retired 2010) of Corning Incorporated (communications equipment) and director of Corning Incorporated (2000–2010) and Dow Corning (2001–2010). Director (2012) of SPX Corporation (multi-industry manufacturing). Overseer of the Amos Tuck School of Business Administration, Dartmouth College (2001–2013). Chairman of the board of trustees of Colby-Sawyer College. Member of the board of Hypertherm Inc. (industrial cutting systems, software, and consumables).
Executive Officers
John Bendl
Born in 1970. Principal occupation(s) during the past five years and other experience: principal of Vanguard. Chief financial officer (October 2019–present) of each of the investment companies served by Vanguard. Chief accounting officer, treasurer, and controller of Vanguard (2017–present). Partner (2003–2016) at KPMG (audit, tax, and advisory services).
Glenn Booraem
Born in 1967. Principal occupation(s) during the past five years and other experience: principal of Vanguard. Investment stewardship officer (2017–present), treasurer (2015–2017), controller (2010–2015), and assistant controller (2001–2010) of each of the investment companies served by Vanguard.
Christine M. Buchanan
Born in 1970. Principal occupation(s) during the past five years and other experience: principal of Vanguard. Treasurer (2017–present) of each of the investment companies served by Vanguard. Partner (2005–2017) at KPMG (audit, tax, and advisory services).
David Cermak
Born in 1960. Principal occupation(s) during the past five years and other experience: principal of Vanguard. Finance director (October 2019–present) of each of the investment companies served by Vanguard. Managing director and head (2017–present) of Vanguard Investments Singapore. Managing director and head (2017–2019) of Vanguard Investments Hong Kong. Representative director and head (2014–2017) of Vanguard Investments Japan.
Thomas J. Higgins
Born in 1957. Principal occupation(s) during the past five years and other experience: principal of Vanguard. Finance director (October 2019–present), chief financial officer (2008–2019), and treasurer (1998–2008) of each of the investment companies served by Vanguard.
Peter Mahoney
Born in 1974. Principal occupation(s) during the past five years and other experience: principal of Vanguard. Controller (2015–present) of each of the investment companies served by Vanguard. Head of International Fund Services (2008–2014) at Vanguard.
Anne E. Robinson
Born in 1970. Principal occupation(s) during the past five years and other experience: general counsel (2016–present) of Vanguard. Secretary (2016–present) of Vanguard and of each of the investment companies served by Vanguard. Managing director (2016–present) of Vanguard. Managing director and general counsel of Global Cards and Consumer Services (2014–2016) at Citigroup. Counsel (2003–2014) at American Express.
Michael Rollings
Born in 1963. Principal occupation(s) during the past five years and other experience: finance director (2017–present) and treasurer (2017) of each of the investment companies served by Vanguard. Managing director (2016–present) of Vanguard. Chief financial officer (2016–present) of Vanguard. Director (2016–present) of Vanguard Marketing Corporation. Executive vice president and chief financial officer (2006–2016) of MassMutual Financial Group.
John E. Schadl
Born in 1972. Principal occupation(s) during the past five years and other experience: principal of Vanguard. Chief compliance officer (2019–present) of Vanguard and of each of the investment companies served by Vanguard. Assistant vice president (May 2019–present) of Vanguard Marketing Corporation.
Vanguard Senior Management Team
Joseph Brennan | Chris D. McIsaac |
|
|
Mortimer J. Buckley | James M. Norris |
|
|
Gregory Davis | Thomas M. Rampulla |
|
|
John James | Karin A. Risi |
|
|
Martha G. King | Anne E. Robinson |
|
|
John T. Marcante | Michael Rollings |
|
|
|
|
|
|
| P.O. Box 2600 |
| Valley Forge, PA 19482-2600 |

Connect with Vanguard® > vanguard.com
Fund Information > 800-662-7447
Direct Investor Account Services > 800-662-2739
Institutional Investor Services > 800-523-1036
Text Telephone for People
Who Are Deaf or Hard of Hearing > 800-749-7273
This material may be used in conjunction with the offering of shares of any Vanguard fund only if preceded or accompanied by the fund’s current prospectus.
All comparative mutual fund data are from Morningstar, Inc., unless otherwise noted.
You can obtain a free copy of Vanguard’s proxy voting guidelines by visiting vanguard.com/proxyreporting or by calling Vanguard at 800-662-2739. The guidelines are also available from the SEC’s website, www.sec.gov. In addition, you may obtain a free report on how your fund voted the proxies for securities it owned during the 12 months ended June 30. To get the report, visit either vanguard.com/proxyreporting or www.sec.gov.
You can review information about your fund on the SEC’s website, and you can receive copies of this information, for a fee, by sending a request via email addressed to publicinfo@sec.gov.
Source for Bloomberg Barclays indexes: Bloomberg Index Services Limited. Copyright 2019, Bloomberg. All rights reserved.
CFA® is a registered trademark owned by CFA Institute.
| © 2019 The Vanguard Group, Inc. All rights reserved. Vanguard Marketing Corporation, Distributor.
Q7520 122019 |

Annual Report | October 31, 2019
Vanguard Alternative Strategies Fund
|
See the inside front cover for important information about access to your fund’s annual and semiannual shareholder reports.
|
Important information about access to shareholder reports
Beginning on January 1, 2021, as permitted by regulations adopted by the Securities and Exchange Commission, paper copies of your fund’s annual and semiannual shareholder reports will no longer be sent to you by mail, unless you specifically request them. Instead, you will be notified by mail each time a report is posted on the website and will be provided with a link to access the report.
If you have already elected to receive shareholder reports electronically, you will not be affected by this change and do not need to take any action. You may elect to receive shareholder reports and other communications from the fund electronically by contacting your financial intermediary (such as a broker-dealer or bank) or, if you invest directly with the fund, by calling Vanguard at one of the phone numbers on the back cover of this report or by logging on to vanguard.com.
You may elect to receive paper copies of all future shareholder reports free of charge. If you invest through a financial intermediary, you can contact the intermediary to request that you continue to receive paper copies. If you invest directly with the fund, you can call Vanguard at one of the phone numbers on the back cover of this report or log on to vanguard.com. Your election to receive paper copies will apply to all the funds you hold through an intermediary or directly with Vanguard.
Contents |
|
|
|
A Note From Our Chairman | 1 |
Your Fund’s Performance at a Glance | 2 |
Advisor’s Report | 3 |
About Your Fund’s Expenses | 6 |
Performance Summary | 8 |
Consolidated Financial Statements | 10 |
Please note: The opinions expressed in this report are just that—informed opinions. They should not be considered promises or advice. Also, please keep in mind that the information and opinions cover the period through the date on the front of this report. Of course, the risks of investing in your fund are spelled out in the prospectus.
A Note From Our Chairman

Tim Buckley
Chairman and Chief Executive Officer
Dear Shareholder,
Recent volatility in financial markets—affecting stocks, bonds, and commodities—has been a good reminder of the wise old adage, “Never keep all your eggs in one basket.” Maintaining balance and diversification in your investment portfolio can help to both limit risk and set you up for long-term success.
It’s understandable why some investors might become complacent after a long market run-up like the one that lifted stock prices, especially U.S. stock prices, in the years following the global financial crisis. But failing to rebalance regularly can leave a portfolio with a much different mix of assets than intended and, often, more risk than intended.
Balance across and diversification within asset classes are powerful tools for managing risk and achieving your investment goals. A portfolio’s allocation will determine a large portion of its long-term return and also the majority of its volatility risk. A well-diversified portfolio is less vulnerable to significant swings in the performance of any one segment of the asset classes in which it invests.
Balance and diversification will never eliminate the risk of loss, nor will they guarantee positive returns in a declining market. But they should reduce the chance that you’ll suffer disproportionate losses in one particular high-flying asset class or sector when it comes back to earth. And exposure to all key market components should give you at least some participation in the sectors that are performing best at any given time.
Vanguard is committed to helping you achieve balance and diversification in your portfolios to help meet your investment goals. We thank you for your continued loyalty.
Sincerely,

Mortimer J. Buckley
Chairman and Chief Executive Officer
November 18, 2019
Your Fund’s Performance at a Glance
· Vanguard Alternative Strategies Fund returned 10.30% for the 12 months ended October 31, 2019. Its benchmark, the FTSE 3-month U.S. T-Bill Index + 4%, returned 6.40%.
· The fund seeks to generate returns using a combination of several alternative strategies that collectively are expected to have low correlation with traditional capital markets. These strategies are long/short equity, event-driven, fixed income relative value, currencies, equity index futures, and commodity-linked investments.
· Long/short equity was the biggest driver of performance; the fund benefited from exposure to low-volatility, high-yielding names. Fixed income relative value also generated solid results. The currencies strategy was the only one to produce negative returns. The diversification resulting from the fund’s variety of exposures helped reduce overall volatility substantially compared with the broad U.S. stock market.
· The fund regularly uses derivatives to hedge portfolio risks. Its holdings of forward currency contracts and equity index and bond futures contracts boosted performance.
· Shortly after the period ended, the fund’s benchmark changed to the FTSE 3-Month Treasury Bill Index. The fund also changed its risk methodology and lowered the Investor Shares initial minimum investment to $50,000 from $250,000.
Market Barometer
|
| Average Annual Total Returns |
| ||||
|
| Periods Ended October 31, 2019 |
| ||||
|
| One Year |
| Three Years |
| Five Years |
|
Stocks |
|
|
|
|
|
|
|
Russell 1000 Index (Large-caps) |
| 14.15% |
| 14.73% |
| 10.55% |
|
Russell 2000 Index (Small-caps) |
| 4.90 |
| 10.96 |
| 7.37 |
|
Russell 3000 Index (Broad U.S. market) |
| 13.49 |
| 14.47 |
| 10.31 |
|
FTSE All-World ex US Index (International) |
| 11.52 |
| 8.21 |
| 4.16 |
|
|
|
|
|
|
|
|
|
Bonds |
|
|
|
|
|
|
|
Bloomberg Barclays U.S. Aggregate Bond Index (Broad taxable market) |
| 11.51% |
| 3.29% |
| 3.24% |
|
Bloomberg Barclays Municipal Bond Index (Broad tax-exempt market) |
| 9.42 |
| 3.62 |
| 3.55 |
|
FTSE Three-Month U.S. Treasury Bill Index |
| 2.35 |
| 1.57 |
| 0.98 |
|
|
|
|
|
|
|
|
|
CPI |
|
|
|
|
|
|
|
Consumer Price Index |
| 1.76% |
| 2.11% |
| 1.62% |
|
Advisor’s Report
For the 12 months ended October 31, 2019, Vanguard Alternative Strategies Fund returned 10.30%. The fund out-performed its benchmark, which was the FTSE 3-month U.S. T-Bill Index + 4% through the end of the period.
Note that the fund’s benchmark changed after the reporting period ended, to the FTSE 3-month U.S. T-Bill Index. The new benchmark is expected to give investors a clearer expectation of how the fund will behave.
The Alternative Strategies Fund’s risk methodology also changed. We still expect to produce a portfolio with lower volatility than the broader U.S. stock market, but we now target a fixed range of volatility. This fixed range of volatility may change from time to time. We will consider risk levels of the individual strategies, composition of the portfolio, and market conditions when determining the fixed volatility range.
Investment objective and strategy
The fund seeks positive returns that have low correlations with stock and bond returns by using a combination of six alternative investment strategies that span multiple asset classes: equities, fixed income, currencies, and commodities.
Each strategy can use long and short positions to try to minimize market exposure while attempting to capture attractive risk premiums. Individually, the strategies are expected to have low long-term correlation with one another and with traditional capital markets.
In addition, the fund can use limited amounts of leverage as it seeks to match the expected risk profile for each strategy. The goal is to achieve a similar risk profile across the portfolio to maximize diversification and performance.
The strategies the fund currently employs are:
· Long/short equity. This approach focuses on building a long/short portfolio of equity securities based on their volatility characteristics by executing long positions in low-volatility stocks and short positions in high-volatility stocks. It seeks to capture a risk-adjusted spread by constructing positions to reduce the net market exposure of the overall portfolio to general market movements (beta).
· Event-driven. This strategy seeks to profit from the expectation that a specific event or catalyst (such as a merger/acquisition deal closure) will affect the stock price of a U.S. or foreign company.
· Fixed income relative value. This approach seeks to exploit the steepness of the Treasury yield curve that is created by investors’ desire to hold shorter-maturity bonds because they tend to be more liquid (easily traded) and less sensitive to growth
and inflation risk. We try to capture this premium by investing in Treasury futures with longer times to maturity and borrowing those with short maturities.
· Currencies. The fund seeks to benefit from expected currency movements across countries by using long and short foreign currency exchange forward contracts. It does this by selling currencies of countries with poor fundamental characteristics and buying those of countries with strong ones.
· Commodity-linked investments. This strategy seeks to capture the risk premium associated with inventory levels of commodities, which are reflected in the prices of their futures contracts. We take long positions in commodities whose prices are expected to rise because of limited inventory and short positions in those whose prices are expected to fall.
· Equity index futures. The fund uses long and short positions in global equity index futures to capture excess return opportunities. The strategy seeks to benefit from global differences in market and fundamental characteristics by buying equity index futures with strong characteristics and selling equity index futures with poor characteristics.
Investment environment
Stocks posted strong returns for the 12 months ended October 31, 2019, despite uncertainty over U.S.-China trade, tensions with Iran, uncertainty over Brexit, and recession jitters spurred by an inversion of the yield curve.
U.S. stocks returned 14.33%, as measured by the Standard & Poor’s 500 Index. Large-capitalization stocks beat small-caps, and growth stocks outpaced value. Non-U.S. stocks once again lagged their U.S. counterparts. The FTSE Global All Cap ex US Index, which tracks non-U.S. stocks of all sizes in both developed and emerging markets, returned 11.18%. Outside the United States, emerging markets outpaced developed markets.
Facing dimmer growth prospects, below-target inflation, and a deteriorating global economic outlook, a number of major central banks shifted to a more accommodative monetary policy.
The U.S. Federal Reserve, after hiking interest rates four times in 2018, cut them in August, September, and the end of October. The federal funds rate target ended the period at 1.5%–1.75%. U.S. GDP growth slowed, as did the U.S. labor market, but both remained in positive territory. In September, the European Central Bank announced plans to push its deposit rate further below zero and start a new round of open-ended asset purchases in November.
With investors expecting weaker growth, tame inflation, and ongoing central bank support, global bond yields fell and prices rose. The overall U.S. market for taxable, investment-grade bonds, as measured by the Bloomberg Barclays U.S. Aggregate Bond Index, returned 11.51%. The Bloomberg Barclays Global Aggregate Bond Index returned 9.54%.
In commodities markets, precious metals advanced, with silver leading the pack. Industrial metals broadly declined in line with slowing global growth; nickel was a notable exception here, because of a looming shortage. Continued growth in U.S. stockpiles and slowing demand pushed down oil and natural gas. Grains, especially soybeans, advanced, as did livestock.
Successes and shortfalls
Although it’s important to understand the impact of macroeconomic factors on the markets, our process seeks to earn a positive absolute return regardless of market performance while controlling volatility. The correlations of the fund’s daily returns with the equity and bond markets—0.18 and 0.10, respectively—were very low.
Our equity futures, event-driven, long/short, commodity, and fixed income strategies aided performance. Long/short equity was the biggest contributor, as the fund benefited from exposure to low-volatility, high-yielding companies. Fixed income relative value also generated solid results. The currencies strategy was the only one to produce negative returns for the portfolio.
Although markets can be unpredictable, we are confident that our team of experienced managers and analysts can find opportunities to produce competitive returns over the long term at volatility levels lower than those of the market.
Portfolio Managers:
Anatoly Shtekhman, CFA
Fei Xu, CFA
Vanguard Quantitative Equity Group
November 25, 2019
About Your Fund’s Expenses
As a shareholder of the fund, you incur ongoing costs, which include costs for portfolio management, administrative services, and shareholder reports (like this one), among others. Operating expenses, which are deducted from a fund’s gross income, directly reduce the investment return of the fund.
A fund’s expenses are expressed as a percentage of its average net assets. This figure is known as the expense ratio. The following examples are intended to help you understand the ongoing costs (in dollars) of investing in your fund and to compare these costs with those of other mutual funds. The examples are based on an investment of $1,000 made at the beginning of the period shown and held for the entire period.
The accompanying table illustrates your fund’s costs in two ways:
· Based on actual fund return. This section helps you to estimate the actual expenses that you paid over the period. The “Ending Account Value” shown is derived from the fund’s actual return, and the third column shows the dollar amount that would have been paid by an investor who started with $1,000 in the fund. You may use the information here, together with the amount you invested, to estimate the expenses that you paid over the period.
To do so, simply divide your account value by $1,000 (for example, an $8,600 account value divided by $1,000 = 8.6), then multiply the result by the number given for your fund under the heading “Expenses Paid During Period.”
· Based on hypothetical 5% yearly return. This section is intended to help you compare your fund’s costs with those of other mutual funds. It assumes that the fund had a yearly return of 5% before expenses, but that the expense ratio is unchanged. In this case—because the return used is not the fund’s actual return—the results do not apply to your investment. The example is useful in making comparisons because the Securities and Exchange Commission requires all mutual funds to calculate expenses based on a 5% return. You can assess your fund’s costs by comparing this hypothetical example with the hypothetical examples that appear in shareholder reports of other funds.
Note that the expenses shown in the table are meant to highlight and help you compare ongoing costs only and do not reflect transaction costs incurred by the fund for buying and selling securities. Further, the expenses do not include any purchase, redemption, or account service fees described in the fund prospectus. If such fees were applied to your account, your costs would be higher. Your fund does not carry a “sales load.”
The calculations assume no shares were bought or sold during the period. Your actual costs may have been higher or lower, depending on the amount of your investment and the timing of any purchases or redemptions.
You can find more information about the fund’s expenses, including annual expense ratios, in the Consolidated Financial Statements section of this report. For additional information on operating expenses and other shareholder costs, please refer to your fund’s current prospectus.
Six Months Ended October 31, 2019
|
| Beginning |
| Ending |
| Expenses |
|
| Account Value |
| Account Value |
| Paid During |
Alternative Strategies Fund |
| 4/30/2019 |
| 10/31/2019 |
| Period |
Based on Actual Fund Return |
| $1,000.00 |
| $1,028.69 |
| $4.19 |
Based on Hypothetical 5% Yearly Return |
| 1,000.00 |
| 1,021.07 |
| 4.18 |
The calculations are based on expenses incurred in the most recent six-month period. The fund’s annualized six-month expense ratio for that period was 0.82%. The dollar amounts shown as “Expenses Paid” are equal to the annualized expense ratio multiplied by the average account value over the period, multiplied by the number of days in the most recent six-month period, then divided by the number of days in the most recent 12-month period (184/365).
Alternative Strategies Fund
Performance Summary
All of the returns in this report represent past performance, which is not a guarantee of future results that may be achieved by the fund. (Current performance may be lower or higher than the performance data cited. For performance data current to the most recent month-end, visit our website at vanguard.com/performance.) Note, too, that both investment returns and principal value can fluctuate widely, so an investor’s shares, when sold, could be worth more or less than their original cost. The returns shown do not reflect taxes that a shareholder would pay on fund distributions or on the sale of fund shares.
Cumulative Performance: August 11, 2015, Through October 31, 2019
Initial Investment of $50,000

|
|
|
| Average Annual Total Returns |
|
| |||||||
|
|
|
| Periods Ended October 31, 2019 |
|
| |||||||
|
|
|
|
|
| Since |
| Final Value | |||||
|
|
|
| One |
| Inception |
| of a $50,000 | |||||
|
|
|
| Year |
| (8/11/2015) |
| Investment | |||||
|
| Alternative Strategies Fund |
| 10.30% |
| 4.07% |
| $59,179 | |||||
|
| FTSE 3-month U.S. T-Bill Index + 4% |
| 6.40 |
| 5.32 |
| 62,229 | |||||
“Since Inception” performance is calculated from the fund’s inception date for both the fund and its comparative standard(s).
See Financial Highlights for dividend and capital gains information.
Alternative Strategies Fund
Sector Diversification
As of October 31, 2019
|
| Long Portfolio |
| Short Portfolio |
Communication Services |
| 7.8% |
| 5.0% |
Consumer Discretionary |
| 10.6 |
| 9.9 |
Consumer Staples |
| 5.1 |
| 3.0 |
Energy |
| 3.2 |
| 12.2 |
Financials |
| 8.5 |
| 14.9 |
Health Care |
| 21.8 |
| 29.3 |
Industrials |
| 18.2 |
| 4.7 |
Information Technology |
| 10.0 |
| 18.1 |
Materials |
| 3.8 |
| 1.4 |
Real Estate |
| 6.1 |
| 1.1 |
Utilities |
| 4.9 |
| 0.4 |
The table reflects the fund’s equity exposure, based on its investments in stocks and stock index futures. Any holdings in short-term reserves are excluded. Sector categories are based on the Global Industry Classification Standard (“GICS”), except for the “Other” category (if applicable), which includes securities that have not been provided a GICS classification as of the effective reporting period.
The Global Industry Classification Standard (“GICS”) was developed by and is the exclusive property and a service mark of MSCI Inc. (“MSCI”) and Standard and Poor’s, a division of McGraw-Hill Companies, Inc. (“S&P”), and is licensed for use by Vanguard. Neither MSCI, S&P nor any third party involved in making or compiling the GICS or any GICS classification makes any express or implied warranties or representations with respect to such standard or classification (or the results to be obtained by the use thereof), and all such parties hereby expressly disclaim all warranties of originality, accuracy, completeness, merchantability or fitness for a particular purpose with respect to any such standard or classification. Without limiting any of the foregoing, in no event shall MSCI, S&P, any of its affiliates or any third party involved in making or compiling the GICS or any GICS classification have any liability for any direct, indirect, special, punitive, consequential or any other damages (including lost profits) even if notified of the possibility of such damages.
Alternative Strategies Fund
Consolidated Financial Statements
Consolidated Statement of Net Assets
As of October 31, 2019
The fund files its complete schedule of portfolio holdings with the Securities and Exchange Commission (SEC) for the first and third quarters of each fiscal year as an exhibit to its reports on Form N-PORT. The fund’s Form N-PORT reports are available on the SEC’s website at www.sec.gov.
|
|
|
|
| Market |
|
|
|
|
|
| Value· |
|
|
|
| Shares |
| ($000 | ) |
Common Stocks—Long Positions (76.2%) |
|
|
|
|
| |
Communication Services (6.0%) |
|
|
|
|
| |
* | Zayo Group Holdings Inc. |
| 144,800 |
| 4,944 |
|
| Inmarsat plc |
| 600,000 |
| 4,280 |
|
| Gannett Co. Inc. |
| 250,000 |
| 2,713 |
|
| Axel Springer SE |
| 35,000 |
| 2,450 |
|
*,† | T-Mobile US Inc. |
| 3,947 |
| 326 |
|
* | Liberty Media Corp-Liberty SiriusXM Class A |
| 7,249 |
| 326 |
|
† | Cable One Inc. |
| 243 |
| 322 |
|
| AT&T Inc. |
| 8,267 |
| 318 |
|
| Verizon Communications Inc. |
| 5,065 |
| 306 |
|
† | News Corp. Class B |
| 21,560 |
| 304 |
|
*,† | Alphabet Inc. Class A |
| 241 |
| 303 |
|
| Comcast Corp. Class A |
| 6,684 |
| 300 |
|
| Omnicom Group Inc. |
| 3,776 |
| 292 |
|
| Walt Disney Co. |
| 2,143 |
| 278 |
|
| Fox Corp. Class B |
| 7,911 |
| 247 |
|
|
|
|
|
| 17,709 |
|
Consumer Discretionary (8.1%) |
|
|
|
|
| |
* | Caesars Entertainment Corp. |
| 379,000 |
| 4,654 |
|
1 | GrandVision NV |
| 115,476 |
| 3,530 |
|
* | Transat AT Inc. Class B |
| 220,000 |
| 2,567 |
|
* | Vitamin Shoppe Inc. |
| 358,968 |
| 2,319 |
|
| Hudson’s Bay Co. |
| 247,000 |
| 1,872 |
|
1 | Merlin Entertainments plc |
| 280,000 |
| 1,650 |
|
| Leggett & Platt Inc. |
| 7,440 |
| 382 |
|
* | O’Reilly Automotive Inc. |
| 782 |
| 340 |
|
| Pool Corp. |
| 1,613 |
| 334 |
|
| Dollar General Corp. |
| 2,052 |
| 329 |
|
† | Home Depot Inc. |
| 1,400 |
| 328 |
|
| Garmin Ltd. |
| 3,452 |
| 324 |
|
| NIKE Inc. Class B |
| 3,480 |
| 312 |
|
| Genuine Parts Co. |
| 3,030 |
| 311 |
|
*,† | AutoZone Inc. |
| 269 |
| 308 |
|
| TJX Cos. Inc. |
| 5,336 |
| 308 |
|
| Hyatt Hotels Corp. Class A |
| 4,076 |
| 305 |
|
| H&R Block Inc. |
| 12,142 |
| 303 |
|
| Service Corp. International |
| 6,597 |
| 300 |
|
† | Wendy’s Co. |
| 13,974 |
| 296 |
|
| Choice Hotels International Inc. |
| 3,342 |
| 296 |
|
* | NVR Inc. |
| 81 |
| 294 |
|
† | McDonald’s Corp. |
| 1,443 |
| 284 |
|
| Dunkin’ Brands Group Inc. |
| 3,600 |
| 283 |
|
| Starbucks Corp. |
| 3,300 |
| 279 |
|
* | Bright Horizons Family Solutions Inc. |
| 1,877 |
| 279 |
|
| Yum! Brands Inc. |
| 2,655 |
| 270 |
|
† | Graham Holdings Co. Class B |
| 427 |
| 269 |
|
| Darden Restaurants Inc. |
| 2,380 |
| 267 |
|
| Marriott International Inc. Class A |
| 2,022 |
| 256 |
|
| Columbia Sportswear Co. |
| 2,757 |
| 249 |
|
|
|
|
|
| 24,098 |
|
Consumer Staples (3.9%) |
|
|
|
|
| |
* | Bellamy’s Australia Ltd. |
| 450,000 |
| 3,968 |
|
| Brown-Forman Corp. Class B |
| 5,227 |
| 343 |
|
| Lamb Weston Holdings Inc. |
| 4,193 |
| 327 |
|
| Walmart Inc. |
| 2,767 |
| 324 |
|
| Costco Wholesale Corp. |
| 1,084 |
| 322 |
|
| Kellogg Co. |
| 5,056 |
| 321 |
|
| Archer-Daniels-Midland Co. |
| 7,565 |
| 318 |
|
| PepsiCo Inc. |
| 2,290 |
| 314 |
|
| Procter & Gamble Co. |
| 2,494 |
| 311 |
|
† | Sysco Corp. |
| 3,883 |
| 310 |
|
| Keurig Dr Pepper Inc. |
| 10,805 |
| 304 |
|
| Mondelez International Inc. Class A |
| 5,797 |
| 304 |
|
† | Coca-Cola Co. |
| 5,582 |
| 304 |
|
| McCormick & Co. Inc. |
| 1,870 |
| 301 |
|
| Hormel Foods Corp. |
| 7,332 |
| 300 |
|
† | Seaboard Corp. |
| 71 |
| 300 |
|
* | US Foods Holding Corp. |
| 7,270 |
| 288 |
|
| Clorox Co. |
| 1,948 |
| 288 |
|
| Kimberly-Clark Corp. |
| 2,156 |
| 287 |
|
| Colgate-Palmolive Co. |
| 4,152 |
| 285 |
|
Alternative Strategies Fund
|
|
|
|
| Market |
|
|
|
|
|
| Value· |
|
|
|
| Shares |
| ($000 | ) |
| Flowers Foods Inc. |
| 12,959 |
| 281 |
|
| General Mills Inc. |
| 5,467 |
| 278 |
|
| Hershey Co. |
| 1,887 |
| 277 |
|
† | Church & Dwight Co. Inc. |
| 3,716 |
| 260 |
|
| Bunge Ltd. |
| 3,432 |
| 185 |
|
| Tyson Foods Inc. Class A |
| 2,085 |
| 173 |
|
| Altria Group Inc. |
| 3,758 |
| 168 |
|
| Ingredion Inc. |
| 1,165 |
| 92 |
|
|
|
|
|
| 11,533 |
|
Energy (2.4%) |
|
|
|
|
| |
* | Carrizo Oil & Gas Inc. |
| 565,000 |
| 4,158 |
|
* | Roan Resources Inc. |
| 1,113,600 |
| 1,670 |
|
* | Cheniere Energy Inc. |
| 4,925 |
| 303 |
|
† | Kinder Morgan Inc. |
| 14,938 |
| 299 |
|
| ONEOK Inc. |
| 4,204 |
| 294 |
|
| Exxon Mobil Corp. |
| 4,096 |
| 277 |
|
| Chevron Corp. |
| 2,352 |
| 273 |
|
|
|
|
|
| 7,274 |
|
Financials (6.5%) |
|
|
|
|
| |
| SunTrust Banks Inc. |
| 96,117 |
| 6,569 |
|
* | Entegra Financial Corp. |
| 120,000 |
| 3,612 |
|
| United Financial Bancorp Inc. |
| 42,136 |
| 595 |
|
† | AGNC Investment Corp. |
| 19,777 |
| 337 |
|
| TFS Financial Corp. |
| 16,722 |
| 322 |
|
*,† | Alleghany Corp. |
| 410 |
| 319 |
|
| Intercontinental Exchange Inc. |
| 3,372 |
| 318 |
|
† | Two Harbors Investment Corp. |
| 22,869 |
| 317 |
|
† | Starwood Property Trust Inc. |
| 12,877 |
| 317 |
|
| Globe Life Inc. |
| 3,252 |
| 317 |
|
† | MFA Financial Inc. |
| 41,206 |
| 313 |
|
| Brown & Brown Inc. |
| 8,231 |
| 310 |
|
| Marsh & McLennan Cos. Inc. |
| 2,985 |
| 309 |
|
| Hartford Financial Services Group Inc. |
| 5,386 |
| 307 |
|
| Arthur J Gallagher & Co. |
| 3,349 |
| 306 |
|
* | Berkshire Hathaway Inc. Class B |
| 1,436 |
| 305 |
|
† | White Mountains Insurance Group Ltd. |
| 285 |
| 305 |
|
| Allstate Corp. |
| 2,849 |
| 303 |
|
*,† | Markel Corp. |
| 258 |
| 302 |
|
| WR Berkley Corp. |
| 4,319 |
| 302 |
|
† | Chimera Investment Corp. |
| 14,807 |
| 300 |
|
| American Express Co. |
| 2,553 |
| 299 |
|
| Willis Towers Watson plc |
| 1,593 |
| 298 |
|
† | Annaly Capital Management Inc. |
| 32,905 |
| 296 |
|
| Aflac Inc. |
| 5,537 |
| 294 |
|
| Chubb Ltd. |
| 1,923 |
| 293 |
|
| Hanover Insurance Group Inc. |
| 2,223 |
| 293 |
|
| Loews Corp. |
| 5,281 |
| 259 |
|
| American Financial Group Inc. |
| 2,413 |
| 251 |
|
| Travelers Cos. Inc. |
| 1,723 |
| 226 |
|
| US Bancorp |
| 2,608 |
| 149 |
|
† | Aon plc |
| 732 |
| 141 |
|
| CME Group Inc. |
| 471 |
| 97 |
|
* | Arch Capital Group Ltd. |
| 1,205 |
| 50 |
|
|
|
|
|
| 19,331 |
|
Health Care (16.6%) |
|
|
|
|
| |
* | Celgene Corp. |
| 64,200 |
| 6,936 |
|
* | Spark Therapeutics Inc. |
| 56,000 |
| 6,114 |
|
* | WellCare Health Plans Inc. |
| 17,500 |
| 5,191 |
|
| Allergan plc |
| 28,000 |
| 4,931 |
|
* | Cambrex Corp. |
| 82,000 |
| 4,898 |
|
* | Ra Pharmaceuticals Inc. |
| 104,000 |
| 4,895 |
|
* | Genomic Health Inc. |
| 54,926 |
| 3,662 |
|
* | Pacific Biosciences of California Inc. |
| 600,000 |
| 2,904 |
|
* | Achillion Pharmaceuticals Inc. |
| 201,800 |
| 1,294 |
|
* | Avedro Inc. |
| 50,541 |
| 1,175 |
|
† | Zoetis Inc. |
| 2,538 |
| 325 |
|
| Thermo Fisher Scientific Inc. |
| 1,061 |
| 320 |
|
| Pfizer Inc. |
| 8,272 |
| 317 |
|
| Merck & Co. Inc. |
| 3,655 |
| 317 |
|
| Zimmer Biomet Holdings Inc. |
| 2,274 |
| 314 |
|
| Amgen Inc. |
| 1,468 |
| 313 |
|
| Stryker Corp. |
| 1,430 |
| 309 |
|
† | Medtronic plc |
| 2,836 |
| 309 |
|
| UnitedHealth Group Inc. |
| 1,204 |
| 304 |
|
† | Danaher Corp. |
| 2,201 |
| 303 |
|
| Becton Dickinson and Co. |
| 1,182 |
| 303 |
|
| Eli Lilly & Co. |
| 2,615 |
| 298 |
|
| Quest Diagnostics Inc. |
| 2,913 |
| 295 |
|
* | Boston Scientific Corp. |
| 6,938 |
| 289 |
|
| Abbott Laboratories |
| 3,450 |
| 288 |
|
| Johnson & Johnson |
| 2,130 |
| 281 |
|
| Universal Health Services Inc. Class B |
| 2,042 |
| 281 |
|
| Chemed Corp. |
| 706 |
| 278 |
|
* | Varian Medical Systems Inc. |
| 2,296 |
| 277 |
|
† | STERIS plc |
| 1,950 |
| 276 |
|
| Cerner Corp. |
| 4,072 |
| 273 |
|
† | Baxter International Inc. |
| 3,561 |
| 273 |
|
| Cooper Cos. Inc. |
| 922 |
| 268 |
|
* | Henry Schein Inc. |
| 4,195 |
| 263 |
|
* | QIAGEN NV |
| 8,477 |
| 253 |
|
|
|
|
|
| 49,327 |
|
Alternative Strategies Fund
|
|
|
|
| Market |
|
|
|
|
|
| Value· |
|
|
|
| Shares |
| ($000 | ) |
Industrials (13.8%) |
|
|
|
|
| |
* | WABCO Holdings Inc. |
| 45,000 |
| 6,058 |
|
* | Advanced Disposal Services Inc. |
| 165,000 |
| 5,409 |
|
* | Genesee & Wyoming Inc. Class A |
| 43,275 |
| 4,805 |
|
| WestJet Airlines Ltd. |
| 190,000 |
| 4,419 |
|
* | Wesco Aircraft Holdings Inc. |
| 381,366 |
| 4,203 |
|
| Cobham plc |
| 1,800,000 |
| 3,682 |
|
| OSRAM Licht AG |
| 74,000 |
| 3,313 |
|
| Illinois Tool Works Inc. |
| 2,076 |
| 350 |
|
| Kansas City Southern |
| 2,431 |
| 342 |
|
| Raytheon Co. |
| 1,587 |
| 337 |
|
| AMERCO |
| 811 |
| 328 |
|
*,† | IHS Markit Ltd. |
| 4,680 |
| 328 |
|
† | Toro Co. |
| 4,222 |
| 326 |
|
| Johnson Controls International plc |
| 7,447 |
| 323 |
|
| Watsco Inc. |
| 1,798 |
| 317 |
|
| Allegion plc |
| 2,720 |
| 316 |
|
| AMETEK Inc. |
| 3,442 |
| 315 |
|
| Eaton Corp. plc |
| 3,621 |
| 315 |
|
† | Honeywell International Inc. |
| 1,805 |
| 312 |
|
| United Technologies Corp. |
| 2,148 |
| 308 |
|
| Lockheed Martin Corp. |
| 812 |
| 306 |
|
| Norfolk Southern Corp. |
| 1,677 |
| 305 |
|
* | HD Supply Holdings Inc. |
| 7,692 |
| 304 |
|
| Ingersoll-Rand plc |
| 2,378 |
| 302 |
|
| General Dynamics Corp. |
| 1,649 |
| 291 |
|
| Republic Services Inc. Class A |
| 3,330 |
| 291 |
|
† | Expeditors International of Washington Inc. |
| 3,924 |
| 286 |
|
| Waste Management Inc. |
| 2,525 |
| 283 |
|
| Lennox International Inc. |
| 1,129 |
| 279 |
|
† | Roper Technologies Inc. |
| 822 |
| 277 |
|
| Verisk Analytics Inc. Class A |
| 1,861 |
| 269 |
|
† | CH Robinson Worldwide Inc. |
| 3,554 |
| 269 |
|
| IDEX Corp. |
| 1,727 |
| 269 |
|
| Fortive Corp. |
| 3,622 |
| 250 |
|
| Rollins Inc. |
| 6,506 |
| 248 |
|
| Pentair plc |
| 5,831 |
| 242 |
|
| 3M Co. |
| 1,412 |
| 233 |
|
| CSX Corp. |
| 2,158 |
| 152 |
|
| Hexcel Corp. |
| 1,611 |
| 120 |
|
| PACCAR Inc. |
| 1,031 |
| 78 |
|
|
|
|
|
| 41,160 |
|
Information Technology (7.7%) |
|
|
|
|
| |
* | Acacia Communications Inc. |
| 69,774 |
| 4,581 |
|
* | Pivotal Software Inc. Class A |
| 288,785 |
| 4,323 |
|
* | Mellanox Technologies Ltd. |
| 32,000 |
| 3,606 |
|
1 | Sophos Group plc |
| 200,000 |
| 1,471 |
|
| Citrix Systems Inc. |
| 3,163 |
| 344 |
|
| Apple Inc. |
| 1,381 |
| 344 |
|
† | Western Union Co. |
| 13,583 |
| 340 |
|
| CDW Corp. |
| 2,535 |
| 324 |
|
† | Microsoft Corp. |
| 2,249 |
| 322 |
|
† | Amphenol Corp. Class A |
| 3,193 |
| 320 |
|
| Leidos Holdings Inc. |
| 3,668 |
| 316 |
|
| Amdocs Ltd. |
| 4,839 |
| 315 |
|
* | Tyler Technologies Inc. |
| 1,159 |
| 311 |
|
| Visa Inc. Class A |
| 1,738 |
| 311 |
|
* | Black Knight Inc. |
| 4,790 |
| 308 |
|
† | Broadridge Financial Solutions Inc. |
| 2,401 |
| 301 |
|
| Mastercard Inc. Class A |
| 1,085 |
| 300 |
|
| Cisco Systems Inc. |
| 6,282 |
| 298 |
|
† | Booz Allen Hamilton Holding Corp. Class A |
| 4,221 |
| 297 |
|
* | Fiserv Inc. |
| 2,795 |
| 297 |
|
† | Jack Henry & Associates Inc. |
| 2,081 |
| 295 |
|
| Dolby Laboratories Inc. Class A |
| 4,527 |
| 291 |
|
* | Synopsys Inc. |
| 2,142 |
| 291 |
|
† | Fidelity National Information Services Inc. |
| 2,206 |
| 291 |
|
| Paychex Inc. |
| 3,429 |
| 287 |
|
† | Motorola Solutions Inc. |
| 1,723 |
| 287 |
|
† | Accenture plc Class A |
| 1,530 |
| 284 |
|
| Automatic Data Processing Inc. |
| 1,743 |
| 283 |
|
† | Genpact Ltd. |
| 7,201 |
| 282 |
|
| Oracle Corp. |
| 5,147 |
| 280 |
|
* | CACI International Inc. Class A |
| 1,147 |
| 257 |
|
| International Business Machines Corp. |
| 1,815 |
| 243 |
|
* | Gartner Inc. |
| 1,042 |
| 161 |
|
| Presidio Inc. |
| 6,000 |
| 100 |
|
| Juniper Networks Inc. |
| 3,878 |
| 96 |
|
|
|
|
|
| 22,757 |
|
Materials (2.9%) |
|
|
|
|
| |
* | OMNOVA Solutions Inc. |
| 355,626 |
| 3,595 |
|
| Reliance Steel & Aluminum Co. |
| 3,203 |
| 372 |
|
| RPM International Inc. |
| 4,733 |
| 343 |
|
Alternative Strategies Fund
|
|
|
|
| Market |
|
|
|
|
|
| Value· |
|
|
|
| Shares |
| ($000 | ) |
† | Sherwin-Williams Co. |
| 581 |
| 333 |
|
| PPG Industries Inc. |
| 2,633 |
| 329 |
|
| Avery Dennison Corp. |
| 2,548 |
| 326 |
|
† | Silgan Holdings Inc. |
| 10,280 |
| 316 |
|
*,† | Axalta Coating Systems Ltd. |
| 10,618 |
| 313 |
|
† | Linde plc |
| 1,574 |
| 312 |
|
| NewMarket Corp. |
| 636 |
| 309 |
|
| Sonoco Products Co. |
| 5,177 |
| 299 |
|
| Air Products & Chemicals Inc. |
| 1,396 |
| 298 |
|
| Ecolab Inc. |
| 1,527 |
| 293 |
|
| WR Grace & Co. |
| 4,340 |
| 288 |
|
| AptarGroup Inc. |
| 2,401 |
| 284 |
|
| Ashland Global Holdings Inc. |
| 3,631 |
| 281 |
|
| Ball Corp. |
| 3,809 |
| 266 |
|
|
|
|
|
| 8,557 |
|
Real Estate (4.6%) |
|
|
|
|
| |
| Dream Global REIT |
| 313,500 |
| 3,970 |
|
| Aveo Group |
| 2,000,000 |
| 2,952 |
|
| Mid-America Apartment Communities Inc. |
| 2,528 |
| 351 |
|
| Sun Communities Inc. |
| 2,118 |
| 345 |
|
| Invitation Homes Inc. |
| 10,813 |
| 333 |
|
| Equity LifeStyle Properties Inc. |
| 4,756 |
| 333 |
|
| UDR Inc. |
| 6,586 |
| 331 |
|
| Realty Income Corp. |
| 4,036 |
| 330 |
|
| Camden Property Trust |
| 2,838 |
| 325 |
|
| Duke Realty Corp. |
| 9,224 |
| 324 |
|
| Gaming and Leisure Properties Inc. |
| 7,890 |
| 319 |
|
† | Equity Residential |
| 3,578 |
| 317 |
|
| Essex Property Trust Inc. |
| 964 |
| 315 |
|
| WP Carey Inc. |
| 3,409 |
| 314 |
|
† | Douglas Emmett Inc. |
| 7,208 |
| 312 |
|
† | Apple Hospitality REIT Inc. |
| 18,732 |
| 309 |
|
| AvalonBay Communities Inc. |
| 1,407 |
| 306 |
|
† | American Homes 4 Rent Class A |
| 11,535 |
| 305 |
|
| Life Storage Inc. |
| 2,795 |
| 304 |
|
† | Equity Commonwealth |
| 8,754 |
| 282 |
|
| Public Storage |
| 1,229 |
| 274 |
|
| CubeSmart |
| 8,111 |
| 257 |
|
| Welltower Inc. |
| 2,066 |
| 187 |
|
| Simon Property Group Inc. |
| 657 |
| 99 |
|
| Kilroy Realty Corp. |
| 1,130 |
| 95 |
|
| American Tower Corp. |
| 407 |
| 89 |
|
| Highwoods Properties Inc. |
| 669 |
| 31 |
|
|
|
|
|
| 13,709 |
|
Utilities (3.7%) |
|
|
|
|
| |
| El Paso Electric Co. |
| 73,581 |
| 4,909 |
|
| Dominion Energy Inc. |
| 3,997 |
| 330 |
|
| American Electric Power Co. Inc. |
| 3,394 |
| 320 |
|
| Eversource Energy |
| 3,825 |
| 320 |
|
| Atmos Energy Corp. |
| 2,801 |
| 315 |
|
| CMS Energy Corp. |
| 4,893 |
| 313 |
|
| Southern Co. |
| 4,956 |
| 310 |
|
| NextEra Energy Inc. |
| 1,298 |
| 309 |
|
| Duke Energy Corp. |
| 3,274 |
| 309 |
|
| Alliant Energy Corp. |
| 5,767 |
| 308 |
|
| Entergy Corp. |
| 2,509 |
| 305 |
|
| Hawaiian Electric Industries Inc. |
| 6,713 |
| 303 |
|
| Consolidated Edison Inc. |
| 3,261 |
| 301 |
|
| American Water Works Co. Inc. |
| 2,436 |
| 300 |
|
| OGE Energy Corp. |
| 6,964 |
| 300 |
|
| Xcel Energy Inc. |
| 4,644 |
| 295 |
|
| Pinnacle West Capital Corp. |
| 3,094 |
| 291 |
|
| CenterPoint Energy Inc. |
| 9,914 |
| 288 |
|
| Exelon Corp. |
| 6,037 |
| 275 |
|
| Ameren Corp. |
| 3,500 |
| 272 |
|
| DTE Energy Co. |
| 1,962 |
| 250 |
|
| Avangrid Inc. |
| 2,317 |
| 116 |
|
| FirstEnergy Corp. |
| 931 |
| 45 |
|
|
|
|
|
| 11,084 |
|
Total Common Stocks—Long Positions |
|
|
|
|
| |
(Cost $208,859) |
|
|
| 226,539 |
| |
Common Stocks Sold Short (-21.6%) |
|
|
|
|
| |
Communication Services (-1.1%) |
|
|
|
|
| |
| New Media Investment Group Inc. |
| (135,675 | ) | (1,195 | ) |
* | Netflix Inc. |
| (1,126 | ) | (324 | ) |
* | United States Cellular Corp. |
| (8,018 | ) | (298 | ) |
* | Take-Two Interactive Software Inc. |
| (2,414 | ) | (291 | ) |
* | Electronic Arts Inc. |
| (2,919 | ) | (281 | ) |
| Sinclair Broadcast Group Inc. Class A |
| (6,598 | ) | (263 | ) |
* | Lions Gate Entertainment Corp. Class B |
| (34,477 | ) | (258 | ) |
* | Twitter Inc. |
| (7,373 | ) | (221 | ) |
* | Zillow Group Inc. Class A |
| (2,434 | ) | (79 | ) |
|
|
|
|
| (3,210 | ) |
Consumer Discretionary (-2.1%) |
|
|
|
|
| |
* | Eldorado Resorts Inc. |
| (34,072 | ) | (1,525 | ) |
* | Roku Inc. |
| (2,591 | ) | (381 | ) |
* | Ollie’s Bargain Outlet Holdings Inc. |
| (5,139 | ) | (328 | ) |
| Newell Brands Inc. |
| (17,292 | ) | (328 | ) |
| Thor Industries Inc. |
| (5,163 | ) | (327 | ) |
Alternative Strategies Fund
|
|
|
|
| Market |
|
|
|
|
|
| Value· |
|
|
|
| Shares |
| ($000 | ) |
* | Under Armour Inc. Class A |
| (15,802 | ) | (326 | ) |
| Wynn Resorts Ltd. |
| (2,670 | ) | (324 | ) |
* | Skechers U.S.A. Inc. Class A |
| (8,281 | ) | (309 | ) |
* | Hilton Grand Vacations Inc. |
| (8,708 | ) | (302 | ) |
* | frontdoor Inc. |
| (6,151 | ) | (297 | ) |
| International Game Technology plc |
| (21,146 | ) | (280 | ) |
| L Brands Inc. |
| (16,414 | ) | (280 | ) |
* | Qurate Retail Group Inc. QVC Group Class A |
| (29,212 | ) | (279 | ) |
* | Floor & Decor Holdings Inc. Class A |
| (5,982 | ) | (274 | ) |
* | Etsy Inc. |
| (5,571 | ) | (248 | ) |
* | Wayfair Inc. |
| (2,609 | ) | (215 | ) |
* | GrubHub Inc. |
| (5,361 | ) | (183 | ) |
| Macy’s Inc. |
| (8,154 | ) | (124 | ) |
|
|
|
|
| (6,330 | ) |
Consumer Staples (-0.7%) |
|
|
|
|
| |
| Coty Inc. Class A |
| (30,794 | ) | (360 | ) |
| Kraft Heinz Co. |
| (10,787 | ) | (349 | ) |
* | Hain Celestial Group Inc. |
| (14,217 | ) | (336 | ) |
| Nu Skin Enterprises Inc. Class A |
| (7,361 | ) | (328 | ) |
| Spectrum Brands Holdings Inc. |
| (5,504 | ) | (276 | ) |
| Conagra Brands Inc. |
| (10,033 | ) | (272 | ) |
|
|
|
|
| (1,921 | ) |
Energy (-2.6%) |
|
|
|
|
| |
* | Callon Petroleum Co. |
| (1,158,250 | ) | (4,401 | ) |
| PBF Energy Inc. Class A |
| (11,401 | ) | (368 | ) |
* | Transocean Ltd. |
| (67,411 | ) | (320 | ) |
| EQT Corp. |
| (28,320 | ) | (304 | ) |
| Hess Corp. |
| (4,558 | ) | (300 | ) |
| Concho Resources Inc. |
| (4,438 | ) | (300 | ) |
| Patterson-UTI Energy Inc. |
| (35,243 | ) | (293 | ) |
* | Continental Resources Inc. |
| (9,786 | ) | (288 | ) |
| Kosmos Energy Ltd. |
| (45,321 | ) | (281 | ) |
| Parsley Energy Inc. Class A |
| (16,259 | ) | (257 | ) |
* | Antero Resources Corp. |
| (99,777 | ) | (250 | ) |
| Noble Energy Inc. |
| (12,794 | ) | (246 | ) |
* | Centennial Resource Development Inc. Class A |
| (61,013 | ) | (208 | ) |
|
|
|
|
| (7,816 | ) |
Financials (-3.2%) |
|
|
|
|
| |
| BB&T Corp. |
| (124,471 | ) | (6,603 | ) |
| People’s United Financial Inc. |
| (36,869 | ) | (596 | ) |
* | LendingTree Inc. |
| (912 | ) | (328 | ) |
| Bank OZK |
| (11,399 | ) | (320 | ) |
| OneMain Holdings Inc. |
| (7,745 | ) | (310 | ) |
| Navient Corp. |
| (21,718 | ) | (299 | ) |
* | SVB Financial Group |
| (1,316 | ) | (291 | ) |
| LPL Financial Holdings Inc. |
| (3,532 | ) | (286 | ) |
* | Brighthouse Financial Inc. |
| (7,491 | ) | (283 | ) |
| Unum Group |
| (7,758 | ) | (214 | ) |
|
|
|
|
| (9,530 | ) |
Health Care (-6.3%) |
|
|
|
|
| |
| Bristol-Myers Squibb Co. |
| (64,200 | ) | (3,683 | ) |
* | Centene Corp. |
| (59,150 | ) | (3,140 | ) |
* | Exact Sciences Corp. |
| (28,074 | ) | (2,442 | ) |
| AbbVie Inc. |
| (24,248 | ) | (1,929 | ) |
* | Glaukos Corp. |
| (18,447 | ) | (1,178 | ) |
* | Seattle Genetics Inc. |
| (3,647 | ) | (392 | ) |
* | ABIOMED Inc. |
| (1,694 | ) | (352 | ) |
* | Penumbra Inc. |
| (2,240 | ) | (349 | ) |
* | Alnylam Pharmaceuticals Inc. |
| (3,948 | ) | (343 | ) |
* | Sarepta Therapeutics Inc. |
| (4,001 | ) | (332 | ) |
* | Guardant Health Inc. |
| (4,721 | ) | (328 | ) |
* | Align Technology Inc. |
| (1,256 | ) | (317 | ) |
* | DexCom Inc. |
| (2,019 | ) | (311 | ) |
* | Neurocrine Biosciences Inc. |
| (3,062 | ) | (305 | ) |
* | Mylan NV |
| (15,218 | ) | (291 | ) |
* | Sage Therapeutics Inc. |
| (2,148 | ) | (291 | ) |
* | Nektar Therapeutics Class A |
| (16,738 | ) | (287 | ) |
* | Molina Healthcare Inc. |
| (2,430 | ) | (286 | ) |
* | Ionis Pharmaceuticals Inc. |
| (5,030 | ) | (280 | ) |
* | Agios Pharmaceuticals Inc. |
| (9,300 | ) | (280 | ) |
* | Insulet Corp. |
| (1,915 | ) | (278 | ) |
* | Veeva Systems Inc. Class A |
| (1,881 | ) | (267 | ) |
* | Bluebird Bio Inc. |
| (3,282 | ) | (266 | ) |
* | Exelixis Inc. |
| (17,038 | ) | (263 | ) |
* | Alkermes plc |
| (13,458 | ) | (263 | ) |
* | Covetrus Inc. |
| (25,343 | ) | (251 | ) |
* | Horizon Therapeutics plc |
| (1,757 | ) | (51 | ) |
|
|
|
|
| (18,755 | ) |
Industrials (-1.0%) |
|
|
|
|
| |
| General Electric Co. |
| (35,646 | ) | (356 | ) |
| American Airlines Group Inc. |
| (11,173 | ) | (336 | ) |
* | XPO Logistics Inc. |
| (4,336 | ) | (331 | ) |
* | Gardner Denver Holdings Inc. |
| (10,254 | ) | (327 | ) |
* | United Rentals Inc. |
| (2,383 | ) | (318 | ) |
* | Gates Industrial Corp. plc |
| (31,083 | ) | (311 | ) |
* | Lyft Inc. Class A |
| (7,378 | ) | (306 | ) |
| GrafTech International Ltd. |
| (23,541 | ) | (284 | ) |
| Fluor Corp. |
| (15,273 | ) | (246 | ) |
* | Resideo Technologies Inc. |
| (21,341 | ) | (203 | ) |
|
|
|
|
| (3,018 | ) |
Alternative Strategies Fund
|
|
|
|
| Market |
|
|
|
|
|
| Value· |
|
|
|
| Shares |
| ($000 | ) |
Information Technology (-3.9%) |
|
|
|
|
| |
| Universal Display Corp. |
| (1,795) |
| (359) |
|
* | Pure Storage Inc. Class A |
| (18,278) |
| (356) |
|
| NVIDIA Corp. |
| (1,767) |
| (355) |
|
* | Nutanix Inc. |
| (11,920) |
| (348) |
|
* | ON Semiconductor Corp. |
| (16,522) |
| (337) |
|
* | Okta Inc. |
| (3,060) |
| (334) |
|
* | Advanced Micro Devices Inc. |
| (9,809) |
| (333) |
|
* | Micron Technology Inc. |
| (6,965) |
| (331) |
|
* | Pluralsight Inc. Class A |
| (18,266) |
| (330) |
|
* | Smartsheet Inc. Class A |
| (8,363) |
| (330) |
|
* | New Relic Inc. |
| (5,129) |
| (329) |
|
| Teradyne Inc. |
| (5,364) |
| (328) |
|
* | DocuSign Inc. Class A |
| (4,887) |
| (323) |
|
* | Trade Desk Inc. Class A |
| (1,607) |
| (323) |
|
| QUALCOMM Inc. |
| (3,992) |
| (321) |
|
* | MongoDB Inc. |
| (2,501) |
| (320) |
|
* | Avalara Inc. |
| (4,478) |
| (318) |
|
* | Coherent Inc. |
| (2,125) |
| (316) |
|
* | SolarWinds Corp. |
| (16,565) |
| (314) |
|
| Cognex Corp. |
| (6,039) |
| (311) |
|
* | 2U Inc. |
| (17,096) |
| (306) |
|
* | Anaplan Inc. |
| (6,411) |
| (303) |
|
| Symantec Corp. |
| (13,005) |
| (298) |
|
| MKS Instruments Inc. |
| (2,716) |
| (294) |
|
* | Square Inc. |
| (4,756) |
| (292) |
|
| Xilinx Inc. |
| (3,142) |
| (285) |
|
| DXC Technology Co. |
| (10,214) |
| (283) |
|
* | CommScope Holding Co. Inc. |
| (25,132) |
| (281) |
|
* | Zscaler Inc. |
| (6,376) |
| (280) |
|
* | Splunk Inc. |
| (2,333) |
| (280) |
|
* | IPG Photonics Corp. |
| (2,049) |
| (275) |
|
* | Arista Networks Inc. |
| (1,116) |
| (273) |
|
| Switch Inc. |
| (17,932) |
| (265) |
|
* | Twilio Inc. Class A |
| (2,740) |
| (265) |
|
* | Elastic NV |
| (3,659) |
| (263) |
|
| Western Digital Corp. |
| (5,093) |
| (263) |
|
* | Alteryx Inc. Class A |
| (2,805) |
| (257) |
|
* | Atlassian Corp. plc Class A |
| (2,120) |
| (256) |
|
|
|
|
|
| (11,635) |
|
Materials (-0.3%) |
|
|
|
|
| |
| Chemours Co. |
| (20,754) |
| (340) |
|
| United States Steel Corp. |
| (26,089) |
| (300) |
|
| Huntsman Corp. |
| (12,998) |
| (288) |
|
|
|
|
|
| (928) |
|
Real Estate (-0.3%) |
|
|
|
|
| |
| Colony Capital Inc. |
| (50,054) |
| (280) |
|
* | Howard Hughes Corp. |
| (2,180) |
| (244) |
|
| CyrusOne Inc. |
| (2,485) |
| (177) |
|
|
|
|
|
| (701) |
|
Utilities (-0.1%) |
|
|
|
|
| |
| Edison International |
| (4,298) |
| (270) |
|
Total Common Stocks Sold Short |
|
|
|
|
| |
(Proceeds $68,003) |
|
|
| (64,114 | ) | |
Temporary Cash Investments (19.3%) |
|
|
|
|
| |
Money Market Fund (4.6%) |
|
|
|
|
| |
2 | Vanguard Market Liquidity Fund, 1.984% |
| 135,013 |
| 13,503 |
|
|
|
|
|
|
|
|
|
|
| Face |
|
|
|
|
|
| Amount |
|
|
|
|
|
| ($000 | ) |
|
|
U.S. Government and Agency Obligations (14.7%) |
|
|
|
|
| |
3 | United States Treasury Bill, 1.981%, 11/7/19 |
| 3,000 |
| 2,999 |
|
4 | United States Treasury Bill, 2.009%, 11/12/19 |
| 7,400 |
| 7,396 |
|
3 | United States Treasury Bill, 2.050%, 11/21/19 |
| 3,000 |
| 2,997 |
|
3 | United States Treasury Bill, 2.045%, 11/21/19 |
| 6,500 |
| 6,494 |
|
4 | United States Treasury Bill, 2.045%, 11/21/19 |
| 4,000 |
| 3,997 |
|
3,4 | United States Treasury Bill, 1.961%, 11/29/19 |
| 13,000 |
| 12,985 |
|
3,4 | United States Treasury Bill, 2.049%, 12/26/19 |
| 5,300 |
| 5,288 |
|
3 | United States Treasury Bill, 1.872%, 2/20/20 |
| 1,700 |
| 1,692 |
|
|
|
|
|
| 43,848 |
|
Total Temporary Cash Investments |
|
|
|
|
| |
(Cost $57,335) |
|
|
| 57,351 |
| |
†,3,5 Other Assets and Liabilities–Net (26.1%) |
|
|
| 77,630 |
| |
Net Assets (100%) |
|
|
|
|
| |
Applicable to 13,378,601 outstanding $.001 par value shares of beneficial interest (unlimited authorization) |
| 297,406 |
| |||
Net Asset Value Per Share |
|
|
| $22.23 |
| |
Alternative Strategies Fund
| Amount |
|
| ($000 | ) |
Consolidated Statement of Assets and Liabilities |
|
|
Assets |
|
|
Investments in Securities, Long Positions, at Value |
|
|
Unaffiliated Issuers | 270,387 |
|
Affiliated Issuers | 13,503 |
|
Total Long Positions | 283,890 |
|
Investment in Vanguard | 14 |
|
†Cash Segregated for Short Positions | 71,099 |
|
Receivables for Investment Securities Sold | 9 |
|
Receivables for Accrued Income | 173 |
|
Variation Margin Receivable—Futures Contracts | 2,876 |
|
Unrealized Appreciation—Forward Currency Contracts | 1,767 |
|
3,5Other Assets | 6,808 |
|
Total Assets | 366,636 |
|
Liabilities |
|
|
Securities Sold Short, at Value | 64,114 |
|
Payables for Investment Securities Purchased | 65 |
|
Payables to Vanguard | 95 |
|
Variation Margin Payable—Futures Contracts | 2,130 |
|
Unrealized Depreciation—Forward Currency Contracts | 2,711 |
|
Accrued Dividend Expense on Securities Sold Short | 115 |
|
Total Liabilities | 69,230 |
|
Net Assets | 297,406 |
|
At October 31, 2019, net assets consisted of:
| Amount |
|
| ($000 | ) |
Paid-in Capital | 259,071 |
|
Total Distributable Earnings (Loss) | 38,335 |
|
Net Assets | 297,406 |
|
· See Note A in Notes to Consolidated Financial Statements.
* Non-income-producing security.
† Long security positions with a value of $15,745,000 and cash of $71,099,000 are held in a segregated account at the fund’s custodian bank and pledged to a broker-dealer as collateral for the fund’s obligation to return borrowed securities. For so long as such obligations continue, the fund’s access to these assets is subject to authorization from the broker-dealer.
1 Security exempt from registration under Rule 144A of the Securities Act of 1933. Such securities may be sold in transactions exempt from registration, normally to qualified institutional buyers. At October 31, 2019, the aggregate value of these securities was $6,651,000, representing 2.2% of net assets.
2 Affiliated money market fund available only to Vanguard funds and certain trusts and accounts managed by Vanguard. Rate shown is the 7-day yield.
3 Securities with a value of $19,819,000 and cash of $75,000 have been segregated as initial margin for open futures contracts.
4 Security is owned by the Vanguard ASF Portfolio, which is a wholly owned subsidiary of the Alternative Strategies Fund.
5 Cash of $580,000 has been segregated as collateral for open forward currency contracts.
REIT—Real Estate Investment Trust.
Alternative Strategies Fund
Derivative Financial Instruments Outstanding as of Period End
Futures Contracts |
|
|
|
|
|
|
|
|
|
|
|
|
|
|
|
|
|
|
|
|
|
|
|
|
|
|
| ($000 | ) |
|
|
|
|
|
|
|
|
|
|
|
|
|
|
|
|
|
|
|
|
|
|
|
|
|
|
|
| Value and |
|
|
|
|
| Number of |
|
|
| Unrealized |
|
|
|
|
| Long (Short | ) | Notional |
| Appreciation |
|
|
| Expiration |
| Contracts |
| Amount |
| (Depreciation | ) |
Long Futures Contracts |
|
|
|
|
|
|
|
|
|
2-Year U.S. Treasury Note |
| January 2020 |
| 794 |
| 171,188 |
| (330 | ) |
5-Year U.S. Treasury Note |
| January 2020 |
| 338 |
| 40,291 |
| (201 | ) |
10-Year U.S. Treasury Note |
| December 2019 |
| 199 |
| 25,929 |
| (227 | ) |
Hang Seng Index |
| November 2019 |
| 97 |
| 16,702 |
| 118 |
|
IBEX 35 Index |
| November 2019 |
| 160 |
| 16,556 |
| 203 |
|
MSCI Taiwan Index |
| November 2019 |
| 385 |
| 16,501 |
| 119 |
|
OMX Stockholm 30 Index |
| November 2019 |
| 916 |
| 16,438 |
| 856 |
|
FTSE 100 Index |
| December 2019 |
| 175 |
| 16,426 |
| (193 | ) |
Amsterdam Exchange Index |
| November 2019 |
| 128 |
| 16,423 |
| 99 |
|
Wheat1 |
| December 2019 |
| 318 |
| 8,089 |
| 535 |
|
LME Aluminum1 |
| December 2019 |
| 183 |
| 8,079 |
| 176 |
|
LME Nickel1 |
| December 2019 |
| 80 |
| 8,011 |
| (114 | ) |
LME Zinc1 |
| December 2019 |
| 127 |
| 7,960 |
| 207 |
|
LME Tin1 |
| December 2019 |
| 96 |
| 7,934 |
| (87 | ) |
Copper1 |
| December 2019 |
| 120 |
| 7,914 |
| 119 |
|
NY Harbor ULSD1 |
| December 2019 |
| 99 |
| 7,800 |
| (137 | ) |
RBOB Gasoline1 |
| December 2019 |
| 116 |
| 7,769 |
| 92 |
|
|
|
|
|
|
|
|
| 1,235 |
|
|
|
|
|
|
|
|
|
|
|
Short Futures Contracts |
|
|
|
|
|
|
|
|
|
Topix Index |
| December 2019 |
| (108 | ) | (16,687 | ) | (709 | ) |
KOSPI 200 Index |
| December 2019 |
| (279 | ) | (16,576 | ) | (621) |
|
MSCI Singapore Index |
| November 2019 |
| (608 | ) | (16,563 | ) | (280 | ) |
E-mini S&P 500 Index |
| December 2019 |
| (109 | ) | (16,545 | ) | (148 | ) |
DAX 30 Index |
| December 2019 |
| (46 | ) | (16,537 | ) | (649 | ) |
S&P ASX 200 Index |
| December 2019 |
| (144 | ) | (16,476 | ) | 142 |
|
Coffee1 |
| December 2019 |
| (217 | ) | (8,296 | ) | (293 | ) |
Sugar #111 |
| February 2020 |
| (585 | ) | (8,177 | ) | (388 | ) |
Soybean Meal1 |
| December 2019 |
| (267 | ) | (8,127 | ) | (83 | ) |
Live Cattle1 |
| January 2020 |
| (173 | ) | (8,112 | ) | (853 | ) |
Cotton No.21 |
| December 2019 |
| (249 | ) | (8,023 | ) | (144 | ) |
WTI Crude Oil1 |
| December 2019 |
| (145 | ) | (7,856 | ) | (90 | ) |
Natural Gas1 |
| December 2019 |
| (303 | ) | (7,978 | ) | (371 | ) |
LME Lead1 |
| December 2019 |
| (144 | ) | (7,773 | ) | (98 | ) |
|
|
|
|
|
|
|
| (4,585 | ) |
|
|
|
|
|
|
|
| (3,350 | ) |
1 Security is owned by the subsidiary.
Alternative Strategies Fund
Forward Currency Contracts | |||||||||||
|
|
|
|
|
|
|
| ||||
| Contract |
|
|
|
|
|
|
| Unrealized |
| Unrealized |
| Settlement |
| Contract Amount (000) |
| Appreciation |
| (Depreciation) | ||||
Counterparty | Date |
|
| Receive |
|
| Deliver |
| ($000 | ) | ($000) |
State Street Bank & Trust Co. | 11/8/19 |
| CAD | 57,309 |
| USD | 43,164 |
| 348 |
| — |
Bank of America, N.A. | 11/8/19 |
| NOK | 390,115 |
| USD | 42,749 |
| — |
| (326) |
Bank of America, N.A. | 11/8/19 |
| AUD | 63,429 |
| USD | 42,508 |
| 1,227 |
| — |
Bank of America, N.A. | 11/8/19 |
| EUR | 4,175 |
| USD | 4,639 |
| 20 |
| — |
Standard Chartered Bank | 11/8/19 |
| CHF | 3,894 |
| USD | 3,921 |
| 29 |
| — |
Standard Chartered Bank | 11/8/19 |
| JPY | 375,502 |
| USD | 3,449 |
| 29 |
| — |
BNP Paribas | 11/8/19 |
| AUD | 3,046 |
| USD | 2,041 |
| 59 |
| — |
BNP Paribas | 11/8/19 |
| NOK | 17,241 |
| USD | 1,889 |
| — |
| (14) |
Bank of America, N.A. | 11/8/19 |
| CAD | 2,050 |
| USD | 1,546 |
| 11 |
| — |
State Street Bank & Trust Co. | 11/8/19 |
| CAD | 1,098 |
| USD | 830 |
| 4 |
| — |
Bank of America, N.A. | 11/8/19 |
| EUR | 113 |
| USD | 125 |
| 1 |
| — |
State Street Bank & Trust Co. | 11/8/19 |
| EUR | 50 |
| USD | 55 |
| 1 |
| — |
Bank of America, N.A. | 11/8/19 |
| USD | 43,000 |
| EUR | 39,364 |
| — |
| (927) |
State Street Bank & Trust Co. | 11/8/19 |
| USD | 42,969 |
| CHF | 42,903 |
| — |
| (548) |
BNP Paribas | 11/8/19 |
| USD | 42,951 |
| JPY | 4,643,379 |
| — |
| (67) |
Bank of America, N.A. | 11/8/19 |
| USD | 10,773 |
| CAD | 14,301 |
| — |
| (84) |
State Street Bank & Trust Co. | 11/8/19 |
| USD | 9,156 |
| EUR | 8,380 |
| — |
| (195) |
State Street Bank & Trust Co. | 11/8/19 |
| USD | 6,318 |
| AUD | 9,404 |
| — |
| (167) |
State Street Bank & Trust Co. | 11/8/19 |
| USD | 4,618 |
| GBP | 3,763 |
| — |
| (256) |
Bank of America, N.A. | 11/8/19 |
| USD | 4,545 |
| AUD | 6,627 |
| — |
| (24) |
Bank of America, N.A. | 11/8/19 |
| USD | 4,309 |
| CAD | 5,644 |
| 24 |
| — |
Bank of America, N.A. | 11/8/19 |
| USD | 3,059 |
| NOK | 28,234 |
| — |
| (11) |
BNP Paribas | 11/8/19 |
| USD | 1,923 |
| EUR | 1,760 |
| — |
| (41) |
State Street Bank & Trust Co. | 11/8/19 |
| USD | 1,869 |
| JPY | 202,017 |
| — |
| (3) |
BNP Paribas | 11/8/19 |
| USD | 1,807 |
| CHF | 1,803 |
| — |
| (22) |
Bank of America, N.A. | 11/8/19 |
| USD | 1,079 |
| CAD | 1,412 |
| 7 |
| — |
State Street Bank & Trust Co. | 11/8/19 |
| USD | 748 |
| CAD | 980 |
| 4 |
| — |
State Street Bank & Trust Co. | 11/8/19 |
| USD | 649 |
| CAD | 863 |
| — |
| (6) |
Bank of America, N.A. | 11/8/19 |
| USD | 434 |
| AUD | 637 |
| — |
| (6) |
BNP Paribas | 11/8/19 |
| USD | 351 |
| CAD | 459 |
| 3 |
| — |
Bank of America, N.A. | 11/8/19 |
| USD | 196 |
| GBP | 160 |
| — |
| (12) |
BNP Paribas | 11/8/19 |
| USD | 188 |
| GBP | 147 |
| — |
| (2) |
Bank of America, N.A. | 11/8/19 |
| USD | 117 |
| EUR | 105 |
| — |
| — |
Bank of America, N.A. | 11/8/19 |
| USD | 101 |
| EUR | 91 |
| — |
| — |
|
|
|
|
|
|
|
|
| 1,767 |
| (2,711) |
AUD—Australian dollar.
CAD—Canadian dollar.
CHF—Swiss franc.
EUR—euro.
GBP—British pound.
JPY—Japanese yen.
NOK—Norwegian krone.
USD—U.S. dollar.
See accompanying Notes, which are an integral part of the Financial Statements.
Alternative Strategies Fund
Consolidated Statement of Operations
|
| Year Ended |
|
|
| October 31, 2019 |
|
|
| ($000 | ) |
Investment Income |
|
|
|
Income |
|
|
|
Dividends1 |
| 4,351 |
|
Interest2 |
| 1,732 |
|
Total Income |
| 6,083 |
|
Expenses |
|
|
|
The Vanguard Group—Note B |
|
|
|
Investment Advisory Services |
| 280 |
|
Management and Administrative |
| 651 |
|
Marketing and Distribution |
| 30 |
|
Custodian Fees |
| 187 |
|
Auditing Fees |
| 61 |
|
Shareholders’ Reports |
| 2 |
|
Trustees’ Fees and Expenses |
| 10 |
|
Dividend Expense on Securities Sold Short |
| 1,282 |
|
Total Expenses |
| 2,503 |
|
Expenses Paid Indirectly |
| (146 | ) |
Net Expenses |
| 2,357 |
|
Net Investment Income |
| 3,726 |
|
Realized Net Gain (Loss) |
|
|
|
Investment Securities Sold—Long Positions2 |
| 8,623 |
|
Investment Securities Sold Short |
| 2,081 |
|
Futures Contracts |
| 13,526 |
|
Forward Currency Contracts |
| (1,405 | ) |
Foreign Currencies |
| (63 | ) |
Realized Net Gain (Loss) |
| 22,762 |
|
Change in Unrealized Appreciation (Depreciation) |
|
|
|
Investment Securities—Long Positions2 |
| 12,734 |
|
Investment Securities Sold Short |
| (2,929 | ) |
Futures Contracts |
| (4,233 | ) |
Forward Currency Contracts |
| (1,269 | ) |
Foreign Currencies |
| 14 |
|
Change in Unrealized Appreciation (Depreciation) |
| 4,317 |
|
Net Increase (Decrease) in Net Assets Resulting from Operations |
| 30,805 |
|
1 Dividends are net of foreign withholding taxes of $62,000.
2 Interest income, realized net gain (loss), and change in unrealized appreciation (depreciation) from an affiliated company of the fund were $985,000, $4,000, and ($4,000), respectively. Purchases and sales are for temporary cash investment purposes.
See accompanying Notes, which are an integral part of the Financial Statements.
Alternative Strategies Fund
Consolidated Statement of Changes in Net Assets
|
| Year Ended October 31, |
| ||
|
| 2019 |
| 2018 |
|
|
| ($000) |
| ($000 | ) |
Increase (Decrease) in Net Assets |
|
|
|
|
|
Operations |
|
|
|
|
|
Net Investment Income |
| 3,726 |
| 3,156 |
|
Realized Net Gain (Loss) |
| 22,762 |
| (3,766 | ) |
Change in Unrealized Appreciation (Depreciation) |
| 4,317 |
| 1,841 |
|
Net Increase (Decrease) in Net Assets Resulting from Operations |
| 30,805 |
| 1,231 |
|
Distributions |
|
|
|
|
|
Net Investment Income |
| (3,935) |
| (1,498 | ) |
Realized Capital Gain |
| — |
| — |
|
Total Distributions |
| (3,935) |
| (1,498 | ) |
Capital Share Transactions |
|
|
|
|
|
Issued |
| 21,069 |
| 67,391 |
|
Issued in Lieu of Cash Distributions |
| 3,928 |
| 1,482 |
|
Redeemed |
| (74,370) |
| (40,944 | ) |
Net Increase (Decrease) from Capital Share Transactions |
| (49,373) |
| 27,929 |
|
Total Increase (Decrease) |
| (22,503) |
| 27,662 |
|
Net Assets |
|
|
|
|
|
Beginning of Period |
| 319,909 |
| 292,247 |
|
End of Period |
| 297,406 |
| 319,909 |
|
See accompanying Notes, which are an integral part of the Financial Statements.
Alternative Strategies Fund
Consolidated Financial Highlights
|
|
|
|
|
| Aug. 11, |
| |||||
|
|
|
|
|
| 20151 to |
| |||||
|
|
|
| Year Ended October 31, |
|
| Oct. 31, |
| ||||
For a Share Outstanding Throughout Each Period |
| 2019 |
| 2018 |
| 2017 |
| 2016 |
| 2015 |
| |
Net Asset Value, Beginning of Period |
| $20.41 |
| $20.46 |
| $21.28 |
| $20.23 |
| $20.00 |
| |
Investment Operations |
|
|
|
|
|
|
|
|
|
|
| |
Net Investment Income (Loss) |
| .252 | 2 | .197 | 2 | .153 | 2 | .106 |
| .004 |
| |
Net Realized and Unrealized Gain (Loss) on Investmenagts |
| 1.828 |
| (.143 | ) | (.139 | ) | 1.039 |
| .226 |
| |
Total from Investment Operations |
| 2.080 |
| .054 |
| .014 |
| 1.145 |
| .230 |
| |
Distributions |
|
|
|
|
|
|
|
|
|
|
| |
Dividends from Net Investment Income |
| (.260 | ) | (.104 | ) | (.093 | ) | (.095 | ) | — |
| |
Distributions from Realized Capital Gains |
| — |
| — |
| (.741 | ) | — |
| — |
| |
Total Distributions |
| (.260 | ) | (.104 | ) | (.834 | ) | (.095 | ) | — |
| |
Net Asset Value, End of Period |
| $22.23 |
| $20.41 |
| $20.46 |
| $21.28 |
| $20.23 |
| |
|
|
|
|
|
|
|
|
|
|
|
| |
Total Return3 |
| 10.30% |
| 0.27% |
| 0.11% |
| 5.68% |
| 1.15% |
| |
|
|
|
|
|
|
|
|
|
|
|
| |
Ratios/Supplemental Data |
|
|
|
|
|
|
|
|
|
|
| |
Net Assets, End of Period (Millions) |
| $297 |
| $320 |
| $292 |
| $235 |
| $159 |
| |
Ratio of Total Expenses to Average Net Assets |
|
|
|
|
|
|
|
|
|
|
| |
Based on Total Expenses4,5 |
| 0.79%6 |
| 0.66%6 |
| 0.79% |
| 0.71% |
| 0.73%7 |
| |
Net of Dividend and Borrowing Expense on Securities Sold Short |
| 0.38%6 |
| 0.33%6 |
| 0.35% |
| 0.36% |
| 0.36%7 |
| |
Ratio of Net Investment Income (Loss) to Average Net Assets |
| 1.18% |
| 0.93% |
| 0.75% |
| 0.50% |
| 0.09%7 |
| |
Portfolio Turnover Rate |
| 157% |
| 131% |
| 125% |
| 120% |
| 25% |
| |
1 Inception.
2 Calculated based on average shares outstanding.
3 Total returns do not include account service fees that may have applied in the periods shown. Fund prospectuses provide information about any applicable account service fees.
4 Includes dividend expense on securities sold short of 0.41%, 0.33%, 0.44%, 0.35%, and 0.34%, respectively.
5 Includes borrowing expense on securities sold short of 0.00%, 0.00%, 0.00%, 0.00%, and 0.03%, respectively.
6 The ratio of total expenses to average net assets for the periods ended 2019 and 2018, net of reduction from custody fee offset arrangement for total expenses and net of dividend and borrowing expense on securities sold short, was 0.74% and 0.33%, and 0.65% and 0.32%, respectively.
7 Annualized.
See accompanying Notes, which are an integral part of the Financial Statements.
Alternative Strategies Fund
Notes to Consolidated Financial Statements
Vanguard Alternative Strategies Fund is registered under the Investment Company Act of 1940 as an open-end investment company, or mutual fund.
The Consolidated Financial Statements include Vanguard ASF Portfolio (“the subsidiary”), which commenced operations on August 11, 2015. The subsidiary is wholly owned by the fund and is a unit trust established in the Cayman Islands under the Trusts Law (2011 Revision) of the Cayman Islands, which is organized to invest in certain commodity-linked investments on behalf of the fund, consistent with the fund’s investment objectives and policies. The commodity-linked investments and other investments held by the subsidiary are subject to the same risks that apply to similar investments if held directly by the fund. As of October 31, 2019, the fund held $34,919,000 in the subsidiary, representing 12% of the fund’s net assets. All inter-fund transactions and balances (including the fund’s investment in the subsidiary) have been eliminated, and the Consolidated Financial Statements include all investments and other accounts of the subsidiary as if held directly by the fund. A summary of the subsidiary’s financial information is presented below.
Subsidiary Financial Statement Information |
| Amount | ) |
Total Assets |
| 36,025 |
|
Total Liabilities |
| (1,106 | ) |
Net Assets |
| 34,919 |
|
Net Investment Income (Loss) |
| 346 |
|
Realized Net Gain (Loss) |
| 3,155 |
|
Change in Unrealized Appreciation (Depreciation) |
| (844 | ) |
Net Increase (Decrease) in Net Assets Resulting from Operations |
| 2,657 |
|
A. The following significant accounting policies conform to generally accepted accounting principles for U.S. investment companies. The fund consistently follows such policies in preparing its financial statements.
1. Security Valuation: Securities are valued as of the close of trading on the New York Stock Exchange (generally 4 p.m., Eastern time) on the valuation date. Equity securities are valued at the latest quoted sales prices or official closing prices taken from the primary market in which each security trades; such securities not traded on the valuation date are valued at the mean of the latest quoted bid and asked prices. Securities for which market quotations are not readily available, or whose values have been materially affected by events occurring before the fund’s pricing time but after the close of the securities’ primary markets, are valued by methods deemed by the board of trustees to represent fair value. Investments in Vanguard Market Liquidity Fund are valued at that fund’s net asset value. Temporary cash investments acquired are valued using the latest bid prices or using valuations based on a matrix system (which considers such factors as security prices, yields, maturities, and ratings), both as furnished by independent pricing services.
2. Foreign Currency: Securities and other assets and liabilities denominated in foreign currencies are translated into U.S. dollars using exchange rates obtained from an independent third party as of the fund’s pricing time on the valuation date. Realized gains (losses) and unrealized appreciation (depreciation) on investment securities include the effects of changes in exchange rates since the
Alternative Strategies Fund
securities were purchased, combined with the effects of changes in security prices. Fluctuations in the value of other assets and liabilities resulting from changes in exchange rates are recorded as unrealized foreign currency gains (losses) until the assets or liabilities are settled in cash, at which time they are recorded as realized foreign currency gains (losses).
3. Futures Contracts: The fund gains exposure to commodities through the subsidiary’s investment in exchange-traded commodity futures contracts. The fund also uses interest rate futures contracts to invest in fixed income asset classes with greater efficiency and lower cost than is possible through direct investment, to add value when these instruments are attractively priced, or to adjust sensitivity to changes in interest rates. The fund uses global equity index futures contracts to capture excess return opportunities. The primary risk associated with the use of futures contracts are imperfect correlation between changes in market values of the underlying securities or commodities and the prices of futures contracts, and the possibility of an illiquid market. In addition, commodity futures trading is volatile, and even a small movement in market prices could cause large losses. Counterparty risk involving futures is mitigated because a regulated clearinghouse is the counterparty instead of the clearing broker. To further mitigate counterparty risk, the fund trades futures contracts on an exchange, monitors the financial strength of its clearing brokers and clearinghouse, and has entered into clearing agreements with its clearing brokers. The clearinghouse imposes initial margin requirements to secure the fund’s performance and requires daily settlement of variation margin representing changes in the market value of each contract. Any assets pledged as initial margin for open contracts are noted in the Consolidated Statement of Net Assets.
Futures contracts are valued at their quoted daily settlement prices. The notional amounts of the contracts are not recorded in the Consolidated Statement of Net Assets. Fluctuations in the value of the contracts are recorded in the Consolidated Statement of Assets and Liabilities as an asset (liability) and in the Consolidated Statement of Operations as unrealized appreciation (depreciation) until the contracts are closed, when they are recorded as realized futures gains (losses).
During the year ended October 31, 2019, the fund’s average investments in long and short futures contracts represented 100% and 27% of net assets, respectively.
4. Forward Currency Contracts: The fund enters into forward currency contracts to enhance returns and protect the value of securities and related receivables and payables against changes in future foreign exchange rates. The fund’s risks in using these contracts include movement in the values of the foreign currencies relative to the U.S. dollar and the ability of the counterparties to fulfill their obligations under the contracts. The fund mitigates its counterparty risk by entering into forward currency contracts only with a diverse group of prequalified counterparties, monitoring their financial strength, entering into master netting arrangements with its counterparties, and requiring its counter- parties to transfer collateral as security for their performance. In the absence of a default, the collateral pledged or received by the fund cannot be repledged, resold or rehypothecated. The master netting arrangements provide that, in the event of a counterparty’s default (including bankruptcy), the fund may terminate the forward currency contracts, determine the net amount owed by either party in accordance with its master netting arrangements, and sell or retain any collateral held up to the net amount owed to the fund under the master netting arrangements. The forward currency contracts contain provisions whereby a counterparty may terminate open contracts if the fund’s net assets decline below a certain level, triggering a payment by the fund if
Alternative Strategies Fund
the fund is in a net liability position at the time of the termination. The payment amount would be reduced by any collateral the fund has pledged. Any assets pledged as collateral for open contracts are noted in the Consolidated Statement of Net Assets. The value of collateral received or pledged is compared daily to the value of the forward currency contracts exposure with each counterparty, and any difference, if in excess of a specified minimum transfer amount, is adjusted and settled within two business days.
Forward currency contracts are valued at their quoted daily prices obtained from an independent third party, adjusted for currency risk based on the expiration date of each contract. The notional amounts of the contracts are not recorded in the Consolidated Statement of Net Assets. Fluctuations in the value of the contracts are recorded in the Consolidated Statement of Assets and Liabilities as an asset (liability) and in the Consolidated Statement of Operations as unrealized appreciation (depreciation) until the contracts are closed, when they are recorded as realized forward currency contract gains (losses).
During the year ended October 31, 2019, the fund’s average investment in forward currency contracts represented 7% of net assets, based on the average of notional amounts at each quarter-end during the period.
The following table summarizes the fund’s derivative assets and liabilities by counterparty for derivatives subject to arrangements that provide for offsetting assets and liabilities. Exchange-traded derivatives are listed separately.
|
| Assets |
| Liabilities |
|
|
| Amounts Not Offset in |
|
|
| ||
|
| Reflected in |
| Reflected in |
|
|
| the Consolidated |
|
|
| ||
|
| Consolidated |
| Consolidated |
|
|
| Statement of Assets |
| Net |
| ||
|
| Statement of |
| Statement of |
| Net Amount |
| and Liabilities |
| Exposure3 |
| ||
|
| Assets and |
| Assets and |
| Receivable |
| Collateral |
| Collateral |
| (Not Less |
|
|
| Liabilities1 |
| Liabilities1 |
| (Payable | ) | Pledged2 |
| Received2 |
| Than $0 | ) |
|
| ($000 | ) | ($000 | ) | ($000 | ) | ($000 | ) | ($000 | ) | ($000 | ) |
Derivatives Subject to Offsetting Arrangements, by Counterparty |
|
|
|
|
|
|
|
|
|
|
|
|
|
Bank of America, N.A. |
| 1,290 |
| (1,390 | ) | (100 | ) | — |
| — |
| — |
|
BNP Paribas |
| 62 |
| (146 | ) | (84 | ) | — |
| — |
| — |
|
State Street Bank & Trust Co. |
| 357 |
| (1,175 | ) | (818 | ) | 580 |
| — |
| — |
|
Standard Chartered Bank |
| 58 |
| — |
| 58 |
| — |
| — |
| 58 |
|
Exchange—Traded Futures Contracts |
| 2,876 |
| (2,130 | ) | 746 |
| 19,894 |
| — |
| — |
|
Total |
| 4,643 |
| (4,841 | ) | (198 | ) | 20,474 |
| — |
| 58 |
|
1 Absent an event of default or early termination, derivative assets and liabilities are presented gross and not offset in the Consolidated Statement of Assets and Liabilities.
2 Securities or other assets pledged as collateral are noted in the Consolidated Statement of Net Assets. Securities or other assets received as collateral are held in a segregated account and not included in the fund’s security holdings in the Consolidated Statement of Net Assets.
3 Net Exposure represents the net amount receivable from the counterparty in the event of default. Counterparties are not required to exchange collateral if amount is below a specified minimum transfer amount.
Alternative Strategies Fund
5. Short Sales: Short sales are the sales of securities that the fund does not own. The fund sells a security it does not own in anticipation of a decline in the value of that security. In order to deliver the security to the purchaser, the fund borrows the security from a broker-dealer. The fund must segregate, as collateral for its obligation to return the borrowed security, an amount of cash and long security positions at least equal to the market value of the security sold short, and in the absence of a default, such collateral cannot be repledged, resold, or rehypothecated. This results in the fund holding a significant portion of its assets in cash. The fund later closes out the position by returning the security to the lender, typically by purchasing the security in the open market. A gain, limited to the price at which the fund sold the security short, or a loss, theoretically unlimited in size, is recognized upon the termination of the short sale. The fund may receive a portion of the income from the investment of collateral, or be charged a fee on borrowed securities, based on the market value of each borrowed security and a variable rate that is dependent upon the availability of such security. The net amounts of income or fees are recorded as interest income (for net income received) or borrowing expense on securities sold short (for net fees charged) on the Consolidated Statement of Operations. Dividends on securities sold short are reported as an expense in the Consolidated Statement of Operations. Cash collateral segregated for securities sold short is recorded as an asset in the Consolidated Statement of Assets and Liabilities. Long security positions segregated as collateral are shown in the Consolidated Statement of Net Assets.
6. Federal Income Taxes: The fund intends to continue to qualify as a regulated investment company and distribute all of its taxable income. The subsidiary is classified as a foreign corporation for U.S. tax purposes, and because it does not carry on a U.S. trade or business, is generally not subject to U.S. federal income tax. The subsidiary also complies with the Foreign Account Tax Compliance Act (“FATCA”) and thus will not be subject to 30% withholding under FATCA on any income from U.S. investments. In addition, the subsidiary is not subject to Cayman Islands income tax. The subsidiary is not required to distribute any earnings and profits to the fund. Management has analyzed the fund’s tax positions taken for all open federal income tax years (October 31, 2016–2019), and has concluded that no provision for federal income tax is required in the fund’s financial statements.
7. Distributions: Distributions to shareholders are recorded on the ex-dividend date. Distributions are determined on a tax basis and may differ from net investment income and realized capital gains for financial reporting purposes.
8. Credit Facility: The fund and certain other funds managed by The Vanguard Group (“Vanguard”) participate in a $4.3 billion committed credit facility provided by a syndicate of lenders pursuant to a credit agreement that may be renewed annually; each fund is individually liable for its borrowings, if any, under the credit facility. Borrowings may be utilized for temporary and emergency purposes, and are subject to the fund’s regulatory and contractual borrowing restrictions. The participating funds are charged administrative fees and an annual commitment fee of 0.10% of the undrawn amount of the facility; these fees are allocated to the funds based on a method approved by the fund’s board of trustees and included in Management and Administrative expenses on the fund’s Consolidated Statement of Operations. Any borrowings under this facility bear interest at a rate based upon the higher of the one-month London Interbank Offered Rate, federal funds effective rate, or overnight bank funding rate plus an agreed-upon spread.
The fund had no borrowings outstanding at October 31, 2019, or at any time during the period then ended.
Alternative Strategies Fund
9. Other: Dividend income (or dividend expenses on short positions) is recorded on the ex-dividend date. Interest income includes income distributions received from Vanguard Market Liquidity Fund and is accrued daily. Premiums and discounts on debt securities purchased are amortized and accreted, respectively, to interest income over the lives of the respective securities. Security transactions are accounted for on the date securities are bought or sold. Costs used to determine realized gains (losses) on the sale of investment securities are those of the specific securities sold.
B. In accordance with the terms of a Funds’ Service Agreement (the “FSA”) between Vanguard and the fund, Vanguard furnishes to the fund investment advisory, corporate management, administrative, marketing, and distribution services at Vanguard’s cost of operations (as defined by the FSA). These costs of operations are allocated to the fund based on methods and guidelines approved by the board of trustees. Vanguard does not require reimbursement in the current period for certain costs of operations (such as deferred compensation/benefits and risk/insurance costs); the fund’s liability for these costs of operations is included in Payables to Vanguard on the Consolidated Statement of Assets and Liabilities. All other costs of operations payable to Vanguard are generally settled twice a month.
Upon the request of Vanguard, the fund may invest up to 0.40% of its net assets as capital in Vanguard. At October 31, 2019, the fund had contributed to Vanguard capital in the amount of $14,000, representing less than 0.01% of the fund’s net assets and 0.01% of Vanguard’s capital received pursuant to the FSA. The fund’s trustees and officers are also directors and employees, respectively, of Vanguard.
C. The fund’s custodian bank has agreed to reduce its fees when the fund maintains cash on deposit in the non-interest-bearing custody account. For the period ended October 31, 2019, custodian fee offset arrangements reduced the fund’s expenses by $146,000 (an annual rate of 0.05% of average net assets).
D. Various inputs may be used to determine the value of the fund’s investments. These inputs are summarized in three broad levels for financial statement purposes. The inputs or methodologies used to value securities are not necessarily an indication of the risk associated with investing in those securities.
Level 1—Quoted prices in active markets for identical securities.
Level 2—Other significant observable inputs (including quoted prices for similar securities, interest rates, prepayment speeds, credit risk, etc.).
Level 3—Significant unobservable inputs (including the fund’s own assumptions used to determine the fair value of investments). Any investments valued with significant unobservable inputs are noted on the Consolidated Statement of Net Assets.
Alternative Strategies Fund
The following table summarizes the market value of the fund’s investments and derivatives as of October 31, 2019, based on the inputs used to value them:
Investments | Level 1 | ) | Level 2 | ) | Level 3 | ) |
Common Stocks—Long Positions | 199,243 |
| 27,296 |
| — |
|
Common Stocks Sold Short | (64,114 | ) | — |
| — |
|
Temporary Cash Investments | 13,503 |
| 43,848 |
| — |
|
Futures Contracts—Assets1 | 2,876 |
| — |
| — |
|
Futures Contracts—Liabilities1 | (2,130 | ) | — |
| — |
|
Forward Currency Contracts—Assets | — |
| 1,767 |
| — |
|
Forward Currency Contracts—Liabilities | — |
| (2,711 | ) | — |
|
Total | 149,378 |
| 70,200 |
| — |
|
1 Represents variation margin on the last day of the reporting period.
E. At October 31, 2019, the fair values of derivatives were reflected in the Consolidated Statement of Assets and Liabilities as follows:
Consolidated Statement of |
| Equity | ) | Commodity | ) | Interest | ) | Foreign | ) | Total | ) |
Variation Margin Receivable—Futures Contracts |
| 910 |
| 1,331 |
| 635 |
| — |
| 2,876 |
|
Unrealized Appreciation—Forward Currency Contracts |
| — |
| — |
| — |
| 1,767 |
| 1,767 |
|
Total Assets |
| 910 |
| 1,331 |
| 635 |
| 1,767 |
| 4,643 |
|
|
|
|
|
|
|
|
|
|
|
|
|
Variation Margin Payable—Futures Contracts |
| (1,053 | ) | (1,077 | ) | — |
| — |
| (2,130 | ) |
Unrealized Depreciation—Forward Currency Contracts |
| — |
| — |
| — |
| (2,711 | ) | (2,711 | ) |
Total Liabilities |
| (1,053 | ) | (1,077 | ) | — |
| (2,711 | ) | (4,841 | ) |
Alternative Strategies Fund
Realized net gain (loss) and the change in unrealized appreciation (depreciation) on derivatives for the year ended October 31, 2019, were:
Realized Net Gain (Loss) |
| Equity | ) | Commodity | ) | Interest | ) | Foreign | ) | Total | ) |
Futures Contracts |
| 3,595 |
| 3,156 |
| 6,775 |
| — |
| 13,526 |
|
Forward Currency Contracts |
| — |
| — |
| — |
| (1,405 | ) | (1,405 | ) |
Realized Net Gain (Loss) on Derivatives |
| 3,595 |
| 3,156 |
| 6,775 |
| (1,405 | ) | 12,121 |
|
Change in Unrealized Appreciation (Depreciation) on Derivatives |
|
|
|
|
| ||||||
Futures Contracts |
| (3,940 | ) | (855 | ) | 562 |
| — |
| (4,233 | ) |
Forward Currency Contracts |
| — |
| — |
| — |
| (1,269 | ) | (1,269 | ) |
Change in Unrealized Appreciation (Depreciation) on Derivatives |
| (3,940 | ) | (855 | ) | 562 |
| (1,269 | ) | (5,502 | ) |
F. Permanent differences between book-basis and tax-basis components of net assets are reclassified among capital accounts in the financial statements to reflect their tax character. These reclassifications have no effect on net assets or net asset value per share. As of period end, permanent differences primarily attributable to the accounting for foreign currency transactions, passive foreign investment companies, distributions in connection with fund share redemptions, and the operations of the subsidiary were reclassified between the following accounts:
|
| Amount | ) |
Paid-in Capital |
| 2,178 |
|
Total Distributable Earnings (Loss) |
| (2,178 | ) |
Temporary differences between book-basis and tax-basis components of total distributable earnings (loss) arise when certain items of income, gain, or loss are recognized in different periods for financial statement and tax purposes; these differences will reverse at some time in the future. The differences are primarily related to the tax deferral of losses on wash sales; the realization of unrealized gains or losses on certain futures contracts and forward currency contracts; and unrealized gains on passive foreign investment companies. As of period end, the tax-basis components of total distributable earnings (loss) are detailed in the table as follows:
|
| Amount | ) |
Undistributed Ordinary Income |
| 13,062 |
|
Undistributed Long-Term Gains |
| 4,060 |
|
Capital Loss Carryforwards (Non-Expiring)* |
| — |
|
Net Unrealized Gains (Losses) |
| 21,228 |
|
* The fund used capital loss carryforwards of $2,919,000 to offset taxable capital gains realized during the year ended October 31, 2019.
Alternative Strategies Fund
As of October 31, 2019, gross unrealized appreciation and depreciation for investments, derivatives, and securities sold short based on cost for U.S. federal income tax purposes were as follows:
|
| Amount |
|
|
| ($000 | ) |
Tax Cost |
| 266,575 |
|
Gross Unrealized Appreciation |
| 45,472 |
|
Gross Unrealized Depreciation |
| (24,257 | ) |
Net Unrealized Appreciation (Depreciation) |
| 21,215 |
|
G. During the year ended October 31, 2019, the fund purchased $431,400,000 of investment securities and sold $323,979,000 of investment securities, other than temporary cash investments. The proceeds of short sales and the cost of purchases to cover short sales were $120,592,000 and $59,431,000, respectively.
H. Capital shares issued and redeemed were:
|
| Year Ended |
| Year Ended |
|
|
| October 31, 2019 |
| October 31, 2018 |
|
|
| Shares |
| Shares |
|
|
| (000 | ) | (000 | ) |
Issued |
| 991 |
| 3,346 |
|
Issued in Lieu of Cash Distributions |
| 192 |
| 74 |
|
Redeemed |
| (3,475 | ) | (2,032 | ) |
Net Increase (Decrease) in Shares Outstanding |
| (2,292 | ) | 1,388 |
|
At October 31, 2019, Vanguard Managed Payout Fund was the record or beneficial owner of 76% of the fund’s net assets. If this shareholder were to redeem its investment in the fund, the redemption might result in an increase in the fund’s expense ratio, cause the fund to incur higher transaction costs, or lead to the realization of taxable capital gains.
I. Effective November 1, 2019, the fund’s benchmark changed from the FTSE 3-month U.S. T-Bill Index + 4% to the FTSE 3-month Treasury Bill Index. Management has determined that no other material events or transactions occurred subsequent to October 31, 2019, that would require recognition or disclosure in these financial statements.
Report of Independent Registered Public Accounting Firm
To the Board of Trustees of Vanguard Trustees’ Equity Fund and Shareholders of Vanguard Alternative Strategies Fund
Opinion on the Financial Statements
We have audited the accompanying consolidated statement of net assets and consolidated statement of assets and liabilities of Vanguard Alternative Strategies Fund (one of the funds constituting Vanguard Trustees’ Equity Fund, referred to hereafter as the “Fund”) as of October 31, 2019, the related consolidated statement of operations for the year ended October 31, 2019, the consolidated statement of changes in net assets for each of the two years in the period ended October 31, 2019, including the related notes, and the consolidated financial highlights for each of the periods indicated therein (collectively referred to as the “consolidated financial statements”). In our opinion, the consolidated financial statements present fairly, in all material respects, the financial position of the Fund as of October 31, 2019, the results of its operations for the year then ended, the changes in its net assets for each of the two years in the period ended October 31, 2019 and the financial highlights for each of the periods indicated therein in conformity with accounting principles generally accepted in the United States of America.
Basis for Opinion
These consolidated financial statements are the responsibility of the Fund’s management. Our responsibility is to express an opinion on the Fund’s consolidated financial statements based on our audits. We are a public accounting firm registered with the Public Company Accounting Oversight Board (United States) (“PCAOB”) and are required to be independent with respect to the Fund in accordance with the U.S. federal securities laws and the applicable rules and regulations of the Securities and Exchange Commission and the PCAOB.
We conducted our audits of these consolidated financial statements in accordance with the standards of the PCAOB. Those standards require that we plan and perform the audit to obtain reasonable assurance about whether the consolidated financial statements are free of material misstatement, whether due to error or fraud.
Our audits included performing procedures to assess the risks of material misstatement of the consolidated financial statements, whether due to error or fraud, and performing procedures that respond to those risks. Such procedures included examining, on a test basis, evidence regarding the amounts and disclosures in the consolidated financial statements. Our audits also included evaluating the accounting principles used and significant estimates made by management, as well as evaluating the overall presentation of the consolidated financial statements. Our procedures included confirmation of securities owned as of October 31, 2019 by correspondence with the custodian, transfer agent and brokers; when replies were not received from brokers, we performed other auditing procedures. We believe that our audits provide a reasonable basis for our opinion.
/s/PricewaterhouseCoopers LLP
Philadelphia, Pennsylvania
December 18, 2019
We have served as the auditor of one or more investment companies in The Vanguard Group of Funds since 1975.
Special 2019 tax information (unaudited) for Vanguard Alternative Strategies Fund
This information for the fiscal year ended October 31, 2019, is included pursuant to provisions of the Internal Revenue Code.
The fund distributed $3,935,000 of qualified dividend income to shareholders during the fiscal year.
For corporate shareholders, 13.3% of investment income (dividend income plus short-term gains, if any) qualifies for the dividends-received deduction.
This page intentionally left blank.
This page intentionally left blank.
This page intentionally left blank.
The People Who Govern Your Fund
The trustees of your mutual fund are there to see that the fund is operated and managed in your best interests since, as a shareholder, you are a part owner of the fund. Your fund’s trustees also serve on the board of directors of The Vanguard Group, Inc., which is owned by the Vanguard funds and provides services to them.
A majority of Vanguard’s board members are independent, meaning that they have no affiliation with Vanguard or the funds they oversee, apart from the sizable personal investments they have made as private individuals. The independent board members have distinguished backgrounds in business, academia, and public service. Each of the trustees and executive officers oversees 213 Vanguard funds.
Information for each trustee and executive officer of the fund appears below. That information, as well as the Vanguard fund count, is as of the date on the cover of this fund report. The mailing address of the trustees and officers is P.O. Box 876, Valley Forge, PA 19482. More information about the trustees is in the Statement of Additional Information, which can be obtained, without charge, by contacting Vanguard at 800-662-7447, or online at vanguard.com.
Interested Trustee1
Mortimer J. Buckley
Born in 1969. Trustee since January 2018. Principal occupation(s) during the past five years and other experience: chairman of the board (January 2019– present) of Vanguard and of each of the investment companies served by Vanguard; chief executive officer (January 2018–present) of Vanguard; chief executive officer, president, and trustee (January 2018–present) of each of the investment companies served by Vanguard; president and director (2017–present) of Vanguard; and president (February 2018–present) of Vanguard Marketing Corporation. Chief investment officer (2013–2017), managing director (2002–2017), head of the Retail Investor Group (2006–2012), and chief information officer (2001–2006) of Vanguard. Chairman of the board (2011–2017) and trustee (2009–2017) of the Children’s Hospital of Philadelphia; trustee (2018–present) of The Shipley School.
Independent Trustees
Emerson U. Fullwood
Born in 1948. Trustee since January 2008. Principal occupation(s) during the past five years and other experience: executive chief staff and marketing officer for North America and corporate vice president (retired 2008) of Xerox Corporation (document management products and services). Former president of the Worldwide Channels Group, Latin America, and Worldwide Customer Service and executive chief staff officer of Developing Markets of Xerox. Executive in residence and 2009–2010 Distinguished Minett Professor at the Rochester Institute of Technology. Director of SPX FLOW, Inc. (multi-industry manufacturing). Director of the University of Rochester Medical Center, the Monroe Community College Foundation, the United Way of Rochester, North Carolina A&T University, and Roberts Wesleyan College. Trustee of the University of Rochester.
Amy Gutmann
Born in 1949. Trustee since June 2006. Principal occupation(s) during the past five years and other experience: president (2004–present) of the University of Pennsylvania. Christopher H. Browne Distinguished Professor of Political Science, School of Arts and Sciences, and professor of communication, Annenberg School for Communication, with secondary faculty appointments in the Department of Philosophy, School of Arts and Sciences, and at the Graduate School of Education, University of Pennsylvania. Trustee of the National Constitution Center.
F. Joseph Loughrey
Born in 1949. Trustee since October 2009. Principal occupation(s) during the past five years and other experience: president and chief operating officer (retired 2009) and vice chairman of the board (2008–2009) of Cummins Inc. (industrial machinery). Chairman of the board of Hillenbrand, Inc. (specialized consumer services), and the Lumina Foundation.
1 Mr. Buckley is considered an “interested person,” as defined in the Investment Company Act of 1940, because he is an officer of the Vanguard funds.
Director of the V Foundation and Oxfam America. Member of the advisory council for the College of Arts and Letters and chair of the advisory board to the Kellogg Institute for International Studies, both at the University of Notre Dame.
Mark Loughridge
Born in 1953. Trustee since March 2012. Principal occupation(s) during the past five years and other experience: senior vice president and chief financial officer (retired 2013) of IBM (information technology services). Fiduciary member of IBM’s Retirement Plan Committee (2004–2013), senior vice president and general manager (2002–2004) of IBM Global Financing, vice president and controller (1998–2002) of IBM, and a variety of other prior management roles at IBM. Member of the Council on Chicago Booth.
Scott C. Malpass
Born in 1962. Trustee since March 2012. Principal occupation(s) during the past five years and other experience: chief investment officer (1989–present) and vice president (1996–present) of the University of Notre Dame. Assistant professor of finance at the Mendoza College of Business, University of Notre Dame, and member of the Notre Dame 403(b) Investment Committee. Chairman of the board of TIFF Advisory Services, Inc. Member of the board of Catholic Investment Services, Inc. (investment advisors) and the board of superintendence of the Institute for the Works of Religion.
Deanna Mulligan
Born in 1963. Trustee since January 2018. Principal occupation(s) during the past five years and other experience: president (2010–present) and chief executive officer (2011–present) of The Guardian Life Insurance Company of America. Chief operating officer (2010–2011) and executive vice president (2008–2010) of Individual Life and Disability of The Guardian Life Insurance Company of America. Member of the board of The Guardian Life Insurance Company of America, the American Council of Life Insurers, the Partnership for New York City (business leadership), and the Committee Encouraging Corporate Philanthropy. Trustee of the Economic Club of New York and the Bruce Museum (arts and science). Member of the Advisory Council for the Stanford Graduate School of Business.
André F. Perold
Born in 1952. Trustee since December 2004. Principal occupation(s) during the past five years and other experience: George Gund Professor of Finance and Banking, Emeritus at the Harvard Business School (retired 2011). Chief investment officer and co-managing partner of HighVista Strategies (private investment firm). Board of advisors and investment committee member of the Museum of Fine Arts Boston. Board member (2018–present) of RIT Capital Partners (investment firm); investment committee member of Partners Health Care System.
Sarah Bloom Raskin
Born in 1961. Trustee since January 2018. Principal occupation(s) during the past five years and other experience: deputy secretary (2014–2017) of the United States Department of the Treasury. Governor (2010–2014) of the Federal Reserve Board. Commissioner (2007–2010) of financial regulation for the State of Maryland. Member of the board of directors (2012–2014) of Neighborhood Reinvestment Corporation. Director (2017–present) of i(x) Investments; director (2017–present) of Reserve Trust. Rubinstein Fellow (2017–present) of Duke University; trustee (2017–present) of Amherst College.
Peter F. Volanakis
Born in 1955. Trustee since July 2009. Principal occupation(s) during the past five years and other experience: president and chief operating officer (retired 2010) of Corning Incorporated (communications equipment) and director of Corning Incorporated (2000–2010) and Dow Corning (2001–2010). Director (2012) of SPX Corporation (multi-industry manufacturing). Overseer of the Amos Tuck School of Business Administration, Dartmouth College (2001–2013). Chairman of the board of trustees of Colby-Sawyer College. Member of the board of Hypertherm Inc. (industrial cutting systems, software, and consumables).
Executive Officers
John Bendl
Born in 1970. Principal occupation(s) during the past five years and other experience: principal of Vanguard. Chief financial officer (October 2019–present) of each of the investment companies served by Vanguard. Chief accounting officer, treasurer, and controller of Vanguard (2017–present). Partner (2003–2016) at KPMG (audit, tax, and advisory services).
Glenn Booraem
Born in 1967. Principal occupation(s) during the past five years and other experience: principal of Vanguard. Investment stewardship officer (2017–present), treasurer (2015–2017), controller (2010–2015), and assistant controller (2001–2010) of each of the investment companies served by Vanguard.
Christine M. Buchanan
Born in 1970. Principal occupation(s) during the past five years and other experience: principal of Vanguard. Treasurer (2017–present) of each of the investment companies served by Vanguard. Partner (2005–2017) at KPMG (audit, tax, and advisory services).
David Cermak
Born in 1960. Principal occupation(s) during the past five years and other experience: principal of Vanguard. Finance director (October 2019–present) of each of the investment companies served by Vanguard. Managing director and head (2017–present) of Vanguard Investments Singapore. Managing director and head (2017–2019) of Vanguard Investments Hong Kong. Representative director and head (2014–2017) of Vanguard Investments Japan.
Thomas J. Higgins
Born in 1957. Principal occupation(s) during the past five years and other experience: principal of Vanguard. Finance director (October 2019–present), chief financial officer (2008–2019), and treasurer (1998–2008) of each of the investment companies served by Vanguard.
Peter Mahoney
Born in 1974. Principal occupation(s) during the past five years and other experience: principal of Vanguard. Controller (2015–present) of each of the investment companies served by Vanguard. Head of International Fund Services (2008–2014) at Vanguard.
Anne E. Robinson
Born in 1970. Principal occupation(s) during the past five years and other experience: general counsel (2016–present) of Vanguard. Secretary (2016–present) of Vanguard and of each of the investment companies served by Vanguard. Managing director (2016–present) of Vanguard. Managing director and general counsel of Global Cards and Consumer Services (2014–2016) at Citigroup. Counsel (2003–2014) at American Express.
Michael Rollings
Born in 1963. Principal occupation(s) during the past five years and other experience: finance director (2017–present) and treasurer (2017) of each of the investment companies served by Vanguard. Managing director (2016–present) of Vanguard. Chief financial officer (2016–present) of Vanguard. Director (2016–present) of Vanguard Marketing Corporation. Executive vice president and chief financial officer (2006–2016) of MassMutual Financial Group.
John E. Schadl
Born in 1972. Principal occupation(s) during the past five years and other experience: principal of Vanguard. Chief compliance officer (2019–present) of Vanguard and of each of the investment companies served by Vanguard. Assistant vice president (May 2019–present) of Vanguard Marketing Corporation.
Vanguard Senior Management Team
Joseph Brennan |
| Chris D. McIsaac |
Mortimer J. Buckley |
| James M. Norris |
Gregory Davis |
| Thomas M. Rampulla |
John James |
| Karin A. Risi |
Martha G. King |
| Anne E. Robinson |
John T. Marcante |
| Michael Rollings |
|
|
|
|
| P.O. Box 2600 |
| Valley Forge, PA 19482-2600 |

Connect with Vanguard® > vanguard.com
Fund Information > 800-662-7447
Direct Investor Account Services > 800-662-2739
Institutional Investor Services > 800-523-1036
Text Telephone for People Who Are Deaf or Hard of Hearing > 800-749-7273
This material may be used in conjunction with the offering of shares of any Vanguard fund only if preceded or accompanied by the fund’s current prospectus.
All comparative mutual fund data are from Morningstar, Inc., unless otherwise noted.
You can obtain a free copy of Vanguard’s proxy voting guidelines by visiting vanguard.com/proxyreporting or by calling Vanguard at 800-662-2739. The guidelines are also available from the SEC’s website, www.sec.gov. In addition, you may obtain a free report on how your fund voted the proxies for securities it owned during the 12 months ended June 30. To get the report, visit either vanguard.com/proxyreporting or www.sec.gov.
You can review information about your fund on the SEC’s website, and you can receive copies of this information, for a fee, by sending a request via email addressed to publicinfo@sec.gov.
Source for Bloomberg Barclays indexes: Bloomberg Index Services Limited. Copyright 2019, Bloomberg. All rights reserved.
CFA® is a registered trademark owned by CFA Institute.
| © 2019 The Vanguard Group, Inc. All rights reserved. Vanguard Marketing Corporation, Distributor.
Q12980 122019 |

Annual Report | October 31, 2019
Vanguard Commodity Strategy Fund
|
See the inside front cover for important information about access to your fund’s annual and semiannual shareholder reports.
|
Important information about access to shareholder reports
Beginning on January 1, 2021, as permitted by regulations adopted by the Securities and Exchange Commission, paper copies of your fund’s annual and semiannual shareholder reports will no longer be sent to you by mail, unless you specifically request them. Instead, you will be notified by mail each time a report is posted on the website and will be provided with a link to access the report.
If you have already elected to receive shareholder reports electronically, you will not be affected by this change and do not need to take any action. You may elect to receive shareholder reports and other communications from the fund electronically by contacting your financial intermediary (such as a broker-dealer or bank) or, if you invest directly with the fund, by calling Vanguard at one of the phone numbers on the back cover of this report or by logging on to vanguard.com.
You may elect to receive paper copies of all future shareholder reports free of charge. If you invest through a financial intermediary, you can contact the intermediary to request that you continue to receive paper copies. If you invest directly with the fund, you can call Vanguard at one of the phone numbers on the back cover of this report or log on to vanguard.com. Your election to receive paper copies will apply to all the funds you hold through an intermediary or directly with Vanguard.
Contents |
|
|
|
A Note From Our Chairman | 1 |
Your Fund’s Performance at a Glance | 2 |
Advisor’s Report | 3 |
About Your Fund’s Expenses | 5 |
Performance Summary | 7 |
Financial Statements | 9 |
Trustees Approve Advisory Arrangement | 22 |
Please note: The opinions expressed in this report are just that—informed opinions. They should not be considered promises or advice. Also, please keep in mind that the information and opinions cover the period through the date on the front of this report. Of course, the risks of investing in your fund are spelled out in the prospectus.
A Note From Our Chairman

Tim Buckley
Chairman and Chief Executive Officer
Dear Shareholder,
Recent volatility in financial markets—affecting stocks, bonds, and commodities—has been a good reminder of the wise old adage, “Never keep all your eggs in one basket.” Maintaining balance and diversification in your investment portfolio can help to both limit risk and set you up for long-term success.
It’s understandable why some investors might become complacent after a long market run-up like the one that lifted stock prices, especially U.S. stock prices, in the years following the global financial crisis. But failing to rebalance regularly can leave a portfolio with a much different mix of assets than intended and, often, more risk than intended.
Balance across and diversification within asset classes are powerful tools for managing risk and achieving your investment goals. A portfolio’s allocation will determine a large portion of its long-term return and also the majority of its volatility risk. A well-diversified portfolio is less vulnerable to significant swings in the performance of any one segment of the asset classes in which it invests.
Balance and diversification will never eliminate the risk of loss, nor will they guarantee positive returns in a declining market. But they should reduce the chance that you’ll suffer disproportionate losses in one particular high-flying asset class or sector when it comes back to earth. And exposure to all key market components should give you at least some participation in the sectors that are performing best at any given time.
Vanguard is committed to helping you achieve balance and diversification in your portfolios to help meet your investment goals. We thank you for your continued loyalty.
Sincerely,

Mortimer J. Buckley
Chairman and Chief Executive Officer
November 18, 2019
Your Fund’s Performance at a Glance
· Vanguard launched the Commodity Strategy Fund on June 25, 2019. From inception through October 31, the fund returned –0.68%, trailing its benchmark, the Bloomberg Commodity Total Return Index, which returned –0.07%.
· By investing in commodity swaps and a mix of short-term Treasury Inflation-Protected Securities and U.S. Treasury bills, the fund offers the potential for inflation protection and enhanced returns over time without taking excessive risk.
· Rather than holding near-month futures contracts and rolling contracts over a five-day period, the fund attempts to take advantage of liquidity premiums by holding contracts further from expiration and avoiding congested trading periods.
· The fund underperformed the benchmark largely because of its underweight to near-month futures contracts, which benefited from a spike in oil prices after the attack on Saudi oil facilities in September.
· The attack also produced higher volatility in oil prices. Because the fund had less exposure to these near-month contracts, its volatility was nearly a percentage point lower than that of its benchmark.
· The fund regularly uses derivatives to hedge portfolio risks. Its holdings of commodity index swaps detracted from performance.
Market Barometer |
|
|
|
|
| Average Annual Total Returns | ||
|
| Periods Ended October 31, 2019 | ||
|
| One Year | Three Years | Five Years |
Stocks |
|
|
|
|
Russell 1000 Index (Large-caps) |
| 14.15% | 14.73% | 10.55% |
Russell 2000 Index (Small-caps) |
| 4.90 | 10.96 | 7.37 |
Russell 3000 Index (Broad U.S. market) |
| 13.49 | 14.47 | 10.31 |
FTSE All-World ex US Index (International) |
| 11.52 | 8.21 | 4.16 |
|
|
|
|
|
Bonds |
|
|
|
|
Bloomberg Barclays U.S. Aggregate Bond Index (Broad taxable market) |
| 11.51% | 3.29% | 3.24% |
Bloomberg Barclays Municipal Bond Index (Broad tax-exempt market) |
| 9.42 | 3.62 | 3.55 |
FTSE Three-Month U.S. Treasury Bill Index |
| 2.35 | 1.57 | 0.98 |
|
|
|
|
|
CPI |
|
|
|
|
Consumer Price Index |
| 1.76% | 2.11% | 1.62% |
Advisor’s Report
Since its inception on June 25, 2019, through October 31, 2019, Vanguard Commodity Strategy Fund returned –0.68%. The fund underperformed its benchmark, the Bloomberg Commodity Total Return Index, which returned –0.07%.
Investment objective and strategy
The Commodity Strategy Fund is designed to serve investors as a potential hedge against inflation risk and as further diversification for a traditional stock/bond portfolio. It invests in commodity swaps, collateralized by a mix of short-term Treasury Inflation-Protected Securities (TIPS) and U.S. Treasury bills. With its blend of commodity-linked futures and mix of short-term TIPS and Treasury bills, the fund is expected to offer a controlled approach that has the potential for inflation protection and enhanced returns over time without taking on excessive risk.
The fund uses multiple strategies for enhancing commodity returns, such as commodity curve positioning. It also takes advantage of roll schedules, a practice that involves rolling over commodity futures contracts before or after the roll schedule of the Bloomberg Commodity Index.
Investment environment
Stocks posted strong returns for the 12 months ended October 31, 2019, despite uncertainty over U.S.-China trade and the U.K.’s leaving the European Union, tensions with Iran, and recession jitters spurred by an inversion of the yield curve.
U.S. stocks returned 14.33% for the 12-month period, as measured by the Standard & Poor’s 500 Index. Large-capitalization stocks beat small-caps and growth stocks outpaced value.
U.S. stocks once again performed better than their non-U.S. counterparts. The FTSE Global All Cap ex US Index, which tracks non-U.S. stocks of all sizes in both developed and emerging markets, returned 11.18% for the period. Emerging markets outpaced developed markets outside the United States.
Fixed income markets advanced as central banks moved to more accommodative monetary policies amid a deteriorating global economic outlook—in particular, dimmer growth prospects and below-target inflation.
The U.S. Federal Reserve, after raising short-term interest rates four times in 2018, cut them in August, September, and October of this year. The range for the federal funds rate ended the period at 1.5%–1.75% as U.S. GDP growth and labor market gains slowed but remained in positive territory. The European Central Bank in September announced that it would push its deposit rate further below zero and start a new round of open-ended asset purchases in November.
Given the outlook for weaker growth, tame inflation, and continuing central bank support, global bond yields fell and prices rose. The overall U.S. market for taxable
investment-grade bonds, as measured by the Bloomberg Barclays U.S. Aggregate Bond Index, returned 11.51%. The Bloomberg Barclays Global Aggregate Index returned 9.54%.
In commodities markets, precious metals advanced, with silver leading the pack. Industrial metals broadly declined in line with slowing global growth, although nickel, because of a looming shortage, was a notable exception. Oil and natural gas both fell because of continued growing U.S. stockpiles and slowing demand. Grains advanced, and soybeans performed especially well, as did livestock.
Successes and shortfalls
The fund underperformed the benchmark largely because of its underweight to near-month futures contracts, which benefited from a spike in oil prices after an attack on Saudi oil facilities in September. The attack also produced higher volatility in oil prices. Because the fund had less exposure to these near-month contracts (futures contracts closest to expiration or delivery), its volatility was nearly a percentage point lower than that of its benchmark.
Although markets can be unpredictable, we are confident that our team of experienced managers and analysts can find opportunities to produce competitive returns without taking excessive risks.
Portfolio Managers:
Anatoly Shtekhman, CFA
Fei Xu, CFA
Vanguard Quantitative Equity Group
Joshua C. Barrickman, CFA, Principal
Vanguard Fixed Income Group
November 25, 2019
About Your Fund’s Expenses
As a shareholder of the fund, you incur ongoing costs, which include costs for portfolio management, administrative services, and shareholder reports (like this one), among others. Operating expenses, which are deducted from a fund’s gross income, directly reduce the investment return of the fund.
A fund’s expenses are expressed as a percentage of its average net assets. This figure is known as the expense ratio. The following examples are intended to help you understand the ongoing costs (in dollars) of investing in your fund and to compare these costs with those of other mutual funds. The examples are based on an investment of $1,000 made at the beginning of the period shown and held for the entire period.
The accompanying table illustrates your fund’s costs in two ways:
· Based on actual fund return. This section helps you to estimate the actual expenses that you paid over the period. The “Ending Account Value” shown is derived from the fund’s actual return, and the third column shows the dollar amount that would have been paid by an investor who started with $1,000 in the fund. You may use the information here, together with the amount you invested, to estimate the expenses that you paid over the period.
To do so, simply divide your account value by $1,000 (for example, an $8,600 account value divided by $1,000 = 8.6), then multiply the result by the number given for your fund under the heading “Expenses Paid During Period.”
· Based on hypothetical 5% yearly return. This section is intended to help you compare your fund’s costs with those of other mutual funds. It assumes that the fund had a yearly return of 5% before expenses, but that the expense ratio is unchanged. In this case—because the return used is not the fund’s actual return—the results do not apply to your investment. The example is useful in making comparisons because the Securities and Exchange Commission requires all mutual funds to calculate expenses based on a 5% return. You can assess your fund’s costs by comparing this hypothetical example with the hypothetical examples that appear in shareholder reports of other funds.
Note that the expenses shown in the table are meant to highlight and help you compare ongoing costs only and do not reflect transaction costs incurred by the fund for buying and selling securities. Further, the expenses do not include any purchase, redemption, or account service fees described in the fund prospectus. If such fees were applied to your account, your costs would be higher. Your fund does not carry a “sales load.”
The calculations assume no shares were bought or sold during the period. Your actual costs may have been higher or lower, depending on the amount of your investment and the timing of any purchases or redemptions.
You can find more information about the fund’s expenses, including annual expense ratios, in the Financial Statements section of this report. For additional information on operating expenses and other shareholder costs, please refer to your fund’s current prospectus.
Period Ended October 31, 2019
|
| Beginning |
| Ending |
| Expenses |
|
| Account Value |
| Account Value |
| Paid During |
Commodity Strategy Fund |
| 6/25/2019 |
| 10/31/2019 |
| Period |
Based on Actual Fund Return |
| $1,000.00 |
| $993.20 |
| $0.70 |
Based on Hypothetical 5% Yearly Return |
| 1,000.00 |
| 1,016.83 |
| 0.71 |
The calculations are based on expenses incurred in the period from the fund’s June 25, 2019, inception through October 31, 2019. The fund’s annualized expense ratio for that period is 0.20%. The dollar amounts shown as “Expenses Paid” are equal to the annualized expense ratio multiplied by the average account value over the period from inception through October 31, 2019, multiplied by the number of days in that period, then divided by the number of days in the most recent 12-month period (128/365).
Commodity Strategy Fund
Performance Summary
All of the returns in this report represent past performance, which is not a guarantee of future results that may be achieved by the fund. (Current performance may be lower or higher than the performance data cited. For performance data current to the most recent month-end, visit our website at vanguard.com/performance.) Note, too, that both investment returns and principal value can fluctuate widely, so an investor’s shares, when sold, could be worth more or less than their original cost. The returns shown do not reflect taxes that a shareholder would pay on fund distributions or on the sale of fund shares.
Cumulative Performance: June 25, 2019, Through October 31, 2019
Initial Investment of $50,000

|
| Total Returns |
|
|
|
| Period Ended October 31, 2019 |
|
|
|
| Since Inception (6/25/2019) |
| Final Value of a $50,000 Investment |
| Commodity Strategy Fund | -0.68% |
| $49,660 |
| Bloomberg Commodity Total Return Index | -0.07 |
| 49,966 |
“Since Inception” performance is calculated from the fund’s inception date for both the fund and its comparative standard(s).
See Financial Highlights for dividend and capital gains information.
Commodity Strategy Fund
Sector Diversification
As of October 31, 2019
Treasury/Agency | 100.0% |
The table reflects the fund’s market exposure. Any holdings in short-term reserves are excluded. The agency and mortgage-backed securities sectors may include issues from government-sponsored enterprises; such issues are generally not backed by the full faith and credit of the U.S. government.
Commodity Strategy Fund
Consolidated Financial Statements
Consolidated Statement of Net Assets
As of October 31, 2019
The fund files its complete schedule of portfolio holdings with the Securities and Exchange Commission (SEC) for the first and third quarters of each fiscal year as an exhibit to its reports on Form N-PORT. The fund’s Form N-PORT reports are available on the SEC’s website at www.sec.gov.
|
|
|
|
|
| Face |
| Market |
|
|
|
|
| Maturity |
| Amount |
| Value· |
|
|
| Coupon |
| Date |
| ($000 | ) | ($000 | ) |
U.S. Government and Agency Obligations (73.2%) |
|
|
|
|
|
|
|
|
|
U.S. Government Securities (73.2%) |
|
|
|
|
|
|
|
|
|
United States Treasury Inflation Indexed Bonds |
| 1.375 | % | 1/15/20 |
| 4,230 |
| 5,017 |
|
United States Treasury Inflation Indexed Bonds |
| 0.125 | % | 4/15/20 |
| 11,763 |
| 12,815 |
|
United States Treasury Inflation Indexed Bonds |
| 1.250 | % | 7/15/20 |
| 6,560 |
| 7,773 |
|
United States Treasury Inflation Indexed Bonds |
| 1.125 | % | 1/15/21 |
| 7,526 |
| 8,882 |
|
United States Treasury Inflation Indexed Bonds |
| 0.125 | % | 4/15/21 |
| 10,334 |
| 11,099 |
|
United States Treasury Inflation Indexed Bonds |
| 0.625 | % | 7/15/21 |
| 8,232 |
| 9,432 |
|
United States Treasury Inflation Indexed Bonds |
| 0.125 | % | 1/15/22 |
| 9,113 |
| 10,259 |
|
United States Treasury Inflation Indexed Bonds |
| 0.125 | % | 4/15/22 |
| 10,337 |
| 10,818 |
|
United States Treasury Inflation Indexed Bonds |
| 0.125 | % | 7/15/22 |
| 9,560 |
| 10,646 |
|
United States Treasury Inflation Indexed Bonds |
| 0.125 | % | 1/15/23 |
| 9,600 |
| 10,602 |
|
United States Treasury Inflation Indexed Bonds |
| 0.625 | % | 4/15/23 |
| 10,350 |
| 10,792 |
|
United States Treasury Inflation Indexed Bonds |
| 0.375 | % | 7/15/23 |
| 9,642 |
| 10,716 |
|
United States Treasury Inflation Indexed Bonds |
| 0.625 | % | 1/15/24 |
| 9,641 |
| 10,773 |
|
United States Treasury Inflation Indexed Bonds |
| 0.500 | % | 4/15/24 |
| 7,526 |
| 7,750 |
|
United States Treasury Inflation Indexed Bonds |
| 0.125 | % | 7/15/24 |
| 9,633 |
| 10,415 |
|
United States Treasury Inflation Indexed Bonds |
| 0.125 | % | 10/15/24 |
| 3,990 |
| 3,997 |
|
Total U.S. Government and Agency Obligations (Cost $151,782) |
| 151,786 |
| ||||||
Commodity Strategy Fund
|
|
|
| Market |
| |
|
|
|
| Value· |
| |
|
| Shares |
| ($000 | ) | |
Temporary Cash Investments (27.3%) |
|
|
|
|
| |
Money Market Fund (7.8%) |
|
|
|
|
| |
1 | Vanguard Market Liquidity Fund, 1.984% |
| 162,146 |
| 16,216 |
|
|
|
|
|
|
| |
|
| Face |
|
|
| |
|
| Amount |
|
|
| |
|
| ($000) |
|
|
| |
U.S. Government and Agency Obligations (19.5%) |
|
|
|
|
| |
2 | United States Treasury Bill, 2.007%, 11/12/19 |
| 8,500 |
| 8,496 |
|
2 | United States Treasury Bill, 1.833%–1.944%, 11/14/19 |
| 6,600 |
| 6,597 |
|
2 | United States Treasury Bill, 1.704%, 11/19/19 |
| 4,400 |
| 4,397 |
|
2 | United States Treasury Bill, 1.839%, 12/5/19 |
| 9,550 |
| 9,536 |
|
2 | United States Treasury Bill, 1.609%–1.808%, 12/12/19 |
| 9,400 |
| 9,384 |
|
2 | United States Treasury Bill, 1.598%, 1/9/20 |
| 1,900 |
| 1,894 |
|
|
|
|
| 40,304 |
| |
Total Temporary Cash Investments (Cost $56,512) |
|
|
| 56,520 |
| |
Total Investments (100.5%) (Cost $208,294) |
|
|
| 208,306 |
| |
|
|
|
|
|
| |
|
|
|
| Amount |
| |
|
|
|
| ($000 | ) | |
Other Assets and Liabilities (-0.5%) |
|
|
|
|
| |
Other Assets |
|
|
| 4,333 |
| |
Liabilities |
|
|
| (5,350 | ) | |
|
|
|
| (1,017 | ) | |
Net Assets (100%) |
|
|
|
|
| |
Applicable to 8,346,760 outstanding $.001 par value shares of beneficial interest (unlimited authorization) |
|
|
| 207,289 |
| |
Net Asset Value Per Share |
|
|
| $24.83 |
| |
Commodity Strategy Fund
|
| Amount |
|
|
| ($000 | ) |
Consolidated Statement of Assets and Liabilities |
|
|
|
Assets |
|
|
|
Investments in Securities, at Value |
|
|
|
Unaffiliated Issuers |
| 192,090 |
|
Affiliated Issuers |
| 16,216 |
|
Total Investments in Securities |
| 208,306 |
|
Investment in Vanguard |
| 10 |
|
Receivables for Investment Securities Sold |
| 3,923 |
|
Receivables for Accrued Income |
| 183 |
|
Receivables for Capital Shares Issued |
| 185 |
|
Unrealized Appreciation—OTC Swap Contracts |
| 4 |
|
Other Assets |
| 28 |
|
Total Assets |
| 212,639 |
|
Liabilities |
|
|
|
Payables for Investment Securities Purchased |
| 4,031 |
|
Payables for Capital Shares Redeemed |
| 403 |
|
Payables to Vanguard |
| 24 |
|
Unrealized Depreciation—OTC Swap Contracts |
| 892 |
|
Total Liabilities |
| 5,350 |
|
Net Assets |
| 207,289 |
|
At October 31, 2019, net assets consisted of:
|
| Amount |
|
|
| ($000 | ) |
Paid-in Capital |
| 206,478 |
|
Total Distributable Earnings (Loss) |
| 811 |
|
Net Assets |
| 207,289 |
|
· See Note A in Notes to Financial Statements.
1 Affiliated money market fund available only to Vanguard funds and certain trusts and accounts managed by Vanguard. Rate shown is the 7-day yield.
2 Security is owned by the Vanguard CSF Portfolio, which is a wholly owned subsidiary of the Commodity Strategy Fund.
OTC—Over-the-Counter.
Commodity Strategy Fund
Derivative Financial Instruments Outstanding as of Period End
Over-the-Counter Total Return Swaps
|
|
|
|
|
|
|
| Floating |
|
|
|
|
|
|
|
|
|
|
|
|
| Interest |
|
|
|
|
|
|
|
|
|
|
|
|
| Rate |
| Value and |
| Value and |
|
|
|
|
|
|
| Notional |
| Received |
| Unrealized |
| Unrealized |
|
|
| Termination |
|
|
| Amount |
| (Paid | )1 | Appreciation |
| (Depreciation | ) |
Reference Entity |
| Date |
| Counterparty |
| ($000 | ) | (% | ) | ($000 | ) | ($000 | ) |
BofA Merrill Lynch Commodity Excess Return Strategy2 |
| 11/25/19 |
| MLI |
| 44,000 |
| (0.170 | ) | — |
| (203 | ) |
Bloomberg Commodity Index2 |
| 11/25/19 |
| BARC |
| 1,500 |
| (0.100 | ) | 4 |
| — |
|
Bloomberg Commodity Index2 |
| 11/25/19 |
| BARC |
| 10,500 |
| (0.100 | ) | — |
| (34 | ) |
Bloomberg Commodity Index 2 Month Forward2 |
| 11/25/19 |
| BARC |
| 30,000 |
| (0.110 | ) | — |
| (128 | ) |
Bloomberg Commodity Index 3 Month Forward2 |
| 11/25/19 |
| GSI |
| 24,000 |
| (0.120 | ) | — |
| (99 | ) |
Credit Suisse Custom 34 – 01E Forward Excess Return2 |
| 11/25/19 |
| CSFBI |
| 72,000 |
| (0.160 | ) | — |
| (301 | ) |
Credit Suisse Custom 34 – 01E Forward Excess Return2 |
| 11/25/19 |
| CSFBI |
| 1,000 |
| (0.160 | ) | — |
| — |
|
Modified Strategy DBS18 on the Bloomberg Commodity Index2 |
| 11/25/19 |
| GSI |
| 26,000 |
| (0.120 | ) | — |
| (127 | ) |
|
|
|
|
|
|
|
|
|
| 4 |
| (892 | ) |
1 Payment received/paid monthly.
2 Security is owned by the subsidiary.
BARC—Barclays Bank plc.
CSFBI—Credit Suisse First Boston International.
GSI—Goldman Sachs International.
MLI—Merrill Lynch International.
At October 31, 2019, a counterparty had deposited in a segregated account securities with a value of $36,000 in connection with open over-the-counter swap contracts.
See accompanying Notes, which are an integral part of the Financial Statements.
Commodity Strategy Fund
Consolidated Statement of Operations
|
| June 25, 20191 to |
|
|
| October 31, 2019 |
|
|
| ($000 | ) |
Investment Income |
|
|
|
Income |
|
|
|
Interest2 |
| 1,185 |
|
Total Income |
| 1,185 |
|
Expenses |
|
|
|
The Vanguard Group—Note B |
|
|
|
Investment Advisory Services |
| 10 |
|
Management and Administrative |
| 95 |
|
Marketing and Distribution |
| 5 |
|
Custodian Fees |
| 1 |
|
Auditing Fees |
| 18 |
|
Shareholders’ Reports |
| 1 |
|
Trustees’ Fees and Expenses—Note B |
| — |
|
Total Expenses |
| 130 |
|
Net Investment Income |
| 1,055 |
|
Realized Net Gain (Loss) |
|
|
|
Investment Securities Sold2 |
| (22 | ) |
Swap Contracts |
| (413 | ) |
Realized Net Gain (Loss) |
| (435 | ) |
Change in Unrealized Appreciation (Depreciation) |
|
|
|
Investment Securities2 |
| 12 |
|
Swap Contracts |
| (888 | ) |
Change in Unrealized Appreciation (Depreciation) |
| (876 | ) |
Net Increase (Decrease) in Net Assets Resulting from Operations |
| (256 | ) |
1 Inception.
2 Interest income, realized net gain (loss), and change in unrealized appreciation (depreciation) from an affiliated company of the fund were $103,000, ($1,000), and $1,000, respectively. Purchases and sales are for temporary cash investment purposes.
See accompanying Notes, which are an integral part of the Financial Statements.
Commodity Strategy Fund
Consolidated Statement of Changes in Net Assets
|
| June 25, 20191 to |
|
|
| October 31, 2019 |
|
|
| ($000 | ) |
Increase (Decrease) in Net Assets |
|
|
|
Operations |
|
|
|
Net Investment Income |
| 1,055 |
|
Realized Net Gain (Loss) |
| (435 | ) |
Change in Unrealized Appreciation (Depreciation) |
| (876 | ) |
Net Increase (Decrease) in Net Assets Resulting from Operations |
| (256 | ) |
Distributions |
|
|
|
Net Investment Income |
| — |
|
Realized Capital Gain |
| — |
|
Total Distributions |
| — |
|
Capital Share Transactions |
|
|
|
Issued |
| 214,859 |
|
Issued in Lieu of Cash Distributions |
| — |
|
Redeemed |
| (7,314 | ) |
Net Increase (Decrease) from Capital Share Transactions |
| 207,545 |
|
Total Increase (Decrease) |
| 207,289 |
|
Net Assets |
|
|
|
Beginning of Period |
| — |
|
End of Period |
| 207,289 |
|
1 Inception.
See accompanying Notes, which are an integral part of the Financial Statements.
Commodity Strategy Fund
Consolidated Financial Highlights
|
| June 25, 20191 to |
|
For a Share Outstanding Throughout the Period |
| October 31, 2019 |
|
Net Asset Value, Beginning of Period |
| $25.00 |
|
Investment Operations |
|
|
|
Net Investment Income2 |
| .143 |
|
Net Realized and Unrealized Gain (Loss) on Investments |
| (.313 | ) |
Total from Investment Operations |
| (.170 | ) |
Distributions |
|
|
|
Dividends from Net Investment Income |
| — |
|
Distributions from Realized Capital Gains |
| — |
|
Total Distributions |
| — |
|
Net Asset Value, End of Period |
| $24.83 |
|
|
|
|
|
Total Return3 |
| -0.68% |
|
|
|
|
|
Ratios/Supplemental Data |
|
|
|
Net Assets, End of Period (Millions) |
| $207 |
|
Ratio of Total Expenses to Average Net Assets |
| 0.20%4 |
|
Ratio of Net Investment Income to Average Net Assets |
| 1.65%4 |
|
Portfolio Turnover Rate |
| 7% |
|
1 Inception.
2 Calculated based on average shares outstanding.
3 Total returns do not include account service fees that may have applied in the periods shown. Fund prospectuses provide information about any applicable account service fees.
4 Annualized.
See accompanying Notes, which are an integral part of the Financial Statements.
Commodity Strategy Fund
Notes to Consolidated Financial Statements
Vanguard Commodity Strategy Fund is registered under the Investment Company Act of 1940 as an open-end investment company, or mutual fund.
The Consolidated Financial Statements include Vanguard CSF Portfolio (“the subsidiary”), which commenced operations on June 25, 2019. The subsidiary is wholly owned by the fund and is a unit trust established in the Cayman Islands under the Trusts Law (2011 Revision) of the Cayman Islands, which is organized to invest in certain commodity-linked investments on behalf of the fund, consistent with the fund’s investment objectives and policies. The commodity-linked investments and other investments held by the subsidiary are subject to the same risks that apply to similar investments if held directly by the fund. As of October 31, 2019, the fund held $39,439,000 in the subsidiary, representing 19% of the fund’s net assets. All inter-fund transactions and balances (including the fund’s investment in the subsidiary) have been eliminated, and the Consolidated Financial Statements include all investments and other accounts of the subsidiary as if held directly by the fund. A summary of the subsidiary’s financial information is presented below.
|
| Amount |
|
Subsidiary Financial Statement Information |
| ($000 | ) |
Total Assets |
| 40,336 |
|
Total Liabilities |
| (897 | ) |
Net Assets |
| 39,439 |
|
Net Investment Income (Loss) |
| 234 |
|
Realized Net Gain (Loss) |
| (413 | ) |
Change in Unrealized Appreciation (Depreciation) |
| (880 | ) |
Net Increase (Decrease) in Net Assets Resulting from Operations |
| (1,059 | ) |
A. The following significant accounting policies conform to generally accepted accounting principles for U.S. investment companies. The fund consistently follows such policies in preparing its financial statements.
1. Security Valuation: Securities are valued as of the close of trading on the New York Stock Exchange (generally 4 p.m., Eastern time) on the valuation date. Bonds and temporary cash investments are valued using the latest bid prices or using valuations based on a matrix system (which considers such factors as security prices, yields, maturities, and ratings), both as furnished by independent pricing services. Investments in Vanguard Market Liquidity Fund are valued at that fund’s net asset value. Securities for which market quotations are not readily available, or whose values have been affected by events occurring before the fund’s pricing time but after the close of the securities’ primary markets, are valued by methods deemed by the board of trustees to represent fair value.
2. Swap Contracts: The fund gains exposure to commodities through the subsidiary’s investment in swaps that earn the total return on a specified commodity index. Under the terms of the swaps, the subsidiary receives the total return on the specified index (receiving the increase or paying the decrease in the value of the specified index), applied to a notional amount. The subsidiary also pays a floating rate that is based on short-term interest rates, applied to the notional amount. At the same time, the subsidiary invests an amount approximating the notional amount of the swap in high-quality temporary cash investments.
Commodity Strategy Fund
The notional amounts of swap contracts are not recorded in the Consolidated Statement of Net Assets. Swaps are valued daily based on market quotations received from independent pricing services or recognized dealers and the change in value is recorded in the Consolidated Statement of Assets and Liabilities and Consolidated Statement of Operations as unrealized appreciation (depreciation) until periodic payments are made, or the termination of the swap, at which time realized gain (loss) is recorded.
A risk associated with all types of swaps is the possibility that a counterparty may default on its obligation to pay net amounts due to the subsidiary. The subsidiary’s maximum amount subject to counterparty risk is the unrealized appreciation on the swap contract. The subsidiary mitigates its counterparty risk by entering into swaps only with a diverse group of prequalified counterparties, monitoring their financial strength, entering into master netting arrangements with its counterparties, and requiring its counterparties to transfer collateral as security for their performance. In the absence of a default, the collateral pledged or received by the fund cannot be repledged, resold, or rehypothecated. In the event of a counterparty’s default (including bankruptcy), the subsidiary may terminate any swap contracts with that counterparty, determine the net amount owed by either party in accordance with its master netting arrangements, and sell or retain any collateral held up to the net amount owed to the subsidiary under the master netting arrangements. The swap contracts contain provisions whereby a counterparty may terminate open contracts if the subsidiary’s net assets decline below a certain level, triggering a payment by the subsidiary if the subsidiary is in a net liability position at the time of the termination. The payment amount would be reduced by any collateral the subsidiary has pledged. Any securities pledged as collateral for open contracts are noted in the Consolidated Statement of Net Assets. The value of collateral received or pledged is compared daily to the value of the swap contracts exposure with each counterparty, and any difference, if in excess of a specified minimum transfer amount, is adjusted and settled within two business days.
During the period ended October 31, 2019, the fund’s average amounts of investments in total return swaps represented 100% of net assets, based on the average of notional amounts at each quarter-end during the period.
The following table summarizes the fund’s derivative assets and liabilities by counterparty for derivatives subject to arrangements that provide for offsetting assets and liabilities.
|
| Assets |
| Liabilities |
|
|
| Amounts Not Offset in |
|
|
| ||
|
| Reflected in |
| Reflected in |
|
|
| the Consolidated |
|
|
| ||
|
| Consolidated |
| Consolidated |
|
|
| Statement of Assets |
| Net |
| ||
|
| Statement of |
| Statement of |
| Net Amount |
| and Liabilities |
| Exposure3 |
| ||
|
| Assets and |
| Assets and |
| Receivable |
| Collateral |
| Collateral |
| (Not Less |
|
|
| Liabilities1 |
| Liabilities1 |
| (Payable) |
| Pledged2 |
| Received2 |
| Than $0) |
|
|
| ($000 | ) | ($000 | ) | ($000 | ) | ($000 | ) | ($000 | ) | ($000 | ) |
Derivatives Subject to Offsetting Arrangements, by Counterparty |
|
|
|
|
|
|
|
|
|
|
|
|
|
Barclays Bank plc |
| 4 |
| (162 | ) | (158 | ) | — |
| 36 |
| — |
|
Credit Suisse First Boston International |
| — |
| (301 | ) | (301 | ) | — |
| — |
| — |
|
Commodity Strategy Fund
|
| Assets |
| Liabilities |
|
|
| Amounts Not Offset in |
|
|
| ||
|
| Reflected in |
| Reflected in |
|
|
| the Consolidated |
|
|
| ||
|
| Consolidated |
| Consolidated |
|
|
| Statement of Assets |
| Net |
| ||
|
| Statement of |
| Statement of |
| Net Amount |
| and Liabilities |
| Exposure3 |
| ||
|
| Assets and |
| Assets and |
| Receivable |
| Collateral |
| Collateral |
| (Not Less |
|
|
| Liabilities1 |
| Liabilities1 |
| (Payable | ) | Pledged2 |
| Received2 |
| Than $0 | ) |
|
| ($000 | ) | ($000 | ) | ($000 | ) | ($000 | ) | ($000 | ) | ($000 | ) |
Goldman Sachs International |
| — |
| (226 | ) | (226 | ) | — |
| — |
| — |
|
Merrill Lynch International |
| — |
| (203 | ) | (203 | ) | — |
| — |
| — |
|
Total |
| 4 |
| (892 | ) | (888 | ) | — |
| 36 |
| — |
|
1 Absent an event of default or early termination, derivative assets and liabilities are presented gross and not offset in the Consolidated Statement of Assets and Liabilities.
2 Securities or other assets pledged as collateral are noted in the Consolidated Statement of Net Assets. Securities or other assets received as collateral are held in a segregated account and not included in the fund’s security holdings in the Consolidated Statement of Net Assets.
3 Net Exposure represents the net amount receivable from the counterparty in the event of default. Counterparties are not required to exchange collateral if amount is below a specified minimum transfer amount.
3. Federal Income Taxes: The fund intends to continue to qualify as a regulated investment company and distribute all of its taxable income. The subsidiary is classified as a foreign corporation for U.S. tax purposes, and because it does not carry on a U.S. trade or business, is generally not subject to U.S. federal income tax. The subsidiary also complies with the Foreign Account Tax Compliance Act (“FATCA”) and thus will not be subject to 30% withholding under FATCA on any income from U.S. investments. In addition, the subsidiary is not subject to Cayman Islands income tax. The subsidiary is not required to distribute any earnings and profits to the fund. Management has analyzed the fund’s tax positions taken for the period ended October 31, 2019, and has concluded that no provision for federal income tax is required in the fund’s financial statements.
4. Distributions: Distributions to shareholders are recorded on the ex-dividend date. Distributions are determined on a tax basis and may differ from net investment income and realized capital gains for financial reporting purposes.
5. Other: Interest income includes income distributions received from Vanguard Market Liquidity Fund and is accrued daily. Premiums and discounts on debt securities are amortized and accreted, respectively, to interest income over the lives of the respective securities, except for premiums on certain callable debt securities that are amortized to the earliest call date. Inflation adjustments to the face amount of inflation-indexed securities are included in interest income. Security transactions are accounted for on the date securities are bought or sold. Costs used to determine realized gains (losses) on the sale of investment securities are those of the specific securities sold.
B. In accordance with the terms of a Funds’ Service Agreement (the “FSA”) between Vanguard and the fund, Vanguard furnishes to the fund investment advisory, corporate management, administrative, marketing, and distribution services at Vanguard’s cost of operations (as defined by the FSA). These costs of operations are allocated to the fund based on methods and guidelines approved by the board of trustees and are generally settled twice a month.
Commodity Strategy Fund
Under a separate agreement, Vanguard provides corporate management and administrative services to the subsidiary for an annual fee of 0.10% of average net assets of the subsidiary, generally settled once a month. In addition, the subsidiary pays an unaffiliated third party, VGMF I (Cayman) Limited, an affiliate of Maples Trustee Services (Cayman) Limited, a fee plus reasonable additional expenses for trustee services. All of the subsidiary’s expenses are reflected in the Consolidated Statement of Operations and in the Ratio of Total Expenses to Average Net Assets in the Consolidated Financial Highlights.
Upon the request of Vanguard, the fund may invest up to 0.40% of its net assets as capital in Vanguard. At October 31, 2019, the fund had contributed to Vanguard capital in the amount of $10,000, representing less than 0.01% of the fund’s net assets and less than 0.01% of Vanguard’s capital received pursuant to the FSA. The fund’s trustees and officers are also directors and employees, respectively, of Vanguard.
C. Various inputs may be used to determine the value of the fund’s investments. These inputs are summarized in three broad levels for financial statement purposes. The inputs or methodologies used to value securities are not necessarily an indication of the risk associated with investing in those securities.
Level 1—Quoted prices in active markets for identical securities.
Level 2—Other significant observable inputs (including quoted prices for similar securities, interest rates, prepayment speeds, credit risk, etc.).
Level 3—Significant unobservable inputs (including the fund’s own assumptions used to determine the fair value of investments). Any investments valued with significant unobservable inputs are noted on the Consolidated Statement of Net Assets.
The following table summarizes the market value of the fund’s investments and derivatives as of October 31, 2019, based on the inputs used to value them:
|
| Level 1 |
| Level 2 |
| Level 3 |
|
Investments |
| ($000 | ) | ($000 | ) | ($000 | ) |
U.S. Government and Agency Obligations |
| — |
| 151,786 |
| — |
|
Temporary Cash Investments |
| 16,216 |
| 40,304 |
| — |
|
Swap Contracts—Assets |
| — |
| 4 |
| — |
|
Swap Contracts—Liabilities |
| — |
| (892 | ) | — |
|
Total |
| 16,216 |
| 191,202 |
| — |
|
D. Permanent differences between book-basis and tax-basis components of net assets are reclassified among capital accounts in the financial statements to reflect their tax character. These reclassifications have no effect on net assets or net asset value per share. As of period end, permanent differences primarily attributable to the accounting for operations of the subsidiary were reclassified between the following accounts:
|
| Amount |
|
|
| ($000 | ) |
Paid-in Capital |
| (1,067 | ) |
Total Distributable Earnings (Loss) |
| 1,067 |
|
Commodity Strategy Fund
Temporary differences between book-basis and tax-basis components of total distributable earnings (loss) arise when certain items of income, gain, or loss are recognized in different periods for financial statement and tax purposes; these differences will reverse at some time in the future. The differences are primarily related to the tax deferral of losses on wash sales. As of period end, the tax-basis components of total distributable earnings (loss) are detailed in the table as follows:
|
| Amount |
|
|
| ($000 | ) |
Undistributed Ordinary Income |
| 821 |
|
Undistributed Long-Term Gains |
| — |
|
Capital Loss Carryforwards (Non-expiring) |
| (22 | ) |
Net Unrealized Gains (Losses) |
| 12 |
|
As of October 31, 2019, gross unrealized appreciation and depreciation for investments and derivatives based on cost for U.S. federal income tax purposes were as follows:
|
| Amount |
|
|
| ($000 | ) |
Tax Cost |
| 208,294 |
|
Gross Unrealized Appreciation |
| 2,414 |
|
Gross Unrealized Depreciation |
| (2,402 | ) |
Net Unrealized Appreciation (Depreciation) |
| 12 |
|
E. During the period ended October 31, 2019, the fund purchased $139,891,000 of investment securities and sold $7,705,000 of investment securities, other than temporary cash investments.
The fund purchased securities from and sold securities to other Vanguard funds or accounts managed by Vanguard or its affiliates, in accordance with procedures adopted by the board of trustees in compliance with Rule 17a-7 of the Investment Company Act of 1940. For the period ended October 31, 2019, such purchases and sales were $101,741,000 and $0, respectively; these amounts are included in the purchases and sales of investment securities noted above.
F. Capital shares issued and redeemed were:
|
| June 25, 20191 to |
|
|
| October 31, 2019 |
|
|
| Shares |
|
|
| (000 | ) |
Issued |
| 8,645 |
|
Issued in Lieu of Cash Distributions |
| — |
|
Redeemed |
| (298 | ) |
Net Increase (Decrease) in Shares Outstanding |
| 8,347 |
|
1 Inception.
At October 31, 2019, Vanguard Managed Payout Fund was the record or beneficial owner of 65% of the fund’s net assets.
G. Management has determined that no material events or transactions occurred subsequent to October 31, 2019, that would require recognition or disclosure in these financial statements.
Report of Independent Registered Public Accounting Firm
To the Board of Trustees of Vanguard Trustees’ Equity Fund and Shareholders of Vanguard Commodity Strategy Fund
Opinion on the Financial Statements
We have audited the accompanying consolidated statement of net assets and consolidated statement of assets and liabilities of Vanguard Commodity Strategy Fund (one of the funds constituting Vanguard Trustees’ Equity Fund, referred to hereafter as the “Fund”) as of October 31, 2019, and the related consolidated statements of operations and changes in net assets, including the related notes, and the consolidated financial highlights for the period June 25, 2019 (inception) through October 31, 2019 (collectively referred to as the “consolidated financial statements”). In our opinion, the consolidated financial statements present fairly, in all material respects, the financial position of the Fund as of October 31, 2019, and the results of its operations, changes in its net assets, and the financial highlights for the period June 25, 2019 (inception) through October 31, 2019 in conformity with accounting principles generally accepted in the United States of America.
Basis for Opinion
These consolidated financial statements are the responsibility of the Fund’s management. Our responsibility is to express an opinion on the Fund’s consolidated financial statements based on our audit. We are a public accounting firm registered with the Public Company Accounting Oversight Board (United States) (“PCAOB”) and are required to be independent with respect to the Fund in accordance with the U.S. federal securities laws and the applicable rules and regulations of the Securities and Exchange Commission and the PCAOB.
We conducted our audit of these consolidated financial statements in accordance with the standards of the PCAOB. Those standards require that we plan and perform the audit to obtain reasonable assurance about whether the consolidated financial statements are free of material misstatement, whether due to error or fraud.
Our audit included performing procedures to assess the risks of material misstatement of the consolidated financial statements, whether due to error or fraud, and performing procedures that respond to those risks. Such procedures included examining, on a test basis, evidence regarding the amounts and disclosures in the consolidated financial statements. Our audit also included evaluating the accounting principles used and significant estimates made by management, as well as evaluating the overall presentation of the consolidated financial statements. Our procedures included confirmation of securities owned as of October 31, 2019 by correspondence with the custodian, transfer agent and brokers; when replies were not received from brokers, we performed other auditing procedures. We believe that our audit provides a reasonable basis for our opinion.
/s/PricewaterhouseCoopers LLP
Philadelphia, Pennsylvania
December 18, 2019
We have served as the auditor of one or more investment companies in The Vanguard Group of Funds since 1975.
Trustees Approve Advisory Arrangement
Effective February 2019, the board of Vanguard Trustees’ Equity Fund approved the launch of Vanguard Commodity Strategy Fund, which utilizes an internalized management structure whereby The Vanguard Group, Inc. (Vanguard), through its Quantitative Equity and Fixed Income Groups, provides investment advisory services to the fund. The board determined that the investment advisory arrangement with Vanguard was in the best interests of the fund and its prospective shareholders.
The board based its decision upon an evaluation of the advisor’s investment staff, portfolio management process, and performance. This evaluation included information provided to the board by Vanguard’s Portfolio Review Department, which is responsible for fund and advisor oversight and product management. The trustees considered the factors discussed below, among others. However, no single factor determined whether the board approved the arrangement. Rather, it was the totality of the circumstances that drove the board’s decision.
Nature, extent, and quality of services
The board considered the quality of the investment management services to be provided to the fund and took into account the organizational depth and stability of the advisor. The board noted that Vanguard has been managing investments for more than four decades. Both the Quantitative Equity Group and the Fixed Income Group adhere to sound, disciplined investment management processes; each group’s management team has considerable experience, stability, and depth.
The board concluded that Vanguard’s experience, stability, depth, and performance, among other factors, warranted approval of the advisory arrangement.
Investment performance
The board determined that both the Quantitative Equity Group and the Fixed Income Group, in their management of other Vanguard funds, have a track record of consistent performance and disciplined investment processes.
Cost
The board concluded that the fund’s expense ratio will be well below the average expense ratio charged by funds in its peer group.
The board does not conduct a profitability analysis of Vanguard because of Vanguard’s unique structure. Unlike most other mutual fund management companies, Vanguard is owned by the funds it oversees.
The benefit of economies of scale
The board concluded that Vanguard’s arrangement with the fund ensures that the fund will realize economies of scale as it grows, with the cost to shareholders declining as fund assets increase.
The board will consider whether to renew the advisory arrangement after a one-year period.
The People Who Govern Your Fund
The trustees of your mutual fund are there to see that the fund is operated and managed in your best interests since, as a shareholder, you are a part owner of the fund. Your fund’s trustees also serve on the board of directors of The Vanguard Group, Inc., which is owned by the Vanguard funds and provides services to them.
A majority of Vanguard’s board members are independent, meaning that they have no affiliation with Vanguard or the funds they oversee, apart from the sizable personal investments they have made as private individuals. The independent board members have distinguished backgrounds in business, academia, and public service. Each of the trustees and executive officers oversees 213 Vanguard funds.
Information for each trustee and executive officer of the fund appears below. That information, as well as the Vanguard fund count, is as of the date on the cover of this fund report. The mailing address of the trustees and officers is P.O. Box 876, Valley Forge, PA 19482. More information about the trustees is in the Statement of Additional Information, which can be obtained, without charge, by contacting Vanguard at 800-662-7447, or online at vanguard.com.
Interested Trustee1
Mortimer J. Buckley
Born in 1969. Trustee since January 2018. Principal occupation(s) during the past five years and other experience: chairman of the board (January 2019–present) of Vanguard and of each of the investment companies served by Vanguard; chief executive officer (January 2018–present) of Vanguard; chief executive officer, president, and trustee (January 2018–present) of each of the investment companies served by Vanguard; president and director (2017–present) of Vanguard; and president (February 2018–present) of Vanguard Marketing Corporation. Chief investment officer (2013–2017), managing director (2002–2017), head of the Retail Investor Group (2006–2012), and chief information officer (2001–2006) of Vanguard. Chairman of the board (2011–2017) and trustee (2009–2017) of the Children’s Hospital of Philadelphia; trustee (2018–present) of The Shipley School.
Independent Trustees
Emerson U. Fullwood
Born in 1948. Trustee since January 2008. Principal occupation(s) during the past five years and other experience: executive chief staff and marketing officer for North America and corporate vice president (retired 2008) of Xerox Corporation (document management products and services). Former president of the Worldwide Channels Group, Latin America, and Worldwide Customer Service and executive chief staff officer of Developing Markets of Xerox. Executive in residence and 2009–2010 Distinguished Minett Professor at the Rochester Institute of Technology. Director of SPX FLOW, Inc. (multi-industry manufacturing). Director of the University of Rochester Medical Center, the Monroe Community College Foundation, the United Way of Rochester, North Carolina A&T University, and Roberts Wesleyan College. Trustee of the University of Rochester.
Amy Gutmann
Born in 1949. Trustee since June 2006. Principal occupation(s) during the past five years and other experience: president (2004–present) of the University of Pennsylvania. Christopher H. Browne Distinguished Professor of Political Science, School of Arts and Sciences, and professor of communication, Annenberg School for Communication, with secondary faculty appointments in the Department of Philosophy, School of Arts and Sciences, and at the Graduate School of Education, University of Pennsylvania. Trustee of the National Constitution Center.
F. Joseph Loughrey
Born in 1949. Trustee since October 2009. Principal occupation(s) during the past five years and other experience: president and chief operating officer (retired 2009) and vice chairman of the board (2008–2009) of Cummins Inc. (industrial machinery). Chairman of the board of Hillenbrand, Inc. (specialized consumer services), and the Lumina Foundation.
1 Mr. Buckley is considered an “interested person,” as defined in the Investment Company Act of 1940, because he is an officer of the Vanguard funds.
Director of the V Foundation and Oxfam America. Member of the advisory council for the College of Arts and Letters and chair of the advisory board to the Kellogg Institute for International Studies, both at the University of Notre Dame.
Mark Loughridge
Born in 1953. Trustee since March 2012. Principal occupation(s) during the past five years and other experience: senior vice president and chief financial officer (retired 2013) of IBM (information technology services). Fiduciary member of IBM’s Retirement Plan Committee (2004–2013), senior vice president and general manager (2002–2004) of IBM Global Financing, vice president and controller (1998–2002) of IBM, and a variety of other prior management roles at IBM. Member of the Council on Chicago Booth.
Scott C. Malpass
Born in 1962. Trustee since March 2012. Principal occupation(s) during the past five years and other experience: chief investment officer (1989–present) and vice president (1996–present) of the University of Notre Dame. Assistant professor of finance at the Mendoza College of Business, University of Notre Dame, and member of the Notre Dame 403(b) Investment Committee. Chairman of the board of TIFF Advisory Services, Inc. Member of the board of Catholic Investment Services, Inc. (investment advisors) and the board of superintendence of the Institute for the Works of Religion.
Deanna Mulligan
Born in 1963. Trustee since January 2018. Principal occupation(s) during the past five years and other experience: president (2010–present) and chief executive officer (2011–present) of The Guardian Life Insurance Company of America. Chief operating officer (2010–2011) and executive vice president (2008–2010) of Individual Life and Disability of The Guardian Life Insurance Company of America. Member of the board of The Guardian Life Insurance Company of America, the American Council of Life Insurers, the Partnership for New York City (business leadership), and the Committee Encouraging Corporate Philanthropy. Trustee of the Economic Club of New York and the Bruce Museum (arts and science). Member of the Advisory Council for the Stanford Graduate School of Business.
André F. Perold
Born in 1952. Trustee since December 2004. Principal occupation(s) during the past five years and other experience: George Gund Professor of Finance and Banking, Emeritus at the Harvard Business School (retired 2011). Chief investment officer and co-managing partner of HighVista Strategies (private investment firm). Board of advisors and investment committee member of the Museum of Fine Arts Boston. Board member (2018–present) of RIT Capital Partners (investment firm); investment committee member of Partners Health Care System.
Sarah Bloom Raskin
Born in 1961. Trustee since January 2018. Principal occupation(s) during the past five years and other experience: deputy secretary (2014–2017) of the United States Department of the Treasury. Governor (2010–2014) of the Federal Reserve Board. Commissioner (2007–2010) of financial regulation for the State of Maryland. Member of the board of directors (2012–2014) of Neighborhood Reinvestment Corporation. Director (2017–present) of i(x) Investments; director (2017–present) of Reserve Trust. Rubinstein Fellow (2017–present) of Duke University; trustee (2017–present) of Amherst College.
Peter F. Volanakis
Born in 1955. Trustee since July 2009. Principal occupation(s) during the past five years and other experience: president and chief operating officer (retired 2010) of Corning Incorporated (communications equipment) and director of Corning Incorporated (2000–2010) and Dow Corning (2001–2010). Director (2012) of SPX Corporation (multi-industry manufacturing). Overseer of the Amos Tuck School of Business Administration, Dartmouth College (2001–2013). Chairman of the board of trustees of Colby-Sawyer College. Member of the board of Hypertherm Inc. (industrial cutting systems, software, and consumables).
Executive Officers
John Bendl
Born in 1970. Principal occupation(s) during the past five years and other experience: principal of Vanguard. Chief financial officer (October 2019–present) of each of the investment companies served by Vanguard. Chief accounting officer, treasurer, and controller of Vanguard (2017–present). Partner (2003–2016) at KPMG (audit, tax, and advisory services).
Glenn Booraem
Born in 1967. Principal occupation(s) during the past five years and other experience: principal of Vanguard. Investment stewardship officer (2017–present), treasurer (2015–2017), controller (2010–2015), and assistant controller (2001–2010) of each of the investment companies served by Vanguard.
Christine M. Buchanan
Born in 1970. Principal occupation(s) during the past five years and other experience: principal of Vanguard. Treasurer (2017–present) of each of the investment companies served by Vanguard. Partner (2005–2017) at KPMG (audit, tax, and advisory services).
David Cermak
Born in 1960. Principal occupation(s) during the past five years and other experience: principal of Vanguard. Finance director (October 2019–present) of each of the investment companies served by Vanguard. Managing director and head (2017–present) of Vanguard Investments Singapore. Managing director and head (2017–2019) of Vanguard Investments Hong Kong. Representative director and head (2014–2017) of Vanguard Investments Japan.
Thomas J. Higgins
Born in 1957. Principal occupation(s) during the past five years and other experience: principal of Vanguard. Finance director (October 2019–present), chief financial officer (2008–2019), and treasurer (1998–2008) of each of the investment companies served by Vanguard.
Peter Mahoney
Born in 1974. Principal occupation(s) during the past five years and other experience: principal of Vanguard. Controller (2015–present) of each of the investment companies served by Vanguard. Head of International Fund Services (2008–2014) at Vanguard.
Anne E. Robinson
Born in 1970. Principal occupation(s) during the past five years and other experience: general counsel (2016–present) of Vanguard. Secretary (2016–present) of Vanguard and of each of the investment companies served by Vanguard. Managing director (2016–present) of Vanguard. Managing director and general counsel of Global Cards and Consumer Services (2014–2016) at Citigroup. Counsel (2003–2014) at American Express.
Michael Rollings
Born in 1963. Principal occupation(s) during the past five years and other experience: finance director (2017–present) and treasurer (2017) of each of the investment companies served by Vanguard. Managing director (2016–present) of Vanguard. Chief financial officer (2016–present) of Vanguard. Director (2016–present) of Vanguard Marketing Corporation. Executive vice president and chief financial officer (2006–2016) of MassMutual Financial Group.
John E. Schadl
Born in 1972. Principal occupation(s) during the past five years and other experience: principal of Vanguard. Chief compliance officer (2019–present) of Vanguard and of each of the investment companies served by Vanguard. Assistant vice president (May 2019–present) of Vanguard Marketing Corporation.
Vanguard Senior Management Team
Joseph Brennan | Chris D. McIsaac |
Mortimer J. Buckley | James M. Norris |
Gregory Davis | Thomas M. Rampulla |
John James | Karin A. Risi |
Martha G. King | Anne E. Robinson |
John T. Marcante | Michael Rollings |
|
|
|
|
| P.O. Box 2600 |
| Valley Forge, PA 19482-2600 |

Connect with Vanguard® > vanguard.com
Fund Information > 800-662-7447
Direct Investor Account Services > 800-662-2739
Institutional Investor Services > 800-523-1036
Text Telephone for People Who Are Deaf or Hard of Hearing > 800-749-7273
This material may be used in conjunction with the offering of shares of any Vanguard fund only if preceded or accompanied by the fund’s current prospectus.
All comparative mutual fund data are from Morningstar, Inc., unless otherwise noted.
You can obtain a free copy of Vanguard’s proxy voting guidelines by visiting vanguard.com/proxyreporting or by calling Vanguard at 800-662-2739. The guidelines are also available from the SEC’s website, www.sec.gov. In addition, you may obtain a free report on how your fund voted the proxies for securities it owned during the 12 months ended June 30. To get the report, visit either vanguard.com/proxyreporting or www.sec.gov.
You can review information about your fund on the SEC’s website, and you can receive copies of this information, for a fee, by sending a request via email addressed to publicinfo@sec.gov.
Source for Bloomberg Barclays indexes: Bloomberg Index Services Limited. Copyright 2019, Bloomberg. All rights reserved.
CFA® is a registered trademark owned by CFA Institute.
| © 2019 The Vanguard Group, Inc. All rights reserved. Vanguard Marketing Corporation, Distributor.
Q5170 122019 |
Item 2: Code of Ethics. The Registrant has adopted a code of ethics that applies to the Registrant’s principal executive officer, principal financial officer, principal accounting officer or controller or persons performing similar functions. The Code of Ethics was amended during the reporting period covered by this report to make certain technical, non-material changes.
Item 3: Audit Committee Financial Expert. All members of the Audit Committee have been determined by the Registrant’s Board of Trustees to be Audit Committee Financial Experts and to be independent: F. Joseph Loughrey, Mark Loughridge, Sarah Bloom Raskin, and Peter F. Volanakis.
Item 4: Principal Accountant Fees and Services.
(a) Audit Fees.
Audit Fees of the Registrant.
Fiscal Year Ended October 31, 2019: $164,000
Fiscal Year Ended October 31, 2018: $150,000
Aggregate Audit Fees of Registered Investment Companies in the Vanguard Group.
Fiscal Year Ended October 31, 2019: $9,568,215
Fiscal Year Ended October 31, 2018: $9,734,277
Includes fees billed in connection with audits of the Registrant, other registered investment companies in the Vanguard complex, The Vanguard Group, Inc., and Vanguard Marketing Corporation.
(b) Audit-Related Fees.
Fiscal Year Ended October 31, 2019: $3,012,031
Fiscal Year Ended October 31, 2018: $5,581,336
Includes fees billed in connection with assurance and related services provided to the Registrant, other registered investment companies in the Vanguard complex, The Vanguard Group, Inc., and Vanguard Marketing Corporation.
(c) Tax Fees.
Fiscal Year Ended October 31, 2019: $357,238
Fiscal Year Ended October 31, 2018: $347,985
Includes fees billed in connection with tax compliance, planning, and advice services provided to the Registrant, other registered investment companies in the Vanguard complex, The Vanguard Group, Inc., and Vanguard Marketing Corporation.
(d) All Other Fees.
Fiscal Year Ended October 31, 2019: $0
Fiscal Year Ended October 31, 2018: $0
Includes fees billed for services related to tax reported information provided to the Registrant, other registered investment companies in the Vanguard complex, The Vanguard Group, Inc., and Vanguard Marketing Corporation.
(e) (1) Pre-Approval Policies. The policy of the Registrant’s Audit Committee is to consider, and, if appropriate, approve before the principal accountant is engaged for such services, all specific audit and non-audit services provided to: the Registrant, other registered investment companies in the Vanguard complex, The Vanguard Group, Inc., and entities controlled by The Vanguard Group, Inc. that provide ongoing services to the Registrant. In making a determination, the Audit Committee considers whether the services are consistent with maintaining the principal accountant’s independence.
In the event of a contingency situation in which the principal accountant is needed to provide services in between scheduled Audit Committee meetings, the Chairman of the Audit Committee would be called on to consider and, if appropriate, pre-approve audit or permitted non-audit services in an amount sufficient to complete services through the next Audit Committee meeting, and to determine if such services would be consistent with maintaining the accountant’s independence. At the next scheduled Audit Committee meeting, services and fees would be presented to the Audit Committee for formal consideration, and, if appropriate, approval by the entire Audit Committee. The Audit Committee would again consider whether such services and fees are consistent with maintaining the principal accountant’s independence.
The Registrant’s Audit Committee is informed at least annually of all audit and non-audit services provided by the principal accountant to the Vanguard complex, whether such services are provided to: the Registrant, other registered investment companies in the Vanguard complex, The Vanguard Group, Inc., or other entities controlled by The Vanguard Group, Inc. that provide ongoing services to the Registrant.
(2) No percentage of the principal accountant’s fees or services were approved pursuant to the waiver provision of paragraph (c)(7)(i)(C) of Rule 2-01 of Regulation S-X.
(f) For the most recent fiscal year, over 50% of the hours worked under the principal accountant’s engagement were not performed by persons other than full-time, permanent employees of the principal accountant.
(g) Aggregate Non-Audit Fees.
Fiscal Year Ended October 31, 2019: $357,238
Fiscal Year Ended October 31, 2018: $347,985
Includes fees billed for non-audit services provided to the Registrant, other registered investment companies in the Vanguard complex, The Vanguard Group, Inc., and Vanguard Marketing Corporation.
(h) For the most recent fiscal year, the Audit Committee has determined that the provision of all non-audit services was consistent with maintaining the principal accountant’s independence.
Item 5: Audit Committee of Listed Registrants.
The Registrant is a listed issuer as defined in rule 10A-3 under the Securities Exchange Act of 1934 (“Exchange Act”). The Registrant has a separately-designated standing audit committee established in accordance with Section 3(a)(58)(A) of the Exchange Act. The Registrant’s audit committee members are: F. Joseph Loughrey, Mark Loughridge, Sarah Bloom Raskin, and Peter F. Volanakis.
Item 6: Investments.
Not applicable.
Item 7: Disclosure of Proxy Voting Policies and Procedures for Closed-End Management Investment Companies.
Not applicable.
Item 8: Portfolio Managers of Closed-End Management Investment Companies.
Not applicable.
Item 9: Purchase of Equity Securities by Closed-End Management Investment Company and Affiliated Purchasers.
Not applicable.
Item 10: Submission of Matters to a Vote of Security Holders.
Not applicable.
Item 11: Controls and Procedures.
(a) Disclosure Controls and Procedures. The Principal Executive and Financial Officers concluded that the Registrant’s Disclosure Controls and Procedures are effective based on their evaluation of the Disclosure Controls and Procedures as of a date within 90 days of the filing date of this report.
(b) Internal Control Over Financial Reporting. There were no significant changes in Registrant’s Internal Control Over Financial Reporting or in other factors that could significantly affect this control subsequent to the date of the evaluation, including any corrective actions with regard to significant deficiencies and material weaknesses.
Item 12: Disclosure of Securities Lending Activities for Closed-End Management
Investment Companies.
Not applicable.
Item 13: Exhibits.
(a) Code of Ethics.
(b) Certifications.
Pursuant to the requirements of the Securities Exchange Act of 1934 and the Investment Company Act of 1940, the registrant has duly caused this report to be signed on its behalf by the undersigned, thereunto duly authorized.
| VANGUARD TRUSTEES’ EQUITY FUND | |
|
| |
BY: | /s/ MORTIMER J. BUCKLEY* |
|
|
|
|
| MORTIMER J. BUCKLEY |
|
| CHIEF EXECUTIVE OFFICER |
|
Date: December 18, 2019
Pursuant to the requirements of the Securities Exchange Act of 1934 and the Investment Company Act of 1940, this report has been signed below by the following persons on behalf of the registrant and in the capacities and on the dates indicated.
| VANGUARD TRUSTEES’ EQUITY FUND | |
|
| |
BY: | /s/ MORTIMER J. BUCKLEY* |
|
|
|
|
| MORTIMER J. BUCKLEY |
|
| CHIEF EXECUTIVE OFFICER |
|
| ||
Date: December 18, 2019 | ||
| ||
| VANGUARD TRUSTEES’ EQUITY FUND | |
|
| |
BY: | /s/ JOHN BENDL* |
|
|
|
|
| JOHN BENDL |
|
| CHIEF FINANCIAL OFFICER |
|
| ||
Date: December 18, 2019 | ||
* By: /s/ Anne E. Robinson
Anne E. Robinson, pursuant to a Power of Attorney filed on January 18, 2018 (see file Number 33-32216) and a Power of Attorney filed on October 30, 2019 (see file Number 811-02554), Incorporated by Reference.