| UNITED STATES |
| SECURITIES AND EXCHANGE COMMISSION |
| Washington, D.C. 20549 |
FORM N-CSR
| CERTIFIED SHAREHOLDER REPORT OF REGISTERED MANAGEMENT |
| INVESTMENT COMPANIES |
| Investment Company Act file number | 811-3081 |
| Dreyfus Appreciation Fund, Inc. |
| (Exact name of Registrant as specified in charter) |
| c/o The Dreyfus Corporation | ||
| 200 Park Avenue | ||
| New York, New York 10166 | ||
| (Address of principal executive offices) | (Zip code) | |
| Michael A. Rosenberg, Esq. |
| 200 Park Avenue |
| New York, New York 10166 |
| (Name and address of agent for service) |
| Registrant's telephone number, including area code: | (212) 922-6000 |
| Date of fiscal year end: | 12/31 |
| Date of reporting period: | 06/30/08 |
1
FORM N-CSR
| Item 1. | Reports to Stockholders. |
Save time. Save paper. View your next shareholder report online as soon as it’s available. Log into www.dreyfus.com and sign up for Dreyfus eCommunications. It’s simple and only takes a few minutes.
The views expressed in this report reflect those of the portfolio manager only through the end of the period covered and do not necessarily represent the views of Dreyfus or any other person in the Dreyfus organization. Any such views are subject to change at any time based upon market or other conditions and Dreyfus disclaims any responsibility to update such views.These views may not be relied on as investment advice and, because investment decisions for a Dreyfus fund are based on numerous factors, may not be relied on as an indication of trading intent on behalf of any Dreyfus fund.
Not FDIC-Insured • Not Bank-Guaranteed • May Lose Value
| Contents | ||
| THE FUND | ||
| 2 | A Letter from the CEO | |
| 3 | Discussion of Fund Performance | |
| 6 | Understanding Your Fund’s Expenses | |
| 6 | Comparing Your Fund’s Expenses | |
| With Those of Other Funds | ||
| 7 | Statement of Investments | |
| 11 | Statement of Assets and Liabilities | |
| 12 | Statement of Operations | |
| 13 | Statement of Changes in Net Assets | |
| 14 | Financial Highlights | |
| 15 | Notes to Financial Statements | |
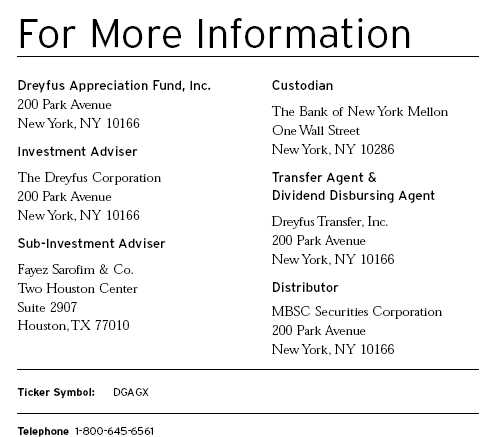
| FOR MORE INFORMATION | ||
| Back Cover | ||
The Fund
Dreyfus Appreciation Fund, Inc.

A LETTER FROM THE CEO
Dear Shareholder:
We are pleased to present this semiannual report for Dreyfus Appreciation Fund, Inc., covering the six-month period from January
1, 2008, through June 30, 2008.
The U.S.equity markets remained turbulent over the first half of 2008 and ended with June posting one of the worst monthly performance slumps on record. A continuously weakening U.S. housing market, surging inflation, devaluation of the U.S. dollar and lingering credit concerns continued to dampen investor sentiment. Of the ten economic sectors represented by the S&P 500® Composite Stock Index, only two —energy and materials — posted positive absolute returns for the reporting period.The financials sector was the hardest-hit industry group, primarily due to massive sub-prime related losses among global financial institutions.
While the U.S and global economy clearly has slowed, the news is not all bad.We have seen signs of more orderly deleveraging among financial institutions, and it appears that most of the damage caused by last year’s sub-prime fiasco has been exposed and, to an extent, ameliorated. Moreover, the global upsurge in inflation should persist longer in fast-growing emerging markets than in more developed countries. These factors support our view that many areas of the stock market may have been punished too severely in the downturn, creating potential long-term opportunities for patient investors. As always, your financial advisor can help you identify suitable investments that may be right for you and your long-term investment goals.
For information about how the fund performed during the reporting period, as well as market perspectives, we have provided a Discussion of Fund Performance given by the fund’s Portfolio Manager.
Thank you for your continued confidence and support.

2

DISCUSSION OF FUND PERFORMANCE
For the period of January 1, 2008, through June 30, 2008, as provided by Fayez Sarofim, of Fayez Sarofim & Co., Sub-Investment Adviser
Fund and Market Performance
For the six-month period ended June 30, 2008, Dreyfus Appreciation Fund produced a total return of –8.81% .1 In comparison, the total return of the fund’s benchmark, the Standard & Poor’s 500 Composite Stock Price Index (“S&P 500 Index”), was –11.90% for the same period.2
Stocks generally declined as a credit crisis intensified, producing massive losses among financial institutions, and the U.S. economy weakened along with home prices, the job market and consumer spending.The fund declined less than its benchmark, primarily due to its focus on industry leaders with strong balance sheets and positive cash flows.
The Fund’s Investment Approach
The fund invests primarily in large, well-established multinational companies that we believe are solidly positioned to weather difficult economic climates and thrive in more favorable environments.We focus on purchasing blue-chip stocks at a price we consider to be justified by the company’s fundamentals.The result is a portfolio of stocks in prominent companies selected for their sustained patterns of profitability, strong balance sheets, expanding global presence and above-average growth potential.
At the same time, we manage the fund in a manner particularly well suited to long-term investors. Generally, we buy and sell relatively few stocks during the course of the year, helping to minimize investors’ tax liabilities and reduce trading costs.3
Stocks Struggled in a Weaker Economy
U.S. stocks generally produced disappointing results over the first half of 2008 amid an onslaught of negative economic news. As housing values continued to plummet, mortgage defaults, delinquencies and foreclosures rose sharply, fueling ongoing turmoil in the mortgage mar-
The Fund 3
DISCUSSION OF FUND PERFORMANCE (continued)
ket.At the same time, escalating commodity prices have burdened consumers with soaring oil, gas and home heating expenditures and rising food costs.These factors caused consumers to cut back on spending in other, more discretionary areas. In turn, many businesses reduced capital spending in anticipation of a more difficult business environment.
At the same time, a credit crisis that began in 2007 in the sub-prime mortgage market continued to batter commercial banks, investment banks and bond insurers.A number of the world’s major financial institutions announced additional write-downs and write-offs over the reporting period, sparking steep declines in their stock prices. Most other market sectors also posted losses in this challenging environment. In fact, of the 10 economic sectors within the S&P 500 Index, only the materials sector recorded a gain over the first six months of the year.
A Focus on Quality Helped Limit Losses
The fund’s unwavering focus on financially strong blue-chip companies helped protect it from the full brunt of the equity market’s slump. In fact, the fund’s relatively light exposure to troubled financial services companies proved to be the reporting period’s greatest contributor to the fund’s relative performance, as we avoided many of the companies most severely embroiled in the sub-prime mortgage meltdown. Conversely, an overweighted position in the energy sector enabled the fund to participate more fully in gains among integrated oil producers, such as Conoco-Phillips and Chevron; oil services companies, such as Halliburton; and exploration-and-production firms.These companies benefited from soaring crude oil prices, which continued to shatter previous record highs and ended the reporting period above $140 per barrel. Other energy commodities, such as natural gas and coal, also surged higher.
To a lesser degree, an underweighted position among health care stocks also boosted the fund’s relative results. In addition, the fund received strong contributions from individual stocks in other areas, including mass merchandiser Wal-Mart Stores, which rebounded strongly after a weak 2007, and beer maker Anheuser-Busch, which gained value after receiving an unsolicited acquisition offer from a global competitor.
4
Although the fund benefited from an underweighted position in the financials sector, even reduced positions in industry leaders such as Citigroup, Bank of America and American International Group ranked among the reporting period’s greater detractors from relative performance. Industrial conglomerate General Electric also stumbled due to losses in its consumer finance business.
Finding Opportunities in a Distressed Market
As of the end of the reporting period, we have identified what we believe are a number of fundamentally strong companies selling at attractive valuations compared to historical averages. As might be expected during a period of heightened volatility, we took advantage of some of these opportunities to upgrade the fund’s portfolio. We added a number of new positions, including metals-and-mining leader Freeport-McMoRan Copper & Gold, Mexican beverage bottler Fomento Economico Mexicano, defense contractor General Dynamics, glass producer Corning, medical devices maker Intuitive Surgical, power-plant builder McDermott International and drug developer Novo Nordisk. All of these companies appear to be poised to benefit from positive, ongoing business trends. On the other hand, we eliminated the fund’s positions in retailer Home Depot, which has suffered in the housing downturn, and SunTrust Banks, which is located in one of the nation’s weaker real estate markets.
July 15, 2008
| 1 | Total return includes reinvestment of dividends and any capital gains paid. Past performance is no | |
| guarantee of future results. Share price and investment return fluctuate such that upon redemption, | ||
| fund shares may be worth more or less than their original cost. | ||
| 2 | SOURCE: LIPPER INC. — Reflects reinvestment of dividends and, where applicable, capital | |
| gain distributions.The Standard & Poor’s 500 Composite Stock Price Index is a widely accepted, | ||
| unmanaged index of U.S. stock market performance. | ||
| 3 | Achieving tax efficiency is not a part of the fund’s investment objective, and there can be no | |
| guarantee that the fund will achieve any particular level of taxable distributions in future years. In | ||
| periods when the manager has to sell significant amounts of securities (e.g., during periods of | ||
| significant net redemptions or changes in index components) funds can be expected to be less tax | ||
| efficient than during periods of more stable market conditions and asset flows. |
The Fund 5
UNDERSTANDING YOUR FUND’S EXPENSES (Unaudited)
As a mutual fund investor, you pay ongoing expenses, such as management fees and other expenses. Using the information below, you can estimate how these expenses affect your investment and compare them with the expenses of other funds.You also may pay one-time transaction expenses, including sales charges (loads) and redemption fees, which are not shown in this section and would have resulted in higher total expenses. For more information, see your fund’s prospectus or talk to your financial adviser.
Review your fund’s expenses
The table below shows the expenses you would have paid on a $1,000 investment in Dreyfus Appreciation Fund, Inc. from January 1, 2008 to June 30, 2008. It also shows how much a $1,000 investment would be worth at the close of the period, assuming actual returns and expenses.
| Expenses and Value of a $1,000 Investment | ||
| assuming actual returns for the six months ended June 30, 2008 | ||
| Expenses paid per $1,000 † | $ 4.52 | |
| Ending value (after expenses) | $911.90 | |
COMPARING YOUR FUND’S EXPENSES WITH THOSE OF OTHER FUNDS (Unaudited)
Using the SEC’s method to compare expenses
The Securities and Exchange Commission (SEC) has established guidelines to help investors assess fund expenses. Per these guidelines, the table below shows your fund’s expenses based on a $1,000 investment, assuming a hypothetical 5% annualized return. You can use this information to compare the ongoing expenses (but not transaction expenses or total cost) of investing in the fund with those of other funds.All mutual fund shareholder reports will provide this information to help you make this comparison. Please note that you cannot use this information to estimate your actual ending account balance and expenses paid during the period.
| Expenses and Value of a $1,000 Investment | ||
| assuming a hypothetical 5% annualized return for the six months ended June 30, 2008 | ||
| Expenses paid per $1,000 † | $ 4.77 | |
| Ending value (after expenses) | $1,020.14 | |
† Expenses are equal to the fund’s annualized expense ratio of .95%, multiplied by the average account value over the period, multiplied by 182/366 (to reflect the one-half year period).
6
| STATEMENT OF INVESTMENTS June 30, 2008 (Unaudited) |
| Common Stocks—99.5% | Shares | Value ($) | ||
| Beverages—6.5% | ||||
| Coca-Cola | 2,396,600 | 124,575,268 | ||
| PepsiCo | 2,041,600 | 129,825,344 | ||
| 254,400,612 | ||||
| Consumer Discretionary—8.1% | ||||
| Christian Dior | 547,800 a | 56,492,899 | ||
| McDonald’s | 1,170,200 | 65,788,644 | ||
| McGraw-Hill | 1,741,200 a | 69,856,944 | ||
| News, Cl. A | 5,135,708 | 77,241,048 | ||
| News, Cl. B | 239,000 a | 3,668,650 | ||
| Target | 946,100 | 43,984,189 | ||
| 317,032,374 | ||||
| Consumer Staples—21.3% | ||||
| Altria Group | 3,500,700 | 71,974,392 | ||
| Anheuser-Busch | 876,300 | 54,435,756 | ||
| Estee Lauder, Cl. A | 731,800 a | 33,992,110 | ||
| Fomento Economico Mexicano, ADR | 400,000 | 18,204,000 | ||
| Kraft Foods, Cl. A | 522,568 | 14,867,059 | ||
| Nestle, ADR | 1,244,900 | 140,636,353 | ||
| Philip Morris International | 3,500,700 | 172,899,573 | ||
| Procter & Gamble | 2,389,400 | 145,299,414 | ||
| SYSCO | 746,900 a | 20,547,219 | ||
| Wal-Mart Stores | 1,027,500 | 57,745,500 | ||
| Walgreen | 2,838,400 | 92,276,384 | ||
| Whole Foods Market | 348,200 a | 8,248,858 | ||
| 831,126,618 | ||||
| Energy—14.9% | ||||
| BP, ADR | 494,000 a | 34,367,580 | ||
| ConocoPhillips | 1,942,000 | 183,305,380 | ||
| Halliburton | 1,248,200 a | 66,241,974 | ||
| Occidental Petroleum | 975,900 | 87,694,374 | ||
| Patriot Coal | 17,500 a,b | 2,682,575 | ||
| Peabody Energy | 175,000 | 15,408,750 | ||
| Royal Dutch Shell, ADR | 632,300 | 51,665,233 |
The Fund 7
STATEMENT OF INVESTMENTS (Unaudited) (continued)
| Common Stocks (continued) | Shares | Value ($) | ||||
| Energy (continued) | ||||||
| Total, ADR | 1,145,300 | 97,659,731 | ||||
| Transocean | 265,848 | a,b | 40,512,577 | |||
| 579,538,174 | ||||||
| Financial—7.8% | ||||||
| American Express | 1,144,100 | 43,098,247 | ||||
| American International Group | 587,100 | 15,534,666 | ||||
| Ameriprise Financial | 547,800 | 22,279,026 | ||||
| Bank of America | 1,550,000 | 36,998,500 | ||||
| Berkshire Hathaway, Cl. A | 400 | b | 48,300,000 | |||
| Citigroup | 1,015,933 | 17,027,037 | ||||
| HSBC Holdings, ADR | 796,700 | a | 61,106,890 | |||
| JPMorgan Chase & Co. | 1,017,100 | 34,896,701 | ||||
| Merrill Lynch & Co. | 405,700 | a | 12,864,747 | |||
| Prudential Financial | 200,000 | a | 11,948,000 | |||
| 304,053,814 | ||||||
| Health Care—7.9% | ||||||
| Abbott Laboratories | 1,294,700 | 68,580,259 | ||||
| Intuitive Surgical | 30,000 | a,b | 8,082,000 | |||
| Johnson & Johnson | 1,892,200 | 121,744,148 | ||||
| Medtronic | 400,000 | 20,700,000 | ||||
| Merck & Co. | 478,000 | 18,015,820 | ||||
| Novo Nordisk, ADR | 250,000 | 16,500,000 | ||||
| Roche Holding, ADR | 597,600 | 53,819,856 | ||||
| 307,442,083 | ||||||
| Industrial—8.5% | ||||||
| Caterpillar | 550,000 | a | 40,601,000 | |||
| Emerson Electric | 1,652,800 | 81,730,960 | ||||
| General Dynamics | 370,000 | 31,154,000 | ||||
| General Electric | 4,678,000 | 124,855,820 |
| 8 |
| Common Stocks (continued) | Shares | Value ($) | ||
| Industrial (continued) | ||||
| McDermott International | 250,000 b | 15,472,500 | ||
| United Technologies | 600,000 | 37,020,000 | ||
| 330,834,280 | ||||
| Information Technology—9.3% | ||||
| Apple | 325,000 b | 54,418,000 | ||
| Automatic Data Processing | 897,100 | 37,588,490 | ||
| Cisco Systems | 1,750,000 b | 40,705,000 | ||
| Corning | 300,000 | 6,915,000 | ||
| Intel | 4,929,800 | 105,892,104 | ||
| Microsoft | 2,190,200 | 60,252,402 | ||
| QUALCOMM | 550,000 | 24,403,500 | ||
| Texas Instruments | 1,200,000 | 33,792,000 | ||
| 363,966,496 | ||||
| Materials—2.5% | ||||
| Freeport-McMoRan Copper & Gold | 340,000 a | 39,844,600 | ||
| Praxair | 622,400 | 58,654,976 | ||
| 98,499,576 | ||||
| Oil & Gas—12.7% | ||||
| Chevron | 1,974,800 | 195,761,924 | ||
| Exxon Mobil | 3,393,398 | 299,060,166 | ||
| 494,822,090 | ||||
| Total Common Stocks | ||||
| (cost $2,520,072,760) | 3,881,716,117 | |||
| Other Investment—1.0% | ||||
| Registered Investment Company; | ||||
| Dreyfus Institutional Preferred | ||||
| Plus Money Market Fund | ||||
| (cost $40,593,000) | 40,593,000 c | 40,593,000 | ||
The Fund 9
STATEMENT OF INVESTMENTS (Unaudited) (continued)
| Investment of Cash Collateral | ||||
| for Securities Loaned—3.2% | Shares | Value ($) | ||
| Registered Investment Company; | ||||
| Dreyfus Institutional Cash | ||||
| Advantage Fund | ||||
| (cost $125,143,041) | 125,143,041 c | 125,143,041 | ||
| Total Investments (cost $2,685,808,801) | 103.7% | 4,047,452,158 | ||
| Liabilities, Less Cash and Receivables | (3.7%) | (146,837,333) | ||
| Net Assets | 100.0% | 3,900,614,825 |
| ADR—American Depository Receipts |
| a All or a portion of these securities are on loan. At June 30, 2008, the total market value of the fund’s securities on |
| loan is $153,955,741 and the total market value of the collateral held by the fund is $159,523,161, consisting of |
| cash collateral of $125,143,041 and U.S. Government and Agency securities valued at $34,380,120. |
| b Non-income producing security. |
| c Investment in affiliated money market mutual fund. |
| Portfolio Summary | (Unaudited) † | |||||
| Value (%) | Value (%) | |||||
| Consumer Staples | 21.3 | Health Care | 7.9 | |||
| Energy | 14.9 | Financial | 7.8 | |||
| Oil & Gas | 12.7 | Beverages | 6.5 | |||
| Information Technology | 9.3 | Money Market Investments | 4.2 | |||
| Industrial | 8.5 | Materials | 2.5 | |||
| Consumer Discretionary | 8.1 | 103.7 | ||||
| † Based on net assets. | ||||||
| See notes to financial statements. | ||||||
| 10 |
| STATEMENT OF ASSETS AND LIABILITIES June 30, 2008 (Unaudited) |
| Cost | Value | |||
| Assets ($): | ||||
| Investments in securities—See Statement of | ||||
| Investments (including securities on loan, | ||||
| valued at $153,955,741)—Note 1(c): | ||||
| Unaffiliated issuers | 2,520,072,760 | 3,881,716,117 | ||
| Affiliated issuers | 165,736,041 | 165,736,041 | ||
| Cash | 3,962,842 | |||
| Receivable for shares of Common Stock subscribed | 8,808,436 | |||
| Receivable for investment securities sold | 6,745,472 | |||
| Dividends and interest receivable | 6,690,356 | |||
| Prepaid expenses | 98,555 | |||
| 4,073,757,819 | ||||
| Liabilities ($): | ||||
| Due to The Dreyfus Corporation and affiliates—Note 3(b) | 2,181,952 | |||
| Due to Fayez Sarofim & Co. | 906,479 | |||
| Liability for securities on loan—Note 1(c) | 125,143,041 | |||
| Payable for shares of Common Stock redeemed | 44,418,382 | |||
| Accrued expenses | 493,140 | |||
| 173,142,994 | ||||
| Net Assets ($) | 3,900,614,825 | |||
| Composition of Net Assets ($): | ||||
| Paid-in capital | 2,480,888,633 | |||
| Accumulated undistributed investment income—net | 33,190,687 | |||
| Accumulated net realized gain (loss) on investments | 24,892,148 | |||
| Accumulated net unrealized appreciation | ||||
| (depreciation) on investments | 1,361,643,357 | |||
| Net Assets ($) | 3,900,614,825 | |||
| Shares Outstanding | ||||
| (300 million shares of $.001 par value Common Stock authorized) | 95,808,929 | |||
| Net Asset Value, offering and redemption price per share ($) | 40.71 | |||
See notes to financial statements.
The Fund 11
| STATEMENT OF OPERATIONS Six Months Ended June 30, 2008 (Unaudited) |
| Investment Income ($): | ||
| Income: | ||
| Cash dividends (net of $1,344,650 foreign taxes withheld at source): | ||
| Unaffiliated issuers | 51,091,426 | |
| Affiliated issuers | 403,058 | |
| Income from securities lending | 862,510 | |
| Total Income | 52,356,994 | |
| Expenses: | ||
| Investment advisory fee—Note 3(a) | 5,655,558 | |
| Sub-Investment advisory fee—Note 3(a) | 5,484,000 | |
| Shareholder servicing costs—Note 3(b) | 7,667,078 | |
| Custodian fees—Note 3(b) | 110,138 | |
| Prospectus and shareholders’ reports | 109,372 | |
| Directors’ fees and expenses—Note 3(c) | 85,602 | |
| Registration fees | 44,929 | |
| Professional fees | 22,536 | |
| Loan commitment fees—Note 2 | 17,500 | |
| Interest expense—Note 2 | 6,841 | |
| Miscellaneous | 69,105 | |
| Total Expenses | 19,272,659 | |
| Less—reduction in fees due to | ||
| earnings credits—Note 1(c) | (120,026) | |
| Net Expenses | 19,152,633 | |
| Investment Income—Net | 33,204,361 | |
| Realized and Unrealized Gain (Loss) on Investments—Note 4 ($): | ||
| Net realized gain (loss) on investments and foreign currency transactions | 24,904,481 | |
| Net unrealized appreciation (depreciation) on investments | (441,710,696) | |
| Net Realized and Unrealized Gain (Loss) on Investments | (416,806,215) | |
| Net (Decrease) in Net Assets Resulting from Operations | (383,601,854) | |
See notes to financial statements.
| 12 |
STATEMENT OF CHANGES IN NET ASSETS
| Six Months Ended | ||||
| June 30, 2008 | Year Ended | |||
| (Unaudited) | December 31, 2007 | |||
| Operations ($): | ||||
| Investment income—net | 33,204,361 | 60,088,014 | ||
| Net realized gain (loss) on investments | 24,904,481 | 127,073,623 | ||
| Net unrealized appreciation | ||||
| (depreciation) on investments | (441,710,696) | 85,819,976 | ||
| Net Increase (Decrease) in Net Assets | ||||
| Resulting from Operations | (383,601,854) | 272,981,613 | ||
| Dividends to Shareholders from ($): | ||||
| Investment income—net | (2,006,153) | (60,345,000) | ||
| Net realized gain on investments | (3,362,695) | (122,515,821) | ||
| Total Dividends | (5,368,848) | (182,860,821) | ||
| Capital Stock Transactions ($): | ||||
| Net proceeds from shares sold | 547,230,603 | 948,441,022 | ||
| Dividends reinvested | 4,750,624 | 161,992,097 | ||
| Cost of shares redeemed | (609,171,966) | (1,235,975,893) | ||
| Increase (Decrease) in Net Assets | ||||
| from Capital Stock Transactions | (57,190,739) | (125,542,774) | ||
| Total Increase (Decrease) in Net Assets | (446,161,441) | (35,421,982) | ||
| Net Assets ($): | ||||
| Beginning of Period | 4,346,776,266 | 4,382,198,248 | ||
| End of Period | 3,900,614,825 | 4,346,776,266 | ||
| Undistributed investment income—net | 33,190,687 | 1,992,479 | ||
| Capital Share Transactions (Shares): | ||||
| Shares sold | 13,011,503 | 20,971,014 | ||
| Shares issued for dividends reinvested | 115,233 | 3,658,644 | ||
| Shares redeemed | (14,569,146) | (27,464,584) | ||
| Net Increase (Decrease) in Shares Outstanding | (1,442,410) | (2,834,926) |
See notes to financial statements.
The Fund 13
FINANCIAL HIGHLIGHTS
The following table describes the performance for the fiscal periods indicated. Total return shows how much your investment in the fund would have increased (or decreased) during each period, assuming you had reinvested all dividends and distributions.These figures have been derived from the fund’s financial statements.
| Six Months Ended | ||||||||||||
| June 30, 2008 | Year Ended December 31, | |||||||||||
| (Unaudited) | 2007 | 2006 | 2005 | 2004 | 2003 | |||||||
| Per Share Data ($): | ||||||||||||
| Net asset value, | ||||||||||||
| beginning of period | 44.70 | 43.78 | 39.75 | 38.69 | 37.14 | 31.20 | ||||||
| Investment Operations: | ||||||||||||
| Investment income—net a | .34 | .62 | .61 | .53 | .52 | .42 | ||||||
| Net realized and | ||||||||||||
| unrealized gain | ||||||||||||
| (loss) on investments | (4.27) | 2.24 | 5.83 | 1.07 | 1.55 | 5.93 | ||||||
| Total from Investment | ||||||||||||
| Operations | (3.93) | 2.86 | 6.44 | 1.60 | 2.07 | 6.35 | ||||||
| Distributions: | ||||||||||||
| Dividends from investment | ||||||||||||
| income—net | (.02) | (.64) | (.62) | (.54) | (.52) | (.41) | ||||||
| Dividends from net realized | ||||||||||||
| gain on investments | (.04) | (1.30) | (1.79) | — | — | — | ||||||
| Total Distributions | (.06) | (1.94) | (2.41) | (.54) | (.52) | (.41) | ||||||
| Net asset value, | ||||||||||||
| end of period | 40.71 | 44.70 | 43.78 | 39.75 | 38.69 | 37.14 | ||||||
| Total Return (%) | (8.81)b | 6.54 | 16.26 | 4.14 | 5.57 | 20.39 | ||||||
| Ratios/Supplemental | ||||||||||||
| Data (%): | ||||||||||||
| Ratio of total expenses | ||||||||||||
| to average net assets | .95c | .95 | .95 | .92 | .95 | .96 | ||||||
| Ratio of net expenses | ||||||||||||
| to average net assets | .95c,d | .95 | .95 | .92 | .95d | .96 | ||||||
| Ratio of net investment | ||||||||||||
| income to average | ||||||||||||
| net assets | 1.64c | 1.37 | 1.45 | 1.35 | 1.40 | 1.28 | ||||||
| Portfolio Turnover Rate | 4.40b | 7.35 | 1.00 | 6.81 | 8.23 | 4.73 | ||||||
| Net Assets, | ||||||||||||
| end of period | ||||||||||||
| ($ x 1,000) 3,900,615 | 4,346,776 | 4,382,198 | 4,462,452 | 4,420,163 | 3,982,040 | |||||||
| a | Based on average shares outstanding at each month end. | |
| b | Not annualized. | |
| c | Annualized. | |
| d | Expense waivers and/or reimbursements amounted to less than .01%. | |
| See notes to financial statements. | ||
14
NOTES TO FINANCIAL STATEMENTS (Unaudited)
NOTE 1—Significant Accounting Policies:
Dreyfus Appreciation Fund, Inc. (the “fund”) is registered under the Investment Company Act of 1940, as amended (the “Act”), as a diversified open-end management investment company. The fund’s investment objective is to provide investors with long-term capital growth consistent with the preservation of capital. The Dreyfus Corporation (the “Manager” or “Dreyfus”), a wholly-owned subsidiary of The Bank of New York Mellon Corporation (“BNY Mellon”), serves as the fund’s investment adviser. Fayez Sarofim & Co. (“Sarofim”) serves as the fund’s sub-investment adviser. MBSC Securities Corporation (the “Distributor”), a wholly-owned subsidiary of the Manager, is the distributor of the fund’s shares, which are sold to the public without a sales charge.
The fund’s financial statements are prepared in accordance with U.S. generally accepted accounting principles, which may require the use of management estimates and assumptions. Actual results could differ from those estimates.
The fund enters into contracts that contain a variety of indemnifications. The fund’s maximum exposure under these arrangements is unknown.The fund does not anticipate recognizing any loss related to these arrangements.
(a) Portfolio valuation: Investments in securities are valued at the last sales price on the securities exchange or national securities market on which such securities are primarily traded. Securities listed on the National Market System for which market quotations are available are valued at the official closing price or, if there is no official closing price that day, at the last sales price. Securities not listed on an exchange or the national securities market, or securities for which there were no transactions, are valued at the average of the most recent bid and asked prices. Bid price is used when no asked price is available. Registered open-end investment companies that are not traded on an exchange are valued at their net asset value.When market quotations or official closing prices are not readily available, or are determined not to reflect accurately fair
The Fund 15
NOTES TO FINANCIAL STATEMENTS (Unaudited) (continued)
value, such as when the value of a security has been significantly affected by events after the close of the exchange or market on which the security is principally traded (for example,a foreign exchange or market),but before the fund calculates its net asset value, the fund may value these investments at fair value as determined in accordance with the procedures approved by the Board of Directors. Fair valuing of securities may be determined with the assistance of a pricing service using calculations based on indices of domestic securities and other appropriate indicators, such as prices of relevant ADRs and futures contracts. For other securities that are fair valued by the Board of Directors, certain factors may be considered such as: fundamental analytical data, the nature and duration of restrictions on disposition, an evaluation of the forces that influence the market in which the securities are purchased and sold, and public trading in similar securities of the issuer or comparable issuers. Financial futures are valued at the last sales price. Investments denominated in foreign currencies are translated to U.S. dollars at the prevailing rates of exchange.
The Financial Accounting Standards Board (“FASB”) released Statement of Financial Accounting Standards No. 157 “Fair Value Measurements” (“FAS 157”). FAS 157 establishes an authoritative definition of fair value, sets out a framework for measuring fair value, and requires additional disclosures about fair-value measurements.The application of FAS 157 is required for fiscal years beginning after November 15, 2007 and interim periods within those fiscal years.
Various inputs are used in determining the value of the fund’s investments relating to FAS 157.
These inputs are summarized in the three broad levels listed below.
| Level | 1—quoted prices in active markets for identical securities. | |
| Level | 2—other significant observable inputs (including quoted | |
| prices for similar securities, interest rates, prepayment speeds, credit | ||
| risk, etc.). | ||
| Level | 3—significant unobservable inputs (including fund’s own | |
| assumptions in determining the fair value of investments). | ||
16
The inputs or methodology used for valuing securities are not necessarily an indication of the risk associated with investing in those securities.
The following is a summary of the inputs used as of June 30, 2008 in valuing the fund’s investments carried at fair value:
| Investments in | Other Financial | |||
| Valuation Inputs | Securities ($) | Instruments ($) † | ||
| Level 1—Quoted Prices | 4,047,452,158 | 0 | ||
| Level 2—Other Significant | ||||
| Observable Inputs | 0 | 0 | ||
| Level 3—Significant | ||||
| Unobservable Inputs | 0 | 0 | ||
| Total | �� | 4,047,452,158 | 0 |
† Other financial instruments include derivative instruments such as futures, forward currency exchange contracts and swap contracts, which are valued at the unrealized appreciation (depreciation) on the instrument.
(b) Foreign currency transactions: The fund does not isolate that portion of the results of operations resulting from changes in foreign exchange rates on investments from the fluctuations arising from changes in market prices of securities held. Such fluctuations are included with the net realized and unrealized gain or loss on investments.
Net realized foreign exchange gains or losses arise from sales and maturities of short-term securities, sales of foreign currencies, currency gains or losses realized on securities transactions and the difference between the amounts of dividends, interest, and foreign withholding taxes recorded on the fund’s books and the U.S. dollar equivalent of the amounts actually received or paid. Net unrealized foreign exchange gains and losses arise from changes in the value of assets and liabilities other than investments in securities, resulting from changes in exchange rates. Such gains and losses are included with net realized and unrealized gain or loss on investments.
(c) Securities transactions and investment income: Securities transactions are recorded on a trade date basis. Realized gains and losses from securities transactions are recorded on the identified cost basis. Dividend income is recognized on the ex-dividend date and interest
The Fund 17
NOTES TO FINANCIAL STATEMENTS (Unaudited) (continued)
income, including, where applicable, accretion of discount and amortization of premium on investments, is recognized on the accrual basis.
The fund has arrangements with the custodian and cash management banks whereby the fund may receive earnings credits when positive cash balances are maintained, which are used to offset custody and cash management fees. For financial reporting purposes, the fund includes net earnings credits as an expense offset in the Statement of Operations.
Pursuant to a securities lending agreement with Mellon Bank, N.A. (“Mellon Bank”), a subsidiary of BNY Mellon and a Dreyfus affiliate, the fund may lend securities to qualified institutions. It is the fund’s policy, that at origination, all loans are secured by collateral of at least 102% of the value of U.S. securities loaned and 105% of the value of foreign securities loaned. Collateral equivalent to at least 100% of the market value of securities on loan is maintained at all times. Collateral is either invested in the form of cash, which can be invested in certain money market mutual funds managed by Dreyfus, U.S Government and Agency securities or Letters of Credit. The fund is entitled to receive all income on securities loaned, in addition to income earned as a result of the lending transaction.Although each security loaned is fully collateralized, the fund bears the risk of delay in recovery of, or loss of rights in, the securities loaned should a borrower fail to return the securities in a timely manner. During the period ended June 30, 2008, Mellon Bank earned $369,647, pursuant to the securities lending agreement.
(d) Affiliated issuers: Investments in other investment companies advised by Dreyfus are defined as “affiliated” in the Act.
(e) Dividends to shareholders: Dividends are recorded on the ex-dividend date. Dividends from investment income-net and dividends from net realized capital gains, if any, are normally declared and paid annually but the fund may make distributions on a more frequent basis to comply with the distribution requirements of the Internal Revenue Code of 1986, as amended (the “Code”).To the extent that net realized capital gains can be offset by capital loss carryovers, it is the policy of
18
the fund not to distribute such gains. Income and capital gain distributions are determined in accordance with income tax regulations, which may differ from U.S. generally accepted accounting principles.
(f) Federal income taxes: It is the policy of the fund to continue to qualify as a regulated investment company, if such qualification is in the best interests of its shareholders, by complying with the applicable provisions of the Code, and to make distributions of taxable income sufficient to relieve it from substantially all federal income and excise taxes.
During the current year, the fund adopted FASB Interpretation No. 48 “Accounting for Uncertainty in Income Taxes” (“FIN 48”). FIN 48 provides guidance for how uncertain tax positions should be recognized, measured, presented and disclosed in the financial statements. FIN 48 requires the evaluation of tax positions taken or expected to be taken in the course of preparing the fund’s tax returns to determine whether the tax positions are “more-likely-than-not” of being sustained by the applicable tax authority. Tax positions not deemed to meet the more-likely-than-not threshold would be recorded as a tax expense in the current year. The adoption of FIN 48 had no impact on the operations of the fund for the period ended June 30, 2008.
As of and during the period ended June 30, 2008, the fund did not have any liabilities for any unrecognized tax benefits.The fund recognizes interest and penalties, if any, related to unrecognized tax benefits as income tax expense in the Statement of Operations. During the period, the fund did not incur any interest or penalties.
Each of the tax years in the three-year period ended December 31, 2007, remains subject to examination by the Internal Revenue Service and state taxing authorities.
The tax character of distributions paid to shareholders during the fiscal year ended December 31, 2007 was as follows: ordinary income $65,435,266 and long-term capital gains $117,425,555.The tax character of current year distributions will be determined at the end of the current fiscal year.
The Fund 19
NOTES TO FINANCIAL STATEMENTS (Unaudited) (continued)
NOTE 2—Bank Line of Credit:
The fund participates with other Dreyfus-managed funds in a $350 million redemption credit facility (the “Facility”) to be utilized for temporary or emergency purposes, including the financing of redemptions. In connection therewith, the fund has agreed to pay commitment fees on its pro rata portion of the Facility. Interest is charged to the fund based on prevailing market rates in effect at the time of borrowing.
The average daily amount of borrowings outstanding under the Facility during the period ended June 30, 2008, was approximately $296,600 with a related weighted average annualized interest rate of 4.63% .
NOTE 3—Investment Advisory Fee, Sub-Investment Advisory Fee and Other Transactions With Affiliates:
(a) Fees payable by the fund pursuant to the provisions of an Investment Advisory Agreement with Dreyfus and a Sub-Investment Advisory Agreement with Sarofim are payable monthly, computed on the average daily value of the fund’s net assets at the following annual rates:
| Average Net Assets | Dreyfus | Sarofim | ||
| 0 up to $25 million | 44% | .11% | ||
| $25 million up to $75 million | 37% | .18% | ||
| $75 million up to $200 million | 33% | .22% | ||
| $200 million up to $300 million | 29% | .26% | ||
| In excess of $300 million | 275% | .275% |
(b) Under the Shareholder Services Plan, the fund pays the Distributor for the provision of certain services at the annual rate of .25% of the value of the fund’s average daily net assets.The services provided may include personal services relating to shareholder accounts, such as answering shareholder inquiries regarding the fund and providing reports and other information, and services related to the maintenance of shareholder accounts. The Distributor may make payments to Service Agents (a securities dealer, financial institution or other industry professional) in respect of these services.The Distributor determines the amounts to be paid to Service Agents. During the period ended
20
June 30, 2008, the fund was charged $5,063,435 pursuant to the Shareholder Services Plan.
The fund compensates Dreyfus Transfer, Inc., a wholly-owned subsidiary of Dreyfus, under a transfer agency agreement for providing personnel and facilities to perform transfer agency services for the fund. During the period ended June 30, 2008, the fund was charged $992,422 pursuant to the transfer agency agreement.
The fund compensates The Bank of New York, a subsidiary of BNY Mellon and a Dreyfus affiliate, under a cash management agreement for performing cash management services related to fund subscriptions and redemptions. During the period ended June 30, 2008, the fund was charged $120,026 pursuant to the cash management agreement.
The fund compensates Mellon Bank under a custody agreement for providing custodial services for the fund. During the period ended June 30, 2008, the fund was charged $110,138 pursuant to the custody agreement.
During the period ended June 30, 2008, the fund was charged $2,820 for services performed by the Chief Compliance Officer.
The components of “Due to The Dreyfus Corporation and affiliates” in the Statement of Assets and Liabilities consist of: investment advisory fees $934,758, shareholder services plan fees $836,926, custodian fees $72,314, chief compliance officer fees $2,820 and transfer agency per account fees $335,134.
(c) Each Board member also serves as a Board member of other funds within the Dreyfus complex. Annual retainer fees and attendance fees are allocated to each fund based on net assets.
NOTE 4—Securities Transactions:
The aggregate amount of purchases and sales of investment securities, excluding short-term securities, during the period ended June 30, 2008, amounted to $178,851,467 and $227,021,445, respectively.
The Fund 21
NOTES TO FINANCIAL STATEMENTS (Unaudited) (continued)
At June 30, 2008, accumulated net unrealized appreciation on investments was $1,361,643,357, consisting of $1,489,721,819 gross unrealized appreciation and $128,078,462 gross unrealized depreciation.
At June 30, 2008, the cost of investments for federal income tax purposes was substantially the same as the cost for financial reporting purposes (see the Statement of Investments).
In March 2008, the FASB released Statement of Financial Accounting Standards No. 161 “Disclosures about Derivative Instruments and Hedging Activities” (“FAS 161”). FAS 161 requires qualitative disclosures about objectives and strategies for using derivatives, quantitative disclosures about fair value amounts of gains and losses on derivative instruments and disclosures about credit-risk-related contingent features in derivative agreements.The application of FAS 161 is required for fiscal years beginning after November 15, 2008 and interim periods within those fiscal years. At this time, management is evaluating the implications of FAS 161 and its impact on the financial statements and the accompanying notes has not yet been determined.
NOTE 5—Subsequent Event:
Effective July 1, 2008, BNY Mellon has reorganized and consolidated a number of its banking and trust company subsidiaries. As a result of the reorganization, any services previously provided to the fund by Mellon Bank, N.A. or Mellon Trust of New England, N.A. are now provided by The Bank of New York, which has changed its name to The Bank of New York Mellon.
22
NOTES
| Mail The Dreyfus Family of Funds, 144 Glenn Curtiss Boulevard, Uniondale, NY 11556-0144 |
| E-mail Send your request to info@dreyfus.com |
| Internet Information can be viewed online or downloaded at: http://www.dreyfus.com |
The fund files its complete schedule of portfolio holdings with the Securities and Exchange Commission (“SEC”) for the first and third quarters of each fiscal year on Form N-Q. The fund’s Forms N-Q are available on the SEC’s website at http://www.sec.gov and may be reviewed and copied at the SEC’s Public Reference Room in Washington, DC. Information on the operation of the Public Reference Room may be obtained by calling 1-800-SEC-0330.
A description of the policies and procedures that the fund uses to determine how to vote proxies relating to portfolio securities, and information regarding how the fund voted these proxies for the 12-month period ended June 30, 2008, is available at http://www.dreyfus.com and on the SEC’s website at http://www.sec.gov. The description of the policies and procedures is also available without charge, upon request, by calling 1-800-645-6561.

| Item 2. | Code of Ethics. | |
| Not applicable. | ||
| Item 3. | Audit Committee Financial Expert. | |
| Not applicable. | ||
| Item 4. | Principal Accountant Fees and Services. | |
| Not applicable. | ||
| Item 5. | Audit Committee of Listed Registrants. | |
| Not applicable. | ||
| Item 6. | Investments. | |
| (a) | Not applicable. | |
| Item 7. | Disclosure of Proxy Voting Policies and Procedures for Closed-End Management | |
| Investment Companies. | ||
| Not applicable. | ||
| Item 8. | Portfolio Managers of Closed-End Management Investment Companies. | |
| Not applicable. | ||
| Item 9. | Purchases of Equity Securities by Closed-End Management Investment Companies and | |
| Affiliated Purchasers. | ||
| Not applicable. [CLOSED END FUNDS ONLY] | ||
| Item 10. | Submission of Matters to a Vote of Security Holders. |
The Registrant has a Nominating Committee (the "Committee"), which is responsible for selecting and nominating persons for election or appointment by the Registrant's Board as Board members. The Committee has adopted a Nominating Committee Charter (the "Charter"). Pursuant to the Charter, the Committee will consider recommendations for nominees from shareholders submitted to the Secretary of the Registrant, c/o The Dreyfus Corporation Legal Department, 200 Park Avenue, 8th Floor East, New York, New York 10166. A nomination submission must include information regarding the recommended nominee as specified in the Charter. This information includes all information relating to a recommended nominee that is required to be disclosed in solicitations or proxy statements for the election of Board members, as well as information sufficient to evaluate the factors to be considered by the Committee, including character and integrity, business and professional experience, and whether the person has the ability to apply sound and
2
independent business judgment and would act in the interests of the Registrant and its shareholders. Nomination submissions are required to be accompanied by a written consent of the individual to stand for election if nominated by the Board and to serve if elected by the shareholders, and such additional information must be provided regarding the recommended nominee as reasonably requested by the Committee.
| Item 11. | Controls and Procedures. |
(a) The Registrant's principal executive and principal financial officers have concluded, based on their evaluation of the Registrant's disclosure controls and procedures as of a date within 90 days of the filing date of this report, that the Registrant's disclosure controls and procedures are reasonably designed to ensure that information required to be disclosed by the Registrant on Form N-CSR is recorded, processed, summarized and reported within the required time periods and that information required to be disclosed by the Registrant in the reports that it files or submits on Form N-CSR is accumulated and communicated to the Registrant's management, including its principal executive and principal financial officers, as appropriate to allow timely decisions regarding required disclosure.
(b) There were no changes to the Registrant's internal control over financial reporting that occurred during the second fiscal quarter of the period covered by this report that have materially affected, or are reasonably likely to materially affect, the Registrant's internal control over financial reporting.
| Item 12. | Exhibits. |
(a)(1) Not applicable.
(a)(2) Certifications of principal executive and principal financial officers as required by Rule 30a-2(a) under the Investment Company Act of 1940.
(a)(3) Not applicable.
(b) Certification of principal executive and principal financial officers as required by Rule 30a-2(b) under the Investment Company Act of 1940.
3
SIGNATURES
Pursuant to the requirements of the Securities Exchange Act of 1934 and the Investment Company Act of 1940, the Registrant has duly caused this Report to be signed on its behalf by the undersigned, thereunto duly authorized.
Dreyfus Appreciation Fund, Inc.
| By: | /s/ J. David Officer | |
| J. David Officer, | ||
| President | ||
| Date: | August 25, 2008 | |
Pursuant to the requirements of the Securities Exchange Act of 1934 and the Investment Company Act of 1940, this Report has been signed below by the following persons on behalf of the Registrant and in the capacities and on the dates indicated.
| By: | /s/ J. David Officer | |
| J. David Officer, | ||
| President | ||
| Date: | August 25, 2008 | |
| By: | /s/ James Windels | |
| James Windels, | ||
| Treasurer | ||
| Date: | August 25, 2008 | |
4
EXHIBIT INDEX
(a)(2) Certifications of principal executive and principal financial officers as required by Rule 30a-2(a) under the Investment Company Act of 1940. (EX-99.CERT)
(b) Certification of principal executive and principal financial officers as required by Rule 30a-2(b) under the Investment Company Act of 1940. (EX-99.906CERT)
5