UNITED STATES
SECURITIES AND EXCHANGE COMMISSION
Washington, D.C. 20549
FORM N-CSR
CERTIFIED SHAREHOLDER REPORT OF REGISTERED
MANAGEMENT INVESTMENT COMPANIES
Investment Company Act file number 811-03114
Fidelity Select Portfolios
(Exact name of registrant as specified in charter)
245 Summer St., Boston, Massachusetts 02210
(Address of principal executive offices) (Zip code)
Margaret Carey, Secretary
245 Summer St.
Boston, Massachusetts 02210
(Name and address of agent for service)
Registrant's telephone number, including area code:
617-563-7000
Date of fiscal year end: | February 28 |
Date of reporting period: | February 28, 2023 |
Item 1.
Reports to Stockholders


Contents
| Average Annual Total Returns | |||
Periods ended February 28, 2023 | Past 1 year | Past 5 years | Past 10 years |
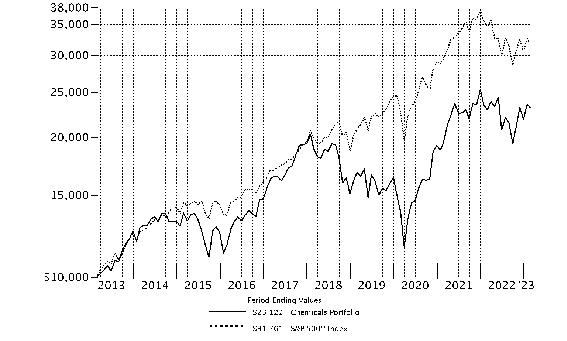
| Chemicals Portfolio | 1.09% | 4.16% | 8.74% |
| $10,000 Over 10 Years |
Let's say hypothetically that $10,000 was invested in Chemicals Portfolio on February 28, 2013. The chart shows how the value of your investment would have changed, and also shows how the S&P 500® Index performed over the same period. |
 |
Top Holdings (% of Fund's net assets) | ||
| Linde PLC | 25.0 | |
| Air Products & Chemicals, Inc. | 8.5 | |
| Corteva, Inc. | 8.4 | |
| DuPont de Nemours, Inc. | 4.9 | |
| Celanese Corp. Class A | 4.8 | |
| Westlake Corp. | 4.8 | |
| FMC Corp. | 4.3 | |
| Olin Corp. | 3.8 | |
| LyondellBasell Industries NV Class A | 3.8 | |
| The Chemours Co. LLC | 3.6 | |
| 71.9 | ||
| Industries (% of Fund's net assets) | ||
| Chemicals | 98.9 | |
Geographic Diversification (% of Fund's net assets) |
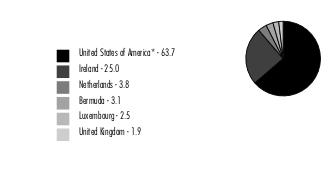 |
* Includes Short-Term investments and Net Other Assets (Liabilities). Percentages are based on country or territory of incorporation and are adjusted for the effect of derivatives, if applicable. |
| Common Stocks - 98.9% | |||
| Shares | Value ($) | ||
| Chemicals - 98.9% | |||
| Commodity Chemicals - 19.4% | |||
| Cabot Corp. | 220,700 | 17,552,271 | |
| LyondellBasell Industries NV Class A | 268,494 | 25,772,739 | |
| Olin Corp. | 448,500 | 25,900,875 | |
| Orion Engineered Carbons SA | 672,126 | 17,139,213 | |
| Tronox Holdings PLC | 828,269 | 12,920,996 | |
| Westlake Corp. (a) | 272,856 | 32,508,064 | |
| 131,794,158 | |||
| Diversified Chemicals - 3.6% | |||
| The Chemours Co. LLC | 717,959 | 24,539,839 | |
| Fertilizers & Agricultural Chemicals - 16.4% | |||
| CF Industries Holdings, Inc. | 148,517 | 12,756,125 | |
| Corteva, Inc. | 916,793 | 57,107,036 | |
| FMC Corp. | 227,300 | 29,355,795 | |
| The Mosaic Co. | 229,000 | 12,180,510 | |
| 111,399,466 | |||
| Industrial Gases - 33.5% | |||
| Air Products & Chemicals, Inc. | 202,811 | 57,999,890 | |
| Linde PLC | 486,016 | 169,313,394 | |
| 227,313,284 | |||
| Specialty Chemicals - 26.0% | |||
| Albemarle Corp. | 74,600 | 18,971,526 | |
| Axalta Coating Systems Ltd. (b) | 709,600 | 21,146,080 | |
| Celanese Corp. Class A | 281,100 | 32,672,253 | |
| DuPont de Nemours, Inc. | 459,094 | 33,527,635 | |
| Ecolab, Inc. | 107,200 | 17,084,464 | |
| Element Solutions, Inc. | 776,443 | 15,948,139 | |
| International Flavors & Fragrances, Inc. (a) | 85,616 | 7,979,411 | |
| Livent Corp. (a)(b) | 200 | 4,690 | |
| PPG Industries, Inc. | 38,900 | 5,137,134 | |
| Sherwin-Williams Co. | 105,999 | 23,462,879 | |
| 175,934,211 | |||
| TOTAL COMMON STOCKS (Cost $419,011,180) | 670,980,958 | ||
| Money Market Funds - 6.5% | |||
| Shares | Value ($) | ||
| Fidelity Cash Central Fund 4.63% (c) | 2,631,044 | 2,631,570 | |
| Fidelity Securities Lending Cash Central Fund 4.63% (c)(d) | 41,322,193 | 41,326,325 | |
| TOTAL MONEY MARKET FUNDS (Cost $43,957,895) | 43,957,895 | ||
| TOTAL INVESTMENT IN SECURITIES - 105.4% (Cost $462,969,075) | 714,938,853 |
NET OTHER ASSETS (LIABILITIES) - (5.4)% | (36,829,759) |
| NET ASSETS - 100.0% | 678,109,094 |
| (a) | Security or a portion of the security is on loan at period end. |
| (b) | Non-income producing |
| (c) | Affiliated fund that is generally available only to investment companies and other accounts managed by Fidelity Investments. The rate quoted is the annualized seven-day yield of the fund at period end. A complete unaudited listing of the fund's holdings as of its most recent quarter end is available upon request. In addition, each Fidelity Central Fund's financial statements, which are not covered by the Fund's Report of Independent Registered Public Accounting Firm, are available on the SEC's website or upon request. |
| (d) | Investment made with cash collateral received from securities on loan. |
| Affiliate | Value, beginning of period ($) | Purchases ($) | Sales Proceeds ($) | Dividend Income ($) | Realized Gain (loss) ($) | Change in Unrealized appreciation (depreciation) ($) | Value, end of period ($) | % ownership, end of period |
| Fidelity Cash Central Fund 4.63% | 1,042,443 | 148,771,348 | 147,182,221 | 376,790 | - | - | 2,631,570 | 0.0% |
| Fidelity Securities Lending Cash Central Fund 4.63% | 2,247,252 | 145,594,708 | 106,515,635 | 7,624 | - | - | 41,326,325 | 0.1% |
| Total | 3,289,695 | 294,366,056 | 253,697,856 | 384,414 | - | - | 43,957,895 | |
| Valuation Inputs at Reporting Date: | ||||
| Description | Total ($) | Level 1 ($) | Level 2 ($) | Level 3 ($) |
Investments in Securities: | ||||
| Common Stocks | 670,980,958 | 670,980,958 | - | - |
| Money Market Funds | 43,957,895 | 43,957,895 | - | - |
| Total Investments in Securities: | 714,938,853 | 714,938,853 | - | - |
| Statement of Assets and Liabilities | ||||
| February 28, 2023 | ||||
| Assets | ||||
| Investment in securities, at value (including securities loaned of $39,941,579) - See accompanying schedule: | ||||
Unaffiliated issuers (cost $419,011,180) | $ | 670,980,958 | ||
Fidelity Central Funds (cost $43,957,895) | 43,957,895 | |||
| Total Investment in Securities (cost $462,969,075) | $ | 714,938,853 | ||
| Receivable for investments sold | 6,068,859 | |||
| Receivable for fund shares sold | 106,376 | |||
| Dividends receivable | 1,349,688 | |||
| Distributions receivable from Fidelity Central Funds | 33,162 | |||
| Prepaid expenses | 4,988 | |||
| Other receivables | 141,795 | |||
Total assets | 722,643,721 | |||
| Liabilities | ||||
| Payable for investments purchased | $ | 2,477,027 | ||
| Payable for fund shares redeemed | 141,943 | |||
| Accrued management fee | 296,781 | |||
| Other affiliated payables | 117,593 | |||
| Other payables and accrued expenses | 174,958 | |||
| Collateral on securities loaned | 41,326,325 | |||
| Total Liabilities | 44,534,627 | |||
| Net Assets | $ | 678,109,094 | ||
| Net Assets consist of: | ||||
| Paid in capital | $ | 420,461,913 | ||
| Total accumulated earnings (loss) | 257,647,181 | |||
| Net Assets | $ | 678,109,094 | ||
Net Asset Value , offering price and redemption price per share ($678,109,094 ÷ 43,948,589 shares) | $ | 15.43 | ||
| Statement of Operations | ||||
Year ended February 28, 2023 | ||||
| Investment Income | ||||
| Dividends | $ | 11,504,338 | ||
| Income from Fidelity Central Funds (including $7,624 from security lending) | 384,414 | |||
| Total Income | 11,888,752 | |||
| Expenses | ||||
| Management fee | $ | 3,669,372 | ||
| Transfer agent fees | 1,232,002 | |||
| Accounting fees | 230,856 | |||
| Custodian fees and expenses | 7,452 | |||
| Independent trustees' fees and expenses | 2,392 | |||
| Registration fees | 27,058 | |||
| Audit | 48,685 | |||
| Legal | 593 | |||
| Miscellaneous | 5,668 | |||
| Total expenses before reductions | 5,224,078 | |||
| Expense reductions | (24,670) | |||
| Total expenses after reductions | 5,199,408 | |||
| Net Investment income (loss) | 6,689,344 | |||
| Realized and Unrealized Gain (Loss) | ||||
| Net realized gain (loss) on: | ||||
| Investment Securities: | ||||
| Unaffiliated issuers | 48,437,834 | |||
| Foreign currency transactions | (22,734) | |||
| Total net realized gain (loss) | 48,415,100 | |||
| Change in net unrealized appreciation (depreciation) on: | ||||
| Investment Securities: | ||||
| Unaffiliated issuers | (52,566,540) | |||
| Assets and liabilities in foreign currencies | (19,547) | |||
| Total change in net unrealized appreciation (depreciation) | (52,586,087) | |||
| Net gain (loss) | (4,170,987) | |||
| Net increase (decrease) in net assets resulting from operations | $ | 2,518,357 | ||
| Statement of Changes in Net Assets | ||||
Year ended February 28, 2023 | Year ended February 28, 2022 | |||
| Increase (Decrease) in Net Assets | ||||
| Operations | ||||
| Net investment income (loss) | $ | 6,689,344 | $ | 6,746,277 |
| Net realized gain (loss) | 48,415,100 | 54,079,063 | ||
| Change in net unrealized appreciation (depreciation) | (52,586,087) | 56,407,256 | ||
| Net increase (decrease) in net assets resulting from operations | 2,518,357 | 117,232,596 | ||
| Distributions to shareholders | (71,422,793) | (9,969,040) | ||
| Share transactions | ||||
| Proceeds from sales of shares | 27,760,569 | 88,405,055 | ||
| Reinvestment of distributions | 67,243,473 | 9,337,590 | ||
| Cost of shares redeemed | (106,890,154) | (146,786,766) | ||
Net increase (decrease) in net assets resulting from share transactions | (11,886,112) | (49,044,121) | ||
| Total increase (decrease) in net assets | (80,790,548) | 58,219,435 | ||
| Net Assets | ||||
| Beginning of period | 758,899,642 | 700,680,207 | ||
| End of period | $ | 678,109,094 | $ | 758,899,642 |
| Other Information | ||||
| Shares | ||||
| Sold | 1,728,193 | 5,113,175 | ||
| Issued in reinvestment of distributions | 4,320,957 | 520,200 | ||
| Redeemed | (6,887,077) | (8,619,384) | ||
| Net increase (decrease) | (837,927) | (2,986,009) | ||
| Chemicals Portfolio |
| Years ended February 28, | 2023 | 2022 | 2021 | 2020 A | 2019 B | |||||
Selected Per-Share Data | ||||||||||
| Net asset value, beginning of period | $ | 16.94 | $ | 14.67 | $ | 10.47 | $ | 13.57 | $ | 17.34 |
| Income from Investment Operations | ||||||||||
Net investment income (loss) C,D | .15 | .15 | .15 | .15 | .23 | |||||
| Net realized and unrealized gain (loss) | .01 | 2.34 | 4.21 | (2.39) | (2.17) | |||||
| Total from investment operations | .16 | 2.49 | 4.36 | (2.24) | (1.94) | |||||
| Distributions from net investment income | (.16) | (.14) | (.16) | (.20) | (.21) | |||||
| Distributions from net realized gain | (1.51) | (.08) | - | (.66) | (1.62) | |||||
| Total distributions | (1.67) | (.22) | (.16) | (.86) | (1.83) | |||||
| Net asset value, end of period | $ | 15.43 | $ | 16.94 | $ | 14.67 | $ | 10.47 | $ | 13.57 |
Total Return E | 1.09% | 16.90% | 41.65% | (17.63)% | (11.10)% | |||||
Ratios to Average Net Assets D,F,G | ||||||||||
| Expenses before reductions | .75% | .74% | .79% | .78% | .77% | |||||
| Expenses net of fee waivers, if any | .75% | .74% | .79% | .78% | .77% | |||||
| Expenses net of all reductions | .75% | .74% | .78% | .77% | .76% | |||||
| Net investment income (loss) | .96% | .85% | 1.28% | 1.21% | 1.50% | |||||
| Supplemental Data | ||||||||||
| Net assets, end of period (000 omitted) | $ | 678,109 | $ | 758,900 | $ | 700,680 | $ | 656,441 | $ | 1,153,379 |
Portfolio turnover rate H | 54% | 15% | 50% | 77% | 62% |
| Fidelity Central Fund | Investment Manager | Investment Objective | Investment Practices | Expense Ratio A |
| Fidelity Money Market Central Funds | Fidelity Management & Research Company LLC (FMR) | Each fund seeks to obtain a high level of current income consistent with the preservation of capital and liquidity. | Short-term Investments | Less than .005% |
| Chemicals Portfolio | $141,795 |
| Gross unrealized appreciation | $255,745,309 |
| Gross unrealized depreciation | (4,268,823) |
| Net unrealized appreciation (depreciation) | $251,476,486 |
| Tax Cost | $463,462,367 |
| Undistributed ordinary income | $375,046 |
| Undistributed long-term capital gain | $5,979,128 |
| Net unrealized appreciation (depreciation) on securities and other investments | $251,436,703 |
| February 28, 2023 | February 28, 2022 | |
| Ordinary Income | $6,622,169 | $ 6,405,447 |
| Long-term Capital Gains | 64,800,624 | 3,563,593 |
| Total | $71,422,793 | $ 9,969,040 |
| Purchases ($) | Sales ($) | |
| Chemicals Portfolio | 368,444,547 | 450,291,682 |
| % of Average Net Assets | |
| Chemicals Portfolio | .03 |
| Amount | |
| Chemicals Portfolio | $8,236 |
| Purchases ($) | Sales ($) | Realized Gain (Loss) ($) | |
| Chemicals Portfolio | 14,920,593 | 23,445,219 | 5,158,708 |
| Amount | |
| Chemicals Portfolio | $1,272 |
| Total Security Lending Fees Paid to NFS | Security Lending Income From Securities Loaned to NFS | Value of Securities Loaned to NFS at Period End | |
| Chemicals Portfolio | $807 | $- | $- |
| Average Annual Total Returns | |||
Periods ended February 28, 2023 | Past 1 year | Past 5 years | Past 10 years |
| Class A (incl.5.75% sales charge) | -24.05% | 3.00% | -3.15% |
| Class M (incl.3.50% sales charge) | -22.47% | 3.20% | -3.20% |
Class C (incl. contingent deferred sales charge) | -20.80% | 3.51% | -3.11% |
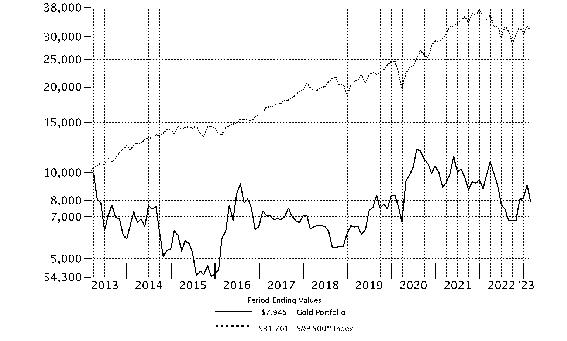
| Gold Portfolio | -19.17% | 4.56% | -2.27% |
| Class I | -19.20% | 4.56% | -2.26% |
| Class Z | -19.07% | 4.69% | -2.20% |
| $10,000 Over 10 Years |
Let's say hypothetically that $10,000 was invested in Gold Portfolio, a class of the fund, on February 28, 2013. The chart shows how the value of your investment would have changed, and also shows how the S&P 500® Index performed over the same period. |
 |
Top Holdings (% of Fund's net assets) | ||
| Newmont Corp. | 9.8 | |
| Agnico Eagle Mines Ltd. (Canada) | 8.9 | |
| Franco-Nevada Corp. | 8.2 | |
| Wheaton Precious Metals Corp. | 8.0 | |
| Barrick Gold Corp. (Canada) | 7.3 | |
| Zijin Mining Group Co. Ltd. (A Shares) | 4.2 | |
| Orla Mining Ltd. | 4.2 | |
| OceanaGold Corp. | 3.9 | |
| Alamos Gold, Inc. | 3.3 | |
| Osisko Gold Royalties Ltd. | 2.5 | |
| 60.3 | ||
| Industries (% of Fund's net assets) | ||
| Gold | 88.3 | |
| Silver | 4.7 | |
| Diversified Metals & Mining | 3.3 | |
| Precious Metals & Minerals | 0.8 | |
| Commodities & Related Investments* | 0.7 | |
| Copper | 0.7 | |
Geographic Diversification (% of Fund's net assets) |
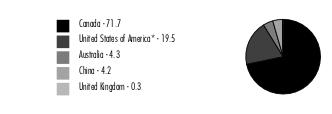 |
* Includes Short-Term investments and Net Other Assets (Liabilities). Percentages are based on country or territory of incorporation and are adjusted for the effect of derivatives, if applicable. |
| Common Stocks - 97.8% | |||
| Shares | Value ($) | ||
| Australia - 4.3% | |||
| Metals & Mining - 4.3% | |||
| Gold - 4.3% | |||
| Gold Road Resources Ltd. | 12,500,000 | 12,364,537 | |
| Newcrest Mining Ltd. | 1,750,000 | 26,790,307 | |
| Northern Star Resources Ltd. | 4,000,000 | 27,911,892 | |
| 67,066,736 | |||
| Canada - 71.7% | |||
| Metals & Mining - 71.7% | |||
| Copper - 0.4% | |||
| Faraday Copper Corp. (a)(b) | 10,000,000 | 6,449,249 | |
| Diversified Metals & Mining - 2.3% | |||
| BeMetals Corp. (a) | 2,000,000 | 197,875 | |
| Foran Mining Corp. (a) | 5,000,000 | 13,741,297 | |
| Paycore Minerals, Inc. (a) | 2,000,000 | 3,048,736 | |
| Vizsla Silver Corp. | 5,000,000 | 5,936,240 | |
| Western Copper & Gold Corp. (TSX) (a)(b)(c) | 8,740,500 | 13,772,133 | |
| 36,696,281 | |||
| Gold - 67.3% | |||
| Agnico Eagle Mines Ltd. (Canada) (c) | 3,000,000 | 138,116,526 | |
| Alamos Gold, Inc. | 5,000,000 | 50,971,052 | |
| Artemis Gold, Inc. (a)(c) | 5,000,000 | 16,086,479 | |
| Ascot Resources Ltd. (a)(b) | 25,000,000 | 11,542,690 | |
| B2Gold Corp. | 7,000,000 | 23,906,193 | |
| Banyan Gold Corp. (a)(b) | 21,000,000 | 6,310,004 | |
| Barrick Gold Corp. (Canada) (c) | 7,000,000 | 113,118,358 | |
| Bonterra Resources, Inc. (a)(b) | 7,500,000 | 1,786,369 | |
| Franco-Nevada Corp. | 1,000,000 | 127,643,826 | |
| Fury Gold Mines Ltd. (b)(d) | 10,000,000 | 6,375,962 | |
| i-80 Gold Corp. (a)(b)(c) | 10,000,000 | 22,792,232 | |
| i-80 Gold Corp. (b)(d) | 2,500,000 | 5,698,058 | |
| Lundin Gold, Inc. | 2,500,000 | 25,833,639 | |
| Maple Gold Mines Ltd. (a)(b) | 20,000,000 | 2,638,329 | |
| Marathon Gold Corp. (a)(b)(c) | 25,000,000 | 16,306,339 | |
| Marathon Gold Corp. warrants 9/20/24 (a)(b) | 5,000,000 | 432,958 | |
| Novagold Resources, Inc. (a) | 3,000,000 | 16,885,306 | |
| OceanaGold Corp. | 30,000,000 | 61,121,290 | |
| Orla Mining Ltd. (a)(c) | 15,000,000 | 65,408,575 | |
| Osisko Development Corp. (a)(c) | 2,000,000 | 8,647,856 | |
| Osisko Development Corp.: | |||
| unit(e) | 1,144,505 | 6,223,272 | |
| rights(a) | 666,666 | 304,390 | |
| Osisko Gold Royalties Ltd. (c) | 3,000,000 | 39,311,103 | |
| Osisko Mining, Inc. (a) | 9,723,000 | 22,018,373 | |
| Osisko Mining, Inc. unit | 2,700,000 | 5,983,988 | |
| Pure Gold Mining, Inc. warrants 3/28/23 (a) | 1,500,000 | 11 | |
| Rupert Resources Ltd. (a) | 4,000,000 | 13,660,682 | |
| Sabina Gold & Silver Corp. (a) | 5,000,000 | 6,485,892 | |
| Seabridge Gold, Inc. (a) | 1,000,000 | 10,978,380 | |
| Skeena Resources Ltd. (a)(c) | 3,000,000 | 15,522,169 | |
| Torex Gold Resources, Inc. (a) | 1,000,000 | 12,312,202 | |
| Triple Flag Precious Metals Corp. | 2,000,000 | 27,145,475 | |
| Victoria Gold Corp. (a)(b) | 4,000,000 | 24,829,608 | |
| Wesdome Gold Mines, Inc. (a) | 3,500,000 | 16,698,424 | |
| Wheaton Precious Metals Corp. | 3,000,000 | 124,990,839 | |
| 1,048,086,849 | |||
| Precious Metals & Minerals - 0.8% | |||
| Dolly Varden Silver Corp. (a)(b) | 17,000,000 | 11,835,837 | |
| Silver - 0.9% | |||
| GoGold Resources, Inc. (a)(c) | 9,000,000 | 13,851,228 | |
TOTAL METALS & MINING | 1,116,919,444 | ||
| China - 4.2% | |||
| Metals & Mining - 4.2% | |||
| Gold - 4.2% | |||
| Zijin Mining Group Co. Ltd. (A Shares) | 39,999,964 | 65,826,231 | |
| United Kingdom - 0.3% | |||
| Metals & Mining - 0.3% | |||
| Copper - 0.3% | |||
| Solgold PLC (a) | 20,000,000 | 3,979,028 | |
| United States of America - 17.3% | |||
| Metals & Mining - 17.3% | |||
| Diversified Metals & Mining - 1.0% | |||
| Ivanhoe Electric, Inc. (a)(c) | 1,000,000 | 15,030,000 | |
| Gold - 12.5% | |||
| Dakota Gold Corp. (a)(c) | 2,500,000 | 7,025,000 | |
| Newmont Corp. | 3,500,000 | 152,634,997 | |
| Royal Gold, Inc. (c) | 300,000 | 35,637,000 | |
| 195,296,997 | |||
| Silver - 3.8% | |||
| Gatos Silver, Inc. (a)(b)(c) | 6,900,000 | 27,876,000 | |
| Hecla Mining Co. (c) | 6,000,000 | 30,900,000 | |
| 58,776,000 | |||
TOTAL METALS & MINING | 269,102,997 | ||
| TOTAL COMMON STOCKS (Cost $1,212,110,032) | 1,522,894,436 | ||
| Commodities - 0.7% | |||
| Troy Ounces | Value ($) | ||
Gold Bullion (a) (Cost $4,575,085) | 5,582 | 10,199,654 | |
| Money Market Funds - 20.0% | |||
| Shares | Value ($) | ||
| Fidelity Cash Central Fund 4.63% (f) | 14,255,006 | 14,257,857 | |
| Fidelity Securities Lending Cash Central Fund 4.63% (f)(g) | 297,681,559 | 297,711,327 | |
| TOTAL MONEY MARKET FUNDS (Cost $311,969,184) | 311,969,184 | ||
| TOTAL INVESTMENT IN SECURITIES - 118.5% (Cost $1,528,654,301) | 1,845,063,274 |
NET OTHER ASSETS (LIABILITIES) - (18.5)% | (288,281,971) |
| NET ASSETS - 100.0% | 1,556,781,303 |
| (a) | Non-income producing |
| (b) | Affiliated company |
| (c) | Security or a portion of the security is on loan at period end. |
| (d) | Security exempt from registration under Rule 144A of the Securities Act of 1933. These securities may be resold in transactions exempt from registration, normally to qualified institutional buyers. At the end of the period, the value of these securities amounted to $12,074,020 or 0.8% of net assets. |
| (e) | Security or a portion of the security purchased on a delayed delivery or when-issued basis. |
| (f) | Affiliated fund that is generally available only to investment companies and other accounts managed by Fidelity Investments. The rate quoted is the annualized seven-day yield of the fund at period end. A complete unaudited listing of the fund's holdings as of its most recent quarter end is available upon request. In addition, each Fidelity Central Fund's financial statements, which are not covered by the Fund's Report of Independent Registered Public Accounting Firm, are available on the SEC's website or upon request. |
| (g) | Investment made with cash collateral received from securities on loan. |
| Affiliate | Value, beginning of period ($) | Purchases ($) | Sales Proceeds ($) | Dividend Income ($) | Realized Gain (loss) ($) | Change in Unrealized appreciation (depreciation) ($) | Value, end of period ($) | % ownership, end of period |
| Fidelity Cash Central Fund 4.63% | 58,603,905 | 597,039,758 | 641,385,806 | 438,329 | - | - | 14,257,857 | 0.0% |
| Fidelity Securities Lending Cash Central Fund 4.63% | 105,810,777 | 1,178,638,323 | 986,737,773 | 762,133 | - | - | 297,711,327 | 0.9% |
| Total | 164,414,682 | 1,775,678,081 | 1,628,123,579 | 1,200,462 | - | - | 311,969,184 | |
| Fund | Value, beginning of period ($) | Purchases ($) | Sales Proceeds ($) | Dividend Income ($) | Realized Gain /loss ($) | Change in Unrealized appreciation (depreciation) ($) | Value, end of period ($) |
| Fidelity Select Gold Cayman Ltd. | 13,353,169 | - | 2,474,914 | - | 1,074,938 | (1,734,410) | 10,218,783 |
| Affiliate | Value, beginning of period ($) | Purchases ($) | Sales Proceeds ($) | Dividend Income ($) | Realized Gain (loss) ($) | Change in Unrealized appreciation (depreciation) ($) | Value, end of period ($) |
| Ascot Resources Ltd. | 17,199,211 | 3,907,938 | - | - | - | (9,564,459) | 11,542,690 |
| Banyan Gold Corp. | - | 6,168,986 | - | - | - | 141,018 | 6,310,004 |
| Bonterra Resources, Inc. | 1,352,663 | - | - | - | - | 69,807 | - |
| Bonterra Resources, Inc. | 6,011,834 | - | - | - | - | (5,647,935) | 1,786,369 |
| Dolly Varden Silver Corp. | - | 4,989,727 | - | - | - | 6,846,110 | 11,835,837 |
| Faraday Copper Corp. | - | 5,966,439 | - | - | - | 482,810 | 6,449,249 |
| Fury Gold Mines Ltd. | - | 6,328,113 | - | - | - | - | - |
| Fury Gold Mines Ltd. | - | - | - | - | - | 47,849 | 6,375,962 |
| Gatos Silver, Inc. | 16,850,000 | 7,052,371 | - | - | - | 3,973,629 | 27,876,000 |
| Gold Standard Ventures Corp. | 10,256,410 | 767,541 | 11,621,826 | - | (12,324,901) | 12,922,776 | - |
| Maple Gold Mines Ltd. | 5,285,996 | - | - | - | - | (2,647,667) | 2,638,329 |
| Marathon Gold Corp. | 22,406,312 | 3,994,624 | - | - | - | (17,776,315) | 16,306,339 |
| Marathon Gold Corp. warrants 9/20/24 | - | - | - | - | - | (240,493) | 432,958 |
| Orla Mining Ltd. | 51,692,308 | 12,624,099 | 4,918,086 | - | (728,760) | 6,739,014 | - |
| Pure Gold Mining, Inc. | 16,173,570 | - | 4,101,640 | - | (24,122,553) | 12,050,623 | - |
| Pure Gold Mining, Inc. warrants 3/28/23 | 58,434 | - | - | - | - | (58,423) | - |
| Victoria Gold Corp. | 25,341,223 | 21,109,331 | 5,907,354 | - | (986,601) | (14,726,991) | 24,829,608 |
| Western Copper & Gold Corp. (TSX) | 14,327,416 | 1,130,705 | - | - | - | (1,685,988) | 13,772,133 |
| i-80 Gold Corp. | 5,369,822 | - | - | - | - | (78,175) | - |
| i-80 Gold Corp. | 21,696,252 | - | - | - | - | 1,095,980 | 22,792,232 |
| i-80 Gold Corp. | - | - | - | - | - | 406,411 | 5,698,058 |
| i-80 Gold Corp. warrants 9/30/22 | 76,880 | - | - | - | (340) | (76,540) | - |
| Total | 214,098,331 | 74,039,874 | 26,548,906 | - | (38,163,155) | (7,726,959) | 158,645,768 |
| Valuation Inputs at Reporting Date: | ||||
| Description | Total ($) | Level 1 ($) | Level 2 ($) | Level 3 ($) |
Investments in Securities: | ||||
| Common Stocks | 1,522,894,436 | 1,477,223,270 | 45,671,166 | - |
| Commodities | 10,199,654 | 10,199,654 | - | - |
| Money Market Funds | 311,969,184 | 311,969,184 | - | - |
| Total Investments in Securities: | 1,845,063,274 | 1,799,392,108 | 45,671,166 | - |
| Consolidated Statement of Assets and Liabilities | ||||
| February 28, 2023 | ||||
| Assets | ||||
| Investment in securities, at value (including securities loaned of $283,944,222) - See accompanying schedule: | ||||
Unaffiliated issuers (cost $1,018,589,358) | $ | 1,364,248,668 | ||
Fidelity Central Funds (cost $311,969,184) | 311,969,184 | |||
Commodities (cost $4,575,085) | 10,199,654 | |||
Other affiliated issuers (cost $193,520,674) | 158,645,768 | |||
| Total Investment in Securities (cost $1,528,654,301) | $ | 1,845,063,274 | ||
| Cash | 19,429 | |||
| Foreign currency held at value (cost $724,631) | 724,631 | |||
| Receivable for investments sold | 13,958,096 | |||
| Receivable for fund shares sold | 1,662,448 | |||
| Dividends receivable | 2,228,171 | |||
| Distributions receivable from Fidelity Central Funds | 98,226 | |||
| Prepaid expenses | 4,110 | |||
| Other receivables | 131,460 | |||
Total assets | 1,863,889,845 | |||
| Liabilities | ||||
| Payable for investments purchased | ||||
Regular delivery | $ | 779,103 | ||
Delayed delivery | 5,535,898 | |||
| Payable for fund shares redeemed | 1,799,080 | |||
| Accrued management fee | 723,443 | |||
| Distribution and service plan fees payable | 50,384 | |||
| Other affiliated payables | 305,491 | |||
| Other payables and accrued expenses | 203,110 | |||
| Collateral on securities loaned | 297,712,033 | |||
| Total Liabilities | 307,108,542 | |||
| Net Assets | $ | 1,556,781,303 | ||
| Net Assets consist of: | ||||
| Paid in capital | $ | 2,807,202,133 | ||
| Total accumulated earnings (loss) | (1,250,420,830) | |||
| Net Assets | $ | 1,556,781,303 | ||
| Net Asset Value and Maximum Offering Price | ||||
| Class A : | ||||
Net Asset Value and redemption price per share ($73,943,387 ÷ 3,501,509 shares) (a) | $ | 21.12 | ||
| Maximum offering price per share (100/94.25 of $21.12) | $ | 22.41 | ||
| Class M : | ||||
Net Asset Value and redemption price per share ($21,586,448 ÷ 1,050,434 shares) (a) | $ | 20.55 | ||
| Maximum offering price per share (100/96.50 of $20.55) | $ | 21.30 | ||
| Class C : | ||||
Net Asset Value and offering price per share ($27,977,723 ÷ 1,445,354 shares) (a) | $ | 19.36 | ||
| Gold : | ||||
Net Asset Value , offering price and redemption price per share ($1,229,415,990 ÷ 56,191,220 shares) | $ | 21.88 | ||
| Class I : | ||||
Net Asset Value , offering price and redemption price per share ($110,223,764 ÷ 5,036,837 shares) | $ | 21.88 | ||
| Class Z : | ||||
Net Asset Value , offering price and redemption price per share ($93,633,991 ÷ 4,271,325 shares) | $ | 21.92 | ||
(a)Redemption price per share is equal to net asset value less any applicable contingent deferred sales charge. | ||||
| Consolidated Statement of Operations | ||||
Year ended February 28, 2023 | ||||
| Investment Income | ||||
| Dividends | $ | 27,797,934 | ||
| Income from Fidelity Central Funds (including $762,133 from security lending) | 1,200,462 | |||
| Income before foreign taxes withheld | $ | 28,998,396 | ||
| Less foreign taxes withheld | (2,469,785) | |||
| Total Income | 26,528,611 | |||
| Expenses | ||||
| Management fee | $ | 7,996,988 | ||
| Transfer agent fees | 2,771,363 | |||
| Distribution and service plan fees | 648,308 | |||
| Accounting fees | 660,646 | |||
| Custodian fees and expenses | 71,865 | |||
| Independent trustees' fees and expenses | 5,125 | |||
| Registration fees | 141,062 | |||
| Audit | 72,523 | |||
| Legal | 907 | |||
| Interest | 2,027 | |||
| Miscellaneous | 8,679 | |||
| Total expenses before reductions | 12,379,493 | |||
| Expense reductions | (63,432) | |||
| Total expenses after reductions | 12,316,061 | |||
| Net Investment income (loss) | 14,212,550 | |||
| Realized and Unrealized Gain (Loss) | ||||
| Net realized gain (loss) on: | ||||
| Investments: | ||||
| Unaffiliated issuers | (70,010,728) | |||
| Affiliated issuers | (38,163,155) | |||
| Commodities | 998,453 | |||
| Foreign currency transactions | (73,020) | |||
| Total net realized gain (loss) | (107,248,450) | |||
| Change in net unrealized appreciation (depreciation) on: | ||||
| Investments: | ||||
| Investments | (274,248,514) | |||
| Affiliated issuers | (7,726,959) | |||
| Assets and liabilities in foreign currencies | 63,595 | |||
| Commodities | (1,656,941) | |||
| Total change in net unrealized appreciation (depreciation) | (283,568,819) | |||
| Net gain (loss) | (390,817,269) | |||
| Net increase (decrease) in net assets resulting from operations | $ | (376,604,719) | ||
| Consolidated Statement of Changes in Net Assets | ||||
Year ended February 28, 2023 | Year ended February 28, 2022 | |||
| Increase (Decrease) in Net Assets | ||||
| Operations | ||||
| Net investment income (loss) | $ | 14,212,550 | $ | 23,266,597 |
| Net realized gain (loss) | (107,248,450) | 68,341,551 | ||
| Change in net unrealized appreciation (depreciation) | (283,568,819) | 70,246,590 | ||
| Net increase (decrease) in net assets resulting from operations | (376,604,719) | 161,854,738 | ||
| Distributions to shareholders | (5,320,281) | (27,126,849) | ||
| Share transactions - net increase (decrease) | 189,254,819 | (106,344,853) | ||
| Total increase (decrease) in net assets | (192,670,181) | 28,383,036 | ||
| Net Assets | ||||
| Beginning of period | 1,749,451,484 | 1,721,068,448 | ||
| End of period | $ | 1,556,781,303 | $ | 1,749,451,484 |
| Fidelity Advisor® Gold Fund Class A |
| Years ended February 28, | 2023 | 2022 | 2021 | 2020 A | 2019 | |||||
Selected Per-Share Data | ||||||||||
| Net asset value, beginning of period | $ | 26.27 | $ | 24.15 | $ | 21.67 | $ | 18.52 | $ | 18.30 |
| Income from Investment Operations | ||||||||||
Net investment income (loss) B,C | .15 | .27 D | (.04) | (.01) E | (.03) | |||||
| Net realized and unrealized gain (loss) | (5.23) | 2.20 | 3.74 | 3.20 | .25 | |||||
| Total from investment operations | (5.08) | 2.47 | 3.70 | 3.19 | .22 | |||||
| Distributions from net investment income | (.07) | (.35) | (1.22) | (.01) | - | |||||
| Distributions from net realized gain | - | - | - | (.03) | - | |||||
| Total distributions | (.07) | (.35) | (1.22) | (.04) | - | |||||
| Net asset value, end of period | $ | 21.12 | $ | 26.27 | $ | 24.15 | $ | 21.67 | $ | 18.52 |
Total Return F,G | (19.42)% | 10.37% | 16.59% | 17.23% | 1.20% | |||||
Ratios to Average Net Assets C,H,I | ||||||||||
| Expenses before reductions | 1.09% | 1.07% | 1.08% | 1.13% | 1.19% | |||||
| Expenses net of fee waivers, if any | 1.08% | 1.07% | 1.08% | 1.13% | 1.18% | |||||
| Expenses net of all reductions | 1.08% | 1.07% | 1.07% | 1.12% | 1.18% | |||||
| Net investment income (loss) | .67% | 1.02% D | (.12)% | (.05)% E | (.15)% | |||||
| Supplemental Data | ||||||||||
| Net assets, end of period (000 omitted) | $ | 73,943 | $ | 86,977 | $ | 82,989 | $ | 64,971 | $ | 50,479 |
Portfolio turnover rate J | 46% | 38% | 46% | 56% | 37% |
| Fidelity Advisor® Gold Fund Class M |
| Years ended February 28, | 2023 | 2022 | 2021 | 2020 A | 2019 | |||||
Selected Per-Share Data | ||||||||||
| Net asset value, beginning of period | $ | 25.63 | $ | 23.57 | $ | 21.16 | $ | 18.11 | $ | 17.94 |
| Income from Investment Operations | ||||||||||
Net investment income (loss) B,C | .09 | .19 D | (.12) | (.07) E | (.07) | |||||
| Net realized and unrealized gain (loss) | (5.11) | 2.16 | 3.67 | 3.12 | .24 | |||||
| Total from investment operations | (5.02) | 2.35 | 3.55 | 3.05 | .17 | |||||
| Distributions from net investment income | (.06) | (.29) | (1.14) | - | - | |||||
| Total distributions | (.06) | (.29) | (1.14) | - | - | |||||
| Net asset value, end of period | $ | 20.55 | $ | 25.63 | $ | 23.57 | $ | 21.16 | $ | 18.11 |
Total Return F,G | (19.66)% | 10.08% | 16.28% | 16.84% | .95% | |||||
Ratios to Average Net Assets C,H,I | ||||||||||
| Expenses before reductions | 1.35% | 1.36% | 1.37% | 1.42% | 1.48% | |||||
| Expenses net of fee waivers, if any | 1.35% | 1.35% | 1.37% | 1.42% | 1.46% | |||||
| Expenses net of all reductions | 1.35% | 1.35% | 1.36% | 1.41% | 1.46% | |||||
| Net investment income (loss) | .40% | .74% D | (.42)% | (.34)% E | (.43)% | |||||
| Supplemental Data | ||||||||||
| Net assets, end of period (000 omitted) | $ | 21,586 | $ | 26,201 | $ | 24,535 | $ | 19,620 | $ | 17,401 |
Portfolio turnover rate J | 46% | 38% | 46% | 56% | 37% |
| Fidelity Advisor® Gold Fund Class C |
| Years ended February 28, | 2023 | 2022 | 2021 | 2020 A | 2019 | |||||
Selected Per-Share Data | ||||||||||
| Net asset value, beginning of period | $ | 24.24 | $ | 22.30 | $ | 20.07 | $ | 17.24 | $ | 17.15 |
| Income from Investment Operations | ||||||||||
Net investment income (loss) B,C | (.01) | .08 D | (.22) | (.14) E | (.13) | |||||
| Net realized and unrealized gain (loss) | (4.82) | 2.05 | 3.49 | 2.97 | .22 | |||||
| Total from investment operations | (4.83) | 2.13 | 3.27 | 2.83 | .09 | |||||
| Distributions from net investment income | (.05) | (.19) | (1.04) | - | - | |||||
| Total distributions | (.05) | (.19) | (1.04) | - | - | |||||
| Net asset value, end of period | $ | 19.36 | $ | 24.24 | $ | 22.30 | $ | 20.07 | $ | 17.24 |
Total Return F,G | (20.00)% | 9.62% | 15.81% | 16.42% | .52% | |||||
Ratios to Average Net Assets C,H,I | ||||||||||
| Expenses before reductions | 1.79% | 1.77% | 1.78% | 1.80% | 1.84% | |||||
| Expenses net of fee waivers, if any | 1.78% | 1.77% | 1.78% | 1.80% | 1.83% | |||||
| Expenses net of all reductions | 1.78% | 1.77% | 1.77% | 1.79% | 1.83% | |||||
| Net investment income (loss) | (.03)% | .32% D | (.83)% | (.72)% E | (.80)% | |||||
| Supplemental Data | ||||||||||
| Net assets, end of period (000 omitted) | $ | 27,978 | $ | 43,031 | $ | 51,195 | $ | 52,375 | $ | 67,760 |
Portfolio turnover rate J | 46% | 38% | 46% | 56% | 37% |
| Gold Portfolio |
| Years ended February 28, | 2023 | 2022 | 2021 | 2020 A | 2019 | |||||
Selected Per-Share Data | ||||||||||
| Net asset value, beginning of period | $ | 27.14 | $ | 24.93 | $ | 22.33 | $ | 19.07 | $ | 18.78 |
| Income from Investment Operations | ||||||||||
Net investment income (loss) B,C | .23 | .36 D | .06 | .06 E | .03 | |||||
| Net realized and unrealized gain (loss) | (5.41) | 2.27 | 3.84 | 3.30 | .26 | |||||
| Total from investment operations | (5.18) | 2.63 | 3.90 | 3.36 | .29 | |||||
| Distributions from net investment income | (.08) | (.42) | (1.30) | (.06) | - | |||||
| Distributions from net realized gain | - | - | - | (.03) | - | |||||
| Total distributions | (.08) | (.42) | (1.30) | (.10) F | - | |||||
| Net asset value, end of period | $ | 21.88 | $ | 27.14 | $ | 24.93 | $ | 22.33 | $ | 19.07 |
Total Return G | (19.17)% | 10.71% | 16.96% | 17.60% | 1.54% | |||||
Ratios to Average Net Assets C,H,I | ||||||||||
| Expenses before reductions | .78% | .76% | .76% | .79% | .86% | |||||
| Expenses net of fee waivers, if any | .78% | .76% | .76% | .79% | .85% | |||||
| Expenses net of all reductions | .77% | .76% | .75% | .78% | .85% | |||||
| Net investment income (loss) | .97% | 1.33% D | .19% | .29% E | .18% | |||||
| Supplemental Data | ||||||||||
| Net assets, end of period (000 omitted) | $ | 1,229,416 | $ | 1,330,602 | $ | 1,319,440 | $ | 1,292,204 | $ | 1,035,697 |
Portfolio turnover rate J | 46% | 38% | 46% | 56% | 37% |
| Fidelity Advisor® Gold Fund Class I |
| Years ended February 28, | 2023 | 2022 | 2021 | 2020 A | 2019 | |||||
Selected Per-Share Data | ||||||||||
| Net asset value, beginning of period | $ | 27.15 | $ | 24.93 | $ | 22.33 | $ | 19.07 | $ | 18.78 |
| Income from Investment Operations | ||||||||||
Net investment income (loss) B,C | .23 | .36 D | .05 | .06 E | .04 | |||||
| Net realized and unrealized gain (loss) | (5.42) | 2.27 | 3.85 | 3.30 | .25 | |||||
| Total from investment operations | (5.19) | 2.63 | 3.90 | 3.36 | .29 | |||||
| Distributions from net investment income | (.08) | (.41) | (1.30) | (.07) | - | |||||
| Distributions from net realized gain | - | - | - | (.03) | - | |||||
| Total distributions | (.08) | (.41) | (1.30) | (.10) | - | |||||
| Net asset value, end of period | $ | 21.88 | $ | 27.15 | $ | 24.93 | $ | 22.33 | $ | 19.07 |
Total Return F | (19.20)% | 10.74% | 16.96% | 17.60% | 1.54% | |||||
Ratios to Average Net Assets C,G,H | ||||||||||
| Expenses before reductions | .77% | .76% | .77% | .79% | .84% | |||||
| Expenses net of fee waivers, if any | .77% | .76% | .77% | .79% | .82% | |||||
| Expenses net of all reductions | .77% | .76% | .76% | .77% | .82% | |||||
| Net investment income (loss) | .98% | 1.33% D | .18% | .30% E | .21% | |||||
| Supplemental Data | ||||||||||
| Net assets, end of period (000 omitted) | $ | 110,224 | $ | 152,799 | $ | 137,617 | $ | 115,699 | $ | 84,956 |
Portfolio turnover rate I | 46% | 38% | 46% | 56% | 37% |
| Fidelity Advisor® Gold Fund Class Z |
| Years ended February 28, | 2023 | 2022 | 2021 | 2020 A | 2019 B | |||||
Selected Per-Share Data | ||||||||||
| Net asset value, beginning of period | $ | 27.16 | $ | 24.94 | $ | 22.34 | $ | 19.08 | $ | 16.62 |
| Income from Investment Operations | ||||||||||
Net investment income (loss) C,D | .26 | .40 E | .09 | .10 F | .07 | |||||
| Net realized and unrealized gain (loss) | (5.41) | 2.27 | 3.85 | 3.29 | 2.39 | |||||
| Total from investment operations | (5.15) | 2.67 | 3.94 | 3.39 | 2.46 | |||||
| Distributions from net investment income | (.09) | (.45) | (1.34) | (.10) | - | |||||
| Distributions from net realized gain | - | - | - | (.03) | - | |||||
| Total distributions | (.09) | (.45) | (1.34) | (.13) | - | |||||
| Net asset value, end of period | $ | 21.92 | $ | 27.16 | $ | 24.94 | $ | 22.34 | $ | 19.08 |
Total Return G,H | (19.07)% | 10.88% | 17.12% | 17.75% | 14.80% | |||||
Ratios to Average Net Assets D,I,J | ||||||||||
| Expenses before reductions | .63% | .63% | .64% | .65% | .68% K | |||||
| Expenses net of fee waivers, if any | .63% | .62% | .64% | .64% | .68% K | |||||
| Expenses net of all reductions | .63% | .62% | .62% | .63% | .67% K | |||||
| Net investment income (loss) | 1.12% | 1.47% E | .32% | .44% F | .97% K | |||||
| Supplemental Data | ||||||||||
| Net assets, end of period (000 omitted) | $ | 93,634 | $ | 109,842 | $ | 105,293 | $ | 95,076 | $ | 3,037 |
Portfolio turnover rate L | 46% | 38% | 46% | 56% | 37% |
| Subsidiary Name | $ Amount | % of Fund's Net Assets | |
| Gold Portfolio | Fidelity Select Gold Cayman Ltd. | 10,218,783 | .7 |
| Fidelity Central Fund | Investment Manager | Investment Objective | Investment Practices | Expense Ratio A |
| Fidelity Money Market Central Funds | Fidelity Management & Research Company LLC (FMR) | Each fund seeks to obtain a high level of current income consistent with the preservation of capital and liquidity. | Short-term Investments | Less than .005% |
| Gold Portfolio | $131,460 |
| Gross unrealized appreciation | $390,850,953 |
| Gross unrealized depreciation | (187,874,314) |
| Net unrealized appreciation (depreciation) | $202,976,639 |
| Tax Cost | $1,642,086,635 |
| Undistributed ordinary income | $8,563,393 |
| Capital loss carryforward | $(1,461,988,083) |
| Net unrealized appreciation (depreciation) on securities and other investments | $203,138,503 |
Short-term | $(274,109,326) |
Long-term | (1,187,878,757) |
| Total capital loss carryforward | $(1,461,988,083) |
| February 28, 2023 | February 28, 2022 | |
| Ordinary Income | $5,320,281 | $27,126,849 |
| Purchases ($) | Sales ($) | |
| Gold Portfolio | 861,480,974 | 675,375,560 |
| Distribution Fee | Service Fee | Total Fees | Retained by FDC | |
| Class A | - % | .25% | $194,867 | $4,428 |
| Class M | .25% | .25% | 117,966 | - |
| Class C | .75% | .25% | 335,475 | 24,479 |
| $648,308 | $28,907 |
| Retained by FDC | |
| Class A | $40,149 |
| Class M | 3,412 |
Class C A | 196 |
| $43,757 |
| Amount | % of Class-Level Average Net Assets | |
| Class A | $192,552 | .25 |
| Class M | 62,058 | .26 |
| Class C | 66,798 | .20 |
| Gold | 2,182,343 | .19 |
| Class I | 227,241 | .18 |
| Class Z | 40,371 | .04 |
| $2,771,363 |
| % of Average Net Assets | |
| Gold Portfolio | .04 |
| Amount | |
| Gold Portfolio | $5,875 |
| Borrower or Lender | Average Loan Balance | Weighted Average Interest Rate | Interest Expense | |
| Gold Portfolio | Borrower | $ 3,344,667 | 3.64% | $2,027 |
| Purchases ($) | Sales ($) | Realized Gain (Loss) ($) | |
| Gold Portfolio | 8,187,898 | 37,112,292 | (1,397,642) |
| Amount | |
| Gold Portfolio | $2,689 |
| Total Security Lending Fees Paid to NFS | Security Lending Income From Securities Loaned to NFS | Value of Securities Loaned to NFS at Period End | |
| Gold Portfolio | $79,640 | $70 | $- |
| Expense reduction | |
| Class M | $255 |
Year ended February 28, 2023 | Year ended February 28, 2022 | |
| Gold Portfolio | ||
| Distributions to shareholders | ||
| Class A | $236,581 | $1,159,197 |
| Class M | 64,063 | 296,704 |
| Class C | 82,259 | 340,514 |
| Gold | 4,119,368 | 21,360,877 |
| Class I | 460,437 | 2,173,450 |
| Class Z | 357,573 | 1,796,107 |
Total | $5,320,281 | $27,126,849 |
| Shares | Shares | Dollars | Dollars | |
Year ended February 28, 2023 | Year ended February 28, 2022 | Year ended February 28, 2023 | Year ended February 28, 2022 | |
| Gold Portfolio | ||||
| Class A | ||||
| Shares sold | 1,122,921 | 1,096,721 | $27,099,950 | $29,272,417 |
| Reinvestment of distributions | 7,775 | 47,654 | 230,842 | 1,130,833 |
| Shares redeemed | (939,774) | (1,270,387) | (21,685,894) | (33,037,200) |
| Net increase (decrease) | 190,922 | (126,012) | $5,644,898 | $(2,633,950) |
| Class M | ||||
| Shares sold | 371,999 | 261,284 | $8,541,059 | $6,743,876 |
| Reinvestment of distributions | 2,211 | 12,798 | 64,030 | 296,405 |
| Shares redeemed | (346,180) | (292,712) | (7,235,921) | (7,361,263) |
| Net increase (decrease) | 28,030 | (18,630) | $1,369,168 | $(320,982) |
| Class C | ||||
| Shares sold | 330,090 | 196,401 | $7,857,068 | $4,759,229 |
| Reinvestment of distributions | 2,997 | 15,464 | 82,054 | 339,121 |
| Shares redeemed | (663,298) | (732,472) | (13,627,374) | (17,728,207) |
| Net increase (decrease) | (330,211) | (520,607) | $(5,688,252) | $(12,629,857) |
| Gold | ||||
| Shares sold | 24,882,743 | 15,683,398 | $614,447,230 | $428,540,719 |
| Reinvestment of distributions | 128,260 | 836,569 | 3,933,734 | 20,495,942 |
| Shares redeemed | (17,838,751) | (20,431,260) | (424,861,608) | (537,992,891) |
| Net increase (decrease) | 7,172,252 | (3,911,293) | $193,519,356 | $(88,956,230) |
| Class I | ||||
| Shares sold | 1,703,267 | 1,719,405 | $41,572,132 | $46,014,104 |
| Reinvestment of distributions | 14,570 | 85,689 | 447,009 | 2,100,234 |
| Shares redeemed | (2,309,414) | (1,696,668) | (53,976,142) | (45,357,188) |
| Net increase (decrease) | (591,577) | 108,426 | $(11,957,001) | $2,757,150 |
| Class Z | ||||
| Shares sold | 2,207,248 | 1,719,289 | $52,782,706 | $46,800,221 |
| Reinvestment of distributions | 11,475 | 72,350 | 352,174 | 1,773,309 |
| Shares redeemed | (1,991,473) | (1,969,124) | (46,768,230) | (53,134,514) |
| Net increase (decrease) | 227,250 | (177,485) | $6,366,650 | $(4,560,984) |
| Average Annual Total Returns | |||
Periods ended February 28, 2023 | Past 1 year | Past 5 years | Past 10 years |
| Class A (incl.5.75% sales charge) | -5.38% | 4.49% | 6.23% |
| Class M (incl.3.50% sales charge) | -3.36% | 4.70% | 6.18% |
Class C (incl. contingent deferred sales charge) | -1.33% | 4.95% | 6.22% |
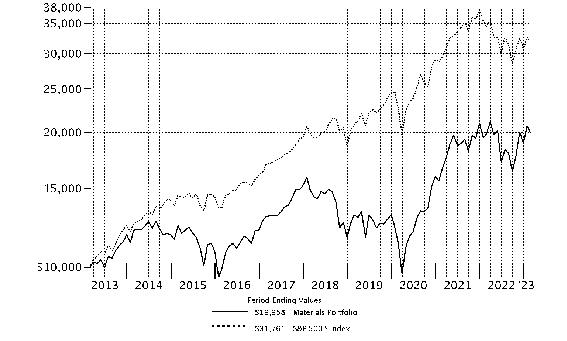
| Materials Portfolio | 0.67% | 6.03% | 7.15% |
| Class I | 0.66% | 6.03% | 7.17% |
| Class Z | 0.81% | 6.17% | 7.24% |
| $10,000 Over 10 Years |
Let's say hypothetically that $10,000 was invested in Materials Portfolio, a class of the fund, on February 28, 2013. The chart shows how the value of your investment would have changed, and also shows how the S&P 500® Index performed over the same period. |
 |
Top Holdings (% of Fund's net assets) | ||
| Linde PLC | 17.2 | |
| Air Products & Chemicals, Inc. | 7.5 | |
| Freeport-McMoRan, Inc. | 7.3 | |
| Corteva, Inc. | 5.9 | |
| First Quantum Minerals Ltd. | 5.1 | |
| LyondellBasell Industries NV Class A | 4.7 | |
| DuPont de Nemours, Inc. | 3.8 | |
| Celanese Corp. Class A | 3.5 | |
| CF Industries Holdings, Inc. | 3.1 | |
| Olin Corp. | 2.8 | |
| 60.9 | ||
| Industries (% of Fund's net assets) | ||
| Chemicals | 64.6 | |
| Metals & Mining | 21.4 | |
| Containers & Packaging | 8.3 | |
| Construction Materials | 4.2 | |
Geographic Diversification (% of Fund's net assets) |
 |
* Includes Short-Term investments and Net Other Assets (Liabilities). Percentages are based on country or territory of incorporation and are adjusted for the effect of derivatives, if applicable. |
| Common Stocks - 98.5% | |||
| Shares | Value ($) | ||
| Chemicals - 64.6% | |||
| Commodity Chemicals - 16.4% | |||
| Cabot Corp. (a) | 289,600 | 23,031,888 | |
| Chemtrade Logistics Income Fund | 1,926,900 | 12,963,680 | |
| Dow, Inc. | 210,100 | 12,017,720 | |
| LyondellBasell Industries NV Class A | 542,739 | 52,097,517 | |
| Olin Corp. | 525,600 | 30,353,400 | |
| Orion Engineered Carbons SA | 194,500 | 4,959,750 | |
| Tronox Holdings PLC | 1,765,203 | 27,537,167 | |
| Westlake Corp. (a) | 139,900 | 16,667,686 | |
| 179,628,808 | |||
| Diversified Chemicals - 3.4% | |||
| Huntsman Corp. | 262,500 | 7,701,750 | |
| The Chemours Co. LLC | 874,303 | 29,883,677 | |
| 37,585,427 | |||
| Fertilizers & Agricultural Chemicals - 9.0% | |||
| CF Industries Holdings, Inc. | 396,300 | 34,038,207 | |
| Corteva, Inc. | 1,035,811 | 64,520,667 | |
| 98,558,874 | |||
| Industrial Gases - 24.7% | |||
| Air Products & Chemicals, Inc. | 288,200 | 82,419,436 | |
| Linde PLC | 541,486 | 188,637,477 | |
| 271,056,913 | |||
| Specialty Chemicals - 11.1% | |||
| Albemarle Corp. | 7,900 | 2,009,049 | |
| Ashland, Inc. | 179,000 | 18,218,620 | |
| Celanese Corp. Class A | 326,500 | 37,949,095 | |
| DuPont de Nemours, Inc. | 578,417 | 42,241,794 | |
| Eastman Chemical Co. | 70,200 | 5,981,040 | |
| Element Solutions, Inc. | 390,200 | 8,014,708 | |
| RPM International, Inc. | 85,200 | 7,551,276 | |
| 121,965,582 | |||
TOTAL CHEMICALS | 708,795,604 | ||
| Construction Materials - 4.2% | |||
| Construction Materials - 4.2% | |||
| Martin Marietta Materials, Inc. | 61,900 | 22,275,953 | |
| Vulcan Materials Co. | 131,700 | 23,825,847 | |
| 46,101,800 | |||
| Containers & Packaging - 8.3% | |||
| Metal & Glass Containers - 5.7% | |||
| Aptargroup, Inc. | 226,700 | 26,460,424 | |
| Crown Holdings, Inc. | 187,959 | 16,260,333 | |
| Greif, Inc. Class A | 281,200 | 19,979,260 | |
| 62,700,017 | |||
| Paper Packaging - 2.6% | |||
| Avery Dennison Corp. | 103,000 | 18,765,570 | |
| Sealed Air Corp. | 203,149 | 9,877,104 | |
| 28,642,674 | |||
TOTAL CONTAINERS & PACKAGING | 91,342,691 | ||
| Metals & Mining - 21.4% | |||
| Aluminum - 2.1% | |||
| Alcoa Corp. | 477,100 | 23,349,274 | |
| Copper - 12.4% | |||
| First Quantum Minerals Ltd. | 2,524,900 | 55,161,062 | |
| Freeport-McMoRan, Inc. | 1,960,300 | 80,313,491 | |
| 135,474,553 | |||
| Diversified Metals & Mining - 1.9% | |||
| Glencore PLC | 3,396,600 | 20,250,073 | |
| Steel - 5.0% | |||
| Commercial Metals Co. | 319,700 | 16,544,475 | |
| Reliance Steel & Aluminum Co. | 105,200 | 26,072,768 | |
| Steel Dynamics, Inc. | 99,000 | 12,484,890 | |
| 55,102,133 | |||
TOTAL METALS & MINING | 234,176,033 | ||
| TOTAL COMMON STOCKS (Cost $796,683,232) | 1,080,416,128 | ||
| Money Market Funds - 2.7% | |||
| Shares | Value ($) | ||
| Fidelity Cash Central Fund 4.63% (b) | 12,466,384 | 12,468,877 | |
| Fidelity Securities Lending Cash Central Fund 4.63% (b)(c) | 17,447,305 | 17,449,050 | |
| TOTAL MONEY MARKET FUNDS (Cost $29,917,927) | 29,917,927 | ||
| TOTAL INVESTMENT IN SECURITIES - 101.2% (Cost $826,601,159) | 1,110,334,055 |
NET OTHER ASSETS (LIABILITIES) - (1.2)% | (13,033,869) |
| NET ASSETS - 100.0% | 1,097,300,186 |
| (a) | Security or a portion of the security is on loan at period end. |
| (b) | Affiliated fund that is generally available only to investment companies and other accounts managed by Fidelity Investments. The rate quoted is the annualized seven-day yield of the fund at period end. A complete unaudited listing of the fund's holdings as of its most recent quarter end is available upon request. In addition, each Fidelity Central Fund's financial statements, which are not covered by the Fund's Report of Independent Registered Public Accounting Firm, are available on the SEC's website or upon request. |
| (c) | Investment made with cash collateral received from securities on loan. |
| Affiliate | Value, beginning of period ($) | Purchases ($) | Sales Proceeds ($) | Dividend Income ($) | Realized Gain (loss) ($) | Change in Unrealized appreciation (depreciation) ($) | Value, end of period ($) | % ownership, end of period |
| Fidelity Cash Central Fund 4.63% | 1,212,250 | 270,921,057 | 259,664,430 | 245,566 | - | - | 12,468,877 | 0.0% |
| Fidelity Securities Lending Cash Central Fund 4.63% | 20,127,155 | 202,620,830 | 205,298,935 | 15,081 | - | - | 17,449,050 | 0.1% |
| Total | 21,339,405 | 473,541,887 | 464,963,365 | 260,647 | - | - | 29,917,927 | |
| Valuation Inputs at Reporting Date: | ||||
| Description | Total ($) | Level 1 ($) | Level 2 ($) | Level 3 ($) |
Investments in Securities: | ||||
| Common Stocks | 1,080,416,128 | 1,060,166,055 | 20,250,073 | - |
| Money Market Funds | 29,917,927 | 29,917,927 | - | - |
| Total Investments in Securities: | 1,110,334,055 | 1,090,083,982 | 20,250,073 | - |
| Statement of Assets and Liabilities | ||||
| February 28, 2023 | ||||
| Assets | ||||
| Investment in securities, at value (including securities loaned of $16,870,503) - See accompanying schedule: | ||||
Unaffiliated issuers (cost $796,683,232) | $ | 1,080,416,128 | ||
Fidelity Central Funds (cost $29,917,927) | 29,917,927 | |||
| Total Investment in Securities (cost $826,601,159) | $ | 1,110,334,055 | ||
| Foreign currency held at value (cost $19,046) | 18,872 | |||
| Receivable for investments sold | 16,053,961 | |||
| Receivable for fund shares sold | 453,744 | |||
| Dividends receivable | 1,564,527 | |||
| Distributions receivable from Fidelity Central Funds | 20,504 | |||
| Prepaid expenses | 5,442 | |||
| Other receivables | 170,960 | |||
Total assets | 1,128,622,065 | |||
| Liabilities | ||||
| Payable for investments purchased | $ | 11,940,264 | ||
| Payable for fund shares redeemed | 997,681 | |||
| Accrued management fee | 483,068 | |||
| Distribution and service plan fees payable | 56,550 | |||
| Other affiliated payables | 183,135 | |||
| Other payables and accrued expenses | 212,131 | |||
| Collateral on securities loaned | 17,449,050 | |||
| Total Liabilities | 31,321,879 | |||
| Net Assets | $ | 1,097,300,186 | ||
| Net Assets consist of: | ||||
| Paid in capital | $ | 773,543,103 | ||
| Total accumulated earnings (loss) | 323,757,083 | |||
| Net Assets | $ | 1,097,300,186 | ||
| Net Asset Value and Maximum Offering Price | ||||
| Class A : | ||||
Net Asset Value and redemption price per share ($124,776,777 ÷ 1,247,999 shares) (a) | $ | 99.98 | ||
| Maximum offering price per share (100/94.25 of $99.98) | $ | 106.08 | ||
| Class M : | ||||
Net Asset Value and redemption price per share ($38,569,794 ÷ 390,508 shares) (a) | $ | 98.77 | ||
| Maximum offering price per share (100/96.50 of $98.77) | $ | 102.35 | ||
| Class C : | ||||
Net Asset Value and offering price per share ($17,052,876 ÷ 177,917 shares) (a) | $ | 95.85 | ||
| Materials : | ||||
Net Asset Value , offering price and redemption price per share ($603,330,274 ÷ 5,995,367 shares) | $ | 100.63 | ||
| Class I : | ||||
Net Asset Value , offering price and redemption price per share ($208,630,149 ÷ 2,077,644 shares) | $ | 100.42 | ||
| Class Z : | ||||
Net Asset Value , offering price and redemption price per share ($104,940,316 ÷ 1,046,539 shares) | $ | 100.27 | ||
(a)Redemption price per share is equal to net asset value less any applicable contingent deferred sales charge. | ||||
| Statement of Operations | ||||
Year ended February 28, 2023 | ||||
| Investment Income | ||||
| Dividends | $ | 19,398,883 | ||
| Income from Fidelity Central Funds (including $15,081 from security lending) | 260,647 | |||
| Total Income | 19,659,530 | |||
| Expenses | ||||
| Management fee | $ | 5,632,622 | ||
| Transfer agent fees | 1,875,435 | |||
| Distribution and service plan fees | 681,630 | |||
| Accounting fees | 323,931 | |||
| Custodian fees and expenses | 14,513 | |||
| Independent trustees' fees and expenses | 3,645 | |||
| Registration fees | 113,186 | |||
| Audit | 49,937 | |||
| Legal | 804 | |||
| Interest | 201 | |||
| Miscellaneous | 7,525 | |||
| Total expenses before reductions | 8,703,429 | |||
| Expense reductions | (38,566) | |||
| Total expenses after reductions | 8,664,863 | |||
| Net Investment income (loss) | 10,994,667 | |||
| Realized and Unrealized Gain (Loss) | ||||
| Net realized gain (loss) on: | ||||
| Investment Securities: | ||||
| Unaffiliated issuers | 108,078,773 | |||
| Foreign currency transactions | 20,417 | |||
| Total net realized gain (loss) | 108,099,190 | |||
| Change in net unrealized appreciation (depreciation) on: | ||||
| Investment Securities: | ||||
| Unaffiliated issuers | (119,331,153) | |||
| Assets and liabilities in foreign currencies | (16,905) | |||
| Total change in net unrealized appreciation (depreciation) | (119,348,058) | |||
| Net gain (loss) | (11,248,868) | |||
| Net increase (decrease) in net assets resulting from operations | $ | (254,201) | ||
| Statement of Changes in Net Assets | ||||
Year ended February 28, 2023 | Year ended February 28, 2022 | |||
| Increase (Decrease) in Net Assets | ||||
| Operations | ||||
| Net investment income (loss) | $ | 10,994,667 | $ | 8,580,339 |
| Net realized gain (loss) | 108,099,190 | 32,188,411 | ||
| Change in net unrealized appreciation (depreciation) | (119,348,058) | 129,763,897 | ||
| Net increase (decrease) in net assets resulting from operations | (254,201) | 170,532,647 | ||
| Distributions to shareholders | (33,314,365) | (8,437,183) | ||
| Share transactions - net increase (decrease) | (23,554,987) | 72,770,453 | ||
| Total increase (decrease) in net assets | (57,123,553) | 234,865,917 | ||
| Net Assets | ||||
| Beginning of period | 1,154,423,739 | 919,557,822 | ||
| End of period | $ | 1,097,300,186 | $ | 1,154,423,739 |
| Fidelity Advisor® Materials Fund Class A |
| Years ended February 28, | 2023 | 2022 | 2021 | 2020 A | 2019 | |||||
Selected Per-Share Data | ||||||||||
| Net asset value, beginning of period | $ | 102.68 | $ | 87.03 | $ | 59.39 | $ | 69.57 | $ | 88.50 |
| Income from Investment Operations | ||||||||||
Net investment income (loss) B,C | .79 | .46 | .33 | .58 | .84 | |||||
| Net realized and unrealized gain (loss) | (.54) | 15.77 | 27.72 | (10.10) | (12.01) | |||||
| Total from investment operations | .25 | 16.23 | 28.05 | (9.52) | (11.17) | |||||
| Distributions from net investment income | (.80) | (.58) | (.41) | (.66) | (.67) | |||||
| Distributions from net realized gain | (2.15) | - | - | - | (7.09) | |||||
| Total distributions | (2.95) | (.58) | (.41) | (.66) | (7.76) | |||||
| Net asset value, end of period | $ | 99.98 | $ | 102.68 | $ | 87.03 | $ | 59.39 | $ | 69.57 |
Total Return D,E | .39% | 18.64% | 47.27% | (13.81)% | (12.59)% | |||||
Ratios to Average Net Assets C,F,G | ||||||||||
| Expenses before reductions | 1.03% | 1.03% | 1.08% | 1.08% | 1.06% | |||||
| Expenses net of fee waivers, if any | 1.03% | 1.03% | 1.08% | 1.08% | 1.06% | |||||
| Expenses net of all reductions | 1.03% | 1.03% | 1.08% | 1.07% | 1.05% | |||||
| Net investment income (loss) | .81% | .46% | .48% | .87% | 1.08% | |||||
| Supplemental Data | ||||||||||
| Net assets, end of period (000 omitted) | $ | 124,777 | $ | 138,219 | $ | 101,238 | $ | 76,869 | $ | 126,182 |
Portfolio turnover rate H | 47% | 43% | 36% | 69% | 77% I |
| Fidelity Advisor® Materials Fund Class M |
| Years ended February 28, | 2023 | 2022 | 2021 | 2020 A | 2019 | |||||
Selected Per-Share Data | ||||||||||
| Net asset value, beginning of period | $ | 101.52 | $ | 86.14 | $ | 58.84 | $ | 68.98 | $ | 87.79 |
| Income from Investment Operations | ||||||||||
Net investment income (loss) B,C | .54 | .20 | .14 | .39 | .61 | |||||
| Net realized and unrealized gain (loss) | (.53) | 15.59 | 27.42 | (10.01) | (11.88) | |||||
| Total from investment operations | .01 | 15.79 | 27.56 | (9.62) | (11.27) | |||||
| Distributions from net investment income | (.61) | (.41) | (.26) | (.52) | (.45) | |||||
| Distributions from net realized gain | (2.15) | - | - | - | (7.09) | |||||
| Total distributions | (2.76) | (.41) | (.26) | (.52) | (7.54) | |||||
| Net asset value, end of period | $ | 98.77 | $ | 101.52 | $ | 86.14 | $ | 58.84 | $ | 68.98 |
Total Return D,E | .15% | 18.32% | 46.86% | (14.05)% | (12.84)% | |||||
Ratios to Average Net Assets C,F,G | ||||||||||
| Expenses before reductions | 1.28% | 1.29% | 1.36% | 1.37% | 1.35% | |||||
| Expenses net of fee waivers, if any | 1.28% | 1.29% | 1.36% | 1.36% | 1.35% | |||||
| Expenses net of all reductions | 1.28% | 1.29% | 1.36% | 1.36% | 1.34% | |||||
| Net investment income (loss) | .56% | .20% | .21% | .58% | .79% | |||||
| Supplemental Data | ||||||||||
| Net assets, end of period (000 omitted) | $ | 38,570 | $ | 37,100 | $ | 24,768 | $ | 19,423 | $ | 27,436 |
Portfolio turnover rate H | 47% | 43% | 36% | 69% | 77% I |
| Fidelity Advisor® Materials Fund Class C |
| Years ended February 28, | 2023 | 2022 | 2021 | 2020 A | 2019 | |||||
Selected Per-Share Data | ||||||||||
| Net asset value, beginning of period | $ | 98.63 | $ | 83.76 | $ | 57.30 | $ | 67.13 | $ | 85.52 |
| Income from Investment Operations | ||||||||||
Net investment income (loss) B,C | .06 | (.28) | (.18) | .08 | .25 | |||||
| Net realized and unrealized gain (loss) | (.53) | 15.15 | 26.64 | (9.76) | (11.50) | |||||
| Total from investment operations | (.47) | 14.87 | 26.46 | (9.68) | (11.25) | |||||
| Distributions from net investment income | (.16) | - | - | (.15) | (.04) | |||||
| Distributions from net realized gain | (2.15) | - | - | - | (7.09) | |||||
| Total distributions | (2.31) | - | - | (.15) | (7.14) D | |||||
| Net asset value, end of period | $ | 95.85 | $ | 98.63 | $ | 83.76 | $ | 57.30 | $ | 67.13 |
Total Return E,F | (.36)% | 17.75% | 46.18% | (14.46)% | (13.24)% | |||||
Ratios to Average Net Assets C,G,H | ||||||||||
| Expenses before reductions | 1.78% | 1.78% | 1.83% | 1.82% | 1.81% | |||||
| Expenses net of fee waivers, if any | 1.78% | 1.78% | 1.83% | 1.82% | 1.81% | |||||
| Expenses net of all reductions | 1.78% | 1.78% | 1.83% | 1.81% | 1.79% | |||||
| Net investment income (loss) | .06% | (.29)% | (.27)% | .12% | .33% | |||||
| Supplemental Data | ||||||||||
| Net assets, end of period (000 omitted) | $ | 17,053 | $ | 21,261 | $ | 23,296 | $ | 24,239 | $ | 51,659 |
Portfolio turnover rate I | 47% | 43% | 36% | 69% | 77% J |
| Materials Portfolio |
| Years ended February 28, | 2023 | 2022 | 2021 | 2020 A | 2019 | |||||
Selected Per-Share Data | ||||||||||
| Net asset value, beginning of period | $ | 103.29 | $ | 87.46 | $ | 59.63 | $ | 69.84 | $ | 88.90 |
| Income from Investment Operations | ||||||||||
Net investment income (loss) B,C | 1.07 | .75 | .53 | .77 | 1.06 | |||||
| Net realized and unrealized gain (loss) | (.55) | 15.86 | 27.87 | (10.14) | (12.09) | |||||
| Total from investment operations | .52 | 16.61 | 28.40 | (9.37) | (11.03) | |||||
| Distributions from net investment income | (1.03) | (.78) | (.57) | (.84) | (.93) | |||||
| Distributions from net realized gain | (2.15) | - | - | - | (7.09) | |||||
| Total distributions | (3.18) | (.78) | (.57) | (.84) | (8.03) D | |||||
| Net asset value, end of period | $ | 100.63 | $ | 103.29 | $ | 87.46 | $ | 59.63 | $ | 69.84 |
Total Return E | .67% | 18.98% | 47.68% | (13.57)% | (12.35)% | |||||
Ratios to Average Net Assets C,F,G | ||||||||||
| Expenses before reductions | .76% | .75% | .80% | .80% | .79% | |||||
| Expenses net of fee waivers, if any | .75% | .74% | .80% | .80% | .79% | |||||
| Expenses net of all reductions | .75% | .74% | .80% | .79% | .78% | |||||
| Net investment income (loss) | 1.09% | .75% | .76% | 1.14% | 1.35% | |||||
| Supplemental Data | ||||||||||
| Net assets, end of period (000 omitted) | $ | 603,330 | $ | 645,773 | $ | 533,073 | $ | 405,668 | $ | 626,759 |
Portfolio turnover rate H | 47% | 43% | 36% | 69% | 77% I |
| Fidelity Advisor® Materials Fund Class I |
| Years ended February 28, | 2023 | 2022 | 2021 | 2020 A | 2019 | |||||
Selected Per-Share Data | ||||||||||
| Net asset value, beginning of period | $ | 103.07 | $ | 87.29 | $ | 59.52 | $ | 69.70 | $ | 88.73 |
| Income from Investment Operations | ||||||||||
Net investment income (loss) B,C | 1.06 | .74 | .55 | .78 | 1.07 | |||||
| Net realized and unrealized gain (loss) | (.54) | 15.83 | 27.80 | (10.12) | (12.08) | |||||
| Total from investment operations | .52 | 16.57 | 28.35 | (9.34) | (11.01) | |||||
| Distributions from net investment income | (1.02) | (.79) | (.58) | (.84) | (.93) | |||||
| Distributions from net realized gain | (2.15) | - | - | - | (7.09) | |||||
| Total distributions | (3.17) | (.79) | (.58) | (.84) | (8.02) | |||||
| Net asset value, end of period | $ | 100.42 | $ | 103.07 | $ | 87.29 | $ | 59.52 | $ | 69.70 |
Total Return D | .66% | 18.97% | 47.70% | (13.55)% | (12.34)% | |||||
Ratios to Average Net Assets C,E,F | ||||||||||
| Expenses before reductions | .76% | .75% | .78% | .79% | .78% | |||||
| Expenses net of fee waivers, if any | .76% | .75% | .78% | .79% | .78% | |||||
| Expenses net of all reductions | .76% | .75% | .78% | .78% | .77% | |||||
| Net investment income (loss) | 1.08% | .74% | .78% | 1.16% | 1.36% | |||||
| Supplemental Data | ||||||||||
| Net assets, end of period (000 omitted) | $ | 208,630 | $ | 238,282 | $ | 190,132 | $ | 137,887 | $ | 254,240 |
Portfolio turnover rate G | 47% | 43% | 36% | 69% | 77% H |
| Fidelity Advisor® Materials Fund Class Z |
| Years ended February 28, | 2023 | 2022 | 2021 | 2020 A | 2019 B | |||||
Selected Per-Share Data | ||||||||||
| Net asset value, beginning of period | $ | 102.92 | $ | 87.14 | $ | 59.40 | $ | 69.58 | $ | 79.81 |
| Income from Investment Operations | ||||||||||
Net investment income (loss) C,D | 1.20 | .88 | .67 | .88 | .62 | |||||
| Net realized and unrealized gain (loss) | (.54) | 15.81 | 27.75 | (10.10) | (6.96) | |||||
| Total from investment operations | .66 | 16.69 | 28.42 | (9.22) | (6.34) | |||||
| Distributions from net investment income | (1.16) | (.91) | (.68) | (.96) | (.96) | |||||
| Distributions from net realized gain | (2.15) | - | - | - | (2.93) | |||||
| Total distributions | (3.31) | (.91) | (.68) | (.96) | (3.89) | |||||
| Net asset value, end of period | $ | 100.27 | $ | 102.92 | $ | 87.14 | $ | 59.40 | $ | 69.58 |
Total Return E,F | .81% | 19.14% | 47.92% | (13.43)% | (7.35)% | |||||
Ratios to Average Net Assets D,G,H | ||||||||||
| Expenses before reductions | .62% | .62% | .64% | .63% | .63% I | |||||
| Expenses net of fee waivers, if any | .61% | .62% | .64% | .63% | .62% I | |||||
| Expenses net of all reductions | .61% | .62% | .63% | .62% | .61% I | |||||
| Net investment income (loss) | 1.23% | .88% | .93% | 1.31% | 2.27% I | |||||
| Supplemental Data | ||||||||||
| Net assets, end of period (000 omitted) | $ | 104,940 | $ | 73,790 | $ | 47,051 | $ | 13,267 | $ | 10,039 |
Portfolio turnover rate J | 47% | 43% | 36% | 69% | 77% K |
| Fidelity Central Fund | Investment Manager | Investment Objective | Investment Practices | Expense Ratio A |
| Fidelity Money Market Central Funds | Fidelity Management & Research Company LLC (FMR) | Each fund seeks to obtain a high level of current income consistent with the preservation of capital and liquidity. | Short-term Investments | Less than .005% |
| Materials Portfolio | $170,960 |
| Gross unrealized appreciation | $298,730,549 |
| Gross unrealized depreciation | (17,040,907) |
| Net unrealized appreciation (depreciation) | $281,689,642 |
| Tax Cost | $828,644,413 |
| Undistributed ordinary income | $404,924 |
| Undistributed long-term capital gain | $41,868,671 |
| Net unrealized appreciation (depreciation) on securities and other investments | $281,655,866 |
| February 28, 2023 | February 28, 2022 | |
| Ordinary Income | $10,457,127 | $ 8,437,183 |
| Long-term Capital Gains | 22,857,238 | - |
| Total | $33,314,365 | $ 8,437,183 |
| Purchases ($) | Sales ($) | |
| Materials Portfolio | 504,389,945 | 559,316,282 |
| Distribution Fee | Service Fee | Total Fees | Retained by FDC | |
| Class A | - % | .25% | $313,970 | $5,234 |
| Class M | .25% | .25% | 181,244 | 496 |
| Class C | .75% | .25% | 186,416 | 27,734 |
| $681,630 | $33,464 |
| Retained by FDC | |
| Class A | $20,160 |
| Class M | 2,307 |
Class C A | 106 |
| $22,573 |
| Amount | % of Class-Level Average Net Assets | |
| Class A | $257,456 | .20 |
| Class M | 74,589 | .21 |
| Class C | 38,561 | .21 |
| Materials | 1,069,263 | .18 |
| Class I | 402,014 | .18 |
| Class Z | 33,552 | .04 |
| $1,875,435 |
| % of Average Net Assets | |
| Materials Portfolio | .03 |
| Amount | |
| Materials Portfolio | $6,556 |
| Borrower or Lender | Average Loan Balance | Weighted Average Interest Rate | Interest Expense | |
| Materials Portfolio | Borrower | $ 7,643,667 | .32% | $201 |
| Purchases ($) | Sales ($) | Realized Gain (Loss) ($) | |
| Materials Portfolio | 23,186,744 | 9,817,568 | 1,313,266 |
| Amount | |
| Materials Portfolio | $1,920 |
| Total Security Lending Fees Paid to NFS | Security Lending Income From Securities Loaned to NFS | Value of Securities Loaned to NFS at Period End | |
| Materials Portfolio | $1,523 | $- | $- |
| Expense reduction | |
| Class M | $73 |
Year ended February 28, 2023 | Year ended February 28, 2022 | |
| Materials Portfolio | ||
| Distributions to shareholders | ||
| Class A | $ 3,653,799 | $762,533 |
| Class M | 1,013,870 | 147,448 |
| Class C | 430,794 | - |
| Materials | 18,471,243 | 5,007,156 |
| Class I | 6,523,647 | 1,869,092 |
| Class Z | 3,221,012 | 650,954 |
Total | $33,314,365 | $8,437,183 |
| Shares | Shares | Dollars | Dollars | |
Year ended February 28, 2023 | Year ended February 28, 2022 | Year ended February 28, 2023 | Year ended February 28, 2022 | |
| Materials Portfolio | ||||
| Class A | ||||
| Shares sold | 174,329 | 462,367 | $17,454,764 | $46,208,008 |
| Reinvestment of distributions | 37,585 | 7,168 | 3,573,539 | 745,309 |
| Shares redeemed | (310,006) | (286,710) | (30,402,251) | (28,650,346) |
| Net increase (decrease) | (98,092) | 182,825 | $(9,373,948) | $18,302,971 |
| Class M | ||||
| Shares sold | 92,789 | 179,127 | $9,181,513 | $17,772,580 |
| Reinvestment of distributions | 10,767 | 1,429 | 1,011,814 | 147,010 |
| Shares redeemed | (78,482) | (102,671) | (7,550,323) | (10,013,298) |
| Net increase (decrease) | 25,074 | 77,885 | $2,643,004 | $7,906,292 |
| Class C | ||||
| Shares sold | 33,396 | 94,534 | $3,198,388 | $9,060,563 |
| Reinvestment of distributions | 4,589 | - | 418,955 | - |
| Shares redeemed | (75,621) | (157,099) | (7,005,317) | (14,767,417) |
| Net increase (decrease) | (37,636) | (62,565) | $(3,387,974) | $(5,706,854) |
| Materials | ||||
| Shares sold | 1,012,996 | 5,001,453 | $103,105,703 | $502,734,189 |
| Reinvestment of distributions | 179,022 | 44,769 | 17,121,716 | 4,680,116 |
| Shares redeemed | (1,448,920) | (4,889,252) | (140,887,042) | (485,592,599) |
| Net increase (decrease) | (256,902) | 156,970 | $(20,659,623) | $21,821,706 |
| Class I | ||||
| Shares sold | 699,555 | 1,335,457 | $69,977,727 | $132,303,721 |
| Reinvestment of distributions | 64,549 | 16,505 | 6,160,539 | 1,721,641 |
| Shares redeemed | (998,267) | (1,218,271) | (97,071,794) | (121,416,087) |
| Net increase (decrease) | (234,163) | 133,691 | $(20,933,528) | $12,609,275 |
| Class Z | ||||
| Shares sold | 598,908 | 511,529 | $54,583,653 | $50,914,703 |
| Reinvestment of distributions | 32,902 | 5,860 | 3,134,918 | 610,221 |
| Shares redeemed | (302,227) | (340,358) | (29,561,489) | (33,687,861) |
| Net increase (decrease) | 329,583 | 177,031 | $28,157,082 | $17,837,063 |
| Chemicals Portfolio (1) |
| Gold Portfolio (2) |
| Materials Portfolio (1) |
(1) Statement of assets and liabilities, including the schedule of investments, as of February 28, 2023, the related statement of operations for the year ended February 28, 2023, the statement of changes in net assets for each of the two years in the period ended February 28, 2023, and the financial highlights for each of the periods indicated therein. (2) Consolidated statement of asset and liabilities, including the consolidated schedule of investments, as of February 28, 2023, the related consolidated statement of operations for the year ended February 28, 2023, the consolidated statement of changes in net assets for each of the two years in the period ended February 28, 2023, and the consolidated financial highlights for each of the periods indicated therein. |
| The Example is based on an investment of $1,000 invested at the beginning of the period and held for the entire period (September 1, 2022 to February 28, 2023). |
Annualized Expense Ratio- A | Beginning Account Value September 1, 2022 | Ending Account Value February 28, 2023 | Expenses Paid During Period- C September 1, 2022 to February 28, 2023 | |||||||
| Chemicals Portfolio | .75% | |||||||||
| Actual | $ 1,000 | $ 1,077.90 | $ 3.86 | |||||||
Hypothetical- B | $ 1,000 | $ 1,021.08 | $ 3.76 | |||||||
| Gold Portfolio | ||||||||||
| Class A | 1.09% | |||||||||
| Actual | $ 1,000 | $ 1,165.60 | $ 5.85 | |||||||
Hypothetical- B | $ 1,000 | $ 1,019.39 | $ 5.46 | |||||||
| Class M | 1.35% | |||||||||
| Actual | $ 1,000 | $ 1,163.60 | $ 7.24 | |||||||
Hypothetical- B | $ 1,000 | $ 1,018.10 | $ 6.76 | |||||||
| Class C | 1.80% | |||||||||
| Actual | $ 1,000 | $ 1,161.40 | $ 9.65 | |||||||
Hypothetical- B | $ 1,000 | $ 1,015.87 | $ 9.00 | |||||||
| Gold Portfolio | .78% | |||||||||
| Actual | $ 1,000 | $ 1,166.90 | $ 4.19 | |||||||
Hypothetical- B | $ 1,000 | $ 1,020.93 | $ 3.91 | |||||||
| Class I | .77% | |||||||||
| Actual | $ 1,000 | $ 1,166.90 | $ 4.14 | |||||||
Hypothetical- B | $ 1,000 | $ 1,020.98 | $ 3.86 | |||||||
| Class Z | .63% | |||||||||
| Actual | $ 1,000 | $ 1,167.80 | $ 3.39 | |||||||
Hypothetical- B | $ 1,000 | $ 1,021.67 | $ 3.16 | |||||||
| Materials Portfolio | ||||||||||
| Class A | 1.03% | |||||||||
| Actual | $ 1,000 | $ 1,110.00 | $ 5.39 | |||||||
Hypothetical- B | $ 1,000 | $ 1,019.69 | $ 5.16 | |||||||
| Class M | 1.28% | |||||||||
| Actual | $ 1,000 | $ 1,108.60 | $ 6.69 | |||||||
Hypothetical- B | $ 1,000 | $ 1,018.45 | $ 6.41 | |||||||
| Class C | 1.78% | |||||||||
| Actual | $ 1,000 | $ 1,105.90 | $ 9.29 | |||||||
Hypothetical- B | $ 1,000 | $ 1,015.97 | $ 8.90 | |||||||
| Materials Portfolio | .76% | |||||||||
| Actual | $ 1,000 | $ 1,111.50 | $ 3.98 | |||||||
Hypothetical- B | $ 1,000 | $ 1,021.03 | $ 3.81 | |||||||
| Class I | .76% | |||||||||
| Actual | $ 1,000 | $ 1,111.60 | $ 3.98 | |||||||
Hypothetical- B | $ 1,000 | $ 1,021.03 | $ 3.81 | |||||||
| Class Z | .61% | |||||||||
| Actual | $ 1,000 | $ 1,112.20 | $ 3.19 | |||||||
Hypothetical- B | $ 1,000 | $ 1,021.77 | $ 3.06 | |||||||
| Chemicals Portfolio | $48,236,858 |
| Materials Portfolio | $67,863,923 |
| Gold Portfolio | $97,520 |
| April 2022 | December 2022 | |
| Chemicals Portfolio | 100% | 100% |
| Gold Portfolio | ||
| Class A | 3% | - |
| Class M | 4% | - |
| Class C | 5% | - |
| Gold | 3% | - |
| Class I | 3% | - |
| Class Z | 3% | - |
| Materials Portfolio | ||
| Class A | - | 100% |
| Class M | - | 100% |
| Class C | - | 100% |
| Materials | - | 98% |
| Class I | - | 99% |
| Class Z | - | 87% |
| April 2022 | December 2022 | |
| Chemicals Portfolio | 100% | 100% |
| Gold Portfolio | ||
| Class A | 100% | - |
| Class M | 100% | - |
| Class C | 100% | - |
| Gold | 100% | - |
| Class I | 100% | - |
| Class Z | 100% | - |
| Materials Portfolio | ||
| Class A | - | 100% |
| Class M | - | 100% |
| Class C | - | 100% |
| Materials | - | 100% |
| Class I | - | 100% |
| Class Z | - | 100% |
| Pay Date | Income | Taxes | |
| Gold Portfolio | |||
| Class A | 04/11/2022 | $0.0728 | $0.0038 |
| Class M | 04/11/2022 | $0.0628 | $0.0038 |
| Class C | 04/11/2022 | $0.0488 | $0.0038 |
| Gold | 04/11/2022 | $0.0848 | $0.0038 |
| Class I | 04/11/2022 | $0.0848 | $0.0038 |
| Class Z | 04/11/2022 | $0.0898 | $0.0038 |
- Highly liquid investments - cash or convertible to cash within three business days or less
- Moderately liquid investments - convertible to cash in three to seven calendar days
- Less liquid investments - can be sold or disposed of, but not settled, within seven calendar days
- Illiquid investments - cannot be sold or disposed of within seven calendar days
 |


Contents
| Average Annual Total Returns | |||
Periods ended February 28, 2023 | Past 1 year | Past 5 years | Past 10 years |
| Automotive Portfolio | -16.92% | 10.56% | 10.95% |
| $10,000 Over 10 Years |
Let's say hypothetically that $10,000 was invested in Automotive Portfolio on February 28, 2013. The chart shows how the value of your investment would have changed, and also shows how the S&P 500® Index performed over the same period. |
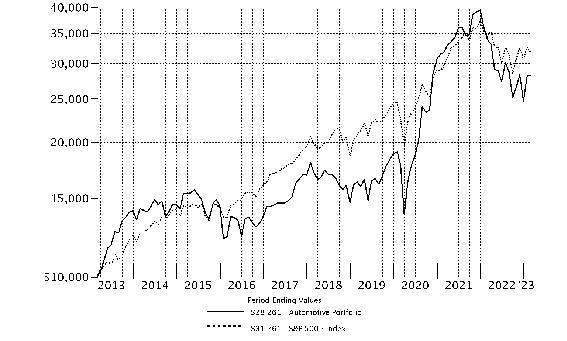 |
Top Holdings (% of Fund's net assets) | ||
| Tesla, Inc. | 11.9 | |
| Toyota Motor Corp. sponsored ADR | 10.7 | |
| General Motors Co. | 8.6 | |
| O'Reilly Automotive, Inc. | 7.7 | |
| Aptiv PLC | 5.6 | |
| Ferrari NV | 4.9 | |
| Ford Motor Co. | 4.3 | |
| AutoZone, Inc. | 4.0 | |
| Copart, Inc. | 3.7 | |
| Li Auto, Inc. ADR | 3.2 | |
| 64.6 | ||
| Industries (% of Fund's net assets) | ||
| Automobiles | 55.4 | |
| Auto Components | 18.2 | |
| Specialty Retail | 14.8 | |
| Distributors | 5.0 | |
| Commercial Services & Supplies | 3.7 | |
| Internet & Direct Marketing Retail | 1.0 | |
| Semiconductors & Semiconductor Equipment | 0.8 | |
| Electrical Equipment | 0.5 | |
| Electronic Equipment & Components | 0.0 | |
Geographic Diversification (% of Fund's net assets) |
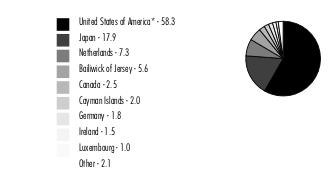 |
* Includes Short-Term investments and Net Other Assets (Liabilities). Percentages are based on country or territory of incorporation and are adjusted for the effect of derivatives, if applicable. |
| Common Stocks - 98.8% | |||
| Shares | Value ($) | ||
| Auto Components - 18.2% | |||
| Auto Parts & Equipment - 18.2% | |||
| Adient PLC (a) | 38,245 | 1,633,826 | |
| Aptiv PLC (a) | 50,920 | 5,920,978 | |
| Autoliv, Inc. | 23,935 | 2,215,902 | |
| Cie Automotive SA | 32,800 | 960,290 | |
| DENSO Corp. | 33,858 | 1,800,140 | |
| Hanon Systems | 104,270 | 712,659 | |
| Lear Corp. | 16,762 | 2,340,813 | |
| Magna International, Inc. Class A (sub. vtg.) | 48,241 | 2,688,698 | |
| Novem Group SA | 117,407 | 1,092,796 | |
| 19,366,102 | |||
| Automobiles - 54.8% | |||
| Automobile Manufacturers - 54.8% | |||
| Ferrari NV | 20,234 | 5,268,327 | |
| Ford Motor Co. | 379,179 | 4,576,691 | |
| General Motors Co. | 236,161 | 9,148,877 | |
| Honda Motor Co. Ltd. sponsored ADR | 117,000 | 3,038,490 | |
| Li Auto, Inc. ADR (a)(b) | 145,852 | 3,443,566 | |
| Lucid Group, Inc. Class A (a)(b) | 35,764 | 326,525 | |
| Mercedes-Benz Group AG (Germany) | 16,447 | 1,260,544 | |
| NIO, Inc. sponsored ADR (a)(b) | 103,784 | 974,532 | |
| Rivian Automotive, Inc. (a)(b) | 32,680 | 630,724 | |
| Stellantis NV (b) | 144,048 | 2,523,721 | |
| Suzuki Motor Corp. | 53,701 | 1,886,467 | |
| Tesla, Inc. (a) | 61,848 | 12,722,752 | |
| Toyota Motor Corp. sponsored ADR (b) | 83,507 | 11,350,271 | |
| XPeng, Inc. ADR (a)(b) | 130,945 | 1,168,029 | |
| 58,319,516 | |||
| Commercial Services & Supplies - 3.7% | |||
| Diversified Support Services - 3.7% | |||
| Copart, Inc. (a) | 55,597 | 3,917,365 | |
| Distributors - 5.0% | |||
| Distributors - 5.0% | |||
| Central Automotive Products Ltd. | 300 | 5,927 | |
| Genuine Parts Co. | 16,721 | 2,957,276 | |
| LKQ Corp. | 40,709 | 2,332,219 | |
| 5,295,422 | |||
| Electrical Equipment - 0.5% | |||
| Electrical Components & Equipment - 0.5% | |||
| Sensata Technologies, Inc. PLC | 11,023 | 557,543 | |
| Internet & Direct Marketing Retail - 1.0% | |||
| Internet & Direct Marketing Retail - 1.0% | |||
| Uber Technologies, Inc. (a) | 33,454 | 1,112,680 | |
| Semiconductors & Semiconductor Equipment - 0.8% | |||
| Semiconductors - 0.8% | |||
| Mitsui High-Tec, Inc. | 16,000 | 823,767 | |
| Specialty Retail - 14.8% | |||
| Automotive Retail - 14.8% | |||
| Advance Auto Parts, Inc. | 2,978 | 431,691 | |
| AutoZone, Inc. (a) | 1,706 | 4,242,037 | |
| CarMax, Inc. (a)(b) | 13,986 | 965,593 | |
| Carvana Co. Class A (a)(b) | 21,410 | 201,682 | |
| Lithia Motors, Inc. Class A (sub. vtg.) | 6,638 | 1,693,885 | |
| O'Reilly Automotive, Inc. (a) | 9,917 | 8,232,102 | |
| 15,766,990 | |||
| TOTAL COMMON STOCKS (Cost $77,309,580) | 105,159,385 | ||
| Preferred Stocks - 0.6% | |||
| Shares | Value ($) | ||
| Convertible Preferred Stocks - 0.0% | |||
| Electronic Equipment & Components - 0.0% | |||
| Electronic Components - 0.0% | |||
| CelLink Corp. Series D (a)(c)(d) | 3,700 | 48,174 | |
| Nonconvertible Preferred Stocks - 0.6% | |||
| Automobiles - 0.6% | |||
| Automobile Manufacturers - 0.6% | |||
| Dr. Ing. h.c. F. Porsche AG Series F (a) | 4,864 | 587,005 | |
| TOTAL PREFERRED STOCKS (Cost $482,262) | 635,179 | ||
| Money Market Funds - 18.5% | |||
| Shares | Value ($) | ||
| Fidelity Cash Central Fund 4.63% (e) | 311,851 | 311,913 | |
| Fidelity Securities Lending Cash Central Fund 4.63% (e)(f) | 19,446,540 | 19,448,485 | |
| TOTAL MONEY MARKET FUNDS (Cost $19,760,398) | 19,760,398 | ||
| TOTAL INVESTMENT IN SECURITIES - 117.9% (Cost $97,552,240) | 125,554,962 |
NET OTHER ASSETS (LIABILITIES) - (17.9)% | (19,075,791) |
| NET ASSETS - 100.0% | 106,479,171 |
| (a) | Non-income producing |
| (b) | Security or a portion of the security is on loan at period end. |
| (c) | Restricted securities (including private placements) - Investment in securities not registered under the Securities Act of 1933 (excluding 144A issues). At the end of the period, the value of restricted securities (excluding 144A issues) amounted to $48,174 or 0.0% of net assets. |
| (d) | Level 3 security |
| (e) | Affiliated fund that is generally available only to investment companies and other accounts managed by Fidelity Investments. The rate quoted is the annualized seven-day yield of the fund at period end. A complete unaudited listing of the fund's holdings as of its most recent quarter end is available upon request. In addition, each Fidelity Central Fund's financial statements, which are not covered by the Fund's Report of Independent Registered Public Accounting Firm, are available on the SEC's website or upon request. |
| (f) | Investment made with cash collateral received from securities on loan. |
| Additional information on each restricted holding is as follows: | ||
| Security | Acquisition Date | Acquisition Cost ($) |
| CelLink Corp. Series D | 1/20/22 | 77,048 |
| Affiliate | Value, beginning of period ($) | Purchases ($) | Sales Proceeds ($) | Dividend Income ($) | Realized Gain (loss) ($) | Change in Unrealized appreciation (depreciation) ($) | Value, end of period ($) | % ownership, end of period |
| Fidelity Cash Central Fund 4.63% | 252,289 | 33,405,522 | 33,345,898 | 12,217 | - | - | 311,913 | 0.0% |
| Fidelity Securities Lending Cash Central Fund 4.63% | 18,145,010 | 179,259,737 | 177,956,262 | 291,519 | - | - | 19,448,485 | 0.1% |
| Total | 18,397,299 | 212,665,259 | 211,302,160 | 303,736 | - | - | 19,760,398 | |
| Valuation Inputs at Reporting Date: | ||||
| Description | Total ($) | Level 1 ($) | Level 2 ($) | Level 3 ($) |
Investments in Securities: | ||||
| Common Stocks | 105,159,385 | 103,898,841 | 1,260,544 | - |
| Preferred Stocks | 635,179 | 587,005 | - | 48,174 |
| Money Market Funds | 19,760,398 | 19,760,398 | - | - |
| Total Investments in Securities: | 125,554,962 | 124,246,244 | 1,260,544 | 48,174 |
| Statement of Assets and Liabilities | ||||
| February 28, 2023 | ||||
| Assets | ||||
| Investment in securities, at value (including securities loaned of $19,098,673) - See accompanying schedule: | ||||
Unaffiliated issuers (cost $77,791,842) | $ | 105,794,564 | ||
Fidelity Central Funds (cost $19,760,398) | 19,760,398 | |||
| Total Investment in Securities (cost $97,552,240) | $ | 125,554,962 | ||
| Foreign currency held at value (cost $10,651) | 10,651 | |||
| Receivable for fund shares sold | 168,722 | |||
| Dividends receivable | 305,078 | |||
| Distributions receivable from Fidelity Central Funds | 29,707 | |||
| Prepaid expenses | 230 | |||
| Other receivables | 2,213 | |||
Total assets | 126,071,563 | |||
| Liabilities | ||||
| Payable for investments purchased | $ | 10,649 | ||
| Payable for fund shares redeemed | 30,330 | |||
| Accrued management fee | 46,050 | |||
| Other affiliated payables | 23,466 | |||
| Other payables and accrued expenses | 33,822 | |||
| Collateral on securities loaned | 19,448,075 | |||
| Total Liabilities | 19,592,392 | |||
| Net Assets | $ | 106,479,171 | ||
| Net Assets consist of: | ||||
| Paid in capital | $ | 92,929,377 | ||
| Total accumulated earnings (loss) | 13,549,794 | |||
| Net Assets | $ | 106,479,171 | ||
Net Asset Value , offering price and redemption price per share ($106,479,171 ÷ 2,315,078 shares) | $ | 45.99 | ||
| Statement of Operations | ||||
Year ended February 28, 2023 | ||||
| Investment Income | ||||
| Dividends | $ | 1,342,022 | ||
| Special dividends | 222,964 | |||
| Income from Fidelity Central Funds (including $291,519 from security lending) | 303,736 | |||
| Total Income | 1,868,722 | |||
| Expenses | ||||
| Management fee | $ | 606,539 | ||
| Transfer agent fees | 289,869 | |||
| Accounting fees | 41,943 | |||
| Custodian fees and expenses | 15,351 | |||
| Independent trustees' fees and expenses | 407 | |||
| Registration fees | 28,143 | |||
| Audit | 40,354 | |||
| Legal | 738 | |||
| Miscellaneous | 696 | |||
| Total expenses before reductions | 1,024,040 | |||
| Expense reductions | (4,274) | |||
| Total expenses after reductions | 1,019,766 | |||
| Net Investment income (loss) | 848,956 | |||
| Realized and Unrealized Gain (Loss) | ||||
| Net realized gain (loss) on: | ||||
| Investment Securities: | ||||
| Unaffiliated issuers | (14,151,090) | |||
| Foreign currency transactions | 3,546 | |||
| Total net realized gain (loss) | (14,147,544) | |||
| Change in net unrealized appreciation (depreciation) on: | ||||
| Investment Securities: | ||||
| Unaffiliated issuers | (16,315,495) | |||
| Assets and liabilities in foreign currencies | (713) | |||
| Total change in net unrealized appreciation (depreciation) | (16,316,208) | |||
| Net gain (loss) | (30,463,752) | |||
| Net increase (decrease) in net assets resulting from operations | $ | (29,614,796) | ||
| Statement of Changes in Net Assets | ||||
Year ended February 28, 2023 | Year ended February 28, 2022 | |||
| Increase (Decrease) in Net Assets | ||||
| Operations | ||||
| Net investment income (loss) | $ | 848,956 | $ | 753,430 |
| Net realized gain (loss) | (14,147,544) | 10,793,755 | ||
| Change in net unrealized appreciation (depreciation) | (16,316,208) | 607,122 | ||
| Net increase (decrease) in net assets resulting from operations | (29,614,796) | 12,154,307 | ||
| Distributions to shareholders | (2,701,513) | (6,137,128) | ||
| Share transactions | ||||
| Proceeds from sales of shares | 45,458,045 | 189,559,902 | ||
| Reinvestment of distributions | 2,537,929 | 5,872,623 | ||
| Cost of shares redeemed | (74,376,081) | (234,498,841) | ||
Net increase (decrease) in net assets resulting from share transactions | (26,380,107) | (39,066,316) | ||
| Total increase (decrease) in net assets | (58,696,416) | (33,049,137) | ||
| Net Assets | ||||
| Beginning of period | 165,175,587 | 198,224,724 | ||
| End of period | $ | 106,479,171 | $ | 165,175,587 |
| Other Information | ||||
| Shares | ||||
| Sold | 949,641 | 3,055,146 | ||
| Issued in reinvestment of distributions | 51,998 | 95,061 | ||
| Redeemed | (1,606,800) | (3,886,592) | ||
| Net increase (decrease) | (605,161) | (736,385) | ||
| Automotive Portfolio |
| Years ended February 28, | 2023 | 2022 | 2021 | 2020 A | 2019 | |||||
Selected Per-Share Data | ||||||||||
| Net asset value, beginning of period | $ | 56.56 | $ | 54.21 | $ | 34.91 | $ | 33.29 | $ | 37.52 |
| Income from Investment Operations | ||||||||||
Net investment income (loss) B,C | .34 D | .23 E | .05 F | .46 G | .36 | |||||
| Net realized and unrealized gain (loss) | (9.86) | 3.82 | 23.73 | 2.67 H | (2.15) | |||||
| Total from investment operations | (9.52) | 4.05 | 23.78 | 3.13 | (1.79) | |||||
| Distributions from net investment income | (.28) | (.29) | (.01) | (.49) I | (.38) | |||||
| Distributions from net realized gain | (.77) | (1.40) | (4.47) | (1.02) I | (2.06) | |||||
| Total distributions | (1.05) | (1.70) J | (4.48) | (1.51) | (2.44) | |||||
| Net asset value, end of period | $ | 45.99 | $ | 56.56 | $ | 54.21 | $ | 34.91 | $ | 33.29 |
Total Return K | (16.92)% | 7.20% | 78.19% | 9.14% H | (4.66)% | |||||
Ratios to Average Net Assets C,L,M | ||||||||||
| Expenses before reductions | .89% | .80% | .88% | 1.00% | .97% | |||||
| Expenses net of fee waivers, if any | .88% | .80% | .88% | 1.00% | .97% | |||||
| Expenses net of all reductions | .88% | .80% | .87% | .99% | .97% | |||||
| Net investment income (loss) | .73% D | .37% E | .10% F | 1.33% G | 1.04% | |||||
| Supplemental Data | ||||||||||
| Net assets, end of period (000 omitted) | $ | 106,479 | $ | 165,176 | $ | 198,225 | $ | 36,480 | $ | 40,781 |
Portfolio turnover rate N | 54% | 69% | 56% | 45% | 31% |
| Average Annual Total Returns | |||
Periods ended February 28, 2023 | Past 1 year | Past 5 years | Past 10 years |
| Class A (incl.5.75% sales charge) | -25.15% | 5.32% | 8.70% |
| Class M (incl.3.50% sales charge) | -23.55% | 5.59% | 8.84% |
Class C (incl. contingent deferred sales charge) | -21.93% | 5.91% | 9.00% |
| Communication Services Portfolio | -20.36% | 6.84% | 9.48% |
| Class I | -20.32% | 6.85% | 9.49% |
| Class Z | -20.23% | 6.97% | 9.55% |
| $10,000 Over 10 Years |
Let's say hypothetically that $10,000 was invested in Communication Services Portfolio, a class of the fund, on February 28, 2013. The chart shows how the value of your investment would have changed, and also shows how the S&P 500® Index performed over the same period. |
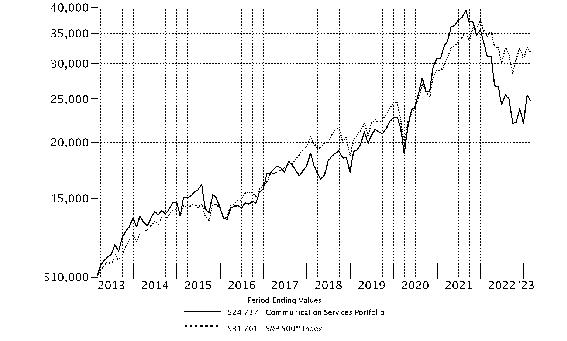 |
Top Holdings (% of Fund's net assets) | ||
| Meta Platforms, Inc. Class A | 17.8 | |
| Alphabet, Inc. Class A | 17.8 | |
| Netflix, Inc. | 8.9 | |
| Activision Blizzard, Inc. | 5.8 | |
| Liberty Broadband Corp. Class A | 4.4 | |
| T-Mobile U.S., Inc. | 4.4 | |
| Charter Communications, Inc. Class A | 4.4 | |
| Comcast Corp. Class A | 4.2 | |
| The Walt Disney Co. | 3.9 | |
| Uber Technologies, Inc. | 2.4 | |
| 74.0 | ||
| Industries (% of Fund's net assets) | ||
| Interactive Media & Services | 39.9 | |
| Entertainment | 29.5 | |
| Media | 15.7 | |
| Internet & Direct Marketing Retail | 4.7 | |
| Wireless Telecommunication Services | 4.4 | |
| Diversified Telecommunication Services | 4.0 | |
| Real Estate Management & Development | 0.3 | |
| Software | 0.1 | |
| IT Services | 0.1 | |
| Common Stocks - 98.4% | |||
| Shares | Value ($) | ||
| Diversified Telecommunication Services - 4.0% | |||
| Alternative Carriers - 4.0% | |||
| EchoStar Holding Corp. Class A (a)(b) | 129,700 | 2,588,812 | |
| Iridium Communications, Inc. | 28,600 | 1,755,182 | |
| Liberty Global PLC Class C (a) | 677,300 | 14,392,625 | |
| Liberty Latin America Ltd. Class C (a) | 1,274,786 | 11,192,621 | |
| 29,929,240 | |||
| Integrated Telecommunication Services - 0.0% | |||
| AT&T, Inc. | 4,000 | 75,640 | |
TOTAL DIVERSIFIED TELECOMMUNICATION SERVICES | 30,004,880 | ||
| Entertainment - 29.5% | |||
| Interactive Home Entertainment - 7.8% | |||
| Activision Blizzard, Inc. | 579,400 | 44,179,250 | |
| Roblox Corp. (a)(b) | 61,100 | 2,238,704 | |
| Skillz, Inc. (a) | 26,600 | 16,638 | |
| Take-Two Interactive Software, Inc. (a) | 118,300 | 12,959,765 | |
| 59,394,357 | |||
| Movies & Entertainment - 21.7% | |||
| Cinemark Holdings, Inc. (a)(b) | 590,000 | 8,029,900 | |
| Endeavor Group Holdings, Inc. (a)(b) | 306,500 | 6,838,015 | |
| Liberty Media Corp. Liberty Formula One Class A (a) | 222,262 | 13,504,639 | |
| Lions Gate Entertainment Corp.: | |||
| Class A (a) | 34,500 | 366,045 | |
| Class B (a) | 562,434 | 5,596,218 | |
| Marcus Corp. (b) | 297,200 | 4,781,948 | |
| Netflix, Inc. (a) | 209,400 | 67,454,022 | |
| The Walt Disney Co. (a) | 300,971 | 29,979,721 | |
| Warner Bros Discovery, Inc. (a) | 427,014 | 6,669,959 | |
| Warner Music Group Corp. Class A | 501,600 | 15,830,496 | |
| World Wrestling Entertainment, Inc. Class A (b) | 68,700 | 5,770,800 | |
| 164,821,763 | |||
TOTAL ENTERTAINMENT | 224,216,120 | ||
| Interactive Media & Services - 39.6% | |||
| Interactive Media & Services - 39.6% | |||
| Alphabet, Inc. Class A (a) | 1,504,400 | 135,486,264 | |
| Angi, Inc. (a)(b) | 2,088,100 | 5,345,536 | |
| Match Group, Inc. (a)(b) | 237,070 | 9,819,439 | |
| Meta Platforms, Inc. Class A (a) | 774,900 | 135,561,007 | |
| Shutterstock, Inc. (b) | 19,600 | 1,474,312 | |
| Snap, Inc. Class A (a) | 895,600 | 9,090,340 | |
| Vimeo, Inc. (a) | 51,464 | 197,107 | |
| Zoominfo Technologies, Inc. (a) | 172,800 | 4,176,576 | |
| 301,150,581 | |||
| Internet & Direct Marketing Retail - 4.7% | |||
| Internet & Direct Marketing Retail - 4.7% | |||
| Amazon.com, Inc. (a) | 187,700 | 17,686,971 | |
| Uber Technologies, Inc. (a) | 553,100 | 18,396,106 | |
| 36,083,077 | |||
| IT Services - 0.1% | |||
| Internet Services & Infrastructure - 0.1% | |||
| X Holdings I, Inc. (c)(d) | 1,724 | 629,950 | |
| Media - 15.7% | |||
| Advertising - 0.6% | |||
| S4 Capital PLC (a) | 1,876,500 | 4,636,182 | |
| TechTarget, Inc. (a) | 12,100 | 456,533 | |
| 5,092,715 | |||
| Broadcasting - 0.3% | |||
| Fox Corp. Class A (b) | 58,600 | 2,052,172 | |
| Cable & Satellite - 14.8% | |||
| Altice U.S.A., Inc. Class A (a) | 1,361,600 | 5,391,936 | |
| Charter Communications, Inc. Class A (a) | 90,200 | 33,158,422 | |
| Comcast Corp. Class A | 865,400 | 32,166,918 | |
| DISH Network Corp. Class A (a) | 44,539 | 508,190 | |
| Liberty Broadband Corp. Class A (a) | 389,123 | 33,748,638 | |
| Liberty Media Corp. Liberty SiriusXM Series A (a) | 232,800 | 7,540,392 | |
| 112,514,496 | |||
TOTAL MEDIA | 119,659,383 | ||
| Real Estate Management & Development - 0.3% | |||
| Real Estate Services - 0.3% | |||
| Zillow Group, Inc. Class A (a) | 59,600 | 2,464,460 | |
| Software - 0.1% | |||
| Application Software - 0.1% | |||
| Viant Technology, Inc. (a) | 257,200 | 1,010,796 | |
| Wireless Telecommunication Services - 4.4% | |||
| Wireless Telecommunication Services - 4.4% | |||
| T-Mobile U.S., Inc. (a) | 235,750 | 33,518,935 | |
| TOTAL COMMON STOCKS (Cost $674,835,934) | 748,738,182 | ||
| Convertible Preferred Stocks - 0.3% | |||
| Shares | Value ($) | ||
| Interactive Media & Services - 0.3% | |||
| Interactive Media & Services - 0.3% | |||
Reddit, Inc. Series F (a)(c)(d) (Cost $3,584,075) | 58,000 | 2,209,800 | |
| Money Market Funds - 5.2% | |||
| Shares | Value ($) | ||
| Fidelity Cash Central Fund 4.63% (e) | 10,669,917 | 10,672,051 | |
| Fidelity Securities Lending Cash Central Fund 4.63% (e)(f) | 29,123,764 | 29,126,676 | |
| TOTAL MONEY MARKET FUNDS (Cost $39,798,727) | 39,798,727 | ||
| TOTAL INVESTMENT IN SECURITIES - 103.9% (Cost $718,218,736) | 790,746,709 |
NET OTHER ASSETS (LIABILITIES) - (3.9)% | (29,498,696) |
| NET ASSETS - 100.0% | 761,248,013 |
| (a) | Non-income producing |
| (b) | Security or a portion of the security is on loan at period end. |
| (c) | Restricted securities (including private placements) - Investment in securities not registered under the Securities Act of 1933 (excluding 144A issues). At the end of the period, the value of restricted securities (excluding 144A issues) amounted to $2,839,750 or 0.4% of net assets. |
| (d) | Level 3 security |
| (e) | Affiliated fund that is generally available only to investment companies and other accounts managed by Fidelity Investments. The rate quoted is the annualized seven-day yield of the fund at period end. A complete unaudited listing of the fund's holdings as of its most recent quarter end is available upon request. In addition, each Fidelity Central Fund's financial statements, which are not covered by the Fund's Report of Independent Registered Public Accounting Firm, are available on the SEC's website or upon request. |
| (f) | Investment made with cash collateral received from securities on loan. |
| Additional information on each restricted holding is as follows: | ||
| Security | Acquisition Date | Acquisition Cost ($) |
| Reddit, Inc. Series F | 8/11/21 | 3,584,075 |
| X Holdings I, Inc. | 10/27/21 | 1,266,192 |
| Affiliate | Value, beginning of period ($) | Purchases ($) | Sales Proceeds ($) | Dividend Income ($) | Realized Gain (loss) ($) | Change in Unrealized appreciation (depreciation) ($) | Value, end of period ($) | % ownership, end of period |
| Fidelity Cash Central Fund 4.63% | 605 | 252,151,916 | 241,480,470 | 138,792 | - | - | 10,672,051 | 0.0% |
| Fidelity Securities Lending Cash Central Fund 4.63% | 30,567,219 | 304,774,181 | 306,214,724 | 32,570 | - | - | 29,126,676 | 0.1% |
| Total | 30,567,824 | 556,926,097 | 547,695,194 | 171,362 | - | - | 39,798,727 | |
| Valuation Inputs at Reporting Date: | ||||
| Description | Total ($) | Level 1 ($) | Level 2 ($) | Level 3 ($) |
Investments in Securities: | ||||
| Common Stocks | 748,738,182 | 748,108,232 | - | 629,950 |
| Convertible Preferred Stocks | 2,209,800 | - | - | 2,209,800 |
| Money Market Funds | 39,798,727 | 39,798,727 | - | - |
| Total Investments in Securities: | 790,746,709 | 787,906,959 | - | 2,839,750 |
| Statement of Assets and Liabilities | ||||
| February 28, 2023 | ||||
| Assets | ||||
| Investment in securities, at value (including securities loaned of $28,132,058) - See accompanying schedule: | ||||
Unaffiliated issuers (cost $678,420,009) | $ | 750,947,982 | ||
Fidelity Central Funds (cost $39,798,727) | 39,798,727 | |||
| Total Investment in Securities (cost $718,218,736) | $ | 790,746,709 | ||
| Foreign currency held at value (cost $799) | 797 | |||
| Receivable for fund shares sold | 632,792 | |||
| Dividends receivable | 94,144 | |||
| Distributions receivable from Fidelity Central Funds | 39,302 | |||
| Prepaid expenses | 1,869 | |||
Total assets | 791,515,613 | |||
| Liabilities | ||||
| Payable for fund shares redeemed | $ | 587,717 | ||
| Accrued management fee | 346,801 | |||
| Distribution and service plan fees payable | 13,210 | |||
| Other affiliated payables | 154,278 | |||
| Other payables and accrued expenses | 39,812 | |||
| Collateral on securities loaned | 29,125,782 | |||
| Total Liabilities | 30,267,600 | |||
| Net Assets | $ | 761,248,013 | ||
| Net Assets consist of: | ||||
| Paid in capital | $ | 734,201,364 | ||
| Total accumulated earnings (loss) | 27,046,649 | |||
| Net Assets | $ | 761,248,013 | ||
| Net Asset Value and Maximum Offering Price | ||||
| Class A : | ||||
Net Asset Value and redemption price per share ($24,285,213 ÷ 390,186 shares) (a) | $ | 62.24 | ||
| Maximum offering price per share (100/94.25 of $62.24) | $ | 66.04 | ||
| Class M : | ||||
Net Asset Value and redemption price per share ($3,499,049 ÷ 56,665 shares) (a) | $ | 61.75 | ||
| Maximum offering price per share (100/96.50 of $61.75) | $ | 63.99 | ||
| Class C : | ||||
Net Asset Value and offering price per share ($7,478,221 ÷ 123,463 shares) (a) | $ | 60.57 | ||
| Communication Services : | ||||
Net Asset Value , offering price and redemption price per share ($710,710,435 ÷ 11,299,039 shares) | $ | 62.90 | ||
| Class I : | ||||
Net Asset Value , offering price and redemption price per share ($11,960,813 ÷ 190,199 shares) | $ | 62.89 | ||
| Class Z : | ||||
Net Asset Value , offering price and redemption price per share ($3,314,282 ÷ 52,456 shares) | $ | 63.18 | ||
(a)Redemption price per share is equal to net asset value less any applicable contingent deferred sales charge. | ||||
| Statement of Operations | ||||
Year ended February 28, 2023 | ||||
| Investment Income | ||||
| Dividends | $ | 2,373,848 | ||
| Income from Fidelity Central Funds (including $32,570 from security lending) | 171,362 | |||
| Total Income | 2,545,210 | |||
| Expenses | ||||
| Management fee | $ | 4,130,707 | ||
| Transfer agent fees | 1,693,195 | |||
| Distribution and service plan fees | 159,757 | |||
| Accounting fees | 253,372 | |||
| Custodian fees and expenses | 8,848 | |||
| Independent trustees' fees and expenses | 2,720 | |||
| Registration fees | 98,848 | |||
| Audit | 45,964 | |||
| Legal | 1,915 | |||
| Interest | 993 | |||
| Miscellaneous | 4,948 | |||
| Total expenses before reductions | 6,401,267 | |||
| Expense reductions | (27,974) | |||
| Total expenses after reductions | 6,373,293 | |||
| Net Investment income (loss) | (3,828,083) | |||
| Realized and Unrealized Gain (Loss) | ||||
| Net realized gain (loss) on: | ||||
| Investment Securities: | ||||
| Unaffiliated issuers | (27,501,704) | |||
| Foreign currency transactions | (65,206) | |||
| Total net realized gain (loss) | (27,566,910) | |||
| Change in net unrealized appreciation (depreciation) on: | ||||
| Investment Securities: | ||||
| Unaffiliated issuers | (178,868,019) | |||
| Assets and liabilities in foreign currencies | 29 | |||
| Total change in net unrealized appreciation (depreciation) | (178,867,990) | |||
| Net gain (loss) | (206,434,900) | |||
| Net increase (decrease) in net assets resulting from operations | $ | (210,262,983) | ||
| Statement of Changes in Net Assets | ||||
Year ended February 28, 2023 | Year ended February 28, 2022 | |||
| Increase (Decrease) in Net Assets | ||||
| Operations | ||||
| Net investment income (loss) | $ | (3,828,083) | $ | (4,780,267) |
| Net realized gain (loss) | (27,566,910) | 19,842,720 | ||
| Change in net unrealized appreciation (depreciation) | (178,867,990) | (98,753,641) | ||
| Net increase (decrease) in net assets resulting from operations | (210,262,983) | (83,691,188) | ||
| Distributions to shareholders | - | (63,905,764) | ||
| Share transactions - net increase (decrease) | (73,791,815) | 267,487,210 | ||
| Total increase (decrease) in net assets | (284,054,798) | 119,890,258 | ||
| Net Assets | ||||
| Beginning of period | 1,045,302,811 | 925,412,553 | ||
| End of period | $ | 761,248,013 | $ | 1,045,302,811 |
| Fidelity Advisor® Communication Services Fund Class A |
| Years ended February 28, | 2023 | 2022 | 2021 | 2020 A | 2019 B | |||||
Selected Per-Share Data | ||||||||||
| Net asset value, beginning of period | $ | 78.37 | $ | 87.31 | $ | 60.63 | $ | 74.85 | $ | 78.20 |
| Income from Investment Operations | ||||||||||
Net investment income (loss) C,D | (.48) | (.60) | (.59) | (.30) | (.12) | |||||
| Net realized and unrealized gain (loss) | (15.65) | (3.18) | 30.37 | 8.77 | 2.68 | |||||
| Total from investment operations | (16.13) | (3.78) | 29.78 | 8.47 | 2.56 | |||||
| Distributions from net investment income | - | - | - | - | (.14) | |||||
| Distributions from net realized gain | - | (5.16) | (3.10) | (22.69) | (5.77) | |||||
| Total distributions | - | (5.16) | (3.10) | (22.69) | (5.91) | |||||
| Net asset value, end of period | $ | 62.24 | $ | 78.37 | $ | 87.31 | $ | 60.63 | $ | 74.85 |
Total Return E,F,G | (20.58)% | (5.05)% | 50.81% | 11.90% | 3.83% | |||||
Ratios to Average Net Assets D,H,I | ||||||||||
| Expenses before reductions | 1.07% | 1.03% | 1.08% | 1.07% | 1.13% J | |||||
| Expenses net of fee waivers, if any | 1.07% | 1.03% | 1.08% | 1.07% | 1.12% J | |||||
| Expenses net of all reductions | 1.07% | 1.03% | 1.07% | 1.06% | 1.11% J | |||||
| Net investment income (loss) | (.74)% | (.65)% | (.81)% | (.47)% | (.68)% J | |||||
| Supplemental Data | ||||||||||
| Net assets, end of period (000 omitted) | $ | 24,285 | $ | 33,679 | $ | 22,962 | $ | 9,947 | $ | 715 |
Portfolio turnover rate K | 45% | 57% | 63% | 73% | 107% |
| Fidelity Advisor® Communication Services Fund Class M |
| Years ended February 28, | 2023 | 2022 | 2021 | 2020 A | 2019 B | |||||
Selected Per-Share Data | ||||||||||
| Net asset value, beginning of period | $ | 77.94 | $ | 86.94 | $ | 60.52 | $ | 74.82 | $ | 78.20 |
| Income from Investment Operations | ||||||||||
Net investment income (loss) C,D | (.63) | (.82) | (.77) | (.48) | (.16) | |||||
| Net realized and unrealized gain (loss) | (15.56) | (3.15) | 30.29 | 8.75 | 2.67 | |||||
| Total from investment operations | (16.19) | (3.97) | 29.52 | 8.27 | 2.51 | |||||
| Distributions from net investment income | - | - | - | - | (.12) | |||||
| Distributions from net realized gain | - | (5.03) | (3.10) | (22.57) | (5.77) | |||||
| Total distributions | - | (5.03) | (3.10) | (22.57) | (5.89) | |||||
| Net asset value, end of period | $ | 61.75 | $ | 77.94 | $ | 86.94 | $ | 60.52 | $ | 74.82 |
Total Return E,F,G | (20.77)% | (5.28)% | 50.47% | 11.58% | 3.76% | |||||
Ratios to Average Net Assets D,H,I | ||||||||||
| Expenses before reductions | 1.31% | 1.27% | 1.32% | 1.35% | 1.36% J | |||||
| Expenses net of fee waivers, if any | 1.31% | 1.27% | 1.32% | 1.35% | 1.35% J | |||||
| Expenses net of all reductions | 1.31% | 1.27% | 1.32% | 1.34% | 1.34% J | |||||
| Net investment income (loss) | (.98)% | (.88)% | (1.06)% | (.75)% | (.90)% J | |||||
| Supplemental Data | ||||||||||
| Net assets, end of period (000 omitted) | $ | 3,499 | $ | 5,817 | $ | 5,386 | $ | 2,264 | $ | 485 |
Portfolio turnover rate K | 45% | 57% | 63% | 73% | 107% |
| Fidelity Advisor® Communication Services Fund Class C |
| Years ended February 28, | 2023 | 2022 | 2021 | 2020 A | 2019 B | |||||
Selected Per-Share Data | ||||||||||
| Net asset value, beginning of period | $ | 76.81 | $ | 86.05 | $ | 60.20 | $ | 74.76 | $ | 78.20 |
| Income from Investment Operations | ||||||||||
Net investment income (loss) C,D | (.90) | (1.27) | (1.12) | (.81) | (.25) | |||||
| Net realized and unrealized gain (loss) | (15.34) | (3.07) | 30.07 | 8.74 | 2.67 | |||||
| Total from investment operations | (16.24) | (4.34) | 28.95 | 7.93 | 2.42 | |||||
| Distributions from net investment income | - | - | - | - | (.09) | |||||
| Distributions from net realized gain | - | (4.90) | (3.10) | (22.49) | (5.77) | |||||
| Total distributions | - | (4.90) | (3.10) | (22.49) | (5.86) | |||||
| Net asset value, end of period | $ | 60.57 | $ | 76.81 | $ | 86.05 | $ | 60.20 | $ | 74.76 |
Total Return E,F,G | (21.14)% | (5.76)% | 49.77% | 11.01% | 3.63% | |||||
Ratios to Average Net Assets D,H,I | ||||||||||
| Expenses before reductions | 1.78% | 1.78% | 1.80% | 1.86% | 1.87% J | |||||
| Expenses net of fee waivers, if any | 1.78% | 1.78% | 1.80% | 1.86% | 1.85% J | |||||
| Expenses net of all reductions | 1.78% | 1.78% | 1.79% | 1.85% | 1.84% J | |||||
| Net investment income (loss) | (1.45)% | (1.39)% | (1.53)% | (1.26)% | (1.37)% J | |||||
| Supplemental Data | ||||||||||
| Net assets, end of period (000 omitted) | $ | 7,478 | $ | 8,938 | $ | 6,856 | $ | 1,982 | $ | 377 |
Portfolio turnover rate K | 45% | 57% | 63% | 73% | 107% |
| Communication Services Portfolio |
| Years ended February 28, | 2023 | 2022 | 2021 | 2020 A | 2019 | |||||
Selected Per-Share Data | ||||||||||
| Net asset value, beginning of period | $ | 78.98 | $ | 87.88 | $ | 60.82 | $ | 74.88 | $ | 79.70 |
| Income from Investment Operations | ||||||||||
Net investment income (loss) B,C | (.30) | (.34) | (.36) | (.12) | .13 | |||||
| Net realized and unrealized gain (loss) | (15.78) | (3.22) | 30.52 | 8.79 | 5.31 | |||||
| Total from investment operations | (16.08) | (3.56) | 30.16 | 8.67 | 5.44 | |||||
| Distributions from net investment income | - | - | - | - | (.20) | |||||
| Distributions from net realized gain | - | (5.34) | (3.10) | (22.73) | (10.06) | |||||
| Total distributions | - | (5.34) | (3.10) | (22.73) | (10.26) | |||||
| Net asset value, end of period | $ | 62.90 | $ | 78.98 | $ | 87.88 | $ | 60.82 | $ | 74.88 |
Total Return D | (20.36)% | (4.79)% | 51.29% | 12.22% | 8.12% | |||||
Ratios to Average Net Assets C,E,F | ||||||||||
| Expenses before reductions | .80% | .75% | .77% | .78% | .82% | |||||
| Expenses net of fee waivers, if any | .79% | .74% | .77% | .78% | .81% | |||||
| Expenses net of all reductions | .79% | .74% | .76% | .77% | .80% | |||||
| Net investment income (loss) | (.47)% | (.36)% | (.51)% | (.18)% | .17% | |||||
| Supplemental Data | ||||||||||
| Net assets, end of period (000 omitted) | $ | 710,710 | $ | 958,304 | $ | 859,871 | $ | 577,157 | $ | 562,422 |
Portfolio turnover rate G | 45% | 57% | 63% | 73% | 107% |
| Fidelity Advisor® Communication Services Fund Class I |
| Years ended February 28, | 2023 | 2022 | 2021 | 2020 A | 2019 B | |||||
Selected Per-Share Data | ||||||||||
| Net asset value, beginning of period | $ | 78.93 | $ | 87.86 | $ | 60.80 | $ | 74.89 | $ | 78.20 |
| Income from Investment Operations | ||||||||||
Net investment income (loss) C,D | (.28) | (.34) | (.39) | (.11) | (.06) | |||||
| Net realized and unrealized gain (loss) | (15.76) | (3.22) | 30.55 | 8.78 | 2.67 | |||||
| Total from investment operations | (16.04) | (3.56) | 30.16 | 8.67 | 2.61 | |||||
| Distributions from net investment income | - | - | - | - | (.15) | |||||
| Distributions from net realized gain | - | (5.37) | (3.10) | (22.76) | (5.77) | |||||
| Total distributions | - | (5.37) | (3.10) | (22.76) | (5.92) | |||||
| Net asset value, end of period | $ | 62.89 | $ | 78.93 | $ | 87.86 | $ | 60.80 | $ | 74.89 |
Total Return E,F | (20.32)% | (4.79)% | 51.31% | 12.22% | 3.91% | |||||
Ratios to Average Net Assets D,G,H | ||||||||||
| Expenses before reductions | .76% | .75% | .78% | .77% | .70% I | |||||
| Expenses net of fee waivers, if any | .75% | .75% | .77% | .77% | .69% I | |||||
| Expenses net of all reductions | .75% | .75% | .77% | .76% | .68% I | |||||
| Net investment income (loss) | (.43)% | (.37)% | (.51)% | (.17)% | (.30)% I | |||||
| Supplemental Data | ||||||||||
| Net assets, end of period (000 omitted) | $ | 11,961 | $ | 32,089 | $ | 26,521 | $ | 2,493 | $ | 452 |
Portfolio turnover rate J | 45% | 57% | 63% | 73% | 107% |
| Fidelity Advisor® Communication Services Fund Class Z |
| Years ended February 28, | 2023 | 2022 | 2021 | 2020 A | 2019 B | |||||
Selected Per-Share Data | ||||||||||
| Net asset value, beginning of period | $ | 79.20 | $ | 88.04 | $ | 60.85 | $ | 74.89 | $ | 78.20 |
| Income from Investment Operations | ||||||||||
Net investment income (loss) C,D | (.19) | (.22) | (.28) | (.03) | (.03) | |||||
| Net realized and unrealized gain (loss) | (15.83) | (3.23) | 30.57 | 8.80 | 2.65 | |||||
| Total from investment operations | (16.02) | (3.45) | 30.29 | 8.77 | 2.62 | |||||
| Distributions from net investment income | - | - | - | - | (.16) | |||||
| Distributions from net realized gain | - | (5.39) | (3.10) | (22.81) | (5.77) | |||||
| Total distributions | - | (5.39) | (3.10) | (22.81) | (5.93) | |||||
| Net asset value, end of period | $ | 63.18 | $ | 79.20 | $ | 88.04 | $ | 60.85 | $ | 74.89 |
Total Return E,F | (20.23)% | (4.65)% | 51.48% | 12.38% | 3.92% | |||||
Ratios to Average Net Assets C,G,H | ||||||||||
| Expenses before reductions | .62% | .62% | .64% | .65% | .64% I | |||||
| Expenses net of fee waivers, if any | .62% | .61% | .64% | .65% | .62% I | |||||
| Expenses net of all reductions | .62% | .61% | .63% | .64% | .61% I | |||||
| Net investment income (loss) | (.29)% | (.23)% | (.38)% | (.05)% | (.16)% I | |||||
| Supplemental Data | ||||||||||
| Net assets, end of period (000 omitted) | $ | 3,314 | $ | 6,477 | $ | 3,817 | $ | 1,833 | $ | 529 |
Portfolio turnover rate J | 45% | 57% | 63% | 73% | 107% |
| Average Annual Total Returns | |||
Periods ended February 28, 2023 | Past 1 year | Past 5 years | Past 10 years |
| Construction and Housing Portfolio | -0.70% | 16.08% | 13.75% |
| $10,000 Over 10 Years |
Let's say hypothetically that $10,000 was invested in Construction and Housing Portfolio on February 28, 2013. The chart shows how the value of your investment would have changed, and also shows how the S&P 500® Index performed over the same period. |
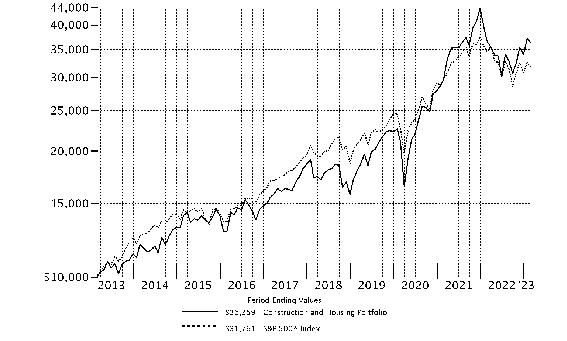 |
Top Holdings (% of Fund's net assets) | ||
| The Home Depot, Inc. | 16.8 | |
| Lowe's Companies, Inc. | 15.4 | |
| Johnson Controls International PLC | 5.8 | |
| Trane Technologies PLC | 4.0 | |
| Vulcan Materials Co. | 3.3 | |
| Invitation Homes, Inc. | 3.2 | |
| Willscot Mobile Mini Holdings | 3.1 | |
| Floor & Decor Holdings, Inc. Class A | 3.0 | |
| Builders FirstSource, Inc. | 3.0 | |
| Essex Property Trust, Inc. | 2.6 | |
| 60.2 | ||
| Industries (% of Fund's net assets) | ||
| Specialty Retail | 36.2 | |
| Building Products | 23.4 | |
| Equity Real Estate Investment Trusts (Reits) | 12.8 | |
| Household Durables | 12.6 | |
| Construction & Engineering | 8.7 | |
| Construction Materials | 3.7 | |
| Real Estate Management & Development | 0.9 | |
| Chemicals | 0.5 | |
| Electrical Equipment | 0.3 | |
| Trading Companies & Distributors | 0.3 | |
| IT Services | 0.1 | |
Geographic Diversification (% of Fund's net assets) |
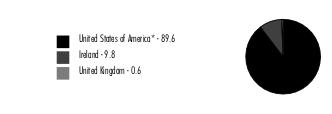 |
* Includes Short-Term investments and Net Other Assets (Liabilities). Percentages are based on country or territory of incorporation and are adjusted for the effect of derivatives, if applicable. |
| Common Stocks - 99.5% | |||
| Shares | Value ($) | ||
| Building Products - 23.4% | |||
| Building Products - 23.4% | |||
| Apogee Enterprises, Inc. | 96,400 | 4,411,264 | |
| Armstrong World Industries, Inc. (a) | 64,400 | 5,077,940 | |
| Builders FirstSource, Inc. (b) | 174,935 | 14,830,989 | |
| Carlisle Companies, Inc. | 46,100 | 11,903,942 | |
| Carrier Global Corp. | 216,400 | 9,744,492 | |
| Fortune Brands Home & Security, Inc. | 77,100 | 4,776,345 | |
| Johnson Controls International PLC | 459,951 | 28,848,127 | |
| MasterBrand, Inc. (b) | 219,600 | 2,138,904 | |
| Resideo Technologies, Inc. (b) | 85,200 | 1,562,568 | |
| Simpson Manufacturing Co. Ltd. | 50,900 | 5,490,074 | |
| The AZEK Co., Inc. (a)(b) | 145,000 | 3,493,050 | |
| Trane Technologies PLC | 107,700 | 19,921,269 | |
| UFP Industries, Inc. | 55,326 | 4,732,033 | |
| 116,930,997 | |||
| Chemicals - 0.5% | |||
| Specialty Chemicals - 0.5% | |||
| PPG Industries, Inc. | 8,500 | 1,122,510 | |
| Sherwin-Williams Co. | 6,400 | 1,416,640 | |
| 2,539,150 | |||
| Construction & Engineering - 8.7% | |||
| Construction & Engineering - 8.7% | |||
| AECOM | 62,600 | 5,406,136 | |
| EMCOR Group, Inc. | 41,370 | 6,917,891 | |
| Fluor Corp. (b) | 17,100 | 627,057 | |
| Granite Construction, Inc. | 96,818 | 4,182,538 | |
| Quanta Services, Inc. | 66,599 | 10,749,079 | |
| Willscot Mobile Mini Holdings (b) | 303,350 | 15,592,190 | |
| 43,474,891 | |||
| Construction Materials - 3.7% | |||
| Construction Materials - 3.7% | |||
| Summit Materials, Inc. | 75,558 | 2,231,983 | |
| Vulcan Materials Co. | 89,876 | 16,259,467 | |
| 18,491,450 | |||
| Electrical Equipment - 0.3% | |||
| Electrical Components & Equipment - 0.3% | |||
| Generac Holdings, Inc. (b) | 13,200 | 1,584,132 | |
| Equity Real Estate Investment Trusts (REITs) - 12.8% | |||
| Residential REITs - 12.8% | |||
| Elme Communities (SBI) | 482,400 | 8,977,464 | |
| Equity Lifestyle Properties, Inc. | 129,700 | 8,885,747 | |
| Equity Residential (SBI) | 83,000 | 5,189,160 | |
| Essex Property Trust, Inc. | 56,600 | 12,908,196 | |
| Invitation Homes, Inc. | 515,100 | 16,102,026 | |
| Mid-America Apartment Communities, Inc. | 72,200 | 11,559,220 | |
| 63,621,813 | |||
| Household Durables - 12.6% | |||
| Home Furnishings - 1.9% | |||
| Tempur Sealy International, Inc. | 215,500 | 9,210,470 | |
| Homebuilding - 10.4% | |||
| Blu Investments LLC (b)(c)(d) | 11,990,913 | 3,717 | |
| D.R. Horton, Inc. | 44,156 | 4,083,547 | |
| Installed Building Products, Inc. | 57,938 | 6,684,886 | |
| KB Home | 172,700 | 6,091,129 | |
| Lennar Corp. Class A | 11,000 | 1,064,140 | |
| NVR, Inc. (b) | 2,421 | 12,525,334 | |
| PulteGroup, Inc. | 224,485 | 12,272,595 | |
| Toll Brothers, Inc. | 154,400 | 9,254,736 | |
| 51,980,084 | |||
| Household Appliances - 0.3% | |||
| Whirlpool Corp. (a) | 10,400 | 1,434,992 | |
TOTAL HOUSEHOLD DURABLES | 62,625,546 | ||
| IT Services - 0.1% | |||
| Internet Services & Infrastructure - 0.1% | |||
| Cyxtera Technologies, Inc. Class A (b) | 200,000 | 448,000 | |
| Real Estate Management & Development - 0.9% | |||
| Diversified Real Estate Activities - 0.3% | |||
| The RMR Group, Inc. | 56,060 | 1,577,528 | |
| Real Estate Services - 0.6% | |||
| Cushman & Wakefield PLC (b) | 219,895 | 2,845,441 | |
TOTAL REAL ESTATE MANAGEMENT & DEVELOPMENT | 4,422,969 | ||
| Specialty Retail - 36.2% | |||
| Home Improvement Retail - 35.2% | |||
| Floor & Decor Holdings, Inc. Class A (a)(b) | 162,900 | 14,955,849 | |
| Lowe's Companies, Inc. | 372,695 | 76,681,996 | |
| The Home Depot, Inc. | 283,190 | 83,977,164 | |
| 175,615,009 | |||
| Homefurnishing Retail - 1.0% | |||
| Williams-Sonoma, Inc. (a) | 40,400 | 5,046,768 | |
TOTAL SPECIALTY RETAIL | 180,661,777 | ||
| Trading Companies & Distributors - 0.3% | |||
| Trading Companies & Distributors - 0.3% | |||
| Beacon Roofing Supply, Inc. (b) | 19,903 | 1,293,695 | |
| TOTAL COMMON STOCKS (Cost $328,519,990) | 496,094,420 | ||
| Money Market Funds - 5.8% | |||
| Shares | Value ($) | ||
| Fidelity Cash Central Fund 4.63% (e) | 3,548,798 | 3,549,508 | |
| Fidelity Securities Lending Cash Central Fund 4.63% (e)(f) | 25,264,199 | 25,266,725 | |
| TOTAL MONEY MARKET FUNDS (Cost $28,816,233) | 28,816,233 | ||
| TOTAL INVESTMENT IN SECURITIES - 105.3% (Cost $357,336,223) | 524,910,653 |
NET OTHER ASSETS (LIABILITIES) - (5.3)% | (26,213,732) |
| NET ASSETS - 100.0% | 498,696,921 |
| (a) | Security or a portion of the security is on loan at period end. |
| (b) | Non-income producing |
| (c) | Restricted securities (including private placements) - Investment in securities not registered under the Securities Act of 1933 (excluding 144A issues). At the end of the period, the value of restricted securities (excluding 144A issues) amounted to $3,717 or 0.0% of net assets. |
| (d) | Level 3 security |
| (e) | Affiliated fund that is generally available only to investment companies and other accounts managed by Fidelity Investments. The rate quoted is the annualized seven-day yield of the fund at period end. A complete unaudited listing of the fund's holdings as of its most recent quarter end is available upon request. In addition, each Fidelity Central Fund's financial statements, which are not covered by the Fund's Report of Independent Registered Public Accounting Firm, are available on the SEC's website or upon request. |
| (f) | Investment made with cash collateral received from securities on loan. |
| Additional information on each restricted holding is as follows: | ||
| Security | Acquisition Date | Acquisition Cost ($) |
| Blu Investments LLC | 5/21/20 | 20,739 |
| Affiliate | Value, beginning of period ($) | Purchases ($) | Sales Proceeds ($) | Dividend Income ($) | Realized Gain (loss) ($) | Change in Unrealized appreciation (depreciation) ($) | Value, end of period ($) | % ownership, end of period |
| Fidelity Cash Central Fund 4.63% | 5,377,678 | 135,395,564 | 137,223,734 | 43,281 | - | - | 3,549,508 | 0.0% |
| Fidelity Securities Lending Cash Central Fund 4.63% | 2,014,150 | 161,339,327 | 138,086,752 | 15,855 | - | - | 25,266,725 | 0.1% |
| Total | 7,391,828 | 296,734,891 | 275,310,486 | 59,136 | - | - | 28,816,233 | |
| Valuation Inputs at Reporting Date: | ||||
| Description | Total ($) | Level 1 ($) | Level 2 ($) | Level 3 ($) |
Investments in Securities: | ||||
| Common Stocks | 496,094,420 | 496,090,703 | - | 3,717 |
| Money Market Funds | 28,816,233 | 28,816,233 | - | - |
| Total Investments in Securities: | 524,910,653 | 524,906,936 | - | 3,717 |
| Statement of Assets and Liabilities | ||||
| February 28, 2023 | ||||
| Assets | ||||
| Investment in securities, at value (including securities loaned of $24,852,288) - See accompanying schedule: | ||||
Unaffiliated issuers (cost $328,519,990) | $ | 496,094,420 | ||
Fidelity Central Funds (cost $28,816,233) | 28,816,233 | |||
| Total Investment in Securities (cost $357,336,223) | $ | 524,910,653 | ||
| Receivable for investments sold | 6,093,975 | |||
| Receivable for fund shares sold | 290,632 | |||
| Dividends receivable | 97,561 | |||
| Distributions receivable from Fidelity Central Funds | 13,250 | |||
| Prepaid expenses | 1,202 | |||
Total assets | 531,407,273 | |||
| Liabilities | ||||
| Payable for investments purchased | $ | 6,930,955 | ||
| Payable for fund shares redeemed | 164,442 | |||
| Accrued management fee | 222,923 | |||
| Other affiliated payables | 91,966 | |||
| Other payables and accrued expenses | 33,341 | |||
| Collateral on securities loaned | 25,266,725 | |||
| Total Liabilities | 32,710,352 | |||
| Net Assets | $ | 498,696,921 | ||
| Net Assets consist of: | ||||
| Paid in capital | $ | 347,408,093 | ||
| Total accumulated earnings (loss) | 151,288,828 | |||
| Net Assets | $ | 498,696,921 | ||
Net Asset Value , offering price and redemption price per share ($498,696,921 ÷ 5,636,414 shares) | $ | 88.48 | ||
| Statement of Operations | ||||
Year ended February 28, 2023 | ||||
| Investment Income | ||||
| Dividends | $ | 8,517,917 | ||
| Income from Fidelity Central Funds (including $15,855 from security lending) | 59,136 | |||
| Total Income | 8,577,053 | |||
| Expenses | ||||
| Management fee | $ | 2,702,438 | ||
| Transfer agent fees | 955,911 | |||
| Accounting fees | 183,832 | |||
| Custodian fees and expenses | 9,809 | |||
| Independent trustees' fees and expenses | 1,802 | |||
| Registration fees | 45,219 | |||
| Audit | 39,151 | |||
| Legal | 1,525 | |||
| Interest | 952 | |||
| Miscellaneous | 2,937 | |||
| Total expenses before reductions | 3,943,576 | |||
| Expense reductions | (18,633) | |||
| Total expenses after reductions | 3,924,943 | |||
| Net Investment income (loss) | 4,652,110 | |||
| Realized and Unrealized Gain (Loss) | ||||
| Net realized gain (loss) on: | ||||
| Investment Securities: | ||||
| Unaffiliated issuers | (12,450,749) | |||
| Total net realized gain (loss) | (12,450,749) | |||
| Change in net unrealized appreciation (depreciation) on investment securities | (9,276,236) | |||
| Net gain (loss) | (21,726,985) | |||
| Net increase (decrease) in net assets resulting from operations | $ | (17,074,875) | ||
| Statement of Changes in Net Assets | ||||
Year ended February 28, 2023 | Year ended February 28, 2022 | |||
| Increase (Decrease) in Net Assets | ||||
| Operations | ||||
| Net investment income (loss) | $ | 4,652,110 | $ | 3,741,270 |
| Net realized gain (loss) | (12,450,749) | 26,178,157 | ||
| Change in net unrealized appreciation (depreciation) | (9,276,236) | 24,955,718 | ||
| Net increase (decrease) in net assets resulting from operations | (17,074,875) | 54,875,145 | ||
| Distributions to shareholders | (3,697,710) | (39,900,442) | ||
| Share transactions | ||||
| Proceeds from sales of shares | 79,113,675 | 712,970,980 | ||
| Reinvestment of distributions | 3,425,079 | 37,862,407 | ||
| Cost of shares redeemed | (276,407,546) | (395,931,225) | ||
Net increase (decrease) in net assets resulting from share transactions | (193,868,792) | 354,902,162 | ||
| Total increase (decrease) in net assets | (214,641,377) | 369,876,865 | ||
| Net Assets | ||||
| Beginning of period | 713,338,298 | 343,461,433 | ||
| End of period | $ | 498,696,921 | $ | 713,338,298 |
| Other Information | ||||
| Shares | ||||
| Sold | 926,693 | 7,347,600 | ||
| Issued in reinvestment of distributions | 40,601 | 384,753 | ||
| Redeemed | (3,274,232) | (4,219,107) | ||
| Net increase (decrease) | (2,306,938) | 3,513,246 | ||
| Construction and Housing Portfolio |
| Years ended February 28, | 2023 | 2022 | 2021 | 2020 A | 2019 | |||||
Selected Per-Share Data | ||||||||||
| Net asset value, beginning of period | $ | 89.80 | $ | 77.53 | $ | 58.56 | $ | 54.22 | $ | 59.88 |
| Income from Investment Operations | ||||||||||
Net investment income (loss) B,C | .76 | .57 | .59 | .53 | .49 | |||||
| Net realized and unrealized gain (loss) | (1.42) | 17.59 | 21.82 | 8.71 | 1.32 | |||||
| Total from investment operations | (.66) | 18.16 | 22.41 | 9.24 | 1.81 | |||||
| Distributions from net investment income | (.66) | (.53) | (.61) | (.60) | (.55) | |||||
| Distributions from net realized gain | - | (5.36) | (2.83) | (4.31) | (6.92) | |||||
| Total distributions | (.66) | (5.89) | (3.44) | (4.90) D | (7.47) | |||||
| Net asset value, end of period | $ | 88.48 | $ | 89.80 | $ | 77.53 | $ | 58.56 | $ | 54.22 |
Total Return E | (.70)% | 22.95% | 41.70% | 17.10% | 4.03% | |||||
Ratios to Average Net Assets C,F,G | ||||||||||
| Expenses before reductions | .77% | .75% | .78% | .79% | .80% | |||||
| Expenses net of fee waivers, if any | .76% | .75% | .78% | .79% | .80% | |||||
| Expenses net of all reductions | .76% | .75% | .77% | .79% | .79% | |||||
| Net investment income (loss) | .90% | .60% | .94% | .88% | .86% | |||||
| Supplemental Data | ||||||||||
| Net assets, end of period (000 omitted) | $ | 498,697 | $ | 713,338 | $ | 343,461 | $ | 318,905 | $ | 225,255 |
Portfolio turnover rate H | 20% | 70% | 93% | 161% | 90% |
| Average Annual Total Returns | |||
Periods ended February 28, 2023 | Past 1 year | Past 5 years | Past 10 years |
| Consumer Discretionary Portfolio | -16.87% | 7.13% | 11.20% |
| $10,000 Over 10 Years |
Let's say hypothetically that $10,000 was invested in Consumer Discretionary Portfolio on February 28, 2013. The chart shows how the value of your investment would have changed, and also shows how the S&P 500® Index performed over the same period. |
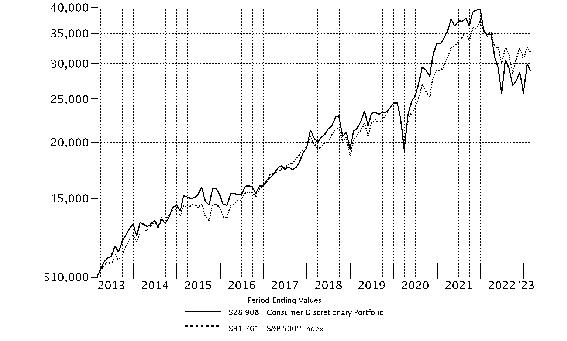 |
Top Holdings (% of Fund's net assets) | ||
| Amazon.com, Inc. | 21.1 | |
| Tesla, Inc. | 12.4 | |
| The Home Depot, Inc. | 4.9 | |
| Lowe's Companies, Inc. | 4.9 | |
| NIKE, Inc. Class B | 4.1 | |
| TJX Companies, Inc. | 3.9 | |
| Hilton Worldwide Holdings, Inc. | 2.9 | |
| Booking Holdings, Inc. | 2.6 | |
| Dollar Tree, Inc. | 2.5 | |
| Target Corp. | 2.2 | |
| 61.5 | ||
| Industries (% of Fund's net assets) | ||
| Internet & Direct Marketing Retail | 21.9 | |
| Specialty Retail | 21.9 | |
| Hotels, Restaurants & Leisure | 17.5 | |
| Automobiles | 12.8 | |
| Textiles, Apparel & Luxury Goods | 12.0 | |
| Multiline Retail | 7.1 | |
| Household Durables | 3.1 | |
| Auto Components | 2.0 | |
| Food & Staples Retailing | 0.8 | |
| Building Products | 0.4 | |
| Common Stocks - 99.5% | |||
| Shares | Value ($) | ||
| Auto Components - 2.0% | |||
| Auto Parts & Equipment - 2.0% | |||
| Adient PLC (a) | 73,900 | 3,157,008 | |
| Aptiv PLC (a) | 17,400 | 2,023,272 | |
| Magna International, Inc. Class A (b) | 60,090 | 3,348,816 | |
| 8,529,096 | |||
| Automobiles - 12.8% | |||
| Automobile Manufacturers - 12.8% | |||
| Ferrari NV | 6,127 | 1,595,287 | |
| Tesla, Inc. (a) | 255,951 | 52,651,680 | |
| 54,246,967 | |||
| Building Products - 0.4% | |||
| Building Products - 0.4% | |||
| The AZEK Co., Inc. (a)(b) | 68,146 | 1,641,637 | |
| Food & Staples Retailing - 0.8% | |||
| Food Distributors - 0.8% | |||
| Performance Food Group Co. (a) | 62,778 | 3,552,607 | |
| Hotels, Restaurants & Leisure - 17.5% | |||
| Casinos & Gaming - 3.1% | |||
| Caesars Entertainment, Inc. (a) | 57,448 | 2,916,060 | |
| Churchill Downs, Inc. | 26,581 | 6,533,078 | |
| Penn Entertainment, Inc. (a) | 112,374 | 3,430,778 | |
| 12,879,916 | |||
| Hotels, Resorts & Cruise Lines - 7.8% | |||
| Booking Holdings, Inc. (a) | 4,312 | 10,883,488 | |
| Hilton Worldwide Holdings, Inc. | 86,081 | 12,439,565 | |
| Marriott International, Inc. Class A | 51,179 | 8,661,534 | |
| Royal Caribbean Cruises Ltd. (a) | 17,400 | 1,229,136 | |
| 33,213,723 | |||
| Leisure Facilities - 0.5% | |||
| Planet Fitness, Inc. (a) | 25,233 | 2,045,135 | |
| Restaurants - 6.1% | |||
| ARAMARK Holdings Corp. | 127,664 | 4,698,035 | |
| Brinker International, Inc. (a) | 25,830 | 981,540 | |
| Chipotle Mexican Grill, Inc. (a) | 3,855 | 5,748,113 | |
| Domino's Pizza, Inc. | 17,194 | 5,055,208 | |
| Dutch Bros, Inc. (a)(b) | 19,571 | 652,693 | |
| McDonald's Corp. | 33,425 | 8,821,192 | |
| 25,956,781 | |||
TOTAL HOTELS, RESTAURANTS & LEISURE | 74,095,555 | ||
| Household Durables - 3.1% | |||
| Home Furnishings - 1.4% | |||
| Tempur Sealy International, Inc. | 136,687 | 5,842,002 | |
| Homebuilding - 1.7% | |||
| KB Home | 81,330 | 2,868,509 | |
| PulteGroup, Inc. | 84,060 | 4,595,560 | |
| 7,464,069 | |||
TOTAL HOUSEHOLD DURABLES | 13,306,071 | ||
| Internet & Direct Marketing Retail - 21.9% | |||
| Internet & Direct Marketing Retail - 21.9% | |||
| Amazon.com, Inc. (a) | 953,605 | 89,858,201 | |
| eBay, Inc. | 70,656 | 3,243,110 | |
| Wayfair LLC Class A (a) | 1,500 | 60,735 | |
| 93,162,046 | |||
| Multiline Retail - 7.1% | |||
| General Merchandise Stores - 7.1% | |||
| Dollar General Corp. | 32,104 | 6,944,095 | |
| Dollar Tree, Inc. (a) | 73,200 | 10,634,496 | |
| Ollie's Bargain Outlet Holdings, Inc. (a) | 55,682 | 3,203,942 | |
| Target Corp. | 54,625 | 9,204,313 | |
| 29,986,846 | |||
| Specialty Retail - 21.9% | |||
| Apparel Retail - 5.7% | |||
| Burlington Stores, Inc. (a) | 23,587 | 5,053,515 | |
| TJX Companies, Inc. | 217,297 | 16,644,950 | |
| Victoria's Secret & Co. (a) | 69,439 | 2,752,562 | |
| 24,451,027 | |||
| Automotive Retail - 0.5% | |||
| O'Reilly Automotive, Inc. (a) | 2,410 | 2,000,541 | |
| Home Improvement Retail - 11.6% | |||
| Floor & Decor Holdings, Inc. Class A (a)(b) | 84,567 | 7,764,096 | |
| Lowe's Companies, Inc. | 100,441 | 20,665,736 | |
| The Home Depot, Inc. | 70,531 | 20,915,263 | |
| 49,345,095 | |||
| Homefurnishing Retail - 0.6% | |||
| Williams-Sonoma, Inc. (b) | 19,020 | 2,375,978 | |
| Specialty Stores - 3.5% | |||
| Bath & Body Works, Inc. | 39,688 | 1,622,049 | |
| Dick's Sporting Goods, Inc. (b) | 67,837 | 8,725,873 | |
| Five Below, Inc. (a) | 18,052 | 3,688,024 | |
| Sally Beauty Holdings, Inc. (a) | 53,100 | 854,379 | |
| 14,890,325 | |||
TOTAL SPECIALTY RETAIL | 93,062,966 | ||
| Textiles, Apparel & Luxury Goods - 12.0% | |||
| Apparel, Accessories & Luxury Goods - 5.9% | |||
| Capri Holdings Ltd. (a) | 147,768 | 7,324,860 | |
| lululemon athletica, Inc. (a) | 20,130 | 6,224,196 | |
| LVMH Moet Hennessy Louis Vuitton SE | 2,833 | 2,355,150 | |
| PVH Corp. | 36,578 | 2,935,019 | |
| Tapestry, Inc. | 149,128 | 6,488,559 | |
| 25,327,784 | |||
| Footwear - 6.1% | |||
| Deckers Outdoor Corp. (a) | 16,527 | 6,881,016 | |
| NIKE, Inc. Class B | 144,202 | 17,129,756 | |
| On Holding AG (a) | 41,093 | 898,704 | |
| Skechers U.S.A., Inc. Class A (sub. vtg.) (a) | 20,500 | 912,455 | |
| 25,821,931 | |||
TOTAL TEXTILES, APPAREL & LUXURY GOODS | 51,149,715 | ||
| TOTAL COMMON STOCKS (Cost $296,361,047) | 422,733,506 | ||
| Money Market Funds - 4.2% | |||
| Shares | Value ($) | ||
| Fidelity Cash Central Fund 4.63% (c) | 1,290,574 | 1,290,832 | |
| Fidelity Securities Lending Cash Central Fund 4.63% (c)(d) | 16,276,186 | 16,277,814 | |
| TOTAL MONEY MARKET FUNDS (Cost $17,568,646) | 17,568,646 | ||
| TOTAL INVESTMENT IN SECURITIES - 103.7% (Cost $313,929,693) | 440,302,152 |
NET OTHER ASSETS (LIABILITIES) - (3.7)% | (15,510,805) |
| NET ASSETS - 100.0% | 424,791,347 |
| (a) | Non-income producing |
| (b) | Security or a portion of the security is on loan at period end. |
| (c) | Affiliated fund that is generally available only to investment companies and other accounts managed by Fidelity Investments. The rate quoted is the annualized seven-day yield of the fund at period end. A complete unaudited listing of the fund's holdings as of its most recent quarter end is available upon request. In addition, each Fidelity Central Fund's financial statements, which are not covered by the Fund's Report of Independent Registered Public Accounting Firm, are available on the SEC's website or upon request. |
| (d) | Investment made with cash collateral received from securities on loan. |
| Affiliate | Value, beginning of period ($) | Purchases ($) | Sales Proceeds ($) | Dividend Income ($) | Realized Gain (loss) ($) | Change in Unrealized appreciation (depreciation) ($) | Value, end of period ($) | % ownership, end of period |
| Fidelity Cash Central Fund 4.63% | - | 82,765,441 | 81,474,609 | 48,808 | - | - | 1,290,832 | 0.0% |
| Fidelity Securities Lending Cash Central Fund 4.63% | 6,819,964 | 125,949,027 | 116,491,177 | 230,764 | - | - | 16,277,814 | 0.1% |
| Total | 6,819,964 | 208,714,468 | 197,965,786 | 279,572 | - | - | 17,568,646 | |
| Valuation Inputs at Reporting Date: | ||||
| Description | Total ($) | Level 1 ($) | Level 2 ($) | Level 3 ($) |
Investments in Securities: | ||||
| Common Stocks | 422,733,506 | 420,378,356 | 2,355,150 | - |
| Money Market Funds | 17,568,646 | 17,568,646 | - | - |
| Total Investments in Securities: | 440,302,152 | 437,947,002 | 2,355,150 | - |
| Statement of Assets and Liabilities | ||||
| February 28, 2023 | ||||
| Assets | ||||
| Investment in securities, at value (including securities loaned of $16,046,701) - See accompanying schedule: | ||||
Unaffiliated issuers (cost $296,361,047) | $ | 422,733,506 | ||
Fidelity Central Funds (cost $17,568,646) | 17,568,646 | |||
| Total Investment in Securities (cost $313,929,693) | $ | 440,302,152 | ||
| Cash | 16,056 | |||
| Foreign currency held at value (cost $1) | 1 | |||
| Receivable for investments sold | 3,563,098 | |||
| Receivable for fund shares sold | 173,902 | |||
| Dividends receivable | 273,971 | |||
| Distributions receivable from Fidelity Central Funds | 17,868 | |||
| Prepaid expenses | 2,350 | |||
| Other receivables | 15,085 | |||
Total assets | 444,364,483 | |||
| Liabilities | ||||
| Payable for investments purchased | $ | 2,441,904 | ||
| Payable for fund shares redeemed | 562,994 | |||
| Accrued management fee | 190,921 | |||
| Other affiliated payables | 70,259 | |||
| Other payables and accrued expenses | 33,533 | |||
| Collateral on securities loaned | 16,273,525 | |||
| Total Liabilities | 19,573,136 | |||
| Net Assets | $ | 424,791,347 | ||
| Net Assets consist of: | ||||
| Paid in capital | $ | 296,165,809 | ||
| Total accumulated earnings (loss) | 128,625,538 | |||
| Net Assets | $ | 424,791,347 | ||
Net Asset Value , offering price and redemption price per share ($424,791,347 ÷ 8,936,375 shares) | $ | 47.54 | ||
| Statement of Operations | ||||
Year ended February 28, 2023 | ||||
| Investment Income | ||||
| Dividends | $ | 2,849,741 | ||
| Income from Fidelity Central Funds (including $230,764 from security lending) | 279,572 | |||
| Total Income | 3,129,313 | |||
| Expenses | ||||
| Management fee | $ | 2,109,514 | ||
| Transfer agent fees | 681,929 | |||
| Accounting fees | 144,975 | |||
| Custodian fees and expenses | 12,064 | |||
| Independent trustees' fees and expenses | 1,364 | |||
| Registration fees | 50,963 | |||
| Audit | 40,160 | |||
| Legal | 3,356 | |||
| Interest | 966 | |||
| Miscellaneous | 3,196 | |||
| Total expenses before reductions | 3,048,487 | |||
| Expense reductions | (14,515) | |||
| Total expenses after reductions | 3,033,972 | |||
| Net Investment income (loss) | 95,341 | |||
| Realized and Unrealized Gain (Loss) | ||||
| Net realized gain (loss) on: | ||||
| Investment Securities: | ||||
| Unaffiliated issuers | 14,819,825 | |||
| Foreign currency transactions | 3,643 | |||
| Total net realized gain (loss) | 14,823,468 | |||
| Change in net unrealized appreciation (depreciation) on: | ||||
| Investment Securities: | ||||
| Unaffiliated issuers | (78,173,699) | |||
| Assets and liabilities in foreign currencies | (1,786) | |||
| Total change in net unrealized appreciation (depreciation) | (78,175,485) | |||
| Net gain (loss) | (63,352,017) | |||
| Net increase (decrease) in net assets resulting from operations | $ | (63,256,676) | ||
| Statement of Changes in Net Assets | ||||
Year ended February 28, 2023 | Year ended February 28, 2022 | |||
| Increase (Decrease) in Net Assets | ||||
| Operations | ||||
| Net investment income (loss) | $ | 95,341 | $ | (1,380,277) |
| Net realized gain (loss) | 14,823,468 | 69,875,616 | ||
| Change in net unrealized appreciation (depreciation) | (78,175,485) | (55,774,464) | ||
| Net increase (decrease) in net assets resulting from operations | (63,256,676) | 12,720,875 | ||
| Distributions to shareholders | (36,965,013) | (57,919,716) | ||
| Share transactions | ||||
| Proceeds from sales of shares | 214,276,530 | 211,466,743 | ||
| Reinvestment of distributions | 34,220,095 | 54,428,730 | ||
| Cost of shares redeemed | (142,158,153) | (385,959,972) | ||
Net increase (decrease) in net assets resulting from share transactions | 106,338,472 | (120,064,499) | ||
| Total increase (decrease) in net assets | 6,116,783 | (165,263,340) | ||
| Net Assets | ||||
| Beginning of period | 418,674,564 | 583,937,904 | ||
| End of period | $ | 424,791,347 | $ | 418,674,564 |
| Other Information | ||||
| Shares | ||||
| Sold | 4,618,411 | 2,966,018 | ||
| Issued in reinvestment of distributions | 617,903 | 780,014 | ||
| Redeemed | (2,921,858) | (5,710,596) | ||
| Net increase (decrease) | 2,314,456 | (1,964,564) | ||
| Consumer Discretionary Portfolio |
| Years ended February 28, | 2023 | 2022 | 2021 | 2020 A | 2019 | |||||
Selected Per-Share Data | ||||||||||
| Net asset value, beginning of period | $ | 63.23 | $ | 68.01 | $ | 45.58 | $ | 44.31 | $ | 43.65 |
| Income from Investment Operations | ||||||||||
Net investment income (loss) B,C | .01 | (.16) | (.03) | .11 | .12 | |||||
| Net realized and unrealized gain (loss) | (9.85) | 1.92 | 23.23 | 2.26 | 1.87 | |||||
| Total from investment operations | (9.84) | 1.76 | 23.20 | 2.37 | 1.99 | |||||
| Distributions from net investment income | (.02) | - | - | (.11) | (.15) | |||||
| Distributions from net realized gain | (5.83) | (6.54) | (.77) | (.99) | (1.18) | |||||
| Total distributions | (5.85) | (6.54) | (.77) | (1.10) | (1.33) | |||||
| Net asset value, end of period | $ | 47.54 | $ | 63.23 | $ | 68.01 | $ | 45.58 | $ | 44.31 |
Total Return D | (16.87)% | 1.88% | 50.96% | 5.30% | 4.81% | |||||
Ratios to Average Net Assets C,E,F | ||||||||||
| Expenses before reductions | .76% | .73% | .76% | .76% | .78% | |||||
| Expenses net of fee waivers, if any | .76% | .73% | .76% | .76% | .77% | |||||
| Expenses net of all reductions | .76% | .73% | .75% | .76% | .77% | |||||
| Net investment income (loss) | .02% | (.22)% | (.06)% | .23% | .27% | |||||
| Supplemental Data | ||||||||||
| Net assets, end of period (000 omitted) | $ | 424,791 | $ | 418,675 | $ | 583,938 | $ | 402,403 | $ | 433,188 |
Portfolio turnover rate G | 46% | 38% | 55% | 41% H | 46% H |
| Average Annual Total Returns | |||
Periods ended February 28, 2023 | Past 1 year | Past 5 years | Past 10 years |
| Leisure Portfolio | -0.22% | 10.02% | 12.63% |
| $10,000 Over 10 Years |
Let's say hypothetically that $10,000 was invested in Leisure Portfolio on February 28, 2013. The chart shows how the value of your investment would have changed, and also shows how the S&P 500® Index performed over the same period. |
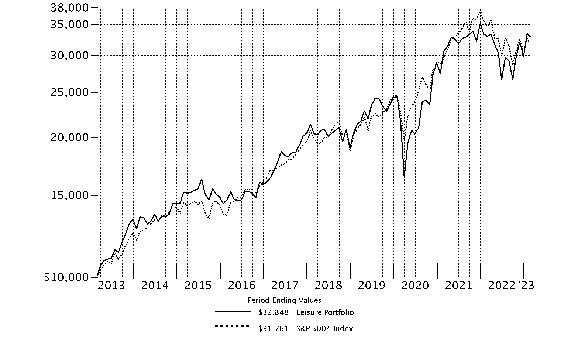 |
Top Holdings (% of Fund's net assets) | ||
| McDonald's Corp. | 16.7 | |
| Booking Holdings, Inc. | 11.5 | |
| Hilton Worldwide Holdings, Inc. | 7.9 | |
| Starbucks Corp. | 7.1 | |
| Yum! Brands, Inc. | 6.3 | |
| Marriott International, Inc. Class A | 4.7 | |
| Airbnb, Inc. Class A | 4.7 | |
| Chipotle Mexican Grill, Inc. | 3.7 | |
| Las Vegas Sands Corp. | 3.4 | |
| Domino's Pizza, Inc. | 3.3 | |
| 69.3 | ||
| Industries (% of Fund's net assets) | ||
| Hotels, Restaurants & Leisure | 91.5 | |
| Food & Staples Retailing | 2.5 | |
| Diversified Consumer Services | 2.1 | |
| Beverages | 1.8 | |
| IT Services | 0.7 | |
| Specialty Retail | 0.3 | |
| Common Stocks - 98.9% | |||
| Shares | Value ($) | ||
| Beverages - 1.8% | |||
| Soft Drinks - 1.8% | |||
| The Coca-Cola Co. | 168,900 | 10,051,239 | |
| Diversified Consumer Services - 2.1% | |||
| Specialized Consumer Services - 2.1% | |||
| H&R Block, Inc. | 117,200 | 4,312,960 | |
| OneSpaWorld Holdings Ltd. (a)(b) | 464,500 | 5,383,555 | |
| Service Corp. International | 35,400 | 2,390,562 | |
| 12,087,077 | |||
| Food & Staples Retailing - 2.5% | |||
| Food Distributors - 2.5% | |||
| U.S. Foods Holding Corp. (a) | 368,300 | 13,822,299 | |
| Hotels, Restaurants & Leisure - 91.5% | |||
| Casinos & Gaming - 12.9% | |||
| Bally's Corp. (a)(b) | 130,900 | 2,585,275 | |
| Boyd Gaming Corp. | 200 | 13,026 | |
| Caesars Entertainment, Inc. (a) | 216,949 | 11,012,331 | |
| Churchill Downs, Inc. | 64,648 | 15,889,185 | |
| Draftkings Holdings, Inc. (a) | 32,400 | 611,064 | |
| Flutter Entertainment PLC (a) | 48,600 | 7,795,442 | |
| Las Vegas Sands Corp. (a)(b) | 337,200 | 19,378,884 | |
| MGM Resorts International | 212,500 | 9,139,625 | |
| Penn Entertainment, Inc. (a) | 87,708 | 2,677,725 | |
| Red Rock Resorts, Inc. (b) | 87,200 | 3,808,024 | |
| 72,910,581 | |||
| Hotels, Resorts & Cruise Lines - 32.3% | |||
| Airbnb, Inc. Class A (a) | 215,300 | 26,542,184 | |
| Booking Holdings, Inc. (a) | 25,576 | 64,553,824 | |
| Carnival Corp. (a)(b) | 100,000 | 1,062,000 | |
| Expedia, Inc. (a) | 25,800 | 2,811,426 | |
| Hilton Grand Vacations, Inc. (a) | 63,400 | 3,026,716 | |
| Hilton Worldwide Holdings, Inc. | 308,532 | 44,585,959 | |
| Marriott International, Inc. Class A | 157,525 | 26,659,531 | |
| Royal Caribbean Cruises Ltd. (a)(b) | 176,400 | 12,460,896 | |
| 181,702,536 | |||
| Leisure Facilities - 2.0% | |||
| Planet Fitness, Inc. (a) | 38,744 | 3,140,201 | |
| Vail Resorts, Inc. | 33,682 | 7,864,410 | |
| 11,004,611 | |||
| Restaurants - 44.3% | |||
| ARAMARK Holdings Corp. | 61,200 | 2,252,160 | |
| Brinker International, Inc. (a) | 218,300 | 8,295,400 | |
| Chipotle Mexican Grill, Inc. (a) | 14,009 | 20,888,540 | |
| Darden Restaurants, Inc. | 26,900 | 3,846,431 | |
| Domino's Pizza, Inc. | 63,642 | 18,711,384 | |
| Dutch Bros, Inc. (a)(b) | 135,300 | 4,512,255 | |
| First Watch Restaurant Group, Inc. (a) | 235,000 | 3,590,800 | |
| McDonald's Corp. | 357,493 | 94,345,980 | |
| Noodles & Co. (a) | 628,700 | 3,671,608 | |
| Restaurant Brands International, Inc. | 154,674 | 9,980,979 | |
| Ruth's Hospitality Group, Inc. | 79,800 | 1,488,270 | |
| Starbucks Corp. | 394,456 | 40,270,013 | |
| Wingstop, Inc. | 15,300 | 2,606,355 | |
| Yum! Brands, Inc. | 278,400 | 35,401,344 | |
| 249,861,519 | |||
TOTAL HOTELS, RESTAURANTS & LEISURE | 515,479,247 | ||
| IT Services - 0.7% | |||
| Data Processing & Outsourced Services - 0.7% | |||
| Toast, Inc. (a)(b) | 211,000 | 3,992,120 | |
| Specialty Retail - 0.3% | |||
| Automotive Retail - 0.3% | |||
| Diversified Royalty Corp. (b) | 782,000 | 1,931,359 | |
| TOTAL COMMON STOCKS (Cost $402,647,832) | 557,363,341 | ||
| Money Market Funds - 3.0% | |||
| Shares | Value ($) | ||
| Fidelity Cash Central Fund 4.63% (c) | 4,288,587 | 4,289,445 | |
| Fidelity Securities Lending Cash Central Fund 4.63% (c)(d) | 12,552,861 | 12,554,116 | |
| TOTAL MONEY MARKET FUNDS (Cost $16,843,561) | 16,843,561 | ||
| TOTAL INVESTMENT IN SECURITIES - 101.9% (Cost $419,491,393) | 574,206,902 |
NET OTHER ASSETS (LIABILITIES) - (1.9)% | (10,826,226) |
| NET ASSETS - 100.0% | 563,380,676 |
| (a) | Non-income producing |
| (b) | Security or a portion of the security is on loan at period end. |
| (c) | Affiliated fund that is generally available only to investment companies and other accounts managed by Fidelity Investments. The rate quoted is the annualized seven-day yield of the fund at period end. A complete unaudited listing of the fund's holdings as of its most recent quarter end is available upon request. In addition, each Fidelity Central Fund's financial statements, which are not covered by the Fund's Report of Independent Registered Public Accounting Firm, are available on the SEC's website or upon request. |
| (d) | Investment made with cash collateral received from securities on loan. |
| Affiliate | Value, beginning of period ($) | Purchases ($) | Sales Proceeds ($) | Dividend Income ($) | Realized Gain (loss) ($) | Change in Unrealized appreciation (depreciation) ($) | Value, end of period ($) | % ownership, end of period |
| Fidelity Cash Central Fund 4.63% | 1,262,544 | 75,531,284 | 72,504,383 | 49,634 | - | - | 4,289,445 | 0.0% |
| Fidelity Securities Lending Cash Central Fund 4.63% | 19,544,251 | 292,662,916 | 299,653,051 | 775,162 | - | - | 12,554,116 | 0.0% |
| Total | 20,806,795 | 368,194,200 | 372,157,434 | 824,796 | - | - | 16,843,561 | |
| Valuation Inputs at Reporting Date: | ||||
| Description | Total ($) | Level 1 ($) | Level 2 ($) | Level 3 ($) |
Investments in Securities: | ||||
| Common Stocks | 557,363,341 | 557,363,341 | - | - |
| Money Market Funds | 16,843,561 | 16,843,561 | - | - |
| Total Investments in Securities: | 574,206,902 | 574,206,902 | - | - |
| Statement of Assets and Liabilities | ||||
| February 28, 2023 | ||||
| Assets | ||||
| Investment in securities, at value (including securities loaned of $12,235,162) - See accompanying schedule: | ||||
Unaffiliated issuers (cost $402,647,832) | $ | 557,363,341 | ||
Fidelity Central Funds (cost $16,843,561) | 16,843,561 | |||
| Total Investment in Securities (cost $419,491,393) | $ | 574,206,902 | ||
| Cash | 3,460 | |||
| Foreign currency held at value (cost $498) | 497 | |||
| Receivable for investments sold | 4,438,124 | |||
| Receivable for fund shares sold | 99,887 | |||
| Dividends receivable | 847,195 | |||
| Distributions receivable from Fidelity Central Funds | 34,220 | |||
| Prepaid expenses | 1,753 | |||
Total assets | 579,632,038 | |||
| Liabilities | ||||
| Payable for investments purchased | $ | 3,062,964 | ||
| Payable for fund shares redeemed | 257,516 | |||
| Accrued management fee | 251,791 | |||
| Other affiliated payables | 89,986 | |||
| Other payables and accrued expenses | 34,989 | |||
| Collateral on securities loaned | 12,554,116 | |||
| Total Liabilities | 16,251,362 | |||
| Net Assets | $ | 563,380,676 | ||
| Net Assets consist of: | ||||
| Paid in capital | $ | 409,344,281 | ||
| Total accumulated earnings (loss) | 154,036,395 | |||
| Net Assets | $ | 563,380,676 | ||
Net Asset Value , offering price and redemption price per share ($563,380,676 ÷ 35,542,715 shares) | $ | 15.85 | ||
| Statement of Operations | ||||
Year ended February 28, 2023 | ||||
| Investment Income | ||||
| Dividends | $ | 5,720,008 | ||
| Income from Fidelity Central Funds (including $775,162 from security lending) | 824,796 | |||
| Total Income | 6,544,804 | |||
| Expenses | ||||
| Management fee | $ | 2,896,810 | ||
| Transfer agent fees | 906,194 | |||
| Accounting fees | 194,142 | |||
| Custodian fees and expenses | 10,583 | |||
| Independent trustees' fees and expenses | 1,889 | |||
| Registration fees | 33,005 | |||
| Audit | 40,049 | |||
| Legal | 1,835 | |||
| Interest | 7,139 | |||
| Miscellaneous | 3,469 | |||
| Total expenses before reductions | 4,095,115 | |||
| Expense reductions | (19,474) | |||
| Total expenses after reductions | 4,075,641 | |||
| Net Investment income (loss) | 2,469,163 | |||
| Realized and Unrealized Gain (Loss) | ||||
| Net realized gain (loss) on: | ||||
| Investment Securities: | ||||
| Unaffiliated issuers | 1,162,305 | |||
| Foreign currency transactions | (15,965) | |||
| Total net realized gain (loss) | 1,146,340 | |||
| Change in net unrealized appreciation (depreciation) on: | ||||
| Investment Securities: | ||||
| Unaffiliated issuers | (15,645,084) | |||
| Assets and liabilities in foreign currencies | (3,349) | |||
| Total change in net unrealized appreciation (depreciation) | (15,648,433) | |||
| Net gain (loss) | (14,502,093) | |||
| Net increase (decrease) in net assets resulting from operations | $ | (12,032,930) | ||
| Statement of Changes in Net Assets | ||||
Year ended February 28, 2023 | Year ended February 28, 2022 | |||
| Increase (Decrease) in Net Assets | ||||
| Operations | ||||
| Net investment income (loss) | $ | 2,469,163 | $ | 336,640 |
| Net realized gain (loss) | 1,146,340 | 141,336,647 | ||
| Change in net unrealized appreciation (depreciation) | (15,648,433) | (91,223,907) | ||
| Net increase (decrease) in net assets resulting from operations | (12,032,930) | 50,449,380 | ||
| Distributions to shareholders | (18,288,153) | (140,839,314) | ||
| Share transactions | ||||
| Proceeds from sales of shares | 73,923,002 | 249,737,495 | ||
| Reinvestment of distributions | 17,168,093 | 130,602,409 | ||
| Cost of shares redeemed | (144,189,598) | (296,858,478) | ||
Net increase (decrease) in net assets resulting from share transactions | (53,098,503) | 83,481,426 | ||
| Total increase (decrease) in net assets | (83,419,586) | (6,908,508) | ||
| Net Assets | ||||
| Beginning of period | 646,800,262 | 653,708,770 | ||
| End of period | $ | 563,380,676 | $ | 646,800,262 |
| Other Information | ||||
| Shares | ||||
| Sold | 4,908,793 | 13,101,449 | ||
| Issued in reinvestment of distributions | 1,119,877 | 7,680,514 | ||
| Redeemed | (9,983,968) | (15,791,115) | ||
| Net increase (decrease) | (3,955,298) | 4,990,848 | ||
| Leisure Portfolio |
| Years ended February 28, | 2023 | 2022 | 2021 | 2020 A | 2019 B | |||||
Selected Per-Share Data | ||||||||||
| Net asset value, beginning of period | $ | 16.38 | $ | 18.94 | $ | 13.89 | $ | 14.53 | $ | 16.58 |
| Income from Investment Operations | ||||||||||
Net investment income (loss) C,D | .07 | .01 | .07 | .12 | .16 | |||||
| Net realized and unrealized gain (loss) | (.12) | 1.41 | 5.40 | .25 | .39 | |||||
| Total from investment operations | (.05) | 1.42 | 5.47 | .37 | .55 | |||||
| Distributions from net investment income | (.05) | (.02) | (.08) | (.11) | (.16) | |||||
| Distributions from net realized gain | (.42) | (3.96) | (.34) | (.89) | (2.44) | |||||
| Total distributions | (.48) E | (3.98) | (.42) | (1.01) E | (2.60) | |||||
Redemption fees added to paid in capital C | - | - | - | - | - F | |||||
| Net asset value, end of period | $ | 15.85 | $ | 16.38 | $ | 18.94 | $ | 13.89 | $ | 14.53 |
Total Return G | (.22)% | 7.53% | 41.30% | 1.76% | 4.48% | |||||
Ratios to Average Net Assets D,H,I | ||||||||||
| Expenses before reductions | .74% | .73% | .77% | .76% | .76% | |||||
| Expenses net of fee waivers, if any | .74% | .73% | .77% | .75% | .76% | |||||
| Expenses net of all reductions | .74% | .73% | .76% | .75% | .76% | |||||
| Net investment income (loss) | .45% | .05% | .48% | .79% | 1.05% | |||||
| Supplemental Data | ||||||||||
| Net assets, end of period (000 omitted) | $ | 563,381 | $ | 646,800 | $ | 653,709 | $ | 431,146 | $ | 472,923 |
Portfolio turnover rate J | 46% | 79% | 72% | 53% | 41% |
| Average Annual Total Returns | |||
Periods ended February 28, 2023 | Past 1 year | Past 5 years | Past 10 years |
| Retailing Portfolio | -13.86% | 9.24% | 14.66% |
| $10,000 Over 10 Years |
Let's say hypothetically that $10,000 was invested in Retailing Portfolio on February 28, 2013. The chart shows how the value of your investment would have changed, and also shows how the S&P 500® Index performed over the same period. |
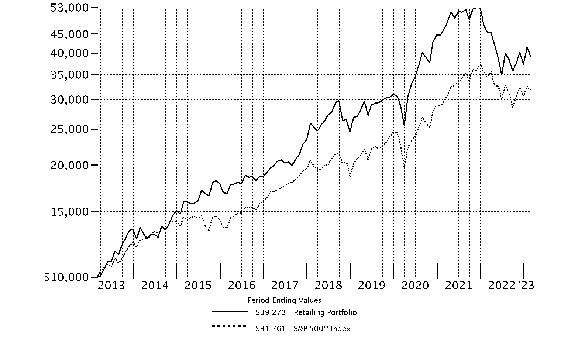 |
Top Holdings (% of Fund's net assets) | ||
| Amazon.com, Inc. | 23.8 | |
| The Home Depot, Inc. | 11.6 | |
| Lowe's Companies, Inc. | 7.5 | |
| Target Corp. | 5.3 | |
| TJX Companies, Inc. | 4.8 | |
| Dollar General Corp. | 4.8 | |
| O'Reilly Automotive, Inc. | 4.3 | |
| Dollar Tree, Inc. | 4.3 | |
| Capri Holdings Ltd. | 2.9 | |
| eBay, Inc. | 2.8 | |
| 72.1 | ||
| Industries (% of Fund's net assets) | ||
| Specialty Retail | 39.3 | |
| Internet & Direct Marketing Retail | 30.3 | |
| Multiline Retail | 18.6 | |
| Textiles, Apparel & Luxury Goods | 6.2 | |
| Food & Staples Retailing | 1.5 | |
| Interactive Media & Services | 0.4 | |
| Common Stocks - 96.3% | |||
| Shares | Value ($) | ||
| Food & Staples Retailing - 1.5% | |||
| Food Retail - 1.0% | |||
| Alimentation Couche-Tard, Inc. Class A (multi-vtg.) | 562,300 | 26,378,031 | |
| Hypermarkets & Super Centers - 0.5% | |||
| Walmart, Inc. | 100,600 | 14,298,278 | |
TOTAL FOOD & STAPLES RETAILING | 40,676,309 | ||
| Interactive Media & Services - 0.4% | |||
| Interactive Media & Services - 0.4% | |||
| Pinterest, Inc. Class A (a) | 507,100 | 12,733,281 | |
| Internet & Direct Marketing Retail - 30.3% | |||
| Internet & Direct Marketing Retail - 30.3% | |||
| Amazon.com, Inc. (a) | 7,006,900 | 660,260,186 | |
| eBay, Inc. | 1,662,600 | 76,313,340 | |
| Etsy, Inc. (a) | 276,560 | 33,577,150 | |
| MercadoLibre, Inc. (a) | 54,400 | 66,368,000 | |
| thredUP, Inc. (a)(b) | 677,862 | 1,077,801 | |
| Wayfair LLC Class A (a) | 48,100 | 1,947,569 | |
| 839,544,046 | |||
| Multiline Retail - 18.6% | |||
| Department Stores - 1.0% | |||
| Kohl's Corp. (b) | 966,100 | 27,089,444 | |
| General Merchandise Stores - 17.6% | |||
| Dollar General Corp. | 618,900 | 133,868,070 | |
| Dollar Tree, Inc. (a) | 828,200 | 120,320,896 | |
| Dollarama, Inc. | 412,900 | 23,851,065 | |
| Ollie's Bargain Outlet Holdings, Inc. (a)(b) | 1,106,864 | 63,688,955 | |
| Target Corp. (b) | 872,000 | 146,932,000 | |
| 488,660,986 | |||
TOTAL MULTILINE RETAIL | 515,750,430 | ||
| Specialty Retail - 39.3% | |||
| Apparel Retail - 9.4% | |||
| American Eagle Outfitters, Inc. (b) | 1,604,000 | 23,049,480 | |
| Burlington Stores, Inc. (a) | 176,394 | 37,792,415 | |
| TJX Companies, Inc. | 1,748,232 | 133,914,571 | |
| Victoria's Secret & Co. (a) | 1,685,533 | 66,814,528 | |
| 261,570,994 | |||
| Automotive Retail - 4.4% | |||
| CarMax, Inc. (a)(b) | 30,200 | 2,085,008 | |
| O'Reilly Automotive, Inc. (a) | 146,000 | 121,194,600 | |
| 123,279,608 | |||
| Home Improvement Retail - 19.6% | |||
| Floor & Decor Holdings, Inc. Class A (a)(b) | 150,737 | 13,839,164 | |
| Lowe's Companies, Inc. | 1,019,900 | 209,844,425 | |
| The Home Depot, Inc. | 1,083,700 | 321,360,398 | |
| 545,043,987 | |||
| Homefurnishing Retail - 0.9% | |||
| RH (a)(b) | 79,800 | 23,862,594 | |
| Specialty Stores - 5.0% | |||
| Bath & Body Works, Inc. | 1,027,200 | 41,981,664 | |
| Dick's Sporting Goods, Inc. (b) | 135,000 | 17,365,050 | |
| Five Below, Inc. (a) | 133,800 | 27,335,340 | |
| Ulta Beauty, Inc. (a) | 97,700 | 50,686,760 | |
| 137,368,814 | |||
TOTAL SPECIALTY RETAIL | 1,091,125,997 | ||
| Textiles, Apparel & Luxury Goods - 6.2% | |||
| Apparel, Accessories & Luxury Goods - 5.0% | |||
| Canada Goose Holdings, Inc. (a)(b) | 274,800 | 5,165,716 | |
| Capri Holdings Ltd. (a) | 1,640,300 | 81,309,671 | |
| lululemon athletica, Inc. (a) | 80,557 | 24,908,224 | |
| Tapestry, Inc. (b) | 622,300 | 27,076,273 | |
| 138,459,884 | |||
| Footwear - 1.2% | |||
| Deckers Outdoor Corp. (a) | 79,300 | 33,016,555 | |
TOTAL TEXTILES, APPAREL & LUXURY GOODS | 171,476,439 | ||
| TOTAL COMMON STOCKS (Cost $1,532,466,845) | 2,671,306,502 | ||
| Money Market Funds - 7.2% | |||
| Shares | Value ($) | ||
| Fidelity Cash Central Fund 4.63% (c) | 87,145,065 | 87,162,494 | |
| Fidelity Securities Lending Cash Central Fund 4.63% (c)(d) | 112,251,534 | 112,262,759 | |
| TOTAL MONEY MARKET FUNDS (Cost $199,425,253) | 199,425,253 | ||
| TOTAL INVESTMENT IN SECURITIES - 103.5% (Cost $1,731,892,098) | 2,870,731,755 |
NET OTHER ASSETS (LIABILITIES) - (3.5)% | (96,641,369) |
| NET ASSETS - 100.0% | 2,774,090,386 |
| (a) | Non-income producing |
| (b) | Security or a portion of the security is on loan at period end. |
| (c) | Affiliated fund that is generally available only to investment companies and other accounts managed by Fidelity Investments. The rate quoted is the annualized seven-day yield of the fund at period end. A complete unaudited listing of the fund's holdings as of its most recent quarter end is available upon request. In addition, each Fidelity Central Fund's financial statements, which are not covered by the Fund's Report of Independent Registered Public Accounting Firm, are available on the SEC's website or upon request. |
| (d) | Investment made with cash collateral received from securities on loan. |
| Affiliate | Value, beginning of period ($) | Purchases ($) | Sales Proceeds ($) | Dividend Income ($) | Realized Gain (loss) ($) | Change in Unrealized appreciation (depreciation) ($) | Value, end of period ($) | % ownership, end of period |
| Fidelity Cash Central Fund 4.63% | - | 563,016,645 | 475,854,151 | 551,894 | - | - | 87,162,494 | 0.2% |
| Fidelity Securities Lending Cash Central Fund 4.63% | 262,083,095 | 1,748,991,828 | 1,898,812,164 | 185,199 | - | - | 112,262,759 | 0.4% |
| Total | 262,083,095 | 2,312,008,473 | 2,374,666,315 | 737,093 | - | - | 199,425,253 | |
| Valuation Inputs at Reporting Date: | ||||
| Description | Total ($) | Level 1 ($) | Level 2 ($) | Level 3 ($) |
Investments in Securities: | ||||
| Common Stocks | 2,671,306,502 | 2,671,306,502 | - | - |
| Money Market Funds | 199,425,253 | 199,425,253 | - | - |
| Total Investments in Securities: | 2,870,731,755 | 2,870,731,755 | - | - |
| Statement of Assets and Liabilities | ||||
| February 28, 2023 | ||||
| Assets | ||||
| Investment in securities, at value (including securities loaned of $108,125,906) - See accompanying schedule: | ||||
Unaffiliated issuers (cost $1,532,466,845) | $ | 2,671,306,502 | ||
Fidelity Central Funds (cost $199,425,253) | 199,425,253 | |||
| Total Investment in Securities (cost $1,731,892,098) | $ | 2,870,731,755 | ||
| Receivable for investments sold | 17,476,425 | |||
| Receivable for fund shares sold | 316,258 | |||
| Dividends receivable | 1,873,752 | |||
| Distributions receivable from Fidelity Central Funds | 114,068 | |||
| Prepaid expenses | 7,983 | |||
Total assets | 2,890,520,241 | |||
| Liabilities | ||||
| Payable for investments purchased | $ | 334,907 | ||
| Payable for fund shares redeemed | 2,067,609 | |||
| Accrued management fee | 1,273,782 | |||
| Other affiliated payables | 459,664 | |||
| Other payables and accrued expenses | 35,468 | |||
| Collateral on securities loaned | 112,258,425 | |||
| Total Liabilities | 116,429,855 | |||
| Net Assets | $ | 2,774,090,386 | ||
| Net Assets consist of: | ||||
| Paid in capital | $ | 1,634,485,112 | ||
| Total accumulated earnings (loss) | 1,139,605,274 | |||
| Net Assets | $ | 2,774,090,386 | ||
Net Asset Value , offering price and redemption price per share ($2,774,090,386 ÷ 165,601,459 shares) | $ | 16.75 | ||
| Statement of Operations | ||||
Year ended February 28, 2023 | ||||
| Investment Income | ||||
| Dividends | $ | 29,926,342 | ||
| Income from Fidelity Central Funds (including $185,199 from security lending) | 737,093 | |||
| Total Income | 30,663,435 | |||
| Expenses | ||||
| Management fee | $ | 15,701,471 | ||
| Transfer agent fees | 4,957,643 | |||
| Accounting fees | 797,545 | |||
| Custodian fees and expenses | 17,004 | |||
| Independent trustees' fees and expenses | 10,324 | |||
| Registration fees | 31,718 | |||
| Audit | 40,053 | |||
| Legal | 2,876 | |||
| Interest | 3,488 | |||
| Miscellaneous | 18,359 | |||
| Total expenses before reductions | 21,580,481 | |||
| Expense reductions | (106,174) | |||
| Total expenses after reductions | 21,474,307 | |||
| Net Investment income (loss) | 9,189,128 | |||
| Realized and Unrealized Gain (Loss) | ||||
| Net realized gain (loss) on: | ||||
| Investment Securities: | ||||
| Unaffiliated issuers | 3,484,457 | |||
| Foreign currency transactions | 9,603 | |||
| Total net realized gain (loss) | 3,494,060 | |||
| Change in net unrealized appreciation (depreciation) on: | ||||
| Investment Securities: | ||||
| Unaffiliated issuers | (524,806,259) | |||
| Unfunded commitments | 1,090,000 | |||
| Assets and liabilities in foreign currencies | (1,526) | |||
| Total change in net unrealized appreciation (depreciation) | (523,717,785) | |||
| Net gain (loss) | (520,223,725) | |||
| Net increase (decrease) in net assets resulting from operations | $ | (511,034,597) | ||
| Statement of Changes in Net Assets | ||||
Year ended February 28, 2023 | Year ended February 28, 2022 | |||
| Increase (Decrease) in Net Assets | ||||
| Operations | ||||
| Net investment income (loss) | $ | 9,189,128 | $ | (3,062,137) |
| Net realized gain (loss) | 3,494,060 | 530,772,015 | ||
| Change in net unrealized appreciation (depreciation) | (523,717,785) | (548,230,610) | ||
| Net increase (decrease) in net assets resulting from operations | (511,034,597) | (20,520,732) | ||
| Distributions to shareholders | (83,419,587) | (645,718,415) | ||
| Share transactions | ||||
| Proceeds from sales of shares | 155,857,098 | 589,399,734 | ||
| Reinvestment of distributions | 78,542,305 | 608,923,199 | ||
| Cost of shares redeemed | (570,045,662) | (883,831,786) | ||
Net increase (decrease) in net assets resulting from share transactions | (335,646,259) | 314,491,147 | ||
| Total increase (decrease) in net assets | (930,100,443) | (351,748,000) | ||
| Net Assets | ||||
| Beginning of period | 3,704,190,829 | 4,055,938,829 | ||
| End of period | $ | 2,774,090,386 | $ | 3,704,190,829 |
| Other Information | ||||
| Shares | ||||
| Sold | 9,021,587 | 24,397,911 | ||
| Issued in reinvestment of distributions | 4,134,935 | 26,457,673 | ||
| Redeemed | (33,503,885) | (37,526,804) | ||
| Net increase (decrease) | (20,347,363) | 13,328,780 | ||
| Retailing Portfolio |
| Years ended February 28, | 2023 | 2022 | 2021 | 2020 A | 2019 B | |||||
Selected Per-Share Data | ||||||||||
| Net asset value, beginning of period | $ | 19.92 | $ | 23.50 | $ | 15.71 | $ | 15.01 | $ | 14.35 |
| Income from Investment Operations | ||||||||||
Net investment income (loss) C,D | .05 | (.02) | (.01) | .04 | .03 | |||||
| Net realized and unrealized gain (loss) | (2.76) | .11 | 9.35 | 1.02 | .93 | |||||
| Total from investment operations | (2.71) | .09 | 9.34 | 1.06 | .96 | |||||
| Distributions from net investment income | (.06) | - | - | (.05) | (.02) | |||||
| Distributions from net realized gain | (.41) | (3.67) | (1.55) | (.31) | (.27) | |||||
| Total distributions | (.46) E | (3.67) | (1.55) | (.36) | (.30) E | |||||
| Net asset value, end of period | $ | 16.75 | $ | 19.92 | $ | 23.50 | $ | 15.71 | $ | 15.01 |
Total Return F | (13.86)% | (1.23)% | 59.90% | 7.02% | 6.83% | |||||
Ratios to Average Net Assets D,G,H | ||||||||||
| Expenses before reductions | .72% | .70% | .73% | .74% | .76% | |||||
| Expenses net of fee waivers, if any | .72% | .70% | .73% | .74% | .75% | |||||
| Expenses net of all reductions | .72% | .70% | .73% | .74% | .75% | |||||
| Net investment income (loss) | .31% | (.07)% | (.07)% | .26% | .20% | |||||
| Supplemental Data | ||||||||||
| Net assets, end of period (000 omitted) | $ | 2,774,090 | $ | 3,704,191 | $ | 4,055,939 | $ | 2,698,998 | $ | 3,035,591 |
Portfolio turnover rate I | 32% | 33% | 46% | 17% | 34% |
| Fidelity Central Fund | Investment Manager | Investment Objective | Investment Practices | Expense Ratio A |
| Fidelity Money Market Central Funds | Fidelity Management & Research Company LLC (FMR) | Each fund seeks to obtain a high level of current income consistent with the preservation of capital and liquidity. | Short-term Investments | Less than .005% |
| Tax cost | Gross unrealized appreciation | Gross unrealized depreciation | Net unrealized appreciation (depreciation) | |
| Automotive Portfolio | $98,166,405 | $34,016,849 | $ (6,628,292) | $27,388,557 |
| Communication Services Portfolio | 745,607,110 | 170,561,391 | (125,421,792) | 45,139,599 |
| Construction and Housing Portfolio | 359,157,041 | 192,962,924 | (27,209,312) | 165,753,612 |
| Consumer Discretionary Portfolio | 317,301,952 | 137,226,512 | (14,226,312) | 123,000,200 |
| Leisure Portfolio | 423,253,375 | 170,793,304 | (19,839,777) | 150,953,527 |
| Retailing Portfolio | 1,739,310,620 | 1,261,124,421 | (129,703,286) | 1,131,421,135 |
| Undistributed ordinary income | Undistributed long-term capital gain | Capital loss carryforward | Net unrealized appreciation (depreciation) on securities and other investments | |
| Automotive Portfolio | $30,141 | $- | $(13,865,998) | $27,385,652 |
| Communication Services Portfolio | - | - | (17,461,483) | 45,139,430 |
| Construction and Housing Portfolio | - | - | (14,661,781) | 165,753,612 |
| Consumer Discretionary Portfolio | - | 5,720,978 | - | 122,995,881 |
| Leisure Portfolio | 699,955 | 2,386,264 | - | 150,950,176 |
| Retailing Portfolio | - | 8,369,938 | - | 1,131,419,620 |
| Short-term | Long-term | Total capital loss carryforward | |
| Automotive Portfolio | $ (9,853,453) | $ (4,012,545) | $(13,865,998) |
| Communication Services Portfolio | (17,461,483) | - | (17,461,483) |
| Construction and Housing Portfolio | (14,661,781) | - | (14,661,781) |
| Ordinary losses | |
| Communication Services Portfolio | $(631,297) |
| Consumer Discretionary Portfolio | (91,321) |
| Retailing Portfolio | (184,284) |
| February 28, 2023 | |||
| Ordinary Income | Long-term Capital Gains | Total | |
| Automotive Portfolio | $634,736 | $2,066,777 | $2,701,513 |
| Construction and Housing Portfolio | 3,697,710 | - | 3,697,710 |
| Consumer Discretionary Portfolio | 190,305 | 36,774,708 | 36,965,013 |
| Leisure Portfolio | 1,954,866 | 16,333,287 | 18,288,153 |
| Retailing Portfolio | 9,439,958 | 73,979,629 | 83,419,587 |
| February 28, 2022 | |||
| Ordinary Income | Long-term Capital Gains | Total | |
| Automotive Portfolio | $1,558,029 | $4,579,099 | $6,137,128 |
| Communication Services Portfolio | 29,776,343 | 34,129,421 | 63,905,764 |
| Construction and Housing Portfolio | 14,753,592 | 25,146,850 | 39,900,442 |
| Consumer Discretionary Portfolio | 1,098,748 | 56,820,968 | 57,919,716 |
| Leisure Portfolio | 26,867,028 | 113,972,286 | 140,839,314 |
| Retailing Portfolio | 157,489,329 | 488,229,086 | 645,718,415 |
| Purchases ($) | Sales ($) | |
| Automotive Portfolio | 63,784,327 | 93,165,795 |
| Communication Services Portfolio | 355,925,584 | 440,179,830 |
| Construction and Housing Portfolio | 102,428,686 | 296,780,970 |
| Consumer Discretionary Portfolio | 248,907,854 | 185,143,873 |
| Leisure Portfolio | 253,896,509 | 327,657,234 |
| Retailing Portfolio | 944,520,411 | 1,440,265,904 |
| Individual Rate | Group Rate | Total | |
| Automotive Portfolio | .30% | .23% | .52% |
| Communication Services Portfolio | .30% | .23% | .53% |
| Construction and Housing Portfolio | .30% | .23% | .53% |
| Consumer Discretionary Portfolio | .30% | .23% | .53% |
| Leisure Portfolio | .30% | .23% | .53% |
| Retailing Portfolio | .30% | .23% | .53% |
| Distribution Fee | Service Fee | Total Fees | Retained by FDC | |
| Communication Services Portfolio | ||||
Class A | -% | .25% | $63,176 | $1,611 |
Class M | .25% | .25% | 21,462 | - |
Class C | .75% | .25% | 75,119 | 19,487 |
| $159,757 | $21,098 |
| Retained by FDC | |
| Communication Services Portfolio | |
Class A | $10,526 |
Class M | 739 |
Class C A | 398 |
| $11,663 |
| Amount | % of Average Net Assets | |
| Automotive Portfolio | $289,869 | .25 |
| Communication Services Portfolio | ||
| Class A | 61,436 | .24 |
| Class M | 10,175 | .24 |
Class C | 15,346 | .20 |
| Communication Services | 1,575,629 | .22 |
Class I | 28,925 | .18 |
Class Z | 1,684 | .04 |
| 1,693,195 | ||
| Construction and Housing Portfolio | 955,911 | .19 |
| Consumer Discretionary Portfolio | 681,929 | .17 |
| Leisure Portfolio | 906,194 | .16 |
| Retailing Portfolio | 4,957,643 | .17 |
| % of Average Net Assets | |
| Automotive Portfolio | .04 |
| Communication Services Portfolio | .03 |
| Construction and Housing Portfolio | .04 |
| Consumer Discretionary Portfolio | .04 |
| Leisure Portfolio | .04 |
| Retailing Portfolio | .03 |
| Amount | |
| Automotive Portfolio | $2,114 |
| Communication Services Portfolio | 9,791 |
| Construction and Housing Portfolio | 2,144 |
| Consumer Discretionary Portfolio | 3,231 |
| Leisure Portfolio | 5,770 |
| Retailing Portfolio | 12,106 |
| Borrower or Lender | Average Loan Balance | Weighted Average Interest Rate | Interest Expense | |
| Communication Services Portfolio | Borrower | $13,940,000 | 2.57% | $993 |
| Construction and Housing Portfolio | Borrower | $8,880,000 | 1.93% | $952 |
| Consumer Discretionary Portfolio | Borrower | $3,766,000 | .75% | $866 |
| Leisure Portfolio | Borrower | $9,977,000 | 4.29% | $7,139 |
| Retailing Portfolio | Borrower | $6,545,864 | .87% | $3,488 |
| Purchases ($) | Sales ($) | Realized Gain (Loss) ($) | |
| Automotive Portfolio | 2,067,487 | 1,521,202 | (382,780) |
| Communication Services Portfolio | 5,862,139 | 19,203,525 | 176,263 |
| Construction and Housing Portfolio | 8,565,222 | 13,309,552 | 1,282,292 |
| Consumer Discretionary Portfolio | 21,503,056 | 10,570,951 | (4,953,312) |
| Leisure Portfolio | 10,544,150 | 12,232,907 | (3,452,866) |
| Retailing Portfolio | 87,932,284 | 71,324,019 | (2,442,672) |
| Amount | |
| Automotive Portfolio | $234 |
| Communication Services Portfolio | 1,510 |
| Construction and Housing Portfolio | 1,014 |
| Consumer Discretionary Portfolio | 741 |
| Leisure Portfolio | 1,009 |
| Retailing Portfolio | 5,620 |
| Total Security Lending Fees Paid to NFS | Security Lending Income From Securities Loaned to NFS | Value of Securities Loaned to NFS at Period End | |
| Automotive Portfolio | $30,647 | $3,806 | $314,985 |
| Communication Services Portfolio | $3,175 | $148 | $- |
| Construction and Housing Portfolio | $1,616 | $- | $- |
| Consumer Discretionary Portfolio | $24,073 | $23,071 | $- |
| Leisure Portfolio | $80,257 | $129,817 | $- |
| Retailing Portfolio | $18,762 | $24 | $- |
| Average Loan Balance | Weighted Average Interest Rate | Interest Expense | |
| Consumer Discretionary Portfolio | $288,000 | .83% | $100 |
| Amount | |
| Automotive Portfolio | $4,274 |
| Construction and Housing Portfolio | 18,633 |
| Consumer Discretionary Portfolio | 14,515 |
| Leisure Portfolio | 19,474 |
| Retailing Portfolio | 106,174 |
| Fund-Level Amount | |
| Communication Services Portfolio | 27,974 |
Year ended February 28, 2023 | Year ended February 28, 2022 | |
| Communication Services Portfolio | ||
| Distributions to shareholders | ||
| Class A | $- | $1,776,273 |
| Class M | - | 363,201 |
| Class C | - | 474,822 |
| Communication Services | - | 59,014,431 |
| Class I | - | 1,922,707 |
| Class Z | - | 354,330 |
| Total | $- | $63,905,764 |
| Shares | Shares | Dollars | Dollars | |
| Year ended February 28, 2023 | Year ended February 28, 2022 | Year ended February 28, 2023 | Year ended February 28, 2022 | |
| Communication Services Portfolio | ||||
| Class A | ||||
| Shares sold | 106,946 | 288,312 | $6,909,623 | $27,200,334 |
| Reinvestment of distributions | - | 19,346 | - | 1,740,757 |
| Shares redeemed | (146,490) | (140,910) | (9,350,947) | (12,635,364) |
| Net increase (decrease) | (39,544) | 166,748 | $(2,441,324) | $16,305,727 |
| Class M | ||||
| Shares sold | 11,811 | 38,436 | $749,050 | $3,599,648 |
| Reinvestment of distributions | - | 3,956 | - | 355,421 |
| Shares redeemed | (29,773) | (29,716) | (1,798,790) | (2,591,005) |
| Net increase (decrease) | (17,962) | 12,676 | $(1,049,740) | $1,364,064 |
| Class C | ||||
| Shares sold | 44,574 | 59,277 | $2,778,261 | $5,482,069 |
| Reinvestment of distributions | - | 5,320 | - | 471,861 |
| Shares redeemed | (37,470) | (27,914) | (2,303,544) | (2,486,600) |
| Net increase (decrease) | 7,104 | 36,683 | $474,717 | $3,467,330 |
| Communication Services | ||||
| Shares sold | 2,037,740 | 6,404,833 | $131,199,352 | $608,572,415 |
| Reinvestment of distributions | - | 621,227 | - | 56,410,302 |
| Shares redeemed | (2,871,553) | (4,677,647) | (185,590,458) | (433,498,431) |
| Net increase (decrease) | (833,813) | 2,348,413 | $(54,391,106) | $231,484,286 |
| Class I | ||||
| Shares sold | 74,777 | 316,400 | $4,946,728 | $30,080,975 |
| Reinvestment of distributions | - | 19,631 | - | 1,780,227 |
| Shares redeemed | (291,105) | (231,351) | (19,399,461) | (20,888,532) |
| Net increase (decrease) | (216,328) | 104,680 | $(14,452,733) | $10,972,670 |
| Class Z | ||||
| Shares sold | 19,696 | 98,916 | $1,307,319 | $9,255,551 |
| Reinvestment of distributions | - | 3,767 | - | 340,659 |
| Shares redeemed | (49,019) | (64,255) | (3,238,948) | (5,703,077) |
| Net increase (decrease) | (29,323) | 38,428 | $(1,931,629) | $3,893,133 |
| The Example is based on an investment of $1,000 invested at the beginning of the period and held for the entire period (September 1, 2022 to February 28, 2023). |
Annualized Expense Ratio- A | Beginning Account Value September 1, 2022 | Ending Account Value February 28, 2023 | Expenses Paid During Period- C September 1, 2022 to February 28, 2023 | |||||||
| Automotive Portfolio | .89% | |||||||||
| Actual | $ 1,000 | $ 984.10 | $ 4.38 | |||||||
Hypothetical- B | $ 1,000 | $ 1,020.38 | $ 4.46 | |||||||
| Communication Services Portfolio | ||||||||||
| Class A | 1.08% | |||||||||
| Actual | $ 1,000 | $ 987.80 | $ 5.32 | |||||||
Hypothetical- B | $ 1,000 | $ 1,019.44 | $ 5.41 | |||||||
| Class M | 1.33% | |||||||||
| Actual | $ 1,000 | $ 986.60 | $ 6.55 | |||||||
Hypothetical- B | $ 1,000 | $ 1,018.20 | $ 6.66 | |||||||
| Class C | 1.78% | |||||||||
| Actual | $ 1,000 | $ 984.40 | $ 8.76 | |||||||
Hypothetical- B | $ 1,000 | $ 1,015.97 | $ 8.90 | |||||||
| Communication Services Portfolio | .81% | |||||||||
| Actual | $ 1,000 | $ 989.10 | $ 3.99 | |||||||
Hypothetical- B | $ 1,000 | $ 1,020.78 | $ 4.06 | |||||||
| Class I | .76% | |||||||||
| Actual | $ 1,000 | $ 989.60 | $ 3.75 | |||||||
Hypothetical- B | $ 1,000 | $ 1,021.03 | $ 3.81 | |||||||
| Class Z | .62% | |||||||||
| Actual | $ 1,000 | $ 990.10 | $ 3.06 | |||||||
Hypothetical- B | $ 1,000 | $ 1,021.72 | $ 3.11 | |||||||
| Construction and Housing Portfolio | .77% | |||||||||
| Actual | $ 1,000 | $ 1,108.30 | $ 4.03 | |||||||
Hypothetical- B | $ 1,000 | $ 1,020.98 | $ 3.86 | |||||||
| Consumer Discretionary Portfolio | .75% | |||||||||
| Actual | $ 1,000 | $ 988.40 | $ 3.70 | |||||||
Hypothetical- B | $ 1,000 | $ 1,021.08 | $ 3.76 | |||||||
| Leisure Portfolio | .74% | |||||||||
| Actual | $ 1,000 | $ 1,126.90 | $ 3.90 | |||||||
Hypothetical- B | $ 1,000 | $ 1,021.12 | $ 3.71 | |||||||
| Retailing Portfolio | .72% | |||||||||
| Actual | $ 1,000 | $ 1,023.00 | $ 3.61 | |||||||
Hypothetical- B | $ 1,000 | $ 1,021.22 | $ 3.61 | |||||||
| Leisure Portfolio | $2,661,213 |
| Retailing Portfolio | $8,641,370 |
| Consumer Discretionary Portfolio | $6,203,283 |
| Leisure Portfolio | |
April 2022 December 2022 | 100% 100% |
| Retailing Portfolio | |
| December 2022 | 100% |
| Automotive Portfolio | |
| December 2022 | 77% |
| Construction and Housing Portfolio | |
| December 2022 | 100% |
| Consumer Discretionary Portfolio | |
| December 2022 | 100% |
| Leisure Portfolio | |
| April 2022 | 100% |
| December 2022 | 100% |
| Retailing Portfolio | |
| December 2022 | 100% |
| Automotive Portfolio | |
| December 2022 | 100% |
| Construction and Housing Portfolio | |
| December 2022 | 100% |
| Consumer Discretionary Portfolio | |
| December 2022 | 100% |
- Highly liquid investments - cash or convertible to cash within three business days or less
- Moderately liquid investments - convertible to cash in three to seven calendar days
- Less liquid investments - can be sold or disposed of, but not settled, within seven calendar days
- Illiquid investments - cannot be sold or disposed of within seven calendar days
 |


Contents
| Average Annual Total Returns | |||
Periods ended February 28, 2023 | Past 1 year | Past 5 years | Past 10 years |
| Biotechnology Portfolio | 1.14% | 2.58% | 10.64% |
| $10,000 Over 10 Years |
Let's say hypothetically that $10,000 was invested in Biotechnology Portfolio on February 28, 2013. The chart shows how the value of your investment would have changed, and also shows how the S&P 500® Index performed over the same period. |
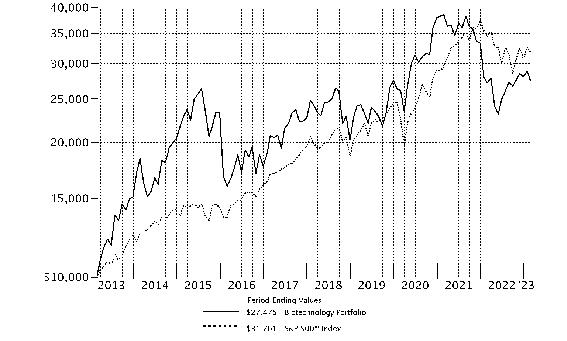 |
Top Holdings (% of Fund's net assets) | ||
| AbbVie, Inc. | 12.6 | |
| Regeneron Pharmaceuticals, Inc. | 5.1 | |
| Vertex Pharmaceuticals, Inc. | 5.0 | |
| Alnylam Pharmaceuticals, Inc. | 5.0 | |
| Krystal Biotech, Inc. | 3.5 | |
| Argenx SE ADR | 2.9 | |
| Biogen, Inc. | 2.5 | |
| Moderna, Inc. | 2.3 | |
| Apellis Pharmaceuticals, Inc. | 2.0 | |
| Cytokinetics, Inc. | 1.7 | |
| 42.6 | ||
| Industries (% of Fund's net assets) | ||
| Biotechnology | 92.1 | |
| Pharmaceuticals | 7.1 | |
| Health Care Technology | 0.2 | |
| Health Care Providers & Services | 0.2 | |
| Health Care Equipment & Supplies | 0.1 | |
| Life Sciences Tools & Services | 0.0 | |
| Food & Staples Retailing | 0.0 | |
Geographic Diversification (% of Fund's net assets) |
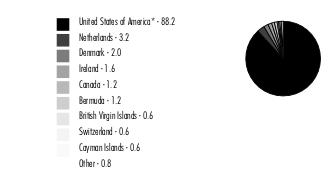 |
* Includes Short-Term investments and Net Other Assets (Liabilities). Percentages are based on country or territory of incorporation and are adjusted for the effect of derivatives, if applicable. |
| Common Stocks - 98.4% | |||
| Shares | Value ($) | ||
| Biotechnology - 91.0% | |||
| Biotechnology - 91.0% | |||
| 2seventy bio, Inc. (a) | 103,752 | 1,399,614 | |
| AbbVie, Inc. | 4,077,678 | 627,554,646 | |
| Absci Corp. (a)(b) | 993,000 | 2,105,160 | |
| ADC Therapeutics SA (a) | 546,270 | 1,966,572 | |
| Adverum Biotechnologies, Inc. (a)(c) | 7,472,259 | 5,380,026 | |
| Aerovate Therapeutics, Inc. (a)(b) | 174,813 | 4,295,155 | |
| Aldeyra Therapeutics, Inc. (a)(b) | 888,537 | 6,006,510 | |
| Alector, Inc. (a) | 1,351,818 | 11,544,526 | |
| Alkermes PLC (a) | 640,536 | 17,127,933 | |
| Allena Pharmaceuticals, Inc. (a) | 93,683 | 56 | |
| Allogene Therapeutics, Inc. (a)(b) | 1,556,685 | 9,884,950 | |
| Allovir, Inc. (a)(b) | 852,383 | 5,753,585 | |
| Alnylam Pharmaceuticals, Inc. (a) | 1,298,706 | 248,637,264 | |
| ALX Oncology Holdings, Inc. (a) | 1,280,549 | 8,477,234 | |
| Ambrx Biopharma, Inc. ADR (a)(b) | 1,361,508 | 8,754,496 | |
| Amgen, Inc. | 40,497 | 9,381,535 | |
| Amicus Therapeutics, Inc. (a) | 2,268,301 | 29,918,890 | |
| AnaptysBio, Inc. (a)(b) | 289,228 | 7,201,777 | |
| Apellis Pharmaceuticals, Inc. (a)(b) | 1,487,684 | 97,413,548 | |
| Applied Therapeutics, Inc. (a)(b)(c) | 2,639,536 | 2,665,931 | |
| Arcellx, Inc. | 643,801 | 18,032,866 | |
| Arcturus Therapeutics Holdings, Inc. (a)(b) | 794,024 | 12,902,890 | |
| Arcus Biosciences, Inc. (a)(b) | 3,193,396 | 58,151,741 | |
| Arcutis Biotherapeutics, Inc. (a) | 802,774 | 12,988,883 | |
| Argenx SE ADR (a) | 393,547 | 144,046,073 | |
| Arrowhead Pharmaceuticals, Inc. (a) | 1,337,032 | 43,186,134 | |
| Ars Pharmaceuticals, Inc. (a)(b) | 1,541,977 | 13,754,435 | |
| Ascendis Pharma A/S sponsored ADR (a) | 659,409 | 73,253,746 | |
| Astria Therapeutics, Inc. (a) | 1,177,041 | 14,336,359 | |
| aTyr Pharma, Inc. (a)(b) | 2,258,063 | 4,764,513 | |
| Aura Biosciences, Inc. (a) | 356,492 | 3,561,355 | |
| Avidity Biosciences, Inc. (a)(b) | 762,250 | 18,065,325 | |
| Axcella Health, Inc. (a)(b) | 1,661,354 | 963,918 | |
| Beam Therapeutics, Inc. (a)(b) | 669,379 | 26,935,811 | |
| BeiGene Ltd. ADR (a) | 37,198 | 8,355,787 | |
| BELLUS Health, Inc. (a) | 1,621,196 | 12,483,209 | |
| Bicycle Therapeutics PLC ADR (a)(b) | 377,647 | 8,583,916 | |
| BioCryst Pharmaceuticals, Inc. (a)(b) | 2,693,042 | 23,833,422 | |
| Biogen, Inc. (a) | 467,336 | 126,115,293 | |
| Biohaven Ltd. (a)(b) | 2,038,409 | 31,146,890 | |
| BioInvent International AB (a) | 153,043 | 423,251 | |
| BioMarin Pharmaceutical, Inc. (a) | 402,236 | 40,058,683 | |
| Biomea Fusion, Inc. (a)(b) | 358,129 | 4,598,376 | |
| BioNTech SE ADR | 60,750 | 7,900,538 | |
| BioXcel Therapeutics, Inc. (a)(b) | 351,727 | 11,227,126 | |
| Blueprint Medicines Corp. (a) | 1,254,408 | 53,149,267 | |
| BridgeBio Pharma, Inc. (a)(b) | 820,042 | 9,364,880 | |
| Candel Therapeutics, Inc. (a)(b) | 716,096 | 1,288,973 | |
| Celldex Therapeutics, Inc. (a) | 819,700 | 35,074,963 | |
| Centessa Pharmaceuticals PLC ADR (a)(b) | 1,230,909 | 4,332,800 | |
| Century Therapeutics, Inc. (a) | 834,618 | 3,764,127 | |
| Cerevel Therapeutics Holdings (a) | 1,028,280 | 27,444,793 | |
| Chinook Therapeutics, Inc. (a)(b) | 303,781 | 6,628,501 | |
| Chinook Therapeutics, Inc. rights (a)(d) | 115,821 | 1 | |
| Codiak Biosciences, Inc. (a)(b) | 448,539 | 215,299 | |
| Codiak Biosciences, Inc. warrants 9/15/27 (a) | 46,000 | 2,611 | |
| Cogent Biosciences, Inc. (a) | 1,096,367 | 14,504,935 | |
| Compass Therapeutics, Inc. (a)(b) | 1,709,500 | 6,479,005 | |
| Crinetics Pharmaceuticals, Inc. (a) | 891,534 | 17,509,728 | |
| CRISPR Therapeutics AG (a)(b) | 295,222 | 14,560,349 | |
| Cyclerion Therapeutics, Inc. (a) | 837,285 | 545,073 | |
| Cyclerion Therapeutics, Inc. (a)(e) | 94,809 | 61,721 | |
| Cytokinetics, Inc. (a)(b) | 1,922,671 | 83,367,015 | |
| Day One Biopharmaceuticals, Inc. (a) | 664,771 | 12,245,082 | |
| Denali Therapeutics, Inc. (a) | 333,369 | 9,050,968 | |
| Design Therapeutics, Inc. (a)(b) | 1,119,405 | 7,914,193 | |
| Disc Medicine, Inc. (a)(b) | 155,590 | 3,889,750 | |
| Disc Medicine, Inc. rights (a)(b)(d) | 1,555,907 | 16 | |
| Dyne Therapeutics, Inc. (a) | 380,913 | 4,906,159 | |
| Enanta Pharmaceuticals, Inc. (a) | 212,946 | 10,327,881 | |
| Entrada Therapeutics, Inc. (a)(b) | 503,853 | 6,424,126 | |
| EQRx, Inc. (a) | 507,567 | 1,147,101 | |
| EQRx, Inc.: | |||
| rights (a)(d) | 116,649 | 75,822 | |
| rights (a)(d) | 49,993 | 22,497 | |
| Erasca, Inc. (a)(b) | 583,402 | 2,100,247 | |
| Evelo Biosciences, Inc. (a)(b) | 1,098,999 | 681,269 | |
| Exact Sciences Corp. (a) | 27,000 | 1,682,910 | |
| Exelixis, Inc. (a) | 1,040,134 | 17,765,489 | |
| Fate Therapeutics, Inc. (a) | 516,787 | 3,162,736 | |
| FibroGen, Inc. (a) | 76,500 | 1,698,300 | |
| Foghorn Therapeutics, Inc. (a)(b) | 178,719 | 1,024,060 | |
| Fusion Pharmaceuticals, Inc. (a) | 1,142,702 | 5,050,743 | |
| Fusion Pharmaceuticals, Inc. (e) | 1,483,000 | 5,899,374 | |
| Generation Bio Co. (a) | 137,100 | 542,916 | |
| Geron Corp. (a) | 3,753,406 | 10,434,469 | |
| Geron Corp. warrants 12/31/25 (a) | 2,100,000 | 1,828,679 | |
| Gilead Sciences, Inc. | 558,701 | 44,992,192 | |
| Gritstone Bio, Inc. (a) | 669,785 | 1,640,973 | |
| Halozyme Therapeutics, Inc. (a) | 478,800 | 22,977,612 | |
| Hookipa Pharma, Inc. (a) | 1,480,200 | 1,280,373 | |
| Icosavax, Inc. (a)(b) | 788,357 | 6,448,760 | |
| Ideaya Biosciences, Inc. (a)(b) | 647,657 | 11,431,146 | |
| Idorsia Ltd. (a)(b) | 1,092,661 | 14,455,121 | |
| IGM Biosciences, Inc. (a)(b) | 690,509 | 14,514,499 | |
| Immuneering Corp. (a)(b) | 476,458 | 2,329,880 | |
| Immunocore Holdings PLC ADR (a) | 248,518 | 13,631,212 | |
| ImmunoGen, Inc. (a) | 922,023 | 3,577,449 | |
| Incyte Corp. (a) | 434,700 | 33,463,206 | |
| Inhibrx, Inc. (a)(b) | 210,609 | 5,067,253 | |
| Inozyme Pharma, Inc. (a) | 640,812 | 1,813,498 | |
| Insmed, Inc. (a) | 412,092 | 8,398,435 | |
| Instil Bio, Inc. (a) | 1,173,143 | 911,649 | |
| Intellia Therapeutics, Inc. (a) | 885,001 | 35,550,490 | |
| Ionis Pharmaceuticals, Inc. (a) | 987,777 | 35,461,194 | |
| Iovance Biotherapeutics, Inc. (a) | 136,800 | 997,272 | |
| iTeos Therapeutics, Inc. (a) | 211,500 | 3,745,665 | |
| Iveric Bio, Inc. (a) | 356,209 | 7,402,023 | |
| Janux Therapeutics, Inc. (a)(b) | 498,148 | 8,284,201 | |
| Karuna Therapeutics, Inc. (a) | 328,542 | 65,517,846 | |
| Keros Therapeutics, Inc. (a) | 466,029 | 24,802,063 | |
| Kiniksa Pharmaceuticals Ltd. (a) | 177,166 | 2,278,355 | |
| Kinnate Biopharma, Inc. (a) | 979,677 | 5,172,695 | |
| Kronos Bio, Inc. (a)(b) | 279,857 | 486,951 | |
| Krystal Biotech, Inc. (a)(c) | 2,097,722 | 171,824,409 | |
| Kymera Therapeutics, Inc. (a)(b) | 647,713 | 20,325,234 | |
| Legend Biotech Corp. ADR (a) | 839,216 | 38,754,995 | |
| Madrigal Pharmaceuticals, Inc. (a) | 153,340 | 41,556,673 | |
| MannKind Corp. (a)(b) | 6,449,301 | 34,052,309 | |
| Merus BV (a)(b) | 597,056 | 11,385,858 | |
| Mirati Therapeutics, Inc. (a)(b) | 321,748 | 14,748,928 | |
| Moderna, Inc. (a) | 822,986 | 114,238,687 | |
| Monte Rosa Therapeutics, Inc. (a)(b) | 1,257,805 | 7,647,454 | |
| Morphic Holding, Inc. (a) | 809,437 | 34,417,261 | |
| Natera, Inc. (a) | 356,133 | 17,290,257 | |
| Nkarta, Inc. (a)(b) | 63,730 | 267,666 | |
| Nurix Therapeutics, Inc. (a)(b) | 739,346 | 6,972,033 | |
| Nuvalent, Inc. Class A (a) | 218,574 | 6,620,606 | |
| Omega Therapeutics, Inc. (a)(b) | 1,088,551 | 7,032,039 | |
| Oragenics, Inc. (a) | 2,596 | 11,942 | |
| PepGen, Inc. | 440,591 | 6,727,825 | |
| Poseida Therapeutics, Inc. (a) | 570,083 | 3,243,772 | |
| Prelude Therapeutics, Inc. (a) | 359,156 | 2,032,823 | |
| Prime Medicine, Inc. (b) | 53,800 | 883,934 | |
| Prometheus Biosciences, Inc. (a) | 397,555 | 48,656,756 | |
| Prothena Corp. PLC (a) | 933,189 | 52,034,619 | |
| PTC Therapeutics, Inc. (a) | 1,621,544 | 70,812,826 | |
| Rallybio Corp. (a)(b) | 1,550,692 | 12,203,946 | |
| RAPT Therapeutics, Inc. (a) | 724,582 | 21,338,940 | |
| Recursion Pharmaceuticals, Inc. (a) | 89,200 | 726,980 | |
| Regeneron Pharmaceuticals, Inc. (a) | 333,148 | 253,332,402 | |
| Regulus Therapeutics, Inc. (a)(b)(c) | 2,195,000 | 2,941,300 | |
| Relay Therapeutics, Inc. (a)(b) | 632,189 | 10,209,852 | |
| Repare Therapeutics, Inc. (a)(b) | 174,960 | 1,793,340 | |
| Replimune Group, Inc. (a) | 1,121,714 | 24,565,537 | |
| Revolution Medicines, Inc. (a) | 517,472 | 13,847,551 | |
| Rezolute, Inc. (a) | 200 | 496 | |
| Rhythm Pharmaceuticals, Inc. (a)(b) | 752,703 | 18,298,210 | |
| Rocket Pharmaceuticals, Inc. (a) | 223,736 | 4,297,969 | |
| Roivant Sciences Ltd. (a) | 6,582,325 | 53,251,009 | |
| Sage Therapeutics, Inc. (a) | 989,753 | 41,213,315 | |
| Sarepta Therapeutics, Inc. (a) | 552,604 | 67,489,527 | |
| Scholar Rock Holding Corp. (a)(b) | 1,693,925 | 14,533,877 | |
| Scholar Rock Holding Corp. warrants 12/31/25 (a)(e) | 17,850 | 64,915 | |
| Seagen, Inc. (a) | 420,136 | 75,494,238 | |
| Selecta Biosciences, Inc. (a) | 395,568 | 644,776 | |
| Sensorion SA (a)(b) | 1,973,044 | 813,887 | |
| Seres Therapeutics, Inc. (a)(b) | 854,347 | 4,314,452 | |
| Shattuck Labs, Inc. (a) | 110,936 | 523,618 | |
| SpringWorks Therapeutics, Inc. (a)(b) | 463,611 | 14,789,191 | |
| SpringWorks Therapeutics, Inc. (e) | 54,800 | 1,573,308 | |
| Stoke Therapeutics, Inc. (a) | 146,536 | 1,302,705 | |
| Sutro Biopharma, Inc. (a) | 304,500 | 1,717,380 | |
| Tango Therapeutics, Inc. (a) | 1,289,988 | 6,746,637 | |
| Taysha Gene Therapies, Inc. (a)(b) | 811,647 | 819,763 | |
| Tenaya Therapeutics, Inc. (a) | 2,081,279 | 6,389,527 | |
| TG Therapeutics, Inc. (a)(b) | 1,718,820 | 27,535,496 | |
| Travere Therapeutics, Inc. (a) | 167,028 | 3,701,340 | |
| Twist Bioscience Corp. (a) | 681,332 | 13,258,721 | |
| Tyra Biosciences, Inc. (a) | 301,101 | 3,977,544 | |
| Ultragenyx Pharmaceutical, Inc. (a) | 876,351 | 38,988,856 | |
| uniQure B.V. (a) | 255,608 | 5,357,544 | |
| United Therapeutics Corp. (a) | 269,569 | 66,324,757 | |
| Vaxcyte, Inc. (a) | 1,319,350 | 54,053,770 | |
| Vera Therapeutics, Inc. (a)(b) | 910,368 | 6,764,034 | |
| Vertex Pharmaceuticals, Inc. (a) | 861,862 | 250,189,920 | |
| Verve Therapeutics, Inc. (a)(b) | 348,293 | 6,617,567 | |
| Vigil Neuroscience, Inc. (a)(b) | 86,610 | 1,039,320 | |
| Viking Therapeutics, Inc. (a) | 25,000 | 275,250 | |
| Viridian Therapeutics, Inc. (a) | 60,700 | 1,988,532 | |
| Vor Biopharma, Inc. (a)(b) | 1,194,902 | 6,667,553 | |
| Werewolf Therapeutics, Inc. (a) | 2,100 | 6,059 | |
| X4 Pharmaceuticals, Inc. warrants 4/12/24 (a) | 450,000 | 5 | |
| Xencor, Inc. (a) | 179,643 | 5,771,930 | |
| Xenon Pharmaceuticals, Inc. (a) | 977,333 | 38,565,560 | |
| Zealand Pharma A/S (a) | 776,333 | 24,755,988 | |
| Zentalis Pharmaceuticals, Inc. (a) | 638,433 | 12,085,537 | |
| 4,522,643,626 | |||
| Food & Staples Retailing - 0.0% | |||
| Drug Retail - 0.0% | |||
| MedAvail Holdings, Inc. (a) | 2,777 | 1,032 | |
| Health Care Equipment & Supplies - 0.1% | |||
| Health Care Equipment - 0.1% | |||
| Alpha Tau Medical Ltd. Class A (a)(b) | 362,046 | 1,144,065 | |
| Novocure Ltd. (a) | 11,113 | 855,368 | |
| 1,999,433 | |||
| Health Care Providers & Services - 0.1% | |||
| Health Care Services - 0.1% | |||
| 23andMe Holding Co. Class A (a)(b) | 1,488,074 | 3,735,066 | |
| Health Care Technology - 0.2% | |||
| Health Care Technology - 0.2% | |||
| Akili, Inc. (a)(b) | 1,500 | 2,475 | |
| Schrodinger, Inc. (a) | 539,101 | 11,714,665 | |
| 11,717,140 | |||
| Life Sciences Tools & Services - 0.0% | |||
| Life Sciences Tools & Services - 0.0% | |||
| Olink Holding AB ADR (a) | 53,800 | 1,261,072 | |
| Pharmaceuticals - 7.0% | |||
| Pharmaceuticals - 7.0% | |||
| Acelyrin, Inc. (d) | 2,378,678 | 14,795,615 | |
| Acelyrin, Inc. rights (a)(d) | 289,045 | 1,713,028 | |
| Adimab LLC (a)(d)(e)(f) | 1,954,526 | 79,959,659 | |
| Afferent Pharmaceuticals, Inc. rights 12/31/24 (a)(d) | 8,274,568 | 9,184,770 | |
| Aradigm Corp. (a)(d) | 11,945 | 549 | |
| Aradigm Corp. (a)(d) | 148,009 | 6,808 | |
| Arvinas Holding Co. LLC (a) | 297,316 | 9,112,735 | |
| Atea Pharmaceuticals, Inc. (a) | 66,800 | 236,472 | |
| Axsome Therapeutics, Inc. (a)(b) | 369,673 | 25,208,002 | |
| Corcept Therapeutics, Inc. (a) | 88,400 | 1,841,372 | |
| DICE Therapeutics, Inc. (a) | 338,246 | 10,093,261 | |
| Edgewise Therapeutics, Inc. (a) | 1,177,285 | 11,278,390 | |
| Fulcrum Therapeutics, Inc. (a)(b) | 1,448,597 | 8,749,526 | |
| GH Research PLC (a)(b) | 893,124 | 8,556,128 | |
| Harmony Biosciences Holdings, Inc. (a) | 124,525 | 5,482,836 | |
| Ikena Oncology, Inc. (a) | 416,547 | 1,670,353 | |
| Intra-Cellular Therapies, Inc. (a) | 464,276 | 22,763,452 | |
| Longboard Pharmaceuticals, Inc. (a) | 869,289 | 4,520,303 | |
| Nuvation Bio, Inc. (a) | 2,913,126 | 5,651,464 | |
| Ocular Therapeutix, Inc. (a) | 45,654 | 275,750 | |
| OptiNose, Inc. (a)(b) | 794,031 | 1,429,256 | |
| OptiNose, Inc. warrants (a) | 91,712 | 60,319 | |
| Pharvaris BV (a) | 353,507 | 2,937,643 | |
| Pliant Therapeutics, Inc. (a) | 314,631 | 10,024,144 | |
| Rain Oncology, Inc. (a)(b) | 349,069 | 3,124,168 | |
| Reata Pharmaceuticals, Inc. (a)(b) | 116,773 | 3,639,814 | |
| Royalty Pharma PLC | 52,920 | 1,897,182 | |
| Structure Therapeutics, Inc. ADR (b) | 301,997 | 7,719,043 | |
| Terns Pharmaceuticals, Inc. (a) | 1,140,467 | 11,552,931 | |
| Theseus Pharmaceuticals, Inc. (a)(b) | 1,343,694 | 12,469,480 | |
| UCB SA | 95,777 | 8,244,065 | |
| Ventyx Biosciences, Inc. (a) | 785,545 | 33,974,821 | |
| Verona Pharma PLC ADR (a) | 548,295 | 11,755,445 | |
| Verrica Pharmaceuticals, Inc. (a)(b) | 1,451,876 | 11,252,039 | |
| WAVE Life Sciences (a)(b) | 1,477,633 | 6,206,059 | |
| 347,386,882 | |||
| TOTAL COMMON STOCKS (Cost $3,731,521,360) | 4,888,744,251 | ||
| Convertible Preferred Stocks - 1.3% | |||
| Shares | Value ($) | ||
| Biotechnology - 1.1% | |||
| Biotechnology - 1.1% | |||
| ElevateBio LLC Series C (a)(d)(e) | 216,600 | 688,788 | |
| Korro Bio, Inc.: | |||
| Series B1 (a)(d)(e) | 957,854 | 2,059,386 | |
| Series B2 (a)(d)(e) | 899,280 | 1,978,416 | |
| National Resilience, Inc. Series B (a)(d)(e) | 732,064 | 44,458,247 | |
| SalioGen Therapeutics, Inc. Series B (a)(d)(e) | 94,461 | 7,047,735 | |
| 56,232,572 | |||
| Health Care Providers & Services - 0.1% | |||
| Health Care Services - 0.1% | |||
| Scorpion Therapeutics, Inc. Series B (a)(d)(e) | 3,099,905 | 4,804,853 | |
| Pharmaceuticals - 0.1% | |||
| Pharmaceuticals - 0.1% | |||
| Afferent Pharmaceuticals, Inc. Series C (a)(d)(e) | 8,274,568 | 83 | |
| Aristea Therapeutics, Inc. Series B (a)(d)(e) | 836,400 | 4,608,564 | |
| 4,608,647 | |||
| TOTAL CONVERTIBLE PREFERRED STOCKS (Cost $38,020,306) | 65,646,072 | ||
| Money Market Funds - 7.5% | |||
| Shares | Value ($) | ||
| Fidelity Cash Central Fund 4.63% (g) | 16,572,078 | 16,575,392 | |
| Fidelity Securities Lending Cash Central Fund 4.63% (g)(h) | 353,586,391 | 353,621,750 | |
| TOTAL MONEY MARKET FUNDS (Cost $370,163,501) | 370,197,142 | ||
| TOTAL INVESTMENT IN SECURITIES - 107.2% (Cost $4,139,705,167) | 5,324,587,465 |
NET OTHER ASSETS (LIABILITIES) - (7.2)% | (355,480,379) |
| NET ASSETS - 100.0% | 4,969,107,086 |
| (a) | Non-income producing |
| (b) | Security or a portion of the security is on loan at period end. |
| (c) | Affiliated company |
| (d) | Level 3 security |
| (e) | Restricted securities (including private placements) - Investment in securities not registered under the Securities Act of 1933 (excluding 144A issues). At the end of the period, the value of restricted securities (excluding 144A issues) amounted to $153,205,049 or 3.1% of net assets. |
| (f) | Investment is owned by a wholly-owned subsidiary (Subsidiary) that is treated as a corporation for U.S. tax purposes. |
| (g) | Affiliated fund that is generally available only to investment companies and other accounts managed by Fidelity Investments. The rate quoted is the annualized seven-day yield of the fund at period end. A complete unaudited listing of the fund's holdings as of its most recent quarter end is available upon request. In addition, each Fidelity Central Fund's financial statements, which are not covered by the Fund's Report of Independent Registered Public Accounting Firm, are available on the SEC's website or upon request. |
| (h) | Investment made with cash collateral received from securities on loan. |
| Additional information on each restricted holding is as follows: | ||
| Security | Acquisition Date | Acquisition Cost ($) |
| Adimab LLC | 9/17/14 - 6/05/15 | 31,091,029 |
| Afferent Pharmaceuticals, Inc. Series C | 7/01/15 | 0 |
| Aristea Therapeutics, Inc. Series B | 10/06/20 | 4,611,659 |
| Cyclerion Therapeutics, Inc. | 4/02/19 | 1,404,026 |
| ElevateBio LLC Series C | 3/09/21 | 908,637 |
| Fusion Pharmaceuticals, Inc. | 2/13/23 | 5,042,200 |
| Korro Bio, Inc. Series B1 | 12/17/21 | 2,499,999 |
| Korro Bio, Inc. Series B2 | 12/17/21 | 2,499,998 |
| National Resilience, Inc. Series B | 12/01/20 | 9,999,994 |
| SalioGen Therapeutics, Inc. Series B | 12/10/21 | 10,000,019 |
| Scholar Rock Holding Corp. warrants 12/31/25 | 6/17/22 | 0 |
| Scorpion Therapeutics, Inc. Series B | 1/08/21 | 7,500,000 |
| SpringWorks Therapeutics, Inc. | 9/07/22 | 1,425,348 |
| Affiliate | Value, beginning of period ($) | Purchases ($) | Sales Proceeds ($) | Dividend Income ($) | Realized Gain (loss) ($) | Change in Unrealized appreciation (depreciation) ($) | Value, end of period ($) | % ownership, end of period |
| Fidelity Cash Central Fund 4.63% | 42,446,755 | 1,036,118,462 | 1,061,989,825 | 598,495 | 3,258 | (3,258) | 16,575,392 | 0.0% |
| Fidelity Securities Lending Cash Central Fund 4.63% | 492,109,261 | 2,216,802,618 | 2,355,290,129 | 7,098,036 | - | - | 353,621,750 | 1.1% |
| Total | 534,556,016 | 3,252,921,080 | 3,417,279,954 | 7,696,531 | 3,258 | (3,258) | 370,197,142 | |
| Affiliate | Value, beginning of period ($) | Purchases ($) | Sales Proceeds ($) | Dividend Income ($) | Realized Gain (loss) ($) | Change in Unrealized appreciation (depreciation) ($) | Value, end of period ($) |
| Adverum Biotechnologies, Inc. | - | 14,311,388 | 2,132,127 | - | (2,107,259) | (4,691,976) | 5,380,026 |
| Applied Therapeutics, Inc. | 1,070,923 | 2,575,660 | 1,176,547 | - | (14,439,872) | 14,635,767 | 2,665,931 |
| Candel Therapeutics, Inc. | 8,593,545 | - | 6,186,049 | - | (4,771,678) | 3,653,155 | - |
| Krystal Biotech, Inc. | 126,760,516 | 6,531,325 | 631,314 | - | 13,464 | 39,150,418 | 171,824,409 |
| Regulus Therapeutics, Inc. | - | 4,631,450 | - | - | - | (1,690,150) | 2,941,300 |
| Total | 136,424,984 | 28,049,823 | 10,126,037 | - | (21,305,345) | 51,057,214 | 182,811,666 |
| Valuation Inputs at Reporting Date: | ||||
| Description | Total ($) | Level 1 ($) | Level 2 ($) | Level 3 ($) |
Investments in Securities: | ||||
| Common Stocks | 4,888,744,251 | 4,773,556,275 | 9,429,211 | 105,758,765 |
| Convertible Preferred Stocks | 65,646,072 | - | - | 65,646,072 |
| Money Market Funds | 370,197,142 | 370,197,142 | - | - |
| Total Investments in Securities: | 5,324,587,465 | 5,143,753,417 | 9,429,211 | 171,404,837 |
| Investments in Securities: | |||
| Common Stocks | |||
| Beginning Balance | $ | 90,662,671 | |
| Net Realized Gain (Loss) on Investment Securities | 109,862 | ||
| Net Unrealized Gain (Loss) on Investment Securities | 4,185,734 | ||
| Cost of Purchases | 23,265 | ||
| Proceeds of Sales | (109,876) | ||
| Amortization/Accretion | - | ||
| Transfers into Level 3 | 10,887,109 | ||
| Transfers out of Level 3 | - | ||
| Ending Balance | $ | 105,758,765 | |
| The change in unrealized gain (loss) for the period attributable to Level 3 securities held at February 28, 2023 | $ | 4,185,734 | |
| Convertible Preferred Stocks | |||
| Beginning Balance | $ | 80,070,979 | |
| Net Realized Gain (Loss) on Investment Securities | - | ||
| Net Unrealized Gain (Loss) on Investment Securities | (3,537,798) | ||
| Cost of Purchases | - | ||
| Proceeds of Sales | - | ||
| Amortization/Accretion | - | ||
| Transfers into Level 3 | - | ||
| Transfers out of Level 3 | (10,887,109) | ||
| Ending Balance | $ | 65,646,072 | |
| The change in unrealized gain (loss) for the period attributable to Level 3 securities held at February 28, 2023 | $ | (3,537,798) | |
| The information used in the above reconciliation represents fiscal year to date activity for any Investments in Securities identified as using Level 3 inputs at either the beginning or the end of the current fiscal period. Cost of purchases and proceeds of sales may include securities received and/or delivered through in-kind transactions. Transfers into Level 3 were attributable to a lack of observable market data resulting from decreases in market activity, decreases in liquidity, security restructurings or corporate actions. Transfers out of Level 3 were attributable to observable market data becoming available for those securities. Transfers in or out of Level 3 represent the beginning value of any Security or Instrument where a change in the pricing level occurred from the beginning to the end of the period. The cost of purchases and the proceeds of sales may include securities received or delivered through corporate actions or exchanges. Realized and unrealized gains (losses) disclosed in the reconciliation are included in Net Gain (Loss) on the Fund's Statement of Operations. | |||
| Statement of Assets and Liabilities | ||||
| February 28, 2023 | ||||
| Assets | ||||
| Investment in securities, at value (including securities loaned of $342,668,967) - See accompanying schedule: | ||||
Unaffiliated issuers (cost $3,666,478,431) | $ | 4,771,578,657 | ||
Fidelity Central Funds (cost $370,163,501) | 370,197,142 | |||
Other affiliated issuers (cost $103,063,235) | 182,811,666 | |||
| Total Investment in Securities (cost $4,139,705,167) | $ | 5,324,587,465 | ||
| Foreign currency held at value (cost $748) | 748 | |||
| Receivable for investments sold | 34,503,570 | |||
| Receivable for fund shares sold | 199,281 | |||
| Dividends receivable | 284,333 | |||
| Distributions receivable from Fidelity Central Funds | 340,399 | |||
| Prepaid expenses | 26,248 | |||
| Other receivables | 1,094,128 | |||
Total assets | 5,361,036,172 | |||
| Liabilities | ||||
| Payable for investments purchased | $ | 31,855,192 | ||
| Payable for fund shares redeemed | 2,427,899 | |||
| Accrued management fee | 2,245,745 | |||
| Other affiliated payables | 771,070 | |||
| Other payables and accrued expenses | 1,168,498 | |||
| Collateral on securities loaned | 353,460,682 | |||
| Total Liabilities | 391,929,086 | |||
| Net Assets | $ | 4,969,107,086 | ||
| Net Assets consist of: | ||||
| Paid in capital | $ | 4,464,873,986 | ||
| Total accumulated earnings (loss) | 504,233,100 | |||
| Net Assets | $ | 4,969,107,086 | ||
Net Asset Value , offering price and redemption price per share ($4,969,107,086 ÷ 311,304,219 shares) | $ | 15.96 | ||
| Statement of Operations | ||||
Year ended February 28, 2023 | ||||
| Investment Income | ||||
| Dividends | $ | 26,156,334 | ||
| Income from Fidelity Central Funds (including $7,098,036 from security lending) | 7,696,531 | |||
| Total Income | 33,852,865 | |||
| Expenses | ||||
| Management fee | $ | 26,913,334 | ||
| Transfer agent fees | 8,279,353 | |||
| Accounting fees | 993,571 | |||
| Custodian fees and expenses | 137,419 | |||
| Independent trustees' fees and expenses | 17,490 | |||
| Registration fees | 67,130 | |||
| Audit | 116,132 | |||
| Legal | 4,678 | |||
| Miscellaneous | 37,989 | |||
| Total expenses before reductions | 36,567,096 | |||
| Expense reductions | (185,851) | |||
| Total expenses after reductions | 36,381,245 | |||
| Net Investment income (loss) | (2,528,380) | |||
| Realized and Unrealized Gain (Loss) | ||||
| Net realized gain (loss) on: | ||||
| Investment Securities: | ||||
| Unaffiliated issuers | (525,539,837) | |||
| Fidelity Central Funds | 3,258 | |||
| Other affiliated issuers | (21,305,345) | |||
| Foreign currency transactions | (13,547) | |||
| Total net realized gain (loss) | (546,855,471) | |||
| Change in net unrealized appreciation (depreciation) on: | ||||
| Investment Securities: | ||||
| Unaffiliated issuers | 557,700,901 | |||
| Fidelity Central Funds | (3,258) | |||
| Other affiliated issuers | 51,057,214 | |||
| Assets and liabilities in foreign currencies | (8,889) | |||
| Total change in net unrealized appreciation (depreciation) | 608,745,968 | |||
| Net gain (loss) | 61,890,497 | |||
| Net increase (decrease) in net assets resulting from operations | $ | 59,362,117 | ||
| Statement of Changes in Net Assets | ||||
Year ended February 28, 2023 | Year ended February 28, 2022 | |||
| Increase (Decrease) in Net Assets | ||||
| Operations | ||||
| Net investment income (loss) | $ | (2,528,380) | $ | (10,105,462) |
| Net realized gain (loss) | (546,855,471) | 288,016,862 | ||
| Change in net unrealized appreciation (depreciation) | 608,745,968 | (2,639,724,294) | ||
| Net increase (decrease) in net assets resulting from operations | 59,362,117 | (2,361,812,894) | ||
| Distributions to shareholders | - | (951,630,731) | ||
| Share transactions | ||||
| Proceeds from sales of shares | 544,996,692 | 514,676,797 | ||
| Reinvestment of distributions | - | 898,472,847 | ||
| Cost of shares redeemed | (915,943,690) | (1,692,638,148) | ||
Net increase (decrease) in net assets resulting from share transactions | (370,946,998) | (279,488,504) | ||
| Total increase (decrease) in net assets | (311,584,881) | (3,592,932,129) | ||
| Net Assets | ||||
| Beginning of period | 5,280,691,967 | 8,873,624,096 | ||
| End of period | $ | 4,969,107,086 | $ | 5,280,691,967 |
| Other Information | ||||
| Shares | ||||
| Sold | 35,714,869 | 24,447,337 | ||
| Issued in reinvestment of distributions | - | 43,520,026 | ||
| Redeemed | (58,965,046) | (81,104,304) | ||
| Net increase (decrease) | (23,250,177) | (13,136,941) | ||
| Biotechnology Portfolio |
| Years ended February 28, | 2023 | 2022 | 2021 | 2020 A | 2019 B | |||||
Selected Per-Share Data | ||||||||||
| Net asset value, beginning of period | $ | 15.78 | $ | 25.52 | $ | 21.02 | $ | 21.14 | $ | 23.45 |
| Income from Investment Operations | ||||||||||
Net investment income (loss) C,D | (.01) | (.03) | (.01) | .05 | (.04) | |||||
| Net realized and unrealized gain (loss) | .19 | (6.91) | 9.41 | 1.79 | (.29) E | |||||
| Total from investment operations | .18 | (6.94) | 9.40 | 1.84 | (.33) | |||||
| Distributions from net investment income | - | (.03) | (.07) | (.03) | - | |||||
| Distributions from net realized gain | - | (2.77) | (4.84) | (1.93) | (1.98) | |||||
| Total distributions | - | (2.80) | (4.90) F | (1.96) | (1.98) | |||||
| Net asset value, end of period | $ | 15.96 | $ | 15.78 | $ | 25.52 | $ | 21.02 | $ | 21.14 |
Total Return G | 1.14% | (29.49)% | 47.35% | 8.57% | (.46)% E | |||||
Ratios to Average Net Assets D,H,I | ||||||||||
| Expenses before reductions | .72% | .69% | .70% | .72% | .72% | |||||
| Expenses net of fee waivers, if any | .71% | .69% | .70% | .72% | .72% | |||||
| Expenses net of all reductions | .71% | .69% | .69% | .72% | .72% | |||||
| Net investment income (loss) | (.05)% | (.14)% | (.03)% | .22% | (.20)% | |||||
| Supplemental Data | ||||||||||
| Net assets, end of period (000 omitted) | $ | 4,969,107 | $ | 5,280,692 | $ | 8,873,624 | $ | 6,624,752 | $ | 7,583,722 |
Portfolio turnover rate J | 51% | 46% | 78% | 50% | 37% |
| Average Annual Total Returns | |||
Periods ended February 28, 2023 | Past 1 year | Past 5 years | Past 10 years |
| Health Care Portfolio | -2.05% | 9.82% | 14.38% |
| $10,000 Over 10 Years |
Let's say hypothetically that $10,000 was invested in Health Care Portfolio on February 28, 2013. The chart shows how the value of your investment would have changed, and also shows how the S&P 500® Index performed over the same period. |
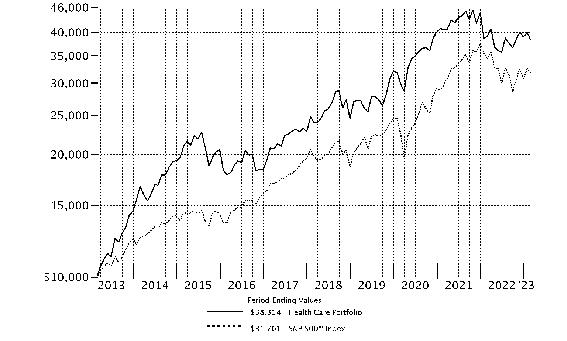 |
Top Holdings (% of Fund's net assets) | ||
| UnitedHealth Group, Inc. | 9.4 | |
| Boston Scientific Corp. | 6.1 | |
| Thermo Fisher Scientific, Inc. | 6.0 | |
| Eli Lilly & Co. | 5.5 | |
| Danaher Corp. | 4.7 | |
| Penumbra, Inc. | 4.6 | |
| Regeneron Pharmaceuticals, Inc. | 3.9 | |
| Cigna Group | 3.3 | |
| Insulet Corp. | 3.2 | |
| Centene Corp. | 2.8 | |
| 49.5 | ||
| Industries (% of Fund's net assets) | ||
| Health Care Providers & Services | 25.5 | |
| Health Care Equipment & Supplies | 21.8 | |
| Biotechnology | 19.5 | |
| Life Sciences Tools & Services | 15.8 | |
| Pharmaceuticals | 14.4 | |
| Health Care Technology | 2.2 | |
| Personal Products | 0.4 | |
| Specialty Retail | 0.2 | |
| Diversified Financial Services | 0.1 | |
| Common Stocks - 98.7% | |||
| Shares | Value ($) | ||
| Biotechnology - 18.8% | |||
| Biotechnology - 18.8% | |||
| ADC Therapeutics SA (a)(b) | 825,782 | 2,972,815 | |
| Alnylam Pharmaceuticals, Inc. (a) | 280,000 | 53,606,000 | |
| Ambrx Biopharma, Inc. ADR (a)(b) | 354,700 | 2,280,721 | |
| Arcutis Biotherapeutics, Inc. (a) | 900,000 | 14,562,000 | |
| Argenx SE ADR (a) | 485,000 | 177,519,700 | |
| Ascendis Pharma A/S sponsored ADR (a) | 900,000 | 99,981,000 | |
| Avidity Biosciences, Inc. (a) | 400,000 | 9,480,000 | |
| Beam Therapeutics, Inc. (a)(b) | 400,000 | 16,096,000 | |
| Blueprint Medicines Corp. (a) | 1,000,000 | 42,370,000 | |
| Caris Life Sciences, Inc. (c)(d) | 1,420,479 | 7,954,682 | |
| Celldex Therapeutics, Inc. (a) | 672,066 | 28,757,704 | |
| Cerevel Therapeutics Holdings (a) | 1,363,500 | 36,391,815 | |
| Cytokinetics, Inc. (a) | 1,500,000 | 65,040,000 | |
| Exact Sciences Corp. (a) | 585,000 | 36,463,050 | |
| Generation Bio Co. (a) | 509,353 | 2,017,038 | |
| Instil Bio, Inc. (a) | 570,745 | 443,526 | |
| Janux Therapeutics, Inc. (a) | 500,000 | 8,315,000 | |
| Karuna Therapeutics, Inc. (a) | 240,000 | 47,860,800 | |
| Keros Therapeutics, Inc. (a) | 540,000 | 28,738,800 | |
| Legend Biotech Corp. ADR (a) | 1,800,000 | 83,124,000 | |
| Morphic Holding, Inc. (a) | 320,000 | 13,606,400 | |
| Nuvalent, Inc. Class A (a) | 382,530 | 11,586,834 | |
| Poseida Therapeutics, Inc. (a)(b) | 1,922,313 | 10,937,961 | |
| PTC Therapeutics, Inc. (a) | 670,000 | 29,258,900 | |
| Regeneron Pharmaceuticals, Inc. (a) | 415,000 | 315,574,300 | |
| Relay Therapeutics, Inc. (a)(b) | 800,000 | 12,920,000 | |
| Repligen Corp. (a) | 320,000 | 55,798,400 | |
| Sarepta Therapeutics, Inc. (a) | 460,000 | 56,179,800 | |
| Scholar Rock Holding Corp. (a) | 155,315 | 1,332,603 | |
| Shattuck Labs, Inc. (a) | 1,162,800 | 5,488,416 | |
| Stoke Therapeutics, Inc. (a)(b) | 500,000 | 4,445,000 | |
| uniQure B.V. (a)(b) | 670,000 | 14,043,200 | |
| Vaxcyte, Inc. (a) | 900,000 | 36,873,000 | |
| Vertex Pharmaceuticals, Inc. (a) | 280,000 | 81,281,200 | |
| Verve Therapeutics, Inc. (a)(b) | 280,000 | 5,320,000 | |
| Xencor, Inc. (a) | 1,400,000 | 44,982,000 | |
| Xenon Pharmaceuticals, Inc. (a) | 528,214 | 20,843,324 | |
| Zai Lab Ltd. (a)(e) | 6,700,000 | 24,532,952 | |
| Zentalis Pharmaceuticals, Inc. (a) | 1,200,000 | 22,716,000 | |
| 1,531,694,941 | |||
| Health Care Equipment & Supplies - 21.8% | |||
| Health Care Equipment - 21.8% | |||
| Boston Scientific Corp. (a) | 10,600,000 | 495,232,000 | |
| Inspire Medical Systems, Inc. (a) | 145,000 | 37,689,850 | |
| Insulet Corp. (a) | 950,000 | 262,542,000 | |
| Intuitive Surgical, Inc. (a) | 100,000 | 22,939,000 | |
| iRhythm Technologies, Inc. (a) | 291,067 | 34,252,765 | |
| Masimo Corp. (a) | 1,000,000 | 167,310,000 | |
| Nevro Corp. (a) | 850,000 | 26,724,000 | |
| Novocure Ltd. (a) | 488,501 | 37,599,922 | |
| Outset Medical, Inc. (a) | 1,000,000 | 22,810,000 | |
| Penumbra, Inc. (a) | 1,460,000 | 379,585,400 | |
| PROCEPT BioRobotics Corp. (a) | 600,000 | 22,470,000 | |
| ResMed, Inc. | 540,000 | 115,020,000 | |
| Stryker Corp. | 400,000 | 105,152,000 | |
| Tandem Diabetes Care, Inc. (a) | 1,400,000 | 50,204,000 | |
| 1,779,530,937 | |||
| Health Care Providers & Services - 25.5% | |||
| Health Care Facilities - 2.4% | |||
| Acadia Healthcare Co., Inc. (a) | 720,000 | 52,207,200 | |
| HCA Holdings, Inc. | 75,000 | 18,258,750 | |
| Surgery Partners, Inc. (a) | 3,756,500 | 125,654,925 | |
| The Oncology Institute, Inc. (a)(c) | 2,232,581 | 3,147,939 | |
| 199,268,814 | |||
| Health Care Services - 7.1% | |||
| agilon health, Inc. (a)(b) | 9,400,000 | 199,374,000 | |
| Cigna Group | 920,000 | 268,732,000 | |
| CVS Health Corp. | 650,000 | 54,301,000 | |
| LifeStance Health Group, Inc. (a) | 3,816,138 | 19,538,627 | |
| Oak Street Health, Inc. (a) | 1,000,000 | 35,400,000 | |
| 577,345,627 | |||
| Managed Health Care - 16.0% | |||
| Alignment Healthcare, Inc. (a) | 3,800,000 | 37,772,000 | |
| Centene Corp. (a) | 3,300,000 | 225,720,000 | |
| Humana, Inc. | 440,000 | 217,808,800 | |
| Molina Healthcare, Inc. (a) | 190,000 | 52,312,700 | |
| UnitedHealth Group, Inc. | 1,620,000 | 771,022,801 | |
| 1,304,636,301 | |||
TOTAL HEALTH CARE PROVIDERS & SERVICES | 2,081,250,742 | ||
| Health Care Technology - 1.9% | |||
| Health Care Technology - 1.9% | |||
| Doximity, Inc. (a)(b) | 850,000 | 28,585,500 | |
| Evolent Health, Inc. (a) | 450,000 | 15,754,500 | |
| Medlive Technology Co. Ltd. (f) | 3,000,000 | 3,661,426 | |
| Phreesia, Inc. (a) | 1,080,000 | 39,744,000 | |
| Veeva Systems, Inc. Class A (a) | 400,000 | 66,264,000 | |
| 154,009,426 | |||
| Life Sciences Tools & Services - 15.8% | |||
| Life Sciences Tools & Services - 15.8% | |||
| 10X Genomics, Inc. Class B (a)(f) | 500,000 | 23,760,000 | |
| Bruker Corp. | 1,200,000 | 82,704,000 | |
| Danaher Corp. | 1,560,000 | 386,146,800 | |
| IQVIA Holdings, Inc. (a) | 670,000 | 139,674,900 | |
| Lonza Group AG | 75,000 | 44,673,128 | |
| Olink Holding AB ADR (a) | 1,156,600 | 27,110,704 | |
| Sartorius Stedim Biotech | 60,000 | 19,590,719 | |
| Thermo Fisher Scientific, Inc. | 900,000 | 487,584,000 | |
| West Pharmaceutical Services, Inc. | 235,000 | 74,502,050 | |
| 1,285,746,301 | |||
| Personal Products - 0.4% | |||
| Personal Products - 0.4% | |||
| The Beauty Health Co. (a)(b) | 479,105 | 6,041,514 | |
| The Beauty Health Co. (a)(c) | 1,800,000 | 22,698,000 | |
| 28,739,514 | |||
| Pharmaceuticals - 14.3% | |||
| Pharmaceuticals - 14.3% | |||
| Arvinas Holding Co. LLC (a) | 750,000 | 22,987,500 | |
| AstraZeneca PLC (United Kingdom) | 1,500,000 | 195,417,133 | |
| Eli Lilly & Co. | 1,450,000 | 451,269,000 | |
| Merck & Co., Inc. | 1,400,000 | 148,736,000 | |
| Novo Nordisk A/S Series B | 500,000 | 70,627,636 | |
| Pharvaris BV (a) | 620,000 | 5,152,200 | |
| Royalty Pharma PLC | 5,700,000 | 204,345,000 | |
| UCB SA | 600,000 | 51,645,376 | |
| Ventyx Biosciences, Inc. (a) | 250,000 | 10,812,500 | |
| Verona Pharma PLC ADR (a) | 400,000 | 8,576,000 | |
| 1,169,568,345 | |||
| Specialty Retail - 0.2% | |||
| Specialty Stores - 0.2% | |||
| Warby Parker, Inc. (a) | 1,000,000 | 13,010,000 | |
| TOTAL COMMON STOCKS (Cost $5,503,766,184) | 8,043,550,206 | ||
| Preferred Stocks - 1.2% | |||
| Shares | Value ($) | ||
| Convertible Preferred Stocks - 1.1% | |||
| Biotechnology - 0.7% | |||
| Biotechnology - 0.7% | |||
| Asimov, Inc. Series B (a)(c)(d) | 101,438 | 5,166,237 | |
| Caris Life Sciences, Inc. Series D (a)(c)(d) | 3,206,021 | 17,953,718 | |
| Cleerly, Inc. Series C (c)(d) | 1,285,367 | 14,935,965 | |
| Element Biosciences, Inc. Series C (a)(c)(d) | 572,265 | 9,413,759 | |
| ElevateBio LLC Series C (a)(c)(d) | 254,900 | 810,582 | |
| Inscripta, Inc. Series E (a)(c)(d) | 1,282,228 | 5,423,824 | |
| 53,704,085 | |||
| Health Care Providers & Services - 0.0% | |||
| Health Care Services - 0.0% | |||
| dMed Biopharmaceutical Co. Ltd. Series C (a)(c)(d) | 380,451 | 4,127,893 | |
| Health Care Technology - 0.3% | |||
| Health Care Technology - 0.3% | |||
| Aledade, Inc.: | |||
| Series B1(a)(c)(d) | 201,220 | 10,733,075 | |
| Series E1(c)(d) | 56,664 | 3,022,458 | |
| Omada Health, Inc. Series E (a)(c)(d) | 2,153,073 | 7,708,001 | |
| Wugen, Inc. Series B (a)(c)(d) | 454,342 | 2,421,643 | |
| 23,885,177 | |||
| Pharmaceuticals - 0.1% | |||
| Pharmaceuticals - 0.1% | |||
| Aristea Therapeutics, Inc. Series B (a)(c)(d) | 1,037,400 | 5,716,074 | |
| Galvanize Therapeutics Series B (c)(d) | 3,696,429 | 6,246,965 | |
| 11,963,039 | |||
| TOTAL CONVERTIBLE PREFERRED STOCKS | 93,680,194 | ||
| Nonconvertible Preferred Stocks - 0.1% | |||
| Diversified Financial Services - 0.1% | |||
| Other Diversified Financial Services - 0.1% | |||
| Thriveworks TopCo LLC Series B (a)(c)(d)(g) | 473,270 | 7,794,757 | |
| TOTAL PREFERRED STOCKS (Cost $132,756,423) | 101,474,951 | ||
| Money Market Funds - 2.3% | |||
| Shares | Value ($) | ||
Fidelity Securities Lending Cash Central Fund 4.63% (h)(i) (Cost $189,952,575) | 189,935,332 | 189,954,325 | |
| TOTAL INVESTMENT IN SECURITIES - 102.2% (Cost $5,826,475,182) | 8,334,979,482 |
NET OTHER ASSETS (LIABILITIES) - (2.2)% | (181,515,079) |
| NET ASSETS - 100.0% | 8,153,464,403 |
| (a) | Non-income producing |
| (b) | Security or a portion of the security is on loan at period end. |
| (c) | Restricted securities (including private placements) - Investment in securities not registered under the Securities Act of 1933 (excluding 144A issues). At the end of the period, the value of restricted securities (excluding 144A issues) amounted to $135,275,572 or 1.7% of net assets. |
| (d) | Level 3 security |
| (e) | Affiliated company |
| (f) | Security exempt from registration under Rule 144A of the Securities Act of 1933. These securities may be resold in transactions exempt from registration, normally to qualified institutional buyers. At the end of the period, the value of these securities amounted to $27,421,426 or 0.3% of net assets. |
| (g) | Investment is owned by a wholly-owned subsidiary (Subsidiary) that is treated as a corporation for U.S. tax purposes. |
| (h) | Affiliated fund that is generally available only to investment companies and other accounts managed by Fidelity Investments. The rate quoted is the annualized seven-day yield of the fund at period end. A complete unaudited listing of the fund's holdings as of its most recent quarter end is available upon request. In addition, each Fidelity Central Fund's financial statements, which are not covered by the Fund's Report of Independent Registered Public Accounting Firm, are available on the SEC's website or upon request. |
| (i) | Investment made with cash collateral received from securities on loan. |
| Additional information on each restricted holding is as follows: | ||
| Security | Acquisition Date | Acquisition Cost ($) |
| Aledade, Inc. Series B1 | 5/07/21 | 7,704,855 |
| Aledade, Inc. Series E1 | 5/20/22 | 2,822,683 |
| Aristea Therapeutics, Inc. Series B | 10/06/20 | 5,719,912 |
| Asimov, Inc. Series B | 10/29/21 | 9,401,345 |
| Caris Life Sciences, Inc. | 10/06/22 | 7,954,682 |
| Caris Life Sciences, Inc. Series D | 5/11/21 | 25,968,770 |
| Cleerly, Inc. Series C | 7/08/22 | 15,142,394 |
| dMed Biopharmaceutical Co. Ltd. Series C | 12/01/20 | 5,403,602 |
| Element Biosciences, Inc. Series C | 6/21/21 | 11,763,880 |
| ElevateBio LLC Series C | 3/09/21 | 1,069,306 |
| Galvanize Therapeutics Series B | 3/29/22 | 6,399,572 |
| Inscripta, Inc. Series E | 3/30/21 | 11,322,073 |
| Omada Health, Inc. Series E | 12/22/21 | 12,908,103 |
| The Beauty Health Co. | 12/08/20 | 18,000,000 |
| The Oncology Institute, Inc. | 6/28/21 | 22,325,810 |
| Thriveworks TopCo LLC Series B | 7/23/21 - 2/25/22 | 13,584,368 |
| Wugen, Inc. Series B | 7/09/21 | 3,523,377 |
| Affiliate | Value, beginning of period ($) | Purchases ($) | Sales Proceeds ($) | Dividend Income ($) | Realized Gain (loss) ($) | Change in Unrealized appreciation (depreciation) ($) | Value, end of period ($) | % ownership, end of period |
| Fidelity Cash Central Fund 4.63% | 36,264,694 | 1,123,481,826 | 1,159,746,520 | 1,215,198 | - | - | - | 0.0% |
| Fidelity Securities Lending Cash Central Fund 4.63% | 202,861,851 | 1,295,221,054 | 1,308,128,580 | 1,754,556 | - | - | 189,954,325 | 0.6% |
| Total | 239,126,545 | 2,418,702,880 | 2,467,875,100 | 2,969,754 | - | - | 189,954,325 | |
| Affiliate | Value, beginning of period ($) | Purchases ($) | Sales Proceeds ($) | Dividend Income ($) | Realized Gain (loss) ($) | Change in Unrealized appreciation (depreciation) ($) | Value, end of period ($) |
| Zai Lab Ltd. | 26,625,199 | 15,386,597 | 4,441,986 | - | (22,717,266) | 9,680,408 | 24,532,952 |
| Total | 26,625,199 | 15,386,597 | 4,441,986 | - | (22,717,266) | 9,680,408 | 24,532,952 |
| Valuation Inputs at Reporting Date: | ||||
| Description | Total ($) | Level 1 ($) | Level 2 ($) | Level 3 ($) |
Investments in Securities: | ||||
| Common Stocks | 8,043,550,206 | 7,700,344,675 | 335,250,849 | 7,954,682 |
| Preferred Stocks | 101,474,951 | - | - | 101,474,951 |
| Money Market Funds | 189,954,325 | 189,954,325 | - | - |
| Total Investments in Securities: | 8,334,979,482 | 7,890,299,000 | 335,250,849 | 109,429,633 |
| Investments in Securities: | |||
| Preferred Stocks | |||
| Beginning Balance | $ | 99,854,613 | |
| Net Realized Gain (Loss) on Investment Securities | - | ||
| Net Unrealized Gain (Loss) on Investment Securities | (22,766,495) | ||
| Cost of Purchases | 24,386,833 | ||
| Proceeds of Sales | - | ||
| Amortization/Accretion | - | ||
| Transfers into Level 3 | - | ||
| Transfers out of Level 3 | - | ||
| Ending Balance | $ | 101,474,951 | |
| The change in unrealized gain (loss) for the period attributable to Level 3 securities held at February 28, 2023 | $ | (22,766,495) | |
| Other Investments in Securities | |||
| Beginning Balance | $ | - | |
| Net Realized Gain (Loss) on Investment Securities | - | ||
| Net Unrealized Gain (Loss) on Investment Securities | - | ||
| Cost of Purchases | 7,954,682 | ||
| Proceeds of Sales | - | ||
| Amortization/Accretion | - | ||
| Transfers into Level 3 | - | ||
| Transfers out of Level 3 | - | ||
| Ending Balance | $ | 7,954,682 | |
| The change in unrealized gain (loss) for the period attributable to Level 3 securities held at February 28, 2023 | $ | - | |
| The information used in the above reconciliation represents fiscal year to date activity for any Investments in Securities identified as using Level 3 inputs at either the beginning or the end of the current fiscal period. Cost of purchases and proceeds of sales may include securities received and/or delivered through in-kind transactions. Transfers into Level 3 were attributable to a lack of observable market data resulting from decreases in market activity, decreases in liquidity, security restructurings or corporate actions. Transfers out of Level 3 were attributable to observable market data becoming available for those securities. Transfers in or out of Level 3 represent the beginning value of any Security or Instrument where a change in the pricing level occurred from the beginning to the end of the period. The cost of purchases and the proceeds of sales may include securities received or delivered through corporate actions or exchanges. Realized and unrealized gains (losses) disclosed in the reconciliation are included in Net Gain (Loss) on the Fund's Statement of Operations. | |||
| Statement of Assets and Liabilities | ||||
| February 28, 2023 | ||||
| Assets | ||||
| Investment in securities, at value (including securities loaned of $186,141,172) - See accompanying schedule: | ||||
Unaffiliated issuers (cost $5,600,449,554) | $ | 8,120,492,205 | ||
Fidelity Central Funds (cost $189,952,575) | 189,954,325 | |||
Other affiliated issuers (cost $36,073,053) | 24,532,952 | |||
| Total Investment in Securities (cost $5,826,475,182) | $ | 8,334,979,482 | ||
| Foreign currency held at value (cost $8) | 8 | |||
| Receivable for investments sold | 41,227,458 | |||
| Receivable for fund shares sold | 1,146,495 | |||
| Dividends receivable | 5,955,720 | |||
| Reclaims receivable | 5,412,240 | |||
| Distributions receivable from Fidelity Central Funds | 227,672 | |||
| Prepaid expenses | 23,661 | |||
| Other receivables | 761,986 | |||
Total assets | 8,389,734,722 | |||
| Liabilities | ||||
| Payable to custodian bank | $ | 1,425,616 | ||
| Payable for investments purchased | 35,003,078 | |||
| Payable for fund shares redeemed | 4,264,695 | |||
| Accrued management fee | 3,706,834 | |||
| Other affiliated payables | 1,106,774 | |||
| Other payables and accrued expenses | 830,822 | |||
| Collateral on securities loaned | 189,932,500 | |||
| Total Liabilities | 236,270,319 | |||
| Net Assets | $ | 8,153,464,403 | ||
| Net Assets consist of: | ||||
| Paid in capital | $ | 5,757,809,383 | ||
| Total accumulated earnings (loss) | 2,395,655,020 | |||
| Net Assets | $ | 8,153,464,403 | ||
Net Asset Value , offering price and redemption price per share ($8,153,464,403 ÷ 299,940,737 shares) | $ | 27.18 | ||
| Statement of Operations | ||||
Year ended February 28, 2023 | ||||
| Investment Income | ||||
| Dividends | $ | 45,809,321 | ||
| Income from Fidelity Central Funds (including $1,754,556 from security lending) | 2,969,754 | |||
| Total Income | 48,779,075 | |||
| Expenses | ||||
| Management fee | $ | 44,295,591 | ||
| Transfer agent fees | 12,171,724 | |||
| Accounting fees | 1,128,857 | |||
| Custodian fees and expenses | 97,261 | |||
| Independent trustees' fees and expenses | 28,748 | |||
| Registration fees | 69,017 | |||
| Audit | 55,185 | |||
| Legal | 7,343 | |||
| Interest | 4,620 | |||
| Miscellaneous | 49,613 | |||
| Total expenses before reductions | 57,907,959 | |||
| Expense reductions | (300,032) | |||
| Total expenses after reductions | 57,607,927 | |||
| Net Investment income (loss) | (8,828,852) | |||
| Realized and Unrealized Gain (Loss) | ||||
| Net realized gain (loss) on: | ||||
| Investment Securities: | ||||
| Unaffiliated issuers | (54,216,767) | |||
| Affiliated issuers | (22,717,266) | |||
| Foreign currency transactions | (128,287) | |||
| Total net realized gain (loss) | (77,062,320) | |||
| Change in net unrealized appreciation (depreciation) on: | ||||
| Investment Securities: | ||||
| Unaffiliated issuers | (119,731,988) | |||
| Affiliated issuers | 9,680,408 | |||
| Assets and liabilities in foreign currencies | (335,389) | |||
| Total change in net unrealized appreciation (depreciation) | (110,386,969) | |||
| Net gain (loss) | (187,449,289) | |||
| Net increase (decrease) in net assets resulting from operations | $ | (196,278,141) | ||
| Statement of Changes in Net Assets | ||||
Year ended February 28, 2023 | Year ended February 28, 2022 | |||
| Increase (Decrease) in Net Assets | ||||
| Operations | ||||
| Net investment income (loss) | $ | (8,828,852) | $ | (10,700,587) |
| Net realized gain (loss) | (77,062,320) | 831,099,766 | ||
| Change in net unrealized appreciation (depreciation) | (110,386,969) | (1,151,771,898) | ||
| Net increase (decrease) in net assets resulting from operations | (196,278,141) | (331,372,719) | ||
| Distributions to shareholders | (185,553,756) | (929,859,235) | ||
| Share transactions | ||||
| Proceeds from sales of shares | 519,950,859 | 1,043,831,682 | ||
| Reinvestment of distributions | 171,960,992 | 861,023,255 | ||
| Cost of shares redeemed | (1,155,824,340) | (1,997,490,811) | ||
Net increase (decrease) in net assets resulting from share transactions | (463,912,489) | (92,635,874) | ||
| Total increase (decrease) in net assets | (845,744,386) | (1,353,867,828) | ||
| Net Assets | ||||
| Beginning of period | 8,999,208,789 | 10,353,076,617 | ||
| End of period | $ | 8,153,464,403 | $ | 8,999,208,789 |
| Other Information | ||||
| Shares | ||||
| Sold | 19,098,646 | 32,480,198 | ||
| Issued in reinvestment of distributions | 5,803,593 | 27,447,935 | ||
| Redeemed | (42,956,929) | (63,667,769) | ||
| Net increase (decrease) | (18,054,690) | (3,739,636) | ||
| Health Care Portfolio |
| Years ended February 28, | 2023 | 2022 | 2021 | 2020 A | 2019 B | |||||
Selected Per-Share Data | ||||||||||
| Net asset value, beginning of period | $ | 28.30 | $ | 32.18 | $ | 26.53 | $ | 24.48 | $ | 23.56 |
| Income from Investment Operations | ||||||||||
Net investment income (loss) C,D | (.03) | (.03) | - E | .04 | .02 | |||||
| Net realized and unrealized gain (loss) | (.50) | (.92) | 9.23 | 2.40 | 2.90 | |||||
| Total from investment operations | (.53) | (.95) | 9.23 | 2.44 | 2.92 | |||||
| Distributions from net investment income | - | (.04) F | (.18) | (.03) | (.03) | |||||
| Distributions from net realized gain | (.59) | (2.89) F | (3.40) | (.36) | (1.97) | |||||
| Total distributions | (.59) | (2.93) | (3.58) | (.39) | (2.00) | |||||
| Net asset value, end of period | $ | 27.18 | $ | 28.30 | $ | 32.18 | $ | 26.53 | $ | 24.48 |
Total Return G | (2.05)% | (3.67)% | 36.00% | 9.84% | 13.30% | |||||
Ratios to Average Net Assets D,H,I | ||||||||||
| Expenses before reductions | .69% | .68% | .69% | .70% | .71% | |||||
| Expenses net of fee waivers, if any | .68% | .67% | .69% | .70% | .71% | |||||
| Expenses net of all reductions | .68% | .67% | .69% | .70% | .71% | |||||
| Net investment income (loss) | (.10)% | (.10)% | (.01)% | .16% | .10% | |||||
| Supplemental Data | ||||||||||
| Net assets, end of period (000 omitted) | $ | 8,153,464 | $ | 8,999,209 | $ | 10,353,077 | $ | 7,220,187 | $ | 7,450,707 |
Portfolio turnover rate J | 40% | 31% | 52% | 36% K | 60% K |
| Average Annual Total Returns | |||
Periods ended February 28, 2023 | Past 1 year | Past 5 years | Past 10 years |
| Health Care Services Portfolio | -0.64% | 11.87% | 14.63% |
| $10,000 Over 10 Years |
Let's say hypothetically that $10,000 was invested in Health Care Services Portfolio on February 28, 2013. The chart shows how the value of your investment would have changed, and also shows how the S&P 500® Index performed over the same period. |
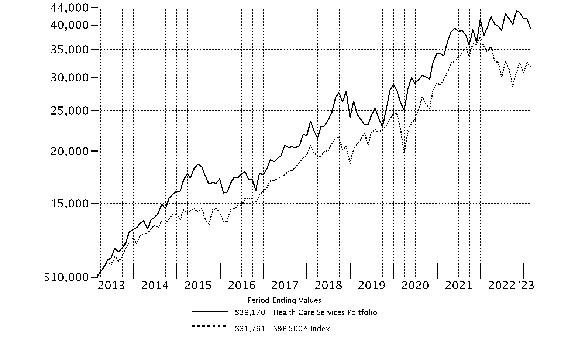 |
Top Holdings (% of Fund's net assets) | ||
| UnitedHealth Group, Inc. | 24.6 | |
| CVS Health Corp. | 8.9 | |
| Humana, Inc. | 8.2 | |
| Centene Corp. | 7.7 | |
| Cigna Group | 4.8 | |
| Elevance Health, Inc. | 4.7 | |
| Molina Healthcare, Inc. | 4.4 | |
| AmerisourceBergen Corp. | 4.3 | |
| McKesson Corp. | 4.3 | |
| HCA Holdings, Inc. | 3.5 | |
| 75.4 | ||
| Industries (% of Fund's net assets) | ||
| Health Care Providers & Services | 96.5 | |
| Health Care Technology | 2.0 | |
| Diversified Financial Services | 0.1 | |
| Common Stocks - 98.2% | |||
| Shares | Value ($) | ||
| Health Care Providers & Services - 96.5% | |||
| Health Care Distributors & Services - 8.6% | |||
| AmerisourceBergen Corp. | 475,300 | 73,937,668 | |
| McKesson Corp. | 207,500 | 72,585,575 | |
| 146,523,243 | |||
| Health Care Facilities - 12.1% | |||
| Acadia Healthcare Co., Inc. (a) | 532,600 | 38,618,826 | |
| Encompass Health Corp. | 446,600 | 25,241,832 | |
| HCA Holdings, Inc. | 247,200 | 60,180,840 | |
| Surgery Partners, Inc. (a) | 1,304,400 | 43,632,180 | |
| U.S. Physical Therapy, Inc. (b) | 180,300 | 18,269,799 | |
| Universal Health Services, Inc. Class B | 164,000 | 21,905,480 | |
| 207,848,957 | |||
| Health Care Services - 24.0% | |||
| agilon health, Inc. (a)(b) | 2,325,673 | 49,327,524 | |
| Andlauer Healthcare Group, Inc. | 184,939 | 6,477,270 | |
| Chemed Corp. | 52,200 | 27,226,476 | |
| Cigna Group | 282,572 | 82,539,281 | |
| CVS Health Corp. | 1,824,570 | 152,424,578 | |
| DaVita HealthCare Partners, Inc. (a) | 99,900 | 8,217,774 | |
| LifeStance Health Group, Inc. (a) | 3,643,950 | 18,657,024 | |
| Option Care Health, Inc. (a) | 1,298,932 | 39,838,244 | |
| Privia Health Group, Inc. (a)(b) | 654,800 | 18,288,564 | |
| Quest Diagnostics, Inc. | 48,000 | 6,641,280 | |
| 409,638,015 | |||
| Managed Health Care - 51.8% | |||
| Alignment Healthcare, Inc. (a) | 828,696 | 8,237,238 | |
| Centene Corp. (a) | 1,918,284 | 131,210,626 | |
| Elevance Health, Inc. | 171,802 | 80,690,245 | |
| HealthEquity, Inc. (a) | 460,900 | 30,036,853 | |
| Humana, Inc. | 282,900 | 140,041,158 | |
| Molina Healthcare, Inc. (a) | 271,500 | 74,752,095 | |
| UnitedHealth Group, Inc. | 883,950 | 420,707,164 | |
| 885,675,379 | |||
TOTAL HEALTH CARE PROVIDERS & SERVICES | 1,649,685,594 | ||
| Health Care Technology - 1.7% | |||
| Health Care Technology - 1.7% | |||
| Evolent Health, Inc. (a)(b) | 581,900 | 20,372,319 | |
| Phreesia, Inc. (a) | 239,335 | 8,807,528 | |
| 29,179,847 | |||
| TOTAL COMMON STOCKS (Cost $1,085,319,586) | 1,678,865,441 | ||
| Preferred Stocks - 0.4% | |||
| Shares | Value ($) | ||
| Convertible Preferred Stocks - 0.3% | |||
| Health Care Technology - 0.3% | |||
| Health Care Technology - 0.3% | |||
| Aledade, Inc.: | |||
| Series B1(a)(c)(d) | 52,232 | 2,786,055 | |
| Series E1(c)(d) | 40,149 | 2,141,548 | |
| 4,927,603 | |||
| Nonconvertible Preferred Stocks - 0.1% | |||
| Diversified Financial Services - 0.1% | |||
| Other Diversified Financial Services - 0.1% | |||
| Thriveworks TopCo LLC Series B (a)(c)(d)(e) | 69,639 | 1,146,954 | |
| TOTAL PREFERRED STOCKS (Cost $6,021,044) | 6,074,557 | ||
| Money Market Funds - 4.8% | |||
| Shares | Value ($) | ||
| Fidelity Cash Central Fund 4.63% (f) | 18,113,222 | 18,116,844 | |
| Fidelity Securities Lending Cash Central Fund 4.63% (f)(g) | 63,164,293 | 63,170,610 | |
| TOTAL MONEY MARKET FUNDS (Cost $81,287,454) | 81,287,454 | ||
| TOTAL INVESTMENT IN SECURITIES - 103.4% (Cost $1,172,628,084) | 1,766,227,452 |
NET OTHER ASSETS (LIABILITIES) - (3.4)% | (57,525,285) |
| NET ASSETS - 100.0% | 1,708,702,167 |
| (a) | Non-income producing |
| (b) | Security or a portion of the security is on loan at period end. |
| (c) | Restricted securities (including private placements) - Investment in securities not registered under the Securities Act of 1933 (excluding 144A issues). At the end of the period, the value of restricted securities (excluding 144A issues) amounted to $6,074,557 or 0.4% of net assets. |
| (d) | Level 3 security |
| (e) | Investment is owned by a wholly-owned subsidiary (Subsidiary) that is treated as a corporation for U.S. tax purposes. |
| (f) | Affiliated fund that is generally available only to investment companies and other accounts managed by Fidelity Investments. The rate quoted is the annualized seven-day yield of the fund at period end. A complete unaudited listing of the fund's holdings as of its most recent quarter end is available upon request. In addition, each Fidelity Central Fund's financial statements, which are not covered by the Fund's Report of Independent Registered Public Accounting Firm, are available on the SEC's website or upon request. |
| (g) | Investment made with cash collateral received from securities on loan. |
| Additional information on each restricted holding is as follows: | ||
| Security | Acquisition Date | Acquisition Cost ($) |
| Aledade, Inc. Series B1 | 5/07/21 | 2,000,000 |
| Aledade, Inc. Series E1 | 5/20/22 | 1,999,998 |
| Thriveworks TopCo LLC Series B | 7/23/21 - 2/25/22 | 1,998,863 |
| Affiliate | Value, beginning of period ($) | Purchases ($) | Sales Proceeds ($) | Dividend Income ($) | Realized Gain (loss) ($) | Change in Unrealized appreciation (depreciation) ($) | Value, end of period ($) | % ownership, end of period |
| Fidelity Cash Central Fund 4.63% | 1,067,186 | 580,484,359 | 563,434,701 | 1,076,184 | - | - | 18,116,844 | 0.0% |
| Fidelity Securities Lending Cash Central Fund 4.63% | 47,754,630 | 445,979,300 | 430,563,320 | 235,417 | - | - | 63,170,610 | 0.2% |
| Total | 48,821,816 | 1,026,463,659 | 993,998,021 | 1,311,601 | - | - | 81,287,454 | |
| Valuation Inputs at Reporting Date: | ||||
| Description | Total ($) | Level 1 ($) | Level 2 ($) | Level 3 ($) |
Investments in Securities: | ||||
| Common Stocks | 1,678,865,441 | 1,678,865,441 | - | - |
| Preferred Stocks | 6,074,557 | - | - | 6,074,557 |
| Money Market Funds | 81,287,454 | 81,287,454 | - | - |
| Total Investments in Securities: | 1,766,227,452 | 1,760,152,895 | - | 6,074,557 |
| Statement of Assets and Liabilities | ||||
| February 28, 2023 | ||||
| Assets | ||||
| Investment in securities, at value (including securities loaned of $61,908,240) - See accompanying schedule: | ||||
Unaffiliated issuers (cost $1,091,340,630) | $ | 1,684,939,998 | ||
Fidelity Central Funds (cost $81,287,454) | 81,287,454 | |||
| Total Investment in Securities (cost $1,172,628,084) | $ | 1,766,227,452 | ||
| Receivable for investments sold | 8,761,110 | |||
| Receivable for fund shares sold | 1,664,275 | |||
| Dividends receivable | 164,686 | |||
| Distributions receivable from Fidelity Central Funds | 60,883 | |||
| Prepaid expenses | 3,156 | |||
| Other receivables | 81,398 | |||
Total assets | 1,776,962,960 | |||
| Liabilities | ||||
| Payable for investments purchased | $ | 2,292,067 | ||
| Payable for fund shares redeemed | 1,625,946 | |||
| Accrued management fee | 772,314 | |||
| Other affiliated payables | 289,699 | |||
| Other payables and accrued expenses | 113,586 | |||
| Collateral on securities loaned | 63,167,181 | |||
| Total Liabilities | 68,260,793 | |||
| Net Assets | $ | 1,708,702,167 | ||
| Net Assets consist of: | ||||
| Paid in capital | $ | 1,155,599,730 | ||
| Total accumulated earnings (loss) | 553,102,437 | |||
| Net Assets | $ | 1,708,702,167 | ||
Net Asset Value , offering price and redemption price per share ($1,708,702,167 ÷ 13,694,715 shares) | $ | 124.77 | ||
| Statement of Operations | ||||
Year ended February 28, 2023 | ||||
| Investment Income | ||||
| Dividends | $ | 13,140,050 | ||
| Income from Fidelity Central Funds (including $235,417 from security lending) | 1,311,601 | |||
| Total Income | 14,451,651 | |||
| Expenses | ||||
| Management fee | $ | 8,157,383 | ||
| Transfer agent fees | 2,462,813 | |||
| Accounting fees | 440,095 | |||
| Custodian fees and expenses | 11,182 | |||
| Independent trustees' fees and expenses | 5,168 | |||
| Registration fees | 135,537 | |||
| Audit | 39,601 | |||
| Legal | 1,783 | |||
| Miscellaneous | 7,423 | |||
| Total expenses before reductions | 11,260,985 | |||
| Expense reductions | (54,520) | |||
| Total expenses after reductions | 11,206,465 | |||
| Net Investment income (loss) | 3,245,186 | |||
| Realized and Unrealized Gain (Loss) | ||||
| Net realized gain (loss) on: | ||||
| Investment Securities: | ||||
| Unaffiliated issuers | (18,499,864) | |||
| Foreign currency transactions | (1,200) | |||
| Total net realized gain (loss) | (18,501,064) | |||
| Change in net unrealized appreciation (depreciation) on: | ||||
| Investment Securities: | ||||
| Unaffiliated issuers | (28,481,279) | |||
| Assets and liabilities in foreign currencies | (180) | |||
| Total change in net unrealized appreciation (depreciation) | (28,481,459) | |||
| Net gain (loss) | (46,982,523) | |||
| Net increase (decrease) in net assets resulting from operations | $ | (43,737,337) | ||
| Statement of Changes in Net Assets | ||||
Year ended February 28, 2023 | Year ended February 28, 2022 | |||
| Increase (Decrease) in Net Assets | ||||
| Operations | ||||
| Net investment income (loss) | $ | 3,245,186 | $ | 2,679,968 |
| Net realized gain (loss) | (18,501,064) | 122,701,804 | ||
| Change in net unrealized appreciation (depreciation) | (28,481,459) | 56,927,180 | ||
| Net increase (decrease) in net assets resulting from operations | (43,737,337) | 182,308,952 | ||
| Distributions to shareholders | (70,592,721) | (87,625,390) | ||
| Share transactions | ||||
| Proceeds from sales of shares | 1,010,359,737 | 148,662,940 | ||
| Reinvestment of distributions | 65,526,668 | 81,964,453 | ||
| Cost of shares redeemed | (466,886,272) | (212,192,301) | ||
Net increase (decrease) in net assets resulting from share transactions | 609,000,133 | 18,435,092 | ||
| Total increase (decrease) in net assets | 494,670,075 | 113,118,654 | ||
| Net Assets | ||||
| Beginning of period | 1,214,032,092 | 1,100,913,438 | ||
| End of period | $ | 1,708,702,167 | $ | 1,214,032,092 |
| Other Information | ||||
| Shares | ||||
| Sold | 7,599,624 | 1,120,061 | ||
| Issued in reinvestment of distributions | 474,418 | 621,521 | ||
| Redeemed | (3,577,704) | (1,608,688) | ||
| Net increase (decrease) | 4,496,338 | 132,894 | ||
| Health Care Services Portfolio |
| Years ended February 28, | 2023 | 2022 | 2021 | 2020 A | 2019 | |||||
Selected Per-Share Data | ||||||||||
| Net asset value, beginning of period | $ | 131.98 | $ | 121.44 | $ | 94.72 | $ | 89.28 | $ | 92.21 |
| Income from Investment Operations | ||||||||||
Net investment income (loss) B,C | .28 | .29 | .06 | .23 | .13 | |||||
| Net realized and unrealized gain (loss) | (.47) | 20.01 | 27.59 | 5.50 | 8.27 | |||||
| Total from investment operations | (.19) | 20.30 | 27.65 | 5.73 | 8.40 | |||||
| Distributions from net investment income | (.31) | (.22) D | (.93) | (.29) | (.10) | |||||
| Distributions from net realized gain | (6.71) | (9.55) D | - | - | (11.23) | |||||
| Total distributions | (7.02) | (9.76) E | (.93) | (.29) | (11.33) | |||||
| Net asset value, end of period | $ | 124.77 | $ | 131.98 | $ | 121.44 | $ | 94.72 | $ | 89.28 |
Total Return F | (.64)% | 16.85% | 29.43% | 6.39% | 9.61% | |||||
Ratios to Average Net Assets C,G,H | ||||||||||
| Expenses before reductions | .73% | .71% | .73% | .75% | .76% | |||||
| Expenses net of fee waivers, if any | .73% | .71% | .73% | .75% | .76% | |||||
| Expenses net of all reductions | .73% | .71% | .73% | .75% | .76% | |||||
| Net investment income (loss) | .21% | .22% | .05% | .25% | .14% | |||||
| Supplemental Data | ||||||||||
| Net assets, end of period (000 omitted) | $ | 1,708,702 | $ | 1,214,032 | $ | 1,100,913 | $ | 1,003,206 | $ | 1,343,070 |
Portfolio turnover rate I | 30% | 35% | 34% | 37% | 60% |
| Average Annual Total Returns | |||
Periods ended February 28, 2023 | Past 1 year | Past 5 years | Past 10 years |
| Medical Technology and Devices Portfolio | -11.64% | 11.79% | 15.99% |
| $10,000 Over 10 Years |
Let's say hypothetically that $10,000 was invested in Medical Technology and Devices Portfolio on February 28, 2013. The chart shows how the value of your investment would have changed, and also shows how the S&P 500® Index performed over the same period. |
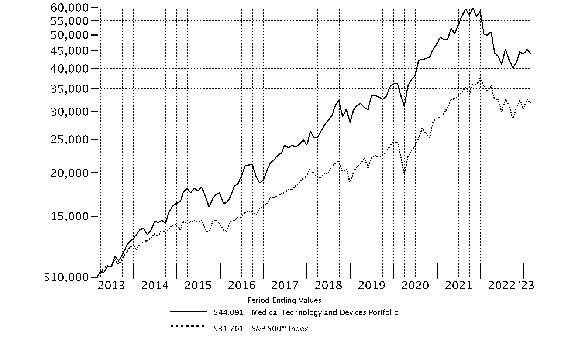 |
Top Holdings (% of Fund's net assets) | ||
| Thermo Fisher Scientific, Inc. | 16.3 | |
| Danaher Corp. | 11.6 | |
| Boston Scientific Corp. | 11.4 | |
| Stryker Corp. | 5.7 | |
| Penumbra, Inc. | 5.1 | |
| Insulet Corp. | 4.6 | |
| IQVIA Holdings, Inc. | 4.4 | |
| Masimo Corp. | 3.5 | |
| Abbott Laboratories | 3.5 | |
| ResMed, Inc. | 3.3 | |
| 69.4 | ||
| Industries (% of Fund's net assets) | ||
| Health Care Equipment & Supplies | 48.2 | |
| Life Sciences Tools & Services | 41.2 | |
| Biotechnology | 4.6 | |
| Health Care Technology | 4.2 | |
| Personal Products | 0.6 | |
| Health Care Providers & Services | 0.5 | |
| Textiles, Apparel & Luxury Goods | 0.4 | |
| Specialty Retail | 0.2 | |
| Professional Services | 0.2 | |
| Pharmaceuticals | 0.1 | |
| Common Stocks - 96.9% | |||
| Shares | Value ($) | ||
| Biotechnology - 3.2% | |||
| Biotechnology - 3.2% | |||
| Abcam PLC ADR (a) | 2,800,000 | 40,348,000 | |
| Exact Sciences Corp. (a) | 600,000 | 37,398,000 | |
| Natera, Inc. (a)(b) | 840,000 | 40,782,000 | |
| Repligen Corp. (a)(b) | 600,000 | 104,622,000 | |
| Saluda Medical Pty Ltd. warrants (a)(c)(d) | 235,185 | 585,611 | |
| 223,735,611 | |||
| Health Care Equipment & Supplies - 47.7% | |||
| Health Care Equipment - 46.8% | |||
| Abbott Laboratories | 2,340,000 | 238,024,800 | |
| Angelalign Technology, Inc. (e) | 1,000,000 | 13,708,054 | |
| Boston Scientific Corp. (a) | 16,800,000 | 784,896,000 | |
| DexCom, Inc. (a) | 700,000 | 77,707,000 | |
| Inspire Medical Systems, Inc. (a) | 250,000 | 64,982,500 | |
| Insulet Corp. (a)(b) | 1,140,000 | 315,050,400 | |
| Intuitive Surgical, Inc. (a) | 700,000 | 160,573,000 | |
| iRhythm Technologies, Inc. (a) | 424,559 | 49,962,103 | |
| Masimo Corp. (a) | 1,450,000 | 242,599,500 | |
| Nevro Corp. (a)(f) | 2,000,000 | 62,880,000 | |
| Novocure Ltd. (a) | 800,000 | 61,576,000 | |
| Outset Medical, Inc. (a) | 1,000,000 | 22,810,000 | |
| Penumbra, Inc. (a)(b) | 1,342,460 | 349,026,175 | |
| PROCEPT BioRobotics Corp. (a)(b) | 1,280,000 | 47,936,000 | |
| ResMed, Inc. | 1,063,647 | 226,556,811 | |
| Shockwave Medical, Inc. (a) | 210,000 | 39,950,400 | |
| Stryker Corp. | 1,500,000 | 394,320,000 | |
| Tandem Diabetes Care, Inc. (a) | 2,180,000 | 78,174,800 | |
| 3,230,733,543 | |||
| Health Care Supplies - 0.9% | |||
| Nanosonics Ltd. (a) | 8,500,000 | 25,967,211 | |
| The Cooper Companies, Inc. | 118,000 | 38,582,460 | |
| 64,549,671 | |||
TOTAL HEALTH CARE EQUIPMENT & SUPPLIES | 3,295,283,214 | ||
| Health Care Providers & Services - 0.3% | |||
| Health Care Services - 0.3% | |||
| LifeStance Health Group, Inc. (a) | 3,861,743 | 19,772,124 | |
| Health Care Technology - 3.5% | |||
| Health Care Technology - 3.5% | |||
| DNA Script (a)(c)(d) | 1,220 | 845,492 | |
| DNA Script (a)(c)(d) | 4,668 | 3,235,046 | |
| Doximity, Inc. (a)(b) | 1,080,000 | 36,320,400 | |
| Evolent Health, Inc. (a) | 396,500 | 13,881,465 | |
| Medlive Technology Co. Ltd. (e) | 5,000,000 | 6,102,377 | |
| Phreesia, Inc. (a) | 1,670,000 | 61,456,000 | |
| Veeva Systems, Inc. Class A (a) | 700,000 | 115,962,000 | |
| 237,802,780 | |||
| Life Sciences Tools & Services - 41.2% | |||
| Life Sciences Tools & Services - 41.2% | |||
| 10X Genomics, Inc. Class B (a)(e) | 392,772 | 18,664,525 | |
| Agilent Technologies, Inc. | 500,000 | 70,985,000 | |
| Bio-Techne Corp. | 870,000 | 63,196,800 | |
| Bruker Corp. | 1,800,000 | 124,056,000 | |
| Danaher Corp. | 3,240,000 | 801,997,200 | |
| Eurofins Scientific SA | 500,000 | 34,904,100 | |
| IQVIA Holdings, Inc. (a) | 1,475,000 | 307,493,250 | |
| Lonza Group AG | 90,000 | 53,607,754 | |
| Olink Holding AB ADR (a)(b) | 1,227,800 | 28,779,632 | |
| Pacific Biosciences of California, Inc. (a)(b) | 2,000,000 | 18,160,000 | |
| Sartorius Stedim Biotech | 160,000 | 52,241,918 | |
| Seer, Inc. (a)(b) | 2,800,000 | 11,452,000 | |
| Thermo Fisher Scientific, Inc. | 2,080,000 | 1,126,860,800 | |
| West Pharmaceutical Services, Inc. | 435,000 | 137,908,050 | |
| 2,850,307,029 | |||
| Personal Products - 0.6% | |||
| Personal Products - 0.6% | |||
| The Beauty Health Co. (a)(b) | 155,239 | 1,957,564 | |
| The Beauty Health Co. (a)(c) | 3,000,000 | 37,830,000 | |
| 39,787,564 | |||
| Professional Services - 0.2% | |||
| Research & Consulting Services - 0.2% | |||
| Clarivate Analytics PLC (a)(b) | 1,500,000 | 15,195,000 | |
| Specialty Retail - 0.2% | |||
| Specialty Stores - 0.2% | |||
| Warby Parker, Inc. (a)(b) | 1,200,000 | 15,612,000 | |
| TOTAL COMMON STOCKS (Cost $4,107,275,816) | 6,697,495,322 | ||
| Convertible Preferred Stocks - 3.0% | |||
| Shares | Value ($) | ||
| Biotechnology - 1.4% | |||
| Biotechnology - 1.4% | |||
| Asimov, Inc. Series B (a)(c)(d) | 97,985 | 4,990,376 | |
| Caris Life Sciences, Inc. Series D (a)(c)(d) | 2,803,935 | 15,702,036 | |
| Element Biosciences, Inc. Series B (a)(c)(d) | 2,385,223 | 39,236,918 | |
| ElevateBio LLC Series C (a)(c)(d) | 214,700 | 682,746 | |
| Inscripta, Inc. Series D (a)(c)(d) | 3,938,731 | 16,660,832 | |
| Saluda Medical Pty Ltd. Series D (a)(c)(d) | 1,567,904 | 18,140,649 | |
| 95,413,557 | |||
| Health Care Equipment & Supplies - 0.2% | |||
| Health Care Supplies - 0.2% | |||
| Kardium, Inc. Series D6 (a)(c)(d) | 13,783,189 | 13,645,357 | |
| Health Care Providers & Services - 0.2% | |||
| Health Care Services - 0.2% | |||
| Conformal Medical, Inc. Series C (a)(c)(d) | 2,605,625 | 9,276,025 | |
| dMed Biopharmaceutical Co. Ltd. Series C (a)(c)(d) | 309,255 | 3,355,417 | |
| 12,631,442 | |||
| Health Care Technology - 0.7% | |||
| Health Care Technology - 0.7% | |||
| Aledade, Inc.: | |||
| Series B1 (a)(c)(d) | 175,232 | 9,346,875 | |
| Series E1 (c)(d) | 58,567 | 3,123,964 | |
| DNA Script: | |||
| Series B (a)(c)(d) | 59 | 40,889 | |
| Series C (a)(c)(d) | 28,249 | 19,577,297 | |
| Omada Health, Inc. Series E (a)(c)(d) | 2,182,939 | 7,814,922 | |
| PrognomIQ, Inc.: | |||
| Series A5 (a)(c)(d) | 833,333 | 1,366,666 | |
| Series B (a)(c)(d) | 2,735,093 | 6,372,767 | |
| Series C (c)(d) | 752,098 | 2,000,581 | |
| 49,643,961 | |||
| Pharmaceuticals - 0.1% | |||
| Pharmaceuticals - 0.1% | |||
| Galvanize Therapeutics Series B (c)(d) | 3,641,139 | 6,153,525 | |
| Textiles, Apparel & Luxury Goods - 0.4% | |||
| Textiles - 0.4% | |||
| Freenome, Inc.: | |||
| Series C (a)(c)(d) | 2,268,156 | 17,668,935 | |
| Series D (a)(c)(d) | 1,325,855 | 10,832,235 | |
| 28,501,170 | |||
| TOTAL CONVERTIBLE PREFERRED STOCKS (Cost $198,835,399) | 205,989,012 | ||
| Preferred Securities - 0.3% | |||
Principal Amount (g) | Value ($) | ||
| Health Care Equipment & Supplies - 0.3% | |||
| Health Care Supplies - 0.3% | |||
Kardium, Inc. 0% (c)(d)(h) (Cost $19,551,861) | 19,551,861 | 19,043,513 | |
| Money Market Funds - 1.7% | |||
| Shares | Value ($) | ||
| Fidelity Cash Central Fund 4.63% (i) | 12,566,738 | 12,569,252 | |
| Fidelity Securities Lending Cash Central Fund 4.63% (i)(j) | 104,968,993 | 104,979,490 | |
| TOTAL MONEY MARKET FUNDS (Cost $117,548,742) | 117,548,742 | ||
| TOTAL INVESTMENT IN SECURITIES - 101.9% (Cost $4,443,211,818) | 7,040,076,589 |
NET OTHER ASSETS (LIABILITIES) - (1.9)% | (128,591,920) |
| NET ASSETS - 100.0% | 6,911,484,669 |
| (a) | Non-income producing |
| (b) | Security or a portion of the security is on loan at period end. |
| (c) | Restricted securities (including private placements) - Investment in securities not registered under the Securities Act of 1933 (excluding 144A issues). At the end of the period, the value of restricted securities (excluding 144A issues) amounted to $267,528,674 or 3.9% of net assets. |
| (d) | Level 3 security |
| (e) | Security exempt from registration under Rule 144A of the Securities Act of 1933. These securities may be resold in transactions exempt from registration, normally to qualified institutional buyers. At the end of the period, the value of these securities amounted to $38,474,956 or 0.6% of net assets. |
| (f) | Affiliated company |
| (g) | Amount is stated in United States dollars unless otherwise noted. |
| (h) | Security is perpetual in nature with no stated maturity date. |
| (i) | Affiliated fund that is generally available only to investment companies and other accounts managed by Fidelity Investments. The rate quoted is the annualized seven-day yield of the fund at period end. A complete unaudited listing of the fund's holdings as of its most recent quarter end is available upon request. In addition, each Fidelity Central Fund's financial statements, which are not covered by the Fund's Report of Independent Registered Public Accounting Firm, are available on the SEC's website or upon request. |
| (j) | Investment made with cash collateral received from securities on loan. |
| Additional information on each restricted holding is as follows: | ||
| Security | Acquisition Date | Acquisition Cost ($) |
| Aledade, Inc. Series B1 | 5/07/21 | 6,709,756 |
| Aledade, Inc. Series E1 | 5/20/22 | 2,917,480 |
| Asimov, Inc. Series B | 10/29/21 | 9,081,318 |
| Caris Life Sciences, Inc. Series D | 5/11/21 | 22,711,874 |
| Conformal Medical, Inc. Series C | 7/24/20 | 9,554,996 |
| dMed Biopharmaceutical Co. Ltd. Series C | 12/01/20 | 4,392,395 |
| DNA Script | 12/17/21 | 4,714,776 |
| DNA Script Series B | 12/17/21 | 47,244 |
| DNA Script Series C | 10/01/21 | 24,572,393 |
| Element Biosciences, Inc. Series B | 12/13/19 | 12,500,000 |
| ElevateBio LLC Series C | 3/09/21 | 900,667 |
| Freenome, Inc. Series C | 8/14/20 | 14,999,996 |
| Freenome, Inc. Series D | 11/22/21 | 9,999,996 |
| Galvanize Therapeutics Series B | 3/29/22 | 6,303,849 |
| Inscripta, Inc. Series D | 11/13/20 | 18,000,001 |
| Kardium, Inc. Series D6 | 12/30/20 | 14,001,515 |
| Kardium, Inc. 0% | 12/30/20 | 19,551,861 |
| Omada Health, Inc. Series E | 12/22/21 | 13,087,156 |
| PrognomIQ, Inc. Series A5 | 8/20/20 | 503,333 |
| PrognomIQ, Inc. Series B | 9/11/20 | 6,249,999 |
| PrognomIQ, Inc. Series C | 2/16/22 | 2,301,420 |
| Saluda Medical Pty Ltd. Series D | 1/20/22 | 20,000,011 |
| Saluda Medical Pty Ltd. warrants | 1/20/22 | 0 |
| The Beauty Health Co. | 12/08/20 | 30,000,000 |
| Affiliate | Value, beginning of period ($) | Purchases ($) | Sales Proceeds ($) | Dividend Income ($) | Realized Gain (loss) ($) | Change in Unrealized appreciation (depreciation) ($) | Value, end of period ($) | % ownership, end of period |
| Fidelity Cash Central Fund 4.63% | 21,433,102 | 1,229,311,033 | 1,238,174,883 | 1,366,847 | - | - | 12,569,252 | 0.0% |
| Fidelity Securities Lending Cash Central Fund 4.63% | 73,452,626 | 1,009,017,643 | 977,490,779 | 2,117,441 | - | - | 104,979,490 | 0.3% |
| Total | 94,885,728 | 2,238,328,676 | 2,215,665,662 | 3,484,288 | - | - | 117,548,742 | |
| Affiliate | Value, beginning of period ($) | Purchases ($) | Sales Proceeds ($) | Dividend Income ($) | Realized Gain (loss) ($) | Change in Unrealized appreciation (depreciation) ($) | Value, end of period ($) |
| Nanosonics Ltd. | 63,907,137 | - | 37,068,368 | - | 5,841,844 | (6,713,402) | - |
| Nevro Corp. | 91,776,000 | 63,146,247 | 30,147,923 | - | (49,499,645) | (12,394,679) | 62,880,000 |
| Total | 155,683,137 | 63,146,247 | 67,216,291 | - | (43,657,801) | (19,108,081) | 62,880,000 |
| Valuation Inputs at Reporting Date: | ||||
| Description | Total ($) | Level 1 ($) | Level 2 ($) | Level 3 ($) |
Investments in Securities: | ||||
| Common Stocks | 6,697,495,322 | 6,639,221,419 | 53,607,754 | 4,666,149 |
| Convertible Preferred Stocks | 205,989,012 | - | - | 205,989,012 |
| Preferred Securities | 19,043,513 | - | - | 19,043,513 |
| Money Market Funds | 117,548,742 | 117,548,742 | - | - |
| Total Investments in Securities: | 7,040,076,589 | 6,756,770,161 | 53,607,754 | 229,698,674 |
| Investments in Securities: | |||
| Convertible Preferred Stocks | |||
| Beginning Balance | $ | 240,783,918 | |
| Net Realized Gain (Loss) on Investment Securities | - | ||
| Net Unrealized Gain (Loss) on Investment Securities | (44,016,235) | ||
| Cost of Purchases | 9,221,329 | ||
| Proceeds of Sales | - | ||
| Amortization/Accretion | - | ||
| Transfers into Level 3 | - | ||
| Transfers out of Level 3 | - | ||
| Ending Balance | $ | 205,989,012 | |
| The change in unrealized gain (loss) for the period attributable to Level 3 securities held at February 28, 2023 | $ | (44,016,235) | |
| Other Investments in Securities | |||
| Beginning Balance | $ | 25,605,694 | |
| Net Realized Gain (Loss) on Investment Securities | - | ||
| Net Unrealized Gain (Loss) on Investment Securities | (1,896,032) | ||
| Cost of Purchases | - | ||
| Proceeds of Sales | - | ||
| Amortization/Accretion | - | ||
| Transfers into Level 3 | - | ||
| Transfers out of Level 3 | - | ||
| Ending Balance | $ | 23,709,662 | |
| The change in unrealized gain (loss) for the period attributable to Level 3 securities held at February 28, 2023 | $ | (1,896,032) | |
| The information used in the above reconciliation represents fiscal year to date activity for any Investments in Securities identified as using Level 3 inputs at either the beginning or the end of the current fiscal period. Cost of purchases and proceeds of sales may include securities received and/or delivered through in-kind transactions. Transfers into Level 3 were attributable to a lack of observable market data resulting from decreases in market activity, decreases in liquidity, security restructurings or corporate actions. Transfers out of Level 3 were attributable to observable market data becoming available for those securities. Transfers in or out of Level 3 represent the beginning value of any Security or Instrument where a change in the pricing level occurred from the beginning to the end of the period. The cost of purchases and the proceeds of sales may include securities received or delivered through corporate actions or exchanges. Realized and unrealized gains (losses) disclosed in the reconciliation are included in Net Gain (Loss) on the Fund's Statement of Operations. | |||
| Statement of Assets and Liabilities | ||||
| February 28, 2023 | ||||
| Assets | ||||
| Investment in securities, at value (including securities loaned of $103,361,313) - See accompanying schedule: | ||||
Unaffiliated issuers (cost $4,207,610,407) | $ | 6,859,647,847 | ||
Fidelity Central Funds (cost $117,548,742) | 117,548,742 | |||
Other affiliated issuers (cost $118,052,669) | 62,880,000 | |||
| Total Investment in Securities (cost $4,443,211,818) | $ | 7,040,076,589 | ||
| Foreign currency held at value (cost $84) | 83 | |||
| Receivable for investments sold | 60,512,509 | |||
| Receivable for fund shares sold | 734,870 | |||
| Dividends receivable | 851,175 | |||
| Distributions receivable from Fidelity Central Funds | 376,931 | |||
| Prepaid expenses | 15,703 | |||
| Other receivables | 230,636 | |||
Total assets | 7,102,798,496 | |||
| Liabilities | ||||
| Payable for investments purchased | $ | 66,888,599 | ||
| Payable for fund shares redeemed | 14,995,911 | |||
| Accrued management fee | 3,158,294 | |||
| Other affiliated payables | 1,025,159 | |||
| Other payables and accrued expenses | 274,939 | |||
| Collateral on securities loaned | 104,970,925 | |||
| Total Liabilities | 191,313,827 | |||
| Net Assets | $ | 6,911,484,669 | ||
| Net Assets consist of: | ||||
| Paid in capital | $ | 4,664,629,971 | ||
| Total accumulated earnings (loss) | 2,246,854,698 | |||
| Net Assets | $ | 6,911,484,669 | ||
Net Asset Value , offering price and redemption price per share ($6,911,484,669 ÷ 112,133,731 shares) | $ | 61.64 | ||
| Statement of Operations | ||||
Year ended February 28, 2023 | ||||
| Investment Income | ||||
| Dividends | $ | 19,804,120 | ||
| Income from Fidelity Central Funds (including $2,117,441 from security lending) | 3,484,288 | |||
| Total Income | 23,288,408 | |||
| Expenses | ||||
| Management fee | $ | 38,848,557 | ||
| Transfer agent fees | 11,566,502 | |||
| Accounting fees | 1,086,483 | |||
| Custodian fees and expenses | 75,956 | |||
| Independent trustees' fees and expenses | 25,455 | |||
| Registration fees | 32,525 | |||
| Audit | 41,138 | |||
| Legal | 4,741 | |||
| Interest | 2,108 | |||
| Miscellaneous | 41,425 | |||
| Total expenses before reductions | 51,724,890 | |||
| Expense reductions | (266,416) | |||
| Total expenses after reductions | 51,458,474 | |||
| Net Investment income (loss) | (28,170,066) | |||
| Realized and Unrealized Gain (Loss) | ||||
| Net realized gain (loss) on: | ||||
| Investment Securities: | ||||
| Unaffiliated issuers | (202,286,083) | |||
| Affiliated issuers | (43,657,801) | |||
| Foreign currency transactions | (91,142) | |||
| Total net realized gain (loss) | (246,035,026) | |||
| Change in net unrealized appreciation (depreciation) on: | ||||
| Investment Securities: | ||||
| Unaffiliated issuers | (752,446,539) | |||
| Affiliated issuers | (19,108,081) | |||
| Assets and liabilities in foreign currencies | (7,069) | |||
| Total change in net unrealized appreciation (depreciation) | (771,561,689) | |||
| Net gain (loss) | (1,017,596,715) | |||
| Net increase (decrease) in net assets resulting from operations | $ | (1,045,766,781) | ||
| Statement of Changes in Net Assets | ||||
Year ended February 28, 2023 | Year ended February 28, 2022 | |||
| Increase (Decrease) in Net Assets | ||||
| Operations | ||||
| Net investment income (loss) | $ | (28,170,066) | $ | (44,939,672) |
| Net realized gain (loss) | (246,035,026) | 498,712,415 | ||
| Change in net unrealized appreciation (depreciation) | (771,561,689) | (241,663,649) | ||
| Net increase (decrease) in net assets resulting from operations | (1,045,766,781) | 212,109,094 | ||
| Distributions to shareholders | (137,786,409) | (808,325,364) | ||
| Share transactions | ||||
| Proceeds from sales of shares | 418,873,849 | 1,949,163,820 | ||
| Reinvestment of distributions | 128,702,740 | 757,192,690 | ||
| Cost of shares redeemed | (1,358,373,047) | (1,877,605,232) | ||
Net increase (decrease) in net assets resulting from share transactions | (810,796,458) | 828,751,278 | ||
| Total increase (decrease) in net assets | (1,994,349,648) | 232,535,008 | ||
| Net Assets | ||||
| Beginning of period | 8,905,834,317 | 8,673,299,309 | ||
| End of period | $ | 6,911,484,669 | $ | 8,905,834,317 |
| Other Information | ||||
| Shares | ||||
| Sold | 6,616,291 | 24,345,738 | ||
| Issued in reinvestment of distributions | 1,786,046 | 9,855,790 | ||
| Redeemed | (22,012,597) | (24,120,700) | ||
| Net increase (decrease) | (13,610,260) | 10,080,828 | ||
| Medical Technology and Devices Portfolio |
| Years ended February 28, | 2023 | 2022 | 2021 | 2020 A | 2019 | |||||
Selected Per-Share Data | ||||||||||
| Net asset value, beginning of period | $ | 70.83 | $ | 74.99 | $ | 55.88 | $ | 52.92 | $ | 46.09 |
| Income from Investment Operations | ||||||||||
Net investment income (loss) B,C | (.24) | (.37) | (.24) | (.08) | (.04) | |||||
| Net realized and unrealized gain (loss) | (7.84) | 2.97 | 24.19 | 4.10 | 10.40 | |||||
| Total from investment operations | (8.08) | 2.60 | 23.95 | 4.02 | 10.36 | |||||
| Distributions from net realized gain | (1.11) | (6.76) | (4.84) | (1.06) | (3.53) | |||||
| Total distributions | (1.11) | (6.76) | (4.84) | (1.06) | (3.53) | |||||
| Net asset value, end of period | $ | 61.64 | $ | 70.83 | $ | 74.99 | $ | 55.88 | $ | 52.92 |
Total Return D | (11.64)% | 2.95% | 44.20% | 7.46% | 23.85% | |||||
Ratios to Average Net Assets C,E,F | ||||||||||
| Expenses before reductions | .70% | .68% | .70% | .71% | .73% | |||||
| Expenses net of fee waivers, if any | .70% | .68% | .70% | .71% | .73% | |||||
| Expenses net of all reductions | .70% | .68% | .70% | .71% | .73% | |||||
| Net investment income (loss) | (.38)% | (.46)% | (.36)% | (.15)% | (.07)% | |||||
| Supplemental Data | ||||||||||
| Net assets, end of period (000 omitted) | $ | 6,911,485 | $ | 8,905,834 | $ | 8,673,299 | $ | 6,058,766 | $ | 6,787,645 |
Portfolio turnover rate G | 37% | 32% | 58% | 35% | 43% |
| Average Annual Total Returns | |||
Periods ended February 28, 2023 | Past 1 year | Past 5 years | Past 10 years |
| Pharmaceuticals Portfolio | 1.60% | 10.48% | 10.57% |
| $10,000 Over 10 Years |
Let's say hypothetically that $10,000 was invested in Pharmaceuticals Portfolio on February 28, 2013. The chart shows how the value of your investment would have changed, and also shows how the S&P 500® Index performed over the same period. |
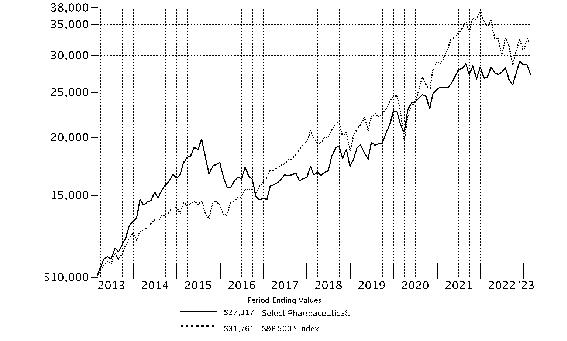 |
Top Holdings (% of Fund's net assets) | ||
| Eli Lilly & Co. | 14.3 | |
| AstraZeneca PLC sponsored ADR | 10.9 | |
| Novo Nordisk A/S Series B sponsored ADR | 8.8 | |
| Sanofi SA sponsored ADR | 8.2 | |
| Merck & Co., Inc. | 7.1 | |
| Royalty Pharma PLC | 4.2 | |
| Roche Holding AG (participation certificate) | 4.0 | |
| Gilead Sciences, Inc. | 3.8 | |
| UCB SA | 3.4 | |
| Merck KGaA | 3.1 | |
| 67.8 | ||
| Industries (% of Fund's net assets) | ||
| Pharmaceuticals | 74.4 | |
| Biotechnology | 20.9 | |
| Health Care Providers & Services | 1.9 | |
| Diversified Financial Services | 0.3 | |
| Software | 0.0 | |
| Food & Staples Retailing | 0.0 | |
Geographic Diversification (% of Fund's net assets) |
 |
* Includes Short-Term investments and Net Other Assets (Liabilities). Percentages are based on country or territory of incorporation and are adjusted for the effect of derivatives, if applicable. |
| Common Stocks - 97.0% | |||
| Shares | Value ($) | ||
| Biotechnology - 20.7% | |||
| Biotechnology - 20.7% | |||
| 2seventy bio, Inc. (a) | 183,600 | 2,476,764 | |
| ADC Therapeutics SA (a)(b) | 419,700 | 1,510,920 | |
| Alnylam Pharmaceuticals, Inc. (a) | 29,471 | 5,642,223 | |
| Apellis Pharmaceuticals, Inc. (a) | 60,400 | 3,954,992 | |
| Arcus Biosciences, Inc. (a) | 115,100 | 2,095,971 | |
| Argenx SE (a) | 15,200 | 5,532,882 | |
| Argenx SE ADR (a) | 11,000 | 4,026,220 | |
| Ascendis Pharma A/S sponsored ADR (a) | 40,500 | 4,499,145 | |
| Avidity Biosciences, Inc. (a) | 302,800 | 7,176,360 | |
| Biogen, Inc. (a) | 61,100 | 16,488,446 | |
| BioInvent International AB (a) | 396,505 | 1,096,563 | |
| Blueprint Medicines Corp. (a) | 153,900 | 6,520,743 | |
| Cullinan Oncology, Inc. (a) | 88,100 | 994,649 | |
| Cytokinetics, Inc. (a) | 67,100 | 2,909,456 | |
| Galapagos NV sponsored ADR (a) | 36,900 | 1,383,197 | |
| Generation Bio Co. (a) | 387,856 | 1,535,910 | |
| Gilead Sciences, Inc. | 356,100 | 28,676,733 | |
| Intellia Therapeutics, Inc. (a) | 15,400 | 618,618 | |
| iTeos Therapeutics, Inc. (a) | 116,000 | 2,054,360 | |
| Kalvista Pharmaceuticals, Inc. (a) | 374,800 | 2,747,284 | |
| Leap Therapeutics, Inc. warrants 1/31/26 (a) | 606,000 | 22,749 | |
| Legend Biotech Corp. ADR (a) | 293,400 | 13,549,212 | |
| Moderna, Inc. (a) | 15,100 | 2,096,031 | |
| Natera, Inc. (a) | 96,000 | 4,660,800 | |
| Oxurion NV (a)(b) | 3,128,819 | 41,698 | |
| PepGen, Inc. | 243,600 | 3,719,772 | |
| Prothena Corp. PLC (a) | 104,100 | 5,804,616 | |
| PTC Therapeutics, Inc. (a) | 49,500 | 2,161,665 | |
| Relay Therapeutics, Inc. (a)(b) | 168,000 | 2,713,200 | |
| Sarepta Therapeutics, Inc. (a) | 101,100 | 12,347,343 | |
| Synlogic, Inc. (a) | 520,500 | 364,350 | |
| uniQure B.V. (a) | 150,300 | 3,150,288 | |
| Xencor, Inc. (a) | 123,168 | 3,957,388 | |
| XOMA Corp. (a)(b) | 53,300 | 1,134,224 | |
| 157,664,772 | |||
| Food & Staples Retailing - 0.0% | |||
| Drug Retail - 0.0% | |||
| MedAvail Holdings, Inc. (a) | 3,333 | 1,239 | |
| Health Care Providers & Services - 1.9% | |||
| Health Care Services - 1.9% | |||
| Cigna Group | 49,500 | 14,458,950 | |
| Pharmaceuticals - 74.4% | |||
| Pharmaceuticals - 74.4% | |||
| Acelyrin, Inc. (c) | 317,157 | 1,972,748 | |
| Acelyrin, Inc. rights (a)(c) | 38,539 | 228,402 | |
| Arvinas Holding Co. LLC (a) | 55,600 | 1,704,140 | |
| AstraZeneca PLC sponsored ADR | 1,268,300 | 82,667,794 | |
| Axsome Therapeutics, Inc. (a)(b) | 43,400 | 2,959,446 | |
| Bristol-Myers Squibb Co. | 234,280 | 16,155,949 | |
| Edgewise Therapeutics, Inc. (a) | 532,200 | 5,098,476 | |
| Eli Lilly & Co. | 349,561 | 108,790,372 | |
| GSK PLC sponsored ADR | 345,060 | 11,825,206 | |
| Harmony Biosciences Holdings, Inc. (a) | 73,077 | 3,217,580 | |
| Intra-Cellular Therapies, Inc. (a) | 11,200 | 549,136 | |
| Jazz Pharmaceuticals PLC (a) | 31,600 | 4,436,640 | |
| Johnson & Johnson | 41,550 | 6,367,953 | |
| Merck & Co., Inc. | 508,136 | 53,984,369 | |
| Merck KGaA | 124,300 | 23,579,523 | |
| Novartis AG sponsored ADR | 150,096 | 12,626,076 | |
| Novo Nordisk A/S Series B sponsored ADR | 477,800 | 67,365,022 | |
| Reata Pharmaceuticals, Inc. (a) | 52,100 | 1,623,957 | |
| Roche Holding AG (participation certificate) | 105,596 | 30,447,443 | |
| Royalty Pharma PLC | 888,500 | 31,852,725 | |
| Sanofi SA sponsored ADR | 1,329,022 | 62,264,681 | |
| Sosei Group Corp. (a) | 181,400 | 2,939,065 | |
| Structure Therapeutics, Inc. ADR | 98,000 | 2,504,880 | |
| UCB SA | 302,000 | 25,994,839 | |
| Zoetis, Inc. Class A | 29,500 | 4,926,500 | |
| 566,082,922 | |||
| TOTAL COMMON STOCKS (Cost $579,287,424) | 738,207,883 | ||
| Convertible Preferred Stocks - 0.5% | |||
| Shares | Value ($) | ||
| Biotechnology - 0.2% | |||
| Biotechnology - 0.2% | |||
| Castle Creek Biosciences, Inc.: | |||
| Series D1 (c)(d) | 6,308 | 1,285,192 | |
| Series D2 (c)(d) | 85 | 17,318 | |
| 1,302,510 | |||
| Diversified Financial Services - 0.3% | |||
| Other Diversified Financial Services - 0.3% | |||
| Paragon Biosciences Emalex Capital, Inc.: | |||
| Series C (a)(c)(d) | 158,879 | 1,720,660 | |
| Series D1 (c)(d) | 14,400 | 155,952 | |
| Series D2 (c)(d) | 22,477 | 243,426 | |
| 2,120,038 | |||
| Pharmaceuticals - 0.0% | |||
| Pharmaceuticals - 0.0% | |||
| Castle Creek Pharmaceutical Holdings, Inc. Series C (a)(c)(d) | 200 | 44,304 | |
| Software - 0.0% | |||
| Systems Software - 0.0% | |||
| Evozyne LLC Series A (a)(c)(d) | 5,900 | 91,981 | |
| TOTAL CONVERTIBLE PREFERRED STOCKS (Cost $3,635,756) | 3,558,833 | ||
| Money Market Funds - 3.1% | |||
| Shares | Value ($) | ||
| Fidelity Cash Central Fund 4.63% (e) | 16,714,569 | 16,717,912 | |
| Fidelity Securities Lending Cash Central Fund 4.63% (e)(f) | 7,205,438 | 7,206,158 | |
| TOTAL MONEY MARKET FUNDS (Cost $23,924,070) | 23,924,070 | ||
| TOTAL INVESTMENT IN SECURITIES - 100.6% (Cost $606,847,250) | 765,690,786 |
NET OTHER ASSETS (LIABILITIES) - (0.6)% | (4,511,787) |
| NET ASSETS - 100.0% | 761,178,999 |
| (a) | Non-income producing |
| (b) | Security or a portion of the security is on loan at period end. |
| (c) | Level 3 security |
| (d) | Restricted securities (including private placements) - Investment in securities not registered under the Securities Act of 1933 (excluding 144A issues). At the end of the period, the value of restricted securities (excluding 144A issues) amounted to $3,558,833 or 0.5% of net assets. |
| (e) | Affiliated fund that is generally available only to investment companies and other accounts managed by Fidelity Investments. The rate quoted is the annualized seven-day yield of the fund at period end. A complete unaudited listing of the fund's holdings as of its most recent quarter end is available upon request. In addition, each Fidelity Central Fund's financial statements, which are not covered by the Fund's Report of Independent Registered Public Accounting Firm, are available on the SEC's website or upon request. |
| (f) | Investment made with cash collateral received from securities on loan. |
| Additional information on each restricted holding is as follows: | ||
| Security | Acquisition Date | Acquisition Cost ($) |
| Castle Creek Biosciences, Inc. Series D1 | 4/19/22 | 1,356,409 |
| Castle Creek Biosciences, Inc. Series D2 | 6/28/21 | 14,700 |
| Castle Creek Pharmaceutical Holdings, Inc. Series C | 12/09/19 | 82,370 |
| Evozyne LLC Series A | 4/09/21 | 132,573 |
| Paragon Biosciences Emalex Capital, Inc. Series C | 2/26/21 | 1,700,005 |
| Paragon Biosciences Emalex Capital, Inc. Series D1 | 10/21/22 | 155,952 |
| Paragon Biosciences Emalex Capital, Inc. Series D2 | 5/18/22 | 193,747 |
| Affiliate | Value, beginning of period ($) | Purchases ($) | Sales Proceeds ($) | Dividend Income ($) | Realized Gain (loss) ($) | Change in Unrealized appreciation (depreciation) ($) | Value, end of period ($) | % ownership, end of period |
| Fidelity Cash Central Fund 4.63% | 10,726,575 | 345,673,519 | 339,682,182 | 260,885 | - | - | 16,717,912 | 0.0% |
| Fidelity Securities Lending Cash Central Fund 4.63% | 7,039,136 | 316,048,806 | 315,881,784 | 70,984 | - | - | 7,206,158 | 0.0% |
| Total | 17,765,711 | 661,722,325 | 655,563,966 | 331,869 | - | - | 23,924,070 | |
| Affiliate | Value, beginning of period ($) | Purchases ($) | Sales Proceeds ($) | Dividend Income ($) | Realized Gain (loss) ($) | Change in Unrealized appreciation (depreciation) ($) | Value, end of period ($) |
| Oxurion NV | - | 4,984,659 | - | - | - | (4,942,961) | - |
| Total | - | 4,984,659 | - | - | - | (4,942,961) | - |
| Valuation Inputs at Reporting Date: | ||||
| Description | Total ($) | Level 1 ($) | Level 2 ($) | Level 3 ($) |
Investments in Securities: | ||||
| Common Stocks | 738,207,883 | 700,003,659 | 36,003,074 | 2,201,150 |
| Convertible Preferred Stocks | 3,558,833 | - | - | 3,558,833 |
| Money Market Funds | 23,924,070 | 23,924,070 | - | - |
| Total Investments in Securities: | 765,690,786 | 723,927,729 | 36,003,074 | 5,759,983 |
| Statement of Assets and Liabilities | ||||
| February 28, 2023 | ||||
| Assets | ||||
| Investment in securities, at value (including securities loaned of $6,996,498) - See accompanying schedule: | ||||
Unaffiliated issuers (cost $582,923,180) | $ | 741,766,716 | ||
Fidelity Central Funds (cost $23,924,070) | 23,924,070 | |||
| Total Investment in Securities (cost $606,847,250) | $ | 765,690,786 | ||
| Cash | 159,847 | |||
| Foreign currency held at value (cost $412) | 407 | |||
| Receivable for investments sold | 1,230,882 | |||
| Receivable for fund shares sold | 248,073 | |||
| Dividends receivable | 2,043,399 | |||
| Reclaims receivable | 1,581,798 | |||
| Distributions receivable from Fidelity Central Funds | 20,089 | |||
| Prepaid expenses | 2,521 | |||
| Other receivables | 152,095 | |||
Total assets | 771,129,897 | |||
| Liabilities | ||||
| Payable for investments purchased | $ | 1,626,236 | ||
| Payable for fund shares redeemed | 392,504 | |||
| Accrued management fee | 346,935 | |||
| Other affiliated payables | 140,229 | |||
| Other payables and accrued expenses | 239,544 | |||
| Collateral on securities loaned | 7,205,450 | |||
| Total Liabilities | 9,950,898 | |||
| Net Assets | $ | 761,178,999 | ||
| Net Assets consist of: | ||||
| Paid in capital | $ | 568,675,833 | ||
| Total accumulated earnings (loss) | 192,503,166 | |||
| Net Assets | $ | 761,178,999 | ||
Net Asset Value , offering price and redemption price per share ($761,178,999 ÷ 34,967,627 shares) | $ | 21.77 | ||
| Statement of Operations | ||||
Year ended February 28, 2023 | ||||
| Investment Income | ||||
| Dividends | $ | 15,133,055 | ||
| Foreign Tax Reclaims | 1,005,089 | |||
| Interest | 64 | |||
| Income from Fidelity Central Funds (including $70,984 from security lending) | 331,869 | |||
| Income before foreign taxes withheld | $ | 16,470,077 | ||
| Less foreign taxes withheld | (1,896,569) | |||
| Total Income | 14,573,508 | |||
| Expenses | ||||
| Management fee | $ | 4,390,775 | ||
| Transfer agent fees | 1,461,483 | |||
| Accounting fees | 264,946 | |||
| Custodian fees and expenses | 126,989 | |||
| Independent trustees' fees and expenses | 2,865 | |||
| Registration fees | 42,492 | |||
| Audit | 55,353 | |||
| Legal | 5,429 | |||
| Interest | 3,363 | |||
| Miscellaneous | 4,916 | |||
| Total expenses before reductions | 6,358,611 | |||
| Expense reductions | (29,167) | |||
| Total expenses after reductions | 6,329,444 | |||
| Net Investment income (loss) | 8,244,064 | |||
| Realized and Unrealized Gain (Loss) | ||||
| Net realized gain (loss) on: | ||||
| Investment Securities: | ||||
| Unaffiliated issuers | 67,953,495 | |||
| Foreign currency transactions | 71,322 | |||
| Total net realized gain (loss) | 68,024,817 | |||
| Change in net unrealized appreciation (depreciation) on: | ||||
| Investment Securities: | ||||
| Unaffiliated issuers | (55,955,025) | |||
| Affiliated issuers | (4,942,961) | |||
| Assets and liabilities in foreign currencies | (71,565) | |||
| Total change in net unrealized appreciation (depreciation) | (60,969,551) | |||
| Net gain (loss) | 7,055,266 | |||
| Net increase (decrease) in net assets resulting from operations | $ | 15,299,330 | ||
| Statement of Changes in Net Assets | ||||
Year ended February 28, 2023 | Year ended February 28, 2022 | |||
| Increase (Decrease) in Net Assets | ||||
| Operations | ||||
| Net investment income (loss) | $ | 8,244,064 | $ | 9,312,735 |
| Net realized gain (loss) | 68,024,817 | 66,607,987 | ||
| Change in net unrealized appreciation (depreciation) | (60,969,551) | (29,793,616) | ||
| Net increase (decrease) in net assets resulting from operations | 15,299,330 | 46,127,106 | ||
| Distributions to shareholders | (41,990,940) | (87,692,898) | ||
| Share transactions | ||||
| Proceeds from sales of shares | 164,880,948 | 223,427,519 | ||
| Reinvestment of distributions | 39,396,332 | 83,261,883 | ||
| Cost of shares redeemed | (351,154,587) | (163,755,378) | ||
Net increase (decrease) in net assets resulting from share transactions | (146,877,307) | 142,934,024 | ||
| Total increase (decrease) in net assets | (173,568,917) | 101,368,232 | ||
| Net Assets | ||||
| Beginning of period | 934,747,916 | 833,379,684 | ||
| End of period | $ | 761,178,999 | $ | 934,747,916 |
| Other Information | ||||
| Shares | ||||
| Sold | 7,124,169 | 9,855,327 | ||
| Issued in reinvestment of distributions | 1,698,146 | 3,596,826 | ||
| Redeemed | (15,341,002) | (6,801,557) | ||
| Net increase (decrease) | (6,518,687) | 6,650,596 | ||
| Pharmaceuticals Portfolio |
| Years ended February 28, | 2023 | 2022 | 2021 | 2020 A | 2019 | |||||
Selected Per-Share Data | ||||||||||
| Net asset value, beginning of period | $ | 22.53 | $ | 23.92 | $ | 21.71 | $ | 21.07 | $ | 18.82 |
| Income from Investment Operations | ||||||||||
Net investment income (loss) B,C | .23 | .27 | .27 | .29 | .29 | |||||
| Net realized and unrealized gain (loss) | .19 | .97 | 4.04 | 2.29 | 2.34 | |||||
| Total from investment operations | .42 | 1.24 | 4.31 | 2.58 | 2.63 | |||||
| Distributions from net investment income | (.30) | (.28) | (.31) | (.31) | (.28) | |||||
| Distributions from net realized gain | (.88) | (2.35) | (1.79) | (1.64) | (.10) | |||||
| Total distributions | (1.18) | (2.63) | (2.10) | (1.94) D | (.38) | |||||
| Net asset value, end of period | $ | 21.77 | $ | 22.53 | $ | 23.92 | $ | 21.71 | $ | 21.07 |
Total Return E | 1.60% | 5.15% | 20.46% | 12.06% | 14.15% | |||||
Ratios to Average Net Assets C,F,G | ||||||||||
| Expenses before reductions | .76% | .75% | .77% | .78% | .80% | |||||
| Expenses net of fee waivers, if any | .76% | .75% | .77% | .78% | .79% | |||||
| Expenses net of all reductions | .76% | .75% | .76% | .77% | .79% | |||||
| Net investment income (loss) | .99% | 1.10% | 1.13% | 1.36% | 1.48% | |||||
| Supplemental Data | ||||||||||
| Net assets, end of period (000 omitted) | $ | 761,179 | $ | 934,748 | $ | 833,380 | $ | 764,285 | $ | 747,604 |
Portfolio turnover rate H | 45% | 29% | 32% | 52% | 55% |
| Fidelity Central Fund | Investment Manager | Investment Objective | Investment Practices | Expense Ratio A |
| Fidelity Money Market Central Funds | Fidelity Management & Research Company LLC (FMR) | Each fund seeks to obtain a high level of current income consistent with the preservation of capital and liquidity. | Short-term Investments | Less than .005% |
| Asset Type | Fair Value | Valuation Technique(s) | Unobservable Input | Amount or Range/Weighted Average | Impact to Valuation from an Increase in Input A |
| Equities | $171,404,837 | Market comparable | Enterprise value/Revenue multiple (EV/R) | 18.0 | Increase |
| Recovery value | Recovery value | $0.00 - $5.51 / $5.50 | Increase | ||
| Market Approach | Transaction price | $2.42 - $105.86 / $46.47 | Increase | ||
| Discount rate | 4.7% - 40.0% / 32.0% | Decrease | |||
| Parity Price | $0.00 | Increase | |||
| Discounted cash flow | Discount rate | 4.9% - 14.1% / 10.5% | Decrease | ||
| Probability rate | 0.0% - 90.0% / 39.0% | Increase | |||
| Term | 0.1 - 7.8 / 4.3 | Increase | |||
| Black scholes | Discount rate | 4.2% - 4.4% / 4.4% | Increase | ||
| Volatility | 80.0% - 85.0% / 82.8% | Increase | |||
| Term | 2.0 - 3.0 / 3.0 | Increase |
| Asset Type | Fair Value | Valuation Technique(s) | Unobservable Input | Amount or Range/Weighted Average | Impact to Valuation from an Increase in Input A |
| Equities | $ 109,429,633 | Market comparable | Enterprise value/Revenue multiple (EV/R) | 3.6 - 18.0/6.7 | Increase |
| Recovery Value | Recovery Value | $5.51 | Increase | ||
| Market Approach | Transaction price Discount rate | $7.75 - $20.56 / $13.55 20.0%-50.0% / 31.0% | Increase Decrease | ||
| Black scholes | Discount rate | 4.3%-4.9% / 4.5% | Increase | ||
| Term | 1.5-4.0/3.2 | Increase | |||
| Volatility | 45.0%-90.0% / 52.3% | Increase |
| Asset Type | Fair Value | Valuation Technique(s) | Unobservable Input | Amount or Range/Weighted Average | Impact to Valuation from an Increase in Input A |
| Equities | $210,655,161 | Market Comparable | Enterprise value/Revenue multiple (EV/R) | 3.6% - 18.0 / 6.4 | Increase |
| Market approach | Transaction price | $1.02 - $20.56 / $11.75 | Increase | ||
| Discount rate | 15.0% - 50.0% / 23.6% | Decrease | |||
| Discounted cash flow | Weighted average cost of capital (WACC) | 28.3% | Decrease | ||
| Exit multiple | 2.0 | Increase | |||
| Black scholes | Discount rate | 4.3% - 4.9% /4.6% | Increase | ||
| Volatility | 55.0% - 80.0% /67.3% | Increase | |||
| Term | 1.5 - 4.0 / 2.5 | Increase | |||
| Preferred Securities | $19,043,513 | Market approach | Transaction price | $100.00 | Increase |
| Black scholes | Discount rate | 4.4% | Increase | ||
| Volatility | 70.0% | Increase | |||
| Term | 3.0 | Increase |
| Biotechnology Portfolio | $1,065,322 |
| Health Care Portfolio | 702,098 |
| Health Care Services Portfolio | 79,036 |
| Medical Technology and Devices Portfolio | 230,636 |
| Pharmaceuticals Portfolio | 144,281 |
| Tax cost | Gross unrealized appreciation | Gross unrealized depreciation | Net unrealized appreciation (depreciation) | |
| Biotechnology Portfolio | $4,168,288,756 | $1,702,606,798 | $(546,308,089) | $1,156,298,709) |
| Health Care Portfolio | 5,843,402,990 | 2,997,884,694 | (506,308,202) | 2,491,576,492 |
| Health Care Services Portfolio | 1,188,870,647 | 654,128,922 | (76,772,117) | 577,356,805 |
Medical Technology and Devices Portfolio | 4,456,431,098 | 2,844,407,593 | (260,762,102) | 2,583,645,491 |
| Pharmaceuticals Portfolio | 608,145,883 | 208,618,302 | (51,073,399) | 157,544,903 |
| Undistributed long-term capital gain | Capital loss carryforward | Net unrealized appreciation (depreciation) on securities and other investments | |
| Biotechnology Portfolio | $- | $(648,368,714) | $1,156,284,868 |
| Health Care Portfolio | - | (82,842,812) | 2,491,637,226 |
| Health Care Services Portfolio | - | - | 577,354,880 |
Medical Technology and Devices Portfolio | - | (330,894,459) | 2,583,640,172 |
| Pharmaceuticals Portfolio | 35,641,716 | - | 157,539,749 |
Short-term | Long-term | Total capital loss carryforward | |
| Biotechnology Portfolio | $(486,419,734) | $(161,948,980) | $(648,368,714) |
| Health Care Portfolio | (82,842,812) | - | (82,842,812) |
Medical Technology and Devices Portfolio | (323,788,266) | (7,106,193) | (330,894,459) |
Capital Losses | Ordinary Losses | |
| Biotechnology Portfolio | $- | $(2,587,831) |
| Health Care Portfolio | - | (12,417,992) |
| Health Care Services Portfolio | (23,317,441) | (854,077) |
Medical Technology and Devices Portfolio | - | (5,653,348) |
| Pharmaceuticals Portfolio | - | (529,772) |
| February 28, 2023 | |||
| Ordinary Income | Long-term Capital Gains | Total | |
| Health Care Portfolio | - | 185,553,756 | 185,553,756 |
| Health Care Services Portfolio | 6,851,701 | 63,741,020 | 70,592,721 |
Medical Technology and Devices Portfolio | - | 137,786,409 | 137,786,409 |
| Pharmaceuticals Portfolio | 10,747,779 | 31,243,161 | 41,990,940 |
| February 28, 2022 | |||
| Ordinary Income | Long-term Capital Gains | Total | |
| Biotechnology Portfolio | $44,710,367 | $906,920,364 | $951,630,731 |
| Health Care Portfolio | 30,213,050 | 899,646,185 | 929,859,235 |
| Health Care Services Portfolio | 2,649,600 | 84,975,790 | 87,625,390 |
Medical Technology and Devices Portfolio | 80,106,652 | 728,218,712 | 808,325,364 |
| Pharmaceuticals Portfolio | 14,327,993 | 73,364,905 | 87,692,898 |
| $ Amount | % of Net Assets | |
| Biotechnology Portfolio | 79,959,659 | 1.61 |
| Health Care Portfolio | 7,794,757 | .10 |
| Health Care Services Portfolio | 1,146,954 | .07 |
| Purchases ($) | Sales ($) | |
| Biotechnology Portfolio | 2,560,920,434 | 2,902,731,897 |
| Health Care Portfolio | 3,354,725,863 | 3,936,409,570 |
| Health Care Services Portfolio | 990,960,891 | 452,917,413 |
| Medical Technology and Devices Portfolio | 2,735,274,233 | 3,629,714,765 |
| Pharmaceuticals Portfolio | 372,188,874 | 556,621,213 |
| Individual Rate | Group Rate | Total | |
| Biotechnology Portfolio | .30% | .23% | .53% |
| Health Care Portfolio | .30% | .23% | .53% |
| Health Care Services Portfolio | .30% | .23% | .53% |
| Medical Technology and Devices Portfolio | .30% | .23% | .53% |
| Pharmaceuticals Portfolio | .30% | .23% | .53% |
| Biotechnology Portfolio | .16% |
| Health Care Portfolio | .14% |
| Health Care Services Portfolio | .16% |
| Medical Technology and Devices Portfolio | .16% |
| Pharmaceuticals Portfolio | .18% |
| % of Average Net Assets | |
| Biotechnology Portfolio | .02 |
| Health Care Portfolio | .01 |
| Health Care Services Portfolio | .03 |
| Medical Technology and Devices Portfolio | .01 |
| Pharmaceuticals Portfolio | .03 |
| Amount | |
| Biotechnology Portfolio | $181,009 |
| Health Care Portfolio | 71,796 |
| Health Care Services Portfolio | 17,269 |
| Medical Technology and Devices Portfolio | 54,685 |
| Pharmaceuticals Portfolio | 10,984 |
| Borrower or Lender | Average Loan Balance | Weighted Average Interest Rate | Interest Expense | |
| Health Care Portfolio | Borrower | $6,682,938 | 1.56% | $4,620 |
Medical Technology and Devices Portfolio | Borrower | $8,557,857 | 1.27% | $2,108 |
| Pharmaceuticals Portfolio | Borrower | $13,288,500 | 2.28% | $3,363 |
| Purchases ($) | Sales ($) | Realized Gain (Loss) ($) | |
| Biotechnology Portfolio | 133,000,609 | 166,195,767 | (10,338,109) |
| Health Care Portfolio | 225,043,889 | 352,657,619 | 61,499,881 |
| Health Care Services Portfolio | 101,703,304 | 75,854,331 | 16,713,553 |
| Medical Technology and Devices Portfolio | 124,184,811 | 173,350,227 | 47,346 |
| Pharmaceuticals Portfolio | 41,271,572 | 51,407,690 | 5,208,222 |
| Amount | |
| Biotechnology Portfolio | $9,236 |
| Health Care Portfolio | 15,190 |
| Health Care Services Portfolio | 2,581 |
| Medical Technology and Devices Portfolio | 13,710 |
| Pharmaceuticals Portfolio | 1,500 |
| Total Security Lending Fees Paid to NFS | Security Lending Income From Securities Loaned to NFS | Value of Securities Loaned to NFS at Period End | |
| Biotechnology Portfolio | $739,889 | $101,109 | $492,191 |
| Health Care Portfolio | $183,363 | $50,233 | $- |
| Health Care Services Portfolio | $24,291 | $8,760 | $- |
| Medical Technology and Devices Portfolio | $222,443 | $13,812 | $- |
| Pharmaceuticals Portfolio | $7,328 | $6,855 | $821,408 |
| Custodian credits | |
| Biotechnology Portfolio | $4,661 |
| Health Care Portfolio | 2,216 |
| Health Care Services Portfolio | 909 |
Medical Technology and Devices Portfolio | 1,917 |
| Amount | |
| Biotechnology Portfolio | $181,190 |
| Health Care Portfolio | 297,816 |
| Health Care Services Portfolio | 53,611 |
| Medical Technology and Devices Portfolio | 264,499 |
| Pharmaceuticals Portfolio | 29,167 |
| The Example is based on an investment of $1,000 invested at the beginning of the period and held for the entire period (September 1, 2022 to February 28, 2023). |
Annualized Expense Ratio- A | Beginning Account Value September 1, 2022 | Ending Account Value February 28, 2023 | Expenses Paid During Period- C September 1, 2022 to February 28, 2023 | |||||||
| Biotechnology Portfolio | .71% | |||||||||
| Actual | $ 1,000 | $ 1,008.20 | $ 3.54 | |||||||
Hypothetical- B | $ 1,000 | $ 1,021.27 | $ 3.56 | |||||||
| Health Care Portfolio | .69% | |||||||||
| Actual | $ 1,000 | $ 1,019.90 | $ 3.46 | |||||||
Hypothetical- B | $ 1,000 | $ 1,021.37 | $ 3.46 | |||||||
| Health Care Services Portfolio | .73% | |||||||||
| Actual | $ 1,000 | $ 945.70 | $ 3.52 | |||||||
Hypothetical- B | $ 1,000 | $ 1,021.17 | $ 3.66 | |||||||
| Medical Technology and Devices Portfolio | .70% | |||||||||
| Actual | $ 1,000 | $ 1,038.90 | $ 3.54 | |||||||
Hypothetical- B | $ 1,000 | $ 1,021.32 | $ 3.51 | |||||||
| Pharmaceuticals Portfolio | .77% | |||||||||
| Actual | $ 1,000 | $ 1,027.50 | $ 3.87 | |||||||
Hypothetical- B | $ 1,000 | $ 1,020.98 | $ 3.86 | |||||||
| Health Care Services Portfolio | $8,714,096 |
Pharmaceuticals Portfolio | $66,573,883 |
| Health Care Services Portfolio | |
April 2022 December 2022 | 100% 100% |
| Pharmaceuticals Portfolio | |
April 2022 December 2022 | 62% 54% |
| Health Care Services Portfolio | |
April 2022 December 2022 | 100% 100% |
| Pharmaceuticals Portfolio | |
April 2022 December 2022 | 100% 100% |
| April, 2022 | |
| Health Care Services Portfolio | 100% |
| Pharmaceuticals Portfolio | $81,637 |
- Highly liquid investments - cash or convertible to cash within three business days or less
- Moderately liquid investments - convertible to cash in three to seven calendar days
- Less liquid investments - can be sold or disposed of, but not settled, within seven calendar days
- Illiquid investments - cannot be sold or disposed of within seven calendar days
 |


Contents
| Average Annual Total Returns | |||
Periods ended February 28, 2023 | Past 1 year | Past 5 years | Past 10 years |
| Banking Portfolio | -11.27% | 3.88% | 9.81% |
| $10,000 Over 10 Years |
Let's say hypothetically that $10,000 was invested in Banking Portfolio on February 28, 2013. The chart shows how the value of your investment would have changed, and also shows how the S&P 500® Index performed over the same period. |
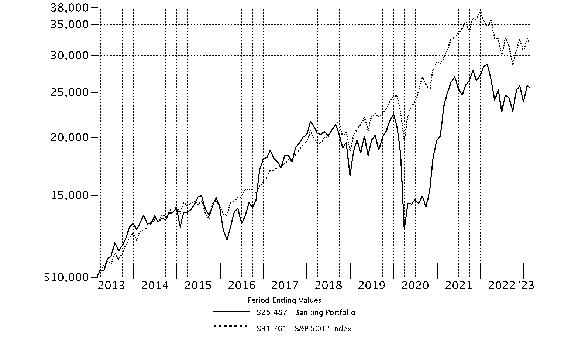 |
Top Holdings (% of Fund's net assets) | ||
| Wells Fargo & Co. | 9.0 | |
| Bank of America Corp. | 6.9 | |
| U.S. Bancorp | 6.7 | |
| JPMorgan Chase & Co. | 5.4 | |
| Citigroup, Inc. | 5.1 | |
| Truist Financial Corp. | 4.4 | |
| M&T Bank Corp. | 4.1 | |
| KeyCorp | 3.4 | |
| East West Bancorp, Inc. | 3.1 | |
| Essent Group Ltd. | 3.1 | |
| 51.2 | ||
| Industries (% of Fund's net assets) | ||
| Banks | 87.9 | |
| Thrifts & Mortgage Finance | 6.3 | |
| Consumer Finance | 2.8 | |
| Capital Markets | 1.9 | |
| IT Services | 0.6 | |
| Diversified Financial Services | 0.0 | |
| Common Stocks - 98.9% | |||
| Shares | Value ($) | ||
| Banks - 87.9% | |||
| Diversified Banks - 33.1% | |||
| Bank of America Corp. | 863,376 | 29,613,797 | |
| Citigroup, Inc. | 434,000 | 21,999,460 | |
| JPMorgan Chase & Co. | 160,500 | 23,007,675 | |
| U.S. Bancorp | 606,800 | 28,962,564 | |
| Wells Fargo & Co. | 821,992 | 38,444,566 | |
| 142,028,062 | |||
| Regional Banks - 54.8% | |||
| 1st Source Corp. | 102,881 | 5,125,531 | |
| American National Bankshares, Inc. | 131,886 | 4,437,964 | |
| Associated Banc-Corp. | 489,100 | 11,322,665 | |
| BankUnited, Inc. | 97,369 | 3,448,810 | |
| Cadence Bank | 375,539 | 9,974,316 | |
| Comerica, Inc. | 155,900 | 10,928,590 | |
| Community Trust Bancorp, Inc. | 112,676 | 4,816,899 | |
| ConnectOne Bancorp, Inc. | 103,300 | 2,505,025 | |
| East West Bancorp, Inc. | 175,300 | 13,359,613 | |
| Eastern Bankshares, Inc. | 127,200 | 1,994,496 | |
| First Citizens Bancshares, Inc. | 14,000 | 10,272,640 | |
| First Hawaiian, Inc. | 246,800 | 6,749,980 | |
| First Interstate Bancsystem, Inc. | 286,234 | 10,172,756 | |
| Heartland Financial U.S.A., Inc. | 179,100 | 8,854,704 | |
| Independent Bank Group, Inc. | 47,000 | 2,766,420 | |
| KeyCorp | 789,700 | 14,443,613 | |
| M&T Bank Corp. | 112,560 | 17,479,442 | |
| Old National Bancorp, Indiana | 203,454 | 3,595,032 | |
| PacWest Bancorp | 275,336 | 7,640,574 | |
| PNC Financial Services Group, Inc. | 19,800 | 3,126,816 | |
| Popular, Inc. | 169,900 | 12,130,860 | |
| Preferred Bank, Los Angeles (a) | 69,295 | 4,878,368 | |
| Sierra Bancorp | 135,100 | 2,730,371 | |
| Signature Bank | 63,590 | 7,316,030 | |
| Trico Bancshares | 96,087 | 4,853,354 | |
| Truist Financial Corp. | 406,200 | 19,071,090 | |
| UMB Financial Corp. | 103,466 | 9,380,228 | |
| Univest Corp. of Pennsylvania | 194,500 | 5,484,900 | |
| Wintrust Financial Corp. | 95,300 | 8,779,989 | |
| Zions Bancorp NA | 159,450 | 8,071,359 | |
| 235,712,435 | |||
TOTAL BANKS | 377,740,497 | ||
| Capital Markets - 1.9% | |||
| Asset Management & Custody Banks - 1.9% | |||
| Phoenix Vega Mezz PLC | 330,200 | 16,415 | |
| State Street Corp. | 95,300 | 8,451,204 | |
| 8,467,619 | |||
| Consumer Finance - 2.8% | |||
| Consumer Finance - 2.8% | |||
| Capital One Financial Corp. | 55,200 | 6,021,216 | |
| OneMain Holdings, Inc. (a) | 143,900 | 6,200,651 | |
| 12,221,867 | |||
| Diversified Financial Services - 0.0% | |||
| Other Diversified Financial Services - 0.0% | |||
| Sunrisemezz Ltd. (b) | 47,171 | 6,421 | |
| Thrifts & Mortgage Finance - 6.3% | |||
| Thrifts & Mortgage Finance - 6.3% | |||
| Essent Group Ltd. | 308,229 | 13,238,436 | |
| NMI Holdings, Inc. (b) | 394,502 | 9,207,677 | |
| Radian Group, Inc. | 162,236 | 3,463,739 | |
| Southern Missouri Bancorp, Inc. (a) | 23,700 | 1,096,836 | |
| 27,006,688 | |||
| TOTAL COMMON STOCKS (Cost $350,739,427) | 425,443,092 | ||
| Convertible Bonds - 0.6% | |||
Principal Amount (c) | Value ($) | ||
| IT Services - 0.6% | |||
| Data Processing & Outsourced Services - 0.6% | |||
Affirm Holdings, Inc. 0% 11/15/26 (Cost $2,291,212) | 3,658,000 | 2,439,520 | |
| Money Market Funds - 1.3% | |||
| Shares | Value ($) | ||
| Fidelity Cash Central Fund 4.63% (d) | 1,486,764 | 1,487,061 | |
| Fidelity Securities Lending Cash Central Fund 4.63% (d)(e) | 4,036,789 | 4,037,193 | |
| TOTAL MONEY MARKET FUNDS (Cost $5,524,254) | 5,524,254 | ||
| TOTAL INVESTMENT IN SECURITIES - 100.8% (Cost $358,554,893) | 433,406,866 |
NET OTHER ASSETS (LIABILITIES) - (0.8)% | (3,522,827) |
| NET ASSETS - 100.0% | 429,884,039 |
| (a) | Security or a portion of the security is on loan at period end. |
| (b) | Non-income producing |
| (c) | Amount is stated in United States dollars unless otherwise noted. |
| (d) | Affiliated fund that is generally available only to investment companies and other accounts managed by Fidelity Investments. The rate quoted is the annualized seven-day yield of the fund at period end. A complete unaudited listing of the fund's holdings as of its most recent quarter end is available upon request. In addition, each Fidelity Central Fund's financial statements, which are not covered by the Fund's Report of Independent Registered Public Accounting Firm, are available on the SEC's website or upon request. |
| (e) | Investment made with cash collateral received from securities on loan. |
| Affiliate | Value, beginning of period ($) | Purchases ($) | Sales Proceeds ($) | Dividend Income ($) | Realized Gain (loss) ($) | Change in Unrealized appreciation (depreciation) ($) | Value, end of period ($) | % ownership, end of period |
| Fidelity Cash Central Fund 4.63% | 70,784 | 65,907,156 | 64,490,879 | 11,824 | - | - | 1,487,061 | 0.0% |
| Fidelity Securities Lending Cash Central Fund 4.63% | 39,878,125 | 291,681,674 | 327,522,606 | 14,953 | - | - | 4,037,193 | 0.0% |
| Total | 39,948,909 | 357,588,830 | 392,013,485 | 26,777 | - | - | 5,524,254 | |
| Valuation Inputs at Reporting Date: | ||||
| Description | Total ($) | Level 1 ($) | Level 2 ($) | Level 3 ($) |
Investments in Securities: | ||||
| Common Stocks | 425,443,092 | 425,443,092 | - | - |
| Convertible Bonds | 2,439,520 | - | 2,439,520 | - |
| Money Market Funds | 5,524,254 | 5,524,254 | - | - |
| Total Investments in Securities: | 433,406,866 | 430,967,346 | 2,439,520 | - |
| Statement of Assets and Liabilities | ||||
| February 28, 2023 | ||||
| Assets | ||||
| Investment in securities, at value (including securities loaned of $3,913,304) - See accompanying schedule: | ||||
Unaffiliated issuers (cost $353,030,639) | $ | 427,882,612 | ||
Fidelity Central Funds (cost $5,524,254) | 5,524,254 | |||
| Total Investment in Securities (cost $358,554,893) | $ | 433,406,866 | ||
| Receivable for investments sold | 40,282 | |||
| Receivable for fund shares sold | 27,710 | |||
| Dividends receivable | 881,831 | |||
| Distributions receivable from Fidelity Central Funds | 1,081 | |||
| Prepaid expenses | 2,436 | |||
Total assets | 434,360,206 | |||
| Liabilities | ||||
| Payable for fund shares redeemed | $ | 138,213 | ||
| Accrued management fee | 193,670 | |||
| Other affiliated payables | 72,244 | |||
| Other payables and accrued expenses | 34,847 | |||
| Collateral on securities loaned | 4,037,193 | |||
| Total Liabilities | 4,476,167 | |||
| Net Assets | $ | 429,884,039 | ||
| Net Assets consist of: | ||||
| Paid in capital | $ | 345,505,777 | ||
| Total accumulated earnings (loss) | 84,378,262 | |||
| Net Assets | $ | 429,884,039 | ||
Net Asset Value , offering price and redemption price per share ($429,884,039 ÷ 16,383,289 shares) | $ | 26.24 | ||
| Statement of Operations | ||||
Year ended February 28, 2023 | ||||
| Investment Income | ||||
| Dividends | $ | 14,770,963 | ||
| Interest | 200,713 | |||
| Income from Fidelity Central Funds (including $14,953 from security lending) | 26,777 | |||
| Total Income | 14,998,453 | |||
| Expenses | ||||
| Management fee | $ | 2,593,092 | ||
| Transfer agent fees | 804,025 | |||
| Accounting fees | 176,905 | |||
| Custodian fees and expenses | 18,106 | |||
| Independent trustees' fees and expenses | 1,734 | |||
| Registration fees | 43,908 | |||
| Audit | 42,588 | |||
| Legal | 878 | |||
| Interest | 3,052 | |||
| Miscellaneous | 3,585 | |||
| Total expenses before reductions | 3,687,873 | |||
| Expense reductions | (17,651) | |||
| Total expenses after reductions | 3,670,222 | |||
| Net Investment income (loss) | 11,328,231 | |||
| Realized and Unrealized Gain (Loss) | ||||
| Net realized gain (loss) on: | ||||
| Investment Securities: | ||||
| Unaffiliated issuers | 20,549,485 | |||
| Foreign currency transactions | 481 | |||
| Total net realized gain (loss) | 20,549,966 | |||
| Change in net unrealized appreciation (depreciation) on investment securities | (115,880,770) | |||
| Net gain (loss) | (95,330,804) | |||
| Net increase (decrease) in net assets resulting from operations | $ | (84,002,573) | ||
| Statement of Changes in Net Assets | ||||
Year ended February 28, 2023 | Year ended February 28, 2022 | |||
| Increase (Decrease) in Net Assets | ||||
| Operations | ||||
| Net investment income (loss) | $ | 11,328,231 | $ | 12,596,370 |
| Net realized gain (loss) | 20,549,966 | 29,218,859 | ||
| Change in net unrealized appreciation (depreciation) | (115,880,770) | 75,273,957 | ||
| Net increase (decrease) in net assets resulting from operations | (84,002,573) | 117,089,186 | ||
| Distributions to shareholders | (27,365,238) | (20,298,948) | ||
| Share transactions | ||||
| Proceeds from sales of shares | 86,486,325 | 519,785,682 | ||
| Reinvestment of distributions | 25,505,449 | 19,052,468 | ||
| Cost of shares redeemed | (287,573,573) | (456,654,461) | ||
Net increase (decrease) in net assets resulting from share transactions | (175,581,799) | 82,183,689 | ||
| Total increase (decrease) in net assets | (286,949,610) | 178,973,927 | ||
| Net Assets | ||||
| Beginning of period | 716,833,649 | 537,859,722 | ||
| End of period | $ | 429,884,039 | $ | 716,833,649 |
| Other Information | ||||
| Shares | ||||
| Sold | 3,179,002 | 17,252,319 | ||
| Issued in reinvestment of distributions | 1,010,981 | 659,756 | ||
| Redeemed | (10,660,796) | (15,503,674) | ||
| Net increase (decrease) | (6,470,813) | 2,408,401 | ||
| Banking Portfolio |
| Years ended February 28, | 2023 | 2022 | 2021 | 2020 A | 2019 | |||||
Selected Per-Share Data | ||||||||||
| Net asset value, beginning of period | $ | 31.37 | $ | 26.31 | $ | 23.37 | $ | 26.42 | $ | 36.82 |
| Income from Investment Operations | ||||||||||
Net investment income (loss) B,C | .61 | .58 | .54 | .58 | .49 | |||||
| Net realized and unrealized gain (loss) | (4.24) | 5.48 | 4.32 | (1.96) | (3.62) | |||||
| Total from investment operations | (3.63) | 6.06 | 4.86 | (1.38) | (3.13) | |||||
| Distributions from net investment income | (.67) | (.54) | (.55) | (.53) | (.54) | |||||
| Distributions from net realized gain | (.83) | (.46) | (1.37) | (1.14) | (6.73) | |||||
| Total distributions | (1.50) | (1.00) | (1.92) | (1.67) | (7.27) | |||||
| Net asset value, end of period | $ | 26.24 | $ | 31.37 | $ | 26.31 | $ | 23.37 | $ | 26.42 |
Total Return D | (11.27)% | 23.37% | 25.90% | (6.05)% | (6.57)% | |||||
Ratios to Average Net Assets C,E,F | ||||||||||
| Expenses before reductions | .75% | .73% | .79% | .77% | .77% | |||||
| Expenses net of fee waivers, if any | .74% | .73% | .79% | .77% | .77% | |||||
| Expenses net of all reductions | .74% | .73% | .79% | .77% | .76% | |||||
| Net investment income (loss) | 2.29% | 1.93% | 2.84% | 2.21% | 1.54% | |||||
| Supplemental Data | ||||||||||
| Net assets, end of period (000 omitted) | $ | 429,884 | $ | 716,834 | $ | 537,860 | $ | 361,696 | $ | 514,650 |
Portfolio turnover rate G | 21% | 34% | 32% | 31% | 44% |
| Average Annual Total Returns | |||
Periods ended February 28, 2023 | Past 1 year | Past 5 years | Past 10 years |
| Brokerage and Investment Management Portfolio | -2.98% | 10.64% | 11.64% |
| $10,000 Over 10 Years |
Let's say hypothetically that $10,000 was invested in Brokerage and Investment Management Portfolio on February 28, 2013. The chart shows how the value of your investment would have changed, and also shows how the S&P 500® Index performed over the same period. |
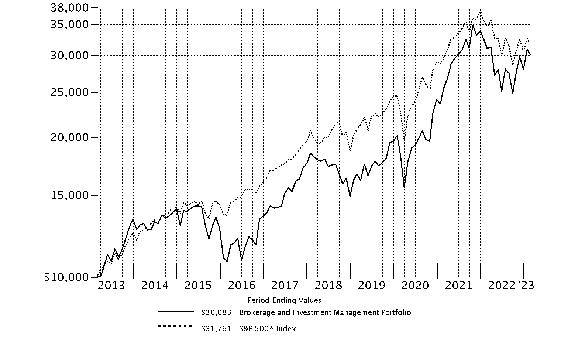 |
Top Holdings (% of Fund's net assets) | ||
| Ameriprise Financial, Inc. | 6.1 | |
| Morgan Stanley | 5.9 | |
| BlackRock, Inc. Class A | 5.4 | |
| S&P Global, Inc. | 5.3 | |
| Charles Schwab Corp. | 5.3 | |
| LPL Financial | 5.0 | |
| Intercontinental Exchange, Inc. | 4.7 | |
| Bank of New York Mellon Corp. | 4.4 | |
| KKR & Co. LP | 4.1 | |
| MSCI, Inc. | 3.5 | |
| 49.7 | ||
| Industries (% of Fund's net assets) | ||
| Capital Markets | 94.3 | |
| Diversified Financial Services | 2.9 | |
| Banks | 0.6 | |
| IT Services | 0.2 | |
| Common Stocks - 98.0% | |||
| Shares | Value ($) | ||
| Banks - 0.6% | |||
| Diversified Banks - 0.6% | |||
| Wells Fargo & Co. | 98,300 | 4,597,491 | |
| Capital Markets - 94.3% | |||
| Asset Management & Custody Banks - 40.7% | |||
| Affiliated Managers Group, Inc. | 40,400 | 6,440,164 | |
| Ameriprise Financial, Inc. | 144,100 | 49,407,567 | |
| Ares Management Corp. | 347,400 | 28,010,862 | |
| Artisan Partners Asset Management, Inc. | 46,500 | 1,533,105 | |
| Avantax, Inc. (a) | 18,600 | 531,774 | |
| Bank of New York Mellon Corp. | 710,600 | 36,155,328 | |
| BlackRock, Inc. Class A | 63,600 | 43,847,748 | |
| Blackstone, Inc. (b) | 211,500 | 19,204,200 | |
| Blue Owl Capital, Inc. Class A (b) | 806,100 | 9,947,274 | |
| Bridge Investment Group Holdings, Inc. | 93,500 | 1,270,665 | |
| Carlyle Group LP | 353,900 | 12,174,160 | |
| Cohen & Steers, Inc. | 16,128 | 1,167,022 | |
| Focus Financial Partners, Inc. Class A (a) | 9,000 | 466,740 | |
| Franklin Resources, Inc. (b) | 275,300 | 8,113,091 | |
| Invesco Ltd. (b) | 345,100 | 6,094,466 | |
| Janus Henderson Group PLC (b) | 135,600 | 3,723,576 | |
| KKR & Co. LP | 591,800 | 33,347,930 | |
| Northern Trust Corp. | 104,200 | 9,927,134 | |
| P10, Inc. | 143,400 | 1,544,418 | |
| Patria Investments Ltd. | 432,372 | 6,857,420 | |
| Petershill Partners PLC (c) | 425,200 | 855,147 | |
| State Street Corp. | 299,200 | 26,533,056 | |
| T. Rowe Price Group, Inc. | 150,700 | 16,920,596 | |
| Virtus Investment Partners, Inc. | 32,300 | 6,796,889 | |
| 330,870,332 | |||
| Financial Exchanges & Data - 26.7% | |||
| Cboe Global Markets, Inc. | 88,938 | 11,221,307 | |
| CME Group, Inc. | 139,800 | 25,913,328 | |
| Coinbase Global, Inc. (a)(b) | 79,000 | 5,121,570 | |
| FactSet Research Systems, Inc. | 1,500 | 621,825 | |
| Intercontinental Exchange, Inc. | 379,400 | 38,622,920 | |
| MarketAxess Holdings, Inc. | 23,800 | 8,126,510 | |
| Moody's Corp. | 77,200 | 22,399,580 | |
| MSCI, Inc. | 54,100 | 28,248,315 | |
| NASDAQ, Inc. | 463,100 | 25,961,386 | |
| Open Lending Corp. (a) | 208,400 | 1,475,472 | |
| S&P Global, Inc. | 127,300 | 43,434,760 | |
| Tradeweb Markets, Inc. Class A | 86,800 | 6,153,252 | |
| 217,300,225 | |||
| Investment Banking & Brokerage - 26.9% | |||
| BGC Partners, Inc. Class A | 386,500 | 1,878,390 | |
| Charles Schwab Corp. | 555,061 | 43,250,353 | |
| Goldman Sachs Group, Inc. | 79,600 | 27,991,340 | |
| Interactive Brokers Group, Inc. | 100,000 | 8,611,000 | |
| Jefferies Financial Group, Inc. | 11,100 | 419,469 | |
| LPL Financial | 164,300 | 41,002,708 | |
| Moelis & Co. Class A (b) | 95,500 | 4,090,265 | |
| Morgan Stanley | 492,516 | 47,527,794 | |
| Piper Jaffray Companies (b) | 3,300 | 498,267 | |
| PJT Partners, Inc. | 145,412 | 11,470,099 | |
| Raymond James Financial, Inc. (b) | 216,000 | 23,427,360 | |
| Robinhood Markets, Inc. (a)(b) | 322,700 | 3,249,589 | |
| Virtu Financial, Inc. Class A | 270,400 | 4,969,952 | |
| 218,386,586 | |||
TOTAL CAPITAL MARKETS | 766,557,143 | ||
| Diversified Financial Services - 2.9% | |||
| Other Diversified Financial Services - 2.9% | |||
| Apollo Global Management, Inc. | 333,900 | 23,673,510 | |
| IT Services - 0.2% | |||
| Data Processing & Outsourced Services - 0.2% | |||
| PayPal Holdings, Inc. (a) | 21,900 | 1,611,840 | |
| TOTAL COMMON STOCKS (Cost $584,224,005) | 796,439,984 | ||
| Money Market Funds - 6.8% | |||
| Shares | Value ($) | ||
| Fidelity Cash Central Fund 4.63% (d) | 16,323,202 | 16,326,467 | |
| Fidelity Securities Lending Cash Central Fund 4.63% (d)(e) | 38,915,333 | 38,919,225 | |
| TOTAL MONEY MARKET FUNDS (Cost $55,245,692) | 55,245,692 | ||
| TOTAL INVESTMENT IN SECURITIES - 104.8% (Cost $639,469,697) | 851,685,676 |
NET OTHER ASSETS (LIABILITIES) - (4.8)% | (38,712,731) |
| NET ASSETS - 100.0% | 812,972,945 |
| (a) | Non-income producing |
| (b) | Security or a portion of the security is on loan at period end. |
| (c) | Security exempt from registration under Rule 144A of the Securities Act of 1933. These securities may be resold in transactions exempt from registration, normally to qualified institutional buyers. At the end of the period, the value of these securities amounted to $855,147 or 0.1% of net assets. |
| (d) | Affiliated fund that is generally available only to investment companies and other accounts managed by Fidelity Investments. The rate quoted is the annualized seven-day yield of the fund at period end. A complete unaudited listing of the fund's holdings as of its most recent quarter end is available upon request. In addition, each Fidelity Central Fund's financial statements, which are not covered by the Fund's Report of Independent Registered Public Accounting Firm, are available on the SEC's website or upon request. |
| (e) | Investment made with cash collateral received from securities on loan. |
| Affiliate | Value, beginning of period ($) | Purchases ($) | Sales Proceeds ($) | Dividend Income ($) | Realized Gain (loss) ($) | Change in Unrealized appreciation (depreciation) ($) | Value, end of period ($) | % ownership, end of period |
| Fidelity Cash Central Fund 4.63% | 8,617,943 | 90,194,816 | 82,486,292 | 130,279 | - | - | 16,326,467 | 0.0% |
| Fidelity Securities Lending Cash Central Fund 4.63% | 47,542,900 | 621,049,140 | 629,672,815 | 129,568 | - | - | 38,919,225 | 0.1% |
| Total | 56,160,843 | 711,243,956 | 712,159,107 | 259,847 | - | - | 55,245,692 | |
| Valuation Inputs at Reporting Date: | ||||
| Description | Total ($) | Level 1 ($) | Level 2 ($) | Level 3 ($) |
Investments in Securities: | ||||
| Common Stocks | 796,439,984 | 796,439,984 | - | - |
| Money Market Funds | 55,245,692 | 55,245,692 | - | - |
| Total Investments in Securities: | 851,685,676 | 851,685,676 | - | - |
| Statement of Assets and Liabilities | ||||
| February 28, 2023 | ||||
| Assets | ||||
| Investment in securities, at value (including securities loaned of $38,510,858) - See accompanying schedule: | ||||
Unaffiliated issuers (cost $584,224,005) | $ | 796,439,984 | ||
Fidelity Central Funds (cost $55,245,692) | 55,245,692 | |||
| Total Investment in Securities (cost $639,469,697) | $ | 851,685,676 | ||
| Receivable for fund shares sold | 392,250 | |||
| Dividends receivable | 918,328 | |||
| Distributions receivable from Fidelity Central Funds | 72,094 | |||
| Prepaid expenses | 1,821 | |||
| Other receivables | 50,189 | |||
Total assets | 853,120,358 | |||
| Liabilities | ||||
| Payable for fund shares redeemed | $ | 636,515 | ||
| Accrued management fee | 365,831 | |||
| Other affiliated payables | 141,350 | |||
| Other payables and accrued expenses | 84,492 | |||
| Collateral on securities loaned | 38,919,225 | |||
| Total Liabilities | 40,147,413 | |||
| Net Assets | $ | 812,972,945 | ||
| Net Assets consist of: | ||||
| Paid in capital | $ | 676,147,635 | ||
| Total accumulated earnings (loss) | 136,825,310 | |||
| Net Assets | $ | 812,972,945 | ||
Net Asset Value , offering price and redemption price per share ($812,972,945 ÷ 7,067,000 shares) | $ | 115.04 | ||
| Statement of Operations | ||||
Year ended February 28, 2023 | ||||
| Investment Income | ||||
| Dividends | $ | 18,398,630 | ||
| Income from Fidelity Central Funds (including $129,568 from security lending) | 259,847 | |||
| Total Income | 18,658,477 | |||
| Expenses | ||||
| Management fee | $ | 4,728,555 | ||
| Transfer agent fees | 1,580,638 | |||
| Accounting fees | 281,702 | |||
| Custodian fees and expenses | 13,961 | |||
| Independent trustees' fees and expenses | 3,140 | |||
| Registration fees | 57,329 | |||
| Audit | 40,842 | |||
| Legal | 729 | |||
| Interest | 18,216 | |||
| Miscellaneous | 4,499 | |||
| Total expenses before reductions | 6,729,611 | |||
| Expense reductions | (32,083) | |||
| Total expenses after reductions | 6,697,528 | |||
| Net Investment income (loss) | 11,960,949 | |||
| Realized and Unrealized Gain (Loss) | ||||
| Net realized gain (loss) on: | ||||
| Investment Securities: | ||||
| Unaffiliated issuers | (74,755,629) | |||
| Foreign currency transactions | 1,000 | |||
| Total net realized gain (loss) | (74,754,629) | |||
| Change in net unrealized appreciation (depreciation) on: | ||||
| Investment Securities: | ||||
| Unaffiliated issuers | (8,919,201) | |||
| Assets and liabilities in foreign currencies | (1,534) | |||
| Total change in net unrealized appreciation (depreciation) | (8,920,735) | |||
| Net gain (loss) | (83,675,364) | |||
| Net increase (decrease) in net assets resulting from operations | $ | (71,714,415) | ||
| Statement of Changes in Net Assets | ||||
Year ended February 28, 2023 | Year ended February 28, 2022 | |||
| Increase (Decrease) in Net Assets | ||||
| Operations | ||||
| Net investment income (loss) | $ | 11,960,949 | $ | 8,497,410 |
| Net realized gain (loss) | (74,754,629) | 5,615,492 | ||
| Change in net unrealized appreciation (depreciation) | (8,920,735) | 42,391,470 | ||
| Net increase (decrease) in net assets resulting from operations | (71,714,415) | 56,504,372 | ||
| Distributions to shareholders | (17,226,958) | (11,958,952) | ||
| Share transactions | ||||
| Proceeds from sales of shares | 189,388,454 | 1,076,173,907 | ||
| Reinvestment of distributions | 15,606,994 | 11,131,114 | ||
| Cost of shares redeemed | (512,802,938) | (351,448,797) | ||
Net increase (decrease) in net assets resulting from share transactions | (307,807,490) | 735,856,224 | ||
| Total increase (decrease) in net assets | (396,748,863) | 780,401,644 | ||
| Net Assets | ||||
| Beginning of period | 1,209,721,808 | 429,320,164 | ||
| End of period | $ | 812,972,945 | $ | 1,209,721,808 |
| Other Information | ||||
| Shares | ||||
| Sold | 1,678,022 | 8,446,490 | ||
| Issued in reinvestment of distributions | 142,147 | 92,249 | ||
| Redeemed | (4,750,290) | (2,792,832) | ||
| Net increase (decrease) | (2,930,121) | 5,745,907 | ||
| Brokerage and Investment Management Portfolio |
| Years ended February 28, | 2023 | 2022 | 2021 | 2020 A | 2019 | |||||
Selected Per-Share Data | ||||||||||
| Net asset value, beginning of period | $ | 121.01 | $ | 100.99 | $ | 74.99 | $ | 71.71 | $ | 84.47 |
| Income from Investment Operations | ||||||||||
Net investment income (loss) B,C | 1.45 | 1.31 | .93 | 1.01 | .77 | |||||
| Net realized and unrealized gain (loss) | (5.19) | 20.54 | 28.01 | 5.70 | (7.60) | |||||
| Total from investment operations | (3.74) | 21.85 | 28.94 | 6.71 | (6.83) | |||||
| Distributions from net investment income | (1.83) | (.83) | (1.06) | (.98) | (.96) | |||||
| Distributions from net realized gain | (.41) | (1.01) | (1.88) | (2.45) | (4.96) | |||||
| Total distributions | (2.23) D | (1.83) D | (2.94) | (3.43) | (5.93) D | |||||
| Net asset value, end of period | $ | 115.04 | $ | 121.01 | $ | 100.99 | $ | 74.99 | $ | 71.71 |
Total Return E | (2.98)% | 21.70% | 39.69% | 9.28% | (8.04)% | |||||
Ratios to Average Net Assets C,F,G | ||||||||||
| Expenses before reductions | .75% | .74% | .76% | .77% | .78% | |||||
| Expenses net of fee waivers, if any | .74% | .74% | .76% | .77% | .77% | |||||
| Expenses net of all reductions | .74% | .74% | .76% | .77% | .77% | |||||
| Net investment income (loss) | 1.33% | 1.06% | 1.14% | 1.33% | 1.01% | |||||
| Supplemental Data | ||||||||||
| Net assets, end of period (000 omitted) | $ | 812,973 | $ | 1,209,722 | $ | 429,320 | $ | 309,088 | $ | 327,128 |
Portfolio turnover rate H | 4% | 3% | 11% | 9% | 30% |
| Average Annual Total Returns | |||
Periods ended February 28, 2023 | Past 1 year | Past 5 years | Past 10 years |
| Financial Services Portfolio | -3.30% | 7.92% | 11.14% |
| $10,000 Over 10 Years |
Let's say hypothetically that $10,000 was invested in Financial Services Portfolio on February 28, 2013. The chart shows how the value of your investment would have changed, and also shows how the S&P 500® Index performed over the same period. |
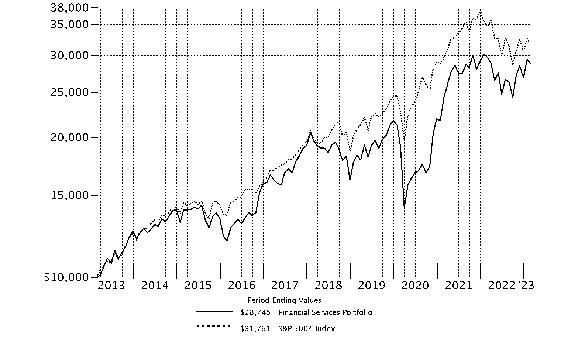 |
Top Holdings (% of Fund's net assets) | ||
| Wells Fargo & Co. | 6.4 | |
| Bank of America Corp. | 5.2 | |
| JPMorgan Chase & Co. | 4.7 | |
| Morgan Stanley | 3.6 | |
| Chubb Ltd. | 3.3 | |
| Citigroup, Inc. | 3.2 | |
| State Street Corp. | 3.2 | |
| U.S. Bancorp | 2.9 | |
| Reinsurance Group of America, Inc. | 2.7 | |
| Marsh & McLennan Companies, Inc. | 2.6 | |
| 37.8 | ||
| Industries (% of Fund's net assets) | ||
| Banks | 39.2 | |
| Insurance | 26.1 | |
| Capital Markets | 18.9 | |
| Consumer Finance | 4.3 | |
| Thrifts & Mortgage Finance | 3.8 | |
| IT Services | 3.3 | |
| Diversified Financial Services | 2.9 | |
| Professional Services | 0.7 | |
| Software | 0.4 | |
Geographic Diversification (% of Fund's net assets) |
 |
* Includes Short-Term investments and Net Other Assets (Liabilities). Percentages are based on country or territory of incorporation and are adjusted for the effect of derivatives, if applicable. |
| Common Stocks - 99.0% | |||
| Shares | Value ($) | ||
| Banks - 39.2% | |||
| Diversified Banks - 22.4% | |||
| Bank of America Corp. | 1,105,600 | 37,922,080 | |
| Citigroup, Inc. | 457,900 | 23,210,951 | |
| JPMorgan Chase & Co. | 241,300 | 34,590,355 | |
| U.S. Bancorp | 443,600 | 21,173,028 | |
| Wells Fargo & Co. | 1,009,090 | 47,195,141 | |
| 164,091,555 | |||
| Regional Banks - 16.8% | |||
| Associated Banc-Corp. (a) | 261,100 | 6,044,465 | |
| BankUnited, Inc. | 98,200 | 3,478,244 | |
| Cadence Bank | 202,530 | 5,379,197 | |
| Comerica, Inc. | 68,700 | 4,815,870 | |
| East West Bancorp, Inc. | 105,500 | 8,040,155 | |
| First Citizens Bancshares, Inc. (a) | 12,600 | 9,245,376 | |
| First Interstate Bancsystem, Inc. | 162,221 | 5,765,334 | |
| Heartland Financial U.S.A., Inc. | 105,700 | 5,225,808 | |
| KeyCorp | 570,200 | 10,428,958 | |
| M&T Bank Corp. | 100,937 | 15,674,507 | |
| PacWest Bancorp | 136,300 | 3,782,325 | |
| Popular, Inc. | 125,100 | 8,932,140 | |
| Signature Bank | 64,400 | 7,409,220 | |
| Truist Financial Corp. | 278,700 | 13,084,965 | |
| UMB Financial Corp. (a) | 49,800 | 4,514,868 | |
| Wintrust Financial Corp. | 62,900 | 5,794,977 | |
| Zions Bancorp NA | 100,600 | 5,092,372 | |
| 122,708,781 | |||
TOTAL BANKS | 286,800,336 | ||
| Capital Markets - 18.9% | |||
| Asset Management & Custody Banks - 9.1% | |||
| Affiliated Managers Group, Inc. | 32,800 | 5,228,648 | |
| Bank of New York Mellon Corp. | 222,200 | 11,305,536 | |
| Brookfield Asset Management Ltd. Class A (a) | 31,628 | 1,063,333 | |
| Brookfield Corp. Class A | 131,515 | 4,372,874 | |
| Carlyle Group LP | 313,400 | 10,780,960 | |
| Northern Trust Corp. | 50,100 | 4,773,027 | |
| Patria Investments Ltd. | 391,600 | 6,210,776 | |
| State Street Corp. | 261,600 | 23,198,688 | |
| 66,933,842 | |||
| Financial Exchanges & Data - 3.5% | |||
| Bolsa Mexicana de Valores S.A.B. de CV | 2,208,400 | 4,294,530 | |
| Cboe Global Markets, Inc. | 29,300 | 3,696,781 | |
| CME Group, Inc. | 94,600 | 17,535,056 | |
| 25,526,367 | |||
| Investment Banking & Brokerage - 6.3% | |||
| Lazard Ltd. Class A | 147,292 | 5,502,829 | |
| Morgan Stanley | 271,300 | 26,180,450 | |
| Raymond James Financial, Inc. | 91,100 | 9,880,706 | |
| Virtu Financial, Inc. Class A | 229,300 | 4,214,534 | |
| 45,778,519 | |||
TOTAL CAPITAL MARKETS | 138,238,728 | ||
| Consumer Finance - 4.3% | |||
| Consumer Finance - 4.3% | |||
| Capital One Financial Corp. | 158,200 | 17,256,456 | |
| FirstCash Holdings, Inc. | 86,311 | 7,616,946 | |
| OneMain Holdings, Inc. (a) | 157,300 | 6,778,057 | |
| 31,651,459 | |||
| Diversified Financial Services - 2.9% | |||
| Multi-Sector Holdings - 0.8% | |||
| Cannae Holdings, Inc. (b) | 253,890 | 5,732,836 | |
| Other Diversified Financial Services - 2.1% | |||
| Apollo Global Management, Inc. | 219,500 | 15,562,550 | |
TOTAL DIVERSIFIED FINANCIAL SERVICES | 21,295,386 | ||
| Insurance - 26.1% | |||
| Insurance Brokers - 4.4% | |||
| Arthur J. Gallagher & Co. | 72,300 | 13,545,405 | |
| Marsh & McLennan Companies, Inc. | 115,500 | 18,727,170 | |
| 32,272,575 | |||
| Life & Health Insurance - 3.1% | |||
| Globe Life, Inc. | 114,700 | 13,957,843 | |
| Primerica, Inc. | 44,500 | 8,541,330 | |
| 22,499,173 | |||
| Multi-Line Insurance - 1.9% | |||
| Hartford Financial Services Group, Inc. | 179,200 | 14,027,776 | |
| Property & Casualty Insurance - 14.0% | |||
| American Financial Group, Inc. | 59,700 | 8,006,367 | |
| Beazley PLC | 908,100 | 7,460,464 | |
| Chubb Ltd. | 112,900 | 23,824,158 | |
| Direct Line Insurance Group PLC | 3,895,600 | 8,450,881 | |
| Fidelity National Financial, Inc. | 216,600 | 8,633,676 | |
| First American Financial Corp. | 192,100 | 10,907,438 | |
| Hiscox Ltd. | 573,700 | 7,866,855 | |
| Lancashire Holdings Ltd. | 882,400 | 6,506,350 | |
| Selective Insurance Group, Inc. | 55,100 | 5,594,303 | |
| The Travelers Companies, Inc. | 80,300 | 14,865,136 | |
| 102,115,628 | |||
| Reinsurance - 2.7% | |||
| Reinsurance Group of America, Inc. | 138,500 | 20,009,095 | |
TOTAL INSURANCE | 190,924,247 | ||
| IT Services - 2.7% | |||
| Data Processing & Outsourced Services - 2.7% | |||
| Global Payments, Inc. | 78,300 | 8,785,260 | |
| MasterCard, Inc. Class A | 29,600 | 10,516,584 | |
| 19,301,844 | |||
| Professional Services - 0.7% | |||
| Research & Consulting Services - 0.7% | |||
| Dun & Bradstreet Holdings, Inc. | 431,300 | 5,179,913 | |
| Software - 0.4% | |||
| Application Software - 0.4% | |||
| Black Knight, Inc. (b) | 49,600 | 2,956,160 | |
| Thrifts & Mortgage Finance - 3.8% | |||
| Thrifts & Mortgage Finance - 3.8% | |||
| Essent Group Ltd. | 315,138 | 13,535,177 | |
| NMI Holdings, Inc. (b) | 422,743 | 9,866,822 | |
| Walker & Dunlop, Inc. | 46,800 | 4,082,364 | |
| 27,484,363 | |||
| TOTAL COMMON STOCKS (Cost $605,283,373) | 723,832,436 | ||
| Convertible Bonds - 0.6% | |||
Principal Amount (c) | Value ($) | ||
| IT Services - 0.6% | |||
| Data Processing & Outsourced Services - 0.6% | |||
Affirm Holdings, Inc. 0% 11/15/26 (Cost $3,952,686) | 6,166,000 | 4,112,105 | |
| Money Market Funds - 1.4% | |||
| Shares | Value ($) | ||
| Fidelity Cash Central Fund 4.63% (d) | 2,743,120 | 2,743,668 | |
| Fidelity Securities Lending Cash Central Fund 4.63% (d)(e) | 7,671,008 | 7,671,775 | |
| TOTAL MONEY MARKET FUNDS (Cost $10,415,443) | 10,415,443 | ||
| TOTAL INVESTMENT IN SECURITIES - 101.0% (Cost $619,651,502) | 738,359,984 |
NET OTHER ASSETS (LIABILITIES) - (1.0)% | (7,200,545) |
| NET ASSETS - 100.0% | 731,159,439 |
| (a) | Security or a portion of the security is on loan at period end. |
| (b) | Non-income producing |
| (c) | Amount is stated in United States dollars unless otherwise noted. |
| (d) | Affiliated fund that is generally available only to investment companies and other accounts managed by Fidelity Investments. The rate quoted is the annualized seven-day yield of the fund at period end. A complete unaudited listing of the fund's holdings as of its most recent quarter end is available upon request. In addition, each Fidelity Central Fund's financial statements, which are not covered by the Fund's Report of Independent Registered Public Accounting Firm, are available on the SEC's website or upon request. |
| (e) | Investment made with cash collateral received from securities on loan. |
| Affiliate | Value, beginning of period ($) | Purchases ($) | Sales Proceeds ($) | Dividend Income ($) | Realized Gain (loss) ($) | Change in Unrealized appreciation (depreciation) ($) | Value, end of period ($) | % ownership, end of period |
| Fidelity Cash Central Fund 4.63% | 3,554,184 | 182,834,592 | 183,645,108 | 73,718 | - | - | 2,743,668 | 0.0% |
| Fidelity Securities Lending Cash Central Fund 4.63% | 19,553,600 | 222,511,087 | 234,392,912 | 17,171 | - | - | 7,671,775 | 0.0% |
| Total | 23,107,784 | 405,345,679 | 418,038,020 | 90,889 | - | - | 10,415,443 | |
| Valuation Inputs at Reporting Date: | ||||
| Description | Total ($) | Level 1 ($) | Level 2 ($) | Level 3 ($) |
Investments in Securities: | ||||
| Common Stocks | 723,832,436 | 723,832,436 | - | - |
| Convertible Bonds | 4,112,105 | - | 4,112,105 | - |
| Money Market Funds | 10,415,443 | 10,415,443 | - | - |
| Total Investments in Securities: | 738,359,984 | 734,247,879 | 4,112,105 | - |
| Statement of Assets and Liabilities | ||||
| February 28, 2023 | ||||
| Assets | ||||
| Investment in securities, at value (including securities loaned of $7,430,650) - See accompanying schedule: | ||||
Unaffiliated issuers (cost $609,236,059) | $ | 727,944,541 | ||
Fidelity Central Funds (cost $10,415,443) | 10,415,443 | |||
| Total Investment in Securities (cost $619,651,502) | $ | 738,359,984 | ||
| Cash | 13,608 | |||
| Receivable for fund shares sold | 660,519 | |||
| Dividends receivable | 983,178 | |||
| Distributions receivable from Fidelity Central Funds | 12,254 | |||
| Prepaid expenses | 3,713 | |||
| Other receivables | 1,374 | |||
Total assets | 740,034,630 | |||
| Liabilities | ||||
| Payable for fund shares redeemed | $ | 721,512 | ||
| Accrued management fee | 326,857 | |||
| Other affiliated payables | 119,444 | |||
| Other payables and accrued expenses | 35,603 | |||
| Collateral on securities loaned | 7,671,775 | |||
| Total Liabilities | 8,875,191 | |||
| Net Assets | $ | 731,159,439 | ||
| Net Assets consist of: | ||||
| Paid in capital | $ | 606,732,787 | ||
| Total accumulated earnings (loss) | 124,426,652 | |||
| Net Assets | $ | 731,159,439 | ||
Net Asset Value , offering price and redemption price per share ($731,159,439 ÷ 63,512,865 shares) | $ | 11.51 | ||
| Statement of Operations | ||||
Year ended February 28, 2023 | ||||
| Investment Income | ||||
| Dividends | $ | 18,804,473 | ||
| Interest | 296,712 | |||
| Income from Fidelity Central Funds (including $17,171 from security lending) | 90,889 | |||
| Total Income | 19,192,074 | |||
| Expenses | ||||
| Management fee | $ | 3,524,239 | ||
| Transfer agent fees | 1,141,925 | |||
| Accounting fees | 223,748 | |||
| Custodian fees and expenses | 16,347 | |||
| Independent trustees' fees and expenses | 2,292 | |||
| Registration fees | 59,205 | |||
| Audit | 41,388 | |||
| Legal | 558 | |||
| Interest | 2,103 | |||
| Miscellaneous | 4,936 | |||
| Total expenses before reductions | 5,016,741 | |||
| Expense reductions | (23,514) | |||
| Total expenses after reductions | 4,993,227 | |||
| Net Investment income (loss) | 14,198,847 | |||
| Realized and Unrealized Gain (Loss) | ||||
| Net realized gain (loss) on: | ||||
| Investment Securities: | ||||
| Unaffiliated issuers | 36,726,142 | |||
| Foreign currency transactions | 2,635 | |||
| Total net realized gain (loss) | 36,728,777 | |||
| Change in net unrealized appreciation (depreciation) on: | ||||
| Investment Securities: | ||||
| Unaffiliated issuers | (79,393,122) | |||
| Assets and liabilities in foreign currencies | (130) | |||
| Total change in net unrealized appreciation (depreciation) | (79,393,252) | |||
| Net gain (loss) | (42,664,475) | |||
| Net increase (decrease) in net assets resulting from operations | $ | (28,465,628) | ||
| Statement of Changes in Net Assets | ||||
Year ended February 28, 2023 | Year ended February 28, 2022 | |||
| Increase (Decrease) in Net Assets | ||||
| Operations | ||||
| Net investment income (loss) | $ | 14,198,847 | $ | 15,691,678 |
| Net realized gain (loss) | 36,728,777 | 64,214,173 | ||
| Change in net unrealized appreciation (depreciation) | (79,393,252) | 59,571,315 | ||
| Net increase (decrease) in net assets resulting from operations | (28,465,628) | 139,477,166 | ||
| Distributions to shareholders | (73,318,860) | (29,541,664) | ||
| Share transactions | ||||
| Proceeds from sales of shares | 247,678,669 | 634,993,625 | ||
| Reinvestment of distributions | 67,840,973 | 27,204,727 | ||
| Cost of shares redeemed | (302,485,447) | (558,271,824) | ||
Net increase (decrease) in net assets resulting from share transactions | 13,034,195 | 103,926,528 | ||
| Total increase (decrease) in net assets | (88,750,293) | 213,862,030 | ||
| Net Assets | ||||
| Beginning of period | 819,909,732 | 606,047,702 | ||
| End of period | $ | 731,159,439 | $ | 819,909,732 |
| Other Information | ||||
| Shares | ||||
| Sold | 21,744,109 | 48,475,233 | ||
| Issued in reinvestment of distributions | 6,070,885 | 2,146,844 | ||
| Redeemed | (26,254,915) | (42,497,145) | ||
| Net increase (decrease) | 1,560,079 | 8,124,932 | ||
| Financial Services Portfolio |
| Years ended February 28, | 2023 | 2022 | 2021 | 2020 A | 2019 B | |||||
Selected Per-Share Data | ||||||||||
| Net asset value, beginning of period | $ | 13.23 | $ | 11.26 | $ | 9.49 | $ | 9.65 | $ | 11.67 |
| Income from Investment Operations | ||||||||||
Net investment income (loss) C,D | .24 | .25 | .20 | .19 | .14 | |||||
| Net realized and unrealized gain (loss) | (.74) | 2.26 | 2.17 | .26 | (1.04) | |||||
| Total from investment operations | (.50) | 2.51 | 2.37 | .45 | (.90) | |||||
| Distributions from net investment income | (.23) | (.26) | (.21) | (.16) | (.14) | |||||
| Distributions from net realized gain | (.98) | (.28) | (.39) | (.45) | (.98) | |||||
| Total distributions | (1.22) E | (.54) | (.60) | (.61) | (1.12) | |||||
| Net asset value, end of period | $ | 11.51 | $ | 13.23 | $ | 11.26 | $ | 9.49 | $ | 9.65 |
Total Return F | (3.30)% | 22.47% | 27.89% | 3.81% | (6.91)% | |||||
Ratios to Average Net Assets D,G,H | ||||||||||
| Expenses before reductions | .75% | .73% | .77% | .77% | .76% | |||||
| Expenses net of fee waivers, if any | .75% | .72% | .77% | .77% | .76% | |||||
| Expenses net of all reductions | .75% | .72% | .77% | .76% | .75% | |||||
| Net investment income (loss) | 2.12% | 1.89% | 2.36% | 1.81% | 1.28% | |||||
| Supplemental Data | ||||||||||
| Net assets, end of period (000 omitted) | $ | 731,159 | $ | 819,910 | $ | 606,048 | $ | 483,337 | $ | 558,429 |
Portfolio turnover rate I | 46% | 53% | 63% | 61% J | 49% J |
| Average Annual Total Returns | |||
Periods ended February 28, 2023 | Past 1 year | Past 5 years | Past 10 years |
| FinTech Portfolio | -14.51% | 2.54% | 7.49% |
| $10,000 Over 10 Years |
Let's say hypothetically that $10,000 was invested in FinTech Portfolio on February 28, 2013. The chart shows how the value of your investment would have changed, and also shows how the S&P 500® Index performed over the same period. |
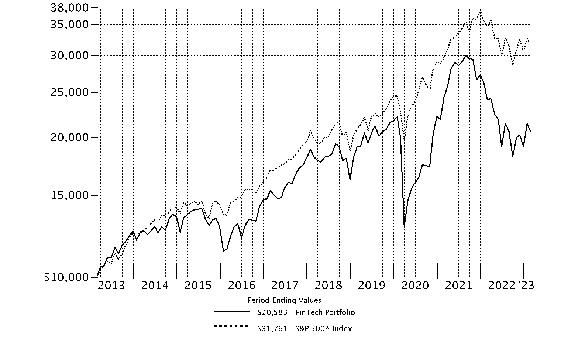 |
Top Holdings (% of Fund's net assets) | ||
| Visa, Inc. Class A | 14.4 | |
| MasterCard, Inc. Class A | 14.2 | |
| Intuit, Inc. | 10.8 | |
| American Express Co. | 8.0 | |
| Fiserv, Inc. | 5.0 | |
| Block, Inc. Class A | 4.9 | |
| Discover Financial Services | 4.8 | |
| Capital One Financial Corp. | 4.7 | |
| Global Payments, Inc. | 4.3 | |
| Adyen BV | 4.2 | |
| 75.3 | ||
| Industries (% of Fund's net assets) | ||
| IT Services | 63.9 | |
| Consumer Finance | 18.6 | |
| Software | 16.5 | |
| Banks | 0.5 | |
| Common Stocks - 99.5% | |||
| Shares | Value ($) | ||
| Banks - 0.5% | |||
| Diversified Banks - 0.5% | |||
| Wells Fargo & Co. | 12,037 | 562,970 | |
| Consumer Finance - 18.6% | |||
| Consumer Finance - 18.6% | |||
| American Express Co. | 49,303 | 8,578,229 | |
| Capital One Financial Corp. | 46,171 | 5,036,333 | |
| Discover Financial Services | 46,698 | 5,230,176 | |
| OneMain Holdings, Inc. | 26,874 | 1,158,001 | |
| 20,002,739 | |||
| IT Services - 63.9% | |||
| Data Processing & Outsourced Services - 63.9% | |||
| Adyen BV (a)(b) | 3,219 | 4,562,708 | |
| Affirm Holdings, Inc. (a)(c) | 12,234 | 166,627 | |
| AvidXchange Holdings, Inc. (a) | 10,800 | 107,460 | |
| Block, Inc. Class A (a) | 69,008 | 5,294,984 | |
| Dlocal Ltd. (a) | 31,523 | 470,954 | |
| Edenred SA | 43,585 | 2,458,044 | |
| Fidelity National Information Services, Inc. | 26,430 | 1,674,869 | |
| Fiserv, Inc. (a) | 46,422 | 5,342,708 | |
| FleetCor Technologies, Inc. (a) | 15,140 | 3,251,921 | |
| Flywire Corp. (a) | 58,576 | 1,448,584 | |
| Global Payments, Inc. | 40,744 | 4,571,477 | |
| MasterCard, Inc. Class A | 43,086 | 15,308,025 | |
| Nuvei Corp. (Canada) (a)(b) | 10,046 | 307,601 | |
| PagSeguro Digital Ltd. (a) | 59,646 | 517,131 | |
| PayPal Holdings, Inc. (a) | 60,050 | 4,419,680 | |
| Repay Holdings Corp. (a) | 45,774 | 388,164 | |
| Shift4 Payments, Inc. (a)(c) | 16,547 | 1,067,282 | |
| Visa, Inc. Class A | 70,660 | 15,540,958 | |
| Worldline SA (a)(b) | 44,111 | 1,837,333 | |
| 68,736,510 | |||
| Software - 16.5% | |||
| Application Software - 16.5% | |||
| Bill Holdings, Inc. (a) | 14,899 | 1,260,902 | |
| Black Knight, Inc. (a) | 43,031 | 2,564,648 | |
| EngageSmart, Inc. (a) | 42,588 | 896,052 | |
| Guidewire Software, Inc. (a) | 5,385 | 378,081 | |
| Intuit, Inc. | 28,565 | 11,631,097 | |
| Lightspeed Commerce, Inc. (Canada) (a) | 10,056 | 153,733 | |
| Workiva, Inc. (a) | 10,182 | 908,234 | |
| 17,792,747 | |||
| TOTAL COMMON STOCKS (Cost $120,895,764) | 107,094,966 | ||
| Money Market Funds - 0.7% | |||
| Shares | Value ($) | ||
| Fidelity Cash Central Fund 4.63% (d) | 355,472 | 355,543 | |
| Fidelity Securities Lending Cash Central Fund 4.63% (d)(e) | 376,955 | 376,993 | |
| TOTAL MONEY MARKET FUNDS (Cost $732,536) | 732,536 | ||
| TOTAL INVESTMENT IN SECURITIES - 100.2% (Cost $121,628,300) | 107,827,502 |
NET OTHER ASSETS (LIABILITIES) - (0.2)% | (249,170) |
| NET ASSETS - 100.0% | 107,578,332 |
| (a) | Non-income producing |
| (b) | Security exempt from registration under Rule 144A of the Securities Act of 1933. These securities may be resold in transactions exempt from registration, normally to qualified institutional buyers. At the end of the period, the value of these securities amounted to $6,707,642 or 6.2% of net assets. |
| (c) | Security or a portion of the security is on loan at period end. |
| (d) | Affiliated fund that is generally available only to investment companies and other accounts managed by Fidelity Investments. The rate quoted is the annualized seven-day yield of the fund at period end. A complete unaudited listing of the fund's holdings as of its most recent quarter end is available upon request. In addition, each Fidelity Central Fund's financial statements, which are not covered by the Fund's Report of Independent Registered Public Accounting Firm, are available on the SEC's website or upon request. |
| (e) | Investment made with cash collateral received from securities on loan. |
| Affiliate | Value, beginning of period ($) | Purchases ($) | Sales Proceeds ($) | Dividend Income ($) | Realized Gain (loss) ($) | Change in Unrealized appreciation (depreciation) ($) | Value, end of period ($) | % ownership, end of period |
| Fidelity Cash Central Fund 4.63% | 870,270 | 20,075,742 | 20,590,469 | 9,259 | - | - | 355,543 | 0.0% |
| Fidelity Securities Lending Cash Central Fund 4.63% | 8,602,318 | 28,499,830 | 36,725,155 | 5,831 | - | - | 376,993 | 0.0% |
| Total | 9,472,588 | 48,575,572 | 57,315,624 | 15,090 | - | - | 732,536 | |
| Valuation Inputs at Reporting Date: | ||||
| Description | Total ($) | Level 1 ($) | Level 2 ($) | Level 3 ($) |
Investments in Securities: | ||||
| Common Stocks | 107,094,966 | 100,694,925 | 6,400,041 | - |
| Money Market Funds | 732,536 | 732,536 | - | - |
| Total Investments in Securities: | 107,827,502 | 101,427,461 | 6,400,041 | - |
| Statement of Assets and Liabilities | ||||
| February 28, 2023 | ||||
| Assets | ||||
| Investment in securities, at value (including securities loaned of $405,018) - See accompanying schedule: | ||||
Unaffiliated issuers (cost $120,895,764) | $ | 107,094,966 | ||
Fidelity Central Funds (cost $732,536) | 732,536 | |||
| Total Investment in Securities (cost $121,628,300) | $ | 107,827,502 | ||
| Receivable for investments sold | 619,770 | |||
| Receivable for fund shares sold | 16,352 | |||
| Dividends receivable | 64,217 | |||
| Distributions receivable from Fidelity Central Funds | 708 | |||
| Prepaid expenses | 355 | |||
Total assets | 108,528,904 | |||
| Liabilities | ||||
| Payable for investments purchased | $ | 427,483 | ||
| Payable for fund shares redeemed | 37,437 | |||
| Accrued management fee | 49,080 | |||
| Other affiliated payables | 26,734 | |||
| Other payables and accrued expenses | 33,688 | |||
| Collateral on securities loaned | 376,150 | |||
| Total Liabilities | 950,572 | |||
| Net Assets | $ | 107,578,332 | ||
| Net Assets consist of: | ||||
| Paid in capital | $ | 143,812,487 | ||
| Total accumulated earnings (loss) | (36,234,155) | |||
| Net Assets | $ | 107,578,332 | ||
Net Asset Value , offering price and redemption price per share ($107,578,332 ÷ 7,836,303 shares) | $ | 13.73 | ||
| Statement of Operations | ||||
Year ended February 28, 2023 | ||||
| Investment Income | ||||
| Dividends | $ | 1,016,352 | ||
| Income from Fidelity Central Funds (including $5,831 from security lending) | 15,090 | |||
| Total Income | 1,031,442 | |||
| Expenses | ||||
| Management fee | $ | 647,241 | ||
| Transfer agent fees | 311,131 | |||
| Accounting fees | 44,771 | |||
| Custodian fees and expenses | 3,757 | |||
| Independent trustees' fees and expenses | 430 | |||
| Registration fees | 30,932 | |||
| Audit | 40,048 | |||
| Legal | 952 | |||
| Miscellaneous | (1,299) | |||
| Total expenses before reductions | 1,077,963 | |||
| Expense reductions | (4,444) | |||
| Total expenses after reductions | 1,073,519 | |||
| Net Investment income (loss) | (42,077) | |||
| Realized and Unrealized Gain (Loss) | ||||
| Net realized gain (loss) on: | ||||
| Investment Securities: | ||||
| Unaffiliated issuers | (16,199,835) | |||
| Foreign currency transactions | 6,292 | |||
| Total net realized gain (loss) | (16,193,543) | |||
| Change in net unrealized appreciation (depreciation) on: | ||||
| Investment Securities: | ||||
| Unaffiliated issuers | (7,892,700) | |||
| Assets and liabilities in foreign currencies | (380) | |||
| Total change in net unrealized appreciation (depreciation) | (7,893,080) | |||
| Net gain (loss) | (24,086,623) | |||
| Net increase (decrease) in net assets resulting from operations | $ | (24,128,700) | ||
| Statement of Changes in Net Assets | ||||
Year ended February 28, 2023 | Year ended February 28, 2022 | |||
| Increase (Decrease) in Net Assets | ||||
| Operations | ||||
| Net investment income (loss) | $ | (42,077) | $ | 1,580,188 |
| Net realized gain (loss) | (16,193,543) | 42,675,935 | ||
| Change in net unrealized appreciation (depreciation) | (7,893,080) | (51,830,285) | ||
| Net increase (decrease) in net assets resulting from operations | (24,128,700) | (7,574,162) | ||
| Distributions to shareholders | - | (37,026,602) | ||
| Share transactions | ||||
| Proceeds from sales of shares | 14,085,599 | 281,706,628 | ||
| Reinvestment of distributions | - | 33,727,405 | ||
| Cost of shares redeemed | (44,229,846) | (253,862,105) | ||
Net increase (decrease) in net assets resulting from share transactions | (30,144,247) | 61,571,928 | ||
| Total increase (decrease) in net assets | (54,272,947) | 16,971,164 | ||
| Net Assets | ||||
| Beginning of period | 161,851,279 | 144,880,115 | ||
| End of period | $ | 107,578,332 | $ | 161,851,279 |
| Other Information | ||||
| Shares | ||||
| Sold | 980,123 | 12,489,588 | ||
| Issued in reinvestment of distributions | - | 1,901,219 | ||
| Redeemed | (3,218,612) | (11,797,499) | ||
| Net increase (decrease) | (2,238,489) | 2,593,308 | ||
| FinTech Portfolio |
| Years ended February 28, | 2023 | 2022 | 2021 | 2020 A | 2019 | |||||
Selected Per-Share Data | ||||||||||
| Net asset value, beginning of period | $ | 16.06 | $ | 19.37 | $ | 16.23 | $ | 15.80 | $ | 16.29 |
| Income from Investment Operations | ||||||||||
Net investment income (loss) B,C | - D | .14 E | .34 F | .39 | .24 | |||||
| Net realized and unrealized gain (loss) | (2.33) | .04 G,H | 3.14 | .35 | .43 | |||||
| Total from investment operations | (2.33) | .18 | 3.48 | .74 | .67 | |||||
| Distributions from net investment income | - | (.25) | (.34) | (.31) | (.20) | |||||
| Distributions from net realized gain | - | (3.24) | - | (.01) | (.95) | |||||
| Total distributions | - | (3.49) | (.34) | (.31) I | (1.16) I | |||||
| Net asset value, end of period | $ | 13.73 | $ | 16.06 | $ | 19.37 | $ | 16.23 | $ | 15.80 |
Total Return J | (14.51)% | (.75)% G | 21.94% | 4.54% | 4.83% | |||||
Ratios to Average Net Assets C,K,L | ||||||||||
| Expenses before reductions | .87% | .81% | .89% | .86% | .87% | |||||
| Expenses net of fee waivers, if any | .87% | .81% | .89% | .86% | .87% | |||||
| Expenses net of all reductions | .87% | .81% | .89% | .85% | .86% | |||||
| Net investment income (loss) | (.03)% | .63% E | 2.35% F | 2.29% | 1.57% | |||||
| Supplemental Data | ||||||||||
| Net assets, end of period (000 omitted) | $ | 107,578 | $ | 161,851 | $ | 144,880 | $ | 148,247 | $ | 102,334 |
Portfolio turnover rate M | 15% | 164% | 25% | 20% | 32% |
| Average Annual Total Returns | |||
Periods ended February 28, 2023 | Past 1 year | Past 5 years | Past 10 years |
| Insurance Portfolio | 8.75% | 10.60% | 12.71% |
| $10,000 Over 10 Years |
Let's say hypothetically that $10,000 was invested in Insurance Portfolio on February 28, 2013. The chart shows how the value of your investment would have changed, and also shows how the S&P 500® Index performed over the same period. |
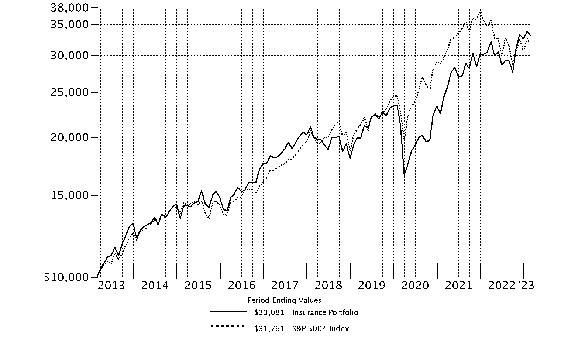 |
Top Holdings (% of Fund's net assets) | ||
| Chubb Ltd. | 10.8 | |
| Marsh & McLennan Companies, Inc. | 10.6 | |
| Progressive Corp. | 8.5 | |
| The Travelers Companies, Inc. | 6.5 | |
| Arthur J. Gallagher & Co. | 5.9 | |
| Hartford Financial Services Group, Inc. | 5.0 | |
| American International Group, Inc. | 4.9 | |
| Aon PLC | 4.7 | |
| Globe Life, Inc. | 4.4 | |
| Unum Group | 4.2 | |
| 65.5 | ||
| Industries (% of Fund's net assets) | ||
| Insurance | 97.3 | |
| Diversified Financial Services | 1.9 | |
Geographic Diversification (% of Fund's net assets) |
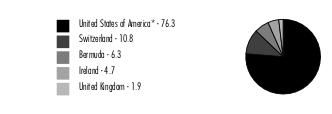 |
* Includes Short-Term investments and Net Other Assets (Liabilities). Percentages are based on country or territory of incorporation and are adjusted for the effect of derivatives, if applicable. |
| Common Stocks - 99.2% | |||
| Shares | Value ($) | ||
| Diversified Financial Services - 1.9% | |||
| Multi-Sector Holdings - 1.9% | |||
| Berkshire Hathaway, Inc. Class B (a) | 28,900 | 8,819,702 | |
| Insurance - 97.3% | |||
| Insurance Brokers - 25.7% | |||
| Aon PLC | 73,200 | 22,256,460 | |
| Arthur J. Gallagher & Co. | 150,800 | 28,252,380 | |
| Brown & Brown, Inc. | 220,900 | 12,385,863 | |
| Marsh & McLennan Companies, Inc. | 309,200 | 50,133,688 | |
| Willis Towers Watson PLC | 37,628 | 8,818,498 | |
| 121,846,889 | |||
| Life & Health Insurance - 15.2% | |||
| CNO Financial Group, Inc. | 283,500 | 7,263,270 | |
| Globe Life, Inc. | 171,600 | 20,882,004 | |
| Primerica, Inc. | 56,700 | 10,882,998 | |
| Principal Financial Group, Inc. | 146,000 | 13,075,760 | |
| Unum Group | 450,100 | 20,051,955 | |
| 72,155,987 | |||
| Multi-Line Insurance - 11.0% | |||
| American International Group, Inc. | 377,950 | 23,096,525 | |
| Assurant, Inc. | 41,700 | 5,312,163 | |
| Hartford Financial Services Group, Inc. | 301,500 | 23,601,420 | |
| 52,010,108 | |||
| Property & Casualty Insurance - 40.7% | |||
| Allstate Corp. | 149,800 | 19,291,244 | |
| American Financial Group, Inc. | 200 | 26,822 | |
| Arch Capital Group Ltd. (a) | 240,000 | 16,800,000 | |
| Assured Guaranty Ltd. | 57,600 | 3,594,816 | |
| Chubb Ltd. | 242,105 | 51,088,997 | |
| Cincinnati Financial Corp. (b) | 26,100 | 3,150,270 | |
| Fidelity National Financial, Inc. | 106,700 | 4,253,062 | |
| First American Financial Corp. | 89,200 | 5,064,776 | |
| Loews Corp. | 143,100 | 8,741,979 | |
| Markel Corp. (a) | 3,620 | 4,814,093 | |
| Mercury General Corp. | 200 | 6,810 | |
| Progressive Corp. | 279,900 | 40,171,248 | |
| Selective Insurance Group, Inc. | 51,500 | 5,228,795 | |
| The Travelers Companies, Inc. | 167,800 | 31,063,136 | |
| 193,296,048 | |||
| Reinsurance - 4.7% | |||
| Everest Re Group Ltd. | 16,000 | 6,143,520 | |
| Reinsurance Group of America, Inc. | 86,900 | 12,554,443 | |
| RenaissanceRe Holdings Ltd. | 17,800 | 3,825,220 | |
| 22,523,183 | |||
TOTAL INSURANCE | 461,832,215 | ||
| TOTAL COMMON STOCKS (Cost $342,466,535) | 470,651,917 | ||
| Money Market Funds - 1.6% | |||
| Shares | Value ($) | ||
| Fidelity Cash Central Fund 4.63% (c) | 4,179,419 | 4,180,255 | |
| Fidelity Securities Lending Cash Central Fund 4.63% (c)(d) | 3,210,679 | 3,211,000 | |
| TOTAL MONEY MARKET FUNDS (Cost $7,391,255) | 7,391,255 | ||
| TOTAL INVESTMENT IN SECURITIES - 100.8% (Cost $349,857,790) | 478,043,172 |
NET OTHER ASSETS (LIABILITIES) - (0.8)% | (3,581,801) |
| NET ASSETS - 100.0% | 474,461,371 |
| (a) | Non-income producing |
| (b) | Security or a portion of the security is on loan at period end. |
| (c) | Affiliated fund that is generally available only to investment companies and other accounts managed by Fidelity Investments. The rate quoted is the annualized seven-day yield of the fund at period end. A complete unaudited listing of the fund's holdings as of its most recent quarter end is available upon request. In addition, each Fidelity Central Fund's financial statements, which are not covered by the Fund's Report of Independent Registered Public Accounting Firm, are available on the SEC's website or upon request. |
| (d) | Investment made with cash collateral received from securities on loan. |
| Affiliate | Value, beginning of period ($) | Purchases ($) | Sales Proceeds ($) | Dividend Income ($) | Realized Gain (loss) ($) | Change in Unrealized appreciation (depreciation) ($) | Value, end of period ($) | % ownership, end of period |
| Fidelity Cash Central Fund 4.63% | 1,824,492 | 219,013,538 | 216,657,775 | 107,289 | - | - | 4,180,255 | 0.0% |
| Fidelity Securities Lending Cash Central Fund 4.63% | 550 | 15,439,439 | 12,228,989 | 723 | - | - | 3,211,000 | 0.0% |
| Total | 1,825,042 | 234,452,977 | 228,886,764 | 108,012 | - | - | 7,391,255 | |
| Valuation Inputs at Reporting Date: | ||||
| Description | Total ($) | Level 1 ($) | Level 2 ($) | Level 3 ($) |
Investments in Securities: | ||||
| Common Stocks | 470,651,917 | 470,651,917 | - | - |
| Money Market Funds | 7,391,255 | 7,391,255 | - | - |
| Total Investments in Securities: | 478,043,172 | 478,043,172 | - | - |
| Statement of Assets and Liabilities | ||||
| February 28, 2023 | ||||
| Assets | ||||
| Investment in securities, at value (including securities loaned of $3,138,200) - See accompanying schedule: | ||||
Unaffiliated issuers (cost $342,466,535) | $ | 470,651,917 | ||
Fidelity Central Funds (cost $7,391,255) | 7,391,255 | |||
| Total Investment in Securities (cost $349,857,790) | $ | 478,043,172 | ||
| Foreign currency held at value (cost $3) | 3 | |||
| Receivable for fund shares sold | 575,128 | |||
| Dividends receivable | 337,602 | |||
| Distributions receivable from Fidelity Central Funds | 9,069 | |||
| Prepaid expenses | 1,074 | |||
Total assets | 478,966,048 | |||
| Liabilities | ||||
| Payable for fund shares redeemed | $ | 959,148 | ||
| Accrued management fee | 208,801 | |||
| Other affiliated payables | 90,434 | |||
| Other payables and accrued expenses | 35,294 | |||
| Collateral on securities loaned | 3,211,000 | |||
| Total Liabilities | 4,504,677 | |||
| Net Assets | $ | 474,461,371 | ||
| Net Assets consist of: | ||||
| Paid in capital | $ | 332,981,780 | ||
| Total accumulated earnings (loss) | 141,479,591 | |||
| Net Assets | $ | 474,461,371 | ||
Net Asset Value , offering price and redemption price per share ($474,461,371 ÷ 6,292,242 shares) | $ | 75.40 | ||
| Statement of Operations | ||||
Year ended February 28, 2023 | ||||
| Investment Income | ||||
| Dividends | $ | 5,549,633 | ||
| Income from Fidelity Central Funds (including $723 from security lending) | 108,012 | |||
| Total Income | 5,657,645 | |||
| Expenses | ||||
| Management fee | $ | 1,758,172 | ||
| Transfer agent fees | 660,418 | |||
| Accounting fees | 120,715 | |||
| Custodian fees and expenses | 10,429 | |||
| Independent trustees' fees and expenses | 1,083 | |||
| Registration fees | 105,027 | |||
| Audit | 40,049 | |||
| Legal | 156 | |||
| Interest | 2,321 | |||
| Miscellaneous | 1,614 | |||
| Total expenses before reductions | 2,699,984 | |||
| Expense reductions | (11,132) | |||
| Total expenses after reductions | 2,688,852 | |||
| Net Investment income (loss) | 2,968,793 | |||
| Realized and Unrealized Gain (Loss) | ||||
| Net realized gain (loss) on: | ||||
| Investment Securities: | ||||
| Unaffiliated issuers | 14,737,111 | |||
| Foreign currency transactions | (753) | |||
| Total net realized gain (loss) | 14,736,358 | |||
| Change in net unrealized appreciation (depreciation) on: | ||||
| Investment Securities: | ||||
| Unaffiliated issuers | 5,173,256 | |||
| Assets and liabilities in foreign currencies | (2,745) | |||
| Total change in net unrealized appreciation (depreciation) | 5,170,511 | |||
| Net gain (loss) | 19,906,869 | |||
| Net increase (decrease) in net assets resulting from operations | $ | 22,875,662 | ||
| Statement of Changes in Net Assets | ||||
Year ended February 28, 2023 | Year ended February 28, 2022 | |||
| Increase (Decrease) in Net Assets | ||||
| Operations | ||||
| Net investment income (loss) | $ | 2,968,793 | $ | 2,475,589 |
| Net realized gain (loss) | 14,736,358 | 6,591,336 | ||
| Change in net unrealized appreciation (depreciation) | 5,170,511 | 35,822,023 | ||
| Net increase (decrease) in net assets resulting from operations | 22,875,662 | 44,888,948 | ||
| Distributions to shareholders | (2,977,551) | (17,750,181) | ||
| Share transactions | ||||
| Proceeds from sales of shares | 393,392,705 | 71,913,727 | ||
| Reinvestment of distributions | 2,747,103 | 16,623,368 | ||
| Cost of shares redeemed | (187,507,051) | (54,446,500) | ||
Net increase (decrease) in net assets resulting from share transactions | 208,632,757 | 34,090,595 | ||
| Total increase (decrease) in net assets | 228,530,868 | 61,229,362 | ||
| Net Assets | ||||
| Beginning of period | 245,930,503 | 184,701,141 | ||
| End of period | $ | 474,461,371 | $ | 245,930,503 |
| Other Information | ||||
| Shares | ||||
| Sold | 5,401,580 | 1,054,727 | ||
| Issued in reinvestment of distributions | 37,851 | 256,213 | ||
| Redeemed | (2,667,446) | (810,083) | ||
| Net increase (decrease) | 2,771,985 | 500,857 | ||
| Insurance Portfolio |
| Years ended February 28, | 2023 | 2022 | 2021 | 2020 A | 2019 | |||||
Selected Per-Share Data | ||||||||||
| Net asset value, beginning of period | $ | 69.86 | $ | 61.17 | $ | 58.44 | $ | 59.27 | $ | 78.49 |
| Income from Investment Operations | ||||||||||
Net investment income (loss) B,C | .63 | .78 | .88 | .87 | .98 | |||||
| Net realized and unrealized gain (loss) | 5.46 | 13.73 | 6.99 | 2.77 | (2.40) | |||||
| Total from investment operations | 6.09 | 14.51 | 7.87 | 3.64 | (1.42) | |||||
| Distributions from net investment income | (.55) | (.89) | (.94) | (.91) | (1.16) | |||||
| Distributions from net realized gain | - | (4.93) | (4.20) | (3.56) | (16.63) | |||||
| Total distributions | (.55) | (5.82) | (5.14) | (4.47) | (17.80) D | |||||
| Net asset value, end of period | $ | 75.40 | $ | 69.86 | $ | 61.17 | $ | 58.44 | $ | 59.27 |
Total Return E | 8.75% | 24.68% | 15.54% | 5.95% | (.29)% | |||||
Ratios to Average Net Assets C,F,G | ||||||||||
| Expenses before reductions | .81% | .78% | .83% | .81% | .82% | |||||
| Expenses net of fee waivers, if any | .81% | .78% | .83% | .81% | .81% | |||||
| Expenses net of all reductions | .81% | .78% | .83% | .80% | .81% | |||||
| Net investment income (loss) | .90% | 1.16% | 1.68% | 1.37% | 1.48% | |||||
| Supplemental Data | ||||||||||
| Net assets, end of period (000 omitted) | $ | 474,461 | $ | 245,931 | $ | 184,701 | $ | 219,539 | $ | 223,081 |
Portfolio turnover rate H | 48% | 15% | 18% | 28% | 9% |
| Fidelity Central Fund | Investment Manager | Investment Objective | Investment Practices | Expense Ratio A |
| Fidelity Money Market Central Funds | Fidelity Management & Research Company LLC (FMR) | Each fund seeks to obtain a high level of current income consistent with the preservation of capital and liquidity. | Short-term Investments | Less than .005% |
| Brokerage and Investment Management Portfolio | $50,189 |
| Tax cost | Gross unrealized appreciation | Gross unrealized depreciation | Net unrealized appreciation (depreciation) | |
| Banking Portfolio | $360,943,658 | $88,065,024 | $(15,601,816) | $72,463,208 |
Brokerage and Investment Management Portfolio | 640,361,716 | 261,687,029 | (50,363,069) | 211,323,960 |
| Financial Services Portfolio | 622,803,456 | 141,240,830 | (25,684,302) | 115,556,528 |
| FinTech Portfolio | 122,064,043 | 24,169,564 | (38,406,105) | (14,236,541) |
| Insurance Portfolio | 351,792,227 | 133,103,830 | (6,852,885) | 126,250,945 |
| Undistributed ordinary income | Undistributed long-term capital gain | Capital loss carryforward | Net unrealized appreciation (depreciation) on securities and other investments | |
| Banking Portfolio | $1,684,994 | $10,230,061 | $- | $72,463,208 |
Brokerage and Investment Management Portfolio | - | - | (74,446,146) | 211,322,364 |
| Financial Services Portfolio | 2,197,325 | 6,673,975 | - | 115,555,352 |
| FinTech Portfolio | - | - | (21,997,614) | (14,236,541) |
| Insurance Portfolio | - | 15,230,446 | - | 126,249,144 |
Short-term | Long-term | Total capital loss carryforward | |
Brokerage and Investment Management Portfolio | (74,446,146) | (-) | (74,446,146) |
| FinTech Portfolio | (21,997,614) | (-) | (21,997,614) |
| February 28, 2023 | |||
| Ordinary Income | Long-term Capital Gains | Total | |
| Banking Portfolio | $11,563,840 | $15,801,398 | $27,365,238 |
Brokerage and Investment Management Portfolio | 13,893,658 | 3,333,300 | 17,226,958 |
| Financial Services Portfolio | 14,414,547 | 58,904,313 | 73,318,860 |
| FinTech Portfolio | - | - | - |
| Insurance Portfolio | 2,977,551 | - | 2,977,551 |
| February 28, 2022 | |||
| Ordinary Income | Long-term Capital Gains | Total | |
| Banking Portfolio | $10,967,463 | $9,331,485 | $20,298,948 |
| Brokerage and Investment Management Portfolio | 7,406,134 | 4,552,818 | 11,958,952 |
| Financial Services Portfolio | 15,183,491 | 14,358,173 | 29,541,664 |
| FinTech Portfolio | 3,215,617 | 33,810,985 | 37,026,602 |
| Insurance Portfolio | 2,910,816 | 14,839,365 | 17,750,181 |
| Purchases ($) | Sales ($) | |
| Banking Portfolio | 105,972,044 | 293,602,359 |
| Brokerage and Investment Management Portfolio | 37,829,108 | 359,862,620 |
| Financial Services Portfolio | 308,990,905 | 353,640,986 |
| FinTech Portfolio | 18,324,727 | 46,555,622 |
| Insurance Portfolio | 369,184,926 | 161,478,550 |
| Individual Rate | Group Rate | Total | |
| Banking Portfolio | .30% | .23% | .52% |
| Brokerage and Investment Management Portfolio | .30% | .23% | .53% |
| Financial Services Portfolio | .30% | .23% | .53% |
| FinTech Portfolio | .30% | .23% | .53% |
| Insurance Portfolio | .30% | .23% | .53% |
| Banking Portfolio | .16% |
| Brokerage and Investment Management Portfolio | .18% |
| Financial Services Portfolio | .17% |
| FinTech Portfolio | .25% |
| Insurance Portfolio | .20% |
| % of Average Net Assets | |
| Banking Portfolio | .04 |
| Brokerage and Investment Management Portfolio | .03 |
| Financial Services Portfolio | .03 |
| FinTech Portfolio | .04 |
| Insurance Portfolio | .04 |
| Amount | |
| Banking Portfolio | $3,948 |
| Brokerage and Investment Management Portfolio | 1,770 |
| Financial Services Portfolio | 5,032 |
| FinTech Portfolio | 190 |
| Insurance Portfolio | 2,281 |
| Borrower or Lender | Average Loan Balance | Weighted Average Interest Rate | Interest Expense | |
| Banking Portfolio | Borrower | $4,813,400 | 4.57% | $3,052 |
| Brokerage and Investment Management Portfolio | Borrower | $4,922,128 | 3.01% | $16,040 |
| Financial Services Portfolio | Borrower | $8,406,400 | 1.80% | $2,103 |
| Insurance Portfolio | Borrower | $9,918,000 | 3.12% | $1,721 |
| Purchases ($) | Sales ($) | Realized Gain (Loss) ($) | |
| Banking Portfolio | 2,195,220 | 10,254,750 | (686,955) |
| Brokerage and Investment Management Portfolio | 521,795 | 11,761,351 | (494,769) |
| Financial Services Portfolio | 13,519,173 | 19,425,362 | 3,728,865 |
| FinTech Portfolio | 1,207,696 | 46,801 | 14,984 |
| Insurance Portfolio | 28,784,056 | 13,945,703 | 3,832,914 |
| Amount | |
| Banking Portfolio | $956 |
| Brokerage and Investment Management Portfolio | 1,720 |
| Financial Services Portfolio | 1,210 |
| FinTech Portfolio | 239 |
| Insurance Portfolio | 519 |
| Total Security Lending Fees Paid to NFS | Security Lending Income From Securities Loaned to NFS | Value of Securities Loaned to NFS at Period End | |
| Banking Portfolio | $1,488 | $11 | $- |
| Brokerage and Investment Management Portfolio | $13,416 | $1,587 | $- |
| Financial Services Portfolio | $1,721 | $- | $- |
| FinTech Portfolio | $581 | $- | $- |
| Insurance Portfolio | $76 | $- | $- |
| Average Loan Balance | Weighted Average Interest Rate | Interest Expense | |
| Brokerage and Investment Management Portfolio | $944,406 | 2.59% | $2,176 |
| Insurance Portfolio | $10,389,000 | 2.08% | $600 |
| Amount | |
| Banking Portfolio | $17,651 |
| Brokerage and Investment Management Portfolio | 32,083 |
| Financial Services Portfolio | 23,514 |
| FinTech Portfolio | 4,444 |
| Insurance Portfolio | 11,132 |
| The Example is based on an investment of $1,000 invested at the beginning of the period and held for the entire period (September 1, 2022 to February 28, 2023). |
Annualized Expense Ratio- A | Beginning Account Value September 1, 2022 | Ending Account Value February 28, 2023 | Expenses Paid During Period- C September 1, 2022 to February 28, 2023 | |||||||
| Banking Portfolio | .75% | |||||||||
| Actual | $ 1,000 | $ 1,048.80 | $ 3.81 | |||||||
Hypothetical- B | $ 1,000 | $ 1,021.08 | $ 3.76 | |||||||
| Brokerage and Investment Management Portfolio | .75% | |||||||||
| Actual | $ 1,000 | $ 1,096.10 | $ 3.90 | |||||||
Hypothetical- B | $ 1,000 | $ 1,021.08 | $ 3.76 | |||||||
| Financial Services Portfolio | .74% | |||||||||
| Actual | $ 1,000 | $ 1,093.40 | $ 3.84 | |||||||
Hypothetical- B | $ 1,000 | $ 1,021.12 | $ 3.71 | |||||||
| FinTech Portfolio | .88% | |||||||||
| Actual | $ 1,000 | $ 1,001.50 | $ 4.37 | |||||||
Hypothetical- B | $ 1,000 | $ 1,020.43 | $ 4.41 | |||||||
| Insurance Portfolio | .81% | |||||||||
| Actual | $ 1,000 | $ 1,133.40 | $ 4.28 | |||||||
Hypothetical- B | $ 1,000 | $ 1,020.78 | $ 4.06 | |||||||
| Banking Portfolio | $21,316,509 |
| Financial Services Portfolio | $37,414,936 |
| Insurance Portfolio | $16,255,082 |
| Banking Portfolio | |
| April 2022 | 100% |
| December 2022 | 100% |
| Brokerage and Investment Management Portfolio | |
| April 2022 | 100% |
| December 2022 | 100% |
| Financial Services Portfolio | |
| April 2022 | 100% |
| December 2022 | 100% |
| FinTech Portfolio | |
| April 2022 | - |
| December 2022 | - |
| Insurance Portfolio | |
| April 2022 | - |
| December 2022 | 100% |
| Banking Portfolio | |
| April 2022 | 100% |
| December 2022 | 100% |
| Brokerage and Investment Management Portfolio | |
| April 2022 | 100% |
| December 2022 | 100% |
| Financial Services Portfolio | |
| April 2022 | 100% |
| December 2022 | 100% |
| FinTech Portfolio | |
| April 2022 | - |
| December 2022 | - |
| Insurance Portfolio | |
April 2022 December 2022 | - 100% |
| April, 2022 | December, 2022 | |
| Banking Portfolio | - | - |
| Brokerage and Investment Management Portfolio | 100% | - |
| Financial Services Portfolio | - | - |
| FinTech Portfolio | - | - |
| Insurance Portfolio | - | - |
- Highly liquid investments - cash or convertible to cash within three business days or less
- Moderately liquid investments - convertible to cash in three to seven calendar days
- Less liquid investments - can be sold or disposed of, but not settled, within seven calendar days
- Illiquid investments - cannot be sold or disposed of within seven calendar days
 |


Contents
| Average Annual Total Returns | |||
Periods ended February 28, 2023 | Past 1 year | Past 5 years | Past 10 years |
| Energy Portfolio | 24.63% | 8.51% | 3.70% |
| $10,000 Over 10 Years |
Let's say hypothetically that $10,000 was invested in Energy Portfolio on February 28, 2013. The chart shows how the value of your investment would have changed, and also shows how the S&P 500® Index performed over the same period. |
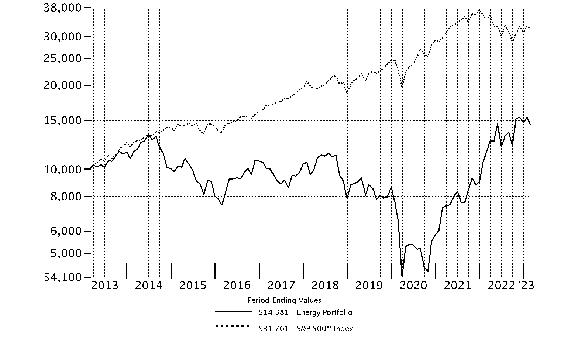 |
Top Holdings (% of Fund's net assets) | ||
| Exxon Mobil Corp. | 24.6 | |
| Chevron Corp. | 6.6 | |
| Valero Energy Corp. | 5.2 | |
| ConocoPhillips Co. | 4.6 | |
| Schlumberger Ltd. | 4.5 | |
| Halliburton Co. | 4.4 | |
| Marathon Petroleum Corp. | 4.3 | |
| Hess Corp. | 3.6 | |
| Occidental Petroleum Corp. | 3.5 | |
| Cheniere Energy, Inc. | 3.5 | |
| 64.8 | ||
| Industries (% of Fund's net assets) | ||
| Oil, Gas & Consumable Fuels | 83.8 | |
| Energy Equipment & Services | 15.7 | |
| Independent Power and Renewable Electricity Producers | 0.4 | |
Geographic Diversification (% of Fund's net assets) |
 |
* Includes Short-Term investments and Net Other Assets (Liabilities). Percentages are based on country or territory of incorporation and are adjusted for the effect of derivatives, if applicable. |
| Common Stocks - 99.9% | |||
| Shares | Value ($) | ||
| Energy Equipment & Services - 15.7% | |||
| Oil & Gas Drilling - 1.6% | |||
| Nabors Industries Ltd. (a) | 8,999 | 1,352,640 | |
| Nabors Industries Ltd. warrants 6/11/26 (a) | 36,999 | 1,032,272 | |
| Noble Corp. PLC (a) | 210,700 | 8,784,083 | |
| Odfjell Drilling Ltd. (a) | 1,535,318 | 3,969,579 | |
| Shelf Drilling Ltd. (a)(b) | 1,347,589 | 4,009,755 | |
| Valaris Ltd. (a) | 410,300 | 27,592,675 | |
| 46,741,004 | |||
| Oil & Gas Equipment & Services - 14.1% | |||
| Cactus, Inc. | 48,586 | 2,232,527 | |
| Halliburton Co. | 3,420,700 | 123,931,961 | |
| Nextier Oilfield Solutions, Inc. (a) | 4,239,500 | 38,706,635 | |
| NOV, Inc. | 787,200 | 17,223,936 | |
| Oceaneering International, Inc. (a) | 897,530 | 18,749,402 | |
| ProPetro Holding Corp. (a) | 1,333,701 | 11,749,906 | |
| Schlumberger Ltd. | 2,429,569 | 129,277,366 | |
| TechnipFMC PLC (a) | 3,765,172 | 57,569,480 | |
| 399,441,213 | |||
TOTAL ENERGY EQUIPMENT & SERVICES | 446,182,217 | ||
| Independent Power and Renewable Electricity Producers - 0.4% | |||
| Independent Power Producers & Energy Traders - 0.4% | |||
| Vistra Corp. | 421,300 | 9,264,387 | |
| Oil, Gas & Consumable Fuels - 83.8% | |||
| Coal & Consumable Fuels - 0.3% | |||
| Arch Resources, Inc. | 49,000 | 7,710,150 | |
| Integrated Oil & Gas - 40.2% | |||
| Cenovus Energy, Inc.: | |||
| warrants (a) | 97,500 | 1,326,000 | |
| (Canada) | 4,627,106 | 85,319,155 | |
| Chevron Corp. | 1,168,303 | 187,828,073 | |
| Exxon Mobil Corp. | 6,356,746 | 698,669,955 | |
| Imperial Oil Ltd. | 484,100 | 23,944,235 | |
| Occidental Petroleum Corp. | 1,701,815 | 99,658,286 | |
| Occidental Petroleum Corp. warrants 8/3/27 (a) | 99,550 | 3,669,413 | |
| Suncor Energy, Inc. (c) | 1,203,200 | 40,438,807 | |
| 1,140,853,924 | |||
| Oil & Gas Exploration & Production - 26.9% | |||
| Antero Resources Corp. (a) | 1,134,300 | 29,718,660 | |
| APA Corp. | 1,012,500 | 38,859,750 | |
| Callon Petroleum Co. (a) | 108,100 | 4,189,956 | |
| Canadian Natural Resources Ltd. | 1,688,900 | 95,442,344 | |
| Canadian Natural Resources Ltd. | 25,780 | 1,456,828 | |
| Chord Energy Corp. | 74,152 | 9,982,342 | |
| Civitas Resources, Inc. | 221,054 | 15,511,359 | |
| ConocoPhillips Co. | 1,274,166 | 131,685,056 | |
| Coterra Energy, Inc. (c) | 468,098 | 11,688,407 | |
| Devon Energy Corp. | 815,800 | 43,987,936 | |
| Diamondback Energy, Inc. | 169,500 | 23,828,310 | |
| EOG Resources, Inc. | 294,464 | 33,280,321 | |
| EQT Corp. | 278,700 | 9,247,266 | |
| Hess Corp. | 764,000 | 102,910,800 | |
| Magnolia Oil & Gas Corp. Class A | 460,900 | 10,070,665 | |
| National Energy Services Reunited Corp. (a) | 1,711,418 | 11,055,760 | |
| Northern Oil & Gas, Inc. | 140,560 | 4,362,982 | |
| Ovintiv, Inc. | 729,400 | 31,196,438 | |
| PDC Energy, Inc. | 1,011,107 | 67,855,391 | |
| Pioneer Natural Resources Co. | 226,666 | 45,426,133 | |
| Range Resources Corp. | 1,318,000 | 35,506,920 | |
| SM Energy Co. | 258,900 | 7,640,139 | |
| 764,903,763 | |||
| Oil & Gas Refining & Marketing - 11.3% | |||
| Marathon Petroleum Corp. | 992,392 | 122,659,651 | |
| Phillips 66 Co. | 514,273 | 52,743,839 | |
| Valero Energy Corp. | 1,116,700 | 147,102,891 | |
| 322,506,381 | |||
| Oil & Gas Storage & Transport - 5.1% | |||
| Cheniere Energy, Inc. | 622,612 | 97,961,772 | |
| Energy Transfer LP | 2,990,200 | 37,855,932 | |
| Golar LNG Ltd. (a) | 382,733 | 8,737,794 | |
| �� | 144,555,498 | ||
TOTAL OIL, GAS & CONSUMABLE FUELS | 2,380,529,716 | ||
| TOTAL COMMON STOCKS (Cost $1,717,013,668) | 2,835,976,320 | ||
| Money Market Funds - 1.6% | |||
| Shares | Value ($) | ||
| Fidelity Cash Central Fund 4.63% (d) | 613 | 613 | |
| Fidelity Securities Lending Cash Central Fund 4.63% (d)(e) | 46,143,793 | 46,148,408 | |
| TOTAL MONEY MARKET FUNDS (Cost $46,149,021) | 46,149,021 | ||
| TOTAL INVESTMENT IN SECURITIES - 101.5% (Cost $1,763,162,689) | 2,882,125,341 |
NET OTHER ASSETS (LIABILITIES) - (1.5)% | (41,415,579) |
| NET ASSETS - 100.0% | 2,840,709,762 |
| (a) | Non-income producing |
| (b) | Security exempt from registration under Rule 144A of the Securities Act of 1933. These securities may be resold in transactions exempt from registration, normally to qualified institutional buyers. At the end of the period, the value of these securities amounted to $4,009,755 or 0.1% of net assets. |
| (c) | Security or a portion of the security is on loan at period end. |
| (d) | Affiliated fund that is generally available only to investment companies and other accounts managed by Fidelity Investments. The rate quoted is the annualized seven-day yield of the fund at period end. A complete unaudited listing of the fund's holdings as of its most recent quarter end is available upon request. In addition, each Fidelity Central Fund's financial statements, which are not covered by the Fund's Report of Independent Registered Public Accounting Firm, are available on the SEC's website or upon request. |
| (e) | Investment made with cash collateral received from securities on loan. |
| Affiliate | Value, beginning of period ($) | Purchases ($) | Sales Proceeds ($) | Dividend Income ($) | Realized Gain (loss) ($) | Change in Unrealized appreciation (depreciation) ($) | Value, end of period ($) | % ownership, end of period |
| Fidelity Cash Central Fund 4.63% | 7,528,525 | 437,616,346 | 445,144,258 | 143,542 | - | - | 613 | 0.0% |
| Fidelity Securities Lending Cash Central Fund 4.63% | 23,406,482 | 1,096,817,177 | 1,074,075,251 | 134,767 | - | - | 46,148,408 | 0.1% |
| Total | 30,935,007 | 1,534,433,523 | 1,519,219,509 | 278,309 | - | - | 46,149,021 | |
| Valuation Inputs at Reporting Date: | ||||
| Description | Total ($) | Level 1 ($) | Level 2 ($) | Level 3 ($) |
Investments in Securities: | ||||
| Common Stocks | 2,835,976,320 | 2,835,976,320 | - | - |
| Money Market Funds | 46,149,021 | 46,149,021 | - | - |
| Total Investments in Securities: | 2,882,125,341 | 2,882,125,341 | - | - |
| Statement of Assets and Liabilities | ||||
| February 28, 2023 | ||||
| Assets | ||||
| Investment in securities, at value (including securities loaned of $43,430,465) - See accompanying schedule: | ||||
Unaffiliated issuers (cost $1,717,013,668) | $ | 2,835,976,320 | ||
Fidelity Central Funds (cost $46,149,021) | 46,149,021 | |||
| Total Investment in Securities (cost $1,763,162,689) | $ | 2,882,125,341 | ||
| Receivable for investments sold | 7,007,336 | |||
| Receivable for fund shares sold | 1,948,241 | |||
| Dividends receivable | 12,230,628 | |||
| Distributions receivable from Fidelity Central Funds | 3,155 | |||
| Prepaid expenses | 6,356 | |||
| Other receivables | 390,326 | |||
Total assets | 2,903,711,383 | |||
| Liabilities | ||||
| Payable for fund shares redeemed | $ | 7,827,551 | ||
| Accrued management fee | 1,307,883 | |||
| Notes payable to affiliates | 6,854,000 | |||
| Other affiliated payables | 488,686 | |||
| Other payables and accrued expenses | 375,701 | |||
| Collateral on securities loaned | 46,147,800 | |||
| Total Liabilities | 63,001,621 | |||
| Net Assets | $ | 2,840,709,762 | ||
| Net Assets consist of: | ||||
| Paid in capital | $ | 2,937,158,169 | ||
| Total accumulated earnings (loss) | (96,448,407) | |||
| Net Assets | $ | 2,840,709,762 | ||
Net Asset Value , offering price and redemption price per share ($2,840,709,762 ÷ 51,706,133 shares) | $ | 54.94 | ||
| Statement of Operations | ||||
Year ended February 28, 2023 | ||||
| Investment Income | ||||
| Dividends | $ | 100,859,156 | ||
| Income from Fidelity Central Funds (including $134,767 from security lending) | 278,309 | |||
| Total Income | 101,137,465 | |||
| Expenses | ||||
| Management fee | $ | 15,345,560 | ||
| Transfer agent fees | 4,730,354 | |||
| Accounting fees | 780,816 | |||
| Custodian fees and expenses | 41,315 | |||
| Independent trustees' fees and expenses | 9,769 | |||
| Registration fees | 228,445 | |||
| Audit | 60,663 | |||
| Legal | 2,943 | |||
| Interest | 132,773 | |||
| Miscellaneous | 8,769 | |||
| Total expenses before reductions | 21,341,407 | |||
| Expense reductions | (100,733) | |||
| Total expenses after reductions | 21,240,674 | |||
| Net Investment income (loss) | 79,896,791 | |||
| Realized and Unrealized Gain (Loss) | ||||
| Net realized gain (loss) on: | ||||
| Investment Securities: | ||||
| Unaffiliated issuers | 62,610,001 | |||
| Foreign currency transactions | (59,395) | |||
| Total net realized gain (loss) | 62,550,606 | |||
| Change in net unrealized appreciation (depreciation) on: | ||||
| Investment Securities: | ||||
| Unaffiliated issuers | 379,247,000 | |||
| Assets and liabilities in foreign currencies | (4,963) | |||
| Total change in net unrealized appreciation (depreciation) | 379,242,037 | |||
| Net gain (loss) | 441,792,643 | |||
| Net increase (decrease) in net assets resulting from operations | $ | 521,689,434 | ||
| Statement of Changes in Net Assets | ||||
Year ended February 28, 2023 | Year ended February 28, 2022 | |||
| Increase (Decrease) in Net Assets | ||||
| Operations | ||||
| Net investment income (loss) | $ | 79,896,791 | $ | 37,737,303 |
| Net realized gain (loss) | 62,550,606 | (5,935,534) | ||
| Change in net unrealized appreciation (depreciation) | 379,242,037 | 661,757,391 | ||
| Net increase (decrease) in net assets resulting from operations | 521,689,434 | 693,559,160 | ||
| Distributions to shareholders | (76,651,144) | (31,460,812) | ||
| Share transactions | ||||
| Proceeds from sales of shares | 2,107,751,018 | 1,435,953,793 | ||
| Net asset value of shares issued in exchange for the net assets of the Target Fund(s) (see Merger Information note) | - | 388,960,944 | ||
| Reinvestment of distributions | 71,674,644 | 29,620,722 | ||
| Cost of shares redeemed | (2,191,394,921) | (1,089,636,722) | ||
Net increase (decrease) in net assets resulting from share transactions | (11,969,259) | 764,898,737 | ||
| Total increase (decrease) in net assets | 433,069,031 | 1,426,997,085 | ||
| Net Assets | ||||
| Beginning of period | 2,407,640,731 | 980,643,646 | ||
| End of period | $ | 2,840,709,762 | $ | 2,407,640,731 |
| Other Information | ||||
| Shares | ||||
| Sold | 39,822,947 | 39,603,793 | ||
| Issued in exchange for the shares of the Target Fund(s) (see Merger Information note) | - | 11,161,009 | ||
| Issued in reinvestment of distributions | 1,340,218 | 884,794 | ||
| Redeemed | (42,677,565) | (31,953,761) | ||
| Net increase (decrease) | (1,514,400) | 19,695,835 | ||
| Energy Portfolio |
| Years ended February 28, | 2023 | 2022 | 2021 | 2020 A | 2019 | |||||
Selected Per-Share Data | ||||||||||
| Net asset value, beginning of period | $ | 45.24 | $ | 29.25 | $ | 26.79 | $ | 37.50 | $ | 41.01 |
| Income from Investment Operations | ||||||||||
Net investment income (loss) B,C | 1.46 | .96 | .99 D | .71 | .49 | |||||
| Net realized and unrealized gain (loss) | 9.64 | 15.82 | 2.27 | (10.76) | (3.51) | |||||
| Total from investment operations | 11.10 | 16.78 | 3.26 | (10.05) | (3.02) | |||||
| Distributions from net investment income | (1.40) | (.79) | (.80) | (.64) | (.48) | |||||
| Distributions from net realized gain | - | - | - | (.02) | (.01) | |||||
| Total distributions | (1.40) | (.79) | (.80) | (.66) | (.49) | |||||
| Net asset value, end of period | $ | 54.94 | $ | 45.24 | $ | 29.25 | $ | 26.79 | $ | 37.50 |
Total Return E | 24.63% | 58.37% | 13.03% | (27.24)% | (7.30)% | |||||
Ratios to Average Net Assets C,F,G | ||||||||||
| Expenses before reductions | .73% | .77% | .85% | .81% | .78% | |||||
| Expenses net of fee waivers, if any | .73% | .77% | .85% | .81% | .78% | |||||
| Expenses net of all reductions | .73% | .77% | .84% | .80% | .77% | |||||
| Net investment income (loss) | 2.75% | 2.79% | 4.50% D | 2.00% | 1.12% | |||||
| Supplemental Data | ||||||||||
| Net assets, end of period (000 omitted) | $ | 2,840,710 | $ | 2,407,641 | $ | 980,644 | $ | 676,312 | $ | 1,152,173 |
Portfolio turnover rate H | 43% | 56% I | 31% | 79% | 59% |
| Fidelity Central Fund | Investment Manager | Investment Objective | Investment Practices | Expense Ratio A |
| Fidelity Money Market Central Funds | Fidelity Management & Research Company LLC (FMR) | Each fund seeks to obtain a high level of current income consistent with the preservation of capital and liquidity. | Short-term Investments | Less than .005% |
| Energy Portfolio | $336,105 |
| Gross unrealized appreciation | $1,131,819,264 |
| Gross unrealized depreciation | (25,206,828) |
| Net unrealized appreciation (depreciation) | $1,106,612,436) |
| Tax Cost | $1,775,512,905 |
| Capital loss carryforward | $(1,200,162,975) |
| Net unrealized appreciation (depreciation) on securities and other investments | $1,104,063,112 |
Short-term | $(463,978,664) |
Long-term | (736,184,311) |
| Total capital loss carryforward | $(1,200,162,975) |
| February 28, 2023 | February 28, 2022 | |
| Ordinary Income | $76,651,144 | $ 31,460,812 |
| Purchases ($) | Sales ($) | |
| Energy Portfolio | 1,245,039,230 | 1,236,016,778 |
| % of Average Net Assets | |
| Energy Portfolio | .03 |
| Amount | |
| Energy Portfolio | $33,462 |
| Borrower or Lender | Average Loan Balance | Weighted Average Interest Rate | Interest Expense | |
| Energy Portfolio | Borrower | $11,772,827 | 2.86% | $130,182 |
| Purchases ($) | Sales ($) | Realized Gain (Loss) ($) | |
| Energy Portfolio | 67,861,814 | 145,361,073 | 2,659,746 |
| Amount | |
| Energy Portfolio | $4,852 |
| Total Security Lending Fees Paid to NFS | Security Lending Income From Securities Loaned to NFS | Value of Securities Loaned to NFS at Period End | |
| Energy Portfolio | $13,861 | $- | $- |
| Average Loan Balance | Weighted Average Interest Rate | Interest Expense | |
| Energy Portfolio | $4,316,125 | 2.70% | $2,591 |
| Target Fund | Investments $ | Unrealized appreciation (depreciation) $ | Net Assets $ | Shares Exchanged | Shares Exchanged Ratio |
| Energy Service Portfolio | 239,225,585 | (29,042,821) | 240,539,236 | 6,902,147 | .5578794835 |
| Natural Gas Portfolio | 148,458,051 | 3,907,464 | 148,421,708 | 4,258,862 | .4453142037 |
| Surviving Fund | Net Assets $ | Total net assets after the acquisition $ |
| Energy Portfolio | 1,269,646,810 | 1,658,607,754 |
| Net investment income (loss) | $41,213,855 |
| Total net realized gain (loss) | 31,547,962 |
| Total change in net unrealized appreciation (depreciation) | 637,928,213 |
| Net increase (decrease) in net assets resulting from operations | $710,690,030 |
| The Example is based on an investment of $1,000 invested at the beginning of the period and held for the entire period (September 1, 2022 to February 28, 2023). |
Annualized Expense Ratio- A | Beginning Account Value September 1, 2022 | Ending Account Value February 28, 2023 | Expenses Paid During Period- C September 1, 2022 to February 28, 2023 | |||||||
| Energy Portfolio | .73% | |||||||||
| Actual | $ 1,000 | $ 1,062.50 | $ 3.73 | |||||||
Hypothetical- B | $ 1,000 | $ 1,021.17 | $ 3.66 | |||||||
- Highly liquid investments - cash or convertible to cash within three business days or less
- Moderately liquid investments - convertible to cash in three to seven calendar days
- Less liquid investments - can be sold or disposed of, but not settled, within seven calendar days
- Illiquid investments - cannot be sold or disposed of within seven calendar days
 |


Contents
| Average Annual Total Returns | |||
Periods ended February 28, 2023 | Past 1 year | Past 5 years | Past 10 years |
| Fidelity® Environment and Alternative Energy Fund | -9.46% | 6.49% | 9.79% |
| $10,000 Over 10 Years |
Let's say hypothetically that $10,000 was invested in Fidelity® Environment and Alternative Energy Fund on February 28, 2013. The chart shows how the value of your investment would have changed, and also shows how the S&P 500® Index performed over the same period. |
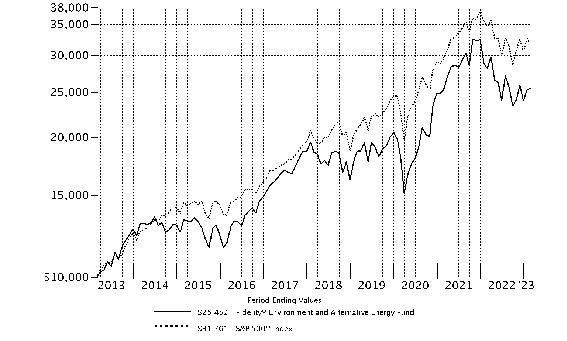 |
Top Holdings (% of Fund's net assets) | ||
| Microsoft Corp. | 13.2 | |
| Tesla, Inc. | 9.3 | |
| Linde PLC | 8.0 | |
| Danaher Corp. | 7.2 | |
| Analog Devices, Inc. | 4.9 | |
| IBM Corp. | 4.9 | |
| Prologis (REIT), Inc. | 4.7 | |
| Eaton Corp. PLC | 4.3 | |
| Waste Management, Inc. | 3.7 | |
| Cummins, Inc. | 2.8 | |
| 63.0 | ||
| Industries (% of Fund's net assets) | ||
| Software | 13.5 | |
| Semiconductors & Semiconductor Equipment | 12.3 | |
| Automobiles | 9.3 | |
| Chemicals | 8.4 | |
| Life Sciences Tools & Services | 8.4 | |
| Electrical Equipment | 6.8 | |
| Commercial Services & Supplies | 5.2 | |
| Independent Power and Renewable Electricity Producers | 5.1 | |
| IT Services | 4.9 | |
| Equity Real Estate Investment Trusts (Reits) | 4.7 | |
| Building Products | 4.5 | |
| Machinery | 4.2 | |
| Electric Utilities | 3.4 | |
| Construction & Engineering | 2.6 | |
| Containers & Packaging | 1.8 | |
| Oil, Gas & Consumable Fuels | 1.7 | |
| Energy Equipment & Services | 0.9 | |
| Electronic Equipment & Components | 0.7 | |
| Metals & Mining | 0.6 | |
| Aerospace & Defense | 0.3 | |
| Professional Services | 0.1 | |
Geographic Diversification (% of Fund's net assets) |
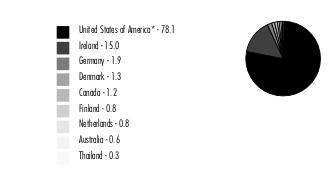 |
* Includes Short-Term investments and Net Other Assets (Liabilities). Percentages are based on country or territory of incorporation and are adjusted for the effect of derivatives, if applicable. |
| Common Stocks - 99.4% | |||
| Shares | Value ($) | ||
| Aerospace & Defense - 0.3% | |||
| Aerospace & Defense - 0.3% | |||
| BWX Technologies, Inc. | 22,600 | 1,381,086 | |
| Woodward, Inc. | 1,900 | 188,100 | |
| 1,569,186 | |||
| Automobiles - 9.3% | |||
| Automobile Manufacturers - 9.3% | |||
| Tesla, Inc. (a) | 214,280 | 44,079,539 | |
| Building Products - 4.5% | |||
| Building Products - 4.5% | |||
| Owens Corning | 54,020 | 5,282,616 | |
| The AZEK Co., Inc. (a)(b) | 134,380 | 3,237,214 | |
| Trane Technologies PLC | 69,800 | 12,910,906 | |
| 21,430,736 | |||
| Chemicals - 8.4% | |||
| Industrial Gases - 8.0% | |||
| Linde PLC | 108,440 | 37,777,243 | |
| Specialty Chemicals - 0.4% | |||
| Aspen Aerogels, Inc. (a) | 197,880 | 2,146,998 | |
TOTAL CHEMICALS | 39,924,241 | ||
| Commercial Services & Supplies - 5.2% | |||
| Environmental & Facility Services - 5.2% | |||
| Clean Harbors, Inc. (a) | 29,590 | 3,907,951 | |
| Tetra Tech, Inc. | 23,140 | 3,167,635 | |
| Waste Management, Inc. | 117,870 | 17,652,211 | |
| 24,727,797 | |||
| Construction & Engineering - 2.6% | |||
| Construction & Engineering - 2.6% | |||
| AECOM | 98,300 | 8,489,188 | |
| Quanta Services, Inc. | 23,210 | 3,746,094 | |
| 12,235,282 | |||
| Containers & Packaging - 1.8% | |||
| Metal & Glass Containers - 1.8% | |||
| Ball Corp. | 148,390 | 8,341,002 | |
| Electric Utilities - 3.4% | |||
| Electric Utilities - 3.4% | |||
| ORSTED A/S (c) | 68,040 | 5,922,410 | |
| PG&E Corp. (a) | 647,250 | 10,110,045 | |
| 16,032,455 | |||
| Electrical Equipment - 6.8% | |||
| Electrical Components & Equipment - 6.1% | |||
| Acuity Brands, Inc. | 5,320 | 1,031,867 | |
| Eaton Corp. PLC | 115,880 | 20,270,888 | |
| Fluence Energy, Inc. (a)(b) | 123,670 | 2,308,919 | |
| Hubbell, Inc. Class B | 8,230 | 2,070,174 | |
| Plug Power, Inc. (a)(b) | 63,690 | 947,070 | |
| Sunrun, Inc. (a) | 87,510 | 2,103,740 | |
| 28,732,658 | |||
| Heavy Electrical Equipment - 0.7% | |||
| Bloom Energy Corp. Class A (a)(b) | 96,400 | 2,090,916 | |
| NuScale Power Corp. (a)(b) | 129,300 | 1,338,255 | |
| 3,429,171 | |||
TOTAL ELECTRICAL EQUIPMENT | 32,161,829 | ||
| Electronic Equipment & Components - 0.7% | |||
| Electronic Equipment & Instruments - 0.7% | |||
| Badger Meter, Inc. | 1,120 | 136,214 | |
| Itron, Inc. (a) | 53,600 | 2,989,272 | |
| 3,125,486 | |||
| Energy Equipment & Services - 0.9% | |||
| Oil & Gas Equipment & Services - 0.9% | |||
| Baker Hughes Co. Class A | 137,030 | 4,193,118 | |
| Equity Real Estate Investment Trusts (REITs) - 4.7% | |||
| Industrial REITs - 4.7% | |||
| Prologis (REIT), Inc. | 180,820 | 22,313,188 | |
| Independent Power and Renewable Electricity Producers - 5.1% | |||
| Independent Power Producers & Energy Traders - 3.6% | |||
| RWE AG | 214,500 | 9,129,516 | |
| The AES Corp. | 312,980 | 7,724,346 | |
| 16,853,862 | |||
| Renewable Electricity - 1.5% | |||
| Brookfield Renewable Corp. | 195,320 | 5,439,662 | |
| Energy Absolute PCL NVDR | 742,250 | 1,648,976 | |
| 7,088,638 | |||
TOTAL INDEPENDENT POWER AND RENEWABLE ELECTRICITY PRODUCERS | 23,942,500 | ||
| IT Services - 4.9% | |||
| IT Consulting & Other Services - 4.9% | |||
| IBM Corp. | 179,030 | 23,148,579 | |
| Life Sciences Tools & Services - 8.4% | |||
| Life Sciences Tools & Services - 8.4% | |||
| Agilent Technologies, Inc. | 39,740 | 5,641,888 | |
| Danaher Corp. | 137,210 | 33,963,591 | |
| 39,605,479 | |||
| Machinery - 4.2% | |||
| Agricultural & Farm Machinery - 0.8% | |||
| Deere & Co. | 9,290 | 3,894,740 | |
| Construction Machinery & Heavy Trucks - 2.8% | |||
| Cummins, Inc. | 53,622 | 13,034,436 | |
| Industrial Machinery - 0.6% | |||
| Timken Co. | 36,100 | 3,084,745 | |
TOTAL MACHINERY | 20,013,921 | ||
| Metals & Mining - 0.6% | |||
| Diversified Metals & Mining - 0.6% | |||
| Lynas Rare Earths Ltd. (a) | 500,804 | 2,750,417 | |
| Oil, Gas & Consumable Fuels - 1.7% | |||
| Oil & Gas Exploration & Production - 0.9% | |||
| Denbury, Inc. (a) | 49,510 | 4,127,649 | |
| Oil & Gas Refining & Marketing - 0.8% | |||
| Neste OYJ | 80,000 | 3,866,105 | |
TOTAL OIL, GAS & CONSUMABLE FUELS | 7,993,754 | ||
| Professional Services - 0.1% | |||
| Research & Consulting Services - 0.1% | |||
| KBR, Inc. | 4,260 | 234,769 | |
| Semiconductors & Semiconductor Equipment - 12.3% | |||
| Semiconductor Equipment - 3.3% | |||
| AEHR Test Systems (a) | 8,890 | 296,482 | |
| Enphase Energy, Inc. (a) | 36,100 | 7,600,133 | |
| Entegris, Inc. | 6,100 | 519,903 | |
| SolarEdge Technologies, Inc. (a) | 22,310 | 7,092,795 | |
| 15,509,313 | |||
| Semiconductors - 9.0% | |||
| Allegro MicroSystems LLC (a) | 93,470 | 4,082,770 | |
| Analog Devices, Inc. | 126,910 | 23,284,178 | |
| NXP Semiconductors NV | 20,220 | 3,608,866 | |
| onsemi (a) | 150,350 | 11,638,594 | |
| 42,614,408 | |||
TOTAL SEMICONDUCTORS & SEMICONDUCTOR EQUIPMENT | 58,123,721 | ||
| Software - 13.5% | |||
| Application Software - 0.3% | |||
| Aspen Technology, Inc. (a) | 6,230 | 1,320,822 | |
| Systems Software - 13.2% | |||
| Microsoft Corp. | 250,920 | 62,584,466 | |
TOTAL SOFTWARE | 63,905,288 | ||
| TOTAL COMMON STOCKS (Cost $414,381,496) | 469,852,287 | ||
| Convertible Preferred Stocks - 0.0% | |||
| Shares | Value ($) | ||
| Electronic Equipment & Components - 0.0% | |||
| Electronic Components - 0.0% | |||
CelLink Corp. Series D (a)(d)(e) (Cost $295,699) | 14,200 | 184,884 | |
| Money Market Funds - 1.2% | |||
| Shares | Value ($) | ||
| Fidelity Cash Central Fund 4.63% (f) | 480,542 | 480,638 | |
| Fidelity Securities Lending Cash Central Fund 4.63% (f)(g) | 5,109,814 | 5,110,325 | |
| TOTAL MONEY MARKET FUNDS (Cost $5,590,963) | 5,590,963 | ||
| TOTAL INVESTMENT IN SECURITIES - 100.6% (Cost $420,268,158) | 475,628,134 |
NET OTHER ASSETS (LIABILITIES) - (0.6)% | (3,024,304) |
| NET ASSETS - 100.0% | 472,603,830 |
| (a) | Non-income producing |
| (b) | Security or a portion of the security is on loan at period end. |
| (c) | Security exempt from registration under Rule 144A of the Securities Act of 1933. These securities may be resold in transactions exempt from registration, normally to qualified institutional buyers. At the end of the period, the value of these securities amounted to $5,922,410 or 1.3% of net assets. |
| (d) | Restricted securities (including private placements) - Investment in securities not registered under the Securities Act of 1933 (excluding 144A issues). At the end of the period, the value of restricted securities (excluding 144A issues) amounted to $184,884 or 0.0% of net assets. |
| (e) | Level 3 security |
| (f) | Affiliated fund that is generally available only to investment companies and other accounts managed by Fidelity Investments. The rate quoted is the annualized seven-day yield of the fund at period end. A complete unaudited listing of the fund's holdings as of its most recent quarter end is available upon request. In addition, each Fidelity Central Fund's financial statements, which are not covered by the Fund's Report of Independent Registered Public Accounting Firm, are available on the SEC's website or upon request. |
| (g) | Investment made with cash collateral received from securities on loan. |
| Additional information on each restricted holding is as follows: | ||
| Security | Acquisition Date | Acquisition Cost ($) |
| CelLink Corp. Series D | 1/20/22 | 295,699 |
| Affiliate | Value, beginning of period ($) | Purchases ($) | Sales Proceeds ($) | Dividend Income ($) | Realized Gain (loss) ($) | Change in Unrealized appreciation (depreciation) ($) | Value, end of period ($) | % ownership, end of period |
| Fidelity Cash Central Fund 4.63% | 620,575 | 67,251,993 | 67,391,930 | 39,672 | - | - | 480,638 | 0.0% |
| Fidelity Securities Lending Cash Central Fund 4.63% | 1,297,050 | 85,681,854 | 81,868,579 | 90,570 | - | - | 5,110,325 | 0.0% |
| Total | 1,917,625 | 152,933,847 | 149,260,509 | 130,242 | - | - | 5,590,963 | |
| Valuation Inputs at Reporting Date: | ||||
| Description | Total ($) | Level 1 ($) | Level 2 ($) | Level 3 ($) |
Investments in Securities: | ||||
| Common Stocks | 469,852,287 | 461,179,460 | 8,672,827 | - |
| Convertible Preferred Stocks | 184,884 | - | - | 184,884 |
| Money Market Funds | 5,590,963 | 5,590,963 | - | - |
| Total Investments in Securities: | 475,628,134 | 466,770,423 | 8,672,827 | 184,884 |
| Statement of Assets and Liabilities | ||||
| February 28, 2023 | ||||
| Assets | ||||
| Investment in securities, at value (including securities loaned of $4,979,104) - See accompanying schedule: | ||||
Unaffiliated issuers (cost $414,677,195) | $ | 470,037,171 | ||
Fidelity Central Funds (cost $5,590,963) | 5,590,963 | |||
| Total Investment in Securities (cost $420,268,158) | $ | 475,628,134 | ||
| Foreign currency held at value (cost $5) | 5 | |||
| Receivable for investments sold | 2,534,870 | |||
| Receivable for fund shares sold | 392,830 | |||
| Dividends receivable | 862,834 | |||
| Distributions receivable from Fidelity Central Funds | 14,280 | |||
| Prepaid expenses | 971 | |||
Total assets | 479,433,924 | |||
| Liabilities | ||||
| Payable for investments purchased | $ | 938,726 | ||
| Payable for fund shares redeemed | 431,903 | |||
| Accrued management fee | 211,529 | |||
| Other affiliated payables | 109,366 | |||
| Other payables and accrued expenses | 28,245 | |||
| Collateral on securities loaned | 5,110,325 | |||
| Total Liabilities | 6,830,094 | |||
| Net Assets | $ | 472,603,830 | ||
| Net Assets consist of: | ||||
| Paid in capital | $ | 546,618,489 | ||
| Total accumulated earnings (loss) | (74,014,659) | |||
| Net Assets | $ | 472,603,830 | ||
Net Asset Value , offering price and redemption price per share ($472,603,830 ÷ 16,968,880 shares) | $ | 27.85 | ||
| Statement of Operations | ||||
Year ended February 28, 2023 | ||||
| Investment Income | ||||
| Dividends | $ | 7,913,482 | ||
| Income from Fidelity Central Funds (including $90,570 from security lending) | 130,242 | |||
| Total Income | 8,043,724 | |||
| Expenses | ||||
| Management fee | $ | 3,228,120 | ||
| Transfer agent fees | 1,318,834 | |||
| Accounting fees | 209,780 | |||
| Custodian fees and expenses | 19,239 | |||
| Independent trustees' fees and expenses | 2,143 | |||
| Registration fees | 35,306 | |||
| Audit | 47,712 | |||
| Legal | 2,510 | |||
| Interest | 6,784 | |||
| Miscellaneous | 3,135 | |||
| Total expenses before reductions | 4,873,563 | |||
| Expense reductions | (22,188) | |||
| Total expenses after reductions | 4,851,375 | |||
| Net Investment income (loss) | 3,192,349 | |||
| Realized and Unrealized Gain (Loss) | ||||
| Net realized gain (loss) on: | ||||
| Investment Securities: | ||||
| Unaffiliated issuers (net of foreign taxes of $24,438) | (103,176,826) | |||
| Foreign currency transactions | (9,970) | |||
| Total net realized gain (loss) | (103,186,796) | |||
| Change in net unrealized appreciation (depreciation) on: | ||||
| Investment Securities: | ||||
| Unaffiliated issuers (net of decrease in deferred foreign taxes of $15,075) | 14,332,944 | |||
| Assets and liabilities in foreign currencies | (5,090) | |||
| Total change in net unrealized appreciation (depreciation) | 14,327,854 | |||
| Net gain (loss) | (88,858,942) | |||
| Net increase (decrease) in net assets resulting from operations | $ | (85,666,593) | ||
| Statement of Changes in Net Assets | ||||
Year ended February 28, 2023 | Year ended February 28, 2022 | |||
| Increase (Decrease) in Net Assets | ||||
| Operations | ||||
| Net investment income (loss) | $ | 3,192,349 | $ | 2,066,511 |
| Net realized gain (loss) | (103,186,796) | 45,207,872 | ||
| Change in net unrealized appreciation (depreciation) | 14,327,854 | (30,454,510) | ||
| Net increase (decrease) in net assets resulting from operations | (85,666,593) | 16,819,873 | ||
| Distributions to shareholders | (3,228,177) | (64,644,758) | ||
| Share transactions | ||||
| Proceeds from sales of shares | 106,568,582 | 631,087,095 | ||
| Reinvestment of distributions | 3,006,815 | 61,338,201 | ||
| Cost of shares redeemed | (303,818,497) | (262,840,215) | ||
Net increase (decrease) in net assets resulting from share transactions | (194,243,100) | 429,585,081 | ||
| Total increase (decrease) in net assets | (283,137,870) | 381,760,196 | ||
| Net Assets | ||||
| Beginning of period | 755,741,700 | 373,981,504 | ||
| End of period | $ | 472,603,830 | $ | 755,741,700 |
| Other Information | ||||
| Shares | ||||
| Sold | 3,656,658 | 18,010,951 | ||
| Issued in reinvestment of distributions | 111,940 | 1,802,725 | ||
| Redeemed | (11,200,238) | (7,814,961) | ||
| Net increase (decrease) | (7,431,640) | 11,998,715 | ||
| Fidelity® Environment and Alternative Energy Fund |
| Years ended February 28, | 2023 | 2022 | 2021 | 2020 A | 2019 | |||||
Selected Per-Share Data | ||||||||||
| Net asset value, beginning of period | $ | 30.97 | $ | 30.16 | $ | 23.80 | $ | 24.92 | $ | 26.31 |
| Income from Investment Operations | ||||||||||
Net investment income (loss) B,C | .15 | .11 | .24 | .27 | .24 | |||||
| Net realized and unrealized gain (loss) | (3.09) | 3.46 | 8.02 | (.81) | (.25) | |||||
| Total from investment operations | (2.94) | 3.57 | 8.26 | (.54) | (.01) | |||||
| Distributions from net investment income | (.18) | (.10) | (.26) | (.23) | (.22) | |||||
| Distributions from net realized gain | - | (2.66) | (1.64) | (.35) | (1.16) | |||||
| Total distributions | (.18) | (2.76) | (1.90) | (.58) | (1.38) | |||||
| Net asset value, end of period | $ | 27.85 | $ | 30.97 | $ | 30.16 | $ | 23.80 | $ | 24.92 |
Total Return D | (9.46)% | 11.02% | 38.97% | (2.35)% | .39% | |||||
Ratios to Average Net Assets C,E,F | ||||||||||
| Expenses before reductions | .79% | .79% | .85% | .85% | .87% | |||||
| Expenses net of fee waivers, if any | .79% | .79% | .85% | .85% | .87% | |||||
| Expenses net of all reductions | .79% | .79% | .85% | .85% | .87% | |||||
| Net investment income (loss) | .52% | .33% | .95% | 1.08% | .96% | |||||
| Supplemental Data | ||||||||||
| Net assets, end of period (000 omitted) | $ | 472,604 | $ | 755,742 | $ | 373,982 | $ | 181,456 | $ | 160,960 |
Portfolio turnover rate G | 34% | 89% | 28% | 49% | 62% |
| Average Annual Total Returns | |||
Periods ended February 28, 2023 | Past 1 year | Past 5 years | Past 10 years |
| Fidelity® Natural Resources Fund | 19.78% | 9.58% | 3.68% |
| $10,000 Over 10 Years |
Let's say hypothetically that $10,000 was invested in Fidelity® Natural Resources Fund on February 28, 2013. The chart shows how the value of your investment would have changed, and also shows how the S&P 500® Index performed over the same period. |
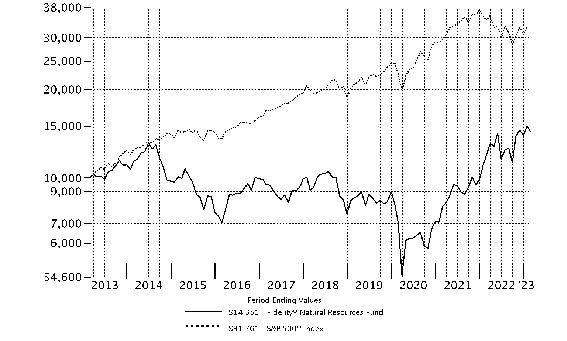 |
Top Holdings (% of Fund's net assets) | ||
| Exxon Mobil Corp. | 19.0 | |
| Hess Corp. | 8.4 | |
| Canadian Natural Resources Ltd. | 7.9 | |
| Imperial Oil Ltd. | 6.3 | |
| Freeport-McMoRan, Inc. | 4.7 | |
| Phillips 66 Co. | 4.6 | |
| Schlumberger Ltd. | 4.6 | |
| Valero Energy Corp. | 4.5 | |
| MEG Energy Corp. | 4.3 | |
| Kosmos Energy Ltd. | 3.3 | |
| 67.6 | ||
| Industries (% of Fund's net assets) | ||
| Oil, Gas & Consumable Fuels | 64.7 | |
| Energy Equipment & Services | 12.9 | |
| Metals & Mining | 11.7 | |
| Chemicals | 4.2 | |
| Containers & Packaging | 4.1 | |
Geographic Diversification (% of Fund's net assets) |
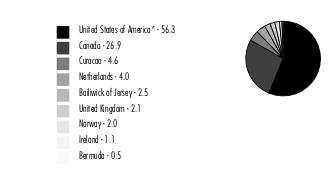 |
* Includes Short-Term investments and Net Other Assets (Liabilities). Percentages are based on country or territory of incorporation and are adjusted for the effect of derivatives, if applicable. |
| Common Stocks - 97.6% | |||
| Shares | Value ($) | ||
| Chemicals - 4.2% | |||
| Commodity Chemicals - 1.7% | |||
| Chemtrade Logistics Income Fund | 828,800 | 5,575,950 | |
| LyondellBasell Industries NV Class A | 89,600 | 8,600,704 | |
| 14,176,654 | |||
| Diversified Chemicals - 0.5% | |||
| The Chemours Co. LLC | 109,800 | 3,752,964 | |
| Fertilizers & Agricultural Chemicals - 0.5% | |||
| CF Industries Holdings, Inc. | 48,900 | 4,200,021 | |
| Industrial Gases - 1.1% | |||
| Linde PLC | 24,900 | 8,674,413 | |
| Specialty Chemicals - 0.4% | |||
| Celanese Corp. Class A | 30,600 | 3,556,638 | |
TOTAL CHEMICALS | 34,360,690 | ||
| Containers & Packaging - 4.1% | |||
| Metal & Glass Containers - 2.3% | |||
| Aptargroup, Inc. | 85,400 | 9,967,888 | |
| Crown Holdings, Inc. | 9,600 | 830,496 | |
| Greif, Inc. Class A | 107,200 | 7,616,560 | |
| 18,414,944 | |||
| Paper Packaging - 1.8% | |||
| Avery Dennison Corp. | 55,200 | 10,056,888 | |
| Sealed Air Corp. | 94,100 | 4,575,142 | |
| 14,632,030 | |||
TOTAL CONTAINERS & PACKAGING | 33,046,974 | ||
| Energy Equipment & Services - 12.9% | |||
| Oil & Gas Drilling - 0.7% | |||
| Diamond Offshore Drilling, Inc. (a) | 100,900 | 1,198,692 | |
| Valaris Ltd. (a) | 58,800 | 3,954,300 | |
| 5,152,992 | |||
| Oil & Gas Equipment & Services - 12.2% | |||
| Expro Group Holdings NV (a) | 1,083,300 | 24,623,409 | |
| Schlumberger Ltd. | 701,000 | 37,300,210 | |
| TechnipFMC PLC (a) | 902,500 | 13,799,225 | |
| Weatherford International PLC (a) | 355,164 | 23,661,026 | |
| 99,383,870 | |||
TOTAL ENERGY EQUIPMENT & SERVICES | 104,536,862 | ||
| Metals & Mining - 11.7% | |||
| Copper - 7.1% | |||
| First Quantum Minerals Ltd. | 880,500 | 19,236,134 | |
| Freeport-McMoRan, Inc. | 934,700 | 38,294,659 | |
| 57,530,793 | |||
| Diversified Metals & Mining - 3.4% | |||
| Glencore PLC | 3,422,800 | 20,406,274 | |
| Horizonte Minerals PLC (a) | 1,579,600 | 2,764,532 | |
| Ivanhoe Mines Ltd. (a) | 551,000 | 4,603,444 | |
| 27,774,250 | |||
| Gold - 1.2% | |||
| Franco-Nevada Corp. | 77,900 | 9,943,454 | |
TOTAL METALS & MINING | 95,248,497 | ||
| Oil, Gas & Consumable Fuels - 64.7% | |||
| Coal & Consumable Fuels - 0.6% | |||
| Cameco Corp. (b) | 180,553 | 4,936,319 | |
| Integrated Oil & Gas - 27.3% | |||
| Equinor ASA sponsored ADR | 536,600 | 16,371,666 | |
| Exxon Mobil Corp. | 1,402,800 | 154,181,747 | |
| Imperial Oil Ltd. | 1,032,400 | 51,063,889 | |
| 221,617,302 | |||
| Oil & Gas Exploration & Production - 27.1% | |||
| Africa Oil Corp. | 5,977,121 | 12,221,449 | |
| Canadian Natural Resources Ltd. | 1,131,200 | 63,924,112 | |
| Deltic Energy PLC (a) | 24,667,915 | 697,287 | |
| Eco Atlantic Oil & Gas Ltd. (a) | 3,803,000 | 1,031,228 | |
| Hess Corp. | 505,800 | 68,131,260 | |
| Kosmos Energy Ltd. (a) | 3,452,500 | 27,171,175 | |
| MEG Energy Corp. (a) | 2,194,012 | 34,666,837 | |
| Talos Energy, Inc. (a) | 103,900 | 1,850,459 | |
| Tourmaline Oil Corp. | 242,100 | 10,610,172 | |
| 220,303,979 | |||
| Oil & Gas Refining & Marketing - 9.7% | |||
| Delek U.S. Holdings, Inc. | 65,200 | 1,641,084 | |
| PBF Energy, Inc. Class A | 82,900 | 3,623,559 | |
| Phillips 66 Co. | 366,616 | 37,600,137 | |
| Valero Energy Corp. | 276,100 | 36,370,653 | |
| 79,235,433 | |||
TOTAL OIL, GAS & CONSUMABLE FUELS | 526,093,033 | ||
| TOTAL COMMON STOCKS (Cost $561,836,770) | 793,286,056 | ||
| Money Market Funds - 1.7% | |||
| Shares | Value ($) | ||
| Fidelity Cash Central Fund 4.63% (c) | 8,696,194 | 8,697,934 | |
| Fidelity Securities Lending Cash Central Fund 4.63% (c)(d) | 5,143,736 | 5,144,250 | |
| TOTAL MONEY MARKET FUNDS (Cost $13,842,184) | 13,842,184 | ||
| TOTAL INVESTMENT IN SECURITIES - 99.3% (Cost $575,678,954) | 807,128,240 |
NET OTHER ASSETS (LIABILITIES) - 0.7% | 5,300,840 |
| NET ASSETS - 100.0% | 812,429,080 |
| (a) | Non-income producing |
| (b) | Security or a portion of the security is on loan at period end. |
| (c) | Affiliated fund that is generally available only to investment companies and other accounts managed by Fidelity Investments. The rate quoted is the annualized seven-day yield of the fund at period end. A complete unaudited listing of the fund's holdings as of its most recent quarter end is available upon request. In addition, each Fidelity Central Fund's financial statements, which are not covered by the Fund's Report of Independent Registered Public Accounting Firm, are available on the SEC's website or upon request. |
| (d) | Investment made with cash collateral received from securities on loan. |
| Affiliate | Value, beginning of period ($) | Purchases ($) | Sales Proceeds ($) | Dividend Income ($) | Realized Gain (loss) ($) | Change in Unrealized appreciation (depreciation) ($) | Value, end of period ($) | % ownership, end of period |
| Fidelity Cash Central Fund 4.63% | 5,185,303 | 220,931,359 | 217,418,728 | 197,425 | - | - | 8,697,934 | 0.0% |
| Fidelity Securities Lending Cash Central Fund 4.63% | 18,439,385 | 152,215,332 | 165,510,467 | 39,015 | - | - | 5,144,250 | 0.0% |
| Total | 23,624,688 | 373,146,691 | 382,929,195 | 236,440 | - | - | 13,842,184 | |
| Valuation Inputs at Reporting Date: | ||||
| Description | Total ($) | Level 1 ($) | Level 2 ($) | Level 3 ($) |
Investments in Securities: | ||||
| Common Stocks | 793,286,056 | 772,879,782 | 20,406,274 | - |
| Money Market Funds | 13,842,184 | 13,842,184 | - | - |
| Total Investments in Securities: | 807,128,240 | 786,721,966 | 20,406,274 | - |
| Statement of Assets and Liabilities | ||||
| February 28, 2023 | ||||
| Assets | ||||
| Investment in securities, at value (including securities loaned of $4,934,870) - See accompanying schedule: | ||||
Unaffiliated issuers (cost $561,836,770) | $ | 793,286,056 | ||
Fidelity Central Funds (cost $13,842,184) | 13,842,184 | |||
| Total Investment in Securities (cost $575,678,954) | $ | 807,128,240 | ||
| Foreign currency held at value (cost $19) | 24 | |||
| Receivable for investments sold | 7,205,808 | |||
| Receivable for fund shares sold | 5,706,694 | |||
| Dividends receivable | 2,250,622 | |||
| Distributions receivable from Fidelity Central Funds | 55,230 | |||
| Prepaid expenses | 2,774 | |||
| Other receivables | 82,424 | |||
Total assets | 822,431,816 | |||
| Liabilities | ||||
| Payable for investments purchased | $ | 3,485,880 | ||
| Payable for fund shares redeemed | 749,305 | |||
| Accrued management fee | 362,016 | |||
| Other affiliated payables | 143,227 | |||
| Other payables and accrued expenses | 118,058 | |||
| Collateral on securities loaned | 5,144,250 | |||
| Total Liabilities | 10,002,736 | |||
| Net Assets | $ | 812,429,080 | ||
| Net Assets consist of: | ||||
| Paid in capital | $ | 853,225,602 | ||
| Total accumulated earnings (loss) | (40,796,522) | |||
| Net Assets | $ | 812,429,080 | ||
Net Asset Value , offering price and redemption price per share ($812,429,080 ÷ 20,321,529 shares) | $ | 39.98 | ||
| Statement of Operations | ||||
Year ended February 28, 2023 | ||||
| Investment Income | ||||
| Dividends | $ | 22,061,786 | ||
| Income from Fidelity Central Funds (including $39,015 from security lending) | 236,440 | |||
| Total Income | 22,298,226 | |||
| Expenses | ||||
| Management fee | $ | 3,952,551 | ||
| Transfer agent fees | 1,371,619 | |||
| Accounting fees | 243,740 | |||
| Custodian fees and expenses | 32,889 | |||
| Independent trustees' fees and expenses | 2,488 | |||
| Registration fees | 93,794 | |||
| Audit | 50,627 | |||
| Legal | 788 | |||
| Interest | 10,132 | |||
| Miscellaneous | 3,735 | |||
| Total expenses before reductions | 5,762,363 | |||
| Expense reductions | (25,812) | |||
| Total expenses after reductions | 5,736,551 | |||
| Net Investment income (loss) | 16,561,675 | |||
| Realized and Unrealized Gain (Loss) | ||||
| Net realized gain (loss) on: | ||||
| Investment Securities: | ||||
| Unaffiliated issuers | 16,006,711 | |||
| Foreign currency transactions | (73,780) | |||
| Total net realized gain (loss) | 15,932,931 | |||
| Change in net unrealized appreciation (depreciation) on: | ||||
| Investment Securities: | ||||
| Unaffiliated issuers | 64,591,935 | |||
| Assets and liabilities in foreign currencies | (1,683) | |||
| Total change in net unrealized appreciation (depreciation) | 64,590,252 | |||
| Net gain (loss) | 80,523,183 | |||
| Net increase (decrease) in net assets resulting from operations | $ | 97,084,858 | ||
| Statement of Changes in Net Assets | ||||
Year ended February 28, 2023 | Year ended February 28, 2022 | |||
| Increase (Decrease) in Net Assets | ||||
| Operations | ||||
| Net investment income (loss) | $ | 16,561,675 | $ | 7,161,576 |
| Net realized gain (loss) | 15,932,931 | 22,873,313 | ||
| Change in net unrealized appreciation (depreciation) | 64,590,252 | 124,171,738 | ||
| Net increase (decrease) in net assets resulting from operations | 97,084,858 | 154,206,627 | ||
| Distributions to shareholders | (18,584,123) | (5,734,164) | ||
| Share transactions | ||||
| Proceeds from sales of shares | 634,417,680 | 383,163,467 | ||
| Reinvestment of distributions | 17,432,108 | 5,352,192 | ||
| Cost of shares redeemed | (515,954,973) | (231,841,612) | ||
Net increase (decrease) in net assets resulting from share transactions | 135,894,815 | 156,674,047 | ||
| Total increase (decrease) in net assets | 214,395,550 | 305,146,510 | ||
| Net Assets | ||||
| Beginning of period | 598,033,530 | 292,887,020 | ||
| End of period | $ | 812,429,080 | $ | 598,033,530 |
| Other Information | ||||
| Shares | ||||
| Sold | 16,884,073 | 13,086,738 | ||
| Issued in reinvestment of distributions | 466,676 | 199,634 | ||
| Redeemed | (14,503,991) | (8,430,799) | ||
| Net increase (decrease) | 2,846,758 | 4,855,573 | ||
| Fidelity® Natural Resources Fund |
| Years ended February 28, | 2023 | 2022 | 2021 | 2020 A | 2019 | |||||
Selected Per-Share Data | ||||||||||
| Net asset value, beginning of period | $ | 34.22 | $ | 23.21 | $ | 20.59 | $ | 25.55 | $ | 27.51 |
| Income from Investment Operations | ||||||||||
Net investment income (loss) B,C | .83 | .51 | .30 | .30 | .29 | |||||
| Net realized and unrealized gain (loss) | 5.87 | 10.91 | 2.69 | (4.88) | (1.97) | |||||
| Total from investment operations | 6.70 | 11.42 | 2.99 | (4.58) | (1.68) | |||||
| Distributions from net investment income | (.94) | (.41) | (.37) | (.30) | (.28) | |||||
| Distributions from net realized gain | - | - | - | (.08) | - D | |||||
| Total distributions | (.94) | (.41) | (.37) | (.38) | (.28) | |||||
| Net asset value, end of period | $ | 39.98 | $ | 34.22 | $ | 23.21 | $ | 20.59 | $ | 25.55 |
Total Return E | 19.78% | 49.71% | 14.76% | (18.25)% | (6.06)% | |||||
Ratios to Average Net Assets C,F,G | ||||||||||
| Expenses before reductions | .77% | .82% | .89% | .84% | .81% | |||||
| Expenses net of fee waivers, if any | .77% | .81% | .89% | .84% | .81% | |||||
| Expenses net of all reductions | .77% | .81% | .88% | .84% | .80% | |||||
| Net investment income (loss) | 2.21% | 1.84% | 1.62% | 1.18% | 1.02% | |||||
| Supplemental Data | ||||||||||
| Net assets, end of period (000 omitted) | $ | 812,429 | $ | 598,034 | $ | 292,887 | $ | 315,533 | $ | 424,167 |
Portfolio turnover rate H | 74% | 98% | 90% | 8% | 26% |
| Fidelity Central Fund | Investment Manager | Investment Objective | Investment Practices | Expense Ratio A |
| Fidelity Money Market Central Funds | Fidelity Management & Research Company LLC (FMR) | Each fund seeks to obtain a high level of current income consistent with the preservation of capital and liquidity. | Short-term Investments | Less than .005% |
| Fidelity Natural Resources Fund | $ 82,424 |
| Tax cost | Gross unrealized appreciation | Gross unrealized depreciation | Net unrealized appreciation (depreciation) | |
Fidelity Environment and Alternative Energy Fund | $423,925,811 | $75,132,570 | $(23,430,247) | $51,702,323 |
| Fidelity Natural Resources Fund | 581,345,367 | 238,158,794 | (12,375,921) | 225,782,873 |
| Undistributed ordinary income | Capital loss carryforward | Net unrealized appreciation (depreciation) on securities and other investments | |
Fidelity Environment and Alternative Energy Fund | $- | $(125,059,440) | $51,696,755 |
| Fidelity Natural Resources Fund | 1,175,087 | (267,670,186) | 225,782,763 |
Short-term | Long-term | Total capital loss carryforward | |
Fidelity Environment and Alternative Energy Fund | $(90,583,038) | $(34,476,402) | $(125,059,440) |
| Fidelity Natural Resources Fund | (93,181,409) | (174,488,777) | (267,670,186) |
Ordinary Losses | |
Fidelity Environment and Alternative Energy Fund | $(657,360) |
| February 28, 2023 | |||
| Ordinary Income | Long-term Capital Gains | Total | |
Fidelity Environment and Alternative Energy Fund | $3,228,177 | $ - | $3,228,177 |
| Fidelity Natural Resources Fund | 18,584,123 | - | 18,584,123 |
| February 28, 2022 | |||
| Ordinary Income | Long-term Capital Gains | Total | |
Fidelity Environment and Alternative Energy Fund | $6,756,801 | $57,887,957 | $64,644,758 |
| Fidelity Natural Resources Fund | 5,734,164 | - | 5,734,164 |
| Purchases ($) | Sales ($) | |
| Fidelity Environment and Alternative Energy Fund | 210,397,570 | 404,970,986 |
| Fidelity Natural Resources Fund | 665,954,799 | 545,714,598 |
| Individual Rate | Group Rate | Total | |
| Fidelity Environment and Alternative Energy Fund | .30% | .23% | .52% |
| Fidelity Natural Resources Fund | .30% | .23% | .53% |
| Fidelity Environment and Alternative Energy Fund | .21% |
| Fidelity Natural Resources Fund | .18% |
| % of Average Net Assets | |
| Fidelity Environment and Alternative Energy Fund | .03 |
| Fidelity Natural Resources Fund | .03 |
| Amount | |
| Fidelity Environment and Alternative Energy Fund | $ 5,887 |
| Fidelity Natural Resources Fund | 20,032 |
| Borrower or Lender | Average Loan Balance | Weighted Average Interest Rate | Interest Expense | |
Fidelity Environment and Alternative Energy Fund | Borrower | $ 10,524,286 | 3.32% | $ 6,784 |
| Fidelity Natural Resources Fund | Borrower | $ 5,503,371 | 1.74% | $ 9,289 |
| Purchases ($) | Sales ($) | Realized Gain (Loss) ($) | |
| Fidelity Environment and Alternative Energy Fund | 3,320,455 | 14,369,538 | (3,803,443) |
| Fidelity Natural Resources Fund | 51,481,080 | 50,979,009 | (689,613) |
| Amount | |
| Fidelity Environment and Alternative Energy Fund | $ 1,182 |
| Fidelity Natural Resources Fund | 1,230 |
| Total Security Lending Fees Paid to NFS | Security Lending Income From Securities Loaned to NFS | Value of Securities Loaned to NFS at Period End | |
| Fidelity Environment and Alternative Energy Fund | $ 9,625 | $ 436 | $257,715 |
| Fidelity Natural Resources Fund | $ 4,006 | $ - | $- |
| Average Loan Balance | Weighted Average Interest Rate | Interest Expense | |
| Fidelity Natural Resources Fund | $ 1,824,000 | 2.08% | $ 843 |
| Custodian credits | |
| Fidelity Natural Resources Fund | 43 |
| Amount | |
| Fidelity Environment and Alternative Energy Fund | $ 22,188 |
| Fidelity Natural Resources Fund | 25,769 |
| The Example is based on an investment of $1,000 invested at the beginning of the period and held for the entire period (September 1, 2022 to February 28, 2023). |
Annualized Expense Ratio- A | Beginning Account Value September 1, 2022 | Ending Account Value February 28, 2023 | Expenses Paid During Period- C September 1, 2022 to February 28, 2023 | |||||||
| Fidelity® Environment and Alternative Energy Fund | .81% | |||||||||
| Actual | $ 1,000 | $ 993.60 | $ 4.00 | |||||||
Hypothetical- B | $ 1,000 | $ 1,020.78 | $ 4.06 | |||||||
| Fidelity® Natural Resources Fund | .76% | |||||||||
| Actual | $ 1,000 | $ 1,136.40 | $ 4.03 | |||||||
Hypothetical- B | $ 1,000 | $ 1,021.03 | $ 3.81 | |||||||
| Fidelity Environment and Alternative Energy Fund | |
| December 2022 | 100% |
| Fidelity Natural Resources Fund | |
| April 2022 | 40% |
| December 2022 | 54% |
| Fidelity Environment and Alternative Energy Fund | |
| December 2022 | 100% |
| Fidelity Natural Resources Fund | |
| April 2022 | 100% |
| December 2022 | 100% |
- Highly liquid investments - cash or convertible to cash within three business days or less
- Moderately liquid investments - convertible to cash in three to seven calendar days
- Less liquid investments - can be sold or disposed of, but not settled, within seven calendar days
- Illiquid investments - cannot be sold or disposed of within seven calendar days
 |


Contents
| Average Annual Total Returns | |||
Periods ended February 28, 2023 | Past 1 year | Past 5 years | Past 10 years |
| Class A (incl.5.75% sales charge) | -7.15% | 6.26% | 6.84% |
| Class M (incl.3.50% sales charge) | -5.18% | 6.47% | 6.80% |
Class C (incl. contingent deferred sales charge) | -3.18% | 6.72% | 6.84% |
| Consumer Staples Portfolio | -1.21% | 7.83% | 7.78% |
| Class I | -1.22% | 7.82% | 7.76% |
| Class Z | -1.09% | 7.94% | 7.83% |
| $10,000 Over 10 Years |
Let's say hypothetically that $10,000 was invested in Consumer Staples Portfolio, a class of the fund, on February 28, 2013. The chart shows how the value of your investment would have changed, and also shows how the S&P 500® Index performed over the same period. |
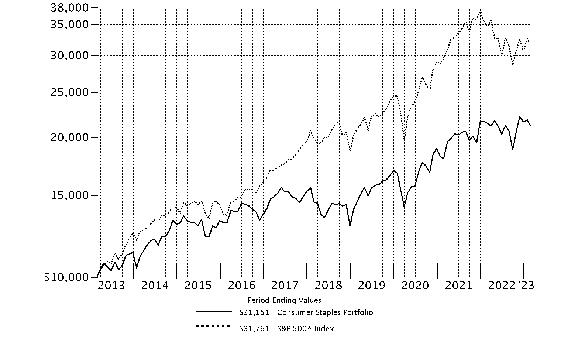 |
Top Holdings (% of Fund's net assets) | ||
| Procter & Gamble Co. | 14.2 | |
| The Coca-Cola Co. | 14.2 | |
| Walmart, Inc. | 6.5 | |
| Mondelez International, Inc. | 5.9 | |
| Altria Group, Inc. | 5.5 | |
| Constellation Brands, Inc. Class A (sub. vtg.) | 4.4 | |
| Monster Beverage Corp. | 4.3 | |
| Philip Morris International, Inc. | 4.3 | |
| PepsiCo, Inc. | 4.2 | |
| Keurig Dr. Pepper, Inc. | 4.1 | |
| 67.6 | ||
| Industries (% of Fund's net assets) | ||
| Beverages | 35.8 | |
| Household Products | 21.6 | |
| Food Products | 17.2 | |
| Food & Staples Retailing | 11.7 | |
| Tobacco | 9.8 | |
| Personal Products | 2.4 | |
| Internet & Direct Marketing Retail | 0.8 | |
| Household Durables | 0.4 | |
| Media | 0.3 | |
| Hotels, Restaurants & Leisure | 0.0 | |
| Common Stocks - 100.0% | |||
| Shares | Value ($) | ||
| Beverages - 35.8% | |||
| Brewers - 2.9% | |||
| Boston Beer Co., Inc. Class A (a) | 139,100 | 45,040,580 | |
| Distillers & Vintners - 5.5% | |||
| Brown-Forman Corp. Class B (non-vtg.) | 27,400 | 1,777,438 | |
| Constellation Brands, Inc. Class A (sub. vtg.) | 304,384 | 68,090,701 | |
| Diageo PLC | 372,624 | 15,812,847 | |
| Pernod Ricard SA | 1,600 | 334,572 | |
| 86,015,558 | |||
| Soft Drinks - 27.4% | |||
| Celsius Holdings, Inc. (a) | 15,000 | 1,362,000 | |
| Keurig Dr. Pepper, Inc. | 1,841,827 | 63,635,123 | |
| Monster Beverage Corp. (a) | 657,013 | 66,857,643 | |
| PepsiCo, Inc. | 375,604 | 65,178,562 | |
| Primo Water Corp. | 433,500 | 6,710,580 | |
| The Coca-Cola Co. | 3,698,018 | 220,069,051 | |
| The Vita Coco Co., Inc. (a) | 8,800 | 148,808 | |
| 423,961,767 | |||
TOTAL BEVERAGES | 555,017,905 | ||
| Food & Staples Retailing - 11.7% | |||
| Drug Retail - 0.2% | |||
| Walgreens Boots Alliance, Inc. | 59,100 | 2,099,823 | |
| Food Distributors - 2.9% | |||
| Performance Food Group Co. (a) | 144,800 | 8,194,232 | |
| Sysco Corp. | 276,956 | 20,652,609 | |
| U.S. Foods Holding Corp. (a) | 441,674 | 16,576,025 | |
| 45,422,866 | |||
| Food Retail - 1.3% | |||
| Albertsons Companies, Inc. | 557,100 | 11,075,148 | |
| Alimentation Couche-Tard, Inc. Class A (multi-vtg.) | 14,400 | 675,518 | |
| Grocery Outlet Holding Corp. (a) | 74,050 | 2,003,053 | |
| Kroger Co. | 144,600 | 6,238,044 | |
| 19,991,763 | |||
| Hypermarkets & Super Centers - 7.3% | |||
| Costco Wholesale Corp. | 26,900 | 13,024,442 | |
| Walmart, Inc. | 705,900 | 100,329,567 | |
| 113,354,009 | |||
TOTAL FOOD & STAPLES RETAILING | 180,868,461 | ||
| Food Products - 17.2% | |||
| Agricultural Products - 3.4% | |||
| Archer Daniels Midland Co. | 113,600 | 9,042,560 | |
| Bunge Ltd. | 303,993 | 29,031,332 | |
| Darling Ingredients, Inc. (a) | 197,961 | 12,524,992 | |
| Ingredion, Inc. | 16,000 | 1,590,400 | |
| 52,189,284 | |||
| Packaged Foods & Meats - 13.8% | |||
| Conagra Brands, Inc. | 354,541 | 12,908,838 | |
| Freshpet, Inc. (a)(b) | 269,600 | 16,763,728 | |
| Laird Superfood, Inc. (a)(b) | 220,582 | 247,052 | |
| McCormick & Co., Inc. (non-vtg.) | 119,900 | 8,910,968 | |
| Mondelez International, Inc. | 1,409,497 | 91,871,014 | |
| Nomad Foods Ltd. (a) | 1,876,159 | 33,620,769 | |
| Pilgrim's Pride Corp. (a) | 32,200 | 753,158 | |
| Sovos Brands, Inc. (a) | 292,298 | 3,820,335 | |
| The Hain Celestial Group, Inc. (a) | 125,700 | 2,241,231 | |
| The Kraft Heinz Co. | 27,000 | 1,051,380 | |
| The Real Good Food Co. LLC: | |||
| Class B (c) | 58,667 | 1 | |
| Class B unit (d) | 58,667 | 226,455 | |
| The Simply Good Foods Co. (a) | 113,800 | 4,357,402 | |
| TreeHouse Foods, Inc. (a) | 402,708 | 19,648,123 | |
| Tyson Foods, Inc. Class A | 286,166 | 16,952,474 | |
| 213,372,928 | |||
TOTAL FOOD PRODUCTS | 265,562,212 | ||
| Hotels, Restaurants & Leisure - 0.0% | |||
| Restaurants - 0.0% | |||
| Compass Group PLC | 4 | 92 | |
| Household Durables - 0.4% | |||
| Household Appliances - 0.3% | |||
| Helen of Troy Ltd. (a) | 41,500 | 4,676,635 | |
| Housewares & Specialties - 0.1% | |||
| Tupperware Brands Corp. (a) | 276,662 | 1,134,314 | |
TOTAL HOUSEHOLD DURABLES | 5,810,949 | ||
| Household Products - 21.6% | |||
| Household Products - 21.6% | |||
| Church & Dwight Co., Inc. | 30,300 | 2,538,534 | |
| Colgate-Palmolive Co. | 124,700 | 9,140,510 | |
| Energizer Holdings, Inc. (b) | 913,144 | 33,083,207 | |
| Kimberly-Clark Corp. | 164,533 | 20,574,852 | |
| Procter & Gamble Co. | 1,600,282 | 220,134,790 | |
| Reckitt Benckiser Group PLC | 82,200 | 5,703,448 | |
| Reynolds Consumer Products, Inc. (b) | 412,339 | 11,314,582 | |
| Spectrum Brands Holdings, Inc. | 275,000 | 17,605,500 | |
| The Clorox Co. | 94,174 | 14,638,407 | |
| 334,733,830 | |||
| Internet & Direct Marketing Retail - 0.8% | |||
| Internet & Direct Marketing Retail - 0.8% | |||
| Amazon.com, Inc. (a) | 128,800 | 12,136,824 | |
| Media - 0.3% | |||
| Advertising - 0.3% | |||
| Advantage Solutions, Inc. Class A (a)(b) | 2,060,867 | 4,533,907 | |
| Personal Products - 2.4% | |||
| Personal Products - 2.4% | |||
| BellRing Brands, Inc. (a) | 151,700 | 4,684,496 | |
| Edgewell Personal Care Co. (b) | 26,100 | 1,114,470 | |
| Estee Lauder Companies, Inc. Class A | 27,155 | 6,600,023 | |
| Herbalife Nutrition Ltd. (a)(b) | 749,050 | 14,494,118 | |
| Olaplex Holdings, Inc. (a)(b) | 2,198,100 | 10,814,652 | |
| 37,707,759 | |||
| Tobacco - 9.8% | |||
| Tobacco - 9.8% | |||
| Altria Group, Inc. | 1,847,617 | 85,784,857 | |
| Philip Morris International, Inc. | 685,182 | 66,668,209 | |
| 152,453,066 | |||
| TOTAL COMMON STOCKS (Cost $1,234,376,846) | 1,548,825,005 | ||
| Money Market Funds - 2.4% | |||
| Shares | Value ($) | ||
| Fidelity Cash Central Fund 4.63% (e) | 691,479 | 691,618 | |
| Fidelity Securities Lending Cash Central Fund 4.63% (e)(f) | 36,894,714 | 36,898,404 | |
| TOTAL MONEY MARKET FUNDS (Cost $37,590,022) | 37,590,022 | ||
| TOTAL INVESTMENT IN SECURITIES - 102.4% (Cost $1,271,966,868) | 1,586,415,027 |
NET OTHER ASSETS (LIABILITIES) - (2.4)% | (37,601,127) |
| NET ASSETS - 100.0% | 1,548,813,900 |
| (a) | Non-income producing |
| (b) | Security or a portion of the security is on loan at period end. |
| (c) | Level 3 security |
| (d) | Security exempt from registration under Rule 144A of the Securities Act of 1933. These securities may be resold in transactions exempt from registration, normally to qualified institutional buyers. At the end of the period, the value of these securities amounted to $226,455 or 0.0% of net assets. |
| (e) | Affiliated fund that is generally available only to investment companies and other accounts managed by Fidelity Investments. The rate quoted is the annualized seven-day yield of the fund at period end. A complete unaudited listing of the fund's holdings as of its most recent quarter end is available upon request. In addition, each Fidelity Central Fund's financial statements, which are not covered by the Fund's Report of Independent Registered Public Accounting Firm, are available on the SEC's website or upon request. |
| (f) | Investment made with cash collateral received from securities on loan. |
| Affiliate | Value, beginning of period ($) | Purchases ($) | Sales Proceeds ($) | Dividend Income ($) | Realized Gain (loss) ($) | Change in Unrealized appreciation (depreciation) ($) | Value, end of period ($) | % ownership, end of period |
| Fidelity Cash Central Fund 4.63% | 14,588,277 | 206,081,384 | 219,978,043 | 87,644 | - | - | 691,618 | 0.0% |
| Fidelity Securities Lending Cash Central Fund 4.63% | 13,163,424 | 344,789,252 | 321,054,272 | 39,959 | - | - | 36,898,404 | 0.1% |
| Total | 27,751,701 | 550,870,636 | 541,032,315 | 127,603 | - | - | 37,590,022 | |
| Valuation Inputs at Reporting Date: | ||||
| Description | Total ($) | Level 1 ($) | Level 2 ($) | Level 3 ($) |
Investments in Securities: | ||||
| Common Stocks | 1,548,825,005 | 1,527,308,617 | 21,516,387 | 1 |
| Money Market Funds | 37,590,022 | 37,590,022 | - | - |
| Total Investments in Securities: | 1,586,415,027 | 1,564,898,639 | 21,516,387 | 1 |
| Statement of Assets and Liabilities | ||||
| February 28, 2023 | ||||
| Assets | ||||
| Investment in securities, at value (including securities loaned of $35,485,524) - See accompanying schedule: | ||||
Unaffiliated issuers (cost $1,234,376,846) | $ | 1,548,825,005 | ||
Fidelity Central Funds (cost $37,590,022) | 37,590,022 | |||
| Total Investment in Securities (cost $1,271,966,868) | $ | 1,586,415,027 | ||
| Receivable for investments sold | 470,148 | |||
| Receivable for fund shares sold | 432,262 | |||
| Dividends receivable | 1,120,560 | |||
| Distributions receivable from Fidelity Central Funds | 2,412 | |||
| Prepaid expenses | 6,674 | |||
| Other receivables | 272,512 | |||
Total assets | 1,588,719,595 | |||
| Liabilities | ||||
| Payable for investments purchased | $ | 564,298 | ||
| Payable for fund shares redeemed | 1,021,497 | |||
| Accrued management fee | 696,239 | |||
| Distribution and service plan fees payable | 157,714 | |||
| Other affiliated payables | 255,154 | |||
| Other payables and accrued expenses | 312,618 | |||
| Collateral on securities loaned | 36,898,175 | |||
| Total Liabilities | 39,905,695 | |||
| Net Assets | $ | 1,548,813,900 | ||
| Net Assets consist of: | ||||
| Paid in capital | $ | 1,240,880,615 | ||
| Total accumulated earnings (loss) | 307,933,285 | |||
| Net Assets | $ | 1,548,813,900 | ||
| Net Asset Value and Maximum Offering Price | ||||
| Class A : | ||||
Net Asset Value and redemption price per share ($297,850,131 ÷ 3,264,269 shares) (a) | $ | 91.25 | ||
| Maximum offering price per share (100/94.25 of $91.25) | $ | 96.82 | ||
| Class M : | ||||
Net Asset Value and redemption price per share ($62,869,916 ÷ 697,735 shares) (a) | $ | 90.11 | ||
| Maximum offering price per share (100/96.50 of $90.11) | $ | 93.38 | ||
| Class C : | ||||
Net Asset Value and offering price per share ($78,496,964 ÷ 889,750 shares) (a) | $ | 88.22 | ||
| Consumer Staples : | ||||
Net Asset Value , offering price and redemption price per share ($862,837,178 ÷ 9,334,961 shares) | $ | 92.43 | ||
| Class I : | ||||
Net Asset Value , offering price and redemption price per share ($158,018,769 ÷ 1,714,573 shares) | $ | 92.16 | ||
| Class Z : | ||||
Net Asset Value , offering price and redemption price per share ($88,740,942 ÷ 964,084 shares) | $ | 92.05 | ||
(a)Redemption price per share is equal to net asset value less any applicable contingent deferred sales charge. | ||||
| Statement of Operations | ||||
Year ended February 28, 2023 | ||||
| Investment Income | ||||
| Dividends | $ | 40,213,248 | ||
| Income from Fidelity Central Funds (including $39,959 from security lending) | 127,603 | |||
| Total Income | 40,340,851 | |||
| Expenses | ||||
| Management fee | $ | 8,428,642 | ||
| Transfer agent fees | 2,631,292 | |||
| Distribution and service plan fees | 1,872,304 | |||
| Accounting fees | 455,820 | |||
| Custodian fees and expenses | 24,854 | |||
| Independent trustees' fees and expenses | 5,474 | |||
| Registration fees | 138,871 | |||
| Audit | 49,914 | |||
| Legal | 4,059 | |||
| Interest | 13,604 | |||
| Miscellaneous | 9,878 | |||
| Total expenses before reductions | 13,634,712 | |||
| Expense reductions | (55,573) | |||
| Total expenses after reductions | 13,579,139 | |||
| Net Investment income (loss) | 26,761,712 | |||
| Realized and Unrealized Gain (Loss) | ||||
| Net realized gain (loss) on: | ||||
| Investment Securities: | ||||
| Unaffiliated issuers | 557,787 | |||
| Foreign currency transactions | (48,065) | |||
| Total net realized gain (loss) | 509,722 | |||
| Change in net unrealized appreciation (depreciation) on: | ||||
| Investment Securities: | ||||
| Unaffiliated issuers | (58,457,249) | |||
| Assets and liabilities in foreign currencies | (4,462) | |||
| Total change in net unrealized appreciation (depreciation) | (58,461,711) | |||
| Net gain (loss) | (57,951,989) | |||
| Net increase (decrease) in net assets resulting from operations | $ | (31,190,277) | ||
| Statement of Changes in Net Assets | ||||
Year ended February 28, 2023 | Year ended February 28, 2022 | |||
| Increase (Decrease) in Net Assets | ||||
| Operations | ||||
| Net investment income (loss) | $ | 26,761,712 | $ | 23,869,410 |
| Net realized gain (loss) | 509,722 | 117,808,690 | ||
| Change in net unrealized appreciation (depreciation) | (58,461,711) | 106,519,256 | ||
| Net increase (decrease) in net assets resulting from operations | (31,190,277) | 248,197,356 | ||
| Distributions to shareholders | (52,925,514) | (153,414,832) | ||
| Share transactions - net increase (decrease) | (73,640,667) | 254,802,169 | ||
| Total increase (decrease) in net assets | (157,756,458) | 349,584,693 | ||
| Net Assets | ||||
| Beginning of period | 1,706,570,358 | 1,356,985,665 | ||
| End of period | $ | 1,548,813,900 | $ | 1,706,570,358 |
| Fidelity Advisor® Consumer Staples Fund Class A |
| Years ended February 28, | 2023 | 2022 | 2021 | 2020 A | 2019 | |||||
Selected Per-Share Data | ||||||||||
| Net asset value, beginning of period | $ | 95.55 | $ | 89.40 | $ | 79.57 | $ | 76.88 | $ | 87.07 |
| Income from Investment Operations | ||||||||||
Net investment income (loss) B,C | 1.38 | 1.40 | 1.34 | 1.40 | 2.08 D | |||||
| Net realized and unrealized gain (loss) | (2.79) | 14.98 | 11.24 | 3.54 | (2.64) | |||||
| Total from investment operations | (1.41) | 16.38 | 12.58 | 4.94 | (.56) | |||||
| Distributions from net investment income | (1.36) | (1.55) | (1.42) | (1.35) | (2.11) | |||||
| Distributions from net realized gain | (1.53) | (8.68) | (1.33) | (.90) | (7.53) | |||||
| Total distributions | (2.89) | (10.23) | (2.75) | (2.25) | (9.63) E | |||||
| Net asset value, end of period | $ | 91.25 | $ | 95.55 | $ | 89.40 | $ | 79.57 | $ | 76.88 |
Total Return F,G | (1.49)% | 18.83% | 16.00% | 6.17% | (.32)% | |||||
Ratios to Average Net Assets C,H,I | ||||||||||
| Expenses before reductions | 1.01% | 1.01% | 1.04% | 1.04% | 1.05% | |||||
| Expenses net of fee waivers, if any | 1.01% | 1.01% | 1.04% | 1.04% | 1.05% | |||||
| Expenses net of all reductions | 1.01% | 1.01% | 1.03% | 1.04% | 1.04% | |||||
| Net investment income (loss) | 1.51% | 1.45% | 1.57% | 1.67% | 2.65% D | |||||
| Supplemental Data | ||||||||||
| Net assets, end of period (000 omitted) | $ | 297,850 | $ | 293,276 | $ | 248,234 | $ | 239,067 | $ | 232,020 |
Portfolio turnover rate J | 46% | 61% | 51% | 40% | 41% K |
| Fidelity Advisor® Consumer Staples Fund Class M |
| Years ended February 28, | 2023 | 2022 | 2021 | 2020 A | 2019 | |||||
Selected Per-Share Data | ||||||||||
| Net asset value, beginning of period | $ | 94.39 | $ | 88.43 | $ | 78.74 | $ | 76.13 | $ | 86.30 |
| Income from Investment Operations | ||||||||||
Net investment income (loss) B,C | 1.13 | 1.13 | 1.10 | 1.16 | 1.85 D | |||||
| Net realized and unrealized gain (loss) | (2.76) | 14.81 | 11.11 | 3.50 | (2.61) | |||||
| Total from investment operations | (1.63) | 15.94 | 12.21 | 4.66 | (.76) | |||||
| Distributions from net investment income | (1.12) | (1.30) | (1.19) | (1.15) | (1.88) | |||||
| Distributions from net realized gain | (1.53) | (8.68) | (1.33) | (.90) | (7.53) | |||||
| Total distributions | (2.65) | (9.98) | (2.52) | (2.05) | (9.41) | |||||
| Net asset value, end of period | $ | 90.11 | $ | 94.39 | $ | 88.43 | $ | 78.74 | $ | 76.13 |
Total Return E,F | (1.74)% | 18.51% | 15.69% | 5.88% | (.59)% | |||||
Ratios to Average Net Assets C,G,H | ||||||||||
| Expenses before reductions | 1.27% | 1.28% | 1.31% | 1.31% | 1.33% | |||||
| Expenses net of fee waivers, if any | 1.27% | 1.28% | 1.31% | 1.31% | 1.32% | |||||
| Expenses net of all reductions | 1.27% | 1.28% | 1.30% | 1.31% | 1.31% | |||||
| Net investment income (loss) | 1.25% | 1.18% | 1.30% | 1.40% | 2.37% D | |||||
| Supplemental Data | ||||||||||
| Net assets, end of period (000 omitted) | $ | 62,870 | $ | 64,707 | $ | 56,664 | $ | 55,954 | $ | 60,069 |
Portfolio turnover rate I | 46% | 61% | 51% | 40% | 41% J |
| Fidelity Advisor® Consumer Staples Fund Class C |
| Years ended February 28, | 2023 | 2022 | 2021 | 2020 A | 2019 | |||||
Selected Per-Share Data | ||||||||||
| Net asset value, beginning of period | $ | 92.48 | $ | 86.73 | $ | 77.27 | $ | 74.79 | $ | 84.85 |
| Income from Investment Operations | ||||||||||
Net investment income (loss) B,C | .67 | .65 | .68 | .75 | 1.46 D | |||||
| Net realized and unrealized gain (loss) | (2.69) | 14.51 | 10.87 | 3.44 | (2.57) | |||||
| Total from investment operations | (2.02) | 15.16 | 11.55 | 4.19 | (1.11) | |||||
| Distributions from net investment income | (.71) | (.79) | (.80) | (.81) | (1.43) | |||||
| Distributions from net realized gain | (1.53) | (8.62) | (1.30) | (.90) | (7.53) | |||||
| Total distributions | (2.24) | (9.41) | (2.09) E | (1.71) | (8.95) E | |||||
| Net asset value, end of period | $ | 88.22 | $ | 92.48 | $ | 86.73 | $ | 77.27 | $ | 74.79 |
Total Return F,G | (2.23)% | 17.92% | 15.14% | 5.39% | (1.05)% | |||||
Ratios to Average Net Assets B,H,I | ||||||||||
| Expenses before reductions | 1.77% | 1.77% | 1.79% | 1.79% | 1.79% | |||||
| Expenses net of fee waivers, if any | 1.76% | 1.76% | 1.79% | 1.79% | 1.79% | |||||
| Expenses net of all reductions | 1.76% | 1.76% | 1.78% | 1.79% | 1.78% | |||||
| Net investment income (loss) | .76% | .70% | .83% | .92% | 1.91% D | |||||
| Supplemental Data | ||||||||||
| Net assets, end of period (000 omitted) | $ | 78,497 | $ | 88,645 | $ | 104,955 | $ | 117,328 | $ | 150,822 |
Portfolio turnover rate J | 46% | 61% | 51% | 40% | 41% K |
| Consumer Staples Portfolio |
| Years ended February 28, | 2023 | 2022 | 2021 | 2020 A | 2019 | |||||
Selected Per-Share Data | ||||||||||
| Net asset value, beginning of period | $ | 96.75 | $ | 90.40 | $ | 80.42 | $ | 77.63 | $ | 87.85 |
| Income from Investment Operations | ||||||||||
Net investment income (loss) B,C | 1.66 | 1.69 | 1.60 | 1.66 | 2.34 D | |||||
| Net realized and unrealized gain (loss) | (2.84) | 15.16 | 11.39 | 3.59 | (2.67) | |||||
| Total from investment operations | (1.18) | 16.85 | 12.99 | 5.25 | (.33) | |||||
| Distributions from net investment income | (1.61) | (1.81) | (1.68) | (1.55) | (2.36) | |||||
| Distributions from net realized gain | (1.53) | (8.68) | (1.33) | (.90) | (7.53) | |||||
| Total distributions | (3.14) | (10.50) E | (3.01) | (2.46) E | (9.89) | |||||
| Net asset value, end of period | $ | 92.43 | $ | 96.75 | $ | 90.40 | $ | 80.42 | $ | 77.63 |
Total Return F | (1.21)% | 19.16% | 16.34% | 6.48% | (.03)% | |||||
Ratios to Average Net Assets C,G,H | ||||||||||
| Expenses before reductions | .73% | .73% | .75% | .75% | .77% | |||||
| Expenses net of fee waivers, if any | .73% | .73% | .75% | .75% | .76% | |||||
| Expenses net of all reductions | .73% | .73% | .74% | .75% | .75% | |||||
| Net investment income (loss) | 1.79% | 1.74% | 1.86% | 1.96% | 2.94% D | |||||
| Supplemental Data | ||||||||||
| Net assets, end of period (000 omitted) | $ | 862,837 | $ | 1,032,956 | $ | 770,644 | $ | 773,437 | $ | 814,350 |
Portfolio turnover rate I | 46% | 61% | 51% | 40% | 41% J |
| Fidelity Advisor® Consumer Staples Fund Class I |
| Years ended February 28, | 2023 | 2022 | 2021 | 2020 A | 2019 | |||||
Selected Per-Share Data | ||||||||||
| Net asset value, beginning of period | $ | 96.48 | $ | 90.17 | $ | 80.23 | $ | 77.45 | $ | 87.68 |
| Income from Investment Operations | ||||||||||
Net investment income (loss) B,C | 1.65 | 1.67 | 1.60 | 1.65 | 2.33 D | |||||
| Net realized and unrealized gain (loss) | (2.83) | 15.13 | 11.34 | 3.58 | (2.68) | |||||
| Total from investment operations | (1.18) | 16.80 | 12.94 | 5.23 | (.35) | |||||
| Distributions from net investment income | (1.61) | (1.80) | (1.67) | (1.55) | (2.36) | |||||
| Distributions from net realized gain | (1.53) | (8.68) | (1.33) | (.90) | (7.53) | |||||
| Total distributions | (3.14) | (10.49) E | (3.00) | (2.45) | (9.88) E | |||||
| Net asset value, end of period | $ | 92.16 | $ | 96.48 | $ | 90.17 | $ | 80.23 | $ | 77.45 |
Total Return F | (1.22)% | 19.15% | 16.32% | 6.48% | (.04)% | |||||
Ratios to Average Net Assets C,G,H | ||||||||||
| Expenses before reductions | .74% | .74% | .76% | .76% | .77% | |||||
| Expenses net of fee waivers, if any | .74% | .74% | .75% | .76% | .77% | |||||
| Expenses net of all reductions | .74% | .74% | .75% | .76% | .76% | |||||
| Net investment income (loss) | 1.78% | 1.72% | 1.86% | 1.95% | 2.93% D | |||||
| Supplemental Data | ||||||||||
| Net assets, end of period (000 omitted) | $ | 158,019 | $ | 149,160 | $ | 132,898 | $ | 149,514 | $ | 159,614 |
Portfolio turnover rate I | 46% | 61% | 51% | 40% | 41% J |
| Fidelity Advisor® Consumer Staples Fund Class Z |
| Years ended February 28, | 2023 | 2022 | 2021 | 2020 A | 2019 B | |||||
Selected Per-Share Data | ||||||||||
| Net asset value, beginning of period | $ | 96.36 | $ | 90.08 | $ | 80.14 | $ | 77.36 | $ | 81.61 |
| Income from Investment Operations | ||||||||||
Net investment income (loss) C,D | 1.76 | 1.79 | 1.71 | 1.78 | .05 E | |||||
| Net realized and unrealized gain (loss) | (2.82) | 15.10 | 11.35 | 3.56 | .33 | |||||
| Total from investment operations | (1.06) | 16.89 | 13.06 | 5.34 | .38 | |||||
| Distributions from net investment income | (1.73) | (1.93) | (1.79) | (1.66) | (2.23) | |||||
| Distributions from net realized gain | (1.53) | (8.68) | (1.33) | (.90) | (2.40) | |||||
| Total distributions | (3.25) F | (10.61) | (3.12) | (2.56) | (4.63) | |||||
| Net asset value, end of period | $ | 92.05 | $ | 96.36 | $ | 90.08 | $ | 80.14 | $ | 77.36 |
Total Return G,H | (1.09)% | 19.29% | 16.49% | 6.61% | .79% | |||||
Ratios to Average Net Assets D,I,J | ||||||||||
| Expenses before reductions | .61% | .61% | .62% | .63% | .63% K | |||||
| Expenses net of fee waivers, if any | .61% | .61% | .62% | .63% | .62% K | |||||
| Expenses net of all reductions | .61% | .61% | .62% | .62% | .61% K | |||||
| Net investment income (loss) | 1.91% | 1.85% | 1.99% | 2.08% | .16% E,K | |||||
| Supplemental Data | ||||||||||
| Net assets, end of period (000 omitted) | $ | 88,741 | $ | 77,826 | $ | 43,591 | $ | 41,629 | $ | 8,052 |
Portfolio turnover rate L | 46% | 61% | 51% | 40% | 41% M |
| Fidelity Central Fund | Investment Manager | Investment Objective | Investment Practices | Expense Ratio A |
| Fidelity Money Market Central Funds | Fidelity Management & Research Company LLC (FMR) | Each fund seeks to obtain a high level of current income consistent with the preservation of capital and liquidity. | Short-term Investments | Less than .005% |
| Consumer Staples Portfolio | $270,166 |
| Gross unrealized appreciation | $369,649,219 |
| Gross unrealized depreciation | (62,864,136) |
| Net unrealized appreciation (depreciation) | $306,785,083 |
| Tax Cost | $1,279,629,944 |
| Undistributed ordinary income | $1,233,664 |
| Undistributed long-term capital gain | $200,332 |
| Net unrealized appreciation (depreciation) on securities and other investments | $306,777,388 |
| February 28, 2023 | February 28, 2022 | |
| Ordinary Income | $28,235,236 | $63,314,112 |
| Long-term Capital Gains | 24,690,278 | 90,100,720 |
| Total | $52,925,514 | $153,414,832 |
| Purchases ($) | Sales ($) | |
| Consumer Staples Portfolio | 729,718,522 | 807,132,287 |
| Distribution Fee | Service Fee | Total Fees | Retained by FDC | |
| Class A | - % | .25% | $732,627 | $10,901 |
| Class M | .25% | .25% | 316,344 | 794 |
| Class C | .75% | .25% | 823,333 | 64,385 |
| $1,872,304 | $76,080 |
| Retained by FDC | |
| Class A | $89,410 |
| Class M | 10,980 |
Class C A | 764 |
| $101,154 |
| Amount | % of Class-Level Average Net Assets | |
| Class A | $562,332 | .19 |
| Class M | 129,078 | .20 |
| Class C | 160,479 | .19 |
| Consumer Staples | 1,475,084 | .16 |
| Class I | 269,609 | .17 |
| Class Z | 34,710 | .04 |
| $2,631,292 |
| % of Average Net Assets | |
| Consumer Staples Portfolio | .03 |
| Amount | |
| Consumer Staples Portfolio | $23,098 |
| Borrower or Lender | Average Loan Balance | Weighted Average Interest Rate | Interest Expense | |
| Consumer Staples Portfolio | Borrower | $ 5,741,097 | 2.50% | $12,374 |
| Purchases ($) | Sales ($) | Realized Gain (Loss) ($) | |
| Consumer Staples Portfolio | 72,178,515 | 73,723,353 | (1,490,894) |
| Amount | |
| Consumer Staples Portfolio | $2,851 |
| Total Security Lending Fees Paid to NFS | Security Lending Income From Securities Loaned to NFS | Value of Securities Loaned to NFS at Period End | |
| Consumer Staples Portfolio | $4,015 | $- | $- |
| Average Loan Balance | Weighted Average Interest Rate | Interest Expense | |
| Consumer Staples Portfolio | $753,867 | 3.92% | $1,230 |
Year ended February 28, 2023 | Year ended February 28, 2022 | |
| Consumer Staples Portfolio | ||
| Distributions to shareholders | ||
| Class A | $ 9,061,460 | $28,728,133 |
| Class M | 1,830,918 | 6,378,016 |
| Class C | 2,098,957 | 9,724,881 |
| Consumer Staples | 32,004,733 | 88,326,666 |
| Class I | 5,160,204 | 14,778,169 |
| Class Z | 2,769,242 | 5,478,967 |
Total | $52,925,514 | $153,414,832 |
| Shares | Shares | Dollars | Dollars | |
Year ended February 28, 2023 | Year ended February 28, 2022 | Year ended February 28, 2023 | Year ended February 28, 2022 | |
| Consumer Staples Portfolio | ||||
| Class A | ||||
| Shares sold | 565,130 | 512,430 | $51,861,919 | $49,258,142 |
| Reinvestment of distributions | 95,040 | 295,095 | 8,776,247 | 27,710,518 |
| Shares redeemed | (465,315) | (514,641) | (42,475,640) | (49,392,846) |
| Net increase (decrease) | 194,855 | 292,884 | $18,162,526 | $27,575,814 |
| Class M | ||||
| Shares sold | 86,908 | 69,762 | $7,782,299 | $6,632,101 |
| Reinvestment of distributions | 19,900 | 68,289 | 1,820,900 | 6,339,502 |
| Shares redeemed | (94,625) | (93,262) | (8,558,414) | (8,856,119) |
| Net increase (decrease) | 12,183 | 44,789 | $1,044,785 | $4,115,484 |
| Class C | ||||
| Shares sold | 167,163 | 80,488 | $14,879,754 | $7,503,197 |
| Reinvestment of distributions | 22,978 | 105,499 | 2,076,666 | 9,608,492 |
| Shares redeemed | (258,894) | (437,630) | (22,861,871) | (40,618,649) |
| Net increase (decrease) | (68,753) | (251,643) | $(5,905,451) | $(23,506,960) |
| Consumer Staples | ||||
| Shares sold | 2,183,669 | 3,003,388 | $203,864,179 | $293,188,867 |
| Reinvestment of distributions | 316,888 | 851,019 | 29,626,850 | 80,858,070 |
| Shares redeemed | (3,842,578) | (1,702,337) | (351,826,884) | (165,649,882) |
| Net increase (decrease) | (1,342,021) | 2,152,070 | $(118,335,855) | $208,397,055 |
| Class I | ||||
| Shares sold | 795,767 | 366,907 | $73,693,384 | $35,605,195 |
| Reinvestment of distributions | 52,268 | 144,626 | 4,854,356 | 13,704,710 |
| Shares redeemed | (679,428) | (439,361) | (62,277,443) | (42,622,622) |
| Net increase (decrease) | 168,607 | 72,172 | $16,270,297 | $6,687,283 |
| Class Z | ||||
| Shares sold | 568,677 | 567,361 | $52,889,407 | $55,256,648 |
| Reinvestment of distributions | 27,861 | 53,280 | 2,580,426 | 5,041,341 |
| Shares redeemed | (440,111) | (296,902) | (40,346,802) | (28,764,496) |
| Net increase (decrease) | 156,427 | 323,739 | $15,123,031 | $31,533,493 |
| The Example is based on an investment of $1,000 invested at the beginning of the period and held for the entire period (September 1, 2022 to February 28, 2023). |
Annualized Expense Ratio- A | Beginning Account Value September 1, 2022 | Ending Account Value February 28, 2023 | Expenses Paid During Period- C September 1, 2022 to February 28, 2023 | |||||||
| Consumer Staples Portfolio | ||||||||||
| Class A | 1.01% | |||||||||
| Actual | $ 1,000 | $ 1,024.50 | $ 5.07 | |||||||
Hypothetical- B | $ 1,000 | $ 1,019.79 | $ 5.06 | |||||||
| Class M | 1.27% | |||||||||
| Actual | $ 1,000 | $ 1,023.20 | $ 6.37 | |||||||
Hypothetical- B | $ 1,000 | $ 1,018.50 | $ 6.36 | |||||||
| Class C | 1.76% | |||||||||
| Actual | $ 1,000 | $ 1,020.50 | $ 8.82 | |||||||
Hypothetical- B | $ 1,000 | $ 1,016.07 | $ 8.80 | |||||||
| Consumer Staples Portfolio | .73% | |||||||||
| Actual | $ 1,000 | $ 1,025.90 | $ 3.67 | |||||||
Hypothetical- B | $ 1,000 | $ 1,021.17 | $ 3.66 | |||||||
| Class I | .74% | |||||||||
| Actual | $ 1,000 | $ 1,025.80 | $ 3.72 | |||||||
Hypothetical- B | $ 1,000 | $ 1,021.12 | $ 3.71 | |||||||
| Class Z | .61% | |||||||||
| Actual | $ 1,000 | $ 1,026.60 | $ 3.07 | |||||||
Hypothetical- B | $ 1,000 | $ 1,021.77 | $ 3.06 | |||||||
- Highly liquid investments - cash or convertible to cash within three business days or less
- Moderately liquid investments - convertible to cash in three to seven calendar days
- Less liquid investments - can be sold or disposed of, but not settled, within seven calendar days
- Illiquid investments - cannot be sold or disposed of within seven calendar days
 |


Contents
| Average Annual Total Returns | |||
Periods ended February 28, 2023 | Past 1 year | Past 5 years | Past 10 years |
| Defense and Aerospace Portfolio | 1.54% | 3.57% | 12.07% |
| $10,000 Over 10 Years |
Let's say hypothetically that $10,000 was invested in Defense and Aerospace Portfolio on February 28, 2013. The chart shows how the value of your investment would have changed, and also shows how the S&P 500® Index performed over the same period. |
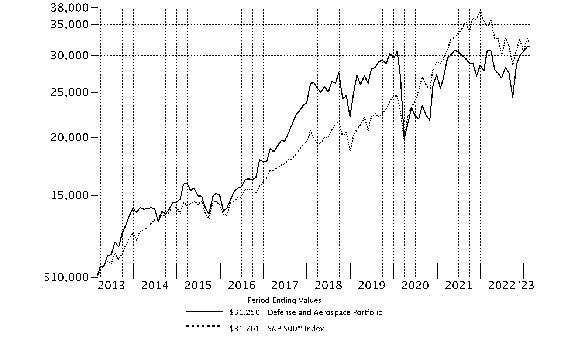 |
Top Holdings (% of Fund's net assets) | ||
| The Boeing Co. | 17.9 | |
| Lockheed Martin Corp. | 16.0 | |
| Raytheon Technologies Corp. | 13.0 | |
| Howmet Aerospace, Inc. | 5.0 | |
| TransDigm Group, Inc. | 5.0 | |
| Northrop Grumman Corp. | 4.7 | |
| HEICO Corp. Class A | 4.4 | |
| L3Harris Technologies, Inc. | 3.3 | |
| Textron, Inc. | 2.7 | |
| General Dynamics Corp. | 2.5 | |
| 74.5 | ||
| Industries (% of Fund's net assets) | ||
| Aerospace & Defense | 91.5 | |
| Professional Services | 3.9 | |
| Electronic Equipment & Components | 2.4 | |
| Metals & Mining | 0.7 | |
| Common Stocks - 98.5% | |||
| Shares | Value ($) | ||
| Aerospace & Defense - 91.5% | |||
| Aerospace & Defense - 91.5% | |||
| AerSale Corp. (a) | 419,200 | 8,325,312 | |
| Airbus Group NV | 272,500 | 35,689,477 | |
| Axon Enterprise, Inc. (a) | 65,100 | 13,040,181 | |
| BWX Technologies, Inc. | 562,700 | 34,386,597 | |
| Curtiss-Wright Corp. | 108,400 | 18,947,236 | |
| Elbit Systems Ltd. (b) | 87,400 | 14,763,608 | |
| General Dynamics Corp. | 174,500 | 39,770,295 | |
| HEICO Corp. Class A | 533,800 | 69,474,070 | |
| Howmet Aerospace, Inc. | 1,858,100 | 78,374,658 | |
| Huntington Ingalls Industries, Inc. | 168,500 | 36,261,200 | |
| Kratos Defense & Security Solutions, Inc. (a) | 978,300 | 12,375,495 | |
| L3Harris Technologies, Inc. | 241,800 | 51,065,742 | |
| Lockheed Martin Corp. | 531,300 | 251,974,338 | |
| Mercury Systems, Inc. (a) | 426,300 | 22,312,542 | |
| Northrop Grumman Corp. | 159,300 | 73,932,723 | |
| Raytheon Technologies Corp. | 2,088,500 | 204,860,965 | |
| Spirit AeroSystems Holdings, Inc. Class A | 699,100 | 23,895,238 | |
| Textron, Inc. | 581,500 | 42,176,195 | |
| The Boeing Co. (a) | 1,394,200 | 281,001,011 | |
| TransDigm Group, Inc. | 105,300 | 78,329,511 | |
| Triumph Group, Inc. (a) | 1,489,200 | 18,793,704 | |
| Triumph Group, Inc. warrants 12/19/23 (a) | 415,950 | 316,122 | |
| Woodward, Inc. | 296,100 | 29,313,900 | |
| 1,439,380,120 | |||
| Electronic Equipment & Components - 2.4% | |||
| Electronic Equipment & Instruments - 2.4% | |||
| Teledyne Technologies, Inc. (a) | 89,100 | 38,319,237 | |
| Metals & Mining - 0.7% | |||
| Steel - 0.7% | |||
| ATI, Inc. (a) | 275,900 | 11,215,335 | |
| Professional Services - 3.9% | |||
| Research & Consulting Services - 3.9% | |||
| Booz Allen Hamilton Holding Corp. Class A | 335,000 | 31,734,550 | |
| CACI International, Inc. Class A (a) | 103,300 | 30,266,900 | |
| 62,001,450 | |||
| TOTAL COMMON STOCKS (Cost $1,068,155,129) | 1,550,916,142 | ||
| Money Market Funds - 1.4% | |||
| Shares | Value ($) | ||
| Fidelity Cash Central Fund 4.63% (c) | 20,586,689 | 20,590,806 | |
| Fidelity Securities Lending Cash Central Fund 4.63% (c)(d) | 1,136,595 | 1,136,708 | |
| TOTAL MONEY MARKET FUNDS (Cost $21,727,514) | 21,727,514 | ||
| TOTAL INVESTMENT IN SECURITIES - 99.9% (Cost $1,089,882,643) | 1,572,643,656 |
NET OTHER ASSETS (LIABILITIES) - 0.1% | 1,130,716 |
| NET ASSETS - 100.0% | 1,573,774,372 |
| (a) | Non-income producing |
| (b) | Security or a portion of the security is on loan at period end. |
| (c) | Affiliated fund that is generally available only to investment companies and other accounts managed by Fidelity Investments. The rate quoted is the annualized seven-day yield of the fund at period end. A complete unaudited listing of the fund's holdings as of its most recent quarter end is available upon request. In addition, each Fidelity Central Fund's financial statements, which are not covered by the Fund's Report of Independent Registered Public Accounting Firm, are available on the SEC's website or upon request. |
| (d) | Investment made with cash collateral received from securities on loan. |
| Affiliate | Value, beginning of period ($) | Purchases ($) | Sales Proceeds ($) | Dividend Income ($) | Realized Gain (loss) ($) | Change in Unrealized appreciation (depreciation) ($) | Value, end of period ($) | % ownership, end of period |
| Fidelity Cash Central Fund 4.63% | 10,252,211 | 280,724,206 | 270,385,611 | 384,062 | - | - | 20,590,806 | 0.0% |
| Fidelity Securities Lending Cash Central Fund 4.63% | 19,275,358 | 168,180,131 | 186,318,781 | 20,637 | - | - | 1,136,708 | 0.0% |
| Total | 29,527,569 | 448,904,337 | 456,704,392 | 404,699 | - | - | 21,727,514 | |
| Valuation Inputs at Reporting Date: | ||||
| Description | Total ($) | Level 1 ($) | Level 2 ($) | Level 3 ($) |
Investments in Securities: | ||||
| Common Stocks | 1,550,916,142 | 1,515,226,665 | 35,689,477 | - |
| Money Market Funds | 21,727,514 | 21,727,514 | - | - |
| Total Investments in Securities: | 1,572,643,656 | 1,536,954,179 | 35,689,477 | - |
| Statement of Assets and Liabilities | ||||
| February 28, 2023 | ||||
| Assets | ||||
| Investment in securities, at value (including securities loaned of $1,114,872) - See accompanying schedule: | ||||
Unaffiliated issuers (cost $1,068,155,129) | $ | 1,550,916,142 | ||
Fidelity Central Funds (cost $21,727,514) | 21,727,514 | |||
| Total Investment in Securities (cost $1,089,882,643) | $ | 1,572,643,656 | ||
| Cash | 16,971 | |||
| Receivable for investments sold | 1,241,739 | |||
| Receivable for fund shares sold | 921,238 | |||
| Dividends receivable | 3,442,698 | |||
| Distributions receivable from Fidelity Central Funds | 51,687 | |||
| Prepaid expenses | 8,685 | |||
| Other receivables | 112,362 | |||
Total assets | 1,578,439,036 | |||
| Liabilities | ||||
| Payable for investments purchased | $ | 1,610,263 | ||
| Payable for fund shares redeemed | 806,576 | |||
| Accrued management fee | 696,808 | |||
| Other affiliated payables | 266,729 | |||
| Other payables and accrued expenses | 147,438 | |||
| Collateral on securities loaned | 1,136,850 | |||
| Total Liabilities | 4,664,664 | |||
| Net Assets | $ | 1,573,774,372 | ||
| Net Assets consist of: | ||||
| Paid in capital | $ | 1,083,508,000 | ||
| Total accumulated earnings (loss) | 490,266,372 | |||
| Net Assets | $ | 1,573,774,372 | ||
Net Asset Value , offering price and redemption price per share ($1,573,774,372 ÷ 98,946,583 shares) | $ | 15.91 | ||
| Statement of Operations | ||||
Year ended February 28, 2023 | ||||
| Investment Income | ||||
| Dividends | $ | 16,697,160 | ||
| Special dividends | 2,072,000 | |||
| Income from Fidelity Central Funds (including $20,637 from security lending) | 404,699 | |||
| Total Income | 19,173,859 | |||
| Expenses | ||||
| Management fee | $ | 7,610,119 | ||
| Transfer agent fees | 2,645,479 | |||
| Accounting fees | 416,979 | |||
| Custodian fees and expenses | 11,859 | |||
| Independent trustees' fees and expenses | 4,871 | |||
| Registration fees | 58,189 | |||
| Audit | 40,051 | |||
| Legal | 772 | |||
| Miscellaneous | 10,624 | |||
| Total expenses before reductions | 10,798,943 | |||
| Expense reductions | (50,343) | |||
| Total expenses after reductions | 10,748,600 | |||
| Net Investment income (loss) | 8,425,259 | |||
| Realized and Unrealized Gain (Loss) | ||||
| Net realized gain (loss) on: | ||||
| Investment Securities: | ||||
| Unaffiliated issuers | 8,872,934 | |||
| Foreign currency transactions | 20,294 | |||
| Total net realized gain (loss) | 8,893,228 | |||
| Change in net unrealized appreciation (depreciation) on investment securities | (9,553,385) | |||
| Net gain (loss) | (660,157) | |||
| Net increase (decrease) in net assets resulting from operations | $ | 7,765,102 | ||
| Statement of Changes in Net Assets | ||||
Year ended February 28, 2023 | Year ended February 28, 2022 | |||
| Increase (Decrease) in Net Assets | ||||
| Operations | ||||
| Net investment income (loss) | $ | 8,425,259 | $ | 932,889 |
| Net realized gain (loss) | 8,893,228 | 353,125,938 | ||
| Change in net unrealized appreciation (depreciation) | (9,553,385) | (141,504,262) | ||
| Net increase (decrease) in net assets resulting from operations | 7,765,102 | 212,554,565 | ||
| Distributions to shareholders | (131,285,966) | (114,456,735) | ||
| Share transactions | ||||
| Proceeds from sales of shares | 374,622,368 | 116,915,674 | ||
| Reinvestment of distributions | 123,852,822 | 107,992,135 | ||
| Cost of shares redeemed | (337,711,083) | (424,668,107) | ||
Net increase (decrease) in net assets resulting from share transactions | 160,764,107 | (199,760,298) | ||
| Total increase (decrease) in net assets | 37,243,243 | (101,662,468) | ||
| Net Assets | ||||
| Beginning of period | 1,536,531,129 | 1,638,193,597 | ||
| End of period | $ | 1,573,774,372 | $ | 1,536,531,129 |
| Other Information | ||||
| Shares | ||||
| Sold | 23,993,181 | 6,800,815 | ||
| Issued in reinvestment of distributions | 8,055,567 | 7,086,098 | ||
| Redeemed | (23,077,316) | (24,520,122) | ||
| Net increase (decrease) | 8,971,432 | (10,633,209) | ||
| Defense and Aerospace Portfolio |
| Years ended February 28, | 2023 | 2022 | 2021 | 2020 A | 2019 B | |||||
Selected Per-Share Data | ||||||||||
| Net asset value, beginning of period | $ | 17.08 | $ | 16.28 | $ | 16.61 | $ | 17.27 | $ | 18.45 |
| Income from Investment Operations | ||||||||||
Net investment income (loss) C,D | .09 E | .01 | (.04) | .27 F | .11 | |||||
| Net realized and unrealized gain (loss) | .12 G | 2.12 | .06 | (.45) | .33 | |||||
| Total from investment operations | .21 | 2.13 | .02 | (.18) | .44 | |||||
| Distributions from net investment income | (.07) | - | (.05) | (.22) | (.10) | |||||
| Distributions from net realized gain | (1.31) | (1.33) | (.30) | (.26) | (1.52) | |||||
| Total distributions | (1.38) | (1.33) | (.35) | (.48) | (1.62) | |||||
| Net asset value, end of period | $ | 15.91 | $ | 17.08 | $ | 16.28 | $ | 16.61 | $ | 17.27 |
Total Return H | 1.54% | 14.06% | .69% | (1.32)% | 3.57% | |||||
Ratios to Average Net Assets D,I,J | ||||||||||
| Expenses before reductions | .75% | .74% | .77% | .75% | .75% | |||||
| Expenses net of fee waivers, if any | .74% | .74% | .77% | .74% | .75% | |||||
| Expenses net of all reductions | .74% | .74% | .76% | .74% | .75% | |||||
| Net investment income (loss) | .58% E | .06% | (.29)% | 1.49% F | .66% | |||||
| Supplemental Data | ||||||||||
| Net assets, end of period (000 omitted) | $ | 1,573,774 | $ | 1,536,531 | $ | 1,638,194 | $ | 2,728,959 | $ | 2,795,259 |
Portfolio turnover rate K | 15% | 52% | 30% | 40% | 44% |
| Average Annual Total Returns | |||
Periods ended February 28, 2023 | Past 1 year | Past 5 years | Past 10 years |
| Industrials Portfolio | 1.19% | 5.59% | 9.26% |
| $10,000 Over 10 Years |
Let's say hypothetically that $10,000 was invested in Industrials Portfolio on February 28, 2013. The chart shows how the value of your investment would have changed, and also shows how the S&P 500® Index performed over the same period. |
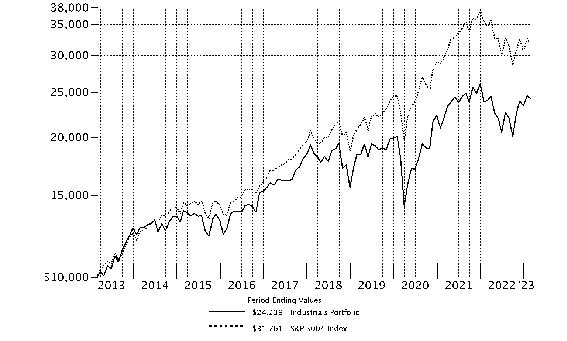 |
Top Holdings (% of Fund's net assets) | ||
| Fortive Corp. | 7.2 | |
| Willscot Mobile Mini Holdings | 6.9 | |
| The Boeing Co. | 6.5 | |
| Saia, Inc. | 6.0 | |
| FedEx Corp. | 6.0 | |
| AMETEK, Inc. | 5.9 | |
| Parker Hannifin Corp. | 5.8 | |
| Pentair PLC | 5.3 | |
| TransDigm Group, Inc. | 4.4 | |
| Old Dominion Freight Lines, Inc. | 4.2 | |
| 58.2 | ||
| Industries (% of Fund's net assets) | ||
| Machinery | 36.1 | |
| Aerospace & Defense | 17.9 | |
| Road & Rail | 14.4 | |
| Electrical Equipment | 13.5 | |
| Construction & Engineering | 7.1 | |
| Air Freight & Logistics | 6.0 | |
| Industrial Conglomerates | 2.9 | |
| Internet & Direct Marketing Retail | 2.4 | |
| Commercial Services & Supplies | 0.0 | |
| Common Stocks - 100.3% | |||
| Shares | Value ($) | ||
| Aerospace & Defense - 17.9% | |||
| Aerospace & Defense - 17.9% | |||
| HEICO Corp. | 54,600 | 9,040,122 | |
| HEICO Corp. Class A | 35,300 | 4,594,295 | |
| Hexcel Corp. (a) | 24,100 | 1,758,095 | |
| Howmet Aerospace, Inc. | 385,700 | 16,268,826 | |
| The Boeing Co. (b) | 146,560 | 29,539,168 | |
| TransDigm Group, Inc. | 26,937 | 20,037,626 | |
| 81,238,132 | |||
| Air Freight & Logistics - 6.0% | |||
| Air Freight & Logistics - 6.0% | |||
| FedEx Corp. | 133,800 | 27,190,836 | |
| Commercial Services & Supplies - 0.0% | |||
| Environmental & Facility Services - 0.0% | |||
| Tetra Tech, Inc. | 800 | 109,512 | |
| Construction & Engineering - 7.1% | |||
| Construction & Engineering - 7.1% | |||
| AECOM | 9,500 | 820,420 | |
| Willscot Mobile Mini Holdings (b) | 613,500 | 31,533,900 | |
| 32,354,320 | |||
| Electrical Equipment - 13.5% | |||
| Electrical Components & Equipment - 13.5% | |||
| Acuity Brands, Inc. | 7,000 | 1,357,720 | |
| AMETEK, Inc. | 188,220 | 26,644,423 | |
| nVent Electric PLC | 379,552 | 17,398,664 | |
| Regal Rexnord Corp. | 94,770 | 14,939,543 | |
| Vertiv Holdings Co. | 52,300 | 849,875 | |
| 61,190,225 | |||
| Industrial Conglomerates - 2.9% | |||
| Industrial Conglomerates - 2.9% | |||
| General Electric Co. | 54,400 | 4,608,224 | |
| Honeywell International, Inc. | 44,598 | 8,539,625 | |
| 13,147,849 | |||
| Internet & Direct Marketing Retail - 2.4% | |||
| Internet & Direct Marketing Retail - 2.4% | |||
| Uber Technologies, Inc. (b) | 321,400 | 10,689,764 | |
| Machinery - 36.1% | |||
| Industrial Machinery - 36.1% | |||
| Barnes Group, Inc. | 184,718 | 7,784,017 | |
| Crane Holdings Co. | 140,411 | 16,818,430 | |
| Flowserve Corp. | 411,973 | 14,291,343 | |
| Fortive Corp. | 490,000 | 32,663,399 | |
| Ingersoll Rand, Inc. | 299,600 | 17,397,772 | |
| Middleby Corp. (b) | 108,300 | 16,839,567 | |
| Parker Hannifin Corp. | 74,600 | 26,248,010 | |
| Pentair PLC | 429,500 | 24,026,230 | |
| RBC Bearings, Inc. (a)(b) | 34,300 | 7,882,483 | |
| 163,951,251 | |||
| Road & Rail - 14.4% | |||
| Trucking - 14.4% | |||
| ArcBest Corp. (a) | 54,600 | 5,252,520 | |
| J.B. Hunt Transport Services, Inc. | 11,252 | 2,034,249 | |
| Knight-Swift Transportation Holdings, Inc. Class A | 204,400 | 11,618,096 | |
| Old Dominion Freight Lines, Inc. | 55,723 | 18,904,585 | |
| Saia, Inc. (b) | 101,000 | 27,357,870 | |
| 65,167,320 | |||
| TOTAL COMMON STOCKS (Cost $394,687,054) | 455,039,209 | ||
| Money Market Funds - 1.0% | |||
| Shares | Value ($) | ||
Fidelity Securities Lending Cash Central Fund 4.63% (c)(d) (Cost $4,537,200) | 4,536,746 | 4,537,200 | |
| TOTAL INVESTMENT IN SECURITIES - 101.3% (Cost $399,224,254) | 459,576,409 |
NET OTHER ASSETS (LIABILITIES) - (1.3)% | (6,050,916) |
| NET ASSETS - 100.0% | 453,525,493 |
| (a) | Security or a portion of the security is on loan at period end. |
| (b) | Non-income producing |
| (c) | Affiliated fund that is generally available only to investment companies and other accounts managed by Fidelity Investments. The rate quoted is the annualized seven-day yield of the fund at period end. A complete unaudited listing of the fund's holdings as of its most recent quarter end is available upon request. In addition, each Fidelity Central Fund's financial statements, which are not covered by the Fund's Report of Independent Registered Public Accounting Firm, are available on the SEC's website or upon request. |
| (d) | Investment made with cash collateral received from securities on loan. |
| Affiliate | Value, beginning of period ($) | Purchases ($) | Sales Proceeds ($) | Dividend Income ($) | Realized Gain (loss) ($) | Change in Unrealized appreciation (depreciation) ($) | Value, end of period ($) | % ownership, end of period |
| Fidelity Cash Central Fund 4.63% | 1,945,359 | 196,769,883 | 198,715,242 | 98,564 | - | - | - | 0.0% |
| Fidelity Securities Lending Cash Central Fund 4.63% | 1,593,775 | 179,463,597 | 176,520,172 | 8,608 | - | - | 4,537,200 | 0.0% |
| Total | 3,539,134 | 376,233,480 | 375,235,414 | 107,172 | - | - | 4,537,200 | |
| Valuation Inputs at Reporting Date: | ||||
| Description | Total ($) | Level 1 ($) | Level 2 ($) | Level 3 ($) |
Investments in Securities: | ||||
| Common Stocks | 455,039,209 | 455,039,209 | - | - |
| Money Market Funds | 4,537,200 | 4,537,200 | - | - |
| Total Investments in Securities: | 459,576,409 | 459,576,409 | - | - |
| Statement of Assets and Liabilities | ||||
| February 28, 2023 | ||||
| Assets | ||||
| Investment in securities, at value (including securities loaned of $4,420,884) - See accompanying schedule: | ||||
Unaffiliated issuers (cost $394,687,054) | $ | 455,039,209 | ||
Fidelity Central Funds (cost $4,537,200) | 4,537,200 | |||
| Total Investment in Securities (cost $399,224,254) | $ | 459,576,409 | ||
| Receivable for investments sold | 2,351,194 | |||
| Receivable for fund shares sold | 67,873 | |||
| Dividends receivable | 294,304 | |||
| Distributions receivable from Fidelity Central Funds | 22,926 | |||
| Prepaid expenses | 2,907 | |||
| Other receivables | 106,169 | |||
Total assets | 462,421,782 | |||
| Liabilities | ||||
| Payable to custodian bank | $ | 1,910,330 | ||
| Payable for investments purchased | 1,349,653 | |||
| Payable for fund shares redeemed | 684,373 | |||
| Accrued management fee | 203,102 | |||
| Other affiliated payables | 72,137 | |||
| Other payables and accrued expenses | 139,494 | |||
| Collateral on securities loaned | 4,537,200 | |||
| Total Liabilities | 8,896,289 | |||
| Net Assets | $ | 453,525,493 | ||
| Net Assets consist of: | ||||
| Paid in capital | $ | 390,407,023 | ||
| Total accumulated earnings (loss) | 63,118,470 | |||
| Net Assets | $ | 453,525,493 | ||
Net Asset Value , offering price and redemption price per share ($453,525,493 ÷ 14,825,716 shares) | $ | 30.59 | ||
| Statement of Operations | ||||
Year ended February 28, 2023 | ||||
| Investment Income | ||||
| Dividends | $ | 2,683,729 | ||
| Special dividends | 411,385 | |||
| Income from Fidelity Central Funds (including $8,608 from security lending) | 107,172 | |||
| Total Income | 3,202,286 | |||
| Expenses | ||||
| Management fee | $ | 1,875,889 | ||
| Transfer agent fees | 595,224 | |||
| Accounting fees | 129,010 | |||
| Custodian fees and expenses | 7,349 | |||
| Independent trustees' fees and expenses | 1,190 | |||
| Registration fees | 52,099 | |||
| Audit | 39,375 | |||
| Legal | 3,178 | |||
| Interest | 1,537 | |||
| Miscellaneous | 2,795 | |||
| Total expenses before reductions | 2,707,646 | |||
| Expense reductions | (13,331) | |||
| Total expenses after reductions | 2,694,315 | |||
| Net Investment income (loss) | 507,971 | |||
| Realized and Unrealized Gain (Loss) | ||||
| Net realized gain (loss) on: | ||||
| Investment Securities: | ||||
| Unaffiliated issuers | 4,343,765 | |||
| Foreign currency transactions | 2,899 | |||
| Total net realized gain (loss) | 4,346,664 | |||
| Change in net unrealized appreciation (depreciation) on: | ||||
| Investment Securities: | ||||
| Unaffiliated issuers | 7,992,006 | |||
| Assets and liabilities in foreign currencies | (18) | |||
| Total change in net unrealized appreciation (depreciation) | 7,991,988 | |||
| Net gain (loss) | 12,338,652 | |||
| Net increase (decrease) in net assets resulting from operations | $ | 12,846,623 | ||
| Statement of Changes in Net Assets | ||||
Year ended February 28, 2023 | Year ended February 28, 2022 | |||
| Increase (Decrease) in Net Assets | ||||
| Operations | ||||
| Net investment income (loss) | $ | 507,971 | $ | (443,437) |
| Net realized gain (loss) | 4,346,664 | 100,676,384 | ||
| Change in net unrealized appreciation (depreciation) | 7,991,988 | (46,229,650) | ||
| Net increase (decrease) in net assets resulting from operations | 12,846,623 | 54,003,297 | ||
| Distributions to shareholders | (13,235,663) | (115,424,416) | ||
| Share transactions | ||||
| Proceeds from sales of shares | 164,045,053 | 116,900,003 | ||
| Reinvestment of distributions | 12,491,921 | 108,515,761 | ||
| Cost of shares redeemed | (82,387,426) | (368,438,524) | ||
Net increase (decrease) in net assets resulting from share transactions | 94,149,548 | (143,022,760) | ||
| Total increase (decrease) in net assets | 93,760,508 | (204,443,879) | ||
| Net Assets | ||||
| Beginning of period | 359,764,985 | 564,208,864 | ||
| End of period | $ | 453,525,493 | $ | 359,764,985 |
| Other Information | ||||
| Shares | ||||
| Sold | 5,797,934 | 3,139,766 | ||
| Issued in reinvestment of distributions | 419,387 | 3,143,897 | ||
| Redeemed | (2,846,988) | (10,008,148) | ||
| Net increase (decrease) | 3,370,333 | (3,724,485) | ||
| Industrials Portfolio |
| Years ended February 28, | 2023 | 2022 | 2021 | 2020 A | 2019 | |||||
Selected Per-Share Data | ||||||||||
| Net asset value, beginning of period | $ | 31.41 | $ | 37.17 | $ | 31.90 | $ | 33.84 | $ | 36.96 |
| Income from Investment Operations | ||||||||||
Net investment income (loss) B,C | .04 D | (.04) | (.02) | .28 E | .32 | |||||
| Net realized and unrealized gain (loss) | .30 | 3.70 | 6.38 | (.76) | (.70) | |||||
| Total from investment operations | .34 | 3.66 | 6.36 | (.48) | (.38) | |||||
| Distributions from net investment income | (.04) | - | (.07) F | (.24) | (.25) | |||||
| Distributions from net realized gain | (1.13) | (9.42) | (1.02) F | (1.23) | (2.49) | |||||
| Total distributions | (1.16) G | (9.42) | (1.09) | (1.46) G | (2.74) | |||||
| Net asset value, end of period | $ | 30.59 | $ | 31.41 | $ | 37.17 | $ | 31.90 | $ | 33.84 |
Total Return H | 1.19% | 9.33% | 21.41% | (1.82)% | (.45)% | |||||
Ratios to Average Net Assets C,I,J | ||||||||||
| Expenses before reductions | .76% | .74% | .76% | .76% | .76% | |||||
| Expenses net of fee waivers, if any | .76% | .74% | .76% | .76% | .76% | |||||
| Expenses net of all reductions | .76% | .74% | .74% | .75% | .75% | |||||
| Net investment income (loss) | .14% D | (.10)% | (.05)% | .81% E | .92% | |||||
| Supplemental Data | ||||||||||
| Net assets, end of period (000 omitted) | $ | 453,525 | $ | 359,765 | $ | 564,209 | $ | 529,023 | $ | 632,470 |
Portfolio turnover rate K | 125% | 151% | 272% | 143% L | 88% L |
| Average Annual Total Returns | |||
Periods ended February 28, 2023 | Past 1 year | Past 5 years | Past 10 years |
| Transportation Portfolio | -0.46% | 9.05% | 12.53% |
| $10,000 Over 10 Years |
Let's say hypothetically that $10,000 was invested in Transportation Portfolio on February 28, 2013. The chart shows how the value of your investment would have changed, and also shows how the S&P 500® Index performed over the same period. |
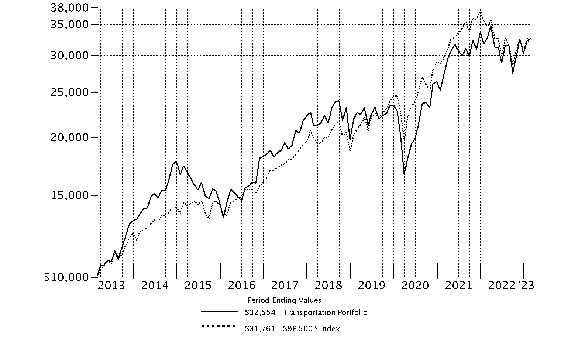 |
Top Holdings (% of Fund's net assets) | ||
| United Parcel Service, Inc. Class B | 16.3 | |
| Union Pacific Corp. | 12.7 | |
| CSX Corp. | 8.2 | |
| Uber Technologies, Inc. | 5.2 | |
| Scorpio Tankers, Inc. | 4.8 | |
| Air Transport Services Group, Inc. | 4.5 | |
| FedEx Corp. | 4.3 | |
| Alaska Air Group, Inc. | 4.3 | |
| Kirby Corp. | 3.8 | |
| Copa Holdings SA Class A | 3.1 | |
| 67.2 | ||
| Industries (% of Fund's net assets) | ||
| Air Freight & Logistics | 32.2 | |
| Road & Rail | 29.5 | |
| Airlines | 13.6 | |
| Oil, Gas & Consumable Fuels | 11.9 | |
| Internet & Direct Marketing Retail | 5.6 | |
| Marine | 4.5 | |
| Energy Equipment & Services | 1.2 | |
Geographic Diversification (% of Fund's net assets) |
 |
* Includes Short-Term investments and Net Other Assets (Liabilities). Percentages are based on country or territory of incorporation and are adjusted for the effect of derivatives, if applicable. |
| Common Stocks - 98.5% | |||
| Shares | Value ($) | ||
| Air Freight & Logistics - 32.2% | |||
| Air Freight & Logistics - 32.2% | |||
| Air Transport Services Group, Inc. (a) | 1,279,523 | 26,780,416 | |
| Atlas Air Worldwide Holdings, Inc. (a) | 67,800 | 6,834,918 | |
| C.H. Robinson Worldwide, Inc. | 107,396 | 10,735,304 | |
| Expeditors International of Washington, Inc. (b) | 127,538 | 13,335,373 | |
| FedEx Corp. | 123,741 | 25,146,646 | |
| Forward Air Corp. | 44,400 | 4,582,524 | |
| GXO Logistics, Inc. (a) | 21,522 | 1,066,846 | |
| Hub Group, Inc. Class A (a) | 55,649 | 5,104,683 | |
| United Parcel Service, Inc. Class B | 523,441 | 95,522,750 | |
| 189,109,460 | |||
| Airlines - 13.6% | |||
| Airlines - 13.6% | |||
| Alaska Air Group, Inc. (a) | 524,700 | 25,096,401 | |
| Allegiant Travel Co. (a) | 16,200 | 1,661,310 | |
| Canada Jetlines Ltd. (a) | 1,250 | 220 | |
| Copa Holdings SA Class A (a)(b) | 198,700 | 18,349,945 | |
| Delta Air Lines, Inc. (a) | 456,561 | 17,504,549 | |
| Frontier Group Holdings, Inc. (a) | 409,699 | 4,818,060 | |
| Spirit Airlines, Inc. | 72,200 | 1,322,704 | |
| Sun Country Airlines Holdings, Inc. (a) | 432,410 | 8,669,821 | |
| United Airlines Holdings, Inc. (a) | 50,679 | 2,633,281 | |
| 80,056,291 | |||
| Energy Equipment & Services - 1.2% | |||
| Oil & Gas Drilling - 1.2% | |||
| Noble Corp. PLC (a) | 138,100 | 5,757,389 | |
| Valaris Ltd. (a) | 15,000 | 1,008,750 | |
| 6,766,139 | |||
| Internet & Direct Marketing Retail - 5.6% | |||
| Internet & Direct Marketing Retail - 5.6% | |||
| Lyft, Inc. (a) | 272,000 | 2,720,000 | |
| Uber Technologies, Inc. (a) | 914,304 | 30,409,751 | |
| 33,129,751 | |||
| Marine - 4.5% | |||
| Marine - 4.5% | |||
| Eagle Bulk Shipping, Inc. (b) | 20,230 | 1,320,412 | |
| Kirby Corp. (a)(b) | 308,885 | 22,403,429 | |
| Matson, Inc. | 36,795 | 2,447,235 | |
| 26,171,076 | |||
| Oil, Gas & Consumable Fuels - 11.9% | |||
| Oil & Gas Exploration & Production - 0.3% | |||
| Canadian Natural Resources Ltd. | 33,000 | 1,864,830 | |
| Oil & Gas Storage & Transport - 11.6% | |||
| Ardmore Shipping Corp. | 119,700 | 2,172,555 | |
| Cool Co. Ltd. | 218,860 | 2,835,856 | |
| DHT Holdings, Inc. | 380,000 | 4,396,600 | |
| Frontline PLC (NY Shares) | 492,000 | 9,288,960 | |
| Hafnia Ltd. | 1,950,447 | 11,832,501 | |
| International Seaways, Inc. | 178,800 | 9,197,472 | |
| Scorpio Tankers, Inc. | 468,600 | 28,284,696 | |
| 68,008,640 | |||
TOTAL OIL, GAS & CONSUMABLE FUELS | 69,873,470 | ||
| Road & Rail - 29.5% | |||
| Railroads - 23.0% | |||
| CSX Corp. | 1,578,501 | 48,128,495 | |
| Norfolk Southern Corp. | 53,336 | 11,991,000 | |
| Union Pacific Corp. | 360,137 | 74,649,197 | |
| 134,768,692 | |||
| Trucking - 6.5% | |||
| ArcBest Corp. | 30,800 | 2,962,960 | |
| Hertz Global Holdings, Inc. (a) | 81,700 | 1,512,267 | |
| J.B. Hunt Transport Services, Inc. | 3,361 | 607,635 | |
| Knight-Swift Transportation Holdings, Inc. Class A | 118,000 | 6,707,120 | |
| RXO, Inc. (a) | 64,622 | 1,329,275 | |
| Ryder System, Inc. | 77,007 | 7,539,755 | |
| Saia, Inc. (a)(b) | 10,374 | 2,810,005 | |
| TFI International, Inc. | 37,577 | 4,585,897 | |
| TFI International, Inc. (Canada) | 27,700 | 3,380,232 | |
| U-Haul Holding Co. (non-vtg.) | 102,821 | 5,719,932 | |
| Werner Enterprises, Inc. | 23,783 | 1,104,720 | |
| 38,259,798 | |||
TOTAL ROAD & RAIL | 173,028,490 | ||
| TOTAL COMMON STOCKS (Cost $406,686,070) | 578,134,677 | ||
| Money Market Funds - 5.0% | |||
| Shares | Value ($) | ||
| Fidelity Cash Central Fund 4.63% (c) | 7,754,056 | 7,755,607 | |
| Fidelity Securities Lending Cash Central Fund 4.63% (c)(d) | 21,903,985 | 21,906,175 | |
| TOTAL MONEY MARKET FUNDS (Cost $29,661,782) | 29,661,782 | ||
| TOTAL INVESTMENT IN SECURITIES - 103.5% (Cost $436,347,852) | 607,796,459 |
NET OTHER ASSETS (LIABILITIES) - (3.5)% | (20,689,437) |
| NET ASSETS - 100.0% | 587,107,022 |
| (a) | Non-income producing |
| (b) | Security or a portion of the security is on loan at period end. |
| (c) | Affiliated fund that is generally available only to investment companies and other accounts managed by Fidelity Investments. The rate quoted is the annualized seven-day yield of the fund at period end. A complete unaudited listing of the fund's holdings as of its most recent quarter end is available upon request. In addition, each Fidelity Central Fund's financial statements, which are not covered by the Fund's Report of Independent Registered Public Accounting Firm, are available on the SEC's website or upon request. |
| (d) | Investment made with cash collateral received from securities on loan. |
| Affiliate | Value, beginning of period ($) | Purchases ($) | Sales Proceeds ($) | Dividend Income ($) | Realized Gain (loss) ($) | Change in Unrealized appreciation (depreciation) ($) | Value, end of period ($) | % ownership, end of period |
| Fidelity Cash Central Fund 4.63% | 10,409,172 | 142,116,426 | 144,769,991 | 252,434 | - | - | 7,755,607 | 0.0% |
| Fidelity Securities Lending Cash Central Fund 4.63% | 71,035,353 | 367,895,168 | 417,024,346 | 40,575 | - | - | 21,906,175 | 0.1% |
| Total | 81,444,525 | 510,011,594 | 561,794,337 | 293,009 | - | - | 29,661,782 | |
| Valuation Inputs at Reporting Date: | ||||
| Description | Total ($) | Level 1 ($) | Level 2 ($) | Level 3 ($) |
Investments in Securities: | ||||
| Common Stocks | 578,134,677 | 578,134,677 | - | - |
| Money Market Funds | 29,661,782 | 29,661,782 | - | - |
| Total Investments in Securities: | 607,796,459 | 607,796,459 | - | - |
| Statement of Assets and Liabilities | ||||
| February 28, 2023 | ||||
| Assets | ||||
| Investment in securities, at value (including securities loaned of $21,662,832) - See accompanying schedule: | ||||
Unaffiliated issuers (cost $406,686,070) | $ | 578,134,677 | ||
Fidelity Central Funds (cost $29,661,782) | 29,661,782 | |||
| Total Investment in Securities (cost $436,347,852) | $ | 607,796,459 | ||
| Receivable for fund shares sold | 226,439 | |||
| Dividends receivable | 1,607,011 | |||
| Distributions receivable from Fidelity Central Funds | 38,288 | |||
| Prepaid expenses | 1,731 | |||
Total assets | 609,669,928 | |||
| Liabilities | ||||
| Payable for fund shares redeemed | $ | 253,535 | ||
| Accrued management fee | 261,929 | |||
| Other affiliated payables | 107,248 | |||
| Other payables and accrued expenses | 34,019 | |||
| Collateral on securities loaned | 21,906,175 | |||
| Total Liabilities | 22,562,906 | |||
| Net Assets | $ | 587,107,022 | ||
| Net Assets consist of: | ||||
| Paid in capital | $ | 416,733,559 | ||
| Total accumulated earnings (loss) | 170,373,463 | |||
| Net Assets | $ | 587,107,022 | ||
Net Asset Value , offering price and redemption price per share ($587,107,022 ÷ 6,052,593 shares) | $ | 97.00 | ||
| Statement of Operations | ||||
Year ended February 28, 2023 | ||||
| Investment Income | ||||
| Dividends | $ | 12,087,166 | ||
| Income from Fidelity Central Funds (including $40,575 from security lending) | 293,009 | |||
| Total Income | 12,380,175 | |||
| Expenses | ||||
| Management fee | $ | 3,193,686 | ||
| Transfer agent fees | 1,140,822 | |||
| Accounting fees | 208,257 | |||
| Custodian fees and expenses | 8,708 | |||
| Independent trustees' fees and expenses | 2,080 | |||
| Registration fees | 35,819 | |||
| Audit | 48,008 | |||
| Legal | 1,699 | |||
| Interest | 670 | |||
| Miscellaneous | 514 | |||
| Total expenses before reductions | 4,640,263 | |||
| Expense reductions | (21,756) | |||
| Total expenses after reductions | 4,618,507 | |||
| Net Investment income (loss) | 7,761,668 | |||
| Realized and Unrealized Gain (Loss) | ||||
| Net realized gain (loss) on: | ||||
| Investment Securities: | ||||
| Unaffiliated issuers | 28,252,642 | |||
| Foreign currency transactions | (12,300) | |||
| Total net realized gain (loss) | 28,240,342 | |||
| Change in net unrealized appreciation (depreciation) on: | ||||
| Investment Securities: | ||||
| Unaffiliated issuers | (46,772,094) | |||
| Assets and liabilities in foreign currencies | (156) | |||
| Total change in net unrealized appreciation (depreciation) | (46,772,250) | |||
| Net gain (loss) | (18,531,908) | |||
| Net increase (decrease) in net assets resulting from operations | $ | (10,770,240) | ||
| Statement of Changes in Net Assets | ||||
Year ended February 28, 2023 | Year ended February 28, 2022 | |||
| Increase (Decrease) in Net Assets | ||||
| Operations | ||||
| Net investment income (loss) | $ | 7,761,668 | $ | 2,903,332 |
| Net realized gain (loss) | 28,240,342 | 53,873,633 | ||
| Change in net unrealized appreciation (depreciation) | (46,772,250) | 9,800,484 | ||
| Net increase (decrease) in net assets resulting from operations | (10,770,240) | 66,577,449 | ||
| Distributions to shareholders | (48,641,050) | (47,428,580) | ||
| Share transactions | ||||
| Proceeds from sales of shares | 81,246,776 | 148,678,513 | ||
| Net asset value of shares issued in exchange for the net assets of the Target Fund(s) (see Merger Information note) | - | 322,796,887 | ||
| Reinvestment of distributions | 46,145,200 | 44,843,850 | ||
| Cost of shares redeemed | (160,176,373) | (191,945,005) | ||
Net increase (decrease) in net assets resulting from share transactions | (32,784,397) | 324,374,245 | ||
| Total increase (decrease) in net assets | (92,195,687) | 343,523,114 | ||
| Net Assets | ||||
| Beginning of period | 679,302,709 | 335,779,595 | ||
| End of period | $ | 587,107,022 | $ | 679,302,709 |
| Other Information | ||||
| Shares | ||||
| Sold | 813,431 | 1,386,810 | ||
| Issued in exchange for the shares of the Target Fund(s) (see Merger Information note) | - | 3,028,967 | ||
| Issued in reinvestment of distributions | 489,169 | 421,380 | ||
| Redeemed | (1,669,220) | (1,810,854) | ||
| Net increase (decrease) | (366,620) | 3,026,303 | ||
| Transportation Portfolio |
| Years ended February 28, | 2023 | 2022 | 2021 | 2020 A | 2019 | |||||
Selected Per-Share Data | ||||||||||
| Net asset value, beginning of period | $ | 105.82 | $ | 98.97 | $ | 82.12 | $ | 95.41 | $ | 99.07 |
| Income from Investment Operations | ||||||||||
Net investment income (loss) B,C | 1.24 | .64 | 1.06 D | .93 | .85 | |||||
| Net realized and unrealized gain (loss) | (2.12) | 19.26 | 23.43 | (10.43) | 5.05 | |||||
| Total from investment operations | (.88) | 19.90 | 24.49 | (9.50) | 5.90 | |||||
| Distributions from net investment income | (1.16) | (1.03) | (.76) | (1.10) | (.78) | |||||
| Distributions from net realized gain | (6.78) | (12.03) | (6.88) | (2.70) | (8.78) | |||||
| Total distributions | (7.94) | (13.05) E | (7.64) | (3.79) E | (9.56) | |||||
| Net asset value, end of period | $ | 97.00 | $ | 105.82 | $ | 98.97 | $ | 82.12 | $ | 95.41 |
Total Return F | (.46)% | 20.35% | 34.62% | (10.49)% | 6.85% | |||||
Ratios to Average Net Assets C,G,H | ||||||||||
| Expenses before reductions | .76% | .77% | .80% | .79% | .79% | |||||
| Expenses net of fee waivers, if any | .76% | .77% | .80% | .79% | .79% | |||||
| Expenses net of all reductions | .76% | .77% | .80% | .79% | .78% | |||||
| Net investment income (loss) | 1.28% | .60% | 1.29% D | 1.00% | .87% | |||||
| Supplemental Data | ||||||||||
| Net assets, end of period (000 omitted) | $ | 587,107 | $ | 679,303 | $ | 335,780 | $ | 310,441 | $ | 451,192 |
Portfolio turnover rate I | 23% | 66% J | 52% | 78% | 58% |
| Fidelity Central Fund | Investment Manager | Investment Objective | Investment Practices | Expense Ratio A |
| Fidelity Money Market Central Funds | Fidelity Management & Research Company LLC (FMR) | Each fund seeks to obtain a high level of current income consistent with the preservation of capital and liquidity. | Short-term Investments | Less than .005% |
| Defense and Aerospace Portfolio | $112,362 |
| Industrials Portfolio | 105,971 |
| Tax cost | Gross unrealized appreciation | Gross unrealized depreciation | Net unrealized appreciation (depreciation) | |
| Defense and Aerospace Portfolio | $1,094,818,344 | $505,132,320 | $(27,307,008) | $477,825,312 |
| Industrials Portfolio | 400,076,088 | 65,680,712 | (6,180,391) | 59,500,321 |
| Transportation Portfolio | 440,112,118 | 205,561,824 | (37,877,483) | 167,684,341 |
| Undistributed tax-exempt income | Undistributed ordinary income | Undistributed long-term capital gain | Capital loss carryforward | Net unrealized appreciation (depreciation) on securities and other investments | |
| Defense and Aerospace Portfolio | $- | $2,207,681 | $10,349,148 | $- | $ 477,825,312 |
| Industrials Portfolio | - | 1,143 | 3,725,343 | - | 59,500,262 |
| Transportation Portfolio | - | 2,118,786 | 570,443 | - | 167,684,234 |
| February 28, 2023 | |||
| Ordinary Income | Long-term Capital Gains | Total | |
| Defense and Aerospace Portfolio | $6,194,533 | $125,091,433 | $131,285,966 |
| Industrials Portfolio | 1,806,461 | 11,429,202 | 13,235,663 |
| Transportation Portfolio | 12,102,302 | 36,538,748 | 48,641,050 |
| February 28, 2022 | |||
| Ordinary Income | Long-term Capital Gains | Total | |
| Defense and Aerospace Portfolio | $- | $114,456,735 | $114,456,735 |
| Industrials Portfolio | 26,589,200 | 88,835,216 | 115,424,416 |
| Transportation Portfolio | 8,956,782 | 38,471,798 | 47,428,580 |
| Purchases ($) | Sales ($) | |
| Defense and Aerospace Portfolio | 249,295,898 | 213,166,353 |
| Industrials Portfolio | 536,497,256 | 451,250,507 |
| Transportation Portfolio | 139,763,617 | 217,369,687 |
| Individual Rate | Group Rate | Total | |
| Defense and Aerospace Portfolio | .30% | .23% | .53% |
| Industrials Portfolio | .30% | .23% | .53% |
| Transportation Portfolio | .30% | .23% | .53% |
| Defense and Aerospace Portfolio | .18% |
| Industrials Portfolio | .17% |
| Transportation Portfolio | .19% |
| % of Average Net Assets | |
| Defense and Aerospace Portfolio | .03 |
| Industrials Portfolio | .04 |
| Transportation Portfolio | .03 |
| Amount | |
| Defense and Aerospace Portfolio | $3,038 |
| Industrials Portfolio | 8,326 |
| Transportation Portfolio | 4,059 |
| Borrower or Lender | Average Loan Balance | Weighted Average Interest Rate | Interest Expense | |
| Industrials Portfolio | Borrower | $4,029,000 | 4.58% | $1,537 |
| Transportation Portfolio | Borrower | $7,277,000 | 3.32% | $670 |
| Purchases ($) | Sales ($) | Realized Gain (Loss) ($) | |
| Defense and Aerospace Portfolio | 13,651,830 | 13,902,776 | 1,401,133 |
| Industrials Portfolio | 10,961,464 | 13,973,650 | 543,241 |
| Transportation Portfolio | 5,578,387 | 7,973,622 | (795,661) |
| Amount | |
| Defense and Aerospace Portfolio | $2,528 |
| Industrials Portfolio | 610 |
| Transportation Portfolio | 1,106 |
| Total Security Lending Fees Paid to NFS | Security Lending Income From Securities Loaned to NFS | Value of Securities Loaned to NFS at Period End | |
| Defense and Aerospace Portfolio | $2,092 | $- | $- |
| Industrials Portfolio | $867 | $1 | $- |
| Transportation Portfolio | $4,038 | $2,497 | $- |
| Custodian credits | |
| Defense and Aerospace Portfolio | $108 |
| Industrials Portfolio | 957 |
| Transportation Portfolio | 188 |
| Amount | |
| Defense and Aerospace Portfolio | $50,235 |
| Industrials Portfolio | 12,374 |
| Transportation Portfolio | 21,568 |
| Target Fund | Investments $ | Unrealized appreciation (depreciation) $ | Net Assets $ | Shares Exchanged | Shares Exchanged Ratio |
| Air Transportation Portfolio | 320,705,550 | 47,927,461 | 322,796,887 | 3,028,967 | .5404138125 |
| Surviving Fund | Net Assets $ | Total net assets after the acquisition $ |
| Transportation Portfolio | 411,872,847 | 734,669,734 |
| Net investment income (loss) | $2,600,527 |
| Total net realized gain (loss) | 134,920,339 |
| Total change in net unrealized appreciation (depreciation) | (53,851,879) |
| Net increase (decrease) in net assets resulting from operations | $83,668,987 |
| The Example is based on an investment of $1,000 invested at the beginning of the period and held for the entire period (September 1, 2022 to February 28, 2023). |
Annualized Expense Ratio- A | Beginning Account Value September 1, 2022 | Ending Account Value February 28, 2023 | Expenses Paid During Period- C September 1, 2022 to February 28, 2023 | |||||||
| Defense and Aerospace Portfolio | .74% | |||||||||
| Actual | $ 1,000 | $ 1,137.20 | $ 3.92 | |||||||
Hypothetical- B | $ 1,000 | $ 1,021.12 | $ 3.71 | |||||||
| Industrials Portfolio | .76% | |||||||||
| Actual | $ 1,000 | $ 1,102.50 | $ 3.96 | |||||||
Hypothetical- B | $ 1,000 | $ 1,021.03 | $ 3.81 | |||||||
| Transportation Portfolio | .76% | |||||||||
| Actual | $ 1,000 | $ 1,036.10 | $ 3.84 | |||||||
Hypothetical- B | $ 1,000 | $ 1,021.03 | $ 3.81 | |||||||
| Defense and Aerospace Portfolio | $11,042,652 |
| Industrials Portfolio | $3,866,414 |
| Transportation Portfolio | $19,013,173 |
| Defense and Aerospace Portfolio | |
| December 2022 | 100% |
| Industrials Portfolio | |
| April 2022 | 40% |
| December 2022 | 100% |
| Transportation Portfolio | |
| April 2022 | 98% |
| December 2022 | 49% |
| Defense and Aerospace Portfolio | |
| December 2022 | 100% |
| Industrials Portfolio | |
| April 2022 | 43.62% |
| December 2022 | 100% |
| Transportation Portfolio | |
| April 2022 | 98.11% |
| December 2022 | 60.65% |
| April, 2022 | December, 2022 | |
| Industrials Portfolio | 100% | - |
| Transportation Portfolio | - | 100% |
| Transportation Portfolio | $141,621 |
- Highly liquid investments - cash or convertible to cash within three business days or less
- Moderately liquid investments - convertible to cash in three to seven calendar days
- Less liquid investments - can be sold or disposed of, but not settled, within seven calendar days
- Illiquid investments - cannot be sold or disposed of within seven calendar days
 |


Contents
| Average Annual Total Returns | |||
Periods ended February 28, 2023 | Past 1 year | Past 5 years | Past 10 years |
| Class A (incl.5.75% sales charge) | -13.27% | 2.20% | 5.10% |
| Class M (incl.3.50% sales charge) | -11.42% | 2.39% | 5.03% |
Class C (incl. contingent deferred sales charge) | -9.52% | 2.67% | 5.12% |
| Telecommunications Portfolio | -7.71% | 3.76% | 6.07% |
| Class I | -7.67% | 3.75% | 6.06% |
| Class Z | -7.56% | 3.89% | 6.13% |
| $10,000 Over 10 Years |
Let's say hypothetically that $10,000 was invested in Telecommunications Portfolio, a class of the fund, on February 28, 2013. The chart shows how the value of your investment would have changed, and also shows how the S&P 500® Index performed over the same period. |
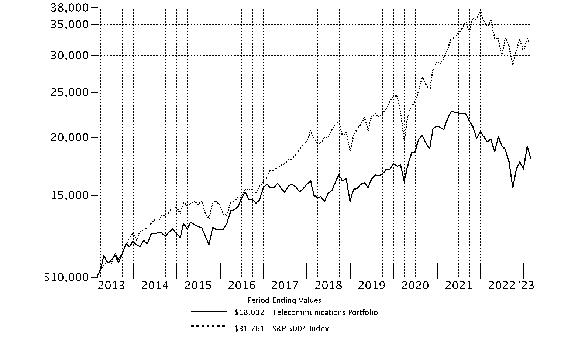 |
Top Holdings (% of Fund's net assets) | ||
| Verizon Communications, Inc. | 24.4 | |
| AT&T, Inc. | 19.7 | |
| Cogent Communications Group, Inc. | 4.8 | |
| Iridium Communications, Inc. | 4.7 | |
| T-Mobile U.S., Inc. | 4.4 | |
| Liberty Global PLC Class C | 4.3 | |
| Telephone & Data Systems, Inc. | 3.7 | |
| Liberty Latin America Ltd. Class C | 3.7 | |
| Gogo, Inc. | 3.6 | |
| Radius Global Infrastructure, Inc. | 3.1 | |
| 76.4 | ||
| Industries (% of Fund's net assets) | ||
| Diversified Telecommunication Services | 77.0 | |
| Wireless Telecommunication Services | 13.1 | |
| Media | 5.7 | |
| IT Services | 0.5 | |
| Construction & Engineering | 0.1 | |
| Software | 0.1 | |
| Common Stocks - 96.5% | |||
| Shares | Value ($) | ||
| Construction & Engineering - 0.1% | |||
| Construction & Engineering - 0.1% | |||
| Dycom Industries, Inc. (a) | 2,600 | 218,946 | |
| Diversified Telecommunication Services - 77.0% | |||
| Alternative Carriers - 24.5% | |||
| Anterix, Inc. (a) | 145,700 | 4,400,140 | |
| Bandwidth, Inc. (a) | 77,900 | 1,238,610 | |
| Cogent Communications Group, Inc. | 171,039 | 11,073,065 | |
| EchoStar Holding Corp. Class A (a)(b) | 260,500 | 5,199,580 | |
| Globalstar, Inc. (a)(b) | 2,554,300 | 3,269,504 | |
| Iridium Communications, Inc. | 180,111 | 11,053,412 | |
| Liberty Global PLC Class C (a) | 470,736 | 10,003,140 | |
| Liberty Latin America Ltd. Class C (a) | 975,133 | 8,561,668 | |
| Lumen Technologies, Inc. (b) | 685,200 | 2,329,680 | |
| 57,128,799 | |||
| Integrated Telecommunication Services - 52.5% | |||
| AT&T, Inc. | 2,432,420 | 45,997,062 | |
| ATN International, Inc. | 52,400 | 2,203,420 | |
| Deutsche Telekom AG | 35,300 | 792,240 | |
| Frontier Communications Parent, Inc. (a)(b) | 175,200 | 4,793,472 | |
| IDT Corp. Class B (a) | 144,700 | 4,400,327 | |
| Radius Global Infrastructure, Inc. (a)(b) | 532,400 | 7,256,612 | |
| Verizon Communications, Inc. | 1,462,897 | 56,775,033 | |
| 122,218,166 | |||
TOTAL DIVERSIFIED TELECOMMUNICATION SERVICES | 179,346,965 | ||
| IT Services - 0.5% | |||
| Internet Services & Infrastructure - 0.1% | |||
| Twilio, Inc. Class A (a) | 4,000 | 268,840 | |
| IT Consulting & Other Services - 0.4% | |||
| Amdocs Ltd. | 9,800 | 897,778 | |
TOTAL IT SERVICES | 1,166,618 | ||
| Media - 5.7% | |||
| Cable & Satellite - 5.7% | |||
| Charter Communications, Inc. Class A (a) | 4,400 | 1,617,484 | |
| Comcast Corp. Class A | 190,600 | 7,084,602 | |
| Liberty Broadband Corp. Class C (a) | 52,424 | 4,543,588 | |
| 13,245,674 | |||
| Software - 0.1% | |||
| Application Software - 0.1% | |||
| RingCentral, Inc. (a) | 7,400 | 244,496 | |
| Wireless Telecommunication Services - 13.1% | |||
| Wireless Telecommunication Services - 13.1% | |||
| Gogo, Inc. (a) | 507,700 | 8,356,742 | |
| Millicom International Cellular SA (a) | 70,110 | 1,387,477 | |
| Shenandoah Telecommunications Co. | 5,623 | 109,761 | |
| T-Mobile U.S., Inc. (a) | 72,324 | 10,283,026 | |
| Telephone & Data Systems, Inc. | 682,664 | 8,663,006 | |
| U.S. Cellular Corp. (a)(b) | 73,500 | 1,773,555 | |
| 30,573,567 | |||
| TOTAL COMMON STOCKS (Cost $234,849,854) | 224,796,266 | ||
| Money Market Funds - 8.6% | |||
| Shares | Value ($) | ||
| Fidelity Cash Central Fund 4.63% (c) | 10,882,095 | 10,884,272 | |
| Fidelity Securities Lending Cash Central Fund 4.63% (c)(d) | 9,165,008 | 9,165,924 | |
| TOTAL MONEY MARKET FUNDS (Cost $20,050,196) | 20,050,196 | ||
| TOTAL INVESTMENT IN SECURITIES - 105.1% (Cost $254,900,050) | 244,846,462 |
NET OTHER ASSETS (LIABILITIES) - (5.1)% | (11,868,026) |
| NET ASSETS - 100.0% | 232,978,436 |
| (a) | Non-income producing |
| (b) | Security or a portion of the security is on loan at period end. |
| (c) | Affiliated fund that is generally available only to investment companies and other accounts managed by Fidelity Investments. The rate quoted is the annualized seven-day yield of the fund at period end. A complete unaudited listing of the fund's holdings as of its most recent quarter end is available upon request. In addition, each Fidelity Central Fund's financial statements, which are not covered by the Fund's Report of Independent Registered Public Accounting Firm, are available on the SEC's website or upon request. |
| (d) | Investment made with cash collateral received from securities on loan. |
| Affiliate | Value, beginning of period ($) | Purchases ($) | Sales Proceeds ($) | Dividend Income ($) | Realized Gain (loss) ($) | Change in Unrealized appreciation (depreciation) ($) | Value, end of period ($) | % ownership, end of period |
| Fidelity Cash Central Fund 4.63% | 2,983,817 | 64,700,227 | 56,799,772 | 141,928 | - | - | 10,884,272 | 0.0% |
| Fidelity Securities Lending Cash Central Fund 4.63% | 27,079,836 | 127,589,611 | 145,503,523 | 22,823 | - | - | 9,165,924 | 0.0% |
| Total | 30,063,653 | 192,289,838 | 202,303,295 | 164,751 | - | - | 20,050,196 | |
| Valuation Inputs at Reporting Date: | ||||
| Description | Total ($) | Level 1 ($) | Level 2 ($) | Level 3 ($) |
Investments in Securities: | ||||
| Common Stocks | 224,796,266 | 224,004,026 | 792,240 | - |
| Money Market Funds | 20,050,196 | 20,050,196 | - | - |
| Total Investments in Securities: | 244,846,462 | 244,054,222 | 792,240 | - |
| Statement of Assets and Liabilities | ||||
| February 28, 2023 | ||||
| Assets | ||||
| Investment in securities, at value (including securities loaned of $9,000,796) - See accompanying schedule: | ||||
Unaffiliated issuers (cost $234,849,854) | $ | 224,796,266 | ||
Fidelity Central Funds (cost $20,050,196) | 20,050,196 | |||
| Total Investment in Securities (cost $254,900,050) | $ | 244,846,462 | ||
| Receivable for fund shares sold | 36,105 | |||
| Distributions receivable from Fidelity Central Funds | 38,155 | |||
| Prepaid expenses | 1,096 | |||
| Other receivables | 4,615 | |||
Total assets | 244,926,433 | |||
| Liabilities | ||||
| Payable for investments purchased | $ | 2,527,967 | ||
| Payable for fund shares redeemed | 60,427 | |||
| Accrued management fee | 100,519 | |||
| Distribution and service plan fees payable | 10,442 | |||
| Other affiliated payables | 44,463 | |||
| Other payables and accrued expenses | 38,731 | |||
| Collateral on securities loaned | 9,165,448 | |||
| Total Liabilities | 11,947,997 | |||
| Net Assets | $ | 232,978,436 | ||
| Net Assets consist of: | ||||
| Paid in capital | $ | 240,723,192 | ||
| Total accumulated earnings (loss) | (7,744,756) | |||
| Net Assets | $ | 232,978,436 | ||
| Net Asset Value and Maximum Offering Price | ||||
| Class A : | ||||
Net Asset Value and redemption price per share ($18,744,402 ÷ 402,473 shares) (a) | $ | 46.57 | ||
| Maximum offering price per share (100/94.25 of $46.57) | $ | 49.41 | ||
| Class M : | ||||
Net Asset Value and redemption price per share ($7,300,643 ÷ 157,988 shares) (a) | $ | 46.21 | ||
| Maximum offering price per share (100/96.50 of $46.21) | $ | 47.89 | ||
| Class C : | ||||
Net Asset Value and offering price per share ($3,923,028 ÷ 84,581 shares) (a) | $ | 46.38 | ||
| Telecommunications : | ||||
Net Asset Value , offering price and redemption price per share ($171,884,681 ÷ 3,659,330 shares) | $ | 46.97 | ||
| Class I : | ||||
Net Asset Value , offering price and redemption price per share ($28,440,751 ÷ 607,163 shares) | $ | 46.84 | ||
| Class Z : | ||||
Net Asset Value , offering price and redemption price per share ($2,684,931 ÷ 57,467 shares) | $ | 46.72 | ||
(a)Redemption price per share is equal to net asset value less any applicable contingent deferred sales charge. | ||||
| Statement of Operations | ||||
Year ended February 28, 2023 | ||||
| Investment Income | ||||
| Dividends | $ | 7,071,751 | ||
| Interest | 31 | |||
| Income from Fidelity Central Funds (including $22,823 from security lending) | 164,751 | |||
| Total Income | 7,236,533 | |||
| Expenses | ||||
| Management fee | $ | 1,259,693 | ||
| Transfer agent fees | 477,431 | |||
| Distribution and service plan fees | 130,220 | |||
| Accounting fees | 86,966 | |||
| Custodian fees and expenses | 3,432 | |||
| Independent trustees' fees and expenses | 820 | |||
| Registration fees | 84,674 | |||
| Audit | 56,787 | |||
| Legal | 1,458 | |||
| Interest | 1,985 | |||
| Miscellaneous | 1,590 | |||
| Total expenses before reductions | 2,105,056 | |||
| Expense reductions | (8,526) | |||
| Total expenses after reductions | 2,096,530 | |||
| Net Investment income (loss) | 5,140,003 | |||
| Realized and Unrealized Gain (Loss) | ||||
| Net realized gain (loss) on: | ||||
| Investment Securities: | ||||
| Unaffiliated issuers (net of foreign taxes of $40,436) | 7,523,922 | |||
| Foreign currency transactions | 7,005 | |||
| Total net realized gain (loss) | 7,530,927 | |||
| Change in net unrealized appreciation (depreciation) on: | ||||
| Investment Securities: | ||||
| Unaffiliated issuers (net of decrease in deferred foreign taxes of $33,773) | (35,291,633) | |||
| Assets and liabilities in foreign currencies | (435) | |||
| Total change in net unrealized appreciation (depreciation) | (35,292,068) | |||
| Net gain (loss) | (27,761,141) | |||
| Net increase (decrease) in net assets resulting from operations | $ | (22,621,138) | ||
| Statement of Changes in Net Assets | ||||
Year ended February 28, 2023 | Year ended February 28, 2022 | |||
| Increase (Decrease) in Net Assets | ||||
| Operations | ||||
| Net investment income (loss) | $ | 5,140,003 | $ | 7,853,249 |
| Net realized gain (loss) | 7,530,927 | 30,387,100 | ||
| Change in net unrealized appreciation (depreciation) | (35,292,068) | (51,298,844) | ||
| Net increase (decrease) in net assets resulting from operations | (22,621,138) | (13,058,495) | ||
| Distributions to shareholders | (16,991,172) | (39,228,015) | ||
| Share transactions - net increase (decrease) | 20,395,222 | (46,334,121) | ||
| Total increase (decrease) in net assets | (19,217,088) | (98,620,631) | ||
| Net Assets | ||||
| Beginning of period | 252,195,524 | 350,816,155 | ||
| End of period | $ | 232,978,436 | $ | 252,195,524 |
| Fidelity Advisor® Telecommunications Fund Class A |
| Years ended February 28, | 2023 | 2022 | 2021 | 2020 A | 2019 | |||||
Selected Per-Share Data | ||||||||||
| Net asset value, beginning of period | $ | 54.28 | $ | 66.52 | $ | 60.60 | $ | 55.68 | $ | 55.58 |
| Income from Investment Operations | ||||||||||
Net investment income (loss) B,C | .93 | 1.51 D | .66 | .87 | 1.10 E | |||||
| Net realized and unrealized gain (loss) | (5.19) | (5.14) | 10.61 | 5.86 | .56 | |||||
| Total from investment operations | (4.26) | (3.63) | 11.27 | 6.73 | 1.66 | |||||
| Distributions from net investment income | (.99) | (1.66) | (.39) | (.96) | (.94) | |||||
| Distributions from net realized gain | (2.46) | (6.95) | (4.96) | (.85) | (.62) | |||||
| Total distributions | (3.45) | (8.61) | (5.35) | (1.81) | (1.56) | |||||
| Net asset value, end of period | $ | 46.57 | $ | 54.28 | $ | 66.52 | $ | 60.60 | $ | 55.68 |
Total Return F,G | (7.98)% | (6.28)% | 18.75% | 12.12% | 3.03% | |||||
Ratios to Average Net Assets C,H,I | ||||||||||
| Expenses before reductions | 1.13% | 1.09% | 1.11% | 1.18% | 1.18% | |||||
| Expenses net of fee waivers, if any | 1.13% | 1.09% | 1.11% | 1.17% | 1.17% | |||||
| Expenses net of all reductions | 1.13% | 1.09% | 1.10% | 1.17% | 1.16% | |||||
| Net investment income (loss) | 1.89% | 2.27% D | 1.01% | 1.47% | 1.96% E | |||||
| Supplemental Data | ||||||||||
| Net assets, end of period (000 omitted) | $ | 18,744 | $ | 22,023 | $ | 29,800 | $ | 21,376 | $ | 20,589 |
Portfolio turnover rate J | 24% | 28% | 58% | 58% | 64% K |
| Fidelity Advisor® Telecommunications Fund Class M |
| Years ended February 28, | 2023 | 2022 | 2021 | 2020 A | 2019 | |||||
Selected Per-Share Data | ||||||||||
| Net asset value, beginning of period | $ | 53.88 | $ | 66.09 | $ | 60.25 | $ | 55.40 | $ | 55.31 |
| Income from Investment Operations | ||||||||||
Net investment income (loss) B,C | .80 | 1.29 D | .46 | .70 | .92 E | |||||
| Net realized and unrealized gain (loss) | (5.14) | (5.08) | 10.54 | 5.83 | .55 | |||||
| Total from investment operations | (4.34) | (3.79) | 11.00 | 6.53 | 1.47 | |||||
| Distributions from net investment income | (.86) | (1.48) | (.20) | (.83) | (.76) | |||||
| Distributions from net realized gain | (2.46) | (6.95) | (4.96) | (.85) | (.62) | |||||
| Total distributions | (3.33) F | (8.42) F | (5.16) | (1.68) | (1.38) | |||||
| Net asset value, end of period | $ | 46.21 | $ | 53.88 | $ | 66.09 | $ | 60.25 | $ | 55.40 |
Total Return G,H | (8.21)% | (6.55)% | 18.39% | 11.81% | 2.69% | |||||
Ratios to Average Net Assets C,I,J | ||||||||||
| Expenses before reductions | 1.39% | 1.39% | 1.41% | 1.46% | 1.50% | |||||
| Expenses net of fee waivers, if any | 1.38% | 1.38% | 1.41% | 1.46% | 1.49% | |||||
| Expenses net of all reductions | 1.38% | 1.38% | 1.40% | 1.45% | 1.48% | |||||
| Net investment income (loss) | 1.64% | 1.97% D | .71% | 1.19% | 1.64% E | |||||
| Supplemental Data | ||||||||||
| Net assets, end of period (000 omitted) | $ | 7,301 | $ | 7,733 | $ | 9,038 | $ | 6,919 | $ | 6,018 |
Portfolio turnover rate K | 24% | 28% | 58% | 58% | 64% L |
| Fidelity Advisor® Telecommunications Fund Class C |
| Years ended February 28, | 2023 | 2022 | 2021 | 2020 A | 2019 | |||||
Selected Per-Share Data | ||||||||||
| Net asset value, beginning of period | $ | 54.04 | $ | 66.17 | $ | 60.32 | $ | 55.45 | $ | 55.29 |
| Income from Investment Operations | ||||||||||
Net investment income (loss) B,C | .56 | 1.01 D | .17 | .46 | .70 E | |||||
| Net realized and unrealized gain (loss) | (5.15) | (5.09) | 10.54 | 5.82 | .56 | |||||
| Total from investment operations | (4.59) | (4.08) | 10.71 | 6.28 | 1.26 | |||||
| Distributions from net investment income | (.61) | (1.10) | (.07) | (.56) | (.48) | |||||
| Distributions from net realized gain | (2.46) | (6.95) | (4.79) | (.85) | (.62) | |||||
| Total distributions | (3.07) | (8.05) | (4.86) | (1.41) | (1.10) | |||||
| Net asset value, end of period | $ | 46.38 | $ | 54.04 | $ | 66.17 | $ | 60.32 | $ | 55.45 |
Total Return F,G | (8.66)% | (6.97)% | 17.88% | 11.34% | 2.30% | |||||
Ratios to Average Net Assets C,H,I | ||||||||||
| Expenses before reductions | 1.88% | 1.83% | 1.86% | 1.88% | 1.88% | |||||
| Expenses net of fee waivers, if any | 1.87% | 1.83% | 1.86% | 1.87% | 1.88% | |||||
| Expenses net of all reductions | 1.87% | 1.83% | 1.84% | 1.87% | 1.86% | |||||
| Net investment income (loss) | 1.15% | 1.52% D | .26% | .77% | 1.26% E | |||||
| Supplemental Data | ||||||||||
| Net assets, end of period (000 omitted) | $ | 3,923 | $ | 5,254 | $ | 7,801 | $ | 6,491 | $ | 6,994 |
Portfolio turnover rate J | 24% | 28% | 58% | 58% | 64% K |
| Telecommunications Portfolio |
| Years ended February 28, | 2023 | 2022 | 2021 | 2020 A | 2019 | |||||
Selected Per-Share Data | ||||||||||
| Net asset value, beginning of period | $ | 54.73 | $ | 67.04 | $ | 60.99 | $ | 56.04 | $ | 55.88 |
| Income from Investment Operations | ||||||||||
Net investment income (loss) B,C | 1.09 | 1.71 D | .86 | 1.09 | 1.30 E | |||||
| Net realized and unrealized gain (loss) | (5.24) | (5.18) | 10.71 | 5.90 | .56 | |||||
| Total from investment operations | (4.15) | (3.47) | 11.57 | 6.99 | 1.86 | |||||
| Distributions from net investment income | (1.15) | (1.89) | (.57) | (1.19) | (1.08) | |||||
| Distributions from net realized gain | (2.46) | (6.95) | (4.96) | (.85) | (.62) | |||||
| Total distributions | (3.61) | (8.84) | (5.52) F | (2.04) | (1.70) | |||||
| Net asset value, end of period | $ | 46.97 | $ | 54.73 | $ | 67.04 | $ | 60.99 | $ | 56.04 |
Total Return G | (7.71)% | (5.99)% | 19.15% | 12.50% | 3.38% | |||||
Ratios to Average Net Assets C,H,I | ||||||||||
| Expenses before reductions | .82% | .79% | .81% | .83% | .84% | |||||
| Expenses net of fee waivers, if any | .82% | .79% | .81% | .82% | .83% | |||||
| Expenses net of all reductions | .82% | .79% | .79% | .82% | .82% | |||||
| Net investment income (loss) | 2.20% | 2.57% D | 1.31% | 1.82% | 2.30% E | |||||
| Supplemental Data | ||||||||||
| Net assets, end of period (000 omitted) | $ | 171,885 | $ | 199,560 | $ | 242,284 | $ | 219,854 | $ | 227,438 |
Portfolio turnover rate J | 24% | 28% | 58% | 58% | 64% K |
| Fidelity Advisor® Telecommunications Fund Class I |
| Years ended February 28, | 2023 | 2022 | 2021 | 2020 A | 2019 | |||||
Selected Per-Share Data | ||||||||||
| Net asset value, beginning of period | $ | 54.58 | $ | 66.84 | $ | 60.86 | $ | 55.84 | $ | 55.74 |
| Income from Investment Operations | ||||||||||
Net investment income (loss) B,C | 1.10 | 1.74 D | .88 | 1.04 | 1.27 E | |||||
| Net realized and unrealized gain (loss) | (5.21) | (5.18) | 10.66 | 5.91 | .57 | |||||
| Total from investment operations | (4.11) | (3.44) | 11.54 | 6.95 | 1.84 | |||||
| Distributions from net investment income | (1.16) | (1.87) | (.60) | (1.08) | (1.12) | |||||
| Distributions from net realized gain | (2.46) | (6.95) | (4.96) | (.85) | (.62) | |||||
| Total distributions | (3.63) F | (8.82) | (5.56) | (1.93) | (1.74) | |||||
| Net asset value, end of period | $ | 46.84 | $ | 54.58 | $ | 66.84 | $ | 60.86 | $ | 55.84 |
Total Return G | (7.67)% | (5.97)% | 19.13% | 12.47% | 3.35% | |||||
Ratios to Average Net Assets C,H,I | ||||||||||
| Expenses before reductions | .78% | .77% | .79% | .88% | .91% | |||||
| Expenses net of fee waivers, if any | .78% | .77% | .79% | .88% | .90% | |||||
| Expenses net of all reductions | .78% | .77% | .78% | .88% | .88% | |||||
| Net investment income (loss) | 2.25% | 2.59% D | 1.33% | 1.76% | 2.23% E | |||||
| Supplemental Data | ||||||||||
| Net assets, end of period (000 omitted) | $ | 28,441 | $ | 12,038 | $ | 30,622 | $ | 12,428 | $ | 25,181 |
Portfolio turnover rate J | 24% | 28% | 58% | 58% | 64% K |
| Fidelity Advisor® Telecommunications Fund Class Z |
| Years ended February 28, | 2023 | 2022 | 2021 | 2020 A | 2019 B | |||||
Selected Per-Share Data | ||||||||||
| Net asset value, beginning of period | $ | 54.46 | $ | 66.75 | $ | 60.75 | $ | 55.84 | $ | 60.97 |
| Income from Investment Operations | ||||||||||
Net investment income (loss) C,D | 1.18 | 1.83 E | .95 | 1.20 | .39 F | |||||
| Net realized and unrealized gain (loss) | (5.23) | (5.20) | 10.67 | 5.86 | (4.55) | |||||
| Total from investment operations | (4.05) | (3.37) | 11.62 | 7.06 | (4.16) | |||||
| Distributions from net investment income | (1.22) | (1.98) | (.67) | (1.30) | (.97) | |||||
| Distributions from net realized gain | (2.46) | (6.95) | (4.96) | (.85) | - | |||||
| Total distributions | (3.69) G | (8.92) G | (5.62) G | (2.15) | (.97) | |||||
| Net asset value, end of period | $ | 46.72 | $ | 54.46 | $ | 66.75 | $ | 60.75 | $ | 55.84 |
Total Return H,I | (7.56)% | (5.87)% | 19.31% | 12.68% | (6.80)% | |||||
Ratios to Average Net Assets D,J,K | ||||||||||
| Expenses before reductions | .67% | .65% | .67% | .68% | .68% L | |||||
| Expenses net of fee waivers, if any | .66% | .65% | .67% | .67% | .66% L | |||||
| Expenses net of all reductions | .66% | .65% | .65% | .67% | .64% L | |||||
| Net investment income (loss) | 2.36% | 2.71% E | 1.45% | 1.97% | 1.67% F,L | |||||
| Supplemental Data | ||||||||||
| Net assets, end of period (000 omitted) | $ | 2,685 | $ | 5,587 | $ | 31,271 | $ | 25,223 | $ | 383 |
Portfolio turnover rate M | 24% | 28% | 58% | 58% | 64% N |
| Fidelity Central Fund | Investment Manager | Investment Objective | Investment Practices | Expense Ratio A |
| Fidelity Money Market Central Funds | Fidelity Management & Research Company LLC (FMR) | Each fund seeks to obtain a high level of current income consistent with the preservation of capital and liquidity. | Short-term Investments | Less than .005% |
| Gross unrealized appreciation | $31,772,801 |
| Gross unrealized depreciation | (42,588,672) |
| Net unrealized appreciation (depreciation) | $(10,815,871) |
| Tax Cost | $255,662,333 |
| Undistributed ordinary income | $740,134 |
| Undistributed long-term capital gain | $2,335,513 |
| Net unrealized appreciation (depreciation) on securities and other investments | $(10,820,402) |
| February 28, 2023 | February 28, 2022 | |
| Ordinary Income | $5,364,741 | $ 10,889,499 |
| Long-term Capital Gains | 11,626,431 | 28,338,516 |
| Total | $16,991,172 | $ 39,228,015 |
| Purchases ($) | Sales ($) | |
| Telecommunications Portfolio | 60,649,139 | 54,489,794 |
| Distribution Fee | Service Fee | Total Fees | Retained by FDC | |
| Class A | - % | .25% | $48,969 | $1,338 |
| Class M | .25% | .25% | 35,890 | 410 |
| Class C | .75% | .25% | 45,361 | 4,352 |
| $130,220 | $6,100 |
| Retained by FDC | |
| Class A | $5,475 |
| Class M | 762 |
Class C A | 80 |
| $6,317 |
| Amount | % of Class-Level Average Net Assets | |
| Class A | $50,235 | .26 |
| Class M | 18,704 | .26 |
| Class C | 11,486 | .25 |
| Telecommunications | 359,749 | .20 |
| Class I | 35,504 | .15 |
| Class Z | 1,753 | .04 |
| $477,431 |
| % of Average Net Assets | |
| Telecommunications Portfolio | .04 |
| Amount | |
| Telecommunications Portfolio | $2,152 |
| Borrower or Lender | Average Loan Balance | Weighted Average Interest Rate | Interest Expense | |
| Telecommunications Portfolio | Borrower | $8,789,000 | 4.07% | $1,985 |
| Purchases ($) | Sales ($) | Realized Gain (Loss) ($) | |
| Telecommunications Portfolio | 3,251,984 | 2,319,024 | 1,153,501 |
| Amount | |
| Telecommunications Portfolio | $437 |
| Total Security Lending Fees Paid to NFS | Security Lending Income From Securities Loaned to NFS | Value of Securities Loaned to NFS at Period End | |
| Telecommunications Portfolio | $2,247 | $- | $- |
| Expense reduction | |
| Class M | $179 |
Year ended February 28, 2023 | Year ended February 28, 2022 | |
| Telecommunications Portfolio | ||
| Distributions to shareholders | ||
| Class A | $1,371,752 | $3,450,435 |
| Class M | 479,499 | 1,137,728 |
| Class C | 286,410 | 810,598 |
| Telecommunications | 13,019,579 | 30,567,586 |
| Class I | 1,515,681 | 2,148,608 |
| Class Z | 318,251 | 1,113,060 |
| Total | $16,991,172 | $39,228,015 |
| Shares | Shares | Dollars | Dollars | |
Year ended February 28, 2023 | Year ended February 28, 2022 | Year ended February 28, 2023 | Year ended February 28, 2022 | |
| Telecommunications Portfolio | ||||
| Class A | ||||
| Shares sold | 78,714 | 90,188 | $3,917,123 | $6,068,619 |
| Reinvestment of distributions | 27,038 | 54,998 | 1,318,232 | 3,273,159 |
| Shares redeemed | (108,969) | (187,477) | (5,376,984) | (12,278,980) |
| Net increase (decrease) | (3,217) | (42,291) | $(141,629) | $(2,937,202) |
| Class M | ||||
| Shares sold | 34,367 | 30,229 | $1,663,349 | $1,999,078 |
| Reinvestment of distributions | 9,903 | 19,272 | 478,658 | 1,135,663 |
| Shares redeemed | (29,810) | (42,731) | (1,403,232) | (2,753,637) |
| Net increase (decrease) | 14,460 | 6,770 | $738,775 | $381,104 |
| Class C | ||||
| Shares sold | 10,310 | 11,499 | $526,650 | $770,363 |
| Reinvestment of distributions | 5,729 | 13,391 | 280,668 | 796,726 |
| Shares redeemed | (28,682) | (45,557) | (1,415,361) | (2,968,982) |
| Net increase (decrease) | (12,643) | (20,667) | $(608,043) | $(1,401,893) |
| Telecommunications | ||||
| Shares sold | 538,813 | 360,254 | $26,964,598 | $23,554,030 |
| Reinvestment of distributions | 247,377 | 475,371 | 12,134,608 | 28,443,914 |
| Shares redeemed | (773,315) | (803,327) | (38,015,718) | (52,542,566) |
| Net increase (decrease) | 12,875 | 32,298 | $1,083,488 | $(544,622) |
| Class I | ||||
| Shares sold | 817,391 | 96,788 | $41,395,131 | $6,174,851 |
| Reinvestment of distributions | 29,024 | 32,650 | 1,455,032 | 1,972,758 |
| Shares redeemed | (459,823) | (367,007) | (21,772,889) | (24,500,148) |
| Net increase (decrease) | 386,592 | (237,569) | $21,077,274 | $(16,352,539) |
| Class Z | ||||
| Shares sold | 30,184 | 57,644 | $1,459,810 | $3,735,025 |
| Reinvestment of distributions | 4,499 | 12,790 | 231,168 | 768,028 |
| Shares redeemed | (79,794) | (436,350) | (3,445,621) | (29,982,022) |
| Net increase (decrease) | (45,111) | (365,916) | $(1,754,643) | $(25,478,969) |
| Average Annual Total Returns | |||
Periods ended February 28, 2023 | Past 1 year | Past 5 years | Past 10 years |
| Wireless Portfolio | -14.79% | 8.34% | 9.93% |
| $10,000 Over 10 Years |
Let's say hypothetically that $10,000 was invested in Wireless Portfolio on February 28, 2013. The chart shows how the value of your investment would have changed, and also shows how the S&P 500® Index performed over the same period. |
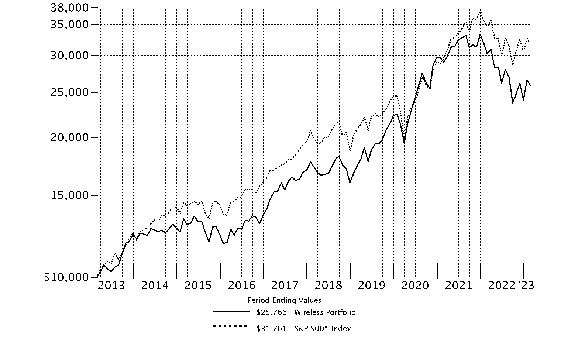 |
Top Holdings (% of Fund's net assets) | ||
| Apple, Inc. | 13.0 | |
| T-Mobile U.S., Inc. | 11.4 | |
| American Tower Corp. | 9.2 | |
| AT&T, Inc. | 8.1 | |
| Qualcomm, Inc. | 5.7 | |
| Marvell Technology, Inc. | 4.9 | |
| Uber Technologies, Inc. | 3.2 | |
| Motorola Solutions, Inc. | 2.7 | |
| Orange SA ADR | 2.6 | |
| Liberty Global PLC Class A | 2.6 | |
| 63.4 | ||
| Industries (% of Fund's net assets) | ||
| Diversified Telecommunication Services | 19.7 | |
| Wireless Telecommunication Services | 16.5 | |
| Semiconductors & Semiconductor Equipment | 14.7 | |
| Technology Hardware, Storage & Peripherals | 14.4 | |
| Equity Real Estate Investment Trusts (Reits) | 12.0 | |
| Communications Equipment | 7.2 | |
| Internet & Direct Marketing Retail | 5.1 | |
| Entertainment | 3.9 | |
| Interactive Media & Services | 3.3 | |
| Oil, Gas & Consumable Fuels | 1.1 | |
| Software | 0.6 | |
| IT Services | 0.5 | |
| Media | 0.3 | |
Geographic Diversification (% of Fund's net assets) |
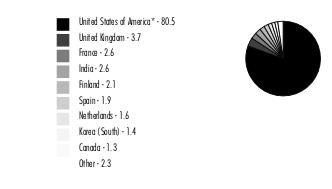 |
* Includes Short-Term investments and Net Other Assets (Liabilities). Percentages are based on country or territory of incorporation and are adjusted for the effect of derivatives, if applicable. |
| Common Stocks - 99.3% | |||
| Shares | Value ($) | ||
| Communications Equipment - 7.2% | |||
| Communications Equipment - 7.2% | |||
| CommScope Holding Co., Inc. (a) | 246,400 | 1,783,936 | |
| Ericsson: | |||
| (B Shares) | 163,600 | 905,952 | |
| (B Shares) sponsored ADR | 467,700 | 2,572,350 | |
| Motorola Solutions, Inc. | 30,768 | 8,086,138 | |
| Nokia Corp. sponsored ADR | 1,398,100 | 6,431,260 | |
| ViaSat, Inc. (a)(b) | 61,201 | 1,943,744 | |
| 21,723,380 | |||
| Diversified Telecommunication Services - 19.7% | |||
| Alternative Carriers - 4.6% | |||
| Iridium Communications, Inc. | 64,800 | 3,976,776 | |
| Liberty Global PLC Class A (a) | 387,500 | 7,939,875 | |
| Liberty Latin America Ltd. Class C (a) | 219,900 | 1,930,722 | |
| 13,847,373 | |||
| Integrated Telecommunication Services - 15.1% | |||
| AT&T, Inc. | 1,292,700 | 24,444,957 | |
| Cellnex Telecom SA (c) | 79,015 | 2,964,548 | |
| Orange SA ADR (b) | 701,200 | 8,049,776 | |
| Telefonica SA sponsored ADR (b) | 653,249 | 2,671,788 | |
| Verizon Communications, Inc. | 194,501 | 7,548,584 | |
| 45,679,653 | |||
TOTAL DIVERSIFIED TELECOMMUNICATION SERVICES | 59,527,026 | ||
| Entertainment - 3.9% | |||
| Interactive Home Entertainment - 2.3% | |||
| Activision Blizzard, Inc. | 90,900 | 6,931,125 | |
| Movies & Entertainment - 1.6% | |||
| Spotify Technology SA (a) | 9,500 | 1,104,850 | |
| Warner Bros Discovery, Inc. (a) | 236,537 | 3,694,708 | |
| 4,799,558 | |||
TOTAL ENTERTAINMENT | 11,730,683 | ||
| Equity Real Estate Investment Trusts (REITs) - 12.0% | |||
| Specialized REITs - 12.0% | |||
| American Tower Corp. | 139,792 | 27,680,214 | |
| Crown Castle International Corp. | 12,801 | 1,673,731 | |
| SBA Communications Corp. Class A | 26,200 | 6,794,970 | |
| 36,148,915 | |||
| Interactive Media & Services - 3.3% | |||
| Interactive Media & Services - 3.3% | |||
| Meta Platforms, Inc. Class A (a) | 45,300 | 7,924,782 | |
| Snap, Inc. Class A (a) | 184,100 | 1,868,615 | |
| 9,793,397 | |||
| Internet & Direct Marketing Retail - 5.1% | |||
| Internet & Direct Marketing Retail - 5.1% | |||
| Amazon.com, Inc. (a) | 60,900 | 5,738,607 | |
| Uber Technologies, Inc. (a) | 290,100 | 9,648,726 | |
| 15,387,333 | |||
| IT Services - 0.5% | |||
| Internet Services & Infrastructure - 0.5% | |||
| Twilio, Inc. Class A (a) | 22,400 | 1,505,504 | |
| Media - 0.3% | |||
| Cable & Satellite - 0.3% | |||
| DISH Network Corp. Class A (a) | 71,349 | 814,092 | |
| Oil, Gas & Consumable Fuels - 1.1% | |||
| Oil & Gas Refining & Marketing - 1.1% | |||
| Reliance Industries Ltd. | 120,800 | 3,394,810 | |
| Semiconductors & Semiconductor Equipment - 14.7% | |||
| Semiconductor Equipment - 0.9% | |||
| Teradyne, Inc. | 27,500 | 2,781,350 | |
| Semiconductors - 13.8% | |||
| Marvell Technology, Inc. | 329,000 | 14,854,350 | |
| NXP Semiconductors NV | 26,400 | 4,711,872 | |
| Qorvo, Inc. (a) | 47,200 | 4,762,008 | |
| Qualcomm, Inc. | 140,350 | 17,337,436 | |
| 41,665,666 | |||
TOTAL SEMICONDUCTORS & SEMICONDUCTOR EQUIPMENT | 44,447,016 | ||
| Software - 0.6% | |||
| Application Software - 0.6% | |||
| LivePerson, Inc. (a) | 84,000 | 850,080 | |
| RingCentral, Inc. (a) | 31,400 | 1,037,456 | |
| Zoom Video Communications, Inc. Class A (a) | 300 | 22,377 | |
| 1,909,913 | |||
| Technology Hardware, Storage & Peripherals - 14.4% | |||
| Technology Hardware, Storage & Peripherals - 14.4% | |||
| Apple, Inc. | 267,620 | 39,449,862 | |
| Samsung Electronics Co. Ltd. | 91,160 | 4,181,303 | |
| 43,631,165 | |||
| Wireless Telecommunication Services - 16.5% | |||
| Wireless Telecommunication Services - 16.5% | |||
| Bharti Airtel Ltd. | 487,600 | 4,379,226 | |
| Bharti Airtel Ltd. | 47,900 | 209,724 | |
| Millicom International Cellular SA (a)(b) | 183,680 | 3,635,027 | |
| Rogers Communications, Inc. Class B (non-vtg.) | 82,400 | 3,936,117 | |
| Shenandoah Telecommunications Co. | 300 | 5,856 | |
| Spok Holdings, Inc. | 1 | 10 | |
| T-Mobile U.S., Inc. (a) | 242,516 | 34,480,925 | |
| Vodafone Group PLC sponsored ADR | 276,981 | 3,315,463 | |
| 49,962,348 | |||
| TOTAL COMMON STOCKS (Cost $244,332,132) | 299,975,582 | ||
| Money Market Funds - 4.5% | |||
| Shares | Value ($) | ||
| Fidelity Cash Central Fund 4.63% (d) | 2,911,720 | 2,912,303 | |
| Fidelity Securities Lending Cash Central Fund 4.63% (d)(e) | 10,798,653 | 10,799,733 | |
| TOTAL MONEY MARKET FUNDS (Cost $13,712,036) | 13,712,036 | ||
| TOTAL INVESTMENT IN SECURITIES - 103.8% (Cost $258,044,168) | 313,687,618 |
NET OTHER ASSETS (LIABILITIES) - (3.8)% | (11,481,583) |
| NET ASSETS - 100.0% | 302,206,035 |
| (a) | Non-income producing |
| (b) | Security or a portion of the security is on loan at period end. |
| (c) | Security exempt from registration under Rule 144A of the Securities Act of 1933. These securities may be resold in transactions exempt from registration, normally to qualified institutional buyers. At the end of the period, the value of these securities amounted to $2,964,548 or 1.0% of net assets. |
| (d) | Affiliated fund that is generally available only to investment companies and other accounts managed by Fidelity Investments. The rate quoted is the annualized seven-day yield of the fund at period end. A complete unaudited listing of the fund's holdings as of its most recent quarter end is available upon request. In addition, each Fidelity Central Fund's financial statements, which are not covered by the Fund's Report of Independent Registered Public Accounting Firm, are available on the SEC's website or upon request. |
| (e) | Investment made with cash collateral received from securities on loan. |
| Affiliate | Value, beginning of period ($) | Purchases ($) | Sales Proceeds ($) | Dividend Income ($) | Realized Gain (loss) ($) | Change in Unrealized appreciation (depreciation) ($) | Value, end of period ($) | % ownership, end of period |
| Fidelity Cash Central Fund 4.63% | 678,387 | 52,911,810 | 50,677,894 | 29,296 | - | - | 2,912,303 | 0.0% |
| Fidelity Securities Lending Cash Central Fund 4.63% | 11,173,355 | 132,164,749 | 132,538,371 | 196,298 | - | - | 10,799,733 | 0.0% |
| Total | 11,851,742 | 185,076,559 | 183,216,265 | 225,594 | - | - | 13,712,036 | |
| Valuation Inputs at Reporting Date: | ||||
| Description | Total ($) | Level 1 ($) | Level 2 ($) | Level 3 ($) |
Investments in Securities: | ||||
| Common Stocks | 299,975,582 | 296,105,082 | 3,870,500 | - |
| Money Market Funds | 13,712,036 | 13,712,036 | - | - |
| Total Investments in Securities: | 313,687,618 | 309,817,118 | 3,870,500 | - |
| Statement of Assets and Liabilities | ||||
| February 28, 2023 | ||||
| Assets | ||||
| Investment in securities, at value (including securities loaned of $10,324,284) - See accompanying schedule: | ||||
Unaffiliated issuers (cost $244,332,132) | $ | 299,975,582 | ||
Fidelity Central Funds (cost $13,712,036) | 13,712,036 | |||
| Total Investment in Securities (cost $258,044,168) | $ | 313,687,618 | ||
| Foreign currency held at value (cost $16) | 16 | |||
| Receivable for fund shares sold | 30,194 | |||
| Dividends receivable | 109,470 | |||
| Distributions receivable from Fidelity Central Funds | 20,553 | |||
| Prepaid expenses | 955 | |||
| Other receivables | 11,722 | |||
Total assets | 313,860,528 | |||
| Liabilities | ||||
| Payable for fund shares redeemed | $ | 207,732 | ||
| Accrued management fee | 137,941 | |||
| Other affiliated payables | 62,860 | |||
| Other payables and accrued expenses | 446,158 | |||
| Collateral on securities loaned | 10,799,802 | |||
| Total Liabilities | 11,654,493 | |||
| Net Assets | $ | 302,206,035 | ||
| Net Assets consist of: | ||||
| Paid in capital | $ | 248,605,064 | ||
| Total accumulated earnings (loss) | 53,600,971 | |||
| Net Assets | $ | 302,206,035 | ||
Net Asset Value , offering price and redemption price per share ($302,206,035 ÷ 29,714,321 shares) | $ | 10.17 | ||
| Statement of Operations | ||||
Year ended February 28, 2023 | ||||
| Investment Income | ||||
| Dividends | $ | 5,304,399 | ||
| Income from Fidelity Central Funds (including $196,298 from security lending) | 225,594 | |||
| Total Income | 5,529,993 | |||
| Expenses | ||||
| Management fee | $ | 1,782,936 | ||
| Transfer agent fees | 678,545 | |||
| Accounting fees | 123,187 | |||
| Custodian fees and expenses | (1,760) | |||
| Independent trustees' fees and expenses | 1,173 | |||
| Registration fees | 28,699 | |||
| Audit | 56,986 | |||
| Legal | 2,541 | |||
| Interest | 927 | |||
| Miscellaneous | 1,916 | |||
| Total expenses before reductions | 2,675,150 | |||
| Expense reductions | (12,049) | |||
| Total expenses after reductions | 2,663,101 | |||
| Net Investment income (loss) | 2,866,892 | |||
| Realized and Unrealized Gain (Loss) | ||||
| Net realized gain (loss) on: | ||||
| Investment Securities: | ||||
| Unaffiliated issuers (net of foreign taxes of $305,473) | 10,209,051 | |||
| Foreign currency transactions | (4,251) | |||
| Total net realized gain (loss) | 10,204,800 | |||
| Change in net unrealized appreciation (depreciation) on: | ||||
| Investment Securities: | ||||
| Unaffiliated issuers (net of decrease in deferred foreign taxes of $315,365) | (72,756,061) | |||
| Assets and liabilities in foreign currencies | (4,105) | |||
| Total change in net unrealized appreciation (depreciation) | (72,760,166) | |||
| Net gain (loss) | (62,555,366) | |||
| Net increase (decrease) in net assets resulting from operations | $ | (59,688,474) | ||
| Statement of Changes in Net Assets | ||||
Year ended February 28, 2023 | Year ended February 28, 2022 | |||
| Increase (Decrease) in Net Assets | ||||
| Operations | ||||
| Net investment income (loss) | $ | 2,866,892 | $ | 3,198,096 |
| Net realized gain (loss) | 10,204,800 | 34,525,197 | ||
| Change in net unrealized appreciation (depreciation) | (72,760,166) | (15,899,186) | ||
| Net increase (decrease) in net assets resulting from operations | (59,688,474) | 21,824,107 | ||
| Distributions to shareholders | (26,743,653) | (34,390,230) | ||
| Share transactions | ||||
| Proceeds from sales of shares | 36,656,737 | 52,081,537 | ||
| Reinvestment of distributions | 24,990,417 | 32,470,195 | ||
| Cost of shares redeemed | (76,575,168) | (108,715,196) | ||
Net increase (decrease) in net assets resulting from share transactions | (14,928,014) | (24,163,464) | ||
| Total increase (decrease) in net assets | (101,360,141) | (36,729,587) | ||
| Net Assets | ||||
| Beginning of period | 403,566,176 | 440,295,763 | ||
| End of period | $ | 302,206,035 | $ | 403,566,176 |
| Other Information | ||||
| Shares | ||||
| Sold | 3,281,452 | 3,719,197 | ||
| Issued in reinvestment of distributions | 2,265,748 | 2,345,099 | ||
| Redeemed | (7,089,181) | (7,824,819) | ||
| Net increase (decrease) | (1,541,981) | (1,760,523) | ||
| Wireless Portfolio |
| Years ended February 28, | 2023 | 2022 | 2021 | 2020 A | 2019 | |||||
Selected Per-Share Data | ||||||||||
| Net asset value, beginning of period | $ | 12.91 | $ | 13.34 | $ | 10.69 | $ | 8.93 | $ | 10.29 |
| Income from Investment Operations | ||||||||||
Net investment income (loss) B,C | .09 | .10 | .10 | .14 | .20 D | |||||
| Net realized and unrealized gain (loss) | (1.95) | .54 | 3.50 | 1.93 | (.24) E | |||||
| Total from investment operations | (1.86) | .64 | 3.60 | 2.07 | (.04) | |||||
| Distributions from net investment income | (.09) | (.09) | (.10) | (.12) | (.19) | |||||
| Distributions from net realized gain | (.79) | (.98) | (.86) | (.19) | (1.13) | |||||
| Total distributions | (.88) | (1.07) | (.95) F | (.31) | (1.32) | |||||
| Net asset value, end of period | $ | 10.17 | $ | 12.91 | $ | 13.34 | $ | 10.69 | $ | 8.93 |
Total Return G | (14.79)% | 4.40% | 36.09% | 23.01% | .21% | |||||
Ratios to Average Net Assets C,H,I | ||||||||||
| Expenses before reductions | .79% | .77% | .79% | .81% | .83% | |||||
| Expenses net of fee waivers, if any | .79% | .77% | .79% | .81% | .83% | |||||
| Expenses net of all reductions | .79% | .77% | .78% | .81% | .82% | |||||
| Net investment income (loss) | .85% | .69% | .80% | 1.39% | 2.07% D | |||||
| Supplemental Data | ||||||||||
| Net assets, end of period (000 omitted) | $ | 302,206 | $ | 403,566 | $ | 440,296 | $ | 355,309 | $ | 237,907 |
Portfolio turnover rate J | 11% | 30% | 55% | 78% | 54% |
| Fidelity Central Fund | Investment Manager | Investment Objective | Investment Practices | Expense Ratio A |
| Fidelity Money Market Central Funds | Fidelity Management & Research Company LLC (FMR) | Each fund seeks to obtain a high level of current income consistent with the preservation of capital and liquidity. | Short-term Investments | Less than .005% |
| Gross unrealized appreciation | $99,703,763 |
| Gross unrealized depreciation | (44,855,157) |
| Net unrealized appreciation (depreciation) | $54,848,606 |
| Tax Cost | $258,839,012 |
| Net unrealized appreciation (depreciation) on securities and other investments | $54,840,219 |
| February 28, 2023 | February 28, 2022 | |
| Ordinary Income | $2,921,826 | $ 9,236,354 |
| Long-term Capital Gains | 23,821,827 | 25,153,876 |
| Total | $26,743,653 | $ 34,390,230 |
| Purchases ($) | Sales ($) | |
| Wireless Portfolio | 37,017,603 | 75,921,965 |
| % of Average Net Assets | |
| Wireless Portfolio | .04 |
| Amount | |
| Wireless Portfolio | $2,253 |
| Borrower or Lender | Average Loan Balance | Weighted Average Interest Rate | Interest Expense | |
| Wireless Portfolio | Borrower | $6,244,000 | 1.78% | $927 |
| Purchases ($) | Sales ($) | Realized Gain (Loss) ($) | |
| Wireless Portfolio | 6,308,469 | 1,044,026 | 264,127 |
| Amount | |
| Wireless Portfolio | $638 |
| Total Security Lending Fees Paid to NFS | Security Lending Income From Securities Loaned to NFS | Value of Securities Loaned to NFS at Period End | |
| Wireless Portfolio | $20,543 | $170 | $- |
| The Example is based on an investment of $1,000 invested at the beginning of the period and held for the entire period (September 1, 2022 to February 28, 2023). |
Annualized Expense Ratio- A | Beginning Account Value September 1, 2022 | Ending Account Value February 28, 2023 | Expenses Paid During Period- C September 1, 2022 to February 28, 2023 | |||||||
| Telecommunications Portfolio | ||||||||||
| Class A | 1.14% | |||||||||
| Actual | $ 1,000 | $ 1,018.60 | $ 5.71 | |||||||
Hypothetical- B | $ 1,000 | $ 1,019.14 | $ 5.71 | |||||||
| Class M | 1.38% | |||||||||
| Actual | $ 1,000 | $ 1,017.50 | $ 6.90 | |||||||
Hypothetical- B | $ 1,000 | $ 1,017.95 | $ 6.90 | |||||||
| Class C | 1.89% | |||||||||
| Actual | $ 1,000 | $ 1,014.80 | $ 9.44 | |||||||
Hypothetical- B | $ 1,000 | $ 1,015.42 | $ 9.44 | |||||||
| Telecommunications Portfolio | .84% | |||||||||
| Actual | $ 1,000 | $ 1,020.20 | $ 4.21 | |||||||
Hypothetical- B | $ 1,000 | $ 1,020.63 | $ 4.21 | |||||||
| Class I | .78% | |||||||||
| Actual | $ 1,000 | $ 1,020.40 | $ 3.91 | |||||||
Hypothetical- B | $ 1,000 | $ 1,020.93 | $ 3.91 | |||||||
| Class Z | .69% | |||||||||
| Actual | $ 1,000 | $ 1,020.80 | $ 3.46 | |||||||
Hypothetical- B | $ 1,000 | $ 1,021.37 | $ 3.46 | |||||||
| Wireless Portfolio | .81% | |||||||||
| Actual | $ 1,000 | $ 958.30 | $ 3.93 | |||||||
Hypothetical- B | $ 1,000 | $ 1,020.78 | $ 4.06 | |||||||
| Telecommunications Portfolio | $6,734,770 |
| Wireless Portfolio | $10,181,897 |
| Telecommunications Portfolio | 0.01% |
| April, 2022 | ||
| Wireless Portfolio | 100.00% |
| April 2022 | July 2022 | October 2022 | December 2022 | |
| Telecommunications Portfolio | ||||
| Class A | 100% | 100% | 100% | 100% |
| Class M | 100% | 100% | 100% | 100% |
| Class C | 100% | 100% | 100% | 100% |
| Telecommunications | 100% | 100% | 100% | 100% |
| Class I | 100% | 100% | 100% | 100% |
| Class Z | 100% | 100% | 100% | 100% |
| Wireless Portfolio | ||||
| Wireless | 98% | 82% |
| April 2022 | July 2022 | October 2022 | December 2022 | |
| Telecommunications Portfolio | ||||
| Class A | 100% | 100% | 100% | 100% |
| Class M | 100% | 100% | 100% | 100% |
| Class C | 100% | 100% | 100% | 100% |
| Telecommunications | 100% | 100% | 100% | 100% |
| Class I | 100% | 100% | 100% | 100% |
| Class Z | 100% | 100% | 100% | 100% |
| Wireless Portfolio | ||||
| Wireless | 100% | 100% |
- Highly liquid investments - cash or convertible to cash within three business days or less
- Moderately liquid investments - convertible to cash in three to seven calendar days
- Less liquid investments - can be sold or disposed of, but not settled, within seven calendar days
- Illiquid investments - cannot be sold or disposed of within seven calendar days
 |


Contents
| Average Annual Total Returns | |||
Periods ended February 28, 2023 | Past 1 year | Past 5 years | Past 10 years |
| Utilities Portfolio | 1.46% | 9.69% | 9.57% |
| $10,000 Over 10 Years |
Let's say hypothetically that $10,000 was invested in Utilities Portfolio on February 28, 2013. The chart shows how the value of your investment would have changed, and also shows how the S&P 500® Index performed over the same period. |
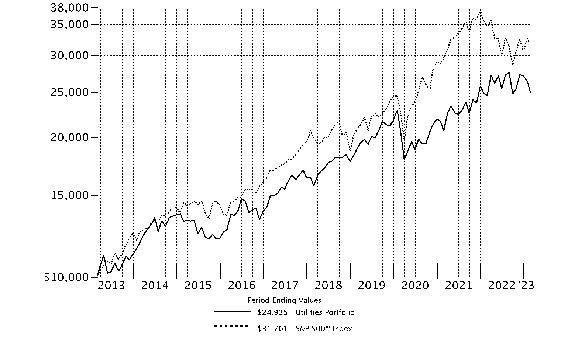 |
Top Holdings (% of Fund's net assets) | ||
| NextEra Energy, Inc. | 16.3 | |
| Southern Co. | 12.1 | |
| Sempra Energy | 6.8 | |
| Constellation Energy Corp. | 6.6 | |
| PG&E Corp. | 5.9 | |
| Dominion Energy, Inc. | 5.0 | |
| Edison International | 4.9 | |
| FirstEnergy Corp. | 4.3 | |
| PPL Corp. | 4.1 | |
| Public Service Enterprise Group, Inc. | 4.0 | |
| 70.0 | ||
| Industries (% of Fund's net assets) | ||
| Electric Utilities | 71.9 | |
| Multi-Utilities | 19.7 | |
| Independent Power and Renewable Electricity Producers | 4.4 | |
| Common Stocks - 96.0% | |||
| Shares | Value ($) | ||
| Electric Utilities - 71.9% | |||
| Electric Utilities - 71.9% | |||
| Constellation Energy Corp. | 1,185,890 | 88,811,302 | |
| Duke Energy Corp. | 432,947 | 40,809,584 | |
| Edison International | 1,003,410 | 66,435,776 | |
| Entergy Corp. | 483,300 | 49,717,071 | |
| Eversource Energy | 567,784 | 42,788,202 | |
| Exelon Corp. | 1,161,489 | 46,912,541 | |
| FirstEnergy Corp. (a) | 1,486,202 | 58,764,427 | |
| NextEra Energy, Inc. | 3,107,206 | 220,704,844 | |
| PG&E Corp. (b) | 5,153,284 | 80,494,296 | |
| Pinnacle West Capital Corp. | 139,740 | 10,296,043 | |
| PPL Corp. | 2,048,900 | 55,463,723 | |
| Southern Co. | 2,596,494 | 163,734,912 | |
| Xcel Energy, Inc. | 738,300 | 47,672,031 | |
| 972,604,752 | |||
| Independent Power and Renewable Electricity Producers - 4.4% | |||
| Independent Power Producers & Energy Traders - 2.5% | |||
| Energy Harbor Corp. (b) | 231,300 | 17,810,100 | |
| Vistra Corp. | 718,197 | 15,793,152 | |
| 33,603,252 | |||
| Renewable Electricity - 1.9% | |||
| Clearway Energy, Inc. Class A | 166,124 | 4,935,544 | |
| NextEra Energy Partners LP | 319,861 | 21,193,990 | |
| 26,129,534 | |||
TOTAL INDEPENDENT POWER AND RENEWABLE ELECTRICITY PRODUCERS | 59,732,786 | ||
| Multi-Utilities - 19.7% | |||
| Multi-Utilities - 19.7% | |||
| Dominion Energy, Inc. | 1,207,860 | 67,181,173 | |
| NiSource, Inc. | 1,955,619 | 53,642,629 | |
| Public Service Enterprise Group, Inc. | 906,303 | 54,767,890 | |
| Sempra Energy | 611,071 | 91,636,207 | |
| 267,227,899 | |||
| TOTAL COMMON STOCKS (Cost $1,144,345,355) | 1,299,565,437 | ||
| Money Market Funds - 1.7% | |||
| Shares | Value ($) | ||
| Fidelity Cash Central Fund 4.63% (c) | 13,604,136 | 13,606,856 | |
| Fidelity Securities Lending Cash Central Fund 4.63% (c)(d) | 9,118,938 | 9,119,850 | |
| TOTAL MONEY MARKET FUNDS (Cost $22,726,706) | 22,726,706 | ||
| TOTAL INVESTMENT IN SECURITIES - 97.7% (Cost $1,167,072,061) | 1,322,292,143 |
NET OTHER ASSETS (LIABILITIES) - 2.3% | 30,473,804 |
| NET ASSETS - 100.0% | 1,352,765,947 |
| (a) | Security or a portion of the security is on loan at period end. |
| (b) | Non-income producing |
| (c) | Affiliated fund that is generally available only to investment companies and other accounts managed by Fidelity Investments. The rate quoted is the annualized seven-day yield of the fund at period end. A complete unaudited listing of the fund's holdings as of its most recent quarter end is available upon request. In addition, each Fidelity Central Fund's financial statements, which are not covered by the Fund's Report of Independent Registered Public Accounting Firm, are available on the SEC's website or upon request. |
| (d) | Investment made with cash collateral received from securities on loan. |
| Affiliate | Value, beginning of period ($) | Purchases ($) | Sales Proceeds ($) | Dividend Income ($) | Realized Gain (loss) ($) | Change in Unrealized appreciation (depreciation) ($) | Value, end of period ($) | % ownership, end of period |
| Fidelity Cash Central Fund 4.63% | 15,713,381 | 641,855,916 | 643,962,441 | 833,291 | - | - | 13,606,856 | 0.0% |
| Fidelity Securities Lending Cash Central Fund 4.63% | 21,483,975 | 579,066,127 | 591,430,252 | 38,654 | - | - | 9,119,850 | 0.0% |
| Total | 37,197,356 | 1,220,922,043 | 1,235,392,693 | 871,945 | - | - | 22,726,706 | |
| Valuation Inputs at Reporting Date: | ||||
| Description | Total ($) | Level 1 ($) | Level 2 ($) | Level 3 ($) |
Investments in Securities: | ||||
| Common Stocks | 1,299,565,437 | 1,299,565,437 | - | - |
| Money Market Funds | 22,726,706 | 22,726,706 | - | - |
| Total Investments in Securities: | 1,322,292,143 | 1,322,292,143 | - | - |
| Statement of Assets and Liabilities | ||||
| February 28, 2023 | ||||
| Assets | ||||
| Investment in securities, at value (including securities loaned of $8,849,052) - See accompanying schedule: | ||||
Unaffiliated issuers (cost $1,144,345,355) | $ | 1,299,565,437 | ||
Fidelity Central Funds (cost $22,726,706) | 22,726,706 | |||
| Total Investment in Securities (cost $1,167,072,061) | $ | 1,322,292,143 | ||
| Receivable for investments sold | 42,750,257 | |||
| Receivable for fund shares sold | 649,677 | |||
| Dividends receivable | 5,949,059 | |||
| Distributions receivable from Fidelity Central Funds | 42,078 | |||
| Prepaid expenses | 2,826 | |||
Total assets | 1,371,686,040 | |||
| Liabilities | ||||
| Payable for investments purchased | $ | 6,401,010 | ||
| Payable for fund shares redeemed | 2,490,287 | |||
| Accrued management fee | 625,311 | |||
| Other affiliated payables | 249,268 | |||
| Other payables and accrued expenses | 34,367 | |||
| Collateral on securities loaned | 9,119,850 | |||
| Total Liabilities | 18,920,093 | |||
| Net Assets | $ | 1,352,765,947 | ||
| Net Assets consist of: | ||||
| Paid in capital | $ | 1,184,129,411 | ||
| Total accumulated earnings (loss) | 168,636,536 | |||
| Net Assets | $ | 1,352,765,947 | ||
Net Asset Value , offering price and redemption price per share ($1,352,765,947 ÷ 13,901,981 shares) | $ | 97.31 | ||
| Statement of Operations | ||||
Year ended February 28, 2023 | ||||
| Investment Income | ||||
| Dividends | $ | 33,697,774 | ||
| Income from Fidelity Central Funds (including $38,654 from security lending) | 871,945 | |||
| Total Income | 34,569,719 | |||
| Expenses | ||||
| Management fee | $ | 7,367,347 | ||
| Transfer agent fees | 2,365,300 | |||
| Accounting fees | 403,573 | |||
| Custodian fees and expenses | 9,000 | |||
| Independent trustees' fees and expenses | 4,698 | |||
| Registration fees | 117,313 | |||
| Audit | 40,152 | |||
| Legal | 923 | |||
| Interest | 2,976 | |||
| Miscellaneous | 6,669 | |||
| Total expenses before reductions | 10,317,951 | |||
| Expense reductions | (49,100) | |||
| Total expenses after reductions | 10,268,851 | |||
| Net Investment income (loss) | 24,300,868 | |||
| Realized and Unrealized Gain (Loss) | ||||
| Net realized gain (loss) on: | ||||
| Investment Securities: | ||||
| Unaffiliated issuers | 32,167,164 | |||
| Foreign currency transactions | (69) | |||
| Total net realized gain (loss) | 32,167,095 | |||
| Change in net unrealized appreciation (depreciation) on: | ||||
| Investment Securities: | ||||
| Unaffiliated issuers | (78,849,482) | |||
| Assets and liabilities in foreign currencies | (1,006) | |||
| Total change in net unrealized appreciation (depreciation) | (78,850,488) | |||
| Net gain (loss) | (46,683,393) | |||
| Net increase (decrease) in net assets resulting from operations | $ | (22,382,525) | ||
| Statement of Changes in Net Assets | ||||
Year ended February 28, 2023 | Year ended February 28, 2022 | |||
| Increase (Decrease) in Net Assets | ||||
| Operations | ||||
| Net investment income (loss) | $ | 24,300,868 | $ | 19,728,195 |
| Net realized gain (loss) | 32,167,095 | 38,512,444 | ||
| Change in net unrealized appreciation (depreciation) | (78,850,488) | 110,781,817 | ||
| Net increase (decrease) in net assets resulting from operations | (22,382,525) | 169,022,456 | ||
| Distributions to shareholders | (62,216,948) | (28,337,938) | ||
| Share transactions | ||||
| Proceeds from sales of shares | 921,832,942 | 248,500,596 | ||
| Reinvestment of distributions | 57,299,028 | 26,334,666 | ||
| Cost of shares redeemed | (613,822,146) | (239,748,839) | ||
Net increase (decrease) in net assets resulting from share transactions | 365,309,824 | 35,086,423 | ||
| Total increase (decrease) in net assets | 280,710,351 | 175,770,941 | ||
| Net Assets | ||||
| Beginning of period | 1,072,055,596 | 896,284,655 | ||
| End of period | $ | 1,352,765,947 | $ | 1,072,055,596 |
| Other Information | ||||
| Shares | ||||
| Sold | 8,651,956 | 2,524,118 | ||
| Issued in reinvestment of distributions | 535,973 | 259,200 | ||
| Redeemed | (5,965,477) | (2,459,097) | ||
| Net increase (decrease) | 3,222,452 | 324,221 | ||
| Utilities Portfolio |
| Years ended February 28, | 2023 | 2022 | 2021 | 2020 A | 2019 | |||||
Selected Per-Share Data | ||||||||||
| Net asset value, beginning of period | $ | 100.38 | $ | 86.55 | $ | 91.20 | $ | 85.32 | $ | 76.75 |
| Income from Investment Operations | ||||||||||
Net investment income (loss) B,C | 1.82 | 1.92 | 1.61 | 2.09 | 2.06 | |||||
| Net realized and unrealized gain (loss) | .04 D | 14.72 | (1.81) | 5.99 | 13.35 | |||||
| Total from investment operations | 1.86 | 16.64 | (.20) | 8.08 | 15.41 | |||||
| Distributions from net investment income | (1.75) | (1.71) | (2.12) | (1.94) | (1.37) | |||||
| Distributions from net realized gain | (3.18) | (1.10) | (2.34) | (.26) | (5.46) | |||||
| Total distributions | (4.93) | (2.81) | (4.45) E | (2.20) | (6.84) E | |||||
| Net asset value, end of period | $ | 97.31 | $ | 100.38 | $ | 86.55 | $ | 91.20 | $ | 85.32 |
Total Return F | 1.46% | 19.19% | (.05)% | 9.34% | 20.17% | |||||
Ratios to Average Net Assets C,G,H | ||||||||||
| Expenses before reductions | .74% | .74% | .76% | .75% | .78% | |||||
| Expenses net of fee waivers, if any | .74% | .73% | .76% | .75% | .78% | |||||
| Expenses net of all reductions | .74% | .73% | .75% | .74% | .76% | |||||
| Net investment income (loss) | 1.74% | 1.96% | 1.88% | 2.25% | 2.45% | |||||
| Supplemental Data | ||||||||||
| Net assets, end of period (000 omitted) | $ | 1,352,766 | $ | 1,072,056 | $ | 896,285 | $ | 1,247,009 | $ | 1,040,763 |
Portfolio turnover rate I | 53% | 37% | 64% | 65% J | 97% J |
| Fidelity Central Fund | Investment Manager | Investment Objective | Investment Practices | Expense Ratio A |
| Fidelity Money Market Central Funds | Fidelity Management & Research Company LLC (FMR) | Each fund seeks to obtain a high level of current income consistent with the preservation of capital and liquidity. | Short-term Investments | Less than .005% |
| Gross unrealized appreciation | $205,091,487 |
| Gross unrealized depreciation | (56,923,405) |
| Net unrealized appreciation (depreciation) | $148,168,082 |
| Tax Cost | $1,174,124,061 |
| Undistributed ordinary income | $1,301,853 |
| Undistributed long-term capital gain | $19,167,575 |
| Net unrealized appreciation (depreciation) on securities and other investments | $148,167,108 |
| February 28, 2023 | February 28, 2022 | |
| Ordinary Income | $23,713,330 | $17,236,478 |
| Long-term Capital Gains | 38,503,618 | 11,101,460 |
| Total | $62,216,948 | $28,337,938 |
| Purchases ($) | Sales ($) | |
| Utilities Portfolio | 1,021,841,389 | 715,703,064 |
| % of Average Net Assets | |
| Utilities Portfolio | .03 |
| Amount | |
| Utilities Portfolio | $17,947 |
| Borrower or Lender | Average Loan Balance | Weighted Average Interest Rate | Interest Expense | |
| Utilities Portfolio | Borrower | $16,158,500 | 3.32% | $2,976 |
| Purchases ($) | Sales ($) | Realized Gain (Loss) ($) | |
| Utilities Portfolio | 20,325,476 | 5,559,057 | (584,045) |
| Amount | |
| Utilities Portfolio | $2,361 |
| Total Security Lending Fees Paid to NFS | Security Lending Income From Securities Loaned to NFS | Value of Securities Loaned to NFS at Period End | |
| Utilities Portfolio | $3,889 | $- | $- |
| The Example is based on an investment of $1,000 invested at the beginning of the period and held for the entire period (September 1, 2022 to February 28, 2023). |
Annualized Expense Ratio- A | Beginning Account Value September 1, 2022 | Ending Account Value February 28, 2023 | Expenses Paid During Period- C September 1, 2022 to February 28, 2023 | |||||||
| Utilities Portfolio | .74% | |||||||||
| Actual | $ 1,000 | $ 904.40 | $ 3.49 | |||||||
Hypothetical- B | $ 1,000 | $ 1,021.12 | $ 3.71 | |||||||
- Highly liquid investments - cash or convertible to cash within three business days or less
- Moderately liquid investments - convertible to cash in three to seven calendar days
- Less liquid investments - can be sold or disposed of, but not settled, within seven calendar days
- Illiquid investments - cannot be sold or disposed of within seven calendar days
 |


Contents
| Average Annual Total Returns | |||
Periods ended February 28, 2023 | Past 1 year | Past 5 years | Past 10 years |
| IT Services Portfolio | -11.88% | 6.73% | 13.50% |
| $10,000 Over 10 Years |
Let's say hypothetically that $10,000 was invested in IT Services Portfolio on February 28, 2013. The chart shows how the value of your investment would have changed, and also shows how the S&P 500® Index performed over the same period. |
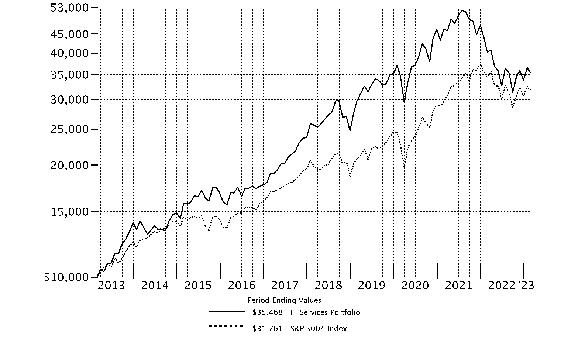 |
Top Holdings (% of Fund's net assets) | ||
| Visa, Inc. Class A | 23.1 | |
| MasterCard, Inc. Class A | 16.5 | |
| Accenture PLC Class A | 9.1 | |
| Block, Inc. Class A | 5.1 | |
| Fiserv, Inc. | 5.1 | |
| EPAM Systems, Inc. | 4.7 | |
| Gartner, Inc. | 4.5 | |
| Intuit, Inc. | 3.1 | |
| H&R Block, Inc. | 3.0 | |
| ExlService Holdings, Inc. | 3.0 | |
| 77.2 | ||
| Industries (% of Fund's net assets) | ||
| IT Services | 88.4 | |
| Software | 5.4 | |
| Diversified Consumer Services | 3.0 | |
| Consumer Finance | 1.3 | |
| Internet & Direct Marketing Retail | 1.2 | |
| Interactive Media & Services | 0.3 | |
Geographic Diversification (% of Fund's net assets) |
 |
* Includes Short-Term investments and Net Other Assets (Liabilities). Percentages are based on country or territory of incorporation and are adjusted for the effect of derivatives, if applicable. |
| Common Stocks - 99.6% | |||
| Shares | Value ($) | ||
| Consumer Finance - 1.3% | |||
| Consumer Finance - 1.3% | |||
| NerdWallet, Inc. (a)(b) | 1,269,223 | 26,196,763 | |
| Diversified Consumer Services - 3.0% | |||
| Specialized Consumer Services - 3.0% | |||
| H&R Block, Inc. (b) | 1,719,300 | 63,270,240 | |
| Interactive Media & Services - 0.3% | |||
| Interactive Media & Services - 0.3% | |||
| Meta Platforms, Inc. Class A (a) | 34,600 | 6,052,924 | |
| Internet & Direct Marketing Retail - 1.2% | |||
| Internet & Direct Marketing Retail - 1.2% | |||
| Global-e Online Ltd. (a)(b) | 924,125 | 26,152,738 | |
| IT Services - 88.4% | |||
| Data Processing & Outsourced Services - 60.6% | |||
| Automatic Data Processing, Inc. | 143,875 | 31,626,603 | |
| Block, Inc. Class A (a)(b) | 1,387,900 | 106,493,567 | |
| ExlService Holdings, Inc. (a) | 384,300 | 63,221,193 | |
| Fiserv, Inc. (a) | 918,617 | 105,723,631 | |
| Global Payments, Inc. (b) | 387,023 | 43,423,981 | |
| MasterCard, Inc. Class A | 967,300 | 343,672,017 | |
| Nuvei Corp. (a)(b)(c) | 255,900 | 7,843,335 | |
| Paychex, Inc. | 129,200 | 14,263,680 | |
| PayPal Holdings, Inc. (a) | 69,640 | 5,125,504 | |
| TaskUs, Inc. (a)(b) | 415,437 | 7,147,594 | |
| The Western Union Co. | 4,800 | 62,208 | |
| Visa, Inc. Class A (b) | 2,191,348 | 481,965,076 | |
| WEX, Inc. (a) | 700 | 134,967 | |
| WNS Holdings Ltd. sponsored ADR (a) | 618,792 | 53,785,401 | |
| 1,264,488,757 | |||
| Internet Services & Infrastructure - 6.0% | |||
| Cloudflare, Inc. (a)(b) | 303,200 | 18,195,032 | |
| GoDaddy, Inc. (a) | 51,527 | 3,901,109 | |
| MongoDB, Inc. Class A (a) | 301,300 | 63,128,376 | |
| Snowflake, Inc. (a) | 192,500 | 29,718,150 | |
| Twilio, Inc. Class A (a)(b) | 136,600 | 9,180,886 | |
| 124,123,553 | |||
| IT Consulting & Other Services - 21.8% | |||
| Accenture PLC Class A | 717,680 | 190,579,924 | |
| Amdocs Ltd. | 628,400 | 57,567,724 | |
| DXC Technology Co. (a) | 152,900 | 4,241,446 | |
| Endava PLC ADR (a) | 147,900 | 11,763,966 | |
| EPAM Systems, Inc. (a) | 316,900 | 97,494,285 | |
| Gartner, Inc. (a) | 284,400 | 93,229,164 | |
| 454,876,509 | |||
TOTAL IT SERVICES | 1,843,488,819 | ||
| Software - 5.4% | |||
| Application Software - 5.4% | |||
| Intuit, Inc. | 159,356 | 64,886,576 | |
| Paycom Software, Inc. (a) | 163,800 | 47,348,028 | |
| 112,234,604 | |||
| TOTAL COMMON STOCKS (Cost $1,182,213,785) | 2,077,396,088 | ||
| Money Market Funds - 26.3% | |||
| Shares | Value ($) | ||
| Fidelity Cash Central Fund 4.63% (d) | 1,121,391 | 1,121,615 | |
| Fidelity Securities Lending Cash Central Fund 4.63% (d)(e) | 548,030,182 | 548,084,985 | |
| TOTAL MONEY MARKET FUNDS (Cost $549,206,600) | 549,206,600 | ||
| TOTAL INVESTMENT IN SECURITIES - 125.9% (Cost $1,731,420,385) | 2,626,602,688 |
NET OTHER ASSETS (LIABILITIES) - (25.9)% | (540,134,794) |
| NET ASSETS - 100.0% | 2,086,467,894 |
| (a) | Non-income producing |
| (b) | Security or a portion of the security is on loan at period end. |
| (c) | Security exempt from registration under Rule 144A of the Securities Act of 1933. These securities may be resold in transactions exempt from registration, normally to qualified institutional buyers. At the end of the period, the value of these securities amounted to $7,843,335 or 0.4% of net assets. |
| (d) | Affiliated fund that is generally available only to investment companies and other accounts managed by Fidelity Investments. The rate quoted is the annualized seven-day yield of the fund at period end. A complete unaudited listing of the fund's holdings as of its most recent quarter end is available upon request. In addition, each Fidelity Central Fund's financial statements, which are not covered by the Fund's Report of Independent Registered Public Accounting Firm, are available on the SEC's website or upon request. |
| (e) | Investment made with cash collateral received from securities on loan. |
| Affiliate | Value, beginning of period ($) | Purchases ($) | Sales Proceeds ($) | Dividend Income ($) | Realized Gain (loss) ($) | Change in Unrealized appreciation (depreciation) ($) | Value, end of period ($) | % ownership, end of period |
| Fidelity Cash Central Fund 4.63% | 1,591,416 | 562,144,393 | 562,614,194 | 279,246 | - | - | 1,121,615 | 0.0% |
| Fidelity Securities Lending Cash Central Fund 4.63% | 84,129,800 | 1,849,469,642 | 1,385,514,457 | 402,883 | - | - | 548,084,985 | 1.7% |
| Total | 85,721,216 | 2,411,614,035 | 1,948,128,651 | 682,129 | - | - | 549,206,600 | |
| Valuation Inputs at Reporting Date: | ||||
| Description | Total ($) | Level 1 ($) | Level 2 ($) | Level 3 ($) |
Investments in Securities: | ||||
| Common Stocks | 2,077,396,088 | 2,077,396,088 | - | - |
| Money Market Funds | 549,206,600 | 549,206,600 | - | - |
| Total Investments in Securities: | 2,626,602,688 | 2,626,602,688 | - | - |
| Statement of Assets and Liabilities | ||||
| February 28, 2023 | ||||
| Assets | ||||
| Investment in securities, at value (including securities loaned of $533,927,904) - See accompanying schedule: | ||||
Unaffiliated issuers (cost $1,182,213,785) | $ | 2,077,396,088 | ||
Fidelity Central Funds (cost $549,206,600) | 549,206,600 | |||
| Total Investment in Securities (cost $1,731,420,385) | $ | 2,626,602,688 | ||
| Receivable for investments sold | 33,556,288 | |||
| Receivable for fund shares sold | 147,484 | |||
| Dividends receivable | 1,068,348 | |||
| Distributions receivable from Fidelity Central Funds | 85,424 | |||
| Prepaid expenses | 7,425 | |||
| Other receivables | 15,141 | |||
Total assets | 2,661,482,798 | |||
| Liabilities | ||||
| Payable for investments purchased | $ | 24,705,819 | ||
| Payable for fund shares redeemed | 869,777 | |||
| Accrued management fee | 951,107 | |||
| Other affiliated payables | 354,394 | |||
| Other payables and accrued expenses | 64,912 | |||
| Collateral on securities loaned | 548,068,895 | |||
| Total Liabilities | 575,014,904 | |||
| Net Assets | $ | 2,086,467,894 | ||
| Net Assets consist of: | ||||
| Paid in capital | $ | 1,201,485,177 | ||
| Total accumulated earnings (loss) | 884,982,717 | |||
| Net Assets | $ | 2,086,467,894 | ||
Net Asset Value , offering price and redemption price per share ($2,086,467,894 ÷ 37,823,657 shares) | $ | 55.16 | ||
| Statement of Operations | ||||
Year ended February 28, 2023 | ||||
| Investment Income | ||||
| Dividends | $ | 16,660,621 | ||
| Income from Fidelity Central Funds (including $402,883 from security lending) | 682,129 | |||
| Total Income | 17,342,750 | |||
| Expenses | ||||
| Management fee | $ | 12,019,813 | ||
| Transfer agent fees | 3,913,095 | |||
| Accounting fees | 627,246 | |||
| Custodian fees and expenses | 16,046 | |||
| Independent trustees' fees and expenses | 7,950 | |||
| Registration fees | 31,137 | |||
| Audit | 44,972 | |||
| Legal | 2,381 | |||
| Interest | 57,048 | |||
| Miscellaneous | 45,598 | |||
| Total expenses before reductions | 16,765,286 | |||
| Expense reductions | (82,130) | |||
| Total expenses after reductions | 16,683,156 | |||
| Net Investment income (loss) | 659,594 | |||
| Realized and Unrealized Gain (Loss) | ||||
| Net realized gain (loss) on: | ||||
| Investment Securities: | ||||
| Unaffiliated issuers | 1,431,105 | |||
| Foreign currency transactions | (6,706) | |||
| Total net realized gain (loss) | 1,424,399 | |||
| Change in net unrealized appreciation (depreciation) on: | ||||
| Investment Securities: | ||||
| Unaffiliated issuers | (348,837,882) | |||
| Assets and liabilities in foreign currencies | (1,441) | |||
| Total change in net unrealized appreciation (depreciation) | (348,839,323) | |||
| Net gain (loss) | (347,414,924) | |||
| Net increase (decrease) in net assets resulting from operations | $ | (346,755,330) | ||
| Statement of Changes in Net Assets | ||||
Year ended February 28, 2023 | Year ended February 28, 2022 | |||
| Increase (Decrease) in Net Assets | ||||
| Operations | ||||
| Net investment income (loss) | $ | 659,594 | $ | (11,605,499) |
| Net realized gain (loss) | 1,424,399 | 758,484,744 | ||
| Change in net unrealized appreciation (depreciation) | (348,839,323) | (1,177,179,444) | ||
| Net increase (decrease) in net assets resulting from operations | (346,755,330) | (430,300,199) | ||
| Distributions to shareholders | (302,562,844) | (528,547,016) | ||
| Share transactions | ||||
| Proceeds from sales of shares | 102,221,072 | 283,388,277 | ||
| Reinvestment of distributions | 284,601,905 | 495,301,813 | ||
| Cost of shares redeemed | (524,875,862) | (1,081,314,912) | ||
Net increase (decrease) in net assets resulting from share transactions | (138,052,885) | (302,624,822) | ||
| Total increase (decrease) in net assets | (787,371,059) | (1,261,472,037) | ||
| Net Assets | ||||
| Beginning of period | 2,873,838,953 | 4,135,310,990 | ||
| End of period | $ | 2,086,467,894 | $ | 2,873,838,953 |
| Other Information | ||||
| Shares | ||||
| Sold | 1,767,664 | 3,049,821 | ||
| Issued in reinvestment of distributions | 4,611,673 | 5,895,522 | ||
| Redeemed | (9,454,797) | (12,068,264) | ||
| Net increase (decrease) | (3,075,460) | (3,122,921) | ||
| IT Services Portfolio |
| Years ended February 28, | 2023 | 2022 | 2021 | 2020 A | 2019 | |||||
Selected Per-Share Data | ||||||||||
| Net asset value, beginning of period | $ | 70.27 | $ | 93.94 | $ | 73.62 | $ | 64.96 | $ | 58.69 |
| Income from Investment Operations | ||||||||||
Net investment income (loss) B,C | .02 | (.27) | (.09) | .03 | .04 | |||||
| Net realized and unrealized gain (loss) | (7.56) | (10.44) | 25.34 | 10.36 | 8.92 | |||||
| Total from investment operations | (7.54) | (10.71) | 25.25 | 10.39 | 8.96 | |||||
| Distributions from net investment income | (.01) | - | (.01) | (.03) | (.03) | |||||
| Distributions from net realized gain | (7.55) | (12.96) | (4.93) | (1.70) | (2.66) | |||||
| Total distributions | (7.57) D | (12.96) | (4.93) D | (1.73) | (2.69) | |||||
| Net asset value, end of period | $ | 55.16 | $ | 70.27 | $ | 93.94 | $ | 73.62 | $ | 64.96 |
Total Return E | (11.88)% | (13.31)% | 34.67% | 15.99% | 16.04% | |||||
Ratios to Average Net Assets C,F,G | ||||||||||
| Expenses before reductions | .73% | .70% | .72% | .73% | .74% | |||||
| Expenses net of fee waivers, if any | .73% | .70% | .72% | .73% | .74% | |||||
| Expenses net of all reductions | .73% | .70% | .72% | .73% | .74% | |||||
| Net investment income (loss) | .03% | (.29)% | (.11)% | .04% | .06% | |||||
| Supplemental Data | ||||||||||
| Net assets, end of period (000 omitted) | $ | 2,086,468 | $ | 2,873,839 | $ | 4,135,311 | $ | 4,099,114 | $ | 2,867,321 |
Portfolio turnover rate H | 43% | 41% | 31% | 24% | 26% |
| Average Annual Total Returns | |||
Periods ended February 28, 2023 | Past 1 year | Past 5 years | Past 10 years |
| Semiconductors Portfolio | -2.91% | 21.09% | 24.35% |
| $10,000 Over 10 Years |
Let's say hypothetically that $10,000 was invested in Semiconductors Portfolio on February 28, 2013. The chart shows how the value of your investment would have changed, and also shows how the S&P 500® Index performed over the same period. |
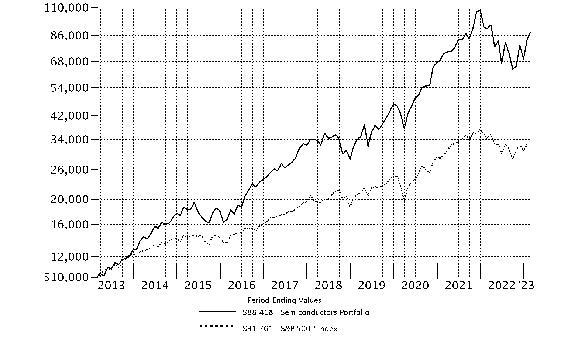 |
Top Holdings (% of Fund's net assets) | ||
| NVIDIA Corp. | 24.6 | |
| NXP Semiconductors NV | 9.1 | |
| onsemi | 8.2 | |
| Marvell Technology, Inc. | 7.6 | |
| GlobalFoundries, Inc. | 4.7 | |
| Taiwan Semiconductor Manufacturing Co. Ltd. sponsored ADR | 4.6 | |
| Microchip Technology, Inc. | 4.3 | |
| Broadcom, Inc. | 4.1 | |
| Lam Research Corp. | 3.8 | |
| Teradyne, Inc. | 3.6 | |
| 74.6 | ||
| Industries (% of Fund's net assets) | ||
| Semiconductors & Semiconductor Equipment | 95.0 | |
| Technology Hardware, Storage & Peripherals | 0.6 | |
| Electrical Equipment | 0.2 | |
| Metals & Mining | 0.1 | |
| Electronic Equipment & Components | 0.0 | |
| Software | 0.0 | |
| Auto Components | 0.0 | |
Geographic Diversification (% of Fund's net assets) |
 |
* Includes Short-Term investments and Net Other Assets (Liabilities). Percentages are based on country or territory of incorporation and are adjusted for the effect of derivatives, if applicable. |
| Common Stocks - 95.1% | |||
| Shares | Value ($) | ||
| Auto Components - 0.0% | |||
| Auto Parts & Equipment - 0.0% | |||
| Mobileye Global, Inc. (a) | 8,576 | 338,838 | |
| Electrical Equipment - 0.2% | |||
| Electrical Components & Equipment - 0.2% | |||
| Array Technologies, Inc. (b) | 983,600 | 18,432,664 | |
| Electronic Equipment & Components - 0.0% | |||
| Electronic Equipment & Instruments - 0.0% | |||
| Aeva Technologies, Inc. (a)(b) | 1,097,800 | 1,965,062 | |
| Semiconductors & Semiconductor Equipment - 94.3% | |||
| Semiconductor Equipment - 9.6% | |||
| Enphase Energy, Inc. (b) | 159,100 | 33,495,323 | |
| KLA Corp. | 95,613 | 36,273,660 | |
| Lam Research Corp. | 611,473 | 297,181,993 | |
| Nova Ltd. (a)(b) | 1,061,628 | 96,162,264 | |
| Teradyne, Inc. | 2,780,722 | 281,242,223 | |
| 744,355,463 | |||
| Semiconductors - 84.7% | |||
| Advanced Micro Devices, Inc. (b) | 1,736,018 | 136,416,294 | |
| Allegro MicroSystems LLC (b) | 2,709,700 | 118,359,696 | |
| Alpha & Omega Semiconductor Ltd. (b) | 513,296 | 13,710,136 | |
| Analog Devices, Inc. | 759,338 | 139,315,743 | |
| Broadcom, Inc. | 534,550 | 317,677,720 | |
| Cirrus Logic, Inc. (b) | 1,223,779 | 125,743,292 | |
| GlobalFoundries, Inc. (a)(b) | 5,562,993 | 363,485,963 | |
| Impinj, Inc. (b) | 67,077 | 8,895,752 | |
| Lattice Semiconductor Corp. (b) | 1,451,000 | 123,276,960 | |
| MACOM Technology Solutions Holdings, Inc. (b) | 1,978,700 | 135,620,098 | |
| Marvell Technology, Inc. | 12,992,376 | 586,605,776 | |
| Microchip Technology, Inc. | 4,149,861 | 336,263,237 | |
| Monolithic Power Systems, Inc. | 428,676 | 207,603,500 | |
| NVIDIA Corp. | 8,214,068 | 1,906,978,023 | |
| NXP Semiconductors NV | 3,978,614 | 710,103,027 | |
| onsemi (b) | 8,235,209 | 637,487,529 | |
| Qualcomm, Inc. | 811,888 | 100,292,525 | |
| Skyworks Solutions, Inc. | 1,422,586 | 158,717,920 | |
| Taiwan Semiconductor Manufacturing Co. Ltd. sponsored ADR | 4,141,400 | 360,591,698 | |
| Texas Instruments, Inc. | 426,135 | 73,060,846 | |
| Wolfspeed, Inc. (a)(b) | 195,200 | 14,440,896 | |
| 6,574,646,631 | |||
TOTAL SEMICONDUCTORS & SEMICONDUCTOR EQUIPMENT | 7,319,002,094 | ||
| Technology Hardware, Storage & Peripherals - 0.6% | |||
| Technology Hardware, Storage & Peripherals - 0.6% | |||
| IonQ, Inc. (b)(c) | 155,600 | 737,544 | |
| Western Digital Corp. (b) | 1,157,800 | 44,552,144 | |
| 45,289,688 | |||
| TOTAL COMMON STOCKS (Cost $4,534,789,982) | 7,385,028,346 | ||
| Convertible Preferred Stocks - 0.6% | |||
| Shares | Value ($) | ||
| Electronic Equipment & Components - 0.0% | |||
| Electronic Components - 0.0% | |||
| Menlo Micro, Inc. Series C (c)(d) | 739,500 | 687,735 | |
| Metals & Mining - 0.1% | |||
| Precious Metals & Minerals - 0.1% | |||
| Diamond Foundry, Inc. Series C (b)(c)(d) | 189,999 | 6,739,265 | |
| Semiconductors & Semiconductor Equipment - 0.5% | |||
| Semiconductor Equipment - 0.2% | |||
| Astera Labs, Inc.: | |||
| Series A (c)(d) | 269,049 | 2,391,846 | |
| Series B (c)(d) | 45,810 | 407,251 | |
| Series C (b)(c)(d) | 185,800 | 1,651,762 | |
| Series D (c)(d) | 1,092,759 | 9,714,628 | |
| 14,165,487 | |||
| Semiconductors - 0.3% | |||
| Alif Semiconductor Series C (c)(d) | 444,283 | 7,930,452 | |
| GaN Systems, Inc.: | |||
| Series F1 (b)(c)(d) | 496,628 | 5,582,099 | |
| Series F2 (b)(c)(d) | 262,241 | 2,947,589 | |
| SiMa.ai: | |||
| Series B (b)(c)(d) | 309,900 | 1,998,855 | |
| Series B1 (c)(d) | 163,147 | 1,218,708 | |
| 19,677,703 | |||
TOTAL SEMICONDUCTORS & SEMICONDUCTOR EQUIPMENT | 33,843,190 | ||
| Software - 0.0% | |||
| Systems Software - 0.0% | |||
| Tenstorrent, Inc. Series C1 (b)(c)(d) | 8,800 | 494,912 | |
| TOTAL CONVERTIBLE PREFERRED STOCKS (Cost $39,202,120) | 41,765,102 | ||
| Preferred Securities - 0.2% | |||
Principal Amount (e) | Value ($) | ||
| Semiconductors & Semiconductor Equipment - 0.2% | |||
| Semiconductors - 0.2% | |||
| GaN Systems, Inc. 0% (c)(d)(f) | 11,640,267 | 14,468,852 | |
| Software - 0.0% | |||
| Systems Software - 0.0% | |||
| Tenstorrent, Inc. 0% (c)(d)(f) | 490,000 | 463,540 | |
| TOTAL PREFERRED SECURITIES (Cost $12,130,267) | 14,932,392 | ||
| Money Market Funds - 2.7% | |||
| Shares | Value ($) | ||
| Fidelity Cash Central Fund 4.63% (g) | 91,805,127 | 91,823,488 | |
| Fidelity Securities Lending Cash Central Fund 4.63% (g)(h) | 119,191,693 | 119,203,612 | |
| TOTAL MONEY MARKET FUNDS (Cost $211,027,100) | 211,027,100 | ||
| TOTAL INVESTMENT IN SECURITIES - 98.6% (Cost $4,797,149,469) | 7,652,752,940 |
NET OTHER ASSETS (LIABILITIES) - 1.4% | 111,699,608 |
| NET ASSETS - 100.0% | 7,764,452,548 |
| (a) | Security or a portion of the security is on loan at period end. |
| (b) | Non-income producing |
| (c) | Restricted securities (including private placements) - Investment in securities not registered under the Securities Act of 1933 (excluding 144A issues). At the end of the period, the value of restricted securities (excluding 144A issues) amounted to $57,435,038 or 0.7% of net assets. |
| (d) | Level 3 security |
| (e) | Amount is stated in United States dollars unless otherwise noted. |
| (f) | Security is perpetual in nature with no stated maturity date. |
| (g) | Affiliated fund that is generally available only to investment companies and other accounts managed by Fidelity Investments. The rate quoted is the annualized seven-day yield of the fund at period end. A complete unaudited listing of the fund's holdings as of its most recent quarter end is available upon request. In addition, each Fidelity Central Fund's financial statements, which are not covered by the Fund's Report of Independent Registered Public Accounting Firm, are available on the SEC's website or upon request. |
| (h) | Investment made with cash collateral received from securities on loan. |
| Additional information on each restricted holding is as follows: | ||
| Security | Acquisition Date | Acquisition Cost ($) |
| Alif Semiconductor Series C | 3/08/22 | 9,018,296 |
| Astera Labs, Inc. Series A | 5/17/22 | 2,736,094 |
| Astera Labs, Inc. Series B | 5/17/22 | 465,865 |
| Astera Labs, Inc. Series C | 8/24/21 | 624,622 |
| Astera Labs, Inc. Series D | 5/17/22 - 5/27/22 | 11,112,812 |
| Diamond Foundry, Inc. Series C | 3/15/21 | 4,559,976 |
| GaN Systems, Inc. Series F1 | 11/30/21 | 4,211,405 |
| GaN Systems, Inc. Series F2 | 11/30/21 | 2,223,804 |
| GaN Systems, Inc. 0% | 11/30/21 | 11,640,267 |
| IonQ, Inc. | 3/07/21 | 1,556,000 |
| Menlo Micro, Inc. Series C | 2/09/22 | 980,207 |
| SiMa.ai Series B | 5/10/21 | 1,588,981 |
| SiMa.ai Series B1 | 4/25/22 - 10/17/22 | 1,156,859 |
| Tenstorrent, Inc. Series C1 | 4/23/21 | 523,198 |
| Tenstorrent, Inc. 0% | 4/23/21 | 490,000 |
| Affiliate | Value, beginning of period ($) | Purchases ($) | Sales Proceeds ($) | Dividend Income ($) | Realized Gain (loss) ($) | Change in Unrealized appreciation (depreciation) ($) | Value, end of period ($) | % ownership, end of period |
| Fidelity Cash Central Fund 4.63% | 56,307,633 | 1,644,135,620 | 1,608,619,765 | 2,392,797 | - | - | 91,823,488 | 0.2% |
| Fidelity Securities Lending Cash Central Fund 4.63% | 109,291,689 | 2,000,522,355 | 1,990,610,432 | 5,518,967 | - | - | 119,203,612 | 0.4% |
| Total | 165,599,322 | 3,644,657,975 | 3,599,230,197 | 7,911,764 | - | - | 211,027,100 | |
| Valuation Inputs at Reporting Date: | ||||
| Description | Total ($) | Level 1 ($) | Level 2 ($) | Level 3 ($) |
Investments in Securities: | ||||
| Common Stocks | 7,385,028,346 | 7,385,028,346 | - | - |
| Convertible Preferred Stocks | 41,765,102 | - | - | 41,765,102 |
| Preferred Securities | 14,932,392 | - | - | 14,932,392 |
| Money Market Funds | 211,027,100 | 211,027,100 | - | - |
| Total Investments in Securities: | 7,652,752,940 | 7,596,055,446 | - | 56,697,494 |
| Statement of Assets and Liabilities | ||||
| February 28, 2023 | ||||
| Assets | ||||
| Investment in securities, at value (including securities loaned of $117,817,408) - See accompanying schedule: | ||||
Unaffiliated issuers (cost $4,586,122,369) | $ | 7,441,725,840 | ||
Fidelity Central Funds (cost $211,027,100) | 211,027,100 | |||
| Total Investment in Securities (cost $4,797,149,469) | $ | 7,652,752,940 | ||
| Receivable for investments sold | 226,937,495 | |||
| Receivable for fund shares sold | 10,520,174 | |||
| Dividends receivable | 3,456,510 | |||
| Distributions receivable from Fidelity Central Funds | 931,835 | |||
| Prepaid expenses | 14,037 | |||
| Other receivables | 196,560 | |||
Total assets | 7,894,809,551 | |||
| Liabilities | ||||
| Payable to custodian bank | $ | 3,293,715 | ||
| Payable for investments purchased | 26,885 | |||
| Payable for fund shares redeemed | 3,280,437 | |||
| Accrued management fee | 3,395,584 | |||
| Other affiliated payables | 922,129 | |||
| Other payables and accrued expenses | 234,641 | |||
| Collateral on securities loaned | 119,203,612 | |||
| Total Liabilities | 130,357,003 | |||
| Net Assets | $ | 7,764,452,548 | ||
| Net Assets consist of: | ||||
| Paid in capital | $ | 4,943,674,815 | ||
| Total accumulated earnings (loss) | 2,820,777,733 | |||
| Net Assets | $ | 7,764,452,548 | ||
Net Asset Value , offering price and redemption price per share ($7,764,452,548 ÷ 418,151,068 shares) | $ | 18.57 | ||
| Statement of Operations | ||||
Year ended February 28, 2023 | ||||
| Investment Income | ||||
| Dividends | $ | 50,974,849 | ||
| Income from Fidelity Central Funds (including $5,518,967 from security lending) | 7,911,764 | |||
| Total Income | 58,886,613 | |||
| Expenses | ||||
| Management fee | $ | 35,905,087 | ||
| Transfer agent fees | 10,000,117 | |||
| Accounting fees | 1,063,585 | |||
| Custodian fees and expenses | 42,104 | |||
| Independent trustees' fees and expenses | 23,255 | |||
| Registration fees | 88,695 | |||
| Audit | 42,370 | |||
| Legal | 5,697 | |||
| Interest | 1,055 | |||
| Miscellaneous | 35,093 | |||
| Total expenses before reductions | 47,207,058 | |||
| Expense reductions | (242,348) | |||
| Total expenses after reductions | 46,964,710 | |||
| Net Investment income (loss) | 11,921,903 | |||
| Realized and Unrealized Gain (Loss) | ||||
| Net realized gain (loss) on: | ||||
| Investment Securities: | ||||
| Unaffiliated issuers | 102,354,704 | |||
| Foreign currency transactions | (128,159) | |||
| Total net realized gain (loss) | 102,226,545 | |||
| Change in net unrealized appreciation (depreciation) on: | ||||
| Investment Securities: | ||||
| Unaffiliated issuers | (478,504,613) | |||
| Assets and liabilities in foreign currencies | 2,926 | |||
| Total change in net unrealized appreciation (depreciation) | (478,501,687) | |||
| Net gain (loss) | (376,275,142) | |||
| Net increase (decrease) in net assets resulting from operations | $ | (364,353,239) | ||
| Statement of Changes in Net Assets | ||||
Year ended February 28, 2023 | Year ended February 28, 2022 | |||
| Increase (Decrease) in Net Assets | ||||
| Operations | ||||
| Net investment income (loss) | $ | 11,921,903 | $ | 2,075,831 |
| Net realized gain (loss) | 102,226,545 | 704,123,799 | ||
| Change in net unrealized appreciation (depreciation) | (478,501,687) | 616,660,274 | ||
| Net increase (decrease) in net assets resulting from operations | (364,353,239) | 1,322,859,904 | ||
| Distributions to shareholders | (401,716,905) | (613,939,297) | ||
| Share transactions | ||||
| Proceeds from sales of shares | 1,289,524,725 | 3,146,391,881 | ||
| Reinvestment of distributions | 378,004,092 | 580,580,568 | ||
| Cost of shares redeemed | (1,563,929,144) | (1,726,756,170) | ||
Net increase (decrease) in net assets resulting from share transactions | 103,599,673 | 2,000,216,279 | ||
| Total increase (decrease) in net assets | (662,470,471) | 2,709,136,886 | ||
| Net Assets | ||||
| Beginning of period | 8,426,923,019 | 5,717,786,133 | ||
| End of period | $ | 7,764,452,548 | $ | 8,426,923,019 |
| Other Information | ||||
| Shares | ||||
| Sold | 74,773,935 | 150,199,767 | ||
| Issued in reinvestment of distributions | 22,013,643 | 28,114,026 | ||
| Redeemed | (95,214,839) | (86,759,172) | ||
| Net increase (decrease) | 1,572,739 | 91,554,621 | ||
| Semiconductors Portfolio |
| Years ended February 28, | 2023 | 2022 | 2021 | 2020 A | 2019 B | |||||
Selected Per-Share Data | ||||||||||
| Net asset value, beginning of period | $ | 20.23 | $ | 17.59 | $ | 11.47 | $ | 9.41 | $ | 11.77 |
| Income from Investment Operations | ||||||||||
Net investment income (loss) C,D | .03 | .01 | .07 | .09 | .10 | |||||
| Net realized and unrealized gain (loss) | (.71) | 4.30 | 7.37 | 2.39 | (.35) | |||||
| Total from investment operations | (.68) | 4.31 | 7.44 | 2.48 | (.25) | |||||
| Distributions from net investment income | (.03) | (.01) | (.08) | (.10) | (.06) | |||||
| Distributions from net realized gain | (.95) | (1.66) | (1.24) | (.33) | (2.05) | |||||
| Total distributions | (.98) | (1.67) | (1.32) | (.42) E | (2.11) | |||||
| Net asset value, end of period | $ | 18.57 | $ | 20.23 | $ | 17.59 | $ | 11.47 | $ | 9.41 |
Total Return F | (2.91)% | 24.57% | 70.47% | 26.01% | .19% | |||||
Ratios to Average Net Assets D,G,H | ||||||||||
| Expenses before reductions | .69% | .68% | .70% | .72% | .73% | |||||
| Expenses net of fee waivers, if any | .69% | .67% | .70% | .72% | .73% | |||||
| Expenses net of all reductions | .69% | .67% | .69% | .71% | .72% | |||||
| Net investment income (loss) | .17% | .03% | .53% | .85% | .92% | |||||
| Supplemental Data | ||||||||||
| Net assets, end of period (000 omitted) | $ | 7,764,453 | $ | 8,426,923 | $ | 5,717,786 | $ | 3,778,557 | $ | 3,052,506 |
Portfolio turnover rate I | 35% | 33% | 87% | 114% | 130% |
| Average Annual Total Returns | |||
Periods ended February 28, 2023 | Past 1 year | Past 5 years | Past 10 years |
| Software and IT Services Portfolio | -13.67% | 11.77% | 17.14% |
| $10,000 Over 10 Years |
Let's say hypothetically that $10,000 was invested in Software and IT Services Portfolio on February 28, 2013. The chart shows how the value of your investment would have changed, and also shows how the S&P 500® Index performed over the same period. |
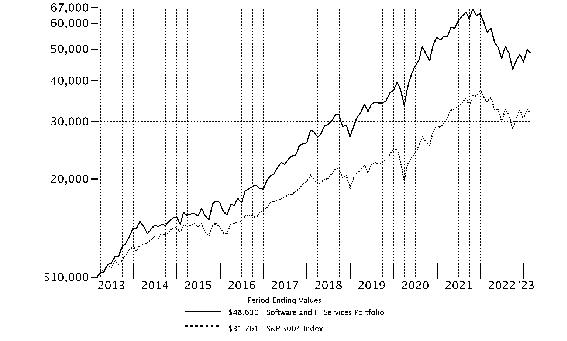 |
Top Holdings (% of Fund's net assets) | ||
| Microsoft Corp. | 24.8 | |
| Visa, Inc. Class A | 7.2 | |
| MasterCard, Inc. Class A | 6.1 | |
| Adobe, Inc. | 5.4 | |
| Salesforce.com, Inc. | 5.4 | |
| Palo Alto Networks, Inc. | 2.8 | |
| Autodesk, Inc. | 2.6 | |
| Alphabet, Inc. Class A | 2.6 | |
| Oracle Corp. | 2.4 | |
| Cognizant Technology Solutions Corp. Class A | 2.4 | |
| 61.7 | ||
| Industries (% of Fund's net assets) | ||
| Software | 57.8 | |
| IT Services | 34.4 | |
| Interactive Media & Services | 3.4 | |
| Entertainment | 1.6 | |
| Internet & Direct Marketing Retail | 0.2 | |
| Media | 0.2 | |
| Communications Equipment | 0.0 | |
| Common Stocks - 97.6% | |||
| Shares | Value ($) | ||
| Communications Equipment - 0.0% | |||
| Communications Equipment - 0.0% | |||
| Lumine Group, Inc. (a)(b) | 75,609 | 774,000 | |
| Entertainment - 1.6% | |||
| Interactive Home Entertainment - 1.6% | |||
| Activision Blizzard, Inc. | 814,900 | 62,136,125 | |
| Electronic Arts, Inc. | 684,300 | 75,916,242 | |
| 138,052,367 | |||
| Interactive Media & Services - 3.4% | |||
| Interactive Media & Services - 3.4% | |||
| Alphabet, Inc. Class A (a) | 2,434,900 | 219,287,094 | |
| Meta Platforms, Inc. Class A (a) | 408,000 | 71,375,520 | |
| 290,662,614 | |||
| Internet & Direct Marketing Retail - 0.2% | |||
| Internet & Direct Marketing Retail - 0.2% | |||
| Uber Technologies, Inc. (a) | 632,100 | 21,023,646 | |
| IT Services - 34.4% | |||
| Data Processing & Outsourced Services - 20.0% | |||
| AvidXchange Holdings, Inc. (a) | 36,300 | 361,185 | |
| Block, Inc. Class A (a) | 1,350,700 | 103,639,211 | |
| ExlService Holdings, Inc. (a) | 153,900 | 25,318,089 | |
| Fidelity National Information Services, Inc. | 611,200 | 38,731,744 | |
| Fiserv, Inc. (a) | 272,400 | 31,350,516 | |
| FleetCor Technologies, Inc. (a) | 153,200 | 32,905,828 | |
| Global Payments, Inc. | 1,149,470 | 128,970,534 | |
| MasterCard, Inc. Class A | 1,488,500 | 528,849,165 | |
| PayPal Holdings, Inc. (a) | 2,706,500 | 199,198,400 | |
| StoneCo Ltd. Class A (a) | 88,700 | 754,837 | |
| Visa, Inc. Class A | 2,833,820 | 623,270,371 | |
| WEX, Inc. (a) | 90,600 | 17,468,586 | |
| 1,730,818,466 | |||
| Internet Services & Infrastructure - 5.7% | |||
| Akamai Technologies, Inc. (a) | 1,122,900 | 81,522,540 | |
| Cloudflare, Inc. (a) | 225,649 | 13,541,196 | |
| GoDaddy, Inc. (a) | 1,449,500 | 109,741,645 | |
| MongoDB, Inc. Class A (a) | 575,400 | 120,557,808 | |
| Snowflake, Inc. (a) | 339,900 | 52,473,762 | |
| Twilio, Inc. Class A (a) | 1,200,100 | 80,658,721 | |
| Wix.com Ltd. (a) | 415,700 | 37,633,321 | |
| 496,128,993 | |||
| IT Consulting & Other Services - 8.7% | |||
| Accenture PLC Class A | 655,900 | 174,174,245 | |
| Capgemini SA | 691,100 | 130,004,165 | |
| Cognizant Technology Solutions Corp. Class A | 3,294,200 | 206,315,746 | |
| DXC Technology Co. (a) | 707,800 | 19,634,372 | |
| Gartner, Inc. (a) | 197,300 | 64,676,913 | |
| IBM Corp. | 1,241,200 | 160,487,160 | |
| Kyndryl Holdings, Inc. (a) | 165,700 | 2,599,833 | |
| Thoughtworks Holding, Inc. (a) | 46,100 | 339,296 | |
| 758,231,730 | |||
TOTAL IT SERVICES | 2,985,179,189 | ||
| Media - 0.2% | |||
| Publishing - 0.2% | |||
| The New York Times Co. Class A | 482,900 | 18,591,650 | |
| Software - 57.8% | |||
| Application Software - 25.7% | |||
| Adobe, Inc. (a) | 1,454,100 | 471,055,695 | |
| Alteryx, Inc. Class A (a) | 302,800 | 19,775,868 | |
| Aspen Technology, Inc. (a) | 180,862 | 38,344,553 | |
| Atlassian Corp. PLC (a) | 234,300 | 38,502,519 | |
| Autodesk, Inc. (a) | 1,125,000 | 223,526,250 | |
| Blackbaud, Inc. (a) | 646,300 | 35,992,447 | |
| Braze, Inc. (a) | 15,500 | 475,850 | |
| Ceridian HCM Holding, Inc. (a) | 952,542 | 69,468,888 | |
| Confluent, Inc. (a) | 497,344 | 12,130,220 | |
| Constellation Software, Inc. | 25,200 | 43,329,595 | |
| Coupa Software, Inc. (a) | 637,700 | 51,653,700 | |
| Datadog, Inc. Class A (a) | 111,932 | 8,565,037 | |
| DocuSign, Inc. (a) | 129,800 | 7,963,230 | |
| Dropbox, Inc. Class A (a) | 213,000 | 4,345,200 | |
| Elastic NV (a) | 1,007,600 | 59,468,552 | |
| Everbridge, Inc. (a) | 473,000 | 15,457,640 | |
| Five9, Inc. (a) | 596,000 | 39,336,000 | |
| HashiCorp, Inc. (a) | 16,900 | 493,480 | |
| HubSpot, Inc. (a) | 280,400 | 108,475,544 | |
| Intuit, Inc. | 281,600 | 114,661,888 | |
| Momentive Global, Inc. (a) | 850,700 | 5,869,830 | |
| New Relic, Inc. (a) | 402,500 | 29,370,425 | |
| PTC, Inc. (a) | 830,000 | 104,023,900 | |
| Qualtrics International, Inc. (a) | 1,579,815 | 26,730,470 | |
| RingCentral, Inc. (a) | 137,300 | 4,536,392 | |
| Salesforce.com, Inc. (a) | 2,856,084 | 467,283,903 | |
| SAP SE | 73,900 | 8,395,852 | |
| Workday, Inc. Class A (a) | 872,300 | 161,785,481 | |
| Workiva, Inc. (a) | 263,000 | 23,459,600 | |
| Zoom Video Communications, Inc. Class A (a) | 444,400 | 33,147,796 | |
| 2,227,625,805 | |||
| Systems Software - 32.1% | |||
| Crowdstrike Holdings, Inc. (a) | 137,486 | 16,593,185 | |
| Gen Digital, Inc. | 4,479,100 | 87,387,241 | |
| GitLab, Inc. (a)(c) | 11,200 | 493,248 | |
| Microsoft Corp. | 8,640,502 | 2,155,114,009 | |
| Oracle Corp. | 2,364,027 | 206,615,960 | |
| Palo Alto Networks, Inc. (a) | 1,270,600 | 239,342,922 | |
| Tenable Holdings, Inc. (a) | 1,623,500 | 71,807,405 | |
| Zuora, Inc. (a) | 1,207,700 | 10,229,219 | |
| 2,787,583,189 | |||
TOTAL SOFTWARE | 5,015,208,994 | ||
| TOTAL COMMON STOCKS (Cost $4,823,829,661) | 8,469,492,460 | ||
| Money Market Funds - 2.1% | |||
| Shares | Value ($) | ||
| Fidelity Cash Central Fund 4.63% (d) | 182,319,759 | 182,356,223 | |
| Fidelity Securities Lending Cash Central Fund 4.63% (d)(e) | 102,915 | 102,925 | |
| TOTAL MONEY MARKET FUNDS (Cost $182,459,148) | 182,459,148 | ||
| TOTAL INVESTMENT IN SECURITIES - 99.7% (Cost $5,006,288,809) | 8,651,951,608 |
NET OTHER ASSETS (LIABILITIES) - 0.3% | 23,087,734 |
| NET ASSETS - 100.0% | 8,675,039,342 |
| (a) | Non-income producing |
| (b) | Level 3 security |
| (c) | Security or a portion of the security is on loan at period end. |
| (d) | Affiliated fund that is generally available only to investment companies and other accounts managed by Fidelity Investments. The rate quoted is the annualized seven-day yield of the fund at period end. A complete unaudited listing of the fund's holdings as of its most recent quarter end is available upon request. In addition, each Fidelity Central Fund's financial statements, which are not covered by the Fund's Report of Independent Registered Public Accounting Firm, are available on the SEC's website or upon request. |
| (e) | Investment made with cash collateral received from securities on loan. |
| Affiliate | Value, beginning of period ($) | Purchases ($) | Sales Proceeds ($) | Dividend Income ($) | Realized Gain (loss) ($) | Change in Unrealized appreciation (depreciation) ($) | Value, end of period ($) | % ownership, end of period |
| Fidelity Cash Central Fund 4.63% | 46,704,772 | 946,264,868 | 810,613,417 | 3,055,107 | - | - | 182,356,223 | 0.4% |
| Fidelity Securities Lending Cash Central Fund 4.63% | 582,500 | 185,535,472 | 186,015,047 | 26,300 | - | - | 102,925 | 0.0% |
| Total | 47,287,272 | 1,131,800,340 | 996,628,464 | 3,081,407 | - | - | 182,459,148 | |
| Valuation Inputs at Reporting Date: | ||||
| Description | Total ($) | Level 1 ($) | Level 2 ($) | Level 3 ($) |
Investments in Securities: | ||||
| Common Stocks | 8,469,492,460 | 8,460,322,608 | 8,395,852 | 774,000 |
| Money Market Funds | 182,459,148 | 182,459,148 | - | - |
| Total Investments in Securities: | 8,651,951,608 | 8,642,781,756 | 8,395,852 | 774,000 |
| Statement of Assets and Liabilities | ||||
| February 28, 2023 | ||||
| Assets | ||||
| Investment in securities, at value (including securities loaned of $101,292) - See accompanying schedule: | ||||
Unaffiliated issuers (cost $4,823,829,661) | $ | 8,469,492,460 | ||
Fidelity Central Funds (cost $182,459,148) | 182,459,148 | |||
| Total Investment in Securities (cost $5,006,288,809) | $ | 8,651,951,608 | ||
| Cash | 51,653,699 | |||
| Receivable for investments sold | 20,799,010 | |||
| Receivable for fund shares sold | 1,105,911 | |||
| Dividends receivable | 9,936,413 | |||
| Distributions receivable from Fidelity Central Funds | 551,771 | |||
| Prepaid expenses | 20,919 | |||
| Other receivables | 437,798 | |||
Total assets | 8,736,457,129 | |||
| Liabilities | ||||
| Payable for fund shares redeemed | $ | 4,131,818 | ||
| Accrued management fee | 3,965,092 | |||
| Other affiliated payables | 1,185,438 | |||
| Deferred dividend income | 51,653,699 | |||
| Other payables and accrued expenses | 378,815 | |||
| Collateral on securities loaned | 102,925 | |||
| Total Liabilities | 61,417,787 | |||
| Net Assets | $ | 8,675,039,342 | ||
| Net Assets consist of: | ||||
| Paid in capital | $ | 5,022,965,278 | ||
| Total accumulated earnings (loss) | 3,652,074,064 | |||
| Net Assets | $ | 8,675,039,342 | ||
Net Asset Value , offering price and redemption price per share ($8,675,039,342 ÷ 412,800,411 shares) | $ | 21.02 | ||
| Statement of Operations | ||||
Year ended February 28, 2023 | ||||
| Investment Income | ||||
| Dividends | $ | 59,442,879 | ||
| Income from Fidelity Central Funds (including $26,300 from security lending) | 3,081,407 | |||
| Total Income | 62,524,286 | |||
| Expenses | ||||
| Management fee | $ | 48,800,201 | ||
| Transfer agent fees | 13,850,537 | |||
| Accounting fees | 1,163,937 | |||
| Custodian fees and expenses | 53,984 | |||
| Independent trustees' fees and expenses | 32,008 | |||
| Registration fees | 40,342 | |||
| Audit | 55,805 | |||
| Legal | 8,126 | |||
| Interest | 9,682 | |||
| Miscellaneous | 53,859 | |||
| Total expenses before reductions | 64,068,481 | |||
| Expense reductions | (333,964) | |||
| Total expenses after reductions | 63,734,517 | |||
| Net Investment income (loss) | (1,210,231) | |||
| Realized and Unrealized Gain (Loss) | ||||
| Net realized gain (loss) on: | ||||
| Investment Securities: | ||||
| Unaffiliated issuers | 381,865,496 | |||
| Foreign currency transactions | (133,777) | |||
| Total net realized gain (loss) | 381,731,719 | |||
| Change in net unrealized appreciation (depreciation) on: | ||||
| Investment Securities: | ||||
| Unaffiliated issuers | (1,924,472,417) | |||
| Assets and liabilities in foreign currencies | (10,290) | |||
| Total change in net unrealized appreciation (depreciation) | (1,924,482,707) | |||
| Net gain (loss) | (1,542,750,988) | |||
| Net increase (decrease) in net assets resulting from operations | $ | (1,543,961,219) | ||
| Statement of Changes in Net Assets | ||||
Year ended February 28, 2023 | Year ended February 28, 2022 | |||
| Increase (Decrease) in Net Assets | ||||
| Operations | ||||
| Net investment income (loss) | $ | (1,210,231) | $ | (21,892,746) |
| Net realized gain (loss) | 381,731,719 | 1,110,704,960 | ||
| Change in net unrealized appreciation (depreciation) | (1,924,482,707) | (688,232,505) | ||
| Net increase (decrease) in net assets resulting from operations | (1,543,961,219) | 400,579,709 | ||
| Distributions to shareholders | (738,727,367) | (831,854,738) | ||
| Share transactions | ||||
| Proceeds from sales of shares | 474,830,990 | 1,277,423,928 | ||
| Reinvestment of distributions | 691,638,248 | 783,418,638 | ||
| Cost of shares redeemed | (1,477,032,652) | (2,255,819,953) | ||
Net increase (decrease) in net assets resulting from share transactions | (310,563,414) | (194,977,387) | ||
| Total increase (decrease) in net assets | (2,593,252,000) | (626,252,416) | ||
| Net Assets | ||||
| Beginning of period | 11,268,291,342 | 11,894,543,758 | ||
| End of period | $ | 8,675,039,342 | $ | 11,268,291,342 |
| Other Information | ||||
| Shares | ||||
| Sold | 21,172,412 | 42,971,848 | ||
| Issued in reinvestment of distributions | 30,858,073 | 26,896,267 | ||
| Redeemed | (67,265,870) | (77,442,780) | ||
| Net increase (decrease) | (15,235,385) | (7,574,665) | ||
| Software and IT Services Portfolio |
| Years ended February 28, | 2023 | 2022 | 2021 | 2020 A | 2019 B | |||||
Selected Per-Share Data | ||||||||||
| Net asset value, beginning of period | $ | 26.33 | $ | 27.31 | $ | 19.90 | $ | 18.71 | $ | 17.89 |
| Income from Investment Operations | ||||||||||
Net investment income (loss) C,D | - E | (.05) | (.03) | .19 F | .02 | |||||
| Net realized and unrealized gain (loss) | (3.53) | 1.03 | 8.82 | 3.52 | 1.81 | |||||
| Total from investment operations | (3.53) | .98 | 8.79 | 3.71 | 1.83 | |||||
| Distributions from net investment income | - | - | (.15) | (.05) | (.01) | |||||
| Distributions from net realized gain | (1.78) | (1.96) | (1.23) | (2.47) | (1.00) | |||||
| Total distributions | (1.78) | (1.96) | (1.38) | (2.52) | (1.01) | |||||
| Net asset value, end of period | $ | 21.02 | $ | 26.33 | $ | 27.31 | $ | 19.90 | $ | 18.71 |
Total Return G | (13.67)% | 2.98% | 45.80% | 21.33% | 10.90% | |||||
Ratios to Average Net Assets D,H,I | ||||||||||
| Expenses before reductions | .69% | .67% | .70% | .70% | .72% | |||||
| Expenses net of fee waivers, if any | .69% | .67% | .70% | .70% | .72% | |||||
| Expenses net of all reductions | .69% | .67% | .69% | .70% | .71% | |||||
| Net investment income (loss) | (.01)% | (.17)% | (.11)% | .98% F | .10% | |||||
| Supplemental Data | ||||||||||
| Net assets, end of period (000 omitted) | $ | 8,675,039 | $ | 11,268,291 | $ | 11,894,544 | $ | 8,031,911 | $ | 6,540,896 |
Portfolio turnover rate J | 4% | 10% | 22% | 23% | 48% |
| Average Annual Total Returns | |||
Periods ended February 28, 2023 | Past 1 year | Past 5 years | Past 10 years |
| Tech Hardware Portfolio | -13.62% | 11.74% | 13.28% |
| $10,000 Over 10 Years |
Let's say hypothetically that $10,000 was invested in Tech Hardware Portfolio on February 28, 2013. The chart shows how the value of your investment would have changed, and also shows how the S&P 500® Index performed over the same period. |
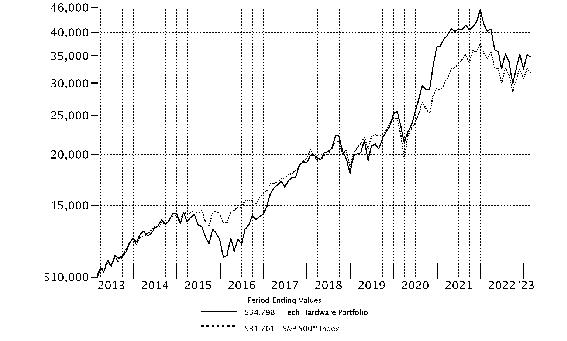 |
Top Holdings (% of Fund's net assets) | ||
| Cisco Systems, Inc. | 11.4 | |
| Sony Group Corp. | 11.4 | |
| Samsung Electronics Co. Ltd. | 11.0 | |
| Apple, Inc. | 10.7 | |
| Palo Alto Networks, Inc. | 5.5 | |
| Motorola Solutions, Inc. | 5.0 | |
| Arista Networks, Inc. | 4.4 | |
| FUJIFILM Holdings Corp. | 4.2 | |
| Keysight Technologies, Inc. | 3.7 | |
| CDW Corp. | 3.6 | |
| 70.9 | ||
| Industries (% of Fund's net assets) | ||
| Technology Hardware, Storage & Peripherals | 38.0 | |
| Communications Equipment | 26.5 | |
| Household Durables | 11.4 | |
| Electronic Equipment & Components | 10.9 | |
| Software | 7.3 | |
| Entertainment | 2.8 | |
| Semiconductors & Semiconductor Equipment | 1.5 | |
| IT Services | 0.6 | |
Geographic Diversification (% of Fund's net assets) |
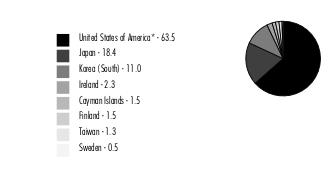 |
* Includes Short-Term investments and Net Other Assets (Liabilities). Percentages are based on country or territory of incorporation and are adjusted for the effect of derivatives, if applicable. |
| Common Stocks - 99.0% | |||
| Shares | Value ($) | ||
| Communications Equipment - 26.5% | |||
| Communications Equipment - 26.5% | |||
| Arista Networks, Inc. (a) | 226,435 | 31,406,535 | |
| Calix, Inc. (a) | 51,885 | 2,653,918 | |
| Ciena Corp. (a) | 127,496 | 6,147,857 | |
| Cisco Systems, Inc. | 1,694,987 | 82,071,271 | |
| Ericsson (B Shares) | 679,865 | 3,764,823 | |
| Infinera Corp. (a)(b) | 560,032 | 3,959,426 | |
| Juniper Networks, Inc. | 460,073 | 14,161,047 | |
| Motorola Solutions, Inc. | 135,290 | 35,555,565 | |
| Nokia Corp. | 2,258,810 | 10,463,253 | |
| 190,183,695 | |||
| Electronic Equipment & Components - 10.9% | |||
| Electronic Equipment & Instruments - 3.7% | |||
| Keysight Technologies, Inc. (a) | 167,482 | 26,790,421 | |
| Technology Distributors - 7.2% | |||
| CDW Corp. (b) | 125,436 | 25,390,755 | |
| Insight Enterprises, Inc. (a) | 113,459 | 15,194,429 | |
| TD SYNNEX Corp. | 112,816 | 10,889,000 | |
| 51,474,184 | |||
TOTAL ELECTRONIC EQUIPMENT & COMPONENTS | 78,264,605 | ||
| Entertainment - 2.8% | |||
| Interactive Home Entertainment - 2.8% | |||
| Nintendo Co. Ltd. | 543,428 | 20,344,357 | |
| Household Durables - 11.4% | |||
| Consumer Electronics - 11.4% | |||
| Sony Group Corp. | 976,129 | 81,620,475 | |
| IT Services - 0.6% | |||
| Internet Services & Infrastructure - 0.6% | |||
| Cloudflare, Inc. (a)(b) | 65,794 | 3,948,298 | |
| Semiconductors & Semiconductor Equipment - 1.5% | |||
| Semiconductors - 1.5% | |||
| MACOM Technology Solutions Holdings, Inc. (a) | 16,436 | 1,126,523 | |
| Taiwan Semiconductor Manufacturing Co. Ltd. | 575,638 | 9,439,494 | |
| 10,566,017 | |||
| Software - 7.3% | |||
| Systems Software - 7.3% | |||
| Fortinet, Inc. (a) | 219,978 | 13,075,492 | |
| Palo Alto Networks, Inc. (a) | 208,257 | 39,229,371 | |
| 52,304,863 | |||
| Technology Hardware, Storage & Peripherals - 38.0% | |||
| Technology Hardware, Storage & Peripherals - 38.0% | |||
| Apple, Inc. | 520,340 | 76,703,319 | |
| Dell Technologies, Inc. | 498,056 | 20,240,996 | |
| FUJIFILM Holdings Corp. | 641,207 | 29,923,464 | |
| HP, Inc. | 385,156 | 11,369,805 | |
| NetApp, Inc. | 194,824 | 12,575,889 | |
| Pure Storage, Inc. Class A (a) | 479,929 | 13,697,174 | |
| Samsung Electronics Co. Ltd. | 1,713,814 | 78,608,776 | |
| Seagate Technology Holdings PLC | 254,900 | 16,456,344 | |
| Western Digital Corp. (a) | 53,645 | 2,064,260 | |
| Xiaomi Corp. Class B (a)(c) | 7,172,333 | 10,836,990 | |
| 272,477,017 | |||
| TOTAL COMMON STOCKS (Cost $548,671,320) | 709,709,327 | ||
| Money Market Funds - 1.1% | |||
| Shares | Value ($) | ||
| Fidelity Cash Central Fund 4.63% (d) | 1,156,807 | 1,157,038 | |
| Fidelity Securities Lending Cash Central Fund 4.63% (d)(e) | 7,105,547 | 7,106,258 | |
| TOTAL MONEY MARKET FUNDS (Cost $8,263,296) | 8,263,296 | ||
| TOTAL INVESTMENT IN SECURITIES - 100.1% (Cost $556,934,616) | 717,972,623 |
NET OTHER ASSETS (LIABILITIES) - (0.1)% | (1,017,066) |
| NET ASSETS - 100.0% | 716,955,557 |
| (a) | Non-income producing |
| (b) | Security or a portion of the security is on loan at period end. |
| (c) | Security exempt from registration under Rule 144A of the Securities Act of 1933. These securities may be resold in transactions exempt from registration, normally to qualified institutional buyers. At the end of the period, the value of these securities amounted to $10,836,990 or 1.5% of net assets. |
| (d) | Affiliated fund that is generally available only to investment companies and other accounts managed by Fidelity Investments. The rate quoted is the annualized seven-day yield of the fund at period end. A complete unaudited listing of the fund's holdings as of its most recent quarter end is available upon request. In addition, each Fidelity Central Fund's financial statements, which are not covered by the Fund's Report of Independent Registered Public Accounting Firm, are available on the SEC's website or upon request. |
| (e) | Investment made with cash collateral received from securities on loan. |
| Affiliate | Value, beginning of period ($) | Purchases ($) | Sales Proceeds ($) | Dividend Income ($) | Realized Gain (loss) ($) | Change in Unrealized appreciation (depreciation) ($) | Value, end of period ($) | % ownership, end of period |
| Fidelity Cash Central Fund 4.63% | 2,163,365 | 92,787,582 | 93,793,909 | 32,376 | - | - | 1,157,038 | 0.0% |
| Fidelity Securities Lending Cash Central Fund 4.63% | 13,140,825 | 315,363,796 | 321,398,363 | 30,551 | - | - | 7,106,258 | 0.0% |
| Total | 15,304,190 | 408,151,378 | 415,192,272 | 62,927 | - | - | 8,263,296 | |
| Valuation Inputs at Reporting Date: | ||||
| Description | Total ($) | Level 1 ($) | Level 2 ($) | Level 3 ($) |
Investments in Securities: | ||||
| Common Stocks | 709,709,327 | 594,540,178 | 115,169,149 | - |
| Money Market Funds | 8,263,296 | 8,263,296 | - | - |
| Total Investments in Securities: | 717,972,623 | 602,803,474 | 115,169,149 | - |
| Statement of Assets and Liabilities | ||||
| February 28, 2023 | ||||
| Assets | ||||
| Investment in securities, at value (including securities loaned of $6,932,264) - See accompanying schedule: | ||||
Unaffiliated issuers (cost $548,671,320) | $ | 709,709,327 | ||
Fidelity Central Funds (cost $8,263,296) | 8,263,296 | |||
| Total Investment in Securities (cost $556,934,616) | $ | 717,972,623 | ||
| Receivable for investments sold | 25,313,555 | |||
| Receivable for fund shares sold | 89,325 | |||
| Dividends receivable | 999,140 | |||
| Distributions receivable from Fidelity Central Funds | 2,877 | |||
| Prepaid expenses | 1,913 | |||
| Other receivables | 164,687 | |||
Total assets | 744,544,120 | |||
| Liabilities | ||||
| Payable to custodian bank | $ | 8 | ||
| Payable for investments purchased | 19,256,645 | |||
| Payable for fund shares redeemed | 693,495 | |||
| Accrued management fee | 323,532 | |||
| Other affiliated payables | 114,945 | |||
| Other payables and accrued expenses | 93,680 | |||
| Collateral on securities loaned | 7,106,258 | |||
| Total Liabilities | 27,588,563 | |||
| Net Assets | $ | 716,955,557 | ||
| Net Assets consist of: | ||||
| Paid in capital | $ | 591,889,001 | ||
| Total accumulated earnings (loss) | 125,066,556 | |||
| Net Assets | $ | 716,955,557 | ||
Net Asset Value , offering price and redemption price per share ($716,955,557 ÷ 9,382,753 shares) | $ | 76.41 | ||
| Statement of Operations | ||||
Year ended February 28, 2023 | ||||
| Investment Income | ||||
| Dividends | $ | 10,933,240 | ||
| Income from Fidelity Central Funds (including $30,551 from security lending) | 62,927 | |||
| Total Income | 10,996,167 | |||
| Expenses | ||||
| Management fee | $ | 3,947,513 | ||
| Transfer agent fees | 1,185,743 | |||
| Accounting fees | 244,223 | |||
| Custodian fees and expenses | 32,436 | |||
| Independent trustees' fees and expenses | 2,590 | |||
| Registration fees | 27,625 | |||
| Audit | 52,187 | |||
| Legal | 3,971 | |||
| Interest | 909 | |||
| Miscellaneous | (7,289) | |||
| Total expenses before reductions | 5,489,908 | |||
| Expense reductions | (26,705) | |||
| Total expenses after reductions | 5,463,203 | |||
| Net Investment income (loss) | 5,532,964 | |||
| Realized and Unrealized Gain (Loss) | ||||
| Net realized gain (loss) on: | ||||
| Investment Securities: | ||||
| Unaffiliated issuers | (33,577,142) | |||
| Foreign currency transactions | (26,861) | |||
| Total net realized gain (loss) | (33,604,003) | |||
| Change in net unrealized appreciation (depreciation) on: | ||||
| Investment Securities: | ||||
| Unaffiliated issuers | (97,749,286) | |||
| Assets and liabilities in foreign currencies | (96,081) | |||
| Total change in net unrealized appreciation (depreciation) | (97,845,367) | |||
| Net gain (loss) | (131,449,370) | |||
| Net increase (decrease) in net assets resulting from operations | $ | (125,916,406) | ||
| Statement of Changes in Net Assets | ||||
Year ended February 28, 2023 | Year ended February 28, 2022 | |||
| Increase (Decrease) in Net Assets | ||||
| Operations | ||||
| Net investment income (loss) | $ | 5,532,964 | $ | 3,223,590 |
| Net realized gain (loss) | (33,604,003) | 173,943,867 | ||
| Change in net unrealized appreciation (depreciation) | (97,845,367) | (149,735,648) | ||
| Net increase (decrease) in net assets resulting from operations | (125,916,406) | 27,431,809 | ||
| Distributions to shareholders | (113,303,240) | (131,911,413) | ||
| Share transactions | ||||
| Proceeds from sales of shares | 40,943,701 | 125,851,574 | ||
| Net asset value of shares issued in exchange for the net assets of the Target Fund(s) (see Merger Information note) | - | 189,381,924 | ||
| Reinvestment of distributions | 107,418,146 | 125,862,871 | ||
| Cost of shares redeemed | (105,835,572) | (193,743,884) | ||
Net increase (decrease) in net assets resulting from share transactions | 42,526,275 | 247,352,485 | ||
| Total increase (decrease) in net assets | (196,693,371) | 142,872,881 | ||
| Net Assets | ||||
| Beginning of period | 913,648,928 | 770,776,047 | ||
| End of period | $ | 716,955,557 | $ | 913,648,928 |
| Other Information | ||||
| Shares | ||||
| Sold | 520,712 | 1,206,665 | ||
| Issued in exchange for the shares of the Target Fund(s) (see Merger Information note) | - | 1,755,160 | ||
| Issued in reinvestment of distributions | 1,242,912 | 1,142,875 | ||
| Redeemed | (1,384,081) | (1,819,249) | ||
| Net increase (decrease) | 379,543 | 2,285,451 | ||
| Tech Hardware Portfolio |
| Years ended February 28, | 2023 | 2022 | 2021 | 2020 A | 2019 | |||||
Selected Per-Share Data | ||||||||||
| Net asset value, beginning of period | $ | 101.48 | $ | 114.74 | $ | 78.64 | $ | 75.84 | $ | 92.81 |
| Income from Investment Operations | ||||||||||
Net investment income (loss) B,C | .57 | .42 | .93 D | 1.51 E | .81 | |||||
| Net realized and unrealized gain (loss) | (13.00) | 5.73 | 44.83 | 11.48 | (1.67) | |||||
| Total from investment operations | (12.43) | 6.15 | 45.76 | 12.99 | (.86) | |||||
| Distributions from net investment income | (.51) | (.73) F | (1.61) | (.77) | (.88) F | |||||
| Distributions from net realized gain | (12.13) | (18.68) F | (8.05) | (9.42) | (15.23) F | |||||
| Total distributions | (12.64) | (19.41) | (9.66) | (10.19) | (16.11) | |||||
| Net asset value, end of period | $ | 76.41 | $ | 101.48 | $ | 114.74 | $ | 78.64 | $ | 75.84 |
Total Return G | (13.62)% | 4.72% | 62.60% | 17.80% | .54% | |||||
Ratios to Average Net Assets C,H,I | ||||||||||
| Expenses before reductions | .73% | .72% J | .74% | .76% | .77% | |||||
| Expenses net of fee waivers, if any | .73% | .72% J | .74% | .76% | .77% | |||||
| Expenses net of all reductions | .73% | .72% J | .73% | .75% | .77% | |||||
| Net investment income (loss) | .74% | .38% J | 1.04% D | 1.95% E | .90% | |||||
| Supplemental Data | ||||||||||
| Net assets, end of period (000 omitted) | $ | 716,956 | $ | 913,649 | $ | 770,776 | $ | 533,793 | $ | 491,780 |
Portfolio turnover rate K | 30% | 99% L | 78% | 116% | 81% |
| Average Annual Total Returns | |||
Periods ended February 28, 2023 | Past 1 year | Past 5 years | Past 10 years |
| Technology Portfolio | -15.43% | 12.96% | 17.68% |
| $10,000 Over 10 Years |
Let's say hypothetically that $10,000 was invested in Technology Portfolio on February 28, 2013. The chart shows how the value of your investment would have changed, and also shows how the S&P 500® Index performed over the same period. |
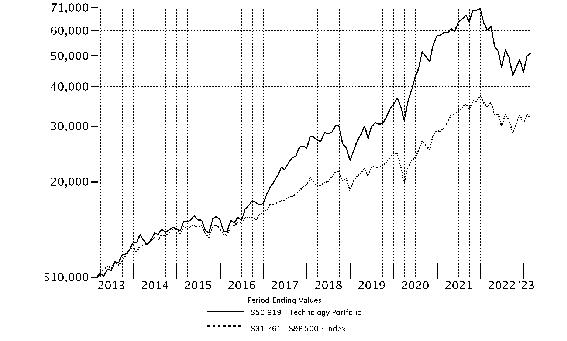 |
Top Holdings (% of Fund's net assets) | ||
| Apple, Inc. | 19.4 | |
| Microsoft Corp. | 15.4 | |
| NVIDIA Corp. | 8.6 | |
| MasterCard, Inc. Class A | 5.5 | |
| Marvell Technology, Inc. | 4.4 | |
| NXP Semiconductors NV | 4.2 | |
| onsemi | 3.4 | |
| Cisco Systems, Inc. | 3.4 | |
| Salesforce.com, Inc. | 2.8 | |
| GlobalFoundries, Inc. | 2.6 | |
| 69.7 | ||
| Industries (% of Fund's net assets) | ||
| Software | 29.2 | |
| Semiconductors & Semiconductor Equipment | 28.7 | |
| Technology Hardware, Storage & Peripherals | 19.4 | |
| IT Services | 12.1 | |
| Communications Equipment | 3.5 | |
| Internet & Direct Marketing Retail | 1.8 | |
| Hotels, Restaurants & Leisure | 1.3 | |
| Interactive Media & Services | 1.1 | |
| Entertainment | 1.0 | |
| Electronic Equipment & Components | 0.4 | |
| Chemicals | 0.3 | |
| Aerospace & Defense | 0.1 | |
| Diversified Financial Services | 0.1 | |
| Air Freight & Logistics | 0.0 | |
| Construction & Engineering | 0.0 | |
| Electrical Equipment | 0.0 | |
| Food Products | 0.0 | |
| Life Sciences Tools & Services | 0.0 | |
| Pharmaceuticals | 0.0 | |
Geographic Diversification (% of Fund's net assets) |
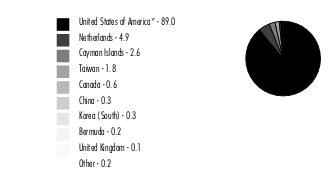 |
* Includes Short-Term investments and Net Other Assets (Liabilities). Percentages are based on country or territory of incorporation and are adjusted for the effect of derivatives, if applicable. |
| Common Stocks - 97.7% | |||
| Shares | Value ($) | ||
| Air Freight & Logistics - 0.0% | |||
| Air Freight & Logistics - 0.0% | |||
| Delhivery Private Ltd. | 579,000 | 2,421,228 | |
| Chemicals - 0.3% | |||
| Commodity Chemicals - 0.3% | |||
| LG Chemical Ltd. | 40,787 | 20,992,560 | |
| Communications Equipment - 3.4% | |||
| Communications Equipment - 3.4% | |||
| Cisco Systems, Inc. | 6,086,073 | 294,687,655 | |
| Diversified Financial Services - 0.1% | |||
| Other Diversified Financial Services - 0.1% | |||
| Ant International Co. Ltd. Class C (a)(b)(c) | 6,426,931 | 9,704,666 | |
| Electrical Equipment - 0.0% | |||
| Electrical Components & Equipment - 0.0% | |||
| ESS Tech, Inc. Class A (a) | 787,286 | 1,432,861 | |
| Electronic Equipment & Components - 0.4% | |||
| Electronic Manufacturing Services - 0.4% | |||
| Jabil, Inc. | 420,525 | 34,916,191 | |
| Entertainment - 1.0% | |||
| Movies & Entertainment - 1.0% | |||
| Netflix, Inc. (a) | 255,230 | 82,217,240 | |
| Food Products - 0.0% | |||
| Agricultural Products - 0.0% | |||
| Local Bounti Corp. (a) | 1,546,921 | 1,061,343 | |
| Hotels, Restaurants & Leisure - 1.3% | |||
| Hotels, Resorts & Cruise Lines - 1.3% | |||
| Airbnb, Inc. Class A (a) | 917,709 | 113,135,166 | |
| Interactive Media & Services - 0.8% | |||
| Interactive Media & Services - 0.8% | |||
| Epic Games, Inc. (a)(b)(c) | 17,917 | 13,365,544 | |
| Snap, Inc. Class A (a) | 5,762,510 | 58,489,477 | |
| 71,855,021 | |||
| Internet & Direct Marketing Retail - 1.8% | |||
| Internet & Direct Marketing Retail - 1.8% | |||
| Cazoo Group Ltd. (a)(b) | 144,100 | 16,211 | |
| Deliveroo PLC Class A (a)(d) | 6,252,898 | 6,220,114 | |
| Lyft, Inc. (a) | 1,718,528 | 17,185,280 | |
| Uber Technologies, Inc. (a) | 4,033,438 | 134,152,148 | |
| 157,573,753 | |||
| IT Services - 12.0% | |||
| Data Processing & Outsourced Services - 7.7% | |||
| Genpact Ltd. | 343,176 | 16,379,790 | |
| MasterCard, Inc. Class A | 1,331,380 | 473,026,000 | |
| Visa, Inc. Class A (e) | 794,787 | 174,805,453 | |
| 664,211,243 | |||
| Internet Services & Infrastructure - 4.2% | |||
| MongoDB, Inc. Class A (a) | 189,014 | 39,602,213 | |
| Okta, Inc. (a) | 2,587,535 | 184,465,370 | |
| Shopify, Inc. Class A (a)(e) | 944,500 | 38,856,730 | |
| Snowflake, Inc. (a) | 291,590 | 45,015,664 | |
| Twilio, Inc. Class A (a) | 740,765 | 49,786,816 | |
| 357,726,793 | |||
| IT Consulting & Other Services - 0.1% | |||
| Thoughtworks Holding, Inc. (a)(e) | 1,329,904 | 9,788,093 | |
TOTAL IT SERVICES | 1,031,726,129 | ||
| Life Sciences Tools & Services - 0.0% | |||
| Life Sciences Tools & Services - 0.0% | |||
| Eden Biologics, Inc. (a)(c) | 1,015,442 | 0 | |
| Pharmaceuticals - 0.0% | |||
| Pharmaceuticals - 0.0% | |||
| Chime Biologics Wuhan Co. Ltd. (a)(c) | 1,015,442 | 528,873 | |
| Semiconductors & Semiconductor Equipment - 28.3% | |||
| Semiconductor Equipment - 2.2% | |||
| ASML Holding NV (Netherlands) | 104,750 | 64,563,352 | |
| Teradyne, Inc. | 1,244,228 | 125,841,220 | |
| 190,404,572 | |||
| Semiconductors - 26.1% | |||
| GlobalFoundries, Inc. (a)(e) | 3,434,107 | 224,384,551 | |
| Marvell Technology, Inc. | 8,421,514 | 380,231,357 | |
| Microchip Technology, Inc. | 1,126,240 | 91,259,227 | |
| NVIDIA Corp. | 3,193,657 | 741,439,409 | |
| NXP Semiconductors NV | 2,053,522 | 366,512,607 | |
| onsemi (a) | 3,814,447 | 295,276,342 | |
| Renesas Electronics Corp. (a) | 1 | 13 | |
| Taiwan Semiconductor Manufacturing Co. Ltd. | 9,441,488 | 154,824,502 | |
| 2,253,928,008 | |||
TOTAL SEMICONDUCTORS & SEMICONDUCTOR EQUIPMENT | 2,444,332,580 | ||
| Software - 28.9% | |||
| Application Software - 9.9% | |||
| Algolia, Inc. (a)(b)(c) | 153,503 | 2,724,678 | |
| Bill Holdings, Inc. (a) | 566,500 | 47,942,895 | |
| CCC Intelligent Solutions Holdings, Inc. (a)(b) | 102,045 | 913,303 | |
| Cvent Holding Corp. (a)(b) | 1,099,667 | 7,983,582 | |
| Dynatrace, Inc. (a) | 1,209,000 | 51,418,770 | |
| HubSpot, Inc. (a)(e) | 181,476 | 70,205,805 | |
| Intuit, Inc. | 399,013 | 162,470,113 | |
| Nutanix, Inc. Class B (a)(d) | 72,872 | 2,058,634 | |
| Otonomo Technologies Ltd. (a) | 1,048,000 | 597,360 | |
| Paycom Software, Inc. (a) | 225,700 | 65,240,842 | |
| Salesforce.com, Inc. (a) | 1,489,452 | 243,689,242 | |
| Splunk, Inc. (a) | 1,894,900 | 194,227,250 | |
| Stripe, Inc. Class B (a)(b)(c) | 38,600 | 836,462 | |
| Zoom Video Communications, Inc. Class A (a) | 50,928 | 3,798,720 | |
| 854,107,656 | |||
| Systems Software - 19.0% | |||
| Microsoft Corp. | 5,344,986 | 1,333,146,408 | |
| Palo Alto Networks, Inc. (a)(e) | 342,900 | 64,592,073 | |
| ServiceNow, Inc. (a) | 448,100 | 193,655,377 | |
| Tenable Holdings, Inc. (a) | 1,161,072 | 51,354,215 | |
| 1,642,748,073 | |||
TOTAL SOFTWARE | 2,496,855,729 | ||
| Technology Hardware, Storage & Peripherals - 19.4% | |||
| Technology Hardware, Storage & Peripherals - 19.4% | |||
| Apple, Inc. | 11,352,450 | 1,673,464,655 | |
| IonQ, Inc. (a)(b) | 8,400 | 39,816 | |
| 1,673,504,471 | |||
| TOTAL COMMON STOCKS (Cost $6,417,296,934) | 8,436,945,466 | ||
| Preferred Stocks - 1.2% | |||
| Shares | Value ($) | ||
| Convertible Preferred Stocks - 1.1% | |||
| Aerospace & Defense - 0.1% | |||
| Aerospace & Defense - 0.1% | |||
| ABL Space Systems: | |||
| Series B(a)(b)(c) | 98,000 | 3,607,380 | |
| Series B2(a)(b)(c) | 74,989 | 2,723,600 | |
| 6,330,980 | |||
| Communications Equipment - 0.1% | |||
| Communications Equipment - 0.1% | |||
| Astranis Space Technologies Corp. Series C (a)(b)(c) | 605,440 | 9,911,053 | |
| Construction & Engineering - 0.0% | |||
| Construction & Engineering - 0.0% | |||
| Beta Technologies, Inc. Series A (a)(b)(c) | 72,591 | 5,525,627 | |
| Hotels, Restaurants & Leisure - 0.0% | |||
| Casinos & Gaming - 0.0% | |||
| Discord, Inc. Series I (a)(b)(c) | 1,300 | 438,555 | |
| Interactive Media & Services - 0.3% | |||
| Interactive Media & Services - 0.3% | |||
| ByteDance Ltd. Series E1 (a)(b)(c) | 70,707 | 14,055,137 | |
| Reddit, Inc.: | |||
| Series D(a)(b)(c) | 250,861 | 9,557,804 | |
| Series E(a)(b)(c) | 14,400 | 548,640 | |
| 24,161,581 | |||
| Semiconductors & Semiconductor Equipment - 0.3% | |||
| Semiconductor Equipment - 0.2% | |||
| Astera Labs, Inc.: | |||
| Series A(b)(c) | 351,532 | 3,125,119 | |
| Series B(b)(c) | 59,853 | 532,093 | |
| Series C(a)(b)(c) | 344,200 | 3,059,938 | |
| Series D(b)(c) | 1,443,456 | 12,832,324 | |
| 19,549,474 | |||
| Semiconductors - 0.1% | |||
| GaN Systems, Inc.: | |||
| Series F1(a)(b)(c) | 133,634 | 1,502,046 | |
| Series F2(a)(b)(c) | 70,564 | 793,139 | |
| Xsight Labs Ltd. Series D (a)(b)(c) | 281,500 | 2,046,505 | |
| 4,341,690 | |||
TOTAL SEMICONDUCTORS & SEMICONDUCTOR EQUIPMENT | 23,891,164 | ||
| Software - 0.3% | |||
| Application Software - 0.3% | |||
| Algolia, Inc. Series D (a)(b)(c) | 109,867 | 1,950,139 | |
| Bolt Technology OU Series E (a)(b)(c) | 40,842 | 5,109,528 | |
| Convoy, Inc. Series D (a)(b)(c) | 203,844 | 1,463,600 | |
| Databricks, Inc.: | |||
| Series G(a)(b)(c) | 45,012 | 2,392,388 | |
| Series H(a)(b)(c) | 174,018 | 9,249,057 | |
| Skyryse, Inc. Series B (a)(b)(c) | 121,800 | 2,448,180 | |
| Stripe, Inc. Series H (a)(b)(c) | 17,100 | 370,557 | |
| 22,983,449 | |||
| TOTAL CONVERTIBLE PREFERRED STOCKS | 93,242,409 | ||
| Nonconvertible Preferred Stocks - 0.1% | |||
| IT Services - 0.1% | |||
| Data Processing & Outsourced Services - 0.1% | |||
| Checkr, Inc. Series E (a)(c) | 711,000 | 9,335,430 | |
| Internet Services & Infrastructure - 0.0% | |||
| Gupshup, Inc. (a)(b)(c) | 257,284 | 4,263,196 | |
TOTAL IT SERVICES | 13,598,626 | ||
| TOTAL PREFERRED STOCKS (Cost $121,026,281) | 106,841,035 | ||
| Preferred Securities - 0.1% | |||
Principal Amount (f) | Value ($) | ||
| Semiconductors & Semiconductor Equipment - 0.1% | |||
| Semiconductors - 0.1% | |||
GaN Systems, Inc. 0% (b)(c)(g) (Cost $3,132,190) | 3,132,190 | 3,893,312 | |
| Money Market Funds - 3.4% | |||
| Shares | Value ($) | ||
| Fidelity Cash Central Fund 4.63% (h) | 107,643,928 | 107,665,457 | |
| Fidelity Securities Lending Cash Central Fund 4.63% (h)(i) | 184,951,697 | 184,970,192 | |
| TOTAL MONEY MARKET FUNDS (Cost $292,635,649) | 292,635,649 | ||
| TOTAL INVESTMENT IN SECURITIES - 102.4% (Cost $6,834,091,054) | 8,840,315,462 |
NET OTHER ASSETS (LIABILITIES) - (2.4)% | (204,169,127) |
| NET ASSETS - 100.0% | 8,636,146,335 |
| (a) | Non-income producing |
| (b) | Restricted securities (including private placements) - Investment in securities not registered under the Securities Act of 1933 (excluding 144A issues). At the end of the period, the value of restricted securities (excluding 144A issues) amounted to $136,983,179 or 1.6% of net assets. |
| (c) | Level 3 security |
| (d) | Security exempt from registration under Rule 144A of the Securities Act of 1933. These securities may be resold in transactions exempt from registration, normally to qualified institutional buyers. At the end of the period, the value of these securities amounted to $8,278,748 or 0.1% of net assets. |
| (e) | Security or a portion of the security is on loan at period end. |
| (f) | Amount is stated in United States dollars unless otherwise noted. |
| (g) | Security is perpetual in nature with no stated maturity date. |
| (h) | Affiliated fund that is generally available only to investment companies and other accounts managed by Fidelity Investments. The rate quoted is the annualized seven-day yield of the fund at period end. A complete unaudited listing of the fund's holdings as of its most recent quarter end is available upon request. In addition, each Fidelity Central Fund's financial statements, which are not covered by the Fund's Report of Independent Registered Public Accounting Firm, are available on the SEC's website or upon request. |
| (i) | Investment made with cash collateral received from securities on loan. |
| Additional information on each restricted holding is as follows: | ||
| Security | Acquisition Date | Acquisition Cost ($) |
| ABL Space Systems Series B | 3/24/21 | 4,413,489 |
| ABL Space Systems Series B2 | 10/22/21 | 5,098,960 |
| Algolia, Inc. | 10/27/21 | 4,489,203 |
| Algolia, Inc. Series D | 7/23/21 | 3,213,066 |
| Ant International Co. Ltd. Class C | 5/16/18 | 24,495,442 |
| Astera Labs, Inc. Series A | 5/17/22 | 3,574,905 |
| Astera Labs, Inc. Series B | 5/17/22 | 608,675 |
| Astera Labs, Inc. Series C | 8/24/21 | 1,157,132 |
| Astera Labs, Inc. Series D | 5/17/22 - 5/27/22 | 14,679,226 |
| Astranis Space Technologies Corp. Series C | 3/19/21 | 13,271,808 |
| Beta Technologies, Inc. Series A | 4/09/21 | 5,318,743 |
| Bolt Technology OU Series E | 1/03/22 | 10,610,609 |
| ByteDance Ltd. Series E1 | 11/18/20 | 7,747,662 |
| Cazoo Group Ltd. | 3/28/21 | 1,441,000 |
| CCC Intelligent Solutions Holdings, Inc. | 2/02/21 | 1,020,450 |
| Convoy, Inc. Series D | 10/30/19 | 2,760,048 |
| Cvent Holding Corp. | 7/23/21 | 10,996,670 |
| Databricks, Inc. Series G | 2/01/21 | 2,661,228 |
| Databricks, Inc. Series H | 8/31/21 | 12,787,562 |
| Discord, Inc. Series I | 9/15/21 | 715,812 |
| Epic Games, Inc. | 3/29/21 | 15,856,545 |
| GaN Systems, Inc. Series F1 | 11/30/21 | 1,133,216 |
| GaN Systems, Inc. Series F2 | 11/30/21 | 598,383 |
| GaN Systems, Inc. 0% | 11/30/21 | 3,132,190 |
| Gupshup, Inc. | 6/08/21 | 5,882,850 |
| IonQ, Inc. | 3/07/21 | 84,000 |
| Reddit, Inc. Series D | 2/04/19 | 5,440,247 |
| Reddit, Inc. Series E | 5/18/21 | 611,628 |
| Skyryse, Inc. Series B | 10/21/21 | 3,006,020 |
| Stripe, Inc. Class B | 5/18/21 | 1,548,955 |
| Stripe, Inc. Series H | 3/15/21 | 686,138 |
| Xsight Labs Ltd. Series D | 2/16/21 | 2,250,874 |
| Affiliate | Value, beginning of period ($) | Purchases ($) | Sales Proceeds ($) | Dividend Income ($) | Realized Gain (loss) ($) | Change in Unrealized appreciation (depreciation) ($) | Value, end of period ($) | % ownership, end of period |
| Fidelity Cash Central Fund 4.63% | 49,633,884 | 1,733,087,737 | 1,675,056,164 | 2,658,057 | - | - | 107,665,457 | 0.2% |
| Fidelity Securities Lending Cash Central Fund 4.63% | 122,541,953 | 1,423,893,857 | 1,361,465,618 | 2,582,296 | - | - | 184,970,192 | 0.6% |
| Total | 172,175,837 | 3,156,981,594 | 3,036,521,782 | 5,240,353 | - | - | 292,635,649 | |
| Valuation Inputs at Reporting Date: | ||||
| Description | Total ($) | Level 1 ($) | Level 2 ($) | Level 3 ($) |
Investments in Securities: | ||||
| Common Stocks | 8,436,945,466 | 8,190,397,376 | 219,387,867 | 27,160,223 |
| Preferred Stocks | 106,841,035 | - | - | 106,841,035 |
| Preferred Securities | 3,893,312 | - | - | 3,893,312 |
| Money Market Funds | 292,635,649 | 292,635,649 | - | - |
| Total Investments in Securities: | 8,840,315,462 | 8,483,033,025 | 219,387,867 | 137,894,570 |
| Net Unrealized Depreciation on Unfunded Commitments | (1,200,024) | - | - | (1,200,024) |
| Total | (1,200,024) | - | - | (1,200,024) |
| Investments in Securities: | |||
| Preferred Stocks | |||
| Beginning Balance | $ | 124,004,300 | |
| Net Realized Gain (Loss) on Investment Securities | - | ||
| Net Unrealized Gain (Loss) on Investment Securities | (36,026,071) | ||
| Cost of Purchases | 18,862,806 | ||
| Proceeds of Sales | - | ||
| Amortization/Accretion | - | ||
| Transfers into Level 3 | - | ||
| Transfers out of Level 3 | - | ||
| Ending Balance | $ | 106,841,035 | |
| The change in unrealized gain (loss) for the period attributable to Level 3 securities held at February 28, 2023 | $ | (36,026,071) | |
| Other Investments in Securities | |||
| Beginning Balance | $ | 39,422,488 | |
| Net Realized Gain (Loss) on Investment Securities | - | ||
| Net Unrealized Gain (Loss) on Investment Securities | (3,866,629) | ||
| Cost of Purchases | - | ||
| Proceeds of Sales | - | ||
| Amortization/Accretion | - | ||
| Transfers into Level 3 | - | ||
| Transfers out of Level 3 | (4,502,324) | ||
| Ending Balance | $ | 31,053,535 | |
| The change in unrealized gain (loss) for the period attributable to Level 3 securities held at February 28, 2023 | $ | (3,866,629) | |
| The information used in the above reconciliation represents fiscal year to date activity for any Investments in Securities identified as using Level 3 inputs at either the beginning or the end of the current fiscal period. Cost of purchases and proceeds of sales may include securities received and/or delivered through in-kind transactions. Transfers into Level 3 were attributable to a lack of observable market data resulting from decreases in market activity, decreases in liquidity, security restructurings or corporate actions. Transfers out of Level 3 were attributable to observable market data becoming available for those securities. Transfers in or out of Level 3 represent the beginning value of any Security or Instrument where a change in the pricing level occurred from the beginning to the end of the period. The cost of purchases and the proceeds of sales may include securities received or delivered through corporate actions or exchanges. Realized and unrealized gains (losses) disclosed in the reconciliation are included in Net Gain (Loss) on the Fund's Statement of Operations. | |||
| Statement of Assets and Liabilities | ||||
| February 28, 2023 | ||||
| Assets | ||||
| Investment in securities, at value (including securities loaned of $180,803,355) - See accompanying schedule: | ||||
Unaffiliated issuers (cost $6,541,455,405) | $ | 8,547,679,813 | ||
Fidelity Central Funds (cost $292,635,649) | 292,635,649 | |||
| Total Investment in Securities (cost $6,834,091,054) | $ | 8,840,315,462 | ||
| Receivable for fund shares sold | 4,409,228 | |||
| Dividends receivable | 4,879,928 | |||
| Distributions receivable from Fidelity Central Funds | 938,786 | |||
| Prepaid expenses | 24,655 | |||
| Other receivables | 342,599 | |||
Total assets | 8,850,910,658 | |||
| Liabilities | ||||
| Payable for investments purchased | $ | 17,209,602 | ||
| Unrealized depreciation on unfunded commitments | 1,200,024 | |||
| Payable for fund shares redeemed | 5,992,480 | |||
| Accrued management fee | 3,881,009 | |||
| Other affiliated payables | 1,152,024 | |||
| Other payables and accrued expenses | 374,184 | |||
| Collateral on securities loaned | 184,955,000 | |||
| Total Liabilities | 214,764,323 | |||
| Net Assets | $ | 8,636,146,335 | ||
| Net Assets consist of: | ||||
| Paid in capital | $ | 7,328,418,467 | ||
| Total accumulated earnings (loss) | 1,307,727,868 | |||
| Net Assets | $ | 8,636,146,335 | ||
Net Asset Value , offering price and redemption price per share ($8,636,146,335 ÷ 421,999,945 shares) | $ | 20.46 | ||
| Statement of Operations | ||||
Year ended February 28, 2023 | ||||
| Investment Income | ||||
| Dividends | $ | 57,756,235 | ||
| Income from Fidelity Central Funds (including $2,582,296 from security lending) | 5,240,353 | |||
| Total Income | 62,996,588 | |||
| Expenses | ||||
| Management fee | $ | 46,203,979 | ||
| Transfer agent fees | 13,443,610 | |||
| Accounting fees | 1,143,740 | |||
| Custodian fees and expenses | 96,152 | |||
| Independent trustees' fees and expenses | 30,287 | |||
| Registration fees | 67,039 | |||
| Audit | 63,544 | |||
| Legal | 27,413 | |||
| Interest | 9,648 | |||
| Miscellaneous | 53,572 | |||
| Total expenses before reductions | 61,138,984 | |||
| Expense reductions | (312,630) | |||
| Total expenses after reductions | 60,826,354 | |||
| Net Investment income (loss) | 2,170,234 | |||
| Realized and Unrealized Gain (Loss) | ||||
| Net realized gain (loss) on: | ||||
| Investment Securities: | ||||
| Unaffiliated issuers (net of foreign taxes of $768,639) | (393,835,641) | |||
| Foreign currency transactions | (256,128) | |||
| Total net realized gain (loss) | (394,091,769) | |||
| Change in net unrealized appreciation (depreciation) on: | ||||
| Investment Securities: | ||||
| Unaffiliated issuers (net of decrease in deferred foreign taxes of $423,278) | (1,343,016,204) | |||
| Unfunded commitments | (1,200,024) | |||
| Assets and liabilities in foreign currencies | (17,683) | |||
| Total change in net unrealized appreciation (depreciation) | (1,344,233,911) | |||
| Net gain (loss) | (1,738,325,680) | |||
| Net increase (decrease) in net assets resulting from operations | $ | (1,736,155,446) | ||
| Statement of Changes in Net Assets | ||||
Year ended February 28, 2023 | Year ended February 28, 2022 | |||
| Increase (Decrease) in Net Assets | ||||
| Operations | ||||
| Net investment income (loss) | $ | 2,170,234 | $ | (28,034,349) |
| Net realized gain (loss) | (394,091,769) | 942,930,071 | ||
| Change in net unrealized appreciation (depreciation) | (1,344,233,911) | (674,451,714) | ||
| Net increase (decrease) in net assets resulting from operations | (1,736,155,446) | 240,444,008 | ||
| Distributions to shareholders | (310,416,447) | (1,453,950,149) | ||
| Share transactions | ||||
| Proceeds from sales of shares | 1,126,004,874 | 2,156,919,710 | ||
| Reinvestment of distributions | 291,925,397 | 1,378,760,437 | ||
| Cost of shares redeemed | (1,789,000,437) | (3,254,727,729) | ||
Net increase (decrease) in net assets resulting from share transactions | (371,070,166) | 280,952,418 | ||
| Total increase (decrease) in net assets | (2,417,642,059) | (932,553,723) | ||
| Net Assets | ||||
| Beginning of period | 11,053,788,394 | 11,986,342,117 | ||
| End of period | $ | 8,636,146,335 | $ | 11,053,788,394 |
| Other Information | ||||
| Shares | ||||
| Sold | 54,722,947 | 76,869,741 | ||
| Issued in reinvestment of distributions | 12,438,232 | 49,764,669 | ||
| Redeemed | (88,698,413) | (118,513,597) | ||
| Net increase (decrease) | (21,537,234) | 8,120,813 | ||
| Technology Portfolio |
| Years ended February 28, | 2023 | 2022 | 2021 | 2020 A | 2019 B | |||||
Selected Per-Share Data | ||||||||||
| Net asset value, beginning of period | $ | 24.92 | $ | 27.53 | $ | 19.65 | $ | 15.45 | $ | 19.36 |
| Income from Investment Operations | ||||||||||
Net investment income (loss) C,D | .01 | (.06) | (.03) | .05 | .06 | |||||
| Net realized and unrealized gain (loss) | (3.76) | .83 | 12.98 | 4.52 | (.78) | |||||
| Total from investment operations | (3.75) | .77 | 12.95 | 4.57 | (.72) | |||||
| Distributions from net investment income | - | - | (.03) | (.05) | (.02) | |||||
| Distributions from net realized gain | (.71) | (3.38) | (5.04) | (.32) | (3.17) | |||||
| Total distributions | (.71) | (3.38) | (5.07) | (.37) | (3.19) | |||||
| Net asset value, end of period | $ | 20.46 | $ | 24.92 | $ | 27.53 | $ | 19.65 | $ | 15.45 |
Total Return E | (15.43)% | 1.91% | 69.87% | 29.57% | (3.03)% | |||||
Ratios to Average Net Assets D,F,G | ||||||||||
| Expenses before reductions | .70% | .67% | .69% | .71% | .72% | |||||
| Expenses net of fee waivers, if any | .69% | .67% | .69% | .71% | .72% | |||||
| Expenses net of all reductions | .69% | .67% | .68% | .71% | .71% | |||||
| Net investment income (loss) | .02% | (.23)% | (.13)% | .30% | .34% | |||||
| Supplemental Data | ||||||||||
| Net assets, end of period (000 omitted) | $ | 8,636,146 | $ | 11,053,788 | $ | 11,986,342 | $ | 6,558,578 | $ | 5,124,121 |
Portfolio turnover rate H | 24% | 87% | 107% | 32% I | 126% I |
| Fidelity Central Fund | Investment Manager | Investment Objective | Investment Practices | Expense Ratio A |
| Fidelity Money Market Central Funds | Fidelity Management & Research Company LLC (FMR) | Each fund seeks to obtain a high level of current income consistent with the preservation of capital and liquidity. | Short-term Investments | Less than .005% |
| Asset Type | Fair Value | Valuation Techniques | Unobservable Input | Amount or Range / Weighted Average | Impact to Valuation from an Increase in Input* |
| Equities | $ 134,001,258 | Market comparable | Enterprise value/Revenue multiple (EV/R) | 2.0 - 27.0 / 7.8 | Increase |
| Probability rate | 10.0% - 90.0% / 50.0% | Increase | |||
| Recovery value | Recovery value | $0.00 | Increase | ||
| Market approach | Transaction price | $8.00 | Increase | ||
| Discount rate | 10.0% - 75.0% / 23.3% | Decrease | |||
| Book value | Book value multiple | 1.5 | Increase | ||
| Black scholes | Discount rate | 4.4% - 5.1% / 4.4% | Increase | ||
| Volatility | 50.0% - 70.0% / 59.1% | Increase | |||
| Term | 3.0 | Increase | |||
| Preferred Securities | $ 3,893,312 | Market comparable | Enterprise value/Revenue multiple (EV/R) | 4.8 | Increase |
| Probability rate | 10.0% - 90.0% / 50.0% | Increase | |||
| Discounted cash flow | Discount rate | 20.0% | Decrease | ||
| Semiconductors Portfolio | $196,560 |
| Software and IT Services Portfolio | 339,198 |
| Tech Hardware Portfolio | 55,276 |
| Technology Portfolio | 321,941 |
| Tax cost | Gross unrealized appreciation | Gross unrealized depreciation | Net unrealized appreciation (depreciation) | |
| IT Services Portfolio | $1,738,302,243 | $973,338,499 | $(85,038,054) | $888,300,445 |
| Semiconductors Portfolio | 4,849,603,565 | 3,089,541,700 | (286,392,325) | 2,803,149,375 |
| Software and IT Services Portfolio | 5,008,527,304 | 4,366,734,373 | (723,310,069) | 3,643,424,304 |
| Tech Hardware Portfolio | 559,924,495 | 198,184,592 | (40,136,464) | 158,048,128 |
| Technology Portfolio | 6,846,325,356 | 2,946,928,650 | (954,138,568) | 1,992,790,082 |
| Undistributed ordinary income | Undistributed long-term capital gain | Capital loss carryforward | Net unrealized appreciation (depreciation) on securities and other investments | |
| IT Services Portfolio | $75,637 | $- | $(3,381,994) | $888,289,073 |
| Semiconductors Portfolio | - | 18,819,797 | - | 2,803,148,951 |
| Software and IT Services Portfolio | - | 8,753,117 | - | 3,643,320,946 |
| Tech Hardware Portfolio | 46,604 | - | (32,807,843) | 157,882,936 |
| Technology Portfolio | 457,501 | - | (685,498,878) | 1,992,769,245 |
Short-term | Long-term | Total capital loss carryforward | |
| IT Services Portfolio | $ (3,381,994) | $- | $(3,381,994) |
| Tech Hardware Portfolio | (32,807,843) | - | (32,807,843) |
| Technology Portfolio | (685,498,878) | - | (685,498,878) |
Ordinary losses | |
| Semiconductors Portfolio | $ (1,191,014) |
| February 28, 2023 | |||
| Ordinary Income | Long-term Capital Gains | Total | |
| IT Services Portfolio | $469,696 | $302,093,148 | $302,562,844 |
| Semiconductors Portfolio | 10,523,254 | 391,193,651 | 401,716,905 |
| Software and IT Services Portfolio | - | 738,727,367 | 738,727,367 |
| Tech Hardware Portfolio | 20,911,542 | 92,391,698 | 113,303,240 |
| Technology Portfolio | - | 310,416,447 | 310,416,447 |
| February 28, 2022 | |||
| Ordinary Income | Long-term Capital Gains | Total | |
| IT Services Portfolio | $89,426,516 | $439,120,500 | $528,547,016 |
| Semiconductors Portfolio | 136,166,549 | 477,772,748 | 613,939,297 |
| Software and IT Services Portfolio | 148,809,597 | 683,045,141 | 831,854,738 |
| Tech Hardware Portfolio | 37,057,085 | 94,854,328 | 131,911,413 |
| Technology Portfolio | 859,319,443 | 594,630,706 | 1,453,950,149 |
| Investment to be Acquired | Commitment Amount | Unrealized Appreciation (Depreciation) | |
| Technology Portfolio | Stripe, Inc. | $5,314,677 | $(1,200,024) |
| Purchases ($) | Sales ($) | |
| IT Services Portfolio | 983,282,408 | 1,437,682,922 |
| Semiconductors Portfolio | 2,381,302,565 | 2,927,312,423 |
| Software and IT Services Portfolio | 341,353,392 | 1,132,149,141 |
| Tech Hardware Portfolio | 223,681,637 | 287,440,407 |
| Technology Portfolio | 2,115,636,482 | 2,859,365,864 |
| Individual Rate | Group Rate | Total | |
| IT Services Portfolio | .30% | .23% | .53% |
| Semiconductors Portfolio | .30% | .23% | .53% |
| Software and IT Services Portfolio | .30% | .23% | .53% |
| Tech Hardware Portfolio | .30% | .23% | .53% |
| Technology Portfolio | .30% | .23% | .53% |
| IT Services Portfolio | .17% |
| Semiconductors Portfolio | .15% |
| Software and IT Services Portfolio | .15% |
| Tech Hardware Portfolio | .16% |
| Technology Portfolio | .15% |
| % of Average Net Assets | |
| IT Services Portfolio | .03 |
| Semiconductors Portfolio | .02 |
| Software and IT Services Portfolio | .01 |
| Tech Hardware Portfolio | .03 |
| Technology Portfolio | .01 |
| Amount | |
| IT Services Portfolio | $19,984 |
| Semiconductors Portfolio | 40,277 |
| Software and IT Services Portfolio | 3,703 |
| Tech Hardware Portfolio | 4,077 |
| Technology Portfolio | 36,136 |
| Borrower or Lender | Average Loan Balance | Weighted Average Interest Rate | Interest Expense | |
| IT Services Portfolio | Borrower | $ 17,631,241 | 2.92% | $41,435 |
| Semiconductors Portfolio | Borrower | $ 8,964,125 | .53% | $1,055 |
| Software and IT Services Portfolio | Borrower | $8,280,488 | 1.01% | $9,488 |
| Tech Hardware Portfolio | Borrower | $ 3,681,200 | 1.77% | $909 |
| Technology Portfolio | Borrower | $ 16,161,739 | .93% | $9,648 |
| Purchases ($) | Sales ($) | Realized Gain (Loss) ($) | |
| IT Services Portfolio | 31,077,881 | 76,153,255 | (690,812) |
| Semiconductors Portfolio | 111,712,341 | 121,010,887 | 2,197,167 |
| Software and IT Services Portfolio | 23,280,151 | 44,367,174 | 7,835,662 |
| Tech Hardware Portfolio | 14,375,817 | 22,597,081 | (2,545,888) |
| Technology Portfolio | 114,426,024 | 176,817,279 | 9,071,230 |
| Amount | |
| IT Services Portfolio | $4,360 |
| Semiconductors Portfolio | 12,582 |
| Software and IT Services Portfolio | 17,368 |
| Tech Hardware Portfolio | 1,402 |
| Technology Portfolio | 16,563 |
| Total Security Lending Fees Paid to NFS | Security Lending Income From Securities Loaned to NFS | Value of Securities Loaned to NFS at Period End | |
| IT Services Portfolio | $41,259 | $27,718 | $- |
| Semiconductors Portfolio | $583,078 | $31,408 | $19,595,466 |
| Software and IT Services Portfolio | $2,728 | $- | $- |
| Tech Hardware Portfolio | $3,108 | $- | $- |
| Technology Portfolio | $273,611 | $137,207 | $- |
| Average Loan Balance | Weighted Average Interest Rate | Interest Expense | |
| IT Services Portfolio | $36,272,500 | 3.87% | $15,613 |
| Software and IT Services Portfolio | $ 2,098,500 | .83% | $194 |
| Custodian credits | |
| Semiconductors Portfolio | $627 |
| Software and IT Services Portfolio | 4,655 |
| Technology Portfolio | 18 |
| Amount | |
| IT Services Portfolio | $82,130 |
| Semiconductors Portfolio | 241,721 |
| Software and IT Services Portfolio | 329,309 |
| Tech Hardware Portfolio | 26,705 |
| Technology Portfolio | 312,612 |
| Target Fund | Investments $ | Unrealized appreciation (depreciation) $ | Net Assets $ | Shares Exchanged | Shares Exchanged Ratio |
| Communications Equipment Portfolio | 187,085,638 | 75,879,300 | 189,381,924 | 1,755,160 | .4176867470 |
| Surviving Fund | Net Assets $ | Total net assets after the acquisition $ |
| Tech Hardware Portfolio | 798,971,790 | 988,353,714 |
| Net investment income (loss) | $3,770,342 |
| Total net realized gain (loss) | 191,061,539 |
| Total change in net unrealized appreciation (depreciation) | (130,804,365) |
| Net increase (decrease) in net assets resulting from operations | $64,027,516 |
| The Example is based on an investment of $1,000 invested at the beginning of the period and held for the entire period (September 1, 2022 to February 28, 2023). |
Annualized Expense Ratio- A | Beginning Account Value September 1, 2022 | Ending Account Value February 28, 2023 | Expenses Paid During Period- C September 1, 2022 to February 28, 2023 | |||||||
| IT Services Portfolio | .74% | |||||||||
| Actual | $ 1,000 | $ 1,002.40 | $ 3.67 | |||||||
Hypothetical- B | $ 1,000 | $ 1,021.12 | $ 3.71 | |||||||
| Semiconductors Portfolio | .70% | |||||||||
| Actual | $ 1,000 | $ 1,204.40 | $ 3.83 | |||||||
Hypothetical- B | $ 1,000 | $ 1,021.32 | $ 3.51 | |||||||
| Software and IT Services Portfolio | .69% | |||||||||
| Actual | $ 1,000 | $ 1,002.60 | $ 3.43 | |||||||
Hypothetical- B | $ 1,000 | $ 1,021.37 | $ 3.46 | |||||||
| Tech Hardware Portfolio | .74% | |||||||||
| Actual | $ 1,000 | $ 1,028.20 | $ 3.72 | |||||||
Hypothetical- B | $ 1,000 | $ 1,021.12 | $ 3.71 | |||||||
| Technology Portfolio | .70% | |||||||||
| Actual | $ 1,000 | $ 1,031.30 | $ 3.53 | |||||||
Hypothetical- B | $ 1,000 | $ 1,021.32 | $ 3.51 | |||||||
| Semiconductors Portfolio | $135,817,674 |
| Software and IT Services Portfolio | $378,238,151 |
| April 2022 | December 2022 | |
| IT Services Portfolio | - | 100% |
| Semiconductors Portfolio | - | 100% |
| Tech Hardware Portfolio | 6% | 97% |
| April 2022 | December 2022 | |
| IT Services Portfolio | - | 100% |
| Semiconductors Portfolio | - | 100% |
| Tech Hardware Portfolio | 4.13% | 100% |
| April 2022 | December 2022 | |
| Tech Hardware Portfolio | 99.97% | - |
- Highly liquid investments - cash or convertible to cash within three business days or less
- Moderately liquid investments - convertible to cash in three to seven calendar days
- Less liquid investments - can be sold or disposed of, but not settled, within seven calendar days
- Illiquid investments - cannot be sold or disposed of within seven calendar days
 |
Item 2.
Code of Ethics
As of the end of the period, February 28, 2023, Fidelity Select Portfolios (the trust) has adopted a code of ethics, as defined in Item 2 of Form N-CSR, that applies to its President and Treasurer and its Chief Financial Officer. A copy of the code of ethics is filed as an exhibit to this Form N-CSR.
Item 3.
Audit Committee Financial Expert
The Board of Trustees of the trust has determined that Donald F. Donahue is an audit committee financial expert, as defined in Item 3 of Form N-CSR. Mr. Donahue is independent for purposes of Item 3 of Form N-CSR.
Item 4.
Principal Accountant Fees and Services
Fees and Services
The following table presents fees billed by PricewaterhouseCoopers LLP (“PwC”) in each of the last two fiscal years for services rendered to Automotive Portfolio, Banking Portfolio, Biotechnology Portfolio, Brokerage and Investment Management Portfolio, Chemicals Portfolio, Communication Services Portfolio, Construction and Housing Portfolio, Consumer Discretionary Portfolio, Consumer Staples Portfolio, Defense and Aerospace Portfolio, Energy Portfolio, Fidelity Environment and Alternative Energy Fund, Fidelity Natural Resources Fund, Financial Services Portfolio, FinTech Portfolio, Gold Portfolio, Health Care Portfolio, Health Care Services Portfolio, Industrials Portfolio, Insurance Portfolio, IT Services Portfolio, Leisure Portfolio, Materials Portfolio, Medical Technology and Devices Portfolio, Pharmaceuticals Portfolio, Retailing Portfolio, Semiconductors Portfolio, Software and IT Services Portfolio, Tech Hardware Portfolio, Technology Portfolio, Telecommunications Portfolio, Transportation Portfolio, Utilities Portfolio and Wireless Portfolio (the “Funds”):
Services Billed by PwC
February 28, 2023 FeesA
Audit Fees | Audit-Related Fees | Tax Fees | All Other Fees | |
Automotive Portfolio | $28,900 | $2,600 | $6,800 | $900 |
Banking Portfolio | $29,100 | $2,600 | $6,800 | $900 |
Biotechnology Portfolio | $82,500 | $6,400 | $19,600 | $2,200 |
Brokerage and Investment Management Portfolio | $29,300 | $2,600 | $7,600 | $900 |
Chemicals Portfolio | $28,700 | $2,500 | $7,600 | $900 |
Communication Services Portfolio | $34,600 | $3,000 | $6,800 | $1,000 |
Construction and Housing Portfolio | $28,500 | $2,500 | $6,800 | $900 |
Consumer Discretionary Portfolio | $28,700 | $2,500 | $6,800 | $900 |
Consumer Staples Portfolio | $35,000 | $3,000 | $7,000 | $1,000 |
Defense and Aerospace Portfolio | $29,300 | $2,600 | $6,800 | $900 |
Energy Portfolio | $32,900 | $2,600 | $12,100 | $900 |
Fidelity Environment and Alternative Energy Fund | $28,700 | $2,500 | $6,800 | $900 |
Fidelity Natural Resources Fund | $28,200 | $2,500 | $7,600 | $900 |
Financial Services Portfolio | $29,800 | $2,600 | $7,600 | $900 |
FinTech Portfolio | $29,300 | $2,600 | $6,800 | $900 |
Gold Portfolio | $50,200 | $4,600 | $15,300 | $1,600 |
Health Care Portfolio | $41,500 | $3,500 | $7,400 | $1,200 |
Health Care Services Portfolio | $28,900 | $2,600 | $6,800 | $900 |
Industrials Portfolio | $28,700 | $2,500 | $6,800 | $900 |
Insurance Portfolio | $29,300 | $2,600 | $6,800 | $900 |
IT Services Portfolio | $29,500 | $2,600 | $8,200 | $900 |
Leisure Portfolio | $29,300 | $2,600 | $6,800 | $900 |
Materials Portfolio | $35,000 | $3,000 | $6,800 | $1,000 |
Medical Technology and Devices Portfolio | $28,900 | $2,600 | $6,800 | $900 |
Pharmaceuticals Portfolio | $28,700 | $2,500 | $6,800 | $900 |
Retailing Portfolio | $29,300 | $2,600 | $6,800 | $900 |
Semiconductors Portfolio | $29,500 | $2,600 | $8,900 | $900 |
Software and IT Services Portfolio | $28,500 | $2,500 | $7,600 | $900 |
Tech Hardware Portfolio | $32,800 | $2,600 | $8,900 | $900 |
Technology Portfolio | $33,300 | $2,900 | $8,200 | $1,000 |
Telecommunications Portfolio | $34,400 | $3,000 | $6,800 | $1,000 |
Transportation Portfolio | $31,900 | $2,600 | $8,900 | $900 |
Utilities Portfolio | $29,400 | $2,600 | $6,800 | $900 |
Wireless Portfolio | $28,200 | $2,500 | $6,800 | $900 |
February 28, 2022 FeesA
Automotive Portfolio | $27,700 | $2,700 | $6,500 | $900 |
Banking Portfolio | $27,800 | $2,700 | $6,500 | $900 |
Biotechnology Portfolio | $78,600 | $5,400 | $18,700 | $1,800 |
Brokerage and Investment Management Portfolio | $28,100 | $2,800 | $7,300 | $900 |
Chemicals Portfolio | $27,500 | $2,700 | $6,500 | $900 |
Communication Services Portfolio | $33,200 | $3,200 | $6,500 | $1,000 |
Construction and Housing Portfolio | $27,300 | $2,700 | $6,500 | $900 |
Consumer Discretionary Portfolio | $27,500 | $2,700 | $6,500 | $900 |
Consumer Staples Portfolio | $33,500 | $3,200 | $7,400 | $1,000 |
Defense and Aerospace Portfolio | $28,100 | $2,800 | $7,200 | $900 |
Energy Portfolio | $34,600 | $2,800 | $7,600 | $900 |
Fidelity Environment and Alternative Energy Fund | $27,500 | $2,700 | $7,400 | $900 |
Fidelity Natural Resources Fund | $27,100 | $2,700 | $7,300 | $900 |
Financial Services Portfolio | $28,500 | $2,800 | $7,300 | $900 |
FinTech Portfolio | $28,100 | $2,800 | $6,500 | $900 |
Gold Portfolio | $47,900 | $4,900 | $13,400 | $1,600 |
Health Care Portfolio | $39,700 | $3,700 | $7,400 | $1,200 |
Health Care Services Portfolio | $27,700 | $2,700 | $6,500 | $900 |
Industrials Portfolio | $27,500 | $2,700 | $7,400 | $900 |
Insurance Portfolio | $28,100 | $2,800 | $6,500 | $900 |
IT Services Portfolio | $28,200 | $2,800 | $6,500 | $900 |
Leisure Portfolio | $28,100 | $2,800 | $7,400 | $900 |
Materials Portfolio | $33,500 | $3,200 | $6,500 | $1,000 |
Medical Technology and Devices Portfolio | $27,700 | $2,700 | $7,400 | $900 |
Pharmaceuticals Portfolio | $27,500 | $2,700 | $7,200 | $900 |
Retailing Portfolio | $28,100 | $2,800 | $6,500 | $900 |
Semiconductors Portfolio | $28,200 | $2,800 | $6,500 | $900 |
Software and IT Services Portfolio | $27,300 | $2,700 | $7,400 | $900 |
Tech Hardware Portfolio | $34,500 | $2,800 | $6,500 | $900 |
Technology Portfolio | $31,900 | $3,100 | $7,400 | $1,000 |
Telecommunications Portfolio | $33,000 | $3,100 | $6,500 | $1,000 |
Transportation Portfolio | $33,700 | $2,700 | $6,500 | $900 |
Utilities Portfolio | $28,100 | $2,800 | $7,300 | $900 |
Wireless Portfolio | $27,100 | $2,700 | $6,500 | $900 |
A Amounts may reflect rounding.
The following table(s) present(s) fees billed by PwC that were required to be approved by the Audit Committee for services that relate directly to the operations and financial reporting of the Fund(s) and that are rendered on behalf of Fidelity Management & Research Company LLC ("FMR") and entities controlling, controlled by, or under common control with FMR (not including any sub-adviser whose role is primarily
portfolio management and is subcontracted with or overseen by another investment adviser) that provide ongoing services to the Fund(s) (“Fund Service Providers”):
Services Billed by PwC
February 28, 2023A | February 28, 2022A | |
Audit-Related Fees | $7,914,600 | $8,239,800 |
Tax Fees | $1,000 | $354,200 |
All Other Fees | $- | $- |
A Amounts may reflect rounding.
“Audit-Related Fees” represent fees billed for assurance and related services that are reasonably related to the performance of the fund audit or the review of the fund's financial statements and that are not reported under Audit Fees.
“Tax Fees” represent fees billed for tax compliance, tax advice or tax planning that relate directly to the operations and financial reporting of the fund.
“All Other Fees” represent fees billed for services provided to the fund or Fund Service Provider, a significant portion of which are assurance related, that relate directly to the operations and financial reporting of the fund, excluding those services that are reported under Audit Fees, Audit-Related Fees or Tax Fees.
Assurance services must be performed by an independent public accountant.
* * *
The aggregate non-audit fees billed by PwC for services rendered to the Fund(s), FMR (not including any sub-adviser whose role is primarily portfolio management and is subcontracted with or overseen by another investment adviser), and any Fund Service Provider for each of the last two fiscal years of the Fund(s) are as follows:
Billed By | February 28, 2023A | February 28, 2022A |
PwC | $13,284,200 | $14,223,900 |
A Amounts may reflect rounding.
The trust's Audit Committee has considered non-audit services that were not pre-approved that were provided by PwC to Fund Service Providers to be compatible with maintaining the independence of PwC in its(their) audit of the Fund(s), taking into account representations from PwC, in accordance with Public Company Accounting
Oversight Board rules, regarding its independence from the Fund(s) and its(their) related entities and FMR’s review of the appropriateness and permissibility under applicable law of such non-audit services prior to their provision to the Fund(s) Service Providers.
Audit Committee Pre-Approval Policies and Procedures
The trust’s Audit Committee must pre-approve all audit and non-audit services provided by a fund’s independent registered public accounting firm relating to the operations or financial reporting of the fund. Prior to the commencement of any audit or non-audit services to a fund, the Audit Committee reviews the services to determine whether they are appropriate and permissible under applicable law.
The Audit Committee has adopted policies and procedures to, among other purposes, provide a framework for the Committee’s consideration of non-audit services by the audit firms that audit the Fidelity funds. The policies and procedures require that any non-audit service provided by a fund audit firm to a Fidelity fund and any non-audit service provided by a fund auditor to a Fund Service Provider that relates directly to the operations and financial reporting of a Fidelity fund (“Covered Service”) are subject to approval by the Audit Committee before such service is provided.
All Covered Services must be approved in advance of provision of the service either: (i) by formal resolution of the Audit Committee, or (ii) by oral or written approval of the service by the Chair of the Audit Committee (or if the Chair is unavailable, such other member of the Audit Committee as may be designated by the Chair to act in the Chair’s absence). The approval contemplated by (ii) above is permitted where the Treasurer determines that action on such an engagement is necessary before the next meeting of the Audit Committee.
Non-audit services provided by a fund audit firm to a Fund Service Provider that do not relate directly to the operations and financial reporting of a Fidelity fund are reported to the Audit Committee periodically.
Non-Audit Services Approved Pursuant to Rule 2-01(c)(7)(i)(C) and (ii) of Regulation S-X (“De Minimis Exception”)
There were no non-audit services approved or required to be approved by the Audit Committee pursuant to the De Minimis Exception during the Fund’s(s’) last two fiscal years relating to services provided to (i) the Fund(s) or (ii) any Fund Service Provider that relate directly to the operations and financial reporting of the Fund(s).
Item 5.
Audit Committee of Listed Registrants
Not applicable.
Item 6.
Investments
(a)
Not applicable.
(b)
Not applicable.
Item 7.
Disclosure of Proxy Voting Policies and Procedures for Closed-End Management Investment Companies
Not applicable.
Item 8.
Portfolio Managers of Closed-End Management Investment Companies
Not applicable.
Item 9.
Purchase of Equity Securities by Closed-End Management Investment Company and Affiliated Purchasers
Not applicable.
Item 10.
Submission of Matters to a Vote of Security Holders
There were no material changes to the procedures by which shareholders may recommend nominees to the trust’s Board of Trustees.
Item 11.
Controls and Procedures
(a)(i) The President and Treasurer and the Chief Financial Officer have concluded that the trust’s disclosure controls and procedures (as defined in Rule 30a-3(c) under the Investment Company Act) provide reasonable assurances that material information relating to the trust is made known to them by the appropriate persons, based on their evaluation of these controls and procedures as of a date within 90 days of the filing date of this report.
(a)(ii) There was no change in the trust’s internal control over financial reporting (as defined in Rule 30a-3(d) under the Investment Company Act) that occurred during the period covered by this report that has materially affected, or is reasonably likely to materially affect, the trust’s internal control over financial reporting.
Item 12.
Disclosure of Securities Lending Activities for Closed-End Management
Investment Companies
Not applicable.
Item 13.
Exhibits
(a) | (1) | Code of Ethics pursuant to Item 2 of Form N-CSR is filed and attached hereto as EX-99.CODE ETH. |
(a) | (2) | |
(a) | (3) | Not applicable. |
(b) |
SIGNATURES
Pursuant to the requirements of the Securities Exchange Act of 1934 and the Investment Company Act of 1940, the registrant has duly caused this report to be signed on its behalf by the undersigned, thereunto duly authorized.
Fidelity Select Portfolios
By: | /s/Stacie M. Smith |
Stacie M. Smith | |
President and Treasurer | |
Date: | April 20, 2023 |
Pursuant to the requirements of the Securities Exchange Act of 1934 and the Investment Company Act of 1940, this report has been signed below by the following persons on behalf of the registrant and in the capacities and on the dates indicated.
By: | /s/Stacie M. Smith |
Stacie M. Smith | |
President and Treasurer | |
Date: | April 20, 2023 |
By: | /s/John J. Burke III |
John J. Burke III | |
Chief Financial Officer | |
Date: | April 20, 2023 |