 Jefferies & Company September 23, 2009 (NYSE AMEX: PDC) www.pioneerdrlg.com Exhibit 99.1 |
 2 Forward-looking Statements This presentation contains various forward-looking statements and information that are based on management’s current expectations and assumptions about future events. Forward-looking statements are generally accompanied by words such as “estimate,” “project,” “predict,” “expect,” “anticipate,” “plan,” “intend,” “seek,” “will,” “should,” “goal,” and other words that convey the uncertainty of future events and outcomes. Forward-looking information includes , among other matters, statements regarding the Company’s anticipated growth, quality of assets, rig utilization rate, capital spending by oil and gas companies, production rates, the Company's growth strategy, and the Company's international operations. Although the Company believes that the expectations and assumptions reflected in such forward-looking statements are reasonable, it can give no assurance that such expectations and assumptions will prove to have been correct. Such statements are subject to certain risks, uncertainties and assumptions, including, among others: general and regional economic conditions and industry trends; the continued strength of the contract land drilling industry in the geographic areas where the Company operates; decisions about onshore exploration and development projects to be made by oil and gas companies; the highly competitive nature of the contract land drilling business; the Company’s future financial performance, including availability, terms and deployment of capital; the continued availability of qualified personnel; changes in governmental regulations, including those relating to the environment; the political, economic and other uncertainties encountered in the Company's international operations and other risks, contingencies and uncertainties, most of which are difficult to predict and many of which are beyond our control. Should one or more of these risks, contingencies or uncertainties materialize, or should underlying assumptions prove incorrect, actual results may vary materially from those expected. Many of these factors have been discussed in more detail in the Company's annual report on Form 10-K for the fiscal year ended December 31, 2008 and quarterly reports on Form 10Q for the quarters ended June 30, 2009. Unpredictable or unknown factors that the Company has not discussed in this presentation or in its filings with the Securities and Exchange Commission could also have material adverse effects on actual results of matters that are the subject of the forward-looking statements. All forward-looking statements speak only as the date on which they are made and the Company undertakes no duty to update or revise any forward-looking statements. We advise our shareholders to use caution and common sense when considering our forward looking statements. |
 3 Pioneer Overview Ticker Symbol NYSE AMEX US: PDC Market Cap (9/18/09) $333 million Stock Price (9/18/09) $6.61 Average daily trading volume approximately 276,000 shares Public float approximately 50 million shares Employees 1,200 Headquarters San Antonio, Texas |
 Company Profile Drilling Services – 71 high-quality drilling rigs capable of drilling 6,000- 25,000 feet Production Services – 74 workover rigs, 61 wireline units, $15 million of fishing & rental tools 4 |
 5 Balanced Business Mix, Focus on Returns Pioneer is a multi-faceted energy services provider Modern, high-quality drilling and well services fleet provides a competitive advantage in up and down markets – Over 80% of drilling rig fleet is new or upgraded since 2001 – Newest, premium workover rig fleet in the U.S. Production Services offers business diversification, strong margins Geographic diversification – Broad reach in most prolific U.S. oil and gas plays – Successful international operations in Colombia – Exploring other expansion opportunities in Latin America |
 6 Strategic Growth Initiatives Disciplined program of acquisitions and new-builds – Acquired 39 drilling rigs through 9 acquisitions – Built 31 drilling rigs, with the newest 2000- horsepower rig delivered in May 2009 International Expansion – September 2007 – Launched land drilling operations in Latin America Oilfield Services Diversification – March 2008 – Formed Production Services Division through the $340 million acquisition of WEDGE Companies and Competition Wireline |
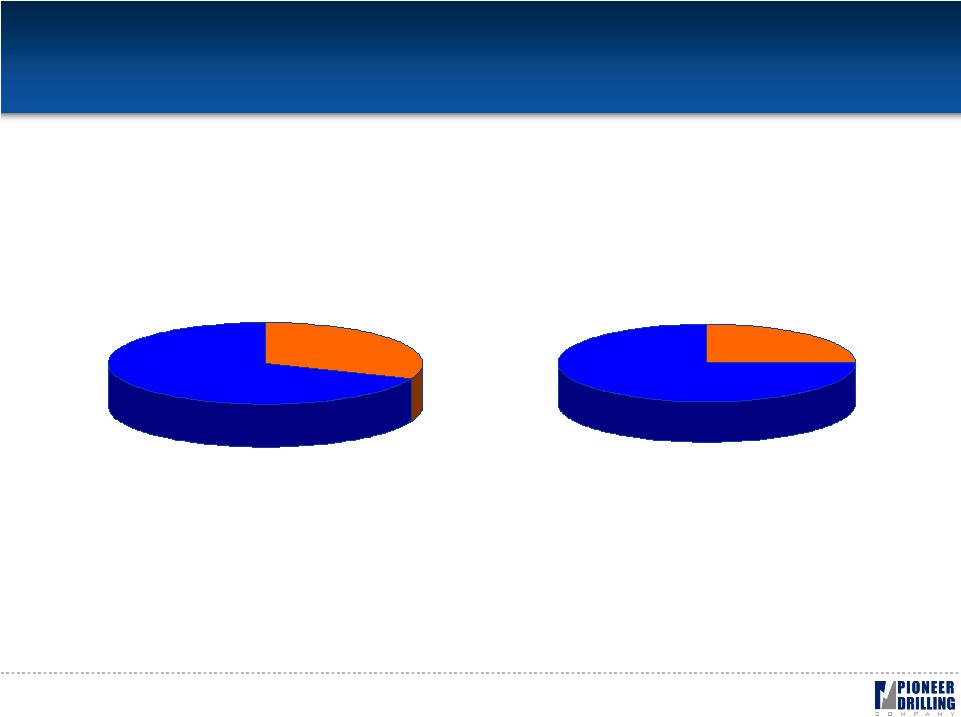 7 Contribution by Segment Revenue (1) Drilling Services 69% Production Services 31% (1) Revenue percentages are based on revenues of $117.1 million and $52.9 million for Drilling Services and Production Services, respectively, for the six months ended June 30, 2009. (2) Earnings before interest, taxes, depreciation and amortization, and impairments (EBITDA) percentages are based on EBITDA of $34.4 million and $11.3 million for Drilling Services and Production Services, respectively, for the six months ended June 30, 2009. EBITDA (2) Drilling Services 75% Production Services 25% |
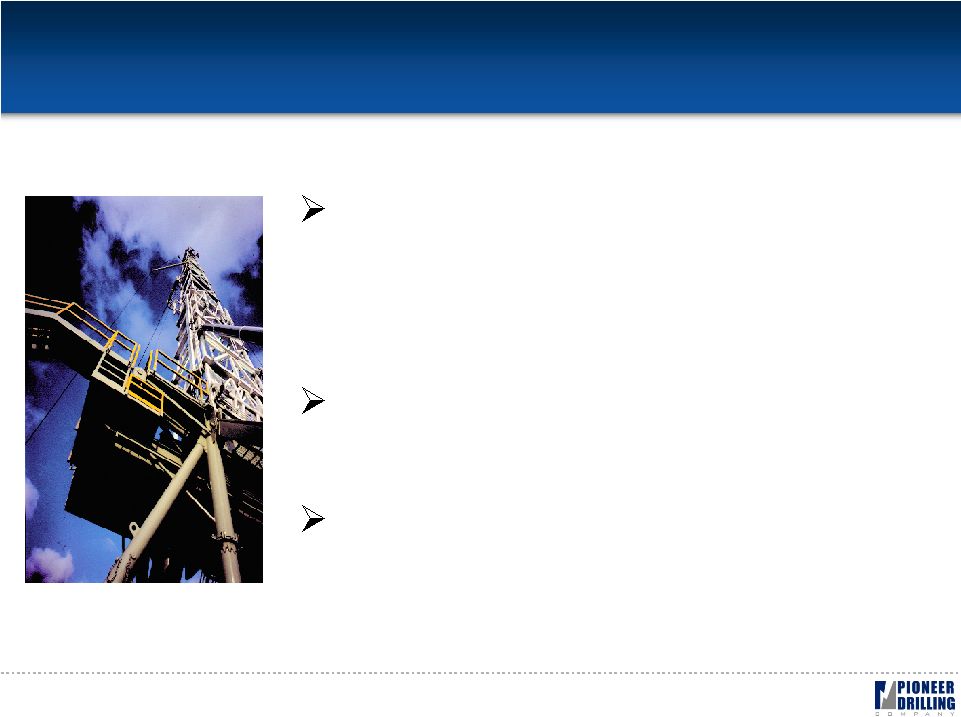
 8 Drilling Services Division |
 9 Efficient, Safe, High-Quality Assets EFFICIENCY Modern, well-maintained drilling fleet – 17 top drives installed, 4 of which are integrated into the mast – Over 65% have tier 1, 2, or 3 engines – Over 65% have rounded bottom mud tanks – Over 85% with matched horsepower mud pumps – Over 50% with mobile or fast-pace subs – 3 rigs with automatic catwalks – 25% of rigs with BOP handling systems SAFETY Consistently beat the IADC average for recordable incidents – Over 65% improvement in recordable incidents since 2005 Iron roughnecks installed on 63% of active U.S. drilling rigs to improve safety and efficiency Earned a score of 100% from Ecopetrol for HSEQ audit in July 2009 – First time such a score has been earned by a service provider from Ecopetrol |
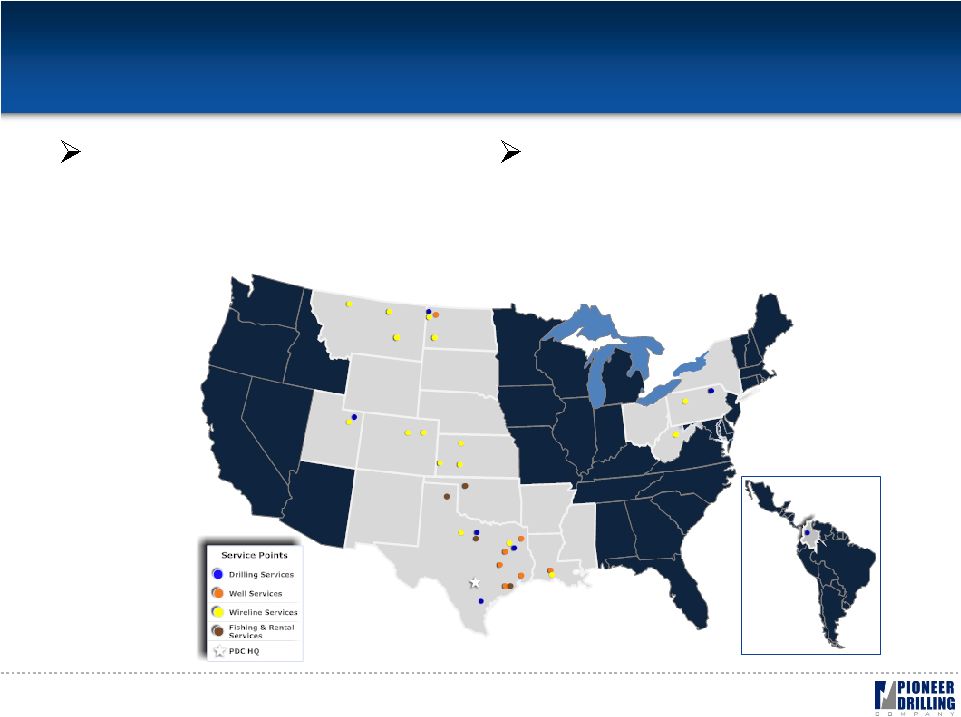
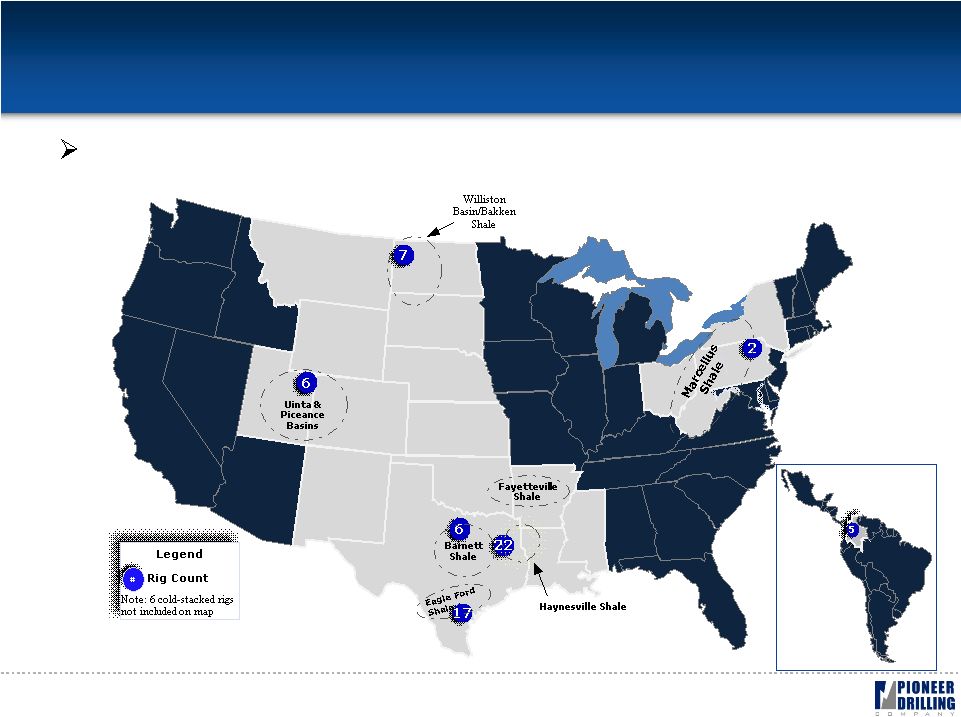 Drilling Services in Prolific U.S. Basins & Shale Plays Our service points are within close proximity to active drilling areas 10 |
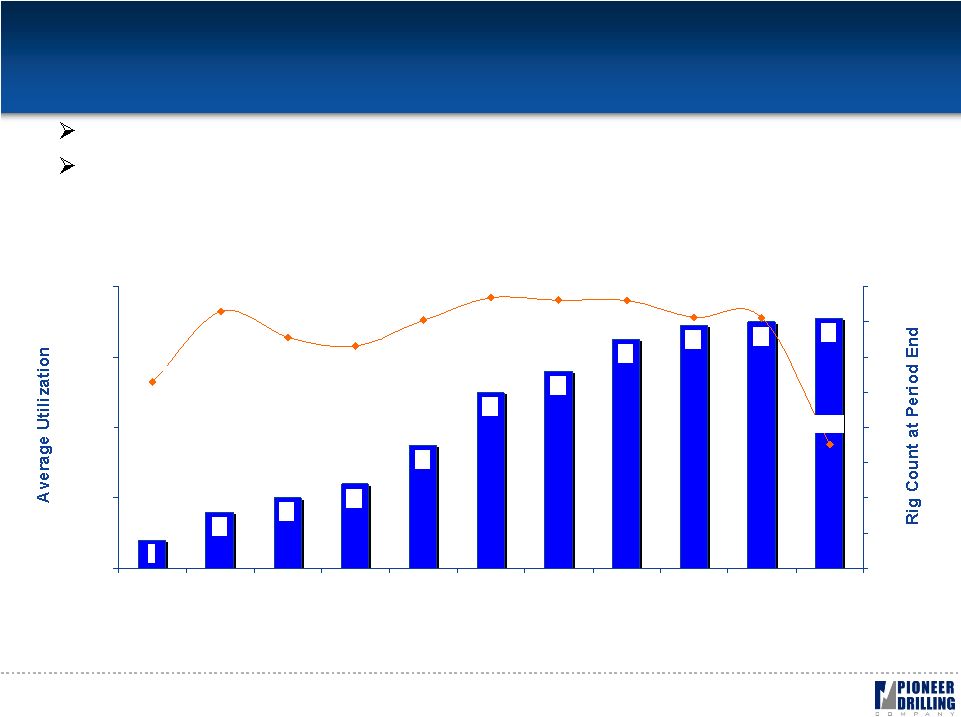 11 Focused on Growth and Return on Investment Maintained high utilization rate while growing fleet Disciplined program of acquisitions and new-builds – Acquired 39 rigs at average of $2.4 million per rig – Built 31 rigs at average cost of $9.8 million per rig * Fiscal year end was changed from March 31 to December 31 effective on December 31, 2007 8 16 20 24 35 50 56 65 69 70 71 66% 91% 82% 79% 88% 96% 95% 95% 89% 89% 44% 0% 25% 50% 75% 100% FY 2000 FY 2001 FY 2002 FY 2003 FY 2004 FY 2005 FY 2006 FY 2007 FYE Dec. '07* FY 2008 Q2 2009 YTD 0 10 20 30 40 50 60 70 80 |
 12 Strong Utilization Through the Cycles Averaged 88% utilization through cycles since beginning of 2001 Source: Helmerich & Payne, Grey Wolf, Patterson-UTI, & Precision Drilling consists of U.S. domestic utilization rates derived from Form 10-K, Form 10-Q reports, & press releases. Nabors utilization rates for worldwide land fleet obtained from public documents and industry analysts. Pioneer Drilling utilization rates include Colombian operations beginning Q3 2007. 0% 20% 40% 60% 80% 100% Pioneer Helmerich & Payne Grey Wolf Patterson-UTI Nabors Precision |
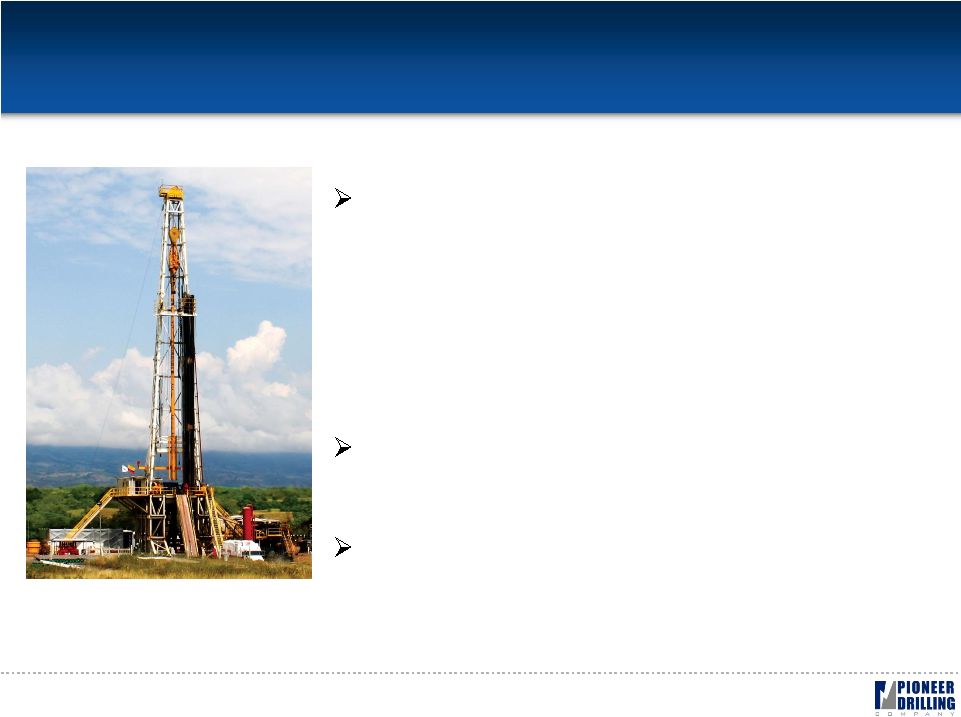 13 International Expansion Colombia – Provides geographic and commodity diversification with more exposure to oil – Strong E&P spending expected to continue – Stable government encourages foreign investment – In 2008, drilling margins were higher than US average drilling margins Current status of Colombian operations – All 5 rigs are currently operating under contract in Colombia Actively pursuing expansion into other parts of Latin America Pioneer Rig 301, National 110UE, diesel-electric, 1,500-HP rig operating outside the city of Neiva, Colombia. |
 14 Recovery Year Ahead Short-term oversupply of natural gas in U.S. putting downward pressure on price expectations for the remainder of 2009 Expect gradual recovery of natural gas prices and rig utilization in 2010 For the week ending 9/18/09, the U.S. land rig count was 978 rigs, a decline of 50% from the August 2008 peak of 1,961 rigs*, but up 18% from the June 2009 bottom *Source: Baker Hughes -50% -58% % Change from Peak 978 829 1,961 U.S. Land Rig Count* Current September 18, 2009 Bottom June 2009 Peak August 2008 |
 15 Production Services Division |
 16 Advantages of Production Services Complementary services -- well services, wireline, fishing and rental tools – Less cyclical cash flow and earnings stream – New platforms for growth in domestic and international markets – Somewhat counter cyclical to land drilling business Premium assets – Homogenous 550HP workover fleet – Very modern wireline fleet Attractive margins – approximately 45% to 50% in 2008 Overlapping market presence creates cross-selling opportunities Strong management team, each business line manager with over 25 years of industry experience and proven track record of managing Transformation of Pioneer from a pure-play U.S. land driller into a multi-faceted, energy services provider rowth g |
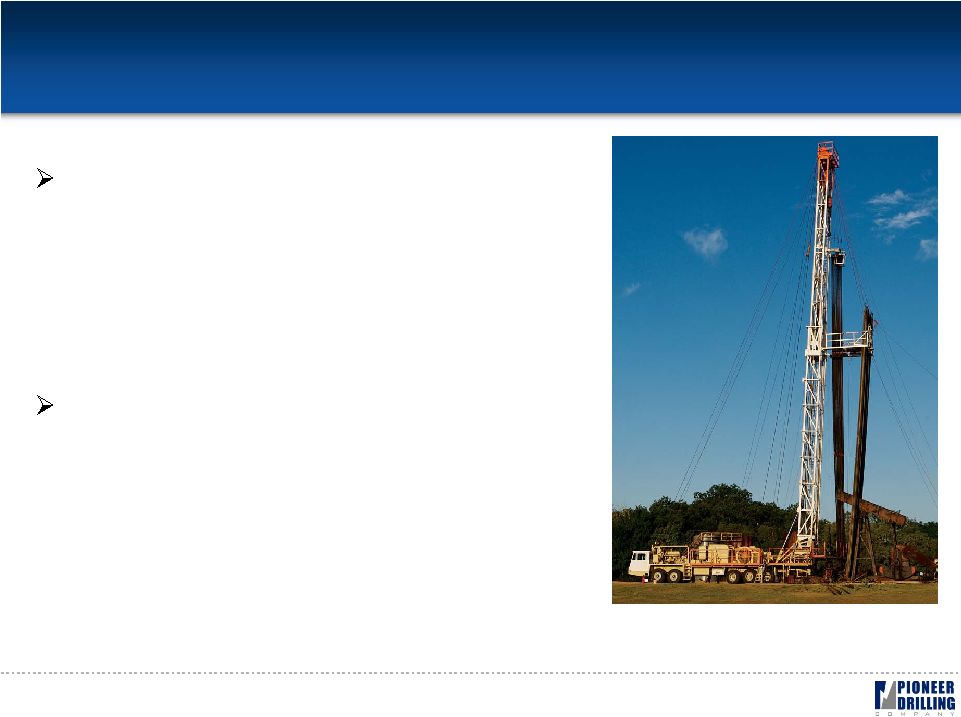 17 Production Services New-build Program New-build orientation – 99% of well service equipment is 550-600 horsepower rigs capable of working at depths of 20,000 feet – Custom-designed wireline units and proprietary open-hole wireline tools New equipment strategy has led to gains in market share and relative performance – Highest hourly workover rate in industry – Highest workover utilization rate in industry – One of the most active wireline companies in industry Pioneer workover rig, a new National 5C, 550 HP working outside the city of Bryan, Texas. |
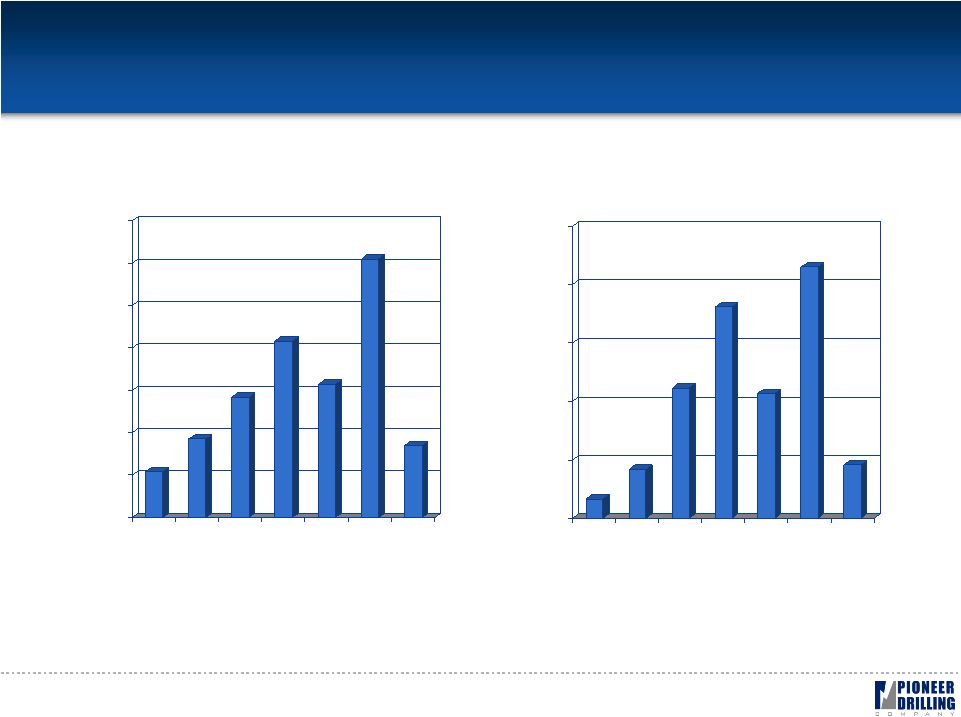
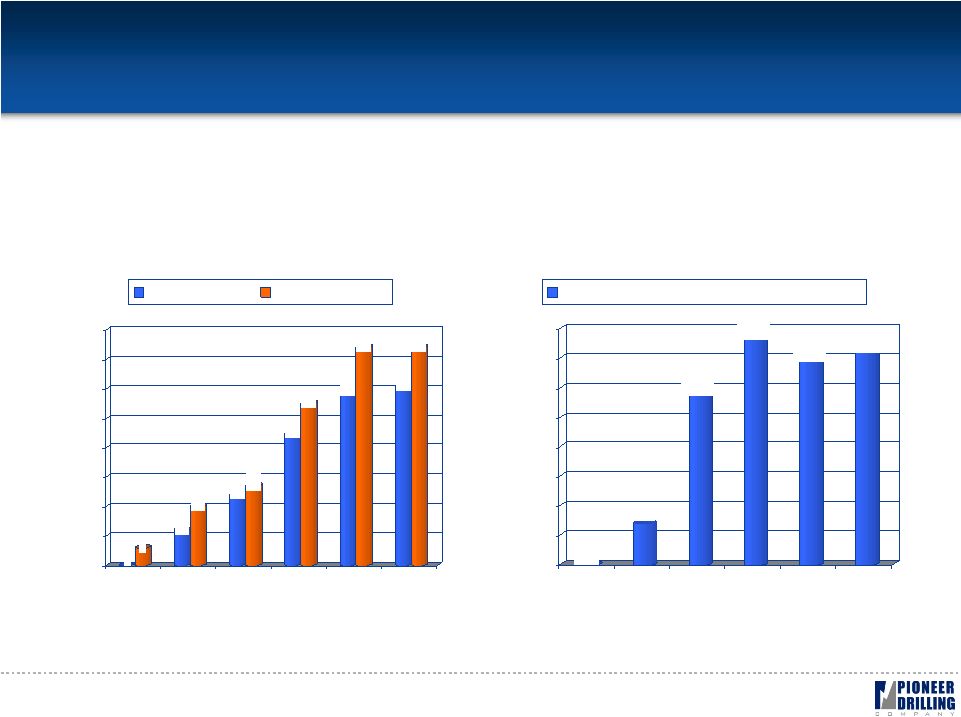 18 Production Services New-build Program (Cont.) 0 6 12 20 24 27 45 55 59 74 61 74 0 10 20 30 40 50 60 70 80 2004 2005 2006 2007 2008 2Q 2009 Wireline Units Workover Rigs Fishing & Rental Services Gross Equipment and Tools Value Wireline Units And Workover Rigs 20 Information for the years 2004 to 2007 represents workover rig and wireline unit counts and fishing and rental tool inventory values when the Production Services business was owned by WEDGE group. $0.0 $2.8 $11.7 $15.5 $14.0 $14.6 $0.0 $2.0 $4.0 $6.0 $8.0 $10.0 $12.0 $14.0 $16.0 2004 2005 2006 2007 2008 2Q 2009 Approx. Value of Equipment in Millions |
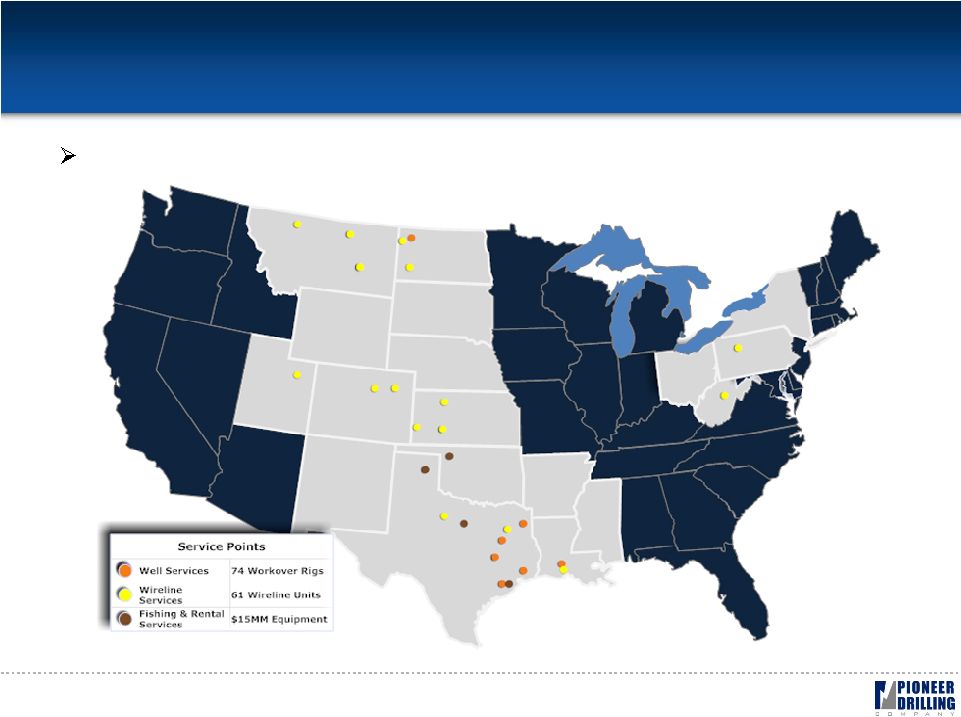 19 Production Services Locations Production Services’ locations dovetail with Drilling Services Division |
 20 Management |
 21 Experienced Management Team Wm. Stacy Locke - President and Chief Executive Officer Joined Pioneer as President in 1995 Seven years experience in investment banking, six years experience as exploration geologist B.A. in Geology from the University of California Santa Barbara, MBA in Finance from Southern Methodist University Lorne E. Phillips – Executive Vice President and Chief Financial Officer Joined Pioneer in February 2009, after ten years experience with Cameron International Corporation, most recently as Vice President and Treasurer International and multi-business unit experience, investment banking experience B.A. from Rice University, MBA from Harvard Graduate School of Business F.C. “Red” West - Executive Vice President and President of Drilling Service Division 45 years experience in the drilling services industry Supervised the drilling of over 7,000 wells Joe Eustace – Executive Vice President and President of Production Services Division Joined WEDGE in 2004 as President of WEDGE Oil and Gas Services Served as Group Vice President for Key Energy Services from 1998 – 2004 Served as VP of Operations for Dawson Production Services from 1982 until acquired by Key Energy Services in 1998 Carlos R. Peña – Vice President, General Counsel, Secretary and Compliance Officer Joined Pioneer in October 2008 and practicing law since 1992 Experience providing both outside corporate and securities counsel and in-house M&A counsel B.A. from Princeton, law degree from the University of Texas at Austin |
 22 Experienced Management Team (Cont.) Left to Right: Donald Lacombe, Senior Vice President of Drilling Services Division – Marketing and Red West, President of the Drilling Services Division. Left to Right: Joe Freeman, Vice President of Well Services, Mark Gjovig, Vice President of Wireline Services, Joe Eustace, President of the Production Services Division, Randy Watson, Vice President of Fishing and Rental Services. Drilling Services Division Production Services Division |
 23 Financial Overview |
 24 Historical Financial Performance $0 $100 $200 $300 $400 $500 $600 $700 FY 2004 FY 2005 FY 2006 FY 2007 YE 2007 (1) YE 2008 YTD Q2 2009 Revenue 2004 - 2009 (1) FY 2004 - FY 2007 data based on Company fiscal years ended March 31. Due to the change in fiscal year end from March 31 to December 31, YE 2007 information represents the nine month fiscal year ended December 31, 2007. (2) See page 26 for EBITDA reconciliation. $0 $50 $100 $150 $200 $250 FY 2004 FY 2005 FY 2006 FY 2007 YE 2007 (1) YE 2008 YTD Q2 2009 EBITDA (2) 2004 - 2009 |
 25 Capitalization Capitalization At June 30, 2009 ($Millions) Cash 43.7 $ Debt: Senior secured credit facility $400 million 257.5 $ Subordinated notes payable and other 5.5 Total debt 263.0 $ Total shareholders' equity 411.6 $ Total capitalization 674.6 $ Debt to total capitalization ratio 39% Capital Expenditures Actuals FY 2008 Actuals 2Q YTD 2009 Budget FY 2009 Routine 22.6 $ 8.4 $ 23.9 $ Discretionary 125.5 18.4 41.3 Subtotals 148.1 26.8 65.2 FY 2008 Budget carryover to be incurred in FY 2009 - 18.4 19.3 Totals 148.1 $ 45.2 $ 84.5 $ ($Millions) |
 26 Reconciliation of EBITDA to Net Income (1) Due to change in fiscal year end from March 31 to December 31 that was effective December 31, 2007, Pioneer had a nine month fiscal year ended December 31, 2007. Nine Months Fiscal Yr 6 Months and FY Ended Ended Ended 3/31/04 3/31/05 3/31/06 3/31/07 12/31/07 (1) 12/31/08 06/30/09 EBITDA 16.6 41.8 111.4 179.9 104.2 214.8 45.7 Depreciation & Amortization (16.2) (23.1) (33.4) (52.9) (48.9) (88.1) (51.5) Net Interest (2.6) (1.7) 1.9 3.8 2.4 (11.8) (3.6) Impairment charges - - - - - (171.5) - Income Tax (Expense) Benefit 0.4 (6.4) (29.3) (46.6) (18.1) (6.1) 3.7 Net Income (Loss) (1.7) 10.8 50.6 84.2 39.6 (62.7) (5.6) Fiscal Years Ended ($Millions) |
 27 |