5
(continued)
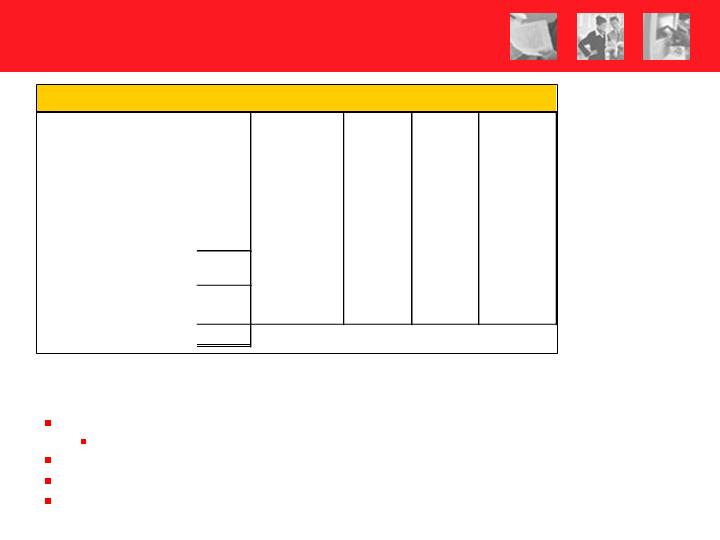
Second Quarter Recap
GAAP
Non-GAAP
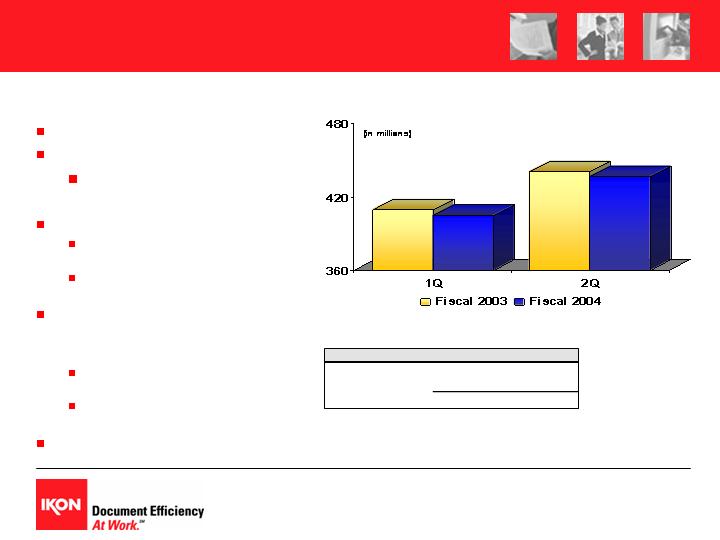
Three Months Ended March 31, 2004
As Reported
Adjustments
Adjusted
(in millions, except per share data)
Loss on divestiture of business
12,125
(a)
(12,125)
-
Operating Income
49,514
$
61,639
$
Loss on early extinguishment of debt
3,146
(b)
(3,146)
-
Interest expense, net
9,662
9,662
Income before income taxes
36,706
51,977
Incomes taxes
6,533
(c)
10,485
17,018
Net Income
30,173
$
34,959
$
Weighted Avg. Shares Outstanding, Diluted
170,901
(d)
170,901
Diluted earnings per common share
0.19
$
(d)
0.22
$
(a)
(b)
(c)
(d)
See footnote (a) on Profit and Loss Statement for conversion calculation
Excludes the loss on divestiture which arose from expenses associated with the sale of certain assets and liabilities and all of the operations
of IOS Capital on March 31, 2004. Loss on divestiture of business, net of taxes, for the three months ended March 31, 2004 was $7,548
Excludes the tax benefit recognized on the reversal of a valuation allowance against net operating losses of IOS Capital as a result of the tax
gain on IOSC sale to GE of $4,720 and taxes related to (a) and (b) above
Excludes the loss from the early extinguishment of debt which arose primarily from the write-off of unamortized costs related to the 2002
credit facility. Loss from early extinguishment of debt, net of taxes, for the three months ended March 31, 2004 was $1,958

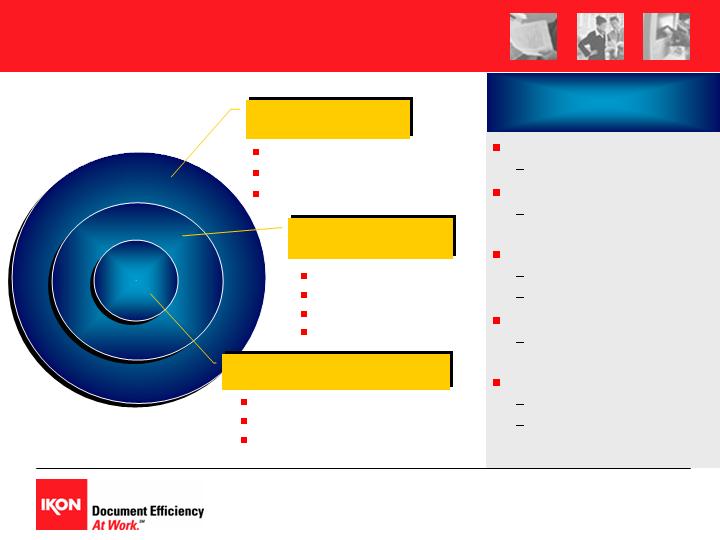
Second Quarter Highlights
Growth platforms beginning to yield results in each strategic area:
Equipment: improving mix, but market remains competitive
Aftermarket: color and high-end B&W fueling positive aftermarket results
Document Services: Outsourcing, Professional Services improving trends
Efficiency initiatives driving early benefits in selected areas
e-IKON - supply chain
Early Six Sigma benefits in the quarter
Improved Canadian performance drives tax benefit of $2.6 million in quarter
Financial flexibility objectives achieved
Exiting captive leasing business in U.S. and Canada
Business model simplified; capital structure transformed
Sale proceeds being deployed to improve long-term earnings stream and
return value to shareholders
6

Revenue Trends Improving
Blended growth for three strategic areas
of business
Services mix will continue to strengthen;
54% at quarter end
Finance income will begin to decline in
the third quarter
7
8
(continued)
Revenue Trends Improving
Year Over Year Revenue Growth
% of
(Note: not in financial reporting format)
Revenue
1Q03
2Q03
3Q03
4Q03
1Q04
2Q04
Mix
Equipment
-3%
-3%
-4%
4%
-1%
-1%
37%
Aftermarket (service & supplies)
-2%
-4%
-1%
-4%
-6%
2%
35%
Document Services
0%
-2%
-2%
-1%
7%
2%
19%
Blended Revenue growth(decline)
-2%
-3%
-2%
0%
-1%
1%
91%
Technology hardware
-58%
-54%
-60%
-51%
-39%
-25%
1%
Divested, downsized services
-78%
-64%
-49%
3%
n/a
n/a
0%
Finance
2%
4%
5%
4%
4%
1%
8%
Total Revenue growth(decline)
-6.1%
-5.3%
-5.0%
-1.3%
-1.8%
0.4%
100%
Foreign currency translation
0.9%
1.5%
1.6%
1.2%
1.9%
2.2%
Equipment Trends
Sequential growth of 8%
Year over year decline of 1%
Office, analog declines
offsetting color and production
Color revenues up 62%
IKON CPP8050, co-branded
with Konica-Minolta, successful
Canon and Ricoh product
refreshes also driving demand
Installed base of higher-end
Seg. 6 Canon iR110/iR150s
continues to grow
20% increase in placements (yr-
yr)
IKON distributing over 80% of
these products for Canon
Stronger mix strengthens
future aftermarket
9
Equipment Revenue Mix
FY ‘01
FY ‘02
FY '03
YTD'04
B&W segment 1-4
76%
70%
63%
62%
B&W segment 5-6, color
24%
30%
37%
38%
TOTAL
100%
100%
100%
100%
Growth Platforms
Executing operational priorities
National account revenues up over 100% from prior year
Increased level of wins in 2nd Qtr., including largest win yet
Building pipeline of equipment, aftermarket and services
potential
National account revenues 8% of total revenues for 2nd Qtr.
Metro markets gaining share
Above average growth in equipment revenues in 2nd Qtr.
European expansion; new cities delivering new revenues
New cities contributing to performance
6 Pan European account wins year to date
Outsourcing gaining vertical strengths
Professional Services
Continues to outperform
New platform will leverage IKON’s channel, services strengths
Goals
Grow share of
equipment market
to expand
aftermarket base
Strengthen
services mix
Priorities
Supplier integration
National accounts,
metro markets
Product mix: color
& high-end
Europe expansion
Services
expansion
10
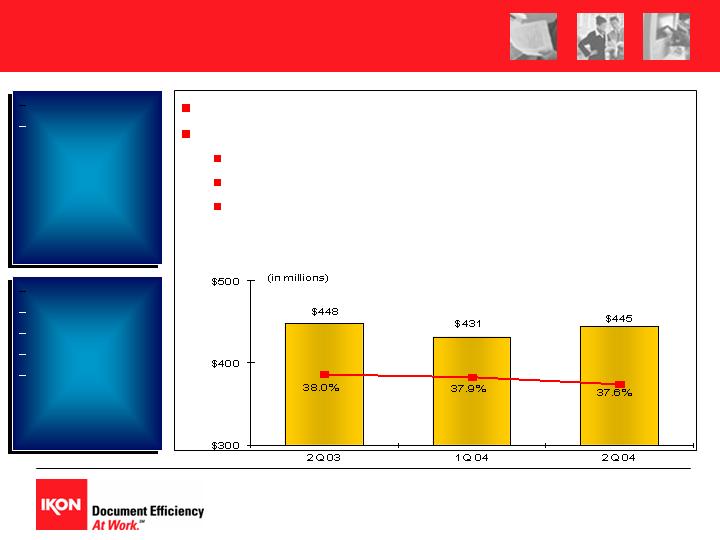
Gross Margins
Gross margins declined 40 basis points (bp) to 37.6%
Gross profit relatively flat due to services mix benefit
Net Sales – market competitiveness; customer mix
Services - revenue and productivity improvements
Finance - benefiting from rate reductions
Goals
Maintain gross
margins: offset
equipment pricing
with improved mix
& services
Priorities
e-IKON
Six Sigma
Sales effectiveness
Asset management
11

Selling & Administrative
$5.3 million increase from prior year
Foreign currency hit was more than year-to-year change
Pension and other benefits, insurance continue to be
headwinds
Headcount reductions are leveling off
Funding second wave of structural improvements
Goals
Achieve an S&A
expense-to-
revenue ratio of
less than 30%
long-term
Fund critical long-
term investments
Priorities
e-IKON
Six Sigma
Sales effectiveness
Asset management
32.4%
33.1%
32.0%
12
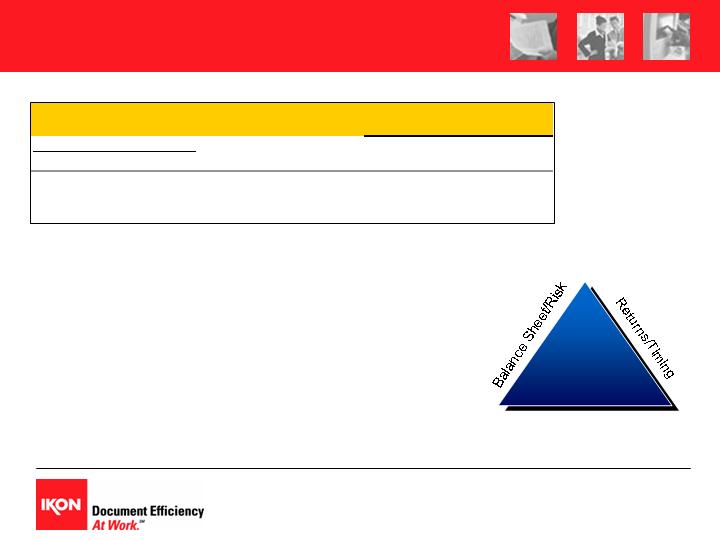
Strengthened Financial Position
March 31, 2004
Exiting lease financing in the U.S. and Canada
Closed IOSC/GE transaction for U.S. leasing business
Continues lease financing through GE Commercial Finance
under the tradename IKON Financial ServicesSM
Signed definitive agreement for Canadian lease portfolio
Improved flexibility for share repurchases and acquisitions
$250 million share repurchase authorized by Board
Strengthened financial position:
Cash balance as of 3/31/04: $853 million
Debt to capital ratio will continue to trend down
April 28, 2004
Successful tender for $250 million, 7.25% 2008 Notes
Goals
Strengthen balance
sheet
Improve financial
flexibility
Priorities
Monetize value
created in IOS
Capital to achieve
financial flexibility,
simplify business
model, and fund
new growth
opportunity
Continue to
improve coverage
& debt ratios
13
IOSC/GE transaction
Bill Urkiel
Senior Vice President & CFO
14
Transaction overview & strategic
implications
Cash: proceeds and uses to date
Financial implications to P&L
Capital structure
Cash flow dynamics
Transaction Highlights
IKON transitions out of U.S. and Canadian leasing business
Strategic alliance with GE Commercial Finance for lease financing in
the U.S. and Canada
U.S. leasing: Asset Purchase & Program Agreement – closed 3/31/04
GE purchased certain assets and liabilities of IOS Capital’s portfolio
Future lease originations through GE as preferred lease-financing source
Financing profits partially replaced with origination fees, volume fee & profit-sharing
Canadian leasing: Definitive Agreement – expected to close by 6/30/04
GE to purchase lease receivable portfolio of approximately $177 million
Future lease originations through GE as preferred lease-financing source
Financing profits partially replaced with origination fees of 3%
IKON retains certain lease assets and liabilities
Asset-backed receivables and related debt; other leases
$678 million of unsecured IOS Capital debt
5% convertible Notes; 7.25% 2008 Notes; escrowed 9.75% 2004 Notes
15
16
Analysis of Cash Proceeds
in millions
Realized
Expected
as of
Future
Transaction Related Proceeds
3/31/04
Sources
Total
Initial proceeds received at closing
1,505
$
1,505
$
Post-closing receivable
177
$
177
Canadian proceeds, net of related debt
90
90
Net cash after retained run-off, debt and tax liabilities
226
226
Combined proceeds
1,505
$
493
$
1,998
$
Initial payment: $1.5 billion
Balance sheet contains $177 million
receivable
Closing of Canadian transaction expected by
6/30/04
Net cash from retained assets realized
through 2007
(continued)
Analysis of Cash Proceeds
17
Shareholders/Bondholders
Value
Creation
* All EPS projections based on 3/31 diluted share count of 170 million shares
in millions
18
Preliminary Use of Proceeds
Announced
Use of Proceeds
By 3/31/04
as of 4/29/04
Embedded in Pro-Forma P&L
Conduit paydown
(796)
$
Tender for $250 million, June 2008 Notes, net of tax benefit
(267)
$
Deferred taxes due 6/15/04
(285)
Pension contribution, net of tax benefit
(47)

Tender for $250 million in 7.25% 2008 Notes improves
balance sheet and pro-forma earnings baseline for
2005 - approx. $.07 per diluted share*
$285M reflects deferred taxes triggered by sale to GE
(no P&L impact)
Advanced pension contribution improves under-funded
status, reduces future cash contributions; and
improves pro-forma earnings baseline for 2005 –
approx. $.01 per diluted share*
Preliminary Use of Proceeds
(continued)
19
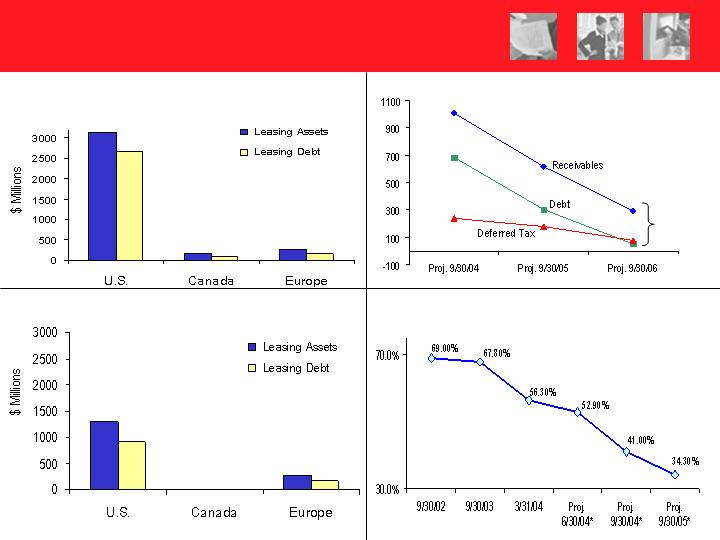
Leasing Assets vs. Debt: Prior to Sale
Retained Asset Profile
Projected Total debt to capital ratio
* Assumes constant equity and Europe levels
Retained U.S. Portfolio: Run Off
Net LT cash
benefit =
$226 M
Leasing Assets vs. Debt: After 3/31/04
Gone
7/1/04
Stays
Retained
$1.3 B
Retained
$0.9 M, 69%
$3.1 B
$2.7* B, 87%
$.27 B
$.18 B
$.07 B
$.15 B
$.27 B
$.15 B
* $678 was reclassified to non-lease financing as a result of the IOSC/GE transaction
20
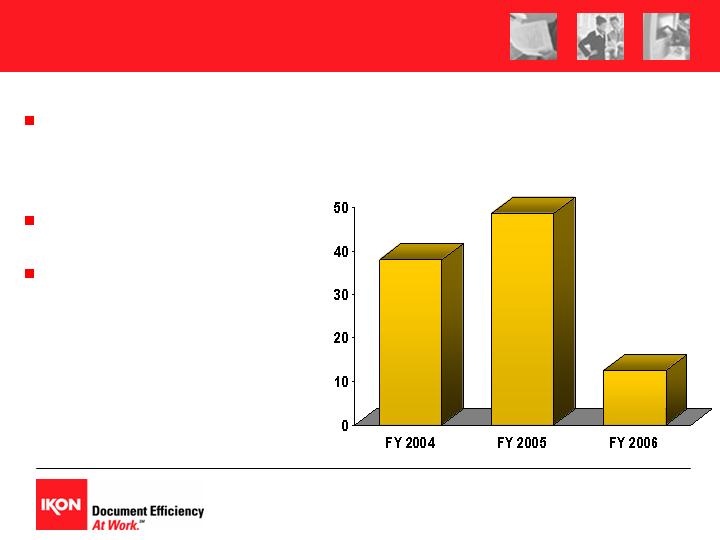
Retained Asset Run-Off
Approximately $100 million
in operating income to be
recognized 4/1/04 –
9/30/06
IKON pays GE to service
portfolio over run-off period
NOTE: estimates can
change based on activity
within portfolio as a result
of upgrades, cancellations,
buyouts, etc.
(in millions)
38%
13%
49%
21
* Includes Canada based on expected close date of June 30, 2004;
22
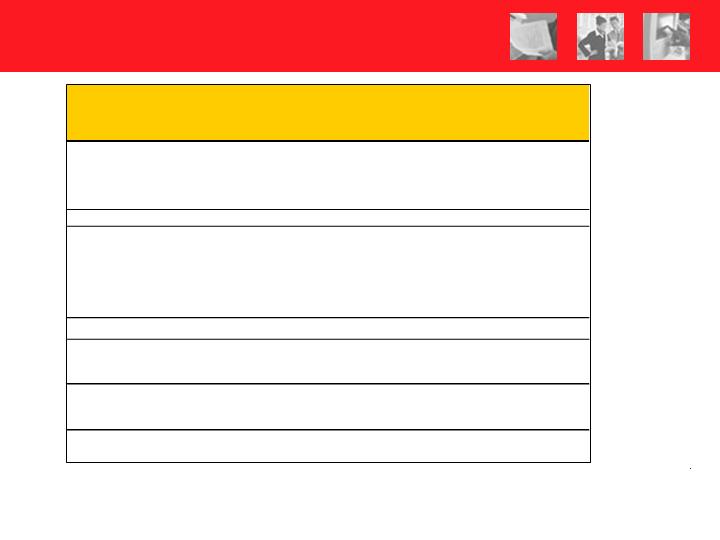
Deal Related Adjustments
* Net
New Fees,
Combined
(in millions)
Leasing
Profit-Sharing
Adjustments
& Rental
and
4/1 to 9/30
Consolidated Statement of Income
Activities
Investments
Impact to P&L
Net sales
45
32
77
Services
(26)
28
2
Finance income
(127)
(127)
Revenues
(108)
60
(48)
Cost of goods sold
57
57
Services costs
(10)
(10)
Finance interest expense
(52)
(52)
Costs and Expenses
(5)
0
(5)
Gross Profit
(103)
60
(43)
Selling and administrative
(39)
(39)
Operating income
(64)
60
(4)
Interest expense, net
18
(10)
8
Income from continuing operations
before taxes on income
(82)
70
(12)
Pro-Forma P&L FY
’04**
Assumes limited investment
* Canada based on expected close date of June 30, 2004
** Excludes loss on divestiture and related tax benefit, and losses on early extinguishment of debt; assumes use of proceeds identified on slide 15
23
* Net
New Fees,
FY 2004
(in millions)
1st Half
Leasing
Profit-Sharing
Preliminary
Fiscal 2004
& Rental
and
Pro-Forma
Consolidated Statement of Income
x 2, tax @ 37.75%
Activities
Investments
as of 4/29/04
Net sales
1,927
$
45
32
2,004
$
Services
2,320
(26)
28
2,322
Finance income
395
(127)
268
Revenues
4,642
(108)
60
4,594
Costs and Expenses
2,890
(5)
0
2,885
Gross Profit
1,752
(103)
60
1,709
Selling and administrative
1,519
(39)
1,480
Operating income
233
(64)
60
229
Interest expense, net
39
18
(10)
47
Income from continuing operations
before taxes on income
194
(82)
70
182
Income taxes (@ 37.75%)
73
69
Income from continuing operations
121
$
113
$
Net Income (as adjusted for tax effected
convertible interest)
130
$
122
$
Diluted Shares (@ 3/31/04
170
170
Diluted EPS
0.76
$
0.72
$
Shareholders/Bondholders
Value
Creation
24
Additional Use of Proceeds
Announced
Other
Use of Proceeds
By 3/31/04
as of 4/29/04
Future
Embedded in Pro-Forma P&L
Conduit paydown
(796)
$
Tender for $250 million, June 2008 Notes, net of tax benefit
(267)
$
Deferred taxes due 6/15/04
(285)
Pension contribution, net of tax benefit
(47)
Dependent on price, timing, & other factors
Share repurchase authorization up to $250 million
(250)
$
Debt reduction, acquisitions, other investments
(250)
Improve short-term cash position
(100)

Share repurchases expected over next 18 to
24 months
No formal commitment to the dollar amounts
within each of these categories
Actions dependent on business conditions,
and price, timing and other factors
Additional Use of Proceeds
(continued)
25
FY ’04 Expectations &
Long-Term Targets
All figures assume current diluted share count and exclude any additional actions such as
share or debt repurchases, acquisitions, etc.
* Excludes special charges related to losses from early extinguishment of debt, loss on divestiture of business, and the $4.7 million tax benefit
associated with the divestiture.
26
Fiscal 2004 Expectations*
Full year
$.70 to $.75 per diluted share
Third quarter
$.15 to $.18 per diluted share
Full year growth rate assumptions:
Net Sales, Services
(1%) to 1%
Finance
(30%)
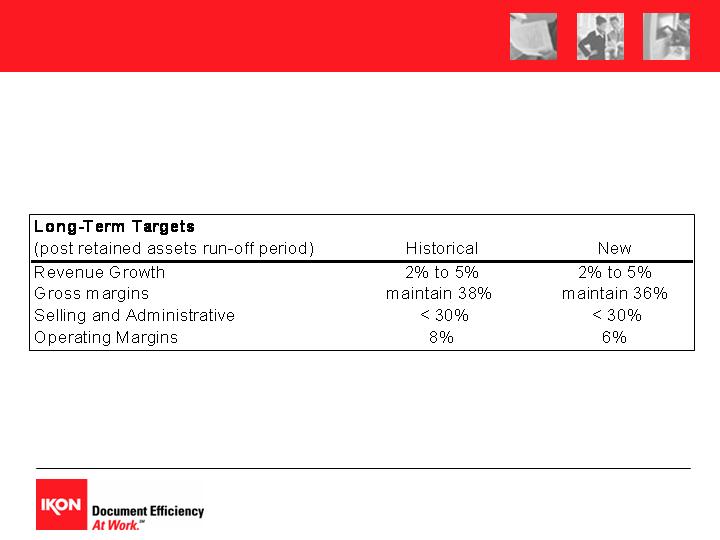
* Excludes special charges related to losses from early extinguishment of debt, loss on divestiture of business, and the $4.7 million tax benefit associated
with the divestiture.
FY ‘04 Expectations and
Long-Term Targets
(continued)
27
CASH DYNAMICS
Sources & Uses of Free Cash Flow
Fiscal 2004 Expectations – Free Cash Flow
Cash from operations ($240) to ($250)M
Includes $285M deferred tax on gain; $75M pension contribution
Less: capital expenditures*, net of proceeds * $70 M
Plus: lease collections*, net of lease additions * $290 to $310 M
Free Cash Flow $0 to ($30) M
* Reported in Investing on Cash Flow Statement; leasing additions would only be generated by European leasing prospectively
28
(in millions)
Deal Changes
Beyond
SOURCES / USES
FY 2003
Fiscal 2004
Fiscal 2005
Fiscal 2006
Run-Off Period
Net Income (GAAP)
116
$
pro-forma
Depreciation and Amortization
112
less $16M depr.
Changes in operating assets & liab.
(7)
Provision for A/R
14
Provision for Lease Default
68
1/2 yr. source
Europe only
Europe only
Europe only
Provision for deferred taxes
72
significant use
use
use
neutral
Other items & special charges
65
Cash From Operations
440
Capital expenditures
(68)
Original IKON Free Cash Flow
372
Changes in finance receivables
(171)
becomes source
source
source
Europe only
Free Cash Flow
201
$
Strategic Goals
and Priorities
Long-term
Goals
Revenues
2% to 5% growth
Gross Margin
Maintain with stronger
services mix
S&A to Revenue < 30%
$40M+ structural savings
2%+ revenue growth
Operating Margins
Expand by 2 points from
core baseline of 4%
Cash\Capital Structure
Alternative uses of cash
30% to 35% debt-to-
capital ratio
Expansion
Core Growth
Operating Leverage
e-IKON
Six Sigma
Asset Management
Supplier Integration
Customer segmentation
National & Metros
Color
Europe
Managed Services
Professional Services
Services
Strength
450+
acquisitions
to 1 company
Channel
Development
29
Value Proposition
Leading market positions
Strong vendor relationships
Business model aligns with industry and customer
trends
Strong recurring revenue mix
Creating operating leverage and differentiation
Improving financial position
Strong, consistent cash flows
30

Investor Conference
31
Analysts and institutional investors:
Please join us...
For:
IKON’s 2004 Investor Conference
When:
May 25, 2004
Time:
2:00 p.m. – 5:00 p.m. (1:30 check-in)
(will be webcast live)
Where: Millennium Broadway Hotel & Conference Center
New York, NY
Please register! email TRAwichhart@IKON.com