| ITEM 1. | REPORTS TO STOCKHOLDERS. |

The Alger Funds
| Shareholders’ Letter (Unaudited) | October 31, 2022 |
Dear Shareholders,
Steering into Stability
The late MIT economist and Nobel laureate Paul Samuelson acknowledged that “good questions outrank easy answers.” The uncertainty around inflation has complicated the market environment since the beginning of 2022, and is expected to continue in the months ahead. Reflecting on the fiscal year, Russia’s invasion of Ukraine sparked a surge in commodity prices into the summer, exacerbating inflation around the world. Consequently, interest rates continued their climb seven months into the Federal Reserve’s (the Fed) hiking cycle, making mortgage rates and consumer finance products more expensive across the economy. Moreover, the Fed increased the Federal Funds rate by 75 basis points in each of June, July and September 2022, ending the third quarter of 2022, with a target rate of 3.25%. Hopes of the Fed pivoting or reversing its tightening policy were dampened after an August speech by Fed chair Jerome Powell, where he argued that restoring price stability will require a restrictive policy for some time and may bring pain to households and businesses.
These higher interest rates have been a headwind for longer duration stocks, as investors discount cash flows further into the future, pushing down the valuations of many of these companies to levels not seen since the COVID-19 crash of 2020, or the financial crisis of 2008-2009. And, while valuation multiples of many of these companies have decreased considerably, we believe their growth rates should buoy them, even in a weakening economy. How high will the Fed ultimately push interest rates? We can’t know for certain, but we believe that valuations of such long duration stocks have compressed to the point where they have diverged from fundamentals and we remain confident in the long-term trajectory of such companies, rather than the short-term vicissitudes of the economy.
As a result of the rotations described above, value stocks outperformed growth stocks during the past twelve months, with the Russell 3000 Value Index down -7.25%, outperforming the Russell 3000 Growth Index which fell to -24.67%.
Navigating a Weakening Economy
Over the past thirteen tightening cycles, we have only experienced three soft landings (i.e., a cyclical slowdown in economic growth that avoids a recession). Among those soft landings, all three experienced approximately 300 basis points of rate hikes – specifically in 1984, 1994-1995 and 2020. As of this writing, the Fed is hiking approximately 450 basis points on its target policy rate, and as a result, we feel it is unlikely the Fed can successfully achieve tighter financial conditions while avoiding a recession (i.e., a soft landing).
Moreover, the Conference Board’s Index of Leading Economic Indicators – a composite of economic information from areas like housing, building permits and durable goods orders – has historically proven to be a strong predictor of recessions, particularly when the index moves into negative territory. In August 2022, that index moved into negative territory, flashing a warning light that the U.S. economy might be heading into recession in the next few months.
As a result of the foregoing, our current expectation is that the United States will enter – or perhaps has already entered – a recession. As of the writing of this letter, the Fed has continued to tighten financial conditions via its interest rate increases and the roll-off of debt from its balance sheet. Further, the broader money supply growth is decelerating and appears to be heading into its first outright contraction since 1938, which is likely to slow economic activity all on its own.
International Markets Also Struggle
Concerns about interest rates, inflation and the Russian invasion of Ukraine extended beyond the United States. Investors also assessed the spread of COVID-19 in China. Among non-U.S. equities, emerging markets significantly underperformed with the MSCI Emerging Markets Index declining -30.73% during the fiscal 12-month reporting period. Within the index, the Utilities sector was the only sector to generate positive performance, as investors focused on companies that they perceived as having recession resistant fundamentals that provide a relatively high return of cash to shareholders. Consumer Discretionary, Healthcare and Energy were among the worst performing sectors. The selloff also included developed markets with the MSCI EAFE Index declining -22.62%. From a broader perspective, the MSCI ACWI Index declined -19.58%.
What Has Happened
Typically, we tend to see two phases when entering a recession, where companies in phase one experience valuation compression, followed by slower earnings growth in phase two:
Phase One
Higher interest rates lead to compressed valuations of long duration assets. As in the bond market, where interest rate changes impact long-term bonds more than short-term notes, long duration stocks, having more of their cashflows further into the future, are impacted more by rising rates. The best example of this would be small-cap growth stocks, which are generally perceived as long duration assets. However, we believe that long duration, small-cap growth stock valuations may have reached a floor, at least on a relative basis, as of this writing.
Phase Two
Corporate earnings tend to decline during recessions, although consensus expectations for the S&P 500 Index show earnings growth in 2023, as of this writing. That means that there may be a period of downward earnings revisions as we move into the new year. While the Treasury bond market appears to have priced in a recession, it remains to be seen whether equities will agree.
Not All Stocks Are Equal
In 2020, at the height of the pandemic, value stocks saw earnings decline while growth stocks as a group held up better, and small-cap growth stocks actually posted earnings increases. This is because small growth fundamentals, in general, tend to hold up better in a recession. Fortunately, over the last three recessions, growth stock earnings have declined less than half as much as value stock earnings. There are, in our view, three reasons for this trend:
| ● | Growth stocks tend to have better balance sheets and less leverage, resulting in lower interest expenses. Having less interest expense means that a negative change to the topline (i.e., sales) may be less magnified on the bottom line. So, better balance sheets and lower interest expense help companies when revenues are not growing. |
| ● | Growth stocks tend to have higher operating leverage, where higher margins generally help a company’s fundamental resiliency (i.e., companies with low variable costs tend to experience margin stability during periods of economic stress). |
| ● | Growth stock fundamentals tend to be driven by market share gains, whereas value stock fundamentals tend to be more closely tied to the performance of the overall economy. For example, if a company is gaining market share, even in a stagnant or contracting market, it can post earnings-per-share (EPS). We have observed this in many sectors of the economy. Historically, innovative companies have shown growth during recessions. We saw it with personal computers in the early 1990s and smartphones and online advertising during the global financial crisis of 2008-2009, and with the continued steady growth of software during the COVID-19 crash of 2020. |
During 2022, long duration stocks have dramatically underperformed the broader stock market, while companies with higher dividends and share repurchases have held up better. Unfortunately, this explains why some of the Alger strategies, which are comprised of higher growth, longer duration companies, have underperformed in 2022. Moreover, strategies tied to smaller growth companies with longer durations have seen relative valuation multiples drop to their lowest levels in nearly a quarter century. While it is certainly frustrating for shareholders to see performance fall to such levels, we believe that this may create a favorable opportunity going forward. The last time that small-cap growth traded this cheaply was in 2001, and these stocks went on to outperform the S&P 500 Index by more than 20% over the following two years.
Going Forward
We continue to believe that unprecedented levels of innovation, such as healthcare advancements in genetic science, and digital technologies including artificial intelligence, e-commerce, streaming entertainment, and cloud computing are providing opportunities for leading companies to reward investors by generating long-term earnings growth. We will continue to focus on conducting in-depth fundamental research as we seek leaders of innovation rather than taking short-term bets on the fickle nature of investor sentiment. We believe doing so is the best strategy for helping our valued shareholders reach their investment goals.
Portfolio Matters
Alger Capital Appreciation Fund
The Alger Capital Appreciation Fund returned -34.88% for the fiscal year ended October 31, 2022, compared to the -24.60% return of the Russell 1000 Growth Index. During the reporting period, the largest sector weightings were Information Technology and Consumer Discretionary. The largest sector overweight was Healthcare and the largest underweight was Consumer Staples.
Contributors to Performance
The Communication Services and Real Estate sectors provided the largest contributions to relative performance. Regarding individual positions, UnitedHealth Group Incorporated; Vertex Pharmaceuticals Incorporated; McKesson Corporation; Humana Inc.; and Eli Lilly and Company were among the top contributors to absolute performance.
UnitedHealth is an integrated healthcare benefits company. Alger believes UnitedHealth Group’s vertical integration of insurance benefits, primary care services, pharmacy services, and data analytics along with its size and scale make it unique in the healthcare services universe in effectively addressing rising healthcare costs for its customers. Shares contributed to performance during the period, as the company announced strong operating results driven by a better-than-expected medical loss ratio (MLR). Management also noted that utilization is returning in pockets, citing senior preventative care as a standout while pediatric and ER visits remain below trend, implying a favorable Medicaid MLR.
Detractors from Performance
The Information Technology and Consumer Discretionary sectors were the were the most significant detractors from relative performance. Regarding individual positions, Microsoft Corporation; Amazon.com, Inc.; Alphabet Inc.; Tesla Inc.; and Advanced Micro Devices, Inc. were among the top detractors from absolute performance.
We believe that Microsoft is a Positive Dynamic Change beneficiary of corporate America’s transformative digitization. Microsoft’s enterprise cloud product, Azure, is rapidly growing and accruing market share. This high unit volume growth is a primary driver of the company’s higher share price, but Microsoft’s operating execution has enabled notable margin expansion. Additionally, investors appreciate Microsoft’s strong free cash flow generation and its return of cash to shareholders in the form of dividends and share repurchases. Microsoft’s shares detracted from performance during the period because the company slightly missed analysts’ estimates. However, Microsoft has shown that despite consumer, advertising, and small and medium sized business weakness, the company’s main business, the digitization of corporate America, continues to grow. We believe the secular forces of cloud adoption (Azure and Office 365) remain resilient, and the company’s commercial bookings growth attests to the continued demand for digital transformation.
Alger 35 Fund
The Alger 35 Fund generated a -39.09% return during the fiscal year ended October 31, 2022, compared to the -14.61% return of the S&P 500 Index. During the reporting period, the largest sector weightings were Information Technology and Healthcare. The largest sector overweight was Information Technology and the largest underweight was Financials.
Contributors to Performance
The Industrials and Materials sectors provided the largest contributions to relative performance. Regarding individual positions, Toast, Inc.; McKesson Corporation; HEICO Corporation; 908 Devices Inc.; and Palo Alto Networks, Inc. were among the top contributors to absolute performance.
HEICO is the leading non-original equipment manufacturer supplier of aircraft replacement parts and electronics for high-tech niche applications. HEICO is a high-quality growth company with a resilient business model and the ability to differentiate its products through superior design aimed to meet the most stringent customer requirements. HEICO combines this focus on organic product development with a robust acquisition program, which has resulted in a successful long-term track record of value creation. Shares contributed to performance as the company reported strong operating results during the period, driven by the recovery in commercial aerospace aftermarket business, as air travel continued to rebound from pandemic led declines. The company is also executing well and delivering strong operating margins, offsetting the inflationary pressures on cost.
Detractors from Performance
The Information Technology and Healthcare sectors were the most significant detractors from relative performance. Regarding individual positions, Shopify, Inc.; Amazon.com, Inc.; Block, Inc.; Advanced Micro Devices, Inc.; and Upstart Holdings, Inc. were among the top detractors from absolute performance.
Shopify provides a full-service, cloud-based software platform for small- and medium-sized businesses to establish and conduct e-commerce operations. Shopify’s solutions enable merchants to run their businesses across a multitude of channels by facilitating merchants’ ability to manage products and inventory, process orders and payments, build customer relationships, automate marketing campaigns and leverage analytics and reporting. Shopify is an innovation-led company that is generating high unit volume growth as it benefits from the positive dynamic change of consumer adoption of e-commerce. The company also generates attractive free cash flow. Shopify’s share price declined during the reporting period after the company announced it would reinvest gross profits into research and development, hire more engineers and salespeople, and introduce new marketing programs in order to expedite its growth. The level of investment was more than many investors had contemplated, which hurt the performance of Shopify shares.
Alger Growth & Income Fund
The Alger Growth & Income Fund returned -11.53% for the fiscal year ended October 31, 2022, compared to the -14.61% return of the S&P 500 Index. During the reporting period, the largest sector weightings were Information Technology and Healthcare. The largest sector overweight was Financials and the largest underweight was Consumer Discretionary.
Contributors to Performance
The Consumer Discretionary and Information Technology sectors provided the largest contributions to relative performance. Regarding individual positions, Chevron Corporation; UnitedHealth Group Incorporated; Exxon Mobil Corporation; AbbVie, Inc.; and Eli Lilly and Company were among the top contributors to absolute performance. Shares of UnitedHealth Group Incorporated contributed to performance in response to developments identified in the Alger Capital Appreciation Fund discussion.
Detractors from Performance
The Financials and Real Estate sectors were the most significant detractors from relative performance. Regarding individual positions, Microsoft Corporation; Alphabet Inc.; Meta Platforms Inc.; and Amazon.com, Inc. were among the top detractors from absolute performance. Shares of Microsoft detracted from performance in response to developments identified in the Alger Capital Appreciation Fund discussion.
Alger Mid Cap Growth Fund
The Alger Mid Cap Growth Fund returned -39.13% for the fiscal year ended October 31, 2022, compared to the -28.94% return of the Russell Midcap Growth Index. Effective August 1, 2022, Brandon Geisler became a portfolio manager of the Fund. Brandon is a Senior Vice President with over 21 years of investment experience. Before joining Alger, Brandon was a Partner, Managing Director of Research, Portfolio Manager and Senior Securities Analyst for Marsico Capital Management, where he managed several billion dollars in large and mid cap U.S., global and focused growth portfolios for mutual fund, institutional and high net worth clients. During the reporting period, the largest sector weightings were Information Technology and Healthcare. The largest sector overweight was Energy and the largest underweight was Information Technology.
Contributors to Performance
The Consumer Discretionary and Information Technology sectors provided the largest contributions to relative performance. Regarding individual positions, Diamondback Energy, Inc.; AutoZone, Inc.; McKesson Corporation; BJ’s Wholesale Club Holdings, Inc.; and HEICO Corporation were among the top contributors to absolute performance. Shares of HEICO contributed to performance in response to developments identified in the Alger 35 Fund discussion.
Detractors from Performance
The Financials and Healthcare sectors were the most significant detractors from relative performance. Regarding individual positions, Upstart Holdings, Inc.; Generac Holdings Inc.; MongoDB, Inc.; SVB Financial Group; and Natera, Inc. were among the top detractors from absolute performance.
Natera is a specialty lab providing genetic testing services in reproductive health, oncology and transplant. Non-invasive prenatal testing (NIPT), part of the company’s reproductive health franchise, has generated the majority of revenue historically; however, we believe Natera’s oncology business has potential to contribute toward a larger share of revenue as customers increasingly adopt these tests following positive insurance reimbursement decisions and favorable clinical trial results. Natera shares detracted from performance after the publication of what we believe was a largely unfounded short report by Hindenburg Research. The company also lost a false advertisement lawsuit brought by CareDx, and high-growth, high-valuation companies were out of favor with investors during the fiscal reporting period. We believe many of the allegations in the short report regarding sales and the company’s relationship with a third-party billing vendor are irrelevant to Natera’s outlook and its oncology franchise, which we view as the company’s key growth engine.
Alger Mid Cap Focus Fund
The Alger Mid Cap Focus Fund generated a -42.27% return for the fiscal year ended October 31, 2022, compared to the -28.94% return of the Russell Midcap Growth Index. During the reporting period, the largest sector weightings were Information Technology and Healthcare. The largest sector overweight was Healthcare and the largest underweight was Financials.
Contributors to Performance
The Communication Services and Utilities sectors provided the largest contributions to relative performance. Regarding individual positions, Constellation Energy Corporation; Enphase Energy, Inc.; Natera, Inc.; Vocera Communications, Inc.; and Vertex Pharmaceuticals Incorporated were among the top contributors to absolute performance.
Vertex is a biotech company that has revolutionized the treatment of cystic fibrosis (CF). It introduced the first drugs that treat the underlying disease (vs. the symptoms) which has not only led to the company providing treatment to many CF patients, but also has created a strong foothold in the space. Vertex’s shares drove contributed to performance as a competing developmental product for CF seems to be less imminent – according to Vertex management – and perhaps less effective than previously thought. Further, management announced pipeline progress in early-stage developments related to kidney, diabetes, and opioid pain management, creating opportunity for additional growth and diversified end markets.
Detractors from Performance
The Information Technology and Industrials sectors were the most significant detractors from relative performance. Regarding individual positions, Herc Holdings, Inc.; Avantor, Inc.; Generac Holdings Inc.; Signature Bank; and Confluent Inc. were among the top detractors from absolute performance.
Confluent is pioneering a new category of data infrastructure focused on data in motion (being transferred among locations) for software developers and enterprises. Confluent was founded by the original creators of event streaming company Apache Kafka and it is a large contributor to the open-source community and a leading commercial vendor behind Kafka. Confluent is designed to be the connective tissue by having real-time data from multiple sources constantly streamed across the enterprise for real-time analysis and data processing, powering smarter, faster and more modern digital applications. The company’s cloud service is the only cloud-native Apache Kafka solution, a fully managed service that is serverless, infinitely scalable, elastic and secure. The stock detracted from performance during the period because its revenue growth slowed. Cloud revenue recognition is consumption-based and Confluent stated that its fourth quarter 2021 was impacted by the holidays and workloads being shut off.
Alger Weatherbie Enduring Growth Fund
The Alger Weatherbie Enduring Growth Fund returned -26.50% from its December 17, 2021, inception date to October 31, 2022, compared to the -23.65% return of the Russell Midcap Growth Index. During the reporting period, the largest sector weightings were Industrials and Information Technology. The largest sector overweight was Industrials and the largest underweight was Information Technology. The Fund had no exposure to the Consumer Staples, Materials or Utilities sectors.
Contributors to Performance
The Information Technology and Industrials sectors provided the largest contributions to relative performance. Regarding individual positions, Paylocity Holding Corp.; Vertex, Inc.; Insulet Corporation; Ollie’s Bargain Outlet Holdings Inc.; and Waste Connections, Inc. were among the top contributors to absolute performance.
Paylocity is a leading software-as-a-service company that provides cloud-based payroll and human capital management in underserved small- to mid-size markets. Most new sales activity covers employers with 50 to 500 employees. Shares contributed to performance during the period as the company reported strong fiscal fourth-quarter earnings, which were generated by improving product demand. Sales momentum was also strong with a 28% year-over-year increase during the period, exceeding consensus expectations. In another positive development, the time required to establish initial meetings, receive decisions from potential clients and complete implementations have all returned to normal following previous challenges resulting from the COVID-19 pandemic.
Detractors from Performance
The Financials and Energy sectors were the most significant detractors from relative performance. Regarding individual positions, Signature Bank; Upstart Holdings, Inc.; FirstService Corp; HubSpot, Inc.; and Nevro Corp. were the top detractors from absolute performance.
FirstService is a leading provider of property management services to owners and homeowners associations of community and high-rise properties, as well as the provider of branded services such as California Closets and CertaPro Painters for residential homeowners. Services also include home restoration after fires, flooding or other events. FirstService continues to extend its significant scale advantage as it provides higher quality and greater breadth of services than its competition, while using its free cash and strong balance sheet to continue to make what we believe are attractive value-enhancing acquisitions. FirstService’s share price declined during the early 2022 market turmoil due in part to inflation concerns. While the company’s fourth quarter results met analyst expectations, wage inflation was a notable headwind during the period. However, management reported improved employee retention and more favorable conditions for filling open positions. FirstService’s residential business has continued to grow faster than the overall market, and the company’s branded services continue to experience strong demand in home improvement and other areas, which we believe should help offset a tougher near-term year-over-year comparison in restoration services.
Alger Weatherbie Specialized Growth Fund
The Alger Weatherbie Specialized Growth Fund generated a -42.03% return during the fiscal year ended October 31, 2022, compared to the -27.38% return of the Russell 2500 Growth Index. During the reporting period, the largest sector weightings were Information Technology and Industrials. The largest sector overweight was Financials and the largest underweight was Information Technology. The Fund had no exposure to Consumer Staples or Utilities sectors.
Contributors to Performance
The Information Technology and Communication Services sectors provided the largest contributions to relative performance. Regarding individual positions, Impinj, Inc.; Glaukos Corp; Wingstop, Inc.; Aerie Pharmaceuticals, Inc.; and Apria, Inc. were among the top contributors to absolute performance.
Impinj engages in the development and sale of RAIN, a radio frequency identification solution. Its platform allows inventory management, patient safety, asset tracking and item authentication for the retail, healthcare, supply chain and logistics, hospitality, food and beverage, and industrial manufacturing industries. Shares contributed to performance during the period as the company reported better-than-expected operating results. Further, company revenues are now beginning to pull through to profitability.
Detractors from Performance
The Financials and Industrials sectors were the most significant detractors from relative performance. Regarding individual positions, SiteOne Landscape Supply, Inc.; Latham Group Inc.; Chegg, Inc.; Natera, Inc.; and Progyny, Inc. were among the top detractors from absolute performance. Shares of Natera detracted from performance in response to developments identified in the Alger Mid Cap Growth Fund discussion.
Alger Small Cap Growth Fund
The Alger Small Cap Growth Fund returned -39.87% for the fiscal year ended October 31, 2022, compared to the -26.02% return of the Russell 2000 Growth Index. During the reporting period, the largest sector weightings were Healthcare and Information Technology. The largest sector overweight was Healthcare and the largest underweight was Industrials.
Contributors to Performance
The Real Estate and Financials sectors provided the largest contributions to relative performance. Regarding individual positions, Vocera Communications, Inc.; BJ’s Wholesale Club Holdings, Inc.; Magnolia Oil & Gas Corp.; HealthEquity Inc.; and HEICO Corporation were among the top contributors to absolute performance.
BJ’s Wholesale Club operates membership club stores primarily located on the east coast, with a particular concentration in the Northeast. Of BJ’s merchandise sales, about 71% is “grocery” and 14% is “general-merchandise.” The company has a much higher grocery mix than Costco. Moreover, BJ’s sells a significant amount of gas, which is roughly 15% of total sales. Gas sales are boosted by BJ’s 10- to 20-cent discount per gallon compared to the average gas station, which helps drive traffic when gas prices rise to high levels. The club store model does particularly well in times of high inflation as consumers visit the club to seek value, because BJ’s products are priced approximately 25% below traditional grocery stores. Further, with a large grocery mix, BJ’s is well positioned to pass on higher product costs to the consumer. The stock outperformed during the period as investors shifted to defensive stocks, and club-store models like BJ’s were favored. Nearly half of BJ’s operating profit comes from recurring membership income, which could be viewed as a more stable cash flow stream versus other business models. Additionally, BJ’s posted strong second quarter results, where positive key performance indicators around membership growth and retention exceeded consensus expectations. Management execution continues to improve as the company remains less exposed to inventory, supply chain, and labor issues than other retailers and grocers. Over the past few years, BJ’s has significantly improved its operations and execution, as investors expect to see the company holding on to its pandemic gains. Despite its better execution and ability to raise prices to mitigate rising cost pressures, BJ’s trades at a significant discount to Costco while generating similar revenue and earnings growth.
Detractors from Performance
The Healthcare and Information Technology sectors were the most significant detractors from relative performance. Regarding individual positions, Neogen Corporation; Joint Corp; HubSpot, Inc.; NanoString Technologies, Inc.; and Bio-Techne Corporation were among the top detractors from absolute performance.
Neogen develops, manufactures and markets a diverse line of products for food and animal safety. Food safety products include diagnostic test kits and complementary products sold to food producers and processors to detect dangerous and/or unintended substances in human food and animal feed. Animal safety products include pharmaceuticals, rodenticides, disinfectants, vaccines, veterinary instruments, topicals, diagnostic products and genomic testing that are used worldwide. Neogen’s detraction from performance was primarily attributable to concerns over the integration of the 3M Food Safety business, the largest M&A deal the company has ever completed.
Alger Small Cap Focus Fund
The Alger Small Cap Focus Fund returned -42.88% during the fiscal year ended October 31, 2022, compared to the -26.02% return of the Russell 2000 Growth Index. During the reporting period, the largest sector weightings were Healthcare and Information Technology. The largest sector overweight was Healthcare and the largest underweight was Consumer Discretionary. The Fund had no exposure to Materials, Real Estate or Utilities.
Contributors to Performance
The Consumer Discretionary and Real Estate sectors provided the largest contributions to relative performance. Regarding individual positions, RBC Bearings Incorporated; Shockwave Medical, Inc.; HealthEquity Inc; Evolent Health Inc.; and Viper Energy Partners LP were among the top contributors to absolute performance.
RBC Bearings is a leading manufacturer of highly engineered precision bearings that are integral to the production and operation of most machines, aircraft and mechanical systems. These products reduce wear and tear for moving parts, facilitate proper power transmission, reduce damage and energy loss caused by friction, and control pressure and flow. RBC focuses on highly technical, regulated and engineered bearings products for specialized markets that require sophisticated design, testing and manufacturing capabilities. In November 2021, RBC completed the acquisition of ABB’s Dodge mechanical power transmission business. It is the largest acquisition in RBC’s history, and we believe it is highly transformative. The transaction has created a leading manufacturer with strong brand recognition for mission-critical, premium performance bearings and motion control products for original equipment manufacturers (OEMs) and the industrial aftermarket. The combined company has a more diversified end market, including additional industries such as food and beverage, warehousing, general machinery and the construction and mining aftermarket. The combined company also has greater aftermarket exposure, which tends to generate recurring revenues. Shares contributed to performance as the company benefitted from a recovery in its commercial aerospace OEM business as aircraft production at Boeing and Airbus is increasing, and demand for products remains strong. The company is also able to offset inflationary pressures on cost and has demonstrated solid operating leverage despite a challenging environment.
Detractors from Performance
The Healthcare and Information Technology sectors were the most significant detractors from relative performance. Regarding individual positions, Heska Corporation; CryoPort, Inc.; Herc Holdings, Inc.; Everbridge, Inc.; and Guidewire Software, Inc. were among the top detractors from absolute performance.
Heska Corporation sells diagnostic tools and specialty products to the animal health market. Specifically, Heska sells blood testing and supplies, digital imaging products, software and single-use products primarily for cats and dogs. The company also offers private label vaccines and pharmaceutical production primarily for cattle and other small mammals. Shares of Heska detracted from performance largely due to an industry-wide slowdown in the animal health market. The company reported lower than expected earnings results due to weakness in vet visitation trends. Consequently, management lowered forward expectations given the difficult macroeconomic outlook.
Alger International Focus Fund
The Alger International Focus Fund recorded a -34.27% return for the fiscal year ended October 31, 2022, compared to the -24.35% return of the MSCI ACWI ex USA Index. During the reporting period, the largest sector weightings were Consumer Discretionary and Industrials. The largest sector overweight was Consumer Discretionary and the largest underweight was Financials.
Contributors to Performance
The Energy and Communication Services sectors provided the largest contributions to relative performance. From a country perspective, Brazil, Germany, and Japan were among the top contributors to relative performance. The Fund’s lack of exposure to Russia and Poland also contributed to relative performance. Regarding individual positions, Schlumberger NV; Arezzo Industria e Comercio S.A.; VERBIO Vereinigte BioEnergie AG; Alfen NV; and Keyence Corporation were among the top contributors to absolute performance.
VERBIO Vereinigte BioEnergie is a leading producer of the complete range of biofuels (biodiesel, bioethanol and biomethane) and by-products at the industrial scale. The company benefits from environmental protection tailwinds and an increasing effort to curb greenhouse gas emissions globally. VERBIO saw an increase in revenues during the period, primarily driven by higher sales prices of both biodiesel and bioethanol. Moreover, the Russia-Ukraine conflict continues to highlight Europe’s increasing need for energy independence. With biomethane serving as a direct substitute for natural gas, there is heightened investor focus on VERBIO’s ability to scale and serve as a potential solution to the ongoing energy crisis.
Detractors from Performance
The Healthcare and Industrials sectors detracted from relative performance, while Switzerland, Norway, Australia and Singapore were among countries that detracted from relative performance. Regarding individual positions, Aker Carbon Capture ASA; PolyPeptide Group AG; Eurofins Scientific Societe Europeenne; ASML Holding NV; and PUMA SE were among the top detractors from absolute performance.
PolyPeptide is a contract development and manufacturing organization focusing on proprietary and generic good manufacturing practice grade peptides used by pharmaceutical and biotech companies in approved pharmaceutical products, drugs in clinical development as well as in generic products. Shares detracted from performance during the period as the company experienced rising cost inflation that could not be passed on in the short-term, leading to meaningful margin compression. However, the company clarified its price cost model and provided greater visibility of purchase orders heading into the end of 2022. Consequently, PolyPeptide’s management stated that they expect the full benefit of its current pricing and contractual changes to come through in 2023.
Alger Health Sciences Fund
The Alger Health Sciences Fund returned -27.31% for the fiscal year ended October 31, 2022, compared to the -14.61% return of the S&P 500 Index and the -5.82% return of the Russell 3000 Healthcare Index.
Contributors to Performance
Regarding individual positions, McKesson Corporation; Prometheus Biosciences, Inc.; Acadia Healthcare Company, Inc.; Vertex Pharmaceuticals Incorporated; and AbbVie, Inc. were among the top contributors to absolute performance. Shares of Vertex Pharmaceuticals contributed to performance in response to developments identified in the Alger Mid Cap Focus Fund discussion.
Detractors from Performance
Regarding individual positions, InMode Ltd.; Edwards Lifesciences Corporation; Catalent Inc.; Azenta, Inc.; and Inspire Medical Systems, Inc. were among the top detractors from absolute performance.
InMode designs, develops, manufactures and commercializes innovative minimally invasive and non-invasive aesthetic medical products. InMode’s platforms harness novel radio frequency (RF) technology for emerging minimally invasive procedures that bridge the gap between temporary treatments like facials and more invasive surgical procedures like facelifts across several specialty categories such as plastic surgery, gynecology, dermatology, ophthalmology and otolaryngology (ear, nose and throat care). The aesthetics market experienced strong tailwinds coming out of the COVID-19 pandemic. These tailwinds include the “Zoom effect,” or dissatisfaction with one’s personal appearance after viewing one’s own face on Zoom, which resulted in more people deciding to undergo aesthetic procedures. De-stigmatization of aesthetics procedures, aided by social media platforms, has also supported InMode’s results. However, the stock price declined during the period, in part due to a rotation out of long duration names. Some investors also feared a wallet share shift away from aesthetics and have concerns about InMode’s exposure to international markets due to Russia’s invasion of Ukraine; however, our research suggests the company’s revenue exposure to Europe is minimal.
I thank you for putting your trust in Alger.
Sincerely,
Daniel C. Chung, CFA
Chief Executive Officer
Fred Alger Management, LLC
Investors cannot invest directly in an index. Index performance does not reflect the deduction for fees, expenses, or taxes.
This report and the financial statements contained herein are submitted for the general information of shareholders of the funds. This report is not authorized for distribution to prospective investors in a fund unless preceded or accompanied by an effective prospectus for the fund. Performance of funds discussed above other than the Alger 35 Fund and the Alger Mid Cap Focus Fund represents the return of Class A shares prior to the deduction of any sales charges and includes the reinvestment of any dividends or distributions. Performance for the Alger 35 Fund represents Class Z shares. Performance for the Alger Mid Cap Focus Fund represents Class I shares.
The performance data quoted represents past performance, which is not an indication or guarantee of future results.
Standardized performance results can be found on the following pages. The investment return and principal value of an investment in a fund will fluctuate so that an investor’s shares, when redeemed, may be worth more or less than their original cost. Current performance may be lower or higher than the performance quoted. For performance data current to the most recent month-end, visit us at www.alger.com or call us at (800) 992-3863.
The views and opinions of the funds’ management in this report are as of the date of the Shareholders’ Letter and are subject to change at any time subsequent to this date. There is no guarantee that any of the assumptions that formed the basis for the opinions stated herein are accurate or that they will materialize. Moreover, the information forming the basis for such assumptions is from sources believed to be reliable; however, there is no guarantee that such information is accurate. Any securities mentioned, whether owned in a fund or otherwise, are considered in the context of the construction of an overall portfolio of securities and therefore reference to them should not be construed as a recommendation or offer to purchase or sell any such security. Inclusion of such securities in a fund and transactions in such securities, if any, may be for a variety of reasons, including, without limitation, in response to cash flows, inclusion in a benchmark, and risk control. The reference to a specific security should also be understood in such context and not viewed as a statement that the security is a significant holding in a fund. Please refer to the Schedules of Investments for each fund which is included in this report for a complete list of fund holdings as of October 31, 2022. Securities mentioned in the Shareholders’ Letter, if not found in the Schedules of Investments, may have been held by the funds during the fiscal 12-month period ended October 31, 2022.
Risk Disclosures
Alger Capital Appreciation Fund
Investing in the stock market involves risks, including the potential loss of principal. Growth stocks may be more volatile than other stocks as their prices tend to be higher in relation to their companies’ earnings and may be more sensitive to market, political, and economic developments. Local, regional or global events such as environmental or natural disasters, war, terrorism, pandemics, outbreaks of infectious diseases and similar public health threats, recessions, or other events could have a significant impact on investments. A significant portion of assets may be invested in securities of companies in related sectors, and may be similarly affected by economic, political, or market events and conditions and may be more vulnerable to unfavorable sector developments. Foreign securities involve special risks including currency fluctuations, inefficient trading, political and economic instability, and increased volatility.
Alger 35 Fund
Investing in the stock market involves risks, including the potential loss of principal. Growth stocks may be more volatile than other stocks as their prices tend to be higher in relation to their companies’ earnings and may be more sensitive to market, political, and economic developments. Local, regional or global events such as environmental or natural disasters, war, terrorism, pandemics, outbreaks of infectious diseases and similar public health threats, recessions, or other events could have a significant impact on investments. A significant portion of assets may be invested in securities of companies in related sectors, and may be similarly affected by economic, political, or market events and conditions and may be more vulnerable to unfavorable sector developments. Investing in companies of small and medium capitalizations involves the risk that such issuers may have limited product lines or financial resources, lack management depth, or have limited liquidity. Foreign securities involve special risks including currency fluctuations, inefficient trading, political and economic instability, and increased volatility. The Fund is classified as a “non-diversified fund” under federal securities laws because it can invest in fewer individual companies than a diversified fund. Assets may be focused in a small number of holdings, making them susceptible to risks associated with a single economic, political or regulatory event than a more diversified portfolio. Active trading may increase transaction costs, brokerage commissions, and taxes, which can lower the return on investment.
Alger Growth & Income Fund
Investing in the stock market involves risks, including the potential loss of principal. Growth stocks may be more volatile than other stocks as their prices tend to be higher in relation to their companies’ earnings and may be more sensitive to market, political, and economic developments. Local, regional or global events such as environmental or natural disasters, war, terrorism, pandemics, outbreaks of infectious diseases and similar public health threats, recessions, or other events could have a significant impact on investments. A significant portion of assets may be invested in securities of companies in related sectors, and may be similarly affected by economic, political, or market events and conditions and may be more vulnerable to unfavorable sector developments. Income-producing securities may cut or fail to declare dividends due to market downturns or for other reasons. At times, the Fund may hold a large cash position, which may underperform relative to equity securities.
Alger Mid Cap Growth Fund
Investing in the stock market involves risks, including the potential loss of principal. Growth stocks may be more volatile than other stocks as their prices tend to be higher in relation to their companies’ earnings and may be more sensitive to market, political, and economic developments. Local, regional or global events such as environmental or natural disasters, war, terrorism, pandemics, outbreaks of infectious diseases and similar public health threats, recessions, or other events could have a significant impact on investments. A significant portion of assets may be invested in securities of companies in related sectors, and may be similarly affected by economic, political, or market events and conditions and may be more vulnerable to unfavorable sector developments. Investing in companies of medium capitalizations involves the risk that such issuers may have limited product lines or financial resources, lack management depth, or have limited liquidity. Foreign securities involve special risks including currency fluctuations, inefficient trading, political and economic instability, and increased volatility. Active trading may increase transaction costs, brokerage commissions, and taxes, which can lower the return on investment. At times, the Fund may hold a large cash position, which may underperform relative to equity securities.
Alger Mid Cap Focus Fund
Investing in the stock market involves risks, including the potential loss of principal. Growth stocks may be more volatile than other stocks as their prices tend to be higher in relation to their companies’ earnings and may be more sensitive to market, political, and economic developments. Local, regional or global events such as environmental or natural disasters, war, terrorism, pandemics, outbreaks of infectious diseases and similar public health threats, recessions, or other events could have a significant impact on investments. Investing in companies of medium capitalizations involves the risk that such issuers may have limited product lines or financial resources, lack management depth, or have limited liquidity. Assets may be focused in a small number of holdings, making them susceptible to risks associated with a single economic, political or regulatory event than a more diversified portfolio. A significant portion of assets may be invested in securities of companies in related sectors or industries, and may be similarly affected by economic, political, or market events and conditions and may be more vulnerable to unfavorable sector or industry developments. The Fund is classified as a “non-diversified fund” under federal securities laws because it can invest in fewer individual companies than a diversified fund. Foreign securities involve special risks including currency fluctuations, inefficient trading, political and economic instability, and increased volatility. Active trading may increase transaction costs, brokerage commissions, and taxes, which can lower the return on investment. At times, the Fund may hold a large cash position, which may underperform relative to equity securities.
Alger Weatherbie Enduring Growth Fund
Investing in the stock market involves risks, including the potential loss of principal. Growth stocks may be more volatile than other stocks as their prices tend to be higher in relation to their companies’ earnings and may be more sensitive to market, political, and economic developments. Local, regional or global events such as environmental or natural disasters, war, terrorism, pandemics, outbreaks of infectious diseases and similar public health threats, recessions, or other events could have a significant impact on investments. A significant portion of assets may be invested in securities of companies in related sectors, and may be similarly affected by economic, political, or market events and conditions and may be more vulnerable to unfavorable sector developments. Weatherbie Capital, LLC’s use of an environmental, social, and governance (“ESG”) rating agency to implement the investment strategy may result in the selection or exclusion of securities for reasons other than financial performance and the strategy may underperform strategies that do not utilize an ESG rating agency or employ another type of ESG investment strategy. In evaluating a particular issuer’s ESG rating, as well as the account’s weighted average ESG rating, Weatherbie Capital, LLC relies exclusively on the ESG rating agency and, therefore, is dependent upon information and data from the ESG rating agency that may be incomplete or inaccurate, or that may present conflicting information and data with respect to an issuer than other third party ESG data providers utilized throughout the industry. Investing in companies of medium capitalizations involves the risk that such issuers may have limited product lines or financial resources, lack management depth, or have limited liquidity. Assets may be focused in a small number of holdings, making them susceptible to risks associated with a single economic, political or regulatory event than a more diversified portfolio. Investing in new issues involves special risks including lack of trading history, limited information and availability, and volatility. Cash positions may underperform relative to equity and fixed-income securities. Active trading may increase transaction costs, brokerage commissions, and taxes, which can lower the return on investment. The Fund is classified as a “non-diversified fund” under federal securities laws because it can invest in fewer individual companies than a diversified fund.
Alger Weatherbie Specialized Growth Fund
Investing in the stock market involves risks, including the potential loss of principal. Growth stocks may be more volatile than other stocks as their prices tend to be higher in relation to their companies’ earnings and may be more sensitive to market, political, and economic developments. Local, regional or global events such as environmental or natural disasters, war, terrorism, pandemics, outbreaks of infectious diseases and similar public health threats, recessions, or other events could have a significant impact on investments. A significant portion of assets may be invested in securities of companies in related sectors, and may be similarly affected by economic, political, or market events and conditions and may be more vulnerable to unfavorable sector developments. Investing in companies of small and medium capitalizations involves the risk that such issuers may have limited product lines or financial resources, lack management depth, or have limited liquidity. Assets may be focused in a small number of holdings, making them susceptible to risks associated with a single economic, political or regulatory event than a more diversified portfolio. Foreign securities and emerging markets involve special risks including currency fluctuations, inefficient trading, political and economic instability, and increased volatility.
Alger Small Cap Growth Fund
Investing in the stock market involves risks, including the potential loss of principal. Growth stocks may be more volatile than other stocks as their prices tend to be higher in relation to their companies’ earnings and may be more sensitive to market, political, and economic developments. Local, regional or global events such as environmental or natural disasters, war, terrorism, pandemics, outbreaks of infectious diseases and similar public health threats, recessions, or other events could have a significant impact on investments. A significant portion of assets may be invested in securities of companies in related sectors or industries, and may be similarly affected by economic, political, or market events and conditions and may be more vulnerable to unfavorable sector or industry developments. Investing in companies of small capitalizations involves the risk that such issuers may have limited product lines or financial resources, lack management depth, or have limited liquidity. At times, the Fund may hold a large cash position, which may underperform relative to equity securities.
Alger Small Cap Focus Fund
Investing in the stock market involves risks, including the potential loss of principal. Growth stocks may be more volatile than other stocks as their prices tend to be higher in relation to their companies’ earnings and may be more sensitive to market, political, and economic developments. Local, regional or global events such as environmental or natural disasters, war, terrorism, pandemics, outbreaks of infectious diseases and similar public health threats, recessions, or other events could have a significant impact on investments. A significant portion of assets may be invested in securities of companies in related sectors or industries, and may be similarly affected by economic, political, or market events and conditions and may be more vulnerable to unfavorable sector or industry developments. Investing in companies of small capitalizations involves the risk that such issuers may have limited product lines or financial resources, lack management depth, or have limited liquidity. Assets may be focused in a small number of holdings, making them susceptible to risks associated with a single economic, political or regulatory event than a more diversified portfolio. Foreign securities involve special risks including currency fluctuations, inefficient trading, political and economic instability. At times, the Fund may hold a large cash position, which may underperform relative to equity securities.
Alger International Focus Fund
Investing in the stock market involves risks, including the potential loss of principal. Growth stocks may be more volatile than other stocks as their prices tend to be higher in relation to their companies’ earnings and may be more sensitive to market, political, and economic developments. Local, regional or global events such as environmental or natural disasters, war, terrorism, pandemics, outbreaks of infectious diseases and similar public health threats, recessions, or other events could have a significant impact on investments. A significant portion of assets may be invested in securities of companies in related sectors, and may be similarly affected by economic, political, or market events and conditions and may be more vulnerable to unfavorable sector developments. Assets may be focused in a small number of holdings, making them susceptible to risks associated with a single economic, political or regulatory event than a more diversified portfolio. Foreign securities and emerging markets involve special risks including currency fluctuations, inefficient trading, political and economic instability, and increased volatility. Investing in companies of small capitalizations involves the risk that such issuers may have limited product lines or financial resources, lack management depth, or have limited liquidity. Active trading may increase transaction costs, brokerage commissions, and taxes, which can lower the return on investment.
Alger Health Sciences Fund
Investing in the stock market involves risks, including the potential loss of principal. Growth stocks may be more volatile than other stocks as their prices tend to be higher in relation to their companies’ earnings and may be more sensitive to market, political, and economic developments. Local, regional or global events such as environmental or natural disasters, war, terrorism, pandemics, outbreaks of infectious diseases and similar public health threats, recessions, or other events could have a significant impact on investments. A significant portion of assets will be invested in healthcare companies, which may be significantly affected by competition, innovation, regulation, and product obsolescence, and may be more volatile than the securities of other companies. A significant portion of assets may be invested in securities of companies in related industries, and may be similarly affected by economic, political, or market events and conditions and may be more vulnerable to unfavorable industry developments. Investing in companies of small capitalizations involves the risk that such issuers may have limited product lines or financial resources, lack management depth, or have limited liquidity. Private placements are offerings of a company’s securities not registered with the SEC and not offered to the public, for which limited information may be available. Such investments are generally considered to be illiquid. Foreign securities involve special risks including currency fluctuations, inefficient trading, political and economic instability, and increased volatility. Active trading may increase transaction costs, brokerage commissions, and taxes, which can lower the return on investment. At times, the Fund may hold a large cash position, which may underperform relative to equity securities.
For a more detailed discussion of the risks associated with a fund, please see the prospectus.
Before investing, carefully consider a fund’s investment objective, risks, charges, and expenses. For a prospectus and summary prospectus containing this and other information or for The Alger Funds’ most recent month-end performance data, visit www.alger.com, call (800) 992-3863 or consult your financial advisor. Read the prospectus and summary prospectus carefully before investing.
Distributor: Fred Alger & Company, LLC
NOT FDIC INSURED. NOT BANK GUARANTEED. MAY LOSE VALUE.
Definitions:
| ● | Price-to-earnings is the ratio for valuing a company that measures its current share price relative to its earnings per share (EPS). |
| ● | The Russell 3000 Growth Index combines the large-cap Russell 1000 Growth, the small-cap Russell 2000 Growth and the Russell Microcap Growth Index. It includes companies that are considered more growth oriented relative to the overall market as defined by Russell’s leading style methodology. The Russell 3000 Growth Index is constructed to provide a comprehensive, unbiased, and stable barometer of the growth opportunities within the broad market. |
| ● | The Russell Microcap Growth Index measures the performance of the microcap growth segment of the US equity market. It includes Russell Microcap companies with relatively higher price-to-book ratios, higher I/B/E/S forecast medium term (2 year) growth and higher sales per share historical growth (5 years). |
| ● | The Russell 3000 Value Index measures the performance of the broad value segment of the US equity value universe. It includes those Russell 3000 companies with lower price-to-book ratios and lower forecasted growth values. The Russell 3000 Value Index is constructed to provide a comprehensive, unbiased and stable barometer of the broad value market. |
| ● | The MSCI ACWI Index is a free float-adjusted market capitalization weighted index that is designed to measure the equity market performance of developed and emerging markets. The MSCI ACWI captures large and mid cap representation across developed markets and 26 emerging markets countries. |
| ● | The MSCI ACWI ex USA Index captures large- and mid-cap representation across developed markets countries (excluding the US) and emerging markets countries. The index covers approximately 85% of the global equity opportunity set outside the US. |
| ● | The MSCI Emerging Markets Index is a free float-adjusted market capitalization index that is designed to measure equity market performance in the global emerging markets. |
| ● | The MSCI EAFE Index is designed to represent the performance of large and mid-cap securities across developed markets, including countries in Europe, Australasia and the Far East, excluding the U.S. and Canada. |
| ● | The Russell 1000 Growth Index measures the performance of the large-cap growth segment of the U.S. equity universe. It includes those Russell 1000 companies with higher growth earning potential as defined by Russell’s leading style methodology. The Russell 1000 Growth Index is constructed to provide a comprehensive and unbiased barometer for the large-cap growth segment. |
| ● | The S&P 500 Index is an unmanaged index considered representative of large-cap growth stocks. |
| ● | The Russell Midcap Growth Index measures the performance of the mid-cap growth segment of the U.S. equity universe. It includes those Russell Midcap Index companies with higher growth earning potential as defined by Russell’s leading style methodology. The Russell Midcap Growth Index is constructed to provide a comprehensive and unbiased barometer of the mid-cap growth market. |
| ● | The Russell 2500 Growth Index measures the performance of the small to mid-cap growth segment of the U.S. equity universe. It includes those Russell 2500 companies with higher growth earning potential as defined by Russell’s leading style methodology. The Russell 2500 Growth Index is constructed to provide a comprehensive and unbiased barometer of the small to mid-cap growth market. |
| ● | The Russell 2000 Growth Index measures the performance of the small-cap growth segment of the U.S. equity universe. It includes those Russell 2000 companies with higher growth earning potential as defined by Russell’s leading style methodology. The Russell 2000 Growth Index is constructed to provide a comprehensive and unbiased barometer for the small-cap growth segment. |
| ● | The Russell 3000 Healthcare Index is an unmanaged index that measures the performance of those companies in the Russell 3000 Index involved in the medical services or healthcare field. Also included are companies involved in research, development and production of pharmaceuticals and biotechnology. |
ALGER CAPITAL APPRECIATION FUND
Fund Highlights Through October 31, 2022 (Unaudited)
HYPOTHETICAL $10,000 INVESTMENT IN CLASS A SHARES
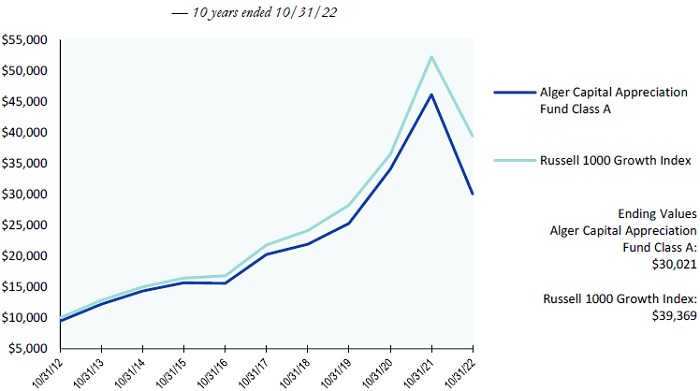
The chart above illustrates the change in value of a hypothetical $10,000 investment made in the Alger Capital Appreciation Fund Class A shares, with a maximum sales charge of 5.25%, and the Russell 1000 Growth Index (an unmanaged index of common stocks) for the ten years ended October 31, 2022. Figures for the Alger Capital Appreciation Fund Class A shares and the Russell 1000 Growth Index include reinvestment of dividends. Figures for the Alger Capital Appreciation Fund Class A shares also include reinvestment of capital gains. Performance for Alger Capital Appreciation Fund Class C and Class Z shares will vary from the results shown above due to differences in expenses and sales charges those classes bear. Investors cannot invest directly in any index. Index performance does not reflect deduction for fees, expenses, or taxes.
ALGER CAPITAL APPRECIATION FUND
Fund Highlights Through October 31, 2022 (Unaudited) (Continued)
PERFORMANCE COMPARISON AS OF 10/31/22
AVERAGE ANNUAL TOTAL RETURNS
| 1 YEAR | 5 YEARS | 10 YEARS | |
| Class A | (38.30)% | 7.03% | 11.62% |
| Class C | (35.83)% | 7.39% | 11.39% |
| Class Z | (34.67)% | 8.55% | 12.60% |
| Russell 1000 Growth Index | (24.60)% | 12.59% | 14.69% |
The performance data quoted represents past performance, which is not an indication or a guarantee of future results. The Fund’s average annual total returns include changes in share price and reinvestment of dividends and capital gains. Class A returns reflect the maximum initial sales charge and Class C returns reflect the applicable contingent deferred sales charge. The chart and table above do not reflect the deduction of taxes that a shareholder would have paid on Fund distributions or on the redemption of Fund shares. Investment return and principal will fluctuate and the Fund’s shares, when redeemed, may be worth more or less than their original cost. Current performance may be higher or lower than the performance quoted. For updated performance, visit us at www.alger.com or call us at (800) 992-3863.
ALGER 35 FUND
Fund Highlights Through October 31, 2022 (Unaudited)
HYPOTHETICAL $10,000 INVESTMENT IN CLASS Z SHARES
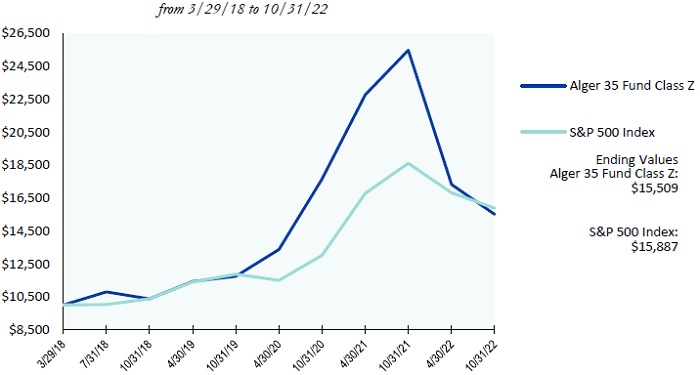
The chart above illustrates the change in value of a hypothetical $10,000 investment made in the Alger 35 Fund Class Z shares and the S&P 500 Index (an unmanaged index of common stocks) from March 29, 2018, the inception date of the Alger 35 Fund Class Z shares, through October 31, 2022. Effective May 7, 2021, Class P shares of the Alger 35 Fund were reclassified as Class Z shares. The reclassified Class Z shares have the same annual returns as the Class P shares because the shares are invested in the same portfolio of securities and the reclassified Class Z shares have the same expenses as the Fund’s Class P shares. Historical performance prior to May 7, 2021 is that of the Fund’s Class P shares. Figures for the Alger 35 Fund Class Z shares and the S&P 500 Index include reinvestment of dividends. Figures for the Alger 35 Fund Class Z shares also include reinvestment of capital gains. Investors cannot invest directly in any index. Index performance does not reflect deduction for fees, expenses, or taxes.
ALGER 35 FUND
Fund Highlights Through October 31, 2022 (Unaudited) (Continued)
PERFORMANCE COMPARISON AS OF 10/31/22
AVERAGE ANNUAL TOTAL RETURNS
| Since | |||
| 1 YEAR | 5 YEARS | inception | |
| Class Z (Inception 3/29/18) | (39.09)% | n/a | 10.03% |
| S&P 500 Index | (14.61)% | n/a | 10.61% |
The performance data quoted represents past performance, which is not an indication or a guarantee of future results. The Fund’s average annual total returns include changes in share price and reinvestment of dividends and capital gains. Effective May 7, 2021, Class P shares of the Alger 35 Fund were reclassified as Class Z shares. The reclassified Class Z shares have the same annual returns as the Class P shares because the shares are invested in the same portfolio of securities and the reclassified Class Z shares have the same expenses as the Fund’s Class P shares. Historical performance prior to May 7, 2021 is that of the Fund’s Class P shares. The chart and table above do not reflect the deduction of taxes that a shareholder would have paid on Fund distributions or on the redemption of Fund shares. Investment return and principal will fluctuate and the Fund’s shares, when redeemed, may be worth more or less than their original cost. Current performance may be higher or lower than the performance quoted. For updated performance, visit us at www.alger. com or call us at (800) 992-3863.
ALGER GROWTH & INCOME FUND
Fund Highlights Through October 31, 2022 (Unaudited)
HYPOTHETICAL $10,000 INVESTMENT IN CLASS A SHARES
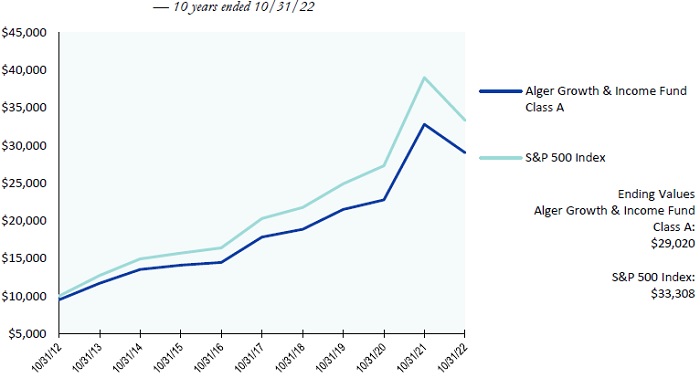
The chart above illustrates the change in value of a hypothetical $10,000 investment made in the Alger Growth & Income Fund Class A shares, with a maximum sales charge of 5.25%, and the S&P 500 Index (an unmanaged index of common stocks) for the ten years ended October 31, 2022. Figures for the Alger Growth & Income Fund Class A shares and the S&P 500 Index include reinvestment of dividends. Figures for the Alger Growth & Income Fund Class A shares also include reinvestment of capital gains. Performance for the Alger Growth & Income Fund Class C and Class Z shares will vary from the results shown above due to differences in expenses and sales charges those classes bear. Investors cannot invest directly in any index. Index performance does not reflect deduction for fees, expenses, or taxes.
ALGER GROWTH & INCOME FUND
Fund Highlights Through October 31, 2022 (Unaudited) (Continued)
PERFORMANCE COMPARISON AS OF 10/31/22
AVERAGE ANNUAL TOTAL RETURNS
| 1 YEAR | 5 YEARS | 10 YEARS | |
| Class A | (16.17)% | 9.06% | 11.24% |
| Class C | (13.03)% | 9.42% | 11.00% |
| Class Z | (11.25)% | 10.63% | 12.18% |
| S&P 500 Index | (14.61)% | 10.44% | 12.79% |
The performance data quoted represents past performance, which is not an indication or a guarantee of future results. The Fund’s average annual total returns include changes in share price and reinvestment of dividends and capital gains. Class A returns reflect the maximum initial sales charge and Class C returns reflect the applicable contingent deferred sales charge. The chart and table above do not reflect the deduction of taxes that a shareholder would have paid on Fund distributions or on the redemption of Fund shares. Investment return and principal will fluctuate and the Fund’s shares, when redeemed, may be worth more or less than their original cost. Current performance may be higher or lower than the performance quoted. For updated performance, visit us at www.alger.com or call us at (800) 992-3863.
ALGER MID CAP GROWTH FUND*
Fund Highlights Through October 31, 2022 (Unaudited)
HYPOTHETICAL $10,000 INVESTMENT IN CLASS A SHARES
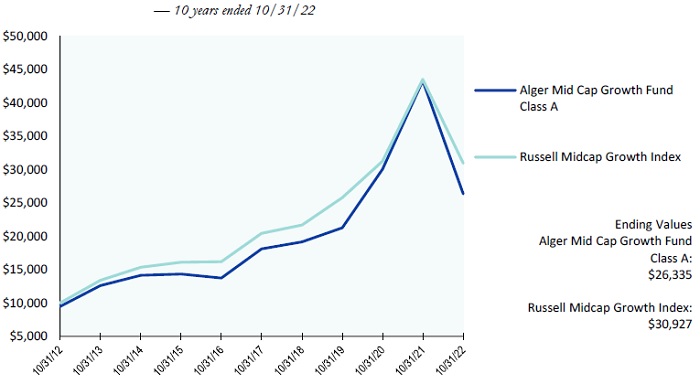
The chart above illustrates the change in value of a hypothetical $10,000 investment made in the Alger Mid Cap Growth Fund Class A shares, with a maximum sales charge of 5.25%, and the Russell Midcap Growth Index (an unmanaged index of common stocks) for the ten years ended October 31, 2022. Figures for the Alger Mid Cap Growth Fund Class A shares and Russell Midcap Growth Index include reinvestment of dividends. Figures for the Alger Mid Cap Growth Fund Class A shares also include reinvestment of capital gains. Performance for the Alger Mid Cap Growth Fund Class B, Class C and Class Z shares will vary from the results shown above due to differences in expenses and sales charges those classes bear. Investors cannot invest directly in any index. Index performance does not reflect deduction for fees, expenses, or taxes.
ALGER MID CAP GROWTH FUND*
Fund Highlights Through October 31, 2022 (Unaudited) (Continued)
PERFORMANCE COMPARISON AS OF 10/31/22
AVERAGE ANNUAL TOTAL RETURNS
| 1 YEAR | 5 YEARS | 10 YEARS | |
| Class A | (42.33)% | 6.62% | 10.17% |
| Class B | (40.99)% | 7.40% | 10.26% |
| Class C | (39.95)% | 6.93% | 9.87% |
| Russell Midcap Growth Index | (28.94)% | 8.66% | 11.95% |
| 1 YEAR | 5 YEARS | Since inception | |
| Class Z (Inception 5/28/15) | (38.95)% | 8.10% | 7.51% |
| Russell Midcap Growth Index | (28.94)% | 8.66% | 8.54% |
The performance data quoted represents past performance, which is not an indication or a guarantee of future results. The Fund’s average annual total returns include changes in share price and reinvestment of dividends and capital gains. Class A returns reflect the maximum initial sales charge and Class B and C returns reflect the applicable contingent deferred sales charge. The chart and table above do not reflect the deduction of taxes that a shareholder would have paid on Fund distributions or on the redemption of Fund shares. Investment return and principal will fluctuate and the Fund’s shares, when redeemed, may be worth more or less than their original cost. Current performance may be higher or lower than the performance quoted. For updated performance, visit us at www.alger.com or call us at (800) 992-3863.
| * | Pursuant to the U.S. Securities and Exchange Commission’s rules on Fair Fund and Disgorgement Plans, the Alger Mid Cap Growth Fund received a Fair Fund distribution of $9,346,397 on September 10, 2021, which contributed approximately 0.60% and 0.31% to its five and ten year annual returns, respectively. |
ALGER MID CAP FOCUS FUND
Fund Highlights Through October 31, 2022 (Unaudited)
HYPOTHETICAL $10,000 INVESTMENT IN CLASS I SHARES

The chart above illustrates the change in value of a hypothetical $10,000 investment made in the Alger Mid Cap Focus Fund Class I shares and the Russell Midcap Growth Index (an unmanaged index of common stocks) from June 14, 2019, the inception date of the Alger Mid Cap Focus Fund Class I shares, through October 31, 2022. Figures for the Alger Mid Cap Focus Fund Class I shares and the Russell Midcap Growth Index include reinvestment of dividends. Figures for the Alger Mid Cap Focus Fund Class I shares also include reinvestment of capital gains. Performance for the Alger Mid Cap Focus Fund Class A, C, Y and Z shares will vary from the results shown above due to differences in the expenses and sales charges that those classes bear. Investors cannot invest directly in any index. Index performance does not reflect deduction for fees, expenses, or taxes.
ALGER MID CAP FOCUS FUND
Fund Highlights Through October 31, 2022 (Unaudited) (Continued)
PERFORMANCE COMPARISON AS OF 10/31/22
AVERAGE ANNUAL TOTAL RETURNS
| Since | |||
| 1 YEAR | 5 YEARS | inception | |
| Class I (Inception 6/14/19) | (42.28)% | n/a | 9.81% |
| Class Z (Inception 6/14/19) | (42.10)% | n/a | 10.11% |
| Russell Midcap Growth Index | (28.94)% | n/a | 6.50% |
| Since | |||
| 1 YEAR | 5 YEARS | inception | |
| Class Y (Inception 2/26/21) | (42.07)% | n/a | (21.94)% |
| Russell Midcap Growth Index | (28.94)% | n/a | (11.05)% |
| Since | |||
| 1 YEAR | 5 YEARS | inception | |
| Class A (Inception 7/29/21) | (45.31)% | n/a | (31.64)% |
| Class C (Inception 7/29/21) | (43.29)% | n/a | (29.22)% |
| Russell Midcap Growth Index | (28.94)% | n/a | (20.98)% |
The performance data quoted represents past performance, which is not an indication or a guarantee of future results. The Fund’s average annual total returns include changes in share price and reinvestment of dividends and capital gains. Class A returns reflect the maximum initial sales charge and Class C returns reflect the applicable contingent deferred sales charge. The chart and table above do not reflect the deduction of taxes that a shareholder would have paid on Fund distributions or on the redemption of Fund shares. Investment return and principal will fluctuate and the Fund’s shares, when redeemed, may be worth more or less than their original cost. Current performance may be higher or lower than the performance quoted. For updated performance, visit us at www.alger.com or call us at (800) 992-3863.
ALGER WEATHERBIE ENDURING GROWTH FUND
Fund Highlights Through October 31, 2022 (Unaudited)
HYPOTHETICAL $10,000 INVESTMENT IN CLASS A SHARES

The chart above illustrates the change in value of a hypothetical $10,000 investment made in the Alger Weatherbie Enduring Growth Fund Class A shares, with a maximum sales charge of 5.25%, and the Russell Midcap Growth Index (an unmanaged index of common stocks) from December 17, 2021, the inception date of the Alger Weatherbie Enduring Growth Fund, through October 31, 2022. Figures for the Alger Weatherbie Enduring Growth Fund Class A shares and Russell Midcap Growth Index include reinvestment of dividends. Figures for the Alger Weatherbie Enduring Growth Fund Class A shares also include reinvestment of capital gains. Performance for Alger Weatherbie Enduring Growth Fund Class C, Class I, Class Y and Class Z shares will vary from the results shown above due to differences in expenses and sales charges those classes bear. Investors cannot invest directly in any index. Index performance does not reflect deduction for fees, expenses, or taxes.
ALGER WEATHERBIE ENDURING GROWTH FUND
Fund Highlights Through October 31, 2022 (Unaudited) (Continued)
PERFORMANCE COMPARISON AS OF 10/31/22
AVERAGE ANNUAL TOTAL RETURNS
| Since | |||
| 1 YEAR | 5 YEARS | inception | |
| Class A (Inception 12/17/21) | n/a | n/a | (30.33)% |
| Class C (Inception 12/17/21) | n/a | n/a | (27.63)% |
| Class I (Inception 12/17/21) | n/a | n/a | (26.40)% |
| Class Y (Inception 12/17/21) | n/a | n/a | (26.20)% |
| Class Z (Inception 12/17/21) | n/a | n/a | (26.20)% |
| Russell Midcap Growth Index | n/a | n/a | (23.65)% |
The performance data quoted represents past performance, which is not an indication or a guarantee of future results. The Fund’s average annual total returns include changes in share price and reinvestment of dividends and capital gains. The chart and table above do not reflect the deduction of taxes that a shareholder would have paid on Fund distributions or on the redemption of Fund shares. Investment return and principal will fluctuate and the Fund’s shares, when redeemed, may be worth more or less than their original cost. Current performance may be higher or lower than the performance quoted. For updated performance, visit us at www.alger.com or call us at (800) 992-3863.
ALGER WEATHERBIE SPECIALIZED GROWTH FUND
Fund Highlights Through October 31, 2022 (Unaudited)
HYPOTHETICAL $10,000 INVESTMENT IN CLASS A SHARES

The chart above illustrates the change in value of a hypothetical $10,000 investment made in the Alger Weatherbie Specialized Growth Fund Class A shares, with a maximum sales charge of 5.25%, and the Russell 2500 Growth Index (an unmanaged index of common stocks) for the ten years ended October 31, 2022. From August 30, 2017 to September 30, 2019, the Fund was named Alger SMid Cap Focus Fund. Prior to August 30, 2017, the Fund followed different investment strategies under the name Alger SMid Cap Growth Fund and prior to March 1, 2017 was managed by different portfolio managers. Accordingly, performance prior to those dates does not reflect the Fund’s current investment strategies and investment personnel. Figures for the Alger Weatherbie Specialized Growth Fund Class A shares and the Russell 2500 Growth Index include reinvestment of dividends. Figures for the Alger Weatherbie Specialized Growth Fund Class A shares also include reinvestment of capital gains. Performance for the Alger Weatherbie Specialized Growth Fund Class C, Class I, Class Y and Class Z shares will vary from the results shown above due to differences in expenses and sales charges those classes bear. Investors cannot invest directly in any index. Index performance does not reflect deduction for fees, expenses, or taxes.
ALGER WEATHERBIE SPECIALIZED GROWTH FUND
Fund Highlights Through October 31, 2022 (Unaudited) (Continued)
PERFORMANCE COMPARISON AS OF 10/31/22
AVERAGE ANNUAL TOTAL RETURNS
| 1 YEAR | 5 YEARS | 10 YEARS | |
| Class A | (45.07)% | 7.60% | 10.49% |
| Class C | (42.85)% | 7.95% | 10.25% |
| Class I | (42.02)% | 8.78% | 11.09% |
| Class Z | (41.82)% | 9.13% | 11.46% |
| Russell 2500 Growth Index | (27.38)% | 7.41% | 11.38% |
| Since | |||
| 1 YEAR | 5 YEARS | inception | |
| Class Y (Inception 8/30/17) | (41.81)% | 9.20% | 10.33% |
| Russell 2500 Growth Index | (27.38)% | 7.41% | 8.81% |
The performance data quoted represents past performance, which is not an indication or a guarantee of future results. The Fund’s average annual total returns include changes in share price and reinvestment of dividends and capital gains. Class A returns reflect the maximum initial sales charge and Class C returns reflect the applicable contingent deferred sales charge. The chart and table above do not reflect the deduction of taxes that a shareholder would have paid on Fund distributions or on the redemption of Fund shares. From August 30, 2017 to September 30, 2019, the Fund was named “Alger SMid Cap Focus Fund.” Prior to August 30, 2017, the Fund followed different investment strategies under the name “Alger SMid Cap Growth Fund” and prior to March 1, 2017 was managed by different portfolio managers. Accordingly, performance prior to those dates does not reflect the Fund’s current investment strategies and investment personnel. Investment return and principal will fluctuate and the Fund’s shares, when redeemed, may be worth more or less than their original cost. Current performance may be higher or lower than the performance quoted. For updated performance, visit us at www.alger. com or call us at (800) 992-3863.
ALGER SMALL CAP GROWTH FUND*
Fund Highlights Through October 31, 2022 (Unaudited)
HYPOTHETICAL $10,000 INVESTMENT IN CLASS A SHARES
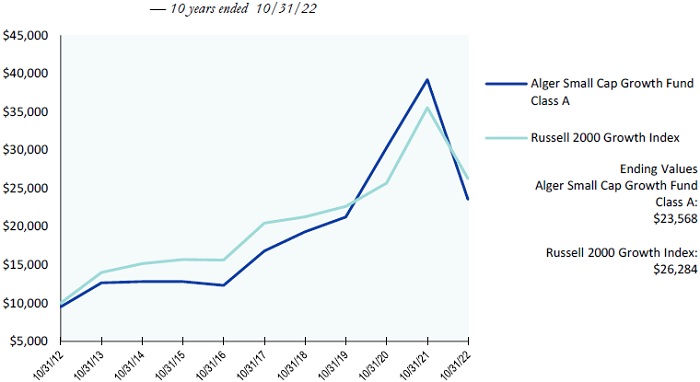
The chart above illustrates the change in value of a hypothetical $10,000 investment made in the Alger Small Cap Growth Fund Class A shares, with a maximum sales charge of 5.25%, and the Russell 2000 Growth Index (an unmanaged index of common stocks) for the ten years ended October 31, 2022. Figures for the Alger Small Cap Growth Fund Class A shares and the Russell 2000 Growth Index include reinvestment of dividends. Figures for the Alger Small Cap Growth Fund Class A shares also include reinvestment of capital gains. Performance for the Alger Small Cap Growth Fund Class B, Class C, Class Y and Class Z shares will vary from the results shown above due to differences in expenses and sales charges those classes bear. Investors cannot invest directly in any index. Index performance does not reflect deduction for fees, expenses, or taxes.
ALGER SMALL CAP GROWTH FUND*
Fund Highlights Through October 31, 2022 (Unaudited) (Continued)
PERFORMANCE COMPARISON AS OF 10/31/22
AVERAGE ANNUAL TOTAL RETURNS
| 1 YEAR | 5 YEARS | 10 YEARS | |
| Class A | (43.03)% | 5.84% | 8.95% |
| Class B | (42.51)% | 6.43% | 8.98% |
| Class C | (40.83)% | 6.20% | 8.67% |
| Class Z | (39.66)% | 7.37% | 9.93% |
| Russell 2000 Growth Index | (26.02)% | 5.17% | 10.15% |
| Since | |||
| 1 YEAR | 5 YEARS | Inception | |
| Class Y (Inception 12/31/21) | n/a | n/a | (32.73)% |
| Russell 2000 Growth Index | n/a | n/a | (22.57)% |
The performance data quoted represents past performance, which is not an indication or a guarantee of future results. The Fund’s average annual total returns include changes in share price and reinvestment of dividends and capital gains. Class A returns reflect the maximum initial sales charge and Class B and C returns reflect the applicable contingent deferred sales charge. The chart and table above do not reflect the deduction of taxes that a shareholder would have paid on Fund distributions or on the redemption of Fund shares. Investment return and principal will fluctuate and the Fund’s shares, when redeemed, may be worth more or less than their original cost. Current performance may be higher or lower than the performance quoted. For updated performance, visit us at www.alger.com or call us at (800) 992-3863.
| * | Pursuant to the U.S. Securities and Exchange Commission’s Rules on Fair Fund and Disgorgement Plans, the Alger Small Cap Growth Fund received a Fair Fund distribution of $3,738,004 on September 10, 2021, which contributed approximately 0.12% and 0.06% to its five and ten year annual returns, respectively. |
ALGER SMALL CAP FOCUS FUND
Fund Highlights Through October 31, 2022 (Unaudited)
HYPOTHETICAL $10,000 INVESTMENT IN CLASS A SHARES
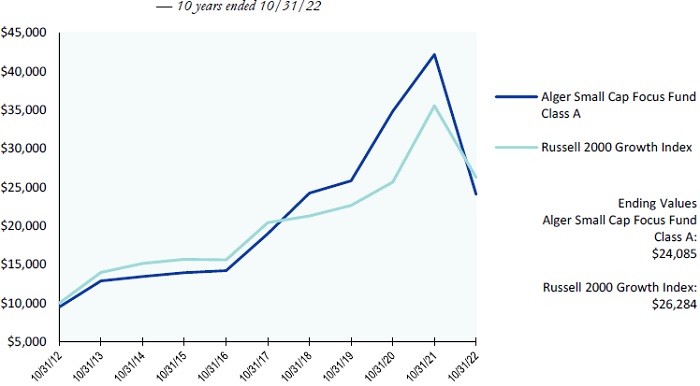
The chart above illustrates the change in value of a hypothetical $10,000 investment made in the Alger Small Cap Focus Fund Class A shares, with an initial 5.25% maximum sales charge, and the Russell 2000 Growth (an unmanaged index of common stocks) for the ten years ended October 31, 2022. Prior to August 7, 2015, the Fund followed different investment strategies under the name “Alger Growth Opportunities Fund” and prior to February 12, 2015 was managed by a different portfolio manager. Accordingly, performance prior to those dates does not reflect the Fund’s current investment strategies and investment personnel. Figures for the Alger Small Cap Focus Fund Class A shares and the Russell 2000 Growth Index include reinvestment of dividends. Figures for the Alger Small Cap Focus Fund Class A shares also include reinvestment of capital gains. Performance for the Alger Small Cap Focus Fund Class C, Class I, Class Y and Class Z shares will vary from the results shown above due to differences in expenses and sales charges those classes bear. Investors cannot invest directly in any index. Index performance does not reflect deduction for fees, expenses, or taxes.
ALGER SMALL CAP FOCUS FUND
Fund Highlights Through October 31, 2022 (Unaudited) (Continued)
PERFORMANCE COMPARISON AS OF 10/31/22
AVERAGE ANNUAL TOTAL RETURNS
| 1 YEAR | 5 YEARS | 10 YEARS | |
| Class A | (45.88)% | 3.74% | 9.19% |
| Class C | (43.76)% | 4.14% | 9.01% |
| Class I | (42.77)% | 4.94% | 9.90% |
| Class Z | (42.61)% | 5.27% | 10.21% |
| Russell 2000 Growth Index | (26.02)% | 5.17% | 10.15% |
| Since | |||
| 1 YEAR | 5 YEARS | Inception | |
| Class Y (Inception 2/28/17) | (42.58)% | 5.28% | 7.96% |
| Russell 2000 Growth Index | (26.02)% | 5.17% | 6.98% |
The performance data quoted represents past performance, which is not an indication or a guarantee of future results. The Fund’s average annual total returns include changes in share price and reinvestment of dividends and capital gains. Class A returns reflect the maximum initial sales charge and Class C returns reflect the applicable contingent deferred sales charge. The chart and table above do not reflect the deduction of taxes that a shareholder would have paid on Fund distributions or on the redemption of Fund shares. Prior to August 7, 2015, the Fund followed different investment strategies under the name “Alger Growth Opportunities Fund” and prior to February 12, 2015 was managed by a different portfolio manager. Accordingly, performance prior to those dates does not reflect the Fund’s current investment strategies and investment personnel. Investment return and principal will fluctuate and the Fund’s shares, when redeemed, may be worth more or less than their original cost. Current performance may be higher or lower than the performance quoted. For updated performance, visit us at www.alger.com or call us at (800) 992-3863.
ALGER INTERNATIONAL FOCUS FUND*
Fund Highlights Through October 31, 2022 (Unaudited)
HYPOTHETICAL $10,000 INVESTMENT IN CLASS A SHARES
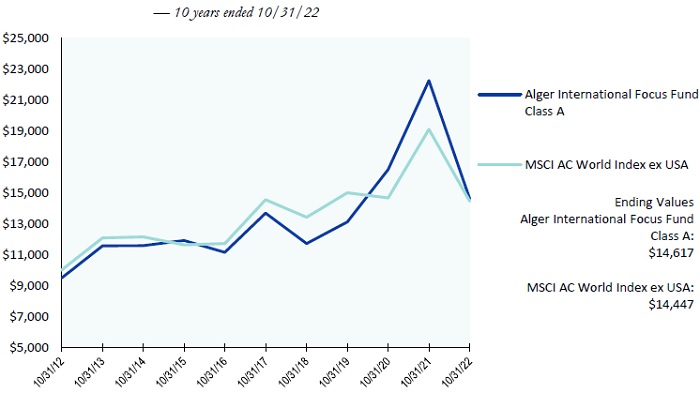
The chart above illustrates the change in value of a hypothetical $10,000 investment made in the Alger International Focus Fund Class A shares, with a maximum sales charge of 5.25%, and MSCI AC World Index ex USA (an unmanaged index of common stocks) for the ten years ended October 31, 2022. Before March 28, 2018, the Fund followed different investment strategies and was managed by different portfolio managers. Prior to May 31, 2013, the Fund was named “Alger Large Cap Growth Fund,” and from May 31, 2013 to August 15, 2018 the Fund was named “Alger International Growth Fund.” Performance prior to March 28, 2018 reflects these prior management styles and does not reflect the Fund’s current investment strategies and investment personnel. Figures for the Alger International Focus Fund Class A shares and the index include reinvestment of dividends. Figures for the Alger International Focus Fund Class A shares also include reinvestment of capital gains. Performance for the Alger International Focus Fund Class B, Class C, Class I and Class Z shares will vary from the results shown above due to differences in expenses and sales charges those classes bear. Investors cannot invest directly in any index. Index performance does not reflect deduction for fees, expenses, or taxes.
ALGER INTERNATIONAL FOCUS FUND*
Fund Highlights Through October 31, 2022 (Unaudited) (Continued)
PERFORMANCE COMPARISON AS OF 10/31/22
AVERAGE ANNUAL TOTAL RETURNS
| 1 YEAR | 5 YEARS | 10 YEARS | |
| Class A | (37.73)% | 0.26% | 3.87% |
| Class B | (37.29)% | 0.86% | 3.98% |
| Class C | (35.40)% | 0.52% | 3.60% |
| Class Z | (34.03)% | 1.77% | 4.89% |
| MSCI AC World Index ex USA | (24.35)% | (0.13)% | 3.75% |
| Since | |||
| 1 YEAR | 5 YEARS | Inception | |
| Class I (Inception 5/31/13) | (34.28)% | 1.49% | 3.70% |
| MSCI AC World Index ex USA | (24.35)% | (0.13)% | 2.89% |
The performance data quoted represents past performance, which is not an indication or a guarantee of future results. The Fund’s average annual total returns include changes in share price and reinvestment of dividends and capital gains. Class A returns reflect the maximum initial sales charge and Class B and C returns reflect the applicable contingent deferred sales charge. The chart and table above do not reflect the deduction of taxes that a shareholder would have paid on Fund distributions or on the redemption of Fund shares. Investment return and principal will fluctuate and the Fund’s shares, when redeemed, may be worth more or less than their original cost. Before March 28, 2018, the Fund followed different investment strategies and was managed by different portfolio managers. Prior to May 31, 2013, the Fund was named “Alger Large Cap Growth Fund,” and from May 31, 2013 to August 15, 2018 the Fund was named “Alger International Growth Fund.” Performance prior to March 28, 2018 reflects these prior management styles and does not reflect the Fund’s current investment strategies and investment personnel. Current performance may be higher or lower than the performance quoted. For updated performance, visit us at www.alger.com or call us at (800) 992-3863.
| * | Pursuant to the U.S. Securities and Exchange Commission’s Rules on Fair Fund and Disgorgement Plans, the Alger International Focus Fund received a Fair Fund distribution of $159,091 on September 10, 2021, which contributed 0.01% to its five and ten year annual returns. |
ALGER HEALTH SCIENCES FUND*
Fund Highlights Through October 31, 2022 (Unaudited)
HYPOTHETICAL $10,000 INVESTMENT IN CLASS A SHARES
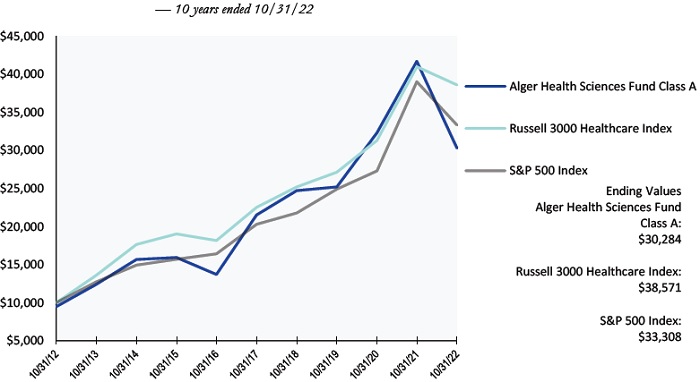
The chart above illustrates the change in value of a hypothetical $10,000 investment made in the Alger Health Sciences Fund Class A shares, with a maximum sales charge of 5.25%, the Russell 3000 Healthcare Index and the S&P 500 Index (each an unmanaged index of common stocks) for the ten years ended October 31, 2022. Figures for the Alger Health Sciences Fund Class A shares, the Russell 3000 Healthcare Index and the S&P 500 Index include reinvestment of dividends. Figures for the Alger Health Sciences Fund Class A shares also include reinvestment of capital gains. Performance for the Alger Health Sciences Fund Class C and Class Z shares will vary from the results shown above due to differences in expenses and sales charges those classes bear. Investors cannot invest directly in any index. Index performance does not reflect deduction for fees, expenses, or taxes.
ALGER HEALTH SCIENCES FUND*
Fund Highlights Through October 31, 2022 (Unaudited) (Continued)
PERFORMANCE COMPARISON AS OF 10/31/22
AVERAGE ANNUAL TOTAL RETURNS
| 1 YEAR | 5 YEARS | 10 YEARS | |
| Class A | (31.13)% | 5.95% | 11.72% |
| Class C | (28.35)% | 6.28% | 11.47% |
| Russell 3000 Healthcare Index | (5.82)% | 11.38% | 14.45% |
| S&P 500 Index | (14.61)% | 10.44% | 12.79% |
| Since | |||
| 1 YEAR | 5 YEARS | Inception | |
| Class Z (Inception 5/28/15) | (27.05)% | 7.46% | 7.37% |
| Russell 3000 Healthcare Index | (5.82)% | 11.38% | 9.14% |
| S&P 500 Index | (14.61)% | 10.44% | 10.50% |
The performance data quoted represents past performance, which is not an indication or a guarantee of future results. The Fund’s average annual total returns include changes in share price and reinvestment of dividends and capital gains. Class A returns reflect the maximum initial sales charge and Class C returns reflect the applicable contingent deferred sales charge. The chart and table above do not reflect the deduction of taxes that a shareholder would have paid on Fund distributions or on the redemption of Fund shares. Investment return and principal will fluctuate and the Fund’s shares, when redeemed, may be worth more or less than their original cost. Current performance may be higher or lower than the performance quoted. For updated performance, visit us at www.alger.com or call us at (800) 992-3863.
| * | Pursuant to the U.S. Securities and Exchange Commission’s Rules on Fair Fund and Disgorgement Plans, the Alger Health Sciences Fund received a Fair Fund distribution of $179,832 on September 10, 2021, which contributed approximately 0.01% to its five and ten year annual returns. |
October 31, 2022 (Unaudited)
| SECTORS | Alger Capital Appreciation Fund | Alger 35 Fund | Alger Growth & Income Fund | Alger Mid Cap Growth Fund | ||||||||||||
| Communication Services | 9.4 | % | 12.8 | % | 7.6 | % | 6.6 | % | ||||||||
| Consumer Discretionary | 16.5 | 9.8 | 6.8 | 12.8 | ||||||||||||
| Consumer Staples | 1.0 | 0.0 | 7.4 | 2.5 | ||||||||||||
| Energy | 4.2 | 8.1 | 6.4 | 4.7 | ||||||||||||
| Financials | 2.2 | 1.4 | 11.7 | 5.5 | ||||||||||||
| Healthcare | 20.4 | 28.3 | 16.3 | 17.5 | ||||||||||||
| Industrials | 7.0 | 4.7 | 6.7 | 14.1 | ||||||||||||
| Information Technology | 33.6 | 29.0 | 25.2 | 26.6 | ||||||||||||
| Materials | 1.2 | 0.0 | 1.9 | 1.9 | ||||||||||||
| Real Estate | 0.3 | 5.1 | 3.5 | 0.0 | ||||||||||||
| Utilities | 1.2 | 0.0 | 1.5 | 0.0 | ||||||||||||
| Short-Term Investments and Net Other Assets | 3.0 | 0.8 | 5.0 | 7.8 | ||||||||||||
| 100.0 | % | 100.0 | % | 100.0 | % | 100.0 | % | |||||||||
| SECTORS | Alger Mid Cap Focus Fund | Alger Weatherbie Enduring Growth Fund | Alger Weatherbie Specialized Growth Fund | Alger Small Cap Growth Fund | ||||||||||||
| Communication Services | 3.1 | % | 0.8 | % | 0.7 | % | 5.3 | % | ||||||||
| Consumer Discretionary | 10.8 | 6.4 | 10.8 | 11.8 | ||||||||||||
| Consumer Staples | 1.4 | 0.0 | 0.0 | 5.6 | ||||||||||||
| Energy | 3.7 | 4.5 | 5.5 | 6.6 | ||||||||||||
| Financials | 0.0 | 9.7 | 11.5 | 1.4 | ||||||||||||
| Healthcare | 28.9 | 9.1 | 18.7 | 27.0 | ||||||||||||
| Industrials | 12.8 | 34.7 | 21.6 | 7.2 | ||||||||||||
| Information Technology | 32.9 | 17.6 | 21.5 | 23.7 | ||||||||||||
| Materials | 0.0 | 0.0 | 0.0 | 3.7 | ||||||||||||
| Real Estate | 0.0 | 8.0 | 5.7 | 1.2 | ||||||||||||
| Utilities | 5.1 | 0.0 | 0.0 | 0.0 | ||||||||||||
| Short-Term Investments and Net Other Assets | 1.3 | 9.2 | 4.0 | 6.5 | ||||||||||||
| 100.0 | % | 100.0 | % | 100.0 | % | 100.0 | % | |||||||||
| SECTORS | Alger Small Cap Focus Fund | Alger Health Sciences Fund | ||||||||||||||
| Consumer Discretionary | 7.2 | % | 0.0 | % | ||||||||||||
| Consumer Staples | 2.3 | 0.0 | ||||||||||||||
| Energy | 7.5 | 0.0 | ||||||||||||||
| Financials | 2.1 | 0.0 | ||||||||||||||
| Healthcare | 43.6 | 96.2 | ||||||||||||||
| Industrials | 11.1 | 0.0 | ||||||||||||||
| Information Technology | 24.0 | 0.0 | ||||||||||||||
| Short-Term Investments and Net Other Assets | 2.2 | 3.8 | ||||||||||||||
| 100.0 | % | 100.0 | % | |||||||||||||
PORTFOLIO SUMMARY†
October 31, 2022 (Unaudited) (Continued)
| COUNTRY | Alger International Focus Fund | |||
| Argentina | 2.0 | % | ||
| Australia | 5.4 | |||
| Brazil | 5.8 | |||
| China | 4.9 | |||
| France | 15.8 | |||
| Germany | 5.8 | |||
| Hong Kong | 1.2 | |||
| India | 6.3 | |||
| Ireland | 2.2 | |||
| Italy | 6.9 | |||
| Japan | 6.9 | |||
| Netherlands | 9.0 | |||
| Norway | 2.7 | |||
| South Korea | 1.8 | |||
| Spain | 1.5 | |||
| Sweden | 1.1 | |||
| Switzerland | 3.6 | |||
| United Kingdom | 5.1 | |||
| United States | 10.4 | |||
| Short-Term Investments, Cash and Net Other Assets | 1.6 | |||
| 100.0 | % | |||
| † | Based on net assets for each Fund. |
THE ALGER FUNDS | ALGER CAPITAL APPRECIATION FUND
Schedule of Investments October 31, 2022
| COMMON STOCKS—96.4% | SHARES | VALUE | ||||||
| ADVERTISING—0.8% | ||||||||
| The Trade Desk, Inc., Cl. A* | 258,232 | $ | 13,748,272 | |||||
| AEROSPACE & DEFENSE—3.7% | ||||||||
| HEICO Corp. | 80,135 | 13,033,156 | ||||||
| Lockheed Martin Corp. | 35,385 | 17,221,172 | ||||||
| TransDigm Group, Inc. | 64,741 | 37,275,278 | ||||||
| 67,529,606 | ||||||||
| AGRICULTURAL & FARM MACHINERY—0.5% | ||||||||
| Deere & Co. | 23,996 | 9,498,097 | ||||||
| APPAREL ACCESSORIES & LUXURY GOODS—1.1% | ||||||||
| Capri Holdings Ltd.* | 143,674 | 6,563,028 | ||||||
| LVMH Moet Hennessy Louis Vuitton SE | 21,983 | 13,870,459 | ||||||
| 20,433,487 | ||||||||
| APPLICATION SOFTWARE—4.6% | ||||||||
| Adobe, Inc.* | 17,791 | 5,666,433 | ||||||
| Cadence Design Systems, Inc.* | 78,345 | 11,860,650 | ||||||
| Datadog, Inc., Cl. A* | 163,338 | 13,150,342 | ||||||
| Intuit, Inc. | 106,997 | 45,741,218 | ||||||
| Salesforce, Inc.* | 48,198 | 7,836,513 | ||||||
| 84,255,156 | ||||||||
| AUTO PARTS & EQUIPMENT—0.2% | ||||||||
| Aptiv PLC* | 47,498 | 4,325,643 | ||||||
| AUTOMOBILE MANUFACTURERS—1.8% | ||||||||
| Tesla, Inc.* | 145,546 | 33,117,537 | ||||||
| BIOTECHNOLOGY—5.3% | ||||||||
| AbbVie, Inc. | 172,972 | 25,323,101 | ||||||
| Biogen, Inc.* | 43,283 | 12,268,133 | ||||||
| Natera, Inc.* | 471,494 | 22,141,358 | ||||||
| Neurocrine Biosciences, Inc.* | 47,272 | 5,441,953 | ||||||
| Regeneron Pharmaceuticals, Inc.* | 3,517 | 2,633,354 | ||||||
| Vaxcyte, Inc.* | 82,926 | 3,616,403 | ||||||
| Vertex Pharmaceuticals, Inc.* | 78,657 | 24,540,984 | ||||||
| 95,965,286 | ||||||||
| CASINOS & GAMING—2.4% | ||||||||
| Las Vegas Sands Corp.* | 237,539 | 9,028,858 | ||||||
| MGM Resorts International | 977,583 | 34,772,627 | ||||||
| 43,801,485 | ||||||||
| COAL & CONSUMABLE FUELS—0.2% | ||||||||
| Cameco Corp. | 138,939 | 3,295,633 | ||||||
| CONSTRUCTION MACHINERY & HEAVY TRUCKS—0.2% | ||||||||
| Wabtec Corp. | 38,611 | 3,601,634 | ||||||
| DATA PROCESSING & OUTSOURCED SERVICES—3.8% | ||||||||
| Mastercard, Inc., Cl. A | 15,010 | 4,925,982 | ||||||
| PayPal Holdings, Inc.* | 144,377 | 12,067,029 | ||||||
| Visa, Inc., Cl. A | 253,730 | 52,562,707 | ||||||
| 69,555,718 | ||||||||
THE ALGER FUNDS | ALGER CAPITAL APPRECIATION FUND
Schedule of Investments October 31, 2022 (Continued)
| COMMON STOCKS—96.4% (CONT.) | SHARES | VALUE | ||||||
| DIVERSIFIED SUPPORT SERVICES—0.4% | ||||||||
| Cintas Corp. | 17,968 | $ | 7,682,218 | |||||
| ELECTRIC UTILITIES—1.2% | ||||||||
| NextEra Energy, Inc. | 283,553 | 21,975,358 | ||||||
| ELECTRICAL COMPONENTS & EQUIPMENT—1.8% | ||||||||
| AMETEK, Inc. | 26,791 | 3,473,721 | ||||||
| Eaton Corp., PLC | 189,357 | 28,416,805 | ||||||
| Generac Holdings, Inc.* | 11,581 | 1,342,354 | ||||||
| 33,232,880 | ||||||||
| ELECTRONIC EQUIPMENT & INSTRUMENTS—0.5% | ||||||||
| Zebra Technologies Corp., Cl. A* | 32,888 | 9,314,539 | ||||||
| FINANCIAL EXCHANGES & DATA—1.2% | ||||||||
| S&P Global, Inc. | 68,756 | 22,087,865 | ||||||
| HEALTHCARE DISTRIBUTORS—1.9% | ||||||||
| McKesson Corp. | 87,117 | 33,920,746 | ||||||
| HEALTHCARE EQUIPMENT—1.8% | ||||||||
| Boston Scientific Corp.* | 191,839 | 8,270,179 | ||||||
| Intuitive Surgical, Inc.* | 79,625 | 19,625,174 | ||||||
| Shockwave Medical, Inc.* | 14,118 | 4,138,692 | ||||||
| 32,034,045 | ||||||||
| HEALTHCARE FACILITIES—1.0% | ||||||||
| Acadia Healthcare Co., Inc.* | 232,921 | 18,936,477 | ||||||
| HYPERMARKETS & SUPER CENTERS—1.0% | ||||||||
| Costco Wholesale Corp. | 34,810 | 17,457,215 | ||||||
| INTERACTIVE HOME ENTERTAINMENT—0.6% | ||||||||
| Take-Two Interactive Software, Inc.* | 89,955 | 10,657,868 | ||||||
| INTERACTIVE MEDIA & SERVICES—4.2% | ||||||||
| Alphabet, Inc., Cl. C* | 728,110 | 68,922,893 | ||||||
| Meta Platforms, Inc., Cl. A* | 29,358 | 2,734,991 | ||||||
| Pinterest, Inc., Cl. A* | 196,172 | 4,825,831 | ||||||
| 76,483,715 | ||||||||
| INTERNET & DIRECT MARKETING RETAIL—8.8% | ||||||||
| Alibaba Group Holding Ltd.#,* | 147,626 | 9,386,061 | ||||||
| Altaba, Inc.*,(a) | 259,825 | 444,301 | ||||||
| Amazon.com, Inc.* | 1,224,230 | 125,410,121 | ||||||
| Farfetch Ltd., Cl. A* | 761,206 | 6,455,027 | ||||||
| Meituan, Cl. B* | 347,280 | 5,560,142 | ||||||
| MercadoLibre, Inc.* | 13,666 | 12,321,539 | ||||||
| 159,577,191 | ||||||||
| INTERNET SERVICES & INFRASTRUCTURE—0.2% | ||||||||
| Snowflake, Inc., Cl. A* | 17,052 | 2,733,436 | ||||||
| LEISURE FACILITIES—0.6% | ||||||||
| Vail Resorts, Inc. | 50,709 | 11,111,863 | ||||||
| LIFE SCIENCES TOOLS & SERVICES—2.7% | ||||||||
| Danaher Corp. | 195,454 | 49,189,908 | ||||||
THE ALGER FUNDS | ALGER CAPITAL APPRECIATION FUND
Schedule of Investments October 31, 2022 (Continued)
| COMMON STOCKS—96.4% (CONT.) | SHARES | VALUE | ||||||
| MANAGED HEALTHCARE—5.5% | ||||||||
| Humana, Inc. | 65,703 | $ | 36,667,530 | |||||
| UnitedHealth Group, Inc. | 111,997 | 62,175,135 | ||||||
| 98,842,665 | ||||||||
| MOVIES & ENTERTAINMENT—3.8% | ||||||||
| Live Nation Entertainment, Inc.* | 475,813 | 37,879,473 | ||||||
| Netflix, Inc.* | 74,980 | 21,885,162 | ||||||
| The Walt Disney Co.* | 89,177 | 9,500,918 | ||||||
| 69,265,553 | ||||||||
| OIL & GAS EXPLORATION & PRODUCTION—3.1% | ||||||||
| Antero Resources Corp.* | 256,099 | 9,388,589 | ||||||
| Devon Energy Corp. | 224,996 | 17,403,441 | ||||||
| Diamondback Energy, Inc. | 39,152 | 6,151,171 | ||||||
| Pioneer Natural Resources Co. | 91,150 | 23,371,771 | ||||||
| 56,314,972 | ||||||||
| OIL & GAS STORAGE & TRANSPORTATION—0.9% | ||||||||
| Cheniere Energy, Inc. | 92,789 | 16,368,908 | ||||||
| PHARMACEUTICALS—2.2% | ||||||||
| Eli Lilly & Co. | 93,391 | 33,815,947 | ||||||
| Reata Pharmaceuticals, Inc., Cl. A* | 197,925 | 6,373,185 | ||||||
| 40,189,132 | ||||||||
| REGIONAL BANKS—1.0% | ||||||||
| Signature Bank | 115,467 | 18,304,984 | ||||||
| RESTAURANTS—1.6% | ||||||||
| Domino’s Pizza, Inc. | 18,340 | 6,093,281 | ||||||
| Shake Shack, Inc., Cl. A* | 218,966 | 12,167,941 | ||||||
| Starbucks Corp. | 113,886 | 9,861,389 | ||||||
| 28,122,611 | ||||||||
| SEMICONDUCTOR EQUIPMENT—0.3% | ||||||||
| SolarEdge Technologies, Inc.* | 25,563 | 5,880,257 | ||||||
| SEMICONDUCTORS—5.0% | ||||||||
| Advanced Micro Devices, Inc.* | 310,216 | 18,631,573 | ||||||
| First Solar, Inc.* | 126,370 | 18,395,681 | ||||||
| Marvell Technology, Inc. | 598,825 | 23,761,376 | ||||||
| NVIDIA Corp. | 196,926 | 26,579,102 | ||||||
| ON Semiconductor Corp.* | 67,314 | 4,135,099 | ||||||
| 91,502,831 | ||||||||
| SPECIALTY CHEMICALS—1.2% | ||||||||
| Albemarle Corp. | 51,807 | 14,499,225 | ||||||
| The Sherwin-Williams Co. | 32,479 | 7,308,749 | ||||||
| 21,807,974 | ||||||||
THE ALGER FUNDS | ALGER CAPITAL APPRECIATION FUND
Schedule of Investments October 31, 2022 (Continued)
| COMMON STOCKS—96.4% (CONT.) | SHARES | VALUE | ||||||
| SYSTEMS SOFTWARE—12.8% | ||||||||
| Crowdstrike Holdings, Inc., Cl. A* | 23,560 | $ | 3,797,872 | |||||
| Microsoft Corp. | 847,364 | 196,698,605 | ||||||
| Palo Alto Networks, Inc.* | 108,840 | 18,675,856 | ||||||
| ServiceNow, Inc.* | 29,441 | 12,387,006 | ||||||
| 231,559,339 | ||||||||
| TECHNOLOGY HARDWARE STORAGE & PERIPHERALS—6.1% | ||||||||
| Apple, Inc. | 723,151 | 110,887,974 | ||||||
| TRUCKING—0.4% | ||||||||
| Uber Technologies, Inc.* | 277,209 | 7,365,443 | ||||||
| TOTAL COMMON STOCKS | ||||||||
| (Cost $1,237,851,665) | 1,751,935,521 | |||||||
| PREFERRED STOCKS—0.1% | SHARES | VALUE | ||||||
| DATA PROCESSING & OUTSOURCED SERVICES—0.1% | ||||||||
| Chime Financial, Inc., Series G*,@,(a) | 27,841 | 1,215,538 | ||||||
| (Cost $1,922,972) | 1,215,538 | |||||||
| REAL ESTATE INVESTMENT TRUST—0.3% | SHARES | VALUE | ||||||
| SPECIALIZED—0.3% | ||||||||
| SBA Communications Corp., Cl. A | 20,957 | 5,656,294 | ||||||
| (Cost $5,455,226) | 5,656,294 | |||||||
| SPECIAL PURPOSE VEHICLE—0.2% | VALUE | |||||||
| DATA PROCESSING & OUTSOURCED SERVICES—0.2% | ||||||||
| Crosslink Ventures Capital LLC, Cl. A*,@,(a),(b) | 2,934,840 | |||||||
| (Cost $2,775,000) | 2,934,840 | |||||||
| Total Investments | ||||||||
| (Cost $1,248,004,863) | 97.0 | % | $ | 1,761,742,193 | ||||
| Affiliated Securities (Cost $2,775,000) | 2,934,840 | |||||||
| Unaffiliated Securities (Cost $1,245,229,863) | 1,758,807,353 | |||||||
| Other Assets in Excess of Liabilities | 3.0 | % | 53,795,273 | |||||
| NET ASSETS | 100.0 | % | $ | 1,815,537,466 | ||||
| # | American Depositary Receipts. |
| (a) | Security is valued in good faith at fair value determined using significant unobservable inputs pursuant to procedures established by the Valuation Designee (as defined in Note 2). |
| (b) | Deemed an affiliate of the Fund in accordance with Section 2(a)(3) of the Investment Company Act of 1940. See Note 11 - Affiliated Securities. |
| * | Non-income producing security. |
| @ | Restricted security - Investment in security not registered under the Securities Act of 1933. Sales or transfers of the investment may be restricted only to qualified buyers. |
| Security | Acquisition Date(s) | Acquisition Cost | % of net assets (Acquisition Date) | Market Value | % of net assets as of 10/31/2022 | |||||||||||||
| Chime Financial, Inc., Series G | 8/24/21 | $ | 1,922,972 | 0.06% | $ | 1,215,538 | 0.07% | |||||||||||
| Crosslink Ventures Capital LLC, Cl. A | 10/2/20 | 2,775,000 | 0.08% | 2,934,840 | 0.16% | |||||||||||||
| Total | $ | 4,150,378 | 0.23% | |||||||||||||||
See Notes to Financial Statements.
THE ALGER FUNDS | ALGER 35 FUND
Schedule of Investments October 31, 2022
| COMMON STOCKS—96.7% | SHARES | VALUE | ||||||
| AEROSPACE & DEFENSE—4.7% | | |||||||
| HEICO Corp. | 7,446 | $ | 1,211,017 | |||||
| APPLICATION SOFTWARE—1.9% | | |||||||
| Datadog, Inc., Cl. A* | 6,234 | 501,899 | ||||||
| BIOTECHNOLOGY—8.3% | | |||||||
| Biogen, Inc.* | 2,785 | 789,381 | ||||||
| Natera, Inc.* | 16,896 | 793,436 | ||||||
| Seagen, Inc.* | 4,489 | 570,821 | ||||||
| 2,153,638 | ||||||||
| CASINOS & GAMING—2.4% | | |||||||
| MGM Resorts International | 17,403 | 619,025 | ||||||
| DATA PROCESSING & OUTSOURCED SERVICES—5.3% | | |||||||
| Marqeta, Inc., Cl. A* | 69,095 | 544,469 | ||||||
| Toast, Inc., Cl. A* | 37,771 | 834,361 | ||||||
| 1,378,830 | ||||||||
| ELECTRONIC EQUIPMENT & INSTRUMENTS—1.9% | | |||||||
| 908 Devices, Inc.* | 30,322 | 484,849 | ||||||
| FINANCIAL EXCHANGES & DATA—1.4% | | |||||||
| S&P Global, Inc. | 1,135 | 364,619 | ||||||
| HEALTHCARE DISTRIBUTORS—4.4% | | |||||||
| McKesson Corp. | 2,943 | 1,145,916 | ||||||
| HEALTHCARE EQUIPMENT—3.8% | | |||||||
| Intuitive Surgical, Inc.* | 2,071 | 510,440 | ||||||
| TransMedics Group, Inc.* | 9,910 | 477,860 | ||||||
| 988,300 | ||||||||
| HEALTHCARE SERVICES—1.1% | | |||||||
| Accolade, Inc.* | 26,856 | 289,508 | ||||||
| HEALTHCARE TECHNOLOGY—2.8% | | |||||||
| Veeva Systems, Inc., Cl. A* | 4,250 | 713,745 | ||||||
| INTERACTIVE HOME ENTERTAINMENT—1.2% | | |||||||
| Take-Two Interactive Software, Inc.* | 2,622 | 310,655 | ||||||
| INTERACTIVE MEDIA & SERVICES—1.7% | | |||||||
| Alphabet, Inc., Cl. C* | 4,767 | 451,244 | ||||||
| INTERNET & DIRECT MARKETING RETAIL—7.4% | | |||||||
| Amazon.com, Inc.* | 13,934 | 1,427,399 | ||||||
| MercadoLibre, Inc.* | 543 | 489,580 | ||||||
| 1,916,979 | ||||||||
| LIFE SCIENCES TOOLS & SERVICES—1.4% | | |||||||
| Bio-Techne Corp. | 1,261 | 373,584 | ||||||
| MANAGED HEALTHCARE—4.1% | | |||||||
| Centene Corp.* | 12,389 | 1,054,676 | ||||||
| MOVIES & ENTERTAINMENT—9.9% | | |||||||
| Live Nation Entertainment, Inc.* | 9,568 | 761,708 | ||||||
| Netflix, Inc.* | 3,200 | 934,016 | ||||||
| The Walt Disney Co.* | 8,122 | 865,318 | ||||||
| 2,561,042 | ||||||||
| OIL & GAS EQUIPMENT & SERVICES—2.0% | | |||||||
| Baker Hughes Co., Cl. A | 19,083 | 527,836 | ||||||
THE ALGER FUNDS | ALGER 35 FUND
Schedule of Investments October 31, 2022 (Continued)
| COMMON STOCKS—96.7% (CONT.) | SHARES | VALUE | ||||||
| OIL & GAS EXPLORATION & PRODUCTION—4.1% | ||||||||
| Antero Resources Corp.* | 28,908 | $ | 1,059,767 | |||||
| OIL & GAS STORAGE & TRANSPORTATION—2.0% | ||||||||
| Cheniere Energy, Inc. | 2,989 | 527,289 | ||||||
| PHARMACEUTICALS—2.4% | ||||||||
| Catalent, Inc.* | 9,525 | 626,078 | ||||||
| REAL ESTATE SERVICES—2.6% | ||||||||
| FirstService Corp. | 5,326 | 665,803 | ||||||
| SEMICONDUCTOR EQUIPMENT—2.7% | ||||||||
| SolarEdge Technologies, Inc.* | 3,051 | 701,821 | ||||||
| SEMICONDUCTORS—2.4% | ||||||||
| Advanced Micro Devices, Inc.* | 10,485 | 629,729 | ||||||
| SYSTEMS SOFTWARE—6.7% | ||||||||
| Crowdstrike Holdings, Inc., Cl. A* | 1,450 | 233,740 | ||||||
| Microsoft Corp. | 6,521 | 1,513,720 | ||||||
| 1,747,460 | ||||||||
| TECHNOLOGY HARDWARE STORAGE & PERIPHERALS—8.1% | ||||||||
| Apple, Inc. | 13,786 | 2,113,945 | ||||||
| TOTAL COMMON STOCKS | ||||||||
| (Cost $26,406,877) | 25,119,254 | |||||||
| REAL ESTATE INVESTMENT TRUST—2.5% | SHARES | VALUE | ||||||
| SPECIALIZED—2.5% | ||||||||
| Crown Castle, Inc. | 4,927 | 656,572 | ||||||
| (Cost $925,767) | 656,572 | |||||||
| Total Investments | ||||||||
| (Cost $27,332,644) | 99.2 | % | $ | 25,775,826 | ||||
| Unaffiliated Securities (Cost $27,332,644) | 25,775,826 | |||||||
| Other Assets in Excess of Liabilities | 0.8 | % | 200,572 | |||||
| NET ASSETS | 100.0 | % | $ | 25,976,398 | ||||
| * | Non-income producing security. |
See Notes to Financial Statements.
THE ALGER FUNDS | ALGER GROWTH & INCOME FUND
Schedule of Investments October 31, 2022
| COMMON STOCKS—90.2% | SHARES | VALUE | ||||||
| AEROSPACE & DEFENSE—1.7% | | | ||||||
| General Dynamics Corp. | 6,490 | $ | 1,621,202 | |||||
| Raytheon Technologies Corp. | 13,949 | 1,322,644 | ||||||
| TransDigm Group, Inc. | 1,933 | 1,112,944 | ||||||
| 4,056,790 | ||||||||
| ASSET MANAGEMENT & CUSTODY BANKS—2.9% | | | ||||||
| BlackRock, Inc., Cl. A | 5,838 | 3,770,823 | ||||||
| Blackstone, Inc. | 28,855 | 2,629,845 | ||||||
| The Carlyle Group, Inc. | 22,876 | 646,933 | ||||||
| 7,047,601 | ||||||||
| BIOTECHNOLOGY—3.4% | | | ||||||
| AbbVie, Inc. | 38,631 | 5,655,578 | ||||||
| Amgen, Inc. | 5,961 | 1,611,556 | ||||||
| Gilead Sciences, Inc. | 13,771 | 1,080,473 | ||||||
| 8,347,607 | ||||||||
| BUILDING PRODUCTS—0.5% | | | ||||||
| Johnson Controls International PLC | 23,426 | 1,354,960 | ||||||
| CABLE & SATELLITE—0.9% | | | ||||||
| Comcast Corp., Cl. A | 69,485 | 2,205,454 | ||||||
| COMMODITY CHEMICALS—0.3% | | | ||||||
| Dow, Inc. | 15,418 | 720,637 | ||||||
| COMMUNICATIONS EQUIPMENT—1.0% | | | ||||||
| Cisco Systems, Inc. | 52,857 | 2,401,294 | ||||||
| CONSUMER ELECTRONICS—0.4% | | | ||||||
| Garmin Ltd. | 11,624 | 1,023,377 | ||||||
| COPPER—0.4% | | | ||||||
| Southern Copper Corp. | 20,837 | 978,714 | ||||||
| DATA PROCESSING & OUTSOURCED SERVICES—1.5% | | | ||||||
| Visa, Inc., Cl. A | 17,317 | 3,587,390 | ||||||
| DIVERSIFIED BANKS—4.3% | | | ||||||
| Bank of America Corp. | 101,216 | 3,647,825 | ||||||
| JPMorgan Chase & Co. | 54,062 | 6,805,324 | ||||||
| 10,453,149 | ||||||||
| ELECTRIC UTILITIES—0.8% | | | ||||||
| NextEra Energy, Inc. | 25,208 | 1,953,620 | ||||||
| ELECTRICAL COMPONENTS & EQUIPMENT—1.2% | | | ||||||
| Eaton Corp., PLC | 19,963 | 2,995,847 | ||||||
| FINANCIAL EXCHANGES & DATA—1.0% | | | ||||||
| CME Group, Inc., Cl. A | 13,583 | 2,353,934 | ||||||
| FOOD DISTRIBUTORS—0.7% | | | ||||||
| Sysco Corp. | 19,022 | 1,646,544 | ||||||
| GOLD—0.2% | | | ||||||
| Newmont Corp. | 11,141 | 471,487 | ||||||
| HEALTHCARE DISTRIBUTORS—0.6% | | | ||||||
| Cardinal Health, Inc. | 19,240 | 1,460,316 | ||||||
| HEALTHCARE EQUIPMENT—0.7% | | | ||||||
| Medtronic PLC | 18,542 | 1,619,458 | ||||||
| HEALTHCARE SERVICES—1.4% | | | ||||||
| CVS Health Corp. | 35,029 | 3,317,246 | ||||||
THE ALGER FUNDS | ALGER GROWTH & INCOME FUND
Schedule of Investments October 31, 2022 (Continued)
| COMMON STOCKS—90.2% (CONT.) | SHARES | VALUE | ||||||
| HOME IMPROVEMENT RETAIL—2.5% | | | ||||||
| The Home Depot, Inc. | 20,767 | $ | 6,149,732 | |||||
| HOUSEHOLD PRODUCTS—1.6% | | | ||||||
| The Procter & Gamble Co. | 28,854 | 3,885,768 | ||||||
| HYPERMARKETS & SUPER CENTERS—0.8% | | | ||||||
| Walmart, Inc. | 13,838 | 1,969,563 | ||||||
| INDUSTRIAL CONGLOMERATES—2.1% | | | ||||||
| Honeywell International, Inc. | 24,679 | 5,035,010 | ||||||
| INDUSTRIAL GASES—1.0% | | | ||||||
| Air Products & Chemicals, Inc. | 10,045 | 2,515,268 | ||||||
| INDUSTRIAL MACHINERY—0.5% | | | ||||||
| Parker-Hannifin Corp. | 4,456 | 1,295,003 | ||||||
| INTEGRATED OIL & GAS—4.7% | | | ||||||
| Chevron Corp. | 30,924 | 5,594,152 | ||||||
| Exxon Mobil Corp. | 36,176 | 4,008,662 | ||||||
| TotalEnergies SE# | 33,431 | 1,831,016 | ||||||
| 11,433,830 | ||||||||
| INTEGRATED TELECOMMUNICATION SERVICES—1.3% | | | ||||||
| AT&T, Inc. | 45,383 | 827,332 | ||||||
| Verizon Communications, Inc. | 64,479 | 2,409,580 | ||||||
| 3,236,912 | ||||||||
| INTERACTIVE MEDIA & SERVICES—5.4% | | | ||||||
| Alphabet, Inc., Cl. A* | 70,455 | 6,658,702 | ||||||
| Alphabet, Inc., Cl. C* | 57,251 | 5,419,380 | ||||||
| Meta Platforms, Inc., Cl. A* | 11,474 | 1,068,918 | ||||||
| 13,147,000 | ||||||||
| INTERNET & DIRECT MARKETING RETAIL—2.0% | | | ||||||
| Amazon.com, Inc.* | 47,802 | 4,896,837 | ||||||
| INVESTMENT BANKING & BROKERAGE—2.4% | | | ||||||
| Morgan Stanley | 70,494 | 5,792,492 | ||||||
| LEISURE FACILITIES—0.4% | | | ||||||
| Vail Resorts, Inc. | 4,741 | 1,038,895 | ||||||
| MANAGED HEALTHCARE—3.4% | | | ||||||
| UnitedHealth Group, Inc. | 15,201 | 8,438,835 | ||||||
| MULTI-LINE INSURANCE—0.5% | | | ||||||
| The Hartford Financial Services Group, Inc. | 18,213 | 1,318,803 | ||||||
| MULTI-UTILITIES—0.7% | | | ||||||
| Sempra Energy | 11,304 | 1,706,226 | ||||||
| OIL & GAS EXPLORATION & PRODUCTION—0.6% | | | ||||||
| Pioneer Natural Resources Co. | 6,251 | 1,602,819 | ||||||
| OIL & GAS STORAGE & TRANSPORTATION—0.4% | | | ||||||
| ONEOK, Inc. | 18,664 | 1,107,148 | ||||||
THE ALGER FUNDS | ALGER GROWTH & INCOME FUND
Schedule of Investments October 31, 2022 (Continued)
| COMMON STOCKS—90.2% (CONT.) | SHARES | VALUE | ||||||
| PHARMACEUTICALS—6.8% | | | ||||||
| AstraZeneca PLC# | 33,875 | $ | 1,992,189 | |||||
| Bristol-Myers Squibb Co. | 21,378 | 1,656,154 | ||||||
| Eli Lilly & Co. | 7,290 | 2,639,636 | ||||||
| GSK PLC# | 20,444 | 678,128 | ||||||
| Johnson & Johnson | 27,358 | 4,759,471 | ||||||
| Merck & Co., Inc. | 17,065 | 1,726,978 | ||||||
| Novartis AG# | 12,695 | 1,029,945 | ||||||
| Pfizer, Inc. | 48,064 | 2,237,379 | ||||||
| 16,719,880 | ||||||||
| RAILROADS—0.7% | | | ||||||
| Union Pacific Corp. | 8,420 | 1,659,919 | ||||||
| RESTAURANTS—1.5% | | | ||||||
| McDonald’s Corp. | 7,151 | 1,949,792 | ||||||
| Starbucks Corp. | 18,761 | 1,624,515 | ||||||
| 3,574,307 | ||||||||
| SEMICONDUCTOR EQUIPMENT—2.1% | | | ||||||
| KLA Corp. | 16,265 | 5,147,059 | ||||||
| SEMICONDUCTORS—3.9% | | | ||||||
| Broadcom, Inc. | 10,409 | 4,893,479 | ||||||
| QUALCOMM, Inc. | 30,065 | 3,537,448 | ||||||
| Taiwan Semiconductor Manufacturing Co., Ltd.# | 17,780 | 1,094,359 | ||||||
| 9,525,286 | ||||||||
| SOFT DRINKS—3.1% | | | ||||||
| PepsiCo, Inc. | 23,132 | 4,200,309 | ||||||
| The Coca-Cola Co. | 55,146 | 3,300,488 | ||||||
| 7,500,797 | ||||||||
| SYSTEMS SOFTWARE—8.2% | | | ||||||
| Microsoft Corp. | 80,284 | 18,636,325 | ||||||
| Oracle Corp. | 18,792 | 1,467,091 | ||||||
| 20,103,416 | ||||||||
| TECHNOLOGY HARDWARE STORAGE & PERIPHERALS—8.5% | | | ||||||
| Apple, Inc. | 135,581 | 20,789,991 | ||||||
| TOBACCO—1.2% | | | ||||||
| Altria Group, Inc. | 39,478 | 1,826,647 | ||||||
| Philip Morris International, Inc. | 11,820 | 1,085,667 | ||||||
| 2,912,314 | ||||||||
| TOTAL COMMON STOCKS | ||||||||
| (Cost $150,889,653) | 220,498,535 | |||||||
| MASTER LIMITED PARTNERSHIP—0.7% | SHARES | VALUE | ||||||
| OIL & GAS STORAGE & TRANSPORTATION—0.7% | | | ||||||
| Cheniere Energy Partners LP | 30,377 | 1,826,569 | ||||||
| (Cost $1,236,456) | 1,826,569 | |||||||
| REAL ESTATE INVESTMENT TRUST—4.1% | SHARES | VALUE | ||||||
| HEALTHCARE—0.5% | | | ||||||
| Welltower, Inc. | 20,839 | 1,272,013 | ||||||
| INDUSTRIAL—0.5% | | | ||||||
| Prologis, Inc. | 9,540 | 1,056,555 | ||||||
THE ALGER FUNDS | ALGER GROWTH & INCOME FUND
Schedule of Investments October 31, 2022 (Continued)
| REAL ESTATE INVESTMENT TRUST—4.1% (CONT.) | SHARES | VALUE | ||||||
| MORTGAGE—0.6% | | | ||||||
| Blackstone Mortgage Trust, Inc., Cl. A | 61,590 | $ | 1,537,286 | |||||
| RETAIL—0.7% | | | ||||||
| Simon Property Group, Inc. | 15,700 | 1,710,986 | ||||||
| SPECIALIZED—1.8% | | | ||||||
| Crown Castle, Inc. | 22,107 | 2,945,979 | ||||||
| Lamar Advertising Co., Cl. A | 15,632 | 1,441,739 | ||||||
| 4,387,718 | ||||||||
| TOTAL REAL ESTATE INVESTMENT TRUST | ||||||||
| (Cost $10,361,896) | 9,964,558 | |||||||
| Total Investments | ||||||||
| (Cost $162,488,005) | 95.0 | % | $ | 232,289,662 | ||||
| Unaffiliated Securities (Cost $162,488,005) | 232,289,662 | |||||||
| Other Assets in Excess of Liabilities | 5.0 | % | 12,111,820 | |||||
| NET ASSETS | 100.0 | % | $ | 244,401,482 | ||||
| # | American Depositary Receipts. |
| * | Non-income producing security. |
See Notes to Financial Statements.
THE ALGER FUNDS | ALGER MID CAP GROWTH FUND
Schedule of Investments October 31, 2022
| COMMON STOCKS—91.1% | SHARES | VALUE | ||||||
| ADVERTISING—2.3% | | | ||||||
| The Trade Desk, Inc., Cl. A* | 81,880 | $ | 4,359,291 | |||||
| AEROSPACE & DEFENSE—4.6% | | | ||||||
| HEICO Corp. | 31,721 | 5,159,103 | ||||||
| TransDigm Group, Inc.* | 6,472 | 3,726,319 | ||||||
| 8,885,422 | ||||||||
| APPAREL ACCESSORIES & LUXURY GOODS—1.9% | | | ||||||
| Lululemon Athletica, Inc.* | 11,046 | 3,634,576 | ||||||
| APPAREL RETAIL—2.5% | | | ||||||
| Aritzia, Inc.* | 110,173 | 4,273,318 | ||||||
| Burlington Stores, Inc.* | 3,476 | 496,929 | ||||||
| 4,770,247 | ||||||||
| APPLICATION SOFTWARE—11.1% | | | ||||||
| Bill.com Holdings, Inc.* | 11,229 | 1,497,500 | ||||||
| Cadence Design Systems, Inc.* | 23,822 | 3,606,413 | ||||||
| Constellation Software, Inc. | 2,368 | 3,424,135 | ||||||
| Datadog, Inc., Cl. A* | 23,097 | 1,859,540 | ||||||
| Manhattan Associates, Inc.* | 28,002 | 3,407,003 | ||||||
| Paycom Software, Inc.* | 10,188 | 3,525,048 | ||||||
| Sprout Social, Inc., Cl. A* | 35,289 | 2,128,985 | ||||||
| The Descartes Systems Group, Inc.* | 28,562 | 1,970,805 | ||||||
| 21,419,429 | ||||||||
| AUTOMOTIVE RETAIL—3.5% | | | ||||||
| AutoZone, Inc.* | 2,637 | 6,679,205 | ||||||
| BIOTECHNOLOGY—4.8% | | | ||||||
| Alkermes PLC* | 47,791 | 1,084,856 | ||||||
| Apellis Pharmaceuticals, Inc.* | 16,405 | 992,338 | ||||||
| Celldex Therapeutics, Inc.* | 36,161 | 1,270,336 | ||||||
| Natera, Inc.* | 62,485 | 2,934,296 | ||||||
| Neurocrine Biosciences, Inc.* | 16,688 | 1,921,122 | ||||||
| Prometheus Biosciences, Inc.* | 18,550 | 974,246 | ||||||
| 9,177,194 | ||||||||
| BUILDING PRODUCTS—1.2% | | | ||||||
| Trex Co., Inc.* | 47,676 | 2,292,739 | ||||||
| CASINOS & GAMING—1.0% | | | ||||||
| MGM Resorts International | 55,292 | 1,966,736 | ||||||
| CONSTRUCTION MACHINERY & HEAVY TRUCKS—1.8% | | | ||||||
| Wabtec Corp. | 36,808 | 3,433,450 | ||||||
| DIVERSIFIED METALS & MINING—1.5% | | | ||||||
| MP Materials Corp.* | 94,515 | 2,839,231 | ||||||
| ELECTRICAL COMPONENTS & EQUIPMENT—1.8% | | | ||||||
| AMETEK, Inc. | 22,392 | 2,903,346 | ||||||
| Generac Holdings, Inc.* | 4,313 | 499,920 | ||||||
| 3,403,266 | ||||||||
| ELECTRONIC COMPONENTS—0.8% | | | ||||||
| Amphenol Corp., Cl. A | 19,719 | 1,495,292 | ||||||
THE ALGER FUNDS | ALGER MID CAP GROWTH FUND
Schedule of Investments October 31, 2022 (Continued)
| COMMON STOCKS—91.1% (CONT.) | SHARES | VALUE | ||||||
| ELECTRONIC EQUIPMENT & INSTRUMENTS—3.7% | | | ||||||
| 908 Devices, Inc.* | 112,646 | $ | 1,801,209 | |||||
| Novanta, Inc.* | 24,470 | 3,460,058 | ||||||
| Trimble, Inc.* | 31,674 | 1,905,508 | ||||||
| 7,166,775 | ||||||||
| FINANCIAL EXCHANGES & DATA—2.6% | | | ||||||
| MSCI, Inc., Cl. A | 10,534 | 4,938,971 | ||||||
| HEALTHCARE DISTRIBUTORS—2.6% | | | ||||||
| McKesson Corp. | 12,843 | 5,000,679 | ||||||
| HEALTHCARE EQUIPMENT—2.5% | | | ||||||
| Insulet Corp.* | 18,374 | 4,755,375 | ||||||
| HEALTHCARE FACILITIES—1.9% | | | ||||||
| Acadia Healthcare Co., Inc.* | 45,323 | 3,684,760 | ||||||
| HEALTHCARE TECHNOLOGY—1.7% | | | ||||||
| Veeva Systems, Inc., Cl. A* | 19,268 | 3,235,868 | ||||||
| HOTELS RESORTS & CRUISE LINES—1.8% | | | ||||||
| Hilton Worldwide Holdings, Inc. | 26,130 | 3,534,344 | ||||||
| HYPERMARKETS & SUPER CENTERS—2.5% | | | ||||||
| BJ’s Wholesale Club Holdings, Inc.* | 62,092 | 4,805,921 | ||||||
| INSURANCE BROKERS—0.3% | | | ||||||
| Ryan Specialty Holdings, Inc., Cl. A* | 11,723 | 525,777 | ||||||
| INTERACTIVE HOME ENTERTAINMENT—1.3% | | | ||||||
| Take-Two Interactive Software, Inc.* | 20,830 | 2,467,938 | ||||||
| INTERNET SERVICES & INFRASTRUCTURE—0.5% | | | ||||||
| MongoDB, Inc., Cl. A* | 5,866 | 1,073,654 | ||||||
| IT CONSULTING & OTHER SERVICES—0.6% | | | ||||||
| EPAM Systems, Inc.* | 3,345 | 1,170,750 | ||||||
| LIFE SCIENCES TOOLS & SERVICES—3.1% | | | ||||||
| Repligen Corp.* | 14,209 | 2,593,001 | ||||||
| West Pharmaceutical Services, Inc. | 14,694 | 3,381,089 | ||||||
| 5,974,090 | ||||||||
| METAL & GLASS CONTAINERS—0.4% | | | ||||||
| Ball Corp. | 17,745 | 876,425 | ||||||
| MOVIES & ENTERTAINMENT—3.0% | | | ||||||
| Liberty Media Corp.-Liberty Formula One, Cl. C* | 34,393 | 1,985,508 | ||||||
| Live Nation Entertainment, Inc.* | 46,621 | 3,711,498 | ||||||
| 5,697,006 | ||||||||
| OIL & GAS EQUIPMENT & SERVICES—1.2% | | | ||||||
| Baker Hughes Co., Cl. A | 83,777 | 2,317,272 | ||||||
| OIL & GAS EXPLORATION & PRODUCTION—3.5% | | | ||||||
| Diamondback Energy, Inc. | 42,657 | 6,701,841 | ||||||
| PHARMACEUTICALS—0.7% | | | ||||||
| Jazz Pharmaceuticals PLC* | 9,220 | 1,325,744 | ||||||
| PROPERTY & CASUALTY INSURANCE—1.0% | | | ||||||
| Intact Financial Corp. | 12,841 | 1,951,270 | ||||||
| REGIONAL BANKS—1.6% | | | ||||||
| First Republic Bank | 17,328 | 2,081,093 | ||||||
| SVB Financial Group* | 4,275 | 987,354 | ||||||
| 3,068,447 | ||||||||
THE ALGER FUNDS | ALGER MID CAP GROWTH FUND
Schedule of Investments October 31, 2022 (Continued)
| COMMON STOCKS—91.1% (CONT.) | SHARES | VALUE | ||||||
| RESEARCH & CONSULTING SERVICES—2.7% | | | ||||||
| CoStar Group, Inc.* | 53,993 | $ | 4,466,301 | |||||
| Verisk Analytics, Inc., Cl. A | 3,769 | 689,086 | ||||||
| 5,155,387 | ||||||||
| RESTAURANTS—2.1% | | | ||||||
| Chipotle Mexican Grill, Inc., Cl. A* | 1,743 | 2,611,589 | ||||||
| The Cheesecake Factory, Inc. | 42,650 | 1,527,297 | ||||||
| 4,138,886 | ||||||||
| SEMICONDUCTOR EQUIPMENT—3.4% | | | ||||||
| Enphase Energy, Inc.* | 6,389 | 1,961,423 | ||||||
| KLA Corp. | 8,220 | 2,601,219 | ||||||
| Onto Innovation, Inc.* | 7,034 | 470,153 | ||||||
| SolarEdge Technologies, Inc.* | 6,601 | 1,518,428 | ||||||
| 6,551,223 | ||||||||
| SEMICONDUCTORS—2.2% | | | ||||||
| Microchip Technology, Inc. | 44,773 | 2,764,285 | ||||||
| ON Semiconductor Corp.* | 24,171 | 1,484,825 | ||||||
| 4,249,110 | ||||||||
| SYSTEMS SOFTWARE—3.4% | | | ||||||
| Crowdstrike Holdings, Inc., Cl. A* | 15,155 | 2,442,986 | ||||||
| Palo Alto Networks, Inc.* | 23,605 | 4,050,382 | ||||||
| 6,493,368 | ||||||||
| TRUCKING—2.0% | | | ||||||
| Old Dominion Freight Line, Inc. | 13,855 | 3,804,583 | ||||||
| TOTAL COMMON STOCKS | ||||||||
| (Cost $178,124,264) | 175,021,542 | |||||||
| PREFERRED STOCKS—0.0% | SHARES | VALUE | ||||||
| BIOTECHNOLOGY—0.0% | | | ||||||
| Prosetta Biosciences, Inc., Series D*,@,(a),(b) | 219,610 | — | ||||||
| (Cost $988,245) | — | |||||||
| RIGHTS—0.2% | SHARES | VALUE | ||||||
| BIOTECHNOLOGY—0.2% | | | ||||||
| Tolero CDR*,@,(a),(c) | 590,059 | 354,035 | ||||||
| (Cost $315,501) | 354,035 | |||||||
| SPECIAL PURPOSE VEHICLE—0.9% | | VALUE | ||||||
| DATA PROCESSING & OUTSOURCED SERVICES—0.9% | | | ||||||
| Crosslink Ventures Capital LLC, Cl. A*,@,(a),(b) | 1,269,120 | |||||||
| Crosslink Ventures Capital LLC, Cl. B*,@,(a),(b) | 506,426 | |||||||
| 1,775,546 | ||||||||
| TOTAL SPECIAL PURPOSE VEHICLE | ||||||||
| (Cost $1,675,000) | 1,775,546 | |||||||
| Total Investments | ||||||||
| (Cost $181,103,010) | 92.2 | % | $ | 177,151,123 | ||||
| Affiliated Securities (Cost $2,663,245) | 1,775,546 | |||||||
| Unaffiliated Securities (Cost $178,439,765) | 175,375,577 | |||||||
| Other Assets in Excess of Liabilities | 7.8 | % | 14,951,530 | |||||
| NET ASSETS | 100.0 | % | $ | 192,102,653 | ||||
| (a) | Security is valued in good faith at fair value determined using significant unobservable inputs pursuant to procedures established by the Valuation Designee (as defined in Note 2). |
THE ALGER FUNDS | ALGER MID CAP GROWTH FUND
Schedule of Investments October 31, 2022 (Continued)
| (b) | Deemed an affiliate of the Fund in accordance with Section 2(a)(3) of the Investment Company Act of 1940. See Note 11 - Affiliated Securities. |
| (c) | Contingent Deferred Rights. |
| * | Non-income producing security. |
| @ | Restricted security - Investment in security not registered under the Securities Act of 1933. Sales or transfers of the investment may be restricted only to qualified buyers. |
| Security | Acquisition Date(s) | Acquisition Cost | % of net assets (Acquisition Date) | Market Value | % of net assets as of 10/31/2022 | |||||||||||
| Crosslink Ventures Capital LLC, Cl. A | 10/2/20 | $ | 1,200,000 | 0.50% | $ | 1,269,120 | 0.66% | |||||||||
| Crosslink Ventures Capital LLC, Cl. B | 12/16/20 | 475,000 | 0.19% | 506,426 | 0.26% | |||||||||||
| Prosetta Biosciences, Inc., Series D | 2/6/15 | 988,245 | 0.50% | 0 | 0.00% | |||||||||||
| Tolero CDR | 2/6/17 | 315,501 | 0.19% | 354,035 | 0.19% | |||||||||||
| Total | $ | 2,129,581 | 1.11% | |||||||||||||
See Notes to Financial Statements.
THE ALGER FUNDS | ALGER MID CAP FOCUS FUND
Schedule of Investments October 31, 2022
| COMMON STOCKS—98.7% | SHARES | VALUE | ||||||
| ADVERTISING—1.4% | | | ||||||
| The Trade Desk, Inc., Cl. A* | 114,620 | $ | 6,102,369 | |||||
| AEROSPACE & DEFENSE—4.0% | | | ||||||
| HEICO Corp. | 45,840 | 7,455,418 | ||||||
| Mercury Systems, Inc.* | 207,430 | 10,039,612 | ||||||
| 17,495,030 | ||||||||
| APPAREL ACCESSORIES & LUXURY GOODS—2.7% | | | ||||||
| Lululemon Athletica, Inc.* | 36,280 | 11,937,571 | ||||||
| APPLICATION SOFTWARE—19.4% | | | ||||||
| Alteryx, Inc., Cl. A* | 214,663 | 10,460,528 | ||||||
| Bentley Systems, Inc., Cl. B | 374,851 | 13,224,743 | ||||||
| Bill.com Holdings, Inc.* | 47,510 | 6,335,934 | ||||||
| Cadence Design Systems, Inc.* | 33,467 | 5,066,569 | ||||||
| Everbridge, Inc.* | 381,295 | 11,945,972 | ||||||
| Manhattan Associates, Inc.* | 61,650 | 7,500,955 | ||||||
| Paylocity Holding Corp.* | 49,083 | 11,376,949 | ||||||
| Splunk, Inc.* | 93,944 | 7,807,686 | ||||||
| Tyler Technologies, Inc.* | 33,407 | 10,801,485 | ||||||
| 84,520,821 | ||||||||
| AUTOMOTIVE RETAIL—1.9% | | | ||||||
| O’Reilly Automotive, Inc.* | 10,152 | 8,498,950 | ||||||
| BIOTECHNOLOGY—9.3% | | | ||||||
| Natera, Inc.* | 416,179 | 19,543,766 | ||||||
| Seagen, Inc.* | 35,124 | 4,466,368 | ||||||
| Vertex Pharmaceuticals, Inc.* | 29,211 | 9,113,832 | ||||||
| Viridian Therapeutics, Inc.* | 377,814 | 7,518,498 | ||||||
| 40,642,464 | ||||||||
| CASINOS & GAMING—2.4% | | | ||||||
| MGM Resorts International | 294,653 | 10,480,807 | ||||||
| ELECTRIC UTILITIES—5.1% | | | ||||||
| Constellation Energy Corp. | 236,216 | 22,331,861 | ||||||
| ELECTRICAL COMPONENTS & EQUIPMENT—1.1% | | | ||||||
| Generac Holdings, Inc.* | 40,378 | 4,680,214 | ||||||
| ELECTRONIC EQUIPMENT & INSTRUMENTS—1.1% | | | ||||||
| 908 Devices, Inc.* | 288,530 | 4,613,595 | ||||||
| ENVIRONMENTAL & FACILITIES SERVICES—2.5% | | | ||||||
| Waste Connections, Inc. | 81,715 | 10,779,026 | ||||||
| HEALTHCARE DISTRIBUTORS—2.6% | | | ||||||
| McKesson Corp. | 29,118 | 11,337,676 | ||||||
| HEALTHCARE EQUIPMENT—9.2% | | | ||||||
| Axonics, Inc.* | 96,618 | 7,066,640 | ||||||
| Cutera, Inc.* | 113,681 | 5,225,916 | ||||||
| Dexcom, Inc.* | 55,570 | 6,711,745 | ||||||
| Insulet Corp.* | 65,198 | 16,873,894 | ||||||
| Omnicell, Inc.* | 53,244 | 4,116,826 | ||||||
| 39,995,021 | ||||||||
| HEALTHCARE FACILITIES—1.4% | | | ||||||
| Acadia Healthcare Co., Inc.* | 73,879 | 6,006,363 | ||||||
THE ALGER FUNDS | ALGER MID CAP FOCUS FUND
Schedule of Investments October 31, 2022 (Continued)
| COMMON STOCKS—98.7% (CONT.) | SHARES | VALUE | ||||||
| HEALTHCARE SERVICES—2.5% | | | ||||||
| Signify Health, Inc., Cl. A* | 377,862 | $ | 11,044,906 | |||||
| HEALTHCARE TECHNOLOGY—1.3% | | | ||||||
| Veeva Systems, Inc., Cl. A* | 34,361 | 5,770,586 | ||||||
| HYPERMARKETS & SUPER CENTERS—1.4% | | | ||||||
| BJ’s Wholesale Club Holdings, Inc.* | 79,457 | 6,149,972 | ||||||
| INTERNET & DIRECT MARKETING RETAIL—1.2% | | | ||||||
| MercadoLibre, Inc.* | 6,051 | 5,455,703 | ||||||
| INTERNET SERVICES & INFRASTRUCTURE—2.8% | | | ||||||
| MongoDB, Inc., Cl. A* | 24,261 | 4,440,491 | ||||||
| VeriSign, Inc.* | 39,499 | 7,917,969 | ||||||
| 12,358,460 | ||||||||
| LIFE SCIENCES TOOLS & SERVICES—2.6% | | | ||||||
| Avantor, Inc.* | 114,850 | 2,316,525 | ||||||
| Sartorius AG | 14,673 | 5,173,299 | ||||||
| Waters Corp.* | 12,408 | 3,712,101 | ||||||
| 11,201,925 | ||||||||
| MOVIES & ENTERTAINMENT—1.7% | | | ||||||
| Liberty Media Corp.-Liberty Formula One, Cl. C* | 127,034 | 7,333,673 | ||||||
| OIL & GAS EXPLORATION & PRODUCTION—3.7% | | | ||||||
| Diamondback Energy, Inc. | 102,949 | 16,174,317 | ||||||
| SEMICONDUCTOR EQUIPMENT—1.7% | | | ||||||
| Enphase Energy, Inc.* | 24,654 | 7,568,778 | ||||||
| SPECIALTY STORES—2.6% | | | ||||||
| Petco Health & Wellness Co., Inc., Cl. A* | 337,697 | 3,555,949 | ||||||
| Ulta Beauty, Inc.* | 18,581 | 7,792,314 | ||||||
| 11,348,263 | ||||||||
| SYSTEMS SOFTWARE—7.9% | | | ||||||
| Crowdstrike Holdings, Inc., Cl. A* | 64,760 | 10,439,312 | ||||||
| CyberArk Software Ltd.* | 70,551 | 11,070,157 | ||||||
| Palo Alto Networks, Inc.* | 74,340 | 12,756,001 | ||||||
| 34,265,470 | ||||||||
| TRADING COMPANIES & DISTRIBUTORS—2.6% | | | ||||||
| United Rentals, Inc.* | 36,226 | 11,436,910 | ||||||
| TRUCKING—2.6% | | | ||||||
| XPO Logistics, Inc.* | 219,249 | 11,343,943 | ||||||
| TOTAL COMMON STOCKS | ||||||||
| (Cost $467,534,432) | 430,874,674 | |||||||
| Total Investments | ||||||||
| (Cost $467,534,432) | 98.7 | % | $ | 430,874,674 | ||||
| Unaffiliated Securities (Cost $467,534,432) | 430,874,674 | |||||||
| Other Assets in Excess of Liabilities | 1.3 | % | 5,558,674 | |||||
| NET ASSETS | 100.0 | % | $ | 436,433,348 | ||||
| * | Non-income producing security. |
See Notes to Financial Statements.
THE ALGER FUNDS | ALGER WEATHERBIE ENDURING GROWTH FUND
Schedule of Investments October 31, 2022
| COMMON STOCKS—90.8% | SHARES | VALUE | ||||||
| ADVERTISING—0.8% | | | ||||||
| The Trade Desk, Inc., Cl. A* | 672 | $ | 35,777 | |||||
| AEROSPACE & DEFENSE—6.4% | | | ||||||
| TransDigm Group, Inc. | 492 | 283,274 | ||||||
| APPLICATION SOFTWARE—17.6% | | | ||||||
| HubSpot, Inc.* | 379 | 112,396 | ||||||
| Paylocity Holding Corp.* | 1,389 | 321,956 | ||||||
| SPS Commerce, Inc.* | 1,668 | 211,035 | ||||||
| Vertex, Inc., Cl. A* | 7,677 | 138,340 | ||||||
| 783,727 | ||||||||
| ASSET MANAGEMENT & CUSTODY BANKS—5.7% | | | ||||||
| Hamilton Lane, Inc., Cl. A | 2,033 | 121,614 | ||||||
| StepStone Group, Inc., Cl. A | 4,483 | 132,338 | ||||||
| 253,952 | ||||||||
| CONSUMER FINANCE—0.6% | | | ||||||
| Upstart Holdings, Inc.* | 1,072 | 24,849 | ||||||
| EDUCATION SERVICES—4.9% | | | ||||||
| Chegg, Inc.* | 10,107 | 218,008 | ||||||
| ENVIRONMENTAL & FACILITIES SERVICES—23.6% | | | ||||||
| Casella Waste Systems, Inc., Cl. A* | 5,158 | 421,976 | ||||||
| Montrose Environmental Group, Inc.* | 5,072 | 222,052 | ||||||
| Waste Connections, Inc. | 3,101 | 409,053 | ||||||
| 1,053,081 | ||||||||
| GENERAL MERCHANDISE STORES—1.5% | | | ||||||
| Ollie’s Bargain Outlet Holdings, Inc.* | 1,203 | 67,368 | ||||||
| HEALTHCARE EQUIPMENT—4.1% | | | ||||||
| Insulet Corp.* | 285 | 73,761 | ||||||
| Nevro Corp.* | 2,849 | 109,231 | ||||||
| 182,992 | ||||||||
| HEALTHCARE SERVICES—2.0% | | | ||||||
| Agiliti, Inc.* | 5,061 | 88,416 | ||||||
| HEALTHCARE TECHNOLOGY—1.4% | | | ||||||
| Definitive Healthcare Corp., Cl. A* | 3,961 | 62,505 | ||||||
| MANAGED HEALTHCARE—1.6% | | | ||||||
| Progyny, Inc.* | 1,632 | 72,575 | ||||||
| OIL & GAS EQUIPMENT & SERVICES—4.5% | | | ||||||
| Core Laboratories NV | 7,282 | 141,708 | ||||||
| Dril-Quip, Inc.* | 2,386 | 59,363 | ||||||
| 201,071 | ||||||||
| REAL ESTATE SERVICES—8.0% | | | ||||||
| FirstService Corp. | 2,847 | 355,903 | ||||||
| REGIONAL BANKS—3.4% | | | ||||||
| Signature Bank | 958 | 151,872 | ||||||
| TRADING COMPANIES & DISTRIBUTORS—2.3% | | | ||||||
| SiteOne Landscape Supply, Inc.* | 870 | 100,807 | ||||||
THE ALGER FUNDS | ALGER WEATHERBIE ENDURING GROWTH FUND
Schedule of Investments October 31, 2022 (Continued)
| COMMON STOCKS—90.8% (CONT.) | SHARES | VALUE | ||||||
| TRUCKING—2.4% | | | ||||||
| XPO Logistics, Inc.* | 2,097 | $ | 108,499 | |||||
| TOTAL COMMON STOCKS | ||||||||
| (Cost $4,996,157) | 4,044,676 | |||||||
| Total Investments | ||||||||
| (Cost $4,996,157) | 90.8 | % | $ | 4,044,676 | ||||
| Unaffiliated Securities (Cost $4,996,157) | 4,044,676 | |||||||
| Other Assets in Excess of Liabilities | 9.2 | % | 408,531 | |||||
| NET ASSETS | 100.0 | % | $ | 4,453,207 | ||||
| * | Non-income producing security. |
See Notes to Financial Statements.
THE ALGER FUNDS | ALGER WEATHERBIE SPECIALIZED GROWTH FUND
Schedule of Investments October 31, 2022
| COMMON STOCKS—96.0% | SHARES | VALUE | ||||||
| ADVERTISING—0.7% | | | ||||||
| TechTarget, Inc.* | 85,124 | $ | 5,494,754 | |||||
| AEROSPACE & DEFENSE—0.6% | | | ||||||
| Kratos Defense & Security Solutions, Inc.* | 435,384 | 4,824,055 | ||||||
| APPAREL ACCESSORIES & LUXURY GOODS—0.7% | | | ||||||
| Canada Goose Holdings, Inc.* | 309,026 | 5,055,665 | ||||||
| APPAREL RETAIL—0.7% | | | ||||||
| MYT Netherlands Parent BV#,* | 498,528 | 5,698,175 | ||||||
| APPLICATION SOFTWARE—8.9% | | | ||||||
| Ebix, Inc. | 161,711 | 3,200,261 | ||||||
| Everbridge, Inc.* | 10,169 | 318,595 | ||||||
| SEMrush Holdings, Inc., Cl. A* | 90,656 | 1,108,723 | ||||||
| SPS Commerce, Inc.* | 343,412 | 43,448,486 | ||||||
| Vertex, Inc., Cl. A* | 1,177,375 | 21,216,297 | ||||||
| 69,292,362 | ||||||||
| ASSET MANAGEMENT & CUSTODY BANKS—6.8% | | | ||||||
| Hamilton Lane, Inc., Cl. A | 384,751 | 23,015,805 | ||||||
| StepStone Group, Inc., Cl. A | 1,004,980 | 29,667,010 | ||||||
| 52,682,815 | ||||||||
| BIOTECHNOLOGY—3.1% | | | ||||||
| ACADIA Pharmaceuticals, Inc.* | 528,355 | 8,469,531 | ||||||
| Natera, Inc.* | 165,757 | 7,783,949 | ||||||
| Ultragenyx Pharmaceutical, Inc.* | 194,435 | 7,866,840 | ||||||
| 24,120,320 | ||||||||
| CONSTRUCTION & ENGINEERING—2.6% | | | ||||||
| Ameresco, Inc., Cl. A* | 335,642 | 20,299,628 | ||||||
| CONSUMER FINANCE—0.4% | | | ||||||
| LendingTree, Inc.* | 53,395 | 1,347,156 | ||||||
| Upstart Holdings, Inc.* | 81,978 | 1,900,250 | ||||||
| 3,247,406 | ||||||||
| EDUCATION SERVICES—3.3% | | | ||||||
| Chegg, Inc.* | 1,178,186 | 25,413,472 | ||||||
| ELECTRONIC EQUIPMENT & INSTRUMENTS—2.1% | | | ||||||
| Novanta, Inc.* | 113,610 | 16,064,454 | ||||||
| ENVIRONMENTAL & FACILITIES SERVICES—11.8% | | | ||||||
| Casella Waste Systems, Inc., Cl. A* | 551,027 | 45,079,519 | ||||||
| Montrose Environmental Group, Inc.* | 1,069,936 | 46,841,798 | ||||||
| 91,921,317 | ||||||||
| GENERAL MERCHANDISE STORES—1.2% | | | ||||||
| Ollie’s Bargain Outlet Holdings, Inc.* | 160,191 | 8,970,696 | ||||||
| HEALTHCARE DISTRIBUTORS—0.3% | | | ||||||
| PetIQ, Inc., Cl. A* | 310,397 | 2,551,463 | ||||||
| HEALTHCARE EQUIPMENT—8.2% | | | ||||||
| Glaukos Corp.* | 482,505 | 27,054,055 | ||||||
| Impulse Dynamics NV, Series E*,@,(a) | 904,912 | 2,986,210 | ||||||
| Inogen, Inc.* | 374,668 | 8,489,977 | ||||||
| Inspire Medical Systems, Inc.* | 51,083 | 9,958,631 | ||||||
| Nevro Corp.* | 403,215 | 15,459,263 | ||||||
| 63,948,136 | ||||||||
THE ALGER FUNDS | ALGER WEATHERBIE SPECIALIZED GROWTH FUND
Schedule of Investments October 31, 2022 (Continued)
| COMMON STOCKS—96.0% (CONT.) | SHARES | VALUE | ||||||
| HEALTHCARE FACILITIES—1.2% | | | ||||||
| US Physical Therapy, Inc. | 106,259 | $ | 9,435,799 | |||||
| HEALTHCARE SERVICES—1.8% | | | ||||||
| Agiliti, Inc.* | 789,028 | 13,784,319 | ||||||
| HEALTHCARE TECHNOLOGY—2.0% | | | ||||||
| Definitive Healthcare Corp., Cl. A* | 952,400 | 15,028,872 | ||||||
| INSURANCE BROKERS—0.0% | | | ||||||
| Goosehead Insurance, Inc., Cl. A* | 555 | 23,038 | ||||||
| INTERNET & DIRECT MARKETING RETAIL—1.1% | | | ||||||
| Xometry, Inc., Cl. A* | 142,898 | 8,582,454 | ||||||
| IT CONSULTING & OTHER SERVICES—7.0% | | | ||||||
| CI&T, Inc., Cl. A* | 1,111,816 | 9,116,891 | ||||||
| Globant SA* | 191,497 | 36,131,654 | ||||||
| Grid Dynamics Holdings, Inc.* | 676,513 | 9,207,342 | ||||||
| 54,455,887 | ||||||||
| LEISURE FACILITIES—2.5% | | | ||||||
| Planet Fitness, Inc., Cl. A* | 296,716 | 19,428,964 | ||||||
| LEISURE PRODUCTS—0.3% | | | ||||||
| Latham Group, Inc.* | 530,497 | 2,344,797 | ||||||
| MANAGED HEALTHCARE—2.1% | | | ||||||
| Progyny, Inc.* | 370,531 | 16,477,514 | ||||||
| OIL & GAS EQUIPMENT & SERVICES—5.5% | | | ||||||
| Core Laboratories NV | 1,374,503 | 26,747,828 | ||||||
| Dril-Quip, Inc.* | 646,492 | 16,084,721 | ||||||
| 42,832,549 | ||||||||
| REAL ESTATE SERVICES—5.7% | | | ||||||
| FirstService Corp. | 353,211 | 44,154,907 | ||||||
| REGIONAL BANKS—2.3% | | | ||||||
| Seacoast Banking Corp. of Florida | 579,648 | 17,911,123 | ||||||
| RESTAURANTS—1.0% | | | ||||||
| Wingstop, Inc. | 48,891 | 7,743,846 | ||||||
| SEMICONDUCTORS—2.7% | | | ||||||
| Impinj, Inc.* | 180,252 | 20,662,287 | ||||||
| SPECIALTY STORES—0.0% | | | ||||||
| National Vision Holdings, Inc.* | 1,280 | 47,411 | ||||||
| SYSTEMS SOFTWARE—0.8% | | | ||||||
| Rapid7, Inc.* | 142,183 | 6,436,624 | ||||||
| THRIFTS & MORTGAGE FINANCE—2.0% | | | ||||||
| Axos Financial, Inc.* | 404,768 | 15,769,761 | ||||||
| TRADING COMPANIES & DISTRIBUTORS—6.6% | | | ||||||
| SiteOne Landscape Supply, Inc.* | 249,165 | 28,870,748 | ||||||
| Transcat, Inc.* | 269,605 | 22,312,510 | ||||||
| 51,183,258 | ||||||||
| TOTAL COMMON STOCKS | ||||||||
| (Cost $824,815,385) | 745,888,128 | |||||||
THE ALGER FUNDS | ALGER WEATHERBIE SPECIALIZED GROWTH FUND
Schedule of Investments October 31, 2022 (Continued)
| PREFERRED STOCKS—0.0% | SHARES | VALUE | ||||||
| BIOTECHNOLOGY—0.0% | | | ||||||
| Prosetta Biosciences, Inc., Series D*,@,(a),(b) | 231,474 | $ | — | |||||
| (Cost $1,041,633) | — | |||||||
| Total Investments | ||||||||
| (Cost $825,857,018) | 96.0 | % | $ | 745,888,128 | ||||
| Affiliated Securities (Cost $1,041,633) | — | |||||||
| Unaffiliated Securities (Cost $824,815,385) | 745,888,128 | |||||||
| Other Assets in Excess of Liabilities | 4.0 | % | 30,829,756 | |||||
| NET ASSETS | 100.0 | % | $ | 776,717,884 | ||||
| # | American Depositary Receipts. |
| (a) | Security is valued in good faith at fair value determined using significant unobservable inputs pursuant to procedures established by the Valuation Designee (as defined in Note 2). |
| (b) | Deemed an affiliate of the Fund in accordance with Section 2(a)(3) of the Investment Company Act of 1940. See Note 11 - Affiliated Securities. |
| * | Non-income producing security. |
| @ | Restricted security - Investment in security not registered under the Securities Act of 1933. Sales or transfers of the investment may be restricted only to qualified buyers. |
| Security | Acquisition Date(s) | Acquisition Cost | % of net assets (Acquisition Date) | Market Value | % of net assets as of 10/31/2022 | |||||||||||
| Impulse Dynamics NV, Series E | 2/11/22 | $ | 2,986,210 | 0.24% | $ | 2,986,210 | 0.38% | |||||||||
| Prosetta Biosciences, Inc., Series D | 2/6/15 | 1,041,633 | 0.10% | 0 | 0.00% | |||||||||||
| Total | $ | 2,986,210 | 0.38% | |||||||||||||
See Notes to Financial Statements.
THE ALGER FUNDS | ALGER SMALL CAP GROWTH FUND
Schedule of Investments October 31, 2022
| COMMON STOCKS—91.7% | SHARES | VALUE | ||||||
| ADVERTISING—0.3% | | | ||||||
| Magnite, Inc.* | 179,986 | $ | 1,312,098 | |||||
| AEROSPACE & DEFENSE—5.1% | | | ||||||
| HEICO Corp. | 89,724 | 14,592,711 | ||||||
| Hexcel Corp. | 34,820 | 1,939,474 | ||||||
| Mercury Systems, Inc.* | 71,176 | 3,444,919 | ||||||
| 19,977,104 | ||||||||
| APPAREL ACCESSORIES & LUXURY GOODS—1.6% | | | ||||||
| Capri Holdings Ltd.* | 138,140 | 6,310,235 | ||||||
| APPAREL RETAIL—1.7% | | | ||||||
| Aritzia, Inc.* | 119,563 | 4,637,531 | ||||||
| Victoria’s Secret & Co.* | 53,575 | 2,014,420 | ||||||
| 6,651,951 | ||||||||
| APPLICATION SOFTWARE—19.3% | | | ||||||
| ACI Worldwide, Inc.* | 257,174 | 6,257,043 | ||||||
| Appfolio, Inc., Cl. A* | 15,632 | 1,959,784 | ||||||
| Bill.com Holdings, Inc.* | 51,956 | 6,928,852 | ||||||
| Blackbaud, Inc.* | 79,209 | 4,332,732 | ||||||
| Blackline, Inc.* | 55,731 | 3,120,936 | ||||||
| Digital Turbine, Inc.* | 54,079 | 789,553 | ||||||
| Everbridge, Inc.* | 82,052 | 2,570,689 | ||||||
| ForgeRock, Inc., Cl. A* | 30,441 | 686,749 | ||||||
| Guidewire Software, Inc.* | 36,894 | 2,191,873 | ||||||
| HubSpot, Inc.* | 16,330 | 4,842,825 | ||||||
| Manhattan Associates, Inc.* | 70,581 | 8,587,590 | ||||||
| Paycom Software, Inc.* | 21,276 | 7,361,496 | ||||||
| Q2 Holdings, Inc.* | 108,919 | 3,380,846 | ||||||
| SEMrush Holdings, Inc., Cl. A* | 94,341 | 1,153,791 | ||||||
| Smartsheet, Inc., Cl. A* | 71,669 | 2,502,682 | ||||||
| Sprout Social, Inc., Cl. A* | 73,507 | 4,434,677 | ||||||
| SPS Commerce, Inc.* | 72,109 | 9,123,231 | ||||||
| Vertex, Inc., Cl. A* | 260,255 | 4,689,795 | ||||||
| 74,915,144 | ||||||||
| ASSET MANAGEMENT & CUSTODY BANKS—0.3% | | | ||||||
| Affiliated Managers Group, Inc. | 7,756 | 962,985 | ||||||
| BIOTECHNOLOGY—2.6% | | | ||||||
| Alkermes PLC* | 40,937 | 929,270 | ||||||
| CareDx, Inc.* | 258,904 | 5,154,779 | ||||||
| Celldex Therapeutics, Inc.* | 32,811 | 1,152,650 | ||||||
| Karuna Therapeutics, Inc.* | 12,763 | 2,799,436 | ||||||
| 10,036,135 | ||||||||
| DATA PROCESSING & OUTSOURCED SERVICES—1.3% | | | ||||||
| DLocal Ltd., Cl. A* | 173,167 | 3,861,624 | ||||||
| Marqeta, Inc., Cl. A* | 161,948 | 1,276,150 | ||||||
| 5,137,774 | ||||||||
| DIVERSIFIED SUPPORT SERVICES—0.4% | | | ||||||
| IAA, Inc.* | 42,596 | 1,615,666 | ||||||
| ELECTRICAL COMPONENTS & EQUIPMENT—0.4% | | | ||||||
| Sunrun, Inc.* | 66,735 | 1,502,205 | ||||||
THE ALGER FUNDS | ALGER SMALL CAP GROWTH FUND
Schedule of Investments October 31, 2022 (Continued)
| COMMON STOCKS—91.7% (CONT.) | SHARES | VALUE | ||||||
| ELECTRONIC EQUIPMENT & INSTRUMENTS—1.3% | | | ||||||
| 908 Devices, Inc.* | 105,842 | $ | 1,692,414 | |||||
| Cognex Corp. | 76,543 | 3,538,583 | ||||||
| 5,230,997 | ||||||||
| FOOD DISTRIBUTORS—2.2% | | | ||||||
| The Chefs’ Warehouse, Inc.* | 94,528 | 3,462,561 | ||||||
| US Foods Holding Corp.* | 170,857 | 5,084,704 | ||||||
| 8,547,265 | ||||||||
| HEALTHCARE DISTRIBUTORS—0.1% | | | ||||||
| PetIQ, Inc., Cl. A* | 62,035 | 509,928 | ||||||
| HEALTHCARE EQUIPMENT—8.9% | | | ||||||
| Impulse Dynamics NV, Series E*,@,(a) | 1,105,151 | 3,646,998 | ||||||
| Inmode Ltd.* | 190,868 | 6,550,590 | ||||||
| Insulet Corp.* | 29,158 | 7,546,382 | ||||||
| Mesa Laboratories, Inc. | 27,736 | 3,666,977 | ||||||
| Paragon 28, Inc.* | 75,516 | 1,508,055 | ||||||
| QuidelOrtho Corp.* | 79,576 | 7,147,516 | ||||||
| Tandem Diabetes Care, Inc.* | 79,550 | 4,466,732 | ||||||
| 34,533,250 | ||||||||
| HEALTHCARE SERVICES—1.1% | | | ||||||
| Guardant Health, Inc.* | 54,919 | 2,718,491 | ||||||
| Privia Health Group, Inc.* | 48,330 | 1,618,088 | ||||||
| 4,336,579 | ||||||||
| HEALTHCARE SUPPLIES—1.5% | | | ||||||
| Neogen Corp.* | 443,260 | 5,851,032 | ||||||
| HEALTHCARE TECHNOLOGY—2.6% | | | ||||||
| Definitive Healthcare Corp., Cl. A* | 33,958 | 535,857 | ||||||
| Doximity, Inc., Cl. A* | 18,271 | 483,633 | ||||||
| Renalytix PLC#,* | 165,345 | 322,423 | ||||||
| Sophia Genetics SA* | 79,654 | 175,239 | ||||||
| Veeva Systems, Inc., Cl. A* | 50,210 | 8,432,268 | ||||||
| 9,949,420 | ||||||||
| HOMEBUILDING—0.4% | | | ||||||
| Skyline Champion Corp.* | 23,895 | 1,390,928 | ||||||
| HOMEFURNISHING RETAIL—0.4% | | | ||||||
| Arhaus, Inc., Cl. A* | 50,615 | 421,623 | ||||||
| Bed Bath & Beyond, Inc.* | 213,037 | 973,579 | ||||||
| 1,395,202 | ||||||||
| HUMAN RESOURCE & EMPLOYMENT SERVICES—0.5% | | | ||||||
| Upwork, Inc.* | 133,462 | 1,795,064 | ||||||
| HYPERMARKETS & SUPER CENTERS—3.4% | | | ||||||
| BJ’s Wholesale Club Holdings, Inc.* | 171,422 | 13,268,063 | ||||||
| INDUSTRIAL MACHINERY—0.5% | | | ||||||
| Gates Industrial Corp., PLC* | 161,017 | 1,795,340 | ||||||
| INTERACTIVE HOME ENTERTAINMENT—1.1% | | | ||||||
| Take-Two Interactive Software, Inc.* | 35,288 | 4,180,922 | ||||||
THE ALGER FUNDS | ALGER SMALL CAP GROWTH FUND
Schedule of Investments October 31, 2022 (Continued)
| COMMON STOCKS—91.7% (CONT.) | SHARES | VALUE | ||||||
| INTERACTIVE MEDIA & SERVICES—1.2% | | | ||||||
| Bumble, Inc., Cl. A* | 66,183 | $ | 1,681,048 | |||||
| Tripadvisor, Inc.* | 127,813 | 3,018,943 | ||||||
| 4,699,991 | ||||||||
| INTERNET & DIRECT MARKETING RETAIL—1.4% | | | ||||||
| Farfetch Ltd., Cl. A* | 136,984 | 1,161,624 | ||||||
| The RealReal, Inc.* | 267,138 | 451,463 | ||||||
| Xometry, Inc., Cl. A* | 62,192 | 3,735,252 | ||||||
| 5,348,339 | ||||||||
| LEISURE FACILITIES—0.7% | | | ||||||
| Planet Fitness, Inc., Cl. A* | 40,235 | 2,634,588 | ||||||
| LIFE SCIENCES TOOLS & SERVICES—8.3% | | | ||||||
| Akoya Biosciences, Inc.* | 139,659 | 1,920,311 | ||||||
| Alpha Teknova, Inc.* | 31,939 | 146,600 | ||||||
| Bio-Techne Corp. | 37,684 | 11,164,262 | ||||||
| CryoPort, Inc.* | 115,779 | 3,214,025 | ||||||
| Cytek Biosciences, Inc.* | 55,786 | 865,799 | ||||||
| ICON PLC* | 9,581 | 1,895,505 | ||||||
| Maravai LifeSciences Holdings, Inc., Cl. A* | 38,721 | 642,769 | ||||||
| MaxCyte, Inc.* | 48,111 | 332,928 | ||||||
| NanoString Technologies, Inc.* | 232,258 | 2,429,419 | ||||||
| NeoGenomics, Inc.* | 396,391 | 3,014,554 | ||||||
| Personalis, Inc.* | 109,708 | 292,920 | ||||||
| Rapid Micro Biosystems, Inc., Cl. A* | 64,657 | 188,798 | ||||||
| Repligen Corp.* | 34,746 | 6,340,797 | ||||||
| 32,448,687 | ||||||||
| MANAGED HEALTHCARE—1.9% | | | ||||||
| HealthEquity, Inc.* | 96,344 | 7,506,161 | ||||||
| MOVIES & ENTERTAINMENT—2.7% | | | ||||||
| Live Nation Entertainment, Inc.* | 134,030 | 10,670,128 | ||||||
| OIL & GAS EQUIPMENT & SERVICES—1.1% | | | ||||||
| ChampionX Corp. | 79,644 | 2,279,411 | ||||||
| ProPetro Holding Corp.* | 166,265 | 1,968,578 | ||||||
| 4,247,989 | ||||||||
| OIL & GAS EXPLORATION & PRODUCTION—5.5% | | | ||||||
| Coterra Energy, Inc. | 85,796 | 2,670,829 | ||||||
| Magnolia Oil & Gas Corp., Cl. A | 731,251 | 18,778,526 | ||||||
| 21,449,355 | ||||||||
| REGIONAL BANKS—1.1% | | | ||||||
| Webster Financial Corp. | 79,755 | 4,327,506 | ||||||
| RESEARCH & CONSULTING SERVICES—0.3% | | | ||||||
| LegalZoom.com, Inc.* | 144,125 | 1,333,156 | ||||||
| RESTAURANTS—5.6% | | | ||||||
| Shake Shack, Inc., Cl. A* | 151,624 | 8,425,746 | ||||||
| The Cheesecake Factory, Inc. | 174,365 | 6,244,011 | ||||||
| Wingstop, Inc. | 43,860 | 6,946,985 | ||||||
| 21,616,742 | ||||||||
| SEMICONDUCTOR EQUIPMENT—0.6% | | | ||||||
| SolarEdge Technologies, Inc.* | 10,807 | 2,485,934 | ||||||
THE ALGER FUNDS | ALGER SMALL CAP GROWTH FUND
Schedule of Investments October 31, 2022 (Continued)
| COMMON STOCKS—91.7% (CONT.) | SHARES | VALUE | ||||||
| SEMICONDUCTORS—0.6% | | | ||||||
| Universal Display Corp. | 22,496 | $ | 2,142,069 | |||||
| SPECIALTY CHEMICALS—3.7% | | | ||||||
| Balchem Corp. | 104,187 | 14,565,343 | ||||||
| TOTAL COMMON STOCKS | ||||||||
| (Cost $399,212,169) | 356,681,275 | |||||||
| PREFERRED STOCKS—0.0% | SHARES | VALUE | ||||||
| BIOTECHNOLOGY—0.0% | | | ||||||
| Prosetta Biosciences, Inc., Series D*,@,(a),(b) | 50,688 | — | ||||||
| (Cost $228,096) | — | |||||||
| RIGHTS—0.0% | SHARES | VALUE | ||||||
| BIOTECHNOLOGY—0.0% | | | ||||||
| Tolero CDR*,@,(a),(c) | 174,782 | 104,869 | ||||||
| (Cost $94,483) | 104,869 | |||||||
| REAL ESTATE INVESTMENT TRUST—1.2% | SHARES | VALUE | ||||||
| RETAIL—1.2% | | | ||||||
| Tanger Factory Outlet Centers, Inc. | 258,634 | 4,657,998 | ||||||
| (Cost $4,259,450) | 4,657,998 | |||||||
| SPECIAL PURPOSE VEHICLE—0.6% | | VALUE | ||||||
| DATA PROCESSING & OUTSOURCED SERVICES—0.6% | | | ||||||
| Crosslink Ventures Capital LLC, Cl. A*,@,(a),(b) | 1,903,680 | |||||||
| Crosslink Ventures Capital LLC, Cl. B*,@,(a),(b) | 506,426 | |||||||
| 2,410,106 | ||||||||
| TOTAL SPECIAL PURPOSE VEHICLE | ||||||||
| (Cost $2,275,000) | 2,410,106 | |||||||
| Total Investments | ||||||||
| (Cost $406,069,198) | 93.5 | % | $ | 363,854,248 | ||||
| Affiliated Securities (Cost $2,503,096) | 2,410,106 | |||||||
| Unaffiliated Securities (Cost $403,566,102) | 361,444,142 | |||||||
| Other Assets in Excess of Liabilities | 6.5 | % | 25,402,005 | |||||
| NET ASSETS | 100.0 | % | $ | 389,256,253 | ||||
| # | American Depositary Receipts. |
| (a) | Security is valued in good faith at fair value determined using significant unobservable inputs pursuant to procedures established by the Valuation Designee (as defined in Note 2). |
| (b) | Deemed an affiliate of the Fund in accordance with Section 2(a)(3) of the Investment Company Act of 1940. See Note 11 - Affiliated Securities. |
| (c) | Contingent Deferred Rights. |
| * | Non-income producing security. |
THE ALGER FUNDS | ALGER SMALL CAP GROWTH FUND
Schedule of Investments October 31, 2022 (Continued)
| @ | Restricted security - Investment in security not registered under the Securities Act of 1933. Sales or transfers of the investment may be restricted only to qualified buyers. |
| Security | Acquisition Date(s) | Acquisition Cost | % of net assets (Acquisition Date) | Market Value | % of net assets as of 10/31/2022 | |||||||||||
| Crosslink Ventures Capital LLC, Cl. A | 10/2/20 | $ | 1,800,000 | 0.49% | $ | 1,903,680 | 0.49% | |||||||||
| Crosslink Ventures Capital LLC, Cl. B | 12/16/20 | 475,000 | 0.10% | 506,426 | 0.13% | |||||||||||
| Impulse Dynamics NV, Series E | 2/11/22 | 3,646,998 | 0.69% | 3,646,998 | 0.94% | |||||||||||
| Prosetta Biosciences, Inc., Series D | 2/6/15 | 228,096 | 0.10% | 0 | 0.00% | |||||||||||
| Tolero CDR | 2/6/17 | 94,483 | 0.08% | 104,869 | 0.02% | |||||||||||
| Total | $ | 6,161,973 | 1.58% | |||||||||||||
See Notes to Financial Statements.
THE ALGER FUNDS | ALGER SMALL CAP FOCUS FUND
Schedule of Investments October 31, 2022
| COMMON STOCKS—97.8% | SHARES | VALUE | ||||||
| AEROSPACE & DEFENSE—1.4% | | | ||||||
| Mercury Systems, Inc.* | 831,310 | $ | 40,235,404 | |||||
| APPAREL RETAIL—1.9% | | | ||||||
| Aritzia, Inc.* | 1,435,618 | 55,683,811 | ||||||
| APPLICATION SOFTWARE—20.5% | | | ||||||
| Appfolio, Inc., Cl. A* | 299,847 | 37,591,818 | ||||||
| Blackline, Inc.* | 1,180,430 | 66,104,080 | ||||||
| Clearwater Analytics Holdings, Inc., Cl. A* | 4,079,624 | 66,457,075 | ||||||
| Everbridge, Inc.* | 1,191,100 | 37,317,163 | ||||||
| Guidewire Software, Inc.* | 1,235,361 | 73,392,797 | ||||||
| Paycom Software, Inc.* | 326,733 | 113,049,618 | ||||||
| PROS Holdings, Inc.*,(a) | 2,978,898 | 74,323,505 | ||||||
| Q2 Holdings, Inc.* | 1,478,494 | 45,892,454 | ||||||
| Smartsheet, Inc., Cl. A* | 947,142 | 33,074,199 | ||||||
| Sprout Social, Inc., Cl. A* | 868,419 | 52,391,718 | ||||||
| 599,594,427 | ||||||||
| BIOTECHNOLOGY—6.6% | | | ||||||
| CareDx, Inc.* | 1,289,980 | 25,683,502 | ||||||
| Natera, Inc.* | 2,476,547 | 116,298,647 | ||||||
| Prometheus Biosciences, Inc.* | 373,136 | 19,597,102 | ||||||
| Vericel Corp.* | 1,198,752 | 32,222,454 | ||||||
| 193,801,705 | ||||||||
| ELECTRONIC EQUIPMENT & INSTRUMENTS—1.1% | | | ||||||
| 908 Devices, Inc.*,(a) | 1,991,055 | 31,836,969 | ||||||
| ENVIRONMENTAL & FACILITIES SERVICES—1.6% | | | ||||||
| Casella Waste Systems, Inc., Cl. A* | 556,833 | 45,554,508 | ||||||
| FOOD RETAIL—1.0% | | | ||||||
| Grocery Outlet Holding Corp.* | 827,345 | 28,601,317 | ||||||
| HEALTHCARE EQUIPMENT—16.9% | | | ||||||
| AtriCure, Inc.* | 1,735,391 | 73,094,669 | ||||||
| Axonics, Inc.* | 688,409 | 50,350,234 | ||||||
| Heska Corp.* | 468,150 | 33,594,444 | ||||||
| Inspire Medical Systems, Inc.* | 252,662 | 49,256,457 | ||||||
| Insulet Corp.* | 333,527 | 86,320,123 | ||||||
| QuidelOrtho Corp.* | 934,489 | 83,935,802 | ||||||
| Shockwave Medical, Inc.* | 401,805 | 117,789,136 | ||||||
| 494,340,865 | ||||||||
| HEALTHCARE SERVICES—1.6% | | | ||||||
| Signify Health, Inc., Cl. A* | 1,610,839 | 47,084,824 | ||||||
| HEALTHCARE SUPPLIES—1.5% | | | ||||||
| BioLife Solutions, Inc.* | 1,866,392 | 43,897,540 | ||||||
| HEALTHCARE TECHNOLOGY—4.0% | | | ||||||
| Evolent Health, Inc., Cl. A* | 2,128,115 | 67,695,338 | ||||||
| Veeva Systems, Inc., Cl. A* | 293,880 | 49,354,207 | ||||||
| 117,049,545 | ||||||||
| INDUSTRIAL MACHINERY—6.4% | | | ||||||
| RBC Bearings, Inc.* | 743,485 | 188,495,752 | ||||||
| INTERNET & DIRECT MARKETING RETAIL—1.3% | | | ||||||
| Xometry, Inc., Cl. A* | 626,331 | 37,617,440 | ||||||
THE ALGER FUNDS | ALGER SMALL CAP FOCUS FUND
Schedule of Investments October 31, 2022 (Continued)
| COMMON STOCKS—97.8% (CONT.) | SHARES | VALUE | ||||||
| LIFE SCIENCES TOOLS & SERVICES—9.3% | | | ||||||
| Bio-Techne Corp. | 227,941 | $ | 67,529,801 | |||||
| Bruker Corp. | 882,031 | 54,544,797 | ||||||
| CryoPort, Inc.* | 2,305,188 | 63,992,019 | ||||||
| NanoString Technologies, Inc.* | 1,804,146 | 18,871,367 | ||||||
| Repligen Corp.* | 363,423 | 66,321,063 | ||||||
| 271,259,047 | ||||||||
| MANAGED HEALTHCARE—3.7% | | | ||||||
| HealthEquity, Inc.* | 1,377,578 | 107,327,102 | ||||||
| OIL & GAS EQUIPMENT & SERVICES—2.4% | | | ||||||
| ChampionX Corp. | 2,420,059 | 69,262,089 | ||||||
| OIL & GAS EXPLORATION & PRODUCTION—5.1% | | | ||||||
| PDC Energy, Inc. | 1,092,059 | 78,781,136 | ||||||
| Viper Energy Partners LP | 2,161,590 | 72,089,027 | ||||||
| 150,870,163 | ||||||||
| PACKAGED FOODS & MEATS—1.3% | | | ||||||
| Freshpet, Inc.* | 655,781 | 38,658,290 | ||||||
| REGIONAL BANKS—2.1% | | | ||||||
| Popular, Inc. | 891,007 | 63,012,015 | ||||||
| RESTAURANTS—4.0% | | | ||||||
| Kura Sushi USA, Inc., Cl. A* | 307,518 | 24,303,147 | ||||||
| Shake Shack, Inc., Cl. A* | 591,744 | 32,883,214 | ||||||
| Wingstop, Inc. | 385,299 | 61,027,509 | ||||||
| 118,213,870 | ||||||||
| SEMICONDUCTORS—1.2% | | | ||||||
| Monolithic Power Systems, Inc. | 106,152 | 36,033,296 | ||||||
| SYSTEMS SOFTWARE—1.2% | | | ||||||
| Tenable Holdings, Inc.* | 888,555 | 36,110,875 | ||||||
| TRADING COMPANIES & DISTRIBUTORS—1.3% | | | ||||||
| Herc Holdings, Inc. | 327,548 | 38,522,920 | ||||||
| TRUCKING—0.4% | | | ||||||
| Saia, Inc.* | 65,466 | 13,018,569 | ||||||
| TOTAL COMMON STOCKS | ||||||||
| (Cost $2,779,294,265) | 2,866,082,343 | |||||||
| RIGHTS—0.0% | SHARES | VALUE | ||||||
| BIOTECHNOLOGY—0.0% | | | ||||||
| Tolero CDR*,@,(b),(c) | 11,905 | 7,143 | ||||||
| (Cost $6,436) | 7,143 | |||||||
| Total Investments | ||||||||
| (Cost $2,779,300,701) | 97.8 | % | $ | 2,866,089,486 | ||||
| Affiliated Securities (Cost $159,441,783) | 106,160,474 | |||||||
| Unaffiliated Securities (Cost $2,619,858,918) | 2,759,929,012 | |||||||
| Other Assets in Excess of Liabilities | 2.2 | % | 63,353,555 | |||||
| NET ASSETS | 100.0 | % | $ | 2,929,443,041 | ||||
| (a) | Deemed an affiliate of the Fund in accordance with Section 2(a)(3) of the Investment Company Act of 1940. See Note 11 - Affiliated Securities. |
| (b) | Security is valued in good faith at fair value determined using significant unobservable inputs pursuant to procedures established by the Valuation Designee (as defined in Note 2). |
| (c) | Contingent Deferred Rights. |
THE ALGER FUNDS | ALGER SMALL CAP FOCUS FUND
Schedule of Investments October 31, 2022 (Continued)
| * | Non-income producing security. |
| @ | Restricted security - Investment in security not registered under the Securities Act of 1933. Sales or transfers of the investment may be restricted only to qualified buyers. |
| Security | Acquisition Date(s) | Acquisition Cost | % of net assets (Acquisition Date) | Market Value | % of net assets as of 10/31/2022 | |||||||||||
| Tolero CDR | 2/6/17 | $ | 6,436 | 0.00% | $ | 7,143 | 0.00% | |||||||||
| Total | $ | 7,143 | 0.00% | |||||||||||||
See Notes to Financial Statements.
THE ALGER FUNDS | ALGER INTERNATIONAL FOCUS FUND
Schedule of Investments October 31, 2022
| COMMON STOCKS—98.4% | SHARES | VALUE | ||||||
| ARGENTINA—2.0% | | | ||||||
| INTERNET & DIRECT MARKETING RETAIL—2.0% | ||||||||
| MercadoLibre, Inc.* | 2,850 | $ | 2,569,617 | |||||
| (Cost $3,902,261) | ||||||||
| AUSTRALIA—5.4% | | | ||||||
| APPLICATION SOFTWARE—1.8% | ||||||||
| Xero Ltd.* | 46,600 | 2,314,277 | ||||||
| HEALTHCARE SUPPLIES—1.4% | ||||||||
| Nanosonics Ltd.* | 694,062 | 1,819,483 | ||||||
| HEALTHCARE TECHNOLOGY—2.2% | ||||||||
| Pro Medicus Ltd. | 81,000 | 2,886,045 | ||||||
| TOTAL AUSTRALIA | ||||||||
| (Cost $7,093,135) | 7,019,805 | |||||||
| BRAZIL—5.8% | | | ||||||
| DIVERSIFIED CAPITAL MARKETS—3.0% | ||||||||
| Banco BTG Pactual SA | 691,000 | 3,870,841 | ||||||
| FOOTWEAR—2.8% | ||||||||
| Arezzo Industria e Comercio SA | 182,000 | 3,681,430 | ||||||
| TOTAL BRAZIL | ||||||||
| (Cost $6,140,925) | 7,552,271 | |||||||
| CHINA—4.9% | | | ||||||
| AUTOMOBILE MANUFACTURERS—1.7% | ||||||||
| BYD Co., Ltd., Cl. H | 100,484 | 2,251,157 | ||||||
| BREWERS—1.9% | ||||||||
| Budweiser Brewing Co. APAC Ltd. | 1,153,000 | 2,426,747 | ||||||
| INTERNET & DIRECT MARKETING RETAIL—1.3% | ||||||||
| Meituan, Cl. B* | 108,000 | 1,729,139 | ||||||
| TOTAL CHINA | ||||||||
| (Cost $8,582,180) | 6,407,043 | |||||||
| FRANCE—15.8% | | | ||||||
| APPAREL ACCESSORIES & LUXURY GOODS—2.9% | ||||||||
| LVMH Moet Hennessy Louis Vuitton SE | 5,900 | 3,722,681 | ||||||
| ELECTRICAL COMPONENTS & EQUIPMENT—2.4% | ||||||||
| Schneider Electric SE | 25,200 | 3,186,541 | ||||||
| HEALTHCARE SUPPLIES—2.7% | ||||||||
| EssilorLuxottica SA | 22,300 | 3,526,081 | ||||||
| LIFE SCIENCES TOOLS & SERVICES—3.1% | ||||||||
| Eurofins Scientific SE | 62,200 | 3,981,521 | ||||||
| OIL & GAS STORAGE & TRANSPORTATION—1.8% | ||||||||
| Gaztransport Et Technigaz SA | 20,624 | 2,399,247 | ||||||
| RESEARCH & CONSULTING SERVICES—2.9% | ||||||||
| Teleperformance | 14,157 | 3,792,892 | ||||||
| TOTAL FRANCE | ||||||||
| (Cost $19,340,585) | 20,608,963 | |||||||
THE ALGER FUNDS | ALGER INTERNATIONAL FOCUS FUND
Schedule of Investments October 31, 2022 (Continued)
| COMMON STOCKS—98.4% (CONT.) | SHARES | VALUE | ||||||
| GERMANY—5.8% | | | ||||||
| AEROSPACE & DEFENSE—2.3% | ||||||||
| Hensoldt AG | 126,800 | $ | 2,979,003 | |||||
| OIL & GAS REFINING & MARKETING—3.5% | ||||||||
| VERBIO Vereinigte BioEnergie AG | 58,100 | 4,576,489 | ||||||
| TOTAL GERMANY | ||||||||
| (Cost $6,441,659) | 7,555,492 | |||||||
| HONG KONG—1.2% | | | ||||||
| INDUSTRIAL MACHINERY—1.2% | ||||||||
| Techtronic Industries Co., Ltd. | 159,000 | 1,505,534 | ||||||
| (Cost $1,162,958) | ||||||||
| INDIA—6.3% | | | ||||||
| DIVERSIFIED BANKS—2.3% | ||||||||
| HDFC Bank Ltd.# | 47,900 | 2,984,649 | ||||||
| HOTELS RESORTS & CRUISE LINES—1.5% | ||||||||
| MakeMyTrip Ltd.* | 69,778 | 1,941,922 | ||||||
| INVESTMENT BANKING & BROKERAGE—2.5% | ||||||||
| Angel One Ltd. | 169,000 | 3,274,320 | ||||||
| TOTAL INDIA | ||||||||
| (Cost $7,196,919) | 8,200,891 | |||||||
| IRELAND—2.2% | | | ||||||
| PACKAGED FOODS & MEATS—2.2% | ||||||||
| Kerry Group PLC, Cl. A | 33,741 | 2,930,423 | ||||||
| (Cost $3,756,244) | ||||||||
| ITALY—6.9% | | | ||||||
| APPAREL ACCESSORIES & LUXURY GOODS—2.6% | ||||||||
| Moncler SpA | 78,786 | 3,398,990 | ||||||
| AUTOMOBILE MANUFACTURERS—3.3% | ||||||||
| Ferrari NV | 22,162 | 4,360,817 | ||||||
| INDUSTRIAL MACHINERY—1.0% | ||||||||
| Industrie de Nora SpA* | 90,000 | 1,303,619 | ||||||
| TOTAL ITALY | ||||||||
| (Cost $7,968,703) | 9,063,426 | |||||||
| JAPAN—6.9% | | | ||||||
| ELECTRONIC EQUIPMENT & INSTRUMENTS—2.3% | ||||||||
| Keyence Corp. | 7,900 | 2,979,016 | ||||||
| HEALTHCARE SUPPLIES—1.9% | ||||||||
| Hoya Corp. | 26,900 | 2,500,830 | ||||||
| SEMICONDUCTOR EQUIPMENT—2.7% | ||||||||
| Lasertec Corp. | 25,400 | 3,569,218 | ||||||
| TOTAL JAPAN | ||||||||
| (Cost $9,843,220) | 9,049,064 | |||||||
| NETHERLANDS—9.0% | | | ||||||
| DATA PROCESSING & OUTSOURCED SERVICES—2.2% | ||||||||
| Adyen NV* | 2,075 | 2,962,119 | ||||||
THE ALGER FUNDS | ALGER INTERNATIONAL FOCUS FUND
Schedule of Investments October 31, 2022 (Continued)
| COMMON STOCKS—98.4% (CONT.) | SHARES | VALUE | ||||||
| NETHERLANDS—9.0% (CONT.) | ||||||||
| HEAVY ELECTRICAL EQUIPMENT—3.0% | ||||||||
| Alfen Beheer BV* | 36,800 | $ | 3,903,501 | |||||
| SEMICONDUCTOR EQUIPMENT—3.8% | ||||||||
| ASML Holding NV | 10,500 | 4,925,166 | ||||||
| TOTAL NETHERLANDS | ||||||||
| (Cost $5,150,054) | 11,790,786 | |||||||
| NORWAY—2.7% | | | ||||||
| ENVIRONMENTAL & FACILITIES SERVICES—1.3% | ||||||||
| Aker Carbon Capture ASA* | 1,560,510 | 1,755,951 | ||||||
| INDUSTRIAL MACHINERY—1.4% | ||||||||
| AutoStore Holdings Ltd.*,(a) | 930,036 | 1,757,555 | ||||||
| TOTAL NORWAY | ||||||||
| (Cost $6,954,347) | 3,513,506 | |||||||
| SOUTH KOREA—1.8% | | | ||||||
| SPECIALTY CHEMICALS—1.8% | ||||||||
| Chunbo Co., Ltd. | 15,800 | 2,412,072 | ||||||
| (Cost $2,580,839) | ||||||||
| SPAIN—1.5% | | | ||||||
| BIOTECHNOLOGY—1.5% | ||||||||
| Grifols SA#,* | 309,741 | 1,954,466 | ||||||
| (Cost $5,399,542) | ||||||||
| SWEDEN—1.1% | | | ||||||
| ASSET MANAGEMENT & CUSTODY BANKS—1.1% | ||||||||
| EQT AB | 74,298 | 1,461,698 | ||||||
| (Cost $755,883) | ||||||||
| SWITZERLAND—3.6% | | | ||||||
| ASSET MANAGEMENT & CUSTODY BANKS—1.6% | ||||||||
| Partners Group Holding AG | 2,284 | 2,050,183 | ||||||
| SPECIALTY CHEMICALS—2.0% | ||||||||
| Sika AG | 11,800 | 2,660,748 | ||||||
| TOTAL SWITZERLAND | ||||||||
| (Cost $3,247,332) | 4,710,931 | |||||||
| UNITED KINGDOM—5.1% | | | ||||||
| FINANCIAL EXCHANGES & DATA—3.0% | ||||||||
| London Stock Exchange Group PLC | 44,700 | 3,874,688 | ||||||
| PHARMACEUTICALS—2.1% | ||||||||
| AstraZeneca PLC | 23,500 | 2,757,306 | ||||||
| TOTAL UNITED KINGDOM | ||||||||
| (Cost $6,408,780) | 6,631,994 | |||||||
| UNITED STATES—10.4% | | | ||||||
| APPAREL ACCESSORIES & LUXURY GOODS—2.1% | ||||||||
| Lululemon Athletica, Inc.* | 8,400 | 2,763,936 | ||||||
| APPLICATION SOFTWARE—1.9% | ||||||||
| Atlassian Corp., Cl. A* | 12,500 | 2,534,125 | ||||||
THE ALGER FUNDS | ALGER INTERNATIONAL FOCUS FUND
Schedule of Investments October 31, 2022 (Continued)
| COMMON STOCKS—98.4% (CONT.) | SHARES | VALUE | ||||||
| UNITED STATES—10.4% (CONT.) | ||||||||
| IT CONSULTING & OTHER SERVICES—2.6% | ||||||||
| EPAM Systems, Inc.* | 9,550 | $ | 3,342,500 | |||||
| OIL & GAS EQUIPMENT & SERVICES—3.8% | ||||||||
| Schlumberger NV | 94,500 | 4,916,835 | ||||||
| TOTAL UNITED STATES | ||||||||
| (Cost $12,973,929) | 13,557,396 | |||||||
| TOTAL COMMON STOCKS | ||||||||
| (Cost $124,899,495) | 128,495,378 | |||||||
| Total Investments | ||||||||
| (Cost $124,899,495) | 98.4% | $ | 128,495,378 | |||||
| Unaffiliated Securities (Cost $124,899,495) | 128,495,378 | |||||||
| Other Assets in Excess of Liabilities | 1.6% | 2,149,662 | ||||||
| NET ASSETS | 100.0% | $ | 130,645,040 | |||||
| # | American Depositary Receipts. |
| (a) | Pursuant to Securities and Exchange Commission Rule 144A, this security may be sold only to qualified institutional buyers. This security represents 1.4% of the net assets of the Fund. |
| * | Non-income producing security. |
See Notes to Financial Statements.
THE ALGER FUNDS | ALGER HEALTH SCIENCES FUND
Schedule of Investments October 31, 2022
| COMMON STOCKS—95.5% | SHARES | VALUE | ||||||
| BIOTECHNOLOGY—40.2% | | |||||||
| AbbVie, Inc. | 64,462 | $ | 9,437,237 | |||||
| ADMA Biologics, Inc.* | 1,238,994 | 3,493,963 | ||||||
| Aerovate Therapeutics, Inc.* | 167,007 | 3,258,307 | ||||||
| Alkermes PLC* | 76,823 | 1,743,882 | ||||||
| Apellis Pharmaceuticals, Inc.* | 70,195 | 4,246,096 | ||||||
| Biohaven Ltd.* | 200,000 | 3,314,000 | ||||||
| Celldex Therapeutics, Inc.* | 117,917 | 4,142,424 | ||||||
| Compass Therapeutics, Inc.* | 608,536 | 1,922,974 | ||||||
| HilleVax, Inc.* | 107,710 | 2,302,840 | ||||||
| Ionis Pharmaceuticals, Inc.* | 141,459 | 6,252,488 | ||||||
| Mersana Therapeutics, Inc.* | 327,168 | 2,571,540 | ||||||
| Neurocrine Biosciences, Inc.* | 46,854 | 5,393,832 | ||||||
| Prometheus Biosciences, Inc.* | 99,693 | 5,235,876 | ||||||
| Regeneron Pharmaceuticals, Inc.* | 9,562 | 7,159,548 | ||||||
| Vaxcyte, Inc.* | 63,151 | 2,754,015 | ||||||
| Vertex Pharmaceuticals, Inc.* | 26,585 | 8,294,520 | ||||||
| 71,523,542 | ||||||||
| HEALTHCARE DISTRIBUTORS—10.9% | | |||||||
| Cardinal Health, Inc. | 117,900 | 8,948,610 | ||||||
| McKesson Corp. | 26,938 | 10,488,849 | ||||||
| 19,437,459 | ||||||||
| HEALTHCARE EQUIPMENT—9.9% | | |||||||
| Impulse Dynamics NV, Series E*,@,(a) | 1,515,152 | 5,000,002 | ||||||
| Inmode Ltd.* | 60,256 | 2,067,986 | ||||||
| Shockwave Medical, Inc.* | 11,610 | 3,403,471 | ||||||
| Tandem Diabetes Care, Inc.* | 62,947 | 3,534,474 | ||||||
| TransMedics Group, Inc.* | 72,209 | 3,481,918 | ||||||
| 17,487,851 | ||||||||
| HEALTHCARE FACILITIES—3.9% | | |||||||
| Acadia Healthcare Co., Inc.* | 85,988 | 6,990,824 | ||||||
| HEALTHCARE SERVICES—4.0% | | |||||||
| Accolade, Inc.* | 254,012 | 2,738,249 | ||||||
| Cigna Corp. | 6,036 | 1,949,990 | ||||||
| Option Care Health, Inc.* | 81,722 | 2,472,908 | ||||||
| 7,161,147 | ||||||||
| HEALTHCARE TECHNOLOGY—1.0% | | |||||||
| Evolent Health, Inc., Cl. A* | 56,818 | 1,807,381 | ||||||
| MANAGED HEALTHCARE—15.5% | | |||||||
| Centene Corp.* | 81,105 | 6,904,469 | ||||||
| Humana, Inc. | 17,007 | 9,491,266 | ||||||
| UnitedHealth Group, Inc. | 19,934 | 11,066,360 | ||||||
| 27,462,095 | ||||||||
THE ALGER FUNDS | ALGER HEALTH SCIENCES FUND
Schedule of Investments October 31, 2022 (Continued)
| COMMON STOCKS—95.5% (CONT.) | SHARES | VALUE | ||||||
| PHARMACEUTICALS—10.1% | | |||||||
| Eli Lilly & Co. | 21,533 | $ | 7,796,884 | |||||
| Merck & Co., Inc. | 55,276 | 5,593,931 | ||||||
| Reata Pharmaceuticals, Inc., Cl. A* | 143,396 | 4,617,351 | ||||||
| 18,008,166 | ||||||||
| TOTAL COMMON STOCKS | ||||||||
| (Cost $145,059,032) | 169,878,465 | |||||||
| PREFERRED STOCKS—0.0% | SHARES | VALUE | ||||||
| BIOTECHNOLOGY—0.0% | | |||||||
| Prosetta Biosciences, Inc., Series D*,@,(a),(b) | 897,366 | — | ||||||
| (Cost $4,038,147) | — | |||||||
| RIGHTS—0.7% | SHARES | VALUE | ||||||
| BIOTECHNOLOGY—0.7% | | |||||||
| Tolero CDR*,@,(a),(c) | 1,956,996 | 1,174,198 | ||||||
| (Cost $1,044,370) | 1,174,198 | |||||||
| Total Investments | ||||||||
| (Cost $150,141,549) | 96.2 | % | $ | 171,052,663 | ||||
| Affiliated Securities (Cost $4,038,147) | — | |||||||
| Unaffiliated Securities (Cost $146,103,402) | 171,052,663 | |||||||
| Other Assets in Excess of Liabilities | 3.8 | % | 6,762,483 | |||||
| NET ASSETS | 100.0 | % | $ | 177,815,146 | ||||
| (a) | Security is valued in good faith at fair value determined using significant unobservable inputs pursuant to procedures established by the Valuation Designee (as defined in Note 2). |
| (b) | Deemed an affiliate of the Fund in accordance with Section 2(a)(3) of the Investment Company Act of 1940. See Note 11 - Affiliated Securities. |
| (c) | Contingent Deferred Rights. |
| * | Non-income producing security. |
| @ | Restricted security - Investment in security not registered under the Securities Act of 1933. Sales or transfers of the investment may be restricted only to qualified buyers. |
| Security | Acquisition Date(s) | Acquisition Cost | % of net assets (Acquisition Date) | Market Value | % of net assets as of 10/31/2022 | ||||||||||||||
| Impulse Dynamics NV, Series E | 2/11/22 | $ | 5,000,002 | 2.09% | $ | 5,000,002 | 2.81% | ||||||||||||
| Prosetta Biosciences, Inc., Series D | 2/6/15 | 4,038,147 | 2.00% | 0 | 0.00% | ||||||||||||||
| Tolero CDR | 2/6/17 | 1,044,370 | 0.90% | 1,174,198 | 0.66% | ||||||||||||||
| Total | $ | 6,174,200 | 3.47% | ||||||||||||||||
See Notes to Financial Statements.
THE ALGER FUNDS
Statements of Assets and Liabilities October 31, 2022
| Alger Capital Appreciation Fund | Alger 35 Fund | |||||||
| ASSETS: | ||||||||
| Investments in unaffiliated securities, at value (Identified cost below)* see accompanying schedules of investments | $ | 1,758,807,353 | $ | 25,775,826 | ||||
| Investments in affiliated securities, at value (Identified cost below)** see accompanying schedules of investments | 2,934,840 | — | ||||||
| Cash and cash equivalents | 56,887,196 | 248,587 | ||||||
| Foreign cash † | 737 | — | ||||||
| Receivable for investment securities sold | 35,292,445 | — | ||||||
| Receivable for shares of beneficial interest sold | 667,351 | — | ||||||
| Dividends and interest receivable | 694,444 | 546 | ||||||
| Receivable from Investment Manager | 41,885 | 8,287 | ||||||
| Prepaid expenses | 234,954 | 593 | ||||||
| Total Assets | 1,855,561,205 | 26,033,839 | ||||||
| LIABILITIES: | ||||||||
| Payable for investment securities purchased | 35,743,694 | — | ||||||
| Payable for shares of beneficial interest redeemed | 2,270,734 | — | ||||||
| Accrued investment advisory fees | 1,232,894 | 9,730 | ||||||
| Accrued distribution fees | 239,371 | — | ||||||
| Accrued shareholder administrative fees | 19,938 | 216 | ||||||
| Accrued administrative fees | 41,858 | 595 | ||||||
| Accrued transfer agent fees | 281,603 | 443 | ||||||
| Accrued professional fees | 67,256 | 35,340 | ||||||
| Accrued printing fees | 57,673 | 484 | ||||||
| Accrued fund accounting fees | 45,571 | 8,438 | ||||||
| Accrued custodian fees | 12,884 | 1,390 | ||||||
| Accrued trustee fees | 6,678 | 84 | ||||||
| Accrued other expenses | 3,585 | 721 | ||||||
| Total Liabilities | 40,023,739 | 57,441 | ||||||
| NET ASSETS | $ | 1,815,537,466 | $ | 25,976,398 | ||||
| NET ASSETS CONSIST OF: | ||||||||
| Paid in capital (par value of $.001 per share) | 1,269,730,987 | 40,844,624 | ||||||
| Distributable earnings (Distributions in excess of earnings) | 545,806,479 | (14,868,226 | ) | |||||
| NET ASSETS | $ | 1,815,537,466 | $ | 25,976,398 | ||||
| * Identified cost | $ | 1,245,229,863 | (a) | $ | 27,332,644 | (b) | ||
| ** Identified cost | $ | 2,775,000 | (a) | $ | — | |||
| † Cost of foreign cash | $ | 1,571 | $ | — | ||||
See Notes to Financial Statements.
THE ALGER FUNDS
Statements of Assets and Liabilities October 31, 2022 (Continued)
| Alger Capital Appreciation Fund | Alger 35 Fund | |||||||
| NET ASSETS BY CLASS: | ||||||||
| Class A | $ | 774,249,385 | $ | — | ||||
| Class C | $ | 91,814,720 | $ | — | ||||
| Class Z | $ | 949,473,361 | $ | 25,976,398 | ||||
| SHARES OF BENEFICIAL INTEREST OUTSTANDING — NOTE 6: | ||||||||
| Class A | 37,285,742 | — | ||||||
| Class C | 7,272,048 | — | ||||||
| Class Z | 42,845,656 | 2,720,579 | ||||||
| NET ASSET VALUE PER SHARE: | ||||||||
| Class A — Net Asset Value Per Share Class A | $ | 20.77 | $ | — | ||||
| Class A — Offering Price Per Share | ||||||||
| (includes a 5.25% sales charge) | $ | 21.92 | $ | — | ||||
| Class C — Net Asset Value Per Share Class C | $ | 12.63 | $ | — | ||||
| Class Z — Net Asset Value Per Share Class Z | $ | 22.16 | $ | 9.55 | ||||
See Notes to Financial Statements.
| (a) | At October 31, 2022, the net unrealized appreciation on investments, based on cost for federal income tax purposes of $1,279,204,692 amounted to $482,537,501 which consisted of aggregate gross unrealized appreciation of $572,327,363 and aggregate gross unrealized depreciation of $89,789,862. |
| (b) | At October 31, 2022, the net unrealized depreciation on investments, based on cost for federal income tax purposes of $28,456,404, amounted to $2,680,578 which consisted of aggregate gross unrealized appreciation of $1,405,124 and aggregate gross unrealized depreciation of $4,085,702. |
THE ALGER FUNDS
Statements of Assets and Liabilities October 31, 2022 (Continued)
| Alger Growth & Income Fund | Alger Mid Cap Growth Fund | |||||||
| ASSETS: | ||||||||
| Investments in unaffiliated securities, at value (Identified cost below)* see accompanying schedules of investments | $ | 232,289,662 | $ | 175,375,577 | ||||
| Investments in affiliated securities, at value (Identified cost below)** see accompanying schedules of investments | — | 1,775,546 | ||||||
| Cash and cash equivalents | 14,202,816 | 16,512,960 | ||||||
| Receivable for shares of beneficial interest sold | 390,956 | 70,942 | ||||||
| Dividends and interest receivable | 299,251 | 9,342 | ||||||
| Receivable from Investment Manager | — | 5,161 | ||||||
| Prepaid expenses | 64,673 | 84,112 | ||||||
| Total Assets | 247,247,358 | 193,833,640 | ||||||
| LIABILITIES: | ||||||||
| Payable for investment securities purchased | 2,494,791 | 1,361,915 | ||||||
| Payable for shares of beneficial interest redeemed | 116,810 | 61,929 | ||||||
| Accrued investment advisory fees | 98,669 | 120,106 | ||||||
| Accrued distribution fees | 38,932 | 42,386 | ||||||
| Accrued shareholder administrative fees | 2,655 | 2,443 | ||||||
| Accrued administrative fees | 5,427 | 4,346 | ||||||
| Accrued professional fees | 37,520 | 52,236 | ||||||
| Accrued transfer agent fees | 26,900 | 32,977 | ||||||
| Accrued fund accounting fees | 12,330 | 13,401 | ||||||
| Accrued printing fees | 8,302 | 12,044 | ||||||
| Accrued custodian fees | 681 | 15,179 | ||||||
| Accrued trustee fees | 321 | 651 | ||||||
| Accrued registration fees | — | 1,255 | ||||||
| Accrued other expenses | 2,538 | 10,119 | ||||||
| Total Liabilities | 2,845,876 | 1,730,987 | ||||||
| NET ASSETS | $ | 244,401,482 | $ | 192,102,653 | ||||
| NET ASSETS CONSIST OF: | ||||||||
| Paid in capital (par value of $.001 per share) | 173,548,398 | 254,602,214 | ||||||
| Distributable earnings (Distributions in excess of earnings) | 70,853,084 | (62,499,561 | ) | |||||
| NET ASSETS | $ | 244,401,482 | $ | 192,102,653 | ||||
| * Identified cost | $ | 162,488,005 | (a) | $ | 178,439,765 | (b) | ||
| ** Identified cost | $ | — | $ | 2,663,245 | (b) | |||
See Notes to Financial Statements.
THE ALGER FUNDS
Statements of Assets and Liabilities October 31, 2022 (Continued)
| Alger Growth & Income Fund | Alger Mid Cap Growth Fund | |||||||
| NET ASSETS BY CLASS: | ||||||||
| Class A | $ | 108,039,157 | $ | 146,648,390 | ||||
| Class B | $ | — | $ | 10,404,261 | ||||
| Class C | $ | 21,110,880 | $ | 4,562,186 | ||||
| Class Z | $ | 115,251,445 | $ | 30,487,816 | ||||
| SHARES OF BENEFICIAL INTEREST OUTSTANDING — NOTE 6: | ||||||||
| Class A | 2,063,851 | 13,557,879 | ||||||
| Class B | — | 1,535,460 | ||||||
| Class C | 410,200 | 720,046 | ||||||
| Class Z | 2,198,553 | 2,732,874 | ||||||
| NET ASSET VALUE PER SHARE: | ||||||||
| Class A — Net Asset Value Per Share Class A | $ | 52.35 | $ | 10.82 | ||||
| Class A — Offering Price Per Share | ||||||||
| (includes a 5.25% sales charge) | $ | 55.25 | $ | 11.42 | ||||
| Class B — Net Asset Value Per Share Class B | $ | — | $ | 6.78 | ||||
| Class C — Net Asset Value Per Share Class C | $ | 51.46 | $ | 6.34 | ||||
| Class Z — Net Asset Value Per Share Class Z | $ | 52.42 | $ | 11.16 | ||||
See Notes to Financial Statements.
| (a) | At October 31, 2022, the net unrealized appreciation on investments, based on cost for federal income tax purposes of $161,698,963, amounted to $70,590,699 which consisted of aggregate gross unrealized appreciation of $73,566,912 and aggregate gross unrealized depreciation of $2,976,213. |
| (b) | At October 31, 2022, the net unrealized depreciation on investments, based on cost for federal income tax purposes of $183,415,599, amounted to $6,264,476 which consisted of aggregate gross unrealized appreciation of $11,703,900 and aggregate gross unrealized depreciation of $17,968,376. |
THE ALGER FUNDS
Statements of Assets and Liabilities October 31, 2022 (Continued)
| Alger Mid Cap Focus Fund | Alger Weatherbie Enduring Growth Fund | |||||||
| ASSETS: | ||||||||
| Investments in unaffiliated securities, at value (Identified cost below)* see accompanying schedules of investments | $ | 430,874,674 | $ | 4,044,676 | ||||
| Cash and cash equivalents | 5,134,355 | 369,430 | ||||||
| Foreign cash † | 564 | — | ||||||
| Receivable for investment securities sold | 717,950 | 26,477 | ||||||
| Receivable for shares of beneficial interest sold | 431,198 | — | ||||||
| Dividends and interest receivable | 508 | 536 | ||||||
| Receivable from Investment Manager | 28 | 17,505 | ||||||
| Prepaid expenses | 115,367 | 40,972 | ||||||
| Total Assets | 437,274,644 | 4,499,596 | ||||||
| LIABILITIES: | ||||||||
| Payable for shares of beneficial interest redeemed | 466,229 | — | ||||||
| Accrued investment advisory fees | 223,658 | 2,534 | ||||||
| Accrued distribution fees | 15,706 | 99 | ||||||
| Accrued shareholder administrative fees | 3,660 | 37 | ||||||
| Accrued administrative fees | 9,966 | 100 | ||||||
| Accrued professional fees | 37,816 | 32,379 | ||||||
| Accrued printing fees | 37,389 | 225 | ||||||
| Accrued transfer agent fees | 18,364 | 160 | ||||||
| Accrued fund accounting fees | 18,346 | 9,229 | ||||||
| Accrued custodian fees | 3,585 | 754 | ||||||
| Accrued trustee fees | 1,784 | 15 | ||||||
| Accrued other expenses | 4,793 | 857 | ||||||
| Total Liabilities | 841,296 | 46,389 | ||||||
| NET ASSETS | $ | 436,433,348 | $ | 4,453,207 | ||||
| NET ASSETS CONSIST OF: | ||||||||
| Paid in capital (par value of $.001 per share) | 593,121,737 | 5,896,138 | ||||||
| Distributions in excess of earnings | (156,688,389 | ) | (1,442,931 | ) | ||||
| NET ASSETS | $ | 436,433,348 | $ | 4,453,207 | ||||
| * Identified cost | $ | 467,534,432 | (a) | $ | 4,996,157 | (b) | ||
| † Cost of foreign cash | $ | 623 | $ | — | ||||
See Notes to Financial Statements.
THE ALGER FUNDS
Statements of Assets and Liabilities October 31, 2022 (Continued)
| Alger Mid Cap Focus Fund | Alger Weatherbie Enduring Growth Fund | |||||||
| NET ASSETS BY CLASS: | ||||||||
| Class A | $ | 5,082,878 | $ | 120,124 | ||||
| Class C | $ | 2,432,536 | $ | 73,082 | ||||
| Class I | $ | 62,498,812 | $ | 73,562 | ||||
| Class Y | $ | 443,314 | $ | 369,097 | ||||
| Class Z | $ | 365,975,808 | $ | 3,817,342 | ||||
| SHARES OF BENEFICIAL INTEREST OUTSTANDING — NOTE 6: | ||||||||
| Class A | 418,850 | 16,335 | ||||||
| Class C | 202,512 | 10,000 | ||||||
| Class I | 5,146,661 | 10,000 | ||||||
| Class Y | 36,172 | 50,000 | ||||||
| Class Z | 29,848,374 | 517,335 | ||||||
| NET ASSET VALUE PER SHARE: | ||||||||
| Class A — Net Asset Value Per Share Class A | $ | 12.14 | $ | 7.35 | ||||
| Class A — Offering Price Per Share | ||||||||
| (includes a 5.25% sales charge) | $ | 12.81 | $ | 7.76 | ||||
| Class C — Net Asset Value Per Share Class C | $ | 12.01 | $ | 7.31 | ||||
| Class I — Net Asset Value Per Share Class I | $ | 12.14 | $ | 7.36 | ||||
| Class Y — Net Asset Value Per Share Class Y | $ | 12.26 | $ | 7.38 | ||||
| Class Z — Net Asset Value Per Share Class Z | $ | 12.26 | $ | 7.38 | ||||
See Notes to Financial Statements.
| (a) | At October 31, 2022, the net unrealized depreciation on investments, based on cost for federal income tax purposes of $472,796,946, amounted to $41,922,272 which consisted of aggregate gross unrealized appreciation of $29,999,635 and aggregate gross unrealized depreciation of $71,921,907. |
| (b) | At October 31, 2022, the net unrealized depreciation on investments, based on cost for federal income tax purposes of $5,054,154, amounted to $1,009,478 which consisted of aggregate gross unrealized appreciation of $66,894 and aggregate gross unrealized depreciation of $1,076,372. |
THE ALGER FUNDS
Statements of Assets and Liabilities October 31, 2022 (Continued)
| Alger Weatherbie Specialized Growth Fund | Alger Small Cap Growth Fund | |||||||
| ASSETS: | ||||||||
| Investments in unaffiliated securities, at value (Identified cost below)* see accompanying schedules of investments | $ | 745,888,128 | $ | 361,444,142 | ||||
| Investments in affiliated securities, at value (Identified cost below)** see accompanying schedules of investments | — | 2,410,106 | ||||||
| Cash and cash equivalents | 30,506,732 | 27,763,326 | ||||||
| Receivable for investment securities sold | 1,740,533 | — | ||||||
| Receivable for shares of beneficial interest sold | 711,052 | 434,596 | ||||||
| Dividends and interest receivable | 18,090 | 56,899 | ||||||
| Receivable from Investment Manager | — | 2,338 | ||||||
| Prepaid expenses | 106,828 | 99,931 | ||||||
| Total Assets | 778,971,363 | 392,211,338 | ||||||
| LIABILITIES: | ||||||||
| Payable for investment securities purchased | 123,047 | 788,284 | ||||||
| Payable for shares of beneficial interest redeemed | 1,298,092 | 1,649,366 | ||||||
| Due to investment adviser | 534 | — | ||||||
| Accrued investment advisory fees | 514,016 | 257,862 | ||||||
| Accrued distribution fees | 66,364 | 48,302 | ||||||
| Accrued shareholder administrative fees | 7,209 | 4,058 | ||||||
| Accrued administrative fees | 17,451 | 8,755 | ||||||
| Accrued transfer agent fees | 81,581 | 46,387 | ||||||
| Accrued printing fees | 56,320 | 38,335 | ||||||
| Accrued professional fees | 51,885 | 55,162 | ||||||
| Accrued fund accounting fees | 25,362 | 16,288 | ||||||
| Accrued custodian fees | 5,289 | 30,386 | ||||||
| Accrued trustee fees | 3,331 | 1,323 | ||||||
| Accrued other expenses | 2,998 | 10,577 | ||||||
| Total Liabilities | 2,253,479 | 2,955,085 | ||||||
| NET ASSETS | $ | 776,717,884 | $ | 389,256,253 | ||||
| NET ASSETS CONSIST OF: | ||||||||
| Paid in capital (par value of $.001 per share) | 1,072,941,911 | 459,615,694 | ||||||
| Distributions in excess of earnings | (296,224,027 | ) | (70,359,441 | ) | ||||
| NET ASSETS | $ | 776,717,884 | $ | 389,256,253 | ||||
| * Identified cost | $ | 824,815,385 | (a) | $ | 403,566,102 | (b) | ||
| ** Identified cost | $ | 1,041,633 | (a) | $ | 2,503,096 | (b) | ||
See Notes to Financial Statements.
THE ALGER FUNDS
Statements of Assets and Liabilities October 31, 2022 (Continued)
| Alger Weatherbie Specialized Growth Fund | Alger Small Cap Growth Fund | |||||||
| NET ASSETS BY CLASS: | ||||||||
| Class A | $ | 119,740,500 | $ | 142,244,210 | ||||
| Class B | $ | — | $ | 3,037,813 | ||||
| Class C | $ | 44,814,918 | $ | 21,105,400 | ||||
| Class I | $ | 29,611,928 | $ | — | ||||
| Class Y | $ | 47,378,902 | $ | 8,050,087 | ||||
| Class Z | $ | 535,171,636 | $ | 214,818,743 | ||||
| SHARES OF BENEFICIAL INTEREST OUTSTANDING — NOTE 6: | ||||||||
| Class A | 10,348,469 | 16,102,934 | ||||||
| Class B | — | 511,312 | ||||||
| Class C | 7,128,826 | 3,832,887 | ||||||
| Class I | 2,470,670 | — | ||||||
| Class Y | 3,854,893 | 865,034 | ||||||
| Class Z | 42,053,953 | 23,124,299 | ||||||
| NET ASSET VALUE PER SHARE: | ||||||||
| Class A — Net Asset Value Per Share Class A | $ | 11.57 | $ | 8.83 | ||||
| Class A — Offering Price Per Share | ||||||||
| (includes a 5.25% sales charge) | $ | 12.21 | $ | 9.32 | ||||
| Class B — Net Asset Value Per Share Class B | $ | — | $ | 5.94 | ||||
| Class C — Net Asset Value Per Share Class C | $ | 6.29 | $ | 5.51 | ||||
| Class I — Net Asset Value Per Share Class I | $ | 11.99 | $ | — | ||||
| Class Y — Net Asset Value Per Share Class Y | $ | 12.29 | $ | 9.31 | ||||
| Class Z — Net Asset Value Per Share Class Z | $ | 12.73 | $ | 9.29 | ||||
See Notes to Financial Statements.
| (a) | At October 31, 2022, the net unrealized depreciation on investments, based on cost for federal income tax purposes of $852,651,210, amounted to $106,763,083 which consisted of aggregate gross unrealized appreciation of $56,407,040 and aggregate gross unrealized depreciation of $163,170,123. |
| (b) | At October 31, 2022, the net unrealized depreciation on investments, based on cost for federal income tax purposes of $406,359,520, amounted to $42,505,272 which consisted of aggregate gross unrealized appreciation of $69,261,318 and aggregate gross unrealized depreciation of $111,766,590. |
THE ALGER FUNDS
Statements of Assets and Liabilities October 31, 2022 (Continued)
| Alger Small Cap Focus Fund | Alger International Focus Fund | |||||||
| ASSETS: | ||||||||
| Investments in unaffiliated securities, at value (Identified cost below)* see accompanying schedules of investments | $ | 2,759,929,012 | $ | 128,495,378 | ||||
| Investments in affiliated securities, at value (Identified cost below)** see accompanying schedules of investments | 106,160,474 | — | ||||||
| Cash and cash equivalents | 64,973,920 | 2,119,704 | ||||||
| Foreign cash † | — | 14,613 | ||||||
| Receivable for investment securities sold | 7,388,807 | — | ||||||
| Receivable for shares of beneficial interest sold | 2,259,581 | 15,687 | ||||||
| Dividends and interest receivable | — | 219,794 | ||||||
| Receivable from Investment Manager | — | 8,160 | ||||||
| Prepaid expenses | 266,028 | 61,812 | ||||||
| Total Assets | 2,940,977,822 | 130,935,148 | ||||||
| LIABILITIES: | ||||||||
| Payable for investment securities purchased | 2,957,587 | — | ||||||
| Payable for shares of beneficial interest redeemed | 5,735,713 | 36,233 | ||||||
| Accrued investment advisory fees | 1,787,209 | 75,773 | ||||||
| Accrued distribution fees | 163,414 | 32,721 | ||||||
| Accrued shareholder administrative fees | 25,596 | 1,677 | ||||||
| Accrued administrative fees | 65,531 | 2,935 | ||||||
| Accrued transfer agent fees | 360,618 | 29,322 | ||||||
| Accrued printing fees | 285,215 | 12,357 | ||||||
| Accrued fund accounting fees | 65,368 | 12,953 | ||||||
| Accrued professional fees | 54,451 | 54,132 | ||||||
| Accrued trustee fees | 14,692 | 422 | ||||||
| Accrued custodian fees | 14,585 | 15,328 | ||||||
| Accrued other expenses | 4,802 | 16,255 | ||||||
| Total Liabilities | 11,534,781 | 290,108 | ||||||
| NET ASSETS | $ | 2,929,443,041 | $ | 130,645,040 | ||||
| NET ASSETS CONSIST OF: | ||||||||
| Paid in capital (par value of $.001 per share) | 3,432,195,609 | 136,745,765 | ||||||
| Distributions in excess of earnings | (502,752,568 | ) | (6,100,725 | ) | ||||
| NET ASSETS | $ | 2,929,443,041 | $ | 130,645,040 | ||||
| * Identified cost | $ | 2,619,858,918 | (a) | $ | 124,899,495 | (b) | ||
| ** Identified cost | $ | 159,441,783 | (a) | $ | — | |||
| † Cost of foreign cash | $ | — | $ | 14,616 | ||||
See Notes to Financial Statements.
THE ALGER FUNDS
Statements of Assets and Liabilities October 31, 2022 (Continued)
| Alger Small Cap Focus Fund | Alger International Focus Fund | |||||||
| NET ASSETS BY CLASS: | ||||||||
| Class A | $ | 226,737,929 | $ | 100,261,626 | ||||
| Class B | $ | — | $ | 13,200,192 | ||||
| Class C | $ | 108,988,068 | $ | 1,594,302 | ||||
| Class I | $ | 144,513,482 | $ | 1,061,251 | ||||
| Class Y | $ | 257,064,402 | $ | — | ||||
| Class Z | $ | 2,192,139,160 | $ | 14,527,669 | ||||
| SHARES OF BENEFICIAL INTEREST OUTSTANDING — NOTE 6: | ||||||||
| Class A | 13,407,088 | 6,584,161 | ||||||
| Class B | — | 1,012,115 | ||||||
| Class C | 7,387,555 | 128,924 | ||||||
| Class I | 8,286,500 | 69,458 | ||||||
| Class Y | 14,372,341 | — | ||||||
| Class Z | 122,571,325 | 934,046 | ||||||
| NET ASSET VALUE PER SHARE: | ||||||||
| Class A — Net Asset Value Per Share Class A | $ | 16.91 | $ | 15.23 | ||||
| Class A — Offering Price Per Share | ||||||||
| (includes a 5.25% sales charge) | $ | 17.85 | $ | 16.07 | ||||
| Class B — Net Asset Value Per Share Class B | $ | — | $ | 13.04 | ||||
| Class C — Net Asset Value Per Share Class C | $ | 14.75 | $ | 12.37 | ||||
| Class I — Net Asset Value Per Share Class I | $ | 17.44 | $ | 15.28 | ||||
| Class Y — Net Asset Value Per Share Class Y | $ | 17.89 | $ | — | ||||
| Class Z — Net Asset Value Per Share Class Z | $ | 17.88 | $ | 15.55 | ||||
See Notes to Financial Statements.
| (a) | At October 31, 2022, the net unrealized appreciation on investments, based on cost for federal income tax purposes of $2,808,030,573, amounted to $58,058,913 which consisted of aggregate gross unrealized appreciation of $564,443,044 and aggregate gross unrealized depreciation of $506,384,131. |
| (b) | At October 31, 2022, the net unrealized appreciation on investments, based on cost for federal income tax purposes of $127,285,815, amounted to $1,209,563 which consisted of aggregate gross unrealized appreciation of $21,709,961 and aggregate gross unrealized depreciation of $20,500,398. |
THE ALGER FUNDS
Statements of Assets and Liabilities October 31, 2022 (Continued)
Alger Health Sciences Fund | ||||
| ASSETS: | ||||
| Investments in unaffiliated securities, at value (Identified cost below)* see accompanying schedule of investments | $ | 171,052,663 | ||
| Investments in affiliated securities, at value (Identified cost below)** see accompanying schedule of investments | — | |||
| Cash and cash equivalents | 4,636,417 | |||
| Receivable for investment securities sold | 2,142,015 | |||
| Receivable for shares of beneficial interest sold | 137,982 | |||
| Dividends and interest receivable | 189,138 | |||
| Prepaid expenses | 55,727 | |||
| Total Assets | 178,213,942 | |||
| LIABILITIES: | ||||
| Payable for shares of beneficial interest redeemed | 159,441 | |||
| Accrued investment advisory fees | 80,421 | |||
| Accrued distribution fees | 24,888 | |||
| Accrued shareholder administrative fees | 1,985 | |||
| Accrued administrative fees | 4,021 | |||
| Accrued professional fees | 48,847 | |||
| Accrued transfer agent fees | 38,671 | |||
| Accrued printing fees | 18,237 | |||
| Accrued fund accounting fees | 12,532 | |||
| Accrued custodian fees | 2,766 | |||
| Accrued trustee fees | 661 | |||
| Accrued other expenses | 6,326 | |||
| Total Liabilities | 398,796 | |||
| NET ASSETS | $ | 177,815,146 | ||
| NET ASSETS CONSIST OF: | ||||
| Paid in capital (par value of $.001 per share) | 200,866,594 | |||
| Distributions in excess of earnings | (23,051,448 | ) | ||
| NET ASSETS | $ | 177,815,146 | ||
| * Identified cost | $ | 146,103,402 | (a) | |
| ** Identified cost | $ | 4,038,147 | (a) | |
See Notes to Financial Statements.
THE ALGER FUNDS
Statements of Assets and Liabilities October 31, 2022 (Continued)
Alger Health Sciences Fund | ||||
| NET ASSETS BY CLASS: | ||||
| Class A | $ | 91,058,505 | ||
| Class C | $ | 7,828,291 | ||
| Class Z | $ | 78,928,350 | ||
| SHARES OF BENEFICIAL INTEREST OUTSTANDING — NOTE 6: | ||||
| Class A | 4,367,315 | |||
| Class C | 598,685 | |||
| Class Z | 3,716,540 | |||
| NET ASSET VALUE PER SHARE: | ||||
| Class A — Net Asset Value Per Share Class A | $ | 20.85 | ||
| Class A — Offering Price Per Share (includes a 5.25% sales charge) | $ | 22.01 | ||
| Class C — Net Asset Value Per Share Class C | $ | 13.08 | ||
| Class Z — Net Asset Value Per Share Class Z | $ | 21.24 | ||
See Notes to Financial Statements.
| (a) | At October 31, 2022, the net unrealized appreciation on investments, based on cost for federal income tax purposes of $150,923,728, amounted to $20,128,935 which consisted of aggregate gross unrealized appreciation of $25,995,534 and aggregate gross unrealized depreciation of $5,866,599. |
THE ALGER FUNDS
Statements of Operations for the year ended October 31, 2022
Alger Capital Appreciation Fund | Alger 35 Fund | |||||||
| INCOME: | ||||||||
| Dividends (net of foreign withholding taxes*) | $ | 17,143,708 | $ | 171,684 | ||||
| Interest | 200,643 | 11,766 | ||||||
| Total Income | 17,344,351 | 183,450 | ||||||
| EXPENSES: | ||||||||
| Investment advisory fees — Note 3(a) | 18,966,853 | 146,126 | ||||||
| Distribution fees — Note 3(c) | ||||||||
| Class A | 2,640,895 | — | ||||||
| Class C | 1,355,838 | — | ||||||
| Shareholder administrative fees — Note 3(f) | 321,364 | 3,247 | ||||||
| Administration fees — Note 3(b) | 670,692 | 8,930 | ||||||
| Transfer agent fees — Note 3(f) | 1,109,918 | 2,617 | ||||||
| Fund accounting fees | 331,022 | 46,714 | ||||||
| Printing fees | 129,300 | 2,566 | ||||||
| Professional fees | 120,729 | 34,335 | ||||||
| Registration fees | 110,835 | 50,261 | ||||||
| Custodian fees | 97,537 | 4,751 | ||||||
| Trustee fees — Note 3(g) | 90,746 | 1,249 | ||||||
| Interest expenses | 57,143 | 614 | ||||||
| Other expenses | 109,800 | 4,967 | ||||||
| Total Expenses | 26,112,672 | 306,377 | ||||||
| Less, expense reimbursements/waivers — Note 3(a) | (179,703 | ) | (126,948 | ) | ||||
| Net Expenses | 25,932,969 | 179,429 | ||||||
| NET INVESTMENT INCOME (LOSS) | (8,588,618 | ) | 4,021 | |||||
| REALIZED AND UNREALIZED GAIN (LOSS) ON INVESTMENTS AND FOREIGN CURRENCY: | ||||||||
| Net realized gain (loss) on unaffiliated investments | 54,836,643 | (4,926,270 | ) | |||||
| Net realized gain (loss) on foreign currency transactions | 1,366 | (294 | ) | |||||
| Net change in unrealized (depreciation) on unaffiliated investments | (1,139,244,337 | ) | (12,333,487 | ) | ||||
| Net change in unrealized (depreciation) on affiliated investments | (1,508,268 | ) | — | |||||
| Net change in unrealized (depreciation) on foreign currency | (15,791 | ) | (72 | ) | ||||
| Net realized and unrealized (loss) on investments and foreign currency | (1,085,930,387 | ) | (17,260,123 | ) | ||||
| NET DECREASE IN NET ASSETS RESULTING FROM OPERATIONS | $ | (1,094,519,005 | ) | $ | (17,256,102 | ) | ||
| * Foreign withholding taxes | $ | 259,446 | $ | 871 | ||||
See Notes to Financial Statements.
THE ALGER FUNDS
Statements of Operations for the year ended October 31, 2022 (Continued)
Alger Growth & Income Fund | Alger Mid Cap Growth Fund | |||||||
| INCOME: | ||||||||
| Dividends (net of foreign withholding taxes*) | $ | 4,309,571 | $ | 1,228,139 | ||||
| Interest | 93,399 | 93,990 | ||||||
| Income from securities lending | 45 | — | ||||||
| Total Income | 4,403,015 | 1,322,129 | ||||||
| EXPENSES: | ||||||||
| Investment advisory fees — Note 3(a) | 985,435 | 1,794,863 | ||||||
| Distribution fees — Note 3(c) | ||||||||
| Class A | 273,790 | 447,070 | ||||||
| Class B | — | 121,314 | ||||||
| Class C | 200,406 | 57,169 | ||||||
| Shareholder administrative fees — Note 3(f) | 28,130 | 36,400 | ||||||
| Administration fees — Note 3(b) | 54,199 | 64,946 | ||||||
| Transfer agent fees — Note 3(f) | 94,467 | 123,206 | ||||||
| Fund accounting fees | 75,376 | 78,155 | ||||||
| Registration fees | 48,215 | 64,857 | ||||||
| Professional fees | 37,990 | 46,030 | ||||||
| Printing fees | 18,686 | 25,340 | ||||||
| Custodian fees | 14,013 | 29,970 | ||||||
| Trustee fees — Note 3(g) | 6,988 | 8,748 | ||||||
| Interest expenses | — | 1,878 | ||||||
| Other expenses | 12,481 | 30,839 | ||||||
| Total Expenses | 1,850,176 | 2,930,785 | ||||||
| Less, expense reimbursements/waivers — Note 3(a) | — | (80,610 | ) | |||||
| Net Expenses | 1,850,176 | 2,850,175 | ||||||
| NET INVESTMENT INCOME (LOSS) | 2,552,839 | (1,528,046 | ) | |||||
| REALIZED AND UNREALIZED (LOSS) ON INVESTMENTS AND FOREIGN CURRENCY: | ||||||||
| Net realized (loss) on unaffiliated investments | (246,144 | ) | (55,821,926 | ) | ||||
| Net realized (loss) on foreign currency transactions | — | (3,637 | ) | |||||
| Net change in unrealized (depreciation) on unaffiliated investments | (27,439,139 | ) | (72,700,717 | ) | ||||
| Net change in unrealized (depreciation) on affiliated investments | — | (947,161 | ) | |||||
| Net change in unrealized (depreciation) on foreign currency | — | (575 | ) | |||||
| Net realized and unrealized (loss) on investments and foreign currency | (27,685,283 | ) | (129,474,016 | ) | ||||
| NET DECREASE IN NET ASSETS RESULTING FROM OPERATIONS | $ | (25,132,444 | ) | $ | (131,002,062 | ) | ||
| * Foreign withholding taxes | $ | 19,643 | $ | 6,462 | ||||
See Notes to Financial Statements.
THE ALGER FUNDS
Statements of Operations for the year ended October 31, 2022 (Continued)
Alger Mid Cap Focus Fund | Alger Weatherbie Growth Fund | |||||||
| From December 17, 2021 (commencement of operations) to October 31, 2022 | ||||||||
| INCOME: | ||||||||
| Dividends (net of foreign withholding taxes*) | $ | 2,273,458 | $ | 17,548 | ||||
| Interest | 98,150 | 2,744 | ||||||
| Total Income | 2,371,608 | 20,292 | ||||||
| EXPENSES: | ||||||||
| Investment advisory fees — Note 3(a) | 3,638,059 | 26,859 | ||||||
| Distribution fees — Note 3(c) | ||||||||
| Class A | 8,148 | 265 | ||||||
| Class C | 26,883 | 691 | ||||||
| Class I | 231,467 | 173 | ||||||
| Shareholder administrative fees — Note 3(f) | 63,093 | 395 | ||||||
| Administration fees — Note 3(b) | 172,443 | 1,055 | ||||||
| Registration fees | 147,515 | 66,032 | ||||||
| Fund accounting fees | 129,876 | 49,286 | ||||||
| Transfer agent fees — Note 3(f) | 103,590 | 584 | ||||||
| Printing fees | 90,264 | 8,750 | ||||||
| Professional fees | 50,333 | 32,442 | ||||||
| Custodian fees | 27,941 | 3,394 | ||||||
| Trustee fees — Note 3(g) | 23,622 | 117 | ||||||
| Interest expenses | 1,376 | — | ||||||
| Other expenses | 31,129 | 6,718 | ||||||
| Total Expenses | 4,745,739 | 196,761 | ||||||
| Less, expense reimbursements/waivers — Note 3(a) | (83 | ) | (166,730 | ) | ||||
| Net Expenses | 4,745,656 | 30,031 | ||||||
| NET INVESTMENT LOSS | (2,374,048 | ) | (9,739 | ) | ||||
| REALIZED AND UNREALIZED (LOSS) ON INVESTMENTS AND FOREIGN CURRENCY: | ||||||||
| Net realized (loss) on unaffiliated investments | (114,962,857 | ) | (482,933 | ) | ||||
| Net realized (loss) on foreign currency transactions | (4,021 | ) | — | |||||
| Net change in unrealized (depreciation) on unaffiliated investments | (271,331,283 | ) | (951,481 | ) | ||||
| Net change in unrealized (depreciation) on foreign currency | (15,606 | ) | — | |||||
| Net realized and unrealized (loss) on investments and foreign currency | (386,313,767 | ) | (1,434,414 | ) | ||||
| NET DECREASE IN NET ASSETS RESULTING FROM OPERATIONS | $ | (388,687,815 | ) | $ | (1,444,153 | ) | ||
| * Foreign withholding taxes | $ | 5,106 | $ | 759 | ||||
See Notes to Financial Statements.
THE ALGER FUNDS
Statements of Operations for the year ended October 31, 2022 (Continued)
Alger Weatherbie Growth Fund | Alger Small Cap Growth Fund | |||||||
| INCOME: | ||||||||
| Dividends (net of foreign withholding taxes*) | $ | 2,909,327 | $ | 1,192,921 | ||||
| Interest | 360,911 | 140,364 | ||||||
| Total Income | 3,270,238 | 1,333,285 | ||||||
| EXPENSES: | ||||||||
| Investment advisory fees — Note 3(a) | 8,738,128 | 3,846,321 | ||||||
| Distribution fees — Note 3(c) | ||||||||
| Class A | 403,250 | 439,718 | ||||||
| Class B | — | 37,291 | ||||||
| Class C | 616,426 | 263,326 | ||||||
| Class I | 113,085 | — | ||||||
| Shareholder administrative fees — Note 3(f) | 123,661 | 60,872 | ||||||
| Administration fees — Note 3(b) | 300,216 | 130,585 | ||||||
| Transfer agent fees — Note 3(f) | 335,116 | 208,226 | ||||||
| Fund accounting fees | 184,207 | 105,563 | ||||||
| Registration fees | 155,236 | 114,403 | ||||||
| Printing fees | 119,450 | 75,667 | ||||||
| Professional fees | 72,885 | 67,116 | ||||||
| Custodian fees | 67,786 | 60,511 | ||||||
| Trustee fees — Note 3(g) | 41,571 | 17,686 | ||||||
| Interest expenses | 1,779 | 215 | ||||||
| Other expenses | 60,214 | 47,382 | ||||||
| Total Expenses | 11,333,010 | 5,474,882 | ||||||
| Less, expense reimbursements/waivers — Note 3(a) | (21,864 | ) | (26,687 | ) | ||||
| Net Expenses | 11,311,146 | 5,448,195 | ||||||
| NET INVESTMENT LOSS | (8,040,908 | ) | (4,114,910 | ) | ||||
| REALIZED AND UNREALIZED GAIN (LOSS) ON INVESTMENTS AND FOREIGN CURRENCY: | ||||||||
| Net realized (loss) on unaffiliated investments | (193,750,670 | ) | (24,264,985 | ) | ||||
| Net realized gain on foreign currency transactions | 84 | 16,158 | ||||||
| Net change in unrealized (depreciation) on unaffiliated investments | (501,688,673 | ) | (241,295,182 | ) | ||||
| Net change in unrealized (depreciation) on affiliated investments | — | (1,273,273 | ) | |||||
| Net realized and unrealized (loss) on investments and foreign currency | (695,439,259 | ) | (266,817,282 | ) | ||||
| NET DECREASE IN NET ASSETS RESULTING FROM OPERATIONS | $ | (703,480,167 | ) | $ | (270,932,192 | ) | ||
| * Foreign withholding taxes | $ | 60,317 | $ | — | ||||
See Notes to Financial Statements.
THE ALGER FUNDS
Statements of Operations for the year ended October 31, 2022 (Continued)
Alger Small Cap Focus Fund | Alger International Focus Fund | |||||||
| INCOME: | ||||||||
| Dividends (net of foreign withholding taxes*) | $ | 14,902,724 | $ | 1,206,421 | ||||
| Interest | 674,074 | 14,163 | ||||||
| Total Income | 15,576,798 | 1,220,584 | ||||||
| EXPENSES: | ||||||||
| Investment advisory fees — Note 3(a) | 32,446,171 | 1,163,396 | ||||||
| Distribution fees — Note 3(c) | ||||||||
| Class A | 793,617 | 306,055 | ||||||
| Class B | — | 164,185 | ||||||
| Class C | 1,532,577 | 27,143 | ||||||
| Class I | 536,246 | 2,946 | ||||||
| Shareholder administrative fees — Note 3(f) | 463,212 | 25,587 | ||||||
| Administration fees — Note 3(b) | 1,189,693 | 45,061 | ||||||
| Transfer agent fees — Note 3(f) | 1,369,384 | 102,121 | ||||||
| Fund accounting fees | 526,523 | 77,359 | ||||||
| Printing fees | 525,613 | 20,465 | ||||||
| Registration fees | 314,085 | 75,819 | ||||||
| Professional fees | 170,392 | 54,325 | ||||||
| Trustee fees — Note 3(g) | 161,301 | 6,057 | ||||||
| Custodian fees | 115,638 | 58,983 | ||||||
| Interest expenses | 10,272 | 20 | ||||||
| Other expenses | 234,706 | 28,207 | ||||||
| Total Expenses | 40,389,430 | 2,157,729 | ||||||
| Less, expense reimbursements/waivers — Note 3(a) | — | (133,498 | ) | |||||
| Net Expenses | 40,389,430 | 2,024,231 | ||||||
| NET INVESTMENT LOSS | (24,812,632 | ) | (803,647 | ) | ||||
| REALIZED AND UNREALIZED GAIN (LOSS) ON INVESTMENTS, FORWARD FOREIGN CURRENCY CONTRACTS AND FOREIGN CURRENCY: | ||||||||
| Net realized (loss) on unaffiliated investments | (543,972,081 | ) | (6,993,730 | )** | ||||
| Net realized (loss) on affiliated investments | (19,081,955 | ) | — | |||||
| Net realized gain on forward foreign currency contracts | — | 219 | ||||||
| Net realized gain (loss) on foreign currency transactions | 106,542 | (39,122 | ) | |||||
| Net change in unrealized (depreciation) on unaffiliated investments | (2,033,216,043 | ) | (63,536,546 | )*** | ||||
| Net change in unrealized (depreciation) on affiliated investments | (483,629,873 | ) | — | |||||
| Net change in unrealized (depreciation) on foreign currency | — | (16,909 | ) | |||||
| Net realized and unrealized (loss) on investments, forward foreign currency contracts and foreign currency | (3,079,793,410 | ) | (70,586,088 | ) | ||||
| NET DECREASE IN NET ASSETS RESULTING FROM OPERATIONS | $ | (3,104,606,042 | ) | $ | (71,389,735 | ) | ||
| * Foreign withholding taxes | $ | 168,505 | $ | 156,547 | ||||
See Notes to Financial Statements.
** Includes capital gain tax of $198,489.
*** Includes net change in unrealized appreciation (depreciation) of foreign capital gains taxes of $280,633.
THE ALGER FUNDS
Statements of Operations for the year ended October 31, 2022 (Continued)
Alger Health Sciences Fund | ||||
| INCOME: | ||||
| Dividends (net of foreign withholding taxes*) | $ | 1,638,843 | ||
| Interest | 27,263 | |||
| Total Income | 1,666,106 | |||
| EXPENSES: | ||||
| Investment advisory fees — Note 3(a) | 1,235,763 | |||
| Distribution fees — Note 3(c) | ||||
| Class A | 261,071 | |||
| Class C | 93,963 | |||
| Shareholder administrative fees — Note 3(f) | 29,867 | |||
| Administration fees — Note 3(b) | 61,788 | |||
| Transfer agent fees — Note 3(f) | 105,242 | |||
| Fund accounting fees | 80,398 | |||
| Registration fees | 58,510 | |||
| Printing fees | 45,848 | |||
| Professional fees | 44,986 | |||
| Custodian fees | 23,786 | |||
| Trustee fees — Note 3(g) | 8,363 | |||
| Interest expenses | 4,419 | |||
| Other expenses | 20,543 | |||
| Total Expenses | 2,074,547 | |||
| NET INVESTMENT LOSS | (408,441 | ) | ||
| REALIZED AND UNREALIZED (LOSS) ON INVESTMENTS AND FOREIGN CURRENCY: | ||||
| Net realized (loss) on unaffiliated investments | (43,409,245 | ) | ||
| Net realized (loss) on foreign currency transactions | (20,687 | ) | ||
| Net change in unrealized (depreciation) on unaffiliated investments | (47,163,085 | ) | ||
| Net change in unrealized (depreciation) on foreign currency | (2,906 | ) | ||
| Net realized and unrealized (loss) on investments and foreign currency | (90,595,923 | ) | ||
| NET DECREASE IN NET ASSETS RESULTING FROM OPERATIONS | $ | (91,004,364 | ) | |
| * Foreign withholding taxes | $ | 56,835 | ||
See Notes to Financial Statements.
THE ALGER FUNDS
Statements of Changes in Net Assets
| Alger Capital Appreciation Fund | ||||||||
| For the Year Ended October 31, 2022 | For the Year Ended October 31, 2021 | |||||||
| Net investment loss | $ | (8,588,618 | ) | $ | (18,111,841 | ) | ||
| Net realized gain on investments and foreign currency | 54,838,009 | 722,556,860 | ||||||
| Net change in unrealized appreciation (depreciation) on investments and foreign currency | (1,140,768,396 | ) | 296,147,744 | |||||
| Net increase (decrease) in net assets resulting from operations | (1,094,519,005 | ) | 1,000,592,763 | |||||
| Dividends and distributions to shareholders: | ||||||||
| Class A | (284,398,857 | ) | (192,316,638 | ) | ||||
| Class C | (53,540,254 | ) | (41,889,152 | ) | ||||
| Class Z | (297,591,139 | ) | (187,550,241 | ) | ||||
| Total dividends and distributions to shareholders | (635,530,250 | ) | (421,756,031 | ) | ||||
| Increase (decrease) from shares of beneficial interest transactions: | ||||||||
| Class A | 13,515,228 | (35,800,613 | ) | |||||
| Class C | (4,551,506 | ) | (14,687,747 | ) | ||||
| Class Z | 113,901,081 | (453,649,540 | ) | |||||
| Net increase (decrease) from shares of beneficial interest transactions — Note 6 | 122,864,803 | (504,137,900 | ) | |||||
| Total increase (decrease) | (1,607,184,452 | ) | 74,698,832 | |||||
| Net Assets: | ||||||||
| Beginning of period | 3,422,721,918 | 3,348,023,086 | ||||||
| END OF PERIOD | $ | 1,815,537,466 | $ | 3,422,721,918 | ||||
See Notes to Financial Statements.
THE ALGER FUNDS
Statements of Changes in Net Assets (Continued)
| Alger 35 Fund | ||||||||
| For the Year Ended October 31, 2022 | For the Year Ended October 31, 2021 | |||||||
| Net investment income (loss) | $ | 4,021 | $ | (29,841 | ) | |||
| Net realized gain (loss) on investments and foreign currency | (4,926,564 | ) | 10,555,178 | |||||
| Net change in unrealized (depreciation) on investments and foreign currency | (12,333,559 | ) | (1,103,828 | ) | ||||
| Net increase (decrease) in net assets resulting from operations | (17,256,102 | ) | 9,421,509 | |||||
| Dividends and distributions to shareholders: | ||||||||
| Class Z* | (10,551,417 | ) | (2,452,471 | ) | ||||
| Class P-2* | — | (51,070 | ) | |||||
| Total dividends and distributions to shareholders | (10,551,417 | ) | (2,503,541 | ) | ||||
| Increase (decrease) from shares of beneficial interest transactions: | ||||||||
| Class Z* | 9,624,945 | 23,183,654 | ||||||
| Class P-2* | — | (321,436 | ) | |||||
| Net increase from shares of beneficial interest transactions — Note 6 | 9,624,945 | 22,862,218 | ||||||
| Total increase (decrease) | (18,182,574 | ) | 29,780,186 | |||||
| Net Assets: | ||||||||
| Beginning of period | 44,158,972 | 14,378,786 | ||||||
| END OF PERIOD | $ | 25,976,398 | $ | 44,158,972 | ||||
See Notes to Financial Statements.
| * | On May 7, 2021, Class P Shares of the Alger 35 Fund were reclassified as Class Z Shares of the Fund. After the close of business on October 29, 2021, Class P-2 Shares of the Fund were converted to Class Z Shares. |
THE ALGER FUNDS
Statements of Changes in Net Assets (Continued)
| Alger Growth & Income Fund | ||||||||
| For the Year Ended October 31, 2022 | For the Year Ended October 31, 2021 | |||||||
| Net investment income | $ | 2,552,839 | $ | 1,562,657 | ||||
| Net realized gain (loss) on investments and foreign currency | (246,144 | ) | 5,495,295 | |||||
| Net change in unrealized appreciation (depreciation) on investments and foreign currency | (27,439,139 | ) | 41,033,641 | |||||
| Net increase (decrease) in net assets resulting from operations | (25,132,444 | ) | 48,091,593 | |||||
| Dividends and distributions to shareholders: | ||||||||
| Class A | (4,709,966 | ) | (2,056,460 | ) | ||||
| Class C | (687,923 | ) | (252,675 | ) | ||||
| Class Z | (2,219,203 | ) | (730,285 | ) | ||||
| Total dividends and distributions to shareholders | (7,617,092 | ) | (3,039,420 | ) | ||||
| Increase (decrease) from shares of beneficial interest transactions: | ||||||||
| Class A | 19,951,923 | 1,774,061 | ||||||
| Class C | 6,180,541 | (172,021 | ) | |||||
| Class Z | 88,363,764 | 6,950,403 | ||||||
| Net increase from shares of beneficial interest transactions — Note 6 | 114,496,228 | 8,552,443 | ||||||
| Total increase | 81,746,692 | 53,604,616 | ||||||
| Net Assets: | ||||||||
| Beginning of period | 162,654,790 | 109,050,174 | ||||||
| END OF PERIOD | $ | 244,401,482 | $ | 162,654,790 | ||||
See Notes to Financial Statements.
THE ALGER FUNDS
Statements of Changes in Net Assets (Continued)
| Alger Mid Cap Growth Fund | ||||||||
| For the Year Ended October 31, 2022 | For the Year Ended October 31, 2021 | |||||||
| Net investment income (loss) | $ | (1,528,046 | ) | $ | 6,653,774 | |||
| Net realized gain (loss) on investments and foreign currency | (55,825,563) | 89,927,726 | ||||||
| Net change in unrealized appreciation (depreciation) on investments and foreign currency | (73,648,453) | 7,163,383 | ||||||
| Net increase (decrease) in net assets resulting from operations | (131,002,062) | 103,744,883 | ||||||
| Dividends and distributions to shareholders: | ||||||||
| Class A | (67,153,291) | (20,930,151) | ||||||
| Class B | (6,406,978) | (2,145,611) | ||||||
| Class C | (2,944,693) | (835,010) | ||||||
| Class Z | (15,837,405) | (3,167,651) | ||||||
| Total dividends and distributions to shareholders | (92,342,367) | (27,078,423) | ||||||
| Increase (decrease) from shares of beneficial interest transactions: | ||||||||
| Class A | 52,482,791 | 12,073,737 | ||||||
| Class B | 5,161,326 | (1,268,494 | ) | |||||
| Class C | 2,481,849 | 949,265 | ||||||
| Class Z | 16,160,525 | 15,282,249 | ||||||
| Net increase from shares of beneficial interest transactions — Note 6 | 76,286,491 | 27,036,757 | ||||||
| Total increase (decrease) | (147,057,938 | ) | 103,703,217 | |||||
| Net Assets: | ||||||||
| Beginning of period | 339,160,591 | 235,457,374 | ||||||
| END OF PERIOD | $ | 192,102,653 | $ | 339,160,591 | ||||
See Notes to Financial Statements.
THE ALGER FUNDS
Statements of Changes in Net Assets (Continued)
| Alger Mid Cap Focus Fund | ||||||||
| For the Year Ended October 31, 2022 | For the Year Ended October 31, 2021 | |||||||
| Net investment loss | $ | (2,374,048 | ) | $ | (4,374,822 | ) | ||
| Net realized gain (loss) on investments and foreign currency | (114,966,878) | 85,655,529 | ||||||
| Net change in unrealized appreciation (depreciation) on investments and foreign currency | (271,346,889) | 185,806,424 | ||||||
| Net increase (decrease) in net assets resulting from operations | (388,687,815) | 267,087,131 | ||||||
| Dividends and distributions to shareholders: | ||||||||
| Class A | (237,662) | — | ||||||
| Class C | (228,199) | — | ||||||
| Class I | (12,826,323) | (1,305,962) | ||||||
| Class Y | (12,097) | — | ||||||
| Class Z | (70,824,262) | (5,908,321) | ||||||
| Total dividends and distributions to shareholders | (84,128,543) | (7,214,283) | ||||||
| Increase (decrease) from shares of beneficial interest transactions: | ||||||||
| Class A | 5,256,417 | 1,561,701 | ||||||
| Class C | 1,924,208 | 2,225,078 | ||||||
| Class I | (12,108,519) | 35,683,690 | ||||||
| Class Y | 422,581 | 119,925 | ||||||
| Class Z | (31,386,124) | 270,350,323 | ||||||
| Net increase (decrease) from shares of beneficial interest transactions — Note 6 | (35,891,437 | ) | 309,940,717 | |||||
| Total increase (decrease) | (508,707,795) | 569,813,565 | ||||||
| Net Assets: | ||||||||
| Beginning of period | 945,141,143 | 375,327,578 | ||||||
| END OF PERIOD | $ | 436,433,348 | $ | 945,141,143 | ||||
See Notes to Financial Statements.
THE ALGER FUNDS
Statements of Changes in Net Assets (Continued)
| Alger Weatherbie Enduring Growth Fund | ||||
| From December 17, 2021 (commencement of operations) to October 31, 2022 | ||||
| Net investment loss | $ | (9,739 | ) | |
| Net realized loss on investments and foreign currency | (482,933) | |||
| Net change in unrealized depreciation on investments and foreign currency | (951,481) | |||
| Net decrease in net assets resulting from operations | (1,444,153) | |||
| Increase from shares of beneficial interest transactions: | ||||
| Class A | 153,000 | |||
| Class C | 100,000 | |||
| Class I | 100,000 | |||
| Class Y | 500,000 | |||
| Class Z | 5,044,360 | |||
| Net increase from shares of beneficial interest transactions — Note 6 | 5,897,360 | |||
| Total increase | 4,453,207 | |||
| Net Assets: | ||||
| Beginning of period | — | |||
| END OF PERIOD | $ | 4,453,207 | ||
See Notes to Financial Statements.
THE ALGER FUNDS
Statements of Changes in Net Assets (Continued)
| Alger Weatherbie Specialized Growth Fund | ||||||||
| For the Year Ended October 31, 2022 | For the Year Ended October 31, 2021 | |||||||
| Net investment loss | $ | (8,040,908 | ) | $ | (12,388,903 | ) | ||
| Net realized gain (loss) on investments and foreign currency | (193,750,586 | ) | 337,344,305 | |||||
| Net change in unrealized appreciation (depreciation) on investments and foreign currency | (501,688,673) | 197,674,887 | ||||||
| Net increase (decrease) in net assets resulting from operations | (703,480,167) | 522,630,289 | ||||||
| Dividends and distributions to shareholders: | ||||||||
| Class A | (45,296,523) | (9,723,657) | ||||||
| Class C | (27,504,338) | (5,566,217) | ||||||
| Class I | (12,964,988) | (3,675,447) | ||||||
| Class Y | (10,407,118) | (1,800,147) | ||||||
| Class Z | (205,452,142) | (33,989,310) | ||||||
| Total dividends and distributions to shareholders | (301,625,109) | (54,754,778) | ||||||
| Increase (decrease) from shares of beneficial interest transactions: | ||||||||
| Class A | 8,933,676 | 8,382,707 | ||||||
| Class C | 9,708,887 | 11,840,459 | ||||||
| Class I | (4,904,091) | (14,587,055 | ) | |||||
| Class Y | 26,302,379 | 12,611,659 | ||||||
| Class Z | (36,895,543) | 334,347,543 | ||||||
| Net increase from shares of beneficial interest transactions — Note 6 | 3,145,308 | 352,595,313 | ||||||
| Total increase (decrease) | (1,001,959,968) | 820,470,824 | ||||||
| Net Assets: | ||||||||
| Beginning of period | 1,778,677,852 | 958,207,028 | ||||||
| END OF PERIOD | $ | 776,717,884 | $ | 1,778,677,852 | ||||
See Notes to Financial Statements.
THE ALGER FUNDS
Statements of Changes in Net Assets (Continued)
| Alger Small Cap Growth Fund | ||||||||
| For the Year Ended October 31, 2022 | For the Year Ended October 31, 2021 | |||||||
| Net investment loss | $ | (4,114,910 | ) | $ | (1,965,063 | ) | ||
| Net realized gain (loss) on investments and foreign currency | (24,248,827) | 59,202,184 | ||||||
| Net change in unrealized appreciation (depreciation) on investments and foreign currency | (242,568,455) | 65,225,704 | ||||||
| Net increase (decrease) in net assets resulting from operations | (270,932,192) | 122,462,825 | ||||||
| Dividends and distributions to shareholders: | ||||||||
| Class A | (21,314,734) | (1,079,051) | ||||||
| Class B | (673,335) | (39,964) | ||||||
| Class C | (4,854,023) | (177,822) | ||||||
| Class Z | (30,391,004) | (1,109,231) | ||||||
| Total dividends and distributions to shareholders | (57,233,096) | (2,406,068) | ||||||
| Increase (decrease) from shares of beneficial interest transactions: | ||||||||
| Class A | 1,762,230 | 21,347,746 | ||||||
| Class B | 32,505 | (695,421 | ) | |||||
| Class C | 2,204,699 | 15,105,566 | ||||||
| Class Y* | 8,398,532 | — | ||||||
| Class Z | 13,599,272 | 145,384,763 | ||||||
| Net increase from shares of beneficial interest transactions — Note 6 | 25,997,238 | 181,142,654 | ||||||
| Total increase (decrease) | (302,168,050) | 301,199,411 | ||||||
| Net Assets: | ||||||||
| Beginning of period | 691,424,303 | 390,224,892 | ||||||
| END OF PERIOD | $ | 389,256,253 | $ | 691,424,303 | ||||
See Notes to Financial Statements.
| * | Class Y shares of Alger Small Cap Growth Fund were launched on December 31, 2021. |
THE ALGER FUNDS
Statements of Changes in Net Assets (Continued)
| Alger Small Cap Focus Fund | ||||||||
| For the Year Ended October 31, 2022 | For the Year Ended October 31, 2021 | |||||||
| Net investment loss | $ | (24,812,632 | ) | $ | (56,943,544 | ) | ||
| Net realized gain (loss) on investments and foreign currency | (562,947,494) | 490,107,360 | ||||||
| Net change in unrealized appreciation (depreciation) on investments and foreign currency | (2,516,845,916) | 823,162,579 | ||||||
| Net increase (decrease) in net assets resulting from operations | (3,104,606,042) | 1,256,326,395 | ||||||
| Dividends and distributions to shareholders: | ||||||||
| Class A | (30,754,287) | — | ||||||
| Class C | (16,779,423) | — | ||||||
| Class I | (22,355,553) | — | ||||||
| Class Y | (21,468,256) | — | ||||||
| Class Z | (324,678,159) | — | ||||||
| Total dividends and distributions to shareholders | (416,035,678) | — | ||||||
| Increase (decrease) from shares of beneficial interest transactions: | ||||||||
| Class A | (79,791,951) | (120,477,671 | ) | |||||
| Class C | (33,316,935) | (30,745,132 | ) | |||||
| Class I | (96,988,803) | (10,377,165 | ) | |||||
| Class Y | 58,351,945 | 71,307,361 | ||||||
| Class Z | (1,239,048,797) | 732,504,935 | ||||||
| Net increase (decrease) from shares of beneficial interest transactions — Note 6 | (1,390,794,541) | 642,212,328 | ||||||
| Total increase (decrease) | (4,911,436,261) | 1,898,538,723 | ||||||
| Net Assets: | ||||||||
| Beginning of period | 7,840,879,302 | 5,942,340,579 | ||||||
| END OF PERIOD | $ | 2,929,443,041 | $ | 7,840,879,302 | ||||
See Notes to Financial Statements.
THE ALGER FUNDS
Statements of Changes in Net Assets (Continued)
| Alger International Focus Fund | ||||||||
| For the Year Ended October 31, 2022 | For the Year Ended October 31, 2021 | |||||||
| Net investment loss | $ | (803,647 | ) | $ | (885,412 | ) | ||
| Net realized gain (loss) on investments, forward foreign currency | ||||||||
| contracts and foreign currency | (7,032,633) | 30,418,574 | ||||||
| Net change in unrealized appreciation (depreciation) on investments and foreign currency | (63,553,455) | 24,822,002 | ||||||
| Net increase (decrease) in net assets resulting from operations | (71,389,735) | 54,355,164 | ||||||
| Dividends and distributions to shareholders: | ||||||||
| Class A | (12,365,251) | — | ||||||
| Class B | (1,940,439) | — | ||||||
| Class C | (400,190) | — | ||||||
| Class I | (49,121) | — | ||||||
| Class Z | (2,237,931) | — | ||||||
| Total dividends and distributions to shareholders | (16,992,932) | — | ||||||
| Increase (decrease) from shares of beneficial interest transactions: | ||||||||
| Class A | 7,386,726 | (3,992,372 | ) | |||||
| Class B | 116,320 | (2,518,776 | ) | |||||
| Class C | (1,107,606) | 613,764 | ||||||
| Class I | 1,119,741 | (221,462 | ) | |||||
| Class Z | (2,079,971) | 10,073,982 | ||||||
| Net increase from shares of beneficial interest transactions — Note 6 | 5,435,210 | 3,955,136 | ||||||
| Total increase (decrease) | (82,947,457) | 58,310,300 | ||||||
| Net Assets: | ||||||||
| Beginning of period | 213,592,497 | 155,282,197 | ||||||
| END OF PERIOD | $ | 130,645,040 | $ | 213,592,497 | ||||
See Notes to Financial Statements.
THE ALGER FUNDS
Statements of Changes in Net Assets (Continued)
| Alger Health Sciences Fund | ||||||||
| For the Year Ended October 31, 2022 | For the Year Ended October 31, 2021 | |||||||
| Net investment loss | $ | (408,441 | ) | $ | (1,597,959 | ) | ||
| Net realized gain (loss) on investments and foreign currency | (43,429,932) | 76,778,620 | ||||||
| Net change in unrealized appreciation (depreciation) on investments and foreign currency | (47,165,991) | 1,518,279 | ||||||
| Net increase (decrease) in net assets resulting from operations | (91,004,364) | 76,698,940 | ||||||
| Dividends and distributions to shareholders: | ||||||||
| Class A | (28,166,595) | (14,998,910) | ||||||
| Class C | (3,704,768) | (1,922,517) | ||||||
| Class Z | (34,925,658) | (15,773,204) | ||||||
| Total dividends and distributions to shareholders | (66,797,021) | (32,694,631) | ||||||
| Increase (decrease) from shares of beneficial interest transactions: | ||||||||
| Class A | 7,680,846 | 2,966,483 | ||||||
| Class C | 956,992 | 1,074,596 | ||||||
| Class Z | (23,842,039) | 31,879,794 | ||||||
| Net increase (decrease) from shares of beneficial interest transactions — Note 6 | (15,204,201) | 35,920,873 | ||||||
| Total increase (decrease) | (173,005,586) | 79,925,182 | ||||||
| Net Assets: | ||||||||
| Beginning of period | 350,820,732 | 270,895,550 | ||||||
| END OF PERIOD | $ | 177,815,146 | $ | 350,820,732 | ||||
See Notes to Financial Statements.
THE ALGER FUNDS
Financial Highlights for a share outstanding throughout the period
| Alger Capital Appreciation Fund | Class A | |||||||||||||||||||
| Year ended | Year ended | Year ended | Year ended | Year ended | ||||||||||||||||
| 10/31/2022 | 10/31/2021 | 10/31/2020 | 10/31/2019 | 10/31/2018 | ||||||||||||||||
| Net asset value, beginning of period | $ | 39.48 | $ | 33.76 | $ | 27.12 | $ | 26.20 | $ | 25.86 | ||||||||||
| INCOME FROM INVESTMENT OPERATIONS: | ||||||||||||||||||||
| Net investment loss(i) | (0.13 | ) | (0.24 | ) | (0.12 | ) | (0.07 | ) | (0.06 | ) | ||||||||||
| Net realized and unrealized gain (loss) on investments | (11.17 | ) | 11.11 | 8.96 | 3.53 | 2.07 | ||||||||||||||
| Total from investment operations | (11.30 | ) | 10.87 | 8.84 | 3.46 | 2.01 | ||||||||||||||
| Distributions from net realized gains | (7.41 | ) | (5.15 | ) | (2.20 | ) | (2.54 | ) | (1.67 | ) | ||||||||||
| Net asset value, end of period | $ | 20.77 | $ | 39.48 | $ | 33.76 | $ | 27.12 | $ | 26.20 | ||||||||||
| Total return(ii) | (34.88 | )% | 35.41 | % | 34.79 | % | 15.29 | % | 8.15 | % | ||||||||||
| RATIOS/SUPPLEMENTAL DATA: | ||||||||||||||||||||
| Net assets, end of period (000’s omitted) | $ | 774,249 | $ | 1,523,572 | $ | 1,320,073 | $ | 1,174,346 | $ | 1,257,811 | ||||||||||
| Ratio of gross expenses to average net assets | 1.20 | % | 1.15 | % | 1.17 | % | 1.21 | % | 1.21 | % | ||||||||||
| Ratio of net expenses to average net assets | 1.20 | % | 1.15 | % | 1.17 | % | 1.21 | % | 1.21 | % | ||||||||||
| Ratio of net investment loss to average net assets | (0.49 | )% | (0.67 | )% | (0.41 | )% | (0.27 | )% | (0.23 | )% | ||||||||||
| Portfolio turnover rate | 108.26 | % | 78.77 | % | 89.91 | % | 77.04 | % | 67.33 | % | ||||||||||
See Notes to Financial Statements.
| (i) | Amount was computed based on average shares outstanding during the period. |
| (ii) | Does not reflect the effect of sales charges, if applicable. |
THE ALGER FUNDS
Financial Highlights for a share outstanding throughout the period
| Alger Capital Appreciation Fund | Class C | |||||||||||||||||||
| Year ended | Year ended | Year ended | Year ended | Year ended | ||||||||||||||||
| 10/31/2022 | 10/31/2021 | 10/31/2020 | 10/31/2019 | 10/31/2018 | ||||||||||||||||
| Net asset value, beginning of period | $ | 27.13 | $ | 24.79 | $ | 20.60 | $ | 20.69 | $ | 20.91 | ||||||||||
| INCOME FROM INVESTMENT OPERATIONS: | ||||||||||||||||||||
| Net investment loss(i) | (0.20 | ) | (0.35 | ) | (0.25 | ) | (0.20 | ) | (0.20 | ) | ||||||||||
| Net realized and unrealized gain (loss) on investments | (6.89 | ) | 7.84 | 6.64 | 2.65 | 1.65 | ||||||||||||||
| Total from investment operations | (7.09 | ) | 7.49 | 6.39 | 2.45 | 1.45 | ||||||||||||||
| Distributions from net realized gains | (7.41 | ) | (5.15 | ) | (2.20 | ) | (2.54 | ) | (1.67 | ) | ||||||||||
| Net asset value, end of period | $ | 12.63 | $ | 27.13 | $ | 24.79 | $ | 20.60 | $ | 20.69 | ||||||||||
| Total return(ii) | (35.36 | )% | 34.43 | % | 33.82 | % | 14.44 | % | 7.35 | % | ||||||||||
| RATIOS/SUPPLEMENTAL DATA: | ||||||||||||||||||||
| Net assets, end of period (000’s omitted) | $ | 91,815 | $ | 211,972 | $ | 204,909 | $ | 219,511 | $ | 243,523 | ||||||||||
| Ratio of gross expenses to average net assets | 1.95 | % | 1.90 | % | 1.91 | % | 1.95 | % | 1.94 | % | ||||||||||
| Ratio of net expenses to average net assets | 1.95 | % | 1.90 | % | 1.91 | % | 1.95 | % | 1.94 | % | ||||||||||
| Ratio of net investment loss to average net assets | (1.24 | )% | (1.42 | )% | (1.13 | )% | (1.01 | )% | (0.96 | )% | ||||||||||
| Portfolio turnover rate | 108.26 | % | 78.77 | % | 89.91 | % | 77.04 | % | 67.33 | % | ||||||||||
See Notes to Financial Statements.
| (i) | Amount was computed based on average shares outstanding during the period. |
| (ii) | Does not reflect the effect of sales charges, if applicable. |
THE ALGER FUNDS
Financial Highlights for a share outstanding throughout the period
| Alger Capital Appreciation Fund | Class Z | |||||||||||||||||||
| Year ended 10/31/2022 | Year ended 10/31/2021 | Year ended 10/31/2020 | Year ended 10/31/2019 | Year ended 10/31/2018 | ||||||||||||||||
| Net asset value, beginning of period | $ | 41.50 | $ | 35.15 | $ | 28.06 | $ | 26.94 | $ | 26.46 | ||||||||||
| INCOME FROM INVESTMENT OPERATIONS: | ||||||||||||||||||||
| Net investment income (loss)(i) | (0.04 | ) | (0.13 | ) | (0.03 | ) | 0.02 | 0.03 | ||||||||||||
| Net realized and unrealized gain (loss) on investments | (11.89 | ) | 11.63 | 9.32 | 3.64 | 2.12 | ||||||||||||||
| Total from investment operations | (11.93 | ) | 11.50 | 9.29 | 3.66 | 2.15 | ||||||||||||||
| Distributions from net realized gains | (7.41 | ) | (5.15 | ) | (2.20 | ) | (2.54 | ) | (1.67 | ) | ||||||||||
| Net asset value, end of period | $ | 22.16 | $ | 41.50 | $ | 35.15 | $ | 28.06 | $ | 26.94 | ||||||||||
| Total return(ii) | (34.67 | )% | 35.85 | % | 35.26 | % | 15.69 | % | 8.51 | % | ||||||||||
| RATIOS/SUPPLEMENTAL DATA: | ||||||||||||||||||||
| Net assets, end of period (000’s omitted) | $ | 949,473 | $ | 1,687,179 | $ | 1,823,041 | $ | 1,409,374 | $ | 1,240,605 | ||||||||||
| Ratio of gross expenses to average net assets | 0.86 | % | 0.83 | % | 0.84 | % | 0.87 | % | 0.87 | % | ||||||||||
| Ratio of expense reimbursements to average net assets | (0.01 | )% | — | — | — | — | ||||||||||||||
| Ratio of net expenses to average net assets | 0.85 | % | 0.83 | % | 0.84 | % | 0.87 | % | 0.87 | % | ||||||||||
| Ratio of net investment income (loss) to average net assets | (0.14 | )% | (0.34 | )% | (0.09 | )% | 0.06 | % | 0.10 | % | ||||||||||
| Portfolio turnover rate | 108.26 | % | 78.77 | % | 89.91 | % | 77.04 | % | 67.33 | % | ||||||||||
See Notes to Financial Statements.
| (i) | Amount was computed based on average shares outstanding during the period. |
| (ii) | Does not reflect the effect of sales charges, if applicable. |
THE ALGER FUNDS
Financial Highlights for a share outstanding throughout the period
| Alger 35 Fund | Class Z | |||||||||||||||||||
| Year ended 10/31/2022 | Year ended 10/31/2021(i) | Year ended 10/31/2020 | Year ended 10/31/2019 | From 3/29/2018 (commencement of operations) to 10/31/2018(ii) | ||||||||||||||||
| Net asset value, beginning of period | $ | 21.33 | $ | 17.41 | $ | 11.61 | $ | 10.38 | $ | 10.00 | ||||||||||
| INCOME FROM INVESTMENT OPERATIONS: | ||||||||||||||||||||
| Net investment income (loss)(iii) | — | (iv) | (0.01 | ) | (0.05 | ) | 0.03 | 0.01 | ||||||||||||
| Net realized and unrealized gain (loss) on investments | (6.68 | ) | 6.95 | 5.87 | 1.31 | 0.37 | ||||||||||||||
| Total from investment operations | (6.68 | ) | 6.94 | 5.82 | 1.34 | 0.38 | ||||||||||||||
| Dividends from net investment income | — | — | (v) | (0.02 | ) | (0.04 | ) | — | ||||||||||||
| Distributions from net realized gains | (5.10 | ) | (3.02 | ) | — | (0.07 | ) | — | ||||||||||||
| Net asset value, end of period | $ | 9.55 | $ | 21.33 | $ | 17.41 | $ | 11.61 | $ | 10.38 | ||||||||||
| Total return(vi) | (39.09 | )% | 44.27 | % | 50.22 | % | 13.19 | % | 3.80 | % | ||||||||||
| RATIOS/SUPPLEMENTAL DATA: | ||||||||||||||||||||
| Net assets, end of period (000’s omitted) | $ | 25,976 | $ | 44,159 | $ | 14,128 | $ | 9,094 | $ | 7,782 | ||||||||||
| Ratio of gross expenses to average net assets | 0.94 | % | 0.92 | % | 2.02 | % | 2.37 | % | 2.46 | % | ||||||||||
| Ratio of expense reimbursements to average net assets | (0.39 | )% | (0.52 | )% | (1.12 | )% | (1.97 | )% | (2.06 | )% | ||||||||||
| Ratio of net expenses to average net assets | 0.55 | % | 0.40 | % | 0.90 | % | 0.40 | % | 0.40 | % | ||||||||||
| Ratio of net investment income (loss) to average net assets | 0.01 | % | (0.07 | )% | 0.36 | % | 0.30 | % | 0.23 | % | ||||||||||
| Portfolio turnover rate | 202.40 | % | 136.61 | % | 121.74 | % | 115.25 | % | 31.20 | % | ||||||||||
See Notes to Financial Statements.
| (i) | Class P Shares were reclassified as Class Z Shares on May 7, 2021 and after the close of business on October 29, 2021, Class P-2 Shares were converted to Class Z Shares. |
| (ii) | Ratios have been annualized; total return has not been annualized; portfolio turnover is for the seven months then ended. |
| (iii) | Amount was computed based on average shares outstanding during the period. |
| (iv) | Amount was less than $0.005 per share. |
| (v) | Amount was more than $(0.001) per share. |
| (vi) | Does not reflect the effect of sales charges, if applicable. |
THE ALGER FUNDS
Financial Highlights for a share outstanding throughout the period
| Alger Growth & Income Fund | Class A | |||||||||||||||||||
| Year ended 10/31/2022 | Year ended 10/31/2021 | Year ended 10/31/2020 | Year ended 10/31/2019 | Year ended 10/31/2018 | ||||||||||||||||
| Net asset value, beginning of period | $ | 61.76 | $ | 43.88 | $ | 43.55 | $ | 40.77 | $ | 39.68 | ||||||||||
| INCOME FROM INVESTMENT OPERATIONS: | ||||||||||||||||||||
| Net investment income(i) | 0.71 | 0.63 | 0.69 | 0.70 | 0.65 | |||||||||||||||
| Net realized and unrealized gain (loss) on investments | (7.49 | ) | 18.47 | 1.88 | 4.54 | 1.64 | ||||||||||||||
| Total from investment operations | (6.78 | ) | 19.10 | 2.57 | 5.24 | 2.29 | ||||||||||||||
| Dividends from net investment income | (0.56 | ) | (0.55 | ) | (0.66 | ) | (0.61 | ) | (0.57 | ) | ||||||||||
| Distributions from net realized gains | (2.07 | ) | (0.67 | ) | (1.58 | ) | (1.85 | ) | (0.63 | ) | ||||||||||
| Net asset value, end of period | $ | 52.35 | $ | 61.76 | $ | 43.88 | $ | 43.55 | $ | 40.77 | ||||||||||
| Total return(ii) | (11.53 | )% | 44.12 | % | 5.98 | % | 13.94 | % | 5.78 | % | ||||||||||
| RATIOS/SUPPLEMENTAL DATA: | ||||||||||||||||||||
| Net assets, end of period (000’s omitted) | $ | 108,039 | $ | 106,439 | $ | 74,251 | $ | 74,924 | $ | 70,859 | ||||||||||
| Ratio of gross expenses to average net assets | 0.97 | % | 0.98 | % | 1.06 | % | 1.07 | % | 1.06 | % | ||||||||||
| Ratio of net expenses to average net assets | 0.97 | % | 0.98 | % | 1.06 | % | 1.07 | % | 1.06 | % | ||||||||||
| Ratio of net investment income to average net assets | 1.24 | % | 1.15 | % | 1.60 | % | 1.72 | % | 1.59 | % | ||||||||||
| Portfolio turnover rate | 1.96 | % | 8.40 | % | 9.29 | % | 7.30 | % | 11.05 | % | ||||||||||
See Notes to Financial Statements.
| (i) | Amount was computed based on average shares outstanding during the period. |
| (ii) | Does not reflect the effect of sales charges, if applicable. |
THE ALGER FUNDS
Financial Highlights for a share outstanding throughout the period
| Alger Growth & Income Fund | Class C | |||||||||||||||||||
| Year ended 10/31/2022 | Year ended 10/31/2021 | Year ended 10/31/2020 | Year ended 10/31/2019 | Year ended 10/31/2018 | ||||||||||||||||
| Net asset value, beginning of period | $ | 60.77 | $ | 43.22 | $ | 42.93 | $ | 40.20 | $ | 39.14 | ||||||||||
| INCOME FROM INVESTMENT OPERATIONS: | ||||||||||||||||||||
| Net investment income(i) | 0.28 | 0.21 | 0.36 | 0.39 | 0.34 | |||||||||||||||
| Net realized and unrealized gain (loss) on investments | (7.38 | ) | 18.18 | 1.85 | 4.49 | 1.60 | ||||||||||||||
| Total from investment operations | (7.10 | ) | 18.39 | 2.21 | 4.88 | 1.94 | ||||||||||||||
| Dividends from net investment income | (0.14 | ) | (0.17 | ) | (0.34 | ) | (0.30 | ) | (0.25 | ) | ||||||||||
| Distributions from net realized gains | (2.07 | ) | (0.67 | ) | (1.58 | ) | (1.85 | ) | (0.63 | ) | ||||||||||
| Net asset value, end of period | $ | 51.46 | $ | 60.77 | $ | 43.22 | $ | 42.93 | $ | 40.20 | ||||||||||
| Total return(ii) | (12.18 | )% | 43.01 | % | 5.19 | % | 13.12 | % | 4.96 | % | ||||||||||
| RATIOS/SUPPLEMENTAL DATA: | ||||||||||||||||||||
| Net assets, end of period (000’s omitted) | $ | 21,111 | $ | 18,194 | $ | 13,127 | $ | 14,946 | $ | 16,074 | ||||||||||
| Ratio of gross expenses to average net assets | 1.73 | % | 1.73 | % | 1.81 | % | 1.82 | % | 1.82 | % | ||||||||||
| Ratio of net expenses to average net assets | 1.73 | % | 1.73 | % | 1.81 | % | 1.82 | % | 1.82 | % | ||||||||||
| Ratio of net investment income to average net assets | 0.49 | % | 0.40 | % | 0.86 | % | 0.97 | % | 0.84 | % | ||||||||||
| Portfolio turnover rate | 1.96 | % | 8.40 | % | 9.29 | % | 7.30 | % | 11.05 | % | ||||||||||
See Notes to Financial Statements.
| (i) | Amount was computed based on average shares outstanding during the period. |
| (ii) | Does not reflect the effect of sales charges, if applicable. |
THE ALGER FUNDS
Financial Highlights for a share outstanding throughout the period
| Alger Growth & Income Fund | Class Z | |||||||||||||||||||
| Year ended 10/31/2022 | Year ended 10/31/2021 | Year ended 10/31/2020 | Year ended 10/31/2019 | Year ended 10/31/2018 | ||||||||||||||||
| Net asset value, beginning of period | $ | 61.84 | $ | 43.94 | $ | 43.60 | $ | 40.81 | $ | 39.71 | ||||||||||
| INCOME FROM INVESTMENT OPERATIONS: | ||||||||||||||||||||
| Net investment income(i) | 0.90 | 0.80 | 0.86 | 0.85 | 0.80 | |||||||||||||||
| Net realized and unrealized gain (loss) on investments | (7.51 | ) | 18.49 | 1.88 | 4.56 | 1.64 | ||||||||||||||
| Total from investment operations | (6.61 | ) | 19.29 | 2.74 | 5.41 | 2.44 | ||||||||||||||
| Dividends from net investment income | (0.74 | ) | (0.72 | ) | (0.82 | ) | (0.77 | ) | (0.71 | ) | ||||||||||
| Distributions from net realized gains | (2.07 | ) | (0.67 | ) | (1.58 | ) | (1.85 | ) | (0.63 | ) | ||||||||||
| Net asset value, end of period | $ | 52.42 | $ | 61.84 | $ | 43.94 | $ | 43.60 | $ | 40.81 | ||||||||||
| Total return(ii) | (11.25 | )% | 44.54 | % | 6.39 | % | 14.39 | % | 6.16 | % | ||||||||||
| RATIOS/SUPPLEMENTAL DATA: | ||||||||||||||||||||
| Net assets, end of period (000’s omitted) | $ | 115,251 | $ | 38,021 | $ | 21,672 | $ | 26,979 | $ | 24,604 | ||||||||||
| Ratio of gross expenses to average net assets | 0.65 | % | 0.66 | % | 0.73 | % | 0.76 | % | 0.76 | % | ||||||||||
| Ratio of expense reimbursements to average net assets | — | — | (iii) | (0.04 | )% | (0.07 | )% | (0.05 | )% | |||||||||||
| Ratio of net expenses to average net assets | 0.65 | % | 0.66 | % | 0.69 | % | 0.69 | % | 0.71 | % | ||||||||||
| Ratio of net investment income to average net assets | 1.62 | % | 1.45 | % | 2.00 | % | 2.10 | % | 1.96 | % | ||||||||||
| Portfolio turnover rate | 1.96 | % | 8.40 | % | 9.29 | % | 7.30 | % | 11.05 | % | ||||||||||
See Notes to Financial Statements.
| (i) | Amount was computed based on average shares outstanding during the period. |
| (ii) | Does not reflect the effect of sales charges, if applicable. |
| (iii) | Amount was less than 0.005%. |
THE ALGER FUNDS
Financial Highlights for a share outstanding throughout the period
| Alger Mid Cap Growth Fund | Class A | |||||||||||||||||||
| Year ended 10/31/2022 | Year ended 10/31/2021 | Year ended 10/31/2020 | Year ended 10/31/2019 | Year ended 10/31/2018 | ||||||||||||||||
| Net asset value, beginning of period | $ | 25.20 | $ | 19.29 | $ | 14.81 | $ | 14.13 | $ | 13.47 | ||||||||||
| INCOME FROM INVESTMENT OPERATIONS: | ||||||||||||||||||||
| Net investment income (loss)(i) | (0.09 | ) | 0.48 | (0.12 | ) | (0.09 | ) | (0.11 | ) | |||||||||||
| Net realized and unrealized gain (loss) on investments | (7.71 | ) | 7.58 | 5.80 | 1.48 | 0.88 | ||||||||||||||
| Total from investment operations | (7.80 | ) | 8.06 | 5.68 | 1.39 | 0.77 | ||||||||||||||
| Dividends from net investment income | (0.45 | ) | — | — | — | — | ||||||||||||||
| Distributions from net realized gains | (6.13 | ) | (2.15 | ) | (1.20 | ) | (0.71 | ) | (0.11 | ) | ||||||||||
| Net asset value, end of period | $ | 10.82 | $ | 25.20 | $ | 19.29 | $ | 14.81 | $ | 14.13 | ||||||||||
| Total return(ii) | (39.13 | )% | 44.05 | %(iii) | 41.34 | % | 10.95 | % | 5.78 | % | ||||||||||
| RATIOS/SUPPLEMENTAL DATA: | ||||||||||||||||||||
| Net assets, end of period (000’s omitted) | $ | 146,648 | $ | 259,895 | $ | 187,552 | $ | 139,110 | $ | 138,370 | ||||||||||
| Ratio of gross expenses to average net assets | 1.24 | % | 1.21 | % | 1.30 | % | 1.30 | % | 1.30 | % | ||||||||||
| Ratio of net expenses to average net assets | 1.24 | % | 1.21 | % | 1.30 | % | 1.30 | % | 1.30 | % | ||||||||||
| Ratio of net investment income (loss) to average net assets | (0.68 | )% | 2.15 | % | (0.76 | )% | (0.65 | )% | (0.77 | )% | ||||||||||
| Portfolio turnover rate | 204.79 | % | 170.96 | % | 181.73 | % | 182.97 | % | 125.34 | % | ||||||||||
See Notes to Financial Statements.
| (i) | Amount was computed based on average shares outstanding during the period. |
| (ii) | Does not reflect the effect of sales charges, if applicable. |
| (iii) | Pursuant to the U.S. Securities and Exchange Commission’s Rules on Fair Fund and Disgorgement Plans, the Alger Mid Cap Growth Fund received a Fair Fund distribution of $9,346,397, which contributed approximately 3.89% to its annual return. |
THE ALGER FUNDS
Financial Highlights for a share outstanding throughout the period
| Alger Mid Cap Growth Fund | Class B | |||||||||||||||||||
| Year ended 10/31/2022 | Year ended 10/31/2021 | Year ended 10/31/2020 | Year ended 10/31/2019 | Year ended 10/31/2018 | ||||||||||||||||
| Net asset value, beginning of period | $ | 18.60 | $ | 14.70 | $ | 11.55 | $ | 11.22 | $ | 10.80 | ||||||||||
| INCOME FROM INVESTMENT OPERATIONS: | ||||||||||||||||||||
| Net investment income (loss)(i) | (0.06 | ) | 0.35 | (0.08 | ) | (0.10 | ) | (0.17 | ) | |||||||||||
| Net realized and unrealized gain (loss) on investments | (5.15 | ) | 5.70 | 4.43 | 1.14 | 0.70 | ||||||||||||||
| Total from investment operations | (5.21 | ) | 6.05 | 4.35 | 1.04 | 0.53 | ||||||||||||||
| Dividends from net investment income | (0.48 | ) | — | — | — | — | ||||||||||||||
| Distributions from net realized gains | (6.13 | ) | (2.15 | ) | (1.20 | ) | (0.71 | ) | (0.11 | ) | ||||||||||
| Net asset value, end of period | $ | 6.78 | $ | 18.60 | $ | 14.70 | $ | 11.55 | $ | 11.22 | ||||||||||
| Total return(ii) | (39.16 | )% | 44.24 | %(iii) | 41.41 | % | 10.66 | % | 4.98 | % | ||||||||||
| RATIOS/SUPPLEMENTAL DATA: | ||||||||||||||||||||
| Net assets, end of period (000’s omitted) | $ | 10,404 | $ | 18,276 | $ | 15,411 | $ | 13,772 | $ | 15,361 | ||||||||||
| Ratio of gross expenses to average net assets | 1.95 | % | 1.93 | % | 2.03 | % | 2.04 | % | 2.05 | % | ||||||||||
| Ratio of expense reimbursements to average net assets | (0.67 | )% | (0.76 | )% | (0.82 | )% | (0.47 | )% | — | |||||||||||
| Ratio of net expenses to average net assets | 1.28 | % | 1.17 | % | 1.21 | % | 1.57 | % | 2.05 | % | ||||||||||
| Ratio of net investment income (loss) to average net assets | (0.71 | )% | 2.08 | % | (0.66 | )% | (0.92 | )% | (1.50 | )% | ||||||||||
| Portfolio turnover rate | 204.79 | % | 170.96 | % | 181.73 | % | 182.97 | % | 125.34 | % | ||||||||||
See Notes to Financial Statements.
| (i) | Amount was computed based on average shares outstanding during the period. |
| (ii) | Does not reflect the effect of sales charges, if applicable. |
| (iii) | Pursuant to the U.S. Securities and Exchange Commission’s Rules on Fair Fund and Disgorgement Plans, the Alger Mid Cap Growth Fund received a Fair Fund distribution of $9,346,397, which contributed approximately 3.89% to its annual return. |
THE ALGER FUNDS
Financial Highlights for a share outstanding throughout the period
| Alger Mid Cap Growth Fund | Class C | |||||||||||||||||||
| Year ended 10/31/2022 | Year ended 10/31/2021 | Year ended 10/31/2020 | Year ended 10/31/2019 | Year ended 10/31/2018 | ||||||||||||||||
| Net asset value, beginning of period | $ | 17.82 | $ | 14.26 | $ | 11.33 | $ | 11.08 | $ | 10.67 | ||||||||||
| INCOME FROM INVESTMENT OPERATIONS: | ||||||||||||||||||||
| Net investment income (loss)(i) | (0.12 | ) | 0.23 | (0.18 | ) | (0.16 | ) | (0.18 | ) | |||||||||||
| Net realized and unrealized gain (loss) on investments | (4.88 | ) | 5.48 | 4.31 | 1.12 | 0.70 | ||||||||||||||
| Total from investment operations | (5.00 | ) | 5.71 | 4.13 | 0.96 | 0.52 | ||||||||||||||
| Dividends from net investment income | (0.35 | ) | — | — | — | — | ||||||||||||||
| Distributions from net realized gains | (6.13 | ) | (2.15 | ) | (1.20 | ) | (0.71 | ) | (0.11 | ) | ||||||||||
| Net asset value, end of period | $ | 6.34 | $ | 17.82 | $ | 14.26 | $ | 11.33 | $ | 11.08 | ||||||||||
| Total return(ii) | (39.60 | )% | 42.91 | %(iii) | 40.26 | % | 10.03 | % | 4.94 | % | ||||||||||
| RATIOS/SUPPLEMENTAL DATA: | ||||||||||||||||||||
| Net assets, end of period (000’s omitted) | $ | 4,562 | $ | 8,244 | $ | 5,691 | $ | 6,014 | $ | 7,647 | ||||||||||
| Ratio of gross expenses to average net assets | 2.05 | % | 2.00 | % | 2.10 | % | 2.14 | % | 2.11 | % | ||||||||||
| Ratio of net expenses to average net assets | 2.05 | % | 2.00 | % | 2.10 | % | 2.14 | % | 2.11 | % | ||||||||||
| Ratio of net investment income (loss) to average net assets | (1.49 | )% | 1.41 | % | (1.52 | )% | (1.48 | )% | (1.55 | )% | ||||||||||
| Portfolio turnover rate | 204.79 | % | 170.96 | % | 181.73 | % | 182.97 | % | 125.34 | % | ||||||||||
See Notes to Financial Statements.
| (i) | Amount was computed based on average shares outstanding during the period. |
| (ii) | Does not reflect the effect of sales charges, if applicable. |
| (iii) | Pursuant to the U.S. Securities and Exchange Commission’s Rules on Fair Fund and Disgorgement Plans, the Alger Mid Cap Growth Fund received a Fair Fund distribution of $9,346,397, which contributed approximately 3.89% to its annual return. |
THE ALGER FUNDS
Financial Highlights for a share outstanding throughout the period
| Alger Mid Cap Growth Fund | Class Z | |||||||||||||||||||
| Year ended 10/31/2022 | Year ended 10/31/2021 | Year ended 10/31/2020 | Year ended 10/31/2019 | Year ended 10/31/2018 | ||||||||||||||||
| Net asset value, beginning of period | $ | 25.78 | $ | 19.63 | $ | 15.01 | $ | 14.27 | $ | 13.56 | ||||||||||
| INCOME FROM INVESTMENT OPERATIONS: | ||||||||||||||||||||
| Net investment income (loss)(i) | (0.05 | ) | 0.63 | (0.07 | ) | (0.06 | ) | (0.07 | ) | |||||||||||
| Net realized and unrealized gain (loss) on investments | (7.92 | ) | 7.67 | 5.89 | 1.51 | 0.89 | ||||||||||||||
| Total from investment operations | (7.97 | ) | 8.30 | 5.82 | 1.45 | 0.82 | ||||||||||||||
| Dividends from net investment income | (0.52 | ) | — | — | — | — | ||||||||||||||
| Distributions from net realized gains | (6.13 | ) | (2.15 | ) | (1.20 | ) | (0.71 | ) | (0.11 | ) | ||||||||||
| Net asset value, end of period | $ | 11.16 | $ | 25.78 | $ | 19.63 | $ | 15.01 | $ | 14.27 | ||||||||||
| Total return(ii) | (38.95 | )% | 44.55 | %(iii) | 41.75 | % | 11.27 | % | 6.03 | % | ||||||||||
| RATIOS/SUPPLEMENTAL DATA: | ||||||||||||||||||||
| Net assets, end of period (000’s omitted) | $ | 30,488 | $ | 52,746 | $ | 26,804 | $ | 17,558 | $ | 14,230 | ||||||||||
| Ratio of gross expenses to average net assets | 0.93 | % | 0.92 | % | 0.99 | % | 1.03 | % | 1.03 | % | ||||||||||
| Ratio of net expenses to average net assets | 0.93 | % | 0.92 | % | 0.99 | % | 1.03 | % | 1.03 | % | ||||||||||
| Ratio of net investment income (loss) to average net assets | (0.37 | )% | 2.75 | % | (0.46 | )% | (0.38 | )% | (0.49 | )% | ||||||||||
| Portfolio turnover rate | 204.79 | % | 170.96 | % | 181.73 | % | 182.97 | % | 125.34 | % | ||||||||||
See Notes to Financial Statements.
| (i) | Amount was computed based on average shares outstanding during the period. |
| (ii) | Does not reflect the effect of sales charges, if applicable. |
| (iii) | Pursuant to the U.S. Securities and Exchange Commission’s Rules on Fair Fund and Disgorgement Plans, the Alger Mid Cap Growth Fund received a Fair Fund distribution of $9,346,397, which contributed approximately 3.89% to its annual return. |
THE ALGER FUNDS
Financial Highlights for a share outstanding throughout the period
| Alger Mid Cap Focus Fund | Class A | |||||||
| Year ended 10/31/2022 | From 7/29/2021 (commencement of operations) to 10/31/2021(i) | |||||||
| Net asset value, beginning of period | $ | 23.43 | $ | 20.67 | ||||
| INCOME FROM INVESTMENT OPERATIONS: | ||||||||
| Net investment loss(ii) | (0.09 | ) | (0.04 | ) | ||||
| Net realized and unrealized gain (loss) on investments | (9.14 | ) | 2.80 | |||||
| Total from investment operations | (9.23 | ) | 2.76 | |||||
| Distributions from net realized gains | (2.06 | ) | — | |||||
| Net asset value, end of period | $ | 12.14 | $ | 23.43 | ||||
| Total return(iii) | (42.27 | )% | 13.35 | % | ||||
| RATIOS/SUPPLEMENTAL DATA: | ||||||||
| Net assets, end of period (000’s omitted) | $ | 5,083 | $ | 1,669 | ||||
| Ratio of gross expenses to average net assets | 1.05 | % | 0.96 | % | ||||
| Ratio of net expenses to average net assets | 1.05 | % | 0.96 | % | ||||
| Ratio of net investment loss to average net assets | (0.66 | )% | (0.72 | )% | ||||
| Portfolio turnover rate | 267.86 | % | 250.31 | % | ||||
See Notes to Financial Statements.
| (i) | Ratios have been annualized; total return has not been annualized; portfolio turnover is for the twelve months then ended. |
| (ii) | Amount was computed based on average shares outstanding during the period. |
| (iii) | Does not reflect the effect of sales charges, if applicable. |
THE ALGER FUNDS
Financial Highlights for a share outstanding throughout the period
| Alger Mid Cap Focus Fund | Class C | |||||||
| Year ended 10/31/2022 | From 7/29/2021 (commencement of operations) to 10/31/2021(i) | |||||||
| Net asset value, beginning of period | $ | 23.38 | $ | 20.67 | ||||
| INCOME FROM INVESTMENT OPERATIONS: | ||||||||
| Net investment loss(ii) | (0.21 | ) | (0.09 | ) | ||||
| Net realized and unrealized gain (loss) on investments | (9.10 | ) | 2.80 | |||||
| Total from investment operations | (9.31 | ) | 2.71 | |||||
| Distributions from net realized gains | (2.06 | ) | — | |||||
| Net asset value, end of period | $ | 12.01 | $ | 23.38 | ||||
| Total return(iii) | (42.78 | )% | 13.16 | % | ||||
| RATIOS/SUPPLEMENTAL DATA: | ||||||||
| Net assets, end of period (000’s omitted) | $ | 2,433 | $ | 2,317 | ||||
| Ratio of gross expenses to average net assets | 1.85 | % | 1.76 | % | ||||
| Ratio of net expenses to average net assets | 1.85 | % | 1.76 | % | ||||
| Ratio of net investment loss to average net assets | (1.46 | )% | (1.50 | )% | ||||
| Portfolio turnover rate | 267.86 | % | 250.31 | % | ||||
See Notes to Financial Statements.
| (i) | Ratios have been annualized; total return has not been annualized; portfolio turnover is for the twelve months then ended. |
| (ii) | Amount was computed based on average shares outstanding during the period. |
| (iii) | Does not reflect the effect of sales charges, if applicable. |
THE ALGER FUNDS
Financial Highlights for a share outstanding throughout the period
| Alger Mid Cap Focus Fund | Class I | |||||||||||||||
| Year ended 10/31/2022 | Year ended 10/31/2021 | Year ended 10/31/2020 | From 6/14/2019 (commencement of operations) to 10/31/2019(i) | |||||||||||||
| Net asset value, beginning of period | $ | 23.43 | $ | 15.10 | $ | 9.70 | $ | 10.00 | ||||||||
| INCOME FROM INVESTMENT OPERATIONS: | ||||||||||||||||
| Net investment loss(ii) | (0.10 | ) | (0.17 | ) | (0.14 | ) | (0.04 | ) | ||||||||
| Net realized and unrealized gain (loss) on investments | (9.13 | ) | 8.76 | 5.54 | (0.26 | ) | ||||||||||
| Total from investment operations | (9.23 | ) | 8.59 | 5.40 | (0.30 | ) | ||||||||||
| Distributions from net realized gains | (2.06 | ) | (0.26 | ) | — | — | ||||||||||
| Net asset value, end of period | $ | 12.14 | $ | 23.43 | $ | 15.10 | $ | 9.70 | ||||||||
| Total return(iii) | (42.28 | )% | 57.36 | % | 55.35 | % | (3.00 | )% | ||||||||
| RATIOS/SUPPLEMENTAL DATA: | ||||||||||||||||
| Net assets, end of period (000’s omitted) | $ | 62,499 | $ | 145,539 | $ | 67,796 | $ | 2,023 | ||||||||
| Ratio of gross expenses to average net assets | 1.01 | % | 0.95 | % | 1.14 | % | 1.91 | % | ||||||||
| Ratio of expense reimbursements to average net assets | — | — | (0.03 | )% | (0.71 | )% | ||||||||||
| Ratio of net expenses to average net assets | 1.01 | % | 0.95 | % | 1.11 | % | 1.20 | % | ||||||||
| Ratio of net investment loss to average net assets | (0.63 | )% | (0.85 | )% | (1.04 | )% | (0.97 | )% | ||||||||
| Portfolio turnover rate | 267.86 | % | 250.31 | % | 123.43 | % | 65.50 | % | ||||||||
See Notes to Financial Statements.
| (i) | Ratios have been annualized; total return has not been annualized; portfolio turnover is for the five months then ended. |
| (ii) | Amount was computed based on average shares outstanding during the period. |
| (iii) | Does not reflect the effect of sales charges, if applicable. |
THE ALGER FUNDS
Financial Highlights for a share outstanding throughout the period
| Alger Mid Cap Focus Fund | Class Y | |||||||
| Year ended 10/31/2022 | From 2/26/2021 (commencement of operations) to 10/31/2021(i) | |||||||
| Net asset value, beginning of period | $ | 23.56 | $ | 20.65 | ||||
| INCOME FROM INVESTMENT OPERATIONS: | ||||||||
| Net investment loss(ii) | (0.06 | ) | (0.08 | ) | ||||
| Net realized and unrealized gain (loss) on investments | (9.18 | ) | 2.99 | |||||
| Total from investment operations | (9.24 | ) | 2.91 | |||||
| Distributions from net realized gains | (2.06 | ) | — | |||||
| Net asset value, end of period | $ | 12.26 | $ | 23.56 | ||||
| Total return(iii) | (42.07 | )% | 14.09 | % | ||||
| RATIOS/SUPPLEMENTAL DATA: | ||||||||
| Net assets, end of period (000’s omitted) | $ | 443 | $ | 137 | ||||
| Ratio of gross expenses to average net assets | 0.74 | % | 0.72 | % | ||||
| Ratio of expense reimbursements to average net assets | (0.05 | )% | (0.02 | )% | ||||
| Ratio of net expenses to average net assets | 0.69 | % | 0.70 | % | ||||
| Ratio of net investment loss to average net assets | (0.44 | )% | (0.57 | )% | ||||
| Portfolio turnover rate | 267.86 | % | 250.31 | % | ||||
See Notes to Financial Statements.
| (i) | Ratios have been annualized; total return has not been annualized; portfolio turnover is for the twelve months then ended. |
| (ii) | Amount was computed based on average shares outstanding during the period. |
| (iii) | Does not reflect the effect of sales charges, if applicable. |
THE ALGER FUNDS
Financial Highlights for a share outstanding throughout the period
| Alger Mid Cap Focus Fund | Class Z | |||||||||||||||
| Year ended 10/31/2022 | Year ended 10/31/2021 | Year ended 10/31/2020 | From 6/14/2019 (commencement of operations) to 10/31/2019(i) | |||||||||||||
| Net asset value, beginning of period | $ | 23.57 | $ | 15.15 | $ | 9.71 | $ | 10.00 | ||||||||
| INCOME FROM INVESTMENT OPERATIONS: | ||||||||||||||||
| Net investment loss(ii) | (0.05 | ) | (0.12 | ) | (0.10 | ) | (0.03 | ) | ||||||||
| Net realized and unrealized gain (loss) on investments | (9.20 | ) | 8.80 | 5.54 | (0.26 | ) | ||||||||||
| Total from investment operations | (9.25 | ) | 8.68 | 5.44 | (0.29 | ) | ||||||||||
| Distributions from net realized gains | (2.06 | ) | (0.26 | ) | — | — | ||||||||||
| Net asset value, end of period | $ | 12.26 | $ | 23.57 | $ | 15.15 | $ | 9.71 | ||||||||
| Total return(iii) | (42.10 | )% | 57.77 | % | 55.70 | % | (2.80 | )% | ||||||||
| RATIOS/SUPPLEMENTAL DATA: | ||||||||||||||||
| Net assets, end of period (000’s omitted) | $ | 365,976 | $ | 795,479 | $ | 307,532 | $ | 28,230 | ||||||||
| Ratio of gross expenses to average net assets | 0.71 | % | 0.68 | % | 0.91 | % | 1.86 | % | ||||||||
| Ratio of expense reimbursements to average net assets | — | — | (0.05 | )% | (0.87 | )% | ||||||||||
| Ratio of net expenses to average net assets | 0.71 | % | 0.68 | % | 0.86 | % | 0.99 | % | ||||||||
| Ratio of net investment income (loss) to average net assets | (0.33 | )% | (0.58 | )% | (0.77 | )% | (0.74 | )% | ||||||||
| Portfolio turnover rate | 267.86 | % | 250.31 | % | 123.43 | % | 65.50 | % | ||||||||
See Notes to Financial Statements.
| (i) | Ratios have been annualized; total return has not been annualized; portfolio turnover is for the five months then ended. |
| (ii) | Amount was computed based on average shares outstanding during the period. |
| (iii) | Does not reflect the effect of sales charges, if applicable. |
THE ALGER FUNDS
Financial Highlights for a share outstanding throughout the period
| Alger Weatherbie Enduring Growth Fund | Class A | |||
| From 12/17/2021 (commencement of operations) to 10/31/2022(i) | ||||
| Net asset value, beginning of period | $ | 10.00 | ||
| INCOME FROM INVESTMENT OPERATIONS: | ||||
| Net investment loss(ii) | (0.04 | ) | ||
| Net realized and unrealized loss on investments | (2.61 | ) | ||
| Total from investment operations | (2.65 | ) | ||
| Net asset value, end of period | $ | 7.35 | ||
| Total return(iii) | (26.50 | )% | ||
| RATIOS/SUPPLEMENTAL DATA: | ||||
| Net assets, end of period (000’s omitted) | $ | 120 | ||
| Ratio of gross expenses to average net assets | 5.64 | % | ||
| Ratio of expense reimbursements to average net assets | (4.49 | )% | ||
| Ratio of net expenses to average net assets | 1.15 | % | ||
| Ratio of net investment loss to average net assets | (0.59 | )% | ||
| Portfolio turnover rate | 32.72 | % | ||
See Notes to Financial Statements.
| (i) | Ratios have been annualized; total return has not been annualized; portfolio turnover is for the eleven months then ended. |
| (ii) | Amount was computed based on average shares outstanding during the period. |
| (iii) | Does not reflect the effect of sales charges, if applicable. |
THE ALGER FUNDS
Financial Highlights for a share outstanding throughout the period
| Alger Weatherbie Enduring Growth Fund | Class C | |||
| From 12/17/2021 (commencement of operations) to 10/31/2022(i) | ||||
| Net asset value, beginning of period | $ | 10.00 | ||
| INCOME FROM INVESTMENT OPERATIONS: | ||||
| Net investment loss(ii) | (0.09 | ) | ||
| Net realized and unrealized loss on investments | (2.60 | ) | ||
| Total from investment operations | (2.69 | ) | ||
| Net asset value, end of period | $ | 7.31 | ||
| Total return(iii) | (26.90 | )% | ||
| RATIOS/SUPPLEMENTAL DATA: | ||||
| Net assets, end of period (000’s omitted) | $ | 73 | ||
| Ratio of gross expenses to average net assets | 6.12 | % | ||
| Ratio of expense reimbursements to average net assets | (4.27 | )% | ||
| Ratio of net expenses to average net assets | 1.85 | % | ||
| Ratio of net investment loss to average net assets | (1.32 | )% | ||
| Portfolio turnover rate | 32.72 | % | ||
See Notes to Financial Statements.
| (i) | Ratios have been annualized; total return has not been annualized; portfolio turnover is for the eleven months then ended. |
| (ii) | Amount was computed based on average shares outstanding during the period. |
| (iii) | Does not reflect the effect of sales charges, if applicable. |
THE ALGER FUNDS
Financial Highlights for a share outstanding throughout the period
| Alger Weatherbie Enduring Growth Fund | Class I | |||
| From 12/17/2021 (commencement of operations) to 10/31/2022(i) | ||||
| Net asset value, beginning of period | $ | 10.00 | ||
| INCOME FROM INVESTMENT OPERATIONS: | ||||
| Net investment loss(ii) | (0.04 | ) | ||
| Net realized and unrealized loss on investments | (2.60 | ) | ||
| Total from investment operations | (2.64 | ) | ||
| Net asset value, end of period | $ | 7.36 | ||
| Total return(iii) | (26.40 | )% | ||
| RATIOS/SUPPLEMENTAL DATA: | ||||
| Net assets, end of period (000’s omitted) | $ | 74 | ||
| Ratio of gross expenses to average net assets | 5.35 | % | ||
| Ratio of expense reimbursements to average net assets | (4.25 | )% | ||
| Ratio of net expenses to average net assets | 1.10 | % | ||
| Ratio of net investment loss to average net assets | (0.57 | )% | ||
| Portfolio turnover rate | 32.72 | % | ||
See Notes to Financial Statements.
| (i) | Ratios have been annualized; total return has not been annualized; portfolio turnover is for the eleven months then ended. |
| (ii) | Amount was computed based on average shares outstanding during the period. |
| (iii) | Does not reflect the effect of sales charges, if applicable. |
THE ALGER FUNDS
Financial Highlights for a share outstanding throughout the period
| Alger Weatherbie Enduring Growth Fund | Class Y | |||
| From 12/17/2021 (commencement of operations) to 10/31/2022(i) | ||||
| Net asset value, beginning of period | $ | 10.00 | ||
| INCOME FROM INVESTMENT OPERATIONS: | ||||
| Net investment loss(ii) | (0.01 | ) | ||
| Net realized and unrealized loss on investments | (2.61 | ) | ||
| Total from investment operations | (2.62 | ) | ||
| Net asset value, end of period | $ | 7.38 | ||
| Total return(iii) | (26.20 | )% | ||
| RATIOS/SUPPLEMENTAL DATA: | ||||
| Net assets, end of period (000’s omitted) | $ | 369 | ||
| Ratio of gross expenses to average net assets | 5.08 | % | ||
| Ratio of expense reimbursements to average net assets | (4.38 | )% | ||
| Ratio of net expenses to average net assets | 0.70 | % | ||
| Ratio of net investment loss to average net assets | (0.17 | )% | ||
| Portfolio turnover rate | 32.72 | % | ||
See Notes to Financial Statements.
| (i) | Ratios have been annualized; total return has not been annualized; portfolio turnover is for the eleven months then ended. |
| (ii) | Amount was computed based on average shares outstanding during the period. |
| (iii) | Does not reflect the effect of sales charges, if applicable. |
THE ALGER FUNDS
Financial Highlights for a share outstanding throughout the period
| Alger Weatherbie Enduring Growth Fund | Class Z | |||
| From 12/17/2021 (commencement of operations) to 10/31/2022(i) | ||||
| Net asset value, beginning of period | $ | 10.00 | ||
| INCOME FROM INVESTMENT OPERATIONS: | ||||
| Net investment loss(ii) | (0.02 | ) | ||
| Net realized and unrealized loss on investments | (2.60 | ) | ||
| Total from investment operations | (2.62 | ) | ||
| Net asset value, end of period | $ | 7.38 | ||
| Total return(iii) | (26.20 | )% | ||
| RATIOS/SUPPLEMENTAL DATA: | ||||
| Net assets, end of period (000’s omitted) | $ | 3,817 | ||
| Ratio of gross expenses to average net assets | 5.09 | % | ||
| Ratio of expense reimbursements to average net assets | (4.34 | )% | ||
| Ratio of net expenses to average net assets | 0.75 | % | ||
| Ratio of net investment loss to average net assets | (0.22 | )% | ||
| Portfolio turnover rate | 32.72 | % | ||
See Notes to Financial Statements.
| (i) | Ratios have been annualized; total return has not been annualized; portfolio turnover is for the eleven months then ended. |
| (ii) | Amount was computed based on average shares outstanding during the period. |
| (iii) | Does not reflect the effect of sales charges, if applicable. |
THE ALGER FUNDS
Financial Highlights for a share outstanding throughout the period
| Alger Weatherbie Specialized Growth Fund | Class A | |||||||||||||||||||
| Year ended 10/31/2022 | Year ended 10/31/2021 | Year ended 10/31/2020 | Year ended 10/31/2019 | Year ended 10/31/2018 | ||||||||||||||||
| Net asset value, beginning of period | $ | 24.96 | $ | 17.46 | $ | 13.30 | $ | 13.08 | $ | 12.87 | ||||||||||
| INCOME FROM INVESTMENT OPERATIONS: | ||||||||||||||||||||
| Net investment loss(i) | (0.14 | ) | (0.23 | ) | (0.16 | ) | (0.14 | ) | (0.15 | ) | ||||||||||
| Net realized and unrealized gain (loss) on investments | (8.91 | ) | 8.70 | 4.88 | 1.39 | 1.90 | ||||||||||||||
| Total from investment operations | (9.05 | ) | 8.47 | 4.72 | 1.25 | 1.75 | ||||||||||||||
| Distributions from net realized gains | (4.34 | ) | (0.97 | ) | (0.56 | ) | (1.03 | ) | (1.54 | ) | ||||||||||
| Net asset value, end of period | $ | 11.57 | $ | 24.96 | $ | 17.46 | $ | 13.30 | $ | 13.08 | ||||||||||
| Total return(ii) | (42.03 | )% | 49.80 | % | 36.57 | % | 11.57 | % | 15.02 | % | ||||||||||
| RATIOS/SUPPLEMENTAL DATA: | ||||||||||||||||||||
| Net assets, end of period (000’s omitted) | $ | 119,741 | $ | 259,394 | $ | 174,709 | $ | 140,368 | $ | 111,456 | ||||||||||
| Ratio of gross expenses to average net assets | 1.25 | % | 1.20 | % | 1.27 | % | 1.31 | % | 1.33 | % | ||||||||||
| Ratio of net expenses to average net assets | 1.25 | % | 1.20 | % | 1.27 | % | 1.31 | % | 1.33 | % | ||||||||||
| Ratio of net investment loss to average net assets | (0.95 | )% | (1.03 | )% | (1.09 | )% | (1.08 | )% | (1.16 | )% | ||||||||||
| Portfolio turnover rate | 55.97 | % | 61.53 | % | 66.84 | % | 64.83 | % | 42.56 | % | ||||||||||
See Notes to Financial Statements.
| (i) | Amount was computed based on average shares outstanding during the period. |
| (ii) | Does not reflect the effect of sales charges, if applicable. |
THE ALGER FUNDS
Financial Highlights for a share outstanding throughout the period
| Alger Weatherbie Specialized Growth Fund | Class C | |||||||||||||||||||
| Year ended 10/31/2022 | Year ended 10/31/2021 | Year ended 10/31/2020 | Year ended 10/31/2019 | Year ended 10/31/2018 | ||||||||||||||||
| Net asset value, beginning of period | $ | 15.93 | $ | 11.52 | $ | 9.01 | $ | 9.30 | $ | 9.65 | ||||||||||
| INCOME FROM INVESTMENT OPERATIONS: | ||||||||||||||||||||
| Net investment loss(i) | (0.14 | ) | (0.25 | ) | (0.19 | ) | (0.17 | ) | (0.18 | ) | ||||||||||
| Net realized and unrealized gain (loss) on investments | (5.16 | ) | 5.63 | 3.26 | 0.91 | 1.37 | ||||||||||||||
| Total from investment operations | (5.30 | ) | 5.38 | 3.07 | 0.74 | 1.19 | ||||||||||||||
| Distributions from net realized gains | (4.34 | ) | (0.97 | ) | (0.56 | ) | (1.03 | ) | (1.54 | ) | ||||||||||
| Net asset value, end of period | $ | 6.29 | $ | 15.93 | $ | 11.52 | $ | 9.01 | $ | 9.30 | ||||||||||
| Total return(ii) | (42.46 | )% | 48.68 | % | 35.62 | % | 10.70 | % | 14.11 | % | ||||||||||
| RATIOS/SUPPLEMENTAL DATA: | ||||||||||||||||||||
| Net assets, end of period (000’s omitted) | $ | 44,815 | $ | 103,331 | $ | 64,497 | $ | 44,908 | $ | 36,325 | ||||||||||
| Ratio of gross expenses to average net assets | 2.02 | % | 1.95 | % | 2.03 | % | 2.05 | % | 2.08 | % | ||||||||||
| Ratio of net expenses to average net assets | 2.02 | % | 1.95 | % | 2.03 | % | 2.05 | % | 2.08 | % | ||||||||||
| Ratio of net investment loss to average net assets | (1.72 | )% | (1.79 | )% | (1.85 | )% | (1.82 | )% | (1.91 | )% | ||||||||||
| Portfolio turnover rate | 55.97 | % | 61.53 | % | 66.84 | % | 64.83 | % | 42.56 | % | ||||||||||
See Notes to Financial Statements.
| (i) | Amount was computed based on average shares outstanding during the period. |
| (ii) | Does not reflect the effect of sales charges, if applicable. |
THE ALGER FUNDS
Financial Highlights for a share outstanding throughout the period
| Alger Weatherbie Specialized Growth Fund | Class I | |||||||||||||||||||
| Year ended 10/31/2022 | Year ended 10/31/2021 | Year ended 10/31/2020 | Year ended 10/31/2019 | Year ended 10/31/2018 | ||||||||||||||||
| Net asset value, beginning of period | $ | 25.67 | $ | 17.94 | $ | 13.64 | $ | 13.38 | $ | 13.14 | ||||||||||
| INCOME FROM INVESTMENT OPERATIONS: | ||||||||||||||||||||
| Net investment loss(i) | (0.14 | ) | (0.23 | ) | (0.16 | ) | (0.14 | ) | (0.16 | ) | ||||||||||
| Net realized and unrealized gain (loss) on investments | (9.20 | ) | 8.93 | 5.02 | 1.43 | 1.94 | ||||||||||||||
| Total from investment operations | (9.34 | ) | 8.70 | 4.86 | 1.29 | 1.78 | ||||||||||||||
| Distributions from net realized gains | (4.34 | ) | (0.97 | ) | (0.56 | ) | (1.03 | ) | (1.54 | ) | ||||||||||
| Net asset value, end of period | $ | 11.99 | $ | 25.67 | $ | 17.94 | $ | 13.64 | $ | 13.38 | ||||||||||
| Total return(ii) | (42.02 | )% | 49.81 | % | 36.69 | % | 11.61 | % | 14.94 | % | ||||||||||
| RATIOS/SUPPLEMENTAL DATA: | ||||||||||||||||||||
| Net assets, end of period (000’s omitted) | $ | 29,612 | $ | 77,214 | $ | 66,294 | $ | 58,615 | $ | 35,669 | ||||||||||
| Ratio of gross expenses to average net assets | 1.25 | % | 1.19 | % | 1.24 | % | 1.26 | % | 1.35 | % | ||||||||||
| Ratio of net expenses to average net assets | 1.25 | % | 1.19 | % | 1.24 | % | 1.26 | % | 1.35 | % | ||||||||||
| Ratio of net investment loss to average net assets | (0.95 | )% | (1.02 | )% | (1.07 | )% | (1.03 | )% | (1.18 | )% | ||||||||||
| Portfolio turnover rate | 55.97 | % | 61.53 | % | 66.84 | % | 64.83 | % | 42.56 | % | ||||||||||
See Notes to Financial Statements.
| (i) | Amount was computed based on average shares outstanding during the period. |
| (ii) | Does not reflect the effect of sales charges, if applicable. |
THE ALGER FUNDS
Financial Highlights for a share outstanding throughout the period
| Alger Weatherbie Specialized Growth Fund | Class Y | |||||||||||||||||||
| Year ended 10/31/2022 | Year ended 10/31/2021 | Year ended 10/31/2020 | Year ended 10/31/2019 | Year ended 10/31/2018 | ||||||||||||||||
| Net asset value, beginning of period | $ | 26.12 | $ | 18.17 | $ | 13.77 | $ | 13.44 | $ | 13.14 | ||||||||||
| INCOME FROM INVESTMENT OPERATIONS: | ||||||||||||||||||||
| Net investment loss(i) | (0.08 | ) | (0.16 | ) | (0.11 | ) | (0.09 | ) | (0.10 | ) | ||||||||||
| Net realized and unrealized gain (loss) on investments | (9.41 | ) | 9.08 | 5.07 | 1.45 | 1.94 | ||||||||||||||
| Total from investment operations | (9.49 | ) | 8.92 | 4.96 | 1.36 | 1.84 | ||||||||||||||
| Distributions from net realized gains | (4.34 | ) | (0.97 | ) | (0.56 | ) | (1.03 | ) | (1.54 | ) | ||||||||||
| Net asset value, end of period | $ | 12.29 | $ | 26.12 | $ | 18.17 | $ | 13.77 | $ | 13.44 | ||||||||||
| Total return(ii) | (41.81 | )% | 50.35 | % | 37.08 | % | 12.12 | % | 15.45 | % | ||||||||||
| RATIOS/SUPPLEMENTAL DATA: | ||||||||||||||||||||
| Net assets, end of period (000’s omitted) | $ | 47,379 | $ | 61,163 | $ | 32,702 | $ | 12,903 | $ | 3,832 | ||||||||||
| Ratio of gross expenses to average net assets | 0.91 | % | 0.89 | % | 0.94 | % | 0.97 | % | 1.05 | % | ||||||||||
| Ratio of expense reimbursements to average net assets | (0.04 | )% | (0.02 | )% | (0.07 | )% | (0.10 | )% | (0.18 | )% | ||||||||||
| Ratio of net expenses to average net assets | 0.87 | % | 0.87 | % | 0.87 | % | 0.87 | % | 0.87 | % | ||||||||||
| Ratio of net investment loss to average net assets | (0.55 | )% | (0.70 | )% | (0.69 | )% | (0.64 | )% | (0.67 | )% | ||||||||||
| Portfolio turnover rate | 55.97 | % | 61.53 | % | 66.84 | % | 64.83 | % | 42.56 | % | ||||||||||
See Notes to Financial Statements.
| (i) | Amount was computed based on average shares outstanding during the period. |
| (ii) | Does not reflect the effect of sales charges, if applicable. |
THE ALGER FUNDS
Financial Highlights for a share outstanding throughout the period
| Alger Weatherbie Specialized Growth Fund | Class Z | |||||||||||||||||||
| Year ended 10/31/2022 | Year ended 10/31/2021 | Year ended 10/31/2020 | Year ended 10/31/2019 | Year ended 10/31/2018 | ||||||||||||||||
| Net asset value, beginning of period | $ | 26.87 | $ | 18.68 | $ | 14.15 | $ | 13.80 | $ | 13.46 | ||||||||||
| INCOME FROM INVESTMENT OPERATIONS: | ||||||||||||||||||||
| Net investment loss(i) | (0.10 | ) | (0.17 | ) | (0.12 | ) | (0.10 | ) | (0.12 | ) | ||||||||||
| Net realized and unrealized gain (loss) on investments | (9.70 | ) | 9.33 | 5.21 | 1.48 | 2.00 | ||||||||||||||
| Total from investment operations | (9.80 | ) | 9.16 | 5.09 | 1.38 | 1.88 | ||||||||||||||
| Distributions from net realized gains | (4.34 | ) | (0.97 | ) | (0.56 | ) | (1.03 | ) | (1.54 | ) | ||||||||||
| Net asset value, end of period | $ | 12.73 | $ | 26.87 | $ | 18.68 | $ | 14.15 | $ | 13.80 | ||||||||||
| Total return(ii) | (41.82 | )% | 50.32 | % | 37.00 | % | 11.94 | % | 15.37 | % | ||||||||||
| RATIOS/SUPPLEMENTAL DATA: | ||||||||||||||||||||
| Net assets, end of period (000’s omitted) | $ | 535,172 | $ | 1,277,576 | $ | 620,005 | $ | 284,393 | $ | 147,665 | ||||||||||
| Ratio of gross expenses to average net assets | 0.91 | % | 0.88 | % | 0.94 | % | 0.97 | % | 1.00 | % | ||||||||||
| Ratio of expense reimbursements to average net assets | — | — | — | — | (0.01 | )% | ||||||||||||||
| Ratio of net expenses to average net assets | 0.91 | % | 0.88 | % | 0.94 | % | 0.97 | % | 0.99 | % | ||||||||||
| Ratio of net investment loss to average net assets | (0.61 | )% | (0.72 | )% | (0.76 | )% | (0.73 | )% | (0.82 | )% | ||||||||||
| Portfolio turnover rate | 55.97 | % | 61.53 | % | 66.84 | % | 64.83 | % | 42.56 | % | ||||||||||
See Notes to Financial Statements.
| (i) | Amount was computed based on average shares outstanding during the period. |
| (ii) | Does not reflect the effect of sales charges, if applicable. |
THE ALGER FUNDS
Financial Highlights for a share outstanding throughout the period
| Alger Small Cap Growth Fund | Class A | |||||||||||||||||||
| Year ended 10/31/2022 | Year ended 10/31/2021 | Year ended 10/31/2020 | Year ended 10/31/2019 | Year ended 10/31/2018 | ||||||||||||||||
| Net asset value, beginning of period | $ | 16.21 | $ | 12.59 | $ | 9.34 | $ | 9.54 | $ | 8.40 | ||||||||||
| INCOME FROM INVESTMENT OPERATIONS: | ||||||||||||||||||||
| Net investment loss(i) | (0.11 | ) | (0.07 | ) | (0.12 | ) | (0.11 | ) | (0.10 | ) | ||||||||||
| Net realized and unrealized gain (loss) on investments | (5.93 | ) | 3.76 | 3.91 | 0.85 | 1.34 | ||||||||||||||
| Total from investment operations | (6.04 | ) | 3.69 | 3.79 | 0.74 | 1.24 | ||||||||||||||
| Distributions from net realized gains | (1.34 | ) | (0.07 | ) | (0.54 | ) | (0.94 | ) | (0.10 | ) | ||||||||||
| Net asset value, end of period | $ | 8.83 | $ | 16.21 | $ | 12.59 | $ | 9.34 | $ | 9.54 | ||||||||||
| Total return(ii) | (39.87 | )% | 29.27 | %(iii) | 42.80 | % | 9.94 | % | 14.94 | % | ||||||||||
| RATIOS/SUPPLEMENTAL DATA: | ||||||||||||||||||||
| Net assets, end of period (000’s omitted) | $ | 142,244 | $ | 262,708 | $ | 187,489 | $ | 116,308 | $ | 111,271 | ||||||||||
| Ratio of gross expenses to average net assets | 1.29 | % | 1.23 | % | 1.33 | % | 1.39 | % | 1.38 | % | ||||||||||
| Ratio of net expenses to average net assets | 1.29 | % | 1.23 | % | 1.33 | % | 1.39 | % | 1.38 | % | ||||||||||
| Ratio of net investment loss to average net assets | (1.01 | )% | (0.46 | )% | (1.11 | )% | (1.17 | )% | (1.06 | )% | ||||||||||
| Portfolio turnover rate | 15.44 | % | 34.85 | % | 12.67 | % | 17.09 | % | 28.68 | % | ||||||||||
See Notes to Financial Statements.
| (i) | Amount was computed based on average shares outstanding during the period. |
| (ii) | Does not reflect the effect of sales charges, if applicable. |
| (iii) | Pursuant to the U.S. Securities and Exchange Commission’s Rules on Fair Fund and Disgorgement Plans, the Alger Small Cap Growth Fund received a Fair Fund distribution of $3,738,004, which contributed approximately 0.72% to its annual return. |
THE ALGER FUNDS
Financial Highlights for a share outstanding throughout the period
| Alger Small Cap Growth Fund | Class B | |||||||||||||||||||
| Year ended 10/31/2022 | Year ended 10/31/2021 | Year ended 10/31/2020 | Year ended 10/31/2019 | Year ended 10/31/2018 | ||||||||||||||||
| Net asset value, beginning of period | $ | 11.41 | $ | 8.88 | $ | 6.74 | $ | 7.20 | $ | 6.42 | ||||||||||
| INCOME FROM INVESTMENT OPERATIONS: | ||||||||||||||||||||
| Net investment loss(i) | (0.08 | ) | (0.05 | ) | (0.08 | ) | (0.11 | ) | (0.13 | ) | ||||||||||
| Net realized and unrealized gain (loss) on investments | (4.05 | ) | 2.65 | 2.76 | 0.59 | 1.01 | ||||||||||||||
| Total from investment operations | (4.13 | ) | 2.60 | 2.68 | 0.48 | 0.88 | ||||||||||||||
| Distributions from net realized gains | (1.34 | ) | (0.07 | ) | (0.54 | ) | (0.94 | ) | (0.10 | ) | ||||||||||
| Net asset value, end of period | $ | 5.94 | $ | 11.41 | $ | 8.88 | $ | 6.74 | $ | 7.20 | ||||||||||
| Total return(ii) | (39.91 | )% | 29.38 | %(iii) | 42.68 | % | 9.51 | % | 13.93 | % | ||||||||||
| RATIOS/SUPPLEMENTAL DATA: | ||||||||||||||||||||
| Net assets, end of period (000’s omitted) | $ | 3,038 | $ | 5,821 | $ | 5,095 | $ | 4,523 | $ | 4,958 | ||||||||||
| Ratio of gross expenses to average net assets | 2.00 | % | 1.96 | % | 2.07 | % | 2.19 | % | 2.23 | % | ||||||||||
| Ratio of expense reimbursements to average net assets | (0.64 | )% | (0.74 | )% | (0.73 | )% | (0.41 | )% | — | |||||||||||
| Ratio of net expenses to average net assets | 1.36 | % | 1.22 | % | 1.34 | % | 1.78 | % | 2.23 | % | ||||||||||
| Ratio of net investment loss to average net assets | (1.09 | )% | (0.48 | )% | (1.11 | )% | (1.57 | )% | (1.90 | )% | ||||||||||
| Portfolio turnover rate | 15.44 | % | 34.85 | % | 12.67 | % | 17.09 | % | 28.68 | % | ||||||||||
See Notes to Financial Statements.
| (i) | Amount was computed based on average shares outstanding during the period. |
| (ii) | Does not reflect the effect of sales charges, if applicable. |
| (iii) | Pursuant to the U.S. Securities and Exchange Commission’s Rules on Fair Fund and Disgorgement Plans, the Alger Small Cap Growth Fund received a Fair Fund distribution of $3,738,004, which contributed approximately 0.72% to its annual return. |
THE ALGER FUNDS
Financial Highlights for a share outstanding throughout the period
| Alger Small Cap Growth Fund | Class C | |||||||||||||||||||
| Year ended 10/31/2022 | Year ended 10/31/2021 | Year ended 10/31/2020 | Year ended 10/31/2019 | Year ended 10/31/2018 | ||||||||||||||||
| Net asset value, beginning of period | $ | 10.76 | $ | 8.44 | $ | 6.47 | $ | 6.99 | $ | 6.22 | ||||||||||
| INCOME FROM INVESTMENT OPERATIONS: | ||||||||||||||||||||
| Net investment loss(i) | (0.12 | ) | (0.13 | ) | (0.14 | ) | (0.13 | ) | (0.12 | ) | ||||||||||
| Net realized and unrealized gain (loss) on investments | (3.79 | ) | 2.52 | 2.65 | 0.55 | 0.99 | ||||||||||||||
| Total from investment operations | (3.91 | ) | 2.39 | 2.51 | 0.42 | 0.87 | ||||||||||||||
| Distributions from net realized gains | (1.34 | ) | (0.07 | ) | (0.54 | ) | (0.94 | ) | (0.10 | ) | ||||||||||
| Net asset value, end of period | $ | 5.51 | $ | 10.76 | $ | 8.44 | $ | 6.47 | $ | 6.99 | ||||||||||
| Total return(ii) | (40.32 | )% | 28.41 | %(iii) | 41.76 | % | 8.87 | % | 14.22 | % | ||||||||||
| RATIOS/SUPPLEMENTAL DATA: | ||||||||||||||||||||
| Net assets, end of period (000’s omitted) | $ | 21,105 | $ | 39,148 | $ | 18,365 | $ | 6,257 | $ | 5,837 | ||||||||||
| Ratio of gross expenses to average net assets | 2.09 | % | 2.00 | % | 2.09 | % | 2.20 | % | 2.16 | % | ||||||||||
| Ratio of net expenses to average net assets | 2.09 | % | 2.00 | % | 2.09 | % | 2.20 | % | 2.16 | % | ||||||||||
| Ratio of net investment loss to average net assets | (1.81 | )% | (1.21 | )% | (1.90 | )% | (1.98 | )% | (1.82 | )% | ||||||||||
| Portfolio turnover rate | 15.44 | % | 34.85 | % | 12.67 | % | 17.09 | % | 28.68 | % | ||||||||||
See Notes to Financial Statements.
| (i) | Amount was computed based on average shares outstanding during the period. |
| (ii) | Does not reflect the effect of sales charges, if applicable. |
| (iii) | Pursuant to the U.S. Securities and Exchange Commission’s Rules on Fair Fund and Disgorgement Plans, the Alger Small Cap Growth Fund received a Fair Fund distribution of $3,738,004, which contributed approximately 0.72% to its annual return. |
THE ALGER FUNDS
Financial Highlights for a share outstanding throughout the period
| Alger Small Cap Growth Fund | Class Y | |||
| From 12/31/2021 (commencement of operations) to 10/31/2022(i) | ||||
| Net asset value, beginning of period | $ | 13.84 | ||
| INCOME FROM INVESTMENT OPERATIONS: | ||||
| Net investment loss(ii) | (0.04 | ) | ||
| Net realized and unrealized loss on investments | (4.49 | ) | ||
| Total from investment operations | (4.53 | ) | ||
| Net asset value, end of period | $ | 9.31 | ||
| Total return(iii) | (32.73 | )% | ||
| RATIOS/SUPPLEMENTAL DATA: | ||||
| Net assets, end of period (000’s omitted) | $ | 8,050 | ||
| Ratio of gross expenses to average net assets | 0.96 | % | ||
| Ratio of expense reimbursements to average net assets | (0.12 | )% | ||
| Ratio of net expenses to average net assets | 0.84 | % | ||
| Ratio of net investment loss to average net assets | (0.44 | )% | ||
| Portfolio turnover rate | 15.44 | % | ||
See Notes to Financial Statements.
| (i) | Ratios have been annualized; total return has not been annualized; portfolio turnover is for the twelve months then ended. |
| (ii) | Amount was computed based on average shares outstanding during the period. |
| (iii) | Does not reflect the effect of sales charges, if applicable. |
THE ALGER FUNDS
Financial Highlights for a share outstanding throughout the period
| Alger Small Cap Growth Fund | Class Z | |||||||||||||||||||
| Year ended 10/31/2022 | Year ended 10/31/2021 | Year ended 10/31/2020 | Year ended 10/31/2019 | Year ended 10/31/2018 | ||||||||||||||||
| Net asset value, beginning of period | $ | 16.92 | $ | 13.10 | $ | 9.66 | $ | 9.80 | $ | 8.60 | ||||||||||
| INCOME FROM INVESTMENT OPERATIONS: | ||||||||||||||||||||
| Net investment loss(i) | (0.08 | ) | (0.02 | ) | (0.10 | ) | (0.07 | ) | (0.06 | ) | ||||||||||
| Net realized and unrealized gain (loss) on investments | (6.21 | ) | 3.91 | 4.08 | 0.87 | 1.36 | ||||||||||||||
| Total from investment operations | (6.29 | ) | 3.89 | 3.98 | 0.80 | 1.30 | ||||||||||||||
| Distributions from net realized gains | (1.34 | ) | (0.07 | ) | (0.54 | ) | (0.94 | ) | (0.10 | ) | ||||||||||
| Net asset value, end of period | $ | 9.29 | $ | 16.92 | $ | 13.10 | $ | 9.66 | $ | 9.80 | ||||||||||
| Total return(ii) | (39.66 | )% | 29.66 | %(iii) | 43.38 | % | 10.33 | % | 15.30 | % | ||||||||||
| RATIOS/SUPPLEMENTAL DATA: | ||||||||||||||||||||
| Net assets, end of period (000’s omitted) | $ | 214,819 | $ | 383,748 | $ | 179,276 | $ | 21,782 | $ | 13,179 | ||||||||||
| Ratio of gross expenses to average net assets | 0.96 | % | 0.93 | % | 1.00 | % | 1.12 | % | 1.12 | % | ||||||||||
| Ratio of expense reimbursements to average net assets | — | — | (0.03 | )% | (0.13 | )% | (0.13 | )% | ||||||||||||
| Ratio of net expenses to average net assets | 0.96 | % | 0.93 | % | 0.97 | % | 0.99 | % | 0.99 | % | ||||||||||
| Ratio of net investment loss to average net assets | (0.68 | )% | (0.12 | )% | (0.81 | )% | (0.78 | )% | (0.65 | )% | ||||||||||
| Portfolio turnover rate | 15.44 | % | 34.85 | % | 12.67 | % | 17.09 | % | 28.68 | % | ||||||||||
See Notes to Financial Statements.
| (i) | Amount was computed based on average shares outstanding during the period. |
| (ii) | Does not reflect the effect of sales charges, if applicable. |
| (iii) | Pursuant to the U.S. Securities and Exchange Commission’s Rules on Fair Fund and Disgorgement Plans, the Alger Small Cap Growth Fund received a Fair Fund distribution of $3,738,004, which contributed approximately 0.72% to its annual return. |
THE ALGER FUNDS
Financial Highlights for a share outstanding throughout the period
| Alger Small Cap Focus Fund | Class A | |||||||||||||||||||
| Year ended 10/31/2022 | Year ended 10/31/2021 | Year ended 10/31/2020 | Year ended 10/31/2019 | Year ended 10/31/2018 | ||||||||||||||||
| Net asset value, beginning of period | $ | 31.74 | $ | 26.22 | $ | 19.93 | $ | 18.86 | $ | 14.91 | ||||||||||
| INCOME FROM INVESTMENT OPERATIONS: | ||||||||||||||||||||
| Net investment loss(i) | (0.19 | ) | (0.31 | ) | (0.25 | ) | (0.19 | ) | (0.17 | ) | ||||||||||
| Net realized and unrealized gain (loss) on investments | (12.84 | ) | 5.83 | 7.03 | 1.41 | 4.26 | ||||||||||||||
| Total from investment operations | (13.03 | ) | 5.52 | 6.78 | 1.22 | 4.09 | ||||||||||||||
| Dividends from net investment income | — | — | (0.19 | ) | — | — | ||||||||||||||
| Distributions from net realized gains | (1.80 | ) | — | (0.30 | ) | (0.15 | ) | (0.14 | ) | |||||||||||
| Net asset value, end of period | $ | 16.91 | $ | 31.74 | $ | 26.22 | $ | 19.93 | $ | 18.86 | ||||||||||
| Total return(ii) | (42.88 | )% | 21.05 | % | 34.74 | % | 6.59 | % | 27.72 | % | ||||||||||
| RATIOS/SUPPLEMENTAL DATA: | ||||||||||||||||||||
| Net assets, end of period (000’s omitted) | $ | 226,738 | $ | 560,577 | $ | 566,606 | $ | 523,291 | $ | 300,066 | ||||||||||
| Ratio of gross expenses to average net assets | 1.32 | % | 1.18 | % | 1.22 | % | 1.19 | % | 1.18 | % | ||||||||||
| Ratio of net expenses to average net assets | 1.32 | % | 1.18 | % | 1.22 | % | 1.19 | % | 1.18 | % | ||||||||||
| Ratio of net investment loss to average net assets | (0.96 | )% | (0.98 | )% | (1.11 | )% | (0.95 | )% | (0.92 | )% | ||||||||||
| Portfolio turnover rate | 37.57 | % | 56.71 | % | 37.49 | % | 48.84 | % | 27.04 | % | ||||||||||
See Notes to Financial Statements.
| (i) | Amount was computed based on average shares outstanding during the period. |
| (ii) | Does not reflect the effect of sales charges, if applicable. |
THE ALGER FUNDS
Financial Highlights for a share outstanding throughout the period
| Alger Small Cap Focus Fund | Class C | |||||||||||||||||||
| Year ended 10/31/2022 | Year ended 10/31/2021 | Year ended 10/31/2020 | Year ended 10/31/2019 | Year ended 10/31/2018 | ||||||||||||||||
| Net asset value, beginning of period | $ | 28.12 | $ | 23.40 | $ | 17.85 | $ | 17.04 | $ | 13.58 | ||||||||||
| INCOME FROM INVESTMENT OPERATIONS: | ||||||||||||||||||||
| Net investment loss(i) | (0.28 | ) | (0.47 | ) | (0.37 | ) | (0.31 | ) | (0.27 | ) | ||||||||||
| Net realized and unrealized gain (loss) on investments | (11.29 | ) | 5.19 | 6.30 | 1.27 | 3.87 | ||||||||||||||
| Total from investment operations | (11.57 | ) | 4.72 | 5.93 | 0.96 | 3.60 | ||||||||||||||
| Dividends from net investment income | — | — | (0.08 | ) | — | — | ||||||||||||||
| Distributions from net realized gains | (1.80 | ) | — | (0.30 | ) | (0.15 | ) | (0.14 | ) | |||||||||||
| Net asset value, end of period | $ | 14.75 | $ | 28.12 | $ | 23.40 | $ | 17.85 | $ | 17.04 | ||||||||||
| Total return(ii) | (43.23 | )% | 20.17 | % | 33.85 | % | 5.76 | % | 26.82 | % | ||||||||||
| RATIOS/SUPPLEMENTAL DATA: | ||||||||||||||||||||
| Net assets, end of period (000’s omitted) | $ | 108,988 | $ | 267,800 | $ | 248,577 | $ | 212,737 | $ | 131,655 | ||||||||||
| Ratio of gross expenses to average net assets | 1.93 | % | 1.90 | % | 1.94 | % | 1.95 | % | 1.94 | % | ||||||||||
| Ratio of net expenses to average net assets | 1.93 | % | 1.90 | % | 1.94 | % | 1.95 | % | 1.94 | % | ||||||||||
| Ratio of net investment loss to average net assets | (1.57 | )% | (1.70 | )% | (1.83 | )% | (1.71 | )% | (1.66 | )% | ||||||||||
| Portfolio turnover rate | 37.57 | % | 56.71 | % | 37.49 | % | 48.84 | % | 27.04 | % | ||||||||||
See Notes to Financial Statements.
| (i) | Amount was computed based on average shares outstanding during the period. |
| (ii) | Does not reflect the effect of sales charges, if applicable. |
THE ALGER FUNDS
Financial Highlights for a share outstanding throughout the period
| Alger Small Cap Focus Fund | Class I | |||||||||||||||||||
| Year ended 10/31/2022 | Year ended 10/31/2021 | Year ended 10/31/2020 | Year ended 10/31/2019 | Year ended 10/31/2018 | ||||||||||||||||
| Net asset value, beginning of period | $ | 32.61 | $ | 26.93 | $ | 20.44 | $ | 19.34 | $ | 15.28 | ||||||||||
| INCOME FROM INVESTMENT OPERATIONS: | ||||||||||||||||||||
| Net investment loss(i) | (0.18 | ) | (0.31 | ) | (0.24 | ) | (0.19 | ) | (0.17 | ) | ||||||||||
| Net realized and unrealized gain (loss) on investments | (13.19 | ) | 5.99 | 7.22 | 1.44 | 4.37 | ||||||||||||||
| Total from investment operations | (13.37 | ) | 5.68 | 6.98 | 1.25 | 4.20 | ||||||||||||||
| Dividends from net investment income | — | — | (0.19 | ) | — | — | ||||||||||||||
| Distributions from net realized gains | (1.80 | ) | — | (0.30 | ) | (0.15 | ) | (0.14 | ) | |||||||||||
| Net asset value, end of period | $ | 17.44 | $ | 32.61 | $ | 26.93 | $ | 20.44 | $ | 19.34 | ||||||||||
| Total return(ii) | (42.77 | )% | 21.09 | % | 34.86 | % | 6.58 | % | 27.77 | % | ||||||||||
| RATIOS/SUPPLEMENTAL DATA: | ||||||||||||||||||||
| Net assets, end of period (000’s omitted) | $ | 144,513 | $ | 421,986 | $ | 360,756 | $ | 455,937 | $ | 340,636 | ||||||||||
| Ratio of gross expenses to average net assets | 1.18 | % | 1.14 | % | 1.15 | % | 1.18 | % | 1.17 | % | ||||||||||
| Ratio of net expenses to average net assets | 1.18 | % | 1.14 | % | 1.15 | % | 1.18 | % | 1.17 | % | ||||||||||
| Ratio of net investment loss to average net assets | (0.83 | )% | (0.95 | )% | (1.04 | )% | (0.93 | )% | (0.90 | )% | ||||||||||
| Portfolio turnover rate | 37.57 | % | 56.71 | % | 37.49 | % | 48.84 | % | 27.04 | % | ||||||||||
See Notes to Financial Statements.
| (i) | Amount was computed based on average shares outstanding during the period. |
| (ii) | Does not reflect the effect of sales charges, if applicable. |
THE ALGER FUNDS
Financial Highlights for a share outstanding throughout the period
| Alger Small Cap Focus Fund | Class Y | |||||||||||||||||||
| Year ended 10/31/2022 | Year ended 10/31/2021 | Year ended 10/31/2020 | Year ended 10/31/2019 | Year ended 10/31/2018 | ||||||||||||||||
| Net asset value, beginning of period | $ | 33.29 | $ | 27.41 | $ | 20.79 | $ | 19.60 | $ | 15.44 | ||||||||||
| INCOME FROM INVESTMENT OPERATIONS: | ||||||||||||||||||||
| Net investment loss(i) | (0.09 | ) | (0.21 | ) | (0.18 | ) | (0.14 | ) | (0.12 | ) | ||||||||||
| Net realized and unrealized gain (loss) on investments | (13.51 | ) | 6.09 | 7.36 | 1.48 | 4.42 | ||||||||||||||
| Total from investment operations | (13.60 | ) | 5.88 | 7.18 | 1.34 | 4.30 | ||||||||||||||
| Dividends from net investment income | — | — | (0.26 | ) | — | — | ||||||||||||||
| Distributions from net realized gains | (1.80 | ) | — | (0.30 | ) | (0.15 | ) | (0.14 | ) | |||||||||||
| Net asset value, end of period | $ | 17.89 | $ | 33.29 | $ | 27.41 | $ | 20.79 | $ | 19.60 | ||||||||||
| Total return(ii) | (42.58 | )% | 21.45 | % | 35.32 | % | 6.96 | % | 28.13 | % | ||||||||||
| RATIOS/SUPPLEMENTAL DATA: | ||||||||||||||||||||
| Net assets, end of period (000’s omitted) | $ | 257,064 | $ | 394,801 | $ | 266,570 | $ | 94,694 | $ | 25,691 | ||||||||||
| Ratio of gross expenses to average net assets | 0.85 | % | 0.83 | % | 0.84 | % | 0.87 | % | 0.88 | % | ||||||||||
| Ratio of expense reimbursements to average net assets | — | — | — | (iii) | (0.02 | )% | — | |||||||||||||
| Ratio of net expenses to average net assets | 0.85 | % | 0.83 | % | 0.84 | % | 0.85 | % | 0.88 | % | ||||||||||
| Ratio of net investment loss to average net assets | (0.46 | )% | (0.65 | )% | (0.74 | )% | (0.64 | )% | (0.63 | )% | ||||||||||
| Portfolio turnover rate | 37.57 | % | 56.71 | % | 37.49 | % | 48.84 | % | 27.04 | % | ||||||||||
See Notes to Financial Statements.
| (i) | Amount was computed based on average shares outstanding during the period. |
| (ii) | Does not reflect the effect of sales charges, if applicable. |
| (iii) | Amount was more than (0.005)% per share. |
THE ALGER FUNDS
Financial Highlights for a share outstanding throughout the period
| Alger Small Cap Focus Fund | Class Z | |||||||||||||||||||
| Year ended 10/31/2022 | Year ended 10/31/2021 | Year ended 10/31/2020 | Year ended 10/31/2019 | Year ended 10/31/2018 | ||||||||||||||||
| Net asset value, beginning of period | $ | 33.29 | $ | 27.41 | $ | 20.79 | $ | 19.60 | $ | 15.44 | ||||||||||
| INCOME FROM INVESTMENT OPERATIONS: | ||||||||||||||||||||
| Net investment loss(i) | (0.10 | ) | (0.21 | ) | (0.18 | ) | (0.13 | ) | (0.12 | ) | ||||||||||
| Net realized and unrealized gain (loss) on investments | (13.51 | ) | 6.09 | 7.36 | 1.47 | 4.42 | ||||||||||||||
| Total from investment operations | (13.61 | ) | 5.88 | 7.18 | 1.34 | 4.30 | ||||||||||||||
| Dividends from net investment income | — | — | (0.26 | ) | — | — | ||||||||||||||
| Distributions from net realized gains | (1.80 | ) | — | (0.30 | ) | (0.15 | ) | (0.14 | ) | |||||||||||
| Net asset value, end of period | $ | 17.88 | $ | 33.29 | $ | 27.41 | $ | 20.79 | $ | 19.60 | ||||||||||
| Total return(ii) | (42.61 | )% | 21.45 | % | 35.30 | % | 6.96 | % | 28.13 | % | ||||||||||
| RATIOS/SUPPLEMENTAL DATA: | ||||||||||||||||||||
| Net assets, end of period (000’s omitted) | $ | 2,192,139 | $ | 6,195,714 | $ | 4,499,832 | $ | 2,459,793 | $ | 1,329,712 | ||||||||||
| Ratio of gross expenses to average net assets | 0.84 | % | 0.83 | % | 0.85 | % | 0.86 | % | 0.87 | % | ||||||||||
| Ratio of net expenses to average net assets | 0.84 | % | 0.83 | % | 0.85 | % | 0.86 | % | 0.87 | % | ||||||||||
| Ratio of net investment loss to average net assets | (0.49 | )% | (0.65 | )% | (0.74 | )% | (0.62 | )% | (0.61 | )% | ||||||||||
| Portfolio turnover rate | 37.57 | % | 56.71 | % | 37.49 | % | 48.84 | % | 27.04 | % | ||||||||||
See Notes to Financial Statements.
| (i) | Amount was computed based on average shares outstanding during the period. |
| (ii) | Does not reflect the effect of sales charges, if applicable. |
THE ALGER FUNDS
Financial Highlights for a share outstanding throughout the period
| Alger International Focus Fund | Class A | |||||||||||||||||||
| Year ended 10/31/2022 | Year ended 10/31/2021 | Year ended 10/31/2020 | Year ended 10/31/2019 | Year ended 10/31/2018 | ||||||||||||||||
| Net asset value, beginning of period | $ | 25.12 | $ | 18.67 | $ | 15.51 | $ | 14.30 | $ | 17.58 | ||||||||||
| INCOME FROM INVESTMENT OPERATIONS: | ||||||||||||||||||||
| Net investment income (loss)(i) | (0.10 | ) | (0.11 | ) | (0.06 | ) | (0.02 | ) | 0.06 | |||||||||||
| Net realized and unrealized gain (loss) on investments | (7.82 | ) | 6.56 | 3.91 | 1.66 | (2.46 | ) | |||||||||||||
| Total from investment operations | (7.92 | ) | 6.45 | 3.85 | 1.64 | (2.40 | ) | |||||||||||||
| Dividends from net investment income | — | — | (0.69 | ) | (0.43 | ) | (0.88 | ) | ||||||||||||
| Distributions from net realized gains | (1.97 | ) | — | — | — | — | ||||||||||||||
| Net asset value, end of period | $ | 15.23 | $ | 25.12 | $ | 18.67 | $ | 15.51 | $ | 14.30 | ||||||||||
| Total return(ii) | (34.27 | )% | 34.87 | %(iii) | 25.69 | % | 11.99 | % | (14.35 | )% | ||||||||||
| RATIOS/SUPPLEMENTAL DATA: | ||||||||||||||||||||
| Net assets, end of period (000’s omitted) | $ | 100,262 | $ | 158,223 | $ | 120,832 | $ | 100,814 | $ | 98,105 | ||||||||||
| Ratio of gross expenses to average net assets | 1.27 | % | 1.22 | % | 1.34 | % | 1.37 | % | 1.29 | % | ||||||||||
| Ratio of net expenses to average net assets | 1.27 | % | 1.22 | % | 1.34 | % | 1.37 | % | 1.29 | % | ||||||||||
| Ratio of net investment income (loss) to average net assets | (0.53 | )% | (0.49 | )% | (0.37 | )% | (0.11 | )% | 0.38 | % | ||||||||||
| Portfolio turnover rate | 49.36 | % | 75.27 | % | 105.22 | % | 151.99 | % | 207.22 | % | ||||||||||
See Notes to Financial Statements.
| (i) | Amount was computed based on average shares outstanding during the period. |
| (ii) | Does not reflect the effect of sales charges, if applicable. |
| (iii) | Pursuant to the U.S. Securities and Exchange Commission’s Rules on Fair Fund and Disgorgement Plans, the Alger International Focus Fund received a Fair Fund distribution of $159,091, which contributed approximately 0.11% to its annual return. |
THE ALGER FUNDS
Financial Highlights for a share outstanding throughout the period
| Alger International Focus Fund | Class B | |||||||||||||||||||
| Year ended 10/31/2022 | Year ended 10/31/2021 | Year ended 10/31/2020 | Year ended 10/31/2019 | Year ended 10/31/2018 | ||||||||||||||||
| Net asset value, beginning of period | $ | 21.81 | $ | 16.19 | $ | 13.44 | $ | 12.38 | $ | 15.35 | ||||||||||
| INCOME FROM INVESTMENT OPERATIONS: | ||||||||||||||||||||
| Net investment loss(i) | (0.09 | ) | (0.08 | ) | (0.02 | ) | (0.04 | ) | (0.06 | ) | ||||||||||
| Net realized and unrealized gain (loss) on investments | (6.71 | ) | 5.70 | 3.38 | 1.44 | (2.13 | ) | |||||||||||||
| Total from investment operations | (6.80 | ) | 5.62 | 3.36 | 1.40 | (2.19 | ) | |||||||||||||
| Dividends from net investment income | — | — | (0.61 | ) | (0.34 | ) | (0.78 | ) | ||||||||||||
| Distributions from net realized gains | (1.97 | ) | — | — | — | — | ||||||||||||||
| Net asset value, end of period | $ | 13.04 | $ | 21.81 | $ | 16.19 | $ | 13.44 | $ | 12.38 | ||||||||||
| Total return(ii) | (34.30 | )% | 35.02 | %(iii) | 25.83 | % | 11.82 | % | (15.00 | )% | ||||||||||
| RATIOS/SUPPLEMENTAL DATA: | ||||||||||||||||||||
| Net assets, end of period (000’s omitted) | $ | 13,200 | $ | 22,147 | $ | 18,427 | $ | 17,646 | $ | 17,639 | ||||||||||
| Ratio of gross expenses to average net assets | 1.97 | % | 1.94 | % | 2.05 | % | 2.09 | % | 2.01 | % | ||||||||||
| Ratio of expense reimbursements to average net assets | (0.69 | )% | (0.82 | )% | (0.88 | )% | (0.51 | )% | — | |||||||||||
| Ratio of net expenses to average net assets | 1.28 | % | 1.12 | % | 1.17 | % | 1.58 | % | 2.01 | % | ||||||||||
| Ratio of net investment loss to average net assets | (0.54 | )% | (0.39 | )% | (0.18 | )% | (0.30 | )% | (0.40 | )% | ||||||||||
| Portfolio turnover rate | 49.36 | % | 75.27 | % | 105.22 | % | 151.99 | % | 207.22 | % | ||||||||||
See Notes to Financial Statements.
| (i) | Amount was computed based on average shares outstanding during the period. |
| (ii) | Does not reflect the effect of sales charges, if applicable. |
| (iii) | Pursuant to the U.S. Securities and Exchange Commission’s Rules on Fair Fund and Disgorgement Plans, the Alger International Focus Fund received a Fair Fund distribution of $159,091, which contributed approximately 0.11% to its annual return. |
THE ALGER FUNDS
Financial Highlights for a share outstanding throughout the period
| Alger International Focus Fund | Class C | |||||||||||||||||||
| Year ended 10/31/2022 | Year ended 10/31/2021 | Year ended 10/31/2020 | Year ended 10/31/2019 | Year ended 10/31/2018 | ||||||||||||||||
| Net asset value, beginning of period | $ | 20.94 | $ | 15.68 | $ | 13.11 | $ | 12.07 | $ | 14.98 | ||||||||||
| INCOME FROM INVESTMENT OPERATIONS: | ||||||||||||||||||||
| Net investment loss(i) | (0.22 | ) | (0.24 | ) | (0.15 | ) | (0.12 | ) | (0.06 | ) | ||||||||||
| Net realized and unrealized gain (loss) on investments | (6.38 | ) | 5.50 | 3.29 | 1.41 | (2.09 | ) | |||||||||||||
| Total from investment operations | (6.60 | ) | 5.26 | 3.14 | 1.29 | (2.15 | ) | |||||||||||||
| Dividends from net investment income | — | — | (0.57 | ) | (0.25 | ) | (0.76 | ) | ||||||||||||
| Distributions from net realized gains | (1.97 | ) | — | — | — | — | ||||||||||||||
| Net asset value, end of period | $ | 12.37 | $ | 20.94 | $ | 15.68 | $ | 13.11 | $ | 12.07 | ||||||||||
| Total return(ii) | (34.82 | )% | 33.86 | %(iii) | 24.68 | % | 11.07 | % | (15.08 | )% | ||||||||||
| RATIOS/SUPPLEMENTAL DATA: | ||||||||||||||||||||
| Net assets, end of period (000’s omitted) | $ | 1,594 | $ | 4,368 | $ | 2,760 | $ | 3,603 | $ | 4,712 | ||||||||||
| Ratio of gross expenses to average net assets | 2.09 | % | 1.97 | % | 2.13 | % | 2.23 | % | 2.09 | % | ||||||||||
| Ratio of net expenses to average net assets | 2.09 | % | 1.97 | % | 2.13 | % | 2.23 | % | 2.09 | % | ||||||||||
| Ratio of net investment loss to average net assets | (1.40 | )% | (1.23 | )% | (1.13 | )% | (0.99 | )% | (0.41 | )% | ||||||||||
| Portfolio turnover rate | 49.36 | % | 75.27 | % | 105.22 | % | 151.99 | % | 207.22 | % | ||||||||||
See Notes to Financial Statements.
| (i) | Amount was computed based on average shares outstanding during the period. |
| (ii) | Does not reflect the effect of sales charges, if applicable. |
| (iii) | Pursuant to the U.S. Securities and Exchange Commission’s Rules on Fair Fund and Disgorgement Plans, the Alger International Focus Fund received a Fair Fund distribution of $159,091, which contributed approximately 0.11% to its annual return. |
THE ALGER FUNDS
Financial Highlights for a share outstanding throughout the period
| Alger International Focus Fund | Class I | |||||||||||||||||||
| Year ended 10/31/2022 | Year ended 10/31/2021 | Year ended 10/31/2020 | Year ended 10/31/2019 | Year ended 10/31/2018 | ||||||||||||||||
| Net asset value, beginning of period | $ | 25.20 | $ | 18.72 | $ | 15.54 | $ | 14.31 | $ | 17.54 | ||||||||||
| INCOME FROM INVESTMENT OPERATIONS: | ||||||||||||||||||||
| Net investment income (loss)(i) | (0.08 | ) | (0.10 | ) | (0.02 | ) | 0.01 | 0.09 | ||||||||||||
| Net realized and unrealized gain (loss) on investments | (7.87 | ) | 6.58 | 3.93 | 1.67 | (2.48 | ) | |||||||||||||
| Total from investment operations | (7.95 | ) | 6.48 | 3.91 | 1.68 | (2.39 | ) | |||||||||||||
| Dividends from net investment income | — | — | (0.73 | ) | (0.45 | ) | (0.84 | ) | ||||||||||||
| Distributions from net realized gains | (1.97 | ) | — | — | — | — | ||||||||||||||
| Net asset value, end of period | $ | 15.28 | $ | 25.20 | $ | 18.72 | $ | 15.54 | $ | 14.31 | ||||||||||
| Total return(ii) | (34.28 | )% | 34.94 | %(iii) | 25.98 | % | 12.41 | % | (14.27 | )% | ||||||||||
| RATIOS/SUPPLEMENTAL DATA: | ||||||||||||||||||||
| Net assets, end of period (000’s omitted) | $ | 1,061 | $ | 591 | $ | 642 | $ | 970 | $ | 2,156 | ||||||||||
| Ratio of gross expenses to average net assets | 1.30 | % | 1.24 | % | 1.34 | % | 1.48 | % | 1.19 | % | ||||||||||
| Ratio of expense reimbursements to average net assets | (0.05 | )% | (0.05 | )% | (0.27 | )% | (0.36 | )% | (0.04 | )% | ||||||||||
| Ratio of net expenses to average net assets | 1.25 | % | 1.19 | % | 1.07 | % | 1.12 | % | 1.15 | % | ||||||||||
| Ratio of net investment income (loss) to average net assets | (0.44 | )% | (0.45 | )% | (0.10 | )% | 0.06 | % | 0.51 | % | ||||||||||
| Portfolio turnover rate | 49.36 | % | 75.27 | % | 105.22 | % | 151.99 | % | 207.22 | % | ||||||||||
See Notes to Financial Statements.
| (i) | Amount was computed based on average shares outstanding during the period. |
| (ii) | Does not reflect the effect of sales charges, if applicable. |
| (iii) | Pursuant to the U.S. Securities and Exchange Commission’s Rules on Fair Fund and Disgorgement Plans, the Alger International Focus Fund received a Fair Fund distribution of $159,091, which contributed approximately 0.11% to its annual return. |
THE ALGER FUNDS
Financial Highlights for a share outstanding throughout the period
| Alger International Focus Fund | Class Z | |||||||||||||||||||
| Year ended 10/31/2022 | Year ended 10/31/2021 | Year ended 10/31/2020 | Year ended 10/31/2019 | Year ended 10/31/2018 | ||||||||||||||||
| Net asset value, beginning of period | $ | 25.52 | $ | 18.90 | $ | 15.69 | $ | 14.46 | $ | 17.77 | ||||||||||
| INCOME FROM INVESTMENT OPERATIONS: | ||||||||||||||||||||
| Net investment income (loss)(i) | (0.02 | ) | (0.03 | ) | — | (ii) | 0.05 | 0.12 | ||||||||||||
| Net realized and unrealized gain (loss) on investments | (7.98 | ) | 6.65 | 3.98 | 1.67 | (2.48 | ) | |||||||||||||
| Total from investment operations | (8.00 | ) | 6.62 | 3.98 | 1.72 | (2.36 | ) | |||||||||||||
| Dividends from net investment income | — | — | (0.77 | ) | (0.49 | ) | (0.95 | ) | ||||||||||||
| Distributions from net realized gains | (1.97 | ) | — | — | — | — | ||||||||||||||
| Net asset value, end of period | $ | 15.55 | $ | 25.52 | $ | 18.90 | $ | 15.69 | $ | 14.46 | ||||||||||
| Total return(iii) | (34.03 | )% | 35.34 | %(iv) | 26.23 | % | 12.64 | % | (14.03 | )% | ||||||||||
| RATIOS/SUPPLEMENTAL DATA: | ||||||||||||||||||||
| Net assets, end of period (000’s omitted) | $ | 14,528 | $ | 28,264 | $ | 12,621 | $ | 13,462 | $ | 14,597 | ||||||||||
| Ratio of gross expenses to average net assets | 0.95 | % | 0.92 | % | 1.02 | % | 1.10 | % | 1.01 | % | ||||||||||
| Ratio of expense reimbursements to average net assets | (0.09 | )% | (0.03 | )% | (0.13 | )% | (0.21 | )% | (0.12 | )% | ||||||||||
| Ratio of net expenses to average net assets | 0.86 | % | 0.89 | % | 0.89 | % | 0.89 | % | 0.89 | % | ||||||||||
| Ratio of net investment income (loss) to average net assets | (0.13 | )% | (0.13 | )% | 0.01 | % | 0.36 | % | 0.71 | % | ||||||||||
| Portfolio turnover rate | 49.36 | % | 75.27 | % | 105.22 | % | 151.99 | % | 207.22 | % | ||||||||||
See Notes to Financial Statements.
| (i) | Amount was computed based on average shares outstanding during the period. |
| (ii) | Amount was less than $0.005 per share. |
| (iii) | Does not reflect the effect of sales charges, if applicable. |
| (iv) | Pursuant to the U.S. Securities and Exchange Commission’s Rules on Fair Fund and Disgorgement Plans, the Alger International Focus Fund received a Fair Fund distribution of $159,091, which contributed approximately 0.11% to its annual return. |
THE ALGER FUNDS
Financial Highlights for a share outstanding throughout the period
| Alger Health Sciences Fund | Class A | |||||||||||||||||||
| Year ended 10/31/2022 | Year ended 10/31/2021 | Year ended 10/31/2020 | Year ended 10/31/2019 | Year ended 10/31/2018 | ||||||||||||||||
| Net asset value, beginning of period | $ | 36.66 | $ | 31.75 | $ | 26.55 | $ | 28.04 | $ | 25.16 | ||||||||||
| INCOME FROM INVESTMENT OPERATIONS: | ||||||||||||||||||||
| Net investment loss(i) | (0.07 | ) | (0.21 | ) | (0.09 | ) | (0.09 | ) | (0.19 | ) | ||||||||||
| Net realized and unrealized gain (loss) on investments | (8.74 | ) | 8.87 | 7.20 | 0.48 | 3.82 | ||||||||||||||
| Total from investment operations | (8.81 | ) | 8.66 | 7.11 | 0.39 | 3.63 | ||||||||||||||
| Distributions from net realized gains | (7.00 | ) | (3.75 | ) | (1.91 | ) | (1.88 | ) | (0.75 | ) | ||||||||||
| Net asset value, end of period | $ | 20.85 | $ | 36.66 | $ | 31.75 | $ | 26.55 | $ | 28.04 | ||||||||||
| Total return(ii) | (27.31 | )% | 29.12 | %(iii) | 28.09 | % | 1.96 | % | 14.92 | % | ||||||||||
| RATIOS/SUPPLEMENTAL DATA: | ||||||||||||||||||||
| Net assets, end of period (000’s omitted) | $ | 91,059 | $ | 151,514 | $ | 127,925 | $ | 108,095 | $ | 131,731 | ||||||||||
| Ratio of gross expenses to average net assets | 1.05 | % | 1.00 | % | 1.04 | % | 1.12 | % | 1.15 | % | ||||||||||
| Ratio of net expenses to average net assets | 1.05 | % | 1.00 | % | 1.04 | % | 1.12 | % | 1.15 | % | ||||||||||
| Ratio of net investment loss to average net assets | (0.30 | )% | (0.63 | )% | (0.30 | )% | (0.34 | )% | (0.68 | )% | ||||||||||
| Portfolio turnover rate | 240.89 | % | 152.78 | % | 131.29 | % | 148.78 | % | 89.73 | % | ||||||||||
See Notes to Financial Statements.
| (i) | Amount was computed based on average shares outstanding during the period. |
| (ii) | Does not reflect the effect of sales charges, if applicable. |
| (iii) | Pursuant to the U.S. Securities and Exchange Commission’s Rules on Fair Fund and Disgorgement Plans, the Alger Health Sciences Fund received a Fair Fund distribution of $179,832, which contributed approximately 0.07% to its annual return. |
THE ALGER FUNDS
Financial Highlights for a share outstanding throughout the period
| Alger Health Sciences Fund | Class C | |||||||||||||||||||
| Year ended 10/31/2022 | Year ended 10/31/2021 | Year ended 10/31/2020 | Year ended 10/31/2019 | Year ended 10/31/2018 | ||||||||||||||||
| Net asset value, beginning of period | $ | 26.11 | $ | 23.74 | $ | 20.44 | $ | 22.21 | $ | 20.23 | ||||||||||
| INCOME FROM INVESTMENT OPERATIONS: | ||||||||||||||||||||
| Net investment loss(i) | (0.16 | ) | (0.34 | ) | (0.23 | ) | (0.23 | ) | (0.31 | ) | ||||||||||
| Net realized and unrealized gain (loss) on investments | (5.87 | ) | 6.46 | 5.44 | 0.34 | 3.04 | ||||||||||||||
| Total from investment operations | (6.03 | ) | 6.12 | 5.21 | 0.11 | 2.73 | ||||||||||||||
| Distributions from net realized gains | (7.00 | ) | (3.75 | ) | (1.91 | ) | (1.88 | ) | (0.75 | ) | ||||||||||
| Net asset value, end of period | $ | 13.08 | $ | 26.11 | $ | 23.74 | $ | 20.44 | $ | 22.21 | ||||||||||
| Total return(ii) | (27.85 | )% | 28.11 | %(iii) | 27.12 | % | 1.20 | % | 14.03 | % | ||||||||||
| RATIOS/SUPPLEMENTAL DATA: | ||||||||||||||||||||
| Net assets, end of period (000’s omitted) | $ | 7,828 | $ | 14,334 | $ | 11,862 | $ | 10,963 | $ | 15,322 | ||||||||||
| Ratio of gross expenses to average net assets | 1.84 | % | 1.76 | % | 1.81 | % | 1.89 | % | 1.93 | % | ||||||||||
| Ratio of net expenses to average net assets | 1.84 | % | 1.76 | % | 1.81 | % | 1.89 | % | 1.93 | % | ||||||||||
| Ratio of net investment loss to average net assets | (1.10 | )% | (1.39 | )% | (1.07 | )% | (1.12 | )% | (1.46 | )% | ||||||||||
| Portfolio turnover rate | 240.89 | % | 152.78 | % | 131.29 | % | 148.78 | % | 89.73 | % | ||||||||||
See Notes to Financial Statements.
| (i) | Amount was computed based on average shares outstanding during the period. |
| (ii) | Does not reflect the effect of sales charges, if applicable. |
| (iii) | Pursuant to the U.S. Securities and Exchange Commission’s Rules on Fair Fund and Disgorgement Plans, the Alger Health Sciences Fund received a Fair Fund distribution of $179,832, which contributed approximately 0.07% to its annual return. |
THE ALGER FUNDS
Financial Highlights for a share outstanding throughout the period
| Alger Health Sciences Fund | Class Z | |||||||||||||||||||
| Year ended 10/31/2022 | Year ended 10/31/2021 | Year ended 10/31/2020 | Year ended 10/31/2019 | Year ended 10/31/2018 | ||||||||||||||||
| Net asset value, beginning of period | $ | 37.09 | $ | 31.99 | $ | 26.69 | $ | 28.09 | $ | 25.11 | ||||||||||
| INCOME FROM INVESTMENT OPERATIONS: | ||||||||||||||||||||
| Net investment income (loss)(i) | — | (ii) | (0.11 | ) | — | (ii) | 0.01 | (0.09 | ) | |||||||||||
| Net realized and unrealized gain (loss) on investments | (8.85 | ) | 8.96 | 7.25 | 0.47 | 3.82 | ||||||||||||||
| Total from investment operations | (8.85 | ) | 8.85 | 7.25 | 0.48 | 3.73 | ||||||||||||||
| Dividends from net investment income | — | — | (0.04 | ) | — | — | ||||||||||||||
| Distributions from net realized gains | (7.00 | ) | (3.75 | ) | (1.91 | ) | (1.88 | ) | (0.75 | ) | ||||||||||
| Net asset value, end of period | $ | 21.24 | $ | 37.09 | $ | 31.99 | $ | 26.69 | $ | 28.09 | ||||||||||
| Total return(iii) | (27.05 | )% | 29.53 | %(iv) | 28.50 | % | 2.34 | % | 15.32 | % | ||||||||||
| RATIOS/SUPPLEMENTAL DATA: | ||||||||||||||||||||
| Net assets, end of period (000’s omitted) | $ | 78,928 | $ | 184,972 | $ | 131,109 | $ | 77,023 | $ | 57,640 | ||||||||||
| Ratio of gross expenses to average net assets | 0.72 | % | 0.68 | % | 0.71 | % | 0.79 | % | 0.84 | % | ||||||||||
| Ratio of expense reimbursements to average net assets | — | — | — | (0.04 | )% | (0.06 | )% | |||||||||||||
| Ratio of net expenses to average net assets | 0.72 | % | 0.68 | % | 0.71 | % | 0.75 | % | 0.78 | % | ||||||||||
| Ratio of net investment income (loss) to average net assets | 0.01 | % | (0.31 | )% | (0.01 | )% | 0.02 | % | (0.32 | )% | ||||||||||
| Portfolio turnover rate | 240.89 | % | 152.78 | % | 131.29 | % | 148.78 | % | 89.73 | % | ||||||||||
See Notes to Financial Statements.
| (i) | Amount was computed based on average shares outstanding during the period. |
| (ii) | Amount was less than $0.005 per share. |
| (iii) | Does not reflect the effect of sales charges, if applicable. |
| (iv) | Pursuant to the U.S. Securities and Exchange Commission’s Rules on Fair Fund and Disgorgement Plans, the Alger Health Sciences Fund received a Fair Fund distribution of $179,832, which contributed approximately 0.07% to its annual return. |
THE ALGER FUNDS
NOTE 1 — General:
The Alger Funds (the “Trust”) is an open-end registered investment company organized as a business trust under the laws of the Commonwealth of Massachusetts. The Trust qualifies as an investment company as defined in Financial Accounting Standards Board (“FASB”) Accounting Standards Codification 946 – Financial Services – Investment Companies. The Trust operates as a series company currently offering an unlimited number of shares of beneficial interest in eleven series — Alger Capital Appreciation Fund, Alger 35 Fund, Alger Growth & Income Fund, Alger Mid Cap Growth Fund, Alger Mid Cap Focus Fund, Alger Weatherbie Enduring Growth Fund, Alger Weatherbie Specialized Growth Fund, Alger Small Cap Growth Fund, Alger Small Cap Focus Fund, Alger International Focus Fund and Alger Health Sciences Fund (collectively, the “Funds” or individually, each a “Fund”). Alger Capital Appreciation Fund, Alger 35 Fund, Alger Mid Cap Growth Fund, Alger Mid Cap Focus Fund, Alger Weatherbie Enduring Growth Fund, Alger Weatherbie Specialized Growth Fund, Alger Small Cap Growth Fund, Alger Small Cap Focus Fund, Alger International Focus Fund and Alger Health Sciences Fund normally invest primarily in equity securities and each has an investment objective of long-term capital appreciation. Alger Growth & Income Fund also normally invests primarily in equity securities and has an investment objective of both capital appreciation and current income.
Each Fund offers one or more of the following share classes: Class A, B, C, I, Y and Z. Class A shares are generally subject to an initial sales charge while Class B and C shares are generally subject to a deferred sales charge. Class B shares will automatically convert to Class A shares eight years after the end of the calendar month in which the order to purchase was accepted. The conversion is completed without the imposition of any sales charges or other fees. Class C shares will automatically convert to Class A shares on the fifth business day of the month following the eighth anniversary of the purchase date of a shareholder’s Class C shares, without the imposition of any sales load, fee or other charge. Class B and C shares held at certain dealers may not convert to Class A shares or may be converted on a different schedule. At conversion, a proportionate amount of shares representing reinvested dividends and distributions will also be converted into Class A shares. Effective August 27, 2019, Class C shares were closed to direct shareholders and are only available for purchase through certain financial intermediaries and group retirement plan recordkeeping platforms. Class I, Y and Z shares are sold to investors without an initial or deferred sales charge. Each class has identical rights to assets and earnings, except that each share class bears the pro rata allocation of the Fund’s expenses other than a class expense (not including advisory or custodial fees or other expenses related to the management of the Fund’s assets).
Effective July 31, 2019, the Board of Trustees (the “Board”) of The Alger Funds authorized a partial closing of the Alger Small Cap Growth Fund. Effective or about October 17, 2022, the Alger Small Cap Growth Fund’s Class A, C, I, Y and Z shares resumed sale of shares to qualifying investors.
Class P-2 Shares of the Alger 35 Fund were converted to Class Z shares after the close of business on October 29, 2021.
THE ALGER FUNDS
NOTES TO FINANCIAL STATEMENTS (Continued)
Alger Weatherbie Enduring Growth Fund launched on December 17, 2021.
The Board of Trustees of the Trust (the “Board”) approved a Plan of Reorganization dated as of February 11, 2021 (the “Plan”), adopted with respect to Alger 25 Fund and Alger 35 Fund. The Plan provides for the transfer of the Alger 25 Fund’s assets to the Alger 35 Fund in a tax-free exchange for shares of the Alger 35 Fund and the assumption by the Alger 35 Fund of the Alger 25 Fund’s stated liabilities, the distribution of such shares of the Alger 35 Fund to Alger 25 Fund shareholders and the subsequent termination of the Alger 25 Fund (the “Reorganization”). Because the Reorganization satisfies the requisite conditions of Rule 17a-8 under the Investment Company Act of 1940, as amended (the “1940 Act”), in accordance with the Trust’s Amended and Restated Agreement and Declaration of Trust, and applicable Massachusetts state and U.S. federal law (including Rule 17a-8), the Reorganization may be effected without the approval of shareholders of either fund. The Reorganization became effective after the close of business on May 7, 2021.
After the close of business on May 7, 2021, the Alger 35 Fund acquired substantially all of the assets and liabilities of the Alger 25 Fund in exchange for Class P shares of the Alger 35 Fund, which were distributed to the Alger 25 Fund’s shareholders. Upon completion of the Reorganization, Class P shares were reclassified as Class Z shares. The investment portfolio of the Alger 25 Fund, with a fair value of $25,885,380 and identified cost of $17,519,227 as of the date of the Reorganization, was the principal asset acquired by the Alger 35 Fund. The acquisition was accomplished by a tax-free exchange of 1,536,300 shares of the Alger 25 Fund, valued at $26,249,571 for 1,429,347 shares of the Alger 35 Fund. The net assets of the Alger 25 Fund and the Alger 35 Fund immediately before the acquisition were $26,249,571 (including $8,366,153 of net unrealized appreciation) and $18,981,690, respectively. The combined net assets of the Alger 35 Fund immediately following the acquisition were $45,231,261. For financial reporting purposes, assets received and shares issued by the Alger 35 Fund were recorded at fair value; however the cost basis of the investments received from the Alger 25 Fund was carried forward to align ongoing reporting of the Alger 35 Fund’s realized and unrealized gains and losses with amounts distributable to shareholders for tax purposes.
Fred Alger Management, LLC (“Alger Management” or the “Investment Manager”) and/ or its affiliates paid the expenses directly relating to the Reorganization. Assuming the acquisition had been completed on November 1, 2020, the Alger 35 Fund’s pro-forma results of operations for the year ended October 31, 2021, are as follows:
| Net investment loss | $ | (32,302 | ) | |
| Net realized and unrealized gain on investments in securities | 13,917,443 | |||
| Net increase in net assets resulting from operations | $ | 13,885,141 | ||
| Undistributed net investment loss | $ | (115,723 | ) |
Because the combined investment portfolios have been managed as a single integrated portfolio since the acquisition was completed, it is not practicable to separate the amounts of changes in revenue and earnings attributable to the Alger 25 Fund that have been included in the Alger 35 Fund’s Statement of Operations since May 7, 2021.
THE ALGER FUNDS
NOTES TO FINANCIAL STATEMENTS (Continued)
Class Y shares of Alger Small Cap Growth Fund launched on December 31, 2021.
NOTE 2 — Significant Accounting Policies:
(a) Investment Valuation: The Funds value their financial instruments at fair value using independent dealers or pricing services under policies approved by the Board. Investments held by the Funds are valued on each day the New York Stock Exchange (the “NYSE”) is open, as of the close of the NYSE (normally 4:00 p.m. Eastern Time).
The Board has designated, pursuant to Rule 2a-5 under the Investment Company Act of 1940, as amended (the “1940 Act”), the Funds’ investment adviser, Fred Alger Management, LLC (“Alger Management” or the “Investment Manager”) as the valuation designee (the “Valuation Designee”) to make fair value determinations subject to the Board’s review and oversight. The Valuation Designee has established a Valuation Committee (“Committee”) comprised of representatives of the Investment Manager and officers of the Funds to assist in performing the duties and responsibilities of the Valuation Designee.
The Valuation Designee has established valuation processes, including but not limited to: making fair value determinations when market quotations for a financial instrument are not readily available in accordance with valuation policies and procedures adopted by the Board; assessing and managing material risks associated with fair valuation determinations; selecting, applying and testing fair valuation methodologies; and overseeing and evaluating pricing services used by the Funds. The Valuation Designee reports its fair valuation determinations and related valuation information to the Board. The Committee meets on an as-needed basis and generally meets quarterly to review and evaluate the effectiveness of the valuation policies and procedures in accordance with the requirements of Rule 2a-5.
Investments in money market funds and short-term securities held by the Funds having a remaining maturity of sixty days or less are valued at amortized cost which approximates market value.
Equity securities, including traded rights, warrants and option contracts for which valuation information is readily available, are valued at the last quoted sales price or official closing price on the primary market or exchange on which they are traded as reported by an independent pricing service. In the absence of quoted sales, such securities are valued at the bid price or, in the absence of a recent bid price, the equivalent as obtained from one or more of the major market makers for the securities to be valued.
Securities in which the Funds invest may be traded in foreign markets that close before the close of the NYSE. Developments that occur between the close of the foreign markets and the close of the NYSE may result in adjustments to the closing foreign prices to reflect what the Valuation Designee, with assistance from the Committee, believes to be the fair value of these securities as of the close of the NYSE. The Funds may also fair value securities in other situations, for example, when a particular foreign market is closed but the Funds are open.
THE ALGER FUNDS
NOTES TO FINANCIAL STATEMENTS (Continued)
FASB Accounting Standards Codification 820 – Fair Value Measurements and Disclosures (“ASC 820”) defines fair value as the price that the Funds would receive upon selling an investment in a timely transaction to an independent buyer in the principal or most advantageous market of the investment. ASC 820 established a three-tier hierarchy to maximize the use of observable market data and minimize the use of unobservable inputs and to establish classification of fair value measurements for disclosure purposes. Inputs refer broadly to the assumptions that market participants would use in pricing the asset or liability and may be observable or unobservable. Observable inputs are based on market data obtained from sources independent of the Funds. Unobservable inputs are inputs that reflect the Funds’ own assumptions based on the best information available in the circumstances. The three-tier hierarchy of inputs is summarized in the three broad Levels listed below.
| ● | Level 1 – quoted prices in active markets for identical investments |
| ● | Level 2 – significant other observable inputs (including quoted prices for similar investments, interest rates, prepayment speeds, credit risk, etc.) |
| ● | Level 3 – significant unobservable inputs (including the Funds’ own assumptions in determining the fair value of investments) |
The Funds’ valuation techniques are generally consistent with either the market or the income approach to fair value. The market approach considers prices and other relevant information generated by market transactions involving identical or comparable assets to measure fair value. The income approach converts future amounts to a current, or discounted, single amount. These fair value measurements are determined on the basis of the value indicated by current market expectations about such future events. Inputs for Level 1 include exchange-listed prices and broker quotes in an active market. Inputs for Level 2 include the last trade price in the case of a halted security, an exchange-listed price which has been adjusted for fair value factors, and prices of closely related securities. Additional Level 2 inputs include an evaluated price which is based upon a compilation of observable market information such as spreads for fixed income and preferred securities. Inputs for Level 3 include, but are not limited to, revenue multiples, earnings before interest, taxes, depreciation and amortization (“EBITDA”) multiples, discount rates, time to exit and the probabilities of success of certain outcomes. Such unobservable market information may be obtained from a company’s financial statements and from industry studies, market data, and market indicators such as benchmarks and indexes. Because of the inherent uncertainty and often limited markets for restricted securities, the valuations assigned to such securities by the Funds may significantly differ from the valuations that would have been assigned by the Funds had there been an active market for such securities.
(b) Cash and Cash Equivalents: Cash and cash equivalents include U.S. dollars, foreign cash and overnight time deposits.
(c) Securities Transactions and Investment Income: Securities transactions are recorded on a trade date basis. Realized gains and losses from securities transactions are recorded on the identified cost basis. Dividend income is recognized on the ex-dividend date and interest income is recognized on the accrual basis.
THE ALGER FUNDS
NOTES TO FINANCIAL STATEMENTS (Continued)
Premiums and discounts on debt securities purchased are amortized or accreted over the lives of the respective securities.
(d) Foreign Currency Transactions: The books and records of the Funds are maintained in U.S. dollars. Foreign currencies, investments and other assets and liabilities are translated into U.S. dollars at the prevailing rates of exchange on the valuation date. Purchases and sales of investment securities and income and expenses are translated into U.S. dollars at the prevailing exchange rates on the respective dates of such transactions.
Net realized gains and losses on foreign currency transactions represent net gains and losses from the disposition of foreign currencies, currency gains and losses realized between the trade dates and settlement dates of security transactions, and the difference between the amount of net investment income accrued and the U.S. dollar amount actually received. The effects of changes in foreign currency exchange rates on investments in securities are included in realized and unrealized gain or loss on investments in the accompanying Statements of Operations.
(e) Forward Foreign Exchange Contracts: Certain Funds may enter into forward foreign currency contracts to hedge against foreign currency exchange rate risk on their non-U.S. dollar denominated securities or to facilitate settlement of foreign currency denominated portfolio transactions. A forward foreign currency contract is an agreement between two parties to buy and sell a currency at a set price on a future date. The contract is marked-to-market daily and the change in value is recorded by a Fund as an unrealized gain or loss. Realized gains or losses equal to the difference between the value of the contract at the time it was opened and the value at the time it was closed are recorded upon delivery or receipt of the currency.
These contracts may involve market risk in excess of the unrealized gain or loss reflected on the Statements of Assets and Liabilities. In addition, the Funds could be exposed to risk if the counterparties are unable to meet the terms of the contracts or if the value of the currency changes unfavorably to the base currency.
(f) Lending of Fund Securities: The Funds may lend their securities to financial institutions, provided that the market value of the securities loaned will not at any time exceed one third of a Fund’s total assets including borrowings, as defined in its prospectuses. The Funds earn fees on the securities loaned, which are included in interest income in the accompanying Statements of Operations. In order to protect against the risk of failure by the borrower to return the securities loaned or any delay in the delivery of such securities, the loan is collateralized by cash or securities that are maintained with Brown Brothers Harriman & Company, the Funds’ custodian (the “Custodian”), in an amount equal to at least 102 percent of the current market value of U.S. loaned securities or 105 percent for non-U.S. loaned securities. The market value of the loaned securities is determined at the close of business of the Funds. Any required additional collateral is delivered to the Custodian each day and any excess collateral is returned to the borrower on the next business day. In the event the borrower fails to return the loaned securities when due, the Funds may take the collateral to replace the securities. If the value of the collateral is less than the purchase cost of replacement securities, the Custodian shall be responsible for any shortfall, but only to the extent that the shortfall is not due to any diminution in collateral value, as defined in the securities lending agreement. The Funds are required to maintain the collateral in a segregated account and determine its value each day until the loaned securities are returned. Cash collateral may be invested as determined by the Funds. Collateral is returned to the borrower upon settlement of the loan. There were no securities loaned as of October 31, 2022.
THE ALGER FUNDS
NOTES TO FINANCIAL STATEMENTS (Continued)
(g) Dividends to Shareholders: Dividends and distributions payable to shareholders are recorded on the ex-dividend date. The Funds declare and pay dividends from net investment income, if available, annually except that Alger Growth & Income Fund declares and pays such dividends quarterly. With respect to all Funds, dividends from net realized gains, offset by any loss carryforward, are declared and paid annually after the end of the fiscal year in which earned.
Each share class is treated separately in determining the amount of dividends from net investment income payable to holders of its shares.
The characterization of distributions to shareholders for financial reporting purposes is determined in accordance with federal income tax rules. Therefore, the source of a Fund’s distributions may be shown in the accompanying financial statements as either from, or in excess of, net investment income, net realized gain on investment transactions, or return of capital, depending on the type of book/tax differences that may exist. Capital accounts within the financial statements are adjusted for permanent book/tax differences. Reclassifications result primarily from the differences in tax treatment of net operating losses, passive foreign investment companies, and foreign currency transactions. The reclassifications are done annually at year-end and have no impact on the net asset values of the Funds and are designed to present each Fund’s capital accounts on a tax basis.
(h) Federal Income Taxes: It is each Fund’s policy to comply with the requirements of the Internal Revenue Code Subchapter M applicable to regulated investment companies and to distribute all of its taxable income to its shareholders. Provided that the Funds maintain such compliance, no federal income tax provision is required. Each Fund is treated as a separate entity for the purpose of determining such compliance.
FASB Accounting Standards Codification 740 – Income Taxes (“ASC 740”) requires the Funds to measure and recognize in their financial statements the benefit of a tax position taken (or expected to be taken) on an income tax return if such position will more likely than not be sustained upon examination based on the technical merits of the position. No tax years are currently under investigation. The Funds file income tax returns in the U.S. Federal jurisdiction, as well as the New York State and New York City jurisdictions. The statute of limitations on the Funds’ tax returns remains open for the tax years 2018-2021. Management does not believe there are any uncertain tax positions that require recognition of a tax liability.
(i) Allocation Methods: The Trust accounts separately for the assets, liabilities and operations of each Fund. Expenses directly attributable to each Fund are charged to that Fund’s operations; expenses which are applicable to all Funds are allocated among them based on net assets. Income, realized and unrealized gains and losses, and expenses of each Fund are allocated among the Fund’s classes based on relative net assets, with the exception of distribution fees, transfer agency fees, and shareholder servicing and related fees.
THE ALGER FUNDS
NOTES TO FINANCIAL STATEMENTS (Continued)
(j) Estimates: These financial statements have been prepared in accordance with accounting principles generally accepted in the United States of America, which require using estimates and assumptions that affect the reported amounts therein. Actual results may differ from those estimates. All such estimates are of a normal recurring nature.
NOTE 3 — Investment Advisory Fees and Other Transactions with Affiliates:
(a) Investment Advisory Fees: Fees incurred by each Fund, pursuant to the provisions of the Trust’s Investment Advisory Agreement with the Investment Manager, are payable monthly and computed based on the following rates. The actual rate paid as a percentage of average daily net assets, for the year ended October 31, 2022, is set forth below under the heading “Actual Rate”:
| Tier 1 | Tier 2 | Tier 3 | Tier 4 | Tier 5 | Actual Rate | |||||||||||||||||||
| Alger Capital Appreciation Fund(a) | 0.81 | % | 0.65 | % | 0.60 | % | 0.55 | % | 0.45 | % | 0.78 | % | ||||||||||||
| Alger 35 Fund(b) | 0.45 | — | — | — | — | 0.45 | ||||||||||||||||||
| Alger Growth & Income Fund(b) | 0.50 | — | — | — | — | 0.50 | ||||||||||||||||||
| Alger Mid Cap Growth Fund(c) | 0.76 | 0.70 | — | — | — | 0.76 | ||||||||||||||||||
| Alger Mid Cap Focus Fund(d) | 0.70 | 0.50 | — | — | — | 0.58 | ||||||||||||||||||
| Alger Weatherbie Enduring Growth Fund(d) | 0.70 | 0.50 | — | — | — | 0.70 | ||||||||||||||||||
| Alger Weatherbie Specialized Growth Fund(c) | 0.81 | 0.75 | — | — | — | 0.80 | ||||||||||||||||||
| Alger Small Cap Growth Fund(c) | 0.81 | 0.75 | — | — | — | 0.81 | ||||||||||||||||||
| Alger Small Cap Focus Fund(b) | 0.75 | — | — | — | — | 0.75 | ||||||||||||||||||
| Alger International Focus Fund(c) | 0.71 | 0.60 | — | — | — | 0.71 | ||||||||||||||||||
| Alger Health Sciences Fund(b) | 0.55 | — | — | — | — | 0.55 | ||||||||||||||||||
(a) Tier 1 rate is paid on assets up to $2 billion, Tier 2 rate is paid on assets between $2 billion and $3 billion, Tier 3 rate is paid on assets between $3 billion and $4 billion, Tier 4 rate is paid on assets between $4 billion and $5 billion, and Tier 5 rate is paid on assets in excess of $5 billion.
(b) Tier 1 rate is paid on all assets.
(c) Tier 1 rate is paid on assets up to $1 billion and Tier 2 rate is paid on assets in excess of $1 billion.
(d) Tier 1 rate is paid on assets up to $250 million, and Tier 2 rate is paid on assets in excess of $250 million.
THE ALGER FUNDS
NOTES TO FINANCIAL STATEMENTS (Continued)
The sub-adviser to the Alger Weatherbie Enduring Growth Fund and the Alger Weatherbie Specialized Growth Fund, Weatherbie Capital, LLC (“Weatherbie” or the “Sub-Adviser”), an affiliate of Alger Management, is paid a fee out of the advisory fee that Alger Management receives at no additional cost to the Alger Weatherbie Enduring Growth Fund and the Alger Weatherbie Specialized Growth Fund. The sub-advisory fee is equal to 70% of the net management fee paid by each of Alger Weatherbie Enduring Growth Fund and the Alger Weatherbie Specialized Growth Fund to Alger Management with respect to the sub-advised assets. For the year ended October 31, 2022, Alger Management paid a sub-advisory fee of $0 and $6,101,385 for the Alger Weatherbie Enduring Growth Fund and Alger Weatherbie Specialized Growth Fund, respectively, to Weatherbie.
Alger Management has contractually agreed to waive fees or to reimburse Fund expenses (excluding acquired fund fees and expenses, dividend expense on short sales, borrowing costs, interest, taxes, brokerage and extraordinary expenses, if applicable) for certain Funds through February 29, 2024 to the extent necessary to limit the amount by which the total annual fund operating expenses exceed the rates, based on average daily net assets, as listed in the table below:
| FEES WAIVED / | ||||||||||||||||||||||||
| REIMBURSED | ||||||||||||||||||||||||
| FOR THE YEAR | ||||||||||||||||||||||||
| CLASS | ENDED | |||||||||||||||||||||||
| OCTOBER 31, | ||||||||||||||||||||||||
| A | C | I | Y | Z | 2022 | |||||||||||||||||||
| Alger Capital Appreciation Fund | — | — | — | — | 0.85 | % | $ | 179,703 | ||||||||||||||||
| Alger Mid Cap Growth Fund | — | — | — | — | 0.99 | — | ||||||||||||||||||
| Alger Mid Cap Focus Fund | 1.15 | % | 1.90 | % | 1.20 | % | 0.69 | % | 0.99 | 83 | ||||||||||||||
| Alger Weatherbie Enduring Growth Fund | 1.15 | (a) | 1.85 | (a) | 1.10 | (a) | 0.70 | (a) | 0.75 | (a) | 166,730 | |||||||||||||
| Alger Weatherbie Specialized Growth Fund | — | — | — | 0.87 | — | 21,864 | ||||||||||||||||||
| Alger Small Cap Growth Fund | — | — | — | 0.84 | (b) | 0.99 | 2,982 | |||||||||||||||||
| Alger Small Cap Focus Fund | — | — | — | 0.85 | — | — | ||||||||||||||||||
| Alger International Focus Fund | — | — | 1.25 | — | 0.84 | (c) | 19,625 | |||||||||||||||||
| Alger Health Sciences Fund | — | — | — | — | 0.75 | — | ||||||||||||||||||
(a) Effective December 17, 2021, inception of the Fund.
(b) Effective December 31, 2021, inception of the Class.
(e) Prior to March 1, 2022, the expense cap for Alger International Focus Fund, Class Z, was 0.89%.
Alger Management may recoup any fees waived or expenses reimbursed pursuant to the contract; however, a Fund will only make repayments to the Investment Manager if such repayment does not cause a Fund’s expense ratio after the repayment is taken into account, to exceed both (i) the expense cap in place at the time such amounts were waived or reimbursed, and (ii) a Fund’s current expense cap. Such recoupment is limited to two years from the date the amount is initially waived or reimbursed. For the year ended October 31, 2022, the recoupment made by the Alger Weatherbie Specialized Growth Fund to the Investment Manager was $534.
Alger Management has also agreed to limit expenses of the Class Z shares (formerly class P shares) of Alger 35 Fund, for the life of the Fund, whereby it reimburses expenses to the extent Fund operating expenses, excluding advisory fees, exceed 0.10%, based on average daily net assets. The expense reimbursement arrangement does not include interest, taxes, brokerage, dividend expense on short sales, borrowing costs and extraordinary expenses. Fees waived for the Alger 35 Fund were $126,948 for the year ended October 31, 2022.
THE ALGER FUNDS
NOTES TO FINANCIAL STATEMENTS (Continued)
In addition, Alger Management voluntarily reduced its 12b-1 fee effective April 1, 2019, for the Class B shares of the Alger Mid Cap Growth Fund, Alger Small Cap Growth Fund and Alger International Focus Fund by $80,610, $23,705 and $113,873, respectively, for the year ended October 31, 2022.
(b) Administration Fees: Fees incurred by each Fund, pursuant to the provisions of the Trust’s Fund Administration Agreement with Alger Management, are payable monthly and computed based on the average daily net assets of each Fund at the annual rate of 0.0275%.
(c) Distribution Fees:
Class A Shares: The Trust has adopted a Plan of Distribution pursuant to which each Fund pays Fred Alger & Company, LLC, each Fund’s distributor (the “Distributor” or “Alger LLC”) a fee at the annual rate of 0.25% of the respective average daily net assets of the Class A shares of the designated Fund to compensate Alger LLC for its activities and expenses incurred in distributing and/or administering the Class A shares and/or shareholder servicing. The fees paid may be more or less than the expenses incurred by Alger LLC.
Class B Shares: The Trust has adopted a Plan of Distribution pursuant to which Class B shares of each Fund issuing such shares reimburse Alger LLC for costs and expenses incurred by Alger LLC in connection with advertising, marketing and selling the Class B shares, and shareholder servicing, not to exceed an annual rate of 1% of the respective average daily net assets of the Class B shares of the designated Fund. If in any month, the costs incurred by Alger LLC relating to the Class B shares are in excess of the distribution fees charged to the Class B shares of the Fund, the excess may be carried forward, with interest, and sought to be reimbursed in future periods. As of October 31, 2022, such excess carried forward was $12,514,732, $19,735,640 and $19,502,757 for Class B shares of Alger Mid Cap Growth Fund, Alger Small Cap Growth Fund and Alger International Focus Fund, respectively. Contingent deferred sales charges imposed on redemptions of Class B shares will reduce the amount of distribution expenses for which reimbursement may be sought. See Note 3(d) below.
Class C Shares: The Trust has adopted a Distribution Plan pursuant to which Class C shares of each Fund pays Alger LLC a fee at the annual rate of 1% of the respective average daily net assets of the Class C shares of the designated Fund to compensate Alger LLC for its activities and expenses incurred in distributing the Class C shares and/or shareholder servicing. Fees paid may be more or less than the expenses incurred by Alger LLC.
Class I Shares: The Trust has adopted a Distribution Plan pursuant to which Class I shares of each Fund issuing such shares pays Alger LLC a fee at the annual rate of 0.25% of the average daily net assets of the Fund’s Class I shares to compensate Alger LLC for its activities and expenses incurred in distributing the Class I shares and/or shareholder servicing. Fees paid may be more or less than the expenses incurred by Alger LLC.
THE ALGER FUNDS
NOTES TO FINANCIAL STATEMENTS (Continued)
(d) Sales Charges: Sales of shares of the Funds may be subject to contingent deferred sales charges. The contingent deferred sales charges are used by Alger LLC to offset distribution expenses previously incurred. Sales charges do not represent expenses of the Trust. For the year ended October 31, 2022, contingent deferred sales charges imposed, all of which were retained by Alger LLC, were as follows:
| CONTINGENT DEFERRED SALES CHARGES | ||||
| Alger Capital Appreciation Fund | $ | 11,691 | ||
| Alger Growth & Income Fund | 3,019 | |||
| Alger Mid Cap Growth Fund | 1,381 | |||
| Alger Mid Cap Focus Fund | 1,714 | |||
| Alger Weatherbie Specialized Growth Fund | 13,863 | |||
| Alger Small Cap Growth Fund | 12,754 | |||
| CONTINGENT DEFERRED SALES CHARGES | ||||
| Alger Small Cap Focus Fund | $ | 9,620 | ||
| Alger International Focus Fund | 1,018 | |||
| Alger Health Sciences Fund | 1,451 | |||
(e) Brokerage Commissions: During the year ended October 31, 2022, Alger Capital Appreciation Fund, Alger 35 Fund, Alger Growth & Income Fund, Alger Mid Cap Growth Fund, Alger Mid Cap Focus Fund, Alger Small Cap Growth Fund, Alger Small Cap Focus Fund, Alger International Focus Fund and Alger Health Sciences Fund paid Alger LLC, $255,413, $12,239, $2,116, $77,465, $195,114, $15,989, $389,927, $300 and $127,351, respectively, in connection with securities transactions.
(f) Shareholder Administrative Fees: The Trust has entered into a Shareholder Administrative Services Agreement with Alger Management to compensate Alger Management for liaising with, and providing administrative oversight of, the Trust’s transfer agent, and for other related services. The Funds compensate Alger Management at the annual rate of 0.0165% of their respective average daily net assets for the Class A, Class B and Class C shares and 0.01% of their respective average daily net assets for the Class I, Class Y and Class Z shares for these services.
Alger Management makes payments to intermediaries that provide sub-accounting services to omnibus accounts invested in the Funds. A portion of the fees paid by Alger Management to intermediaries that provide sub-accounting services are charged back to the appropriate Fund, subject to certain limitations, as approved by the Board. For the year ended October 31, 2022, Alger Management charged back to Alger Capital Appreciation Fund, Alger Growth & Income Fund, Alger Mid Cap Growth Fund, Alger Mid Cap Focus Fund, Alger Weatherbie Enduring Growth Fund, Alger Weatherbie Specialized Growth Fund, Alger Small Cap Growth Fund, Alger Small Cap Focus Fund, Alger International Focus Fund and Alger Health Sciences Fund $755,475, $48,508, $51,156, $31,479, $30, $170,550, $90,637, $837,384, $27,991 and $59,405, respectively, for these services, which are included in transfer agent fees in the accompanying Statements of Operations.
THE ALGER FUNDS
NOTES TO FINANCIAL STATEMENTS (Continued)
(g) Trustee Fees: Each trustee who is not an “interested person” of the Trust, as defined in the 1940 Act (“Independent Trustee”), receives a fee of $156,000 per annum, paid pro rata based on net assets by each fund in the Alger Fund Complex, plus travel expenses incurred for attending board meetings. The term “Alger Fund Complex” refers to the Trust, The Alger Institutional Funds, The Alger Funds II, The Alger Portfolios, Alger Global Focus Fund and The Alger ETF Trust, each of which is a registered investment company managed by Alger Management. The Independent Trustee appointed as Chairman of the Board receives additional compensation of $22,000 per annum paid pro rata based on net assets by each fund in the Alger Fund Complex. Additionally, each member of the Audit Committee receives a fee of $13,000 per annum, paid pro rata based on net assets by each fund in the Alger Fund Complex.
Effective January 1, 2022, the Board adopted a policy requiring Trustees to receive a minimum of 10% of their annual compensation in shares of one or more of the funds in the Alger Fund Complex.
Prior to January 1, 2022, each Independent Trustee received a fee of $142,000 per annum, paid pro rata based on net assets by each fund in the Alger Fund Complex, plus travel expenses incurred for attending board meetings. The Independent Trustee appointed as Chairman of the Board received additional compensation of $20,000 per annum paid pro rata based on net assets by each fund in the Alger Fund Complex. Additionally, each member of the Audit Committee received a fee of $13,000 per annum, paid pro rata based on net assets by each fund in the Alger Fund Complex.
(h) Interfund Trades: The Funds may engage in purchase and sale transactions with other funds advised by Alger Management or Weatherbie. For the year ended October 31, 2022, these purchases and sales were as follows:
| PURCHASES | SALES | REALIZED (LOSS) | ||||||||||
| Alger Mid Cap Growth Fund | $ | — | $ | 761,543 | $ | (6,266 | ) | |||||
| Alger Mid Cap Focus Fund | — | 16,578,285 | (1,955,173 | ) | ||||||||
| Alger Small Cap Growth Fund | 3,400,732 | — | — | |||||||||
| Alger Small Cap Focus Fund | 10,492,009 | — | — | |||||||||
(i) Interfund Loans: The Funds, along with other funds in the Alger Fund Complex, may borrow money from and lend money to each other for temporary or emergency purposes with the exception of the Alger International Focus Fund, which can only borrow for temporary or emergency purposes. To the extent permitted under its investment restrictions, each Fund may lend uninvested cash in an amount up to 15% of its net assets to other funds in the Alger Fund Complex. If a Fund has borrowed from other funds in the Alger Fund Complex and has aggregate borrowings from all sources that exceed 10% of the Fund’s total assets, such Fund will secure all of its loans from other funds in the Alger Fund Complex. The interest rate charged on interfund loans is equal to the average of the overnight time deposit rate and bank loan rate available to the Funds. There were no interfund loans outstanding as of October 31, 2022.
THE ALGER FUNDS
NOTES TO FINANCIAL STATEMENTS (Continued)
During the year ended October 31, 2022, Alger Capital Appreciation Fund, Alger Mid Cap Focus Fund, Alger Weatherbie Specialized Growth Fund and Alger Small Cap Focus Fund earned interfund loan interest income of $249, $583, $12,063 and $58,726, respectively, and Alger Capital Appreciation Fund, Alger Mid Cap Growth Fund, Alger Mid Cap Focus Fund, Alger Weatherbie Specialized Growth Fund, Alger Small Cap Growth Fund, Alger Small Cap Focus Fund and Alger Health Sciences Fund incurred interfund loan interest expenses of $27,397, $355, $1,374, $49, $206, $6,064 and $3,341, respectively, which are included in interest income and interest expenses, respectively, in the accompanying Statements of Operations.
(j) Other Transactions with Affiliates: Certain officers and one Trustee of the Trust are directors and/or officers of Alger Management, the Distributor (the “Distributor” or “Alger LLC”), or their affiliates. At October 31, 2022, Alger Management and its affiliated entities owned the following shares:
| SHARE CLASS | ||||||||||||||||||||
| A | C | I | Y | Z | ||||||||||||||||
| Alger Capital Appreciation Fund | 73,980 | — | — | — | 44,857 | |||||||||||||||
| Alger 35 Fund | — | — | — | — | 1,593,347 | |||||||||||||||
| Alger Growth & Income Fund | — | — | — | — | 32,241 | |||||||||||||||
| Alger Mid Cap Growth Fund | — | — | — | — | 149,032 | |||||||||||||||
| Alger Mid Cap Focus Fund | — | — | 100,035 | 4,843 | 937,772 | |||||||||||||||
| Alger Weatherbie Enduring Growth Fund | 10,000 | 10,000 | 10,000 | 50,000 | 420,000 | |||||||||||||||
| Alger Weatherbie Specialized Growth Fund | 187,751 | — | — | 10,066 | 185 | |||||||||||||||
| Alger Small Cap Growth Fund | 71,040 | — | — | 36,127 | 115,717 | |||||||||||||||
| Alger Small Cap Focus Fund | — | — | — | 787 | 317,534 | |||||||||||||||
| Alger International Focus Fund | — | — | — | — | 90,832 | |||||||||||||||
NOTE 4 — Securities Transactions:
The following summarizes the securities transactions by each Fund, other than U.S. Government securities, short-term securities and forward foreign currency contracts, for the year ended October 31, 2022:
| PURCHASES | SALES | |||||||
| Alger Capital Appreciation Fund | $ | 2,654,171,970 | $ | 3,207,856,248 | ||||
| Alger 35 Fund | 64,495,691 | 64,331,942 | ||||||
| Alger Growth & Income Fund | 107,539,714 | 3,652,296 | ||||||
| Alger Mid Cap Growth Fund | 472,320,209 | 498,579,511 | ||||||
| Alger Mid Cap Focus Fund | 1,616,801,484 | 1,736,508,075 | ||||||
| Alger Weatherbie Enduring Growth Fund | 6,800,648 | 1,321,558 | ||||||
| Alger Weatherbie Specialized Growth Fund | 594,535,683 | 819,188,472 | ||||||
| Alger Small Cap Growth Fund | 74,661,747 | 71,289,008 | ||||||
| Alger Small Cap Focus Fund | 1,630,141,158 | 3,434,969,013 | ||||||
| Alger International Focus Fund | 79,926,993 | 88,609,944 | ||||||
| Alger Health Sciences Fund | 536,745,600 | 625,993,441 | ||||||
THE ALGER FUNDS
NOTES TO FINANCIAL STATEMENTS (Continued)
NOTE 5 — Borrowing:
The Funds may borrow from the Custodian on an uncommitted basis. Each Fund pays the Custodian a market rate of interest, generally based upon a rate of return with respect to each respective currency borrowed, taking into consideration relevant overnight and short-term reference rates and the range of distribution between and among the interest rates paid on deposits to other institutions, less applicable commissions, if any. The Funds may also borrow from other funds in the Alger Fund Complex, as discussed in Note 3(i). For the year ended October 31, 2022, the Funds had the following borrowings from the Custodian and other funds in the Alger Fund Complex:
| AVERAGE DAILY BORROWING | WEIGHTED AVERAGE INTEREST RATE | |||||||
| Alger Capital Appreciation Fund | $ | 3,596,722 | 1.59 | % | ||||
| Alger 35 Fund | 23,246 | 2.65 | ||||||
| Alger Growth & Income Fund | 22 | 5.15 | ||||||
| Alger Mid Cap Growth Fund | 106,336 | 1.77 | ||||||
| Alger Mid Cap Focus Fund | 36,590 | 3.76 | ||||||
| Alger Weatherbie Specialized Growth Fund | 86,641 | 2.05 | ||||||
| Alger Small Cap Growth Fund | 12,744 | 1.69 | ||||||
| Alger Small Cap Focus Fund | 574,555 | 1.78 | ||||||
| Alger International Focus Fund | 906 | 2.20 | ||||||
| Alger Health Sciences Fund | 227,510 | 1.94 | ||||||
The highest amount borrowed from the Custodian and other funds in the Alger Fund Complex during the year ended October 31, 2022 by each Fund was as follows:
| HIGHEST BORROWING | ||||
| Alger Capital Appreciation Fund | $ | 68,253,982 | ||
| Alger 35 Fund | 443,385 | |||
| Alger Growth & Income Fund | 7,940 | |||
| Alger Mid Cap Growth Fund | 5,271,001 | |||
| Alger Mid Cap Focus Fund | 7,269,000 | |||
| Alger Weatherbie Specialized Growth Fund | 11,838,394 | |||
| Alger Small Cap Growth Fund | 2,297,000 | |||
| Alger Small Cap Focus Fund | 33,426,745 | |||
| Alger International Focus Fund | 92,245 | |||
| Alger Health Sciences Fund | 5,739,000 | |||
THE ALGER FUNDS
NOTES TO FINANCIAL STATEMENTS (Continued)
NOTE 6 — Share Capital:
The Trust has an unlimited number of authorized shares of beneficial interest of $.001 par value which are presently divided into eleven series. Each series is divided into separate classes. During the year ended October 31, 2021 and the year ended October 31, 2022, transactions of shares of beneficial interest were as follows:
| FOR THE YEAR ENDED OCTOBER 31, 2022 | FOR THE YEAR ENDED OCTOBER 31, 2021 | |||||||||||||||
| SHARES | AMOUNT | SHARES | AMOUNT | |||||||||||||
| Alger Capital Appreciation Fund | ||||||||||||||||
| Class A: | ||||||||||||||||
| Shares sold | 6,000,142 | $ | 160,613,838 | 4,903,852 | $ | 171,217,144 | ||||||||||
| Shares converted from Class C | 78,399 | 2,165,868 | 193,285 | 6,736,530 | ||||||||||||
| Dividends reinvested | 7,597,941 | 236,675,867 | 4,906,578 | 160,052,587 | ||||||||||||
| Shares redeemed | (14,983,247 | ) | (385,940,345 | ) | (10,514,085 | ) | (373,806,874 | ) | ||||||||
| Net decrease | (1,306,765 | ) | $ | 13,515,228 | (510,370 | ) | $ | (35,800,613 | ) | |||||||
| Class C: | ||||||||||||||||
| Shares sold | 917,381 | $ | 14,823,256 | 611,212 | $ | 14,822,713 | ||||||||||
| Shares converted to Class A | (126,672 | ) | (2,165,868 | ) | (279,454 | ) | (6,736,530 | ) | ||||||||
| Dividends reinvested | 2,637,277 | 50,292,867 | 1,702,406 | 38,406,276 | ||||||||||||
| Shares redeemed | (3,969,807 | ) | (67,501,761 | ) | (2,485,325 | ) | (61,180,206 | ) | ||||||||
| Net decrease | (541,821 | ) | $ | (4,551,506 | ) | (451,161 | ) | $ | (14,687,747 | ) | ||||||
| Class Z: | ||||||||||||||||
| Shares sold | 8,886,657 | $ | 247,659,419 | 8,958,009 | $ | 331,347,123 | ||||||||||
| Dividends reinvested | 7,554,946 | 250,370,897 | 4,753,533 | 162,570,831 | ||||||||||||
| Shares redeemed | (14,251,217 | ) | (384,129,235 | ) | (24,919,637 | ) | (947,567,494 | ) | ||||||||
| Net increase (decrease) | 2,190,386 | $ | 113,901,081 | (11,208,095 | ) | $ | (453,649,540 | ) | ||||||||
| Alger 35 Fund* | ||||||||||||||||
| Class Z: | ||||||||||||||||
| Shares sold | 40,255 | $ | 487,994 | 192,476 | $ | 3,393,415 | ||||||||||
| Shares from the Reorganization** | — | — | 1,429,347 | 26,249,571 | ||||||||||||
| Shares converted from Class P-2 | — | — | 18,102 | 386,258 | ||||||||||||
| Dividends reinvested | 747,267 | 10,551,417 | 9,316 | 159,019 | ||||||||||||
| Shares redeemed | (136,944 | ) | (1,414,466 | ) | (390,886 | ) | (7,004,609 | ) | ||||||||
| Net increase | 650,578 | $ | 9,624,945 | 1,258,355 | $ | 23,183,654 | ||||||||||
| Class P-2: | ||||||||||||||||
| Shares sold | — | $ | — | 9,353 | $ | 179,455 | ||||||||||
| Shares converted to Class Z | — | — | (18,083 | ) | (386,258 | ) | ||||||||||
| Dividends reinvested | — | — | 1,272 | 21,760 | ||||||||||||
| Shares redeemed | — | — | (6,943 | ) | (136,393 | ) | ||||||||||
| Net decrease | — | $ | — | (14,401 | ) | $ | (321,436 | ) | ||||||||
THE ALGER FUNDS
NOTES TO FINANCIAL STATEMENTS (Continued)
| FOR THE YEAR ENDED OCTOBER 31, 2022 | FOR THE YEAR ENDED OCTOBER 31, 2021 | |||||||||||||||
| SHARES | AMOUNT | SHARES | AMOUNT | |||||||||||||
| Alger Growth & Income Fund | ||||||||||||||||
| Class A: | ||||||||||||||||
| Shares sold | 515,271 | $ | 29,459,291 | 187,753 | $ | 10,422,890 | ||||||||||
| Shares converted from Class C | 3,410 | 186,340 | 9,932 | 526,506 | ||||||||||||
| Dividends reinvested | 71,532 | 4,322,564 | 35,990 | 1,847,272 | ||||||||||||
| Shares redeemed | (249,872 | ) | (14,016,272 | ) | (202,222 | ) | (11,022,607 | ) | ||||||||
| Net increase | 340,341 | $ | 19,951,923 | 31,453 | $ | 1,774,061 | ||||||||||
| Class C: | ||||||||||||||||
| Shares sold | 180,118 | $ | 9,975,860 | 60,755 | $ | 3,319,485 | ||||||||||
| Shares converted to Class A | (3,467 | ) | (186,340 | ) | (10,088 | ) | (526,506 | ) | ||||||||
| Dividends reinvested | 11,180 | 673,395 | 5,024 | 247,364 | ||||||||||||
| Shares redeemed | (77,010 | ) | (4,282,374 | ) | (60,069 | ) | (3,212,364 | ) | ||||||||
| Net increase (decrease) | 110,821 | $ | 6,180,541 | (4,378 | ) | $ | (172,021 | ) | ||||||||
| Class Z: | ||||||||||||||||
| Shares sold | 1,892,410 | $ | 104,985,589 | 231,639 | $ | 12,822,447 | ||||||||||
| Dividends reinvested | 34,141 | 2,015,228 | 12,292 | 636,900 | ||||||||||||
| Shares redeemed | (342,836 | ) | (18,637,053 | ) | (122,372 | ) | (6,508,944 | ) | ||||||||
| Net increase | 1,583,715 | $ | 88,363,764 | 121,559 | $ | 6,950,403 | ||||||||||
| Alger Mid Cap Growth Fund | ||||||||||||||||
| Class A: | ||||||||||||||||
| Shares sold | 914,935 | $ | 12,779,301 | 914,462 | $ | 20,634,057 | ||||||||||
| Shares converted from Class B | 39,929 | 499,789 | 82,391 | 1,863,637 | ||||||||||||
| Shares converted from Class C | 4,455 | 62,406 | 18,436 | 428,750 | ||||||||||||
| Dividends reinvested | 3,949,371 | 62,202,597 | 919,277 | 19,139,352 | ||||||||||||
| Shares redeemed | (1,662,534 | ) | (23,061,302 | ) | (1,345,940 | ) | (29,992,059 | ) | ||||||||
| Net increase | 3,246,156 | $ | 52,482,791 | 588,626 | $ | 12,073,737 | ||||||||||
| Class B: | ||||||||||||||||
| Shares sold | 306,507 | $ | 2,429,187 | 24,929 | $ | 412,167 | ||||||||||
| Shares converted to Class A | (63,092 | ) | (499,789 | ) | (111,173 | ) | (1,863,637 | ) | ||||||||
| Dividends reinvested | 648,341 | 6,399,126 | 139,453 | 2,141,998 | ||||||||||||
| Shares redeemed | (338,973 | ) | (3,167,198 | ) | (118,881 | ) | (1,959,022 | ) | ||||||||
| Net increase (decrease) | 552,783 | $ | 5,161,326 | (65,672 | ) | $ | (1,268,494 | ) | ||||||||
| Class C: | ||||||||||||||||
| Shares sold | 129,451 | $ | 1,156,792 | 143,711 | $ | 2,319,146 | ||||||||||
| Shares converted to Class A | (7,374 | ) | (62,406 | ) | (25,839 | ) | (428,750 | ) | ||||||||
| Dividends reinvested | 312,841 | 2,906,295 | 55,517 | 822,766 | ||||||||||||
| Shares redeemed | (177,595 | ) | (1,518,832 | ) | (109,683 | ) | (1,763,897 | ) | ||||||||
| Net increase | 257,323 | $ | 2,481,849 | 63,706 | $ | 949,265 | ||||||||||
| Class Z: | ||||||||||||||||
| Shares sold | 1,467,938 | $ | 24,776,780 | 1,002,401 | $ | 22,629,348 | ||||||||||
| Dividends reinvested | 730,556 | 11,835,012 | 96,479 | 2,049,208 | ||||||||||||
| Shares redeemed | (1,511,602 | ) | (20,451,267 | ) | (418,013 | ) | (9,396,307 | ) | ||||||||
| Net increase | 686,892 | $ | 16,160,525 | 680,867 | $ | 15,282,249 | ||||||||||
THE ALGER FUNDS
NOTES TO FINANCIAL STATEMENTS (Continued)
| FOR THE YEAR ENDED OCTOBER 31, 2022 | FOR THE YEAR ENDED OCTOBER 31, 2021 | |||||||||||||||
| SHARES | AMOUNT | SHARES | AMOUNT | |||||||||||||
| Alger Mid Cap Focus Fund | ||||||||||||||||
| Class A:*** | ||||||||||||||||
| Shares sold | 437,847 | $ | 6,471,602 | 71,524 | $ | 1,568,079 | ||||||||||
| Dividends reinvested | 12,508 | 226,140 | — | — | ||||||||||||
| Shares redeemed | (102,747 | ) | (1,441,325 | ) | (282 | ) | (6,378 | ) | ||||||||
| Net increase | 347,608 | $ | 5,256,417 | 71,242 | $ | 1,561,701 | ||||||||||
| Class C:*** | ||||||||||||||||
| Shares sold | 205,863 | $ | 3,441,176 | 99,334 | $ | 2,230,152 | ||||||||||
| Dividends reinvested | 12,103 | 218,218 | — | — | ||||||||||||
| Shares redeemed | (114,553 | ) | (1,735,186 | ) | (235 | ) | (5,074 | ) | ||||||||
| Net increase | 103,413 | $ | 1,924,208 | 99,099 | $ | 2,225,078 | ||||||||||
| Class I: | ||||||||||||||||
| Shares sold | 1,024,323 | $ | 17,245,006 | 3,340,683 | $ | 67,099,072 | ||||||||||
| Dividends reinvested | 678,515 | 12,274,336 | 68,847 | 1,263,336 | ||||||||||||
| Shares redeemed | (2,767,242 | ) | (41,627,861 | ) | (1,688,941 | ) | (32,678,718 | ) | ||||||||
| Net increase (decrease) | (1,064,404 | ) | $ | (12,108,519 | ) | 1,720,589 | $ | 35,683,690 | ||||||||
| Class Y:**** | ||||||||||||||||
| Shares sold | 30,243 | $ | 420,561 | 5,822 | $ | 119,925 | ||||||||||
| Dividends reinvested | 116 | 2,107 | — | — | ||||||||||||
| Shares redeemed | (9 | ) | (87 | ) | — | — | ||||||||||
| Net increase | 30,350 | $ | 422,581 | 5,822 | $ | 119,925 | ||||||||||
| Class Z: | ||||||||||||||||
| Shares sold | 13,358,332 | $ | 215,931,807 | 20,605,283 | $ | 415,538,623 | ||||||||||
| Dividends reinvested | 3,770,479 | 68,698,120 | 320,018 | 5,894,736 | ||||||||||||
| Shares redeemed | (21,026,998 | ) | (316,016,051 | ) | (7,483,745 | ) | (151,083,036 | ) | ||||||||
| Net increase (decrease) | (3,898,187 | ) | $ | (31,386,124 | ) | 13,441,556 | $ | 270,350,323 | ||||||||
| Alger Weatherbie Enduring Growth Fund***** | ||||||||||||||||
| Class A: | ||||||||||||||||
| Shares sold | 16,335 | $ | 153,000 | — | $ | — | ||||||||||
| Net increase | 16,335 | $ | 153,000 | — | $ | — | ||||||||||
| Class C: | ||||||||||||||||
| Shares sold | 10,000 | $ | 100,000 | — | $ | — | ||||||||||
| Net increase | 10,000 | $ | 100,000 | — | $ | — | ||||||||||
| Class I: | ||||||||||||||||
| Shares sold | 10,000 | $ | 100,000 | — | $ | — | ||||||||||
| Net increase | 10,000 | $ | 100,000 | — | $ | — | ||||||||||
| Class Y: | ||||||||||||||||
| Shares sold | 50,000 | $ | 500,000 | — | $ | — | ||||||||||
| Net increase | 50,000 | $ | 500,000 | — | $ | — | ||||||||||
| Class Z: | ||||||||||||||||
| Shares sold | 520,429 | $ | 5,065,743 | — | $ | — | ||||||||||
| Shares redeemed | (3,094 | ) | (21,383 | ) | — | — | ||||||||||
| Net increase | 517,335 | $ | 5,044,360 | — | $ | — | ||||||||||
THE ALGER FUNDS
NOTES TO FINANCIAL STATEMENTS (Continued)
| FOR THE YEAR ENDED OCTOBER 31, 2022 | FOR THE YEAR ENDED OCTOBER 31, 2021 | |||||||||||||||
| SHARES | AMOUNT | SHARES | AMOUNT | |||||||||||||
| Alger Weatherbie Specialized Growth Fund | ||||||||||||||||
| Class A: | ||||||||||||||||
| Shares sold | 2,207,109 | $ | 31,475,922 | 2,777,160 | $ | 60,409,142 | ||||||||||
| Shares converted from Class C | 10,193 | 195,953 | 65,661 | 1,472,818 | ||||||||||||
| Dividends reinvested | 2,355,077 | 40,837,032 | 438,339 | 8,823,757 | ||||||||||||
| Shares redeemed | (4,618,177 | ) | (63,575,231 | ) | (2,894,846 | ) | (62,323,010 | ) | ||||||||
| Net increase (decrease) | (45,798 | ) | $ | 8,933,676 | 386,314 | $ | 8,382,707 | |||||||||
| Class C: | ||||||||||||||||
| Shares sold | 1,004,246 | $ | 8,908,341 | 1,791,191 | $ | 25,231,160 | ||||||||||
| Shares converted to Class A | (17,106 | ) | (195,953 | ) | (102,088 | ) | (1,472,818 | ) | ||||||||
| Dividends reinvested | 2,635,295 | 24,982,600 | 412,015 | 5,327,351 | ||||||||||||
| Shares redeemed | (2,980,283 | ) | (23,986,101 | ) | (1,215,169 | ) | (17,245,234 | ) | ||||||||
| Net increase | 642,152 | $ | 9,708,887 | 885,949 | $ | 11,840,459 | ||||||||||
| Class I: | ||||||||||||||||
| Shares sold | 430,300 | $ | 7,169,370 | 1,135,719 | $ | 25,501,619 | ||||||||||
| Dividends reinvested | 505,518 | 9,079,102 | 127,791 | 2,646,555 | ||||||||||||
| Shares redeemed | (1,472,639 | ) | (21,152,563 | ) | (1,952,131 | ) | (42,735,229 | ) | ||||||||
| Net decrease | (536,821 | ) | $ | (4,904,091 | ) | (688,621 | ) | $ | (14,587,055 | ) | ||||||
| Class Y: | ||||||||||||||||
| Shares sold | 2,793,770 | $ | 42,898,361 | 837,092 | $ | 19,514,973 | ||||||||||
| Dividends reinvested | 343,618 | 6,305,382 | 45,583 | 957,251 | ||||||||||||
| Shares redeemed | (1,624,371 | ) | (22,901,364 | ) | (340,146 | ) | (7,860,565 | ) | ||||||||
| Net increase | 1,513,017 | $ | 26,302,379 | 542,529 | $ | 12,611,659 | ||||||||||
| Class Z: | ||||||||||||||||
| Shares sold | 25,026,249 | $ | 397,063,874 | 23,475,062 | $ | 551,582,721 | ||||||||||
| Dividends reinvested | 9,047,802 | 171,998,722 | 1,449,362 | 31,335,212 | ||||||||||||
| Shares redeemed | (39,559,633 | ) | (605,958,139 | ) | (10,574,421 | ) | (248,570,390 | ) | ||||||||
| Net increase (decrease) | (5,485,582 | ) | $ | (36,895,543 | ) | 14,350,003 | $ | 334,347,543 | ||||||||
THE ALGER FUNDS
NOTES TO FINANCIAL STATEMENTS (Continued)
| FOR THE YEAR ENDED OCTOBER 31, 2022 | FOR THE YEAR ENDED OCTOBER 31, 2021 | |||||||||||||||
| SHARES | AMOUNT | SHARES | AMOUNT | |||||||||||||
| Alger Small Cap Growth Fund | ||||||||||||||||
| Class A: | ||||||||||||||||
| Shares sold | 2,219,196 | $ | 24,488,782 | 4,316,492 | $ | 67,234,025 | ||||||||||
| Shares converted from Class B | 49,641 | 549,484 | 9,900 | 151,028 | ||||||||||||
| Shares converted from Class C | 1,542 | 15,219 | 9,831 | 156,933 | ||||||||||||
| Dividends reinvested | 1,565,131 | 20,221,493 | 69,156 | 1,020,044 | ||||||||||||
| Shares redeemed | (3,937,640 | ) | (43,512,748 | ) | (3,086,481 | ) | (47,214,284 | ) | ||||||||
| Net increase (decrease) | (102,130 | ) | $ | 1,762,230 | 1,318,898 | $ | 21,347,746 | |||||||||
| Class B: | ||||||||||||||||
| Shares sold | 69,274 | $ | 489,107 | 18,146 | $ | 202,310 | ||||||||||
| Shares converted to Class A | (73,759 | ) | (549,484 | ) | (14,060 | ) | (151,028 | ) | ||||||||
| Dividends reinvested | 77,256 | 672,125 | 3,843 | 39,897 | ||||||||||||
| Shares redeemed | (71,673 | ) | (579,243 | ) | (71,442 | ) | (786,600 | ) | ||||||||
| Net increase (decrease) | 1,098 | $ | 32,505 | (63,513 | ) | $ | (695,421 | ) | ||||||||
| Class C: | ||||||||||||||||
| Shares sold | 791,975 | $ | 5,337,182 | 2,192,233 | $ | 22,769,276 | ||||||||||
| Shares converted to Class A | (2,453 | ) | (15,219 | ) | (14,746 | ) | (156,933 | ) | ||||||||
| Dividends reinvested | 590,149 | 4,786,108 | 17,615 | 173,504 | ||||||||||||
| Shares redeemed | (1,186,581 | ) | (7,903,372 | ) | (731,088 | ) | (7,680,281 | ) | ||||||||
| Net increase | 193,090 | $ | 2,204,699 | 1,464,014 | $ | 15,105,566 | ||||||||||
| Class Y:****** | ||||||||||||||||
| Shares sold | 890,852 | $ | 8,643,853 | — | $ | — | ||||||||||
| Shares redeemed | (25,818 | ) | (245,321 | ) | — | — | ||||||||||
| Net increase | 865,034 | $ | 8,398,532 | — | $ | — | ||||||||||
| Class Z: | ||||||||||||||||
| Shares sold | 14,423,124 | $ | 162,619,241 | 16,501,975 | $ | 267,006,423 | ||||||||||
| Dividends reinvested | 2,222,719 | 30,117,848 | 71,444 | 1,096,671 | ||||||||||||
| Shares redeemed | (16,204,110 | ) | (179,137,817 | ) | (7,573,401 | ) | (122,718,331 | ) | ||||||||
| Net increase | 441,733 | $ | 13,599,272 | 9,000,018 | $ | 145,384,763 | ||||||||||
THE ALGER FUNDS
NOTES TO FINANCIAL STATEMENTS (Continued)
| FOR THE YEAR ENDED OCTOBER 31, 2022 | FOR THE YEAR ENDED OCTOBER 31, 2021 | |||||||||||||||
| SHARES | AMOUNT | SHARES | AMOUNT | |||||||||||||
| Alger Small Cap Focus Fund | ||||||||||||||||
| Class A: | ||||||||||||||||
| Shares sold | 2,079,038 | $ | 42,247,967 | 2,869,366 | $ | 90,147,930 | ||||||||||
| Shares converted from Class C | 3,678 | 95,518 | 15,477 | 522,326 | ||||||||||||
| Dividends reinvested | 1,045,786 | 26,134,180 | — | — | ||||||||||||
| Shares redeemed | (7,382,999 | ) | (148,269,616 | ) | (6,829,853 | ) | (211,147,927 | ) | ||||||||
| Net decrease | (4,254,497 | ) | $ | (79,791,951 | ) | (3,945,010 | ) | $ | (120,477,671 | ) | ||||||
| Class C: | ||||||||||||||||
| Shares sold | 361,903 | $ | 6,758,876 | 412,494 | $ | 11,510,179 | ||||||||||
| Shares converted to Class A | (4,175 | ) | (95,518 | ) | (17,406 | ) | (522,326 | ) | ||||||||
| Dividends reinvested | 669,148 | 14,661,031 | — | — | ||||||||||||
| Shares redeemed | (3,163,891 | ) | (54,641,324 | ) | (1,494,411 | ) | (41,732,985 | ) | ||||||||
| Net decrease | (2,137,015 | ) | $ | (33,316,935 | ) | (1,099,323 | ) | $ | (30,745,132 | ) | ||||||
| Class I: | ||||||||||||||||
| Shares sold | 2,388,085 | $ | 52,040,663 | 5,521,632 | $ | 177,853,968 | ||||||||||
| Dividends reinvested | 817,179 | 21,017,843 | — | — | ||||||||||||
| Shares redeemed | (7,857,664 | ) | (170,047,309 | ) | (5,977,164 | ) | (188,231,133 | ) | ||||||||
| Net decrease | (4,652,400 | ) | $ | (96,988,803 | ) | (455,532 | ) | $ | (10,377,165 | ) | ||||||
| Class Y: | ||||||||||||||||
| Shares sold | 5,178,987 | $ | 111,652,914 | 5,833,923 | $ | 191,192,930 | ||||||||||
| Dividends reinvested | 722,905 | 19,019,637 | — | — | ||||||||||||
| Shares redeemed | (3,388,609 | ) | (72,320,606 | ) | (3,700,823 | ) | (119,885,569 | ) | ||||||||
| Net increase | 2,513,283 | $ | 58,351,945 | 2,133,100 | $ | 71,307,361 | ||||||||||
| Class Z: | ||||||||||||||||
| Shares sold | 53,012,266 | $ | 1,149,885,044 | 76,188,007 | $ | 2,500,577,465 | ||||||||||
| Dividends reinvested | 10,465,710 | 275,248,186 | — | — | ||||||||||||
| Shares redeemed | (127,025,685 | ) | (2,664,182,027 | ) | (54,259,719 | ) | (1,768,072,530 | ) | ||||||||
| Net increase (decrease) | (63,547,709 | ) | $ | (1,239,048,797 | ) | 21,928,288 | $ | 732,504,935 | ||||||||
THE ALGER FUNDS
NOTES TO FINANCIAL STATEMENTS (Continued)
| FOR THE YEAR ENDED OCTOBER 31, 2022 | FOR THE YEAR ENDED OCTOBER 31, 2021 | |||||||||||||||
| SHARES | AMOUNT | SHARES | AMOUNT | |||||||||||||
| Alger International Focus Fund | ||||||||||||||||
| Class A: | ||||||||||||||||
| Shares sold | 272,542 | $ | 5,095,123 | 308,062 | $ | 7,102,758 | ||||||||||
| Shares converted from Class B | 11,100 | 214,147 | 15,746 | 357,201 | ||||||||||||
| Shares converted from Class C | 2,157 | 41,626 | 9,648 | 226,184 | ||||||||||||
| Dividends reinvested | 517,441 | 11,740,747 | — | — | ||||||||||||
| Shares redeemed | (517,683 | ) | (9,704,917 | ) | (507,496 | ) | (11,678,515 | ) | ||||||||
| Net increase (decrease) | 285,557 | $ | 7,386,726 | (174,040 | ) | $ | (3,992,372 | ) | ||||||||
| Class B: | ||||||||||||||||
| Shares sold | 10,257 | $ | 145,522 | 24,912 | $ | 439,834 | ||||||||||
| Shares converted to Class A | (12,932 | ) | (214,147 | ) | (18,146 | ) | (357,201 | ) | ||||||||
| Dividends reinvested | 99,778 | 1,938,691 | — | — | ||||||||||||
| Shares redeemed | (100,637 | ) | (1,753,746 | ) | (129,422 | ) | (2,601,409 | ) | ||||||||
| Net increase (decrease) | (3,534 | ) | $ | 116,320 | (122,656 | ) | $ | (2,518,776 | ) | |||||||
| Class C: | ||||||||||||||||
| Shares sold | 14,352 | $ | 245,440 | 71,044 | $ | 1,356,820 | ||||||||||
| Shares converted to Class A | (2,638 | ) | (41,626 | ) | (11,520 | ) | (226,184 | ) | ||||||||
| Dividends reinvested | 21,218 | 393,811 | — | — | ||||||||||||
| Shares redeemed | (112,626 | ) | (1,705,231 | ) | (26,935 | ) | (516,872 | ) | ||||||||
| Net increase (decrease) | (79,694 | ) | $ | (1,107,606 | ) | 32,589 | $ | 613,764 | ||||||||
| Class I: | ||||||||||||||||
| Shares sold | 64,844 | $ | 1,462,329 | 15,704 | $ | 367,108 | ||||||||||
| Dividends reinvested | 2,147 | 48,866 | — | — | ||||||||||||
| Shares redeemed | (20,997 | ) | (391,454 | ) | (26,546 | ) | (588,570 | ) | ||||||||
| Net increase (decrease) | 45,994 | $ | 1,119,741 | (10,842 | ) | $ | (221,462 | ) | ||||||||
| Class Z: | ||||||||||||||||
| Shares sold | 356,479 | $ | 6,998,893 | 684,090 | $ | 15,690,006 | ||||||||||
| Dividends reinvested | 90,502 | 2,089,682 | — | — | ||||||||||||
| Shares redeemed | (620,623 | ) | (11,168,546 | ) | (244,218 | ) | (5,616,024 | ) | ||||||||
| Net increase (decrease) | (173,642 | ) | $ | (2,079,971 | ) | 439,872 | $ | 10,073,982 | ||||||||
THE ALGER FUNDS
NOTES TO FINANCIAL STATEMENTS (Continued)
| FOR THE YEAR ENDED OCTOBER 31, 2022 | FOR THE YEAR ENDED OCTOBER 31, 2021 | |||||||||||||||
| SHARES | AMOUNT | SHARES | AMOUNT | |||||||||||||
| Alger Health Sciences Fund | ||||||||||||||||
| Class A: | ||||||||||||||||
| Shares sold | 551,350 | $ | 12,970,639 | 647,684 | $ | 21,813,029 | ||||||||||
| Shares converted from Class C | 7,202 | 167,019 | 19,072 | 665,710 | ||||||||||||
| Dividends reinvested | 974,155 | 24,529,213 | 417,346 | 13,167,263 | ||||||||||||
| Shares redeemed | (1,298,720 | ) | (29,986,025 | ) | (979,932 | ) | (32,679,519 | ) | ||||||||
| Net increase | 233,987 | $ | 7,680,846 | 104,170 | $ | 2,966,483 | ||||||||||
| Class C: | ||||||||||||||||
| Shares sold | 69,406 | $ | 1,071,149 | 151,682 | $ | 3,657,493 | ||||||||||
| Shares converted to Class A | (11,391 | ) | (167,019 | ) | (26,699 | ) | (665,710 | ) | ||||||||
| Dividends reinvested | 226,913 | 3,607,915 | 82,622 | 1,869,732 | ||||||||||||
| Shares redeemed | (235,168 | ) | (3,555,053 | ) | (158,253 | ) | (3,786,919 | ) | ||||||||
| Net increase | 49,760 | $ | 956,992 | 49,352 | $ | 1,074,596 | ||||||||||
| Class Z: | ||||||||||||||||
| Shares sold | 1,269,543 | $ | 31,739,077 | 2,662,275 | $ | 91,145,762 | ||||||||||
| Dividends reinvested | 1,302,121 | 33,295,227 | 490,804 | 15,627,187 | ||||||||||||
| Shares redeemed | (3,842,061 | ) | (88,876,343 | ) | (2,264,211 | ) | (74,893,155 | ) | ||||||||
| Net increase (decrease) | (1,270,397 | ) | $ | (23,842,039 | ) | 888,868 | $ | 31,879,794 | ||||||||
| * | On May 7, 2021, Class P Shares of Alger 35 Fund were reclassified as Class Z Shares. After the close of business on October 29, 2021, Class P-2 Shares of the Alger 35 Fund were converted to Class Z Shares. |
| ** | Includes shares and amounts from the Reorganization. |
| *** | Inception date July 29, 2021. |
| **** | Inception date February 26, 2021. |
| ***** | Inception date December 17, 2021. |
| ****** | Inception date December 31, 2021. |
NOTE 7 — Income Tax Information:
The tax character of distributions paid during the year ended October 31, 2022 and the year ended October 31, 2021 was as follows:
| FOR THE YEAR ENDED OCTOBER 31, 2022 | FOR THE YEAR ENDED OCTOBER 31, 2021 | |||||||
| Alger Capital Appreciation Fund | ||||||||
| Distributions paid from: | ||||||||
| Ordinary Income | $ | 84,937,556 | $ | — | ||||
| Long-term capital gain | 550,592,694 | 421,756,031 | ||||||
| Total distributions paid | $ | 635,530,250 | $ | 421,756,031 | ||||
| Alger 35 Fund | ||||||||
| Distributions paid from: | ||||||||
| Ordinary Income | $ | 2,856,188 | $ | 903,681 | ||||
| Long-term capital gain | 7,695,229 | 1,599,860 | ||||||
| Total distributions paid | $ | 10,551,417 | $ | 2,503,541 | ||||
THE ALGER FUNDS
NOTES TO FINANCIAL STATEMENTS (Continued)
| FOR THE YEAR ENDED OCTOBER 31, 2022 | FOR THE YEAR ENDED OCTOBER 31, 2021 | |||||||
| Alger Growth & Income Fund | ||||||||
| Distributions paid from: | ||||||||
| Ordinary Income | $ | 2,654,256 | $ | 1,367,989 | ||||
| Long-term capital gain | 4,962,836 | 1,671,431 | ||||||
| Total distributions paid | $ | 7,617,092 | $ | 3,039,420 | ||||
| Alger Mid Cap Growth Fund | ||||||||
| Distributions paid from: | ||||||||
| Ordinary Income | $ | 39,056,482 | $ | 9,986,404 | ||||
| Long-term capital gain | 53,285,885 | 17,092,019 | ||||||
| Total distributions paid | $ | 92,342,367 | $ | 27,078,423 | ||||
| Alger Mid Cap Focus Fund | ||||||||
| Distributions paid from: | ||||||||
| Ordinary Income | $ | 69,647,668 | $ | 4,477,639 | ||||
| Long-term capital gain | 14,480,875 | 2,736,644 | ||||||
| Total distributions paid | $ | 84,128,543 | $ | 7,214,283 | ||||
| Alger Weatherbie Enduring Growth Fund | ||||||||
| Distributions paid from: | ||||||||
| Ordinary Income | $ | — | $ | — | ||||
| Long-term capital gain | — | — | ||||||
| Total distributions paid | $ | — | $ | — | ||||
| Alger Weatherbie Specialized Growth Fund | ||||||||
| Distributions paid from: | ||||||||
| Ordinary Income | $ | 157,918,577 | $ | — | ||||
| Long-term capital gain | 143,706,532 | 54,754,778 | ||||||
| Total distributions paid | $ | 301,625,109 | $ | 54,754,778 | ||||
| Alger Small Cap Growth Fund | ||||||||
| Distributions paid from: | ||||||||
| Ordinary Income | $ | — | $ | — | ||||
| Long-term capital gain | 57,233,096 | 2,406,068 | ||||||
| Total distributions paid | $ | 57,233,096 | $ | 2,406,068 | ||||
| Alger Small Cap Focus Fund | ||||||||
| Distributions paid from: | ||||||||
| Ordinary Income | $ | — | $ | — | ||||
| Long-term capital gain | 416,035,678 | — | ||||||
| Total distributions paid | $ | 416,035,678 | $ | — | ||||
THE ALGER FUNDS
NOTES TO FINANCIAL STATEMENTS (Continued)
| FOR THE YEAR ENDED OCTOBER 31, 2022 | FOR THE YEAR ENDED OCTOBER 31, 2021 | |||||||
| Alger International Focus Fund | ||||||||
| Distributions paid from: | ||||||||
| Ordinary Income | $ | — | $ | — | ||||
| Long-term capital gain | 16,992,932 | — | ||||||
| Total distributions paid | $ | 16,992,932 | $ | — | ||||
| Alger Health Sciences Fund | ||||||||
| Distributions paid from: | ||||||||
| Ordinary Income | $ | 15,390,772 | $ | 5,701,478 | ||||
| Long-term capital gain | 51,406,248 | 26,993,153 | ||||||
| Total distributions paid | $ | 66,797,020 | $ | 32,694,631 | ||||
As of October 31, 2022, the components of accumulated gains (losses) on a tax basis were as follows:
| Alger Capital Appreciation Fund | ||||
| Undistributed ordinary income | $ | — | ||
| Undistributed long-term gains | 68,990,335 | |||
| Net accumulated earnings | 68,990,335 | |||
| Capital loss carryforwards | — | |||
| Late year ordinary income losses | (5,660,436 | ) | ||
| Net unrealized appreciation | 482,476,580 | |||
| Total accumulated earnings | $ | 545,806,479 | ||
| Alger 35 Fund | ||||
| Undistributed ordinary income | $ | — | ||
| Undistributed long-term gains | — | |||
| Net accumulated earnings | — | |||
| Capital loss carryforwards | (3,821,422 | ) | ||
| Late year ordinary income losses | — | |||
| Net unrealized depreciation | (11,046,804 | ) | ||
| Total accumulated earnings | $ | (14,868,226 | ) | |
| Alger Growth & Income Fund | ||||
| Undistributed ordinary income | $ | 439,274 | ||
| Undistributed long-term gains | — | |||
| Net accumulated earnings | 439,274 | |||
| Capital loss carryforwards | (175,048 | ) | ||
| Late year ordinary income losses | — | |||
| Net unrealized appreciation | 70,588,858 | |||
| Total accumulated earnings | $ | 70,853,084 | ||
THE ALGER FUNDS
NOTES TO FINANCIAL STATEMENTS (Continued)
| Alger Mid Cap Growth Fund | ||||
| Undistributed ordinary income | $ | — | ||
| Undistributed long-term gains | — | |||
| Net accumulated earnings | — | |||
| Capital loss carryforwards | (55,039,064 | ) | ||
| Late year ordinary income losses | (1,195,330 | ) | ||
| Net unrealized depreciation | (6,265,167 | ) | ||
| Total accumulated earnings | $ | (62,499,561 | ) | |
| Alger Mid Cap Focus Fund | ||||
| Undistributed ordinary income | $ | — | ||
| Undistributed long-term gains | — | |||
| Net accumulated earnings | — | |||
| Capital loss carryforwards | (112,987,257 | ) | ||
| Late year ordinary income losses | (1,778,801 | ) | ||
| Net unrealized depreciation | (41,922,331 | ) | ||
| Total accumulated earnings | $ | (156,688,389 | ) | |
| Alger Weatherbie Enduring Growth Fund | ||||
| Undistributed ordinary income | $ | — | ||
| Undistributed long-term gains | — | |||
| Net accumulated earnings | — | |||
| Capital loss carryforwards | (424,936 | ) | ||
| Late year ordinary income losses | (8,517 | ) | ||
| Net unrealized depreciation | (1,009,478 | ) | ||
| Total accumulated earnings | $ | (1,442,931 | ) | |
| Alger Weatherbie Specialized Growth Fund | ||||
| Undistributed ordinary income | $ | — | ||
| Undistributed long-term gains | — | |||
| Net accumulated earnings | — | |||
| Capital loss carryforwards | (183,450,481 | ) | ||
| Late year ordinary income losses | (6,010,463 | ) | ||
| Net unrealized depreciation | (106,763,083 | ) | ||
| Total accumulated earnings | $ | (296,224,027 | ) | |
| Alger Small Cap Growth Fund | ||||
| Undistributed ordinary income | $ | — | ||
| Undistributed long-term gains | — | |||
| Net accumulated earnings | — | |||
| Capital loss carryforwards | (24,317,021 | ) | ||
| Late year ordinary income losses | (3,537,148 | ) | ||
| Net unrealized depreciation | (42,505,272 | ) | ||
| Total accumulated earnings | $ | (70,359,441 | ) |
THE ALGER FUNDS
NOTES TO FINANCIAL STATEMENTS (Continued)
| Alger Small Cap Focus Fund | ||||
| Undistributed ordinary income | $ | — | ||
| Undistributed long-term gains | — | |||
| Net accumulated earnings | — | |||
| Capital loss carryforwards | (545,792,970 | ) | ||
| Late year ordinary income losses | (15,018,511 | ) | ||
| Net unrealized appreciation | 58,058,913 | |||
| Total accumulated earnings | $ | (502,752,568 | ) | |
| Alger International Focus Fund | ||||
| Undistributed ordinary income | $ | — | ||
| Undistributed long-term gains | — | |||
| Net accumulated earnings | — | |||
| Capital loss carryforwards | (6,464,970 | ) | ||
| Late year ordinary income losses | (649,006 | ) | ||
| Net unrealized appreciation | 1,013,251 | |||
| Total accumulated earnings | $ | (6,100,725 | ) | |
| Alger Health Sciences Fund | ||||
| Undistributed ordinary income | $ | — | ||
| Undistributed long-term gains | — | |||
| Net accumulated earnings | — | |||
| Capital loss carryforwards | (43,177,529 | ) | ||
| Late year ordinary income losses | — | |||
| Net unrealized appreciation | 20,126,081 | |||
| Total accumulated earnings | $ | (23,051,448 | ) |
During the year ended October 31, 2022, the Funds had no capital loss carryforwards utilized for federal income tax purposes.
The difference between book-basis and tax-basis unrealized appreciation (depreciation) is determined annually and is attributable primarily to the tax deferral of losses on wash sales, U.S. Internal Revenue Code Section 988 currency transactions, nondeductible expenses on dividends sold short, tax treatment of partnership investments, realization of unrealized appreciation of passive foreign investment companies, and return of capital from real estate investment trust investments.
The Funds accrue tax on unrealized gains in foreign jurisdictions that impose a foreign capital tax.
Permanent differences, primarily from net operating losses and real estate investment trusts and partnership investments sold by the Funds, resulted in the following reclassifications among the Funds’ components of net assets at October 31, 2022:
| Alger Capital Appreciation Fund | ||||
| Distributable earnings | $ | 3,051,484 | ||
| Paid-in Capital | $ | (3,051,484 | ) | |
THE ALGER FUNDS
NOTES TO FINANCIAL STATEMENTS (Continued)
| Alger 35 Fund | ||||
| Distributable earnings | $ | 4,721 | ||
| Paid-in Capital | $ | (4,721 | ) | |
| Alger Mid Cap Growth Fund | ||||
| Distributable earnings | $ | 449,832 | ||
| Paid-in Capital | $ | (449,832 | ) | |
| Alger Mid Cap Focus Fund | ||||
| Distributable earnings | $ | 623,118 | ||
| Paid-in Capital | $ | (623,118 | ) | |
| Alger Weatherbie Enduring Growth Fund | ||||
| Distributable earnings | $ | 1,222 | ||
| Paid-in Capital | $ | (1,222 | ) | |
| Alger Weatherbie Specialized Growth Fund | ||||
| Distributable earnings | $ | 2,039,596 | ||
| Paid-in Capital | $ | (2,039,596 | ) | |
| Alger Small Cap Growth Fund | ||||
| Distributable earnings | $ | 3,083,631 | ||
| Paid-in Capital | $ | (3,083,631 | ) | |
| Alger Small Cap Focus Fund | ||||
| Distributable earnings | $ | 72,926,502 | ||
| Paid-in Capital | $ | (72,926,502 | ) | |
| Alger International Focus Fund | ||||
| Distributable earnings | $ | 919,351 | ||
| Paid-in Capital | $ | (919,351 | ) | |
| Alger Health Sciences Fund | ||||
| Distributable earnings | $ | 591,652 | ||
| Paid-in Capital | $ | (591,652 | ) | |
NOTE 8 — Fair Value Measurements:
The following is a summary of the inputs used as of October 31, 2022 in valuing the Funds’ investments carried at fair value on a recurring basis. Based upon the nature, characteristics, and risks associated with their investments, the Funds have determined that presenting them by security type and sector is appropriate.
THE ALGER FUNDS
NOTES TO FINANCIAL STATEMENTS (Continued)
| Alger Capital Appreciation Fund | TOTAL | LEVEL 1 | LEVEL 2 | LEVEL 3 | ||||||||||||
| COMMON STOCKS | ||||||||||||||||
| Communication Services | $ | 170,155,408 | $ | 170,155,408 | $ | — | $ | — | ||||||||
| Consumer Discretionary | 300,489,817 | 280,614,915 | 19,430,601 | 444,301 | ||||||||||||
| Consumer Staples | 17,457,215 | 17,457,215 | — | — | ||||||||||||
| Energy | 75,979,513 | 75,979,513 | — | — | ||||||||||||
| Financials | 40,392,849 | 40,392,849 | — | — | ||||||||||||
| Healthcare | 369,078,259 | 369,078,259 | — | — | ||||||||||||
| Industrials | 128,909,878 | 128,909,878 | — | — | ||||||||||||
| Information Technology | 605,689,250 | 605,689,250 | — | — | ||||||||||||
| Materials | 21,807,974 | 21,807,974 | — | — | ||||||||||||
| Utilities | 21,975,358 | 21,975,358 | — | — | ||||||||||||
| TOTAL COMMON STOCKS | $ | 1,751,935,521 | $ | 1,732,060,619 | $ | 19,430,601 | $ | 444,301 | ||||||||
| PREFERRED STOCKS | ||||||||||||||||
| Information Technology | 1,215,538 | — | — | 1,215,538 | ||||||||||||
| REAL ESTATE INVESTMENT TRUST | ||||||||||||||||
| Real Estate | 5,656,294 | 5,656,294 | — | — | ||||||||||||
| SPECIAL PURPOSE VEHICLE | ||||||||||||||||
| Information Technology | 2,934,840 | — | — | 2,934,840 | ||||||||||||
| TOTAL INVESTMENTS IN SECURITIES | $ | 1,761,742,193 | $ | 1,737,716,913 | $ | 19,430,601 | $ | 4,594,679 | ||||||||
| Alger 35 Fund | TOTAL | LEVEL 1 | LEVEL 2 | LEVEL 3 | ||||||||||||
| COMMON STOCKS | ||||||||||||||||
| Communication Services | 3,322,941 | 3,322,941 | — | — | ||||||||||||
| Consumer Discretionary | 2,536,004 | 2,536,004 | — | — | ||||||||||||
| Energy | 2,114,892 | 2,114,892 | — | — | ||||||||||||
| Financials | 364,619 | 364,619 | — | — | ||||||||||||
| Healthcare | 7,345,445 | 7,345,445 | — | — | ||||||||||||
| Industrials | 1,211,017 | 1,211,017 | — | — | ||||||||||||
| Information Technology | 7,558,533 | 7,558,533 | — | — | ||||||||||||
| Real Estate | 665,803 | 665,803 | — | — | ||||||||||||
| TOTAL COMMON STOCKS | $ | 25,119,254 | $ | 25,119,254 | $ | — | $ | — | ||||||||
| REAL ESTATE INVESTMENT TRUST | ||||||||||||||||
| Real Estate | 656,572 | 656,572 | — | — | ||||||||||||
| TOTAL INVESTMENTS IN SECURITIES | $ | 25,775,826 | $ | 25,775,826 | $ | — | $ | — | ||||||||
| Alger Growth & Income Fund | TOTAL | LEVEL 1 | LEVEL 2 | LEVEL 3 | ||||||||||||
| COMMON STOCKS | ||||||||||||||||
| Communication Services | 18,589,366 | 18,589,366 | — | — | ||||||||||||
| Consumer Discretionary | 16,683,148 | 16,683,148 | — | — | ||||||||||||
| Consumer Staples | 17,914,986 | 17,914,986 | — | — | ||||||||||||
| Energy | 14,143,797 | 14,143,797 | — | — | ||||||||||||
| Financials | 26,965,979 | 26,965,979 | — | — | ||||||||||||
| Healthcare | 39,903,342 | 39,903,342 | — | — | ||||||||||||
| Industrials | 16,397,529 | 16,397,529 | — | — | ||||||||||||
| Information Technology | 61,554,436 | 61,554,436 | — | — | ||||||||||||
| Materials | 4,686,106 | 4,686,106 | — | — | ||||||||||||
| Utilities | 3,659,846 | 3,659,846 | — | — | ||||||||||||
| TOTAL COMMON STOCKS | $ | 220,498,535 | $ | 220,498,535 | $ | — | $ | — | ||||||||
THE ALGER FUNDS
NOTES TO FINANCIAL STATEMENTS (Continued)
| Alger Growth & Income Fund | TOTAL | LEVEL 1 | LEVEL 2 | LEVEL 3 | ||||||||||||
| MASTER LIMITED PARTNERSHIP | ||||||||||||||||
| Energy | $ | 1,826,569 | $ | 1,826,569 | $ | — | $ | — | ||||||||
| REAL ESTATE INVESTMENT TRUST | ||||||||||||||||
| Financials | 1,537,286 | 1,537,286 | — | — | ||||||||||||
| Real Estate | 8,427,272 | 8,427,272 | — | — | ||||||||||||
| TOTAL REAL ESTATE INVESTMENT TRUST | $ | 9,964,558 | $ | 9,964,558 | $ | — | $ | — | ||||||||
| TOTAL INVESTMENTS IN SECURITIES | $ | 232,289,662 | $ | 232,289,662 | $ | — | $ | — | ||||||||
| Alger Mid Cap Growth Fund | TOTAL | LEVEL 1 | LEVEL 2 | LEVEL 3 | ||||||||||||
| COMMON STOCKS | ||||||||||||||||
| Communication Services | 12,524,235 | 12,524,235 | — | — | ||||||||||||
| Consumer Discretionary | 24,723,994 | 24,723,994 | — | — | ||||||||||||
| Consumer Staples | 4,805,921 | 4,805,921 | — | — | ||||||||||||
| Energy | 9,019,113 | 9,019,113 | — | — | ||||||||||||
| Financials | 10,484,465 | 10,484,465 | — | — | ||||||||||||
| Healthcare | 33,153,710 | 33,153,710 | — | — | ||||||||||||
| Industrials | 26,974,847 | 26,974,847 | — | — | ||||||||||||
| Information Technology | 49,619,601 | 49,619,601 | — | — | ||||||||||||
| Materials | 3,715,656 | 3,715,656 | — | — | ||||||||||||
| TOTAL COMMON STOCKS | $ | 175,021,542 | $ | 175,021,542 | $ | — | $ | — | ||||||||
| PREFERRED STOCKS | ||||||||||||||||
| Healthcare | — | * | — | — | — | * | ||||||||||
| RIGHTS | ||||||||||||||||
| Healthcare | 354,035 | — | — | 354,035 | ||||||||||||
| SPECIAL PURPOSE VEHICLE | ||||||||||||||||
| Information Technology | 1,775,546 | — | — | 1,775,546 | ||||||||||||
| TOTAL INVESTMENTS IN SECURITIES | $ | 177,151,123 | $ | 175,021,542 | $ | — | $ | 2,129,581 | ||||||||
| Alger Mid Cap Focus Fund | TOTAL | LEVEL 1 | LEVEL 2 | LEVEL 3 | ||||||||||||
| COMMON STOCKS | ||||||||||||||||
| Communication Services | 13,436,042 | 13,436,042 | — | — | ||||||||||||
| Consumer Discretionary | 47,721,294 | 47,721,294 | — | — | ||||||||||||
| Consumer Staples | 6,149,972 | 6,149,972 | — | — | ||||||||||||
| Energy | 16,174,317 | 16,174,317 | — | — | ||||||||||||
| Healthcare | 125,998,941 | 120,825,642 | 5,173,299 | — | ||||||||||||
| Industrials | 55,735,123 | 55,735,123 | — | — | ||||||||||||
| Information Technology | 143,327,124 | 143,327,124 | — | — | ||||||||||||
| Utilities | 22,331,861 | 22,331,861 | — | — | ||||||||||||
| TOTAL COMMON STOCKS | $ | 430,874,674 | $ | 425,701,375 | $ | 5,173,299 | $ | — | ||||||||
| TOTAL INVESTMENTS IN SECURITIES | $ | 430,874,674 | $ | 425,701,375 | $ | 5,173,299 | $ | — | ||||||||
THE ALGER FUNDS
NOTES TO FINANCIAL STATEMENTS (Continued)
| Alger Weatherbie Enduring Growth Fund | TOTAL | LEVEL 1 | LEVEL 2 | LEVEL 3 | ||||||||||||
| COMMON STOCKS | ||||||||||||||||
| Communication Services | $ | 35,777 | $ | 35,777 | $ | — | $ | — | ||||||||
| Consumer Discretionary | 285,376 | 285,376 | — | — | ||||||||||||
| Energy | 201,071 | 201,071 | — | — | ||||||||||||
| Financials | 430,673 | 430,673 | — | — | ||||||||||||
| Healthcare | 406,488 | 406,488 | — | — | ||||||||||||
| Industrials | 1,545,661 | 1,545,661 | — | — | ||||||||||||
| Information Technology | 783,727 | 783,727 | — | — | ||||||||||||
| Real Estate | 355,903 | 355,903 | — | — | ||||||||||||
| TOTAL COMMON STOCKS | $ | 4,044,676 | $ | 4,044,676 | $ | — | $ | — | ||||||||
| TOTAL INVESTMENTS IN SECURITIES | $ | 4,044,676 | $ | 4,044,676 | $ | — | $ | — | ||||||||
| Alger Weatherbie Specialized Growth Fund | TOTAL | LEVEL 1 | LEVEL 2 | LEVEL 3 | ||||||||||||
| COMMON STOCKS | ||||||||||||||||
| Communication Services | 5,494,754 | 5,494,754 | — | — | ||||||||||||
| Consumer Discretionary | 83,285,480 | 83,285,480 | — | — | ||||||||||||
| Energy | 42,832,549 | 42,832,549 | — | — | ||||||||||||
| Financials | 89,634,143 | 89,634,143 | — | — | ||||||||||||
| Healthcare | 145,346,423 | 142,360,213 | — | 2,986,210 | ||||||||||||
| Industrials | 168,228,258 | 168,228,258 | — | — | ||||||||||||
| Information Technology | 166,911,614 | 166,911,614 | — | — | ||||||||||||
| Real Estate | 44,154,907 | 44,154,907 | — | — | ||||||||||||
| TOTAL COMMON STOCKS | $ | 745,888,128 | $ | 742,901,918 | $ | — | $ | 2,986,210 | ||||||||
| PREFERRED STOCKS | ||||||||||||||||
| Healthcare | — | * | — | — | — | * | ||||||||||
| TOTAL INVESTMENTS IN SECURITIES | $ | 745,888,128 | $ | 742,901,918 | $ | — | $ | 2,986,210 | ||||||||
| Alger Small Cap Growth Fund | TOTAL | LEVEL 1 | LEVEL 2 | LEVEL 3 | ||||||||||||
| COMMON STOCKS | ||||||||||||||||
| Communication Services | 20,863,139 | 20,863,139 | — | — | ||||||||||||
| Consumer Discretionary | 45,347,985 | 45,347,985 | — | — | ||||||||||||
| Consumer Staples | 21,815,328 | 21,815,328 | — | — | ||||||||||||
| Energy | 25,697,344 | 25,697,344 | — | — | ||||||||||||
| Financials | 5,290,491 | 5,290,491 | — | — | ||||||||||||
| Healthcare | 105,171,192 | 101,524,194 | — | 3,646,998 | ||||||||||||
| Industrials | 28,018,535 | 28,018,535 | — | — | ||||||||||||
| Information Technology | 89,911,918 | 89,911,918 | — | — | ||||||||||||
| Materials | 14,565,343 | 14,565,343 | — | — | ||||||||||||
| TOTAL COMMON STOCKS | $ | 356,681,275 | $ | 353,034,277 | $ | — | $ | 3,646,998 | ||||||||
| PREFERRED STOCKS | ||||||||||||||||
| Healthcare | — | * | — | — | — | * | ||||||||||
| RIGHTS | ||||||||||||||||
| Healthcare | 104,869 | — | — | 104,869 | ||||||||||||
THE ALGER FUNDS
NOTES TO FINANCIAL STATEMENTS (Continued)
| Alger Small Cap Growth Fund | TOTAL | LEVEL 1 | LEVEL 2 | LEVEL 3 | ||||||||||||
| REAL ESTATE INVESTMENT TRUST | ||||||||||||||||
| Real Estate | $ | 4,657,998 | $ | 4,657,998 | $ | — | $ | — | ||||||||
| SPECIAL PURPOSE VEHICLE | ||||||||||||||||
| Information Technology | 2,410,106 | — | — | 2,410,106 | ||||||||||||
| TOTAL INVESTMENTS IN SECURITIES | $ | 363,854,248 | $ | 357,692,275 | $ | — | $ | 6,161,973 | ||||||||
| Alger Small Cap Focus Fund | TOTAL | LEVEL 1 | LEVEL 2 | LEVEL 3 | ||||||||||||
| COMMON STOCKS | ||||||||||||||||
| Consumer Discretionary | 211,515,121 | 211,515,121 | — | — | ||||||||||||
| Consumer Staples | 67,259,607 | 67,259,607 | — | — | ||||||||||||
| Energy | 220,132,252 | 220,132,252 | — | — | ||||||||||||
| Financials | 63,012,015 | 63,012,015 | — | — | ||||||||||||
| Healthcare | 1,274,760,628 | 1,274,760,628 | — | — | ||||||||||||
| Industrials | 325,827,153 | 325,827,153 | — | — | ||||||||||||
| Information Technology | 703,575,567 | 703,575,567 | — | — | ||||||||||||
| TOTAL COMMON STOCKS | $ | 2,866,082,343 | $ | 2,866,082,343 | $ | — | $ | — | ||||||||
| RIGHTS | ||||||||||||||||
| Healthcare | 7,143 | — | — | 7,143 | ||||||||||||
| TOTAL INVESTMENTS IN SECURITIES | $ | 2,866,089,486 | $ | 2,866,082,343 | $ | — | $ | 7,143 | ||||||||
| Alger International Focus Fund | TOTAL | LEVEL 1 | LEVEL 2 | LEVEL 3 | ||||||||||||
| COMMON STOCKS | ||||||||||||||||
| Consumer Discretionary | 26,419,689 | 15,317,722 | 11,101,967 | — | ||||||||||||
| Consumer Staples | 5,357,170 | — | 5,357,170 | — | ||||||||||||
| Energy | 11,892,571 | 4,916,835 | 6,975,736 | — | ||||||||||||
| Financials | 17,516,379 | 6,855,490 | 10,660,889 | — | ||||||||||||
| Healthcare | 19,425,732 | 1,954,466 | 17,471,266 | — | ||||||||||||
| Industrials | 20,184,596 | — | 20,184,596 | — | ||||||||||||
| Information Technology | 22,626,421 | 5,876,625 | 16,749,796 | — | ||||||||||||
| Materials | 5,072,820 | — | 5,072,820 | — | ||||||||||||
| TOTAL COMMON STOCKS | $ | 128,495,378 | $ | 34,921,138 | $ | 93,574,240 | $ | — | ||||||||
| TOTAL INVESTMENTS IN SECURITIES | $ | 128,495,378 | $ | 34,921,138 | $ | 93,574,240 | $ | — | ||||||||
| Alger Health Sciences Fund | TOTAL | LEVEL 1 | LEVEL 2 | LEVEL 3 | ||||||||||||
| COMMON STOCKS | ||||||||||||||||
| Healthcare | 169,878,465 | 164,878,463 | — | 5,000,002 | ||||||||||||
| PREFERRED STOCKS | ||||||||||||||||
| Healthcare | — | * | — | — | — | * | ||||||||||
| RIGHTS | ||||||||||||||||
| Healthcare | 1,174,198 | — | — | 1,174,198 | ||||||||||||
| TOTAL INVESTMENTS IN SECURITIES | $ | 171,052,663 | $ | 164,878,463 | $ | — | $ | 6,174,200 | ||||||||
* Alger Mid Cap Growth Fund’s, Alger Weatherbie Specialized Growth Fund’s, Alger Small Cap Growth Fund’s and Alger Health Sciences Fund’s holdings of Prosetta Biosciences, Inc., Series D shares are classified as a Level 3 investment and are fair valued at zero as of October 31, 2022.
THE ALGER FUNDS
NOTES TO FINANCIAL STATEMENTS (Continued)
| FAIR VALUE MEASUREMENTS USING SIGNIFICANT UNOBSERVABLE INPUTS (LEVEL 3) | ||||
| Alger Capital Appreciation Fund | Common Stocks | |||
| Opening balance at November 1, 2021 | $ | 1,015,916 | ||
| Transfers into Level 3 | — | |||
| Transfers out of Level 3 | — | |||
| Total gains or losses | ||||
| Included in net realized gain (loss) on investments | 802,859 | |||
| Included in net change in unrealized appreciation (depreciation) on investments | (571,615 | ) | ||
| Purchases and sales | ||||
| Purchases | — | |||
| Sales/Distributions | (802,859 | ) | ||
| Closing balance at October 31, 2022 | 444,301 | |||
| Net change in unrealized appreciation (depreciation) attributable to investments still held at October 31, 2022** | $ | (571,615 | ) | |
| Alger Capital Appreciation Fund | Preferred Stocks | |||
| Opening balance at November 1, 2021 | $ | 1,922,972 | ||
| Transfers into Level 3 | — | |||
| Transfers out of Level 3 | — | |||
| Total gains or losses | ||||
| Included in net realized gain (loss) on investments | — | |||
| Included in net change in unrealized appreciation (depreciation) on investments | (707,434 | ) | ||
| Purchases and sales | ||||
| Purchases | — | |||
| Sales | — | |||
| Closing balance at October 31, 2022 | 1,215,538 | |||
| Net change in unrealized appreciation (depreciation) attributable to investments still held at October 31, 2022** | $ | (707,434 | ) | |
| Alger Capital Appreciation Fund | Special Purpose Vehicle | |||
| Opening balance at November 1, 2021 | $ | 4,443,108 | ||
| Transfers into Level 3 | — | |||
| Transfers out of Level 3 | — | |||
| Total gains or losses | ||||
| Included in net realized gain (loss) on investments | — | |||
| Included in net change in unrealized appreciation (depreciation) on investments | (1,508,268 | ) | ||
| Purchases and sales | ||||
| Purchases | — | |||
| Sales | — | |||
| Closing balance at October 31, 2022 | 2,934,840 | |||
| Net change in unrealized appreciation (depreciation) attributable to investments still held at October 31, 2022** | $ | (1,508,268 | ) | |
THE ALGER FUNDS
NOTES TO FINANCIAL STATEMENTS (Continued)
| FAIR VALUE MEASUREMENTS USING SIGNIFICANT UNOBSERVABLE INPUTS (LEVEL 3) | ||||
| Alger Mid Cap Growth Fund | Preferred Stocks | |||
| Opening balance at November 1, 2021 | $ | — | * | |
| Transfers into Level 3 | — | |||
| Transfers out of Level 3 | — | |||
| Total gains or losses | ||||
| Included in net realized gain (loss) on investments | — | |||
| Included in net change in unrealized appreciation (depreciation) on investments | — | |||
| Purchases and sales | ||||
| Purchases | — | |||
| Sales | — | |||
| Closing balance at October 31, 2022 | — | * | ||
| Net change in unrealized appreciation (depreciation) attributable to investments still held at October 31, 2022** | $ | — | ||
| Alger Mid Cap Growth Fund | Rights | |||
| Opening balance at November 1, 2021 | $ | 442,544 | ||
| Transfers into Level 3 | — | |||
| Transfers out of Level 3 | — | |||
| Total gains or losses | ||||
| Included in net realized gain (loss) on investments | — | |||
| Included in net change in unrealized appreciation (depreciation) on investments | (88,509 | ) | ||
| Purchases and sales | ||||
| Purchases | — | |||
| Sales | — | |||
| Closing balance at October 31, 2022 | 354,035 | |||
| Net change in unrealized appreciation (depreciation) attributable to investments still held at October 31, 2022** | $ | (88,509 | ) | |
| Alger Mid Cap Growth Fund | Special Purpose Vehicle | |||
| Opening balance at November 1, 2021 | $ | 2,722,707 | ||
| Transfers into Level 3 | — | |||
| Transfers out of Level 3 | — | |||
| Total gains or losses | ||||
| Included in net realized gain (loss) on investments | — | |||
| Included in net change in unrealized appreciation (depreciation) on investments | (947,161 | ) | ||
| Purchases and sales | ||||
| Purchases | — | |||
| Sales | — | |||
| Closing balance at October 31, 2022 | 1,775,546 | |||
| Net change in unrealized appreciation (depreciation) attributable to investments still held at October 31, 2022** | $ | (947,161 | ) | |
THE ALGER FUNDS
NOTES TO FINANCIAL STATEMENTS (Continued)
| FAIR VALUE MEASUREMENTS USING SIGNIFICANT UNOBSERVABLE INPUTS (LEVEL 3) | ||||
| Alger Weatherbie Specialized Growth Fund | Common Stocks | |||
| Opening balance at November 1, 2021 | $ | — | ||
| Transfers into Level 3 | — | |||
| Transfers out of Level 3 | — | |||
| Total gains or losses | ||||
| Included in net realized gain (loss) on investments | — | |||
| Included in net change in unrealized appreciation (depreciation) on investments | — | |||
| Purchases and sales | ||||
| Purchases | 2,986,210 | |||
| Sales | — | |||
| Closing balance at October 31, 2022 | 2,986,210 | |||
| Net change in unrealized appreciation (depreciation) attributable to investments still held at October 31, 2022** | $ | — | ||
| Alger Weatherbie Specialized Growth Fund | Preferred Stocks | |||
| Opening balance at November 1, 2021 | $ | — | * | |
| Transfers into Level 3 | — | |||
| Transfers out of Level 3 | — | |||
| Total gains or losses | ||||
| Included in net realized gain (loss) on investments | — | |||
| Included in net change in unrealized appreciation (depreciation) on investments | — | |||
| Purchases and sales | ||||
| Purchases | — | |||
| Sales | — | |||
| Closing balance at October 31, 2022 | — | * | ||
| Net change in unrealized appreciation (depreciation) attributable to investments still held at October 31, 2022** | $ | — | ||
THE ALGER FUNDS
NOTES TO FINANCIAL STATEMENTS (Continued)
| FAIR VALUE MEASUREMENTS USING SIGNIFICANT UNOBSERVABLE INPUTS (LEVEL 3) | ||||
| Alger Small Cap Growth Fund | Common Stocks | |||
| Opening balance at November 1, 2021 | $ | — | ||
| Transfers into Level 3 | — | |||
| Transfers out of Level 3 | — | |||
| Total gains or losses | ||||
| Included in net realized gain (loss) on investments | — | |||
| Included in net change in unrealized appreciation (depreciation) on investments | — | |||
| Purchases and sales | ||||
| Purchases | 3,646,998 | |||
| Sales | — | |||
| Closing balance at October 31, 2022 | 3,646,998 | |||
| Net change in unrealized appreciation (depreciation) attributable to investments still held at October 31, 2022** | $ | — | ||
| Alger Small Cap Growth Fund | Preferred Stocks | |||
| Opening balance at November 1, 2021 | $ | — | * | |
| Transfers into Level 3 | — | |||
| Transfers out of Level 3 | — | |||
| Total gains or losses | ||||
| Included in net realized gain (loss) on investments | — | |||
| Included in net change in unrealized appreciation (depreciation) on investments | — | |||
| Purchases and sales | ||||
| Purchases | — | |||
| Sales | — | |||
| Closing balance at October 31, 2022 | — | * | ||
| Net change in unrealized appreciation (depreciation) attributable to investments still held at October 31, 2022** | $ | — | ||
| Alger Small Cap Growth Fund | Rights | |||
| Opening balance at November 1, 2021 | $ | 131,087 | ||
| Transfers into Level 3 | — | |||
| Transfers out of Level 3 | — | |||
| Total gains or losses | ||||
| Included in net realized gain (loss) on investments | — | |||
| Included in net change in unrealized appreciation (depreciation) on investments | (26,218 | ) | ||
| Purchases and sales | ||||
| Purchases | — | |||
| Sales | — | |||
| Closing balance at October 31, 2022 | 104,869 | |||
| Net change in unrealized appreciation (depreciation) attributable to investments still held at October 31, 2022** | $ | (26,218 | ) | |
THE ALGER FUNDS
NOTES TO FINANCIAL STATEMENTS (Continued)
| FAIR VALUE MEASUREMENTS USING SIGNIFICANT UNOBSERVABLE INPUTS (LEVEL 3) | ||||
| Alger Small Cap Growth Fund | Special Purpose Vehicle | |||
| Opening balance at November 1, 2021 | $ | 3,683,379 | ||
| Transfers into Level 3 | — | |||
| Transfers out of Level 3 | — | |||
| Total gains or losses | ||||
| Included in net realized gain (loss) on investments | — | |||
| Included in net change in unrealized appreciation (depreciation) on investments | (1,273,273 | ) | ||
| Purchases and sales | ||||
| Purchases | — | |||
| Sales | — | |||
| Closing balance at October 31, 2022 | 2,410,106 | |||
| Net change in unrealized appreciation (depreciation) attributable to investments still held at October 31, 2022** | $ | (1,273,273 | ) | |
| FAIR VALUE MEASUREMENTS USING SIGNIFICANT UNOBSERVABLE INPUTS (LEVEL 3) | ||||
| Alger Small Cap Focus Fund | Rights | |||
| Opening balance at November 1, 2021 | $ | 8,929 | ||
| Transfers into Level 3 | — | |||
| Transfers out of Level 3 | — | |||
| Total gains or losses | ||||
| Included in net realized gain (loss) on investments | — | |||
| Included in net change in unrealized appreciation (depreciation) on investments | (1,786 | ) | ||
| Purchases and sales | ||||
| Purchases | — | |||
| Sales | — | |||
| Closing balance at October 31, 2022 | 7,143 | |||
| Net change in unrealized appreciation (depreciation) attributable to investments still held at October 31, 2022** | $ | (1,786 | ) | |
THE ALGER FUNDS
NOTES TO FINANCIAL STATEMENTS (Continued)
| FAIR VALUE MEASUREMENTS USING SIGNIFICANT UNOBSERVABLE INPUTS (LEVEL 3) | ||||
| Alger Health Sciences Fund | Common Stocks | |||
| Opening balance at November 1, 2021 | $ | — | ||
| Transfers into Level 3 | — | |||
| Transfers out of Level 3 | — | |||
| Total gains or losses | ||||
| Included in net realized gain (loss) on investments | — | |||
| Included in net change in unrealized appreciation (depreciation) on investments | — | |||
| Purchases and sales | ||||
| Purchases | 5,000,002 | |||
| Sales | — | |||
| Closing balance at October 31, 2022 | 5,000,002 | |||
| Net change in unrealized appreciation (depreciation) attributable to investments still held at October 31, 2022** | $ | — | ||
| Alger Health Sciences Fund | Preferred Stocks | |||
| Opening balance at November 1, 2021 | $ | — | * | |
| Transfers into Level 3 | — | |||
| Transfers out of Level 3 | — | |||
| Total gains or losses | ||||
| Included in net realized gain (loss) on investments | — | |||
| Included in net change in unrealized appreciation (depreciation) on investments | — | |||
| Purchases and sales | ||||
| Purchases | — | |||
| Sales | — | |||
| Closing balance at October 31, 2022 | — | * | ||
| Net change in unrealized appreciation (depreciation) attributable to investments still held at October 31, 2022** | $ | — | ||
| Alger Health Sciences Fund | Rights | |||
| Opening balance at November 1, 2021 | $ | 1,467,747 | ||
| Transfers into Level 3 | — | |||
| Transfers out of Level 3 | — | |||
| Total gains or losses | ||||
| Included in net realized gain (loss) on investments | — | |||
| Included in net change in unrealized appreciation (depreciation) on investments | (293,549 | ) | ||
| Purchases and sales | ||||
| Purchases | — | |||
| Sales | — | |||
| Closing balance at October 31, 2022 | 1,174,198 | |||
| Net change in unrealized appreciation (depreciation) attributable to investments still held at October 31, 2022** | $ | (293,549 | ) | |
* Includes securities that are fair valued at zero.
** Net change in unrealized appreciation (depreciation) is included in net change in unrealized appreciation (depreciation) on investments in the accompanying statement of operations.
THE ALGER FUNDS
NOTES TO FINANCIAL STATEMENTS (Continued)
The following table provides quantitative information about each Fund’s Level 3 fair value measurements of its investments as of October 31, 2022. The table below is not intended to be all-inclusive, but rather provides information on the Level 3 inputs as they relate to each Fund’s fair value measurements.
| Fair Value October 31, 2022 | Valuation Methodology | Unobservable Input | Input/Range | Weighted Average Inputs | ||||||||||||
| Alger Capital Appreciation Fund | ||||||||||||||||
| Common Stocks | $ | 444,301 | Income Approach | Discount Rate | 7.89% | N/A | ||||||||||
| Probability of Success | 15.00%-50.00% | |||||||||||||||
| Preferred Stocks | 1,215,538 | Market Approach | Transaction Price | N/A | N/A | |||||||||||
| Revenue Multiple | 17.0x-19.0x | |||||||||||||||
| Special Purpose Vehicle | 2,934,840 | Market Approach | Transaction Price | N/A | N/A | |||||||||||
| Revenue Multiple | 17.0x-19.0x | |||||||||||||||
| Alger Mid Cap Growth Fund | ||||||||||||||||
| Preferred Stocks | $ | — | * | Income Approach | Discount Rate | 100.00% | N/A | |||||||||
| Rights | 354,035 | Income Approach | Discount Rate | 9.34%-9.70% | N/A | |||||||||||
| Probability of Success | 0.00%-60.00% | |||||||||||||||
| Special Purpose Vehicle | 1,775,546 | Market Approach | Transaction Price | N/A | N/A | |||||||||||
| Revenue Multiple | 17.0x-19.0x | |||||||||||||||
| Alger Weatherbie Specialized Growth Fund | ||||||||||||||||
| Common Stocks | $ | 2,986,210 | Market Approach | Priced at Cost | N/A | N/A | ||||||||||
| Preferred Stocks | — | * | Income Approach | Discount Rate | 100.00% | N/A | ||||||||||
| Alger Small Cap Growth Fund | ||||||||||||||||
| Common Stocks | $ | 3,646,998 | Market Approach | Priced at Cost | N/A | N/A | ||||||||||
| Preferred Stocks | — | * | Income Approach | Discount Rate | 100.00% | N/A | ||||||||||
| Rights | 104,869 | Income Approach | Discount Rate | 9.34%-9.70% | N/A | |||||||||||
| Probability of Success | 0.00%-60.00% | |||||||||||||||
| Special Purpose Vehicle | 2,410,106 | Market Approach | Transaction Price | N/A | N/A | |||||||||||
| Revenue Multiple | 17.0x-19.0x | |||||||||||||||
| Alger Small Cap Focus Fund | ||||||||||||||||
| Rights | 7,143 | Income Approach | Discount Rate | 9.34%-9.70% | N/A | |||||||||||
| Probability of Success | 0.00%-60.00% | |||||||||||||||
| Alger Health Sciences Fund | ||||||||||||||||
| Common Stocks | $ | 5,000,002 | Market Approach | Priced at Cost | N/A | N/A | ||||||||||
| Preferred Stocks | — | * | Income Approach | Discount Rate | 100.00% | N/A | ||||||||||
| Rights | 1,174,198 | Income Approach | Discount Rate | 9.34%-9.70% | N/A | |||||||||||
| Probability of Success | 0.00%-60.00% | |||||||||||||||
* Prosetta Biosciences, Inc., Series D shares are classified as a Level 3 investment and are fair valued at zero as of October 31, 2022.
THE ALGER FUNDS
NOTES TO FINANCIAL STATEMENTS (Continued)
The significant unobservable inputs used in the fair value measurement of each Fund’s securities are revenue and EBITDA multiples, discount rates, and the probability of success of certain outcomes. Significant increases and decreases in these inputs in isolation and interrelationships between these inputs would have resulted in significantly higher or lower fair value measurements than those noted in the table above. Generally, all other things being equal, increases in revenue and EBITDA multiples, decreases in discount rates, and increases in the probability of success result in higher fair value measurements, whereas decreases in revenues and EBITDA multiples, increases in discount rates, and decreases in the probability of success result in lower fair value measurements.
Certain of the Funds’ assets and liabilities are held at carrying amount or face value, which approximates fair value for financial reporting purposes. As of October 31, 2022, such assets were categorized within the ASC 820 disclosure hierarchy as follows:
| TOTAL | LEVEL 1 | LEVEL 2 | LEVEL 3 | |||||||||||||
| Cash, Foreign Cash and Cash Equivalents: | ||||||||||||||||
| Alger Capital Appreciation Fund | $ | 56,887,933 | $ | 737 | $ | 56,887,196 | $ | — | ||||||||
| Alger 35 Fund | 248,587 | — | 248,587 | — | ||||||||||||
| Alger Growth & Income Fund | 14,202,816 | — | 14,202,816 | — | ||||||||||||
| Alger Mid Cap Growth Fund | 16,512,960 | — | 16,512,960 | — | ||||||||||||
| Alger Mid Cap Focus Fund | 5,134,919 | 564 | 5,134,355 | — | ||||||||||||
| Alger Weatherbie Enduring Growth Fund | 369,430 | — | 369,430 | — | ||||||||||||
| Alger Weatherbie Specialized Growth Fund | 30,506,732 | — | 30,506,732 | — | ||||||||||||
| Alger Small Cap Growth Fund | 27,763,326 | — | 27,763,326 | — | ||||||||||||
| Alger Small Cap Focus Fund | 64,973,920 | — | 64,973,920 | — | ||||||||||||
| Alger International Focus Fund | 2,134,317 | 14,613 | 2,119,704 | — | ||||||||||||
| Alger Health Sciences Fund | 4,636,417 | — | 4,636,417 | — | ||||||||||||
NOTE 9 — Derivatives:
FASB Accounting Standards Codification 815 – Derivatives and Hedging (“ASC 815”) requires qualitative disclosures about objectives and strategies for using derivatives, quantitative disclosures about fair value amounts of and gains and losses on derivative instruments, and disclosures about credit-risk-related contingent features in derivative agreements.
THE ALGER FUNDS
NOTES TO FINANCIAL STATEMENTS (Continued)
Forward Foreign Currency Contracts—In connection with portfolio purchases and sales of securities denominated in foreign currencies, the Funds may enter into forward foreign currency contracts. Additionally, each Fund may enter into such contracts to economically hedge certain other foreign currency denominated investments. These contracts are valued at the current cost of covering or offsetting such contracts and the related realized and unrealized foreign exchange gains and losses are included in the Statements of Operations. In the event that counterparties fail to settle these currency contracts or the related foreign security trades, a Fund could be exposed to foreign currency fluctuations.
For the year ended October 31, 2022, the average notional amount of forward foreign currency contracts outstanding for Alger International Focus Fund was $3,024,447. Forward foreign currency contracts were held during 1 month of the period.
The effect of derivative instruments on the accompanying Statements of Operations for the year ended October 31, 2022, is as follows:
NET REALIZED GAIN ON DERIVATIVES
Alger International Focus Fund
| Derivatives not accounted for as hedging instruments | ||||
| Forward Foreign Currency Contracts | $ | 219 | ||
| Total | $ | 219 | ||
The Funds’ Forward Foreign Currency Contracts were not subject to any right of offset with any Counterparty.
There were no open derivative instruments as of October 31, 2022.
NOTE 10 — Principal Risks:
Alger Capital Appreciation Fund — Investing in the stock market involves risks, including the potential loss of principal. The value of these securities, like other investments, may move up or down, sometimes rapidly and unpredictably. Your Fund shares at any point in time may be worth less than what you invested, even after taking into account the reinvestment of Fund dividends and distributions. Local, regional or global events such as environmental or natural disasters, war, terrorism, pandemics, outbreaks of infectious diseases and similar public health threats, recessions, or other events could have a significant impact on investments. Growth stocks may be more volatile than other stocks as their prices tend to be higher in relation to their companies’ earnings and may be more sensitive to market, political, and economic developments. A significant portion of assets may be invested in securities of companies in related sectors, and may be similarly affected by economic, political, or market events and conditions and may be more vulnerable to unfavorable sector developments. Foreign securities involve special risks including currency fluctuations, inefficient trading, political and economic instability, and increased volatility.
THE ALGER FUNDS
NOTES TO FINANCIAL STATEMENTS (Continued)
Alger 35 Fund — Investing in the stock market involves risks, including the potential loss of principal. The value of these securities, like other investments, may move up or down, sometimes rapidly and unpredictably. Your Fund shares at any point in time may be worth less than what you invested, even after taking into account the reinvestment of Fund dividends and distributions. Local, regional or global events such as environmental or natural disasters, war, terrorism, pandemics, outbreaks of infectious diseases and similar public health threats, recessions, or other events could have a significant impact on investments. Growth stocks may be more volatile than other stocks as their prices tend to be higher in relation to their companies’ earnings and may be more sensitive to market, political, and economic developments. A significant portion of assets may be invested in securities of companies in related sectors, and may be similarly affected by economic, political, or market events and conditions and may be more vulnerable to unfavorable sector developments. Investing in companies of small and medium capitalizations involves the risk that such issuers may have limited product lines or financial resources, lack management depth, or have limited liquidity. Foreign securities involve special risks including currency fluctuations, inefficient trading, political and economic instability, and increased volatility. The Fund is classified as a “non-diversified fund” under federal securities laws because it can invest in fewer individual companies than a diversified fund. Assets may be focused in a small number of holdings, making them susceptible to risks associated with a single economic, political or regulatory event than a more diversified portfolio. Active trading may increase transaction costs, brokerage commissions, and taxes, which can lower the return on investment.
Alger Growth & Income Fund — Investing in the stock market involves risks, including the potential loss of principal. The value of these securities, like other investments, may move up or down, sometimes rapidly and unpredictably. Your Fund shares at any point in time may be worth less than what you invested, even after taking into account the reinvestment of Fund dividends and distributions. Local, regional or global events such as environmental or natural disasters, war, terrorism, pandemics, outbreaks of infectious diseases and similar public health threats, recessions, or other events could have a significant impact on investments. Growth stocks may be more volatile than other stocks as their prices tend to be higher in relation to their companies’ earnings and may be more sensitive to market, political, and economic developments. A significant portion of assets may be invested in securities of companies in related sectors, and may be similarly affected by economic, political, or market events and conditions and may be more vulnerable to unfavorable sector developments. Income-producing securities may cut or fail to declare dividends due to market downturns or for other reasons. At times, the Fund may hold a large cash position, which may underperform relative to equity securities.
Alger Mid Cap Growth Fund — Investing in the stock market involves risks, including the potential loss of principal. The value of these securities, like other investments, may move up or down, sometimes rapidly and unpredictably. Your Fund shares at any point in time may be worth less than what you invested, even after taking into account the reinvestment of Fund dividends and distributions. Local, regional or global events such as environmental or natural disasters, war, terrorism, pandemics, outbreaks of infectious diseases and similar public health threats, recessions, or other events could have a significant impact on investments. Growth stocks may be more volatile than other stocks as their prices tend to be higher in relation to their companies’ earnings and may be more sensitive to market, political, and economic developments. A significant portion of assets may be invested in securities of companies in related sectors, and may be similarly affected by economic, political, or market events and conditions and may be more vulnerable to unfavorable sector developments. Investing in companies of medium capitalizations involves the risk that such issuers may have limited product lines or financial resources, lack management depth, or have limited liquidity. Foreign securities involve special risks including currency fluctuations, inefficient trading, political and economic instability, and increased volatility. Active trading may increase transaction costs, brokerage commissions, and taxes, which can lower the return on investment. At times, the Fund may hold a large cash position, which may underperform relative to equity securities.
THE ALGER FUNDS
NOTES TO FINANCIAL STATEMENTS (Continued)
Alger Mid Cap Focus Fund — Investing in the stock market involves risks, including the potential loss of principal. The value of these securities, like other investments, may move up or down, sometimes rapidly and unpredictably. Your Fund shares at any point in time may be worth less than what you invested, even after taking into account the reinvestment of Fund dividends and distributions. Local, regional or global events such as environmental or natural disasters, war, terrorism, pandemics, outbreaks of infectious diseases and similar public health threats, recessions, or other events could have a significant impact on investments. Growth stocks may be more volatile than other stocks as their prices tend to be higher in relation to their companies’ earnings and may be more sensitive to market, political, and economic developments. Investing in companies of medium capitalizations involves the risk that such issuers may have limited product lines or financial resources, lack management depth, or have limited liquidity. Assets may be focused in a small number of holdings, making them susceptible to risks associated with a single economic, political or regulatory event than a more diversified portfolio. A significant portion of assets may be invested in securities of companies in related sectors or industries, and may be similarly affected by economic, political, or market events and conditions and may be more vulnerable to unfavorable sector or industry developments. Foreign securities involve special risks including currency fluctuations, inefficient trading, political and economic instability, and increased volatility. The Fund is classified as a “non-diversified fund” under federal securities laws because it can invest in fewer individual companies than a diversified fund. Active trading may increase transaction costs, brokerage commissions, and taxes, which can lower the return on investment. At times, the Fund may hold a large cash position, which may underperform relative to equity securities.
THE ALGER FUNDS
NOTES TO FINANCIAL STATEMENTS (Continued)
Alger Weatherbie Enduring Growth Fund — Investing in the stock market involves risks, including the potential loss of principal. The value of these securities, like other investments, may move up or down, sometimes rapidly and unpredictably. Your Fund shares at any point in time may be worth less than what you invested, even after taking into account the reinvestment of Fund dividends and distributions. Local, regional or global events such as environmental or natural disasters, war, terrorism, pandemics, outbreaks of infectious diseases and similar public health threats, recessions, or other events could have a significant impact on investments. Growth stocks may be more volatile than other stocks as their prices tend to be higher in relation to their companies’ earnings and may be more sensitive to market, political, and economic developments. A significant portion of assets may be invested in securities of companies in related sectors, and may be similarly affected by economic, political, or market events and conditions and may be more vulnerable to unfavorable sector developments. The Sub-Adviser's use of an ESG rating agency to implement the investment strategy may result in the selection or exclusion of securities for reasons other than financial performance and the strategy may underperform strategies that do not utilize an ESG rating agency or employ another type of ESG investment strategy. In evaluating a particular issuer’s ESG rating, as well as the account's weighted average ESG rating, the Sub-Adviser relies exclusively on the ESG rating agency and, therefore, is dependent upon information and data from the ESG rating agency that may be incomplete or inaccurate, or that may present conflicting information and data with respect to an issuer than other third party ESG data providers utilized throughout the industry. Investing in companies of medium capitalizations involves the risk that such issuers may have limited product lines or financial resources, lack management depth, or have limited liquidity. Assets may be focused in a small number of holdings, making them susceptible to risks associated with a single economic, political or regulatory event than a more diversified portfolio. Investing in new issues involves special risks including lack of trading history, limited information and availability, and volatility. Cash positions may underperform relative to equity and fixed-income securities. Active trading may increase transaction costs, brokerage commissions, and taxes, which can lower the return on investment. The Fund is classified as a “non-diversified fund” under federal securities laws because it can invest in fewer individual companies than a diversified fund.
Alger Weatherbie Specialized Growth Fund — Investing in the stock market involves risks, including the potential loss of principal. The value of these securities, like other investments, may move up or down, sometimes rapidly and unpredictably. Your Fund shares at any point in time may be worth less than what you invested, even after taking into account the reinvestment of Fund dividends and distributions. Local, regional or global events such as environmental or natural disasters, war, terrorism, pandemics, outbreaks of infectious diseases and similar public health threats, recessions, or other events could have a significant impact on investments. Growth stocks may be more volatile than other stocks as their prices tend to be higher in relation to their companies’ earnings and may be more sensitive to market, political, and economic developments. A significant portion of assets may be invested in securities of companies in related sectors, and may be similarly affected by economic, political, or market events and conditions and may be more vulnerable to unfavorable sector developments. Investing in companies of small and medium capitalizations involves the risk that such issuers may have limited product lines or financial resources, lack management depth, or have limited liquidity. Assets may be focused in a small number of holdings, making them susceptible to risks associated with a single economic, political or regulatory event than a more diversified portfolio. Foreign securities and emerging markets involve special risks including currency fluctuations, inefficient trading, political and economic instability, and increased volatility.
THE ALGER FUNDS
NOTES TO FINANCIAL STATEMENTS (Continued)
Alger Small Cap Growth Fund — Investing in the stock market involves risks, including the potential loss of principal. The value of these securities, like other investments, may move up or down, sometimes rapidly and unpredictably. Your Fund shares at any point in time may be worth less than what you invested, even after taking into account the reinvestment of Fund dividends and distributions. Local, regional or global events such as environmental or natural disasters, war, terrorism, pandemics, outbreaks of infectious diseases and similar public health threats, recessions, or other events could have a significant impact on investments. Growth stocks may be more volatile than other stocks as their prices tend to be higher in relation to their companies’ earnings and may be more sensitive to market, political, and economic developments. A significant portion of assets may be invested in securities of companies in related sectors, and may be similarly affected by economic, political, or market events and conditions and may be more vulnerable to unfavorable sector developments. Investing in companies of small capitalizations involves the risk that such issuers may have limited product lines or financial resources, lack management depth, or have limited liquidity. At times, the Fund may hold a large cash position, which may underperform relative to equity securities.
Alger Small Cap Focus Fund — Investing in the stock market involves risks, including the potential loss of principal. The value of these securities, like other investments, may move up or down, sometimes rapidly and unpredictably. Your Fund shares at any point in time may be worth less than what you invested, even after taking into account the reinvestment of Fund dividends and distributions. Local, regional or global events such as environmental or natural disasters, war, terrorism, pandemics, outbreaks of infectious diseases and similar public health threats, recessions, or other events could have a significant impact on investments. Growth stocks may be more volatile than other stocks as their prices tend to be higher in relation to their companies’ earnings and may be more sensitive to market, political, and economic developments. Foreign securities involve special risks including currency fluctuations, inefficient trading, political and economic instability, and increased volatility. A significant portion of assets may be invested in securities of companies in related sectors or industries, and may be similarly affected by economic, political, or market events and conditions and may be more vulnerable to unfavorable sector or industry developments. Investing in companies of small capitalizations involves the risk that such issuers may have limited product lines or financial resources, lack management depth, or have limited liquidity. Assets may be focused in a small number of holdings, making them susceptible to risks associated with a single economic, political or regulatory event than a more diversified portfolio. At times, the Fund may hold a large cash position, which may underperform relative to equity securities.
Alger International Focus Fund — Investing in the stock market involves risks, including the potential loss of principal. The value of these securities, like other investments, may move up or down, sometimes rapidly and unpredictably. Your Fund shares at any point in time may be worth less than what you invested, even after taking into account the reinvestment of Fund dividends and distributions. Local, regional or global events such as environmental or natural disasters, war, terrorism, pandemics, outbreaks of infectious diseases and similar public health threats, recessions, or other events could have a significant impact on investments. Growth stocks may be more volatile than other stocks as their prices tend to be higher in relation to their companies’ earnings and may be more sensitive to market, political, and economic developments. A significant portion of assets may be invested in securities of companies in related sectors, and may be similarly affected by economic, political, or market events and conditions and may be more vulnerable to unfavorable sector developments. Assets may be focused in a small number of holdings, making them susceptible to risks associated with a single economic, political or regulatory event than a more diversified portfolio. Foreign securities and emerging markets involve special risks including currency fluctuations, inefficient trading, political and economic instability, and increased volatility. Investing in companies of small capitalizations involves the risk that such issuers may have limited product lines or financial resources, lack management depth, or have limited liquidity. Active trading may increase transaction costs, brokerage commissions, and taxes, which can lower the return on investment.
THE ALGER FUNDS
NOTES TO FINANCIAL STATEMENTS (Continued)
Alger Health Sciences Fund — Investing in the stock market involves risks, including the potential loss of principal. The value of these securities, like other investments, may move up or down, sometimes rapidly and unpredictably. Your Fund shares at any point in time may be worth less than what you invested, even after taking into account the reinvestment of Fund dividends and distributions. Local, regional or global events such as environmental or natural disasters, war, terrorism, pandemics, outbreaks of infectious diseases and similar public health threats, recessions, or other events could have a significant impact on investments. Growth stocks may be more volatile than other stocks as their prices tend to be higher in relation to their companies’ earnings and may be more sensitive to market, political, and economic developments. A significant portion of assets will be invested in healthcare companies, which may be significantly affected by competition, innovation, regulation, and product obsolescence, and may be more volatile than the securities of other companies. A significant portion of assets may be invested in securities of companies in related industries, and may be similarly affected by economic, political, or market events and conditions and may be more vulnerable to unfavorable industry developments. Investing in companies of small capitalizations involves the risk that such issuers may have limited product lines or financial resources, lack management depth, or have limited liquidity. Private placements are offerings of a company’s securities not registered with the SEC and not offered to the public, for which limited information may be available. Such investments are generally considered to be illiquid. Foreign securities involve special risks including currency fluctuations, inefficient trading, political and economic instability, and increased volatility. Active trading may increase transaction costs, brokerage commissions, and taxes, which can lower the return on investment. At times, the Fund may hold a large cash position, which may underperform relative to equity securities.
NOTE 11 — Affiliated Securities:
During the year ended October 31, 2022, as disclosed in the following table, certain Funds held 5% or more of the outstanding voting securities of the issuers listed below. As such, these issuers were “affiliated persons” of the applicable Fund(s) for purposes of the 1940 Act. Transactions during the year ended October 31, 2022 with such affiliated persons are summarized below. During this year, other Funds in the Trust may also have held voting shares of the issuers at levels below 5%.
THE ALGER FUNDS
NOTES TO FINANCIAL STATEMENTS (Continued)
| Security | Shares Held at October 31, 2021 | Shares Purchases | Shares Sold | Shares Held at October 31, 2022 | Dividend Income | Realized Gain (Loss) | Net Change in Unrealized App(Dep) | Value at October 31, 2022 | ||||||||||||||||||||||||
| Alger Capital Appreciation Fund | ||||||||||||||||||||||||||||||||
| Special Purpose Vehicle | ||||||||||||||||||||||||||||||||
| Crosslink Ventures Capital LLC, Cl. A*** | — | — | — | — | $ | — | $ | — | $ | (1,508,268 | ) | $ | 2,934,840 | |||||||||||||||||||
| Total | $ | — | $ | — | $ | (1,508,268 | ) | $ | 2,934,840 | |||||||||||||||||||||||
| Security | Shares Held at October 31, 2021 | Shares Purchases | Shares Sold | Shares Held at October 31, 2022 | Dividend Income | Realized Gain (Loss) | Net Change in Unrealized App(Dep) | Value at October 31, 2022 | ||||||||||||||||||||||||
| Alger Mid Cap Growth Fund | ||||||||||||||||||||||||||||||||
| Preferred Stocks | ||||||||||||||||||||||||||||||||
| Prosetta Biosciences, Inc., Series D** | 219,610 | — | — | 219,610 | $ | — | $ | — | $ | — | $ | — | * | |||||||||||||||||||
| Special Purpose Vehicle | ||||||||||||||||||||||||||||||||
| Crosslink Ventures Capital LLC, Cl. A*** | — | — | — | — | — | — | (652,224 | ) | 1,269,120 | |||||||||||||||||||||||
| Crosslink Ventures Capital LLC, Cl. B*** | — | — | — | — | — | — | (294,937 | ) | 506,426 | |||||||||||||||||||||||
| Total | $ | — | $ | — | $ | (947,161 | ) | $ | 1,775,546 | * | ||||||||||||||||||||||
| Security | Shares Held at October 31, 2021 | Shares Purchases | Shares Sold | Shares Held at October 31, 2022 | Dividend Income | Realized Gain (Loss) | Net Change in Unrealized App(Dep) | Value at October 31, 2022 | ||||||||||||||||||||||||
| Alger Weatherbie Specialized Growth Fund | ||||||||||||||||||||||||||||||||
| Preferred Stocks | ||||||||||||||||||||||||||||||||
| Prosetta Biosciences, Inc., Series D** | 231,474 | — | — | 231,474 | $ | — | $ | — | $ | — | $ | — | * | |||||||||||||||||||
| Total | $ | — | $ | — | $ | — | $ | — | * | |||||||||||||||||||||||
| Security | Shares Held at October 31, 2021 | Shares Purchases | Shares Sold | Shares Held at October 31, 2022 | Dividend Income | Realized Gain (Loss) | Net Change in Unrealized App(Dep) | Value at October 31, 2022 | ||||||||||||||||||||||||
| Alger Small Cap Growth Fund | ||||||||||||||||||||||||||||||||
| Preferred Stocks | ||||||||||||||||||||||||||||||||
| Prosetta Biosciences, Inc., Series D** | 50,688 | — | — | 50,688 | $ | — | $ | — | $ | — | $ | — | * | |||||||||||||||||||
THE ALGER FUNDS
NOTES TO FINANCIAL STATEMENTS (Continued)
| Security | Shares Held at October 31, 2021 | Shares Purchases | Shares Sold | Shares Held at October 31, 2022 | Dividend Income | Realized Gain (Loss) | Net Change in Unrealized App(Dep) | Value at October 31, 2022 | ||||||||||||||||||||||||
| Alger Small Cap Growth Fund | ||||||||||||||||||||||||||||||||
| Special Purpose Vehicle | ||||||||||||||||||||||||||||||||
| Crosslink Ventures Capital LLC, Cl. A*** | — | — | — | — | — | $ | — | $ | (978,336 | ) | $ | 1,903,680 | ||||||||||||||||||||
| Crosslink Ventures Capital LLC, Cl. B*** | — | — | — | — | — | — | (294,937 | ) | 506,426 | |||||||||||||||||||||||
| Total | $ | — | $ | — | $ | (1,273,273 | ) | $ | 2,410,106 | * | ||||||||||||||||||||||
| Security | Shares Held at October 31, 2021 | Shares Purchases | Shares Sold | Shares Held at October 31, 2022 | Dividend Income | Realized Gain (Loss) | Net Change in Unrealized App(Dep) | Value at October 31, 2022 | ||||||||||||||||||||||||
| Alger Small Cap Focus Fund | ||||||||||||||||||||||||||||||||
| Common Stocks | ||||||||||||||||||||||||||||||||
| 908 Devices, Inc. | — | 1,991,055 | — | 1,991,055 | $ | — | $ | — | $ | (9,318,305 | ) | $ | 31,836,969 | |||||||||||||||||||
| AtriCure, Inc.**** | 2,839,044 | — | (1,103,653 | ) | 1,735,391 | — | (15,274,364 | ) | (66,126,501 | ) | — | |||||||||||||||||||||
| CryoPort, Inc.**** | 4,395,628 | 278,268 | (2,368,708 | ) | 2,305,188 | — | 34,752,578 | (230,669,553 | ) | — | ||||||||||||||||||||||
| Heska Corp.**** | 987,040 | — | (518,890 | ) | 468,150 | — | 9,477,717 | (138,168,380 | ) | — | ||||||||||||||||||||||
| PROS Holdings, Inc. | 3,528,151 | — | (549,253 | ) | 2,978,898 | — | (19,081,955 | ) | 2,302,652 | 74,323,505 | ||||||||||||||||||||||
| The Joint Corp.**** | 1,644,019 | 372,452 | (2,016,471 | ) | — | — | (92,783,668 | ) | (8,452,912 | ) | — | |||||||||||||||||||||
| Vericel Corp.**** | 2,841,805 | — | (1,643,053 | ) | 1,198,752 | — | (32,293,033 | ) | (15,046,470 | ) | — | |||||||||||||||||||||
| Total | $ | — | $ | (115,202,725 | ) | $ | (465,479,469 | ) | $ | 106,160,474 | ||||||||||||||||||||||
| Security | Shares Held at October 31, 2021 | Shares Purchases | Shares Sold | Shares Held at October 31, 2022 | Dividend Income | Realized Gain (Loss) | Net Change in Unrealized App(Dep) | Value at October 31, 2022 | ||||||||||||||||||||||||
| Alger Health Sciences Fund | ||||||||||||||||||||||||||||||||
| Preferred Stocks | ||||||||||||||||||||||||||||||||
| Prosetta Biosciences, Inc., Series D** | 897,366 | — | — | 897,366 | $ | — | $ | — | $ | — | $ | — | * | |||||||||||||||||||
| Total | $ | — | $ | — | $ | — | $ | — | * | |||||||||||||||||||||||
* Prosetta Biosciences, Inc., Series D shares are classified as a Level 3 investment and are fair valued at zero as of October 31, 2022.
** Prosetta Biosciences, Inc., Series D is deemed to be an affiliate of the Funds because the Funds and Prosetta Biosciences, Inc., Series D are under common control.
*** The Alger Fund Complex and other entities managed by Alger Management fully own Crosslink Ventures Capital, LLC Class A and Crosslink Ventures Capital, LLC Class B. There were no capital increases or decreases for the year ended October 31, 2022.
**** Non-affiliated at October 31, 2022.
THE ALGER FUNDS
NOTES TO FINANCIAL STATEMENTS (Continued)
NOTE 12 — Subsequent Events:
Management of each Fund has evaluated events that have occurred subsequent to October 31, 2022, through the issuance date of the Financial Statements. The following item was noted which require recognition and/or disclosure:
On December 6, 2022, the Board approved the liquidation of the Alger Weatherbie Enduring Growth Fund, effective on or about March 31, 2023. The Alger Weatherbie Enduring Growth Fund will be closed to further investment, excluding reinvestment of any dividends and distributions, effective January 6, 2023.
REPORT OF INDEPENDENT REGISTERED PUBLIC ACCOUNTING FIRM
To the Shareholders and the Board of Trustees of The Alger Funds:
Opinion on the Financial Statements and Financial Highlights
We have audited the accompanying statements of assets and liabilities of The Alger Funds comprised of Alger Capital Appreciation Fund, Alger 35 Fund, Alger Growth & Income Fund, Alger Mid Cap Growth Fund, Alger Mid Cap Focus Fund, Alger Weatherbie Enduring Growth Fund, Alger Weatherbie Specialized Growth Fund, Alger Small Cap Growth Fund, Alger Small Cap Focus Fund, Alger International Focus Fund and Alger Health Sciences Fund (collectively, the “Funds”), including the schedules of investments, as of October 31, 2022, the related statements of operations for the year then ended (or for the period listed in the table below), the statements of changes in net assets for each of the two years in the period then ended (or for the period listed in the table below), the financial highlights for each of the five years in the period then ended for the Funds (or for the period listed in the table below), and the related notes. In our opinion, the financial statements and financial highlights present fairly, in all material respects, the financial position of each of the funds constituting The Alger Funds as of October 31, 2022, and the results of their operations for the year then ended (or for the period listed in the table below), the changes in their net assets for each of the two years in the period then ended (or for the period listed in the table below), and the financial highlights for each of the five years in the period then ended (or for the period listed in the table below), in conformity with accounting principles generally accepted in the United States of America.
| Individual Fund comprising The Alger Funds | Statements of Operations | Statements of Changes in Net Assets | Financial Highlights |
| Alger 35 Fund | For the year ended October 31, 2022 | For each of the two years in the period ended October 31, 2022 | For each of the four years in the period ended October 31, 2022 and the period from March 29, 2018 (commencement of operations) through October 31, 2018 |
Alger Mid Cap Focus Fund | For the year ended October 31, 2022 | For each of the two years in the period ended October 31, 2022 | For each of the three years in the period ended October 31, 2022 and the period from June 14, 2019 (commencement of operations) through October 31, 2019 |
| Alger Weatherbie Enduring Growth Fund | For the period from December 17, 2021 (commencement of operations) through October 31, 2022 | ||
REPORT OF INDEPENDENT REGISTERED PUBLIC ACCOUNTING FIRM
Basis for Opinion
These financial statements and financial highlights are the responsibility of the Funds’ management. Our responsibility is to express an opinion on the Funds’ financial statements and financial highlights based on our audits. We are a public accounting firm registered with the Public Company Accounting Oversight Board (United States) (PCAOB) and are required to be independent with respect to the Funds in accordance with the U.S. federal securities laws and the applicable rules and regulations of the Securities and Exchange Commission and the PCAOB.
We conducted our audits in accordance with the standards of the PCAOB. Those standards require that we plan and perform the audit to obtain reasonable assurance about whether the financial statements and financial highlights are free of material misstatement, whether due to error or fraud. The Funds are not required to have, nor were we engaged to perform, an audit of their internal control over financial reporting. As part of our audits we are required to obtain an understanding of internal control over financial reporting but not for the purpose of expressing an opinion on the effectiveness of the Funds’ internal control over financial reporting. Accordingly, we express no such opinion.
Our audits included performing procedures to assess the risks of material misstatement of the financial statements and financial highlights, whether due to error or fraud, and performing procedures that respond to those risks. Such procedures included examining, on a test basis, evidence regarding the amounts and disclosures in the financial statements and financial highlights. Our audits also included evaluating the accounting principles used and significant estimates made by management, as well as evaluating the overall presentation of the financial statements and financial highlights. Our procedures included confirmation of securities owned as of October 31, 2022, by correspondence with the custodian and brokers; when replies were not received from brokers, we performed other auditing procedures. We believe that our audits provide a reasonable basis for our opinion.
Deloitte & Touche LLP
New York, New York
December 23, 2022
We have served as the auditor of one or more investment companies within the Alger group of investment companies since 2009.
THE ALGER FUNDS
ADDITIONAL INFORMATION (Unaudited)
Shareholder Expense Example
As a shareholder of a Fund, you incur two types of costs: transaction costs, if applicable, including sales charges (loads) and redemption fees; and ongoing costs, including management fees, distribution (12b-1) fees, if applicable, and other fund expenses. This example is intended to help you understand your ongoing costs (in dollars) of investing in a Fund and to compare these costs with the ongoing costs of investing in other mutual funds.
The example below is based on an investment of $1,000 invested at the beginning of the six-month period starting May 1, 2022 and ending October 31, 2022 and held for the entire period.
Actual Expenses
The first line for each class of shares in the table below provides information about actual account values and actual expenses. You may use the information in this line, together with the amount you invested, to estimate the expenses that you paid over the period. Simply divide your account value by $1,000 (for example, an $8,600 account value divided by $1,000 = 8.6), then multiply the result by the number in the first line under the heading entitled “Expenses Paid During the Six Months Ended October 31, 2022” to estimate the expenses you paid on your account during this period.
Hypothetical Example for Comparison Purposes
The second line for each class of shares in the table below provides information about hypothetical account values and hypothetical expenses based on the actual expense ratio for each class of the Fund’s shares and an assumed rate of return of 5% per year before expenses, which is not the Fund’s actual return. The hypothetical account values and expenses may not be used to estimate the actual ending account balance or expenses you paid for the period. You may use this information to compare the ongoing costs of investing in the Fund and other funds. To do so, compare this 5% hypothetical example with the 5% hypothetical examples that appear in the shareholder reports of other funds.
Please note that the expenses shown in the table are meant to highlight your ongoing costs only and do not reflect any transaction costs, such as sales charges (loads) and redemption fees. Therefore, the second line under each class of shares in the table is useful in comparing ongoing costs only, and will not help you determine the relative total costs of owning different funds. In addition, if these transactional costs were included, your costs would have been higher.
THE ALGER FUNDS
ADDITIONAL INFORMATION (Unaudited) (Continued)
| Beginning Account Value May 1, 2022 | Ending Account Value October 31, 2022 | Expenses Paid During the Six Months Ended October 31, 2022(a) | Annualized Expense Ratio For the Six Months Ended October 31, 2022(b) | ||||||||||||||||
| Alger Capital Appreciation Fund | |||||||||||||||||||
| Class A | Actual | $ | 1,000.00 | $ | 841.20 | $ | 5.57 | 1.20 | % | ||||||||||
| Hypothetical(c) | 1,000.00 | 1,019.16 | 6.11 | 1.20 | |||||||||||||||
| Class C | Actual | 1,000.00 | 875.60 | 9.22 | 1.95 | ||||||||||||||
| Hypothetical(c) | 1,000.00 | 1,015.38 | 9.91 | 1.95 | |||||||||||||||
| Class Z | Actual | 1,000.00 | 889.20 | 4.05 | 0.85 | ||||||||||||||
| Hypothetical(c) | 1,000.00 | 1,020.92 | 4.33 | 0.85 | |||||||||||||||
| Alger 35 Fund | |||||||||||||||||||
| Class Z | Actual | 1,000.00 | 895.90 | 2.63 | 0.55 | ||||||||||||||
| Hypothetical(c) | 1,000.00 | 1,022.43 | 2.80 | 0.55 | |||||||||||||||
| Alger Growth & Income Fund | |||||||||||||||||||
| Class A | Actual | $ | 1,000.00 | $ | 896.40 | $ | 4.64 | 0.97 | % | ||||||||||
| Hypothetical(c) | 1,000.00 | 1,020.32 | 4.94 | 0.97 | |||||||||||||||
| Class C | Actual | 1,000.00 | 933.10 | 8.43 | 1.73 | ||||||||||||||
| Hypothetical(c) | 1,000.00 | 1,016.48 | 8.79 | 1.73 | |||||||||||||||
| Class Z | Actual | 1,000.00 | 947.40 | 3.19 | 0.65 | ||||||||||||||
| Hypothetical(c) | 1,000.00 | 1,021.93 | 3.31 | 0.65 | |||||||||||||||
| Alger Mid Cap Growth Fund | |||||||||||||||||||
| Class A | Actual | $ | 1,000.00 | $ | 876.10 | $ | 5.86 | 1.24 | % | ||||||||||
| Hypothetical(c) | 1,000.00 | 1,018.95 | 6.31 | 1.24 | |||||||||||||||
| Class B | Actual | 1,000.00 | 878.70 | 6.06 | 1.28 | ||||||||||||||
| Hypothetical(c) | 1,000.00 | 1,018.75 | 6.51 | 1.28 | |||||||||||||||
| Class C | Actual | 1,000.00 | 912.30 | 9.88 | 2.05 | ||||||||||||||
| Hypothetical(c) | 1,000.00 | 1,014.87 | 10.41 | 2.05 | |||||||||||||||
| Class Z | Actual | 1,000.00 | 926.90 | 4.52 | 0.93 | ||||||||||||||
| Hypothetical(c) | 1,000.00 | 1,020.52 | 4.74 | 0.93 | |||||||||||||||
THE ALGER FUNDS
ADDITIONAL INFORMATION (Unaudited) (Continued)
| Beginning Account Value May 1, 2022 | Ending Account Value October 31, 2022 | Expenses Paid During the Six Months Ended October 31, 2022(a) | Annualized Expense Ratio For the Six Months Ended October 31, 2022(b) | ||||||||||||||||
| Alger Mid Cap Focus Fund | |||||||||||||||||||
| Class A | Actual | $ | 1,000.00 | $ | 820.80 | $ | 4.82 | 1.05 | % | ||||||||||
| Hypothetical(c) | 1,000.00 | 1,019.91 | 5.35 | 1.05 | |||||||||||||||
| Class C | Actual | 1,000.00 | 853.50 | 8.64 | 1.85 | ||||||||||||||
| Hypothetical(c) | 1,000.00 | 1,015.88 | 9.40 | 1.85 | |||||||||||||||
| Class I | Actual | 1,000.00 | 866.50 | 4.75 | 1.01 | ||||||||||||||
| Hypothetical(c) | 1,000.00 | 1,020.11 | 5.14 | 1.01 | |||||||||||||||
| Class Y | Actual | 1,000.00 | 868.30 | 3.25 | 0.69 | ||||||||||||||
| Hypothetical(c) | 1,000.00 | 1,021.73 | 3.52 | 0.69 | |||||||||||||||
| Class Z | Actual | 1,000.00 | 867.70 | 3.34 | 0.71 | ||||||||||||||
| Hypothetical(c) | 1,000.00 | 1,021.63 | 3.62 | 0.71 | |||||||||||||||
| Alger Weatherbie Enduring Growth Fund | |||||||||||||||||||
| Class A | Actual | $ | 1,000.00 | $ | 893.10 | $ | 5.49 | 1.15 | % | ||||||||||
| Hypothetical(c) | 1,000.00 | 1,019.41 | 5.85 | 1.15 | |||||||||||||||
| Class C | Actual | 1,000.00 | 930.20 | 9.00 | 1.85 | ||||||||||||||
| Hypothetical(c) | 1,000.00 | 1,015.88 | 9.40 | 1.85 | |||||||||||||||
| Class I | Actual | 1,000.00 | 943.60 | 5.39 | 1.10 | ||||||||||||||
| Hypothetical(c) | 1,000.00 | 1,019.66 | 5.60 | 1.10 | |||||||||||||||
| Class Y | Actual | 1,000.00 | 944.90 | 3.42 | 0.70 | ||||||||||||||
| Hypothetical(c) | 1,000.00 | 1,021.68 | 3.57 | 0.70 | |||||||||||||||
| Class Z | Actual | 1,000.00 | 944.90 | 3.68 | 0.75 | ||||||||||||||
| Hypothetical(c) | 1,000.00 | 1,021.42 | 3.82 | 0.75 | |||||||||||||||
| Alger Weatherbie Specialized Growth Fund | |||||||||||||||||||
| Class A | Actual | $ | 1,000.00 | $ | 873.20 | $ | 5.90 | 1.25 | % | ||||||||||
| Hypothetical(c) | 1,000.00 | 1,018.90 | 6.36 | 1.25 | |||||||||||||||
| Class C | Actual | 1,000.00 | 910.40 | 9.73 | 2.02 | ||||||||||||||
| Hypothetical(c) | 1,000.00 | 1,015.02 | 10.26 | 2.02 | |||||||||||||||
| Class I | Actual | 1,000.00 | 922.30 | 6.06 | 1.25 | ||||||||||||||
| Hypothetical(c) | 1,000.00 | 1,018.90 | 6.36 | 1.25 | |||||||||||||||
| Class Y | Actual | 1,000.00 | 924.10 | 4.22 | 0.87 | ||||||||||||||
| Hypothetical(c) | 1,000.00 | 1,020.82 | 4.43 | 0.87 | |||||||||||||||
| Class Z | Actual | 1,000.00 | 923.80 | 4.41 | 0.91 | ||||||||||||||
| Hypothetical(c) | 1,000.00 | 1,020.62 | 4.63 | 0.91 | |||||||||||||||
THE ALGER FUNDS
ADDITIONAL INFORMATION (Unaudited) (Continued)
| Beginning Account Value May 1, 2022 | Ending Account Value October 31, 2022 | Expenses Paid During the Six Months Ended October 31, 2022(a) | Annualized Expense Ratio For the Six Months Ended October 31, 2022(b) | ||||||||||||||||
| Alger Small Cap Growth Fund | |||||||||||||||||||
| Class A | Actual | $ | 1,000.00 | $ | 870.00 | $ | 6.08 | 1.29 | % | ||||||||||
| Hypothetical(c) | 1,000.00 | 1,018.70 | 6.56 | 1.29 | |||||||||||||||
| Class B | Actual | 1,000.00 | 872.20 | 6.42 | 1.36 | ||||||||||||||
| Hypothetical(c) | 1,000.00 | 1,018.35 | 6.92 | 1.36 | |||||||||||||||
| Class C | Actual | 1,000.00 | 906.10 | 10.04 | 2.09 | ||||||||||||||
| Hypothetical(c) | 1,000.00 | 1,014.67 | 10.61 | 2.09 | |||||||||||||||
| Class Y | Actual | 1,000.00 | 920.90 | 4.07 | 0.84 | ||||||||||||||
| Hypothetical(c) | 1,000.00 | 1,020.97 | 4.28 | 0.84 | |||||||||||||||
| Class Z | Actual | 1,000.00 | 919.80 | 4.65 | 0.96 | ||||||||||||||
| Hypothetical(c) | 1,000.00 | 1,020.37 | 4.89 | 0.96 | |||||||||||||||
| Alger Small Cap Focus Fund | |||||||||||||||||||
| Class A | Actual | $ | 1,000.00 | $ | 916.50 | $ | 6.38 | 1.32 | % | ||||||||||
| Hypothetical(c) | 1,000.00 | 1,018.55 | 6.72 | 1.32 | |||||||||||||||
| Class C | Actual | 1,000.00 | 955.00 | 9.51 | 1.93 | ||||||||||||||
| Hypothetical(c) | 1,000.00 | 1,015.48 | 9.80 | 1.93 | |||||||||||||||
| Class I | Actual | 1,000.00 | 968.90 | 5.86 | 1.18 | ||||||||||||||
| Hypothetical(c) | 1,000.00 | 1,019.26 | 6.01 | 1.18 | |||||||||||||||
| Class Y | Actual | 1,000.00 | 970.20 | 4.22 | 0.85 | ||||||||||||||
| Hypothetical(c) | 1,000.00 | 1,020.92 | 4.33 | 0.85 | |||||||||||||||
| Class Z | Actual | 1,000.00 | 969.60 | 4.17 | 0.84 | ||||||||||||||
| Hypothetical(c) | 1,000.00 | 1,020.97 | 4.28 | 0.84 | |||||||||||||||
| Alger International Focus Fund | |||||||||||||||||||
| Class A | Actual | $ | 1,000.00 | $ | 834.10 | $ | 5.87 | 1.27 | % | ||||||||||
| Hypothetical(c) | 1,000.00 | 1,018.80 | 6.46 | 1.27 | |||||||||||||||
| Class B | Actual | 1,000.00 | 835.90 | 5.92 | 1.28 | ||||||||||||||
| Hypothetical(c) | 1,000.00 | 1,018.75 | 6.51 | 1.28 | |||||||||||||||
| Class C | Actual | 1,000.00 | 867.90 | 9.84 | 2.09 | ||||||||||||||
| Hypothetical(c) | 1,000.00 | 1,014.67 | 10.61 | 2.09 | |||||||||||||||
| Class I | Actual | 1,000.00 | 880.70 | 5.93 | 1.25 | ||||||||||||||
| Hypothetical(c) | 1,000.00 | 1,018.90 | 6.36 | 1.25 | |||||||||||||||
| Class Z | Actual | 1,000.00 | 882.00 | 4.08 | 0.86 | ||||||||||||||
| Hypothetical(c) | 1,000.00 | 1,020.87 | 4.38 | 0.86 | |||||||||||||||
THE ALGER FUNDS
ADDITIONAL INFORMATION (Unaudited) (Continued)
| Beginning Account Value May 1, 2022 | Ending Account Value October 31, 2022 | Expenses Paid During the Six Months Ended October 31, 2022(a) | Annualized Expense Ratio For the Six Months Ended October 31, 2022(b) | ||||||||||||||||
| Alger Health Sciences Fund | |||||||||||||||||||
| Class A | Actual | $ | 1,000.00 | $ | 963.00 | $ | 5.20 | 1.05 | % | ||||||||||
| Hypothetical(c) | 1,000.00 | 1,019.91 | 5.35 | 1.05 | |||||||||||||||
| Class C | Actual | 1,000.00 | 1,003.20 | 9.29 | 1.84 | ||||||||||||||
| Hypothetical(c) | 1,000.00 | 1,015.93 | 9.35 | 1.84 | |||||||||||||||
| Class Z | Actual | 1,000.00 | 1,018.70 | 3.66 | 0.72 | ||||||||||||||
| Hypothetical(c) | 1,000.00 | 1,021.58 | 3.67 | 0.72 | |||||||||||||||
(a) Expenses are equal to the annualized expense ratio of the respective share class, multiplied by the average account value over the period, multiplied by 184/365 (to reflect the one-half year period).
(b) Annualized.
(c) 5% annual return before expenses.
THE ALGER FUNDS
ADDITIONAL INFORMATION (Unaudited) (Continued)
Tax Information
Alger Capital Appreciation Fund, Alger 35 Fund, Alger Growth & Income Fund, Alger Mid Cap Growth Fund, Alger Mid Cap Focus Fund, Alger Weatherbie Specialized Growth Fund, Alger Small Cap Growth Fund, Alger Small Cap Focus Fund, Alger International Focus Fund and Alger Health Sciences Fund designate $550,592,694, $7,695,229, $4,962,836, $53,285,885, $14,480,875, $143,706,532, $57,233,096, $416,035,678, $16,992,932 and $51,406,248, respectively, as approximate amounts of capital gain dividend for the purpose of dividends paid deduction.
In accordance with subchapter M of the Internal Revenue Code of 1986, as amended, for the year ended October 31, 2022, 15.34%, 2.24%, 100%, 0.91%, 0.69%, 1.09% and 5.38% of the Alger Capital Appreciation Fund’s, Alger 35 Fund’s, Alger Growth & Income Fund’s, Alger Mid Cap Growth Fund’s, Alger Mid Cap Focus Fund’s, Alger Weatherbie Specialized Growth Fund’s and Alger Health Sciences Fund’s dividends qualified for the dividends deduction for corporations, respectively. For the year ended October 31, 2022, certain dividends paid by the Funds may be subject to a maximum rate of 15%, as provided by the Jobs and Growth Tax Relief Reconciliation Act of 2003. Of the distributions paid during the fiscal year, 16.95% of the Alger Capital Appreciation Fund’s, 2.25% of the Alger 35 Fund’s, 100% of the Alger Growth & Income Fund’s, 0.95% of the Alger Mid Cap Growth Fund’s, 0.69% of the Alger Mid Cap Focus Fund’s, 1.35% of the Alger Weatherbie Specialized Growth Fund’s and 5.52% of the Alger Health Sciences Fund’s dividends may be considered qualified dividend income.
Shareholders should not use the above information to prepare their tax returns. Since the Fund’s fiscal year is not the calendar year, another notification will be sent with respect to calendar year 2022. Such notification, which will reflect the amount to be used by tax payers on their federal income tax returns, will be made in conjunction with Form 1099 DIV and will be mailed in January 2023. Shareholders are advised to consult their own tax advisers with respect to the tax consequences of their investment in the Fund.
THE ALGER FUNDS
ADDITIONAL INFORMATION (Unaudited) (Continued)
Trustees and Officers of the Trust
Information about the trustees and officers of the Trust is set forth below. In the table the term “Alger Fund Complex” refers to the Trust, The Alger Portfolios, The Alger Institutional Funds, Alger Global Focus Fund, The Alger Funds II and The Alger ETF Trust, each of which is a registered investment company managed by Alger Management. Each Trustee serves until an event of termination, such as death or resignation, or until his or her successor is duly elected; each officer’s term of office is one year.
Additional information regarding the Trustees and Officers of the Trust is available in the Trust’s Statement of Additional Information.
THE ALGER FUNDS
ADDITIONAL INFORMATION (Unaudited) (Continued)
| Name (Year of Birth) and Address(1) | Position(s) Held with the Trust and Length of Time Served | Principal Occupation(s) During Past Five Years | Number of Funds in the Alger Fund Complex(3) which are Overseen by Trustee | Other Directorships Held by Trustee During Past Five Years |
| Interested Trustee(2): | ||||
| Hilary M. Alger (1961) | Trustee since 2003 | Non-Profit Fundraising Consultant since 2015, Schultz & Williams, Non-profit Fundraising Consultant since 2014, Hilary Alger Consulting; Emeritus Trustee since 2020 and Trustee from 2013 to 2020, Philadelphia Ballet; School Committee Member since 2017, Germantown Friends School. | 29 | Board of Directors, Alger Associates, Inc.; Director of Target Margin Theater |
| Non-Interested Trustees: | ||||
| Charles F. Baird, Jr. (1953) | Trustee since 2000 | Managing Partner since 1997, North Castle Partners (private equity securities group). | 29 | None |
| Roger P. Cheever (1945) | Trustee since 2000 | Retired; Associate Vice President for Development Strategy from 2020 to 2021 and Associate Vice President Principal Gifts from 2008 to 2020, Harvard University. | 29 | Board of Directors, Alger SICAV Fund |
| Stephen E. O’Neil (1932) | Trustee since 1986 | Retired. | 29 | None |
| David Rosenberg (1962) | Trustee since 2007 | Associate Professor of Law since August 2000, Zicklin School of Business, Baruch College, City University of New York. | 29 | None |
| Nathan E. Saint-Amand M.D. (1938) | Trustee since 1986 | Medical doctor in private practice since 1970; Member of the Board of the Manhattan Institute (non-profit policy research) since 1988. | 29 | None |
(1) The address of each Trustee is c/o Fred Alger Management, LLC, 100 Pearl Street, 27th Floor, New York, NY 10004.
(2) Ms. Alger is an “interested person” (as defined in the Investment Company Act of 1940, as amended) of the Trust by virtue of her ownership control of Alger Associates, Inc., which indirectly controls Alger Management and its affiliates.
(3) “Alger Fund Complex” refers to the Trust and the five other registered investment companies managed by Alger Management and the series therof. Each Trustee serves until an event of termination, such as death or resignation, or until his or her successor is duly elected. Each of the Trustees serves on the board of trustees of the other five registered investment companies in the Alger Fund Complex.
THE ALGER FUNDS
ADDITIONAL INFORMATION (Unaudited) (Continued)
| Name (Year of Birth), Position with Trust and Address(1) | Principal Occupations | Officer Since |
| Officers(2): | ||
| Hal Liebes (1964) President, Principal Executive Officer | Executive Vice President, Chief Operating Officer (“COO”), Secretary and Managing Member, Alger Management; Managing Member, Alger LLC; COO and Secretary, Alger Associates, Inc.; COO, Secretary and Manager, Alger Alternative Holdings, LLC and Alger Alternative Holdings II, LLC; Director, Alger SICAV, Alger International Holdings and Alger Dynamic Return Offshore Fund; Vice President, COO, Managing Member and Secretary, Alger Capital, LLC and Alger Group Holdings, LLC; Executive Director and Chairman, Alger Management, Ltd.; Manager and Secretary, Weatherbie Capital, LLC, Alger-Weatherbie Holdings, LLC and Alger Apple Real Estate LLC; Manager, Alger Partners Investors I LLC, Alger Partners Investors II LLC, and Alger Partners Investors KEIGF; Secretary, Alger Boulder I LLC; Director and Secretary, The Foundation for Alger Families. | 2005 |
| Tina Payne (1974) Secretary, Chief Compliance Officer, Chief Legal Officer | Senior Vice President, General Counsel, Chief Compliance Officer (“CCO”) and Assistant Secretary, Alger Management; Senior Vice President, General Counsel, and Secretary, Alger LLC; CCO, and Authorized Signer, Alger Management, Ltd.; Vice President and Assistant Secretary, Alger Group Holdings, LLC; Assistant Secretary, Weatherbie Capital, LLC, Alger Alternative Holdings, LLC, Alger Alternative Holdings II, LLC and Alger-Weatherbie Holdings, LLC. | 2017 |
| Michael D. Martins (1965) Treasurer, Principal Financial Officer | Senior Vice President of Alger Management; Director, Alger Dynamic Return Offshore Fund. | 2005 |
| Anthony S. Caputo (1955) Assistant Treasurer | Vice President of Alger Management. | 2007 |
| Sergio M. Pavone (1961) Assistant Treasurer | Vice President of Alger Management. | 2007 |
| Mia G. Pillinger (1989) Assistant Secretary | Vice President and Associate Counsel of Alger Management. Formerly, Associate at Willkie Farr & Gallagher, LLP, from 2016 to 2020. | 2020 |
| Sushmita Sahu (1981) AML Compliance Officer | Vice President of Alger Management. | 2021 |
(1) The address of each officer is c/o Fred Alger Management, LLC, 100 Pearl Street, 27th Floor, New York, NY 10004.
(2) Each officer’s term of office is one year. Each officer serves in the same capacity for the other funds in the Alger Fund Complex.
The Statement of Additional Information contains additional information about the Trust’s Trustees and officers and is available without charge upon request by calling (800) 992-3863.
THE ALGER FUNDS
ADDITIONAL INFORMATION (Unaudited) (Continued)
Board Approval of Investment Advisory Agreements
At a meeting held on September 13, 2022 (the “Meeting”), the Board of Trustees (the “Board”) of The Alger Funds (the “Trust”), including a majority of the trustees who are not “interested persons” (as defined in the Investment Company Act of 1940, as amended) of the Trust (the “Independent Trustees”), reviewed and approved the continuation of the investment advisory agreement between Fred Alger Management, LLC (“Fred Alger Management”) and the Trust, on behalf of each Fund, and the investment sub-advisory agreement between Fred Alger Management and Weatherbie Capital, LLC (the “Sub-Adviser”), an affiliate of Fred Alger Management, on behalf of Alger Weatherbie Specialized Growth Fund (each, a “Management Agreement”), for an additional one-year period. Fred Alger Management and the Sub-Adviser are collectively referred to herein as the “Manager.”
In considering the continuation of each Management Agreement, the Board reviewed and considered information provided by the Manager and its representatives at the Meeting and throughout the year at meetings of the Board and its committees. The Board also reviewed and considered information the Manager provided in response to a request for information Independent Trustee counsel submitted to the Manager on behalf of the Independent Trustees in connection with the Board’s annual contract consideration, as well as information provided in response to a supplemental request from Independent Trustee counsel on behalf of the Independent Trustees. The materials for the Meeting included a presentation and analysis of the Funds and the Manager by FUSE Research Network LLC (“FUSE”), an independent consulting firm. The Board also received a presentation from FUSE representatives at the Meeting and, among other things, received a description of the methodology FUSE used to select the mutual funds included in each Fund’s Peer Universe and Peer Group (as described below). The Board considered the information provided to it about the Funds together, and with respect to each Fund separately, as the Board deemed appropriate.
The Independent Trustees also received advice from, and met separately with, their Independent Trustee counsel in considering whether to approve the continuation of each Management Agreement. The Independent Trustees also received a memorandum from Independent Trustee counsel discussing the legal standards and their duties in considering the continuation of the Management Agreements. In addition, prior to the Meeting, the chair of the Board, on behalf of the other Independent Trustees, conferred with Independent Trustee counsel about the contract renewal process.
The Board reviewed the materials provided and considered all of the factors it deemed relevant in approving the continuance of each Management Agreement, including, but not limited to: (i) the nature, extent and quality of the services provided by the Manager; (ii) the short- and long-term investment performance of each Fund; (iii) the costs of the services the Manager provided and profits it realized; (iv) the extent to which economies of scale are realized as a Fund grows; and (v) whether fee levels reflect these economies of scale for the benefit of Fund shareholders. The Board did not identify any one factor as dispositive, and each Board member may have attributed different weights to the factors considered.
THE ALGER FUNDS
ADDITIONAL INFORMATION (Unaudited) (Continued)
In the discussions that follow, reference is made to the “median” in the Peer Group and Peer Universe categories. With respect to performance, below median performance represents performance that is worse relative to the median, and above median performance represents performance that is better relative to the median of the funds in the relevant Performance Universe. With respect to expenses, below median fees or expenses represent fees or expenses that are lower relative to the median, and above median fees or expenses represent fees or expenses that are higher relative to the median of the funds in the relevant Expense Group (as described below). FUSE information is calculated on a share class basis. References appearing below with regard to a Fund’s performance results and comparative fees and expenses generally relate to Class A shares of the Fund (each Fund’s oldest share class), except for Alger 35 Fund, for which Class Z shares were used (the Fund’s only share class), and Alger Mid Cap Focus Fund, for which Class I shares were used (the Fund’s oldest share class).
In particular, in approving the continuance of each Management Agreement, the Board considered the following factors:
Nature, Extent and Quality of Services
The Board reviewed and considered information regarding the nature, extent and quality of investment management services provided by the Manager to the Funds. This information included, among other things, the qualifications, background and experience of the professional personnel who perform services for the Funds; the structure of investment professional compensation; oversight of third-party service providers; short- and long-term investment performance, fee information and related financial information for each Fund; fees and payments to intermediaries for fund administration, transfer agency and shareholder services; legal and compliance matters; risk controls; pricing and other services provided by the Manager; and the range of advisory fees charged by the Manager to other funds and accounts, including the Manager’s explanation of differences among accounts where relevant. The Board noted that it received information at regular meetings throughout the year regarding the services rendered by the Manager concerning the management of each Fund’s affairs, including certain portfolio manager presentations, and Fred Alger Management’s role in coordinating and overseeing providers of other services to the Funds.
The Board noted Fred Alger Management’s history and expertise in the “growth” style of investment management, as well as Fred Alger Management’s consistency in applying its “growth” style investment philosophy and process. With respect to the Alger Weatherbie Specialized Growth Fund, the Board also considered the investment approach of the Sub-Adviser, which takes a fundamental, bottom-up research approach to investing in growth equities, similar to that of Fred Alger Management. The Board noted the length of time the Manager had provided services as an investment adviser to each Fund and also noted FUSE’s analysis that certain Funds’ long-term performance record supports Fred Alger Management’s overall investment capabilities.
The Board also reviewed and considered the benefits provided to Fund shareholders of investing in a Fund that is part of the Alger Family of Funds. The Board noted the strong financial position of the Manager and its commitment to the fund business.
THE ALGER FUNDS
ADDITIONAL INFORMATION (Unaudited) (Continued)
Following consideration of such information, the Trustees determined that they remain satisfied with the nature, extent and quality of services provided by the Manager to the Funds under the Management Agreements.
Fund Performance
The Board reviewed and considered the performance results of each Fund over various time periods. The Board considered the performance returns for each Fund in comparison to the performance returns of a universe of mutual funds deemed comparable to the Fund based on various investment, operational, and pricing characteristics (“Peer Universe”), and a group of mutual funds from within such Peer Universe deemed comparable to the Fund based primarily on investment strategy similarity (“Peer Group”), each as selected by FUSE, as well as to the Fund’s benchmark index. The Board noted that long-term performance could be impacted by one period of significant outperformance or underperformance.
The Board also reviewed and considered Fund performance reports provided by management and discussions that occurred with investment personnel and senior management at Board meetings throughout the year. The Board further noted that representatives of the Manager review with the Trustees the recent and longer-term performance of each Fund, including contributors to and detractors from Fund performance at every quarterly meeting of the Board throughout the year. In considering the Funds’ performance generally, the Board observed the Manager’s consistency in implementing its growth style investment process and philosophy for the Funds and considered how growth-oriented stocks recently have been negatively impacted by various market events, which resulted in the underperformance of funds that invest in such stocks, particularly “growthier offerings” such as the Funds, for the year-to-date period ended June 30, 2022. In this regard, the Board considered FUSE’s commentary regarding the Funds’ growth investment style as compared to a universe of peers comprised of actively managed funds within each Fund’s Morningstar category and as compared to each Fund’s benchmark index, as measured by Morningstar’s Raw Value-Growth score.
The Trustees concluded that each Fund’s performance was acceptable, noting the Funds’ recent underperformance (as applicable) but acknowledging the overall performance of growth-oriented stocks in light of the Funds’ growth investment style. In evaluating Fund performance, the Board considered that a Peer Universe that is concentrated around the median can result in smaller differences in performance having a larger impact on rankings as compared to less concentrated peer universes. Further discussion of the Board’s considerations with respect to each Fund’s performance is set forth below.
Alger Capital Appreciation Fund. The Board noted that the Fund’s annualized total return for the one-year period underperformed the median of its Peer Group, and for the three-, five- and 10-year periods outperformed or was equal to the median of its Peer Group. The Board also noted that the Fund’s annualized total return for the one-year period was in the fourth quartile of its Peer Universe, and for the three-, five- and 10-year periods was in the third quartile of its Peer Universe. The Board further noted that the Fund had underperformed its benchmark index for the one-, three , five- and 10-year periods. In this regard, the Board considered FUSE’s commentary that the Fund is “growthier” than its benchmark index. The Board also considered that the Fund has generally been “growthier” than the median of its peers, as measured by Morningstar’s Raw Value-Growth score.
THE ALGER FUNDS
ADDITIONAL INFORMATION (Unaudited) (Continued)
Alger 35 Fund. The Board noted that the Fund’s annualized total return for the one- and three-year periods underperformed the median of its Peer Group, and for the since inception period outperformed the median of its Peer Group. The Board also noted that the Fund’s annualized total return for the one-year period was in the fourth quartile of its Peer Universe, and for the three-year and since inception periods was in the first quartile of its Peer Universe. The Board further noted that the Fund had underperformed its benchmark index for the one- and three-year periods, and outperformed for the since inception period. In this regard, the Board considered FUSE’s commentary that the Fund has a “growth bent” as compared to its benchmark index. The Board also considered that the Fund has generally been “growthier” than the median of its peers, as measured by Morningstar’s Raw Value-Growth score.
Alger Growth & Income Fund. The Board noted that the Fund’s annualized total return for the one-, three-, five- and 10-year periods outperformed the median of its Peer Group. The Board also noted that the Fund’s annualized total return for the one-, three- and five- periods was in the first quartile of its Peer Universe, and for the 10-year period was in the second quartile of its Peer Universe. The Board further noted that the Fund had outperformed its benchmark index for the one- and three-year periods, and underperformed the benchmark index for the five- and 10-year periods. In this regard, the Board considered FUSE’s commentary that the Fund’s outperformance during the last 12 months reinforces the strength of the Fund’s strategy.
Alger Mid Cap Growth Fund. The Board noted that the Fund’s annualized total return for the one-year period underperformed the median of its Peer Group, and for the three-, five- and 10-year periods outperformed the median of its Peer Group. The Board also noted that the Fund’s annualized total return for the one-year period was in the fourth quartile of its Peer Universe, for the three- and 10-year periods was in the third quartile of its Peer Universe, and for the five-year period was in the second quartile of its Peer Universe. The Board further noted that the Fund had underperformed its benchmark index for the one- and 10-year periods and outperformed its benchmark index for the three- and five-year periods. The Board considered FUSE’s commentary that the Fund’s strategy benefitted over the long-term relative to peers in its growth-oriented conviction and is among its category’s “growthiest” strategies as measured by Morningstar’s Raw Value-Growth score.
Alger Mid Cap Focus Fund. The Board noted that the Fund’s annualized total return for the one-year period underperformed the median of its Peer Group, and for the three-year and since inception periods outperformed the median of its Peer Group. The Board also noted that the Fund’s annualized total return for the one-year period was in the fourth quartile of its Peer Universe, and for the three-year and since inception periods was in the first quartile. The Board further noted that the Fund had underperformed its benchmark index for the one-year period, and outperformed its benchmark index for the three-year and since inception periods.
THE ALGER FUNDS
ADDITIONAL INFORMATION (Unaudited) (Continued)
Alger Weatherbie Specialized Growth Fund. The Board noted that the Fund’s annualized total return for the one- and three-year periods underperformed the median of its Peer Group, and for the five- and 10-year periods outperformed or was equal to the median of its Peer Group. The Board also noted that the Fund’s annualized total return for the one- and three-year periods was in the fourth quartile of its Peer Universe, the five-year period was in the second quartile, and the 10 year period was in the third quartile of its Peer Universe. The Board further noted that the Fund had underperformed its benchmark index for the one-, three- and 10-year periods, and outperformed its benchmark index for the five-year period. The Board considered FUSE’s commentary that the Fund is among the “growthiest” products of its peers, as measured by Morningstar’s Raw Value-Growth score.
Alger Small Cap Growth Fund. The Board noted that the Fund’s annualized total return for the one-, three-, five- and 10-year periods underperformed the median of its Peer Group. The Board also noted that the Fund’s annualized total return for the one-, three- and 10-year periods was in the fourth quartile of its Peer Universe, and for the five-year period was in the second quartile of its Peer Universe. The Board further noted that the Fund had underperformed its benchmark index for the one-, three- and 10-year periods, and outperformed its benchmark index for the five-year period. The Board considered FUSE’s commentary that the Fund continues to be one of the “growthiest” strategies among its peers, as measured by Morningstar’s Raw Value-Growth score.
Alger Small Cap Focus Fund. The Board noted that the Fund’s annualized total return for the one-, three-, five- and 10-year periods underperformed the median of its Peer Group. The Board also noted that the Fund’s annualized total return for the one-, three- and five-year periods was in the fourth quartile of its Peer Universe, and for the 10-year period was in the third quartile of its Peer Universe. The Board further noted that the Fund had underperformed its benchmark index for the one-, three-, five- and 10-year periods. In this regard, the Board considered FUSE’s commentary that the Fund has successfully delivered on its portfolio objective over the long-term. The Board also considered that the Fund has generally been “growthier” than the median of its peers and benchmark, as measured by Morningstar’s Raw Value-Growth score.
Alger International Focus Fund. The Board noted that the Fund’s annualized total return for the one- and 10-year periods underperformed the median of its Peer Group, and for the three- and five-year periods outperformed the median of its Peer Group. The Board also noted that the Fund’s annualized total return for the one-year period was in the third quartile of its Peer Universe, for the three-year period was in the first quartile of its Peer Universe, for the five-year period was in second quartile of its Peer Universe, and for the 10-year period was in the fourth quartile of its Peer Universe. The Board further noted that the Fund had underperformed its benchmark index for the one-year period, and outperformed the benchmark index for the three-, five- and 10-year periods. The Board considered FUSE’s commentary that the Fund has become one of the “growthiest” products among its peers as measured by Morningstar’s Raw Value-Growth score, which is a factor in the Fund’s near-term underperformance.
THE ALGER FUNDS
ADDITIONAL INFORMATION (Unaudited) (Continued)
Alger Health Sciences Fund. The Board noted that the Fund’s annualized total return for the one-, three-, five- and 10-year periods underperformed the median of its Peer Group. The Board also noted that the Fund’s annualized total return for the one-, three- and five-year periods was in the fourth quartile of its Peer Universe, and for the 10-year period was in the third quartile of its Peer Universe. The Board further noted that the Fund had underperformed its benchmark index for the one-, three-, five- and 10-year periods. The Board considered FUSE’s commentary that the Fund’s growth style makes the Fund unique in the healthcare universe.
Comparative Fees and Expenses
For each Fund, the Board reviewed and considered the contractual management fee (the “Contractual Management Fee”) payable by the Fund to Fred Alger Management in light of the nature, extent and quality of the services provided by the Manager pursuant to the Management Agreement. The Board also reviewed and considered any fee waiver and/or expense reimbursement arrangements for each Fund, including specific share classes thereof, and considered the actual fee rate (after taking any waivers and reimbursements into account) payable by the Fund (the “Actual Management Fee”). Additionally, the Board received and considered information comparing each Fund’s Contractual Management Fee, Actual Management Fee and overall expenses, including administrative fees payable to Fred Alger Management, with those of the funds in the Peer Group provided by FUSE. For purposes of the comparisons below, the FUSE Contractual Management Fee includes fees paid to affiliates for administrative services under a separate agreement.
The Board discussed the factors that could contribute to each Fund’s Contractual Management Fee, Actual Management Fee or total expenses being above or below the median of the Fund’s Peer Group. The Board concluded that the Contractual Management Fee charged to each Fund is reasonable in relation to the services rendered by Fred Alger Management and is the product of arm’s length negotiations. Further discussion of the Board’s considerations with respect to each Fund’s comparative fees and expenses is set forth below.
Alger Capital Appreciation Fund. The Board noted that the Contractual Management Fee and total expenses for the Fund were above the median and in the third quartile of its Peer Group.
Alger 35 Fund. The Board noted that the Contractual Management Fee and total expenses for the Fund were below the median and in the first quartile (least expensive) of its Peer Group. The Board also noted that shareholders of the Alger 35 Fund had voted to approve an amendment to the investment advisory agreement between Fred Alger Management and the Trust, on behalf of the Fund, to implement an advisory fee of 0.45% of average daily net assets of the Fund, which became effective November 1, 2021.
Alger Growth & Income Fund. The Board noted that the Contractual Management Fee and total expenses for the Fund were below the median and in the first (least expensive) quartile of its Peer Group.
THE ALGER FUNDS
ADDITIONAL INFORMATION (Unaudited) (Continued)
Alger Mid Cap Growth Fund. The Board noted that the Contractual Management Fee for the Fund was below the median and in the second quartile of its Peer Group, and that the total expenses for the Fund were above the median and in the third quartile of its Peer Group.
Alger Mid Cap Focus Fund. The Board noted that the Contractual Management Fee and total expenses for the Fund were below the median and in the first (least expensive) quartile of its Peer Group.
Alger Weatherbie Specialized Growth Fund. The Board noted that the Contractual Management Fee and total expenses for the Fund were above the median and in the third quartile of its Peer Group. The Board also noted that, with respect to the Fund, the Sub-Adviser is paid by Fred Alger Management out of the management fee Fred Alger Management receives from the Fund.
Alger Small Cap Growth Fund. The Board noted that the Contractual Management Fee and total expenses for the Fund were below the median and in the second quartile of its Peer Group.
Alger Small Cap Focus Fund. The Board noted that the Contractual Management Fee for the Fund was above the median and in the third quartile of its Peer Group, and total expenses for the Fund were below the median and in the second quartile of its Peer Group.
Alger International Focus Fund. The Board noted that the Contractual Management Fee for the Fund was below the median and in the first (least expensive) quartile of its Peer Group, and that total expenses for the Fund were above the median and in the third quartile of its Peer Group.
Alger Health Sciences Fund. The Board noted that the Contractual Management Fee and total expenses for the Fund were below the median and in the first (least expensive) quartile of its Peer Group.
In connection with its consideration of each Fund’s fees payable under the Management Agreement, the Board also received information on the range of fees charged by the Manager for funds and accounts of a similar investment strategy to each Fund. The Board noted management’s explanation that comparisons with such accounts may be of limited relevance given the different structures and regulatory requirements of mutual funds, such as the Funds, versus those accounts and the differences in the levels of services required by the Funds and those accounts.
Profitability
The Board reviewed and considered information regarding the profits realized by Fred Alger Management in connection with the operation of each Fund. In this respect, the Board considered overall profitability, including in comparison to certain investment advisory peers, as well as the profits of Fred Alger Management in providing investment management and other services to each Fund during the year ended June 30, 2022. The Board also reviewed the profitability methodology and any changes thereto, noting that management maintains a consistent methodology year to year. The Board considered FUSE’s commentary that the profitability methodology is consistent with the methodology other public asset managers use.
THE ALGER FUNDS
ADDITIONAL INFORMATION (Unaudited) (Continued)
The Board noted that costs incurred in establishing and maintaining the infrastructure necessary for the mutual fund operations conducted by Fred Alger Management may not be fully reflected in the expenses allocated to each Fund in determining Fred Alger Management’s profitability. The Board also noted that the scope of services provided by the Manager, and the related costs of providing those services, had expanded over time as a result of regulatory and other developments.
The Board also considered the extent to which the Manager might derive ancillary benefits from Fund operations, including, for example, through soft dollar arrangements. Based upon its consideration of all these factors, the Trustees concluded that the level of profits realized by Fred Alger Management from providing services to each Fund was not excessive in view of the nature, extent and quality of services provided to each Fund.
Economies of Scale
For each Fund, the Board reviewed and considered the extent to which the Manager may realize economies of scale, if any, as the Fund grows larger and whether the Fund’s management fee structure reflects any economies of scale for the benefit of Fund shareholders. The Board noted the existence of management fee breakpoints for Alger Capital Appreciation Fund, Alger International Focus Fund, Alger Mid Cap Focus Fund, Alger Mid Cap Growth Fund, Alger Weatherbie Specialized Growth Fund, and Alger Small Cap Growth Fund, which operate to share economies of scale with a Fund’s shareholders by reducing the Fund’s effective management fees as the Fund grows in size. The Board considered the Manager’s view that the overall size of Fred Alger Management allows it to realize other economies of scale, such as with office space, purchases of technology, and other general business expenses, including with respect to Funds that did not have management fee breakpoints.
The Trustees concluded that for each Fund, to the extent economies of scale may be realized by Fred Alger Management, the benefits of such economies of scale would be shared with the Fund and its shareholders as the Fund grows, including through the management fee breakpoints in place for applicable Funds.
Conclusion
The Board’s consideration of the Contractual Management Fee for each Fund also had the benefit of a number of years of reviews of the Management Agreement, during which lengthy discussions took place between the Board and representatives of the Manager. Certain aspects of the arrangements may receive greater scrutiny in some years than in others, and the Board’s conclusions may be based, in part, on its consideration of the Fund’s arrangements in prior years.
Based on its review, consideration and evaluation of all factors it believed relevant, including the above-described factors and conclusions, the Board, including the Independent Trustees voting separately, unanimously approved the continuation of each Management Agreement for an additional one-year period.
THE ALGER FUNDS
ADDITIONAL INFORMATION (Unaudited) (Continued)
Privacy Policy
| U.S. Consumer Privacy Notice | Rev. 6/22/21 |
| FACTS | WHAT DOES ALGER DO WITH YOUR PERSONAL INFORMATION? |
| Why? | Financial companies choose how they share your personal information. Federal law gives consumers the right to limit some but not all sharing. Federal law also requires us to tell you how we collect, share, and protect your personal information. Please read this notice carefully to understand what we do. |
| What? | The types of personal information we collect and share depend on the product or service you have with us. |
This information can include: ● Social Security number and ● Account balances and ● Transaction history and ● Purchase history and ● Assets When you are no longer our customer, we continue to share your information as described in this notice. | |
| How? | All financial companies need to share personal information to run their everyday business. In the section below, we list the reasons financial companies can share personal information; the reasons Alger chooses to share; and whether you can limit this sharing. |
| Reasons we can share your personal information | Does Alger share? | Can you limit this sharing? |
| For our everyday business purposes — such as to process your transactions, maintain your account(s), respond to court orders and legal investigations, or report to credit bureaus | Yes | No |
| For our marketing purposes — to offer our products and services to you | Yes | No |
| For joint marketing with other financial companies | No | We don’t share |
| For our affiliates’ everyday business purposes — information about your transactions and experiences | Yes | No |
| For our affiliates’ everyday business purposes — information about your creditworthiness | No | We don’t share |
| For nonaffiliates to market to you | No | We don’t share |
| Questions? Call 1-800-223-3810 |
THE ALGER FUNDS
ADDITIONAL INFORMATION (Unaudited) (Continued)
| Who we are | |
| Who is providing this notice? | Alger includes Fred Alger Management, LLC and Fred Alger & Company, LLC as well as the following funds: The Alger Funds, The Alger Funds II, The Alger Institutional Funds, The Alger Portfolios, Alger Global Focus Fund, and The Alger ETF Trust. |
| What we do | |
| How does Alger protect my personal information? | To protect your personal information from unauthorized access and use, we use security measures that comply with federal law. These measures include computer safeguards and secured files and buildings. |
| How does Alger collect my personal information? | We collect your personal information, for example, when you: ● Open an account or ● Make deposits or withdrawals from your account or ● Give us your contact information or ● Provide account information or ● Pay us by check. |
| Why can’t I limit all sharing? | Federal law gives you the right to limit some but not all sharing related to: ● sharing for affiliates’ everyday business purposes ─ information about your credit worthiness ● affiliates from using your information to market to you ● sharing for nonaffiliates to market to you State laws and individual companies may give you additional rights to limit sharing. |
| Definitions | |
| Affiliates | Companies related by common ownership or control. They can be financial and nonfinancial companies. ● Our affiliates include Fred Alger Management, LLC, Weatherbie Capital, LLC and Fred Alger & Company, LLC as well as the following funds: The Alger Funds, The Alger Funds II, The Alger Institutional Funds, The Alger Portfolios, Alger Global Focus Fund, and The Alger ETF Trust. |
| Nonaffiliates | Companies not related by common ownership or control. They can be financial and nonfinancial companies. |
| Joint marketing | A formal agreement between nonaffiliated financial companies that together market financial products or services to you. |
THE ALGER FUNDS
ADDITIONAL INFORMATION (Unaudited) (Continued)
Proxy Voting Policies
A description of the policies and procedures the Funds use to determine how to vote proxies relating to portfolio securities and the proxy voting record is available, without charge, by calling (800) 992-3863 or online on the Funds’ website at http://www.alger.com or on the SEC’s website at http://www.sec.gov.
Fund Holdings
The Board has adopted policies and procedures relating to disclosure of the Funds’ portfolio securities. These policies and procedures recognize that there may be legitimate business reasons for holdings to be disclosed and seek to balance those interests to protect the proprietary nature of the trading strategies and implementation thereof by the Funds.
Generally, the policies prohibit the release of information concerning portfolio holdings, which have not previously been made public, to individual investors, institutional investors, intermediaries that distribute the Funds’ shares and other parties which are not employed by the Investment Manager or its affiliates except when the legitimate business purposes for selective disclosure and other conditions (designed to protect the Funds) are acceptable.
The Funds file their complete schedules of portfolio holdings with the SEC semi-annually in shareholder reports on Form N-CSR and after the first and third fiscal quarters as an exhibit to their reports on Form N-PORT. The Funds’ Forms N-CSR and N-PORT are available online on the SEC’s website at www.sec.gov.
In addition, the Funds make publicly available their month-end top 10 holdings (top 5 holdings with respect to Alger 35 Fund and Alger Weatherbie Enduring Growth Fund) with a 10 day lag and their month-end full portfolios with a 60 day lag on their website www.alger. com and through other marketing communications (including printed advertising/sales literature and/or shareholder telephone customer service centers). No compensation or other consideration is directly received for the non-public disclosure of portfolio holdings information.
In accordance with the foregoing, the Funds provide portfolio holdings information to third parties including financial intermediaries and service providers who need access to this information in the performance of their services and are subject to duties of confidentiality (1) imposed by law, including a duty not to trade on non-public information, and/or (2) pursuant to an agreement that confidential information is not to be disclosed or used (including trading on such information) other than as required by law. From time to time, the Funds will communicate with these third parties to confirm that they understand the Funds’ policies and procedures regarding such disclosure. These agreements must be approved by the Trust’s Chief Compliance Officer.
The Board periodically reviews a report disclosing the third parties to whom each Fund’s holdings information has been disclosed and the purpose for such disclosure, and it considers whether or not the release of information to such third parties is in the best interest of the Fund and its shareholders.
THE ALGER FUNDS
ADDITIONAL INFORMATION (Unaudited) (Continued)
In addition to material the Funds routinely provide to shareholders, the Investment Manager may make additional statistical information available regarding the Alger Family of Funds. Such information may include, but not be limited to, relative weightings and characteristics of a Fund versus an index (such as P/E ratio, alpha, beta, capture ratio, maximum drawdown, standard deviation, EPS forecasts, Sharpe ratio, information ratio, R-squared, and market cap analysis), security specific impact on overall portfolio performance, month-end top ten contributors to and detractors from performance, portfolio turnover, and other similar information. Shareholders should visit www.alger.com or may also contact the Funds at (800) 992-3863 to obtain such information.
THE ALGER FUNDS
100 Pearl Street, 27th Floor
New York, NY 10004
(800) 992-3863
www.alger.com
Investment Manager
Fred Alger Management, LLC
100 Pearl Street, 27th Floor
New York, NY 10004
Sub-Advisor
Weatherbie Capital, LLC
265 Franklin Street, Suite 1603
Boston, MA 02110
Distributor
Fred Alger & Company, LLC
100 Pearl Street, 27th Floor
New York, NY 10004
Transfer Agent and Dividend Disbursing Agent
UMB Fund Services, Inc.
235 W. Galena Street
Milwaukee, WI 53212
Custodian
Brown Brothers Harriman & Company
50 Post Office Square
Boston, MA 02110
Independent Registered Public Accounting Firm
Deloitte & Touche LLP
30 Rockefeller Plaza
New York, NY 10112
This report is submitted for the general information of the shareholders of the series of The Alger Funds. It is not authorized for distribution to prospective investors unless accompanied by an effective Prospectus for the Fund, which contains information concerning the Fund’s investment policies, fees and expenses as well as other pertinent information.
(This page has been intentionally left blank)
(This page has been intentionally left blank)
(This page has been intentionally left blank)
(This page has been intentionally left blank)
(This page has been intentionally left blank)
(This page has been intentionally left blank)
(This page has been intentionally left blank)

| ITEM 2. | CODE OF ETHICS. |
| (a) | The Registrant has adopted a code of ethics (the “Code of Ethics”) that applies to its principal executive officer, principal financial officer, principal accounting officer or controller, or persons performing similar functions. |
| (b) | Not applicable. |
| (c) | The Registrant has not amended its Code of Ethics during the period covered by the shareholder report presented in Item 1 hereto. |
| (d) | The Registrant has not granted a waiver or an implicit waiver from a provision of its Code of Ethics during the period covered by the shareholder report presented in Item 1 hereto. |
| (e) | Not applicable. |
| (f) | The Registrant’s Code of Ethics is attached as an Exhibit hereto. |
| ITEM 3. | AUDIT COMMITTEE FINANCIAL EXPERT. |
| ITEM 4. | PRINCIPAL ACCOUNTANT FEES AND SERVICES. |
| October 31, 2022 | $ | 397,800 | ||
| October 31, 2021 | $ | 380,700 |
| October 31, 2022 | $ | 69,117 | ||
| October 31, 2021 | $ | 70,965 |
| October 31, 2022 | $ | 33,342 | ||
| October 31, 2021 | $ | 22,681 |
| October 31, 2022 | $ | 300,142, | € | 99,042 | ||||
| October 31, 2021 | $ | 228,972, | € | 91,934 |
| ITEM 5. | AUDIT COMMITTEE OF LISTED REGISTRANTS. |
| ITEM 6. | INVESTMENTS. |
| ITEM 7. | DISCLOSURE OF PROXY VOTING POLICIES AND PROCEDURES FOR CLOSED-END MANAGEMENT INVESTMENT COMPANIES. |
| ITEM 8. | PORTFOLIO MANAGERS OF CLOSED-END MANAGEMENT INVESTMENT COMPANIES. |
| ITEM 9. | PURCHASES OF EQUITY SECURITIES BY CLOSED-END MANAGEMENT INVESTMENT COMPANY AND AFFILIATED PURCHASERS. |
| ITEM 10. | SUBMISSION OF MATTERS TO A VOTE OF SECURITY HOLDERS. |
| ITEM 11. | CONTROLS AND PROCEDURES. |
| ITEM 12. | Disclosure of Securities Lending Activities for Closed-End Management Investment Companies. |
| ITEM 13. | EXHIBITS. |
| The Alger Funds | |
| By: | /s/ Hal Liebes |
| Hal Liebes | |
| President | |
| Date: | December 21, 2022 |
| By: | /s/ Hal Liebes |
| Hal Liebes | |
| President | |
| Date: | December 21, 2022 |
| By: | /s/ Michael D. Martins |
| Michael D. Martins | |
| Treasurer | |
| Date: | December 21, 2022 |