FORM 6-K
SECURITIES AND EXCHANGE COMMISSION
Washington, D.C. 20549
Report of Foreign Private Issuer
Dated October 25, 2021.
Pursuant to Rule 13a-16 or 15d-16 of
the Securities Exchange Act of 1934
Aktiebolaget Svensk Exportkredit
Swedish Export Credit Corporation
(Translation of Registrant’s Name into English)
Klarabergsviadukten
61-63
SE-101 23 Stockholm
Sweden
(Address of Principal Executive Offices)
Indicate by check mark whether the registrant files or will file annual reports under cover Form 20-F or Form 40-F.
| Form 20-F x | Form 40-F ¨ |
Indicate by check mark if the registrant is submitting the Form 6-K in paper as permitted by Regulation S-T Rule 101(b)(1): N/A
Indicate by check mark if the registrant is submitting the Form 6-K in paper as permitted by Regulation S-T Rule 101(b)(7): N/A
Indicate by check mark whether by furnishing the information contained in this Form, the registrant is also thereby furnishing the information to the Commission pursuant to Rule 12g3-2(b) under the Securities Exchange Act of 1934.
| Yes ¨ | No x |
If “Yes” is marked, indicate below the file number assigned to the registrant in connection with Rule 12g3-2(b): N/A
Incorporation by Reference
This Report on Form 6-K, including the exhibits hereto, is hereby incorporated by reference, in its entirety, into the registration statement on Form F-3 (File No. 333-249829) of Aktiebolaget Svensk Exportkredit (publ) (“SEK”).
This Report comprises the following:
| 1. | Registrant’s report for the third quarter of 2021. |
| 2. | Table of unaudited consolidated capitalization of the Registrant (attached as Exhibit 99.2 hereto). |
1
AB Svensk Exportkredit
Swedish Export Credit Corporation
Interim Report 2021
January-September 2021
2
SIGNATURE
Pursuant to the requirements of the Securities Exchange Act of 1934, the Registrant has duly caused this Report to be signed on its behalf by the undersigned, thereunto duly authorized.
Dated: October 25, 2021
| AB Svensk Exportkredit | ||
| (Swedish Export Credit Corporation) | ||
| By: | /s/ Magnus Montan | |
| Magnus Montan, Chief Executive Officer | ||
3
 | AB Svensk Exportkredit Swedish Export Credit Corporation |


January-September 2021
(Compared to the period January-September 2020)
 | Net interest income Skr 1,425 million (9M20: Skr 1,427 million) |
| Operating profit Skr 1,005 million (9M20: Skr 802 million) |
| Net profit Skr 798 million (9M20: Skr 627 million) |
| New lending Skr 50.4 billion (9M20: Skr 106.9 billion) |
| Volume of green bonds issued Skr 6.1 billion (9M20: 3.5 billion) |
| Basic and diluted earnings per share Skr 200 (9M20: Skr 157) |
| After-tax return on equity 5.2 percent (9M20: 4.3 percent) |
Third quarter of 2021
(Compared to the third quarter of 2020)
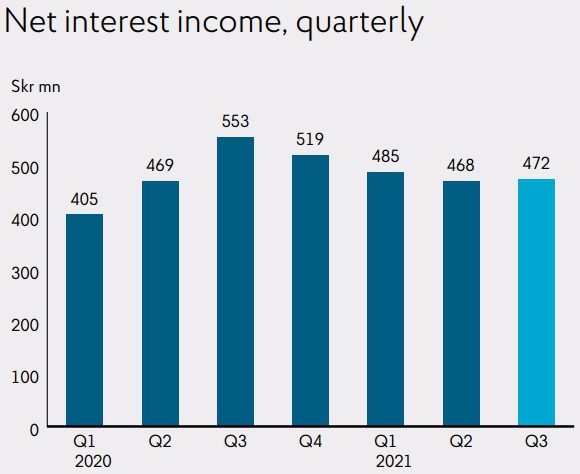
| Net interest income Skr 472 million (3Q20: Skr 553 million) |
| Operating profit Skr 402 million (3Q20: Skr 512 million) |
| Net profit Skr 319 million (3Q20: Skr 403 million) |
| New lending Skr 12.3 billion (3Q20: Skr 17.1 billion) |
| Volume of green bonds issued Skr 2.1 billion (3Q20: 1.3 billion) |
| Basic and diluted earnings per share Skr 80 (3Q20: Skr 101) |
| After-tax return on equity 6.3 percent (3Q20: 8.2 percent) |
Equity and balances
(Compared to December 31, 2020)
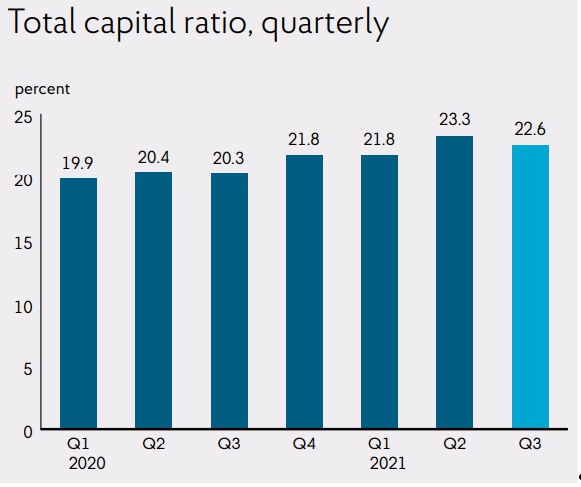
| Total capital ratio 22.6 percent (year-end 2020: 21.8 percent) |
| Total assets Skr 329.3 billion (year-end 2020: Skr 335.4 billion) |
| Loans, outstanding and undisbursed Skr 279.6 billion (year-end 2020: Skr 288.9 billion) |
| Interim report January–September 2021 | Page 2 of 29 |

Sustainable financing increasingly important
In July, I assumed the position of CEO of SEK, which makes this my first Statement by the CEO. It is important and meaningful to strengthen the Swedish export industry through international competitive financing and, in doing so, to contribute to public welfare.
After a year and a half of tackling the COVID-19 pandemic, Sweden’s economy is back at pre-crisis levels with exports acting as a catalyst for the recovery. At the same time, challenges remain such as shortages of input goods and disruptions in container and shipping traffic. Another challenge is the major disparity in vaccination rates across the world, which has led to an asymmetrical and negative effect on the global economy.
New lending for the first nine months of the year amounted to Skr 50 billion, in line with historical non-pandemic years but significantly lower than the high volumes in 2020. Following limited demand for financing from Swedish exporters during the first half of the year, lending has increased toward the end of the third quarter. Despite lower new lending during the year, we have seen an increased demand for export credits and project financing, meaning financing for Swedish exporters’ customers abroad. Projects have long lead times and it is difficult to forecast with any precision when the transactions will be closed. During the quarter, the company has financed Skr 400 million in export credits to Finland, the Ivory Coast and Argentina. The company works actively to finance a number of major projects, many with positive sustainability effects, which is why the forecast for business growth in this area remains favorable.
The pandemic has likely had a positive effect on the green transition. An important step in SEK’s endeavor to be a positive force in the transition and achieve the UN Sustainable Development Goals is the ability to offer sustainable financing regardless of the type of loan that clients require. SEK has extensive experience in financing renewable energy and sustainable infrastructure on an international scale. Together with EKN, SEK has established a scientific climate council, the first of its kind in the world. The climate council is an advisory specialist body tasked with guiding the Swedish export finance system to strive toward the 1.5°C target of the Paris Agreement.
Interest for sustainable investments and business is growing, and we are developing our offering in line with this interest to meet the needs of clients and investors. SEK now offers three kinds of loans connected to sustainability: green-, social- and sustainability-linked loans. The sustainability-linked loan is connected to the borrower’s sustainability targets, for example to reduce energy consumption. In line with SEK’s focus on sustainability, the company issued Skr 6.1 billion in green bonds during the first nine months of the year, of which Skr 2.1 billion was issued in the third quarter.
Operating profit for the third quarter amounted to Skr 402 million (3Q20: Skr 512 million), of which Skr 72 million consisted of non-recurring items, such as reversal of reserves for expected credit losses and net results of financial transactions. Net interest income totaled Skr 472 million (3Q20: Skr 553 million).

Magnus Montan
Chief Executive Officer
| Interim report January–September 2021 | Page 3 of 29 |


Increased demand from Swedish exporters
Following a period of lower demand for working capital from Swedish exporters during the first half of the year, lending increased toward the end of the third quarter. The demand for credit has been impacted positively by generally higher acquisition activities in addition to a continued positive economic trend. As credit risk assessments are stabilizing and the pandemic-related restrictions are relaxed, the company has been able to plan meetings, events and other sales-focused initiatives to grow the client portfolio. During the year, the number of new customers increased about 6 percent and customer growth appears to be developing positively.
While working capital financing to Swedish exporters has increased, several of the major projects that the company is financing across the world have been delayed, which explains why new lending in export credits and project financing have not met the company's goals. During the quarter, the company has financed Skr 400 million in export credits to Finland, the Ivory Coast and Argentina. The company works actively to finance a number of major projects, many with positive sustainability effects, which is why the forecast for growth in this area remains favorable.
SEK continues to see great demand for sustainable financing, and it has the ability to offer green-, social- and sustainability-linked financing solutions. During the quarter, SEK continued to finance Swedish wind power through a loan of approximately Skr 700 million for investments in existing parks and construction of new ones.
| SEK’s new lending | |||
| Skr bn | Jan-Sep 2021 | Jan-Sep 2020 | Jan-Dec 2020 |
| Lending to Swedish exporters1 | 16.5 | 55.7 | 62.2 |
| Lending to exporters’ customers2 | 33.9 | 51.2 | 63.3 |
| Total | 50.4 | 106.9 | 125.5 |
| CIRR loans as percentage of new lending | 18% | 16% | 15% |
| 1 | Of which Skr 1.1 billion (9M20: Skr 0.8 billion; year-end 2020: Skr 1.1 billion) had not been disbursed at period end. |
| 2 | Of which Skr 10.6 billion (9M20: Skr 16.7 billion; year-end 2020: Skr 17.9 billion) had not been disbursed at period end. |

| Interim report January–September 2021 | Page 4 of 29 |


Lower borrowing costs in a stable bond market
After a substantial increase in borrowing requirements in 2020 due to increased customer demand, mainly driven by the COVID-19 pandemic, SEK's need to raise long-term financing has normalized in 2021. SEK raised borrowings corresponding to Skr 18.6 billion with maturities of at least one year in the third quarter and Skr 62 billion in the first nine months of the year, which was Skr 38 billion less than the corresponding period of 2020. During the third quarter, SEK conducted a public offering of a USD 1.25 billion three-year fixed rate bond. In accordance with the changes that are ongoing in the market in conjunction with the replacement of LIBOR, the bond was marketed and priced against SOFR instead of LIBOR. The cost of new long-term borrowings has continued to decline in line with improved market levels and the cost to SEK of its public offerings is now the lowest it has been in the last ten years.
The proportion of structured debt has increased year-on-year. Structured borrowing has accounted for 20 percent of new long-term borrowings so far this year, compared with 11 percent for the same period in the previous year. In furtherance of SEK's commitment to sustainability, the company has issued Skr 6.1 billion in green bonds this year, of which Skr 2.1 billion was issued in the third quarter.
SEK continues to have high liquidity for new lending and is well prepared to meet the future financing needs of the Swedish export industry.
| SEK’s borrowing | |||
| Skr bn | Jan-Sep 2021 | Jan-Sep 2020 | Jan-Dec 2020 |
| New long-term borrowing | 62.0 | 99.8 | 123.2 |
| Volume of green bonds issued during the period | 6.1 | 3,5 | 5.1 |
| Outstanding senior debt | 287.4 | 325.2 | 287.5 |
| Repurchase and redemption of own debt | 1.1 | 2.8 | 3.0 |

| Interim report January–September 2021 | Page 5 of 29 |
January-September 2021
Operating profit amounted to Skr 1,005 million (9M20: Skr 802 million). Net profit amounted to Skr 798 million (9M20: Skr 627 million).
The higher net profit compared with the same period in the previous year is mainly explained by an improved net result from financial transactions and lower provisions for expected credit losses. The lower provisions are largely attributable to the decrease of part of the reserve for expected credit losses that had been increased in connection with the COVID-19 pandemic.
Net interest income
Net interest income amounted to Skr 1,425 million (9M20: Skr 1,427 million) and is in line with net interest income in the same period in the previous year. The record high lending in 2020 had a positive impact on the company's net interest income. New lending for the current year in terms of working capital has not completely met loan maturities and amortization, but the company has nevertheless been able to attain the same level of net interest income as in the previous year.
The table below shows average interest-bearing assets and liabilities.
| Skr bn, average | Jan-Sep 2021 | Jan-Sep 2020 | Change |
| Total loans | 230.3 | 232.4 | -1% |
| Liquidity investments | 59.8 | 71.1 | -16% |
| Interest-bearing assets | 306.8 | 320.8 | -4% |
| Interest-bearing liabilities | 287.4 | 299.1 | -4% |
Net results of financial transactions
Net results of financial transactions amounted to Skr 15 million (9M20: Skr -4 million) mainly due to unrealized value changes in derivatives and early loan redemptions. Although the volatility in the fixed income market was relatively high during the period, the company's risk hedging strategies have worked well and the volatility in the company's net results of financial transactions has been kept low.
Operating expenses
Operating expenses amounted to Skr -462 million (9M20: Skr -433 million), an increase of 7 percent compared to the same period in the previous year. The increase in expenses is mainly due to increased costs for regulatory compliance adaption of operations. A provision of Skr 6 million (9M20: Skr 6 million) was made for the individual variable remuneration program.
Net credit losses
Net credit losses amounted to Skr 50 million (9M20: Skr -160 million). Net credit losses were primarily attributable to decreased provisions for expected credit losses for exposures in stage 1 and stage 2, offset by increased provisions for expected credit losses for exposures in stage 3. The decrease in provisions for stage 1 and stage 2 are largely attributable to a gradual decrease of the reserve for expected credit losses that had been increased in connection with the COVID-19 pandemic.
SEK's IFRS 9 model is based on GDP growth projections estimating the impact on the probability of default. SEK's management believes the model underestimates the probability of default within the asset portfolio, see Note 4. Although the recovery has been faster than expected, SEK has made an overall adjustment accordingly.
Loss allowances as of September 30, 2021 amounted to Skr -192 million compared to Skr -249 million as of December 31, 2020, of which exposures in stage 3 amounted to Skr -79 million (year-end 2020: Skr -46 million). The increase in stage 3 is the result of a few counterparties being moved from stage 2 to stage 3.
The provision ratio amounted to 0.07 percent (year-end 2020: 0.08 percent).
Taxes
Tax costs amounted to Skr -207 million (9M20: Skr -175 million), and the effective tax rate amounted to 20.6 percent (9M20: 21.8 percent).
Other comprehensive income (OCI)
Other comprehensive income before tax amounted to Skr 10 million (9M20: Skr -6 million) due to positive results related to the revaluation of defined benefit plans, which have been affected by a higher discount rate. This result was partly offset by a negative result from changes in own credit risk.
July-September 2021
Operating profit for the third quarter amounted to Skr 402 million (3Q20: Skr 512 million), of which Skr 72 million consisted of non-recurring items, such as reversal of reserves for expected credit losses and net results of financial transactions. Net profit amounted to Skr 319 million (3Q20: Skr 403 million). The decrease in profit compared to the same period in the previous year was mainly attributable to lower net interest income and lower net results of financial transactions, offset by lower provisions for expected credit losses. The lower provisions are largely attributable to the decrease of part of the reserve for expected credit losses that had been increased in connection with the COVID-19 pandemic. During both the third quarter of 2021 and the third quarter of 2020, the company made net gains on credit losses.
Net interest income
Net interest income amounted to Skr 472 million (3Q20: Skr 553 million), a decrease of 15 percent compared to the same period in the previous year. Even if the preceding year's high new lending had a positive effect on the company's net interest income, SEK is now noting a stabilization of net interest income at a somewhat lower level. Some short-term working capital financing that was raised at relatively high interest rates at the start of the pandemic has now matured. During the end of the third quarter, new lending related to working capital financing increased compared with the first half of the year. However, customer demand for financing in 2021 as a whole across all lending products has been considerably lower year-on-year during the third quarter and during the first nine months of the year.
The table below shows average interest-bearing assets and liabilities.
| Interim report January–September 2021 | Page 6 of 29 |
| Skr bn, average | Jul-Sep 2021 | Jul-Sep 2020 | Change |
| Total loans | 225.3 | 247.6 | -9% |
| Liquidity investments | 63.6 | 67.4 | -6% |
| Interest-bearing assets | 300.9 | 334.1 | -10% |
| Interest-bearing liabilities | 284.3 | 314.8 | -10% |
Net results of financial transactions
Net results of financial transactions amounted to Skr 23 million (3Q20: Skr 87 million) mainly due to unrealized value changes in derivatives. Volatility in the fixed income market was relatively high during the period, but the company’s risk hedging strategies have worked well and the volatility in the company’s net results of financial transactions has been kept low.
Operating expenses
Operating expenses amounted to Skr -136 million (3Q20: Skr -132 million), an increase of 3 percent compared to the same period in the previous year. The costs associated with regulatory compliance have increased during the period compared to the same period in the previous year. A provision of Skr 2 million (3Q20: Skr 6 million) was made for the individual variable remuneration program.
Net credit losses
Net credit losses amounted to Skr 49 million (3Q20: Skr 15 million). Net credit losses were primarily attributable to decreased provisions for expected credit losses for exposures in stage 1, stage 2 and stage 3. The decrease in provisions for stage 1 and stage 2 are largely attributable to a gradual decrease of the reserve for expected credit losses that had been increased in connection with the COVID-19 pandemic.
SEK’s IFRS 9 model is based on GDP growth projections estimating the impact on the probability of default. SEK’s management believes the model underestimates the probability of default within the asset portfolio, see Note 4. Although the recovery is faster than expected, SEK has made an overall adjustment accordingly.
Taxes
Tax costs amounted to Skr -83 million (3Q20: Skr -109 million), and the effective tax rate amounted to 20.6 percent (3Q20: 21.3 percent).
Other comprehensive income (OCI)
Other comprehensive income before tax amounted to Skr -5 million (3Q20: Skr -54 million) due to a negative result from changes in own credit risk. This result was partly offset by positive results related to the revaluation of defined benefit plans, which have been affected by a higher discount rate.
Statement of Financial Position
Total assets and liquidity investments
Total assets decreased compared to the end of 2020, mainly explained by the fact that outstanding customer exposures have been amortized at a higher rate than new customer lending.
| Skr bn | September 30, 2021 | December 31, 2020 | Change |
| Total assets | 329.3 | 335.4 | -2% |
| Liquidity investments | 60.5 | 59.2 | 2% |
| Total loans | 228.8 | 231.7 | -1% |
| of which loans in the CIRR-system | 81.3 | 69.2 | 17% |
SEK’s total net exposures, after risk mitigation, amounted to Skr 356.5 billion as of September 30, 2021 (year-end 2020: Skr 359.5 billion). Credit exposures have decreased to central governments, but increased to financial institutions, which is mainly due to the increase in liquidity investments.
Liabilities and equity
As of September 30, 2021, the aggregate volume of available funds and shareholders’ equity exceeded the aggregate volume of loans outstanding and loans committed at all maturities. SEK considers all of its outstanding commitments to be covered through maturity.
SEK has a credit facility in place with the Swedish National Debt Office of up to Skr 200 billion, of which Skr 10 billion was utilized as of September 30, 2021. The Skr 10 billion draw was made in March 2020, at the start of the COVID-19 pandemic, to ensure coverage of the increased demand from clients that arose. The credit facility can be utilized when the Swedish export industry’s demand for financing is particularly high.
Capital adequacy
As of September 30, 2021, SEK’s total own funds amounted to Skr 19.8 billion (year-end 2020: Skr 19.5 billion). The total capital ratio was 22.6 percent (year-end 2020: 21.8 percent), representing a margin of 6.9 percentage points above SEK’s estimate of Finansinspektionen’s (the Swedish FSA) requirement of 15.7 percent as of September 30, 2021. The corresponding Common Equity Tier 1 capital estimated requirement was 10.6 percent. Given that SEK’s own funds are comprised solely of Common Equity Tier 1 capital, this total capital ratio represents a margin of 12.0 percentage points above the requirement. Overall, SEK is strongly capitalized and has healthy liquidity.
The leverage ratio has improved compared with the end of 2020, primarily as the result of the Capital Requirements Regulation (CRRII) that entered into force on June 28, 2021. The regulation has introduced changes to the bases of calculation for the ratio in which certain exposures are no longer included.
The liquidity coverage ratio has increased compared with the end of 2020. This increase was mainly the result of lower net liquidity outflows in September, 2021, compared with December, 2020. The LCR ratio varies during the year due to the volatility of inflows and outflows, and is a normal aspect of SEK’s business.
| Interim report January–September 2021 | Page 7 of 29 |
| Percent | September 30, 2021 | December 31, 2020 |
| Common Equity Tier 1 capital ratio | 22.6 | 21.8 |
| Tier 1 capital ratio | 22.6 | 21.8 |
| Total capital ratio | 22.6 | 21.8 |
| Leverage ratio1 | 9.7 | 5.8 |
| Liquidity coverage ratio (LCR) | 1,399 | 447 |
| Net stable funding ratio (NSFR) | 141 | 135 |
1 In the second quarter of 2021, SEK changed its methodology for calculating Leverage ratio to comply with new regulatory requirements (CRRII). Comparative figures have not been recalculated.
Rating
| Skr | Foreign currency | |
| Moody’s | Aa1/Stable | Aa1/Stable |
| Standard & Poor’s | AA+/Stable | AA+/Stable |
Other events
SEK has implemented a new organizational structure to meet its customers’ needs in a more efficient way, which became effective on January 1, 2021. The Large Corporates and Mid Corporates functions have been replaced by the Customer Relations and Structured Finance functions. The Sustainability Analysis function has moved from Credit to Legal, with the Legal function changing its name to Legal and Sustainability Analysis.
In February 2021, the Swedish parliament decided to extend the credit facility of Skr 200 billion that SEK has in place with the Swedish National Debt Office, for 2021.
At SEK’s annual general meeting on March 24, 2021, Lennart Jacobsen was elected as a new member of the Board of Directors of SEK (the “Board”). After ten years of service, Ulla Nilsson and Cecilia Ardström stepped down from their respective positions as members of the Board. A resolution passed at the annual general meeting to adopt the income statement and balance sheet in the Annual and Sustainability Report 2020, and to appropriate distributable funds pursuant to the Board’s proposal. Resolutions were also passed at the annual general meeting relating to the company’s financial goals. The profitability target was changed from 6 percent to 5 percent return on equity after tax. The change was the result of lower policy rates. Furthermore, the dividend policy was changed from the previous 30 percent dividend to a 20-40 percent dividend range of the year’s profit with the aim of increasing the company’s flexibility with respect to capitalization. The company’s capital target was left unchanged.
Catrin Fransson stepped down as CEO of SEK on July 15, 2021, at her own request. On May 3, 2021, Magnus Montan was appointed as the new CEO of SEK, and assumed his new office on July 16, 2021.
In the fourth quarter of 2021, SEK will move to a new office at Fleminggatan in Stockholm. A new lease was signed in the first quarter and will commence in the fourth quarter.
Risk factors and
the macro environment
Various risks arise as part of SEK’s operations, primarily credit risks, but also market, liquidity, re-financing, operational and sustainability risks. For a more detailed description of these risks, refer to the separate risk report Capital Adequacy and Risk Management Report Pillar 3 2020 and Note 30 to the annual financial statements included in SEK’s 2020 Annual Report on Form 20-F, as well as the “Risk Factors” section in SEK’s 2020 Annual Report on Form 20-F.
According to Statistics Sweden, the annualized rate of Swedish GDP growth was 9.7 percent in the second quarter of 2021 and the unemployment rate was 8.8 percent as of August 2021. The consumer price index rose 2.1 percent on an annualized basis in August 2021 and the repo rate remained unchanged at zero percent.
Material shortages, inflation forecasts, China and the Evergrande crisis, and disrupted logistics chains dominated the news in the third quarter of 2021. The COVID-19 pandemic situation has gradually improved, particularly in the United States and Europe, as more people have been vaccinated. About 70 percent of the adult population of the United States and Europe has received two vaccination doses, and restrictions have been rapidly relaxed. While the pace of vaccination appears to have increased, vaccination rates have not reached the same levels in other parts of the world and restrictions in these areas largely remain in force. However, the overall trend, particularly in developed countries, seems to be going in the right direction in line with the vaccine being rolled out on a much larger scale. Nevertheless, the risk of the appearance of new variants of the virus remains.
The quarter was dominated by generally strong global macro figures that appear to go hand in hand with the vaccination rollout, even if the figures from the autumn were not as positive given higher interest rates, energy prices and disrupted logistics chains. Nevertheless, the figures remain very strong on an aggregated basis, with, for example, an IMF forecast for 2021 growth in the United States of a full 7 percent. Overall, this is a far more positive trend than many had believed at the start of the pandemic. The massive support programs introduced are impacting growth, but are simultaneously increasing public debt.
In the first half of 2020, the COVID-19 pandemic had a substantial adverse effect on Swedish exports, but was followed by a relatively strong recovery in the second half of the year. After exports continued to increase in the first quarter of 2021, they decreased by 1.1 percent in the second quarter compared with the preceding quarter. Industry order intake in Sweden declined 2.4 percent between July and August, and Business Sweden’s Export Managers’ Index fell 4.8 points to 66.1 in the third quarter of 2021 compared with the preceding quarter’s top notation of 70.9.
The strong state of Sweden’s public finances, with low public debt, has allowed the use of fiscal stimuli. The Swedish state has implemented special measures to promote Swedish exports during the COVID-19 pandemic, and SEK’s role of securing financing for the Swedish export industry has become even clearer. For example, SEK’s credit facility with the Swedish National Debt Office was increased from Skr 125 billion to Skr 200 billion in June 2020, and in February 2021, the expanded facility was extended for 2021.
| Interim report January–September 2021 | Page 8 of 29 |
Financial targets
| Profitability target | A return on equity after tax of at least 5 percent. |
| Dividend policy | Payment of an ordinary dividend of 20-40 percent of the profit for the year. |
| Capital target | SEK’s total capital ratio is to exceed the Swedish FSA’s requirement by 2 to 4 percentage points and SEK’s Common Equity Tier 1 capital ratio is to exceed the Swedish FSA’s requirement by at least 4 percentage points. Currently, the capital targets mean that the total capital ratio should amount to 17.7-19.7 percent and the Common Equity Tier 1 capital ratio should amount to 14.6 percent, based on SEK’s estimation of the Swedish FSA’s requirements as of September 30, 2021. |
Key performance indicators (unaudited)
| Skr mn (if not otherwise indicated) | Jul-Sep 2021 | Apr-Jun 2021 | Jul-Sep 2020 | Jan-Sep 2021 | Jan-Sep 2020 | Jan-Dec 2020 |
| New lending | 12,356 | 23,199 | 17,097 | 50,423 | 106,896 | 125,470 |
| of which to Swedish exporters | 5,871 | 8,593 | 3,288 | 16,555 | 55,654 | 62,148 |
| of which to exporters’ customers | 6,485 | 14,606 | 13,809 | 33,868 | 51,242 | 63,322 |
| CIRR-loans as a percentage of new lending | 0% | 28% | 37% | 18% | 16% | 15% |
| Loans, outstanding and undisbursed | 279,598 | 281,382 | 306,473 | 279,598 | 306,473 | 288,891 |
| New long-term borrowings | 18,563 | 9,287 | 33,423 | 62,003 | 99,784 | 123,156 |
| Volume of green bonds issued during the period | 2,100 | 1,600 | 1,300 | 6,100 | 3,500 | 5,100 |
| Outstanding senior debt | 287,423 | 281,195 | 325,177 | 287,423 | 325,177 | 287,462 |
| After-tax return on equity | 6.3% | 4.9% | 8.2% | 5.2% | 4.3% | 4.9% |
| Common Equity Tier 1 capital ratio | 22.6% | 23.3% | 20.3% | 22.6% | 20.3% | 21.8% |
| Tier 1 capital ratio | 22.6% | 23.3% | 20.3% | 22.6% | 20.3% | 21.8% |
| Total capital ratio | 22.6% | 23.3% | 20.3% | 22.6% | 20.3% | 21.8% |
| Leverage ratio1 | 9.7% | 9.3% | 5.1% | 9.7% | 5.1% | 5.8% |
| Liquidity coverage ratio (LCR) | 1,399% | 1,000% | 337% | 1,399% | 337% | 447% |
| Net stable funding ratio (NSFR) | 141% | 144% | 139% | 141% | 139% | 135% |
1 In the second quarter of 2021, SEK changed its methodology for calculating Leverage ratio to comply with new regulatory requirements (CRRII). Comparative figures have not been recalculated.
See definitions on page 31.
| Interim report January–September 2021 | Page 9 of 29 |
Condensed Consolidated Statement of Comprehensive Income (unaudited)
| Skr mn | Note | Jul-Sep 2021 | Apr-Jun 2021 | Jul-Sep 20201 | Jan-Sep 2021 | Jan-Sep 20201 | Jan-Dec 2020 |
| Interest income | 678 | 678 | 890 | 2,016 | 3,370 | 4,108 | |
| Interest expenses | -206 | -210 | -337 | -591 | -1,943 | -2,162 | |
| Net interest income | 2 | 472 | 468 | 553 | 1,425 | 1,427 | 1,946 |
| Net fee and commission expense | -6 | -7 | -11 | -23 | -28 | -42 | |
| Net results of financial transactions | 3 | 23 | 9 | 87 | 15 | -4 | 83 |
| Total operating income | 489 | 470 | 629 | 1,417 | 1,395 | 1,987 | |
| Personnel expenses | -76 | -98 | -75 | -263 | -252 | -347 | |
| Other administrative expenses | -49 | -61 | -44 | -165 | -142 | -198 | |
| Depreciation and impairment of non-financial assets | -11 | -12 | -13 | -34 | -39 | -51 | |
| Total operating expenses | -136 | -171 | -132 | -462 | -433 | -596 | |
| Operating profit before credit losses | 353 | 299 | 497 | 955 | 962 | 1,391 | |
| Net credit losses | 4 | 49 | 13 | 15 | 50 | -160 | -153 |
| Operating profit | 402 | 312 | 512 | 1,005 | 802 | 1,238 | |
| Tax expenses | -83 | -64 | -109 | -207 | -175 | -270 | |
| Net profit2 | 319 | 248 | 403 | 798 | 627 | 968 | |
| Other comprehensive income related to: | |||||||
| Items not to be reclassified to profit or loss | |||||||
| Own credit risk | -11 | -2 | -22 | -31 | 27 | 18 | |
| Revaluation of defined benefit plans | 6 | 4 | -32 | 41 | -33 | 1 | |
| Tax on items not to be reclassified to profit or loss | 1 | 0 | 11 | -2 | 0 | -5 | |
| Net items not to be reclassified to profit or loss | -4 | 2 | -43 | 8 | -6 | 14 | |
| Total other comprehensive income | -4 | 2 | -43 | 8 | -6 | 14 | |
| Total comprehensive income2 | 315 | 250 | 360 | 806 | 621 | 982 | |
| Skr | |||||||
| Basic and diluted earnings per share3 | 80 | 62 | 101 | 200 | 157 | 243 |
| 1 | Since Q4 2020, SEK has changed the accounting principle regarding the CIRR-system, see Note 1 to the consolidated financial statements included in SEK’s 2020 Annual Report on Form 20-F. The comparative figures have been adjusted. |
| 2 | The entire profit is attributable to the shareholder of the Parent Company. |
| 3 | Net profit divided by average number of shares, which amounts to 3,990,000 for each period. |
| Interim report January–September 2021 | Page 10 of 29 |
Consolidated Statement of Financial Position (unaudited)
| Skr mn | Note | September 30, 2021 | December 31, 2020 |
| Assets | |||
| Cash and cash equivalents | 5 | 7,176 | 3,362 |
| Treasuries/government bonds | 5 | 9,836 | 22,266 |
| Other interest-bearing securities except loans | 5 | 43,476 | 33,551 |
| Loans in the form of interest-bearing securities | 4, 5 | 48,021 | 50,780 |
| Loans to credit institutions | 4, 5 | 22,288 | 31,315 |
| Loans to the public | 4, 5 | 170,032 | 171,562 |
| Derivatives | 5, 6 | 6,730 | 7,563 |
| Tangible and intangible assets | 192 | 145 | |
| Deferred tax asset | 6 | 15 | |
| Other assets | 19,535 | 12,853 | |
| Prepaid expenses and accrued revenues | 2,017 | 1,987 | |
| Total assets | 329,309 | 335,399 | |
| Liabilities and equity | |||
| Borrowing from credit institutions | 5 | 2,867 | 3,486 |
| Borrowing from the public | 5 | 10,000 | 10,000 |
| Debt securities issued | 5 | 274,556 | 273,976 |
| Derivatives | 5, 6 | 14,991 | 25,395 |
| Other liabilities | 4,501 | 455 | |
| Accrued expenses and prepaid revenues | 1,764 | 1,924 | |
| Provisions | 50 | 99 | |
| Total liabilities | 308,729 | 315,335 | |
| Share capital | 3,990 | 3,990 | |
| Reserves | -121 | -129 | |
| Retained earnings | 16,711 | 16,203 | |
| Total equity | 20,580 | 20,064 | |
| Total liabilities and equity | 329,309 | 335,399 |
| Interim report January–September 2021 | Page 11 of 29 |
Condensed Consolidated Statement
of Changes in Equity (unaudited)
| Skr mn | Equity | Share capital | Reserves | Retained earnings | |
Own credit risk | Defined benefit plans | ||||
| Opening balance of equity January 1, 2020 | 19,082 | 3,990 | -98 | -45 | 15,235 |
| Net profit Jan-Sep 2020 | 627 | 627 | |||
| Other comprehensive income Jan-Sep 2020 | -6 | 21 | -27 | ||
| Total comprehensive income Jan-Sep 2020 | 621 | - | 21 | -27 | 627 |
| Dividend | - | - | |||
| Closing balance of equity September 30, 20201 | 19,703 | 3,990 | -77 | -72 | 15,862 |
| Opening balance of equity January 1, 2020 | 19,082 | 3,990 | -98 | -45 | 15,235 |
| Net profit Jan-Dec 2020 | 968 | 968 | |||
| Other comprehensive income Jan-Dec 2020 | 14 | 14 | 0 | ||
| Total comprehensive income Jan-Dec 2020 | 982 | - | 14 | 0 | 968 |
| Dividend | - | - | |||
| Closing balance of equity December 31, 20201 | 20,064 | 3,990 | -84 | -45 | 16,203 |
| Opening balance of equity January 1, 2021 | 20,064 | 3,990 | -84 | -45 | 16,203 |
| Net profit Jan-Sep 2021 | 798 | 798 | |||
| Other comprehensive income Jan-Sep 2021 | 8 | -24 | 32 | ||
| Total comprehensive income Jan-Sep 2021 | 806 | - | -24 | 32 | 798 |
| Dividend | -290 | -290 | |||
| Closing balance of equity September 30, 20211 | 20,580 | 3,990 | -108 | -13 | 16,711 |
| 1 | The entire equity is attributable to the shareholder of the Parent Company. |
| Interim report January–September 2021 | Page 12 of 29 |
Condensed Statement of Cash Flows
in the Consolidated Group (unaudited)
| Skr mn | Jan-Sep 2021 | Jan-Sep 2020 | Jan-Dec 2020 |
| Operating activities | |||
| Operating profit | 1,005 | 802 | 1,238 |
| Adjustments for non-cash items in operating profit | -145 | -201 | 140 |
| Income tax paid | -197 | -249 | -311 |
| Changes in assets and liabilities from operating activities | 17,770 | -31,383 | -19,055 |
| Cash flow from operating activities | 18,433 | -31,031 | -17,988 |
| Investing activities | |||
| Capital expenditures | -63 | -22 | -35 |
| Cash flow from investing activities | -63 | -22 | -35 |
| Financing activities | |||
| Change in senior debt | -12,752 | 43,328 | 29,460 |
| Derivatives, net | -1,705 | -5,896 | -8,651 |
| Dividend paid | -290 | - | - |
| Payment of lease liability | -18 | -20 | -27 |
| Cash flow from financing activities | -14,765 | 37,412 | 20,782 |
| Cash flow for the period | 3,605 | 6,359 | 2,759 |
| Cash and cash equivalents at beginning of the period | 3,362 | 1,362 | 1,362 |
| Cash flow for the period | 3,605 | 6,359 | 2,759 |
| Exchange-rate differences on cash and cash equivalents | 209 | -407 | -759 |
| Cash and cash equivalents at end of the period1 | 7,176 | 7,314 | 3,362 |
| 1 | Cash and cash equivalents include, in this context, cash at banks that can be immediately converted into cash and short-term deposits for which the time to maturity does not exceed three months from trade date. |
| Interim report January–September 2021 | Page 13 of 29 |
Notes
Note 1. Accounting policies
Note 2. Net interest income
Note 3. Net results of financial transactions
Note 4. Impairments
Note 5. Financial assets and liabilities at fair value
Note 6. Derivatives
Note 7. CIRR-system
Note 8. Pledged assets and contingent liabilities
Note 9. Capital adequacy
Note 10. Exposures
Note 11. Transactions with related parties
Note 12. Events after the reporting period
References to “SEK” or the “Parent Company” are to AB Svensk Exportkredit. References to “Consolidated Group” are to SEK and its consolidated subsidiary. All amounts are in Skr million, unless otherwise indicated. All figures relate to the Consolidated Group, unless otherwise indicated.
Note 1. Accounting policies
This condensed interim report is presented in accordance with International Accounting Standard (IAS) 34, Interim Financial Reporting. The Consolidated Group’s consolidated accounts have been prepared in accordance with the International Financial Reporting Standards (IFRS) as issued by the International Accounting Standards Board (IASB), together with the interpretations from IFRS Interpretations Committee (IFRS IC). The IFRS standards applied by SEK are all endorsed by the European Union (EU). The accounting also follows the additional standards imposed by the Annual Accounts Act for Credit Institutions and Securities Companies (1995:1559) (ÅRKL) and the regulation and general guidelines issued by Finansinspektionen (the Swedish FSA), “Annual Reports in Credit Institutions and Securities Companies” (FFFS 2008:25). In addition to this, the supplementary accounting rules for groups (RFR 1) issued by the Swedish Financial Reporting Board have been applied. SEK also follows the state’s principles for external reporting in accordance with its State Ownership Policy and principles for state-owned enterprises.
The accounting policies, methods of computation and presentation of the Consolidated Group are, in all material aspects, the same as those used for the 2020 annual financial statements on Form 20-F, except for the changes described below. In addition to the changes below, certain amounts reported in prior periods have been restated to conform to the current presentation. SEK analyzes and assesses the application and impact of changes in financial reporting standards that are applied within the Group. Changes that are not mentioned are either not applicable to SEK or have been determined to not have a material impact on SEK’s financial reporting.
The amendments to IFRS 9, IAS 39, IFRS 7, IFRS 4 and IFRS 16 in “Reform for new reference rates - phase 2” are applicable from January 1, 2021. Phase 2 of the reform of the reference rates is comprised of three main areas: hedge accounting, modifications and information. The changes clarify that hedge accounting does not have to cease just because the hedged items and hedging instruments were modified as a result of the IBOR reform. Security conditions (and associated documentation) must be changed to reflect the modifications made to the hedged item, the hedging instrument and the hedged risk. Any value adjustments resulting from the changes must be reported as hedging inefficiency. SEK has not made any changes related to the IBOR reform during the reporting period,
nor entered into a hedging relationship where an alternative benchmark interest rate constitutes the hedged risk. The reform of the reference rates further clarifies that modifications required as a direct result of the IBOR reform and made in an economically equivalent way should not be reported as modifications for instruments valued at accrued acquisition value. For such modifications, the effective interest rate must be adjusted in line with those modified cash flows. SEK did not use the accounting relief rule for modifications. SEK’s exposure that is directly affected by the reference interest rate reform is mainly its lending contracts to variable interest rates, its lending and borrowing contracts at fixed interest rates that are hedged at variable interest rates and currency swaps at variable interest rates. The exposures to variable interest rates are mainly against USD LIBOR, STIBOR and EURIBOR. After 2021-12-31, GBP LIBOR, CHF LIBOR and JPY LIBOR are expected to cease. For USD LIBOR, the most common maturities are expected to expire after 2023-06-30. SEK has lending contracts and derivative contracts maturing after 2023-06-30 in USD LIBOR with a nominal amount of USD 1,890 million and USD 18,973 million respectively. The changes are not expected to result in a change to SEK’s hedging conditions and no significant modification gains or modification losses are expected to be reported. The changes are therefore not expected to have any significant impact on SEK’s accounts, capital adequacy or large exposures when first applied.
To further improve the resilience of credit institutions within the EU, a reform package was adopted in June 2019: Regulation (EU) 2019/876 (CRRII) and Directive (EU) 2019/878 (CRDV) of the European Parliament and of the Council. As of June 28, 2021, the Capital Requirements Regulation (CRRII) entered into force. This means that new requirements such as a binding leverage ratio and a binding net stable funding ratio (NSFR) are included in Note 9, Capital adequacy, per 2021-09-30. The information is published in accordance with Supervisory Regulations FFFS 2014:12 and FFFS 2008:25.
There are no other IFRS or IFRS Interpretations Committee interpretations that are not yet applicable that are expected to have a material impact on SEK’s financial statements, capital adequacy or large exposure ratios.
| Interim report January–September 2021 | Page 14 of 29 |
Note 2. Net interest income
| Skr mn | Jul-Sep 2021 | Apr-Jun 2021 | Jul-Sep 20201 | Jan-Sep 2021 | Jan-Sep 20201 | Jan-Dec 2020 |
| Interest income | ||||||
| Loans to credit institutions | 35 | 34 | 53 | 102 | 199 | 236 |
| Loans to the public | 948 | 919 | 1,035 | 2,787 | 3,234 | 4,210 |
| Loans in the form of interest-bearing securities | 199 | 189 | 233 | 583 | 689 | 897 |
| Interest-bearing securities excluding loans in the form of interest-bearing securities | 9 | 12 | 32 | 40 | 223 | 242 |
| Derivatives | -568 | -529 | -517 | -1,655 | -1,151 | -1,708 |
| Administrative remuneration CIRR-system | 50 | 48 | 48 | 143 | 151 | 197 |
| Other assets | 5 | 5 | 6 | 16 | 25 | 34 |
| Total interest income2 | 678 | 678 | 890 | 2,016 | 3,370 | 4,108 |
| Interest expenses | ||||||
| Interest expenses | -184 | -191 | -316 | -525 | -1,879 | -2,076 |
| Resolution fee | -22 | -19 | -21 | -66 | -64 | -86 |
| Total interest expenses | -206 | -210 | -337 | -591 | -1,943 | -2,162 |
| Net interest income | 472 | 468 | 553 | 1,425 | 1,427 | 1,946 |
1 Since Q4 2020, SEK has changed the accounting principle regarding the CIRR-system, see Note 1 to the consolidated financial statements included in SEK’s 2020 Annual Report on Form 20-F. The comparative figures have been adjusted. 2 Interest income calculated using the effective interest method amounted to Skr 3,157 million during January-September 2021 (9M20: Skr 3,838 million). | ||||||
Note 3. Net results of financial transactions
| Skr mn | Jul-Sep 2021 | Apr-Jun 2021 | Jul-Sep 2020 | Jan-Sep 2021 | Jan-Sep 2020 | Jan-Dec 2020 |
| Derecognition of financial instruments not measured at fair value through profit or loss | 1 | 29 | 1 | 31 | 11 | 14 |
| Financial assets or liabilities at fair value through profit or loss | 19 | -28 | 48 | -20 | -61 | -22 |
| Financial instruments under fair-value hedge accounting | 4 | 7 | 36 | 7 | 44 | 86 |
| Currency exchange-rate effects on all assets and liabilities excl. currency exchange-rate effects related to revaluation at fair value | -1 | 1 | 2 | -3 | 2 | 5 |
| Total net results of financial transactions | 23 | 9 | 87 | 15 | -4 | 83 |
| Interim report January–September 2021 | Page 15 of 29 |
Note 4. Impairments
| Skr mn | Jul-Sep 2021 | Apr-Jun 2021 | Jul-Sep 2020 | Jan-Sep 2021 | Jan-Sep 2020 | Jan-Dec 2020 |
| Expected credit losses, stage 1 | 27 | 31 | 20 | 63 | -107 | -98 |
| Expected credit losses, stage 2 | 10 | 8 | 0 | 28 | -46 | -48 |
| Expected credit losses, stage 3 | 12 | -30 | -5 | -45 | -7 | -7 |
| Established losses | -7 | -3 | - | -10 | -20 | -20 |
| Reserves applied to cover established credit losses | 7 | 3 | - | 10 | 20 | 20 |
| Recovered credit losses | 0 | 4 | - | 4 | - | - |
| Net credit losses | 49 | 13 | 15 | 50 | -160 | -153 |
| Skr mn | September 30, 2021 | December 31, 2020 | |||
| Stage 1 | Stage 2 | Stage 3 | Total | Total | |
| Loans, before expected credit losses | 189,876 | 36,806 | 2,349 | 229,031 | 231,927 |
| Off balance sheet exposures, before expected credit losses | 29,320 | 30,042 | 104 | 59,466 | 62,504 |
| Total, before expected credit losses | 219,196 | 66,848 | 2,453 | 288,497 | 294,431 |
| Loss allowance, loans | -81 | -28 | -79 | -188 | -240 |
| Loss allowance, off balance sheet exposures1 | -4 | 0 | 0 | -4 | -9 |
| Total loss allowance | -85 | -28 | -79 | -192 | -249 |
| Provision ratio (in percent) | 0.04 | 0.04 | 3.22 | 0.07 | 0.08 |
| 1 Recognized under provision in Consolidated Statement of Financial Position. Off balance sheet exposures consist of guarantee commitments, committed undisbursed loans and binding offers, see Note 8. | |||||
The table above shows the book value of loans and nominal amounts for off-balance sheet exposures before expected credit losses for each stage as well as related loss allowance amounts, in order to place expected credit losses in relation to credit exposures. Overall, the credit portfolio has an extremely high credit quality and SEK
often uses risk mitigation measures, primarily through guarantees from the Swedish Export Credit Agency (EKN) and other government export credit agencies in the Organisation for Economic Co-operation and Development (OECD), which explains the low provision ratio.
Loss Allowance
| September 30, 2021 | December 31, 2020 | ||||
| Skr mn | Stage 1 | Stage 2 | Stage 3 | Total | Total |
| Opening balance January 1 | -147 | -56 | -46 | -249 | -128 |
| Increases due to origination and acquisition | -26 | 1 | -23 | -48 | -84 |
| Net remeasurement of loss allowance | 52 | 15 | -3 | 64 | -69 |
| Transfer to stage 1 | - | - | - | - | - |
| Transfer to stage 2 | 0 | -5 | - | -5 | - |
| Transfer to stage 3 | 0 | 3 | -23 | -20 | -9 |
| Decreases due to derecognition | 37 | 17 | 7 | 61 | 8 |
| Decrease in allowance account due to write-offs | - | - | 10 | 10 | 20 |
| Exchange-rate differences1 | -1 | -3 | -1 | -5 | 13 |
| Closing balance | -85 | -28 | -79 | -192 | -249 |
| 1 Recognized under net results of financial transactions in Statement of Comprehensive Income. | |||||
Provisions for expected credit losses (ECLs) are calculated using quantitative models based on inputs, assumptions and methods that are highly reliant on assessments. In particular, the following could heavily impact the level of provisions: the establishment of a material increase in credit risk, allowing for forward-looking macroeconomic scenarios, and the measurement of both ECLs over the next 12 months and lifetime ECLs. ECLs are based on objective assessments of what SEK expects to lose on the exposures given what was known on the reporting date and taking into account possible future events. The ECL is a probability-weighted amount that is determined by evaluating the outcome of several possible scenarios and where the data taken into consideration comprises information from previous conditions, current conditions and projections of future economic conditions. SEK’s method entails three scenarios being prepared for each probability of default curve: (i) a base scenario, (ii) a downturn scenario and (iii) an upturn scenario. The base scenario consists of
GDP forecasts from the World Bank. When calculating the ECL as of September 30, 2021 the latest available forecast was the World Bank’s forecast from June 2021. According to the World Bank’s forecast, global economic output is expected to increase by 5.6 percent in 2021 and to increase by 4.3 percent in 2022. The base scenario has been weighted at between 73 and 80 percent, and the downturn and upturn scenarios weighted equally at between 10 and 14 percent.
SEK’s IFRS 9 model is based on GDP growth projections estimating the impact on the probability of default. SEK’s management believes that the strong positive GDP growth projections for 2021 may understate the probability of default of the asset portfolio. In the third quarter, as the IFRS 9 model is assessed to underestimate the probability of default, SEK made an overall adjustment to increase expected credit losses which was calculated pursuant to SEK’s IFRS 9 model as of September 30, 2021.
| Interim report January–September 2021 | Page 16 of 29 |
Note 5. Financial assets and liabilities at fair value
| Skr mn | September 30, 2021 | ||
| Book value | Fair value | Surplus value (+)/ Deficit value (–) | |
| Cash and cash equivalents | 7,176 | 7,176 | - |
| Treasuries/governments bonds | 9,836 | 9,836 | - |
| Other interest-bearing securities except loans | 43,476 | 43,476 | - |
| Loans in the form of interest-bearing securities | 48,021 | 49,342 | 1,321 |
| Loans to credit institutions | 22,288 | 22,548 | 260 |
| Loans to the public | 170,032 | 177,100 | 7,068 |
| Derivatives | 6,730 | 6,730 | - |
| Total financial assets | 307,559 | 316,208 | 8,649 |
| Borrowing from credit institutions | 2,867 | 2,867 | - |
| Borrowing from the public | 10,000 | 10,000 | - |
| Debt securities issued | 274,556 | 275,318 | 762 |
| Derivatives | 14,991 | 14,991 | - |
| Total financial liabilities | 302,414 | 303,176 | 762 |
| Skr mn | December 31, 2020 | ||
| Book value | Fair value | Surplus value (+)/ Deficit value (–) | |
| Cash and cash equivalents | 3,362 | 3,362 | - |
| Treasuries/governments bonds | 22,266 | 22,266 | - |
| Other interest-bearing securities except loans | 33,551 | 33,551 | - |
| Loans in the form of interest-bearing securities | 50,780 | 52,091 | 1,311 |
| Loans to credit institutions | 31,315 | 31,424 | 109 |
| Loans to the public | 171,562 | 180,453 | 8,891 |
| Derivatives | 7,563 | 7,563 | - |
| Total financial assets | 320,399 | 330,710 | 10,311 |
| Borrowing from credit institutions | 3,486 | 3,486 | - |
| Borrowing from the public | 10,000 | 10,000 | - |
| Debt securities issued | 273,976 | 274,552 | 576 |
| Derivatives | 25,395 | 25,395 | - |
| Total financial liabilities | 312,857 | 313,433 | 576 |
Determination of fair value
The determination of fair value is described in the annual financial statements included in SEK's 2020 Annual Report on Form 20-F, see Note 1 (h) (viii) Principles for determination of fair value of financial
instruments and (ix) Determination of fair value of certain types of financial instruments.
| Interim report January–September 2021 | Page 17 of 29 |
Financial assets in fair value hierarchy
| Skr mn | Financial assets at fair value through profit or loss | |||
| Level 1 | Level 2 | Level 3 | Total | |
| Treasuries/governments bonds | 6,447 | 3,389 | - | 9,836 |
| Other interest-bearing securities except loans | 21,519 | 21,957 | - | 43,476 |
| Derivatives | - | 6,172 | 558 | 6,730 |
| Total, September 30, 2021 | 27,966 | 31,518 | 558 | 60,042 |
| Total, December 31, 2020 | 33,582 | 28,220 | 1,578 | 63,380 |
Financial liabilities in fair value hierarchy
| Skr mn | Financial liabilities at fair value through profit or loss | |||
| Level 1 | Level 2 | Level 3 | Total | |
| Debt securities issued | - | 6,714 | 32,057 | 38,771 |
| Derivatives | - | 12,833 | 2,158 | 14,991 |
| Total, September 30, 2021 | - | 19,547 | 34,215 | 53,762 |
| Total, December 31, 2020 | - | 29,744 | 43,039 | 72,783 |
| Due to an increased element of subjective assessment of the input in the valuation, a transfer of Skr -1 million for derivatives was made from level 2 to level 3 (year-end 2020: a transfer of Skr -10,649 million for debt securities issued was made from level 2 to level 3, a | transfer from level 3 to level 2 of Skr 6,534 million for debt securities issued was made and a transfer from level 3 to level 2 of net Skr -1,259 million for derivatives was made). |
Financial assets and liabilities at fair value in Level 3, 2021
| Skr mn | January 1, 2021 | Purchases | Settlements & sales | Transfers to Level 3 | Transfers from Level 3 | Gains (+) and losses (–) through profit or loss1 | Gains (+) and losses (–) in Other comprehensive income | Exchange- rate differences | September 30, 2021 |
| Debt securities issued | -41,198 | -8,917 | 18,508 | - | - | 20 | -46 | -424 | -32,057 |
| Derivatives, net | -263 | 5 | -590 | -1 | - | 424 | - | -1,175 | -1,600 |
| Net assets and liabilities | -41,461 | -8 912 | 17,918 | -1 | - | 444 | -46 | -1,599 | -33,657 |
Financial assets and liabilities at fair value in Level 3, 2020
| Skr mn | January 1, 2020 | Purchases | Settlements & sales | Transfers to Level 3 | Transfers from Level 3 | Gains (+) and losses (–) through profit or loss1 | Gains (+) and losses (–) in Other comprehensive income | Exchange- rate differences | December 31, 2020 |
| Debt securities issued | -43,752 | -10,584 | 16,285 | -10,649 | 6,534 | -1,345 | 44 | 2,269 | -41,198 |
| Derivatives, net | 22 | 7 | -400 | - | -1,259 | -1,597 | - | 2,964 | -263 |
| Net assets and liabilities | -43,730 | -10,577 | 15,885 | -10,649 | 5,275 | -2,942 | 44 | 5,233 | -41,461 |
| 1 Gains and losses through profit or loss, including the impact of exchange-rates, is reported as net interest income and net results of financial transactions. The unrealized fair value changes for assets and liabilities, including the impact of exchange-rates, held as of September 30, 2021 amounted to a Skr 430 million gain (year-end 2020: Skr 36 million gain) and are reported as net results of financial transactions. | |||||||||
Uncertainty of valuation of Level 3 instruments
As the estimation of parameters included in the models used to calculate the market value of Level 3 instruments is associated with subjectivity and uncertainty, SEK has conducted an analysis of the difference in fair value of Level 3 instruments using other established parameter values. Option models and discounted cash flows are used to value the Level 3 instruments. For the Level 3 instruments that are significantly affected by different types of correlations, which are not based on observable market data, a revaluation has been made by shifting the correlations. The correlation is expressed as a value between 1 and -1, where 0 indicates no relationship, 1 indicates a maximum positive relationship and -1 indicates a maximum negative relationship. The maximum correlation in the range of unobservable inputs can thus be from 1 to -1. In the analysis, the correlations have been adjusted by +/- 0.12, which represents the level SEK uses within its prudent valuation framework. For Level 3 instruments that are significantly affected by non-observable market data |
in the form of SEK's own creditworthiness, a revaluation has been made by shifting the credit curve. The revaluation is made by shifting the credit spreads by +/- 10 basis points, which has been assessed as a reasonable change in SEK's credit spread. The analysis shows the impact of the non-observable market data on the market value. In addition, the market value will be affected by observable market data. The result of the analysis corresponds with SEK's business model where issued securities are linked with a matched hedging derivative. The underlying market data is used to evaluate the issued security as well as to evaluate the fair value in the derivative. This means that a change in fair value of the issued security, excluding SEK's own credit spread, is offset by an equally large change in fair value in the derivative. |
| Interim report January–September 2021 | Page 18 of 29 |
Sensitivity analysis – level 3 assets and liabilities
| Assets and liabilities | September 30, 2021 | |||||
| Skr mn | Fair Value | Unobservable input | Range of estimates for unobservable input | Valuation method | Sensitivity max | Sensitivity min |
| Equity | -646 | Correlation | 0.12 – (0.12) | Option Model | -4 | 4 |
| Interest rate | 1 | Correlation | 0.12 – (0.12) | Option Model | 0 | 0 |
| FX | -843 | Correlation | 0.12 – (0.12) | Option Model | -58 | 58 |
| Other | -112 | Correlation | 0.12 – (0.12) | Option Model | 0 | 0 |
| Sum derivatives, net | -1,600 | -62 | 62 | |||
| Equity | -8,620 | Correlation | 0.12 – (0.12) | Option Model | 4 | -4 |
| Credit spreads | 10BP – (10BP) | Discounted cash flow | 8 | -8 | ||
| Interest rate | -12,231 | Correlation | 0.12 – (0.12) | Option Model | 0 | 0 |
| Credit spreads | 10BP – (10BP) | Discounted cash flow | 59 | -59 | ||
| FX | -11,082 | Correlation | 0.12 – (0.12) | Option Model | 62 | -62 |
| Credit spreads | 10BP – (10BP) | Discounted cash flow | 53 | -53 | ||
| Other | -124 | Correlation | 0.12 – (0.12) | Option Model | 0 | 0 |
| Credit spreads | 10BP – (10BP) | Discounted cash flow | 1 | -1 | ||
| Sum debt securities issued | -32,057 | 187 | -187 | |||
| Total effect on total comprehensive income | 125 | -125 | ||||
| Derivatives, net, December 31, 2020 | -263 | -59 | 59 | |||
| Debt securities issued, December 31, 2020 | -41,198 | 196 | -196 | |||
| Total effect on total comprehensive income, December 31, 2020 | 137 | -137 | ||||
| The sensitivity analysis shows the effect that a shift in correlations or SEK's own credit spread has on Level 3 instruments. The table presents maximum positive and negative change in fair value when correlations or SEK's own credit spread is shifted by +/- 0.12 and +/- 10 basis points, respectively. When determining the total maximum/minimum effect on total comprehensive income the most adverse/favorable shift is | chosen, considering the net exposure arising from the issued securities and the derivatives, for each correlation. The resulting effect related to correlation sensitivity is Skr +/- 4 million. The impact from SEK's own credit spread amounts to Skr 121 million (year-end 2020: Skr 137 million) under a maximum scenario and Skr -121 million (year-end 2020: Skr -137 million) under a minimum scenario. |
Fair value related to credit risk
Fair value originating from credit risk (- liabilities increase/ + liabilities decrease) | The period’s change in fair value originating from credit risk (+ income/ - loss) | |||
| Skr mn | September 30, 2021 | 31 December 2020 | Jan–Sep 2021 | Jan–Sep 2020 |
| CVA/DVA, net1 | -12 | -17 | 5 | -11 |
| OCA2 | -139 | -108 | -31 | 27 |
1 Credit value adjustment (CVA) and Debt value adjustment (DVA) reflects how the counterparties’ credit risk as well as SEK’s own credit rating affects the fair value of derivatives. 2 Own credit adjustment (OCA) reflects how the changes in SEK’s credit rating affect the fair value of financial liabilities measured at fair value through profit and loss. | ||||
| Interim report January–September 2021 | Page 19 of 29 |
Note 6. Derivatives
Derivatives by category
| Skr mn | September 30, 2021 | December 31, 2020 | ||||
Assets Fair value | Liabilities Fair value | Nominal amounts | Assets Fair value | Liabilities Fair value | Nominal amounts | |
| Interest rate-related contracts | 3,186 | 8,989 | 330,902 | 3,846 | 11,774 | 323,664 |
| Currency-related contracts | 3,445 | 4,086 | 155,324 | 3,249 | 11,236 | 153,838 |
| Equity-related contracts | 9 | 654 | 8,893 | 457 | 620 | 15,598 |
| Contracts related to commodities, credit risk, etc. | 90 | 1,262 | 7,498 | 11 | 1,765 | 7,513 |
| Total derivatives | 6,730 | 14,991 | 502,617 | 7,563 | 25,395 | 500,613 |
| In accordance with SEK’s policies with regard to counterparty, interest rate, currency exchange, and other exposures, SEK uses, and is a party to, different kinds of derivative instruments, mostly various interest rate-related and currency exchange-related contracts, | primarily to hedge risk exposure inherent in financial assets and liabilities. These contracts are carried at fair value in the statements of financial position on a contract-by-contract basis. |
Note 7. CIRR-system
Pursuant to the company’s assignment as stated in its owner instruction issued by the Swedish government, SEK administers credit granting in the Swedish system for officially supported export credits (CIRR-system). SEK receives compensation from the Swedish government in the form of an administrative compensation, which is calculated based on the principal amount outstanding. The administrative compensation paid by the state to SEK as compensation is recognized in the CIRR-system as administrative compensation to SEK. Refer to the following tables of the statement of comprehensive income and statement of financial positions for the CIRR-system, presented as reported to the owner. Interest expenses includes interest expenses for loans between SEK and the CIRR-system which reflects the borrowing cost for the CIRR-system. Interest expenses for derivatives hedging CIRR-loans are also recognized | as interest expenses, which differs from SEK’s accounting principles. Arrangement fees to SEK are recognized together with other arrangement fees as interest expenses. In addition to the CIRR-system, SEK administers the Swedish government’s previous concessionary credit program according to the same principles as the CIRR-system. No new lending is being offered under the concessionary credit program. As of September 30, 2021, concessionary loans outstanding amounted to Skr 357 million (year-end 2020: Skr 382 million) and operating profit for the program amounted to Skr -16 million (9M20: Skr -22 million) for the period January-September 2021. SEK’s administrative compensation for administrating the concessionary credit program amounted to Skr 1 million (9M20: Skr 1 million). |
Statement of Comprehensive Income for the CIRR-system
| Skr mn | Jul-Sep 2021 | Apr-Jun 2021 | Jul-Sep 2020 | Jan-Sep 2021 | Jan-Sep 2020 | Jan-Dec 2020 |
| Interest income | 541 | 498 | 540 | 1,527 | 1,661 | 2,170 |
| Interest expenses | -514 | -494 | -511 | 1,529 | -1,552 | -2,087 |
| Interest compensation | - | 7 | 0 | 7 | 14 | 14 |
| Exchange-rate differences | 0 | 0 | 0 | -1 | 2 | 4 |
| Profit before compensation to SEK | 27 | 11 | 29 | 4 | 125 | 101 |
| Administrative remuneration to SEK | -50 | -47 | -48 | -142 | -150 | -196 |
| Operating profit CIRR-system | -23 | -36 | -19 | -138 | -25 | -95 |
| Reimbursement to (–) / from (+) the State | 23 | 36 | 19 | 138 | 25 | 95 |
| Interim report January–September 2021 | Page 20 of 29 |
Statement of Financial Position for the CIRR-system
| Skr mn | September 30, 2021 | December 31, 2020 |
| Cash and cash equivalents | 1 | 2 |
| Loans | 81,251 | 69,163 |
| Other assets | 8,439 | 12,528 |
| Prepaid expenses and accrued revenues | 607 | 407 |
| Total assets | 90,298 | 82,100 |
| Liabilities | 81,664 | 69,289 |
| Derivatives | 8,109 | 12,232 |
| Accrued expenses and prepaid revenues | 525 | 579 |
| Total liabilities | 90,298 | 82,100 |
| Commitments | ||
| Committed undisbursed loans | 44,219 | 51,463 |
| Binding offers | 4,182 | 1,322 |
Note 8. Pledged assets and contingent liabilities
| Skr mn | September 30, 2021 | December 31, 2020 |
| Collateral provided | ||
| Cash collateral under the security agreements for derivative contracts | 11,499 | 21,979 |
| Contingent liabilities1 | ||
| Guarantee commitments | 4,241 | 3,969 |
| Commitments1 | ||
| Committed undisbursed loans | 50,756 | 57,213 |
| Binding offers | 4,469 | 1,322 |
| Leases committed but not yet commenced | 154 | - |
1 For expected credit losses in guarantee commitments, committed undisbursed loans and binding offers, see Note 4.
| Interim report January–September 2021 | Page 21 of 29 |
Note 9. Capital adequacy
The capital adequacy analysis relates to the parent company AB Svensk Exportkredit. The information is disclosed according to FFFS 2014:12 and FFFS 2008:25. For further information on capital adequacy and risks, see Note 30 to the annual financial statements included in SEK’s 2020 Annual Report on Form 20-F and SEK’s 2020 Capital Adequacy and Risk Management (Pillar 3) Report.
Capital Adequacy Analysis
| September 30, 2021 | December 31, 2020 | |
| Capital ratios | percent1 | percent1 |
| Common Equity Tier 1 capital ratio | 22.6 | 21.8 |
| Tier 1 capital ratio | 22.6 | 21.8 |
| Total capital ratio | 22.6 | 21.8 |
| 1 | Capital ratios exclusive of buffer requirements are the quotients of the relevant capital measure and the total risk exposure amount. See tables Own funds – adjusting items and Minimum capital requirements exclusive of buffer. |
| September 30, 2021 | December 31, 2020 | |||
| Total risk-based capital requirement | Skr mn | percent1 | Skr mn | percent1 |
| Capital base requirement of 8 percent2 | 7,002 | 8.0 | 7,136 | 8.0 |
| of which Tier 1 requirement of 6 percent | 5,252 | 6.0 | 5,352 | 6.0 |
| of which minimum requirement of 4.5 percent | 3,939 | 4.5 | 4,014 | 4.5 |
| Pillar 2 capital requirements3 | 3,212 | 3.7 | 3,921 | 4.4 |
| Common Equity Tier 1 capital available to meet buffer requirements4 | 9,540 | 10.9 | 12,310 | 13.8 |
| Capital buffer requirements | 2,217 | 2.5 | 2,259 | 2.5 |
| of which Capital conservation buffer | 2,188 | 2.5 | 2,230 | 2.5 |
| of which Countercyclical buffer | 29 | 0.0 | 29 | 0.0 |
| Pillar 2 guidance5 | 1,313 | 1.5 | - | - |
| Total risk-based capital requirement | 13,744 | 15.7 | 13,316 | 14.9 |
1 Expressed as a percentage of total risk exposure amount. 2 The minimum requirements according to CRR (Regulation (EU) No 575/2013 of the European Parliament and of the Council of June 26, 2013 on prudential requirements for credit institutions and investment firms and amending Regulation (EU) No 648/2012) have fully come into force in Sweden without regard to the transitional period. 3 Individual Pillar 2 requirement of 3.67 percent calculated on the total risk exposure amount, according to the decision from the latest Swedish FSA SREP. 4 Common Equity Tier 1 capital available to meet buffer requirement after 8 percent minimum capital requirement (SEK covers all minimum requirements with CET1 capital - i.e., 4.5 percent, 1.5 percent and 2 percent) and after the Pillar 2 requirements (3.67 percent). The Pillar 2 requirement was not deducted in the previous year’s figure. 5 The Swedish FSA has on September 29, 2021 notified SEK, within the latest SREP, that in addition to the capital requirements according to Regulation (EU) no 575/2013 on prudential requirements, SEK should hold additional capital (pillar 2 guidance) of 1.50 percent of the total risk-weighted exposure amount. The Pillar 2 guidance is not a binding requirement. | ||||
| September 30, 2021 | December 31, 2020 | |
| Leverage ratio1 | Skr mn | Skr mn |
| On-balance sheet exposures | 199,218 | 297,605 |
| Off-balance sheet exposures | 4,060 | 37,162 |
| Total exposure measure2 | 203,278 | 334,767 |
| Leverage ratio3 | 9.7% | 5.8% |
1 The leverage ratio reflects the full impact of IFRS 9 as no transitional rules were utilized. 2 In the second quarter of 2021, SEK changed its methodology for calculating the exposure measure in leverage ratio to comply with new regulatory requirements (CRRII), in which certain exposures are no longer included. Comparative figures have not been recalculated. 3 Defined by CRR as the quotient of the Tier 1 capital and an exposure measure. | ||
| September 30, 2021 | December 31, 2020 | |||
| Total Leverage ratio requirement | Skr mn | percent1 | Skr mn | percent1 |
| Capital base requirement of 3 percent | 6,098 | 3.0 | - | - |
| Pillar 2 guidance2 | 305 | 0.2 | - | - |
| Total capital requirement relating to leverage ratio | 6,403 | 3.2 | - | - |
1 Expressed as a percentage of total exposure amount. 2 The Swedish FSA has on September 29, 2021 notified SEK, within the latest SREP, that SEK may hold additional capital (pillar 2 guidance) of 0.15 percent calculated on the total leverage ratio exposure measure. The Pillar 2 guidance is not a binding requirement. | ||||
| Interim report January–September 2021 | Page 22 of 29 |
Own funds – Adjusting items
| Skr mn | September 30, 2021 | December 31, 2020 |
| Share capital | 3,990 | 3,990 |
| Retained earnings | 15,501 | 14,856 |
| Accumulated other comprehensive income and other reserves | 339 | 292 |
| Independently reviewed profit net of any foreseeable charge or dividend | 453 | 694 |
| Common Equity Tier 1 (CET1) capital before regulatory adjustments | 20,283 | 19,832 |
| Additional value adjustments due to prudent valuation | -372 | -306 |
| Intangible assets1 | -124 | -98 |
| Gains or losses on liabilities valued at fair value resulting from changes in own credit standing | 104 | 77 |
| Negative amounts resulting from the calculation of expected loss amounts | -94 | -55 |
| Total regulatory adjustments to Common Equity Tier 1 capital | -486 | -382 |
| Total Common Equity Tier 1 capital | 19,797 | 19,450 |
| Total Own funds | 19,797 | 19,450 |
| 1 From December 31, 2020, SEK applies the amendments to Delegated Regulation (EU) No 241/2014 regarding deduction of software assets from Common Equity Tier 1 (CET1). The amendments introduce an exemption from the deduction of intangible assets from CET1 for prudently valued software assets of which the value is not negatively affected by resolution, insolvency or liquidation of the institution. | ||
Minimum capital requirements exclusive of buffer
| Skr mn | September 30, 2021 | December 31, 2020 | ||||
| EAD1 | Risk exposure amount | Minimum capital requirement | EAD1 | Risk exposure amount | Minimum capital requirement | |
| Credit risk standardized method | ||||||
| Corporates | 2,297 | 2,297 | 184 | 2,238 | 2,238 | 179 |
| Exposures in default | 88 | 88 | 7 | 7 | 7 | 1 |
| Total credit risk standardized method | 2,385 | 2,385 | 191 | 2,245 | 2,245 | 180 |
| Credit risk IRB method | ||||||
| Central Governments | 185,394 | 9,189 | 735 | 192,077 | 9,684 | 775 |
| Financial institutions2 | 39,492 | 8,790 | 703 | 30,661 | 6,764 | 541 |
| Corporates3 | 112,905 | 59,849 | 4,788 | 117,415 | 63,766 | 5,101 |
| Assets without counterparty | 220 | 220 | 18 | 163 | 163 | 13 |
| Total credit risk IRB method | 338,011 | 78,048 | 6,244 | 340,316 | 80,377 | 6,430 |
| Credit valuation adjustment risk | n.a. | 2,816 | 225 | n.a. | 2,284 | 183 |
| Foreign exchange risk | n.a. | 644 | 51 | n.a. | 664 | 52 |
| Commodities risk | n.a. | 8 | 1 | n.a. | 7 | 1 |
| Operational risk | n.a. | 3,625 | 290 | n.a. | 3,625 | 290 |
| Total | 340,396 | 87,526 | 7,002 | 342,561 | 89,202 | 7,136 |
1 Exposure at default (EAD) shows the size of the outstanding exposure at default. 2 Of which counterparty risk in derivatives: EAD Skr 6,188 million (year-end 2020: Skr 5,535 million), Risk exposure amount of Skr 2,077 million 3 Of which related to specialized lending: EAD Skr 4,799 million (year-end 2020: 3,847 million), Risk exposure amount of Skr 3,342 million | ||||||
Credit risk
For classification and quantification of credit risk, SEK uses the IRB approach. Specifically, SEK applies the Foundation Approach. Under the Foundation Approach, the company determines the probability of default within one year (PD) for each of its counterparties, while the remaining parameters are established in accordance with CRR. Application of the IRB approach requires the Swedish FSA’s permission and is subject to ongoing supervision. Certain exposures are, by permission from the Swedish FSA, exempted from application of the IRB approach, and, instead, the standardized approach is applied. In 2020, SEK reviewed its credit risk processes in order to comply with new regulatory requirements, EBA Guidelines EBA/GL/2016/07 and Commission Delegated Regulation (EU) 2018/171, on the definition of default. As a result, SEK established a new internal
definition of default, which was subsequently approved by the Swedish FSA and later, on January 1, 2021, implemented in the IRB approach for own funds requirements calculation. Counterparty risk exposure amounts in derivatives are calculated in accordance with the standardized approach for counterparty credit risk. SEK has been applying a new standardized approach for counterparty credit risk since June 30, 2021.
Credit valuation adjustment risk
Credit valuation adjustment risk is calculated for all over-the-counter derivative contracts, except for credit derivatives used as credit protection and transactions with a qualifying central counterparty. SEK calculates this capital requirement according to the standardized method.
| Interim report January–September 2021 | Page 23 of 29 |
Foreign exchange risk
Foreign exchange risk is calculated according to the standardized approach, whereas the scenario approach is used for calculating the gamma and volatility risks.
Commodities risk
Capital requirements for commodity risk are calculated in -accordance with the simplified approach under the standardized approach. The scenario approach is used for calculating the gamma and volatility risks.
Operational risk
Capital requirement for operational risk is calculated according to the standardized approach. The company’s operations are divided into business areas as defined in the CRR. The capital requirement for each area is calculated by multiplying a factor depending on the business area by an income indicator. The factors applicable for SEK are 15 percent and 18 percent. The income indicators consist of the average operating income for the past three financial years for each business area.
Transitional rules
The capital adequacy ratios reflect the full impact of IFRS 9 as no transitional rules for IFRS 9 were utilized.
Capital buffer requirements
SEK expects to meet capital buffer requirements with Common Equity Tier 1 capital. The mandatory capital conservation buffer is 2.5 percent. The countercyclical buffer rate that is applied to exposures located in Sweden was lowered from 2.5 percent to 0 percent as of March 16, 2020. The reduction was made for preventive purposes, in order to counteract credit tightening due to the development and spread of COVID-19 and its effects on the economy. The Swedish FSA decided on September 29, 2021 to increase the countercyclical buffer rate to 1 percent. The new countercyclical buffer rate applies from September 29, 2022. As of September 30, 2021, the capital requirement related to relevant exposures in Sweden was 70 percent (year-end 2020: 70 percent) of the total relevant capital requirement regardless of location; this fraction is also the weight applied on the Swedish buffer rate when calculating SEK’s countercyclical capital buffer. The countercyclical capital buffer as of September 30, 2021 for Sweden has been dissolved due to the reduction of the countercyclical buffer value to 0 percent. Buffer rates applicable in other countries may have effects on SEK, but as most capital requirements for SEK’s relevant credit exposures are related to Sweden, the potential effect is limited. As of September 30, 2021, the contribution to SEK’s countercyclical buffer from buffer rates in other countries was 0.03 percentage points (year-end 2020: 0.03 percentage points). SEK has not been classified as a systemically important institution by any financial regulatory authority. The capital buffer requirements for systemically important institutions that came into force January 1, 2016, therefore do not apply to SEK.
Pillar 2 guidance
The Pillar 2 guidance refers to what the Swedish FSA believes to be an appropriate level of the institution’s own funds. The difference between the believed appropriate level of own funds and the minimum capital requirement, the Pillar 2 capital requirement and the combined capital buffer requirement will be calculated, decided and established by the Swedish FSA in the form of a non-binding recommendation (so-called pillar 2 guidance). The Pillar 2 guidance covers both the risk-based capital requirement and the leverage ratio requirement, and replaces the previous capital planning buffer.
Internally assessed economic capital
| Skr mn | September 30, 2021 | December 31, 2020 |
| Credit risk | 5,925 | 6,121 |
| Operational risk | 203 | 203 |
| Market risk | 1,136 | 1,140 |
| Other risks | 225 | 183 |
| Capital planning buffer | 1,610 | 2,831 |
| Total | 9,099 | 10,478 |
SEK regularly conducts an internal capital adequacy assessment process, during which the company determines how much capital is needed in order to cover its risks. The result of SEK’s assessment of capital adequacy is presented above. For more information regarding the internal capital adequacy assessment process and its methods, please see Note 30 to the annual financial statements included in SEK’s 2020 Annual Report on Form 20-F.
Liquidity coverage
| Skr bn, 12 month average | September 30, 2021 | December 31, 2020 |
| Total liquid assets | 55.9 | 49.0 |
| Net liquidity outflows1 | 9.8 | 10.1 |
| Liquidity outflows | 20.4 | 22.1 |
| Liquidity inflows | 12.1 | 13.3 |
| Liquidity Coverage Ratio | 718% | 604% |
| 1 Net liquidity outflows is calculated as the net of liquidity outflows and capped liquidity inflows. Capped liquidity inflows is calculated in accordance with article 425 of CRR (EU 575/2013) and article 33 of the Commission Delegated Regulation (EU) 2015/61. | ||
Information on Liquidity Coverage Ratio (LCR) in accordance with article 447 of the CRR (EU 575/2013), calculated in accordance with the Commission Delegated Regulation (EU) 2015/61.
Net stable funding
| Skr bn | September 30, 2021 | December 31, 2020 |
| Available stable funding | 241.5 | 242.6 |
| Requiring stable funding | 171.1 | 179.7 |
| Net Stable Funding Ratio | 141% | 135% |
Information on Net Stable Funding Ratio (NSFR) in accordance with article 447 of the CRR (EU 575/2013), calculated in accordance with the Commission Delegated Regulation (EU) 2015/61.
| Interim report January–September 2021 | Page 24 of 29 |
Note 10. Exposures
Net exposures are reported after taking into consideration effects of guarantees and credit default swaps. Amounts are calculated in accordance with capital adequacy calculations, but before the application of credit conversion factors.
Total net exposures by exposure class
| Credits & interest-bearing securities | Committed undisbursed loans, derivatives, etc. | Total | ||||||||||
| September 30, 2021 | December 31, 2020 | September 30, 2021 | December 31, 2020 | September 30, 2021 | December 31, 2020 | |||||||
| Skr bn | Amount | % | Amount | % | Amount | % | Amount | % | Amount | % | Amount | % |
| Central -governments | 127,2 | 43.7 | 131.6 | 45.0 | 50.7 | 77.2 | 53.9 | 80.0 | 177.9 | 49.9 | 185.5 | 51.6 |
| Regional -governments | 12,8 | 4.4 | 12.3 | 4.2 | - | - | - | - | 12.8 | 3.6 | 12.3 | 3.4 |
| Multilateral development banks | 2,0 | 0.7 | 3.5 | 1.2 | - | - | 0.0 | 0.0 | 2.0 | 0.6 | 3.5 | 1.0 |
| Public Sector Entity | 5,4 | 1.9 | 4.2 | 1.5 | - | - | - | - | 5.4 | 1.5 | 4.2 | 1.2 |
| Financial -institutions | 32,9 | 11.3 | 24.5 | 8.4 | 6.7 | 10.2 | 6.4 | 9.5 | 39.6 | 11.1 | 30.9 | 8.6 |
| Corporates | 110,5 | 38.0 | 116.0 | 39.7 | 8.3 | 12.6 | 7.1 | 10.5 | 118.8 | 33.3 | 123.1 | 34.2 |
| Total | 290,8 | 100.0 | 292.1 | 100.0 | 65.7 | 100.0 | 67.4 | 100.0 | 356.5 | 100.0 | 359.5 | 100.0 |
Net exposure by region and exposure class, as of September 30, 2021
| Skr bn | Middle East/ Africa | Asia excl. Japan | Japan | North America | Oceania | Latin America | Sweden | West European countries excl. Sweden | Central- and East European countries | Total |
| Central governments | - | 0.4 | 2.0 | 0.8 | - | - | 156.1 | 16.0 | 2.6 | 177.9 |
| Regional governments | - | - | - | - | - | - | 12.8 | - | - | 12.8 |
| Multilateral development banks | - | - | - | - | - | - | - | 2.0 | - | 2.0 |
| Public Sector Entity | - | - | - | - | - | - | - | 5.4 | - | 5.4 |
| Financial institutions | 0.0 | 1.0 | 0.3 | 1.7 | - | - | 19.7 | 16.7 | 0.2 | 39.6 |
| Corporates | 1.4 | 1.2 | 3.5 | 5.5 | - | 2.9 | 81.0 | 22.7 | 0.6 | 118.8 |
| Total | 1.4 | 2.6 | 5.8 | 8.0 | - | 2.9 | 269.6 | 62.8 | 3.4 | 356.5 |
Net exposure by region and exposure class, as of December 31, 2020
| Skr bn | Middle East/ Africa | Asia excl. Japan | Japan | North America | Oceania | Latin America | Sweden | West European countries excl. Sweden | Central- and East European countries | Total |
| Central governments | 0.1 | 0.4 | 2.4 | 1.6 | - | - | 159.2 | 19.0 | 2.8 | 185.5 |
| Regional governments | - | - | - | - | - | - | 12.2 | 0.1 | - | 12.3 |
| Multilateral development banks | - | - | - | - | - | - | - | 3.5 | - | 3.5 |
| Public Sector Entity | - | - | - | - | - | - | - | 4.2 | - | 4.2 |
| Financial institutions | 0.0 | 1.2 | 0.6 | 1.7 | 0.8 | - | 11.4 | 15.0 | 0.2 | 30.9 |
| Corporates | 2.6 | 1.1 | 3.9 | 5.7 | - | 3.3 | 85.2 | 20.9 | 0.4 | 123.1 |
| Total | 2.7 | 2.7 | 6.9 | 9.0 | 0.8 | 3.3 | 268.0 | 62.7 | 3.4 | 359.5 |
| Interim report January–September 2021 | Page 25 of 29 |
Net exposure to European countries, excluding Sweden
| Skr bn | September 30, 2021 | December 31, 2020 |
| Germany | 10.0 | 8.6 |
| France | 7.6 | 8.0 |
| Finland | 7.0 | 8.9 |
| The Netherlands | 6.6 | 3.2 |
| United Kingdom | 5.6 | 7.0 |
| Denmark | 5.1 | 5.2 |
| Norway | 4.8 | 4.8 |
| Luxembourg | 4.3 | 4.6 |
| Spain | 3.7 | 1.9 |
| Austria | 3.4 | 5.7 |
| Poland | 2.8 | 2.9 |
| Belgium | 2.8 | 2.5 |
| Ireland | 0.7 | 0.6 |
| Portugal | 0.6 | 0.7 |
| Switzerland | 0.4 | 0.8 |
| Serbia | 0.2 | 0.3 |
| Lithuania | 0.2 | - |
| Latvia | 0.1 | 0.2 |
| Iceland | 0.1 | 0.1 |
| Estonia | 0.1 | 0.1 |
| Italy | 0.1 | 0.1 |
| Total | 66.2 | 66.2 |
Note 11. Transactions with
related parties
Transactions with related parties are described in Note 27 to the consolidated financial statements included in SEK’s 2020 Annual Report on Form 20-F. No material changes have taken place in relation to transactions with related parties compared to that description.
Note 12. Events after the
reporting period
No events with significant impact on the information in this report have occurred after the end of the reporting period.
| Interim report January–September 2021 | Page 26 of 29 |
The Board of Directors and the Chief Executive Officer confirm that this Interim report provides a fair overview of the Consolidated Group’s operations and financial position and result, and describes material risks and uncertainties facing the Consolidated Group.
Stockholm, October 25, 2021
AB SVENSK EXPORTKREDIT
SWEDISH EXPORT CREDIT CORPORATION
| Lars Linder-Aronson | Anna Brandt |
| Chairman of the Board | Director of the Board |
| Reinhold Geijer | Lennart Jacobsen | Hanna Lagercrantz |
| Director of the Board | Director of the Board | Director of the Board |
| Hans Larsson | Eva Nilsagård |
| Director of the Board | Director of the Board |
Magnus Montan
Chief Executive Officer
SEK has established the following expected dates for the publication of financial information and other related matters:
February 2, 2022 Year-end report for the period January 1, 2021 – December 31, 2021
The report contains information that SEK will disclose pursuant to the Securities Markets Act and/or the Financial Instruments Trading Act. The information was submitted for publication on October 25, 2021, 15:00 (CEST).
Additional information about SEK, including investor presentations and SEK’s 2020 Annual Report on Form 20-F, is available at www.sek.se. Information available on or accessible through SEK’s website is not incorporated herein by reference.
| Interim report January–September 2021 | Page 27 of 29 |

Alternative performance measures (see *)
Alternative performance measures (APMs) are key performance indicators that are not defined under IFRS or in the Capital Requirements Directive IV (CRD IV) or in regulation (EU) No. 575/2013 on prudential requirements for credit institutions and investment firms (CRR). SEK has presented these, either because they are in common use within the industry or because they comply with SEK’s assignment from the Swedish government. The APMs are used internally to monitor and manage operations, and are not considered to be directly comparable with similar key performance indicators presented by other companies. For additional information regarding the APMs, refer to www.sek.se.
* After-tax return on equity
Net profit, expressed as a percentage per annum of the current year’s average equity (calculated using the opening and closing balances for the report period).
* Average interest-bearing assets
The total of cash and cash equivalents, treasuries/government bonds, other interest-bearing securities except loans, loans in the form of interest-bearing securities, loans to credit institutions and loans to the public. Calculated using the opening and closing balances for the report period.
* Average interest-bearing liabilities
The total of outstanding senior debt and subordinated liabilities. Calculated using the opening and closing balances for the report period.
Basic and diluted earnings per share (Skr)
Net profit divided by the average number of shares, which amounted to 3,990,000 for each period.
* CIRR loans as percentage of new lending
The proportion of officially supported export credits (CIRR) of new lending.
CIRR-system
The CIRR-system comprises of the system of officially supported export credits (CIRR).
Common Equity Tier 1 capital ratio
The capital ratio is the quotient of total common equity tier 1 capital and the total risk exposure amount.
Green bond
A green bond is a bond where the capital is earmarked for various forms of environmental projects.
Green lending and green loans
SEK’s green lending comprises green loans that promote the transition to a low-carbon economy. The classification is performed by sustainability analysts at SEK. The effects that the loan will give rise to, such as reduced emissions of greenhouse gases, are monitored and reported. The term green project is assigned the same meaning as the term green loan. Green loans are categorized under SEK’s framework for green bonds and green loans finance products or services that lead to significant and demonstrable progress toward the goal of sustainable development.
Leverage ratio
Tier 1 capital expressed as a percentage of the exposure measured under CRR (refer to Note 9).
Liquidity coverage ratio (LCR)
The liquidity coverage ratio is a liquidity metric that shows SEK’s highly -liquid assets in relation to the company’s net cash outflows for the next 30 calendar days. An LCR of 100 percent means that the company’s liquidity reserve is of sufficient size to enable the company to manage stressed liquidity outflows over a period of 30 days. Unlike the Swedish FSA’s rules, the EU rules take into account the outflows that correspond to the need to pledge collateral for derivatives that would arise as a result of the effects of a negative market scenario.
Loans
Lending pertains to all credit facilities provided in the form of interest-bearing securities, and credit facilities granted by traditional documentation. SEK considers these amounts to be useful measurements of SEK’s lending volumes. Accordingly, comments on lending volumes in this report pertain to amounts based on this definition.
* Loans, outstanding and undisbursed
The total of loans in the form of interest-bearing securities, loans to credit institutions, loans to the public and loans, outstanding and undisbursed. Deduction is made for cash collateral under the security agreements for derivative contracts and deposits with time to maturity exceeding three months (see the Statement of Financial Position and Note 8).
Net stable funding ratio (NSFR)
This ratio measures stable funding in relation to the company’s illiquid assets over a one-year, stressed scenario in accordance with Basel III.
* New lending
New lending includes all new committed loans, irrespective of tenor. Not all new lending is reported in the Consolidated Statement of Financial Position and the Consolidated Statement of Cash Flows since certain portions comprise committed undisbursed loans (see Note 8). The amounts reported for committed undisbursed loans may change when presented in the Con-solidated Statement of Financial Position due to changes in exchange rates, for example.
* New long-term borrowings
New borrowings with maturities exceeding one year, for which the amounts are based on the trade date.
* Outstanding senior debt
The total of borrowing from credit institutions, borrowing from the public and debt securities issued.
Own credit risk
Net fair value change due to credit risk on financial liabilities designated as at fair value through profit or loss.
Repurchase and redemption of own debt
The amounts are based on the trade date.
Swedish exporters
SEK’s clients that directly or indirectly promote Swedish export.
Tier 1 capital ratio
The capital ratio is the quotient of total tier 1 capital and the total risk -exposure amount.
Total capital ratio
The capital ratio is the quotient of total Own funds and the total risk -exposure amount.
Unless otherwise stated, amounts in this report are in millions (mn) of Swedish kronor (Skr), abbreviated “Skr mn” and relate to the group consisting of the Parent Company and its consolidated subsidiary (together, the “Group” or the “Consolidated Group”). AB Svensk Exportkredit (SEK), is a Swedish corporation with the identity number 556084-0315, and with its registered office in Stockholm, Sweden. SEK is a public limited liability company as defined in the Swedish Companies Act. In some instances, under Swedish law, a public company is obliged to add “(publ.)” to its company name.
| Interim report January–September 2021 | Page 28 of 29 |

About Swedish Export Credit Corporation (SEK)
SEK is owned by the Swedish state, and since 1962 has enabled growth for thousands of Swedish companies. To expand their production, make acquisitions, employ more people and enable selling goods and services to customers worldwide.
| SEK’s mission | Our mission is to ensure access to financial solutions for the Swedish export industry on commercial and sustainable terms. The mission includes making available fixed-interest export credits within the officially supported CIRR-system. |
| SEK’s vision | Our vision is a sustainable world through increased Swedish exports. |
| SEK’s core values | We are professionals, make the difficult easy and build sustainable relationships. |
| SEK’s clients | We finance exporters, their subcontractors and foreign clients. The target group is companies with annual sales exceeding Skr 200 million and that are linked to Swedish interests and exports. |
| SEK’s partnerships | Through Team Sweden, we have close partnerships with other export promotion agencies in Sweden such as Business Sweden and The Swedish Export Credit Agency (EKN). Our international network is substantial and we also work with numerous Swedish and international banks. |
| Interim report January–September 2021 | Page 29 of 29 |