UNITED STATES
SECURITIES AND EXCHANGE COMMISSION
Washington, D.C. 20549
FORM N-CSR
CERTIFIED SHAREHOLDER REPORT OF REGISTERED
MANAGEMENT INVESTMENT COMPANIES
Investment Company Act file number 811-02105
Fidelity Salem Street Trust
(Exact name of registrant as specified in charter)
245 Summer St., Boston, Massachusetts 02210
(Address of principal executive offices) (Zip code)
Margaret Carey, Secretary
245 Summer St.
Boston, Massachusetts 02210
(Name and address of agent for service)
Registrant's telephone number, including area code:
617-563-7000
Date of fiscal year end: | March 31 |
Date of reporting period: | March 31, 2023 |
Item 1.
Reports to Stockholders


Contents
| Current 7-Day Yields | ||
| Fidelity® SAI Municipal Money Market Fund | 4.00% | |
Yield refers to the income paid by the Fund over a given period. Yield for money market funds is usually for seven-day periods, as it is here, though it is expressed as an annual percentage rate. Past performance is no guarantee of future results. Yield will vary and it's possible to lose money investing in the Fund. A portion of the Fund's expenses was reimbursed and/or waived. Absent such reimbursements and/or waivers the yield for the period ending March 31, 2023, the most recent period shown in the table, would have been 3.97% for Fidelity® SAI Municipal Money Market Fund. | ||
| Effective Maturity Diversification (% of Fund's Investments) | ||
| Days | ||
| 1 - 7 | 77.9 | |
| 8 - 30 | 2.6 | |
| 31 - 60 | 6.7 | |
| 61 - 90 | 3.4 | |
| 91 - 180 | 6.6 | |
| > 180 | 2.7 | |
| Effective maturity is determined in accordance with the requirements of Rule 2a-7 under the Investment Company Act of 1940. | ||
Asset Allocation (% of Fund's net assets) |
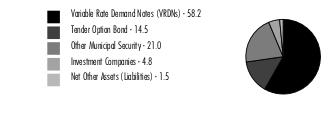 |
| Variable Rate Demand Note - 58.2% | |||
Principal Amount (a) | Value ($) | ||
| Alabama - 0.3% | |||
| West Jefferson Indl. Dev. Series 2008, 4.09% 4/7/23, VRDN (b) | 500,000 | 500,000 | |
| Alaska - 0.8% | |||
| Valdez Marine Term. Rev. (ConocoPhillips Proj.) Series 1994 A, 4.15% 4/7/23 (ConocoPhillips Co. Guaranteed), VRDN (b) | 1,300,000 | 1,300,000 | |
| Arizona - 1.1% | |||
| Maricopa County Poll. Cont. Rev.: | |||
| Series 2009 B, 4.3% 4/7/23, VRDN (b) | 1,400,000 | 1,400,000 | |
| Series 2009 C, 4.15% 4/7/23, VRDN (b) | 400,000 | 400,000 | |
TOTAL ARIZONA | 1,800,000 | ||
| Delaware - 0.4% | |||
| Delaware Econ. Dev. Auth. Rev. (Delmarva Pwr. & Lt. Co. Proj.): | |||
| Series 1993 C, 3.95% 4/7/23, VRDN (b) | 200,000 | 200,000 | |
| Series 1999 B, 4.3% 4/7/23, VRDN (b)(c) | 400,000 | 400,000 | |
TOTAL DELAWARE | 600,000 | ||
| Florida - 3.6% | |||
| Bay County Indl. Rev. Dev. (Gulf Pwr. Co. Proj.) Series 2020, 4.2% 4/3/23, VRDN (b)(c) | 2,000,000 | 2,000,000 | |
| Broward County Indl. Dev. Rev. (Florida Pwr. & Lt. Co. Proj.) Series 2015, 4.2% 4/3/23, VRDN (b)(c) | 600,000 | 600,000 | |
| Lee County Indl. Dev. Auth. Rev. (Florida Pwr. & Lt. Co. Proj.) Series 2016 A, 4.2% 4/3/23, VRDN (b)(c) | 700,000 | 700,000 | |
| Martin County Rev. (Florida Pwr. & Lt. Co. Proj.) Series 2022, 4.08% 4/7/23, VRDN (b) | 750,000 | 750,000 | |
| Pinellas County Health Facilities Auth. Rev. (Suncoast Hospice Proj.) Series 2004, 4% 4/7/23, LOC Wells Fargo Bank NA, VRDN (b) | 1,780,000 | 1,780,000 | |
TOTAL FLORIDA | 5,830,000 | ||
| Georgia - 1.6% | |||
| Burke County Indl. Dev. Auth. Poll. Cont. Rev. (Georgia Pwr. Co. Plant Vogtle Proj.) Series 2012, 4.2% 4/3/23, VRDN (b)(c) | 2,500,000 | 2,500,000 | |
| Indiana - 3.3% | |||
| Indiana Dev. Fin. Auth. Envir. Rev. (PSI Energy Proj.): | |||
| Series 2003 A, 4.25% 4/7/23, VRDN (b)(c) | 3,500,000 | 3,500,000 | |
| Series 2003 B, 4.04% 4/7/23, VRDN (b)(c) | 1,850,000 | 1,850,000 | |
TOTAL INDIANA | 5,350,000 | ||
| Iowa - 3.7% | |||
| Iowa Fin. Auth. Solid Disp. Waste Rev. (MidAmerican Energy Co. Proj.) Series 2016 B, 4.28% 4/7/23, VRDN (b)(c) | 6,000,000 | 6,000,000 | |
| Kansas - 0.8% | |||
| Burlington Envir. Impt. Rev. (Kansas City Pwr. and Lt. Co. Proj.): | |||
| Series 2007 A, 4.05% 4/7/23, VRDN (b) | 100,000 | 100,000 | |
| Series 2007 B, 4.05% 4/7/23, VRDN (b) | 600,000 | 600,000 | |
| Wamego Kansas Poll. Cont. Rfdg. Rev. (Western Resources, Inc. Proj.) Series 1994, 4% 4/7/23, VRDN (b) | 600,000 | 600,000 | |
TOTAL KANSAS | 1,300,000 | ||
| Kentucky - 4.5% | |||
| Daviess County Solid Waste Disp. Facilities Rev. (Scott Paper Co. Proj.) Series 1993 A, 4% 4/7/23 (Kimberly-Clark Corp. Guaranteed), VRDN (b)(c) | 7,200,000 | 7,200,000 | |
| Louisiana - 2.3% | |||
| Saint James Parish Gen. Oblig. (Nucor Steel Louisiana LLC Proj.) Series 2010 B1, 4.4% 4/7/23, VRDN (b) | 3,700,000 | 3,700,000 | |
| Michigan - 1.0% | |||
| Michigan Hsg. Dev. Auth. Rental Hsg. Rev.: | |||
| Series 2002 A, 3.95% 4/7/23, LOC Bank of America NA, VRDN (b)(c) | 1,300,000 | 1,300,000 | |
| Series 2018 C, 3.9% 4/7/23, LOC Bank of America NA, VRDN (b)(c) | 200,000 | 200,000 | |
| FHLMC Livonia Econ. Dev. Corp. (Madonna Univ. Proj.) Series 2009, 4.01% 4/7/23, LOC Fed. Home Ln. Bank Chicago, VRDN (b) | 10,000 | 10,000 | |
TOTAL MICHIGAN | 1,510,000 | ||
| Mississippi - 6.2% | |||
| Mississippi Bus. Fin. Corp. Solid Waste Disp. Rev. (Waste Mgmt., Inc. Proj.) Series 2003, 4.05% 4/7/23, LOC Bank of America NA, VRDN (b)(c) | 10,000,000 | 9,999,997 | |
| Nebraska - 6.0% | |||
| Nebraska Invt. Fin. Auth. Single Family Hsg. Rev.: | |||
| Series 2013 F, 4.05% 4/7/23 (Liquidity Facility Fed. Home Ln. Bank Topeka), VRDN (b)(c) | 2,280,000 | 2,280,000 | |
| Series 2015 B, 4.05% 4/7/23 (Liquidity Facility Fed. Home Ln. Bank Topeka), VRDN (b)(c) | 1,000,000 | 1,000,000 | |
| Series 2015 D, 4.05% 4/7/23 (Liquidity Facility Fed. Home Ln. Bank Topeka), VRDN (b)(c) | 4,400,000 | 4,400,000 | |
| Series 2016 B, 4.05% 4/7/23 (Liquidity Facility Fed. Home Ln. Bank Topeka), VRDN (b)(c) | 900,000 | 900,000 | |
| Series 2016 D, 4.05% 4/7/23 (Liquidity Facility Fed. Home Ln. Bank Topeka), VRDN (b)(c) | 200,000 | 200,000 | |
| Series B, 4.05% 4/7/23 (Liquidity Facility Fed. Home Ln. Bank Topeka), VRDN (b)(c) | 600,000 | 600,000 | |
| Stanton County Indl. Dev. Rev. Series 1998, 4.39% 4/7/23, VRDN (b)(c) | 200,000 | 200,000 | |
TOTAL NEBRASKA | 9,580,000 | ||
| Nevada - 1.6% | |||
| Clark County Arpt. Rev. Series 2008 C1, 4.02% 4/7/23, LOC Bank of America NA, VRDN (b)(c) | 2,500,000 | 2,500,000 | |
| North Carolina - 0.4% | |||
| Cumberland County Indl. Facilities & Poll. Cont. Fing. Auth. (Cargill, Inc. Proj.) Series 2022, 4.02% 4/7/23, VRDN (b)(c) | 600,000 | 600,000 | |
| Ohio - 0.4% | |||
| Ohio Hsg. Fin. Agcy. Residential Mtg. Rev. Series 2016 H, 4.05% 4/7/23 (Liquidity Facility Ohio Gen. Oblig.), VRDN (b)(c) | 700,000 | 700,000 | |
| Pennsylvania - 0.1% | |||
| FNMA Montgomery County Redev. Auth. Multi-family Hsg. Rev. (Kingswood Apts. Proj.) Series 2001 A, 4.05% 4/7/23, LOC Fannie Mae, VRDN (b) | 200,000 | 200,000 | |
| Tennessee - 4.0% | |||
| Loudon County Indl. Dev. Board Exempt Facilities Rev. (Kimberly-Clark Corp. Proj.) Series 1999, 4% 4/7/23, VRDN (b)(c) | 6,400,000 | 6,400,000 | |
| Texas - 1.6% | |||
| Port Arthur Navigation District Jefferson County Rev. Series 2022 B, 3.97% 4/7/23 (TotalEnergies SE Guaranteed), VRDN (b)(c) | 700,000 | 700,000 | |
| Texas Gen. Oblig. Series 2019, 4% 4/7/23 (Liquidity Facility JPMorgan Chase Bank), VRDN (b) | 1,885,000 | 1,885,000 | |
TOTAL TEXAS | 2,585,000 | ||
| Washington - 4.9% | |||
| Port of Seattle Rev. Series 2008, 4.18% 4/7/23, LOC MUFG Bank Ltd., VRDN (b)(c) | 7,900,000 | 7,900,000 | |
| West Virginia - 3.4% | |||
| West Virginia Econ. Dev. Auth. Solid Waste Disp. Facilities Rev.: | |||
| (Appalachian Pwr. Co. Amos Proj.) Series 2008 B, 4.18% 4/7/23, VRDN (b)(c) | 1,100,000 | 1,100,000 | |
| (Appalachian Pwr. Co.- Mountaineer Proj.) Series 2008 A, 3.99% 4/7/23, VRDN (b)(c) | 4,000,000 | 4,000,000 | |
| West Virginia Hosp. Fin. Auth. Hosp. Rev.: | |||
| (Cabell Huntington Hosp. Proj.) Series 2008 B, 4.15% 4/7/23, LOC Truist Bank, VRDN (b) | 300,000 | 300,000 | |
| Series A, 4.15% 4/7/23, LOC Truist Bank, VRDN (b) | 100,000 | 100,000 | |
TOTAL WEST VIRGINIA | 5,500,000 | ||
| Wisconsin - 3.1% | |||
| Green Bay Redev. Auth. (Green Bay Packaging, Inc. Proj.) Series 2019, 4% 4/7/23, LOC Wells Fargo Bank NA, VRDN (b)(c)(d) | 4,900,000 | 4,900,000 | |
| Wyoming - 3.1% | |||
| Converse County Envir. Impt. Rev. Series 1995, 4.25% 4/7/23, VRDN (b)(c) | 700,000 | 700,000 | |
| Lincoln County Envir. (PacifiCorp Proj.) Series 1995, 4.23% 4/7/23, VRDN (b)(c) | 4,300,000 | 4,300,000 | |
TOTAL WYOMING | 5,000,000 | ||
| TOTAL VARIABLE RATE DEMAND NOTE (Cost $93,455,001) | 93,454,997 | ||
| Tender Option Bond - 14.5% | |||
Principal Amount (a) | Value ($) | ||
| Arizona - 0.3% | |||
| Arizona Indl. Dev. Auth. Hosp. Rev. Participating VRDN Series XM 10 13, 4.09% 4/7/23 (Liquidity Facility JPMorgan Chase Bank) (b)(e)(f) | 75,000 | 75,000 | |
| Phoenix Civic Impt. Board Arpt. Rev. Participating VRDN Series Floaters ZF 27 58, 4.07% 4/7/23 (Liquidity Facility Barclays Bank PLC) (b)(c)(e)(f) | 400,000 | 400,000 | |
TOTAL ARIZONA | 475,000 | ||
| Colorado - 0.8% | |||
| Colorado Health Facilities Auth. Rev. Bonds Participating VRDN Series 2022 004, 4.17% (e)(f) | 1,300,000 | 1,300,000 | |
| Connecticut - 2.3% | |||
| Connecticut Gen. Oblig. Participating VRDN: | |||
| Series Floaters 014, 4.17% 5/12/23 (Liquidity Facility Barclays Bank PLC) (b)(e)(f) | 300,000 | 300,000 | |
| Series Floaters 016, 4.17% 5/12/23 (Liquidity Facility Barclays Bank PLC) (b)(e)(f) | 3,100,000 | 3,100,000 | |
| Connecticut Spl. Tax Oblig. Trans. Infrastructure Rev. Bonds Series Floaters G 110, 4.15%, tender 10/2/23 (Liquidity Facility Royal Bank of Canada) (b)(e)(f)(g) | 200,000 | 200,000 | |
TOTAL CONNECTICUT | 3,600,000 | ||
| District Of Columbia - 0.2% | |||
| Metropolitan Washington Arpts. Auth. Dulles Toll Road Rev. Participating VRDN Series XG 02 67, 4.02% 4/7/23 (Liquidity Facility Bank of America NA) (b)(e)(f) | 170,000 | 170,000 | |
| Metropolitan Washington DC Arpts. Auth. Sys. Rev. Participating VRDN Series Floaters XF 06 94, 4.09% 4/7/23 (Liquidity Facility Bank of America NA) (b)(c)(e)(f) | 215,000 | 215,000 | |
TOTAL DISTRICT OF COLUMBIA | 385,000 | ||
| Florida - 2.0% | |||
| Broward County Convention Ctr. Bonds Series MS 00 11, 3.95%, tender 5/25/23 (Liquidity Facility Morgan Stanley Bank, West Valley City Utah) (b)(e)(f)(g) | 600,000 | 600,000 | |
| Broward County Port Facilities Rev. Participating VRDN Series XF 09 52, 4.03% 4/7/23 (Liquidity Facility Toronto-Dominion Bank) (b)(c)(e)(f) | 75,000 | 75,000 | |
| County of Broward Tourist Dev. Tax Rev. Participating VRDN Series XL 04 29, 4.08% 4/7/23 (Liquidity Facility Wells Fargo Bank NA) (b)(e)(f) | 100,000 | 100,000 | |
| Escambia County Health Facilities Auth. Health Facilities Rev. Participating VRDN Series XG 02 81, 3.46% 4/7/23 (Liquidity Facility Bank of America NA) (b)(e)(f) | 45,000 | 45,000 | |
| Florida Dev. Fin. Corp. Healthcare Facility Rev. Participating VRDN Series BAML 80 87, 4.04% 4/3/23 (Liquidity Facility Bank of America NA) (b)(e)(f) | 2,200,000 | 2,200,000 | |
| Greater Orlando Aviation Auth. Arpt. Facilities Rev.: | |||
| Bonds Series Floaters G 25, 4.22%, tender 10/2/23 (Liquidity Facility Royal Bank of Canada) (b)(c)(e)(f)(g) | 100,000 | 100,000 | |
| Participating VRDN Series XM 08 96, 4.02% 4/7/23 (Liquidity Facility JPMorgan Chase Bank) (b)(c)(e)(f) | 125,000 | 125,000 | |
TOTAL FLORIDA | 3,245,000 | ||
| Georgia - 0.2% | |||
| Fulton County Dev. Auth. Rev. Participating VRDN Series XL 02 68, 4.07% 4/7/23 (Liquidity Facility Bank of America NA) (b)(e)(f) | 90,000 | 90,000 | |
| Georgia Muni. Elec. Auth. Pwr. Rev. Participating VRDN Series XF 08 23, 4.02% 4/7/23 (Liquidity Facility Bank of America NA) (b)(e)(f) | 75,000 | 75,000 | |
| Main Street Natural Gas, Inc. Participating VRDN Series 2022 ZL 03 05, 4.02% 4/7/23 (Liquidity Facility Royal Bank of Canada) (b)(e)(f) | 150,000 | 150,000 | |
TOTAL GEORGIA | 315,000 | ||
| Hawaii - 0.2% | |||
| Hawaii Dept. of Budget & Fin. Spl. Purp. Rev. Participating VRDN Series Floaters XM 06 19, 4.02% 4/7/23 (Liquidity Facility Barclays Bank PLC) (b)(c)(e)(f) | 300,000 | 300,000 | |
| Illinois - 0.3% | |||
| Chicago O'Hare Int'l. Arpt. Rev. Participating VRDN Series Floaters XM 06 86, 4.04% 4/7/23 (Liquidity Facility Bank of America NA) (b)(c)(e)(f) | 200,000 | 200,000 | |
| Illinois Gen. Oblig. Participating VRDN Series XM 10 49, 4.02% 4/7/23 (Liquidity Facility Bank of America NA) (b)(e)(f) | 250,000 | 250,000 | |
TOTAL ILLINOIS | 450,000 | ||
| Indiana - 0.6% | |||
| Indiana Health Facility Fing. Auth. Rev. Bonds Series MS 00 12, 4.07%, tender 4/13/23 (Liquidity Facility Morgan Stanley Bank, West Valley City Utah) (b)(e)(f)(g) | 1,000,000 | 1,000,000 | |
| Louisiana - 0.2% | |||
| New Orleans Aviation Board Rev. Participating VRDN Series Floaters XL 00 46, 4.02% 4/7/23 (Liquidity Facility Barclays Bank PLC) (b)(c)(e)(f) | 300,000 | 300,000 | |
| Maryland - 0.1% | |||
| RBC Muni. Products, Inc. Trust Bonds Series 2023, 4.17%, tender 11/1/23 (Liquidity Facility Royal Bank of Canada) (b)(e)(f) | 100,000 | 100,000 | |
| Michigan - 0.4% | |||
| Mclaren Health Care Corp. Participating VRDN Series XL 02 71, 4.07% 4/7/23 (Liquidity Facility Bank of America NA) (b)(e)(f) | 90,000 | 90,000 | |
| Michigan Hosp. Fin. Auth. Rev. Bonds Series MS 00 15, 4.07%, tender 6/1/23 (Liquidity Facility Morgan Stanley Bank, West Valley City Utah) (b)(e)(f)(g) | 600,000 | 600,000 | |
TOTAL MICHIGAN | 690,000 | ||
| New York - 2.4% | |||
| New York Dorm. Auth. Rev. Bonds Series MS 00 09, 4.05%, tender 5/25/23 (Liquidity Facility Morgan Stanley Bank, West Valley City Utah) (b)(e)(f) | 200,000 | 200,000 | |
| New York Metropolitan Trans. Auth. Rev. Participating VRDN Series RBC E 126, 4.02% 4/7/23 (Liquidity Facility Royal Bank of Canada) (b)(e)(f) | 400,000 | 400,000 | |
| New York Trans. Dev. Corp. Participating VRDN Series 2022 E 154, 4.07% 4/7/23 (Liquidity Facility Royal Bank of Canada) (b)(c)(e)(f) | 3,200,000 | 3,200,000 | |
TOTAL NEW YORK | 3,800,000 | ||
| North Carolina - 1.3% | |||
| Greater Asheville Reg'l. Arpt. Auth. Participating VRDN Series XM 10 11, 4.04% 4/7/23 (Liquidity Facility Royal Bank of Canada) (b)(c)(e)(f) | 2,100,000 | 2,100,000 | |
| Ohio - 0.5% | |||
| Cuyahoga County Ctfs. of Prtn. Participating VRDN Series Floaters XG 02 06, 4.07% 4/7/23 (Liquidity Facility Bank of America NA) (b)(e)(f) | 400,000 | 400,000 | |
| Ohio Hosp. Rev. Participating VRDN Series C18, 4.01% 4/7/23 (Liquidity Facility Royal Bank of Canada) (b)(e)(f) | 300,000 | 300,000 | |
| Ohio Univ. Gen. Receipts Athens Bonds Series Floaters G 27, 4.17%, tender 6/1/23 (Liquidity Facility Royal Bank of Canada) (b)(e)(f)(g) | 100,000 | 100,000 | |
TOTAL OHIO | 800,000 | ||
| Pennsylvania - 0.4% | |||
| Geisinger Auth. Health Sys. Rev. Participating VRDN Series Floaters XF 05 43, 4.04% 4/7/23 (Liquidity Facility Royal Bank of Canada) (b)(e)(f) | 185,000 | 185,000 | |
| Pennsylvania Econ. Dev. Fing. Auth. Participating VRDN Series XM 10 83, 4.06% 4/7/23 (Liquidity Facility Royal Bank of Canada) (b)(c)(e)(f) | 500,000 | 500,000 | |
TOTAL PENNSYLVANIA | 685,000 | ||
| South Carolina - 0.1% | |||
| South Carolina Trans. Infrastructure Bank Rev. Bonds Series Floaters G 109, 4.17%, tender 10/2/23 (Liquidity Facility Royal Bank of Canada) (b)(e)(f)(g) | 100,000 | 100,000 | |
| Tennessee - 0.1% | |||
| Metropolitan Nashville Arpt. Auth. Rev. Participating VRDN Series YX 12 89, 4.02% 4/7/23 (Liquidity Facility Barclays Bank PLC) (b)(c)(e)(f) | 210,000 | 210,000 | |
| Texas - 0.8% | |||
| Alamo Cmnty. College District Rev. Bonds Series G-111, 4.17%, tender 5/1/23 (Liquidity Facility Royal Bank of Canada) (b)(e)(f)(g) | 100,000 | 100,000 | |
| Austin Arpt. Sys. Rev. Participating VRDN Series YX 11 99, 4.02% 4/7/23 (Liquidity Facility Barclays Bank PLC) (b)(c)(e)(f) | 700,000 | 700,000 | |
| El Paso Wtr. & Swr. Rev. Bonds Series 2022 MS 00 10, 4.07%, tender 5/18/23 (Liquidity Facility Morgan Stanley Bank, West Valley City Utah) (b)(e)(f) | 400,000 | 400,000 | |
| RBC Muni. Products, Inc. Trust Bonds Series G 124, 4.17%, tender 9/1/23 (Liquidity Facility Royal Bank of Canada) (b)(e)(f)(g)(h) | 100,000 | 100,000 | |
TOTAL TEXAS | 1,300,000 | ||
| Virginia - 0.1% | |||
| Virginia Pub. Bldg. Auth. Pub. Facilities Rev. Bonds Series Floaters G 40, 4.17%, tender 8/1/23 (Liquidity Facility Royal Bank of Canada) (b)(e)(f)(g) | 100,000 | 100,000 | |
| Virginia Small Bus. Fing. Auth. Health Care Facilities Rev. Participating VRDN Series XF 09 26, 4.12% 4/7/23 (Liquidity Facility JPMorgan Chase Bank) (b)(e)(f) | 70,000 | 70,000 | |
TOTAL VIRGINIA | 170,000 | ||
| Washington - 1.2% | |||
| Port of Seattle Rev. Participating VRDN: | |||
| Series 2022 ZL 03 16, 4.04% 4/7/23 (Liquidity Facility Barclays Bank PLC) (b)(c)(e)(f) | 400,000 | 400,000 | |
| Series Floaters XM 06 65, 4.07% 4/7/23 (Liquidity Facility JPMorgan Chase Bank) (b)(c)(e)(f) | 500,000 | 500,000 | |
| Series XF 13 71, 4.11% 4/7/23 (Liquidity Facility JPMorgan Chase Bank) (b)(c)(e)(f) | 300,000 | 300,000 | |
| Series XM 08 75, 4.07% 4/7/23 (Liquidity Facility JPMorgan Chase Bank) (b)(c)(e)(f) | 90,000 | 90,000 | |
| Port of Tacoma Rev. Participating VRDN Series Floaters XF 06 58, 4.05% 4/7/23 (Liquidity Facility Bank of America NA) (b)(c)(e)(f) | 200,000 | 200,000 | |
| RBC Muni. Products, Inc. Trust Bonds Series G 123, 4.17%, tender 11/1/23 (Liquidity Facility Royal Bank of Canada) (b)(e)(f)(g) | 100,000 | 100,000 | |
| Washington Health Care Facilities Auth. Rev. Participating VRDN Series YX 12 10, 4.07% 4/7/23 (Liquidity Facility Barclays Bank PLC) (b)(e)(f) | 300,000 | 300,000 | |
TOTAL WASHINGTON | 1,890,000 | ||
| TOTAL TENDER OPTION BOND (Cost $23,215,000) | 23,215,000 | ||
| Other Municipal Security - 21.0% | |||
Principal Amount (a) | Value ($) | ||
| Guam - 0.5% | |||
| Guam Int'l. Arpt. Auth. Rev. Bonds Series 2019 A, 5% 10/1/23 (Escrowed to Maturity) (c) | 825,000 | 832,585 | |
| Alabama - 0.6% | |||
| Huntsville Health Care Auth. Rev. Series 2023, 3.4% 4/5/23, CP | 900,000 | 899,868 | |
| Colorado - 0.4% | |||
| Colorado Ed. Ln. Prog. TRAN Series 2022 A, 5% 6/29/23 | 355,000 | 356,890 | |
| Colorado Health Facilities Auth. Rev. Bonds Bonds Series 2016 C, 5%, tender 11/15/23 (b) | 130,000 | 131,526 | |
| Denver City & County Arpt. Rev. Bonds Series 2012 A, 5% 11/15/23 (c) | 100,000 | 100,150 | |
TOTAL COLORADO | 588,566 | ||
| Connecticut - 0.6% | |||
| Connecticut Gen. Oblig. Bonds: | |||
| Series 2018 A, 5% 4/15/23 | 100,000 | 100,074 | |
| Series 2021 B, 3% 6/1/23 | 365,000 | 365,256 | |
| Series C, 4% 6/1/23 | 400,000 | 400,906 | |
| Tolland Gen. Oblig. BAN Series 2022, 3.75% 9/14/23 | 140,000 | 140,640 | |
TOTAL CONNECTICUT | 1,006,876 | ||
| District Of Columbia - 0.7% | |||
| Metropolitan Washington DC Arpts. Auth. Sys. Rev. Bonds: | |||
| Series 2014 A, 5% 10/1/23 (c) | 810,000 | 816,932 | |
| Series 2018 A, 5% 10/1/23 (c) | 255,000 | 257,182 | |
TOTAL DISTRICT OF COLUMBIA | 1,074,114 | ||
| Florida - 1.3% | |||
| Alachua County Health Facilities Auth. Health Facilities Rev. Bonds Series 2023 A, 3.54% tender 4/6/23, LOC Bank of America NA, CP mode | 700,000 | 699,946 | |
| Florida Board of Ed. Pub. Ed. Cap. Outlay Bonds Series 2019 D, 5% 6/1/23 | 300,000 | 301,153 | |
| Florida Local Govt. Fin. Cmnty. Series 2023 A1, 3% 4/4/23, LOC JPMorgan Chase Bank, CP | 700,000 | 699,887 | |
| Miami-Dade County Bonds Series 2013 B, 6% 10/1/23 (Pre-Refunded to 10/1/23 @ 100) (c) | 200,000 | 203,083 | |
| Miami-Dade County School Board Ctfs. of Prtn. Bonds Series 2013 A, 5% 5/1/23 (Pre-Refunded to 5/1/23 @ 100) | 145,000 | 145,216 | |
TOTAL FLORIDA | 2,049,285 | ||
| Georgia - 1.6% | |||
| Atlanta Arpt. Rev.: | |||
| Series 2023 N2, 3.55% 4/25/23, LOC PNC Bank NA, CP (c) | 1,404,000 | 1,403,699 | |
| Series 2023 O2, 3.45% 4/25/23, LOC JPMorgan Chase Bank, CP (c) | 1,200,000 | 1,199,743 | |
TOTAL GEORGIA | 2,603,442 | ||
| Hawaii - 0.1% | |||
| Hawaii Gen. Oblig. Bonds Series 2016 FB, 5% 4/1/23 | 100,000 | 100,000 | |
| Honolulu City & County Gen. Oblig. Bonds Series 2018 B, 5% 9/1/23 | 100,000 | 100,985 | |
TOTAL HAWAII | 200,985 | ||
| Illinois - 0.1% | |||
| Illinois Fin. Auth. Rev. Bonds Series 2014, 5% 8/1/23 | 120,000 | 120,857 | |
| Indiana - 3.0% | |||
| Indiana Fin. Auth. Rev. Bonds (Ohio River Bridges East End Crossing Proj.) Series 2013 A: | |||
| 5% 7/1/23 (Pre-Refunded to 7/1/23 @ 100) (c) | 200,000 | 201,063 | |
| 5% 7/1/23 (Pre-Refunded to 7/1/23 @ 100) (c) | 1,700,000 | 1,709,036 | |
| 5% 7/1/23 (Pre-Refunded to 7/1/23 @ 100) (c) | 1,700,000 | 1,709,036 | |
| 5.25% 7/1/23 (Pre-Refunded to 7/1/23 @ 100) (c) | 1,265,000 | 1,272,478 | |
TOTAL INDIANA | 4,891,613 | ||
| Kentucky - 0.3% | |||
| Kentucky State Property & Buildings Commission Rev. Bonds Series B, 5% 8/1/23 | 100,000 | 100,763 | |
| Kentucky Tpk. Auth. Econ. Dev. Road Rev. Bonds (Revitilization Projs.) Series 2015 B, 5% 7/1/23 | 300,000 | 301,573 | |
TOTAL KENTUCKY | 402,336 | ||
| Louisiana - 0.1% | |||
| Louisiana Pub. Facilities Auth. Rev. Bonds Series 2002 B, 5.75% 5/15/23 (Escrowed to Maturity) | 140,000 | 140,492 | |
| Michigan - 0.6% | |||
| Kent Hosp. Fin. Auth. Hosp. Facilities Rev. Bonds (Spectrum Health Sys. Proj.) Series 2015 A, SIFMA Municipal Swap Index + 0.250% 4.22%, tender 10/27/23 (b)(h) | 100,000 | 100,000 | |
| Michigan Fin. Auth. Rev.: | |||
| Bonds Series 2022, 5% 4/15/23 | 270,000 | 270,182 | |
| RAN Series 2022 A, 5% 8/21/23, LOC JPMorgan Chase Bank | 325,000 | 327,723 | |
| Michigan Gen. Oblig. Bonds Series 2017 A, 5% 5/1/23 | 285,000 | 285,518 | |
TOTAL MICHIGAN | 983,423 | ||
| Nebraska - 0.2% | |||
| Omaha Pub. Pwr. District Elec. Rev. Series 2023, 3.05% 4/6/23, CP | 300,000 | 299,946 | |
| Nevada - 0.1% | |||
| Clark County School District Bonds Series 2016 B, 5% 6/15/23 | 125,000 | 125,566 | |
| New Jersey - 0.3% | |||
| New Jersey Econ. Dev. Auth. Rev. Bonds: | |||
| Series 2005 N1, 5.5% 9/1/23 | 100,000 | 100,990 | |
| Series 2015 XX, 5% 6/15/23 | 290,000 | 291,094 | |
| New Jersey Edl. Facility Bonds Series 2014 A, 5% 9/1/23 | 100,000 | 100,789 | |
TOTAL NEW JERSEY | 492,873 | ||
| New York - 0.6% | |||
| North Hempstead Gen. Oblig. BAN Series 2022 C, 4.5% 9/22/23 | 700,000 | 706,223 | |
| Rockville Ctr. Union Free School District TAN Series 2022, 3.25% 6/28/23 | 200,000 | 200,266 | |
TOTAL NEW YORK | 906,489 | ||
| New York And New Jersey - 1.1% | |||
| Port Auth. of New York & New Jersey Bonds Series 207, 5% 9/15/23 (c) | 1,760,000 | 1,773,978 | |
| North Carolina - 0.4% | |||
| North Carolina Gen. Oblig. Bonds: | |||
| Series 2013 D, 4% 6/1/23 | 250,000 | 250,534 | |
| Series 2018 A, 5% 6/1/23 | 325,000 | 326,202 | |
| North Carolina Ltd. Oblig. Bonds Series 2017 B, 5% 5/1/23 | 135,000 | 135,251 | |
TOTAL NORTH CAROLINA | 711,987 | ||
| Ohio - 0.5% | |||
| Columbus Gen. Oblig. Bonds: | |||
| Series 2018 A, 5% 4/1/23 | 300,000 | 300,000 | |
| Series 2021 A, 5% 4/1/23 | 150,000 | 150,000 | |
| Ohio Gen. Oblig. Bonds Series 2015 A, 5% 9/1/23 | 100,000 | 100,998 | |
| Ohio Wtr. Dev. Auth. Wtr. Poll. Cont. Rev. Bonds Series 2014, 5% 6/1/23 | 150,000 | 150,574 | |
| Union Township Clermont County Gen. Oblig. BAN Series 2022, 3% 8/30/23 (Ohio Gen. Oblig. Guaranteed) | 145,000 | 145,067 | |
TOTAL OHIO | 846,639 | ||
| Oklahoma - 0.2% | |||
| Oklahoma City Wtr. Utils. Series 2023 A, 3.1% 4/5/23 (Liquidity Facility State Street Bank & Trust Co., Boston), CP | 300,000 | 299,964 | |
| Oregon - 0.4% | |||
| Port of Portland Arpt. Rev. Bonds Series 2019 25B, 5% 7/1/23 (c) | 520,000 | 522,218 | |
| Salem Hosp. Facility Auth. Rev. Bonds (Salem Health Projs.) Series 2019 A, 5% 5/15/23 | 100,000 | 100,240 | |
TOTAL OREGON | 622,458 | ||
| Pennsylvania - 0.1% | |||
| Commonwealth Fing. Auth. Tobacco Bonds Series 2018, 5% 6/1/23 | 110,000 | 110,283 | |
| Pennsylvania Gen. Oblig. Bonds Series 2013, 5% 4/1/23 | 100,000 | 100,000 | |
TOTAL PENNSYLVANIA | 210,283 | ||
| South Carolina - 0.1% | |||
| Berkeley County School District Bonds Series 2022 A, 5% 6/1/23 | 125,000 | 125,434 | |
| Tennessee - 0.3% | |||
| Metropolitan Govt. Nashville & Davidson County Wtr. & Swr. Sys. Rev. Series 2023 A, 3.45% 5/17/23, LOC TD Banknorth, NA, CP | 400,000 | 399,941 | |
| Texas - 4.7% | |||
| Austin Elec. Util. Sys. Rev. Series 2023 A, 2.84% 4/4/23 (Liquidity Facility JPMorgan Chase Bank), CP | 100,000 | 99,989 | |
| Harris County Cultural Ed. Facilities Fin. Corp. Rev. Bonds Series 2023, 3.2% tender 4/4/23, CP mode | �� | 800,000 | 800,000 |
| Harris County Gen. Oblig. Series 2023 D: | |||
| 2.84% 4/4/23 (Liquidity Facility JPMorgan Chase Bank), CP | 200,000 | 199,978 | |
| 3.3% 6/6/23 (Liquidity Facility JPMorgan Chase Bank), CP | 500,000 | 499,808 | |
| Love Field Arpt. Modernization Rev. Series 2023, 3.4% 5/3/23, LOC JPMorgan Chase Bank, CP (c) | 600,000 | 599,529 | |
| Lower Colorado River Auth. Rev. Series 2023 B, 3.35% 4/27/23, LOC State Street Bank & Trust Co., Boston, CP | 200,000 | 200,000 | |
| San Antonio Wtr. Sys. Rev. Bonds Series 2020 A, 5% 5/15/23 | 325,000 | 325,890 | |
| Tarrant County Cultural Ed. Facilities Fin. Corp. Hosp. Rev. Bonds ( Baylor Health Care Sys. Proj.) Series 2013 A, 4% 5/15/23 (Pre-Refunded to 5/15/23 @ 100) | 335,000 | 335,502 | |
| Texas A&M Univ. Rev. Bonds Series 2013 D, 5% 5/15/23 | 475,000 | 476,312 | |
| Texas Gen. Oblig. Bonds Series 2019, 4% 8/1/23 (c) | 195,000 | 195,672 | |
| Texas Trans. Commission State Hwy. Fund Rev. Bonds Series 2014 A, 5% 4/1/23 | 580,000 | 580,000 | |
| Univ. of Texas Board of Regents Sys. Rev. Series 2023 A: | |||
| 3.2% 4/5/23 (Liquidity Facility Univ. of Texas Invt. Mgmt. Co.), CP | 300,000 | 299,968 | |
| 3.2% 8/1/23 (Liquidity Facility Univ. of Texas Invt. Mgmt. Co.), CP | 200,000 | 199,355 | |
| 3.25% 4/3/23 (Liquidity Facility Univ. of Texas Invt. Mgmt. Co.), CP | 1,000,000 | 999,891 | |
| 3.5% 4/6/23 (Liquidity Facility Univ. of Texas Invt. Mgmt. Co.), CP | 500,000 | 499,962 | |
| Univ. of Texas Permanent Univ. Fund Rev. Series 2023 A: | |||
| 3.45% 6/26/23, CP | 600,000 | 599,837 | |
| 3.45% 6/26/23, CP | 600,000 | 599,838 | |
TOTAL TEXAS | 7,511,531 | ||
| Virginia - 0.1% | |||
| Fairfax County Indl. Dev. Auth. Bonds (Inova Health Sys. Proj.) Series 2018 B, 5%, tender 5/15/23 (b) | 220,000 | 220,426 | |
| Washington - 1.3% | |||
| Port of Seattle Rev. Bonds: | |||
| Series 2017 C, 5% 5/1/23 (c) | 520,000 | 520,622 | |
| Series 2018 A, 5% 5/1/23 (c) | 680,000 | 680,814 | |
| Series 2018 B, 5% 5/1/23 (c) | 300,000 | 300,359 | |
| Series 2019, 5% 4/1/23 (c) | 100,000 | 100,000 | |
| Series 2021 C, 5% 8/1/23 (c) | 100,000 | 100,528 | |
| Series 2022 B, 5% 8/1/23 (c) | 300,000 | 301,583 | |
| Seattle Muni. Lt. & Pwr. Rev. Bonds Series 2016 B, 5% 4/1/23 | 125,000 | 125,000 | |
TOTAL WASHINGTON | 2,128,906 | ||
| Wisconsin - 0.7% | |||
| Wisconsin Gen. Oblig. Series 2023: | |||
| 3.12% 11/27/23, CP | 900,000 | 899,920 | |
| 3.28% 12/1/23, CP | 300,000 | 299,817 | |
TOTAL WISCONSIN | 1,199,737 | ||
| TOTAL OTHER MUNICIPAL SECURITY (Cost $33,643,153) | 33,670,600 | ||
| Investment Company - 4.8% | |||
| Shares | Value ($) | ||
Fidelity Municipal Cash Central Fund 4.21% (i)(j) (Cost $7,743,874) | 7,742,480 | 7,744,028 | |
| TOTAL INVESTMENT IN SECURITIES - 98.5% (Cost $158,057,028) | 158,084,625 |
NET OTHER ASSETS (LIABILITIES) - 1.5% | 2,399,674 |
| NET ASSETS - 100.0% | 160,484,299 |
| BAN | - | BOND ANTICIPATION NOTE |
| CP | - | COMMERCIAL PAPER |
| RAN | - | REVENUE ANTICIPATION NOTE |
| TAN | - | TAX ANTICIPATION NOTE |
| TRAN | - | TAX AND REVENUE ANTICIPATION NOTE |
| VRDN | - | VARIABLE RATE DEMAND NOTE (A debt instrument that is payable upon demand, either daily, weekly or monthly) |
| (a) | Amount is stated in United States dollars unless otherwise noted. |
| (b) | Coupon rates for floating and adjustable rate securities reflect the rates in effect at period end. |
| (c) | Private activity obligations whose interest is subject to the federal alternative minimum tax for individuals. |
| (d) | Security exempt from registration under Rule 144A of the Securities Act of 1933. These securities may be resold in transactions exempt from registration, normally to qualified institutional buyers. At the end of the period, the value of these securities amounted to $4,900,000 or 3.1% of net assets. |
| (e) | Provides evidence of ownership in one or more underlying municipal bonds. |
| (f) | Coupon rates are determined by re-marketing agents based on current market conditions. |
| (g) | Restricted securities (including private placements) - Investment in securities not registered under the Securities Act of 1933 (excluding 144A issues). At the end of the period, the value of restricted securities (excluding 144A issues) amounted to $3,100,000 or 1.9% of net assets. |
| (h) | Coupon is indexed to a floating interest rate which may be multiplied by a specified factor and/or subject to caps or floors. |
| (i) | Information in this report regarding holdings by state and security types does not reflect the holdings of the Fidelity Municipal Cash Central Fund. |
| (j) | Affiliated fund that is generally available only to investment companies and other accounts managed by Fidelity Investments. The rate quoted is the annualized seven-day yield of the fund at period end. A complete unaudited listing of the fund's holdings as of its most recent quarter end is available upon request. In addition, each Fidelity Central Fund's financial statements, which are not covered by the Fund's Report of Independent Registered Public Accounting Firm, are available on the SEC's website or upon request. |
| Additional information on each restricted holding is as follows: | ||
| Security | Acquisition Date | Cost ($) |
| Alamo Cmnty. College District Rev. Bonds Series G-111, 4.17%, tender 5/1/23 (Liquidity Facility Royal Bank of Canada) | 5/03/21 | 100,000 |
| Broward County Convention Ctr. Bonds Series MS 00 11, 3.95%, tender 5/25/23 (Liquidity Facility Morgan Stanley Bank, West Valley City Utah) | 1/19/23 | 600,000 |
| Connecticut Spl. Tax Oblig. Trans. Infrastructure Rev. Bonds Series Floaters G 110, 4.15%, tender 10/2/23 (Liquidity Facility Royal Bank of Canada) | 4/01/21 | 200,000 |
| Greater Orlando Aviation Auth. Arpt. Facilities Rev. Bonds Series Floaters G 25, 4.22%, tender 10/2/23 (Liquidity Facility Royal Bank of Canada) | 4/01/21 | 100,000 |
| Indiana Health Facility Fing. Auth. Rev. Bonds Series MS 00 12, 4.07%, tender 4/13/23 (Liquidity Facility Morgan Stanley Bank, West Valley City Utah) | 2/09/23 | 1,000,000 |
| Michigan Hosp. Fin. Auth. Rev. Bonds Series MS 00 15, 4.07%, tender 6/1/23 (Liquidity Facility Morgan Stanley Bank, West Valley City Utah) | 3/23/23 | 600,000 |
| Ohio Univ. Gen. Receipts Athens Bonds Series Floaters G 27, 4.17%, tender 6/1/23 (Liquidity Facility Royal Bank of Canada) | 12/01/22 | 100,000 |
| RBC Muni. Products, Inc. Trust Bonds Series G 123, 4.17%, tender 11/1/23 (Liquidity Facility Royal Bank of Canada) | 2/09/23 | 100,000 |
| RBC Muni. Products, Inc. Trust Bonds Series G 124, 4.17%, tender 9/1/23 (Liquidity Facility Royal Bank of Canada) | 2/09/23 | 100,000 |
| South Carolina Trans. Infrastructure Bank Rev. Bonds Series Floaters G 109, 4.17%, tender 10/2/23 (Liquidity Facility Royal Bank of Canada) | 4/01/21 | 100,000 |
| Virginia Pub. Bldg. Auth. Pub. Facilities Rev. Bonds Series Floaters G 40, 4.17%, tender 8/1/23 (Liquidity Facility Royal Bank of Canada) | 2/01/21 | 100,000 |
| Affiliate | Value, beginning of period ($) | Purchases ($) | Sales Proceeds ($) | Dividend Income ($) | Realized Gain (loss) ($) | Change in Unrealized appreciation (depreciation) ($) | Value, end of period ($) | % ownership, end of period |
| Fidelity Municipal Cash Central Fund 4.21% | 83,233,024 | 179,518,000 | 255,007,000 | 618,810 | 4,449 | (4,445) | 7,744,028 | 0.4% |
| Total | 83,233,024 | 179,518,000 | 255,007,000 | 618,810 | 4,449 | (4,445) | 7,744,028 | |
| Valuation Inputs at Reporting Date: | ||||
| Description | Total ($) | Level 1 ($) | Level 2 ($) | Level 3 ($) |
Investments in Securities: | ||||
| Variable Rate Demand Note | 93,454,997 | - | 93,454,997 | - |
| Tender Option Bond | 23,215,000 | - | 23,215,000 | - |
| Other Municipal Security | 33,670,600 | - | 33,670,600 | - |
| Investment Company | 7,744,028 | 7,744,028 | - | - |
| Total Investments in Securities: | 158,084,625 | 7,744,028 | 150,340,597 | - |
| Statement of Assets and Liabilities | ||||
| March 31, 2023 | ||||
| Assets | ||||
| Investment in securities, at value - See accompanying schedule: | ||||
Unaffiliated issuers (cost $150,313,154) | $ | 150,340,597 | ||
Fidelity Central Funds (cost $7,743,874) | 7,744,028 | |||
| Total Investment in Securities (cost $158,057,028) | $ | 158,084,625 | ||
| Receivable for securities sold on a delayed delivery basis | 3,845,000 | |||
| Interest receivable | 821,704 | |||
| Distributions receivable from Fidelity Central Funds | 38,318 | |||
| Prepaid expenses | 169 | |||
| Receivable from investment adviser for expense reductions | 4,547 | |||
| Other receivables | 7 | |||
Total assets | 162,794,370 | |||
| Liabilities | ||||
| Payable to custodian bank | $ | 393,174 | ||
| Payable for investments purchased | 367,488 | |||
| Payable for fund shares redeemed | 1,483,958 | |||
| Accrued management fee | 26,042 | |||
| Other payables and accrued expenses | 39,409 | |||
| Total Liabilities | 2,310,071 | |||
| Net Assets | $ | 160,484,299 | ||
| Net Assets consist of: | ||||
| Paid in capital | $ | 160,483,098 | ||
| Total accumulated earnings (loss) | 1,201 | |||
| Net Assets | $ | 160,484,299 | ||
Net Asset Value , offering price and redemption price per share ($160,484,299 ÷ 160,415,693 shares) | $ | 1.0004 | ||
| Statement of Operations | ||||
Year ended March 31, 2023 | ||||
| Investment Income | ||||
| Interest | $ | 5,196,037 | ||
| Income from Fidelity Central Funds | 618,378 | |||
| Total Income | 5,814,415 | |||
| Expenses | ||||
| Management fee | $ | 476,002 | ||
| Custodian fees and expenses | 6,826 | |||
| Independent trustees' fees and expenses | 1,344 | |||
| Registration fees | 23,101 | |||
| Audit | 41,244 | |||
| Legal | 279 | |||
| Miscellaneous | 818 | |||
| Total expenses before reductions | 549,614 | |||
| Expense reductions | (72,185) | |||
| Total expenses after reductions | 477,429 | |||
| Net Investment income (loss) | 5,336,986 | |||
| Realized and Unrealized Gain (Loss) | ||||
| Net realized gain (loss) on: | ||||
| Investment Securities: | ||||
| Unaffiliated issuers | (31,418) | |||
| Fidelity Central Funds | 4,449 | |||
| Capital gain distributions from Fidelity Central Funds | 432 | |||
| Total net realized gain (loss) | (26,537) | |||
| Change in net unrealized appreciation (depreciation) on: | ||||
| Investment Securities: | ||||
| Unaffiliated issuers | 214,090 | |||
| Fidelity Central Funds | (4,445) | |||
| Total change in net unrealized appreciation (depreciation) | 209,645 | |||
| Net increase in net assets resulting from operations | $ | 5,520,094 | ||
| Statement of Changes in Net Assets | ||||
Year ended March 31, 2023 | Year ended March 31, 2022 | |||
| Increase (Decrease) in Net Assets | ||||
| Operations | ||||
| Net investment income (loss) | $ | 5,336,986 | $ | 160,396 |
| Net realized gain (loss) | (26,537) | 13,452 | ||
| Change in net unrealized appreciation (depreciation) | 209,645 | (191,454) | ||
Net increase in net assets resulting from operations | 5,520,094 | (17,606) | ||
| Distributions to shareholders | (5,339,450) | (197,071) | ||
| Share transactions | ||||
| Proceeds from sales of shares | 53,902,848 | 95,610,355 | ||
| Reinvestment of distributions | 5,339,450 | 197,059 | ||
| Cost of shares redeemed | (436,349,504) | (4,009,724) | ||
Net increase (decrease) in net assets and shares resulting from share transactions | (377,107,206) | 91,797,690 | ||
| Total increase (decrease) in net assets | (376,926,562) | 91,583,013 | ||
| Net Assets | ||||
| Beginning of period | 537,410,861 | 445,827,848 | ||
| End of period | $ | 160,484,299 | $ | 537,410,861 |
| Other Information | ||||
| Shares | ||||
| Sold | 53,885,181 | 95,589,058 | ||
| Issued in reinvestment of distributions | 5,337,763 | 197,027 | ||
| Redeemed | (436,220,379) | (4,008,121) | ||
| Net increase (decrease) | (376,997,435) | 91,777,964 | ||
| Fidelity® SAI Municipal Money Market Fund |
| Years ended March 31, | 2023 | 2022 | 2021 | 2020 | 2019 | |||||
Selected Per-Share Data | ||||||||||
| Net asset value, beginning of period | $ | 1.0000 | $ | 1.0004 | $ | 1.0002 | $ | 1.0001 | $ | .9999 |
| Income from Investment Operations | ||||||||||
Net investment income (loss) A | .0180 | .0003 | .0013 | .0142 | .0146 | |||||
| Net realized and unrealized gain (loss) | .0004 | (.0003) | .0002 | .0001 | .0002 | |||||
| Total from investment operations | .0184 | - | .0015 | .0143 | .0148 | |||||
| Distributions from net investment income | (.0180) | (.0003) | (.0013) | (.0142) | (.0146) | |||||
| Distributions from net realized gain | - | (.0001) | (.0001) | - | - | |||||
| Total distributions | (.0180) | (.0004) | (.0013) B | (.0142) | (.0146) | |||||
| Net asset value, end of period | $ | 1.0004 | $ | 1.0000 | $ | 1.0004 | $ | 1.0002 | $ | 1.0001 |
Total Return C | 1.85% | -% | .15% | 1.44% | 1.49% | |||||
Ratios to Average Net Assets A,D,E | ||||||||||
| Expenses before reductions | .16% | .16% | .16% | .19% | .21% | |||||
| Expenses net of fee waivers, if any | .14% | .09% | .12% | .14% | .14% | |||||
| Expenses net of all reductions | .14% | .09% | .12% | .14% | .14% | |||||
| Net investment income (loss) | 1.57% | .03% | .08% | 1.41% | 1.46% | |||||
| Supplemental Data | ||||||||||
| Net assets, end of period (000 omitted) | $ | 160,484 | $ | 537,411 | $ | 445,828 | $ | 134,798 | $ | 295,510 |
| Fidelity Central Fund | Investment Manager | Investment Objective | Investment Practices | Expense Ratio A |
| Fidelity Money Market Central Funds | Fidelity Management & Research Company LLC (FMR) | Each fund seeks to obtain a high level of current income consistent with the preservation of capital and liquidity. | Short-term Investments | Less than .005% |
| Gross unrealized appreciation | $30,786 |
| Gross unrealized depreciation | (3,189) |
| Net unrealized appreciation (depreciation) | $27,597 |
| Tax Cost | $158,057,028 |
| Capital loss carryforward | $(26,476) |
| Net unrealized appreciation (depreciation) on securities and other investments | $27,597 |
Short-term | $(26,476) |
Long-term | (-) |
| Total capital loss carryforward | $(26,476) |
| March 31, 2023 | March 31, 2022 | |
| Tax-exempt Income | 5,336,470 | 160,274 |
| Ordinary Income | $2,980 | $ 9,560 |
| Long-term Capital Gains | - | 27,237 |
| Total | $5,339,450 | $ 197,071 |
| Purchases ($) | Sales ($) | Realized Gain (Loss) ($) | |
| Fidelity SAI Municipal Money Market Fund | 16,730,000 | 170,556,034 | (4,330) |
| Strategic Advisers Tax-Sensitive Short Duration Fund | |
| Fidelity SAI Municipal Money Market Fund | 99% |
| Fund | % of shares held |
| Fidelity SAI Municipal Money Market Fund | 100% |
| The Example is based on an investment of $1,000 invested at the beginning of the period and held for the entire period (October 1, 2022 to March 31, 2023). |
Annualized Expense Ratio- A | Beginning Account Value October 1, 2022 | Ending Account Value March 31, 2023 | Expenses Paid During Period- C October 1, 2022 to March 31, 2023 | |||||||
| Fidelity® SAI Municipal Money Market Fund | .14% | |||||||||
| Actual | $ 1,000 | $ 1,013.60 | $ .70 | |||||||
Hypothetical- B | $ 1,000 | $ 1,024.23 | $ .71 | |||||||
 |
Item 2.
Code of Ethics
As of the end of the period, March 31, 2023, Fidelity Salem Street Trust (the trust) has adopted a code of ethics, as defined in Item 2 of Form N-CSR, that applies to its President and Treasurer and its Chief Financial Officer. A copy of the code of ethics is filed as an exhibit to this Form N-CSR.
Item 3.
Audit Committee Financial Expert
The Board of Trustees of the trust has determined that Elizabeth S. Acton is an audit committee financial expert, as defined in Item 3 of Form N-CSR. Ms. Acton is independent for purposes of Item 3 of Form N-CSR.
Item 4.
Principal Accountant Fees and Services
Fees and Services
The following table presents fees billed by PricewaterhouseCoopers LLP (“PwC”) in each of the last two fiscal years for services rendered to Fidelity SAI Municipal Money Market Fund (the “Fund”):
Services Billed by PwC
March 31, 2023 FeesA
Audit Fees | Audit-Related Fees | Tax Fees | All Other Fees | |
Fidelity SAI Municipal Money Market Fund | $34,700 | $2,600 | $2,100 | $1,100 |
March 31, 2022 FeesA
Audit Fees | Audit-Related Fees | Tax Fees | All Other Fees | |
Fidelity SAI Municipal Money Market Fund | $33,100 | $2,700 | $2,000 | $1,200 |
A Amounts may reflect rounding.
The following table(s) present(s) fees billed by PwC that were required to be approved by the Audit Committee for services that relate directly to the operations and financial reporting of the Fund(s) and that are rendered on behalf of Fidelity Management & Research Company LLC ("FMR") and entities controlling, controlled by, or under common control with FMR (not including any sub-adviser whose role is primarily portfolio management and is subcontracted with or overseen by another investment adviser) that provide ongoing services to the Fund(s) (“Fund Service Providers”):
Services Billed by PwC
March 31, 2023A | March 31, 2022A | |
Audit-Related Fees | $8,199,200 | $7,914,600 |
Tax Fees | $1,000 | $353,200 |
All Other Fees | $- | $- |
A Amounts may reflect rounding.
“Audit-Related Fees” represent fees billed for assurance and related services that are reasonably related to the performance of the fund audit or the review of the fund's financial statements and that are not reported under Audit Fees.
“Tax Fees” represent fees billed for tax compliance, tax advice or tax planning that relate directly to the operations and financial reporting of the fund.
“All Other Fees” represent fees billed for services provided to the fund or Fund Service Provider, a significant portion of which are assurance related, that relate directly to the operations and financial reporting of the fund, excluding those services that are reported under Audit Fees, Audit-Related Fees or Tax Fees.
Assurance services must be performed by an independent public accountant.
* * *
The aggregate non-audit fees billed by PwC for services rendered to the Fund(s), FMR (not including any sub-adviser whose role is primarily portfolio management and is subcontracted with or overseen by another investment adviser), and any Fund Service Provider for each of the last two fiscal years of the Fund(s) are as follows:
Billed By | March 31, 2023A | March 31, 2022A |
PwC | $13,508,600 | $13,423,100 |
A Amounts may reflect rounding.
The trust's Audit Committee has considered non-audit services that were not pre-approved that were provided by PwC to Fund Service Providers to be compatible with maintaining the independence of PwC in its(their) audit of the Fund(s), taking into account representations from PwC, in accordance with Public Company Accounting
Oversight Board rules, regarding its independence from the Fund(s) and its(their) related entities and FMR’s review of the appropriateness and permissibility under applicable law of such non-audit services prior to their provision to the Fund(s) Service Providers.
Audit Committee Pre-Approval Policies and Procedures
The trust’s Audit Committee must pre-approve all audit and non-audit services provided by a fund’s independent registered public accounting firm relating to the operations or financial reporting of the fund. Prior to the commencement of any audit or non-audit services to a fund, the Audit Committee reviews the services to determine whether they are appropriate and permissible under applicable law.
The Audit Committee has adopted policies and procedures to, among other purposes, provide a framework for the Committee’s consideration of non-audit services by the audit firms that audit the Fidelity funds. The policies and procedures require that any non-audit service provided by a fund audit firm to a Fidelity fund and any non-audit service provided by a fund auditor to a Fund Service Provider that relates directly to the operations and financial reporting of a Fidelity fund (“Covered Service”) are subject to approval by the Audit Committee before such service is provided.
All Covered Services must be approved in advance of provision of the service either: (i) by formal resolution of the Audit Committee, or (ii) by oral or written approval of the service by the Chair of the Audit Committee (or if the Chair is unavailable, such other member of the Audit Committee as may be designated by the Chair to act in the Chair’s absence). The approval contemplated by (ii) above is permitted where the Treasurer determines that action on such an engagement is necessary before the next meeting of the Audit Committee.
Non-audit services provided by a fund audit firm to a Fund Service Provider that do not relate directly to the operations and financial reporting of a Fidelity fund are reported to the Audit Committee periodically.
Non-Audit Services Approved Pursuant to Rule 2-01(c)(7)(i)(C) and (ii) of Regulation S-X (“De Minimis Exception”)
There were no non-audit services approved or required to be approved by the Audit Committee pursuant to the De Minimis Exception during the Fund’s(s’) last two fiscal years relating to services provided to (i) the Fund(s) or (ii) any Fund Service Provider that relate directly to the operations and financial reporting of the Fund(s).
Item 5.
Audit Committee of Listed Registrants
Not applicable.
Item 6.
Investments
(a)
Not applicable.
(b)
Not applicable.
Item 7.
Disclosure of Proxy Voting Policies and Procedures for Closed-End Management Investment Companies
Not applicable.
Item 8.
Portfolio Managers of Closed-End Management Investment Companies
Not applicable.
Item 9.
Purchase of Equity Securities by Closed-End Management Investment Company and Affiliated Purchasers
Not applicable.
Item 10.
Submission of Matters to a Vote of Security Holders
There were no material changes to the procedures by which shareholders may recommend nominees to the trust’s Board of Trustees.
Item 11.
Controls and Procedures
(a)(i) The President and Treasurer and the Chief Financial Officer have concluded that the trust’s disclosure controls and procedures (as defined in Rule 30a-3(c) under the Investment Company Act) provide reasonable assurances that material information relating to the trust is made known to them by the appropriate persons, based on their evaluation of these controls and procedures as of a date within 90 days of the filing date of this report.
(a)(ii) There was no change in the trust’s internal control over financial reporting (as defined in Rule 30a-3(d) under the Investment Company Act) that occurred during the period covered by this report that has materially affected, or is reasonably likely to materially affect, the trust’s internal control over financial reporting.
Item 12.
Disclosure of Securities Lending Activities for Closed-End Management
Investment Companies
Not applicable.
Item 13.
Exhibits
(a) | (1) | Code of Ethics pursuant to Item 2 of Form N-CSR is filed and attached hereto as EX-99.CODE ETH. |
(a) | (2) | |
(a) | (3) | Not applicable. |
(b) |
SIGNATURES
Pursuant to the requirements of the Securities Exchange Act of 1934 and the Investment Company Act of 1940, the registrant has duly caused this report to be signed on its behalf by the undersigned, thereunto duly authorized.
Fidelity Salem Street Trust
By: | /s/Laura M. Del Prato |
Laura M. Del Prato | |
President and Treasurer | |
Date: | May 19, 2023 |
Pursuant to the requirements of the Securities Exchange Act of 1934 and the Investment Company Act of 1940, this report has been signed below by the following persons on behalf of the registrant and in the capacities and on the dates indicated.
By: | /s/Laura M. Del Prato |
Laura M. Del Prato | |
President and Treasurer | |
Date: | May 19, 2023 |
By: | /s/John J. Burke III |
John J. Burke III | |
Chief Financial Officer | |
Date: | May 19, 2023 |