UNITED STATES
SECURITIES AND EXCHANGE COMMISSION
Washington, D.C. 20549
FORM N-CSR
CERTIFIED SHAREHOLDER REPORT OF REGISTERED
MANAGEMENT INVESTMENT COMPANIES
Investment Company Act file number 811-02105
Fidelity Salem Street Trust
(Exact name of registrant as specified in charter)
245 Summer St., Boston, Massachusetts 02210
(Address of principal executive offices) (Zip code)
Margaret Carey, Secretary
245 Summer St.
Boston, Massachusetts 02210
(Name and address of agent for service)
Registrant's telephone number, including area code:
617-563-7000
Date of fiscal year end: | September 30 |
Date of reporting period: | September 30, 2023 |
Item 1.
Reports to Stockholders


Contents
| Average Annual Total Returns | |||
Periods ended September 30, 2023 | Past 1 year | Past 5 years | Past 10 years |
Class A (incl. 4.00% sales charge) | 0.74% | 3.16% | 2.15% |
Class M (incl. 4.00% sales charge) | 0.74% | 3.15% | 2.14% |
Class C (incl. contingent deferred sales charge) | 3.25% | 3.24% | 1.95% |
| Fidelity® Strategic Real Return Fund | 5.21% | 4.27% | 2.84% |
| Class K6 | 5.44% | 4.40% | 2.90% |
| Class I | 5.33% | 4.28% | 2.84% |
| Class Z | 5.32% | 4.36% | 2.88% |
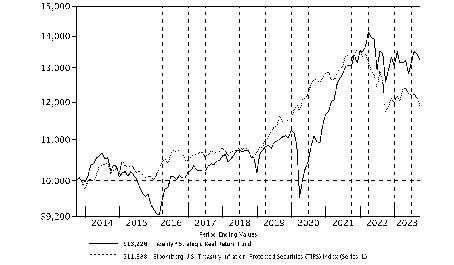
| $10,000 Over 10 Years |
Let's say hypothetically that $10,000 was invested in Fidelity® Strategic Real Return Fund, a class of the fund, on September 30, 2013. The chart shows how the value of your investment would have changed, and also shows how the Bloomberg U.S. Treasury Inflation-Protected Securities (TIPS) Index (Series-L) performed over the same period. |
 |
Quality Diversification (% of Fund's net assets) |
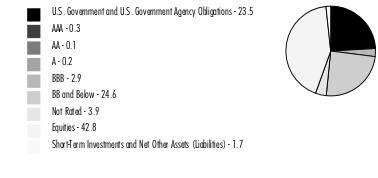 |
| We have used ratings from Moody's Investors Service, Inc. Where Moody's® ratings are not available, we have used S&P® ratings. All ratings are as of the date indicated and do not reflect subsequent changes. |
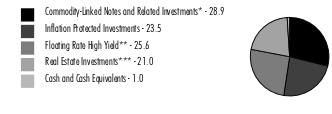
Asset Allocation (% of Fund's net assets) |
 |
U.S. Treasury Inflation-Indexed Securities - 23.5% |
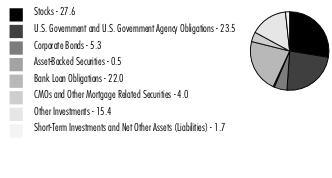
Holdings Distribution (% of Fund's net assets) |
 |
Geographic Diversification (% of Fund's net assets) |
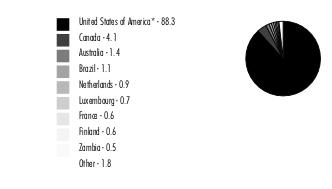 |
* Includes Short-Term investments and Net Other Assets (Liabilities). Percentages are adjusted for the effect of derivatives, if applicable. |
| Nonconvertible Bonds - 3.6% | |||
Principal Amount (a) | Value ($) | ||
| CONSUMER DISCRETIONARY - 0.4% | |||
| Hotels, Restaurants & Leisure - 0.3% | |||
| Caesars Entertainment, Inc. 8.125% 7/1/27 (b) | 535,000 | 537,550 | |
| Hilton Domestic Operating Co., Inc. 4% 5/1/31 (b) | 350,000 | 294,237 | |
| Hilton Grand Vacations Borrower Escrow LLC 4.875% 7/1/31 (b) | 745,000 | 607,340 | |
| Marriott Ownership Resorts, Inc. 4.5% 6/15/29 (b) | 285,000 | 238,802 | |
| Times Square Hotel Trust 8.528% 8/1/26 (b) | 190,342 | 187,829 | |
| 1,865,758 | |||
| Household Durables - 0.1% | |||
| LGI Homes, Inc. 4% 7/15/29 (b) | 170,000 | 135,634 | |
| M/I Homes, Inc. 3.95% 2/15/30 | 100,000 | 81,398 | |
| TRI Pointe Homes, Inc. 5.25% 6/1/27 | 100,000 | 93,577 | |
| 310,609 | |||
TOTAL CONSUMER DISCRETIONARY | 2,176,367 | ||
| FINANCIALS - 0.1% | |||
| Financial Services - 0.1% | |||
| Brixmor Operating Partnership LP 4.05% 7/1/30 | 350,000 | 305,551 | |
| HEALTH CARE - 0.0% | |||
| Health Care Providers & Services - 0.0% | |||
| Sabra Health Care LP 3.2% 12/1/31 | 250,000 | 187,066 | |
| REAL ESTATE - 3.1% | |||
| Equity Real Estate Investment Trusts (REITs) - 2.9% | |||
| American Homes 4 Rent LP: | |||
| 2.375% 7/15/31 | 750,000 | 571,822 | |
| 3.625% 4/15/32 | 1,000,000 | 827,437 | |
| American Tower Corp.: | |||
| 2.7% 4/15/31 | 750,000 | 594,800 | |
| 3.8% 8/15/29 | 1,250,000 | 1,111,888 | |
| 4.05% 3/15/32 | 750,000 | 646,451 | |
| 5.55% 7/15/33 | 250,000 | 238,216 | |
| CBL & Associates LP 5.95% (c)(d) | 132,000 | 0 | |
| Crown Castle International Corp.: | |||
| 2.25% 1/15/31 | 1,250,000 | 970,084 | |
| 3.8% 2/15/28 | 100,000 | 91,690 | |
| CTR Partnership LP/CareTrust Capital Corp. 3.875% 6/30/28 (b) | 225,000 | 192,388 | |
| EPR Properties: | |||
| 3.6% 11/15/31 | 250,000 | 185,317 | |
| 4.95% 4/15/28 | 250,000 | 221,518 | |
| Equinix, Inc.: | |||
| 2.15% 7/15/30 | 500,000 | 392,716 | |
| 3.2% 11/18/29 | 750,000 | 642,252 | |
| 3.9% 4/15/32 | 250,000 | 213,623 | |
| GLP Capital LP/GLP Financing II, Inc.: | |||
| 3.25% 1/15/32 | 250,000 | 194,022 | |
| 4% 1/15/31 | 500,000 | 416,258 | |
| 5.3% 1/15/29 | 1,000,000 | 927,020 | |
| Invitation Homes Operating Partnership LP: | |||
| 2% 8/15/31 | 750,000 | 555,031 | |
| 4.15% 4/15/32 | 1,000,000 | 860,074 | |
| MPT Operating Partnership LP/MPT Finance Corp. 4.625% 8/1/29 | 915,000 | 648,061 | |
| Omega Healthcare Investors, Inc.: | |||
| 3.375% 2/1/31 | 500,000 | 390,896 | |
| 4.5% 4/1/27 | 83,000 | 77,322 | |
| SBA Communications Corp. 3.125% 2/1/29 | 500,000 | 417,036 | |
| Spirit Realty LP 4% 7/15/29 | 250,000 | 221,157 | |
| Sun Communities Operating LP: | |||
| 2.7% 7/15/31 | 1,000,000 | 769,626 | |
| 4.2% 4/15/32 | 4,000 | 3,413 | |
| 5.7% 1/15/33 | 250,000 | 236,229 | |
| Uniti Group LP / Uniti Group Finance, Inc.: | |||
| 6.5% 2/15/29 (b) | 435,000 | 284,830 | |
| 10.5% 2/15/28 (b) | 235,000 | 230,171 | |
| Uniti Group, Inc. 6% 1/15/30 (b) | 105,000 | 66,675 | |
| Ventas Realty LP 4.75% 11/15/30 | 250,000 | 228,635 | |
| VICI Properties LP 5.125% 5/15/32 | 1,250,000 | 1,118,842 | |
| VICI Properties LP / VICI Note Co. 4.625% 12/1/29 (b) | 500,000 | 443,525 | |
| Welltower OP LLC 3.85% 6/15/32 | 500,000 | 426,483 | |
| Weyerhaeuser Co. 4% 4/15/30 | 250,000 | 221,576 | |
| XHR LP 4.875% 6/1/29 (b) | 250,000 | 212,500 | |
| 15,849,584 | |||
| Real Estate Management & Development - 0.2% | |||
| DTZ U.S. Borrower LLC 6.75% 5/15/28 (b) | 285,000 | 262,941 | |
| Extra Space Storage LP 2.35% 3/15/32 | 500,000 | 377,949 | |
| Howard Hughes Corp.: | |||
| 4.125% 2/1/29 (b) | 40,000 | 32,000 | |
| 4.375% 2/1/31 (b) | 385,000 | 295,402 | |
| Kennedy-Wilson, Inc. 4.75% 3/1/29 | 430,000 | 330,029 | |
| 1,298,321 | |||
TOTAL REAL ESTATE | 17,147,905 | ||
| TOTAL NONCONVERTIBLE BONDS (Cost $21,588,017) | 19,816,889 | ||
| U.S. Treasury Inflation-Protected Obligations - 23.5% | |||
Principal Amount (a) | Value ($) | ||
| U.S. Treasury Inflation-Indexed Bonds: | |||
| 0.125% 2/15/51 | 2,904,847 | 1,620,146 | |
| 0.125% 2/15/52 | 2,613,549 | 1,437,881 | |
| 0.25% 2/15/50 | 83,231 | 49,082 | |
| 0.625% 2/15/43 | 3,200,371 | 2,328,870 | |
| 0.75% 2/15/42 | 687,248 | 521,096 | |
| 0.75% 2/15/45 | 2,103,003 | 1,530,466 | |
| 0.875% 2/15/47 | 953,569 | 696,194 | |
| 1% 2/15/46 | 68,377 | 51,972 | |
| 1% 2/15/48 | 1,226,004 | 913,271 | |
| 1% 2/15/49 | 2,605,789 | 1,925,930 | |
| 1.375% 2/15/44 | 3,134,844 | 2,624,037 | |
| 1.75% 1/15/28 | 1,520,455 | 1,477,105 | |
| 2% 1/15/26 | 1,440,068 | 1,411,860 | |
| 2.125% 2/15/40 | 1,122,970 | 1,089,363 | |
| 2.125% 2/15/41 | 1,584,358 | 1,533,917 | |
| 2.375% 1/15/25 | 2,105,006 | 2,079,753 | |
| 2.375% 1/15/27 | 1,092,921 | 1,084,790 | |
| 2.5% 1/15/29 | 838,624 | 844,503 | |
| 3.375% 4/15/32 | 34,444 | 37,138 | |
| 3.625% 4/15/28 | 1,682,109 | 1,767,781 | |
| U.S. Treasury Inflation-Indexed Notes: | |||
| 0.125% 10/15/24 | 3,786,523 | 3,670,664 | |
| 0.125% 4/15/25 | 3,480,585 | 3,320,323 | |
| 0.125% 10/15/25 | 3,044,314 | 2,884,818 | |
| 0.125% 4/15/26 | 3,097,132 | 2,893,749 | |
| 0.125% 7/15/26 | 3,439,484 | 3,215,154 | |
| 0.125% 10/15/26 | 2,366,029 | 2,200,513 | |
| 0.125% 4/15/27 | 5,781,511 | 5,308,184 | |
| 0.125% 1/15/30 | 4,435,364 | 3,867,949 | |
| 0.125% 7/15/30 | 4,296,977 | 3,725,284 | |
| 0.125% 1/15/31 | 4,215,773 | 3,606,858 | |
| 0.125% 7/15/31 | 5,241,968 | 4,453,124 | |
| 0.125% 1/15/32 | 4,907,327 | 4,113,770 | |
| 0.25% 1/15/25 | 4,673,371 | 4,494,981 | |
| 0.25% 7/15/29 | 4,725,307 | 4,211,309 | |
| 0.375% 7/15/25 | 5,611,235 | 5,372,102 | |
| 0.375% 1/15/27 | 5,711,156 | 5,313,143 | |
| 0.375% 7/15/27 | 4,984,894 | 4,623,436 | |
| 0.5% 1/15/28 | 8,237,561 | 7,594,097 | |
| 0.625% 1/15/26 | 4,531,123 | 4,307,795 | |
| 0.625% 7/15/32 | 5,439,460 | 4,742,452 | |
| 0.75% 7/15/28 | 5,170,821 | 4,812,934 | |
| 0.875% 1/15/29 | 2,763,914 | 2,565,177 | |
| 1.125% 1/15/33 | 5,490,384 | 4,961,555 | |
| 1.25% 4/15/28 | 2,354,213 | 2,238,873 | |
| 1.375% 7/15/33 | 3,220,896 | 2,980,197 | |
| 1.5% 2/15/53 | 1,048,948 | 868,708 | |
| 1.625% 10/15/27 | 268,304 | 260,549 | |
| TOTAL U.S. TREASURY INFLATION-PROTECTED OBLIGATIONS (Cost $144,120,280) | 127,632,853 | ||
| Asset-Backed Securities - 0.5% | |||
Principal Amount (a) | Value ($) | ||
| American Homes 4 Rent Series 2015-SFR2 Class XS, 0% 10/17/52 (b)(d)(e)(f) | 134,653 | 1 | |
| DigitalBridge Issuer, LLC / DigitalBridge Co.-Issuer, LLC Series 2021-1A Class A2, 3.933% 9/25/51 (b) | 85,000 | 77,254 | |
| FirstKey Homes Trust Series 2021-SFR2 Class F1, 2.908% 9/17/38 (b) | 100,000 | 85,055 | |
| Home Partners of America Trust: | |||
| Series 2021-1 Class F, 3.325% 9/17/41 (b) | 85,772 | 68,080 | |
| Series 2021-2 Class G, 4.505% 12/17/26 (b) | 181,941 | 153,029 | |
| New Residential Mortgage Loan Trust Series 2022-SFR2 Class E1, 4% 9/4/39 (b) | 100,000 | 85,299 | |
| Progress Residential: | |||
| Series 2022-SFR3 Class F, 6.6% 4/17/39 (b) | 250,000 | 231,333 | |
| Series 2022-SFR4 Class E1, 6.121% 5/17/41 (b) | 221,000 | 202,965 | |
| Series 2022-SFR5: | |||
Class E1, 6.618% 6/17/39 (b) | 201,000 | 192,752 | |
Class E2, 6.863% 6/17/39 (b) | 336,000 | 321,248 | |
| Progress Residential Trust: | |||
| Series 2021-SFR6 Class F, 3.422% 7/17/38 (b) | 100,000 | 86,355 | |
| Series 2022-SFR2 Class E2, 4.8% 4/17/27 (b) | 100,000 | 91,028 | |
| Starwood Mortgage Residential Trust Series 2022-SFR3 Class F, CME Term SOFR 1 Month Index + 4.500% 9.8322% 5/17/24 (b)(e)(g) | 500,000 | 486,668 | |
| Tricon Residential Series 2022-SFR1: | |||
| Class E1, 5.344% 4/17/39 (b) | 238,000 | 218,013 | |
| Class E2, 5.739% 4/17/39 (b) | 295,000 | 270,826 | |
| TOTAL ASSET-BACKED SECURITIES (Cost $2,765,270) | 2,569,906 | ||
| Commercial Mortgage Securities - 4.0% | |||
Principal Amount (a) | Value ($) | ||
| BAMLL Commercial Mortgage Securities Trust floater Series 2021-JACX Class E, CME Term SOFR 1 Month Index + 3.860% 9.1975% 9/15/38 (b)(e)(g) | 106,000 | 84,465 | |
| BANK: | |||
| sequential payer: | |||
Series 2021-BN35 Class A5, 2.285% 6/15/64 | 134,000 | 103,532 | |
Series 2022-BNK42: | |||
| Class D, 2.5% 6/15/55 (b) | 180,000 | 90,417 | |
| Class E, 2.5% 6/15/55 (b) | 141,000 | 63,613 | |
Series 2022-BNK44, Class A5, 5.937% 11/15/55 (e) | 100,000 | 98,954 | |
| Series 2020-BN30 Class MCDG, 3.0155% 12/15/53 (e) | 264,000 | 115,164 | |
| Series 2021-BN38 Class C, 3.3245% 12/15/64 (e) | 554,000 | 335,042 | |
| Series 2022-BNK41, Class C, 3.9164% 4/15/65 (e) | 567,000 | 377,811 | |
| Series 2022-BNK42 Class C, 4.8795% 6/15/55 (e) | 500,000 | 366,373 | |
| BBCMS Series 2022-C15, Class A5, 3.662% 4/15/55 | 178,000 | 151,229 | |
| BBCMS Mortgage Trust: | |||
| sequential payer Series 2022-C17 Class D, 2.5% 9/15/55 (b)(d) | 163,000 | 76,698 | |
| Series 2020-C7 Class C, 3.7159% 4/15/53 (e) | 500,000 | 315,615 | |
| Series 2022-C16 Class C, 4.6% 6/15/55 (e) | 750,000 | 538,957 | |
| Benchmark Mortgage Trust: | |||
| sequential payer Series 2022-B36 Class A5, 4.4699% 7/15/55 | 100,000 | 89,997 | |
| Series 2020-B18 Class AGNG, 4.5348% 7/15/53 (b)(e) | 63,000 | 53,318 | |
| Series 2020-IG2 Class D, 3.4028% 9/15/48 (b)(e) | 417,000 | 120,238 | |
| Series 2022-B36 Class D, 2.5% 7/15/55 (b) | 250,000 | 111,671 | |
| Series 2023-C5 Class B, 6.6974% 6/15/56 (e) | 250,000 | 243,478 | |
| BMO Mortgage Trust Series 2022-C1: | |||
| Class 360D, 4.0699% 2/17/55 (b)(e) | 84,000 | 46,546 | |
| Class 360E, 4.0699% 2/17/55 (b)(e) | 105,000 | 55,655 | |
| BPR Trust floater Series 2021-TY Class E, CME Term SOFR 1 Month Index + 3.710% 9.0475% 9/15/38 (b)(e)(g) | 100,000 | 92,993 | |
| BX Commercial Mortgage Trust: | |||
| floater: | |||
Series 2021-CIP Class F, CME Term SOFR 1 Month Index + 3.330% 8.6655% 12/15/38 (b)(e)(g) | 210,000 | 199,500 | |
Series 2021-PAC Class G, CME Term SOFR 1 Month Index + 3.060% 8.3926% 10/15/36 (b)(e)(g) | 198,000 | 185,640 | |
Series 2021-VINO: | |||
| Class F, CME Term SOFR 1 Month Index + 2.910% 8.2488% 5/15/38 (b)(e)(g) | 251,691 | 236,521 | |
| Class G, CME Term SOFR 1 Month Index + 4.060% 9.3988% 5/15/38 (b)(e)(g) | 151,922 | 144,235 | |
| Series 2020-VIVA Class E, 3.667% 3/11/44 (b)(e) | 789,000 | 606,472 | |
| BX Trust: | |||
| floater: | |||
Series 2019-XL: | |||
| Class G, CME Term SOFR 1 Month Index + 2.410% 7.7467% 10/15/36 (b)(e)(g) | 386,750 | 380,386 | |
| Class J, CME Term SOFR 1 Month Index + 2.760% 8.0967% 10/15/36 (b)(e)(g) | 145,350 | 142,379 | |
Series 2021-ARIA Class F, CME Term SOFR 1 Month Index + 2.700% 8.04% 10/15/36 (b)(e)(g) | 27,000 | 25,382 | |
Series 2021-MFM1: | |||
| Class F, CME Term SOFR 1 Month Index + 3.110% 8.4465% 1/15/34 (b)(e)(g) | 303,826 | 293,321 | |
| Class G, CME Term SOFR 1 Month Index + 4.010% 9.3465% 1/15/34 (b)(e)(g) | 153,722 | 145,339 | |
Series 2021-SOAR: | |||
| Class F, CME Term SOFR 1 Month Index + 2.460% 7.7975% 6/15/38 (b)(e)(g) | 444,706 | 425,024 | |
| Class J, CME Term SOFR 1 Month Index + 3.860% 9.1975% 6/15/38 (b)(e)(g) | 557,043 | 526,158 | |
Series 2021-VOLT: | |||
| Class F, CME Term SOFR 1 Month Index + 2.510% 7.8467% 9/15/36 (b)(e)(g) | 100,000 | 93,912 | |
| Class G, CME Term SOFR 1 Month Index + 2.960% 8.2967% 9/15/36 (b)(e)(g) | 105,000 | 98,430 | |
Series 2022-LBA6: | |||
| Class F, CME Term SOFR 1 Month Index + 3.350% 8.6822% 1/15/39 (b)(e)(g) | 100,000 | 95,216 | |
| Class G, CME Term SOFR 1 Month Index + 4.200% 9.5322% 1/15/39 (b)(e)(g) | 100,000 | 94,750 | |
Series 2022-VAMF Class F, CME Term SOFR 1 Month Index + 3.290% 8.6312% 1/15/39 (b)(e)(g) | 157,000 | 146,803 | |
| sequential payer Series 2019-OC11 Class A, 3.202% 12/9/41 (b) | 500,000 | 421,560 | |
| Series 2019-OC11 Class E, 4.0755% 12/9/41 (b)(e) | 284,000 | 226,357 | |
| Camb Commercial Mortgage Trust sequential payer Series 2021-CX2 Class A, 2.7% 11/10/46 (b) | 500,000 | 385,143 | |
| Citigroup Commercial Mortgage Series 2023-SMRT Class C, 6.0475% 10/12/40 (b)(e) | 250,000 | 236,295 | |
| COMM Mortgage Trust: | |||
| sequential payer Series 2013-LC6 Class E, 3.5% 1/10/46 (b) | 150,000 | 120,075 | |
| Series 2012-CR1 Class G, 2.462% 5/15/45 (b)(d) | 11,405 | 227 | |
| Series 2017-CD4 Class D, 3.3% 5/10/50 (b) | 313,000 | 206,328 | |
| Series 2019-CD4 Class C, 4.3497% 5/10/50 (e) | 232,000 | 169,060 | |
| Credit Suisse Commercial Mortgage Trust floater Series 2021-SOP2 Class F, CME Term SOFR 1 Month Index + 4.330% 9.6636% 6/15/34 (b)(g) | 80,000 | 57,065 | |
| Credit Suisse Mortgage Trust floater Series 2021-4SZN Class A, CME Term SOFR 1 Month Index + 3.960% 9.2995% 11/15/23 (b)(e)(g) | 141,000 | 136,298 | |
| CSAIL Commercial Mortgage Trust: | |||
| Series 2017-C8 Class D, 4.5811% 6/15/50 (b)(e) | 156,000 | 101,064 | |
| Series 2019-C16 Class C, 4.2371% 6/15/52 (e) | 750,000 | 570,711 | |
| ELP Commercial Mortgage Trust floater Series 2021-ELP: | |||
| Class F, CME Term SOFR 1 Month Index + 2.780% 8.1145% 11/15/38 (b)(e)(g) | 479,000 | 459,768 | |
| Class J, CME Term SOFR 1 Month Index + 3.720% 9.0624% 11/15/38 (b)(e)(g) | 210,000 | 197,511 | |
| GS Mortgage Securities Corp. Trust floater Series 2019-70P: | |||
| Class E, CME Term SOFR 1 Month Index + 2.310% 7.6475% 10/15/36 (b)(e)(g) | 139,000 | 124,119 | |
| Class F, CME Term SOFR 1 Month Index + 2.760% 8.0975% 10/15/36 (b)(e)(g) | 218,000 | 191,485 | |
| GS Mortgage Securities Trust: | |||
| Series 2011-GC5: | |||
Class E, 5.2986% 8/10/44 (b)(e) | 63,000 | 6,333 | |
Class F, 4.5% 8/10/44 (b)(d) | 42,000 | 147 | |
| Series 2013-GC16 Class F, 3.5% 11/10/46 (b) | 269,000 | 221,440 | |
| Hilton U.S.A. Trust Series 2016-HHV: | |||
| Class E, 4.3333% 11/5/38 (b)(e) | 900,000 | 807,257 | |
| Class F, 4.3333% 11/5/38 (b)(e) | 163,000 | 144,468 | |
| ILPT Commercial Mortgage Trust floater Series 2022-LPF2 Class D, CME Term SOFR 1 Month Index + 4.190% 9.5242% 10/15/39 (b)(e)(g) | 231,000 | 228,720 | |
| Independence Plaza Trust Series 2018-INDP Class E, 4.996% 7/10/35 (b) | 100,000 | 89,644 | |
| J.P. Morgan Chase Commercial Mortgage Securities Trust floater Series 2022-NXSS Class D, CME Term SOFR 1 Month Index + 4.120% 9.4612% 9/15/39 (b)(e)(g) | 330,000 | 330,099 | |
| JPMBB Commercial Mortgage Securities Trust Series 2014-C23 Class UH5, 4.7094% 9/15/47 (b)(d) | 54,000 | 40,238 | |
| JPMorgan Chase Commercial Mortgage Securities Trust: | |||
| floater Series 2021-MHC Class F, CME Term SOFR 1 Month Index + 3.060% 8.3965% 4/15/38 (b)(e)(g) | 210,000 | 200,896 | |
| sequential payer Series 2021-1MEM Class E, 2.742% 10/9/42 (b)(e) | 100,000 | 52,922 | |
| Series 2011-C3 Class E, 5.7099% 2/15/46 (b)(e) | 200,000 | 75,955 | |
| Series 2012-CBX Class G 4% 6/15/45 (b)(d) | 151,000 | 41,022 | |
| Series 2019-OSB Class C, 3.749% 6/5/39 (b)(e) | 500,000 | 413,417 | |
| KNDR Trust floater Series 2021-KIND Class F, CME Term SOFR 1 Month Index + 4.060% 9.3965% 8/15/38 (b)(e)(g) | 99,282 | 91,083 | |
| Merit floater Series 2021-STOR: | |||
| Class G, CME Term SOFR 1 Month Index + 2.860% 8.1975% 7/15/38 (b)(e)(g) | 105,000 | 99,510 | |
| Class J, CME Term SOFR 1 Month Index + 4.060% 9.3975% 7/15/38 (b)(e)(g) | 100,000 | 94,499 | |
| MHC Commercial Mortgage Trust floater Series 2021-MHC: | |||
| Class F, CME Term SOFR 1 Month Index + 2.710% 8.0474% 4/15/38 (b)(e)(g) | 92,249 | 89,473 | |
| Class G, CME Term SOFR 1 Month Index + 3.310% 8.6474% 4/15/38 (b)(e)(g) | 184,498 | 176,769 | |
| MHP Commercial Mortgage Trust floater Series 2022-MHIL Class F, CME Term SOFR 1 Month Index + 3.250% 8.5914% 1/15/27 (b)(e)(g) | 97,166 | 91,612 | |
| Morgan Stanley Capital I Trust: | |||
| sequential payer Series 2021-L5 Class C, 3.156% 5/15/54 | 513,000 | 329,818 | |
| Series 2011-C2: | |||
Class D, 5.385% 6/15/44 (b)(e) | 199,829 | 182,190 | |
Class F, 5.385% 6/15/44 (b)(d)(e) | 343,000 | 135,050 | |
Class XB, 0.5002% 6/15/44 (b)(e)(f) | 5,355,324 | 18,085 | |
| Series 2011-C3 Class G, 5.1092% 7/15/49 (b)(d)(e) | 112,000 | 80,469 | |
| Series 2017-H1 Class C, 4.281% 6/15/50 | 231,000 | 187,692 | |
| Series 2020-L4, Class C, 3.536% 2/15/53 | 542,000 | 365,904 | |
| MSCCG Trust floater Series 2018-SELF Class E, CME Term SOFR 1 Month Index + 2.190% 7.53% 10/15/37 (b)(e)(g) | 159,928 | 156,604 | |
| MSWF Commercial Mortgage Trust sequential payer Series 2023-1: | |||
| Class A5, 5.752% 5/15/56 | 1,000,000 | 985,237 | |
| Class B, 6.9055% 5/15/56 (e) | 250,000 | 243,667 | |
| OPG Trust floater Series 2021-PORT: | |||
| Class G, CME Term SOFR 1 Month Index + 2.510% 7.8455% 10/15/36 (b)(e)(g) | 207,743 | 195,553 | |
| Class J, CME Term SOFR 1 Month Index + 3.460% 8.7935% 10/15/36 (b)(e)(g) | 61,923 | 58,737 | |
| PKHL Commercial Mortgage Trust floater Series 2021-MF: | |||
| Class E, CME Term SOFR 1 Month Index + 2.710% 8.0475% 7/15/38 (b)(e)(g) | 100,000 | 80,217 | |
| Class G, CME Term SOFR 1 Month Index + 4.460% 9.7975% 7/15/38 (b)(d)(e)(g) | 100,000 | 76,228 | |
| Prima Capital CRE Securitization Ltd. Series 2020-8A Class C, 3% 12/1/70 (b) | 350,000 | 259,848 | |
| Prima Capital Ltd. floater Series 2021-9A Class C, CME Term SOFR 1 Month Index + 2.460% 7.7893% 12/15/37 (b)(e)(g) | 250,000 | 237,636 | |
| Providence Place Group Ltd. Partnership Series 2000-C1 Class A2, 7.75% 7/20/28 (b) | 164,358 | 164,259 | |
| SG Commercial Mortgage Securities Trust Series 2020-COVE: | |||
| Class F, 3.8518% 3/15/37 (b)(e) | 150,000 | 129,453 | |
| Class G, 3.8518% 3/15/37 (b)(e) | 100,000 | 85,168 | |
| SREIT Trust floater: | |||
| Series 2021-IND Class G, CME Term SOFR 1 Month Index + 3.380% 8.7123% 10/15/38 (b)(e)(g) | 198,000 | 183,761 | |
| Series 2021-MFP Class G, CME Term SOFR 1 Month Index + 3.080% 8.4205% 11/15/38 (b)(e)(g) | 126,000 | 120,960 | |
| Series 2021-MFP2: | |||
Class F, CME Term SOFR 1 Month Index + 2.730% 8.0647% 11/15/36 (b)(e)(g) | 100,000 | 95,483 | |
Class J, CME Term SOFR 1 Month Index + 4.020% 9.362% 11/15/36 (b)(e)(g) | 128,000 | 122,248 | |
| Series 2021-PALM Class G, CME Term SOFR 1 Month Index + 3.730% 9.0626% 10/15/34 (b)(e)(g) | 164,000 | 154,951 | |
| STWD Trust floater sequential payer Series 2021-LIH: | |||
| Class F, CME Term SOFR 1 Month Index + 3.660% 8.998% 11/15/36 (b)(e)(g) | 100,000 | 93,856 | |
| Class G, CME Term SOFR 1 Month Index + 4.310% 9.647% 11/15/36 (b)(e)(g) | 42,000 | 39,234 | |
| TPGI Trust floater Series 2021-DGWD Class E, CME Term SOFR 1 Month Index + 2.460% 7.8045% 6/15/26 (b)(e)(g) | 422,007 | 401,873 | |
| Wells Fargo Commercial Mortgage Trust: | |||
| Series 2018-C44 Class D, 3% 5/15/51 (b)(d) | 535,000 | 316,953 | |
| Series 2019-C52: | |||
Class B, 3.375% 8/15/52 | 785,000 | 607,846 | |
Class C, 3.561% 8/15/52 | 100,000 | 72,222 | |
| Series 2020-C58 Class C, 3.162% 7/15/53 | 1,000,000 | 640,778 | |
| WF-RBS Commercial Mortgage Trust Series 2013-C11 Class E, 4.1945% 3/15/45 (b)(d)(e) | 220,000 | 115,815 | |
| WFCM Series 2022-C62: | |||
| Class C, 4.496% 4/15/55 (e) | 500,000 | 359,819 | |
| Class D, 2.5% 4/15/55 (b) | 294,000 | 134,151 | |
| WP Glimcher Mall Trust Series 2015-WPG Class PR1, 3.6332% 6/5/35 (b)(e) | 140,000 | 113,413 | |
| TOTAL COMMERCIAL MORTGAGE SECURITIES (Cost $25,469,059) | 21,814,982 | ||
| Common Stocks - 15.2% | |||
| Shares | Value ($) | ||
| COMMUNICATION SERVICES - 0.0% | |||
| Diversified Telecommunication Services - 0.0% | |||
| Cellnex Telecom SA (b) | 7,472 | 260,455 | |
| Helios Towers PLC (h) | 24,453 | 21,899 | |
| 282,354 | |||
| CONSUMER STAPLES - 0.5% | |||
| Food Products - 0.5% | |||
| Archer Daniels Midland Co. | 3,730 | 281,317 | |
| Bunge Ltd. | 7,000 | 757,750 | |
| Darling Ingredients, Inc. (h) | 15,300 | 798,660 | |
| Pilgrim's Pride Corp. (h) | 9,180 | 209,579 | |
| Wilmar International Ltd. | 172,560 | 470,848 | |
| 2,518,154 | |||
| ENERGY - 6.7% | |||
| Energy Equipment & Services - 0.7% | |||
| Diamond Offshore Drilling, Inc. (h) | 53,540 | 785,967 | |
| Noble Corp. PLC | 29,870 | 1,512,916 | |
| Valaris Ltd. (h) | 9,560 | 716,809 | |
| Weatherford International PLC (h) | 6,880 | 621,470 | |
| 3,637,162 | |||
| Oil, Gas & Consumable Fuels - 6.0% | |||
| Antero Resources Corp. (h) | 93,761 | 2,379,654 | |
| ARC Resources Ltd. | 114,320 | 1,824,743 | |
| Canadian Natural Resources Ltd. | 44,250 | 2,861,712 | |
| Cenovus Energy, Inc. (Canada) | 119,970 | 2,497,884 | |
| Cheniere Energy, Inc. | 2,158 | 358,142 | |
| Energy Transfer LP | 169,310 | 2,375,419 | |
| Enterprise Products Partners LP | 61,881 | 1,693,683 | |
| Exxon Mobil Corp. | 62,650 | 7,366,387 | |
| Hess Corp. | 6,020 | 921,060 | |
| MEG Energy Corp. (h) | 20,860 | 405,912 | |
| Ovintiv, Inc. | 14,590 | 694,046 | |
| Petroleo Brasileiro SA - Petrobras (ON) | 136,930 | 1,032,175 | |
| Range Resources Corp. | 39,960 | 1,295,104 | |
| Shell PLC (London) | 89,161 | 2,825,889 | |
| Southwestern Energy Co. (h) | 76,040 | 490,458 | |
| Suncor Energy, Inc. | 20,870 | 717,716 | |
| Targa Resources Corp. | 2,680 | 229,730 | |
| The Williams Companies, Inc. | 7,821 | 263,489 | |
| TotalEnergies SE | 38,550 | 2,534,638 | |
| 32,767,841 | |||
TOTAL ENERGY | 36,405,003 | ||
| HEALTH CARE - 0.1% | |||
| Pharmaceuticals - 0.1% | |||
| Bayer AG | 11,570 | 555,643 | |
| INDUSTRIALS - 0.5% | |||
| Commercial Services & Supplies - 0.1% | |||
| GFL Environmental, Inc. | 9,540 | 302,990 | |
| Republic Services, Inc. | 1,725 | 245,830 | |
| Waste Connections, Inc. (United States) | 1,584 | 212,731 | |
| 761,551 | |||
| Construction & Engineering - 0.0% | |||
| Ferrovial SE | 3,504 | 107,322 | |
| VINCI SA | 376 | 41,597 | |
| 148,919 | |||
| Ground Transportation - 0.1% | |||
| Canadian Pacific Kansas City Ltd. | 515 | 38,321 | |
| CSX Corp. | 2,462 | 75,707 | |
| Norfolk Southern Corp. | 165 | 32,493 | |
| Union Pacific Corp. | 394 | 80,230 | |
| 226,751 | |||
| Machinery - 0.1% | |||
| Epiroc AB (A Shares) | 16,570 | 314,619 | |
| Sandvik AB | 15,810 | 290,910 | |
| 605,529 | |||
| Marine Transportation - 0.1% | |||
| Kirby Corp. (h) | 4,762 | 394,294 | |
| Transportation Infrastructure - 0.1% | |||
| Aena SME SA (b) | 3,346 | 504,456 | |
| Grupo Aeroportuario del Pacifico S.A.B. de CV sponsored ADR | 1,155 | 189,847 | |
| 694,303 | |||
TOTAL INDUSTRIALS | 2,831,347 | ||
| MATERIALS - 6.9% | |||
| Chemicals - 1.2% | |||
| Corteva, Inc. | 51,310 | 2,625,020 | |
| FMC Corp. | 15,860 | 1,062,144 | |
| Livent Corp. (h) | 12,010 | 221,104 | |
| Nutrien Ltd. | 31,640 | 1,953,958 | |
| OCI NV | 10,140 | 282,914 | |
| 6,145,140 | |||
| Containers & Packaging - 0.1% | |||
| Billerud AB | 4,300 | 39,889 | |
| Smurfit Kappa Group PLC | 18,550 | 618,954 | |
| 658,843 | |||
| Metals & Mining - 4.4% | |||
| Agnico Eagle Mines Ltd. (Canada) | 25,875 | 1,175,781 | |
| Alamos Gold, Inc. | 75,320 | 849,551 | |
| Anglo American PLC (United Kingdom) | 10,100 | 277,342 | |
| BHP Group Ltd. (London) | 69,304 | 1,978,230 | |
| Champion Iron Ltd. | 365,230 | 1,460,113 | |
| ERO Copper Corp. (h) | 30,590 | 527,457 | |
| First Quantum Minerals Ltd. | 107,485 | 2,539,439 | |
| Franco-Nevada Corp. | 4,810 | 642,148 | |
| Glencore PLC | 451,130 | 2,568,965 | |
| IGO Ltd. | 17,193 | 139,947 | |
| Ivanhoe Mines Ltd. (h) | 67,070 | 574,780 | |
| Reliance Steel & Aluminum Co. | 10,880 | 2,853,062 | |
| Rio Tinto PLC | 13,856 | 870,053 | |
| Sigma Lithium Corp. (h) | 12,655 | 410,528 | |
| Sumitomo Metal Mining Co. Ltd. | 6,710 | 197,047 | |
| Teck Resources Ltd. Class B (sub. vtg.) | 89,240 | 3,840,950 | |
| Vale SA | 54,310 | 730,177 | |
| Wheaton Precious Metals Corp. | 59,130 | 2,399,592 | |
| 24,035,162 | |||
| Paper & Forest Products - 1.2% | |||
| Holmen AB (B Shares) | 3,484 | 135,781 | |
| Interfor Corp. (h) | 27,560 | 408,860 | |
| Mondi PLC | 13 | 218 | |
| Stora Enso Oyj (R Shares) | 78,780 | 990,320 | |
| Suzano Papel e Celulose SA | 74,220 | 801,476 | |
| Svenska Cellulosa AB SCA (B Shares) | 74,480 | 1,022,216 | |
| UPM-Kymmene Corp. | 57,160 | 1,962,240 | |
| West Fraser Timber Co. Ltd. | 16,990 | 1,233,487 | |
| 6,554,598 | |||
TOTAL MATERIALS | 37,393,743 | ||
| REAL ESTATE - 0.1% | |||
| Equity Real Estate Investment Trusts (REITs) - 0.1% | |||
| American Tower Corp. | 982 | 161,490 | |
| CBL & Associates Properties, Inc. | 30 | 629 | |
| Crown Castle International Corp. | 632 | 58,163 | |
| Equinix, Inc. | 241 | 175,029 | |
| Londonmetric Properity PLC | 18,804 | 39,462 | |
| Prologis (REIT), Inc. | 1,018 | 114,230 | |
| Segro PLC | 7,392 | 64,883 | |
| 613,886 | |||
| UTILITIES - 0.4% | |||
| Electric Utilities - 0.3% | |||
| Constellation Energy Corp. | 1,217 | 132,750 | |
| Exelon Corp. | 5,141 | 194,278 | |
| Iberdrola SA | 25,547 | 285,729 | |
| Kansai Electric Power Co., Inc. | 11,565 | 160,112 | |
| NextEra Energy, Inc. | 7,223 | 413,806 | |
| Southern Co. | 5,658 | 366,186 | |
| 1,552,861 | |||
| Independent Power and Renewable Electricity Producers - 0.0% | |||
| EDP Renovaveis SA | 5,073 | 83,214 | |
| RWE AG | 4,138 | 153,778 | |
| 236,992 | |||
| Multi-Utilities - 0.1% | |||
| National Grid PLC | 22,965 | 274,647 | |
| Sempra | 2,185 | 148,646 | |
| WEC Energy Group, Inc. | 2,096 | 168,833 | |
| 592,126 | |||
TOTAL UTILITIES | 2,381,979 | ||
| TOTAL COMMON STOCKS (Cost $75,872,831) | 82,982,109 | ||
| Preferred Stocks - 2.8% | |||
| Shares | Value ($) | ||
| Convertible Preferred Stocks - 0.1% | |||
| FINANCIALS - 0.1% | |||
| Mortgage Real Estate Investment Trusts - 0.1% | |||
| Great Ajax Corp. 7.25% | 16,367 | 394,445 | |
| REAL ESTATE - 0.0% | |||
| Equity Real Estate Investment Trusts (REITs) - 0.0% | |||
| Braemar Hotels & Resorts, Inc. 5.50% | 2,700 | 32,265 | |
| RLJ Lodging Trust Series A, 1.95% | 400 | 9,620 | |
| 41,885 | |||
| TOTAL CONVERTIBLE PREFERRED STOCKS | 436,330 | ||
| Nonconvertible Preferred Stocks - 2.7% | |||
| FINANCIALS - 1.1% | |||
| Mortgage Real Estate Investment Trusts - 1.1% | |||
| AGNC Investment Corp.: | |||
| 6.125%(e) | 7,000 | 151,480 | |
| Series C, 3 month U.S. LIBOR + 5.110% 7.00%(e)(g) | 14,200 | 363,236 | |
| Series E, 6.50%(e) | 17,400 | 410,988 | |
| Series G, 7.75%(e) | 16,000 | 350,400 | |
| Annaly Capital Management, Inc.: | |||
| 6.75%(e) | 8,600 | 204,250 | |
| Series F, 3 month U.S. LIBOR + 4.990% 6.95%(e)(g) | 18,800 | 475,640 | |
| Series G, 3 month U.S. LIBOR + 4.170% 6.50%(e)(g) | 23,000 | 569,710 | |
| Arbor Realty Trust, Inc.: | |||
| Series D, 6.375% | 1,500 | 26,715 | |
| Series F, 6.25%(e) | 13,000 | 240,500 | |
| Armour Residential REIT, Inc. Series C 7.00% | 1,000 | 20,270 | |
| Cherry Hill Mortgage Investment Corp. Series A, 8.20% | 1,600 | 31,776 | |
| Chimera Investment Corp.: | |||
| 8.00%(e) | 5,000 | 103,150 | |
| Series B, 8.00%(e) | 23,287 | 493,452 | |
| Series C, 7.75%(e) | 8,700 | 158,775 | |
| Dynex Capital, Inc. Series C 6.90% (e) | 23,400 | 529,308 | |
| Ellington Financial LLC 6.75% (e) | 2,000 | 45,380 | |
| MFA Financial, Inc.: | |||
| 6.50%(e) | 9,300 | 177,723 | |
| Series B, 7.50% | 15,886 | 289,761 | |
| PennyMac Mortgage Investment Trust: | |||
| 6.75% | 1,300 | 22,529 | |
| 8.125%(e) | 5,700 | 123,436 | |
| Series B, 8.00%(e) | 9,300 | 196,695 | |
| Rithm Capital Corp.: | |||
| 7.125%(e) | 6,200 | 141,174 | |
| Series A, 7.50%(e) | 14,700 | 340,011 | |
| Series C, 6.375%(e) | 10,300 | 203,322 | |
| Series D, 7.00%(e) | 2,700 | 55,242 | |
| Two Harbors Investment Corp.: | |||
| Series A, 8.125%(e) | 6,938 | 146,947 | |
| Series B, 7.625%(e) | 6,320 | 127,474 | |
| 5,999,344 | |||
| REAL ESTATE - 1.6% | |||
| Equity Real Estate Investment Trusts (REITs) - 1.3% | |||
| Agree Realty Corp. 4.375% | 1,500 | 25,050 | |
| American Homes 4 Rent Series G, 5.875% | 5,200 | 113,100 | |
| Armada Hoffler Properties, Inc. 6.75% | 6,000 | 127,200 | |
| Ashford Hospitality Trust, Inc.: | |||
| Series H, 7.50% | 2,300 | 24,541 | |
| Series I, 7.50% | 1,200 | 12,240 | |
| Cedar Realty Trust, Inc.: | |||
| 7.25% | 1,673 | 26,350 | |
| Series C, 6.50% | 4,900 | 62,743 | |
| CTO Realty Growth, Inc. 6.375% | 1,000 | 18,290 | |
| DiamondRock Hospitality Co. 8.25% | 11,337 | 287,846 | |
| Digital Realty Trust, Inc.: | |||
| 5.25% | 5,800 | 118,668 | |
| Series L, 5.20% | 12,700 | 253,873 | |
| Gladstone Commercial Corp.: | |||
| 6.625% | 3,600 | 75,240 | |
| Series G, 6.00% | 18,200 | 327,418 | |
| Global Medical REIT, Inc. Series A, 7.50% | 2,100 | 53,025 | |
| Global Net Lease, Inc.: | |||
| 7.50% | 16,700 | 303,105 | |
| Series A, 7.25% | 9,300 | 175,584 | |
| Series B 6.875% | 2,200 | 38,918 | |
| Series E, 7.375% | 10,000 | 179,800 | |
| Healthcare Trust, Inc.: | |||
| 7.125% | 2,000 | 37,717 | |
| Series A 7.375% | 4,200 | 70,350 | |
| Hudson Pacific Properties, Inc. Series C, 4.75% | 18,100 | 225,164 | |
| Kimco Realty Corp.: | |||
| 5.125% | 11,600 | 246,616 | |
| Series M, 5.25% | 16,500 | 358,050 | |
| National Storage Affiliates Trust Series A, 6.00% | 200 | 4,506 | |
| Pebblebrook Hotel Trust: | |||
| 6.30% | 10,273 | 204,946 | |
| 6.375% | 17,200 | 338,496 | |
| 6.375% | 8,700 | 174,000 | |
| Series H, 5.70% | 10,600 | 196,100 | |
| Pennsylvania (REIT): | |||
| Series B, 7.375%(h) | 4,082 | 2,049 | |
| Series D, 6.875%(h) | 2,500 | 1,225 | |
| Public Storage: | |||
| 4.00% | 1,200 | 20,772 | |
| 4.00% | 5,400 | 93,042 | |
| Series F, 5.15% | 3,200 | 72,896 | |
| Series G, 5.05% | 6,000 | 138,720 | |
| Series I, 4.875% | 6,000 | 126,420 | |
| Series J, 4.70% | 26,500 | 518,075 | |
| Series K, 4.75% | 20,400 | 403,104 | |
| Series L, 4.625% | 23,400 | 460,746 | |
| Series M, 4.125% | 1,000 | 17,930 | |
| Series S, 4.10% | 13,000 | 221,000 | |
| Regency Centers Corp.: | |||
| 5.875% | 2,000 | 46,200 | |
| Series A, 6.25% | 4,500 | 109,980 | |
| Rexford Industrial Realty, Inc.: | |||
| Series B, 5.875% | 1,200 | 25,440 | |
| Series C, 5.625% | 4,400 | 91,255 | |
| Saul Centers, Inc. Series D, 6.125% | 1,300 | 27,300 | |
| SITE Centers Corp. 6.375% | 5,500 | 125,125 | |
| Sotherly Hotels, Inc. Series C, 7.875% | 1,700 | 38,845 | |
| Spirit Realty Capital, Inc. Series A, 6.00% | 6,700 | 140,298 | |
| Summit Hotel Properties, Inc.: | |||
| Series E, 6.25% | 6,800 | 133,960 | |
| Series F, 5.875% | 4,000 | 74,458 | |
| Sunstone Hotel Investors, Inc.: | |||
| Series H, 6.125% | 3,500 | 73,500 | |
| Series I, 5.70% | 9,600 | 198,336 | |
| UMH Properties, Inc. Series D, 6.375% | 3,900 | 82,446 | |
| Vornado Realty Trust Series L, 5.40% | 1,000 | 14,450 | |
| 7,336,508 | |||
| Real Estate Management & Development - 0.3% | |||
| Digitalbridge Group, Inc.: | |||
| Series H, 7.125% | 12,830 | 283,800 | |
| Series I, 7.15% | 22,600 | 481,380 | |
| Series J, 7.15% | 30,200 | 649,904 | |
| 1,415,084 | |||
TOTAL REAL ESTATE | 8,751,592 | ||
| TOTAL NONCONVERTIBLE PREFERRED STOCKS | 14,750,936 | ||
| TOTAL PREFERRED STOCKS (Cost $17,145,361) | 15,187,266 | ||
| Bank Loan Obligations - 0.0% | |||
Principal Amount (a) | Value ($) | ||
| FINANCIALS - 0.0% | |||
| Financial Services - 0.0% | |||
Walker & Dunlop, Inc. Tranche B 1LN, term loan CME Term SOFR 1 Month Index + 2.250% 7.6661% 12/16/28 (e)(g)(i) (Cost $4,903) | 4,913 | 4,888 | |
| Equity Funds - 23.7% | |||
| Shares | Value ($) | ||
| Fidelity Commodity Strategy Central Fund (j) | 851,372 | 80,369,516 | |
| Fidelity Real Estate Equity Central Fund (j) | 435,243 | 48,764,668 | |
| TOTAL EQUITY FUNDS (Cost $150,828,944) | 129,134,184 | ||
| Fixed-Income Funds - 25.6% | |||
| Shares | Value ($) | ||
Fidelity Floating Rate Central Fund (j) (Cost $140,223,287) | 1,419,289 | 139,118,660 | |
| Preferred Securities - 0.0% | |||
Principal Amount (a) | Value ($) | ||
| FINANCIALS - 0.0% | |||
| Financial Services - 0.0% | |||
Crest Clarendon Street 2002-1 Ltd. Series 2002-1A Class PS, 12/28/35 (b)(d) (Cost $594,368) | 500,000 | 0 | |
| Money Market Funds - 1.0% | |||
| Shares | Value ($) | ||
Fidelity Cash Central Fund 5.39% (k) (Cost $5,257,233) | 5,256,181 | 5,257,233 | |
| TOTAL INVESTMENT IN SECURITIES - 99.9% (Cost $583,869,553) | 543,518,970 |
NET OTHER ASSETS (LIABILITIES) - 0.1% | 686,297 |
| NET ASSETS - 100.0% | 544,205,267 |
| (a) | Amount is stated in United States dollars unless otherwise noted. |
| (b) | Security exempt from registration under Rule 144A of the Securities Act of 1933. These securities may be resold in transactions exempt from registration, normally to qualified institutional buyers. At the end of the period, the value of these securities amounted to $21,902,717 or 4.0% of net assets. |
| (c) | Non-income producing - Security is in default. |
| (d) | Level 3 security |
| (e) | Coupon rates for floating and adjustable rate securities reflect the rates in effect at period end. |
| (f) | Interest Only (IO) security represents the right to receive only monthly interest payments on an underlying pool of mortgages or assets. Principal shown is the outstanding par amount of the pool as of the end of the period. |
| (g) | Coupon is indexed to a floating interest rate which may be multiplied by a specified factor and/or subject to caps or floors. |
| (h) | Non-income producing |
| (i) | Remaining maturities of bank loan obligations may be less than the stated maturities shown as a result of contractual or optional prepayments by the borrower. Such prepayments cannot be predicted with certainty. |
| (j) | Affiliated fund that is generally available only to investment companies and other accounts managed by Fidelity Investments. A complete unaudited schedule of portfolio holdings for each Fidelity Central Fund is filed with the SEC for the first and third quarters of each fiscal year on Form N-PORT and is available upon request or at the SEC's website at www.sec.gov. An unaudited holdings listing for the Fund, which presents direct holdings as well as the pro-rata share of securities and other investments held indirectly through its investment in underlying non-money market Fidelity Central Funds, other than the Commodity Strategy Central Fund, is available at fidelity.com and/or institutional.fidelity.com, as applicable. In addition, each Fidelity Central Fund's financial statements,which are not covered by the Fund's Report of Independent Registered Public Accounting Firm, are available on the SEC's website or upon request. |
| (k) | Affiliated fund that is generally available only to investment companies and other accounts managed by Fidelity Investments. The rate quoted is the annualized seven-day yield of the fund at period end. A complete unaudited listing of the fund's holdings as of its most recent quarter end is available upon request. In addition, each Fidelity Central Fund's financial statements, which are not covered by the Fund's Report of Independent Registered Public Accounting Firm, are available on the SEC's website or upon request. |
| Affiliate | Value, beginning of period ($) | Purchases ($) | Sales Proceeds ($) | Dividend Income ($) | Realized Gain (loss) ($) | Change in Unrealized appreciation (depreciation) ($) | Value, end of period ($) | % ownership, end of period |
| Fidelity Cash Central Fund 5.39% | 2,251,280 | 209,796,067 | 206,790,114 | 319,906 | - | - | 5,257,233 | 0.0% |
| Fidelity Commodity Strategy Central Fund | 131,037,841 | 7,744,500 | 50,888,674 | 5,216,479 | (26,487,341) | 18,963,190 | 80,369,516 | 35.3% |
| Fidelity Floating Rate Central Fund | 227,782,537 | 18,980,255 | 115,303,327 | 16,477,374 | (5,777,019) | 13,436,214 | 139,118,660 | 9.4% |
| Fidelity Real Estate Equity Central Fund | 76,562,386 | 5,948,259 | 36,993,038 | 1,898,935 | (5,739,973) | 8,987,034 | 48,764,668 | 5.3% |
| Fidelity Securities Lending Cash Central Fund 5.39% | - | 11,586,670 | 11,586,670 | 1,504 | - | - | - | 0.0% |
| Total | 437,634,044 | 254,055,751 | 421,561,823 | 23,914,198 | (38,004,333) | 41,386,438 | 273,510,077 | |
| Valuation Inputs at Reporting Date: | ||||
| Description | Total ($) | Level 1 ($) | Level 2 ($) | Level 3 ($) |
Investments in Securities: | ||||
| Equities: | ||||
Communication Services | 282,354 | 282,354 | - | - |
Consumer Staples | 2,518,154 | 2,518,154 | - | - |
Energy | 36,405,003 | 31,044,476 | 5,360,527 | - |
Financials | 6,393,789 | 5,999,344 | 394,445 | - |
Health Care | 555,643 | - | 555,643 | - |
Industrials | 2,831,347 | 2,184,221 | 647,126 | - |
Materials | 37,393,743 | 33,480,336 | 3,913,407 | - |
Real Estate | 9,407,363 | 9,365,478 | 41,885 | - |
Utilities | 2,381,979 | 1,661,491 | 720,488 | - |
| Corporate Bonds | 19,816,889 | - | 19,816,889 | - |
| U.S. Government and Government Agency Obligations | 127,632,853 | - | 127,632,853 | - |
| Asset-Backed Securities | 2,569,906 | - | 2,569,905 | 1 |
| Commercial Mortgage Securities | 21,814,982 | - | 20,932,135 | 882,847 |
| Bank Loan Obligations | 4,888 | - | 4,888 | - |
| Equity Funds | 129,134,184 | 129,134,184 | - | - |
| Fixed-Income Funds | 139,118,660 | 139,118,660 | - | - |
| Preferred Securities | - | - | - | - |
| Money Market Funds | 5,257,233 | 5,257,233 | - | - |
| Total Investments in Securities: | 543,518,970 | 360,045,931 | 182,590,191 | 882,848 |
| Statement of Assets and Liabilities | ||||
| September 30, 2023 | ||||
| Assets | ||||
| Investment in securities, at value - See accompanying schedule: | ||||
Unaffiliated issuers (cost $287,560,089) | $ | 270,008,893 | ||
Fidelity Central Funds (cost $296,309,464) | 273,510,077 | |||
| Total Investment in Securities (cost $583,869,553) | $ | 543,518,970 | ||
| Foreign currency held at value (cost $24,852) | 24,834 | |||
| Receivable for investments sold | 8,418,632 | |||
| Receivable for fund shares sold | 319,823 | |||
| Dividends receivable | 310,272 | |||
| Interest receivable | 557,097 | |||
| Distributions receivable from Fidelity Central Funds | 1,173,016 | |||
| Prepaid expenses | 856 | |||
| Receivable from investment adviser for expense reductions | 60,684 | |||
| Other receivables | 49 | |||
Total assets | 554,384,233 | |||
| Liabilities | ||||
| Payable to custodian bank | $ | 2,144,476 | ||
| Payable for investments purchased | 6,936,953 | |||
| Payable for fund shares redeemed | 621,349 | |||
| Accrued management fee | 256,610 | |||
| Distribution and service plan fees payable | 22,574 | |||
| Other affiliated payables | 80,190 | |||
| Other payables and accrued expenses | 116,814 | |||
| Total Liabilities | 10,178,966 | |||
| Net Assets | $ | 544,205,267 | ||
| Net Assets consist of: | ||||
| Paid in capital | $ | 867,858,795 | ||
| Total accumulated earnings (loss) | (323,653,528) | |||
| Net Assets | $ | 544,205,267 | ||
| Net Asset Value and Maximum Offering Price | ||||
| Class A : | ||||
Net Asset Value and redemption price per share ($54,548,272 ÷ 6,578,056 shares)(a) | $ | 8.29 | ||
| Maximum offering price per share (100/96.00 of $8.29) | $ | 8.64 | ||
| Class M : | ||||
Net Asset Value and redemption price per share ($8,795,661 ÷ 1,059,456 shares)(a) | $ | 8.30 | ||
| Maximum offering price per share (100/96.00 of $8.30) | $ | 8.65 | ||
| Class C : | ||||
Net Asset Value and offering price per share ($10,719,742 ÷ 1,316,051 shares)(a) | $ | 8.15 | ||
| Strategic Real Return : | ||||
Net Asset Value, offering price and redemption price per share ($260,909,048 ÷ 31,286,203 shares) | $ | 8.34 | ||
| Class K6 : | ||||
Net Asset Value, offering price and redemption price per share ($101,687,714 ÷ 12,143,972 shares) | $ | 8.37 | ||
| Class I : | ||||
Net Asset Value, offering price and redemption price per share ($66,742,522 ÷ 8,025,691 shares) | $ | 8.32 | ||
| Class Z : | ||||
Net Asset Value, offering price and redemption price per share ($40,802,308 ÷ 4,902,974 shares) | $ | 8.32 | ||
(a)Redemption price per share is equal to net asset value less any applicable contingent deferred sales charge. | ||||
| Statement of Operations | ||||
Year ended September 30, 2023 | ||||
| Investment Income | ||||
| Dividends | $ | 4,480,353 | ||
| Interest | 9,514,864 | |||
| Income from Fidelity Central Funds (including $1,504 from security lending) | 23,914,198 | |||
| Total Income | 37,909,415 | |||
| Expenses | ||||
| Management fee | $ | 3,987,250 | ||
| Transfer agent fees | 886,660 | |||
| Distribution and service plan fees | 321,647 | |||
| Accounting fees | 312,056 | |||
| Custodian fees and expenses | 79,382 | |||
| Independent trustees' fees and expenses | 2,851 | |||
| Registration fees | 135,737 | |||
| Audit | 114,525 | |||
| Legal | 3,357 | |||
| Miscellaneous | 27,976 | |||
| Total expenses before reductions | 5,871,441 | |||
| Expense reductions | (705,099) | |||
| Total expenses after reductions | 5,166,342 | |||
| Net Investment income (loss) | 32,743,073 | |||
| Realized and Unrealized Gain (Loss) | ||||
| Net realized gain (loss) on: | ||||
| Investment Securities: | ||||
| Unaffiliated issuers (net of foreign taxes of $1) | (19,413,520) | |||
| Fidelity Central Funds | (38,004,333) | |||
| Foreign currency transactions | 7,308 | |||
| Total net realized gain (loss) | (57,410,545) | |||
| Change in net unrealized appreciation (depreciation) on: | ||||
| Investment Securities: | ||||
| Unaffiliated issuers | 26,789,352 | |||
| Fidelity Central Funds | 41,386,438 | |||
| Assets and liabilities in foreign currencies | 5,755 | |||
| Total change in net unrealized appreciation (depreciation) | 68,181,545 | |||
| Net gain (loss) | 10,771,000 | |||
| Net increase (decrease) in net assets resulting from operations | $ | 43,514,073 | ||
| Statement of Changes in Net Assets | ||||
Year ended September 30, 2023 | Year ended September 30, 2022 | |||
| Increase (Decrease) in Net Assets | ||||
| Operations | ||||
| Net investment income (loss) | $ | 32,743,073 | $ | 54,923,514 |
| Net realized gain (loss) | (57,410,545) | (35,123,250) | ||
| Change in net unrealized appreciation (depreciation) | 68,181,545 | (87,906,882) | ||
| Net increase (decrease) in net assets resulting from operations | 43,514,073 | (68,106,618) | ||
| Distributions to shareholders | (63,438,683) | (29,458,119) | ||
| Share transactions - net increase (decrease) | (297,827,803) | 546,656,759 | ||
| Total increase (decrease) in net assets | (317,752,413) | 449,092,022 | ||
| Net Assets | ||||
| Beginning of period | 861,957,680 | 412,865,658 | ||
| End of period | $ | 544,205,267 | $ | 861,957,680 |
| Fidelity Advisor® Strategic Real Return Fund Class A |
| Years ended September 30, | 2023 | 2022 | 2021 | 2020 | 2019 | |||||
Selected Per-Share Data | ||||||||||
| Net asset value, beginning of period | $ | 8.53 | $ | 9.42 | $ | 8.07 | $ | 8.39 | $ | 8.88 |
| Income from Investment Operations | ||||||||||
Net investment income (loss) A,B | .358 | .719 | .568 | .257 | .216 | |||||
| Net realized and unrealized gain (loss) | .050 | (1.078) C | .950 | (.365) | .012 | |||||
| Total from investment operations | .408 | (.359) | 1.518 | (.108) | .228 | |||||
| Distributions from net investment income | (.648) | (.531) | (.168) | (.212) | (.293) | |||||
| Distributions from net realized gain | - | - | - | - | (.425) | |||||
| Total distributions | (.648) | (.531) | (.168) | (.212) | (.718) | |||||
| Net asset value, end of period | $ | 8.29 | $ | 8.53 | $ | 9.42 | $ | 8.07 | $ | 8.39 |
Total Return D,E | 4.93% | (4.09)% C | 19.05% | (1.28)% | 2.86% | |||||
Ratios to Average Net Assets B,F,G | ||||||||||
| Expenses before reductions | 1.05% | 1.06% | 1.11% | 1.12% | 1.10% | |||||
| Expenses net of fee waivers, if any | .95% | .96% | 1.00% | 1.00% | 1.09% | |||||
| Expenses net of all reductions | .95% | .96% | 1.00% | 1.00% | 1.09% | |||||
| Net investment income (loss) | 4.26% | 7.81% | 6.40% | 3.22% | 2.60% | |||||
| Supplemental Data | ||||||||||
| Net assets, end of period (000 omitted) | $ | 54,548 | $ | 76,811 | $ | 37,357 | $ | 25,212 | $ | 29,652 |
Portfolio turnover rate H | 29% | 32% | 13% | 47% | 19% |
| Fidelity Advisor® Strategic Real Return Fund Class M |
| Years ended September 30, | 2023 | 2022 | 2021 | 2020 | 2019 | |||||
Selected Per-Share Data | ||||||||||
| Net asset value, beginning of period | $ | 8.54 | $ | 9.43 | $ | 8.07 | $ | 8.39 | $ | 8.89 |
| Income from Investment Operations | ||||||||||
Net investment income (loss) A,B | .359 | .721 | .567 | .257 | .215 | |||||
| Net realized and unrealized gain (loss) | .050 | (1.080) C | .960 | (.365) | .002 | |||||
| Total from investment operations | .409 | (.359) | 1.527 | (.108) | .217 | |||||
| Distributions from net investment income | (.649) | (.531) | (.167) | (.212) | (.292) | |||||
| Distributions from net realized gain | - | - | - | - | (.425) | |||||
| Total distributions | (.649) | (.531) | (.167) | (.212) | (.717) | |||||
| Net asset value, end of period | $ | 8.30 | $ | 8.54 | $ | 9.43 | $ | 8.07 | $ | 8.39 |
Total Return D,E | 4.94% | (4.09)% C | 19.17% | (1.28)% | 2.73% | |||||
Ratios to Average Net Assets B,F,G | ||||||||||
| Expenses before reductions | 1.06% | 1.06% | 1.12% | 1.14% | 1.12% | |||||
| Expenses net of fee waivers, if any | .95% | .96% | 1.00% | 1.00% | 1.10% | |||||
| Expenses net of all reductions | .95% | .96% | 1.00% | 1.00% | 1.10% | |||||
| Net investment income (loss) | 4.26% | 7.81% | 6.40% | 3.22% | 2.59% | |||||
| Supplemental Data | ||||||||||
| Net assets, end of period (000 omitted) | $ | 8,796 | $ | 11,557 | $ | 7,293 | $ | 6,141 | $ | 7,903 |
Portfolio turnover rate H | 29% | 32% | 13% | 47% | 19% |
| Fidelity Advisor® Strategic Real Return Fund Class C |
| Years ended September 30, | 2023 | 2022 | 2021 | 2020 | 2019 | |||||
Selected Per-Share Data | ||||||||||
| Net asset value, beginning of period | $ | 8.39 | $ | 9.28 | $ | 7.95 | $ | 8.26 | $ | 8.77 |
| Income from Investment Operations | ||||||||||
Net investment income (loss) A,B | .290 | .639 | .491 | .195 | .151 | |||||
| Net realized and unrealized gain (loss) | .055 | (1.057) C | .946 | (.358) | .004 | |||||
| Total from investment operations | .345 | (.418) | 1.437 | (.163) | .155 | |||||
| Distributions from net investment income | (.585) | (.472) | (.107) | (.147) | (.240) | |||||
| Distributions from net realized gain | - | - | - | - | (.425) | |||||
| Total distributions | (.585) | (.472) | (.107) | (.147) | (.665) | |||||
| Net asset value, end of period | $ | 8.15 | $ | 8.39 | $ | 9.28 | $ | 7.95 | $ | 8.26 |
Total Return D,E | 4.22% | (4.78)% C | 18.24% | (2.00)% | 1.99% | |||||
Ratios to Average Net Assets B,F,G | ||||||||||
| Expenses before reductions | 1.80% | 1.79% | 1.88% | 1.89% | 1.86% | |||||
| Expenses net of fee waivers, if any | 1.70% | 1.71% | 1.75% | 1.75% | 1.85% | |||||
| Expenses net of all reductions | 1.70% | 1.71% | 1.75% | 1.75% | 1.85% | |||||
| Net investment income (loss) | 3.51% | 7.07% | 5.65% | 2.47% | 1.83% | |||||
| Supplemental Data | ||||||||||
| Net assets, end of period (000 omitted) | $ | 10,720 | $ | 13,730 | $ | 4,549 | $ | 5,694 | $ | 8,555 |
Portfolio turnover rate H | 29% | 32% | 13% | 47% | 19% |
| Fidelity® Strategic Real Return Fund |
| Years ended September 30, | 2023 | 2022 | 2021 | 2020 | 2019 | |||||
Selected Per-Share Data | ||||||||||
| Net asset value, beginning of period | $ | 8.58 | $ | 9.47 | $ | 8.10 | $ | 8.43 | $ | 8.92 |
| Income from Investment Operations | ||||||||||
Net investment income (loss) A,B | .382 | .749 | .593 | .278 | .239 | |||||
| Net realized and unrealized gain (loss) | .050 | (1.087) C | .965 | (.376) | .009 | |||||
| Total from investment operations | .432 | (.338) | 1.558 | (.098) | .248 | |||||
| Distributions from net investment income | (.672) | (.552) | (.188) | (.232) | (.313) | |||||
| Distributions from net realized gain | - | - | - | - | (.425) | |||||
| Total distributions | (.672) | (.552) | (.188) | (.232) | (.738) | |||||
| Net asset value, end of period | $ | 8.34 | $ | 8.58 | $ | 9.47 | $ | 8.10 | $ | 8.43 |
Total Return D | 5.21% | (3.85)% C | 19.51% | (1.14)% | 3.10% | |||||
Ratios to Average Net Assets B,E,F | ||||||||||
| Expenses before reductions | .79% | .78% | .85% | .87% | .83% | |||||
| Expenses net of fee waivers, if any | .70% | .71% | .75% | .75% | .83% | |||||
| Expenses net of all reductions | .70% | .71% | .75% | .75% | .83% | |||||
| Net investment income (loss) | 4.51% | 8.06% | 6.64% | 3.47% | 2.86% | |||||
| Supplemental Data | ||||||||||
| Net assets, end of period (000 omitted) | $ | 260,909 | $ | 387,040 | $ | 236,076 | $ | 158,896 | $ | 197,152 |
Portfolio turnover rate G | 29% | 32% | 13% | 47% | 19% |
| Fidelity® Strategic Real Return Fund Class K6 |
| Years ended September 30, | 2023 | 2022 | 2021 | 2020 A | ||||
Selected Per-Share Data | ||||||||
| Net asset value, beginning of period | $ | 8.60 | $ | 9.48 | $ | 8.11 | $ | 8.34 |
| Income from Investment Operations | ||||||||
Net investment income (loss) B,C | .398 | .760 | .616 | .281 | ||||
| Net realized and unrealized gain (loss) | .054 | (1.082) D | .948 | (.352) | ||||
| Total from investment operations | .452 | (.322) | 1.564 | (.071) | ||||
| Distributions from net investment income | (.682) | (.558) | (.194) | (.159) | ||||
| Total distributions | (.682) | (.558) | (.194) | (.159) | ||||
| Net asset value, end of period | $ | 8.37 | $ | 8.60 | $ | 9.48 | $ | 8.11 |
Total Return E,F | 5.44% | (3.68)% D | 19.57% | (.81)% | ||||
Ratios to Average Net Assets C,G,H | ||||||||
| Expenses before reductions | .65% | .66% | .69% | .71% I | ||||
| Expenses net of fee waivers, if any | .51% | .52% | .56% | .56% I | ||||
| Expenses net of all reductions | .51% | .52% | .56% | .56% I | ||||
| Net investment income (loss) | 4.70% | 8.25% | 6.83% | 3.66% I | ||||
| Supplemental Data | ||||||||
| Net assets, end of period (000 omitted) | $ | 101,688 | $ | 99,831 | $ | 20,606 | $ | 6,331 |
Portfolio turnover rate J | 29% | 32% | 13% | 47% |
| Fidelity Advisor® Strategic Real Return Fund Class I |
| Years ended September 30, | 2023 | 2022 | 2021 | 2020 | 2019 | |||||
Selected Per-Share Data | ||||||||||
| Net asset value, beginning of period | $ | 8.55 | $ | 9.44 | $ | 8.08 | $ | 8.40 | $ | 8.90 |
| Income from Investment Operations | ||||||||||
Net investment income (loss) A,B | .381 | .741 | .594 | .280 | .240 | |||||
| Net realized and unrealized gain (loss) | .060 | (1.079) C | .955 | (.369) | - D | |||||
| Total from investment operations | .441 | (.338) | 1.549 | (.089) | .240 | |||||
| Distributions from net investment income | (.671) | (.552) | (.189) | (.231) | (.315) | |||||
| Distributions from net realized gain | - | - | - | - | (.425) | |||||
| Total distributions | (.671) | (.552) | (.189) | (.231) | (.740) | |||||
| Net asset value, end of period | $ | 8.32 | $ | 8.55 | $ | 9.44 | $ | 8.08 | $ | 8.40 |
Total Return E | 5.33% | (3.86)% C | 19.45% | (1.04)% | 3.01% | |||||
Ratios to Average Net Assets B,F,G | ||||||||||
| Expenses before reductions | .79% | .79% | .83% | .83% | .81% | |||||
| Expenses net of fee waivers, if any | .70% | .71% | .75% | .75% | .81% | |||||
| Expenses net of all reductions | .70% | .71% | .75% | .75% | .81% | |||||
| Net investment income (loss) | 4.51% | 8.07% | 6.64% | 3.47% | 2.88% | |||||
| Supplemental Data | ||||||||||
| Net assets, end of period (000 omitted) | $ | 66,743 | $ | 185,361 | $ | 49,988 | $ | 26,872 | $ | 116,302 |
Portfolio turnover rate H | 29% | 32% | 13% | 47% | 19% |
| Fidelity Advisor® Strategic Real Return Fund Class Z |
| Years ended September 30, | 2023 | 2022 | 2021 | 2020 | 2019 A | |||||
Selected Per-Share Data | ||||||||||
| Net asset value, beginning of period | $ | 8.56 | $ | 9.45 | $ | 8.08 | $ | 8.40 | $ | 8.93 |
| Income from Investment Operations | ||||||||||
Net investment income (loss) B,C | .389 | .755 | .610 | .282 | .244 | |||||
| Net realized and unrealized gain (loss) | .051 | (1.087) D | .952 | (.365) | (.026) | |||||
| Total from investment operations | .440 | (.332) | 1.562 | (.083) | .218 | |||||
| Distributions from net investment income | (.680) | (.558) | (.192) | (.237) | (.323) | |||||
| Distributions from net realized gain | - | - | - | - | (.425) | |||||
| Total distributions | (.680) | (.558) | (.192) | (.237) | (.748) | |||||
| Net asset value, end of period | $ | 8.32 | $ | 8.56 | $ | 9.45 | $ | 8.08 | $ | 8.40 |
Total Return E,F | 5.32% | (3.79)% D | 19.61% | (.96)% | 2.76% | |||||
Ratios to Average Net Assets C,G,H | ||||||||||
| Expenses before reductions | .69% | .70% | .73% | .74% | .71% I | |||||
| Expenses net of fee waivers, if any | .61% | .62% | .66% | .66% | .71% I | |||||
| Expenses net of all reductions | .61% | .62% | .66% | .66% | .71% I | |||||
| Net investment income (loss) | 4.60% | 8.15% | 6.73% | 3.56% | 2.97% I | |||||
| Supplemental Data | ||||||||||
| Net assets, end of period (000 omitted) | $ | 40,802 | $ | 87,627 | $ | 56,997 | $ | 9,511 | $ | 9,369 |
Portfolio turnover rate J | 29% | 32% | 13% | 47% | 19% |
| Fidelity Central Fund | Investment Manager | Investment Objective | Investment Practices | Expense RatioA |
| Fidelity Commodity Strategy Central Fund | Geode Capital Management, LLC (Geode) | Seeks to provide investment returns that correspond to the performance of the commodities market. | Investment in commodity-related investments through a wholly-owned subsidiary organized under the laws of the Cayman Islands Futures | Less than .005% |
| Fidelity Floating Rate Central Fund | Fidelity Management & Research Company LLC (FMR) | Seeks a high level of income by normally investing in floating rate loans and other floating rate securities. | Loans & Direct Debt Instruments Restricted Securities | Less than .005% |
| Fidelity Real Estate Equity Central Fund | Fidelity Management & Research Company LLC (FMR) | Seeks above-average income and long-term capital growth by investing primarily in equity securities of issuers in the real estate industry. | Loans & Direct Debt Instruments | Less than .005% |
| Fidelity Money Market Central Funds | Fidelity Management & Research Company LLC (FMR) | Each fund seeks to obtain a high level of current income consistent with the preservation of capital and liquidity. | Short-term Investments | Less than .005% |
| Gross unrealized appreciation | $12,084,051 |
| Gross unrealized depreciation | (54,997,294) |
| Net unrealized appreciation (depreciation) | $(42,913,243) |
| Tax Cost | $586,432,213 |
| Undistributed ordinary income | $10,009,166 |
| Capital loss carryforward | $(290,745,091) |
| Net unrealized appreciation (depreciation) on securities and other investments | $(42,917,441) |
| Short-term | $(29,929,699) |
| Long-term | (260,815,392) |
| Total capital loss carryforward | $(290,745,091) |
| September 30, 2023 | September 30, 2022 | |
| Ordinary Income | $63,438,683 | $ 29,458,119 |
| Total | $63,438,683 | $ 29,458,119 |
| Purchases ($) | Sales ($) | |
| Fidelity Strategic Real Return Fund | 172,663,707 | 429,634,313 |
| Distribution Fee | Service Fee | Total Fees | Retained by FDC | |
| Class A | - % | .25% | $167,512 | $11,141 |
| Class M | - % | .25% | 26,611 | 74 |
| Class C | .75% | .25% | 127,524 | 45,692 |
| $321,647 | $56,907 |
| Retained by FDC | |
| Class A | $ 9,238 |
| Class M | 511 |
Class C A | 67 |
| $9,816 |
| Amount | % of Class-Level Average Net Assets | |
| Class A | $ 105,134 | .16 |
| Class M | 17,540 | .16 |
| Class C | 19,692 | .15 |
| Strategic Real Return | 496,259 | .15 |
| Class K6 | 10,192 | .01 |
| Class I | 201,429 | .15 |
| Class Z | 36,414 | .05 |
| $886,660 |
| % of Average Net Assets | |
| Fidelity Strategic Real Return Fund | .04 |
| Amount | |
| Fidelity Strategic Real Return Fund | $ 2,148 |
| Purchases ($) | Sales ($) | Realized Gain (Loss) ($) | |
| Fidelity Strategic Real Return Fund | 11,740,309 | 7,985,232 | (336,254) |
| Amount | |
| Fidelity Strategic Real Return Fund | $1,515 |
| Total Security Lending Fees Paid to NFS | Security Lending Income From Securities Loaned to NFS | Value of Securities Loaned to NFS at Period End | |
| Fidelity Strategic Real Return Fund | $164 | $ - | $- |
| Expense Limitations | Reimbursement | |
| Class A | .95% | $ 63,039 |
| Class M | .95% | 10,882 |
| Class C | 1.70% | 11,756 |
| Strategic Real Return | .70% | 289,076 |
| Class K6 | .51% | 141,535 |
| Class I | .70% | 113,113 |
| Class Z | .61% | 55,233 |
| $684,634 |
| Expense reduction | |
| Class M | $64 |
| Class K6 | 24 |
| $88 |
Year ended September 30, 2023 | Year ended September 30, 2022 | |
| Fidelity Strategic Real Return Fund | ||
| Distributions to shareholders | ||
| Class A | $ 5,546,458 | $2,558,277 |
| Class M | 857,201 | 452,232 |
| Class C | 940,471 | 302,603 |
| Strategic Real Return | 28,527,671 | 16,405,632 |
| Class K6 | 8,017,562 | 1,664,840 |
| Class I | 13,013,562 | 4,305,706 |
| Class Z | 6,535,758 | 3,768,829 |
Total | $63,438,683 | $29,458,119 |
| Shares | Shares | Dollars | Dollars | |
Year ended September 30, 2023 | Year ended September 30, 2022 | Year ended September 30, 2023 | Year ended September 30, 2022 | |
| Fidelity Strategic Real Return Fund | ||||
| Class A | ||||
| Shares sold | 1,252,516 | 6,550,405 | $10,533,993 | $61,426,775 |
| Reinvestment of distributions | 657,984 | 274,905 | 5,466,958 | 2,493,534 |
| Shares redeemed | (4,338,289) | (1,785,091) | (36,445,834) | (16,220,042) |
| Net increase (decrease) | (2,427,789) | 5,040,219 | $(20,444,883) | $47,700,267 |
| Class M | ||||
| Shares sold | 185,722 | 795,336 | $1,570,072 | $7,458,038 |
| Reinvestment of distributions | 101,789 | 47,902 | 846,754 | 435,685 |
| Shares redeemed | (581,471) | (263,111) | (4,893,760) | (2,416,336) |
| Net increase (decrease) | (293,960) | 580,127 | $(2,476,934) | $5,477,387 |
| Class C | ||||
| Shares sold | 443,441 | 1,731,586 | $3,679,169 | $15,968,842 |
| Reinvestment of distributions | 114,692 | 33,750 | 937,586 | 301,201 |
| Shares redeemed | (879,026) | (618,530) | (7,278,112) | (5,591,663) |
| Net increase (decrease) | (320,893) | 1,146,806 | $(2,661,357) | $10,678,380 |
| Strategic Real Return | ||||
| Shares sold | 5,370,568 | 42,988,022 | $45,507,707 | $408,715,107 |
| Reinvestment of distributions | 3,058,582 | 1,684,332 | 25,543,645 | 15,374,384 |
| Shares redeemed | (22,270,314) | (24,480,044) | (188,002,277) | (224,776,864) |
| Net increase (decrease) | (13,841,164) | 20,192,310 | $(116,950,925) | $199,312,627 |
| Class K6 | ||||
| Shares sold | 3,319,211 | 12,174,362 | $28,129,663 | $112,370,449 |
| Reinvestment of distributions | 956,923 | 182,287 | 8,017,562 | 1,664,840 |
| Shares redeemed | (3,735,565) | (2,925,773) | (31,582,608) | (26,962,436) |
| Net increase (decrease) | 540,569 | 9,430,876 | $4,564,617 | $87,072,853 |
| Class I | ||||
| Shares sold | 5,829,914 | 23,043,950 | $49,442,614 | $215,368,359 |
| Reinvestment of distributions | 1,531,493 | 468,668 | 12,758,214 | 4,255,520 |
| Shares redeemed | (21,008,384) | (7,133,819) | (177,141,314) | (64,767,338) |
| Net increase (decrease) | (13,646,977) | 16,378,799 | $(114,940,486) | $154,856,541 |
| Class Z | ||||
| Shares sold | 1,838,169 | 10,676,613 | $15,494,846 | $100,797,420 |
| Reinvestment of distributions | 631,756 | 369,813 | 5,264,158 | 3,368,369 |
| Shares redeemed | (7,803,449) | (6,842,448) | (65,676,839) | (62,607,085) |
| Net increase (decrease) | (5,333,524) | 4,203,978 | $(44,917,835) | $41,558,704 |
| The Example is based on an investment of $1,000 invested at the beginning of the period and held for the entire period (April 1, 2023 to September 30, 2023). |
Annualized Expense Ratio- A | Beginning Account Value April 1, 2023 | Ending Account Value September 30, 2023 | Expenses Paid During Period- C April 1, 2023 to September 30, 2023 | |||||||
| Fidelity® Strategic Real Return Fund | ||||||||||
| Class A | .95% | |||||||||
| Actual | $ 1,000 | $ 1,004.00 | $ 4.77 | |||||||
Hypothetical-B | $ 1,000 | $ 1,020.31 | $ 4.81 | |||||||
| Class M | .95% | |||||||||
| Actual | $ 1,000 | $ 1,004.10 | $ 4.77 | |||||||
Hypothetical-B | $ 1,000 | $ 1,020.31 | $ 4.81 | |||||||
| Class C | 1.70% | |||||||||
| Actual | $ 1,000 | $ 1,001.50 | $ 8.53 | |||||||
Hypothetical-B | $ 1,000 | $ 1,016.55 | $ 8.59 | |||||||
| Fidelity® Strategic Real Return Fund | .70% | |||||||||
| Actual | $ 1,000 | $ 1,005.40 | $ 3.52 | |||||||
Hypothetical-B | $ 1,000 | $ 1,021.56 | $ 3.55 | |||||||
| Class K6 | .51% | |||||||||
| Actual | $ 1,000 | $ 1,005.90 | $ 2.56 | |||||||
Hypothetical-B | $ 1,000 | $ 1,022.51 | $ 2.59 | |||||||
| Class I | .70% | |||||||||
| Actual | $ 1,000 | $ 1,006.50 | $ 3.52 | |||||||
Hypothetical-B | $ 1,000 | $ 1,021.56 | $ 3.55 | |||||||
| Class Z | .61% | |||||||||
| Actual | $ 1,000 | $ 1,005.90 | $ 3.07 | |||||||
Hypothetical-B | $ 1,000 | $ 1,022.01 | $ 3.09 | |||||||
 |
Item 2.
Code of Ethics
As of the end of the period, September 30, 2023, Fidelity Salem Street Trust (the trust) has adopted a code of ethics, as defined in Item 2 of Form N-CSR, that applies to its President and Treasurer and its Chief Financial Officer. A copy of the code of ethics is filed as an exhibit to this Form N-CSR.
Item 3.
Audit Committee Financial Expert
The Board of Trustees of the trust has determined that Elizabeth S. Acton is an audit committee financial expert, as defined in Item 3 of Form N-CSR. Ms. Acton is independent for purposes of Item 3 of Form N-CSR.
Item 4.
Principal Accountant Fees and Services
Fees and Services
The following table presents fees billed by Deloitte & Touche LLP, the member firms of Deloitte Touche Tohmatsu, and their respective affiliates (collectively, “Deloitte Entities”) in each of the last two fiscal years for services rendered to Fidelity Strategic Real Return Fund (the “Fund(s)”):
Services Billed by Deloitte Entities
September 30, 2023 FeesA
Audit Fees | Audit-Related Fees | Tax Fees | All Other Fees | |
Fidelity Strategic Real Return Fund | $87,400 | $- | $8,100 | $2,000 |
September 30, 2022 FeesA
Audit Fees | Audit-Related Fees | Tax Fees | All Other Fees | |
Fidelity Strategic Real Return Fund | $86,300 | $- | $7,800 | $1,800 |
A Amounts may reflect rounding.
The following table(s) present(s) fees billed by Deloitte Entities that were required to be approved by the Audit Committee for services that relate directly to the operations and financial reporting of the Fund(s) and that are rendered on behalf of Fidelity Management & Research Company LLC ("FMR") and entities controlling, controlled by, or under
common control with FMR (not including any sub-adviser whose role is primarily portfolio management and is subcontracted with or overseen by another investment adviser) that provide ongoing services to the Fund(s) (“Fund Service Providers”):
Services Billed by Deloitte Entities
September 30, 2023A | September 30, 2022A | |
Audit-Related Fees | $- | $- |
Tax Fees | $- | $- |
All Other Fees | $- | $- |
A Amounts may reflect rounding.
“Audit-Related Fees” represent fees billed for assurance and related services that are reasonably related to the performance of the fund audit or the review of the fund's financial statements and that are not reported under Audit Fees.
“Tax Fees” represent fees billed for tax compliance, tax advice or tax planning that relate directly to the operations and financial reporting of the fund.
“All Other Fees” represent fees billed for services provided to the fund or Fund Service Provider, a significant portion of which are assurance related, that relate directly to the operations and financial reporting of the fund, excluding those services that are reported under Audit Fees, Audit-Related Fees or Tax Fees.
Assurance services must be performed by an independent public accountant.
* * *
The aggregate non-audit fees billed by Deloitte Entities for services rendered to the Fund(s), FMR (not including any sub-adviser whose role is primarily portfolio management and is subcontracted with or overseen by another investment adviser), and any Fund Service Provider for each of the last two fiscal years of the Fund(s) are as follows:
Billed By | September 30, 2023A | September 30, 2022A |
Deloitte Entities | $252,700 | $467,200 |
A Amounts may reflect rounding.
The trust's Audit Committee has considered non-audit services that were not pre-approved that were provided by Deloitte Entities to Fund Service Providers to be
compatible with maintaining the independence of Deloitte Entities in its(their) audit of the Fund(s), taking into account representations from Deloitte Entities, in accordance with Public Company Accounting Oversight Board rules, regarding its independence from the Fund(s) and its(their) related entities and FMR’s review of the appropriateness and permissibility under applicable law of such non-audit services prior to their provision to the Fund(s) Service Providers.
Audit Committee Pre-Approval Policies and Procedures
The trust’s Audit Committee must pre-approve all audit and non-audit services provided by a fund’s independent registered public accounting firm relating to the operations or financial reporting of the fund. Prior to the commencement of any audit or non-audit services to a fund, the Audit Committee reviews the services to determine whether they are appropriate and permissible under applicable law.
The Audit Committee has adopted policies and procedures to, among other purposes, provide a framework for the Committee’s consideration of non-audit services by the audit firms that audit the Fidelity funds. The policies and procedures require that any non-audit service provided by a fund audit firm to a Fidelity fund and any non-audit service provided by a fund auditor to a Fund Service Provider that relates directly to the operations and financial reporting of a Fidelity fund (“Covered Service”) are subject to approval by the Audit Committee before such service is provided.
All Covered Services must be approved in advance of provision of the service either: (i) by formal resolution of the Audit Committee, or (ii) by oral or written approval of the service by the Chair of the Audit Committee (or if the Chair is unavailable, such other member of the Audit Committee as may be designated by the Chair to act in the Chair’s absence). The approval contemplated by (ii) above is permitted where the Treasurer determines that action on such an engagement is necessary before the next meeting of the Audit Committee.
Non-audit services provided by a fund audit firm to a Fund Service Provider that do not relate directly to the operations and financial reporting of a Fidelity fund are reported to the Audit Committee periodically.
Non-Audit Services Approved Pursuant to Rule 2-01(c)(7)(i)(C) and (ii) of Regulation S-X (“De Minimis Exception”)
There were no non-audit services approved or required to be approved by the Audit Committee pursuant to the De Minimis Exception during the Fund’s(s’) last two fiscal years relating to services provided to (i) the Fund(s) or (ii) any Fund Service Provider that relate directly to the operations and financial reporting of the Fund(s).
The Registrant has not retained, for the preparation of the audit report on the financial statements included in the Form N-CSR, a registered public accounting firm that has a branch or office that is located in a foreign jurisdiction and that the Public Company
Accounting Oversight Board (the “PCAOB”) has determined that the PCAOB is unable to inspect or investigate completely because of a position taken by an authority in the foreign jurisdiction.
The Registrant is not a “foreign issuer,” as defined in 17 CFR 240.3b-4.
Item 5.
Audit Committee of Listed Registrants
Not applicable.
Item 6.
Investments
(a)
Not applicable.
(b)
Not applicable.
Item 7.
Disclosure of Proxy Voting Policies and Procedures for Closed-End Management Investment Companies
Not applicable.
Item 8.
Portfolio Managers of Closed-End Management Investment Companies
Not applicable.
Item 9.
Purchase of Equity Securities by Closed-End Management Investment Company and Affiliated Purchasers
Not applicable.
Item 10.
Submission of Matters to a Vote of Security Holders
There were no material changes to the procedures by which shareholders may recommend nominees to the trust’s Board of Trustees.
Item 11.
Controls and Procedures
(a)(i) The President and Treasurer and the Chief Financial Officer have concluded that the trust’s disclosure controls and procedures (as defined in Rule 30a-3(c) under the Investment Company Act) provide reasonable assurances that material information relating to the trust is made known to them by the appropriate persons, based on their evaluation of these controls and procedures as of a date within 90 days of the filing date of this report.
(a)(ii) There was no change in the trust’s internal control over financial reporting (as defined in Rule 30a-3(d) under the Investment Company Act) that occurred during the
period covered by this report that has materially affected, or is reasonably likely to materially affect, the trust’s internal control over financial reporting.
Item 12.
Disclosure of Securities Lending Activities for Closed-End Management
Investment Companies
Not applicable.
Item 13.
Exhibits
(a) | (1) | Code of Ethics pursuant to Item 2 of Form N-CSR is filed and attached hereto as EX-99.CODE ETH. |
(a) | (2) | |
(a) | (3) | Not applicable. |
(b) |
SIGNATURES
Pursuant to the requirements of the Securities Exchange Act of 1934 and the Investment Company Act of 1940, the registrant has duly caused this report to be signed on its behalf by the undersigned, thereunto duly authorized.
Fidelity Salem Street Trust
By: | /s/Laura M. Del Prato |
Laura M. Del Prato | |
President and Treasurer | |
Date: | November 21, 2023 |
Pursuant to the requirements of the Securities Exchange Act of 1934 and the Investment Company Act of 1940, this report has been signed below by the following persons on behalf of the registrant and in the capacities and on the dates indicated.
By: | /s/Laura M. Del Prato |
Laura M. Del Prato | |
President and Treasurer | |
Date: | November 21, 2023 |
By: | /s/John J. Burke III |
John J. Burke III | |
Chief Financial Officer | |
Date: | November 21, 2023 |