UNITED STATES
SECURITIES AND EXCHANGE COMMISSION
Washington, D.C. 20549
FORM N-CSR
CERTIFIED SHAREHOLDER REPORT OF REGISTERED
MANAGEMENT INVESTMENT COMPANIES
Investment Company Act file number 811-02105
Fidelity Salem Street Trust
(Exact name of registrant as specified in charter)
245 Summer St., Boston, MA 02210
(Address of principal executive offices) (Zip code)
Margaret Carey, Secretary
245 Summer St.
Boston, Massachusetts 02210
(Name and address of agent for service)
Registrant's telephone number, including area code:
617-563-7000
Date of fiscal year end: | March 31 |
Date of reporting period: | September 30, 2023 |
Item 1.
Reports to Stockholders
|
|
|
|
|
|
|
|
|
|
|
|
|
| |
| |
|
|
|
|
| |
| |
|
|
|
|
| |
| |
|
|


Contents
| Current 7-Day Yields | ||
| Fidelity® SAI Municipal Money Market Fund | 4.09% | |
Yield refers to the income paid by the Fund over a given period. Yield for money market funds is usually for seven-day periods, as it is here, though it is expressed as an annual percentage rate. Past performance is no guarantee of future results. Yield will vary and it's possible to lose money investing in the Fund. A portion of the Fund's expenses was reimbursed and/or waived. Absent such reimbursements and/or waivers the yield for the period ending September 30, 2023, the most recent period shown in the table, would have been 4.00% for Fidelity® SAI Municipal Money Market Fund. | ||
| Effective Maturity Diversification (% of Fund's Investments) | ||
| Days | ||
| 1 - 7 | 83.3 | |
| 8 - 30 | 0.5 | |
| 31 - 60 | 7.8 | |
| 61 - 90 | 4.7 | |
| 91 - 180 | 2.2 | |
| > 180 | 1.5 | |
| Effective maturity is determined in accordance with the requirements of Rule 2a-7 under the Investment Company Act of 1940. | ||
Asset Allocation (% of Fund's net assets) |
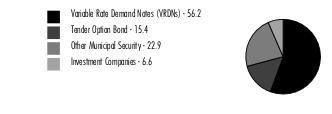 |
Net Other Assets (Liabilities) - (1.1)% |
| Variable Rate Demand Note - 56.2% | |||
Principal Amount (a) | Value ($) | ||
| Alabama - 5.1% | |||
| Walker County Econ. & Indl. Dev. Auth. Solid Waste Disp. Rev. (Alabama Pwr. Co. Plant Gorgas Proj.) Series 2023, 4.78% 10/2/23, VRDN (b)(c) | 800,000 | 800,000 | |
| West Jefferson Indl. Dev. Board Solid Waste Disp. Rev.: | |||
| (Alabama Pwr. Co. Miller Plant Proj.) Series 2008, 4.78% 10/2/23, VRDN (b)(c) | 2,800,000 | 2,800,000 | |
| (Alabama Pwr. Co. Plant Miller Proj.) Series 2023, 4.35% 10/6/23, VRDN (b)(c) | 400,000 | 400,000 | |
| Wilsonville Indl. Dev. Board Poll. Cont. Rev. (Alabama Pwr. Co. Gaston Plant Proj.) Series 2008, 4.78% 10/2/23, VRDN (b)(c) | 1,600,000 | 1,600,000 | |
TOTAL ALABAMA | 5,600,000 | ||
| Alaska - 1.2% | |||
| Valdez Marine Term. Rev. (ConocoPhillips Proj.) Series 1994 A, 3.95% 10/6/23 (ConocoPhillips Co. Guaranteed), VRDN (b) | 1,300,000 | 1,300,000 | |
| Arizona - 1.6% | |||
| Maricopa County Poll. Cont. Rev.: | |||
| Series 2009 B, 4.24% 10/6/23, VRDN (b) | 1,400,000 | 1,400,000 | |
| Series 2009 C, 4% 10/6/23, VRDN (b) | 400,000 | 400,000 | |
TOTAL ARIZONA | 1,800,000 | ||
| Colorado - 1.0% | |||
| Colorado Health Facilities Auth. Rev. (Boulder Cmnty. Hosp. Proj.) Series 2000, 4.13% 10/6/23, LOC JPMorgan Chase Bank, VRDN (b) | 570,000 | 570,000 | |
| Colorado Health Facilities Auth. Rev. Bonds Series 2020 B, 4.1% 10/6/23, LOC The Toronto-Dominion Bank, VRDN (b) | 550,000 | 550,000 | |
TOTAL COLORADO | 1,120,000 | ||
| Connecticut - 0.5% | |||
| Connecticut Hsg. Fin. Auth. Series 2019 B2, 3.88% 10/6/23 (Liquidity Facility Bank of America NA), VRDN (b)(c) | 505,000 | 505,000 | |
| Delaware - 0.5% | |||
| Delaware Econ. Dev. Auth. Rev. (Delmarva Pwr. & Lt. Co. Proj.): | |||
| Series 1993 C, 3.86% 10/6/23, VRDN (b) | 200,000 | 200,000 | |
| Series 1999 B, 4.35% 10/6/23, VRDN (b)(c) | 400,000 | 400,000 | |
TOTAL DELAWARE | 600,000 | ||
| Florida - 4.1% | |||
| Bay County Indl. Rev. Dev. (Gulf Pwr. Co. Proj.) Series 2020, 4% 10/6/23, VRDN (b)(c) | 900,000 | 900,000 | |
| Broward County Indl. Dev. Rev. (Florida Pwr. & Lt. Co. Proj.) Series 2018 B, 4.2% 10/6/23, VRDN (b)(c) | 200,000 | 200,000 | |
| Escambia County Solid Waste Disp. Rev. (Gulf Pwr. Co. Proj.) Series 2009, 3.9% 10/6/23, VRDN (b) | 100,000 | 100,000 | |
| Florida Keys Aqueduct Auth. Wtr. Rev. Series 2008, 4.13% 10/6/23, LOC TD Banknorth, NA, VRDN (b) | 100,000 | 100,000 | |
| Lee County Indl. Dev. Auth. Rev. (Florida Pwr. & Lt. Co. Proj.) Series 2016 A, 4.56% 10/6/23, VRDN (b)(c) | 300,000 | 300,000 | |
| Martin County Rev. (Florida Pwr. & Lt. Co. Proj.) Series 2022, 4.17% 10/6/23, VRDN (b) | 750,000 | 750,000 | |
| Miami-Dade County Indl. Dev. Auth. Rev. (Florida Pwr. & Lt. Co. Proj.) Series 2021, 4.1% 10/6/23, VRDN (b)(c) | 200,000 | 200,000 | |
| Pinellas County Health Facilities Auth. Rev. (Suncoast Hospice Proj.) Series 2004, 3.95% 10/6/23, LOC Wells Fargo Bank NA, VRDN (b) | 2,020,000 | 2,020,000 | |
TOTAL FLORIDA | 4,570,000 | ||
| Georgia - 0.5% | |||
| Monroe County Dev. Auth. Poll. Cont. Rev. (Gulf Pwr. Co. Plant Scherer Proj.) Series 2010, 4.1% 10/6/23, VRDN (b) | 100,000 | 100,000 | |
| Monroe County Dev. Auth. Rev. (Florida Pwr. & Lt. Co. Proj.) Series 2019, 4% 10/6/23, VRDN (b)(c) | 500,000 | 500,000 | |
TOTAL GEORGIA | 600,000 | ||
| Illinois - 0.4% | |||
| Illinois Dev. Fin. Auth. Rev. (Glenwood School for Boys Proj.) Series 1998, 4.18% 10/6/23, LOC Northern Trust Co., VRDN (b) | 100,000 | 100,000 | |
| FHLMC Illinois Hsg. Dev. Auth. Multi-family Hsg. Rev. Series 2008, 4.12% 10/6/23, LOC Freddie Mac, VRDN (b) | 300,000 | 300,000 | |
TOTAL ILLINOIS | 400,000 | ||
| Indiana - 2.5% | |||
| Indiana Dev. Fin. Auth. Envir. Rev.: | |||
| (Duke Energy Indiana, Inc. Proj.) Series 2009 A3, 3.75% 10/6/23, LOC Mizuho Bank Ltd., VRDN (b) | 100,000 | 100,000 | |
| (PSI Energy Proj.): | |||
Series 2003 A, 4.3% 10/6/23, VRDN (b)(c) | 2,000,000 | 2,000,000 | |
Series 2003 B, 3.89% 10/6/23, VRDN (b)(c) | 450,000 | 450,000 | |
| Indiana Fin. Auth. Hosp. Rev. (Parkview Health Sys. Oblig. Group Proj.) Series 2009 C, 4.2% 10/6/23, LOC Sumitomo Mitsui Banking Corp., VRDN (b) | 200,000 | 200,000 | |
TOTAL INDIANA | 2,750,000 | ||
| Iowa - 5.0% | |||
| Iowa Fin. Auth. Solid Disp. Waste Rev. (MidAmerican Energy Co. Proj.) Series 2016 B, 4.3% 10/6/23, VRDN (b)(c) | 5,500,000 | 5,500,000 | |
| Kansas - 1.2% | |||
| Burlington Envir. Impt. Rev. (Kansas City Pwr. and Lt. Co. Proj.): | |||
| Series 2007 A, 4.03% 10/6/23, VRDN (b) | 100,000 | 100,000 | |
| Series 2007 B, 4.03% 10/6/23, VRDN (b) | 600,000 | 600,000 | |
| Wamego Kansas Poll. Cont. Rfdg. Rev. (Western Resources, Inc. Proj.) Series 1994, 3.9% 10/6/23, VRDN (b) | 600,000 | 600,000 | |
TOTAL KANSAS | 1,300,000 | ||
| Louisiana - 3.7% | |||
| Saint James Parish Gen. Oblig. (Nucor Steel Louisiana LLC Proj.) Series 2010 B1, 4.3% 10/6/23, VRDN (b) | 3,700,000 | 3,700,000 | |
| FHLMC Louisiana Hsg. Fin. Auth. Multi-family Hsg. Rev. (The Reserve at Jefferson Proj.) Series 2008, 4% 10/6/23, LOC Freddie Mac, VRDN (b) | 400,000 | 400,000 | |
TOTAL LOUISIANA | 4,100,000 | ||
| Mississippi - 5.6% | |||
| Mississippi Bus. Fin. Corp. Rev. (Gulf Pwr. Co. Proj.) Series 2019, 4.56% 10/6/23, VRDN (b)(c) | 700,000 | 700,000 | |
| Mississippi Bus. Fin. Corp. Solid Waste Disp. Rev. (Waste Mgmt., Inc. Proj.) Series 2003, 4.1% 10/6/23, LOC Bank of America NA, VRDN (b)(c) | 5,500,000 | 5,500,000 | |
TOTAL MISSISSIPPI | 6,200,000 | ||
| Nebraska - 0.2% | |||
| Stanton County Indl. Dev. Rev. Series 1998, 4.3% 10/6/23, VRDN (b)(c) | 200,000 | 200,000 | |
| New York - 1.6% | |||
| New York City Muni. Wtr. Fin. Auth. Wtr. & Swr. Sys. Rev. Series 2014 AA, 4.5% 10/2/23 (Liquidity Facility Mizuho Corporate Bank Ltd.), VRDN (b) | 1,600,000 | 1,600,000 | |
| New York Hsg. Fin. Agcy. Rev. Series 2010 A, 4.15% 10/6/23, LOC Landesbank Hessen-Thuringen, VRDN (b) | 200,000 | 200,000 | |
TOTAL NEW YORK | 1,800,000 | ||
| North Carolina - 0.8% | |||
| Cumberland County Indl. Facilities & Poll. Cont. Fing. Auth. (Cargill, Inc. Proj.) Series 2022, 4.02% 10/6/23, VRDN (b)(c) | 600,000 | 600,000 | |
| Lower Cape Fear Wtr. & Swr. Auth. Rev. (Bladen Bluffs Proj.) Series 2010, 3.98% 10/6/23, LOC Rabobank Nederland New York Branch, VRDN (b) | 250,000 | 250,000 | |
TOTAL NORTH CAROLINA | 850,000 | ||
| Ohio - 0.7% | |||
| Franklin County Hosp. Facilities Rev. Series 1998, 4.08% 10/6/23, LOC Northern Trust Co., VRDN (b) | 300,000 | 300,000 | |
| Hamilton County Hosp. Facilities Rev. (Elizabeth Gamble Deaconess Home Assoc. Proj.) Series 2002 B, 3.94% 10/6/23, LOC PNC Bank NA, VRDN (b) | 500,000 | 500,000 | |
TOTAL OHIO | 800,000 | ||
| Pennsylvania - 1.0% | |||
| Philadelphia Auth. for Indl. Dev. Rev. (The Franklin Institute Proj.) Series 2006, 3.89% 10/6/23, LOC Bank of America NA, VRDN (b) | 865,000 | 865,000 | |
| FNMA Montgomery County Redev. Auth. Multi-family Hsg. Rev. (Kingswood Apts. Proj.) Series 2001 A, 4.06% 10/6/23, LOC Fannie Mae, VRDN (b) | 200,000 | 200,000 | |
TOTAL PENNSYLVANIA | 1,065,000 | ||
| Tennessee - 5.8% | |||
| Loudon County Indl. Dev. Board Exempt Facilities Rev. (Kimberly-Clark Corp. Proj.) Series 1999, 4% 10/6/23, VRDN (b)(c) | 6,400,000 | 6,400,000 | |
| Texas - 1.6% | |||
| Harris County Cultural Ed. Facilities Fin. Corp. Rev. Series 2019 F, 4.11% 10/6/23, VRDN (b) | 500,000 | 500,000 | |
| Tarrant County Cultural Ed. Facilities Fin. Corp. Rev. (Christus Health Proj.): | |||
| Series 2008 C1, 4.05% 10/6/23, LOC Sumitomo Mitsui Banking Corp., VRDN (b) | 200,000 | 200,000 | |
| Series 2008 C4, 4.05% 10/6/23, LOC Bank of Montreal, VRDN (b) | 250,000 | 250,000 | |
| Texas Gen. Oblig.: | |||
| (Texas Veterans Land Board Proj.) Series 2017, 4.1% 10/6/23 (Liquidity Facility Sumitomo Mitsui Banking Corp.), VRDN (b) | 300,000 | 300,000 | |
| Series 2003 A, 4% 10/6/23 (Liquidity Facility State Street Bank & Trust Co., Boston), VRDN (b)(c) | 500,000 | 500,000 | |
TOTAL TEXAS | 1,750,000 | ||
| Virginia - 0.3% | |||
| Fairfax County Indl. Dev. Auth. (Inova Health Sys. Proj.) Series 2018 C, 4.09% 10/6/23, VRDN (b) | 350,000 | 350,000 | |
| Washington - 4.5% | |||
| Port of Seattle Rev. Series 2008, 4.15% 10/6/23, LOC Bank of America NA, VRDN (b)(c) | 4,000,000 | 4,000,000 | |
| FHLMC Washington Hsg. Fin. Commission Multi-family Hsg. Rev.: | |||
| (Interurban Sr. Living Apts. Proj.) Series 2012, 4.12% 10/6/23, LOC Freddie Mac, VRDN (b) | 200,000 | 200,000 | |
| (Urban Ctr. Apts. Proj.) Series 2012, 4.1% 10/6/23, LOC Freddie Mac, VRDN (b) | 600,000 | 600,000 | |
| FNMA Washington Hsg. Fin. Commission Multi-family Hsg. Rev. (New Haven Apts. Proj.) Series 2009, 4.1% 10/6/23, LOC Fannie Mae, VRDN (b) | 200,000 | 200,000 | |
TOTAL WASHINGTON | 5,000,000 | ||
| West Virginia - 2.4% | |||
| West Virginia Econ. Dev. Auth. Solid Waste Disp. Facilities Rev. (Appalachian Pwr. Co.- Mountaineer Proj.) Series 2008 A, 4.01% 10/6/23, VRDN (b)(c) | 2,600,000 | 2,600,000 | |
| Wisconsin - 4.4% | |||
| Green Bay Redev. Auth. (Green Bay Packaging, Inc. Proj.) Series 2019, 3.95% 10/6/23, LOC Wells Fargo Bank NA, VRDN (b)(c)(d) | 4,900,000 | 4,900,000 | |
| TOTAL VARIABLE RATE DEMAND NOTE (Cost $62,060,000) | 62,060,000 | ||
| Tender Option Bond - 15.4% | |||
Principal Amount (a) | Value ($) | ||
| Arizona - 0.1% | |||
| Arizona Indl. Dev. Auth. Hosp. Rev. Participating VRDN Series XM 10 13, 4.1% 10/6/23 (Liquidity Facility JPMorgan Chase Bank) (b)(e)(f) | 75,000 | 75,000 | |
| Colorado - 0.6% | |||
| Denver City & County Arpt. Rev. Participating VRDN Series Floaters XG 01 96, 4.06% 10/6/23 (Liquidity Facility Toronto-Dominion Bank) (b)(c)(e)(f) | 620,000 | 620,000 | |
| Connecticut - 0.4% | |||
| Connecticut Spl. Tax Oblig. Trans. Infrastructure Rev.: | |||
| Bonds Series Floaters G 110, 4.16%, tender (b)(e)(f)(g) | 200,000 | 200,000 | |
| Participating VRDN Series Floaters YX 10 77, 3.8% 10/6/23 (Liquidity Facility Barclays Bank PLC) (b)(e)(f) | 200,000 | 200,000 | |
TOTAL CONNECTICUT | 400,000 | ||
| Florida - 0.7% | |||
| Broward County Convention Ctr. Bonds Series MS 00 11, 3.83%, tender 11/2/23 (Liquidity Facility Morgan Stanley Bank, West Valley City Utah) (b)(e)(f)(g) | 600,000 | 600,000 | |
| County of Broward Tourist Dev. Tax Rev. Participating VRDN Series XL 04 29, 4.09% 10/6/23 (Liquidity Facility Wells Fargo Bank NA) (b)(e)(f) | 100,000 | 100,000 | |
| Greater Orlando Aviation Auth. Arpt. Facilities Rev. Bonds Series Floaters G 25, 4.23%, tender (b)(c)(e)(f)(g) | 100,000 | 100,000 | |
TOTAL FLORIDA | 800,000 | ||
| Georgia - 2.6% | |||
| Fulton County Dev. Auth. Rev. Participating VRDN Series XL 02 68, 4.08% 10/6/23 (Liquidity Facility Bank of America NA) (b)(e)(f) | 90,000 | 90,000 | |
| Hosp. Auth. of Savannah Auth. Rev. Participating VRDN Series BAML 5042, 4.5% 10/2/23 (Liquidity Facility Bank of America NA) (b)(e)(f) | 2,800,000 | 2,800,000 | |
TOTAL GEORGIA | 2,890,000 | ||
| Louisiana - 1.0% | |||
| New Orleans Aviation Board Rev. Participating VRDN Series XF 31 48, 4.03% 10/6/23 (Liquidity Facility Barclays Bank PLC) (b)(c)(e)(f) | 100,000 | 100,000 | |
| RIB Floater Trust Various States Participating VRDN Series Floater 2023, 4.02% 10/6/23 (Liquidity Facility Barclays Bank PLC) (b)(e)(f) | 1,000,000 | 1,000,000 | |
TOTAL LOUISIANA | 1,100,000 | ||
| Maryland - 0.1% | |||
| Maryland Stadium Auth. Rev. Bonds Series 2023, 4.18%, tender 11/1/23 (Liquidity Facility Royal Bank of Canada) (b)(e)(f) | 100,000 | 100,000 | |
| Michigan - 0.1% | |||
| Mclaren Health Care Corp. Participating VRDN Series XL 02 71, 4.08% 10/6/23 (Liquidity Facility Bank of America NA) (b)(e)(f) | 90,000 | 90,000 | |
| Missouri - 0.2% | |||
| Kansas City Indl. Dev. Auth. Participating VRDN Series XG 03 96, 4.06% 10/6/23 (Liquidity Facility Toronto-Dominion Bank) (b)(c)(e)(f) | 200,000 | 200,000 | |
| New York - 3.6% | |||
| New York Dorm. Auth. Rev. Bonds Series MS 00 09, 4.13%, tender 10/26/23 (Liquidity Facility Morgan Stanley Bank, West Valley City Utah) (b)(e)(f) | 200,000 | 200,000 | |
| New York Trans. Dev. Corp. Participating VRDN Series 2022 E 154, 4.08% 10/6/23 (Liquidity Facility Royal Bank of Canada) (b)(c)(e)(f) | 3,800,000 | 3,800,000 | |
TOTAL NEW YORK | 4,000,000 | ||
| North Carolina - 2.2% | |||
| Charlotte Int'l. Arpt. Rev. Participating VRDN Series XG 05 27, 0% 10/6/23 (Liquidity Facility Bank of America NA) (b)(c)(e)(f) | 130,000 | 130,000 | |
| Greater Asheville Reg'l. Arpt. Auth. Participating VRDN Series XM 10 11, 4.05% 10/6/23 (Liquidity Facility Royal Bank of Canada) (b)(c)(e)(f) | 2,100,000 | 2,100,000 | |
| North Carolina Hsg. Fin. Agcy. Home Ownership Rev. Participating VRDN Series YX 13 16, 4.01% 10/6/23 (Liquidity Facility Barclays Bank PLC) (b)(e)(f) | 200,000 | 200,000 | |
TOTAL NORTH CAROLINA | 2,430,000 | ||
| Ohio - 0.4% | |||
| Cuyahoga County Ctfs. of Prtn. Participating VRDN Series Floaters XG 02 06, 4.08% 10/6/23 (Liquidity Facility Bank of America NA) (b)(e)(f) | 400,000 | 400,000 | |
| Pennsylvania - 0.5% | |||
| Lehigh County Gen. Purp. Hosp. Rev. Participating VRDN Series BAML 23 50 39, 4.06% 11/3/23 (Liquidity Facility Bank of America NA) (b)(e)(f) | 100,000 | 100,000 | |
| Pennsylvania Econ. Dev. Fing. Auth. Participating VRDN Series XM 10 83, 4.06% 10/6/23 (Liquidity Facility Royal Bank of Canada) (b)(c)(e)(f) | 500,000 | 500,000 | |
TOTAL PENNSYLVANIA | 600,000 | ||
| South Carolina - 0.1% | |||
| South Carolina Trans. Infrastructure Bank Rev. Bonds Series Floaters G 109, 4.18%, tender (b)(e)(f)(g) | 100,000 | 100,000 | |
| Texas - 0.5% | |||
| El Paso Wtr. & Swr. Rev. Bonds Series 2022 MS 00 10, 4.15%, tender 10/5/23 (Liquidity Facility Morgan Stanley Bank, West Valley City Utah) (b)(e)(f) | 500,000 | 500,000 | |
| Texas Private Activity Bond Surface Trans. Corp. Participating VRDN Series XM 11 23, 4.05% 10/6/23 (Liquidity Facility Royal Bank of Canada) (b)(c)(e)(f) | 100,000 | 100,000 | |
TOTAL TEXAS | 600,000 | ||
| Utah - 0.8% | |||
| Salt Lake City Arpt. Rev. Participating VRDN: | |||
| Series Floaters XM 06 99, 4.03% 10/6/23 (Liquidity Facility UBS AG) (b)(c)(e)(f) | 400,000 | 400,000 | |
| Series XL 04 59, 4.03% 10/6/23 (Liquidity Facility Barclays Bank PLC) (b)(c)(e)(f) | 480,000 | 480,000 | |
TOTAL UTAH | 880,000 | ||
| Washington - 1.5% | |||
| Central Puget Sound Reg'l. Trans. Auth. Sales & Use Tax Rev. Bonds Series G 123, 4.18%, tender 11/1/23 (Liquidity Facility Royal Bank of Canada) (b)(e)(f)(g) | 100,000 | 100,000 | |
| Port of Seattle Rev. Participating VRDN: | |||
| Series 2022 ZL 03 16, 4.05% 10/6/23 (Liquidity Facility Barclays Bank PLC) (b)(c)(e)(f) | 400,000 | 400,000 | |
| Series Floaters XM 06 65, 4.08% 10/6/23 (Liquidity Facility JPMorgan Chase Bank) (b)(c)(e)(f) | 500,000 | 500,000 | |
| Series XF 13 71, 4.12% 10/6/23 (Liquidity Facility JPMorgan Chase Bank) (b)(c)(e)(f) | 300,000 | 300,000 | |
| Series XM 08 75, 3.91% 10/6/23 (Liquidity Facility JPMorgan Chase Bank) (b)(c)(e)(f) | 90,000 | 90,000 | |
| Washington Health Care Facilities Auth. Rev. Participating VRDN Series YX 12 10, 4.08% 10/6/23 (Liquidity Facility Barclays Bank PLC) (b)(e)(f) | 300,000 | 300,000 | |
TOTAL WASHINGTON | 1,690,000 | ||
| TOTAL TENDER OPTION BOND (Cost $16,975,000) | 16,975,000 | ||
| Other Municipal Security - 22.9% | |||
Principal Amount (a) | Value ($) | ||
| Guam - 0.7% | |||
| Guam Int'l. Arpt. Auth. Rev. Bonds Series 2019 A, 5% 10/1/23 (Escrowed to Maturity) (c) | 825,000 | 825,000 | |
| Alabama - 0.6% | |||
| Black Belt Energy Gas District Bonds Series 2018 A, 4%, tender 11/30/23 (b) | 700,000 | 699,993 | |
| Alaska - 0.2% | |||
| Anchorage Gen. Oblig. TAN Series 2023, 4.25% 12/15/23 | 250,000 | 250,105 | |
| Arizona - 0.3% | |||
| Arizona Health Facilities Auth. Rev. Bonds Series 2015 A, 5% 1/1/24 | 310,000 | 310,673 | |
| Colorado - 1.4% | |||
| Colorado Ctfs. of Prtn. Bonds Series 2020 A, 5% 12/15/23 | 210,000 | 210,318 | |
| Colorado Health Facilities Auth. Rev. Bonds Series 2013 A, 5% 1/1/24 (Pre-Refunded to 1/1/24 @ 100) | 275,000 | 275,631 | |
| Colorado Health Facilities Auth. Rev. Bonds Bonds: | |||
| Series 2016 B, 5% 11/15/23 | 100,000 | 100,099 | |
| Series 2016 C, 5%, tender 11/15/23 (b) | 130,000 | 130,146 | |
| Denver City & County Arpt. Rev. Bonds: | |||
| Series 2012 A, 5% 11/15/23 (c) | 200,000 | 200,063 | |
| Series 2012 B, 5% 11/15/23 | 250,000 | 250,300 | |
| Series 2016 A, 5% 11/15/23 | 175,000 | 175,210 | |
| Series 2020 A1, 5% 11/15/23 | 150,000 | 150,180 | |
| Series 2022 C, 5% 11/15/23 | 100,000 | 100,120 | |
TOTAL COLORADO | 1,592,067 | ||
| Connecticut - 1.5% | |||
| Connecticut Gen. Oblig. Bonds Series 2013 A, 5% 10/15/23 (Escrowed to Maturity) | 115,000 | 115,035 | |
| Connecticut Spl. Tax Oblig. Trans. Infrastructure Rev. Bonds Series 2013 A, 5% 10/1/23 | 450,000 | 450,000 | |
| Danbury Gen. Oblig. BAN Series 2023, 5% 1/24/24 | 500,000 | 501,402 | |
| North Haven Gen. Oblig. BAN Series 2022 B, 4.25% 11/2/23 | 485,000 | 485,107 | |
| Univ. of Connecticut Gen. Oblig. Bonds Series 2020 A, 5% 2/15/24 | 100,000 | 100,289 | |
TOTAL CONNECTICUT | 1,651,833 | ||
| District Of Columbia - 1.8% | |||
| District of Columbia Income Tax Rev. Bonds Series 2020 B, 5% 10/1/23 | 250,000 | 250,000 | |
| Metropolitan Washington DC Arpts. Auth. Sys. Rev. Bonds: | |||
| Series 2014 A, 5% 10/1/23 (c) | 810,000 | 810,000 | |
| Series 2018 A, 5% 10/1/23 (c) | 600,000 | 600,000 | |
| Series 2019 B, 5% 10/1/23 | 200,000 | 200,000 | |
| Series 2020 A, 5% 10/1/23 (c) | 100,000 | 100,000 | |
TOTAL DISTRICT OF COLUMBIA | 1,960,000 | ||
| Florida - 3.4% | |||
| Broward County Arpt. Sys. Rev. Bonds: | |||
| Series 2013 A: | |||
5.25% 10/1/23 (Pre-Refunded to 10/1/23 @ 100) (c) | 1,000,000 | 1,000,000 | |
5.25% 10/1/23 (Pre-Refunded to 10/1/23 @ 100) (c) | 335,000 | 335,000 | |
| Series 2013 C: | |||
5.25% 10/1/23 (Pre-Refunded to 10/1/23 @ 100) | 175,000 | 175,000 | |
5.25% 10/1/23 (Pre-Refunded to 10/1/23 @ 100) | 100,000 | 100,000 | |
| Gainesville Utils. Sys. Rev. Bonds Series 2017 A, 5% 10/1/23 | 200,000 | 200,000 | |
| Greater Orlando Aviation Auth. Arpt. Facilities Rev. Bonds Series 2019 A, 5% 10/1/23 (c) | 300,000 | 300,000 | |
| Hillsborough County Aviation Auth. Rev. Bonds Series 2013 A, 5.5% 10/1/23 (Pre-Refunded to 10/1/23 @ 100) (c) | 100,000 | 100,000 | |
| Miami-Dade County Bonds Series 2013 B, 6% 10/1/23 (Pre-Refunded to 10/1/23 @ 100) (c) | 200,000 | 200,000 | |
| Miami-Dade County School Board Ctfs. of Prtn. Bonds: | |||
| Series 2014 D, 5% 11/1/23 | 310,000 | 310,199 | |
| Series 2015 D, 5% 2/1/24 | 560,000 | 561,636 | |
| Miami-Dade County Wtr. & Swr. Rev. Bonds: | |||
| Series 2013 B, 5% 10/1/23 (Pre-Refunded to 10/1/23 @ 100) | 255,000 | 255,000 | |
| Series 2015, 5% 10/1/23 | 120,000 | 120,000 | |
| Series 2017 B, 5% 10/1/23 | 150,000 | 150,000 | |
TOTAL FLORIDA | 3,806,835 | ||
| Georgia - 0.6% | |||
| Atlanta Arpt. Rev. Bonds Series 2023 C, 5% 7/1/24 (c) | 380,000 | 381,917 | |
| Cobb County School District TAN Series 2023, 4% 12/14/23 | 255,000 | 254,981 | |
TOTAL GEORGIA | 636,898 | ||
| Illinois - 1.9% | |||
| Cook County Gen. Oblig. Bonds: | |||
| Series 2013 B, 5% 11/15/23 | 325,000 | 325,321 | |
| Series 2021 B, 4% 11/15/23 | 405,000 | 404,862 | |
| Series 2022 A, 5% 11/15/23 | 560,000 | 560,513 | |
| Cook County Sales Tax Rev. Bonds Series 2022 A, 5% 11/15/23 | 125,000 | 125,123 | |
| Illinois Fin. Auth. Rev. Bonds Series 2014 A, 5% 10/1/23 | 100,000 | 100,000 | |
| Illinois Gen. Oblig. Bonds: | |||
| Series 2016, 5% 2/1/24 | 100,000 | 100,220 | |
| Series 2017 D, 5% 11/1/23 | 200,000 | 200,086 | |
| Southwestern Dev. Auth. Heath Facility Rev. Bonds Series 2013: | |||
| 7.125% 11/1/23 (Pre-Refunded to 11/1/23 @ 100) | 165,000 | 165,338 | |
| 7.625% 11/1/23 (Pre-Refunded to 11/1/23 @ 100) | 145,000 | 145,352 | |
TOTAL ILLINOIS | 2,126,815 | ||
| Kentucky - 1.3% | |||
| Kentucky State Property & Buildings Commission Rev. Bonds: | |||
| Series 2013 A, 5% 10/1/23 | 150,000 | 150,000 | |
| Series 2016 B, 5% 11/1/23 | 715,000 | 715,381 | |
| Series 2016, 5% 11/1/23 | 575,000 | 575,397 | |
TOTAL KENTUCKY | 1,440,778 | ||
| Maryland - 0.1% | |||
| Baltimore Proj. Rev. Bonds Series 2013 C, 5% 1/1/24 (Pre-Refunded to 1/1/24 @ 100) | 150,000 | 150,363 | |
| Massachusetts - 0.4% | |||
| Massachusetts Gen. Oblig. Bonds Series 2021 B, 5% 11/1/23 | 400,000 | 400,340 | |
| Michigan - 1.6% | |||
| Kent Hosp. Fin. Auth. Hosp. Facilities Rev. Bonds (Spectrum Health Sys. Proj.) Series 2015 A, SIFMA Municipal Swap Index + 0.250% 4.23%, tender 4/26/24 (b)(h) | 100,000 | 100,000 | |
| Michigan Fin. Auth. Rev. Bonds: | |||
| (Trinity Health Proj.) Series 2017, 5% 12/1/23 | 575,000 | 575,832 | |
| Series 2015 MI, 5% 12/1/23 | 150,000 | 150,202 | |
| Series 2016 E1, 4%, tender 8/15/24 (b) | 110,000 | 109,677 | |
| Michigan Hosp. Fin. Auth. Rev. Bonds: | |||
| Series 2005 A4, 5% 11/1/23 | 275,000 | 275,157 | |
| Series 2008 C, 5% 12/1/23 | 250,000 | 250,362 | |
| Royal Oak Hosp. Fin. Auth. Hosp. Rev. Bonds Series 2014 D, 5% 3/1/24 (Pre-Refunded to 3/1/24 @ 100) | 275,000 | 275,946 | |
TOTAL MICHIGAN | 1,737,176 | ||
| Minnesota - 0.3% | |||
| Minnesota Gen. Oblig. Bonds: | |||
| Series 2013 D, 5% 10/1/23 | 100,000 | 100,000 | |
| Series 2017 A, 5% 10/1/23 | 200,000 | 200,000 | |
TOTAL MINNESOTA | 300,000 | ||
| Nevada - 0.2% | |||
| Clark County Fuel Tax Bonds: | |||
| Series 2016 A, 5% 11/1/23 | 105,000 | 105,070 | |
| Series 2016 B, 5% 11/1/23 | 135,000 | 135,099 | |
TOTAL NEVADA | 240,169 | ||
| New Jersey - 0.1% | |||
| Jefferson Township Gen. Oblig. BAN Series 2023, 5% 6/14/24 | 100,000 | 100,491 | |
| North Carolina - 0.1% | |||
| North Carolina Ltd. Oblig. Bonds Series 2021 A, 5% 5/1/24 | 135,000 | 135,774 | |
| Ohio - 0.6% | |||
| Cuyahoga County Ohio Excise Tax Bonds (Sports Facilities Impt. Proj.) Series 2015, 5% 12/1/23 (Pre-Refunded to 12/1/23 @ 100) | 100,000 | 100,166 | |
| Ohio Cap. Facilities Lease Bonds (Administrative Bldg. Fund Projs.) Series 2017 B, 5% 10/1/23 | 150,000 | 150,000 | |
| Ohio Gen. Oblig. Bonds Series 2016 A, 5% 12/15/23 | 105,000 | 105,224 | |
| Ohio State Univ. Gen. Receipts Bonds (Multiyear Debt Issuance Prog.) Series 2020 A, 5% 12/1/23 | 150,000 | 150,263 | |
| Ohio Wtr. Dev. Auth. Wtr. Poll. Cont. Rev. Bonds Series 2014, 5% 12/1/23 | 100,000 | 100,163 | |
TOTAL OHIO | 605,816 | ||
| Oregon - 0.9% | |||
| Oregon Dept. of Trans. Hwy. User Tax Rev. Bonds Series 2013 A, 5% 11/15/23 (Pre-Refunded to 11/15/23 @ 100) | 145,000 | 145,172 | |
| Oregon Gen. Oblig. Bonds Series 2019 M, 5% 11/1/23 | 350,000 | 350,283 | |
| Port of Portland Arpt. Rev. Bonds Series 2017 B, 5% 7/1/24 (c) | 510,000 | 511,755 | |
TOTAL OREGON | 1,007,210 | ||
| Pennsylvania - 1.1% | |||
| Allegheny County Bonds Series 2013 C72, 5.25% 12/1/23 (Pre-Refunded to 12/1/23 @ 100) | 245,000 | 245,503 | |
| Pennsylvania Gen. Oblig. Bonds Series 2013, 5% 10/15/23 | 230,000 | 230,060 | |
| Pennsylvania Hsg. Fin. Agcy. Bonds Series 2022 138, 5% 10/1/23 | 115,000 | 115,000 | |
| Pennsylvania Tpk. Commission Tpk. Rev. Bonds Series 2013 C, 5% 12/1/23 (Pre-Refunded to 12/1/23 @ 100) | 585,000 | 585,779 | |
TOTAL PENNSYLVANIA | 1,176,342 | ||
| South Carolina - 0.3% | |||
| Charleston Edl. Excellence Fing. Corp. Rev. Bonds Series 2013 B, 5% 12/1/23 (Pre-Refunded to 12/1/23 @ 100) | 125,000 | 125,207 | |
| Greenville County School District Bonds Series 2023 B, 5% 6/25/24 | 155,000 | 156,338 | |
TOTAL SOUTH CAROLINA | 281,545 | ||
| Texas - 1.6% | |||
| Dallas Wtrwks. & Swr. Sys. Rev. Bonds Series 2012 A, 5% 10/1/23 | 125,000 | 125,000 | |
| Harris County Cultural Ed. Facilities Fin. Corp. Rev. Bonds Series 2023 B2, 3.7% tender 12/1/23, CP mode | 400,000 | 399,882 | |
| Harris County Metropolitan Trans. Auth. Bonds Series 2017 A, 5% 11/1/23 | 125,000 | 125,079 | |
| Houston Util. Sys. Rev. Bonds: | |||
| Series 2002 C, 5% 11/15/23 | 100,000 | 100,094 | |
| Series 2013 B, 4% 11/15/23 | 100,000 | 99,970 | |
| Series 2016 B, 5% 11/15/23 | 110,000 | 110,103 | |
| Series 2021 A, 4% 11/15/23 | 100,000 | 99,970 | |
| Texas Gen. Oblig. Bonds: | |||
| Series 2014 A, 5% 10/1/23 | 540,000 | 540,000 | |
| Series 2014, 5% 10/1/23 | 115,000 | 115,000 | |
| Univ. of Texas Board of Regents Sys. Rev. Series 2023 A, 3.68% 10/31/23 (Liquidity Facility Univ. of Texas Invt. Mgmt. Co.), CP | 100,000 | 99,985 | |
TOTAL TEXAS | 1,815,083 | ||
| Virginia - 0.1% | |||
| Virginia College Bldg. Auth. Edl. Facilities Rev. Bonds Series 2017 A, 5% 2/1/24 | 125,000 | 125,378 | |
| Washington - 1.2% | |||
| Central Puget Sound Reg'l. Trans. Auth. Sales & Use Tax Rev. Bonds Series 2016 S1, 5% 11/1/23 | 115,000 | 115,071 | |
| King County #405 Bellevue School District Bonds (Washington St. School District Cr. Enhancement Prog.) Series 2016, 5% 12/1/23 (Washington Gen. Oblig. Guaranteed) | 495,000 | 495,845 | |
| King County Highline School District # 401 Bonds: | |||
| Series 2022 B, 5% 12/1/23 (Washington Gen. Oblig. Guaranteed) | 225,000 | 225,377 | |
| Series 2023, 5% 12/1/23 (Washington Gen. Oblig. Guaranteed) | 150,000 | 150,251 | |
| King County School District 210 Bonds Series 2015, 4% 12/1/23 (Washington Gen. Oblig. Guaranteed) | 145,000 | 145,018 | |
| Port of Seattle Rev. Bonds Series 2022 B, 5% 8/1/24 (c) | 195,000 | 196,149 | |
TOTAL WASHINGTON | 1,327,711 | ||
| Wisconsin - 0.6% | |||
| Wisconsin Gen. Oblig. Bonds: | |||
| Series 2016 1, 5% 11/1/23 | 100,000 | 100,076 | |
| Series 2016 2, 5% 11/1/23 | 205,000 | 205,156 | |
| Series 2017 2, 5% 11/1/23 | 100,000 | 100,076 | |
| Series 2022 3, 5% 11/1/23 | 100,000 | 100,076 | |
| Wisconsin Health & Edl. Facilities Bonds Series 2018 B, 5%, tender 1/31/24 (b) | 100,000 | 100,253 | |
TOTAL WISCONSIN | 605,637 | ||
| TOTAL OTHER MUNICIPAL SECURITY (Cost $25,318,724) | 25,310,032 | ||
| Investment Company - 6.6% | |||
| Shares | Value ($) | ||
Fidelity Municipal Cash Central Fund 4.2% (i)(j) (Cost $7,329,874) | 7,328,562 | 7,330,028 | |
| TOTAL INVESTMENT IN SECURITIES - 101.1% (Cost $111,683,598) | 111,675,060 |
NET OTHER ASSETS (LIABILITIES) - (1.1)% | (1,231,448) |
| NET ASSETS - 100.0% | 110,443,612 |
| BAN | - | BOND ANTICIPATION NOTE |
| CP | - | COMMERCIAL PAPER |
| TAN | - | TAX ANTICIPATION NOTE |
| VRDN | - | VARIABLE RATE DEMAND NOTE (A debt instrument that is payable upon demand, either daily, weekly or monthly) |
| (a) | Amount is stated in United States dollars unless otherwise noted. |
| (b) | Coupon rates for floating and adjustable rate securities reflect the rates in effect at period end. |
| (c) | Private activity obligations whose interest is subject to the federal alternative minimum tax for individuals. |
| (d) | Security exempt from registration under Rule 144A of the Securities Act of 1933. These securities may be resold in transactions exempt from registration, normally to qualified institutional buyers. At the end of the period, the value of these securities amounted to $4,900,000 or 4.4% of net assets. |
| (e) | Provides evidence of ownership in one or more underlying municipal bonds. |
| (f) | Coupon rates are determined by re-marketing agents based on current market conditions. |
| (g) | Restricted securities (including private placements) - Investment in securities not registered under the Securities Act of 1933 (excluding 144A issues). At the end of the period, the value of restricted securities (excluding 144A issues) amounted to $1,100,000 or 1.0% of net assets. |
| (h) | Coupon is indexed to a floating interest rate which may be multiplied by a specified factor and/or subject to caps or floors. |
| (i) | Information in this report regarding holdings by state and security types does not reflect the holdings of the Fidelity Municipal Cash Central Fund. |
| (j) | Affiliated fund that is generally available only to investment companies and other accounts managed by Fidelity Investments. The rate quoted is the annualized seven-day yield of the fund at period end. A complete unaudited listing of the fund's holdings as of its most recent quarter end is available upon request. In addition, each Fidelity Central Fund's financial statements are available on the SEC's website or upon request. |
| Additional information on each restricted holding is as follows: | ||
| Security | Acquisition Date | Cost ($) |
| Broward County Convention Ctr. Bonds Series MS 00 11, 3.83%, tender 11/2/23 (Liquidity Facility Morgan Stanley Bank, West Valley City Utah) | 1/19/23 | 600,000 |
| Central Puget Sound Reg'l. Trans. Auth. Sales & Use Tax Rev. Bonds Series G 123, 4.18%, tender 11/1/23 (Liquidity Facility Royal Bank of Canada) | 2/09/23 | 100,000 |
| Connecticut Spl. Tax Oblig. Trans. Infrastructure Rev. Bonds Series Floaters G 110, 4.16%, tender 10/5/23 (Liquidity Facility Royal Bank of Canada) | 4/01/21 | 200,000 |
| Greater Orlando Aviation Auth. Arpt. Facilities Rev. Bonds Series Floaters G 25, 4.23%, tender 10/5/23 (Liquidity Facility Royal Bank of Canada) | 4/01/21 | 100,000 |
| South Carolina Trans. Infrastructure Bank Rev. Bonds Series Floaters G 109, 4.18%, tender 10/5/23 (Liquidity Facility Royal Bank of Canada) | 4/01/21 | 100,000 |
| Affiliate | Value, beginning of period ($) | Purchases ($) | Sales Proceeds ($) | Dividend Income ($) | Realized Gain (loss) ($) | Change in Unrealized appreciation (depreciation) ($) | Value, end of period ($) | % ownership, end of period |
| Fidelity Municipal Cash Central Fund 4.42% | 7,744,028 | 36,832,000 | 37,246,000 | 154,514 | - | - | 7,330,028 | 0.3% |
| Total | 7,744,028 | 36,832,000 | 37,246,000 | 154,514 | - | - | 7,330,028 | |
| Valuation Inputs at Reporting Date: | ||||
| Description | Total ($) | Level 1 ($) | Level 2 ($) | Level 3 ($) |
Investments in Securities: | ||||
| Variable Rate Demand Note | 62,060,000 | - | 62,060,000 | - |
| Tender Option Bond | 16,975,000 | - | 16,975,000 | - |
| Other Municipal Security | 25,310,032 | - | 25,310,032 | - |
| Investment Company | 7,330,028 | 7,330,028 | - | - |
| Total Investments in Securities: | 111,675,060 | 7,330,028 | 104,345,032 | - |
| Statement of Assets and Liabilities | ||||
September 30, 2023 (Unaudited) | ||||
| Assets | ||||
| Investment in securities, at value - See accompanying schedule: | ||||
Unaffiliated issuers (cost $104,353,724) | $ | 104,345,032 | ||
Fidelity Central Funds (cost $7,329,874) | 7,330,028 | |||
| Total Investment in Securities (cost $111,683,598) | $ | 111,675,060 | ||
| Receivable for investments sold | 2,205,000 | |||
| Receivable for fund shares sold | 223 | |||
| Interest receivable | 834,585 | |||
| Distributions receivable from Fidelity Central Funds | 19,412 | |||
| Prepaid expenses | 199 | |||
| Receivable from investment adviser for expense reductions | 4,194 | |||
| Other receivables | 8 | |||
Total assets | 114,738,681 | |||
| Liabilities | ||||
| Payable to custodian bank | $ | 1,253,085 | ||
| Payable for investments purchased | 1,017,291 | |||
| Payable for fund shares redeemed | 1,988,423 | |||
| Accrued management fee | 13,522 | |||
| Other payables and accrued expenses | 22,748 | |||
| Total Liabilities | 4,295,069 | |||
| Net Assets | $ | 110,443,612 | ||
| Net Assets consist of: | ||||
| Paid in capital | $ | 110,477,818 | ||
| Total accumulated earnings (loss) | (34,206) | |||
| Net Assets | $ | 110,443,612 | ||
Net Asset Value, offering price and redemption price per share ($110,443,612 ÷ 110,424,892 shares) | $ | 1.0002 | ||
| Statement of Operations | ||||
Six months ended September 30, 2023 (Unaudited) | ||||
| Investment Income | ||||
| Interest | $ | 2,341,228 | ||
| Income from Fidelity Central Funds | 154,514 | |||
| Total Income | 2,495,742 | |||
| Expenses | ||||
| Management fee | $ | 98,859 | ||
| Custodian fees and expenses | 2,939 | |||
| Independent trustees' fees and expenses | 273 | |||
| Registration fees | 6,795 | |||
| Audit | 20,713 | |||
| Legal | 62 | |||
| Miscellaneous | 238 | |||
| Total expenses before reductions | 129,879 | |||
| Expense reductions | (30,380) | |||
| Total expenses after reductions | 99,499 | |||
| Net Investment income (loss) | 2,396,243 | |||
| Realized and Unrealized Gain (Loss) | ||||
| Net realized gain (loss) on: | ||||
| Investment Securities: | ||||
| Unaffiliated issuers | (1,048) | |||
| Total net realized gain (loss) | (1,048) | |||
| Change in net unrealized appreciation (depreciation) on investment securities | (36,135) | |||
| Net gain (loss) | (37,183) | |||
| Net increase in net assets resulting from operations | $ | 2,359,060 | ||
| Statement of Changes in Net Assets | ||||
Six months ended September 30, 2023 (Unaudited) | Year ended March 31, 2023 | |||
| Increase (Decrease) in Net Assets | ||||
| Operations | ||||
| Net investment income (loss) | $ | 2,396,243 | $ | 5,336,986 |
| Net realized gain (loss) | (1,048) | (26,537) | ||
| Change in net unrealized appreciation (depreciation) | (36,135) | 209,645 | ||
Net increase in net assets resulting from operations | 2,359,060 | 5,520,094 | ||
| Distributions to shareholders | (2,394,467) | (5,339,450) | ||
| Share transactions | ||||
| Proceeds from sales of shares | 11,905,930 | 53,902,848 | ||
| Reinvestment of distributions | 2,394,467 | 5,339,450 | ||
| Cost of shares redeemed | (64,305,677) | (436,349,504) | ||
Net increase (decrease) in net assets and shares resulting from share transactions | (50,005,280) | (377,107,206) | ||
| Total increase (decrease) in net assets | (50,040,687) | (376,926,562) | ||
| Net Assets | ||||
| Beginning of period | 160,484,299 | 537,410,861 | ||
| End of period | $ | 110,443,612 | $ | 160,484,299 |
| Other Information | ||||
| Shares | ||||
| Sold | 11,902,468 | 53,885,181 | ||
| Issued in reinvestment of distributions | 2,394,007 | 5,337,763 | ||
| Redeemed | (64,287,276) | (436,220,379) | ||
| Net increase (decrease) | (49,990,801) | (376,997,435) | ||
| Fidelity® SAI Municipal Money Market Fund |
Six months ended (Unaudited) September 30, 2023 | Years ended March 31, 2023 | 2022 | 2021 | 2020 | 2019 | |||||||
Selected Per-Share Data | ||||||||||||
| Net asset value, beginning of period | $ | 1.0004 | $ | 1.0000 | $ | 1.0004 | $ | 1.0002 | $ | 1.0001 | $ | .9999 |
| Income from Investment Operations | ||||||||||||
Net investment income (loss) A | .0170 | .0180 | .0003 | .0013 | .0142 | .0146 | ||||||
| Net realized and unrealized gain (loss) | (.0002) | .0004 | (.0003) | .0002 | .0001 | .0002 | ||||||
| Total from investment operations | .0168 | .0184 | - | .0015 | .0143 | .0148 | ||||||
| Distributions from net investment income | (.0170) | (.0180) | (.0003) | (.0013) | (.0142) | (.0146) | ||||||
| Distributions from net realized gain | - | - | (.0001) | (.0001) | - | - | ||||||
| Total distributions | (.0170) | (.0180) | (.0004) | (.0013) B | (.0142) | (.0146) | ||||||
| Net asset value, end of period | $ | 1.0002 | $ | 1.0004 | $ | 1.0000 | $ | 1.0004 | $ | 1.0002 | $ | 1.0001 |
Total Return C,D | 1.69% | 1.85% | -% | .15% | 1.44% | 1.49% | ||||||
Ratios to Average Net Assets A,E,F | ||||||||||||
| Expenses before reductions | .18% G | .16% | .16% | .16% | .19% | .21% | ||||||
| Expenses net of fee waivers, if any | .14% G | .14% | .09% | .12% | .14% | .14% | ||||||
| Expenses net of all reductions | .14% G | .14% | .09% | .12% | .14% | .14% | ||||||
| Net investment income (loss) | 3.38% G | 1.57% | .03% | .08% | 1.41% | 1.46% | ||||||
| Supplemental Data | ||||||||||||
| Net assets, end of period (000 omitted) | $ | 110,444 | $ | 160,484 | $ | 537,411 | $ | 445,828 | $ | 134,798 | $ | 295,510 |
| Fidelity Central Fund | Investment Manager | Investment Objective | Investment Practices | Expense RatioA |
| Fidelity Money Market Central Funds | Fidelity Management & Research Company LLC (FMR) | Each fund seeks to obtain a high level of current income consistent with the preservation of capital and liquidity. | Short-term Investments | Less than .005% |
| Gross unrealized appreciation | $1,481 |
| Gross unrealized depreciation | (10,019) |
| Net unrealized appreciation (depreciation) | $(8,538) |
| Tax cost | $111,683,598 |
Short-term | $(26,476) |
Long-term | - |
| Total capital loss carryforward | $(26,476) |
| Purchases ($) | Sales ($) | Realized Gain (Loss) ($) | |
| Fidelity SAI Municipal Money Market Fund | 513,344 | 27,510,000 | - |
| Strategic Advisers Tax-Sensitive Short Duration Fund | |
| Fidelity SAI Municipal Money Market Fund | 99% |
| Fund | % of shares held |
| Fidelity SAI Municipal Money Market Fund | 100% |
| The Example is based on an investment of $1,000 invested at the beginning of the period and held for the entire period (April 1, 2023 to September 30, 2023). |
Annualized Expense Ratio- A | Beginning Account Value April 1, 2023 | Ending Account Value September 30, 2023 | Expenses Paid During Period- C April 1, 2023 to September 30, 2023 | |||||||
| Fidelity® SAI Municipal Money Market Fund | .14% | |||||||||
| Actual | $ 1,000 | $ 1,016.90 | $ .71 | |||||||
Hypothetical-B | $ 1,000 | $ 1,024.30 | $ .71 | |||||||
 |
|
|
|
|
Item 2.
Code of Ethics
Not applicable.
Item 3.
Audit Committee Financial Expert
Not applicable.
Item 4.
Principal Accountant Fees and Services
Not applicable.
Item 5.
Audit Committee of Listed Registrants
Not applicable.
Item 6.
Investments
(a)
Not applicable.
(b)
Not applicable
Item 7.
Disclosure of Proxy Voting Policies and Procedures for Closed-End Management Investment Companies
Not applicable.
Item 8.
Portfolio Managers of Closed-End Management Investment Companies
Not applicable.
Item 9.
Purchase of Equity Securities by Closed-End Management Investment Company and Affiliated Purchasers
Not applicable.
Item 10.
Submission of Matters to a Vote of Security Holders
There were no material changes to the procedures by which shareholders may recommend nominees to the Fidelity Salem Street Trust’s Board of Trustees.
Item 11.
Controls and Procedures
(a)(i) The President and Treasurer and the Chief Financial Officer have concluded that the Fidelity Salem Street Trust’s (the “Trust”) disclosure controls and procedures (as defined in Rule 30a-3(c) under the Investment Company Act) provide reasonable assurances that material information relating to the Trust is made known to them by the appropriate persons, based on their evaluation of these controls and procedures as of a date within 90 days of the filing date of this report.
(a)(ii) There was no change in the Trust’s internal control over financial reporting (as defined in Rule 30a-3(d) under the Investment Company Act) that occurred during the period covered by this report that has materially affected, or is reasonably likely to materially affect, the Trust’s internal control over financial reporting.
Item 12.
Disclosure of Securities Lending Activities for Closed-End Management
Investment Companies
Not applicable.
Item 13.
Exhibits
(a) | (1) | Not applicable. |
(a) | (2) | |
(a) | (3) | Not applicable. |
(b) |
SIGNATURES
Pursuant to the requirements of the Securities Exchange Act of 1934 and the Investment Company Act of 1940, the registrant has duly caused this report to be signed on its behalf by the undersigned, thereunto duly authorized.
Fidelity Salem Street Trust
By: | /s/Laura M. Del Prato |
Laura M. Del Prato | |
President and Treasurer | |
Date: | November 21, 2023 |
Pursuant to the requirements of the Securities Exchange Act of 1934 and the Investment Company Act of 1940, this report has been signed below by the following persons on behalf of the registrant and in the capacities and on the dates indicated.
By: | /s/Laura M. Del Prato |
Laura M. Del Prato | |
President and Treasurer | |
Date: | November 21, 2023 |
By: | /s/John J. Burke III |
John J. Burke III | |
Chief Financial Officer | |
Date: | November 21, 2023 |