UNITED STATES
SECURITIES AND EXCHANGE COMMISSION
Washington, D.C. 20549
FORM N-CSR
CERTIFIED SHAREHOLDER REPORT OF REGISTERED
MANAGEMENT INVESTMENT COMPANIES
Investment Company Act file number 811-02105
Fidelity Salem Street Trust
(Exact name of registrant as specified in charter)
245 Summer St., Boston, Massachusetts 02210
(Address of principal executive offices) (Zip code)
Margaret Carey, Secretary
245 Summer St.
Boston, Massachusetts 02210
(Name and address of agent for service)
Registrant's telephone number, including area code:
617-563-7000
Date of fiscal year end: | October 31 |
Date of reporting period: | October 31, 2023 |
Item 1.
Reports to Stockholders


Contents
| Average Annual Total Returns | |||
Periods ended October 31, 2023 | Past 1 year | Life of Fund A |
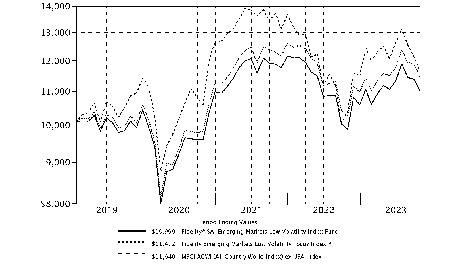
| Fidelity® SAI Emerging Markets Low Volatility Index Fund | 11.41% | 2.02% |
| $10,000 Over Life of Fund |
Let's say hypothetically that $10,000 was invested in Fidelity® SAI Emerging Markets Low Volatility Index Fund on January 30, 2019, when the fund started. The chart shows how the value of your investment would have changed, and also shows how the Fidelity Emerging Markets Low Volatility Focus Index℠ and MSCI ACWI (All Country World Index) ex USA Index performed over the same period. |
 |
Top Holdings (% of Fund's net assets) | ||
| Nestle India Ltd. (India, Food Products) | 1.7 | |
| Agricultural Bank of China Ltd. (H Shares) (China, Banks) | 1.7 | |
| China Shenhua Energy Co. Ltd. (H Shares) (China, Oil, Gas & Consumable Fuels) | 1.7 | |
| HCL Technologies Ltd. (India, IT Services) | 1.7 | |
| Power Grid Corp. of India Ltd. (India, Electric Utilities) | 1.6 | |
| Industrial & Commercial Bank of China Ltd. (H Shares) (China, Banks) | 1.6 | |
| Bank of Communications Co. Ltd. (H Shares) (China, Banks) | 1.6 | |
| Chunghwa Telecom Co. Ltd. (Taiwan, Diversified Telecommunication Services) | 1.6 | |
| KT&G Corp. (Korea (South), Tobacco) | 1.6 | |
| Bank of China Ltd. (H Shares) (China, Banks) | 1.5 | |
| 16.3 | ||
| Market Sectors (% of Fund's net assets) | ||
| Financials | 27.5 | |
| Information Technology | 15.8 | |
| Communication Services | 12.5 | |
| Consumer Staples | 10.0 | |
| Consumer Discretionary | 9.2 | |
| Utilities | 7.3 | |
| Health Care | 6.5 | |
| Energy | 4.7 | |
| Materials | 3.1 | |
| Industrials | 2.2 | |
| Real Estate | 0.5 | |
Asset Allocation (% of Fund's net assets) |
 |
Futures - 0.7% |
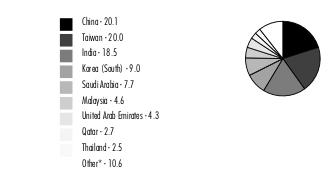
Geographic Diversification (% of Fund's net assets) |
 |
* Includes Short-Term investments and Net Other Assets (Liabilities). Percentages are adjusted for the effect of derivatives, if applicable. |
| Common Stocks - 99.3% | |||
| Shares | Value ($) | ||
| Brazil - 1.9% | |||
| Rumo SA | 7,556,800 | 33,439,224 | |
| Telefonica Brasil SA | 3,107,800 | 27,886,522 | |
TOTAL BRAZIL | 61,325,746 | ||
| Chile - 0.8% | |||
| Banco de Chile | 241,951,263 | 24,857,451 | |
| China - 20.1% | |||
| Agricultural Bank of China Ltd. (H Shares) | 144,283,000 | 53,291,890 | |
| Anta Sports Products Ltd. | 2,380,200 | 26,918,850 | |
| Bank of China Ltd. (H Shares) | 139,663,000 | 48,789,231 | |
| Bank of Communications Co. Ltd. (H Shares) | 86,825,000 | 51,357,503 | |
| CGN Power Co. Ltd. (H Shares) (b) | 82,742,000 | 19,883,535 | |
| China CITIC Bank Corp. Ltd. (H Shares) | 69,273,000 | 30,903,259 | |
| China Construction Bank Corp. (H Shares) | 30,497,000 | 17,247,825 | |
| China Minsheng Banking Corp. Ltd. (H Shares) | 50,154,500 | 16,674,407 | |
| China Railway Group Ltd. (H Shares) | 31,190,000 | 14,720,570 | |
| China Resource Gas Group Ltd. | 6,690,000 | 19,776,485 | |
| China Resources Power Holdings Co. Ltd. | 8,579,000 | 16,625,172 | |
| China Shenhua Energy Co. Ltd. (H Shares) | 17,327,500 | 53,108,307 | |
| China Tower Corp. Ltd. (H Shares) (b) | 201,604,000 | 18,799,748 | |
| Guangdong Investment Ltd. | 20,832,000 | 14,215,384 | |
| Hengan International Group Co. Ltd. | 4,605,000 | 15,423,516 | |
| Industrial & Commercial Bank of China Ltd. (H Shares) | 107,520,000 | 51,528,397 | |
| PetroChina Co. Ltd. (H Shares) | 71,616,000 | 46,744,885 | |
| Postal Savings Bank of China Co. Ltd. (H Shares) (b) | 57,314,000 | 26,159,788 | |
| Shandong Weigao Medical Polymer Co. Ltd. (H Shares) | 15,428,000 | 14,320,143 | |
| Shenzhou International Group Holdings Ltd. | 580,400 | 5,700,963 | |
| Sinopharm Group Co. Ltd. (H Shares) | 4,572,000 | 10,932,947 | |
| Want Want China Holdings Ltd. | 36,997,000 | 22,988,454 | |
| Yum China Holdings, Inc. | 799,587 | 42,026,293 | |
TOTAL CHINA | 638,137,552 | ||
| India - 18.5% | |||
| Cipla Ltd./India (a) | 2,425,887 | 34,959,079 | |
| Crompton Greaves Consumer Electricals Ltd. | 2,650,090 | 8,973,155 | |
| Dr. Reddy's Laboratories Ltd. | 735,153 | 47,436,053 | |
| HCL Technologies Ltd. | 3,437,865 | 52,715,778 | |
| Hindustan Unilever Ltd. | 1,434,338 | 42,792,783 | |
| Infosys Ltd. | 2,386,517 | 39,236,439 | |
| Jubilant Foodworks Ltd. | 2,837,059 | 17,065,778 | |
| Lupin Ltd. | 1,350,398 | 18,293,844 | |
| MRF Ltd. | 18,443 | 23,989,203 | |
| Nestle India Ltd. | 183,716 | 53,480,208 | |
| Pidilite Industries Ltd. | 31,205 | 921,054 | |
| Power Grid Corp. of India Ltd. | 21,355,216 | 51,850,797 | |
| Sona Blw Precision Forgings Ltd. (b) | 2,367,253 | 15,401,422 | |
| Sun Pharmaceutical Industries Ltd. | 1,340,812 | 17,524,775 | |
| Tata Consultancy Services Ltd. | 1,138,872 | 46,091,932 | |
| Tech Mahindra Ltd. | 2,701,271 | 36,802,328 | |
| Tvs Motor Co. Ltd. | 1,739,975 | 33,239,964 | |
| Wipro Ltd. | 6,225,636 | 28,571,667 | |
| WNS Holdings Ltd. sponsored ADR (a) | 298,427 | 16,210,555 | |
TOTAL INDIA | 585,556,814 | ||
| Indonesia - 2.3% | |||
| PT Bank Central Asia Tbk | 78,585,700 | 43,294,485 | |
| PT Telkom Indonesia Persero Tbk | 141,568,000 | 31,033,944 | |
TOTAL INDONESIA | 74,328,429 | ||
| Korea (South) - 9.0% | |||
| Coway Co. Ltd. | 422,439 | 13,498,344 | |
| Db Insurance Co. Ltd. | 294,229 | 19,113,845 | |
| GS Holdings Corp. | 6,926 | 201,952 | |
| Hankook Tire Co. Ltd. | 586,076 | 16,603,224 | |
| Hotel Shilla Co. (c) | 167,803 | 7,752,873 | |
| Hyundai Mobis | 283,937 | 43,906,653 | |
| Industrial Bank of Korea | 2,190,340 | 18,100,327 | |
| Korea Electric Power Corp. (a) | 1,109,098 | 13,861,915 | |
| KT&G Corp. | 777,438 | 48,970,641 | |
| NCSOFT Corp. | 117,183 | 20,215,328 | |
| Orion Corp./Republic of Korea | 77,820 | 6,877,260 | |
| Samsung Electronics Co. Ltd. | 726,731 | 36,119,325 | |
| Samsung SDS Co. Ltd. | 324,777 | 33,241,884 | |
| SK Hynix, Inc. | 65,817 | 5,707,215 | |
TOTAL KOREA (SOUTH) | 284,170,786 | ||
| Kuwait - 2.5% | |||
| Boubyan Bank KSC | 7,707,665 | 14,595,869 | |
| Mobile Telecommunication Co. | 16,176,909 | 25,144,913 | |
| National Bank of Kuwait | 13,695,994 | 38,815,275 | |
TOTAL KUWAIT | 78,556,057 | ||
| Malaysia - 4.6% | |||
| CelcomDigi Bhd | 19,533,100 | 17,497,878 | |
| IHH Healthcare Bhd | 17,395,300 | 21,897,101 | |
| Malayan Banking Bhd | 8,289,316 | 15,696,299 | |
| MISC Bhd | 4,180,100 | 6,363,690 | |
| Nestle (Malaysia) Bhd | 233,400 | 6,065,625 | |
| Petronas Gas Bhd | 2,988,800 | 10,886,772 | |
| PPB Group Bhd | 3,579,500 | 11,507,155 | |
| Public Bank Bhd | 21,593,300 | 18,859,627 | |
| Tenaga Nasional Bhd | 18,266,200 | 37,958,362 | |
TOTAL MALAYSIA | 146,732,509 | ||
| Mexico - 0.4% | |||
| Kimberly-Clark de Mexico SA de CV Series A | 7,379,000 | 13,526,871 | |
| Philippines - 2.0% | |||
| Bank of the Philippine Islands (BPI) | 11,666,773 | 20,635,658 | |
| BDO Unibank, Inc. | 13,074,732 | 29,361,025 | |
| PLDT, Inc. | 607,215 | 12,944,209 | |
TOTAL PHILIPPINES | 62,940,892 | ||
| Qatar - 2.7% | |||
| Masraf al Rayan | 6,657,256 | 3,839,670 | |
| Qatar Electricity & Water Co. (a) | 630,446 | 2,863,932 | |
| Qatar Islamic Bank | 6,677,899 | 31,913,058 | |
| Qatar National Bank SAQ | 8,250,039 | 33,738,830 | |
| The Commercial Bank of Qatar (a) | 8,429,925 | 11,868,112 | |
TOTAL QATAR | 84,223,602 | ||
| Russia - 0.0% | |||
| PhosAgro PJSC (d) | 1,400 | 86 | |
| PhosAgro PJSC: | |||
| GDR (Reg. S) (a)(d) | 586,072 | 12,020 | |
| sponsored GDR (Reg. S) (a)(d) | 3,774 | 77 | |
TOTAL RUSSIA | 12,183 | ||
| Saudi Arabia - 7.7% | |||
| Alinma Bank | 4,475,932 | 39,252,096 | |
| Almarai Co. Ltd. | 1,853,174 | 27,612,866 | |
| Jarir Marketing Co. | 4,486,803 | 17,317,653 | |
| Mouwasat Medical Services Co. | 696,810 | 18,573,675 | |
| Sabic Agriculture-Nutrients Co. | 807,123 | 28,785,867 | |
| Saudi Basic Industries Corp. | 2,023,026 | 41,521,751 | |
| Saudi Electricity Co. | 4,931,360 | 23,397,539 | |
| Saudi Telecom Co. | 4,544,003 | 46,510,746 | |
| The Savola Group | 6,081 | 59,001 | |
| Yanbu National Petrochemical Co. | 205,130 | 2,069,562 | |
TOTAL SAUDI ARABIA | 245,100,756 | ||
| Taiwan - 20.0% | |||
| ASUSTeK Computer, Inc. | 3,722,000 | 38,995,609 | |
| Chang Hwa Commercial Bank | 43,910,869 | 23,245,108 | |
| Chicony Electronics Co. Ltd. | 4,960,000 | 19,080,033 | |
| Chunghwa Telecom Co. Ltd. | 13,705,000 | 48,978,766 | |
| Compal Electronics, Inc. | 30,710,000 | 26,692,069 | |
| Far EasTone Telecommunications Co. Ltd. | 12,185,000 | 28,520,471 | |
| Formosa Petrochemical Corp. | 11,040,000 | 26,950,348 | |
| Formosa Plastics Corp. | 11,114,000 | 26,410,656 | |
| Highwealth Construction Corp. | 12,087,900 | 15,176,214 | |
| Inventec Corp. | 23,817,000 | 29,814,118 | |
| Lite-On Technology Corp. | 11,437,000 | 35,581,814 | |
| Mega Financial Holding Co. Ltd. | 40,239,627 | 45,626,120 | |
| President Chain Store Corp. | 4,284,000 | 34,050,194 | |
| Quanta Computer, Inc. | 4,473,000 | 26,389,622 | |
| Sinopac Financial Holdings Co. | 54,582,344 | 30,079,852 | |
| Synnex Technology International Corp. | 9,397,000 | 19,927,957 | |
| Taiwan Cooperative Financial Holding Co. Ltd. | 48,425,723 | 37,576,856 | |
| Taiwan Mobile Co. Ltd. | 13,159,000 | 38,858,417 | |
| The Shanghai Commercial & Savings Bank Ltd. | 19,244,080 | 25,478,607 | |
| Uni-President Enterprises Corp. | 15,702,000 | 32,916,614 | |
| WPG Holding Co. Ltd. | 10,828,000 | 23,942,041 | |
TOTAL TAIWAN | 634,291,486 | ||
| Thailand - 2.5% | |||
| Advanced Info Service PCL (For. Reg.) | 7,308,800 | 44,518,034 | |
| Advanced Information Service PCL NVDR | 533,500 | 3,249,558 | |
| Bangkok Bank PCL (For. Reg.) | 3,107,900 | 13,543,774 | |
| Bangkok Dusit Medical Services PCL (For. Reg.) | 25,994,900 | 19,056,477 | |
TOTAL THAILAND | 80,367,843 | ||
| United Arab Emirates - 4.3% | |||
| Abu Dhabi National Oil Co. for Distribution PJSC | 21,938,003 | 20,068,524 | |
| ADNOC Drilling Co. PJSC | 18,974,984 | 18,804,504 | |
| Dubai Electricity & Water Authority PJSC (a) | 37,636,434 | 24,387,344 | |
| Dubai Islamic Bank Pakistan Ltd. | 21,464,884 | 31,557,412 | |
| Emirates Telecommunications Corp. | 6,385,139 | 32,090,843 | |
| First Abu Dhabi Bank PJSC | 2,477,401 | 8,552,531 | |
TOTAL UNITED ARAB EMIRATES | 135,461,158 | ||
| TOTAL COMMON STOCKS (Cost $3,150,848,052) | 3,149,590,135 | ||
| Government Obligations - 0.1% | |||
Principal Amount (e) | Value ($) | ||
| United States of America - 0.1% | |||
U.S. Treasury Bills, yield at date of purchase 5.42% 2/22/24 (f) (Cost $1,770,075) | 1,800,000 | 1,769,970 | |
| Money Market Funds - 0.8% | |||
| Shares | Value ($) | ||
| Fidelity Cash Central Fund 5.40% (g) | 22,632,886 | 22,637,413 | |
| Fidelity Securities Lending Cash Central Fund 5.40% (g)(h) | 4,427,557 | 4,428,000 | |
| TOTAL MONEY MARKET FUNDS (Cost $27,065,413) | 27,065,413 | ||
| TOTAL INVESTMENT IN SECURITIES - 100.2% (Cost $3,179,683,540) | 3,178,425,518 |
NET OTHER ASSETS (LIABILITIES) - (0.2)% | (6,476,593) |
| NET ASSETS - 100.0% | 3,171,948,925 |
| Futures Contracts | |||||
Number of contracts | Expiration Date | Notional Amount ($) | Value ($) | Unrealized Appreciation/ (Depreciation) ($) | |
| Purchased | |||||
| Equity Index Contracts | |||||
| ICE MSCI Emerging Markets Index Contracts (United States) | 487 | Dec 2023 | 22,382,520 | (630,612) | (630,612) |
| The notional amount of futures purchased as a percentage of Net Assets is 0.7% | |||||
| (a) | Non-income producing |
| (b) | Security exempt from registration under Rule 144A of the Securities Act of 1933. These securities may be resold in transactions exempt from registration, normally to qualified institutional buyers. At the end of the period, the value of these securities amounted to $80,244,493 or 2.5% of net assets. |
| (c) | Security or a portion of the security is on loan at period end. |
| (d) | Level 3 security |
| (e) | Amount is stated in United States dollars unless otherwise noted. |
| (f) | Security or a portion of the security was pledged to cover margin requirements for futures contracts. At period end, the value of securities pledged amounted to $702,088. |
| (g) | Affiliated fund that is generally available only to investment companies and other accounts managed by Fidelity Investments. The rate quoted is the annualized seven-day yield of the fund at period end. A complete unaudited listing of the fund's holdings as of its most recent quarter end is available upon request. In addition, each Fidelity Central Fund's financial statements, which are not covered by the Fund's Report of Independent Registered Public Accounting Firm, are available on the SEC's website or upon request. |
| (h) | Investment made with cash collateral received from securities on loan. |
| Affiliate | Value, beginning of period ($) | Purchases ($) | Sales Proceeds ($) | Dividend Income ($) | Realized Gain (loss) ($) | Change in Unrealized appreciation (depreciation) ($) | Value, end of period ($) | % ownership, end of period |
| Fidelity Cash Central Fund 5.40% | 30,186,116 | 758,471,044 | 766,019,747 | 772,954 | - | - | 22,637,413 | 0.0% |
| Fidelity Securities Lending Cash Central Fund 5.40% | 12,500,000 | 32,696,469 | 40,768,469 | 4,221 | - | - | 4,428,000 | 0.0% |
| Total | 42,686,116 | 791,167,513 | 806,788,216 | 777,175 | - | - | 27,065,413 | |
| Valuation Inputs at Reporting Date: | ||||
| Description | Total ($) | Level 1 ($) | Level 2 ($) | Level 3 ($) |
Investments in Securities: | ||||
| Equities: | ||||
Communication Services | 396,249,377 | 131,633,024 | 264,616,353 | - |
Consumer Discretionary | 292,462,899 | 79,412,470 | 213,050,429 | - |
Consumer Staples | 316,271,188 | 41,198,738 | 275,072,450 | - |
Energy | 145,608,044 | 18,804,504 | 126,803,540 | - |
Financials | 875,554,187 | 238,990,304 | 636,563,883 | - |
Health Care | 202,994,094 | 18,573,675 | 184,420,419 | - |
Industrials | 70,935,991 | 49,649,779 | 21,286,212 | - |
Information Technology | 498,909,831 | - | 498,909,831 | - |
Materials | 99,721,073 | 72,377,180 | 27,331,710 | 12,183 |
Real Estate | 15,176,214 | - | 15,176,214 | - |
Utilities | 235,707,237 | 50,648,815 | 185,058,422 | - |
| Government Obligations | 1,769,970 | - | 1,769,970 | - |
| Money Market Funds | 27,065,413 | 27,065,413 | - | - |
| Total Investments in Securities: | 3,178,425,518 | 728,353,902 | 2,450,059,433 | 12,183 |
Derivative Instruments: Liabilities | ||||
Futures Contracts | (630,612) | (630,612) | - | - |
| Total Liabilities | (630,612) | (630,612) | - | - |
| Total Derivative Instruments: | (630,612) | (630,612) | - | - |
Primary Risk Exposure / Derivative Type | Value | |
| Asset ($) | Liability ($) | |
| Equity Risk | ||
Futures Contracts (a) | 0 | (630,612) |
| Total Equity Risk | 0 | (630,612) |
| Total Value of Derivatives | 0 | (630,612) |
| Statement of Assets and Liabilities | ||||
| October 31, 2023 | ||||
| Assets | ||||
| Investment in securities, at value (including securities loaned of $3,781,487) - See accompanying schedule: | ||||
Unaffiliated issuers (cost $3,152,618,127) | $ | 3,151,360,105 | ||
Fidelity Central Funds (cost $27,065,413) | 27,065,413 | |||
| Total Investment in Securities (cost $3,179,683,540) | $ | 3,178,425,518 | ||
| Foreign currency held at value (cost $11,950,056) | 11,863,522 | |||
| Receivable for investments sold | 4,701 | |||
| Receivable for fund shares sold | 2,218,648 | |||
| Dividends receivable | 1,649,306 | |||
| Distributions receivable from Fidelity Central Funds | 83,749 | |||
| Prepaid expenses | 3,861 | |||
| Receivable from investment adviser for expense reductions | 8,200 | |||
| Other receivables | 409,791 | |||
Total assets | 3,194,667,296 | |||
| Liabilities | ||||
| Payable for fund shares redeemed | $ | 3,186,425 | ||
| Accrued management fee | 403,094 | |||
| Payable for daily variation margin on futures contracts | 157,043 | |||
| Deferred taxes | 13,351,843 | |||
| Other payables and accrued expenses | 1,191,966 | |||
| Collateral on securities loaned | 4,428,000 | |||
| Total Liabilities | 22,718,371 | |||
| Net Assets | $ | 3,171,948,925 | ||
| Net Assets consist of: | ||||
| Paid in capital | $ | 3,124,517,982 | ||
| Total accumulated earnings (loss) | 47,430,943 | |||
| Net Assets | $ | 3,171,948,925 | ||
Net Asset Value, offering price and redemption price per share ($3,171,948,925 ÷ 312,305,005 shares) | $ | 10.16 | ||
| Statement of Operations | ||||
Year ended October 31, 2023 | ||||
| Investment Income | ||||
| Dividends | $ | 126,431,986 | ||
| Interest | 83,578 | |||
| Income from Fidelity Central Funds (including $4,221 from security lending) | 777,175 | |||
| Income before foreign taxes withheld | $ | 127,292,739 | ||
| Less foreign taxes withheld | (15,785,271) | |||
| Total Income | 111,507,468 | |||
| Expenses | ||||
| Management fee | $ | 4,607,946 | ||
| Custodian fees and expenses | 3,056,368 | |||
| Independent trustees' fees and expenses | 10,138 | |||
| Registration fees | 184,429 | |||
| Audit | 105,049 | |||
| Legal | 3,253 | |||
| Interest | 144,520 | |||
| Miscellaneous | 13,689 | |||
| Total expenses before reductions | 8,125,392 | |||
| Expense reductions | (286,923) | |||
| Total expenses after reductions | 7,838,469 | |||
| Net Investment income (loss) | 103,668,999 | |||
| Realized and Unrealized Gain (Loss) | ||||
| Net realized gain (loss) on: | ||||
| Investment Securities: | ||||
| Unaffiliated issuers (net of foreign taxes of $971,747) | 3,525,174 | |||
| Foreign currency transactions | (405,293) | |||
| Futures contracts | 6,972,476 | |||
| Total net realized gain (loss) | 10,092,357 | |||
| Change in net unrealized appreciation (depreciation) on: | ||||
| Investment Securities: | ||||
| Unaffiliated issuers(net of increase in deferred foreign taxes of $6,437,329) | 154,605,623 | |||
| Assets and liabilities in foreign currencies | (11,673) | |||
| Futures contracts | 710,647 | |||
| Total change in net unrealized appreciation (depreciation) | 155,304,597 | |||
| Net gain (loss) | 165,396,954 | |||
| Net increase (decrease) in net assets resulting from operations | $ | 269,065,953 | ||
| Statement of Changes in Net Assets | ||||
Year ended October 31, 2023 | Year ended October 31, 2022 | |||
| Increase (Decrease) in Net Assets | ||||
| Operations | ||||
| Net investment income (loss) | $ | 103,668,999 | $ | 59,863,843 |
| Net realized gain (loss) | 10,092,357 | (6,168,928) | ||
| Change in net unrealized appreciation (depreciation) | 155,304,597 | (412,507,271) | ||
| Net increase (decrease) in net assets resulting from operations | 269,065,953 | (358,812,356) | ||
| Distributions to shareholders | (53,120,773) | (41,568,890) | ||
| Share transactions | ||||
| Proceeds from sales of shares | 1,377,836,095 | 901,012,848 | ||
| Reinvestment of distributions | 51,309,868 | 41,085,516 | ||
| Cost of shares redeemed | (545,094,970) | (262,187,253) | ||
Net increase (decrease) in net assets resulting from share transactions | 884,050,993 | 679,911,111 | ||
| Total increase (decrease) in net assets | 1,099,996,173 | 279,529,865 | ||
| Net Assets | ||||
| Beginning of period | 2,071,952,752 | 1,792,422,887 | ||
| End of period | $ | 3,171,948,925 | $ | 2,071,952,752 |
| Other Information | ||||
| Shares | ||||
| Sold | 137,366,579 | 87,667,616 | ||
| Issued in reinvestment of distributions | 5,225,037 | 3,675,772 | ||
| Redeemed | (53,285,723) | (25,061,997) | ||
| Net increase (decrease) | 89,305,893 | 66,281,391 | ||
| Fidelity® SAI Emerging Markets Low Volatility Index Fund |
| Years ended October 31, | 2023 | 2022 | 2021 | 2020 | 2019 A | |||||
Selected Per-Share Data | ||||||||||
| Net asset value, beginning of period | $ | 9.29 | $ | 11.44 | $ | 9.41 | $ | 10.11 | $ | 10.00 |
| Income from Investment Operations | ||||||||||
Net investment income (loss) B,C | .35 | .33 | .27 | .24 | .22 | |||||
| Net realized and unrealized gain (loss) | .70 | (2.22) | 1.95 | (.75) | (.11) | |||||
| Total from investment operations | 1.05 | (1.89) | 2.22 | (.51) | .11 | |||||
| Distributions from net investment income | (.18) | (.26) | (.19) | (.19) | - | |||||
| Total distributions | (.18) | (.26) | (.19) | (.19) | - | |||||
| Net asset value, end of period | $ | 10.16 | $ | 9.29 | $ | 11.44 | $ | 9.41 | $ | 10.11 |
Total Return D,E | 11.41% | (16.88)% | 23.79% | (5.10)% | 1.10% | |||||
Ratios to Average Net Assets C,F,G | ||||||||||
| Expenses before reductions | .26% | .26% | .23% | .24% | .35% H | |||||
| Expenses net of fee waivers, if any | .26% | .25% | .23% | .24% | .26% H | |||||
| Expenses net of all reductions | .26% | .25% | .23% | .24% | .26% H | |||||
| Net investment income (loss) | 3.37% | 3.09% | 2.44% | 2.59% | 2.90% H | |||||
| Supplemental Data | ||||||||||
| Net assets, end of period (000 omitted) | $ | 3,171,949 | $ | 2,071,953 | $ | 1,792,423 | $ | 1,259,405 | $ | 644,085 |
Portfolio turnover rate I | 22% | 21% | 28% | 30% | 75% H |
| Average Annual Total Returns | |||
Periods ended October 31, 2023 | Past 1 year | Past 5 years | Life of Fund A |
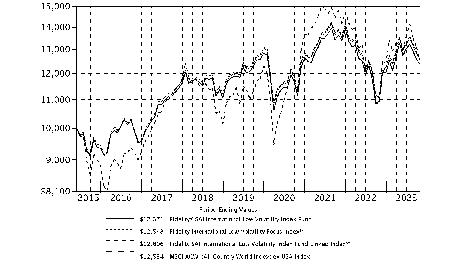
| Fidelity® SAI International Low Volatility Index Fund | 13.07% | 2.18% | 2.56% |
| $10,000 Over Life of Fund |
Let's say hypothetically that $10,000 was invested in Fidelity® SAI International Low Volatility Index Fund on May 29, 2015, when the fund started. The chart shows how the value of your investment would have changed, and also shows how the Fidelity International Low Volatility Focus Index℠, Fidelity SAI International Low Volatility Index Fund Linked Index and MSCI ACWI (All Country World Index) ex USA Index performed over the same period. |
 |
Top Holdings (% of Fund's net assets) | ||
| Novo Nordisk A/S Series B (Denmark, Pharmaceuticals) | 2.5 | |
| Toyota Motor Corp. (Japan, Automobiles) | 2.1 | |
| RELX PLC (London Stock Exchange) (United Kingdom, Professional Services) | 2.1 | |
| Air Liquide SA (France, Chemicals) | 2.0 | |
| GSK PLC (United States of America, Pharmaceuticals) | 1.9 | |
| Novartis AG (Switzerland, Pharmaceuticals) | 1.9 | |
| Tokio Marine Holdings, Inc. (Japan, Insurance) | 1.9 | |
| Unilever PLC (United Kingdom, Personal Care Products) | 1.9 | |
| AstraZeneca PLC (United Kingdom) (United Kingdom, Pharmaceuticals) | 1.9 | |
| Sanofi SA (United States of America, Pharmaceuticals) | 1.9 | |
| 20.1 | ||
| Market Sectors (% of Fund's net assets) | ||
| Health Care | 17.2 | |
| Financials | 14.5 | |
| Consumer Staples | 13.8 | |
| Industrials | 12.8 | |
| Communication Services | 9.5 | |
| Utilities | 8.0 | |
| Consumer Discretionary | 7.8 | |
| Real Estate | 6.2 | |
| Materials | 6.0 | |
| Information Technology | 3.4 | |
Asset Allocation (% of Fund's net assets) |
 |
Futures - 0.8% |
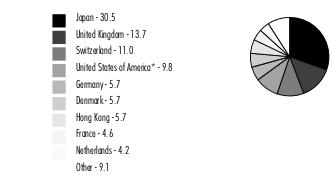
Geographic Diversification (% of Fund's net assets) |
 |
* Includes Short-Term investments and Net Other Assets (Liabilities). Percentages are adjusted for the effect of derivatives, if applicable. |
| Common Stocks - 99.2% | |||
| Shares | Value ($) | ||
| Australia - 2.0% | |||
| ASX Ltd. | 1,080,831 | 38,615,482 | |
| Insurance Australia Group Ltd. | 13,760,071 | 49,639,983 | |
| Medibank Private Ltd. | 15,522,664 | 33,874,780 | |
TOTAL AUSTRALIA | 122,130,245 | ||
| Belgium - 0.5% | |||
| Elia Group SA/NV | 154,969 | 14,700,152 | |
| Warehouses de Pauw | 679,989 | 16,778,655 | |
TOTAL BELGIUM | 31,478,807 | ||
| China - 0.0% | |||
| China Huishan Dairy Holdings Co. Ltd. (a)(b) | 5,145,000 | 7 | |
| Denmark - 5.7% | |||
| Chr. Hansen Holding A/S | 577,608 | 39,346,538 | |
| Coloplast A/S Series B | 667,618 | 69,565,725 | |
| Novo Nordisk A/S Series B | 1,585,356 | 152,949,177 | |
| Novozymes A/S Series B | 606,047 | 27,201,769 | |
| Ringkjoebing Landbobank A/S | 119,780 | 16,310,287 | |
| Tryg A/S | 1,967,487 | 38,394,412 | |
TOTAL DENMARK | 343,767,908 | ||
| Finland - 0.6% | |||
| Elisa Corp. (A Shares) | 844,779 | 35,825,935 | |
| France - 4.6% | |||
| Air Liquide SA | 723,368 | 123,950,736 | |
| bioMerieux SA | 204,715 | 19,603,109 | |
| Hermes International SCA | 15,574 | 28,996,183 | |
| Orange SA | 9,194,913 | 108,151,010 | |
TOTAL FRANCE | 280,701,038 | ||
| Germany - 5.7% | |||
| Beiersdorf AG | 555,161 | 72,868,936 | |
| Deutsche Borse AG | 573,934 | 94,467,505 | |
| Deutsche Telekom AG | 1,397,316 | 30,326,879 | |
| Hannover Reuck SE | 335,781 | 74,006,881 | |
| Symrise AG | 740,798 | 75,701,608 | |
TOTAL GERMANY | 347,371,809 | ||
| Hong Kong - 5.7% | |||
| CLP Holdings Ltd. | 9,330,000 | 68,284,241 | |
| Hang Seng Bank Ltd. | 4,075,000 | 46,589,825 | |
| Hong Kong & China Gas Co. Ltd. | 60,578,015 | 42,168,894 | |
| Jardine Matheson Holdings Ltd. | 1,352,576 | 54,807,921 | |
| Link (REIT) | 9,495,829 | 43,577,716 | |
| MTR Corp. Ltd. | 8,692,083 | 32,492,620 | |
| Power Assets Holdings Ltd. | 7,632,500 | 36,489,674 | |
| Sino Land Ltd. | 19,234,000 | 19,201,849 | |
TOTAL HONG KONG | 343,612,740 | ||
| Ireland - 0.2% | |||
| Kerry Group PLC Class A | 168,488 | 12,992,839 | |
| Israel - 0.7% | |||
| Elbit Systems Ltd. (Israel) | 139,468 | 25,888,877 | |
| Mizrahi Tefahot Bank Ltd. | 499,340 | 15,442,232 | |
TOTAL ISRAEL | 41,331,109 | ||
| Italy - 0.4% | |||
| Recordati SpA | 565,199 | 26,074,416 | |
| Japan - 30.5% | |||
| Advance Residence Investment Corp. | 7,780 | 16,915,309 | |
| Ajinomoto Co., Inc. | 2,231,900 | 81,514,983 | |
| Alfresa Holdings Corp. | 556,900 | 8,821,627 | |
| Bridgestone Corp. | 250,100 | 9,465,086 | |
| Canon, Inc. | 2,110,200 | 49,886,598 | |
| Chubu Electric Power Co., Inc. | 4,124,000 | 49,835,062 | |
| Daiwa House REIT Investment Corp. | 11,993 | 21,224,583 | |
| FUJIFILM Holdings Corp. | 1,776,510 | 97,171,196 | |
| Hankyu Hanshin Holdings, Inc. | 1,360,540 | 42,807,488 | |
| Japan Post Bank Co. Ltd. | 7,686,100 | 71,244,043 | |
| Japan Post Holdings Co. Ltd. | 11,516,600 | 101,935,768 | |
| Japan Real Estate Investment Corp. | 7,714 | 28,652,279 | |
| Kansai Electric Power Co., Inc. | 4,608,700 | 59,009,069 | |
| KDDI Corp. | 965,400 | 28,879,692 | |
| Kintetsu Group Holdings Co. Ltd. | 1,073,200 | 30,196,381 | |
| Kyushu Railway Co. | 888,000 | 18,156,313 | |
| McDonald's Holdings Co. (Japan) Ltd. (c) | 489,300 | 19,037,588 | |
| Medipal Holdings Corp. | 1,176,300 | 19,777,119 | |
| Nagoya Railroad Co. Ltd. | 1,107,900 | 15,509,269 | |
| Nippon Building Fund, Inc. | 9,413 | 37,820,808 | |
| Nippon Prologis REIT, Inc. | 14,705 | 26,165,722 | |
| Nippon Telegraph & Telephone Corp. | 85,089,500 | 100,131,253 | |
| Oriental Land Co. Ltd. | 2,997,700 | 96,961,708 | |
| Osaka Gas Co. Ltd. | 2,350,260 | 44,320,703 | |
| Otsuka Holdings Co. Ltd. | 1,024,160 | 34,458,850 | |
| Pan Pacific International Holdings Ltd. | 3,001,600 | 58,128,575 | |
| Secom Co. Ltd. | 1,197,670 | 83,183,987 | |
| Sega Sammy Holdings, Inc. | 604,100 | 9,447,869 | |
| Sekisui House Ltd. | 1,302,400 | 25,504,574 | |
| Seven & i Holdings Co. Ltd. | 1,553,200 | 56,907,245 | |
| Skylark Holdings Co. Ltd. (a) | 1,282,400 | 18,920,260 | |
| SoftBank Corp. | 8,682,000 | 98,166,230 | |
| Sohgo Security Services Co., Ltd. | 2,446,300 | 14,326,070 | |
| Suntory Beverage & Food Ltd. | 200,700 | 6,039,678 | |
| Tobu Railway Co. Ltd. | 1,181,700 | 28,442,871 | |
| Tokio Marine Holdings, Inc. | 5,109,100 | 114,301,991 | |
| Tokyo Gas Co. Ltd. | 1,432,300 | 32,165,391 | |
| Toyota Motor Corp. | 7,377,100 | 129,053,139 | |
| Trend Micro, Inc. | 785,400 | 29,597,499 | |
| Zensho Holdings Co. Ltd. | 505,600 | 26,575,278 | |
TOTAL JAPAN | 1,840,659,154 | ||
| Netherlands - 4.2% | |||
| ASML Holding NV (Netherlands) | 13,016 | 7,824,183 | |
| Koninklijke Ahold Delhaize NV | 3,158,103 | 93,564,486 | |
| Koninklijke KPN NV | 12,119,044 | 40,734,278 | |
| Wolters Kluwer NV | 864,771 | 110,808,219 | |
TOTAL NETHERLANDS | 252,931,166 | ||
| Norway - 0.8% | |||
| Gjensidige Forsikring ASA | 1,059,930 | 15,873,877 | |
| Orkla ASA | 2,733,899 | 18,829,749 | |
| Telenor ASA | 1,279,731 | 13,076,891 | |
TOTAL NORWAY | 47,780,517 | ||
| Singapore - 2.2% | |||
| CapitaLand Ascendas REIT | 19,029,999 | 36,157,855 | |
| CapitaMall Trust | 18,562,500 | 23,856,912 | |
| Mapletree Industrial (REIT) | 11,305,910 | 17,771,794 | |
| Singapore Exchange Ltd. | 4,633,300 | 32,079,409 | |
| Singapore Technologies Engineering Ltd. | 8,789,700 | 24,129,992 | |
TOTAL SINGAPORE | 133,995,962 | ||
| Spain - 0.6% | |||
| Redeia Corp. SA | 2,440,978 | 37,980,057 | |
| Sweden - 1.1% | |||
| Axfood AB | 604,939 | 13,364,267 | |
| Ericsson (B Shares) | 5,427,407 | 24,313,319 | |
| Telia Co. AB (c) | 13,264,606 | 28,120,265 | |
TOTAL SWEDEN | 65,797,851 | ||
| Switzerland - 11.0% | |||
| Allreal Holding AG | 86,418 | 13,851,200 | |
| Banque Cantonale Vaudoise | 159,612 | 18,002,739 | |
| Barry Callebaut AG | 1,609 | 2,432,117 | |
| BKW AG | 71,725 | 12,032,359 | |
| DKSH Holding AG | 198,599 | 12,160,682 | |
| Galenica AG (d) | 279,854 | 21,089,421 | |
| Givaudan SA | 30,693 | 101,899,478 | |
| Lindt & Spruengli AG | 773 | 84,127,961 | |
| Novartis AG | 1,228,510 | 115,012,574 | |
| PSP Swiss Property AG | 257,684 | 31,642,173 | |
| Sandoz Group AG | 245,879 | 6,392,611 | |
| SGS SA (Reg.) | 647,279 | 52,641,896 | |
| Swiss Prime Site AG | 430,903 | 39,980,447 | |
| Swisscom AG | 143,235 | 85,659,144 | |
| Zurich Insurance Group Ltd. | 137,457 | 65,067,866 | |
TOTAL SWITZERLAND | 661,992,668 | ||
| United Kingdom - 13.7% | |||
| Admiral Group PLC | 1,553,054 | 46,115,521 | |
| AstraZeneca PLC (United Kingdom) | 901,970 | 112,930,028 | |
| Bunzl PLC | 1,882,334 | 67,080,725 | |
| Diageo PLC | 2,554,069 | 96,584,737 | |
| National Grid PLC | 8,204,637 | 97,823,699 | |
| Pearson PLC | 4,032,816 | 46,682,816 | |
| Reckitt Benckiser Group PLC | 1,077,314 | 72,079,806 | |
| RELX PLC (London Stock Exchange) | 3,611,883 | 126,154,822 | |
| Smith & Nephew PLC | 4,683,170 | 52,409,982 | |
| Unilever PLC | 2,389,080 | 113,148,464 | |
TOTAL UNITED KINGDOM | 831,010,600 | ||
| United States of America - 9.0% | |||
| CSL Ltd. | 459,338 | 67,886,540 | |
| Experian PLC | 1,032,716 | 31,267,397 | |
| GSK PLC | 6,578,292 | 117,269,727 | |
| Nestle SA (Reg. S) | 997,037 | 107,519,254 | |
| Roche Holding AG (participation certificate) | 409,732 | 105,591,887 | |
| Sanofi SA | 1,238,183 | 112,434,718 | |
TOTAL UNITED STATES OF AMERICA | 541,969,523 | ||
| TOTAL COMMON STOCKS (Cost $6,038,736,054) | 5,999,404,351 | ||
| Government Obligations - 0.0% | |||
Principal Amount (e) | Value ($) | ||
| United States of America - 0.0% | |||
U.S. Treasury Bills, yield at date of purchase 5.42% 2/22/24 (f) (Cost $2,851,787) | 2,900,000 | 2,851,619 | |
| Money Market Funds - 0.8% | |||
| Shares | Value ($) | ||
Fidelity Securities Lending Cash Central Fund 5.40% (g)(h) (Cost $45,398,400) | 45,393,861 | 45,398,400 | |
| TOTAL INVESTMENT IN SECURITIES - 100.0% (Cost $6,086,986,241) | 6,047,654,370 |
NET OTHER ASSETS (LIABILITIES) - 0.0% | (1,960,508) |
| NET ASSETS - 100.0% | 6,045,693,862 |
| Futures Contracts | |||||
Number of contracts | Expiration Date | Notional Amount ($) | Value ($) | Unrealized Appreciation/ (Depreciation) ($) | |
| Purchased | |||||
| Equity Index Contracts | |||||
| ICE MSCI EAFE Index Contracts (United States) | 469 | Dec 2023 | 46,292,645 | (1,927,253) | (1,927,253) |
| The notional amount of futures purchased as a percentage of Net Assets is 0.8% | |||||
| (a) | Non-income producing |
| (b) | Level 3 security |
| (c) | Security or a portion of the security is on loan at period end. |
| (d) | Security exempt from registration under Rule 144A of the Securities Act of 1933. These securities may be resold in transactions exempt from registration, normally to qualified institutional buyers. At the end of the period, the value of these securities amounted to $21,089,421 or 0.3% of net assets. |
| (e) | Amount is stated in United States dollars unless otherwise noted. |
| (f) | Security or a portion of the security was pledged to cover margin requirements for futures contracts. At period end, the value of securities pledged amounted to $1,534,958. |
| (g) | Affiliated fund that is generally available only to investment companies and other accounts managed by Fidelity Investments. The rate quoted is the annualized seven-day yield of the fund at period end. A complete unaudited listing of the fund's holdings as of its most recent quarter end is available upon request. In addition, each Fidelity Central Fund's financial statements, which are not covered by the Fund's Report of Independent Registered Public Accounting Firm, are available on the SEC's website or upon request. |
| (h) | Investment made with cash collateral received from securities on loan. |
| Affiliate | Value, beginning of period ($) | Purchases ($) | Sales Proceeds ($) | Dividend Income ($) | Realized Gain (loss) ($) | Change in Unrealized appreciation (depreciation) ($) | Value, end of period ($) | % ownership, end of period |
| Fidelity Cash Central Fund 5.40% | - | 657,037,047 | 657,037,047 | 578,902 | - | - | - | 0.0% |
| Fidelity Securities Lending Cash Central Fund 5.40% | 50,539,138 | 439,954,515 | 445,095,253 | 372,339 | - | - | 45,398,400 | 0.2% |
| Total | 50,539,138 | 1,096,991,562 | 1,102,132,300 | 951,241 | - | - | 45,398,400 | |
| Valuation Inputs at Reporting Date: | ||||
| Description | Total ($) | Level 1 ($) | Level 2 ($) | Level 3 ($) |
Investments in Securities: | ||||
| Equities: | ||||
Communication Services | 569,071,577 | 134,561,970 | 434,509,607 | - |
Consumer Discretionary | 468,773,076 | 28,996,183 | 439,776,893 | - |
Consumer Staples | 831,974,529 | 298,180,355 | 533,794,167 | 7 |
Financials | 871,962,601 | 289,213,815 | 582,748,786 | - |
Health Care | 1,042,267,511 | 142,725,282 | 899,542,229 | - |
Industrials | 770,055,530 | 299,847,796 | 470,207,734 | - |
Information Technology | 208,792,795 | - | 208,792,795 | - |
Materials | 368,100,129 | 168,447,785 | 199,652,344 | - |
Real Estate | 373,597,302 | 102,252,475 | 271,344,827 | - |
Utilities | 494,809,301 | 64,712,568 | 430,096,733 | - |
| Government Obligations | 2,851,619 | - | 2,851,619 | - |
| Money Market Funds | 45,398,400 | 45,398,400 | - | - |
| Total Investments in Securities: | 6,047,654,370 | 1,574,336,629 | 4,473,317,734 | 7 |
Derivative Instruments: Liabilities | ||||
Futures Contracts | (1,927,253) | (1,927,253) | - | - |
| Total Liabilities | (1,927,253) | (1,927,253) | - | - |
| Total Derivative Instruments: | (1,927,253) | (1,927,253) | - | - |
Primary Risk Exposure / Derivative Type | Value | |
| Asset ($) | Liability ($) | |
| Equity Risk | ||
Futures Contracts (a) | 0 | (1,927,253) |
| Total Equity Risk | 0 | (1,927,253) |
| Total Value of Derivatives | 0 | (1,927,253) |
| Statement of Assets and Liabilities | ||||
| October 31, 2023 | ||||
| Assets | ||||
| Investment in securities, at value (including securities loaned of $42,878,310) - See accompanying schedule: | ||||
Unaffiliated issuers (cost $6,041,587,841) | $ | 6,002,255,970 | ||
Fidelity Central Funds (cost $45,398,400) | 45,398,400 | |||
| Total Investment in Securities (cost $6,086,986,241) | $ | 6,047,654,370 | ||
| Foreign currency held at value (cost $4,803,582) | 4,787,318 | |||
| Receivable for fund shares sold | 5,148,271 | |||
| Dividends receivable | 17,311,228 | |||
| Reclaims receivable | 24,752,422 | |||
| Distributions receivable from Fidelity Central Funds | 75,898 | |||
| Receivable for daily variation margin on futures contracts | 141,111 | |||
| Prepaid expenses | 7,475 | |||
Total assets | 6,099,878,093 | |||
| Liabilities | ||||
| Payable to custodian bank | $ | 1,737,495 | ||
| Payable for fund shares redeemed | 6,051,852 | |||
| Accrued management fee | 754,437 | |||
| Other payables and accrued expenses | 242,047 | |||
| Collateral on securities loaned | 45,398,400 | |||
| Total Liabilities | 54,184,231 | |||
| Net Assets | $ | 6,045,693,862 | ||
| Net Assets consist of: | ||||
| Paid in capital | $ | 6,236,367,763 | ||
| Total accumulated earnings (loss) | (190,673,901) | |||
| Net Assets | $ | 6,045,693,862 | ||
Net Asset Value, offering price and redemption price per share ($6,045,693,862 ÷ 597,595,058 shares) | $ | 10.12 | ||
| Statement of Operations | ||||
Year ended October 31, 2023 | ||||
| Investment Income | ||||
| Dividends | $ | 174,510,343 | ||
| Interest | 127,275 | |||
| Income from Fidelity Central Funds (including $372,339 from security lending) | 951,241 | |||
| Income before foreign taxes withheld | $ | 175,588,859 | ||
| Less foreign taxes withheld | (14,417,820) | |||
| Total Income | 161,171,039 | |||
| Expenses | ||||
| Management fee | $ | 8,631,686 | ||
| Custodian fees and expenses | 467,180 | |||
| Independent trustees' fees and expenses | 19,807 | |||
| Registration fees | 151,158 | |||
| Audit | 57,940 | |||
| Legal | 6,984 | |||
| Interest | 392,278 | |||
| Miscellaneous | 33,136 | |||
| Total expenses before reductions | 9,760,169 | |||
| Expense reductions | (57,981) | |||
| Total expenses after reductions | 9,702,188 | |||
| Net Investment income (loss) | 151,468,851 | |||
| Realized and Unrealized Gain (Loss) | ||||
| Net realized gain (loss) on: | ||||
| Investment Securities: | ||||
| Unaffiliated issuers | (166,070,175) | |||
| Foreign currency transactions | (1,239,676) | |||
| Futures contracts | 7,334,337 | |||
| Total net realized gain (loss) | (159,975,514) | |||
| Change in net unrealized appreciation (depreciation) on: | ||||
| Investment Securities: | ||||
| Unaffiliated issuers | 651,159,946 | |||
| Assets and liabilities in foreign currencies | 2,673,747 | |||
| Futures contracts | (4,359,914) | |||
| Total change in net unrealized appreciation (depreciation) | 649,473,779 | |||
| Net gain (loss) | 489,498,265 | |||
| Net increase (decrease) in net assets resulting from operations | $ | 640,967,116 | ||
| Statement of Changes in Net Assets | ||||
Year ended October 31, 2023 | Year ended October 31, 2022 | |||
| Increase (Decrease) in Net Assets | ||||
| Operations | ||||
| Net investment income (loss) | $ | 151,468,851 | $ | 139,463,048 |
| Net realized gain (loss) | (159,975,514) | (61,447,136) | ||
| Change in net unrealized appreciation (depreciation) | 649,473,779 | (1,303,036,818) | ||
| Net increase (decrease) in net assets resulting from operations | 640,967,116 | (1,225,020,906) | ||
| Distributions to shareholders | (105,861,928) | (141,537,086) | ||
| Share transactions | ||||
| Proceeds from sales of shares | 1,822,038,768 | 2,573,305,678 | ||
| Reinvestment of distributions | 98,129,051 | 136,529,604 | ||
| Cost of shares redeemed | (1,904,398,706) | (1,787,195,386) | ||
Net increase (decrease) in net assets resulting from share transactions | 15,769,113 | 922,639,896 | ||
| Total increase (decrease) in net assets | 550,874,301 | (443,918,096) | ||
| Net Assets | ||||
| Beginning of period | 5,494,819,561 | 5,938,737,657 | ||
| End of period | $ | 6,045,693,862 | $ | 5,494,819,561 |
| Other Information | ||||
| Shares | ||||
| Sold | 175,043,162 | 254,202,230 | ||
| Issued in reinvestment of distributions | 9,952,236 | 12,222,883 | ||
| Redeemed | (189,480,961) | (173,081,629) | ||
| Net increase (decrease) | (4,485,563) | 93,343,484 | ||
| Fidelity® SAI International Low Volatility Index Fund |
| Years ended October 31, | 2023 | 2022 | 2021 | 2020 | 2019 | |||||
Selected Per-Share Data | ||||||||||
| Net asset value, beginning of period | $ | 9.13 | $ | 11.67 | $ | 9.64 | $ | 11.54 | $ | 10.49 |
| Income from Investment Operations | ||||||||||
Net investment income (loss) A,B | .27 | .26 | .27 | .24 | .28 | |||||
| Net realized and unrealized gain (loss) | .92 | (2.52) | 1.90 | (1.46) | 1.04 | |||||
| Total from investment operations | 1.19 | (2.26) | 2.17 | (1.22) | 1.32 | |||||
| Distributions from net investment income | (.20) | (.28) | (.14) | (.22) | (.24) | |||||
| Distributions from net realized gain | - | - | - | (.46) | (.03) | |||||
| Total distributions | (.20) | (.28) | (.14) | (.68) | (.27) | |||||
| Net asset value, end of period | $ | 10.12 | $ | 9.13 | $ | 11.67 | $ | 9.64 | $ | 11.54 |
Total Return C | 13.07% | (19.80)% | 22.69% | (11.31)% | 12.89% | |||||
Ratios to Average Net Assets B,D,E | ||||||||||
| Expenses before reductions | .17% | .17% | .17% | .18% | .25% | |||||
| Expenses net of fee waivers, if any | .17% | .17% | .17% | .18% | .20% | |||||
| Expenses net of all reductions | .17% | .17% | .17% | .18% | .20% | |||||
| Net investment income (loss) | 2.63% | 2.46% | 2.37% | 2.39% | 2.59% | |||||
| Supplemental Data | ||||||||||
| Net assets, end of period (000 omitted) | $ | 6,045,694 | $ | 5,494,820 | $ | 5,938,738 | $ | 4,603,961 | $ | 2,548,056 |
Portfolio turnover rate F | 37% | 26% | 26% | 20% | 93% |
| Average Annual Total Returns | |||
Periods ended October 31, 2023 | Past 1 year | Past 5 years | Life of Fund A |
| Fidelity® SAI U.S. Low Volatility Index Fund | 6.39% | 8.98% | 9.70% |
| $10,000 Over Life of Fund |
Let's say hypothetically that $10,000 was invested in Fidelity® SAI U.S. Low Volatility Index Fund on May 29, 2015, when the fund started. The chart shows how the value of your investment would have changed, and also shows how the Fidelity U.S. Low Volatility Focus Index℠, Fidelity SAI U.S. Low Volatility Index Fund Linked Index and S&P 500® Index performed over the same period. |
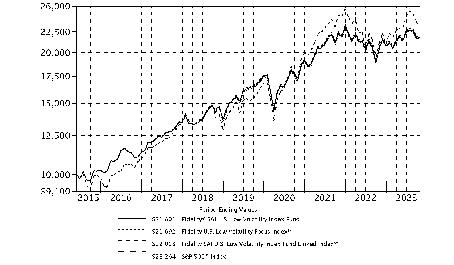 |
Top Holdings (% of Fund's net assets) | ||
| Microsoft Corp. | 8.4 | |
| Apple, Inc. | 4.4 | |
| Eli Lilly & Co. | 3.6 | |
| UnitedHealth Group, Inc. | 3.3 | |
| Visa, Inc. Class A | 3.0 | |
| Procter & Gamble Co. | 2.8 | |
| Merck & Co., Inc. | 2.7 | |
| Cisco Systems, Inc. | 2.6 | |
| Johnson & Johnson | 2.6 | |
| The Home Depot, Inc. | 2.5 | |
| 35.9 | ||
| Market Sectors (% of Fund's net assets) | ||
| Information Technology | 25.1 | |
| Health Care | 15.4 | |
| Financials | 12.6 | |
| Industrials | 9.0 | |
| Consumer Discretionary | 8.5 | |
| Consumer Staples | 7.9 | |
| Communication Services | 5.8 | |
| Real Estate | 4.5 | |
| Materials | 4.4 | |
| Utilities | 4.3 | |
| Energy | 2.3 | |
Asset Allocation (% of Fund's net assets) |
 |
Futures - 0.2% |
| Common Stocks - 99.8% | |||
| Shares | Value ($) | ||
| COMMUNICATION SERVICES - 5.8% | |||
| Diversified Telecommunication Services - 3.2% | |||
| AT&T, Inc. | 8,486,018 | 130,684,677 | |
| Verizon Communications, Inc. | 4,990,229 | 175,306,745 | |
| 305,991,422 | |||
| Interactive Media & Services - 1.4% | |||
| Alphabet, Inc. Class A (a) | 1,072,289 | 133,049,619 | |
| Media - 0.2% | |||
| Omnicom Group, Inc. | 236,829 | 17,740,860 | |
| Wireless Telecommunication Services - 1.0% | |||
| T-Mobile U.S., Inc. | 683,663 | 98,351,759 | |
TOTAL COMMUNICATION SERVICES | 555,133,660 | ||
| CONSUMER DISCRETIONARY - 8.5% | |||
| Automobile Components - 0.1% | |||
| Gentex Corp. | 277,411 | 7,956,147 | |
| Broadline Retail - 0.8% | |||
| Amazon.com, Inc. (a) | 570,360 | 75,909,212 | |
| Diversified Consumer Services - 0.1% | |||
| Service Corp. International (b) | 179,442 | 9,765,234 | |
| Hotels, Restaurants & Leisure - 2.8% | |||
| Domino's Pizza, Inc. | 41,948 | 14,219,953 | |
| McDonald's Corp. | 859,397 | 225,308,111 | |
| Yum China Holdings, Inc. | 495,977 | 26,068,551 | |
| Yum! Brands, Inc. | 49,617 | 5,996,711 | |
| 271,593,326 | |||
| Household Durables - 0.2% | |||
| Garmin Ltd. | 181,652 | 18,624,780 | |
| Specialty Retail - 4.5% | |||
| AutoZone, Inc. (a) | 21,839 | 54,098,042 | |
| O'Reilly Automotive, Inc. (a) | 72,265 | 67,238,247 | |
| The Home Depot, Inc. | 845,718 | 240,767,457 | |
| TJX Companies, Inc. | 450,638 | 39,687,689 | |
| Tractor Supply Co. (b) | 130,060 | 25,044,354 | |
| 426,835,789 | |||
TOTAL CONSUMER DISCRETIONARY | 810,684,488 | ||
| CONSUMER STAPLES - 7.9% | |||
| Beverages - 1.1% | |||
| PepsiCo, Inc. | 478,047 | 78,055,514 | |
| The Coca-Cola Co. | 435,761 | 24,616,139 | |
| 102,671,653 | |||
| Consumer Staples Distribution & Retail - 0.4% | |||
| Dollar General Corp. | 260,086 | 30,960,637 | |
| Walmart, Inc. | 56,146 | 9,174,818 | |
| 40,135,455 | |||
| Food Products - 1.6% | |||
| Campbell Soup Co. | 238,175 | 9,624,652 | |
| Flowers Foods, Inc. | 228,813 | 5,017,869 | |
| General Mills, Inc. | 697,202 | 45,485,458 | |
| Hormel Foods Corp. | 343,836 | 11,191,862 | |
| Kellanova | 305,146 | 15,400,719 | |
| McCormick & Co., Inc. (non-vtg.) | 282,595 | 18,057,821 | |
| The Hershey Co. | 174,830 | 32,754,401 | |
| The J.M. Smucker Co. | 126,579 | 14,409,753 | |
| WK Kellogg Co. (b) | 76,286 | 764,386 | |
| 152,706,921 | |||
| Household Products - 4.6% | |||
| Church & Dwight Co., Inc. | 289,947 | 26,367,780 | |
| Colgate-Palmolive Co. | 984,715 | 73,971,791 | |
| Kimberly-Clark Corp. | 400,479 | 47,913,308 | |
| Procter & Gamble Co. | 1,831,275 | 274,746,188 | |
| The Clorox Co. | 146,744 | 17,271,769 | |
| 440,270,836 | |||
| Personal Care Products - 0.2% | |||
| Kenvue, Inc. | 1,054,737 | 19,618,108 | |
TOTAL CONSUMER STAPLES | 755,402,973 | ||
| ENERGY - 2.3% | |||
| Oil, Gas & Consumable Fuels - 2.3% | |||
| Chesapeake Energy Corp. (b) | 123,217 | 10,606,519 | |
| Chevron Corp. | 646,293 | 94,184,279 | |
| Coterra Energy, Inc. | 899,113 | 24,725,608 | |
| DT Midstream, Inc. (b) | 115,011 | 6,207,144 | |
| Kinder Morgan, Inc. | 2,341,126 | 37,926,241 | |
| The Williams Companies, Inc. | 1,446,015 | 49,742,916 | |
| 223,392,707 | |||
| FINANCIALS - 12.6% | |||
| Banks - 0.4% | |||
| Commerce Bancshares, Inc. | 134,719 | 5,908,775 | |
| First Financial Bankshares, Inc. | 154,177 | 3,707,957 | |
| M&T Bank Corp. | 196,891 | 22,199,460 | |
| Prosperity Bancshares, Inc. | 111,912 | 6,103,680 | |
| 37,919,872 | |||
| Capital Markets - 1.7% | |||
| Cboe Global Markets, Inc. | 125,319 | 20,538,531 | |
| CME Group, Inc. | 426,990 | 91,145,285 | |
| FactSet Research Systems, Inc. | 45,485 | 19,644,517 | |
| Houlihan Lokey | 59,886 | 6,019,741 | |
| NASDAQ, Inc. | 401,960 | 19,937,216 | |
| SEI Investments Co. | 120,260 | 6,453,152 | |
| 163,738,442 | |||
| Financial Services - 4.1% | |||
| Fiserv, Inc. (a) | 732,760 | 83,351,450 | |
| Jack Henry & Associates, Inc. | 86,504 | 12,196,199 | |
| The Western Union Co. | 444,502 | 5,018,428 | |
| Visa, Inc. Class A | 1,220,411 | 286,918,626 | |
| 387,484,703 | |||
| Insurance - 6.4% | |||
| Arch Capital Group Ltd. (a) | 442,074 | 38,318,974 | |
| Arthur J. Gallagher & Co. | 254,260 | 59,875,687 | |
| Assurant, Inc. | 63,093 | 9,394,548 | |
| Brown & Brown, Inc. | 279,454 | 19,399,697 | |
| Chubb Ltd. | 491,633 | 105,514,274 | |
| Erie Indemnity Co. Class A | 29,607 | 8,177,157 | |
| Globe Life, Inc. | 105,486 | 12,274,351 | |
| Hanover Insurance Group, Inc. (b) | 42,408 | 4,970,642 | |
| Hartford Financial Services Group, Inc. | 368,256 | 27,048,403 | |
| Marsh & McLennan Companies, Inc. | 587,245 | 111,371,014 | |
| Progressive Corp. | 694,842 | 109,847,572 | |
| RLI Corp. (b) | 48,127 | 6,412,441 | |
| Ryan Specialty Group Holdings, Inc. (a)(b) | 110,517 | 4,774,334 | |
| Selective Insurance Group, Inc. | 71,806 | 7,475,723 | |
| The Travelers Companies, Inc. | 274,175 | 45,907,862 | |
| W.R. Berkley Corp. | 238,350 | 16,069,557 | |
| Willis Towers Watson PLC | 126,315 | 29,796,445 | |
| 616,628,681 | |||
TOTAL FINANCIALS | 1,205,771,698 | ||
| HEALTH CARE - 15.4% | |||
| Biotechnology - 1.2% | |||
| Amgen, Inc. | 436,574 | 111,631,972 | |
| Health Care Equipment & Supplies - 1.4% | |||
| Medtronic PLC | 1,524,031 | 107,535,627 | |
| ResMed, Inc. | 174,410 | 24,630,180 | |
| 132,165,807 | |||
| Health Care Providers & Services - 3.4% | |||
| Chemed Corp. | 17,829 | 10,031,487 | |
| UnitedHealth Group, Inc. | 593,987 | 318,115,678 | |
| 328,147,165 | |||
| Pharmaceuticals - 9.4% | |||
| Eli Lilly & Co. | 631,569 | 349,845,016 | |
| Johnson & Johnson | 1,655,868 | 245,631,459 | |
| Merck & Co., Inc. | 2,490,794 | 255,804,544 | |
| Zoetis, Inc. Class A | 326,153 | 51,206,021 | |
| 902,487,040 | |||
TOTAL HEALTH CARE | 1,474,431,984 | ||
| INDUSTRIALS - 9.0% | |||
| Aerospace & Defense - 3.3% | |||
| General Dynamics Corp. | 267,027 | 64,436,285 | |
| Huntington Ingalls Industries, Inc. | 47,351 | 10,408,697 | |
| L3Harris Technologies, Inc. | 224,885 | 40,346,618 | |
| Lockheed Martin Corp. | 267,549 | 121,638,477 | |
| Northrop Grumman Corp. | 169,444 | 79,880,985 | |
| 316,711,062 | |||
| Air Freight & Logistics - 0.1% | |||
| C.H. Robinson Worldwide, Inc. | 138,216 | 11,310,215 | |
| Building Products - 0.2% | |||
| Lennox International, Inc. (b) | 38,349 | 14,209,838 | |
| Commercial Services & Supplies - 1.2% | |||
| Republic Services, Inc. | 244,032 | 36,236,312 | |
| Rollins, Inc. | 274,926 | 10,339,967 | |
| Waste Management, Inc. | 439,440 | 72,213,175 | |
| 118,789,454 | |||
| Construction & Engineering - 0.0% | |||
| MDU Resources Group, Inc. | 241,723 | 4,498,465 | |
| Ground Transportation - 0.1% | |||
| Landstar System, Inc. | 42,653 | 7,028,361 | |
| Machinery - 1.5% | |||
| Graco, Inc. (b) | 199,823 | 14,856,840 | |
| IDEX Corp. | 89,710 | 17,171,391 | |
| Nordson Corp. | 63,892 | 13,582,800 | |
| Otis Worldwide Corp. | 490,585 | 37,878,068 | |
| PACCAR, Inc. | 620,313 | 51,194,432 | |
| Toro Co. (b) | 123,789 | 10,007,103 | |
| 144,690,634 | |||
| Professional Services - 2.6% | |||
| Automatic Data Processing, Inc. | 490,386 | 107,012,033 | |
| Booz Allen Hamilton Holding Corp. Class A | 157,014 | 18,830,689 | |
| Exponent, Inc. (b) | 60,342 | 4,422,465 | |
| FTI Consulting, Inc. (a)(b) | 40,335 | 8,561,507 | |
| Leidos Holdings, Inc. | 162,820 | 16,138,718 | |
| Maximus, Inc. | 72,152 | 5,391,197 | |
| Paychex, Inc. | 380,850 | 42,293,393 | |
| Science Applications International Corp. | 64,090 | 7,001,192 | |
| Verisk Analytics, Inc. | 171,870 | 39,076,363 | |
| 248,727,557 | |||
TOTAL INDUSTRIALS | 865,965,586 | ||
| INFORMATION TECHNOLOGY - 25.1% | |||
| Communications Equipment - 3.2% | |||
| Cisco Systems, Inc. | 4,728,905 | 246,517,818 | |
| Juniper Networks, Inc. | 381,737 | 10,276,360 | |
| Motorola Solutions, Inc. | 199,084 | 55,436,931 | |
| 312,231,109 | |||
| Electronic Equipment, Instruments & Components - 0.3% | |||
| Badger Meter, Inc. | 34,798 | 4,821,263 | |
| Teledyne Technologies, Inc. (a) | 55,845 | 20,918,979 | |
| 25,740,242 | |||
| IT Services - 1.5% | |||
| Accenture PLC Class A | 170,729 | 50,721,879 | |
| Akamai Technologies, Inc. (a) | 180,667 | 18,668,321 | |
| Amdocs Ltd. | 143,412 | 11,495,906 | |
| IBM Corp. | 280,906 | 40,630,244 | |
| VeriSign, Inc. (a) | 107,501 | 21,463,650 | |
| 142,980,000 | |||
| Semiconductors & Semiconductor Equipment - 4.1% | |||
| Intel Corp. | 4,951,069 | 180,714,019 | |
| NVIDIA Corp. | 138,609 | 56,524,750 | |
| Texas Instruments, Inc. | 1,077,405 | 153,002,284 | |
| 390,241,053 | |||
| Software - 11.6% | |||
| Aspen Technology, Inc. (a)(b) | 34,650 | 6,159,038 | |
| Check Point Software Technologies Ltd. (a)(b) | 116,111 | 15,587,902 | |
| Dolby Laboratories, Inc. Class A | 70,533 | 5,708,941 | |
| Microsoft Corp. | 2,376,434 | 803,496,096 | |
| Oracle Corp. | 1,826,693 | 188,880,056 | |
| Qualys, Inc. (a)(b) | 39,855 | 6,095,822 | |
| Roper Technologies, Inc. | 126,527 | 61,817,296 | |
| SPS Commerce, Inc. (a)(b) | 43,365 | 6,953,144 | |
| Tyler Technologies, Inc. (a) | 49,766 | 18,557,741 | |
| 1,113,256,036 | |||
| Technology Hardware, Storage & Peripherals - 4.4% | |||
| Apple, Inc. | 2,465,608 | 421,051,878 | |
TOTAL INFORMATION TECHNOLOGY | 2,405,500,318 | ||
| MATERIALS - 4.4% | |||
| Chemicals - 3.5% | |||
| Air Products & Chemicals, Inc. | 263,665 | 74,469,543 | |
| Balchem Corp. | 38,255 | 4,446,761 | |
| Ecolab, Inc. | 139,010 | 23,317,537 | |
| FMC Corp. | 148,424 | 7,896,157 | |
| Linde PLC | 581,162 | 222,096,870 | |
| 332,226,868 | |||
| Construction Materials - 0.6% | |||
| Martin Marietta Materials, Inc. | 64,170 | 26,241,680 | |
| Vulcan Materials Co. | 157,944 | 31,034,417 | |
| 57,276,097 | |||
| Containers & Packaging - 0.3% | |||
| Aptargroup, Inc. | 77,775 | 9,509,549 | |
| Packaging Corp. of America | 106,751 | 16,338,241 | |
| Sonoco Products Co. | 116,276 | 6,024,260 | |
| 31,872,050 | |||
TOTAL MATERIALS | 421,375,015 | ||
| REAL ESTATE - 4.5% | |||
| Equity Real Estate Investment Trusts (REITs) - 4.2% | |||
| Agree Realty Corp. | 110,628 | 6,188,530 | |
| American Homes 4 Rent Class A | 372,959 | 12,210,678 | |
| American Tower Corp. | 553,203 | 98,575,243 | |
| Crown Castle International Corp. | 514,777 | 47,863,965 | |
| CubeSmart | 266,697 | 9,091,701 | |
| Digital Realty Trust, Inc. | 237,437 | 29,527,665 | |
| Equinix, Inc. | 111,014 | 81,000,255 | |
| Equity Lifestyle Properties, Inc. | 207,773 | 13,671,463 | |
| Essex Property Trust, Inc. | 9,841 | 2,105,187 | |
| Extra Space Storage, Inc. | 250,706 | 25,970,635 | |
| Mid-America Apartment Communities, Inc. | 29,550 | 3,491,333 | |
| Public Storage | 187,823 | 44,835,228 | |
| Realty Income Corp. | 169,514 | 8,031,573 | |
| Sun Communities, Inc. | 147,675 | 16,427,367 | |
| 398,990,823 | |||
| Real Estate Management & Development - 0.3% | |||
| CoStar Group, Inc. (a) | 401,348 | 29,462,957 | |
TOTAL REAL ESTATE | 428,453,780 | ||
| UTILITIES - 4.3% | |||
| Electric Utilities - 2.9% | |||
| Alliant Energy Corp. | 298,403 | 14,559,082 | |
| American Electric Power Co., Inc. | 611,068 | 46,160,077 | |
| Duke Energy Corp. | 914,781 | 81,314,883 | |
| Evergy, Inc. | 272,636 | 13,397,333 | |
| Eversource Energy | 414,083 | 22,273,525 | |
| Exelon Corp. | 1,078,608 | 42,000,996 | |
| Hawaiian Electric Industries, Inc. (b) | 130,064 | 1,688,231 | |
| IDACORP, Inc. | 60,073 | 5,689,514 | |
| Pinnacle West Capital Corp. | 134,437 | 9,972,537 | |
| Xcel Energy, Inc. | 653,285 | 38,720,202 | |
| 275,776,380 | |||
| Gas Utilities - 0.2% | |||
| Atmos Energy Corp. | 171,509 | 18,464,659 | |
| Multi-Utilities - 1.2% | |||
| Ameren Corp. | 311,723 | 23,600,548 | |
| CMS Energy Corp. | 346,202 | 18,812,617 | |
| Consolidated Edison, Inc. | 411,351 | 36,112,504 | |
| DTE Energy Co. | 24,666 | 2,377,309 | |
| WEC Energy Group, Inc. | 374,428 | 30,474,695 | |
| 111,377,673 | |||
| Water Utilities - 0.0% | |||
| American Water Works Co., Inc. | 22,626 | 2,661,949 | |
TOTAL UTILITIES | 408,280,661 | ||
| TOTAL COMMON STOCKS (Cost $8,110,374,299) | 9,554,392,870 | ||
| U.S. Treasury Obligations - 0.0% | |||
Principal Amount (c) | Value ($) | ||
U.S. Treasury Bills, yield at date of purchase 5.42% 2/22/24 (d) (Cost $688,362) | 700,000 | 688,322 | |
| Money Market Funds - 0.5% | |||
| Shares | Value ($) | ||
Fidelity Securities Lending Cash Central Fund 5.40% (e)(f) (Cost $51,820,121) | 51,814,939 | 51,820,121 | |
| TOTAL INVESTMENT IN SECURITIES - 100.3% (Cost $8,162,882,782) | 9,606,901,313 |
NET OTHER ASSETS (LIABILITIES) - (0.3)% | (32,140,853) |
| NET ASSETS - 100.0% | 9,574,760,460 |
| Futures Contracts | |||||
Number of contracts | Expiration Date | Notional Amount ($) | Value ($) | Unrealized Appreciation/ (Depreciation) ($) | |
| Purchased | |||||
| Equity Index Contracts | |||||
| CME E-mini S&P 500 Index Contracts (United States) | 73 | Dec 2023 | 15,374,713 | 30,470 | 30,470 |
| CME E-mini S&P MidCap 400 Index Contracts (United States) | 21 | Dec 2023 | 4,987,710 | (22,684) | (22,684) |
| TOTAL FUTURES CONTRACTS | 7,786 | ||||
| The notional amount of futures purchased as a percentage of Net Assets is 0.2% | |||||
| (a) | Non-income producing |
| (b) | Security or a portion of the security is on loan at period end. |
| (c) | Amount is stated in United States dollars unless otherwise noted. |
| (d) | Security or a portion of the security was pledged to cover margin requirements for futures contracts. At period end, the value of securities pledged amounted to $688,322. |
| (e) | Affiliated fund that is generally available only to investment companies and other accounts managed by Fidelity Investments. The rate quoted is the annualized seven-day yield of the fund at period end. A complete unaudited listing of the fund's holdings as of its most recent quarter end is available upon request. In addition, each Fidelity Central Fund's financial statements, which are not covered by the Fund's Report of Independent Registered Public Accounting Firm, are available on the SEC's website or upon request. |
| (f) | Investment made with cash collateral received from securities on loan. |
| Affiliate | Value, beginning of period ($) | Purchases ($) | Sales Proceeds ($) | Dividend Income ($) | Realized Gain (loss) ($) | Change in Unrealized appreciation (depreciation) ($) | Value, end of period ($) | % ownership, end of period |
| Fidelity Cash Central Fund 5.40% | 17,178,803 | 2,629,037,802 | 2,646,216,605 | 1,224,292 | - | - | - | 0.0% |
| Fidelity Securities Lending Cash Central Fund 5.40% | 246,547,154 | 433,603,816 | 628,330,849 | 265,405 | - | - | 51,820,121 | 0.2% |
| Total | 263,725,957 | 3,062,641,618 | 3,274,547,454 | 1,489,697 | - | - | 51,820,121 | |
| Valuation Inputs at Reporting Date: | ||||
| Description | Total ($) | Level 1 ($) | Level 2 ($) | Level 3 ($) |
Investments in Securities: | ||||
| Equities: | ||||
Communication Services | 555,133,660 | 555,133,660 | - | - |
Consumer Discretionary | 810,684,488 | 810,684,488 | - | - |
Consumer Staples | 755,402,973 | 755,402,973 | - | - |
Energy | 223,392,707 | 223,392,707 | - | - |
Financials | 1,205,771,698 | 1,205,771,698 | - | - |
Health Care | 1,474,431,984 | 1,474,431,984 | - | - |
Industrials | 865,965,586 | 865,965,586 | - | - |
Information Technology | 2,405,500,318 | 2,405,500,318 | - | - |
Materials | 421,375,015 | 421,375,015 | - | - |
Real Estate | 428,453,780 | 428,453,780 | - | - |
Utilities | 408,280,661 | 408,280,661 | - | - |
| U.S. Government and Government Agency Obligations | 688,322 | - | 688,322 | - |
| Money Market Funds | 51,820,121 | 51,820,121 | - | - |
| Total Investments in Securities: | 9,606,901,313 | 9,606,212,991 | 688,322 | - |
Derivative Instruments: Assets | ||||
Futures Contracts | 30,470 | 30,470 | - | - |
| Total Assets | 30,470 | 30,470 | - | - |
| Liabilities | ||||
Futures Contracts | (22,684) | (22,684) | - | - |
| Total Liabilities | (22,684) | (22,684) | - | - |
| Total Derivative Instruments: | 7,786 | 7,786 | - | - |
Primary Risk Exposure / Derivative Type | Value | |
| Asset ($) | Liability ($) | |
| Equity Risk | ||
Futures Contracts (a) | 30,470 | (22,684) |
| Total Equity Risk | 30,470 | (22,684) |
| Total Value of Derivatives | 30,470 | (22,684) |
| Statement of Assets and Liabilities | ||||
| October 31, 2023 | ||||
| Assets | ||||
| Investment in securities, at value (including securities loaned of $50,908,730) - See accompanying schedule: | ||||
Unaffiliated issuers (cost $8,111,062,661) | $ | 9,555,081,192 | ||
Fidelity Central Funds (cost $51,820,121) | 51,820,121 | |||
| Total Investment in Securities (cost $8,162,882,782) | $ | 9,606,901,313 | ||
| Segregated cash with brokers for derivative instruments | 13,181 | |||
| Receivable for investments sold | 12,082,732 | |||
| Receivable for fund shares sold | 3,175,409 | |||
| Dividends receivable | 12,554,790 | |||
| Distributions receivable from Fidelity Central Funds | 86,215 | |||
| Receivable for daily variation margin on futures contracts | 79,123 | |||
| Prepaid expenses | 10,572 | |||
Total assets | 9,634,903,335 | |||
| Liabilities | ||||
| Payable to custodian bank | $ | 578,749 | ||
| Payable for fund shares redeemed | 6,665,589 | |||
| Accrued management fee | 796,385 | |||
| Other payables and accrued expenses | 285,960 | |||
| Collateral on securities loaned | 51,816,192 | |||
| Total Liabilities | 60,142,875 | |||
| Net Assets | $ | 9,574,760,460 | ||
| Net Assets consist of: | ||||
| Paid in capital | $ | 8,087,266,018 | ||
| Total accumulated earnings (loss) | 1,487,494,442 | |||
| Net Assets | $ | 9,574,760,460 | ||
Net Asset Value, offering price and redemption price per share ($9,574,760,460 ÷ 550,615,013 shares) | $ | 17.39 | ||
| Statement of Operations | ||||
Year ended October 31, 2023 | ||||
| Investment Income | ||||
| Dividends | $ | 174,005,815 | ||
| Interest | 55,851 | |||
| Income from Fidelity Central Funds (including $265,405 from security lending) | 1,489,697 | |||
| Total Income | 175,551,363 | |||
| Expenses | ||||
| Management fee | $ | 8,268,215 | ||
| Custodian fees and expenses | 110,751 | |||
| Independent trustees' fees and expenses | 27,863 | |||
| Registration fees | 353,608 | |||
| Audit | 46,946 | |||
| Legal | 10,980 | |||
| Interest | 650,452 | |||
| Miscellaneous | 43,626 | |||
| Total expenses before reductions | 9,512,441 | |||
| Expense reductions | (2,884) | |||
| Total expenses after reductions | 9,509,557 | |||
| Net Investment income (loss) | 166,041,806 | |||
| Realized and Unrealized Gain (Loss) | ||||
| Net realized gain (loss) on: | ||||
| Investment Securities: | ||||
| Unaffiliated issuers | (27,383,730) | |||
| Futures contracts | 2,537,728 | |||
| Total net realized gain (loss) | (24,846,002) | |||
| Change in net unrealized appreciation (depreciation) on: | ||||
| Investment Securities: | ||||
| Unaffiliated issuers | 313,395,961 | |||
| Futures contracts | (1,232,581) | |||
| Total change in net unrealized appreciation (depreciation) | 312,163,380 | |||
| Net gain (loss) | 287,317,378 | |||
| Net increase (decrease) in net assets resulting from operations | $ | 453,359,184 | ||
| Statement of Changes in Net Assets | ||||
Year ended October 31, 2023 | Year ended October 31, 2022 | |||
| Increase (Decrease) in Net Assets | ||||
| Operations | ||||
| Net investment income (loss) | $ | 166,041,806 | $ | 144,362,325 |
| Net realized gain (loss) | (24,846,002) | 178,740,822 | ||
| Change in net unrealized appreciation (depreciation) | 312,163,380 | (1,000,149,044) | ||
| Net increase (decrease) in net assets resulting from operations | 453,359,184 | (677,045,897) | ||
| Distributions to shareholders | (303,046,026) | (268,770,756) | ||
| Share transactions | ||||
| Proceeds from sales of shares | 5,108,381,896 | 3,039,157,235 | ||
| Reinvestment of distributions | 300,330,158 | 267,624,606 | ||
| Cost of shares redeemed | (3,696,540,350) | (2,464,734,875) | ||
Net increase (decrease) in net assets resulting from share transactions | 1,712,171,704 | 842,046,966 | ||
| Total increase (decrease) in net assets | 1,862,484,862 | (103,769,687) | ||
| Net Assets | ||||
| Beginning of period | 7,712,275,598 | 7,816,045,285 | ||
| End of period | $ | 9,574,760,460 | $ | 7,712,275,598 |
| Other Information | ||||
| Shares | ||||
| Sold | 294,395,239 | 172,683,980 | ||
| Issued in reinvestment of distributions | 17,887,442 | 14,640,296 | ||
| Redeemed | (215,136,108) | (139,598,293) | ||
| Net increase (decrease) | 97,146,573 | 47,725,983 | ||
| Fidelity® SAI U.S. Low Volatility Index Fund |
| Years ended October 31, | 2023 | 2022 | 2021 | 2020 | 2019 | |||||
Selected Per-Share Data | ||||||||||
| Net asset value, beginning of period | $ | 17.01 | $ | 19.26 | $ | 14.87 | $ | 15.12 | $ | 13.18 |
| Income from Investment Operations | ||||||||||
Net investment income (loss) A,B | .35 | .33 | .31 | .30 | .29 | |||||
| Net realized and unrealized gain (loss) | .71 | (1.90) | 4.30 | .03 | 1.98 | |||||
| Total from investment operations | 1.06 | (1.57) | 4.61 | .33 | 2.27 | |||||
| Distributions from net investment income | (.35) | (.34) | (.22) | (.24) | (.20) | |||||
| Distributions from net realized gain | (.34) | (.35) | - | (.34) | (.13) | |||||
| Total distributions | (.68) C | (.68) C | (.22) | (.58) | (.33) | |||||
| Net asset value, end of period | $ | 17.39 | $ | 17.01 | $ | 19.26 | $ | 14.87 | $ | 15.12 |
Total Return D | 6.39% | (8.39)% | 31.25% | 2.16% | 17.62% | |||||
Ratios to Average Net Assets B,E,F | ||||||||||
| Expenses before reductions | .11% | .11% | .11% | .12% | .19% | |||||
| Expenses net of fee waivers, if any | .11% | .11% | .11% | .12% | .15% | |||||
| Expenses net of all reductions | .11% | .11% | .11% | .12% | .15% | |||||
| Net investment income (loss) | 2.01% | 1.85% | 1.76% | 2.06% | 2.05% | |||||
| Supplemental Data | ||||||||||
| Net assets, end of period (000 omitted) | $ | 9,574,760 | $ | 7,712,276 | $ | 7,816,045 | $ | 5,243,996 | $ | 4,120,541 |
Portfolio turnover rate G | 50% | 41% | 44% | 49% | 72% |
| Fidelity Central Fund | Investment Manager | Investment Objective | Investment Practices | Expense RatioA |
| Fidelity Money Market Central Funds | Fidelity Management & Research Company LLC (FMR) | Each fund seeks to obtain a high level of current income consistent with the preservation of capital and liquidity. | Short-term Investments | Less than .005% |
| Tax cost | Gross unrealized appreciation | Gross unrealized depreciation | Net unrealized appreciation (depreciation) | |
Fidelity SAI Emerging Markets Low Volatility Index Fund | $3,202,110,425 | $300,880,241 | $ (324,565,148) | $ (23,684,907) |
Fidelity SAI International Low Volatility Index Fund | 6,130,089,647 | 559,927,388 | (642,362,665) | (82,435,277) |
Fidelity SAI U.S. Low Volatility Index Fund | 8,244,883,658 | 1,891,094,759 | (529,077,104) | 1,362,017,655 |
| Undistributed ordinary income | Capital loss carryforward | Net unrealized appreciation (depreciation) on securities and other investments | |
Fidelity SAI Emerging Markets Low Volatility Index Fund | $87,930,408 | $ (3,358,628) | $ (23,788,994) |
Fidelity SAI International Low Volatility Index Fund | 135,132,899 | (243,023,037) | (82,784,413) |
Fidelity SAI U.S. Low Volatility Index Fund | 125,476,788 | - | 1,362,017,655 |
| Short-term | Long-term | Total capital loss carryforward | |
Fidelity SAI Emerging Markets Low Volatility Index Fund | $ (3,358,628) | $- | $ (3,358,628) |
Fidelity SAI International Low Volatility Index Fund | (71,961,889) | (171,061,148) | (243,023,037) |
| October 31, 2023 | |||
| Ordinary Income | Long-term Capital Gains | Total | |
Fidelity SAI Emerging Markets Low Volatility Index Fund | $53,120,773 | $- | $53,120,773 |
Fidelity SAI International Low Volatility Index Fund | 105,861,928 | - | 105,861,928 |
Fidelity SAI U.S. Low Volatility Index Fund | 154,189,107 | 148,856,919 | 303,046,026 |
| October 31, 2022 | |||
| Ordinary Income | Long-term Capital Gains | Total | |
Fidelity SAI Emerging Markets Low Volatility Index Fund | $41,568,890 | $- | $41,568,890 |
Fidelity SAI International Low Volatility Index Fund | 141,537,086 | - | 141,537,086 |
Fidelity SAI U.S. Low Volatility Index Fund | 159,841,640 | 108,929,116 | 268,770,756 |
| Equity Risk | Equity risk relates to the fluctuations in the value of financial instruments as a result of changes in market prices (other than those arising from interest rate risk or foreign exchange risk), whether caused by factors specific to an individual investment, its issuer, or all factors affecting all instruments traded in a market or market segment. |
| Purchases ($) | Sales ($) | |
| Fidelity SAI Emerging Markets Low Volatility Index Fund | 1,598,763,368 | 650,290,667 |
| Fidelity SAI International Low Volatility Index Fund | 2,205,138,839 | 2,142,272,742 |
| Fidelity SAI U.S. Low Volatility Index Fund | 5,815,023,410 | 4,156,038,022 |
| Fidelity SAI Emerging Markets Low Volatility Index Fund | .15% |
| Fidelity SAI International Low Volatility Index Fund | .15% |
| Fidelity SAI U.S. Low Volatility Index Fund | .10% |
| Borrower or Lender | Average Loan Balance | Weighted Average Interest Rate | Interest Expense | |
Fidelity SAI Emerging Markets Low Volatility Index Fund | Borrower | $ 14,395,603 | 4.91% | $113,934 |
Fidelity SAI International Low Volatility Index Fund | Borrower | $ 36,744,893 | 4.54% | $347,450 |
Fidelity SAI U.S. Low Volatility Index Fund | Borrower | $ 131,225,771 | 5.10% | $650,452 |
| Amount | |
| Fidelity SAI Emerging Markets Low Volatility Index Fund | $5,372 |
| Fidelity SAI International Low Volatility Index Fund | 10,297 |
| Fidelity SAI U.S. Low Volatility Index Fund | 14,502 |
| Total Security Lending Fees Paid to NFS | Security Lending Income From Securities Loaned to NFS | Value of Securities Loaned to NFS at Period End | |
| Fidelity SAI Emerging Markets Low Volatility Index Fund | $418 | $- | $- |
| Fidelity SAI International Low Volatility Index Fund | $38,591 | $- | $- |
| Fidelity SAI U.S. Low Volatility Index Fund | $22,227 | $1,536 | $368,632 |
| Average Loan Balance | Weighted Average Interest Rate | Interest Expense | |
| Fidelity SAI Emerging Markets Low Volatility Index Fund | $8,082,885 | 5.24% | $30,586 |
| Fidelity SAI International Low Volatility Index Fund | $8,858,128 | 4.67% | $44,828 |
| Expense Limitations | Reimbursement | |
| Fidelity SAI Emerging Markets Low Volatility Index Fund | .25% | $286,923 |
| Custodian credits | |
Fidelity SAI International Low Volatility Index Fund | 57,981 |
Fidelity SAI U.S. Low Volatility Index Fund | 2,884 |
| Strategic Advisers Emerging Markets Fund | Strategic Advisers Fidelity Emerging Markets Fund | Strategic Advisers Fidelity International Fund | Strategic Advisers International Fund | Strategic Advisers Fidelity U.S. Total Stock Fund | Strategic Advisers Large Cap Fund | |
| Fidelity SAI Emerging Markets Low Volatility Index Fund | 18% | 21% | - | - | - | - |
| Fidelity SAI International Low Volatility Index Fund | - | - | 32% | 14% | - | - |
| Fidelity SAI U.S. Low Volatility Index Fund | - | - | - | - | 43% | 11% |
| Fund | % of shares held |
| Fidelity SAI Emerging Markets Low Volatility Index Fund | 39% |
| Fidelity SAI International Low Volatility Index Fund | 46% |
| Fidelity SAI U.S. Low Volatility Index Fund | 54% |
| The Example is based on an investment of $1,000 invested at the beginning of the period and held for the entire period (May 1, 2023 to October 31, 2023). |
Annualized Expense Ratio- A | Beginning Account Value May 1, 2023 | Ending Account Value October 31, 2023 | Expenses Paid During Period- C May 1, 2023 to October 31, 2023 | |||||||
| Fidelity® SAI Emerging Markets Low Volatility Index Fund | .25% | |||||||||
| Actual | $ 1,000 | $ 984.50 | $ 1.25 | |||||||
Hypothetical-B | $ 1,000 | $ 1,023.95 | $ 1.28 | |||||||
| Fidelity® SAI International Low Volatility Index Fund | .16% | |||||||||
| Actual | $ 1,000 | $ 933.60 | $ .78 | |||||||
Hypothetical-B | $ 1,000 | $ 1,024.40 | $ .82 | |||||||
| Fidelity® SAI U.S. Low Volatility Index Fund | .11% | |||||||||
| Actual | $ 1,000 | $ 994.90 | $ .55 | |||||||
Hypothetical-B | $ 1,000 | $ 1,024.65 | $ .56 | |||||||
| Fidelity SAI U.S. Low Volatility Index Fund | $7,329,683 |
| Fidelity SAI U.S. Low Volatility Index Fund | |
| December 2022 | 86% |
| Fidelity SAI Emerging Markets Low Volatility Index Fund | |
| December 2022 | 45.82% |
| Fidelity SAI International Low Volatility Index Fund | |
| December 2022 | 94.89% |
| Fidelity SAI U.S. Low Volatility Index Fund | |
| December 2022 | 93.44% |
| Fidelity SAI U.S. Low Volatility Index Fund | |
| December 2022 | 6.57% |
| Fidelity SAI Emerging Markets Low Volatility Index Fund | $422,687 |
| Pay Date | Income | Taxes | |
| Fidelity SAI Emerging Markets Low Volatility Index Fund | 12/12/2022 | $0.2279 | $0.0439 |
| Fidelity® SAI International Low Volatility Index Fund | 12/12/2022 | $0.2192 | $0.0212 |
| A special meeting of shareholders was held on October 18, 2023. The results of votes taken among shareholders on the proposal before them are reported below. Each vote reported represents one dollar of net asset value held on the record date for the meeting. | ||
| Proposal 1 | ||
| To elect a Board of Trustees. | ||
# of Votes | % of Votes | |
| Abigail P. Johnson | ||
| Affirmative | 378,729,502,260.010 | 97.580 |
| Withheld | 9,407,876,478.960 | 2.420 |
| TOTAL | 388,137,378,738.970 | 100.000 |
| Jennifer Toolin McAuliffe | ||
| Affirmative | 378,454,868,010.950 | 97.510 |
| Withheld | 9,682,510,728.020 | 2.490 |
| TOTAL | 388,137,378,738.970 | 100.000 |
| Christine J. Thompson | ||
| Affirmative | 378,837,121,274.520 | 97.600 |
| Withheld | 9,300,257,464.450 | 2.400 |
| TOTAL | 388,137,378,738.970 | 100.000 |
| Elizabeth S. Acton | ||
| Affirmative | 378,262,110,794.850 | 97.460 |
| Withheld | 9,875,267,944.120 | 2.540 |
| TOTAL | 388,137,378,738.970 | 100.000 |
| Laura M. Bishop | ||
| Affirmative | 380,482,113,171.060 | 98.030 |
| Withheld | 7,655,265,567.910 | 1.970 |
| TOTAL | 388,137,378,738.970 | 100.000 |
| Ann E. Dunwoody | ||
| Affirmative | 380,016,034,008.120 | 97.910 |
| Withheld | 8,121,344,730.850 | 2.090 |
| TOTAL | 388,137,378,738.970 | 100.000 |
| John Engler | ||
| Affirmative | 379,432,488,394.200 | 97.760 |
| Withheld | 8,704,890,344.770 | 2.240 |
| TOTAL | 388,137,378,738.970 | 100.000 |
| Robert F. Gartland | ||
| Affirmative | 378,741,819,600.600 | 97.580 |
| Withheld | 9,395,559,138.370 | 2.420 |
| TOTAL | 388,137,378,738.970 | 100.000 |
| Robert W. Helm | ||
| Affirmative | 380,389,324,755.070 | 98.000 |
| Withheld | 7,748,053,983.900 | 2.000 |
| TOTAL | 388,137,378,738.970 | 100.000 |
| Arthur E. Johnson | ||
| Affirmative | 378,427,694,151.670 | 97.500 |
| Withheld | 9,709,684,587.300 | 2.500 |
| TOTAL | 388,137,378,738.970 | 100.000 |
| Michael E. Kenneally | ||
| Affirmative | 377,842,228,145.180 | 97.350 |
| Withheld | 10,295,150,593.790 | 2.650 |
| TOTAL | 388,137,378,738.970 | 100.000 |
| Mark A. Murray | ||
| Affirmative | 380,158,432,703.370 | 97.940 |
| Withheld | 7,978,946,035.600 | 2.060 |
| TOTAL | 388,137,378,738.970 | 100.000 |
| Carol J. Zierhoffer | ||
| Affirmative | 380,522,113,360.240 | 98.040 |
| Withheld | 7,615,265,378.730 | 1.960 |
| TOTAL | 388,137,378,738.970 | 100.000 |
| Proposal 1 reflects trust wide proposal and voting results. | ||
 |


Contents
| Average Annual Total Returns | |||
Periods ended October 31, 2023 | Past 1 year | Life of Fund A |
| Fidelity® SAI Emerging Markets Value Index Fund | 15.81% | 6.85% |
| $10,000 Over Life of Fund |
Let's say hypothetically that $10,000 was invested in Fidelity® SAI Emerging Markets Value Index Fund on May 12, 2020, when the fund started. The chart shows how the value of your investment would have changed, and also shows how the Fidelity Emerging Markets Value Focus Index℠ and MSCI ACWI (All Country World Index) ex USA Index performed over the same period. |
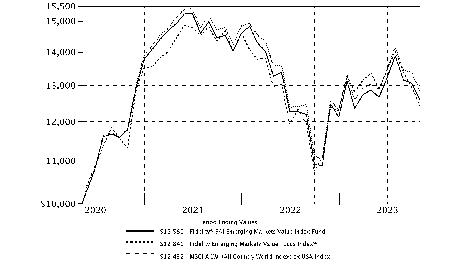 |
Top Holdings (% of Fund's net assets) | ||
| Taiwan Semiconductor Manufacturing Co. Ltd. (Taiwan, Semiconductors & Semiconductor Equipment) | 4.1 | |
| Samsung Electronics Co. Ltd. (Korea (South), Technology Hardware, Storage & Peripherals) | 3.8 | |
| Tencent Holdings Ltd. (China, Interactive Media & Services) | 2.8 | |
| Petroleo Brasileiro SA - Petrobras (PN) (non-vtg.) (Brazil, Oil, Gas & Consumable Fuels) | 2.1 | |
| China Construction Bank Corp. (H Shares) (China, Banks) | 2.0 | |
| Alibaba Group Holding Ltd. (China, Broadline Retail) | 1.9 | |
| Vale SA (Brazil, Metals & Mining) | 1.8 | |
| Industrial & Commercial Bank of China Ltd. (H Shares) (China, Banks) | 1.6 | |
| Hon Hai Precision Industry Co. Ltd. (Foxconn) (Taiwan, Electronic Equipment, Instruments & Components) | 1.5 | |
| Bank of China Ltd. (H Shares) (China, Banks) | 1.5 | |
| 23.1 | ||
| Market Sectors (% of Fund's net assets) | ||
| Financials | 23.9 | |
| Information Technology | 20.1 | |
| Consumer Discretionary | 13.3 | |
| Communication Services | 8.9 | |
| Materials | 7.9 | |
| Industrials | 6.6 | |
| Energy | 5.4 | |
| Consumer Staples | 5.0 | |
| Health Care | 3.3 | |
| Utilities | 2.6 | |
| Real Estate | 1.6 | |
Asset Allocation (% of Fund's net assets) |
 |
Futures - 1.4% |
Geographic Diversification (% of Fund's net assets) |
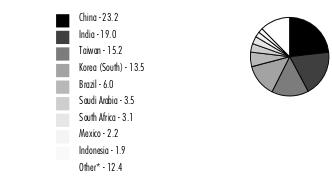 |
* Includes Short-Term investments and Net Other Assets (Liabilities). Percentages are adjusted for the effect of derivatives, if applicable. |
| Common Stocks - 95.8% | |||
| Shares | Value ($) | ||
| Brazil - 3.4% | |||
| Banco do Brasil SA | 3,188,400 | 30,576,514 | |
| Embraer SA (a) | 1,549,000 | 5,404,256 | |
| Telefonica Brasil SA | 925,500 | 8,304,581 | |
| Vale SA | 3,533,300 | 48,355,769 | |
TOTAL BRAZIL | 92,641,120 | ||
| Chile - 0.3% | |||
| Cencosud SA | 2,867,251 | 4,645,267 | |
| Empresas CMPC SA | 2,447,964 | 4,376,248 | |
TOTAL CHILE | 9,021,515 | ||
| China - 23.2% | |||
| Agricultural Bank of China Ltd. (H Shares) | 68,407,000 | 25,266,582 | |
| Alibaba Group Holding Ltd. (a) | 5,212,800 | 53,666,188 | |
| Aluminum Corp. of China Ltd. (H Shares) | 8,778,000 | 4,695,620 | |
| Anhui Conch Cement Co. Ltd. (H Shares) | 2,632,000 | 6,550,245 | |
| Bank of China Ltd. (H Shares) | 117,997,000 | 41,220,530 | |
| Bank of Communications Co. Ltd. (H Shares) | 47,529,000 | 28,113,686 | |
| Beijing Enterprises Holdings Ltd. | 1,065,500 | 3,550,098 | |
| CGN Power Co. Ltd. (H Shares) (b) | 24,843,500 | 5,970,083 | |
| China CITIC Bank Corp. Ltd. (H Shares) | 20,203,000 | 9,012,726 | |
| China Construction Bank Corp. (H Shares) | 97,604,000 | 55,200,732 | |
| China Feihe Ltd. (b) | 7,063,000 | 4,388,751 | |
| China Galaxy Securities Co. Ltd. (H Shares) | 7,721,000 | 3,951,672 | |
| China Life Insurance Co. Ltd. (H Shares) | 16,560,000 | 22,428,845 | |
| China Minsheng Banking Corp. Ltd. (H Shares) | 14,628,000 | 4,863,237 | |
| China National Building Materials Co. Ltd. (H Shares) | 10,144,000 | 4,828,502 | |
| China Overseas Land and Investment Ltd. | 8,281,500 | 15,628,098 | |
| China Railway Group Ltd. (H Shares) | 9,363,000 | 4,419,003 | |
| China State Construction International Holdings Ltd. | 3,923,400 | 4,202,512 | |
| China Tower Corp. Ltd. (H Shares) (b) | 103,846,000 | 9,683,730 | |
| China Vanke Co. Ltd. (H Shares) | 4,910,400 | 4,593,956 | |
| CITIC Pacific Ltd. | 14,242,000 | 12,104,827 | |
| COSCO SHIPPING Holdings Co. Ltd. (H Shares) | 7,465,800 | 7,592,997 | |
| Daqo New Energy Corp. ADR (a) | 128,484 | 3,271,203 | |
| GCL Technology Holdings Ltd. | 42,180,000 | 6,211,753 | |
| Geely Automobile Holdings Ltd. | 10,967,000 | 12,451,109 | |
| Haitong Securities Co. Ltd. (H Shares) | 6,070,000 | 3,485,310 | |
| Hengan International Group Co. Ltd. | 1,448,500 | 4,851,458 | |
| Industrial & Commercial Bank of China Ltd. (H Shares) | 94,740,000 | 45,403,649 | |
| JD.com, Inc. Class A | 2,802,200 | 35,624,824 | |
| Jiangxi Copper Co. Ltd. (H Shares) | 2,408,800 | 3,405,938 | |
| Kunlun Energy Co. Ltd. | 8,864,000 | 7,384,633 | |
| Lenovo Group Ltd. | 16,464,000 | 19,159,685 | |
| Longfor Properties Co. Ltd. (b) | 3,810,620 | 5,547,353 | |
| Meituan Class B (a)(b) | 448,340 | 6,355,226 | |
| New China Life Insurance Co. Ltd. (H Shares) | 1,910,100 | 4,190,111 | |
| People's Insurance Co. of China Group Ltd. (H Shares) | 18,254,000 | 6,023,081 | |
| PICC Property & Casualty Co. Ltd. (H Shares) | 15,354,000 | 17,533,581 | |
| Postal Savings Bank of China Co. Ltd. (H Shares) (b) | 17,233,000 | 7,865,646 | |
| Qifu Technology, Inc. ADR | 323,395 | 4,783,012 | |
| Sinopharm Group Co. Ltd. (H Shares) | 2,986,000 | 7,140,372 | |
| SITC International Holdings Co. Ltd. | 2,866,000 | 4,414,803 | |
| Tencent Holdings Ltd. | 2,065,800 | 76,452,688 | |
| Vipshop Holdings Ltd. ADR (a) | 734,989 | 10,480,943 | |
| Yangzijiang Shipbuilding Holdings Ltd. | 6,066,300 | 6,430,176 | |
| Yankuang Energy Group Co. Ltd. (H Shares) | 4,821,000 | 8,372,915 | |
TOTAL CHINA | 638,772,089 | ||
| Czech Republic - 0.1% | |||
| CEZ A/S | 96,661 | 4,136,043 | |
| Egypt - 0.1% | |||
| Commercial International Bank SAE | 1,081,217 | 2,109,990 | |
| Greece - 0.4% | |||
| Eurobank Ergasias Services and Holdings SA (a) | 3,246,101 | 5,296,307 | |
| National Bank of Greece SA (a) | 1,100,642 | 6,288,782 | |
TOTAL GREECE | 11,585,089 | ||
| Hong Kong - 0.5% | |||
| Orient Overseas International Ltd. | 294,000 | 3,707,281 | |
| WH Group Ltd. (b) | 17,417,000 | 10,402,010 | |
TOTAL HONG KONG | 14,109,291 | ||
| Hungary - 0.3% | |||
| MOL Hungarian Oil and Gas PLC Series A (For. Reg.) | 952,292 | 7,577,240 | |
| India - 19.0% | |||
| Aurobindo Pharma Ltd. | 625,901 | 6,384,985 | |
| Bajaj Auto Ltd. | 151,128 | 9,637,720 | |
| Bank of Baroda | 2,301,692 | 5,425,591 | |
| Cipla Ltd./India (a) | 1,193,478 | 17,199,025 | |
| Dr. Reddy's Laboratories Ltd. | 270,521 | 17,455,480 | |
| HCL Technologies Ltd. | 2,355,229 | 36,114,778 | |
| HDFC Bank Ltd. | 873,951 | 15,503,249 | |
| Hero Motocorp Ltd. | 289,073 | 10,724,138 | |
| Hindalco Industries Ltd. | 3,250,581 | 17,937,070 | |
| Indus Towers Ltd. (a) | 1,859,186 | 3,846,206 | |
| Infosys Ltd. | 1,748,673 | 28,749,723 | |
| ITC Ltd. | 6,546,395 | 33,687,819 | |
| Jindal Steel & Power Ltd. | 885,349 | 6,739,190 | |
| Mahindra & Mahindra Ltd. | 1,925,207 | 33,729,770 | |
| Maruti Suzuki India Ltd. | 295,493 | 36,889,230 | |
| NMDC Ltd. | 2,543,515 | 4,712,442 | |
| NTPC Ltd. | 9,840,174 | 27,870,430 | |
| Oil & Natural Gas Corp. Ltd. | 8,678,890 | 19,413,989 | |
| Power Finance Corp. Ltd. | 3,231,412 | 9,566,964 | |
| REC Ltd. | 2,754,215 | 9,517,129 | |
| Reliance Industries Ltd. | 605,865 | 16,654,997 | |
| State Bank of India | 3,972,193 | 26,983,361 | |
| Sun Pharmaceutical Industries Ltd. | 2,171,924 | 28,387,633 | |
| Tata Motors Ltd. | 4,499,126 | 33,971,866 | |
| Tata Steel Ltd. | 17,950,116 | 25,606,967 | |
| Tech Mahindra Ltd. | 1,409,151 | 19,198,384 | |
| Vedanta Ltd. | 2,481,696 | 6,456,271 | |
| Wipro Ltd. | 3,297,591 | 15,133,823 | |
TOTAL INDIA | 523,498,230 | ||
| Indonesia - 1.9% | |||
| Indofood Sukses Makmur Tbk PT | 9,770,100 | 4,090,290 | |
| PT Adaro Energy Indonesia Tbk | 31,320,200 | 5,053,491 | |
| PT Astra International Tbk | 45,046,500 | 16,386,997 | |
| PT Telkom Indonesia Persero Tbk | 94,334,900 | 20,679,701 | |
| PT United Tractors Tbk | 3,320,500 | 5,254,718 | |
TOTAL INDONESIA | 51,465,197 | ||
| Korea (South) - 13.5% | |||
| GS Holdings Corp. | 206,775 | 6,029,266 | |
| Hana Financial Group, Inc. | 658,509 | 19,118,940 | |
| Hankook Tire Co. Ltd. | 170,918 | 4,842,017 | |
| HMM Co. Ltd. | 805,355 | 8,710,105 | |
| Hyundai Glovis Co. Ltd. | 49,237 | 6,239,451 | |
| Hyundai Mobis | 146,877 | 22,712,353 | |
| Hyundai Motor Co. Ltd. | 279,437 | 35,152,449 | |
| Hyundai Steel Co. | 190,063 | 4,615,177 | |
| Industrial Bank of Korea | 638,860 | 5,279,352 | |
| KB Financial Group, Inc. | 844,103 | 32,128,047 | |
| Kia Corp. | 591,304 | 33,731,975 | |
| Korea Investment Holdings Co. Ltd. | 101,931 | 3,804,902 | |
| Korean Air Lines Co. Ltd. | 409,723 | 6,224,765 | |
| Kumho Petro Chemical Co. Ltd. | 42,549 | 3,993,107 | |
| LG Corp. | 294,051 | 16,806,239 | |
| LG Electronics, Inc. | 183,508 | 13,592,994 | |
| LG Uplus Corp. | 476,107 | 3,562,996 | |
| Samsung Electronics Co. Ltd. | 2,089,922 | 103,871,407 | |
| Shinhan Financial Group Co. Ltd. | 1,124,079 | 28,850,742 | |
| Woori Financial Group, Inc. | 1,507,582 | 13,296,363 | |
TOTAL KOREA (SOUTH) | 372,562,647 | ||
| Kuwait - 0.8% | |||
| Agility Public Warehousing Co. KSC (a) | 3,573,304 | 6,073,866 | |
| Mobile Telecommunication Co. | 4,718,483 | 7,334,272 | |
| National Bank of Kuwait | 3,575,855 | 10,134,189 | |
TOTAL KUWAIT | 23,542,327 | ||
| Malaysia - 1.5% | |||
| Genting Bhd | 4,745,300 | 4,015,396 | |
| IHH Healthcare Bhd | 7,055,700 | 8,881,673 | |
| Kuala Lumpur Kepong Bhd | 1,251,000 | 5,774,804 | |
| PPB Group Bhd | 1,582,900 | 5,088,609 | |
| Sime Darby Plantation Bhd | 7,387,400 | 6,734,577 | |
| Tenaga Nasional Bhd | 5,942,700 | 12,349,320 | |
TOTAL MALAYSIA | 42,844,379 | ||
| Mexico - 2.2% | |||
| Alfa SA de CV Series A | 6,970,500 | 4,345,689 | |
| America Movil S.A.B. de CV Series L | 36,113,800 | 29,826,085 | |
| Arca Continental S.A.B. de CV | 1,019,600 | 9,142,977 | |
| CEMEX S.A.B. de CV unit (a) | 17,636,200 | 10,594,045 | |
| Grupo Televisa SA de CV | 5,630,600 | 2,582,787 | |
| Ternium SA sponsored ADR | 109,217 | 4,094,545 | |
TOTAL MEXICO | 60,586,128 | ||
| Peru - 0.2% | |||
| Credicorp Ltd. (United States) | 36,594 | 4,572,786 | |
| Philippines - 0.7% | |||
| Aboitiz Equity Ventures, Inc. | 5,011,900 | 4,036,661 | |
| Ayala Corp. | 551,150 | 5,878,778 | |
| Metropolitan Bank & Trust Co. | 4,003,460 | 3,682,823 | |
| PLDT, Inc. | 192,325 | 4,099,858 | |
| Universal Robina Corp. | 726,130 | 1,396,536 | |
TOTAL PHILIPPINES | 19,094,656 | ||
| Poland - 0.8% | |||
| KGHM Polska Miedz SA (Bearer) | 52,329 | 1,394,554 | |
| Orlen SA | 1,188,449 | 18,763,276 | |
| PGE Polska Grupa Energetyczna SA (a) | 1,897,419 | 3,287,559 | |
TOTAL POLAND | 23,445,389 | ||
| Qatar - 0.9% | |||
| Industries Qatar QSC (a) | 3,339,700 | 11,208,771 | |
| Ooredoo QSC | 1,710,835 | 4,647,118 | |
| Qatar National Bank SAQ | 2,323,608 | 9,502,478 | |
TOTAL QATAR | 25,358,367 | ||
| Russia - 0.1% | |||
| Gazprom OAO (c) | 9,889,350 | 1,035,073 | |
| Inter Rao Ues JSC (c) | 63,735,100 | 351,472 | |
| Magnit OJSC (c) | 135,409 | 2,783 | |
| Mobile TeleSystems OJSC sponsored ADR (a)(c) | 753,517 | 750,495 | |
| Sberbank of Russia (c) | 440,500 | 2,709 | |
| Surgutneftegas OJSC (c) | 29,672,400 | 363,173 | |
| VK Co. Ltd. GDR (Reg. S) (a)(c) | 217,763 | 479,079 | |
| VTB Bank OJSC (a)(c) | 9,075,720,096 | 346,829 | |
TOTAL RUSSIA | 3,331,613 | ||
| Saudi Arabia - 3.5% | |||
| Almarai Co. Ltd. | 556,355 | 8,289,862 | |
| Banque Saudi Fransi | 962,003 | 9,192,826 | |
| Etihad Etisalat Co. | 839,652 | 10,317,720 | |
| Riyad Bank | 1,688,807 | 11,951,654 | |
| Sahara International Petrochemical Co. | 762,349 | 6,553,405 | |
| Saudi Electricity Co. | 1,761,760 | 8,358,921 | |
| Saudi Telecom Co. | 3,429,710 | 35,105,252 | |
| The Savola Group | 582,283 | 5,649,616 | |
TOTAL SAUDI ARABIA | 95,419,256 | ||
| South Africa - 3.1% | |||
| Absa Group Ltd. | 1,264,127 | 11,525,176 | |
| Anglo American Platinum Ltd. | 123,981 | 4,142,402 | |
| Aspen Pharmacare Holdings Ltd. | 866,830 | 7,873,677 | |
| Exxaro Resources Ltd. | 536,372 | 5,380,556 | |
| Growthpoint Properties Ltd. (d) | 5,717,169 | 2,972,468 | |
| Impala Platinum Holdings Ltd. | 1,931,851 | 8,047,303 | |
| MTN Group Ltd. | 1,970,850 | 9,620,815 | |
| MultiChoice Group Ltd. (a) | 982,129 | 3,678,735 | |
| Sasol Ltd. | 1,298,732 | 16,415,634 | |
| Sibanye-Stillwater Ltd. | 6,299,205 | 8,034,964 | |
| Woolworths Holdings Ltd. | 1,814,035 | 6,753,904 | |
TOTAL SOUTH AFRICA | 84,445,634 | ||
| Taiwan - 15.2% | |||
| Acer, Inc. | 6,783,000 | 7,163,334 | |
| ASE Technology Holding Co. Ltd. | 7,592,000 | 26,558,977 | |
| ASUSTeK Computer, Inc. | 1,515,000 | 15,872,742 | |
| Catcher Technology Co. Ltd. | 1,514,000 | 8,486,841 | |
| Cathay Financial Holding Co. Ltd. | 20,714,023 | 28,088,319 | |
| Compal Electronics, Inc. | 9,219,000 | 8,012,836 | |
| EVA Airways Corp. | 5,729,000 | 4,854,532 | |
| Evergreen Marine Corp. (Taiwan) | 2,260,300 | 7,515,984 | |
| Foxconn Technology Co. Ltd. | 2,329,000 | 3,775,967 | |
| Fubon Financial Holding Co. Ltd. | 11,296,675 | 20,991,059 | |
| Hon Hai Precision Industry Co. Ltd. (Foxconn) | 13,992,000 | 41,729,957 | |
| Novatek Microelectronics Corp. | 1,259,000 | 17,716,934 | |
| Pegatron Corp. | 4,689,000 | 10,933,930 | |
| Pou Chen Corp. | 5,640,000 | 5,023,415 | |
| Powerchip Semiconductor Manufacturing Corp. | 6,606,600 | 5,430,538 | |
| Powertech Technology, Inc. | 1,588,000 | 5,155,177 | |
| Radiant Opto-Electronics Corp. | 1,035,000 | 3,964,083 | |
| Sino-American Silicon Products, Inc. | 1,239,000 | 6,267,479 | |
| Taiwan Semiconductor Manufacturing Co. Ltd. | 6,933,000 | 113,146,143 | |
| Uni-President Enterprises Corp. | 8,116,000 | 17,013,835 | |
| Unimicron Technology Corp. | 2,882,000 | 12,843,574 | |
| United Microelectronics Corp. | 24,877,000 | 35,748,413 | |
| Wan Hai Lines Ltd. | 3,122,000 | 4,458,720 | |
| Yang Ming Marine Transport Corp. | 3,886,000 | 5,061,030 | |
| Zhen Ding Technology Holding Ltd. | 1,412,400 | 4,267,015 | |
TOTAL TAIWAN | 420,080,834 | ||
| Thailand - 1.6% | |||
| Advanced Information Service PCL NVDR | 2,225,500 | 13,555,561 | |
| Bangkok Bank PCL: | |||
| (For. Reg.) | 400 | 1,743 | |
| NVDR | 1,274,000 | 5,551,906 | |
| Charoen Pokphand Foods PCL: | |||
| (For. Reg.) | 34,900 | 18,054 | |
| NVDR | 7,630,800 | 3,947,470 | |
| Kasikornbank PCL: | |||
| (For. Reg.) | 12,500 | 45,463 | |
| NVDR | 2,571,100 | 9,351,123 | |
| SCB X PCL NVDR | 1,873,300 | 5,107,696 | |
| Thai Beverage PCL | 19,007,800 | 7,507,721 | |
TOTAL THAILAND | 45,086,737 | ||
| Turkey - 0.7% | |||
| Haci Omer Sabanci Holding A/S | 2,115,265 | 3,996,104 | |
| Koc Holding A/S | 1,819,812 | 8,790,850 | |
| Turkiye Is Bankasi A/S Series C | 7,169,662 | 5,311,564 | |
TOTAL TURKEY | 18,098,518 | ||
| United Arab Emirates - 1.6% | |||
| Emaar Properties PJSC | 7,896,101 | 14,381,954 | |
| Emirates NBD Bank PJSC | 4,976,618 | 22,965,879 | |
| Multiply Group (a) | 7,477,417 | 6,921,649 | |
TOTAL UNITED ARAB EMIRATES | 44,269,482 | ||
| United States of America - 0.2% | |||
| JBS SA | 1,480,900 | 5,883,359 | |
| TOTAL COMMON STOCKS (Cost $2,877,127,400) | 2,643,537,916 | ||
| Nonconvertible Preferred Stocks - 2.8% | |||
| Shares | Value ($) | ||
| Brazil - 2.6% | |||
| Gerdau SA | 2,419,390 | 10,446,793 | |
| Metalurgica Gerdau SA (PN) | 1,691,500 | 3,465,700 | |
| Petroleo Brasileiro SA - Petrobras (PN) (non-vtg.) | 8,138,000 | 56,074,601 | |
TOTAL BRAZIL | 69,987,094 | ||
| Chile - 0.1% | |||
| Sociedad Quimica y Minera de Chile SA (PN-B) | 50,837 | 2,459,488 | |
| Colombia - 0.1% | |||
| Bancolombia SA (PN) | 447,671 | 2,871,359 | |
| Russia - 0.0% | |||
| AK Transneft OAO (c) | 2,792 | 810,352 | |
| TOTAL NONCONVERTIBLE PREFERRED STOCKS (Cost $64,570,123) | 76,128,293 | ||
| Government Obligations - 0.1% | |||
Principal Amount (e) | Value ($) | ||
| United States of America - 0.1% | |||
U.S. Treasury Bills, yield at date of purchase 5.42% 2/22/24 (f) (Cost $1,868,412) | 1,900,000 | 1,868,302 | |
| Money Market Funds - 1.5% | |||
| Shares | Value ($) | ||
| Fidelity Cash Central Fund 5.40% (g) | 38,486,483 | 38,494,181 | |
| Fidelity Securities Lending Cash Central Fund 5.40% (g)(h) | 2,999,700 | 3,000,000 | |
| TOTAL MONEY MARKET FUNDS (Cost $41,494,181) | 41,494,181 | ||
| TOTAL INVESTMENT IN SECURITIES - 100.2% (Cost $2,985,060,116) | 2,763,028,692 |
NET OTHER ASSETS (LIABILITIES) - (0.2)% | (4,584,065) |
| NET ASSETS - 100.0% | 2,758,444,627 |
| Futures Contracts | |||||
Number of contracts | Expiration Date | Notional Amount ($) | Value ($) | Unrealized Appreciation/ (Depreciation) ($) | |
| Purchased | |||||
| Equity Index Contracts | |||||
| ICE MSCI Emerging Markets Index Contracts (United States) | 839 | Dec 2023 | 38,560,440 | (1,090,836) | (1,090,836) |
| The notional amount of futures purchased as a percentage of Net Assets is 1.4% | |||||
| (a) | Non-income producing |
| (b) | Security exempt from registration under Rule 144A of the Securities Act of 1933. These securities may be resold in transactions exempt from registration, normally to qualified institutional buyers. At the end of the period, the value of these securities amounted to $50,212,799 or 1.8% of net assets. |
| (c) | Level 3 security |
| (d) | Security or a portion of the security is on loan at period end. |
| (e) | Amount is stated in United States dollars unless otherwise noted. |
| (f) | Security or a portion of the security was pledged to cover margin requirements for futures contracts. At period end, the value of securities pledged amounted to $1,080,665. |
| (g) | Affiliated fund that is generally available only to investment companies and other accounts managed by Fidelity Investments. The rate quoted is the annualized seven-day yield of the fund at period end. A complete unaudited listing of the fund's holdings as of its most recent quarter end is available upon request. In addition, each Fidelity Central Fund's financial statements, which are not covered by the Fund's Report of Independent Registered Public Accounting Firm, are available on the SEC's website or upon request. |
| (h) | Investment made with cash collateral received from securities on loan. |
| Affiliate | Value, beginning of period ($) | Purchases ($) | Sales Proceeds ($) | Dividend Income ($) | Realized Gain (loss) ($) | Change in Unrealized appreciation (depreciation) ($) | Value, end of period ($) | % ownership, end of period |
| Fidelity Cash Central Fund 5.40% | 19,455,170 | 255,325,068 | 236,286,057 | 725,568 | - | - | 38,494,181 | 0.1% |
| Fidelity Securities Lending Cash Central Fund 5.40% | 1,612,397 | 239,621,177 | 238,233,574 | 247,005 | - | - | 3,000,000 | 0.0% |
| Total | 21,067,567 | 494,946,245 | 474,519,631 | 972,573 | - | - | 41,494,181 | |
| Valuation Inputs at Reporting Date: | ||||
| Description | Total ($) | Level 1 ($) | Level 2 ($) | Level 3 ($) |
Investments in Securities: | ||||
| Equities: | ||||
Communication Services | 244,527,679 | 111,417,365 | 131,880,740 | 1,229,574 |
Consumer Discretionary | 369,355,517 | 17,234,847 | 352,120,670 | - |
Consumer Staples | 138,515,798 | 33,611,081 | 104,901,934 | 2,783 |
Energy | 144,754,381 | 87,795,673 | 54,750,110 | 2,208,598 |
Financials | 658,282,318 | 141,078,620 | 516,854,160 | 349,538 |
Health Care | 93,322,845 | 7,873,677 | 85,449,168 | - |
Industrials | 180,278,696 | 45,204,569 | 135,074,127 | - |
Information Technology | 558,784,696 | 3,271,203 | 555,513,493 | - |
Materials | 215,461,891 | 89,281,059 | 126,180,832 | - |
Real Estate | 43,123,829 | 17,354,422 | 25,769,407 | - |
Utilities | 73,258,559 | 15,782,523 | 57,124,564 | 351,472 |
| Government Obligations | 1,868,302 | - | 1,868,302 | - |
| Money Market Funds | 41,494,181 | 41,494,181 | - | - |
| Total Investments in Securities: | 2,763,028,692 | 611,399,220 | 2,147,487,507 | 4,141,965 |
Derivative Instruments: Liabilities | ||||
Futures Contracts | (1,090,836) | (1,090,836) | - | - |
| Total Liabilities | (1,090,836) | (1,090,836) | - | - |
| Total Derivative Instruments: | (1,090,836) | (1,090,836) | - | - |
Primary Risk Exposure / Derivative Type | Value | |
| Asset ($) | Liability ($) | |
| Equity Risk | ||
Futures Contracts (a) | 0 | (1,090,836) |
| Total Equity Risk | 0 | (1,090,836) |
| Total Value of Derivatives | 0 | (1,090,836) |
| Statement of Assets and Liabilities | ||||
| October 31, 2023 | ||||
| Assets | ||||
| Investment in securities, at value (including securities loaned of $2,584,428) - See accompanying schedule: | ||||
Unaffiliated issuers (cost $2,943,565,935) | $ | 2,721,534,511 | ||
Fidelity Central Funds (cost $41,494,181) | 41,494,181 | |||
| Total Investment in Securities (cost $2,985,060,116) | $ | 2,763,028,692 | ||
| Foreign currency held at value (cost $4,221,823) | 4,216,586 | |||
| Receivable for fund shares sold | 2,317,512 | |||
| Dividends receivable | 5,813,151 | |||
| Distributions receivable from Fidelity Central Funds | 144,073 | |||
| Prepaid expenses | 3,390 | |||
| Other receivables | 382,004 | |||
Total assets | 2,775,905,408 | |||
| Liabilities | ||||
| Payable for fund shares redeemed | $ | 890,942 | ||
| Accrued management fee | 350,648 | |||
| Payable for daily variation margin on futures contracts | 241,189 | |||
| Deferred taxes | 12,312,442 | |||
| Other payables and accrued expenses | 665,560 | |||
| Collateral on securities loaned | 3,000,000 | |||
| Total Liabilities | 17,460,781 | |||
| Net Assets | $ | 2,758,444,627 | ||
| Net Assets consist of: | ||||
| Paid in capital | $ | 3,178,256,686 | ||
| Total accumulated earnings (loss) | (419,812,059) | |||
| Net Assets | $ | 2,758,444,627 | ||
Net Asset Value, offering price and redemption price per share ($2,758,444,627 ÷ 244,818,579 shares) | $ | 11.27 | ||
| Statement of Operations | ||||
Year ended October 31, 2023 | ||||
| Investment Income | ||||
| Dividends | $ | 150,610,028 | ||
| Interest | 100,090 | |||
| Income from Fidelity Central Funds (including $247,005 from security lending) | 972,573 | |||
| Income before foreign taxes withheld | $ | 151,682,691 | ||
| Less foreign taxes withheld | (17,813,290) | |||
| Total Income | 133,869,401 | |||
| Expenses | ||||
| Management fee | $ | 4,141,661 | ||
| Custodian fees and expenses | 1,698,634 | |||
| Independent trustees' fees and expenses | 9,472 | |||
| Registration fees | 97,630 | |||
| Audit | 97,216 | |||
| Legal | 3,160 | |||
| Interest | 126,333 | |||
| Miscellaneous | 13,557 | |||
| Total Expenses | 6,187,663 | |||
| Net Investment income (loss) | 127,681,738 | |||
| Realized and Unrealized Gain (Loss) | ||||
| Net realized gain (loss) on: | ||||
| Investment Securities: | ||||
| Unaffiliated issuers (net of foreign taxes of $1,688,078) | (128,353,720) | |||
| Foreign currency transactions | (568,467) | |||
| Futures contracts | 2,249,443 | |||
| Total net realized gain (loss) | (126,672,744) | |||
| Change in net unrealized appreciation (depreciation) on: | ||||
| Investment Securities: | ||||
| Unaffiliated issuers(net of increase in deferred foreign taxes of $6,257,757) | 378,091,203 | |||
| Assets and liabilities in foreign currencies | (63,959) | |||
| Futures contracts | (908,699) | |||
| Total change in net unrealized appreciation (depreciation) | 377,118,545 | |||
| Net gain (loss) | 250,445,801 | |||
| Net increase (decrease) in net assets resulting from operations | $ | 378,127,539 | ||
| Statement of Changes in Net Assets | ||||
Year ended October 31, 2023 | Year ended October 31, 2022 | |||
| Increase (Decrease) in Net Assets | ||||
| Operations | ||||
| Net investment income (loss) | $ | 127,681,738 | $ | 126,441,332 |
| Net realized gain (loss) | (126,672,744) | (160,063,213) | ||
| Change in net unrealized appreciation (depreciation) | 377,118,545 | (724,011,121) | ||
| Net increase (decrease) in net assets resulting from operations | 378,127,539 | (757,633,002) | ||
| Distributions to shareholders | (124,080,652) | (110,523,013) | ||
| Share transactions | ||||
| Proceeds from sales of shares | 172,147,252 | 1,475,059,590 | ||
| Reinvestment of distributions | 113,809,111 | 110,523,013 | ||
| Cost of shares redeemed | (214,463,522) | (254,572,119) | ||
Net increase (decrease) in net assets resulting from share transactions | 71,492,841 | 1,331,010,484 | ||
| Total increase (decrease) in net assets | 325,539,728 | 462,854,469 | ||
| Net Assets | ||||
| Beginning of period | 2,432,904,899 | 1,970,050,430 | ||
| End of period | $ | 2,758,444,627 | $ | 2,432,904,899 |
| Other Information | ||||
| Shares | ||||
| Sold | 15,065,921 | 116,250,779 | ||
| Issued in reinvestment of distributions | 10,374,577 | 8,108,805 | ||
| Redeemed | (19,027,713) | (23,481,271) | ||
| Net increase (decrease) | 6,412,785 | 100,878,313 | ||
| Fidelity® SAI Emerging Markets Value Index Fund |
| Years ended October 31, | 2023 | 2022 | 2021 | 2020 A | ||||
Selected Per-Share Data | ||||||||
| Net asset value, beginning of period | $ | 10.20 | $ | 14.32 | $ | 11.78 | $ | 10.00 |
| Income from Investment Operations | ||||||||
Net investment income (loss) B,C | .53 | .61 | .51 | .19 | ||||
| Net realized and unrealized gain (loss) | 1.07 | (4.04) | 2.22 | 1.59 | ||||
| Total from investment operations | 1.60 | (3.43) | 2.73 | 1.78 | ||||
| Distributions from net investment income | (.53) | (.37) | (.17) | - | ||||
| Distributions from net realized gain | - | (.32) | (.02) | - | ||||
| Total distributions | (.53) | (.69) | (.19) | - | ||||
| Net asset value, end of period | $ | 11.27 | $ | 10.20 | $ | 14.32 | $ | 11.78 |
Total Return D,E | 15.81% | (25.19)% | 23.32% | 17.80% | ||||
Ratios to Average Net Assets C,F,G | ||||||||
| Expenses before reductions | .22% | .22% | .22% | .27% H,I | ||||
| Expenses net of fee waivers, if any | .22% | .22% | .22% | .25% I | ||||
| Expenses net of all reductions | .22% | .22% | .22% | .25% I | ||||
| Net investment income (loss) | 4.63% | 4.95% | 3.53% | 3.43% I | ||||
| Supplemental Data | ||||||||
| Net assets, end of period (000 omitted) | $ | 2,758,445 | $ | 2,432,905 | $ | 1,970,050 | $ | 838,148 |
Portfolio turnover rate J | 35% | 30% | 33% | 17% K |
| Fidelity Central Fund | Investment Manager | Investment Objective | Investment Practices | Expense RatioA |
| Fidelity Money Market Central Funds | Fidelity Management & Research Company LLC (FMR) | Each fund seeks to obtain a high level of current income consistent with the preservation of capital and liquidity. | Short-term Investments | Less than .005% |
| Gross unrealized appreciation | $247,083,704 |
| Gross unrealized depreciation | (504,861,151) |
| Net unrealized appreciation (depreciation) | $(257,777,447) |
| Tax Cost | $3,020,806,139 |
| Undistributed ordinary income | $122,190,850 |
| Capital loss carryforward | $(271,838,382) |
| Net unrealized appreciation (depreciation) on securities and other investments | $(257,852,085) |
Short-term | $(120,116,043) |
Long-term | (151,722,339) |
| Total capital loss carryforward | $(271,838,382) |
| October 31, 2023 | October 31, 2022 | |
| Ordinary Income | $124,080,652 | $ 96,324,436 |
| Long-term Capital Gains | - | 14,198,577 |
| Total | $124,080,652 | $ 110,523,013 |
| Equity Risk | Equity risk relates to the fluctuations in the value of financial instruments as a result of changes in market prices (other than those arising from interest rate risk or foreign exchange risk), whether caused by factors specific to an individual investment, its issuer, or all factors affecting all instruments traded in a market or market segment. |
| Purchases ($) | Sales ($) | |
| Fidelity SAI Emerging Markets Value Index Fund | 998,351,091 | 950,053,249 |
| Borrower or Lender | Average Loan Balance | Weighted Average Interest Rate | Interest Expense | |
Fidelity SAI Emerging Markets Value Index Fund | Borrower | $ 16,177,980 | 4.90% | $108,006 |
| Amount | |
| Fidelity SAI Emerging Markets Value Index Fund | $4,957 |
| Total Security Lending Fees Paid to NFS | Security Lending Income From Securities Loaned to NFS | Value of Securities Loaned to NFS at Period End | |
| Fidelity SAI Emerging Markets Value Index Fund | $26,171 | $- | $- |
| Average Loan Balance | Weighted Average Interest Rate | Interest Expense | |
| Fidelity SAI Emerging Markets Value Index Fund | $13,659,800 | 4.83% | $ 18,327 |
| Strategic Advisers Emerging Markets Fund | Strategic Advisers Fidelity Emerging Markets Fund | |
| Fidelity SAI Emerging Markets Value Index Fund | 27% | 64% |
| Fund | % of shares held |
| Fidelity SAI Emerging Markets Value Index Fund | 91% |
| The Example is based on an investment of $1,000 invested at the beginning of the period and held for the entire period (May 1, 2023 to October 31, 2023). |
Annualized Expense Ratio- A | Beginning Account Value May 1, 2023 | Ending Account Value October 31, 2023 | Expenses Paid During Period- C May 1, 2023 to October 31, 2023 | |||||||
| Fidelity® SAI Emerging Markets Value Index Fund | .22% | |||||||||
| Actual | $ 1,000 | $ 978.30 | $ 1.10 | |||||||
Hypothetical-B | $ 1,000 | $ 1,024.10 | $ 1.12 | |||||||
| A special meeting of shareholders was held on October 18, 2023. The results of votes taken among shareholders on the proposal before them are reported below. Each vote reported represents one dollar of net asset value held on the record date for the meeting. | ||
| Proposal 1 | ||
| To elect a Board of Trustees. | ||
# of Votes | % of Votes | |
| Abigail P. Johnson | ||
| Affirmative | 378,729,502,260.010 | 97.580 |
| Withheld | 9,407,876,478.960 | 2.420 |
| TOTAL | 388,137,378,738.970 | 100.000 |
| Jennifer Toolin McAuliffe | ||
| Affirmative | 378,454,868,010.950 | 97.510 |
| Withheld | 9,682,510,728.020 | 2.490 |
| TOTAL | 388,137,378,738.970 | 100.000 |
| Christine J. Thompson | ||
| Affirmative | 378,837,121,274.520 | 97.600 |
| Withheld | 9,300,257,464.450 | 2.400 |
| TOTAL | 388,137,378,738.970 | 100.000 |
| Elizabeth S. Acton | ||
| Affirmative | 378,262,110,794.850 | 97.460 |
| Withheld | 9,875,267,944.120 | 2.540 |
| TOTAL | 388,137,378,738.970 | 100.000 |
| Laura M. Bishop | ||
| Affirmative | 380,482,113,171.060 | 98.030 |
| Withheld | 7,655,265,567.910 | 1.970 |
| TOTAL | 388,137,378,738.970 | 100.000 |
| Ann E. Dunwoody | ||
| Affirmative | 380,016,034,008.120 | 97.910 |
| Withheld | 8,121,344,730.850 | 2.090 |
| TOTAL | 388,137,378,738.970 | 100.000 |
| John Engler | ||
| Affirmative | 379,432,488,394.200 | 97.760 |
| Withheld | 8,704,890,344.770 | 2.240 |
| TOTAL | 388,137,378,738.970 | 100.000 |
| Robert F. Gartland | ||
| Affirmative | 378,741,819,600.600 | 97.580 |
| Withheld | 9,395,559,138.370 | 2.420 |
| TOTAL | 388,137,378,738.970 | 100.000 |
| Robert W. Helm | ||
| Affirmative | 380,389,324,755.070 | 98.000 |
| Withheld | 7,748,053,983.900 | 2.000 |
| TOTAL | 388,137,378,738.970 | 100.000 |
| Arthur E. Johnson | ||
| Affirmative | 378,427,694,151.670 | 97.500 |
| Withheld | 9,709,684,587.300 | 2.500 |
| TOTAL | 388,137,378,738.970 | 100.000 |
| Michael E. Kenneally | ||
| Affirmative | 377,842,228,145.180 | 97.350 |
| Withheld | 10,295,150,593.790 | 2.650 |
| TOTAL | 388,137,378,738.970 | 100.000 |
| Mark A. Murray | ||
| Affirmative | 380,158,432,703.370 | 97.940 |
| Withheld | 7,978,946,035.600 | 2.060 |
| TOTAL | 388,137,378,738.970 | 100.000 |
| Carol J. Zierhoffer | ||
| Affirmative | 380,522,113,360.240 | 98.040 |
| Withheld | 7,615,265,378.730 | 1.960 |
| TOTAL | 388,137,378,738.970 | 100.000 |
| Proposal 1 reflects trust wide proposal and voting results. | ||
 |


Contents
| Average Annual Total Returns | |||
Periods ended October 31, 2023 | Past 1 year | Past 5 years | Past 10 years |
| Fidelity® Emerging Markets Index Fund | 10.74% | 1.43% | 1.31% |
| $10,000 Over 10 Years |
Let's say hypothetically that $10,000 was invested in Fidelity® Emerging Markets Index Fund on October 31, 2013. The chart shows how the value of your investment would have changed, and also shows how the MSCI Emerging Markets Index performed over the same period. |
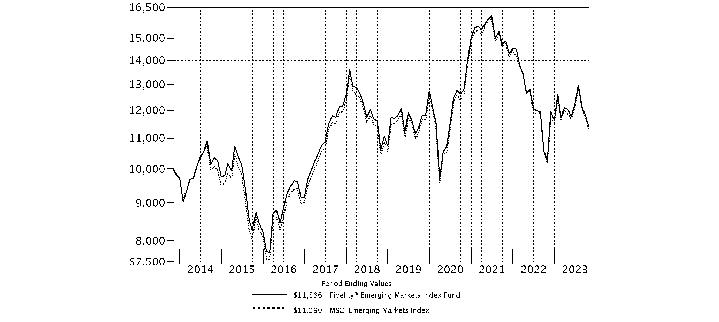 |
Top Holdings (% of Fund's net assets) | ||
| Taiwan Semiconductor Manufacturing Co. Ltd. (Taiwan, Semiconductors & Semiconductor Equipment) | 6.2 | |
| Tencent Holdings Ltd. (China, Interactive Media & Services) | 3.8 | |
| Samsung Electronics Co. Ltd. (Korea (South), Technology Hardware, Storage & Peripherals) | 3.7 | |
| Alibaba Group Holding Ltd. (China, Broadline Retail) | 2.6 | |
| Reliance Industries Ltd. (India, Oil, Gas & Consumable Fuels) | 1.3 | |
| Meituan Class B (China, Hotels, Restaurants & Leisure) | 1.1 | |
| PDD Holdings, Inc. ADR (China, Broadline Retail) | 1.0 | |
| ICICI Bank Ltd. (India, Banks) | 0.9 | |
| Infosys Ltd. (India, IT Services) | 0.8 | |
| China Construction Bank Corp. (H Shares) (China, Banks) | 0.8 | |
| 22.2 | ||
| Market Sectors (% of Fund's net assets) | ||
| Financials | 21.9 | |
| Information Technology | 19.9 | |
| Consumer Discretionary | 12.8 | |
| Communication Services | 8.9 | |
| Materials | 6.7 | |
| Industrials | 6.2 | |
| Consumer Staples | 6.0 | |
| Energy | 5.2 | |
| Health Care | 4.1 | |
| Utilities | 3.0 | |
| Real Estate | 1.6 | |
Asset Allocation (% of Fund's net assets) |
 |
Futures - 3.4% |
Geographic Diversification (% of Fund's net assets) |
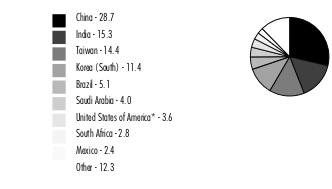 |
* Includes Short-Term investments and Net Other Assets (Liabilities). Percentages are adjusted for the effect of derivatives, if applicable. |
| Common Stocks - 94.3% | |||
| Shares | Value ($) | ||
| Brazil - 3.7% | |||
| Ambev SA | 4,583,100 | 11,690,121 | |
| Atacadao SA | 612,900 | 1,090,437 | |
| B3 SA - Brasil Bolsa Balcao | 5,642,142 | 12,421,833 | |
| Banco Bradesco SA | 1,557,080 | 3,795,609 | |
| Banco BTG Pactual SA unit | 1,143,700 | 6,714,637 | |
| Banco do Brasil SA | 833,400 | 7,992,243 | |
| Banco Santander SA (Brasil) unit | 362,900 | 1,937,674 | |
| BB Seguridade Participacoes SA | 678,800 | 4,141,397 | |
| CCR SA | 979,500 | 2,327,448 | |
| Centrais Eletricas Brasileiras SA (Electrobras) | 1,149,565 | 7,943,838 | |
| Companhia de Saneamento Basico do Estado de Sao Paulo (SABESP) | 332,700 | 3,851,777 | |
| Companhia Siderurgica Nacional SA (CSN) | 642,900 | 1,499,579 | |
| Cosan SA | 1,180,796 | 3,688,707 | |
| CPFL Energia SA (a) | 218,100 | 1,446,574 | |
| Energisa SA unit | 205,800 | 1,902,581 | |
| Eneva SA (a) | 850,800 | 1,825,885 | |
| ENGIE Brasil Energia SA | 200,750 | 1,564,829 | |
| Equatorial Energia SA | 991,980 | 6,217,398 | |
| Hapvida Participacoes e Investimentos SA (a)(b) | 5,117,044 | 3,745,107 | |
| Hypera SA (a) | 368,400 | 2,213,286 | |
| Itausa-Investimentos Itau SA | 73,365 | 124,852 | |
| Klabin SA unit | 734,700 | 3,118,477 | |
| Localiza Rent a Car SA | 873,934 | 8,817,776 | |
| Localiza Rent a Car SA rights 11/10/23 (a) | 6,408 | 8,897 | |
| Lojas Renner SA (a) | 933,498 | 2,269,983 | |
| Magazine Luiza SA (a) | 2,943,224 | 776,415 | |
| Natura & Co. Holding SA | 871,390 | 2,203,644 | |
| Petroleo Brasileiro SA - Petrobras (ON) | 3,589,997 | 26,944,114 | |
| Prio SA (a) | 774,200 | 7,324,707 | |
| Raia Drogasil SA | 1,249,536 | 6,394,214 | |
| Rede D'Oregon Sao Luiz SA (b) | 554,920 | 2,379,604 | |
| Rumo SA | 1,258,300 | 5,568,041 | |
| Sendas Distribuidora SA | 1,309,200 | 2,840,809 | |
| Suzano Papel e Celulose SA | 770,217 | 7,878,235 | |
| Telefonica Brasil SA | 403,500 | 3,620,636 | |
| TIM SA | 820,900 | 2,469,986 | |
| Totvs SA | 508,200 | 2,551,206 | |
| Ultrapar Participacoes SA | 702,600 | 2,849,838 | |
| Vale SA | 3,300,907 | 45,175,303 | |
| Vibra Energia SA (a) | 1,129,491 | 4,433,506 | |
| Weg SA | 1,627,964 | 10,658,817 | |
TOTAL BRAZIL | 236,420,020 | ||
| Chile - 0.4% | |||
| Banco de Chile | 44,087,921 | 4,529,480 | |
| Banco de Credito e Inversiones | 73,972 | 1,768,716 | |
| Banco Santander Chile | 63,959,192 | 2,788,478 | |
| Cencosud SA | 1,251,133 | 2,026,975 | |
| Compania Cervecerias Unidas SA | 125,964 | 716,095 | |
| Compania Sud Americana de Vapores SA | 14,909,355 | 827,927 | |
| Empresas CMPC SA | 1,090,735 | 1,949,917 | |
| Empresas COPEC SA | 378,195 | 2,503,693 | |
| Enel Americas SA (a) | 20,621,719 | 2,119,774 | |
| Enel Chile SA | 26,843,636 | 1,589,623 | |
| Falabella SA | 849,597 | 1,730,045 | |
TOTAL CHILE | 22,550,723 | ||
| China - 28.7% | |||
| 360 Security Technology, Inc. (A Shares) (a) | 415,500 | 510,647 | |
| 37 Interactive Entertainment Network Technology Group Co. Ltd. (A Shares) | 129,000 | 364,965 | |
| 3Peak, Inc. (A Shares) | 6,867 | 151,231 | |
| 3SBio, Inc. (b) | 1,773,500 | 1,577,780 | |
| AAC Technology Holdings, Inc. | 697,500 | 1,255,526 | |
| Accelink Technologies Co. Ltd. (A Shares) | 46,700 | 172,120 | |
| Advanced Micro-Fabrication Equipment, Inc., China (A Shares) | 35,954 | 842,310 | |
| AECC Aero-Engine Control Co. Ltd. (A Shares) | 77,100 | 218,918 | |
| AECC Aviation Power Co. Ltd. | 155,500 | 752,070 | |
| Agricultural Bank of China Ltd.: | |||
| (A Shares) | 4,900,000 | 2,405,101 | |
| (H Shares) | 28,388,000 | 10,485,297 | |
| Aier Eye Hospital Group Co. Ltd. (A Shares) | 542,971 | 1,357,793 | |
| AIMA Technology Group Co. Ltd. | 50,000 | 192,063 | |
| Air China Ltd.: | |||
| (A Shares) (a) | 591,200 | 648,477 | |
| (H Shares) (a) | 1,912,000 | 1,300,750 | |
| Airtac International Group | 136,551 | 4,486,011 | |
| Akeso, Inc. (a)(b) | 489,000 | 2,746,007 | |
| Alibaba Group Holding Ltd. (a) | 15,921,840 | 163,916,602 | |
| Alibaba Health Information Technology Ltd. (a) | 5,250,000 | 3,092,664 | |
| Aluminum Corp. of China Ltd.: | |||
| (A shares) | 826,400 | 700,453 | |
| (H Shares) | 3,714,000 | 1,986,732 | |
| Amlogic Shanghai Co. Ltd. (A Shares) (a) | 24,160 | 198,538 | |
| Angel Yeast Co. Ltd. (A Shares) | 50,800 | 242,943 | |
| Anhui Conch Cement Co. Ltd.: | |||
| (A Shares) | 245,600 | 812,383 | |
| (H Shares) | 1,177,000 | 2,929,194 | |
| Anhui Gujing Distillery Co. Ltd.: | |||
| (A Shares) | 23,200 | 884,389 | |
| (B Shares) | 106,200 | 1,655,279 | |
| Anhui Honglu Steel Construction Group Co. Ltd. | 40,210 | 138,157 | |
| Anhui Jianghuai Automobile Group Corp. Ltd. (A Shares) (a) | 126,900 | 314,554 | |
| Anhui Kouzi Distillery Co. Ltd. (A Shares) | 35,000 | 240,245 | |
| Anhui Yingjia Distillery Co. Ltd. (A Shares) | 38,900 | 407,933 | |
| Anjoy Foods Group Co. Ltd. (A Shares) | 17,000 | 300,319 | |
| Anker Innovations Technology Co. Ltd. (A Shares) | 19,700 | 252,385 | |
| Anta Sports Products Ltd. | 1,236,000 | 13,978,531 | |
| Apeloa Pharmaceutical Co. Ltd. A Shares | 68,300 | 161,010 | |
| Asia - Potash International Investment Guangzhou Co. Ltd. (A Shares) (a) | 54,000 | 210,552 | |
| ASR Microelectronics Co. Ltd. (A Shares) | 24,255 | 216,198 | |
| Asymchem Laboratories Tianjin Co. Ltd. (A Shares) | 19,940 | 411,574 | |
| Autobio Diagnostics Co. Ltd. | 34,300 | 208,449 | |
| Autohome, Inc. ADR Class A | 65,668 | 1,756,619 | |
| Avary Holding Shenzhen Co. Ltd. (A Shares) | 112,300 | 329,144 | |
| AVIC Capital Co. Ltd. (A Shares) | 513,700 | 233,971 | |
| AviChina Industry & Technology Co. Ltd. (H Shares) | 2,412,000 | 1,093,159 | |
| Avicopter PLC (A Shares) | 34,500 | 179,115 | |
| BAIC BluePark New Energy Technology Co. Ltd. (A Shares) (a) | 324,200 | 303,906 | |
| Baidu, Inc. Class A (a) | 2,186,852 | 28,710,762 | |
| Bank of Beijing Co. Ltd. (A Shares) | 1,226,980 | 765,191 | |
| Bank of Changsha Co. Ltd. (A Shares) | 232,500 | 233,599 | |
| Bank of Chengdu Co. Ltd. (A Shares) | 221,400 | 374,262 | |
| Bank of China Ltd.: | |||
| (A Shares) | 1,997,700 | 1,065,067 | |
| (H Shares) | 77,104,000 | 26,935,157 | |
| Bank of Communications Co. Ltd.: | |||
| (A Shares) | 2,212,800 | 1,703,030 | |
| (H Shares) | 8,587,000 | 5,079,261 | |
| Bank of Hangzhou Co. Ltd. (A Shares) | 343,120 | 501,957 | |
| Bank of Jiangsu Co. Ltd. (A Shares) | 901,800 | 850,942 | |
| Bank of Nanjing Co. Ltd. (A Shares) | 599,800 | 642,997 | |
| Bank of Ningbo Co. Ltd. (A Shares) | 384,180 | 1,312,266 | |
| Bank of Shanghai Co. Ltd. (A Shares) | 823,377 | 683,390 | |
| Bank of Suzhou Co. Ltd. | 211,900 | 181,966 | |
| Baoshan Iron & Steel Co. Ltd. (A Shares) | 1,296,800 | 1,109,561 | |
| BeiGene Ltd. (a) | 670,030 | 9,618,871 | |
| Beijing Capital International Airport Co. Ltd. (H Shares) (a) | 1,822,000 | 671,111 | |
| Beijing Dabeinong Technology Group Co. Ltd. (A Shares) (a) | 243,900 | 235,113 | |
| Beijing E-Hualu Information Technology Co. Ltd. (A Shares) (a) | 39,200 | 155,511 | |
| Beijing Easpring Material Technology Co. Ltd. (A Shares) | 29,600 | 178,513 | |
| Beijing Enlight Media Co. Ltd. (A Shares) | 171,500 | 183,430 | |
| Beijing Enterprises Holdings Ltd. | 492,500 | 1,640,942 | |
| Beijing Enterprises Water Group Ltd. | 3,860,000 | 814,481 | |
| Beijing Kingsoft Office Software, Inc. (A Shares) | 26,847 | 1,056,195 | |
| Beijing New Building Materials PLC (A Shares) | 98,200 | 328,397 | |
| Beijing Oriental Yuhong Waterproof Technology Co. Ltd. (A Shares) | 73,000 | 248,565 | |
| Beijing Roborock Technology Co. Ltd. (A Shares) | 7,579 | 327,685 | |
| Beijing Shiji Information Technology Co. Ltd. (A Shares) | 132,196 | 190,718 | |
| Beijing Tiantan Biological Products Corp. Ltd. (A Shares) | 95,800 | 378,038 | |
| Beijing Tongrentang Co. Ltd. (A Shares) | 79,800 | 560,117 | |
| Beijing United Information Technology Co. Ltd. (A Shares) | 42,070 | 216,616 | |
| Beijing Wantai Biological Pharmacy Enterprise Co. Ltd. (A Shares) | 49,207 | 295,152 | |
| Beijing Yanjing Brewery Co. Ltd. (A Shares) | 164,700 | 234,177 | |
| Beijing-Shanghai High Speed Railway Co. Ltd. (A Shares) | 1,905,000 | 1,302,455 | |
| Beiqi Foton Motor Co. Ltd. (A Shares) (a) | 464,900 | 192,733 | |
| Bethel Automotive Safety Systems Co. Ltd. (A Shares) | 23,900 | 247,377 | |
| Betta Pharmaceuticals Co. Ltd. (A Shares) | 24,300 | 202,152 | |
| BGI Genomics Co. Ltd. | 24,100 | 162,174 | |
| Bilibili, Inc. Class Z (a)(c) | 190,452 | 2,555,434 | |
| Bloomage Biotechnology Corp. Ltd. (A Shares) | 28,015 | 292,887 | |
| BOC Aviation Ltd. Class A (b) | 201,700 | 1,240,472 | |
| BOC International China Co. Ltd. | 161,900 | 241,331 | |
| BOE Technology Group Co. Ltd. (A Shares) | 2,183,000 | 1,170,323 | |
| Bosideng International Holdings Ltd. | 3,694,000 | 1,458,500 | |
| BTG Hotels Group Co. Ltd. (a) | 64,500 | 147,280 | |
| By-Health Co. Ltd. (A Shares) | 98,400 | 246,418 | |
| BYD Co. Ltd.: | |||
| (A Shares) | 105,900 | 3,456,217 | |
| (H Shares) | 1,011,000 | 30,744,641 | |
| BYD Electronic International Co. Ltd. | 764,500 | 3,191,417 | |
| C&D International Investment Group Ltd. | 716,674 | 1,612,352 | |
| Caitong Securities Co. Ltd. | 271,490 | 294,788 | |
| Cambricon Technologies Corp. Ltd. (A Shares) (a) | 24,229 | 357,678 | |
| Canmax Technologies Co. Ltd. (A Shares) | 48,320 | 179,746 | |
| CECEP Solar Energy Co. Ltd. (A Shares) | 221,500 | 173,829 | |
| CECEP Wind-Power Corp. (A Shares) | 366,910 | 159,055 | |
| CETC Cyberspace Security Technology Co. Ltd. (A Shares) | 49,100 | 148,055 | |
| CGN Power Co. Ltd. (H Shares) (b) | 10,377,000 | 2,493,672 | |
| Changchun High & New Technology Industry Group, Inc. (A Shares) | 23,500 | 500,271 | |
| Changjiang Securities Co. Ltd. (A Shares) | 323,200 | 251,423 | |
| Changzhou Xingyu Automotive Lighting Systems Co. Ltd. (A Shares) | 16,500 | 329,953 | |
| Chaozhou Three-Circle Group Co. (A Shares) | 111,400 | 470,490 | |
| Chengxin Lithium Group Co. Ltd. (A Shares) | 52,900 | 169,928 | |
| Chifeng Jilong Gold Mining Co. Ltd. (A Shares) (a) | 96,900 | 195,084 | |
| China Baoan Group Co. Ltd. (A Shares) | 150,200 | 212,215 | |
| China Cinda Asset Management Co. Ltd. (H Shares) | 9,218,000 | 896,386 | |
| China CITIC Bank Corp. Ltd.: | |||
| (A Shares) | 32,900 | 24,199 | |
| (H Shares) | 8,594,000 | 3,833,855 | |
| China Coal Energy Co. Ltd. (H Shares) | 1,990,000 | 1,563,079 | |
| China Communications Services Corp. Ltd. (H Shares) | 2,320,000 | 948,941 | |
| China Conch Venture Holdings Ltd. | 1,406,000 | 1,164,412 | |
| China Construction Bank Corp.: | |||
| (A Shares) | 488,800 | 418,890 | |
| (H Shares) | 93,357,000 | 52,798,807 | |
| China CSSC Holdings Ltd. (A Shares) | 259,900 | 919,746 | |
| China Eastern Airlines Corp. Ltd. (A Shares) (a) | 988,700 | 589,314 | |
| China Energy Engineering Corp. Ltd. (A Shares) | 1,897,500 | 565,625 | |
| China Everbright Bank Co. Ltd.: | |||
| (A Shares) | 2,528,700 | 1,026,510 | |
| (H Shares) | 3,323,000 | 947,874 | |
| China Everbright International Ltd. | 3,584,333 | 1,223,607 | |
| China Feihe Ltd. (b) | 3,518,000 | 2,185,987 | |
| China Film Co. Ltd. (A Shares) (a) | 108,300 | 176,973 | |
| China Galaxy Securities Co. Ltd.: | |||
| (A Shares) | 259,800 | 430,869 | |
| (H Shares) | 3,398,500 | 1,739,381 | |
| China Gas Holdings Ltd. | 2,649,000 | 2,381,469 | |
| China Great Wall Securities Co. Ltd. (A Shares) | 236,300 | 269,998 | |
| China Greatwall Technology Group Co. Ltd. (A Shares) | 187,400 | 281,667 | |
| China Hongqiao Group Ltd. | 2,298,000 | 2,151,421 | |
| China Huishan Dairy Holdings Co. Ltd. (a)(d) | 888,000 | 1 | |
| China International Capital Corp. Ltd. | 114,200 | 575,403 | |
| China International Capital Corp. Ltd. (H Shares) (b) | 1,474,800 | 2,348,997 | |
| China Jinmao Holdings Group Ltd. | 5,906,210 | 724,437 | |
| China Jushi Co. Ltd. (A Shares) | 232,104 | 367,412 | |
| China Life Insurance Co. Ltd.: | |||
| (A Shares) | 156,100 | 717,049 | |
| (H Shares) | 7,234,000 | 9,797,721 | |
| China Literature Ltd. (a)(b) | 394,600 | 1,328,809 | |
| China Longyuan Power Grid Corp. Ltd. (H Shares) | 3,255,000 | 2,755,449 | |
| China Medical System Holdings Ltd. | 1,308,000 | 2,091,621 | |
| China Meheco Co. Ltd. (A Shares) | 87,760 | 143,436 | |
| China Meidong Auto Holding Ltd. (c) | 650,000 | 348,589 | |
| China Mengniu Dairy Co. Ltd. | 3,061,000 | 9,994,584 | |
| China Merchants Bank Co. Ltd.: | |||
| (A Shares) | 1,211,000 | 5,095,977 | |
| (H Shares) | 3,770,846 | 14,303,930 | |
| China Merchants Energy Shipping Co. Ltd. (A Shares) | 472,600 | 415,557 | |
| China Merchants Holdings International Co. Ltd. | 1,357,283 | 1,727,733 | |
| China Merchants Securities Co. Ltd. (A Shares) | 434,000 | 839,156 | |
| China Merchants Shekou Industrial Zone Holdings Co. Ltd. (A Shares) | 451,000 | 680,422 | |
| China Minmetals Rare Earth Co. Ltd. (A Shares) | 57,100 | 234,170 | |
| China Minsheng Banking Corp. Ltd.: | |||
| (A Shares) | 2,617,500 | 1,331,147 | |
| (H Shares) | 5,524,040 | 1,836,527 | |
| China National Building Materials Co. Ltd. (H Shares) | 3,756,000 | 1,787,841 | |
| China National Chemical Engineering Co. Ltd. (A Shares) | 355,700 | 340,508 | |
| China National Medicines Corp. Ltd. (A Shares) | 43,900 | 172,780 | |
| China National Nuclear Power Co. Ltd. (A Shares) | 1,097,100 | 1,113,083 | |
| China National Software & Service Co. Ltd. (A Shares) | 49,910 | 234,671 | |
| China Northern Rare Earth Group High-Tech Co. Ltd. | 210,500 | 601,572 | |
| China Oilfield Services Ltd. (H Shares) | 1,754,000 | 2,073,789 | |
| China Overseas Land and Investment Ltd. | 3,715,000 | 7,010,612 | |
| China Overseas Property Holdings Ltd. | 1,275,000 | 1,107,314 | |
| China Pacific Insurance (Group) Co. Ltd. | 393,700 | 1,492,937 | |
| China Pacific Insurance (Group) Co. Ltd. (H Shares) | 2,563,000 | 6,313,618 | |
| China Petroleum & Chemical Corp.: | |||
| (A Shares) | 2,099,700 | 1,568,022 | |
| (H Shares) | 23,629,000 | 12,084,764 | |
| China Power International Development Ltd. | 4,821,563 | 1,873,831 | |
| China Railway Group Ltd.: | |||
| (A Shares) | 1,188,100 | 982,682 | |
| (H Shares) | 4,094,000 | 1,932,222 | |
| China Railway Signal & Communications Corp. (A Shares) | 417,386 | 268,001 | |
| China Resource Gas Group Ltd. | 900,800 | 2,662,879 | |
| China Resources Beer Holdings Co. Ltd. | 1,572,878 | 8,323,147 | |
| China Resources Cement Holdings Ltd. | 2,362,000 | 607,338 | |
| China Resources Land Ltd. | 3,110,744 | 11,643,852 | |
| China Resources Microelectronics Ltd. (A Shares) | 76,694 | 557,784 | |
| China Resources Mixc Lifestyle Services Ltd. (b) | 664,400 | 2,592,103 | |
| China Resources Pharmaceutical Group Ltd. (b) | 1,522,500 | 945,772 | |
| China Resources Power Holdings Co. Ltd. | 1,869,691 | 3,623,258 | |
| China Resources Sanjiu Medical & Pharmaceutical Co. Ltd. (A Shares) | 57,400 | 338,346 | |
| China Ruyi Holdings Ltd. (a)(c) | 5,436,000 | 1,251,784 | |
| China Shenhua Energy Co. Ltd.: | |||
| (A Shares) | 358,700 | 1,485,739 | |
| (H Shares) | 3,308,000 | 10,138,928 | |
| China Southern Airlines Ltd.: | |||
| (A Shares) (a) | 487,000 | 411,202 | |
| (H Shares) (a) | 2,096,000 | 991,803 | |
| China State Construction Engineering Corp. Ltd. (A Shares) | 2,441,780 | 1,728,496 | |
| China State Construction International Holdings Ltd. | 1,957,000 | 2,096,221 | |
| China Taiping Insurance Group Ltd. | 1,393,777 | 1,287,538 | |
| China Three Gorges Renewables Group Co. Ltd. (A Shares) | 1,652,000 | 1,084,282 | |
| China Tourism Group Duty Free Corp. Ltd.: | |||
| (A Shares) | 111,200 | 1,438,538 | |
| (H Shares) (b) | 81,700 | 922,655 | |
| China Tower Corp. Ltd. (H Shares) (b) | 43,022,000 | 4,011,839 | |
| China Traditional Chinese Medicine Holdings Co. Ltd. | 2,928,000 | 1,442,761 | |
| China United Network Communications Ltd. (A Shares) | 1,849,900 | 1,127,641 | |
| China Vanke Co. Ltd.: | |||
| (A Shares) | 594,700 | 920,066 | |
| (H Shares) | 2,091,900 | 1,957,090 | |
| China XD Electric Co. Ltd. (A Shares) | 299,900 | 189,547 | |
| China Yangtze Power Co. Ltd. (A Shares) | 1,433,300 | 4,422,560 | |
| China Zhenhua (Group) Science & Technology Co. Ltd. (A Shares) | 30,200 | 276,340 | |
| China Zheshang Bank Co. Ltd. | 1,248,480 | 435,417 | |
| ChinaSoft International Ltd. | 2,602,000 | 1,887,798 | |
| Chongqing Brewery Co. Ltd. (A Shares) | 28,200 | 302,631 | |
| Chongqing Changan Automobile Co. Ltd. (A Shares) | 481,176 | 995,990 | |
| Chongqing Fuling Zhacai Group Co. Ltd. Group (A Shares) | 67,260 | 142,062 | |
| Chongqing Rural Commercial Bank Co. Ltd.: | |||
| (A Shares) | 459,300 | 266,882 | |
| (H Shares) | 70,000 | 26,501 | |
| Chongqing Taiji Industry Group Co. Ltd. (A Shares) (a) | 32,400 | 185,922 | |
| Chongqing Zhifei Biological Products Co. Ltd. (A Shares) | 139,650 | 1,197,167 | |
| Chow Tai Fook Jewellery Group Ltd. | 1,938,000 | 2,736,697 | |
| CITIC Pacific Ltd. | 5,640,000 | 4,793,654 | |
| CITIC Securities Co. Ltd.: | |||
| (A Shares) | 733,695 | 2,178,338 | |
| (H Shares) | 1,743,425 | 3,392,457 | |
| Cmoc Group Ltd.: | |||
| (A Shares) | 955,900 | 724,935 | |
| (H Shares) | 3,720,000 | 2,218,650 | |
| CNGR Advanced Material Co. Ltd. | 39,100 | 290,912 | |
| CNNC Hua Yuan Titanium Dioxide Co. Ltd. (A Shares) | 225,620 | 146,933 | |
| CNPC Capital Co. Ltd. (A Shares) | 367,300 | 298,011 | |
| Contemporary Amperex Technology Co. Ltd. | 255,880 | 6,498,675 | |
| COSCO Shipping Development Co. Ltd. (A Shares) | 577,600 | 181,587 | |
| COSCO Shipping Energy Transportation Co. Ltd.: | |||
| (A Shares) | 190,200 | 374,888 | |
| (H Shares) | 1,276,000 | 1,353,240 | |
| COSCO SHIPPING Holdings Co. Ltd.: | |||
| (A Shares) (a) | 688,410 | 920,055 | |
| (H Shares) | 3,001,550 | 3,052,688 | |
| Cosco Shipping Ports Ltd. | 1,356,977 | 818,653 | |
| Country Garden Holdings Co. Ltd. (a)(c) | 12,058,958 | 1,078,345 | |
| Country Garden Services Holdings Co. Ltd. (c) | 2,128,000 | 1,858,823 | |
| CRRC Corp. Ltd.: | |||
| (A Shares) | 1,405,800 | 1,026,960 | |
| (H Shares) | 4,249,000 | 1,770,236 | |
| CSC Financial Co. Ltd. (A Shares) | 252,800 | 836,182 | |
| CSPC Pharmaceutical Group Ltd. | 8,655,840 | 7,560,615 | |
| Dajin Heavy Industry Co. Ltd. | 37,600 | 142,451 | |
| Daqin Railway Co. Ltd. (A Shares) | 882,500 | 869,982 | |
| Daqo New Energy Corp. ADR (a) | 56,168 | 1,430,037 | |
| DaShenLin Pharmaceutical Group Co. Ltd. | 66,367 | 216,069 | |
| Datang International Power Generation Co. Ltd. (A Shares) | 586,200 | 207,569 | |
| DHC Software Co. Ltd. (A Shares) | 185,900 | 160,224 | |
| Do-Fluoride New Materials Co. Ltd. (A Shares) | 68,880 | 150,689 | |
| Dong-E-E-Jiao Co. Ltd. (A Shares) | 37,500 | 237,944 | |
| Dongfang Electric Corp. Ltd. (A Shares) | 162,100 | 330,302 | |
| Dongfeng Motor Group Co. Ltd. (H Shares) | 2,548,000 | 1,121,692 | |
| Dongxing Securities Co. Ltd. (A Shares) | 186,800 | 204,324 | |
| Dongyue Group Co. Ltd. | 1,529,000 | 1,217,925 | |
| East Buy Holding Ltd. (a)(b)(c) | 393,500 | 1,605,285 | |
| East Money Information Co. Ltd. (A Shares) | 922,917 | 1,926,130 | |
| Eastroc Beverage Group Co. Ltd. | 15,500 | 407,045 | |
| Ecovacs Robotics Co. Ltd. Class A | 33,200 | 196,029 | |
| ENN Energy Holdings Ltd. | 768,300 | 5,819,985 | |
| ENN Natural Gas Co. Ltd. (A Shares) | 148,100 | 349,591 | |
| Eoptolink Technology, Inc. Ltd. (A Shares) | 41,200 | 177,719 | |
| Eve Energy Co. Ltd. (A shares) | 119,155 | 755,934 | |
| Everbright Securities Co. Ltd. (A Shares) | 228,100 | 513,540 | |
| Everdisplay Optronics Shanghai Co. Ltd. (A Shares) (a) | 677,068 | 242,542 | |
| Fangda Carbon New Material Co. Ltd. (A Shares) (a) | 236,281 | 190,612 | |
| Far East Horizon Ltd. | 1,259,000 | 885,879 | |
| Farasis Energy Gan Zhou Co. Ltd. (A Shares) (a) | 71,061 | 171,184 | |
| FAW Jiefang Group Co. Ltd. (A Shares) (a) | 175,800 | 221,564 | |
| First Capital Securities Co. Ltd. (A Shares) | 246,400 | 197,084 | |
| Flat Glass Group Co. Ltd. (c) | 346,000 | 621,374 | |
| Flat Glass Group Co. Ltd. (A Shares) (a) | 135,000 | 476,831 | |
| Focus Media Information Technology Co. Ltd. (A Shares) | 839,420 | 793,651 | |
| Foshan Haitian Flavouring & Food Co. Ltd. (A Shares) | 269,556 | 1,387,577 | |
| Fosun International Ltd. | 2,387,000 | 1,430,148 | |
| Founder Securities Co. Ltd. (A Shares) | 480,400 | 497,997 | |
| Foxconn Industrial Internet Co. Ltd. (A Shares) | 577,896 | 1,164,618 | |
| Fujian Sunner Development Co. Ltd. A Shares | 72,700 | 178,845 | |
| Fuyao Glass Industries Group Co. Ltd.: | |||
| (A Shares) | 151,500 | 771,023 | |
| (H Shares) (b) | 543,200 | 2,476,499 | |
| G-bits Network Technology Xiamen Co. Ltd. (A Shares) | 4,200 | 152,835 | |
| GalaxyCore, Inc. (A Shares) | 96,916 | 244,043 | |
| Ganfeng Lithium Group Co. Ltd.: | |||
| (A Shares) | 113,500 | 687,806 | |
| (H Shares) (b) | 365,640 | 1,313,297 | |
| GCL Technology Holdings Ltd. | 19,626,000 | 2,890,277 | |
| GD Power Development Co. Ltd. (A Shares) | 1,019,500 | 507,258 | |
| GDS Holdings Ltd. Class A (a) | 923,292 | 1,176,221 | |
| Geely Automobile Holdings Ltd. | 5,850,000 | 6,641,651 | |
| GEM Co. Ltd. (A Shares) | 301,000 | 241,238 | |
| Gemdale Corp. (A Shares) | 263,100 | 185,709 | |
| Genscript Biotech Corp. (a) | 1,130,000 | 3,285,099 | |
| GF Securities Co. Ltd.: | |||
| (A Shares) | 318,000 | 645,224 | |
| (H Shares) | 1,029,400 | 1,340,240 | |
| Giant Network Group Co. Ltd. (A Shares) | 116,500 | 188,145 | |
| Gigadevice Semiconductor Beijing, Inc. (A Shares) | 38,684 | 566,689 | |
| Ginlong Technologies Co. Ltd. (A Shares) | 23,150 | 212,430 | |
| GoerTek, Inc. (A Shares) | 198,800 | 490,899 | |
| Goldwind Science & Technology Co. Ltd. (A Shares) | 202,900 | 244,018 | |
| Gongniu Group Co. Ltd. (A Shares) | 26,000 | 375,829 | |
| GoodWe Technologies Co. Ltd. (A Shares) | 10,129 | 161,817 | |
| Gotion High-tech Co. Ltd. (A Shares) (a) | 104,000 | 323,842 | |
| Great Wall Motor Co. Ltd.: | |||
| (A Shares) | 141,200 | 567,401 | |
| (H Shares) | 2,255,000 | 3,152,249 | |
| Gree Electric Appliances, Inc. of Zhuhai (A Shares) | 163,900 | 760,347 | |
| Greenland Holdings Corp. Ltd. (A Shares) (a) | 684,100 | 238,457 | |
| Greentown China Holdings Ltd. | 983,000 | 953,649 | |
| GRG Banking Equipment Co. Ltd. (A Shares) | 144,100 | 229,998 | |
| Guangdong Haid Group Co. Ltd. (A Shares) | 96,700 | 595,386 | |
| Guangdong HEC Technology Holding Co. Ltd. (A Shares) (a) | 177,700 | 172,894 | |
| Guangdong Investment Ltd. | 2,870,000 | 1,958,437 | |
| Guanghui Energy Co. Ltd. (A Shares) | 381,500 | 391,728 | |
| Guangzhou Automobile Group Co. Ltd. | 316,900 | 434,388 | |
| Guangzhou Automobile Group Co. Ltd. (H Shares) | 2,762,000 | 1,293,992 | |
| Guangzhou Baiyun International Airport Co. Ltd. (A Shares) (a) | 136,900 | 198,223 | |
| Guangzhou Baiyunshan Pharma Health (A Shares) | 81,900 | 333,742 | |
| Guangzhou Great Power Energy & Technology Co. Ltd. (A Shares) | 27,100 | 114,276 | |
| Guangzhou Haige Communications Group (A Shares) | 133,100 | 211,408 | |
| Guangzhou Kingmed Diagnostics Group Co. Ltd. (A Shares) | 27,200 | 230,236 | |
| Guangzhou Shiyuan Electronic Technology Co. Ltd. (A Shares) | 40,700 | 233,833 | |
| Guangzhou Tinci Materials Technology Co. Ltd. (A Shares) | 111,900 | 425,828 | |
| Guangzhou Yuexiu Financial Holdings Group Co. Ltd. (A Shares) | 239,517 | 214,927 | |
| Guolian Securities Co. Ltd. (a) | 139,500 | 205,148 | |
| Guosen Securities Co. Ltd. (A Shares) | 374,400 | 491,886 | |
| Guotai Junan Securities Co. Ltd. (A Shares) | 438,900 | 886,641 | |
| Guoyuan Securities Co. Ltd. (A Shares) | 254,110 | 240,531 | |
| H World Group Ltd. ADR (a) | 200,849 | 7,563,973 | |
| Haidilao International Holding Ltd. (b) | 1,621,000 | 4,058,670 | |
| Haier Smart Home Co. Ltd. | 2,377,000 | 6,779,986 | |
| Haier Smart Home Co. Ltd. (A Shares) | 347,700 | 1,056,658 | |
| Hainan Airlines Co. Ltd. (A Shares) (a) | 2,494,700 | 498,040 | |
| Hainan Airport Infrastructure Co. Ltd. (A Shares) (a) | 670,700 | 349,436 | |
| Haitian International Holdings Ltd. | 618,000 | 1,474,291 | |
| Haitong Securities Co. Ltd.: | |||
| (A Shares) | 477,900 | 638,415 | |
| (H Shares) | 2,836,800 | 1,628,851 | |
| Hanergy Mobile Energy Holding (a)(d) | 1,618,000 | 2 | |
| Hangzhou Binjiang Real Estate Group Co. Ltd. (A Shares) | 181,700 | 208,005 | |
| Hangzhou Chang Chuan Technology Co. Ltd. | 35,400 | 197,722 | |
| Hangzhou First Applied Material Co. Ltd. (A Shares) | 108,384 | 378,767 | |
| Hangzhou GreatStar Industrial Co. Ltd. (A Shares) (a) | 69,800 | 189,147 | |
| Hangzhou Lion Electronics Co. Ltd. (A Shares) | 39,300 | 172,918 | |
| Hangzhou Oxygen Plant Group Co. Ltd. (A Shares) | 57,200 | 258,204 | |
| Hangzhou Robam Appliances Co. Ltd. (A Shares) | 55,100 | 173,871 | |
| Hangzhou Silan Microelectronics Co. Ltd. (A Shares) | 82,200 | 272,990 | |
| Hangzhou Tigermed Consulting Co. Ltd.: | |||
| (A Shares) | 20,300 | 185,243 | |
| (H Shares) (b) | 2,300 | 12,924 | |
| Hansoh Pharmaceutical Group Co. Ltd. (b) | 1,150,000 | 2,163,717 | |
| Haohua Chemical Science & Technology Co. Ltd. (A Shares) | 44,100 | 185,402 | |
| Hebei Hengshui Laobaigan Liquor Co. Ltd. | 53,400 | 173,702 | |
| Hebei Yangyuan Zhihui Beverage Co. Ltd. (A Shares) | 74,200 | 252,511 | |
| Heilongjiang Agriculture Co. Ltd. (A Shares) | 103,300 | 179,913 | |
| Henan Shenhuo Coal & Power Co. Ltd. (A Shares) | 131,700 | 296,108 | |
| Henan Shuanghui Investment & Development Co. Ltd. (A Shares) | 202,623 | 725,382 | |
| Hengan International Group Co. Ltd. | 619,500 | 2,074,890 | |
| Hengdian Group DMEGC Magnetics Co. Ltd. (A Shares) | 94,300 | 187,797 | |
| Hengli Petrochemical Co. Ltd. (A Shares) (a) | 410,040 | 821,597 | |
| Hengtong Optic-electric Co. Ltd. (A Shares) | 144,200 | 260,051 | |
| Hengyi Petrochemical Co. Ltd. (A Shares) (a) | 214,220 | 210,634 | |
| Hesteel Co. Ltd. (A Shares) | 609,200 | 186,554 | |
| Hisense Electric Co. Ltd. | 76,100 | 242,231 | |
| Hithink RoyalFlush Information Network Co. Ltd. (A Shares) | 31,200 | 599,347 | |
| Hongfa Technology Co. Ltd. (A Shares) | 30,640 | 121,609 | |
| Hoshine Silicon Industry Co. Ltd. (A Shares) | 46,000 | 360,010 | |
| Hoymiles Power Electronics, Inc. (A Shares) | 4,727 | 144,789 | |
| Hoyuan Green Energy Co. Ltd. (A Shares) | 33,075 | 168,934 | |
| Hua Hong Semiconductor Ltd. (a)(b) | 571,000 | 1,405,850 | |
| Huadian Power International Corp. Ltd. (A Shares) | 497,600 | 333,769 | |
| Huadong Medicine Co. Ltd. (A Shares) | 102,080 | 599,840 | |
| Huafon Chemical Co. Ltd. (A Shares) | 288,000 | 285,639 | |
| Huagong Tech Co. Ltd. (A Shares) | 58,600 | 226,500 | |
| Huaibei Mining Holdings Co. Ltd. (A Shares) | 145,200 | 291,105 | |
| Hualan Biological Engineer, Inc. (A Shares) | 106,060 | 340,358 | |
| Huaneng Power International, Inc.: | |||
| (A Shares) (a) | 508,400 | 528,977 | |
| (H Shares) (a) | 4,166,000 | 1,949,489 | |
| Huatai Securities Co. Ltd.: | |||
| (A Shares) | 337,900 | 740,689 | |
| (H Shares) (b) | 1,404,000 | 1,838,120 | |
| HUAXI Securities Co. Ltd. | 153,400 | 166,246 | |
| Huaxia Bank Co. Ltd. (A Shares) | 769,500 | 589,221 | |
| Huayu Automotive Systems Co. Ltd. (A Shares) | 182,600 | 438,017 | |
| Hubei Feilihua Quartz Glass Co. Ltd. (A Shares) | 30,200 | 163,546 | |
| Hubei Jumpcan Pharmaceutical Co. Ltd. (A Shares) | 53,600 | 198,617 | |
| Hubei Xingfa Chemicals Group Co. Ltd. (A Shares) | 64,600 | 173,571 | |
| Huizhou Desay SV Automotive Co. Ltd. | 32,300 | 554,583 | |
| Humanwell Healthcare Group Co. Ltd. (A Shares) | 95,100 | 304,103 | |
| Hunan Changyuan Lico Co. Ltd. (A Shares) | 111,693 | 130,225 | |
| Hunan Valin Steel Co. Ltd. (A Shares) | 402,100 | 320,422 | |
| Hundsun Technologies, Inc. (A Shares) | 110,452 | 470,437 | |
| Hygeia Healthcare Holdings Co. (b) | 336,800 | 2,033,622 | |
| iFlytek Co. Ltd. (A Shares) | 134,800 | 841,008 | |
| IMEIK Technology Development Co. Ltd. (A Shares) | 12,600 | 568,188 | |
| Industrial & Commercial Bank of China Ltd.: | |||
| (A Shares) | 3,941,700 | 2,549,396 | |
| (H Shares) | 62,692,000 | 30,044,813 | |
| Industrial Bank Co. Ltd. (A Shares) | 1,207,800 | 2,490,909 | |
| Industrial Securities Co. Ltd. (A Shares) | 505,510 | 431,397 | |
| Ingenic Semiconductor Co. Ltd. (A Shares) | 27,900 | 281,821 | |
| Inner Mongoli Yili Industries Co. Ltd. (A Shares) | 371,300 | 1,392,237 | |
| Inner Mongolia Baotou Steel Union Co. Ltd. (A Shares) (a) | 2,651,800 | 587,630 | |
| Inner Mongolia Dian Tou Energy Corp. Ltd. | 129,800 | 241,512 | |
| Inner Mongolia Junzheng Energy & Chemical Industry Group Co. Ltd. (A Shares) | 489,000 | 267,466 | |
| Inner Mongolia Yitai Coal Co. Ltd. (B Shares) (a) | 1,029,304 | 1,412,689 | |
| Inner Mongolia Yuan Xing Energy Co. Ltd. (A Shares) | 211,500 | 196,771 | |
| Innovent Biologics, Inc. (a)(b)(c) | 1,121,000 | 6,606,236 | |
| Inspur Electronic Information Industry Co. Ltd. (A Shares) | 85,696 | 347,335 | |
| iQIYI, Inc. ADR (a) | 430,317 | 2,005,277 | |
| iRay Technology Co. Ltd. (A Shares) | 5,836 | 179,839 | |
| iSoftStone Information Technology Group Co. Ltd. (A Shares) | 56,200 | 274,869 | |
| JA Solar Technology Co. Ltd. (A Shares) | 192,272 | 589,131 | |
| Jason Furniture Hangzhou Co. Ltd. (A Shares) | 47,810 | 242,066 | |
| JCET Group Co. Ltd. (A Shares) | 103,900 | 438,573 | |
| JD Health International, Inc. (a)(b) | 1,079,150 | 4,901,801 | |
| JD Logistics, Inc. (a)(b) | 1,920,300 | 2,273,820 | |
| JD.com, Inc. Class A | 2,275,807 | 28,932,704 | |
| Jiangsu Eastern Shenghong Co. Ltd. | 385,500 | 560,910 | |
| Jiangsu Expressway Co. Ltd. (H Shares) | 1,186,000 | 1,078,243 | |
| Jiangsu Hengli Hydraulic Co. Ltd. | 77,776 | 598,693 | |
| Jiangsu Hengrui Medicine Co. Ltd. (A Shares) | 371,175 | 2,430,985 | |
| Jiangsu King's Luck Brewery JSC Ltd. (A Shares) | 73,300 | 586,185 | |
| Jiangsu Nhwa Pharmaceutical Co. Ltd. (A Shares) | 58,600 | 210,643 | |
| Jiangsu Pacific Quartz Co. Ltd. (A Shares) | 21,000 | 264,058 | |
| Jiangsu Phoenix Publishing & Media Corp. Ltd. | 147,700 | 194,039 | |
| Jiangsu Yanghe Brewery JSC Ltd. (A Shares) | 87,900 | 1,466,033 | |
| Jiangsu Yangnong Chemical Co. Ltd. (A Shares) | 23,560 | 217,556 | |
| Jiangsu Yoke Technology Co. Ltd. (A Shares) | 27,600 | 217,964 | |
| Jiangsu Yuyue Medical Equipment & Supply Co. Ltd. (A Shares) | 58,900 | 270,907 | |
| Jiangsu Zhongtian Technology Co. Ltd. (A Shares) | 198,800 | 380,823 | |
| Jiangxi Copper Co. Ltd.: | |||
| (A Shares) | 120,500 | 302,076 | |
| (H Shares) | 1,079,000 | 1,525,659 | |
| Jiangxi Special Electric Motor Co. Ltd. (A Shares) (a) | 99,400 | 162,763 | |
| Jinduicheng Molybdenum Co. Ltd. (A Shares) | 187,800 | 257,840 | |
| Jinko Solar Co. Ltd. (A Shares) | 387,615 | 502,972 | |
| JiuGui Liquor Co. Ltd. (A Shares) | 19,000 | 198,525 | |
| Jiumaojiu International Holdings Ltd. (b) | 916,000 | 996,716 | |
| Jizhong Energy Resources Co. Ltd. (A Shares) | 204,600 | 179,624 | |
| Joincare Pharmaceutical Group Industry Co. Ltd. (A Shares) | 111,000 | 179,920 | |
| Jointown Pharmaceutical Group (A Shares) | 229,546 | 223,424 | |
| Jonjee Hi-Tech Industrial & Commercial Holding Co. Ltd. (A Shares) (a) | 45,700 | 209,954 | |
| JOYY, Inc. ADR | 43,505 | 1,693,215 | |
| Juewei Food Co. Ltd. | 36,700 | 177,236 | |
| Juneyao Airlines Co. Ltd. (A shares) (a) | 127,800 | 254,867 | |
| Kangmei Pharmaceutical Co. Ltd. rights (a)(d) | 10,350 | 0 | |
| Kanzhun Ltd. ADR (a) | 212,216 | 3,140,797 | |
| KE Holdings, Inc. ADR | 638,613 | 9,393,997 | |
| Keda Industrial Group Co. Ltd. | 110,400 | 164,450 | |
| Kingboard Chemical Holdings Ltd. | 644,500 | 1,569,536 | |
| Kingdee International Software Group Co. Ltd. (a) | 2,696,000 | 3,577,237 | |
| Kingnet Network Co. Ltd. (A Shares) | 125,100 | 184,599 | |
| Kingsoft Corp. Ltd. | 926,800 | 3,234,049 | |
| Kuaishou Technology Class B (a)(b) | 2,249,900 | 14,489,011 | |
| Kuang-Chi Technologies Co. Ltd. (A Shares) | 126,700 | 242,383 | |
| Kunlun Energy Co. Ltd. | 3,794,000 | 3,160,796 | |
| Kunlun Tech Co. Ltd. (A Shares) (a) | 69,600 | 299,574 | |
| Kweichow Moutai Co. Ltd. (A Shares) | 73,100 | 16,838,894 | |
| Lb Group Co. Ltd. (A Shares) | 139,073 | 354,024 | |
| Lenovo Group Ltd. | 7,058,000 | 8,213,621 | |
| Lens Technology Co. Ltd. (A Shares) | 289,500 | 517,285 | |
| Lepu Medical Technology Beijing Co. Ltd. (A Shares) | 109,800 | 258,622 | |
| Li Auto, Inc. Class A (a) | 1,089,648 | 18,429,902 | |
| Li Ning Co. Ltd. | 2,299,500 | 7,046,597 | |
| Liaoning Port Co. Ltd. (A Shares) | 1,097,200 | 226,440 | |
| Lingyi iTech Guangdong Co. (A Shares) | 407,800 | 339,044 | |
| Livzon Pharmaceutical Group, Inc. (A Shares) | 36,400 | 174,256 | |
| Longfor Properties Co. Ltd. (b) | 1,845,060 | 2,685,967 | |
| LONGi Green Energy Technology Co. Ltd. | 440,948 | 1,455,741 | |
| Lufax Holding Ltd. ADR | 666,346 | 636,227 | |
| Luxi Chemical Group Co. Ltd. | 112,000 | 173,880 | |
| Luxshare Precision Industry Co. Ltd. (A Shares) | 414,928 | 1,863,483 | |
| Luzhou Laojiao Co. Ltd. (A Shares) | 85,700 | 2,510,626 | |
| Mango Excellent Media Co. Ltd. (A Shares) | 108,707 | 375,822 | |
| Maxscend Microelectronics Co. Ltd. (A Shares) | 31,076 | 641,265 | |
| Meihua Holdings Group Co. Ltd. (A Shares) | 172,000 | 223,433 | |
| Meinian Onehealth Healthcare Holdings Co. Ltd. (A Shares) (a) | 230,060 | 193,986 | |
| Meituan Class B (a)(b) | 4,919,620 | 69,735,683 | |
| Metallurgical Corp. China Ltd. (A Shares) | 1,039,800 | 470,596 | |
| Microport Scientific Corp. (a) | 800,800 | 1,261,877 | |
| Ming Yang Smart Energy Group Ltd. (A Shares) | 133,100 | 254,488 | |
| MINISO Group Holding Ltd. ADR | 91,891 | 2,325,761 | |
| Minth Group Ltd. | 730,000 | 1,629,527 | |
| Montage Technology Co. Ltd. (A Shares) | 66,088 | 498,311 | |
| Muyuan Foodstuff Co. Ltd. (A Shares) | 318,440 | 1,642,498 | |
| Nanjing King-Friend Biochemical Pharmaceutical Co. Ltd. | 93,835 | 162,310 | |
| Nanjing Securities Co. Ltd. (A Shares) | 216,300 | 237,867 | |
| NARI Technology Co. Ltd. (A Shares) | 468,094 | 1,445,568 | |
| National Silicon Industry Group Co. Ltd. (A Shares) (a) | 158,762 | 394,040 | |
| NAURA Technology Group Co. Ltd. | 30,900 | 1,083,933 | |
| NavInfo Co. Ltd. (A Shares) (a) | 137,700 | 188,381 | |
| NetEase, Inc. | 1,876,050 | 40,150,379 | |
| New China Life Insurance Co. Ltd. | 108,900 | 497,775 | |
| New China Life Insurance Co. Ltd. (H Shares) | 834,500 | 1,830,610 | |
| New Hope Liuhe Co. Ltd. (A Shares) (a) | 266,300 | 369,625 | |
| New Oriental Education & Technology Group, Inc. (a) | 1,458,710 | 9,510,844 | |
| Ninestar Corp. (A Shares) | 82,100 | 275,453 | |
| Ningbo Deye Technology Co. Ltd. (A Shares) | 25,020 | 236,759 | |
| Ningbo Joyson Electronic Corp. (A shares) | 81,800 | 210,971 | |
| Ningbo Orient Wires & Cables Co. Ltd. (A Shares) | 40,200 | 231,501 | |
| Ningbo Ronbay New Energy Technology Co. Ltd. (A Shares) | 26,422 | 160,087 | |
| Ningbo Shanshan Co. Ltd. (A Shares) | 131,400 | 251,592 | |
| Ningbo Tuopu Group Co. Ltd. (A Shares) | 64,100 | 566,308 | |
| Ningxia Baofeng Energy Group Co. Ltd. | 426,800 | 841,706 | |
| NIO, Inc. sponsored ADR (a)(c) | 1,343,216 | 9,805,477 | |
| Nongfu Spring Co. Ltd. (H Shares) (b) | 1,709,200 | 9,735,164 | |
| North Industries Group Red Arrow Co. Ltd. (A Shares) | 79,000 | 154,064 | |
| Offcn Education Technology Co. A Shares (a) | 358,800 | 193,840 | |
| Offshore Oil Enginering Co. Ltd. (A Shares) | 254,700 | 216,436 | |
| Oppein Home Group, Inc. (A Shares) | 29,560 | 351,816 | |
| Orient Securities Co. Ltd. (A Shares) | 435,308 | 516,371 | |
| Oriental Pearl Group Co. Ltd. | 197,300 | 199,193 | |
| Ovctek China, Inc. (A Shares) | 52,220 | 180,112 | |
| Pangang Group Vanadium Titanium & Resources Co. Ltd. (A Shares) (a) | 541,000 | 258,385 | |
| PDD Holdings, Inc. ADR (a) | 579,703 | 58,793,478 | |
| People's Insurance Co. of China Group Ltd.: | |||
| (A Shares) | 514,500 | 375,659 | |
| (H Shares) | 8,551,000 | 2,821,484 | |
| People.cn Co. Ltd. (A Shares) | 64,300 | 285,128 | |
| Perfect World Co. Ltd. (A Shares) | 112,700 | 185,017 | |
| PetroChina Co. Ltd.: | |||
| (A Shares) | 1,231,400 | 1,199,745 | |
| (H Shares) | 20,496,000 | 13,378,060 | |
| Pharmaron Beijing Co. Ltd.: | |||
| (A Shares) | 81,625 | 371,271 | |
| (H Shares) (b) | 8,075 | 19,276 | |
| PICC Property & Casualty Co. Ltd. (H Shares) | 6,689,840 | 7,639,498 | |
| Ping An Bank Co. Ltd. (A Shares) | 1,127,400 | 1,612,848 | |
| Ping An Healthcare and Technology Co. Ltd. (a)(b)(c) | 542,400 | 1,267,008 | |
| Ping An Insurance Group Co. of China Ltd.: | |||
| (A Shares) | 637,694 | 3,963,058 | |
| (H Shares) | 6,486,000 | 32,900,084 | |
| Piotech, Inc. (A Shares) | 10,623 | 367,104 | |
| Poly Developments & Holdings (A Shares) | 697,600 | 1,050,084 | |
| Pop Mart International Group Ltd. (b) | 460,200 | 1,270,388 | |
| Postal Savings Bank of China Co. Ltd. | 1,580,200 | 987,281 | |
| Postal Savings Bank of China Co. Ltd. (H Shares) (b) | 7,858,000 | 3,586,621 | |
| Power Construction Corp. of China Ltd. (A Shares) | 1,003,900 | 722,014 | |
| Pylon Technologies Co. Ltd. (Series A) | 10,354 | 161,244 | |
| Qi An Xin Technology Group, Inc. (A Shares) (a) | 39,804 | 251,123 | |
| Qifu Technology, Inc. ADR | 109,532 | 1,619,978 | |
| Qinghai Salt Lake Potash Co. Ltd. Class A (a) | 315,700 | 731,053 | |
| Raytron Technology Co. Ltd. (A Shares) | 26,014 | 167,554 | |
| Risen Energy Co. Ltd. (A Shares) | 66,800 | 162,238 | |
| Riyue Heavy Industry Co. Ltd. (A Shares) | 58,500 | 112,584 | |
| Rockchip Electronics Co. Ltd. | 20,200 | 180,023 | |
| Rongsheng Petrochemical Co. Ltd. (A Shares) | 589,400 | 918,179 | |
| SAIC Motor Corp. Ltd. (A Shares) | 453,100 | 899,802 | |
| Sailun Group Co. Ltd. A Shares | 178,200 | 273,679 | |
| Sanan Optoelectronics Co. Ltd. (A Shares) | 290,100 | 590,549 | |
| Sangfor Technologies, Inc. (a) | 24,200 | 277,670 | |
| Sany Heavy Equipment International Holdings Co. Ltd. | 1,079,000 | 1,417,393 | |
| Sany Heavy Industry Co. Ltd. (A Shares) | 492,600 | 974,198 | |
| Satellite Chemical Co. Ltd. (A Shares) | 196,456 | 436,716 | |
| SDIC Capital Co. Ltd. | 375,100 | 350,509 | |
| SDIC Power Holdings Co. Ltd. (A Shares) | 431,500 | 719,883 | |
| Seazen Holdings Co. Ltd. (A Shares) (a) | 131,800 | 214,070 | |
| Seres Group Co. Ltd. (A Shares) (a) | 88,100 | 983,493 | |
| SF Holding Co. Ltd. (A Shares) | 284,600 | 1,527,297 | |
| SG Micro Corp. (A Shares) | 27,175 | 333,285 | |
| Shaanxi Coal Industry Co. Ltd. (A Shares) | 563,800 | 1,390,246 | |
| Shan Xi Hua Yang Group New Energy Co. Ltd. | 209,600 | 231,171 | |
| Shandong Buchang Pharmaceuticals Co. Ltd. (A Shares) | 64,043 | 151,857 | |
| Shandong Gold Mining Co. Ltd.: | |||
| (A Shares) | 361,484 | 1,173,935 | |
| (H Shares) (b) | 404,750 | 758,270 | |
| Shandong Himile Mechanical Science & Technology Co. Ltd. (A Shares) | 46,200 | 203,142 | |
| Shandong Hualu Hengsheng Chemical Co. Ltd. (A Shares) | 123,420 | 542,922 | |
| Shandong Linglong Tyre Co. Ltd. (A Shares) | 85,400 | 233,788 | |
| Shandong Nanshan Aluminum Co. Ltd. (A Shares) | 685,000 | 290,344 | |
| Shandong Sun Paper Industry JSC Ltd. (A Shares) | 162,200 | 275,748 | |
| Shandong Weigao Medical Polymer Co. Ltd. (H Shares) | 2,412,800 | 2,239,541 | |
| Shanghai Aiko Solar Energy Co. Ltd. (A Shares) | 106,140 | 284,464 | |
| Shanghai Bairun Investment Holding Group Co. Ltd. (A Shares) | 61,340 | 220,833 | |
| Shanghai Baosight Software Co. Ltd. | 589,084 | 1,211,530 | |
| Shanghai Baosight Software Co. Ltd. (A Shares) | 103,388 | 602,996 | |
| Shanghai Construction Group Co. Ltd. (A Shares) | 522,300 | 187,850 | |
| Shanghai Electric Group Co. Ltd. (A Shares) (a) | 738,700 | 448,509 | |
| Shanghai Electric Power Co. Ltd. (A Shares) | 159,700 | 190,800 | |
| Shanghai Fosun Pharmaceutical (Group) Co. Ltd.: | |||
| (A Shares) | 111,400 | 433,325 | |
| (H Shares) | 502,000 | 1,158,341 | |
| Shanghai Friendess Electronic Technology Corp. Ltd. (A Shares) | 8,599 | 284,145 | |
| Shanghai Fudan Microelectronics Group Co. Ltd.: | |||
| (A Shares) | 13,725 | 90,894 | |
| (H Shares) (c) | 56,000 | 105,853 | |
| Shanghai International Airport Co. Ltd. (A Shares) (a) | 72,500 | 368,897 | |
| Shanghai International Port Group Co. Ltd. (A Shares) | 408,900 | 279,531 | |
| Shanghai Jinjiang International Hotels Co. Ltd. (A Shares) | 53,000 | 238,009 | |
| Shanghai Junshi Biosciences Co. Ltd. (A Shares) (a) | 44,569 | 279,530 | |
| Shanghai Lingang Holdings Corp. Ltd. (A Shares) | 140,960 | 206,782 | |
| Shanghai M&G Stationery, Inc. (A Shares) | 54,100 | 286,680 | |
| Shanghai Moons' Electric Co. Ltd. (A Shares) | 24,400 | 219,966 | |
| Shanghai Pharmaceuticals Holding Co. Ltd.: | |||
| (A Shares) | 153,600 | 378,525 | |
| (H Shares) | 727,000 | 1,057,640 | |
| Shanghai Pudong Development Bank Co. Ltd. (A Shares) | 1,705,800 | 1,590,740 | |
| Shanghai Putailai New Energy Technology Co. Ltd. | 117,164 | 400,871 | |
| Shanghai RAAS Blood Products Co. Ltd. (A Shares) | 391,900 | 374,318 | |
| Shanghai Rural Commercial Bank Co. Ltd. (A Shares) | 558,000 | 454,683 | |
| Shanghai Yuyuan Tourist Mart Group Co. Ltd. | 224,800 | 199,740 | |
| Shanxi Coal International Energy Group Co. Ltd. (A Shares) | 115,000 | 256,296 | |
| Shanxi Lu'an Environmental Energy Development Co. Ltd. (A Shares) | 173,800 | 452,239 | |
| Shanxi Meijin Energy Co. Ltd. (A Shares) (a) | 253,300 | 242,916 | |
| Shanxi Securities Co. Ltd. (A Shares) | 209,930 | 161,276 | |
| Shanxi Taigang Stainless Steel Co. Ltd. (A Shares) | 333,800 | 178,468 | |
| Shanxi Xinghuacun Fen Wine Factory Co. Ltd. (A Shares) | 71,040 | 2,399,942 | |
| Shanxi Xishan Coal & Electricity Power Co. Ltd. (A Shares) | 330,160 | 390,580 | |
| Shede Spirits Co. Ltd. (A Shares) | 19,500 | 307,088 | |
| Shenergy Co. Ltd. (A Shares) | 278,700 | 224,448 | |
| Shenghe Resources Holding Co. Ltd. (A Shares) | 102,300 | 149,585 | |
| Shengyi Technology Co. Ltd. | 137,500 | 330,687 | |
| Shennan Circuits Co. Ltd. (A Shares) | 29,840 | 283,918 | |
| Shenwan Hongyuan Group Co. Ltd. (A Shares) | 1,314,800 | 789,024 | |
| Shenzhen Capchem Technology Co. Ltd. (A Shares) | 43,380 | 261,821 | |
| Shenzhen Dynanonic Co. Ltd. (A Shares) | 16,140 | 173,624 | |
| Shenzhen Energy Group Co. Ltd. (A Shares) | 270,060 | 228,123 | |
| Shenzhen Inovance Technology Co. Ltd. (A Shares) | 77,150 | 637,862 | |
| Shenzhen International Holdings Ltd. | 1,392,336 | 917,722 | |
| Shenzhen Kaifa Technology Co. Ltd. (A Shares) | 90,800 | 213,630 | |
| Shenzhen Kangtai Biological Products Co. Ltd. | 65,000 | 269,573 | |
| Shenzhen Kedali Industry Co. Ltd. | 15,600 | 193,797 | |
| Shenzhen Kstar Science & Technology Co. Ltd. (A Shares) | 34,200 | 122,012 | |
| Shenzhen Mindray Bio-Medical Electronics Co. Ltd. (A Shares) (a) | 70,600 | 2,759,996 | |
| Shenzhen New Industries Biomedical Engineering Co. Ltd. | 45,800 | 430,825 | |
| Shenzhen Overseas Chinese Town Co. Ltd. (A Shares) (a) | 478,200 | 236,373 | |
| Shenzhen Salubris Pharmaceuticals Co. Ltd. (A Shares) | 64,800 | 288,522 | |
| Shenzhen SC New Energy Technology Corp. (A Shares) | 20,200 | 201,661 | |
| Shenzhen Sed Industry Co. Ltd. (A Shares) | 66,200 | 173,469 | |
| Shenzhen Senior Technology Material Co. Ltd. (A Shares) | 73,938 | 155,352 | |
| Shenzhen Sunlord Electronics Co. Ltd. (A Shares) | 47,300 | 188,830 | |
| Shenzhen Transsion Holdings Co. Ltd. (A Shares) (a) | 46,766 | 859,582 | |
| Shenzhen YUTO Packaging Technology Co. Ltd. (A Shares) | 54,400 | 195,322 | |
| Shenzhou International Group Holdings Ltd. | 801,600 | 7,873,694 | |
| Shijiazhuang Yiling Pharmaceutical Co. Ltd. (A Shares) | 96,960 | 294,615 | |
| Shuangliang Eco-Energy Systems Ltd. (A Shares) | 108,100 | 138,382 | |
| Sichuan Chuantou Energy Co. Ltd. (A Shares) | 255,900 | 514,687 | |
| Sichuan Hebang Biotechnology Co. Ltd. (A Shares) | 509,400 | 165,823 | |
| Sichuan Kelun Pharmaceutical Co. Ltd. (A Shares) | 86,000 | 323,091 | |
| Sichuan New Energy Power Co. Ltd. (A Shares) (a) | 84,900 | 136,039 | |
| Sichuan Road & Bridge (Group) Co. Ltd. (A Shares) | 423,400 | 446,309 | |
| Sichuan Swellfun Co. Ltd. (A Shares) | 28,500 | 238,223 | |
| Sichuan Yahua Industrial Group Co. Ltd. (A Shares) | 65,300 | 125,795 | |
| Sieyuan Electric Co. Ltd. (A Shares) | 45,000 | 303,353 | |
| Silergy Corp. | 315,000 | 2,813,251 | |
| Sinolink Securities Co. Ltd. (A Shares) | 217,100 | 271,354 | |
| Sinoma International Engineering Co. Ltd. (A Shares) | 153,700 | 207,300 | |
| Sinoma Science & Technology Co. Ltd. (A Shares) | 97,500 | 230,543 | |
| Sinomine Resource Group Co. Ltd. (A Shares) | 41,780 | 213,637 | |
| Sinopec Shanghai Petrochemical Co. Ltd. (A Shares) (a) | 418,700 | 171,297 | |
| Sinopharm Group Co. Ltd. (H Shares) | 1,301,200 | 3,111,538 | |
| Sinotruk Hong Kong Ltd. | 668,500 | 1,259,122 | |
| SKSHU Paint Co. Ltd. (A Shares) | 30,632 | 249,393 | |
| Smoore International Holdings Ltd. (b)(c) | 1,768,000 | 1,362,524 | |
| Songcheng Performance Development Co. Ltd. (A Shares) | 150,580 | 226,170 | |
| Soochow Securities Co. Ltd. (A Shares) | 291,745 | 319,954 | |
| Southwest Securities Co. Ltd. (A Shares) | 387,500 | 217,235 | |
| Spring Airlines Co. Ltd. (A Shares) (a) | 56,600 | 423,766 | |
| StarPower Semiconductor Ltd. (A Shares) | 9,900 | 233,093 | |
| Sungrow Power Supply Co. Ltd. (A Shares) | 86,400 | 995,862 | |
| Sunny Optical Technology Group Co. Ltd. | 691,300 | 5,791,666 | |
| Sunresin New Materials Co. Ltd. (A Shares) | 29,200 | 217,042 | |
| Sunwoda Electronic Co. Ltd. (A Shares) | 109,400 | 241,003 | |
| SUPCON Technology Co. Ltd. (A Shares) | 42,153 | 251,574 | |
| Suzhou Dongshan Precision Manufacturing Co. Ltd. (A Shares) | 99,300 | 254,356 | |
| Suzhou Maxwell Technologies Co. Ltd. (A Shares) | 16,244 | 268,271 | |
| Suzhou TFC Optical Communication Co. Ltd. (A Shares) | 22,900 | 223,959 | |
| TAL Education Group ADR (a) | 428,479 | 3,757,761 | |
| Tangshan Jidong Cement Co. Ltd. A Shares | 151,300 | 147,955 | |
| TBEA Co. Ltd. (A Shares) | 294,970 | 564,624 | |
| TCL Technology Group Corp. (A Shares) | 1,094,090 | 588,428 | |
| TCL Zhonghuan Renewable Energy Technology Co. Ltd. (A Shares) | 235,175 | 593,861 | |
| Tencent Holdings Ltd. | 6,498,400 | 240,497,701 | |
| Tencent Music Entertainment Group ADR (a) | 728,185 | 5,286,623 | |
| Thunder Software Technology Co. Ltd. (A Shares) | 26,600 | 255,638 | |
| Tianhe Chemicals Group Ltd. (a)(d) | 376,000 | 0 | |
| Tianjin 712 Communication & Broadcasting Co. Ltd. | 44,700 | 162,655 | |
| Tianma Microelectronics Co. Ltd. (A Shares) (a) | 143,300 | 192,029 | |
| Tianqi Lithium Corp. (A Shares) | 85,700 | 644,950 | |
| Tianshan Aluminum Group Co. Ltd. | 271,800 | 240,784 | |
| Tianshui Huatian Technology Co. Ltd. (A Shares) | 185,900 | 227,088 | |
| Tingyi (Cayman Islands) Holding Corp. | 1,914,000 | 2,540,476 | |
| Titan Wind Energy Suzhou Co. Ltd. (A Shares) (a) | 105,500 | 192,456 | |
| Tongcheng Travel Holdings Ltd. (a) | 1,198,400 | 2,289,484 | |
| TongFu Microelectronics Co. Ltd. (A Shares) | 88,000 | 247,123 | |
| Tongkun Group Co. Ltd. (A Shares) (a) | 140,700 | 277,981 | |
| Tongling Nonferrous Metals Group Co. Ltd. (A Shares) | 615,800 | 261,612 | |
| Tongwei Co. Ltd. (A Shares) | 261,800 | 978,112 | |
| Topchoice Medical Corp. (a) | 18,600 | 227,956 | |
| Topsports International Holdings Ltd. (b) | 1,802,000 | 1,515,378 | |
| TravelSky Technology Ltd. (H Shares) | 903,000 | 1,426,499 | |
| Trina Solar Co. Ltd. (A Shares) | 126,384 | 516,171 | |
| Trip.com Group Ltd. (a) | 532,512 | 18,148,874 | |
| Tsingtao Brewery Co. Ltd.: | |||
| (A Shares) | 49,500 | 565,769 | |
| (H Shares) | 590,000 | 4,474,282 | |
| Uni-President China Holdings Ltd. | 1,256,000 | 854,822 | |
| Unigroup Guoxin Microelectronics Co. Ltd. (a) | 49,419 | 509,614 | |
| Unisplendour Corp. Ltd. (A Shares) (a) | 166,403 | 446,596 | |
| Universal Scientific Industrial Shanghai Co. Ltd. (A Shares) | 107,700 | 213,957 | |
| Verisilicon Microelectronics Shanghai Co. Ltd. (A Shares) (a) | 29,021 | 211,815 | |
| Vipshop Holdings Ltd. ADR (a) | 329,256 | 4,695,191 | |
| Walvax Biotechnology Co. Ltd. (A Shares) | 93,400 | 297,396 | |
| Wanda Film Holding Co. Ltd. (A Shares) (a) | 126,700 | 216,419 | |
| Wanhua Chemical Group Co. Ltd. (A Shares) | 182,800 | 2,217,861 | |
| Want Want China Holdings Ltd. | 4,610,000 | 2,864,469 | |
| Weibo Corp. sponsored ADR | 78,551 | 929,258 | |
| Weichai Power Co. Ltd.: | |||
| (A Shares) | 372,600 | 708,274 | |
| (H Shares) | 1,912,200 | 2,862,223 | |
| Weihai Guangwei Composites Co. Ltd. (A Shares) | 48,360 | 169,405 | |
| Wens Foodstuffs Group Co. Ltd. (A Shares) | 381,780 | 980,709 | |
| Western Mining Co. Ltd. (A Shares) | 140,400 | 241,422 | |
| Western Securities Co. Ltd. (A Shares) | 260,000 | 236,711 | |
| Western Superconducting Technologies Co. Ltd. (A Shares) | 37,834 | 239,227 | |
| Will Semiconductor Ltd. | 68,735 | 1,037,259 | |
| Wingtech Technology Co. Ltd. (A Shares) (a) | 72,300 | 492,233 | |
| Wintime Energy Group Co. Ltd. (A Shares) (a) | 1,262,200 | 236,479 | |
| Wuchan Zhongda Group Co. Ltd. | 300,500 | 187,791 | |
| Wuhan Guide Infrared Co. Ltd. (A Shares) | 247,769 | 268,457 | |
| Wuliangye Yibin Co. Ltd. (A Shares) | 225,900 | 4,816,436 | |
| WUS Printed Circuit Kunshan Co. Ltd. (A Shares) | 110,790 | 296,733 | |
| WuXi AppTec Co. Ltd. | 143,644 | 1,698,685 | |
| WuXi AppTec Co. Ltd. (H Shares) (b)(c) | 357,122 | 4,291,373 | |
| Wuxi Autowell Technology Co. Ltd. (A Shares) | 8,997 | 168,114 | |
| Wuxi Biologics (Cayman), Inc. (a)(b) | 3,707,500 | 23,052,278 | |
| XCMG Construction Machinery Co. Ltd. (A Shares) | 685,800 | 537,222 | |
| Xiamen C&D, Inc. (A Shares) | 173,900 | 232,418 | |
| Xiamen Faratronic Co. Ltd. (A Shares) | 13,200 | 180,160 | |
| Xiamen Tungsten Co. Ltd. (A Shares) | 82,900 | 192,163 | |
| Xiaomi Corp. Class B (a)(b) | 14,876,600 | 26,674,101 | |
| Xinjiang Daqo New Energy Co. Ltd. (A Shares) | 103,489 | 505,487 | |
| Xinyi Solar Holdings Ltd. | 4,747,498 | 2,793,947 | |
| XPeng, Inc. Class A (a)(c) | 1,005,552 | 7,307,122 | |
| XTEP International Holdings Ltd. | 1,404,500 | 1,276,877 | |
| Yadea Group Holdings Ltd. (b) | 1,190,000 | 2,172,178 | |
| Yangzhou Yangjie Electronic Technology Co. Ltd. (A Shares) | 29,700 | 154,238 | |
| Yankuang Energy Group Co. Ltd.: | |||
| (A Shares) | 237,150 | 633,583 | |
| (H Shares) | 2,190,000 | 3,803,502 | |
| Yantai Jereh Oilfield Services (A Shares) | 59,300 | 231,914 | |
| Yealink Network Technology Corp. Ltd. | 73,430 | 335,070 | |
| Yifeng Pharmacy Chain Co. Ltd. | 58,825 | 263,566 | |
| Yihai International Holding Ltd. | 502,000 | 913,590 | |
| Yihai Kerry Arawana Holdings Co. Ltd. (A Shares) | 84,600 | 404,654 | |
| Yintai Gold Co. Ltd. (A Shares) | 161,780 | 299,371 | |
| Yonghui Superstores Co. Ltd. (A Shares) (a) | 530,500 | 223,373 | |
| YongXing Special Materials Technology Co. Ltd. (A Shares) | 31,610 | 216,234 | |
| Yonyou Network Technology Co. Ltd. (A Shares) | 199,538 | 447,016 | |
| Youngor Group Co. Ltd. (A Shares) | 273,689 | 252,617 | |
| YTO Express Group Co. Ltd. (A Shares) | 199,300 | 370,176 | |
| Yuan Longping High-tech Agriculture Co. Ltd. (A Shares) (a) | 77,300 | 174,240 | |
| Yuexiu Property Co. Ltd. | 1,561,620 | 1,624,332 | |
| Yum China Holdings, Inc. | 404,448 | 21,257,787 | |
| Yunda Holding Co. Ltd. (A Shares) | 168,390 | 209,924 | |
| Yunnan Aluminium Co. Ltd. (A Shares) | 202,100 | 384,256 | |
| Yunnan Baiyao Group Co. Ltd. (A Shares) | 104,500 | 726,245 | |
| Yunnan Botanee Bio-Technology Group Co., Ltd. (A Shares) | 24,700 | 266,403 | |
| Yunnan Chihong Zinc & Germanium Co. Ltd. (A Shares) | 296,900 | 210,013 | |
| Yunnan Energy New Material Co. Ltd. | 56,900 | 522,364 | |
| Yunnan Tin Co. Ltd. (A Shares) | 96,200 | 185,865 | |
| Yunnan Yuntianhua Co. Ltd. (Series A) | 106,800 | 243,237 | |
| Yutong Bus Co. Ltd. | 127,900 | 238,507 | |
| Zai Lab Ltd. (a) | 906,200 | 2,312,673 | |
| Zangge Mining Co. Ltd. (Series A) | 91,600 | 280,387 | |
| Zhangzhou Pientzehuang Pharmaceutical Co. Ltd. (A Shares) | 35,200 | 1,204,828 | |
| Zhaojin Mining Industry Co. Ltd. (H Shares) | 1,265,500 | 1,568,902 | |
| Zhefu Holding Group Co. Ltd. (A Shares) | 310,700 | 157,154 | |
| Zhejiang Century Huatong Group Co. Ltd. (A Shares) (a) | 433,197 | 350,083 | |
| Zhejiang China Commodities City Group Co. Ltd. (A Shares) | 319,500 | 340,006 | |
| Zhejiang Chint Electric Co. Ltd. (A Shares) | 125,900 | 397,902 | |
| Zhejiang Dahua Technology Co. Ltd. (A Shares) (a) | 193,400 | 539,950 | |
| Zhejiang Dingli Machinery Co. Ltd. (A Shares) | 29,160 | 217,202 | |
| Zhejiang Expressway Co. Ltd. (H Shares) | 1,184,000 | 891,239 | |
| Zhejiang Huahai Pharmaceutical Co. Ltd. (A Shares) | 86,220 | 190,680 | |
| Zhejiang Huayou Cobalt Co. Ltd. (A Shares) | 93,050 | 468,407 | |
| Zhejiang Jingsheng Mechanical & Electrical Co. Ltd. (A Shares) | 76,000 | 452,045 | |
| Zhejiang Jiuzhou Pharmaceutical Co. Ltd. (A Shares) | 52,100 | 211,769 | |
| Zhejiang Juhua Co. Ltd. (A Shares) | 157,500 | 326,138 | |
| Zhejiang Longsheng Group Co. Ltd. (A Shares) | 189,000 | 229,987 | |
| Zhejiang NHU Co. Ltd. (A Shares) | 180,028 | 398,140 | |
| Zhejiang Sanhua Intelligent Controls Co. Ltd. (A Shares) | 104,200 | 381,442 | |
| Zhejiang Supor Cookware Co. Ltd. | 31,200 | 213,984 | |
| Zhejiang Weiming Enviroment Protection Co. Ltd. (A Shares) | 100,590 | 246,780 | |
| Zhejiang Weixing New Building Materials Co. Ltd. (A Shares) | 92,000 | 207,410 | |
| Zhejiang Zheneng Electric Power Co. Ltd. (A Shares) (a) | 653,400 | 410,896 | |
| Zheshang Securities Co. Ltd. | 226,400 | 311,868 | |
| ZhongAn Online P & C Insurance Co. Ltd. (H Shares) (a)(b) | 688,500 | 1,886,916 | |
| Zhongji Innolight Co. Ltd. (A Shares) | 46,800 | 563,914 | |
| Zhongjin Gold Co. Ltd. (A Shares) | 282,500 | 420,066 | |
| Zhongsheng Group Holdings Ltd. Class H | 812,000 | 1,875,148 | |
| Zhongtai Securities Co. Ltd. (A Shares) | 406,900 | 398,369 | |
| Zhuzhou CRRC Times Electric Co. Ltd.: | |||
| (A Shares) | 46,495 | 246,173 | |
| (H Shares) | 498,100 | 1,607,552 | |
| Zhuzhou Kibing Group Co. Ltd. (A Shares) | 155,600 | 169,775 | |
| Zibo Qixiang Tengda Chemical Co. Ltd. (A Shares) | 167,300 | 133,846 | |
| Zijin Mining Group Co. Ltd.: | |||
| (A Shares) (a) | 1,150,500 | 1,951,704 | |
| (H Shares) | 5,336,000 | 8,254,322 | |
| Zoomlion Heavy Industry Science and Technology Co. Ltd.: | |||
| (A Shares) | 155,100 | 136,128 | |
| (H Shares) | 462,000 | 240,185 | |
| ZTE Corp.: | |||
| (A Shares) | 200,600 | 717,379 | |
| (H Shares) | 787,880 | 1,750,873 | |
| ZTO Express, Inc. sponsored ADR | 414,675 | 9,773,890 | |
TOTAL CHINA | 1,812,612,591 | ||
| Colombia - 0.1% | |||
| Bancolombia SA | 247,914 | 1,767,803 | |
| Bancolombia SA sponsored ADR | 3,513 | 89,160 | |
| Interconexion Electrica SA ESP | 431,012 | 1,518,385 | |
TOTAL COLOMBIA | 3,375,348 | ||
| Czech Republic - 0.2% | |||
| CEZ A/S | 157,206 | 6,726,712 | |
| Komercni Banka A/S | 73,385 | 2,149,226 | |
| MONETA Money Bank A/S (b) | 318,834 | 1,231,751 | |
TOTAL CZECH REPUBLIC | 10,107,689 | ||
| Egypt - 0.1% | |||
| Commercial International Bank SAE | 2,457,789 | 4,796,364 | |
| Eastern Co. SAE | 1,003,356 | 853,299 | |
| EFG-Hermes Holding SAE | 918,835 | 496,186 | |
TOTAL EGYPT | 6,145,849 | ||
| Greece - 0.4% | |||
| Alpha Bank SA (a) | 2,162,869 | 3,226,830 | |
| Eurobank Ergasias Services and Holdings SA (a) | 2,518,350 | 4,108,915 | |
| Ff Group (a)(d) | 1,035 | 0 | |
| Hellenic Telecommunications Organization SA | 186,279 | 2,607,657 | |
| Jumbo SA | 112,117 | 2,949,167 | |
| Motor Oil (HELLAS) Corinth Refineries SA | 64,537 | 1,536,448 | |
| Mytilineos SA | 103,935 | 3,846,877 | |
| National Bank of Greece SA (a) | 532,105 | 3,040,310 | |
| OPAP SA | 179,345 | 3,036,239 | |
| Piraeus Financial Holdings SA (a) | 666,625 | 1,967,943 | |
| Public Power Corp. of Greece (a) | 202,287 | 2,061,204 | |
TOTAL GREECE | 28,381,590 | ||
| Hong Kong - 0.1% | |||
| Kingboard Laminates Holdings Ltd. | 906,500 | 850,108 | |
| Nine Dragons Paper (Holdings) Ltd. | 1,595,000 | 908,001 | |
| Orient Overseas International Ltd. | 128,000 | 1,614,054 | |
| Sino Biopharmaceutical Ltd. | 10,031,000 | 3,896,835 | |
| Vinda International Holdings Ltd. (c) | 351,000 | 867,402 | |
TOTAL HONG KONG | 8,136,400 | ||
| Hungary - 0.2% | |||
| MOL Hungarian Oil and Gas PLC Series A (For. Reg.) | 437,013 | 3,477,245 | |
| OTP Bank PLC | 230,794 | 8,588,134 | |
| Richter Gedeon PLC | 135,594 | 3,179,305 | |
TOTAL HUNGARY | 15,244,684 | ||
| India - 15.3% | |||
| ABB India Ltd. | 51,411 | 2,534,867 | |
| Adani Enterprises Ltd. | 165,812 | 4,570,823 | |
| Adani Green Energy Ltd. (a) | 307,551 | 3,396,859 | |
| Adani Ports & Special Economic Zone Ltd. | 512,305 | 4,831,558 | |
| Adani Power Ltd. (a) | 748,925 | 3,262,380 | |
| Ambuja Cements Ltd. | 577,488 | 2,945,303 | |
| Apollo Hospitals Enterprise Ltd. | 97,640 | 5,651,979 | |
| Ashok Leyland Ltd. | 1,423,457 | 2,869,085 | |
| Asian Paints Ltd. | 371,944 | 13,393,897 | |
| Astral Ltd. | 117,184 | 2,604,180 | |
| AU Small Finance Bank Ltd. (b) | 161,728 | 1,299,475 | |
| Aurobindo Pharma Ltd. | 255,746 | 2,608,934 | |
| Avenue Supermarts Ltd. (a)(b) | 157,799 | 6,887,610 | |
| Axis Bank Ltd. | 2,210,079 | 26,070,770 | |
| Bajaj Auto Ltd. | 65,870 | 4,200,655 | |
| Bajaj Finance Ltd. | 264,424 | 23,796,238 | |
| Bajaj Finserv Ltd. | 370,467 | 6,983,334 | |
| Bajaj Holdings & Investment Ltd. | 25,909 | 2,154,887 | |
| Balkrishna Industries Ltd. | 74,991 | 2,299,427 | |
| Bandhan Bank Ltd. (b) | 703,063 | 1,809,832 | |
| Bank of Baroda | 1,003,033 | 2,364,368 | |
| Berger Paints India Ltd. | 282,985 | 1,898,181 | |
| Bharat Electronics Ltd. | 3,546,562 | 5,680,230 | |
| Bharat Forge Ltd. | 248,469 | 3,042,474 | |
| Bharat Petroleum Corp. Ltd. | 736,464 | 3,086,455 | |
| Bharti Airtel Ltd. | 2,166,711 | 23,789,084 | |
| Britannia Industries Ltd. | 105,214 | 5,595,230 | |
| Cg Power & Industrial Soluti | 592,906 | 2,775,811 | |
| Cholamandalam Investment and Finance Co. Ltd. | 398,784 | 5,448,056 | |
| Cipla Ltd./India (a) | 508,864 | 7,333,160 | |
| Coal India Ltd. | 1,494,425 | 5,639,382 | |
| Colgate-Palmolive Ltd. | 118,650 | 3,011,540 | |
| Container Corp. of India Ltd. | 266,002 | 2,198,955 | |
| Cummins India Ltd. | 134,296 | 2,704,239 | |
| Dabur India Ltd. | 601,320 | 3,818,823 | |
| Divi's Laboratories Ltd. | 115,854 | 4,713,454 | |
| DLF Ltd. | 600,477 | 4,066,661 | |
| Dr. Reddy's Laboratories Ltd. | 104,996 | 6,774,911 | |
| Eicher Motors Ltd. | 132,690 | 5,250,047 | |
| GAIL India Ltd. | 2,241,206 | 3,217,013 | |
| Godrej Consumer Products Ltd. | 396,634 | 4,724,506 | |
| Godrej Properties Ltd. (a) | 121,474 | 2,423,271 | |
| Grasim Industries Ltd. | 255,453 | 5,787,848 | |
| Havells India Ltd. | 243,201 | 3,640,018 | |
| HCL Technologies Ltd. | 918,928 | 14,090,723 | |
| HDFC Asset Management Co. Ltd. (b) | 82,819 | 2,719,565 | |
| HDFC Bank Ltd. | 2,704,321 | 47,972,668 | |
| HDFC Standard Life Insurance Co. Ltd. (b) | 938,182 | 6,967,375 | |
| Hero Motocorp Ltd. | 106,586 | 3,954,167 | |
| Hindalco Industries Ltd. | 1,194,550 | 6,591,661 | |
| Hindustan Aeronautics Ltd. | 162,228 | 3,549,264 | |
| Hindustan Petroleum Corp. Ltd. (a) | 550,986 | 1,638,748 | |
| Hindustan Unilever Ltd. | 797,394 | 23,789,866 | |
| ICICI Bank Ltd. | 5,020,887 | 55,222,392 | |
| ICICI Lombard General Insurance Co. Ltd. (b) | 233,442 | 3,851,681 | |
| ICICI Prudential Life Insurance Co. Ltd. (b) | 348,908 | 2,201,077 | |
| IDFC Bank Ltd. (a) | 3,354,598 | 3,332,649 | |
| Indian Oil Corp. Ltd. | 2,740,372 | 2,951,154 | |
| Indian Railway Catering & Tourism Corp. Ltd. | 233,353 | 1,864,627 | |
| Indraprastha Gas Ltd. | 305,187 | 1,401,480 | |
| Info Edge India Ltd. | 68,782 | 3,374,479 | |
| Infosys Ltd. | 3,219,368 | 52,929,243 | |
| InterGlobe Aviation Ltd. (a)(b) | 130,799 | 3,856,967 | |
| ITC Ltd. | 2,895,160 | 14,898,524 | |
| Jindal Steel & Power Ltd. | 346,484 | 2,637,403 | |
| Jio Financial Services Ltd. | 2,952,178 | 7,832,833 | |
| JSW Steel Ltd. (a) | 586,700 | 5,189,626 | |
| Jubilant Foodworks Ltd. | 383,928 | 2,309,444 | |
| Kotak Mahindra Bank Ltd. | 1,059,842 | 22,149,231 | |
| Larsen & Toubro Ltd. | 668,052 | 23,502,367 | |
| Ltimindtree Ltd. (b) | 86,088 | 5,236,105 | |
| Lupin Ltd. | 198,721 | 2,692,074 | |
| Mahindra & Mahindra Ltd. | 904,477 | 15,846,504 | |
| Marico Ltd. | 501,944 | 3,233,483 | |
| Maruti Suzuki India Ltd. | 131,798 | 16,453,611 | |
| Max Healthcare Institute Ltd. | 753,649 | 5,193,634 | |
| Mphasis BFL Ltd. | 73,140 | 1,866,730 | |
| MRF Ltd. | 1,850 | 2,406,334 | |
| Muthoot Finance Ltd. | 116,887 | 1,823,267 | |
| Nestle India Ltd. | 32,741 | 9,530,991 | |
| NTPC Ltd. | 4,237,279 | 12,001,291 | |
| Oil & Natural Gas Corp. Ltd. | 3,050,729 | 6,824,239 | |
| Page Industries Ltd. | 5,947 | 2,701,423 | |
| Petronet LNG Ltd. | 727,549 | 1,743,389 | |
| PI Industries Ltd. | 80,896 | 3,302,943 | |
| Pidilite Industries Ltd. | 147,959 | 4,367,191 | |
| Power Finance Corp. Ltd. | 1,280,597 | 3,791,354 | |
| Power Grid Corp. of India Ltd. | 4,399,906 | 10,683,040 | |
| REC Ltd. | 1,149,578 | 3,972,341 | |
| Reliance Industries Ltd. | 2,952,129 | 81,152,896 | |
| Samvardhana Motherson International Ltd. | 2,300,165 | 2,539,612 | |
| SBI Cards & Payment Services Ltd. | 275,585 | 2,468,881 | |
| SBI Life Insurance Co. Ltd. (b) | 436,972 | 7,174,804 | |
| Shree Cement Ltd. | 8,747 | 2,695,136 | |
| Shriram Transport Finance Co. Ltd. | 272,767 | 6,153,202 | |
| Siemens Ltd. | 86,322 | 3,452,790 | |
| Sona Blw Precision Forgings Ltd. (b) | 397,365 | 2,585,269 | |
| SRF Ltd. | 143,804 | 3,790,801 | |
| State Bank of India | 1,730,968 | 11,758,576 | |
| Sun Pharmaceutical Industries Ltd. | 930,761 | 12,165,298 | |
| Supreme Industries Ltd. | 61,600 | 3,202,051 | |
| Tata Consultancy Services Ltd. | 887,036 | 35,899,735 | |
| Tata Consumer Products Ltd. | 540,813 | 5,849,929 | |
| Tata Elxsi Ltd. | 33,220 | 3,042,113 | |
| Tata Motors Ltd. | 1,610,944 | 12,163,868 | |
| Tata Power Co. Ltd./The | 1,393,682 | 4,008,592 | |
| Tata Steel Ltd. | 7,115,829 | 10,151,176 | |
| Tech Mahindra Ltd. | 519,873 | 7,082,791 | |
| The Indian Hotels Co. Ltd. | 826,322 | 3,804,711 | |
| Titan Co. Ltd. | 344,382 | 13,198,225 | |
| Torrent Pharmaceuticals Ltd. | 98,523 | 2,276,722 | |
| Trent Ltd. | 175,878 | 4,551,142 | |
| Tube Investments of India Ltd. | 103,074 | 3,898,300 | |
| Tvs Motor Co. Ltd. | 230,594 | 4,405,199 | |
| Ultratech Cement Ltd. | 111,976 | 11,329,057 | |
| United Spirits Ltd. (a) | 282,584 | 3,503,351 | |
| UPL Ltd. | 437,060 | 2,836,969 | |
| Varun Beverages Ltd. | 441,213 | 4,814,337 | |
| Vedanta Ltd. | 721,828 | 1,877,876 | |
| Wipro Ltd. | 1,265,523 | 5,807,937 | |
| Yes Bank Ltd. (a) | 12,551,065 | 2,404,769 | |
| Zomato Ltd. (a) | 4,159,006 | 5,258,852 | |
TOTAL INDIA | 964,909,935 | ||
| Indonesia - 1.8% | |||
| Indofood Sukses Makmur Tbk PT | 4,260,800 | 1,783,800 | |
| PT Adaro Energy Indonesia Tbk | 13,955,600 | 2,251,726 | |
| PT Aneka Tambang Tbk | 8,160,900 | 874,386 | |
| PT Astra International Tbk | 19,626,300 | 7,139,647 | |
| PT Bank Central Asia Tbk | 53,786,100 | 29,631,874 | |
| PT Bank Mandiri (Persero) Tbk | 36,197,400 | 12,931,598 | |
| PT Bank Negara Indonesia (Persero) Tbk | 14,461,200 | 4,364,196 | |
| PT Bank Rakyat Indonesia (Persero) Tbk | 66,127,385 | 20,676,968 | |
| PT Barito Pacific Tbk | 27,393,488 | 1,941,203 | |
| PT Charoen Pokphand Indonesia Tbk (a) | 7,157,100 | 2,636,750 | |
| PT GoTo Gojek Tokopedia Tbk (a) | 803,777,912 | 3,040,891 | |
| PT Indah Kiat Pulp & Paper Tbk | 2,651,900 | 1,602,815 | |
| PT Indofood CBP Sukses Makmur Tbk | 2,264,600 | 1,476,004 | |
| PT Kalbe Farma Tbk | 20,450,200 | 2,174,972 | |
| PT Merdeka Copper Gold Tbk (a) | 11,692,396 | 1,639,927 | |
| PT Sarana Menara Nusantara Tbk | 19,840,900 | 1,112,762 | |
| PT Semen Indonesia (Persero) Tbk | 3,270,499 | 1,256,699 | |
| PT Sumber Alfaria Trijaya Tbk | 16,110,800 | 2,932,112 | |
| PT Telkom Indonesia Persero Tbk | 48,042,000 | 10,531,566 | |
| PT Unilever Indonesia Tbk | 7,411,500 | 1,689,886 | |
| PT United Tractors Tbk | 1,446,200 | 2,288,623 | |
| PT Vale Indonesia Tbk | 2,408,100 | 750,483 | |
TOTAL INDONESIA | 114,728,888 | ||
| Korea (South) - 10.8% | |||
| AMOREPACIFIC Corp. | 28,353 | 2,657,440 | |
| BGF Retail Co. Ltd. | 8,389 | 856,601 | |
| Celltrion Healthcare Co. Ltd. | 103,656 | 5,119,805 | |
| Celltrion Pharm, Inc. | 17,280 | 811,778 | |
| Celltrion, Inc. | 106,464 | 11,805,663 | |
| CJ CheilJedang Corp. | 8,037 | 1,681,229 | |
| Cosmo AM&T Co. Ltd. (a) | 22,317 | 2,320,035 | |
| Cosmo AM&T Co. Ltd. rights 11/7/23 (a) | 1,139 | 13,979 | |
| Coway Co. Ltd. | 53,699 | 1,715,863 | |
| Db Insurance Co. Ltd. | 44,627 | 2,899,080 | |
| Doosan Bobcat, Inc. | 53,435 | 1,532,966 | |
| Doosan Heavy Industries & Construction Co. Ltd. (a) | 434,898 | 4,326,892 | |
| Ecopro BM Co. Ltd. (c) | 47,417 | 6,926,698 | |
| Ecopro Co. Ltd. (c) | 19,364 | 8,934,340 | |
| F&F Co. Ltd. | 16,707 | 1,156,482 | |
| GS Holdings Corp. | 45,072 | 1,314,236 | |
| Hana Financial Group, Inc. | 286,903 | 8,329,850 | |
| Hankook Tire Co. Ltd. | 72,030 | 2,040,572 | |
| Hanmi Pharm Co. Ltd. | 6,700 | 1,398,803 | |
| Hanmi Semiconductor Co. Ltd. | 42,471 | 1,661,650 | |
| Hanon Systems | 181,172 | 923,102 | |
| Hanwha Aerospace Co. Ltd. | 34,371 | 2,580,216 | |
| Hanwha Ocean Co. Ltd. (a)(c) | 42,038 | 734,081 | |
| Hanwha Ocean Co. Ltd. rights 11/9/23 (a) | 13,877 | 17,955 | |
| Hanwha Solutions Corp. (a) | 100,001 | 2,126,888 | |
| HD Hyundai Co. Ltd. | 42,136 | 1,792,012 | |
| HD Hyundai Heavy Industries Co. Ltd. (a) | 21,502 | 1,627,885 | |
| HD Korea Shipbuilding & Offshore Engineering Co. Ltd. (a) | 41,156 | 2,756,779 | |
| HLB, Inc. | 112,573 | 2,421,884 | |
| HMM Co. Ltd. | 237,022 | 2,563,449 | |
| Hotel Shilla Co. (c) | 30,445 | 1,406,627 | |
| HYBE Co. Ltd. (a) | 18,172 | 2,955,172 | |
| Hyundai Engineering & Construction Co. Ltd. | 75,617 | 1,872,581 | |
| Hyundai Glovis Co. Ltd. | 18,176 | 2,303,314 | |
| Hyundai Mipo Dockyard Co. Ltd. (a) | 23,211 | 1,194,346 | |
| Hyundai Mobis | 59,418 | 9,188,114 | |
| Hyundai Motor Co. Ltd. | 133,386 | 16,779,612 | |
| Hyundai Steel Co. | 84,185 | 2,044,210 | |
| Industrial Bank of Korea | 270,912 | 2,238,737 | |
| JYP Entertainment Corp. | 27,527 | 2,092,242 | |
| Kakao Corp. | 301,481 | 8,484,896 | |
| Kakao Games Corp. (a) | 35,960 | 623,220 | |
| Kakao Pay Corp. (a) | 25,988 | 661,544 | |
| KakaoBank Corp. | 161,788 | 2,186,274 | |
| Kangwon Land, Inc. | 92,963 | 1,010,733 | |
| KB Financial Group, Inc. | 371,698 | 14,147,481 | |
| Kia Corp. | 253,388 | 14,454,964 | |
| Korea Aerospace Industries Ltd. | 70,926 | 2,330,340 | |
| Korea Electric Power Corp. (a) | 249,610 | 3,119,718 | |
| Korea Investment Holdings Co. Ltd. | 40,587 | 1,515,040 | |
| Korea Zinc Co. Ltd. | 7,707 | 2,674,356 | |
| Korean Air Lines Co. Ltd. | 178,123 | 2,706,155 | |
| KRAFTON, Inc. (a) | 28,130 | 3,419,249 | |
| KT Corp. | 63,441 | 1,532,501 | |
| KT&G Corp. | 99,839 | 6,288,836 | |
| Kumho Petro Chemical Co. Ltd. | 17,051 | 1,600,190 | |
| L&F Co. Ltd. (c) | 24,597 | 2,389,076 | |
| LG Chemical Ltd. | 47,921 | 15,682,452 | |
| LG Corp. | 91,512 | 5,230,292 | |
| LG Display Co. Ltd. (a) | 225,561 | 2,038,013 | |
| LG Electronics, Inc. | 103,146 | 7,640,337 | |
| LG Energy Solution (a) | 45,384 | 12,990,889 | |
| LG H & H Co. Ltd. | 9,084 | 2,126,534 | |
| LG Innotek Co. Ltd. | 13,769 | 2,281,887 | |
| LG Uplus Corp. | 208,276 | 1,558,655 | |
| Lotte Chemical Corp. | 18,663 | 2,023,741 | |
| Lotte Energy Materials Corp. | 22,344 | 639,155 | |
| Meritz Financial Holdings Co. | 100,993 | 3,753,148 | |
| Mirae Asset Securities Co. Ltd. | 264,817 | 1,295,337 | |
| NAVER Corp. | 127,245 | 17,762,885 | |
| NCSOFT Corp. | 13,835 | 2,386,686 | |
| Netmarble Corp. (a)(b) | 20,824 | 596,952 | |
| NH Investment & Securities Co. Ltd. | 145,173 | 1,039,989 | |
| Orion Corp./Republic of Korea | 23,008 | 2,033,307 | |
| Pan Ocean Co., Ltd. (Korea) | 258,843 | 825,159 | |
| Pearl Abyss Corp. (a) | 31,139 | 1,139,107 | |
| POSCO | 69,703 | 21,306,214 | |
| POSCO Chemtech Co. Ltd. (c) | 30,045 | 5,286,772 | |
| Posco International Corp. | 51,172 | 1,905,894 | |
| S-Oil Corp. | 43,665 | 2,151,786 | |
| Samsung Biologics Co. Ltd. (a)(b) | 17,255 | 9,057,625 | |
| Samsung C&T Corp. | 81,007 | 6,395,383 | |
| Samsung Electro-Mechanics Co. Ltd. | 54,317 | 5,014,767 | |
| Samsung Electronics Co. Ltd. | 4,630,764 | 230,154,031 | |
| Samsung Engineering Co. Ltd. (a) | 152,055 | 2,675,942 | |
| Samsung Fire & Marine Insurance Co. Ltd. | 29,863 | 5,702,016 | |
| Samsung Heavy Industries Co. Ltd. (a) | 639,726 | 3,238,272 | |
| Samsung Life Insurance Co. Ltd. | 77,576 | 4,147,210 | |
| Samsung SDI Co. Ltd. | 53,342 | 16,864,899 | |
| Samsung SDS Co. Ltd. | 37,512 | 3,839,464 | |
| Samsung Securities Co. Ltd. | 60,738 | 1,588,756 | |
| Shinhan Financial Group Co. Ltd. | 427,228 | 10,965,283 | |
| SK Biopharmaceuticals Co. Ltd. (a) | 30,375 | 1,697,341 | |
| SK Bioscience Co. Ltd. (a)(c) | 26,058 | 1,171,061 | |
| SK Hynix, Inc. | 529,423 | 45,908,064 | |
| SK IE Technology Co. Ltd. (a)(b) | 24,194 | 1,065,252 | |
| SK Innovation Co., Ltd. | 61,731 | 5,615,641 | |
| SK Square Co. Ltd. (a) | 96,007 | 3,029,127 | |
| SK, Inc. | 35,504 | 3,737,672 | |
| SKC Co. Ltd. (c) | 18,360 | 1,072,132 | |
| Woori Financial Group, Inc. | 589,845 | 5,202,233 | |
| Yuhan Corp. | 52,018 | 2,214,146 | |
TOTAL KOREA (SOUTH) | 680,319,249 | ||
| Kuwait - 0.8% | |||
| Agility Public Warehousing Co. KSC (a) | 1,557,116 | 2,646,770 | |
| Boubyan Bank KSC | 1,345,451 | 2,547,857 | |
| Gulf Bank | 1,792,180 | 1,372,586 | |
| Gulf Bank rights 11/12/23 (a) | 139,121 | 2,877 | |
| Kuwait Finance House KSCP | 7,875,663 | 17,408,155 | |
| Mabanee Co. SAKC | 639,498 | 1,704,915 | |
| Mobile Telecommunication Co. | 1,890,305 | 2,938,235 | |
| National Bank of Kuwait | 7,305,672 | 20,704,716 | |
TOTAL KUWAIT | 49,326,111 | ||
| Luxembourg - 0.0% | |||
| Reinet Investments SCA | 133,014 | 2,763,836 | |
| Malaysia - 1.4% | |||
| AMMB Holdings Bhd | 1,635,600 | 1,312,149 | |
| Axiata Group Bhd | 2,714,441 | 1,241,967 | |
| CelcomDigi Bhd | 3,474,500 | 3,112,480 | |
| CIMB Group Holdings Bhd | 6,311,720 | 7,562,052 | |
| Dialog Group Bhd | 3,338,200 | 1,506,166 | |
| Gamuda Bhd | 1,850,604 | 1,818,467 | |
| Genting Bhd | 2,103,500 | 1,779,947 | |
| Genting Malaysia Bhd | 2,931,200 | 1,489,512 | |
| Hong Leong Bank Bhd | 642,500 | 2,616,132 | |
| Hong Leong Credit Bhd | 226,800 | 843,415 | |
| IHH Healthcare Bhd | 2,176,100 | 2,739,262 | |
| Inari Amertron Bhd | 2,574,600 | 1,543,621 | |
| IOI Corp. Bhd | 2,483,700 | 2,049,278 | |
| Kuala Lumpur Kepong Bhd | 480,447 | 2,217,816 | |
| Malayan Banking Bhd | 5,352,181 | 10,134,664 | |
| Malaysia Airports Holdings Bhd | 825,603 | 1,280,930 | |
| Maxis Bhd | 2,319,700 | 1,928,806 | |
| MISC Bhd | 1,322,600 | 2,013,496 | |
| MR DIY Group M Sdn Bhd (b) | 2,792,450 | 867,568 | |
| Nestle (Malaysia) Bhd | 69,700 | 1,811,371 | |
| Petronas Chemicals Group Bhd | 2,761,900 | 4,258,869 | |
| Petronas Dagangan Bhd | 294,400 | 1,425,240 | |
| Petronas Gas Bhd | 768,730 | 2,800,117 | |
| PPB Group Bhd | 632,320 | 2,032,743 | |
| Press Metal Aluminium Holdings | 3,660,300 | 3,783,566 | |
| Public Bank Bhd | 14,357,300 | 12,539,692 | |
| QL Resources Bhd | 1,084,450 | 1,258,616 | |
| RHB Bank Bhd | 1,483,334 | 1,737,434 | |
| Sime Darby Bhd | 2,691,849 | 1,293,750 | |
| Sime Darby Plantation Bhd | 2,051,056 | 1,869,805 | |
| Telekom Malaysia Bhd | 1,129,093 | 1,201,948 | |
| Tenaga Nasional Bhd | 2,527,200 | 5,251,687 | |
TOTAL MALAYSIA | 89,322,566 | ||
| Mexico - 2.4% | |||
| Alfa SA de CV Series A | 3,037,100 | 1,893,450 | |
| America Movil S.A.B. de CV Series L | 18,367,800 | 15,169,812 | |
| Arca Continental S.A.B. de CV | 507,700 | 4,552,657 | |
| Banco del Bajio SA (b) | 749,600 | 2,294,244 | |
| CEMEX S.A.B. de CV unit (a) | 14,691,918 | 8,825,419 | |
| Coca-Cola FEMSA S.A.B. de CV unit | 509,515 | 3,865,803 | |
| Fibra Uno Administracion SA de CV | 2,809,500 | 4,265,129 | |
| Fomento Economico Mexicano S.A.B. de CV unit | 1,886,400 | 21,351,089 | |
| Gruma S.A.B. de CV Series B | 179,405 | 3,121,900 | |
| Grupo Aeroportuario del Pacifico S.A.B. de CV Series B | 380,100 | 4,433,903 | |
| Grupo Aeroportuario del Sureste S.A.B. de CV Series B | 188,005 | 4,051,769 | |
| Grupo Bimbo S.A.B. de CV Series A | 1,288,100 | 5,242,708 | |
| Grupo Carso SA de CV Series A1 | 545,100 | 3,475,772 | |
| Grupo Financiero Banorte S.A.B. de CV Series O | 2,516,200 | 20,421,010 | |
| Grupo Financiero Inbursa S.A.B. de CV Series O (a) | 1,779,100 | 3,668,919 | |
| Grupo Mexico SA de CV Series B | 3,019,507 | 12,314,846 | |
| Grupo Televisa SA de CV | 2,327,000 | 1,067,408 | |
| Industrias Penoles SA de CV (a) | 192,720 | 2,151,465 | |
| Kimberly-Clark de Mexico SA de CV Series A | 1,476,800 | 2,707,207 | |
| Operadora de Sites Mexicanos, SA de CV | 1,246,800 | 1,060,150 | |
| Orbia Advance Corp. S.A.B. de CV | 974,155 | 1,578,294 | |
| Promotora y Operadora de Infraestructura S.A.B. de CV | 184,135 | 1,507,274 | |
| Southern Copper Corp. (c) | 82,457 | 5,846,201 | |
| Wal-Mart de Mexico SA de CV Series V | 5,079,600 | 18,181,074 | |
TOTAL MEXICO | 153,047,503 | ||
| Peru - 0.2% | |||
| Compania de Minas Buenaventura SAA | 3,005 | 24,341 | |
| Compania de Minas Buenaventura SAA sponsored ADR | 206,382 | 1,671,694 | |
| Credicorp Ltd. | 511 | 63,722 | |
| Credicorp Ltd. (United States) | 64,963 | 8,117,776 | |
TOTAL PERU | 9,877,533 | ||
| Philippines - 0.6% | |||
| Aboitiz Equity Ventures, Inc. | 1,640,060 | 1,320,929 | |
| Ayala Corp. | 240,755 | 2,567,985 | |
| Ayala Land, Inc. | 6,533,340 | 3,207,109 | |
| Bank of the Philippine Islands (BPI) | 1,918,749 | 3,393,796 | |
| BDO Unibank, Inc. | 2,297,983 | 5,160,422 | |
| International Container Terminal Services, Inc. | 986,440 | 3,486,687 | |
| JG Summit Holdings, Inc. | 2,554,356 | 1,652,925 | |
| Jollibee Food Corp. | 434,460 | 1,566,757 | |
| Manila Electric Co. | 266,650 | 1,665,235 | |
| Metropolitan Bank & Trust Co. | 1,745,977 | 1,606,142 | |
| PLDT, Inc. | 73,445 | 1,565,652 | |
| SM Investments Corp. | 237,350 | 3,346,576 | |
| SM Prime Holdings, Inc. | 9,812,600 | 5,179,327 | |
| Universal Robina Corp. | 846,170 | 1,627,404 | |
TOTAL PHILIPPINES | 37,346,946 | ||
| Poland - 0.9% | |||
| Allegro.eu SA (a)(b) | 461,041 | 3,300,147 | |
| Bank Polska Kasa Opieki SA | 178,100 | 5,399,596 | |
| Budimex SA | 12,383 | 1,381,752 | |
| CD Projekt RED SA | 62,965 | 1,569,622 | |
| Cyfrowy Polsat SA (c) | 247,735 | 771,369 | |
| Dino Polska SA (a)(b) | 47,541 | 4,497,831 | |
| KGHM Polska Miedz SA (Bearer) | 135,791 | 3,618,794 | |
| LPP SA | 1,079 | 3,473,662 | |
| mBank SA (a) | 14,404 | 1,777,567 | |
| Orlen SA | 562,754 | 8,884,781 | |
| PGE Polska Grupa Energetyczna SA (a) | 875,622 | 1,517,145 | |
| Powszechna Kasa Oszczednosci Bank SA (a) | 848,264 | 8,764,485 | |
| Powszechny Zaklad Ubezpieczen SA | 586,267 | 6,626,743 | |
| Santander Bank Polska SA (a) | 34,673 | 3,757,020 | |
TOTAL POLAND | 55,340,514 | ||
| Qatar - 0.9% | |||
| Barwa Real Estate Co. (a) | 2,081,270 | 1,446,200 | |
| Dukhan Bank | 1,777,612 | 1,770,289 | |
| Industries Qatar QSC (a) | 1,467,114 | 4,923,959 | |
| Masraf al Rayan | 5,412,453 | 3,121,711 | |
| Mesaieed Petrochemical Holding Co. (a) | 4,267,362 | 1,863,528 | |
| Ooredoo QSC | 779,048 | 2,116,118 | |
| Qatar Electricity & Water Co. (a) | 419,079 | 1,903,754 | |
| Qatar Fuel Co. (a) | 578,744 | 2,360,436 | |
| Qatar Gas Transport Co. Ltd. (Nakilat) (a) | 2,420,651 | 2,340,206 | |
| Qatar International Islamic Bank QSC (a) | 954,700 | 2,425,426 | |
| Qatar Islamic Bank | 1,604,227 | 7,666,451 | |
| Qatar National Bank SAQ | 4,478,926 | 18,316,728 | |
| The Commercial Bank of Qatar (a) | 3,140,826 | 4,421,828 | |
TOTAL QATAR | 54,676,634 | ||
| Romania - 0.0% | |||
| NEPI Rockcastle PLC | 486,610 | 2,628,151 | |
| Russia - 0.1% | |||
| Alrosa Co. Ltd. (d) | 2,234,923 | 371,902 | |
| Gazprom OAO (d) | 8,473,436 | 886,875 | |
| Gazprom OAO sponsored ADR (Reg. S) (a)(d) | 863,533 | 197,265 | |
| Inter Rao Ues JSC (d) | 31,187,844 | 171,988 | |
| LUKOIL PJSC (d) | 334,533 | 103,570 | |
| LUKOIL PJSC sponsored ADR (a)(d) | 22,773 | 6,442 | |
| MMC Norilsk Nickel PJSC (a)(d) | 48,442 | 322,245 | |
| MMC Norilsk Nickel PJSC sponsored ADR (a)(d) | 59,247 | 142,193 | |
| Mobile TeleSystems OJSC sponsored ADR (a)(d) | 396,417 | 394,827 | |
| Moscow Exchange MICEX-RTS OAO (d) | 1,311,841 | 252,234 | |
| Novatek PJSC GDR (Reg. S) (a)(d) | 78,382 | 4,075,864 | |
| Novolipetsk Steel OJSC (a)(d) | 1,258,902 | 12,089 | |
| Novolipetsk Steel OJSC GDR (Reg. S) (a)(d) | 3,783 | 470 | |
| Ozon Holdings PLC ADR (a)(d) | 40,002 | 83,826 | |
| PhosAgro PJSC: | |||
| GDR (Reg. S) (a)(d) | 116,446 | 2,388 | |
| sponsored GDR (Reg. S) (a)(d) | 749 | 15 | |
| Polyus PJSC (a)(d) | 26,742 | 62,902 | |
| Polyus PJSC GDR (a)(d) | 5,226 | 8,008 | |
| Rosneft Oil Co. OJSC (d) | 857,494 | 143,441 | |
| Rosneft Oil Co. OJSC GDR (Reg. S) (a)(d) | 150,200 | 35,515 | |
| Sberbank of Russia (d) | 9,313,306 | 57,276 | |
| Severstal PAO (a)(d) | 155,372 | 3,470 | |
| Severstal PAO GDR (Reg. S) (a)(d) | 26,165 | 618 | |
| Surgutneftegas OJSC (d) | 5,613,549 | 68,707 | |
| Surgutneftegas OJSC sponsored ADR (a)(d) | 73,333 | 13,542 | |
| Tatneft PAO (d) | 1,103,564 | 137,293 | |
| Tatneft PAO sponsored ADR (a)(d) | 18,698 | 17,264 | |
| TCS Group Holding PLC GDR (a)(d) | 103,050 | 131,252 | |
| United Co. RUSAL International PJSC (d) | 2,596,470 | 312,996 | |
| VK Co. Ltd. GDR (Reg. S) (a)(d) | 100,000 | 29,716 | |
| VTB Bank OJSC (a)(d) | 2,380,815,800 | 90,983 | |
| VTB Bank OJSC sponsored GDR (Reg. S) (a)(d) | 221,738 | 37,021 | |
| X5 Retail Group NV: | |||
| GDR (Reg. S) (a)(d) | 102,956 | 24,296 | |
| GDR (Reg. S) (a)(d) | 4,876 | 49,150 | |
| Yandex NV Class A (a)(d) | 261,431 | 976,296 | |
TOTAL RUSSIA | 9,223,939 | ||
| Saudi Arabia - 4.0% | |||
| ACWA Power Co. | 92,348 | 5,587,748 | |
| Advanced Petrochemicals Co. | 123,541 | 1,228,297 | |
| Al Rajhi Bank | 1,900,395 | 33,989,899 | |
| Alinma Bank | 950,104 | 8,332,024 | |
| Almarai Co. Ltd. | 242,463 | 3,612,774 | |
| Arab National Bank | 654,259 | 4,143,617 | |
| Arabian Internet and Communications Services Co. Ltd. | 23,265 | 1,939,784 | |
| Bank Al-Jazira (a) | 389,095 | 1,696,768 | |
| Bank Albilad | 475,006 | 4,710,050 | |
| Banque Saudi Fransi | 572,562 | 5,471,358 | |
| Bupa Arabia for Cooperative Insurance Co. | 72,726 | 4,129,075 | |
| Dallah Healthcare Co. | 33,160 | 1,308,157 | |
| Dar Al Arkan Real Estate Development Co. (a) | 513,467 | 2,066,679 | |
| Dr Sulaiman Al Habib Medical Services Group Co. | 84,850 | 5,699,488 | |
| Elm Co. | 23,270 | 4,349,324 | |
| Etihad Etisalat Co. | 365,817 | 4,495,192 | |
| Jarir Marketing Co. | 569,601 | 2,198,481 | |
| Luberef | 49,078 | 1,687,563 | |
| Mobile Telecommunications Co. Saudi Arabia | 426,955 | 1,570,524 | |
| Mouwasat Medical Services Co. | 95,026 | 2,532,946 | |
| Nahdi Medical Co. | 37,835 | 1,430,057 | |
| National Industrialization Co. (a) | 317,621 | 983,782 | |
| Power & Water Utility Co. for Jubail & Yanbu | 72,571 | 1,052,314 | |
| Rabigh Refining & Petrochemical Co. (a) | 405,198 | 1,088,708 | |
| Riyad Bank | 1,425,205 | 10,086,148 | |
| Sabic Agriculture-Nutrients Co. | 226,136 | 8,065,091 | |
| Sahara International Petrochemical Co. | 348,302 | 2,994,120 | |
| Saudi Arabian Mining Co. | 1,253,134 | 12,024,956 | |
| Saudi Arabian Oil Co. (b) | 2,581,335 | 22,912,479 | |
| Saudi Awwal Bank | 976,169 | 8,703,714 | |
| Saudi Basic Industries Corp. | 872,688 | 17,911,551 | |
| Saudi Electricity Co. | 805,804 | 3,823,252 | |
| Saudi Industrial Investment Group | 358,506 | 2,289,637 | |
| Saudi Investment Bank/The | 474,594 | 1,859,615 | |
| Saudi Kayan Petrochemical Co. (a) | 712,745 | 2,010,034 | |
| Saudi Research & Marketing Group (a) | 34,870 | 1,310,553 | |
| Saudi Tadawul Group Holding Co. | 46,545 | 2,061,995 | |
| Saudi Telecom Co. | 1,939,588 | 19,852,911 | |
| The Co. for Cooperative Insurance | 71,265 | 2,294,704 | |
| The Saudi National Bank | 2,850,595 | 25,492,446 | |
| The Savola Group | 253,758 | 2,462,094 | |
| Yanbu National Petrochemical Co. | 267,114 | 2,694,921 | |
TOTAL SAUDI ARABIA | 254,154,830 | ||
| South Africa - 2.8% | |||
| Absa Group Ltd. | 821,918 | 7,493,511 | |
| African Rainbow Minerals Ltd. | 108,874 | 897,163 | |
| Anglo American Platinum Ltd. | 64,307 | 2,148,599 | |
| Aspen Pharmacare Holdings Ltd. | 367,760 | 3,340,474 | |
| Bid Corp. Ltd. | 325,291 | 6,900,969 | |
| Bidvest Group Ltd./The | 280,539 | 3,970,972 | |
| Capitec Bank Holdings Ltd. (c) | 84,422 | 7,496,130 | |
| Clicks Group Ltd. | 234,864 | 3,460,928 | |
| Discovery Ltd. | 522,113 | 3,602,054 | |
| Exxaro Resources Ltd. (c) | 237,029 | 2,377,730 | |
| FirstRand Ltd. (c) | 4,895,747 | 16,139,219 | |
| Gold Fields Ltd. | 866,432 | 11,429,926 | |
| Growthpoint Properties Ltd. (c) | 3,344,709 | 1,738,979 | |
| Harmony Gold Mining Co. Ltd. (c) | 539,432 | 2,473,225 | |
| Impala Platinum Holdings Ltd. | 840,073 | 3,499,401 | |
| Kumba Iron Ore Ltd. | 62,486 | 1,655,632 | |
| MTN Group Ltd. | 1,644,346 | 8,026,967 | |
| Naspers Ltd. Class N | 190,022 | 29,662,600 | |
| Nedbank Group Ltd. | 426,156 | 4,586,136 | |
| Northam Platinum Holdings Ltd. | 346,141 | 2,089,197 | |
| Old Mutual Ltd. | 4,724,302 | 3,003,782 | |
| OUTsurance Group Ltd. | 817,387 | 1,768,319 | |
| Pepkor Holdings Ltd. (b) | 1,953,025 | 1,781,431 | |
| Remgro Ltd. | 513,102 | 3,966,612 | |
| Sanlam Ltd. | 1,708,917 | 5,993,932 | |
| Sasol Ltd. | 553,579 | 6,997,094 | |
| Shoprite Holdings Ltd. | 487,606 | 6,248,421 | |
| Sibanye-Stillwater Ltd. | 2,744,660 | 3,500,957 | |
| Standard Bank Group Ltd. | 1,299,790 | 12,754,854 | |
| Vodacom Group Ltd. | 604,502 | 3,290,826 | |
| Woolworths Holdings Ltd. | 910,063 | 3,388,291 | |
TOTAL SOUTH AFRICA | 175,684,331 | ||
| Taiwan - 14.4% | |||
| Accton Technology Corp. | 489,000 | 7,570,864 | |
| Acer, Inc. | 2,807,994 | 2,965,443 | |
| Advantech Co. Ltd. | 456,100 | 4,680,421 | |
| ASE Technology Holding Co. Ltd. | 2,968,927 | 10,386,152 | |
| Asia Cement Corp. | 2,234,153 | 2,756,775 | |
| ASUSTeK Computer, Inc. | 685,000 | 7,176,784 | |
| AUO Corp. | 6,344,400 | 3,068,610 | |
| Catcher Technology Co. Ltd. | 561,000 | 3,144,728 | |
| Cathay Financial Holding Co. Ltd. | 9,245,410 | 12,536,822 | |
| Chailease Holding Co. Ltd. | 1,486,944 | 8,059,790 | |
| Chang Hwa Commercial Bank | 5,259,011 | 2,783,964 | |
| Cheng Shin Rubber Industry Co. Ltd. | 1,885,937 | 2,575,230 | |
| China Airlines Ltd. | 2,796,000 | 1,674,788 | |
| China Development Financial Ho (a) | 15,511,648 | 5,418,056 | |
| China Steel Corp. | 11,448,204 | 8,534,399 | |
| Chunghwa Telecom Co. Ltd. | 3,687,000 | 13,176,557 | |
| Compal Electronics, Inc. | 4,059,000 | 3,527,942 | |
| CTBC Financial Holding Co. Ltd. | 17,087,826 | 12,858,988 | |
| Delta Electronics, Inc. | 1,889,381 | 17,013,782 | |
| E Ink Holdings, Inc. | 829,000 | 4,310,069 | |
| E.SUN Financial Holdings Co. Ltd. | 13,650,270 | 10,050,309 | |
| ECLAT Textile Co. Ltd. | 172,613 | 2,745,235 | |
| eMemory Technology, Inc. | 62,000 | 3,881,398 | |
| EVA Airways Corp. | 2,494,000 | 2,113,319 | |
| Evergreen Marine Corp. (Taiwan) | 985,363 | 3,276,544 | |
| Far Eastern New Century Corp. | 2,856,705 | 2,600,775 | |
| Far EasTone Telecommunications Co. Ltd. | 1,549,000 | 3,625,622 | |
| Feng Tay Enterprise Co. Ltd. | 478,408 | 2,639,649 | |
| First Financial Holding Co. Ltd. | 10,562,760 | 8,445,246 | |
| Formosa Chemicals & Fibre Corp. | 3,410,760 | 6,412,319 | |
| Formosa Petrochemical Corp. | 1,108,000 | 2,704,799 | |
| Formosa Plastics Corp. | 3,703,520 | 8,800,827 | |
| Fubon Financial Holding Co. Ltd. | 7,572,356 | 14,070,669 | |
| Giant Manufacturing Co. Ltd. | 303,935 | 1,535,686 | |
| Gigabyte Technology Co. Ltd. | 493,000 | 3,346,833 | |
| Global Unichip Corp. | 85,000 | 3,795,982 | |
| GlobalWafers Co. Ltd. | 211,000 | 3,099,292 | |
| Hon Hai Precision Industry Co. Ltd. (Foxconn) | 12,097,869 | 36,080,871 | |
| Hotai Motor Co. Ltd. | 296,760 | 5,533,021 | |
| Hua Nan Financial Holdings Co. Ltd. | 8,595,032 | 5,385,999 | |
| Innolux Corp. | 8,362,133 | 3,149,822 | |
| Inventec Corp. | 2,608,865 | 3,265,777 | |
| Largan Precision Co. Ltd. | 97,000 | 6,207,760 | |
| Lite-On Technology Corp. | 1,952,279 | 6,073,763 | |
| MediaTek, Inc. | 1,473,292 | 38,422,367 | |
| Mega Financial Holding Co. Ltd. | 10,899,691 | 12,358,728 | |
| Micro-Star International Co. Ltd. | 695,000 | 3,555,196 | |
| momo.com, Inc. | 82,080 | 1,352,163 | |
| Nan Ya Plastics Corp. | 4,614,860 | 8,822,916 | |
| Nan Ya Printed Circuit Board Corp. | 220,000 | 1,613,579 | |
| Nanya Technology Corp. | 1,201,000 | 2,405,886 | |
| Nien Made Enterprise Co. Ltd. | 170,000 | 1,502,890 | |
| Novatek Microelectronics Corp. | 560,000 | 7,880,447 | |
| Pegatron Corp. | 1,938,000 | 4,519,078 | |
| PharmaEssentia Corp. (a) | 231,000 | 2,297,032 | |
| Pou Chen Corp. | 2,139,000 | 1,905,157 | |
| Powerchip Semiconductor Manufacturing Corp. | 2,956,294 | 2,430,035 | |
| President Chain Store Corp. | 555,000 | 4,411,265 | |
| Quanta Computer, Inc. | 2,622,000 | 15,469,168 | |
| Realtek Semiconductor Corp. | 473,401 | 5,895,393 | |
| Ruentex Development Co. Ltd. | 1,480,555 | 1,483,671 | |
| Shin Kong Financial Holding Co. Ltd. (a) | 12,723,127 | 3,415,412 | |
| Sinopac Financial Holdings Co. | 10,198,435 | 5,620,268 | |
| Synnex Technology International Corp. | 1,213,500 | 2,573,436 | |
| Taishin Financial Holdings Co. Ltd. | 10,885,689 | 5,801,593 | |
| Taiwan Business Bank | 5,977,696 | 2,354,979 | |
| Taiwan Cement Corp. | 6,244,730 | 6,217,561 | |
| Taiwan Cooperative Financial Holding Co. Ltd. | 9,979,868 | 7,744,067 | |
| Taiwan High Speed Rail Corp. | 1,918,000 | 1,740,090 | |
| Taiwan Mobile Co. Ltd. | 1,672,900 | 4,940,060 | |
| Taiwan Semiconductor Manufacturing Co. Ltd. | 23,887,000 | 389,834,403 | |
| The Shanghai Commercial & Savings Bank Ltd. | 3,730,609 | 4,939,219 | |
| Uni-President Enterprises Corp. | 4,684,983 | 9,821,283 | |
| Unimicron Technology Corp. | 1,331,000 | 5,931,574 | |
| United Microelectronics Corp. | 10,911,000 | 15,679,179 | |
| Vanguard International Semiconductor Corp. | 873,000 | 1,894,454 | |
| Voltronic Power Technology Corp. | 63,000 | 2,524,602 | |
| Walsin Lihwa Corp. | 2,737,526 | 2,911,258 | |
| Wan Hai Lines Ltd. | 678,950 | 969,650 | |
| Winbond Electronics Corp. | 2,894,000 | 2,240,897 | |
| Winbond Electronics Corp. rights 11/3/23 (a) | 116,341 | 10,573 | |
| Wistron Corp. | 2,530,000 | 7,049,474 | |
| Wiwynn Corp. | 84,756 | 4,012,913 | |
| WPG Holding Co. Ltd. | 1,547,200 | 3,421,050 | |
| Yageo Corp. | 327,845 | 5,340,919 | |
| Yang Ming Marine Transport Corp. | 1,692,000 | 2,203,619 | |
| Yuanta Financial Holding Co. Ltd. | 9,844,750 | 7,390,833 | |
| Zhen Ding Technology Holding Ltd. | 643,000 | 1,942,573 | |
TOTAL TAIWAN | 907,912,591 | ||
| Thailand - 1.8% | |||
| Advanced Info Service PCL (For. Reg.) | 1,155,000 | 7,035,126 | |
| Airports of Thailand PCL (For. Reg.) (a) | 4,163,000 | 7,686,326 | |
| Asset World Corp. PCL (For. Reg.) | 6,821,000 | 652,714 | |
| B. Grimm Power PCL (For. Reg.) | 606,400 | 370,964 | |
| Bangkok Dusit Medical Services PCL (For. Reg.) | 10,794,400 | 7,913,215 | |
| Bangkok Expressway and Metro PCL (For. Reg.) | 7,441,000 | 1,625,587 | |
| Banpu PCL: | |||
| (For. Reg.) | 7,382,700 | 1,551,941 | |
| NVDR | 2,300 | 483 | |
| Berli Jucker PCL (For. Reg.) | 977,200 | 764,517 | |
| BTS Group Holdings PCL (For. Reg.) | 7,688,200 | 1,599,020 | |
| Bumrungrad Hospital PCL: | |||
| (For. Reg.) | 556,700 | 4,001,286 | |
| NVDR | 21,800 | 156,688 | |
| Central Pattana PCL (For. Reg.) | 1,964,300 | 3,398,272 | |
| Central Retail Corp. PCL (For. Reg.) | 1,799,916 | 1,830,641 | |
| Charoen Pokphand Foods PCL (For. Reg.) | 3,771,720 | 1,951,139 | |
| CP ALL PCL (For. Reg.) | 5,669,500 | 8,665,070 | |
| CP Axtra PCL: | |||
| (For. Reg.) | 1,727,500 | 1,350,721 | |
| NVDR | 12,800 | 10,008 | |
| Delta Electronics PCL (For. Reg.) | 3,023,900 | 6,609,851 | |
| Electricity Generating PCL (For. Reg.) | 228,500 | 771,365 | |
| Energy Absolute PCL (For. Reg.) | 1,634,500 | 1,899,938 | |
| Global Power Synergy Public Co. Ltd. (For. Reg.) | 687,100 | 741,776 | |
| Gulf Energy Development PCL (For. Reg.) | 2,706,100 | 3,238,870 | |
| Home Product Center PCL (For. Reg.) | 5,750,106 | 1,893,225 | |
| Indorama Ventures PCL (For. Reg.) | 1,636,000 | 1,071,966 | |
| Intouch Holdings PCL (For. Reg.) | 941,300 | 1,849,032 | |
| Kasikornbank PCL (For. Reg.) | 575,700 | 2,093,828 | |
| Krung Thai Bank PCL (For. Reg.) | 3,393,570 | 1,764,558 | |
| Krungthai Card PCL (For. Reg.) | 1,002,700 | 1,213,871 | |
| Land & House PCL (For. Reg.) | 8,248,700 | 1,723,180 | |
| Minor International PCL (For. Reg.) | 3,186,532 | 2,469,464 | |
| Muangthai Leasing PCL (For. Reg.) | 721,900 | 729,082 | |
| Osotspa PCL (For. Reg.) | 1,143,000 | 743,305 | |
| PTT Exploration and Production PCL (For. Reg.) | 1,348,339 | 6,123,561 | |
| PTT Global Chemical PCL (For. Reg.) | 2,188,439 | 2,090,201 | |
| PTT Oil & Retail Business PCL: | |||
| (For. Reg.) | 1,426,500 | 722,398 | |
| NVDR | 1,490,200 | 754,657 | |
| PTT PCL (For. Reg.) | 9,700,800 | 8,929,319 | |
| Ratch Group PCL (For. Reg.) | 1,049,200 | 936,119 | |
| SCB X PCL (For. Reg.) | 818,300 | 2,231,158 | |
| SCG Packaging PCL (For. Reg.) | 1,244,200 | 1,239,773 | |
| Siam Cement PCL (For. Reg.) | 759,550 | 6,050,777 | |
| Thai Oil PCL (For. Reg.) | 1,194,114 | 1,554,806 | |
| TMBThanachart Bank PCL: | |||
| (For. Reg.) | 23,430,400 | 1,082,413 | |
| NVDR | 101,100 | 4,671 | |
| True Corp. PCL | 7,506,579 | 1,258,958 | |
TOTAL THAILAND | 112,355,840 | ||
| Turkey - 0.7% | |||
| Akbank TAS | 3,025,164 | 3,147,023 | |
| Aselsan A/S | 1,327,023 | 1,937,168 | |
| Bim Birlesik Magazalar A/S JSC | 441,619 | 4,241,651 | |
| Eregli Demir ve Celik Fabrikalari T.A.S. (a) | 1,358,415 | 1,816,065 | |
| Ford Otomotiv Sanayi A/S | 68,068 | 1,889,947 | |
| Haci Omer Sabanci Holding A/S | 989,124 | 1,868,628 | |
| Hektas Ticaret A/S (a) | 1,104,152 | 854,649 | |
| Koc Holding A/S | 737,729 | 3,563,701 | |
| Koza Altin Isletmeleri A/S | 931,931 | 722,661 | |
| Pegasus Hava Tasimaciligi A/S (a) | 44,596 | 1,110,205 | |
| Sasa Polyester Sanayi A/S | 1,027,139 | 1,550,905 | |
| Tofas Turk Otomobil Fabrikasi A/S | 121,200 | 1,030,142 | |
| Turk Hava Yollari AO (a) | 535,046 | 4,105,529 | |
| Turkcell Iletisim Hizmet A/S | 1,173,612 | 1,989,226 | |
| Turkiye Is Bankasi A/S Series C | 3,393,937 | 2,514,360 | |
| Turkiye Petrol Rafinerileri A/S | 934,244 | 4,681,241 | |
| Turkiye Sise ve Cam Fabrikalari A/S | 1,336,841 | 2,234,736 | |
| Yapi ve Kredi Bankasi A/S | 3,276,138 | 1,994,425 | |
TOTAL TURKEY | 41,252,262 | ||
| United Arab Emirates - 1.3% | |||
| Abu Dhabi Commercial Bank PJSC | 2,838,873 | 6,206,412 | |
| Abu Dhabi Islamic Bank (a) | 1,408,269 | 3,949,134 | |
| Abu Dhabi National Oil Co. for Distribution PJSC | 3,029,534 | 2,771,368 | |
| Aldar Properties PJSC | 3,738,001 | 5,292,024 | |
| Americana Restaurants International PLC | 2,449,785 | 2,467,793 | |
| Dubai Islamic Bank Pakistan Ltd. | 2,807,102 | 4,126,967 | |
| Emaar Properties PJSC | 6,429,072 | 11,709,908 | |
| Emirates NBD Bank PJSC | 1,837,306 | 8,478,719 | |
| Emirates Telecommunications Corp. | 3,373,862 | 16,956,573 | |
| First Abu Dhabi Bank PJSC | 4,284,709 | 14,791,753 | |
| Multiply Group (a) | 3,801,436 | 3,518,890 | |
TOTAL UNITED ARAB EMIRATES | 80,269,541 | ||
| United Kingdom - 0.1% | |||
| AngloGold Ashanti PLC (c) | 406,912 | 7,521,459 | |
| Pepco Group NV (a) | 167,150 | 676,608 | |
TOTAL UNITED KINGDOM | 8,198,067 | ||
| United States of America - 0.1% | |||
| JBS SA | 752,800 | 2,990,744 | |
| Legend Biotech Corp. ADR (a) | 57,876 | 3,823,867 | |
| Parade Technologies Ltd. | 75,000 | 2,457,123 | |
TOTAL UNITED STATES OF AMERICA | 9,271,734 | ||
| TOTAL COMMON STOCKS (Cost $6,603,225,248) | 5,955,585,895 | ||
| Nonconvertible Preferred Stocks - 2.2% | |||
| Shares | Value ($) | ||
| Brazil - 1.4% | |||
| Banco Bradesco SA (PN) | 5,144,104 | 14,274,015 | |
| Centrais Eletricas Brasileiras SA (Electrobras) (PN-B) | 269,706 | 2,056,864 | |
| Companhia Energetica de Minas Gerais (CEMIG) (PN) | 1,348,780 | 3,140,711 | |
| Gerdau SA | 1,121,275 | 4,841,604 | |
| Itau Unibanco Holding SA | 4,698,231 | 24,992,623 | |
| Itausa-Investimentos Itau SA (PN) | 4,939,252 | 8,464,350 | |
| Petroleo Brasileiro SA - Petrobras (PN) (non-vtg.) | 4,636,600 | 31,948,328 | |
TOTAL BRAZIL | 89,718,495 | ||
| Chile - 0.1% | |||
| Sociedad Quimica y Minera de Chile SA (PN-B) | 138,503 | 6,700,760 | |
| Colombia - 0.1% | |||
| Bancolombia SA (PN) | 423,207 | 2,714,447 | |
| Korea (South) - 0.6% | |||
| Hyundai Motor Co. Ltd. | 21,030 | 1,550,698 | |
| Hyundai Motor Co. Ltd. Series 2 | 36,104 | 2,678,266 | |
| LG Chemical Ltd. | 7,444 | 1,552,419 | |
| LG H & H Co. Ltd. | 2 | 210 | |
| Samsung Electronics Co. Ltd. | 797,899 | 31,808,677 | |
TOTAL KOREA (SOUTH) | 37,590,270 | ||
| Russia - 0.0% | |||
| Surgutneftegas OJSC (d) | 5,794,540 | 100,840 | |
| TOTAL NONCONVERTIBLE PREFERRED STOCKS (Cost $148,346,263) | 136,824,812 | ||
| Nonconvertible Bonds - 0.0% | |||
Principal Amount (e) | Value ($) | ||
| India - 0.0% | |||
NTPC Ltd. 8.49% 3/25/25 (Cost $52,909) | INR | 264,162 | 33,458 |
| Government Obligations - 0.2% | |||
Principal Amount (e) | Value ($) | ||
| United States of America - 0.2% | |||
U.S. Treasury Bills, yield at date of purchase 5.42% 2/22/24 (f) (Cost $14,750,623) | 15,000,000 | 14,749,752 | |
| Money Market Funds - 4.6% | |||
| Shares | Value ($) | ||
| Fidelity Cash Central Fund 5.40% (g) | 205,320,582 | 205,361,646 | |
| Fidelity Securities Lending Cash Central Fund 5.40% (g)(h) | 83,807,006 | 83,815,387 | |
| TOTAL MONEY MARKET FUNDS (Cost $289,177,033) | 289,177,033 | ||
| TOTAL INVESTMENT IN SECURITIES - 101.3% (Cost $7,055,552,076) | 6,396,370,950 |
NET OTHER ASSETS (LIABILITIES) - (1.3)% | (84,984,023) |
| NET ASSETS - 100.0% | 6,311,386,927 |
| Futures Contracts | |||||
Number of contracts | Expiration Date | Notional Amount ($) | Value ($) | Unrealized Appreciation/ (Depreciation) ($) | |
| Purchased | |||||
| Equity Index Contracts | |||||
| ICE MSCI Emerging Markets Index Contracts (United States) | 4,702 | Dec 2023 | 216,103,920 | (9,953,109) | (9,953,109) |
| The notional amount of futures purchased as a percentage of Net Assets is 3.4% | |||||
| INR | - | Indian rupee |
| (a) | Non-income producing |
| (b) | Security exempt from registration under Rule 144A of the Securities Act of 1933. These securities may be resold in transactions exempt from registration, normally to qualified institutional buyers. At the end of the period, the value of these securities amounted to $316,902,537 or 5.0% of net assets. |
| (c) | Security or a portion of the security is on loan at period end. |
| (d) | Level 3 security |
| (e) | Amount is stated in United States dollars unless otherwise noted. |
| (f) | Security or a portion of the security was pledged to cover margin requirements for futures contracts. At period end, the value of securities pledged amounted to $7,277,528. |
| (g) | Affiliated fund that is generally available only to investment companies and other accounts managed by Fidelity Investments. The rate quoted is the annualized seven-day yield of the fund at period end. A complete unaudited listing of the fund's holdings as of its most recent quarter end is available upon request. In addition, each Fidelity Central Fund's financial statements, which are not covered by the Fund's Report of Independent Registered Public Accounting Firm, are available on the SEC's website or upon request. |
| (h) | Investment made with cash collateral received from securities on loan. |
| Affiliate | Value, beginning of period ($) | Purchases ($) | Sales Proceeds ($) | Dividend Income ($) | Realized Gain (loss) ($) | Change in Unrealized appreciation (depreciation) ($) | Value, end of period ($) | % ownership, end of period |
| Fidelity Cash Central Fund 5.40% | 62,332,615 | 1,425,848,979 | 1,282,819,948 | 7,674,790 | - | - | 205,361,646 | 0.5% |
| Fidelity Securities Lending Cash Central Fund 5.40% | 20,632,407 | 371,661,351 | 308,478,371 | 901,498 | - | - | 83,815,387 | 0.3% |
| Total | 82,965,022 | 1,797,510,330 | 1,591,298,319 | 8,576,288 | - | - | 289,177,033 | |
| Valuation Inputs at Reporting Date: | ||||
| Description | Total ($) | Level 1 ($) | Level 2 ($) | Level 3 ($) |
Investments in Securities: | ||||
| Equities: | ||||
Communication Services | 569,839,189 | 104,635,404 | 463,802,946 | 1,400,839 |
Consumer Discretionary | 825,949,623 | 176,035,253 | 649,830,544 | 83,826 |
Consumer Staples | 380,099,419 | 122,683,501 | 257,342,471 | 73,447 |
Energy | 326,848,680 | 124,918,661 | 196,143,401 | 5,786,618 |
Financials | 1,365,401,835 | 500,646,106 | 864,186,963 | 568,766 |
Health Care | 240,441,048 | 28,222,234 | 212,218,814 | - |
Industrials | 390,583,485 | 93,286,283 | 297,297,202 | - |
Information Technology | 1,257,698,668 | 10,270,351 | 1,247,428,317 | - |
Materials | 474,041,461 | 171,355,380 | 301,446,785 | 1,239,296 |
Real Estate | 102,178,520 | 41,306,132 | 60,872,388 | - |
Utilities | 159,328,779 | 57,850,368 | 101,306,421 | 171,990 |
| Corporate Bonds | 33,458 | - | 33,458 | - |
| Government Obligations | 14,749,752 | - | 14,749,752 | - |
| Money Market Funds | 289,177,033 | 289,177,033 | - | - |
| Total Investments in Securities: | 6,396,370,950 | 1,720,386,706 | 4,666,659,462 | 9,324,782 |
Derivative Instruments: Liabilities | ||||
Futures Contracts | (9,953,109) | (9,953,109) | - | - |
| Total Liabilities | (9,953,109) | (9,953,109) | - | - |
| Total Derivative Instruments: | (9,953,109) | (9,953,109) | - | - |
Primary Risk Exposure / Derivative Type | Value | |
| Asset ($) | Liability ($) | |
| Equity Risk | ||
Futures Contracts (a) | 0 | (9,953,109) |
| Total Equity Risk | 0 | (9,953,109) |
| Total Value of Derivatives | 0 | (9,953,109) |
| Statement of Assets and Liabilities | ||||
| October 31, 2023 | ||||
| Assets | ||||
| Investment in securities, at value (including securities loaned of $78,528,995) - See accompanying schedule: | ||||
Unaffiliated issuers (cost $6,766,375,043) | $ | 6,107,193,917 | ||
Fidelity Central Funds (cost $289,177,033) | 289,177,033 | |||
| Total Investment in Securities (cost $7,055,552,076) | $ | 6,396,370,950 | ||
| Cash | 1,480,813 | |||
| Foreign currency held at value (cost $11,949,458) | 11,438,887 | |||
| Receivable for investments sold | 5,046 | |||
| Receivable for fund shares sold | 12,314,673 | |||
| Dividends receivable | 7,753,905 | |||
| Interest receivable | 125 | |||
| Distributions receivable from Fidelity Central Funds | 1,098,972 | |||
| Other receivables | 85,333 | |||
Total assets | 6,430,548,704 | |||
| Liabilities | ||||
| Payable for investments purchased | $ | 348 | ||
| Payable for fund shares redeemed | 8,481,716 | |||
| Accrued management fee | 402,235 | |||
| Payable for daily variation margin on futures contracts | 1,430,948 | |||
| Deferred taxes | 25,034,520 | |||
| Other payables and accrued expenses | 105 | |||
| Collateral on securities loaned | 83,811,905 | |||
| Total Liabilities | 119,161,777 | |||
| Net Assets | $ | 6,311,386,927 | ||
| Net Assets consist of: | ||||
| Paid in capital | $ | 7,653,787,779 | ||
| Total accumulated earnings (loss) | (1,342,400,852) | |||
| Net Assets | $ | 6,311,386,927 | ||
Net Asset Value, offering price and redemption price per share ($6,311,386,927 ÷ 682,174,487 shares) | $ | 9.25 | ||
| Statement of Operations | ||||
Year ended October 31, 2023 | ||||
| Investment Income | ||||
| Dividends | $ | 189,904,744 | ||
| Non-Cash dividends | 14,008,039 | |||
| Interest | 602,427 | |||
| Income from Fidelity Central Funds (including $901,498 from security lending) | 8,576,288 | |||
| Income before foreign taxes withheld | $ | 213,091,498 | ||
| Less foreign taxes withheld | (22,620,498) | |||
| Total Income | 190,471,000 | |||
| Expenses | ||||
| Management fee | $ | 4,732,606 | ||
| Independent trustees' fees and expenses | 21,688 | |||
| Total expenses before reductions | 4,754,294 | |||
| Expense reductions | (64,889) | |||
| Total expenses after reductions | 4,689,405 | |||
| Net Investment income (loss) | 185,781,595 | |||
| Realized and Unrealized Gain (Loss) | ||||
| Net realized gain (loss) on: | ||||
| Investment Securities: | ||||
| Unaffiliated issuers (net of foreign taxes of $1,186,821) | (215,485,861) | |||
| Foreign currency transactions | (149,073) | |||
| Futures contracts | 8,974,516 | |||
| Total net realized gain (loss) | (206,660,418) | |||
| Change in net unrealized appreciation (depreciation) on: | ||||
| Investment Securities: | ||||
| Unaffiliated issuers(net of increase in deferred foreign taxes of $2,388,227) | 565,422,380 | |||
| Assets and liabilities in foreign currencies | (290,798) | |||
| Futures contracts | (9,104,849) | |||
| Total change in net unrealized appreciation (depreciation) | 556,026,733 | |||
| Net gain (loss) | 349,366,315 | |||
| Net increase (decrease) in net assets resulting from operations | $ | 535,147,910 | ||
| Statement of Changes in Net Assets | ||||
Year ended October 31, 2023 | Year ended October 31, 2022 | |||
| Increase (Decrease) in Net Assets | ||||
| Operations | ||||
| Net investment income (loss) | $ | 185,781,595 | $ | 185,918,754 |
| Net realized gain (loss) | (206,660,418) | (288,874,732) | ||
| Change in net unrealized appreciation (depreciation) | 556,026,733 | (2,125,258,642) | ||
| Net increase (decrease) in net assets resulting from operations | 535,147,910 | (2,228,214,620) | ||
| Distributions to shareholders | (144,831,374) | (141,768,973) | ||
| Share transactions | ||||
| Proceeds from sales of shares | 2,426,882,664 | 4,848,475,063 | ||
| Reinvestment of distributions | 115,318,941 | 111,740,080 | ||
| Cost of shares redeemed | (1,855,775,506) | (3,797,103,742) | ||
Net increase (decrease) in net assets resulting from share transactions | 686,426,099 | 1,163,111,401 | ||
| Total increase (decrease) in net assets | 1,076,742,635 | (1,206,872,192) | ||
| Net Assets | ||||
| Beginning of period | 5,234,644,292 | 6,441,516,484 | ||
| End of period | $ | 6,311,386,927 | $ | 5,234,644,292 |
| Other Information | ||||
| Shares | ||||
| Sold | 248,751,213 | 456,938,763 | ||
| Issued in reinvestment of distributions | 12,281,037 | 9,382,039 | ||
| Redeemed | (190,452,525) | (364,529,607) | ||
| Net increase (decrease) | 70,579,725 | 101,791,195 | ||
| Fidelity® Emerging Markets Index Fund |
| Years ended October 31, | 2023 | 2022 | 2021 | 2020 | 2019 | |||||
Selected Per-Share Data | ||||||||||
| Net asset value, beginning of period | $ | 8.56 | $ | 12.64 | $ | 11.07 | $ | 10.48 | $ | 9.62 |
| Income from Investment Operations | ||||||||||
Net investment income (loss) A,B | .29 | .32 | .28 | .22 | .35 C | |||||
| Net realized and unrealized gain (loss) | .63 | (4.14) | 1.48 | .65 | .72 | |||||
| Total from investment operations | .92 | (3.82) | 1.76 | .87 | 1.07 | |||||
| Distributions from net investment income | (.23) | (.26) | (.19) | (.28) | (.21) | |||||
| Total distributions | (.23) | (.26) | (.19) | (.28) | (.21) | |||||
| Net asset value, end of period | $ | 9.25 | $ | 8.56 | $ | 12.64 | $ | 11.07 | $ | 10.48 |
Total Return D | 10.74% | (30.81)% | 15.95% | 8.54% | 11.33% | |||||
Ratios to Average Net Assets B,E,F | ||||||||||
| Expenses before reductions | .08% | .08% | .07% G | .08% | .08% | |||||
| Expenses net of fee waivers, if any | .08% | .08% | .07% G | .08% | .08% | |||||
| Expenses net of all reductions | .07% | .07% | .07% G | .07% | .08% | |||||
| Net investment income (loss) | 2.93% | 2.97% | 2.17% | 2.20% | 3.40% C | |||||
| Supplemental Data | ||||||||||
| Net assets, end of period (000 omitted) | $ | 6,311,387 | $ | 5,234,644 | $ | 6,441,516 | $ | 3,400,765 | $ | 2,938,021 |
Portfolio turnover rate H | 7% | 8% | 5% | 10% | 3% |
| Average Annual Total Returns | |||
Periods ended October 31, 2023 | Past 1 year | Past 5 years | Past 10 years |
| Fidelity® Global ex U.S. Index Fund | 12.74% | 3.64% | 2.65% |
| $10,000 Over 10 Years |
Let's say hypothetically that $10,000 was invested in Fidelity® Global ex U.S. Index Fund on October 31, 2013. The chart shows how the value of your investment would have changed, and also shows how the MSCI ACWI (All Country World Index) ex USA Index performed over the same period. |
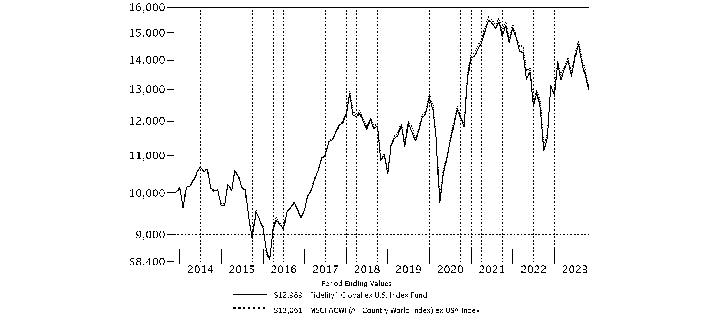 |
Top Holdings (% of Fund's net assets) | ||
| Taiwan Semiconductor Manufacturing Co. Ltd. (Taiwan, Semiconductors & Semiconductor Equipment) | 1.8 | |
| Novo Nordisk A/S Series B (Denmark, Pharmaceuticals) | 1.4 | |
| Nestle SA (Reg. S) (United States of America, Food Products) | 1.3 | |
| Tencent Holdings Ltd. (China, Interactive Media & Services) | 1.1 | |
| ASML Holding NV (Netherlands) (Netherlands, Semiconductors & Semiconductor Equipment) | 1.1 | |
| Samsung Electronics Co. Ltd. (Korea (South), Technology Hardware, Storage & Peripherals) | 1.1 | |
| Shell PLC (London) (Netherlands, Oil, Gas & Consumable Fuels) | 1.0 | |
| LVMH Moet Hennessy Louis Vuitton SE (France, Textiles, Apparel & Luxury Goods) | 0.9 | |
| AstraZeneca PLC (United Kingdom) (United Kingdom, Pharmaceuticals) | 0.9 | |
| Novartis AG (Switzerland, Pharmaceuticals) | 0.9 | |
| 11.5 | ||
| Market Sectors (% of Fund's net assets) | ||
| Financials | 22.4 | |
| Industrials | 11.7 | |
| Consumer Discretionary | 11.7 | |
| Information Technology | 11.2 | |
| Health Care | 9.5 | |
| Consumer Staples | 8.1 | |
| Materials | 7.3 | |
| Energy | 6.7 | |
| Communication Services | 5.4 | |
| Utilities | 2.5 | |
| Real Estate | 1.6 | |
Asset Allocation (% of Fund's net assets) |
 |
Futures - 1.8% |
Geographic Diversification (% of Fund's net assets) |
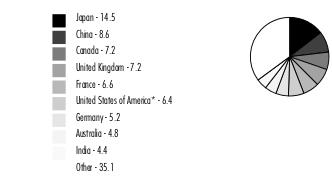 |
* Includes Short-Term investments and Net Other Assets (Liabilities). Percentages are adjusted for the effect of derivatives, if applicable. |
| Common Stocks - 97.2% | |||
| Shares | Value ($) | ||
| Australia - 4.8% | |||
| Ampol Ltd. | 87,270 | 1,769,640 | |
| ANZ Group Holdings Ltd. | 1,106,324 | 17,445,599 | |
| APA Group unit | 469,690 | 2,462,087 | |
| Aristocrat Leisure Ltd. | 217,930 | 5,356,743 | |
| ASX Ltd. | 70,739 | 2,527,334 | |
| Aurizon Holdings Ltd. | 668,740 | 1,456,592 | |
| BHP Group Ltd. | 1,867,998 | 52,878,310 | |
| BlueScope Steel Ltd. | 166,637 | 1,997,555 | |
| Brambles Ltd. | 513,469 | 4,285,286 | |
| Cochlear Ltd. | 24,345 | 3,731,459 | |
| Coles Group Ltd. | 497,823 | 4,831,716 | |
| Commonwealth Bank of Australia | 617,135 | 37,963,618 | |
| Computershare Ltd. | 213,355 | 3,367,159 | |
| DEXUS Property Group unit | 393,147 | 1,623,772 | |
| EBOS Group Ltd. | 56,346 | 1,150,260 | |
| Endeavour Group Ltd. | 518,216 | 1,627,948 | |
| Flutter Entertainment PLC (a) | 11,178 | 1,753,312 | |
| Flutter Entertainment PLC (Ireland) (a) | 54,155 | 8,477,743 | |
| Fortescue Metals Group Ltd. | 625,803 | 8,902,567 | |
| Glencore PLC | 3,886,482 | 20,586,038 | |
| Goodman Group unit | 626,469 | 8,289,381 | |
| IDP Education Ltd. | 90,290 | 1,247,480 | |
| IGO Ltd. | 253,795 | 1,536,823 | |
| Insurance Australia Group Ltd. | 891,545 | 3,216,283 | |
| Lendlease Group unit | 248,471 | 984,068 | |
| Macquarie Group Ltd. | 135,567 | 13,934,929 | |
| Medibank Private Ltd. | 999,467 | 2,181,116 | |
| Mineral Resources Ltd. | 63,841 | 2,353,003 | |
| Mirvac Group unit | 1,446,966 | 1,678,848 | |
| National Australia Bank Ltd. | 1,157,517 | 20,736,055 | |
| Northern Star Resources Ltd. | 426,967 | 3,126,587 | |
| Orica Ltd. | 166,586 | 1,556,567 | |
| Origin Energy Ltd. | 629,689 | 3,652,734 | |
| Pilbara Minerals Ltd. (b) | 1,000,644 | 2,350,511 | |
| Qantas Airways Ltd. (a) | 310,209 | 971,856 | |
| QBE Insurance Group Ltd. | 552,807 | 5,481,693 | |
| Ramsay Health Care Ltd. | 67,175 | 2,080,014 | |
| REA Group Ltd. | 19,400 | 1,781,012 | |
| Reece Ltd. | 82,841 | 923,654 | |
| Rio Tinto Ltd. | 137,289 | 10,255,227 | |
| Rio Tinto PLC | 415,185 | 26,489,019 | |
| Santos Ltd. | 1,184,022 | 5,777,387 | |
| Scentre Group unit | 1,947,326 | 3,016,784 | |
| SEEK Ltd. | 134,023 | 1,768,124 | |
| Sonic Healthcare Ltd. | 167,804 | 3,072,670 | |
| South32 Ltd. | 1,691,051 | 3,617,808 | |
| Stockland Corp. Ltd. unit | 874,883 | 1,974,560 | |
| Suncorp Group Ltd. | 470,935 | 4,008,433 | |
| Telstra Group Ltd. | 1,499,630 | 3,636,423 | |
| The GPT Group | 729,283 | 1,683,061 | |
| The Lottery Corp. Ltd. | 817,274 | 2,359,118 | |
| Transurban Group unit | 1,135,911 | 8,551,699 | |
| Treasury Wine Estates Ltd. | 263,687 | 2,023,965 | |
| Vicinity Centres unit | 1,431,400 | 1,550,395 | |
| Washington H. Soul Pattinson & Co. Ltd. | 87,781 | 1,870,075 | |
| Wesfarmers Ltd. | 420,092 | 13,515,969 | |
| Westpac Banking Corp. | 1,293,801 | 16,989,913 | |
| WiseTech Global Ltd. | 60,436 | 2,250,109 | |
| Woodside Energy Group Ltd. | 699,652 | 15,238,282 | |
| Woolworths Group Ltd. | 451,047 | 10,096,584 | |
TOTAL AUSTRALIA | 402,022,957 | ||
| Austria - 0.2% | |||
| Erste Group Bank AG | 127,509 | 4,553,458 | |
| Mondi PLC | 165,970 | 2,680,968 | |
| Mondi PLC | 11,560 | 186,808 | |
| OMV AG | 53,885 | 2,358,170 | |
| Verbund AG | 25,441 | 2,207,368 | |
| Voestalpine AG | 42,836 | 1,067,852 | |
TOTAL AUSTRIA | 13,054,624 | ||
| Belgium - 0.5% | |||
| Ageas | 58,065 | 2,227,763 | |
| Anheuser-Busch InBev SA NV | 319,956 | 18,204,869 | |
| D'ieteren Group | 7,918 | 1,173,763 | |
| Elia Group SA/NV | 10,902 | 1,034,149 | |
| Groupe Bruxelles Lambert SA | 35,385 | 2,583,420 | |
| KBC Group NV | 92,634 | 5,087,032 | |
| Lotus Bakeries SA | 146 | 1,081,378 | |
| Sofina SA | 5,698 | 1,079,201 | |
| Solvay SA Class A | 27,174 | 2,867,805 | |
| UCB SA | 47,106 | 3,442,148 | |
| Umicore SA | 80,298 | 1,910,518 | |
| Warehouses de Pauw | 60,786 | 1,499,888 | |
TOTAL BELGIUM | 42,191,934 | ||
| Brazil - 1.2% | |||
| Ambev SA | 1,745,600 | 4,452,505 | |
| Atacadao SA | 226,700 | 403,332 | |
| B3 SA - Brasil Bolsa Balcao | 2,165,198 | 4,766,936 | |
| Banco Bradesco SA | 566,415 | 1,380,719 | |
| Banco BTG Pactual SA unit | 431,100 | 2,530,978 | |
| Banco do Brasil SA | 319,900 | 3,067,817 | |
| Banco Santander SA (Brasil) unit | 141,300 | 754,459 | |
| BB Seguridade Participacoes SA | 257,100 | 1,568,582 | |
| CCR SA | 373,000 | 886,307 | |
| Centrais Eletricas Brasileiras SA (Electrobras) | 455,780 | 3,149,576 | |
| Companhia de Saneamento Basico do Estado de Sao Paulo (SABESP) | 125,600 | 1,454,113 | |
| Companhia Siderurgica Nacional SA (CSN) | 236,800 | 552,342 | |
| Cosan SA | 447,464 | 1,397,840 | |
| CPFL Energia SA (a) | 80,700 | 535,252 | |
| Energisa SA unit | 77,800 | 719,246 | |
| Eneva SA (a) | 312,900 | 671,509 | |
| ENGIE Brasil Energia SA | 81,450 | 634,896 | |
| Equatorial Energia SA | 373,347 | 2,340,014 | |
| Hapvida Participacoes e Investimentos SA (a)(c) | 1,914,255 | 1,401,022 | |
| Hypera SA (a) | 139,900 | 840,496 | |
| Itausa-Investimentos Itau SA | 28,608 | 48,685 | |
| Klabin SA unit | 279,300 | 1,185,505 | |
| Localiza Rent a Car SA | 336,784 | 3,398,067 | |
| Localiza Rent a Car SA rights 11/10/23 (a) | 2,469 | 3,428 | |
| Lojas Renner SA (a) | 348,622 | 847,742 | |
| Magazine Luiza SA (a) | 1,104,252 | 291,299 | |
| Natura & Co. Holding SA | 328,603 | 830,999 | |
| Petroleo Brasileiro SA - Petrobras (ON) | 1,375,409 | 10,322,899 | |
| Prio SA (a) | 297,600 | 2,815,594 | |
| Raia Drogasil SA | 468,664 | 2,398,281 | |
| Rede D'Oregon Sao Luiz SA (c) | 209,192 | 897,056 | |
| Rumo SA | 475,900 | 2,105,882 | |
| Sendas Distribuidora SA | 487,800 | 1,058,468 | |
| Suzano Papel e Celulose SA | 290,138 | 2,967,703 | |
| Telefonica Brasil SA | 154,000 | 1,381,854 | |
| TIM SA | 312,900 | 941,477 | |
| Totvs SA | 190,800 | 957,832 | |
| Ultrapar Participacoes SA | 259,100 | 1,050,944 | |
| Vale SA | 1,257,186 | 17,205,501 | |
| Vibra Energia SA (a) | 425,751 | 1,671,168 | |
| Weg SA | 622,700 | 4,077,022 | |
| Wheaton Precious Metals Corp. | 167,461 | 7,072,789 | |
| Yara International ASA | 60,121 | 1,964,396 | |
TOTAL BRAZIL | 99,002,532 | ||
| Burkina Faso - 0.0% | |||
| Endeavour Mining PLC | 67,689 | 1,398,634 | |
| Canada - 7.1% | |||
| Agnico Eagle Mines Ltd. (Canada) | 181,672 | 8,520,603 | |
| Air Canada (a) | 61,918 | 746,990 | |
| Algonquin Power & Utilities Corp. | 239,401 | 1,204,989 | |
| Alimentation Couche-Tard, Inc. Class A (multi-vtg.) | 288,755 | 15,718,850 | |
| AltaGas Ltd. | 103,366 | 1,920,107 | |
| ARC Resources Ltd. | 221,585 | 3,564,854 | |
| Bank of Montreal | 261,841 | 19,786,060 | |
| Bank of Nova Scotia | 438,520 | 17,755,831 | |
| Barrick Gold Corp. (Canada) | 648,184 | 10,353,182 | |
| BCE, Inc. | 26,943 | 1,000,199 | |
| Brookfield Asset Management Ltd. Class A | 130,451 | 3,739,266 | |
| Brookfield Corp. (Canada) Class A | 519,992 | 15,148,857 | |
| CAE, Inc. (a) | 119,224 | 2,489,798 | |
| Cameco Corp. | 160,118 | 6,550,203 | |
| Canadian Apartment Properties (REIT) unit (b) | 29,606 | 871,474 | |
| Canadian Imperial Bank of Commerce | 333,252 | 11,753,636 | |
| Canadian National Railway Co. | 207,350 | 21,939,402 | |
| Canadian Natural Resources Ltd. | 408,423 | 25,935,265 | |
| Canadian Pacific Kansas City Ltd. | 343,385 | 24,380,521 | |
| Canadian Tire Ltd. Class A (non-vtg.) | 19,161 | 1,848,188 | |
| Canadian Utilities Ltd. Class A (non-vtg.) | 45,634 | 965,496 | |
| CCL Industries, Inc. Class B | 54,736 | 2,140,102 | |
| Cenovus Energy, Inc. (Canada) | 528,266 | 10,064,386 | |
| CGI, Inc. Class A (sub. vtg.) (a) | 78,294 | 7,558,681 | |
| Constellation Software, Inc. | 7,434 | 14,902,898 | |
| Constellation Software, Inc. warrants 8/22/28 (a)(d) | 7,326 | 1 | |
| Descartes Systems Group, Inc. (Canada) (a) | 31,829 | 2,300,502 | |
| Dollarama, Inc. | 105,289 | 7,190,098 | |
| Element Fleet Management Corp. | 142,615 | 1,929,300 | |
| Emera, Inc. | 102,457 | 3,355,758 | |
| Empire Co. Ltd. Class A (non-vtg.) | 53,517 | 1,466,484 | |
| Enbridge, Inc. | 784,900 | 25,153,024 | |
| Fairfax Financial Holdings Ltd. (sub. vtg.) | 7,891 | 6,566,757 | |
| FirstService Corp. | 14,838 | 2,099,629 | |
| Fortis, Inc. | 177,260 | 7,037,992 | |
| Franco-Nevada Corp. | 70,778 | 8,610,239 | |
| George Weston Ltd. | 22,928 | 2,486,987 | |
| GFL Environmental, Inc. | 86,405 | 2,489,187 | |
| Gildan Activewear, Inc. | 65,201 | 1,852,005 | |
| Great-West Lifeco, Inc. | 102,674 | 2,844,590 | |
| Hydro One Ltd. (c) | 120,711 | 3,130,173 | |
| iA Financial Corp., Inc. | 37,583 | 2,186,820 | |
| IGM Financial, Inc. | 31,191 | 702,205 | |
| Imperial Oil Ltd. | 75,317 | 4,292,268 | |
| Intact Financial Corp. | 64,529 | 9,066,400 | |
| Ivanhoe Mines Ltd. (a) | 223,295 | 1,645,628 | |
| Keyera Corp. | 84,789 | 1,971,837 | |
| Kinross Gold Corp. | 448,521 | 2,341,656 | |
| Loblaw Companies Ltd. | 58,329 | 4,770,633 | |
| Magna International, Inc. Class A (sub. vtg.) | 100,765 | 4,842,242 | |
| Manulife Financial Corp. | 678,105 | 11,804,186 | |
| Metro, Inc. | 84,597 | 4,297,107 | |
| National Bank of Canada | 124,812 | 7,760,080 | |
| Northland Power, Inc. | 91,764 | 1,289,692 | |
| Nutrien Ltd. | 183,442 | 9,852,360 | |
| Nuvei Corp. (Canada) (c) | 23,214 | 323,247 | |
| Onex Corp. (sub. vtg.) | 25,225 | 1,413,728 | |
| Open Text Corp. | 100,460 | 3,354,100 | |
| Pan American Silver Corp. | 133,171 | 1,945,588 | |
| Parkland Corp. | 51,444 | 1,556,953 | |
| Pembina Pipeline Corp. | 199,099 | 6,127,669 | |
| Power Corp. of Canada (sub. vtg.) | 213,760 | 5,149,971 | |
| Quebecor, Inc. Class B (sub. vtg.) | 56,504 | 1,165,732 | |
| RB Global, Inc. | 67,547 | 4,417,574 | |
| Restaurant Brands International, Inc. | 108,202 | 7,268,085 | |
| Restaurant Brands International, Inc. (b) | 867 | 58,262 | |
| RioCan (REIT) | 51,889 | 630,488 | |
| Rogers Communications, Inc. Class B (non-vtg.) | 132,597 | 4,912,806 | |
| Royal Bank of Canada | 509,352 | 40,682,046 | |
| Saputo, Inc. | 92,696 | 1,871,634 | |
| Shopify, Inc. Class A (a) | 442,797 | 20,911,322 | |
| Stantec, Inc. | 41,664 | 2,549,263 | |
| Sun Life Financial, Inc. | 215,706 | 9,852,402 | |
| Suncor Energy, Inc. | 486,548 | 15,756,893 | |
| TC Energy Corp. | 375,378 | 12,928,108 | |
| Teck Resources Ltd. Class B (sub. vtg.) | 168,344 | 5,948,337 | |
| TELUS Corp. | 171,352 | 2,762,885 | |
| TFI International, Inc. (Canada) | 28,656 | 3,170,086 | |
| The Toronto-Dominion Bank | 677,537 | 37,845,333 | |
| Thomson Reuters Corp. | 58,615 | 7,021,120 | |
| TMX Group Ltd. | 104,910 | 2,184,821 | |
| Toromont Industries Ltd. | 30,166 | 2,271,015 | |
| Tourmaline Oil Corp. | 119,158 | 6,300,960 | |
| West Fraser Timber Co. Ltd. | 20,572 | 1,388,378 | |
| WSP Global, Inc. | 46,087 | 6,031,606 | |
TOTAL CANADA | 593,996,090 | ||
| Chile - 0.1% | |||
| Antofagasta PLC | 144,075 | 2,355,310 | |
| Banco de Chile | 16,697,437 | 1,715,452 | |
| Banco de Credito e Inversiones | 26,537 | 634,516 | |
| Banco Santander Chile | 24,431,455 | 1,065,157 | |
| Cencosud SA | 468,435 | 758,917 | |
| Compania Cervecerias Unidas SA | 44,893 | 255,213 | |
| Compania Sud Americana de Vapores SA | 5,525,781 | 306,851 | |
| Empresas CMPC SA | 401,073 | 717,002 | |
| Empresas COPEC SA | 143,559 | 950,377 | |
| Enel Americas SA (a) | 7,906,370 | 812,722 | |
| Enel Chile SA | 10,181,816 | 602,946 | |
| Falabella SA | 316,660 | 644,819 | |
| Lundin Mining Corp. | 237,405 | 1,482,551 | |
TOTAL CHILE | 12,301,833 | ||
| China - 8.6% | |||
| 360 Security Technology, Inc. (A Shares) (a) | 154,800 | 190,248 | |
| 37 Interactive Entertainment Network Technology Group Co. Ltd. (A Shares) | 48,200 | 136,367 | |
| 3Peak, Inc. (A Shares) | 2,486 | 54,749 | |
| 3SBio, Inc. (c) | 670,500 | 596,505 | |
| AAC Technology Holdings, Inc. | 260,000 | 468,010 | |
| Accelink Technologies Co. Ltd. (A Shares) | 17,000 | 62,656 | |
| Advanced Micro-Fabrication Equipment, Inc., China (A Shares) | 13,645 | 319,667 | |
| AECC Aero-Engine Control Co. Ltd. (A Shares) | 27,900 | 79,219 | |
| AECC Aviation Power Co. Ltd. | 58,200 | 281,482 | |
| Agricultural Bank of China Ltd.: | |||
| (A Shares) | 2,154,700 | 1,057,606 | |
| (H Shares) | 10,475,000 | 3,869,011 | |
| Aier Eye Hospital Group Co. Ltd. (A Shares) | 207,169 | 518,062 | |
| AIMA Technology Group Co. Ltd. | 19,100 | 73,368 | |
| Air China Ltd.: | |||
| (A Shares) (a) | 192,700 | 211,369 | |
| (H Shares) (a) | 744,000 | 506,149 | |
| Airtac International Group | 51,043 | 1,676,879 | |
| Akeso, Inc. (a)(c) | 186,000 | 1,044,493 | |
| Alibaba Group Holding Ltd. (a) | 6,063,512 | 62,424,336 | |
| Alibaba Health Information Technology Ltd. (a) | 1,956,000 | 1,152,238 | |
| Aluminum Corp. of China Ltd.: | |||
| (A shares) | 648,700 | 549,835 | |
| (H Shares) | 936,000 | 500,695 | |
| Amlogic Shanghai Co. Ltd. (A Shares) (a) | 8,978 | 73,778 | |
| Angel Yeast Co. Ltd. (A Shares) | 19,600 | 93,734 | |
| Anhui Conch Cement Co. Ltd.: | |||
| (A Shares) | 32,800 | 108,494 | |
| (H Shares) | 597,500 | 1,486,995 | |
| Anhui Gujing Distillery Co. Ltd.: | |||
| (A Shares) | 1,200 | 45,744 | |
| (B Shares) | 55,802 | 869,754 | |
| Anhui Honglu Steel Construction Group Co. Ltd. | 14,950 | 51,366 | |
| Anhui Jianghuai Automobile Group Corp. Ltd. (A Shares) (a) | 43,400 | 107,578 | |
| Anhui Kouzi Distillery Co. Ltd. (A Shares) | 13,500 | 92,666 | |
| Anhui Yingjia Distillery Co. Ltd. (A Shares) | 14,800 | 155,203 | |
| Anjoy Foods Group Co. Ltd. (A Shares) | 6,700 | 118,361 | |
| Anker Innovations Technology Co. Ltd. (A Shares) | 6,900 | 88,399 | |
| Anta Sports Products Ltd. | 473,800 | 5,358,437 | |
| Apeloa Pharmaceutical Co. Ltd. A Shares | 27,200 | 64,121 | |
| Asia - Potash International Investment Guangzhou Co. Ltd. (A Shares) (a) | 19,000 | 74,083 | |
| ASR Microelectronics Co. Ltd. (A Shares) | 8,869 | 79,054 | |
| Asymchem Laboratories Tianjin Co. Ltd. (A Shares) | 7,360 | 151,915 | |
| Autobio Diagnostics Co. Ltd. | 12,800 | 77,789 | |
| Autohome, Inc. ADR Class A | 25,096 | 671,318 | |
| Avary Holding Shenzhen Co. Ltd. (A Shares) | 39,400 | 115,479 | |
| AVIC Capital Co. Ltd. (A Shares) | 204,200 | 93,005 | |
| AviChina Industry & Technology Co. Ltd. (H Shares) | 871,000 | 394,752 | |
| Avicopter PLC (A Shares) | 13,700 | 71,127 | |
| BAIC BluePark New Energy Technology Co. Ltd. (A Shares) (a) | 105,000 | 98,427 | |
| Baidu, Inc. Class A (a) | 834,344 | 10,953,943 | |
| Bank of Beijing Co. Ltd. (A Shares) | 471,716 | 294,180 | |
| Bank of Changsha Co. Ltd. (A Shares) | 104,200 | 104,692 | |
| Bank of Chengdu Co. Ltd. (A Shares) | 77,600 | 131,178 | |
| Bank of China Ltd.: | |||
| (A Shares) | 1,008,200 | 537,519 | |
| (H Shares) | 29,033,000 | 10,142,255 | |
| Bank of Communications Co. Ltd.: | |||
| (A Shares) | 730,700 | 562,366 | |
| (H Shares) | 3,369,000 | 1,992,784 | |
| Bank of Hangzhou Co. Ltd. (A Shares) | 119,780 | 175,229 | |
| Bank of Jiangsu Co. Ltd. (A Shares) | 314,230 | 296,509 | |
| Bank of Nanjing Co. Ltd. (A Shares) | 211,900 | 227,161 | |
| Bank of Ningbo Co. Ltd. (A Shares) | 146,440 | 500,204 | |
| Bank of Shanghai Co. Ltd. (A Shares) | 770,020 | 639,104 | |
| Bank of Suzhou Co. Ltd. | 79,200 | 68,012 | |
| Baoshan Iron & Steel Co. Ltd. (A Shares) | 470,300 | 402,396 | |
| BeiGene Ltd. (a) | 257,371 | 3,694,787 | |
| Beijing Capital International Airport Co. Ltd. (H Shares) (a) | 666,000 | 245,313 | |
| Beijing Dabeinong Technology Group Co. Ltd. (A Shares) (a) | 96,900 | 93,409 | |
| Beijing E-Hualu Information Technology Co. Ltd. (A Shares) (a) | 14,800 | 58,713 | |
| Beijing Easpring Material Technology Co. Ltd. (A Shares) | 10,900 | 65,736 | |
| Beijing Enlight Media Co. Ltd. (A Shares) | 63,600 | 68,024 | |
| Beijing Enterprises Holdings Ltd. | 187,500 | 624,724 | |
| Beijing Enterprises Water Group Ltd. | 1,442,000 | 304,270 | |
| Beijing Kingsoft Office Software, Inc. (A Shares) | 10,132 | 398,606 | |
| Beijing New Building Materials PLC (A Shares) | 36,100 | 120,724 | |
| Beijing Oriental Yuhong Waterproof Technology Co. Ltd. (A Shares) | 25,200 | 85,806 | |
| Beijing Roborock Technology Co. Ltd. (A Shares) | 3,052 | 131,956 | |
| Beijing Shiji Information Technology Co. Ltd. (A Shares) | 52,733 | 76,077 | |
| Beijing Tiantan Biological Products Corp. Ltd. (A Shares) | 39,300 | 155,083 | |
| Beijing Tongrentang Co. Ltd. (A Shares) | 29,200 | 204,955 | |
| Beijing United Information Technology Co. Ltd. (A Shares) | 16,225 | 83,542 | |
| Beijing Wantai Biological Pharmacy Enterprise Co. Ltd. (A Shares) | 18,746 | 112,442 | |
| Beijing Yanjing Brewery Co. Ltd. (A Shares) | 64,000 | 90,998 | |
| Beijing-Shanghai High Speed Railway Co. Ltd. (A Shares) | 722,800 | 494,181 | |
| Beiqi Foton Motor Co. Ltd. (A Shares) (a) | 158,600 | 65,751 | |
| Bethel Automotive Safety Systems Co. Ltd. (A Shares) | 9,600 | 99,365 | |
| Betta Pharmaceuticals Co. Ltd. (A Shares) | 8,800 | 73,207 | |
| BGI Genomics Co. Ltd. | 8,300 | 55,853 | |
| Bilibili, Inc. Class Z (a)(b) | 71,431 | 958,442 | |
| Bloomage Biotechnology Corp. Ltd. (A Shares) | 10,867 | 113,611 | |
| BOC Aviation Ltd. Class A (c) | 74,000 | 455,106 | |
| BOC Hong Kong (Holdings) Ltd. | 1,369,649 | 3,622,092 | |
| BOC International China Co. Ltd. | 54,800 | 81,686 | |
| BOE Technology Group Co. Ltd. (A Shares) | 775,300 | 415,644 | |
| Bosideng International Holdings Ltd. | 1,368,000 | 540,127 | |
| BTG Hotels Group Co. Ltd. (a) | 29,700 | 67,817 | |
| Budweiser Brewing Co. APAC Ltd. (c) | 621,093 | 1,180,292 | |
| By-Health Co. Ltd. (A Shares) | 33,900 | 84,894 | |
| BYD Co. Ltd.: | |||
| (A Shares) | 37,500 | 1,223,873 | |
| (H Shares) | 388,500 | 11,814,335 | |
| BYD Electronic International Co. Ltd. | 289,000 | 1,206,435 | |
| C&D International Investment Group Ltd. | 263,616 | 593,076 | |
| Caitong Securities Co. Ltd. | 97,770 | 106,160 | |
| Cambricon Technologies Corp. Ltd. (A Shares) (a) | 9,193 | 135,711 | |
| Canmax Technologies Co. Ltd. (A Shares) | 15,730 | 58,514 | |
| CECEP Solar Energy Co. Ltd. (A Shares) | 95,100 | 74,633 | |
| CECEP Wind-Power Corp. (A Shares) | 156,650 | 67,908 | |
| CETC Cyberspace Security Technology Co. Ltd. (A Shares) | 18,900 | 56,991 | |
| CGN Power Co. Ltd. (H Shares) (c) | 3,810,000 | 915,572 | |
| Changchun High & New Technology Industry Group, Inc. (A Shares) | 8,700 | 185,207 | |
| Changjiang Securities Co. Ltd. (A Shares) | 101,100 | 78,648 | |
| Changzhou Xingyu Automotive Lighting Systems Co. Ltd. (A Shares) | 6,100 | 121,983 | |
| Chaozhou Three-Circle Group Co. (A Shares) | 41,300 | 174,428 | |
| Chengxin Lithium Group Co. Ltd. (A Shares) | 18,200 | 58,463 | |
| Chifeng Jilong Gold Mining Co. Ltd. (A Shares) (a) | 37,100 | 74,692 | |
| China Baoan Group Co. Ltd. (A Shares) | 56,600 | 79,969 | |
| China Cinda Asset Management Co. Ltd. (H Shares) | 3,353,000 | 326,056 | |
| China CITIC Bank Corp. Ltd.: | |||
| (A Shares) | 111,700 | 82,158 | |
| (H Shares) | 3,022,000 | 1,348,139 | |
| China Coal Energy Co. Ltd. (H Shares) | 721,000 | 566,322 | |
| China Communications Services Corp. Ltd. (H Shares) | 828,000 | 338,674 | |
| China Conch Venture Holdings Ltd. | 538,500 | 445,972 | |
| China Construction Bank Corp.: | |||
| (A Shares) | 658,842 | 564,612 | |
| (H Shares) | 34,899,000 | 19,737,412 | |
| China CSSC Holdings Ltd. (A Shares) | 98,000 | 346,807 | |
| China Eastern Airlines Corp. Ltd. (A Shares) (a) | 332,700 | 198,306 | |
| China Energy Engineering Corp. Ltd. (A Shares) | 648,100 | 193,192 | |
| China Everbright Bank Co. Ltd.: | |||
| (A Shares) | 324,600 | 131,769 | |
| (H Shares) | 2,080,000 | 593,313 | |
| China Everbright International Ltd. | 1,282,481 | 437,809 | |
| China Feihe Ltd. (c) | 1,351,000 | 839,474 | |
| China Film Co. Ltd. (A Shares) (a) | 38,800 | 63,403 | |
| China Galaxy Securities Co. Ltd.: | |||
| (A Shares) | 80,200 | 133,009 | |
| (H Shares) | 1,345,500 | 688,638 | |
| China Gas Holdings Ltd. | 1,008,600 | 906,738 | |
| China Great Wall Securities Co. Ltd. (A Shares) | 68,600 | 78,383 | |
| China Greatwall Technology Group Co. Ltd. (A Shares) | 71,700 | 107,767 | |
| China Hongqiao Group Ltd. | 878,000 | 821,996 | |
| China Huishan Dairy Holdings Co. Ltd. (a)(d) | 397,000 | 1 | |
| China International Capital Corp. Ltd. | 17,200 | 86,663 | |
| China International Capital Corp. Ltd. (H Shares) (c) | 626,800 | 998,340 | |
| China Jinmao Holdings Group Ltd. (b) | 2,149,483 | 263,649 | |
| China Jushi Co. Ltd. (A Shares) | 70,122 | 111,001 | |
| China Life Insurance Co. Ltd.: | |||
| (A Shares) | 31,100 | 142,859 | |
| (H Shares) | 2,864,000 | 3,878,998 | |
| China Literature Ltd. (a)(c) | 150,400 | 506,469 | |
| China Longyuan Power Grid Corp. Ltd. (H Shares) | 1,234,000 | 1,044,616 | |
| China Medical System Holdings Ltd. | 501,000 | 801,148 | |
| China Meheco Co. Ltd. (A Shares) | 33,180 | 54,230 | |
| China Meidong Auto Holding Ltd. | 248,000 | 133,000 | |
| China Mengniu Dairy Co. Ltd. | 1,186,000 | 3,872,453 | |
| China Merchants Bank Co. Ltd.: | |||
| (A Shares) | 345,400 | 1,453,469 | |
| (H Shares) | 1,587,251 | 6,020,911 | |
| China Merchants Energy Shipping Co. Ltd. (A Shares) | 190,000 | 167,067 | |
| China Merchants Holdings International Co. Ltd. | 494,655 | 629,664 | |
| China Merchants Securities Co. Ltd. (A Shares) | 156,930 | 303,430 | |
| China Merchants Shekou Industrial Zone Holdings Co. Ltd. (A Shares) | 172,400 | 260,099 | |
| China Minmetals Rare Earth Co. Ltd. (A Shares) | 22,700 | 93,094 | |
| China Minsheng Banking Corp. Ltd.: | |||
| (A Shares) | 801,300 | 407,506 | |
| (H Shares) | 2,321,800 | 771,908 | |
| China National Building Materials Co. Ltd. (H Shares) | 1,431,000 | 681,150 | |
| China National Chemical Engineering Co. Ltd. (A Shares) | 123,200 | 117,938 | |
| China National Medicines Corp. Ltd. (A Shares) | 17,200 | 67,695 | |
| China National Nuclear Power Co. Ltd. (A Shares) | 406,100 | 412,016 | |
| China National Software & Service Co. Ltd. (A Shares) | 19,630 | 92,298 | |
| China Northern Rare Earth Group High-Tech Co. Ltd. | 79,700 | 227,769 | |
| China Oilfield Services Ltd. (H Shares) | 650,000 | 768,508 | |
| China Oriental Group Co. Ltd. (H Shares) | 107 | 16 | |
| China Overseas Land and Investment Ltd. | 1,403,500 | 2,648,558 | |
| China Overseas Property Holdings Ltd. | 490,000 | 425,556 | |
| China Pacific Insurance (Group) Co. Ltd. | 101,700 | 385,653 | |
| China Pacific Insurance (Group) Co. Ltd. (H Shares) | 1,098,800 | 2,706,751 | |
| China Petroleum & Chemical Corp.: | |||
| (A Shares) | 924,000 | 690,028 | |
| (H Shares) | 8,906,000 | 4,554,865 | |
| China Power International Development Ltd. | 1,856,248 | 721,404 | |
| China Railway Group Ltd.: | |||
| (A Shares) | 695,300 | 575,085 | |
| (H Shares) | 1,065,000 | 502,642 | |
| China Railway Signal & Communications Corp. (A Shares) | 163,929 | 105,258 | |
| China Resource Gas Group Ltd. | 340,100 | 1,005,379 | |
| China Resources Beer Holdings Co. Ltd. | 611,162 | 3,234,066 | |
| China Resources Cement Holdings Ltd. | 934,000 | 240,158 | |
| China Resources Land Ltd. | 1,200,634 | 4,494,103 | |
| China Resources Microelectronics Ltd. (A Shares) | 29,035 | 211,167 | |
| China Resources Mixc Lifestyle Services Ltd. (c) | 245,400 | 957,408 | |
| China Resources Pharmaceutical Group Ltd. (c) | 576,000 | 357,809 | |
| China Resources Power Holdings Co. Ltd. | 708,523 | 1,373,041 | |
| China Resources Sanjiu Medical & Pharmaceutical Co. Ltd. (A Shares) | 21,900 | 129,090 | |
| China Ruyi Holdings Ltd. (a)(b) | 2,060,000 | 474,370 | |
| China Shenhua Energy Co. Ltd.: | |||
| (A Shares) | 135,500 | 561,242 | |
| (H Shares) | 1,268,000 | 3,886,385 | |
| China Southern Airlines Ltd.: | |||
| (A Shares) (a) | 323,800 | 273,403 | |
| (H Shares) (a) | 572,000 | 270,664 | |
| China State Construction Engineering Corp. Ltd. (A Shares) | 907,460 | 642,376 | |
| China State Construction International Holdings Ltd. | 717,250 | 768,275 | |
| China Taiping Insurance Group Ltd. | 534,777 | 494,014 | |
| China Three Gorges Renewables Group Co. Ltd. (A Shares) | 613,400 | 402,602 | |
| China Tourism Group Duty Free Corp. Ltd.: | |||
| (A Shares) | 63,900 | 826,642 | |
| (H Shares) (c) | 3,400 | 38,397 | |
| China Tower Corp. Ltd. (H Shares) (c) | 16,040,000 | 1,495,744 | |
| China Traditional Chinese Medicine Holdings Co. Ltd. | 1,108,000 | 545,963 | |
| China United Network Communications Ltd. (A Shares) | 707,400 | 431,209 | |
| China Vanke Co. Ltd.: | |||
| (A Shares) | 148,200 | 229,282 | |
| (H Shares) | 889,600 | 832,271 | |
| China XD Electric Co. Ltd. (A Shares) | 103,000 | 65,100 | |
| China Yangtze Power Co. Ltd. (A Shares) | 545,530 | 1,683,276 | |
| China Zhenhua (Group) Science & Technology Co. Ltd. (A Shares) | 11,100 | 101,569 | |
| China Zheshang Bank Co. Ltd. | 508,950 | 177,500 | |
| ChinaSoft International Ltd. | 990,000 | 718,263 | |
| Chongqing Brewery Co. Ltd. (A Shares) | 10,800 | 115,901 | |
| Chongqing Changan Automobile Co. Ltd. (A Shares) | 188,290 | 389,743 | |
| Chongqing Fuling Zhacai Group Co. Ltd. Group (A Shares) | 23,140 | 48,875 | |
| Chongqing Rural Commercial Bank Co. Ltd. (A Shares) | 232,300 | 134,981 | |
| Chongqing Taiji Industry Group Co. Ltd. (A Shares) (a) | 11,700 | 67,138 | |
| Chongqing Zhifei Biological Products Co. Ltd. (A Shares) | 53,400 | 457,778 | |
| Chow Tai Fook Jewellery Group Ltd. | 740,200 | 1,045,255 | |
| CITIC Pacific Ltd. | 2,133,000 | 1,812,919 | |
| CITIC Securities Co. Ltd.: | |||
| (A Shares) | 204,630 | 607,546 | |
| (H Shares) | 768,675 | 1,495,732 | |
| Cmoc Group Ltd.: | |||
| (A Shares) | 361,400 | 274,078 | |
| (H Shares) | 1,419,000 | 846,308 | |
| CNGR Advanced Material Co. Ltd. | 13,100 | 97,467 | |
| CNNC Hua Yuan Titanium Dioxide Co. Ltd. (A Shares) | 62,975 | 41,012 | |
| CNPC Capital Co. Ltd. (A Shares) | 133,600 | 108,397 | |
| Contemporary Amperex Technology Co. Ltd. | 96,580 | 2,452,877 | |
| COSCO Shipping Development Co. Ltd. (A Shares) | 201,700 | 63,411 | |
| COSCO Shipping Energy Transportation Co. Ltd.: | |||
| (A Shares) | 80,100 | 157,879 | |
| (H Shares) | 472,000 | 500,571 | |
| COSCO SHIPPING Holdings Co. Ltd.: | |||
| (A Shares) (a) | 464,620 | 620,961 | |
| (H Shares) | 870,650 | 885,484 | |
| Cosco Shipping Ports Ltd. | 542,344 | 327,192 | |
| Country Garden Holdings Co. Ltd. (a)(b) | 4,534,517 | 405,489 | |
| Country Garden Services Holdings Co. Ltd. | 801,000 | 699,679 | |
| CRRC Corp. Ltd.: | |||
| (A Shares) | 1,213,400 | 886,409 | |
| (H Shares) | 476,000 | 198,313 | |
| CSC Financial Co. Ltd. (A Shares) | 95,200 | 314,891 | |
| CSPC Pharmaceutical Group Ltd. | 3,274,640 | 2,860,299 | |
| Dajin Heavy Industry Co. Ltd. | 14,200 | 53,798 | |
| Daqin Railway Co. Ltd. (A Shares) | 322,100 | 317,531 | |
| Daqo New Energy Corp. ADR (a) | 21,215 | 540,134 | |
| DaShenLin Pharmaceutical Group Co. Ltd. | 24,830 | 80,838 | |
| Datang International Power Generation Co. Ltd. (A Shares) | 202,600 | 71,739 | |
| DHC Software Co. Ltd. (A Shares) | 60,800 | 52,402 | |
| Do-Fluoride New Materials Co. Ltd. (A Shares) | 23,380 | 51,149 | |
| Dong-E-E-Jiao Co. Ltd. (A Shares) | 13,300 | 84,391 | |
| Dongfang Electric Corp. Ltd. (A Shares) | 61,400 | 125,111 | |
| Dongfeng Motor Group Co. Ltd. (H Shares) | 944,000 | 415,572 | |
| Dongxing Securities Co. Ltd. (A Shares) | 67,500 | 73,832 | |
| Dongyue Group Co. Ltd. | 575,000 | 458,016 | |
| East Buy Holding Ltd. (a)(b)(c) | 149,000 | 607,846 | |
| East Money Information Co. Ltd. (A Shares) | 348,789 | 727,923 | |
| Eastroc Beverage Group Co. Ltd. | 5,400 | 141,809 | |
| Ecovacs Robotics Co. Ltd. Class A | 12,700 | 74,987 | |
| ENN Energy Holdings Ltd. | 289,500 | 2,193,005 | |
| ENN Natural Gas Co. Ltd. (A Shares) | 60,000 | 141,630 | |
| Eoptolink Technology, Inc. Ltd. (A Shares) | 15,300 | 65,998 | |
| ESR Group Ltd. (c) | 791,259 | 1,016,685 | |
| Eve Energy Co. Ltd. (A shares) | 45,524 | 288,810 | |
| Everbright Securities Co. Ltd. (A Shares) | 86,400 | 194,519 | |
| Everdisplay Optronics Shanghai Co. Ltd. (A Shares) (a) | 182,839 | 65,497 | |
| Fangda Carbon New Material Co. Ltd. (A Shares) (a) | 75,600 | 60,988 | |
| Far East Horizon Ltd. | 508,000 | 357,447 | |
| Farasis Energy Gan Zhou Co. Ltd. (A Shares) (a) | 25,172 | 60,639 | |
| FAW Jiefang Group Co. Ltd. (A Shares) (a) | 74,400 | 93,768 | |
| First Capital Securities Co. Ltd. (A Shares) | 83,000 | 66,388 | |
| Flat Glass Group Co. Ltd. | 64,000 | 114,936 | |
| Flat Glass Group Co. Ltd. (A Shares) (a) | 93,700 | 330,956 | |
| Focus Media Information Technology Co. Ltd. (A Shares) | 317,140 | 299,848 | |
| Foshan Haitian Flavouring & Food Co. Ltd. (A Shares) | 103,377 | 532,147 | |
| Fosun International Ltd. | 932,500 | 558,699 | |
| Founder Securities Co. Ltd. (A Shares) | 186,400 | 193,228 | |
| Foxconn Industrial Internet Co. Ltd. (A Shares) | 217,596 | 438,515 | |
| Fujian Sunner Development Co. Ltd. A Shares | 29,800 | 73,309 | |
| Fuyao Glass Industries Group Co. Ltd.: | |||
| (A Shares) | 90,600 | 461,087 | |
| (H Shares) (c) | 160,000 | 729,455 | |
| G-bits Network Technology Xiamen Co. Ltd. (A Shares) | 1,600 | 58,223 | |
| GalaxyCore, Inc. (A Shares) | 36,469 | 91,832 | |
| Ganfeng Lithium Group Co. Ltd.: | |||
| (A Shares) | 83,720 | 507,340 | |
| (H Shares) (c) | 102,740 | 369,019 | |
| GCL Technology Holdings Ltd. | 7,331,000 | 1,079,620 | |
| GD Power Development Co. Ltd. (A Shares) | 411,600 | 204,794 | |
| GDS Holdings Ltd. Class A (a) | 343,600 | 437,727 | |
| Geely Automobile Holdings Ltd. | 2,308,000 | 2,620,330 | |
| GEM Co. Ltd. (A Shares) | 106,200 | 85,114 | |
| Gemdale Corp. (A Shares) | 103,400 | 72,985 | |
| Genscript Biotech Corp. (a) | 426,000 | 1,238,453 | |
| GF Securities Co. Ltd.: | |||
| (A Shares) | 269,600 | 547,020 | |
| (H Shares) | 144,000 | 187,483 | |
| Giant Network Group Co. Ltd. (A Shares) | 44,900 | 72,512 | |
| Gigadevice Semiconductor Beijing, Inc. (A Shares) | 14,384 | 210,714 | |
| Ginlong Technologies Co. Ltd. (A Shares) | 8,900 | 81,669 | |
| GoerTek, Inc. (A Shares) | 76,300 | 188,408 | |
| Goldwind Science & Technology Co. Ltd. (A Shares) | 103,982 | 125,054 | |
| Gongniu Group Co. Ltd. (A Shares) | 9,300 | 134,431 | |
| GoodWe Technologies Co. Ltd. (A Shares) | 3,959 | 63,247 | |
| Gotion High-tech Co. Ltd. (A Shares) (a) | 38,500 | 119,884 | |
| Great Wall Motor Co. Ltd.: | |||
| (A Shares) | 47,200 | 189,669 | |
| (H Shares) | 867,500 | 1,212,672 | |
| Gree Electric Appliances, Inc. of Zhuhai (A Shares) | 62,200 | 288,552 | |
| Greenland Holdings Corp. Ltd. (A Shares) (a) | 263,200 | 91,744 | |
| Greentown China Holdings Ltd. | 366,500 | 355,557 | |
| GRG Banking Equipment Co. Ltd. (A Shares) | 43,500 | 69,430 | |
| Guangdong Haid Group Co. Ltd. (A Shares) | 36,900 | 227,195 | |
| Guangdong HEC Technology Holding Co. Ltd. (A Shares) (a) | 65,100 | 63,339 | |
| Guangdong Investment Ltd. | 1,060,000 | 723,325 | |
| Guanghui Energy Co. Ltd. (A Shares) | 151,500 | 155,562 | |
| Guangzhou Automobile Group Co. Ltd. | 159,600 | 218,770 | |
| Guangzhou Automobile Group Co. Ltd. (H Shares) | 992,000 | 464,750 | |
| Guangzhou Baiyun International Airport Co. Ltd. (A Shares) (a) | 51,700 | 74,859 | |
| Guangzhou Baiyunshan Pharma Health (A Shares) | 30,200 | 123,065 | |
| Guangzhou Great Power Energy & Technology Co. Ltd. (A Shares) | 10,800 | 45,542 | |
| Guangzhou Haige Communications Group (A Shares) | 45,300 | 71,952 | |
| Guangzhou Kingmed Diagnostics Group Co. Ltd. (A Shares) | 10,500 | 88,878 | |
| Guangzhou Shiyuan Electronic Technology Co. Ltd. (A Shares) | 14,300 | 82,158 | |
| Guangzhou Tinci Materials Technology Co. Ltd. (A Shares) | 42,420 | 161,427 | |
| Guangzhou Yuexiu Financial Holdings Group Co. Ltd. (A Shares) | 104,804 | 94,044 | |
| Guolian Securities Co. Ltd. (a) | 55,900 | 82,206 | |
| Guosen Securities Co. Ltd. (A Shares) | 151,000 | 198,384 | |
| Guotai Junan Securities Co. Ltd.: | |||
| (A Shares) | 43,000 | 86,866 | |
| (H Shares) (c) | 228,600 | 255,146 | |
| Guoyuan Securities Co. Ltd. (A Shares) | 91,900 | 86,989 | |
| H World Group Ltd. ADR (a)(b) | 77,552 | 2,920,608 | |
| Haidilao International Holding Ltd. (c) | 611,000 | 1,529,826 | |
| Haier Smart Home Co. Ltd. | 818,000 | 2,333,205 | |
| Haier Smart Home Co. Ltd. (A Shares) | 204,329 | 620,955 | |
| Hainan Airlines Co. Ltd. (A Shares) (a) | 948,700 | 189,398 | |
| Hainan Airport Infrastructure Co. Ltd. (A Shares) (a) | 251,200 | 130,876 | |
| Haitian International Holdings Ltd. | 229,000 | 546,299 | |
| Haitong Securities Co. Ltd.: | |||
| (A Shares) | 130,800 | 174,732 | |
| (H Shares) | 1,136,000 | 652,276 | |
| Hanergy Mobile Energy Holding (a)(d) | 576,000 | 1 | |
| Hangzhou Binjiang Real Estate Group Co. Ltd. (A Shares) | 68,700 | 78,646 | |
| Hangzhou Chang Chuan Technology Co. Ltd. | 12,700 | 70,934 | |
| Hangzhou First Applied Material Co. Ltd. (A Shares) | 39,392 | 137,662 | |
| Hangzhou GreatStar Industrial Co. Ltd. (A Shares) (a) | 24,100 | 65,307 | |
| Hangzhou Lion Electronics Co. Ltd. (A Shares) | 14,900 | 65,559 | |
| Hangzhou Oxygen Plant Group Co. Ltd. (A Shares) | 21,100 | 95,247 | |
| Hangzhou Robam Appliances Co. Ltd. (A Shares) | 21,100 | 66,582 | |
| Hangzhou Silan Microelectronics Co. Ltd. (A Shares) | 29,000 | 96,310 | |
| Hangzhou Tigermed Consulting Co. Ltd.: | |||
| (A Shares) | 4,600 | 41,976 | |
| (H Shares) (c) | 7,800 | 43,830 | |
| Hansoh Pharmaceutical Group Co. Ltd. (c) | 438,000 | 824,094 | |
| Haohua Chemical Science & Technology Co. Ltd. (A Shares) | 17,200 | 72,311 | |
| Hebei Hengshui Laobaigan Liquor Co. Ltd. | 21,600 | 70,262 | |
| Hebei Yangyuan Zhihui Beverage Co. Ltd. (A Shares) | 28,200 | 95,968 | |
| Heilongjiang Agriculture Co. Ltd. (A Shares) | 32,100 | 55,907 | |
| Henan Shenhuo Coal & Power Co. Ltd. (A Shares) | 51,300 | 115,341 | |
| Henan Shuanghui Investment & Development Co. Ltd. (A Shares) | 71,600 | 256,325 | |
| Hengan International Group Co. Ltd. | 232,500 | 778,712 | |
| Hengdian Group DMEGC Magnetics Co. Ltd. (A Shares) | 34,100 | 67,910 | |
| Hengli Petrochemical Co. Ltd. (A Shares) (a) | 157,200 | 314,981 | |
| Hengtong Optic-electric Co. Ltd. (A Shares) | 52,300 | 94,318 | |
| Hengyi Petrochemical Co. Ltd. (A Shares) (a) | 73,630 | 72,397 | |
| Hesteel Co. Ltd. (A Shares) | 237,700 | 72,790 | |
| Hisense Electric Co. Ltd. | 26,900 | 85,624 | |
| Hithink RoyalFlush Information Network Co. Ltd. (A Shares) | 11,600 | 222,834 | |
| Hongfa Technology Co. Ltd. (A Shares) | 18,620 | 73,902 | |
| Hoshine Silicon Industry Co. Ltd. (A Shares) | 17,400 | 136,178 | |
| Hoymiles Power Electronics, Inc. (A Shares) | 1,914 | 58,626 | |
| Hoyuan Green Energy Co. Ltd. (A Shares) | 12,297 | 62,808 | |
| Hua Hong Semiconductor Ltd. (a)(c) | 217,000 | 534,272 | |
| Huadian Power International Corp. Ltd.: | |||
| (A Shares) | 21,700 | 14,555 | |
| (H Shares) | 238,000 | 95,563 | |
| Huadong Medicine Co. Ltd. (A Shares) | 38,660 | 227,173 | |
| Huafon Chemical Co. Ltd. (A Shares) | 94,500 | 93,725 | |
| Huagong Tech Co. Ltd. (A Shares) | 22,800 | 88,126 | |
| Huaibei Mining Holdings Co. Ltd. (A Shares) | 55,500 | 111,269 | |
| Hualan Biological Engineer, Inc. (A Shares) | 41,350 | 132,697 | |
| Huaneng Power International, Inc.: | |||
| (A Shares) (a) | 244,900 | 254,812 | |
| (H Shares) (a) | 1,450,000 | 678,531 | |
| Huatai Securities Co. Ltd.: | |||
| (A Shares) | 66,400 | 145,551 | |
| (H Shares) (c) | 650,600 | 851,767 | |
| HUAXI Securities Co. Ltd. | 59,200 | 64,158 | |
| Huaxia Bank Co. Ltd. (A Shares) | 286,000 | 218,996 | |
| Huayu Automotive Systems Co. Ltd. (A Shares) | 67,031 | 160,793 | |
| Hubei Feilihua Quartz Glass Co. Ltd. (A Shares) | 10,300 | 55,779 | |
| Hubei Jumpcan Pharmaceutical Co. Ltd. (A Shares) | 18,900 | 70,035 | |
| Hubei Xingfa Chemicals Group Co. Ltd. (A Shares) | 24,300 | 65,291 | |
| Huizhou Desay SV Automotive Co. Ltd. | 12,400 | 212,905 | |
| Humanwell Healthcare Group Co. Ltd. (A Shares) | 38,100 | 121,833 | |
| Hunan Changyuan Lico Co. Ltd. (A Shares) | 32,754 | 38,189 | |
| Hunan Valin Steel Co. Ltd. (A Shares) | 139,500 | 111,164 | |
| Hundsun Technologies, Inc. (A Shares) | 41,777 | 177,937 | |
| Hygeia Healthcare Holdings Co. (b)(c) | 129,400 | 781,326 | |
| iFlytek Co. Ltd. (A Shares) | 50,300 | 313,818 | |
| IMEIK Technology Development Co. Ltd. (A Shares) | 4,800 | 216,453 | |
| Industrial & Commercial Bank of China Ltd.: | |||
| (A Shares) | 1,760,800 | 1,138,843 | |
| (H Shares) | 23,569,000 | 11,295,320 | |
| Industrial Bank Co. Ltd. (A Shares) | 441,700 | 910,941 | |
| Industrial Securities Co. Ltd. (A Shares) | 186,940 | 159,533 | |
| Ingenic Semiconductor Co. Ltd. (A Shares) | 9,900 | 100,001 | |
| Inner Mongoli Yili Industries Co. Ltd. (A Shares) | 141,700 | 531,322 | |
| Inner Mongolia Baotou Steel Union Co. Ltd. (A Shares) (a) | 978,800 | 216,899 | |
| Inner Mongolia Dian Tou Energy Corp. Ltd. | 46,800 | 87,078 | |
| Inner Mongolia Junzheng Energy & Chemical Industry Group Co. Ltd. (A Shares) | 164,900 | 90,195 | |
| Inner Mongolia Yitai Coal Co. Ltd. (B Shares) (a) | 372,300 | 510,971 | |
| Inner Mongolia Yuan Xing Energy Co. Ltd. (A Shares) | 78,600 | 73,126 | |
| Innovent Biologics, Inc. (a)(c) | 422,000 | 2,486,915 | |
| Inspur Electronic Information Industry Co. Ltd. (A Shares) | 32,012 | 129,748 | |
| iQIYI, Inc. ADR (a) | 162,192 | 755,815 | |
| iRay Technology Co. Ltd. (A Shares) | 2,161 | 66,592 | |
| iSoftStone Information Technology Group Co. Ltd. (A Shares) | 21,450 | 104,910 | |
| JA Solar Technology Co. Ltd. (A Shares) | 72,996 | 223,663 | |
| Jason Furniture Hangzhou Co. Ltd. (A Shares) | 18,020 | 91,237 | |
| JCET Group Co. Ltd. (A Shares) | 37,800 | 159,558 | |
| JD Health International, Inc. (a)(c) | 405,400 | 1,841,440 | |
| JD Logistics, Inc. (a)(c) | 727,400 | 861,312 | |
| JD.com, Inc. Class A | 869,867 | 11,058,760 | |
| Jiangsu Eastern Shenghong Co. Ltd. | 139,600 | 203,121 | |
| Jiangsu Expressway Co. Ltd. (H Shares) | 456,000 | 414,569 | |
| Jiangsu Hengli Hydraulic Co. Ltd. | 28,772 | 221,477 | |
| Jiangsu Hengrui Medicine Co. Ltd. (A Shares) | 141,048 | 923,784 | |
| Jiangsu King's Luck Brewery JSC Ltd. (A Shares) | 27,900 | 223,118 | |
| Jiangsu Nhwa Pharmaceutical Co. Ltd. (A Shares) | 20,700 | 74,408 | |
| Jiangsu Pacific Quartz Co. Ltd. (A Shares) | 8,000 | 100,594 | |
| Jiangsu Phoenix Publishing & Media Corp. Ltd. | 53,500 | 70,285 | |
| Jiangsu Yanghe Brewery JSC Ltd. (A Shares) | 33,500 | 558,727 | |
| Jiangsu Yangnong Chemical Co. Ltd. (A Shares) | 7,800 | 72,026 | |
| Jiangsu Yoke Technology Co. Ltd. (A Shares) | 10,300 | 81,342 | |
| Jiangsu Yuyue Medical Equipment & Supply Co. Ltd. (A Shares) | 21,300 | 97,968 | |
| Jiangsu Zhongtian Technology Co. Ltd. (A Shares) | 73,400 | 140,606 | |
| Jiangxi Copper Co. Ltd.: | |||
| (A Shares) | 30,000 | 75,206 | |
| (H Shares) | 407,000 | 575,480 | |
| Jiangxi Special Electric Motor Co. Ltd. (A Shares) (a) | 35,600 | 58,293 | |
| Jinduicheng Molybdenum Co. Ltd. (A Shares) | 71,500 | 98,166 | |
| Jinko Solar Co. Ltd. (A Shares) | 147,331 | 191,178 | |
| JiuGui Liquor Co. Ltd. (A Shares) | 7,300 | 76,276 | |
| Jiumaojiu International Holdings Ltd. (c) | 347,000 | 377,577 | |
| Jizhong Energy Resources Co. Ltd. (A Shares) | 84,300 | 74,009 | |
| Joincare Pharmaceutical Group Industry Co. Ltd. (A Shares) | 39,200 | 63,539 | |
| Jointown Pharmaceutical Group (A Shares) | 87,403 | 85,072 | |
| Jonjee Hi-Tech Industrial & Commercial Holding Co. Ltd. (A Shares) (a) | 18,500 | 84,992 | |
| JOYY, Inc. ADR | 16,746 | 651,754 | |
| Juewei Food Co. Ltd. | 13,800 | 66,645 | |
| Juneyao Airlines Co. Ltd. (A shares) (a) | 42,800 | 85,354 | |
| Kangmei Pharmaceutical Co. Ltd. rights (a)(d) | 3,087 | 0 | |
| Kanzhun Ltd. ADR (a) | 79,458 | 1,175,978 | |
| KE Holdings, Inc. ADR | 244,602 | 3,598,095 | |
| Keda Industrial Group Co. Ltd. | 40,500 | 60,328 | |
| Kingboard Chemical Holdings Ltd. | 249,000 | 606,384 | |
| Kingdee International Software Group Co. Ltd. (a) | 1,016,000 | 1,348,098 | |
| Kingnet Network Co. Ltd. (A Shares) | 46,000 | 67,878 | |
| Kingsoft Corp. Ltd. | 347,200 | 1,211,547 | |
| Kuaishou Technology Class B (a)(c) | 862,500 | 5,554,368 | |
| Kuang-Chi Technologies Co. Ltd. (A Shares) | 45,500 | 87,044 | |
| Kunlun Energy Co. Ltd. | 1,448,000 | 1,206,334 | |
| Kunlun Tech Co. Ltd. (A Shares) (a) | 26,500 | 114,062 | |
| Kweichow Moutai Co. Ltd. (A Shares) | 28,500 | 6,565,096 | |
| Lb Group Co. Ltd. (A Shares) | 48,600 | 123,716 | |
| Lenovo Group Ltd. | 2,728,000 | 3,174,661 | |
| Lens Technology Co. Ltd. (A Shares) | 106,900 | 191,011 | |
| Lepu Medical Technology Beijing Co. Ltd. (A Shares) | 37,400 | 88,091 | |
| Li Auto, Inc. Class A (a) | 416,064 | 7,037,152 | |
| Li Ning Co. Ltd. | 885,500 | 2,713,530 | |
| Liaoning Port Co. Ltd. (A Shares) | 390,600 | 80,612 | |
| Lingyi iTech Guangdong Co. (A Shares) | 150,800 | 125,375 | |
| Livzon Pharmaceutical Group, Inc. (A Shares) | 14,900 | 71,330 | |
| Longfor Properties Co. Ltd. (c) | 694,508 | 1,011,038 | |
| LONGi Green Energy Technology Co. Ltd. | 167,968 | 554,528 | |
| Lufax Holding Ltd. ADR | 252,184 | 240,785 | |
| Luxi Chemical Group Co. Ltd. | 42,500 | 65,981 | |
| Luxshare Precision Industry Co. Ltd. (A Shares) | 157,047 | 705,314 | |
| Luzhou Laojiao Co. Ltd. (A Shares) | 32,700 | 957,964 | |
| Mango Excellent Media Co. Ltd. (A Shares) | 41,100 | 142,091 | |
| Maxscend Microelectronics Co. Ltd. (A Shares) | 11,952 | 246,634 | |
| Meihua Holdings Group Co. Ltd. (A Shares) | 69,600 | 90,413 | |
| Meinian Onehealth Healthcare Holdings Co. Ltd. (A Shares) (a) | 86,164 | 72,653 | |
| Meituan Class B (a)(c) | 1,875,010 | 26,578,293 | |
| Metallurgical Corp. China Ltd. (H Shares) | 920,000 | 182,433 | |
| Microport Scientific Corp. (a) | 301,300 | 474,780 | |
| Ming Yang Smart Energy Group Ltd. (A Shares) | 47,800 | 91,394 | |
| MINISO Group Holding Ltd. ADR | 34,655 | 877,118 | |
| Minth Group Ltd. | 280,000 | 625,024 | |
| Montage Technology Co. Ltd. (A Shares) | 24,805 | 187,032 | |
| Muyuan Foodstuff Co. Ltd. (A Shares) | 119,040 | 614,003 | |
| Nanjing King-Friend Biochemical Pharmaceutical Co. Ltd. | 35,293 | 61,048 | |
| Nanjing Securities Co. Ltd. (A Shares) | 88,600 | 97,434 | |
| NARI Technology Co. Ltd. (A Shares) | 171,705 | 530,260 | |
| National Silicon Industry Group Co. Ltd. (A Shares) (a) | 61,329 | 152,216 | |
| NAURA Technology Group Co. Ltd. | 11,600 | 406,913 | |
| NavInfo Co. Ltd. (A Shares) (a) | 52,300 | 71,549 | |
| NetEase, Inc. | 715,795 | 15,319,123 | |
| New China Life Insurance Co. Ltd. | 21,900 | 100,104 | |
| New China Life Insurance Co. Ltd. (H Shares) | 359,900 | 789,498 | |
| New Hope Liuhe Co. Ltd. (A Shares) (a) | 103,800 | 144,075 | |
| New Oriental Education & Technology Group, Inc. (a) | 548,610 | 3,576,958 | |
| Ninestar Corp. (A Shares) | 31,300 | 105,014 | |
| Ningbo Deye Technology Co. Ltd. (A Shares) | 9,100 | 86,112 | |
| Ningbo Joyson Electronic Corp. (A shares) | 29,500 | 76,084 | |
| Ningbo Orient Wires & Cables Co. Ltd. (A Shares) | 15,800 | 90,988 | |
| Ningbo Ronbay New Energy Technology Co. Ltd. (A Shares) | 9,354 | 56,674 | |
| Ningbo Shanshan Co. Ltd. (A Shares) | 44,500 | 85,204 | |
| Ningbo Tuopu Group Co. Ltd. (A Shares) | 24,700 | 218,218 | |
| Ningxia Baofeng Energy Group Co. Ltd. | 159,200 | 313,963 | |
| NIO, Inc. sponsored ADR (a)(b) | 513,690 | 3,749,937 | |
| Nongfu Spring Co. Ltd. (H Shares) (c) | 648,200 | 3,691,981 | |
| North Industries Group Red Arrow Co. Ltd. (A Shares) | 29,900 | 58,310 | |
| Offcn Education Technology Co. A Shares (a) | 141,800 | 76,607 | |
| Offshore Oil Enginering Co. Ltd. (A Shares) | 106,500 | 90,500 | |
| Oppein Home Group, Inc. (A Shares) | 11,260 | 134,014 | |
| Orient Securities Co. Ltd. (A Shares) | 168,708 | 200,125 | |
| Oriental Pearl Group Co. Ltd. | 66,500 | 67,138 | |
| Ovctek China, Inc. (A Shares) | 19,820 | 68,361 | |
| Pangang Group Vanadium Titanium & Resources Co. Ltd. (A Shares) (a) | 191,700 | 91,557 | |
| PDD Holdings, Inc. ADR (a) | 220,831 | 22,396,680 | |
| People's Insurance Co. of China Group Ltd.: | |||
| (A Shares) | 140,700 | 102,731 | |
| (H Shares) | 3,307,000 | 1,091,176 | |
| People.cn Co. Ltd. (A Shares) | 24,000 | 106,424 | |
| Perfect World Co. Ltd. (A Shares) | 42,950 | 70,510 | |
| PetroChina Co. Ltd.: | |||
| (A Shares) | 525,000 | 511,504 | |
| (H Shares) | 7,730,000 | 5,045,492 | |
| Pharmaron Beijing Co. Ltd. (H Shares) (c) | 59,300 | 141,557 | |
| PICC Property & Casualty Co. Ltd. (H Shares) | 2,520,933 | 2,878,793 | |
| Ping An Bank Co. Ltd. (A Shares) | 423,600 | 605,998 | |
| Ping An Healthcare and Technology Co. Ltd. (a)(b)(c) | 205,300 | 479,566 | |
| Ping An Insurance Group Co. of China Ltd.: | |||
| (A Shares) | 253,892 | 1,577,855 | |
| (H Shares) | 2,463,500 | 12,496,046 | |
| Piotech, Inc. (A Shares) | 3,993 | 137,988 | |
| Poly Developments & Holdings (A Shares) | 265,700 | 399,953 | |
| Pop Mart International Group Ltd. (c) | 174,800 | 482,538 | |
| Postal Savings Bank of China Co. Ltd. | 332,900 | 207,990 | |
| Postal Savings Bank of China Co. Ltd. (H Shares) (c) | 3,301,000 | 1,506,673 | |
| Power Construction Corp. of China Ltd. (A Shares) | 360,700 | 259,419 | |
| Prosus NV | 560,311 | 15,669,424 | |
| Pylon Technologies Co. Ltd. (Series A) | 3,990 | 62,137 | |
| Qi An Xin Technology Group, Inc. (A Shares) (a) | 15,199 | 95,890 | |
| Qifu Technology, Inc. ADR | 40,882 | 604,645 | |
| Qinghai Salt Lake Potash Co. Ltd. Class A (a) | 116,300 | 269,311 | |
| Raytron Technology Co. Ltd. (A Shares) | 9,121 | 58,748 | |
| Risen Energy Co. Ltd. (A Shares) | 25,500 | 61,932 | |
| Riyue Heavy Industry Co. Ltd. (A Shares) | 22,600 | 43,494 | |
| Rockchip Electronics Co. Ltd. | 7,900 | 70,405 | |
| Rongsheng Petrochemical Co. Ltd. (A Shares) | 226,550 | 352,924 | |
| SAIC Motor Corp. Ltd. (A Shares) | 164,000 | 325,684 | |
| Sailun Group Co. Ltd. A Shares | 72,900 | 111,960 | |
| Sanan Optoelectronics Co. Ltd. (A Shares) | 110,600 | 225,145 | |
| Sangfor Technologies, Inc. (a) | 9,300 | 106,708 | |
| Sany Heavy Equipment International Holdings Co. Ltd. | 401,000 | 526,760 | |
| Sany Heavy Industry Co. Ltd. (A Shares) | 185,300 | 366,461 | |
| Satellite Chemical Co. Ltd. (A Shares) | 76,099 | 169,166 | |
| SDIC Capital Co. Ltd. | 140,200 | 131,009 | |
| SDIC Power Holdings Co. Ltd. (A Shares) | 167,600 | 279,612 | |
| Seazen Holdings Co. Ltd. (A Shares) (a) | 51,700 | 83,971 | |
| Seres Group Co. Ltd. (A Shares) (a) | 34,200 | 381,787 | |
| SF Holding Co. Ltd. (A Shares) | 107,800 | 578,505 | |
| SG Micro Corp. (A Shares) | 9,847 | 120,768 | |
| Shaanxi Coal Industry Co. Ltd. (A Shares) | 216,000 | 532,623 | |
| Shan Xi Hua Yang Group New Energy Co. Ltd. | 82,650 | 91,156 | |
| Shandong Buchang Pharmaceuticals Co. Ltd. (A Shares) | 24,010 | 56,932 | |
| Shandong Gold Mining Co. Ltd.: | |||
| (A Shares) | 95,832 | 311,219 | |
| (H Shares) (c) | 229,250 | 429,483 | |
| Shandong Himile Mechanical Science & Technology Co. Ltd. (A Shares) | 15,100 | 66,395 | |
| Shandong Hualu Hengsheng Chemical Co. Ltd. (A Shares) | 44,320 | 194,963 | |
| Shandong Linglong Tyre Co. Ltd. (A Shares) | 33,300 | 91,161 | |
| Shandong Nanshan Aluminum Co. Ltd. (A Shares) | 237,000 | 100,455 | |
| Shandong Sun Paper Industry JSC Ltd. (A Shares) | 56,000 | 95,203 | |
| Shandong Weigao Medical Polymer Co. Ltd. (H Shares) | 899,600 | 835,001 | |
| Shanghai Aiko Solar Energy Co. Ltd. (A Shares) | 40,880 | 109,562 | |
| Shanghai Bairun Investment Holding Group Co. Ltd. (A Shares) | 24,180 | 87,052 | |
| Shanghai Baosight Software Co. Ltd. | 278,576 | 572,929 | |
| Shanghai Baosight Software Co. Ltd. (A Shares) | 20,352 | 118,700 | |
| Shanghai Construction Group Co. Ltd. (A Shares) | 168,300 | 60,531 | |
| Shanghai Electric Group Co. Ltd. (A Shares) (a) | 265,500 | 161,201 | |
| Shanghai Electric Power Co. Ltd. (A Shares) | 68,200 | 81,481 | |
| Shanghai Fosun Pharmaceutical (Group) Co. Ltd.: | |||
| (A Shares) | 37,800 | 147,035 | |
| (H Shares) | 199,500 | 460,337 | |
| Shanghai Friendess Electronic Technology Corp. Ltd. (A Shares) | 3,050 | 100,784 | |
| Shanghai Fudan Microelectronics Group Co. Ltd. (A Shares) | 12,650 | 83,775 | |
| Shanghai International Airport Co. Ltd. (A Shares) (a) | 27,600 | 140,435 | |
| Shanghai International Port Group Co. Ltd. (A Shares) | 205,500 | 140,483 | |
| Shanghai Jinjiang International Hotels Co. Ltd. (A Shares) | 19,600 | 88,019 | |
| Shanghai Junshi Biosciences Co. Ltd. (A Shares) (a) | 17,430 | 109,318 | |
| Shanghai Lingang Holdings Corp. Ltd. (A Shares) | 56,280 | 82,560 | |
| Shanghai M&G Stationery, Inc. (A Shares) | 20,300 | 107,571 | |
| Shanghai Moons' Electric Co. Ltd. (A Shares) | 9,000 | 81,135 | |
| Shanghai Pharmaceuticals Holding Co. Ltd.: | |||
| (A Shares) | 112,000 | 276,008 | |
| (H Shares) | 193,300 | 281,213 | |
| Shanghai Pudong Development Bank Co. Ltd. (A Shares) | 623,200 | 581,164 | |
| Shanghai Putailai New Energy Technology Co. Ltd. | 42,380 | 145,001 | |
| Shanghai RAAS Blood Products Co. Ltd. (A Shares) | 153,600 | 146,709 | |
| Shanghai Rural Commercial Bank Co. Ltd. (A Shares) | 162,300 | 132,249 | |
| Shanghai Yuyuan Tourist Mart Group Co. Ltd. | 65,400 | 58,109 | |
| Shanxi Coal International Energy Group Co. Ltd. (A Shares) | 45,200 | 100,736 | |
| Shanxi Lu'an Environmental Energy Development Co. Ltd. (A Shares) | 67,600 | 175,900 | |
| Shanxi Meijin Energy Co. Ltd. (A Shares) (a) | 90,100 | 86,406 | |
| Shanxi Securities Co. Ltd. (A Shares) | 84,350 | 64,801 | |
| Shanxi Taigang Stainless Steel Co. Ltd. (A Shares) | 116,400 | 62,234 | |
| Shanxi Xinghuacun Fen Wine Factory Co. Ltd. (A Shares) | 27,120 | 916,194 | |
| Shanxi Xishan Coal & Electricity Power Co. Ltd. (A Shares) | 126,970 | 150,206 | |
| Shede Spirits Co. Ltd. (A Shares) | 7,600 | 119,685 | |
| Shenergy Co. Ltd. (A Shares) | 114,200 | 91,970 | |
| Shenghe Resources Holding Co. Ltd. (A Shares) | 36,000 | 52,640 | |
| Shengyi Technology Co. Ltd. | 44,800 | 107,744 | |
| Shennan Circuits Co. Ltd. (A Shares) | 10,700 | 101,807 | |
| Shenwan Hongyuan Group Co. Ltd. (A Shares) | 549,400 | 329,700 | |
| Shenzhen Capchem Technology Co. Ltd. (A Shares) | 15,700 | 94,758 | |
| Shenzhen Dynanonic Co. Ltd. (A Shares) | 6,240 | 67,126 | |
| Shenzhen Energy Group Co. Ltd. (A Shares) | 107,820 | 91,077 | |
| Shenzhen Inovance Technology Co. Ltd. (A Shares) | 30,650 | 253,408 | |
| Shenzhen International Holdings Ltd. | 507,097 | 334,240 | |
| Shenzhen Kaifa Technology Co. Ltd. (A Shares) | 35,600 | 83,758 | |
| Shenzhen Kangtai Biological Products Co. Ltd. | 24,060 | 99,783 | |
| Shenzhen Kedali Industry Co. Ltd. | 5,400 | 67,084 | |
| Shenzhen Kstar Science & Technology Co. Ltd. (A Shares) | 12,400 | 44,238 | |
| Shenzhen Mindray Bio-Medical Electronics Co. Ltd. (A Shares) (a) | 26,800 | 1,047,704 | |
| Shenzhen New Industries Biomedical Engineering Co. Ltd. | 16,900 | 158,973 | |
| Shenzhen Overseas Chinese Town Co. Ltd. (A Shares) (a) | 182,400 | 90,160 | |
| Shenzhen Salubris Pharmaceuticals Co. Ltd. (A Shares) | 23,200 | 103,298 | |
| Shenzhen SC New Energy Technology Corp. (A Shares) | 7,800 | 77,869 | |
| Shenzhen Sed Industry Co. Ltd. (A Shares) | 24,300 | 63,675 | |
| Shenzhen Senior Technology Material Co. Ltd. (A Shares) | 27,217 | 57,186 | |
| Shenzhen Sunlord Electronics Co. Ltd. (A Shares) | 18,700 | 74,654 | |
| Shenzhen Transsion Holdings Co. Ltd. (A Shares) (a) | 17,514 | 321,916 | |
| Shenzhen YUTO Packaging Technology Co. Ltd. (A Shares) | 18,100 | 64,988 | |
| Shenzhou International Group Holdings Ltd. | 302,500 | 2,971,298 | |
| Shijiazhuang Yiling Pharmaceutical Co. Ltd. (A Shares) | 38,060 | 115,646 | |
| Shuangliang Eco-Energy Systems Ltd. (A Shares) | 44,100 | 56,454 | |
| Sichuan Chuantou Energy Co. Ltd. (A Shares) | 87,736 | 176,462 | |
| Sichuan Hebang Biotechnology Co. Ltd. (A Shares) | 172,200 | 56,055 | |
| Sichuan Kelun Pharmaceutical Co. Ltd. (A Shares) | 33,000 | 123,977 | |
| Sichuan New Energy Power Co. Ltd. (A Shares) (a) | 31,500 | 50,474 | |
| Sichuan Road & Bridge (Group) Co. Ltd. (A Shares) | 156,940 | 165,431 | |
| Sichuan Swellfun Co. Ltd. (A Shares) | 11,000 | 91,946 | |
| Sichuan Yahua Industrial Group Co. Ltd. (A Shares) | 25,200 | 48,546 | |
| Sieyuan Electric Co. Ltd. (A Shares) | 16,900 | 113,926 | |
| Silergy Corp. | 119,000 | 1,062,784 | |
| Sinolink Securities Co. Ltd. (A Shares) | 92,300 | 115,366 | |
| Sinoma International Engineering Co. Ltd. (A Shares) | 60,700 | 81,868 | |
| Sinoma Science & Technology Co. Ltd. (A Shares) | 36,000 | 85,124 | |
| Sinomine Resource Group Co. Ltd. (A Shares) | 13,916 | 71,158 | |
| Sinopec Shanghai Petrochemical Co. Ltd. (A Shares) (a) | 133,600 | 54,658 | |
| Sinopharm Group Co. Ltd. (H Shares) | 491,600 | 1,175,555 | |
| Sinotruk Hong Kong Ltd. | 248,500 | 468,051 | |
| SITC International Holdings Co. Ltd. | 492,000 | 757,880 | |
| SKSHU Paint Co. Ltd. (A Shares) | 11,424 | 93,010 | |
| Smoore International Holdings Ltd. (b)(c) | 668,000 | 514,800 | |
| Songcheng Performance Development Co. Ltd. (A Shares) | 60,860 | 91,411 | |
| Soochow Securities Co. Ltd. (A Shares) | 96,649 | 105,994 | |
| Southwest Securities Co. Ltd. (A Shares) | 132,600 | 74,337 | |
| Spring Airlines Co. Ltd. (A Shares) (a) | 21,600 | 161,720 | |
| StarPower Semiconductor Ltd. (A Shares) | 3,500 | 82,407 | |
| Sungrow Power Supply Co. Ltd. (A Shares) | 33,100 | 381,517 | |
| Sunny Optical Technology Group Co. Ltd. | 258,800 | 2,168,209 | |
| Sunresin New Materials Co. Ltd. (A Shares) | 11,550 | 85,851 | |
| Sunwoda Electronic Co. Ltd. (A Shares) | 36,300 | 79,967 | |
| SUPCON Technology Co. Ltd. (A Shares) | 14,517 | 86,639 | |
| Suzhou Dongshan Precision Manufacturing Co. Ltd. (A Shares) | 38,200 | 97,849 | |
| Suzhou Maxwell Technologies Co. Ltd. (A Shares) | 6,176 | 101,997 | |
| Suzhou TFC Optical Communication Co. Ltd. (A Shares) | 8,500 | 83,129 | |
| TAL Education Group ADR (a) | 161,370 | 1,415,215 | |
| Tangshan Jidong Cement Co. Ltd. A Shares | 68,000 | 66,496 | |
| TBEA Co. Ltd. (A Shares) | 102,700 | 196,586 | |
| TCL Technology Group Corp. (A Shares) | 403,260 | 216,883 | |
| TCL Zhonghuan Renewable Energy Technology Co. Ltd. (A Shares) | 88,500 | 223,479 | |
| Tencent Holdings Ltd. | 2,474,500 | 91,578,167 | |
| Tencent Music Entertainment Group ADR (a) | 272,669 | 1,979,577 | |
| Thunder Software Technology Co. Ltd. (A Shares) | 10,300 | 98,988 | |
| Tianjin 712 Communication & Broadcasting Co. Ltd. | 16,700 | 60,768 | |
| Tianma Microelectronics Co. Ltd. (A Shares) (a) | 49,300 | 66,064 | |
| Tianqi Lithium Corp. (A Shares) | 32,800 | 246,842 | |
| Tianshan Aluminum Group Co. Ltd. | 86,000 | 76,186 | |
| Tianshui Huatian Technology Co. Ltd. (A Shares) | 63,000 | 76,958 | |
| Tingyi (Cayman Islands) Holding Corp. | 712,000 | 945,046 | |
| Titan Wind Energy Suzhou Co. Ltd. (A Shares) (a) | 42,900 | 78,259 | |
| Tongcheng Travel Holdings Ltd. (a) | 458,800 | 876,515 | |
| TongFu Microelectronics Co. Ltd. (A Shares) | 34,800 | 97,726 | |
| Tongkun Group Co. Ltd. (A Shares) (a) | 49,100 | 97,007 | |
| Tongling Nonferrous Metals Group Co. Ltd. (A Shares) | 217,300 | 92,316 | |
| Tongwei Co. Ltd. (A Shares) | 100,200 | 374,358 | |
| Topchoice Medical Corp. (a) | 7,100 | 87,015 | |
| Topsports International Holdings Ltd. (c) | 691,000 | 581,091 | |
| TravelSky Technology Ltd. (H Shares) | 351,000 | 554,486 | |
| Trina Solar Co. Ltd. (A Shares) | 48,382 | 197,599 | |
| Trip.com Group Ltd. (a) | 204,055 | 6,954,526 | |
| Tsingtao Brewery Co. Ltd.: | |||
| (A Shares) | 32,300 | 369,179 | |
| (H Shares) | 202,000 | 1,531,873 | |
| Uni-President China Holdings Ltd. | 471,000 | 320,558 | |
| Unigroup Guoxin Microelectronics Co. Ltd. (a) | 18,479 | 190,558 | |
| Unisplendour Corp. Ltd. (A Shares) (a) | 62,220 | 166,988 | |
| Universal Scientific Industrial Shanghai Co. Ltd. (A Shares) | 42,000 | 83,437 | |
| Verisilicon Microelectronics Shanghai Co. Ltd. (A Shares) (a) | 11,098 | 81,001 | |
| Vipshop Holdings Ltd. ADR (a) | 124,073 | 1,769,281 | |
| Walvax Biotechnology Co. Ltd. (A Shares) | 35,200 | 112,081 | |
| Wanda Film Holding Co. Ltd. (A Shares) (a) | 49,900 | 85,235 | |
| Wanhua Chemical Group Co. Ltd. (A Shares) | 69,200 | 839,584 | |
| Want Want China Holdings Ltd. | 1,703,000 | 1,058,176 | |
| Weibo Corp. sponsored ADR | 29,143 | 344,762 | |
| Weichai Power Co. Ltd.: | |||
| (A Shares) | 150,200 | 285,515 | |
| (H Shares) | 722,600 | 1,081,604 | |
| Weihai Guangwei Composites Co. Ltd. (A Shares) | 17,920 | 62,774 | |
| Wens Foodstuffs Group Co. Ltd. (A Shares) | 149,200 | 383,262 | |
| Western Mining Co. Ltd. (A Shares) | 57,100 | 98,185 | |
| Western Securities Co. Ltd. (A Shares) | 93,900 | 85,489 | |
| Western Superconducting Technologies Co. Ltd. (A Shares) | 13,872 | 87,713 | |
| Will Semiconductor Ltd. | 25,650 | 387,076 | |
| Wilmar International Ltd. | 706,793 | 1,837,510 | |
| Wingtech Technology Co. Ltd. (A Shares) (a) | 26,800 | 182,460 | |
| Wintime Energy Group Co. Ltd. (A Shares) (a) | 564,400 | 105,743 | |
| Wuchan Zhongda Group Co. Ltd. | 106,200 | 66,367 | |
| Wuhan Guide Infrared Co. Ltd. (A Shares) | 83,044 | 89,978 | |
| Wuliangye Yibin Co. Ltd. (A Shares) | 85,900 | 1,831,482 | |
| WUS Printed Circuit Kunshan Co. Ltd. (A Shares) | 42,530 | 113,910 | |
| WuXi AppTec Co. Ltd. | 46,848 | 554,009 | |
| WuXi AppTec Co. Ltd. (H Shares) (b)(c) | 143,000 | 1,718,366 | |
| Wuxi Autowell Technology Co. Ltd. (A Shares) | 3,291 | 61,494 | |
| Wuxi Biologics (Cayman), Inc. (a)(c) | 1,418,500 | 8,819,867 | |
| XCMG Construction Machinery Co. Ltd. (A Shares) | 255,400 | 200,068 | |
| Xiamen C&D, Inc. (A Shares) | 65,100 | 87,007 | |
| Xiamen Faratronic Co. Ltd. (A Shares) | 4,800 | 65,513 | |
| Xiamen Tungsten Co. Ltd. (A Shares) | 32,200 | 74,640 | |
| Xiaomi Corp. Class B (a)(c) | 5,720,200 | 10,256,456 | |
| Xinjiang Daqo New Energy Co. Ltd. (A Shares) | 39,264 | 191,783 | |
| Xinyi Solar Holdings Ltd. | 1,789,446 | 1,053,106 | |
| XPeng, Inc. Class A (a) | 384,326 | 2,792,811 | |
| XTEP International Holdings Ltd. | 519,000 | 471,840 | |
| Yadea Group Holdings Ltd. (c) | 442,000 | 806,809 | |
| Yangzhou Yangjie Electronic Technology Co. Ltd. (A Shares) | 11,600 | 60,241 | |
| Yankuang Energy Group Co. Ltd.: | |||
| (A Shares) | 116,250 | 310,580 | |
| (H Shares) | 773,000 | 1,342,515 | |
| Yantai Jereh Oilfield Services (A Shares) | 24,000 | 93,861 | |
| Yealink Network Technology Corp. Ltd. | 27,160 | 123,934 | |
| Yifeng Pharmacy Chain Co. Ltd. | 21,719 | 97,312 | |
| Yihai International Holding Ltd. | 192,000 | 349,421 | |
| Yihai Kerry Arawana Holdings Co. Ltd. (A Shares) | 32,600 | 155,931 | |
| Yintai Gold Co. Ltd. (A Shares) | 59,540 | 110,178 | |
| Yonghui Superstores Co. Ltd. (A Shares) (a) | 202,500 | 85,265 | |
| YongXing Special Materials Technology Co. Ltd. (A Shares) | 11,830 | 80,925 | |
| Yonyou Network Technology Co. Ltd. (A Shares) | 77,030 | 172,567 | |
| Youngor Group Co. Ltd. (A Shares) | 112,893 | 104,201 | |
| YTO Express Group Co. Ltd. (A Shares) | 74,000 | 137,446 | |
| Yuan Longping High-tech Agriculture Co. Ltd. (A Shares) (a) | 34,000 | 76,639 | |
| Yuexiu Property Co. Ltd. | 593,920 | 617,771 | |
| Yum China Holdings, Inc. | 155,798 | 8,188,743 | |
| Yunda Holding Co. Ltd. (A Shares) | 64,620 | 80,559 | |
| Yunnan Aluminium Co. Ltd. (A Shares) | 75,600 | 143,740 | |
| Yunnan Baiyao Group Co. Ltd. (A Shares) | 38,080 | 264,645 | |
| Yunnan Botanee Bio-Technology Group Co., Ltd. (A Shares) | 9,500 | 102,463 | |
| Yunnan Chihong Zinc & Germanium Co. Ltd. (A Shares) | 102,400 | 72,433 | |
| Yunnan Energy New Material Co. Ltd. | 21,000 | 192,788 | |
| Yunnan Tin Co. Ltd. (A Shares) | 39,200 | 75,737 | |
| Yunnan Yuntianhua Co. Ltd. (Series A) | 41,500 | 94,516 | |
| Yutong Bus Co. Ltd. | 44,500 | 82,983 | |
| Zai Lab Ltd. (a)(b) | 339,110 | 865,428 | |
| Zangge Mining Co. Ltd. (Series A) | 30,700 | 93,972 | |
| Zhangzhou Pientzehuang Pharmaceutical Co. Ltd. (A Shares) | 13,198 | 451,742 | |
| Zhaojin Mining Industry Co. Ltd. (H Shares) | 477,500 | 591,980 | |
| Zhefu Holding Group Co. Ltd. (A Shares) | 130,200 | 65,856 | |
| Zhejiang Century Huatong Group Co. Ltd. (A Shares) (a) | 167,966 | 135,740 | |
| Zhejiang China Commodities City Group Co. Ltd. (A Shares) | 125,300 | 133,342 | |
| Zhejiang Chint Electric Co. Ltd. (A Shares) | 46,900 | 148,226 | |
| Zhejiang Dahua Technology Co. Ltd. (A Shares) (a) | 74,700 | 208,554 | |
| Zhejiang Dingli Machinery Co. Ltd. (A Shares) | 11,000 | 81,935 | |
| Zhejiang Expressway Co. Ltd. (H Shares) | 476,000 | 358,302 | |
| Zhejiang Huahai Pharmaceutical Co. Ltd. (A Shares) | 33,860 | 74,883 | |
| Zhejiang Huayou Cobalt Co. Ltd. (A Shares) | 34,110 | 171,707 | |
| Zhejiang Jingsheng Mechanical & Electrical Co. Ltd. (A Shares) | 28,400 | 168,922 | |
| Zhejiang Jiuzhou Pharmaceutical Co. Ltd. (A Shares) | 19,700 | 80,074 | |
| Zhejiang Juhua Co. Ltd. (A Shares) | 57,500 | 119,066 | |
| Zhejiang Longsheng Group Co. Ltd. (A Shares) | 77,500 | 94,307 | |
| Zhejiang NHU Co. Ltd. (A Shares) | 65,380 | 144,591 | |
| Zhejiang Sanhua Intelligent Controls Co. Ltd. (A Shares) | 40,500 | 148,257 | |
| Zhejiang Supor Cookware Co. Ltd. | 9,700 | 66,527 | |
| Zhejiang Weiming Enviroment Protection Co. Ltd. (A Shares) | 35,600 | 87,338 | |
| Zhejiang Weixing New Building Materials Co. Ltd. (A Shares) | 33,200 | 74,848 | |
| Zhejiang Zheneng Electric Power Co. Ltd. (A Shares) (a) | 252,300 | 158,661 | |
| Zheshang Securities Co. Ltd. | 76,900 | 105,930 | |
| ZhongAn Online P & C Insurance Co. Ltd. (H Shares) (a)(c) | 262,600 | 719,687 | |
| Zhongji Innolight Co. Ltd. (A Shares) | 17,700 | 213,275 | |
| Zhongjin Gold Co. Ltd. (A Shares) | 107,400 | 159,700 | |
| Zhongsheng Group Holdings Ltd. Class H | 302,000 | 697,407 | |
| Zhongtai Securities Co. Ltd. (A Shares) | 132,800 | 130,016 | |
| Zhuzhou CRRC Times Electric Co. Ltd.: | |||
| (A Shares) | 27,044 | 143,187 | |
| (H Shares) | 166,900 | 538,648 | |
| Zhuzhou Kibing Group Co. Ltd. (A Shares) | 55,400 | 60,447 | |
| Zibo Qixiang Tengda Chemical Co. Ltd. (A Shares) | 74,700 | 59,763 | |
| Zijin Mining Group Co. Ltd.: | |||
| (A Shares) (a) | 99,000 | 167,943 | |
| (H Shares) | 2,464,000 | 3,811,591 | |
| Zoomlion Heavy Industry Science and Technology Co. Ltd. (A Shares) | 197,900 | 173,692 | |
| ZTE Corp.: | |||
| (A Shares) | 28,500 | 101,921 | |
| (H Shares) | 372,080 | 826,858 | |
| ZTO Express, Inc. sponsored ADR | 161,028 | 3,795,430 | |
TOTAL CHINA | 713,733,193 | ||
| Colombia - 0.0% | |||
| Bancolombia SA | 101,022 | 720,359 | |
| Interconexion Electrica SA ESP | 163,149 | 574,747 | |
TOTAL COLOMBIA | 1,295,106 | ||
| Czech Republic - 0.0% | |||
| CEZ A/S | 59,042 | 2,526,357 | |
| Komercni Banka A/S | 27,293 | 799,330 | |
| MONETA Money Bank A/S (c) | 117,594 | 454,301 | |
TOTAL CZECH REPUBLIC | 3,779,988 | ||
| Denmark - 2.2% | |||
| A.P. Moller - Maersk A/S: | |||
| Series A | 1,115 | 1,817,827 | |
| Series B | 1,811 | 3,017,544 | |
| Carlsberg A/S Series B | 36,295 | 4,325,392 | |
| Chr. Hansen Holding A/S | 38,371 | 2,613,825 | |
| Coloplast A/S Series B | 50,541 | 5,266,367 | |
| Danske Bank A/S | 254,847 | 5,970,366 | |
| Demant A/S (a) | 36,269 | 1,381,603 | |
| DSV A/S | 68,641 | 10,237,155 | |
| Genmab A/S (a) | 24,487 | 6,922,057 | |
| Novo Nordisk A/S Series B | 1,204,356 | 116,191,734 | |
| Novozymes A/S Series B | 76,189 | 3,419,662 | |
| ORSTED A/S (c) | 70,094 | 3,386,881 | |
| Pandora A/S | 30,918 | 3,498,671 | |
| Rockwool International A/S Series B | 3,360 | 746,905 | |
| Tryg A/S | 128,142 | 2,500,620 | |
| Vestas Wind Systems A/S (a) | 374,305 | 8,112,980 | |
TOTAL DENMARK | 179,409,589 | ||
| Egypt - 0.0% | |||
| Commercial International Bank SAE | 922,326 | 1,799,915 | |
| Eastern Co. SAE | 374,340 | 318,355 | |
| EFG-Hermes Holding SAE | 342,651 | 185,037 | |
TOTAL EGYPT | 2,303,307 | ||
| Finland - 0.7% | |||
| Elisa Corp. (A Shares) | 53,284 | 2,259,702 | |
| Fortum Corp. | 164,706 | 1,951,885 | |
| Kesko Oyj | 99,505 | 1,680,895 | |
| Kone OYJ (B Shares) | 125,892 | 5,446,807 | |
| Metso Corp. | 242,796 | 2,133,832 | |
| Neste OYJ | 156,084 | 5,236,985 | |
| Nokia Corp. | 1,986,219 | 6,615,465 | |
| Nordea Bank Abp | 1,186,811 | 12,471,539 | |
| Orion Oyj (B Shares) | 39,541 | 1,570,611 | |
| Sampo Oyj (A Shares) | 169,594 | 6,659,293 | |
| Stora Enso Oyj (R Shares) | 213,176 | 2,554,484 | |
| UPM-Kymmene Corp. | 199,066 | 6,691,770 | |
| Wartsila Corp. | 173,257 | 2,060,553 | |
TOTAL FINLAND | 57,333,821 | ||
| France - 6.6% | |||
| Accor SA | 67,376 | 2,143,707 | |
| Adevinta ASA Class B (a) | 106,998 | 939,146 | |
| Aeroports de Paris SA | 10,976 | 1,228,730 | |
| Air Liquide SA | 184,448 | 31,605,580 | |
| Airbus Group NV | 218,968 | 29,358,401 | |
| Alstom SA | 105,755 | 1,432,183 | |
| Amundi SA (c) | 21,837 | 1,137,264 | |
| Arkema SA | 22,791 | 2,131,298 | |
| AXA SA | 676,393 | 20,041,812 | |
| bioMerieux SA | 15,267 | 1,461,938 | |
| BNP Paribas SA | 387,085 | 22,258,946 | |
| Bollore SA | 269,711 | 1,469,713 | |
| Bouygues SA | 70,457 | 2,475,824 | |
| Bureau Veritas SA | 110,059 | 2,502,584 | |
| Capgemini SA | 60,988 | 10,778,335 | |
| Carrefour SA | 223,528 | 3,918,773 | |
| Compagnie de St.-Gobain | 170,905 | 9,303,068 | |
| Compagnie Generale des Etablissements Michelin SCA Series B | 250,672 | 7,447,078 | |
| Covivio | 20,042 | 856,740 | |
| Credit Agricole SA | 446,692 | 5,393,757 | |
| Danone SA | 237,660 | 14,138,501 | |
| Dassault Aviation SA | 7,572 | 1,502,237 | |
| Dassault Systemes SA | 247,321 | 10,187,985 | |
| Edenred SA | 92,610 | 4,923,050 | |
| Eiffage SA | 27,471 | 2,491,047 | |
| Engie SA | 673,732 | 10,715,632 | |
| EssilorLuxottica SA | 108,757 | 19,636,531 | |
| Eurazeo SA | 16,095 | 905,151 | |
| Gecina SA | 16,581 | 1,624,607 | |
| Getlink SE | 131,530 | 2,120,284 | |
| Hermes International SCA | 11,683 | 21,751,792 | |
| Ipsen SA | 13,870 | 1,636,357 | |
| Kering SA | 27,500 | 11,184,296 | |
| Klepierre SA | 78,562 | 1,903,596 | |
| L'Oreal SA (a) | 4,395 | 1,847,353 | |
| L'Oreal SA | 84,537 | 35,533,498 | |
| La Francaise des Jeux SAEM (c) | 37,981 | 1,222,510 | |
| Legrand SA | 98,819 | 8,548,474 | |
| LVMH Moet Hennessy Louis Vuitton SE | 101,872 | 72,933,279 | |
| Orange SA | 688,691 | 8,100,417 | |
| Pernod Ricard SA | 75,379 | 13,359,552 | |
| Publicis Groupe SA | 85,003 | 6,450,617 | |
| Remy Cointreau SA | 8,408 | 953,260 | |
| Renault SA | 71,673 | 2,506,419 | |
| Safran SA | 126,479 | 19,758,492 | |
| Sartorius Stedim Biotech | 10,079 | 1,882,833 | |
| SEB SA | 9,270 | 913,670 | |
| Societe Generale Series A | 269,171 | 6,048,748 | |
| Sodexo SA (a) | 2,224 | 235,039 | |
| Sodexo SA | 30,433 | 3,216,252 | |
| Teleperformance | 21,950 | 2,511,816 | |
| Thales SA | 39,108 | 5,758,051 | |
| TotalEnergies SE | 828,844 | 55,414,423 | |
| Unibail-Rodamco-Westfield NV (a) | 44,998 | 2,221,594 | |
| Valeo SA | 75,794 | 997,659 | |
| Veolia Environnement SA | 251,461 | 6,890,132 | |
| VINCI SA | 195,763 | 21,646,376 | |
| Vivendi SA | 247,982 | 2,218,768 | |
| Wendel SA | 9,872 | 737,457 | |
| Worldline SA (a)(c) | 87,646 | 1,111,004 | |
TOTAL FRANCE | 545,623,636 | ||
| Germany - 4.9% | |||
| adidas AG | 59,890 | 10,595,399 | |
| Allianz SE | 148,566 | 34,800,478 | |
| BASF AG | 330,544 | 15,273,498 | |
| Bayer AG | 362,837 | 15,677,666 | |
| Bayerische Motoren Werke AG (BMW) | 111,079 | 10,299,390 | |
| Bechtle AG | 30,014 | 1,336,369 | |
| Beiersdorf AG | 37,271 | 4,892,091 | |
| Brenntag SE | 54,665 | 4,055,813 | |
| Carl Zeiss Meditec AG | 14,723 | 1,273,379 | |
| Commerzbank AG | 395,310 | 4,245,517 | |
| Continental AG | 40,978 | 2,675,412 | |
| Covestro AG (a)(c) | 71,595 | 3,613,498 | |
| Daimler Truck Holding AG | 182,685 | 5,725,516 | |
| Deutsche Bank AG | 718,621 | 7,874,422 | |
| Deutsche Borse AG | 70,109 | 11,539,693 | |
| Deutsche Lufthansa AG (a) | 218,967 | 1,530,074 | |
| Deutsche Telekom AG | 1,195,354 | 25,943,563 | |
| DHL Group | 366,026 | 14,236,858 | |
| E.ON SE | 828,539 | 9,836,317 | |
| Evonik Industries AG | 78,167 | 1,435,820 | |
| Fresenius Medical Care AG & Co. KGaA | 76,427 | 2,539,376 | |
| Fresenius SE & Co. KGaA | 156,736 | 4,020,019 | |
| GEA Group AG | 57,631 | 1,965,365 | |
| Hannover Reuck SE | 22,262 | 4,906,594 | |
| HeidelbergCement AG | 54,004 | 3,913,059 | |
| HelloFresh AG (a) | 56,530 | 1,229,784 | |
| Henkel AG & Co. KGaA | 37,673 | 2,380,948 | |
| Infineon Technologies AG | 482,065 | 14,081,225 | |
| Knorr-Bremse AG | 26,564 | 1,476,761 | |
| LEG Immobilien AG (a) | 26,802 | 1,668,655 | |
| Mercedes-Benz Group AG (Germany) | 296,012 | 17,415,650 | |
| Merck KGaA | 47,777 | 7,196,197 | |
| MTU Aero Engines AG | 19,998 | 3,745,299 | |
| Muenchener Rueckversicherungs-Gesellschaft AG in Muenchen | 50,305 | 20,146,692 | |
| Nemetschek SE | 21,091 | 1,571,074 | |
| Puma AG | 38,508 | 2,171,725 | |
| Rational AG | 1,875 | 1,066,366 | |
| Rheinmetall AG | 16,233 | 4,644,428 | |
| RWE AG | 234,239 | 8,954,759 | |
| SAP SE | 385,288 | 51,679,578 | |
| Scout24 AG (c) | 27,602 | 1,694,513 | |
| Siemens AG | 280,557 | 37,229,596 | |
| Siemens Energy AG (a)(b) | 194,094 | 1,718,954 | |
| Siemens Healthineers AG (c) | 104,260 | 5,109,907 | |
| Symrise AG | 49,375 | 5,045,595 | |
| Talanx AG | 23,657 | 1,488,121 | |
| Telefonica Deutschland Holding AG | 325,735 | 552,663 | |
| Volkswagen AG | 10,744 | 1,242,005 | |
| Vonovia SE | 271,659 | 6,254,157 | |
| Wacker Chemie AG | 6,691 | 817,711 | |
| Zalando SE (a)(c) | 81,678 | 1,900,453 | |
TOTAL GERMANY | 406,688,002 | ||
| Greece - 0.1% | |||
| Alpha Bank SA (a) | 804,190 | 1,199,788 | |
| Eurobank Ergasias Services and Holdings SA (a) | 939,814 | 1,533,391 | |
| Ff Group (a)(d) | 5,453 | 0 | |
| Hellenic Telecommunications Organization SA | 71,705 | 1,003,774 | |
| Jumbo SA | 41,766 | 1,098,628 | |
| Motor Oil (HELLAS) Corinth Refineries SA | 23,651 | 563,065 | |
| Mytilineos SA | 38,566 | 1,427,418 | |
| National Bank of Greece SA (a) | 201,856 | 1,153,353 | |
| OPAP SA | 72,126 | 1,221,064 | |
| Piraeus Financial Holdings SA (a) | 247,817 | 731,580 | |
| Public Power Corp. of Greece (a) | 77,397 | 788,637 | |
TOTAL GREECE | 10,720,698 | ||
| Hong Kong - 1.4% | |||
| AIA Group Ltd. | 4,265,295 | 37,039,003 | |
| CK Asset Holdings Ltd. | 733,971 | 3,668,625 | |
| CK Infrastructure Holdings Ltd. | 225,636 | 1,045,832 | |
| CLP Holdings Ltd. | 608,608 | 4,454,270 | |
| Futu Holdings Ltd. ADR (a) | 20,212 | 1,120,755 | |
| Hang Lung Properties Ltd. | 669,998 | 880,684 | |
| Hang Seng Bank Ltd. | 280,850 | 3,210,982 | |
| Henderson Land Development Co. Ltd. | 540,059 | 1,413,043 | |
| HKT Trust/HKT Ltd. unit | 1,364,557 | 1,413,388 | |
| Hong Kong & China Gas Co. Ltd. | 4,099,468 | 2,853,676 | |
| Hong Kong Exchanges and Clearing Ltd. | 445,402 | 15,581,344 | |
| Hongkong Land Holdings Ltd. | 408,667 | 1,296,178 | |
| Jardine Matheson Holdings Ltd. | 59,519 | 2,411,778 | |
| Jinmao Property Services Co. Ltd. | 316 | 86 | |
| Kingboard Laminates Holdings Ltd. | 335,000 | 314,160 | |
| Link (REIT) | 947,850 | 4,349,819 | |
| MTR Corp. Ltd. | 584,818 | 2,186,158 | |
| New World Development Co. Ltd. | 559,090 | 1,026,109 | |
| Nine Dragons Paper (Holdings) Ltd. | 574,000 | 326,767 | |
| Orient Overseas International Ltd. (b) | 48,500 | 611,575 | |
| Power Assets Holdings Ltd. | 520,854 | 2,490,114 | |
| Prudential PLC | 1,017,238 | 10,636,636 | |
| Sino Biopharmaceutical Ltd. | 3,710,250 | 1,441,355 | |
| Sino Land Ltd. | 1,344,367 | 1,342,120 | |
| Sun Hung Kai Properties Ltd. | 537,062 | 5,514,931 | |
| Swire Pacific Ltd. (A Shares) | 158,004 | 1,009,305 | |
| Swire Properties Ltd. | 414,155 | 801,889 | |
| Techtronic Industries Co. Ltd. | 509,847 | 4,654,661 | |
| Vinda International Holdings Ltd. (b) | 129,000 | 318,789 | |
| WH Group Ltd. (c) | 3,075,946 | 1,837,057 | |
| Wharf Real Estate Investment Co. Ltd. | 609,654 | 2,132,594 | |
| Xinyi Glass Holdings Ltd. | 623,568 | 716,492 | |
TOTAL HONG KONG | 118,100,175 | ||
| Hungary - 0.1% | |||
| MOL Hungarian Oil and Gas PLC Series A (For. Reg.) | 164,093 | 1,305,663 | |
| OTP Bank PLC | 86,996 | 3,237,230 | |
| Richter Gedeon PLC | 50,797 | 1,191,049 | |
TOTAL HUNGARY | 5,733,942 | ||
| India - 4.4% | |||
| ABB India Ltd. | 19,618 | 967,284 | |
| Adani Enterprises Ltd. | 62,302 | 1,717,435 | |
| Adani Green Energy Ltd. (a) | 115,601 | 1,276,797 | |
| Adani Ports & Special Economic Zone Ltd. | 193,594 | 1,825,789 | |
| Adani Power Ltd. (a) | 282,497 | 1,230,581 | |
| Ambuja Cements Ltd. | 219,608 | 1,120,044 | |
| Apollo Hospitals Enterprise Ltd. | 38,121 | 2,206,668 | |
| Ashok Leyland Ltd. | 521,752 | 1,051,630 | |
| Asian Paints Ltd. | 142,296 | 5,124,153 | |
| Astral Ltd. | 43,218 | 960,434 | |
| AU Small Finance Bank Ltd. (c) | 59,605 | 478,923 | |
| Aurobindo Pharma Ltd. | 94,439 | 963,398 | |
| Avenue Supermarts Ltd. (a)(c) | 59,395 | 2,592,473 | |
| Axis Bank Ltd. | 844,647 | 9,963,715 | |
| Bajaj Auto Ltd. | 24,867 | 1,585,816 | |
| Bajaj Finance Ltd. | 100,930 | 9,082,967 | |
| Bajaj Finserv Ltd. | 140,009 | 2,639,181 | |
| Bajaj Holdings & Investment Ltd. | 9,960 | 828,387 | |
| Balkrishna Industries Ltd. | 28,506 | 874,071 | |
| Bandhan Bank Ltd. (c) | 266,042 | 684,848 | |
| Bank of Baroda | 369,653 | 871,353 | |
| Berger Paints India Ltd. | 118,243 | 793,139 | |
| Bharat Electronics Ltd. | 1,350,273 | 2,162,619 | |
| Bharat Forge Ltd. | 91,658 | 1,122,342 | |
| Bharat Petroleum Corp. Ltd. | 279,211 | 1,170,148 | |
| Bharti Airtel Ltd. | 829,942 | 9,112,226 | |
| Britannia Industries Ltd. | 41,353 | 2,199,133 | |
| Cg Power & Industrial Soluti | 226,053 | 1,058,314 | |
| Cholamandalam Investment and Finance Co. Ltd. | 150,327 | 2,053,718 | |
| Cipla Ltd./India (a) | 192,276 | 2,770,859 | |
| Coal India Ltd. | 569,521 | 2,149,152 | |
| Colgate-Palmolive Ltd. | 43,935 | 1,115,146 | |
| Container Corp. of India Ltd. | 103,684 | 857,123 | |
| Cummins India Ltd. | 49,517 | 997,095 | |
| Dabur India Ltd. | 242,482 | 1,539,939 | |
| Divi's Laboratories Ltd. | 43,798 | 1,781,897 | |
| DLF Ltd. | 226,924 | 1,536,817 | |
| Dr. Reddy's Laboratories Ltd. | 41,026 | 2,647,220 | |
| Eicher Motors Ltd. | 50,016 | 1,978,946 | |
| GAIL India Ltd. | 898,783 | 1,290,108 | |
| Godrej Consumer Products Ltd. | 151,014 | 1,798,803 | |
| Godrej Properties Ltd. (a) | 44,681 | 891,336 | |
| Grasim Industries Ltd. | 96,208 | 2,179,803 | |
| Havells India Ltd. | 92,674 | 1,387,063 | |
| HCL Technologies Ltd. | 347,179 | 5,323,598 | |
| HDFC Asset Management Co. Ltd. (c) | 30,736 | 1,009,292 | |
| HDFC Bank Ltd. | 1,029,318 | 18,259,345 | |
| HDFC Standard Life Insurance Co. Ltd. (c) | 361,721 | 2,686,308 | |
| Hero Motocorp Ltd. | 39,878 | 1,479,409 | |
| Hindalco Industries Ltd. | 455,075 | 2,511,155 | |
| Hindustan Aeronautics Ltd. | 60,952 | 1,333,523 | |
| Hindustan Petroleum Corp. Ltd. (a) | 210,740 | 626,785 | |
| Hindustan Unilever Ltd. | 304,540 | 9,085,804 | |
| ICICI Bank Ltd. | 1,910,929 | 21,017,416 | |
| ICICI Lombard General Insurance Co. Ltd. (c) | 87,990 | 1,451,793 | |
| ICICI Prudential Life Insurance Co. Ltd. (c) | 127,340 | 803,321 | |
| IDFC Bank Ltd. (a) | 1,275,670 | 1,267,323 | |
| Indian Oil Corp. Ltd. | 1,006,099 | 1,083,486 | |
| Indian Railway Catering & Tourism Corp. Ltd. | 98,559 | 787,544 | |
| Indraprastha Gas Ltd. | 111,425 | 511,686 | |
| Info Edge India Ltd. | 26,180 | 1,284,404 | |
| Infosys Ltd. | 1,226,617 | 20,166,663 | |
| InterGlobe Aviation Ltd. (a)(c) | 49,475 | 1,458,906 | |
| ITC Ltd. | 1,113,086 | 5,727,953 | |
| Jindal Steel & Power Ltd. | 130,044 | 989,882 | |
| Jio Financial Services Ltd. | 1,111,895 | 2,950,123 | |
| JSW Steel Ltd. (a) | 223,292 | 1,975,118 | |
| Jubilant Foodworks Ltd. | 140,460 | 844,910 | |
| Kotak Mahindra Bank Ltd. | 404,169 | 8,446,573 | |
| Larsen & Toubro Ltd. | 255,353 | 8,983,432 | |
| Ltimindtree Ltd. (c) | 32,694 | 1,988,538 | |
| Lupin Ltd. | 73,219 | 991,898 | |
| Mahindra & Mahindra Ltd. | 346,581 | 6,072,125 | |
| Marico Ltd. | 184,868 | 1,190,905 | |
| Maruti Suzuki India Ltd. | 50,505 | 6,305,024 | |
| Max Healthcare Institute Ltd. | 283,976 | 1,956,969 | |
| Mphasis BFL Ltd. | 27,939 | 713,078 | |
| MRF Ltd. | 679 | 883,190 | |
| Muthoot Finance Ltd. | 42,327 | 660,240 | |
| Nestle India Ltd. | 12,639 | 3,679,246 | |
| NTPC Ltd. | 1,596,790 | 4,522,605 | |
| Oil & Natural Gas Corp. Ltd. | 1,147,339 | 2,566,506 | |
| Page Industries Ltd. | 2,248 | 1,021,153 | |
| Petronet LNG Ltd. | 280,057 | 671,086 | |
| PI Industries Ltd. | 29,997 | 1,224,763 | |
| Pidilite Industries Ltd. | 55,576 | 1,640,394 | |
| Power Finance Corp. Ltd. | 473,273 | 1,401,179 | |
| Power Grid Corp. of India Ltd. | 1,700,588 | 4,129,054 | |
| REC Ltd. | 428,143 | 1,479,439 | |
| Reliance Industries Ltd. | 1,123,186 | 30,875,953 | |
| Samvardhana Motherson International Ltd. | 866,702 | 956,926 | |
| SBI Cards & Payment Services Ltd. | 103,966 | 931,399 | |
| SBI Life Insurance Co. Ltd. (c) | 168,882 | 2,772,936 | |
| Shree Cement Ltd. | 3,365 | 1,036,828 | |
| Shriram Transport Finance Co. Ltd. | 102,875 | 2,320,701 | |
| Siemens Ltd. | 32,802 | 1,312,046 | |
| Sona Blw Precision Forgings Ltd. (c) | 150,727 | 980,635 | |
| SRF Ltd. | 54,156 | 1,427,600 | |
| State Bank of India | 663,106 | 4,504,522 | |
| Sun Pharmaceutical Industries Ltd. | 357,912 | 4,678,007 | |
| Supreme Industries Ltd. | 23,023 | 1,196,767 | |
| Tata Consultancy Services Ltd. | 338,007 | 13,679,672 | |
| Tata Consumer Products Ltd. | 205,225 | 2,219,902 | |
| Tata Elxsi Ltd. | 12,684 | 1,161,534 | |
| Tata Motors Ltd. | 619,934 | 4,680,979 | |
| Tata Power Co. Ltd./The | 527,853 | 1,518,243 | |
| Tata Steel Ltd. | 2,749,718 | 3,922,645 | |
| Tech Mahindra Ltd. | 201,399 | 2,743,876 | |
| The Indian Hotels Co. Ltd. | 315,462 | 1,452,511 | |
| Titan Co. Ltd. | 132,033 | 5,060,082 | |
| Torrent Pharmaceuticals Ltd. | 38,045 | 879,164 | |
| Trent Ltd. | 65,705 | 1,700,229 | |
| Tube Investments of India Ltd. | 38,431 | 1,453,476 | |
| Tvs Motor Co. Ltd. | 87,225 | 1,666,320 | |
| Ultratech Cement Ltd. | 42,382 | 4,287,955 | |
| United Spirits Ltd. (a) | 113,422 | 1,406,156 | |
| UPL Ltd. | 170,096 | 1,104,098 | |
| Varun Beverages Ltd. | 167,160 | 1,823,982 | |
| Vedanta Ltd. | 277,767 | 722,626 | |
| Wipro Ltd. | 481,355 | 2,209,110 | |
| Yes Bank Ltd. (a) | 4,755,890 | 911,223 | |
| Zomato Ltd. (a) | 1,569,391 | 1,984,415 | |
TOTAL INDIA | 367,384,555 | ||
| Indonesia - 0.5% | |||
| Indofood Sukses Makmur Tbk PT | 1,604,700 | 671,814 | |
| PT Adaro Energy Indonesia Tbk | 5,270,100 | 850,327 | |
| PT Aneka Tambang Tbk | 2,924,000 | 313,287 | |
| PT Astra International Tbk | 7,379,600 | 2,684,548 | |
| PT Bank Central Asia Tbk | 20,523,300 | 11,306,710 | |
| PT Bank Mandiri (Persero) Tbk | 13,946,600 | 4,982,453 | |
| PT Bank Negara Indonesia (Persero) Tbk | 5,490,000 | 1,656,808 | |
| PT Bank Rakyat Indonesia (Persero) Tbk | 25,311,454 | 7,914,484 | |
| PT Barito Pacific Tbk | 10,390,157 | 736,285 | |
| PT Charoen Pokphand Indonesia Tbk (a) | 2,649,500 | 976,103 | |
| PT GoTo Gojek Tokopedia Tbk (a) | 301,949,712 | 1,142,351 | |
| PT Indah Kiat Pulp & Paper Tbk | 1,000,500 | 604,705 | |
| PT Indofood CBP Sukses Makmur Tbk | 818,400 | 533,411 | |
| PT Kalbe Farma Tbk | 7,558,000 | 803,828 | |
| PT Merdeka Copper Gold Tbk (a) | 4,425,195 | 620,659 | |
| PT Sarana Menara Nusantara Tbk | 7,660,100 | 429,611 | |
| PT Semen Indonesia (Persero) Tbk | 1,262,533 | 485,132 | |
| PT Sumber Alfaria Trijaya Tbk | 6,115,600 | 1,113,019 | |
| PT Surya Citra Media Tbk | 20 | 0 | |
| PT Telkom Indonesia Persero Tbk | 18,547,300 | 4,065,861 | |
| PT Unilever Indonesia Tbk | 2,796,100 | 637,535 | |
| PT United Tractors Tbk | 547,700 | 866,740 | |
| PT Vale Indonesia Tbk | 950,600 | 296,254 | |
TOTAL INDONESIA | 43,691,925 | ||
| Ireland - 0.3% | |||
| AerCap Holdings NV (a) | 64,435 | 4,002,702 | |
| AIB Group PLC | 536,700 | 2,324,910 | |
| Bank of Ireland Group PLC | 392,259 | 3,507,166 | |
| Kerry Group PLC Class A | 59,178 | 4,563,472 | |
| Kingspan Group PLC (Ireland) | 57,331 | 3,850,819 | |
| Smurfit Kappa Group PLC | 95,205 | 3,096,637 | |
TOTAL IRELAND | 21,345,706 | ||
| Israel - 0.4% | |||
| Azrieli Group | 15,541 | 667,855 | |
| Bank Hapoalim BM (Reg.) | 472,976 | 3,378,233 | |
| Bank Leumi le-Israel BM | 570,226 | 3,666,545 | |
| Check Point Software Technologies Ltd. (a) | 34,679 | 4,655,656 | |
| Elbit Systems Ltd. (Israel) | 9,757 | 1,811,152 | |
| Global-e Online Ltd. (a)(b) | 32,721 | 1,148,834 | |
| Icl Group Ltd. | 279,311 | 1,354,403 | |
| Israel Discount Bank Ltd. (Class A) | 464,376 | 2,039,256 | |
| Mizrahi Tefahot Bank Ltd. | 55,938 | 1,729,899 | |
| NICE Ltd. (a) | 23,116 | 3,572,057 | |
| NICE Ltd. sponsored ADR (a) | 360 | 55,566 | |
| Teva Pharmaceutical Industries Ltd. sponsored ADR (a) | 415,469 | 3,564,724 | |
| Wix.com Ltd. (a) | 19,697 | 1,573,790 | |
TOTAL ISRAEL | 29,217,970 | ||
| Italy - 1.4% | |||
| Amplifon SpA | 45,559 | 1,284,207 | |
| Assicurazioni Generali SpA | 372,290 | 7,384,031 | |
| Coca-Cola HBC AG | 82,272 | 2,131,947 | |
| Davide Campari Milano NV | 189,684 | 2,093,349 | |
| DiaSorin SpA | 8,238 | 736,555 | |
| Enel SpA | 3,000,163 | 19,043,774 | |
| Eni SpA | 867,616 | 14,183,493 | |
| Ferrari NV (Italy) | 46,480 | 14,041,029 | |
| FinecoBank SpA | 222,809 | 2,620,408 | |
| Infrastrutture Wireless Italiane SpA (c) | 122,193 | 1,334,298 | |
| Intesa Sanpaolo SpA | 5,737,839 | 14,951,609 | |
| Mediobanca SpA (b) | 203,059 | 2,421,435 | |
| Moncler SpA | 76,654 | 3,969,406 | |
| Nexi SpA (a)(c) | 215,843 | 1,250,628 | |
| Poste Italiane SpA (c) | 191,678 | 1,894,287 | |
| Prysmian SpA | 98,158 | 3,665,254 | |
| Recordati SpA | 38,229 | 1,763,625 | |
| Snam SpA | 742,090 | 3,402,887 | |
| Telecom Italia SpA (a) | 1,940,517 | 501,201 | |
| Telecom Italia SpA (Risparmio Shares) (a) | 1,667,908 | 433,791 | |
| Terna - Rete Elettrica Nazionale | 522,807 | 3,997,294 | |
| UniCredit SpA | 681,609 | 17,087,676 | |
TOTAL ITALY | 120,192,184 | ||
| Japan - 14.5% | |||
| Advantest Corp. | 283,348 | 7,298,658 | |
| AEON Co. Ltd. | 243,342 | 5,119,826 | |
| AGC, Inc. | 70,873 | 2,411,035 | |
| Aisin Seiki Co. Ltd. | 53,662 | 1,869,309 | |
| Ajinomoto Co., Inc. | 166,761 | 6,090,560 | |
| Ana Holdings, Inc. (a) | 58,356 | 1,145,638 | |
| Asahi Group Holdings | 177,849 | 6,432,872 | |
| ASAHI INTECC Co. Ltd. | 78,392 | 1,317,192 | |
| Asahi Kasei Corp. | 457,430 | 2,812,182 | |
| Astellas Pharma, Inc. | 669,630 | 8,470,736 | |
| Azbil Corp. | 41,422 | 1,223,965 | |
| Bandai Namco Holdings, Inc. | 223,694 | 4,634,608 | |
| BayCurrent Consulting, Inc. | 48,200 | 1,210,146 | |
| Bridgestone Corp. | 210,120 | 7,952,035 | |
| Brother Industries Ltd. | 84,821 | 1,323,229 | |
| Canon, Inc. | 369,783 | 8,741,928 | |
| Capcom Co. Ltd. | 63,074 | 2,030,310 | |
| Central Japan Railway Co. | 266,210 | 5,991,964 | |
| Chiba Bank Ltd. | 195,532 | 1,456,429 | |
| Chubu Electric Power Co., Inc. | 236,444 | 2,857,226 | |
| Chugai Pharmaceutical Co. Ltd. | 248,260 | 7,362,539 | |
| Concordia Financial Group Ltd. | 389,515 | 1,809,842 | |
| CyberAgent, Inc. | 157,400 | 826,264 | |
| Dai Nippon Printing Co. Ltd. | 80,638 | 2,103,625 | |
| Dai-ichi Mutual Life Insurance Co. | 347,865 | 7,348,659 | |
| Daifuku Co. Ltd. | 110,003 | 1,817,568 | |
| Daiichi Sankyo Kabushiki Kaisha | 683,173 | 17,615,065 | |
| Daikin Industries Ltd. | 97,446 | 14,049,661 | |
| Daito Trust Construction Co. Ltd. | 22,765 | 2,441,919 | |
| Daiwa House Industry Co. Ltd. | 219,059 | 6,025,366 | |
| Daiwa House REIT Investment Corp. | 794 | 1,405,180 | |
| Daiwa Securities Group, Inc. | 499,444 | 2,880,030 | |
| DENSO Corp. | 639,300 | 9,440,117 | |
| Dentsu Group, Inc. | 74,014 | 2,149,810 | |
| Disco Corp. | 34,087 | 6,019,732 | |
| East Japan Railway Co. | 111,695 | 5,801,140 | |
| Eisai Co. Ltd. | 93,348 | 4,945,424 | |
| ENEOS Holdings, Inc. | 1,062,205 | 3,935,913 | |
| FANUC Corp. | 351,950 | 8,734,138 | |
| Fast Retailing Co. Ltd. | 64,674 | 14,318,591 | |
| Fuji Electric Co. Ltd. | 46,825 | 1,782,845 | |
| FUJIFILM Holdings Corp. | 138,253 | 7,562,136 | |
| Fujitsu Ltd. | 64,994 | 8,419,813 | |
| GLP J-REIT | 1,750 | 1,567,401 | |
| GMO Payment Gateway, Inc. | 15,041 | 600,726 | |
| Hakuhodo DY Holdings, Inc. | 78,924 | 640,484 | |
| Hamamatsu Photonics K.K. | 51,042 | 1,895,854 | |
| Hankyu Hanshin Holdings, Inc. | 85,821 | 2,700,238 | |
| Hikari Tsushin, Inc. | 7,322 | 1,056,366 | |
| Hirose Electric Co. Ltd. | 11,215 | 1,270,650 | |
| Hitachi Construction Machinery Co. Ltd. | 38,709 | 1,000,076 | |
| Hitachi Ltd. | 346,456 | 21,960,677 | |
| Honda Motor Co. Ltd. | 1,704,627 | 17,470,335 | |
| Hoshizaki Corp. | 39,100 | 1,262,721 | |
| Hoya Corp. | 130,770 | 12,589,048 | |
| Hulic Co. Ltd. | 139,394 | 1,277,983 | |
| Ibiden Co. Ltd. | 42,105 | 1,795,208 | |
| Idemitsu Kosan Co. Ltd. | 71,085 | 1,613,992 | |
| Iida Group Holdings Co. Ltd. | 60,840 | 944,675 | |
| INPEX Corp. | 358,706 | 5,205,138 | |
| Isuzu Motors Ltd. | 219,645 | 2,449,185 | |
| Itochu Corp. | 438,622 | 15,799,617 | |
| Japan Airlines Co. Ltd. | 52,540 | 965,884 | |
| Japan Exchange Group, Inc. | 187,108 | 3,700,023 | |
| Japan Post Bank Co. Ltd. | 531,590 | 4,927,417 | |
| Japan Post Holdings Co. Ltd. | 829,430 | 7,341,454 | |
| Japan Post Insurance Co. Ltd. | 70,716 | 1,361,714 | |
| Japan Real Estate Investment Corp. | 481 | 1,786,589 | |
| Japan Retail Fund Investment Corp. | 2,562 | 1,653,379 | |
| Japan Tobacco, Inc. | 441,681 | 10,281,836 | |
| JFE Holdings, Inc. | 179,642 | 2,502,929 | |
| JSR Corp. | 64,701 | 1,731,783 | |
| Kajima Corp. | 157,344 | 2,600,487 | |
| Kansai Electric Power Co., Inc. | 261,694 | 3,350,689 | |
| Kao Corp. | 172,405 | 6,290,008 | |
| Kawasaki Kisen Kaisha Ltd. (b) | 50,200 | 1,721,357 | |
| KDDI Corp. | 551,987 | 16,512,549 | |
| KDX Realty Investment Corp. | 1,526 | 1,591,601 | |
| Keio Corp. | 37,002 | 1,098,015 | |
| Keisei Electric Railway Co. | 47,230 | 1,779,137 | |
| Keyence Corp. | 71,820 | 27,802,866 | |
| Kikkoman Corp. | 50,473 | 2,871,650 | |
| Kintetsu Group Holdings Co. Ltd. | 65,470 | 1,842,114 | |
| Kirin Holdings Co. Ltd. | 285,708 | 4,015,146 | |
| Kobayashi Pharmaceutical Co. Ltd. | 18,048 | 745,081 | |
| Kobe Bussan Co. Ltd. | 54,021 | 1,336,915 | |
| Koei Tecmo Holdings Co. Ltd. | 43,876 | 572,918 | |
| Koito Manufacturing Co. Ltd. | 77,404 | 1,159,723 | |
| Komatsu Ltd. | 341,863 | 7,854,781 | |
| Konami Group Corp. | 36,792 | 1,905,903 | |
| Kose Corp. | 12,234 | 810,515 | |
| Kubota Corp. | 375,125 | 5,045,149 | |
| Kurita Water Industries Ltd. | 37,998 | 1,154,510 | |
| Kyocera Corp. | 118,717 | 5,851,728 | |
| Kyowa Hakko Kirin Co., Ltd. | 99,163 | 1,555,302 | |
| Lasertec Corp. | 27,974 | 4,620,752 | |
| LIXIL Group Corp. | 105,261 | 1,154,194 | |
| LY Corp. | 975,996 | 2,488,289 | |
| M3, Inc. | 161,734 | 2,490,897 | |
| Makita Corp. | 81,620 | 2,109,620 | |
| Marubeni Corp. | 534,629 | 7,817,226 | |
| MatsukiyoCocokara & Co. | 125,100 | 2,194,478 | |
| Mazda Motor Corp. | 206,872 | 1,999,623 | |
| McDonald's Holdings Co. (Japan) Ltd. (b) | 31,068 | 1,208,788 | |
| Meiji Holdings Co. Ltd. | 87,526 | 2,154,367 | |
| Minebea Mitsumi, Inc. | 132,360 | 2,075,313 | |
| Misumi Group, Inc. | 103,675 | 1,569,501 | |
| Mitsubishi Chemical Holdings Corp. | 480,462 | 2,718,745 | |
| Mitsubishi Corp. | 424,514 | 19,788,958 | |
| Mitsubishi Electric Corp. | 714,996 | 8,198,510 | |
| Mitsubishi Estate Co. Ltd. | 416,667 | 5,333,471 | |
| Mitsubishi Heavy Industries Ltd. | 118,701 | 6,113,657 | |
| Mitsubishi UFJ Financial Group, Inc. | 4,214,457 | 35,355,700 | |
| Mitsubishi UFJ Lease & Finance Co. Ltd. | 297,899 | 1,963,819 | |
| Mitsui & Co. Ltd. | 484,804 | 17,619,802 | |
| Mitsui Chemicals, Inc. | 62,843 | 1,583,925 | |
| Mitsui Fudosan Co. Ltd. | 329,206 | 7,135,495 | |
| Mitsui OSK Lines Ltd. | 129,100 | 3,333,016 | |
| Mizuho Financial Group, Inc. | 890,414 | 15,117,795 | |
| MonotaRO Co. Ltd. | 90,250 | 721,277 | |
| MS&AD Insurance Group Holdings, Inc. | 158,637 | 5,812,545 | |
| Murata Manufacturing Co. Ltd. | 636,798 | 10,907,954 | |
| NEC Corp. | 91,356 | 4,398,849 | |
| Nexon Co. Ltd. | 124,779 | 2,289,601 | |
| NGK Insulators Ltd. | 83,360 | 1,018,514 | |
| Nidec Corp. | 154,541 | 5,668,725 | |
| Nintendo Co. Ltd. | 383,010 | 15,823,849 | |
| Nippon Building Fund, Inc. | 561 | 2,254,061 | |
| Nippon Express Holdings, Inc. | 26,573 | 1,365,730 | |
| Nippon Paint Holdings Co. Ltd. | 346,610 | 2,330,298 | |
| Nippon Prologis REIT, Inc. | 854 | 1,519,587 | |
| Nippon Sanso Holdings Corp. | 62,647 | 1,579,864 | |
| Nippon Steel & Sumitomo Metal Corp. | 316,124 | 6,818,435 | |
| Nippon Telegraph & Telephone Corp. | 11,001,325 | 12,946,092 | |
| Nippon Yusen KK | 180,553 | 4,417,636 | |
| Nissan Chemical Corp. | 47,622 | 1,942,272 | |
| Nissan Motor Co. Ltd. | 862,771 | 3,319,929 | |
| Nissin Food Holdings Co. Ltd. | 22,663 | 1,971,878 | |
| Nitori Holdings Co. Ltd. | 29,780 | 3,225,020 | |
| Nitto Denko Corp. | 52,155 | 3,374,730 | |
| Nomura Holdings, Inc. | 1,114,106 | 4,304,246 | |
| Nomura Real Estate Holdings, Inc. | 40,814 | 953,255 | |
| Nomura Real Estate Master Fund, Inc. | 1,566 | 1,728,016 | |
| Nomura Research Institute Ltd. | 143,124 | 3,756,999 | |
| NTT Data Corp. | 230,515 | 2,842,230 | |
| Obayashi Corp. | 236,143 | 2,022,756 | |
| OBIC Co. Ltd. | 25,769 | 3,809,080 | |
| Odakyu Electric Railway Co. Ltd. | 117,990 | 1,679,745 | |
| Oji Holdings Corp. | 316,056 | 1,351,734 | |
| Olympus Corp. | 468,248 | 6,253,616 | |
| OMRON Corp. | 65,384 | 2,342,528 | |
| Ono Pharmaceutical Co. Ltd. | 142,265 | 2,456,844 | |
| Open House Group Co. Ltd. | 28,300 | 932,778 | |
| Oracle Corp. Japan | 13,738 | 974,570 | |
| Oriental Land Co. Ltd. | 402,185 | 13,008,822 | |
| ORIX Corp. | 434,196 | 7,896,441 | |
| Osaka Gas Co. Ltd. | 138,975 | 2,620,761 | |
| Otsuka Corp. | 42,104 | 1,688,144 | |
| Otsuka Holdings Co. Ltd. | 145,185 | 4,884,889 | |
| Pan Pacific International Holdings Ltd. | 143,108 | 2,771,410 | |
| Panasonic Holdings Corp. | 817,080 | 7,168,645 | |
| Persol Holdings Co. Ltd. | 664,770 | 996,767 | |
| Rakuten Group, Inc. | 544,950 | 2,015,727 | |
| Recruit Holdings Co. Ltd. | 532,236 | 15,260,647 | |
| Renesas Electronics Corp. (a) | 470,267 | 6,177,249 | |
| Resona Holdings, Inc. | 793,043 | 4,237,484 | |
| Ricoh Co. Ltd. | 200,662 | 1,626,387 | |
| ROHM Co. Ltd. | 129,548 | 2,075,614 | |
| SBI Holdings, Inc. Japan | 92,564 | 1,991,509 | |
| SCSK Corp. | 59,756 | 1,020,051 | |
| Secom Co. Ltd. | 77,706 | 5,397,058 | |
| Seiko Epson Corp. | 105,962 | 1,471,090 | |
| Sekisui Chemical Co. Ltd. | 144,952 | 1,985,390 | |
| Sekisui House Ltd. | 218,908 | 4,286,821 | |
| Seven & i Holdings Co. Ltd. | 278,440 | 10,201,683 | |
| SG Holdings Co. Ltd. | 116,616 | 1,652,986 | |
| Sharp Corp. (a) | 93,013 | 581,537 | |
| Shimadzu Corp. | 86,721 | 2,050,630 | |
| SHIMANO, Inc. | 28,574 | 4,111,973 | |
| SHIMIZU Corp. | 211,843 | 1,507,579 | |
| Shin-Etsu Chemical Co. Ltd. | 672,545 | 20,111,368 | |
| Shionogi & Co. Ltd. | 97,360 | 4,533,533 | |
| Shiseido Co. Ltd. | 148,394 | 4,706,386 | |
| Shizuoka Financial Group | 177,412 | 1,508,668 | |
| SMC Corp. | 21,157 | 9,769,523 | |
| SoftBank Corp. | 1,054,229 | 11,920,028 | |
| SoftBank Group Corp. | 380,142 | 15,568,363 | |
| Sompo Holdings, Inc. | 109,479 | 4,742,627 | |
| Sony Group Corp. | 465,442 | 38,696,330 | |
| Square Enix Holdings Co. Ltd. | 31,292 | 1,039,576 | |
| Subaru Corp. | 225,405 | 3,901,828 | |
| Sumco Corp. | 126,364 | 1,632,895 | |
| Sumitomo Chemical Co. Ltd. | 519,285 | 1,319,899 | |
| Sumitomo Corp. | 387,261 | 7,612,651 | |
| Sumitomo Electric Industries Ltd. | 261,932 | 2,749,823 | |
| Sumitomo Metal Mining Co. Ltd. | 90,428 | 2,540,300 | |
| Sumitomo Mitsui Financial Group, Inc. | 468,785 | 22,599,178 | |
| Sumitomo Mitsui Trust Holdings, Inc. | 121,527 | 4,556,874 | |
| Sumitomo Realty & Development Co. Ltd. | 104,508 | 2,622,518 | |
| Suntory Beverage & Food Ltd. | 51,537 | 1,550,906 | |
| Suzuki Motor Corp. | 136,364 | 5,292,561 | |
| Sysmex Corp. | 62,065 | 2,973,088 | |
| T&D Holdings, Inc. | 186,027 | 3,318,577 | |
| Taisei Corp. | 62,087 | 2,105,538 | |
| Takeda Pharmaceutical Co. Ltd. | 583,446 | 15,837,495 | |
| TDK Corp. | 144,584 | 5,409,642 | |
| Terumo Corp. | 248,935 | 6,810,411 | |
| TIS, Inc. | 80,720 | 1,728,607 | |
| Tobu Railway Co. Ltd. | 69,486 | 1,672,490 | |
| Toho Co. Ltd. | 41,413 | 1,414,796 | |
| Tokio Marine Holdings, Inc. | 664,963 | 14,876,709 | |
| Tokyo Electric Power Co., Inc. (a) | 556,466 | 2,354,819 | |
| Tokyo Electron Ltd. | 174,044 | 22,997,773 | |
| Tokyo Gas Co. Ltd. | 145,162 | 3,259,926 | |
| Tokyu Corp. | 184,281 | 2,080,355 | |
| Toppan Holdings, Inc. | 90,558 | 2,088,618 | |
| Toray Industries, Inc. | 519,353 | 2,512,546 | |
| Tosoh Corp. | 92,951 | 1,138,113 | |
| Toto Ltd. | 48,839 | 1,177,587 | |
| Toyota Industries Corp. | 54,242 | 4,020,131 | |
| Toyota Motor Corp. | 3,912,065 | 68,436,685 | |
| Toyota Tsusho Corp. | 78,711 | 4,190,282 | |
| Trend Micro, Inc. | 50,130 | 1,889,130 | |
| Unicharm Corp. | 148,897 | 5,059,353 | |
| USS Co. Ltd. | 73,417 | 1,283,248 | |
| Welcia Holdings Co. Ltd. | 34,892 | 578,363 | |
| West Japan Railway Co. | 82,059 | 3,127,642 | |
| Yakult Honsha Co. Ltd. | 93,854 | 2,211,664 | |
| Yamaha Corp. | 50,432 | 1,347,035 | |
| Yamaha Motor Co. Ltd. | 111,578 | 2,726,615 | |
| Yamato Holdings Co. Ltd. | 97,702 | 1,627,326 | |
| Yaskawa Electric Corp. | 87,635 | 2,868,568 | |
| Yokogawa Electric Corp. | 85,423 | 1,550,874 | |
| Zensho Holdings Co. Ltd. | 33,700 | 1,771,335 | |
| ZOZO, Inc. | 54,807 | 1,042,141 | |
TOTAL JAPAN | 1,208,418,546 | ||
| Jordan - 0.0% | |||
| Hikma Pharmaceuticals PLC | 59,830 | 1,382,778 | |
| Korea (South) - 3.1% | |||
| AMOREPACIFIC Corp. | 10,754 | 1,007,940 | |
| BGF Retail Co. Ltd. | 2,978 | 304,084 | |
| Celltrion Healthcare Co. Ltd. | 39,021 | 1,927,336 | |
| Celltrion Pharm, Inc. | 6,425 | 301,833 | |
| Celltrion, Inc. | 41,003 | 4,546,773 | |
| CJ CheilJedang Corp. | 2,984 | 624,211 | |
| Cosmo AM&T Co. Ltd. (a) | 9,055 | 941,342 | |
| Cosmo AM&T Co. Ltd. rights 11/7/23 (a) | 439 | 5,388 | |
| Coway Co. Ltd. | 19,776 | 631,910 | |
| Db Insurance Co. Ltd. | 16,693 | 1,084,419 | |
| Delivery Hero AG (a)(c) | 63,563 | 1,612,127 | |
| Doosan Bobcat, Inc. | 19,899 | 570,871 | |
| Doosan Heavy Industries & Construction Co. Ltd. (a) | 164,327 | 1,634,924 | |
| Ecopro BM Co. Ltd. (b) | 18,098 | 2,643,764 | |
| Ecopro Co. Ltd. (b) | 7,383 | 3,406,436 | |
| F&F Co. Ltd. | 6,215 | 430,211 | |
| GS Holdings Corp. | 15,723 | 458,460 | |
| Hana Financial Group, Inc. | 110,474 | 3,207,467 | |
| Hankook Tire Co. Ltd. | 26,753 | 757,898 | |
| Hanmi Pharm Co. Ltd. | 2,484 | 518,601 | |
| Hanmi Semiconductor Co. Ltd. | 15,901 | 622,116 | |
| Hanon Systems | 66,957 | 341,157 | |
| Hanwha Aerospace Co. Ltd. | 12,941 | 971,475 | |
| Hanwha Ocean Co. Ltd. (a)(b) | 15,672 | 273,670 | |
| Hanwha Ocean Co. Ltd. rights 11/9/23 (a) | 5,173 | 6,693 | |
| Hanwha Solutions Corp. (a) | 37,754 | 802,977 | |
| HD Hyundai Co. Ltd. | 16,184 | 688,293 | |
| HD Hyundai Heavy Industries Co. Ltd. (a) | 8,119 | 614,678 | |
| HD Korea Shipbuilding & Offshore Engineering Co. Ltd. (a) | 15,571 | 1,043,002 | |
| HLB, Inc. (b) | 42,137 | 906,531 | |
| HMM Co. Ltd. | 89,876 | 972,030 | |
| Hotel Shilla Co. (b) | 11,331 | 523,518 | |
| HYBE Co. Ltd. (a) | 6,839 | 1,112,174 | |
| Hyundai Engineering & Construction Co. Ltd. | 28,875 | 715,061 | |
| Hyundai Glovis Co. Ltd. | 6,930 | 878,189 | |
| Hyundai Mipo Dockyard Co. Ltd. (a) | 8,651 | 445,146 | |
| Hyundai Mobis | 22,759 | 3,519,342 | |
| Hyundai Motor Co. Ltd. | 51,456 | 6,473,031 | |
| Hyundai Steel Co. | 31,382 | 762,029 | |
| Industrial Bank of Korea | 106,137 | 877,085 | |
| JYP Entertainment Corp. | 10,282 | 781,503 | |
| Kakao Corp. | 115,759 | 3,257,927 | |
| Kakao Games Corp. (a) | 13,207 | 228,889 | |
| Kakao Pay Corp. (a) | 9,806 | 249,619 | |
| KakaoBank Corp. | 61,399 | 829,697 | |
| Kangwon Land, Inc. | 33,604 | 365,357 | |
| KB Financial Group, Inc. | 142,091 | 5,408,234 | |
| Kia Corp. | 96,755 | 5,519,559 | |
| Korea Aerospace Industries Ltd. | 27,010 | 887,439 | |
| Korea Electric Power Corp. (a) | 94,271 | 1,178,234 | |
| Korea Investment Holdings Co. Ltd. | 14,792 | 552,159 | |
| Korea Zinc Co. Ltd. | 2,933 | 1,017,761 | |
| Korean Air Lines Co. Ltd. | 68,768 | 1,044,766 | |
| KRAFTON, Inc. (a) | 10,641 | 1,293,431 | |
| KT Corp. | 23,577 | 569,533 | |
| KT&G Corp. | 37,930 | 2,389,202 | |
| Kumho Petro Chemical Co. Ltd. | 6,598 | 619,204 | |
| L&F Co. Ltd. | 9,244 | 897,858 | |
| LG Chemical Ltd. | 18,028 | 5,899,777 | |
| LG Corp. | 35,322 | 2,018,799 | |
| LG Display Co. Ltd. (a) | 85,208 | 769,881 | |
| LG Electronics, Inc. | 39,626 | 2,935,218 | |
| LG Energy Solution (a) | 17,320 | 4,957,743 | |
| LG H & H Co. Ltd. | 3,165 | 740,916 | |
| LG Innotek Co. Ltd. | 5,244 | 869,069 | |
| LG Uplus Corp. | 81,066 | 606,666 | |
| Lotte Chemical Corp. | 7,127 | 772,823 | |
| Lotte Energy Materials Corp. | 8,384 | 239,826 | |
| Meritz Financial Holdings Co. | 38,130 | 1,417,004 | |
| Mirae Asset Securities Co. Ltd. | 97,474 | 476,788 | |
| NAVER Corp. | 48,622 | 6,787,433 | |
| NCSOFT Corp. | 5,237 | 903,439 | |
| Netmarble Corp. (a)(c) | 7,855 | 225,176 | |
| NH Investment & Securities Co. Ltd. | 50,861 | 364,358 | |
| Orion Corp./Republic of Korea | 8,594 | 759,486 | |
| Pan Ocean Co., Ltd. (Korea) | 95,406 | 304,142 | |
| Pearl Abyss Corp. (a) | 11,592 | 424,051 | |
| POSCO | 26,561 | 8,118,938 | |
| POSCO Chemtech Co. Ltd. (b) | 11,474 | 2,018,986 | |
| Posco International Corp. | 19,224 | 715,995 | |
| S-Oil Corp. | 16,714 | 823,656 | |
| Samsung Biologics Co. Ltd. (a)(c) | 6,628 | 3,479,220 | |
| Samsung C&T Corp. | 31,759 | 2,507,326 | |
| Samsung Electro-Mechanics Co. Ltd. | 21,102 | 1,948,223 | |
| Samsung Electronics Co. Ltd. | 1,759,648 | 87,456,428 | |
| Samsung Engineering Co. Ltd. (a) | 57,508 | 1,012,055 | |
| Samsung Fire & Marine Insurance Co. Ltd. | 11,499 | 2,195,609 | |
| Samsung Heavy Industries Co. Ltd. (a) | 238,547 | 1,207,517 | |
| Samsung Life Insurance Co. Ltd. | 29,412 | 1,572,364 | |
| Samsung SDI Co. Ltd. | 20,370 | 6,440,291 | |
| Samsung SDS Co. Ltd. | 14,052 | 1,438,264 | |
| Samsung Securities Co. Ltd. | 26,460 | 692,128 | |
| Shinhan Financial Group Co. Ltd. | 163,638 | 4,199,952 | |
| SK Biopharmaceuticals Co. Ltd. (a) | 11,308 | 631,886 | |
| SK Bioscience Co. Ltd. (a)(b) | 9,938 | 446,619 | |
| SK Hynix, Inc. | 201,532 | 17,475,523 | |
| SK IE Technology Co. Ltd. (a)(c) | 9,048 | 398,380 | |
| SK Innovation Co., Ltd. | 23,167 | 2,107,492 | |
| SK Square Co. Ltd. (a) | 36,701 | 1,157,957 | |
| SK, Inc. | 14,145 | 1,489,110 | |
| SKC Co. Ltd. | 6,838 | 399,305 | |
| Woori Financial Group, Inc. | 221,739 | 1,955,663 | |
| Yuhan Corp. | 19,312 | 822,015 | |
TOTAL KOREA (SOUTH) | 260,438,061 | ||
| Kuwait - 0.2% | |||
| Agility Public Warehousing Co. KSC (a) | 588,826 | 1,000,881 | |
| Boubyan Bank KSC | 505,024 | 956,355 | |
| Gulf Bank | 650,327 | 498,069 | |
| Gulf Bank rights 11/12/23 (a) | 50,482 | 1,044 | |
| Kuwait Finance House KSCP | 3,015,104 | 6,664,505 | |
| Mabanee Co. SAKC | 229,897 | 612,910 | |
| Mobile Telecommunication Co. | 729,434 | 1,133,811 | |
| National Bank of Kuwait | 2,798,527 | 7,931,195 | |
TOTAL KUWAIT | 18,798,770 | ||
| Luxembourg - 0.1% | |||
| ArcelorMittal SA (Netherlands) | 189,748 | 4,192,127 | |
| Eurofins Scientific SA | 49,302 | 2,495,121 | |
| Reinet Investments SCA | 49,125 | 1,020,746 | |
TOTAL LUXEMBOURG | 7,707,994 | ||
| Macau - 0.1% | |||
| Galaxy Entertainment Group Ltd. | 810,136 | 4,554,152 | |
| Sands China Ltd. (a) | 902,387 | 2,429,271 | |
TOTAL MACAU | 6,983,423 | ||
| Malaysia - 0.4% | |||
| AMMB Holdings Bhd | 622,400 | 499,316 | |
| Axiata Group Bhd | 968,034 | 442,915 | |
| CelcomDigi Bhd | 1,285,200 | 1,151,290 | |
| CIMB Group Holdings Bhd | 2,332,911 | 2,795,053 | |
| Dialog Group Bhd | 1,205,222 | 543,785 | |
| Gamuda Bhd | 682,609 | 670,755 | |
| Genting Bhd | 750,200 | 634,807 | |
| Genting Malaysia Bhd | 1,032,400 | 524,622 | |
| Hong Leong Bank Bhd | 243,800 | 992,705 | |
| Hong Leong Credit Bhd | 78,500 | 291,923 | |
| IHH Healthcare Bhd | 796,700 | 1,002,881 | |
| Inari Amertron Bhd | 988,700 | 592,783 | |
| IOI Corp. Bhd | 895,800 | 739,116 | |
| IOI Properties Group Bhd | 30 | 12 | |
| Kuala Lumpur Kepong Bhd | 176,141 | 813,093 | |
| Malayan Banking Bhd | 1,979,007 | 3,747,364 | |
| Malaysia Airports Holdings Bhd | 292,016 | 453,065 | |
| Maxis Bhd | 837,900 | 696,705 | |
| MISC Bhd | 476,200 | 724,956 | |
| MR DIY Group M Sdn Bhd (c) | 1,080,850 | 335,802 | |
| Nestle (Malaysia) Bhd | 24,600 | 639,308 | |
| Petronas Chemicals Group Bhd | 1,030,600 | 1,589,192 | |
| Petronas Dagangan Bhd | 106,100 | 513,648 | |
| Petronas Gas Bhd | 279,900 | 1,019,542 | |
| PPB Group Bhd | 244,380 | 785,618 | |
| Press Metal Aluminium Holdings | 1,388,600 | 1,435,363 | |
| Public Bank Bhd | 5,379,500 | 4,698,465 | |
| QL Resources Bhd | 385,450 | 447,354 | |
| RHB Bank Bhd | 537,254 | 629,287 | |
| Sime Darby Bhd | 952,885 | 457,973 | |
| Sime Darby Plantation Bhd | 731,340 | 666,712 | |
| Sime Darby Property Bhd | 10 | 1 | |
| SP Setia Bhd | 13 | 2 | |
| Telekom Malaysia Bhd | 395,497 | 421,017 | |
| Tenaga Nasional Bhd | 944,400 | 1,962,525 | |
TOTAL MALAYSIA | 32,918,955 | ||
| Mexico - 0.7% | |||
| Alfa SA de CV Series A | 1,135,400 | 707,854 | |
| America Movil S.A.B. de CV Series L | 7,018,100 | 5,796,190 | |
| Arca Continental S.A.B. de CV | 190,000 | 1,703,772 | |
| Banco del Bajio SA (c) | 277,000 | 847,793 | |
| CEMEX S.A.B. de CV unit (a) | 5,646,094 | 3,391,602 | |
| Coca-Cola FEMSA S.A.B. de CV unit | 201,075 | 1,525,600 | |
| Fibra Uno Administracion SA de CV | 1,078,200 | 1,636,826 | |
| Fomento Economico Mexicano S.A.B. de CV unit | 720,200 | 8,151,534 | |
| Gruma S.A.B. de CV Series B | 68,340 | 1,189,212 | |
| Grupo Aeroportuario del Pacifico S.A.B. de CV Series B | 146,400 | 1,707,770 | |
| Grupo Aeroportuario del Sureste S.A.B. de CV Series B | 73,010 | 1,573,467 | |
| Grupo Bimbo S.A.B. de CV Series A | 486,800 | 1,981,329 | |
| Grupo Carso SA de CV Series A1 | 204,600 | 1,304,610 | |
| Grupo Financiero Banorte S.A.B. de CV Series O | 959,300 | 7,785,500 | |
| Grupo Financiero Inbursa S.A.B. de CV Series O (a) | 674,400 | 1,390,770 | |
| Grupo Mexico SA de CV Series B | 1,150,424 | 4,691,923 | |
| Grupo Televisa SA de CV | 880,900 | 404,074 | |
| Industrias Penoles SA de CV (a) | 72,610 | 810,595 | |
| Kimberly-Clark de Mexico SA de CV Series A | 560,000 | 1,026,568 | |
| Operadora de Sites Mexicanos, SA de CV | 448,200 | 381,103 | |
| Orbia Advance Corp. S.A.B. de CV | 376,937 | 610,701 | |
| Promotora y Operadora de Infraestructura S.A.B. de CV | 70,405 | 576,314 | |
| Southern Copper Corp. | 31,904 | 2,261,994 | |
| Wal-Mart de Mexico SA de CV Series V | 1,935,800 | 6,928,680 | |
TOTAL MEXICO | 58,385,781 | ||
| Netherlands - 3.7% | |||
| ABN AMRO Bank NV GDR (Bearer) (c) | 148,434 | 1,992,281 | |
| Adyen BV (a)(c) | 8,035 | 5,419,495 | |
| AEGON NV | 631,543 | 3,063,192 | |
| Akzo Nobel NV | 63,573 | 4,255,285 | |
| Argenx SE (a) | 20,686 | 9,730,314 | |
| ASM International NV (Netherlands) | 17,354 | 7,133,741 | |
| ASML Holding NV (Netherlands) | 148,734 | 89,407,043 | |
| ASR Nederland NV | 60,025 | 2,235,638 | |
| BE Semiconductor Industries NV | 28,696 | 2,954,343 | |
| Euronext NV (c) | 31,532 | 2,195,352 | |
| EXOR NV | 39,637 | 3,394,616 | |
| Heineken Holding NV | 47,649 | 3,619,970 | |
| Heineken NV (Bearer) | 106,027 | 9,525,831 | |
| IMCD NV | 20,847 | 2,503,607 | |
| ING Groep NV (Certificaten Van Aandelen) | 1,335,991 | 17,128,112 | |
| JDE Peet's BV | 47,301 | 1,313,291 | |
| Koninklijke Ahold Delhaize NV | 359,416 | 10,648,346 | |
| Koninklijke KPN NV | 1,179,152 | 3,963,341 | |
| Koninklijke Philips Electronics NV | 343,251 | 6,529,484 | |
| NN Group NV | 93,151 | 2,987,575 | |
| OCI NV | 38,118 | 887,722 | |
| Randstad NV | 40,523 | 2,094,132 | |
| Shell PLC (London) | 2,469,564 | 79,586,276 | |
| Stellantis NV (Italy) | 816,958 | 15,213,849 | |
| Universal Music Group NV | 302,870 | 7,416,932 | |
| Wolters Kluwer NV | 95,059 | 12,180,471 | |
TOTAL NETHERLANDS | 307,380,239 | ||
| New Zealand - 0.2% | |||
| Auckland International Airport Ltd. | 481,612 | 2,059,987 | |
| Fisher & Paykel Healthcare Corp. | 218,166 | 2,646,270 | |
| Mercury Nz Ltd. | 264,331 | 909,283 | |
| Meridian Energy Ltd. | 471,619 | 1,328,250 | |
| Spark New Zealand Ltd. | 681,762 | 1,979,238 | |
| Xero Ltd. (a) | 53,416 | 3,651,906 | |
TOTAL NEW ZEALAND | 12,574,934 | ||
| Norway - 0.4% | |||
| Aker BP ASA | 118,268 | 3,399,519 | |
| DNB Bank ASA | 343,558 | 6,190,899 | |
| Equinor ASA | 332,690 | 11,152,839 | |
| Gjensidige Forsikring ASA | 72,752 | 1,089,559 | |
| Kongsberg Gruppen ASA | 31,779 | 1,297,224 | |
| Mowi ASA | 160,543 | 2,605,548 | |
| Norsk Hydro ASA | 484,528 | 2,763,121 | |
| Orkla ASA | 272,704 | 1,878,251 | |
| Salmar ASA | 26,521 | 1,255,426 | |
| Telenor ASA | 255,106 | 2,606,793 | |
TOTAL NORWAY | 34,239,179 | ||
| Peru - 0.0% | |||
| Compania de Minas Buenaventura SAA sponsored ADR | 77,885 | 630,869 | |
| Credicorp Ltd. (United States) | 25,342 | 3,166,736 | |
TOTAL PERU | 3,797,605 | ||
| Philippines - 0.2% | |||
| Aboitiz Equity Ventures, Inc. | 623,190 | 501,927 | |
| Altus Property Ventures, Inc. (a) | 7 | 1 | |
| Ayala Corp. | 91,580 | 976,828 | |
| Ayala Land, Inc. | 2,470,300 | 1,212,630 | |
| Bank of the Philippine Islands (BPI) | 752,597 | 1,331,159 | |
| BDO Unibank, Inc. | 887,001 | 1,991,877 | |
| DMCI Holdings, Inc. | 4 | 1 | |
| International Container Terminal Services, Inc. | 372,910 | 1,318,094 | |
| JG Summit Holdings, Inc. | 960,636 | 621,628 | |
| Jollibee Food Corp. | 167,480 | 603,969 | |
| Manila Electric Co. | 99,400 | 620,755 | |
| Metropolitan Bank & Trust Co. | 640,931 | 589,599 | |
| PLDT, Inc. | 28,020 | 597,312 | |
| SM Investments Corp. | 89,033 | 1,255,343 | |
| SM Prime Holdings, Inc. | 3,700,900 | 1,953,424 | |
| Universal Robina Corp. | 323,210 | 621,616 | |
TOTAL PHILIPPINES | 14,196,163 | ||
| Poland - 0.3% | |||
| Allegro.eu SA (a)(b)(c) | 173,794 | 1,244,023 | |
| Bank Polska Kasa Opieki SA | 66,129 | 2,004,884 | |
| Budimex SA (b) | 4,571 | 510,053 | |
| CD Projekt RED SA | 23,714 | 591,154 | |
| Cyfrowy Polsat SA | 87,993 | 273,983 | |
| Dino Polska SA (a)(c) | 17,884 | 1,691,997 | |
| KGHM Polska Miedz SA (Bearer) | 54,577 | 1,454,462 | |
| LPP SA | 403 | 1,297,392 | |
| mBank SA (a) | 5,424 | 669,364 | |
| Orlen SA | 211,698 | 3,342,296 | |
| PGE Polska Grupa Energetyczna SA (a) | 328,516 | 569,203 | |
| Powszechna Kasa Oszczednosci Bank SA (a) | 320,730 | 3,313,866 | |
| Powszechny Zaklad Ubezpieczen SA | 221,357 | 2,502,061 | |
| Santander Bank Polska SA (a) | 13,033 | 1,412,201 | |
TOTAL POLAND | 20,876,939 | ||
| Portugal - 0.1% | |||
| Banco Espirito Santo SA (Reg.) (a)(d) | 82,039 | 1 | |
| Energias de Portugal SA | 1,158,507 | 4,866,491 | |
| Galp Energia SGPS SA Class B | 181,786 | 2,733,262 | |
| Jeronimo Martins SGPS SA | 105,077 | 2,421,543 | |
TOTAL PORTUGAL | 10,021,297 | ||
| Qatar - 0.2% | |||
| Barwa Real Estate Co. (a) | 792,285 | 550,530 | |
| Dukhan Bank | 662,915 | 660,184 | |
| Industries Qatar QSC (a) | 552,383 | 1,853,919 | |
| Masraf al Rayan | 2,063,799 | 1,190,326 | |
| Mesaieed Petrochemical Holding Co. (a) | 1,549,035 | 676,453 | |
| Ooredoo QSC | 296,927 | 806,539 | |
| Qatar Electricity & Water Co. (a) | 160,955 | 731,172 | |
| Qatar Fuel Co. (a) | 212,096 | 865,044 | |
| Qatar Gas Transport Co. Ltd. (Nakilat) (a) | 926,009 | 895,235 | |
| Qatar International Islamic Bank QSC (a) | 349,251 | 887,276 | |
| Qatar Islamic Bank | 623,276 | 2,978,578 | |
| Qatar National Bank SAQ | 1,723,177 | 7,046,994 | |
| The Commercial Bank of Qatar (a) | 1,190,233 | 1,675,675 | |
TOTAL QATAR | 20,817,925 | ||
| Romania - 0.0% | |||
| NEPI Rockcastle PLC | 185,708 | 1,002,998 | |
| Russia - 0.0% | |||
| Alrosa Co. Ltd. (d) | 846,411 | 140,847 | |
| Gazprom OAO (d) | 3,422,762 | 358,245 | |
| Gazprom OAO sponsored ADR (Reg. S) (a)(d) | 266,976 | 60,988 | |
| Inter Rao Ues JSC (d) | 12,405,200 | 68,409 | |
| LUKOIL PJSC (d) | 135,807 | 42,045 | |
| LUKOIL PJSC sponsored ADR (a)(d) | 3,670 | 1,038 | |
| MMC Norilsk Nickel PJSC (a)(d) | 18,102 | 120,418 | |
| MMC Norilsk Nickel PJSC sponsored ADR (a)(d) | 27,948 | 67,075 | |
| Mobile TeleSystems OJSC sponsored ADR (a)(d) | 145,706 | 145,122 | |
| Moscow Exchange MICEX-RTS OAO (d) | 524,685 | 100,884 | |
| Novatek PJSC GDR (Reg. S) (a)(d) | 30,578 | 1,590,056 | |
| Novolipetsk Steel OJSC (a)(d) | 477,930 | 4,589 | |
| Ozon Holdings PLC ADR (a)(d) | 15,142 | 31,731 | |
| PhosAgro PJSC: | |||
| GDR (Reg. S) (a)(d) | 46,691 | 958 | |
| sponsored GDR (Reg. S) (a)(d) | 300 | 6 | |
| Polyus PJSC (a)(d) | 11,075 | 26,050 | |
| Rosneft Oil Co. OJSC (d) | 322,313 | 53,916 | |
| Rosneft Oil Co. OJSC GDR (Reg. S) (a)(d) | 56,929 | 13,461 | |
| Sberbank of Russia (d) | 3,621,326 | 22,271 | |
| Severstal PAO (a)(d) | 60,348 | 1,348 | |
| Severstal PAO GDR (Reg. S) (a)(d) | 9,813 | 232 | |
| Surgutneftegas OJSC (d) | 1,105,600 | 13,532 | |
| Surgutneftegas OJSC sponsored ADR (a)(d) | 71,885 | 13,275 | |
| Tatneft PAO (d) | 446,514 | 55,550 | |
| Tatneft PAO sponsored ADR (a)(d) | 5,142 | 4,748 | |
| TCS Group Holding PLC GDR (a)(d) | 40,237 | 51,249 | |
| United Co. RUSAL International PJSC (d) | 1,020,580 | 123,027 | |
| VK Co. Ltd. GDR (Reg. S) (a)(d) | 38,348 | 11,395 | |
| VTB Bank OJSC (a)(d) | 1,160,850,350 | 44,362 | |
| X5 Retail Group NV GDR (Reg. S) (a)(d) | 41,220 | 9,727 | |
| Yandex NV Class A (a)(d) | 102,848 | 384,079 | |
TOTAL RUSSIA | 3,560,633 | ||
| Saudi Arabia - 1.2% | |||
| ACWA Power Co. | 34,285 | 2,074,500 | |
| Advanced Petrochemicals Co. | 44,679 | 444,218 | |
| Al Rajhi Bank | 724,923 | 12,965,757 | |
| Alinma Bank | 358,609 | 3,144,854 | |
| Almarai Co. Ltd. | 90,017 | 1,341,281 | |
| Arab National Bank | 249,011 | 1,577,061 | |
| Arabian Internet and Communications Services Co. Ltd. | 8,644 | 720,717 | |
| Bank Al-Jazira (a) | 143,415 | 625,405 | |
| Bank Albilad | 177,123 | 1,756,311 | |
| Banque Saudi Fransi | 224,911 | 2,149,232 | |
| Bupa Arabia for Cooperative Insurance Co. | 27,326 | 1,551,455 | |
| Dallah Healthcare Co. | 12,723 | 501,920 | |
| Dar Al Arkan Real Estate Development Co. (a) | 191,613 | 771,233 | |
| Dr Sulaiman Al Habib Medical Services Group Co. | 31,991 | 2,148,878 | |
| Elm Co. | 8,728 | 1,631,324 | |
| Etihad Etisalat Co. | 138,538 | 1,702,367 | |
| Jarir Marketing Co. | 209,964 | 810,395 | |
| Luberef | 19,014 | 653,803 | |
| Mobile Telecommunications Co. Saudi Arabia | 158,559 | 583,248 | |
| Mouwasat Medical Services Co. | 35,490 | 945,996 | |
| Nahdi Medical Co. | 14,006 | 529,388 | |
| National Industrialization Co. (a) | 115,264 | 357,012 | |
| Power & Water Utility Co. for Jubail & Yanbu | 26,802 | 388,642 | |
| Rabigh Refining & Petrochemical Co. (a) | 148,999 | 400,339 | |
| Riyad Bank | 548,448 | 3,881,356 | |
| Sabic Agriculture-Nutrients Co. | 85,577 | 3,052,085 | |
| Sahara International Petrochemical Co. | 132,177 | 1,136,237 | |
| Saudi Arabian Mining Co. | 482,122 | 4,626,397 | |
| Saudi Arabian Oil Co. (c) | 975,646 | 8,660,042 | |
| Saudi Awwal Bank | 377,155 | 3,362,788 | |
| Saudi Basic Industries Corp. | 334,981 | 6,875,343 | |
| Saudi Electricity Co. | 304,925 | 1,446,760 | |
| Saudi Industrial Investment Group | 133,027 | 849,591 | |
| Saudi Investment Bank/The | 184,876 | 724,405 | |
| Saudi Kayan Petrochemical Co. (a) | 263,515 | 743,147 | |
| Saudi Research & Marketing Group (a) | 12,886 | 484,307 | |
| Saudi Tadawul Group Holding Co. | 17,422 | 771,814 | |
| Saudi Telecom Co. | 745,170 | 7,627,286 | |
| The Co. for Cooperative Insurance | 27,959 | 900,268 | |
| The Saudi National Bank | 1,089,514 | 9,743,361 | |
| The Savola Group | 95,658 | 928,124 | |
| Yanbu National Petrochemical Co. | 102,139 | 1,030,483 | |
TOTAL SAUDI ARABIA | 96,619,130 | ||
| Singapore - 1.0% | |||
| CapitaLand Ascendas REIT | 1,417,854 | 2,693,986 | |
| CapitaLand Investment Ltd. | 977,071 | 2,097,952 | |
| CapitaMall Trust | 2,024,548 | 2,601,991 | |
| City Developments Ltd. | 196,552 | 907,247 | |
| DBS Group Holdings Ltd. | 667,700 | 16,040,379 | |
| Genting Singapore Ltd. | 2,229,113 | 1,400,453 | |
| Grab Holdings Ltd. (a) | 683,509 | 2,098,373 | |
| Jardine Cycle & Carriage Ltd. | 35,300 | 727,172 | |
| Keppel (REIT) (e) | 107,064 | 62,168 | |
| Keppel Corp. Ltd. | 535,320 | 2,430,003 | |
| Mapletree Logistics Trust (REIT) | 1,252,466 | 1,344,960 | |
| Mapletree Pan Asia Commercial Trust | 839,843 | 816,248 | |
| Oversea-Chinese Banking Corp. Ltd. | 1,248,751 | 11,577,315 | |
| Sea Ltd. ADR (a) | 135,197 | 5,637,715 | |
| Seatrium Ltd. (a) | 16,046,458 | 1,314,190 | |
| Sembcorp Industries Ltd. | 322,700 | 1,082,629 | |
| Singapore Airlines Ltd. | 562,468 | 2,511,566 | |
| Singapore Exchange Ltd. | 311,717 | 2,158,224 | |
| Singapore Technologies Engineering Ltd. | 562,624 | 1,544,548 | |
| Singapore Telecommunications Ltd. | 3,073,269 | 5,340,340 | |
| STMicroelectronics NV (France) | 252,401 | 9,621,553 | |
| United Overseas Bank Ltd. | 467,009 | 9,211,613 | |
| UOL Group Ltd. | 185,715 | 799,844 | |
TOTAL SINGAPORE | 84,020,469 | ||
| South Africa - 0.9% | |||
| Absa Group Ltd. | 311,306 | 2,838,209 | |
| African Rainbow Minerals Ltd. | 41,763 | 344,143 | |
| Anglo American Platinum Ltd. | 24,316 | 812,436 | |
| Anglo American PLC (United Kingdom) | 469,227 | 11,955,721 | |
| Aspen Pharmacare Holdings Ltd. | 139,215 | 1,264,532 | |
| Bid Corp. Ltd. | 122,668 | 2,602,372 | |
| Bidvest Group Ltd./The | 106,286 | 1,504,457 | |
| Capitec Bank Holdings Ltd. | 31,822 | 2,825,589 | |
| Clicks Group Ltd. | 96,053 | 1,415,426 | |
| Discovery Ltd. | 208,748 | 1,440,151 | |
| Exxaro Resources Ltd. | 90,083 | 903,658 | |
| FirstRand Ltd. | 1,874,715 | 6,180,147 | |
| Gold Fields Ltd. | 331,146 | 4,368,461 | |
| Growthpoint Properties Ltd. | 1,207,438 | 627,771 | |
| Harmony Gold Mining Co. Ltd. | 202,650 | 929,124 | |
| Impala Platinum Holdings Ltd. | 314,611 | 1,310,541 | |
| Kumba Iron Ore Ltd. | 24,061 | 637,521 | |
| MTN Group Ltd. | 632,049 | 3,085,383 | |
| Naspers Ltd. Class N | 71,295 | 11,129,212 | |
| Nedbank Group Ltd. | 162,274 | 1,746,334 | |
| Northam Platinum Holdings Ltd. | 130,360 | 786,811 | |
| Old Mutual Ltd. | 1,749,454 | 1,112,329 | |
| OUTsurance Group Ltd. | 298,629 | 646,048 | |
| Pepkor Holdings Ltd. (c) | 745,795 | 680,269 | |
| Remgro Ltd. | 195,834 | 1,513,924 | |
| Sanlam Ltd. | 648,837 | 2,275,760 | |
| Sasol Ltd. | 214,226 | 2,707,761 | |
| Shoprite Holdings Ltd. | 183,525 | 2,351,779 | |
| Sibanye-Stillwater Ltd. | 1,035,001 | 1,320,198 | |
| Standard Bank Group Ltd. | 498,503 | 4,891,816 | |
| Vodacom Group Ltd. | 229,847 | 1,251,256 | |
| Woolworths Holdings Ltd. | 344,994 | 1,284,461 | |
TOTAL SOUTH AFRICA | 78,743,600 | ||
| Spain - 1.6% | |||
| Acciona SA | 8,958 | 1,127,937 | |
| ACS Actividades de Construccion y Servicios SA | 81,700 | 2,953,886 | |
| Aena SME SA (c) | 27,685 | 4,005,886 | |
| Amadeus IT Holding SA Class A | 165,993 | 9,452,794 | |
| Banco Bilbao Vizcaya Argentaria SA | 2,201,507 | 17,319,772 | |
| Banco Santander SA (Spain) | 5,975,577 | 21,914,679 | |
| CaixaBank SA | 1,524,743 | 6,198,905 | |
| Cellnex Telecom SA (c) | 209,178 | 6,149,019 | |
| Corp. ACCIONA Energias Renovables SA | 25,902 | 701,069 | |
| EDP Renovaveis SA | 114,469 | 1,839,807 | |
| Enagas SA | 92,092 | 1,539,105 | |
| Endesa SA | 116,250 | 2,185,168 | |
| Grifols SA (a) | 108,975 | 1,220,519 | |
| Iberdrola SA | 2,245,971 | 24,979,729 | |
| Industria de Diseno Textil SA | 402,955 | 13,878,236 | |
| Naturgy Energy Group SA | 46,439 | 1,311,961 | |
| Redeia Corp. SA | 150,971 | 2,349,012 | |
| Repsol SA | 471,930 | 6,903,502 | |
| Telefonica SA | 1,917,339 | 7,405,989 | |
TOTAL SPAIN | 133,436,975 | ||
| Sweden - 1.8% | |||
| Alfa Laval AB | 107,905 | 3,485,843 | |
| ASSA ABLOY AB (B Shares) | 370,170 | 7,890,202 | |
| Atlas Copco AB: | |||
| (A Shares) | 989,600 | 12,814,352 | |
| (B Shares) | 577,579 | 6,470,466 | |
| Beijer Ref AB (B Shares) | 140,345 | 1,328,962 | |
| Boliden AB | 99,759 | 2,553,752 | |
| Epiroc AB: | |||
| (A Shares) | 243,768 | 4,016,010 | |
| (B Shares) | 145,133 | 2,011,393 | |
| EQT AB | 129,731 | 2,358,122 | |
| Ericsson (B Shares) | 1,087,556 | 4,871,957 | |
| Essity AB (B Shares) | 225,420 | 5,135,459 | |
| Evolution AB (c) | 67,741 | 6,019,494 | |
| Fastighets AB Balder (a) | 234,258 | 990,341 | |
| Getinge AB (B Shares) | 83,324 | 1,495,920 | |
| H&M Hennes & Mauritz AB (B Shares) (b) | 239,575 | 3,204,364 | |
| Hexagon AB (B Shares) | 769,057 | 6,267,535 | |
| Holmen AB (B Shares) | 36,452 | 1,373,834 | |
| Husqvarna AB (B Shares) | 128,410 | 829,420 | |
| Industrivarden AB: | |||
| (A Shares) | 49,997 | 1,290,858 | |
| (C Shares) | 54,862 | 1,411,551 | |
| Indutrade AB | 99,849 | 1,763,522 | |
| Investment AB Latour (B Shares) | 52,773 | 911,269 | |
| Investor AB: | |||
| (A Shares) | 32,388 | 588,137 | |
| (B Shares) | 605,784 | 11,092,748 | |
| L E Lundbergforetagen AB | 30,127 | 1,227,217 | |
| Lifco AB | 84,744 | 1,547,225 | |
| Nibe Industrier AB (B Shares) | 563,295 | 3,238,740 | |
| Saab AB (B Shares) | 29,327 | 1,502,810 | |
| Sagax AB | 74,669 | 1,347,894 | |
| Sandvik AB | 394,926 | 6,726,782 | |
| Securitas AB (B Shares) | 180,942 | 1,446,894 | |
| Skandinaviska Enskilda Banken AB (A Shares) | 584,740 | 6,511,400 | |
| Skanska AB (B Shares) | 124,670 | 1,869,081 | |
| SKF AB (B Shares) | 123,452 | 1,991,830 | |
| Svenska Cellulosa AB SCA (B Shares) | 221,196 | 3,030,869 | |
| Svenska Handelsbanken AB (A Shares) | 539,680 | 4,601,148 | |
| Swedbank AB (A Shares) | 314,027 | 5,141,204 | |
| Swedish Orphan Biovitrum AB (a) | 79,324 | 1,630,191 | |
| Tele2 AB (B Shares) | 195,504 | 1,386,092 | |
| Telia Co. AB | 863,494 | 1,830,562 | |
| Volvo AB: | |||
| (A Shares) | 76,105 | 1,523,130 | |
| (B Shares) | 554,436 | 10,972,046 | |
| Volvo Car AB (a)(b) | 213,962 | 734,327 | |
TOTAL SWEDEN | 148,434,953 | ||
| Switzerland - 3.9% | |||
| ABB Ltd. (Reg.) | 591,058 | 19,858,200 | |
| Adecco SA (Reg.) | 60,233 | 2,267,221 | |
| Alcon, Inc. (Switzerland) | 184,343 | 13,135,946 | |
| Avolta AG (a) | 35,312 | 1,230,961 | |
| Bachem Holding AG (B Shares) | 12,198 | 879,667 | |
| Baloise Holdings AG | 17,158 | 2,455,858 | |
| Banque Cantonale Vaudoise | 11,162 | 1,258,969 | |
| Barry Callebaut AG | 1,313 | 1,984,692 | |
| BKW AG | 7,656 | 1,284,346 | |
| Clariant AG (Reg.) | 76,983 | 1,089,178 | |
| Compagnie Financiere Richemont SA Series A | 192,764 | 22,741,433 | |
| DSM-Firmenich AG | 68,946 | 6,243,941 | |
| Ems-Chemie Holding AG | 2,540 | 1,731,215 | |
| Geberit AG (Reg.) | 12,393 | 5,746,570 | |
| Givaudan SA | 3,417 | 11,344,297 | |
| Helvetia Holding AG (Reg.) | 13,947 | 1,867,471 | |
| Julius Baer Group Ltd. | 76,365 | 4,525,520 | |
| Kuehne & Nagel International AG | 20,134 | 5,411,711 | |
| Lindt & Spruengli AG | 39 | 4,244,490 | |
| Lindt & Spruengli AG (participation certificate) | 364 | 4,021,547 | |
| Logitech International SA (Reg.) | 61,076 | 4,777,847 | |
| Lonza Group AG | 27,522 | 9,638,314 | |
| Novartis AG | 756,285 | 70,803,074 | |
| Partners Group Holding AG | 8,391 | 8,825,932 | |
| Sandoz Group AG | 151,257 | 3,932,532 | |
| Schindler Holding AG: | |||
| (participation certificate) | 14,560 | 2,932,328 | |
| (Reg.) | 9,290 | 1,802,545 | |
| SGS SA (Reg.) | 55,694 | 4,529,481 | |
| Sig Group AG | 115,139 | 2,530,235 | |
| Sika AG | 54,122 | 12,905,031 | |
| Sonova Holding AG | 19,258 | 4,541,132 | |
| Straumann Holding AG | 41,421 | 4,869,979 | |
| Swatch Group AG (Bearer) | 10,855 | 2,770,880 | |
| Swatch Group AG (Bearer) (Reg.) | 19,132 | 923,316 | |
| Swiss Life Holding AG | 10,937 | 6,995,159 | |
| Swiss Prime Site AG | 27,901 | 2,588,737 | |
| Swisscom AG | 9,549 | 5,710,610 | |
| Temenos Group AG | 23,275 | 1,666,722 | |
| UBS Group AG | 1,213,905 | 28,317,555 | |
| VAT Group AG (c) | 10,032 | 3,536,814 | |
| Zurich Insurance Group Ltd. | 55,299 | 26,176,826 | |
TOTAL SWITZERLAND | 324,098,282 | ||
| Taiwan - 4.2% | |||
| Accton Technology Corp. | 184,000 | 2,848,750 | |
| Acer, Inc. | 1,050,288 | 1,109,179 | |
| Advantech Co. Ltd. | 170,411 | 1,748,729 | |
| ASE Technology Holding Co. Ltd. | 1,134,840 | 3,969,993 | |
| Asia Cement Corp. | 825,466 | 1,018,562 | |
| ASUSTeK Computer, Inc. | 257,000 | 2,692,604 | |
| AUO Corp. | 2,400,000 | 1,160,813 | |
| Catcher Technology Co. Ltd. | 215,000 | 1,205,199 | |
| Cathay Financial Holding Co. Ltd. | 3,499,869 | 4,745,840 | |
| Chailease Holding Co. Ltd. | 560,746 | 3,039,452 | |
| Chang Hwa Commercial Bank | 1,925,454 | 1,019,278 | |
| Cheng Shin Rubber Industry Co. Ltd. | 694,899 | 948,878 | |
| China Airlines Ltd. | 1,067,490 | 639,421 | |
| China Development Financial Ho (a) | 5,843,405 | 2,041,040 | |
| China Steel Corp. | 4,376,426 | 3,262,535 | |
| Chunghwa Telecom Co. Ltd. | 1,408,000 | 5,031,894 | |
| Compal Electronics, Inc. | 1,519,000 | 1,320,262 | |
| CTBC Financial Holding Co. Ltd. | 6,571,579 | 4,945,266 | |
| Delta Electronics, Inc. | 723,621 | 6,516,171 | |
| E Ink Holdings, Inc. | 311,000 | 1,616,926 | |
| E.SUN Financial Holdings Co. Ltd. | 5,245,130 | 3,861,842 | |
| ECLAT Textile Co. Ltd. | 65,941 | 1,048,725 | |
| eMemory Technology, Inc. | 24,000 | 1,502,477 | |
| EVA Airways Corp. | 949,000 | 804,146 | |
| Evergreen Marine Corp. (Taiwan) | 372,248 | 1,237,805 | |
| Far Eastern New Century Corp. | 1,109,664 | 1,010,250 | |
| Far EasTone Telecommunications Co. Ltd. | 590,000 | 1,380,967 | |
| Feng Tay Enterprise Co. Ltd. | 177,244 | 977,956 | |
| First Financial Holding Co. Ltd. | 4,059,596 | 3,245,770 | |
| Formosa Chemicals & Fibre Corp. | 1,328,590 | 2,497,784 | |
| Formosa Petrochemical Corp. | 427,000 | 1,042,373 | |
| Formosa Plastics Corp. | 1,428,480 | 3,394,556 | |
| Fubon Financial Holding Co. Ltd. | 2,894,900 | 5,379,195 | |
| Giant Manufacturing Co. Ltd. | 117,698 | 594,690 | |
| Gigabyte Technology Co. Ltd. | 185,000 | 1,255,911 | |
| Global Unichip Corp. | 32,000 | 1,429,076 | |
| GlobalWafers Co. Ltd. | 81,000 | 1,189,776 | |
| Hon Hai Precision Industry Co. Ltd. (Foxconn) | 4,615,990 | 13,766,800 | |
| Hotai Motor Co. Ltd. | 112,220 | 2,092,316 | |
| Hua Nan Financial Holdings Co. Ltd. | 3,217,423 | 2,016,169 | |
| Innolux Corp. | 3,168,636 | 1,193,552 | |
| Inventec Corp. | 981,280 | 1,228,366 | |
| Largan Precision Co. Ltd. | 37,000 | 2,367,908 | |
| Lite-On Technology Corp. | 734,910 | 2,286,389 | |
| MediaTek, Inc. | 560,970 | 14,629,683 | |
| Mega Financial Holding Co. Ltd. | 4,192,112 | 4,753,270 | |
| Micro-Star International Co. Ltd. | 259,000 | 1,324,886 | |
| momo.com, Inc. | 30,580 | 503,767 | |
| Nan Ya Plastics Corp. | 1,782,780 | 3,408,406 | |
| Nan Ya Printed Circuit Board Corp. | 85,000 | 623,428 | |
| Nanya Technology Corp. | 447,000 | 895,446 | |
| Nien Made Enterprise Co. Ltd. | 63,000 | 556,953 | |
| Novatek Microelectronics Corp. | 215,000 | 3,025,529 | |
| Pegatron Corp. | 723,000 | 1,685,910 | |
| PharmaEssentia Corp. (a) | 87,000 | 865,116 | |
| Pou Chen Corp. | 780,000 | 694,728 | |
| Powerchip Semiconductor Manufacturing Corp. | 1,144,044 | 940,389 | |
| President Chain Store Corp. | 209,000 | 1,661,179 | |
| Quanta Computer, Inc. | 1,001,000 | 5,905,659 | |
| Realtek Semiconductor Corp. | 182,090 | 2,267,617 | |
| Ruentex Development Co. Ltd. | 566,851 | 568,044 | |
| Shin Kong Financial Holding Co. Ltd. (a) | 4,876,475 | 1,309,047 | |
| Sinopac Financial Holdings Co. | 3,859,390 | 2,126,876 | |
| Synnex Technology International Corp. | 473,500 | 1,004,138 | |
| Taishin Financial Holdings Co. Ltd. | 4,147,688 | 2,210,535 | |
| Taiwan Business Bank | 2,211,840 | 871,379 | |
| Taiwan Cement Corp. | 2,417,612 | 2,407,094 | |
| Taiwan Cooperative Financial Holding Co. Ltd. | 3,841,229 | 2,980,674 | |
| Taiwan High Speed Rail Corp. | 686,000 | 622,368 | |
| Taiwan Mobile Co. Ltd. | 625,600 | 1,847,392 | |
| Taiwan Semiconductor Manufacturing Co. Ltd. | 9,091,000 | 148,364,524 | |
| The Shanghai Commercial & Savings Bank Ltd. | 1,455,059 | 1,926,456 | |
| Uni-President Enterprises Corp. | 1,806,080 | 3,786,144 | |
| Unimicron Technology Corp. | 512,000 | 2,281,718 | |
| United Microelectronics Corp. | 4,165,000 | 5,985,132 | |
| Vanguard International Semiconductor Corp. | 341,000 | 739,987 | |
| Voltronic Power Technology Corp. | 24,000 | 961,753 | |
| Walsin Lihwa Corp. | 1,028,312 | 1,093,572 | |
| Wan Hai Lines Ltd. | 263,360 | 376,121 | |
| Winbond Electronics Corp. | 1,109,000 | 858,727 | |
| Winbond Electronics Corp. rights 11/3/23 (a) | 44,582 | 4,052 | |
| Wistron Corp. | 970,000 | 2,702,763 | |
| Wiwynn Corp. | 32,000 | 1,515,093 | |
| WPG Holding Co. Ltd. | 572,320 | 1,265,470 | |
| Yageo Corp. | 122,352 | 1,993,235 | |
| Yang Ming Marine Transport Corp. | 643,000 | 837,427 | |
| Yuanta Financial Holding Co. Ltd. | 3,837,075 | 2,880,640 | |
| Zhen Ding Technology Holding Ltd. | 236,302 | 713,894 | |
TOTAL TAIWAN | 345,661,812 | ||
| Thailand - 0.5% | |||
| Advanced Info Service PCL (For. Reg.) | 228,500 | 1,391,798 | |
| Advanced Information Service PCL NVDR | 206,500 | 1,257,795 | |
| Airports of Thailand PCL: | |||
| (For. Reg.) (a) | 907,200 | 1,675,002 | |
| NVDR (a) | 747,300 | 1,379,772 | |
| Asset World Corp. PCL: | |||
| (For. Reg.) | 2,164,600 | 207,134 | |
| NVDR | 267,100 | 25,559 | |
| B. Grimm Power PCL: | |||
| (For. Reg.) | 222,000 | 135,808 | |
| NVDR | 18,400 | 11,256 | |
| Bangkok Dusit Medical Services PCL: | |||
| (For. Reg.) | 2,030,000 | 1,488,163 | |
| NVDR | 2,039,800 | 1,495,347 | |
| Bangkok Expressway and Metro PCL: | |||
| (For. Reg.) | 1,674,400 | 365,795 | |
| NVDR | 1,011,600 | 220,998 | |
| Banpu PCL NVDR | 2,796,400 | 587,840 | |
| Berli Jucker PCL: | |||
| (For. Reg.) | 279,800 | 218,903 | |
| NVDR | 94,500 | 73,933 | |
| BTS Group Holdings PCL: | |||
| (For. Reg.) | 1,613,500 | 335,582 | |
| NVDR | 1,314,100 | 270,964 | |
| Bumrungrad Hospital PCL: | |||
| (For. Reg.) | 104,400 | 750,376 | |
| NVDR | 114,900 | 825,845 | |
| Central Pattana PCL: | |||
| (For. Reg.) | 540,000 | 934,209 | |
| NVDR | 282,600 | 488,903 | |
| Central Retail Corp. PCL: | |||
| (For. Reg.) | 262,466 | 266,946 | |
| NVDR | 414,100 | 421,169 | |
| Charoen Pokphand Foods PCL: | |||
| (For. Reg.) | 706,700 | 365,581 | |
| NVDR | 648,200 | 335,319 | |
| CP ALL PCL: | |||
| (For. Reg.) | 1,177,300 | 1,799,345 | |
| NVDR | 957,900 | 1,464,022 | |
| CP Axtra PCL NVDR | 767,900 | 600,416 | |
| Delta Electronics PCL NVDR | 1,157,500 | 2,530,391 | |
| Electricity Generating PCL: | |||
| (For. Reg.) | 38,400 | 129,630 | |
| NVDR | 55,800 | 188,368 | |
| Energy Absolute PCL: | |||
| (For. Reg.) | 273,800 | 318,264 | |
| NVDR | 344,500 | 400,446 | |
| Global Power Synergy Public Co. Ltd.: | |||
| (For. Reg.) | 139,900 | 151,032 | |
| NVDR | 113,100 | 122,100 | |
| Gulf Energy Development PCL: | |||
| (For. Reg.) | 350,400 | 419,386 | |
| NVDR | 722,600 | 864,864 | |
| Home Product Center PCL: | |||
| (For. Reg.) | 1,156,167 | 380,669 | |
| NVDR | 1,042,400 | 343,211 | |
| Indorama Ventures PCL NVDR | 597,000 | 391,176 | |
| Intouch Holdings PCL: | |||
| (For. Reg.) | 169,100 | 332,170 | |
| NVDR | 196,000 | 385,010 | |
| Kasikornbank PCL NVDR | 217,200 | 789,959 | |
| Krung Thai Bank PCL: | |||
| (For. Reg.) | 788,655 | 410,078 | |
| NVDR | 429,500 | 223,328 | |
| Krungthai Card PCL: | |||
| (For. Reg.) | 150,000 | 181,590 | |
| NVDR | 224,400 | 271,659 | |
| Land & House PCL: | |||
| (For. Reg.) | 2,087,000 | 435,981 | |
| NVDR | 1,095,500 | 228,853 | |
| Minor International PCL: | |||
| (For. Reg.) | 1,019,598 | 790,157 | |
| NVDR | 184,200 | 142,749 | |
| Muangthai Leasing PCL: | |||
| (For. Reg.) | 145,909 | 147,361 | |
| NVDR | 118,600 | 119,780 | |
| Osotspa PCL: | |||
| (For. Reg.) | 123,400 | 80,248 | |
| NVDR | 368,200 | 239,444 | |
| PTT Exploration and Production PCL: | |||
| (For. Reg.) | 372,744 | 1,692,839 | |
| NVDR | 136,000 | 617,652 | |
| PTT Global Chemical PCL: | |||
| (For. Reg.) | 534,039 | 510,066 | |
| NVDR | 296,600 | 283,286 | |
| PTT Oil & Retail Business PCL NVDR | 1,048,200 | 530,822 | |
| PTT PCL: | |||
| (For. Reg.) | 2,596,900 | 2,390,375 | |
| NVDR | 1,056,300 | 972,295 | |
| Ratch Group PCL: | |||
| (For. Reg.) | 98,200 | 87,616 | |
| NVDR unit | 281,700 | 251,339 | |
| SCB X PCL: | |||
| (For. Reg.) | 94,050 | 256,435 | |
| NVDR | 222,500 | 606,663 | |
| SCG Packaging PCL NVDR | 456,000 | 454,377 | |
| Siam Cement PCL: | |||
| (For. Reg.) | 166,100 | 1,323,197 | |
| NVDR | 117,800 | 938,426 | |
| Thai Oil PCL: | |||
| (For. Reg.) | 321,912 | 419,148 | |
| NVDR | 127,810 | 166,416 | |
| TMBThanachart Bank PCL NVDR | 8,385,400 | 387,380 | |
| True Corp. PCL | 2,632,130 | 441,445 | |
| True Corp. PCL NVDR | 257,971 | 43,265 | |
TOTAL THAILAND | 42,784,726 | ||
| Turkey - 0.2% | |||
| Akbank TAS | 1,136,991 | 1,182,791 | |
| Aselsan A/S | 491,264 | 717,140 | |
| Bim Birlesik Magazalar A/S JSC | 165,029 | 1,585,066 | |
| Eregli Demir ve Celik Fabrikalari T.A.S. (a) | 516,164 | 690,060 | |
| Ford Otomotiv Sanayi A/S | 25,189 | 699,387 | |
| Haci Omer Sabanci Holding A/S | 373,148 | 704,942 | |
| Hektas Ticaret A/S (a) | 413,442 | 320,017 | |
| Koc Holding A/S | 277,334 | 1,339,700 | |
| Koza Altin Isletmeleri A/S | 351,308 | 272,420 | |
| Pegasus Hava Tasimaciligi A/S (a) | 16,395 | 408,149 | |
| Sasa Polyester Sanayi A/S | 383,918 | 579,688 | |
| Tofas Turk Otomobil Fabrikasi A/S | 45,418 | 386,031 | |
| Turk Hava Yollari AO (a) | 201,452 | 1,545,787 | |
| Turkcell Iletisim Hizmet A/S | 437,573 | 741,669 | |
| Turkiye Is Bankasi A/S Series C | 1,283,143 | 950,602 | |
| Turkiye Petrol Rafinerileri A/S | 351,469 | 1,761,115 | |
| Turkiye Sise ve Cam Fabrikalari A/S | 504,329 | 843,064 | |
| Yapi ve Kredi Bankasi A/S | 1,222,059 | 743,957 | |
TOTAL TURKEY | 15,471,585 | ||
| United Arab Emirates - 0.4% | |||
| Abu Dhabi Commercial Bank PJSC | 1,073,414 | 2,346,723 | |
| Abu Dhabi Islamic Bank (a) | 532,055 | 1,492,014 | |
| Abu Dhabi National Oil Co. for Distribution PJSC | 1,161,689 | 1,062,694 | |
| Aldar Properties PJSC | 1,412,581 | 1,999,842 | |
| Americana Restaurants International PLC | 927,903 | 934,724 | |
| Dubai Islamic Bank Pakistan Ltd. | 1,065,413 | 1,566,357 | |
| Emaar Properties PJSC | 2,473,536 | 4,505,297 | |
| Emirates NBD Bank PJSC | 716,042 | 3,304,359 | |
| Emirates Telecommunications Corp. | 1,294,625 | 6,506,610 | |
| First Abu Dhabi Bank PJSC | 1,646,385 | 5,683,681 | |
| Multiply Group (a) | 1,431,968 | 1,325,535 | |
| NMC Health PLC (a)(d) | 30,958 | 6 | |
TOTAL UNITED ARAB EMIRATES | 30,727,842 | ||
| United Kingdom - 7.2% | |||
| 3i Group PLC | 359,706 | 8,481,001 | |
| Abrdn PLC | 710,577 | 1,352,940 | |
| Admiral Group PLC | 77,432 | 2,299,223 | |
| AngloGold Ashanti PLC | 153,056 | 2,829,124 | |
| Ashtead Group PLC | 161,915 | 9,257,453 | |
| Associated British Foods PLC | 127,090 | 3,129,593 | |
| AstraZeneca PLC (United Kingdom) | 572,002 | 71,616,797 | |
| Auto Trader Group PLC (c) | 342,828 | 2,593,238 | |
| Aviva PLC | 1,014,567 | 4,914,127 | |
| BAE Systems PLC | 1,126,738 | 15,150,550 | |
| Barclays PLC | 5,753,533 | 9,234,695 | |
| Barratt Developments PLC | 355,742 | 1,789,648 | |
| Berkeley Group Holdings PLC | 38,866 | 1,906,593 | |
| BP PLC | 6,394,299 | 39,043,715 | |
| British American Tobacco PLC (United Kingdom) | 783,870 | 23,416,115 | |
| BT Group PLC | 2,410,692 | 3,303,660 | |
| Bunzl PLC | 125,377 | 4,468,059 | |
| Burberry Group PLC | 140,598 | 2,891,456 | |
| Centrica PLC | 2,060,990 | 3,940,413 | |
| CK Hutchison Holdings Ltd. | 999,893 | 5,061,745 | |
| CNH Industrial NV | 379,415 | 4,201,269 | |
| Coca-Cola European Partners PLC | 76,271 | 4,462,616 | |
| Compass Group PLC | 638,826 | 16,105,689 | |
| Croda International PLC | 50,926 | 2,709,895 | |
| DCC PLC (United Kingdom) | 36,101 | 2,003,075 | |
| Diageo PLC | 827,456 | 31,291,097 | |
| Entain PLC | 237,333 | 2,683,891 | |
| Halma PLC | 141,738 | 3,178,482 | |
| Hargreaves Lansdown PLC | 127,764 | 1,097,284 | |
| HSBC Holdings PLC (United Kingdom) | 7,287,364 | 52,617,869 | |
| Imperial Brands PLC | 320,047 | 6,818,342 | |
| Informa PLC | 521,330 | 4,509,057 | |
| InterContinental Hotel Group PLC | 61,570 | 4,363,008 | |
| Intertek Group PLC | 59,005 | 2,741,765 | |
| J Sainsbury PLC | 604,942 | 1,891,867 | |
| JD Sports Fashion PLC | 980,670 | 1,519,743 | |
| Johnson Matthey PLC | 70,020 | 1,271,481 | |
| Kingfisher PLC | 696,801 | 1,779,294 | |
| Land Securities Group PLC | 255,519 | 1,767,147 | |
| Legal & General Group PLC | 2,218,949 | 5,701,504 | |
| Lloyds Banking Group PLC | 23,771,232 | 11,569,458 | |
| London Stock Exchange Group PLC | 156,409 | 15,780,901 | |
| M&G PLC | 854,177 | 2,057,731 | |
| Melrose Industries PLC | 503,977 | 2,860,650 | |
| National Grid PLC | 1,357,147 | 16,181,233 | |
| NatWest Group PLC | 2,154,016 | 4,686,745 | |
| Next PLC | 45,039 | 3,768,484 | |
| Ocado Group PLC (a) | 209,891 | 1,187,036 | |
| Pearson PLC | 235,350 | 2,724,350 | |
| Pepco Group NV (a) | 63,590 | 257,407 | |
| Persimmon PLC | 115,527 | 1,426,640 | |
| Phoenix Group Holdings PLC | 269,566 | 1,486,848 | |
| Reckitt Benckiser Group PLC | 263,986 | 17,662,501 | |
| RELX PLC (London Stock Exchange) | 698,535 | 24,398,232 | |
| Rentokil Initial PLC | 934,157 | 4,757,186 | |
| Rolls-Royce Holdings PLC (a) | 3,112,632 | 8,193,153 | |
| Sage Group PLC | 379,665 | 4,478,968 | |
| Schroders PLC | 299,338 | 1,343,626 | |
| Segro PLC | 426,314 | 3,693,468 | |
| Severn Trent PLC | 92,170 | 2,975,464 | |
| Smith & Nephew PLC | 323,737 | 3,622,984 | |
| Smiths Group PLC | 128,329 | 2,516,697 | |
| Spirax-Sarco Engineering PLC | 27,487 | 2,736,871 | |
| SSE PLC | 403,787 | 8,014,485 | |
| St. James's Place PLC | 204,211 | 1,587,540 | |
| Standard Chartered PLC (United Kingdom) | 876,697 | 6,713,163 | |
| Taylor Wimpey PLC | 1,276,835 | 1,719,537 | |
| Tesco PLC | 2,662,256 | 8,736,359 | |
| Unilever PLC | 926,350 | 43,872,570 | |
| United Utilities Group PLC | 248,776 | 3,217,561 | |
| Vodafone Group PLC | 8,329,012 | 7,667,185 | |
| Vodafone Group PLC sponsored ADR | 20,171 | 186,380 | |
| Whitbread PLC | 72,586 | 2,936,116 | |
| Wise PLC (a) | 224,009 | 1,812,241 | |
| WPP PLC | 401,340 | 3,456,031 | |
TOTAL UNITED KINGDOM | 599,680,321 | ||
| United States of America - 4.6% | |||
| Brookfield Renewable Corp. | 48,537 | 1,104,267 | |
| BRP, Inc. | 13,044 | 881,640 | |
| CRH PLC | 268,075 | 14,405,022 | |
| CSL Ltd. | 178,108 | 26,322,960 | |
| CyberArk Software Ltd. (a) | 15,634 | 2,558,348 | |
| Experian PLC | 339,990 | 10,293,829 | |
| Ferrovial SE | 187,066 | 5,629,258 | |
| Ferrovial SE rights (a)(b)(e) | 187,066 | 84,637 | |
| GSK PLC | 1,511,749 | 26,949,608 | |
| Haleon PLC | 2,046,947 | 8,204,349 | |
| Holcim AG | 192,399 | 11,861,415 | |
| James Hardie Industries PLC CDI (a) | 162,933 | 4,065,085 | |
| JBS SA | 282,700 | 1,123,118 | |
| Legend Biotech Corp. ADR (a) | 21,620 | 1,428,433 | |
| Monday.com Ltd. (a) | 7,875 | 1,023,671 | |
| Nestle SA (Reg. S) | 984,386 | 106,154,986 | |
| Parade Technologies Ltd. | 28,000 | 917,326 | |
| QIAGEN NV (Germany) (a) | 83,318 | 3,096,136 | |
| Roche Holding AG: | |||
| (Bearer) | 11,357 | 3,086,297 | |
| (participation certificate) | 259,648 | 66,913,793 | |
| Sanofi SA | 419,348 | 38,079,407 | |
| Schneider Electric SA | 200,933 | 30,915,003 | |
| Swiss Re Ltd. | 111,271 | 12,124,643 | |
| Tenaris SA | 172,674 | 2,711,362 | |
TOTAL UNITED STATES OF AMERICA | 379,934,593 | ||
| Zambia - 0.0% | |||
| First Quantum Minerals Ltd. | 217,930 | 2,525,426 | |
| TOTAL COMMON STOCKS (Cost $8,246,444,329) | 8,096,164,335 | ||
| Nonconvertible Preferred Stocks - 0.9% | |||
| Shares | Value ($) | ||
| Brazil - 0.4% | |||
| Banco Bradesco SA (PN) | 1,992,644 | 5,529,249 | |
| Centrais Eletricas Brasileiras SA (Electrobras) (PN-B) | 91,407 | 697,099 | |
| Companhia Energetica de Minas Gerais (CEMIG) (PN) | 503,805 | 1,173,138 | |
| Gerdau SA | 424,240 | 1,831,845 | |
| Itau Unibanco Holding SA | 1,795,421 | 9,550,888 | |
| Itausa-Investimentos Itau SA (PN) | 1,944,040 | 3,331,483 | |
| Petroleo Brasileiro SA - Petrobras (PN) (non-vtg.) | 1,756,300 | 12,101,723 | |
TOTAL BRAZIL | 34,215,425 | ||
| Chile - 0.0% | |||
| Sociedad Quimica y Minera de Chile SA (PN-B) | 52,077 | 2,519,479 | |
| Colombia - 0.0% | |||
| Bancolombia SA (PN) | 155,262 | 995,850 | |
| France - 0.0% | |||
| Air Liquide SA (a) | 8,637 | 1,479,969 | |
| Germany - 0.3% | |||
| Bayerische Motoren Werke AG (BMW) (non-vtg.) | 21,404 | 1,815,203 | |
| Dr. Ing. h.c. F. Porsche AG Series F (c) | 42,117 | 3,678,312 | |
| Henkel AG & Co. KGaA | 63,009 | 4,538,882 | |
| Porsche Automobil Holding SE (Germany) | 56,007 | 2,506,767 | |
| Sartorius AG (non-vtg.) | 9,756 | 2,438,251 | |
| Volkswagen AG | 76,237 | 8,084,989 | |
TOTAL GERMANY | 23,062,404 | ||
| Korea (South) - 0.2% | |||
| Hyundai Motor Co. Ltd. | 8,203 | 604,868 | |
| Hyundai Motor Co. Ltd. Series 2 | 12,390 | 919,115 | |
| LG Chemical Ltd. | 3,195 | 666,306 | |
| LG H & H Co. Ltd. | 694 | 72,824 | |
| Samsung Electronics Co. Ltd. | 307,552 | 12,260,728 | |
TOTAL KOREA (SOUTH) | 14,523,841 | ||
| Russia - 0.0% | |||
| Surgutneftegas OJSC (d) | 2,913,333 | 50,699 | |
| TOTAL NONCONVERTIBLE PREFERRED STOCKS (Cost $86,723,155) | 76,847,667 | ||
| Nonconvertible Bonds - 0.0% | |||
Principal Amount (f) | Value ($) | ||
| India - 0.0% | |||
NTPC Ltd. 8.49% 3/25/25 (Cost $13,959) | INR | 69,696 | 8,828 |
| Government Obligations - 0.1% | |||
Principal Amount (f) | Value ($) | ||
| United States of America - 0.1% | |||
U.S. Treasury Bills, yield at date of purchase 5.42% 2/22/24 (g) (Cost $9,833,749) | 10,000,000 | 9,833,168 | |
| Money Market Funds - 1.5% | |||
| Shares | Value ($) | ||
| Fidelity Cash Central Fund 5.40% (h) | 93,287,764 | 93,306,422 | |
| Fidelity Securities Lending Cash Central Fund 5.40% (h)(i) | 30,945,994 | 30,949,089 | |
| TOTAL MONEY MARKET FUNDS (Cost $124,255,511) | 124,255,511 | ||
| TOTAL INVESTMENT IN SECURITIES - 99.7% (Cost $8,467,270,703) | 8,307,109,509 |
NET OTHER ASSETS (LIABILITIES) - 0.3% | 21,584,749 |
| NET ASSETS - 100.0% | 8,328,694,258 |
| Futures Contracts | |||||
Number of contracts | Expiration Date | Notional Amount ($) | Value ($) | Unrealized Appreciation/ (Depreciation) ($) | |
| Purchased | |||||
| Equity Index Contracts | |||||
| ICE MSCI EAFE Index Contracts (United States) | 987 | Dec 2023 | 97,421,835 | (874,455) | (874,455) |
| ICE MSCI Emerging Markets Index Contracts (United States) | 944 | Dec 2023 | 43,386,240 | (639,628) | (639,628) |
| TME S&P/TSX 60 Index Contracts (Canada) | 68 | Dec 2023 | 11,131,062 | (204,192) | (204,192) |
| TOTAL FUTURES CONTRACTS | (1,718,275) | ||||
| The notional amount of futures purchased as a percentage of Net Assets is 1.8% | |||||
| INR | - | Indian rupee |
| (a) | Non-income producing |
| (b) | Security or a portion of the security is on loan at period end. |
| (c) | Security exempt from registration under Rule 144A of the Securities Act of 1933. These securities may be resold in transactions exempt from registration, normally to qualified institutional buyers. At the end of the period, the value of these securities amounted to $189,159,484 or 2.3% of net assets. |
| (d) | Level 3 security |
| (e) | Security or a portion of the security purchased on a delayed delivery or when-issued basis. |
| (f) | Amount is stated in United States dollars unless otherwise noted. |
| (g) | Security or a portion of the security was pledged to cover margin requirements for futures contracts. At period end, the value of securities pledged amounted to $5,044,415. |
| (h) | Affiliated fund that is generally available only to investment companies and other accounts managed by Fidelity Investments. The rate quoted is the annualized seven-day yield of the fund at period end. A complete unaudited listing of the fund's holdings as of its most recent quarter end is available upon request. In addition, each Fidelity Central Fund's financial statements, which are not covered by the Fund's Report of Independent Registered Public Accounting Firm, are available on the SEC's website or upon request. |
| (i) | Investment made with cash collateral received from securities on loan. |
| Affiliate | Value, beginning of period ($) | Purchases ($) | Sales Proceeds ($) | Dividend Income ($) | Realized Gain (loss) ($) | Change in Unrealized appreciation (depreciation) ($) | Value, end of period ($) | % ownership, end of period |
| Fidelity Cash Central Fund 5.40% | 122,732,231 | 1,623,463,746 | 1,652,889,554 | 5,242,639 | 634 | (635) | 93,306,422 | 0.2% |
| Fidelity Securities Lending Cash Central Fund 5.40% | 17,459,839 | 268,749,217 | 255,259,967 | 620,220 | - | - | 30,949,089 | 0.1% |
| Total | 140,192,070 | 1,892,212,963 | 1,908,149,521 | 5,862,859 | 634 | (635) | 124,255,511 | |
| Valuation Inputs at Reporting Date: | ||||
| Description | Total ($) | Level 1 ($) | Level 2 ($) | Level 3 ($) |
Investments in Securities: | ||||
| Equities: | ||||
Communication Services | 446,589,178 | 90,930,527 | 355,118,055 | 540,596 |
Consumer Discretionary | 962,927,020 | 279,680,985 | 683,214,304 | 31,731 |
Consumer Staples | 695,635,338 | 163,487,296 | 532,138,314 | 9,728 |
Energy | 500,510,524 | 190,881,054 | 307,371,917 | 2,257,553 |
Financials | 1,730,445,211 | 708,417,426 | 1,021,809,018 | 218,767 |
Health Care | 780,964,655 | 116,050,852 | 664,913,797 | 6 |
Industrials | 1,048,912,692 | 350,435,965 | 698,476,727 | - |
Information Technology | 941,539,254 | 93,414,144 | 848,125,109 | 1 |
Materials | 636,992,976 | 255,592,675 | 380,915,751 | 484,550 |
Real Estate | 165,424,874 | 40,118,718 | 125,306,156 | - |
Utilities | 263,070,280 | 102,016,033 | 160,985,837 | 68,410 |
| Corporate Bonds | 8,828 | - | 8,828 | - |
| Government Obligations | 9,833,168 | - | 9,833,168 | - |
| Money Market Funds | 124,255,511 | 124,255,511 | - | - |
| Total Investments in Securities: | 8,307,109,509 | 2,515,281,186 | 5,788,216,981 | 3,611,342 |
Derivative Instruments: Liabilities | ||||
Futures Contracts | (1,718,275) | (1,718,275) | - | - |
| Total Liabilities | (1,718,275) | (1,718,275) | - | - |
| Total Derivative Instruments: | (1,718,275) | (1,718,275) | - | - |
Primary Risk Exposure / Derivative Type | Value | |
| Asset ($) | Liability ($) | |
| Equity Risk | ||
Futures Contracts (a) | 0 | (1,718,275) |
| Total Equity Risk | 0 | (1,718,275) |
| Total Value of Derivatives | 0 | (1,718,275) |
| Statement of Assets and Liabilities | ||||
| October 31, 2023 | ||||
| Assets | ||||
| Investment in securities, at value (including securities loaned of $29,386,738) - See accompanying schedule: | ||||
Unaffiliated issuers (cost $8,343,015,192) | $ | 8,182,853,998 | ||
Fidelity Central Funds (cost $124,255,511) | 124,255,511 | |||
| Total Investment in Securities (cost $8,467,270,703) | $ | 8,307,109,509 | ||
| Segregated cash with brokers for derivative instruments | 90 | |||
| Cash | 590,849 | |||
| Foreign currency held at value (cost $16,357,104) | 16,200,501 | |||
| Receivable for investments sold | 24,087 | |||
| Receivable for fund shares sold | 17,759,047 | |||
| Dividends receivable | 17,079,106 | |||
| Reclaims receivable | 20,698,954 | |||
| Interest receivable | 33 | |||
| Distributions receivable from Fidelity Central Funds | 277,780 | |||
| Receivable for daily variation margin on futures contracts | 21,037 | |||
| Other receivables | 28,399 | |||
Total assets | 8,379,789,392 | |||
| Liabilities | ||||
| Payable for investments purchased | ||||
Regular delivery | $ | 4,432 | ||
Delayed delivery | 147,195 | |||
| Payable for fund shares redeemed | 8,223,792 | |||
| Accrued management fee | 385,934 | |||
| Deferred taxes | 11,379,761 | |||
| Other payables and accrued expenses | 6,334 | |||
| Collateral on securities loaned | 30,947,686 | |||
| Total Liabilities | 51,095,134 | |||
| Net Assets | $ | 8,328,694,258 | ||
| Net Assets consist of: | ||||
| Paid in capital | $ | 9,002,990,874 | ||
| Total accumulated earnings (loss) | (674,296,616) | |||
| Net Assets | $ | 8,328,694,258 | ||
Net Asset Value, offering price and redemption price per share ($8,328,694,258 ÷ 653,679,282 shares) | $ | 12.74 | ||
| Statement of Operations | ||||
Year ended October 31, 2023 | ||||
| Investment Income | ||||
| Dividends | $ | 293,521,900 | ||
| Foreign Tax Reclaims | 15,616,960 | |||
| Interest | 423,707 | |||
| Income from Fidelity Central Funds (including $620,220 from security lending) | 5,862,859 | |||
| Income before foreign taxes withheld | $ | 315,425,426 | ||
| Less foreign taxes withheld | (35,454,453) | |||
| Total Income | 279,970,973 | |||
| Expenses | ||||
| Management fee | $ | 4,809,860 | ||
| Independent trustees' fees and expenses | 30,129 | |||
| Total expenses before reductions | 4,839,989 | |||
| Expense reductions | (127,082) | |||
| Total expenses after reductions | 4,712,907 | |||
| Net Investment income (loss) | 275,258,066 | |||
| Realized and Unrealized Gain (Loss) | ||||
| Net realized gain (loss) on: | ||||
| Investment Securities: | ||||
| Unaffiliated issuers (net of foreign taxes of $502,625) | (239,053,469) | |||
| Fidelity Central Funds | 634 | |||
| Foreign currency transactions | 1,230,768 | |||
| Futures contracts | 15,823,798 | |||
| Total net realized gain (loss) | (221,998,269) | |||
| Change in net unrealized appreciation (depreciation) on: | ||||
| Investment Securities: | ||||
| Unaffiliated issuers(net of increase in deferred foreign taxes of $995,068) | 914,482,101 | |||
| Fidelity Central Funds | (635) | |||
| Assets and liabilities in foreign currencies | 1,371,043 | |||
| Futures contracts | (590,675) | |||
| Total change in net unrealized appreciation (depreciation) | 915,261,834 | |||
| Net gain (loss) | 693,263,565 | |||
| Net increase (decrease) in net assets resulting from operations | $ | 968,521,631 | ||
| Statement of Changes in Net Assets | ||||
Year ended October 31, 2023 | Year ended October 31, 2022 | |||
| Increase (Decrease) in Net Assets | ||||
| Operations | ||||
| Net investment income (loss) | $ | 275,258,066 | $ | 261,202,687 |
| Net realized gain (loss) | (221,998,269) | (42,009,740) | ||
| Change in net unrealized appreciation (depreciation) | 915,261,834 | (2,580,454,832) | ||
| Net increase (decrease) in net assets resulting from operations | 968,521,631 | (2,361,261,885) | ||
| Distributions to shareholders | (208,386,222) | (232,318,373) | ||
| Share transactions | ||||
| Proceeds from sales of shares | 3,103,954,657 | 3,351,217,856 | ||
| Reinvestment of distributions | 198,751,243 | 222,581,907 | ||
| Cost of shares redeemed | (3,207,929,609) | (2,638,924,650) | ||
Net increase (decrease) in net assets resulting from share transactions | 94,776,291 | 934,875,113 | ||
| Total increase (decrease) in net assets | 854,911,700 | (1,658,705,145) | ||
| Net Assets | ||||
| Beginning of period | 7,473,782,558 | 9,132,487,703 | ||
| End of period | $ | 8,328,694,258 | $ | 7,473,782,558 |
| Other Information | ||||
| Shares | ||||
| Sold | 233,829,985 | 247,319,236 | ||
| Issued in reinvestment of distributions | 15,938,351 | 15,064,264 | ||
| Redeemed | (240,542,102) | (196,149,020) | ||
| Net increase (decrease) | 9,226,234 | 66,234,480 | ||
| Fidelity® Global ex U.S. Index Fund |
| Years ended October 31, | 2023 | 2022 | 2021 | 2020 | 2019 | |||||
Selected Per-Share Data | ||||||||||
| Net asset value, beginning of period | $ | 11.60 | $ | 15.79 | $ | 12.43 | $ | 13.09 | $ | 12.07 |
| Income from Investment Operations | ||||||||||
Net investment income (loss) A,B | .42 | .42 | .38 | .29 | .41 | |||||
| Net realized and unrealized gain (loss) | 1.05 | (4.21) | 3.23 | (.57) | .91 | |||||
| Total from investment operations | 1.47 | (3.79) | 3.61 | (.28) | 1.32 | |||||
| Distributions from net investment income | (.33) | (.40) | (.25) | (.38) | (.30) | |||||
| Total distributions | (.33) | (.40) | (.25) | (.38) | (.30) | |||||
| Net asset value, end of period | $ | 12.74 | $ | 11.60 | $ | 15.79 | $ | 12.43 | $ | 13.09 |
Total Return C | 12.74% | (24.56)% | 29.25% | (2.25)% | 11.28% | |||||
Ratios to Average Net Assets B,D,E | ||||||||||
| Expenses before reductions | .06% | .06% | .05% F | .06% | .06% | |||||
| Expenses net of fee waivers, if any | .06% | .06% | .05% F | .06% | .06% | |||||
| Expenses net of all reductions | .05% | .06% | .05% F | .06% | .06% | |||||
| Net investment income (loss) | 3.13% | 3.06% | 2.46% | 2.37% | 3.32% | |||||
| Supplemental Data | ||||||||||
| Net assets, end of period (000 omitted) | $ | 8,328,694 | $ | 7,473,783 | $ | 9,132,488 | $ | 5,621,566 | $ | 5,343,395 |
Portfolio turnover rate G | 8% | 5% H | 5% H | 5% | 5% H |
| Fidelity Central Fund | Investment Manager | Investment Objective | Investment Practices | Expense RatioA |
| Fidelity Money Market Central Funds | Fidelity Management & Research Company LLC (FMR) | Each fund seeks to obtain a high level of current income consistent with the preservation of capital and liquidity. | Short-term Investments | Less than .005% |
| Tax cost | Gross unrealized appreciation | Gross unrealized depreciation | Net unrealized appreciation (depreciation) | |
| Fidelity Emerging Markets Index Fund | $7,208,929,692 | $908,090,393 | $(1,720,649,135) | $(812,558,742) |
| Fidelity Global ex U.S. Index Fund | 8,549,062,434 | 1,236,059,034 | (1,478,216,151) | (242,157,117) |
| Undistributed ordinary income | Capital loss carryforward | Net unrealized appreciation (depreciation) on securities and other investments | |
| Fidelity Emerging Markets Index Fund | $159,169,902 | $(663,401,306) | $(813,134,928) |
| Fidelity Global ex U.S. Index Fund | 239,709,683 | (659,386,659) | (243,239,882) |
| Short-term | Long-term | Total capital loss carryforward | ||
| Fidelity Emerging Markets Index Fund | $(155,918,326) | $(507,482,980) | $(663,401,306) | |
| Fidelity Global ex U.S. Index Fund | (93,999,433) | (565,387,226) | (659,386,659) | |
| October 31, 2023 | ||
| Ordinary Income | Total | |
Fidelity Emerging Markets Index Fund | $144,831,374 | $144,831,374 |
| Fidelity Global ex U.S. Index Fund | 208,386,222 | 208,386,222 |
| October 31, 2022 | ||
| Ordinary Income | Total | |
Fidelity Emerging Markets Index Fund | $141,768,973 | $141,768,973 |
| Fidelity Global ex U.S. Index Fund | 232,318,373 | 232,318,373 |
| Equity Risk | Equity risk relates to the fluctuations in the value of financial instruments as a result of changes in market prices (other than those arising from interest rate risk or foreign exchange risk), whether caused by factors specific to an individual investment, its issuer, or all factors affecting all instruments traded in a market or market segment. |
| Purchases ($) | Sales ($) | |
| Fidelity Emerging Markets Index Fund | 1,093,942,507 | 456,909,551 |
| Fidelity Global ex U.S. Index Fund | 873,392,607 | 686,741,493 |
| Shares | Total net realized gain or loss ($) | Total Proceeds ($) | |
| Fidelity Global ex U.S. Index Fund | 62,225,242 | 197,626,769 | 805,816,881 |
| Borrower or Lender | Average Loan Balance | Weighted Average Interest Rate | Interest Expense | |
Fidelity Emerging Markets Index Fund | Borrower | $ 34,493,000 | 5.07% | $9,706 |
| Fidelity Global ex U.S. Index Fund | Borrower | $ 29,257,333 | 5.12% | $24,975 |
| Amount ($) | |
| Fidelity Global ex U.S. Index Fund | 48,786 |
| Total Security Lending Fees Paid to NFS | Security Lending Income From Securities Loaned to NFS | Value of Securities Loaned to NFS at Period End | |
| Fidelity Emerging Markets Index Fund | $94,871 | $1 | $- |
| Fidelity Global ex U.S. Index Fund | $65,211 | $- | $- |
| Custodian credits | |
Fidelity Emerging Markets Index Fund | $64,889 |
| Fidelity Global ex U.S. Index Fund | 127,082 |
| Fidelity Multi-Asset Index Fund | |
| Fidelity Emerging Markets Index Fund | 11% |
| The Example is based on an investment of $1,000 invested at the beginning of the period and held for the entire period (May 1, 2023 to October 31, 2023). |
Annualized Expense Ratio- A | Beginning Account Value May 1, 2023 | Ending Account Value October 31, 2023 | Expenses Paid During Period- C May 1, 2023 to October 31, 2023 | |||||||
| Fidelity® Emerging Markets Index Fund | .08% | |||||||||
| Actual | $ 1,000 | $ 947.70 | $ .39 | |||||||
Hypothetical-B | $ 1,000 | $ 1,024.80 | $ .41 | |||||||
| Fidelity® Global ex U.S. Index Fund | .06% | |||||||||
| Actual | $ 1,000 | $ 931.30 | $ .29 | |||||||
Hypothetical-B | $ 1,000 | $ 1,024.90 | $ .31 | |||||||
| Fidelity Emerging Markets Index Fund | |
| December 2022 | 52.74% |
| Fidelity Global ex U.S. Index Fund | |
| December 2022 | 95.40% |
| Fidelity Emerging Markets Index Fund | $1,820,404 |
| Fidelity Global ex U.S. Index Fund | $2,472,486 |
| Pay Date | Income | Taxes | |
| Fidelity Emerging Markets Index Fund | 12/19/2022 | $0.2701 | $0.0371 |
| Fidelity Global ex U.S. Index Fund | 12/19/2022 | $0.3714 | $0.0404 |
| A special meeting of shareholders was held on October 18, 2023. The results of votes taken among shareholders on the proposal before them are reported below. Each vote reported represents one dollar of net asset value held on the record date for the meeting. | ||
| Proposal 1 | ||
| To elect a Board of Trustees. | ||
# of Votes | % of Votes | |
| Abigail P. Johnson | ||
| Affirmative | 378,729,502,260.010 | 97.580 |
| Withheld | 9,407,876,478.960 | 2.420 |
| TOTAL | 388,137,378,738.970 | 100.000 |
| Jennifer Toolin McAuliffe | ||
| Affirmative | 378,454,868,010.950 | 97.510 |
| Withheld | 9,682,510,728.020 | 2.490 |
| TOTAL | 388,137,378,738.970 | 100.000 |
| Christine J. Thompson | ||
| Affirmative | 378,837,121,274.520 | 97.600 |
| Withheld | 9,300,257,464.450 | 2.400 |
| TOTAL | 388,137,378,738.970 | 100.000 |
| Elizabeth S. Acton | ||
| Affirmative | 378,262,110,794.850 | 97.460 |
| Withheld | 9,875,267,944.120 | 2.540 |
| TOTAL | 388,137,378,738.970 | 100.000 |
| Laura M. Bishop | ||
| Affirmative | 380,482,113,171.060 | 98.030 |
| Withheld | 7,655,265,567.910 | 1.970 |
| TOTAL | 388,137,378,738.970 | 100.000 |
| Ann E. Dunwoody | ||
| Affirmative | 380,016,034,008.120 | 97.910 |
| Withheld | 8,121,344,730.850 | 2.090 |
| TOTAL | 388,137,378,738.970 | 100.000 |
| John Engler | ||
| Affirmative | 379,432,488,394.200 | 97.760 |
| Withheld | 8,704,890,344.770 | 2.240 |
| TOTAL | 388,137,378,738.970 | 100.000 |
| Robert F. Gartland | ||
| Affirmative | 378,741,819,600.600 | 97.580 |
| Withheld | 9,395,559,138.370 | 2.420 |
| TOTAL | 388,137,378,738.970 | 100.000 |
| Robert W. Helm | ||
| Affirmative | 380,389,324,755.070 | 98.000 |
| Withheld | 7,748,053,983.900 | 2.000 |
| TOTAL | 388,137,378,738.970 | 100.000 |
| Arthur E. Johnson | ||
| Affirmative | 378,427,694,151.670 | 97.500 |
| Withheld | 9,709,684,587.300 | 2.500 |
| TOTAL | 388,137,378,738.970 | 100.000 |
| Michael E. Kenneally | ||
| Affirmative | 377,842,228,145.180 | 97.350 |
| Withheld | 10,295,150,593.790 | 2.650 |
| TOTAL | 388,137,378,738.970 | 100.000 |
| Mark A. Murray | ||
| Affirmative | 380,158,432,703.370 | 97.940 |
| Withheld | 7,978,946,035.600 | 2.060 |
| TOTAL | 388,137,378,738.970 | 100.000 |
| Carol J. Zierhoffer | ||
| Affirmative | 380,522,113,360.240 | 98.040 |
| Withheld | 7,615,265,378.730 | 1.960 |
| TOTAL | 388,137,378,738.970 | 100.000 |
| Proposal 1 reflects trust wide proposal and voting results. | ||
 |


Contents
| Average Annual Total Returns | |||
Periods ended October 31, 2023 | Past 1 year | Past 5 years | Life of Fund A |
| Fidelity® U.S. Sustainability Index Fund | 12.47% | 11.75% | 11.35% |
| $10,000 Over Life of Fund |
Let's say hypothetically that $10,000 was invested in Fidelity® U.S. Sustainability Index Fund, on May 9, 2017, when the fund started. The chart shows how the value of your investment would have changed, and also shows how the MSCI USA ESG Leaders Index performed over the same period. |
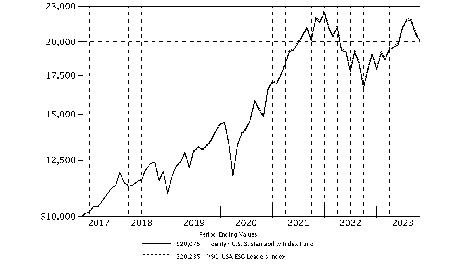 |
Top Holdings (% of Fund's net assets) | ||
| Microsoft Corp. | 12.6 | |
| NVIDIA Corp. | 5.3 | |
| Alphabet, Inc. Class A | 3.9 | |
| Alphabet, Inc. Class C | 3.5 | |
| Tesla, Inc. | 3.0 | |
| Eli Lilly & Co. | 2.3 | |
| Visa, Inc. Class A | 2.0 | |
| Johnson & Johnson | 1.9 | |
| Procter & Gamble Co. | 1.9 | |
| MasterCard, Inc. Class A | 1.7 | |
| 38.1 | ||
| Market Sectors (% of Fund's net assets) | ||
| Information Technology | 29.1 | |
| Health Care | 12.7 | |
| Financials | 12.0 | |
| Communication Services | 10.5 | |
| Consumer Discretionary | 10.4 | |
| Industrials | 9.0 | |
| Consumer Staples | 6.3 | |
| Materials | 2.9 | |
| Energy | 2.6 | |
| Real Estate | 2.4 | |
| Utilities | 1.2 | |
Asset Allocation (% of Fund's net assets) |
 |
Futures - 0.9% |
| Common Stocks - 99.1% | |||
| Shares | Value ($) | ||
| COMMUNICATION SERVICES - 10.5% | |||
| Diversified Telecommunication Services - 0.8% | |||
| Liberty Global PLC Class C (a) | 31,347 | 531,645 | |
| Verizon Communications, Inc. | 536,738 | 18,855,606 | |
| 19,387,251 | |||
| Entertainment - 1.1% | |||
| Electronic Arts, Inc. | 32,999 | 4,084,946 | |
| Take-Two Interactive Software, Inc. (a) | 21,620 | 2,891,675 | |
| The Walt Disney Co. (a) | 233,286 | 19,033,805 | |
| 26,010,426 | |||
| Interactive Media & Services - 7.5% | |||
| Alphabet, Inc.: | |||
| Class A (a) | 758,487 | 94,113,067 | |
| Class C (a) | 674,870 | 84,561,211 | |
| Snap, Inc. Class A (a) | 130,051 | 1,301,811 | |
| Zoominfo Technologies, Inc. (a) | 33,665 | 436,298 | |
| 180,412,387 | |||
| Media - 1.1% | |||
| Comcast Corp. Class A | 531,039 | 21,926,600 | |
| Fox Corp.: | |||
| Class A | 34,777 | 1,056,873 | |
| Class B | 17,551 | 489,848 | |
| Interpublic Group of Companies, Inc. | 49,300 | 1,400,120 | |
| Omnicom Group, Inc. | 25,435 | 1,905,336 | |
| Sirius XM Holdings, Inc. | 98,574 | 421,897 | |
| 27,200,674 | |||
TOTAL COMMUNICATION SERVICES | 253,010,738 | ||
| CONSUMER DISCRETIONARY - 10.4% | |||
| Automobile Components - 0.2% | |||
| Aptiv PLC (a) | 36,109 | 3,148,705 | |
| BorgWarner, Inc. | 29,973 | 1,106,004 | |
| Lear Corp. | 7,556 | 980,467 | |
| 5,235,176 | |||
| Automobiles - 3.1% | |||
| Rivian Automotive, Inc. (a) | 83,146 | 1,348,628 | |
| Tesla, Inc. (a) | 364,171 | 73,140,104 | |
| 74,488,732 | |||
| Broadline Retail - 0.4% | |||
| eBay, Inc. | 68,278 | 2,678,546 | |
| MercadoLibre, Inc. (a) | 5,769 | 7,157,829 | |
| 9,836,375 | |||
| Distributors - 0.2% | |||
| Genuine Parts Co. | 17,959 | 2,314,197 | |
| LKQ Corp. | 34,089 | 1,497,189 | |
| Pool Corp. | 4,979 | 1,572,219 | |
| 5,383,605 | |||
| Hotels, Restaurants & Leisure - 2.0% | |||
| ARAMARK Holdings Corp. | 31,698 | 853,627 | |
| Booking Holdings, Inc. (a) | 4,715 | 13,152,775 | |
| Hilton Worldwide Holdings, Inc. | 33,785 | 5,119,441 | |
| McDonald's Corp. | 93,211 | 24,437,128 | |
| Vail Resorts, Inc. | 5,148 | 1,092,663 | |
| Yum! Brands, Inc. | 35,765 | 4,322,558 | |
| 48,978,192 | |||
| Household Durables - 0.2% | |||
| NVR, Inc. (a) | 414 | 2,240,825 | |
| PulteGroup, Inc. | 28,439 | 2,092,826 | |
| Whirlpool Corp. | 6,982 | 730,038 | |
| 5,063,689 | |||
| Leisure Products - 0.0% | |||
| Hasbro, Inc. | 16,870 | 761,681 | |
| Specialty Retail - 3.3% | |||
| AutoZone, Inc. (a) | 2,318 | 5,741,987 | |
| Best Buy Co., Inc. | 25,081 | 1,675,912 | |
| Burlington Stores, Inc. (a) | 8,297 | 1,004,186 | |
| CarMax, Inc. (a) | 20,207 | 1,234,446 | |
| Lowe's Companies, Inc. | 74,807 | 14,255,970 | |
| The Home Depot, Inc. | 128,349 | 36,539,677 | |
| TJX Companies, Inc. | 146,710 | 12,920,750 | |
| Tractor Supply Co. | 13,993 | 2,694,492 | |
| Ulta Beauty, Inc. (a) | 6,366 | 2,427,419 | |
| 78,494,839 | |||
| Textiles, Apparel & Luxury Goods - 1.0% | |||
| Deckers Outdoor Corp. (a) | 3,341 | 1,994,777 | |
| lululemon athletica, Inc. (a) | 14,790 | 5,819,569 | |
| NIKE, Inc. Class B | 157,299 | 16,165,618 | |
| VF Corp. | 41,995 | 618,586 | |
| 24,598,550 | |||
TOTAL CONSUMER DISCRETIONARY | 252,840,839 | ||
| CONSUMER STAPLES - 6.3% | |||
| Beverages - 2.5% | |||
| Keurig Dr. Pepper, Inc. | 116,482 | 3,532,899 | |
| PepsiCo, Inc. | 175,740 | 28,694,827 | |
| The Coca-Cola Co. | 524,487 | 29,628,271 | |
| 61,855,997 | |||
| Consumer Staples Distribution & Retail - 0.4% | |||
| Kroger Co. | 87,050 | 3,949,459 | |
| Target Corp. | 58,921 | 6,527,858 | |
| 10,477,317 | |||
| Food Products - 0.8% | |||
| Bunge Ltd. | 19,193 | 2,034,074 | |
| Campbell Soup Co. | 24,812 | 1,002,653 | |
| Conagra Brands, Inc. | 60,846 | 1,664,747 | |
| Darling Ingredients, Inc. (a) | 20,425 | 904,623 | |
| General Mills, Inc. | 74,708 | 4,873,950 | |
| Hormel Foods Corp. | 38,368 | 1,248,878 | |
| Kellanova | 34,946 | 1,763,725 | |
| Lamb Weston Holdings, Inc. | 18,606 | 1,670,819 | |
| McCormick & Co., Inc. (non-vtg.) | 32,114 | 2,052,085 | |
| The J.M. Smucker Co. | 13,018 | 1,481,969 | |
| 18,697,523 | |||
| Household Products - 2.6% | |||
| Church & Dwight Co., Inc. | 31,197 | 2,837,055 | |
| Colgate-Palmolive Co. | 100,627 | 7,559,100 | |
| Kimberly-Clark Corp. | 43,081 | 5,154,211 | |
| Procter & Gamble Co. | 300,903 | 45,144,477 | |
| The Clorox Co. | 15,755 | 1,854,364 | |
| 62,549,207 | |||
TOTAL CONSUMER STAPLES | 153,580,044 | ||
| ENERGY - 2.6% | |||
| Energy Equipment & Services - 0.8% | |||
| Baker Hughes Co. Class A | 129,237 | 4,448,338 | |
| Halliburton Co. | 115,165 | 4,530,591 | |
| Schlumberger Ltd. | 181,962 | 10,128,005 | |
| 19,106,934 | |||
| Oil, Gas & Consumable Fuels - 1.8% | |||
| Cheniere Energy, Inc. | 31,013 | 5,161,183 | |
| HF Sinclair Corp. | 19,689 | 1,090,377 | |
| Kinder Morgan, Inc. | 257,455 | 4,170,771 | |
| Marathon Petroleum Corp. | 54,163 | 8,192,154 | |
| ONEOK, Inc. | 74,319 | 4,845,599 | |
| Phillips 66 Co. | 58,576 | 6,681,764 | |
| Targa Resources Corp. | 27,462 | 2,296,098 | |
| The Williams Companies, Inc. | 155,489 | 5,348,822 | |
| Valero Energy Corp. | 46,149 | 5,860,923 | |
| 43,647,691 | |||
TOTAL ENERGY | 62,754,625 | ||
| FINANCIALS - 12.0% | |||
| Banks - 0.9% | |||
| Citizens Financial Group, Inc. | 61,750 | 1,446,803 | |
| Huntington Bancshares, Inc. | 184,023 | 1,775,822 | |
| PNC Financial Services Group, Inc. | 50,967 | 5,834,192 | |
| Regions Financial Corp. | 119,593 | 1,737,686 | |
| Truist Financial Corp. | 170,079 | 4,823,440 | |
| U.S. Bancorp | 195,753 | 6,240,606 | |
| Webster Financial Corp. | 22,186 | 842,402 | |
| 22,700,951 | |||
| Capital Markets - 3.8% | |||
| Ameriprise Financial, Inc. | 13,302 | 4,184,410 | |
| Bank of New York Mellon Corp. | 99,448 | 4,226,540 | |
| BlackRock, Inc. Class A | 19,121 | 11,707,406 | |
| Cboe Global Markets, Inc. | 13,455 | 2,205,140 | |
| Charles Schwab Corp. | 191,979 | 9,990,587 | |
| FactSet Research Systems, Inc. | 4,861 | 2,099,417 | |
| Franklin Resources, Inc. | 38,534 | 878,190 | |
| Intercontinental Exchange, Inc. | 73,011 | 7,844,302 | |
| Invesco Ltd. | 43,698 | 566,763 | |
| LPL Financial | 9,935 | 2,230,606 | |
| MarketAxess Holdings, Inc. | 4,786 | 1,023,008 | |
| Moody's Corp. | 21,087 | 6,494,796 | |
| Morgan Stanley | 159,925 | 11,325,889 | |
| NASDAQ, Inc. | 43,778 | 2,171,389 | |
| Northern Trust Corp. | 26,564 | 1,750,833 | |
| Raymond James Financial, Inc. | 25,730 | 2,455,671 | |
| S&P Global, Inc. | 41,876 | 14,627,706 | |
| State Street Corp. | 42,688 | 2,758,925 | |
| T. Rowe Price Group, Inc. | 28,672 | 2,594,816 | |
| 91,136,394 | |||
| Consumer Finance - 0.7% | |||
| Ally Financial, Inc. | 34,735 | 840,240 | |
| American Express Co. | 80,649 | 11,777,173 | |
| Discover Financial Services | 32,437 | 2,662,429 | |
| Synchrony Financial | 54,658 | 1,533,157 | |
| 16,812,999 | |||
| Financial Services - 4.3% | |||
| Equitable Holdings, Inc. | 45,601 | 1,211,619 | |
| Fidelity National Information Services, Inc. | 75,633 | 3,714,337 | |
| Fiserv, Inc. (a) | 78,808 | 8,964,410 | |
| MasterCard, Inc. Class A | 108,037 | 40,659,725 | |
| Visa, Inc. Class A | 206,589 | 48,569,074 | |
| 103,119,165 | |||
| Insurance - 2.3% | |||
| AFLAC, Inc. | 73,288 | 5,724,526 | |
| Allstate Corp. | 33,557 | 4,299,658 | |
| Arch Capital Group Ltd. (a) | 47,554 | 4,121,981 | |
| Assurant, Inc. | 6,812 | 1,014,307 | |
| Hartford Financial Services Group, Inc. | 39,625 | 2,910,456 | |
| Marsh & McLennan Companies, Inc. | 63,159 | 11,978,104 | |
| Principal Financial Group, Inc. | 30,925 | 2,093,004 | |
| Progressive Corp. | 74,722 | 11,812,801 | |
| Prudential Financial, Inc. | 46,598 | 4,260,921 | |
| The Travelers Companies, Inc. | 29,488 | 4,937,471 | |
| Willis Towers Watson PLC | 13,591 | 3,205,981 | |
| 56,359,210 | |||
| Mortgage Real Estate Investment Trusts - 0.0% | |||
| Annaly Capital Management, Inc. | 63,100 | 984,991 | |
TOTAL FINANCIALS | 291,113,710 | ||
| HEALTH CARE - 12.7% | |||
| Biotechnology - 1.5% | |||
| Amgen, Inc. | 68,217 | 17,443,087 | |
| Biogen, Inc. (a) | 18,479 | 4,389,502 | |
| Gilead Sciences, Inc. | 159,246 | 12,507,181 | |
| Repligen Corp. (a) | 6,772 | 911,240 | |
| 35,251,010 | |||
| Health Care Equipment & Supplies - 1.1% | |||
| Align Technology, Inc. (a) | 9,286 | 1,714,103 | |
| Dentsply Sirona, Inc. | 26,978 | 820,401 | |
| DexCom, Inc. (a) | 49,490 | 4,396,197 | |
| Edwards Lifesciences Corp. (a) | 77,403 | 4,932,119 | |
| Hologic, Inc. (a) | 31,361 | 2,075,157 | |
| IDEXX Laboratories, Inc. (a) | 10,599 | 4,233,983 | |
| Insulet Corp. (a) | 8,900 | 1,179,873 | |
| STERIS PLC | 12,602 | 2,646,168 | |
| Teleflex, Inc. | 5,999 | 1,108,315 | |
| The Cooper Companies, Inc. | 6,310 | 1,967,143 | |
| Zimmer Biomet Holdings, Inc. | 26,666 | 2,784,197 | |
| 27,857,656 | |||
| Health Care Providers & Services - 2.1% | |||
| Cencora, Inc. | 21,946 | 4,063,302 | |
| Cigna Group | 37,771 | 11,678,793 | |
| DaVita HealthCare Partners, Inc. (a) | 6,917 | 534,200 | |
| Elevance Health, Inc. | 30,263 | 13,621,074 | |
| HCA Holdings, Inc. | 26,349 | 5,958,563 | |
| Humana, Inc. | 15,950 | 8,352,856 | |
| Laboratory Corp. of America Holdings | 11,333 | 2,263,540 | |
| Molina Healthcare, Inc. (a) | 7,454 | 2,481,809 | |
| Quest Diagnostics, Inc. | 14,305 | 1,861,081 | |
| 50,815,218 | |||
| Life Sciences Tools & Services - 1.4% | |||
| Agilent Technologies, Inc. | 37,703 | 3,897,359 | |
| Avantor, Inc. (a) | 86,096 | 1,500,653 | |
| Bio-Techne Corp. | 20,115 | 1,098,882 | |
| Danaher Corp. | 89,491 | 17,184,062 | |
| Illumina, Inc. (a) | 20,204 | 2,210,722 | |
| Mettler-Toledo International, Inc. (a) | 2,811 | 2,769,397 | |
| Waters Corp. (a) | 7,523 | 1,794,461 | |
| West Pharmaceutical Services, Inc. | 9,478 | 3,016,753 | |
| 33,472,289 | |||
| Pharmaceuticals - 6.6% | |||
| Bristol-Myers Squibb Co. | 268,209 | 13,820,810 | |
| Eli Lilly & Co. | 103,012 | 57,061,437 | |
| Jazz Pharmaceuticals PLC (a) | 8,151 | 1,035,340 | |
| Johnson & Johnson | 307,391 | 45,598,381 | |
| Merck & Co., Inc. | 323,949 | 33,269,562 | |
| Zoetis, Inc. Class A | 58,997 | 9,262,529 | |
| 160,048,059 | |||
TOTAL HEALTH CARE | 307,444,232 | ||
| INDUSTRIALS - 9.0% | |||
| Aerospace & Defense - 0.2% | |||
| Axon Enterprise, Inc. (a) | 8,957 | 1,831,617 | |
| L3Harris Technologies, Inc. | 24,188 | 4,339,569 | |
| 6,171,186 | |||
| Air Freight & Logistics - 0.7% | |||
| C.H. Robinson Worldwide, Inc. | 14,908 | 1,219,922 | |
| Expeditors International of Washington, Inc. | 19,548 | 2,135,619 | |
| United Parcel Service, Inc. Class B | 92,510 | 13,067,038 | |
| 16,422,579 | |||
| Building Products - 0.9% | |||
| Allegion PLC | 11,251 | 1,106,648 | |
| Builders FirstSource, Inc. (a) | 16,337 | 1,772,891 | |
| Carrier Global Corp. | 106,585 | 5,079,841 | |
| Fortune Brands Home & Security, Inc. | 16,226 | 905,411 | |
| Johnson Controls International PLC | 87,591 | 4,293,711 | |
| Lennox International, Inc. | 4,079 | 1,511,433 | |
| Masco Corp. | 28,726 | 1,496,337 | |
| Owens Corning | 11,502 | 1,303,982 | |
| Trane Technologies PLC | 29,115 | 5,540,876 | |
| 23,011,130 | |||
| Commercial Services & Supplies - 0.6% | |||
| Cintas Corp. | 11,687 | 5,926,711 | |
| Waste Management, Inc. | 51,931 | 8,533,821 | |
| 14,460,532 | |||
| Construction & Engineering - 0.2% | |||
| AECOM | 16,874 | 1,291,705 | |
| Quanta Services, Inc. | 18,534 | 3,097,402 | |
| 4,389,107 | |||
| Electrical Equipment - 0.9% | |||
| Eaton Corp. PLC | 50,889 | 10,580,332 | |
| Emerson Electric Co. | 72,964 | 6,491,607 | |
| Generac Holdings, Inc. (a) | 7,899 | 664,069 | |
| Rockwell Automation, Inc. | 14,666 | 3,854,371 | |
| 21,590,379 | |||
| Ground Transportation - 1.5% | |||
| CSX Corp. | 261,549 | 7,807,238 | |
| J.B. Hunt Transport Services, Inc. | 10,568 | 1,816,322 | |
| Knight-Swift Transportation Holdings, Inc. Class A | 20,462 | 1,000,387 | |
| Norfolk Southern Corp. | 29,067 | 5,545,693 | |
| Old Dominion Freight Lines, Inc. | 12,600 | 4,745,916 | |
| Union Pacific Corp. | 77,843 | 16,160,985 | |
| 37,076,541 | |||
| Industrial Conglomerates - 0.3% | |||
| 3M Co. | 70,429 | 6,405,518 | |
| Machinery - 2.0% | |||
| Caterpillar, Inc. | 65,794 | 14,872,734 | |
| Cummins, Inc. | 18,071 | 3,908,757 | |
| Dover Corp. | 17,877 | 2,323,116 | |
| Fortive Corp. | 45,132 | 2,946,217 | |
| Graco, Inc. | 21,484 | 1,597,335 | |
| IDEX Corp. | 9,633 | 1,843,853 | |
| Illinois Tool Works, Inc. | 38,796 | 8,694,960 | |
| Ingersoll Rand, Inc. | 51,642 | 3,133,637 | |
| Otis Worldwide Corp. | 52,760 | 4,073,600 | |
| Pentair PLC | 21,077 | 1,224,995 | |
| Toro Co. | 13,323 | 1,077,031 | |
| Xylem, Inc. | 30,576 | 2,860,079 | |
| 48,556,314 | |||
| Passenger Airlines - 0.0% | |||
| Delta Air Lines, Inc. | 20,418 | 638,063 | |
| Professional Services - 1.0% | |||
| Automatic Data Processing, Inc. | 52,740 | 11,508,923 | |
| Broadridge Financial Solutions, Inc. | 15,073 | 2,572,057 | |
| Ceridian HCM Holding, Inc. (a) | 18,847 | 1,206,396 | |
| Clarivate Analytics PLC (a) | 42,827 | 273,236 | |
| Paychex, Inc. | 41,424 | 4,600,135 | |
| Paylocity Holding Corp. (a) | 5,674 | 1,017,916 | |
| Robert Half, Inc. | 13,803 | 1,032,050 | |
| TransUnion Holding Co., Inc. | 24,639 | 1,081,159 | |
| 23,291,872 | |||
| Trading Companies & Distributors - 0.7% | |||
| Fastenal Co. | 72,924 | 4,254,386 | |
| Ferguson PLC | 26,106 | 3,921,121 | |
| United Rentals, Inc. | 8,775 | 3,565,019 | |
| W.W. Grainger, Inc. | 5,764 | 4,206,740 | |
| 15,947,266 | |||
TOTAL INDUSTRIALS | 217,960,487 | ||
| INFORMATION TECHNOLOGY - 29.1% | |||
| Electronic Equipment, Instruments & Components - 0.2% | |||
| Keysight Technologies, Inc. (a) | 22,774 | 2,779,567 | |
| Trimble, Inc. (a) | 31,618 | 1,490,156 | |
| 4,269,723 | |||
| IT Services - 2.0% | |||
| Accenture PLC Class A | 80,529 | 23,924,361 | |
| Akamai Technologies, Inc. (a) | 19,396 | 2,004,189 | |
| Gartner, Inc. (a) | 10,091 | 3,350,616 | |
| IBM Corp. | 115,926 | 16,767,537 | |
| Twilio, Inc. Class A (a) | 21,989 | 1,127,156 | |
| 47,173,859 | |||
| Semiconductors & Semiconductor Equipment - 8.2% | |||
| Applied Materials, Inc. | 107,208 | 14,188,979 | |
| Intel Corp. | 532,496 | 19,436,104 | |
| Lam Research Corp. | 17,151 | 10,088,561 | |
| Marvell Technology, Inc. | 109,790 | 5,184,284 | |
| NVIDIA Corp. | 315,333 | 128,592,797 | |
| NXP Semiconductors NV | 33,161 | 5,717,951 | |
| Texas Instruments, Inc. | 115,874 | 16,455,267 | |
| 199,663,943 | |||
| Software - 18.3% | |||
| Adobe, Inc. (a) | 58,189 | 30,960,039 | |
| ANSYS, Inc. (a) | 11,061 | 3,077,834 | |
| Autodesk, Inc. (a) | 27,281 | 5,391,544 | |
| Cadence Design Systems, Inc. (a) | 34,809 | 8,348,939 | |
| DocuSign, Inc. (a) | 25,911 | 1,007,420 | |
| Fair Isaac Corp. (a) | 3,192 | 2,700,017 | |
| Gen Digital, Inc. | 73,732 | 1,228,375 | |
| HubSpot, Inc. (a) | 6,022 | 2,551,943 | |
| Intuit, Inc. | 35,753 | 17,695,947 | |
| Microsoft Corp. | 901,786 | 304,902,852 | |
| PTC, Inc. (a) | 14,333 | 2,012,640 | |
| Salesforce, Inc. (a) | 124,343 | 24,971,805 | |
| ServiceNow, Inc. (a) | 26,004 | 15,130,427 | |
| Splunk, Inc. (a) | 20,089 | 2,956,297 | |
| Synopsys, Inc. (a) | 19,424 | 9,118,403 | |
| VMware, Inc. Class A (a) | 30,217 | 4,401,106 | |
| Workday, Inc. Class A (a) | 26,297 | 5,567,338 | |
| Zscaler, Inc. (a) | 11,169 | 1,772,409 | |
| 443,795,335 | |||
| Technology Hardware, Storage & Peripherals - 0.4% | |||
| Hewlett Packard Enterprise Co. | 164,969 | 2,537,223 | |
| HP, Inc. | 113,326 | 2,983,874 | |
| NetApp, Inc. | 27,076 | 1,970,591 | |
| Seagate Technology Holdings PLC | 23,798 | 1,624,214 | |
| Western Digital Corp. (a) | 40,801 | 1,638,160 | |
| 10,754,062 | |||
TOTAL INFORMATION TECHNOLOGY | 705,656,922 | ||
| MATERIALS - 2.9% | |||
| Chemicals - 1.9% | |||
| Ecolab, Inc. | 32,717 | 5,487,950 | |
| International Flavors & Fragrances, Inc. | 32,497 | 2,221,170 | |
| Linde PLC | 62,507 | 23,887,675 | |
| LyondellBasell Industries NV Class A | 33,230 | 2,998,675 | |
| PPG Industries, Inc. | 30,060 | 3,690,466 | |
| Sherwin-Williams Co. | 31,279 | 7,450,971 | |
| 45,736,907 | |||
| Construction Materials - 0.2% | |||
| Martin Marietta Materials, Inc. | 7,916 | 3,237,169 | |
| Containers & Packaging - 0.3% | |||
| Amcor PLC | 187,721 | 1,668,840 | |
| Avery Dennison Corp. | 10,295 | 1,792,051 | |
| Ball Corp. | 40,104 | 1,931,008 | |
| International Paper Co. | 42,115 | 1,420,539 | |
| WestRock Co. | 32,759 | 1,177,031 | |
| 7,989,469 | |||
| Metals & Mining - 0.5% | |||
| Newmont Corp. | 147,123 | 5,512,699 | |
| Nucor Corp. | 32,078 | 4,740,808 | |
| Steel Dynamics, Inc. | 20,464 | 2,179,621 | |
| 12,433,128 | |||
TOTAL MATERIALS | 69,396,673 | ||
| REAL ESTATE - 2.4% | |||
| Equity Real Estate Investment Trusts (REITs) - 2.3% | |||
| American Tower Corp. | 59,498 | 10,601,949 | |
| Boston Properties, Inc. | 19,047 | 1,020,348 | |
| Crown Castle International Corp. | 55,362 | 5,147,559 | |
| Digital Realty Trust, Inc. | 37,195 | 4,625,570 | |
| Equinix, Inc. | 11,940 | 8,711,902 | |
| Healthpeak Properties, Inc. | 69,953 | 1,087,769 | |
| Iron Mountain, Inc. | 37,148 | 2,194,332 | |
| Prologis (REIT), Inc. | 117,892 | 11,877,619 | |
| SBA Communications Corp. Class A | 13,840 | 2,887,439 | |
| Welltower, Inc. | 63,457 | 5,305,640 | |
| Weyerhaeuser Co. | 93,530 | 2,683,376 | |
| 56,143,503 | |||
| Real Estate Management & Development - 0.1% | |||
| CBRE Group, Inc. (a) | 39,688 | 2,751,966 | |
TOTAL REAL ESTATE | 58,895,469 | ||
| UTILITIES - 1.2% | |||
| Electric Utilities - 0.4% | |||
| Edison International | 48,893 | 3,083,193 | |
| Eversource Energy | 44,577 | 2,397,797 | |
| Exelon Corp. | 126,981 | 4,944,640 | |
| 10,425,630 | |||
| Gas Utilities - 0.1% | |||
| Atmos Energy Corp. | 18,422 | 1,983,313 | |
| Multi-Utilities - 0.5% | |||
| CMS Energy Corp. | 37,169 | 2,019,763 | |
| Consolidated Edison, Inc. | 44,254 | 3,885,059 | |
| Sempra | 80,342 | 5,626,350 | |
| 11,531,172 | |||
| Water Utilities - 0.2% | |||
| American Water Works Co., Inc. | 24,848 | 2,923,367 | |
| Essential Utilities, Inc. | 32,136 | 1,075,271 | |
| 3,998,638 | |||
TOTAL UTILITIES | 27,938,753 | ||
| TOTAL COMMON STOCKS (Cost $2,207,233,959) | 2,400,592,492 | ||
| U.S. Treasury Obligations - 0.0% | |||
Principal Amount (b) | Value ($) | ||
U.S. Treasury Bills, yield at date of purchase 5.42% 2/22/24 (c) (Cost $393,350) | 400,000 | 393,327 | |
| �� | |||
| Money Market Funds - 0.7% | |||
| Shares | Value ($) | ||
Fidelity Cash Central Fund 5.40% (d) (Cost $16,961,349) | 16,957,957 | 16,961,349 | |
| TOTAL INVESTMENT IN SECURITIES - 99.8% (Cost $2,224,588,658) | 2,417,947,168 |
NET OTHER ASSETS (LIABILITIES) - 0.2% | 5,566,620 |
| NET ASSETS - 100.0% | 2,423,513,788 |
| Futures Contracts | |||||
Number of contracts | Expiration Date | Notional Amount ($) | Value ($) | Unrealized Appreciation/ (Depreciation) ($) | |
| Purchased | |||||
| Equity Index Contracts | |||||
| CME E-mini NASDAQ 100 Index Contracts (United States) | 15 | Dec 2023 | 4,347,075 | (37,161) | (37,161) |
| CME E-mini S&P 500 Index Contracts (United States) | 83 | Dec 2023 | 17,480,838 | (61,485) | (61,485) |
| TOTAL FUTURES CONTRACTS | (98,646) | ||||
| The notional amount of futures purchased as a percentage of Net Assets is 0.9% | |||||
| (a) | Non-income producing |
| (b) | Amount is stated in United States dollars unless otherwise noted. |
| (c) | Security or a portion of the security was pledged to cover margin requirements for futures contracts. At period end, the value of securities pledged amounted to $393,327. |
| (d) | Affiliated fund that is generally available only to investment companies and other accounts managed by Fidelity Investments. The rate quoted is the annualized seven-day yield of the fund at period end. A complete unaudited listing of the fund's holdings as of its most recent quarter end is available upon request. In addition, each Fidelity Central Fund's financial statements, which are not covered by the Fund's Report of Independent Registered Public Accounting Firm, are available on the SEC's website or upon request. |
| Affiliate | Value, beginning of period ($) | Purchases ($) | Sales Proceeds ($) | Dividend Income ($) | Realized Gain (loss) ($) | Change in Unrealized appreciation (depreciation) ($) | Value, end of period ($) | % ownership, end of period |
| Fidelity Cash Central Fund 5.40% | 4,031,628 | 344,025,023 | 331,095,302 | 364,916 | - | - | 16,961,349 | 0.0% |
| Fidelity Securities Lending Cash Central Fund 5.40% | 8,384,795 | 3,069,953 | 11,454,748 | 17,421 | - | - | - | 0.0% |
| Total | 12,416,423 | 347,094,976 | 342,550,050 | 382,337 | - | - | 16,961,349 | |
| Valuation Inputs at Reporting Date: | ||||
| Description | Total ($) | Level 1 ($) | Level 2 ($) | Level 3 ($) |
Investments in Securities: | ||||
| Equities: | ||||
Communication Services | 253,010,738 | 253,010,738 | - | - |
Consumer Discretionary | 252,840,839 | 252,840,839 | - | - |
Consumer Staples | 153,580,044 | 153,580,044 | - | - |
Energy | 62,754,625 | 62,754,625 | - | - |
Financials | 291,113,710 | 291,113,710 | - | - |
Health Care | 307,444,232 | 307,444,232 | - | - |
Industrials | 217,960,487 | 217,960,487 | - | - |
Information Technology | 705,656,922 | 705,656,922 | - | - |
Materials | 69,396,673 | 69,396,673 | - | - |
Real Estate | 58,895,469 | 58,895,469 | - | - |
Utilities | 27,938,753 | 27,938,753 | - | - |
| U.S. Government and Government Agency Obligations | 393,327 | - | 393,327 | - |
| Money Market Funds | 16,961,349 | 16,961,349 | - | - |
| Total Investments in Securities: | 2,417,947,168 | 2,417,553,841 | 393,327 | - |
Derivative Instruments: Liabilities | ||||
Futures Contracts | (98,646) | (98,646) | - | - |
| Total Liabilities | (98,646) | (98,646) | - | - |
| Total Derivative Instruments: | (98,646) | (98,646) | - | - |
Primary Risk Exposure / Derivative Type | Value | |
| Asset ($) | Liability ($) | |
| Equity Risk | ||
Futures Contracts (a) | 0 | (98,646) |
| Total Equity Risk | 0 | (98,646) |
| Total Value of Derivatives | 0 | (98,646) |
| Statement of Assets and Liabilities | ||||
| October 31, 2023 | ||||
| Assets | ||||
| Investment in securities, at value - See accompanying schedule: | ||||
Unaffiliated issuers (cost $2,207,627,309) | $ | 2,400,985,819 | ||
Fidelity Central Funds (cost $16,961,349) | 16,961,349 | |||
| Total Investment in Securities (cost $2,224,588,658) | $ | 2,417,947,168 | ||
| Segregated cash with brokers for derivative instruments | 792,253 | |||
| Cash | 408 | |||
| Receivable for fund shares sold | 3,365,034 | |||
| Dividends receivable | 2,088,797 | |||
| Distributions receivable from Fidelity Central Funds | 62,432 | |||
| Receivable for daily variation margin on futures contracts | 122,889 | |||
Total assets | 2,424,378,981 | |||
| Liabilities | ||||
| Payable for fund shares redeemed | $ | 609,126 | ||
| Accrued management fee | 226,620 | |||
| Other payables and accrued expenses | 29,447 | |||
| Total Liabilities | 865,193 | |||
| Net Assets | $ | 2,423,513,788 | ||
| Net Assets consist of: | ||||
| Paid in capital | $ | 2,301,052,812 | ||
| Total accumulated earnings (loss) | 122,460,976 | |||
| Net Assets | $ | 2,423,513,788 | ||
Net Asset Value, offering price and redemption price per share ($2,423,513,788 ÷ 129,734,891 shares) | $ | 18.68 | ||
| Statement of Operations | ||||
Year ended October 31, 2023 | ||||
| Investment Income | ||||
| Dividends | $ | 35,455,297 | ||
| Interest | 20,527 | |||
| Income from Fidelity Central Funds (including $17,421 from security lending) | 382,337 | |||
| Total Income | 35,858,161 | |||
| Expenses | ||||
| Management fee | $ | 2,471,880 | ||
| Independent trustees' fees and expenses | 7,699 | |||
| Interest | 25,094 | |||
| Miscellaneous | 29,438 | |||
| Total expenses before reductions | 2,534,111 | |||
| Expense reductions | (289) | |||
| Total expenses after reductions | 2,533,822 | |||
| Net Investment income (loss) | 33,324,339 | |||
| Realized and Unrealized Gain (Loss) | ||||
| Net realized gain (loss) on: | ||||
| Investment Securities: | ||||
| Unaffiliated issuers | (73,629,779) | |||
| Futures contracts | 184,626 | |||
| Total net realized gain (loss) | (73,445,153) | |||
| Change in net unrealized appreciation (depreciation) on: | ||||
| Investment Securities: | ||||
| Unaffiliated issuers | 281,464,530 | |||
| Futures contracts | (539,995) | |||
| Total change in net unrealized appreciation (depreciation) | 280,924,535 | |||
| Net gain (loss) | 207,479,382 | |||
| Net increase (decrease) in net assets resulting from operations | $ | 240,803,721 | ||
| Statement of Changes in Net Assets | ||||
Year ended October 31, 2023 | Year ended October 31, 2022 | |||
| Increase (Decrease) in Net Assets | ||||
| Operations | ||||
| Net investment income (loss) | $ | 33,324,339 | $ | 30,958,542 |
| Net realized gain (loss) | (73,445,153) | (16,287,855) | ||
| Change in net unrealized appreciation (depreciation) | 280,924,535 | (499,203,720) | ||
| Net increase (decrease) in net assets resulting from operations | 240,803,721 | (484,533,033) | ||
| Distributions to shareholders | (31,003,717) | (20,452,876) | ||
| Share transactions | ||||
| Proceeds from sales of shares | 667,415,739 | 1,362,470,513 | ||
| Reinvestment of distributions | 28,625,159 | 19,223,799 | ||
| Cost of shares redeemed | (661,727,724) | (565,764,704) | ||
Net increase (decrease) in net assets resulting from share transactions | 34,313,174 | 815,929,608 | ||
| Total increase (decrease) in net assets | 244,113,178 | 310,943,699 | ||
| Net Assets | ||||
| Beginning of period | 2,179,400,610 | 1,868,456,911 | ||
| End of period | $ | 2,423,513,788 | $ | 2,179,400,610 |
| Other Information | ||||
| Shares | ||||
| Sold | 35,494,418 | 69,593,522 | ||
| Issued in reinvestment of distributions | 1,672,031 | 949,791 | ||
| Redeemed | (36,785,982) | (30,563,531) | ||
| Net increase (decrease) | 380,467 | 39,979,782 | ||
| Fidelity® U.S. Sustainability Index Fund |
| Years ended October 31, | 2023 | 2022 | 2021 | 2020 | 2019 | |||||
Selected Per-Share Data | ||||||||||
| Net asset value, beginning of period | $ | 16.85 | $ | 20.91 | $ | 14.29 | $ | 13.18 | $ | 11.43 |
| Income from Investment Operations | ||||||||||
Net investment income (loss) A,B | .27 | .25 | .23 | .23 | .23 | |||||
| Net realized and unrealized gain (loss) | 1.81 | (4.10) | 6.56 | 1.08 | 1.69 | |||||
| Total from investment operations | 2.08 | (3.85) | 6.79 | 1.31 | 1.92 | |||||
| Distributions from net investment income | (.25) | (.17) | (.17) | (.18) | (.15) | |||||
| Distributions from net realized gain | - | (.04) | - | (.02) | (.02) | |||||
| Total distributions | (.25) | (.21) | (.17) | (.20) | (.17) | |||||
| Net asset value, end of period | $ | 18.68 | $ | 16.85 | $ | 20.91 | $ | 14.29 | $ | 13.18 |
Total Return C | 12.47% | (18.58)% | 47.84% | 9.99% | 17.06% | |||||
Ratios to Average Net Assets B,D,E | ||||||||||
| Expenses before reductions | .11% | .11% | .11% | .11% | .11% | |||||
| Expenses net of fee waivers, if any | .11% | .11% | .11% | .11% | .11% | |||||
| Expenses net of all reductions | .11% | .11% | .11% | .11% | .11% | |||||
| Net investment income (loss) | 1.48% | 1.37% | 1.28% | 1.68% | 1.84% | |||||
| Supplemental Data | ||||||||||
| Net assets, end of period (000 omitted) | $ | 2,423,514 | $ | 2,179,401 | $ | 1,868,457 | $ | 488,752 | $ | 206,094 |
Portfolio turnover rate F | 21% | 9% | 12% | 10% | 12% |
| Fidelity Central Fund | Investment Manager | Investment Objective | Investment Practices | Expense RatioA |
| Fidelity Money Market Central Funds | Fidelity Management & Research Company LLC (FMR) | Each fund seeks to obtain a high level of current income consistent with the preservation of capital and liquidity. | Short-term Investments | Less than .005% |
| Gross unrealized appreciation | $409,696,103 |
| Gross unrealized depreciation | (226,483,007) |
| Net unrealized appreciation (depreciation) | $183,213,096 |
| Tax Cost | $2,234,734,072 |
| Undistributed ordinary income | $24,269,237 |
| Capital loss carryforward | $(85,021,357) |
| Net unrealized appreciation (depreciation) on securities and other investments | $183,213,096 |
Short-term | $(60,057,755) |
Long-term | (24,963,602) |
| Total capital loss carryforward | $(85,021,357) |
| October 31, 2023 | October 31, 2022 | |
| Ordinary Income | $31,003,717 | $18,202,081 |
| Long-term Capital Gains | - | 2,250,795 |
| Total | $31,003,717 | $20,452,876 |
| Equity Risk | Equity risk relates to the fluctuations in the value of financial instruments as a result of changes in market prices (other than those arising from interest rate risk or foreign exchange risk), whether caused by factors specific to an individual investment, its issuer, or all factors affecting all instruments traded in a market or market segment. |
| Purchases ($) | Sales ($) | |
| Fidelity U.S. Sustainability Index Fund | 499,922,148 | 478,121,101 |
| Borrower or Lender | Average Loan Balance | Weighted Average Interest Rate | Interest Expense | |
| Fidelity U.S. Sustainability Index Fund | Borrower | $ 41,868,400 | 4.32% | $25,094 |
| Total Security Lending Fees Paid to NFS | Security Lending Income From Securities Loaned to NFS | Value of Securities Loaned to NFS at Period End | |
| Fidelity U.S. Sustainability Index Fund | $1,820 | $- | $- |
| The Example is based on an investment of $1,000 invested at the beginning of the period and held for the entire period (May 1, 2023 to October 31, 2023). |
Annualized Expense Ratio- A | Beginning Account Value May 1, 2023 | Ending Account Value October 31, 2023 | Expenses Paid During Period- C May 1, 2023 to October 31, 2023 | |||||||
| Fidelity® U.S. Sustainability Index Fund | .11% | |||||||||
| Actual | $ 1,000 | $ 1,026.90 | $ .56 | |||||||
Hypothetical-B | $ 1,000 | $ 1,024.65 | $ .56 | |||||||
| A special meeting of shareholders was held on October 18, 2023. The results of votes taken among shareholders on the proposal before them are reported below. Each vote reported represents one dollar of net asset value held on the record date for the meeting. | ||
| Proposal 1 | ||
| To elect a Board of Trustees. | ||
# of Votes | % of Votes | |
| Abigail P. Johnson | ||
| Affirmative | 378,729,502,260.010 | 97.580 |
| Withheld | 9,407,876,478.960 | 2.420 |
| TOTAL | 388,137,378,738.970 | 100.000 |
| Jennifer Toolin McAuliffe | ||
| Affirmative | 378,454,868,010.950 | 97.510 |
| Withheld | 9,682,510,728.020 | 2.490 |
| TOTAL | 388,137,378,738.970 | 100.000 |
| Christine J. Thompson | ||
| Affirmative | 378,837,121,274.520 | 97.600 |
| Withheld | 9,300,257,464.450 | 2.400 |
| TOTAL | 388,137,378,738.970 | 100.000 |
| Elizabeth S. Acton | ||
| Affirmative | 378,262,110,794.850 | 97.460 |
| Withheld | 9,875,267,944.120 | 2.540 |
| TOTAL | 388,137,378,738.970 | 100.000 |
| Laura M. Bishop | ||
| Affirmative | 380,482,113,171.060 | 98.030 |
| Withheld | 7,655,265,567.910 | 1.970 |
| TOTAL | 388,137,378,738.970 | 100.000 |
| Ann E. Dunwoody | ||
| Affirmative | 380,016,034,008.120 | 97.910 |
| Withheld | 8,121,344,730.850 | 2.090 |
| TOTAL | 388,137,378,738.970 | 100.000 |
| John Engler | ||
| Affirmative | 379,432,488,394.200 | 97.760 |
| Withheld | 8,704,890,344.770 | 2.240 |
| TOTAL | 388,137,378,738.970 | 100.000 |
| Robert F. Gartland | ||
| Affirmative | 378,741,819,600.600 | 97.580 |
| Withheld | 9,395,559,138.370 | 2.420 |
| TOTAL | 388,137,378,738.970 | 100.000 |
| Robert W. Helm | ||
| Affirmative | 380,389,324,755.070 | 98.000 |
| Withheld | 7,748,053,983.900 | 2.000 |
| TOTAL | 388,137,378,738.970 | 100.000 |
| Arthur E. Johnson | ||
| Affirmative | 378,427,694,151.670 | 97.500 |
| Withheld | 9,709,684,587.300 | 2.500 |
| TOTAL | 388,137,378,738.970 | 100.000 |
| Michael E. Kenneally | ||
| Affirmative | 377,842,228,145.180 | 97.350 |
| Withheld | 10,295,150,593.790 | 2.650 |
| TOTAL | 388,137,378,738.970 | 100.000 |
| Mark A. Murray | ||
| Affirmative | 380,158,432,703.370 | 97.940 |
| Withheld | 7,978,946,035.600 | 2.060 |
| TOTAL | 388,137,378,738.970 | 100.000 |
| Carol J. Zierhoffer | ||
| Affirmative | 380,522,113,360.240 | 98.040 |
| Withheld | 7,615,265,378.730 | 1.960 |
| TOTAL | 388,137,378,738.970 | 100.000 |
| Proposal 1 reflects trust wide proposal and voting results. | ||
 |


Contents
| Average Annual Total Returns | |||
Periods ended October 31, 2023 | Past 1 year | Past 5 years | Life of Fund A |
| Fidelity® SAI Emerging Markets Index Fund | 10.58% | 1.32% | 4.45% |
| $10,000 Over Life of Fund |
Let's say hypothetically that $10,000 was invested in Fidelity® SAI Emerging Markets Index Fund, on January 5, 2016, when the fund started. The chart shows how the value of your investment would have changed, and also shows how the MSCI Emerging Markets Index performed over the same period. |
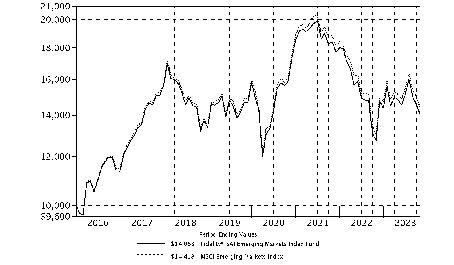 |
Top Holdings (% of Fund's net assets) | ||
| Taiwan Semiconductor Manufacturing Co. Ltd. (Taiwan, Semiconductors & Semiconductor Equipment) | 6.0 | |
| Tencent Holdings Ltd. (China, Interactive Media & Services) | 3.7 | |
| Samsung Electronics Co. Ltd. (Korea (South), Technology Hardware, Storage & Peripherals) | 3.5 | |
| Alibaba Group Holding Ltd. (China, Broadline Retail) | 2.5 | |
| Reliance Industries Ltd. (India, Oil, Gas & Consumable Fuels) | 1.2 | |
| Meituan Class B (China, Hotels, Restaurants & Leisure) | 1.1 | |
| PDD Holdings, Inc. ADR (China, Broadline Retail) | 0.9 | |
| ICICI Bank Ltd. (India, Banks) | 0.8 | |
| Infosys Ltd. (India, IT Services) | 0.8 | |
| China Construction Bank Corp. (H Shares) (China, Banks) | 0.8 | |
| 21.3 | ||
| Market Sectors (% of Fund's net assets) | ||
| Financials | 20.9 | |
| Information Technology | 19.0 | |
| Consumer Discretionary | 12.6 | |
| Communication Services | 8.8 | |
| Materials | 6.7 | |
| Industrials | 5.9 | |
| Consumer Staples | 5.8 | |
| Energy | 4.9 | |
| Health Care | 3.9 | |
| Utilities | 3.0 | |
| Real Estate | 1.6 | |
Asset Allocation (% of Fund's net assets) |
 |
Futures - 6.7% |
Geographic Diversification (% of Fund's net assets) |
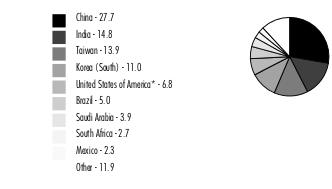 |
* Includes Short-Term investments and Net Other Assets (Liabilities). Percentages are adjusted for the effect of derivatives, if applicable. |
| Common Stocks - 91.2% | |||
| Shares | Value ($) | ||
| Brazil - 3.6% | |||
| Ambev SA | 2,475,198 | 6,313,492 | |
| Atacadao SA | 330,500 | 588,007 | |
| B3 SA - Brasil Bolsa Balcao | 3,024,140 | 6,657,997 | |
| Banco Bradesco SA | 869,412 | 2,119,318 | |
| Banco BTG Pactual SA unit | 610,500 | 3,584,232 | |
| Banco do Brasil SA | 445,805 | 4,275,236 | |
| Banco Santander SA (Brasil) unit | 192,300 | 1,026,770 | |
| BB Seguridade Participacoes SA | 363,858 | 2,219,918 | |
| CCR SA | 523,012 | 1,242,760 | |
| Centrais Eletricas Brasileiras SA (Electrobras) | 641,597 | 4,433,627 | |
| Companhia de Saneamento Basico do Estado de Sao Paulo (SABESP) | 175,500 | 2,031,821 | |
| Companhia Siderurgica Nacional SA (CSN) | 346,200 | 807,520 | |
| Cosan SA | 631,624 | 1,973,140 | |
| CPFL Energia SA (a) | 116,700 | 774,026 | |
| Energisa SA unit | 109,200 | 1,009,533 | |
| Eneva SA (a) | 467,200 | 1,002,649 | |
| ENGIE Brasil Energia SA | 114,020 | 888,776 | |
| Equatorial Energia SA | 524,138 | 3,285,121 | |
| Hapvida Participacoes e Investimentos SA (a)(b) | 2,750,243 | 2,012,872 | |
| Hypera SA (a) | 196,700 | 1,181,741 | |
| Itausa-Investimentos Itau SA | 39,853 | 67,821 | |
| Klabin SA unit | 395,800 | 1,679,996 | |
| Localiza Rent a Car SA | 467,364 | 4,715,586 | |
| Localiza Rent a Car SA rights 11/10/23 (a) | 3,427 | 4,758 | |
| Lojas Renner SA (a) | 502,801 | 1,222,659 | |
| Magazine Luiza SA (a) | 1,587,008 | 418,648 | |
| Natura & Co. Holding SA | 469,726 | 1,187,882 | |
| Petroleo Brasileiro SA - Petrobras (ON) | 1,834,808 | 13,770,840 | |
| Prio SA (a) | 415,400 | 3,930,100 | |
| Raia Drogasil SA | 677,060 | 3,464,699 | |
| Rede D'Oregon Sao Luiz SA (b) | 298,217 | 1,278,812 | |
| Rumo SA | 672,400 | 2,975,404 | |
| Sendas Distribuidora SA | 705,100 | 1,529,983 | |
| Suzano Papel e Celulose SA | 412,212 | 4,216,348 | |
| Telefonica Brasil SA | 217,600 | 1,952,541 | |
| TIM SA | 451,400 | 1,358,207 | |
| Totvs SA | 273,400 | 1,372,491 | |
| Ultrapar Participacoes SA | 376,538 | 1,527,288 | |
| Vale SA | 1,773,773 | 24,275,368 | |
| Vibra Energia SA (a) | 607,449 | 2,384,374 | |
| Weg SA | 878,780 | 5,753,662 | |
TOTAL BRAZIL | 126,516,023 | ||
| Chile - 0.4% | |||
| Banco de Chile | 23,673,840 | 2,432,189 | |
| Banco de Credito e Inversiones | 39,746 | 950,351 | |
| Banco Santander Chile | 34,408,815 | 1,500,147 | |
| Cencosud SA | 680,066 | 1,101,783 | |
| Compania Cervecerias Unidas SA | 69,911 | 397,438 | |
| Compania Sud Americana de Vapores SA | 8,316,838 | 461,840 | |
| Empresas CMPC SA | 580,296 | 1,037,401 | |
| Empresas COPEC SA | 201,660 | 1,335,012 | |
| Enel Americas SA (a) | 10,893,135 | 1,119,741 | |
| Enel Chile SA | 14,063,366 | 832,803 | |
| Falabella SA | 460,403 | 937,525 | |
TOTAL CHILE | 12,106,230 | ||
| China - 27.7% | |||
| 360 Security Technology, Inc. (A Shares) (a) | 219,300 | 269,519 | |
| 37 Interactive Entertainment Network Technology Group Co. Ltd. (A Shares) | 66,800 | 188,990 | |
| 3Peak, Inc. (A Shares) | 3,537 | 77,895 | |
| 3SBio, Inc. (b) | 1,000,000 | 889,642 | |
| AAC Technology Holdings, Inc. | 378,133 | 680,653 | |
| Accelink Technologies Co. Ltd. (A Shares) | 23,600 | 86,982 | |
| Advanced Micro-Fabrication Equipment, Inc., China (A Shares) | 18,956 | 444,090 | |
| AECC Aero-Engine Control Co. Ltd. (A Shares) | 40,700 | 115,564 | |
| AECC Aviation Power Co. Ltd. | 77,700 | 375,793 | |
| Agricultural Bank of China Ltd.: | |||
| (A Shares) | 2,279,500 | 1,118,863 | |
| (H Shares) | 15,802,297 | 5,836,684 | |
| Aier Eye Hospital Group Co. Ltd. (A Shares) | 280,799 | 702,187 | |
| AIMA Technology Group Co. Ltd. | 24,700 | 94,879 | |
| Air China Ltd.: | |||
| (A Shares) (a) | 351,400 | 385,444 | |
| (H Shares) (a) | 980,000 | 666,702 | |
| Airtac International Group | 72,926 | 2,395,785 | |
| Akeso, Inc. (a)(b) | 266,000 | 1,493,738 | |
| Alibaba Group Holding Ltd. (a) | 8,554,916 | 88,073,537 | |
| Alibaba Health Information Technology Ltd. (a) | 2,845,000 | 1,675,930 | |
| Aluminum Corp. of China Ltd.: | |||
| (A shares) | 456,600 | 387,012 | |
| (H Shares) | 2,020,000 | 1,080,560 | |
| Amlogic Shanghai Co. Ltd. (A Shares) (a) | 12,828 | 105,416 | |
| Angel Yeast Co. Ltd. (A Shares) | 26,600 | 127,210 | |
| Anhui Conch Cement Co. Ltd.: | |||
| (A Shares) | 136,900 | 452,831 | |
| (H Shares) | 659,400 | 1,641,045 | |
| Anhui Gujing Distillery Co. Ltd.: | |||
| (A Shares) | 10,100 | 385,014 | |
| (B Shares) | 64,857 | 1,010,889 | |
| Anhui Honglu Steel Construction Group Co. Ltd. | 21,190 | 72,806 | |
| Anhui Jianghuai Automobile Group Corp. Ltd. (A Shares) (a) | 60,900 | 150,956 | |
| Anhui Kouzi Distillery Co. Ltd. (A Shares) | 18,500 | 126,987 | |
| Anhui Yingjia Distillery Co. Ltd. (A Shares) | 20,700 | 217,075 | |
| Anjoy Foods Group Co. Ltd. (A Shares) | 9,000 | 158,993 | |
| Anker Innovations Technology Co. Ltd. (A Shares) | 10,100 | 129,395 | |
| Anta Sports Products Ltd. | 664,600 | 7,516,288 | |
| Apeloa Pharmaceutical Co. Ltd. A Shares | 35,400 | 83,452 | |
| Asia - Potash International Investment Guangzhou Co. Ltd. (A Shares) (a) | 28,900 | 112,684 | |
| ASR Microelectronics Co. Ltd. (A Shares) | 12,281 | 109,467 | |
| Asymchem Laboratories Tianjin Co. Ltd. (A Shares) | 10,560 | 217,965 | |
| Autobio Diagnostics Co. Ltd. | 18,400 | 111,821 | |
| Autohome, Inc. ADR Class A | 35,602 | 952,354 | |
| Avary Holding Shenzhen Co. Ltd. (A Shares) | 60,900 | 178,494 | |
| AVIC Capital Co. Ltd. (A Shares) | 281,800 | 128,349 | |
| AviChina Industry & Technology Co. Ltd. (H Shares) | 1,322,000 | 599,153 | |
| Avicopter PLC (A Shares) | 18,100 | 93,970 | |
| BAIC BluePark New Energy Technology Co. Ltd. (A Shares) (a) | 152,700 | 143,141 | |
| Baidu, Inc. Class A (a) | 1,175,224 | 15,429,291 | |
| Bank of Beijing Co. Ltd. (A Shares) | 619,025 | 386,048 | |
| Bank of Changsha Co. Ltd. (A Shares) | 121,900 | 122,476 | |
| Bank of Chengdu Co. Ltd. (A Shares) | 112,400 | 190,005 | |
| Bank of China Ltd.: | |||
| (A Shares) | 1,191,500 | 635,244 | |
| (H Shares) | 41,241,464 | 14,407,104 | |
| Bank of Communications Co. Ltd.: | |||
| (A Shares) | 735,800 | 566,291 | |
| (H Shares) | 5,261,176 | 3,112,017 | |
| Bank of Hangzhou Co. Ltd. (A Shares) | 169,700 | 248,257 | |
| Bank of Jiangsu Co. Ltd. (A Shares) | 448,843 | 423,530 | |
| Bank of Nanjing Co. Ltd. (A Shares) | 298,200 | 319,676 | |
| Bank of Ningbo Co. Ltd. (A Shares) | 197,520 | 674,680 | |
| Bank of Shanghai Co. Ltd. (A Shares) | 414,380 | 343,929 | |
| Bank of Suzhou Co. Ltd. | 114,700 | 98,497 | |
| Baoshan Iron & Steel Co. Ltd. (A Shares) | 662,400 | 566,759 | |
| BeiGene Ltd. (a) | 361,132 | 5,184,368 | |
| Beijing Capital International Airport Co. Ltd. (H Shares) (a) | 1,031,000 | 379,756 | |
| Beijing Dabeinong Technology Group Co. Ltd. (A Shares) (a) | 128,400 | 123,774 | |
| Beijing E-Hualu Information Technology Co. Ltd. (A Shares) (a) | 19,100 | 75,772 | |
| Beijing Easpring Material Technology Co. Ltd. (A Shares) | 15,400 | 92,875 | |
| Beijing Enlight Media Co. Ltd. (A Shares) | 89,200 | 95,405 | |
| Beijing Enterprises Holdings Ltd. | 267,427 | 891,030 | |
| Beijing Enterprises Water Group Ltd. | 2,056,000 | 433,827 | |
| Beijing Kingsoft Office Software, Inc. (A Shares) | 13,808 | 543,224 | |
| Beijing New Building Materials PLC (A Shares) | 52,600 | 175,903 | |
| Beijing Oriental Yuhong Waterproof Technology Co. Ltd. (A Shares) | 36,600 | 124,623 | |
| Beijing Roborock Technology Co. Ltd. (A Shares) | 3,725 | 161,054 | |
| Beijing Shiji Information Technology Co. Ltd. (A Shares) | 70,480 | 101,681 | |
| Beijing Tiantan Biological Products Corp. Ltd. (A Shares) | 46,000 | 181,522 | |
| Beijing Tongrentang Co. Ltd. (A Shares) | 41,200 | 289,183 | |
| Beijing United Information Technology Co. Ltd. (A Shares) | 22,634 | 116,541 | |
| Beijing Wantai Biological Pharmacy Enterprise Co. Ltd. (A Shares) | 25,012 | 150,026 | |
| Beijing Yanjing Brewery Co. Ltd. (A Shares) | 86,400 | 122,847 | |
| Beijing-Shanghai High Speed Railway Co. Ltd. (A Shares) | 971,400 | 664,150 | |
| Beiqi Foton Motor Co. Ltd. (A Shares) (a) | 228,100 | 94,563 | |
| Bethel Automotive Safety Systems Co. Ltd. (A Shares) | 12,400 | 128,346 | |
| Betta Pharmaceuticals Co. Ltd. (A Shares) | 12,900 | 107,315 | |
| BGI Genomics Co. Ltd. | 12,900 | 86,807 | |
| Bilibili, Inc. Class Z (a)(c) | 102,581 | 1,376,404 | |
| Bloomage Biotechnology Corp. Ltd. (A Shares) | 15,461 | 161,639 | |
| BOC Aviation Ltd. Class A (b) | 106,500 | 654,984 | |
| BOC International China Co. Ltd. | 83,900 | 125,063 | |
| BOE Technology Group Co. Ltd. (A Shares) | 1,142,400 | 612,450 | |
| Bosideng International Holdings Ltd. | 2,036,000 | 803,873 | |
| BTG Hotels Group Co. Ltd. (a) | 34,200 | 78,093 | |
| By-Health Co. Ltd. (A Shares) | 53,100 | 132,976 | |
| BYD Co. Ltd.: | |||
| (A Shares) | 68,700 | 2,242,135 | |
| (H Shares) | 532,300 | 16,187,312 | |
| BYD Electronic International Co. Ltd. | 412,000 | 1,719,900 | |
| C&D International Investment Group Ltd. | 382,982 | 861,622 | |
| Caitong Securities Co. Ltd. | 147,400 | 160,049 | |
| Cambricon Technologies Corp. Ltd. (A Shares) (a) | 12,223 | 180,441 | |
| Canmax Technologies Co. Ltd. (A Shares) | 26,000 | 96,717 | |
| CECEP Solar Energy Co. Ltd. (A Shares) | 118,600 | 93,075 | |
| CECEP Wind-Power Corp. (A Shares) | 171,500 | 74,345 | |
| CETC Cyberspace Security Technology Co. Ltd. (A Shares) | 26,300 | 79,305 | |
| CGN Power Co. Ltd. (H Shares) (b) | 5,854,447 | 1,406,868 | |
| Changchun High & New Technology Industry Group, Inc. (A Shares) | 12,000 | 255,458 | |
| Changjiang Securities Co. Ltd. (A Shares) | 170,000 | 132,246 | |
| Changzhou Xingyu Automotive Lighting Systems Co. Ltd. (A Shares) | 8,800 | 175,975 | |
| Chaozhou Three-Circle Group Co. (A Shares) | 60,300 | 254,673 | |
| Chengxin Lithium Group Co. Ltd. (A Shares) | 28,000 | 89,943 | |
| Chifeng Jilong Gold Mining Co. Ltd. (A Shares) (a) | 47,200 | 95,026 | |
| China Baoan Group Co. Ltd. (A Shares) | 78,800 | 111,335 | |
| China Cinda Asset Management Co. Ltd. (H Shares) | 4,826,000 | 469,295 | |
| China CITIC Bank Corp. Ltd. (H Shares) | 4,662,051 | 2,079,780 | |
| China Coal Energy Co. Ltd. (H Shares) | 1,093,000 | 858,515 | |
| China Communications Services Corp. Ltd. (H Shares) | 1,314,000 | 537,461 | |
| China Conch Venture Holdings Ltd. | 764,600 | 633,222 | |
| China Construction Bank Corp.: | |||
| (A Shares) | 247,500 | 212,102 | |
| (H Shares) | 50,206,000 | 28,394,410 | |
| China CSSC Holdings Ltd. (A Shares) | 138,500 | 490,130 | |
| China Eastern Airlines Corp. Ltd. (A Shares) (a) | 502,400 | 299,455 | |
| China Energy Engineering Corp. Ltd. (A Shares) | 979,000 | 291,830 | |
| China Everbright Bank Co. Ltd.: | |||
| (A Shares) | 1,274,900 | 517,537 | |
| (H Shares) | 1,953,000 | 557,087 | |
| China Everbright International Ltd. | 1,929,814 | 658,793 | |
| China Feihe Ltd. (b) | 1,927,000 | 1,197,384 | |
| China Film Co. Ltd. (A Shares) (a) | 55,200 | 90,202 | |
| China Galaxy Securities Co. Ltd.: | |||
| (A Shares) | 98,300 | 163,027 | |
| (H Shares) | 1,964,500 | 1,005,447 | |
| China Gas Holdings Ltd. | 1,439,900 | 1,294,480 | |
| China Great Wall Securities Co. Ltd. (A Shares) | 105,800 | 120,888 | |
| China Greatwall Technology Group Co. Ltd. (A Shares) | 100,300 | 150,753 | |
| China Hongqiao Group Ltd. | 1,246,200 | 1,166,710 | |
| China Huishan Dairy Holdings Co. Ltd. (a)(d) | 2,302,000 | 3 | |
| China International Capital Corp. Ltd. | 68,800 | 346,653 | |
| China International Capital Corp. Ltd. (H Shares) (b) | 772,600 | 1,230,563 | |
| China Jinmao Holdings Group Ltd. | 3,145,191 | 385,779 | |
| China Jushi Co. Ltd. (A Shares) | 125,114 | 198,051 | |
| China Life Insurance Co. Ltd.: | |||
| (A Shares) | 92,800 | 426,279 | |
| (H Shares) | 3,859,747 | 5,227,637 | |
| China Literature Ltd. (a)(b) | 213,500 | 718,958 | |
| China Longyuan Power Grid Corp. Ltd. (H Shares) | 1,798,000 | 1,522,058 | |
| China Medical System Holdings Ltd. | 711,000 | 1,136,959 | |
| China Meheco Co. Ltd. (A Shares) | 47,000 | 76,818 | |
| China Meidong Auto Holding Ltd. | 352,000 | 188,775 | |
| China Mengniu Dairy Co. Ltd. | 1,652,000 | 5,394,006 | |
| China Merchants Bank Co. Ltd.: | |||
| (A Shares) | 555,200 | 2,336,322 | |
| (H Shares) | 2,137,421 | 8,107,868 | |
| China Merchants Energy Shipping Co. Ltd. (A Shares) | 253,000 | 222,463 | |
| China Merchants Holdings International Co. Ltd. | 748,242 | 952,463 | |
| China Merchants Securities Co. Ltd. (A Shares) | 215,650 | 416,968 | |
| China Merchants Shekou Industrial Zone Holdings Co. Ltd. (A Shares) | 232,700 | 351,073 | |
| China Minmetals Rare Earth Co. Ltd. (A Shares) | 30,700 | 125,902 | |
| China Minsheng Banking Corp. Ltd.: | |||
| (A Shares) | 1,252,200 | 636,814 | |
| (H Shares) | 3,250,061 | 1,080,518 | |
| China National Building Materials Co. Ltd. (H Shares) | 2,034,000 | 968,176 | |
| China National Chemical Engineering Co. Ltd. (A Shares) | 191,108 | 182,946 | |
| China National Medicines Corp. Ltd. (A Shares) | 22,400 | 88,161 | |
| China National Nuclear Power Co. Ltd. (A Shares) | 577,700 | 586,116 | |
| China National Software & Service Co. Ltd. (A Shares) | 26,910 | 126,528 | |
| China Northern Rare Earth Group High-Tech Co. Ltd. | 105,900 | 302,644 | |
| China Oilfield Services Ltd. (H Shares) | 938,000 | 1,109,016 | |
| China Overseas Land and Investment Ltd. | 1,989,702 | 3,754,786 | |
| China Overseas Property Holdings Ltd. | 690,000 | 599,252 | |
| China Pacific Insurance (Group) Co. Ltd. | 161,500 | 612,419 | |
| China Pacific Insurance (Group) Co. Ltd. (H Shares) | 1,473,428 | 3,629,599 | |
| China Petroleum & Chemical Corp.: | |||
| (A Shares) | 437,400 | 326,643 | |
| (H Shares) | 13,822,704 | 7,069,454 | |
| China Power International Development Ltd. | 2,660,619 | 1,034,011 | |
| China Railway Group Ltd.: | |||
| (A Shares) | 562,200 | 464,998 | |
| (H Shares) | 2,356,000 | 1,111,948 | |
| China Railway Signal & Communications Corp. (A Shares) | 234,971 | 150,874 | |
| China Resource Gas Group Ltd. | 487,500 | 1,441,112 | |
| China Resources Beer Holdings Co. Ltd. | 852,144 | 4,509,263 | |
| China Resources Cement Holdings Ltd. | 1,328,000 | 341,467 | |
| China Resources Land Ltd. | 1,668,812 | 6,246,544 | |
| China Resources Microelectronics Ltd. (A Shares) | 39,504 | 287,307 | |
| China Resources Mixc Lifestyle Services Ltd. (b) | 357,000 | 1,392,807 | |
| China Resources Pharmaceutical Group Ltd. (b) | 822,000 | 510,624 | |
| China Resources Power Holdings Co. Ltd. | 1,018,940 | 1,974,595 | |
| China Resources Sanjiu Medical & Pharmaceutical Co. Ltd. (A Shares) | 31,100 | 183,320 | |
| China Ruyi Holdings Ltd. (a)(c) | 2,940,000 | 677,013 | |
| China Shenhua Energy Co. Ltd.: | |||
| (A Shares) | 152,985 | 633,666 | |
| (H Shares) | 1,837,202 | 5,630,973 | |
| China Southern Airlines Ltd.: | |||
| (A Shares) (a) | 442,500 | 373,628 | |
| (H Shares) (a) | 816,000 | 386,122 | |
| China State Construction Engineering Corp. Ltd. (A Shares) | 1,261,840 | 893,236 | |
| China State Construction International Holdings Ltd. | 1,065,500 | 1,141,300 | |
| China Taiping Insurance Group Ltd. | 753,255 | 695,839 | |
| China Three Gorges Renewables Group Co. Ltd. (A Shares) | 847,000 | 555,924 | |
| China Tourism Group Duty Free Corp. Ltd.: | |||
| (A Shares) | 86,300 | 1,116,419 | |
| (H Shares) (b) | 13,000 | 146,812 | |
| China Tower Corp. Ltd. (H Shares) (b) | 23,465,000 | 2,188,132 | |
| China Traditional Chinese Medicine Holdings Co. Ltd. | 1,612,000 | 794,307 | |
| China United Network Communications Ltd. (A Shares) | 959,000 | 584,576 | |
| China Vanke Co. Ltd.: | |||
| (A Shares) | 275,700 | 426,538 | |
| (H Shares) | 1,199,300 | 1,122,013 | |
| China XD Electric Co. Ltd. (A Shares) | 144,400 | 91,266 | |
| China Yangtze Power Co. Ltd. (A Shares) | 740,600 | 2,285,180 | |
| China Zhenhua (Group) Science & Technology Co. Ltd. (A Shares) | 16,200 | 148,235 | |
| China Zheshang Bank Co. Ltd. | 662,350 | 231,000 | |
| ChinaSoft International Ltd. | 1,420,000 | 1,030,235 | |
| Chongqing Brewery Co. Ltd. (A Shares) | 15,100 | 162,047 | |
| Chongqing Changan Automobile Co. Ltd. (A Shares) | 245,274 | 507,695 | |
| Chongqing Fuling Zhacai Group Co. Ltd. Group (A Shares) | 35,360 | 74,685 | |
| Chongqing Rural Commercial Bank Co. Ltd. (A Shares) | 245,800 | 142,825 | |
| Chongqing Taiji Industry Group Co. Ltd. (A Shares) (a) | 16,400 | 94,109 | |
| Chongqing Zhifei Biological Products Co. Ltd. (A Shares) | 70,950 | 608,228 | |
| Chow Tai Fook Jewellery Group Ltd. | 1,054,400 | 1,488,944 | |
| CITIC Pacific Ltd. | 3,034,941 | 2,579,514 | |
| CITIC Securities Co. Ltd.: | |||
| (A Shares) | 280,000 | 831,319 | |
| (H Shares) | 1,142,090 | 2,222,344 | |
| Cmoc Group Ltd.: | |||
| (A Shares) | 597,400 | 453,056 | |
| (H Shares) | 1,921,000 | 1,145,706 | |
| CNGR Advanced Material Co. Ltd. | 19,000 | 141,364 | |
| CNNC Hua Yuan Titanium Dioxide Co. Ltd. (A Shares) | 94,890 | 61,796 | |
| CNPC Capital Co. Ltd. (A Shares) | 188,300 | 152,778 | |
| Contemporary Amperex Technology Co. Ltd. | 133,220 | 3,383,436 | |
| COSCO Shipping Development Co. Ltd. (A Shares) | 321,900 | 101,200 | |
| COSCO Shipping Energy Transportation Co. Ltd.: | |||
| (A Shares) | 108,300 | 213,462 | |
| (H Shares) | 680,000 | 721,162 | |
| COSCO SHIPPING Holdings Co. Ltd.: | |||
| (A Shares) (a) | 330,720 | 442,005 | |
| (H Shares) | 1,751,800 | 1,781,646 | |
| Cosco Shipping Ports Ltd. | 754,473 | 455,168 | |
| Country Garden Holdings Co. Ltd. (a)(c) | 6,470,662 | 578,624 | |
| Country Garden Services Holdings Co. Ltd. | 1,144,000 | 999,292 | |
| CRRC Corp. Ltd.: | |||
| (A Shares) | 791,300 | 578,058 | |
| (H Shares) | 2,248,000 | 936,571 | |
| CSC Financial Co. Ltd. (A Shares) | 128,600 | 425,368 | |
| CSPC Pharmaceutical Group Ltd. | 4,687,608 | 4,094,484 | |
| Dajin Heavy Industry Co. Ltd. | 19,700 | 74,635 | |
| Daqin Railway Co. Ltd. (A Shares) | 456,700 | 450,222 | |
| Daqo New Energy Corp. ADR (a) | 30,503 | 776,606 | |
| DaShenLin Pharmaceutical Group Co. Ltd. | 35,673 | 116,140 | |
| Datang International Power Generation Co. Ltd. (A Shares) | 295,700 | 104,705 | |
| DHC Software Co. Ltd. (A Shares) | 101,700 | 87,654 | |
| Do-Fluoride New Materials Co. Ltd. (A Shares) | 32,900 | 71,975 | |
| Dong-E-E-Jiao Co. Ltd. (A Shares) | 20,300 | 128,807 | |
| Dongfang Electric Corp. Ltd. (A Shares) | 86,100 | 175,441 | |
| Dongfeng Motor Group Co. Ltd. (H Shares) | 1,381,000 | 607,950 | |
| Dongxing Securities Co. Ltd. (A Shares) | 101,500 | 111,022 | |
| Dongyue Group Co. Ltd. | 831,000 | 661,933 | |
| East Buy Holding Ltd. (a)(b)(c) | 212,000 | 864,855 | |
| East Money Information Co. Ltd. (A Shares) | 477,208 | 995,934 | |
| Eastroc Beverage Group Co. Ltd. | 8,000 | 210,088 | |
| Ecovacs Robotics Co. Ltd. Class A | 17,900 | 105,690 | |
| ENN Energy Holdings Ltd. | 413,043 | 3,128,861 | |
| ENN Natural Gas Co. Ltd. (A Shares) | 79,700 | 188,132 | |
| Eoptolink Technology, Inc. Ltd. (A Shares) | 21,200 | 91,448 | |
| Eve Energy Co. Ltd. (A shares) | 61,574 | 390,633 | |
| Everbright Securities Co. Ltd. (A Shares) | 122,458 | 275,700 | |
| Everdisplay Optronics Shanghai Co. Ltd. (A Shares) (a) | 330,422 | 118,365 | |
| Fangda Carbon New Material Co. Ltd. (A Shares) (a) | 124,048 | 100,072 | |
| Far East Horizon Ltd. | 659,000 | 463,697 | |
| Farasis Energy Gan Zhou Co. Ltd. (A Shares) (a) | 34,876 | 84,015 | |
| FAW Jiefang Group Co. Ltd. (A Shares) (a) | 96,100 | 121,117 | |
| First Capital Securities Co. Ltd. (A Shares) | 133,400 | 106,701 | |
| Flat Glass Group Co. Ltd. (c) | 220,000 | 395,094 | |
| Flat Glass Group Co. Ltd. (A Shares) (a) | 53,600 | 189,320 | |
| Focus Media Information Technology Co. Ltd. (A Shares) | 434,940 | 411,225 | |
| Foshan Haitian Flavouring & Food Co. Ltd. (A Shares) | 137,976 | 710,251 | |
| Fosun International Ltd. | 1,302,454 | 780,353 | |
| Founder Securities Co. Ltd. (A Shares) | 238,500 | 247,236 | |
| Foxconn Industrial Internet Co. Ltd. (A Shares) | 300,697 | 605,987 | |
| Fujian Sunner Development Co. Ltd. A Shares | 38,000 | 93,481 | |
| Fuyao Glass Industries Group Co. Ltd.: | |||
| (A Shares) | 52,300 | 266,168 | |
| (H Shares) (b) | 340,400 | 1,551,915 | |
| G-bits Network Technology Xiamen Co. Ltd. (A Shares) | 2,300 | 83,695 | |
| GalaxyCore, Inc. (A Shares) | 47,998 | 120,863 | |
| Ganfeng Lithium Group Co. Ltd.: | |||
| (A Shares) | 49,440 | 299,605 | |
| (H Shares) (b) | 217,120 | 779,846 | |
| GCL Technology Holdings Ltd. | 10,590,000 | 1,559,565 | |
| GD Power Development Co. Ltd. (A Shares) | 520,000 | 258,729 | |
| GDS Holdings Ltd. Class A (a) | 497,552 | 633,853 | |
| Geely Automobile Holdings Ltd. | 3,165,517 | 3,593,891 | |
| GEM Co. Ltd. (A Shares) | 152,100 | 121,901 | |
| Gemdale Corp. (A Shares) | 140,500 | 99,172 | |
| Genscript Biotech Corp. (a) | 610,000 | 1,773,372 | |
| GF Securities Co. Ltd.: | |||
| (A Shares) | 212,700 | 431,570 | |
| (H Shares) | 509,228 | 662,996 | |
| Giant Network Group Co. Ltd. (A Shares) | 57,600 | 93,023 | |
| Gigadevice Semiconductor Beijing, Inc. (A Shares) | 19,760 | 289,468 | |
| Ginlong Technologies Co. Ltd. (A Shares) | 12,300 | 112,868 | |
| GoerTek, Inc. (A Shares) | 100,000 | 246,931 | |
| Goldwind Science & Technology Co. Ltd. (A Shares) | 110,800 | 133,254 | |
| Gongniu Group Co. Ltd. (A Shares) | 13,100 | 189,360 | |
| GoodWe Technologies Co. Ltd. (A Shares) | 5,060 | 80,836 | |
| Gotion High-tech Co. Ltd. (A Shares) (a) | 56,400 | 175,622 | |
| Great Wall Motor Co. Ltd. (H Shares) | 1,412,500 | 1,974,524 | |
| Gree Electric Appliances, Inc. of Zhuhai (A Shares) | 84,200 | 390,612 | |
| Greenland Holdings Corp. Ltd. (A Shares) (a) | 351,400 | 122,487 | |
| Greentown China Holdings Ltd. | 527,500 | 511,750 | |
| GRG Banking Equipment Co. Ltd. (A Shares) | 78,900 | 125,932 | |
| Guangdong Haid Group Co. Ltd. (A Shares) | 49,000 | 301,695 | |
| Guangdong HEC Technology Holding Co. Ltd. (A Shares) (a) | 95,800 | 93,209 | |
| Guangdong Investment Ltd. | 1,513,126 | 1,032,530 | |
| Guanghui Energy Co. Ltd. (A Shares) | 205,000 | 210,496 | |
| Guangzhou Automobile Group Co. Ltd. | 261,900 | 358,997 | |
| Guangzhou Automobile Group Co. Ltd. (H Shares) | 1,284,200 | 601,645 | |
| Guangzhou Baiyun International Airport Co. Ltd. (A Shares) (a) | 68,400 | 99,039 | |
| Guangzhou Baiyunshan Pharma Health (A Shares) | 44,100 | 179,707 | |
| Guangzhou Great Power Energy & Technology Co. Ltd. (A Shares) | 14,300 | 60,300 | |
| Guangzhou Haige Communications Group (A Shares) | 74,600 | 118,490 | |
| Guangzhou Kingmed Diagnostics Group Co. Ltd. (A Shares) | 14,500 | 122,736 | |
| Guangzhou Shiyuan Electronic Technology Co. Ltd. (A Shares) | 22,000 | 126,396 | |
| Guangzhou Tinci Materials Technology Co. Ltd. (A Shares) | 56,500 | 215,007 | |
| Guangzhou Yuexiu Financial Holdings Group Co. Ltd. (A Shares) | 129,431 | 116,143 | |
| Guolian Securities Co. Ltd. (a) | 73,200 | 107,647 | |
| Guosen Securities Co. Ltd. (A Shares) | 183,500 | 241,082 | |
| Guotai Junan Securities Co. Ltd. (A Shares) | 216,900 | 438,169 | |
| Guoyuan Securities Co. Ltd. (A Shares) | 135,170 | 127,947 | |
| H World Group Ltd. ADR (a)(c) | 107,958 | 4,065,698 | |
| Haidilao International Holding Ltd. (b) | 873,000 | 2,185,823 | |
| Haier Smart Home Co. Ltd. | 1,288,000 | 3,673,800 | |
| Haier Smart Home Co. Ltd. (A Shares) | 187,500 | 569,811 | |
| Hainan Airlines Co. Ltd. (A Shares) (a) | 1,288,700 | 257,275 | |
| Hainan Airport Infrastructure Co. Ltd. (A Shares) (a) | 324,600 | 169,117 | |
| Haitian International Holdings Ltd. | 335,000 | 799,171 | |
| Haitong Securities Co. Ltd.: | |||
| (A Shares) | 367,100 | 490,400 | |
| (H Shares) | 1,274,800 | 731,973 | |
| Hangzhou Binjiang Real Estate Group Co. Ltd. (A Shares) | 97,200 | 111,272 | |
| Hangzhou Chang Chuan Technology Co. Ltd. | 19,000 | 106,122 | |
| Hangzhou First Applied Material Co. Ltd. (A Shares) | 55,672 | 194,556 | |
| Hangzhou GreatStar Industrial Co. Ltd. (A Shares) (a) | 34,700 | 94,032 | |
| Hangzhou Lion Electronics Co. Ltd. (A Shares) | 21,300 | 93,719 | |
| Hangzhou Oxygen Plant Group Co. Ltd. (A Shares) | 30,800 | 139,033 | |
| Hangzhou Robam Appliances Co. Ltd. (A Shares) | 29,400 | 92,773 | |
| Hangzhou Silan Microelectronics Co. Ltd. (A Shares) | 44,800 | 148,783 | |
| Hangzhou Tigermed Consulting Co. Ltd. (A Shares) | 10,700 | 97,640 | |
| Hansoh Pharmaceutical Group Co. Ltd. (b) | 624,000 | 1,174,052 | |
| Haohua Chemical Science & Technology Co. Ltd. (A Shares) | 20,900 | 87,866 | |
| Hebei Hengshui Laobaigan Liquor Co. Ltd. | 24,500 | 79,695 | |
| Hebei Yangyuan Zhihui Beverage Co. Ltd. (A Shares) | 35,000 | 119,109 | |
| Heilongjiang Agriculture Co. Ltd. (A Shares) | 58,000 | 101,016 | |
| Henan Shenhuo Coal & Power Co. Ltd. (A Shares) | 71,100 | 159,858 | |
| Henan Shuanghui Investment & Development Co. Ltd. (A Shares) | 102,600 | 367,304 | |
| Hengan International Group Co. Ltd. | 347,900 | 1,165,221 | |
| Hengdian Group DMEGC Magnetics Co. Ltd. (A Shares) | 50,900 | 101,367 | |
| Hengli Petrochemical Co. Ltd. (A Shares) (a) | 208,320 | 417,411 | |
| Hengtong Optic-electric Co. Ltd. (A Shares) | 73,500 | 132,550 | |
| Hengyi Petrochemical Co. Ltd. (A Shares) (a) | 120,280 | 118,267 | |
| Hesteel Co. Ltd. (A Shares) | 340,100 | 104,148 | |
| Hisense Electric Co. Ltd. | 38,700 | 123,185 | |
| Hithink RoyalFlush Information Network Co. Ltd. (A Shares) | 16,700 | 320,805 | |
| Hongfa Technology Co. Ltd. (A Shares) | 16,980 | 67,393 | |
| Hoshine Silicon Industry Co. Ltd. (A Shares) | 22,200 | 173,744 | |
| Hoymiles Power Electronics, Inc. (A Shares) | 2,372 | 72,655 | |
| Hoyuan Green Energy Co. Ltd. (A Shares) | 16,209 | 82,789 | |
| Hua Hong Semiconductor Ltd. (a)(b) | 312,000 | 768,170 | |
| Huadian Power International Corp. Ltd. (A Shares) | 253,200 | 169,836 | |
| Huadong Medicine Co. Ltd. (A Shares) | 52,400 | 307,911 | |
| Huafon Chemical Co. Ltd. (A Shares) | 159,700 | 158,391 | |
| Huagong Tech Co. Ltd. (A Shares) | 27,500 | 106,293 | |
| Huaibei Mining Holdings Co. Ltd. (A Shares) | 79,600 | 159,586 | |
| Hualan Biological Engineer, Inc. (A Shares) | 53,370 | 171,270 | |
| Huaneng Power International, Inc.: | |||
| (A Shares) (a) | 319,600 | 332,535 | |
| (H Shares) (a) | 2,162,186 | 1,011,800 | |
| Huatai Securities Co. Ltd.: | |||
| (A Shares) | 189,400 | 415,171 | |
| (H Shares) (b) | 750,400 | 982,426 | |
| HUAXI Securities Co. Ltd. | 80,700 | 87,458 | |
| Huaxia Bank Co. Ltd. (A Shares) | 391,758 | 299,977 | |
| Huayu Automotive Systems Co. Ltd. (A Shares) | 98,300 | 235,800 | |
| Hubei Feilihua Quartz Glass Co. Ltd. (A Shares) | 15,700 | 85,022 | |
| Hubei Jumpcan Pharmaceutical Co. Ltd. (A Shares) | 28,300 | 104,867 | |
| Hubei Xingfa Chemicals Group Co. Ltd. (A Shares) | 34,100 | 91,622 | |
| Huizhou Desay SV Automotive Co. Ltd. | 16,600 | 285,018 | |
| Humanwell Healthcare Group Co. Ltd. (A Shares) | 51,300 | 164,043 | |
| Hunan Changyuan Lico Co. Ltd. (A Shares) | 61,437 | 71,631 | |
| Hunan Valin Steel Co. Ltd. (A Shares) | 221,600 | 176,587 | |
| Hundsun Technologies, Inc. (A Shares) | 57,119 | 243,281 | |
| Hygeia Healthcare Holdings Co. (b) | 184,200 | 1,112,212 | |
| iFlytek Co. Ltd. (A Shares) | 69,100 | 431,110 | |
| IMEIK Technology Development Co. Ltd. (A Shares) | 6,700 | 302,132 | |
| Industrial & Commercial Bank of China Ltd.: | |||
| (A Shares) | 4,401,000 | 2,846,460 | |
| (H Shares) | 30,390,000 | 14,564,248 | |
| Industrial Bank Co. Ltd. (A Shares) | 619,100 | 1,276,802 | |
| Industrial Securities Co. Ltd. (A Shares) | 266,670 | 227,573 | |
| Ingenic Semiconductor Co. Ltd. (A Shares) | 15,300 | 154,547 | |
| Inner Mongoli Yili Industries Co. Ltd. (A Shares) | 190,200 | 713,179 | |
| Inner Mongolia Baotou Steel Union Co. Ltd. (A Shares) (a) | 1,313,500 | 291,067 | |
| Inner Mongolia Dian Tou Energy Corp. Ltd. | 60,800 | 113,127 | |
| Inner Mongolia Junzheng Energy & Chemical Industry Group Co. Ltd. (A Shares) | 230,600 | 126,130 | |
| Inner Mongolia Yitai Coal Co. Ltd. (B Shares) (a) | 631,290 | 866,427 | |
| Inner Mongolia Yuan Xing Energy Co. Ltd. (A Shares) | 113,000 | 105,131 | |
| Innovent Biologics, Inc. (a)(b) | 605,000 | 3,565,364 | |
| Inspur Electronic Information Industry Co. Ltd. (A Shares) | 45,972 | 186,329 | |
| iQIYI, Inc. ADR (a) | 231,280 | 1,077,765 | |
| iRay Technology Co. Ltd. (A Shares) | 3,046 | 93,864 | |
| iSoftStone Information Technology Group Co. Ltd. (A Shares) | 27,450 | 134,256 | |
| JA Solar Technology Co. Ltd. (A Shares) | 100,304 | 307,336 | |
| Jason Furniture Hangzhou Co. Ltd. (A Shares) | 25,720 | 130,223 | |
| JCET Group Co. Ltd. (A Shares) | 56,900 | 240,181 | |
| JD Health International, Inc. (a)(b) | 582,150 | 2,644,288 | |
| JD Logistics, Inc. (a)(b) | 1,042,100 | 1,233,947 | |
| JD.com, Inc. Class A | 1,224,050 | 15,561,546 | |
| Jiangsu Eastern Shenghong Co. Ltd. | 191,200 | 278,200 | |
| Jiangsu Expressway Co. Ltd. (H Shares) | 658,000 | 598,216 | |
| Jiangsu Hengli Hydraulic Co. Ltd. | 41,676 | 320,808 | |
| Jiangsu Hengrui Medicine Co. Ltd. (A Shares) | 192,658 | 1,261,800 | |
| Jiangsu King's Luck Brewery JSC Ltd. (A Shares) | 37,300 | 298,291 | |
| Jiangsu Nhwa Pharmaceutical Co. Ltd. (A Shares) | 29,700 | 106,759 | |
| Jiangsu Pacific Quartz Co. Ltd. (A Shares) | 11,400 | 143,346 | |
| Jiangsu Phoenix Publishing & Media Corp. Ltd. | 76,100 | 99,975 | |
| Jiangsu Yanghe Brewery JSC Ltd. (A Shares) | 45,100 | 752,196 | |
| Jiangsu Yangnong Chemical Co. Ltd. (A Shares) | 12,870 | 118,843 | |
| Jiangsu Yoke Technology Co. Ltd. (A Shares) | 14,800 | 116,879 | |
| Jiangsu Yuyue Medical Equipment & Supply Co. Ltd. (A Shares) | 31,400 | 144,423 | |
| Jiangsu Zhongtian Technology Co. Ltd. (A Shares) | 101,000 | 193,476 | |
| Jiangxi Copper Co. Ltd.: | |||
| (A Shares) | 83,300 | 208,821 | |
| (H Shares) | 584,000 | 825,751 | |
| Jiangxi Special Electric Motor Co. Ltd. (A Shares) (a) | 52,400 | 85,802 | |
| Jinduicheng Molybdenum Co. Ltd. (A Shares) | 91,100 | 125,076 | |
| Jinko Solar Co. Ltd. (A Shares) | 194,730 | 252,683 | |
| JiuGui Liquor Co. Ltd. (A Shares) | 10,000 | 104,487 | |
| Jiumaojiu International Holdings Ltd. (b) | 497,000 | 540,795 | |
| Jizhong Energy Resources Co. Ltd. (A Shares) | 112,700 | 98,943 | |
| Joincare Pharmaceutical Group Industry Co. Ltd. (A Shares) | 56,200 | 91,095 | |
| Jointown Pharmaceutical Group (A Shares) | 123,074 | 119,792 | |
| Jonjee Hi-Tech Industrial & Commercial Holding Co. Ltd. (A Shares) (a) | 24,300 | 111,639 | |
| JOYY, Inc. ADR | 23,693 | 922,132 | |
| Juewei Food Co. Ltd. | 18,600 | 89,825 | |
| Juneyao Airlines Co. Ltd. (A shares) (a) | 64,600 | 128,829 | |
| Kangmei Pharmaceutical Co. Ltd. rights (a)(d) | 18,271 | 0 | |
| Kanzhun Ltd. ADR (a) | 114,357 | 1,692,484 | |
| KE Holdings, Inc. ADR | 343,119 | 5,047,280 | |
| Keda Industrial Group Co. Ltd. | 58,500 | 87,141 | |
| Kingboard Chemical Holdings Ltd. | 347,900 | 847,233 | |
| Kingdee International Software Group Co. Ltd. (a) | 1,451,000 | 1,925,286 | |
| Kingnet Network Co. Ltd. (A Shares) | 64,400 | 95,029 | |
| Kingsoft Corp. Ltd. | 498,400 | 1,739,156 | |
| Kuaishou Technology Class B (a)(b) | 1,209,600 | 7,789,639 | |
| Kuang-Chi Technologies Co. Ltd. (A Shares) | 67,600 | 129,322 | |
| Kunlun Energy Co. Ltd. | 2,061,000 | 1,717,027 | |
| Kunlun Tech Co. Ltd. (A Shares) (a) | 35,500 | 152,800 | |
| Kweichow Moutai Co. Ltd. (A Shares) | 38,100 | 8,776,496 | |
| Lb Group Co. Ltd. (A Shares) | 75,800 | 192,956 | |
| Lenovo Group Ltd. | 3,797,000 | 4,418,691 | |
| Lens Technology Co. Ltd. (A Shares) | 145,400 | 259,804 | |
| Lepu Medical Technology Beijing Co. Ltd. (A Shares) | 56,900 | 134,022 | |
| Li Auto, Inc. Class A (a) | 585,636 | 9,905,230 | |
| Li Ning Co. Ltd. | 1,237,500 | 3,792,200 | |
| Liaoning Port Co. Ltd. (A Shares) | 562,700 | 116,130 | |
| Lingyi iTech Guangdong Co. (A Shares) | 218,900 | 181,993 | |
| Livzon Pharmaceutical Group, Inc. (A Shares) | 19,100 | 91,436 | |
| Longfor Properties Co. Ltd. (b) | 989,095 | 1,439,886 | |
| LONGi Green Energy Technology Co. Ltd. | 228,599 | 754,694 | |
| Lufax Holding Ltd. ADR | 361,053 | 344,733 | |
| Luxi Chemical Group Co. Ltd. | 61,500 | 95,479 | |
| Luxshare Precision Industry Co. Ltd. (A Shares) | 214,524 | 963,449 | |
| Luzhou Laojiao Co. Ltd. (A Shares) | 44,400 | 1,300,721 | |
| Mango Excellent Media Co. Ltd. (A Shares) | 56,170 | 194,191 | |
| Maxscend Microelectronics Co. Ltd. (A Shares) | 16,028 | 330,744 | |
| Meihua Holdings Group Co. Ltd. (A Shares) | 92,700 | 120,420 | |
| Meinian Onehealth Healthcare Holdings Co. Ltd. (A Shares) (a) | 121,488 | 102,438 | |
| Meituan Class B (a)(b) | 2,643,420 | 37,470,516 | |
| Metallurgical Corp. China Ltd. (A Shares) | 560,500 | 253,673 | |
| Microport Scientific Corp. (a) | 434,300 | 684,357 | |
| Ming Yang Smart Energy Group Ltd. (A Shares) | 72,600 | 138,812 | |
| MINISO Group Holding Ltd. ADR | 49,704 | 1,258,008 | |
| Minth Group Ltd. | 396,000 | 883,962 | |
| Montage Technology Co. Ltd. (A Shares) | 33,848 | 255,218 | |
| Muyuan Foodstuff Co. Ltd. (A Shares) | 164,554 | 848,762 | |
| Nanjing King-Friend Biochemical Pharmaceutical Co. Ltd. | 49,253 | 85,195 | |
| Nanjing Securities Co. Ltd. (A Shares) | 92,500 | 101,723 | |
| NARI Technology Co. Ltd. (A Shares) | 238,675 | 737,076 | |
| National Silicon Industry Group Co. Ltd. (A Shares) (a) | 81,486 | 202,244 | |
| NAURA Technology Group Co. Ltd. | 15,700 | 550,736 | |
| NavInfo Co. Ltd. (A Shares) (a) | 77,300 | 105,751 | |
| NetEase, Inc. | 1,008,020 | 21,573,191 | |
| New China Life Insurance Co. Ltd. | 46,800 | 213,920 | |
| New China Life Insurance Co. Ltd. (H Shares) | 480,500 | 1,054,054 | |
| New Hope Liuhe Co. Ltd. (A Shares) (a) | 139,900 | 194,181 | |
| New Oriental Education & Technology Group, Inc. (a) | 784,110 | 5,112,427 | |
| Ninestar Corp. (A Shares) | 44,100 | 147,959 | |
| Ningbo Deye Technology Co. Ltd. (A Shares) | 12,660 | 119,799 | |
| Ningbo Joyson Electronic Corp. (A shares) | 41,500 | 107,033 | |
| Ningbo Orient Wires & Cables Co. Ltd. (A Shares) | 21,100 | 121,509 | |
| Ningbo Ronbay New Energy Technology Co. Ltd. (A Shares) | 13,650 | 82,703 | |
| Ningbo Shanshan Co. Ltd. (A Shares) | 66,800 | 127,902 | |
| Ningbo Tuopu Group Co. Ltd. (A Shares) | 33,000 | 291,547 | |
| Ningxia Baofeng Energy Group Co. Ltd. | 215,200 | 424,403 | |
| NIO, Inc. sponsored ADR (a)(c) | 722,055 | 5,271,002 | |
| Nongfu Spring Co. Ltd. (H Shares) (b) | 929,800 | 5,295,902 | |
| North Industries Group Red Arrow Co. Ltd. (A Shares) | 41,900 | 81,712 | |
| Offcn Education Technology Co. A Shares (a) | 193,800 | 104,700 | |
| Offshore Oil Enginering Co. Ltd. (A Shares) | 137,300 | 116,673 | |
| Oppein Home Group, Inc. (A Shares) | 14,980 | 178,288 | |
| Orient Securities Co. Ltd. (A Shares) | 216,839 | 257,219 | |
| Oriental Pearl Group Co. Ltd. | 101,400 | 102,373 | |
| Ovctek China, Inc. (A Shares) | 28,089 | 96,882 | |
| Pangang Group Vanadium Titanium & Resources Co. Ltd. (A Shares) (a) | 269,000 | 128,476 | |
| PDD Holdings, Inc. ADR (a) | 311,502 | 31,592,533 | |
| People's Insurance Co. of China Group Ltd.: | |||
| (A Shares) | 359,300 | 262,340 | |
| (H Shares) | 4,414,552 | 1,456,623 | |
| People.cn Co. Ltd. (A Shares) | 33,400 | 148,107 | |
| Perfect World Co. Ltd. (A Shares) | 60,700 | 99,650 | |
| PetroChina Co. Ltd.: | |||
| (A Shares) | 735,100 | 716,203 | |
| (H Shares) | 10,905,790 | 7,118,380 | |
| Pharmaron Beijing Co. Ltd. (A Shares) | 43,800 | 199,224 | |
| PICC Property & Casualty Co. Ltd. (H Shares) | 3,603,568 | 4,115,113 | |
| Ping An Bank Co. Ltd. (A Shares) | 571,500 | 817,583 | |
| Ping An Healthcare and Technology Co. Ltd. (a)(b)(c) | 299,600 | 699,844 | |
| Ping An Insurance Group Co. of China Ltd.: | |||
| (A Shares) | 336,996 | 2,094,319 | |
| (H Shares) | 3,492,141 | 17,713,804 | |
| Piotech, Inc. (A Shares) | 5,616 | 194,075 | |
| Poly Developments & Holdings (A Shares) | 356,400 | 536,482 | |
| Pop Mart International Group Ltd. (b) | 250,800 | 692,336 | |
| Postal Savings Bank of China Co. Ltd. | 708,700 | 442,783 | |
| Postal Savings Bank of China Co. Ltd. (H Shares) (b) | 4,456,000 | 2,033,849 | |
| Power Construction Corp. of China Ltd. (A Shares) | 513,700 | 369,458 | |
| Pylon Technologies Co. Ltd. (Series A) | 5,525 | 86,041 | |
| Qi An Xin Technology Group, Inc. (A Shares) (a) | 19,910 | 125,612 | |
| Qifu Technology, Inc. ADR | 59,768 | 883,969 | |
| Qinghai Salt Lake Potash Co. Ltd. Class A (a) | 167,100 | 386,946 | |
| Raytron Technology Co. Ltd. (A Shares) | 13,912 | 89,606 | |
| Risen Energy Co. Ltd. (A Shares) | 36,600 | 88,891 | |
| Riyue Heavy Industry Co. Ltd. (A Shares) | 31,700 | 61,007 | |
| Rockchip Electronics Co. Ltd. | 8,900 | 79,317 | |
| Rongsheng Petrochemical Co. Ltd. (A Shares) | 303,400 | 472,642 | |
| SAIC Motor Corp. Ltd. (A Shares) | 226,600 | 450,000 | |
| Sailun Group Co. Ltd. A Shares | 90,600 | 139,143 | |
| Sanan Optoelectronics Co. Ltd. (A Shares) | 149,500 | 304,333 | |
| Sangfor Technologies, Inc. (a) | 12,400 | 142,277 | |
| Sany Heavy Equipment International Holdings Co. Ltd. | 585,000 | 768,466 | |
| Sany Heavy Industry Co. Ltd. (A Shares) | 253,500 | 501,338 | |
| Satellite Chemical Co. Ltd. (A Shares) | 105,230 | 233,923 | |
| SDIC Capital Co. Ltd. | 196,900 | 183,991 | |
| SDIC Power Holdings Co. Ltd. (A Shares) | 221,200 | 369,034 | |
| Seazen Holdings Co. Ltd. (A Shares) (a) | 70,200 | 114,019 | |
| Seres Group Co. Ltd. (A Shares) (a) | 46,200 | 515,748 | |
| SF Holding Co. Ltd. (A Shares) | 146,400 | 785,651 | |
| SG Micro Corp. (A Shares) | 14,592 | 178,962 | |
| Shaanxi Coal Industry Co. Ltd. (A Shares) | 288,000 | 710,165 | |
| Shan Xi Hua Yang Group New Energy Co. Ltd. | 112,350 | 123,912 | |
| Shandong Buchang Pharmaceuticals Co. Ltd. (A Shares) | 34,188 | 81,066 | |
| Shandong Gold Mining Co. Ltd.: | |||
| (A Shares) | 140,644 | 456,748 | |
| (H Shares) (b) | 333,500 | 624,788 | |
| Shandong Himile Mechanical Science & Technology Co. Ltd. (A Shares) | 23,400 | 102,890 | |
| Shandong Hualu Hengsheng Chemical Co. Ltd. (A Shares) | 66,800 | 293,852 | |
| Shandong Linglong Tyre Co. Ltd. (A Shares) | 44,700 | 122,369 | |
| Shandong Nanshan Aluminum Co. Ltd. (A Shares) | 367,800 | 155,896 | |
| Shandong Sun Paper Industry JSC Ltd. (A Shares) | 83,100 | 141,274 | |
| Shandong Weigao Medical Polymer Co. Ltd. (H Shares) | 1,307,200 | 1,213,332 | |
| Shanghai Aiko Solar Energy Co. Ltd. (A Shares) | 57,820 | 154,962 | |
| Shanghai Bairun Investment Holding Group Co. Ltd. (A Shares) | 32,660 | 117,581 | |
| Shanghai Baosight Software Co. Ltd. | 322,962 | 664,214 | |
| Shanghai Baosight Software Co. Ltd. (A Shares) | 65,068 | 379,500 | |
| Shanghai Construction Group Co. Ltd. (A Shares) | 285,794 | 102,788 | |
| Shanghai Electric Group Co. Ltd. (A Shares) (a) | 397,600 | 241,407 | |
| Shanghai Electric Power Co. Ltd. (A Shares) | 88,600 | 105,854 | |
| Shanghai Fosun Pharmaceutical (Group) Co. Ltd.: | |||
| (A Shares) | 90,900 | 353,584 | |
| (H Shares) | 235,500 | 543,405 | |
| Shanghai Friendess Electronic Technology Corp. Ltd. (A Shares) | 4,341 | 143,444 | |
| Shanghai Fudan Microelectronics Group Co. Ltd. (A Shares) | 15,590 | 103,245 | |
| Shanghai International Airport Co. Ltd. (A Shares) (a) | 38,600 | 196,406 | |
| Shanghai International Port Group Co. Ltd. (A Shares) | 205,143 | 140,239 | |
| Shanghai Jinjiang International Hotels Co. Ltd. (A Shares) | 28,400 | 127,537 | |
| Shanghai Junshi Biosciences Co. Ltd. (A Shares) (a) | 23,119 | 144,999 | |
| Shanghai Lingang Holdings Corp. Ltd. (A Shares) | 71,300 | 104,594 | |
| Shanghai M&G Stationery, Inc. (A Shares) | 28,300 | 149,964 | |
| Shanghai Moons' Electric Co. Ltd. (A Shares) | 12,500 | 112,688 | |
| Shanghai Pharmaceuticals Holding Co. Ltd.: | |||
| (A Shares) | 150,400 | 370,639 | |
| (H Shares) | 296,909 | 431,943 | |
| Shanghai Pudong Development Bank Co. Ltd. (A Shares) | 867,209 | 808,714 | |
| Shanghai Putailai New Energy Technology Co. Ltd. | 58,974 | 201,777 | |
| Shanghai RAAS Blood Products Co. Ltd. (A Shares) | 198,200 | 189,308 | |
| Shanghai Rural Commercial Bank Co. Ltd. (A Shares) | 273,800 | 223,104 | |
| Shanghai Yuyuan Tourist Mart Group Co. Ltd. | 116,900 | 103,868 | |
| Shanxi Coal International Energy Group Co. Ltd. (A Shares) | 54,400 | 121,239 | |
| Shanxi Lu'an Environmental Energy Development Co. Ltd. (A Shares) | 93,700 | 243,814 | |
| Shanxi Meijin Energy Co. Ltd. (A Shares) (a) | 131,800 | 126,397 | |
| Shanxi Securities Co. Ltd. (A Shares) | 113,460 | 87,164 | |
| Shanxi Taigang Stainless Steel Co. Ltd. (A Shares) | 183,800 | 98,269 | |
| Shanxi Xinghuacun Fen Wine Factory Co. Ltd. (A Shares) | 36,860 | 1,245,240 | |
| Shanxi Xishan Coal & Electricity Power Co. Ltd. (A Shares) | 157,890 | 186,784 | |
| Shede Spirits Co. Ltd. (A Shares) | 9,500 | 149,607 | |
| Shenergy Co. Ltd. (A Shares) | 141,900 | 114,278 | |
| Shenghe Resources Holding Co. Ltd. (A Shares) | 53,800 | 78,668 | |
| Shengyi Technology Co. Ltd. | 74,500 | 179,172 | |
| Shennan Circuits Co. Ltd. (A Shares) | 16,340 | 155,470 | |
| Shenwan Hongyuan Group Co. Ltd. (A Shares) | 656,300 | 393,852 | |
| Shenzhen Capchem Technology Co. Ltd. (A Shares) | 23,220 | 140,145 | |
| Shenzhen Dynanonic Co. Ltd. (A Shares) | 8,640 | 92,944 | |
| Shenzhen Energy Group Co. Ltd. (A Shares) | 144,660 | 122,196 | |
| Shenzhen Inovance Technology Co. Ltd. (A Shares) | 39,500 | 326,579 | |
| Shenzhen International Holdings Ltd. | 760,519 | 501,276 | |
| Shenzhen Kaifa Technology Co. Ltd. (A Shares) | 41,700 | 98,110 | |
| Shenzhen Kangtai Biological Products Co. Ltd. | 33,520 | 139,017 | |
| Shenzhen Kedali Industry Co. Ltd. | 7,800 | 96,899 | |
| Shenzhen Kstar Science & Technology Co. Ltd. (A Shares) | 18,200 | 64,930 | |
| Shenzhen Mindray Bio-Medical Electronics Co. Ltd. (A Shares) (a) | 37,100 | 1,450,366 | |
| Shenzhen New Industries Biomedical Engineering Co. Ltd. | 24,700 | 232,345 | |
| Shenzhen Overseas Chinese Town Co. Ltd. (A Shares) (a) | 253,400 | 125,255 | |
| Shenzhen Salubris Pharmaceuticals Co. Ltd. (A Shares) | 35,000 | 155,837 | |
| Shenzhen SC New Energy Technology Corp. (A Shares) | 10,900 | 108,817 | |
| Shenzhen Sed Industry Co. Ltd. (A Shares) | 33,700 | 88,307 | |
| Shenzhen Senior Technology Material Co. Ltd. (A Shares) | 38,758 | 81,435 | |
| Shenzhen Sunlord Electronics Co. Ltd. (A Shares) | 24,800 | 99,006 | |
| Shenzhen Transsion Holdings Co. Ltd. (A Shares) (a) | 24,352 | 447,602 | |
| Shenzhen YUTO Packaging Technology Co. Ltd. (A Shares) | 29,800 | 106,996 | |
| Shenzhou International Group Holdings Ltd. | 431,600 | 4,239,379 | |
| Shijiazhuang Yiling Pharmaceutical Co. Ltd. (A Shares) | 52,260 | 158,793 | |
| Shuangliang Eco-Energy Systems Ltd. (A Shares) | 46,200 | 59,142 | |
| Sichuan Chuantou Energy Co. Ltd. (A Shares) | 131,400 | 264,282 | |
| Sichuan Hebang Biotechnology Co. Ltd. (A Shares) | 286,600 | 93,296 | |
| Sichuan Kelun Pharmaceutical Co. Ltd. (A Shares) | 44,300 | 166,429 | |
| Sichuan New Energy Power Co. Ltd. (A Shares) (a) | 45,200 | 72,426 | |
| Sichuan Road & Bridge (Group) Co. Ltd. (A Shares) | 221,760 | 233,759 | |
| Sichuan Swellfun Co. Ltd. (A Shares) | 15,100 | 126,217 | |
| Sichuan Yahua Industrial Group Co. Ltd. (A Shares) | 37,200 | 71,662 | |
| Sieyuan Electric Co. Ltd. (A Shares) | 23,600 | 159,092 | |
| Silergy Corp. | 170,000 | 1,518,263 | |
| Sinolink Securities Co. Ltd. (A Shares) | 103,900 | 129,865 | |
| Sinoma International Engineering Co. Ltd. (A Shares) | 76,700 | 103,448 | |
| Sinoma Science & Technology Co. Ltd. (A Shares) | 52,200 | 123,429 | |
| Sinomine Resource Group Co. Ltd. (A Shares) | 20,272 | 103,658 | |
| Sinopec Shanghai Petrochemical Co. Ltd. (A Shares) (a) | 239,600 | 98,024 | |
| Sinopharm Group Co. Ltd. (H Shares) | 702,200 | 1,679,159 | |
| Sinotruk Hong Kong Ltd. | 361,500 | 680,886 | |
| SKSHU Paint Co. Ltd. (A Shares) | 16,548 | 134,727 | |
| Smoore International Holdings Ltd. (b)(c) | 939,000 | 723,648 | |
| Songcheng Performance Development Co. Ltd. (A Shares) | 80,160 | 120,399 | |
| Soochow Securities Co. Ltd. (A Shares) | 152,860 | 167,640 | |
| Southwest Securities Co. Ltd. (A Shares) | 202,500 | 113,523 | |
| Spring Airlines Co. Ltd. (A Shares) (a) | 31,000 | 232,098 | |
| StarPower Semiconductor Ltd. (A Shares) | 5,400 | 127,142 | |
| Sungrow Power Supply Co. Ltd. (A Shares) | 44,800 | 516,373 | |
| Sunny Optical Technology Group Co. Ltd. | 372,900 | 3,124,132 | |
| Sunresin New Materials Co. Ltd. (A Shares) | 14,450 | 107,406 | |
| Sunwoda Electronic Co. Ltd. (A Shares) | 52,400 | 115,435 | |
| SUPCON Technology Co. Ltd. (A Shares) | 22,680 | 135,357 | |
| Suzhou Dongshan Precision Manufacturing Co. Ltd. (A Shares) | 53,300 | 136,527 | |
| Suzhou Maxwell Technologies Co. Ltd. (A Shares) | 8,640 | 142,690 | |
| Suzhou TFC Optical Communication Co. Ltd. (A Shares) | 11,800 | 115,403 | |
| TAL Education Group ADR (a) | 230,447 | 2,021,020 | |
| Tangshan Jidong Cement Co. Ltd. A Shares | 84,900 | 83,023 | |
| TBEA Co. Ltd. (A Shares) | 146,700 | 280,809 | |
| TCL Technology Group Corp. (A Shares) | 556,570 | 299,337 | |
| TCL Zhonghuan Renewable Energy Technology Co. Ltd. (A Shares) | 119,375 | 301,444 | |
| Tencent Holdings Ltd. | 3,491,200 | 129,204,969 | |
| Tencent Music Entertainment Group ADR (a) | 392,051 | 2,846,290 | |
| Thunder Software Technology Co. Ltd. (A Shares) | 14,300 | 137,429 | |
| Tianjin 712 Communication & Broadcasting Co. Ltd. | 24,300 | 88,423 | |
| Tianma Microelectronics Co. Ltd. (A Shares) (a) | 81,700 | 109,482 | |
| Tianqi Lithium Corp. (A Shares) | 44,500 | 334,892 | |
| Tianshan Aluminum Group Co. Ltd. | 122,400 | 108,432 | |
| Tianshui Huatian Technology Co. Ltd. (A Shares) | 104,900 | 128,142 | |
| Tingyi (Cayman Islands) Holding Corp. | 1,045,000 | 1,387,041 | |
| Titan Wind Energy Suzhou Co. Ltd. (A Shares) (a) | 55,300 | 100,880 | |
| Tongcheng Travel Holdings Ltd. (a) | 652,000 | 1,245,614 | |
| TongFu Microelectronics Co. Ltd. (A Shares) | 48,200 | 135,356 | |
| Tongkun Group Co. Ltd. (A Shares) (a) | 74,600 | 147,387 | |
| Tongling Nonferrous Metals Group Co. Ltd. (A Shares) | 332,600 | 141,299 | |
| Tongwei Co. Ltd. (A Shares) | 135,600 | 506,616 | |
| Topchoice Medical Corp. (a) | 10,000 | 122,557 | |
| Topsports International Holdings Ltd. (b) | 978,000 | 822,441 | |
| TravelSky Technology Ltd. (H Shares) | 498,000 | 786,707 | |
| Trina Solar Co. Ltd. (A Shares) | 67,540 | 275,843 | |
| Trip.com Group Ltd. (a) | 286,393 | 9,760,739 | |
| Tsingtao Brewery Co. Ltd.: | |||
| (A Shares) | 19,800 | 226,308 | |
| (H Shares) | 334,000 | 2,532,899 | |
| Uni-President China Holdings Ltd. | 727,000 | 494,790 | |
| Unigroup Guoxin Microelectronics Co. Ltd. (a) | 25,439 | 262,330 | |
| Unisplendour Corp. Ltd. (A Shares) (a) | 85,810 | 230,299 | |
| Universal Scientific Industrial Shanghai Co. Ltd. (A Shares) | 53,600 | 106,482 | |
| Verisilicon Microelectronics Shanghai Co. Ltd. (A Shares) (a) | 13,758 | 100,415 | |
| Vipshop Holdings Ltd. ADR (a) | 177,788 | 2,535,257 | |
| Walvax Biotechnology Co. Ltd. (A Shares) | 51,800 | 164,937 | |
| Wanda Film Holding Co. Ltd. (A Shares) (a) | 67,400 | 115,127 | |
| Wanhua Chemical Group Co. Ltd. (A Shares) | 93,800 | 1,138,049 | |
| Want Want China Holdings Ltd. | 2,530,418 | 1,572,300 | |
| Weibo Corp. sponsored ADR | 42,609 | 504,064 | |
| Weichai Power Co. Ltd.: | |||
| (A Shares) | 172,100 | 327,144 | |
| (H Shares) | 1,086,000 | 1,625,549 | |
| Weihai Guangwei Composites Co. Ltd. (A Shares) | 25,440 | 89,116 | |
| Wens Foodstuffs Group Co. Ltd. (A Shares) | 196,700 | 505,279 | |
| Western Mining Co. Ltd. (A Shares) | 75,000 | 128,965 | |
| Western Securities Co. Ltd. (A Shares) | 139,500 | 127,005 | |
| Western Superconducting Technologies Co. Ltd. (A Shares) | 20,343 | 128,630 | |
| Will Semiconductor Ltd. | 36,430 | 549,754 | |
| Wingtech Technology Co. Ltd. (A Shares) (a) | 38,800 | 264,158 | |
| Wintime Energy Group Co. Ltd. (A Shares) (a) | 597,400 | 111,926 | |
| Wuchan Zhongda Group Co. Ltd. | 168,600 | 105,363 | |
| Wuhan Guide Infrared Co. Ltd. (A Shares) | 134,368 | 145,587 | |
| Wuliangye Yibin Co. Ltd. (A Shares) | 117,200 | 2,498,833 | |
| WUS Printed Circuit Kunshan Co. Ltd. (A Shares) | 58,860 | 157,647 | |
| WuXi AppTec Co. Ltd. | 85,284 | 1,008,540 | |
| WuXi AppTec Co. Ltd. (H Shares) (b)(c) | 185,268 | 2,226,281 | |
| Wuxi Autowell Technology Co. Ltd. (A Shares) | 4,855 | 90,718 | |
| Wuxi Biologics (Cayman), Inc. (a)(b) | 1,994,000 | 12,398,177 | |
| XCMG Construction Machinery Co. Ltd. (A Shares) | 346,200 | 271,196 | |
| Xiamen C&D, Inc. (A Shares) | 95,025 | 127,001 | |
| Xiamen Faratronic Co. Ltd. (A Shares) | 7,000 | 95,540 | |
| Xiamen Tungsten Co. Ltd. (A Shares) | 44,800 | 103,847 | |
| Xiaomi Corp. Class B (a)(b) | 8,003,400 | 14,350,289 | |
| Xinjiang Daqo New Energy Co. Ltd. (A Shares) | 53,526 | 261,445 | |
| Xinyi Solar Holdings Ltd. | 2,563,538 | 1,508,666 | |
| XPeng, Inc. Class A (a) | 540,550 | 3,928,056 | |
| XTEP International Holdings Ltd. | 765,500 | 695,941 | |
| Yadea Group Holdings Ltd. (b) | 644,000 | 1,175,532 | |
| Yangzhou Yangjie Electronic Technology Co. Ltd. (A Shares) | 16,300 | 84,649 | |
| Yankuang Energy Group Co. Ltd.: | |||
| (A Shares) | 124,500 | 332,621 | |
| (H Shares) | 1,186,000 | 2,059,796 | |
| Yantai Jereh Oilfield Services (A Shares) | 31,100 | 121,628 | |
| Yealink Network Technology Corp. Ltd. | 40,670 | 185,582 | |
| Yifeng Pharmacy Chain Co. Ltd. | 31,570 | 141,449 | |
| Yihai International Holding Ltd. | 276,000 | 502,292 | |
| Yihai Kerry Arawana Holdings Co. Ltd. (A Shares) | 45,000 | 215,242 | |
| Yintai Gold Co. Ltd. (A Shares) | 86,880 | 160,770 | |
| Yonghui Superstores Co. Ltd. (A Shares) (a) | 270,500 | 113,897 | |
| YongXing Special Materials Technology Co. Ltd. (A Shares) | 16,770 | 114,718 | |
| Yonyou Network Technology Co. Ltd. (A Shares) | 102,820 | 230,343 | |
| Youngor Group Co. Ltd. (A Shares) | 135,387 | 124,963 | |
| YTO Express Group Co. Ltd. (A Shares) | 107,400 | 199,483 | |
| Yuan Longping High-tech Agriculture Co. Ltd. (A Shares) (a) | 40,700 | 91,741 | |
| Yuexiu Property Co. Ltd. | 836,380 | 869,967 | |
| Yum China Holdings, Inc. | 218,086 | 11,462,600 | |
| Yunda Holding Co. Ltd. (A Shares) | 90,460 | 112,773 | |
| Yunnan Aluminium Co. Ltd. (A Shares) | 109,200 | 207,624 | |
| Yunnan Baiyao Group Co. Ltd. (A Shares) | 53,660 | 372,921 | |
| Yunnan Botanee Bio-Technology Group Co., Ltd. (A Shares) | 12,500 | 134,819 | |
| Yunnan Chihong Zinc & Germanium Co. Ltd. (A Shares) | 142,500 | 100,798 | |
| Yunnan Energy New Material Co. Ltd. | 28,400 | 260,723 | |
| Yunnan Tin Co. Ltd. (A Shares) | 49,600 | 95,831 | |
| Yunnan Yuntianhua Co. Ltd. (Series A) | 57,100 | 130,045 | |
| Yutong Bus Co. Ltd. | 63,900 | 119,160 | |
| Zai Lab Ltd. (a) | 491,220 | 1,253,621 | |
| Zangge Mining Co. Ltd. (Series A) | 48,900 | 149,683 | |
| Zhangzhou Pientzehuang Pharmaceutical Co. Ltd. (A Shares) | 18,200 | 622,951 | |
| Zhaojin Mining Industry Co. Ltd. (H Shares) | 683,500 | 847,368 | |
| Zhefu Holding Group Co. Ltd. (A Shares) | 174,400 | 88,213 | |
| Zhejiang Century Huatong Group Co. Ltd. (A Shares) (a) | 232,310 | 187,738 | |
| Zhejiang China Commodities City Group Co. Ltd. (A Shares) | 169,500 | 180,379 | |
| Zhejiang Chint Electric Co. Ltd. (A Shares) | 66,500 | 210,171 | |
| Zhejiang Dahua Technology Co. Ltd. (A Shares) (a) | 99,800 | 278,630 | |
| Zhejiang Dingli Machinery Co. Ltd. (A Shares) | 15,740 | 117,241 | |
| Zhejiang Expressway Co. Ltd. (H Shares) | 672,000 | 505,838 | |
| Zhejiang Huahai Pharmaceutical Co. Ltd. (A Shares) | 45,490 | 100,604 | |
| Zhejiang Huayou Cobalt Co. Ltd. (A Shares) | 47,215 | 237,677 | |
| Zhejiang Jingsheng Mechanical & Electrical Co. Ltd. (A Shares) | 40,600 | 241,487 | |
| Zhejiang Jiuzhou Pharmaceutical Co. Ltd. (A Shares) | 27,700 | 112,591 | |
| Zhejiang Juhua Co. Ltd. (A Shares) | 84,300 | 174,561 | |
| Zhejiang Longsheng Group Co. Ltd. (A Shares) | 84,600 | 102,946 | |
| Zhejiang NHU Co. Ltd. (A Shares) | 96,436 | 213,272 | |
| Zhejiang Sanhua Intelligent Controls Co. Ltd. (A Shares) | 53,400 | 195,480 | |
| Zhejiang Supor Cookware Co. Ltd. | 16,400 | 112,479 | |
| Zhejiang Weiming Enviroment Protection Co. Ltd. (A Shares) | 52,130 | 127,892 | |
| Zhejiang Weixing New Building Materials Co. Ltd. (A Shares) | 50,300 | 113,399 | |
| Zhejiang Zheneng Electric Power Co. Ltd. (A Shares) (a) | 330,300 | 207,712 | |
| Zheshang Securities Co. Ltd. | 122,400 | 168,607 | |
| ZhongAn Online P & C Insurance Co. Ltd. (H Shares) (a)(b) | 372,300 | 1,020,332 | |
| Zhongji Innolight Co. Ltd. (A Shares) | 25,000 | 301,236 | |
| Zhongjin Gold Co. Ltd. (A Shares) | 143,300 | 213,081 | |
| Zhongsheng Group Holdings Ltd. Class H | 438,600 | 1,012,857 | |
| Zhongtai Securities Co. Ltd. (A Shares) | 198,700 | 194,534 | |
| Zhuzhou CRRC Times Electric Co. Ltd.: | |||
| (A Shares) | 15,617 | 82,686 | |
| (H Shares) | 285,627 | 921,823 | |
| Zhuzhou Kibing Group Co. Ltd. (A Shares) | 83,600 | 91,216 | |
| Zibo Qixiang Tengda Chemical Co. Ltd. (A Shares) | 72,500 | 58,003 | |
| Zijin Mining Group Co. Ltd.: | |||
| (A Shares) (a) | 366,600 | 621,899 | |
| (H Shares) | 3,148,000 | 4,869,679 | |
| Zoomlion Heavy Industry Science and Technology Co. Ltd. (A Shares) | 193,500 | 169,830 | |
| ZTE Corp.: | |||
| (A Shares) | 139,200 | 497,803 | |
| (H Shares) | 372,800 | 828,458 | |
| ZTO Express, Inc. sponsored ADR | 223,898 | 5,277,276 | |
TOTAL CHINA | 972,223,200 | ||
| Colombia - 0.1% | |||
| Bancolombia SA | 123,210 | 878,575 | |
| Interconexion Electrica SA ESP | 226,854 | 799,170 | |
TOTAL COLOMBIA | 1,677,745 | ||
| Czech Republic - 0.2% | |||
| CEZ A/S (c) | 84,565 | 3,618,465 | |
| Komercni Banka A/S | 43,215 | 1,265,637 | |
| MONETA Money Bank A/S (b) | 180,736 | 698,237 | |
TOTAL CZECH REPUBLIC | 5,582,339 | ||
| Egypt - 0.1% | |||
| Commercial International Bank SAE | 1,343,412 | 2,621,663 | |
| Eastern Co. SAE | 554,691 | 471,734 | |
| EFG-Hermes Holding SAE | 589,184 | 318,169 | |
TOTAL EGYPT | 3,411,566 | ||
| Greece - 0.4% | |||
| Alpha Bank SA (a) | 1,170,528 | 1,746,335 | |
| Eurobank Ergasias Services and Holdings SA (a) | 1,358,384 | 2,216,326 | |
| Ff Group (a)(d) | 1,944 | 0 | |
| Hellenic Telecommunications Organization SA | 102,399 | 1,433,449 | |
| Jumbo SA | 60,979 | 1,604,014 | |
| Motor Oil (HELLAS) Corinth Refineries SA | 34,727 | 826,754 | |
| Mytilineos SA | 56,169 | 2,078,946 | |
| National Bank of Greece SA (a) | 286,892 | 1,639,226 | |
| OPAP SA | 97,924 | 1,657,814 | |
| Piraeus Financial Holdings SA (a) | 358,975 | 1,059,730 | |
| Public Power Corp. of Greece (a) | 108,370 | 1,104,236 | |
TOTAL GREECE | 15,366,830 | ||
| Hong Kong - 0.1% | |||
| Kingboard Laminates Holdings Ltd. | 497,500 | 466,551 | |
| Nine Dragons Paper (Holdings) Ltd. | 875,000 | 498,120 | |
| Orient Overseas International Ltd. | 70,000 | 882,686 | |
| Sino Biopharmaceutical Ltd. | 5,435,750 | 2,111,676 | |
| Vinda International Holdings Ltd. (c) | 190,000 | 469,534 | |
TOTAL HONG KONG | 4,428,567 | ||
| Hungary - 0.2% | |||
| MOL Hungarian Oil and Gas PLC Series A (For. Reg.) | 236,921 | 1,885,144 | |
| OTP Bank PLC | 124,498 | 4,632,727 | |
| Richter Gedeon PLC | 74,366 | 1,743,677 | |
TOTAL HUNGARY | 8,261,548 | ||
| India - 14.8% | |||
| ABB India Ltd. | 28,208 | 1,390,822 | |
| Adani Enterprises Ltd. | 88,823 | 2,448,521 | |
| Adani Green Energy Ltd. (a) | 165,414 | 1,826,975 | |
| Adani Ports & Special Economic Zone Ltd. | 275,039 | 2,593,898 | |
| Adani Power Ltd. (a) | 404,475 | 1,761,927 | |
| Ambuja Cements Ltd. | 313,498 | 1,598,902 | |
| Apollo Hospitals Enterprise Ltd. | 52,620 | 3,045,956 | |
| Ashok Leyland Ltd. | 761,178 | 1,534,212 | |
| Asian Paints Ltd. | 200,191 | 7,208,982 | |
| Astral Ltd. | 62,691 | 1,393,182 | |
| AU Small Finance Bank Ltd. (b) | 87,183 | 700,510 | |
| Aurobindo Pharma Ltd. | 136,634 | 1,393,840 | |
| Avenue Supermarts Ltd. (a)(b) | 85,139 | 3,716,147 | |
| Axis Bank Ltd. | 1,187,360 | 14,006,463 | |
| Bajaj Auto Ltd. | 35,427 | 2,259,247 | |
| Bajaj Finance Ltd. | 142,192 | 12,796,247 | |
| Bajaj Finserv Ltd. | 197,469 | 3,722,307 | |
| Bajaj Holdings & Investment Ltd. | 13,848 | 1,151,757 | |
| Balkrishna Industries Ltd. | 40,013 | 1,226,907 | |
| Bandhan Bank Ltd. (b) | 378,616 | 974,637 | |
| Bank of Baroda | 535,979 | 1,263,420 | |
| Berger Paints India Ltd. | 155,176 | 1,040,875 | |
| Bharat Electronics Ltd. | 1,897,412 | 3,038,925 | |
| Bharat Forge Ltd. | 133,085 | 1,629,611 | |
| Bharat Petroleum Corp. Ltd. | 393,499 | 1,649,119 | |
| Bharti Airtel Ltd. | 1,166,259 | 12,804,769 | |
| Britannia Industries Ltd. | 56,735 | 3,017,140 | |
| Cg Power & Industrial Soluti | 326,267 | 1,527,486 | |
| Cholamandalam Investment and Finance Co. Ltd. | 214,400 | 2,929,062 | |
| Cipla Ltd./India (a) | 273,130 | 3,936,034 | |
| Coal India Ltd. | 802,253 | 3,027,393 | |
| Colgate-Palmolive Ltd. | 65,267 | 1,656,588 | |
| Container Corp. of India Ltd. | 141,106 | 1,166,479 | |
| Cummins India Ltd. | 72,364 | 1,457,151 | |
| Dabur India Ltd. | 331,226 | 2,103,528 | |
| Divi's Laboratories Ltd. | 62,399 | 2,538,668 | |
| DLF Ltd. | 319,326 | 2,162,598 | |
| Dr. Reddy's Laboratories Ltd. | 56,314 | 3,633,684 | |
| Eicher Motors Ltd. | 71,406 | 2,825,269 | |
| GAIL India Ltd. | 1,202,311 | 1,725,790 | |
| Godrej Consumer Products Ltd. | 215,748 | 2,569,882 | |
| Godrej Properties Ltd. (a) | 64,133 | 1,279,382 | |
| Grasim Industries Ltd. | 138,284 | 3,133,127 | |
| Havells India Ltd. | 134,279 | 2,009,769 | |
| HCL Technologies Ltd. | 493,618 | 7,569,075 | |
| HDFC Asset Management Co. Ltd. (b) | 44,360 | 1,456,669 | |
| HDFC Bank Ltd. | 1,452,338 | 25,763,409 | |
| HDFC Standard Life Insurance Co. Ltd. (b) | 503,029 | 3,735,727 | |
| Hero Motocorp Ltd. | 57,344 | 2,127,369 | |
| Hindalco Industries Ltd. | 642,661 | 3,546,275 | |
| Hindustan Aeronautics Ltd. | 86,722 | 1,897,325 | |
| Hindustan Petroleum Corp. Ltd. (a) | 292,736 | 870,659 | |
| Hindustan Unilever Ltd. | 430,157 | 12,833,527 | |
| ICICI Bank Ltd. | 2,697,260 | 29,665,903 | |
| ICICI Lombard General Insurance Co. Ltd. (b) | 125,023 | 2,062,819 | |
| ICICI Prudential Life Insurance Co. Ltd. (b) | 186,677 | 1,177,647 | |
| IDFC Bank Ltd. (a) | 1,802,339 | 1,790,546 | |
| Indian Oil Corp. Ltd. | 1,455,606 | 1,567,567 | |
| Indian Railway Catering & Tourism Corp. Ltd. | 126,876 | 1,013,813 | |
| Indraprastha Gas Ltd. | 166,208 | 763,261 | |
| Info Edge India Ltd. | 36,850 | 1,807,879 | |
| Infosys Ltd. | 1,729,389 | 28,432,677 | |
| InterGlobe Aviation Ltd. (a)(b) | 69,557 | 2,051,079 | |
| ITC Ltd. | 1,536,751 | 7,908,137 | |
| Jindal Steel & Power Ltd. | 186,796 | 1,421,873 | |
| Jio Financial Services Ltd. | 1,586,870 | 4,210,345 | |
| JSW Steel Ltd. (a) | 315,245 | 2,788,484 | |
| Jubilant Foodworks Ltd. | 206,368 | 1,241,367 | |
| Kotak Mahindra Bank Ltd. | 569,321 | 11,898,021 | |
| Larsen & Toubro Ltd. | 358,405 | 12,608,848 | |
| Ltimindtree Ltd. (b) | 46,287 | 2,815,301 | |
| Lupin Ltd. | 106,152 | 1,438,041 | |
| Mahindra & Mahindra Ltd. | 485,274 | 8,502,037 | |
| Marico Ltd. | 271,671 | 1,750,083 | |
| Maruti Suzuki India Ltd. | 70,868 | 8,847,133 | |
| Max Healthcare Institute Ltd. | 405,373 | 2,793,554 | |
| Mphasis BFL Ltd. | 39,360 | 1,004,573 | |
| MRF Ltd. | 992 | 1,290,316 | |
| Muthoot Finance Ltd. | 63,238 | 986,421 | |
| Nestle India Ltd. | 17,704 | 5,153,681 | |
| NTPC Ltd. | 2,281,397 | 6,461,625 | |
| Oil & Natural Gas Corp. Ltd. | 1,625,900 | 3,637,009 | |
| Page Industries Ltd. | 3,201 | 1,454,053 | |
| Petronet LNG Ltd. | 390,238 | 935,107 | |
| PI Industries Ltd. | 43,738 | 1,785,801 | |
| Pidilite Industries Ltd. | 80,316 | 2,370,625 | |
| Power Finance Corp. Ltd. | 675,551 | 2,000,046 | |
| Power Grid Corp. of India Ltd. | 2,403,413 | 5,835,524 | |
| REC Ltd. | 612,295 | 2,115,772 | |
| Reliance Industries Ltd. | 1,585,291 | 43,579,042 | |
| Samvardhana Motherson International Ltd. | 1,226,874 | 1,354,591 | |
| SBI Cards & Payment Services Ltd. | 149,551 | 1,339,781 | |
| SBI Life Insurance Co. Ltd. (b) | 233,902 | 3,840,523 | |
| Shree Cement Ltd. | 4,784 | 1,474,052 | |
| Shriram Transport Finance Co. Ltd. | 146,664 | 3,308,513 | |
| Siemens Ltd. | 46,465 | 1,858,552 | |
| Sona Blw Precision Forgings Ltd. (b) | 213,266 | 1,387,515 | |
| SRF Ltd. | 77,872 | 2,052,775 | |
| State Bank of India | 928,291 | 6,305,940 | |
| Sun Pharmaceutical Industries Ltd. | 498,567 | 6,516,405 | |
| Supreme Industries Ltd. | 33,254 | 1,728,588 | |
| Tata Consultancy Services Ltd. | 476,231 | 19,273,814 | |
| Tata Consumer Products Ltd. | 292,978 | 3,169,118 | |
| Tata Elxsi Ltd. | 17,847 | 1,634,335 | |
| Tata Motors Ltd. | 863,409 | 6,519,403 | |
| Tata Power Co. Ltd./The | 741,589 | 2,133,003 | |
| Tata Steel Ltd. | 3,834,304 | 5,469,875 | |
| Tech Mahindra Ltd. | 279,479 | 3,807,644 | |
| The Indian Hotels Co. Ltd. | 444,033 | 2,044,502 | |
| Titan Co. Ltd. | 184,432 | 7,068,241 | |
| Torrent Pharmaceuticals Ltd. | 52,242 | 1,207,236 | |
| Trent Ltd. | 94,380 | 2,442,243 | |
| Tube Investments of India Ltd. | 55,234 | 2,088,972 | |
| Tvs Motor Co. Ltd. | 122,994 | 2,349,641 | |
| Ultratech Cement Ltd. | 60,542 | 6,125,275 | |
| United Spirits Ltd. (a) | 154,414 | 1,914,356 | |
| UPL Ltd. | 237,676 | 1,542,762 | |
| Varun Beverages Ltd. | 237,760 | 2,594,341 | |
| Vedanta Ltd. | 388,848 | 1,011,610 | |
| Wipro Ltd. | 679,440 | 3,118,193 | |
| Yes Bank Ltd. (a) | 6,769,711 | 1,297,068 | |
| Zomato Ltd. (a) | 2,237,353 | 2,829,019 | |
TOTAL INDIA | 518,651,119 | ||
| Indonesia - 1.8% | |||
| Indofood Sukses Makmur Tbk PT | 2,316,900 | 969,979 | |
| PT Adaro Energy Indonesia Tbk | 7,497,700 | 1,209,748 | |
| PT Aneka Tambang Tbk | 4,586,900 | 491,456 | |
| PT Astra International Tbk | 10,565,559 | 3,843,535 | |
| PT Bank Central Asia Tbk | 28,937,050 | 15,942,019 | |
| PT Bank Mandiri (Persero) Tbk | 19,468,196 | 6,955,054 | |
| PT Bank Negara Indonesia (Persero) Tbk | 7,841,400 | 2,366,429 | |
| PT Bank Rakyat Indonesia (Persero) Tbk | 35,549,727 | 11,115,827 | |
| PT Barito Pacific Tbk | 14,783,231 | 1,047,594 | |
| PT Charoen Pokphand Indonesia Tbk (a) | 3,880,400 | 1,429,580 | |
| PT GoTo Gojek Tokopedia Tbk (a) | 432,156,000 | 1,634,953 | |
| PT Indah Kiat Pulp & Paper Tbk | 1,416,400 | 856,076 | |
| PT Indofood CBP Sukses Makmur Tbk | 1,234,700 | 804,744 | |
| PT Kalbe Farma Tbk | 11,011,800 | 1,171,155 | |
| PT Merdeka Copper Gold Tbk (a) | 6,304,786 | 884,283 | |
| PT Sarana Menara Nusantara Tbk | 10,667,200 | 598,262 | |
| PT Semen Indonesia (Persero) Tbk | 1,798,832 | 691,207 | |
| PT Sumber Alfaria Trijaya Tbk | 8,760,800 | 1,594,437 | |
| PT Telkom Indonesia Persero Tbk | 25,886,165 | 5,674,657 | |
| PT Unilever Indonesia Tbk | 3,943,295 | 899,105 | |
| PT United Tractors Tbk | 777,900 | 1,231,033 | |
| PT Vale Indonesia Tbk | 1,342,100 | 418,265 | |
TOTAL INDONESIA | 61,829,398 | ||
| Korea (South) - 10.4% | |||
| AMOREPACIFIC Corp. | 15,375 | 1,441,052 | |
| BGF Retail Co. Ltd. | 4,600 | 469,706 | |
| Celltrion Healthcare Co. Ltd. | 55,816 | 2,756,879 | |
| Celltrion Pharm, Inc. | 9,263 | 435,156 | |
| Celltrion, Inc. | 57,474 | 6,373,222 | |
| CJ CheilJedang Corp. | 4,336 | 907,031 | |
| Cosmo AM&T Co. Ltd. (a) | 12,597 | 1,309,562 | |
| Cosmo AM&T Co. Ltd. rights 11/7/23 (a) | 608 | 7,462 | |
| Coway Co. Ltd. | 29,338 | 937,448 | |
| Db Insurance Co. Ltd. | 23,901 | 1,552,668 | |
| Doosan Bobcat, Inc. | 28,628 | 821,292 | |
| Doosan Heavy Industries & Construction Co. Ltd. (a) | 235,529 | 2,343,328 | |
| Ecopro BM Co. Ltd. (c) | 25,483 | 3,722,569 | |
| Ecopro Co. Ltd. (c) | 10,403 | 4,799,832 | |
| F&F Co. Ltd. | 8,982 | 621,747 | |
| GS Holdings Corp. | 23,502 | 685,285 | |
| Hana Financial Group, Inc. | 153,667 | 4,461,519 | |
| Hankook Tire Co. Ltd. | 38,401 | 1,087,880 | |
| Hanmi Pharm Co. Ltd. | 3,591 | 749,717 | |
| Hanmi Semiconductor Co. Ltd. | 22,871 | 894,813 | |
| Hanon Systems | 96,909 | 493,768 | |
| Hanwha Aerospace Co. Ltd. | 18,423 | 1,383,007 | |
| Hanwha Ocean Co. Ltd. (a)(c) | 22,479 | 392,536 | |
| Hanwha Ocean Co. Ltd. rights 11/9/23 (a) | 7,420 | 9,600 | |
| Hanwha Solutions Corp. (a) | 53,799 | 1,144,233 | |
| HD Hyundai Co. Ltd. | 22,294 | 948,147 | |
| HD Hyundai Heavy Industries Co. Ltd. (a) | 11,513 | 871,633 | |
| HD Korea Shipbuilding & Offshore Engineering Co. Ltd. (a) | 22,063 | 1,477,860 | |
| HLB, Inc. | 60,626 | 1,304,302 | |
| HMM Co. Ltd. | 128,307 | 1,387,671 | |
| Hotel Shilla Co. | 16,470 | 760,951 | |
| HYBE Co. Ltd. (a) | 9,746 | 1,584,917 | |
| Hyundai Engineering & Construction Co. Ltd. | 40,884 | 1,012,452 | |
| Hyundai Glovis Co. Ltd. | 9,797 | 1,241,503 | |
| Hyundai Mipo Dockyard Co. Ltd. (a) | 12,521 | 644,281 | |
| Hyundai Mobis | 31,877 | 4,929,306 | |
| Hyundai Motor Co. Ltd. | 71,486 | 8,992,753 | |
| Hyundai Steel Co. | 45,187 | 1,097,247 | |
| Industrial Bank of Korea | 140,986 | 1,165,067 | |
| JYP Entertainment Corp. | 14,803 | 1,125,130 | |
| Kakao Corp. | 161,691 | 4,550,639 | |
| Kakao Games Corp. (a) | 18,818 | 326,133 | |
| Kakao Pay Corp. (a) | 13,927 | 354,522 | |
| KakaoBank Corp. | 86,837 | 1,173,446 | |
| Kangwon Land, Inc. | 51,802 | 563,213 | |
| KB Financial Group, Inc. | 199,472 | 7,592,256 | |
| Kia Corp. | 136,100 | 7,764,064 | |
| Korea Aerospace Industries Ltd. | 38,056 | 1,250,366 | |
| Korea Electric Power Corp. (a) | 130,361 | 1,629,300 | |
| Korea Investment Holdings Co. Ltd. | 20,996 | 783,743 | |
| Korea Zinc Co. Ltd. | 4,163 | 1,444,575 | |
| Korean Air Lines Co. Ltd. | 94,921 | 1,442,099 | |
| KRAFTON, Inc. (a) | 15,071 | 1,831,905 | |
| KT Corp. | 34,217 | 826,557 | |
| KT&G Corp. | 52,808 | 3,326,364 | |
| Kumho Petro Chemical Co. Ltd. | 9,199 | 863,301 | |
| L&F Co. Ltd. (c) | 13,220 | 1,284,042 | |
| LG Chemical Ltd. | 25,804 | 8,444,523 | |
| LG Corp. | 49,258 | 2,815,300 | |
| LG Display Co. Ltd. (a) | 120,399 | 1,087,842 | |
| LG Electronics, Inc. | 55,503 | 4,111,276 | |
| LG Energy Solution (a) | 24,431 | 6,993,223 | |
| LG H & H Co. Ltd. | 4,546 | 1,064,204 | |
| LG Innotek Co. Ltd. | 7,429 | 1,231,182 | |
| LG Uplus Corp. | 111,648 | 835,529 | |
| Lotte Chemical Corp. | 10,037 | 1,088,372 | |
| Lotte Energy Materials Corp. | 12,058 | 344,922 | |
| Meritz Financial Holdings Co. | 53,934 | 2,004,320 | |
| Mirae Asset Securities Co. Ltd. | 139,874 | 684,186 | |
| NAVER Corp. | 68,316 | 9,536,636 | |
| NCSOFT Corp. | 7,416 | 1,279,340 | |
| Netmarble Corp. (a)(b) | 10,867 | 311,519 | |
| NH Investment & Securities Co. Ltd. | 75,235 | 538,968 | |
| Orion Corp./Republic of Korea | 12,445 | 1,099,814 | |
| Pan Ocean Co., Ltd. (Korea) | 143,933 | 458,841 | |
| Pearl Abyss Corp. (a) | 16,652 | 609,153 | |
| POSCO | 37,448 | 11,446,783 | |
| POSCO Chemtech Co. Ltd. (c) | 16,150 | 2,841,783 | |
| Posco International Corp. | 27,452 | 1,022,446 | |
| S-Oil Corp. | 23,308 | 1,148,605 | |
| Samsung Biologics Co. Ltd. (a)(b) | 9,279 | 4,870,803 | |
| Samsung C&T Corp. | 43,855 | 3,462,288 | |
| Samsung Electro-Mechanics Co. Ltd. | 29,189 | 2,694,847 | |
| Samsung Electronics Co. Ltd. | 2,494,618 | 123,985,241 | |
| Samsung Engineering Co. Ltd. (a) | 81,766 | 1,438,960 | |
| Samsung Fire & Marine Insurance Co. Ltd. | 15,997 | 3,054,453 | |
| Samsung Heavy Industries Co. Ltd. (a) | 343,428 | 1,738,421 | |
| Samsung Life Insurance Co. Ltd. | 41,450 | 2,215,915 | |
| Samsung SDI Co. Ltd. | 28,653 | 9,059,090 | |
| Samsung SDS Co. Ltd. | 20,157 | 2,063,128 | |
| Samsung Securities Co. Ltd. | 31,606 | 826,735 | |
| Shinhan Financial Group Co. Ltd. | 228,803 | 5,872,484 | |
| SK Biopharmaceuticals Co. Ltd. (a) | 16,261 | 908,657 | |
| SK Bioscience Co. Ltd. (a)(c) | 14,234 | 639,684 | |
| SK Hynix, Inc. | 284,464 | 24,666,838 | |
| SK IE Technology Co. Ltd. (a)(b) | 13,000 | 572,384 | |
| SK Innovation Co., Ltd. | 33,041 | 3,005,725 | |
| SK Square Co. Ltd. (a) | 51,626 | 1,628,857 | |
| SK, Inc. | 19,033 | 2,003,693 | |
| SKC Co. Ltd. (c) | 9,899 | 578,052 | |
| Woori Financial Group, Inc. | 315,244 | 2,780,345 | |
| Yuhan Corp. | 27,973 | 1,190,671 | |
TOTAL KOREA (SOUTH) | 365,607,095 | ||
| Kuwait - 0.8% | |||
| Agility Public Warehousing Co. KSC (a) | 823,815 | 1,400,312 | |
| Boubyan Bank KSC | 714,445 | 1,352,932 | |
| Gulf Bank | 943,220 | 722,389 | |
| Gulf Bank rights 11/12/23 (a) | 73,219 | 1,514 | |
| Kuwait Finance House KSCP | 4,205,791 | 9,296,368 | |
| Mabanee Co. SAKC | 329,816 | 879,296 | |
| Mobile Telecommunication Co. | 1,028,095 | 1,598,041 | |
| National Bank of Kuwait | 3,906,723 | 11,071,889 | |
TOTAL KUWAIT | 26,322,741 | ||
| Luxembourg - 0.0% | |||
| Reinet Investments SCA | 73,660 | 1,530,547 | |
| Malaysia - 1.4% | |||
| AMMB Holdings Bhd | 852,100 | 683,591 | |
| Axiata Group Bhd | 1,442,998 | 660,230 | |
| CelcomDigi Bhd | 1,851,400 | 1,658,496 | |
| CIMB Group Holdings Bhd | 3,344,531 | 4,007,072 | |
| Dialog Group Bhd | 1,793,865 | 809,376 | |
| Gamuda Bhd | 970,317 | 953,467 | |
| Genting Bhd | 1,094,800 | 926,402 | |
| Genting Malaysia Bhd | 1,522,840 | 773,843 | |
| Hong Leong Bank Bhd | 340,900 | 1,388,077 | |
| Hong Leong Credit Bhd | 120,200 | 446,995 | |
| IHH Healthcare Bhd | 1,160,587 | 1,460,940 | |
| Inari Amertron Bhd | 1,376,600 | 825,351 | |
| IOI Corp. Bhd | 1,320,100 | 1,089,203 | |
| Kuala Lumpur Kepong Bhd | 253,328 | 1,169,400 | |
| Malayan Banking Bhd | 2,828,797 | 5,356,491 | |
| Malaysia Airports Holdings Bhd | 446,580 | 692,873 | |
| Maxis Bhd | 1,237,700 | 1,029,134 | |
| MISC Bhd | 738,900 | 1,124,885 | |
| MR DIY Group M Sdn Bhd (b) | 1,519,150 | 471,975 | |
| Nestle (Malaysia) Bhd | 37,600 | 977,153 | |
| Petronas Chemicals Group Bhd | 1,470,400 | 2,267,367 | |
| Petronas Dagangan Bhd | 155,126 | 750,991 | |
| Petronas Gas Bhd | 418,700 | 1,525,124 | |
| PPB Group Bhd | 337,540 | 1,085,103 | |
| Press Metal Aluminium Holdings | 1,948,500 | 2,014,119 | |
| Public Bank Bhd | 7,597,685 | 6,635,832 | |
| QL Resources Bhd | 586,500 | 680,694 | |
| RHB Bank Bhd | 794,178 | 930,223 | |
| Sime Darby Bhd | 1,423,949 | 684,375 | |
| Sime Darby Plantation Bhd | 1,086,996 | 990,938 | |
| Telekom Malaysia Bhd | 603,847 | 642,811 | |
| Tenaga Nasional Bhd | 1,356,072 | 2,818,007 | |
TOTAL MALAYSIA | 47,530,538 | ||
| Mexico - 2.3% | |||
| Alfa SA de CV Series A | 1,630,200 | 1,016,332 | |
| America Movil S.A.B. de CV Series L | 9,878,247 | 8,158,361 | |
| Arca Continental S.A.B. de CV | 274,900 | 2,465,089 | |
| Banco del Bajio SA (b) | 402,200 | 1,230,983 | |
| CEMEX S.A.B. de CV unit (a) | 7,895,686 | 4,742,930 | |
| Coca-Cola FEMSA S.A.B. de CV unit | 275,384 | 2,089,399 | |
| Fibra Uno Administracion SA de CV | 1,517,383 | 2,303,554 | |
| Fomento Economico Mexicano S.A.B. de CV unit | 1,014,391 | 11,481,315 | |
| Gruma S.A.B. de CV Series B | 96,135 | 1,672,884 | |
| Grupo Aeroportuario del Pacifico S.A.B. de CV Series B | 203,527 | 2,374,162 | |
| Grupo Aeroportuario del Sureste S.A.B. de CV Series B | 100,985 | 2,176,367 | |
| Grupo Bimbo S.A.B. de CV Series A | 690,970 | 2,812,323 | |
| Grupo Carso SA de CV Series A1 | 292,100 | 1,862,545 | |
| Grupo Financiero Banorte S.A.B. de CV Series O | 1,350,481 | 10,960,252 | |
| Grupo Financiero Inbursa S.A.B. de CV Series O (a) | 949,600 | 1,958,297 | |
| Grupo Mexico SA de CV Series B | 1,621,554 | 6,613,393 | |
| Grupo Televisa SA de CV | 1,214,493 | 557,095 | |
| Industrias Penoles SA de CV (a) | 103,620 | 1,156,781 | |
| Kimberly-Clark de Mexico SA de CV Series A | 772,427 | 1,415,981 | |
| Operadora de Sites Mexicanos, SA de CV | 664,300 | 564,852 | |
| Orbia Advance Corp. S.A.B. de CV | 523,820 | 848,676 | |
| Promotora y Operadora de Infraestructura S.A.B. de CV | 98,805 | 808,788 | |
| Southern Copper Corp. | 44,838 | 3,179,014 | |
| Wal-Mart de Mexico SA de CV Series V | 2,731,756 | 9,777,592 | |
TOTAL MEXICO | 82,226,965 | ||
| Peru - 0.2% | |||
| Compania de Minas Buenaventura SAA sponsored ADR | 117,104 | 948,542 | |
| Credicorp Ltd. (United States) | 35,521 | 4,438,704 | |
TOTAL PERU | 5,387,246 | ||
| Philippines - 0.6% | |||
| Aboitiz Equity Ventures, Inc. | 881,040 | 709,603 | |
| Ayala Corp. | 130,196 | 1,388,721 | |
| Ayala Land, Inc. | 3,482,413 | 1,709,459 | |
| Bank of the Philippine Islands (BPI) | 1,033,628 | 1,828,234 | |
| BDO Unibank, Inc. | 1,237,255 | 2,778,418 | |
| International Container Terminal Services, Inc. | 530,460 | 1,874,972 | |
| JG Summit Holdings, Inc. | 1,373,213 | 888,607 | |
| Jollibee Food Corp. | 233,813 | 843,181 | |
| Manila Electric Co. | 144,800 | 904,279 | |
| Metropolitan Bank & Trust Co. | 946,282 | 870,494 | |
| PLDT, Inc. | 40,510 | 863,565 | |
| SM Investments Corp. | 128,010 | 1,804,909 | |
| SM Prime Holdings, Inc. | 5,212,500 | 2,751,283 | |
| Universal Robina Corp. | 461,188 | 886,984 | |
TOTAL PHILIPPINES | 20,102,709 | ||
| Poland - 0.9% | |||
| Allegro.eu SA (a)(b) | 251,725 | 1,801,856 | |
| Bank Polska Kasa Opieki SA | 95,415 | 2,892,771 | |
| Budimex SA | 6,685 | 745,943 | |
| CD Projekt RED SA | 33,743 | 841,162 | |
| Cyfrowy Polsat SA | 130,709 | 406,987 | |
| Dino Polska SA (a)(b) | 25,625 | 2,424,369 | |
| KGHM Polska Miedz SA (Bearer) | 72,986 | 1,945,057 | |
| LPP SA | 578 | 1,860,776 | |
| mBank SA (a) | 7,692 | 949,253 | |
| Orlen SA | 300,378 | 4,742,379 | |
| PGE Polska Grupa Energetyczna SA (a) | 460,062 | 797,126 | |
| Powszechna Kasa Oszczednosci Bank SA (a) | 455,366 | 4,704,960 | |
| Powszechny Zaklad Ubezpieczen SA | 314,110 | 3,550,475 | |
| Santander Bank Polska SA (a) | 18,543 | 2,009,241 | |
TOTAL POLAND | 29,672,355 | ||
| Qatar - 0.8% | |||
| Barwa Real Estate Co. (a) | 1,098,123 | 763,046 | |
| Dukhan Bank | 974,148 | 970,135 | |
| Industries Qatar QSC (a) | 795,593 | 2,670,186 | |
| Masraf al Rayan | 2,937,641 | 1,694,327 | |
| Mesaieed Petrochemical Holding Co. (a) | 2,404,900 | 1,050,204 | |
| Ooredoo QSC | 425,519 | 1,155,832 | |
| Qatar Electricity & Water Co. (a) | 222,239 | 1,009,567 | |
| Qatar Fuel Co. (a) | 317,886 | 1,296,514 | |
| Qatar Gas Transport Co. Ltd. (Nakilat) (a) | 1,306,756 | 1,263,329 | |
| Qatar International Islamic Bank QSC (a) | 525,794 | 1,335,785 | |
| Qatar Islamic Bank | 865,993 | 4,138,500 | |
| Qatar National Bank SAQ | 2,415,713 | 9,879,145 | |
| The Commercial Bank of Qatar (a) | 1,697,644 | 2,390,037 | |
TOTAL QATAR | 29,616,607 | ||
| Romania - 0.0% | |||
| NEPI Rockcastle PLC | 269,421 | 1,455,126 | |
| Russia - 0.2% | |||
| Alrosa Co. Ltd. (d) | 1,399,461 | 232,877 | |
| Gazprom OAO (d) | 6,384,126 | 668,197 | |
| Inter Rao Ues JSC (d) | 20,040,158 | 110,513 | |
| LUKOIL PJSC (d) | 224,329 | 69,451 | |
| MMC Norilsk Nickel PJSC (a)(d) | 34,221 | 227,644 | |
| Mobile TeleSystems OJSC sponsored ADR (a)(d) | 247,296 | 246,304 | |
| Moscow Exchange MICEX-RTS OAO (d) | 808,717 | 155,496 | |
| Novatek PJSC GDR (Reg. S) (a)(d) | 49,200 | 2,558,400 | |
| Novolipetsk Steel OJSC (a)(d) | 812,466 | 7,802 | |
| Ozon Holdings PLC ADR (a)(d) | 28,218 | 59,132 | |
| PhosAgro PJSC: | |||
| GDR (Reg. S) (a)(d) | 73,324 | 1,504 | |
| sponsored GDR (Reg. S) (a)(d) | 472 | 10 | |
| Polyus PJSC (a)(d) | 18,462 | 43,426 | |
| Rosneft Oil Co. OJSC (d) | 635,841 | 106,363 | |
| Sberbank of Russia (d) | 5,823,145 | 35,812 | |
| Severstal PAO (a)(d) | 113,908 | 2,544 | |
| Surgutneftegas OJSC (d) | 4,033,562 | 49,368 | |
| Tatneft PAO (d) | 770,244 | 95,825 | |
| TCS Group Holding PLC GDR (a)(d) | 64,541 | 82,204 | |
| United Co. RUSAL International PJSC (d) | 1,646,280 | 198,453 | |
| VK Co. Ltd. GDR (Reg. S) (a)(d) | 41,654 | 12,378 | |
| VTB Bank OJSC (a)(d) | 1,801,039,946 | 68,827 | |
| X5 Retail Group NV GDR (Reg. S) (a)(d) | 66,442 | 15,679 | |
| Yandex NV Class A (a)(d) | 158,365 | 591,403 | |
TOTAL RUSSIA | 5,639,612 | ||
| Saudi Arabia - 3.9% | |||
| ACWA Power Co. | 49,757 | 3,010,673 | |
| Advanced Petrochemicals Co. | 66,636 | 662,523 | |
| Al Rajhi Bank | 1,020,934 | 18,260,121 | |
| Alinma Bank | 510,253 | 4,474,710 | |
| Almarai Co. Ltd. | 129,964 | 1,936,504 | |
| Arab National Bank | 350,997 | 2,222,969 | |
| Arabian Internet and Communications Services Co. Ltd. | 12,473 | 1,039,971 | |
| Bank Al-Jazira (a) | 209,963 | 915,608 | |
| Bank Albilad | 255,160 | 2,530,108 | |
| Banque Saudi Fransi | 306,896 | 2,932,674 | |
| Bupa Arabia for Cooperative Insurance Co. | 39,050 | 2,217,094 | |
| Dallah Healthcare Co. | 17,740 | 699,840 | |
| Dar Al Arkan Real Estate Development Co. (a) | 271,713 | 1,093,631 | |
| Dr Sulaiman Al Habib Medical Services Group Co. | 45,530 | 3,058,311 | |
| Elm Co. | 12,491 | 2,334,654 | |
| Etihad Etisalat Co. | 197,644 | 2,428,667 | |
| Jarir Marketing Co. | 306,161 | 1,181,685 | |
| Luberef | 26,522 | 911,968 | |
| Mobile Telecommunications Co. Saudi Arabia | 232,300 | 854,499 | |
| Mouwasat Medical Services Co. | 51,090 | 1,361,819 | |
| Nahdi Medical Co. | 20,584 | 778,018 | |
| National Industrialization Co. (a) | 171,275 | 530,498 | |
| Power & Water Utility Co. for Jubail & Yanbu | 37,862 | 549,017 | |
| Rabigh Refining & Petrochemical Co. (a) | 211,394 | 567,985 | |
| Riyad Bank | 765,074 | 5,414,414 | |
| Sabic Agriculture-Nutrients Co. | 121,787 | 4,343,507 | |
| Sahara International Petrochemical Co. | 187,864 | 1,614,941 | |
| Saudi Arabian Mining Co. | 672,550 | 6,453,726 | |
| Saudi Arabian Oil Co. (b) | 1,383,972 | 12,284,430 | |
| Saudi Awwal Bank | 523,797 | 4,670,277 | |
| Saudi Basic Industries Corp. | 469,368 | 9,633,579 | |
| Saudi Electricity Co. | 422,583 | 2,005,005 | |
| Saudi Industrial Investment Group | 194,162 | 1,240,037 | |
| Saudi Investment Bank/The | 253,604 | 993,704 | |
| Saudi Kayan Petrochemical Co. (a) | 383,569 | 1,081,714 | |
| Saudi Research & Marketing Group (a) | 18,556 | 697,408 | |
| Saudi Tadawul Group Holding Co. | 24,920 | 1,103,983 | |
| Saudi Telecom Co. | 1,041,337 | 10,658,743 | |
| The Co. for Cooperative Insurance | 38,233 | 1,231,087 | |
| The Saudi National Bank | 1,530,497 | 13,687,007 | |
| The Savola Group | 135,940 | 1,318,962 | |
| Yanbu National Petrochemical Co. | 144,734 | 1,460,225 | |
TOTAL SAUDI ARABIA | 136,446,296 | ||
| South Africa - 2.7% | |||
| Absa Group Ltd. | 440,294 | 4,014,206 | |
| African Rainbow Minerals Ltd. | 58,672 | 483,479 | |
| Anglo American Platinum Ltd. | 34,479 | 1,151,998 | |
| Aspen Pharmacare Holdings Ltd. | 194,871 | 1,770,072 | |
| Bid Corp. Ltd. | 175,325 | 3,719,477 | |
| Bidvest Group Ltd./The | 150,756 | 2,133,920 | |
| Capitec Bank Holdings Ltd. | 45,339 | 4,025,811 | |
| Clicks Group Ltd. | 128,371 | 1,891,660 | |
| Discovery Ltd. | 277,112 | 1,911,794 | |
| Exxaro Resources Ltd. (c) | 127,187 | 1,275,862 | |
| FirstRand Ltd. | 2,623,737 | 8,649,358 | |
| Gold Fields Ltd. | 465,455 | 6,140,258 | |
| Growthpoint Properties Ltd. | 1,810,536 | 941,333 | |
| Harmony Gold Mining Co. Ltd. | 290,321 | 1,331,084 | |
| Impala Platinum Holdings Ltd. | 451,461 | 1,880,602 | |
| Kumba Iron Ore Ltd. | 33,648 | 891,539 | |
| MTN Group Ltd. | 884,935 | 4,319,860 | |
| Naspers Ltd. Class N | 102,065 | 15,932,435 | |
| Nedbank Group Ltd. | 228,934 | 2,463,704 | |
| Northam Platinum Holdings Ltd. | 185,826 | 1,121,586 | |
| Old Mutual Ltd. (c) | 2,515,720 | 1,599,532 | |
| OUTsurance Group Ltd. | 437,937 | 947,424 | |
| Pepkor Holdings Ltd. (b) | 1,042,032 | 950,479 | |
| Remgro Ltd. | 272,275 | 2,104,863 | |
| Sanlam Ltd. | 915,422 | 3,210,792 | |
| Sasol Ltd. | 297,508 | 3,760,423 | |
| Shoprite Holdings Ltd. | 262,454 | 3,363,213 | |
| Sibanye-Stillwater Ltd. | 1,474,881 | 1,881,287 | |
| Standard Bank Group Ltd. | 697,749 | 6,847,019 | |
| Vodacom Group Ltd. | 330,714 | 1,800,362 | |
| Woolworths Holdings Ltd. | 490,987 | 1,828,013 | |
TOTAL SOUTH AFRICA | 94,343,445 | ||
| Taiwan - 13.9% | |||
| Accton Technology Corp. | 262,000 | 4,056,373 | |
| Acer, Inc. | 1,508,000 | 1,592,556 | |
| Advantech Co. Ltd. | 244,946 | 2,513,595 | |
| ASE Technology Holding Co. Ltd. | 1,595,592 | 5,581,835 | |
| Asia Cement Corp. | 1,215,000 | 1,499,217 | |
| ASUSTeK Computer, Inc. | 367,502 | 3,850,340 | |
| AUO Corp. | 3,395,800 | 1,642,454 | |
| Catcher Technology Co. Ltd. | 300,095 | 1,682,205 | |
| Cathay Financial Holding Co. Ltd. | 4,955,834 | 6,720,136 | |
| Chailease Holding Co. Ltd. | 795,879 | 4,313,960 | |
| Chang Hwa Commercial Bank | 2,859,907 | 1,513,950 | |
| Cheng Shin Rubber Industry Co. Ltd. | 1,006,000 | 1,373,684 | |
| China Airlines Ltd. | 1,501,000 | 899,091 | |
| China Development Financial Ho (a) | 8,315,624 | 2,904,561 | |
| China Steel Corp. | 6,168,289 | 4,598,331 | |
| Chunghwa Telecom Co. Ltd. | 1,987,129 | 7,101,578 | |
| Compal Electronics, Inc. | 2,182,000 | 1,896,519 | |
| CTBC Financial Holding Co. Ltd. | 9,183,778 | 6,911,007 | |
| Delta Electronics, Inc. | 1,014,717 | 9,137,476 | |
| E Ink Holdings, Inc. | 445,000 | 2,313,608 | |
| E.SUN Financial Holdings Co. Ltd. | 7,351,988 | 5,413,062 | |
| ECLAT Textile Co. Ltd. | 93,129 | 1,481,122 | |
| eMemory Technology, Inc. | 34,000 | 2,128,509 | |
| EVA Airways Corp. | 1,341,000 | 1,136,311 | |
| Evergreen Marine Corp. (Taiwan) | 534,494 | 1,777,308 | |
| Far Eastern New Century Corp. | 1,528,000 | 1,391,108 | |
| Far EasTone Telecommunications Co. Ltd. | 845,348 | 1,978,640 | |
| Feng Tay Enterprise Co. Ltd. | 256,596 | 1,415,786 | |
| First Financial Holding Co. Ltd. | 5,695,518 | 4,553,739 | |
| Formosa Chemicals & Fibre Corp. | 1,841,149 | 3,461,409 | |
| Formosa Petrochemical Corp. | 594,347 | 1,450,893 | |
| Formosa Plastics Corp. | 2,000,085 | 4,752,884 | |
| Fubon Financial Holding Co. Ltd. | 4,059,748 | 7,543,672 | |
| Giant Manufacturing Co. Ltd. | 163,837 | 827,816 | |
| Gigabyte Technology Co. Ltd. | 265,000 | 1,799,008 | |
| Global Unichip Corp. | 45,000 | 2,009,637 | |
| GlobalWafers Co. Ltd. | 114,000 | 1,674,499 | |
| Hon Hai Precision Industry Co. Ltd. (Foxconn) | 6,495,465 | 19,372,175 | |
| Hotai Motor Co. Ltd. | 158,960 | 2,963,772 | |
| Hua Nan Financial Holdings Co. Ltd. | 4,635,379 | 2,904,718 | |
| Innolux Corp. | 4,473,961 | 1,685,238 | |
| Inventec Corp. | 1,400,000 | 1,752,520 | |
| Largan Precision Co. Ltd. | 52,451 | 3,356,734 | |
| Lite-On Technology Corp. | 1,048,044 | 3,260,585 | |
| MediaTek, Inc. | 791,615 | 20,644,734 | |
| Mega Financial Holding Co. Ltd. | 5,852,233 | 6,635,615 | |
| Micro-Star International Co. Ltd. | 373,000 | 1,908,040 | |
| momo.com, Inc. | 44,120 | 726,821 | |
| Nan Ya Plastics Corp. | 2,484,358 | 4,749,717 | |
| Nan Ya Printed Circuit Board Corp. | 118,000 | 865,465 | |
| Nanya Technology Corp. | 649,000 | 1,300,100 | |
| Nien Made Enterprise Co. Ltd. | 93,000 | 822,169 | |
| Novatek Microelectronics Corp. | 302,000 | 4,249,813 | |
| Pegatron Corp. | 1,039,000 | 2,422,767 | |
| PharmaEssentia Corp. (a) | 125,000 | 1,242,983 | |
| Pou Chen Corp. | 1,134,391 | 1,010,375 | |
| Powerchip Semiconductor Manufacturing Corp. | 1,602,933 | 1,317,590 | |
| President Chain Store Corp. | 301,000 | 2,392,416 | |
| Quanta Computer, Inc. | 1,408,000 | 8,306,861 | |
| Realtek Semiconductor Corp. | 255,000 | 3,175,585 | |
| Ruentex Development Co. Ltd. | 802,296 | 803,985 | |
| Shin Kong Financial Holding Co. Ltd. (a) | 6,826,732 | 1,832,576 | |
| Sinopac Financial Holdings Co. | 5,490,026 | 3,025,505 | |
| Synnex Technology International Corp. | 645,700 | 1,369,318 | |
| Taishin Financial Holdings Co. Ltd. | 5,859,474 | 3,122,842 | |
| Taiwan Business Bank | 3,237,424 | 1,275,419 | |
| Taiwan Cement Corp. | 3,379,354 | 3,364,651 | |
| Taiwan Cooperative Financial Holding Co. Ltd. | 5,376,991 | 4,172,378 | |
| Taiwan High Speed Rail Corp. | 1,019,000 | 924,479 | |
| Taiwan Mobile Co. Ltd. | 921,000 | 2,719,705 | |
| Taiwan Semiconductor Manufacturing Co. Ltd. | 12,832,740 | 209,429,543 | |
| The Shanghai Commercial & Savings Bank Ltd. | 2,009,439 | 2,660,439 | |
| Uni-President Enterprises Corp. | 2,521,332 | 5,285,550 | |
| Unimicron Technology Corp. | 715,000 | 3,186,383 | |
| United Microelectronics Corp. | 5,874,000 | 8,440,977 | |
| Vanguard International Semiconductor Corp. | 477,000 | 1,035,114 | |
| Voltronic Power Technology Corp. | 35,000 | 1,402,556 | |
| Walsin Lihwa Corp. | 1,486,779 | 1,581,135 | |
| Wan Hai Lines Ltd. | 373,415 | 533,297 | |
| Winbond Electronics Corp. | 1,559,000 | 1,207,173 | |
| Winbond Electronics Corp. rights 11/3/23 (a) | 62,673 | 5,696 | |
| Wistron Corp. | 1,359,000 | 3,786,654 | |
| Wiwynn Corp. | 45,629 | 2,160,381 | |
| WPG Holding Co. Ltd. | 828,880 | 1,832,756 | |
| Yageo Corp. | 176,114 | 2,869,071 | |
| Yang Ming Marine Transport Corp. | 917,000 | 1,194,278 | |
| Yuanta Financial Holding Co. Ltd. | 5,257,343 | 3,946,890 | |
| Zhen Ding Technology Holding Ltd. | 345,000 | 1,042,283 | |
TOTAL TAIWAN | 488,175,706 | ||
| Thailand - 1.7% | |||
| Advanced Information Service PCL NVDR | 623,200 | 3,795,923 | |
| Airports of Thailand PCL NVDR (a) | 2,228,900 | 4,115,314 | |
| Asset World Corp. PCL NVDR | 4,094,200 | 391,781 | |
| B. Grimm Power PCL NVDR | 486,400 | 297,554 | |
| Bangkok Dusit Medical Services PCL: | |||
| (For. Reg.) | 18,200 | 13,342 | |
| NVDR | 5,784,500 | 4,240,531 | |
| Bangkok Expressway and Metro PCL NVDR | 3,934,200 | 859,479 | |
| Banpu PCL NVDR | 3,922,600 | 824,582 | |
| Berli Jucker PCL NVDR | 520,800 | 407,450 | |
| BTS Group Holdings PCL NVDR | 3,985,500 | 821,798 | |
| Bumrungrad Hospital PCL NVDR | 312,800 | 2,248,252 | |
| Central Pattana PCL: | |||
| (For. Reg.) | 381,900 | 660,693 | |
| NVDR | 638,300 | 1,104,270 | |
| Central Retail Corp. PCL: | |||
| (For. Reg.) | 174,024 | 176,995 | |
| NVDR | 764,300 | 777,347 | |
| Charoen Pokphand Foods PCL NVDR | 2,005,800 | 1,037,615 | |
| CP ALL PCL NVDR | 3,046,600 | 4,656,319 | |
| CP Axtra PCL NVDR | 1,106,300 | 865,009 | |
| Delta Electronics PCL NVDR | 1,623,000 | 3,548,013 | |
| Electricity Generating PCL NVDR | 131,500 | 443,915 | |
| Energy Absolute PCL NVDR | 883,100 | 1,026,513 | |
| Global Power Synergy Public Co. Ltd. NVDR | 380,300 | 410,562 | |
| Gulf Energy Development PCL NVDR | 1,537,500 | 1,840,199 | |
| Home Product Center PCL NVDR | 3,058,000 | 1,006,848 | |
| Indorama Ventures PCL NVDR | 868,500 | 569,072 | |
| Intouch Holdings PCL NVDR | 521,200 | 1,023,813 | |
| Kasikornbank PCL NVDR | 309,200 | 1,124,564 | |
| Krung Thai Bank PCL: | |||
| (For. Reg.) | 553,800 | 287,960 | |
| NVDR | 1,246,300 | 648,040 | |
| Krungthai Card PCL: | |||
| (For. Reg.) | 142,000 | 171,906 | |
| NVDR | 400,100 | 484,362 | |
| Land & House PCL NVDR | 4,142,400 | 865,361 | |
| Minor International PCL: | |||
| (For. Reg.) | 110,326 | 85,499 | |
| NVDR | 1,578,500 | 1,223,289 | |
| Muangthai Leasing PCL NVDR | 391,100 | 394,991 | |
| Osotspa PCL NVDR | 724,000 | 470,825 | |
| PTT Exploration and Production PCL NVDR | 720,100 | 3,270,377 | |
| PTT Global Chemical PCL NVDR | 1,164,500 | 1,112,226 | |
| PTT Oil & Retail Business PCL NVDR | 1,548,100 | 783,978 | |
| PTT PCL NVDR | 5,176,900 | 4,765,194 | |
| Ratch Group PCL NVDR unit | 599,300 | 534,709 | |
| Robinsons Department Store PCL (For. Reg.) (a)(d) | 55,100 | 24,327 | |
| SCB X PCL: | |||
| (For. Reg.) | 158,100 | 431,072 | |
| NVDR | 277,300 | 756,080 | |
| SCG Packaging PCL NVDR | 675,000 | 672,598 | |
| Siam Cement PCL NVDR | 407,300 | 3,244,660 | |
| Thai Oil PCL NVDR | 624,421 | 813,032 | |
| TMBThanachart Bank PCL NVDR | 12,508,400 | 577,850 | |
| True Corp. PCL | 2,607,532 | 437,320 | |
| True Corp. PCL NVDR | 2,267,098 | 380,224 | |
TOTAL THAILAND | 60,723,633 | ||
| Turkey - 0.6% | |||
| Akbank TAS | 1,622,931 | 1,688,306 | |
| Aselsan A/S | 707,982 | 1,033,501 | |
| Bim Birlesik Magazalar A/S JSC | 237,577 | 2,281,873 | |
| Eregli Demir ve Celik Fabrikalari T.A.S. (a) | 735,971 | 983,919 | |
| Ford Otomotiv Sanayi A/S | 36,086 | 1,001,948 | |
| Haci Omer Sabanci Holding A/S | 529,008 | 999,388 | |
| Hektas Ticaret A/S (a) | 591,851 | 458,111 | |
| Koc Holding A/S | 395,506 | 1,910,546 | |
| Koza Altin Isletmeleri A/S | 503,840 | 390,700 | |
| Pegasus Hava Tasimaciligi A/S (a) | 23,725 | 590,627 | |
| Sasa Polyester Sanayi A/S | 550,093 | 830,600 | |
| Tofas Turk Otomobil Fabrikasi A/S | 64,493 | 548,159 | |
| Turk Hava Yollari AO (a) | 286,331 | 2,197,082 | |
| Turkcell Iletisim Hizmet A/S | 632,241 | 1,071,623 | |
| Turkiye Is Bankasi A/S Series C | 1,822,714 | 1,350,337 | |
| Turkiye Petrol Rafinerileri A/S | 501,726 | 2,514,011 | |
| Turkiye Sise ve Cam Fabrikalari A/S | 716,967 | 1,198,521 | |
| Yapi ve Kredi Bankasi A/S | 1,756,444 | 1,069,276 | |
TOTAL TURKEY | 22,118,528 | ||
| United Arab Emirates - 1.2% | |||
| Abu Dhabi Commercial Bank PJSC | 1,529,303 | 3,343,399 | |
| Abu Dhabi Islamic Bank (a) | 760,249 | 2,131,926 | |
| Abu Dhabi National Oil Co. for Distribution PJSC | 1,641,224 | 1,501,365 | |
| Aldar Properties PJSC | 1,993,647 | 2,822,479 | |
| Americana Restaurants International PLC | 1,318,520 | 1,328,212 | |
| Dubai Islamic Bank Pakistan Ltd. | 1,526,136 | 2,243,707 | |
| Emaar Properties PJSC | 3,442,373 | 6,269,936 | |
| Emirates NBD Bank PJSC | 987,461 | 4,556,892 | |
| Emirates Telecommunications Corp. | 1,813,003 | 9,111,907 | |
| First Abu Dhabi Bank PJSC | 2,303,321 | 7,951,568 | |
| Multiply Group (a) | 2,042,764 | 1,890,933 | |
TOTAL UNITED ARAB EMIRATES | 43,152,324 | ||
| United Kingdom - 0.1% | |||
| AngloGold Ashanti PLC | 218,684 | 4,042,207 | |
| Pepco Group NV (a) | 100,370 | 406,289 | |
TOTAL UNITED KINGDOM | 4,448,496 | ||
| United States of America - 0.1% | |||
| JBS SA | 403,400 | 1,602,638 | |
| Legend Biotech Corp. ADR (a) | 31,675 | 2,092,767 | |
| Parade Technologies Ltd. | 40,000 | 1,310,465 | |
TOTAL UNITED STATES OF AMERICA | 5,005,870 | ||
| TOTAL COMMON STOCKS (Cost $2,724,237,641) | 3,199,560,404 | ||
| Nonconvertible Preferred Stocks - 2.1% | |||
| Shares | Value ($) | ||
| Brazil - 1.4% | |||
| Banco Bradesco SA (PN) | 2,731,588 | 7,579,693 | |
| Centrais Eletricas Brasileiras SA (Electrobras) (PN-B) | 120,405 | 918,247 | |
| Companhia Energetica de Minas Gerais (CEMIG) (PN) | 715,760 | 1,666,688 | |
| Gerdau SA | 604,710 | 2,611,105 | |
| Itau Unibanco Holding SA | 2,521,671 | 13,414,234 | |
| Itausa-Investimentos Itau SA (PN) | 2,686,713 | 4,604,195 | |
| Petroleo Brasileiro SA - Petrobras (PN) (non-vtg.) | 2,590,100 | 17,846,992 | |
TOTAL BRAZIL | 48,641,154 | ||
| Chile - 0.1% | |||
| Sociedad Quimica y Minera de Chile SA (PN-B) | 74,733 | 3,615,574 | |
| Colombia - 0.0% | |||
| Bancolombia SA (PN) | 243,716 | 1,563,193 | |
| Korea (South) - 0.6% | |||
| Hyundai Motor Co. Ltd. | 5,584 | 411,750 | |
| Hyundai Motor Co. Ltd. Series 2 | 25,073 | 1,859,964 | |
| LG Chemical Ltd. | 3,922 | 817,919 | |
| LG H & H Co. Ltd. | 988 | 103,674 | |
| Samsung Electronics Co. Ltd. | 419,232 | 16,712,912 | |
TOTAL KOREA (SOUTH) | 19,906,219 | ||
| Russia - 0.0% | |||
| Surgutneftegas OJSC (d) | 3,570,022 | 62,127 | |
| TOTAL NONCONVERTIBLE PREFERRED STOCKS (Cost $56,198,738) | 73,788,267 | ||
| Government Obligations - 0.4% | |||
Principal Amount (e) | Value ($) | ||
| United States of America - 0.4% | |||
U.S. Treasury Bills, yield at date of purchase 5.42% 2/22/24 (f) (Cost $14,750,623) | 15,000,000 | 14,749,752 | |
| Money Market Funds - 6.9% | |||
| Shares | Value ($) | ||
| Fidelity Cash Central Fund 5.40% (g) | 215,934,416 | 215,977,603 | |
| Fidelity Securities Lending Cash Central Fund 5.40% (g)(h) | 26,637,037 | 26,639,700 | |
| TOTAL MONEY MARKET FUNDS (Cost $242,617,303) | 242,617,303 | ||
| TOTAL INVESTMENT IN SECURITIES - 100.6% (Cost $3,037,804,305) | 3,530,715,726 |
NET OTHER ASSETS (LIABILITIES) - (0.6)% | (22,049,386) |
| NET ASSETS - 100.0% | 3,508,666,340 |
| Futures Contracts | |||||
Number of contracts | Expiration Date | Notional Amount ($) | Value ($) | Unrealized Appreciation/ (Depreciation) ($) | |
| Purchased | |||||
| Equity Index Contracts | |||||
| ICE MSCI Emerging Markets Index Contracts (United States) | 5,096 | Dec 2023 | 234,212,160 | (7,178,851) | (7,178,851) |
| The notional amount of futures purchased as a percentage of Net Assets is 6.7% | |||||
| CP | - | COMMERCIAL PAPER |
| (a) | Non-income producing |
| (b) | Security exempt from registration under Rule 144A of the Securities Act of 1933. These securities may be resold in transactions exempt from registration, normally to qualified institutional buyers. At the end of the period, the value of these securities amounted to $170,824,958 or 4.9% of net assets. |
| (c) | Security or a portion of the security is on loan at period end. |
| (d) | Level 3 security |
| (e) | Amount is stated in United States dollars unless otherwise noted. |
| (f) | Security or a portion of the security was pledged to cover margin requirements for futures contracts. At period end, the value of securities pledged amounted to $7,917,667. |
| (g) | Affiliated fund that is generally available only to investment companies and other accounts managed by Fidelity Investments. The rate quoted is the annualized seven-day yield of the fund at period end. A complete unaudited listing of the fund's holdings as of its most recent quarter end is available upon request. In addition, each Fidelity Central Fund's financial statements, which are not covered by the Fund's Report of Independent Registered Public Accounting Firm, are available on the SEC's website or upon request. |
| (h) | Investment made with cash collateral received from securities on loan. |
| Affiliate | Value, beginning of period ($) | Purchases ($) | Sales Proceeds ($) | Dividend Income ($) | Realized Gain (loss) ($) | Change in Unrealized appreciation (depreciation) ($) | Value, end of period ($) | % ownership, end of period |
| Fidelity Cash Central Fund 5.40% | 3,464,344 | 1,635,821,476 | 1,423,308,217 | 4,409,178 | - | - | 215,977,603 | 0.5% |
| Fidelity Securities Lending Cash Central Fund 5.40% | 16,509,541 | 189,843,602 | 179,713,443 | 431,369 | - | - | 26,639,700 | 0.1% |
| Total | 19,973,885 | 1,825,665,078 | 1,603,021,660 | 4,840,547 | - | - | 242,617,303 | |
| Valuation Inputs at Reporting Date: | ||||
| Description | Total ($) | Level 1 ($) | Level 2 ($) | Level 3 ($) |
Investments in Securities: | ||||
| Equities: | ||||
Communication Services | 306,683,241 | 56,399,833 | 249,433,323 | 850,085 |
Consumer Discretionary | 443,982,559 | 94,772,369 | 349,126,731 | 83,459 |
Consumer Staples | 204,474,902 | 66,086,315 | 138,372,905 | 15,682 |
Energy | 175,947,433 | 67,039,780 | 105,297,922 | 3,609,731 |
Financials | 732,729,244 | 269,142,183 | 463,244,722 | 342,339 |
Health Care | 129,245,506 | 15,199,911 | 114,045,595 | - |
Industrials | 209,682,781 | 50,135,571 | 159,547,210 | - |
Information Technology | 675,292,976 | 5,523,722 | 669,769,254 | - |
Materials | 255,048,042 | 92,247,194 | 162,086,588 | 714,260 |
Real Estate | 54,524,858 | 22,140,533 | 32,384,325 | - |
Utilities | 85,737,129 | 30,856,291 | 54,770,325 | 110,513 |
| Government Obligations | 14,749,752 | - | 14,749,752 | - |
| Money Market Funds | 242,617,303 | 242,617,303 | - | - |
| Total Investments in Securities: | 3,530,715,726 | 1,012,161,005 | 2,512,828,652 | 5,726,069 |
Derivative Instruments: Liabilities | ||||
Futures Contracts | (7,178,851) | (7,178,851) | - | - |
| Total Liabilities | (7,178,851) | (7,178,851) | - | - |
| Total Derivative Instruments: | (7,178,851) | (7,178,851) | - | - |
Primary Risk Exposure / Derivative Type | Value | |
| Asset ($) | Liability ($) | |
| Equity Risk | ||
Futures Contracts (a) | 0 | (7,178,851) |
| Total Equity Risk | 0 | (7,178,851) |
| Total Value of Derivatives | 0 | (7,178,851) |
| Statement of Assets and Liabilities | ||||
| October 31, 2023 | ||||
| Assets | ||||
| Investment in securities, at value (including securities loaned of $25,035,645) - See accompanying schedule: | ||||
Unaffiliated issuers (cost $2,795,187,002) | $ | 3,288,098,423 | ||
Fidelity Central Funds (cost $242,617,303) | 242,617,303 | |||
| Total Investment in Securities (cost $3,037,804,305) | $ | 3,530,715,726 | ||
| Cash | 935,522 | |||
| Foreign currency held at value (cost $11,117,853) | 11,084,819 | |||
| Receivable for investments sold | 169 | |||
| Receivable for fund shares sold | 1,983,489 | |||
| Dividends receivable | 4,281,512 | |||
| Distributions receivable from Fidelity Central Funds | 690,043 | |||
| Prepaid expenses | 4,159 | |||
| Receivable from investment adviser for expense reductions | 208,208 | |||
Total assets | 3,549,903,647 | |||
| Liabilities | ||||
| Payable for investments purchased | $ | 190 | ||
| Payable for fund shares redeemed | 1,908,800 | |||
| Accrued management fee | 218,024 | |||
| Payable for daily variation margin on futures contracts | 1,555,321 | |||
| Deferred taxes | 10,078,832 | |||
| Other payables and accrued expenses | 825,187 | |||
| Collateral on securities loaned | 26,650,953 | |||
| Total Liabilities | 41,237,307 | |||
| Net Assets | $ | 3,508,666,340 | ||
| Net Assets consist of: | ||||
| Paid in capital | $ | 3,802,927,800 | ||
| Total accumulated earnings (loss) | (294,261,460) | |||
| Net Assets | $ | 3,508,666,340 | ||
Net Asset Value, offering price and redemption price per share ($3,508,666,340 ÷ 293,746,376 shares) | $ | 11.94 | ||
| Statement of Operations | ||||
Year ended October 31, 2023 | ||||
| Investment Income | ||||
| Dividends | $ | 105,906,662 | ||
| Non-Cash dividends | 8,469,029 | |||
| Interest | 584,047 | |||
| Income from Fidelity Central Funds (including $431,369 from security lending) | 4,840,547 | |||
| Income before foreign taxes withheld | $ | 119,800,285 | ||
| Less foreign taxes withheld | (12,560,205) | |||
| Total Income | 107,240,080 | |||
| Expenses | ||||
| Management fee | $ | 2,668,260 | ||
| Custodian fees and expenses | 2,340,544 | |||
| Independent trustees' fees and expenses | 12,260 | |||
| Registration fees | 68,614 | |||
| Audit | 150,771 | |||
| Legal | 4,880 | |||
| Interest | 175,299 | |||
| Miscellaneous | 35,022 | |||
| Total expenses before reductions | 5,455,650 | |||
| Expense reductions | (2,621,691) | |||
| Total expenses after reductions | 2,833,959 | |||
| Net Investment income (loss) | 104,406,121 | |||
| Realized and Unrealized Gain (Loss) | ||||
| Net realized gain (loss) on: | ||||
| Investment Securities: | ||||
| Unaffiliated issuers (net of foreign taxes of $5,198,625) | (167,871,009) | |||
| Foreign currency transactions | (1,048,022) | |||
| Futures contracts | 5,861,748 | |||
| Total net realized gain (loss) | (163,057,283) | |||
| Change in net unrealized appreciation (depreciation) on: | ||||
| Investment Securities: | ||||
| Unaffiliated issuers(net of decrease in deferred foreign taxes of $3,087,558) | 409,141,657 | |||
| Assets and liabilities in foreign currencies | 53,712 | |||
| Futures contracts | (6,784,580) | |||
| Total change in net unrealized appreciation (depreciation) | 402,410,789 | |||
| Net gain (loss) | 239,353,506 | |||
| Net increase (decrease) in net assets resulting from operations | $ | 343,759,627 | ||
| Statement of Changes in Net Assets | ||||
Year ended October 31, 2023 | Year ended October 31, 2022 | |||
| Increase (Decrease) in Net Assets | ||||
| Operations | ||||
| Net investment income (loss) | $ | 104,406,121 | $ | 115,649,880 |
| Net realized gain (loss) | (163,057,283) | (316,446,719) | ||
| Change in net unrealized appreciation (depreciation) | 402,410,789 | (1,203,717,254) | ||
| Net increase (decrease) in net assets resulting from operations | 343,759,627 | (1,404,514,093) | ||
| Distributions to shareholders | (87,971,565) | (108,921,064) | ||
| Share transactions | ||||
| Proceeds from sales of shares | 1,703,730,387 | 1,927,174,410 | ||
| Reinvestment of distributions | 87,324,787 | 106,410,044 | ||
| Cost of shares redeemed | (1,494,269,332) | (1,370,213,430) | ||
Net increase (decrease) in net assets resulting from share transactions | 296,785,842 | 663,371,024 | ||
| Total increase (decrease) in net assets | 552,573,904 | (850,064,133) | ||
| Net Assets | ||||
| Beginning of period | 2,956,092,436 | 3,806,156,569 | ||
| End of period | $ | 3,508,666,340 | $ | 2,956,092,436 |
| Other Information | ||||
| Shares | ||||
| Sold | 137,300,618 | 132,184,146 | ||
| Issued in reinvestment of distributions | 7,193,146 | 6,895,296 | ||
| Redeemed | (117,777,572) | (102,830,412) | ||
| Net increase (decrease) | 26,716,192 | 36,249,030 | ||
| Fidelity® SAI Emerging Markets Index Fund |
| Years ended October 31, | 2023 | 2022 | 2021 | 2020 | 2019 | |||||
Selected Per-Share Data | ||||||||||
| Net asset value, beginning of period | $ | 11.07 | $ | 16.49 | $ | 14.45 | $ | 13.71 | $ | 12.62 |
| Income from Investment Operations | ||||||||||
Net investment income (loss) A,B | .37 | .41 | .36 | .30 | .42 C | |||||
| Net realized and unrealized gain (loss) | .81 | (5.38) | 1.93 | .80 | .99 | |||||
| Total from investment operations | 1.18 | (4.97) | 2.29 | 1.10 | 1.41 | |||||
| Distributions from net investment income | (.31) | (.45) | (.25) | (.36) | (.32) | |||||
| Total distributions | (.31) | (.45) | (.25) | (.36) | (.32) | |||||
| Net asset value, end of period | $ | 11.94 | $ | 11.07 | $ | 16.49 | $ | 14.45 | $ | 13.71 |
Total Return D | 10.58% | (30.89)% | 15.87% | 8.19% | 11.44% | |||||
Ratios to Average Net Assets B,E,F | ||||||||||
| Expenses before reductions | .15% | .15% | .13% | .14% | .16% | |||||
| Expenses net of fee waivers, if any | .08% | .08% | .08% | .08% | .08% | |||||
| Expenses net of all reductions | .08% | .08% | .08% | .08% | .08% | |||||
| Net investment income (loss) | 2.93% | 2.95% | 2.10% | 2.21% | 3.12% C | |||||
| Supplemental Data | ||||||||||
| Net assets, end of period (000 omitted) | $ | 3,508,666 | $ | 2,956,092 | $ | 3,806,157 | $ | 3,564,409 | $ | 3,840,772 |
Portfolio turnover rate G | 32% | 30% | 16% | 38% | 22% |
| Fidelity Central Fund | Investment Manager | Investment Objective | Investment Practices | Expense RatioA |
| Fidelity Money Market Central Funds | Fidelity Management & Research Company LLC (FMR) | Each fund seeks to obtain a high level of current income consistent with the preservation of capital and liquidity. | Short-term Investments | Less than .005% |
| Gross unrealized appreciation | $861,167,474 |
| Gross unrealized depreciation | (436,242,258) |
| Net unrealized appreciation (depreciation) | $424,925,216 |
| Tax Cost | $3,105,790,510 |
| Undistributed ordinary income | $89,867,690 |
| Capital loss carryforward | $(798,905,912) |
| Net unrealized appreciation (depreciation) on securities and other investments | $424,855,593 |
Short-term | $(434,329,895) |
Long-term | (364,576,017) |
| Total capital loss carryforward | $(798,905,912) |
| October 31, 2023 | October 31, 2022 | |
| Ordinary Income | $87,971,565 | $108,921,064 |
| Equity Risk | Equity risk relates to the fluctuations in the value of financial instruments as a result of changes in market prices (other than those arising from interest rate risk or foreign exchange risk), whether caused by factors specific to an individual investment, its issuer, or all factors affecting all instruments traded in a market or market segment. |
| Purchases ($) | Sales ($) | |
| Fidelity SAI Emerging Markets Index Fund | 1,178,318,495 | 1,093,687,318 |
| Borrower or Lender | Average Loan Balance | Weighted Average Interest Rate | Interest Expense | |
Fidelity SAI Emerging Markets Index Fund | Borrower | $ 38,290,833 | 4.90% | $156,385 |
| Amount | |
| Fidelity SAI Emerging Markets Index Fund | $6,388 |
| Total Security Lending Fees Paid to NFS | Security Lending Income From Securities Loaned to NFS | Value of Securities Loaned to NFS at Period End | |
| Fidelity SAI Emerging Markets Index Fund | $45,492 | $- | $- |
| Average Loan Balance | Weighted Average Interest Rate | Interest Expense | |
| Fidelity SAI Emerging Markets Index Fund | $20,337,167 | 5.58% | $18,914 |
| Strategic Advisers Fidelity Emerging Markets Fund | |
| Fidelity SAI Emerging Markets Index Fund | 26% |
| Fund | % of shares held |
| Fidelity SAI Emerging Markets Index Fund | 31% |
| The Example is based on an investment of $1,000 invested at the beginning of the period and held for the entire period (May 1, 2023 to October 31, 2023). |
Annualized Expense Ratio- A | Beginning Account Value May 1, 2023 | Ending Account Value October 31, 2023 | Expenses Paid During Period- C May 1, 2023 to October 31, 2023 | |||||||
| Fidelity® SAI Emerging Markets Index Fund | .08% | |||||||||
| Actual | $ 1,000 | $ 946.90 | $ .39 | |||||||
Hypothetical-B | $ 1,000 | $ 1,024.80 | $ .41 | |||||||
| A special meeting of shareholders was held on October 18, 2023. The results of votes taken among shareholders on the proposal before them are reported below. Each vote reported represents one dollar of net asset value held on the record date for the meeting. | ||
| Proposal 1 | ||
| To elect a Board of Trustees. | ||
# of Votes | % of Votes | |
| Abigail P. Johnson | ||
| Affirmative | 378,729,502,260.010 | 97.580 |
| Withheld | 9,407,876,478.960 | 2.420 |
| TOTAL | 388,137,378,738.970 | 100.000 |
| Jennifer Toolin McAuliffe | ||
| Affirmative | 378,454,868,010.950 | 97.510 |
| Withheld | 9,682,510,728.020 | 2.490 |
| TOTAL | 388,137,378,738.970 | 100.000 |
| Christine J. Thompson | ||
| Affirmative | 378,837,121,274.520 | 97.600 |
| Withheld | 9,300,257,464.450 | 2.400 |
| TOTAL | 388,137,378,738.970 | 100.000 |
| Elizabeth S. Acton | ||
| Affirmative | 378,262,110,794.850 | 97.460 |
| Withheld | 9,875,267,944.120 | 2.540 |
| TOTAL | 388,137,378,738.970 | 100.000 |
| Laura M. Bishop | ||
| Affirmative | 380,482,113,171.060 | 98.030 |
| Withheld | 7,655,265,567.910 | 1.970 |
| TOTAL | 388,137,378,738.970 | 100.000 |
| Ann E. Dunwoody | ||
| Affirmative | 380,016,034,008.120 | 97.910 |
| Withheld | 8,121,344,730.850 | 2.090 |
| TOTAL | 388,137,378,738.970 | 100.000 |
| John Engler | ||
| Affirmative | 379,432,488,394.200 | 97.760 |
| Withheld | 8,704,890,344.770 | 2.240 |
| TOTAL | 388,137,378,738.970 | 100.000 |
| Robert F. Gartland | ||
| Affirmative | 378,741,819,600.600 | 97.580 |
| Withheld | 9,395,559,138.370 | 2.420 |
| TOTAL | 388,137,378,738.970 | 100.000 |
| Robert W. Helm | ||
| Affirmative | 380,389,324,755.070 | 98.000 |
| Withheld | 7,748,053,983.900 | 2.000 |
| TOTAL | 388,137,378,738.970 | 100.000 |
| Arthur E. Johnson | ||
| Affirmative | 378,427,694,151.670 | 97.500 |
| Withheld | 9,709,684,587.300 | 2.500 |
| TOTAL | 388,137,378,738.970 | 100.000 |
| Michael E. Kenneally | ||
| Affirmative | 377,842,228,145.180 | 97.350 |
| Withheld | 10,295,150,593.790 | 2.650 |
| TOTAL | 388,137,378,738.970 | 100.000 |
| Mark A. Murray | ||
| Affirmative | 380,158,432,703.370 | 97.940 |
| Withheld | 7,978,946,035.600 | 2.060 |
| TOTAL | 388,137,378,738.970 | 100.000 |
| Carol J. Zierhoffer | ||
| Affirmative | 380,522,113,360.240 | 98.040 |
| Withheld | 7,615,265,378.730 | 1.960 |
| TOTAL | 388,137,378,738.970 | 100.000 |
| Proposal 1 reflects trust wide proposal and voting results. | ||
 |


Contents
| Average Annual Total Returns | |||
Periods ended October 31, 2023 | Past 1 year | Past 5 years | Life of Fund A |
| Fidelity Flex® International Index Fund | 12.72% | 3.66% | 3.92% |
| $10,000 Over Life of Fund |
Let's say hypothetically that $10,000 was invested in Fidelity Flex® International Index Fund, on March 9, 2017, when the fund started. The chart shows how the value of your investment would have changed, and also shows how the MSCI ACWI (All Country World Index) ex USA Index performed over the same period. |
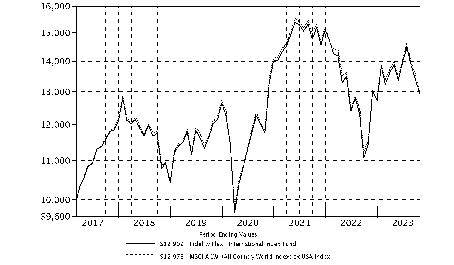 |
Top Holdings (% of Fund's net assets) | ||
| Taiwan Semiconductor Manufacturing Co. Ltd. (Taiwan, Semiconductors & Semiconductor Equipment) | 1.7 | |
| Novo Nordisk A/S Series B (Denmark, Pharmaceuticals) | 1.3 | |
| Nestle SA (Reg. S) (United States of America, Food Products) | 1.2 | |
| Tencent Holdings Ltd. (China, Interactive Media & Services) | 1.1 | |
| ASML Holding NV (Netherlands) (Netherlands, Semiconductors & Semiconductor Equipment) | 1.0 | |
| Samsung Electronics Co. Ltd. (Korea (South), Technology Hardware, Storage & Peripherals) | 1.0 | |
| Shell PLC (London) (Netherlands, Oil, Gas & Consumable Fuels) | 0.9 | |
| LVMH Moet Hennessy Louis Vuitton SE (France, Textiles, Apparel & Luxury Goods) | 0.9 | |
| AstraZeneca PLC (United Kingdom) (United Kingdom, Pharmaceuticals) | 0.8 | |
| Novartis AG (Switzerland, Pharmaceuticals) | 0.8 | |
| 10.7 | ||
| Market Sectors (% of Fund's net assets) | ||
| Financials | 21.4 | |
| Industrials | 12.1 | |
| Consumer Discretionary | 11.1 | |
| Information Technology | 10.6 | |
| Health Care | 9.1 | |
| Consumer Staples | 7.9 | |
| Materials | 7.0 | |
| Energy | 6.2 | |
| Communication Services | 5.2 | |
| Utilities | 2.7 | |
| Real Estate | 1.6 | |
Asset Allocation (% of Fund's net assets) |
 |
Futures - 5.8% |
Geographic Diversification (% of Fund's net assets) |
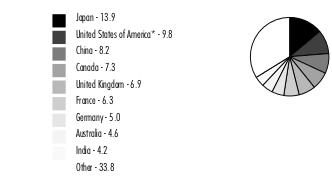 |
* Includes Short-Term investments and Net Other Assets (Liabilities). Percentages are adjusted for the effect of derivatives, if applicable. |
| Common Stocks - 93.3% | |||
| Shares | Value ($) | ||
| Australia - 4.6% | |||
| Ampol Ltd. | 16,496 | 334,502 | |
| ANZ Group Holdings Ltd. | 210,196 | 3,314,576 | |
| APA Group unit | 88,940 | 466,218 | |
| Aristocrat Leisure Ltd. | 41,219 | 1,013,167 | |
| ASX Ltd. | 13,612 | 486,324 | |
| Aurizon Holdings Ltd. | 131,334 | 286,060 | |
| BHP Group Ltd. | 355,115 | 10,052,410 | |
| BlueScope Steel Ltd. | 32,462 | 389,137 | |
| Brambles Ltd. | 96,944 | 809,071 | |
| Cochlear Ltd. | 4,603 | 705,521 | |
| Coles Group Ltd. | 94,303 | 915,276 | |
| Commonwealth Bank of Australia | 117,312 | 7,216,554 | |
| Computershare Ltd. | 39,967 | 630,757 | |
| DEXUS Property Group unit | 77,068 | 318,305 | |
| EBOS Group Ltd. | 10,898 | 222,474 | |
| Endeavour Group Ltd. | 99,789 | 313,482 | |
| Flutter Entertainment PLC (a) | 1,939 | 304,140 | |
| Flutter Entertainment PLC (Ireland) (a) | 10,455 | 1,636,687 | |
| Fortescue Metals Group Ltd. | 118,894 | 1,691,366 | |
| Glencore PLC | 738,609 | 3,912,287 | |
| Goodman Group unit | 118,806 | 1,572,030 | |
| IDP Education Ltd. | 17,765 | 245,448 | |
| IGO Ltd. | 47,480 | 287,509 | |
| Insurance Australia Group Ltd. | 172,231 | 621,330 | |
| Lendlease Group unit | 48,892 | 193,636 | |
| Macquarie Group Ltd. | 25,686 | 2,640,263 | |
| Magellan Financial Group Ltd. warrants 4/16/27 (a) | 50 | 5 | |
| Medibank Private Ltd. | 190,364 | 415,427 | |
| Mineral Resources Ltd. | 12,331 | 454,487 | |
| Mirvac Group unit | 270,160 | 313,454 | |
| National Australia Bank Ltd. | 219,871 | 3,938,825 | |
| Northern Star Resources Ltd. | 80,357 | 588,437 | |
| Orica Ltd. | 32,722 | 305,752 | |
| Origin Energy Ltd. | 120,576 | 699,444 | |
| Pilbara Minerals Ltd. | 188,596 | 443,012 | |
| Qantas Airways Ltd. (a) | 57,463 | 180,026 | |
| QBE Insurance Group Ltd. | 105,017 | 1,041,360 | |
| Ramsay Health Care Ltd. | 12,976 | 401,790 | |
| REA Group Ltd. | 3,699 | 339,586 | |
| Reece Ltd. | 15,209 | 169,576 | |
| Rio Tinto Ltd. | 26,095 | 1,949,247 | |
| Rio Tinto PLC | 78,940 | 5,036,413 | |
| Santos Ltd. | 228,737 | 1,116,113 | |
| Scentre Group unit | 364,489 | 564,664 | |
| SEEK Ltd. | 24,382 | 321,664 | |
| Sonic Healthcare Ltd. | 31,386 | 574,711 | |
| South32 Ltd. | 321,882 | 688,629 | |
| Stockland Corp. Ltd. unit | 171,441 | 386,932 | |
| Suncorp Group Ltd. | 88,734 | 755,273 | |
| Telstra Group Ltd. | 283,741 | 688,038 | |
| The GPT Group | 132,250 | 305,210 | |
| The Lottery Corp. Ltd. | 157,333 | 454,153 | |
| Transurban Group unit | 216,070 | 1,626,682 | |
| Treasury Wine Estates Ltd. | 51,420 | 394,681 | |
| Vicinity Centres unit | 269,081 | 291,450 | |
| Washington H. Soul Pattinson & Co. Ltd. | 16,606 | 353,772 | |
| Wesfarmers Ltd. | 79,148 | 2,546,494 | |
| Westpac Banking Corp. | 245,781 | 3,227,543 | |
| WiseTech Global Ltd. | 11,672 | 434,563 | |
| Woodside Energy Group Ltd. | 133,122 | 2,899,371 | |
| Woolworths Group Ltd. | 85,438 | 1,912,510 | |
TOTAL AUSTRALIA | 76,397,824 | ||
| Austria - 0.2% | |||
| Erste Group Bank AG | 24,175 | 863,310 | |
| Mondi PLC | 31,283 | 505,325 | |
| Mondi PLC | 3,073 | 49,659 | |
| OMV AG | 10,461 | 457,805 | |
| Verbund AG | 4,613 | 400,243 | |
| Voestalpine AG | 7,900 | 196,938 | |
TOTAL AUSTRIA | 2,473,280 | ||
| Belgium - 0.5% | |||
| Ageas | 11,008 | 422,341 | |
| Anheuser-Busch InBev SA NV | 60,747 | 3,456,385 | |
| D'ieteren Group | 1,430 | 211,983 | |
| Elia Group SA/NV | 1,962 | 186,113 | |
| Groupe Bruxelles Lambert SA | 6,797 | 496,241 | |
| KBC Group NV | 17,594 | 966,181 | |
| Lotus Bakeries SA | 29 | 214,794 | |
| Sofina SA | 1,154 | 218,567 | |
| Solvay SA Class A | 5,125 | 540,866 | |
| UCB SA | 8,887 | 649,394 | |
| Umicore SA | 14,921 | 355,013 | |
| Warehouses de Pauw | 10,941 | 269,968 | |
TOTAL BELGIUM | 7,987,846 | ||
| Brazil - 1.1% | |||
| Ambev SA | 328,300 | 837,395 | |
| Atacadao SA | 42,200 | 75,080 | |
| B3 SA - Brasil Bolsa Balcao | 410,800 | 904,424 | |
| Banco Bradesco SA | 114,068 | 278,057 | |
| Banco BTG Pactual SA unit | 80,200 | 470,852 | |
| Banco do Brasil SA | 60,900 | 584,026 | |
| Banco Santander SA (Brasil) unit | 25,400 | 135,621 | |
| BB Seguridade Participacoes SA | 47,500 | 289,800 | |
| CCR SA | 67,400 | 160,153 | |
| Centrais Eletricas Brasileiras SA (Electrobras) | 77,800 | 537,621 | |
| Companhia de Saneamento Basico do Estado de Sao Paulo (SABESP) | 23,600 | 273,225 | |
| Companhia Siderurgica Nacional SA (CSN) | 49,700 | 115,926 | |
| Cosan SA | 85,008 | 265,558 | |
| CPFL Energia SA (a) | 17,300 | 114,744 | |
| Energisa SA unit | 13,900 | 128,503 | |
| Eneva SA (a) | 59,300 | 127,263 | |
| ENGIE Brasil Energia SA | 13,250 | 103,283 | |
| Equatorial Energia SA | 70,289 | 440,548 | |
| Hapvida Participacoes e Investimentos SA (a)(b) | 362,073 | 264,997 | |
| Hypera SA (a) | 26,600 | 159,808 | |
| Itausa-Investimentos Itau SA | 5,093 | 8,667 | |
| Klabin SA unit | 55,000 | 233,451 | |
| Localiza Rent a Car SA | 63,945 | 645,189 | |
| Localiza Rent a Car SA rights 11/10/23 (a) | 468 | 650 | |
| Lojas Renner SA (a) | 62,673 | 152,402 | |
| Magazine Luiza SA (a) | 190,632 | 50,288 | |
| Natura & Co. Holding SA | 58,893 | 148,934 | |
| Petroleo Brasileiro SA - Petrobras (ON) | 255,444 | 1,917,192 | |
| Prio SA (a) | 56,600 | 535,493 | |
| Raia Drogasil SA | 88,524 | 453,001 | |
| Rede D'Oregon Sao Luiz SA (b) | 37,361 | 160,211 | |
| Rumo SA | 89,900 | 397,812 | |
| Sendas Distribuidora SA | 93,100 | 202,016 | |
| Suzano Papel e Celulose SA | 54,722 | 559,729 | |
| Telefonica Brasil SA | 27,700 | 248,554 | |
| TIM SA | 55,100 | 165,789 | |
| Totvs SA | 39,600 | 198,795 | |
| Ultrapar Participacoes SA | 52,800 | 214,164 | |
| Vale SA | 239,026 | 3,271,244 | |
| Vibra Energia SA (a) | 82,878 | 325,315 | |
| Weg SA | 117,060 | 766,430 | |
| Wheaton Precious Metals Corp. | 31,877 | 1,346,339 | |
| Yara International ASA | 11,530 | 376,732 | |
TOTAL BRAZIL | 18,645,281 | ||
| Burkina Faso - 0.0% | |||
| Endeavour Mining PLC | 12,566 | 259,647 | |
| Canada - 6.9% | |||
| Agnico Eagle Mines Ltd. (Canada) | 34,586 | 1,622,119 | |
| Air Canada (a) | 11,423 | 137,809 | |
| Algonquin Power & Utilities Corp. | 47,041 | 236,774 | |
| Alimentation Couche-Tard, Inc. Class A (multi-vtg.) | 54,748 | 2,980,297 | |
| AltaGas Ltd. (c) | 20,054 | 372,519 | |
| ARC Resources Ltd. | 42,333 | 681,052 | |
| Bank of Montreal | 49,880 | 3,769,191 | |
| Bank of Nova Scotia | 83,430 | 3,378,110 | |
| Barrick Gold Corp. (Canada) | 123,346 | 1,970,156 | |
| BCE, Inc. | 5,157 | 191,442 | |
| Brookfield Asset Management Ltd. Class A | 24,891 | 713,479 | |
| Brookfield Corp. (Canada) Class A | 98,647 | 2,873,870 | |
| CAE, Inc. (a) | 22,186 | 463,318 | |
| Cameco Corp. | 30,435 | 1,245,053 | |
| Canadian Apartment Properties (REIT) unit | 5,339 | 157,157 | |
| Canadian Imperial Bank of Commerce | 63,514 | 2,240,108 | |
| Canadian National Railway Co. | 39,458 | 4,174,994 | |
| Canadian Natural Resources Ltd. | 77,637 | 4,930,026 | |
| Canadian Pacific Kansas City Ltd. | 65,262 | 4,633,637 | |
| Canadian Tire Ltd. Class A (non-vtg.) | 3,766 | 363,252 | |
| Canadian Utilities Ltd. Class A (non-vtg.) | 9,439 | 199,705 | |
| CCL Industries, Inc. Class B | 10,367 | 405,335 | |
| Cenovus Energy, Inc. (Canada) | 100,427 | 1,913,309 | |
| CGI, Inc. Class A (sub. vtg.) (a) | 14,867 | 1,435,294 | |
| Constellation Software, Inc. | 1,410 | 2,826,619 | |
| Constellation Software, Inc. warrants 8/22/28 (a)(d) | 1,367 | 0 | |
| Descartes Systems Group, Inc. (Canada) (a) | 5,948 | 429,903 | |
| Dollarama, Inc. | 19,939 | 1,361,618 | |
| Element Fleet Management Corp. | 26,861 | 363,377 | |
| Emera, Inc. | 19,399 | 635,372 | |
| Empire Co. Ltd. Class A (non-vtg.) | 10,191 | 279,256 | |
| Enbridge, Inc. (c) | 151,195 | 4,845,218 | |
| Fairfax Financial Holdings Ltd. (sub. vtg.) | 1,500 | 1,248,275 | |
| FirstService Corp. | 2,781 | 393,521 | |
| Fortis, Inc. | 33,721 | 1,338,870 | |
| Franco-Nevada Corp. | 13,498 | 1,642,050 | |
| George Weston Ltd. | 4,333 | 469,998 | |
| GFL Environmental, Inc. | 16,365 | 471,449 | |
| Gildan Activewear, Inc. | 12,649 | 359,289 | |
| Great-West Lifeco, Inc. | 19,692 | 545,568 | |
| Hydro One Ltd. (b) | 23,280 | 603,677 | |
| iA Financial Corp., Inc. | 7,201 | 419,000 | |
| IGM Financial, Inc. | 5,458 | 122,876 | |
| Imperial Oil Ltd. | 14,353 | 817,968 | |
| Intact Financial Corp. | 12,306 | 1,729,007 | |
| Ivanhoe Mines Ltd. (a) | 42,053 | 309,920 | |
| Keyera Corp. | 16,496 | 383,628 | |
| Kinross Gold Corp. | 86,844 | 453,399 | |
| Loblaw Companies Ltd. | 11,221 | 917,747 | |
| Magna International, Inc. Class A (sub. vtg.) | 19,137 | 919,625 | |
| Manulife Financial Corp. | 129,123 | 2,247,723 | |
| Metro, Inc. | 16,145 | 820,086 | |
| National Bank of Canada | 23,734 | 1,475,641 | |
| Northland Power, Inc. | 17,556 | 246,740 | |
| Nutrien Ltd. | 34,804 | 1,869,264 | |
| Nuvei Corp. (Canada) (b) | 4,089 | 56,938 | |
| Onex Corp. (sub. vtg.) | 4,850 | 271,817 | |
| Open Text Corp. | 18,819 | 628,318 | |
| Pan American Silver Corp. | 25,401 | 371,101 | |
| Parkland Corp. | 9,791 | 296,325 | |
| Pembina Pipeline Corp. | 38,937 | 1,198,364 | |
| Power Corp. of Canada (sub. vtg.) | 40,800 | 982,966 | |
| Quebecor, Inc. Class B (sub. vtg.) | 11,124 | 229,499 | |
| RB Global, Inc. | 12,759 | 834,439 | |
| Restaurant Brands International, Inc. | 17,298 | 1,161,932 | |
| Restaurant Brands International, Inc. | 3,458 | 232,378 | |
| RioCan (REIT) | 11,422 | 138,785 | |
| Rogers Communications, Inc. Class B (non-vtg.) | 25,111 | 930,379 | |
| Royal Bank of Canada | 96,990 | 7,746,611 | |
| Saputo, Inc. | 17,602 | 355,404 | |
| Shopify, Inc. Class A (a) | 84,084 | 3,970,911 | |
| Stantec, Inc. | 7,711 | 471,807 | |
| Sun Life Financial, Inc. | 41,189 | 1,881,313 | |
| Suncor Energy, Inc. | 92,482 | 2,995,036 | |
| TC Energy Corp. | 71,444 | 2,460,548 | |
| Teck Resources Ltd. Class B (sub. vtg.) | 31,989 | 1,130,313 | |
| TELUS Corp. | 33,173 | 534,882 | |
| TFI International, Inc. (Canada) | 5,337 | 590,409 | |
| The Toronto-Dominion Bank | 128,789 | 7,193,796 | |
| Thomson Reuters Corp. | 11,125 | 1,332,593 | |
| TMX Group Ltd. | 19,642 | 409,058 | |
| Toromont Industries Ltd. | 5,855 | 440,787 | |
| Tourmaline Oil Corp. | 22,641 | 1,197,234 | |
| West Fraser Timber Co. Ltd. | 4,041 | 272,722 | |
| WSP Global, Inc. | 8,748 | 1,144,889 | |
TOTAL CANADA | 113,096,244 | ||
| Chile - 0.2% | |||
| Antofagasta PLC | 27,884 | 455,842 | |
| Banco de Chile | 3,272,124 | 336,170 | |
| Banco de Credito e Inversiones | 4,825 | 115,369 | |
| Banco Santander Chile | 4,269,821 | 186,155 | |
| Cencosud SA | 85,649 | 138,761 | |
| Compania Cervecerias Unidas SA | 8,514 | 48,401 | |
| Compania Sud Americana de Vapores SA | 912,743 | 50,685 | |
| Empresas CMPC SA | 88,109 | 157,513 | |
| Empresas COPEC SA | 30,418 | 201,371 | |
| Enel Americas SA (a) | 1,356,829 | 139,473 | |
| Enel Chile SA | 1,719,015 | 101,796 | |
| Falabella SA | 75,417 | 153,573 | |
| Lundin Mining Corp. | 46,626 | 291,171 | |
TOTAL CHILE | 2,376,280 | ||
| China - 8.2% | |||
| 360 Security Technology, Inc. (A Shares) (a) | 27,700 | 34,043 | |
| 37 Interactive Entertainment Network Technology Group Co. Ltd. (A Shares) | 8,800 | 24,897 | |
| 3Peak, Inc. (A Shares) | 452 | 9,954 | |
| 3SBio, Inc. (b) | 119,000 | 105,867 | |
| AAC Technology Holdings, Inc. | 45,000 | 81,002 | |
| Accelink Technologies Co. Ltd. (A Shares) | 4,200 | 15,480 | |
| Advanced Micro-Fabrication Equipment, Inc., China (A Shares) | 2,277 | 53,344 | |
| AECC Aero-Engine Control Co. Ltd. (A Shares) | 4,200 | 11,926 | |
| AECC Aviation Power Co. Ltd. | 10,300 | 49,816 | |
| Agricultural Bank of China Ltd.: | |||
| (A Shares) | 392,900 | 192,850 | |
| (H Shares) | 1,988,000 | 734,281 | |
| Aier Eye Hospital Group Co. Ltd. (A Shares) | 34,495 | 86,261 | |
| AIMA Technology Group Co. Ltd. | 2,900 | 11,140 | |
| Air China Ltd.: | |||
| (A Shares) (a) | 90,900 | 99,707 | |
| (H Shares) (a) | 92,000 | 62,588 | |
| Airtac International Group | 10,278 | 337,656 | |
| Akeso, Inc. (a)(b) | 33,000 | 185,313 | |
| Alibaba Group Holding Ltd. (a) | 1,151,344 | 11,853,178 | |
| Alibaba Health Information Technology Ltd. (a) | 358,000 | 210,890 | |
| Aluminum Corp. of China Ltd.: | |||
| (A shares) | 88,000 | 74,588 | |
| (H Shares) | 196,000 | 104,846 | |
| Amlogic Shanghai Co. Ltd. (A Shares) (a) | 1,229 | 10,099 | |
| Angel Yeast Co. Ltd. (A Shares) | 3,600 | 17,216 | |
| Anhui Conch Cement Co. Ltd.: | |||
| (A Shares) | 8,200 | 27,124 | |
| (H Shares) | 116,000 | 288,689 | |
| Anhui Gujing Distillery Co. Ltd. (B Shares) | 12,700 | 197,948 | |
| Anhui Honglu Steel Construction Group Co. Ltd. | 2,990 | 10,273 | |
| Anhui Jianghuai Automobile Group Corp. Ltd. (A Shares) (a) | 13,500 | 33,463 | |
| Anhui Kouzi Distillery Co. Ltd. (A Shares) | 2,300 | 15,788 | |
| Anhui Yingjia Distillery Co. Ltd. (A Shares) | 2,500 | 26,217 | |
| Anjoy Foods Group Co. Ltd. (A Shares) | 1,000 | 17,666 | |
| Anker Innovations Technology Co. Ltd. (A Shares) | 1,700 | 21,779 | |
| Anta Sports Products Ltd. | 89,200 | 1,008,807 | |
| Apeloa Pharmaceutical Co. Ltd. A Shares | 3,600 | 8,487 | |
| Asia - Potash International Investment Guangzhou Co. Ltd. (A Shares) (a) | 2,600 | 10,138 | |
| ASR Microelectronics Co. Ltd. (A Shares) | 1,602 | 14,280 | |
| Asymchem Laboratories Tianjin Co. Ltd. (A Shares) | 1,260 | 26,007 | |
| Autobio Diagnostics Co. Ltd. | 2,100 | 12,762 | |
| Autohome, Inc. ADR Class A | 4,715 | 126,126 | |
| Avary Holding Shenzhen Co. Ltd. (A Shares) | 7,400 | 21,689 | |
| AVIC Capital Co. Ltd. (A Shares) | 32,600 | 14,848 | |
| AviChina Industry & Technology Co. Ltd. (H Shares) | 168,000 | 76,140 | |
| Avicopter PLC (A Shares) | 1,800 | 9,345 | |
| BAIC BluePark New Energy Technology Co. Ltd. (A Shares) (a) | 66,100 | 61,962 | |
| Baidu, Inc. Class A (a) | 158,442 | 2,080,155 | |
| Bank of Beijing Co. Ltd. (A Shares) | 75,200 | 46,898 | |
| Bank of Changsha Co. Ltd. (A Shares) | 20,100 | 20,195 | |
| Bank of Chengdu Co. Ltd. (A Shares) | 15,200 | 25,695 | |
| Bank of China Ltd.: | |||
| (A Shares) | 514,800 | 274,464 | |
| (H Shares) | 4,996,000 | 1,745,280 | |
| Bank of Communications Co. Ltd.: | |||
| (A Shares) | 22,600 | 17,394 | |
| (H Shares) | 831,000 | 491,541 | |
| Bank of Hangzhou Co. Ltd. (A Shares) | 18,900 | 27,649 | |
| Bank of Jiangsu Co. Ltd. (A Shares) | 56,660 | 53,465 | |
| Bank of Nanjing Co. Ltd. (A Shares) | 38,600 | 41,380 | |
| Bank of Ningbo Co. Ltd. (A Shares) | 34,780 | 118,800 | |
| Bank of Shanghai Co. Ltd. (A Shares) | 51,018 | 42,344 | |
| Bank of Suzhou Co. Ltd. | 15,800 | 13,568 | |
| Baoshan Iron & Steel Co. Ltd. (A Shares) | 85,200 | 72,898 | |
| BeiGene Ltd. (a) | 48,477 | 695,930 | |
| Beijing Capital International Airport Co. Ltd. (H Shares) (a) | 118,000 | 43,464 | |
| Beijing Dabeinong Technology Group Co. Ltd. (A Shares) (a) | 13,400 | 12,917 | |
| Beijing E-Hualu Information Technology Co. Ltd. (A Shares) (a) | 2,600 | 10,314 | |
| Beijing Easpring Material Technology Co. Ltd. (A Shares) | 1,900 | 11,459 | |
| Beijing Enlight Media Co. Ltd. (A Shares) | 13,000 | 13,904 | |
| Beijing Enterprises Holdings Ltd. | 33,000 | 109,951 | |
| Beijing Enterprises Water Group Ltd. | 246,000 | 51,907 | |
| Beijing Kingsoft Office Software, Inc. (A Shares) | 1,987 | 78,171 | |
| Beijing New Building Materials PLC (A Shares) | 6,500 | 21,737 | |
| Beijing Oriental Yuhong Waterproof Technology Co. Ltd. (A Shares) | 10,700 | 36,433 | |
| Beijing Roborock Technology Co. Ltd. (A Shares) | 530 | 22,915 | |
| Beijing Shiji Information Technology Co. Ltd. (A Shares) | 10,519 | 15,176 | |
| Beijing Tiantan Biological Products Corp. Ltd. (A Shares) | 6,700 | 26,439 | |
| Beijing Tongrentang Co. Ltd. (A Shares) | 5,100 | 35,797 | |
| Beijing United Information Technology Co. Ltd. (A Shares) | 2,972 | 15,303 | |
| Beijing Wantai Biological Pharmacy Enterprise Co. Ltd. (A Shares) | 2,856 | 17,131 | |
| Beijing Yanjing Brewery Co. Ltd. (A Shares) | 11,400 | 16,209 | |
| Beijing-Shanghai High Speed Railway Co. Ltd. (A Shares) | 123,400 | 84,369 | |
| Beiqi Foton Motor Co. Ltd. (A Shares) (a) | 77,700 | 32,212 | |
| Bethel Automotive Safety Systems Co. Ltd. (A Shares) | 1,700 | 17,596 | |
| Betta Pharmaceuticals Co. Ltd. (A Shares) | 2,200 | 18,302 | |
| BGI Genomics Co. Ltd. | 1,300 | 8,748 | |
| Bilibili, Inc. Class Z (a) | 14,066 | 188,734 | |
| Bloomage Biotechnology Corp. Ltd. (A Shares) | 1,779 | 18,599 | |
| BOC Aviation Ltd. Class A (b) | 15,600 | 95,941 | |
| BOC Hong Kong (Holdings) Ltd. | 262,500 | 694,192 | |
| BOC International China Co. Ltd. | 9,900 | 14,757 | |
| BOE Technology Group Co. Ltd. (A Shares) | 138,100 | 74,037 | |
| Bosideng International Holdings Ltd. | 244,000 | 96,338 | |
| BTG Hotels Group Co. Ltd. (a) | 4,200 | 9,590 | |
| Budweiser Brewing Co. APAC Ltd. (b) | 127,100 | 241,534 | |
| By-Health Co. Ltd. (A Shares) | 5,100 | 12,772 | |
| BYD Co. Ltd.: | |||
| (A Shares) | 12,300 | 401,430 | |
| (H Shares) | 69,000 | 2,098,299 | |
| BYD Electronic International Co. Ltd. | 57,000 | 237,947 | |
| C&D International Investment Group Ltd. | 54,961 | 123,650 | |
| Caitong Securities Co. Ltd. | 14,300 | 15,527 | |
| Cambricon Technologies Corp. Ltd. (A Shares) (a) | 1,596 | 23,561 | |
| Canmax Technologies Co. Ltd. (A Shares) | 3,120 | 11,606 | |
| CECEP Solar Energy Co. Ltd. (A Shares) | 16,700 | 13,106 | |
| CECEP Wind-Power Corp. (A Shares) | 17,550 | 7,608 | |
| CETC Cyberspace Security Technology Co. Ltd. (A Shares) | 3,700 | 11,157 | |
| CGN Power Co. Ltd. (H Shares) (b) | 718,000 | 172,541 | |
| Changchun High & New Technology Industry Group, Inc. (A Shares) | 1,400 | 29,803 | |
| Changjiang Securities Co. Ltd. (A Shares) | 16,200 | 12,602 | |
| Changzhou Xingyu Automotive Lighting Systems Co. Ltd. (A Shares) | 1,000 | 19,997 | |
| Chaozhou Three-Circle Group Co. (A Shares) | 6,300 | 26,608 | |
| Chengxin Lithium Group Co. Ltd. (A Shares) | 3,200 | 10,279 | |
| Chifeng Jilong Gold Mining Co. Ltd. (A Shares) (a) | 6,500 | 13,086 | |
| China Baoan Group Co. Ltd. (A Shares) | 7,400 | 10,455 | |
| China Cinda Asset Management Co. Ltd. (H Shares) | 571,000 | 55,526 | |
| China CITIC Bank Corp. Ltd.: | |||
| (A Shares) | 67,800 | 49,869 | |
| (H Shares) | 514,000 | 229,300 | |
| China Coal Energy Co. Ltd. (H Shares) | 125,000 | 98,183 | |
| China Communications Services Corp. Ltd. (H Shares) | 178,000 | 72,807 | |
| China Conch Venture Holdings Ltd. | 95,500 | 79,091 | |
| China Construction Bank Corp.: | |||
| (A Shares) | 291,400 | 249,723 | |
| (H Shares) | 6,369,000 | 3,602,040 | |
| China CSSC Holdings Ltd. (A Shares) | 17,100 | 60,514 | |
| China Eastern Airlines Corp. Ltd. (A Shares) (a) | 34,300 | 20,445 | |
| China Energy Engineering Corp. Ltd. (A Shares) | 101,000 | 30,107 | |
| China Everbright Bank Co. Ltd.: | |||
| (A Shares) | 77,100 | 31,298 | |
| (H Shares) | 360,000 | 102,689 | |
| China Everbright International Ltd. | 239,888 | 81,892 | |
| China Feihe Ltd. (b) | 239,000 | 148,508 | |
| China Film Co. Ltd. (A Shares) (a) | 13,600 | 22,224 | |
| China Galaxy Securities Co. Ltd.: | |||
| (A Shares) | 10,400 | 17,248 | |
| (H Shares) | 249,000 | 127,440 | |
| China Gas Holdings Ltd. | 180,200 | 162,001 | |
| China Great Wall Securities Co. Ltd. (A Shares) | 14,800 | 16,911 | |
| China Greatwall Technology Group Co. Ltd. (A Shares) | 12,600 | 18,938 | |
| China Hongqiao Group Ltd. | 179,000 | 167,582 | |
| China International Capital Corp. Ltd. (H Shares) (b) | 134,800 | 214,704 | |
| China Jinmao Holdings Group Ltd. | 356,413 | 43,717 | |
| China Jushi Co. Ltd. (A Shares) | 13,715 | 21,710 | |
| China Life Insurance Co. Ltd.: | |||
| (A Shares) | 6,600 | 30,317 | |
| (H Shares) | 539,000 | 730,021 | |
| China Literature Ltd. (a)(b) | 25,000 | 84,187 | |
| China Longyuan Power Grid Corp. Ltd. (H Shares) | 272,000 | 230,256 | |
| China Medical System Holdings Ltd. | 88,000 | 140,721 | |
| China Meheco Co. Ltd. (A Shares) | 5,180 | 8,466 | |
| China Meidong Auto Holding Ltd. | 42,000 | 22,524 | |
| China Mengniu Dairy Co. Ltd. | 220,000 | 718,330 | |
| China Merchants Bank Co. Ltd.: | |||
| (A Shares) | 30,400 | 127,925 | |
| (H Shares) | 342,000 | 1,297,307 | |
| China Merchants Energy Shipping Co. Ltd. (A Shares) | 29,900 | 26,291 | |
| China Merchants Holdings International Co. Ltd. | 95,219 | 121,208 | |
| China Merchants Securities Co. Ltd. (A Shares) | 61,150 | 118,236 | |
| China Merchants Shekou Industrial Zone Holdings Co. Ltd. (A Shares) | 30,700 | 46,317 | |
| China Minmetals Rare Earth Co. Ltd. (A Shares) | 3,800 | 15,584 | |
| China Minsheng Banking Corp. Ltd.: | |||
| (A Shares) | 26,000 | 13,222 | |
| (H Shares) | 676,900 | 225,043 | |
| China National Building Materials Co. Ltd. (H Shares) | 253,000 | 120,427 | |
| China National Chemical Engineering Co. Ltd. (A Shares) | 21,700 | 20,773 | |
| China National Medicines Corp. Ltd. (A Shares) | 2,700 | 10,627 | |
| China National Nuclear Power Co. Ltd. (A Shares) | 69,900 | 70,918 | |
| China National Software & Service Co. Ltd. (A Shares) | 3,380 | 15,892 | |
| China Northern Rare Earth Group High-Tech Co. Ltd. | 13,800 | 39,438 | |
| China Oilfield Services Ltd. (H Shares) | 120,000 | 141,878 | |
| China Overseas Land and Investment Ltd. | 270,500 | 510,463 | |
| China Overseas Property Holdings Ltd. | 80,000 | 69,479 | |
| China Pacific Insurance (Group) Co. Ltd. | 23,600 | 89,493 | |
| China Pacific Insurance (Group) Co. Ltd. (H Shares) | 192,800 | 474,938 | |
| China Petroleum & Chemical Corp.: | |||
| (A Shares) | 183,700 | 137,184 | |
| (H Shares) | 1,642,000 | 839,781 | |
| China Power International Development Ltd. | 405,805 | 157,710 | |
| China Railway Group Ltd.: | |||
| (A Shares) | 102,100 | 84,447 | |
| (H Shares) | 265,000 | 125,071 | |
| China Railway Signal & Communications Corp. (A Shares) | 29,107 | 18,689 | |
| China Resource Gas Group Ltd. | 61,300 | 181,211 | |
| China Resources Beer Holdings Co. Ltd. | 112,000 | 592,667 | |
| China Resources Cement Holdings Ltd. | 144,000 | 37,027 | |
| China Resources Land Ltd. | 228,000 | 853,429 | |
| China Resources Microelectronics Ltd. (A Shares) | 4,411 | 32,081 | |
| China Resources Mixc Lifestyle Services Ltd. (b) | 56,000 | 218,479 | |
| China Resources Pharmaceutical Group Ltd. (b) | 104,000 | 64,604 | |
| China Resources Power Holdings Co. Ltd. | 144,000 | 279,056 | |
| China Resources Sanjiu Medical & Pharmaceutical Co. Ltd. (A Shares) | 4,000 | 23,578 | |
| China Ruyi Holdings Ltd. (a) | 392,000 | 90,268 | |
| China Shenhua Energy Co. Ltd.: | |||
| (A Shares) | 14,800 | 61,302 | |
| (H Shares) | 254,000 | 778,503 | |
| China Southern Airlines Ltd.: | |||
| (A Shares) (a) | 61,500 | 51,928 | |
| (H Shares) (a) | 92,000 | 43,533 | |
| China State Construction Engineering Corp. Ltd. (A Shares) | 164,300 | 116,305 | |
| China State Construction International Holdings Ltd. | 128,000 | 137,106 | |
| China Taiping Insurance Group Ltd. | 91,000 | 84,064 | |
| China Three Gorges Renewables Group Co. Ltd. (A Shares) | 203,500 | 133,566 | |
| China Tourism Group Duty Free Corp. Ltd.: | |||
| (A Shares) | 11,100 | 143,595 | |
| (H Shares) (b) | 1,600 | 18,069 | |
| China Tower Corp. Ltd. (H Shares) (b) | 3,334,000 | 310,898 | |
| China Traditional Chinese Medicine Holdings Co. Ltd. | 196,000 | 96,578 | |
| China United Network Communications Ltd. (A Shares) | 120,700 | 73,575 | |
| China Vanke Co. Ltd.: | |||
| (A Shares) | 10,100 | 15,626 | |
| (H Shares) | 251,200 | 235,012 | |
| China XD Electric Co. Ltd. (A Shares) | 61,800 | 39,060 | |
| China Yangtze Power Co. Ltd. (A Shares) | 107,800 | 332,625 | |
| China Zhenhua (Group) Science & Technology Co. Ltd. (A Shares) | 1,700 | 15,556 | |
| China Zheshang Bank Co. Ltd. | 83,200 | 29,017 | |
| ChinaSoft International Ltd. | 178,000 | 129,142 | |
| Chongqing Brewery Co. Ltd. (A Shares) | 1,700 | 18,244 | |
| Chongqing Changan Automobile Co. Ltd. (A Shares) | 30,488 | 63,107 | |
| Chongqing Fuling Zhacai Group Co. Ltd. Group (A Shares) | 3,770 | 7,963 | |
| Chongqing Rural Commercial Bank Co. Ltd. (H Shares) | 102,000 | 38,615 | |
| Chongqing Taiji Industry Group Co. Ltd. (A Shares) (a) | 3,100 | 17,789 | |
| Chongqing Zhifei Biological Products Co. Ltd. (A Shares) | 9,150 | 78,440 | |
| Chow Tai Fook Jewellery Group Ltd. | 158,000 | 223,116 | |
| CITIC Pacific Ltd. | 432,000 | 367,174 | |
| CITIC Securities Co. Ltd.: | |||
| (A Shares) | 27,925 | 82,909 | |
| (H Shares) | 192,225 | 374,042 | |
| Cmoc Group Ltd.: | |||
| (A Shares) | 48,200 | 36,554 | |
| (H Shares) | 273,000 | 162,820 | |
| CNGR Advanced Material Co. Ltd. | 2,000 | 14,880 | |
| CNNC Hua Yuan Titanium Dioxide Co. Ltd. (A Shares) | 18,940 | 12,334 | |
| CNPC Capital Co. Ltd. (A Shares) | 34,400 | 27,911 | |
| Contemporary Amperex Technology Co. Ltd. | 18,880 | 479,502 | |
| COSCO Shipping Development Co. Ltd. (A Shares) | 37,900 | 11,915 | |
| COSCO Shipping Energy Transportation Co. Ltd.: | |||
| (A Shares) | 57,200 | 112,742 | |
| (H Shares) | 16,000 | 16,969 | |
| COSCO SHIPPING Holdings Co. Ltd.: | |||
| (A Shares) (a) | 46,470 | 62,107 | |
| (H Shares) | 225,550 | 229,393 | |
| Cosco Shipping Ports Ltd. | 115,757 | 69,835 | |
| Country Garden Holdings Co. Ltd. (a) | 888,784 | 79,477 | |
| Country Garden Services Holdings Co. Ltd. | 159,000 | 138,888 | |
| CRRC Corp. Ltd.: | |||
| (A Shares) | 86,000 | 62,824 | |
| (H Shares) | 309,000 | 128,737 | |
| CSC Financial Co. Ltd. (A Shares) | 17,000 | 56,231 | |
| CSPC Pharmaceutical Group Ltd. | 625,760 | 546,582 | |
| Dajin Heavy Industry Co. Ltd. | 2,200 | 8,335 | |
| Daqin Railway Co. Ltd. (A Shares) | 53,000 | 52,248 | |
| Daqo New Energy Corp. ADR (a) | 3,947 | 100,491 | |
| DaShenLin Pharmaceutical Group Co. Ltd. | 5,232 | 17,034 | |
| Datang International Power Generation Co. Ltd. (A Shares) | 34,800 | 12,322 | |
| DHC Software Co. Ltd. (A Shares) | 13,100 | 11,291 | |
| Do-Fluoride New Materials Co. Ltd. (A Shares) | 4,480 | 9,801 | |
| Dong-E-E-Jiao Co. Ltd. (A Shares) | 2,200 | 13,959 | |
| Dongfang Electric Corp. Ltd. (A Shares) | 11,400 | 23,229 | |
| Dongfeng Motor Group Co. Ltd. (H Shares) | 174,000 | 76,599 | |
| Dongxing Securities Co. Ltd. (A Shares) | 7,700 | 8,422 | |
| Dongyue Group Co. Ltd. | 102,000 | 81,248 | |
| East Buy Holding Ltd. (a)(b) | 29,000 | 118,306 | |
| East Money Information Co. Ltd. (A Shares) | 62,240 | 129,895 | |
| Eastroc Beverage Group Co. Ltd. | 1,800 | 47,270 | |
| Ecovacs Robotics Co. Ltd. Class A | 2,300 | 13,580 | |
| ENN Energy Holdings Ltd. | 54,400 | 412,088 | |
| ENN Natural Gas Co. Ltd. (A Shares) | 9,300 | 21,953 | |
| Eoptolink Technology, Inc. Ltd. (A Shares) | 3,700 | 15,960 | |
| ESR Group Ltd. (b) | 157,800 | 202,757 | |
| Eve Energy Co. Ltd. (A shares) | 7,371 | 46,763 | |
| Everbright Securities Co. Ltd. (A Shares) | 15,000 | 33,771 | |
| Everdisplay Optronics Shanghai Co. Ltd. (A Shares) (a) | 115,707 | 41,449 | |
| Fangda Carbon New Material Co. Ltd. (A Shares) (a) | 11,940 | 9,632 | |
| Far East Horizon Ltd. | 97,000 | 68,253 | |
| Farasis Energy Gan Zhou Co. Ltd. (A Shares) (a) | 12,895 | 31,064 | |
| FAW Jiefang Group Co. Ltd. (A Shares) (a) | 12,800 | 16,132 | |
| First Capital Securities Co. Ltd. (A Shares) | 14,400 | 11,518 | |
| Flat Glass Group Co. Ltd. | 15,000 | 26,938 | |
| Flat Glass Group Co. Ltd. (A Shares) (a) | 14,400 | 50,862 | |
| Focus Media Information Technology Co. Ltd. (A Shares) | 60,200 | 56,918 | |
| Foshan Haitian Flavouring & Food Co. Ltd. (A Shares) | 28,492 | 146,667 | |
| Fosun International Ltd. | 164,500 | 98,559 | |
| Founder Securities Co. Ltd. (A Shares) | 29,000 | 30,062 | |
| Foxconn Industrial Internet Co. Ltd. (A Shares) | 42,500 | 85,649 | |
| Fujian Sunner Development Co. Ltd. A Shares | 3,700 | 9,102 | |
| Fuyao Glass Industries Group Co. Ltd.: | |||
| (A Shares) | 2,500 | 12,723 | |
| (H Shares) (b) | 58,000 | 264,427 | |
| G-bits Network Technology Xiamen Co. Ltd. (A Shares) | 400 | 14,556 | |
| GalaxyCore, Inc. (A Shares) | 6,414 | 16,151 | |
| Ganfeng Lithium Group Co. Ltd.: | |||
| ��(A Shares) | 9,960 | 60,357 | |
| (H Shares) (b) | 28,260 | 101,504 | |
| GCL Technology Holdings Ltd. | 1,454,000 | 214,127 | |
| GD Power Development Co. Ltd. (A Shares) | 61,500 | 30,600 | |
| GDS Holdings Ltd. Class A (a) | 61,700 | 78,602 | |
| Geely Automobile Holdings Ltd. | 424,000 | 481,378 | |
| GEM Co. Ltd. (A Shares) | 13,600 | 10,900 | |
| Gemdale Corp. (A Shares) | 16,900 | 11,929 | |
| Genscript Biotech Corp. (a) | 76,000 | 220,945 | |
| GF Securities Co. Ltd.: | |||
| (A Shares) | 17,700 | 35,913 | |
| (H Shares) | 82,200 | 107,021 | |
| Giant Network Group Co. Ltd. (A Shares) | 7,800 | 12,597 | |
| Gigadevice Semiconductor Beijing, Inc. (A Shares) | 2,540 | 37,209 | |
| Ginlong Technologies Co. Ltd. (A Shares) | 1,350 | 12,388 | |
| GoerTek, Inc. (A Shares) | 12,500 | 30,866 | |
| Goldwind Science & Technology Co. Ltd. (H Shares) | 69,216 | 33,025 | |
| Gongniu Group Co. Ltd. (A Shares) | 3,400 | 49,147 | |
| GoodWe Technologies Co. Ltd. (A Shares) | 662 | 10,576 | |
| Gotion High-tech Co. Ltd. (A Shares) (a) | 7,000 | 21,797 | |
| Great Wall Motor Co. Ltd.: | |||
| (A Shares) | 8,300 | 33,353 | |
| (H Shares) | 157,500 | 220,168 | |
| Gree Electric Appliances, Inc. of Zhuhai (A Shares) | 11,300 | 52,422 | |
| Greenland Holdings Corp. Ltd. (A Shares) (a) | 46,000 | 16,034 | |
| Greentown China Holdings Ltd. | 65,000 | 63,059 | |
| GRG Banking Equipment Co. Ltd. (A Shares) | 10,900 | 17,397 | |
| Guangdong Haid Group Co. Ltd. (A Shares) | 6,600 | 40,636 | |
| Guangdong HEC Technology Holding Co. Ltd. (A Shares) (a) | 12,600 | 12,259 | |
| Guangdong Investment Ltd. | 194,000 | 132,382 | |
| Guanghui Energy Co. Ltd. (A Shares) | 22,400 | 23,001 | |
| Guangzhou Automobile Group Co. Ltd. | 29,400 | 40,300 | |
| Guangzhou Automobile Group Co. Ltd. (H Shares) | 164,000 | 76,834 | |
| Guangzhou Baiyun International Airport Co. Ltd. (A Shares) (a) | 8,900 | 12,887 | |
| Guangzhou Baiyunshan Pharma Health (A Shares) | 5,100 | 20,782 | |
| Guangzhou Great Power Energy & Technology Co. Ltd. (A Shares) | 1,800 | 7,590 | |
| Guangzhou Haige Communications Group (A Shares) | 11,300 | 17,948 | |
| Guangzhou Kingmed Diagnostics Group Co. Ltd. (A Shares) | 1,900 | 16,083 | |
| Guangzhou Shiyuan Electronic Technology Co. Ltd. (A Shares) | 2,600 | 14,938 | |
| Guangzhou Tinci Materials Technology Co. Ltd. (A Shares) | 8,160 | 31,052 | |
| Guangzhou Yuexiu Financial Holdings Group Co. Ltd. (A Shares) | 13,776 | 12,362 | |
| Guolian Securities Co. Ltd. (a) | 6,400 | 9,412 | |
| Guosen Securities Co. Ltd. (A Shares) | 26,300 | 34,553 | |
| Guotai Junan Securities Co. Ltd.: | |||
| (A Shares) | 19,300 | 38,989 | |
| (H Shares) (b) | 80,600 | 89,960 | |
| Guoyuan Securities Co. Ltd. (A Shares) | 14,510 | 13,735 | |
| H World Group Ltd. ADR (a) | 14,685 | 553,037 | |
| Haidilao International Holding Ltd. (b) | 121,000 | 302,961 | |
| Haier Smart Home Co. Ltd. | 166,600 | 475,198 | |
| Haier Smart Home Co. Ltd. (A Shares) | 26,400 | 80,229 | |
| Hainan Airlines Co. Ltd. (A Shares) (a) | 161,400 | 32,222 | |
| Hainan Airport Infrastructure Co. Ltd. (A Shares) (a) | 43,200 | 22,507 | |
| Haitian International Holdings Ltd. | 39,000 | 93,038 | |
| Haitong Securities Co. Ltd.: | |||
| (A Shares) | 16,400 | 21,908 | |
| (H Shares) | 311,600 | 178,916 | |
| Hangzhou Binjiang Real Estate Group Co. Ltd. (A Shares) | 12,200 | 13,966 | |
| Hangzhou Chang Chuan Technology Co. Ltd. | 2,300 | 12,846 | |
| Hangzhou First Applied Material Co. Ltd. (A Shares) | 5,616 | 19,626 | |
| Hangzhou GreatStar Industrial Co. Ltd. (A Shares) (a) | 11,700 | 31,705 | |
| Hangzhou Lion Electronics Co. Ltd. (A Shares) | 2,100 | 9,240 | |
| Hangzhou Oxygen Plant Group Co. Ltd. (A Shares) | 3,800 | 17,153 | |
| Hangzhou Robam Appliances Co. Ltd. (A Shares) | 3,100 | 9,782 | |
| Hangzhou Silan Microelectronics Co. Ltd. (A Shares) | 4,600 | 15,277 | |
| Hangzhou Tigermed Consulting Co. Ltd.: | |||
| (A Shares) | 2,500 | 22,813 | |
| (H Shares) (b) | 2,100 | 11,800 | |
| Hansoh Pharmaceutical Group Co. Ltd. (b) | 74,000 | 139,231 | |
| Haohua Chemical Science & Technology Co. Ltd. (A Shares) | 2,900 | 12,192 | |
| Hebei Hengshui Laobaigan Liquor Co. Ltd. | 3,600 | 11,710 | |
| Hebei Yangyuan Zhihui Beverage Co. Ltd. (A Shares) | 4,800 | 16,335 | |
| Heilongjiang Agriculture Co. Ltd. (A Shares) | 5,300 | 9,231 | |
| Henan Shenhuo Coal & Power Co. Ltd. (A Shares) | 7,500 | 16,863 | |
| Henan Shuanghui Investment & Development Co. Ltd. (A Shares) | 11,300 | 40,454 | |
| Hengan International Group Co. Ltd. | 51,000 | 170,814 | |
| Hengdian Group DMEGC Magnetics Co. Ltd. (A Shares) | 6,600 | 13,144 | |
| Hengli Petrochemical Co. Ltd. (A Shares) (a) | 26,600 | 53,298 | |
| Hengtong Optic-electric Co. Ltd. (A Shares) | 9,100 | 16,411 | |
| Hengyi Petrochemical Co. Ltd. (A Shares) (a) | 10,900 | 10,718 | |
| Hesteel Co. Ltd. (A Shares) | 30,300 | 9,279 | |
| Hisense Electric Co. Ltd. | 9,900 | 31,512 | |
| Hithink RoyalFlush Information Network Co. Ltd. (A Shares) | 2,000 | 38,420 | |
| Hongfa Technology Co. Ltd. (A Shares) | 2,660 | 10,557 | |
| Hoshine Silicon Industry Co. Ltd. (A Shares) | 2,900 | 22,696 | |
| Hoymiles Power Electronics, Inc. (A Shares) | 326 | 9,985 | |
| Hoyuan Green Energy Co. Ltd. (A Shares) | 2,263 | 11,559 | |
| Hua Hong Semiconductor Ltd. (a)(b) | 39,000 | 96,021 | |
| Huadian Power International Corp. Ltd.: | |||
| (A Shares) | 23,100 | 15,494 | |
| (H Shares) | 26,000 | 10,440 | |
| Huadong Medicine Co. Ltd. (A Shares) | 6,200 | 36,432 | |
| Huafon Chemical Co. Ltd. (A Shares) | 13,300 | 13,191 | |
| Huagong Tech Co. Ltd. (A Shares) | 3,800 | 14,688 | |
| Huaibei Mining Holdings Co. Ltd. (A Shares) | 8,100 | 16,239 | |
| Hualan Biological Engineer, Inc. (A Shares) | 7,410 | 23,780 | |
| Huaneng Power International, Inc.: | |||
| (A Shares) (a) | 61,600 | 64,093 | |
| (H Shares) (a) | 216,000 | 101,078 | |
| Huatai Securities Co. Ltd.: | |||
| (A Shares) | 16,700 | 36,607 | |
| (H Shares) (b) | 110,800 | 145,060 | |
| HUAXI Securities Co. Ltd. | 9,900 | 10,729 | |
| Huaxia Bank Co. Ltd. (A Shares) | 50,000 | 38,286 | |
| Huayu Automotive Systems Co. Ltd. (A Shares) | 10,300 | 24,707 | |
| Hubei Feilihua Quartz Glass Co. Ltd. (A Shares) | 2,000 | 10,831 | |
| Hubei Jumpcan Pharmaceutical Co. Ltd. (A Shares) | 3,700 | 13,711 | |
| Hubei Xingfa Chemicals Group Co. Ltd. (A Shares) | 4,300 | 11,553 | |
| Huizhou Desay SV Automotive Co. Ltd. | 2,200 | 37,773 | |
| Humanwell Healthcare Group Co. Ltd. (A Shares) | 5,400 | 17,268 | |
| Hunan Changyuan Lico Co. Ltd. (A Shares) | 5,814 | 6,779 | |
| Hunan Valin Steel Co. Ltd. (A Shares) | 20,300 | 16,177 | |
| Hundsun Technologies, Inc. (A Shares) | 7,808 | 33,256 | |
| Hygeia Healthcare Holdings Co. (b) | 22,400 | 135,253 | |
| iFlytek Co. Ltd. (A Shares) | 8,500 | 53,031 | |
| IMEIK Technology Development Co. Ltd. (A Shares) | 800 | 36,075 | |
| Industrial & Commercial Bank of China Ltd.: | |||
| (A Shares) | 847,100 | 547,884 | |
| (H Shares) | 3,735,000 | 1,789,979 | |
| Industrial Bank Co. Ltd. (A Shares) | 109,700 | 226,240 | |
| Industrial Securities Co. Ltd. (A Shares) | 38,270 | 32,659 | |
| Ingenic Semiconductor Co. Ltd. (A Shares) | 1,900 | 19,192 | |
| Inner Mongoli Yili Industries Co. Ltd. (A Shares) | 39,400 | 147,735 | |
| Inner Mongolia Baotou Steel Union Co. Ltd. (A Shares) (a) | 184,300 | 40,840 | |
| Inner Mongolia Dian Tou Energy Corp. Ltd. | 6,200 | 11,536 | |
| Inner Mongolia Junzheng Energy & Chemical Industry Group Co. Ltd. (A Shares) | 25,400 | 13,893 | |
| Inner Mongolia Yitai Coal Co. Ltd. (B Shares) (a) | 91,700 | 125,856 | |
| Inner Mongolia Yuan Xing Energy Co. Ltd. (A Shares) | 14,600 | 13,583 | |
| Innovent Biologics, Inc. (a)(b) | 82,000 | 483,239 | |
| Inspur Electronic Information Industry Co. Ltd. (A Shares) | 5,345 | 21,664 | |
| iQIYI, Inc. ADR (a) | 29,150 | 135,839 | |
| iRay Technology Co. Ltd. (A Shares) | 410 | 12,634 | |
| iSoftStone Information Technology Group Co. Ltd. (A Shares) | 3,750 | 18,341 | |
| JA Solar Technology Co. Ltd. (A Shares) | 13,376 | 40,985 | |
| Jason Furniture Hangzhou Co. Ltd. (A Shares) | 3,120 | 15,797 | |
| JCET Group Co. Ltd. (A Shares) | 6,800 | 28,704 | |
| JD Health International, Inc. (a)(b) | 76,200 | 346,122 | |
| JD Logistics, Inc. (a)(b) | 127,800 | 151,328 | |
| JD.com, Inc. Class A | 164,873 | 2,096,057 | |
| Jiangsu Eastern Shenghong Co. Ltd. | 23,700 | 34,484 | |
| Jiangsu Expressway Co. Ltd. (H Shares) | 82,000 | 74,550 | |
| Jiangsu Hengli Hydraulic Co. Ltd. | 4,576 | 35,224 | |
| Jiangsu Hengrui Medicine Co. Ltd. (A Shares) | 24,532 | 160,671 | |
| Jiangsu King's Luck Brewery JSC Ltd. (A Shares) | 5,100 | 40,785 | |
| Jiangsu Nhwa Pharmaceutical Co. Ltd. (A Shares) | 5,700 | 20,489 | |
| Jiangsu Pacific Quartz Co. Ltd. (A Shares) | 1,200 | 15,089 | |
| Jiangsu Phoenix Publishing & Media Corp. Ltd. | 13,500 | 17,735 | |
| Jiangsu Yanghe Brewery JSC Ltd. (A Shares) | 9,000 | 150,106 | |
| Jiangsu Yangnong Chemical Co. Ltd. (A Shares) | 1,430 | 13,205 | |
| Jiangsu Yoke Technology Co. Ltd. (A Shares) | 2,200 | 17,374 | |
| Jiangsu Yuyue Medical Equipment & Supply Co. Ltd. (A Shares) | 4,700 | 21,617 | |
| Jiangsu Zhongtian Technology Co. Ltd. (A Shares) | 11,200 | 21,455 | |
| Jiangxi Copper Co. Ltd.: | |||
| (A Shares) | 9,800 | 24,567 | |
| (H Shares) | 99,000 | 139,982 | |
| Jiangxi Special Electric Motor Co. Ltd. (A Shares) (a) | 5,700 | 9,333 | |
| Jinduicheng Molybdenum Co. Ltd. (A Shares) | 12,400 | 17,025 | |
| Jinko Solar Co. Ltd. (A Shares) | 25,551 | 33,155 | |
| JiuGui Liquor Co. Ltd. (A Shares) | 1,200 | 12,538 | |
| Jiumaojiu International Holdings Ltd. (b) | 61,000 | 66,375 | |
| Jizhong Energy Resources Co. Ltd. (A Shares) | 11,700 | 10,272 | |
| Joincare Pharmaceutical Group Industry Co. Ltd. (A Shares) | 6,300 | 10,212 | |
| Jointown Pharmaceutical Group (A Shares) | 15,019 | 14,618 | |
| Jonjee Hi-Tech Industrial & Commercial Holding Co. Ltd. (A Shares) (a) | 2,700 | 12,404 | |
| JOYY, Inc. ADR | 2,964 | 115,359 | |
| Juewei Food Co. Ltd. | 1,800 | 8,693 | |
| Juneyao Airlines Co. Ltd. (A shares) (a) | 8,100 | 16,154 | |
| Kangmei Pharmaceutical Co. Ltd. rights (a)(d) | 809 | 0 | |
| Kanzhun Ltd. ADR (a) | 15,586 | 230,673 | |
| KE Holdings, Inc. ADR | 46,297 | 681,029 | |
| Keda Industrial Group Co. Ltd. | 6,400 | 9,533 | |
| Kingboard Chemical Holdings Ltd. | 41,000 | 99,846 | |
| Kingdee International Software Group Co. Ltd. (a) | 200,000 | 265,374 | |
| Kingnet Network Co. Ltd. (A Shares) | 12,600 | 18,593 | |
| Kingsoft Corp. Ltd. | 68,000 | 237,285 | |
| Kuaishou Technology Class B (a)(b) | 162,500 | 1,046,475 | |
| Kuang-Chi Technologies Co. Ltd. (A Shares) | 10,200 | 19,513 | |
| Kunlun Energy Co. Ltd. | 308,000 | 256,596 | |
| Kunlun Tech Co. Ltd. (A Shares) (a) | 4,600 | 19,799 | |
| Kweichow Moutai Co. Ltd. (A Shares) | 5,300 | 1,220,877 | |
| Lb Group Co. Ltd. (A Shares) | 8,900 | 22,656 | |
| Lenovo Group Ltd. | 514,000 | 598,158 | |
| Lens Technology Co. Ltd. (A Shares) | 20,300 | 36,272 | |
| Lepu Medical Technology Beijing Co. Ltd. (A Shares) | 7,000 | 16,488 | |
| Li Auto, Inc. Class A (a) | 78,998 | 1,336,143 | |
| Li Ning Co. Ltd. | 168,000 | 514,820 | |
| Liaoning Port Co. Ltd. (A Shares) | 69,500 | 14,343 | |
| Lingyi iTech Guangdong Co. (A Shares) | 30,900 | 25,690 | |
| Livzon Pharmaceutical Group, Inc. (A Shares) | 2,000 | 9,574 | |
| Longfor Properties Co. Ltd. (b) | 130,297 | 189,681 | |
| LONGi Green Energy Technology Co. Ltd. | 33,752 | 111,428 | |
| Lufax Holding Ltd. ADR | 43,164 | 41,213 | |
| Luxi Chemical Group Co. Ltd. | 6,400 | 9,936 | |
| Luxshare Precision Industry Co. Ltd. (A Shares) | 27,793 | 124,821 | |
| Luzhou Laojiao Co. Ltd. (A Shares) | 7,000 | 205,069 | |
| Mango Excellent Media Co. Ltd. (A Shares) | 7,000 | 24,200 | |
| Maxscend Microelectronics Co. Ltd. (A Shares) | 1,824 | 37,639 | |
| Meihua Holdings Group Co. Ltd. (A Shares) | 10,200 | 13,250 | |
| Meinian Onehealth Healthcare Holdings Co. Ltd. (A Shares) (a) | 16,500 | 13,913 | |
| Meituan Class B (a)(b) | 356,080 | 5,047,439 | |
| Metallurgical Corp. China Ltd. (A Shares) | 62,000 | 28,060 | |
| Microport Scientific Corp. (a) | 52,800 | 83,201 | |
| Ming Yang Smart Energy Group Ltd. (A Shares) | 7,300 | 13,958 | |
| MINISO Group Holding Ltd. ADR | 7,028 | 177,879 | |
| Minth Group Ltd. | 48,000 | 107,147 | |
| Montage Technology Co. Ltd. (A Shares) | 4,439 | 33,471 | |
| Muyuan Foodstuff Co. Ltd. (A Shares) | 21,540 | 111,102 | |
| Nanjing King-Friend Biochemical Pharmaceutical Co. Ltd. | 6,501 | 11,245 | |
| Nanjing Securities Co. Ltd. (A Shares) | 14,200 | 15,616 | |
| NARI Technology Co. Ltd. (A Shares) | 44,680 | 137,981 | |
| National Silicon Industry Group Co. Ltd. (A Shares) (a) | 10,561 | 26,212 | |
| NAURA Technology Group Co. Ltd. | 2,000 | 70,157 | |
| NavInfo Co. Ltd. (A Shares) (a) | 7,300 | 9,987 | |
| NetEase, Inc. | 135,890 | 2,908,257 | |
| New China Life Insurance Co. Ltd. | 16,300 | 74,506 | |
| New China Life Insurance Co. Ltd. (H Shares) | 37,500 | 82,262 | |
| New Hope Liuhe Co. Ltd. (A Shares) (a) | 16,100 | 22,347 | |
| New Oriental Education & Technology Group, Inc. (a) | 106,290 | 693,015 | |
| Ninestar Corp. (A Shares) | 5,400 | 18,117 | |
| Ningbo Deye Technology Co. Ltd. (A Shares) | 1,760 | 16,655 | |
| Ningbo Joyson Electronic Corp. (A shares) | 3,600 | 9,285 | |
| Ningbo Orient Wires & Cables Co. Ltd. (A Shares) | 2,300 | 13,245 | |
| Ningbo Ronbay New Energy Technology Co. Ltd. (A Shares) | 1,425 | 8,634 | |
| Ningbo Shanshan Co. Ltd. (A Shares) | 7,100 | 13,594 | |
| Ningbo Tuopu Group Co. Ltd. (A Shares) | 3,700 | 32,689 | |
| Ningxia Baofeng Energy Group Co. Ltd. | 26,400 | 52,064 | |
| NIO, Inc. sponsored ADR (a)(c) | 96,524 | 704,625 | |
| Nongfu Spring Co. Ltd. (H Shares) (b) | 121,800 | 693,742 | |
| North Industries Group Red Arrow Co. Ltd. (A Shares) | 5,900 | 11,506 | |
| Offcn Education Technology Co. A Shares (a) | 22,400 | 12,102 | |
| Offshore Oil Enginering Co. Ltd. (A Shares) | 15,000 | 12,747 | |
| Oppein Home Group, Inc. (A Shares) | 1,760 | 20,947 | |
| Orient Securities Co. Ltd. (A Shares) | 26,240 | 31,126 | |
| Oriental Pearl Group Co. Ltd. | 30,300 | 30,591 | |
| Ovctek China, Inc. (A Shares) | 3,820 | 13,176 | |
| Pangang Group Vanadium Titanium & Resources Co. Ltd. (A Shares) (a) | 33,400 | 15,952 | |
| PDD Holdings, Inc. ADR (a) | 41,918 | 4,251,324 | |
| People's Insurance Co. of China Group Ltd.: | |||
| (A Shares) | 63,300 | 46,218 | |
| (H Shares) | 611,000 | 201,605 | |
| People.cn Co. Ltd. (A Shares) | 5,500 | 24,389 | |
| Perfect World Co. Ltd. (A Shares) | 8,250 | 13,544 | |
| PetroChina Co. Ltd.: | |||
| (A Shares) | 97,400 | 94,896 | |
| (H Shares) | 1,478,000 | 964,714 | |
| Pharmaron Beijing Co. Ltd.: | |||
| (A Shares) | 5,325 | 24,221 | |
| (H Shares) (b) | 8,000 | 19,097 | |
| PICC Property & Casualty Co. Ltd. (H Shares) | 490,000 | 559,558 | |
| Ping An Bank Co. Ltd. (A Shares) | 119,900 | 171,528 | |
| Ping An Healthcare and Technology Co. Ltd. (a)(b) | 35,900 | 83,860 | |
| Ping An Insurance Group Co. of China Ltd.: | |||
| (A Shares) | 57,200 | 355,479 | |
| (H Shares) | 458,000 | 2,323,194 | |
| Piotech, Inc. (A Shares) | 1,006 | 34,765 | |
| Poly Developments & Holdings (A Shares) | 45,000 | 67,738 | |
| Pop Mart International Group Ltd. (b) | 33,600 | 92,753 | |
| Postal Savings Bank of China Co. Ltd. | 120,000 | 74,974 | |
| Postal Savings Bank of China Co. Ltd. (H Shares) (b) | 576,000 | 262,903 | |
| Power Construction Corp. of China Ltd. (A Shares) | 69,600 | 50,057 | |
| Prosus NV | 107,011 | 2,992,625 | |
| Pylon Technologies Co. Ltd. (Series A) | 565 | 8,799 | |
| Qi An Xin Technology Group, Inc. (A Shares) (a) | 2,667 | 16,826 | |
| Qifu Technology, Inc. ADR | 7,332 | 108,440 | |
| Qinghai Salt Lake Potash Co. Ltd. Class A (a) | 19,800 | 45,850 | |
| Raytron Technology Co. Ltd. (A Shares) | 1,967 | 12,669 | |
| Risen Energy Co. Ltd. (A Shares) | 3,900 | 9,472 | |
| Riyue Heavy Industry Co. Ltd. (A Shares) | 3,000 | 5,774 | |
| Rockchip Electronics Co. Ltd. | 1,400 | 12,477 | |
| Rongsheng Petrochemical Co. Ltd. (A Shares) | 37,850 | 58,963 | |
| SAIC Motor Corp. Ltd. (A Shares) | 29,100 | 57,789 | |
| Sailun Group Co. Ltd. A Shares | 9,500 | 14,590 | |
| Sanan Optoelectronics Co. Ltd. (A Shares) | 18,900 | 38,474 | |
| Sangfor Technologies, Inc. (a) | 1,600 | 18,358 | |
| Sany Heavy Equipment International Holdings Co. Ltd. | 72,000 | 94,580 | |
| Sany Heavy Industry Co. Ltd. (A Shares) | 32,400 | 64,076 | |
| Satellite Chemical Co. Ltd. (A Shares) | 11,909 | 26,473 | |
| SDIC Capital Co. Ltd. | 20,500 | 19,156 | |
| SDIC Power Holdings Co. Ltd. (A Shares) | 27,200 | 45,378 | |
| Seazen Holdings Co. Ltd. (A Shares) (a) | 8,200 | 13,318 | |
| Seres Group Co. Ltd. (A Shares) (a) | 6,000 | 66,980 | |
| SF Holding Co. Ltd. (A Shares) | 18,900 | 101,426 | |
| SG Micro Corp. (A Shares) | 1,657 | 20,322 | |
| Shaanxi Coal Industry Co. Ltd. (A Shares) | 36,400 | 89,757 | |
| Shan Xi Hua Yang Group New Energy Co. Ltd. | 11,700 | 12,904 | |
| Shandong Buchang Pharmaceuticals Co. Ltd. (A Shares) | 4,200 | 9,959 | |
| Shandong Gold Mining Co. Ltd.: | |||
| (A Shares) | 17,740 | 57,611 | |
| (H Shares) (b) | 39,250 | 73,532 | |
| Shandong Himile Mechanical Science & Technology Co. Ltd. (A Shares) | 7,000 | 30,779 | |
| Shandong Hualu Hengsheng Chemical Co. Ltd. (A Shares) | 7,260 | 31,937 | |
| Shandong Linglong Tyre Co. Ltd. (A Shares) | 7,300 | 19,984 | |
| Shandong Nanshan Aluminum Co. Ltd. (A Shares) | 55,000 | 23,312 | |
| Shandong Sun Paper Industry JSC Ltd. (A Shares) | 8,700 | 14,790 | |
| Shandong Weigao Medical Polymer Co. Ltd. (H Shares) | 164,400 | 152,595 | |
| Shanghai Aiko Solar Energy Co. Ltd. (A Shares) | 6,440 | 17,260 | |
| Shanghai Bairun Investment Holding Group Co. Ltd. (A Shares) | 3,644 | 13,119 | |
| Shanghai Baosight Software Co. Ltd. | 76,386 | 157,098 | |
| Shanghai Construction Group Co. Ltd. (A Shares) | 23,498 | 8,451 | |
| Shanghai Electric Group Co. Ltd. (A Shares) (a) | 51,500 | 31,269 | |
| Shanghai Electric Power Co. Ltd. (A Shares) | 12,000 | 14,337 | |
| Shanghai Fosun Pharmaceutical (Group) Co. Ltd.: | |||
| (A Shares) | 5,400 | 21,005 | |
| (H Shares) | 38,500 | 88,837 | |
| Shanghai Friendess Electronic Technology Corp. Ltd. (A Shares) | 617 | 20,388 | |
| Shanghai Fudan Microelectronics Group Co. Ltd. (A Shares) | 4,237 | 28,060 | |
| Shanghai International Airport Co. Ltd. (A Shares) (a) | 5,200 | 26,459 | |
| Shanghai International Port Group Co. Ltd. (A Shares) | 34,200 | 23,380 | |
| Shanghai Jinjiang International Hotels Co. Ltd. (A Shares) | 3,300 | 14,819 | |
| Shanghai Junshi Biosciences Co. Ltd. (A Shares) (a) | 2,376 | 14,902 | |
| Shanghai Lingang Holdings Corp. Ltd. (A Shares) | 10,480 | 15,374 | |
| Shanghai M&G Stationery, Inc. (A Shares) | 3,400 | 18,017 | |
| Shanghai Moons' Electric Co. Ltd. (A Shares) | 2,000 | 18,030 | |
| Shanghai Pharmaceuticals Holding Co. Ltd.: | |||
| (A Shares) | 22,000 | 54,216 | |
| (H Shares) | 48,200 | 70,121 | |
| Shanghai Pudong Development Bank Co. Ltd. (A Shares) | 165,800 | 154,616 | |
| Shanghai Putailai New Energy Technology Co. Ltd. | 6,786 | 23,218 | |
| Shanghai RAAS Blood Products Co. Ltd. (A Shares) | 26,800 | 25,598 | |
| Shanghai Rural Commercial Bank Co. Ltd. (A Shares) | 34,900 | 28,438 | |
| Shanghai Yuyuan Tourist Mart Group Co. Ltd. | 11,700 | 10,396 | |
| Shanxi Coal International Energy Group Co. Ltd. (A Shares) | 8,100 | 18,052 | |
| Shanxi Lu'an Environmental Energy Development Co. Ltd. (A Shares) | 11,000 | 28,623 | |
| Shanxi Meijin Energy Co. Ltd. (A Shares) (a) | 18,700 | 17,933 | |
| Shanxi Securities Co. Ltd. (A Shares) | 11,070 | 8,504 | |
| Shanxi Taigang Stainless Steel Co. Ltd. (A Shares) | 17,300 | 9,250 | |
| Shanxi Xinghuacun Fen Wine Factory Co. Ltd. (A Shares) | 5,860 | 197,968 | |
| Shanxi Xishan Coal & Electricity Power Co. Ltd. (A Shares) | 22,030 | 26,062 | |
| Shede Spirits Co. Ltd. (A Shares) | 1,300 | 20,473 | |
| Shenergy Co. Ltd. (A Shares) | 18,400 | 14,818 | |
| Shenghe Resources Holding Co. Ltd. (A Shares) | 5,500 | 8,042 | |
| Shengyi Technology Co. Ltd. | 10,900 | 26,214 | |
| Shennan Circuits Co. Ltd. (A Shares) | 1,740 | 16,556 | |
| Shenwan Hongyuan Group Co. Ltd. (A Shares) | 73,400 | 44,048 | |
| Shenzhen Capchem Technology Co. Ltd. (A Shares) | 3,180 | 19,193 | |
| Shenzhen Dynanonic Co. Ltd. (A Shares) | 1,120 | 12,048 | |
| Shenzhen Energy Group Co. Ltd. (A Shares) | 13,140 | 11,100 | |
| Shenzhen Inovance Technology Co. Ltd. (A Shares) | 6,050 | 50,020 | |
| Shenzhen International Holdings Ltd. | 104,479 | 68,865 | |
| Shenzhen Kaifa Technology Co. Ltd. (A Shares) | 6,000 | 14,117 | |
| Shenzhen Kangtai Biological Products Co. Ltd. | 4,320 | 17,916 | |
| Shenzhen Kedali Industry Co. Ltd. | 1,000 | 12,423 | |
| Shenzhen Kstar Science & Technology Co. Ltd. (A Shares) | 2,300 | 8,205 | |
| Shenzhen Mindray Bio-Medical Electronics Co. Ltd. (A Shares) (a) | 4,700 | 183,739 | |
| Shenzhen New Industries Biomedical Engineering Co. Ltd. | 2,800 | 26,339 | |
| Shenzhen Overseas Chinese Town Co. Ltd. (A Shares) (a) | 27,100 | 13,395 | |
| Shenzhen Salubris Pharmaceuticals Co. Ltd. (A Shares) | 4,600 | 20,481 | |
| Shenzhen SC New Energy Technology Corp. (A Shares) | 1,300 | 12,978 | |
| Shenzhen Sed Industry Co. Ltd. (A Shares) | 6,700 | 17,557 | |
| Shenzhen Senior Technology Material Co. Ltd. (A Shares) | 5,446 | 11,443 | |
| Shenzhen Sunlord Electronics Co. Ltd. (A Shares) | 3,300 | 13,174 | |
| Shenzhen Transsion Holdings Co. Ltd. (A Shares) (a) | 3,371 | 61,961 | |
| Shenzhen YUTO Packaging Technology Co. Ltd. (A Shares) | 4,200 | 15,080 | |
| Shenzhou International Group Holdings Ltd. | 58,900 | 578,544 | |
| Shijiazhuang Yiling Pharmaceutical Co. Ltd. (A Shares) | 5,940 | 18,049 | |
| Shuangliang Eco-Energy Systems Ltd. (A Shares) | 7,300 | 9,345 | |
| Sichuan Chuantou Energy Co. Ltd. (A Shares) | 15,600 | 31,376 | |
| Sichuan Hebang Biotechnology Co. Ltd. (A Shares) | 23,300 | 7,585 | |
| Sichuan Kelun Pharmaceutical Co. Ltd. (A Shares) | 6,700 | 25,171 | |
| Sichuan New Energy Power Co. Ltd. (A Shares) (a) | 6,000 | 9,614 | |
| Sichuan Road & Bridge (Group) Co. Ltd. (A Shares) | 25,620 | 27,006 | |
| Sichuan Swellfun Co. Ltd. (A Shares) | 1,900 | 15,882 | |
| Sichuan Yahua Industrial Group Co. Ltd. (A Shares) | 3,100 | 5,972 | |
| Sieyuan Electric Co. Ltd. (A Shares) | 3,200 | 21,572 | |
| Silergy Corp. | 23,000 | 205,412 | |
| Sinolink Securities Co. Ltd. (A Shares) | 14,700 | 18,374 | |
| Sinoma International Engineering Co. Ltd. (A Shares) | 10,100 | 13,622 | |
| Sinoma Science & Technology Co. Ltd. (A Shares) | 6,700 | 15,842 | |
| Sinomine Resource Group Co. Ltd. (A Shares) | 2,156 | 11,024 | |
| Sinopec Shanghai Petrochemical Co. Ltd.: | |||
| (A Shares) (a) | 29,900 | 12,233 | |
| (H Shares) (a) | 30,000 | 4,027 | |
| Sinopharm Group Co. Ltd. (H Shares) | 96,000 | 229,563 | |
| Sinotruk Hong Kong Ltd. | 52,500 | 98,884 | |
| SITC International Holdings Co. Ltd. | 88,000 | 135,556 | |
| SKSHU Paint Co. Ltd. (A Shares) | 2,156 | 17,553 | |
| Smoore International Holdings Ltd. (b) | 152,000 | 117,140 | |
| Songcheng Performance Development Co. Ltd. (A Shares) | 10,220 | 15,350 | |
| Soochow Securities Co. Ltd. (A Shares) | 16,770 | 18,392 | |
| Southwest Securities Co. Ltd. (A Shares) | 20,800 | 11,661 | |
| Spring Airlines Co. Ltd. (A Shares) (a) | 3,700 | 27,702 | |
| StarPower Semiconductor Ltd. (A Shares) | 700 | 16,481 | |
| Sungrow Power Supply Co. Ltd. (A Shares) | 5,600 | 64,547 | |
| Sunny Optical Technology Group Co. Ltd. | 49,000 | 410,519 | |
| Sunresin New Materials Co. Ltd. (A Shares) | 1,950 | 14,494 | |
| Sunwoda Electronic Co. Ltd. (A Shares) | 6,600 | 14,539 | |
| SUPCON Technology Co. Ltd. (A Shares) | 2,853 | 17,027 | |
| Suzhou Dongshan Precision Manufacturing Co. Ltd. (A Shares) | 6,700 | 17,162 | |
| Suzhou Maxwell Technologies Co. Ltd. (A Shares) | 928 | 15,326 | |
| Suzhou TFC Optical Communication Co. Ltd. (A Shares) | 2,000 | 19,560 | |
| TAL Education Group ADR (a) | 31,427 | 275,615 | |
| Tangshan Jidong Cement Co. Ltd. A Shares | 8,100 | 7,921 | |
| TBEA Co. Ltd. (A Shares) | 20,150 | 38,571 | |
| TCL Technology Group Corp. (A Shares) | 65,340 | 35,141 | |
| TCL Zhonghuan Renewable Energy Technology Co. Ltd. (A Shares) | 15,875 | 40,087 | |
| Tencent Holdings Ltd. | 470,000 | 17,394,115 | |
| Tencent Music Entertainment Group ADR (a) | 50,717 | 368,205 | |
| Thunder Software Technology Co. Ltd. (A Shares) | 1,700 | 16,338 | |
| Tianjin 712 Communication & Broadcasting Co. Ltd. | 1,900 | 6,914 | |
| Tianma Microelectronics Co. Ltd. (A Shares) (a) | 13,200 | 17,689 | |
| Tianqi Lithium Corp. (A Shares) | 5,300 | 39,886 | |
| Tianshan Aluminum Group Co. Ltd. | 12,200 | 10,808 | |
| Tianshui Huatian Technology Co. Ltd. (A Shares) | 14,800 | 18,079 | |
| Tingyi (Cayman Islands) Holding Corp. | 132,000 | 175,205 | |
| Titan Wind Energy Suzhou Co. Ltd. (A Shares) (a) | 8,000 | 14,594 | |
| Tongcheng Travel Holdings Ltd. (a) | 81,200 | 155,129 | |
| TongFu Microelectronics Co. Ltd. (A Shares) | 5,500 | 15,445 | |
| Tongkun Group Co. Ltd. (A Shares) (a) | 9,400 | 18,572 | |
| Tongling Nonferrous Metals Group Co. Ltd. (A Shares) | 33,000 | 14,019 | |
| Tongwei Co. Ltd. (A Shares) | 17,100 | 63,887 | |
| Topchoice Medical Corp. (a) | 1,300 | 15,932 | |
| Topsports International Holdings Ltd. (b) | 115,000 | 96,708 | |
| TravelSky Technology Ltd. (H Shares) | 59,000 | 93,204 | |
| Trina Solar Co. Ltd. (A Shares) | 8,264 | 33,751 | |
| Trip.com Group Ltd. (a) | 38,700 | 1,318,959 | |
| Tsingtao Brewery Co. Ltd.: | |||
| (A Shares) | 500 | 5,715 | |
| (H Shares) | 50,000 | 379,176 | |
| Uni-President China Holdings Ltd. | 80,000 | 54,447 | |
| Unigroup Guoxin Microelectronics Co. Ltd. (a) | 3,299 | 34,020 | |
| Unisplendour Corp. Ltd. (A Shares) (a) | 10,220 | 27,429 | |
| Universal Scientific Industrial Shanghai Co. Ltd. (A Shares) | 7,000 | 13,906 | |
| Verisilicon Microelectronics Shanghai Co. Ltd. (A Shares) (a) | 1,918 | 13,999 | |
| Vipshop Holdings Ltd. ADR (a) | 24,728 | 352,621 | |
| Walvax Biotechnology Co. Ltd. (A Shares) | 5,400 | 17,194 | |
| Wanda Film Holding Co. Ltd. (A Shares) (a) | 7,300 | 12,469 | |
| Wanhua Chemical Group Co. Ltd. (A Shares) | 15,800 | 191,697 | |
| Want Want China Holdings Ltd. | 320,000 | 198,835 | |
| Weibo Corp. sponsored ADR | 4,919 | 58,192 | |
| Weichai Power Co. Ltd.: | |||
| (A Shares) | 22,700 | 43,150 | |
| (H Shares) | 162,000 | 242,485 | |
| Weihai Guangwei Composites Co. Ltd. (A Shares) | 3,520 | 12,331 | |
| Wens Foodstuffs Group Co. Ltd. (A Shares) | 23,060 | 59,236 | |
| Western Mining Co. Ltd. (A Shares) | 7,900 | 13,584 | |
| Western Securities Co. Ltd. (A Shares) | 13,000 | 11,836 | |
| Western Superconducting Technologies Co. Ltd. (A Shares) | 2,303 | 14,562 | |
| Will Semiconductor Ltd. | 4,750 | 71,681 | |
| Wilmar International Ltd. | 137,700 | 357,990 | |
| Wingtech Technology Co. Ltd. (A Shares) (a) | 4,100 | 27,914 | |
| Wintime Energy Group Co. Ltd. (A Shares) (a) | 78,900 | 14,782 | |
| Wuchan Zhongda Group Co. Ltd. | 14,500 | 9,061 | |
| Wuhan Guide Infrared Co. Ltd. (A Shares) | 17,590 | 19,059 | |
| Wuliangye Yibin Co. Ltd. (A Shares) | 17,700 | 377,383 | |
| WUS Printed Circuit Kunshan Co. Ltd. (A Shares) | 5,140 | 13,767 | |
| WuXi AppTec Co. Ltd. | 7,860 | 92,950 | |
| WuXi AppTec Co. Ltd. (H Shares) (b) | 29,764 | 357,660 | |
| Wuxi Autowell Technology Co. Ltd. (A Shares) | 600 | 11,211 | |
| Wuxi Biologics (Cayman), Inc. (a)(b) | 268,500 | 1,669,464 | |
| XCMG Construction Machinery Co. Ltd. (A Shares) | 46,100 | 36,113 | |
| Xiamen C&D, Inc. (A Shares) | 12,400 | 16,573 | |
| Xiamen Faratronic Co. Ltd. (A Shares) | 900 | 12,284 | |
| Xiamen Tungsten Co. Ltd. (A Shares) | 6,000 | 13,908 | |
| Xiaomi Corp. Class B (a)(b) | 1,081,000 | 1,938,259 | |
| Xinjiang Daqo New Energy Co. Ltd. (A Shares) | 6,651 | 32,486 | |
| Xinyi Solar Holdings Ltd. | 352,968 | 207,725 | |
| XPeng, Inc. Class A (a) | 72,902 | 529,763 | |
| XTEP International Holdings Ltd. | 93,500 | 85,004 | |
| Yadea Group Holdings Ltd. (b) | 80,000 | 146,029 | |
| Yangzhou Yangjie Electronic Technology Co. Ltd. (A Shares) | 1,600 | 8,309 | |
| Yankuang Energy Group Co. Ltd.: | |||
| (A Shares) | 18,150 | 48,491 | |
| (H Shares) | 160,000 | 277,881 | |
| Yantai Jereh Oilfield Services (A Shares) | 3,100 | 12,124 | |
| Yealink Network Technology Corp. Ltd. | 4,130 | 18,846 | |
| Yifeng Pharmacy Chain Co. Ltd. | 4,060 | 18,191 | |
| Yihai International Holding Ltd. | 34,000 | 61,877 | |
| Yihai Kerry Arawana Holdings Co. Ltd. (A Shares) | 5,000 | 23,916 | |
| Yintai Gold Co. Ltd. (A Shares) | 8,120 | 15,026 | |
| Yonghui Superstores Co. Ltd. (A Shares) (a) | 32,700 | 13,769 | |
| YongXing Special Materials Technology Co. Ltd. (A Shares) | 1,950 | 13,339 | |
| Yonyou Network Technology Co. Ltd. (A Shares) | 13,020 | 29,168 | |
| Youngor Group Co. Ltd. (A Shares) | 20,800 | 19,199 | |
| YTO Express Group Co. Ltd. (A Shares) | 11,100 | 20,617 | |
| Yuan Longping High-tech Agriculture Co. Ltd. (A Shares) (a) | 3,500 | 7,889 | |
| Yuexiu Property Co. Ltd. | 120,240 | 125,069 | |
| Yum China Holdings, Inc. | 29,525 | 1,551,834 | |
| Yunda Holding Co. Ltd. (A Shares) | 10,180 | 12,691 | |
| Yunnan Aluminium Co. Ltd. (A Shares) | 12,100 | 23,006 | |
| Yunnan Baiyao Group Co. Ltd. (A Shares) | 7,100 | 49,343 | |
| Yunnan Botanee Bio-Technology Group Co., Ltd. (A Shares) | 1,700 | 18,335 | |
| Yunnan Chihong Zinc & Germanium Co. Ltd. (A Shares) | 51,300 | 36,287 | |
| Yunnan Energy New Material Co. Ltd. | 3,400 | 31,213 | |
| Yunnan Tin Co. Ltd. (A Shares) | 4,300 | 8,308 | |
| Yunnan Yuntianhua Co. Ltd. (Series A) | 7,000 | 15,942 | |
| Yutong Bus Co. Ltd. | 16,700 | 31,142 | |
| Zai Lab Ltd. (a) | 66,740 | 170,324 | |
| Zangge Mining Co. Ltd. (Series A) | 6,100 | 18,672 | |
| Zhangzhou Pientzehuang Pharmaceutical Co. Ltd. (A Shares) | 2,400 | 82,147 | |
| Zhaojin Mining Industry Co. Ltd. (H Shares) | 83,500 | 103,519 | |
| Zhefu Holding Group Co. Ltd. (A Shares) | 15,500 | 7,840 | |
| Zhejiang Century Huatong Group Co. Ltd. (A Shares) (a) | 34,940 | 28,236 | |
| Zhejiang China Commodities City Group Co. Ltd. (A Shares) | 23,100 | 24,583 | |
| Zhejiang Chint Electric Co. Ltd. (A Shares) | 7,000 | 22,123 | |
| Zhejiang Dahua Technology Co. Ltd. (A Shares) (a) | 13,200 | 36,853 | |
| Zhejiang Dingli Machinery Co. Ltd. (A Shares) | 1,600 | 11,918 | |
| Zhejiang Expressway Co. Ltd. (H Shares) | 78,000 | 58,713 | |
| Zhejiang Huahai Pharmaceutical Co. Ltd. (A Shares) | 5,290 | 11,699 | |
| Zhejiang Huayou Cobalt Co. Ltd. (A Shares) | 5,840 | 29,398 | |
| Zhejiang Jingsheng Mechanical & Electrical Co. Ltd. (A Shares) | 5,000 | 29,740 | |
| Zhejiang Jiuzhou Pharmaceutical Co. Ltd. (A Shares) | 3,700 | 15,039 | |
| Zhejiang Juhua Co. Ltd. (A Shares) | 11,400 | 23,606 | |
| Zhejiang Longsheng Group Co. Ltd. (A Shares) | 11,600 | 14,116 | |
| Zhejiang NHU Co. Ltd. (A Shares) | 10,632 | 23,513 | |
| Zhejiang Sanhua Intelligent Controls Co. Ltd. (A Shares) | 6,800 | 24,893 | |
| Zhejiang Supor Cookware Co. Ltd. | 1,700 | 11,659 | |
| Zhejiang Weiming Enviroment Protection Co. Ltd. (A Shares) | 6,240 | 15,309 | |
| Zhejiang Weixing New Building Materials Co. Ltd. (A Shares) | 5,900 | 13,301 | |
| Zhejiang Zheneng Electric Power Co. Ltd. (A Shares) (a) | 42,200 | 26,538 | |
| Zheshang Securities Co. Ltd. | 16,700 | 23,004 | |
| ZhongAn Online P & C Insurance Co. Ltd. (H Shares) (a)(b) | 46,100 | 126,343 | |
| Zhongji Innolight Co. Ltd. (A Shares) | 3,300 | 39,763 | |
| Zhongjin Gold Co. Ltd. (A Shares) | 18,400 | 27,360 | |
| Zhongsheng Group Holdings Ltd. Class H | 61,000 | 140,867 | |
| Zhongtai Securities Co. Ltd. (A Shares) | 26,300 | 25,749 | |
| Zhuzhou CRRC Times Electric Co. Ltd.: | |||
| (A Shares) | 4,183 | 22,147 | |
| (H Shares) | 31,900 | 102,953 | |
| Zhuzhou Kibing Group Co. Ltd. (A Shares) | 8,200 | 8,947 | |
| Zibo Qixiang Tengda Chemical Co. Ltd. (A Shares) | 10,900 | 8,720 | |
| Zijin Mining Group Co. Ltd.: | |||
| (A Shares) (a) | 72,100 | 122,310 | |
| (H Shares) | 398,000 | 615,671 | |
| Zoomlion Heavy Industry Science and Technology Co. Ltd.: | |||
| (A Shares) | 25,800 | 22,644 | |
| (H Shares) | 10,200 | 5,303 | |
| ZTE Corp. (H Shares) | 83,000 | 184,447 | |
| ZTO Express, Inc. sponsored ADR | 29,738 | 700,925 | |
TOTAL CHINA | 135,648,137 | ||
| Colombia - 0.0% | |||
| Bancolombia SA | 14,586 | 104,009 | |
| Interconexion Electrica SA ESP | 27,677 | 97,502 | |
TOTAL COLOMBIA | 201,511 | ||
| Czech Republic - 0.1% | |||
| CEZ A/S | 11,247 | 481,250 | |
| Komercni Banka A/S | 5,205 | 152,439 | |
| MONETA Money Bank A/S (b) | 23,657 | 91,394 | |
TOTAL CZECH REPUBLIC | 725,083 | ||
| Denmark - 2.1% | |||
| A.P. Moller - Maersk A/S: | |||
| Series A | 219 | 357,044 | |
| Series B | 337 | 561,520 | |
| Carlsberg A/S Series B | 6,827 | 813,596 | |
| Chr. Hansen Holding A/S | 7,446 | 507,220 | |
| Coloplast A/S Series B | 9,591 | 999,381 | |
| Danske Bank A/S | 48,368 | 1,133,129 | |
| Demant A/S (a) | 7,109 | 270,805 | |
| DSV A/S | 13,037 | 1,944,345 | |
| Genmab A/S (a) | 4,643 | 1,312,497 | |
| Novo Nordisk A/S Series B | 228,754 | 22,069,325 | |
| Novozymes A/S Series B | 14,422 | 647,316 | |
| ORSTED A/S (b) | 13,288 | 642,065 | |
| Pandora A/S | 5,886 | 666,058 | |
| Rockwool International A/S Series B | 656 | 145,824 | |
| Tryg A/S | 24,508 | 478,260 | |
| Vestas Wind Systems A/S (a) | 70,230 | 1,522,220 | |
TOTAL DENMARK | 34,070,605 | ||
| Egypt - 0.0% | |||
| Commercial International Bank SAE | 149,891 | 292,512 | |
| Commercial International Bank SAE GDR | 49,558 | 56,397 | |
| Eastern Co. SAE | 62,936 | 53,524 | |
| EFG-Hermes Holding SAE | 61,361 | 33,136 | |
TOTAL EGYPT | 435,569 | ||
| Finland - 0.7% | |||
| Elisa Corp. (A Shares) | 10,070 | 427,055 | |
| Fortum Corp. | 31,461 | 372,836 | |
| Kesko Oyj | 19,100 | 322,648 | |
| Kone OYJ (B Shares) | 23,881 | 1,033,228 | |
| Metso Corp. | 46,453 | 408,256 | |
| Neste OYJ | 29,682 | 995,901 | |
| Nokia Corp. | 375,132 | 1,249,446 | |
| Nordea Bank Abp | 225,584 | 2,370,537 | |
| Orion Oyj (B Shares) | 7,642 | 303,548 | |
| Sampo Oyj (A Shares) | 32,207 | 1,264,643 | |
| Stora Enso Oyj (R Shares) | 40,111 | 480,649 | |
| UPM-Kymmene Corp. | 37,436 | 1,258,442 | |
| Wartsila Corp. | 32,859 | 390,794 | |
TOTAL FINLAND | 10,877,983 | ||
| France - 6.3% | |||
| Accor SA | 13,067 | 415,754 | |
| Adevinta ASA Class B (a) | 20,538 | 180,267 | |
| Aeroports de Paris SA | 2,141 | 239,678 | |
| Air Liquide SA | 36,703 | 6,289,142 | |
| Airbus Group NV | 41,581 | 5,575,023 | |
| Alstom SA | 20,153 | 272,921 | |
| Amundi SA (b) | 4,307 | 224,307 | |
| Arkema SA | 4,193 | 392,108 | |
| AXA SA | 128,576 | 3,809,762 | |
| bioMerieux SA | 2,956 | 283,061 | |
| BNP Paribas SA | 73,517 | 4,227,523 | |
| Bollore SA | 51,836 | 282,466 | |
| Bouygues SA | 13,329 | 468,374 | |
| Bureau Veritas SA | 20,811 | 473,212 | |
| Capgemini SA | 11,569 | 2,044,575 | |
| Carrefour SA | 42,240 | 740,529 | |
| Compagnie de St.-Gobain | 32,462 | 1,767,041 | |
| Compagnie Generale des Etablissements Michelin SCA Series B | 47,660 | 1,415,905 | |
| Covivio | 3,698 | 158,079 | |
| Credit Agricole SA | 84,872 | 1,024,820 | |
| Danone SA | 45,181 | 2,687,838 | |
| Dassault Aviation SA | 1,459 | 289,456 | |
| Dassault Systemes SA | 46,929 | 1,933,164 | |
| Edenred SA | 17,597 | 935,438 | |
| Eiffage SA | 5,114 | 463,733 | |
| Engie SA | 127,880 | 2,033,917 | |
| EssilorLuxottica SA | 20,667 | 3,731,513 | |
| Eurazeo SA | 2,983 | 167,758 | |
| Gecina SA | 3,233 | 316,770 | |
| Getlink SE | 25,215 | 406,470 | |
| Hermes International SCA | 2,218 | 4,129,545 | |
| Ipsen SA | 2,715 | 320,311 | |
| Kering SA | 5,220 | 2,122,983 | |
| Klepierre SA | 14,720 | 356,673 | |
| L'Oreal SA | 16,886 | 7,097,704 | |
| La Francaise des Jeux SAEM (b) | 7,646 | 246,105 | |
| Legrand SA | 18,614 | 1,610,230 | |
| LVMH Moet Hennessy Louis Vuitton SE | 19,348 | 13,851,825 | |
| Orange SA | 130,779 | 1,538,229 | |
| Pernod Ricard SA | 14,306 | 2,535,477 | |
| Publicis Groupe SA | 16,094 | 1,221,324 | |
| Remy Cointreau SA | 1,611 | 182,648 | |
| Renault SA | 13,311 | 465,488 | |
| Safran SA | 24,042 | 3,755,830 | |
| Sartorius Stedim Biotech | 1,934 | 361,286 | |
| SEB SA | 1,642 | 161,839 | |
| Societe Generale Series A | 51,048 | 1,147,139 | |
| Sodexo SA | 6,207 | 655,975 | |
| Teleperformance | 4,154 | 475,357 | |
| Thales SA | 7,283 | 1,072,310 | |
| TotalEnergies SE | 157,586 | 10,535,803 | |
| Unibail-Rodamco-Westfield NV (a) | 8,600 | 424,590 | |
| Valeo SA | 14,795 | 194,743 | |
| Veolia Environnement SA | 47,687 | 1,306,643 | |
| VINCI SA | 37,232 | 4,116,906 | |
| Vivendi SA | 46,800 | 418,733 | |
| Wendel SA | 1,874 | 139,991 | |
| Worldline SA (a)(b) | 17,061 | 216,266 | |
TOTAL FRANCE | 103,912,557 | ||
| Germany - 4.7% | |||
| adidas AG | 11,363 | 2,010,277 | |
| Allianz SE | 28,252 | 6,617,820 | |
| BASF AG | 62,750 | 2,899,499 | |
| Bayer AG | 68,947 | 2,979,101 | |
| Bayerische Motoren Werke AG (BMW) | 21,224 | 1,967,917 | |
| Bechtle AG | 5,832 | 259,669 | |
| Beiersdorf AG | 7,075 | 928,645 | |
| Brenntag SE | 10,304 | 764,495 | |
| Carl Zeiss Meditec AG | 2,807 | 242,775 | |
| Commerzbank AG | 74,859 | 803,964 | |
| Continental AG | 7,580 | 494,891 | |
| Covestro AG (a)(b) | 13,401 | 676,367 | |
| Daimler Truck Holding AG | 34,758 | 1,089,348 | |
| Deutsche Bank AG | 135,942 | 1,489,609 | |
| Deutsche Borse AG | 13,316 | 2,191,766 | |
| Deutsche Lufthansa AG (a) | 40,446 | 282,624 | |
| Deutsche Telekom AG | 227,104 | 4,928,989 | |
| DHL Group | 69,593 | 2,706,872 | |
| E.ON SE | 157,335 | 1,867,863 | |
| Evonik Industries AG | 15,697 | 288,332 | |
| Fresenius Medical Care AG & Co. KGaA | 14,450 | 480,118 | |
| Fresenius SE & Co. KGaA | 29,658 | 760,679 | |
| GEA Group AG | 10,608 | 361,760 | |
| Hannover Reuck SE | 4,243 | 935,167 | |
| HeidelbergCement AG | 10,066 | 729,369 | |
| HelloFresh AG (a) | 10,579 | 230,141 | |
| Henkel AG & Co. KGaA | 7,330 | 463,259 | |
| Infineon Technologies AG | 91,647 | 2,677,029 | |
| Knorr-Bremse AG | 5,191 | 288,581 | |
| LEG Immobilien AG (a) | 5,228 | 325,488 | |
| Mercedes-Benz Group AG (Germany) | 56,271 | 3,310,663 | |
| Merck KGaA | 9,072 | 1,366,429 | |
| MTU Aero Engines AG | 3,735 | 699,505 | |
| Muenchener Rueckversicherungs-Gesellschaft AG in Muenchen | 9,567 | 3,831,496 | |
| Nemetschek SE | 4,028 | 300,047 | |
| Puma AG | 7,357 | 414,911 | |
| Rational AG | 350 | 199,055 | |
| Rheinmetall AG | 3,007 | 860,333 | |
| RWE AG | 44,272 | 1,692,481 | |
| SAP SE | 73,152 | 9,812,048 | |
| Scout24 AG (b) | 5,306 | 325,740 | |
| Siemens AG | 53,276 | 7,069,665 | |
| Siemens Energy AG (a)(c) | 36,501 | 323,264 | |
| Siemens Healthineers AG (b) | 19,838 | 972,284 | |
| Symrise AG | 9,358 | 956,287 | |
| Talanx AG | 4,488 | 282,313 | |
| Telefonica Deutschland Holding AG | 59,029 | 100,152 | |
| Volkswagen AG | 2,256 | 260,793 | |
| Vonovia SE | 51,043 | 1,175,116 | |
| Wacker Chemie AG | 1,322 | 161,562 | |
| Zalando SE (a)(b) | 15,797 | 367,559 | |
TOTAL GERMANY | 77,224,117 | ||
| Greece - 0.1% | |||
| Alpha Bank SA (a) | 156,757 | 233,869 | |
| Eurobank Ergasias Services and Holdings SA (a) | 179,905 | 293,531 | |
| Ff Group (a)(d) | 256 | 0 | |
| Hellenic Telecommunications Organization SA | 13,787 | 193,000 | |
| Jumbo SA | 8,062 | 212,066 | |
| Motor Oil (HELLAS) Corinth Refineries SA | 4,805 | 114,394 | |
| Mytilineos SA | 7,503 | 277,704 | |
| National Bank of Greece SA (a) | 38,961 | 222,613 | |
| OPAP SA | 12,902 | 218,426 | |
| Piraeus Financial Holdings SA (a) | 47,647 | 140,659 | |
| Public Power Corp. of Greece (a) | 13,614 | 138,720 | |
TOTAL GREECE | 2,044,982 | ||
| Hong Kong - 1.4% | |||
| AIA Group Ltd. | 810,400 | 7,037,358 | |
| CK Asset Holdings Ltd. | 137,745 | 688,494 | |
| CK Infrastructure Holdings Ltd. | 44,500 | 206,259 | |
| CLP Holdings Ltd. | 116,000 | 848,979 | |
| Futu Holdings Ltd. ADR (a) | 3,902 | 216,366 | |
| Hang Lung Properties Ltd. | 120,000 | 157,735 | |
| Hang Seng Bank Ltd. | 52,600 | 601,380 | |
| Henderson Land Development Co. Ltd. | 106,010 | 277,371 | |
| HKT Trust/HKT Ltd. unit | 253,000 | 262,054 | |
| Hong Kong & China Gas Co. Ltd. | 794,865 | 553,313 | |
| Hong Kong Exchanges and Clearing Ltd. | 84,449 | 2,954,250 | |
| Hongkong Land Holdings Ltd. | 79,509 | 252,180 | |
| Jardine Matheson Holdings Ltd. | 11,235 | 455,255 | |
| Kingboard Laminates Holdings Ltd. | 54,500 | 51,110 | |
| Link (REIT) | 174,560 | 801,081 | |
| MTR Corp. Ltd. | 108,391 | 405,186 | |
| New World Development Co. Ltd. | 110,267 | 202,375 | |
| Nine Dragons Paper (Holdings) Ltd. | 102,000 | 58,067 | |
| Orient Overseas International Ltd. | 10,000 | 126,098 | |
| Power Assets Holdings Ltd. | 97,000 | 463,740 | |
| Prudential PLC | 193,068 | 2,018,794 | |
| Sino Biopharmaceutical Ltd. | 689,250 | 267,759 | |
| Sino Land Ltd. | 270,105 | 269,654 | |
| Sun Hung Kai Properties Ltd. | 102,000 | 1,047,408 | |
| Swire Pacific Ltd. (A Shares) | 28,500 | 182,054 | |
| Swire Properties Ltd. | 76,400 | 147,926 | |
| Techtronic Industries Co. Ltd. | 97,000 | 885,564 | |
| Vinda International Holdings Ltd. | 23,000 | 56,838 | |
| WH Group Ltd. (b) | 591,766 | 353,422 | |
| Wharf Real Estate Investment Co. Ltd. | 118,000 | 412,769 | |
| Xinyi Glass Holdings Ltd. | 110,615 | 127,099 | |
TOTAL HONG KONG | 22,387,938 | ||
| Hungary - 0.1% | |||
| MOL Hungarian Oil and Gas PLC Series A (For. Reg.) | 32,041 | 254,945 | |
| OTP Bank PLC | 16,703 | 621,540 | |
| Richter Gedeon PLC | 10,031 | 235,199 | |
TOTAL HUNGARY | 1,111,684 | ||
| India - 4.2% | |||
| ABB India Ltd. | 3,601 | 177,551 | |
| Adani Enterprises Ltd. | 11,826 | 325,999 | |
| Adani Green Energy Ltd. (a) | 22,157 | 244,721 | |
| Adani Ports & Special Economic Zone Ltd. | 37,196 | 350,796 | |
| Adani Power Ltd. (a) | 54,018 | 235,307 | |
| Ambuja Cements Ltd. | 42,380 | 216,146 | |
| Apollo Hospitals Enterprise Ltd. | 7,073 | 409,427 | |
| Ashok Leyland Ltd. | 102,665 | 206,929 | |
| Asian Paints Ltd. | 26,864 | 967,387 | |
| Astral Ltd. | 8,649 | 192,207 | |
| AU Small Finance Bank Ltd. (b) | 11,896 | 95,584 | |
| Aurobindo Pharma Ltd. | 18,845 | 192,243 | |
| Avenue Supermarts Ltd. (a)(b) | 11,421 | 498,504 | |
| Axis Bank Ltd. | 159,590 | 1,882,573 | |
| Bajaj Auto Ltd. | 4,793 | 305,659 | |
| Bajaj Finance Ltd. | 19,084 | 1,717,421 | |
| Bajaj Finserv Ltd. | 26,662 | 502,581 | |
| Bajaj Holdings & Investment Ltd. | 1,723 | 143,304 | |
| Balkrishna Industries Ltd. | 5,042 | 154,601 | |
| Bandhan Bank Ltd. (b) | 51,805 | 133,357 | |
| Bank of Baroda | 66,869 | 157,625 | |
| Berger Paints India Ltd. | 20,433 | 137,059 | |
| Bharat Electronics Ltd. | 259,014 | 414,841 | |
| Bharat Forge Ltd. | 18,031 | 220,788 | |
| Bharat Petroleum Corp. Ltd. | 53,900 | 225,890 | |
| Bharti Airtel Ltd. | 156,694 | 1,720,399 | |
| Britannia Industries Ltd. | 7,598 | 404,058 | |
| Cg Power & Industrial Soluti | 44,465 | 208,172 | |
| Cholamandalam Investment and Finance Co. Ltd. | 28,819 | 393,716 | |
| Cipla Ltd./India (a) | 36,780 | 530,031 | |
| Coal India Ltd. | 108,432 | 409,180 | |
| Colgate-Palmolive Ltd. | 8,154 | 206,963 | |
| Container Corp. of India Ltd. | 21,372 | 176,676 | |
| Cummins India Ltd. | 9,902 | 199,391 | |
| Dabur India Ltd. | 43,891 | 278,740 | |
| Divi's Laboratories Ltd. | 8,367 | 340,407 | |
| DLF Ltd. | 44,293 | 299,969 | |
| Dr. Reddy's Laboratories Ltd. | 7,600 | 490,393 | |
| Eicher Motors Ltd. | 9,548 | 377,779 | |
| GAIL India Ltd. | 161,972 | 232,494 | |
| Godrej Consumer Products Ltd. | 28,532 | 339,859 | |
| Godrej Properties Ltd. (a) | 8,838 | 176,308 | |
| Grasim Industries Ltd. | 18,621 | 421,900 | |
| Havells India Ltd. | 18,319 | 274,183 | |
| HCL Technologies Ltd. | 66,332 | 1,017,126 | |
| HDFC Asset Management Co. Ltd. (b) | 6,223 | 204,347 | |
| HDFC Bank Ltd. | 195,215 | 3,462,971 | |
| HDFC Standard Life Insurance Co. Ltd. (b) | 67,004 | 497,603 | |
| Hero Motocorp Ltd. | 7,388 | 274,083 | |
| Hindalco Industries Ltd. | 86,482 | 477,217 | |
| Hindustan Aeronautics Ltd. | 12,042 | 263,458 | |
| Hindustan Petroleum Corp. Ltd. (a) | 36,200 | 107,666 | |
| Hindustan Unilever Ltd. | 57,422 | 1,713,158 | |
| ICICI Bank Ltd. | 362,159 | 3,983,218 | |
| ICICI Lombard General Insurance Co. Ltd. (b) | 17,332 | 285,970 | |
| ICICI Prudential Life Insurance Co. Ltd. (b) | 25,698 | 162,115 | |
| IDFC Bank Ltd. (a) | 242,337 | 240,751 | |
| Indian Oil Corp. Ltd. | 201,963 | 217,497 | |
| Indian Railway Catering & Tourism Corp. Ltd. | 16,892 | 134,977 | |
| Indraprastha Gas Ltd. | 20,882 | 95,894 | |
| Info Edge India Ltd. | 5,099 | 250,160 | |
| Infosys Ltd. | 232,692 | 3,825,661 | |
| InterGlobe Aviation Ltd. (a)(b) | 9,935 | 292,961 | |
| ITC Ltd. | 209,293 | 1,077,024 | |
| Jindal Steel & Power Ltd. | 25,829 | 196,608 | |
| Jio Financial Services Ltd. | 213,098 | 565,400 | |
| JSW Steel Ltd. (a) | 42,184 | 373,137 | |
| Jubilant Foodworks Ltd. | 28,276 | 170,089 | |
| Kotak Mahindra Bank Ltd. | 76,544 | 1,599,664 | |
| Larsen & Toubro Ltd. | 48,201 | 1,695,733 | |
| Ltimindtree Ltd. (b) | 6,351 | 386,285 | |
| Lupin Ltd. | 14,760 | 199,954 | |
| Mahindra & Mahindra Ltd. | 65,469 | 1,147,022 | |
| Marico Ltd. | 35,368 | 227,838 | |
| Maruti Suzuki India Ltd. | 9,507 | 1,186,850 | |
| Max Healthcare Institute Ltd. | 54,176 | 373,344 | |
| Mphasis BFL Ltd. | 4,995 | 127,486 | |
| MRF Ltd. | 137 | 178,199 | |
| Muthoot Finance Ltd. | 8,698 | 135,676 | |
| Nestle India Ltd. | 2,338 | 680,598 | |
| NTPC Ltd. | 300,057 | 849,855 | |
| Oil & Natural Gas Corp. Ltd. | 216,047 | 483,280 | |
| Page Industries Ltd. | 428 | 194,419 | |
| Petronet LNG Ltd. | 51,294 | 122,913 | |
| PI Industries Ltd. | 5,920 | 241,711 | |
| Pidilite Industries Ltd. | 10,776 | 318,067 | |
| Power Finance Corp. Ltd. | 90,855 | 268,987 | |
| Power Grid Corp. of India Ltd. | 326,629 | 793,060 | |
| REC Ltd. | 82,817 | 286,172 | |
| Reliance Industries Ltd. | 213,380 | 5,865,734 | |
| Samvardhana Motherson International Ltd. | 167,239 | 184,649 | |
| SBI Cards & Payment Services Ltd. | 20,116 | 180,213 | |
| SBI Life Insurance Co. Ltd. (b) | 31,458 | 516,520 | |
| Shree Cement Ltd. | 599 | 184,565 | |
| Shriram Transport Finance Co. Ltd. | 19,601 | 442,168 | |
| Siemens Ltd. | 6,352 | 254,073 | |
| Sona Blw Precision Forgings Ltd. (b) | 29,322 | 190,770 | |
| SRF Ltd. | 10,530 | 277,580 | |
| State Bank of India | 124,521 | 845,879 | |
| Sun Pharmaceutical Industries Ltd. | 67,355 | 880,348 | |
| Supreme Industries Ltd. | 4,455 | 231,577 | |
| Tata Consultancy Services Ltd. | 63,995 | 2,589,978 | |
| Tata Consumer Products Ltd. | 38,955 | 421,373 | |
| Tata Elxsi Ltd. | 2,406 | 220,329 | |
| Tata Motors Ltd. | 114,490 | 864,488 | |
| Tata Power Co. Ltd./The | 102,851 | 295,826 | |
| Tata Steel Ltd. | 518,497 | 739,669 | |
| Tech Mahindra Ltd. | 37,345 | 508,791 | |
| The Indian Hotels Co. Ltd. | 59,965 | 276,102 | |
| Titan Co. Ltd. | 24,723 | 947,494 | |
| Torrent Pharmaceuticals Ltd. | 7,538 | 174,192 | |
| Trent Ltd. | 12,862 | 332,826 | |
| Tube Investments of India Ltd. | 7,558 | 285,847 | |
| Tvs Motor Co. Ltd. | 17,031 | 325,355 | |
| Ultratech Cement Ltd. | 8,074 | 816,879 | |
| United Spirits Ltd. (a) | 21,125 | 261,898 | |
| UPL Ltd. | 32,622 | 211,750 | |
| Varun Beverages Ltd. | 31,678 | 345,657 | |
| Vedanta Ltd. | 55,051 | 143,218 | |
| Wipro Ltd. | 90,805 | 416,737 | |
| Yes Bank Ltd. (a) | 918,299 | 175,945 | |
| Zomato Ltd. (a) | 299,752 | 379,021 | |
TOTAL INDIA | 69,762,773 | ||
| Indonesia - 0.5% | |||
| Indofood Sukses Makmur Tbk PT | 279,700 | 117,097 | |
| PT Adaro Energy Indonesia Tbk | 1,030,400 | 166,254 | |
| PT Aneka Tambang Tbk | 520,500 | 55,768 | |
| PT Astra International Tbk | 1,428,300 | 519,586 | |
| PT Bank Central Asia Tbk | 3,888,400 | 2,142,200 | |
| PT Bank Mandiri (Persero) Tbk | 2,611,200 | 932,857 | |
| PT Bank Negara Indonesia (Persero) Tbk | 1,053,400 | 317,902 | |
| PT Bank Rakyat Indonesia (Persero) Tbk | 4,787,010 | 1,496,821 | |
| PT Barito Pacific Tbk | 1,995,895 | 141,436 | |
| PT Charoen Pokphand Indonesia Tbk (a) | 494,400 | 182,142 | |
| PT GoTo Gojek Tokopedia Tbk (a) | 57,303,500 | 216,793 | |
| PT Indah Kiat Pulp & Paper Tbk | 200,400 | 121,122 | |
| PT Indofood CBP Sukses Makmur Tbk | 175,600 | 114,451 | |
| PT Kalbe Farma Tbk | 1,528,300 | 162,542 | |
| PT Merdeka Copper Gold Tbk (a) | 861,961 | 120,895 | |
| PT Sarana Menara Nusantara Tbk | 1,370,700 | 76,875 | |
| PT Semen Indonesia (Persero) Tbk | 250,582 | 96,287 | |
| PT Sumber Alfaria Trijaya Tbk | 1,244,500 | 226,495 | |
| PT Telkom Indonesia Persero Tbk | 3,482,400 | 763,397 | |
| PT Unilever Indonesia Tbk | 477,600 | 108,897 | |
| PT United Tractors Tbk | 107,100 | 169,487 | |
| PT Vale Indonesia Tbk | 152,100 | 47,402 | |
TOTAL INDONESIA | 8,296,706 | ||
| Ireland - 0.3% | |||
| AerCap Holdings NV (a) | 12,240 | 760,349 | |
| AIB Group PLC | 99,774 | 432,207 | |
| Bank of Ireland Group PLC | 74,265 | 663,999 | |
| Kerry Group PLC Class A | 11,211 | 864,529 | |
| Kingspan Group PLC (Ireland) | 10,854 | 729,044 | |
| Smurfit Kappa Group PLC | 18,297 | 595,128 | |
TOTAL IRELAND | 4,045,256 | ||
| Israel - 0.3% | |||
| Azrieli Group | 2,987 | 128,363 | |
| Bank Hapoalim BM (Reg.) | 89,085 | 636,290 | |
| Bank Leumi le-Israel BM | 107,524 | 691,378 | |
| Check Point Software Technologies Ltd. (a) | 6,557 | 880,277 | |
| Elbit Systems Ltd. (Israel) | 1,856 | 344,522 | |
| Global-e Online Ltd. (a) | 6,625 | 232,604 | |
| Icl Group Ltd. | 54,055 | 262,117 | |
| Israel Discount Bank Ltd. (Class A) | 85,651 | 376,127 | |
| Mizrahi Tefahot Bank Ltd. | 10,617 | 328,334 | |
| NICE Ltd. (a) | 4,233 | 654,115 | |
| NICE Ltd. sponsored ADR (a) | 209 | 32,259 | |
| Teva Pharmaceutical Industries Ltd. sponsored ADR (a) | 78,668 | 674,971 | |
| Wix.com Ltd. (a) | 3,838 | 306,656 | |
TOTAL ISRAEL | 5,548,013 | ||
| Italy - 1.4% | |||
| Amplifon SpA | 8,827 | 248,814 | |
| Assicurazioni Generali SpA | 70,876 | 1,405,761 | |
| Coca-Cola HBC AG | 15,367 | 398,211 | |
| Davide Campari Milano NV | 36,789 | 406,003 | |
| DiaSorin SpA | 1,586 | 141,803 | |
| Enel SpA | 569,106 | 3,612,446 | |
| Eni SpA | 165,445 | 2,704,639 | |
| Ferrari NV (Italy) | 8,828 | 2,666,829 | |
| FinecoBank SpA | 42,940 | 505,008 | |
| Infrastrutture Wireless Italiane SpA (b) | 23,668 | 258,445 | |
| Intesa Sanpaolo SpA | 1,089,113 | 2,838,001 | |
| Mediobanca SpA (c) | 38,892 | 463,779 | |
| Moncler SpA | 14,448 | 748,167 | |
| Nexi SpA (a)(b) | 42,009 | 243,407 | |
| Poste Italiane SpA (b) | 36,894 | 364,611 | |
| Prysmian SpA | 18,655 | 696,584 | |
| Recordati SpA | 7,434 | 342,954 | |
| Snam SpA | 140,273 | 643,228 | |
| Telecom Italia SpA (a) | 720,399 | 186,066 | |
| Terna - Rete Elettrica Nazionale | 97,157 | 742,846 | |
| UniCredit SpA | 129,269 | 3,240,724 | |
TOTAL ITALY | 22,858,326 | ||
| Japan - 13.9% | |||
| Advantest Corp. | 53,600 | 1,380,663 | |
| AEON Co. Ltd. (c) | 46,000 | 967,823 | |
| AGC, Inc. | 13,500 | 459,258 | |
| Aisin Seiki Co. Ltd. | 10,500 | 365,766 | |
| Ajinomoto Co., Inc. | 31,500 | 1,150,465 | |
| Ana Holdings, Inc. (a) | 11,700 | 229,693 | |
| Asahi Group Holdings | 33,600 | 1,215,326 | |
| ASAHI INTECC Co. Ltd. | 14,900 | 250,359 | |
| Asahi Kasei Corp. | 88,800 | 545,923 | |
| Astellas Pharma, Inc. | 127,000 | 1,606,534 | |
| Azbil Corp. | 8,200 | 242,299 | |
| Bandai Namco Holdings, Inc. | 42,000 | 870,178 | |
| BayCurrent Consulting, Inc. | 9,300 | 233,493 | |
| Bridgestone Corp. | 40,100 | 1,517,593 | |
| Brother Industries Ltd. | 15,700 | 244,924 | |
| Canon, Inc. | 69,900 | 1,652,485 | |
| Capcom Co. Ltd. | 11,900 | 383,053 | |
| Central Japan Railway Co. | 50,500 | 1,136,675 | |
| Chiba Bank Ltd. | 37,500 | 279,320 | |
| Chubu Electric Power Co., Inc. | 45,200 | 546,204 | |
| Chugai Pharmaceutical Co. Ltd. | 47,000 | 1,393,859 | |
| Concordia Financial Group Ltd. | 74,900 | 348,015 | |
| CyberAgent, Inc. | 31,800 | 166,933 | |
| Dai Nippon Printing Co. Ltd. | 15,500 | 404,353 | |
| Dai-ichi Mutual Life Insurance Co. | 66,000 | 1,394,252 | |
| Daifuku Co. Ltd. | 21,700 | 358,547 | |
| Daiichi Sankyo Kabushiki Kaisha | 129,700 | 3,344,210 | |
| Daikin Industries Ltd. | 18,500 | 2,667,310 | |
| Daito Trust Construction Co. Ltd. | 4,300 | 461,245 | |
| Daiwa House Industry Co. Ltd. | 41,400 | 1,138,735 | |
| Daiwa House REIT Investment Corp. | 157 | 277,850 | |
| Daiwa Securities Group, Inc. | 93,400 | 538,588 | |
| DENSO Corp. | 121,600 | 1,795,586 | |
| Dentsu Group, Inc. | 14,300 | 415,358 | |
| Disco Corp. | 6,500 | 1,147,894 | |
| East Japan Railway Co. | 21,200 | 1,101,071 | |
| Eisai Co. Ltd. | 17,700 | 937,717 | |
| ENEOS Holdings, Inc. | 203,100 | 752,570 | |
| FANUC Corp. | 66,800 | 1,657,737 | |
| Fast Retailing Co. Ltd. | 12,300 | 2,723,176 | |
| Fuji Electric Co. Ltd. | 8,800 | 335,057 | |
| FUJIFILM Holdings Corp. | 26,100 | 1,427,613 | |
| Fujitsu Ltd. | 12,300 | 1,593,435 | |
| GLP J-REIT | 330 | 295,567 | |
| GMO Payment Gateway, Inc. | 2,900 | 115,824 | |
| Hakuhodo DY Holdings, Inc. | 14,900 | 120,916 | |
| Hamamatsu Photonics K.K. | 9,800 | 364,002 | |
| Hankyu Hanshin Holdings, Inc. | 15,900 | 500,271 | |
| Hikari Tsushin, Inc. | 1,400 | 201,982 | |
| Hirose Electric Co. Ltd. | 2,210 | 250,391 | |
| Hitachi Construction Machinery Co. Ltd. | 7,300 | 188,601 | |
| Hitachi Ltd. | 65,700 | 4,164,501 | |
| Honda Motor Co. Ltd. | 323,400 | 3,314,453 | |
| Hoshizaki Corp. | 7,700 | 248,669 | |
| Hoya Corp. | 24,800 | 2,387,462 | |
| Hulic Co. Ltd. | 25,900 | 237,455 | |
| Ibiden Co. Ltd. | 7,900 | 336,828 | |
| Idemitsu Kosan Co. Ltd. | 13,566 | 308,017 | |
| Iida Group Holdings Co. Ltd. | 11,500 | 178,563 | |
| INPEX Corp. | 68,200 | 989,642 | |
| Isuzu Motors Ltd. | 41,200 | 459,407 | |
| Itochu Corp. | 83,300 | 3,000,552 | |
| Japan Airlines Co. Ltd. | 11,100 | 204,060 | |
| Japan Exchange Group, Inc. | 35,700 | 705,960 | |
| Japan Post Bank Co. Ltd. | 101,100 | 937,117 | |
| Japan Post Holdings Co. Ltd. | 157,500 | 1,394,065 | |
| Japan Post Insurance Co. Ltd. | 13,000 | 250,329 | |
| Japan Real Estate Investment Corp. | 86 | 319,432 | |
| Japan Retail Fund Investment Corp. | 480 | 309,767 | |
| Japan Tobacco, Inc. | 83,900 | 1,953,097 | |
| JFE Holdings, Inc. | 33,800 | 470,931 | |
| JSR Corp. | 12,500 | 334,574 | |
| Kajima Corp. | 29,700 | 490,864 | |
| Kansai Electric Power Co., Inc. | 49,400 | 632,510 | |
| Kao Corp. | 32,700 | 1,193,024 | |
| Kawasaki Kisen Kaisha Ltd. | 9,800 | 336,042 | |
| KDDI Corp. | 104,900 | 3,138,056 | |
| KDX Realty Investment Corp. | 290 | 302,467 | |
| Keio Corp. | 7,500 | 222,559 | |
| Keisei Electric Railway Co. | 8,800 | 331,493 | |
| Keyence Corp. | 13,600 | 5,264,815 | |
| Kikkoman Corp. | 9,400 | 534,811 | |
| Kintetsu Group Holdings Co. Ltd. | 12,700 | 357,337 | |
| Kirin Holdings Co. Ltd. | 53,400 | 750,447 | |
| Kobayashi Pharmaceutical Co. Ltd. | 3,800 | 156,876 | |
| Kobe Bussan Co. Ltd. | 10,300 | 254,905 | |
| Koei Tecmo Holdings Co. Ltd. | 8,280 | 108,118 | |
| Koito Manufacturing Co. Ltd. | 15,000 | 224,741 | |
| Komatsu Ltd. | 64,900 | 1,491,168 | |
| Konami Group Corp. | 7,100 | 367,795 | |
| Kose Corp. | 2,400 | 159,002 | |
| Kubota Corp. | 71,100 | 956,241 | |
| Kurita Water Industries Ltd. | 7,200 | 218,761 | |
| Kyocera Corp. | 22,500 | 1,109,057 | |
| Kyowa Hakko Kirin Co., Ltd. | 19,100 | 299,570 | |
| Lasertec Corp. | 5,300 | 875,455 | |
| LIXIL Group Corp. | 20,400 | 223,687 | |
| LY Corp. | 187,000 | 476,754 | |
| M3, Inc. | 32,130 | 494,840 | |
| Makita Corp. | 15,400 | 398,042 | |
| Marubeni Corp. | 101,300 | 1,481,186 | |
| MatsukiyoCocokara & Co. | 24,300 | 426,266 | |
| Mazda Motor Corp. | 38,700 | 374,074 | |
| McDonald's Holdings Co. (Japan) Ltd. | 6,200 | 241,228 | |
| Meiji Holdings Co. Ltd. | 16,300 | 401,209 | |
| Minebea Mitsumi, Inc. | 25,800 | 404,526 | |
| Misumi Group, Inc. | 20,300 | 307,315 | |
| Mitsubishi Chemical Holdings Corp. | 90,800 | 513,801 | |
| Mitsubishi Corp. | 80,600 | 3,757,214 | |
| Mitsubishi Electric Corp. | 134,300 | 1,539,952 | |
| Mitsubishi Estate Co. Ltd. | 78,600 | 1,006,105 | |
| Mitsubishi Heavy Industries Ltd. | 22,500 | 1,158,855 | |
| Mitsubishi UFJ Financial Group, Inc. | 800,200 | 6,712,996 | |
| Mitsubishi UFJ Lease & Finance Co. Ltd. | 56,800 | 374,439 | |
| Mitsui & Co. Ltd. | 92,000 | 3,343,664 | |
| Mitsui Chemicals, Inc. | 12,100 | 304,974 | |
| Mitsui Fudosan Co. Ltd. | 62,200 | 1,348,176 | |
| Mitsui OSK Lines Ltd. | 24,100 | 622,197 | |
| Mizuho Financial Group, Inc. | 169,010 | 2,869,517 | |
| MonotaRO Co. Ltd. | 17,700 | 141,458 | |
| MS&AD Insurance Group Holdings, Inc. | 30,100 | 1,102,880 | |
| Murata Manufacturing Co. Ltd. | 120,900 | 2,070,942 | |
| NEC Corp. | 17,300 | 833,006 | |
| Nexon Co. Ltd. | 24,000 | 440,382 | |
| NGK Insulators Ltd. | 15,600 | 190,605 | |
| Nidec Corp. | 29,100 | 1,067,418 | |
| Nintendo Co. Ltd. | 72,700 | 3,003,561 | |
| Nippon Building Fund, Inc. | 104 | 417,865 | |
| Nippon Express Holdings, Inc. | 4,900 | 251,838 | |
| Nippon Paint Holdings Co. Ltd. | 66,800 | 449,104 | |
| Nippon Prologis REIT, Inc. | 163 | 290,038 | |
| Nippon Sanso Holdings Corp. | 12,200 | 307,666 | |
| Nippon Steel & Sumitomo Metal Corp. | 60,200 | 1,298,445 | |
| Nippon Telegraph & Telephone Corp. | 2,089,100 | 2,458,402 | |
| Nippon Yusen KK | 34,200 | 836,780 | |
| Nissan Chemical Corp. | 9,100 | 371,145 | |
| Nissan Motor Co. Ltd. | 162,300 | 624,528 | |
| Nissin Food Holdings Co. Ltd. | 4,300 | 374,137 | |
| Nitori Holdings Co. Ltd. | 5,600 | 606,451 | |
| Nitto Denko Corp. | 10,040 | 649,646 | |
| Nomura Holdings, Inc. | 209,500 | 809,384 | |
| Nomura Real Estate Holdings, Inc. | 7,800 | 182,177 | |
| Nomura Real Estate Master Fund, Inc. | 286 | 315,589 | |
| Nomura Research Institute Ltd. | 27,100 | 711,374 | |
| NTT Data Corp. | 44,300 | 546,215 | |
| Obayashi Corp. | 45,800 | 392,314 | |
| OBIC Co. Ltd. | 4,900 | 724,300 | |
| Odakyu Electric Railway Co. Ltd. | 22,400 | 318,894 | |
| Oji Holdings Corp. | 60,400 | 258,324 | |
| Olympus Corp. | 88,900 | 1,187,291 | |
| OMRON Corp. | 12,200 | 437,092 | |
| Ono Pharmaceutical Co. Ltd. | 27,400 | 473,184 | |
| Open House Group Co. Ltd. | 5,700 | 187,874 | |
| Oracle Corp. Japan | 2,700 | 191,537 | |
| Oriental Land Co. Ltd. | 76,400 | 2,471,186 | |
| ORIX Corp. | 82,300 | 1,496,737 | |
| Osaka Gas Co. Ltd. | 26,300 | 495,960 | |
| Otsuka Corp. | 7,700 | 308,729 | |
| Otsuka Holdings Co. Ltd. | 27,400 | 921,899 | |
| Pan Pacific International Holdings Ltd. | 27,590 | 534,304 | |
| Panasonic Holdings Corp. | 154,900 | 1,359,014 | |
| Persol Holdings Co. Ltd. | 131,000 | 196,423 | |
| Rakuten Group, Inc. | 104,600 | 386,907 | |
| Recruit Holdings Co. Ltd. | 101,000 | 2,895,944 | |
| Renesas Electronics Corp. (a) | 89,400 | 1,174,324 | |
| Resona Holdings, Inc. | 150,200 | 802,567 | |
| Ricoh Co. Ltd. | 38,600 | 312,857 | |
| ROHM Co. Ltd. | 24,800 | 397,345 | |
| SBI Holdings, Inc. Japan | 16,800 | 361,451 | |
| SCSK Corp. | 11,100 | 189,480 | |
| Secom Co. Ltd. | 14,700 | 1,020,986 | |
| Seiko Epson Corp. | 20,300 | 281,829 | |
| Sekisui Chemical Co. Ltd. | 26,700 | 365,707 | |
| Sekisui House Ltd. | 41,300 | 808,768 | |
| Seven & i Holdings Co. Ltd. | 52,800 | 1,934,524 | |
| SG Holdings Co. Ltd. | 21,900 | 310,424 | |
| Sharp Corp. (a) | 18,600 | 116,291 | |
| Shimadzu Corp. | 16,700 | 394,893 | |
| SHIMANO, Inc. | 5,400 | 777,093 | |
| SHIMIZU Corp. | 39,800 | 283,236 | |
| Shin-Etsu Chemical Co. Ltd. | 127,700 | 3,818,661 | |
| Shionogi & Co. Ltd. | 18,500 | 861,446 | |
| Shiseido Co. Ltd. | 28,100 | 891,205 | |
| Shizuoka Financial Group | 33,200 | 282,325 | |
| SMC Corp. | 4,000 | 1,847,053 | |
| SoftBank Corp. | 200,800 | 2,270,419 | |
| SoftBank Group Corp. | 72,200 | 2,956,884 | |
| Sompo Holdings, Inc. | 20,600 | 892,391 | |
| Sony Group Corp. | 88,400 | 7,349,478 | |
| Square Enix Holdings Co. Ltd. | 5,800 | 192,686 | |
| Subaru Corp. | 43,500 | 752,998 | |
| Sumco Corp. | 24,100 | 311,424 | |
| Sumitomo Chemical Co. Ltd. | 100,300 | 254,939 | |
| Sumitomo Corp. | 73,300 | 1,440,908 | |
| Sumitomo Electric Industries Ltd. | 50,500 | 530,161 | |
| Sumitomo Metal Mining Co. Ltd. | 17,500 | 491,609 | |
| Sumitomo Mitsui Financial Group, Inc. | 89,000 | 4,290,510 | |
| Sumitomo Mitsui Trust Holdings, Inc. | 23,000 | 862,426 | |
| Sumitomo Realty & Development Co. Ltd. | 20,200 | 506,898 | |
| Suntory Beverage & Food Ltd. | 9,500 | 285,884 | |
| Suzuki Motor Corp. | 25,800 | 1,001,350 | |
| Sysmex Corp. | 11,800 | 565,253 | |
| T&D Holdings, Inc. | 34,400 | 613,669 | |
| Taisei Corp. | 11,700 | 396,779 | |
| Takeda Pharmaceutical Co. Ltd. | 110,877 | 3,009,728 | |
| TDK Corp. | 27,376 | 1,024,279 | |
| Terumo Corp. | 47,200 | 1,291,307 | |
| TIS, Inc. | 15,600 | 334,072 | |
| Tobu Railway Co. Ltd. | 13,300 | 320,124 | |
| Toho Co. Ltd. | 8,000 | 273,305 | |
| Tokio Marine Holdings, Inc. | 126,300 | 2,825,613 | |
| Tokyo Electric Power Co., Inc. (a) | 107,400 | 454,489 | |
| Tokyo Electron Ltd. | 33,100 | 4,373,758 | |
| Tokyo Gas Co. Ltd. | 27,400 | 615,326 | |
| Tokyu Corp. | 35,300 | 398,503 | |
| Toppan Holdings, Inc. | 17,300 | 399,005 | |
| Toray Industries, Inc. | 98,300 | 475,560 | |
| Tosoh Corp. | 17,400 | 213,050 | |
| Toto Ltd. | 9,400 | 226,649 | |
| Toyota Industries Corp. | 10,300 | 763,382 | |
| Toyota Motor Corp. | 743,100 | 12,999,605 | |
| Toyota Tsusho Corp. | 14,900 | 793,221 | |
| Trend Micro, Inc. | 9,400 | 354,235 | |
| Unicharm Corp. | 28,300 | 961,602 | |
| USS Co. Ltd. | 15,300 | 267,427 | |
| Welcia Holdings Co. Ltd. | 6,400 | 106,085 | |
| West Japan Railway Co. | 15,500 | 590,776 | |
| Yakult Honsha Co. Ltd. | 18,000 | 424,169 | |
| Yamaha Corp. | 9,900 | 264,428 | |
| Yamaha Motor Co. Ltd. | 20,500 | 500,955 | |
| Yamato Holdings Co. Ltd. | 19,200 | 319,796 | |
| Yaskawa Electric Corp. | 16,600 | 543,370 | |
| Yokogawa Electric Corp. | 16,100 | 292,299 | |
| Zensho Holdings Co. Ltd. | 6,500 | 341,652 | |
| ZOZO, Inc. | 9,900 | 188,246 | |
TOTAL JAPAN | 229,492,807 | ||
| Jordan - 0.0% | |||
| Hikma Pharmaceuticals PLC | 11,831 | 273,436 | |
| Korea (South) - 3.0% | |||
| AMOREPACIFIC Corp. | 1,528 | 143,215 | |
| BGF Retail Co. Ltd. | 449 | 45,847 | |
| Celltrion Healthcare Co. Ltd. | 7,576 | 374,196 | |
| Celltrion Pharm, Inc. | 1,105 | 51,911 | |
| Celltrion, Inc. | 7,776 | 862,271 | |
| CJ CheilJedang Corp. | 661 | 138,272 | |
| Cosmo AM&T Co. Ltd. (a) | 1,704 | 177,145 | |
| Cosmo AM&T Co. Ltd. rights 11/7/23 (a) | 77 | 945 | |
| Coway Co. Ltd. | 3,392 | 108,386 | |
| Db Insurance Co. Ltd. | 3,021 | 196,252 | |
| Delivery Hero AG (a)(b) | 12,343 | 313,051 | |
| Doosan Bobcat, Inc. | 3,957 | 113,520 | |
| Doosan Heavy Industries & Construction Co. Ltd. (a) | 30,840 | 306,834 | |
| Ecopro BM Co. Ltd. | 3,432 | 501,348 | |
| Ecopro Co. Ltd. | 1,401 | 646,406 | |
| F&F Co. Ltd. | 1,051 | 72,752 | |
| GS Holdings Corp. | 2,790 | 81,352 | |
| Hana Financial Group, Inc. | 20,056 | 582,300 | |
| Hankook Tire Co. Ltd. | 4,832 | 136,888 | |
| Hanmi Pharm Co. Ltd. | 464 | 96,872 | |
| Hanmi Semiconductor Co. Ltd. | 3,107 | 121,559 | |
| Hanon Systems | 11,205 | 57,091 | |
| Hanwha Aerospace Co. Ltd. | 2,541 | 190,752 | |
| Hanwha Ocean Co. Ltd. (a) | 3,167 | 55,303 | |
| Hanwha Ocean Co. Ltd. rights 11/9/23 (a) | 1,045 | 1,352 | |
| Hanwha Solutions Corp. (a) | 6,734 | 143,223 | |
| HD Hyundai Co. Ltd. | 2,816 | 119,762 | |
| HD Hyundai Heavy Industries Co. Ltd. (a) | 1,652 | 125,071 | |
| HD Korea Shipbuilding & Offshore Engineering Co. Ltd. (a) | 2,823 | 189,095 | |
| HLB, Inc. | 7,543 | 162,279 | |
| HMM Co. Ltd. | 16,278 | 176,050 | |
| Hotel Shilla Co. | 2,027 | 93,652 | |
| HYBE Co. Ltd. (a) | 1,340 | 217,914 | |
| Hyundai Engineering & Construction Co. Ltd. | 6,325 | 156,632 | |
| Hyundai Glovis Co. Ltd. | 1,473 | 186,663 | |
| Hyundai Mipo Dockyard Co. Ltd. (a) | 1,463 | 75,280 | |
| Hyundai Mobis | 4,302 | 665,241 | |
| Hyundai Motor Co. Ltd. | 9,096 | 1,144,253 | |
| Hyundai Steel Co. | 6,792 | 164,926 | |
| Industrial Bank of Korea | 17,180 | 141,970 | |
| JYP Entertainment Corp. | 2,066 | 157,030 | |
| Kakao Corp. | 22,194 | 624,629 | |
| Kakao Games Corp. (a) | 2,502 | 43,362 | |
| Kakao Pay Corp. (a) | 1,631 | 41,518 | |
| KakaoBank Corp. | 12,071 | 163,118 | |
| Kangwon Land, Inc. | 5,722 | 62,212 | |
| KB Financial Group, Inc. | 26,666 | 1,014,955 | |
| Kia Corp. | 18,268 | 1,042,130 | |
| Korea Aerospace Industries Ltd. | 5,492 | 180,445 | |
| Korea Electric Power Corp. (a) | 18,484 | 231,020 | |
| Korea Investment Holdings Co. Ltd. | 2,497 | 93,209 | |
| Korea Zinc Co. Ltd. | 527 | 182,871 | |
| Korean Air Lines Co. Ltd. | 13,922 | 211,512 | |
| KRAFTON, Inc. (a) | 2,143 | 260,485 | |
| KT Corp. | 3,989 | 96,360 | |
| KT&G Corp. | 7,324 | 461,337 | |
| Kumho Petro Chemical Co. Ltd. | 1,429 | 134,108 | |
| L&F Co. Ltd. | 1,748 | 169,781 | |
| LG Chemical Ltd. | 3,313 | 1,084,200 | |
| LG Corp. | 6,535 | 373,502 | |
| LG Display Co. Ltd. (a) | 17,414 | 157,341 | |
| LG Electronics, Inc. | 7,499 | 555,474 | |
| LG Energy Solution (a) | 3,285 | 940,311 | |
| LG H & H Co. Ltd. | 465 | 108,855 | |
| LG Innotek Co. Ltd. | 1,037 | 171,858 | |
| LG Uplus Corp. | 12,853 | 96,187 | |
| Lotte Chemical Corp. | 1,356 | 147,039 | |
| Lotte Energy Materials Corp. | 1,528 | 43,709 | |
| Meritz Financial Holdings Co. | 7,394 | 274,779 | |
| Mirae Asset Securities Co. Ltd. | 18,991 | 92,893 | |
| NAVER Corp. | 9,168 | 1,279,816 | |
| NCSOFT Corp. | 938 | 161,815 | |
| Netmarble Corp. (a)(b) | 1,298 | 37,209 | |
| NH Investment & Securities Co. Ltd. | 8,755 | 62,719 | |
| Orion Corp./Republic of Korea | 1,537 | 135,831 | |
| Pan Ocean Co., Ltd. (Korea) | 16,856 | 53,735 | |
| Pearl Abyss Corp. (a) | 2,089 | 76,418 | |
| POSCO | 5,044 | 1,541,807 | |
| POSCO Chemtech Co. Ltd. | 2,175 | 382,717 | |
| Posco International Corp. | 3,688 | 137,359 | |
| S-Oil Corp. | 3,488 | 171,887 | |
| Samsung Biologics Co. Ltd. (a)(b) | 1,267 | 665,083 | |
| Samsung C&T Corp. | 6,246 | 493,112 | |
| Samsung Electro-Mechanics Co. Ltd. | 4,085 | 377,144 | |
| Samsung Electronics Co. Ltd. | 330,974 | 16,449,769 | |
| Samsung Engineering Co. Ltd. (a) | 11,589 | 203,949 | |
| Samsung Fire & Marine Insurance Co. Ltd. | 2,141 | 408,801 | |
| Samsung Heavy Industries Co. Ltd. (a) | 47,466 | 240,271 | |
| Samsung Life Insurance Co. Ltd. | 5,792 | 309,640 | |
| Samsung SDI Co. Ltd. | 3,867 | 1,222,612 | |
| Samsung SDS Co. Ltd. | 2,813 | 287,919 | |
| Samsung Securities Co. Ltd. | 3,846 | 100,602 | |
| Shinhan Financial Group Co. Ltd. | 30,629 | 786,127 | |
| SK Biopharmaceuticals Co. Ltd. (a) | 2,330 | 130,199 | |
| SK Bioscience Co. Ltd. (a) | 1,738 | 78,107 | |
| SK Hynix, Inc. | 38,327 | 3,323,464 | |
| SK IE Technology Co. Ltd. (a)(b) | 1,611 | 70,932 | |
| SK Innovation Co., Ltd. | 4,443 | 404,178 | |
| SK Square Co. Ltd. (a) | 7,416 | 233,983 | |
| SK, Inc. | 2,829 | 297,822 | |
| SKC Co. Ltd. | 1,252 | 73,111 | |
| Woori Financial Group, Inc. | 41,289 | 364,155 | |
| Yuhan Corp. | 3,512 | 149,488 | |
TOTAL KOREA (SOUTH) | 49,065,842 | ||
| Kuwait - 0.2% | |||
| Agility Public Warehousing Co. KSC (a) | 119,374 | 202,911 | |
| Boubyan Bank KSC | 100,284 | 189,906 | |
| Gulf Bank | 120,869 | 92,571 | |
| Gulf Bank rights 11/12/23 (a) | 9,382 | 194 | |
| Kuwait Finance House KSCP | 571,264 | 1,262,707 | |
| Mabanee Co. SAKC | 42,766 | 114,015 | |
| Mobile Telecommunication Co. | 135,875 | 211,200 | |
| National Bank of Kuwait | 530,157 | 1,502,497 | |
TOTAL KUWAIT | 3,576,001 | ||
| Luxembourg - 0.1% | |||
| ArcelorMittal SA (Netherlands) | 35,615 | 786,847 | |
| Eurofins Scientific SA | 9,428 | 477,141 | |
| Reinet Investments SCA | 9,056 | 188,170 | |
TOTAL LUXEMBOURG | 1,452,158 | ||
| Macau - 0.1% | |||
| Galaxy Entertainment Group Ltd. | 151,000 | 848,841 | |
| Sands China Ltd. (a) | 168,400 | 453,341 | |
TOTAL MACAU | 1,302,182 | ||
| Malaysia - 0.4% | |||
| AMMB Holdings Bhd | 111,400 | 89,370 | |
| Axiata Group Bhd | 212,560 | 97,255 | |
| CelcomDigi Bhd | 268,800 | 240,793 | |
| CIMB Group Holdings Bhd | 464,143 | 556,088 | |
| Dialog Group Bhd | 229,400 | 103,503 | |
| Gamuda Bhd | 123,031 | 120,894 | |
| Genting Bhd | 172,600 | 146,051 | |
| Genting Malaysia Bhd | 191,500 | 97,312 | |
| Hong Leong Bank Bhd | 46,900 | 190,967 | |
| Hong Leong Credit Bhd | 13,100 | 48,716 | |
| IHH Healthcare Bhd | 162,900 | 205,058 | |
| Inari Amertron Bhd | 167,900 | 100,666 | |
| IOI Corp. Bhd | 165,500 | 136,553 | |
| Kuala Lumpur Kepong Bhd | 31,100 | 143,562 | |
| Malayan Banking Bhd | 374,598 | 709,323 | |
| Malaysia Airports Holdings Bhd | 49,416 | 76,669 | |
| Maxis Bhd | 150,700 | 125,305 | |
| MISC Bhd | 93,600 | 142,495 | |
| MR DIY Group M Sdn Bhd (b) | 214,700 | 66,704 | |
| Nestle (Malaysia) Bhd | 4,500 | 116,947 | |
| Petronas Chemicals Group Bhd | 201,700 | 311,023 | |
| Petronas Dagangan Bhd | 18,500 | 89,562 | |
| Petronas Gas Bhd | 58,800 | 214,180 | |
| PPB Group Bhd | 48,840 | 157,008 | |
| Press Metal Aluminium Holdings | 250,000 | 258,419 | |
| Public Bank Bhd | 1,010,500 | 882,573 | |
| QL Resources Bhd | 65,500 | 76,019 | |
| RHB Bank Bhd | 116,967 | 137,004 | |
| Sime Darby Bhd | 161,900 | 77,812 | |
| Sime Darby Plantation Bhd | 134,116 | 122,264 | |
| Telekom Malaysia Bhd | 68,521 | 72,942 | |
| Tenaga Nasional Bhd | 186,100 | 386,728 | |
TOTAL MALAYSIA | 6,299,765 | ||
| Mexico - 0.7% | |||
| Alfa SA de CV Series A | 206,900 | 128,990 | |
| America Movil S.A.B. de CV Series L | 1,325,500 | 1,094,719 | |
| Arca Continental S.A.B. de CV | 35,900 | 321,923 | |
| Banco del Bajio SA (b) | 55,500 | 169,865 | |
| CEMEX S.A.B. de CV unit (a) | 1,045,680 | 628,139 | |
| Coca-Cola FEMSA S.A.B. de CV unit | 37,320 | 283,155 | |
| Fibra Uno Administracion SA de CV | 209,400 | 317,892 | |
| Fomento Economico Mexicano S.A.B. de CV unit | 136,300 | 1,542,702 | |
| Gruma S.A.B. de CV Series B | 12,375 | 215,342 | |
| Grupo Aeroportuario del Pacifico S.A.B. de CV Series B | 27,800 | 324,290 | |
| Grupo Aeroportuario del Sureste S.A.B. de CV Series B | 13,860 | 298,702 | |
| Grupo Bimbo S.A.B. de CV Series A | 94,100 | 382,997 | |
| Grupo Carso SA de CV Series A1 | 38,500 | 245,491 | |
| Grupo Financiero Banorte S.A.B. de CV Series O | 182,200 | 1,478,701 | |
| Grupo Financiero Inbursa S.A.B. de CV Series O (a) | 134,600 | 277,577 | |
| Grupo Mexico SA de CV Series B | 219,300 | 894,400 | |
| Grupo Televisa SA de CV | 160,900 | 73,806 | |
| Industrias Penoles SA de CV (a) | 14,220 | 158,748 | |
| Kimberly-Clark de Mexico SA de CV Series A | 109,400 | 200,547 | |
| Operadora de Sites Mexicanos, SA de CV | 80,600 | 68,534 | |
| Orbia Advance Corp. S.A.B. de CV | 77,200 | 125,077 | |
| Promotora y Operadora de Infraestructura S.A.B. de CV | 12,940 | 105,923 | |
| Southern Copper Corp. | 6,024 | 427,102 | |
| Wal-Mart de Mexico SA de CV Series V | 365,300 | 1,307,494 | |
TOTAL MEXICO | 11,072,116 | ||
| Netherlands - 3.5% | |||
| ABN AMRO Bank NV GDR (Bearer) (b) | 28,538 | 383,037 | |
| Adyen BV (a)(b) | 1,524 | 1,027,917 | |
| AEGON NV | 119,574 | 579,973 | |
| Akzo Nobel NV | 11,878 | 795,059 | |
| Argenx SE (a) | 3,927 | 1,847,189 | |
| ASM International NV (Netherlands) | 3,298 | 1,355,715 | |
| ASML Holding NV (Netherlands) | 28,264 | 16,990,067 | |
| ASR Nederland NV | 11,136 | 414,762 | |
| BE Semiconductor Industries NV | 5,402 | 556,153 | |
| Euronext NV (b) | 5,947 | 414,048 | |
| EXOR NV | 7,598 | 650,713 | |
| Heineken Holding NV | 9,014 | 684,808 | |
| Heineken NV (Bearer) | 20,118 | 1,807,470 | |
| IMCD NV | 4,056 | 487,103 | |
| ING Groep NV (Certificaten Van Aandelen) | 253,648 | 3,251,902 | |
| JDE Peet's BV | 9,006 | 250,047 | |
| Koninklijke Ahold Delhaize NV | 68,233 | 2,021,525 | |
| Koninklijke KPN NV | 228,611 | 768,403 | |
| Koninklijke Philips Electronics NV | 65,121 | 1,238,763 | |
| NN Group NV | 17,669 | 566,687 | |
| OCI NV | 7,387 | 172,034 | |
| Randstad NV | 7,758 | 400,915 | |
| Shell PLC (London) | 469,720 | 15,137,597 | |
| Stellantis NV (Italy) | 155,136 | 2,889,029 | |
| Universal Music Group NV | 57,506 | 1,408,255 | |
| Wolters Kluwer NV | 18,046 | 2,312,341 | |
TOTAL NETHERLANDS | 58,411,512 | ||
| New Zealand - 0.1% | |||
| Auckland International Airport Ltd. | 86,266 | 368,983 | |
| Fisher & Paykel Healthcare Corp. | 41,370 | 501,802 | |
| Mercury Nz Ltd. | 45,781 | 157,484 | |
| Meridian Energy Ltd. | 95,629 | 269,326 | |
| Spark New Zealand Ltd. | 126,628 | 367,617 | |
| Xero Ltd. (a) | 10,006 | 684,083 | |
TOTAL NEW ZEALAND | 2,349,295 | ||
| Norway - 0.4% | |||
| Aker BP ASA | 22,209 | 638,380 | |
| DNB Bank ASA | 64,523 | 1,162,701 | |
| Equinor ASA | 63,072 | 2,114,376 | |
| Gjensidige Forsikring ASA | 13,616 | 203,918 | |
| Kongsberg Gruppen ASA | 6,514 | 265,903 | |
| Mowi ASA | 30,849 | 500,667 | |
| Norsk Hydro ASA | 93,838 | 535,131 | |
| Orkla ASA | 51,966 | 357,916 | |
| Salmar ASA | 5,226 | 247,384 | |
| Telenor ASA | 49,072 | 501,441 | |
TOTAL NORWAY | 6,527,817 | ||
| Peru - 0.0% | |||
| Compania de Minas Buenaventura SAA sponsored ADR | 14,294 | 115,781 | |
| Credicorp Ltd. (United States) | 4,783 | 597,684 | |
TOTAL PERU | 713,465 | ||
| Philippines - 0.2% | |||
| Aboitiz Equity Ventures, Inc. | 108,780 | 87,613 | |
| Ayala Corp. | 18,670 | 199,141 | |
| Ayala Land, Inc. | 445,300 | 218,590 | |
| Bank of the Philippine Islands (BPI) | 143,506 | 253,827 | |
| BDO Unibank, Inc. | 168,166 | 377,639 | |
| International Container Terminal Services, Inc. | 70,360 | 248,696 | |
| JG Summit Holdings, Inc. | 173,451 | 112,240 | |
| Jollibee Food Corp. | 31,680 | 114,245 | |
| Manila Electric Co. | 17,080 | 106,665 | |
| Metropolitan Bank & Trust Co. | 118,733 | 109,224 | |
| PLDT, Inc. | 4,815 | 102,643 | |
| SM Investments Corp. | 17,095 | 241,035 | |
| SM Prime Holdings, Inc. | 733,500 | 387,159 | |
| Universal Robina Corp. | 64,390 | 123,839 | |
TOTAL PHILIPPINES | 2,682,556 | ||
| Poland - 0.2% | |||
| Allegro.eu SA (a)(b) | 34,212 | 244,891 | |
| Bank Polska Kasa Opieki SA | 13,095 | 397,011 | |
| Budimex SA | 918 | 102,435 | |
| CD Projekt RED SA | 4,625 | 115,294 | |
| Cyfrowy Polsat SA | 18,168 | 56,569 | |
| Dino Polska SA (a)(b) | 3,368 | 318,645 | |
| KGHM Polska Miedz SA (Bearer) | 10,065 | 268,230 | |
| LPP SA | 78 | 251,108 | |
| mBank SA (a) | 1,073 | 132,417 | |
| Orlen SA | 40,871 | 645,273 | |
| PGE Polska Grupa Energetyczna SA (a) | 63,614 | 110,221 | |
| Powszechna Kasa Oszczednosci Bank SA (a) | 60,340 | 623,449 | |
| Powszechny Zaklad Ubezpieczen SA | 42,134 | 476,253 | |
| Santander Bank Polska SA (a) | 2,535 | 274,682 | |
TOTAL POLAND | 4,016,478 | ||
| Portugal - 0.1% | |||
| Energias de Portugal SA | 219,312 | 921,254 | |
| Galp Energia SGPS SA Class B | 34,333 | 516,217 | |
| Jeronimo Martins SGPS SA | 19,848 | 457,405 | |
TOTAL PORTUGAL | 1,894,876 | ||
| Qatar - 0.2% | |||
| Barwa Real Estate Co. (a) | 138,973 | 96,567 | |
| Dukhan Bank | 130,867 | 130,328 | |
| Industries Qatar QSC (a) | 106,581 | 357,709 | |
| Masraf al Rayan | 396,359 | 228,606 | |
| Mesaieed Petrochemical Holding Co. (a) | 366,853 | 160,202 | |
| Ooredoo QSC | 50,692 | 137,694 | |
| Qatar Electricity & Water Co. (a) | 28,356 | 128,813 | |
| Qatar Fuel Co. (a) | 43,240 | 176,357 | |
| Qatar Gas Transport Co. Ltd. (Nakilat) (a) | 181,878 | 175,834 | |
| Qatar International Islamic Bank QSC (a) | 66,834 | 169,793 | |
| Qatar Islamic Bank | 114,595 | 547,639 | |
| Qatar National Bank SAQ | 324,522 | 1,327,144 | |
| The Commercial Bank of Qatar (a) | 227,965 | 320,942 | |
TOTAL QATAR | 3,957,628 | ||
| Romania - 0.0% | |||
| NEPI Rockcastle PLC | 36,091 | 194,925 | |
| Russia - 0.0% | |||
| Alrosa Co. Ltd. (d) | 120,680 | 20,082 | |
| Gazprom OAO (d) | 601,730 | 62,980 | |
| Inter Rao Ues JSC (d) | 1,756,400 | 9,686 | |
| LUKOIL PJSC (d) | 21,149 | 6,548 | |
| MMC Norilsk Nickel PJSC (a)(d) | 2,499 | 16,624 | |
| MMC Norilsk Nickel PJSC sponsored ADR (a)(d) | 6,705 | 16,092 | |
| Mobile TeleSystems OJSC sponsored ADR (a)(d) | 21,752 | 21,665 | |
| Moscow Exchange MICEX-RTS OAO (d) | 72,930 | 14,023 | |
| Novatek PJSC GDR (Reg. S) (a)(d) | 4,511 | 234,572 | |
| Novolipetsk Steel OJSC (a)(d) | 71,070 | 682 | |
| Ozon Holdings PLC ADR (a)(d) | 2,304 | 4,828 | |
| PhosAgro PJSC: | |||
| GDR (Reg. S) (a)(d) | 6,442 | 132 | |
| sponsored GDR (Reg. S) (a)(d) | 42 | 1 | |
| Polyus PJSC (a)(d) | 1,749 | 4,114 | |
| Rosneft Oil Co. OJSC (d) | 55,210 | 9,235 | |
| Sberbank of Russia (d) | 551,355 | 3,391 | |
| Severstal PAO (a)(d) | 7,553 | 169 | |
| Severstal PAO GDR (Reg. S) (a)(d) | 2,375 | 56 | |
| Surgutneftegas OJSC (d) | 351,800 | 4,306 | |
| Tatneft PAO (d) | 71,609 | 8,909 | |
| TCS Group Holding PLC GDR (a)(d) | 6,170 | 7,859 | |
| United Co. RUSAL International PJSC (d) | 141,950 | 17,112 | |
| VK Co. Ltd. GDR (Reg. S) (a)(d) | 6,898 | 2,050 | |
| VTB Bank OJSC (a)(d) | 152,910,000 | 5,843 | |
| X5 Retail Group NV GDR (Reg. S) (a)(d) | 5,899 | 1,392 | |
| Yandex NV Class A (a)(d) | 15,310 | 57,174 | |
TOTAL RUSSIA | 529,525 | ||
| Saudi Arabia - 1.1% | |||
| ACWA Power Co. | 6,647 | 402,193 | |
| Advanced Petrochemicals Co. | 8,341 | 82,930 | |
| Al Rajhi Bank | 137,250 | 2,454,813 | |
| Alinma Bank | 67,820 | 594,754 | |
| Almarai Co. Ltd. | 18,260 | 272,080 | |
| Arab National Bank | 47,746 | 302,390 | |
| Arabian Internet and Communications Services Co. Ltd. | 1,585 | 132,154 | |
| Bank Al-Jazira (a) | 25,923 | 113,045 | |
| Bank Albilad | 34,442 | 341,519 | |
| Banque Saudi Fransi | 41,615 | 397,670 | |
| Bupa Arabia for Cooperative Insurance Co. | 5,283 | 299,946 | |
| Dallah Healthcare Co. | 2,196 | 86,632 | |
| Dar Al Arkan Real Estate Development Co. (a) | 37,531 | 151,060 | |
| Dr Sulaiman Al Habib Medical Services Group Co. | 6,089 | 409,006 | |
| Elm Co. | 1,683 | 314,564 | |
| Etihad Etisalat Co. | 27,215 | 334,420 | |
| Jarir Marketing Co. | 44,691 | 172,493 | |
| Luberef | 3,252 | 111,821 | |
| Mobile Telecommunications Co. Saudi Arabia | 30,556 | 112,398 | |
| Mouwasat Medical Services Co. | 6,929 | 184,695 | |
| Nahdi Medical Co. | 2,533 | 95,740 | |
| National Industrialization Co. (a) | 20,242 | 62,696 | |
| Power & Water Utility Co. for Jubail & Yanbu | 5,790 | 83,958 | |
| Rabigh Refining & Petrochemical Co. (a) | 27,968 | 75,146 | |
| Riyad Bank | 102,720 | 726,947 | |
| Sabic Agriculture-Nutrients Co. | 16,003 | 570,744 | |
| Sahara International Petrochemical Co. | 25,808 | 221,854 | |
| Saudi Arabian Mining Co. | 90,757 | 870,896 | |
| Saudi Arabian Oil Co. (b) | 185,639 | 1,647,771 | |
| Saudi Awwal Bank | 70,977 | 632,845 | |
| Saudi Basic Industries Corp. | 63,019 | 1,293,438 | |
| Saudi Electricity Co. | 59,810 | 283,777 | |
| Saudi Industrial Investment Group | 26,624 | 170,037 | |
| Saudi Investment Bank/The | 36,006 | 141,083 | |
| Saudi Kayan Petrochemical Co. (a) | 52,977 | 149,402 | |
| Saudi Research & Marketing Group (a) | 2,353 | 88,435 | |
| Saudi Tadawul Group Holding Co. | 3,200 | 141,764 | |
| Saudi Telecom Co. | 140,375 | 1,436,827 | |
| The Co. for Cooperative Insurance | 5,191 | 167,148 | |
| The Saudi National Bank | 206,121 | 1,843,309 | |
| The Savola Group | 17,291 | 167,766 | |
| Yanbu National Petrochemical Co. | 21,391 | 215,814 | |
TOTAL SAUDI ARABIA | 18,357,980 | ||
| Singapore - 1.0% | |||
| CapitaLand Ascendas REIT | 270,858 | 514,642 | |
| CapitaLand Investment Ltd. | 178,645 | 383,584 | |
| CapitaMall Trust | 383,723 | 493,169 | |
| City Developments Ltd. | 35,400 | 163,400 | |
| DBS Group Holdings Ltd. | 126,526 | 3,039,576 | |
| Genting Singapore Ltd. | 426,100 | 267,700 | |
| Grab Holdings Ltd. (a) | 128,854 | 395,582 | |
| Jardine Cycle & Carriage Ltd. | 7,600 | 156,558 | |
| Keppel (REIT) (e) | 20,700 | 12,020 | |
| Keppel Corp. Ltd. | 103,500 | 469,822 | |
| Mapletree Logistics Trust (REIT) | 243,427 | 261,404 | |
| Mapletree Pan Asia Commercial Trust | 160,700 | 156,185 | |
| Oversea-Chinese Banking Corp. Ltd. | 236,052 | 2,188,465 | |
| Sea Ltd. ADR (a) | 25,603 | 1,067,645 | |
| Seatrium Ltd. (a) | 3,122,414 | 255,723 | |
| Sembcorp Industries Ltd. | 63,500 | 213,037 | |
| Singapore Airlines Ltd. | 105,500 | 471,085 | |
| Singapore Exchange Ltd. | 61,800 | 427,882 | |
| Singapore Technologies Engineering Ltd. | 105,900 | 290,723 | |
| Singapore Telecommunications Ltd. | 580,700 | 1,009,067 | |
| STMicroelectronics NV (France) | 48,032 | 1,830,985 | |
| United Overseas Bank Ltd. | 88,403 | 1,743,723 | |
| UOL Group Ltd. | 33,100 | 142,556 | |
TOTAL SINGAPORE | 15,954,533 | ||
| South Africa - 0.9% | |||
| Absa Group Ltd. | 58,271 | 531,263 | |
| African Rainbow Minerals Ltd. | 6,898 | 56,842 | |
| Anglo American Platinum Ltd. | 4,726 | 157,903 | |
| Anglo American PLC (United Kingdom) | 89,190 | 2,272,526 | |
| Aspen Pharmacare Holdings Ltd. | 27,392 | 248,810 | |
| Bid Corp. Ltd. | 23,030 | 488,576 | |
| Bidvest Group Ltd./The | 20,488 | 290,003 | |
| Capitec Bank Holdings Ltd. | 5,979 | 530,897 | |
| Clicks Group Ltd. | 18,721 | 275,870 | |
| Discovery Ltd. | 38,440 | 265,197 | |
| Exxaro Resources Ltd. | 17,421 | 174,757 | |
| FirstRand Ltd. | 354,305 | 1,167,995 | |
| Gold Fields Ltd. | 61,998 | 817,874 | |
| Growthpoint Properties Ltd. | 271,377 | 141,094 | |
| Harmony Gold Mining Co. Ltd. | 39,443 | 180,841 | |
| Impala Platinum Holdings Ltd. | 59,506 | 247,878 | |
| Kumba Iron Ore Ltd. | 3,985 | 105,587 | |
| MTN Group Ltd. | 119,138 | 581,579 | |
| Naspers Ltd. Class N | 13,716 | 2,141,080 | |
| Nedbank Group Ltd. | 30,663 | 329,984 | |
| Northam Platinum Holdings Ltd. | 25,521 | 154,037 | |
| Old Mutual Ltd. | 331,951 | 211,059 | |
| OUTsurance Group Ltd. | 61,030 | 132,031 | |
| Pepkor Holdings Ltd. (b) | 125,121 | 114,128 | |
| Remgro Ltd. | 40,628 | 314,081 | |
| Sanlam Ltd. | 122,743 | 430,514 | |
| Sasol Ltd. | 39,514 | 499,447 | |
| Shoprite Holdings Ltd. | 35,387 | 453,466 | |
| Sibanye-Stillwater Ltd. | 196,324 | 250,421 | |
| Standard Bank Group Ltd. | 93,810 | 920,559 | |
| Vodacom Group Ltd. | 41,374 | 225,234 | |
| Woolworths Holdings Ltd. | 66,982 | 249,383 | |
TOTAL SOUTH AFRICA | 14,960,916 | ||
| Spain - 1.5% | |||
| Acciona SA | 1,843 | 232,059 | |
| ACS Actividades de Construccion y Servicios SA | 15,372 | 555,779 | |
| Aena SME SA (b) | 5,265 | 761,820 | |
| Amadeus IT Holding SA Class A | 31,532 | 1,795,651 | |
| Banco Bilbao Vizcaya Argentaria SA | 417,869 | 3,287,473 | |
| Banco Santander SA (Spain) (c) | 1,134,051 | 4,158,990 | |
| CaixaBank SA | 289,233 | 1,175,889 | |
| Cellnex Telecom SA (b) | 39,654 | 1,165,673 | |
| Corp. ACCIONA Energias Renovables SA | 4,346 | 117,630 | |
| EDP Renovaveis SA | 22,412 | 360,218 | |
| Enagas SA | 17,807 | 297,603 | |
| Endesa SA | 22,262 | 418,462 | |
| Grifols SA (a) | 21,116 | 236,499 | |
| Iberdrola SA | 426,343 | 4,741,794 | |
| Industria de Diseno Textil SA | 76,216 | 2,624,967 | |
| Naturgy Energy Group SA | 8,713 | 246,153 | |
| Redeia Corp. SA | 29,018 | 451,502 | |
| Repsol SA | 89,871 | 1,314,654 | |
| Telefonica SA | 363,067 | 1,402,397 | |
TOTAL SPAIN | 25,345,213 | ||
| Sweden - 1.7% | |||
| Alfa Laval AB | 20,402 | 659,081 | |
| ASSA ABLOY AB (B Shares) | 70,147 | 1,495,189 | |
| Atlas Copco AB: | |||
| (A Shares) | 191,388 | 2,478,287 | |
| (B Shares) | 105,679 | 1,183,894 | |
| Beijer Ref AB (B Shares) | 26,590 | 251,787 | |
| Boliden AB | 19,276 | 493,451 | |
| Epiroc AB: | |||
| (A Shares) | 44,019 | 725,201 | |
| (B Shares) | 29,114 | 403,490 | |
| EQT AB | 24,928 | 453,117 | |
| Ericsson (B Shares) | 205,269 | 919,550 | |
| Essity AB (B Shares) | 42,728 | 973,418 | |
| Evolution AB (b) | 12,749 | 1,132,882 | |
| Fastighets AB Balder (a) | 45,935 | 194,193 | |
| Getinge AB (B Shares) | 15,864 | 284,807 | |
| H&M Hennes & Mauritz AB (B Shares) | 45,302 | 605,923 | |
| Hexagon AB (B Shares) | 145,778 | 1,188,038 | |
| Holmen AB (B Shares) | 6,656 | 250,857 | |
| Husqvarna AB (B Shares) | 25,641 | 165,619 | |
| Industrivarden AB: | |||
| (A Shares) | 8,615 | 222,428 | |
| (C Shares) | 10,709 | 275,533 | |
| Indutrade AB | 19,738 | 348,610 | |
| Investment AB Latour (B Shares) | 9,583 | 165,477 | |
| Investor AB: | |||
| (A Shares) | 4,514 | 81,970 | |
| (B Shares) | 116,676 | 2,136,500 | |
| L E Lundbergforetagen AB | 5,130 | 208,969 | |
| Lifco AB | 16,441 | 300,174 | |
| Nibe Industrier AB (B Shares) | 106,566 | 612,715 | |
| Saab AB (B Shares) | 5,649 | 289,473 | |
| Sagax AB | 14,540 | 262,470 | |
| Sandvik AB | 74,848 | 1,274,887 | |
| Securitas AB (B Shares) | 35,164 | 281,187 | |
| Skandinaviska Enskilda Banken AB (A Shares) | 111,084 | 1,236,981 | |
| Skanska AB (B Shares) | 23,499 | 352,302 | |
| SKF AB (B Shares) | 23,836 | 384,581 | |
| Svenska Cellulosa AB SCA (B Shares) | 42,575 | 583,371 | |
| Svenska Handelsbanken AB (A Shares) | 101,377 | 864,309 | |
| Swedbank AB (A Shares) | 59,550 | 974,944 | |
| Swedish Orphan Biovitrum AB (a) | 15,932 | 327,419 | |
| Tele2 AB (B Shares) | 38,106 | 270,166 | |
| Telia Co. AB | 174,458 | 369,842 | |
| Volvo AB: | |||
| (A Shares) | 16,481 | 329,843 | |
| (B Shares) | 103,372 | 2,045,687 | |
| Volvo Car AB (a) | 41,960 | 144,008 | |
TOTAL SWEDEN | 28,202,630 | ||
| Switzerland - 3.7% | |||
| ABB Ltd. (Reg.) | 112,102 | 3,766,371 | |
| Adecco SA (Reg.) | 11,044 | 415,706 | |
| Alcon, Inc. (Switzerland) | 35,029 | 2,496,103 | |
| Avolta AG (a) | 6,990 | 243,668 | |
| Bachem Holding AG (B Shares) | 2,430 | 175,241 | |
| Baloise Holdings AG | 3,269 | 467,898 | |
| Banque Cantonale Vaudoise | 2,163 | 243,966 | |
| Barry Callebaut AG | 246 | 371,846 | |
| BKW AG | 1,498 | 251,300 | |
| Clariant AG (Reg.) | 14,453 | 204,485 | |
| Compagnie Financiere Richemont SA Series A | 36,594 | 4,317,196 | |
| DSM-Firmenich AG | 12,979 | 1,175,414 | |
| Ems-Chemie Holding AG | 491 | 334,656 | |
| Geberit AG (Reg.) | 2,319 | 1,075,308 | |
| Givaudan SA | 648 | 2,151,333 | |
| Helvetia Holding AG (Reg.) | 2,559 | 342,644 | |
| Julius Baer Group Ltd. | 14,274 | 845,902 | |
| Kuehne & Nagel International AG | 3,843 | 1,032,940 | |
| Lindt & Spruengli AG | 7 | 761,831 | |
| Lindt & Spruengli AG (participation certificate) | 71 | 784,423 | |
| Logitech International SA (Reg.) | 11,534 | 902,280 | |
| Lonza Group AG | 5,213 | 1,825,613 | |
| Novartis AG | 143,671 | 13,450,417 | |
| Partners Group Holding AG | 1,591 | 1,673,467 | |
| Sandoz Group AG | 28,734 | 747,056 | |
| Schindler Holding AG: | |||
| (participation certificate) | 2,878 | 579,618 | |
| (Reg.) | 1,568 | 304,240 | |
| SGS SA (Reg.) | 10,555 | 858,417 | |
| Sig Group AG | 21,561 | 473,813 | |
| Sika AG | 10,274 | 2,449,767 | |
| Sonova Holding AG | 3,654 | 861,631 | |
| Straumann Holding AG | 7,846 | 922,475 | |
| Swatch Group AG (Bearer) | 2,084 | 531,968 | |
| Swatch Group AG (Bearer) (Reg.) | 3,441 | 166,064 | |
| Swiss Life Holding AG | 2,077 | 1,328,421 | |
| Swiss Prime Site AG | 5,424 | 503,255 | |
| Swisscom AG | 1,820 | 1,088,419 | |
| Temenos Group AG | 4,498 | 322,102 | |
| UBS Group AG | 230,446 | 5,375,764 | |
| VAT Group AG (b) | 1,877 | 661,742 | |
| Zurich Insurance Group Ltd. | 10,537 | 4,987,888 | |
TOTAL SWITZERLAND | 61,472,648 | ||
| Taiwan - 4.0% | |||
| Accton Technology Corp. | 35,000 | 541,882 | |
| Acer, Inc. | 206,000 | 217,551 | |
| Advantech Co. Ltd. | 31,674 | 325,033 | |
| ASE Technology Holding Co. Ltd. | 215,500 | 753,880 | |
| Asia Cement Corp. | 155,000 | 191,258 | |
| ASUSTeK Computer, Inc. | 49,000 | 513,376 | |
| AUO Corp. | 450,600 | 217,943 | |
| Catcher Technology Co. Ltd. | 42,000 | 235,434 | |
| Cathay Financial Holding Co. Ltd. | 670,872 | 909,706 | |
| Chailease Holding Co. Ltd. | 108,075 | 585,807 | |
| Chang Hwa Commercial Bank | 372,130 | 196,995 | |
| Cheng Shin Rubber Industry Co. Ltd. | 139,000 | 189,803 | |
| China Airlines Ltd. | 186,000 | 111,413 | |
| China Development Financial Ho (a) | 1,100,313 | 384,328 | |
| China Steel Corp. | 811,000 | 604,584 | |
| Chunghwa Telecom Co. Ltd. | 266,000 | 950,628 | |
| Compal Electronics, Inc. | 296,000 | 257,273 | |
| CTBC Financial Holding Co. Ltd. | 1,213,000 | 912,811 | |
| Delta Electronics, Inc. | 137,000 | 1,233,678 | |
| E Ink Holdings, Inc. | 60,000 | 311,947 | |
| E.SUN Financial Holdings Co. Ltd. | 990,872 | 729,551 | |
| ECLAT Textile Co. Ltd. | 14,000 | 222,656 | |
| eMemory Technology, Inc. | 5,000 | 313,016 | |
| EVA Airways Corp. | 167,000 | 141,509 | |
| Evergreen Marine Corp. (Taiwan) | 73,343 | 243,881 | |
| Far Eastern New Century Corp. | 200,000 | 182,082 | |
| Far EasTone Telecommunications Co. Ltd. | 106,000 | 248,106 | |
| Feng Tay Enterprise Co. Ltd. | 35,584 | 196,337 | |
| First Financial Holding Co. Ltd. | 742,519 | 593,666 | |
| Formosa Chemicals & Fibre Corp. | 256,000 | 481,287 | |
| Formosa Petrochemical Corp. | 81,000 | 197,734 | |
| Formosa Plastics Corp. | 267,000 | 634,483 | |
| Fubon Financial Holding Co. Ltd. | 548,317 | 1,018,862 | |
| Giant Manufacturing Co. Ltd. | 22,688 | 114,635 | |
| Gigabyte Technology Co. Ltd. | 36,000 | 244,394 | |
| Global Unichip Corp. | 6,000 | 267,952 | |
| GlobalWafers Co. Ltd. | 16,000 | 235,017 | |
| Hon Hai Precision Industry Co. Ltd. (Foxconn) | 874,800 | 2,609,017 | |
| Hotai Motor Co. Ltd. | 21,400 | 398,998 | |
| Hua Nan Financial Holdings Co. Ltd. | 626,281 | 392,453 | |
| Innolux Corp. | 589,541 | 222,066 | |
| Inventec Corp. | 184,000 | 230,331 | |
| Largan Precision Co. Ltd. | 7,000 | 447,983 | |
| Lite-On Technology Corp. | 142,000 | 441,778 | |
| MediaTek, Inc. | 107,000 | 2,790,481 | |
| Mega Financial Holding Co. Ltd. | 791,321 | 897,248 | |
| Micro-Star International Co. Ltd. | 48,000 | 245,539 | |
| momo.com, Inc. | 5,060 | 83,357 | |
| Nan Ya Plastics Corp. | 331,000 | 632,822 | |
| Nan Ya Printed Circuit Board Corp. | 16,000 | 117,351 | |
| Nanya Technology Corp. | 89,000 | 178,288 | |
| Nien Made Enterprise Co. Ltd. | 11,000 | 97,246 | |
| Novatek Microelectronics Corp. | 41,000 | 576,961 | |
| Pegatron Corp. | 141,000 | 328,787 | |
| PharmaEssentia Corp. (a) | 17,000 | 169,046 | |
| Pou Chen Corp. | 143,000 | 127,367 | |
| Powerchip Semiconductor Manufacturing Corp. | 222,725 | 183,077 | |
| President Chain Store Corp. | 39,000 | 309,981 | |
| Quanta Computer, Inc. | 190,000 | 1,120,954 | |
| Realtek Semiconductor Corp. | 35,000 | 435,865 | |
| Ruentex Development Co. Ltd. | 100,575 | 100,787 | |
| Shin Kong Financial Holding Co. Ltd. (a) | 928,393 | 249,219 | |
| Sinopac Financial Holdings Co. | 743,686 | 409,839 | |
| Synnex Technology International Corp. | 86,000 | 182,378 | |
| Taishin Financial Holdings Co. Ltd. | 793,482 | 422,891 | |
| Taiwan Business Bank | 408,576 | 160,963 | |
| Taiwan Cement Corp. | 456,667 | 454,680 | |
| Taiwan Cooperative Financial Holding Co. Ltd. | 734,494 | 569,945 | |
| Taiwan High Speed Rail Corp. | 145,000 | 131,550 | |
| Taiwan Mobile Co. Ltd. | 126,000 | 372,077 | |
| Taiwan Semiconductor Manufacturing Co. Ltd. | 1,727,000 | 28,184,517 | |
| The Shanghai Commercial & Savings Bank Ltd. | 266,312 | 352,589 | |
| Uni-President Enterprises Corp. | 332,000 | 695,982 | |
| Unimicron Technology Corp. | 97,000 | 432,279 | |
| United Microelectronics Corp. | 792,000 | 1,138,109 | |
| Vanguard International Semiconductor Corp. | 58,000 | 125,863 | |
| Voltronic Power Technology Corp. | 5,000 | 200,365 | |
| Walsin Lihwa Corp. | 191,162 | 203,294 | |
| Wan Hai Lines Ltd. | 44,145 | 63,046 | |
| Winbond Electronics Corp. | 201,000 | 155,639 | |
| Winbond Electronics Corp. rights 11/3/23 (a) | 8,080 | 734 | |
| Wistron Corp. | 182,000 | 507,116 | |
| Wiwynn Corp. | 6,629 | 313,861 | |
| WPG Holding Co. Ltd. | 107,400 | 237,475 | |
| Yageo Corp. | 25,213 | 410,745 | |
| Yang Ming Marine Transport Corp. | 128,000 | 166,704 | |
| Yuanta Financial Holding Co. Ltd. | 741,367 | 556,573 | |
| Zhen Ding Technology Holding Ltd. | 45,000 | 135,950 | |
TOTAL TAIWAN | 65,682,664 | ||
| Thailand - 0.5% | |||
| Advanced Info Service PCL (For. Reg.) | 27,500 | 167,503 | |
| Advanced Information Service PCL NVDR | 55,700 | 339,270 | |
| Airports of Thailand PCL: | |||
| (For. Reg.) (a) | 171,900 | 317,386 | |
| NVDR (a) | 133,400 | 246,302 | |
| Asset World Corp. PCL: | |||
| (For. Reg.) | 326,600 | 31,253 | |
| NVDR | 303,100 | 29,004 | |
| B. Grimm Power PCL: | |||
| (For. Reg.) | 25,000 | 15,294 | |
| NVDR | 21,900 | 13,397 | |
| Bangkok Dusit Medical Services PCL: | |||
| (For. Reg.) | 292,100 | 214,134 | |
| NVDR | 497,800 | 364,930 | |
| Bangkok Expressway and Metro PCL: | |||
| (For. Reg.) | 154,900 | 33,840 | |
| NVDR | 396,800 | 86,686 | |
| Banpu PCL NVDR | 489,600 | 102,920 | |
| Berli Jucker PCL: | |||
| (For. Reg.) | 16,000 | 12,518 | |
| NVDR | 57,200 | 44,751 | |
| BTS Group Holdings PCL: | |||
| (For. Reg.) | 53,600 | 11,148 | |
| NVDR | 467,200 | 96,335 | |
| Bumrungrad Hospital PCL: | |||
| (For. Reg.) | 10,800 | 77,625 | |
| NVDR | 31,400 | 225,688 | |
| Central Pattana PCL: | |||
| (For. Reg.) | 74,500 | 128,886 | |
| NVDR | 67,000 | 115,911 | |
| Central Retail Corp. PCL: | |||
| (For. Reg.) | 96,317 | 97,961 | |
| NVDR | 25,400 | 25,834 | |
| Charoen Pokphand Foods PCL: | |||
| (For. Reg.) | 110,100 | 56,956 | |
| NVDR | 164,900 | 85,304 | |
| CP ALL PCL: | |||
| (For. Reg.) | 143,900 | 219,932 | |
| NVDR | 271,500 | 414,951 | |
| CP Axtra PCL NVDR | 149,300 | 116,737 | |
| Delta Electronics PCL: | |||
| (For. Reg.) | 16,000 | 34,974 | |
| NVDR | 200,100 | 437,435 | |
| Electricity Generating PCL: | |||
| (For. Reg.) | 6,900 | 23,293 | |
| NVDR | 10,500 | 35,446 | |
| Energy Absolute PCL: | |||
| (For. Reg.) | 54,700 | 63,583 | |
| NVDR | 62,700 | 72,882 | |
| Global Power Synergy Public Co. Ltd.: | |||
| (For. Reg.) | 24,100 | 26,018 | |
| NVDR | 19,400 | 20,944 | |
| Gulf Energy Development PCL: | |||
| (For. Reg.) | 68,700 | 82,225 | |
| NVDR | 150,200 | 179,771 | |
| Home Product Center PCL: | |||
| (For. Reg.) | 187,500 | 61,734 | |
| NVDR | 194,800 | 64,138 | |
| Indorama Ventures PCL: | |||
| (For. Reg.) | 15,800 | 10,353 | |
| NVDR | 95,400 | 62,510 | |
| Intouch Holdings PCL: | |||
| (For. Reg.) | 16,900 | 33,197 | |
| NVDR | 50,600 | 99,396 | |
| Kasikornbank PCL NVDR | 45,400 | 165,120 | |
| Krung Thai Bank PCL: | |||
| (For. Reg.) | 95,600 | 49,709 | |
| NVDR | 132,300 | 68,792 | |
| Krungthai Card PCL: | |||
| (For. Reg.) | 27,500 | 33,292 | |
| NVDR | 38,700 | 46,850 | |
| Land & House PCL: | |||
| (For. Reg.) | 249,000 | 52,017 | |
| NVDR | 268,500 | 56,091 | |
| Minor International PCL: | |||
| (For. Reg.) | 98,681 | 76,475 | |
| NVDR | 132,641 | 102,793 | |
| Muangthai Leasing PCL: | |||
| (For. Reg.) | 19,800 | 19,997 | |
| NVDR | 24,500 | 24,744 | |
| Osotspa PCL: | |||
| (For. Reg.) | 17,500 | 11,380 | |
| NVDR | 66,800 | 43,441 | |
| PTT Exploration and Production PCL: | |||
| (For. Reg.) | 33,000 | 149,871 | |
| NVDR | 66,500 | 302,014 | |
| PTT Global Chemical PCL NVDR | 154,100 | 147,183 | |
| PTT Oil & Retail Business PCL NVDR | 236,900 | 119,969 | |
| PTT PCL: | |||
| (For. Reg.) | 314,700 | 289,673 | |
| NVDR | 385,400 | 354,750 | |
| Ratch Group PCL: | |||
| (For. Reg.) | 15,300 | 13,651 | |
| NVDR unit | 61,700 | 55,050 | |
| SCB X PCL: | |||
| (For. Reg.) | 15,800 | 43,080 | |
| NVDR | 43,600 | 118,879 | |
| SCG Packaging PCL NVDR | 90,400 | 90,078 | |
| Siam Cement PCL: | |||
| (For. Reg.) | 25,900 | 206,326 | |
| NVDR | 28,000 | 223,055 | |
| Thai Oil PCL: | |||
| (For. Reg.) | 22,133 | 28,818 | |
| NVDR | 59,766 | 77,819 | |
| TMBThanachart Bank PCL NVDR | 1,892,300 | 87,419 | |
| True Corp. PCL | 319,517 | 53,587 | |
| True Corp. PCL NVDR | 355,186 | 59,570 | |
TOTAL THAILAND | 8,171,848 | ||
| Turkey - 0.2% | |||
| Akbank TAS | 218,694 | 227,503 | |
| Aselsan A/S | 100,120 | 146,154 | |
| Bim Birlesik Magazalar A/S JSC | 32,007 | 307,420 | |
| Eregli Demir ve Celik Fabrikalari T.A.S. (a) | 106,249 | 142,044 | |
| Ford Otomotiv Sanayi A/S | 5,118 | 142,104 | |
| Haci Omer Sabanci Holding A/S | 67,102 | 126,767 | |
| Hektas Ticaret A/S (a) | 70,312 | 54,424 | |
| Koc Holding A/S | 53,158 | 256,787 | |
| Koza Altin Isletmeleri A/S | 59,481 | 46,124 | |
| Pegasus Hava Tasimaciligi A/S (a) | 2,845 | 70,826 | |
| Sasa Polyester Sanayi A/S | 68,374 | 103,240 | |
| Tofas Turk Otomobil Fabrikasi A/S | 8,249 | 70,113 | |
| Turk Hava Yollari AO (a) | 39,244 | 301,128 | |
| Turkcell Iletisim Hizmet A/S | 79,367 | 134,524 | |
| Turkiye Is Bankasi A/S Series C | 234,027 | 173,376 | |
| Turkiye Petrol Rafinerileri A/S | 67,559 | 338,520 | |
| Turkiye Sise ve Cam Fabrikalari A/S | 102,980 | 172,147 | |
| Yapi ve Kredi Bankasi A/S | 248,797 | 151,461 | |
TOTAL TURKEY | 2,964,662 | ||
| United Arab Emirates - 0.4% | |||
| Abu Dhabi Commercial Bank PJSC | 204,721 | 447,566 | |
| Abu Dhabi Islamic Bank (a) | 103,876 | 291,294 | |
| Abu Dhabi National Oil Co. for Distribution PJSC | 226,354 | 207,065 | |
| Aldar Properties PJSC | 272,121 | 385,252 | |
| Americana Restaurants International PLC | 179,800 | 181,122 | |
| Dubai Islamic Bank Pakistan Ltd. | 206,390 | 303,432 | |
| Emaar Properties PJSC | 462,693 | 842,749 | |
| Emirates NBD Bank PJSC | 134,259 | 619,573 | |
| Emirates Telecommunications Corp. | 245,025 | 1,231,462 | |
| First Abu Dhabi Bank PJSC | 306,548 | 1,058,271 | |
| Multiply Group (a) | 277,046 | 256,454 | |
| NMC Health PLC (a)(d) | 2,259 | 0 | |
TOTAL UNITED ARAB EMIRATES | 5,824,240 | ||
| United Kingdom - 6.9% | |||
| 3i Group PLC | 68,016 | 1,603,653 | |
| Abrdn PLC | 141,578 | 269,565 | |
| Admiral Group PLC | 14,922 | 443,086 | |
| AngloGold Ashanti PLC | 29,570 | 546,579 | |
| Ashtead Group PLC | 30,738 | 1,757,438 | |
| Associated British Foods PLC | 24,374 | 600,210 | |
| AstraZeneca PLC (United Kingdom) | 108,639 | 13,602,010 | |
| Auto Trader Group PLC (b) | 65,390 | 494,627 | |
| Aviva PLC | 192,898 | 934,315 | |
| BAE Systems PLC | 214,000 | 2,877,526 | |
| Barclays PLC | 1,090,724 | 1,750,664 | |
| Barratt Developments PLC | 69,868 | 351,488 | |
| Berkeley Group Holdings PLC | 7,453 | 365,611 | |
| BP PLC | 1,215,949 | 7,424,608 | |
| BP PLC sponsored ADR | 1 | 37 | |
| British American Tobacco PLC (United Kingdom) | 148,886 | 4,447,589 | |
| BT Group PLC | 455,521 | 624,255 | |
| Bunzl PLC | 23,795 | 847,982 | |
| Burberry Group PLC | 26,186 | 538,526 | |
| Centrica PLC | 389,928 | 745,504 | |
| CK Hutchison Holdings Ltd. | 186,000 | 941,585 | |
| CNH Industrial NV | 71,884 | 795,973 | |
| Coca-Cola European Partners PLC | 14,357 | 840,028 | |
| Compass Group PLC | 121,345 | 3,059,276 | |
| Croda International PLC | 9,834 | 523,291 | |
| DCC PLC (United Kingdom) | 6,964 | 386,400 | |
| Diageo PLC | 157,081 | 5,940,179 | |
| Entain PLC | 44,958 | 508,410 | |
| Halma PLC | 26,989 | 605,230 | |
| Hargreaves Lansdown PLC | 25,470 | 218,746 | |
| HSBC Holdings PLC (United Kingdom) | 1,384,830 | 9,999,062 | |
| Imperial Brands PLC | 60,731 | 1,293,825 | |
| Informa PLC | 98,547 | 852,347 | |
| InterContinental Hotel Group PLC | 11,791 | 835,540 | |
| Intertek Group PLC | 11,247 | 522,610 | |
| J Sainsbury PLC | 114,395 | 357,754 | |
| JD Sports Fashion PLC | 185,041 | 286,758 | |
| Johnson Matthey PLC | 14,059 | 255,295 | |
| Kingfisher PLC | 135,645 | 346,372 | |
| Land Securities Group PLC | 50,500 | 349,253 | |
| Legal & General Group PLC | 420,630 | 1,080,793 | |
| Lloyds Banking Group PLC | 4,511,261 | 2,195,631 | |
| London Stock Exchange Group PLC | 29,773 | 3,003,950 | |
| M&G PLC | 152,244 | 366,759 | |
| Melrose Industries PLC | 93,121 | 528,569 | |
| National Grid PLC | 257,504 | 3,070,214 | |
| NatWest Group PLC | 404,049 | 879,137 | |
| Next PLC | 8,575 | 717,484 | |
| Ocado Group PLC (a) | 40,659 | 229,947 | |
| Pearson PLC | 44,347 | 513,349 | |
| Pepco Group NV (a) | 10,645 | 43,090 | |
| Persimmon PLC | 22,762 | 281,087 | |
| Phoenix Group Holdings PLC | 52,364 | 288,825 | |
| Reckitt Benckiser Group PLC | 50,184 | 3,357,659 | |
| RELX PLC (London Stock Exchange) | 132,549 | 4,629,634 | |
| Rentokil Initial PLC | 176,568 | 899,171 | |
| Rolls-Royce Holdings PLC (a) | 590,548 | 1,554,456 | |
| Sage Group PLC | 71,574 | 844,370 | |
| Schroders PLC | 53,653 | 240,830 | |
| Segro PLC | 82,056 | 710,911 | |
| Severn Trent PLC | 17,891 | 577,564 | |
| Smith & Nephew PLC | 61,526 | 688,546 | |
| Smiths Group PLC | 24,184 | 474,279 | |
| Spirax-Sarco Engineering PLC | 5,153 | 513,082 | |
| SSE PLC | 76,484 | 1,518,077 | |
| St. James's Place PLC | 38,525 | 299,494 | |
| Standard Chartered PLC (United Kingdom) | 166,370 | 1,273,951 | |
| Taylor Wimpey PLC | 251,254 | 338,368 | |
| Tesco PLC | 503,384 | 1,651,886 | |
| Unilever PLC | 176,000 | 8,335,480 | |
| United Utilities Group PLC | 47,389 | 612,909 | |
| Vodafone Group PLC | 1,613,103 | 1,484,925 | |
| Vodafone Group PLC sponsored ADR | 257 | 2,375 | |
| Whitbread PLC | 13,907 | 562,541 | |
| Wise PLC (a) | 42,074 | 340,380 | |
| WPP PLC | 75,242 | 647,926 | |
TOTAL UNITED KINGDOM | 113,900,856 | ||
| United States of America - 4.4% | |||
| Brookfield Renewable Corp. | 9,894 | 225,099 | |
| BRP, Inc. | 2,546 | 172,083 | |
| CRH PLC | 50,876 | 2,733,824 | |
| CSL Ltd. | 33,833 | 5,000,251 | |
| CyberArk Software Ltd. (a) | 2,917 | 477,338 | |
| Experian PLC | 64,462 | 1,951,707 | |
| Ferrovial SE | 35,658 | 1,073,034 | |
| Ferrovial SE rights (a)(e) | 35,658 | 16,133 | |
| GSK PLC | 287,010 | 5,116,463 | |
| Haleon PLC | 388,071 | 1,555,424 | |
| Holcim AG | 36,586 | 2,255,530 | |
| James Hardie Industries PLC CDI (a) | 30,884 | 770,538 | |
| JBS SA | 50,800 | 201,820 | |
| Legend Biotech Corp. ADR (a) | 4,098 | 270,755 | |
| Monday.com Ltd. (a) | 1,526 | 198,365 | |
| Nestle SA (Reg. S) | 187,052 | 20,171,460 | |
| Parade Technologies Ltd. | 6,000 | 196,570 | |
| QIAGEN NV (Germany) (a) | 15,926 | 591,818 | |
| Roche Holding AG: | |||
| (Bearer) | 2,263 | 614,977 | |
| (participation certificate) | 49,219 | 12,684,211 | |
| Sanofi SA | 79,649 | 7,232,625 | |
| Schneider Electric SA | 38,126 | 5,865,962 | |
| Swiss Re Ltd. | 21,178 | 2,307,660 | |
| Tenaris SA | 33,027 | 518,597 | |
TOTAL UNITED STATES OF AMERICA | 72,202,244 | ||
| Zambia - 0.0% | |||
| First Quantum Minerals Ltd. | 41,394 | 479,684 | |
| TOTAL COMMON STOCKS (Cost $1,647,633,597) | 1,537,720,144 | ||
| Nonconvertible Preferred Stocks - 0.9% | |||
| Shares | Value ($) | ||
| Brazil - 0.4% | |||
| Banco Bradesco SA (PN) | 373,195 | 1,035,553 | |
| Centrais Eletricas Brasileiras SA (Electrobras) (PN-B) | 22,455 | 171,249 | |
| Companhia Energetica de Minas Gerais (CEMIG) (PN) | 100,420 | 233,834 | |
| Gerdau SA | 80,405 | 347,184 | |
| Itau Unibanco Holding SA | 341,750 | 1,817,967 | |
| Itausa-Investimentos Itau SA (PN) | 367,061 | 629,029 | |
| Petroleo Brasileiro SA - Petrobras (PN) (non-vtg.) | 340,100 | 2,343,447 | |
TOTAL BRAZIL | 6,578,263 | ||
| Chile - 0.0% | |||
| Sociedad Quimica y Minera de Chile SA (PN-B) | 9,858 | 476,929 | |
| Colombia - 0.0% | |||
| Bancolombia SA (PN) | 35,920 | 230,391 | |
| Germany - 0.3% | |||
| Bayerische Motoren Werke AG (BMW) (non-vtg.) | 3,941 | 334,223 | |
| Dr. Ing. h.c. F. Porsche AG Series F (b) | 8,007 | 699,296 | |
| Henkel AG & Co. KGaA | 11,847 | 853,404 | |
| Porsche Automobil Holding SE (Germany) | 10,965 | 490,773 | |
| Sartorius AG (non-vtg.) | 1,843 | 460,608 | |
| Volkswagen AG | 14,277 | 1,514,086 | |
TOTAL GERMANY | 4,352,390 | ||
| Korea (South) - 0.2% | |||
| AMOREPACIFIC Corp. | 2,314 | 62,573 | |
| Hyundai Motor Co. Ltd. | 2,240 | 165,172 | |
| Hyundai Motor Co. Ltd. Series 2 | 2,956 | 219,282 | |
| LG Chemical Ltd. | 770 | 160,581 | |
| LG H & H Co. Ltd. | 569 | 59,707 | |
| Samsung Electronics Co. Ltd. | 62,595 | 2,495,384 | |
TOTAL KOREA (SOUTH) | 3,162,699 | ||
| Russia - 0.0% | |||
| Surgutneftegas OJSC (d) | 352,900 | 6,141 | |
| TOTAL NONCONVERTIBLE PREFERRED STOCKS (Cost $17,830,099) | 14,806,813 | ||
| Government Obligations - 0.3% | |||
Principal Amount (f) | Value ($) | ||
| United States of America - 0.3% | |||
U.S. Treasury Bills, yield at date of purchase 5.42% 2/22/24 (g) (Cost $4,818,537) | 4,900,000 | 4,818,252 | |
| Money Market Funds - 5.3% | |||
| Shares | Value ($) | ||
| Fidelity Cash Central Fund 5.40% (h) | 77,414,469 | 77,429,952 | |
| Fidelity Securities Lending Cash Central Fund 5.40% (h)(i) | 10,749,341 | 10,750,416 | |
| TOTAL MONEY MARKET FUNDS (Cost $88,180,368) | 88,180,368 | ||
| TOTAL INVESTMENT IN SECURITIES - 99.8% (Cost $1,758,462,601) | 1,645,525,577 |
NET OTHER ASSETS (LIABILITIES) - 0.2% | 3,006,342 |
| NET ASSETS - 100.0% | 1,648,531,919 |
| Futures Contracts | |||||
Number of contracts | Expiration Date | Notional Amount ($) | Value ($) | Unrealized Appreciation/ (Depreciation) ($) | |
| Purchased | |||||
| Equity Index Contracts | |||||
| ICE MSCI EAFE Index Contracts (United States) | 621 | Dec 2023 | 61,295,805 | (2,987,773) | (2,987,773) |
| ICE MSCI Emerging Markets Index Contracts (United States) | 596 | Dec 2023 | 27,392,160 | (1,431,719) | (1,431,719) |
| TME S&P/TSX 60 Index Contracts (Canada) | 43 | Dec 2023 | 7,038,760 | (364,549) | (364,549) |
| TOTAL FUTURES CONTRACTS | (4,784,041) | ||||
| The notional amount of futures purchased as a percentage of Net Assets is 5.8% | |||||
| (a) | Non-income producing |
| (b) | Security exempt from registration under Rule 144A of the Securities Act of 1933. These securities may be resold in transactions exempt from registration, normally to qualified institutional buyers. At the end of the period, the value of these securities amounted to $36,197,206 or 2.2% of net assets. |
| (c) | Security or a portion of the security is on loan at period end. |
| (d) | Level 3 security |
| (e) | Security or a portion of the security purchased on a delayed delivery or when-issued basis. |
| (f) | Amount is stated in United States dollars unless otherwise noted. |
| (g) | Security or a portion of the security was pledged to cover margin requirements for futures contracts. At period end, the value of securities pledged amounted to $2,995,183. |
| (h) | Affiliated fund that is generally available only to investment companies and other accounts managed by Fidelity Investments. The rate quoted is the annualized seven-day yield of the fund at period end. A complete unaudited listing of the fund's holdings as of its most recent quarter end is available upon request. In addition, each Fidelity Central Fund's financial statements, which are not covered by the Fund's Report of Independent Registered Public Accounting Firm, are available on the SEC's website or upon request. |
| (i) | Investment made with cash collateral received from securities on loan. |
| Affiliate | Value, beginning of period ($) | Purchases ($) | Sales Proceeds ($) | Dividend Income ($) | Realized Gain (loss) ($) | Change in Unrealized appreciation (depreciation) ($) | Value, end of period ($) | % ownership, end of period |
| Fidelity Cash Central Fund 5.40% | 47,496,410 | 302,803,322 | 272,869,780 | 1,843,625 | - | - | 77,429,952 | 0.2% |
| Fidelity Securities Lending Cash Central Fund 5.40% | 11,111,800 | 104,841,355 | 105,202,739 | 113,364 | - | - | 10,750,416 | 0.0% |
| Total | 58,608,210 | 407,644,677 | 378,072,519 | 1,956,989 | - | - | 88,180,368 | |
| Valuation Inputs at Reporting Date: | ||||
| Description | Total ($) | Level 1 ($) | Level 2 ($) | Level 3 ($) |
Investments in Securities: | ||||
| Equities: | ||||
Communication Services | 84,792,728 | 17,168,996 | 67,542,843 | 80,889 |
Consumer Discretionary | 183,119,724 | 53,285,968 | 129,828,928 | 4,828 |
Consumer Staples | 132,097,705 | 30,991,152 | 101,105,161 | 1,392 |
Energy | 95,247,592 | 36,485,574 | 58,429,327 | 332,691 |
Financials | 328,566,522 | 134,536,255 | 193,999,151 | 31,116 |
Health Care | 148,314,059 | 22,159,332 | 126,154,727 | - |
Industrials | 199,168,172 | 66,439,383 | 132,728,789 | - |
Information Technology | 178,793,133 | 17,731,625 | 161,061,508 | - |
Materials | 120,947,515 | 48,607,454 | 72,264,997 | 75,064 |
Real Estate | 31,423,044 | 7,682,593 | 23,740,451 | - |
Utilities | 50,056,763 | 19,356,437 | 30,690,640 | 9,686 |
| Government Obligations | 4,818,252 | - | 4,818,252 | - |
| Money Market Funds | 88,180,368 | 88,180,368 | - | - |
| Total Investments in Securities: | 1,645,525,577 | 542,625,137 | 1,102,364,774 | 535,666 |
Derivative Instruments: Liabilities | ||||
Futures Contracts | (4,784,041) | (4,784,041) | - | - |
| Total Liabilities | (4,784,041) | (4,784,041) | - | - |
| Total Derivative Instruments: | (4,784,041) | (4,784,041) | - | - |
Primary Risk Exposure / Derivative Type | Value | |
| Asset ($) | Liability ($) | |
| Equity Risk | ||
Futures Contracts (a) | 0 | (4,784,041) |
| Total Equity Risk | 0 | (4,784,041) |
| Total Value of Derivatives | 0 | (4,784,041) |
| Statement of Assets and Liabilities | ||||
| October 31, 2023 | ||||
| Assets | ||||
| Investment in securities, at value (including securities loaned of $10,147,138) - See accompanying schedule: | ||||
Unaffiliated issuers (cost $1,670,282,233) | $ | 1,557,345,209 | ||
Fidelity Central Funds (cost $88,180,368) | 88,180,368 | |||
| Total Investment in Securities (cost $1,758,462,601) | $ | 1,645,525,577 | ||
| Cash | 181 | |||
| Foreign currency held at value (cost $8,868,945) | 8,765,453 | |||
| Receivable for fund shares sold | 2,318,908 | |||
| Dividends receivable | 3,212,305 | |||
| Reclaims receivable | 2,587,866 | |||
| Distributions receivable from Fidelity Central Funds | 297,506 | |||
| Receivable for daily variation margin on futures contracts | 11,459 | |||
| Other receivables | 10,897 | |||
Total assets | 1,662,730,152 | |||
| Liabilities | ||||
| Payable for investments purchased on a delayed delivery basis | $ | 28,228 | ||
| Payable for fund shares redeemed | 1,650,661 | |||
| Deferred taxes | 1,639,011 | |||
| Other payables and accrued expenses | 130,159 | |||
| Collateral on securities loaned | 10,750,174 | |||
| Total Liabilities | 14,198,233 | |||
| Net Assets | $ | 1,648,531,919 | ||
| Net Assets consist of: | ||||
| Paid in capital | $ | 1,790,369,358 | ||
| Total accumulated earnings (loss) | (141,837,439) | |||
| Net Assets | $ | 1,648,531,919 | ||
Net Asset Value, offering price and redemption price per share ($1,648,531,919 ÷ 144,834,863 shares) | $ | 11.38 | ||
| Statement of Operations | ||||
Year ended October 31, 2023 | ||||
| Investment Income | ||||
| Dividends | $ | 50,977,786 | ||
| Interest | 221,982 | |||
| Income from Fidelity Central Funds (including $113,364 from security lending) | 1,956,989 | |||
| Income before foreign taxes withheld | $ | 53,156,757 | ||
| Less foreign taxes withheld | (4,924,165) | |||
| Total Income | 48,232,592 | |||
| Expenses | ||||
| Independent trustees' fees and expenses | $ | 5,248 | ||
| Proxy | 125,905 | |||
| Total expenses before reductions | 131,153 | |||
| Expense reductions | (79,490) | |||
| Total expenses after reductions | 51,663 | |||
| Net Investment income (loss) | 48,180,929 | |||
| Realized and Unrealized Gain (Loss) | ||||
| Net realized gain (loss) on: | ||||
| Investment Securities: | ||||
| Unaffiliated issuers (net of foreign taxes of $8,572) | (21,274,829) | |||
| Foreign currency transactions | (49,106) | |||
| Futures contracts | 5,472,516 | |||
| Total net realized gain (loss) | (15,851,419) | |||
| Change in net unrealized appreciation (depreciation) on: | ||||
| Investment Securities: | ||||
| Unaffiliated issuers(net of increase in deferred foreign taxes of $254,323) | 119,997,569 | |||
| Assets and liabilities in foreign currencies | 91,535 | |||
| Futures contracts | (4,081,367) | |||
| Total change in net unrealized appreciation (depreciation) | 116,007,737 | |||
| Net gain (loss) | 100,156,318 | |||
| Net increase (decrease) in net assets resulting from operations | $ | 148,337,247 | ||
| Statement of Changes in Net Assets | ||||
Year ended October 31, 2023 | Year ended October 31, 2022 | |||
| Increase (Decrease) in Net Assets | ||||
| Operations | ||||
| Net investment income (loss) | $ | 48,180,929 | $ | 40,738,493 |
| Net realized gain (loss) | (15,851,419) | (31,829,297) | ||
| Change in net unrealized appreciation (depreciation) | 116,007,737 | (381,130,025) | ||
| Net increase (decrease) in net assets resulting from operations | 148,337,247 | (372,220,829) | ||
| Distributions to shareholders | (35,599,173) | (29,150,134) | ||
| Share transactions | ||||
| Proceeds from sales of shares | 654,140,985 | 735,487,480 | ||
| Reinvestment of distributions | 24,757,989 | 19,695,566 | ||
| Cost of shares redeemed | (418,912,908) | (350,156,302) | ||
Net increase (decrease) in net assets resulting from share transactions | 259,986,066 | 405,026,744 | ||
| Total increase (decrease) in net assets | 372,724,140 | 3,655,781 | ||
| Net Assets | ||||
| Beginning of period | 1,275,807,779 | 1,272,151,998 | ||
| End of period | $ | 1,648,531,919 | $ | 1,275,807,779 |
| Other Information | ||||
| Shares | ||||
| Sold | 54,718,431 | 60,059,205 | ||
| Issued in reinvestment of distributions | 2,220,447 | 1,491,705 | ||
| Redeemed | (35,235,613) | (28,896,363) | ||
| Net increase (decrease) | 21,703,265 | 32,654,547 | ||
| Fidelity Flex® International Index Fund |
| Years ended October 31, | 2023 | 2022 | 2021 | 2020 | 2019 | |||||
Selected Per-Share Data | ||||||||||
| Net asset value, beginning of period | $ | 10.36 | $ | 14.06 | $ | 11.04 | $ | 11.59 | $ | 10.60 |
| Income from Investment Operations | ||||||||||
Net investment income (loss) A,B | .37 | .37 | .35 | .27 | .37 | |||||
| Net realized and unrealized gain (loss) | .94 | (3.76) | 2.87 | (.52) | .81 | |||||
| Total from investment operations | 1.31 | (3.39) | 3.22 | (.25) | 1.18 | |||||
| Distributions from net investment income | (.29) | (.31) | (.20) | (.30) | (.19) | |||||
| Total distributions | (.29) | (.31) | (.20) | (.30) | (.19) | |||||
| Net asset value, end of period | $ | 11.38 | $ | 10.36 | $ | 14.06 | $ | 11.04 | $ | 11.59 |
Total Return C | 12.72% | (24.60)% | 29.31% | (2.24)% | 11.40% | |||||
Ratios to Average Net Assets B,D,E | ||||||||||
| Expenses before reductions | .01% | -% F | -% F | -% F | -% F | |||||
Expenses net of fee waivers, if any F | -% | -% | -% | -% | -% | |||||
Expenses net of all reductions F | -% | -% | -% | -% | -% | |||||
| Net investment income (loss) | 3.09% | 3.10% | 2.56% | 2.46% | 3.35% | |||||
| Supplemental Data | ||||||||||
| Net assets, end of period (000 omitted) | $ | 1,648,532 | $ | 1,275,808 | $ | 1,272,152 | $ | 575,120 | $ | 378,587 |
Portfolio turnover rate G | 3% | 4% | 5% | 4% | 4% |
| Fidelity Central Fund | Investment Manager | Investment Objective | Investment Practices | Expense RatioA |
| Fidelity Money Market Central Funds | Fidelity Management & Research Company LLC (FMR) | Each fund seeks to obtain a high level of current income consistent with the preservation of capital and liquidity. | Short-term Investments | Less than .005% |
| Gross unrealized appreciation | $172,311,876 |
| Gross unrealized depreciation | (304,261,694) |
| Net unrealized appreciation (depreciation) | $(131,949,818) |
| Tax Cost | $1,777,110,846 |
| Undistributed ordinary income | $42,909,176 |
| Capital loss carryforward | $(50,977,877) |
| Net unrealized appreciation (depreciation) on securities and other investments | $(132,129,727) |
Short-term | $(13,180,581) |
Long-term | (37,797,296) |
| Total capital loss carryforward | $(50,977,877) |
| October 31, 2023 | October 31, 2022 | |
| Ordinary Income | $35,599,173 | $29,150,134 |
| Equity Risk | Equity risk relates to the fluctuations in the value of financial instruments as a result of changes in market prices (other than those arising from interest rate risk or foreign exchange risk), whether caused by factors specific to an individual investment, its issuer, or all factors affecting all instruments traded in a market or market segment. |
| Purchases ($) | Sales ($) | |
| Fidelity Flex International Index Fund | 287,470,974 | 50,362,332 |
| Amount ($) | |
| Fidelity Flex International Index Fund | 4,460 |
| Security Lending Income From Securities Loaned to NFS | Value of Securities Loaned to NFS at Period End | |
| Fidelity Flex International Index Fund | $ - | $ - |
| Reimbursement | |
| Fidelity Flex International Index Fund | $79,100 |
| The Example is based on an investment of $1,000 invested at the beginning of the period and held for the entire period (May 1, 2023 to October 31, 2023). |
Annualized Expense Ratio- A | Beginning Account Value May 1, 2023 | Ending Account Value October 31, 2023 | Expenses Paid During Period- C May 1, 2023 to October 31, 2023 | |||||||
| Fidelity Flex® International Index Fund | .01% | |||||||||
| Actual | $ 1,000 | $ 931.30 | $ .05 | |||||||
Hypothetical-B | $ 1,000 | $ 1,025.16 | $ .05 | |||||||
| A special meeting of shareholders was held on October 18, 2023. The results of votes taken among shareholders on the proposal before them are reported below. Each vote reported represents one dollar of net asset value held on the record date for the meeting. | ||
| Proposal 1 | ||
| To elect a Board of Trustees. | ||
# of Votes | % of Votes | |
| Abigail P. Johnson | ||
| Affirmative | 378,729,502,260.010 | 97.580 |
| Withheld | 9,407,876,478.960 | 2.420 |
| TOTAL | 388,137,378,738.970 | 100.000 |
| Jennifer Toolin McAuliffe | ||
| Affirmative | 378,454,868,010.950 | 97.510 |
| Withheld | 9,682,510,728.020 | 2.490 |
| TOTAL | 388,137,378,738.970 | 100.000 |
| Christine J. Thompson | ||
| Affirmative | 378,837,121,274.520 | 97.600 |
| Withheld | 9,300,257,464.450 | 2.400 |
| TOTAL | 388,137,378,738.970 | 100.000 |
| Elizabeth S. Acton | ||
| Affirmative | 378,262,110,794.850 | 97.460 |
| Withheld | 9,875,267,944.120 | 2.540 |
| TOTAL | 388,137,378,738.970 | 100.000 |
| Laura M. Bishop | ||
| Affirmative | 380,482,113,171.060 | 98.030 |
| Withheld | 7,655,265,567.910 | 1.970 |
| TOTAL | 388,137,378,738.970 | 100.000 |
| Ann E. Dunwoody | ||
| Affirmative | 380,016,034,008.120 | 97.910 |
| Withheld | 8,121,344,730.850 | 2.090 |
| TOTAL | 388,137,378,738.970 | 100.000 |
| John Engler | ||
| Affirmative | 379,432,488,394.200 | 97.760 |
| Withheld | 8,704,890,344.770 | 2.240 |
| TOTAL | 388,137,378,738.970 | 100.000 |
| Robert F. Gartland | ||
| Affirmative | 378,741,819,600.600 | 97.580 |
| Withheld | 9,395,559,138.370 | 2.420 |
| TOTAL | 388,137,378,738.970 | 100.000 |
| Robert W. Helm | ||
| Affirmative | 380,389,324,755.070 | 98.000 |
| Withheld | 7,748,053,983.900 | 2.000 |
| TOTAL | 388,137,378,738.970 | 100.000 |
| Arthur E. Johnson | ||
| Affirmative | 378,427,694,151.670 | 97.500 |
| Withheld | 9,709,684,587.300 | 2.500 |
| TOTAL | 388,137,378,738.970 | 100.000 |
| Michael E. Kenneally | ||
| Affirmative | 377,842,228,145.180 | 97.350 |
| Withheld | 10,295,150,593.790 | 2.650 |
| TOTAL | 388,137,378,738.970 | 100.000 |
| Mark A. Murray | ||
| Affirmative | 380,158,432,703.370 | 97.940 |
| Withheld | 7,978,946,035.600 | 2.060 |
| TOTAL | 388,137,378,738.970 | 100.000 |
| Carol J. Zierhoffer | ||
| Affirmative | 380,522,113,360.240 | 98.040 |
| Withheld | 7,615,265,378.730 | 1.960 |
| TOTAL | 388,137,378,738.970 | 100.000 |
| Proposal 1 reflects trust wide proposal and voting results. | ||
 |


Contents
| Average Annual Total Returns | |||
Periods ended October 31, 2023 | Past 1 year | Past 5 years | Life of Fund A |
| Fidelity® SAI International Value Index Fund | 20.25% | 3.80% | 1.27% |
| $10,000 Over Life of Fund |
Let's say hypothetically that $10,000 was invested in Fidelity® SAI International Value Index Fund on December 19, 2017, when the fund started. The chart shows how the value of your investment would have changed, and also shows how the Fidelity International Value Focus Index℠ and MSCI ACWI (All Country World Index) ex USA Index performed over the same period. |
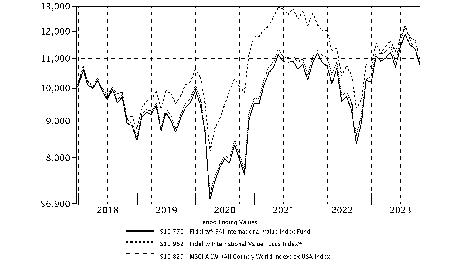 |
Top Holdings (% of Fund's net assets) | ||
| Deutsche Telekom AG (Germany, Diversified Telecommunication Services) | 2.4 | |
| Sanofi SA (United States of America, Pharmaceuticals) | 2.3 | |
| Shell PLC (London) (Netherlands, Oil, Gas & Consumable Fuels) | 2.2 | |
| Mitsubishi Corp. (Japan, Trading Companies & Distributors) | 2.2 | |
| British American Tobacco PLC (United Kingdom) (United Kingdom, Tobacco) | 2.2 | |
| BNP Paribas SA (France, Banks) | 2.1 | |
| TotalEnergies SE (France, Oil, Gas & Consumable Fuels) | 2.0 | |
| Glencore PLC (Australia, Metals & Mining) | 2.0 | |
| Banco Santander SA (Spain) (Spain, Banks) | 2.0 | |
| Mitsui & Co. Ltd. (Japan, Trading Companies & Distributors) | 1.9 | |
| 21.3 | ||
| Market Sectors (% of Fund's net assets) | ||
| Financials | 20.6 | |
| Industrials | 15.4 | |
| Consumer Discretionary | 13.3 | |
| Health Care | 10.1 | |
| Materials | 9.6 | |
| Consumer Staples | 7.8 | |
| Energy | 6.9 | |
| Information Technology | 5.4 | |
| Communication Services | 4.7 | |
| Utilities | 3.1 | |
| Real Estate | 2.0 | |
Asset Allocation (% of Fund's net assets) |
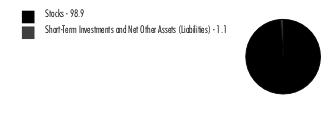 |
Futures - 1% |
Geographic Diversification (% of Fund's net assets) |
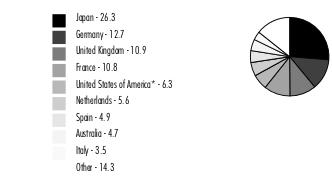 |
* Includes Short-Term investments and Net Other Assets (Liabilities). Percentages are adjusted for the effect of derivatives, if applicable. |
| Common Stocks - 98.9% | |||
| Shares | Value ($) | ||
| Australia - 4.7% | |||
| Allkem Ltd. (a) | 746,510 | 4,561,696 | |
| ANZ Group Holdings Ltd. | 1,413,877 | 22,295,396 | |
| Bank of Queensland Ltd. | 818,692 | 2,660,461 | |
| BlueScope Steel Ltd. | 567,412 | 6,801,829 | |
| Glencore PLC | 13,989,627 | 74,100,689 | |
| Incitec Pivot Ltd. | 2,419,230 | 4,223,213 | |
| Pilbara Minerals Ltd. (b) | 3,510,016 | 8,245,020 | |
| Qantas Airways Ltd. (a) | 1,050,012 | 3,289,589 | |
| Rio Tinto Ltd. | 462,316 | 34,534,125 | |
| Sonic Healthcare Ltd. | 587,052 | 10,749,549 | |
| Whitehaven Coal Ltd. | 1,042,033 | 4,908,274 | |
TOTAL AUSTRALIA | 176,369,841 | ||
| Austria - 0.9% | |||
| Andritz AG | 89,352 | 4,103,181 | |
| Erste Group Bank AG | 444,240 | 15,864,199 | |
| OMV AG | 175,230 | 7,668,593 | |
| Voestalpine AG | 131,244 | 3,271,760 | |
| Wienerberger AG | 130,799 | 3,174,860 | |
TOTAL AUSTRIA | 34,082,593 | ||
| Belgium - 2.0% | |||
| Aedifica SA | 59,242 | 3,225,090 | |
| Ageas | 213,043 | 8,173,758 | |
| Anheuser-Busch InBev SA NV | 935,192 | 53,210,590 | |
| Solvay SA Class A | 90,984 | 9,601,987 | |
TOTAL BELGIUM | 74,211,425 | ||
| Brazil - 0.2% | |||
| Yara International ASA | 203,070 | 6,635,116 | |
| China - 0.8% | |||
| BOC Hong Kong (Holdings) Ltd. | 4,475,500 | 11,835,640 | |
| ENN Energy Holdings Ltd. | 943,800 | 7,149,424 | |
| Wilmar International Ltd. | 3,748,900 | 9,746,337 | |
TOTAL CHINA | 28,731,401 | ||
| Denmark - 0.5% | |||
| A.P. Moller - Maersk A/S Series B | 9,073 | 15,117,713 | |
| ISS A/S | 191,897 | 2,774,906 | |
TOTAL DENMARK | 17,892,619 | ||
| Finland - 0.8% | |||
| Nokia Corp. | 6,593,311 | 21,960,226 | |
| Stora Enso Oyj (R Shares) | 762,636 | 9,138,654 | |
TOTAL FINLAND | 31,098,880 | ||
| France - 10.8% | |||
| Alstom SA | 347,026 | 4,699,587 | |
| Arkema SA | 78,458 | 7,336,990 | |
| BNP Paribas SA | 1,352,726 | 77,787,190 | |
| Bouygues SA | 242,259 | 8,512,860 | |
| Carrefour SA | 672,508 | 11,790,048 | |
| Compagnie de St.-Gobain | 639,925 | 34,833,770 | |
| Compagnie Generale des Etablissements Michelin SCA Series B | 889,056 | 26,412,481 | |
| Credit Agricole SA | 1,394,411 | 16,837,359 | |
| Dassault Aviation SA | 27,166 | 5,389,565 | |
| Eiffage SA | 93,993 | 8,523,207 | |
| Elis SA | 254,782 | 4,170,477 | |
| Engie SA | 2,183,786 | 34,732,872 | |
| Eurazeo SA | 61,194 | 3,441,429 | |
| Forvia (a) | 206,097 | 3,454,248 | |
| Ipsen SA | 48,021 | 5,665,429 | |
| Orange SA | 2,284,989 | 26,876,151 | |
| Renault SA | 235,724 | 8,243,317 | |
| Rexel SA | 287,180 | 5,844,846 | |
| Societe Generale Series A | 879,043 | 19,753,651 | |
| Sopra Steria Group | 18,150 | 3,251,324 | |
| Teleperformance | 74,130 | 8,482,956 | |
| TotalEnergies SE | 1,120,397 | 74,906,922 | |
| Valeo SA | 257,812 | 3,393,519 | |
TOTAL FRANCE | 404,340,198 | ||
| Germany - 12.7% | |||
| Aurubis AG | 39,200 | 3,221,144 | |
| Bayer AG | 1,223,468 | 52,864,295 | |
| Bayerische Motoren Werke AG (BMW) | 428,708 | 39,750,364 | |
| Commerzbank AG | 1,310,136 | 14,070,487 | |
| Continental AG | 134,511 | 8,782,087 | |
| Daimler Truck Holding AG | 645,664 | 20,235,705 | |
| Deutsche Bank AG | 2,540,925 | 27,842,652 | |
| Deutsche Lufthansa AG (a) | 742,682 | 5,189,633 | |
| Deutsche Telekom AG | 4,150,824 | 90,088,092 | |
| DHL Group | 1,172,766 | 45,615,620 | |
| E.ON SE | 2,796,038 | 33,194,233 | |
| Evonik Industries AG | 255,400 | 4,691,345 | |
| Fresenius Medical Care AG & Co. KGaA | 248,472 | 8,255,772 | |
| Fresenius SE & Co. KGaA | 512,033 | 13,132,798 | |
| HeidelbergCement AG | 170,739 | 12,371,524 | |
| K+S AG | 238,407 | 4,003,342 | |
| Mercedes-Benz Group AG (Germany) | 999,243 | 58,789,732 | |
| Merck KGaA | 160,950 | 24,242,375 | |
| Siemens Energy AG (a)(b) | 637,080 | 5,642,170 | |
| Thyssenkrupp AG | 612,533 | 4,250,379 | |
| TUI AG (a)(b) | 562,540 | 2,826,122 | |
TOTAL GERMANY | 479,059,871 | ||
| Hong Kong - 2.0% | |||
| CK Asset Holdings Ltd. | 2,371,000 | 11,851,028 | |
| Hang Lung Properties Ltd. | 2,188,000 | 2,876,033 | |
| Henderson Land Development Co. Ltd. | 1,627,930 | 4,259,415 | |
| Hongkong Land Holdings Ltd. | 1,295,600 | 4,109,283 | |
| Jardine Matheson Holdings Ltd. | 255,833 | 10,366,645 | |
| Link (REIT) | 3,190,400 | 14,641,201 | |
| Sino Land Ltd. | 4,171,500 | 4,164,527 | |
| Sun Hung Kai Properties Ltd. | 1,876,500 | 19,269,225 | |
| Swire Pacific Ltd. (A Shares) | 687,400 | 4,391,003 | |
TOTAL HONG KONG | 75,928,360 | ||
| Ireland - 0.3% | |||
| Ryanair Holdings PLC sponsored ADR (a) | 123,162 | 10,801,307 | |
| Israel - 0.4% | |||
| Bank Leumi le-Israel BM | 1,909,109 | 12,275,543 | |
| Icl Group Ltd. | 899,185 | 4,360,224 | |
TOTAL ISRAEL | 16,635,767 | ||
| Italy - 3.5% | |||
| A2A SpA | 1,949,345 | 3,652,868 | |
| Banco BPM SpA | 1,886,762 | 9,628,555 | |
| BPER Banca | 1,322,249 | 4,293,751 | |
| Buzzi SpA | 117,453 | 3,106,925 | |
| Eni SpA | 2,985,149 | 48,800,206 | |
| Leonardo SpA | 503,831 | 7,588,729 | |
| UniCredit SpA | 2,247,802 | 56,351,532 | |
TOTAL ITALY | 133,422,566 | ||
| Japan - 26.3% | |||
| Aisin Seiki Co. Ltd. | 227,500 | 7,924,935 | |
| Bridgestone Corp. | 728,900 | 27,585,372 | |
| Brother Industries Ltd. | 321,000 | 5,007,681 | |
| Canon, Inc. | 1,262,400 | 29,844,016 | |
| Chubu Electric Power Co., Inc. | 944,000 | 11,407,444 | |
| Credit Saison Co. Ltd. | 194,000 | 2,908,023 | |
| Electric Power Development Co. Ltd. | 216,600 | 3,320,626 | |
| Honda Motor Co. Ltd. | 6,226,200 | 63,810,910 | |
| INPEX Corp. | 1,277,900 | 18,543,448 | |
| Isuzu Motors Ltd. | 774,600 | 8,637,295 | |
| Itochu Corp. | 1,172,000 | 42,216,649 | |
| Japan Post Holdings Co. Ltd. | 2,500,100 | 22,128,893 | |
| Japan Tobacco, Inc. | 1,369,900 | 31,889,728 | |
| JFE Holdings, Inc. (b) | 726,900 | 10,127,803 | |
| JGC Holdings Corp. | 300,600 | 3,702,484 | |
| Kawasaki Kisen Kaisha Ltd. (b) | 312,200 | 10,705,334 | |
| Kobe Steel Ltd. | 493,600 | 5,836,059 | |
| Kyocera Corp. | 432,600 | 21,323,464 | |
| Marubeni Corp. | 2,115,300 | 30,929,444 | |
| Mazda Motor Corp. | 747,500 | 7,225,327 | |
| Medipal Holdings Corp. | 261,100 | 4,389,871 | |
| Mitsubishi Corp. | 1,790,200 | 83,451,176 | |
| Mitsubishi Motors Corp. of Japan | 853,800 | 2,788,997 | |
| Mitsui & Co. Ltd. | 1,923,900 | 69,922,561 | |
| Mitsui OSK Lines Ltd. | 450,900 | 11,641,028 | |
| Mizuho Financial Group, Inc. | 3,063,400 | 52,011,595 | |
| NEC Corp. | 339,800 | 16,361,585 | |
| Nippon Express Holdings, Inc. | 103,800 | 5,334,844 | |
| Nippon Steel & Sumitomo Metal Corp. | 1,183,500 | 25,526,748 | |
| Nippon Yusen KK | 635,300 | 15,544,045 | |
| Nissan Motor Co. Ltd. | 2,943,520 | 11,326,618 | |
| Niterra Co. Ltd. | 213,600 | 4,780,967 | |
| Ono Pharmaceutical Co. Ltd. | 605,700 | 10,460,132 | |
| Otsuka Holdings Co. Ltd. | 694,700 | 23,373,851 | |
| Panasonic Holdings Corp. | 3,056,500 | 26,816,178 | |
| Renesas Electronics Corp. (a) | 1,780,400 | 23,386,658 | |
| Ricoh Co. Ltd. | 759,100 | 6,152,588 | |
| Seiko Epson Corp. | 407,600 | 5,658,785 | |
| Sekisui House Ltd. | 825,600 | 16,167,519 | |
| Shionogi & Co. Ltd. | 348,400 | 16,223,118 | |
| Sojitz Corp. | 272,200 | 5,652,340 | |
| Stanley Electric Co. Ltd. | 183,400 | 2,933,408 | |
| Subaru Corp. | 766,300 | 13,264,882 | |
| Sumco Corp. | 436,100 | 5,635,351 | |
| Sumitomo Corp. | 1,523,100 | 29,940,604 | |
| Sumitomo Electric Industries Ltd. | 988,800 | 10,380,652 | |
| Sumitomo Forestry Co. Ltd. | 243,600 | 5,751,751 | |
| Suzuki Motor Corp. | 611,700 | 23,741,308 | |
| Takeda Pharmaceutical Co. Ltd. | 1,970,500 | 53,488,726 | |
| TDK Corp. | 420,500 | 15,733,099 | |
| Tokyo Gas Co. Ltd. | 503,700 | 11,311,672 | |
| Yamaha Motor Co. Ltd. | 436,100 | 10,656,911 | |
| Yokohama Rubber Co. Ltd. | 166,800 | 3,082,396 | |
TOTAL JAPAN | 987,966,899 | ||
| Luxembourg - 0.3% | |||
| ArcelorMittal SA (Netherlands) | 573,580 | 12,672,176 | |
| Netherlands - 5.6% | |||
| ABN AMRO Bank NV GDR (Bearer) (c) | 515,065 | 6,913,202 | |
| EXOR NV | 129,078 | 11,054,577 | |
| Heineken Holding NV | 125,568 | 9,539,599 | |
| Koninklijke Ahold Delhaize NV | 1,215,046 | 35,997,925 | |
| Randstad NV | 153,471 | 7,931,014 | |
| Shell PLC (London) | 2,622,662 | 84,520,143 | |
| Signify NV (c) | 159,847 | 4,137,020 | |
| Stellantis NV (Italy) | 2,755,122 | 51,307,425 | |
TOTAL NETHERLANDS | 211,400,905 | ||
| Norway - 0.3% | |||
| Norsk Hydro ASA | 1,677,974 | 9,568,994 | |
| Singapore - 3.4% | |||
| City Developments Ltd. | 634,500 | 2,928,733 | |
| Oversea-Chinese Banking Corp. Ltd. | 4,836,186 | 44,836,842 | |
| Singapore Airlines Ltd. | 1,666,100 | 7,439,571 | |
| STMicroelectronics NV (Italy) | 817,042 | 31,145,920 | |
| United Overseas Bank Ltd. | 1,910,500 | 37,684,041 | |
| Venture Corp. Ltd. | 338,148 | 2,887,218 | |
TOTAL SINGAPORE | 126,922,325 | ||
| South Africa - 1.1% | |||
| Anglo American PLC (United Kingdom) | 1,665,654 | 42,440,216 | |
| Spain - 4.9% | |||
| ACS Actividades de Construccion y Servicios SA | 249,425 | 9,018,030 | |
| Banco Bilbao Vizcaya Argentaria SA | 5,267,116 | 41,437,637 | |
| Banco de Sabadell SA | 7,007,155 | 8,682,111 | |
| Banco Santander SA (Spain) | 20,155,048 | 73,916,111 | |
| Repsol SA | 1,590,774 | 23,270,212 | |
| Telefonica SA | 7,161,223 | 27,661,220 | |
TOTAL SPAIN | 183,985,321 | ||
| Sweden - 0.8% | |||
| Ericsson (B Shares) | 3,838,890 | 17,197,191 | |
| Fastighets AB Balder (a) | 825,616 | 3,490,347 | |
| Securitas AB (B Shares) | 626,234 | 5,007,650 | |
| SSAB AB (B Shares) | 1,072,410 | 6,217,844 | |
TOTAL SWEDEN | 31,913,032 | ||
| Switzerland - 0.5% | |||
| Avolta AG (a) | 135,003 | 4,706,145 | |
| Swatch Group AG (Bearer) | 49,075 | 12,527,032 | |
TOTAL SWITZERLAND | 17,233,177 | ||
| United Kingdom - 10.9% | |||
| 3i Group PLC | 1,211,741 | 28,569,932 | |
| Barclays PLC | 18,279,493 | 29,339,458 | |
| Barratt Developments PLC | 1,212,894 | 6,101,764 | |
| British American Tobacco PLC (United Kingdom) | 2,783,993 | 83,164,684 | |
| BT Group PLC | 7,079,782 | 9,702,274 | |
| Centrica PLC | 6,990,631 | 13,365,407 | |
| CK Hutchison Holdings Ltd. | 3,338,500 | 16,900,443 | |
| DCC PLC (United Kingdom) | 125,877 | 6,984,322 | |
| IG Group Holdings PLC | 500,948 | 3,884,637 | |
| Imperial Brands PLC | 1,140,169 | 24,290,378 | |
| International Consolidated Airlines Group SA CDI (a) | 3,054,461 | 5,351,633 | |
| Investec PLC | 807,011 | 4,473,801 | |
| J Sainsbury PLC | 2,208,596 | 6,907,059 | |
| Kingfisher PLC | 2,361,073 | 6,029,044 | |
| Legal & General Group PLC | 7,441,301 | 19,120,135 | |
| Lloyds Banking Group PLC | 83,755,529 | 40,763,815 | |
| NatWest Group PLC | 6,947,848 | 15,117,247 | |
| Persimmon PLC | 397,639 | 4,910,433 | |
| Standard Chartered PLC (United Kingdom) | 2,876,052 | 22,022,894 | |
| Taylor Wimpey PLC | 4,427,090 | 5,962,044 | |
| Tesco PLC | 8,882,075 | 29,147,083 | |
| Virgin Money UK PLC | 1,473,099 | 2,666,917 | |
| Vodafone Group PLC | 28,355,878 | 26,102,706 | |
TOTAL UNITED KINGDOM | 410,878,110 | ||
| United States of America - 5.2% | |||
| GSK PLC | 3,305,656 | 58,929,184 | |
| Holcim AG | 606,284 | 37,377,460 | |
| QIAGEN NV (Germany) (a) | 274,943 | 10,217,012 | |
| Sanofi SA | 979,500 | 88,944,693 | |
TOTAL UNITED STATES OF AMERICA | 195,468,349 | ||
| TOTAL COMMON STOCKS (Cost $3,578,696,606) | 3,719,659,448 | ||
| Government Obligations - 0.1% | |||
Principal Amount (d) | Value ($) | ||
| United States of America - 0.1% | |||
U.S. Treasury Bills, yield at date of purchase 5.42% 2/22/24 (e) (Cost $2,851,787) | 2,900,000 | 2,851,619 | |
| Money Market Funds - 0.9% | |||
| Shares | Value ($) | ||
| Fidelity Cash Central Fund 5.40% (f) | 4,867,246 | 4,868,220 | |
| Fidelity Securities Lending Cash Central Fund 5.40% (f)(g) | 27,000,600 | 27,003,300 | |
| TOTAL MONEY MARKET FUNDS (Cost $31,871,520) | 31,871,520 | ||
| TOTAL INVESTMENT IN SECURITIES - 99.9% (Cost $3,613,419,913) | 3,754,382,587 |
NET OTHER ASSETS (LIABILITIES) - 0.1% | 5,046,596 |
| NET ASSETS - 100.0% | 3,759,429,183 |
| Futures Contracts | |||||
Number of contracts | Expiration Date | Notional Amount ($) | Value ($) | Unrealized Appreciation/ (Depreciation) ($) | |
| Purchased | |||||
| Equity Index Contracts | |||||
| ICE MSCI EAFE Index Contracts (United States) | 389 | Dec 2023 | 38,396,245 | (1,617,168) | (1,617,168) |
| The notional amount of futures purchased as a percentage of Net Assets is 1.0% | |||||
| (a) | Non-income producing |
| (b) | Security or a portion of the security is on loan at period end. |
| (c) | Security exempt from registration under Rule 144A of the Securities Act of 1933. These securities may be resold in transactions exempt from registration, normally to qualified institutional buyers. At the end of the period, the value of these securities amounted to $11,050,222 or 0.3% of net assets. |
| (d) | Amount is stated in United States dollars unless otherwise noted. |
| (e) | Security or a portion of the security was pledged to cover margin requirements for futures contracts. At period end, the value of securities pledged amounted to $1,151,464. |
| (f) | Affiliated fund that is generally available only to investment companies and other accounts managed by Fidelity Investments. The rate quoted is the annualized seven-day yield of the fund at period end. A complete unaudited listing of the fund's holdings as of its most recent quarter end is available upon request. In addition, each Fidelity Central Fund's financial statements, which are not covered by the Fund's Report of Independent Registered Public Accounting Firm, are available on the SEC's website or upon request. |
| (g) | Investment made with cash collateral received from securities on loan. |
| Affiliate | Value, beginning of period ($) | Purchases ($) | Sales Proceeds ($) | Dividend Income ($) | Realized Gain (loss) ($) | Change in Unrealized appreciation (depreciation) ($) | Value, end of period ($) | % ownership, end of period |
| Fidelity Cash Central Fund 5.40% | 1,842,526 | 307,027,728 | 304,002,034 | 668,559 | - | - | 4,868,220 | 0.0% |
| Fidelity Securities Lending Cash Central Fund 5.40% | 16,040,672 | 364,787,851 | 353,825,223 | 714,947 | - | - | 27,003,300 | 0.1% |
| Total | 17,883,198 | 671,815,579 | 657,827,257 | 1,383,506 | - | - | 31,871,520 | |
| Valuation Inputs at Reporting Date: | ||||
| Description | Total ($) | Level 1 ($) | Level 2 ($) | Level 3 ($) |
Investments in Securities: | ||||
| Equities: | ||||
Communication Services | 180,430,443 | 9,702,274 | 170,728,169 | - |
Consumer Discretionary | 490,071,183 | 143,182,413 | 346,888,770 | - |
Consumer Staples | 295,683,431 | 52,444,583 | 243,238,848 | - |
Energy | 262,617,798 | 30,938,805 | 231,678,993 | - |
Financials | 770,643,471 | 248,324,759 | 522,318,712 | - |
Health Care | 380,936,805 | 53,257,614 | 327,679,191 | - |
Industrials | 582,992,658 | 181,304,831 | 401,687,827 | - |
Information Technology | 205,545,106 | 3,251,324 | 202,293,782 | - |
Materials | 357,398,122 | 131,431,730 | 225,966,392 | - |
Real Estate | 75,205,885 | 6,715,437 | 68,490,448 | - |
Utilities | 118,134,546 | 50,212,508 | 67,922,038 | - |
| Government Obligations | 2,851,619 | - | 2,851,619 | - |
| Money Market Funds | 31,871,520 | 31,871,520 | - | - |
| Total Investments in Securities: | 3,754,382,587 | 942,637,798 | 2,811,744,789 | - |
Derivative Instruments: Liabilities | ||||
Futures Contracts | (1,617,168) | (1,617,168) | - | - |
| Total Liabilities | (1,617,168) | (1,617,168) | - | - |
| Total Derivative Instruments: | (1,617,168) | (1,617,168) | - | - |
Primary Risk Exposure / Derivative Type | Value | |
| Asset ($) | Liability ($) | |
| Equity Risk | ||
Futures Contracts (a) | 0 | (1,617,168) |
| Total Equity Risk | 0 | (1,617,168) |
| Total Value of Derivatives | 0 | (1,617,168) |
| Statement of Assets and Liabilities | ||||
| October 31, 2023 | ||||
| Assets | ||||
| Investment in securities, at value (including securities loaned of $25,459,710) - See accompanying schedule: | ||||
Unaffiliated issuers (cost $3,581,548,393) | $ | 3,722,511,067 | ||
Fidelity Central Funds (cost $31,871,520) | 31,871,520 | |||
| Total Investment in Securities (cost $3,613,419,913) | $ | 3,754,382,587 | ||
| Foreign currency held at value (cost $846,958) | 844,510 | |||
| Receivable for investments sold | 1,100 | |||
| Receivable for fund shares sold | 395,581 | |||
| Dividends receivable | 17,079,324 | |||
| Reclaims receivable | 14,779,756 | |||
| Distributions receivable from Fidelity Central Funds | 55,335 | |||
| Receivable for daily variation margin on futures contracts | 110,674 | |||
| Prepaid expenses | 5,085 | |||
Total assets | 3,787,653,952 | |||
| Liabilities | ||||
| Payable for fund shares redeemed | $ | 553,163 | ||
| Accrued management fee | 487,134 | |||
| Other payables and accrued expenses | 181,172 | |||
| Collateral on securities loaned | 27,003,300 | |||
| Total Liabilities | 28,224,769 | |||
| Net Assets | $ | 3,759,429,183 | ||
| Net Assets consist of: | ||||
| Paid in capital | $ | 3,983,610,394 | ||
| Total accumulated earnings (loss) | (224,181,211) | |||
| Net Assets | $ | 3,759,429,183 | ||
Net Asset Value, offering price and redemption price per share ($3,759,429,183 ÷ 427,500,735 shares) | $ | 8.79 | ||
| Statement of Operations | ||||
Year ended October 31, 2023 | ||||
| Investment Income | ||||
| Dividends: | ||||
| Unaffiliated issuers | $ | 215,896,732 | ||
| Interest | 269,835 | |||
| Income from Fidelity Central Funds (including $714,947 from security lending) | 1,383,506 | |||
| Income before foreign taxes withheld | $ | 217,550,073 | ||
| Less foreign taxes withheld | (19,047,527) | |||
| Total Income | 198,502,546 | |||
| Expenses | ||||
| Management fee | $ | 6,625,871 | ||
| Custodian fees and expenses | 410,635 | |||
| Independent trustees' fees and expenses | 15,446 | |||
| Registration fees | 33,489 | |||
| Audit | 61,394 | |||
| Legal | 6,436 | |||
| Interest | 392,358 | |||
| Miscellaneous | 26,468 | |||
| Total Expenses | 7,572,097 | |||
| Net Investment income (loss) | 190,930,449 | |||
| Realized and Unrealized Gain (Loss) | ||||
| Net realized gain (loss) on: | ||||
| Investment Securities: | ||||
| Unaffiliated issuers | (22,674,993) | |||
| Foreign currency transactions | 398,962 | |||
| Futures contracts | 7,562,545 | |||
| Total net realized gain (loss) | (14,713,486) | |||
| Change in net unrealized appreciation (depreciation) on: | ||||
| Investment Securities: | ||||
| Unaffiliated issuers | 666,916,655 | |||
| Assets and liabilities in foreign currencies | 1,529,221 | |||
| Futures contracts | (3,373,692) | |||
| Total change in net unrealized appreciation (depreciation) | 665,072,184 | |||
| Net gain (loss) | 650,358,698 | |||
| Net increase (decrease) in net assets resulting from operations | $ | 841,289,147 | ||
| Statement of Changes in Net Assets | ||||
Year ended October 31, 2023 | Year ended October 31, 2022 | |||
| Increase (Decrease) in Net Assets | ||||
| Operations | ||||
| Net investment income (loss) | $ | 190,930,449 | $ | 262,814,201 |
| Net realized gain (loss) | (14,713,486) | (431,951,862) | ||
| Change in net unrealized appreciation (depreciation) | 665,072,184 | (834,887,039) | ||
| Net increase (decrease) in net assets resulting from operations | 841,289,147 | (1,004,024,700) | ||
| Distributions to shareholders | (199,830,507) | (449,845,102) | ||
| Share transactions | ||||
| Proceeds from sales of shares | 28,673,028 | 1,108,617,933 | ||
| Reinvestment of distributions | 196,381,215 | 447,410,521 | ||
| Cost of shares redeemed | (1,255,801,776) | (1,938,490,026) | ||
Net increase (decrease) in net assets resulting from share transactions | (1,030,747,533) | (382,461,572) | ||
| Total increase (decrease) in net assets | (389,288,893) | (1,836,331,374) | ||
| Net Assets | ||||
| Beginning of period | 4,148,718,076 | 5,985,049,450 | ||
| End of period | $ | 3,759,429,183 | $ | 4,148,718,076 |
| Other Information | ||||
| Shares | ||||
| Sold | 3,212,167 | 118,980,904 | ||
| Issued in reinvestment of distributions | 23,546,908 | 49,328,613 | ||
| Redeemed | (141,228,215) | (222,929,982) | ||
| Net increase (decrease) | (114,469,140) | (54,620,465) | ||
| Fidelity® SAI International Value Index Fund |
| Years ended October 31, | 2023 | 2022 | 2021 | 2020 | 2019 | |||||
Selected Per-Share Data | ||||||||||
| Net asset value, beginning of period | $ | 7.65 | $ | 10.03 | $ | 7.16 | $ | 9.19 | $ | 8.93 |
| Income from Investment Operations | ||||||||||
Net investment income (loss) A,B | .39 | .42 | .38 | .24 | .37 | |||||
| Net realized and unrealized gain (loss) | 1.14 | (1.99) | 2.63 | (1.95) | .07 | |||||
| Total from investment operations | 1.53 | (1.57) | 3.01 | (1.71) | .44 | |||||
| Distributions from net investment income | (.39) | (.46) | (.14) | (.32) | (.18) | |||||
| Distributions from net realized gain | - | (.35) | - | - | - C | |||||
| Total distributions | (.39) | (.81) | (.14) | (.32) | (.18) | |||||
| Net asset value, end of period | $ | 8.79 | $ | 7.65 | $ | 10.03 | $ | 7.16 | $ | 9.19 |
Total Return D | 20.25% | (16.93)% | 42.33% | (19.36)% | 5.12% | |||||
Ratios to Average Net Assets B,E,F | ||||||||||
| Expenses before reductions | .17% | .16% | .17% | .18% | .26% | |||||
| Expenses net of fee waivers, if any | .17% | .16% | .17% | .18% | .20% | |||||
| Expenses net of all reductions | .17% | .16% | .17% | .18% | .20% | |||||
| Net investment income (loss) | 4.33% | 4.82% | 3.84% | 3.04% | 4.22% | |||||
| Supplemental Data | ||||||||||
| Net assets, end of period (000 omitted) | $ | 3,759,429 | $ | 4,148,718 | $ | 5,985,049 | $ | 2,258,397 | $ | 1,036,532 |
Portfolio turnover rate G | 62% | 79% | 60% | 57% | 59% |
| Fidelity Central Fund | Investment Manager | Investment Objective | Investment Practices | Expense RatioA |
| Fidelity Money Market Central Funds | Fidelity Management & Research Company LLC (FMR) | Each fund seeks to obtain a high level of current income consistent with the preservation of capital and liquidity. | Short-term Investments | Less than .005% |
| Gross unrealized appreciation | $397,692,918 |
| Gross unrealized depreciation | (342,636,236) |
| Net unrealized appreciation (depreciation) | $55,056,682 |
| Tax Cost | $3,699,325,905 |
| Undistributed ordinary income | $218,851,448 |
| Capital loss carryforward | $(497,148,276) |
| Net unrealized appreciation (depreciation) on securities and other investments | $54,115,618 |
Short-term | $(286,256,532) |
Long-term | (210,891,744) |
| Total capital loss carryforward | $(497,148,276) |
| October 31, 2023 | October 31, 2022 | |
| Ordinary Income | $199,830,507 | $ 449,845,102 |
| Equity Risk | Equity risk relates to the fluctuations in the value of financial instruments as a result of changes in market prices (other than those arising from interest rate risk or foreign exchange risk), whether caused by factors specific to an individual investment, its issuer, or all factors affecting all instruments traded in a market or market segment. |
| Purchases ($) | Sales ($) | |
| Fidelity SAI International Value Index Fund | 2,676,482,347 | 3,706,518,444 |
| Borrower or Lender | Average Loan Balance | Weighted Average Interest Rate | Interest Expense | |
Fidelity SAI International Value Index Fund | Borrower | $ 38,065,767 | 5.05% | $390,014 |
| Amount | |
| Fidelity SAI International Value Index Fund | $8,099 |
| Total Security Lending Fees Paid to NFS | Security Lending Income From Securities Loaned to NFS | Value of Securities Loaned to NFS at Period End | |
| Fidelity SAI International Value Index Fund | $75,610 | $ - | $- |
| Average Loan Balance | Weighted Average Interest Rate | Interest Expense | |
| Fidelity SAI International Value Index Fund | $1,206,333 | 5.83% | $2,344 |
| Strategic Advisers Fidelity International Fund | Strategic Advisers International Fund | |
| Fidelity SAI International Value Index Fund | 83% | 11% |
| Fund | % of shares held |
| Fidelity SAI International Value Index Fund | 94% |
| The Example is based on an investment of $1,000 invested at the beginning of the period and held for the entire period (May 1, 2023 to October 31, 2023). |
Annualized Expense Ratio- A | Beginning Account Value May 1, 2023 | Ending Account Value October 31, 2023 | Expenses Paid During Period- C May 1, 2023 to October 31, 2023 | |||||||
| Fidelity® SAI International Value Index Fund | .18% | |||||||||
| Actual | $ 1,000 | $ 959.60 | $ .89 | |||||||
Hypothetical-B | $ 1,000 | $ 1,024.30 | $ .92 | |||||||
| A special meeting of shareholders was held on October 18, 2023. The results of votes taken among shareholders on the proposal before them are reported below. Each vote reported represents one dollar of net asset value held on the record date for the meeting. | ||
| Proposal 1 | ||
| To elect a Board of Trustees. | ||
# of Votes | % of Votes | |
| Abigail P. Johnson | ||
| Affirmative | 378,729,502,260.010 | 97.580 |
| Withheld | 9,407,876,478.960 | 2.420 |
| TOTAL | 388,137,378,738.970 | 100.000 |
| Jennifer Toolin McAuliffe | ||
| Affirmative | 378,454,868,010.950 | 97.510 |
| Withheld | 9,682,510,728.020 | 2.490 |
| TOTAL | 388,137,378,738.970 | 100.000 |
| Christine J. Thompson | ||
| Affirmative | 378,837,121,274.520 | 97.600 |
| Withheld | 9,300,257,464.450 | 2.400 |
| TOTAL | 388,137,378,738.970 | 100.000 |
| Elizabeth S. Acton | ||
| Affirmative | 378,262,110,794.850 | 97.460 |
| Withheld | 9,875,267,944.120 | 2.540 |
| TOTAL | 388,137,378,738.970 | 100.000 |
| Laura M. Bishop | ||
| Affirmative | 380,482,113,171.060 | 98.030 |
| Withheld | 7,655,265,567.910 | 1.970 |
| TOTAL | 388,137,378,738.970 | 100.000 |
| Ann E. Dunwoody | ||
| Affirmative | 380,016,034,008.120 | 97.910 |
| Withheld | 8,121,344,730.850 | 2.090 |
| TOTAL | 388,137,378,738.970 | 100.000 |
| John Engler | ||
| Affirmative | 379,432,488,394.200 | 97.760 |
| Withheld | 8,704,890,344.770 | 2.240 |
| TOTAL | 388,137,378,738.970 | 100.000 |
| Robert F. Gartland | ||
| Affirmative | 378,741,819,600.600 | 97.580 |
| Withheld | 9,395,559,138.370 | 2.420 |
| TOTAL | 388,137,378,738.970 | 100.000 |
| Robert W. Helm | ||
| Affirmative | 380,389,324,755.070 | 98.000 |
| Withheld | 7,748,053,983.900 | 2.000 |
| TOTAL | 388,137,378,738.970 | 100.000 |
| Arthur E. Johnson | ||
| Affirmative | 378,427,694,151.670 | 97.500 |
| Withheld | 9,709,684,587.300 | 2.500 |
| TOTAL | 388,137,378,738.970 | 100.000 |
| Michael E. Kenneally | ||
| Affirmative | 377,842,228,145.180 | 97.350 |
| Withheld | 10,295,150,593.790 | 2.650 |
| TOTAL | 388,137,378,738.970 | 100.000 |
| Mark A. Murray | ||
| Affirmative | 380,158,432,703.370 | 97.940 |
| Withheld | 7,978,946,035.600 | 2.060 |
| TOTAL | 388,137,378,738.970 | 100.000 |
| Carol J. Zierhoffer | ||
| Affirmative | 380,522,113,360.240 | 98.040 |
| Withheld | 7,615,265,378.730 | 1.960 |
| TOTAL | 388,137,378,738.970 | 100.000 |
| Proposal 1 reflects trust wide proposal and voting results. | ||
 |


Contents
| Average Annual Total Returns | |||
Periods ended October 31, 2023 | Past 1 year | Past 5 years | Past 10 years |
| Fidelity® Series Global ex U.S. Index Fund | 12.62% | 3.64% | 2.63% |
| $10,000 Over 10 Years |
Let's say hypothetically that $10,000 was invested in Fidelity® Series Global ex U.S. Index Fund on October 31, 2013. The chart shows how the value of your investment would have changed, and also shows how the MSCI ACWI (All Country World Index) ex USA Index performed over the same period. |
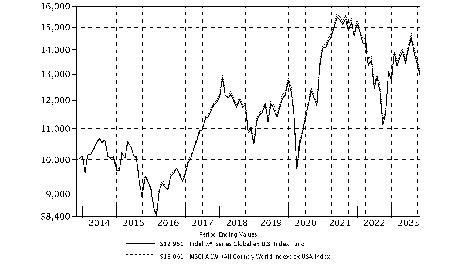 |
Top Holdings (% of Fund's net assets) | ||
| Taiwan Semiconductor Manufacturing Co. Ltd. (Taiwan, Semiconductors & Semiconductor Equipment) | 1.8 | |
| Novo Nordisk A/S Series B (Denmark, Pharmaceuticals) | 1.4 | |
| Nestle SA (Reg. S) (United States of America, Food Products) | 1.3 | |
| Tencent Holdings Ltd. (China, Interactive Media & Services) | 1.1 | |
| ASML Holding NV (Netherlands) (Netherlands, Semiconductors & Semiconductor Equipment) | 1.1 | |
| Samsung Electronics Co. Ltd. (Korea (South), Technology Hardware, Storage & Peripherals) | 1.0 | |
| Shell PLC (London) (Netherlands, Oil, Gas & Consumable Fuels) | 0.9 | |
| LVMH Moet Hennessy Louis Vuitton SE (France, Textiles, Apparel & Luxury Goods) | 0.9 | |
| AstraZeneca PLC (United Kingdom) (United Kingdom, Pharmaceuticals) | 0.9 | |
| Novartis AG (Switzerland, Pharmaceuticals) | 0.8 | |
| 11.2 | ||
| Market Sectors (% of Fund's net assets) | ||
| Financials | 22.1 | |
| Industrials | 12.3 | |
| Consumer Discretionary | 11.6 | |
| Information Technology | 10.7 | |
| Health Care | 9.2 | |
| Consumer Staples | 8.2 | |
| Materials | 7.0 | |
| Energy | 6.3 | |
| Communication Services | 5.3 | |
| Utilities | 2.5 | |
| Real Estate | 1.5 | |
Asset Allocation (% of Fund's net assets) |
 |
Futures - 4.1% |
Geographic Diversification (% of Fund's net assets) |
 |
* Includes Short-Term investments and Net Other Assets (Liabilities). Percentages are adjusted for the effect of derivatives, if applicable. |
| Common Stocks - 94.9% | |||
| Shares | Value ($) | ||
| Australia - 4.7% | |||
| Ampol Ltd. | 367,835 | 7,458,868 | |
| ANZ Group Holdings Ltd. | 4,735,903 | 74,680,352 | |
| APA Group unit | 1,961,739 | 10,283,320 | |
| Aristocrat Leisure Ltd. | 935,993 | 23,006,809 | |
| ASX Ltd. | 301,487 | 10,771,403 | |
| Aurizon Holdings Ltd. | 2,858,154 | 6,225,385 | |
| BHP Group Ltd. | 7,997,144 | 226,378,968 | |
| BlueScope Steel Ltd. | 708,506 | 8,493,188 | |
| Brambles Ltd. | 2,201,008 | 18,369,074 | |
| Cochlear Ltd. | 104,633 | 16,037,533 | |
| Coles Group Ltd. | 2,129,193 | 20,665,288 | |
| Commonwealth Bank of Australia | 2,641,251 | 162,478,945 | |
| Computershare Ltd. | 916,575 | 14,465,345 | |
| DEXUS Property Group unit | 1,670,419 | 6,899,147 | |
| EBOS Group Ltd. | 238,750 | 4,873,896 | |
| Endeavour Group Ltd. | 2,226,260 | 6,993,678 | |
| Flutter Entertainment PLC (a) | 76,515 | 12,001,670 | |
| Flutter Entertainment PLC (Ireland) (a) | 202,601 | 31,716,355 | |
| Fortescue Metals Group Ltd. | 2,681,026 | 38,139,819 | |
| Glencore PLC | 16,634,105 | 88,108,042 | |
| Goodman Group unit | 2,690,236 | 35,596,959 | |
| IDP Education Ltd. | 390,409 | 5,394,035 | |
| IGO Ltd. | 1,062,096 | 6,431,388 | |
| Insurance Australia Group Ltd. | 3,897,067 | 14,058,818 | |
| Lendlease Group unit | 1,070,903 | 4,241,305 | |
| Macquarie Group Ltd. | 580,624 | 59,682,327 | |
| Medibank Private Ltd. | 4,284,628 | 9,350,253 | |
| Mineral Resources Ltd. | 272,564 | 10,045,957 | |
| Mirvac Group unit | 6,126,261 | 7,108,018 | |
| National Australia Bank Ltd. | 4,954,919 | 88,763,685 | |
| Northern Star Resources Ltd. | 1,832,419 | 13,418,409 | |
| Orica Ltd. | 713,354 | 6,665,527 | |
| Origin Energy Ltd. | 2,734,757 | 15,863,925 | |
| Pilbara Minerals Ltd. (b) | 4,289,208 | 10,075,340 | |
| Qantas Airways Ltd. (a) | 1,329,899 | 4,166,449 | |
| QBE Insurance Group Ltd. | 2,369,936 | 23,500,539 | |
| Ramsay Health Care Ltd. | 287,190 | 8,892,581 | |
| REA Group Ltd. | 82,384 | 7,563,240 | |
| Reece Ltd. | 340,434 | 3,795,743 | |
| Rio Tinto Ltd. | 587,061 | 43,852,340 | |
| Rio Tinto PLC | 1,777,061 | 113,377,417 | |
| Santos Ltd. | 5,061,780 | 24,698,748 | |
| Scentre Group unit | 8,497,599 | 13,164,422 | |
| SEEK Ltd. | 554,317 | 7,312,932 | |
| Sonic Healthcare Ltd. | 729,700 | 13,361,586 | |
| South32 Ltd. | 7,276,662 | 15,567,576 | |
| Stockland Corp. Ltd. unit | 3,711,762 | 8,377,231 | |
| Suncorp Group Ltd. | 2,017,635 | 17,173,398 | |
| Telstra Group Ltd. | 6,431,708 | 15,596,121 | |
| The GPT Group | 2,971,635 | 6,858,026 | |
| The Lottery Corp. Ltd. | 3,463,948 | 9,998,928 | |
| Transurban Group unit | 4,899,899 | 36,888,858 | |
| Treasury Wine Estates Ltd. | 1,128,376 | 8,661,002 | |
| Vicinity Centres unit | 6,024,241 | 6,525,047 | |
| Washington H. Soul Pattinson & Co. Ltd. | 362,549 | 7,723,697 | |
| Wesfarmers Ltd. | 1,798,098 | 57,851,700 | |
| Westpac Banking Corp. | 5,538,925 | 72,735,958 | |
| WiseTech Global Ltd. | 266,207 | 9,911,226 | |
| Woodside Energy Group Ltd. | 2,996,925 | 65,272,434 | |
| Woolworths Group Ltd. | 1,927,755 | 43,152,353 | |
TOTAL AUSTRALIA | 1,720,722,583 | ||
| Austria - 0.2% | |||
| Erste Group Bank AG | 545,712 | 19,487,853 | |
| Mondi PLC | 554,249 | 8,952,967 | |
| Mondi PLC | 232,421 | 3,755,898 | |
| OMV AG | 235,082 | 10,287,897 | |
| Verbund AG | 105,897 | 9,188,068 | |
| Voestalpine AG | 178,192 | 4,442,119 | |
TOTAL AUSTRIA | 56,114,802 | ||
| Belgium - 0.5% | |||
| Ageas | 258,340 | 9,911,655 | |
| Anheuser-Busch InBev SA NV | 1,370,117 | 77,956,970 | |
| D'ieteren Group | 32,910 | 4,878,572 | |
| Elia Group SA/NV | 45,741 | 4,338,930 | |
| Groupe Bruxelles Lambert SA | 147,924 | 10,799,768 | |
| KBC Group NV | 396,715 | 21,785,759 | |
| Lotus Bakeries SA | 632 | 4,681,034 | |
| Sofina SA | 23,543 | 4,459,042 | |
| Solvay SA Class A | 119,084 | 12,567,517 | |
| UCB SA | 202,529 | 14,799,277 | |
| Umicore SA | 324,453 | 7,719,660 | |
| Warehouses de Pauw | 255,746 | 6,310,505 | |
TOTAL BELGIUM | 180,208,689 | ||
| Brazil - 1.1% | |||
| Ambev SA | 7,056,530 | 17,999,103 | |
| Atacadao SA | 979,900 | 1,743,383 | |
| B3 SA - Brasil Bolsa Balcao | 9,270,475 | 20,410,031 | |
| Banco Bradesco SA | 1,424,338 | 3,472,031 | |
| Banco BTG Pactual SA unit | 1,877,000 | 11,019,824 | |
| Banco do Brasil SA | 1,359,800 | 13,040,379 | |
| Banco Santander SA (Brasil) unit | 577,500 | 3,083,513 | |
| BB Seguridade Participacoes SA | 1,085,900 | 6,625,137 | |
| CCR SA | 1,564,900 | 3,718,451 | |
| Centrais Eletricas Brasileiras SA (Electrobras) | 1,856,130 | 12,826,413 | |
| Companhia de Saneamento Basico do Estado de Sao Paulo (SABESP) | 532,700 | 6,167,243 | |
| Companhia Siderurgica Nacional SA (CSN) | 1,027,900 | 2,397,601 | |
| Cosan SA | 1,873,932 | 5,854,005 | |
| CPFL Energia SA (a) | 360,800 | 2,393,048 | |
| Energisa SA unit | 336,500 | 3,110,877 | |
| Eneva SA (a) | 1,419,300 | 3,045,932 | |
| ENGIE Brasil Energia SA | 335,950 | 2,618,701 | |
| Equatorial Energia SA | 1,609,616 | 10,088,534 | |
| Hapvida Participacoes e Investimentos SA (a)(c) | 8,205,444 | 6,005,472 | |
| Hypera SA (a) | 635,100 | 3,815,576 | |
| Itausa-Investimentos Itau SA | 118,810 | 202,190 | |
| Klabin SA unit | 1,181,700 | 5,015,794 | |
| Localiza Rent a Car SA | 1,443,562 | 14,565,181 | |
| Localiza Rent a Car SA rights 11/10/23 (a) | 10,585 | 14,696 | |
| Lojas Renner SA (a) | 1,495,209 | 3,635,893 | |
| Magazine Luiza SA (a) | 4,709,132 | 1,242,256 | |
| Natura & Co. Holding SA | 1,396,419 | 3,531,381 | |
| Petroleo Brasileiro SA - Petrobras (ON) | 4,731,911 | 35,514,556 | |
| Prio SA (a) | 1,274,300 | 12,056,153 | |
| Raia Drogasil SA | 2,087,744 | 10,683,551 | |
| Rede D'Oregon Sao Luiz SA (c) | 890,711 | 3,819,541 | |
| Rumo SA | 2,014,500 | 8,914,265 | |
| Sendas Distribuidora SA | 2,097,900 | 4,552,194 | |
| Suzano Papel e Celulose SA | 1,262,395 | 12,912,522 | |
| Telefonica Brasil SA | 646,840 | 5,804,144 | |
| TIM SA | 1,322,403 | 3,978,947 | |
| Totvs SA | 811,100 | 4,071,789 | |
| Ultrapar Participacoes SA | 1,113,100 | 4,514,880 | |
| Vale SA | 5,336,247 | 73,030,405 | |
| Vale SA sponsored ADR | 43,641 | 598,318 | |
| Vibra Energia SA (a) | 1,809,350 | 7,102,105 | |
| Weg SA | 2,662,632 | 17,433,130 | |
| Wheaton Precious Metals Corp. | 717,998 | 30,324,963 | |
| Yara International ASA | 264,220 | 8,633,133 | |
TOTAL BRAZIL | 411,587,241 | ||
| Burkina Faso - 0.0% | |||
| Endeavour Mining PLC | 286,993 | 5,930,036 | |
| Canada - 7.0% | |||
| Agnico Eagle Mines Ltd. (Canada) | 778,498 | 36,512,356 | |
| Air Canada (a) | 272,819 | 3,291,337 | |
| Algonquin Power & Utilities Corp. (b) | 1,037,479 | 5,221,996 | |
| Alimentation Couche-Tard, Inc. Class A (multi-vtg.) | 1,234,303 | 67,191,299 | |
| AltaGas Ltd. (b) | 437,893 | 8,134,216 | |
| ARC Resources Ltd. (b) | 970,527 | 15,613,815 | |
| Bank of Montreal (b) | 1,119,872 | 84,623,318 | |
| Bank of Nova Scotia | 1,876,191 | 75,967,640 | |
| Barrick Gold Corp. (Canada) | 2,777,298 | 44,360,664 | |
| BCE, Inc. (b) | 113,478 | 4,212,618 | |
| Brookfield Asset Management Ltd. Class A (b) | 559,205 | 16,029,132 | |
| Brookfield Corp. (Canada) Class A (b) | 2,226,336 | 64,859,545 | |
| CAE, Inc. (a) | 495,075 | 10,338,830 | |
| Cameco Corp. | 686,993 | 28,103,921 | |
| Canadian Apartment Properties (REIT) unit (b) | 134,176 | 3,949,569 | |
| Canadian Imperial Bank of Commerce (b) | 1,426,460 | 50,310,552 | |
| Canadian National Railway Co. | 888,559 | 94,017,135 | |
| Canadian Natural Resources Ltd. | 1,749,499 | 111,094,921 | |
| Canadian Pacific Kansas City Ltd. | 1,470,651 | 104,417,016 | |
| Canadian Tire Ltd. Class A (non-vtg.) (b) | 83,369 | 8,041,419 | |
| Canadian Utilities Ltd. Class A (non-vtg.) (b) | 211,154 | 4,467,466 | |
| CCL Industries, Inc. Class B | 239,623 | 9,368,927 | |
| Cenovus Energy, Inc. (Canada) | 2,263,060 | 43,115,230 | |
| CGI, Inc. Class A (sub. vtg.) (a) | 335,434 | 32,383,562 | |
| Constellation Software, Inc. | 31,835 | 63,819,447 | |
| Constellation Software, Inc. warrants 8/22/28 (a)(d) | 30,824 | 2 | |
| Descartes Systems Group, Inc. (Canada) (a) | 131,736 | 9,521,471 | |
| Dollarama, Inc. | 450,522 | 30,765,771 | |
| Element Fleet Management Corp. | 605,817 | 8,195,512 | |
| Emera, Inc. (b) | 426,023 | 13,953,463 | |
| Empire Co. Ltd. Class A (non-vtg.) (b) | 241,818 | 6,626,345 | |
| Enbridge, Inc. (b) | 3,355,213 | 107,521,663 | |
| Fairfax Financial Holdings Ltd. (sub. vtg.) | 34,369 | 28,601,303 | |
| FirstService Corp. (b) | 62,611 | 8,859,677 | |
| Fortis, Inc. (b) | 774,126 | 30,736,166 | |
| Franco-Nevada Corp. | 303,592 | 36,932,375 | |
| George Weston Ltd. | 97,327 | 10,557,005 | |
| GFL Environmental, Inc. | 360,771 | 10,393,223 | |
| Gildan Activewear, Inc. | 276,623 | 7,857,350 | |
| Great-West Lifeco, Inc. | 429,608 | 11,902,318 | |
| Hydro One Ltd. (c) | 515,070 | 13,356,349 | |
| iA Financial Corp., Inc. | 158,864 | 9,243,725 | |
| IGM Financial, Inc. | 128,213 | 2,886,468 | |
| Imperial Oil Ltd. | 323,297 | 18,424,490 | |
| Intact Financial Corp. | 276,365 | 38,829,606 | |
| Ivanhoe Mines Ltd. (a) | 948,048 | 6,986,876 | |
| Keyera Corp. (b) | 355,510 | 8,267,674 | |
| Kinross Gold Corp. | 1,910,082 | 9,972,233 | |
| Loblaw Companies Ltd. | 252,691 | 20,667,181 | |
| Magna International, Inc. Class A (sub. vtg.) (b) | 431,019 | 20,712,534 | |
| Manulife Financial Corp. | 2,896,814 | 50,426,602 | |
| Metro, Inc. | 364,215 | 18,500,310 | |
| National Bank of Canada (b) | 534,598 | 33,238,175 | |
| Northland Power, Inc. (b) | 392,387 | 5,514,781 | |
| Nutrien Ltd. | 785,125 | 42,167,738 | |
| Nuvei Corp. (Canada) (c) | 99,114 | 1,380,127 | |
| Onex Corp. (sub. vtg.) | 106,298 | 5,957,440 | |
| Open Text Corp. | 431,225 | 14,397,489 | |
| Pan American Silver Corp. | 567,139 | 8,285,730 | |
| Parkland Corp. | 216,537 | 6,553,494 | |
| Pembina Pipeline Corp. | 869,964 | 26,774,879 | |
| Power Corp. of Canada (sub. vtg.) | 913,704 | 22,013,233 | |
| Quebecor, Inc. Class B (sub. vtg.) | 238,592 | 4,922,385 | |
| RB Global, Inc. | 289,734 | 18,948,604 | |
| Restaurant Brands International, Inc. | 365,684 | 24,563,522 | |
| Restaurant Brands International, Inc. (b) | 101,678 | 6,832,762 | |
| RioCan (REIT) (b) | 230,419 | 2,799,755 | |
| Rogers Communications, Inc. Class B (non-vtg.) | 568,454 | 21,061,595 | |
| Royal Bank of Canada | 2,179,035 | 174,039,961 | |
| Saputo, Inc. | 394,638 | 7,968,173 | |
| Shopify, Inc. Class A (a) | 1,895,459 | 89,514,051 | |
| Stantec, Inc. | 171,678 | 10,504,329 | |
| Sun Life Financial, Inc. | 922,876 | 42,152,490 | |
| Suncor Energy, Inc. | 2,085,187 | 67,528,933 | |
| TC Energy Corp. (b) | 1,609,096 | 55,417,649 | |
| Teck Resources Ltd. Class B (sub. vtg.) | 720,944 | 25,474,134 | |
| TELUS Corp. | 732,318 | 11,807,918 | |
| TFI International, Inc. (Canada) | 122,840 | 13,589,244 | |
| The Toronto-Dominion Bank | 2,899,516 | 161,958,903 | |
| Thomson Reuters Corp. | 250,781 | 30,039,468 | |
| TMX Group Ltd. | 431,909 | 8,994,795 | |
| Toromont Industries Ltd. | 129,207 | 9,727,212 | |
| Tourmaline Oil Corp. (b) | 511,572 | 27,051,433 | |
| West Fraser Timber Co. Ltd. | 87,896 | 5,931,990 | |
| WSP Global, Inc. | 197,281 | 25,819,022 | |
TOTAL CANADA | 2,543,075,037 | ||
| Chile - 0.1% | |||
| Antofagasta PLC | 629,181 | 10,285,727 | |
| Banco de Chile | 70,722,820 | 7,265,881 | |
| Banco de Credito e Inversiones | 118,875 | 2,842,374 | |
| Banco Santander Chile | 102,578,930 | 4,472,212 | |
| Cencosud SA | 1,990,714 | 3,225,179 | |
| Compania Cervecerias Unidas SA | 202,876 | 1,153,333 | |
| Compania Sud Americana de Vapores SA | 22,914,615 | 1,272,465 | |
| Empresas CMPC SA | 1,739,217 | 3,109,215 | |
| Empresas COPEC SA | 596,614 | 3,949,651 | |
| Enel Americas SA (a) | 33,437,585 | 3,437,160 | |
| Enel Chile SA | 42,818,828 | 2,535,640 | |
| Falabella SA | 1,382,822 | 2,815,858 | |
| Lundin Mining Corp. | 1,020,777 | 6,374,566 | |
TOTAL CHILE | 52,739,261 | ||
| China - 8.4% | |||
| 360 Security Technology, Inc. (A Shares) (a) | 657,300 | 807,818 | |
| 37 Interactive Entertainment Network Technology Group Co. Ltd. (A Shares) | 202,700 | 573,476 | |
| 3Peak, Inc. (A Shares) | 11,096 | 244,366 | |
| 3SBio, Inc. (c) | 3,003,500 | 2,672,040 | |
| AAC Technology Holdings, Inc. | 1,112,500 | 2,002,541 | |
| Accelink Technologies Co. Ltd. (A Shares) | 73,700 | 271,633 | |
| Advanced Micro-Fabrication Equipment, Inc., China (A Shares) | 57,519 | 1,347,523 | |
| AECC Aero-Engine Control Co. Ltd. (A Shares) | 120,600 | 342,432 | |
| AECC Aviation Power Co. Ltd. | 245,852 | 1,189,054 | |
| Agricultural Bank of China Ltd.: | |||
| (A Shares) | 7,458,100 | 3,660,711 | |
| (H Shares) | 47,006,000 | 17,361,980 | |
| Aier Eye Hospital Group Co. Ltd. (A Shares) | 869,901 | 2,175,339 | |
| AIMA Technology Group Co. Ltd. | 76,600 | 294,240 | |
| Air China Ltd.: | |||
| (A Shares) (a) | 1,533,400 | 1,681,959 | |
| (H Shares) (a) | 2,076,000 | 1,412,320 | |
| Airtac International Group | 217,456 | 7,143,924 | |
| Akeso, Inc. (a)(c) | 784,000 | 4,402,596 | |
| Alibaba Group Holding Ltd. (a) | 25,951,424 | 267,171,962 | |
| Alibaba Health Information Technology Ltd. (a) | 8,384,000 | 4,938,838 | |
| Aluminum Corp. of China Ltd.: | |||
| (A shares) | 950,100 | 805,301 | |
| (H Shares) | 7,112,000 | 3,804,426 | |
| Amlogic Shanghai Co. Ltd. (A Shares) (a) | 38,668 | 317,759 | |
| Angel Yeast Co. Ltd. (A Shares) | 74,000 | 353,893 | |
| Anhui Conch Cement Co. Ltd.: | |||
| (A Shares) | 254,100 | 840,498 | |
| (H Shares) | 2,144,500 | 5,337,006 | |
| Anhui Gujing Distillery Co. Ltd.: | |||
| (A Shares) | 34,000 | 1,296,088 | |
| (B Shares) | 177,200 | 2,761,916 | |
| Anhui Honglu Steel Construction Group Co. Ltd. | 62,200 | 213,712 | |
| Anhui Jianghuai Automobile Group Corp. Ltd. (A Shares) (a) | 186,200 | 461,545 | |
| Anhui Kouzi Distillery Co. Ltd. (A Shares) | 54,900 | 376,842 | |
| Anhui Yingjia Distillery Co. Ltd. (A Shares) | 61,600 | 645,981 | |
| Anjoy Foods Group Co. Ltd. (A Shares) | 26,600 | 469,912 | |
| Anker Innovations Technology Co. Ltd. (A Shares) | 30,600 | 392,029 | |
| Anta Sports Products Ltd. | 2,026,800 | 22,922,076 | |
| Apeloa Pharmaceutical Co. Ltd. A Shares | 106,500 | 251,062 | |
| Asia - Potash International Investment Guangzhou Co. Ltd. (A Shares) (a) | 86,700 | 338,053 | |
| ASR Microelectronics Co. Ltd. (A Shares) | 38,473 | 342,931 | |
| Asymchem Laboratories Tianjin Co. Ltd. (A Shares) | 31,900 | 658,436 | |
| Autobio Diagnostics Co. Ltd. | 54,700 | 332,424 | |
| Autohome, Inc. ADR Class A | 115,036 | 3,077,213 | |
| Avary Holding Shenzhen Co. Ltd. (A Shares) | 178,500 | 523,171 | |
| AVIC Capital Co. Ltd. (A Shares) | 752,300 | 342,644 | |
| AviChina Industry & Technology Co. Ltd. (H Shares) | 3,941,000 | 1,786,128 | |
| Avicopter PLC (A Shares) | 52,300 | 271,527 | |
| BAIC BluePark New Energy Technology Co. Ltd. (A Shares) (a) | 457,600 | 428,955 | |
| Baidu, Inc. Class A (a) | 3,570,348 | 46,874,417 | |
| Bank of Beijing Co. Ltd. (A Shares) | 1,844,300 | 1,150,176 | |
| Bank of Changsha Co. Ltd. (A Shares) | 484,900 | 487,192 | |
| Bank of Chengdu Co. Ltd. (A Shares) | 328,400 | 555,139 | |
| Bank of China Ltd.: | |||
| (A Shares) | 5,504,400 | 2,934,653 | |
| (H Shares) | 122,138,024 | 42,667,136 | |
| Bank of Communications Co. Ltd.: | |||
| (A Shares) | 2,985,400 | 2,297,643 | |
| (H Shares) | 15,025,200 | 8,887,495 | |
| Bank of Hangzhou Co. Ltd. (A Shares) | 550,431 | 805,236 | |
| Bank of Jiangsu Co. Ltd. (A Shares) | 1,259,460 | 1,188,431 | |
| Bank of Nanjing Co. Ltd. (A Shares) | 834,000 | 894,064 | |
| Bank of Ningbo Co. Ltd. (A Shares) | 607,510 | 2,075,107 | |
| Bank of Shanghai Co. Ltd. (A Shares) | 1,095,700 | 909,413 | |
| Bank of Suzhou Co. Ltd. | 294,400 | 252,811 | |
| Baoshan Iron & Steel Co. Ltd. (A Shares) | 2,034,600 | 1,740,834 | |
| BeiGene Ltd. (a) | 1,101,718 | 15,816,132 | |
| Beijing Capital International Airport Co. Ltd. (H Shares) (a) | 2,942,000 | 1,083,649 | |
| Beijing Dabeinong Technology Group Co. Ltd. (A Shares) (a) | 358,400 | 345,488 | |
| Beijing E-Hualu Information Technology Co. Ltd. (A Shares) (a) | 59,900 | 237,630 | |
| Beijing Easpring Material Technology Co. Ltd. (A Shares) | 44,400 | 267,769 | |
| Beijing Enlight Media Co. Ltd. (A Shares) | 279,600 | 299,050 | |
| Beijing Enterprises Holdings Ltd. | 770,500 | 2,567,199 | |
| Beijing Enterprises Water Group Ltd. | 6,182,000 | 1,304,435 | |
| Beijing Kingsoft Office Software, Inc. (A Shares) | 42,806 | 1,684,043 | |
| Beijing New Building Materials PLC (A Shares) | 145,400 | 486,241 | |
| Beijing Oriental Yuhong Waterproof Technology Co. Ltd. (A Shares) | 105,900 | 360,589 | |
| Beijing Roborock Technology Co. Ltd. (A Shares) | 12,212 | 527,996 | |
| Beijing Shiji Information Technology Co. Ltd. (A Shares) | 206,037 | 297,247 | |
| Beijing Tiantan Biological Products Corp. Ltd. (A Shares) | 154,400 | 609,281 | |
| Beijing Tongrentang Co. Ltd. (A Shares) | 127,500 | 894,923 | |
| Beijing United Information Technology Co. Ltd. (A Shares) | 63,916 | 329,100 | |
| Beijing Wantai Biological Pharmacy Enterprise Co. Ltd. (A Shares) | 78,899 | 473,249 | |
| Beijing Yanjing Brewery Co. Ltd. (A Shares) | 257,300 | 365,839 | |
| Beijing-Shanghai High Speed Railway Co. Ltd. (A Shares) | 2,965,300 | 2,027,386 | |
| Beiqi Foton Motor Co. Ltd. (A Shares) (a) | 677,200 | 280,746 | |
| Bethel Automotive Safety Systems Co. Ltd. (A Shares) | 37,800 | 391,248 | |
| Betta Pharmaceuticals Co. Ltd. (A Shares) | 38,200 | 317,786 | |
| BGI Genomics Co. Ltd. | 38,600 | 259,748 | |
| Bilibili, Inc. Class Z (a) | 304,244 | 4,082,264 | |
| Bloomage Biotechnology Corp. Ltd. (A Shares) | 45,651 | 477,265 | |
| BOC Aviation Ltd. Class A (c) | 308,600 | 1,897,917 | |
| BOC Hong Kong (Holdings) Ltd. | 5,905,951 | 15,618,526 | |
| BOC International China Co. Ltd. | 243,200 | 362,518 | |
| BOE Technology Group Co. Ltd. (A Shares) | 3,560,100 | 1,908,598 | |
| Bosideng International Holdings Ltd. | 6,154,000 | 2,429,781 | |
| BTG Hotels Group Co. Ltd. (a) | 106,500 | 243,184 | |
| Budweiser Brewing Co. APAC Ltd. (c) | 2,690,858 | 5,113,563 | |
| By-Health Co. Ltd. (A Shares) | 155,500 | 389,411 | |
| BYD Co. Ltd.: | |||
| (A Shares) | 356,120 | 11,622,549 | |
| (H Shares) | 1,481,000 | 45,037,401 | |
| BYD Electronic International Co. Ltd. | 1,224,000 | 5,109,607 | |
| C&D International Investment Group Ltd. | 1,134,327 | 2,551,975 | |
| Caitong Securities Co. Ltd. | 377,560 | 409,960 | |
| Cambricon Technologies Corp. Ltd. (A Shares) (a) | 38,724 | 571,660 | |
| Canmax Technologies Co. Ltd. (A Shares) | 75,090 | 279,327 | |
| CECEP Solar Energy Co. Ltd. (A Shares) | 320,700 | 251,680 | |
| CECEP Wind-Power Corp. (A Shares) | 598,130 | 259,288 | |
| CETC Cyberspace Security Technology Co. Ltd. (A Shares) | 79,100 | 238,517 | |
| CGN Power Co. Ltd. (H Shares) (c) | 17,789,000 | 4,274,833 | |
| Changchun High & New Technology Industry Group, Inc. (A Shares) | 37,500 | 798,305 | |
| Changjiang Securities Co. Ltd. (A Shares) | 441,300 | 343,295 | |
| Changzhou Xingyu Automotive Lighting Systems Co. Ltd. (A Shares) | 26,200 | 523,925 | |
| Chaozhou Three-Circle Group Co. (A Shares) | 177,300 | 748,814 | |
| Chengxin Lithium Group Co. Ltd. (A Shares) | 81,500 | 261,798 | |
| Chifeng Jilong Gold Mining Co. Ltd. (A Shares) (a) | 156,200 | 314,470 | |
| China Baoan Group Co. Ltd. (A Shares) | 225,800 | 319,029 | |
| China Cinda Asset Management Co. Ltd. (H Shares) | 14,061,000 | 1,367,334 | |
| China CITIC Bank Corp. Ltd.: | |||
| (A Shares) | 341,500 | 251,183 | |
| (H Shares) | 13,112,293 | 5,849,502 | |
| China Coal Energy Co. Ltd. (H Shares) | 3,121,000 | 2,451,442 | |
| China Communications Services Corp. Ltd. (H Shares) | 3,686,000 | 1,507,671 | |
| China Conch Venture Holdings Ltd. | 2,194,000 | 1,817,013 | |
| China Construction Bank Corp.: | |||
| (A Shares) | 4,294,800 | 3,680,540 | |
| (H Shares) | 146,510,649 | 82,860,284 | |
| China CSSC Holdings Ltd. (A Shares) | 414,000 | 1,465,082 | |
| China Eastern Airlines Corp. Ltd. (A Shares) (a) | 1,486,100 | 885,789 | |
| China Energy Engineering Corp. Ltd. (A Shares) | 2,723,900 | 811,966 | |
| China Everbright Bank Co. Ltd.: | |||
| (A Shares) | 4,728,400 | 1,919,464 | |
| (H Shares) | 4,326,000 | 1,233,977 | |
| China Everbright International Ltd. | 5,881,629 | 2,007,850 | |
| China Feihe Ltd. (c) | 6,028,000 | 3,745,631 | |
| China Film Co. Ltd. (A Shares) (a) | 166,500 | 272,077 | |
| China Galaxy Securities Co. Ltd.: | |||
| (A Shares) | 32,200 | 53,403 | |
| (H Shares) | 6,768,500 | 3,464,175 | |
| China Gas Holdings Ltd. | 4,284,800 | 3,852,065 | |
| China Great Wall Securities Co. Ltd. (A Shares) | 318,100 | 363,464 | |
| China Greatwall Technology Group Co. Ltd. (A Shares) | 293,400 | 440,987 | |
| China Hongqiao Group Ltd. | 3,771,500 | 3,530,932 | |
| China Huishan Dairy Holdings Co. Ltd. (a)(d) | 958,000 | 1 | |
| China International Capital Corp. Ltd. | 195,900 | 987,054 | |
| China International Capital Corp. Ltd. (H Shares) (c) | 2,315,200 | 3,687,549 | |
| China Jinmao Holdings Group Ltd. | 9,446,127 | 1,158,632 | |
| China Jushi Co. Ltd. (A Shares) | 360,740 | 571,038 | |
| China Life Insurance Co. Ltd.: | |||
| (A Shares) | 359,300 | 1,650,452 | |
| (H Shares) | 11,513,000 | 15,593,194 | |
| China Literature Ltd. (a)(c) | 628,800 | 2,117,473 | |
| China Longyuan Power Grid Corp. Ltd. (H Shares) | 5,219,000 | 4,418,030 | |
| China Medical System Holdings Ltd. | 2,157,000 | 3,449,256 | |
| China Meheco Co. Ltd. (A Shares) | 128,420 | 209,892 | |
| China Meidong Auto Holding Ltd. (b) | 1,066,000 | 571,687 | |
| China Mengniu Dairy Co. Ltd. | 5,088,000 | 16,613,017 | |
| China Merchants Bank Co. Ltd.: | |||
| (A Shares) | 1,090,000 | 4,586,800 | |
| (H Shares) | 7,213,191 | 27,361,759 | |
| China Merchants Energy Shipping Co. Ltd. (A Shares) | 712,100 | 626,149 | |
| China Merchants Holdings International Co. Ltd. | 2,361,836 | 3,006,463 | |
| China Merchants Securities Co. Ltd. (A Shares) | 636,600 | 1,230,891 | |
| China Merchants Shekou Industrial Zone Holdings Co. Ltd. (A Shares) | 711,900 | 1,074,040 | |
| China Minmetals Rare Earth Co. Ltd. (A Shares) | 90,600 | 371,556 | |
| China Minsheng Banking Corp. Ltd.: | |||
| (A Shares) | 2,506,500 | 1,274,697 | |
| (H Shares) | 11,487,332 | 3,819,088 | |
| China National Building Materials Co. Ltd. (H Shares) | 6,136,000 | 2,920,711 | |
| China National Chemical Engineering Co. Ltd. (A Shares) | 525,500 | 503,055 | |
| China National Medicines Corp. Ltd. (A Shares) | 70,900 | 279,046 | |
| China National Nuclear Power Co. Ltd. (A Shares) | 1,706,400 | 1,731,259 | |
| China National Software & Service Co. Ltd. (A Shares) | 77,090 | 362,468 | |
| China Northern Rare Earth Group High-Tech Co. Ltd. | 335,200 | 957,943 | |
| China Oilfield Services Ltd. (H Shares) | 2,776,000 | 3,282,120 | |
| China Overseas Land and Investment Ltd. | 6,185,000 | 11,671,773 | |
| China Overseas Property Holdings Ltd. | 2,055,000 | 1,784,730 | |
| China Pacific Insurance (Group) Co. Ltd. | 392,900 | 1,489,903 | |
| China Pacific Insurance (Group) Co. Ltd. (H Shares) | 4,793,400 | 11,807,918 | |
| China Petroleum & Chemical Corp.: | |||
| (A Shares) | 3,523,200 | 2,631,068 | |
| (H Shares) | 38,381,800 | 19,629,904 | |
| China Power International Development Ltd. | 8,331,699 | 3,237,995 | |
| China Railway Group Ltd.: | |||
| (A Shares) | 2,481,900 | 2,052,789 | |
| (H Shares) | 5,467,000 | 2,580,229 | |
| China Railway Signal & Communications Corp. (A Shares) | 659,588 | 423,518 | |
| China Resource Gas Group Ltd. | 1,450,600 | 4,288,157 | |
| China Resources Beer Holdings Co. Ltd. | 2,622,989 | 13,879,985 | |
| China Resources Cement Holdings Ltd. | 3,730,000 | 959,090 | |
| China Resources Land Ltd. | 5,136,465 | 19,226,345 | |
| China Resources Microelectronics Ltd. (A Shares) | 122,447 | 890,539 | |
| China Resources Mixc Lifestyle Services Ltd. (c) | 1,063,000 | 4,147,208 | |
| China Resources Pharmaceutical Group Ltd. (c) | 2,423,000 | 1,505,159 | |
| China Resources Power Holdings Co. Ltd. | 3,043,780 | 5,898,516 | |
| China Resources Sanjiu Medical & Pharmaceutical Co. Ltd. (A Shares) | 91,100 | 536,991 | |
| China Ruyi Holdings Ltd. (a)(b) | 8,920,000 | 2,054,068 | |
| China Shenhua Energy Co. Ltd.: | |||
| (A Shares) | 277,000 | 1,147,337 | |
| (H Shares) | 5,836,000 | 17,887,178 | |
| China Southern Airlines Ltd.: | |||
| (A Shares) (a) | 1,742,200 | 1,471,039 | |
| (H Shares) (a) | 1,968,000 | 931,235 | |
| China State Construction Engineering Corp. Ltd. (A Shares) | 3,805,240 | 2,693,667 | |
| China State Construction International Holdings Ltd. | 3,181,750 | 3,408,100 | |
| China Taiping Insurance Group Ltd. | 2,236,065 | 2,065,624 | |
| China Three Gorges Renewables Group Co. Ltd. (A Shares) | 2,556,300 | 1,677,814 | |
| China Tourism Group Duty Free Corp. Ltd.: | |||
| (A Shares) | 269,900 | 3,491,560 | |
| (H Shares) (c) | 36,000 | 406,556 | |
| China Tower Corp. Ltd. (H Shares) (c) | 68,928,000 | 6,427,596 | |
| China Traditional Chinese Medicine Holdings Co. Ltd. | 4,638,000 | 2,285,357 | |
| China United Network Communications Ltd. (A Shares) | 2,935,500 | 1,789,389 | |
| China Vanke Co. Ltd.: | |||
| (A Shares) | 699,700 | 1,082,512 | |
| (H Shares) | 3,846,300 | 3,598,431 | |
| China XD Electric Co. Ltd. (A Shares) | 443,800 | 280,497 | |
| China Yangtze Power Co. Ltd. (A Shares) | 2,262,200 | 6,980,196 | |
| China Zhenhua (Group) Science & Technology Co. Ltd. (A Shares) | 48,900 | 447,451 | |
| China Zheshang Bank Co. Ltd. | 2,006,420 | 699,754 | |
| ChinaSoft International Ltd. | 4,226,000 | 3,066,039 | |
| Chongqing Brewery Co. Ltd. (A Shares) | 45,300 | 486,141 | |
| Chongqing Changan Automobile Co. Ltd. (A Shares) | 751,464 | 1,555,462 | |
| Chongqing Fuling Zhacai Group Co. Ltd. Group (A Shares) | 95,210 | 201,096 | |
| Chongqing Rural Commercial Bank Co. Ltd.: | |||
| (A Shares) | 300,900 | 174,842 | |
| (H Shares) | 900,000 | 340,723 | |
| Chongqing Taiji Industry Group Co. Ltd. (A Shares) (a) | 50,800 | 291,507 | |
| Chongqing Zhifei Biological Products Co. Ltd. (A Shares) | 224,500 | 1,924,555 | |
| Chow Tai Fook Jewellery Group Ltd. | 3,083,000 | 4,353,580 | |
| CITIC Pacific Ltd. | 9,028,000 | 7,673,247 | |
| CITIC Securities Co. Ltd.: | |||
| (A Shares) | 459,005 | 1,362,784 | |
| (H Shares) | 4,077,775 | 7,934,769 | |
| Cmoc Group Ltd.: | |||
| (A Shares) | 384,300 | 291,445 | |
| (H Shares) | 7,665,000 | 4,571,492 | |
| CNGR Advanced Material Co. Ltd. | 62,300 | 463,525 | |
| CNNC Hua Yuan Titanium Dioxide Co. Ltd. (A Shares) | 352,875 | 229,806 | |
| CNPC Capital Co. Ltd. (A Shares) | 577,000 | 468,152 | |
| Contemporary Amperex Technology Co. Ltd. | 429,560 | 10,909,688 | |
| COSCO Shipping Development Co. Ltd. (A Shares) | 962,000 | 302,435 | |
| COSCO Shipping Energy Transportation Co. Ltd.: | |||
| (A Shares) | 1,552,366 | 3,059,745 | |
| (H Shares) | 218,000 | 231,196 | |
| COSCO SHIPPING Holdings Co. Ltd.: | |||
| (A Shares) (a) | 706,470 | 944,192 | |
| (H Shares) | 5,756,600 | 5,854,677 | |
| Cosco Shipping Ports Ltd. | 2,398,345 | 1,446,903 | |
| Country Garden Holdings Co. Ltd. (a)(b) | 19,233,866 | 1,719,945 | |
| Country Garden Services Holdings Co. Ltd. (b) | 3,408,000 | 2,976,913 | |
| CRRC Corp. Ltd.: | |||
| (A Shares) | 5,254,900 | 3,838,791 | |
| (H Shares) | 2,615,000 | 1,089,472 | |
| CSC Financial Co. Ltd. (A Shares) | 392,500 | 1,298,265 | |
| CSPC Pharmaceutical Group Ltd. | 13,932,800 | 12,169,880 | |
| Dajin Heavy Industry Co. Ltd. | 57,700 | 218,602 | |
| Daqin Railway Co. Ltd. (A Shares) | 1,331,400 | 1,312,515 | |
| Daqo New Energy Corp. ADR (a) | 92,340 | 2,350,976 | |
| DaShenLin Pharmaceutical Group Co. Ltd. | 99,956 | 325,424 | |
| Datang International Power Generation Co. Ltd. (A Shares) | 873,300 | 309,229 | |
| DHC Software Co. Ltd. (A Shares) | 354,900 | 305,882 | |
| Do-Fluoride New Materials Co. Ltd. (A Shares) | 98,000 | 214,395 | |
| Dong-E-E-Jiao Co. Ltd. (A Shares) | 58,900 | 373,730 | |
| Dongfang Electric Corp. Ltd. (A Shares) | 250,724 | 510,886 | |
| Dongfeng Motor Group Co. Ltd. (H Shares) | 4,468,000 | 1,966,923 | |
| Dongxing Securities Co. Ltd. (A Shares) | 241,600 | 264,265 | |
| Dongyue Group Co. Ltd. | 2,556,000 | 2,035,981 | |
| East Buy Holding Ltd. (a)(b)(c) | 630,500 | 2,572,127 | |
| East Money Information Co. Ltd. (A Shares) | 1,472,720 | 3,073,569 | |
| Eastroc Beverage Group Co. Ltd. | 24,700 | 648,645 | |
| Ecovacs Robotics Co. Ltd. Class A | 52,100 | 307,624 | |
| ENN Energy Holdings Ltd. | 1,229,800 | 9,315,916 | |
| ENN Natural Gas Co. Ltd. (A Shares) | 235,000 | 554,719 | |
| Eoptolink Technology, Inc. Ltd. (A Shares) | 65,600 | 282,970 | |
| ESR Group Ltd. (c) | 3,396,591 | 4,364,265 | |
| Eve Energy Co. Ltd. (A shares) | 189,729 | 1,203,664 | |
| Everbright Securities Co. Ltd. (A Shares) | 347,100 | 781,454 | |
| Everdisplay Optronics Shanghai Co. Ltd. (A Shares) (a) | 1,063,280 | 380,892 | |
| Fangda Carbon New Material Co. Ltd. (A Shares) (a) | 306,487 | 247,248 | |
| Far East Horizon Ltd. | 2,075,000 | 1,460,046 | |
| Farasis Energy Gan Zhou Co. Ltd. (A Shares) (a) | 109,850 | 264,626 | |
| FAW Jiefang Group Co. Ltd. (A Shares) (a) | 265,700 | 334,867 | |
| First Capital Securities Co. Ltd. (A Shares) | 329,900 | 263,872 | |
| Flat Glass Group Co. Ltd. (b) | 248,000 | 445,378 | |
| Flat Glass Group Co. Ltd. (A Shares) (a) | 466,500 | 1,647,716 | |
| Focus Media Information Technology Co. Ltd. (A Shares) | 1,322,940 | 1,250,807 | |
| Foshan Haitian Flavouring & Food Co. Ltd. (A Shares) | 427,603 | 2,201,146 | |
| Fosun International Ltd. | 3,878,000 | 2,323,467 | |
| Founder Securities Co. Ltd. (A Shares) | 773,000 | 801,316 | |
| Foxconn Industrial Internet Co. Ltd. (A Shares) | 924,794 | 1,863,712 | |
| Fujian Sunner Development Co. Ltd. A Shares | 106,800 | 262,732 | |
| Fuyao Glass Industries Group Co. Ltd.: | |||
| (A Shares) | 124,600 | 634,122 | |
| (H Shares) (c) | 1,062,800 | 4,845,403 | |
| G-bits Network Technology Xiamen Co. Ltd. (A Shares) | 7,000 | 254,725 | |
| GalaxyCore, Inc. (A Shares) | 156,406 | 393,844 | |
| Ganfeng Lithium Group Co. Ltd.: | |||
| (A Shares) | 275,160 | 1,667,460 | |
| (H Shares) (c) | 483,920 | 1,738,132 | |
| GCL Technology Holdings Ltd. | 31,383,000 | 4,621,703 | |
| GD Power Development Co. Ltd. (A Shares) | 1,798,400 | 894,804 | |
| GDS Holdings Ltd. Class A (a) | 1,470,620 | 1,873,485 | |
| Geely Automobile Holdings Ltd. | 9,378,000 | 10,647,078 | |
| GEM Co. Ltd. (A Shares) | 462,500 | 370,673 | |
| Gemdale Corp. (A Shares) | 395,000 | 278,811 | |
| Genscript Biotech Corp. (a) | 1,814,000 | 5,273,601 | |
| GF Securities Co. Ltd.: | |||
| (A Shares) | 93,000 | 188,698 | |
| (H Shares) | 2,263,400 | 2,946,861 | |
| Giant Network Group Co. Ltd. (A Shares) | 181,500 | 293,118 | |
| Gigadevice Semiconductor Beijing, Inc. (A Shares) | 61,584 | 902,156 | |
| Ginlong Technologies Co. Ltd. (A Shares) | 36,450 | 334,474 | |
| GoerTek, Inc. (A Shares) | 318,300 | 785,981 | |
| Goldwind Science & Technology Co. Ltd.: | |||
| (A Shares) | 98,100 | 117,980 | |
| (H Shares) | 1,521,964 | 726,166 | |
| Gongniu Group Co. Ltd. (A Shares) | 40,735 | 588,823 | |
| GoodWe Technologies Co. Ltd. (A Shares) | 15,908 | 254,139 | |
| Gotion High-tech Co. Ltd. (A Shares) (a) | 161,100 | 501,643 | |
| Great Wall Motor Co. Ltd.: | |||
| (A Shares) | 160,400 | 644,555 | |
| (H Shares) | 3,799,500 | 5,311,295 | |
| Gree Electric Appliances, Inc. of Zhuhai (A Shares) | 252,600 | 1,171,835 | |
| Greenland Holdings Corp. Ltd. (A Shares) (a) | 1,105,900 | 385,483 | |
| Greentown China Holdings Ltd. | 1,558,500 | 1,511,965 | |
| GRG Banking Equipment Co. Ltd. (A Shares) | 216,000 | 344,758 | |
| Guangdong Haid Group Co. Ltd. (A Shares) | 151,300 | 931,560 | |
| Guangdong HEC Technology Holding Co. Ltd. (A Shares) (a) | 278,700 | 271,162 | |
| Guangdong Investment Ltd. | 4,610,000 | 3,145,781 | |
| Guanghui Energy Co. Ltd. (A Shares) | 564,800 | 579,942 | |
| Guangzhou Automobile Group Co. Ltd. | 400,600 | 549,119 | |
| Guangzhou Automobile Group Co. Ltd. (H Shares) | 5,097,526 | 2,388,181 | |
| Guangzhou Baiyun International Airport Co. Ltd. (A Shares) (a) | 216,200 | 313,045 | |
| Guangzhou Baiyunshan Pharma Health (A Shares) | 128,200 | 522,414 | |
| Guangzhou Great Power Energy & Technology Co. Ltd. (A Shares) | 41,700 | 175,841 | |
| Guangzhou Haige Communications Group (A Shares) | 195,700 | 310,838 | |
| Guangzhou Kingmed Diagnostics Group Co. Ltd. (A Shares) | 42,400 | 358,898 | |
| Guangzhou Shiyuan Electronic Technology Co. Ltd. (A Shares) | 65,000 | 373,444 | |
| Guangzhou Tinci Materials Technology Co. Ltd. (A Shares) | 178,940 | 680,944 | |
| Guangzhou Yuexiu Financial Holdings Group Co. Ltd. (A Shares) | 383,716 | 344,322 | |
| Guolian Securities Co. Ltd. (a) | 235,800 | 346,766 | |
| Guosen Securities Co. Ltd. (A Shares) | 582,400 | 765,156 | |
| Guotai Junan Securities Co. Ltd. (A Shares) | 675,400 | 1,364,404 | |
| Guoyuan Securities Co. Ltd. (A Shares) | 410,900 | 388,943 | |
| H World Group Ltd. ADR (a) | 331,533 | 12,485,533 | |
| Haidilao International Holding Ltd. (c) | 2,594,000 | 6,494,873 | |
| Haier Smart Home Co. Ltd. | 3,977,400 | 11,344,854 | |
| Haier Smart Home Co. Ltd. (A Shares) | 534,800 | 1,625,254 | |
| Hainan Airlines Co. Ltd. (A Shares) (a) | 3,934,900 | 785,560 | |
| Hainan Airport Infrastructure Co. Ltd. (A Shares) (a) | 1,031,900 | 537,622 | |
| Haitian International Holdings Ltd. | 984,000 | 2,347,415 | |
| Haitong Securities Co. Ltd.: | |||
| (A Shares) | 143,300 | 191,431 | |
| (H Shares) | 5,935,600 | 3,408,140 | |
| Hanergy Mobile Energy Holding (a)(d) | 1,902,000 | 2 | |
| Hangzhou Binjiang Real Estate Group Co. Ltd. (A Shares) | 281,000 | 321,681 | |
| Hangzhou Chang Chuan Technology Co. Ltd. | 56,600 | 316,132 | |
| Hangzhou First Applied Material Co. Ltd. (A Shares) | 173,500 | 606,327 | |
| Hangzhou GreatStar Industrial Co. Ltd. (A Shares) (a) | 106,700 | 289,141 | |
| Hangzhou Lion Electronics Co. Ltd. (A Shares) | 62,500 | 274,996 | |
| Hangzhou Oxygen Plant Group Co. Ltd. (A Shares) | 90,700 | 409,425 | |
| Hangzhou Robam Appliances Co. Ltd. (A Shares) | 82,800 | 261,280 | |
| Hangzhou Silan Microelectronics Co. Ltd. (A Shares) | 130,600 | 433,729 | |
| Hangzhou Tigermed Consulting Co. Ltd. (A Shares) | 60,807 | 554,880 | |
| Hansoh Pharmaceutical Group Co. Ltd. (c) | 1,840,000 | 3,461,948 | |
| Haohua Chemical Science & Technology Co. Ltd. (A Shares) | 70,800 | 297,652 | |
| Hebei Hengshui Laobaigan Liquor Co. Ltd. | 86,800 | 282,348 | |
| Hebei Yangyuan Zhihui Beverage Co. Ltd. (A Shares) | 115,500 | 393,060 | |
| Heilongjiang Agriculture Co. Ltd. (A Shares) | 147,900 | 257,590 | |
| Henan Shenhuo Coal & Power Co. Ltd. (A Shares) | 201,800 | 453,718 | |
| Henan Shuanghui Investment & Development Co. Ltd. (A Shares) | 305,800 | 1,094,751 | |
| Hengan International Group Co. Ltd. | 1,022,500 | 3,424,657 | |
| Hengdian Group DMEGC Magnetics Co. Ltd. (A Shares) | 152,300 | 303,303 | |
| Hengli Petrochemical Co. Ltd. (A Shares) (a) | 651,260 | 1,304,929 | |
| Hengtong Optic-electric Co. Ltd. (A Shares) | 243,200 | 438,587 | |
| Hengyi Petrochemical Co. Ltd. (A Shares) (a) | 327,310 | 321,831 | |
| Hesteel Co. Ltd. (A Shares) | 847,900 | 259,651 | |
| Hisense Electric Co. Ltd. | 114,900 | 365,734 | |
| Hithink RoyalFlush Information Network Co. Ltd. (A Shares) | 49,900 | 958,572 | |
| Hongfa Technology Co. Ltd. (A Shares) | 76,420 | 303,307 | |
| Hoshine Silicon Industry Co. Ltd. (A Shares) | 72,800 | 569,755 | |
| Hoymiles Power Electronics, Inc. (A Shares) | 7,799 | 238,885 | |
| Hoyuan Green Energy Co. Ltd. (A Shares) | 51,917 | 265,172 | |
| Hua Hong Semiconductor Ltd. (a)(c) | 929,000 | 2,287,276 | |
| Huadian Power International Corp. Ltd. (A Shares) | 776,600 | 520,910 | |
| Huadong Medicine Co. Ltd. (A Shares) | 161,960 | 951,705 | |
| Huafon Chemical Co. Ltd. (A Shares) | 442,200 | 438,575 | |
| Huagong Tech Co. Ltd. (A Shares) | 91,500 | 353,664 | |
| Huaibei Mining Holdings Co. Ltd. (A Shares) | 207,400 | 415,807 | |
| Hualan Biological Engineer, Inc. (A Shares) | 169,250 | 543,142 | |
| Huaneng Power International, Inc.: | |||
| (A Shares) (a) | 1,188,400 | 1,236,499 | |
| (H Shares) (a) | 5,870,000 | 2,746,880 | |
| Huatai Securities Co. Ltd.: | |||
| (A Shares) | 319,600 | 700,574 | |
| (H Shares) (c) | 2,688,800 | 3,520,184 | |
| HUAXI Securities Co. Ltd. | 261,200 | 283,074 | |
| Huaxia Bank Co. Ltd. (A Shares) | 1,423,964 | 1,090,357 | |
| Huayu Automotive Systems Co. Ltd. (A Shares) | 273,200 | 655,347 | |
| Hubei Feilihua Quartz Glass Co. Ltd. (A Shares) | 48,800 | 264,272 | |
| Hubei Jumpcan Pharmaceutical Co. Ltd. (A Shares) | 83,400 | 309,042 | |
| Hubei Xingfa Chemicals Group Co. Ltd. (A Shares) | 97,700 | 262,506 | |
| Huizhou Desay SV Automotive Co. Ltd. | 51,500 | 884,243 | |
| Humanwell Healthcare Group Co. Ltd. (A Shares) | 148,700 | 475,501 | |
| Hunan Changyuan Lico Co. Ltd. (A Shares) | 177,813 | 207,316 | |
| Hunan Valin Steel Co. Ltd. (A Shares) | 600,200 | 478,283 | |
| Hundsun Technologies, Inc. (A Shares) | 176,268 | 750,761 | |
| Hygeia Healthcare Holdings Co. (c) | 539,000 | 3,254,519 | |
| iFlytek Co. Ltd. (A Shares) | 214,000 | 1,335,131 | |
| IMEIK Technology Development Co. Ltd. (A Shares) | 20,300 | 915,414 | |
| Industrial & Commercial Bank of China Ltd.: | |||
| (A Shares) | 11,396,400 | 7,370,916 | |
| (H Shares) | 94,948,008 | 45,503,336 | |
| Industrial Bank Co. Ltd. (A Shares) | 2,717,000 | 5,603,411 | |
| Industrial Securities Co. Ltd. (A Shares) | 838,270 | 715,370 | |
| Ingenic Semiconductor Co. Ltd. (A Shares) | 44,600 | 450,509 | |
| Inner Mongoli Yili Industries Co. Ltd. (A Shares) | 579,300 | 2,172,160 | |
| Inner Mongolia Baotou Steel Union Co. Ltd. (A Shares) (a) | 4,104,600 | 909,566 | |
| Inner Mongolia Dian Tou Energy Corp. Ltd. | 172,700 | 321,334 | |
| Inner Mongolia Junzheng Energy & Chemical Industry Group Co. Ltd. (A Shares) | 731,800 | 400,269 | |
| Inner Mongolia Yitai Coal Co. Ltd. (B Shares) (a) | 1,888,130 | 2,591,402 | |
| Inner Mongolia Yuan Xing Energy Co. Ltd. (A Shares) | 323,600 | 301,064 | |
| Innovent Biologics, Inc. (a)(c) | 1,797,000 | 10,590,015 | |
| Inspur Electronic Information Industry Co. Ltd. (A Shares) | 136,034 | 551,359 | |
| iQIYI, Inc. ADR (a) | 687,015 | 3,201,490 | |
| iRay Technology Co. Ltd. (A Shares) | 9,693 | 298,694 | |
| iSoftStone Information Technology Group Co. Ltd. (A Shares) | 85,950 | 420,374 | |
| JA Solar Technology Co. Ltd. (A Shares) | 307,936 | 943,531 | |
| Jason Furniture Hangzhou Co. Ltd. (A Shares) | 73,430 | 371,783 | |
| JCET Group Co. Ltd. (A Shares) | 164,000 | 692,261 | |
| JD Health International, Inc. (a)(c) | 1,727,450 | 7,846,561 | |
| JD Logistics, Inc. (a)(c) | 3,089,800 | 3,658,621 | |
| JD.com, Inc. Class A | 3,722,249 | 47,321,556 | |
| Jiangsu Eastern Shenghong Co. Ltd. | 613,400 | 892,509 | |
| Jiangsu Expressway Co. Ltd. (H Shares) | 1,866,000 | 1,696,460 | |
| Jiangsu Hengli Hydraulic Co. Ltd. | 122,832 | 945,519 | |
| Jiangsu Hengrui Medicine Co. Ltd. (A Shares) | 593,366 | 3,886,209 | |
| Jiangsu King's Luck Brewery JSC Ltd. (A Shares) | 116,000 | 927,660 | |
| Jiangsu Nhwa Pharmaceutical Co. Ltd. (A Shares) | 92,200 | 331,421 | |
| Jiangsu Pacific Quartz Co. Ltd. (A Shares) | 33,500 | 421,235 | |
| Jiangsu Phoenix Publishing & Media Corp. Ltd. | 230,800 | 303,210 | |
| Jiangsu Yanghe Brewery JSC Ltd. (A Shares) | 140,000 | 2,334,978 | |
| Jiangsu Yangnong Chemical Co. Ltd. (A Shares) | 37,350 | 344,895 | |
| Jiangsu Yoke Technology Co. Ltd. (A Shares) | 43,700 | 345,110 | |
| Jiangsu Yuyue Medical Equipment & Supply Co. Ltd. (A Shares) | 93,900 | 431,888 | |
| Jiangsu Zhongtian Technology Co. Ltd. (A Shares) | 313,200 | 599,968 | |
| Jiangxi Copper Co. Ltd.: | |||
| (A Shares) | 16,300 | 40,862 | |
| (H Shares) | 2,153,000 | 3,044,248 | |
| Jiangxi Special Electric Motor Co. Ltd. (A Shares) (a) | 151,500 | 248,074 | |
| Jinduicheng Molybdenum Co. Ltd. (A Shares) | 290,200 | 398,430 | |
| Jinko Solar Co. Ltd. (A Shares) | 620,853 | 805,623 | |
| JiuGui Liquor Co. Ltd. (A Shares) | 30,400 | 317,641 | |
| Jiumaojiu International Holdings Ltd. (c) | 1,519,000 | 1,652,852 | |
| Jizhong Energy Resources Co. Ltd. (A Shares) | 312,500 | 274,353 | |
| Joincare Pharmaceutical Group Industry Co. Ltd. (A Shares) | 168,000 | 272,311 | |
| Jointown Pharmaceutical Group (A Shares) | 348,104 | 338,821 | |
| Jonjee Hi-Tech Industrial & Commercial Holding Co. Ltd. (A Shares) (a) | 69,300 | 318,377 | |
| JOYY, Inc. ADR | 71,588 | 2,786,205 | |
| Juewei Food Co. Ltd. | 57,400 | 277,203 | |
| Juneyao Airlines Co. Ltd. (A shares) (a) | 193,500 | 385,890 | |
| Kangmei Pharmaceutical Co. Ltd. rights (a)(d) | 10,730 | 0 | |
| Kanzhun Ltd. ADR (a) | 340,034 | 5,032,503 | |
| KE Holdings, Inc. ADR | 1,047,735 | 15,412,182 | |
| Keda Industrial Group Co. Ltd. | 162,400 | 241,909 | |
| Kingboard Chemical Holdings Ltd. | 1,019,000 | 2,481,547 | |
| Kingdee International Software Group Co. Ltd. (a) | 4,314,000 | 5,724,111 | |
| Kingnet Network Co. Ltd. (A Shares) | 195,900 | 289,072 | |
| Kingsoft Corp. Ltd. | 1,480,400 | 5,165,825 | |
| Kuaishou Technology Class B (a)(c) | 3,692,000 | 23,775,915 | |
| Kuang-Chi Technologies Co. Ltd. (A Shares) | 200,400 | 383,375 | |
| Kunlun Energy Co. Ltd. | 6,152,000 | 5,125,255 | |
| Kunlun Tech Co. Ltd. (A Shares) (a) | 110,100 | 473,895 | |
| Kweichow Moutai Co. Ltd. (A Shares) | 122,700 | 28,264,464 | |
| Lb Group Co. Ltd. (A Shares) | 214,100 | 545,012 | |
| Lenovo Group Ltd. | 11,628,000 | 13,531,877 | |
| Lens Technology Co. Ltd. (A Shares) | 455,500 | 813,897 | |
| Lepu Medical Technology Beijing Co. Ltd. (A Shares) | 174,300 | 410,544 | |
| Li Auto, Inc. Class A (a) | 1,780,018 | 30,106,564 | |
| Li Ning Co. Ltd. | 3,792,500 | 11,621,752 | |
| Liaoning Port Co. Ltd. (A Shares) | 1,825,800 | 376,808 | |
| Lingyi iTech Guangdong Co. (A Shares) | 643,200 | 534,755 | |
| Livzon Pharmaceutical Group, Inc. (A Shares) | 54,900 | 262,820 | |
| Longfor Properties Co. Ltd. (c) | 3,034,283 | 4,417,191 | |
| LONGi Green Energy Technology Co. Ltd. | 705,966 | 2,330,669 | |
| Lufax Holding Ltd. ADR | 1,073,530 | 1,025,006 | |
| Luxi Chemical Group Co. Ltd. | 167,000 | 259,268 | |
| Luxshare Precision Industry Co. Ltd. (A Shares) | 665,082 | 2,986,950 | |
| Luzhou Laojiao Co. Ltd. (A Shares) | 137,300 | 4,022,276 | |
| Mango Excellent Media Co. Ltd. (A Shares) | 171,894 | 594,272 | |
| Maxscend Microelectronics Co. Ltd. (A Shares) | 49,716 | 1,025,908 | |
| Meihua Holdings Group Co. Ltd. (A Shares) | 238,200 | 309,429 | |
| Meinian Onehealth Healthcare Holdings Co. Ltd. (A Shares) (a) | 348,864 | 294,161 | |
| Meituan Class B (a)(c) | 8,025,300 | 113,758,741 | |
| Metallurgical Corp. China Ltd. (A Shares) | 1,525,600 | 690,460 | |
| Microport Scientific Corp. (a) | 1,307,900 | 2,060,951 | |
| Ming Yang Smart Energy Group Ltd. (A Shares) | 205,000 | 391,961 | |
| MINISO Group Holding Ltd. ADR | 146,483 | 3,707,485 | |
| Minth Group Ltd. | 1,166,000 | 2,602,778 | |
| Montage Technology Co. Ltd. (A Shares) | 105,349 | 794,343 | |
| Muyuan Foodstuff Co. Ltd. (A Shares) | 505,570 | 2,607,706 | |
| Nanjing King-Friend Biochemical Pharmaceutical Co. Ltd. | 161,458 | 279,281 | |
| Nanjing Securities Co. Ltd. (A Shares) | 374,100 | 411,401 | |
| NARI Technology Co. Ltd. (A Shares) | 739,640 | 2,284,157 | |
| National Silicon Industry Group Co. Ltd. (A Shares) (a) | 254,582 | 631,861 | |
| NAURA Technology Group Co. Ltd. | 49,400 | 1,732,889 | |
| NavInfo Co. Ltd. (A Shares) (a) | 201,200 | 275,253 | |
| NetEase, Inc. | 3,062,735 | 65,547,279 | |
| New China Life Insurance Co. Ltd. | 69,700 | 318,594 | |
| New China Life Insurance Co. Ltd. (H Shares) | 1,607,700 | 3,526,748 | |
| New Hope Liuhe Co. Ltd. (A Shares) (a) | 431,900 | 599,478 | |
| New Oriental Education & Technology Group, Inc. (a) | 2,398,730 | 15,639,809 | |
| Ninestar Corp. (A Shares) | 128,800 | 432,135 | |
| Ningbo Deye Technology Co. Ltd. (A Shares) | 39,740 | 376,052 | |
| Ningbo Joyson Electronic Corp. (A shares) | 122,900 | 316,973 | |
| Ningbo Orient Wires & Cables Co. Ltd. (A Shares) | 63,000 | 362,801 | |
| Ningbo Ronbay New Energy Technology Co. Ltd. (A Shares) | 41,708 | 252,702 | |
| Ningbo Shanshan Co. Ltd. (A Shares) | 202,700 | 388,110 | |
| Ningbo Tuopu Group Co. Ltd. (A Shares) | 102,200 | 902,912 | |
| Ningxia Baofeng Energy Group Co. Ltd. | 672,700 | 1,326,653 | |
| NIO, Inc. sponsored ADR (a)(b) | 2,198,788 | 16,051,152 | |
| Nongfu Spring Co. Ltd. (H Shares) (c) | 2,756,200 | 15,698,607 | |
| North Industries Group Red Arrow Co. Ltd. (A Shares) | 125,900 | 245,527 | |
| Offcn Education Technology Co. A Shares (a) | 563,600 | 304,483 | |
| Offshore Oil Enginering Co. Ltd. (A Shares) | 358,900 | 304,982 | |
| Oppein Home Group, Inc. (A Shares) | 46,300 | 551,052 | |
| Orient Securities Co. Ltd. (A Shares) | 684,072 | 811,461 | |
| Oriental Pearl Group Co. Ltd. | 294,200 | 297,023 | |
| Ovctek China, Inc. (A Shares) | 84,029 | 289,824 | |
| Pangang Group Vanadium Titanium & Resources Co. Ltd. (A Shares) (a) | 865,600 | 413,415 | |
| PDD Holdings, Inc. ADR (a) | 945,161 | 95,858,229 | |
| People's Insurance Co. of China Group Ltd.: | |||
| (A Shares) | 3,335,700 | 2,435,538 | |
| (H Shares) | 8,404,000 | 2,772,980 | |
| People.cn Co. Ltd. (A Shares) | 102,000 | 452,303 | |
| Perfect World Co. Ltd. (A Shares) | 186,450 | 306,091 | |
| PetroChina Co. Ltd.: | |||
| (A Shares) | 1,264,500 | 1,231,994 | |
| (H Shares) | 34,608,000 | 22,589,184 | |
| Pharmaron Beijing Co. Ltd.: | |||
| (A Shares) | 25 | 114 | |
| (H Shares) (c) | 317,500 | 757,914 | |
| PICC Property & Casualty Co. Ltd. (H Shares) | 11,028,001 | 12,593,483 | |
| Ping An Bank Co. Ltd. (A Shares) | 1,716,700 | 2,455,896 | |
| Ping An Healthcare and Technology Co. Ltd. (a)(b)(c) | 906,800 | 2,118,221 | |
| Ping An Insurance Group Co. of China Ltd.: | |||
| (A Shares) | 1,516,577 | 9,425,026 | |
| (H Shares) | 10,028,500 | 50,869,332 | |
| Piotech, Inc. (A Shares) | 17,480 | 604,065 | |
| Poly Developments & Holdings (A Shares) | 1,098,800 | 1,654,003 | |
| Pop Mart International Group Ltd. (c) | 735,600 | 2,030,633 | |
| Postal Savings Bank of China Co. Ltd. | 2,545,500 | 1,590,383 | |
| Postal Savings Bank of China Co. Ltd. (H Shares) (c) | 12,507,000 | 5,708,561 | |
| Power Construction Corp. of China Ltd. (A Shares) | 1,519,639 | 1,092,938 | |
| Prosus NV (b) | 2,405,169 | 67,261,953 | |
| Pylon Technologies Co. Ltd. (Series A) | 16,258 | 253,188 | |
| Qi An Xin Technology Group, Inc. (A Shares) (a) | 61,242 | 386,375 | |
| Qifu Technology, Inc. ADR | 175,571 | 2,596,695 | |
| Qinghai Salt Lake Potash Co. Ltd. Class A (a) | 496,200 | 1,149,029 | |
| Raytron Technology Co. Ltd. (A Shares) | 42,137 | 271,401 | |
| Risen Energy Co. Ltd. (A Shares) | 104,100 | 252,828 | |
| Riyue Heavy Industry Co. Ltd. (A Shares) | 90,600 | 174,361 | |
| Rockchip Electronics Co. Ltd. | 32,100 | 286,076 | |
| Rongsheng Petrochemical Co. Ltd. (A Shares) | 941,650 | 1,466,920 | |
| SAIC Motor Corp. Ltd. (A Shares) | 638,300 | 1,267,587 | |
| Sailun Group Co. Ltd. A Shares | 275,000 | 422,344 | |
| Sanan Optoelectronics Co. Ltd. (A Shares) | 464,300 | 945,163 | |
| Sangfor Technologies, Inc. (a) | 37,400 | 429,127 | |
| Sany Heavy Equipment International Holdings Co. Ltd. | 1,721,000 | 2,260,735 | |
| Sany Heavy Industry Co. Ltd. (A Shares) | 767,300 | 1,517,462 | |
| Satellite Chemical Co. Ltd. (A Shares) | 307,101 | 682,676 | |
| SDIC Capital Co. Ltd. | 531,500 | 496,655 | |
| SDIC Power Holdings Co. Ltd. (A Shares) | 671,200 | 1,119,781 | |
| Seazen Holdings Co. Ltd. (A Shares) (a) | 202,400 | 328,739 | |
| Seres Group Co. Ltd. (A Shares) (a) | 138,500 | 1,546,126 | |
| SF Holding Co. Ltd. (A Shares) | 444,300 | 2,384,322 | |
| SG Micro Corp. (A Shares) | 43,557 | 534,201 | |
| Shaanxi Coal Industry Co. Ltd. (A Shares) | 865,700 | 2,134,686 | |
| Shan Xi Hua Yang Group New Energy Co. Ltd. | 307,650 | 339,311 | |
| Shandong Buchang Pharmaceuticals Co. Ltd. (A Shares) | 100,770 | 238,944 | |
| Shandong Gold Mining Co. Ltd.: | |||
| (A Shares) | 568,823 | 1,847,277 | |
| (H Shares) (c) | 744,250 | 1,394,299 | |
| Shandong Himile Mechanical Science & Technology Co. Ltd. (A Shares) | 71,000 | 312,188 | |
| Shandong Hualu Hengsheng Chemical Co. Ltd. (A Shares) | 194,500 | 855,601 | |
| Shandong Linglong Tyre Co. Ltd. (A Shares) | 129,800 | 355,335 | |
| Shandong Nanshan Aluminum Co. Ltd. (A Shares) | 1,009,900 | 428,056 | |
| Shandong Sun Paper Industry JSC Ltd. (A Shares) | 236,300 | 401,722 | |
| Shandong Weigao Medical Polymer Co. Ltd. (H Shares) | 3,863,200 | 3,585,791 | |
| Shanghai Aiko Solar Energy Co. Ltd. (A Shares) | 169,280 | 453,684 | |
| Shanghai Bairun Investment Holding Group Co. Ltd. (A Shares) | 95,444 | 343,613 | |
| Shanghai Baosight Software Co. Ltd. | 1,487,576 | 3,059,399 | |
| Shanghai Baosight Software Co. Ltd. (A Shares) | 12,362 | 72,100 | |
| Shanghai Construction Group Co. Ltd. (A Shares) | 1,042,233 | 374,848 | |
| Shanghai Electric Group Co. Ltd. (A Shares) (a) | 1,118,000 | 678,804 | |
| Shanghai Electric Power Co. Ltd. (A Shares) | 242,800 | 290,083 | |
| Shanghai Fosun Pharmaceutical (Group) Co. Ltd.: | |||
| (A Shares) | 58,600 | 227,943 | |
| (H Shares) | 1,062,500 | 2,451,669 | |
| Shanghai Friendess Electronic Technology Corp. Ltd. (A Shares) | 13,788 | 455,611 | |
| Shanghai Fudan Microelectronics Group Co. Ltd.: | |||
| (A Shares) | 45,778 | 303,167 | |
| (H Shares) (b) | 123,000 | 232,498 | |
| Shanghai International Airport Co. Ltd. (A Shares) (a) | 109,172 | 555,493 | |
| Shanghai International Port Group Co. Ltd. (A Shares) | 743,900 | 508,543 | |
| Shanghai Jinjiang International Hotels Co. Ltd. (A Shares) | 81,900 | 367,792 | |
| Shanghai Junshi Biosciences Co. Ltd. (A Shares) (a) | 71,882 | 450,833 | |
| Shanghai Lingang Holdings Corp. Ltd. (A Shares) | 224,360 | 329,126 | |
| Shanghai M&G Stationery, Inc. (A Shares) | 81,600 | 432,404 | |
| Shanghai Moons' Electric Co. Ltd. (A Shares) | 38,400 | 346,176 | |
| Shanghai Pharmaceuticals Holding Co. Ltd.: | |||
| (A Shares) | 800,800 | 1,973,458 | |
| (H Shares) | 369,400 | 537,403 | |
| Shanghai Pudong Development Bank Co. Ltd. (A Shares) | 4,032,200 | 3,760,218 | |
| Shanghai Putailai New Energy Technology Co. Ltd. | 186,751 | 638,959 | |
| Shanghai RAAS Blood Products Co. Ltd. (A Shares) | 658,400 | 628,862 | |
| Shanghai Rural Commercial Bank Co. Ltd. (A Shares) | 717,200 | 584,406 | |
| Shanghai Yuyuan Tourist Mart Group Co. Ltd. | 391,800 | 348,123 | |
| Shanxi Coal International Energy Group Co. Ltd. (A Shares) | 192,600 | 429,240 | |
| Shanxi Lu'an Environmental Energy Development Co. Ltd. (A Shares) | 255,900 | 665,869 | |
| Shanxi Meijin Energy Co. Ltd. (A Shares) (a) | 400,100 | 383,698 | |
| Shanxi Securities Co. Ltd. (A Shares) | 332,800 | 255,669 | |
| Shanxi Taigang Stainless Steel Co. Ltd. (A Shares) | 507,700 | 271,444 | |
| Shanxi Xinghuacun Fen Wine Factory Co. Ltd. (A Shares) | 114,060 | 3,853,284 | |
| Shanxi Xishan Coal & Electricity Power Co. Ltd. (A Shares) | 512,980 | 606,856 | |
| Shede Spirits Co. Ltd. (A Shares) | 31,000 | 488,191 | |
| Shenergy Co. Ltd. (A Shares) | 440,800 | 354,993 | |
| Shenghe Resources Holding Co. Ltd. (A Shares) | 159,600 | 233,371 | |
| Shengyi Technology Co. Ltd. | 216,100 | 519,719 | |
| Shennan Circuits Co. Ltd. (A Shares) | 47,440 | 451,377 | |
| Shenwan Hongyuan Group Co. Ltd. (A Shares) | 1,996,815 | 1,198,308 | |
| Shenzhen Capchem Technology Co. Ltd. (A Shares) | 68,620 | 414,158 | |
| Shenzhen Dynanonic Co. Ltd. (A Shares) | 25,880 | 278,401 | |
| Shenzhen Energy Group Co. Ltd. (A Shares) | 384,398 | 324,706 | |
| Shenzhen Inovance Technology Co. Ltd. (A Shares) | 131,000 | 1,083,083 | |
| Shenzhen International Holdings Ltd. | 2,235,236 | 1,473,297 | |
| Shenzhen Kaifa Technology Co. Ltd. (A Shares) | 143,000 | 336,444 | |
| Shenzhen Kangtai Biological Products Co. Ltd. | 104,080 | 431,648 | |
| Shenzhen Kedali Industry Co. Ltd. | 24,500 | 304,361 | |
| Shenzhen Kstar Science & Technology Co. Ltd. (A Shares) | 53,300 | 190,153 | |
| Shenzhen Mindray Bio-Medical Electronics Co. Ltd. (A Shares) (a) | 113,400 | 4,433,195 | |
| Shenzhen New Industries Biomedical Engineering Co. Ltd. | 72,900 | 685,746 | |
| Shenzhen Overseas Chinese Town Co. Ltd. (A Shares) (a) | 657,000 | 324,753 | |
| Shenzhen Salubris Pharmaceuticals Co. Ltd. (A Shares) | 100,900 | 449,257 | |
| Shenzhen SC New Energy Technology Corp. (A Shares) | 32,300 | 322,459 | |
| Shenzhen Sed Industry Co. Ltd. (A Shares) | 104,300 | 273,306 | |
| Shenzhen Senior Technology Material Co. Ltd. (A Shares) | 115,940 | 243,603 | |
| Shenzhen Sunlord Electronics Co. Ltd. (A Shares) | 78,600 | 313,784 | |
| Shenzhen Transsion Holdings Co. Ltd. (A Shares) (a) | 74,621 | 1,371,570 | |
| Shenzhen YUTO Packaging Technology Co. Ltd. (A Shares) | 79,300 | 284,725 | |
| Shenzhou International Group Holdings Ltd. | 1,328,400 | 13,048,173 | |
| Shijiazhuang Yiling Pharmaceutical Co. Ltd. (A Shares) | 152,160 | 462,341 | |
| Shuangliang Eco-Energy Systems Ltd. (A Shares) | 178,200 | 228,119 | |
| Sichuan Chuantou Energy Co. Ltd. (A Shares) | 392,500 | 789,428 | |
| Sichuan Hebang Biotechnology Co. Ltd. (A Shares) | 901,300 | 293,396 | |
| Sichuan Kelun Pharmaceutical Co. Ltd. (A Shares) | 134,600 | 505,674 | |
| Sichuan New Energy Power Co. Ltd. (A Shares) (a) | 122,300 | 195,966 | |
| Sichuan Road & Bridge (Group) Co. Ltd. (A Shares) | 598,500 | 630,883 | |
| Sichuan Swellfun Co. Ltd. (A Shares) | 45,200 | 377,814 | |
| Sichuan Yahua Industrial Group Co. Ltd. (A Shares) | 100,400 | 193,411 | |
| Sieyuan Electric Co. Ltd. (A Shares) | 73,300 | 494,129 | |
| Silergy Corp. | 506,000 | 4,519,064 | |
| Sinolink Securities Co. Ltd. (A Shares) | 377,000 | 471,214 | |
| Sinoma International Engineering Co. Ltd. (A Shares) | 244,200 | 329,360 | |
| Sinoma Science & Technology Co. Ltd. (A Shares) | 152,900 | 361,539 | |
| Sinomine Resource Group Co. Ltd. (A Shares) | 66,328 | 339,160 | |
| Sinopec Shanghai Petrochemical Co. Ltd. (A Shares) (a) | 552,400 | 225,995 | |
| Sinopharm Group Co. Ltd. (H Shares) | 2,080,400 | 4,974,826 | |
| Sinotruk Hong Kong Ltd. | 1,061,500 | 1,999,339 | |
| SITC International Holdings Co. Ltd. | 2,095,000 | 3,227,150 | |
| SKSHU Paint Co. Ltd. (A Shares) | 48,612 | 395,779 | |
| Smoore International Holdings Ltd. (b)(c) | 2,849,000 | 2,195,605 | |
| Songcheng Performance Development Co. Ltd. (A Shares) | 225,152 | 338,176 | |
| Soochow Securities Co. Ltd. (A Shares) | 433,225 | 475,114 | |
| Southwest Securities Co. Ltd. (A Shares) | 582,900 | 326,778 | |
| Spring Airlines Co. Ltd. (A Shares) (a) | 89,700 | 671,586 | |
| StarPower Semiconductor Ltd. (A Shares) | 16,000 | 376,716 | |
| Sungrow Power Supply Co. Ltd. (A Shares) | 138,000 | 1,590,613 | |
| Sunny Optical Technology Group Co. Ltd. | 1,108,200 | 9,284,426 | |
| Sunresin New Materials Co. Ltd. (A Shares) | 47,200 | 350,835 | |
| Sunwoda Electronic Co. Ltd. (A Shares) | 162,600 | 358,200 | |
| SUPCON Technology Co. Ltd. (A Shares) | 67,238 | 401,284 | |
| Suzhou Dongshan Precision Manufacturing Co. Ltd. (A Shares) | 156,500 | 400,873 | |
| Suzhou Maxwell Technologies Co. Ltd. (A Shares) | 25,868 | 427,212 | |
| Suzhou TFC Optical Communication Co. Ltd. (A Shares) | 36,500 | 356,966 | |
| TAL Education Group ADR (a) | 687,874 | 6,032,655 | |
| Tangshan Jidong Cement Co. Ltd. A Shares | 264,300 | 258,456 | |
| TBEA Co. Ltd. (A Shares) | 443,750 | 849,414 | |
| TCL Technology Group Corp. (A Shares) | 1,682,520 | 904,900 | |
| TCL Zhonghuan Renewable Energy Technology Co. Ltd. (A Shares) | 375,200 | 947,451 | |
| Tencent Holdings Ltd. | 10,589,600 | 391,907,924 | |
| Tencent Music Entertainment Group ADR (a) | 1,166,005 | 8,465,196 | |
| Thunder Software Technology Co. Ltd. (A Shares) | 42,600 | 409,405 | |
| Tianjin 712 Communication & Broadcasting Co. Ltd. | 70,300 | 255,808 | |
| Tianma Microelectronics Co. Ltd. (A Shares) (a) | 218,000 | 292,131 | |
| Tianqi Lithium Corp. (A Shares) | 135,500 | 1,019,728 | |
| Tianshan Aluminum Group Co. Ltd. | 419,900 | 371,983 | |
| Tianshui Huatian Technology Co. Ltd. (A Shares) | 288,900 | 352,909 | |
| Tingyi (Cayman Islands) Holding Corp. | 3,120,000 | 4,141,214 | |
| Titan Wind Energy Suzhou Co. Ltd. (A Shares) (a) | 159,500 | 290,964 | |
| Tongcheng Travel Holdings Ltd. (a) | 1,952,800 | 3,730,729 | |
| TongFu Microelectronics Co. Ltd. (A Shares) | 138,900 | 390,062 | |
| Tongkun Group Co. Ltd. (A Shares) (a) | 229,300 | 453,028 | |
| Tongling Nonferrous Metals Group Co. Ltd. (A Shares) | 920,100 | 390,888 | |
| Tongwei Co. Ltd. (A Shares) | 417,200 | 1,558,703 | |
| Topchoice Medical Corp. (a) | 29,700 | 363,994 | |
| Topsports International Holdings Ltd. (c) | 2,865,000 | 2,409,299 | |
| TravelSky Technology Ltd. (H Shares) | 1,459,000 | 2,304,831 | |
| Trina Solar Co. Ltd. (A Shares) | 202,669 | 827,730 | |
| Trip.com Group Ltd. (a) | 872,843 | 29,747,907 | |
| Tsingtao Brewery Co. Ltd.: | |||
| (A Shares) | 57,300 | 654,921 | |
| (H Shares) | 982,000 | 7,447,025 | |
| Uni-President China Holdings Ltd. | 2,015,000 | 1,371,391 | |
| Unigroup Guoxin Microelectronics Co. Ltd. (a) | 79,359 | 818,359 | |
| Unisplendour Corp. Ltd. (A Shares) (a) | 265,180 | 711,696 | |
| Universal Scientific Industrial Shanghai Co. Ltd. (A Shares) | 168,200 | 334,147 | |
| Verisilicon Microelectronics Shanghai Co. Ltd. (A Shares) (a) | 46,295 | 337,892 | |
| Vipshop Holdings Ltd. ADR (a) | 542,757 | 7,739,715 | |
| Walvax Biotechnology Co. Ltd. (A Shares) | 150,900 | 480,483 | |
| Wanda Film Holding Co. Ltd. (A Shares) (a) | 190,200 | 324,884 | |
| Wanhua Chemical Group Co. Ltd. (A Shares) | 290,700 | 3,526,981 | |
| Want Want China Holdings Ltd. | 7,347,000 | 4,565,131 | |
| Weibo Corp. sponsored ADR | 124,777 | 1,476,112 | |
| Weichai Power Co. Ltd.: | |||
| (A Shares) | 257,700 | 489,861 | |
| (H Shares) | 3,513,800 | 5,259,533 | |
| Weihai Guangwei Composites Co. Ltd. (A Shares) | 77,560 | 271,693 | |
| Wens Foodstuffs Group Co. Ltd. (A Shares) | 604,020 | 1,551,594 | |
| Western Mining Co. Ltd. (A Shares) | 210,600 | 362,133 | |
| Western Securities Co. Ltd. (A Shares) | 499,740 | 454,977 | |
| Western Superconducting Technologies Co. Ltd. (A Shares) | 60,200 | 380,648 | |
| Will Semiconductor Ltd. | 109,715 | 1,655,676 | |
| Wilmar International Ltd. | 2,977,780 | 7,741,590 | |
| Wingtech Technology Co. Ltd. (A Shares) (a) | 115,700 | 787,709 | |
| Wintime Energy Group Co. Ltd. (A Shares) (a) | 1,893,800 | 354,812 | |
| Wuchan Zhongda Group Co. Ltd. | 515,800 | 322,338 | |
| Wuhan Guide Infrared Co. Ltd. (A Shares) | 405,243 | 439,079 | |
| Wuliangye Yibin Co. Ltd. (A Shares) | 361,500 | 7,707,576 | |
| WUS Printed Circuit Kunshan Co. Ltd. (A Shares) | 176,240 | 472,031 | |
| WuXi AppTec Co. Ltd. | 156,296 | 1,848,303 | |
| WuXi AppTec Co. Ltd. (H Shares) (b)(c) | 654,774 | 7,868,122 | |
| Wuxi Autowell Technology Co. Ltd. (A Shares) | 14,482 | 270,604 | |
| Wuxi Biologics (Cayman), Inc. (a)(c) | 6,067,500 | 37,726,149 | |
| XCMG Construction Machinery Co. Ltd. (A Shares) | 1,057,300 | 828,237 | |
| Xiamen C&D, Inc. (A Shares) | 250,800 | 335,196 | |
| Xiamen Faratronic Co. Ltd. (A Shares) | 21,000 | 286,619 | |
| Xiamen Tungsten Co. Ltd. (A Shares) | 130,200 | 301,806 | |
| Xiaomi Corp. Class B (a)(c) | 24,419,000 | 43,783,854 | |
| Xinjiang Daqo New Energy Co. Ltd. (A Shares) | 164,580 | 803,883 | |
| Xinyi Solar Holdings Ltd. | 7,605,450 | 4,475,878 | |
| XPeng, Inc. Class A (a)(b) | 1,645,264 | 11,955,766 | |
| XTEP International Holdings Ltd. | 2,250,500 | 2,046,004 | |
| Yadea Group Holdings Ltd. (c) | 1,908,000 | 3,482,787 | |
| Yangzhou Yangjie Electronic Technology Co. Ltd. (A Shares) | 46,600 | 242,003 | |
| Yankuang Energy Group Co. Ltd.: | |||
| (A Shares) | 105,000 | 280,524 | |
| (H Shares) | 4,007,000 | 6,959,193 | |
| Yantai Jereh Oilfield Services (A Shares) | 88,800 | 347,285 | |
| Yealink Network Technology Corp. Ltd. | 117,050 | 534,114 | |
| Yifeng Pharmacy Chain Co. Ltd. | 89,940 | 402,976 | |
| Yihai International Holding Ltd. | 801,000 | 1,457,740 | |
| Yihai Kerry Arawana Holdings Co. Ltd. (A Shares) | 133,500 | 638,550 | |
| Yintai Gold Co. Ltd. (A Shares) | 258,480 | 478,313 | |
| Yonghui Superstores Co. Ltd. (A Shares) (a) | 827,900 | 348,597 | |
| YongXing Special Materials Technology Co. Ltd. (A Shares) | 49,420 | 338,067 | |
| Yonyou Network Technology Co. Ltd. (A Shares) | 310,420 | 695,420 | |
| Youngor Group Co. Ltd. (A Shares) | 729,177 | 673,037 | |
| YTO Express Group Co. Ltd. (A Shares) | 310,700 | 577,088 | |
| Yuan Longping High-tech Agriculture Co. Ltd. (A Shares) (a) | 99,200 | 223,605 | |
| Yuexiu Property Co. Ltd. | 2,701,920 | 2,810,424 | |
| Yum China Holdings, Inc. | 666,347 | 35,023,198 | |
| Yunda Holding Co. Ltd. (A Shares) | 252,250 | 314,469 | |
| Yunnan Aluminium Co. Ltd. (A Shares) | 317,100 | 602,907 | |
| Yunnan Baiyao Group Co. Ltd. (A Shares) | 165,820 | 1,152,401 | |
| Yunnan Botanee Bio-Technology Group Co., Ltd. (A Shares) | 39,700 | 428,186 | |
| Yunnan Chihong Zinc & Germanium Co. Ltd. (A Shares) | 463,900 | 328,142 | |
| Yunnan Energy New Material Co. Ltd. | 90,800 | 833,580 | |
| Yunnan Tin Co. Ltd. (A Shares) | 157,100 | 303,528 | |
| Yunnan Yuntianhua Co. Ltd. (Series A) | 160,100 | 364,627 | |
| Yutong Bus Co. Ltd. | 192,900 | 359,719 | |
| Zai Lab Ltd. (a) | 1,453,500 | 3,709,414 | |
| Zangge Mining Co. Ltd. (Series A) | 143,700 | 439,865 | |
| Zhangzhou Pientzehuang Pharmaceutical Co. Ltd. (A Shares) | 56,200 | 1,923,618 | |
| Zhaojin Mining Industry Co. Ltd. (H Shares) | 2,041,000 | 2,530,327 | |
| Zhefu Holding Group Co. Ltd. (A Shares) | 486,000 | 245,822 | |
| Zhejiang Century Huatong Group Co. Ltd. (A Shares) (a) | 702,900 | 568,040 | |
| Zhejiang China Commodities City Group Co. Ltd. (A Shares) | 513,400 | 546,351 | |
| Zhejiang Chint Electric Co. Ltd. (A Shares) | 185,400 | 585,949 | |
| Zhejiang Dahua Technology Co. Ltd. (A Shares) (a) | 308,600 | 861,575 | |
| Zhejiang Dingli Machinery Co. Ltd. (A Shares) | 44,240 | 329,527 | |
| Zhejiang Expressway Co. Ltd. (H Shares) | 1,934,000 | 1,455,791 | |
| Zhejiang Huahai Pharmaceutical Co. Ltd. (A Shares) | 133,880 | 296,083 | |
| Zhejiang Huayou Cobalt Co. Ltd. (A Shares) | 148,600 | 748,042 | |
| Zhejiang Jingsheng Mechanical & Electrical Co. Ltd. (A Shares) | 122,000 | 725,651 | |
| Zhejiang Jiuzhou Pharmaceutical Co. Ltd. (A Shares) | 84,000 | 341,433 | |
| Zhejiang Juhua Co. Ltd. (A Shares) | 249,800 | 517,265 | |
| Zhejiang Longsheng Group Co. Ltd. (A Shares) | 305,900 | 372,238 | |
| Zhejiang NHU Co. Ltd. (A Shares) | 284,508 | 629,202 | |
| Zhejiang Sanhua Intelligent Controls Co. Ltd. (A Shares) | 165,600 | 606,208 | |
| Zhejiang Supor Cookware Co. Ltd. | 46,000 | 315,489 | |
| Zhejiang Weiming Enviroment Protection Co. Ltd. (A Shares) | 208,520 | 511,567 | |
| Zhejiang Weixing New Building Materials Co. Ltd. (A Shares) | 131,100 | 295,559 | |
| Zhejiang Zheneng Electric Power Co. Ltd. (A Shares) (a) | 1,006,000 | 632,631 | |
| Zheshang Securities Co. Ltd. | 325,800 | 448,792 | |
| ZhongAn Online P & C Insurance Co. Ltd. (H Shares) (a)(c) | 1,128,400 | 3,092,514 | |
| Zhongji Innolight Co. Ltd. (A Shares) | 74,500 | 897,684 | |
| Zhongjin Gold Co. Ltd. (A Shares) | 447,200 | 664,969 | |
| Zhongsheng Group Holdings Ltd. Class H | 1,294,500 | 2,989,384 | |
| Zhongtai Securities Co. Ltd. (A Shares) | 607,800 | 595,057 | |
| Zhuzhou CRRC Times Electric Co. Ltd. (H Shares) | 929,400 | 2,999,516 | |
| Zhuzhou Kibing Group Co. Ltd. (A Shares) | 216,100 | 235,787 | |
| Zibo Qixiang Tengda Chemical Co. Ltd. (A Shares) | 277,600 | 222,090 | |
| Zijin Mining Group Co. Ltd.: | |||
| (A Shares) (a) | 689,400 | 1,169,496 | |
| (H Shares) | 10,099,000 | 15,622,263 | |
| Zoomlion Heavy Industry Science and Technology Co. Ltd. (A Shares) | 832,200 | 730,402 | |
| ZTE Corp.: | |||
| (A Shares) | 94,700 | 338,663 | |
| (H Shares) | 1,622,936 | 3,606,582 | |
| ZTO Express, Inc. sponsored ADR (b) | 688,784 | 16,234,639 | |
TOTAL CHINA | 3,055,413,017 | ||
| Colombia - 0.0% | |||
| Bancolombia SA | 339,687 | 2,422,209 | |
| Interconexion Electrica SA ESP | 692,211 | 2,438,547 | |
TOTAL COLOMBIA | 4,860,756 | ||
| Czech Republic - 0.0% | |||
| CEZ A/S | 251,088 | 10,743,843 | |
| Komercni Banka A/S | 118,322 | 3,465,295 | |
| MONETA Money Bank A/S (c) | 513,426 | 1,983,518 | |
TOTAL CZECH REPUBLIC | 16,192,656 | ||
| Denmark - 2.1% | |||
| A.P. Moller - Maersk A/S: | |||
| Series A | 4,966 | 8,096,261 | |
| Series B | 7,486 | 12,473,405 | |
| Carlsberg A/S Series B | 155,166 | 18,491,631 | |
| Chr. Hansen Holding A/S | 167,577 | 11,415,311 | |
| Coloplast A/S Series B | 215,592 | 22,464,663 | |
| Danske Bank A/S | 1,085,488 | 25,430,004 | |
| Demant A/S (a) | 156,298 | 5,953,893 | |
| DSV A/S | 293,316 | 43,745,303 | |
| Genmab A/S (a) | 104,833 | 29,634,498 | |
| Novo Nordisk A/S Series B | 5,154,866 | 497,322,068 | |
| Novozymes A/S Series B | 325,208 | 14,596,612 | |
| ORSTED A/S (c) | 299,908 | 14,491,292 | |
| Pandora A/S | 137,597 | 15,570,431 | |
| Rockwool International A/S Series B | 13,803 | 3,068,312 | |
| Tryg A/S | 544,529 | 10,626,180 | |
| Vestas Wind Systems A/S (a) | 1,600,969 | 34,700,655 | |
TOTAL DENMARK | 768,080,519 | ||
| Egypt - 0.0% | |||
| Commercial International Bank SAE | 3,908,953 | 7,628,304 | |
| Eastern Co. SAE | 1,558,349 | 1,325,290 | |
| EFG-Hermes Holding SAE | 1,995,216 | 1,077,449 | |
TOTAL EGYPT | 10,031,043 | ||
| Finland - 0.7% | |||
| Elisa Corp. (A Shares) | 228,446 | 9,688,086 | |
| Fortum Corp. (b) | 696,436 | 8,253,268 | |
| Kesko Oyj | 422,015 | 7,128,916 | |
| Kone OYJ (B Shares) | 538,048 | 23,279,028 | |
| Metso Corp. | 1,055,172 | 9,273,462 | |
| Neste OYJ | 668,914 | 22,443,637 | |
| Nokia Corp. (b) | 8,483,820 | 28,256,912 | |
| Nordea Bank Abp | 5,067,385 | 53,250,340 | |
| Orion Oyj (B Shares) | 167,475 | 6,652,287 | |
| Sampo Oyj (A Shares) | 725,435 | 28,484,997 | |
| Stora Enso Oyj (R Shares) | 931,869 | 11,166,570 | |
| UPM-Kymmene Corp. (b) | 849,126 | 28,544,081 | |
| Wartsila Corp. | 734,201 | 8,731,885 | |
TOTAL FINLAND | 245,153,469 | ||
| France - 6.4% | |||
| Accor SA | 294,732 | 9,377,508 | |
| Adevinta ASA Class B (a) | 448,300 | 3,934,832 | |
| Aeroports de Paris SA (b) | 45,367 | 5,078,699 | |
| Air Liquide SA | 779,016 | 133,486,146 | |
| Airbus Group NV | 937,044 | 125,635,313 | |
| Alstom SA (b) | 466,834 | 6,322,083 | |
| Amundi SA (c) | 95,401 | 4,968,454 | |
| Arkema SA | 97,434 | 9,111,529 | |
| AXA SA | 2,891,317 | 85,670,953 | |
| bioMerieux SA | 64,123 | 6,140,293 | |
| BNP Paribas SA | 1,654,675 | 95,150,473 | |
| Bollore SA | 1,238,835 | 6,750,678 | |
| Bouygues SA | 320,966 | 11,278,585 | |
| Bureau Veritas SA | 471,391 | 10,718,757 | |
| Capgemini SA | 261,057 | 46,136,288 | |
| Carrefour SA (b) | 952,383 | 16,696,666 | |
| Compagnie de St.-Gobain | 745,185 | 40,563,509 | |
| Compagnie Generale des Etablissements Michelin SCA Series B | 1,068,509 | 31,743,752 | |
| Covivio | 76,411 | 3,266,359 | |
| Credit Agricole SA | 1,903,956 | 22,990,059 | |
| Danone SA | 1,017,873 | 60,553,727 | |
| Dassault Aviation SA | 34,798 | 6,903,706 | |
| Dassault Systemes SA | 1,058,934 | 43,621,060 | |
| Edenred SA | 397,059 | 21,107,237 | |
| Eiffage SA | 113,760 | 10,315,662 | |
| Engie SA | 2,878,348 | 45,779,803 | |
| EssilorLuxottica SA | 465,285 | 84,009,153 | |
| Eurazeo SA | 66,187 | 3,722,225 | |
| Gecina SA | 71,477 | 7,003,321 | |
| Getlink SE | 578,547 | 9,326,266 | |
| Hermes International SCA | 49,929 | 92,959,447 | |
| Ipsen SA | 58,172 | 6,863,025 | |
| Kering SA | 117,551 | 47,808,189 | |
| Klepierre SA | 354,008 | 8,577,787 | |
| L'Oreal SA (a) | 23,733 | 9,975,709 | |
| L'Oreal SA | 356,729 | 149,944,156 | |
| La Francaise des Jeux SAEM (c) | 161,125 | 5,186,195 | |
| Legrand SA | 422,107 | 36,514,950 | |
| LVMH Moet Hennessy Louis Vuitton SE | 435,811 | 312,010,418 | |
| Orange SA | 2,937,269 | 34,548,299 | |
| Pernod Ricard SA | 322,955 | 57,237,880 | |
| Publicis Groupe SA | 363,983 | 27,621,553 | |
| Remy Cointreau SA | 35,432 | 4,017,118 | |
| Renault SA | 305,326 | 10,677,313 | |
| Safran SA | 541,200 | 84,546,018 | |
| Sartorius Stedim Biotech | 43,943 | 8,208,884 | |
| SEB SA | 37,994 | 3,744,765 | |
| Societe Generale Series A | 1,149,303 | 25,826,871 | |
| Sodexo SA | 131,516 | 13,899,009 | |
| Sodexo SA (a) | 8,142 | 860,471 | |
| Teleperformance | 94,052 | 10,762,701 | |
| Thales SA | 167,652 | 24,684,178 | |
| TotalEnergies SE | 3,547,324 | 237,165,151 | |
| Unibail-Rodamco-Westfield NV (a) | 183,790 | 9,073,886 | |
| Valeo SA | 319,013 | 4,199,093 | |
| Veolia Environnement SA | 1,074,870 | 29,451,868 | |
| VINCI SA | 836,137 | 92,455,346 | |
| Vivendi SA | 1,083,934 | 9,698,276 | |
| Wendel SA | 39,651 | 2,962,003 | |
| Worldline SA (a)(c) | 387,616 | 4,913,435 | |
TOTAL FRANCE | 2,333,757,090 | ||
| Germany - 4.8% | |||
| adidas AG | 256,262 | 45,336,417 | |
| Allianz SE | 635,335 | 148,822,487 | |
| BASF AG | 1,413,919 | 65,333,175 | |
| Bayer AG | 1,552,844 | 67,096,159 | |
| Bayerische Motoren Werke AG (BMW) | 506,629 | 46,975,301 | |
| Bechtle AG | 126,600 | 5,636,846 | |
| Beiersdorf AG | 158,422 | 20,794,045 | |
| Brenntag SE | 236,110 | 17,517,939 | |
| Carl Zeiss Meditec AG | 62,440 | 5,400,379 | |
| Commerzbank AG | 1,692,760 | 18,179,760 | |
| Continental AG | 174,952 | 11,422,438 | |
| Covestro AG (a)(c) | 306,511 | 15,470,030 | |
| Daimler Truck Holding AG | 779,849 | 24,441,187 | |
| Deutsche Bank AG | 3,071,152 | 33,652,712 | |
| Deutsche Borse AG | 300,337 | 49,434,407 | |
| Deutsche Lufthansa AG (a) | 979,332 | 6,843,271 | |
| Deutsche Telekom AG | 5,111,969 | 110,948,464 | |
| DHL Group | 1,565,742 | 60,900,719 | |
| E.ON SE | 3,542,901 | 42,060,902 | |
| Evonik Industries AG | 325,223 | 5,973,896 | |
| Fresenius Medical Care AG & Co. KGaA | 280,263 | 9,312,065 | |
| Fresenius Medical Care AG & Co. KGaA sponsored ADR | 93,838 | 1,560,526 | |
| Fresenius SE & Co. KGaA | 671,503 | 17,222,940 | |
| GEA Group AG | 246,629 | 8,410,681 | |
| Hannover Reuck SE | 95,194 | 20,980,970 | |
| HeidelbergCement AG | 230,453 | 16,698,322 | |
| HelloFresh AG (a) | 245,245 | 5,335,191 | |
| Henkel AG & Co. KGaA | 161,409 | 10,201,111 | |
| Infineon Technologies AG | 2,064,617 | 60,307,918 | |
| Knorr-Bremse AG | 111,548 | 6,201,240 | |
| LEG Immobilien AG (a) | 114,805 | 7,147,599 | |
| Mercedes-Benz Group AG (Germany) | 1,268,767 | 74,646,980 | |
| Merck KGaA | 204,484 | 30,799,489 | |
| MTU Aero Engines AG | 85,742 | 16,058,079 | |
| Muenchener Rueckversicherungs-Gesellschaft AG in Muenchen | 215,067 | 86,132,365 | |
| Nemetschek SE | 89,147 | 6,640,581 | |
| Puma AG | 168,472 | 9,501,270 | |
| Rational AG | 7,896 | 4,490,682 | |
| Rheinmetall AG | 69,615 | 19,917,564 | |
| RWE AG | 1,003,942 | 38,379,852 | |
| SAP SE | 1,648,841 | 221,162,888 | |
| Scout24 AG (c) | 116,323 | 7,141,181 | |
| Siemens AG | 1,200,471 | 159,301,140 | |
| Siemens Energy AG (a)(b) | 830,339 | 7,353,729 | |
| Siemens Healthineers AG (c) | 446,007 | 21,859,335 | |
| Symrise AG | 211,726 | 21,636,126 | |
| Talanx AG | 98,115 | 6,171,830 | |
| Telefonica Deutschland Holding AG | 1,398,279 | 2,372,409 | |
| Volkswagen AG | 44,685 | 5,165,581 | |
| Vonovia SE | 1,163,557 | 26,787,510 | |
| Wacker Chemie AG | 28,075 | 3,431,061 | |
| Zalando SE (a)(c) | 347,354 | 8,082,101 | |
TOTAL GERMANY | 1,742,650,850 | ||
| Greece - 0.1% | |||
| Alpha Bank SA (a) | 3,454,672 | 5,154,098 | |
| Eurobank Ergasias Services and Holdings SA (a) | 4,022,733 | 6,563,452 | |
| Ff Group (a)(d) | 7,962 | 0 | |
| Hellenic Telecommunications Organization SA | 302,698 | 4,237,367 | |
| Jumbo SA | 178,808 | 4,703,431 | |
| Motor Oil (HELLAS) Corinth Refineries SA | 101,617 | 2,419,221 | |
| Mytilineos SA | 165,618 | 6,129,909 | |
| National Bank of Greece SA (a) | 850,510 | 4,859,593 | |
| OPAP SA | 286,587 | 4,851,803 | |
| Piraeus Financial Holdings SA (a) | 1,060,871 | 3,131,796 | |
| Public Power Corp. of Greece (a) | 325,752 | 3,319,251 | |
TOTAL GREECE | 45,369,921 | ||
| Hong Kong - 1.4% | |||
| AIA Group Ltd. | 18,264,409 | 158,604,622 | |
| CK Asset Holdings Ltd. | 3,167,139 | 15,830,390 | |
| CK Infrastructure Holdings Ltd. | 987,631 | 4,577,709 | |
| CLP Holdings Ltd. | 2,620,476 | 19,178,694 | |
| Futu Holdings Ltd. ADR (a) | 86,418 | 4,791,878 | |
| Hang Lung Properties Ltd. | 2,780,125 | 3,654,356 | |
| Hang Seng Bank Ltd. | 1,226,453 | 14,022,143 | |
| Henderson Land Development Co. Ltd. | 2,237,869 | 5,855,296 | |
| HKT Trust/HKT Ltd. unit | 6,030,479 | 6,246,280 | |
| Hong Kong & China Gas Co. Ltd. | 17,429,350 | 12,132,725 | |
| Hong Kong Exchanges and Clearing Ltd. | 1,909,684 | 66,805,813 | |
| Hongkong Land Holdings Ltd. | 1,718,945 | 5,452,015 | |
| Jardine Matheson Holdings Ltd. | 255,864 | 10,367,901 | |
| Kingboard Laminates Holdings Ltd. | 1,439,500 | 1,349,951 | |
| Link (REIT) | 4,111,609 | 18,868,761 | |
| MTR Corp. Ltd. | 2,440,120 | 9,121,622 | |
| New World Development Co. Ltd. | 2,326,491 | 4,269,855 | |
| Nine Dragons Paper (Holdings) Ltd. | 2,525,000 | 1,437,431 | |
| Orient Overseas International Ltd. | 207,500 | 2,616,533 | |
| Power Assets Holdings Ltd. | 2,169,426 | 10,371,654 | |
| Prudential PLC | 4,355,549 | 45,543,314 | |
| Sino Biopharmaceutical Ltd. | 16,123,000 | 6,263,450 | |
| Sino Land Ltd. | 5,710,282 | 5,700,737 | |
| Sun Hung Kai Properties Ltd. | 2,308,422 | 23,704,504 | |
| Swire Pacific Ltd. (A Shares) | 668,060 | 4,267,462 | |
| Swire Properties Ltd. | 1,792,920 | 3,471,462 | |
| Techtronic Industries Co. Ltd. | 2,182,370 | 19,924,002 | |
| Vinda International Holdings Ltd. (b) | 566,000 | 1,398,716 | |
| WH Group Ltd. (c) | 13,029,743 | 7,781,795 | |
| Wharf Real Estate Investment Co. Ltd. | 2,591,349 | 9,064,642 | |
| Xinyi Glass Holdings Ltd. | 2,656,313 | 3,052,158 | |
TOTAL HONG KONG | 505,727,871 | ||
| Hungary - 0.1% | |||
| MOL Hungarian Oil and Gas PLC Series A (For. Reg.) | 690,263 | 5,492,316 | |
| OTP Bank PLC | 378,491 | 14,084,124 | |
| Richter Gedeon PLC | 220,610 | 5,172,695 | |
TOTAL HUNGARY | 24,749,135 | ||
| India - 4.3% | |||
| ABB India Ltd. | 82,394 | 4,062,513 | |
| Adani Enterprises Ltd. | 265,348 | 7,314,662 | |
| Adani Green Energy Ltd. (a) | 492,919 | 5,444,223 | |
| Adani Ports & Special Economic Zone Ltd. | 821,539 | 7,747,949 | |
| Adani Power Ltd. (a) | 1,200,146 | 5,227,937 | |
| Ambuja Cements Ltd. | 915,922 | 4,671,384 | |
| Apollo Hospitals Enterprise Ltd. | 156,793 | 9,076,104 | |
| Ashok Leyland Ltd. | 2,281,279 | 4,598,090 | |
| Asian Paints Ltd. | 611,961 | 22,037,034 | |
| Astral Ltd. | 186,351 | 4,141,279 | |
| AU Small Finance Bank Ltd. (c) | 260,653 | 2,094,331 | |
| Aurobindo Pharma Ltd. | 409,821 | 4,180,695 | |
| Avenue Supermarts Ltd. (a)(c) | 261,700 | 11,422,680 | |
| Axis Bank Ltd. | 3,623,506 | 42,743,989 | |
| Bajaj Auto Ltd. | 104,605 | 6,670,859 | |
| Bajaj Finance Ltd. | 433,436 | 39,006,090 | |
| Bajaj Finserv Ltd. | 592,761 | 11,173,595 | |
| Bajaj Holdings & Investment Ltd. | 41,341 | 3,438,387 | |
| Balkrishna Industries Ltd. | 120,071 | 3,681,701 | |
| Bandhan Bank Ltd. (c) | 1,130,014 | 2,908,894 | |
| Bank of Baroda | 1,607,101 | 3,788,289 | |
| Berger Paints India Ltd. | 460,117 | 3,086,330 | |
| Bharat Electronics Ltd. | 5,691,450 | 9,115,517 | |
| Bharat Forge Ltd. | 398,365 | 4,877,934 | |
| Bharat Petroleum Corp. Ltd. | 1,173,293 | 4,917,166 | |
| Bharti Airtel Ltd. | 3,563,541 | 39,125,373 | |
| Britannia Industries Ltd. | 168,270 | 8,948,518 | |
| Cg Power & Industrial Soluti | 947,979 | 4,438,158 | |
| Cholamandalam Investment and Finance Co. Ltd. | 637,788 | 8,713,250 | |
| Cipla Ltd./India (a) | 817,429 | 11,779,842 | |
| Coal India Ltd. | 2,370,514 | 8,945,403 | |
| Colgate-Palmolive Ltd. | 198,514 | 5,038,626 | |
| Container Corp. of India Ltd. | 424,872 | 3,512,284 | |
| Cummins India Ltd. | 214,795 | 4,325,200 | |
| Dabur India Ltd. | 968,683 | 6,151,848 | |
| Divi's Laboratories Ltd. | 185,196 | 7,534,594 | |
| DLF Ltd. | 961,881 | 6,514,228 | |
| Dr. Reddy's Laboratories Ltd. | 168,597 | 10,878,792 | |
| Eicher Motors Ltd. | 212,430 | 8,405,061 | |
| GAIL India Ltd. | 3,556,985 | 5,105,674 | |
| Godrej Consumer Products Ltd. | 637,805 | 7,597,214 | |
| Godrej Properties Ltd. (a) | 194,577 | 3,881,595 | |
| Grasim Industries Ltd. | 435,095 | 9,858,032 | |
| Havells India Ltd. | 394,769 | 5,908,554 | |
| HCL Technologies Ltd. | 1,517,594 | 23,270,591 | |
| HDFC Asset Management Co. Ltd. (c) | 132,622 | 4,354,968 | |
| HDFC Bank Ltd. | 4,409,396 | 78,219,446 | |
| HDFC Standard Life Insurance Co. Ltd. (c) | 1,557,682 | 11,568,070 | |
| Hero Motocorp Ltd. | 169,957 | 6,305,128 | |
| Hindalco Industries Ltd. | 1,914,067 | 10,562,036 | |
| Hindustan Aeronautics Ltd. | 259,794 | 5,683,838 | |
| Hindustan Petroleum Corp. Ltd. (a) | 868,663 | 2,583,587 | |
| Hindustan Unilever Ltd. | 1,309,874 | 39,079,460 | |
| ICICI Bank Ltd. | 8,189,032 | 90,067,339 | |
| ICICI Lombard General Insurance Co. Ltd. (c) | 373,781 | 6,167,207 | |
| ICICI Prudential Life Insurance Co. Ltd. (c) | 558,348 | 3,522,324 | |
| IDFC Bank Ltd. (a) | 5,460,496 | 5,424,768 | |
| Indian Oil Corp. Ltd. | 4,365,155 | 4,700,911 | |
| Indian Railway Catering & Tourism Corp. Ltd. | 375,573 | 3,001,048 | |
| Indraprastha Gas Ltd. | 499,690 | 2,294,677 | |
| Info Edge India Ltd. | 110,335 | 5,413,090 | |
| Infosys Ltd. | 4,921,844 | 80,919,446 | |
| Infosys Ltd. sponsored ADR | 345,030 | 5,665,393 | |
| InterGlobe Aviation Ltd. (a)(c) | 209,146 | 6,167,243 | |
| ITC Ltd. | 4,787,330 | 24,635,652 | |
| Jindal Steel & Power Ltd. | 564,249 | 4,295,009 | |
| Jio Financial Services Ltd. | 4,883,752 | 12,957,760 | |
| JSW Steel Ltd. (a) | 940,913 | 8,322,800 | |
| Jubilant Foodworks Ltd. | 616,626 | 3,709,194 | |
| Kotak Mahindra Bank Ltd. | 1,734,183 | 36,242,025 | |
| Larsen & Toubro Ltd. | 1,094,066 | 38,489,730 | |
| Ltimindtree Ltd. (c) | 138,080 | 8,398,399 | |
| Lupin Ltd. | 319,099 | 4,322,835 | |
| Mahindra & Mahindra Ltd. | 1,484,585 | 26,010,040 | |
| Marico Ltd. | 810,406 | 5,220,571 | |
| Maruti Suzuki India Ltd. | 216,957 | 27,084,827 | |
| Max Healthcare Institute Ltd. | 1,209,314 | 8,333,766 | |
| Mphasis BFL Ltd. | 117,177 | 2,990,672 | |
| MRF Ltd. | 2,964 | 3,855,338 | |
| Muthoot Finance Ltd. | 185,071 | 2,886,838 | |
| Nestle India Ltd. | 54,866 | 15,971,637 | |
| NTPC Ltd. | 7,003,835 | 19,837,037 | |
| Oil & Natural Gas Corp. Ltd. | 5,069,656 | 11,340,418 | |
| Page Industries Ltd. | 9,560 | 4,342,627 | |
| Petronet LNG Ltd. | 1,135,295 | 2,720,450 | |
| PI Industries Ltd. | 130,145 | 5,313,756 | |
| Pidilite Industries Ltd. | 238,788 | 7,048,121 | |
| Power Finance Corp. Ltd. | 2,027,096 | 6,001,449 | |
| Power Grid Corp. of India Ltd. | 7,495,537 | 18,199,281 | |
| REC Ltd. | 1,832,641 | 6,332,650 | |
| Reliance Industries Ltd. | 4,810,452 | 132,237,483 | |
| Samvardhana Motherson International Ltd. | 3,683,348 | 4,066,784 | |
| SBI Cards & Payment Services Ltd. | 440,680 | 3,947,917 | |
| SBI Life Insurance Co. Ltd. (c) | 700,280 | 11,498,154 | |
| Shree Cement Ltd. | 14,042 | 4,326,638 | |
| Shriram Transport Finance Co. Ltd. | 436,751 | 9,852,428 | |
| Siemens Ltd. | 138,175 | 5,526,856 | |
| Sona Blw Precision Forgings Ltd. (c) | 637,966 | 4,150,627 | |
| SRF Ltd. | 231,779 | 6,109,901 | |
| State Bank of India | 2,850,920 | 19,366,482 | |
| Sun Pharmaceutical Industries Ltd. | 1,541,702 | 20,150,462 | |
| Supreme Industries Ltd. | 98,972 | 5,144,698 | |
| Tata Consultancy Services Ltd. | 1,448,358 | 58,617,315 | |
| Tata Consumer Products Ltd. | 867,593 | 9,384,681 | |
| Tata Elxsi Ltd. | 53,149 | 4,867,106 | |
| Tata Motors Ltd. | 2,659,222 | 20,079,174 | |
| Tata Power Co. Ltd./The | 2,244,206 | 6,454,921 | |
| Tata Steel Ltd. | 11,882,112 | 16,950,578 | |
| Tech Mahindra Ltd. | 867,258 | 11,815,591 | |
| The Indian Hotels Co. Ltd. | 1,324,088 | 6,096,621 | |
| Titan Co. Ltd. | 566,681 | 21,717,695 | |
| Torrent Pharmaceuticals Ltd. | 158,473 | 3,662,078 | |
| Trent Ltd. | 281,473 | 7,283,592 | |
| Tube Investments of India Ltd. | 165,310 | 6,252,090 | |
| Tvs Motor Co. Ltd. | 366,566 | 7,002,768 | |
| Ultratech Cement Ltd. | 185,371 | 18,754,720 | |
| United Spirits Ltd. (a) | 457,619 | 5,673,358 | |
| UPL Ltd. | 747,279 | 4,850,610 | |
| Varun Beverages Ltd. | 708,504 | 7,730,908 | |
| Vedanta Ltd. | 1,155,494 | 3,006,082 | |
| Wipro Ltd. | 2,116,224 | 9,712,108 | |
| Yes Bank Ltd. (a) | 20,145,543 | 3,859,862 | |
| Zomato Ltd. (a) | 6,665,545 | 8,428,244 | |
TOTAL INDIA | 1,572,501,862 | ||
| Indonesia - 0.5% | |||
| Indofood Sukses Makmur Tbk PT | 6,738,300 | 2,821,015 | |
| PT Adaro Energy Indonesia Tbk | 22,563,900 | 3,640,668 | |
| PT Aneka Tambang Tbk | 14,416,000 | 1,544,579 | |
| PT Astra International Tbk | 32,633,500 | 11,871,401 | |
| PT Bank Central Asia Tbk | 87,836,700 | 48,391,052 | |
| PT Bank Mandiri (Persero) Tbk | 59,715,100 | 21,333,347 | |
| PT Bank Negara Indonesia (Persero) Tbk | 23,166,178 | 6,991,242 | |
| PT Bank Rakyat Indonesia (Persero) Tbk | 108,332,000 | 33,873,672 | |
| PT Barito Pacific Tbk | 43,963,326 | 3,115,403 | |
| PT Charoen Pokphand Indonesia Tbk (a) | 11,583,400 | 4,267,446 | |
| PT GoTo Gojek Tokopedia Tbk (a) | 1,287,771,068 | 4,871,957 | |
| PT Indah Kiat Pulp & Paper Tbk | 4,337,400 | 2,621,535 | |
| PT Indofood CBP Sukses Makmur Tbk | 3,584,800 | 2,336,474 | |
| PT Kalbe Farma Tbk | 33,049,400 | 3,514,955 | |
| PT Merdeka Copper Gold Tbk (a) | 18,924,590 | 2,654,284 | |
| PT Sarana Menara Nusantara Tbk | 31,436,700 | 1,763,104 | |
| PT Semen Indonesia (Persero) Tbk | 5,499,496 | 2,113,198 | |
| PT Sumber Alfaria Trijaya Tbk | 25,709,700 | 4,679,081 | |
| PT Surya Citra Media Tbk | 35 | 0 | |
| PT Telkom Indonesia Persero Tbk | 79,464,100 | 17,419,787 | |
| PT Unilever Indonesia Tbk | 11,980,000 | 2,731,544 | |
| PT United Tractors Tbk | 2,336,512 | 3,697,549 | |
| PT Vale Indonesia Tbk | 3,836,200 | 1,195,550 | |
TOTAL INDONESIA | 187,448,843 | ||
| Ireland - 0.3% | |||
| AerCap Holdings NV (a) | 275,816 | 17,133,690 | |
| AIB Group PLC | 2,283,591 | 9,892,200 | |
| Bank of Ireland Group PLC | 1,676,369 | 14,988,323 | |
| Kerry Group PLC Class A | 253,257 | 19,529,743 | |
| Kingspan Group PLC (Ireland) | 244,494 | 16,422,219 | |
| Smurfit Kappa Group PLC | 415,507 | 13,514,778 | |
TOTAL IRELAND | 91,480,953 | ||
| Israel - 0.3% | |||
| Azrieli Group | 65,335 | 2,807,692 | |
| Bank Hapoalim BM (Reg.) | 2,027,419 | 14,480,848 | |
| Bank Leumi le-Israel BM | 2,443,497 | 15,711,649 | |
| Check Point Software Technologies Ltd. (a) | 147,786 | 19,840,271 | |
| Elbit Systems Ltd. (Israel) | 41,306 | 7,667,465 | |
| Global-e Online Ltd. (a)(b) | 140,036 | 4,916,664 | |
| Icl Group Ltd. | 1,198,006 | 5,809,232 | |
| Israel Discount Bank Ltd. (Class A) | 1,994,599 | 8,759,063 | |
| Mizrahi Tefahot Bank Ltd. | 239,157 | 7,395,998 | |
| NICE Ltd. (a) | 81,898 | 12,655,490 | |
| NICE Ltd. sponsored ADR (a) | 19,733 | 3,045,789 | |
| Teva Pharmaceutical Industries Ltd. sponsored ADR (a) | 1,779,598 | 15,268,951 | |
| Wix.com Ltd. (a) | 83,755 | 6,692,025 | |
TOTAL ISRAEL | 125,051,137 | ||
| Italy - 1.4% | |||
| Amplifon SpA | 193,408 | 5,451,743 | |
| Assicurazioni Generali SpA | 1,583,218 | 31,401,679 | |
| Coca-Cola HBC AG | 347,333 | 9,000,577 | |
| Davide Campari Milano NV | 836,364 | 9,230,099 | |
| DiaSorin SpA | 37,685 | 3,369,395 | |
| Enel SpA | 12,824,172 | 81,402,456 | |
| Eni SpA | 3,700,206 | 60,489,716 | |
| Ferrari NV (Italy) | 198,411 | 59,937,493 | |
| FinecoBank SpA | 974,738 | 11,463,681 | |
| Infrastrutture Wireless Italiane SpA (c) | 518,528 | 5,662,114 | |
| Intesa Sanpaolo SpA | 24,661,904 | 64,263,765 | |
| Mediobanca SpA (b) | 870,775 | 10,383,806 | |
| Moncler SpA | 326,556 | 16,910,184 | |
| Nexi SpA (a)(c) | 910,575 | 5,276,013 | |
| Poste Italiane SpA (c) | 800,481 | 7,910,877 | |
| Prysmian SpA | 419,689 | 15,671,334 | |
| Recordati SpA | 162,170 | 7,481,415 | |
| Snam SpA | 3,207,523 | 14,708,239 | |
| Telecom Italia SpA (a) | 7,896,011 | 2,039,399 | |
| Telecom Italia SpA (Risparmio Shares) (a) | 7,564,311 | 1,967,333 | |
| Terna - Rete Elettrica Nazionale | 2,234,666 | 17,085,878 | |
| UniCredit SpA | 2,912,668 | 73,019,467 | |
TOTAL ITALY | 514,126,663 | ||
| Japan - 14.2% | |||
| Advantest Corp. | 1,213,128 | 31,248,522 | |
| AEON Co. Ltd. | 1,039,078 | 21,861,817 | |
| AGC, Inc. | 308,296 | 10,487,951 | |
| Aisin Seiki Co. Ltd. | 227,401 | 7,921,486 | |
| Ajinomoto Co., Inc. | 714,715 | 26,103,312 | |
| Ana Holdings, Inc. (a) | 245,551 | 4,820,626 | |
| Asahi Group Holdings | 763,117 | 27,602,258 | |
| ASAHI INTECC Co. Ltd. | 338,949 | 5,695,235 | |
| Asahi Kasei Corp. | 1,947,025 | 11,969,892 | |
| Astellas Pharma, Inc. | 2,868,765 | 36,289,521 | |
| Azbil Corp. | 178,882 | 5,285,725 | |
| Bandai Namco Holdings, Inc. | 957,394 | 19,835,783 | |
| BayCurrent Consulting, Inc. | 205,800 | 5,166,970 | |
| Bridgestone Corp. | 894,195 | 33,840,995 | |
| Brother Industries Ltd. | 360,175 | 5,618,820 | |
| Canon, Inc. | 1,537,828 | 36,355,325 | |
| Canon, Inc. sponsored ADR (b) | 39,199 | 924,312 | |
| Capcom Co. Ltd. | 276,200 | 8,890,692 | |
| Central Japan Railway Co. | 1,142,190 | 25,708,884 | |
| Chiba Bank Ltd. | 819,194 | 6,101,804 | |
| Chubu Electric Power Co., Inc. | 1,035,595 | 12,514,292 | |
| Chugai Pharmaceutical Co. Ltd. | 1,063,524 | 31,540,469 | |
| Concordia Financial Group Ltd. | 1,638,588 | 7,613,533 | |
| CyberAgent, Inc. | 667,496 | 3,503,989 | |
| Dai Nippon Printing Co. Ltd. | 353,921 | 9,232,831 | |
| Dai-ichi Mutual Life Insurance Co. | 1,488,991 | 31,454,982 | |
| Daifuku Co. Ltd. | 471,227 | 7,786,036 | |
| Daiichi Sankyo Kabushiki Kaisha | 2,925,196 | 75,423,822 | |
| Daikin Industries Ltd. | 416,682 | 60,076,768 | |
| Daito Trust Construction Co. Ltd. | 96,321 | 10,332,006 | |
| Daiwa House Industry Co. Ltd. | 940,108 | 25,858,304 | |
| Daiwa House REIT Investment Corp. | 3,410 | 6,034,839 | |
| Daiwa Securities Group, Inc. | 2,144,651 | 12,367,070 | |
| DENSO Corp. | 2,725,700 | 40,248,596 | |
| Dentsu Group, Inc. | 313,922 | 9,118,175 | |
| Disco Corp. | 145,987 | 25,781,165 | |
| East Japan Railway Co. | 479,581 | 24,908,156 | |
| Eisai Co. Ltd. | 399,997 | 21,191,184 | |
| ENEOS Holdings, Inc. | 4,557,864 | 16,888,788 | |
| FANUC Corp. | 1,506,425 | 37,384,072 | |
| Fast Retailing Co. Ltd. | 277,089 | 61,346,508 | |
| Fuji Electric Co. Ltd. | 201,104 | 7,656,961 | |
| FUJIFILM Holdings Corp. | 589,548 | 32,246,981 | |
| Fujitsu Ltd. | 278,358 | 36,060,597 | |
| GLP J-REIT | 7,247 | 6,490,832 | |
| GMO Payment Gateway, Inc. | 65,228 | 2,605,158 | |
| Hakuhodo DY Holdings, Inc. | 352,907 | 2,863,909 | |
| Hamamatsu Photonics K.K. | 218,546 | 8,117,459 | |
| Hankyu Hanshin Holdings, Inc. | 370,580 | 11,659,781 | |
| Hikari Tsushin, Inc. | 31,270 | 4,511,413 | |
| Hirose Electric Co. Ltd. | 47,968 | 5,434,732 | |
| Hitachi Construction Machinery Co. Ltd. | 165,571 | 4,277,652 | |
| Hitachi Ltd. | 1,481,809 | 93,926,875 | |
| Honda Motor Co. Ltd. | 7,286,958 | 74,682,378 | |
| Hoshizaki Corp. | 167,906 | 5,422,466 | |
| Hoya Corp. | 559,782 | 53,889,441 | |
| Hulic Co. Ltd. | 585,972 | 5,372,270 | |
| Ibiden Co. Ltd. | 175,040 | 7,463,085 | |
| Idemitsu Kosan Co. Ltd. | 316,527 | 7,186,778 | |
| Iida Group Holdings Co. Ltd. | 243,378 | 3,778,978 | |
| INPEX Corp. | 1,535,612 | 22,283,075 | |
| Isuzu Motors Ltd. | 938,792 | 10,468,143 | |
| Itochu Corp. | 1,871,071 | 67,397,908 | |
| Japan Airlines Co. Ltd. | 226,726 | 4,168,082 | |
| Japan Exchange Group, Inc. | 804,894 | 15,916,616 | |
| Japan Post Bank Co. Ltd. | 2,269,540 | 21,036,834 | |
| Japan Post Holdings Co. Ltd. | 3,540,946 | 31,341,633 | |
| Japan Post Insurance Co. Ltd. | 309,842 | 5,966,345 | |
| Japan Real Estate Investment Corp. | 2,008 | 7,458,358 | |
| Japan Retail Fund Investment Corp. | 10,814 | 6,978,782 | |
| Japan Tobacco, Inc. | 1,889,926 | 43,995,347 | |
| JFE Holdings, Inc. (b) | 782,990 | 10,909,298 | |
| JSR Corp. | 275,321 | 7,369,226 | |
| Kajima Corp. | 671,878 | 11,104,395 | |
| Kansai Electric Power Co., Inc. | 1,120,699 | 14,349,253 | |
| Kao Corp. | 739,426 | 26,977,147 | |
| Kawasaki Kisen Kaisha Ltd. (b) | 214,200 | 7,344,916 | |
| KDDI Corp. | 2,362,207 | 70,664,814 | |
| KDX Realty Investment Corp. | 6,540 | 6,821,146 | |
| Keio Corp. | 158,920 | 4,715,867 | |
| Keisei Electric Railway Co. | 199,442 | 7,512,909 | |
| Keyence Corp. | 307,329 | 118,972,808 | |
| Kikkoman Corp. | 217,448 | 12,371,654 | |
| Kintetsu Group Holdings Co. Ltd. | 296,764 | 8,349,980 | |
| Kirin Holdings Co. Ltd. | 1,231,720 | 17,309,754 | |
| Kobayashi Pharmaceutical Co. Ltd. | 79,787 | 3,293,869 | |
| Kobe Bussan Co. Ltd. (b) | 232,972 | 5,765,603 | |
| Koei Tecmo Holdings Co. Ltd. | 179,218 | 2,340,170 | |
| Koito Manufacturing Co. Ltd. | 322,330 | 4,829,384 | |
| Komatsu Ltd. | 1,459,864 | 33,542,418 | |
| Konami Group Corp. | 155,236 | 8,041,549 | |
| Kose Corp. | 51,768 | 3,429,681 | |
| Kubota Corp. | 1,603,267 | 21,562,734 | |
| Kurita Water Industries Ltd. | 162,084 | 4,924,668 | |
| Kyocera Corp. | 509,456 | 25,111,805 | |
| Kyowa Hakko Kirin Co., Ltd. | 420,021 | 6,587,733 | |
| Lasertec Corp. | 120,295 | 19,870,355 | |
| LIXIL Group Corp. | 440,203 | 4,826,856 | |
| LY Corp. | 4,245,749 | 10,824,480 | |
| M3, Inc. | 690,702 | 10,637,635 | |
| Makita Corp. | 348,168 | 8,999,048 | |
| Marubeni Corp. | 2,286,045 | 33,426,039 | |
| MatsukiyoCocokara & Co. | 552,000 | 9,683,070 | |
| Mazda Motor Corp. | 912,009 | 8,815,470 | |
| McDonald's Holdings Co. (Japan) Ltd. (b) | 135,645 | 5,277,649 | |
| Meiji Holdings Co. Ltd. | 364,312 | 8,967,186 | |
| Minebea Mitsumi, Inc. | 562,000 | 8,811,768 | |
| Misumi Group, Inc. | 442,014 | 6,691,501 | |
| Mitsubishi Chemical Holdings Corp. | 2,051,084 | 11,606,275 | |
| Mitsubishi Corp. | 1,813,901 | 84,556,011 | |
| Mitsubishi Electric Corp. | 3,059,697 | 35,084,050 | |
| Mitsubishi Estate Co. Ltd. | 1,791,812 | 22,935,768 | |
| Mitsubishi Heavy Industries Ltd. | 508,128 | 26,170,972 | |
| Mitsubishi UFJ Financial Group, Inc. | 18,033,818 | 151,288,352 | |
| Mitsubishi UFJ Lease & Finance Co. Ltd. | 1,342,916 | 8,852,811 | |
| Mitsui & Co. Ltd. | 2,070,846 | 75,263,192 | |
| Mitsui Chemicals, Inc. | 263,771 | 6,648,211 | |
| Mitsui Fudosan Co. Ltd. | 1,412,510 | 30,615,959 | |
| Mitsui OSK Lines Ltd. (b) | 535,800 | 13,832,918 | |
| Mizuho Financial Group, Inc. | 3,808,732 | 64,666,131 | |
| MonotaRO Co. Ltd. | 385,308 | 3,079,377 | |
| MS&AD Insurance Group Holdings, Inc. | 678,315 | 24,853,826 | |
| Murata Manufacturing Co. Ltd. | 2,727,183 | 46,714,950 | |
| NEC Corp. | 390,663 | 18,810,671 | |
| Nexon Co. Ltd. | 558,159 | 10,241,799 | |
| NGK Insulators Ltd. | 361,795 | 4,420,505 | |
| Nidec Corp. | 661,656 | 24,270,233 | |
| Nintendo Co. Ltd. | 1,640,290 | 67,767,686 | |
| Nippon Building Fund, Inc. | 2,399 | 9,639,023 | |
| Nippon Express Holdings, Inc. | 111,285 | 5,719,539 | |
| Nippon Paint Holdings Co. Ltd. | 1,511,530 | 10,162,185 | |
| Nippon Prologis REIT, Inc. (b) | 3,522 | 6,266,962 | |
| Nippon Sanso Holdings Corp. | 268,586 | 6,773,339 | |
| Nippon Steel & Sumitomo Metal Corp. | 1,350,799 | 29,135,197 | |
| Nippon Telegraph & Telephone Corp. | 47,007,975 | 55,317,841 | |
| Nippon Yusen KK (b) | 774,433 | 18,948,247 | |
| Nissan Chemical Corp. | 196,684 | 8,021,794 | |
| Nissan Motor Co. Ltd. | 3,686,225 | 14,184,536 | |
| Nissin Food Holdings Co. Ltd. | 95,805 | 8,335,867 | |
| Nitori Holdings Co. Ltd. | 127,942 | 13,855,458 | |
| Nitto Denko Corp. | 230,750 | 14,930,859 | |
| Nomura Holdings, Inc. | 4,769,765 | 18,427,550 | |
| Nomura Real Estate Holdings, Inc. | 168,118 | 3,926,578 | |
| Nomura Real Estate Master Fund, Inc. | 6,638 | 7,324,757 | |
| Nomura Research Institute Ltd. | 613,480 | 16,103,823 | |
| NTT Data Corp. | 1,003,456 | 12,372,524 | |
| Obayashi Corp. | 1,006,085 | 8,617,932 | |
| OBIC Co. Ltd. | 110,552 | 16,341,394 | |
| Odakyu Electric Railway Co. Ltd. | 484,239 | 6,893,787 | |
| Oji Holdings Corp. | 1,327,402 | 5,677,142 | |
| Olympus Corp. | 2,006,163 | 26,793,011 | |
| OMRON Corp. | 280,877 | 10,063,048 | |
| Ono Pharmaceutical Co. Ltd. | 603,545 | 10,422,916 | |
| Open House Group Co. Ltd. | 121,000 | 3,988,203 | |
| Oracle Corp. Japan | 59,303 | 4,206,937 | |
| Oriental Land Co. Ltd. | 1,721,240 | 55,674,140 | |
| ORIX Corp. | 1,857,254 | 33,776,674 | |
| Osaka Gas Co. Ltd. | 604,218 | 11,394,214 | |
| Otsuka Corp. | 176,232 | 7,065,956 | |
| Otsuka Holdings Co. Ltd. | 623,103 | 20,964,901 | |
| Pan Pacific International Holdings Ltd. | 613,191 | 11,874,973 | |
| Panasonic Holdings Corp. | 3,495,293 | 30,665,925 | |
| Persol Holdings Co. Ltd. | 2,910,260 | 4,363,690 | |
| Rakuten Group, Inc. | 2,394,760 | 8,858,027 | |
| Recruit Holdings Co. Ltd. | 2,277,983 | 65,315,942 | |
| Renesas Electronics Corp. (a) | 2,014,483 | 26,461,484 | |
| Resona Holdings, Inc. | 3,395,289 | 18,142,124 | |
| Ricoh Co. Ltd. | 848,938 | 6,880,734 | |
| ROHM Co. Ltd. | 543,580 | 8,709,223 | |
| SBI Holdings, Inc. Japan | 382,665 | 8,233,016 | |
| SCSK Corp. | 246,433 | 4,206,679 | |
| Secom Co. Ltd. | 332,859 | 23,118,671 | |
| Seiko Epson Corp. | 449,009 | 6,233,673 | |
| Sekisui Chemical Co. Ltd. | 620,539 | 8,499,445 | |
| Sekisui House Ltd. | 949,003 | 18,584,089 | |
| Seven & i Holdings Co. Ltd. | 1,190,272 | 43,610,031 | |
| SG Holdings Co. Ltd. | 497,649 | 7,053,981 | |
| Sharp Corp. (a) | 402,511 | 2,516,586 | |
| Shimadzu Corp. | 368,577 | 8,715,480 | |
| SHIMANO, Inc. | 122,390 | 17,612,669 | |
| SHIMIZU Corp. | 861,881 | 6,133,569 | |
| Shin-Etsu Chemical Co. Ltd. | 2,877,885 | 86,058,484 | |
| Shionogi & Co. Ltd. | 419,194 | 19,519,614 | |
| Shiseido Co. Ltd. | 636,475 | 20,186,106 | |
| Shizuoka Financial Group | 720,818 | 6,129,659 | |
| SMC Corp. | 90,655 | 41,861,137 | |
| SoftBank Corp. | 4,505,727 | 50,945,661 | |
| SoftBank Group Corp. | 1,627,244 | 66,642,267 | |
| Sompo Holdings, Inc. | 480,954 | 20,834,912 | |
| Sony Group Corp. | 1,991,720 | 165,589,383 | |
| Square Enix Holdings Co. Ltd. | 132,838 | 4,413,115 | |
| Subaru Corp. | 980,278 | 16,968,905 | |
| Sumco Corp. | 550,029 | 7,107,559 | |
| Sumitomo Chemical Co. Ltd. | 2,178,181 | 5,536,420 | |
| Sumitomo Corp. | 1,707,769 | 33,570,767 | |
| Sumitomo Electric Industries Ltd. | 1,135,203 | 11,917,625 | |
| Sumitomo Metal Mining Co. Ltd. | 393,232 | 11,046,657 | |
| Sumitomo Mitsui Financial Group, Inc. | 2,005,572 | 96,684,573 | |
| Sumitomo Mitsui Trust Holdings, Inc. | 519,657 | 19,485,476 | |
| Sumitomo Realty & Development Co. Ltd. | 456,479 | 11,454,857 | |
| Suntory Beverage & Food Ltd. | 218,903 | 6,587,462 | |
| Suzuki Motor Corp. | 583,132 | 22,632,526 | |
| Sysmex Corp. | 266,429 | 12,762,697 | |
| T&D Holdings, Inc. | 796,753 | 14,213,456 | |
| Taisei Corp. | 263,002 | 8,919,109 | |
| Takeda Pharmaceutical Co. Ltd. | 2,495,920 | 67,751,120 | |
| TDK Corp. | 619,887 | 23,193,206 | |
| Terumo Corp. | 1,067,124 | 29,194,581 | |
| TIS, Inc. | 340,767 | 7,297,475 | |
| Tobu Railway Co. Ltd. | 291,193 | 7,008,856 | |
| Toho Co. Ltd. | 172,405 | 5,889,888 | |
| Tokio Marine Holdings, Inc. | 2,845,324 | 63,656,260 | |
| Tokyo Electric Power Co., Inc. (a) | 2,442,226 | 10,334,864 | |
| Tokyo Electron Ltd. | 745,458 | 98,503,100 | |
| Tokyo Gas Co. Ltd. | 624,139 | 14,016,390 | |
| Tokyu Corp. | 810,975 | 9,155,126 | |
| Toppan Holdings, Inc. | 396,177 | 9,137,377 | |
| Toray Industries, Inc. | 2,151,319 | 10,407,736 | |
| Tosoh Corp. | 402,425 | 4,927,383 | |
| Toto Ltd. | 202,517 | 4,883,012 | |
| Toyota Industries Corp. | 231,643 | 17,168,156 | |
| Toyota Motor Corp. | 16,740,530 | 292,854,637 | |
| Toyota Tsusho Corp. | 335,595 | 17,865,832 | |
| Trend Micro, Inc. | 207,245 | 7,809,949 | |
| Unicharm Corp. | 638,397 | 21,692,014 | |
| USS Co. Ltd. | 322,546 | 5,637,749 | |
| Welcia Holdings Co. Ltd. | 152,637 | 2,530,083 | |
| West Japan Railway Co. | 353,680 | 13,480,355 | |
| Yakult Honsha Co. Ltd. | 398,436 | 9,389,121 | |
| Yamaha Corp. | 217,361 | 5,805,696 | |
| Yamaha Motor Co. Ltd. | 475,739 | 11,625,563 | |
| Yamato Holdings Co. Ltd. | 442,829 | 7,375,769 | |
| Yaskawa Electric Corp. | 383,789 | 12,562,615 | |
| Yokogawa Electric Corp. | 355,100 | 6,446,922 | |
| Zensho Holdings Co. Ltd. | 144,100 | 7,574,164 | |
| ZOZO, Inc. | 216,363 | 4,114,087 | |
TOTAL JAPAN | 5,173,181,777 | ||
| Jordan - 0.0% | |||
| Hikma Pharmaceuticals PLC | 255,206 | 5,898,265 | |
| Korea (South) - 3.1% | |||
| AMOREPACIFIC Corp. | 43,515 | 4,078,528 | |
| BGF Retail Co. Ltd. | 13,433 | 1,371,644 | |
| Celltrion Healthcare Co. Ltd. | 166,507 | 8,224,158 | |
| Celltrion Pharm, Inc. | 27,772 | 1,304,671 | |
| Celltrion, Inc. | 177,174 | 19,646,608 | |
| CJ CheilJedang Corp. | 12,905 | 2,699,547 | |
| Cosmo AM&T Co. Ltd. (a) | 38,864 | 4,040,232 | |
| Cosmo AM&T Co. Ltd. rights 11/7/23 (a) | 1,871 | 22,963 | |
| Coway Co. Ltd. | 86,171 | 2,753,453 | |
| Db Insurance Co. Ltd. | 71,436 | 4,640,660 | |
| Delivery Hero AG (a)(c) | 271,868 | 6,895,295 | |
| Doosan Bobcat, Inc. | 85,593 | 2,455,528 | |
| Doosan Heavy Industries & Construction Co. Ltd. (a) | 697,597 | 6,940,540 | |
| Ecopro BM Co. Ltd. | 77,540 | 11,327,080 | |
| Ecopro Co. Ltd. | 31,618 | 14,588,203 | |
| EUSU Holdings Co. Ltd. | 6 | 27 | |
| F&F Co. Ltd. | 26,950 | 1,865,517 | |
| GS Holdings Corp. | 69,067 | 2,013,896 | |
| Hana Financial Group, Inc. | 477,679 | 13,868,780 | |
| Hanjin Shipping Co. Ltd. (a)(d) | 12 | 0 | |
| Hankook Tire Co. Ltd. | 115,649 | 3,276,275 | |
| Hanmi Pharm Co. Ltd. | 10,800 | 2,254,787 | |
| Hanmi Semiconductor Co. Ltd. | 68,110 | 2,664,759 | |
| Hanon Systems | 292,176 | 1,488,685 | |
| Hanwha Aerospace Co. Ltd. | 55,150 | 4,140,087 | |
| Hanwha Ocean Co. Ltd. (a) | 67,239 | 1,174,149 | |
| Hanwha Ocean Co. Ltd. rights 11/9/23 (a) | 22,196 | 28,718 | |
| Hanwha Solutions Corp. (a) | 160,687 | 3,417,599 | |
| HD Hyundai Co. Ltd. | 66,109 | 2,811,565 | |
| HD Hyundai Heavy Industries Co. Ltd. (a) | 34,648 | 2,623,150 | |
| HD Korea Shipbuilding & Offshore Engineering Co. Ltd. (a) | 65,933 | 4,416,433 | |
| HLB, Inc. | 181,437 | 3,903,417 | |
| HMM Co. Ltd. | 377,155 | 4,079,021 | |
| Hotel Shilla Co. | 48,956 | 2,261,877 | |
| HYBE Co. Ltd. (a) | 29,130 | 4,737,187 | |
| Hyundai Engineering & Construction Co. Ltd. | 120,208 | 2,976,834 | |
| Hyundai Glovis Co. Ltd. | 28,848 | 3,655,699 | |
| Hyundai Mipo Dockyard Co. Ltd. (a) | 37,380 | 1,923,427 | |
| Hyundai Mobis | 98,104 | 15,170,331 | |
| Hyundai Motor Co. Ltd. | 210,622 | 26,495,701 | |
| Hyundai Steel Co. | 133,870 | 3,250,678 | |
| Industrial Bank of Korea | 421,904 | 3,486,491 | |
| JYP Entertainment Corp. | 44,099 | 3,351,828 | |
| Kakao Corp. | 501,785 | 14,122,261 | |
| Kakao Games Corp. (a) | 57,364 | 994,170 | |
| Kakao Pay Corp. (a) | 41,853 | 1,065,400 | |
| KakaoBank Corp. | 259,972 | 3,513,054 | |
| Kangwon Land, Inc. | 162,556 | 1,767,378 | |
| KB Financial Group, Inc. | 611,533 | 23,276,023 | |
| Kia Corp. | 416,544 | 23,762,484 | |
| Korea Aerospace Industries Ltd. | 114,558 | 3,763,910 | |
| Korea Electric Power Corp. (a) | 397,073 | 4,962,764 | |
| Korea Investment Holdings Co. Ltd. | 64,399 | 2,403,899 | |
| Korea Zinc Co. Ltd. | 12,518 | 4,343,790 | |
| Korean Air Lines Co. Ltd. | 284,954 | 4,329,197 | |
| KRAFTON, Inc. (a) | 45,189 | 5,492,799 | |
| KT Corp. | 104,253 | 2,518,368 | |
| KT&G Corp. | 161,332 | 10,162,266 | |
| Kumho Petro Chemical Co. Ltd. | 27,304 | 2,562,406 | |
| L&F Co. Ltd. | 39,481 | 3,834,740 | |
| LG Chemical Ltd. | 77,883 | 25,487,706 | |
| LG Corp. | 146,475 | 8,371,656 | |
| LG Display Co. Ltd. (a) | 361,552 | 3,266,734 | |
| LG Electronics, Inc. | 171,016 | 12,667,674 | |
| LG Energy Solution (a) | 74,379 | 21,290,529 | |
| LG H & H Co. Ltd. | 14,113 | 3,303,806 | |
| LG Innotek Co. Ltd. | 22,190 | 3,677,470 | |
| LG Uplus Corp. | 334,145 | 2,500,608 | |
| Lotte Chemical Corp. | 32,272 | 3,499,447 | |
| Lotte Energy Materials Corp. | 36,322 | 1,038,999 | |
| Meritz Financial Holdings Co. | 161,689 | 6,008,760 | |
| Mirae Asset Securities Co. Ltd. | 417,478 | 2,042,070 | |
| NAVER Corp. | 208,994 | 29,174,713 | |
| NCSOFT Corp. | 22,165 | 3,823,701 | |
| Netmarble Corp. (a)(c) | 32,920 | 943,703 | |
| NH Investment & Securities Co. Ltd. | 230,866 | 1,653,876 | |
| Orion Corp./Republic of Korea | 36,970 | 3,267,184 | |
| Pan Ocean Co., Ltd. (Korea) | 392,013 | 1,249,689 | |
| Pearl Abyss Corp. (a) | 49,791 | 1,821,422 | |
| POSCO | 113,763 | 34,774,096 | |
| POSCO Chemtech Co. Ltd. | 49,173 | 8,652,569 | |
| Posco International Corp. | 81,941 | 3,051,881 | |
| S-Oil Corp. | 68,979 | 3,399,245 | |
| Samsung Biologics Co. Ltd. (a)(c) | 28,636 | 15,031,825 | |
| Samsung C&T Corp. | 130,212 | 10,280,045 | |
| Samsung Electro-Mechanics Co. Ltd. | 87,340 | 8,063,584 | |
| Samsung Electronics Co. Ltd. | 7,524,574 | 373,979,550 | |
| Samsung Engineering Co. Ltd. (a) | 244,817 | 4,308,416 | |
| Samsung Fire & Marine Insurance Co. Ltd. | 47,847 | 9,135,865 | |
| Samsung Heavy Industries Co. Ltd. (a) | 1,025,624 | 5,191,675 | |
| Samsung Life Insurance Co. Ltd. | 124,444 | 6,652,771 | |
| Samsung SDI Co. Ltd. | 87,544 | 27,678,391 | |
| Samsung SDS Co. Ltd. | 60,198 | 6,161,443 | |
| Samsung Securities Co. Ltd. | 96,336 | 2,519,911 | |
| Shinhan Financial Group Co. Ltd. | 707,636 | 18,162,267 | |
| SK Biopharmaceuticals Co. Ltd. (a) | 49,155 | 2,746,759 | |
| SK Bioscience Co. Ltd. (a) | 43,109 | 1,937,343 | |
| SK Hynix, Inc. | 864,342 | 74,950,026 | |
| SK IE Technology Co. Ltd. (a)(c) | 38,832 | 1,709,756 | |
| SK Innovation Co., Ltd. | 98,844 | 8,991,794 | |
| SK Square Co. Ltd. (a) | 155,161 | 4,895,501 | |
| SK, Inc. | 56,722 | 5,971,390 | |
| SKC Co. Ltd. | 29,581 | 1,727,383 | |
| Woori Financial Group, Inc. | 1,000,280 | 8,822,131 | |
| Yuhan Corp. | 83,689 | 3,562,222 | |
TOTAL KOREA (SOUTH) | 1,112,648,523 | ||
| Kuwait - 0.2% | |||
| Agility Public Warehousing Co. KSC (a) | 2,471,203 | 4,200,526 | |
| Boubyan Bank KSC | 2,167,404 | 4,104,375 | |
| Gulf Bank | 2,871,778 | 2,199,423 | |
| Gulf Bank rights 11/12/23 (a) | 222,926 | 4,611 | |
| Kuwait Finance House KSCP | 12,992,443 | 28,718,148 | |
| Mabanee Co. SAKC | 1,020,049 | 2,719,471 | |
| Mobile Telecommunication Co. | 2,980,360 | 4,632,584 | |
| National Bank of Kuwait | 11,918,277 | 33,777,117 | |
TOTAL KUWAIT | 80,356,255 | ||
| Luxembourg - 0.1% | |||
| ArcelorMittal SA (Netherlands) | 809,075 | 17,874,997 | |
| Eurofins Scientific SA (b) | 216,274 | 10,945,394 | |
| Reinet Investments SCA | 211,517 | 4,395,014 | |
TOTAL LUXEMBOURG | 33,215,405 | ||
| Macau - 0.1% | |||
| Galaxy Entertainment Group Ltd. | 3,481,239 | 19,569,667 | |
| Sands China Ltd. (a) | 3,872,865 | 10,425,945 | |
TOTAL MACAU | 29,995,612 | ||
| Malaysia - 0.4% | |||
| AMMB Holdings Bhd | 2,600,200 | 2,085,992 | |
| Axiata Group Bhd | 4,211,215 | 1,926,802 | |
| CelcomDigi Bhd | 5,407,400 | 4,843,984 | |
| CIMB Group Holdings Bhd | 10,376,388 | 12,431,918 | |
| Dialog Group Bhd | 5,179,822 | 2,337,090 | |
| Gamuda Bhd | 2,893,109 | 2,842,867 | |
| Genting Bhd | 3,171,900 | 2,684,010 | |
| Genting Malaysia Bhd | 4,651,500 | 2,363,696 | |
| Hong Leong Bank Bhd | 1,036,300 | 4,219,608 | |
| Hong Leong Credit Bhd | 343,800 | 1,278,510 | |
| IHH Healthcare Bhd | 3,420,300 | 4,305,453 | |
| Inari Amertron Bhd | 4,059,600 | 2,433,964 | |
| IOI Corp. Bhd | 3,880,500 | 3,201,765 | |
| IOI Properties Group Bhd | 11 | 4 | |
| Kuala Lumpur Kepong Bhd | 767,013 | 3,540,648 | |
| Malayan Banking Bhd | 8,482,468 | 16,062,044 | |
| Malaysia Airports Holdings Bhd | 1,266,840 | 1,965,513 | |
| Maxis Bhd | 3,611,100 | 3,002,591 | |
| MISC Bhd | 2,146,600 | 3,267,936 | |
| MR DIY Group M Sdn Bhd (c) | 4,844,150 | 1,504,998 | |
| Nestle (Malaysia) Bhd | 108,500 | 2,819,710 | |
| Petronas Chemicals Group Bhd | 4,341,900 | 6,695,239 | |
| Petronas Dagangan Bhd | 442,200 | 2,140,764 | |
| Petronas Gas Bhd | 1,211,800 | 4,414,009 | |
| PPB Group Bhd | 981,520 | 3,155,330 | |
| Press Metal Aluminium Holdings | 5,762,400 | 5,956,458 | |
| Public Bank Bhd | 22,909,500 | 20,009,199 | |
| QL Resources Bhd | 1,684,800 | 1,955,384 | |
| RHB Bank Bhd | 2,493,677 | 2,920,852 | |
| Sime Darby Bhd | 4,345,107 | 2,088,335 | |
| Sime Darby Plantation Bhd | 3,185,624 | 2,904,111 | |
| Sime Darby Property Bhd | 15 | 2 | |
| SP Setia Bhd | 14 | 2 | |
| Telekom Malaysia Bhd | 1,776,399 | 1,891,022 | |
| Tenaga Nasional Bhd | 4,044,125 | 8,403,957 | |
TOTAL MALAYSIA | 141,653,767 | ||
| Mexico - 0.7% | |||
| Alfa SA de CV Series A | 4,725,700 | 2,946,190 | |
| America Movil S.A.B. de CV Series L | 30,304,346 | 25,028,105 | |
| Arca Continental S.A.B. de CV | 813,562 | 7,295,389 | |
| Banco del Bajio SA (c) | 1,189,800 | 3,641,531 | |
| CEMEX S.A.B. de CV unit (a) | 24,137,140 | 14,499,153 | |
| Coca-Cola FEMSA S.A.B. de CV unit | 811,960 | 6,160,520 | |
| Fibra Uno Administracion SA de CV | 4,645,100 | 7,051,771 | |
| Fomento Economico Mexicano S.A.B. de CV unit | 3,087,100 | 34,941,130 | |
| Gruma S.A.B. de CV Series B | 283,265 | 4,929,210 | |
| Grupo Aeroportuario del Pacifico S.A.B. de CV Series B | 632,600 | 7,379,339 | |
| Grupo Aeroportuario del Sureste S.A.B. de CV Series B | 298,975 | 6,443,327 | |
| Grupo Bimbo S.A.B. de CV Series A (b) | 2,142,400 | 8,719,802 | |
| Grupo Carso SA de CV Series A1 | 865,400 | 5,518,131 | |
| Grupo Financiero Banorte S.A.B. de CV Series O | 4,107,100 | 33,332,457 | |
| Grupo Financiero Inbursa S.A.B. de CV Series O (a) | 3,185,500 | 6,569,243 | |
| Grupo Mexico SA de CV Series B | 4,928,123 | 20,099,001 | |
| Grupo Televisa SA de CV | 3,712,800 | 1,703,081 | |
| Industrias Penoles SA de CV (a)(b) | 307,340 | 3,431,046 | |
| Kimberly-Clark de Mexico SA de CV Series A (b) | 2,356,200 | 4,319,286 | |
| Operadora de Sites Mexicanos, SA de CV (b) | 1,953,200 | 1,660,800 | |
| Orbia Advance Corp. S.A.B. de CV | 1,535,716 | 2,488,117 | |
| Promotora y Operadora de Infraestructura S.A.B. de CV | 287,660 | 2,354,699 | |
| Southern Copper Corp. (b) | 131,832 | 9,346,889 | |
| Wal-Mart de Mexico SA de CV Series V | 8,263,300 | 29,576,280 | |
TOTAL MEXICO | 249,434,497 | ||
| Netherlands - 3.6% | |||
| ABN AMRO Bank NV GDR (Bearer) (c) | 642,854 | 8,628,385 | |
| Adyen BV (a)(c) | 34,404 | 23,205,017 | |
| AEGON NV | 2,691,367 | 13,054,019 | |
| Akzo Nobel NV | 271,636 | 18,182,066 | |
| Argenx SE (a) | 88,564 | 41,658,876 | |
| ASM International NV (Netherlands) | 74,331 | 30,555,382 | |
| ASML Holding NV (Netherlands) | 636,628 | 382,690,085 | |
| ASR Nederland NV | 256,925 | 9,569,202 | |
| BE Semiconductor Industries NV | 123,062 | 12,669,618 | |
| Euronext NV (c) | 137,919 | 9,602,332 | |
| EXOR NV (b) | 167,683 | 14,360,810 | |
| Heineken Holding NV | 204,586 | 15,542,722 | |
| Heineken NV (Bearer) | 454,069 | 40,795,124 | |
| IMCD NV | 90,719 | 10,894,839 | |
| ING Groep NV (Certificaten Van Aandelen) | 5,706,084 | 73,155,017 | |
| JDE Peet's BV | 198,958 | 5,523,978 | |
| Koninklijke Ahold Delhaize NV | 1,533,420 | 45,430,327 | |
| Koninklijke KPN NV | 5,094,009 | 17,121,877 | |
| Koninklijke Philips Electronics NV | 1,469,357 | 27,950,809 | |
| NN Group NV | 399,722 | 12,820,037 | |
| OCI NV | 163,217 | 3,801,125 | |
| Randstad NV | 171,309 | 8,852,839 | |
| Shell PLC (London) | 10,566,027 | 340,509,798 | |
| Stellantis NV (Italy) | 3,488,999 | 64,974,093 | |
| Universal Music Group NV | 1,295,960 | 31,736,545 | |
| Wolters Kluwer NV | 406,488 | 52,085,710 | |
TOTAL NETHERLANDS | 1,315,370,632 | ||
| New Zealand - 0.1% | |||
| Auckland International Airport Ltd. | 1,951,985 | 8,349,178 | |
| Fisher & Paykel Healthcare Corp. | 904,176 | 10,967,307 | |
| Mercury Nz Ltd. | 1,112,400 | 3,826,592 | |
| Meridian Energy Ltd. | 2,010,084 | 5,661,123 | |
| Spark New Zealand Ltd. | 2,929,419 | 8,504,461 | |
| Xero Ltd. (a) | 229,164 | 15,667,317 | |
TOTAL NEW ZEALAND | 52,975,978 | ||
| Norway - 0.4% | |||
| Aker BP ASA | 502,945 | 14,456,751 | |
| DNB Bank ASA | 1,446,487 | 26,065,629 | |
| Equinor ASA | 1,380,601 | 46,282,186 | |
| Equinor ASA sponsored ADR | 45,714 | 1,525,476 | |
| Gjensidige Forsikring ASA | 308,339 | 4,617,791 | |
| Kongsberg Gruppen ASA | 136,618 | 5,576,769 | |
| Mowi ASA | 704,803 | 11,438,668 | |
| Norsk Hydro ASA | 2,062,625 | 11,762,546 | |
| Orkla ASA | 1,203,807 | 8,291,230 | |
| Salmar ASA | 112,439 | 5,322,532 | |
| Telenor ASA | 1,114,016 | 11,383,537 | |
TOTAL NORWAY | 146,723,115 | ||
| Peru - 0.0% | |||
| Compania de Minas Buenaventura SAA sponsored ADR | 350,672 | 2,840,443 | |
| Credicorp Ltd. (United States) | 109,208 | 13,646,632 | |
TOTAL PERU | 16,487,075 | ||
| Philippines - 0.2% | |||
| Aboitiz Equity Ventures, Inc. | 2,572,600 | 2,072,011 | |
| Ayala Corp. | 449,135 | 4,790,647 | |
| Ayala Land, Inc. | 10,406,070 | 5,108,168 | |
| Bank of the Philippine Islands (BPI) | 3,094,360 | 5,473,163 | |
| BDO Unibank, Inc. | 3,665,889 | 8,232,234 | |
| International Container Terminal Services, Inc. | 1,564,340 | 5,529,341 | |
| JG Summit Holdings, Inc. | 4,159,565 | 2,691,656 | |
| Jollibee Food Corp. | 682,290 | 2,460,486 | |
| Manila Electric Co. | 431,690 | 2,695,914 | |
| Metropolitan Bank & Trust Co. | 2,731,311 | 2,512,561 | |
| PLDT, Inc. | 115,060 | 2,452,773 | |
| SM Investments Corp. | 377,575 | 5,323,714 | |
| SM Prime Holdings, Inc. | 15,615,175 | 8,242,066 | |
| Universal Robina Corp. | 1,337,310 | 2,571,993 | |
TOTAL PHILIPPINES | 60,156,727 | ||
| Poland - 0.3% | |||
| Allegro.eu SA (a)(c) | 737,136 | 5,276,445 | |
| Bank Polska Kasa Opieki SA | 285,586 | 8,658,333 | |
| Budimex SA | 19,809 | 2,210,380 | |
| CD Projekt RED SA | 100,840 | 2,513,788 | |
| Cyfrowy Polsat SA | 395,100 | 1,230,217 | |
| Dino Polska SA (a)(c) | 76,255 | 7,214,448 | |
| KGHM Polska Miedz SA (Bearer) | 217,816 | 5,804,738 | |
| LPP SA | 1,731 | 5,572,669 | |
| mBank SA (a) | 23,035 | 2,842,700 | |
| Orlen SA | 927,686 | 14,646,341 | |
| PGE Polska Grupa Energetyczna SA (a) | 1,398,669 | 2,423,401 | |
| Powszechna Kasa Oszczednosci Bank SA (a) | 1,432,320 | 14,799,104 | |
| Powszechny Zaklad Ubezpieczen SA | 938,904 | 10,612,699 | |
| Santander Bank Polska SA (a) | 55,614 | 6,026,099 | |
TOTAL POLAND | 89,831,362 | ||
| Portugal - 0.1% | |||
| Banco Espirito Santo SA (Reg.) (a)(d) | 319,729 | 3 | |
| Energias de Portugal SA | 4,993,517 | 20,976,052 | |
| Galp Energia SGPS SA Class B | 775,633 | 11,662,108 | |
| Jeronimo Martins SGPS SA | 449,549 | 10,360,045 | |
TOTAL PORTUGAL | 42,998,208 | ||
| Qatar - 0.2% | |||
| Barwa Real Estate Co. (a) | 3,280,844 | 2,279,741 | |
| Dukhan Bank | 2,883,960 | 2,872,079 | |
| Industries Qatar QSC (a) | 2,352,725 | 7,896,265 | |
| Masraf al Rayan | 8,666,490 | 4,998,525 | |
| Mesaieed Petrochemical Holding Co. (a) | 6,865,821 | 2,998,257 | |
| Ooredoo QSC | 1,245,874 | 3,384,151 | |
| Qatar Electricity & Water Co. (a) | 689,790 | 3,133,515 | |
| Qatar Fuel Co. (a) | 920,855 | 3,755,753 | |
| Qatar Gas Transport Co. Ltd. (Nakilat) (a) | 3,949,670 | 3,818,412 | |
| Qatar International Islamic Bank QSC (a) | 1,545,172 | 3,925,526 | |
| Qatar Islamic Bank | 2,623,016 | 12,535,149 | |
| Qatar National Bank SAQ | 7,335,441 | 29,998,549 | |
| The Commercial Bank of Qatar (a) | 5,021,587 | 7,069,666 | |
TOTAL QATAR | 88,665,588 | ||
| Romania - 0.0% | |||
| NEPI Rockcastle PLC | 818,914 | 4,422,905 | |
| Russia - 0.0% | |||
| Alrosa Co. Ltd. (d) | 3,102,770 | 516,315 | |
| Gazprom OAO (d) | 12,146,244 | 1,271,291 | |
| Gazprom OAO sponsored ADR (Reg. S) (a)(d) | 1,078,053 | 246,270 | |
| Inter Rao Ues JSC (d) | 42,112,900 | 232,235 | |
| LUKOIL PJSC (d) | 451,803 | 139,877 | |
| LUKOIL PJSC sponsored ADR (a)(d) | 52,271 | 14,787 | |
| MMC Norilsk Nickel PJSC (a)(d) | 66,556 | 442,743 | |
| MMC Norilsk Nickel PJSC sponsored ADR (a)(d) | 85,403 | 204,967 | |
| Mobile TeleSystems OJSC sponsored ADR (a)(d) | 504,110 | 502,089 | |
| Moscow Exchange MICEX-RTS OAO (d) | 1,699,470 | 326,765 | |
| Novatek PJSC GDR (Reg. S) (a)(d) | 110,438 | 5,742,776 | |
| Novolipetsk Steel OJSC (a)(d) | 1,805,640 | 17,339 | |
| Ozon Holdings PLC ADR (a)(d) | 62,559 | 131,095 | |
| PhosAgro PJSC: | |||
| GDR (Reg. S) (a)(d) | 158,247 | 3,246 | |
| sponsored GDR (Reg. S) (a)(d) | 1,019 | 21 | |
| Polyus PJSC (a)(d) | 41,353 | 97,270 | |
| Rosneft Oil Co. OJSC (d) | 1,187,356 | 198,620 | |
| Rosneft Oil Co. OJSC GDR (Reg. S) (a)(d) | 214,392 | 50,693 | |
| Sberbank of Russia (d) | 13,066,303 | 80,356 | |
| Severstal PAO (a)(d) | 245,384 | 5,480 | |
| Severstal PAO GDR (Reg. S) (a)(d) | 10,278 | 243 | |
| Surgutneftegas OJSC (d) | 6,111,900 | 74,806 | |
| Surgutneftegas OJSC sponsored ADR (a)(d) | 214,357 | 39,585 | |
| Tatneft PAO (d) | 1,520,327 | 189,142 | |
| Tatneft PAO sponsored ADR (a)(d) | 24,387 | 22,517 | |
| TCS Group Holding PLC GDR (a)(d) | 142,667 | 181,712 | |
| United Co. RUSAL International PJSC (d) | 3,455,150 | 416,507 | |
| VK Co. Ltd. GDR (Reg. S) (a)(d) | 120,267 | 35,738 | |
| VTB Bank OJSC (a)(d) | 4,133,678,016 | 157,969 | |
| X5 Retail Group NV GDR (Reg. S) (a)(d) | 152,037 | 35,878 | |
| Yandex NV Class A (a)(d) | 371,380 | 1,386,893 | |
TOTAL RUSSIA | 12,765,225 | ||
| Saudi Arabia - 1.1% | |||
| ACWA Power Co. | 147,667 | 8,934,963 | |
| Advanced Petrochemicals Co. | 202,799 | 2,016,314 | |
| Al Rajhi Bank | 3,102,647 | 55,493,020 | |
| Alinma Bank | 1,580,583 | 13,861,067 | |
| Almarai Co. Ltd. | 387,928 | 5,780,247 | |
| Arab National Bank | 1,048,517 | 6,640,570 | |
| Arabian Internet and Communications Services Co. Ltd. | 37,234 | 3,104,487 | |
| Bank Al-Jazira (a) | 623,646 | 2,719,599 | |
| Bank Albilad | 762,410 | 7,559,882 | |
| Banque Saudi Fransi | 917,625 | 8,768,754 | |
| Bupa Arabia for Cooperative Insurance Co. | 116,559 | 6,617,728 | |
| Dallah Healthcare Co. | 53,071 | 2,093,642 | |
| Dar Al Arkan Real Estate Development Co. (a) | 821,618 | 3,306,971 | |
| Dr Sulaiman Al Habib Medical Services Group Co. | 136,040 | 9,137,989 | |
| Elm Co. | 37,299 | 6,971,441 | |
| Etihad Etisalat Co. | 583,747 | 7,173,136 | |
| Jarir Marketing Co. | 909,473 | 3,510,281 | |
| Luberef | 81,294 | 2,795,321 | |
| Mobile Telecommunications Co. Saudi Arabia | 684,924 | 2,519,445 | |
| Mouwasat Medical Services Co. | 152,340 | 4,060,667 | |
| Nahdi Medical Co. | 60,653 | 2,292,514 | |
| National Industrialization Co. (a) | 506,912 | 1,570,081 | |
| Power & Water Utility Co. for Jubail & Yanbu | 116,986 | 1,696,353 | |
| Rabigh Refining & Petrochemical Co. (a) | 661,584 | 1,777,579 | |
| Riyad Bank | 2,349,175 | 16,625,066 | |
| Sabic Agriculture-Nutrients Co. | 378,350 | 13,493,771 | |
| Sahara International Petrochemical Co. | 562,208 | 4,832,927 | |
| Saudi Arabian Mining Co. | 2,067,486 | 19,839,401 | |
| Saudi Arabian Oil Co. (c) | 4,168,694 | 37,002,215 | |
| Saudi Awwal Bank | 1,616,437 | 14,412,469 | |
| Saudi Basic Industries Corp. | 1,432,244 | 29,396,201 | |
| Saudi Electricity Co. | 1,285,720 | 6,100,281 | |
| Saudi Industrial Investment Group | 582,667 | 3,721,266 | |
| Saudi Investment Bank/The | 758,127 | 2,970,590 | |
| Saudi Kayan Petrochemical Co. (a) | 1,140,426 | 3,216,150 | |
| Saudi Research & Marketing Group (a) | 55,753 | 2,095,419 | |
| Saudi Tadawul Group Holding Co. | 74,631 | 3,306,235 | |
| Saudi Telecom Co. | 3,189,253 | 32,644,023 | |
| The Co. for Cooperative Insurance | 119,909 | 3,861,021 | |
| The Saudi National Bank | 4,663,551 | 41,705,442 | |
| The Savola Group | 405,641 | 3,935,743 | |
| Yanbu National Petrochemical Co. | 429,029 | 4,328,486 | |
TOTAL SAUDI ARABIA | 413,888,757 | ||
| Singapore - 1.0% | |||
| CapitaLand Ascendas REIT | 5,815,215 | 11,049,170 | |
| CapitaLand Investment Ltd. | 4,055,099 | 8,707,045 | |
| CapitaMall Trust | 8,286,039 | 10,649,390 | |
| City Developments Ltd. | 772,145 | 3,564,077 | |
| DBS Group Holdings Ltd. | 2,867,483 | 68,886,497 | |
| Genting Singapore Ltd. | 9,408,823 | 5,911,145 | |
| Grab Holdings Ltd. (a)(b) | 2,913,671 | 8,944,970 | |
| Jardine Cycle & Carriage Ltd. | 153,800 | 3,168,247 | |
| Keppel (REIT) (e) | 473,431 | 274,904 | |
| Keppel Corp. Ltd. | 2,367,157 | 10,745,347 | |
| Mapletree Logistics Trust (REIT) | 5,391,933 | 5,790,126 | |
| Mapletree Pan Asia Commercial Trust | 3,678,689 | 3,575,340 | |
| Oversea-Chinese Banking Corp. Ltd. | 5,381,291 | 49,890,574 | |
| Sea Ltd. ADR (a) | 579,941 | 24,183,540 | |
| Seatrium Ltd. (a) | 69,011,886 | 5,652,010 | |
| Sembcorp Industries Ltd. | 1,394,400 | 4,678,083 | |
| Singapore Airlines Ltd. | 2,420,939 | 10,810,124 | |
| Singapore Exchange Ltd. | 1,339,890 | 9,276,947 | |
| Singapore Technologies Engineering Ltd. | 2,450,397 | 6,726,971 | |
| Singapore Telecommunications Ltd. | 13,302,918 | 23,116,134 | |
| STMicroelectronics NV (France) | 1,081,055 | 41,209,934 | |
| United Overseas Bank Ltd. | 2,009,315 | 39,633,137 | |
| UOL Group Ltd. | 721,249 | 3,106,300 | |
TOTAL SINGAPORE | 359,550,012 | ||
| South Africa - 0.9% | |||
| Absa Group Ltd. | 1,365,935 | 12,453,370 | |
| African Rainbow Minerals Ltd. | 175,974 | 1,450,092 | |
| Anglo American Platinum Ltd. | 103,214 | 3,448,543 | |
| Anglo American PLC (United Kingdom) | 2,010,150 | 51,217,840 | |
| Aspen Pharmacare Holdings Ltd. | 590,916 | 5,367,467 | |
| Bid Corp. Ltd. | 535,935 | 11,369,730 | |
| Bidvest Group Ltd./The | 448,862 | 6,353,550 | |
| Capitec Bank Holdings Ltd. (b) | 138,753 | 12,320,373 | |
| Clicks Group Ltd. | 376,817 | 5,552,731 | |
| Discovery Ltd. | 832,078 | 5,740,501 | |
| Exxaro Resources Ltd. | 375,608 | 3,767,870 | |
| FirstRand Ltd. | 7,977,610 | 26,298,825 | |
| Gold Fields Ltd. | 1,415,971 | 18,679,417 | |
| Growthpoint Properties Ltd. (b) | 5,296,254 | 2,753,626 | |
| Harmony Gold Mining Co. Ltd. | 864,991 | 3,965,871 | |
| Impala Platinum Holdings Ltd. | 1,347,113 | 5,611,523 | |
| Kumba Iron Ore Ltd. | 100,403 | 2,660,282 | |
| MTN Group Ltd. | 2,699,771 | 13,179,083 | |
| Naspers Ltd. Class N | 304,670 | 47,559,253 | |
| Nedbank Group Ltd. | 698,439 | 7,516,347 | |
| Northam Platinum Holdings Ltd. | 555,845 | 3,354,903 | |
| Old Mutual Ltd. (b) | 7,564,301 | 4,809,495 | |
| OUTsurance Group Ltd. | 1,307,630 | 2,828,901 | |
| Pepkor Holdings Ltd. (c) | 3,119,738 | 2,845,636 | |
| Remgro Ltd. | 863,984 | 6,679,158 | |
| Sanlam Ltd. | 2,827,594 | 9,917,630 | |
| Sasol Ltd. | 914,798 | 11,562,808 | |
| Shoprite Holdings Ltd. | 804,634 | 10,310,972 | |
| Sibanye-Stillwater Ltd. | 4,405,535 | 5,619,489 | |
| Standard Bank Group Ltd. | 2,122,051 | 20,823,711 | |
| Thungela Resources Ltd. | 1 | 9 | |
| Vodacom Group Ltd. | 965,613 | 5,256,665 | |
| Woolworths Holdings Ltd. | 1,479,255 | 5,507,472 | |
TOTAL SOUTH AFRICA | 336,783,143 | ||
| Spain - 1.6% | |||
| Acciona SA | 38,345 | 4,828,168 | |
| ACS Actividades de Construccion y Servicios SA | 356,696 | 12,896,443 | |
| Aena SME SA (c) | 119,621 | 17,308,581 | |
| Amadeus IT Holding SA Class A | 710,699 | 40,472,135 | |
| Banco Bilbao Vizcaya Argentaria SA | 9,417,666 | 74,090,988 | |
| Banco Santander SA (Spain) (b) | 25,559,369 | 93,735,780 | |
| Banco Santander SA (Spain) sponsored ADR | 64 | 232 | |
| CaixaBank SA | 6,527,999 | 26,539,849 | |
| Cellnex Telecom SA (c) | 895,197 | 26,315,309 | |
| Corp. ACCIONA Energias Renovables SA | 106,698 | 2,887,909 | |
| EDP Renovaveis SA | 477,728 | 7,678,302 | |
| Enagas SA (b) | 382,891 | 6,399,138 | |
| Endesa SA | 507,184 | 9,533,612 | |
| Grifols SA (a) | 463,239 | 5,188,271 | |
| Iberdrola SA | 9,614,586 | 106,933,596 | |
| Industria de Diseno Textil SA (b) | 1,723,642 | 59,364,221 | |
| Naturgy Energy Group SA (b) | 192,356 | 5,434,301 | |
| Redeia Corp. SA | 627,637 | 9,765,630 | |
| Repsol SA | 2,040,348 | 29,846,685 | |
| Telefonica SA | 8,202,953 | 31,685,047 | |
TOTAL SPAIN | 570,904,197 | ||
| Sweden - 1.7% | |||
| Alfa Laval AB | 458,452 | 14,810,171 | |
| ASSA ABLOY AB (B Shares) | 1,574,143 | 33,552,978 | |
| Atlas Copco AB: | |||
| (A Shares) (b) | 4,346,814 | 56,286,989 | |
| (B Shares) (b) | 2,334,735 | 26,155,424 | |
| Beijer Ref AB (B Shares) (b) | 588,785 | 5,575,351 | |
| Boliden AB | 434,957 | 11,134,559 | |
| Epiroc AB: | |||
| (A Shares) | 1,060,644 | 17,473,814 | |
| (B Shares) | 593,812 | 8,229,620 | |
| EQT AB (b) | 567,823 | 10,321,326 | |
| Ericsson (B Shares) (b) | 4,650,196 | 20,831,623 | |
| Essity AB (B Shares) | 965,098 | 21,986,609 | |
| Evolution AB (c) | 289,701 | 25,742,953 | |
| Fastighets AB Balder (a) | 1,002,948 | 4,240,029 | |
| Getinge AB (B Shares) | 354,411 | 6,362,758 | |
| H&M Hennes & Mauritz AB (B Shares) (b) | 1,009,426 | 13,501,275 | |
| Hexagon AB (B Shares) | 3,290,894 | 26,819,591 | |
| Holmen AB (B Shares) | 147,855 | 5,572,486 | |
| Husqvarna AB (B Shares) (b) | 610,384 | 3,942,565 | |
| Industrivarden AB: | |||
| (A Shares) | 186,202 | 4,807,494 | |
| (C Shares) | 248,375 | 6,390,470 | |
| Indutrade AB | 419,503 | 7,409,217 | |
| Investment AB Latour (B Shares) | 232,798 | 4,019,889 | |
| Investor AB: | |||
| (A Shares) | 674,957 | 12,256,609 | |
| (B Shares) | 2,149,939 | 39,368,376 | |
| L E Lundbergforetagen AB | 119,693 | 4,875,669 | |
| Lifco AB | 360,339 | 6,578,940 | |
| Nibe Industrier AB (B Shares) (b) | 2,404,118 | 13,822,798 | |
| Saab AB (B Shares) | 123,636 | 6,335,508 | |
| Sagax AB | 302,732 | 5,464,795 | |
| Sandvik AB | 1,682,218 | 28,653,250 | |
| Securitas AB (B Shares) | 754,175 | 6,030,724 | |
| Skandinaviska Enskilda Banken AB (A Shares) | 2,491,617 | 27,745,521 | |
| Skanska AB (B Shares) | 531,138 | 7,962,942 | |
| SKF AB (B Shares) | 545,530 | 8,801,827 | |
| Svenska Cellulosa AB SCA (B Shares) | 969,471 | 13,283,875 | |
| Svenska Handelsbanken AB (A Shares) | 2,299,791 | 19,607,319 | |
| Swedbank AB (A Shares) | 1,339,251 | 21,926,022 | |
| Swedish Orphan Biovitrum AB (a) | 339,941 | 6,986,142 | |
| Tele2 AB (B Shares) | 846,211 | 5,999,502 | |
| Telia Co. AB (b) | 3,842,917 | 8,146,781 | |
| Volvo AB: | |||
| (A Shares) | 302,905 | 6,062,198 | |
| (B Shares) | 2,386,207 | 47,221,992 | |
| Volvo Car AB (a)(b) | 921,020 | 3,160,980 | |
TOTAL SWEDEN | 635,458,961 | ||
| Switzerland - 3.8% | |||
| ABB Ltd. (Reg.) | 2,526,805 | 84,894,884 | |
| Adecco SA (Reg.) | 258,187 | 9,718,378 | |
| Alcon, Inc. (Switzerland) | 789,022 | 56,224,269 | |
| Avolta AG (a) | 149,084 | 5,197,003 | |
| Bachem Holding AG (B Shares) | 51,785 | 3,734,509 | |
| Baloise Holdings AG | 73,673 | 10,544,962 | |
| Banque Cantonale Vaudoise (b) | 46,616 | 5,257,848 | |
| Barry Callebaut AG | 5,842 | 8,830,594 | |
| BKW AG | 32,537 | 5,458,304 | |
| Clariant AG (Reg.) | 344,307 | 4,871,358 | |
| Compagnie Financiere Richemont SA Series A | 824,680 | 97,292,049 | |
| DSM-Firmenich AG | 294,899 | 26,706,873 | |
| Ems-Chemie Holding AG (b) | 10,944 | 7,459,221 | |
| Geberit AG (Reg.) | 52,644 | 24,410,751 | |
| Givaudan SA | 14,625 | 48,554,389 | |
| Helvetia Holding AG (Reg.) | 57,547 | 7,705,408 | |
| Julius Baer Group Ltd. | 328,245 | 19,452,357 | |
| Kuehne & Nagel International AG | 86,621 | 23,282,399 | |
| Lindt & Spruengli AG | 161 | 17,522,124 | |
| Lindt & Spruengli AG (participation certificate) | 1,600 | 17,677,129 | |
| Logitech International SA (Reg.) | 260,801 | 20,401,912 | |
| Lonza Group AG | 117,734 | 41,230,916 | |
| Novartis AG | 3,236,872 | 303,034,556 | |
| Partners Group Holding AG | 35,934 | 37,796,571 | |
| Sandoz Group AG (b) | 647,374 | 16,831,083 | |
| Schindler Holding AG: | |||
| (participation certificate) | 63,722 | 12,833,365 | |
| (Reg.) | 38,138 | 7,399,942 | |
| SGS SA (Reg.) | 238,347 | 19,384,281 | |
| Sig Group AG (b) | 490,185 | 10,772,053 | |
| Sika AG | 231,597 | 55,222,766 | |
| Sonova Holding AG | 82,553 | 19,466,409 | |
| Straumann Holding AG | 177,486 | 20,867,507 | |
| Swatch Group AG (Bearer) | 48,542 | 12,390,977 | |
| Swatch Group AG (Bearer) (Reg.) | 70,669 | 3,410,509 | |
| Swiss Life Holding AG | 47,339 | 30,277,393 | |
| Swiss Prime Site AG | 122,731 | 11,387,343 | |
| Swisscom AG | 40,738 | 24,362,636 | |
| Temenos Group AG | 98,417 | 7,047,637 | |
| UBS Group AG | 5,194,714 | 121,180,488 | |
| UBS Group AG | 657 | 15,413 | |
| VAT Group AG (c) | 42,921 | 15,131,935 | |
| Zurich Insurance Group Ltd. | 236,434 | 111,920,497 | |
TOTAL SWITZERLAND | 1,387,160,998 | ||
| Taiwan - 4.1% | |||
| Accton Technology Corp. | 784,000 | 12,138,154 | |
| Acer, Inc. | 4,563,060 | 4,818,918 | |
| Advantech Co. Ltd. | 730,303 | 7,494,246 | |
| ASE Technology Holding Co. Ltd. | 4,878,943 | 17,067,932 | |
| Asia Cement Corp. | 3,656,785 | 4,512,194 | |
| ASUSTeK Computer, Inc. | 1,129,422 | 11,833,019 | |
| AUO Corp. | 10,157,600 | 4,912,949 | |
| Catcher Technology Co. Ltd. | 980,000 | 5,493,464 | |
| Cathay Financial Holding Co. Ltd. | 15,197,184 | 20,607,458 | |
| Chailease Holding Co. Ltd. | 2,455,727 | 13,310,954 | |
| Chang Hwa Commercial Bank | 8,558,350 | 4,530,536 | |
| Cheng Shin Rubber Industry Co. Ltd. | 3,006,513 | 4,105,366 | |
| China Airlines Ltd. | 4,472,000 | 2,678,703 | |
| China Development Financial Ho (a) | 24,797,457 | 8,661,492 | |
| China Steel Corp. | 18,924,421 | 14,107,763 | |
| Chunghwa Picture Tubes, Ltd. (a)(d) | 551 | 0 | |
| Chunghwa Telecom Co. Ltd. | 6,055,400 | 21,640,717 | |
| Compal Electronics, Inc. | 6,496,394 | 5,646,441 | |
| CTBC Financial Holding Co. Ltd. | 28,274,255 | 21,277,036 | |
| Delta Electronics, Inc. | 3,101,383 | 27,927,800 | |
| E Ink Holdings, Inc. | 1,331,000 | 6,920,026 | |
| E.SUN Financial Holdings Co. Ltd. | 22,663,272 | 16,686,329 | |
| ECLAT Textile Co. Ltd. | 299,420 | 4,761,971 | |
| eMemory Technology, Inc. | 101,000 | 6,322,923 | |
| EVA Airways Corp. | 4,016,000 | 3,403,003 | |
| Evergreen Marine Corp. (Taiwan) | 1,617,221 | 5,377,608 | |
| Far Eastern New Century Corp. | 4,656,032 | 4,238,902 | |
| Far EasTone Telecommunications Co. Ltd. | 2,496,000 | 5,842,191 | |
| Feng Tay Enterprise Co. Ltd. | 762,710 | 4,208,305 | |
| First Financial Holding Co. Ltd. | 17,559,419 | 14,039,286 | |
| Formosa Chemicals & Fibre Corp. | 5,467,620 | 10,279,271 | |
| Formosa Petrochemical Corp. | 1,735,000 | 4,235,403 | |
| Formosa Plastics Corp. | 6,162,640 | 14,644,535 | |
| Fubon Financial Holding Co. Ltd. | 12,418,311 | 23,075,241 | |
| Giant Manufacturing Co. Ltd. | 493,272 | 2,492,344 | |
| Gigabyte Technology Co. Ltd. | 790,000 | 5,363,080 | |
| Global Unichip Corp. | 135,000 | 6,028,912 | |
| GlobalWafers Co. Ltd. | 338,000 | 4,964,743 | |
| Hon Hai Precision Industry Co. Ltd. (Foxconn) | 19,765,593 | 58,949,210 | |
| Hotai Motor Co. Ltd. | 475,180 | 8,859,620 | |
| Hua Nan Financial Holdings Co. Ltd. | 13,791,634 | 8,642,402 | |
| Innolux Corp. | 13,356,597 | 5,031,121 | |
| Inventec Corp. | 4,176,209 | 5,227,778 | |
| Largan Precision Co. Ltd. | 156,000 | 9,983,614 | |
| Lite-On Technology Corp. | 3,223,053 | 10,027,286 | |
| MediaTek, Inc. | 2,403,989 | 62,694,257 | |
| Mega Financial Holding Co. Ltd. | 18,048,846 | 20,464,872 | |
| Micro-Star International Co. Ltd. | 1,112,000 | 5,688,313 | |
| momo.com, Inc. | 129,360 | 2,131,041 | |
| Nan Ya Plastics Corp. | 7,601,980 | 14,533,838 | |
| Nan Ya Printed Circuit Board Corp. | 352,000 | 2,581,726 | |
| Nanya Technology Corp. | 1,923,000 | 3,852,222 | |
| Nien Made Enterprise Co. Ltd. | 272,000 | 2,404,624 | |
| Novatek Microelectronics Corp. | 924,000 | 13,002,738 | |
| Pegatron Corp. | 3,098,652 | 7,225,516 | |
| PharmaEssentia Corp. (a) | 370,000 | 3,679,229 | |
| Pou Chen Corp. | 3,360,240 | 2,992,886 | |
| Powerchip Semiconductor Manufacturing Corp. | 4,725,554 | 3,884,343 | |
| President Chain Store Corp. | 885,000 | 7,034,179 | |
| Quanta Computer, Inc. | 4,285,000 | 25,280,467 | |
| Realtek Semiconductor Corp. | 757,744 | 9,436,394 | |
| Ruentex Development Co. Ltd. | 2,430,661 | 2,435,777 | |
| Shin Kong Financial Holding Co. Ltd. (a) | 20,582,616 | 5,525,223 | |
| Sinopac Financial Holdings Co. | 16,352,301 | 9,011,610 | |
| Synnex Technology International Corp. | 1,941,920 | 4,118,176 | |
| Taishin Financial Holdings Co. Ltd. | 17,420,737 | 9,284,486 | |
| Taiwan Business Bank | 9,618,432 | 3,789,287 | |
| Taiwan Cement Corp. | 10,429,302 | 10,383,927 | |
| Taiwan Cooperative Financial Holding Co. Ltd. | 16,384,294 | 12,713,703 | |
| Taiwan High Speed Rail Corp. | 3,034,000 | 2,752,572 | |
| Taiwan Mobile Co. Ltd. | 2,673,400 | 7,894,528 | |
| Taiwan Semiconductor Manufacturing Co. Ltd. | 38,914,000 | 635,074,125 | |
| The Shanghai Commercial & Savings Bank Ltd. | 5,980,811 | 7,918,421 | |
| Uni-President Enterprises Corp. | 7,788,620 | 16,327,538 | |
| Unimicron Technology Corp. | 2,197,000 | 9,790,886 | |
| United Microelectronics Corp. | 17,902,000 | 25,725,292 | |
| Vanguard International Semiconductor Corp. | 1,397,000 | 3,031,560 | |
| Voltronic Power Technology Corp. | 102,000 | 4,087,450 | |
| Walsin Lihwa Corp. | 4,374,600 | 4,652,226 | |
| Wan Hai Lines Ltd. | 1,097,050 | 1,566,765 | |
| Winbond Electronics Corp. | 4,626,000 | 3,582,029 | |
| Winbond Electronics Corp. rights 11/3/23 (a) | 185,969 | 16,901 | |
| Wistron Corp. | 4,148,000 | 11,557,794 | |
| Wiwynn Corp. | 136,000 | 6,439,145 | |
| WPG Holding Co. Ltd. | 2,546,378 | 5,630,355 | |
| Yageo Corp. | 524,909 | 8,551,286 | |
| Yang Ming Marine Transport Corp. | 2,700,000 | 3,516,413 | |
| Yuanta Financial Holding Co. Ltd. | 16,369,195 | 12,288,984 | |
| Zhen Ding Technology Holding Ltd. | 1,027,230 | 3,103,374 | |
TOTAL TAIWAN | 1,480,026,724 | ||
| Thailand - 0.5% | |||
| Advanced Info Service PCL (For. Reg.) | 834,600 | 5,083,564 | |
| Advanced Information Service PCL NVDR | 1,156,100 | 7,041,826 | |
| Airports of Thailand PCL: | |||
| (For. Reg.) (a) | 2,874,900 | 5,308,051 | |
| NVDR (a) | 3,766,200 | 6,953,697 | |
| Asset World Corp. PCL: | |||
| (For. Reg.) | 7,773,300 | 743,841 | |
| NVDR | 6,688,800 | 640,063 | |
| B. Grimm Power PCL: | |||
| (For. Reg.) | 718,200 | 439,358 | |
| NVDR | 423,100 | 258,831 | |
| Bangkok Dusit Medical Services PCL: | |||
| (For. Reg.) | 8,118,600 | 5,951,626 | |
| NVDR | 9,183,400 | 6,732,215 | |
| Bangkok Expressway and Metro PCL: | |||
| (For. Reg.) | 5,767,300 | 1,259,945 | |
| NVDR | 6,120,100 | 1,337,019 | |
| Banpu PCL NVDR | 11,540,100 | 2,425,881 | |
| Berli Jucker PCL: | |||
| (For. Reg.) | 600,400 | 469,726 | |
| NVDR | 937,500 | 733,458 | |
| BTS Group Holdings PCL: | |||
| (For. Reg.) | 3,939,900 | 819,435 | |
| NVDR | 8,119,300 | 1,674,176 | |
| Bumrungrad Hospital PCL: | |||
| (For. Reg.) | 333,600 | 2,397,753 | |
| NVDR | 664,900 | 4,778,974 | |
| Central Pattana PCL: | |||
| (For. Reg.) | 1,878,700 | 3,250,183 | |
| NVDR | 1,253,900 | 2,169,268 | |
| Central Retail Corp. PCL: | |||
| (For. Reg.) | 1,222,150 | 1,243,013 | |
| NVDR | 1,579,300 | 1,606,259 | |
| Charoen Pokphand Foods PCL: | |||
| (For. Reg.) | 3,517,640 | 1,819,701 | |
| NVDR | 2,490,400 | 1,288,302 | |
| CP ALL PCL: | |||
| (For. Reg.) | 4,316,600 | 6,597,344 | |
| NVDR | 5,316,800 | 8,126,015 | |
| CP Axtra PCL NVDR | 3,268,200 | 2,555,384 | |
| Delta Electronics PCL: | |||
| (For. Reg.) | 2,269,000 | 4,959,738 | |
| NVDR | 2,684,200 | 5,867,884 | |
| Electricity Generating PCL: | |||
| (For. Reg.) | 176,400 | 595,487 | |
| NVDR | 202,800 | 684,608 | |
| Energy Absolute PCL: | |||
| (For. Reg.) | 1,264,600 | 1,469,967 | |
| NVDR | 1,344,400 | 1,562,726 | |
| Global Power Synergy Public Co. Ltd.: | |||
| (For. Reg.) | 472,100 | 509,667 | |
| NVDR | 783,200 | 845,523 | |
| Gulf Energy Development PCL: | |||
| (For. Reg.) | 1,254,900 | 1,501,962 | |
| NVDR | 3,273,100 | 3,917,500 | |
| Home Product Center PCL: | |||
| (For. Reg.) | 4,757,447 | 1,566,392 | |
| NVDR | 4,300,100 | 1,415,810 | |
| Indorama Ventures PCL NVDR | 2,593,300 | 1,699,224 | |
| Intouch Holdings PCL: | |||
| (For. Reg.) | 737,800 | 1,449,289 | |
| NVDR | 736,100 | 1,445,950 | |
| Kasikornbank PCL NVDR | 910,600 | 3,311,864 | |
| Krung Thai Bank PCL: | |||
| (For. Reg.) | 1,971,475 | 1,025,110 | |
| NVDR | 3,607,800 | 1,875,951 | |
| Krungthai Card PCL: | |||
| (For. Reg.) | 402,600 | 487,389 | |
| NVDR | 1,184,500 | 1,433,958 | |
| Land & House PCL: | |||
| (For. Reg.) | 7,055,500 | 1,473,916 | |
| NVDR | 7,750,000 | 1,619,000 | |
| Minor International PCL: | |||
| (For. Reg.) | 2,307,541 | 1,788,273 | |
| NVDR | 2,760,082 | 2,138,978 | |
| Muangthai Leasing PCL: | |||
| (For. Reg.) | 559,091 | 564,653 | |
| NVDR | 617,000 | 623,139 | |
| Osotspa PCL: | |||
| (For. Reg.) | 496,400 | 322,814 | |
| NVDR | 1,539,000 | 1,000,828 | |
| PTT Exploration and Production PCL: | |||
| (For. Reg.) | 1,205,451 | 5,474,627 | |
| NVDR | 930,200 | 4,224,558 | |
| PTT Global Chemical PCL: | |||
| (For. Reg.) | 1,977,086 | 1,888,336 | |
| NVDR | 1,504,100 | 1,436,582 | |
| PTT Oil & Retail Business PCL NVDR | 4,593,200 | 2,326,057 | |
| PTT PCL: | |||
| (For. Reg.) | 7,492,700 | 6,896,824 | |
| NVDR | 8,003,800 | 7,367,277 | |
| Ratch Group PCL: | |||
| (For. Reg.) | 514,200 | 458,781 | |
| NVDR unit | 1,166,300 | 1,040,599 | |
| SCB X PCL: | |||
| (For. Reg.) | 291,200 | 793,979 | |
| NVDR | 1,002,100 | 2,732,302 | |
| SCG Packaging PCL NVDR | 1,999,600 | 1,992,485 | |
| Siam Cement PCL: | |||
| (For. Reg.) | 548,850 | 4,372,285 | |
| NVDR | 655,800 | 5,224,277 | |
| Thai Oil PCL: | |||
| (For. Reg.) | 934,645 | 1,216,962 | |
| NVDR | 880,054 | 1,145,882 | |
| TMBThanachart Bank PCL NVDR | 37,021,300 | 1,710,272 | |
| True Corp. PCL | 9,429,253 | 1,581,418 | |
| True Corp. PCL NVDR | 4,882,205 | 818,814 | |
TOTAL THAILAND | 183,564,825 | ||
| Turkey - 0.2% | |||
| Akbank TAS | 4,832,862 | 5,027,538 | |
| Aselsan A/S | 2,195,754 | 3,205,327 | |
| Bim Birlesik Magazalar A/S JSC | 705,676 | 6,777,859 | |
| Eregli Demir ve Celik Fabrikalari T.A.S. (a) | 2,134,301 | 2,853,347 | |
| Ford Otomotiv Sanayi A/S | 109,011 | 3,026,752 | |
| Haci Omer Sabanci Holding A/S | 1,643,664 | 3,105,168 | |
| Hektas Ticaret A/S (a) | 1,736,311 | 1,343,960 | |
| Koc Holding A/S | 1,174,203 | 5,672,148 | |
| Koza Altin Isletmeleri A/S | 1,528,428 | 1,185,211 | |
| Pegasus Hava Tasimaciligi A/S (a) | 78,297 | 1,949,182 | |
| Sasa Polyester Sanayi A/S | 1,634,967 | 2,468,681 | |
| Tofas Turk Otomobil Fabrikasi A/S | 189,523 | 1,610,854 | |
| Turk Hava Yollari AO (a) | 851,181 | 6,531,304 | |
| Turkcell Iletisim Hizmet A/S | 1,856,995 | 3,147,533 | |
| Turkiye Is Bankasi A/S Series C | 5,419,941 | 4,015,303 | |
| Turkiye Petrol Rafinerileri A/S | 1,495,832 | 7,495,204 | |
| Turkiye Sise ve Cam Fabrikalari A/S | 2,101,495 | 3,512,973 | |
| Yapi ve Kredi Bankasi A/S | 5,220,042 | 3,177,822 | |
TOTAL TURKEY | 66,106,166 | ||
| United Arab Emirates - 0.4% | |||
| Abu Dhabi Commercial Bank PJSC | 4,548,815 | 9,944,728 | |
| Abu Dhabi Islamic Bank (a) | 2,256,222 | 6,327,004 | |
| Abu Dhabi National Oil Co. for Distribution PJSC | 4,834,374 | 4,422,406 | |
| Aldar Properties PJSC | 5,988,264 | 8,477,804 | |
| Americana Restaurants International PLC | 3,932,347 | 3,961,253 | |
| Dubai Islamic Bank Pakistan Ltd. | 4,525,184 | 6,652,871 | |
| Emaar Properties PJSC | 10,717,055 | 19,520,038 | |
| Emirates NBD Bank PJSC | 3,116,385 | 14,381,357 | |
| Emirates Telecommunications Corp. | 5,507,620 | 27,680,551 | |
| First Abu Dhabi Bank PJSC | 7,013,906 | 24,213,539 | |
| Multiply Group (a) | 6,074,844 | 5,623,324 | |
| NMC Health PLC (a)(d) | 75,611 | 15 | |
TOTAL UNITED ARAB EMIRATES | 131,204,890 | ||
| United Kingdom - 7.0% | |||
| 3i Group PLC | 1,535,890 | 36,212,585 | |
| Abrdn PLC | 3,055,112 | 5,816,941 | |
| Admiral Group PLC | 328,820 | 9,763,798 | |
| AngloGold Ashanti PLC | 667,302 | 12,334,570 | |
| Ashtead Group PLC | 691,080 | 39,512,339 | |
| Associated British Foods PLC | 544,928 | 13,418,861 | |
| AstraZeneca PLC (United Kingdom) | 2,448,210 | 306,525,078 | |
| Auto Trader Group PLC (c) | 1,474,648 | 11,154,612 | |
| Aviva PLC | 4,299,799 | 20,826,381 | |
| BAE Systems PLC | 4,821,753 | 64,835,133 | |
| Barclays PLC | 24,577,207 | 39,447,590 | |
| Barratt Developments PLC | 1,586,333 | 7,980,441 | |
| Berkeley Group Holdings PLC | 169,024 | 8,291,567 | |
| BP PLC | 25,864,800 | 157,930,977 | |
| BP PLC sponsored ADR | 266,305 | 9,741,437 | |
| British American Tobacco PLC (United Kingdom) | 3,353,264 | 100,170,202 | |
| BT Group PLC | 10,569,947 | 14,485,265 | |
| Bunzl PLC | 532,690 | 18,983,470 | |
| Burberry Group PLC | 599,920 | 12,337,603 | |
| Centrica PLC | 8,822,522 | 16,867,805 | |
| CK Hutchison Holdings Ltd. | 4,270,723 | 21,619,622 | |
| CNH Industrial NV (b) | 1,618,887 | 17,925,962 | |
| Coca-Cola European Partners PLC | 326,145 | 19,082,744 | |
| Compass Group PLC | 2,733,082 | 68,904,786 | |
| Croda International PLC | 222,764 | 11,853,807 | |
| DCC PLC (United Kingdom) | 158,663 | 8,803,463 | |
| Diageo PLC | 3,541,910 | 133,940,957 | |
| Entain PLC | 1,017,283 | 11,503,992 | |
| Halma PLC | 607,898 | 13,632,145 | |
| Hargreaves Lansdown PLC | 547,446 | 4,701,669 | |
| HSBC Holdings PLC (United Kingdom) | 31,164,489 | 225,020,870 | |
| Imperial Brands PLC | 1,370,643 | 29,200,440 | |
| Informa PLC | 2,234,234 | 19,324,208 | |
| InterContinental Hotel Group PLC | 267,480 | 18,954,318 | |
| Intertek Group PLC | 258,541 | 12,013,535 | |
| J Sainsbury PLC | 2,579,867 | 8,068,154 | |
| JD Sports Fashion PLC | 3,999,380 | 6,197,834 | |
| Johnson Matthey PLC | 285,558 | 5,185,397 | |
| Kingfisher PLC | 2,958,378 | 7,554,273 | |
| Land Securities Group PLC | 1,172,603 | 8,109,617 | |
| Legal & General Group PLC | 9,477,987 | 24,353,321 | |
| Lloyds Banking Group PLC | 101,556,493 | 49,427,544 | |
| London Stock Exchange Group PLC | 669,396 | 67,538,773 | |
| M&G PLC | 3,689,109 | 8,887,144 | |
| Melrose Industries PLC | 2,155,681 | 12,235,972 | |
| National Grid PLC | 5,798,709 | 69,137,875 | |
| NatWest Group PLC | 9,204,369 | 20,027,025 | |
| Next PLC | 188,831 | 15,799,788 | |
| Ocado Group PLC (a) | 899,678 | 5,088,119 | |
| Pearson PLC | 733,970 | 8,496,243 | |
| Pearson PLC sponsored ADR (b) | 294,486 | 3,398,368 | |
| Pepco Group NV (a) | 257,873 | 1,043,847 | |
| Persimmon PLC | 491,875 | 6,074,151 | |
| Phoenix Group Holdings PLC | 1,161,082 | 6,404,194 | |
| Reckitt Benckiser Group PLC | 1,129,928 | 75,600,049 | |
| RELX PLC (London Stock Exchange) | 2,986,922 | 104,326,362 | |
| Rentokil Initial PLC | 3,987,044 | 20,303,985 | |
| Rolls-Royce Holdings PLC (a) | 13,323,668 | 35,070,913 | |
| Sage Group PLC | 1,626,471 | 19,187,735 | |
| Schroders PLC | 1,250,448 | 5,612,832 | |
| Segro PLC | 1,865,704 | 16,163,951 | |
| Severn Trent PLC | 408,459 | 13,186,017 | |
| Smith & Nephew PLC | 1,387,346 | 15,525,975 | |
| Smiths Group PLC | 558,469 | 10,952,295 | |
| Spirax-Sarco Engineering PLC | 117,427 | 11,692,167 | |
| SSE PLC | 1,729,360 | 34,324,853 | |
| St. James's Place PLC | 852,006 | 6,623,510 | |
| Standard Chartered PLC (United Kingdom) | 3,743,716 | 28,666,888 | |
| Taylor Wimpey PLC | 5,478,856 | 7,378,477 | |
| Tesco PLC | 11,276,456 | 37,004,394 | |
| Unilever PLC | 3,961,721 | 187,629,818 | |
| United Utilities Group PLC | 1,101,487 | 14,246,156 | |
| Vodafone Group PLC | 34,578,252 | 31,830,647 | |
| Vodafone Group PLC sponsored ADR | 183,947 | 1,699,670 | |
| Whitbread PLC | 312,381 | 12,635,866 | |
| Wise PLC (a) | 953,586 | 7,714,544 | |
| WPP PLC | 1,721,910 | 14,827,765 | |
TOTAL UNITED KINGDOM | 2,568,351,681 | ||
| United States of America - 4.5% | |||
| Brookfield Renewable Corp. | 207,853 | 4,728,871 | |
| BRP, Inc. | 56,564 | 3,823,143 | |
| CRH PLC | 1,142,789 | 61,407,818 | |
| CSL Ltd. | 762,775 | 112,732,140 | |
| CyberArk Software Ltd. (a) | 67,151 | 10,988,590 | |
| Experian PLC | 1,453,349 | 44,002,843 | |
| Ferrovial SE | 798,895 | 24,040,639 | |
| Ferrovial SE rights (a)(b)(e) | 798,895 | 361,455 | |
| GSK PLC | 6,468,750 | 115,316,947 | |
| Haleon PLC | 8,754,838 | 35,090,183 | |
| Holcim AG | 833,604 | 51,391,758 | |
| James Hardie Industries PLC CDI (a) | 697,911 | 17,412,482 | |
| JBS SA | 1,203,200 | 4,780,105 | |
| Legend Biotech Corp. ADR (a) | 92,680 | 6,123,368 | |
| Monday.com Ltd. (a) | 33,682 | 4,378,323 | |
| Nestle SA (Reg. S) | 4,213,054 | 454,330,606 | |
| Parade Technologies Ltd. | 120,000 | 3,931,396 | |
| QIAGEN NV (Germany) (a) | 357,651 | 13,290,480 | |
| Roche Holding AG: | |||
| (Bearer) | 50,132 | 13,623,515 | |
| (participation certificate) | 1,109,647 | 285,966,730 | |
| Sanofi SA | 1,794,447 | 162,946,949 | |
| Schneider Electric SA | 859,064 | 132,173,245 | |
| Swiss Re Ltd. | 476,096 | 51,877,794 | |
| Tenaris SA | 745,172 | 11,700,843 | |
TOTAL UNITED STATES OF AMERICA | 1,626,420,223 | ||
| Zambia - 0.0% | |||
| First Quantum Minerals Ltd. | 933,810 | 10,821,220 | |
| TOTAL COMMON STOCKS (Cost $35,005,143,767) | 34,639,996,147 | ||
| Nonconvertible Preferred Stocks - 0.9% | |||
| Shares | Value ($) | ||
| Brazil - 0.4% | |||
| Ambev SA sponsored ADR | 427,222 | 1,080,872 | |
| Banco Bradesco SA: | |||
| (PN) | 8,332,734 | 23,121,922 | |
| (PN) sponsored ADR (b) | 1,102,352 | 3,075,562 | |
| Centrais Eletricas Brasileiras SA (Electrobras) (PN-B) | 475,542 | 3,626,636 | |
| Companhia Energetica de Minas Gerais (CEMIG) (PN) | 2,169,554 | 5,051,929 | |
| Gerdau SA | 1,792,382 | 7,739,407 | |
| Itau Unibanco Holding SA | 6,827,061 | 36,317,107 | |
| Itau Unibanco Holding SA sponsored ADR | 837,131 | 4,445,166 | |
| Itausa-Investimentos Itau SA (PN) | 8,265,798 | 14,165,021 | |
| Petroleo Brasileiro SA - Petrobras: | |||
| (PN) (non-vtg.) | 6,647,240 | 45,802,572 | |
| (PN) sponsored ADR (non-vtg.) (b) | 905,983 | 12,529,745 | |
| sponsored ADR | 149,348 | 2,240,220 | |
TOTAL BRAZIL | 159,196,159 | ||
| Chile - 0.0% | |||
| Sociedad Quimica y Minera de Chile SA (PN-B) | 230,503 | 11,151,709 | |
| Colombia - 0.0% | |||
| Bancolombia SA (PN) | 754,127 | 4,836,966 | |
| France - 0.0% | |||
| Air Liquide SA (a) | 46,389 | 7,948,860 | |
| Germany - 0.3% | |||
| Bayerische Motoren Werke AG (BMW) (non-vtg.) | 62,243 | 5,278,624 | |
| Dr. Ing. h.c. F. Porsche AG Series F (c) | 179,721 | 15,696,037 | |
| Henkel AG & Co. KGaA | 270,368 | 19,476,080 | |
| Porsche Automobil Holding SE (Germany) | 244,310 | 10,934,853 | |
| Sartorius AG (non-vtg.) | 41,699 | 10,421,548 | |
| Volkswagen AG | 325,672 | 34,537,750 | |
TOTAL GERMANY | 96,344,892 | ||
| Korea (South) - 0.2% | |||
| AMOREPACIFIC Corp. | 7,985 | 215,923 | |
| Hyundai Motor Co. Ltd. | 41,134 | 3,033,116 | |
| Hyundai Motor Co. Ltd. Series 2 | 66,197 | 4,910,623 | |
| LG Chemical Ltd. | 13,021 | 2,715,482 | |
| LG H & H Co. Ltd. | 1,295 | 135,888 | |
| Samsung Electronics Co. Ltd. | 1,326,911 | 52,898,028 | |
TOTAL KOREA (SOUTH) | 63,909,060 | ||
| Russia - 0.0% | |||
| Surgutneftegas OJSC (d) | 8,898,217 | 154,852 | |
| TOTAL NONCONVERTIBLE PREFERRED STOCKS (Cost $391,430,052) | 343,542,498 | ||
| Nonconvertible Bonds - 0.0% | |||
Principal Amount (f) | Value ($) | ||
| India - 0.0% | |||
NTPC Ltd. 8.49% 3/25/25 (Cost $46,681) | INR | 233,068 | 29,520 |
| U.S. Government and Government Agency Obligations - 0.1% | |||
Principal Amount (f) | Value ($) | ||
| U.S. Treasury Obligations - 0.1% | |||
U.S. Treasury Bills, yield at date of purchase 5.42% 2/22/24 (g) (Cost $39,334,995) | 40,000,000 | 39,332,672 | |
| Money Market Funds - 5.1% | |||
| Shares | Value ($) | ||
| Fidelity Cash Central Fund 5.40% (h) | 1,204,258,069 | 1,204,498,921 | |
| Fidelity Securities Lending Cash Central Fund 5.40% (h)(i) | 645,987,557 | 646,052,156 | |
| TOTAL MONEY MARKET FUNDS (Cost $1,850,550,947) | 1,850,551,077 | ||
| TOTAL INVESTMENT IN SECURITIES - 101.0% (Cost $37,286,506,442) | 36,873,451,914 |
NET OTHER ASSETS (LIABILITIES) - (1.0)% | (381,560,639) |
| NET ASSETS - 100.0% | 36,491,891,275 |
| Futures Contracts | |||||
Number of contracts | Expiration Date | Notional Amount ($) | Value ($) | Unrealized Appreciation/ (Depreciation) ($) | |
| Purchased | |||||
| Equity Index Contracts | |||||
| ICE MSCI EAFE Index Contracts (United States) | 9,789 | Dec 2023 | 966,223,245 | (39,855,997) | (39,855,997) |
| ICE MSCI Emerging Markets Index Contracts (United States) | 9,386 | Dec 2023 | 431,380,560 | (19,635,492) | (19,635,492) |
| TME S&P/TSX 60 Index Contracts (Canada) | 680 | Dec 2023 | 111,310,618 | (4,989,114) | (4,989,114) |
| TOTAL FUTURES CONTRACTS | (64,480,603) | ||||
| The notional amount of futures purchased as a percentage of Net Assets is 4.1% | |||||
| INR | - | Indian rupee |
| (a) | Non-income producing |
| (b) | Security or a portion of the security is on loan at period end. |
| (c) | Security exempt from registration under Rule 144A of the Securities Act of 1933. These securities may be resold in transactions exempt from registration, normally to qualified institutional buyers. At the end of the period, the value of these securities amounted to $809,295,048 or 2.2% of net assets. |
| (d) | Level 3 security |
| (e) | Security or a portion of the security purchased on a delayed delivery or when-issued basis. |
| (f) | Amount is stated in United States dollars unless otherwise noted. |
| (g) | Security or a portion of the security was pledged to cover margin requirements for futures contracts. At period end, the value of securities pledged amounted to $39,332,672. |
| (h) | Affiliated fund that is generally available only to investment companies and other accounts managed by Fidelity Investments. The rate quoted is the annualized seven-day yield of the fund at period end. A complete unaudited listing of the fund's holdings as of its most recent quarter end is available upon request. In addition, each Fidelity Central Fund's financial statements, which are not covered by the Fund's Report of Independent Registered Public Accounting Firm, are available on the SEC's website or upon request. |
| (i) | Investment made with cash collateral received from securities on loan. |
| Affiliate | Value, beginning of period ($) | Purchases ($) | Sales Proceeds ($) | Dividend Income ($) | Realized Gain (loss) ($) | Change in Unrealized appreciation (depreciation) ($) | Value, end of period ($) | % ownership, end of period |
| Fidelity Cash Central Fund 5.40% | 397,660,148 | 7,617,588,722 | 6,810,749,950 | 45,499,626 | 279 | (278) | 1,204,498,921 | 2.6% |
| Fidelity Securities Lending Cash Central Fund 5.40% | 772,628,901 | 8,099,201,240 | 8,225,777,985 | 8,231,219 | - | - | 646,052,156 | 2.7% |
| Total | 1,170,289,049 | 15,716,789,962 | 15,036,527,935 | 53,730,845 | 279 | (278) | 1,850,551,077 | |
| Valuation Inputs at Reporting Date: | ||||
| Description | Total ($) | Level 1 ($) | Level 2 ($) | Level 3 ($) |
Investments in Securities: | ||||
| Equities: | ||||
Communication Services | 1,913,022,738 | 390,565,693 | 1,520,532,325 | 1,924,720 |
Consumer Discretionary | 4,123,185,432 | 1,199,857,083 | 2,923,197,254 | 131,095 |
Consumer Staples | 2,977,645,567 | 700,775,084 | 2,276,834,604 | 35,879 |
Energy | 2,141,705,934 | 829,769,638 | 1,303,791,080 | 8,145,216 |
Financials | 7,407,042,723 | 3,031,429,250 | 4,374,866,668 | 746,805 |
Health Care | 3,342,814,175 | 498,942,215 | 2,843,871,945 | 15 |
Industrials | 4,487,896,918 | 1,498,452,187 | 2,989,444,731 | - |
Information Technology | 4,029,741,081 | 406,096,762 | 3,623,644,317 | 2 |
Materials | 2,727,366,911 | 1,096,259,009 | 1,629,403,771 | 1,704,131 |
Real Estate | 706,314,945 | 172,767,194 | 533,547,751 | - |
Utilities | 1,126,802,221 | 436,452,564 | 690,117,420 | 232,237 |
| Corporate Bonds | 29,520 | - | 29,520 | - |
| U.S. Government and Government Agency Obligations | 39,332,672 | - | 39,332,672 | - |
| Money Market Funds | 1,850,551,077 | 1,850,551,077 | - | - |
| Total Investments in Securities: | 36,873,451,914 | 12,111,917,756 | 24,748,614,058 | 12,920,100 |
Derivative Instruments: Liabilities | ||||
Futures Contracts | (64,480,603) | (64,480,603) | - | - |
| Total Liabilities | (64,480,603) | (64,480,603) | - | - |
| Total Derivative Instruments: | (64,480,603) | (64,480,603) | - | - |
Primary Risk Exposure / Derivative Type | Value | |
| Asset ($) | Liability ($) | |
| Equity Risk | ||
Futures Contracts (a) | 0 | (64,480,603) |
| Total Equity Risk | 0 | (64,480,603) |
| Total Value of Derivatives | 0 | (64,480,603) |
| Statement of Assets and Liabilities | ||||
| October 31, 2023 | ||||
| Assets | ||||
| Investment in securities, at value (including securities loaned of $609,582,954) - See accompanying schedule: | ||||
Unaffiliated issuers (cost $35,435,955,495) | $ | 35,022,900,837 | ||
Fidelity Central Funds (cost $1,850,550,947) | 1,850,551,077 | |||
| Total Investment in Securities (cost $37,286,506,442) | $ | 36,873,451,914 | ||
| Segregated cash with brokers for derivative instruments | 9,278,267 | |||
| Cash | 4,012 | |||
| Foreign currency held at value (cost $48,926,132) | 48,519,768 | |||
| Receivable for investments sold | 11,128 | |||
| Receivable for fund shares sold | 127,980,151 | |||
| Dividends receivable | 72,529,543 | |||
| Reclaims receivable | 44,583,804 | |||
| Interest receivable | 110 | |||
| Distributions receivable from Fidelity Central Funds | 5,225,654 | |||
| Receivable for daily variation margin on futures contracts | 185,244 | |||
| Receivable from investment adviser for expense reductions | 71,559 | |||
| Other receivables | 86,088 | |||
Total assets | 37,181,927,242 | |||
| Liabilities | ||||
| Payable for investments purchased | ||||
Regular delivery | $ | 593 | ||
Delayed delivery | 638,083 | |||
| Payable for fund shares redeemed | 740,206 | |||
| Deferred taxes | 41,134,653 | |||
| Other payables and accrued expenses | 1,450,396 | |||
| Collateral on securities loaned | 646,072,036 | |||
| Total Liabilities | 690,035,967 | |||
| Net Assets | $ | 36,491,891,275 | ||
| Net Assets consist of: | ||||
| Paid in capital | $ | 37,806,758,867 | ||
| Total accumulated earnings (loss) | (1,314,867,592) | |||
| Net Assets | $ | 36,491,891,275 | ||
Net Asset Value, offering price and redemption price per share ($36,491,891,275 ÷ 2,911,544,243 shares) | $ | 12.53 | ||
| Statement of Operations | ||||
Year ended October 31, 2023 | ||||
| Investment Income | ||||
| Dividends | $ | 1,166,300,803 | ||
| Interest | 2,873,998 | |||
| Income from Fidelity Central Funds (including $8,231,219 from security lending) | 53,730,845 | |||
| Income before foreign taxes withheld | $ | 1,222,905,646 | ||
| Less foreign taxes withheld | (112,647,328) | |||
| Total Income | 1,110,258,318 | |||
| Expenses | ||||
| Custodian fees and expenses | $ | 5,383,201 | ||
| Independent trustees' fees and expenses | 120,061 | |||
| Interest | 116,239 | |||
| Miscellaneous | 20 | |||
| Total expenses before reductions | 5,619,521 | |||
| Expense reductions | (775,962) | |||
| Total expenses after reductions | 4,843,559 | |||
| Net Investment income (loss) | 1,105,414,759 | |||
| Realized and Unrealized Gain (Loss) | ||||
| Net realized gain (loss) on: | ||||
| Investment Securities: | ||||
| Unaffiliated issuers (net of foreign taxes of $1,459,859) | (782,165,377) | |||
| Fidelity Central Funds | 279 | |||
| Foreign currency transactions | (536,535) | |||
| Futures contracts | 145,704,606 | |||
| Total net realized gain (loss) | (636,997,027) | |||
| Change in net unrealized appreciation (depreciation) on: | ||||
| Investment Securities: | ||||
| Unaffiliated issuers(net of increase in deferred foreign taxes of $5,127,377) | 3,195,038,147 | |||
| Fidelity Central Funds | (278) | |||
| Assets and liabilities in foreign currencies | 2,553,710 | |||
| Futures contracts | (81,261,192) | |||
| Total change in net unrealized appreciation (depreciation) | 3,116,330,387 | |||
| Net gain (loss) | 2,479,333,360 | |||
| Net increase (decrease) in net assets resulting from operations | $ | 3,584,748,119 | ||
| Statement of Changes in Net Assets | ||||
Year ended October 31, 2023 | Year ended October 31, 2022 | |||
| Increase (Decrease) in Net Assets | ||||
| Operations | ||||
| Net investment income (loss) | $ | 1,105,414,759 | $ | 959,918,355 |
| Net realized gain (loss) | (636,997,027) | (629,944,936) | ||
| Change in net unrealized appreciation (depreciation) | 3,116,330,387 | (8,932,760,322) | ||
| Net increase (decrease) in net assets resulting from operations | 3,584,748,119 | (8,602,786,903) | ||
| Distributions to shareholders | (864,349,534) | (836,166,076) | ||
| Share transactions | ||||
| Proceeds from sales of shares | 8,456,848,187 | 10,356,317,960 | ||
| Reinvestment of distributions | 864,349,534 | 836,166,076 | ||
| Cost of shares redeemed | (5,436,184,955) | (2,731,913,098) | ||
Net increase (decrease) in net assets resulting from share transactions | 3,885,012,766 | 8,460,570,938 | ||
| Total increase (decrease) in net assets | 6,605,411,351 | (978,382,041) | ||
| Net Assets | ||||
| Beginning of period | 29,886,479,924 | 30,864,861,965 | ||
| End of period | $ | 36,491,891,275 | $ | 29,886,479,924 |
| Other Information | ||||
| Shares | ||||
| Sold | 643,820,506 | 773,245,005 | ||
| Issued in reinvestment of distributions | 68,982,405 | 56,080,892 | ||
| Redeemed | (417,024,417) | (198,646,544) | ||
| Net increase (decrease) | 295,778,494 | 630,679,353 | ||
| Fidelity® Series Global ex U.S. Index Fund |
| Years ended October 31, | 2023 | 2022 | 2021 | 2020 | 2019 | |||||
Selected Per-Share Data | ||||||||||
| Net asset value, beginning of period | $ | 11.43 | $ | 15.55 | $ | 12.23 | $ | 12.78 | $ | 11.80 |
| Income from Investment Operations | ||||||||||
Net investment income (loss) A,B | .41 | .42 | .38 | .29 | .40 | |||||
| Net realized and unrealized gain (loss) | 1.03 | (4.15) | 3.18 | (.56) | .90 | |||||
| Total from investment operations | 1.44 | (3.73) | 3.56 | (.27) | 1.30 | |||||
| Distributions from net investment income | (.34) | (.39) | (.24) | (.26) | (.32) | |||||
| Distributions from net realized gain | - | - | - | (.01) | - | |||||
| Total distributions | (.34) | (.39) | (.24) | (.28) C | (.32) | |||||
| Net asset value, end of period | $ | 12.53 | $ | 11.43 | $ | 15.55 | $ | 12.23 | $ | 12.78 |
Total Return D | 12.62% | (24.57)% | 29.34% | (2.27)% | 11.36% | |||||
Ratios to Average Net Assets B,E,F | ||||||||||
| Expenses before reductions | .02% | .02% | .02% | .02% | .04% | |||||
| Expenses net of fee waivers, if any | .01% | .01% | .01% | .01% | .04% | |||||
| Expenses net of all reductions | .01% | .01% | .01% | .01% | .04% | |||||
| Net investment income (loss) | 3.11% | 3.11% | 2.52% | 2.42% | 3.27% | |||||
| Supplemental Data | ||||||||||
| Net assets, end of period (000 omitted) | $ | 36,491,891 | $ | 29,886,480 | $ | 30,864,862 | $ | 18,177,449 | $ | 12,066,585 |
Portfolio turnover rate G | 6% | 4% | 5% H | 5% | 3% H |
| Fidelity Central Fund | Investment Manager | Investment Objective | Investment Practices | Expense RatioA |
| Fidelity Money Market Central Funds | Fidelity Management & Research Company LLC (FMR) | Each fund seeks to obtain a high level of current income consistent with the preservation of capital and liquidity. | Short-term Investments | Less than .005% |
| Gross unrealized appreciation | $5,054,650,035 |
| Gross unrealized depreciation | (5,833,069,104) |
| Net unrealized appreciation (depreciation) | $(778,419,069) |
| Tax Cost | $37,646,881,869 |
| Undistributed ordinary income | $1,044,846,386 |
| Capital loss carryforward | $(1,538,541,064) |
| Net unrealized appreciation (depreciation) on securities and other investments | $(780,038,261) |
Short-term | $(370,074,036) |
Long-term | (1,168,467,028) |
| Total capital loss carryforward | $(1,538,541,064) |
| October 31, 2023 | October 31, 2022 | |
| Ordinary Income | $864,349,534 | $836,166,076 |
| Equity Risk | Equity risk relates to the fluctuations in the value of financial instruments as a result of changes in market prices (other than those arising from interest rate risk or foreign exchange risk), whether caused by factors specific to an individual investment, its issuer, or all factors affecting all instruments traded in a market or market segment. |
| Purchases ($) | Sales ($) | |
| Fidelity Series Global ex U.S. Index Fund | 5,677,536,457 | 2,121,442,446 |
| Borrower or Lender | Average Loan Balance | Weighted Average Interest Rate | Interest Expense | |
Fidelity Series Global ex U.S. Index Fund | Borrower | $1,029,421,000 | 4.07% | $116,239 |
| Total Security Lending Fees Paid to NFS | Security Lending Income From Securities Loaned to NFS | Value of Securities Loaned to NFS at Period End | |
| Fidelity Series Global ex U.S. Index Fund | $887,827 | $11 | $- |
| The Example is based on an investment of $1,000 invested at the beginning of the period and held for the entire period (May 1, 2023 to October 31, 2023). |
Annualized Expense Ratio- A | Beginning Account Value May 1, 2023 | Ending Account Value October 31, 2023 | Expenses Paid During Period- C May 1, 2023 to October 31, 2023 | |||||||
| Fidelity® Series Global ex U.S. Index Fund | .01% | |||||||||
| Actual | $ 1,000 | $ 930.90 | $ .05 | |||||||
Hypothetical-B | $ 1,000 | $ 1,025.16 | $ .05 | |||||||
| A special meeting of shareholders was held on October 18, 2023. The results of votes taken among shareholders on the proposal before them are reported below. Each vote reported represents one dollar of net asset value held on the record date for the meeting. | ||
| Proposal 1 | ||
| To elect a Board of Trustees. | ||
# of Votes | % of Votes | |
| Abigail P. Johnson | ||
| Affirmative | 378,729,502,260.010 | 97.580 |
| Withheld | 9,407,876,478.960 | 2.420 |
| TOTAL | 388,137,378,738.970 | 100.000 |
| Jennifer Toolin McAuliffe | ||
| Affirmative | 378,454,868,010.950 | 97.510 |
| Withheld | 9,682,510,728.020 | 2.490 |
| TOTAL | 388,137,378,738.970 | 100.000 |
| Christine J. Thompson | ||
| Affirmative | 378,837,121,274.520 | 97.600 |
| Withheld | 9,300,257,464.450 | 2.400 |
| TOTAL | 388,137,378,738.970 | 100.000 |
| Elizabeth S. Acton | ||
| Affirmative | 378,262,110,794.850 | 97.460 |
| Withheld | 9,875,267,944.120 | 2.540 |
| TOTAL | 388,137,378,738.970 | 100.000 |
| Laura M. Bishop | ||
| Affirmative | 380,482,113,171.060 | 98.030 |
| Withheld | 7,655,265,567.910 | 1.970 |
| TOTAL | 388,137,378,738.970 | 100.000 |
| Ann E. Dunwoody | ||
| Affirmative | 380,016,034,008.120 | 97.910 |
| Withheld | 8,121,344,730.850 | 2.090 |
| TOTAL | 388,137,378,738.970 | 100.000 |
| John Engler | ||
| Affirmative | 379,432,488,394.200 | 97.760 |
| Withheld | 8,704,890,344.770 | 2.240 |
| TOTAL | 388,137,378,738.970 | 100.000 |
| Robert F. Gartland | ||
| Affirmative | 378,741,819,600.600 | 97.580 |
| Withheld | 9,395,559,138.370 | 2.420 |
| TOTAL | 388,137,378,738.970 | 100.000 |
| Robert W. Helm | ||
| Affirmative | 380,389,324,755.070 | 98.000 |
| Withheld | 7,748,053,983.900 | 2.000 |
| TOTAL | 388,137,378,738.970 | 100.000 |
| Arthur E. Johnson | ||
| Affirmative | 378,427,694,151.670 | 97.500 |
| Withheld | 9,709,684,587.300 | 2.500 |
| TOTAL | 388,137,378,738.970 | 100.000 |
| Michael E. Kenneally | ||
| Affirmative | 377,842,228,145.180 | 97.350 |
| Withheld | 10,295,150,593.790 | 2.650 |
| TOTAL | 388,137,378,738.970 | 100.000 |
| Mark A. Murray | ||
| Affirmative | 380,158,432,703.370 | 97.940 |
| Withheld | 7,978,946,035.600 | 2.060 |
| TOTAL | 388,137,378,738.970 | 100.000 |
| Carol J. Zierhoffer | ||
| Affirmative | 380,522,113,360.240 | 98.040 |
| Withheld | 7,615,265,378.730 | 1.960 |
| TOTAL | 388,137,378,738.970 | 100.000 |
| Proposal 1 reflects trust wide proposal and voting results. | ||
 |


Contents
| Average Annual Total Returns | |||
Periods ended October 31, 2023 | Past 1 year | Past 5 years | Life of Fund A |
| Fidelity® SAI International Index Fund | 15.43% | 4.41% | 4.85% |
| $10,000 Over Life of Fund |
Let's say hypothetically that $10,000 was invested in Fidelity® SAI International Index Fund, on January 5, 2016, when the fund started. The chart shows how the value of your investment would have changed, and also shows how the MSCI EAFE Index performed over the same period. |
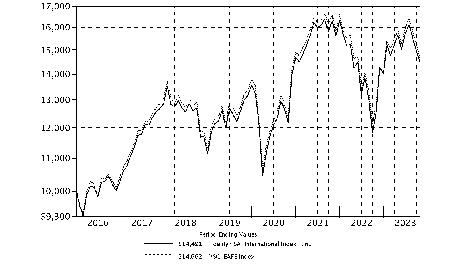 |
Top Holdings (% of Fund's net assets) | ||
| Novo Nordisk A/S Series B (Denmark, Pharmaceuticals) | 2.2 | |
| Nestle SA (Reg. S) (United States of America, Food Products) | 2.0 | |
| ASML Holding NV (Netherlands) (Netherlands, Semiconductors & Semiconductor Equipment) | 1.7 | |
| Shell PLC (London) (Netherlands, Oil, Gas & Consumable Fuels) | 1.5 | |
| LVMH Moet Hennessy Louis Vuitton SE (France, Textiles, Apparel & Luxury Goods) | 1.4 | |
| AstraZeneca PLC (United Kingdom) (United Kingdom, Pharmaceuticals) | 1.3 | |
| Novartis AG (Switzerland, Pharmaceuticals) | 1.3 | |
| Toyota Motor Corp. (Japan, Automobiles) | 1.3 | |
| Roche Holding AG (participation certificate) (United States of America, Pharmaceuticals) | 1.2 | |
| TotalEnergies SE (France, Oil, Gas & Consumable Fuels) | 1.0 | |
| 14.9 | ||
| Market Sectors (% of Fund's net assets) | ||
| Financials | 18.7 | |
| Industrials | 16.1 | |
| Health Care | 12.8 | |
| Consumer Discretionary | 11.7 | |
| Consumer Staples | 9.5 | |
| Information Technology | 7.5 | |
| Materials | 7.5 | |
| Energy | 4.7 | |
| Communication Services | 4.0 | |
| Utilities | 3.9 | |
| Real Estate | 1.8 | |
Asset Allocation (% of Fund's net assets) |
 |
Futures - 1.8% |
Geographic Diversification (% of Fund's net assets) |
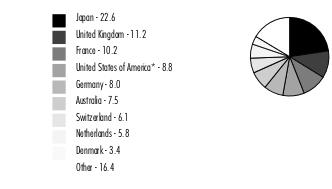 |
* Includes Short-Term investments and Net Other Assets (Liabilities). Percentages are adjusted for the effect of derivatives, if applicable. |
| Common Stocks - 97.8% | |||
| Shares | Value ($) | ||
| Australia - 7.5% | |||
| Ampol Ltd. | 77,030 | 1,561,995 | |
| ANZ Group Holdings Ltd. | 971,697 | 15,322,669 | |
| APA Group unit | 407,091 | 2,133,947 | |
| Aristocrat Leisure Ltd. | 190,256 | 4,676,513 | |
| ASX Ltd. | 62,578 | 2,235,761 | |
| Aurizon Holdings Ltd. | 595,177 | 1,296,363 | |
| BHP Group Ltd. | 1,637,791 | 46,361,731 | |
| BlueScope Steel Ltd. | 147,267 | 1,765,357 | |
| Brambles Ltd. | 449,292 | 3,749,681 | |
| Cochlear Ltd. | 21,219 | 3,252,324 | |
| Coles Group Ltd. | 432,710 | 4,199,749 | |
| Commonwealth Bank of Australia | 541,939 | 33,337,868 | |
| Computershare Ltd. | 185,442 | 2,926,637 | |
| DEXUS Property Group unit | 347,696 | 1,436,050 | |
| EBOS Group Ltd. | 49,552 | 1,011,566 | |
| Endeavour Group Ltd. | 463,224 | 1,455,194 | |
| Flutter Entertainment PLC (Ireland) (a) | 57,092 | 8,937,518 | |
| Fortescue Metals Group Ltd. | 547,480 | 7,788,357 | |
| Glencore PLC | 3,405,205 | 18,036,795 | |
| Goodman Group unit | 548,140 | 7,252,939 | |
| IDP Education Ltd. | 80,977 | 1,118,808 | |
| IGO Ltd. | 220,324 | 1,334,144 | |
| Insurance Australia Group Ltd. | 789,003 | 2,846,359 | |
| Lendlease Group unit | 222,796 | 882,382 | |
| Macquarie Group Ltd. | 118,709 | 12,202,095 | |
| Medibank Private Ltd. | 890,224 | 1,942,717 | |
| Mineral Resources Ltd. | 56,586 | 2,085,604 | |
| Mirvac Group unit | 1,275,568 | 1,479,983 | |
| National Australia Bank Ltd. | 1,015,055 | 18,183,955 | |
| Northern Star Resources Ltd. | 371,845 | 2,722,941 | |
| Orica Ltd. | 147,283 | 1,376,201 | |
| Origin Energy Ltd. | 556,813 | 3,229,991 | |
| Pilbara Minerals Ltd. (b) | 872,438 | 2,049,355 | |
| Qantas Airways Ltd. (a) | 273,169 | 855,813 | |
| QBE Insurance Group Ltd. | 482,395 | 4,783,480 | |
| Ramsay Health Care Ltd. | 59,264 | 1,835,057 | |
| REA Group Ltd. | 17,080 | 1,568,025 | |
| Reece Ltd. | 73,097 | 815,011 | |
| Rio Tinto Ltd. | 120,021 | 8,965,340 | |
| Rio Tinto PLC | 363,997 | 23,223,198 | |
| Santos Ltd. | 1,050,115 | 5,123,993 | |
| Scentre Group unit | 1,678,115 | 2,599,724 | |
| SEEK Ltd. | 115,132 | 1,518,901 | |
| Sonic Healthcare Ltd. | 144,545 | 2,646,773 | |
| South32 Ltd. | 1,469,481 | 3,143,784 | |
| Stockland Corp. Ltd. unit | 771,772 | 1,741,845 | |
| Suncorp Group Ltd. | 409,481 | 3,485,358 | |
| Telstra Group Ltd. | 1,307,384 | 3,170,249 | |
| The GPT Group | 619,225 | 1,429,066 | |
| The Lottery Corp. Ltd. | 719,733 | 2,077,560 | |
| Transurban Group unit | 995,934 | 7,497,883 | |
| Treasury Wine Estates Ltd. | 233,350 | 1,791,109 | |
| Vicinity Centres unit | 1,251,208 | 1,355,223 | |
| Washington H. Soul Pattinson & Co. Ltd. | 75,837 | 1,615,622 | |
| Wesfarmers Ltd. | 366,822 | 11,802,069 | |
| Westpac Banking Corp. | 1,134,547 | 14,898,624 | |
| WiseTech Global Ltd. | 53,643 | 1,997,197 | |
| Woodside Energy Group Ltd. | 613,905 | 13,370,729 | |
| Woolworths Group Ltd. | 394,021 | 8,820,070 | |
TOTAL AUSTRALIA | 352,325,252 | ||
| Austria - 0.2% | |||
| Erste Group Bank AG | 111,152 | 3,969,335 | |
| Mondi PLC | 156,983 | 2,535,798 | |
| OMV AG | 47,611 | 2,083,601 | |
| Verbund AG | 22,011 | 1,909,767 | |
| Voestalpine AG | 37,494 | 934,682 | |
TOTAL AUSTRIA | 11,433,183 | ||
| Belgium - 0.8% | |||
| Ageas | 51,636 | 1,981,103 | |
| Anheuser-Busch InBev SA NV | 280,820 | 15,978,107 | |
| D'ieteren Group | 6,946 | 1,029,674 | |
| Elia Group SA/NV | 9,496 | 900,778 | |
| Groupe Bruxelles Lambert SA | 30,808 | 2,249,258 | |
| KBC Group NV | 80,918 | 4,443,644 | |
| Lotus Bakeries SA | 132 | 977,684 | |
| Sofina SA | 4,977 | 942,643 | |
| Solvay SA Class A | 23,962 | 2,528,827 | |
| UCB SA | 40,837 | 2,984,057 | |
| Umicore SA | 67,717 | 1,611,180 | |
| Warehouses de Pauw | 53,544 | 1,321,192 | |
TOTAL BELGIUM | 36,948,147 | ||
| Brazil - 0.0% | |||
| Yara International ASA | 53,552 | 1,749,760 | |
| Burkina Faso - 0.0% | |||
| Endeavour Mining PLC | 59,935 | 1,238,416 | |
| Chile - 0.0% | |||
| Antofagasta PLC | 127,483 | 2,084,067 | |
| China - 0.5% | |||
| BOC Hong Kong (Holdings) Ltd. | 1,196,500 | 3,164,193 | |
| Budweiser Brewing Co. APAC Ltd. (c) | 556,500 | 1,057,543 | |
| ESR Group Ltd. (c) | 708,200 | 909,963 | |
| Prosus NV | 494,233 | 13,821,514 | |
| SITC International Holdings Co. Ltd. | 434,000 | 668,536 | |
| Wilmar International Ltd. | 621,100 | 1,614,727 | |
TOTAL CHINA | 21,236,476 | ||
| Denmark - 3.4% | |||
| A.P. Moller - Maersk A/S: | |||
| Series A | 982 | 1,600,992 | |
| Series B | 1,567 | 2,610,984 | |
| Carlsberg A/S Series B | 31,841 | 3,794,594 | |
| Chr. Hansen Holding A/S | 34,110 | 2,323,566 | |
| Coloplast A/S Series B | 44,167 | 4,602,197 | |
| Danske Bank A/S | 223,014 | 5,224,606 | |
| Demant A/S (a) | 32,567 | 1,240,582 | |
| DSV A/S | 60,191 | 8,976,918 | |
| Genmab A/S (a) | 21,321 | 6,027,082 | |
| Novo Nordisk A/S Series B | 1,055,037 | 101,786,006 | |
| Novozymes A/S Series B | 66,143 | 2,968,758 | |
| ORSTED A/S (c) | 61,159 | 2,955,149 | |
| Pandora A/S | 27,336 | 3,093,333 | |
| Rockwool International A/S Series B | 2,976 | 661,544 | |
| Tryg A/S | 112,898 | 2,203,142 | |
| Vestas Wind Systems A/S (a) | 326,486 | 7,076,513 | |
TOTAL DENMARK | 157,145,966 | ||
| Finland - 1.1% | |||
| Elisa Corp. (A Shares) | 45,949 | 1,948,635 | |
| Fortum Corp. | 144,991 | 1,718,248 | |
| Kesko Oyj | 88,272 | 1,491,141 | |
| Kone OYJ (B Shares) | 109,894 | 4,754,642 | |
| Metso Corp. | 214,454 | 1,884,746 | |
| Neste OYJ | 136,772 | 4,589,022 | |
| Nokia Corp. | 1,730,132 | 5,762,521 | |
| Nordea Bank Abp | 1,041,182 | 10,941,205 | |
| Orion Oyj (B Shares) | 34,763 | 1,380,824 | |
| Sampo Oyj (A Shares) | 148,664 | 5,837,454 | |
| Stora Enso Oyj (R Shares) | 188,070 | 2,253,640 | |
| UPM-Kymmene Corp. | 172,536 | 5,799,942 | |
| Wartsila Corp. | 153,030 | 1,819,993 | |
TOTAL FINLAND | 50,182,013 | ||
| France - 10.2% | |||
| Accor SA | 59,930 | 1,906,797 | |
| Adevinta ASA Class B (a) | 94,197 | 826,789 | |
| Aeroports de Paris SA | 9,592 | 1,073,795 | |
| Air Liquide SA | 169,334 | 29,015,762 | |
| Airbus Group NV | 191,658 | 25,696,779 | |
| Alstom SA (b) | 92,596 | 1,253,978 | |
| Amundi SA (c) | 19,762 | 1,029,199 | |
| Arkema SA | 19,410 | 1,815,124 | |
| AXA SA | 593,324 | 17,580,443 | |
| bioMerieux SA | 13,375 | 1,280,764 | |
| BNP Paribas SA | 339,208 | 19,505,825 | |
| Bollore SA | 238,572 | 1,300,030 | |
| Bouygues SA | 61,637 | 2,165,893 | |
| Bureau Veritas SA | 95,334 | 2,167,759 | |
| Capgemini SA | 53,314 | 9,422,119 | |
| Carrefour SA | 193,156 | 3,386,307 | |
| Compagnie de St.-Gobain | 149,570 | 8,141,715 | |
| Compagnie Generale des Etablissements Michelin SCA Series B | 219,306 | 6,515,243 | |
| Covivio | 16,322 | 697,720 | |
| Credit Agricole SA | 391,312 | 4,725,049 | |
| Danone SA | 208,144 | 12,382,581 | |
| Dassault Aviation SA | 6,670 | 1,323,286 | |
| Dassault Systemes SA | 216,600 | 8,922,484 | |
| Edenred SA | 80,686 | 4,289,183 | |
| Eiffage SA | 23,764 | 2,154,900 | |
| Engie SA | 590,550 | 9,392,632 | |
| EssilorLuxottica SA | 95,313 | 17,209,161 | |
| Eurazeo SA | 14,084 | 792,056 | |
| Gecina SA | 14,853 | 1,455,298 | |
| Getlink SE | 115,536 | 1,862,458 | |
| Hermes International SCA | 10,239 | 19,063,306 | |
| Ipsen SA | 12,173 | 1,436,148 | |
| Kering SA | 24,067 | 9,788,089 | |
| Klepierre SA | 69,525 | 1,684,625 | |
| L'Oreal SA | 77,974 | 32,774,867 | |
| La Francaise des Jeux SAEM (c) | 33,940 | 1,092,440 | |
| Legrand SA | 86,257 | 7,461,781 | |
| LVMH Moet Hennessy Louis Vuitton SE | 89,272 | 63,912,554 | |
| Orange SA | 601,909 | 7,079,683 | |
| Pernod Ricard SA | 66,117 | 11,718,032 | |
| Publicis Groupe SA | 74,004 | 5,615,936 | |
| Remy Cointreau SA | 7,387 | 837,504 | |
| Renault SA | 62,140 | 2,173,049 | |
| Safran SA | 110,505 | 17,263,041 | |
| Sartorius Stedim Biotech | 8,938 | 1,669,686 | |
| SEB SA | 8,045 | 792,931 | |
| Societe Generale Series A | 235,166 | 5,284,596 | |
| Sodexo SA | 28,602 | 3,022,746 | |
| Teleperformance | 19,114 | 2,187,282 | |
| Thales SA | 33,982 | 5,003,327 | |
| TotalEnergies SE | 726,921 | 48,600,108 | |
| Unibail-Rodamco-Westfield NV (a) | 38,203 | 1,886,118 | |
| Valeo SA | 66,886 | 880,405 | |
| Veolia Environnement SA | 219,747 | 6,021,156 | |
| VINCI SA | 171,835 | 19,000,552 | |
| Vivendi SA | 218,959 | 1,959,090 | |
| Wendel SA | 8,603 | 642,660 | |
| Worldline SA (a)(c) | 77,661 | 984,434 | |
TOTAL FRANCE | 479,127,275 | ||
| Germany - 7.6% | |||
| adidas AG | 52,374 | 9,265,711 | |
| Allianz SE | 130,394 | 30,543,822 | |
| BASF AG | 289,004 | 13,354,053 | |
| Bayer AG | 317,581 | 13,722,219 | |
| Bayerische Motoren Werke AG (BMW) | 97,266 | 9,018,630 | |
| Bechtle AG | 26,475 | 1,178,795 | |
| Beiersdorf AG | 32,585 | 4,277,019 | |
| Brenntag SE | 47,454 | 3,520,801 | |
| Carl Zeiss Meditec AG | 13,002 | 1,124,531 | |
| Commerzbank AG | 344,166 | 3,696,245 | |
| Continental AG | 35,559 | 2,321,611 | |
| Covestro AG (a)(c) | 62,462 | 3,152,543 | |
| Daimler Truck Holding AG | 159,668 | 5,004,142 | |
| Deutsche Bank AG | 626,697 | 6,867,147 | |
| Deutsche Borse AG | 61,428 | 10,110,831 | |
| Deutsche Lufthansa AG (a) | 193,211 | 1,350,099 | |
| Deutsche Telekom AG | 1,047,913 | 22,743,553 | |
| DHL Group | 320,502 | 12,466,168 | |
| E.ON SE | 726,000 | 8,618,986 | |
| Evonik Industries AG | 67,833 | 1,245,998 | |
| Fresenius Medical Care AG & Co. KGaA | 66,395 | 2,206,051 | |
| Fresenius SE & Co. KGaA | 136,560 | 3,502,538 | |
| GEA Group AG | 49,626 | 1,692,374 | |
| Hannover Reuck SE | 19,495 | 4,296,741 | |
| HeidelbergCement AG | 46,824 | 3,392,806 | |
| HelloFresh AG (a) | 50,163 | 1,091,273 | |
| Henkel AG & Co. KGaA | 33,196 | 2,098,000 | |
| Infineon Technologies AG | 422,215 | 12,332,993 | |
| Knorr-Bremse AG | 23,462 | 1,304,313 | |
| LEG Immobilien AG (a) | 23,959 | 1,491,654 | |
| Mercedes-Benz Group AG (Germany) | 259,427 | 15,263,198 | |
| Merck KGaA | 41,775 | 6,292,173 | |
| MTU Aero Engines AG | 17,402 | 3,259,111 | |
| Muenchener Rueckversicherungs-Gesellschaft AG in Muenchen | 44,122 | 17,670,457 | |
| Nemetschek SE | 18,668 | 1,390,584 | |
| Puma AG | 34,132 | 1,924,933 | |
| Rational AG | 1,655 | 941,246 | |
| Rheinmetall AG | 14,083 | 4,029,290 | |
| RWE AG | 204,384 | 7,813,427 | |
| SAP SE | 337,600 | 45,283,075 | |
| Scout24 AG (c) | 24,233 | 1,487,687 | |
| Siemens AG | 245,708 | 32,605,173 | |
| Siemens Energy AG (a)(b) | 167,962 | 1,487,521 | |
| Siemens Healthineers AG (c) | 91,160 | 4,467,860 | |
| Symrise AG | 42,936 | 4,387,599 | |
| Talanx AG | 20,475 | 1,287,960 | |
| Telefonica Deutschland Holding AG | 288,444 | 489,392 | |
| Volkswagen AG | 9,719 | 1,123,515 | |
| Vonovia SE | 237,043 | 5,457,224 | |
| Wacker Chemie AG | 5,904 | 721,531 | |
| Zalando SE (a)(c) | 72,444 | 1,685,599 | |
TOTAL GERMANY | 356,060,202 | ||
| Hong Kong - 2.2% | |||
| AIA Group Ltd. | 3,734,400 | 32,428,813 | |
| CK Asset Holdings Ltd. | 638,925 | 3,193,555 | |
| CK Infrastructure Holdings Ltd. | 203,500 | 943,231 | |
| CLP Holdings Ltd. | 531,000 | 3,886,274 | |
| Futu Holdings Ltd. ADR (a) | 17,859 | 990,282 | |
| Hang Lung Properties Ltd. | 582,000 | 765,014 | |
| Hang Seng Bank Ltd. | 247,200 | 2,826,259 | |
| Henderson Land Development Co. Ltd. | 470,021 | 1,229,791 | |
| HKT Trust/HKT Ltd. unit | 1,225,000 | 1,268,837 | |
| Hong Kong & China Gas Co. Ltd. | 3,619,074 | 2,519,270 | |
| Hong Kong Exchanges and Clearing Ltd. | 389,360 | 13,620,846 | |
| Hongkong Land Holdings Ltd. | 357,920 | 1,135,223 | |
| Jardine Matheson Holdings Ltd. | 51,561 | 2,089,310 | |
| Link (REIT) | 817,796 | 3,752,983 | |
| MTR Corp. Ltd. | 502,190 | 1,877,279 | |
| New World Development Co. Ltd. | 487,845 | 895,352 | |
| Power Assets Holdings Ltd. | 447,500 | 2,139,421 | |
| Prudential PLC | 890,108 | 9,307,315 | |
| Sino Land Ltd. | 1,189,440 | 1,187,452 | |
| Sun Hung Kai Properties Ltd. | 468,500 | 4,810,888 | |
| Swire Pacific Ltd. (A Shares) | 138,500 | 884,716 | |
| Swire Properties Ltd. | 378,200 | 732,273 | |
| Techtronic Industries Co. Ltd. | 445,000 | 4,062,639 | |
| WH Group Ltd. (c) | 2,695,500 | 1,609,842 | |
| Wharf Real Estate Investment Co. Ltd. | 540,000 | 1,888,942 | |
| Xinyi Glass Holdings Ltd. | 534,108 | 613,701 | |
TOTAL HONG KONG | 100,659,508 | ||
| Ireland - 0.4% | |||
| AerCap Holdings NV (a) | 56,447 | 3,506,488 | |
| AIB Group PLC | 465,644 | 2,017,105 | |
| Bank of Ireland Group PLC | 341,615 | 3,054,361 | |
| Kerry Group PLC Class A | 51,522 | 3,973,084 | |
| Kingspan Group PLC (Ireland) | 50,003 | 3,358,611 | |
| Smurfit Kappa Group PLC | 84,138 | 2,736,672 | |
TOTAL IRELAND | 18,646,321 | ||
| Israel - 0.6% | |||
| Azrieli Group | 13,718 | 589,514 | |
| Bank Hapoalim BM (Reg.) | 410,738 | 2,933,698 | |
| Bank Leumi le-Israel BM | 496,248 | 3,190,867 | |
| Check Point Software Technologies Ltd. (a) | 30,259 | 4,062,271 | |
| Elbit Systems Ltd. (Israel) | 8,603 | 1,596,940 | |
| Global-e Online Ltd. (a) | 29,204 | 1,025,352 | |
| Icl Group Ltd. | 250,159 | 1,213,042 | |
| Israel Discount Bank Ltd. (Class A) | 399,921 | 1,756,209 | |
| Mizrahi Tefahot Bank Ltd. | 49,930 | 1,544,099 | |
| NICE Ltd. (a) | 20,455 | 3,160,859 | |
| Teva Pharmaceutical Industries Ltd. sponsored ADR (a) | 362,162 | 3,107,350 | |
| Wix.com Ltd. (a) | 17,455 | 1,394,655 | |
TOTAL ISRAEL | 25,574,856 | ||
| Italy - 2.3% | |||
| Amplifon SpA | 40,241 | 1,134,305 | |
| Assicurazioni Generali SpA | 327,669 | 6,499,015 | |
| Coca-Cola HBC AG | 71,434 | 1,851,097 | |
| Davide Campari Milano NV | 168,978 | 1,864,838 | |
| DiaSorin SpA | 7,225 | 645,983 | |
| Enel SpA | 2,629,391 | 16,690,269 | |
| Eni SpA | 764,112 | 12,491,444 | |
| Ferrari NV (Italy) | 40,753 | 12,310,974 | |
| FinecoBank SpA | 197,410 | 2,321,696 | |
| Infrastrutture Wireless Italiane SpA (c) | 108,590 | 1,185,758 | |
| Intesa Sanpaolo SpA | 5,024,413 | 13,092,570 | |
| Mediobanca SpA | 178,490 | 2,128,455 | |
| Moncler SpA | 66,588 | 3,448,154 | |
| Nexi SpA (a)(c) | 190,970 | 1,106,510 | |
| Poste Italiane SpA (c) | 168,938 | 1,669,556 | |
| Prysmian SpA | 84,901 | 3,170,233 | |
| Recordati SpA | 33,756 | 1,557,271 | |
| Snam SpA | 651,679 | 2,988,303 | |
| Telecom Italia SpA (a) | 3,220,976 | 831,921 | |
| Terna - Rete Elettrica Nazionale | 454,746 | 3,476,911 | |
| UniCredit SpA | 596,089 | 14,943,722 | |
TOTAL ITALY | 105,408,985 | ||
| Japan - 22.6% | |||
| Advantest Corp. | 247,700 | 6,380,414 | |
| AEON Co. Ltd. | 211,400 | 4,447,778 | |
| AGC, Inc. | 62,530 | 2,127,214 | |
| Aisin Seiki Co. Ltd. | 47,590 | 1,657,792 | |
| Ajinomoto Co., Inc. | 145,600 | 5,317,703 | |
| Ana Holdings, Inc. (a) | 51,700 | 1,014,968 | |
| Asahi Group Holdings | 155,700 | 5,631,733 | |
| ASAHI INTECC Co. Ltd. | 70,200 | 1,179,545 | |
| Asahi Kasei Corp. | 405,700 | 2,494,157 | |
| Astellas Pharma, Inc. | 584,900 | 7,398,912 | |
| Azbil Corp. | 37,200 | 1,099,210 | |
| Bandai Namco Holdings, Inc. | 193,800 | 4,015,249 | |
| BayCurrent Consulting, Inc. | 42,700 | 1,072,058 | |
| Bridgestone Corp. | 184,600 | 6,986,225 | |
| Brother Industries Ltd. | 75,000 | 1,170,019 | |
| Canon, Inc. | 323,400 | 7,645,401 | |
| Capcom Co. Ltd. | 56,000 | 1,802,602 | |
| Central Japan Railway Co. | 233,100 | 5,246,711 | |
| Chiba Bank Ltd. | 171,400 | 1,276,681 | |
| Chubu Electric Power Co., Inc. | 208,260 | 2,516,646 | |
| Chugai Pharmaceutical Co. Ltd. | 217,100 | 6,438,440 | |
| Concordia Financial Group Ltd. | 342,600 | 1,591,856 | |
| CyberAgent, Inc. | 139,100 | 730,199 | |
| Dai Nippon Printing Co. Ltd. | 70,920 | 1,850,109 | |
| Dai-ichi Mutual Life Insurance Co. | 304,000 | 6,422,010 | |
| Daifuku Co. Ltd. | 98,300 | 1,624,201 | |
| Daiichi Sankyo Kabushiki Kaisha | 598,000 | 15,418,948 | |
| Daikin Industries Ltd. | 85,300 | 12,298,463 | |
| Daito Trust Construction Co. Ltd. | 20,000 | 2,145,328 | |
| Daiwa House Industry Co. Ltd. | 191,800 | 5,275,588 | |
| Daiwa House REIT Investment Corp. | 713 | 1,261,830 | |
| Daiwa Securities Group, Inc. | 431,200 | 2,486,503 | |
| DENSO Corp. | 560,400 | 8,275,053 | |
| Dentsu Group, Inc. | 65,500 | 1,902,512 | |
| Disco Corp. | 29,800 | 5,262,651 | |
| East Japan Railway Co. | 97,800 | 5,079,471 | |
| Eisai Co. Ltd. | 81,500 | 4,317,736 | |
| ENEOS Holdings, Inc. | 931,500 | 3,451,596 | |
| FANUC Corp. | 308,100 | 7,645,938 | |
| Fast Retailing Co. Ltd. | 56,600 | 12,531,036 | |
| Fuji Electric Co. Ltd. | 41,000 | 1,561,060 | |
| FUJIFILM Holdings Corp. | 120,600 | 6,596,555 | |
| Fujitsu Ltd. | 56,900 | 7,371,256 | |
| GLP J-REIT | 1,513 | 1,355,130 | |
| GMO Payment Gateway, Inc. | 13,600 | 543,174 | |
| Hakuhodo DY Holdings, Inc. | 69,300 | 562,383 | |
| Hamamatsu Photonics K.K. | 45,400 | 1,686,293 | |
| Hankyu Hanshin Holdings, Inc. | 74,000 | 2,328,306 | |
| Hikari Tsushin, Inc. | 6,600 | 952,201 | |
| Hirose Electric Co. Ltd. | 9,930 | 1,125,060 | |
| Hitachi Construction Machinery Co. Ltd. | 34,800 | 899,084 | |
| Hitachi Ltd. | 303,300 | 19,225,164 | |
| Honda Motor Co. Ltd. | 1,493,400 | 15,305,517 | |
| Hoshizaki Corp. | 35,100 | 1,133,542 | |
| Hoya Corp. | 114,500 | 11,022,757 | |
| Hulic Co. Ltd. | 124,200 | 1,138,682 | |
| Ibiden Co. Ltd. | 36,400 | 1,551,967 | |
| Idemitsu Kosan Co. Ltd. | 62,623 | 1,421,862 | |
| Iida Group Holdings Co. Ltd. | 51,300 | 796,545 | |
| INPEX Corp. | 313,800 | 4,553,513 | |
| Isuzu Motors Ltd. | 188,500 | 2,101,898 | |
| Itochu Corp. | 384,300 | 13,842,882 | |
| Japan Airlines Co. Ltd. | 46,600 | 856,684 | |
| Japan Exchange Group, Inc. | 162,300 | 3,209,450 | |
| Japan Post Bank Co. Ltd. | 467,900 | 4,337,061 | |
| Japan Post Holdings Co. Ltd. | 727,400 | 6,438,365 | |
| Japan Post Insurance Co. Ltd. | 61,900 | 1,191,952 | |
| Japan Real Estate Investment Corp. | 414 | 1,537,729 | |
| Japan Retail Fund Investment Corp. | 2,259 | 1,457,839 | |
| Japan Tobacco, Inc. | 387,900 | 9,029,875 | |
| JFE Holdings, Inc. | 158,900 | 2,213,933 | |
| JSR Corp. | 57,300 | 1,533,689 | |
| Kajima Corp. | 136,700 | 2,259,295 | |
| Kansai Electric Power Co., Inc. | 227,600 | 2,914,155 | |
| Kao Corp. | 150,600 | 5,494,476 | |
| Kawasaki Kisen Kaisha Ltd. | 44,600 | 1,529,333 | |
| KDDI Corp. | 483,900 | 14,475,744 | |
| KDX Realty Investment Corp. | 1,338 | 1,395,519 | |
| Keio Corp. | 33,200 | 985,192 | |
| Keisei Electric Railway Co. | 41,800 | 1,574,591 | |
| Keyence Corp. | 62,900 | 24,349,767 | |
| Kikkoman Corp. | 43,900 | 2,497,680 | |
| Kintetsu Group Holdings Co. Ltd. | 58,600 | 1,648,815 | |
| Kirin Holdings Co. Ltd. | 251,200 | 3,530,194 | |
| Kobayashi Pharmaceutical Co. Ltd. | 16,360 | 675,394 | |
| Kobe Bussan Co. Ltd. | 48,600 | 1,202,755 | |
| Koei Tecmo Holdings Co. Ltd. | 38,060 | 496,975 | |
| Koito Manufacturing Co. Ltd. | 67,500 | 1,011,334 | |
| Komatsu Ltd. | 299,000 | 6,869,943 | |
| Konami Group Corp. | 32,500 | 1,683,568 | |
| Kose Corp. | 10,800 | 715,511 | |
| Kubota Corp. | 327,400 | 4,403,283 | |
| Kurita Water Industries Ltd. | 33,800 | 1,026,960 | |
| Kyocera Corp. | 103,800 | 5,116,448 | |
| Kyowa Hakko Kirin Co., Ltd. | 87,200 | 1,367,670 | |
| Lasertec Corp. | 24,400 | 4,030,398 | |
| LIXIL Group Corp. | 92,900 | 1,018,655 | |
| LY Corp. | 863,700 | 2,201,992 | |
| M3, Inc. | 142,600 | 2,196,210 | |
| Makita Corp. | 72,420 | 1,871,829 | |
| Marubeni Corp. | 466,700 | 6,823,983 | |
| MatsukiyoCocokara & Co. | 110,900 | 1,945,385 | |
| Mazda Motor Corp. | 183,800 | 1,776,609 | |
| McDonald's Holdings Co. (Japan) Ltd. (b) | 27,900 | 1,085,528 | |
| Meiji Holdings Co. Ltd. | 75,900 | 1,868,205 | |
| Minebea Mitsumi, Inc. | 117,410 | 1,840,907 | |
| Misumi Group, Inc. | 92,050 | 1,393,514 | |
| Mitsubishi Chemical Holdings Corp. | 414,000 | 2,342,663 | |
| Mitsubishi Corp. | 371,800 | 17,331,665 | |
| Mitsubishi Electric Corp. | 624,800 | 7,164,276 | |
| Mitsubishi Estate Co. Ltd. | 363,900 | 4,658,037 | |
| Mitsubishi Heavy Industries Ltd. | 103,600 | 5,335,885 | |
| Mitsubishi UFJ Financial Group, Inc. | 3,691,800 | 30,971,053 | |
| Mitsubishi UFJ Lease & Finance Co. Ltd. | 260,900 | 1,719,913 | |
| Mitsui & Co. Ltd. | 424,500 | 15,428,103 | |
| Mitsui Chemicals, Inc. | 55,200 | 1,391,287 | |
| Mitsui Fudosan Co. Ltd. | 287,700 | 6,235,858 | |
| Mitsui OSK Lines Ltd. | 111,200 | 2,870,886 | |
| Mizuho Financial Group, Inc. | 779,920 | 13,241,785 | |
| MonotaRO Co. Ltd. | 81,000 | 647,351 | |
| MS&AD Insurance Group Holdings, Inc. | 138,600 | 5,078,378 | |
| Murata Manufacturing Co. Ltd. | 557,200 | 9,544,490 | |
| NEC Corp. | 79,400 | 3,823,160 | |
| Nexon Co. Ltd. | 110,410 | 2,025,941 | |
| NGK Insulators Ltd. | 75,700 | 924,922 | |
| Nidec Corp. | 134,900 | 4,948,273 | |
| Nintendo Co. Ltd. | 335,900 | 13,877,525 | |
| Nippon Building Fund, Inc. | 495 | 1,988,877 | |
| Nippon Express Holdings, Inc. | 23,400 | 1,202,653 | |
| Nippon Paint Holdings Co. Ltd. | 306,600 | 2,061,306 | |
| Nippon Prologis REIT, Inc. | 734 | 1,306,062 | |
| Nippon Sanso Holdings Corp. | 56,000 | 1,412,237 | |
| Nippon Steel & Sumitomo Metal Corp. | 276,500 | 5,963,790 | |
| Nippon Telegraph & Telephone Corp. | 9,661,200 | 11,369,065 | |
| Nippon Yusen KK | 156,700 | 3,834,018 | |
| Nissan Chemical Corp. | 40,900 | 1,668,114 | |
| Nissan Motor Co. Ltd. | 750,500 | 2,887,912 | |
| Nissin Food Holdings Co. Ltd. | 19,900 | 1,731,473 | |
| Nitori Holdings Co. Ltd. | 25,900 | 2,804,836 | |
| Nitto Denko Corp. | 46,000 | 2,976,466 | |
| Nomura Holdings, Inc. | 971,700 | 3,754,074 | |
| Nomura Real Estate Holdings, Inc. | 35,500 | 829,141 | |
| Nomura Real Estate Master Fund, Inc. | 1,372 | 1,513,945 | |
| Nomura Research Institute Ltd. | 124,720 | 3,273,894 | |
| NTT Data Corp. | 204,100 | 2,516,535 | |
| Obayashi Corp. | 209,900 | 1,797,963 | |
| OBIC Co. Ltd. | 22,500 | 3,325,868 | |
| Odakyu Electric Railway Co. Ltd. | 101,300 | 1,442,140 | |
| Oji Holdings Corp. | 278,700 | 1,191,967 | |
| Olympus Corp. | 409,300 | 5,466,345 | |
| OMRON Corp. | 56,700 | 2,031,405 | |
| Ono Pharmaceutical Co. Ltd. | 125,300 | 2,163,867 | |
| Open House Group Co. Ltd. | 25,300 | 833,897 | |
| Oracle Corp. Japan | 12,400 | 879,652 | |
| Oriental Land Co. Ltd. | 352,700 | 11,408,211 | |
| ORIX Corp. | 379,300 | 6,898,083 | |
| Osaka Gas Co. Ltd. | 121,230 | 2,286,130 | |
| Otsuka Corp. | 36,800 | 1,475,482 | |
| Otsuka Holdings Co. Ltd. | 126,100 | 4,242,756 | |
| Pan Pacific International Holdings Ltd. | 123,100 | 2,383,938 | |
| Panasonic Holdings Corp. | 714,100 | 6,265,151 | |
| Persol Holdings Co. Ltd. | 603,000 | 904,148 | |
| Rakuten Group, Inc. | 483,200 | 1,787,319 | |
| Recruit Holdings Co. Ltd. | 466,100 | 13,364,349 | |
| Renesas Electronics Corp. (a) | 411,600 | 5,406,621 | |
| Resona Holdings, Inc. | 691,820 | 3,696,617 | |
| Ricoh Co. Ltd. | 177,400 | 1,437,846 | |
| ROHM Co. Ltd. | 113,200 | 1,813,687 | |
| SBI Holdings, Inc. Japan | 79,200 | 1,703,983 | |
| SCSK Corp. | 50,500 | 862,049 | |
| Secom Co. Ltd. | 67,900 | 4,715,984 | |
| Seiko Epson Corp. | 93,400 | 1,296,689 | |
| Sekisui Chemical Co. Ltd. | 124,300 | 1,702,522 | |
| Sekisui House Ltd. | 192,900 | 3,777,513 | |
| Seven & i Holdings Co. Ltd. | 243,600 | 8,925,190 | |
| SG Holdings Co. Ltd. | 103,500 | 1,467,072 | |
| Sharp Corp. (a) | 84,100 | 525,811 | |
| Shimadzu Corp. | 76,600 | 1,811,306 | |
| SHIMANO, Inc. | 24,900 | 3,583,262 | |
| SHIMIZU Corp. | 180,300 | 1,283,103 | |
| Shin-Etsu Chemical Co. Ltd. | 589,000 | 17,613,090 | |
| Shionogi & Co. Ltd. | 84,400 | 3,930,055 | |
| Shiseido Co. Ltd. | 129,300 | 4,100,811 | |
| Shizuoka Financial Group | 151,300 | 1,286,618 | |
| SMC Corp. | 18,500 | 8,542,618 | |
| SoftBank Corp. | 928,900 | 10,502,950 | |
| SoftBank Group Corp. | 332,700 | 13,625,420 | |
| Sompo Holdings, Inc. | 95,500 | 4,137,057 | |
| Sony Group Corp. | 407,700 | 33,895,724 | |
| Square Enix Holdings Co. Ltd. | 27,700 | 920,243 | |
| Subaru Corp. | 198,900 | 3,443,018 | |
| Sumco Corp. | 113,200 | 1,462,788 | |
| Sumitomo Chemical Co. Ltd. | 455,200 | 1,157,011 | |
| Sumitomo Corp. | 338,100 | 6,646,260 | |
| Sumitomo Electric Industries Ltd. | 231,000 | 2,425,092 | |
| Sumitomo Metal Mining Co. Ltd. | 79,930 | 2,245,390 | |
| Sumitomo Mitsui Financial Group, Inc. | 410,700 | 19,799,017 | |
| Sumitomo Mitsui Trust Holdings, Inc. | 105,900 | 3,970,911 | |
| Sumitomo Realty & Development Co. Ltd. | 92,400 | 2,318,680 | |
| Suntory Beverage & Food Ltd. | 44,900 | 1,351,179 | |
| Suzuki Motor Corp. | 119,100 | 4,622,511 | |
| Sysmex Corp. | 54,200 | 2,596,332 | |
| T&D Holdings, Inc. | 161,800 | 2,886,387 | |
| Taisei Corp. | 54,900 | 1,861,807 | |
| Takeda Pharmaceutical Co. Ltd. | 511,403 | 13,881,906 | |
| TDK Corp. | 125,700 | 4,703,093 | |
| Terumo Corp. | 217,500 | 5,950,406 | |
| TIS, Inc. | 71,100 | 1,522,596 | |
| Tobu Railway Co. Ltd. | 61,000 | 1,468,237 | |
| Toho Co. Ltd. | 36,170 | 1,235,679 | |
| Tokio Marine Holdings, Inc. | 582,700 | 13,036,302 | |
| Tokyo Electric Power Co., Inc. (a) | 493,600 | 2,088,786 | |
| Tokyo Electron Ltd. | 152,500 | 20,150,998 | |
| Tokyo Gas Co. Ltd. | 126,500 | 2,840,831 | |
| Tokyu Corp. | 161,600 | 1,824,308 | |
| Toppan Holdings, Inc. | 79,700 | 1,838,191 | |
| Toray Industries, Inc. | 448,400 | 2,169,287 | |
| Toshiba Corp. | 28,000 | 851,218 | |
| Tosoh Corp. | 84,090 | 1,029,617 | |
| Toto Ltd. | 42,900 | 1,034,388 | |
| Toyota Industries Corp. | 47,370 | 3,510,814 | |
| Toyota Motor Corp. | 3,428,550 | 59,978,194 | |
| Toyota Tsusho Corp. | 68,640 | 3,654,139 | |
| Trend Micro, Inc. | 43,200 | 1,627,976 | |
| Unicharm Corp. | 130,400 | 4,430,846 | |
| USS Co. Ltd. | 66,400 | 1,160,599 | |
| Welcia Holdings Co. Ltd. | 30,500 | 505,562 | |
| West Japan Railway Co. | 71,000 | 2,706,133 | |
| Yakult Honsha Co. Ltd. | 82,900 | 1,953,534 | |
| Yamaha Corp. | 45,400 | 1,212,631 | |
| Yamaha Motor Co. Ltd. | 96,200 | 2,350,825 | |
| Yamato Holdings Co. Ltd. | 86,000 | 1,432,418 | |
| Yaskawa Electric Corp. | 77,600 | 2,540,091 | |
| Yokogawa Electric Corp. | 73,800 | 1,339,856 | |
| Zensho Holdings Co. Ltd. | 30,000 | 1,576,856 | |
| ZOZO, Inc. | 45,300 | 861,368 | |
TOTAL JAPAN | 1,059,272,140 | ||
| Jordan - 0.0% | |||
| Hikma Pharmaceuticals PLC | 53,496 | 1,236,388 | |
| Korea (South) - 0.0% | |||
| Delivery Hero AG (a)(b)(c) | 56,635 | 1,436,414 | |
| Luxembourg - 0.1% | |||
| ArcelorMittal SA (Netherlands) | 165,423 | 3,654,712 | |
| Eurofins Scientific SA | 43,594 | 2,206,245 | |
TOTAL LUXEMBOURG | 5,860,957 | ||
| Macau - 0.1% | |||
| Galaxy Entertainment Group Ltd. | 706,000 | 3,968,755 | |
| Sands China Ltd. (a) | 784,800 | 2,112,721 | |
TOTAL MACAU | 6,081,476 | ||
| Netherlands - 5.8% | |||
| ABN AMRO Bank NV GDR (Bearer) (c) | 130,594 | 1,752,832 | |
| Adyen BV (a)(c) | 7,018 | 4,733,543 | |
| AEGON NV | 545,578 | 2,646,234 | |
| Akzo Nobel NV | 55,168 | 3,692,692 | |
| Argenx SE (a) | 18,083 | 8,505,911 | |
| ASM International NV (Netherlands) | 15,181 | 6,240,482 | |
| ASML Holding NV (Netherlands) | 130,336 | 78,347,630 | |
| ASR Nederland NV | 51,678 | 1,924,753 | |
| BE Semiconductor Industries NV | 24,924 | 2,566,004 | |
| Euronext NV (c) | 27,700 | 1,928,557 | |
| EXOR NV | 35,062 | 3,002,801 | |
| Heineken Holding NV | 41,913 | 3,184,197 | |
| Heineken NV (Bearer) | 93,120 | 8,366,222 | |
| IMCD NV | 18,427 | 2,212,979 | |
| ING Groep NV (Certificaten Van Aandelen) | 1,170,283 | 15,003,647 | |
| JDE Peet's BV | 40,622 | 1,127,851 | |
| Koninklijke Ahold Delhaize NV | 314,026 | 9,303,585 | |
| Koninklijke KPN NV | 1,044,192 | 3,509,716 | |
| Koninklijke Philips Electronics NV | 300,202 | 5,710,586 | |
| NN Group NV | 81,070 | 2,600,108 | |
| OCI NV | 34,122 | 794,660 | |
| Randstad NV | 35,687 | 1,844,219 | |
| Shell PLC (London) | 2,167,548 | 69,853,251 | |
| Stellantis NV (Italy) | 715,308 | 13,320,866 | |
| Universal Music Group NV | 264,928 | 6,487,777 | |
| Wolters Kluwer NV | 83,261 | 10,668,724 | |
TOTAL NETHERLANDS | 269,329,827 | ||
| New Zealand - 0.2% | |||
| Auckland International Airport Ltd. | 404,711 | 1,731,061 | |
| Fisher & Paykel Healthcare Corp. | 187,271 | 2,271,525 | |
| Mercury Nz Ltd. | 224,114 | 770,939 | |
| Meridian Energy Ltd. | 417,188 | 1,174,952 | |
| Spark New Zealand Ltd. | 596,859 | 1,732,755 | |
| Xero Ltd. (a) | 46,493 | 3,178,600 | |
TOTAL NEW ZEALAND | 10,859,832 | ||
| Norway - 0.6% | |||
| Aker BP ASA | 102,176 | 2,936,967 | |
| DNB Bank ASA | 299,275 | 5,392,922 | |
| Equinor ASA | 291,307 | 9,765,548 | |
| Gjensidige Forsikring ASA | 64,629 | 967,906 | |
| Kongsberg Gruppen ASA | 28,442 | 1,161,007 | |
| Mowi ASA | 142,056 | 2,305,511 | |
| Norsk Hydro ASA | 428,933 | 2,446,079 | |
| Orkla ASA | 242,693 | 1,671,550 | |
| Salmar ASA | 23,450 | 1,110,054 | |
| Telenor ASA | 226,173 | 2,311,142 | |
TOTAL NORWAY | 30,068,686 | ||
| Portugal - 0.2% | |||
| Energias de Portugal SA | 1,014,612 | 4,262,037 | |
| Galp Energia SGPS SA Class B | 159,131 | 2,392,630 | |
| Jeronimo Martins SGPS SA | 91,568 | 2,110,223 | |
TOTAL PORTUGAL | 8,764,890 | ||
| Singapore - 1.6% | |||
| CapitaLand Ascendas REIT | 1,206,789 | 2,292,953 | |
| CapitaLand Investment Ltd. | 841,165 | 1,806,136 | |
| CapitaMall Trust | 1,720,627 | 2,211,386 | |
| City Developments Ltd. | 161,800 | 746,838 | |
| DBS Group Holdings Ltd. | 585,705 | 14,070,586 | |
| Genting Singapore Ltd. | 1,954,600 | 1,227,988 | |
| Grab Holdings Ltd. (a)(b) | 605,681 | 1,859,441 | |
| Jardine Cycle & Carriage Ltd. | 31,900 | 657,133 | |
| Keppel (REIT) (d) | 94,160 | 54,675 | |
| Keppel Corp. Ltd. | 470,800 | 2,137,125 | |
| Mapletree Logistics Trust (REIT) | 1,118,812 | 1,201,436 | |
| Mapletree Pan Asia Commercial Trust | 762,900 | 741,467 | |
| Oversea-Chinese Banking Corp. Ltd. | 1,094,864 | 10,150,611 | |
| Sea Ltd. ADR (a) | 117,961 | 4,918,974 | |
| Seatrium Ltd. (a) | 14,341,809 | 1,174,581 | |
| Sembcorp Industries Ltd. | 289,000 | 969,568 | |
| Singapore Airlines Ltd. | 481,290 | 2,149,085 | |
| Singapore Exchange Ltd. | 277,100 | 1,918,547 | |
| Singapore Technologies Engineering Ltd. | 505,100 | 1,386,630 | |
| Singapore Telecommunications Ltd. | 2,669,300 | 4,638,373 | |
| STMicroelectronics NV (France) | 220,971 | 8,423,438 | |
| United Overseas Bank Ltd. | 408,872 | 8,064,878 | |
| UOL Group Ltd. | 150,191 | 646,848 | |
TOTAL SINGAPORE | 73,448,697 | ||
| South Africa - 0.2% | |||
| Anglo American PLC (United Kingdom) | 410,819 | 10,467,508 | |
| Spain - 2.5% | |||
| Acciona SA | 7,979 | 1,004,667 | |
| ACS Actividades de Construccion y Servicios SA | 70,831 | 2,560,914 | |
| Aena SME SA (c) | 24,247 | 3,508,424 | |
| Amadeus IT Holding SA Class A | 145,661 | 8,294,948 | |
| Banco Bilbao Vizcaya Argentaria SA | 1,928,729 | 15,173,764 | |
| Banco Santander SA (Spain) | 5,232,591 | 19,189,871 | |
| CaixaBank SA | 1,334,167 | 5,424,111 | |
| Cellnex Telecom SA (c) | 182,727 | 5,371,463 | |
| Corp. ACCIONA Energias Renovables SA | 21,261 | 575,454 | |
| EDP Renovaveis SA | 99,256 | 1,595,296 | |
| Enagas SA | 80,426 | 1,344,135 | |
| Endesa SA | 102,691 | 1,930,298 | |
| Grifols SA (a) | 95,899 | 1,074,068 | |
| Iberdrola SA | 1,968,374 | 21,892,290 | |
| Industria de Diseno Textil SA (b) | 352,679 | 12,146,672 | |
| Naturgy Energy Group SA | 40,774 | 1,151,917 | |
| Redeia Corp. SA | 131,149 | 2,040,595 | |
| Repsol SA | 413,043 | 6,042,089 | |
| Telefonica SA | 1,673,232 | 6,463,091 | |
TOTAL SPAIN | 116,784,067 | ||
| Sweden - 2.8% | |||
| Alfa Laval AB | 93,462 | 3,019,265 | |
| ASSA ABLOY AB (B Shares) | 323,917 | 6,904,316 | |
| Atlas Copco AB: | |||
| (A Shares) | 876,099 | 11,344,625 | |
| (B Shares) | 495,456 | 5,550,464 | |
| Beijer Ref AB (B Shares) | 124,338 | 1,177,387 | |
| Boliden AB | 88,394 | 2,262,817 | |
| Epiroc AB: | |||
| (A Shares) | 215,114 | 3,543,943 | |
| (B Shares) | 123,409 | 1,710,321 | |
| EQT AB | 114,906 | 2,088,648 | |
| Ericsson (B Shares) | 946,531 | 4,240,203 | |
| Essity AB (B Shares) | 196,784 | 4,483,081 | |
| Evolution AB (c) | 59,232 | 5,263,380 | |
| Fastighets AB Balder (a) | 210,599 | 890,321 | |
| Getinge AB (B Shares) | 73,892 | 1,326,587 | |
| H&M Hennes & Mauritz AB (B Shares) (b) | 208,745 | 2,792,006 | |
| Hexagon AB (B Shares) | 671,098 | 5,469,205 | |
| Holmen AB (B Shares) | 30,231 | 1,139,372 | |
| Husqvarna AB (B Shares) | 112,899 | 729,232 | |
| Industrivarden AB: | |||
| (A Shares) | 42,781 | 1,104,550 | |
| (C Shares) | 48,861 | 1,257,150 | |
| Indutrade AB | 88,233 | 1,558,362 | |
| Investment AB Latour (B Shares) | 47,716 | 823,946 | |
| Investor AB (B Shares) | 559,283 | 10,241,250 | |
| L E Lundbergforetagen AB | 24,333 | 991,200 | |
| Lifco AB | 75,153 | 1,372,116 | |
| Nibe Industrier AB (B Shares) | 489,845 | 2,816,429 | |
| Saab AB (B Shares) | 25,864 | 1,325,355 | |
| Sagax AB | 63,676 | 1,149,453 | |
| Sandvik AB | 344,553 | 5,868,778 | |
| Securitas AB (B Shares) | 158,807 | 1,269,893 | |
| Skandinaviska Enskilda Banken AB (A Shares) | 512,686 | 5,709,040 | |
| Skanska AB (B Shares) | 109,859 | 1,647,031 | |
| SKF AB (B Shares) | 110,073 | 1,775,967 | |
| Svenska Cellulosa AB SCA (B Shares) | 195,695 | 2,681,450 | |
| Svenska Handelsbanken AB (A Shares) | 471,305 | 4,018,203 | |
| Swedbank AB (A Shares) | 274,335 | 4,491,373 | |
| Swedish Orphan Biovitrum AB (a) | 69,162 | 1,421,351 | |
| Tele2 AB (B Shares) | 172,471 | 1,222,792 | |
| Telia Co. AB | 761,303 | 1,613,922 | |
| Volvo AB: | |||
| (A Shares) | 63,368 | 1,268,217 | |
| (B Shares) | 489,085 | 9,678,778 | |
| Volvo Car AB (a)(b) | 192,480 | 660,599 | |
TOTAL SWEDEN | 129,902,378 | ||
| Switzerland - 6.1% | |||
| ABB Ltd. (Reg.) | 517,198 | 17,376,673 | |
| Adecco SA (Reg.) | 51,724 | 1,946,935 | |
| Alcon, Inc. (Switzerland) | 161,539 | 11,510,975 | |
| Avolta AG (a) | 31,180 | 1,086,921 | |
| Bachem Holding AG (B Shares) | 10,898 | 785,916 | |
| Baloise Holdings AG | 14,804 | 2,118,926 | |
| Banque Cantonale Vaudoise | 9,738 | 1,098,355 | |
| Barry Callebaut AG | 1,153 | 1,742,841 | |
| BKW AG | 6,826 | 1,145,108 | |
| Clariant AG (Reg.) | 69,753 | 986,886 | |
| Compagnie Financiere Richemont SA Series A | 168,765 | 19,910,138 | |
| DSM-Firmenich AG | 60,132 | 5,445,721 | |
| Ems-Chemie Holding AG | 2,269 | 1,546,507 | |
| Geberit AG (Reg.) | 10,813 | 5,013,932 | |
| Givaudan SA | 2,986 | 9,913,395 | |
| Helvetia Holding AG (Reg.) | 11,997 | 1,606,370 | |
| Julius Baer Group Ltd. | 66,597 | 3,946,652 | |
| Kuehne & Nagel International AG | 17,565 | 4,721,203 | |
| Lindt & Spruengli AG | 35 | 3,809,157 | |
| Lindt & Spruengli AG (participation certificate) | 310 | 3,424,944 | |
| Logitech International SA (Reg.) | 53,168 | 4,159,220 | |
| Lonza Group AG | 24,074 | 8,430,811 | |
| Novartis AG | 662,644 | 62,036,444 | |
| Partners Group Holding AG | 7,337 | 7,717,300 | |
| Sandoz Group AG | 132,504 | 3,444,973 | |
| Schindler Holding AG: | |||
| (participation certificate) | 13,113 | 2,640,908 | |
| (Reg.) | 7,648 | 1,483,947 | |
| SGS SA (Reg.) | 48,469 | 3,941,886 | |
| Sig Group AG | 98,920 | 2,173,815 | |
| Sika AG | 47,321 | 11,283,378 | |
| Sonova Holding AG | 16,804 | 3,962,467 | |
| Straumann Holding AG | 36,080 | 4,242,023 | |
| Swatch Group AG (Bearer) | 9,371 | 2,392,070 | |
| Swatch Group AG (Bearer) (Reg.) | 16,919 | 816,516 | |
| Swiss Life Holding AG | 9,543 | 6,103,575 | |
| Swiss Prime Site AG | 24,799 | 2,300,924 | |
| Swisscom AG | 8,373 | 5,007,324 | |
| Temenos Group AG | 20,618 | 1,476,454 | |
| UBS Group AG | 1,063,331 | 24,805,017 | |
| VAT Group AG (c) | 8,730 | 3,077,789 | |
| Zurich Insurance Group Ltd. | 48,647 | 23,027,976 | |
TOTAL SWITZERLAND | 283,662,372 | ||
| United Arab Emirates - 0.0% | |||
| NMC Health PLC (a)(e) | 55,366 | 11 | |
| United Kingdom - 11.2% | |||
| 3i Group PLC | 314,691 | 7,419,655 | |
| Abrdn PLC | 629,746 | 1,199,038 | |
| Admiral Group PLC | 68,622 | 2,037,623 | |
| Ashtead Group PLC | 141,684 | 8,100,750 | |
| Associated British Foods PLC | 112,397 | 2,767,778 | |
| AstraZeneca PLC (United Kingdom) | 501,065 | 62,735,218 | |
| Auto Trader Group PLC (c) | 296,893 | 2,245,774 | |
| Aviva PLC | 885,223 | 4,287,640 | |
| BAE Systems PLC | 985,591 | 13,252,633 | |
| Barclays PLC | 5,029,593 | 8,072,737 | |
| Barratt Developments PLC | 315,044 | 1,584,907 | |
| Berkeley Group Holdings PLC | 34,412 | 1,688,100 | |
| BP PLC | 5,609,843 | 34,253,811 | |
| British American Tobacco PLC (United Kingdom) | 686,864 | 20,518,309 | |
| BT Group PLC | 2,087,725 | 2,861,060 | |
| Bunzl PLC | 109,268 | 3,893,983 | |
| Burberry Group PLC | 121,938 | 2,507,705 | |
| Centrica PLC | 1,798,881 | 3,439,286 | |
| CK Hutchison Holdings Ltd. | 867,000 | 4,389,002 | |
| CNH Industrial NV | 330,903 | 3,664,094 | |
| Coca-Cola European Partners PLC | 66,766 | 3,906,479 | |
| Compass Group PLC | 560,491 | 14,130,755 | |
| Croda International PLC | 45,150 | 2,402,540 | |
| DCC PLC (United Kingdom) | 31,924 | 1,771,312 | |
| Diageo PLC | 726,511 | 27,473,758 | |
| Entain PLC | 206,514 | 2,335,373 | |
| Halma PLC | 122,757 | 2,752,832 | |
| Hargreaves Lansdown PLC | 115,006 | 987,714 | |
| HSBC Holdings PLC (United Kingdom) | 6,391,009 | 46,145,804 | |
| Imperial Brands PLC | 279,103 | 5,946,064 | |
| Informa PLC | 452,590 | 3,914,515 | |
| InterContinental Hotel Group PLC | 54,431 | 3,857,120 | |
| Intertek Group PLC | 52,180 | 2,424,630 | |
| J Sainsbury PLC | 535,456 | 1,674,560 | |
| JD Sports Fashion PLC | 837,822 | 1,298,372 | |
| Johnson Matthey PLC | 59,320 | 1,077,181 | |
| Kingfisher PLC | 615,821 | 1,572,510 | |
| Land Securities Group PLC | 227,773 | 1,575,258 | |
| Legal & General Group PLC | 1,932,792 | 4,966,234 | |
| Lloyds Banking Group PLC | 20,823,289 | 10,134,695 | |
| London Stock Exchange Group PLC | 137,288 | 13,851,686 | |
| M&G PLC | 724,557 | 1,745,474 | |
| Melrose Industries PLC | 436,937 | 2,480,121 | |
| National Grid PLC | 1,190,674 | 14,196,379 | |
| NatWest Group PLC | 1,879,257 | 4,088,920 | |
| Next PLC | 38,951 | 3,259,092 | |
| Ocado Group PLC (a) | 187,207 | 1,058,747 | |
| Pearson PLC | 208,325 | 2,411,515 | |
| Persimmon PLC | 103,260 | 1,275,155 | |
| Phoenix Group Holdings PLC | 242,498 | 1,337,549 | |
| Reckitt Benckiser Group PLC | 231,962 | 15,519,872 | |
| RELX PLC (London Stock Exchange) | 612,254 | 21,384,634 | |
| Rentokil Initial PLC | 814,925 | 4,149,998 | |
| Rolls-Royce Holdings PLC (a) | 2,721,097 | 7,162,544 | |
| Sage Group PLC | 331,364 | 3,909,153 | |
| Schroders PLC | 260,389 | 1,168,797 | |
| Segro PLC | 376,164 | 3,258,982 | |
| Severn Trent PLC | 86,924 | 2,806,111 | |
| Smith & Nephew PLC | 282,236 | 3,158,541 | |
| Smiths Group PLC | 113,027 | 2,216,605 | |
| Spirax-Sarco Engineering PLC | 23,859 | 2,375,633 | |
| SSE PLC | 352,482 | 6,996,168 | |
| St. James's Place PLC | 177,340 | 1,378,644 | |
| Standard Chartered PLC (United Kingdom) | 766,919 | 5,872,556 | |
| Taylor Wimpey PLC | 1,141,779 | 1,537,655 | |
| Tesco PLC | 2,317,544 | 7,605,165 | |
| Unilever PLC | 813,137 | 38,510,725 | |
| United Utilities Group PLC | 220,420 | 2,850,817 | |
| Vodafone Group PLC | 7,434,727 | 6,843,960 | |
| Whitbread PLC | 63,992 | 2,588,488 | |
| Wise PLC (a) | 198,790 | 1,608,218 | |
| WPP PLC | 347,587 | 2,993,152 | |
TOTAL UNITED KINGDOM | 522,867,865 | ||
| United States of America - 7.0% | |||
| CRH PLC | 234,605 | 12,606,510 | |
| CSL Ltd. | 155,874 | 23,036,950 | |
| CyberArk Software Ltd. (a) | 13,504 | 2,209,795 | |
| Experian PLC | 297,477 | 9,006,669 | |
| Ferrovial SE | 164,674 | 4,955,430 | |
| Ferrovial SE rights (a)(d) | 164,674 | 74,506 | |
| GSK PLC | 1,323,799 | 23,599,066 | |
| Haleon PLC | 1,791,334 | 7,179,829 | |
| Holcim AG | 168,526 | 10,389,642 | |
| James Hardie Industries PLC CDI (a) | 142,301 | 3,550,329 | |
| Monday.com Ltd. (a) | 7,023 | 912,920 | |
| Nestle SA (Reg. S) | 863,213 | 93,087,837 | |
| QIAGEN NV (Germany) (a) | 73,664 | 2,737,389 | |
| Roche Holding AG: | |||
| (Bearer) | 10,355 | 2,814,001 | |
| (participation certificate) | 227,121 | 58,531,271 | |
| Sanofi SA | 367,289 | 33,352,126 | |
| Schneider Electric SA | 175,938 | 27,069,341 | |
| Swiss Re Ltd. | 97,515 | 10,625,721 | |
| Tenaris SA | 152,640 | 2,396,784 | |
TOTAL UNITED STATES OF AMERICA | 328,136,116 | ||
| TOTAL COMMON STOCKS (Cost $3,977,299,928) | 4,578,000,051 | ||
| Nonconvertible Preferred Stocks - 0.4% | |||
| Shares | Value ($) | ||
| Germany - 0.4% | |||
| Bayerische Motoren Werke AG (BMW) (non-vtg.) | 18,749 | 1,590,041 | |
| Dr. Ing. h.c. F. Porsche AG Series F (c) | 36,818 | 3,215,521 | |
| Henkel AG & Co. KGaA | 55,046 | 3,965,263 | |
| Porsche Automobil Holding SE (Germany) | 49,502 | 2,215,616 | |
| Sartorius AG (non-vtg.) | 8,472 | 2,117,350 | |
| Volkswagen AG | 66,484 | 7,050,676 | |
| TOTAL NONCONVERTIBLE PREFERRED STOCKS (Cost $23,604,994) | 20,154,467 | ||
| Government Obligations - 0.0% | |||
Principal Amount (f) | Value ($) | ||
| United States of America - 0.0% | |||
U.S. Treasury Bills, yield at date of purchase 5.42% 2/22/24 (g) (Cost $1,573,400) | 1,600,000 | 1,573,307 | |
| Money Market Funds - 1.3% | |||
| Shares | Value ($) | ||
| Fidelity Cash Central Fund 5.40% (h) | 38,210,147 | 38,217,789 | |
| Fidelity Securities Lending Cash Central Fund 5.40% (h)(i) | 21,057,503 | 21,059,609 | |
| TOTAL MONEY MARKET FUNDS (Cost $59,277,398) | 59,277,398 | ||
| TOTAL INVESTMENT IN SECURITIES - 99.5% (Cost $4,061,755,720) | 4,659,005,223 |
NET OTHER ASSETS (LIABILITIES) - 0.5% | 21,766,835 |
| NET ASSETS - 100.0% | 4,680,772,058 |
| Futures Contracts | |||||
Number of contracts | Expiration Date | Notional Amount ($) | Value ($) | Unrealized Appreciation/ (Depreciation) ($) | |
| Purchased | |||||
| Equity Index Contracts | |||||
| ICE MSCI EAFE Index Contracts (United States) | 840 | Dec 2023 | 82,912,200 | (2,268,369) | (2,268,369) |
| The notional amount of futures purchased as a percentage of Net Assets is 1.8% | |||||
| (a) | Non-income producing |
| (b) | Security or a portion of the security is on loan at period end. |
| (c) | Security exempt from registration under Rule 144A of the Securities Act of 1933. These securities may be resold in transactions exempt from registration, normally to qualified institutional buyers. At the end of the period, the value of these securities amounted to $56,927,780 or 1.2% of net assets. |
| (d) | Security or a portion of the security purchased on a delayed delivery or when-issued basis. |
| (e) | Level 3 security |
| (f) | Amount is stated in United States dollars unless otherwise noted. |
| (g) | Security or a portion of the security was pledged to cover margin requirements for futures contracts. At period end, the value of securities pledged amounted to $1,573,307. |
| (h) | Affiliated fund that is generally available only to investment companies and other accounts managed by Fidelity Investments. The rate quoted is the annualized seven-day yield of the fund at period end. A complete unaudited listing of the fund's holdings as of its most recent quarter end is available upon request. In addition, each Fidelity Central Fund's financial statements, which are not covered by the Fund's Report of Independent Registered Public Accounting Firm, are available on the SEC's website or upon request. |
| (i) | Investment made with cash collateral received from securities on loan. |
| Affiliate | Value, beginning of period ($) | Purchases ($) | Sales Proceeds ($) | Dividend Income ($) | Realized Gain (loss) ($) | Change in Unrealized appreciation (depreciation) ($) | Value, end of period ($) | % ownership, end of period |
| Fidelity Cash Central Fund 5.40% | 13,901,145 | 1,969,707,822 | 1,945,391,178 | 3,204,504 | - | - | 38,217,789 | 0.1% |
| Fidelity Securities Lending Cash Central Fund 5.40% | 11,418,997 | 88,056,910 | 78,416,298 | 137,715 | - | - | 21,059,609 | 0.1% |
| Total | 25,320,142 | 2,057,764,732 | 2,023,807,476 | 3,342,219 | - | - | 59,277,398 | |
| Valuation Inputs at Reporting Date: | ||||
| Description | Total ($) | Level 1 ($) | Level 2 ($) | Level 3 ($) |
Investments in Securities: | ||||
| Equities: | ||||
Communication Services | 192,543,074 | 35,881,045 | 156,662,029 | - |
Consumer Discretionary | 547,670,797 | 165,583,867 | 382,086,930 | - |
Consumer Staples | 456,253,248 | 75,727,493 | 380,525,755 | - |
Energy | 224,888,943 | 20,441,093 | 204,447,850 | - |
Financials | 877,426,308 | 270,654,499 | 606,771,809 | - |
Health Care | 603,942,586 | 92,515,163 | 511,427,412 | 11 |
Industrials | 721,476,916 | 207,579,170 | 513,897,746 | - |
Information Technology | 362,484,919 | 35,414,024 | 327,070,895 | - |
Materials | 343,895,771 | 110,746,450 | 233,149,321 | - |
Real Estate | 107,441,631 | 18,301,059 | 89,140,572 | - |
Utilities | 160,130,325 | 52,729,189 | 107,401,136 | - |
| Government Obligations | 1,573,307 | - | 1,573,307 | - |
| Money Market Funds | 59,277,398 | 59,277,398 | - | - |
| Total Investments in Securities: | 4,659,005,223 | 1,144,850,450 | 3,514,154,762 | 11 |
Derivative Instruments: Liabilities | ||||
Futures Contracts | (2,268,369) | (2,268,369) | - | - |
| Total Liabilities | (2,268,369) | (2,268,369) | - | - |
| Total Derivative Instruments: | (2,268,369) | (2,268,369) | - | - |
Primary Risk Exposure / Derivative Type | Value | |
| Asset ($) | Liability ($) | |
| Equity Risk | ||
Futures Contracts (a) | 0 | (2,268,369) |
| Total Equity Risk | 0 | (2,268,369) |
| Total Value of Derivatives | 0 | (2,268,369) |
| Statement of Assets and Liabilities | ||||
| October 31, 2023 | ||||
| Assets | ||||
| Investment in securities, at value (including securities loaned of $19,832,511) - See accompanying schedule: | ||||
Unaffiliated issuers (cost $4,002,478,322) | $ | 4,599,727,825 | ||
Fidelity Central Funds (cost $59,277,398) | 59,277,398 | |||
| Total Investment in Securities (cost $4,061,755,720) | $ | 4,659,005,223 | ||
| Segregated cash with brokers for derivative instruments | 1,013,705 | |||
| Foreign currency held at value (cost $11,421,361) | 11,372,512 | |||
| Receivable for fund shares sold | 1,204,726 | |||
| Dividends receivable | 10,502,675 | |||
| Reclaims receivable | 20,667,710 | |||
| Distributions receivable from Fidelity Central Funds | 436,642 | |||
| Receivable for daily variation margin on futures contracts | 248,829 | |||
| Prepaid expenses | 4,748 | |||
| Receivable from investment adviser for expense reductions | 65,748 | |||
Total assets | 4,704,522,518 | |||
| Liabilities | ||||
| Payable for investments purchased on a delayed delivery basis | $ | 129,524 | ||
| Payable for fund shares redeemed | 2,196,983 | |||
| Accrued management fee | 137,588 | |||
| Other payables and accrued expenses | 226,756 | |||
| Collateral on securities loaned | 21,059,609 | |||
| Total Liabilities | 23,750,460 | |||
| Net Assets | $ | 4,680,772,058 | ||
| Net Assets consist of: | ||||
| Paid in capital | $ | 5,059,925,307 | ||
| Total accumulated earnings (loss) | (379,153,249) | |||
| Net Assets | $ | 4,680,772,058 | ||
Net Asset Value, offering price and redemption price per share ($4,680,772,058 ÷ 385,376,403 shares) | $ | 12.15 | ||
| Statement of Operations | ||||
Year ended October 31, 2023 | ||||
| Investment Income | ||||
| Dividends | $ | 123,057,516 | ||
| Foreign Tax Reclaims | 9,706,157 | |||
| Interest | 174,488 | |||
| Income from Fidelity Central Funds (including $137,715 from security lending) | 3,342,219 | |||
| Income before foreign taxes withheld | $ | 136,280,380 | ||
| Less foreign taxes withheld | (16,634,398) | |||
| Total Income | 119,645,982 | |||
| Expenses | ||||
| Management fee | $ | 1,323,828 | ||
| Custodian fees and expenses | 529,071 | |||
| Independent trustees' fees and expenses | 12,524 | |||
| Registration fees | 36,488 | |||
| Audit | 91,644 | |||
| Legal | 5,705 | |||
| Interest | 69,853 | |||
| Miscellaneous | 22,943 | |||
| Total expenses before reductions | 2,092,056 | |||
| Expense reductions | (679,205) | |||
| Total expenses after reductions | 1,412,851 | |||
| Net Investment income (loss) | 118,233,131 | |||
| Realized and Unrealized Gain (Loss) | ||||
| Net realized gain (loss) on: | ||||
| Investment Securities: | ||||
| Unaffiliated issuers | 11,543,422 | |||
| Foreign currency transactions | (510,020) | |||
| Futures contracts | (5,744,370) | |||
| Total net realized gain (loss) | 5,289,032 | |||
| Change in net unrealized appreciation (depreciation) on: | ||||
| Investment Securities: | ||||
| Unaffiliated issuers | 214,272,640 | |||
| Assets and liabilities in foreign currencies | 1,773,487 | |||
| Futures contracts | (3,772,390) | |||
| Total change in net unrealized appreciation (depreciation) | 212,273,737 | |||
| Net gain (loss) | 217,562,769 | |||
| Net increase (decrease) in net assets resulting from operations | $ | 335,795,900 | ||
| Statement of Changes in Net Assets | ||||
Year ended October 31, 2023 | Year ended October 31, 2022 | |||
| Increase (Decrease) in Net Assets | ||||
| Operations | ||||
| Net investment income (loss) | $ | 118,233,131 | $ | 163,367,759 |
| Net realized gain (loss) | 5,289,032 | (476,309,515) | ||
| Change in net unrealized appreciation (depreciation) | 212,273,737 | (937,797,179) | ||
| Net increase (decrease) in net assets resulting from operations | 335,795,900 | (1,250,738,935) | ||
| Distributions to shareholders | (99,352,487) | (164,779,160) | ||
| Share transactions | ||||
| Proceeds from sales of shares | 2,215,904,081 | 1,319,237,205 | ||
| Reinvestment of distributions | 98,336,677 | 164,400,475 | ||
| Cost of shares redeemed | (1,038,838,311) | (3,151,339,963) | ||
Net increase (decrease) in net assets resulting from share transactions | 1,275,402,447 | (1,667,702,283) | ||
| Total increase (decrease) in net assets | 1,511,845,860 | (3,083,220,378) | ||
| Net Assets | ||||
| Beginning of period | 3,168,926,198 | 6,252,146,576 | ||
| End of period | $ | 4,680,772,058 | $ | 3,168,926,198 |
| Other Information | ||||
| Shares | ||||
| Sold | 171,776,026 | 104,093,787 | ||
| Issued in reinvestment of distributions | 8,419,236 | 12,109,857 | ||
| Redeemed | (86,009,290) | (255,655,639) | ||
| Net increase (decrease) | 94,185,972 | (139,451,995) | ||
| Fidelity® SAI International Index Fund |
| Years ended October 31, | 2023 | 2022 | 2021 | 2020 | 2019 | |||||
Selected Per-Share Data | ||||||||||
| Net asset value, beginning of period | $ | 10.88 | $ | 14.52 | $ | 11.04 | $ | 12.19 | $ | 11.27 |
| Income from Investment Operations | ||||||||||
Net investment income (loss) A,B | .39 | .42 | .37 | .28 | .38 | |||||
| Net realized and unrealized gain (loss) | 1.27 | (3.68) | 3.36 | (1.04) | .85 | |||||
| Total from investment operations | 1.66 | (3.26) | 3.73 | (.76) | 1.23 | |||||
| Distributions from net investment income | (.39) | (.38) | (.25) | (.39) | (.31) | |||||
| Total distributions | (.39) | (.38) | (.25) | (.39) | (.31) | |||||
| Net asset value, end of period | $ | 12.15 | $ | 10.88 | $ | 14.52 | $ | 11.04 | $ | 12.19 |
Total Return C | 15.43% | (23.00)% | 34.09% | (6.51)% | 11.36% | |||||
Ratios to Average Net Assets B,D,E | ||||||||||
| Expenses before reductions | .06% | .05% | .05% | .05% | .11% | |||||
| Expenses net of fee waivers, if any | .04% | .04% | .04% | .04% | .05% | |||||
| Expenses net of all reductions | .04% | .04% | .04% | .04% | .05% | |||||
| Net investment income (loss) | 3.12% | 3.28% | 2.66% | 2.51% | 3.35% | |||||
| Supplemental Data | ||||||||||
| Net assets, end of period (000 omitted) | $ | 4,680,772 | $ | 3,168,926 | $ | 6,252,147 | $ | 3,657,921 | $ | 6,490,033 |
Portfolio turnover rate F | 18% | 20% | 10% | 16% | 4% |
| Fidelity Central Fund | Investment Manager | Investment Objective | Investment Practices | Expense RatioA |
| Fidelity Money Market Central Funds | Fidelity Management & Research Company LLC (FMR) | Each fund seeks to obtain a high level of current income consistent with the preservation of capital and liquidity. | Short-term Investments | Less than .005% |
| Gross unrealized appreciation | $911,768,338 |
| Gross unrealized depreciation | (362,748,003) |
| Net unrealized appreciation (depreciation) | $549,020,335 |
| Tax Cost | $4,109,984,888 |
| Undistributed ordinary income | $115,307,942 |
| Capital loss carryforward | $(1,042,535,402) |
| Net unrealized appreciation (depreciation) on securities and other investments | $548,074,212 |
Short-term | $(456,769,397) |
Long-term | (585,766,005) |
| Total capital loss carryforward | $(1,042,535,402) |
| October 31, 2023 | October 31, 2022 | |
| Ordinary Income | $99,352,487 | $164,779,160 |
| Equity Risk | Equity risk relates to the fluctuations in the value of financial instruments as a result of changes in market prices (other than those arising from interest rate risk or foreign exchange risk), whether caused by factors specific to an individual investment, its issuer, or all factors affecting all instruments traded in a market or market segment. |
| Purchases ($) | Sales ($) | |
| Fidelity SAI International Index Fund | 1,935,574,655 | 677,711,473 |
| Borrower or Lender | Average Loan Balance | Weighted Average Interest Rate | Interest Expense | |
Fidelity SAI International Index Fund. | Borrower | $ 15,057,649 | 4.20% | $65,069 |
| Amount | |
| Fidelity SAI International Index Fund | $6,550 |
| Total Security Lending Fees Paid to NFS | Security Lending Income From Securities Loaned to NFS | Value of Securities Loaned to NFS at Period End | |
| Fidelity SAI International Index Fund | $14,929 | $- | $- |
| Average Loan Balance | Weighted Average Interest Rate | Interest Expense | |
| Fidelity SAI International Index Fund | $3,565,400 | 4.83% | $ 4,784 |
| Strategic Advisers Fidelity International Fund | |
| Fidelity SAI International Index Fund | 32% |
| Fund | % of shares held |
| Fidelity SAI International Index Fund | 37% |
| The Example is based on an investment of $1,000 invested at the beginning of the period and held for the entire period (May 1, 2023 to October 31, 2023). |
Annualized Expense Ratio- A | Beginning Account Value May 1, 2023 | Ending Account Value October 31, 2023 | Expenses Paid During Period- C May 1, 2023 to October 31, 2023 | |||||||
| Fidelity® SAI International Index Fund | .04% | |||||||||
| Actual | $ 1,000 | $ 926.10 | $ .19 | |||||||
Hypothetical-B | $ 1,000 | $ 1,025.00 | $ .20 | |||||||
| A special meeting of shareholders was held on October 18, 2023. The results of votes taken among shareholders on the proposal before them are reported below. Each vote reported represents one dollar of net asset value held on the record date for the meeting. | ||
| Proposal 1 | ||
| To elect a Board of Trustees. | ||
# of Votes | % of Votes | |
| Abigail P. Johnson | ||
| Affirmative | 378,729,502,260.010 | 97.580 |
| Withheld | 9,407,876,478.960 | 2.420 |
| TOTAL | 388,137,378,738.970 | 100.000 |
| Jennifer Toolin McAuliffe | ||
| Affirmative | 378,454,868,010.950 | 97.510 |
| Withheld | 9,682,510,728.020 | 2.490 |
| TOTAL | 388,137,378,738.970 | 100.000 |
| Christine J. Thompson | ||
| Affirmative | 378,837,121,274.520 | 97.600 |
| Withheld | 9,300,257,464.450 | 2.400 |
| TOTAL | 388,137,378,738.970 | 100.000 |
| Elizabeth S. Acton | ||
| Affirmative | 378,262,110,794.850 | 97.460 |
| Withheld | 9,875,267,944.120 | 2.540 |
| TOTAL | 388,137,378,738.970 | 100.000 |
| Laura M. Bishop | ||
| Affirmative | 380,482,113,171.060 | 98.030 |
| Withheld | 7,655,265,567.910 | 1.970 |
| TOTAL | 388,137,378,738.970 | 100.000 |
| Ann E. Dunwoody | ||
| Affirmative | 380,016,034,008.120 | 97.910 |
| Withheld | 8,121,344,730.850 | 2.090 |
| TOTAL | 388,137,378,738.970 | 100.000 |
| John Engler | ||
| Affirmative | 379,432,488,394.200 | 97.760 |
| Withheld | 8,704,890,344.770 | 2.240 |
| TOTAL | 388,137,378,738.970 | 100.000 |
| Robert F. Gartland | ||
| Affirmative | 378,741,819,600.600 | 97.580 |
| Withheld | 9,395,559,138.370 | 2.420 |
| TOTAL | 388,137,378,738.970 | 100.000 |
| Robert W. Helm | ||
| Affirmative | 380,389,324,755.070 | 98.000 |
| Withheld | 7,748,053,983.900 | 2.000 |
| TOTAL | 388,137,378,738.970 | 100.000 |
| Arthur E. Johnson | ||
| Affirmative | 378,427,694,151.670 | 97.500 |
| Withheld | 9,709,684,587.300 | 2.500 |
| TOTAL | 388,137,378,738.970 | 100.000 |
| Michael E. Kenneally | ||
| Affirmative | 377,842,228,145.180 | 97.350 |
| Withheld | 10,295,150,593.790 | 2.650 |
| TOTAL | 388,137,378,738.970 | 100.000 |
| Mark A. Murray | ||
| Affirmative | 380,158,432,703.370 | 97.940 |
| Withheld | 7,978,946,035.600 | 2.060 |
| TOTAL | 388,137,378,738.970 | 100.000 |
| Carol J. Zierhoffer | ||
| Affirmative | 380,522,113,360.240 | 98.040 |
| Withheld | 7,615,265,378.730 | 1.960 |
| TOTAL | 388,137,378,738.970 | 100.000 |
| Proposal 1 reflects trust wide proposal and voting results. | ||
 |


Contents
| Average Annual Total Returns | |||
Periods ended October 31, 2023 | Past 1 year | Life of Fund A |
| Fidelity® SAI International Momentum Index Fund | 16.53% | 6.46% |
| $10,000 Over Life of Fund |
Let's say hypothetically that $10,000 was invested in Fidelity® SAI International Momentum Index Fund on May 12, 2020, when the fund started. The chart shows how the value of your investment would have changed, and also shows how the Fidelity International Momentum Focus Index℠ and MSCI ACWI (All Country World Index) ex USA Index performed over the same period. |
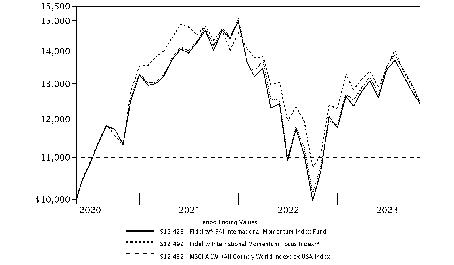 |
Top Holdings (% of Fund's net assets) | ||
| Novo Nordisk A/S Series B (Denmark, Pharmaceuticals) | 4.2 | |
| HSBC Holdings PLC (United Kingdom) (United Kingdom, Banks) | 2.8 | |
| L'Oreal SA (France, Personal Care Products) | 2.5 | |
| Shell PLC (London) (Netherlands, Oil, Gas & Consumable Fuels) | 2.3 | |
| Mitsubishi Corp. (Japan, Trading Companies & Distributors) | 2.1 | |
| Hermes International SCA (France, Textiles, Apparel & Luxury Goods) | 2.0 | |
| Air Liquide SA (France, Chemicals) | 1.9 | |
| Mitsui & Co. Ltd. (Japan, Trading Companies & Distributors) | 1.8 | |
| ABB Ltd. (Reg.) (Switzerland, Electrical Equipment) | 1.8 | |
| Muenchener Rueckversicherungs-Gesellschaft AG in Muenchen (Germany, Insurance) | 1.7 | |
| 23.1 | ||
| Market Sectors (% of Fund's net assets) | ||
| Financials | 18.8 | |
| Industrials | 18.6 | |
| Consumer Discretionary | 14.0 | |
| Health Care | 10.9 | |
| Materials | 9.6 | |
| Consumer Staples | 8.0 | |
| Information Technology | 6.5 | |
| Utilities | 5.3 | |
| Communication Services | 4.4 | |
| Energy | 2.8 | |
| Real Estate | 0.3 | |
Asset Allocation (% of Fund's net assets) |
 |
Futures - 0.8% |
Geographic Diversification (% of Fund's net assets) |
 |
* Includes Short-Term investments and Net Other Assets (Liabilities). Percentages are adjusted for the effect of derivatives, if applicable. |
| Common Stocks - 99.2% | |||
| Shares | Value ($) | ||
| Australia - 5.0% | |||
| AGL Energy Ltd. | 115,059 | 786,537 | |
| Altium Ltd. | 22,674 | 571,918 | |
| BHP Group Ltd. | 79,880 | 2,261,201 | |
| BlueScope Steel Ltd. | 87,486 | 1,048,735 | |
| Brambles Ltd. | 265,177 | 2,213,102 | |
| CAR Group Ltd. | 73,596 | 1,297,296 | |
| Cochlear Ltd. | 12,826 | 1,965,894 | |
| Fortescue Metals Group Ltd. | 317,923 | 4,522,718 | |
| Liontown Resources Ltd. (a) | 359,389 | 369,417 | |
| Medibank Private Ltd. | 525,477 | 1,146,737 | |
| Newcrest Mining Ltd. | 170,626 | 2,615,429 | |
| NIB Holdings Ltd. | 94,444 | 435,256 | |
| Origin Energy Ltd. | 336,585 | 1,952,480 | |
| Pro Medicus Ltd. | 10,206 | 486,142 | |
| Qantas Airways Ltd. (a) | 164,618 | 515,733 | |
| QBE Insurance Group Ltd. | 291,488 | 2,890,426 | |
| Sonic Healthcare Ltd. | 82,511 | 1,510,864 | |
| Steadfast Group Ltd. | 199,583 | 686,315 | |
| Technology One Ltd. | 58,367 | 541,284 | |
| Washington H. Soul Pattinson & Co. Ltd. | 47,953 | 1,021,585 | |
| WiseTech Global Ltd. | 33,560 | 1,249,482 | |
TOTAL AUSTRALIA | 30,088,551 | ||
| Belgium - 0.2% | |||
| Solvay SA Class A | 13,715 | 1,447,411 | |
| Chile - 0.2% | |||
| Antofagasta PLC | 64,694 | 1,057,605 | |
| Denmark - 5.7% | |||
| DSV A/S | 32,321 | 4,820,371 | |
| Genmab A/S (a) | 9,338 | 2,639,693 | |
| Jyske Bank A/S (Reg.) (a) | 9,039 | 635,854 | |
| Novo Nordisk A/S Series B | 259,049 | 24,992,070 | |
| Ringkjoebing Landbobank A/S | 5,244 | 714,069 | |
TOTAL DENMARK | 33,802,057 | ||
| Finland - 1.1% | |||
| Nordea Bank Abp | 601,738 | 6,323,331 | |
| France - 12.5% | |||
| Air Liquide SA | 65,956 | 11,301,709 | |
| Bollore SA | 155,609 | 847,947 | |
| Dassault Aviation SA | 4,261 | 845,356 | |
| Edenred SA | 46,219 | 2,456,953 | |
| Engie SA | 342,525 | 5,447,822 | |
| EssilorLuxottica SA | 39,166 | 7,071,585 | |
| Hermes International SCA | 6,540 | 12,176,386 | |
| Ipsen SA | 7,531 | 888,493 | |
| L'Oreal SA | 36,222 | 15,225,219 | |
| LVMH Moet Hennessy Louis Vuitton SE | 4,959 | 3,550,300 | |
| Pernod Ricard SA | 28,215 | 5,000,594 | |
| Publicis Groupe SA | 43,717 | 3,317,549 | |
| Renault SA | 36,971 | 1,292,883 | |
| SCOR SE | 30,128 | 897,378 | |
| Sodexo SA | 15,558 | 1,644,217 | |
| Technip Energies NV | 24,074 | 526,011 | |
| TotalEnergies SE | 22,946 | 1,534,112 | |
| Verallia SA (b) | 13,615 | 442,841 | |
TOTAL FRANCE | 74,467,355 | ||
| Germany - 11.2% | |||
| adidas AG | 32,350 | 5,723,178 | |
| Aixtron AG | 21,240 | 594,663 | |
| Beiersdorf AG | 18,751 | 2,461,206 | |
| Commerzbank AG | 197,495 | 2,121,040 | |
| Deutsche Telekom AG | 341,698 | 7,416,099 | |
| E.ON SE | 428,365 | 5,085,499 | |
| Fresenius Medical Care AG & Co. KGaA | 38,976 | 1,295,023 | |
| Gerresheimer AG | 5,189 | 482,613 | |
| HeidelbergCement AG | 26,780 | 1,940,444 | |
| Infineon Technologies AG | 245,165 | 7,161,324 | |
| Mercedes-Benz Group AG (Germany) | 144,625 | 8,508,906 | |
| Muenchener Rueckversicherungs-Gesellschaft AG in Muenchen | 26,037 | 10,427,580 | |
| RWE AG | 125,224 | 4,787,207 | |
| Siemens AG | 64,578 | 8,569,427 | |
| Talanx AG | 10,391 | 653,636 | |
TOTAL GERMANY | 67,227,845 | ||
| Ireland - 0.7% | |||
| AIB Group PLC | 219,791 | 952,104 | |
| Bank of Ireland Group PLC | 189,616 | 1,695,346 | |
| Ryanair Holdings PLC sponsored ADR (a) | 18,862 | 1,654,197 | |
TOTAL IRELAND | 4,301,647 | ||
| Italy - 3.0% | |||
| A2A SpA | 306,024 | 573,457 | |
| Banco BPM SpA | 289,098 | 1,475,330 | |
| BPER Banca | 207,441 | 673,625 | |
| Buzzi SpA | 18,434 | 487,625 | |
| Coca-Cola HBC AG | 39,155 | 1,014,639 | |
| Interpump Group SpA | 15,320 | 638,678 | |
| Mediobanca SpA | 124,411 | 1,483,575 | |
| Prada SpA | 97,500 | 587,346 | |
| Prysmian SpA | 50,338 | 1,879,638 | |
| UniCredit SpA | 352,595 | 8,839,421 | |
TOTAL ITALY | 17,653,334 | ||
| Japan - 27.3% | |||
| Ajinomoto Co., Inc. | 103,500 | 3,780,098 | |
| Alfresa Holdings Corp. | 39,600 | 627,288 | |
| Asics Corp. | 36,200 | 1,146,707 | |
| Bridgestone Corp. | 105,100 | 3,977,531 | |
| Capcom Co. Ltd. | 32,800 | 1,055,810 | |
| Chubu Electric Power Co., Inc. | 148,100 | 1,789,664 | |
| Daiichi Sankyo Kabushiki Kaisha | 113,100 | 2,916,192 | |
| Daiwa House Industry Co. Ltd. | 12,500 | 343,821 | |
| DENSO Corp. | 262,100 | 3,870,256 | |
| Disco Corp. | 17,300 | 3,055,163 | |
| Eisai Co. Ltd. | 54,900 | 2,908,512 | |
| Fast Retailing Co. Ltd. | 35,200 | 7,793,153 | |
| Honda Motor Co. Ltd. | 976,700 | 10,009,977 | |
| Ibiden Co. Ltd. | 27,100 | 1,155,448 | |
| Invincible Investment Corp. | 1,278 | 491,519 | |
| Isetan Mitsukoshi Holdings Ltd. | 74,800 | 843,816 | |
| Itochu Corp. | 273,200 | 9,840,946 | |
| Iwatani Corp. | 10,200 | 487,851 | |
| J. Front Retailing Co. Ltd. | 51,000 | 486,198 | |
| Japan Airport Terminal Co. Ltd. | 17,500 | 769,633 | |
| Japan Exchange Group, Inc. | 103,300 | 2,042,737 | |
| Japan Tobacco, Inc. | 209,900 | 4,886,235 | |
| JFE Holdings, Inc. | 111,000 | 1,546,549 | |
| Kajima Corp. | 91,400 | 1,510,604 | |
| Kansai Electric Power Co., Inc. | 161,400 | 2,066,540 | |
| Kansai Paint Co. Ltd. | 46,600 | 681,978 | |
| Kobe Steel Ltd. | 77,400 | 915,136 | |
| Kuraray Co. Ltd. | 64,500 | 737,956 | |
| Kyushu Electric Power Co., Inc. (a) | 91,100 | 582,050 | |
| Lawson, Inc. | 9,800 | 473,599 | |
| Marubeni Corp. | 322,500 | 4,715,523 | |
| MatsukiyoCocokara & Co. | 72,900 | 1,278,797 | |
| Mazda Motor Corp. | 111,100 | 1,073,891 | |
| Medipal Holdings Corp. | 40,900 | 687,651 | |
| Mitsubishi Corp. | 273,000 | 12,726,048 | |
| Mitsubishi Heavy Industries Ltd. | 62,500 | 3,219,043 | |
| Mitsui & Co. Ltd. | 294,700 | 10,710,629 | |
| Nippon Telegraph & Telephone Corp. | 5,533,900 | 6,512,159 | |
| Nissin Food Holdings Co. Ltd. | 15,300 | 1,331,233 | |
| Otsuka Corp. | 22,600 | 906,138 | |
| Otsuka Holdings Co. Ltd. | 74,200 | 2,496,531 | |
| Panasonic Holdings Corp. | 447,900 | 3,929,647 | |
| Renesas Electronics Corp. (a) | 270,900 | 3,558,440 | |
| Rohto Pharmaceutical Co. Ltd. | 42,400 | 989,247 | |
| Sanrio Co. Ltd. | 12,600 | 536,552 | |
| Screen Holdings Co. Ltd. | 18,000 | 836,859 | |
| Sega Sammy Holdings, Inc. | 31,100 | 486,391 | |
| Sekisui House Ltd. | 126,400 | 2,475,260 | |
| Shin-Etsu Chemical Co. Ltd. | 272,800 | 8,157,642 | |
| Skylark Holdings Co. Ltd. (a) | 43,400 | 640,314 | |
| Sojitz Corp. | 39,200 | 814,003 | |
| Sumitomo Corp. | 231,800 | 4,556,649 | |
| Sumitomo Forestry Co. Ltd. | 36,700 | 866,540 | |
| Sumitomo Mitsui Financial Group, Inc. | 68,100 | 3,282,963 | |
| Tohoku Electric Power Co., Inc. | 98,200 | 613,171 | |
| Tokio Marine Holdings, Inc. | 377,800 | 8,452,231 | |
| Toyo Suisan Kaisha Ltd. | 18,900 | 871,875 | |
| Tsuruha Holdings, Inc. | 7,400 | 543,580 | |
| Yamaha Motor Co. Ltd. | 64,900 | 1,585,952 | |
| Yamazaki Baking Co. Ltd. | 32,700 | 692,307 | |
| Zensho Holdings Co. Ltd. | 17,500 | 919,833 | |
TOTAL JAPAN | 163,260,066 | ||
| Jordan - 0.1% | |||
| Hikma Pharmaceuticals PLC | 33,349 | 770,755 | |
| Luxembourg - 0.2% | |||
| ArcelorMittal SA (Netherlands) | 67,920 | 1,500,565 | |
| Macau - 0.5% | |||
| Galaxy Entertainment Group Ltd. | 267,000 | 1,500,931 | |
| Sands China Ltd. (a) | 463,200 | 1,246,957 | |
TOTAL MACAU | 2,747,888 | ||
| Netherlands - 6.0% | |||
| ABN AMRO Bank NV GDR (Bearer) (b) | 77,969 | 1,046,500 | |
| Argenx SE (a) | 10,245 | 4,819,060 | |
| ASM International NV (Netherlands) | 7,170 | 2,947,385 | |
| ASML Holding NV (Netherlands) | 8,414 | 5,057,827 | |
| Shell PLC (London) | 433,417 | 13,967,666 | |
| Stellantis NV (Italy) | 89,549 | 1,667,632 | |
| Wolters Kluwer NV | 47,687 | 6,110,417 | |
TOTAL NETHERLANDS | 35,616,487 | ||
| New Zealand - 0.8% | |||
| Contact Energy Ltd. | 153,384 | 696,742 | |
| Fisher & Paykel Healthcare Corp. | 108,734 | 1,318,902 | |
| Infratil Ltd. | 153,673 | 879,937 | |
| Xero Ltd. (a) | 27,505 | 1,880,442 | |
TOTAL NEW ZEALAND | 4,776,023 | ||
| Norway - 0.1% | |||
| Kongsberg Gruppen ASA | 16,418 | 670,185 | |
| Portugal - 0.2% | |||
| Jeronimo Martins SGPS SA | 53,199 | 1,225,993 | |
| Singapore - 2.5% | |||
| Keppel (REIT) (c) | 53,785 | 31,231 | |
| Keppel Corp. Ltd. | 268,928 | 1,220,757 | |
| Oversea-Chinese Banking Corp. Ltd. | 758,600 | 7,033,069 | |
| Sembcorp Industries Ltd. | 178,100 | 597,509 | |
| Singapore Airlines Ltd. | 261,400 | 1,167,219 | |
| STMicroelectronics NV (Italy) | 121,500 | 4,631,622 | |
TOTAL SINGAPORE | 14,681,407 | ||
| Spain - 3.2% | |||
| ACS Actividades de Construccion y Servicios SA | 39,115 | 1,414,214 | |
| Banco Bilbao Vizcaya Argentaria SA | 1,165,350 | 9,168,082 | |
| Banco de Sabadell SA | 1,056,299 | 1,308,792 | |
| Bankinter SA | 119,844 | 756,023 | |
| CaixaBank SA | 760,520 | 3,091,925 | |
| Industria de Diseno Textil SA | 67,959 | 2,340,586 | |
| Naturgy Energy Group SA | 34,107 | 963,566 | |
TOTAL SPAIN | 19,043,188 | ||
| Sweden - 2.0% | |||
| Epiroc AB (A Shares) | 177,920 | 2,931,182 | |
| Investor AB (B Shares) | 355,928 | 6,517,537 | |
| Swedbank AB (A Shares) | 172,141 | 2,818,267 | |
TOTAL SWEDEN | 12,266,986 | ||
| Switzerland - 3.7% | |||
| ABB Ltd. (Reg.) | 316,184 | 10,623,061 | |
| Alcon, Inc. (Switzerland) | 52,086 | 3,711,553 | |
| Lindt & Spruengli AG | 39 | 4,244,490 | |
| Siegfried Holding AG | 768 | 607,460 | |
| Swisscom AG | 4,766 | 2,850,222 | |
TOTAL SWITZERLAND | 22,036,786 | ||
| United Kingdom - 9.8% | |||
| 3i Group PLC | 190,128 | 4,482,760 | |
| Associated British Foods PLC | 66,167 | 1,629,364 | |
| Auto Trader Group PLC (b) | 105,675 | 799,353 | |
| BAE Systems PLC | 573,522 | 7,711,796 | |
| Beazley PLC | 114,876 | 718,376 | |
| Britvic PLC | 49,370 | 502,857 | |
| Bunzl PLC | 54,822 | 1,953,691 | |
| Centrica PLC | 1,096,353 | 2,096,120 | |
| easyJet PLC (a) | 108,257 | 481,586 | |
| Halma PLC | 67,183 | 1,506,582 | |
| HSBC Holdings PLC (United Kingdom) | 2,304,982 | 16,642,951 | |
| IMI PLC | 51,049 | 908,996 | |
| Informa PLC | 271,191 | 2,345,570 | |
| International Consolidated Airlines Group SA CDI (a) | 476,929 | 835,614 | |
| J Sainsbury PLC | 337,572 | 1,055,707 | |
| Marks & Spencer Group PLC (a) | 385,202 | 1,015,044 | |
| Rolls-Royce Holdings PLC (a) | 1,644,193 | 4,327,889 | |
| Sage Group PLC | 200,004 | 2,359,479 | |
| Shaftesbury Capital PLC | 375,014 | 474,043 | |
| Spectris PLC | 20,869 | 786,322 | |
| SSE PLC | 200,025 | 3,970,156 | |
| Whitbread PLC | 38,182 | 1,544,469 | |
| Wise PLC (a) | 89,945 | 727,658 | |
TOTAL UNITED KINGDOM | 58,876,383 | ||
| United States of America - 3.2% | |||
| CRH PLC | 139,975 | 7,521,563 | |
| GSK PLC | 161,564 | 2,880,165 | |
| Holcim AG | 104,082 | 6,416,664 | |
| James Hardie Industries PLC CDI (a) | 85,978 | 2,145,102 | |
TOTAL UNITED STATES OF AMERICA | 18,963,494 | ||
| TOTAL COMMON STOCKS (Cost $549,105,672) | 592,805,342 | ||
| Government Obligations - 0.1% | |||
Principal Amount (d) | Value ($) | ||
| United States of America - 0.1% | |||
U.S. Treasury Bills, yield at date of purchase 5.42% 2/22/24 (e) (Cost $393,350) | 400,000 | 393,327 | |
| Money Market Funds - 0.0% | |||
| Shares | Value ($) | ||
Fidelity Cash Central Fund 5.40% (f) (Cost $94,176) | 94,157 | 94,176 | |
| TOTAL INVESTMENT IN SECURITIES - 99.3% (Cost $549,593,198) | 593,292,845 |
NET OTHER ASSETS (LIABILITIES) - 0.7% | 4,341,033 |
| NET ASSETS - 100.0% | 597,633,878 |
| Futures Contracts | |||||
Number of contracts | Expiration Date | Notional Amount ($) | Value ($) | Unrealized Appreciation/ (Depreciation) ($) | |
| Purchased | |||||
| Equity Index Contracts | |||||
| ICE MSCI EAFE Index Contracts (United States) | 46 | Dec 2023 | 4,540,430 | (179,538) | (179,538) |
| The notional amount of futures purchased as a percentage of Net Assets is 0.8% | |||||
| (a) | Non-income producing |
| (b) | Security exempt from registration under Rule 144A of the Securities Act of 1933. These securities may be resold in transactions exempt from registration, normally to qualified institutional buyers. At the end of the period, the value of these securities amounted to $2,288,694 or 0.4% of net assets. |
| (c) | Security or a portion of the security purchased on a delayed delivery or when-issued basis. |
| (d) | Amount is stated in United States dollars unless otherwise noted. |
| (e) | Security or a portion of the security was pledged to cover margin requirements for futures contracts. At period end, the value of securities pledged amounted to $165,197. |
| (f) | Affiliated fund that is generally available only to investment companies and other accounts managed by Fidelity Investments. The rate quoted is the annualized seven-day yield of the fund at period end. A complete unaudited listing of the fund's holdings as of its most recent quarter end is available upon request. In addition, each Fidelity Central Fund's financial statements, which are not covered by the Fund's Report of Independent Registered Public Accounting Firm, are available on the SEC's website or upon request. |
| Affiliate | Value, beginning of period ($) | Purchases ($) | Sales Proceeds ($) | Dividend Income ($) | Realized Gain (loss) ($) | Change in Unrealized appreciation (depreciation) ($) | Value, end of period ($) | % ownership, end of period |
| Fidelity Cash Central Fund 5.40% | - | 27,946,628 | 27,852,452 | 34,483 | - | - | 94,176 | 0.0% |
| Fidelity Securities Lending Cash Central Fund 5.40% | - | 11,896,201 | 11,896,201 | 22,897 | - | - | - | 0.0% |
| Total | - | 39,842,829 | 39,748,653 | 57,380 | - | - | 94,176 | |
| Valuation Inputs at Reporting Date: | ||||
| Description | Total ($) | Level 1 ($) | Level 2 ($) | Level 3 ($) |
Investments in Securities: | ||||
| Equities: | ||||
Communication Services | 26,442,005 | 9,361,288 | 17,080,717 | - |
Consumer Discretionary | 82,425,809 | 26,389,351 | 56,036,458 | - |
Consumer Staples | 48,222,084 | 18,149,894 | 30,072,190 | - |
Energy | 16,515,640 | 526,011 | 15,989,629 | - |
Financials | 113,619,432 | 44,402,974 | 69,216,458 | - |
Health Care | 65,076,446 | 13,532,459 | 51,543,987 | - |
Industrials | 111,236,124 | 22,212,943 | 89,023,181 | - |
Information Technology | 38,800,378 | 8,194,431 | 30,605,947 | - |
Materials | 57,118,290 | 23,430,147 | 33,688,143 | - |
Real Estate | 1,340,614 | 474,043 | 866,571 | - |
Utilities | 32,008,520 | 17,476,005 | 14,532,515 | - |
| Government Obligations | 393,327 | - | 393,327 | - |
| Money Market Funds | 94,176 | 94,176 | - | - |
| Total Investments in Securities: | 593,292,845 | 184,243,722 | 409,049,123 | - |
Derivative Instruments: Liabilities | ||||
Futures Contracts | (179,538) | (179,538) | - | - |
| Total Liabilities | (179,538) | (179,538) | - | - |
| Total Derivative Instruments: | (179,538) | (179,538) | - | - |
Primary Risk Exposure / Derivative Type | Value | |
| Asset ($) | Liability ($) | |
| Equity Risk | ||
Futures Contracts (a) | 0 | (179,538) |
| Total Equity Risk | 0 | (179,538) |
| Total Value of Derivatives | 0 | (179,538) |
| Statement of Assets and Liabilities | ||||
| October 31, 2023 | ||||
| Assets | ||||
| Investment in securities, at value - See accompanying schedule: | ||||
Unaffiliated issuers (cost $549,499,022) | $ | 593,198,669 | ||
Fidelity Central Funds (cost $94,176) | 94,176 | |||
| Total Investment in Securities (cost $549,593,198) | $ | 593,292,845 | ||
| Cash | 5,392 | |||
| Foreign currency held at value (cost $468,524) | 466,858 | |||
| Receivable for investments sold | 1,909 | |||
| Receivable for fund shares sold | 87,655 | |||
| Dividends receivable | 1,783,720 | |||
| Reclaims receivable | 2,297,366 | |||
| Distributions receivable from Fidelity Central Funds | 2,053 | |||
| Receivable for daily variation margin on futures contracts | 13,613 | |||
| Prepaid expenses | 779 | |||
Total assets | 597,952,190 | |||
| Liabilities | ||||
| Payable for investments purchased on a delayed delivery basis | $ | 31,427 | ||
| Payable for fund shares redeemed | 138,180 | |||
| Accrued management fee | 75,799 | |||
| Audit fee payable | 42,295 | |||
| Custody fee payable | 24,874 | |||
| Other payables and accrued expenses | 5,737 | |||
| Total Liabilities | 318,312 | |||
| Net Assets | $ | 597,633,878 | ||
| Net Assets consist of: | ||||
| Paid in capital | $ | 795,139,140 | ||
| Total accumulated earnings (loss) | (197,505,262) | |||
| Net Assets | $ | 597,633,878 | ||
Net Asset Value, offering price and redemption price per share ($597,633,878 ÷ 51,093,759 shares) | $ | 11.70 | ||
| Statement of Operations | ||||
Year ended October 31, 2023 | ||||
| Investment Income | ||||
| Dividends | $ | 19,313,137 | ||
| Interest | 30,464 | |||
| Income from Fidelity Central Funds (including $22,897 from security lending) | 57,380 | |||
| Income before foreign taxes withheld | $ | 19,400,981 | ||
| Less foreign taxes withheld | (1,522,342) | |||
| Total Income | 17,878,639 | |||
| Expenses | ||||
| Management fee | $ | 928,446 | ||
| Custodian fees and expenses | 102,979 | |||
| Independent trustees' fees and expenses | 2,156 | |||
| Registration fees | 24,217 | |||
| Audit | 48,246 | |||
| Legal | 732 | |||
| Interest | 9,554 | |||
| Miscellaneous | 8,524 | |||
| Total Expenses | 1,124,854 | |||
| Net Investment income (loss) | 16,753,785 | |||
| Realized and Unrealized Gain (Loss) | ||||
| Net realized gain (loss) on: | ||||
| Investment Securities: | ||||
| Unaffiliated issuers | (10,607,265) | |||
| Foreign currency transactions | 134,299 | |||
| Futures contracts | 591,257 | |||
| Total net realized gain (loss) | (9,881,709) | |||
| Change in net unrealized appreciation (depreciation) on: | ||||
| Investment Securities: | ||||
| Unaffiliated issuers | 84,612,089 | |||
| Assets and liabilities in foreign currencies | 80,780 | |||
| Futures contracts | (299,876) | |||
| Total change in net unrealized appreciation (depreciation) | 84,392,993 | |||
| Net gain (loss) | 74,511,284 | |||
| Net increase (decrease) in net assets resulting from operations | $ | 91,265,069 | ||
| Statement of Changes in Net Assets | ||||
Year ended October 31, 2023 | Year ended October 31, 2022 | |||
| Increase (Decrease) in Net Assets | ||||
| Operations | ||||
| Net investment income (loss) | $ | 16,753,785 | $ | 27,102,380 |
| Net realized gain (loss) | (9,881,709) | (237,671,396) | ||
| Change in net unrealized appreciation (depreciation) | 84,392,993 | (166,173,932) | ||
| Net increase (decrease) in net assets resulting from operations | 91,265,069 | (376,742,948) | ||
| Distributions to shareholders | (14,027,534) | (37,303,193) | ||
| Share transactions | ||||
| Proceeds from sales of shares | 22,436,695 | 594,269,522 | ||
| Reinvestment of distributions | 13,948,304 | 37,266,455 | ||
| Cost of shares redeemed | (86,550,078) | (682,501,019) | ||
Net increase (decrease) in net assets resulting from share transactions | (50,165,079) | (50,965,042) | ||
| Total increase (decrease) in net assets | 27,072,456 | (465,011,183) | ||
| Net Assets | ||||
| Beginning of period | 570,561,422 | 1,035,572,605 | ||
| End of period | $ | 597,633,878 | $ | 570,561,422 |
| Other Information | ||||
| Shares | ||||
| Sold | 1,859,042 | 41,133,495 | ||
| Issued in reinvestment of distributions | 1,243,164 | 2,617,027 | ||
| Redeemed | (7,493,979) | (59,628,242) | ||
| Net increase (decrease) | (4,391,773) | (15,877,720) | ||
| Fidelity® SAI International Momentum Index Fund |
| Years ended October 31, | 2023 | 2022 | 2021 | 2020 A | ||||
Selected Per-Share Data | ||||||||
| Net asset value, beginning of period | $ | 10.28 | $ | 14.51 | $ | 11.33 | $ | 10.00 |
| Income from Investment Operations | ||||||||
Net investment income (loss) B,C | .32 | .30 | .28 | .08 | ||||
| Net realized and unrealized gain (loss) | 1.37 | (4.17) | 3.05 | 1.25 | ||||
| Total from investment operations | 1.69 | (3.87) | 3.33 | 1.33 | ||||
| Distributions from net investment income | (.27) | (.27) D | (.09) | - | ||||
| Distributions from net realized gain | - | (.10) D | (.05) | - | ||||
| Total distributions | (.27) | (.36) E | (.15) E | - | ||||
| Net asset value, end of period | $ | 11.70 | $ | 10.28 | $ | 14.51 | $ | 11.33 |
Total Return F,G | 16.53% | (27.34)% | 29.56% | 13.30% | ||||
Ratios to Average Net Assets C,H,I | ||||||||
| Expenses before reductions | .18% | .18% | .19% | .24% J,K | ||||
| Expenses net of fee waivers, if any | .18% | .18% | .19% | .20% K | ||||
| Expenses net of all reductions | .18% | .18% | .19% | .20% K | ||||
| Net investment income (loss) | 2.71% | 2.47% | 2.03% | 1.55% K | ||||
| Supplemental Data | ||||||||
| Net assets, end of period (000 omitted) | $ | 597,634 | $ | 570,561 | $ | 1,035,573 | $ | 372,738 |
Portfolio turnover rate L | 63% | 113% | 73% | 29% M |
| Fidelity Central Fund | Investment Manager | Investment Objective | Investment Practices | Expense RatioA |
| Fidelity Money Market Central Funds | Fidelity Management & Research Company LLC (FMR) | Each fund seeks to obtain a high level of current income consistent with the preservation of capital and liquidity. | Short-term Investments | Less than .005% |
| Gross unrealized appreciation | $73,845,830 |
| Gross unrealized depreciation | (37,219,979) |
| Net unrealized appreciation (depreciation) | $36,625,851 |
| Tax Cost | $556,666,994 |
| Undistributed ordinary income | $21,080,963 |
| Capital loss carryforward | $(255,056,791) |
| Net unrealized appreciation (depreciation) on securities and other investments | $36,470,564 |
Short-term | $(226,856,496) |
Long-term | (28,200,295) |
| Total capital loss carryforward | $(255,056,791) |
| October 31, 2023 | October 31, 2022 | |
| Ordinary Income | $14,027,534 | $ 27,992,929 |
| Long-term Capital Gains | - | 9,310,264 |
| Total | $14,027,534 | $37,303,193 |
| Equity Risk | Equity risk relates to the fluctuations in the value of financial instruments as a result of changes in market prices (other than those arising from interest rate risk or foreign exchange risk), whether caused by factors specific to an individual investment, its issuer, or all factors affecting all instruments traded in a market or market segment. |
| Purchases ($) | Sales ($) | |
| Fidelity SAI International Momentum Index Fund | 383,624,486 | 430,953,525 |
| Borrower or Lender | Average Loan Balance | Weighted Average Interest Rate | Interest Expense | |
Fidelity SAI International Momentum Index Fund | Borrower | $12,072,714 | 4.07% | $9,543 |
| Amount | |
| Fidelity SAI International Momentum Index Fund | $1,121 |
| Total Security Lending Fees Paid to NFS | Security Lending Income From Securities Loaned to NFS | Value of Securities Loaned to NFS at Period End | |
| Fidelity SAI International Momentum Index Fund | $2,420 | $- | $- |
| Average Loan Balance | Weighted Average Interest Rate | Interest Expense | |
| Fidelity SAI International Momentum Index Fund | $19,200 | 4.15% | $ 11 |
| Strategic Advisers Fidelity International Fund | Strategic Advisers International Fund | |
| Fidelity SAI International Momentum Index Fund | 48% | 19% |
| Fund | % of shares held |
| Fidelity SAI International Momentum Index Fund | 67% |
| The Example is based on an investment of $1,000 invested at the beginning of the period and held for the entire period (May 1, 2023 to October 31, 2023). |
Annualized Expense Ratio- A | Beginning Account Value May 1, 2023 | Ending Account Value October 31, 2023 | Expenses Paid During Period- C May 1, 2023 to October 31, 2023 | |||||||
| Fidelity® SAI International Momentum Index Fund | .18% | |||||||||
| Actual | $ 1,000 | $ 949.70 | $ .88 | |||||||
Hypothetical-B | $ 1,000 | $ 1,024.30 | $ .92 | |||||||
| A special meeting of shareholders was held on October 18, 2023. The results of votes taken among shareholders on the proposal before them are reported below. Each vote reported represents one dollar of net asset value held on the record date for the meeting. | ||
| Proposal 1 | ||
| To elect a Board of Trustees. | ||
# of Votes | % of Votes | |
| Abigail P. Johnson | ||
| Affirmative | 378,729,502,260.010 | 97.580 |
| Withheld | 9,407,876,478.960 | 2.420 |
| TOTAL | 388,137,378,738.970 | 100.000 |
| Jennifer Toolin McAuliffe | ||
| Affirmative | 378,454,868,010.950 | 97.510 |
| Withheld | 9,682,510,728.020 | 2.490 |
| TOTAL | 388,137,378,738.970 | 100.000 |
| Christine J. Thompson | ||
| Affirmative | 378,837,121,274.520 | 97.600 |
| Withheld | 9,300,257,464.450 | 2.400 |
| TOTAL | 388,137,378,738.970 | 100.000 |
| Elizabeth S. Acton | ||
| Affirmative | 378,262,110,794.850 | 97.460 |
| Withheld | 9,875,267,944.120 | 2.540 |
| TOTAL | 388,137,378,738.970 | 100.000 |
| Laura M. Bishop | ||
| Affirmative | 380,482,113,171.060 | 98.030 |
| Withheld | 7,655,265,567.910 | 1.970 |
| TOTAL | 388,137,378,738.970 | 100.000 |
| Ann E. Dunwoody | ||
| Affirmative | 380,016,034,008.120 | 97.910 |
| Withheld | 8,121,344,730.850 | 2.090 |
| TOTAL | 388,137,378,738.970 | 100.000 |
| John Engler | ||
| Affirmative | 379,432,488,394.200 | 97.760 |
| Withheld | 8,704,890,344.770 | 2.240 |
| TOTAL | 388,137,378,738.970 | 100.000 |
| Robert F. Gartland | ||
| Affirmative | 378,741,819,600.600 | 97.580 |
| Withheld | 9,395,559,138.370 | 2.420 |
| TOTAL | 388,137,378,738.970 | 100.000 |
| Robert W. Helm | ||
| Affirmative | 380,389,324,755.070 | 98.000 |
| Withheld | 7,748,053,983.900 | 2.000 |
| TOTAL | 388,137,378,738.970 | 100.000 |
| Arthur E. Johnson | ||
| Affirmative | 378,427,694,151.670 | 97.500 |
| Withheld | 9,709,684,587.300 | 2.500 |
| TOTAL | 388,137,378,738.970 | 100.000 |
| Michael E. Kenneally | ||
| Affirmative | 377,842,228,145.180 | 97.350 |
| Withheld | 10,295,150,593.790 | 2.650 |
| TOTAL | 388,137,378,738.970 | 100.000 |
| Mark A. Murray | ||
| Affirmative | 380,158,432,703.370 | 97.940 |
| Withheld | 7,978,946,035.600 | 2.060 |
| TOTAL | 388,137,378,738.970 | 100.000 |
| Carol J. Zierhoffer | ||
| Affirmative | 380,522,113,360.240 | 98.040 |
| Withheld | 7,615,265,378.730 | 1.960 |
| TOTAL | 388,137,378,738.970 | 100.000 |
| Proposal 1 reflects trust wide proposal and voting results. | ||
 |


Contents
| Average Annual Total Returns | |||
Periods ended October 31, 2023 | Past 1 year | Past 5 years | Life of Fund A |
| Fidelity® Total International Index Fund | 12.29% | 3.61% | 4.26% |
| $10,000 Over Life of Fund |
Let's say hypothetically that $10,000 was invested in Fidelity® Total International Index Fund, on June 7, 2016, when the fund started. The chart shows how the value of your investment would have changed, and also shows how the MSCI ACWI (All Country World Index) ex USA Investable Market Index performed over the same period. |
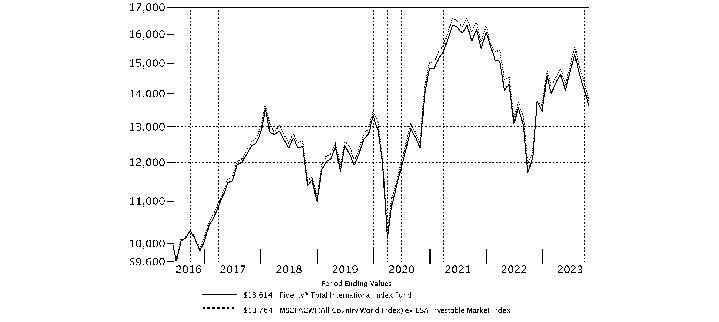 |
Top Holdings (% of Fund's net assets) | ||
| Taiwan Semiconductor Manufacturing Co. Ltd. (Taiwan, Semiconductors & Semiconductor Equipment) | 1.5 | |
| Novo Nordisk A/S Series B (Denmark, Pharmaceuticals) | 1.2 | |
| Nestle SA (Reg. S) (United States of America, Food Products) | 1.1 | |
| Tencent Holdings Ltd. (China, Interactive Media & Services) | 1.0 | |
| ASML Holding NV (Netherlands) (Netherlands, Semiconductors & Semiconductor Equipment) | 0.9 | |
| Samsung Electronics Co. Ltd. (Korea (South), Technology Hardware, Storage & Peripherals) | 0.9 | |
| Shell PLC (London) (Netherlands, Oil, Gas & Consumable Fuels) | 0.8 | |
| LVMH Moet Hennessy Louis Vuitton SE (France, Textiles, Apparel & Luxury Goods) | 0.8 | |
| AstraZeneca PLC (United Kingdom) (United Kingdom, Pharmaceuticals) | 0.7 | |
| Novartis AG (Switzerland, Pharmaceuticals) | 0.7 | |
| 9.6 | ||
| Market Sectors (% of Fund's net assets) | ||
| Financials | 21.5 | |
| Industrials | 11.5 | |
| Consumer Discretionary | 11.3 | |
| Information Technology | 10.6 | |
| Health Care | 9.2 | |
| Materials | 8.0 | |
| Consumer Staples | 7.9 | |
| Energy | 6.0 | |
| Communication Services | 5.1 | |
| Utilities | 3.2 | |
| Real Estate | 1.8 | |
Asset Allocation (% of Fund's net assets) |
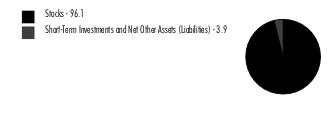 |
Futures - 4% |
Geographic Diversification (% of Fund's net assets) |
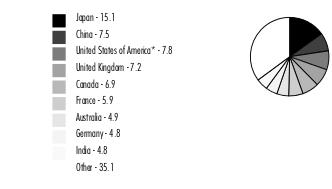 |
* Includes Short-Term investments and Net Other Assets (Liabilities). Percentages are adjusted for the effect of derivatives, if applicable. |
| Common Stocks - 95.3% | |||
| Shares | Value ($) | ||
| Australia - 4.9% | |||
| Accent Group Ltd. | 150,482 | 179,736 | |
| Adbri Ltd. | 157,586 | 197,974 | |
| AGL Energy Ltd. | 223,050 | 1,524,758 | |
| Allkem Ltd. (a) | 221,752 | 1,355,059 | |
| ALS Ltd. | 167,454 | 1,146,031 | |
| Altium Ltd. | 43,466 | 1,096,366 | |
| Alumina Ltd. (a) | 965,262 | 479,674 | |
| AMP Ltd. | 1,099,651 | 732,689 | |
| Ampol Ltd. | 86,013 | 1,744,150 | |
| Ansell Ltd. | 47,413 | 640,588 | |
| ANZ Group Holdings Ltd. | 1,092,187 | 17,222,673 | |
| APA Group unit | 475,888 | 2,494,577 | |
| ARB Corp. Ltd. | 32,259 | 601,966 | |
| Arena (REIT) unit | 133,980 | 271,043 | |
| Aristocrat Leisure Ltd. | 219,195 | 5,387,837 | |
| ASX Ltd. | 74,210 | 2,651,344 | |
| Atlas Arteria Ltd. unit | 487,682 | 1,648,669 | |
| Aub Group Ltd. | 37,853 | 650,069 | |
| Aurizon Holdings Ltd. | 666,652 | 1,452,044 | |
| Aussie Broadband Ltd. (a) | 82,096 | 204,526 | |
| Austal Ltd. | 130,478 | 140,892 | |
| AVZ Minerals Ltd. (a)(b) | 729,530 | 360,966 | |
| Bank of Queensland Ltd. | 243,544 | 791,432 | |
| Bapcor Ltd. | 122,169 | 415,845 | |
| Beach Energy Ltd. | 594,971 | 586,019 | |
| Bega Cheese Ltd. | 116,774 | 206,906 | |
| Bellevue Gold Ltd. (a) | 425,245 | 386,729 | |
| Bendigo & Adelaide Bank Ltd. | 206,467 | 1,143,910 | |
| BHP Group Ltd. | 1,859,516 | 52,638,206 | |
| BlueScope Steel Ltd. | 168,000 | 2,013,894 | |
| Boral Ltd. (a) | 147,247 | 422,125 | |
| Boss Energy Ltd. (a) | 134,702 | 371,207 | |
| Brambles Ltd. | 496,869 | 4,146,747 | |
| Breville Group Ltd. | 39,577 | 536,384 | |
| Brickworks Ltd. | 31,546 | 491,676 | |
| BWP Trust | 167,194 | 345,761 | |
| Calix Ltd. (a) | 60,422 | 103,360 | |
| Capricorn Metals Ltd. (a) | 118,633 | 352,979 | |
| CAR Group Ltd. | 138,279 | 2,437,480 | |
| Centuria Capital Group unit | 310,336 | 227,044 | |
| Centuria Industrial REIT | 195,576 | 353,961 | |
| Chalice Mining Ltd. (a) | 140,109 | 159,654 | |
| Challenger Ltd. | 193,577 | 721,783 | |
| Champion Iron Ltd. | 151,179 | 687,639 | |
| Charter Hall Group unit | 171,759 | 951,542 | |
| Charter Hall Long Wale REIT unit | 222,341 | 427,147 | |
| Charter Hall Retail REIT | 213,222 | 414,319 | |
| Charter Hall Social Infrastruc | 133,666 | 202,547 | |
| Cleanaway Waste Management Ltd. | 768,474 | 1,094,727 | |
| Clinuvel Pharmaceuticals Ltd. | 16,818 | 157,374 | |
| Cochlear Ltd. | 24,302 | 3,724,868 | |
| Codan Ltd./Australia | 46,989 | 233,063 | |
| Coles Group Ltd. | 480,813 | 4,666,622 | |
| Collins Foods Ltd. | 46,336 | 268,696 | |
| Commonwealth Bank of Australia | 612,499 | 37,678,430 | |
| Computershare Ltd. | 215,117 | 3,394,967 | |
| Core Lithium Ltd. (a)(c) | 678,401 | 155,991 | |
| Coronado Global Resources, Inc. CDI (d) | 298,910 | 328,809 | |
| Corporate Travel Management Ltd. | 45,932 | 486,035 | |
| Costa Group Holdings Ltd. | 173,164 | 341,548 | |
| Credit Corp. Group Ltd. | 28,393 | 219,055 | |
| Cromwell Property Group unit | 624,876 | 127,433 | |
| CSR Ltd. | 184,554 | 659,447 | |
| Data#3 Ltd. | 81,230 | 350,161 | |
| De Grey Mining Ltd. (a) | 455,621 | 342,446 | |
| Deterra Royalties Ltd. | 183,036 | 546,913 | |
| Dexus Industria (REIT) | 95,697 | 144,646 | |
| DEXUS Property Group unit | 399,046 | 1,648,136 | |
| Domain Holdings Australia Ltd. | 106,547 | 230,955 | |
| Dominos Pizza Enterprises Ltd. | 25,396 | 823,061 | |
| Downer EDI Ltd. | 249,560 | 600,206 | |
| Eagers Automotive Ltd. | 58,167 | 478,400 | |
| EBOS Group Ltd. | 56,648 | 1,156,425 | |
| Elders Ltd. | 63,491 | 239,583 | |
| Endeavour Group Ltd. | 550,114 | 1,728,154 | |
| Evolution Mining Ltd. | 677,608 | 1,515,549 | |
| EVT Ltd. | 36,245 | 240,329 | |
| Firefinch Ltd. (a)(b) | 386,763 | 49,069 | |
| Flight Centre Travel Group Ltd. | 64,801 | 770,312 | |
| Flutter Entertainment PLC (a) | 26,740 | 4,194,271 | |
| Flutter Entertainment PLC (Ireland) (a) | 39,413 | 6,169,943 | |
| Fortescue Metals Group Ltd. | 624,329 | 8,881,598 | |
| G8 Education Ltd. | 335,502 | 202,748 | |
| Genesis Minerals Ltd. (a) | 351,119 | 322,801 | |
| Glencore PLC | 3,879,565 | 20,549,400 | |
| Gold Road Resources Ltd. | 396,355 | 471,145 | |
| Goodman Group unit | 625,603 | 8,277,922 | |
| GrainCorp Ltd. | 80,935 | 357,704 | |
| Growthpoint Properties Australia Ltd. | 108,767 | 136,556 | |
| GUD Holdings Ltd. | 55,146 | 375,010 | |
| Hansen Technologies Ltd. | 126,789 | 418,683 | |
| Harvey Norman Holdings Ltd. (c) | 212,263 | 496,158 | |
| Healius Ltd. (a) | 217,073 | 250,163 | |
| Helia Group Ltd. | 138,020 | 317,411 | |
| Hmc Capital Ltd. | 117,871 | 320,209 | |
| HomeCo Daily Needs (REIT) unit | 560,224 | 382,037 | |
| HUB24 Ltd. | 29,105 | 561,951 | |
| IDP Education Ltd. | 93,684 | 1,294,373 | |
| IGO Ltd. | 251,610 | 1,523,592 | |
| Iluka Resources Ltd. | 163,864 | 756,684 | |
| Imdex Ltd. | 223,941 | 234,894 | |
| Imugene Ltd. (a) | 2,270,828 | 62,443 | |
| Incitec Pivot Ltd. | 709,787 | 1,239,064 | |
| Ingenia Communities Group unit | 132,176 | 328,984 | |
| Inghams Group Ltd. | 152,740 | 357,738 | |
| Insignia Financial Ltd. | 246,595 | 324,322 | |
| Insurance Australia Group Ltd. | 921,469 | 3,324,235 | |
| Invocare Ltd. | 55,495 | 446,613 | |
| IPH Ltd. | 85,018 | 369,463 | |
| Iress Ltd. | 68,125 | 217,232 | |
| JB Hi-Fi Ltd. | 41,993 | 1,207,087 | |
| Johns Lyng Group Ltd. | 75,046 | 292,156 | |
| Judo Capital Holdings Ltd. (a) | 279,974 | 150,743 | |
| Jumbo Interactive Ltd. | 23,084 | 203,590 | |
| Karoon Energy Ltd. (a) | 227,758 | 366,760 | |
| Kelsian Group Ltd. | 71,751 | 275,941 | |
| Latin Resources Ltd. (a)(c) | 1,038,339 | 163,573 | |
| Lendlease Group unit | 288,702 | 1,143,402 | |
| Leo Lithium Ltd. (a)(b) | 399,362 | 127,934 | |
| Lifestyle Communities Ltd. | 36,079 | 358,923 | |
| Link Administration Holdings Ltd. | 211,741 | 160,731 | |
| Liontown Resources Ltd. (a) | 566,920 | 582,738 | |
| Lovisa Holdings Ltd. | 24,569 | 271,887 | |
| Lynas Rare Earths Ltd. (a) | 343,628 | 1,545,773 | |
| Macquarie Group Ltd. | 134,462 | 13,821,346 | |
| Magellan Financial Group Ltd. | 60,342 | 250,412 | |
| Magellan Financial Group Ltd. warrants 4/16/27 (a) | 4,999 | 496 | |
| McMillan Shakespeare Ltd. | 30,221 | 322,073 | |
| Medibank Private Ltd. | 1,001,635 | 2,185,847 | |
| Megaport Ltd. (a) | 56,625 | 346,308 | |
| Metcash Ltd. | 370,377 | 867,362 | |
| Mineral Resources Ltd. | 66,686 | 2,457,862 | |
| Mirvac Group unit | 1,493,498 | 1,732,837 | |
| Monadelphous Group Ltd. | 37,943 | 339,915 | |
| Nanosonics Ltd. (a) | 102,576 | 244,806 | |
| National Australia Bank Ltd. | 1,153,411 | 20,662,499 | |
| National Storage REIT unit | 454,327 | 579,260 | |
| Netwealth Group Ltd. | 45,811 | 372,221 | |
| Neuren Pharmaceuticals Ltd. (a) | 50,848 | 346,826 | |
| New Hope Corp. Ltd. | 211,601 | 778,711 | |
| Newcrest Mining Ltd. (c) | 18,283 | 273,807 | |
| NEXTDC Ltd. (a) | 188,472 | 1,415,211 | |
| NIB Holdings Ltd. | 180,653 | 832,561 | |
| Nick Scali Ltd. | 45,957 | 315,226 | |
| Nine Entertainment Co. Holdings Ltd. | 532,328 | 627,290 | |
| Northern Star Resources Ltd. | 421,652 | 3,087,667 | |
| NRW Holdings Ltd. | 176,337 | 281,663 | |
| Nufarm Ltd. | 138,803 | 383,541 | |
| OceanaGold Corp. | 269,899 | 451,535 | |
| oOh!media Ltd. | 342,599 | 284,246 | |
| Orica Ltd. | 162,545 | 1,518,808 | |
| Origin Energy Ltd. | 618,076 | 3,585,368 | |
| Orora Ltd. | 426,464 | 668,324 | |
| Paladin Energy Ltd. (Australia) (a) | 1,066,575 | 642,725 | |
| Perpetual Trustees Australia Ltd. | 41,383 | 505,927 | |
| Perseus Mining Ltd. (Australia) | 517,571 | 553,004 | |
| PEXA Group Ltd. (a) | 56,382 | 391,063 | |
| Pilbara Minerals Ltd. (c) | 1,014,185 | 2,382,318 | |
| Pinnacle Investment Management Group Ltd. | 55,312 | 274,135 | |
| Platinum Asset Management Ltd. | 204,193 | 146,020 | |
| PolyNovo Ltd. (a) | 229,715 | 169,395 | |
| Premier Investments Ltd. | 38,013 | 551,200 | |
| Pro Medicus Ltd. | 18,862 | 898,453 | |
| PWR Holdings Ltd. | 55,735 | 347,306 | |
| Qantas Airways Ltd. (a) | 324,637 | 1,017,057 | |
| QBE Insurance Group Ltd. | 555,186 | 5,505,284 | |
| Qube Holdings Ltd. | 599,451 | 1,016,502 | |
| Ramelius Resources Ltd. | 402,299 | 417,837 | |
| Ramsay Health Care Ltd. | 67,755 | 2,097,973 | |
| REA Group Ltd. | 19,187 | 1,761,457 | |
| Reece Ltd. | 84,902 | 946,633 | |
| Region RE Ltd. unit | 410,687 | 513,520 | |
| Regis Resources Ltd. | 290,908 | 314,924 | |
| Resolute Mng Ltd. (a) | 797,052 | 180,022 | |
| Rio Tinto Ltd. | 135,459 | 10,118,530 | |
| Rio Tinto PLC | 413,337 | 26,371,116 | |
| Rural Funds Group unit | 197,377 | 224,993 | |
| Sandfire Resources NL (a) | 175,282 | 664,889 | |
| Santos Ltd. | 1,184,601 | 5,780,212 | |
| Sayona Mining Ltd. (a)(c) | 3,330,003 | 160,000 | |
| Scentre Group unit | 1,883,140 | 2,917,348 | |
| SEEK Ltd. | 144,192 | 1,902,280 | |
| Seven Group Holdings Ltd. | 57,575 | 1,017,444 | |
| Sigma Healthcare Ltd. | 480,219 | 196,988 | |
| Silver Lake Resources Ltd. (a) | 367,897 | 241,986 | |
| SiteMinder Ltd. (a) | 86,600 | 224,521 | |
| Smartgroup Corp. Ltd. | 54,672 | 298,904 | |
| Sonic Healthcare Ltd. | 165,646 | 3,033,155 | |
| South32 Ltd. | 1,725,411 | 3,691,317 | |
| Stanmore Resources Ltd. (a) | 144,904 | 351,127 | |
| Steadfast Group Ltd. | 336,091 | 1,155,731 | |
| Stockland Corp. Ltd. unit | 925,630 | 2,089,093 | |
| Strike Energy Ltd. (a) | 860,289 | 213,633 | |
| Suncorp Group Ltd. | 473,834 | 4,033,108 | |
| Super Retail Group Ltd. | 64,109 | 539,433 | |
| Tabcorp Holdings Ltd. | 817,705 | 403,480 | |
| Technology One Ltd. | 107,114 | 993,353 | |
| Telix Pharmaceuticals Ltd. (a) | 87,874 | 495,765 | |
| Telstra Group Ltd. | 1,461,314 | 3,543,511 | |
| The GPT Group | 749,901 | 1,730,643 | |
| The Lottery Corp. Ltd. | 797,222 | 2,301,237 | |
| The Star Entertainment Group Ltd. (a) | 817,795 | 276,265 | |
| Transurban Group unit | 1,119,832 | 8,430,648 | |
| Treasury Wine Estates Ltd. | 263,051 | 2,019,083 | |
| United Malt Group Ltd. (a) | 98,760 | 313,242 | |
| Ventia Services Group Pty Ltd. | 232,596 | 406,526 | |
| Vicinity Centres unit | 1,455,054 | 1,576,015 | |
| Viva Energy Group Ltd. (d) | 312,665 | 563,023 | |
| Washington H. Soul Pattinson & Co. Ltd. | 83,167 | 1,771,779 | |
| Waypoint (REIT) unit | 316,549 | 427,512 | |
| Webjet Ltd. (a) | 149,355 | 580,391 | |
| Weebit Nano Ltd. (a)(c) | 65,110 | 137,339 | |
| Wesfarmers Ltd. | 412,430 | 13,269,453 | |
| West African Resources Ltd. (a) | 401,793 | 186,689 | |
| Westpac Banking Corp. | 1,289,088 | 16,928,023 | |
| Whitehaven Coal Ltd. | 324,073 | 1,526,477 | |
| WiseTech Global Ltd. | 65,350 | 2,433,064 | |
| Woodside Energy Group Ltd. | 694,555 | 15,127,271 | |
| Woolworths Group Ltd. | 434,608 | 9,728,600 | |
| WorleyParsons Ltd. | 132,253 | 1,382,504 | |
| Yancoal Australia Ltd. (c) | 149,792 | 459,971 | |
TOTAL AUSTRALIA | 480,042,377 | ||
| Austria - 0.2% | |||
| ams-OSRAM AG (a)(c) | 100,515 | 356,800 | |
| Andritz AG | 24,743 | 1,136,237 | |
| AT&S Austria Technologie & Systemtechnik AG | 10,089 | 252,788 | |
| BAWAG Group AG (d) | 30,750 | 1,364,584 | |
| CA Immobilien Anlagen AG | 15,866 | 535,531 | |
| DO & CO Restaurants & Catering AG | 2,920 | 341,098 | |
| Erste Group Bank AG | 124,328 | 4,439,862 | |
| EVN AG | 13,112 | 355,863 | |
| Immofinanz AG (a) | 12,726 | 255,842 | |
| Immofinanz AG (a)(b) | 23,102 | 0 | |
| Kontron AG | 15,666 | 314,948 | |
| Lenzing AG (a) | 6,897 | 268,191 | |
| Mondi PLC | 176,645 | 2,853,405 | |
| Oesterreichische Post AG | 14,085 | 449,336 | |
| OMV AG | 53,002 | 2,319,527 | |
| Raiffeisen International Bank-Holding AG | 53,392 | 772,274 | |
| S IMMO AG rights (a)(b) | 14,648 | 0 | |
| Schoeller-Bleckmann Oilfield Equipment AG | 4,677 | 236,055 | |
| UNIQA Insurance Group AG | 49,820 | 401,685 | |
| Verbund AG | 25,927 | 2,249,535 | |
| Vienna Insurance Group AG | 15,464 | 414,788 | |
| Voestalpine AG | 43,731 | 1,090,163 | |
| Wienerberger AG | 41,283 | 1,002,055 | |
TOTAL AUSTRIA | 21,410,567 | ||
| Bailiwick of Jersey - 0.0% | |||
| JTC PLC (d) | 56,496 | 438,446 | |
| Belgium - 0.6% | |||
| Ackermans & Van Haaren SA | 8,043 | 1,193,995 | |
| Aedifica SA | 17,193 | 935,974 | |
| Ageas | 58,129 | 2,230,218 | |
| Anheuser-Busch InBev SA NV | 317,705 | 18,076,791 | |
| Barco NV | 25,049 | 384,048 | |
| Bekaert SA | 13,460 | 544,045 | |
| Bpost SA | 44,616 | 241,706 | |
| Cofinimmo SA | 11,782 | 731,786 | |
| Colruyt NV | 21,922 | 906,255 | |
| D'ieteren Group | 8,210 | 1,217,049 | |
| Deme Group NV | 3,214 | 297,564 | |
| Elia Group SA/NV | 11,245 | 1,066,686 | |
| Euronav NV | 41,505 | 741,749 | |
| Fagron NV | 27,900 | 489,458 | |
| Galapagos NV (a) | 17,168 | 571,201 | |
| Groupe Bruxelles Lambert SA | 33,622 | 2,454,705 | |
| Intervest Offices & Warehouses NV | 12,334 | 261,665 | |
| KBC Ancora | 13,289 | 501,981 | |
| KBC Group NV | 93,056 | 5,110,207 | |
| Kinepolis Group NV | 5,386 | 265,000 | |
| Lotus Bakeries SA | 162 | 1,199,885 | |
| Melexis NV | 7,374 | 541,098 | |
| Montea SICAFI SCA | 5,000 | 352,876 | |
| Ontex Group NV (a) | 31,095 | 227,350 | |
| Proximus | 59,458 | 492,102 | |
| Recticel SA (c) | 18,227 | 163,738 | |
| Retail Estates NV | 4,573 | 278,225 | |
| Shurgard Self Storage Europe SARL | 9,704 | 362,556 | |
| Sofina SA | 5,618 | 1,064,049 | |
| Solvay SA Class A | 26,788 | 2,827,069 | |
| Tessenderlo Group (c) | 9,880 | 287,486 | |
| UCB SA | 47,943 | 3,503,309 | |
| Umicore SA | 76,081 | 1,810,184 | |
| VGP NV | 4,963 | 403,041 | |
| Warehouses de Pauw | 69,728 | 1,720,531 | |
| X-Fab Silicon Foundries SE (a)(d) | 31,383 | 283,582 | |
| Xior Student Housing NV (a) | 10,852 | 311,750 | |
TOTAL BELGIUM | 54,050,914 | ||
| Brazil - 1.2% | |||
| 3R Petroleum Oleo e Gas SA (a) | 103,793 | 667,833 | |
| AES Brasil Energia SA | 133,315 | 266,273 | |
| Allos SA | 177,864 | 807,871 | |
| Alupar Investimento SA unit | 63,096 | 350,412 | |
| Ambev SA | 1,705,163 | 4,349,362 | |
| Arezzo Industria e Comercio SA | 26,200 | 303,430 | |
| Atacadao SA | 278,400 | 495,314 | |
| Auren Energia SA | 121,789 | 324,175 | |
| B3 SA - Brasil Bolsa Balcao | 2,169,534 | 4,776,482 | |
| Banco ABC Brasil SA | 2,752 | 10,857 | |
| Banco Bradesco SA | 764,030 | 1,862,434 | |
| Banco BTG Pactual SA unit | 429,000 | 2,518,649 | |
| Banco do Brasil SA | 312,800 | 2,999,728 | |
| Banco Santander SA (Brasil) unit | 142,400 | 760,333 | |
| BB Seguridade Participacoes SA | 256,200 | 1,563,091 | |
| BRF SA (a) | 315,972 | 668,701 | |
| Camil Alimentos SA | 137,500 | 187,906 | |
| CCR SA | 406,884 | 966,821 | |
| Centrais Eletricas Brasileiras SA (Electrobras) | 366,976 | 2,535,914 | |
| Cielo SA | 485,400 | 338,892 | |
| CM Hospitalar SA | 95,300 | 281,453 | |
| Cogna Educacao (a) | 734,854 | 349,809 | |
| Companhia de Saneamento Basico do Estado de Sao Paulo (SABESP) | 125,600 | 1,454,113 | |
| Companhia de Saneamento de Minas Gerais - COPASA | 74,100 | 234,275 | |
| Companhia Siderurgica Nacional SA (CSN) | 257,787 | 601,294 | |
| Compania de Saneamento do Parana | 98,300 | 424,064 | |
| Cosan SA | 450,064 | 1,405,962 | |
| CPFL Energia SA (a) | 86,100 | 571,068 | |
| Cyrela Brazil Realty SA | 110,600 | 394,644 | |
| Dexco SA | 152,676 | 207,737 | |
| Embraer SA (a) | 263,088 | 917,879 | |
| Energisa SA unit | 80,800 | 746,980 | |
| Eneva SA (a) | 356,600 | 765,292 | |
| ENGIE Brasil Energia SA | 80,681 | 628,901 | |
| Equatorial Energia SA | 379,179 | 2,376,567 | |
| ERO Copper Corp. (a) | 31,675 | 429,871 | |
| EZ Tec Empreendimentos e Participacoes SA | 62,300 | 177,568 | |
| Fleury SA | 114,112 | 339,275 | |
| Gol Linhas Aereas Inteligentes SA warrants 7/23/24 (a) | 900 | 530 | |
| GPS Participacoes e Empreendimentos SA (d) | 137,300 | 437,356 | |
| Grendene SA | 162,600 | 199,954 | |
| Grupo de Moda Soma SA | 198,016 | 207,766 | |
| Grupo Mateus SA (a) | 214,700 | 247,841 | |
| Hapvida Participacoes e Investimentos SA (a)(d) | 1,926,735 | 1,410,156 | |
| Hidrovias do Brasil SA (a) | 353,400 | 276,874 | |
| Hypera SA (a) | 152,000 | 913,191 | |
| Iguatemi SA unit | 89,810 | 357,512 | |
| Intelbras SA Industria de Telecomunicacao Eletronica Brasileira | 41,200 | 156,489 | |
| IRB Brasil Resseguros SA (a) | 24,413 | 197,028 | |
| Itausa-Investimentos Itau SA | 28,063 | 47,757 | |
| JHSF Participacoes SA | 157,300 | 133,846 | |
| Klabin SA unit | 289,200 | 1,227,526 | |
| Localiza Rent a Car SA | 338,174 | 3,412,091 | |
| Localiza Rent a Car SA rights 11/10/23 (a) | 2,479 | 3,442 | |
| Locaweb Servicos de Internet SA (d) | 140,800 | 151,922 | |
| Lojas Renner SA (a) | 359,737 | 874,771 | |
| M. Dias Branco SA | 32,057 | 207,217 | |
| Magazine Luiza SA (a) | 1,133,568 | 299,032 | |
| Marfrig Global Foods SA | 252,700 | 323,785 | |
| Minerva SA | 113,700 | 170,716 | |
| MRV Engenharia e Participacoes SA | 147,200 | 240,869 | |
| Multiplan Empreendimentos Imobiliarios SA (a) | 109,796 | 538,772 | |
| Natura & Co. Holding SA | 332,052 | 839,721 | |
| Odontoprev SA | 114,790 | 237,697 | |
| Omega Energia SA (a) | 109,551 | 165,139 | |
| Oncoclinicas do Brasil Servicos Medicos SA (a) | 105,400 | 198,184 | |
| Pet Center Comercio e Participacoes SA | 138,100 | 97,513 | |
| Petroleo Brasileiro SA - Petrobras (ON) | 1,286,688 | 9,657,019 | |
| Petroreconcavo SA | 58,800 | 241,883 | |
| Prio SA (a) | 299,600 | 2,834,516 | |
| Raia Drogasil SA | 479,092 | 2,451,644 | |
| Rede D'Oregon Sao Luiz SA (d) | 209,034 | 896,378 | |
| Rumo SA | 480,100 | 2,124,467 | |
| Santos Brasil Participacoes SA | 210,700 | 309,254 | |
| Sao Martinho SA | 62,500 | 439,456 | |
| Sendas Distribuidora SA | 505,405 | 1,096,669 | |
| Simpar SA | 137,800 | 189,136 | |
| Sitios Latinoamerica S.A.B. de CV (a)(c) | 679,255 | 243,008 | |
| SLC Agricola SA | 45,041 | 328,399 | |
| Smartfit Escola de Ginastica e Danca SA | 104,700 | 402,249 | |
| Suzano Papel e Celulose SA | 289,189 | 2,957,996 | |
| Telefonica Brasil SA | 157,000 | 1,408,773 | |
| TIM SA | 328,680 | 988,957 | |
| Totvs SA | 198,800 | 997,992 | |
| Transmissora Alianca de Energia Eletrica SA | 76,300 | 511,366 | |
| Tres Tentos Agroindustrial SA | 69,000 | 150,954 | |
| Ultrapar Participacoes SA | 271,800 | 1,102,456 | |
| Vale SA | 1,249,283 | 17,097,343 | |
| Vamos Locacao de Caminhoes Maquinas e Equipamentos SA | 204,000 | 316,819 | |
| Vibra Energia SA (a) | 433,442 | 1,701,357 | |
| Vivara Participacoes S.A. | 67,100 | 339,376 | |
| Weg SA | 614,280 | 4,021,894 | |
| Wheaton Precious Metals Corp. | 168,516 | 7,117,348 | |
| Yara International ASA | 60,372 | 1,972,597 | |
| YDUQS Participacoes SA | 101,800 | 357,994 | |
TOTAL BRAZIL | 114,893,227 | ||
| Burkina Faso - 0.0% | |||
| Endeavour Mining PLC | 68,792 | 1,421,425 | |
| IAMGOLD Corp. (a) | 174,298 | 446,193 | |
TOTAL BURKINA FASO | 1,867,618 | ||
| Canada - 6.9% | |||
| Advantage Energy Ltd. (a) | 67,556 | 490,563 | |
| Aecon Group, Inc. | 24,865 | 182,890 | |
| Africa Oil Corp. | 219,754 | 405,675 | |
| AG Growth International, Inc. | 7,691 | 269,927 | |
| Agnico Eagle Mines Ltd. (Canada) | 182,365 | 8,553,106 | |
| Air Canada (a) | 64,154 | 773,965 | |
| Alamos Gold, Inc. | 148,731 | 1,841,508 | |
| Algoma Steel Group, Inc. | 37,786 | 264,880 | |
| Algonquin Power & Utilities Corp. (c) | 245,458 | 1,235,476 | |
| Alimentation Couche-Tard, Inc. Class A (multi-vtg.) | 284,702 | 15,498,218 | |
| Allied Properties (REIT) | 23,665 | 270,482 | |
| AltaGas Ltd. | 109,127 | 2,027,122 | |
| Altius Minerals Corp. | 22,821 | 334,231 | |
| Altus Group Ltd. | 16,614 | 564,283 | |
| Andlauer Healthcare Group, Inc. | 8,739 | 244,761 | |
| ARC Resources Ltd. (c) | 222,546 | 3,580,315 | |
| Aritzia, Inc. (a) | 34,222 | 532,301 | |
| ATCO Ltd. Class I (non-vtg.) | 30,949 | 793,392 | |
| Athabasca Oil Corp. (a) | 218,541 | 649,280 | |
| ATS Corp. (a) | 34,015 | 1,145,484 | |
| AutoCanada, Inc. (a) | 11,962 | 206,763 | |
| Aya Gold & Silver, Inc. (a)(c) | 42,438 | 229,825 | |
| B2Gold Corp. | 459,081 | 1,469,854 | |
| Badger Infrastructure Solution | 14,739 | 390,383 | |
| Ballard Power Systems, Inc. (a)(c) | 90,512 | 302,196 | |
| Bank of Montreal | 257,099 | 19,427,730 | |
| Bank of Nova Scotia | 435,730 | 17,642,862 | |
| Barrick Gold Corp. (Canada) | 650,767 | 10,394,440 | |
| Baytex Energy Corp. | 253,417 | 1,096,450 | |
| BCE, Inc. | 23,433 | 869,898 | |
| Birchcliff Energy Ltd. | 103,306 | 570,632 | |
| BlackBerry Ltd. (a) | 205,044 | 737,818 | |
| Boardwalk (REIT) | 9,704 | 453,168 | |
| Bombardier, Inc. Class B (sub. vtg.) (a) | 32,053 | 1,028,331 | |
| Boralex, Inc. Class A | 35,901 | 668,184 | |
| Boyd Group Services, Inc. | 7,924 | 1,350,980 | |
| Brookfield Asset Management Ltd. Class A | 133,764 | 3,834,230 | |
| Brookfield Business Corp. Class A | 13,902 | 196,688 | |
| Brookfield Corp. (Canada) Class A | 521,158 | 15,182,825 | |
| Brookfield Infrastructure Corp. Class A | 38,198 | 983,631 | |
| BSR Real Estate Investment Trust | 19,300 | 203,615 | |
| CAE, Inc. (a) | 116,881 | 2,440,868 | |
| Cameco Corp. | 163,410 | 6,684,874 | |
| Canaccord Genuity Group, Inc. | 36,850 | 190,528 | |
| Canada Goose Holdings, Inc. (a)(c) | 22,515 | 249,707 | |
| Canadian Apartment Properties (REIT) unit (c) | 31,765 | 935,026 | |
| Canadian Imperial Bank of Commerce | 330,935 | 11,671,917 | |
| Canadian National Railway Co. | 205,791 | 21,774,446 | |
| Canadian Natural Resources Ltd. | 407,940 | 25,904,594 | |
| Canadian Pacific Kansas City Ltd. | 343,067 | 24,357,943 | |
| Canadian Tire Ltd. Class A (non-vtg.) | 19,602 | 1,890,725 | |
| Canadian Utilities Ltd. Class A (non-vtg.) | 48,338 | 1,022,706 | |
| Canadian Western Bank, Edmonton | 37,433 | 741,777 | |
| Canfor Corp. (a) | 23,167 | 236,891 | |
| Capital Power Corp. | 45,438 | 1,162,859 | |
| Capstone Copper Corp. (a) | 168,440 | 573,309 | |
| Cardinal Energy Ltd. (c) | 62,096 | 332,253 | |
| Cargojet, Inc. (c) | 3,714 | 211,578 | |
| Cascades, Inc. | 29,695 | 240,686 | |
| CCL Industries, Inc. Class B | 56,948 | 2,226,588 | |
| Celestica, Inc. (sub. vtg.) (a) | 43,446 | 1,014,132 | |
| Cenovus Energy, Inc. (Canada) | 529,688 | 10,091,478 | |
| Centerra Gold, Inc. | 82,752 | 420,697 | |
| CES Energy Solutions Corp. | 143,364 | 375,274 | |
| CGI, Inc. Class A (sub. vtg.) (a) | 78,694 | 7,597,298 | |
| Choice Properties REIT | 48,850 | 424,124 | |
| CI Financial Corp. | 64,616 | 585,703 | |
| Cineplex, Inc. (a)(c) | 29,566 | 177,812 | |
| Cogeco Communications, Inc. | 5,796 | 228,287 | |
| Colliers International Group, Inc. | 15,876 | 1,439,172 | |
| Constellation Software, Inc. | 7,478 | 14,991,105 | |
| Constellation Software, Inc. warrants 8/22/28 (a)(b) | 7,284 | 1 | |
| Converge Technology Solutions Corp. | 85,478 | 170,124 | |
| Crescent Point Energy Corp. | 203,565 | 1,632,337 | |
| Crew Energy, Inc. (a)(c) | 58,738 | 262,187 | |
| Definity Financial Corp. | 30,375 | 839,789 | |
| Denison Mines Corp. (a) | 322,640 | 516,503 | |
| dentalcorp Holdings Ltd. (a) | 52,688 | 208,966 | |
| Descartes Systems Group, Inc. (Canada) (a) | 30,927 | 2,235,308 | |
| Docebo, Inc. (a) | 6,949 | 274,252 | |
| Dollarama, Inc. | 103,368 | 7,058,914 | |
| Dream Industrial (REIT) (c) | 58,630 | 495,084 | |
| DREAM Unlimited Corp. (c) | 10,629 | 129,763 | |
| Dundee Precious Metals, Inc. | 79,475 | 520,950 | |
| Dye & Durham Ltd. | 18,048 | 105,288 | |
| ECN Capital Corp. | 93,147 | 128,965 | |
| Element Fleet Management Corp. | 142,399 | 1,926,378 | |
| Emera, Inc. | 100,975 | 3,307,218 | |
| Empire Co. Ltd. Class A (non-vtg.) | 57,973 | 1,588,588 | |
| Enbridge, Inc. | 794,459 | 25,459,353 | |
| Endeavour Silver Corp. (a) | 76,318 | 163,321 | |
| Enerflex Ltd. | 47,486 | 189,019 | |
| Enerplus Corp. | 82,135 | 1,388,906 | |
| Enghouse Systems Ltd. | 17,183 | 403,446 | |
| EQB, Inc. (c) | 11,374 | 564,456 | |
| Equinox Gold Corp. (a)(c) | 109,964 | 481,328 | |
| Exchange Income Corp. | 8,631 | 265,450 | |
| Extendicare, Inc. | 36,578 | 154,568 | |
| Fairfax Financial Holdings Ltd. (sub. vtg.) | 7,942 | 6,609,199 | |
| Fiera Capital Corp. (c) | 42,902 | 144,167 | |
| Filo Corp. (a) | 34,130 | 444,484 | |
| Finning International, Inc. | 55,168 | 1,478,307 | |
| First Capital (REIT) unit | 52,743 | 495,957 | |
| First Majestic Silver Corp. | 108,739 | 559,868 | |
| First National Financial Corp. | 8,979 | 224,030 | |
| FirstService Corp. | 15,622 | 2,210,568 | |
| Fortis, Inc. | 176,873 | 7,022,627 | |
| Fortuna Silver Mines, Inc. (a) | 111,787 | 313,576 | |
| Franco-Nevada Corp. | 70,771 | 8,609,387 | |
| Freehold Royalties Ltd. | 54,128 | 557,381 | |
| George Weston Ltd. | 22,375 | 2,427,004 | |
| GFL Environmental, Inc. | 84,312 | 2,428,891 | |
| Gibson Energy, Inc. (c) | 56,019 | 851,141 | |
| Gildan Activewear, Inc. | 65,917 | 1,872,342 | |
| goeasy Ltd. (c) | 4,986 | 395,500 | |
| Granite (REIT) | 11,143 | 507,431 | |
| Great-West Lifeco, Inc. | 95,339 | 2,641,373 | |
| H&R (REIT) | 40,969 | 252,003 | |
| Headwater Exploration, Inc. | 92,319 | 496,629 | |
| HudBay Minerals, Inc. | 127,632 | 556,823 | |
| Hut 8 Mining Corp. (a)(c) | 91,415 | 197,761 | |
| Hydro One Ltd. (d) | 117,066 | 3,035,654 | |
| iA Financial Corp., Inc. | 37,986 | 2,210,269 | |
| IGM Financial, Inc. | 28,727 | 646,733 | |
| Imperial Oil Ltd. | 75,963 | 4,329,083 | |
| Innergex Renewable Energy, Inc. | 60,777 | 374,282 | |
| Intact Financial Corp. | 63,612 | 8,937,561 | |
| Interfor Corp. (a) | 19,873 | 245,197 | |
| International Petroleum Corp. (a) | 43,204 | 451,434 | |
| InterRent REIT | 28,813 | 244,342 | |
| Ivanhoe Mines Ltd. (a) | 223,892 | 1,650,028 | |
| Jamieson Wellness, Inc. (d) | 17,550 | 288,165 | |
| K92 Mining, Inc. (a)(c) | 91,878 | 331,271 | |
| Karora Resources, Inc. (a)(c) | 68,498 | 204,000 | |
| Kelt Exploration Ltd. (a) | 66,242 | 376,410 | |
| Keyera Corp. | 82,811 | 1,925,837 | |
| Killam Apartment (REIT) | 25,708 | 290,495 | |
| Kinaxis, Inc. (a) | 10,519 | 1,027,210 | |
| Kinross Gold Corp. | 460,596 | 2,404,698 | |
| Labrador Iron Ore Royalty Corp. | 24,621 | 541,511 | |
| Laurentian Bank of Canada (c) | 20,103 | 368,211 | |
| Lightspeed Commerce, Inc. (Canada) (a) | 49,969 | 623,734 | |
| Linamar Corp. | 15,866 | 686,011 | |
| Lithium Americas Corp. (c) | 37,335 | 206,497 | |
| Lithium Americas Corp. (c) | 37,335 | 250,650 | |
| Loblaw Companies Ltd. | 57,484 | 4,701,522 | |
| Lundin Gold, Inc. | 42,029 | 506,742 | |
| MAG Silver Corp. (a) | 45,387 | 453,952 | |
| Magna International, Inc. Class A (sub. vtg.) | 103,449 | 4,971,221 | |
| Major Drilling Group International, Inc. (a) | 34,937 | 184,920 | |
| Manulife Financial Corp. | 672,257 | 11,702,386 | |
| Maple Leaf Foods, Inc. | 29,689 | 591,104 | |
| Martinrea International, Inc. | 28,628 | 235,960 | |
| MEG Energy Corp. (a) | 114,655 | 2,265,403 | |
| Methanex Corp. | 24,899 | 1,028,099 | |
| Metro, Inc. | 84,080 | 4,270,846 | |
| MTY Food Group, Inc. | 8,222 | 309,374 | |
| Mullen Group Ltd. | 38,645 | 366,734 | |
| National Bank of Canada | 123,735 | 7,693,118 | |
| New Gold, Inc. (a) | 260,362 | 317,297 | |
| NexGen Energy Ltd. (a) | 183,424 | 1,107,091 | |
| NFI Group, Inc. | 39,971 | 373,553 | |
| North American Energy Partners, Inc. | 12,192 | 250,917 | |
| North West Co., Inc. | 21,191 | 540,338 | |
| Northland Power, Inc. | 95,555 | 1,342,972 | |
| Northwest Healthcare Properties REIT | 46,312 | 133,918 | |
| Novagold Resources, Inc. (a) | 98,640 | 343,560 | |
| Nutrien Ltd. | 184,255 | 9,896,025 | |
| Nuvei Corp. (Canada) (d) | 23,567 | 328,162 | |
| NuVista Energy Ltd. (a) | 67,068 | 650,488 | |
| Obsidian Energy Ltd. (a) | 31,617 | 268,804 | |
| Onex Corp. (sub. vtg.) | 26,980 | 1,512,086 | |
| Open Text Corp. | 104,124 | 3,476,431 | |
| Orla Mining Ltd. (a) | 86,021 | 263,630 | |
| Osisko Gold Royalties Ltd. | 66,508 | 812,916 | |
| Osisko Mining, Inc. (a) | 129,328 | 250,869 | |
| Pan American Silver Corp. | 134,486 | 1,964,800 | |
| Paramount Resources Ltd. Class A | 29,834 | 717,049 | |
| Parex Resources, Inc. | 40,000 | 766,685 | |
| Park Lawn Corp. | 14,963 | 175,985 | |
| Parkland Corp. | 53,206 | 1,610,280 | |
| Pason Systems, Inc. | 34,268 | 328,409 | |
| Pembina Pipeline Corp. | 196,313 | 6,041,925 | |
| Pet Valu Holdings Ltd. (c) | 16,947 | 303,561 | |
| Peyto Exploration & Development Corp. (c) | 70,392 | 741,102 | |
| Power Corp. of Canada (sub. vtg.) | 212,273 | 5,114,145 | |
| PrairieSky Royalty Ltd. | 79,505 | 1,396,032 | |
| Precision Drilling Corp. (a) | 5,743 | 332,881 | |
| Premium Brands Holdings Corp. | 16,443 | 1,058,613 | |
| Primaris Real Estate Investmen | 19,357 | 173,505 | |
| Quebecor, Inc. Class B (sub. vtg.) | 56,270 | 1,160,905 | |
| RB Global, Inc. | 69,116 | 4,520,186 | |
| Restaurant Brands International, Inc. | 107,845 | 7,244,104 | |
| Richelieu Hardware Ltd. | 20,333 | 608,194 | |
| RioCan (REIT) | 48,595 | 590,464 | |
| Rogers Communications, Inc. Class B (non-vtg.) | 135,716 | 5,028,367 | |
| Rogers Sugar, Inc. | 80,279 | 298,134 | |
| Royal Bank of Canada | 503,923 | 40,248,431 | |
| Russel Metals, Inc. | 23,410 | 583,245 | |
| Sandstorm Gold Ltd. | 97,703 | 447,387 | |
| Saputo, Inc. | 98,822 | 1,995,324 | |
| Savaria Corp. (c) | 24,554 | 219,556 | |
| Seabridge Gold, Inc. (a) | 27,514 | 300,982 | |
| Secure Energy Services, Inc. | 115,935 | 643,735 | |
| ShawCor Ltd. Class A (a) | 26,666 | 279,207 | |
| Shopify, Inc. Class A (a) | 443,490 | 20,944,049 | |
| Sienna Senior Living, Inc. | 33,200 | 240,127 | |
| Silvercorp Metals, Inc. | 80,792 | 179,441 | |
| SilverCrest Metals, Inc. (a) | 59,834 | 296,419 | |
| Slate Grocery REIT | 29,481 | 209,402 | |
| Sleep Country Canada Holdings, Inc. (d) | 15,140 | 238,768 | |
| Smart (REIT) | 36,671 | 568,278 | |
| SNC-Lavalin Group, Inc. | 64,332 | 1,786,961 | |
| Softchoice Corp. (c) | 12,868 | 153,943 | |
| Spartan Delta Corp. | 57,917 | 186,270 | |
| Spin Master Corp. (d) | 13,893 | 332,110 | |
| Sprott, Inc. | 9,096 | 263,746 | |
| SSR Mining, Inc. | 77,405 | 1,071,139 | |
| Stantec, Inc. | 40,359 | 2,469,415 | |
| Stelco Holdings, Inc. | 14,224 | 400,847 | |
| Stella-Jones, Inc. | 19,751 | 1,034,586 | |
| StorageVault Canada, Inc. | 95,640 | 296,558 | |
| Sun Life Financial, Inc. (c) | 207,721 | 9,487,686 | |
| Suncor Energy, Inc. (c) | 487,353 | 15,782,962 | |
| SunOpta, Inc. (a) | 35,953 | 138,060 | |
| Superior Plus Corp. | 66,065 | 444,006 | |
| Surge Energy, Inc. | 44,598 | 306,164 | |
| Tamarack Valley Energy Ltd. | 206,118 | 622,776 | |
| TC Energy Corp. | 376,620 | 12,970,882 | |
| Teck Resources Ltd. Class B (sub. vtg.) | 169,036 | 5,972,788 | |
| TELUS Corp. | 172,637 | 2,783,604 | |
| TFI International, Inc. (Canada) | 28,456 | 3,147,961 | |
| The Toronto-Dominion Bank | 675,213 | 37,715,521 | |
| Thomson Reuters Corp. | 58,264 | 6,979,076 | |
| Timbercreek Financial Corp. (c) | 81,041 | 337,196 | |
| TMX Group Ltd. | 99,010 | 2,061,950 | |
| Topaz Energy Corp. | 37,212 | 568,880 | |
| Torex Gold Resources, Inc. (a) | 32,926 | 317,448 | |
| Toromont Industries Ltd. | 29,842 | 2,246,623 | |
| Tourmaline Oil Corp. | 121,538 | 6,426,812 | |
| TransAlta Corp. | 89,273 | 653,413 | |
| Transcontinental, Inc. Class A | 30,937 | 227,775 | |
| Trican Well Service Ltd. | 101,749 | 344,116 | |
| Tricon Residential, Inc. | 92,463 | 612,753 | |
| Triple Flag Precious Metals Corp. | 20,984 | 266,773 | |
| Trisura Group Ltd. (a) | 18,001 | 395,782 | |
| Vermilion Energy, Inc. | 60,644 | 875,058 | |
| Well Health Technologies Corp. (a) | 87,295 | 232,913 | |
| Wesdome Gold Mines, Inc. (a) | 59,727 | 319,578 | |
| West Fraser Timber Co. Ltd. | 22,910 | 1,546,167 | |
| Westshore Terminals Investment Corp. | 14,984 | 252,732 | |
| Whitecap Resources, Inc./Alberta | 222,800 | 1,720,705 | |
| Winpak Ltd. | 14,375 | 391,419 | |
| WSP Global, Inc. | 45,741 | 5,986,323 | |
TOTAL CANADA | 679,360,505 | ||
| Chile - 0.2% | |||
| Aguas Andinas SA | 1,125,797 | 328,305 | |
| Antofagasta PLC | 144,453 | 2,361,489 | |
| Banco de Chile | 16,691,761 | 1,714,869 | |
| Banco de Credito e Inversiones | 29,252 | 699,433 | |
| Banco Itau Chile SA | 30,345 | 267,511 | |
| Banco Santander Chile | 24,584,977 | 1,071,850 | |
| CAP SA | 31,094 | 169,957 | |
| Cencosud SA | 487,879 | 790,418 | |
| Colbun SA | 3,357,557 | 487,465 | |
| Compania Cervecerias Unidas SA | 54,559 | 310,163 | |
| Compania Sud Americana de Vapores SA | 5,850,438 | 324,879 | |
| Empresa Nacional de Telecomunicaciones SA (ENTEL) | 69,028 | 232,991 | |
| Empresas CMPC SA | 423,054 | 756,298 | |
| Empresas COPEC SA | 143,017 | 946,789 | |
| Enel Americas SA (a) | 8,015,951 | 823,986 | |
| Enel Chile SA | 10,481,867 | 620,714 | |
| Falabella SA | 334,614 | 681,379 | |
| Lundin Mining Corp. | 241,986 | 1,511,158 | |
| Parque Arauco SA | 300,250 | 410,286 | |
| Plaza SA | 197,999 | 240,320 | |
| Vina Concha y Toro SA | 247,838 | 276,886 | |
TOTAL CHILE | 15,027,146 | ||
| China - 7.5% | |||
| 360 Security Technology, Inc. (A Shares) (a) | 177,400 | 218,024 | |
| 37 Interactive Entertainment Network Technology Group Co. Ltd. (A Shares) | 67,200 | 190,121 | |
| 3SBio, Inc. (d) | 768,000 | 683,245 | |
| A-Living Smart City Services C (H Shares) (d) | 336,500 | 158,656 | |
| AAC Technology Holdings, Inc. | 276,500 | 497,710 | |
| Advanced Micro-Fabrication Equipment, Inc., China (A Shares) | 14,590 | 341,806 | |
| AECC Aviation Power Co. Ltd. | 68,800 | 332,749 | |
| Agricultural Bank of China Ltd.: | |||
| (A Shares) | 2,899,400 | 1,423,133 | |
| (H Shares) | 9,235,000 | 3,411,009 | |
| Aier Eye Hospital Group Co. Ltd. (A Shares) | 291,575 | 729,134 | |
| Air China Ltd.: | |||
| (A Shares) (a) | 458,500 | 502,920 | |
| (H Shares) (a) | 630,000 | 428,594 | |
| Airtac International Group | 51,673 | 1,697,576 | |
| AK Medical Holdings Ltd. (d) | 224,000 | 218,067 | |
| Akeso, Inc. (a)(d) | 189,000 | 1,061,340 | |
| Alibaba Group Holding Ltd. (a) | 6,061,864 | 62,407,369 | |
| Alibaba Health Information Technology Ltd. (a) | 2,184,000 | 1,286,548 | |
| Alphamab Oncology (a)(c)(d) | 173,000 | 254,433 | |
| Aluminum Corp. of China Ltd. (H Shares) | 2,248,000 | 1,202,524 | |
| Anhui Conch Cement Co. Ltd. (H Shares) | 593,500 | 1,477,040 | |
| Anhui Gujing Distillery Co. Ltd. (B Shares) | 73,637 | 1,147,738 | |
| Anjoy Foods Group Co. Ltd. (A Shares) | 9,100 | 160,759 | |
| Anta Sports Products Ltd. | 478,000 | 5,405,937 | |
| Ascentage Pharma Group International (a)(d) | 96,600 | 313,665 | |
| Asia Cement (China) Holdings Corp. | 663,000 | 205,522 | |
| Autohome, Inc. ADR Class A | 28,408 | 759,914 | |
| Avary Holding Shenzhen Co. Ltd. (A Shares) | 54,500 | 159,736 | |
| AviChina Industry & Technology Co. Ltd. (H Shares) | 1,012,000 | 458,656 | |
| Baidu, Inc. Class A (a) | 838,868 | 11,013,338 | |
| Bank of Beijing Co. Ltd. (A Shares) | 444,400 | 277,145 | |
| Bank of Chengdu Co. Ltd. (A Shares) | 92,200 | 155,858 | |
| Bank of China Ltd.: | |||
| (A Shares) | 3,354,300 | 1,788,334 | |
| (H Shares) | 24,847,000 | 8,679,937 | |
| Bank of Communications Co. Ltd.: | |||
| (A Shares) | 676,200 | 520,421 | |
| (H Shares) | 3,690,000 | 2,182,657 | |
| Bank of Hangzhou Co. Ltd. (A Shares) | 175,300 | 256,450 | |
| Bank of Jiangsu Co. Ltd. (A Shares) | 465,510 | 439,257 | |
| Bank of Nanjing Co. Ltd. (A Shares) | 297,600 | 319,033 | |
| Bank of Ningbo Co. Ltd. (A Shares) | 149,150 | 509,460 | |
| Bank of Shanghai Co. Ltd. (A Shares) | 348,700 | 289,415 | |
| Baoshan Iron & Steel Co. Ltd. (A Shares) | 671,100 | 574,203 | |
| BeiGene Ltd. (a) | 263,336 | 3,780,420 | |
| Beijing Capital International Airport Co. Ltd. (H Shares) (a) | 778,000 | 286,567 | |
| Beijing Easpring Material Technology Co. Ltd. (A Shares) | 69,900 | 421,556 | |
| Beijing Enterprises Holdings Ltd. | 187,000 | 623,058 | |
| Beijing Enterprises Water Group Ltd. | 1,596,000 | 336,765 | |
| Beijing Kingsoft Office Software, Inc. (A Shares) | 11,434 | 449,828 | |
| Beijing New Building Materials PLC (A Shares) | 47,200 | 157,845 | |
| Beijing Tong Ren Tang Chinese Medicine Co. Ltd. | 144,000 | 216,285 | |
| Beijing Tongrentang Co. Ltd. (A Shares) | 47,100 | 330,595 | |
| Beijing Wantai Biological Pharmacy Enterprise Co. Ltd. (A Shares) | 30,434 | 182,548 | |
| Beijing-Shanghai High Speed Railway Co. Ltd. (A Shares) | 761,600 | 520,709 | |
| Bilibili, Inc. Class Z (a)(c) | 72,891 | 978,032 | |
| Bloomage Biotechnology Corp. Ltd. (A Shares) | 12,941 | 135,294 | |
| BOC Aviation Ltd. Class A (d) | 79,800 | 490,777 | |
| BOC Hong Kong (Holdings) Ltd. | 1,342,500 | 3,550,295 | |
| BOE Technology Group Co. Ltd. (A Shares) | 1,092,200 | 585,537 | |
| Bosideng International Holdings Ltd. | 1,630,000 | 643,572 | |
| Budweiser Brewing Co. APAC Ltd. (d) | 636,300 | 1,209,191 | |
| BYD Co. Ltd.: | |||
| (A Shares) | 107,100 | 3,495,381 | |
| (H Shares) | 323,500 | 9,837,677 | |
| BYD Electronic International Co. Ltd. | 301,000 | 1,256,529 | |
| C&D International Investment Group Ltd. | 332,637 | 748,357 | |
| Cambricon Technologies Corp. Ltd. (A Shares) (a) | 9,375 | 138,398 | |
| Canaan, Inc. ADR (a)(c) | 61,274 | 117,646 | |
| CARsgen Therapeutics Holdings Ltd. (a)(c)(d) | 190,500 | 253,365 | |
| CGN New Energy Holdings Co. Ltd. (d) | 848,000 | 221,173 | |
| CGN Power Co. Ltd. (H Shares) (d) | 4,099,000 | 985,021 | |
| Changchun High & New Technology Industry Group, Inc. (A Shares) | 18,600 | 395,960 | |
| Chaozhou Three-Circle Group Co. (A Shares) | 44,400 | 187,520 | |
| Chervon Holdings Ltd. | 53,500 | 131,773 | |
| China BlueChemical Ltd. (H Shares) | 768,000 | 179,727 | |
| China Cinda Asset Management Co. Ltd. (H Shares) | 3,902,000 | 379,442 | |
| China CITIC Bank Corp. Ltd. (H Shares) | 3,407,000 | 1,519,891 | |
| China Coal Energy Co. Ltd. (H Shares) | 762,000 | 598,526 | |
| China Communications Services Corp. Ltd. (H Shares) | 994,000 | 406,572 | |
| China Conch Environment Protection Holdings Ltd. (a) | 620,500 | 152,633 | |
| China Conch Venture Holdings Ltd. | 578,000 | 478,684 | |
| China Construction Bank Corp.: | |||
| (A Shares) | 1,273,000 | 1,090,930 | |
| (H Shares) | 33,769,000 | 19,098,331 | |
| China CSSC Holdings Ltd. (A Shares) | 110,700 | 391,750 | |
| China Datang Corp. Renewable Power Co. Ltd. | 1,020,000 | 230,776 | |
| China Eastern Airlines Corp. Ltd. (A Shares) (a) | 943,900 | 562,611 | |
| China Education Group Holdings Ltd. | 483,000 | 401,261 | |
| China Energy Engineering Corp. Ltd. (A Shares) | 879,000 | 262,021 | |
| China Everbright Bank Co. Ltd.: | |||
| (A Shares) | 529,200 | 214,825 | |
| (H Shares) | 1,917,000 | 546,818 | |
| China Everbright International Ltd. | 1,438,370 | 491,026 | |
| China Everbright Ltd. | 414,000 | 246,291 | |
| China Feihe Ltd. (d) | 1,425,000 | 885,455 | |
| China Foods Ltd. | 506,000 | 175,225 | |
| China Galaxy Securities Co. Ltd. (H Shares) | 1,647,000 | 842,948 | |
| China Gas Holdings Ltd. | 1,026,200 | 922,561 | |
| China Hongqiao Group Ltd. | 898,000 | 840,721 | |
| China Huishan Dairy Holdings Co. Ltd. (a)(b) | 51,000 | 0 | |
| China International Capital Corp. Ltd. (H Shares) (d) | 756,400 | 1,204,761 | |
| China Jinmao Holdings Group Ltd. | 2,336,356 | 286,570 | |
| China Jushi Co. Ltd. (A Shares) | 110,030 | 174,173 | |
| China Liansu Group Holdings Ltd. | 463,000 | 248,618 | |
| China Life Insurance Co. Ltd. (H Shares) | 2,891,000 | 3,915,567 | |
| China Literature Ltd. (a)(d) | 151,800 | 511,184 | |
| China Longyuan Power Grid Corp. Ltd. (H Shares) | 1,275,000 | 1,079,323 | |
| China Medical System Holdings Ltd. | 526,000 | 841,126 | |
| China Meidong Auto Holding Ltd. | 254,000 | 136,218 | |
| China Mengniu Dairy Co. Ltd. | 1,231,000 | 4,019,384 | |
| China Merchants Bank Co. Ltd.: | |||
| (A Shares) | 259,200 | 1,090,733 | |
| (H Shares) | 1,725,000 | 6,543,433 | |
| China Merchants Energy Shipping Co. Ltd. (A Shares) | 226,600 | 199,249 | |
| China Merchants Holdings International Co. Ltd. | 560,954 | 714,058 | |
| China Merchants Securities Co. Ltd. (A Shares) | 221,360 | 428,008 | |
| China Merchants Shekou Industrial Zone Holdings Co. Ltd. (A Shares) | 194,000 | 292,687 | |
| China Minsheng Banking Corp. Ltd.: | |||
| (A Shares) | 1,435,500 | 730,033 | |
| (H Shares) | 1,664,000 | 553,215 | |
| China Modern Dairy Holdings Ltd. | 1,713,000 | 175,253 | |
| China National Building Materials Co. Ltd. (H Shares) | 1,469,350 | 699,405 | |
| China National Chemical Engineering Co. Ltd. (A Shares) | 209,300 | 200,361 | |
| China National Nuclear Power Co. Ltd. (A Shares) | 437,400 | 443,772 | |
| China Nonferrous Mining Co. Ltd. | 570,000 | 345,627 | |
| China Northern Rare Earth Group High-Tech Co. Ltd. | 141,600 | 404,668 | |
| China Oilfield Services Ltd. (H Shares) | 684,000 | 808,707 | |
| China Overseas Grand Oceans Group Ltd. | 703,034 | 239,645 | |
| China Overseas Land and Investment Ltd. | 1,489,500 | 2,810,850 | |
| China Overseas Property Holdings Ltd. | 510,000 | 442,926 | |
| China Pacific Insurance (Group) Co. Ltd. (H Shares) | 1,206,200 | 2,971,317 | |
| China Petroleum & Chemical Corp.: | |||
| (A Shares) | 1,106,800 | 826,540 | |
| (H Shares) | 8,544,000 | 4,369,725 | |
| China Power International Development Ltd. | 1,933,042 | 751,249 | |
| China Railway Group Ltd.: | |||
| (A Shares) | 392,200 | 324,390 | |
| (H Shares) | 1,831,000 | 864,167 | |
| China Railway Signal & Communications Corp. (A Shares) | 348,088 | 223,505 | |
| China Resource Gas Group Ltd. | 396,700 | 1,172,695 | |
| China Resources Beer Holdings Co. Ltd. | 632,666 | 3,347,858 | |
| China Resources Cement Holdings Ltd. | 1,070,000 | 275,128 | |
| China Resources Land Ltd. | 1,212,000 | 4,536,647 | |
| China Resources Medical Holdin | 347,500 | 204,948 | |
| China Resources Microelectronics Ltd. (A Shares) | 43,421 | 315,795 | |
| China Resources Mixc Lifestyle Services Ltd. (d) | 256,400 | 1,000,324 | |
| China Resources Pharmaceutical Group Ltd. (d) | 599,000 | 372,097 | |
| China Resources Power Holdings Co. Ltd. | 726,000 | 1,406,909 | |
| China Resources Sanjiu Medical & Pharmaceutical Co. Ltd. (A Shares) | 26,300 | 155,026 | |
| China Ruyi Holdings Ltd. (a)(c) | 2,505,600 | 576,981 | |
| China Shenhua Energy Co. Ltd.: | |||
| (A Shares) | 411,900 | 1,706,094 | |
| (H Shares) | 907,000 | 2,779,930 | |
| China Southern Airlines Ltd.: | |||
| (A Shares) (a) | 373,300 | 315,198 | |
| (H Shares) (a) | 514,000 | 243,219 | |
| China State Construction Engineering Corp. Ltd. (A Shares) | 1,079,600 | 764,231 | |
| China State Construction International Holdings Ltd. | 761,750 | 815,941 | |
| China Taiping Insurance Group Ltd. | 555,000 | 512,696 | |
| China Three Gorges Renewables Group Co. Ltd. (A Shares) | 972,800 | 638,492 | |
| China Tourism Group Duty Free Corp. Ltd. (A Shares) | 77,700 | 1,005,166 | |
| China Tower Corp. Ltd. (H Shares) (d) | 16,854,000 | 1,571,650 | |
| China Traditional Chinese Medicine Holdings Co. Ltd. | 1,226,000 | 604,107 | |
| China United Network Communications Ltd. (A Shares) | 815,600 | 497,164 | |
| China Vanke Co. Ltd. (H Shares) | 1,391,800 | 1,302,107 | |
| China Water Affairs Group Ltd. | 338,000 | 213,896 | |
| China Yangtze Power Co. Ltd. (A Shares) | 545,200 | 1,682,257 | |
| China Zhenhua (Group) Science & Technology Co. Ltd. (A Shares) | 13,400 | 122,615 | |
| China Zheshang Bank Co. Ltd. | 553,670 | 193,097 | |
| ChinaSoft International Ltd. | 1,040,000 | 754,539 | |
| Chindata Group Holdings Ltd. ADR (a)(c) | 60,012 | 532,907 | |
| Chongqing Changan Automobile Co. Ltd. (A Shares) | 263,082 | 544,556 | |
| Chongqing Zhifei Biological Products Co. Ltd. (A Shares) | 59,100 | 506,642 | |
| Chow Tai Fook Jewellery Group Ltd. | 750,000 | 1,059,093 | |
| Cimc Enric Holdings Ltd. | 314,000 | 266,490 | |
| CITIC 1616 Holdings Ltd. | 863,000 | 329,034 | |
| CITIC Pacific Ltd. | 2,265,000 | 1,925,111 | |
| CITIC Securities Co. Ltd. (H Shares) | 1,249,850 | 2,432,030 | |
| Cloud Music, Inc. (a)(c)(d) | 25,650 | 291,667 | |
| Cmoc Group Ltd. (H Shares) | 1,920,000 | 1,145,110 | |
| COFCO Meat Holdings Ltd. (a) | 1,296,000 | 301,637 | |
| Contemporary Amperex Technology Co. Ltd. | 99,240 | 2,520,434 | |
| COSCO Shipping Energy Transportation Co. Ltd. (A Shares) | 411,300 | 810,681 | |
| COSCO SHIPPING Holdings Co. Ltd. (H Shares) | 1,516,600 | 1,542,439 | |
| Cosco Shipping Ports Ltd. | 623,086 | 375,903 | |
| Country Garden Holdings Co. Ltd. (a)(c) | 4,625,081 | 413,587 | |
| Country Garden Services Holdings Co. Ltd. | 816,000 | 712,782 | |
| CRRC Corp. Ltd. (A Shares) | 1,619,000 | 1,182,706 | |
| CSC Financial Co. Ltd. (A Shares) | 145,000 | 479,614 | |
| CSPC Pharmaceutical Group Ltd. | 3,605,600 | 3,149,383 | |
| CT Environmental Group Ltd. (a)(b) | 26,000 | 0 | |
| Daqin Railway Co. Ltd. (A Shares) | 470,300 | 463,629 | |
| Daqo New Energy Corp. ADR (a) | 22,172 | 564,499 | |
| Do-Fluoride New Materials Co. Ltd. (A Shares) | 155,800 | 340,844 | |
| Dongfang Electric Corp. Ltd. (A Shares) | 76,600 | 156,083 | |
| Dongfeng Motor Group Co. Ltd. (H Shares) | 1,040,000 | 457,834 | |
| Dongyue Group Co. Ltd. | 619,000 | 493,064 | |
| East Buy Holding Ltd. (a)(d) | 150,000 | 611,926 | |
| East Money Information Co. Ltd. (A Shares) | 382,604 | 798,495 | |
| ENN Energy Holdings Ltd. | 290,100 | 2,197,550 | |
| ENN Natural Gas Co. Ltd. (A Shares) | 77,800 | 183,647 | |
| ESR Group Ltd. (d) | 895,600 | 1,150,753 | |
| Eve Energy Co. Ltd. (A shares) | 69,600 | 441,551 | |
| Everbright Securities Co. Ltd. (A Shares) | 102,900 | 231,667 | |
| Excellence Commercial Property & Facilities Management Group Ltd. | 750,000 | 174,176 | |
| Far East Horizon Ltd. | 548,000 | 385,593 | |
| FAW Jiefang Group Co. Ltd. (A Shares) (a) | 184,600 | 232,655 | |
| FinVolution Group ADR | 58,552 | 276,951 | |
| Flat Glass Group Co. Ltd. (A Shares) (a) | 155,200 | 548,179 | |
| Focus Media Information Technology Co. Ltd. (A Shares) | 365,000 | 345,098 | |
| Foshan Haitian Flavouring & Food Co. Ltd. (A Shares) | 165,105 | 849,901 | |
| Fosun International Ltd. | 951,000 | 569,783 | |
| Founder Securities Co. Ltd. (A Shares) | 494,100 | 512,199 | |
| Foxconn Industrial Internet Co. Ltd. (A Shares) | 236,500 | 476,612 | |
| Fu Shou Yuan International Group Ltd. | 627,000 | 420,946 | |
| Fufeng Group Ltd. | 621,000 | 322,530 | |
| Fuyao Glass Industries Group Co. Ltd. (H Shares) (d) | 271,200 | 1,236,426 | |
| Ganfeng Lithium Group Co. Ltd.: | |||
| (A Shares) | 119,960 | 726,954 | |
| (H Shares) (d) | 80,800 | 290,216 | |
| GCL Technology Holdings Ltd. | 7,476,000 | 1,100,974 | |
| GD Power Development Co. Ltd. (A Shares) | 580,500 | 288,831 | |
| GDS Holdings Ltd. Class A (a) | 373,184 | 475,415 | |
| Geely Automobile Holdings Ltd. | 2,472,000 | 2,806,523 | |
| Genertec Universal Medical Group Co. Ltd. (d) | 503,500 | 255,673 | |
| Genscript Biotech Corp. (a) | 430,000 | 1,250,082 | |
| GF Securities Co. Ltd. (H Shares) | 597,400 | 777,792 | |
| Gigadevice Semiconductor Beijing, Inc. (A Shares) | 16,844 | 246,751 | |
| GoerTek, Inc. (A Shares) | 88,900 | 219,522 | |
| Golden Solar New Energy Technology Holdings Ltd. (a)(c) | 364,000 | 292,343 | |
| Goldwind Science & Technology Co. Ltd. (H Shares) | 413,792 | 197,430 | |
| Great Wall Motor Co. Ltd.: | |||
| (A Shares) | 86,200 | 346,388 | |
| (H Shares) | 813,000 | 1,136,487 | |
| Gree Electric Appliances, Inc. of Zhuhai (A Shares) | 98,900 | 458,806 | |
| Greentown China Holdings Ltd. | 396,000 | 384,176 | |
| Greentown Management Holdings Co. Ltd. (d) | 294,000 | 216,663 | |
| Greentown Service Group Co. Ltd. | 616,000 | 240,257 | |
| Guangdong Haid Group Co. Ltd. (A Shares) | 38,300 | 235,815 | |
| Guangdong Investment Ltd. | 1,102,000 | 751,985 | |
| Guangzhou Automobile Group Co. Ltd. | 242,900 | 332,953 | |
| Guangzhou Automobile Group Co. Ltd. (H Shares) | 893,600 | 418,650 | |
| Guangzhou Tinci Materials Technology Co. Ltd. (A Shares) | 48,800 | 185,705 | |
| Guosen Securities Co. Ltd. (A Shares) | 377,800 | 496,353 | |
| Guotai Junan Securities Co. Ltd. (A Shares) | 258,300 | 521,803 | |
| H World Group Ltd. ADR (a) | 79,473 | 2,992,953 | |
| Haichang Ocean Park Holdings Ltd. (a)(c)(d) | 1,340,000 | 171,302 | |
| Haidilao International Holding Ltd. (d) | 616,000 | 1,542,345 | |
| Haier Smart Home Co. Ltd. | 730,800 | 2,084,482 | |
| Haier Smart Home Co. Ltd. (A Shares) | 337,100 | 1,024,445 | |
| Hainan Airlines Co. Ltd. (A Shares) (a) | 1,326,800 | 264,881 | |
| Hainan Airport Infrastructure Co. Ltd. (A Shares) (a) | 456,800 | 237,994 | |
| Haitian International Holdings Ltd. | 220,000 | 524,828 | |
| Haitong Securities Co. Ltd. (H Shares) | 1,496,400 | 859,212 | |
| Hangzhou First Applied Material Co. Ltd. (A Shares) | 66,400 | 232,047 | |
| Hangzhou Oxygen Plant Group Co. Ltd. (A Shares) | 30,900 | 139,484 | |
| Hangzhou Steam Turbine Power G | 420,247 | 397,949 | |
| Hansoh Pharmaceutical Group Co. Ltd. (d) | 452,000 | 850,435 | |
| Helens International Holdings Co. Ltd. (c) | 206,000 | 153,704 | |
| Hello Group, Inc. ADR | 64,572 | 457,170 | |
| Henan Shuanghui Investment & Development Co. Ltd. (A Shares) | 121,400 | 434,607 | |
| Hengan International Group Co. Ltd. | 253,500 | 849,047 | |
| Hengli Petrochemical Co. Ltd. (A Shares) (a) | 218,620 | 438,049 | |
| Hengyi Petrochemical Co. Ltd. (A Shares) (a) | 144,600 | 142,179 | |
| Hithink RoyalFlush Information Network Co. Ltd. (A Shares) | 12,900 | 247,807 | |
| Hopson Development Holdings Ltd. | 414,228 | 242,544 | |
| Hoshine Silicon Industry Co. Ltd. (A Shares) | 32,300 | 252,789 | |
| Hua Hong Semiconductor Ltd. (a)(d) | 226,000 | 556,431 | |
| Huadian Power International Corp. Ltd. (A Shares) | 231,200 | 155,079 | |
| Huadong Medicine Co. Ltd. (A Shares) | 39,400 | 231,521 | |
| Huaneng Power International, Inc.: | |||
| (A Shares) (a) | 227,600 | 236,812 | |
| (H Shares) (a) | 1,534,000 | 717,839 | |
| Huatai Securities Co. Ltd. (H Shares) (d) | 772,400 | 1,011,228 | |
| Huaxia Bank Co. Ltd. (A Shares) | 315,000 | 241,202 | |
| Huayu Automotive Systems Co. Ltd. (A Shares) | 123,100 | 295,290 | |
| Huizhou Desay SV Automotive Co. Ltd. | 13,300 | 228,358 | |
| Hundsun Technologies, Inc. (A Shares) | 57,800 | 246,182 | |
| HUTCHMED China Ltd. (a) | 182,320 | 733,126 | |
| Hygeia Healthcare Holdings Co. (d) | 132,800 | 801,856 | |
| iFlytek Co. Ltd. (A Shares) | 56,000 | 349,380 | |
| IMEIK Technology Development Co. Ltd. (A Shares) | 6,400 | 288,603 | |
| Industrial & Commercial Bank of China Ltd.: | |||
| (A Shares) | 3,763,900 | 2,434,399 | |
| (H Shares) | 20,285,000 | 9,721,480 | |
| Industrial Bank Co. Ltd. (A Shares) | 523,100 | 1,078,816 | |
| Industrial Securities Co. Ltd. (A Shares) | 415,400 | 354,498 | |
| Inner Mongoli Yili Industries Co. Ltd. (A Shares) | 168,200 | 630,687 | |
| Inner Mongolia Baotou Steel Union Co. Ltd. (A Shares) (a) | 1,197,000 | 265,251 | |
| Inner Mongolia Yitai Coal Co. Ltd. (B Shares) (a) | 559,673 | 768,134 | |
| Innovent Biologics, Inc. (a)(d) | 426,000 | 2,510,488 | |
| Inspur Electronic Information Industry Co. Ltd. (A Shares) | 38,600 | 156,450 | |
| iQIYI, Inc. ADR (a) | 163,809 | 763,350 | |
| JA Solar Technology Co. Ltd. (A Shares) | 75,216 | 230,466 | |
| JCET Group Co. Ltd. (A Shares) | 47,500 | 200,502 | |
| JD Health International, Inc. (a)(d) | 429,350 | 1,950,228 | |
| JD Logistics, Inc. (a)(d) | 769,500 | 911,162 | |
| JD.com, Inc. Class A | 873,052 | 11,099,252 | |
| Jiangsu Eastern Shenghong Co. Ltd. | 189,600 | 275,872 | |
| Jiangsu Expressway Co. Ltd. (H Shares) | 480,000 | 436,389 | |
| Jiangsu Hengli Hydraulic Co. Ltd. | 39,536 | 304,335 | |
| Jiangsu Hengrui Medicine Co. Ltd. (A Shares) | 143,724 | 941,310 | |
| Jiangsu King's Luck Brewery JSC Ltd. (A Shares) | 36,200 | 289,494 | |
| Jiangsu Yanghe Brewery JSC Ltd. (A Shares) | 35,900 | 598,755 | |
| Jiangsu Zhongtian Technology Co. Ltd. (A Shares) | 82,900 | 158,804 | |
| Jiangxi Copper Co. Ltd. (H Shares) | 521,000 | 736,671 | |
| Jinan Acetate Chemical Co. Ltd. | 15,503 | 465,751 | |
| Jinke Smart Services Group Co. Ltd. (a)(c) | 187,500 | 187,133 | |
| Jinko Solar Co. Ltd. (A Shares) | 164,477 | 213,426 | |
| JinkoSolar Holdings Co. Ltd. ADR (c) | 16,534 | 538,843 | |
| Jinxin Fertility Group Ltd. (a)(d) | 841,500 | 423,670 | |
| Jiumaojiu International Holdings Ltd. (d) | 374,000 | 406,956 | |
| JOYY, Inc. ADR | 17,543 | 682,774 | |
| Kanzhun Ltd. ADR (a) | 88,272 | 1,306,426 | |
| KE Holdings, Inc. ADR | 249,295 | 3,667,129 | |
| Kerry Logistics Network Ltd. | 167,500 | 142,064 | |
| Keymed Biosciences, Inc. (a)(c)(d) | 72,500 | 538,639 | |
| Kingboard Chemical Holdings Ltd. | 259,500 | 631,954 | |
| Kingdee International Software Group Co. Ltd. (a) | 1,023,000 | 1,357,386 | |
| Kingsoft Cloud Holdings Ltd. ADR (a)(c) | 43,966 | 209,278 | |
| Kingsoft Corp. Ltd. | 352,400 | 1,229,692 | |
| Konka Group Co. Ltd. (B Shares) (a) | 2,599,660 | 372,808 | |
| Kuaishou Technology Class B (a)(d) | 877,400 | 5,650,322 | |
| Kunlun Energy Co. Ltd. | 1,448,000 | 1,206,334 | |
| Kweichow Moutai Co. Ltd. (A Shares) | 27,800 | 6,403,848 | |
| Lee & Man Paper Manufacturing Ltd. | 576,000 | 164,050 | |
| Lenovo Group Ltd. | 2,744,000 | 3,193,281 | |
| Lens Technology Co. Ltd. (A Shares) | 121,400 | 216,920 | |
| Lepu Biopharma Co. Ltd. (H Shares) (a)(c)(d) | 316,000 | 158,593 | |
| Li Auto, Inc. Class A (a) | 418,430 | 7,077,170 | |
| Li Ning Co. Ltd. | 868,500 | 2,661,435 | |
| Lifetech Scientific Corp. (a) | 1,526,000 | 468,861 | |
| Longfor Properties Co. Ltd. (d) | 727,086 | 1,058,464 | |
| LONGi Green Energy Technology Co. Ltd. | 205,056 | 676,970 | |
| Lonking Holdings Ltd. | 1,048,000 | 161,896 | |
| Lufax Holding Ltd. ADR | 257,789 | 246,137 | |
| Luxshare Precision Industry Co. Ltd. (A Shares) | 198,178 | 890,037 | |
| Luye Pharma Group Ltd. (a)(d) | 817,000 | 395,842 | |
| Luzhou Laojiao Co. Ltd. (A Shares) | 38,600 | 1,130,807 | |
| Mango Excellent Media Co. Ltd. (A Shares) | 45,479 | 157,230 | |
| Maoyan Entertainment (a)(d) | 198,200 | 238,163 | |
| Maxscend Microelectronics Co. Ltd. (A Shares) | 12,988 | 268,012 | |
| Meitu, Inc. (d) | 824,500 | 330,725 | |
| Meituan Class B (a)(d) | 1,877,142 | 26,608,514 | |
| Metallurgical Corp. China Ltd. (A Shares) | 600,300 | 271,686 | |
| Microport Scientific Corp. (a) | 332,972 | 524,688 | |
| MINISO Group Holding Ltd. ADR | 35,649 | 902,276 | |
| Minth Group Ltd. | 286,000 | 638,417 | |
| MMG Ltd. (a) | 1,128,000 | 332,629 | |
| Montage Technology Co. Ltd. (A Shares) | 35,113 | 264,756 | |
| Muyuan Foodstuff Co. Ltd. (A Shares) | 144,466 | 745,149 | |
| NARI Technology Co. Ltd. (A Shares) | 241,430 | 745,584 | |
| National Silicon Industry Group Co. Ltd. (A Shares) (a) | 98,219 | 243,775 | |
| NAURA Technology Group Co. Ltd. | 11,900 | 417,437 | |
| NetDragon WebSoft, Inc. | 100,000 | 177,682 | |
| NetEase, Inc. | 716,405 | 15,332,178 | |
| New China Life Insurance Co. Ltd. (H Shares) | 432,400 | 948,539 | |
| New Hope Liuhe Co. Ltd. (A Shares) (a) | 294,100 | 408,211 | |
| New Horizon Health Ltd. (a)(c)(d) | 88,500 | 215,192 | |
| New Oriental Education & Technology Group, Inc. (a) | 560,550 | 3,654,807 | |
| Nexteer Auto Group Ltd. | 398,000 | 191,865 | |
| Ninestar Corp. (A Shares) | 42,000 | 140,914 | |
| Ningbo Tuopu Group Co. Ltd. (A Shares) | 26,500 | 234,121 | |
| Ningxia Baofeng Energy Group Co. Ltd. | 269,800 | 532,081 | |
| NIO, Inc. sponsored ADR (a)(c) | 521,204 | 3,804,789 | |
| Noah Holdings Ltd. sponsored ADR | 22,331 | 255,467 | |
| Nongfu Spring Co. Ltd. (H Shares) (d) | 643,200 | 3,663,502 | |
| Oppein Home Group, Inc. (A Shares) | 16,500 | 196,379 | |
| Orient Securities Co. Ltd. (A Shares) | 285,184 | 338,291 | |
| PDD Holdings, Inc. ADR (a) | 220,911 | 22,404,794 | |
| People's Insurance Co. of China Group Ltd. (H Shares) | 3,741,000 | 1,234,378 | |
| PetroChina Co. Ltd. (H Shares) | 8,362,000 | 5,458,008 | |
| PICC Property & Casualty Co. Ltd. (H Shares) | 2,601,000 | 2,970,226 | |
| Ping An Bank Co. Ltd. (A Shares) | 436,300 | 624,167 | |
| Ping An Healthcare and Technology Co. Ltd. (a)(c)(d) | 220,300 | 514,605 | |
| Ping An Insurance Group Co. of China Ltd.: | |||
| (A Shares) | 413,690 | 2,570,947 | |
| (H Shares) | 2,281,500 | 11,572,856 | |
| Poly Developments & Holdings (A Shares) | 380,500 | 572,759 | |
| Poly Property Group Co. Ltd. | 923,327 | 190,035 | |
| Pop Mart International Group Ltd. (d) | 186,200 | 514,007 | |
| Postal Savings Bank of China Co. Ltd. (H Shares) (d) | 3,931,000 | 1,794,224 | |
| Power Construction Corp. of China Ltd. (A Shares) | 620,000 | 445,910 | |
| Prosus NV | 564,797 | 15,794,877 | |
| Qifu Technology, Inc. ADR | 44,829 | 663,021 | |
| Qingdao Ainnovation Technology Group Co. Ltd. (a)(c)(d) | 82,900 | 78,340 | |
| Qinghai Salt Lake Potash Co. Ltd. Class A (a) | 143,300 | 331,834 | |
| Riyue Heavy Industry Co. Ltd. (A Shares) | 136,700 | 263,082 | |
| RLX Technology, Inc. ADR (a)(c) | 219,196 | 372,633 | |
| Rongsheng Petrochemical Co. Ltd. (A Shares) | 244,650 | 381,120 | |
| SAIC Motor Corp. Ltd. (A Shares) | 258,700 | 513,747 | |
| Sanan Optoelectronics Co. Ltd. (A Shares) | 170,000 | 346,064 | |
| Sany Heavy Equipment International Holdings Co. Ltd. | 425,000 | 558,287 | |
| Sany Heavy Industry Co. Ltd. (A Shares) | 228,900 | 452,687 | |
| Satellite Chemical Co. Ltd. (A Shares) | 84,819 | 188,550 | |
| SDIC Power Holdings Co. Ltd. (A Shares) | 162,500 | 271,103 | |
| Seazen Group Ltd. (a)(c) | 1,420,000 | 230,451 | |
| Seres Group Co. Ltd. (A Shares) (a) | 59,700 | 666,453 | |
| SF Holding Co. Ltd. (A Shares) | 140,400 | 753,452 | |
| Shaanxi Coal Industry Co. Ltd. (A Shares) | 221,400 | 545,939 | |
| Shandong Chenming Paper Holdings Ltd. (B Shares) (a) | 2,877,924 | 580,676 | |
| Shandong Gold Mining Co. Ltd. (A Shares) | 245,560 | 797,467 | |
| Shandong Hualu Hengsheng Chemical Co. Ltd. (A Shares) | 71,700 | 315,407 | |
| Shandong Nanshan Aluminum Co. Ltd. (A Shares) | 1,201,400 | 509,226 | |
| Shandong Weigao Medical Polymer Co. Ltd. (H Shares) | 938,000 | 870,644 | |
| Shanghai Bairun Investment Holding Group Co. Ltd. (A Shares) | 48,400 | 174,247 | |
| Shanghai Baosight Software Co. Ltd. | 473,480 | 973,775 | |
| Shanghai Chlor Alkali Co. Ltd. (B Shares) | 1,105,042 | 493,939 | |
| Shanghai Electric Group Co. Ltd. (A Shares) (a) | 365,700 | 222,038 | |
| Shanghai Fosun Pharmaceutical (Group) Co. Ltd. (H Shares) | 273,000 | 629,935 | |
| Shanghai Industrial Holdings Ltd. | 225,000 | 275,315 | |
| Shanghai International Airport Co. Ltd. (A Shares) (a) | 47,500 | 241,691 | |
| Shanghai International Port Group Co. Ltd. (A Shares) | 299,300 | 204,607 | |
| Shanghai Jinjiang International Hotels Co. Ltd. (A Shares) | 35,600 | 159,871 | |
| Shanghai Jinqiao Export Processing Zone Development Co. Ltd. (B Shares) | 374,320 | 330,461 | |
| Shanghai Pharmaceuticals Holding Co. Ltd. (H Shares) | 381,600 | 555,152 | |
| Shanghai Pudong Development Bank Co. Ltd. (A Shares) | 913,000 | 851,416 | |
| Shanghai Putailai New Energy Technology Co. Ltd. | 56,550 | 193,483 | |
| Shanghai Shangling Electric Appliances Co. Ltd. (B Shares) | 356,355 | 334,180 | |
| Shangri-La Asia Ltd. (a) | 498,000 | 317,713 | |
| Shanxi Lu'an Environmental Energy Development Co. Ltd. (A Shares) | 83,000 | 215,972 | |
| Shanxi Taigang Stainless Steel Co. Ltd. (A Shares) | 548,800 | 293,418 | |
| Shanxi Xinghuacun Fen Wine Factory Co. Ltd. (A Shares) | 32,900 | 1,111,459 | |
| Shanxi Xishan Coal & Electricity Power Co. Ltd. (A Shares) | 205,700 | 243,343 | |
| Shede Spirits Co. Ltd. (A Shares) | 12,700 | 200,001 | |
| Shenwan Hongyuan Group Co. Ltd. (A Shares) | 890,400 | 534,338 | |
| Shenzhen Inovance Technology Co. Ltd. (A Shares) | 47,200 | 390,241 | |
| Shenzhen International Holdings Ltd. | 598,956 | 394,786 | |
| Shenzhen Investment Ltd. | 1,160,810 | 170,623 | |
| Shenzhen Mindray Bio-Medical Electronics Co. Ltd. (A Shares) (a) | 29,300 | 1,145,437 | |
| Shenzhen New Industries Biomedical Engineering Co. Ltd. | 28,500 | 268,090 | |
| Shenzhen Overseas Chinese Town Co. Ltd. (A Shares) (a) | 353,500 | 174,734 | |
| Shenzhen Transsion Holdings Co. Ltd. (A Shares) (a) | 17,992 | 330,702 | |
| Shenzhou International Group Holdings Ltd. | 304,300 | 2,988,979 | |
| Shoucheng Holdings Ltd. | 1,020,000 | 167,062 | |
| Shougang Fushan Resources Group Ltd. | 840,335 | 275,990 | |
| Sichuan Chuantou Energy Co. Ltd. (A Shares) | 151,200 | 304,106 | |
| Sichuan Hebang Biotechnology Co. Ltd. (A Shares) | 969,300 | 315,532 | |
| Sichuan Road & Bridge (Group) Co. Ltd. (A Shares) | 221,760 | 233,759 | |
| Sichuan Yahua Industrial Group Co. Ltd. (A Shares) | 133,600 | 257,368 | |
| Sihuan Pharmaceutical Holdings Group Ltd. | 2,358,000 | 199,151 | |
| Silergy Corp. | 120,000 | 1,071,715 | |
| Sinoma Science & Technology Co. Ltd. (A Shares) | 56,700 | 134,070 | |
| Sinopec Engineering Group Co. Ltd. (H Shares) | 683,000 | 341,338 | |
| Sinopec Kantons Holdings Ltd. | 524,000 | 207,689 | |
| Sinopharm Group Co. Ltd. (H Shares) | 493,200 | 1,179,381 | |
| Sinotruk Hong Kong Ltd. | 287,000 | 540,565 | |
| SITC International Holdings Co. Ltd. | 514,000 | 791,769 | |
| SKSHU Paint Co. Ltd. (A Shares) | 14,700 | 119,681 | |
| Smoore International Holdings Ltd. (c)(d) | 696,000 | 536,378 | |
| Spring Airlines Co. Ltd. (A Shares) (a) | 39,100 | 292,743 | |
| Sungrow Power Supply Co. Ltd. (A Shares) | 33,000 | 380,364 | |
| Sunny Optical Technology Group Co. Ltd. | 283,100 | 2,371,793 | |
| SUPCON Technology Co. Ltd. (A Shares) | 24,751 | 147,717 | |
| Suzhou Maxwell Technologies Co. Ltd. (A Shares) | 7,276 | 120,164 | |
| TAL Education Group ADR (a) | 165,719 | 1,453,356 | |
| TBEA Co. Ltd. (A Shares) | 146,640 | 280,694 | |
| TCL Technology Group Corp. (A Shares) | 673,410 | 362,176 | |
| TCL Zhonghuan Renewable Energy Technology Co. Ltd. (A Shares) | 93,125 | 235,158 | |
| Tencent Holdings Ltd. | 2,471,425 | 91,464,365 | |
| Tencent Music Entertainment Group ADR (a) | 290,057 | 2,105,814 | |
| Theme International Holdings Ltd. (a)(c) | 1,850,000 | 137,252 | |
| TI Fluid Systems PLC (d) | 131,782 | 197,976 | |
| Tiangong International Co. Ltd. | 656,000 | 192,824 | |
| Tianli Education International Holdings Ltd. | 715,000 | 204,031 | |
| Tianneng Power International Ltd. (c) | 284,000 | 256,446 | |
| Tianqi Lithium Corp. (A Shares) | 37,200 | 279,955 | |
| Tianshui Huatian Technology Co. Ltd. (A Shares) | 155,000 | 189,342 | |
| Tingyi (Cayman Islands) Holding Corp. | 740,000 | 982,211 | |
| Tong Ren Tang Technologies Co. Ltd. (H Shares) | 283,000 | 215,825 | |
| Tongcheng Travel Holdings Ltd. (a) | 467,200 | 892,563 | |
| Tongwei Co. Ltd. (A Shares) | 127,900 | 477,848 | |
| Topsports International Holdings Ltd. (d) | 727,000 | 611,365 | |
| Towngas Smart Energy Co. Ltd. | 421,892 | 174,764 | |
| TravelSky Technology Ltd. (H Shares) | 359,000 | 567,124 | |
| Trina Solar Co. Ltd. (A Shares) | 48,241 | 197,023 | |
| Trip.com Group Ltd. (a) | 205,332 | 6,998,048 | |
| Tsingtao Brewery Co. Ltd. (H Shares) | 258,000 | 1,956,550 | |
| Uni-President China Holdings Ltd. | 529,000 | 360,033 | |
| Unigroup Guoxin Microelectronics Co. Ltd. (a) | 20,159 | 207,882 | |
| Unisplendour Corp. Ltd. (A Shares) (a) | 68,160 | 182,929 | |
| Vipshop Holdings Ltd. ADR (a) | 131,241 | 1,871,497 | |
| Wanhua Chemical Group Co. Ltd. (A Shares) | 73,400 | 890,541 | |
| Want Want China Holdings Ltd. | 1,781,000 | 1,106,642 | |
| Weibo Corp. sponsored ADR | 42,944 | 508,028 | |
| Weichai Power Co. Ltd. (H Shares) | 920,000 | 1,377,076 | |
| Weimob, Inc. (a)(d) | 904,000 | 363,540 | |
| Wens Foodstuffs Group Co. Ltd. (A Shares) | 151,800 | 389,941 | |
| Will Semiconductor Ltd. | 32,695 | 493,390 | |
| Wilmar International Ltd. | 712,600 | 1,852,607 | |
| Wingtech Technology Co. Ltd. (A Shares) (a) | 28,400 | 193,353 | |
| Wintime Energy Group Co. Ltd. (A Shares) (a) | 2,962,700 | 555,075 | |
| Wuchan Zhongda Group Co. Ltd. | 361,700 | 226,037 | |
| Wuliangye Yibin Co. Ltd. (A Shares) | 95,000 | 2,025,504 | |
| WuXi AppTec Co. Ltd. | 29,016 | 343,133 | |
| WuXi AppTec Co. Ltd. (H Shares) (c)(d) | 174,797 | 2,100,456 | |
| Wuxi Biologics (Cayman), Inc. (a)(d) | 1,422,500 | 8,844,738 | |
| XCMG Construction Machinery Co. Ltd. (A Shares) | 399,200 | 312,714 | |
| XD, Inc. (a) | 135,000 | 204,561 | |
| Xiaomi Corp. Class B (a)(d) | 5,722,400 | 10,260,401 | |
| Xinjiang Daqo New Energy Co. Ltd. (A Shares) | 52,897 | 258,373 | |
| Xinyi Solar Holdings Ltd. | 1,803,379 | 1,061,305 | |
| XPeng, Inc. Class A (a) | 390,468 | 2,837,444 | |
| XTEP International Holdings Ltd. | 620,719 | 564,316 | |
| Yadea Group Holdings Ltd. (d) | 466,000 | 850,618 | |
| Yangzijiang Shipbuilding Holdings Ltd. | 940,700 | 997,126 | |
| Yankuang Energy Group Co. Ltd. (H Shares) | 980,000 | 1,702,024 | |
| Yihai International Holding Ltd. | 212,000 | 385,819 | |
| Yonyou Network Technology Co. Ltd. (A Shares) | 95,059 | 212,956 | |
| YTO Express Group Co. Ltd. (A Shares) | 84,900 | 157,692 | |
| Yuexiu Property Co. Ltd. | 657,720 | 684,133 | |
| Yuexiu Transport Infrastructure Ltd. | 514,000 | 265,621 | |
| Yum China Holdings, Inc. | 157,176 | 8,261,171 | |
| Yunnan Baiyao Group Co. Ltd. (A Shares) | 44,940 | 312,320 | |
| Yunnan Energy New Material Co. Ltd. | 35,300 | 324,068 | |
| Zai Lab Ltd. (a) | 348,410 | 889,162 | |
| Zhangzhou Pientzehuang Pharmaceutical Co. Ltd. (A Shares) | 15,700 | 537,381 | |
| Zhaojin Mining Industry Co. Ltd. (H Shares) | 497,000 | 616,155 | |
| Zhejiang Chint Electric Co. Ltd. (A Shares) | 59,900 | 189,312 | |
| Zhejiang Dahua Technology Co. Ltd. (A Shares) (a) | 97,600 | 272,488 | |
| Zhejiang Expressway Co. Ltd. (H Shares) | 492,000 | 370,346 | |
| Zhejiang Huayou Cobalt Co. Ltd. (A Shares) | 31,460 | 158,367 | |
| Zhejiang Jingsheng Mechanical & Electrical Co. Ltd. (A Shares) | 44,600 | 265,279 | |
| Zhejiang Juhua Co. Ltd. (A Shares) | 87,000 | 180,152 | |
| Zhejiang NHU Co. Ltd. (A Shares) | 92,840 | 205,320 | |
| Zhejiang Sanhua Intelligent Controls Co. Ltd. (A Shares) | 72,100 | 263,935 | |
| Zhejiang Weiming Enviroment Protection Co. Ltd. (A Shares) | 67,080 | 164,569 | |
| Zhejiang Zheneng Electric Power Co. Ltd. (A Shares) (a) | 351,100 | 220,792 | |
| ZhongAn Online P & C Insurance Co. Ltd. (H Shares) (a)(d) | 270,700 | 741,886 | |
| Zhongji Innolight Co. Ltd. (A Shares) | 18,700 | 225,325 | |
| Zhongjin Gold Co. Ltd. (A Shares) | 184,000 | 273,601 | |
| Zhongsheng Group Holdings Ltd. Class H | 359,500 | 830,192 | |
| Zhongtai Securities Co. Ltd. (A Shares) | 477,800 | 467,782 | |
| Zhou Hei Ya International Holdings Co. Ltd. (d) | 621,000 | 204,916 | |
| Zhuzhou CRRC Times Electric Co. Ltd.: | |||
| (A Shares) | 21,033 | 111,362 | |
| (H Shares) | 185,600 | 599,000 | |
| Zijin Mining Group Co. Ltd. (H Shares) | 2,504,000 | 3,873,467 | |
| Zoomlion Heavy Industry Science and Technology Co. Ltd. (A Shares) | 216,400 | 189,929 | |
| ZTE Corp. (H Shares) | 458,600 | 1,019,128 | |
| ZTO Express, Inc. sponsored ADR | 162,035 | 3,819,165 | |
TOTAL CHINA | 742,097,280 | ||
| Colombia - 0.0% | |||
| Bancolombia SA | 102,055 | 727,725 | |
| Interconexion Electrica SA ESP | 159,332 | 561,301 | |
TOTAL COLOMBIA | 1,289,026 | ||
| Czech Republic - 0.0% | |||
| CEZ A/S | 59,424 | 2,542,703 | |
| Komercni Banka A/S | 29,635 | 867,920 | |
| MONETA Money Bank A/S (d) | 148,946 | 575,423 | |
TOTAL CZECH REPUBLIC | 3,986,046 | ||
| Denmark - 2.0% | |||
| A.P. Moller - Maersk A/S: | |||
| Series A | 1,262 | 2,057,487 | |
| Series B | 1,660 | 2,765,943 | |
| ALK-Abello A/S (a) | 48,994 | 542,815 | |
| Alm. Brand A/S | 322,465 | 466,297 | |
| Ambu A/S Series B (a) | 70,512 | 694,549 | |
| Bavarian Nordic A/S (a)(c) | 29,820 | 567,547 | |
| Better Collective A/S (a) | 12,551 | 303,587 | |
| Carlsberg A/S Series B | 35,350 | 4,212,773 | |
| Chemometec A/S | 6,026 | 248,601 | |
| Chr. Hansen Holding A/S | 38,960 | 2,653,947 | |
| Coloplast A/S Series B | 50,430 | 5,254,801 | |
| D/S Norden A/S | 9,394 | 533,509 | |
| Danske Bank A/S | 252,615 | 5,918,076 | |
| Demant A/S (a) | 37,310 | 1,421,258 | |
| DFDS A/S | 14,397 | 415,556 | |
| DSV A/S | 67,350 | 10,044,615 | |
| FLSmidth & Co. A/S | 18,924 | 708,803 | |
| Genmab A/S (a) | 24,895 | 7,037,391 | |
| GN Store Nord A/S (a) | 54,531 | 906,821 | |
| H Lundbeck A/S | 114,235 | 596,297 | |
| ISS A/S | 57,579 | 832,615 | |
| Jyske Bank A/S (Reg.) (a) | 17,842 | 1,255,106 | |
| Matas A/S | 17,566 | 228,610 | |
| Netcompany Group A/S (a)(d) | 17,694 | 552,361 | |
| NKT A/S (a) | 19,928 | 1,000,108 | |
| Novo Nordisk A/S Series B | 1,203,630 | 116,121,692 | |
| Novozymes A/S Series B | 73,563 | 3,301,796 | |
| ORSTED A/S (d) | 69,976 | 3,381,179 | |
| Pandora A/S | 31,602 | 3,576,072 | |
| Per Aarsleff Holding A/S | 7,449 | 325,787 | |
| Ringkjoebing Landbobank A/S | 10,342 | 1,408,257 | |
| Rockwool International A/S Series B | 3,336 | 741,570 | |
| Royal Unibrew A/S | 18,524 | 1,338,796 | |
| Scandinavian Tobacco Group A/S (d) | 21,077 | 312,849 | |
| Schouw & Co. | 4,818 | 297,123 | |
| Solar Holding A/S | 2,485 | 148,140 | |
| Spar Nord Bank A/S | 29,505 | 446,732 | |
| Sydbank A/S | 21,827 | 946,881 | |
| Topdanmark A/S | 16,409 | 735,105 | |
| Trifork Holding AG | 19,239 | 269,748 | |
| Tryg A/S | 128,569 | 2,508,952 | |
| Vestas Wind Systems A/S (a) | 376,852 | 8,168,185 | |
| Zealand Pharma A/S (a) | 18,739 | 777,853 | |
TOTAL DENMARK | 196,026,190 | ||
| Egypt - 0.1% | |||
| Abou Kir Fertilizers & Chemical Industries | 153,279 | 381,649 | |
| Centamin PLC | 464,098 | 465,090 | |
| Commercial International Bank SAE | 961,654 | 1,876,664 | |
| Eastern Co. SAE | 433,130 | 368,353 | |
| EFG-Hermes Holding SAE | 559,982 | 302,399 | |
| Elsewedy Electric Co. | 357,872 | 313,840 | |
| Energean PLC (c) | 51,317 | 531,420 | |
| Talaat Moustafa Group Holding | 631,845 | 459,914 | |
TOTAL EGYPT | 4,699,329 | ||
| Faroe Islands - 0.0% | |||
| Bakkafrost (c) | 18,630 | 839,696 | |
| Finland - 0.7% | |||
| Cargotec Corp. (B Shares) | 15,096 | 594,518 | |
| Caverion Oyj | 37,804 | 341,204 | |
| Citycon Oyj | 39,588 | 209,189 | |
| Elisa Corp. (A Shares) | 51,895 | 2,200,797 | |
| Fortum Corp. | 164,651 | 1,951,233 | |
| Huhtamaki Oyj | 38,751 | 1,328,889 | |
| Kemira Oyj | 41,685 | 673,953 | |
| Kempower OYJ (a)(c) | 6,853 | 214,489 | |
| Kesko Oyj | 101,166 | 1,708,953 | |
| Kojamo OYJ | 47,239 | 402,868 | |
| Kone OYJ (B Shares) | 123,119 | 5,326,831 | |
| Konecranes Oyj | 25,547 | 835,537 | |
| Mandatum Holding OY | 168,329 | 650,454 | |
| Metsa Board OYJ (B Shares) | 66,418 | 501,777 | |
| Metso Corp. | 242,848 | 2,134,289 | |
| Musti Group OYJ | 15,940 | 313,878 | |
| Neste OYJ | 157,178 | 5,273,691 | |
| Nokia Corp. | 2,006,113 | 6,681,726 | |
| Nokian Tyres PLC | 50,477 | 380,704 | |
| Nordea Bank Abp | 1,174,405 | 12,341,171 | |
| Orion Oyj (B Shares) | 39,472 | 1,567,870 | |
| Outokumpu Oyj (A Shares) | 142,958 | 585,845 | |
| Qt Group Oyj (a) | 7,287 | 424,842 | |
| Revenio Group Oyj | 8,912 | 207,078 | |
| Sampo Oyj (A Shares) | 168,329 | 6,609,622 | |
| Stora Enso Oyj (R Shares) | 213,469 | 2,557,995 | |
| TietoEVRY Oyj | 40,400 | 845,540 | |
| Tokmanni Group Corp. | 20,230 | 272,918 | |
| UPM-Kymmene Corp. | 200,524 | 6,740,782 | |
| Uponor Oyj | 19,745 | 596,681 | |
| Valmet Corp. | 57,750 | 1,292,988 | |
| Wartsila Corp. | 172,797 | 2,055,082 | |
| YIT OYJ | 68,000 | 121,021 | |
TOTAL FINLAND | 67,944,415 | ||
| France - 5.9% | |||
| Accor SA | 67,251 | 2,139,730 | |
| Adevinta ASA Class B (a) | 107,432 | 942,955 | |
| Aeroports de Paris SA | 10,852 | 1,214,849 | |
| Air France KLM (Reg.) (a) | 45,637 | 514,466 | |
| Air Liquide SA | 191,452 | 32,805,731 | |
| Airbus Group NV | 217,002 | 29,094,807 | |
| Alstom SA | 110,971 | 1,502,821 | |
| Altarea SCA | 1,710 | 121,588 | |
| ALTEN | 11,058 | 1,302,262 | |
| Amundi SA (d) | 22,126 | 1,152,315 | |
| Antin Infrastructure Partners SA | 14,632 | 174,019 | |
| Arkema SA | 24,092 | 2,252,960 | |
| Atos SE (a)(c) | 41,370 | 288,380 | |
| AXA SA | 674,179 | 19,976,211 | |
| Beneteau SA | 17,513 | 210,877 | |
| BIC SA | 9,318 | 584,168 | |
| bioMerieux SA | 15,349 | 1,469,790 | |
| BNP Paribas SA | 388,851 | 22,360,498 | |
| Boiron SA | 3,556 | 148,058 | |
| Bollore SA | 295,376 | 1,609,567 | |
| Bouygues SA | 75,142 | 2,640,452 | |
| Bureau Veritas SA | 106,735 | 2,427,001 | |
| Capgemini SA | 61,756 | 10,914,063 | |
| Carmila SA | 25,328 | 354,290 | |
| Carrefour SA | 221,589 | 3,884,779 | |
| CGG SA (a) | 298,813 | 210,572 | |
| Clariane SE (c) | 29,939 | 112,839 | |
| Coface SA | 43,695 | 526,139 | |
| Compagnie de St.-Gobain | 172,048 | 9,365,286 | |
| Compagnie Generale des Etablissements Michelin SCA Series B | 251,820 | 7,481,183 | |
| Compagnie Plastic Omnium SA | 24,317 | 272,736 | |
| Covivio | 17,856 | 763,295 | |
| Credit Agricole SA | 445,762 | 5,382,527 | |
| Danone SA | 236,480 | 14,068,303 | |
| Dassault Aviation SA | 8,478 | 1,681,982 | |
| Dassault Systemes SA | 251,181 | 10,346,992 | |
| Derichebourg | 43,229 | 186,713 | |
| Edenred SA | 91,041 | 4,839,643 | |
| Eiffage SA | 26,807 | 2,430,837 | |
| Elis SA | 1,901 | 31,117 | |
| Elis SA | 68,754 | 1,125,421 | |
| Engie SA | 657,552 | 10,458,291 | |
| Eramet SA | 3,632 | 250,757 | |
| Esker SA | 2,170 | 274,840 | |
| EssilorLuxottica SA | 108,489 | 19,588,143 | |
| Eurazeo SA | 16,490 | 927,365 | |
| Euroapi SASU (a) | 21,542 | 112,714 | |
| Eutelsat Communications (c) | 59,940 | 255,593 | |
| Fnac Darty SA (c) | 7,087 | 166,322 | |
| Forvia (a) | 58,346 | 977,897 | |
| Gaztransport et Technigaz SA | 12,445 | 1,589,384 | |
| Gecina SA | 16,709 | 1,637,149 | |
| Getlink SE | 133,280 | 2,148,494 | |
| Hermes International SCA | 11,632 | 21,656,839 | |
| ICADE | 13,199 | 430,149 | |
| ID Logistics Group (a) | 1,171 | 317,193 | |
| Imerys SA | 14,354 | 380,003 | |
| Interparfums SA | 8,677 | 409,020 | |
| Ipsen SA | 13,842 | 1,633,054 | |
| Ipsos SA | 14,838 | 720,006 | |
| JCDecaux SA (a) | 24,321 | 379,835 | |
| Kaufman & Broad SA | 5,875 | 156,030 | |
| Kering SA | 27,536 | 11,198,937 | |
| Klepierre SA | 78,351 | 1,898,483 | |
| L'Oreal SA | 88,555 | 37,222,387 | |
| La Francaise des Jeux SAEM (d) | 38,632 | 1,243,464 | |
| Legrand SA | 97,437 | 8,428,922 | |
| LISI | 8,070 | 186,574 | |
| LVMH Moet Hennessy Louis Vuitton SE | 101,534 | 72,691,295 | |
| Mercialys SA | 34,498 | 293,479 | |
| Mersen SA | 10,308 | 341,386 | |
| Neoen SA (d) | 26,208 | 689,939 | |
| Nexans SA | 10,145 | 715,986 | |
| Nexity (c) | 17,213 | 240,048 | |
| Orange SA | 686,169 | 8,070,753 | |
| Pernod Ricard SA | 74,580 | 13,217,944 | |
| Peugeot Invest | 2,373 | 230,247 | |
| Publicis Groupe SA | 86,524 | 6,566,041 | |
| Quadient SA | 14,034 | 292,830 | |
| Remy Cointreau SA | 8,423 | 954,961 | |
| Renault SA | 69,960 | 2,446,516 | |
| Rexel SA | 89,660 | 1,824,810 | |
| Rubis SCA | 36,579 | 794,985 | |
| Safran SA | 126,516 | 19,764,272 | |
| Sartorius Stedim Biotech | 10,475 | 1,956,809 | |
| SCOR SE | 53,332 | 1,588,521 | |
| SEB SA | 9,261 | 912,783 | |
| SES-imagotag SA (a) | 2,423 | 242,020 | |
| Societe Generale Series A | 271,103 | 6,092,164 | |
| Sodexo SA | 32,524 | 3,437,235 | |
| Soitec SA (a) | 9,780 | 1,453,925 | |
| Sopra Steria Group | 5,751 | 1,030,213 | |
| SPIE SA | 52,951 | 1,391,722 | |
| Technip Energies NV | 54,193 | 1,184,104 | |
| Teleperformance | 22,582 | 2,584,138 | |
| Thales SA | 39,948 | 5,881,728 | |
| TotalEnergies SE | 828,946 | 55,421,242 | |
| Trigano SA | 3,496 | 457,951 | |
| Ubisoft Entertainment SA (a) | 35,074 | 997,565 | |
| Unibail-Rodamco-Westfield NV (a) | 43,464 | 2,145,859 | |
| Valeo SA | 76,563 | 1,007,781 | |
| Vallourec SA (a) | 57,319 | 686,853 | |
| Valneva SE (a) | 38,910 | 220,263 | |
| Veolia Environnement SA | 245,722 | 6,732,881 | |
| Verallia SA (d) | 27,809 | 904,515 | |
| Vicat SA | 9,537 | 292,642 | |
| VINCI SA | 193,755 | 21,424,343 | |
| Virbac SA | 1,667 | 478,004 | |
| Vivendi SA | 264,565 | 2,367,141 | |
| Voltalia SA (a) | 16,649 | 138,993 | |
| Wendel SA | 10,899 | 814,176 | |
| Worldline SA (a)(d) | 88,046 | 1,116,074 | |
TOTAL FRANCE | 575,657,204 | ||
| Georgia - 0.0% | |||
| Bank of Georgia Group PLC | 13,611 | 550,898 | |
| TBC Bank Group PLC | 16,368 | 534,167 | |
TOTAL GEORGIA | 1,085,065 | ||
| Germany - 4.5% | |||
| 1&1 AG | 19,287 | 331,011 | |
| Adesso AG (c) | 1,607 | 151,503 | |
| adidas AG | 60,048 | 10,623,351 | |
| Aixtron AG | 41,723 | 1,168,132 | |
| Allianz SE | 146,607 | 34,341,597 | |
| Amadeus Fire AG | 2,478 | 285,795 | |
| Aroundtown SA (a)(c) | 327,580 | 737,245 | |
| ATOSS Software AG | 1,824 | 384,065 | |
| Aurubis AG | 12,128 | 996,583 | |
| Auto1 Group SE (a)(c)(d) | 39,140 | 229,434 | |
| BASF AG | 329,771 | 15,237,780 | |
| Bayer AG | 361,738 | 15,630,179 | |
| Bayerische Motoren Werke AG (BMW) | 102,451 | 9,499,390 | |
| BayWa AG (c) | 6,630 | 220,979 | |
| Bechtle AG | 29,893 | 1,330,981 | |
| Beiersdorf AG | 36,428 | 4,781,441 | |
| Bilfinger Berger AG | 11,189 | 409,869 | |
| Brenntag SE | 55,803 | 4,140,246 | |
| CANCOM AG (c) | 14,409 | 358,590 | |
| Carl Zeiss Meditec AG | 14,721 | 1,273,206 | |
| Cewe Stiftung & Co. KGAA | 3,300 | 299,241 | |
| Commerzbank AG | 401,274 | 4,309,568 | |
| CompuGroup Medical AG | 10,093 | 368,867 | |
| Continental AG | 41,783 | 2,727,970 | |
| Covestro AG (a)(d) | 70,619 | 3,564,238 | |
| CTS Eventim AG | 22,881 | 1,381,203 | |
| CureVac NV (a)(c) | 37,914 | 200,183 | |
| Daimler Truck Holding AG | 181,046 | 5,674,149 | |
| Dermapharm Holding SE | 7,569 | 291,999 | |
| Deutsche Bank AG | 715,224 | 7,837,198 | |
| Deutsche Beteiligungs AG | 7,102 | 210,410 | |
| Deutsche Borse AG | 69,879 | 11,501,836 | |
| Deutsche EuroShop AG | 8,046 | 145,921 | |
| Deutsche Lufthansa AG (a) | 219,499 | 1,533,791 | |
| Deutsche Pfandbriefbank AG (c)(d) | 51,112 | 340,714 | |
| Deutsche Telekom AG | 1,185,563 | 25,731,062 | |
| Deutz AG | 55,948 | 226,020 | |
| DHL Group | 363,548 | 14,140,474 | |
| Duerr AG | 19,973 | 409,355 | |
| E.ON SE | 799,099 | 9,486,809 | |
| Eckert & Ziegler Strahlen-und Medizintechnik AG | 6,323 | 248,480 | |
| ELMOS Semiconductor AG | 3,350 | 218,704 | |
| Encavis AG (a)(c) | 45,081 | 586,951 | |
| Energiekontor AG | 2,904 | 214,169 | |
| Evonik Industries AG | 77,371 | 1,421,198 | |
| Evotec OAI AG (a)(c) | 51,997 | 895,143 | |
| Fielmann AG | 10,079 | 433,196 | |
| Flatex AG (a)(c) | 26,218 | 264,985 | |
| Formycon AG (a) | 3,914 | 230,676 | |
| Fraport AG Frankfurt Airport Services Worldwide (a)(c) | 13,791 | 681,896 | |
| Freenet AG | 50,684 | 1,283,872 | |
| Fresenius Medical Care AG & Co. KGaA | 74,609 | 2,478,971 | |
| Fresenius SE & Co. KGaA | 156,098 | 4,003,655 | |
| GEA Group AG | 58,473 | 1,994,079 | |
| Gerresheimer AG | 12,786 | 1,189,187 | |
| GFT Technologies AG (c) | 7,105 | 211,852 | |
| Grand City Properties SA (a) | 32,551 | 290,520 | |
| Grenkeleasing AG | 10,796 | 230,750 | |
| Hamborner (REIT) AG | 37,362 | 246,684 | |
| Hamburger Hafen und Logistik AG (c) | 30,855 | 546,522 | |
| Hannover Reuck SE | 21,969 | 4,842,017 | |
| HeidelbergCement AG | 53,087 | 3,846,614 | |
| Heidelberger Druckmaschinen AG (a) | 120,573 | 144,163 | |
| HelloFresh AG (a) | 59,285 | 1,289,718 | |
| Henkel AG & Co. KGaA | 40,492 | 2,559,110 | |
| Hensoldt AG | 20,645 | 609,461 | |
| Hochtief AG | 8,637 | 891,948 | |
| Hornbach Holding AG & Co. KGaA | 4,058 | 241,739 | |
| Hugo Boss AG | 21,296 | 1,241,585 | |
| Hypoport AG (a)(c) | 1,969 | 239,799 | |
| INDUS Holding AG | 9,969 | 193,876 | |
| Infineon Technologies AG | 483,212 | 14,114,729 | |
| Jenoptik AG | 21,667 | 512,622 | |
| JOST Werke AG (d) | 6,321 | 289,601 | |
| K+S AG | 70,828 | 1,189,347 | |
| KION Group AG | 26,347 | 803,995 | |
| Kloeckner & Co. AG | 27,887 | 172,912 | |
| Knorr-Bremse AG | 26,393 | 1,467,255 | |
| Krones AG | 6,017 | 584,453 | |
| Lanxess AG (c) | 30,629 | 700,025 | |
| LEG Immobilien AG (a) | 27,114 | 1,688,080 | |
| Mercedes-Benz Group AG (Germany) | 294,808 | 17,344,813 | |
| Merck KGaA | 47,832 | 7,204,481 | |
| Metro Wholesale & Food Specialist AG (a) | 57,561 | 365,432 | |
| Morphosys AG (a) | 12,538 | 405,271 | |
| MTU Aero Engines AG | 19,731 | 3,695,295 | |
| Muenchener Rueckversicherungs-Gesellschaft AG in Muenchen | 50,720 | 20,312,896 | |
| Nagarro SE (a)(c) | 3,214 | 225,979 | |
| Nemetschek SE | 21,134 | 1,574,277 | |
| Nordex SE (a)(c) | 46,858 | 492,136 | |
| NORMA Group AG | 12,525 | 220,260 | |
| Patrizia Immobilien AG | 17,187 | 138,756 | |
| Pfeiffer Vacuum Technology AG (c) | 1,395 | 215,208 | |
| PNE AG (c) | 15,422 | 195,490 | |
| ProSiebenSat.1 Media AG (c) | 59,660 | 333,180 | |
| Puma AG | 38,654 | 2,179,959 | |
| PVA TePla AG (a) | 9,516 | 144,086 | |
| Rational AG | 1,884 | 1,071,485 | |
| Rheinmetall AG | 15,943 | 4,561,456 | |
| RWE AG | 230,780 | 8,822,524 | |
| SAF-Holland SA | 20,495 | 273,241 | |
| Salzgitter AG | 10,238 | 254,788 | |
| SAP SE | 384,897 | 51,627,132 | |
| Schaeffler AG | 58,431 | 301,957 | |
| Scout24 AG (d) | 28,028 | 1,720,666 | |
| SGL Carbon AG (a)(c) | 28,343 | 173,790 | |
| Siemens AG | 280,069 | 37,164,839 | |
| Siemens Energy AG (a)(c) | 190,129 | 1,683,839 | |
| Siemens Healthineers AG (d) | 103,315 | 5,063,591 | |
| Siltronic AG | 6,786 | 580,884 | |
| Sirius Real Estate Ltd. | 449,291 | 435,780 | |
| Sixt SE (c) | 6,547 | 563,196 | |
| SMA Solar Technology AG (a) | 5,809 | 354,961 | |
| Softwareone Holding AG | 41,733 | 817,547 | |
| Stabilus Se | 9,765 | 618,908 | |
| STRATEC Biomedical Systems AG | 3,213 | 148,226 | |
| Stroeer SE & Co. KGaA | 14,144 | 647,120 | |
| Suedzucker AG (Bearer) | 25,479 | 385,518 | |
| Symrise AG | 50,182 | 5,128,062 | |
| Synlab AG | 25,170 | 264,060 | |
| TAG Immobilien AG (a) | 61,523 | 669,528 | |
| Takkt AG | 13,651 | 174,774 | |
| Talanx AG | 23,123 | 1,454,530 | |
| TeamViewer AG (a)(d) | 51,408 | 788,453 | |
| Telefonica Deutschland Holding AG | 349,362 | 592,750 | |
| Thyssenkrupp AG | 184,590 | 1,280,874 | |
| TUI AG (GB) (a)(c) | 171,283 | 862,722 | |
| United Internet AG (c) | 39,159 | 814,181 | |
| VERBIO Vereinigte BioEnergie AG (c) | 7,454 | 251,361 | |
| Vitesco Technologies Group AG (a) | 7,490 | 729,908 | |
| Volkswagen AG | 11,867 | 1,371,824 | |
| Vonovia SE | 275,692 | 6,347,005 | |
| Vossloh AG | 6,625 | 256,913 | |
| Wacker Chemie AG | 6,815 | 832,865 | |
| Wacker Construction Equipment AG | 12,503 | 228,869 | |
| Wuestenrot & Wuerttembergische AG | 15,478 | 214,870 | |
| Zalando SE (a)(d) | 82,288 | 1,914,646 | |
TOTAL GERMANY | 444,304,086 | ||
| Ghana - 0.0% | |||
| Tullow Oil PLC (a)(c) | 618,043 | 249,248 | |
| Greece - 0.1% | |||
| Aegean Airlines SA (a) | 15,367 | 168,127 | |
| Alpha Bank SA (a) | 841,278 | 1,255,120 | |
| Eurobank Ergasias Services and Holdings SA (a) | 965,819 | 1,575,821 | |
| Ff Group (a)(b) | 881 | 0 | |
| GEK Terna Holding Real Estate Construction SA | 24,540 | 342,748 | |
| Hellenic Telecommunications Organization SA | 77,061 | 1,078,751 | |
| Holding Co. ADMIE IPTO SA | 110,747 | 234,363 | |
| Jumbo SA | 44,102 | 1,160,075 | |
| Lamda Development SA (a) | 35,105 | 225,839 | |
| Motor Oil (HELLAS) Corinth Refineries SA | 25,252 | 601,181 | |
| Mytilineos SA | 40,534 | 1,500,258 | |
| National Bank of Greece SA (a) | 205,706 | 1,175,351 | |
| OPAP SA | 70,599 | 1,195,213 | |
| Piraeus Financial Holdings SA (a) | 260,323 | 768,499 | |
| Public Power Corp. of Greece (a) | 76,877 | 783,338 | |
| Terna Energy SA | 23,839 | 357,929 | |
TOTAL GREECE | 12,422,613 | ||
| Guatemala - 0.0% | |||
| Millicom International Cellular SA (depository receipt) (a) | 56,854 | 891,332 | |
| Hong Kong - 1.4% | |||
| AIA Group Ltd. | 4,264,800 | 37,034,705 | |
| Alibaba Pictures Group Ltd. (a) | 4,970,000 | 317,547 | |
| Alliance International Education Leasing Holdings Co. Ltd. (a)(c)(d) | 330,000 | 60,302 | |
| ASMPT Ltd. | 114,800 | 972,304 | |
| Bank of East Asia Ltd. | 517,981 | 615,171 | |
| Brightoil Petroleum Holdings Ltd. (a)(b) | 26,000 | 0 | |
| Cafe de Coral Holdings Ltd. | 172,000 | 216,631 | |
| Champion (REIT) | 903,000 | 285,247 | |
| Chow Sang Sang Holdings International Ltd. | 245,000 | 281,633 | |
| CK Asset Holdings Ltd. | 710,488 | 3,551,250 | |
| CK Infrastructure Holdings Ltd. | 228,000 | 1,056,789 | |
| CLP Holdings Ltd. | 602,500 | 4,409,566 | |
| Concord New Energy Group Ltd. | 3,100,000 | 253,857 | |
| Cowell e Holdings, Inc. (a)(c) | 102,000 | 244,709 | |
| Dah Sing Banking Group Ltd. | 255,600 | 167,686 | |
| Dah Sing Financial Holdings Ltd. | 99,200 | 224,544 | |
| Far East Consortium International Ltd. | 718,211 | 147,796 | |
| Fortune (REIT) | 629,000 | 351,919 | |
| Futu Holdings Ltd. ADR (a) | 20,683 | 1,146,872 | |
| Giordano International Ltd. | 652,000 | 185,798 | |
| Grand Pharmaceutical Group, Ltd. | 468,000 | 251,583 | |
| Hang Lung Group Ltd. | 318,000 | 423,555 | |
| Hang Lung Properties Ltd. | 683,000 | 897,774 | |
| Hang Seng Bank Ltd. | 277,900 | 3,177,255 | |
| Henderson Land Development Co. Ltd. | 553,345 | 1,447,805 | |
| HKBN Ltd. | 385,000 | 133,372 | |
| HKT Trust/HKT Ltd. unit | 1,383,000 | 1,432,491 | |
| Hong Kong & China Gas Co. Ltd. | 4,159,038 | 2,895,143 | |
| Hong Kong Exchanges and Clearing Ltd. | 445,574 | 15,587,361 | |
| Hong Kong Television Network Ltd. | 251,000 | 89,889 | |
| Hongkong Land Holdings Ltd. | 432,339 | 1,371,259 | |
| Huabao International Holdings Ltd. (c) | 449,000 | 151,055 | |
| Hutchison Port Holdings Trust | 1,951,700 | 306,563 | |
| Hysan Development Co. Ltd. | 229,000 | 421,533 | |
| Jardine Matheson Holdings Ltd. | 59,158 | 2,397,150 | |
| Johnson Electric Holdings Ltd. | 160,427 | 199,010 | |
| K Wah International Holdings Ltd. | 524,902 | 140,943 | |
| Kerry Properties Ltd. | 222,000 | 373,579 | |
| Kingboard Laminates Holdings Ltd. | 389,000 | 364,801 | |
| Kingkey Financial International Holdings Ltd. (a)(c) | 1,370,000 | 153,381 | |
| Link (REIT) | 956,520 | 4,389,607 | |
| LK Technology Holdings Ltd. (c) | 217,500 | 187,087 | |
| Luk Fook Holdings International Ltd. | 167,000 | 414,293 | |
| Man Wah Holdings Ltd. | 619,600 | 384,815 | |
| Melco Crown Entertainment Ltd. sponsored ADR (a) | 82,144 | 693,295 | |
| Melco International Development Ltd. (a) | 289,000 | 202,009 | |
| MH Development Ltd. (a)(b) | 74,000 | 0 | |
| MTR Corp. Ltd. | 571,787 | 2,137,446 | |
| New World Development Co. Ltd. | 551,822 | 1,012,770 | |
| Nine Dragons Paper (Holdings) Ltd. | 668,000 | 380,279 | |
| NWS Holdings Ltd. | 593,367 | 702,095 | |
| Orient Overseas International Ltd. (c) | 49,500 | 624,185 | |
| Pacific Basin Shipping Ltd. | 1,983,000 | 573,828 | |
| PAX Global Technology Ltd. | 347,000 | 239,518 | |
| PCCW Ltd. | 1,652,886 | 808,984 | |
| Power Assets Holdings Ltd. | 501,000 | 2,395,195 | |
| Prudential PLC | 1,019,807 | 10,663,498 | |
| Sino Biopharmaceutical Ltd. | 3,897,000 | 1,513,903 | |
| Sino Land Ltd. | 1,452,033 | 1,449,606 | |
| Skyworth Group Ltd. | 546,625 | 197,521 | |
| SMI Corp. Ltd. (a)(b) | 7,200 | 2,153 | |
| SSY Group Ltd. | 564,000 | 309,367 | |
| Stella International Holdings Ltd. | 300,000 | 338,782 | |
| Sun Hung Kai Properties Ltd. | 524,000 | 5,380,801 | |
| Sunevision Holdings Ltd. | 412,000 | 153,246 | |
| Sunlight (REIT) | 504,000 | 139,398 | |
| Swire Pacific Ltd. (A Shares) | 166,000 | 1,060,382 | |
| Swire Properties Ltd. | 492,400 | 953,388 | |
| Techtronic Industries Co. Ltd. | 513,500 | 4,688,011 | |
| The United Laboratories International Holdings Ltd. | 394,000 | 402,189 | |
| United Energy Group Ltd. | 2,984,000 | 476,460 | |
| Value Partners Group Ltd. | 542,000 | 187,335 | |
| Vinda International Holdings Ltd. (c) | 152,000 | 375,627 | |
| Vitasoy International Holdings Ltd. | 334,000 | 412,048 | |
| Viva Goods Co. Ltd. (a) | 1,632,000 | 214,885 | |
| Vtech Holdings Ltd. | 63,900 | 371,823 | |
| WH Group Ltd. (d) | 3,105,500 | 1,854,708 | |
| Wharf Real Estate Investment Co. Ltd. | 642,000 | 2,245,742 | |
| Xinyi Glass Holdings Ltd. | 656,393 | 754,209 | |
| Yue Yuen Industrial (Holdings) Ltd. | 324,000 | 378,815 | |
| Yuexiu (REIT) | 1,015,654 | 145,392 | |
TOTAL HONG KONG | 133,554,523 | ||
| Hungary - 0.1% | |||
| Magyar Telekom PLC | 180,128 | 280,072 | |
| MOL Hungarian Oil and Gas PLC Series A (For. Reg.) | 163,007 | 1,297,021 | |
| OTP Bank PLC | 87,164 | 3,243,482 | |
| Richter Gedeon PLC | 51,303 | 1,202,914 | |
TOTAL HUNGARY | 6,023,489 | ||
| India - 4.8% | |||
| 360 ONE WAM Ltd. | 64,873 | 409,243 | |
| 3M India Ltd. | 1,213 | 433,671 | |
| Aarti Industries Ltd. | 86,230 | 470,776 | |
| Aavas Financiers Ltd. (a) | 20,653 | 349,288 | |
| ABB India Ltd. | 19,987 | 985,478 | |
| ACC Ltd. | 29,222 | 662,739 | |
| Adani Enterprises Ltd. | 63,909 | 1,761,735 | |
| Adani Green Energy Ltd. (a) | 115,895 | 1,280,044 | |
| Adani Ports & Special Economic Zone Ltd. | 192,839 | 1,818,668 | |
| Adani Power Ltd. (a) | 285,460 | 1,243,488 | |
| Aditya Birla Fashion and Retail Ltd. (a) | 138,232 | 356,488 | |
| Aegis Logistics Ltd. | 56,302 | 197,691 | |
| Affle (India) Ltd. (a) | 22,663 | 286,185 | |
| AIA Engineering Ltd. | 17,278 | 729,385 | |
| Ajanta Pharma Ltd. | 19,814 | 419,454 | |
| Alembic Pharmaceuticals Ltd. | 32,798 | 280,892 | |
| Alkyl Amines Chemicals | 8,423 | 216,680 | |
| Amara Raja Energy & Mobility L | 44,236 | 325,624 | |
| Amber Enterprises India Ltd. (a) | 8,121 | 286,336 | |
| Ambuja Cements Ltd. | 225,339 | 1,149,274 | |
| Angel One Ltd. | 14,396 | 446,667 | |
| Apar Industries Ltd. | 6,515 | 405,275 | |
| APL Apollo Tubes Ltd. | 63,552 | 1,194,752 | |
| Apollo Hospitals Enterprise Ltd. | 37,348 | 2,161,923 | |
| Apollo Tyres Ltd. | 126,534 | 579,356 | |
| Aptus Value Housing Finance India Ltd. | 62,279 | 215,941 | |
| Asahi India Glass Ltd. | 35,932 | 241,396 | |
| Ashok Leyland Ltd. | 560,443 | 1,129,615 | |
| Asian Paints Ltd. | 139,806 | 5,034,487 | |
| Aster DM Healthcare Ltd. (a)(d) | 62,988 | 249,572 | |
| Astral Ltd. | 45,546 | 1,012,169 | |
| AstraZeneca Pharma India Ltd. | 6,304 | 357,013 | |
| Atul Ltd. | 5,999 | 449,641 | |
| AU Small Finance Bank Ltd. (d) | 68,239 | 548,296 | |
| Aurobindo Pharma Ltd. | 100,029 | 1,020,423 | |
| Avenue Supermarts Ltd. (a)(d) | 59,587 | 2,600,853 | |
| Axis Bank Ltd. | 842,880 | 9,942,871 | |
| Bajaj Auto Ltd. | 24,884 | 1,586,900 | |
| Bajaj Electricals Ltd. | 21,874 | 268,571 | |
| Bajaj Finance Ltd. | 100,870 | 9,077,567 | |
| Bajaj Finserv Ltd. | 139,572 | 2,630,944 | |
| Bajaj Holdings & Investment Ltd. | 10,270 | 854,170 | |
| Bajel Projects Ltd. (b) | 21,874 | 34,393 | |
| Balkrishna Industries Ltd. | 29,311 | 898,754 | |
| Balrampur Chini Mills Ltd. | 58,162 | 288,508 | |
| Bandhan Bank Ltd. (d) | 285,591 | 735,171 | |
| Bank of Baroda | 406,920 | 959,199 | |
| BASF India Ltd. | 12,366 | 374,861 | |
| Bata India Ltd. | 29,698 | 558,649 | |
| Bayer CropScience Ltd. | 6,580 | 389,026 | |
| Beml Ltd. | 9,296 | 225,666 | |
| Berger Paints India Ltd. | 113,964 | 764,437 | |
| Bharat Dynamics Ltd. | 22,449 | 262,798 | |
| Bharat Electronics Ltd. | 1,396,859 | 2,237,232 | |
| Bharat Forge Ltd. | 97,863 | 1,198,321 | |
| Bharat Heavy Electricals Ltd. | 425,449 | 617,805 | |
| Bharat Petroleum Corp. Ltd. | 283,791 | 1,189,343 | |
| Bharti Airtel Ltd. | 816,905 | 8,969,088 | |
| Biocon Ltd. | 168,073 | 443,408 | |
| Birlasoft Ltd. | 73,729 | 485,251 | |
| Blue Star Ltd. | 52,897 | 561,990 | |
| Brigade Enterprises Ltd. | 49,435 | 365,203 | |
| Britannia Industries Ltd. | 40,860 | 2,172,915 | |
| Brookfield India Real Estate Trust (d) | 120,143 | 350,724 | |
| BSE Ltd. | 37,241 | 833,390 | |
| Can Finance Homes Ltd. | 41,885 | 384,342 | |
| Carborundum Universal Ltd. | 42,599 | 548,376 | |
| Castrol India Ltd. | 278,638 | 455,562 | |
| CCL Products (India) Ltd. | 34,887 | 247,288 | |
| CEAT Ltd. | 10,060 | 254,769 | |
| Central Depository Services (India) Ltd. | 25,213 | 440,814 | |
| Century Textiles & Industries Ltd. | 35,290 | 458,591 | |
| Cera Sanitaryware Ltd. | 2,533 | 258,036 | |
| CESC Ltd. GDR | 326,089 | 331,972 | |
| Cg Power & Industrial Soluti | 239,587 | 1,121,676 | |
| Chambal Fertilizers & Chemicals Ltd. | 98,798 | 342,383 | |
| Cholamandalam Financial Holdings Ltd. | 42,439 | 579,526 | |
| Cholamandalam Investment and Finance Co. Ltd. | 152,918 | 2,089,115 | |
| Cipla Ltd./India (a) | 192,133 | 2,768,799 | |
| City Union Bank Ltd. | 168,545 | 279,388 | |
| Coal India Ltd. | 564,562 | 2,130,439 | |
| Coforge Ltd. | 21,417 | 1,282,928 | |
| Colgate-Palmolive Ltd. | 50,187 | 1,273,832 | |
| Compagnie Automotive India Ltd. | 43,464 | 240,230 | |
| Computer Age Management Services Private Ltd. | 14,642 | 395,115 | |
| Container Corp. of India Ltd. | 112,295 | 928,308 | |
| Coromandel International Ltd. | 50,230 | 629,214 | |
| Craftsman Automation Ltd. | 5,159 | 301,506 | |
| CreditAccess Grameen Ltd. (a) | 22,640 | 433,946 | |
| CRISIL Ltd. | 7,558 | 371,848 | |
| Crompton Greaves Consumer Electricals Ltd. | 241,075 | 816,275 | |
| Cummins India Ltd. | 52,943 | 1,066,082 | |
| Cyient Ltd. | 32,292 | 615,852 | |
| Dabur India Ltd. | 242,585 | 1,540,593 | |
| Dalmia Bharat Ltd. | 30,909 | 781,261 | |
| Data Patterns India Ltd. (a) | 11,965 | 267,673 | |
| Deepak Fertilisers and Petrochemicals Corp. Ltd. | 33,310 | 257,186 | |
| Deepak Nitrite Ltd. | 25,134 | 599,679 | |
| Delhivery Private Ltd. (a) | 151,534 | 752,023 | |
| Devyani International Ltd. (a) | 139,162 | 300,535 | |
| Divi's Laboratories Ltd. | 43,749 | 1,779,903 | |
| Dixon Technologies India Ltd. (a) | 11,501 | 704,701 | |
| DLF Ltd. | 229,457 | 1,553,971 | |
| Dr Lal Pathlabs Ltd. (d) | 15,402 | 447,300 | |
| Dr. Reddy's Laboratories Ltd. | 41,167 | 2,656,318 | |
| E.I.D. Parry (India) Ltd. | 39,653 | 219,691 | |
| Easy Trip Planners Ltd. | 562,528 | 267,181 | |
| Eicher Motors Ltd. | 50,500 | 1,998,096 | |
| EIH Ltd. | 119,592 | 322,566 | |
| Elgi Equipments Ltd. | 73,736 | 447,544 | |
| Emami Ltd. | 85,849 | 525,757 | |
| Embassy Office Parks (REIT) | 216,565 | 810,163 | |
| Endurance Technologies Ltd. (d) | 13,199 | 253,022 | |
| Engineers India Ltd. | 163,277 | 242,741 | |
| Equitas Small Finance Bank Ltd. (d) | 234,604 | 261,307 | |
| Escorts Kubota Ltd. | 13,365 | 502,824 | |
| Exide Industries Ltd. | 190,932 | 585,525 | |
| Federal Bank Ltd. | 685,783 | 1,158,696 | |
| Fine Organic Industries Ltd. | 3,634 | 193,049 | |
| Finolex Cables Ltd. | 28,076 | 302,481 | |
| Finolex Industries Ltd. | 128,207 | 295,862 | |
| Firstsource Solutions Ltd. | 169,679 | 317,964 | |
| Five Star Business Finance Ltd. | 41,896 | 371,776 | |
| Fortis Healthcare Ltd. | 178,456 | 692,063 | |
| GAIL India Ltd. | 853,304 | 1,224,827 | |
| GHCL Ltd. | 38,920 | 271,792 | |
| Gland Pharma Ltd. (a)(d) | 15,475 | 287,404 | |
| GlaxoSmithKline Pharmaceuticals Ltd. | 24,868 | 424,982 | |
| Glenmark Pharmaceuticals Ltd. | 62,014 | 557,104 | |
| Global Health Ltd. | 28,791 | 271,486 | |
| GMM Pfaudler Ltd. | 14,899 | 310,334 | |
| GMR Airports Infrastructure Ltd. (a) | 817,986 | 536,558 | |
| Godrej Consumer Products Ltd. | 155,051 | 1,846,890 | |
| Godrej Industries Ltd. (a) | 40,550 | 306,018 | |
| Godrej Properties Ltd. (a) | 48,082 | 959,183 | |
| Granules India Ltd. | 80,439 | 314,806 | |
| Grasim Industries Ltd. | 100,188 | 2,269,979 | |
| Great Eastern Shipping Co. Ltd. | 40,193 | 383,400 | |
| Grindwell Norton Ltd. | 18,498 | 476,218 | |
| Gujarat Fluorochemicals Ltd. | 11,333 | 377,846 | |
| Gujarat Gas Ltd. | 72,988 | 358,728 | |
| Gujarat Narmada Valley Fertilizers Co. | 39,985 | 332,106 | |
| Gujarat State Fertilizers & Chemicals Ltd. | 116,636 | 280,441 | |
| Gujarat State Petronet Ltd. | 116,239 | 373,432 | |
| Happiest Minds Technologies Ltd. | 31,257 | 307,585 | |
| Havells India Ltd. | 97,267 | 1,455,807 | |
| HCL Technologies Ltd. | 354,516 | 5,436,103 | |
| HDFC Asset Management Co. Ltd. (d) | 35,780 | 1,174,924 | |
| HDFC Bank Ltd. | 1,020,821 | 18,108,615 | |
| HDFC Standard Life Insurance Co. Ltd. (d) | 357,773 | 2,656,988 | |
| Hero Motocorp Ltd. | 41,358 | 1,534,314 | |
| Hfcl Ltd. | 336,444 | 263,136 | |
| Hindalco Industries Ltd. | 469,663 | 2,591,653 | |
| Hindustan Aeronautics Ltd. | 63,152 | 1,381,655 | |
| Hindustan Petroleum Corp. Ltd. (a) | 220,962 | 657,188 | |
| Hindustan Unilever Ltd. | 300,361 | 8,961,126 | |
| Hitachi Energy India Ltd. | 5,113 | 254,284 | |
| ICICI Bank Ltd. | 1,885,848 | 20,741,562 | |
| ICICI Lombard General Insurance Co. Ltd. (d) | 91,610 | 1,511,521 | |
| ICICI Prudential Life Insurance Co. Ltd. (d) | 136,824 | 863,151 | |
| ICICI Securities Ltd. (d) | 36,539 | 280,457 | |
| IDFC Bank Ltd. (a) | 1,275,600 | 1,267,254 | |
| IDFC Ltd. | 477,728 | 657,476 | |
| Iifl Finance Ltd. | 67,398 | 501,507 | |
| India Cements Ltd./The | 72,267 | 181,611 | |
| Indiabulls Housing Finance Ltd. | 150,736 | 293,254 | |
| Indiabulls Real Estate Ltd. (a) | 198,967 | 174,964 | |
| IndiaMART InterMESH Ltd. (d) | 11,263 | 358,412 | |
| Indian Bank | 96,193 | 485,346 | |
| Indian Energy Exchange Ltd. (d) | 209,961 | 317,434 | |
| Indian Oil Corp. Ltd. | 1,053,026 | 1,134,022 | |
| Indian Railway Catering & Tourism Corp. Ltd. | 96,689 | 772,602 | |
| Indraprastha Gas Ltd. | 124,342 | 571,003 | |
| Info Edge India Ltd. | 26,671 | 1,308,493 | |
| Infosys Ltd. | 1,228,658 | 20,200,219 | |
| Intellect Design Arena Ltd. | 35,868 | 292,570 | |
| InterGlobe Aviation Ltd. (a)(d) | 50,541 | 1,490,340 | |
| Ion Exchange (INDIA) Ltd. | 40,933 | 261,563 | |
| Ipca Laboratories Ltd. | 54,428 | 642,790 | |
| IRB Infrastructure Developers Ltd. | 646,285 | 260,124 | |
| ITC Ltd. | 1,113,548 | 5,730,330 | |
| J.B. Chemicals & Pharmaceuticals Ltd. | 28,642 | 480,829 | |
| JBM Auto Ltd. | 12,394 | 178,609 | |
| Jindal Stainless Ltd. | 142,165 | 755,643 | |
| Jindal Steel & Power Ltd. | 145,269 | 1,105,774 | |
| Jio Financial Services Ltd. | 1,168,818 | 3,101,153 | |
| JK Cement Ltd. | 15,589 | 590,795 | |
| JK Lakshmi Cement Ltd. | 33,659 | 277,738 | |
| JSW Steel Ltd. (a) | 228,045 | 2,017,161 | |
| Jubilant Foodworks Ltd. | 153,996 | 926,333 | |
| Jupiter Wagons Ltd. | 48,374 | 183,203 | |
| Jyothy Laboratories Ltd. | 68,524 | 298,505 | |
| Kajaria Ceramics Ltd. | 31,873 | 482,908 | |
| Kalpataru Power Transmission Ltd. | 42,193 | 335,627 | |
| Kalyan Jewellers India Ltd. | 121,682 | 422,267 | |
| Kansai Nerolac Paints Ltd. | 90,340 | 341,753 | |
| KEC International Ltd. | 50,737 | 382,789 | |
| KEI Industries Ltd. | 22,749 | 654,919 | |
| Kirloskar Oil Engines Ltd. | 48,397 | 316,140 | |
| Kotak Mahindra Bank Ltd. | 404,894 | 8,461,724 | |
| KPIT Technologies Ltd. | 61,150 | 894,474 | |
| KPR Mill Ltd. | 38,954 | 376,524 | |
| Krishna Institute of Medical Sciences Ltd. (a)(d) | 18,905 | 428,523 | |
| L&T Finance Holdings Ltd. | 406,412 | 649,123 | |
| Lakshmi Machine Works Ltd. | 2,579 | 409,114 | |
| Larsen & Toubro Ltd. | 250,932 | 8,827,900 | |
| Laurus Labs Ltd. (d) | 137,462 | 597,213 | |
| Lemon Tree Hotels Ltd. (a)(d) | 235,123 | 309,959 | |
| LIC Housing Finance Ltd. | 122,518 | 675,862 | |
| Linde India Ltd. (a) | 8,572 | 616,845 | |
| Ltimindtree Ltd. (d) | 32,932 | 2,003,013 | |
| Lupin Ltd. | 77,570 | 1,050,841 | |
| Mahanagar Gas Ltd. | 21,960 | 272,204 | |
| Mahindra & Mahindra Financial Services Ltd. | 200,880 | 592,004 | |
| Mahindra & Mahindra Ltd. | 349,520 | 6,123,616 | |
| Mahindra Lifespace Developers Ltd. | 38,777 | 228,675 | |
| Manappuram General Finance & Leasing Ltd. | 220,659 | 364,361 | |
| Marico Ltd. | 196,521 | 1,265,973 | |
| Maruti Suzuki India Ltd. | 50,861 | 6,349,467 | |
| Max Financial Services Ltd. (a) | 95,457 | 1,048,119 | |
| Max Healthcare Institute Ltd. | 288,162 | 1,985,816 | |
| MedPlus Health Services Ltd. (a) | 25,300 | 242,577 | |
| Metropolis Healthcare Ltd. (d) | 13,706 | 231,368 | |
| Mindspace Business Parks (REIT) (d) | 100,246 | 371,871 | |
| Motherson Sumi Wiring India Ltd. | 721,163 | 518,948 | |
| Mphasis BFL Ltd. | 30,233 | 771,627 | |
| MRF Ltd. | 715 | 930,016 | |
| MTAR Technologies Pvt Ltd. (a) | 14,690 | 430,349 | |
| Multi Commodity Exchange of India Ltd. | 13,146 | 367,924 | |
| Muthoot Finance Ltd. | 47,504 | 740,993 | |
| Narayana Hrudayalaya Ltd. | 35,518 | 424,969 | |
| Natco Pharma Ltd. | 37,653 | 361,984 | |
| National Aluminium Co. Ltd. | 391,195 | 433,021 | |
| Navin Fluorine International Ltd. | 13,211 | 545,766 | |
| Ncc Ltd. | 175,577 | 304,732 | |
| Nestle India Ltd. | 12,347 | 3,594,244 | |
| Nexus Select Trust | 244,287 | 376,697 | |
| Nippon Life India Asset Management Ltd. (d) | 76,363 | 359,091 | |
| NMDC Steel Ltd. | 374,962 | 180,885 | |
| NTPC Ltd. | 1,603,483 | 4,541,562 | |
| Nuvama Wealth Management Ltd. | 2,738 | 96,972 | |
| Oberoi Realty Ltd. | 49,227 | 672,610 | |
| Oil & Natural Gas Corp. Ltd. | 1,144,566 | 2,560,303 | |
| Oil India Ltd. | 108,555 | 389,991 | |
| Olectra Greentech Ltd. | 19,898 | 272,220 | |
| Oracle Financial Services Soft | 9,381 | 437,005 | |
| Page Industries Ltd. | 2,382 | 1,082,023 | |
| PB Fintech Ltd. (a) | 78,627 | 661,416 | |
| Persistent Systems Ltd. | 19,443 | 1,439,695 | |
| Petronet LNG Ltd. | 291,347 | 698,140 | |
| Phoenix Mills Ltd. | 37,028 | 807,567 | |
| PI Industries Ltd. | 33,538 | 1,369,340 | |
| Pidilite Industries Ltd. | 56,422 | 1,665,364 | |
| Piramal Enterprises Ltd. | 40,156 | 470,447 | |
| Piramal Pharma Ltd. (a) | 235,792 | 296,106 | |
| PNB Housing Finance Ltd. (a)(d) | 43,182 | 382,072 | |
| Poly Medicure Ltd. | 16,319 | 277,939 | |
| Poonawalla Fincorp Ltd. | 95,637 | 405,144 | |
| Power Finance Corp. Ltd. | 510,965 | 1,512,770 | |
| Power Grid Corp. of India Ltd. | 1,701,784 | 4,131,958 | |
| Praj Industries Ltd. | 69,352 | 446,020 | |
| Prestige Estates Projs. Ltd. | 59,105 | 543,605 | |
| Prince Pipes & Fittings Ltd. | 36,067 | 272,923 | |
| Procter & Gamble Health Ltd. | 4,832 | 296,188 | |
| PVR INOX Ltd. (a) | 32,226 | 618,556 | |
| Quess Corp. Ltd. (d) | 34,295 | 174,109 | |
| Radico Khaitan Ltd. | 30,108 | 440,172 | |
| Rail Vikas Nigam Ltd. | 123,151 | 227,925 | |
| Rainbow Children's Medicare Ltd. | 22,633 | 288,927 | |
| Rajesh Exports Ltd. | 27,220 | 146,781 | |
| Ramkrishna Forgings Ltd. | 34,346 | 264,189 | |
| Ratnamani Metals & Tubes Ltd. | 12,566 | 417,330 | |
| Raymond Ltd. | 14,143 | 299,066 | |
| RBL Bank Ltd. (d) | 187,791 | 497,407 | |
| REC Ltd. | 447,252 | 1,545,469 | |
| Redington (India) Ltd. | 247,321 | 423,600 | |
| Relaxo Footwears Ltd. | 42,253 | 455,534 | |
| Reliance Industries Ltd. | 1,119,149 | 30,764,977 | |
| Reliance Infrastructure Ltd. (a) | 134,442 | 273,339 | |
| Reliance Power Ltd. (a) | 1,074,233 | 220,679 | |
| RHI Magnesita India Ltd. | 30,290 | 249,499 | |
| Route Mobile Ltd. | 11,857 | 221,129 | |
| Samvardhana Motherson International Ltd. | 885,166 | 977,312 | |
| Sanofi India Ltd. | 3,952 | 358,785 | |
| Sapphire Foods India Ltd. (a) | 15,450 | 240,509 | |
| SBI Cards & Payment Services Ltd. | 106,384 | 953,062 | |
| SBI Life Insurance Co. Ltd. (d) | 167,399 | 2,748,586 | |
| Sharda Cropchem Ltd. | 40,008 | 195,130 | |
| Sheela Foam Private Ltd. | 14,928 | 193,504 | |
| Shree Cement Ltd. | 3,599 | 1,108,928 | |
| Shree Renuka Sugars Ltd. (a) | 326,298 | 190,885 | |
| Shriram Transport Finance Co. Ltd. | 103,499 | 2,334,778 | |
| Siemens Ltd. | 33,107 | 1,324,245 | |
| SKF India Ltd. | 10,158 | 604,313 | |
| Solar Industries India Ltd. | 10,987 | 725,573 | |
| Sona Blw Precision Forgings Ltd. (d) | 157,856 | 1,027,016 | |
| Sonata Software Ltd. | 37,775 | 523,236 | |
| SRF Ltd. | 56,278 | 1,483,538 | |
| Star Health & Allied Insurance Co. Ltd. (a) | 67,009 | 466,700 | |
| State Bank of India | 654,002 | 4,442,677 | |
| Sun Pharmaceutical Industries Ltd. | 357,063 | 4,666,910 | |
| Sun TV Ltd. | 47,576 | 362,257 | |
| Sundram Fasteners Ltd. | 44,132 | 664,773 | |
| Supreme Industries Ltd. | 24,234 | 1,259,716 | |
| Suven Pharmaceuticals Ltd. (a) | 51,844 | 360,246 | |
| Suzlon Energy Ltd. (a) | 3,015,375 | 1,109,387 | |
| Syngene International Ltd. (d) | 69,238 | 565,694 | |
| Tamilnad Mercantile Bank Ltd. | 47,819 | 310,334 | |
| Tanla Solutions Ltd. | 25,557 | 292,184 | |
| Tata Chemicals Ltd. | 62,140 | 715,862 | |
| Tata Consultancy Services Ltd. | 335,525 | 13,579,222 | |
| Tata Consumer Products Ltd. | 209,961 | 2,271,131 | |
| Tata Elxsi Ltd. | 12,927 | 1,183,787 | |
| Tata Investment Corp. Ltd. | 6,516 | 243,115 | |
| Tata Motors Ltd. | 629,360 | 4,752,153 | |
| Tata Power Co. Ltd./The | 529,232 | 1,522,209 | |
| Tata Steel Ltd. | 2,725,170 | 3,887,626 | |
| Tata Teleservices (Maharashtra) Ltd. (a) | 259,013 | 267,762 | |
| Tech Mahindra Ltd. | 196,839 | 2,681,750 | |
| Tejas Networks Ltd. (a)(d) | 24,101 | 247,881 | |
| The Indian Hotels Co. Ltd. | 322,944 | 1,486,961 | |
| The Karur Vysya Bank Ltd. | 171,284 | 294,473 | |
| The Ramco Cements Ltd. | 50,247 | 598,523 | |
| Thermax Ltd. | 16,731 | 569,264 | |
| Timken India Ltd. | 12,124 | 422,461 | |
| Titagarh Rail System Ltd. | 29,139 | 266,569 | |
| Titan Co. Ltd. | 129,519 | 4,963,735 | |
| Torrent Pharmaceuticals Ltd. | 38,211 | 883,000 | |
| Torrent Power Ltd. | 69,116 | 603,592 | |
| Trent Ltd. | 69,374 | 1,795,170 | |
| Trident Ltd. | 543,763 | 227,875 | |
| Triveni Turbine Ltd. (a) | 62,393 | 269,107 | |
| TTK Prestige Ltd. (a) | 22,899 | 220,167 | |
| Tube Investments of India Ltd. | 39,439 | 1,491,599 | |
| Tvs Motor Co. Ltd. | 89,596 | 1,711,615 | |
| Ultratech Cement Ltd. | 42,543 | 4,304,244 | |
| United Spirits Ltd. (a) | 111,368 | 1,380,691 | |
| Uno Minda Ltd. | 67,169 | 470,193 | |
| UPL Ltd. | 186,067 | 1,207,766 | |
| Usha Martin Ltd. | 77,019 | 275,304 | |
| V-Guard Industries Ltd. | 124,160 | 446,600 | |
| Vardhman Textiles Ltd. | 54,351 | 240,904 | |
| Varun Beverages Ltd. | 170,145 | 1,856,553 | |
| Vedanta Ltd. | 288,935 | 751,681 | |
| Vinati Organics Ltd. | 12,892 | 267,727 | |
| VIP Industries Ltd. | 38,965 | 285,105 | |
| Vodafone Idea Ltd. (a) | 3,879,016 | 552,061 | |
| Voltas Ltd. | 79,890 | 803,690 | |
| Westlife Foodworld Ltd. | 36,610 | 351,993 | |
| Whirlpool of India Ltd. | 16,586 | 327,135 | |
| Wipro Ltd. | 495,968 | 2,276,174 | |
| Yes Bank Ltd. (a) | 4,936,353 | 945,799 | |
| Zee Entertainment Enterprises Ltd. | 324,204 | 1,009,135 | |
| Zensar Technologies Ltd. | 56,014 | 329,718 | |
| ZF Commercial Vehicle Control Systems India Ltd. | 2,798 | 527,522 | |
| Zomato Ltd. (a) | 1,576,277 | 1,993,122 | |
TOTAL INDIA | 468,366,883 | ||
| Indonesia - 0.5% | |||
| First Pacific Co. Ltd. | 996,000 | 377,051 | |
| First Resources Ltd. | 231,500 | 255,605 | |
| Golden Agri-Resources Ltd. | 2,342,400 | 462,164 | |
| Indofood Sukses Makmur Tbk PT | 1,722,600 | 721,173 | |
| Nickel Industries Ltd. | 864,967 | 411,802 | |
| PT Adaro Energy Indonesia Tbk | 5,380,700 | 868,172 | |
| PT AKR Corporindo Tbk | 3,590,700 | 336,927 | |
| PT Aneka Tambang Tbk | 3,707,700 | 397,255 | |
| PT Astra International Tbk | 7,413,300 | 2,696,807 | |
| PT Bank Aladin Syariah Tbk (a) | 3,864,600 | 255,295 | |
| PT Bank BTPN Syariah Tbk | 1,290,000 | 127,871 | |
| PT Bank Central Asia Tbk | 20,125,600 | 11,087,609 | |
| PT Bank Mandiri (Persero) Tbk | 13,669,200 | 4,883,351 | |
| PT Bank Negara Indonesia (Persero) Tbk | 5,623,000 | 1,696,946 | |
| PT Bank Rakyat Indonesia (Persero) Tbk | 24,915,171 | 7,790,573 | |
| PT Bank Tabungan Negara (Persero) Tbk | 3,300,591 | 254,632 | |
| PT Barito Pacific Tbk | 10,760,007 | 762,494 | |
| PT Berkah Beton Sadaya Tbk (a) | 7,167,500 | 22,536 | |
| PT BFI Finance Indonesia Tbk | 3,260,800 | 212,301 | |
| PT Bukalapak.com Tbk (a) | 22,280,900 | 294,988 | |
| PT Bukit Asam Tbk | 1,579,100 | 246,494 | |
| PT Bumi Resources Minerals Tbk (a) | 29,634,400 | 361,752 | |
| PT Bumi Resources Tbk (a) | 44,874,700 | 319,310 | |
| PT Bumi Serpong Damai Tbk (a) | 3,560,300 | 225,164 | |
| PT Charoen Pokphand Indonesia Tbk (a) | 2,828,100 | 1,041,902 | |
| PT Ciputra Development Tbk | 3,866,900 | 269,835 | |
| PT GoTo Gojek Tokopedia Tbk (a) | 303,498,384 | 1,148,210 | |
| PT Hanson International Tbk (a)(b) | 3,268,900 | 10,289 | |
| PT Indah Kiat Pulp & Paper Tbk | 1,082,100 | 654,024 | |
| PT Indo Tambangraya Megah Tbk | 161,600 | 269,911 | |
| PT Indocement Tunggal Prakarsa Tbk | 534,200 | 312,060 | |
| PT Indofood CBP Sukses Makmur Tbk | 885,200 | 576,949 | |
| PT Inti Agri Resources Tbk (a)(b) | 1,180,800 | 3,717 | |
| PT Japfa Comfeed Indonesia Tbk | 3,277,200 | 252,695 | |
| PT Jasa Marga Tbk | 1,041,096 | 279,392 | |
| PT Kalbe Farma Tbk | 8,017,600 | 852,708 | |
| PT Map Aktif Adiperkasa | 5,581,400 | 264,121 | |
| PT Medco Energi International Tbk | 3,135,500 | 252,079 | |
| PT Medikaloka Hermina Tbk | 2,752,000 | 266,577 | |
| PT Merdeka Copper Gold Tbk (a) | 4,520,025 | 633,960 | |
| PT Metro Healthcare Indonesia Tbk (a)(b) | 7,867,100 | 237,722 | |
| PT Mitra Adiperkasa Tbk | 3,184,700 | 347,943 | |
| PT Pabrik Kertas Tjiwi Kimia Tbk | 606,500 | 292,140 | |
| PT Pacific Strategic Financial Tbk (a) | 4,191,900 | 290,229 | |
| PT Pakuwon Jati Tbk | 8,059,900 | 202,862 | |
| PT Perusahaan Gas Negara Tbk Series B | 4,328,600 | 342,234 | |
| PT Pool Advista Indonesia Tbk (a)(b) | 184,900 | 582 | |
| PT Sarana Menara Nusantara Tbk | 8,338,000 | 467,630 | |
| PT Semen Indonesia (Persero) Tbk | 1,355,169 | 520,728 | |
| PT Smartfren Telecom Tbk (a) | 62,290,000 | 205,743 | |
| PT Sugih Energy Tbk (a)(b) | 40,500 | 127 | |
| PT Sumber Alfaria Trijaya Tbk | 6,257,500 | 1,138,844 | |
| PT Summarecon Agung Tbk | 5,503,500 | 185,257 | |
| PT Telkom Indonesia Persero Tbk | 18,064,800 | 3,960,090 | |
| PT Transcoal Pacific Tbk | 441,700 | 242,492 | |
| PT Unilever Indonesia Tbk | 2,916,400 | 664,965 | |
| PT United Tractors Tbk | 569,800 | 901,713 | |
| PT Vale Indonesia Tbk | 1,054,000 | 328,479 | |
| PT XL Axiata Tbk | 2,027,900 | 289,880 | |
TOTAL INDONESIA | 52,776,361 | ||
| Iraq - 0.0% | |||
| Genel Energy PLC (c) | 202,899 | 201,730 | |
| Ireland - 0.3% | |||
| AerCap Holdings NV (a) | 64,438 | 4,002,889 | |
| AIB Group PLC | 536,289 | 2,323,130 | |
| Bank of Ireland Group PLC | 390,119 | 3,488,033 | |
| C&C Group PLC (United Kingdom) | 165,677 | 280,310 | |
| Cairn Homes PLC | 275,604 | 324,861 | |
| COSMO Pharmaceuticals NV | 4,789 | 181,894 | |
| Dalata Hotel Group PLC | 85,777 | 363,950 | |
| Glanbia PLC | 74,523 | 1,173,329 | |
| Glenveagh Properties PLC (a)(d) | 267,553 | 258,185 | |
| Greencore Group PLC (a)(c) | 232,585 | 254,002 | |
| Irish Residential Properties REIT PLC | 185,058 | 178,187 | |
| Kerry Group PLC Class A | 58,465 | 4,508,489 | |
| Keywords Studios PLC | 28,317 | 449,154 | |
| Kingspan Group PLC (Ireland) | 57,691 | 3,875,000 | |
| Origin Enterprises PLC | 58,773 | 195,269 | |
| Smurfit Kappa Group PLC | 95,247 | 3,098,003 | |
| Uniphar PLC | 110,745 | 245,491 | |
TOTAL IRELAND | 25,200,176 | ||
| Israel - 0.5% | |||
| Airport City Ltd. (a) | 27,763 | 364,793 | |
| Alony Hetz Properties & Investments Ltd. | 61,114 | 297,405 | |
| Amot Investments Ltd. | 94,743 | 396,599 | |
| Ashdod Refinery Ltd. | 4,102 | 80,548 | |
| Ashtrom Group Ltd. | 18,179 | 195,687 | |
| Azrieli Group | 15,676 | 673,657 | |
| Bank Hapoalim BM (Reg.) | 463,388 | 3,309,751 | |
| Bank Leumi le-Israel BM | 563,354 | 3,622,358 | |
| Bezeq The Israel Telecommunication Corp. Ltd. | 779,278 | 958,963 | |
| Big Shopping Centers Ltd. (a) | 4,768 | 333,831 | |
| Camtek Ltd. (a) | 11,669 | 604,813 | |
| Check Point Software Technologies Ltd. (a) | 35,069 | 4,708,013 | |
| Clal Insurance Enterprises Holdings Ltd. (a) | 27,730 | 346,316 | |
| Danel Adir Yeoshua Ltd. | 2,434 | 174,571 | |
| Delek Automotive Systems Ltd. | 25,024 | 115,524 | |
| Delek Group Ltd. | 3,461 | 377,610 | |
| Elbit Systems Ltd. (Israel) | 9,826 | 1,823,960 | |
| Electra Israel Ltd. | 946 | 299,481 | |
| Energix-Renewable Energies Ltd. | 111,144 | 270,106 | |
| Enlight Renewable Energy Ltd. (a) | 52,045 | 700,586 | |
| Equital Ltd. (a) | 9,314 | 202,525 | |
| Fattal Holdings 1998 Ltd. (a) | 3,100 | 256,390 | |
| FIBI Holdings Ltd. | 12,288 | 432,299 | |
| First International Bank of Israel | 20,895 | 710,802 | |
| Formula Systems (1985) Ltd. | 4,412 | 250,072 | |
| Fox Wizel Ltd. | 3,625 | 205,823 | |
| Global-e Online Ltd. (a)(c) | 35,347 | 1,241,033 | |
| Harel Insurance Investments and Financial Services Ltd. | 48,428 | 310,792 | |
| Hilan Ltd. | 6,422 | 275,819 | |
| Icl Group Ltd. | 299,352 | 1,451,583 | |
| Isracard Ltd. | 82,680 | 257,736 | |
| Israel Corp. Ltd. (Class A) | 1,537 | 331,280 | |
| Israel Discount Bank Ltd. (Class A) | 457,344 | 2,008,376 | |
| Ituran Location & Control Ltd. | 8,889 | 219,825 | |
| Kornit Digital Ltd. (a) | 18,779 | 259,150 | |
| M Yochananof & Sons Ltd. | 7,516 | 269,996 | |
| Matrix IT Ltd. | 15,794 | 266,763 | |
| Maytronics Ltd. | 20,114 | 187,107 | |
| Mega Or Holdings Ltd. | 10,370 | 141,978 | |
| Melisron Ltd. | 10,256 | 555,428 | |
| Migdal Insurance & Financial Holdings Ltd. | 194,945 | 183,273 | |
| Mivne Real Estate KD Ltd. | 247,510 | 534,026 | |
| Mizrahi Tefahot Bank Ltd. | 56,939 | 1,760,855 | |
| Nano Dimension Ltd. ADR (a)(c) | 94,591 | 251,612 | |
| NICE Ltd. (a) | 24,008 | 3,709,895 | |
| Nova Ltd. (a) | 10,579 | 1,007,387 | |
| Oil Refineries Ltd. | 1,019,397 | 279,439 | |
| One Software Technologies Ltd. | 31,130 | 315,998 | |
| OPC Energy Ltd. (a) | 45,737 | 248,148 | |
| Partner Communications Co. Ltd. (a) | 54,534 | 198,195 | |
| Paz Oil Co. Ltd. (a) | 3,981 | 282,964 | |
| Perion Network Ltd. (a) | 18,591 | 477,424 | |
| Plus500 Ltd. | 35,270 | 604,880 | |
| Radware Ltd. (a) | 15,914 | 237,278 | |
| Rami Levi Chain Stores Hashikma Marketing 2006 Ltd. | 7,112 | 383,576 | |
| Reit 1 Ltd. | 87,229 | 315,293 | |
| Sapiens International Corp. NV | 12,589 | 317,995 | |
| Sella Capital Real Estate Ltd. | 117,861 | 209,362 | |
| Shapir Engineering and Industry Ltd. | 58,874 | 315,781 | |
| Shikun & Binui Ltd. (a) | 167,340 | 378,399 | |
| Shufersal Ltd. (a) | 107,893 | 454,581 | |
| Strauss Group Ltd. (a) | 21,354 | 395,487 | |
| Summit Real Estate Holdings Ltd. | 15,884 | 151,766 | |
| Taboola.com Ltd. (a)(c) | 82,744 | 303,670 | |
| Tel Aviv Stock Exchange Ltd. (a) | 43,722 | 194,705 | |
| Teva Pharmaceutical Industries Ltd. sponsored ADR (a) | 422,512 | 3,625,153 | |
| The Phoenix Holdings Ltd. | 71,033 | 603,306 | |
| Tower Semiconductor Ltd. (a) | 40,509 | 937,961 | |
| Wix.com Ltd. (a) | 19,877 | 1,588,172 | |
| YH Dimri Construction & Development Ltd. | 3,582 | 192,393 | |
| ZIM Integrated Shipping Services Ltd. (c) | 37,478 | 290,080 | |
TOTAL ISRAEL | 50,238,403 | ||
| Italy - 1.5% | |||
| A2A SpA | 555,805 | 1,041,520 | |
| ACEA SpA | 16,504 | 198,553 | |
| Amco - Asset Management Co. SpA Class B (a)(b) | 141 | 0 | |
| Amplifon SpA | 45,500 | 1,282,544 | |
| Anima Holding SpA (d) | 93,985 | 383,462 | |
| Ariston Holding NV (c) | 29,268 | 163,823 | |
| Assicurazioni Generali SpA | 361,593 | 7,171,866 | |
| Azimut Holding SpA | 41,811 | 879,496 | |
| Banca Generali SpA | 22,192 | 718,999 | |
| Banca Mediolanum S.p.A. | 93,459 | 762,038 | |
| Banca Monte dei Paschi di Siena SpA (a)(c) | 185,613 | 501,009 | |
| Banca Popolare di Sondrio SCARL | 175,539 | 956,550 | |
| Banco BPM SpA | 560,467 | 2,860,184 | |
| BFF Bank SpA (d) | 71,088 | 682,605 | |
| BPER Banca | 389,272 | 1,264,086 | |
| Brembo SpA | 55,201 | 592,843 | |
| Brunello Cucinelli SpA | 12,751 | 1,023,356 | |
| Buzzi SpA | 37,054 | 980,171 | |
| Carel Industries SpA (d) | 15,823 | 329,489 | |
| CIR SpA (a) | 386,033 | 157,462 | |
| Coca-Cola HBC AG | 80,037 | 2,074,030 | |
| Credito Emiliano SpA | 43,402 | 351,316 | |
| Cromwell European (REIT) | 137,562 | 167,338 | |
| Datalogic SpA | 37,873 | 226,816 | |
| Davide Campari Milano NV | 188,604 | 2,081,431 | |
| De'Longhi SpA | 28,465 | 636,109 | |
| DiaSorin SpA | 9,369 | 837,677 | |
| El.En. Group SpA | 19,461 | 181,413 | |
| Enav SpA (d) | 110,162 | 366,472 | |
| Enel SpA | 2,955,169 | 18,758,171 | |
| Eni SpA | 846,063 | 13,831,152 | |
| ERG SpA | 24,348 | 597,693 | |
| Ferrari NV (Italy) | 46,095 | 13,924,726 | |
| FinecoBank SpA | 236,663 | 2,783,342 | |
| Hera SpA | 328,506 | 922,510 | |
| Illimity Bank SpA | 30,736 | 156,560 | |
| Industrie de Nora SpA | 13,038 | 183,894 | |
| Infrastrutture Wireless Italiane SpA (d) | 120,389 | 1,314,599 | |
| Interpump Group SpA | 31,806 | 1,325,965 | |
| Intesa Sanpaolo SpA | 5,768,587 | 15,031,731 | |
| Iren SpA | 246,097 | 491,887 | |
| Italgas SpA | 169,904 | 862,562 | |
| Iveco Group NV (a) | 70,785 | 595,736 | |
| Leonardo SpA | 148,763 | 2,240,676 | |
| Lottomatica Group SpA | 36,408 | 344,244 | |
| Maire Tecnimont SpA | 68,943 | 320,244 | |
| MARR SpA | 17,996 | 213,266 | |
| Mediobanca SpA (c) | 201,469 | 2,402,475 | |
| MFE-MediaForEurope NV Class A | 102,001 | 185,030 | |
| Moncler SpA | 74,985 | 3,882,979 | |
| Nexi SpA (a)(d) | 216,132 | 1,252,302 | |
| OVS (d) | 106,324 | 187,990 | |
| Piaggio & C SpA | 83,956 | 225,460 | |
| Pirelli & C. SpA (d) | 131,130 | 582,883 | |
| Poste Italiane SpA (d) | 185,001 | 1,828,301 | |
| Prysmian SpA | 101,164 | 3,777,499 | |
| Rai Way SpA (d) | 56,156 | 279,268 | |
| Recordati SpA | 38,061 | 1,755,874 | |
| Reply SpA | 9,131 | 858,425 | |
| Saipem SpA (a) | 453,974 | 690,023 | |
| Salvatore Ferragamo Italia SpA (c) | 24,181 | 295,261 | |
| Saras SpA | 196,866 | 285,897 | |
| Sesa SpA | 3,307 | 333,293 | |
| Snam SpA | 741,572 | 3,400,511 | |
| SOL SpA | 16,432 | 472,918 | |
| Tamburi Investment Partners SpA | 49,611 | 415,223 | |
| Technogym SpA (d) | 58,682 | 441,160 | |
| Technoprobe SpA (a) | 68,615 | 499,136 | |
| Telecom Italia SpA (a) | 3,612,585 | 933,066 | |
| Terna - Rete Elettrica Nazionale | 506,644 | 3,873,714 | |
| Tinexta SpA | 10,532 | 181,089 | |
| UniCredit SpA | 681,518 | 17,085,394 | |
| Unipol Gruppo SpA | 146,989 | 795,065 | |
| Webuild SpA | 172,511 | 310,673 | |
| Webuild SpA warrants 8/2/30 (a)(c) | 5,662 | 10,197 | |
TOTAL ITALY | 150,012,722 | ||
| Japan - 15.1% | |||
| 77 Bank Ltd. | 21,300 | 474,757 | |
| Abalance Corp. (c) | 4,000 | 86,119 | |
| ABC-MART, Inc. | 38,121 | 590,458 | |
| Activia Properties, Inc. | 234 | 633,084 | |
| Adeka Corp. | 31,400 | 524,953 | |
| Advance Logistics Investment Corp. | 279 | 227,273 | |
| Advance Residence Investment Corp. | 509 | 1,106,670 | |
| Advantest Corp. | 284,236 | 7,321,532 | |
| Aeon (REIT) Investment Corp. | 563 | 535,972 | |
| AEON Co. Ltd. | 236,125 | 4,967,983 | |
| Aeon Delight Co. Ltd. | 11,200 | 246,958 | |
| AEON Financial Service Co. Ltd. | 47,599 | 392,381 | |
| AEON MALL Co. Ltd. | 35,900 | 408,231 | |
| AGC, Inc. | 71,963 | 2,448,116 | |
| Ai Holdings Corp. | 18,500 | 286,387 | |
| Aica Kogyo Co. Ltd. | 21,600 | 496,272 | |
| Aichi Financial Group, Inc. | 19,800 | 311,632 | |
| Aiful Corp. | 142,700 | 359,387 | |
| Ain Holdings, Inc. | 10,600 | 299,707 | |
| Air Water, Inc. | 67,900 | 856,131 | |
| Aisin Seiki Co. Ltd. | 53,400 | 1,860,182 | |
| Ajinomoto Co., Inc. | 165,525 | 6,045,418 | |
| Alfresa Holdings Corp. | 67,439 | 1,068,274 | |
| Alps Alpine Co. Ltd. | 72,498 | 594,935 | |
| Amada Co. Ltd. | 126,800 | 1,230,018 | |
| Amano Corp. | 21,700 | 443,251 | |
| Amvis Holdings, Inc. | 18,100 | 308,771 | |
| Ana Holdings, Inc. (a) | 57,841 | 1,135,527 | |
| Anicom Holdings, Inc. | 38,500 | 139,538 | |
| Anritsu Corp. | 55,000 | 409,428 | |
| Anycolor, Inc. (a)(c) | 7,000 | 164,335 | |
| Aozora Bank Ltd. (c) | 48,600 | 991,280 | |
| Appier Group, Inc. (a) | 21,800 | 179,465 | |
| Arata Corp. | 6,600 | 245,639 | |
| Arcland Sakamoto Co. Ltd. | 22,100 | 236,726 | |
| ARCS Co. Ltd. | 22,200 | 424,208 | |
| ARE Holdings, Inc. | 34,700 | 439,296 | |
| Argo Graphics, Inc. | 22,700 | 497,480 | |
| Ariake Japan Co. Ltd. | 7,900 | 249,839 | |
| As One Corp. | 10,800 | 344,195 | |
| Asahi Group Holdings | 175,359 | 6,342,808 | |
| ASAHI INTECC Co. Ltd. | 80,360 | 1,350,259 | |
| Asahi Kasei Corp. | 447,000 | 2,748,060 | |
| Asics Corp. | 60,000 | 1,900,619 | |
| ASKUL Corp. | 17,400 | 227,146 | |
| Astellas Pharma, Inc. | 673,103 | 8,514,669 | |
| Atom Corp. (a) | 47,200 | 283,223 | |
| Autobacs Seven Co. Ltd. | 32,700 | 336,352 | |
| Avex, Inc. | 16,000 | 146,119 | |
| Axial Retailing, Inc. | 9,400 | 240,759 | |
| AZ-Com Maruwa Holdings, Inc. | 19,000 | 260,751 | |
| Azbil Corp. | 42,400 | 1,252,864 | |
| Bandai Namco Holdings, Inc. | 224,800 | 4,657,523 | |
| BayCurrent Consulting, Inc. | 48,800 | 1,225,210 | |
| Belc Co. Ltd. | 6,300 | 295,476 | |
| Bell System24 Holdings, Inc. | 15,800 | 162,071 | |
| Benefit One, Inc. | 31,400 | 225,150 | |
| Benesse Holdings, Inc. | 30,600 | 361,796 | |
| Bic Camera, Inc. (c) | 43,800 | 331,607 | |
| Biprogy, Inc. | 28,800 | 718,338 | |
| BML, Inc. | 10,400 | 196,813 | |
| Bridgestone Corp. | 204,058 | 7,722,617 | |
| Brother Industries Ltd. | 87,100 | 1,358,782 | |
| C. Uyemura & Co. Ltd. | 5,200 | 282,335 | |
| Calbee, Inc. | 30,800 | 591,681 | |
| Canon Marketing Japan, Inc. | 17,200 | 412,466 | |
| Canon, Inc. | 361,243 | 8,540,036 | |
| Capcom Co. Ltd. | 66,700 | 2,147,028 | |
| Casio Computer Co. Ltd. | 68,200 | 546,487 | |
| Central Glass Co. Ltd. | 10,200 | 193,315 | |
| Central Japan Railway Co. | 260,275 | 5,858,377 | |
| Change Holdings, Inc. (c) | 17,300 | 176,504 | |
| Chiba Bank Ltd. | 195,400 | 1,455,446 | |
| Chiyoda Corp. (a)(c) | 73,700 | 173,264 | |
| Chubu Electric Power Co., Inc. | 240,216 | 2,902,808 | |
| Chugai Pharmaceutical Co. Ltd. | 247,700 | 7,345,931 | |
| Chugin Financial Group, Inc. | 56,100 | 447,311 | |
| Chugoku Electric Power Co., Inc. | 106,000 | 662,838 | |
| Citizen Watch Co. Ltd. | 86,000 | 501,554 | |
| CKD Corp. | 22,065 | 277,479 | |
| Coca-Cola Bottlers Japan, Inc. | 51,150 | 685,848 | |
| Colowide Co. Ltd. | 33,000 | 513,811 | |
| Comforia Residential REIT, Inc. | 237 | 502,976 | |
| COMSYS Holdings Corp. | 42,200 | 868,065 | |
| Comture Corp. | 12,100 | 161,749 | |
| Concordia Financial Group Ltd. | 389,000 | 1,807,449 | |
| Cosmo Energy Holdings Co. Ltd. | 24,500 | 896,235 | |
| Cosmos Pharmaceutical Corp. | 7,400 | 770,100 | |
| CRE Logistics REIT, Inc. | 242 | 254,284 | |
| Create Restaurants Holdings, Inc. | 45,400 | 314,645 | |
| Create SD Holdings Co. Ltd. | 13,600 | 291,650 | |
| Credit Saison Co. Ltd. | 55,701 | 834,947 | |
| CyberAgent, Inc. | 160,000 | 839,912 | |
| Cybozu, Inc. | 13,200 | 164,465 | |
| Dai Nippon Printing Co. Ltd. | 79,100 | 2,063,503 | |
| Dai-ichi Mutual Life Insurance Co. | 348,999 | 7,372,615 | |
| Daicel Chemical Industries Ltd. | 96,121 | 817,382 | |
| Daido Steel Co. Ltd. | 10,900 | 427,601 | |
| Daiei Kankyo Co. Ltd. | 16,200 | 223,650 | |
| Daifuku Co. Ltd. | 111,100 | 1,835,694 | |
| Daihen Corp. | 9,400 | 296,270 | |
| Daiichi Sankyo Kabushiki Kaisha | 685,000 | 17,662,173 | |
| Daiichikosho Co. Ltd. | 28,300 | 418,315 | |
| Daikin Industries Ltd. | 97,468 | 14,052,833 | |
| Daio Paper Corp. | 35,300 | 290,029 | |
| Daiseki Co. Ltd. | 16,320 | 450,718 | |
| Daishi Hokuetsu Financial Group, Inc. | 15,642 | 408,459 | |
| Daito Trust Construction Co. Ltd. | 22,644 | 2,428,940 | |
| Daiwa House Industry Co. Ltd. | 212,044 | 5,832,413 | |
| Daiwa House REIT Investment Corp. | 816 | 1,444,114 | |
| Daiwa Office Investment Corp. | 103 | 450,570 | |
| Daiwa Securities Group, Inc. | 502,500 | 2,897,652 | |
| Daiwa Securities Living Invest | 683 | 505,016 | |
| Daiwabo Holdings Co. Ltd. | 34,300 | 651,930 | |
| DCM Holdings Co. Ltd. | 44,400 | 346,698 | |
| DeNA Co. Ltd. | 33,000 | 322,383 | |
| Denka Co. Ltd. | 29,300 | 529,261 | |
| DENSO Corp. | 628,488 | 9,280,463 | |
| Dentsu Group, Inc. | 77,700 | 2,256,873 | |
| Descente Ltd. | 14,100 | 393,263 | |
| Dexerials Corp. | 22,400 | 510,951 | |
| Dic Corp. | 31,700 | 499,857 | |
| Digital Arts, Inc. | 5,300 | 146,195 | |
| Digital Garage, Inc. | 13,000 | 260,374 | |
| Dip Corp. | 14,500 | 287,381 | |
| Disco Corp. | 34,300 | 6,057,347 | |
| Dmg Mori Co. Ltd. | 42,000 | 694,680 | |
| Dowa Holdings Co. Ltd. | 21,200 | 648,092 | |
| DTS Corp. | 16,500 | 338,883 | |
| Duskin Co. Ltd. | 17,300 | 377,186 | |
| Dydo Group Holdings, Inc. | 5,600 | 216,730 | |
| Earth Corp. | 7,800 | 256,570 | |
| East Japan Railway Co. | 108,410 | 5,630,526 | |
| Ebara Corp. | 34,000 | 1,505,641 | |
| EDION Corp. | 32,000 | 319,161 | |
| eGuarantee, Inc. | 16,500 | 190,592 | |
| Eiken Chemical Co. Ltd. | 22,200 | 218,969 | |
| Eisai Co. Ltd. | 94,300 | 4,995,859 | |
| Eizo Corp. | 6,800 | 218,196 | |
| Elecom Co. Ltd. | 20,600 | 233,576 | |
| Electric Power Development Co. Ltd. | 54,700 | 838,588 | |
| en japan, Inc. | 14,200 | 211,805 | |
| ENEOS Holdings, Inc. | 1,044,350 | 3,869,753 | |
| euglena Co. Ltd. (a)(c) | 49,400 | 239,785 | |
| Exedy Corp. | 18,800 | 313,892 | |
| Exeo Group, Inc. | 38,000 | 789,251 | |
| Ezaki Glico Co. Ltd. | 20,300 | 590,063 | |
| Fancl Corp. | 32,500 | 485,893 | |
| FANUC Corp. | 351,725 | 8,728,555 | |
| Fast Retailing Co. Ltd. | 64,608 | 14,303,979 | |
| FCC Co. Ltd. | 17,000 | 201,723 | |
| Ferrotec Holdings Corp. (c) | 18,400 | 323,420 | |
| Financial Products Group Co. Ltd. | 27,000 | 256,475 | |
| Food & Life Companies Ltd. | 41,900 | 706,215 | |
| FP Corp. | 20,400 | 392,836 | |
| Freee KK (a) | 15,300 | 255,496 | |
| Frontier Real Estate Investment Corp. | 168 | 502,594 | |
| Fuji Co. Ltd. | 15,900 | 201,005 | |
| Fuji Corp. | 28,600 | 430,654 | |
| Fuji Electric Co. Ltd. | 47,000 | 1,789,508 | |
| Fuji Kyuko Co. Ltd. | 9,400 | 265,327 | |
| Fuji Media Holdings, Inc. | 16,300 | 161,887 | |
| Fuji Oil Holdings, Inc. | 20,300 | 322,452 | |
| Fuji Seal International, Inc. | 22,800 | 253,973 | |
| Fuji Soft ABC, Inc. | 18,800 | 676,524 | |
| FUJIFILM Holdings Corp. | 135,500 | 7,411,552 | |
| Fujikura Ltd. | 95,800 | 688,046 | |
| Fujimi, Inc. | 20,300 | 405,226 | |
| Fujimori Kogyo Co. Ltd. | 9,000 | 227,098 | |
| Fujitec Co. Ltd. | 24,100 | 523,214 | |
| Fujitsu General Ltd. | 22,200 | 394,821 | |
| Fujitsu Ltd. | 64,942 | 8,413,077 | |
| Fukuoka (REIT) Investment Fund | 235 | 253,015 | |
| Fukuoka Financial Group, Inc. | 59,812 | 1,581,055 | |
| Fukuyama Transporting Co. Ltd. | 9,100 | 248,687 | |
| Funai Soken Holdings, Inc. | 21,100 | 346,798 | |
| Furukawa Electric Co. Ltd. | 28,900 | 433,055 | |
| Fuso Chemical Co. Ltd. | 9,000 | 244,548 | |
| Future Corp. | 18,200 | 207,716 | |
| Fuyo General Lease Co. Ltd. | 6,500 | 528,455 | |
| G-Tekt Corp. | 24,100 | 281,263 | |
| Global One Real Estate Investment Corp. | 371 | 281,432 | |
| GLOBERIDE, Inc. | 19,200 | 247,781 | |
| Glory Ltd. | 18,400 | 343,055 | |
| GLP J-REIT | 1,634 | 1,463,505 | |
| GMO Internet, Inc. | 26,400 | 384,510 | |
| GMO Payment Gateway, Inc. | 15,600 | 623,052 | |
| GNI Group Ltd. (a) | 20,000 | 265,633 | |
| GOLDWIN, Inc. | 8,900 | 562,097 | |
| GS Yuasa Corp. | 26,400 | 425,914 | |
| GungHo Online Entertainment, Inc. | 17,400 | 262,349 | |
| Gunma Bank Ltd. | 133,000 | 642,732 | |
| Gunze Ltd. | 10,000 | 299,862 | |
| H.I.S. Co. Ltd. (a)(c) | 21,400 | 241,561 | |
| H.U. Group Holdings, Inc. | 20,947 | 352,036 | |
| H2O Retailing Corp. | 33,000 | 353,532 | |
| Hakuhodo DY Holdings, Inc. | 84,400 | 684,922 | |
| Halows Co. Ltd. | 6,500 | 182,608 | |
| Hamakyorex Co. Ltd. | 10,700 | 267,870 | |
| Hamamatsu Photonics K.K. | 50,200 | 1,864,580 | |
| Hankyu Hanshin Holdings, Inc. | 82,000 | 2,580,015 | |
| Hankyu REIT, Inc. | 272 | 255,551 | |
| Hanwa Co. Ltd. | 12,400 | 373,775 | |
| Harmonic Drive Systems, Inc. | 20,000 | 433,189 | |
| Haseko Corp. | 82,200 | 1,011,623 | |
| Hazama Ando Corp. | 65,100 | 503,876 | |
| Heiwa Corp. | 22,900 | 324,157 | |
| Heiwa Real Estate (REIT), Inc. | 362 | 338,404 | |
| Heiwa Real Estate Co. Ltd. | 12,100 | 309,746 | |
| Heiwado Co. Ltd. | 16,800 | 274,782 | |
| Hiday Hidaka Corp. | 12,676 | 231,799 | |
| Hikari Tsushin, Inc. | 7,400 | 1,067,619 | |
| Hino Motors Ltd. (a) | 105,600 | 307,362 | |
| Hirogin Holdings, Inc. | 97,800 | 621,879 | |
| Hirose Electric Co. Ltd. | 10,955 | 1,241,192 | |
| Hisamitsu Pharmaceutical Co., Inc. | 19,100 | 609,203 | |
| Hitachi Construction Machinery Co. Ltd. | 38,800 | 1,002,427 | |
| Hitachi Ltd. | 343,676 | 21,784,463 | |
| Hitachi Zosen Corp. | 63,800 | 332,818 | |
| Hogy Medical Co. Ltd. | 12,900 | 280,294 | |
| Hokkaido Electric Power Co., Inc. | 63,800 | 268,389 | |
| Hokkoku Financial Holdings, Inc. | 8,200 | 271,312 | |
| Hokuetsu Corp. (c) | 47,700 | 365,988 | |
| Hokuhoku Financial Group, Inc. | 45,100 | 526,546 | |
| Hokuriku Electric Power Co., Inc. (a) | 64,500 | 319,935 | |
| Honda Motor Co. Ltd. | 1,700,616 | 17,429,227 | |
| Horiba Ltd. | 13,700 | 692,690 | |
| Hoshino Resorts REIT, Inc. | 95 | 373,770 | |
| Hoshizaki Corp. | 39,200 | 1,265,951 | |
| Hosiden Corp. | 20,100 | 236,240 | |
| House Foods Group, Inc. | 23,500 | 496,228 | |
| Hoya Corp. | 130,618 | 12,574,415 | |
| Hulic (REIT), Inc. | 443 | 451,901 | |
| Hulic Co. Ltd. | 147,400 | 1,351,383 | |
| Ibiden Co. Ltd. | 41,500 | 1,769,413 | |
| Ichibanya Co. Ltd. | 6,900 | 243,414 | |
| Ichigo Real Estate Investment Corp. | 438 | 245,734 | |
| Ichigo, Inc. | 107,300 | 234,800 | |
| Idec Corp. | 14,000 | 251,210 | |
| Idemitsu Kosan Co. Ltd. | 73,000 | 1,657,472 | |
| IHI Corp. | 52,072 | 999,375 | |
| Iida Group Holdings Co. Ltd. | 57,300 | 889,708 | |
| Inaba Denki Sangyo Co. Ltd. | 23,100 | 481,702 | |
| Inabata & Co. Ltd. | 17,100 | 356,997 | |
| Industrial & Infrastructure Fund Investment Corp. | 762 | 684,886 | |
| Infomart Corp. | 83,600 | 200,513 | |
| Information Services Inter-Dentsu Ltd. | 10,000 | 339,393 | |
| INFRONEER Holdings, Inc. | 68,204 | 719,474 | |
| INPEX Corp. | 358,200 | 5,197,796 | |
| Insource Co. Ltd. | 20,900 | 123,186 | |
| Internet Initiative Japan, Inc. | 39,300 | 635,033 | |
| Invincible Investment Corp. | 2,515 | 967,270 | |
| Iriso Electronics Co. Ltd. | 9,100 | 214,837 | |
| Isetan Mitsukoshi Holdings Ltd. | 128,271 | 1,447,020 | |
| Isuzu Motors Ltd. | 207,468 | 2,313,403 | |
| ITO EN Ltd. | 19,060 | 619,363 | |
| Itochu Corp. | 432,250 | 15,570,091 | |
| Itochu Enex Co. Ltd. | 24,300 | 238,855 | |
| Itoham Yonekyu Holdings, Inc. | 12,080 | 333,844 | |
| Iwatani Corp. | 16,400 | 784,388 | |
| Iyogin Holdings, Inc. | 100,200 | 721,273 | |
| Izumi Co. Ltd. | 14,100 | 356,526 | |
| J. Front Retailing Co. Ltd. | 94,200 | 898,037 | |
| JACCS Co. Ltd. | 9,300 | 319,672 | |
| JAFCO Co. Ltd. | 24,700 | 266,039 | |
| Japan Airlines Co. Ltd. | 51,700 | 950,442 | |
| Japan Airport Terminal Co. Ltd. | 22,300 | 980,733 | |
| Japan Aviation Electronics Industry Ltd. | 20,500 | 386,395 | |
| Japan Elevator Service Holdings Co. Ltd. | 27,000 | 357,808 | |
| Japan Excellent, Inc. | 452 | 396,729 | |
| Japan Exchange Group, Inc. | 181,200 | 3,583,193 | |
| Japan Hotel REIT Investment Corp. | 1,645 | 747,872 | |
| Japan Lifeline Co. Ltd. | 32,500 | 247,824 | |
| Japan Logistics Fund, Inc. | 311 | 576,061 | |
| Japan Material Co. Ltd. | 24,200 | 339,851 | |
| Japan Petroleum Exploration Co. Ltd. | 11,900 | 407,475 | |
| Japan Post Bank Co. Ltd. | 526,834 | 4,883,333 | |
| Japan Post Holdings Co. Ltd. | 807,538 | 7,147,683 | |
| Japan Post Insurance Co. Ltd. | 71,900 | 1,384,513 | |
| Japan Prime Realty Investment Corp. | 296 | 693,320 | |
| Japan Real Estate Investment Corp. | 493 | 1,831,161 | |
| Japan Retail Fund Investment Corp. | 2,550 | 1,645,635 | |
| Japan Securities Finance Co. Ltd. | 52,800 | 525,773 | |
| Japan Steel Works Ltd. | 23,800 | 386,148 | |
| Japan Tobacco, Inc. | 424,643 | 9,885,210 | |
| Japan Wool Textile Co. Ltd./The | 33,100 | 300,930 | |
| JCR Pharmaceuticals Co. Ltd. | 27,000 | 206,642 | |
| Jcu Corp. | 9,400 | 205,042 | |
| JEOL Ltd. | 17,000 | 479,967 | |
| JFE Holdings, Inc. | 179,800 | 2,505,130 | |
| JGC Holdings Corp. | 82,542 | 1,016,668 | |
| JMDC, Inc. | 14,700 | 411,694 | |
| Joshin Denki Co. Ltd. | 15,100 | 239,862 | |
| Joyful Honda Co. Ltd. | 27,700 | 325,342 | |
| JSR Corp. | 64,800 | 1,734,433 | |
| JTEKT Corp. | 77,000 | 634,863 | |
| JTOWER, Inc. (a) | 4,000 | 145,564 | |
| Juroku Financial Group, Inc. | 18,100 | 487,651 | |
| Justsystems Corp. | 13,500 | 240,576 | |
| K's Holdings Corp. | 54,700 | 509,027 | |
| Kadokawa Corp. | 34,300 | 660,722 | |
| KAGA ELECTRONICS Co. Ltd. | 11,700 | 468,181 | |
| Kagome Co. Ltd. | 30,800 | 640,744 | |
| Kajima Corp. | 154,600 | 2,555,136 | |
| Kakaku.com, Inc. | 50,100 | 483,189 | |
| Kaken Pharmaceutical Co. Ltd. | 12,756 | 282,484 | |
| Kameda Seika Co. Ltd. | 7,800 | 210,821 | |
| Kamigumi Co. Ltd. | 36,400 | 738,430 | |
| Kanamoto Co. Ltd. | 14,600 | 236,946 | |
| Kandenko Co. Ltd. | 48,800 | 452,197 | |
| Kaneka Corp. | 21,400 | 523,696 | |
| Kanematsu Corp. | 31,700 | 428,380 | |
| Kansai Electric Power Co., Inc. | 261,899 | 3,353,314 | |
| Kansai Paint Co. Ltd. | 75,039 | 1,098,174 | |
| Kao Corp. | 172,091 | 6,278,552 | |
| Katitas Co. Ltd. | 19,900 | 265,614 | |
| Kato Sangyo | 12,000 | 337,405 | |
| Kawasaki Heavy Industries Ltd. | 56,200 | 1,240,437 | |
| Kawasaki Kisen Kaisha Ltd. (c) | 52,700 | 1,807,082 | |
| KDDI Corp. | 543,737 | 16,265,752 | |
| KDX Realty Investment Corp. | 624 | 650,825 | |
| KeePer Technical Laboratory Co. Ltd. | 5,800 | 218,631 | |
| Keihan Electric Railway Co., Ltd. | 38,100 | 931,848 | |
| Keikyu Corp. | 82,639 | 700,648 | |
| Keio Corp. | 37,803 | 1,121,784 | |
| Keisei Electric Railway Co. | 48,106 | 1,812,136 | |
| Kenedix Residential Investment Corp. | 374 | 521,081 | |
| Kenedix Retail REIT Corp. | 229 | 400,012 | |
| Kewpie Corp. | 39,200 | 680,384 | |
| Keyence Corp. | 71,550 | 27,698,344 | |
| Kfc Holdings Japan Ltd. | 8,300 | 165,338 | |
| KH Neochem Co. Ltd. | 18,200 | 275,688 | |
| Kikkoman Corp. | 51,300 | 2,918,702 | |
| Kinden Corp. | 46,892 | 710,294 | |
| Kintetsu Group Holdings Co. Ltd. | 65,453 | 1,841,636 | |
| Kirin Holdings Co. Ltd. | 280,570 | 3,942,940 | |
| Kisoji Co. Ltd. | 15,200 | 268,519 | |
| Kissei Pharmaceutical Co. Ltd. | 13,000 | 274,962 | |
| Kitz Corp. | 30,900 | 208,797 | |
| Kobayashi Pharmaceutical Co. Ltd. | 18,900 | 780,254 | |
| Kobe Bussan Co. Ltd. | 55,200 | 1,366,092 | |
| Kobe Steel Ltd. | 129,900 | 1,535,867 | |
| Koei Tecmo Holdings Co. Ltd. | 41,296 | 539,230 | |
| Kohnan Shoji Co. Ltd. | 10,700 | 277,376 | |
| Koito Manufacturing Co. Ltd. | 75,800 | 1,135,691 | |
| Kokuyo Co. Ltd. | 33,600 | 520,800 | |
| Komatsu Ltd. | 337,311 | 7,750,192 | |
| KOMEDA Holdings Co. Ltd. | 19,900 | 363,126 | |
| KOMERI Co. Ltd. | 14,100 | 292,375 | |
| Konami Group Corp. | 36,500 | 1,890,776 | |
| Konica Minolta, Inc. | 163,700 | 458,520 | |
| Kose Corp. | 12,500 | 828,137 | |
| Kotobuki Spirits Co. Ltd. | 36,000 | 478,044 | |
| Kubota Corp. | 373,810 | 5,027,463 | |
| Kumagai Gumi Co. Ltd. | 14,300 | 358,374 | |
| Kumiai Chemical Industry Co. Ltd. | 39,100 | 284,989 | |
| Kura Sushi, Inc. | 9,200 | 218,952 | |
| Kuraray Co. Ltd. | 111,252 | 1,272,853 | |
| Kureha Chemical Industry Co. Ltd. | 6,600 | 391,967 | |
| Kurita Water Industries Ltd. | 38,000 | 1,154,570 | |
| Kusuri No Aoki Holdings Co. Ltd. | 6,600 | 432,417 | |
| Kyb Corp. | 7,800 | 230,427 | |
| Kyocera Corp. | 115,837 | 5,709,769 | |
| Kyokuto Kaihatsu Kogyo Co. Ltd. | 16,600 | 202,202 | |
| Kyorin Pharmaceutical Co. Ltd. | 19,900 | 234,729 | |
| Kyoritsu Maintenance Co. Ltd. | 12,500 | 478,075 | |
| Kyoto Financial Group, Inc. | 21,100 | 1,196,239 | |
| Kyowa Hakko Kirin Co., Ltd. | 96,600 | 1,515,103 | |
| Kyudenko Corp. | 17,600 | 525,729 | |
| Kyushu Electric Power Co., Inc. (a) | 144,278 | 921,812 | |
| Kyushu Financial Group, Inc. | 137,785 | 868,249 | |
| Kyushu Railway Co. | 48,700 | 995,735 | |
| LaSalle Logiport REIT | 648 | 635,508 | |
| Lasertec Corp. | 27,600 | 4,558,974 | |
| Lawson, Inc. | 16,800 | 811,884 | |
| Leopalace21 Corp. (a) | 99,900 | 214,895 | |
| LIFE Corp. | 10,600 | 249,869 | |
| Lintec Corp. | 18,100 | 299,180 | |
| Lion Corp. | 85,636 | 821,822 | |
| LIXIL Group Corp. | 104,495 | 1,145,795 | |
| LY Corp. | 1,004,465 | 2,560,870 | |
| M&A Research Institute Holding (a)(c) | 11,600 | 254,227 | |
| M3, Inc. | 160,290 | 2,468,657 | |
| Mabuchi Motor Co. Ltd. | 19,200 | 548,535 | |
| Macnica Fuji Electronics Holdings, Inc. | 17,200 | 698,827 | |
| Makino Milling Machine Co. Ltd. | 9,200 | 383,900 | |
| Makita Corp. | 83,900 | 2,168,551 | |
| Mandom Corp. | 27,400 | 251,331 | |
| Mani, Inc. | 31,100 | 423,065 | |
| Marubeni Corp. | 537,700 | 7,862,129 | |
| Maruha Nichiro Corp. | 18,300 | 313,268 | |
| Marui Group Co. Ltd. | 64,002 | 1,012,073 | |
| Maruichi Steel Tube Ltd. | 24,900 | 617,927 | |
| Maruka Furusato Corp. | 8,200 | 150,581 | |
| Maruwa Ceramic Co. Ltd. | 3,600 | 631,669 | |
| Matsui Securities Co. Ltd. | 50,600 | 251,663 | |
| MatsukiyoCocokara & Co. | 125,100 | 2,194,478 | |
| Maxell Ltd. | 19,300 | 206,428 | |
| Mazda Motor Corp. | 207,800 | 2,008,593 | |
| McDonald's Holdings Co. (Japan) Ltd. (c) | 30,128 | 1,172,214 | |
| MCJ Co. Ltd. | 27,800 | 200,004 | |
| Mebuki Financial Group, Inc. | 370,268 | 1,120,881 | |
| Medipal Holdings Corp. | 68,700 | 1,155,052 | |
| Medley, Inc. (a) | 9,000 | 260,199 | |
| Megachips Corp. | 6,400 | 165,009 | |
| Megmilk Snow Brand Co. Ltd. | 21,600 | 348,148 | |
| Meidensha Corp. | 17,400 | 272,604 | |
| Meiji Holdings Co. Ltd. | 86,900 | 2,138,959 | |
| Meiko Electronics Co. Ltd. | 9,500 | 197,049 | |
| Meitec Group Holdings, Inc. | 30,500 | 536,803 | |
| Menicon Co. Ltd. | 25,100 | 290,985 | |
| Mercari, Inc. (a) | 42,500 | 852,952 | |
| Milbon Co. Ltd. | 11,900 | 314,597 | |
| Minebea Mitsumi, Inc. | 131,895 | 2,068,022 | |
| Mirai Corp. | 805 | 243,080 | |
| Mirait One Corp. | 37,200 | 493,040 | |
| Misumi Group, Inc. | 104,305 | 1,579,038 | |
| Mitsubishi Chemical Holdings Corp. | 460,057 | 2,603,281 | |
| Mitsubishi Corp. | 423,451 | 19,739,406 | |
| Mitsubishi Electric Corp. | 711,592 | 8,159,478 | |
| Mitsubishi Estate Co. Ltd. | 404,671 | 5,179,919 | |
| Mitsubishi Estate Logistics REIT Investment Corp. | 177 | 445,459 | |
| Mitsubishi Gas Chemical Co., Inc. | 57,445 | 776,419 | |
| Mitsubishi Heavy Industries Ltd. | 118,666 | 6,111,855 | |
| Mitsubishi Logistics Corp. | 22,300 | 583,366 | |
| Mitsubishi Materials Corp. | 48,600 | 780,983 | |
| Mitsubishi Motors Corp. of Japan | 246,634 | 805,647 | |
| Mitsubishi Pencil Co. Ltd. | 17,500 | 215,723 | |
| Mitsubishi Research Institute, Inc. | 5,600 | 181,037 | |
| Mitsubishi Shokuhin Co. Ltd. | 9,200 | 242,585 | |
| Mitsubishi UFJ Financial Group, Inc. | 4,203,539 | 35,264,107 | |
| Mitsubishi UFJ Lease & Finance Co. Ltd. | 314,980 | 2,076,420 | |
| Mitsuboshi Belting Ltd. | 10,800 | 311,784 | |
| Mitsui & Co. Ltd. | 482,482 | 17,535,411 | |
| Mitsui Chemicals, Inc. | 63,500 | 1,600,485 | |
| Mitsui Fudosan Co. Ltd. | 324,540 | 7,034,360 | |
| Mitsui Fudosan Logistics Park, Inc. | 197 | 595,577 | |
| Mitsui High-Tec, Inc. | 7,400 | 312,447 | |
| Mitsui Mining & Smelting Co. Ltd. | 22,600 | 586,846 | |
| Mitsui OSK Lines Ltd. | 127,100 | 3,281,381 | |
| Miura Co. Ltd. | 32,455 | 629,270 | |
| MIXI, Inc. | 16,000 | 242,337 | |
| Mizuho Financial Group, Inc. | 884,368 | 15,015,143 | |
| Mizuho Leasing Co. Ltd. | 11,000 | 349,963 | |
| Mizuno Corp. | 8,800 | 258,152 | |
| Mochida Pharmaceutical Co. Ltd. | 10,100 | 222,559 | |
| Monex Group, Inc. | 70,800 | 311,391 | |
| Money Forward, Inc. (a) | 16,500 | 416,758 | |
| MonotaRO Co. Ltd. | 91,400 | 730,468 | |
| Mori Hills REIT Investment Corp. | 522 | 488,564 | |
| MORI TRUST Sogo (REIT), Inc. | 1,034 | 504,089 | |
| Morinaga & Co. Ltd. | 15,000 | 540,965 | |
| Morinaga Milk Industry Co. Ltd. | 14,600 | 569,472 | |
| Morita Holdings Corp. | 22,800 | 233,903 | |
| MOS Food Services, Inc. | 10,600 | 231,240 | |
| MS&AD Insurance Group Holdings, Inc. | 158,297 | 5,800,087 | |
| Murata Manufacturing Co. Ltd. | 631,206 | 10,812,167 | |
| Musashi Seimitsu Industry Co. Ltd. | 20,500 | 197,306 | |
| Nabtesco Corp. | 41,000 | 726,180 | |
| Nachi-Fujikoshi Corp. | 8,000 | 199,352 | |
| Nagaileben Co. Ltd. | 15,600 | 215,278 | |
| Nagase & Co. Ltd. | 35,600 | 539,308 | |
| Nagawa Co. Ltd. | 4,600 | 187,117 | |
| Nagoya Railroad Co. Ltd. | 69,216 | 968,941 | |
| Nakanishi, Inc. | 26,900 | 590,811 | |
| Nankai Electric Railway Co. Ltd. | 39,500 | 756,495 | |
| NEC Corp. | 91,300 | 4,396,153 | |
| NEC Networks & System Integration Corp. | 25,900 | 350,522 | |
| Net One Systems Co. Ltd. | 32,000 | 488,414 | |
| Nexon Co. Ltd. | 134,300 | 2,464,304 | |
| Nextage Co. Ltd. | 16,800 | 232,114 | |
| NGK Insulators Ltd. | 91,700 | 1,120,414 | |
| NH Foods Ltd. | 30,513 | 915,486 | |
| NHK Spring Co. Ltd. | 75,487 | 534,146 | |
| Nichias Corp. | 23,200 | 460,282 | |
| Nichiha Corp. | 12,400 | 244,850 | |
| Nichirei Corp. | 39,610 | 857,320 | |
| Nidec Corp. | 155,490 | 5,703,536 | |
| Nifco, Inc. | 30,000 | 703,566 | |
| Nihon Kohden Corp. | 30,300 | 715,648 | |
| Nihon M&A Center Holdings, Inc. | 115,200 | 526,153 | |
| Nihon Parkerizing Co. Ltd. | 42,500 | 308,447 | |
| Nikkiso Co. Ltd. | 22,700 | 144,591 | |
| Nikkon Holdings Co. Ltd. | 22,300 | 473,178 | |
| Nikon Corp. | 109,000 | 1,034,891 | |
| Nintendo Co. Ltd. | 383,780 | 15,855,661 | |
| Nippn Corp. | 24,200 | 368,549 | |
| Nippon Accommodations Fund, Inc. | 181 | 729,213 | |
| Nippon Building Fund, Inc. | 574 | 2,306,294 | |
| Nippon Carbon Co. Ltd. | 8,900 | 260,700 | |
| Nippon Ceramic Co. Ltd. | 13,900 | 241,830 | |
| Nippon Densetsu Kogyo Co. Ltd. | 19,700 | 268,571 | |
| Nippon Electric Glass Co. Ltd. | 31,500 | 629,757 | |
| Nippon Express Holdings, Inc. | 27,066 | 1,391,068 | |
| Nippon Gas Co. Ltd. | 39,200 | 589,156 | |
| Nippon Kayaku Co. Ltd. | 54,300 | 466,465 | |
| Nippon Light Metal Holding Co. Ltd. | 32,140 | 352,515 | |
| Nippon Paint Holdings Co. Ltd. | 358,685 | 2,411,479 | |
| Nippon Paper Industries Co. Ltd. (a) | 38,245 | 332,774 | |
| Nippon Prologis REIT, Inc. | 862 | 1,533,822 | |
| Nippon REIT Investment Corp. | 170 | 392,755 | |
| Nippon Sanso Holdings Corp. | 62,800 | 1,583,722 | |
| Nippon Shinyaku Co. Ltd. | 19,500 | 790,843 | |
| Nippon Shokubai Co. Ltd. | 11,300 | 419,705 | |
| Nippon Signal Co. Ltd. | 26,300 | 162,634 | |
| Nippon Soda Co. Ltd. | 9,400 | 337,016 | |
| Nippon Steel & Sumitomo Metal Corp. | 309,583 | 6,677,353 | |
| Nippon Telegraph & Telephone Corp. | 10,723,400 | 12,619,036 | |
| Nippon Television Network Corp. | 16,700 | 162,467 | |
| Nippon Yusen KK | 177,600 | 4,345,384 | |
| Nipro Corp. | 66,238 | 504,367 | |
| Nishi-Nippon Financial Holdings, Inc. | 46,700 | 557,744 | |
| Nishi-Nippon Railroad Co. Ltd. | 24,500 | 395,840 | |
| Nishimatsu Construction Co. Ltd. | 14,100 | 339,485 | |
| Nishimatsuya Chain Co. Ltd. | 19,700 | 253,028 | |
| Nissan Chemical Corp. | 46,000 | 1,876,119 | |
| Nissan Motor Co. Ltd. | 878,448 | 3,380,254 | |
| Nissha Co. Ltd. | 17,300 | 179,866 | |
| Nisshin Oillio Group Ltd. | 11,800 | 329,568 | |
| Nisshin Seifun Group, Inc. | 74,300 | 1,120,726 | |
| Nisshinbo Holdings, Inc. | 53,500 | 386,975 | |
| Nissin Food Holdings Co. Ltd. | 22,400 | 1,948,995 | |
| Nissui Corp. | 111,400 | 540,574 | |
| Niterra Co. Ltd. | 55,300 | 1,237,769 | |
| Nitori Holdings Co. Ltd. | 29,800 | 3,227,186 | |
| Nitta Corp. | 8,500 | 191,930 | |
| Nitto Boseki Co. Ltd. | 10,800 | 243,064 | |
| Nitto Denko Corp. | 53,442 | 3,458,006 | |
| Nitto Kogyo Corp. | 14,600 | 333,708 | |
| Noevir Holdings Co. Ltd. | 8,300 | 291,110 | |
| NOF Corp. | 24,300 | 958,658 | |
| Nojima Co. Ltd. | 28,900 | 257,390 | |
| NOK Corp. | 33,900 | 401,843 | |
| NOMURA Co. Ltd. | 44,000 | 253,334 | |
| Nomura Holdings, Inc. | 1,109,954 | 4,288,206 | |
| Nomura Real Estate Holdings, Inc. | 39,900 | 931,908 | |
| Nomura Real Estate Master Fund, Inc. | 1,489 | 1,643,050 | |
| Nomura Research Institute Ltd. | 144,810 | 3,801,256 | |
| North Pacific Bank Ltd. | 125,000 | 321,899 | |
| NS Solutions Corp. | 12,500 | 362,994 | |
| NSD Co. Ltd. | 26,700 | 464,550 | |
| NSK Ltd. | 141,900 | 763,766 | |
| NTN Corp. | 171,300 | 305,162 | |
| NTT Data Corp. | 237,600 | 2,929,587 | |
| Ntt Ud (REIT) Investment Corp. | 484 | 398,993 | |
| Obayashi Corp. | 235,000 | 2,012,965 | |
| OBIC Business Consultants Ltd. | 11,000 | 472,561 | |
| OBIC Co. Ltd. | 25,641 | 3,790,159 | |
| Odakyu Electric Railway Co. Ltd. | 122,300 | 1,741,103 | |
| Ogaki Kyoritsu Bank Ltd. | 17,900 | 249,979 | |
| Ohsho Food Service Corp. | 5,600 | 258,858 | |
| Oisix Ra Daichi, Inc. (a)(c) | 12,100 | 92,077 | |
| Oji Holdings Corp. | 312,800 | 1,337,809 | |
| Okamura Corp. | 21,800 | 310,360 | |
| Okasan Securities Group, Inc. | 68,834 | 311,252 | |
| Oki Electric Industry Co. Ltd. | 47,000 | 283,562 | |
| Okinawa Financial Group, Inc. | 11,400 | 190,141 | |
| Okuma Corp. | 9,200 | 378,769 | |
| Okumura Corp. | 12,500 | 382,368 | |
| Olympus Corp. | 470,500 | 6,283,693 | |
| OMRON Corp. | 67,700 | 2,425,504 | |
| One (REIT), Inc. | 115 | 199,242 | |
| Ono Pharmaceutical Co. Ltd. | 150,080 | 2,591,805 | |
| Open House Group Co. Ltd. | 28,300 | 932,778 | |
| Open Up Group, Inc. | 29,700 | 368,395 | |
| Optex Group Co. Ltd. | 18,200 | 204,597 | |
| Optorun Co. Ltd. | 13,500 | 156,171 | |
| Oracle Corp. Japan | 13,800 | 978,968 | |
| Organo Corp. | 10,900 | 359,382 | |
| Orient Corp. | 29,950 | 223,272 | |
| Oriental Land Co. Ltd. | 399,170 | 12,911,300 | |
| ORIX Corp. | 431,820 | 7,853,230 | |
| ORIX JREIT, Inc. | 927 | 1,065,366 | |
| Osaka Gas Co. Ltd. | 136,900 | 2,581,631 | |
| Osaka Soda Co. Ltd. | 6,400 | 375,876 | |
| OSAKA Titanium technologies Co. Ltd. | 11,100 | 236,980 | |
| OSG Corp. | 35,700 | 407,358 | |
| Otsuka Corp. | 41,000 | 1,643,880 | |
| Otsuka Holdings Co. Ltd. | 145,518 | 4,896,093 | |
| Outsourcing, Inc. | 43,200 | 321,015 | |
| Pacific Industrial Co. Ltd. | 24,500 | 224,903 | |
| Pal Group Holdings Co. Ltd. | 12,800 | 165,566 | |
| PALTAC Corp. | 12,300 | 398,723 | |
| Pan Pacific International Holdings Ltd. | 138,592 | 2,683,954 | |
| Panasonic Holdings Corp. | 814,589 | 7,146,790 | |
| Paramount Bed Holdings Co. Ltd. | 20,300 | 345,864 | |
| Park24 Co. Ltd. (a) | 50,440 | 568,247 | |
| Penta-Ocean Construction Co. Ltd. | 105,100 | 617,875 | |
| PeptiDream, Inc. (a) | 37,400 | 272,640 | |
| Persol Holdings Co. Ltd. | 657,000 | 985,116 | |
| Pigeon Corp. | 46,400 | 492,670 | |
| Pilot Corp. | 12,500 | 424,194 | |
| Piolax, Inc. | 14,300 | 211,192 | |
| Plus Alpha Consulting Co. Ltd. | 17,300 | 278,309 | |
| Pola Orbis Holdings, Inc. | 37,989 | 381,589 | |
| Prestige International, Inc. | 48,900 | 198,490 | |
| Raito Kogyo Co. Ltd. | 20,800 | 269,233 | |
| Raksul, Inc. (a) | 21,000 | 176,481 | |
| Rakus Co. Ltd. | 33,900 | 422,076 | |
| Rakuten Bank Ltd. (c) | 37,200 | 635,279 | |
| Rakuten Group, Inc. | 549,195 | 2,031,429 | |
| Recruit Holdings Co. Ltd. | 531,554 | 15,241,093 | |
| Relo Group, Inc. | 40,200 | 398,546 | |
| Renesas Electronics Corp. (a) | 470,555 | 6,181,032 | |
| Rengo Co. Ltd. | 77,000 | 509,927 | |
| RENOVA, Inc. (a) | 17,400 | 125,171 | |
| Resona Holdings, Inc. | 801,546 | 4,282,919 | |
| Resonac Holdings Corp. | 66,082 | 1,071,271 | |
| Resorttrust, Inc. | 30,300 | 436,021 | |
| Ricoh Co. Ltd. | 196,900 | 1,595,896 | |
| Riken Keiki Co. Ltd. | 5,700 | 233,554 | |
| Ringer Hut Co. Ltd. | 13,300 | 203,118 | |
| Rinnai Corp. | 38,883 | 714,259 | |
| ROHM Co. Ltd. | 128,000 | 2,050,812 | |
| Rohto Pharmaceutical Co. Ltd. | 70,500 | 1,644,857 | |
| Roland Corp. | 8,100 | 234,203 | |
| Rorze Corp. | 4,000 | 297,613 | |
| Round One Corp. | 77,900 | 282,584 | |
| Royal Holdings Co. Ltd. | 14,400 | 245,418 | |
| Ryohin Keikaku Co. Ltd. | 93,630 | 1,320,115 | |
| S Foods, Inc. | 10,000 | 211,537 | |
| Saizeriya Co. Ltd. | 11,800 | 479,453 | |
| Sakai Moving Service Co. Ltd. | 11,400 | 194,575 | |
| Sakata Seed Corp. | 12,900 | 347,110 | |
| San-A Co. Ltd. | 10,100 | 312,882 | |
| San-Ai Obbli Co. Ltd. | 25,700 | 277,496 | |
| Sangetsu Corp. | 17,600 | 330,755 | |
| Sanken Electric Co. Ltd. | 8,500 | 422,758 | |
| Sankyo Co. Ltd. (Gunma) | 15,200 | 631,680 | |
| Sankyu, Inc. | 18,900 | 569,082 | |
| Sanrio Co. Ltd. | 19,500 | 830,379 | |
| Sansan, Inc. (a) | 26,900 | 213,757 | |
| Santen Pharmaceutical Co. Ltd. | 124,360 | 1,078,642 | |
| Sanwa Holdings Corp. | 69,100 | 932,315 | |
| Sanyo Chemical Industries Ltd. | 7,200 | 191,417 | |
| Sanyo Special Steel Co. Ltd. | 10,600 | 180,654 | |
| Sapporo Holdings Ltd. | 24,400 | 859,030 | |
| Sato Holding Corp. | 16,100 | 216,233 | |
| Sawai Group Holdings Co. Ltd. | 16,300 | 519,471 | |
| SBI Holdings, Inc. Japan | 92,500 | 1,990,132 | |
| SBI Sumishin Net Bank Ltd. (c) | 28,000 | 294,735 | |
| Screen Holdings Co. Ltd. | 30,600 | 1,422,660 | |
| SCSK Corp. | 55,500 | 947,400 | |
| Secom Co. Ltd. | 76,733 | 5,329,479 | |
| Sega Sammy Holdings, Inc. | 58,519 | 915,212 | |
| Seibu Holdings, Inc. | 103,600 | 1,011,599 | |
| Seiko Epson Corp. | 107,373 | 1,490,679 | |
| Seiko Group Corp. | 12,500 | 195,201 | |
| Seino Holdings Co. Ltd. | 46,300 | 673,477 | |
| Seiren Co. Ltd. | 17,800 | 264,044 | |
| Sekisui Chemical Co. Ltd. | 139,900 | 1,916,193 | |
| Sekisui House (REIT), Inc. | 1,447 | 762,100 | |
| Sekisui House Ltd. | 217,480 | 4,258,857 | |
| Sekisui Jushi Corp. | 17,500 | 285,382 | |
| SENKO Co. Ltd. | 51,200 | 352,757 | |
| Seria Co. Ltd. | 19,600 | 271,664 | |
| Seven & i Holdings Co. Ltd. | 274,629 | 10,062,052 | |
| Seven Bank Ltd. | 233,000 | 461,344 | |
| SG Holdings Co. Ltd. | 115,800 | 1,641,420 | |
| Sharp Corp. (a) | 112,600 | 704,000 | |
| Shibaura Machine Co. Ltd. | 9,100 | 225,334 | |
| Shibaura Mechatronics Corp. | 5,400 | 233,255 | |
| SHIFT, Inc. (a) | 4,600 | 834,622 | |
| Shiga Bank Ltd. | 14,500 | 383,457 | |
| Shikoku Electric Power Co., Inc. | 55,500 | 378,952 | |
| Shima Seiki Manufacturing Ltd. | 15,700 | 160,180 | |
| Shimadzu Corp. | 85,300 | 2,017,029 | |
| Shimamura Co. Ltd. | 8,300 | 819,125 | |
| SHIMANO, Inc. | 28,165 | 4,053,116 | |
| SHIMIZU Corp. | 200,500 | 1,426,857 | |
| Shin-Etsu Chemical Co. Ltd. | 669,475 | 20,019,564 | |
| Shinko Electric Industries Co. Ltd. | 24,600 | 789,878 | |
| Shinmaywa Industries Ltd. | 27,300 | 217,852 | |
| Shionogi & Co. Ltd. | 97,700 | 4,549,365 | |
| Ship Healthcare Holdings, Inc. | 28,800 | 444,646 | |
| Shiseido Co. Ltd. | 150,055 | 4,759,065 | |
| Shizuoka Financial Group | 164,100 | 1,395,466 | |
| Shizuoka Gas Co. Ltd. | 25,900 | 175,976 | |
| SHO-BOND Holdings Co. Ltd. | 15,100 | 594,684 | |
| Shochiku Co. Ltd. | 3,700 | 235,386 | |
| Shoei Co. Ltd. | 20,800 | 277,134 | |
| Siix Corp. | 18,200 | 170,507 | |
| Simplex Holdings, Inc. | 17,900 | 300,649 | |
| SKY Perfect JSAT Holdings, Inc. | 61,100 | 282,798 | |
| Skylark Holdings Co. Ltd. (a) | 82,700 | 1,220,138 | |
| SMC Corp. | 21,067 | 9,727,964 | |
| SMS Co., Ltd. | 27,200 | 431,607 | |
| Socionext, Inc. | 12,700 | 1,238,721 | |
| SoftBank Corp. | 1,020,500 | 11,538,659 | |
| SoftBank Group Corp. | 381,312 | 15,616,279 | |
| Sohgo Security Services Co., Ltd. | 140,800 | 824,556 | |
| Sojitz Corp. | 86,540 | 1,797,037 | |
| Sompo Holdings, Inc. | 111,819 | 4,843,995 | |
| Sony Group Corp. | 463,905 | 38,568,545 | |
| Sosei Group Corp. (a) | 28,912 | 267,339 | |
| SOSiLA Logistics REIT, Inc. | 279 | 221,042 | |
| Sotetsu Holdings, Inc. | 31,100 | 548,976 | |
| Square Enix Holdings Co. Ltd. | 31,400 | 1,043,164 | |
| Stanley Electric Co. Ltd. | 48,239 | 771,563 | |
| Star Asia Investment Corp. | 705 | 265,628 | |
| Star Micronics Co. Ltd. | 19,400 | 233,230 | |
| Starts Corp., Inc. | 13,000 | 246,904 | |
| Subaru Corp. | 236,625 | 4,096,049 | |
| Sugi Holdings Co. Ltd. | 12,600 | 510,027 | |
| Sumco Corp. | 130,000 | 1,679,880 | |
| Sumitomo Bakelite Co. Ltd. | 13,200 | 587,373 | |
| Sumitomo Chemical Co. Ltd. | 548,500 | 1,394,157 | |
| Sumitomo Corp. | 382,300 | 7,515,129 | |
| Sumitomo Dainippon Pharma Co., Ltd. | 68,100 | 207,954 | |
| Sumitomo Electric Industries Ltd. | 270,400 | 2,838,722 | |
| Sumitomo Forestry Co. Ltd. | 57,723 | 1,362,924 | |
| Sumitomo Heavy Industries Ltd. | 41,047 | 939,556 | |
| Sumitomo Metal Mining Co. Ltd. | 90,300 | 2,536,704 | |
| Sumitomo Mitsui Construction Co. Ltd. | 70,660 | 187,464 | |
| Sumitomo Mitsui Financial Group, Inc. | 467,833 | 22,553,284 | |
| Sumitomo Mitsui Trust Holdings, Inc. | 119,700 | 4,488,367 | |
| Sumitomo Osaka Cement Co. Ltd. | 12,403 | 288,725 | |
| Sumitomo Realty & Development Co. Ltd. | 105,787 | 2,654,613 | |
| Sumitomo Rubber Industries Ltd. | 64,900 | 658,386 | |
| Sundrug Co. Ltd. | 27,341 | 743,457 | |
| Suntory Beverage & Food Ltd. | 52,300 | 1,573,867 | |
| Suruga Bank Ltd. | 67,200 | 287,134 | |
| Suzuken Co. Ltd. | 23,400 | 716,738 | |
| Suzuki Motor Corp. | 137,740 | 5,345,967 | |
| Sysmex Corp. | 62,700 | 3,003,506 | |
| Systena Corp. | 120,500 | 205,139 | |
| T Hasegawa Co. Ltd. | 14,100 | 295,401 | |
| T&D Holdings, Inc. | 183,100 | 3,266,362 | |
| Tadano Ltd. | 44,800 | 336,812 | |
| Taiheiyo Cement Corp. | 44,491 | 762,471 | |
| Taikisha Ltd. | 12,500 | 363,746 | |
| Taisei Corp. | 61,900 | 2,099,196 | |
| Taisho Pharmaceutical Holdings Co. Ltd. | 15,000 | 593,971 | |
| Taiyo Holdings Co. Ltd. | 16,800 | 273,991 | |
| Taiyo Yuden Co. Ltd. | 44,400 | 995,379 | |
| Takara Bio, Inc. | 21,000 | 185,195 | |
| Takara Holdings, Inc. | 59,769 | 498,216 | |
| Takasago International Corp. | 9,800 | 209,204 | |
| Takasago Thermal Engineering Co. Ltd. | 19,700 | 388,969 | |
| Takashimaya Co. Ltd. | 54,100 | 735,715 | |
| Takeda Pharmaceutical Co. Ltd. | 569,870 | 15,468,978 | |
| Takeuchi Manufacturing Co. Ltd. | 13,100 | 373,758 | |
| Takuma Co. Ltd. | 27,500 | 266,796 | |
| Tamron Co. Ltd. | 13,000 | 353,900 | |
| Tbs Holdings, Inc. | 14,400 | 234,751 | |
| TDK Corp. | 141,343 | 5,288,379 | |
| Techmatrix Corp. | 16,900 | 167,017 | |
| TechnoPro Holdings, Inc. | 40,100 | 794,415 | |
| Teijin Ltd. | 66,800 | 604,612 | |
| Terumo Corp. | 249,400 | 6,823,133 | |
| The Awa Bank Ltd. | 15,700 | 260,828 | |
| The Hachijuni Bank Ltd. | 135,100 | 769,412 | |
| The Hyakugo Bank Ltd. | 93,800 | 354,654 | |
| The Keiyo Bank Ltd. | 49,900 | 226,406 | |
| The Kiyo Bank Ltd. (c) | 29,000 | 299,365 | |
| The Monogatari Corp. | 13,200 | 357,463 | |
| The Nanto Bank Ltd. | 13,500 | 242,996 | |
| The Okinawa Electric Power Co., Inc. | 20,401 | 148,967 | |
| The San-In Godo Bank Ltd. | 56,700 | 390,536 | |
| The Sumitomo Warehouse Co. Ltd. | 21,600 | 345,807 | |
| THK Co. Ltd. | 44,600 | 797,075 | |
| TIS, Inc. | 79,800 | 1,708,905 | |
| TKC Corp. | 12,800 | 298,586 | |
| Toagosei Co. Ltd. | 42,600 | 390,835 | |
| Tobu Railway Co. Ltd. | 68,800 | 1,655,978 | |
| Tocalo Co. Ltd. | 31,900 | 288,337 | |
| Toda Corp. | 87,600 | 486,477 | |
| Toei Animation Co. Ltd. (c) | 3,200 | 288,148 | |
| Toei Co. Ltd. | 2,200 | 258,285 | |
| Toho Co. Ltd. | 43,900 | 1,499,760 | |
| Toho Gas Co. Ltd. | 27,000 | 464,976 | |
| Toho Holdings Co. Ltd. | 20,300 | 457,625 | |
| Toho Titanium Co. Ltd. | 12,500 | 163,073 | |
| Tohoku Electric Power Co., Inc. | 164,200 | 1,025,282 | |
| Tokai Carbon Co. Ltd. | 79,500 | 610,074 | |
| TOKAI Holdings Corp. | 46,100 | 297,304 | |
| Tokai Rika Co. Ltd. | 20,800 | 326,400 | |
| Tokai Tokyo Financial Holdings | 80,800 | 274,438 | |
| Tokio Marine Holdings, Inc. | 663,679 | 14,847,983 | |
| Tokuyama Corp. | 27,935 | 423,528 | |
| Tokyo Century Corp. | 13,500 | 520,138 | |
| Tokyo Electric Power Co., Inc. (a) | 559,228 | 2,366,507 | |
| Tokyo Electron Ltd. | 174,069 | 23,001,076 | |
| Tokyo Gas Co. Ltd. | 139,635 | 3,135,806 | |
| Tokyo Ohka Kogyo Co. Ltd. | 12,200 | 704,926 | |
| Tokyo Seimitsu Co. Ltd. | 15,100 | 705,856 | |
| Tokyo Steel Manufacturing Co. Ltd. | 27,000 | 312,069 | |
| Tokyo Tatemono Co. Ltd. | 66,900 | 888,320 | |
| Tokyo TY Financial Group, Inc. | 13,900 | 410,270 | |
| Tokyotokeiba Co. Ltd. | 7,300 | 189,040 | |
| Tokyu Construction Co. Ltd. | 49,800 | 256,243 | |
| Tokyu Corp. | 190,800 | 2,153,948 | |
| Tokyu Fudosan Holdings Corp. | 221,800 | 1,292,279 | |
| Tokyu REIT, Inc. | 322 | 384,240 | |
| TOMONY Holdings, Inc. | 98,700 | 332,602 | |
| Tomy Co. Ltd. | 34,400 | 474,465 | |
| Topcon Corp. | 39,160 | 357,093 | |
| Toppan Holdings, Inc. | 88,800 | 2,048,072 | |
| Toray Industries, Inc. | 497,300 | 2,405,858 | |
| TORIDOLL Holdings Corp. | 17,600 | 425,906 | |
| Toshiba Tec Corp. | 11,300 | 245,635 | |
| Tosoh Corp. | 94,900 | 1,161,977 | |
| Totetsu Kogyo Co. Ltd. | 13,400 | 261,148 | |
| Toto Ltd. | 49,900 | 1,203,170 | |
| Towa Pharmaceutical Co. Ltd. | 13,300 | 244,485 | |
| Toyo Ink South Carolina Holdings Co. Ltd. | 23,649 | 401,748 | |
| Toyo Seikan Group Holdings Ltd. | 47,900 | 805,318 | |
| Toyo Suisan Kaisha Ltd. | 33,136 | 1,528,595 | |
| Toyo Tanso Co. Ltd. | 8,200 | 277,161 | |
| Toyo Tire Corp. | 43,400 | 644,627 | |
| Toyobo Co. Ltd. | 39,800 | 267,035 | |
| Toyoda Gosei Co. Ltd. | 26,000 | 516,557 | |
| Toyota Boshoku Corp. | 28,700 | 499,119 | |
| Toyota Industries Corp. | 53,700 | 3,979,960 | |
| Toyota Motor Corp. | 3,903,360 | 68,284,402 | |
| Toyota Tsusho Corp. | 78,549 | 4,181,657 | |
| Trancom Co. Ltd. | 3,700 | 169,986 | |
| Transcosmos, Inc. | 11,400 | 232,149 | |
| TRE Holdings Corp. | 22,800 | 177,974 | |
| Trend Micro, Inc. | 48,700 | 1,835,241 | |
| Tri Chemical Laboratories, Inc. | 11,000 | 233,950 | |
| Trusco Nakayama Corp. | 20,500 | 309,396 | |
| TS tech Co. Ltd. | 35,100 | 393,127 | |
| Tsubakimoto Chain Co. | 12,000 | 303,339 | |
| Tsuburaya Fields Holdings, Inc. | 14,400 | 156,779 | |
| Tsugami Corp. | 20,400 | 146,164 | |
| Tsumura & Co. | 21,484 | 384,419 | |
| Tsuruha Holdings, Inc. | 14,100 | 1,035,740 | |
| Uacj Corp. | 15,500 | 315,506 | |
| Ube Corp. | 36,500 | 562,056 | |
| Ulvac, Inc. | 17,659 | 607,278 | |
| Unicharm Corp. | 147,300 | 5,005,089 | |
| United Super Markets Holdings, Inc. (c) | 28,900 | 205,116 | |
| United Urban Investment Corp. | 1,059 | 1,067,651 | |
| Universal Entertainment Corp. | 9,700 | 138,363 | |
| USEN-NEXT HOLDINGS Co. Ltd. | 9,000 | 206,438 | |
| Ushio, Inc. | 40,900 | 498,793 | |
| USS Co. Ltd. | 75,500 | 1,319,657 | |
| UT Group Co. Ltd. (a) | 14,300 | 176,631 | |
| Valor Holdings Co. Ltd. | 22,800 | 356,921 | |
| Visional, Inc. (a) | 8,500 | 416,629 | |
| W-Scope Corp. (a) | 21,800 | 126,146 | |
| Wacoal Holdings Corp. | 19,200 | 438,864 | |
| Wacom Co. Ltd. | 61,500 | 212,027 | |
| Welcia Holdings Co. Ltd. | 36,100 | 598,387 | |
| West Holdings Corp. | 9,449 | 208,498 | |
| West Japan Railway Co. | 79,056 | 3,013,184 | |
| Workman Co. Ltd. (c) | 8,100 | 208,683 | |
| Yakult Honsha Co. Ltd. | 93,600 | 2,205,679 | |
| Yamada Holdings Co. Ltd. | 237,810 | 752,091 | |
| Yamaguchi Financial Group, Inc. | 72,000 | 660,777 | |
| Yamaha Corp. | 51,500 | 1,375,561 | |
| Yamaha Motor Co. Ltd. | 107,507 | 2,627,133 | |
| Yamato Holdings Co. Ltd. | 103,700 | 1,727,229 | |
| Yamato Kogyo Co. Ltd. | 14,900 | 713,871 | |
| Yamazaki Baking Co. Ltd. | 41,800 | 884,967 | |
| Yamazen Co. Ltd. | 30,700 | 248,715 | |
| Yaoko Co. Ltd. | 8,100 | 417,007 | |
| Yaskawa Electric Corp. | 91,900 | 3,008,175 | |
| Yokogawa Bridge Holdings Corp. | 17,300 | 285,960 | |
| Yokogawa Electric Corp. | 82,712 | 1,501,655 | |
| Yokohama Rubber Co. Ltd. | 43,900 | 811,254 | |
| YONEX Co. Ltd. | 25,800 | 279,513 | |
| Yoshinoya Holdings Co. Ltd. | 24,300 | 567,903 | |
| Yuasa Trading Co. Ltd. | 8,600 | 235,225 | |
| Zenkoku Hosho Co. Ltd. | 19,500 | 623,576 | |
| Zensho Holdings Co. Ltd. | 34,200 | 1,797,616 | |
| Zeon Corp. | 47,400 | 391,783 | |
| ZERIA Pharmaceutical Co. Ltd. | 13,700 | 182,008 | |
| Zojirushi Thermos | 15,900 | 163,568 | |
| ZOZO, Inc. | 52,700 | 1,002,077 | |
TOTAL JAPAN | 1,489,700,622 | ||
| Jordan - 0.0% | |||
| Hikma Pharmaceuticals PLC | 60,600 | 1,400,574 | |
| Korea (South) - 3.2% | |||
| ABL Bio, Inc. (a) | 13,434 | 158,584 | |
| Advanced Nano Products Co. Ltd. | 3,108 | 276,205 | |
| AfreecaTV Co. Ltd. | 3,505 | 174,268 | |
| Alteogen, Inc. | 13,534 | 626,852 | |
| AMOREPACIFIC Corp. | 11,065 | 1,037,089 | |
| AMOREPACIFIC Group, Inc. | 12,017 | 254,902 | |
| Ananti, Inc. (a)(c) | 28,087 | 138,487 | |
| BGF Retail Co. Ltd. | 3,243 | 331,143 | |
| BH Co. Ltd. | 17,159 | 238,749 | |
| Bioneer Corp. (a) | 8,435 | 198,509 | |
| BNK Financial Group, Inc. | 105,688 | 531,156 | |
| Bukwang Pharmaceutical Co. Ltd. (a) | 30,426 | 128,137 | |
| Caregen Co. Ltd. | 7,265 | 144,613 | |
| Celltrion Healthcare Co. Ltd. | 39,494 | 1,950,698 | |
| Celltrion Pharm, Inc. | 6,691 | 314,329 | |
| Celltrion, Inc. | 42,637 | 4,727,965 | |
| CHA Biotech Co. Ltd. (a) | 20,178 | 240,641 | |
| Cheil Worldwide, Inc. | 28,205 | 414,685 | |
| Chong Kun Dang Pharmaceutical Corp. | 4,304 | 301,978 | |
| Chunbo Co. Ltd. | 1,805 | 132,704 | |
| CJ CGV Co. Ltd. (a) | 23,939 | 90,900 | |
| CJ CheilJedang Corp. | 3,109 | 650,360 | |
| CJ Corp. | 5,821 | 362,555 | |
| CJ ENM Co. Ltd. (a) | 4,106 | 158,549 | |
| CJ Logistics Corp. | 4,311 | 242,012 | |
| Classys, Inc. | 8,815 | 215,045 | |
| Cosmax, Inc. (a) | 3,531 | 354,496 | |
| Cosmo AM&T Co. Ltd. (a) | 8,489 | 882,501 | |
| Cosmo AM&T Co. Ltd. rights 11/7/23 (a) | 444 | 5,449 | |
| Cosmochemical Co. Ltd. (a)(c) | 10,909 | 254,266 | |
| Coway Co. Ltd. | 20,657 | 660,060 | |
| Creative & Innovative System (a) | 20,208 | 134,838 | |
| CS Wind Corp. | 9,654 | 327,095 | |
| Daeduck Electronics Co. Ltd. | 13,266 | 197,261 | |
| Daejoo Electronic Materials Co. Ltd. (c) | 4,278 | 219,277 | |
| Daesang Corp. (c) | 14,412 | 212,164 | |
| Daewoo Engineering & Construction Co. Ltd. (a) | 83,201 | 242,376 | |
| Daewoong Pharmaceutical Co. Ltd. | 2,334 | 172,899 | |
| Daou Data Corp. | 7,256 | 61,412 | |
| DB HiTek Co. Ltd. | 13,575 | 489,350 | |
| Db Insurance Co. Ltd. | 16,951 | 1,101,179 | |
| Delivery Hero AG (a)(d) | 67,560 | 1,713,501 | |
| Dentium Co. Ltd. | 2,962 | 240,091 | |
| DGB Financial Group Co. Ltd. | 63,027 | 366,540 | |
| DL E&C Co. Ltd. | 12,442 | 315,772 | |
| DL Holdings Co. Ltd. | 5,967 | 187,646 | |
| Dongjin Semichem Co. Ltd. | 12,058 | 268,732 | |
| DongKook Pharmaceutical Co. Ltd. | 18,570 | 221,779 | |
| Dongsuh Co., Inc. | 16,631 | 212,333 | |
| Doosan Bobcat, Inc. | 21,854 | 626,957 | |
| Doosan Co. Ltd. | 3,033 | 167,086 | |
| Doosan Fuel Cell Co. Ltd. (a)(c) | 18,550 | 226,105 | |
| Doosan Heavy Industries & Construction Co. Ltd. (a) | 166,538 | 1,656,922 | |
| Douzone Bizon Co. Ltd. | 6,492 | 131,467 | |
| E-Mart, Inc. | 7,417 | 399,280 | |
| Ecopro BM Co. Ltd. (c) | 18,161 | 2,652,967 | |
| Ecopro Co. Ltd. (c) | 7,395 | 3,411,973 | |
| Ecopro HN Co. Ltd. | 4,118 | 176,161 | |
| EM-Tech Co. Ltd. | 6,240 | 229,631 | |
| Emro, Inc. (a) | 3,117 | 127,623 | |
| Enchem Co. Ltd. (a) | 3,424 | 131,891 | |
| EO Technics Co. Ltd. | 3,711 | 384,289 | |
| EoFlow Co. Ltd. (a)(b) | 11,136 | 178,663 | |
| ESR Kendall Square Co. Ltd. (REIT) | 73,476 | 174,081 | |
| Eugene Technology Co. Ltd. | 6,821 | 193,172 | |
| F&F Co. Ltd. | 6,612 | 457,692 | |
| Fila Holdings Corp. | 18,164 | 480,256 | |
| Foosung Co. Ltd. | 21,245 | 157,454 | |
| GemVax & Kael Co. Ltd. (a) | 17,423 | 183,389 | |
| Grand Korea Leisure Co. Ltd. (a) | 14,815 | 171,196 | |
| Green Cross Corp. | 2,690 | 191,453 | |
| Green Cross Holdings Corp. | 17,330 | 173,754 | |
| GS Engineering & Construction Corp. | 26,141 | 255,486 | |
| GS Holdings Corp. | 16,519 | 481,671 | |
| GS Retail Co. Ltd. | 17,841 | 320,919 | |
| HAESUNG DS Co. Ltd. | 4,398 | 144,497 | |
| Hana Financial Group, Inc. | 112,137 | 3,255,750 | |
| Hana Micron, Inc. | 15,805 | 286,796 | |
| Hana Technology Co. Ltd. (a) | 2,814 | 136,945 | |
| Hana Tour Service, Inc. (a) | 5,977 | 194,556 | |
| HanAll BioPharma Co. Ltd. (a) | 17,256 | 373,742 | |
| Handsome Co. Ltd. | 21,675 | 299,235 | |
| Hankook Tire Co. Ltd. | 28,104 | 796,172 | |
| Hanmi Pharm Co. Ltd. | 2,675 | 558,477 | |
| Hanmi Science Co. Ltd. | 12,408 | 291,177 | |
| Hanmi Semiconductor Co. Ltd. | 16,428 | 642,735 | |
| Hanon Systems | 77,152 | 393,102 | |
| Hansol Chemical Co. Ltd. | 3,455 | 384,991 | |
| Hanssem Co. Ltd. | 3,681 | 133,502 | |
| Hanwha Aerospace Co. Ltd. | 14,145 | 1,061,859 | |
| Hanwha Corp. | 18,522 | 304,645 | |
| Hanwha Life Insurance Co. Ltd. (a) | 116,970 | 240,012 | |
| Hanwha Ocean Co. Ltd. (a)(c) | 17,888 | 312,366 | |
| Hanwha Ocean Co. Ltd. rights 11/9/23 (a) | 5,905 | 7,640 | |
| Hanwha Solutions Corp. (a) | 41,029 | 872,632 | |
| Hanwha Systems Co. Ltd. | 27,256 | 256,693 | |
| HD Hyundai Co. Ltd. | 18,091 | 769,396 | |
| HD Hyundai Construction Equipment Co. Ltd. | 4,591 | 151,308 | |
| HD Hyundai Electric Co. Ltd. | 8,279 | 460,087 | |
| HD Hyundai Heavy Industries Co. Ltd. (a) | 8,475 | 641,630 | |
| Hd Hyundai Infracore Co. Ltd. | 48,320 | 239,399 | |
| HD Korea Shipbuilding & Offshore Engineering Co. Ltd. (a) | 15,551 | 1,041,663 | |
| Hite Jinro Co. Ltd. | 15,647 | 246,222 | |
| HK inno.N Corp. | 15,112 | 484,135 | |
| HL Mando Co. Ltd. | 12,825 | 311,866 | |
| HLB Life Science Co. Ltd. | 33,684 | 222,631 | |
| HLB, Inc. | 48,721 | 1,048,179 | |
| HMM Co. Ltd. | 93,211 | 1,008,099 | |
| Hotel Shilla Co. | 12,176 | 562,558 | |
| HPSP Co. Ltd. | 11,349 | 262,863 | |
| HUGEL, Inc. (a) | 2,731 | 287,700 | |
| HYBE Co. Ltd. (a) | 7,353 | 1,195,762 | |
| Hydro Lithium, Inc. (a) | 6,159 | 48,200 | |
| Hyosung Advanced Materials Co. | 1,108 | 293,400 | |
| Hyosung Corp. | 4,222 | 184,389 | |
| Hyosung Heavy Industries Co. Ltd. (a) | 2,203 | 279,008 | |
| Hyosung TNC Co. Ltd. | 1,045 | 276,558 | |
| Hyundai Autoever Corp. | 2,807 | 270,607 | |
| Hyundai Bioscience Co. Ltd. (a) | 13,569 | 375,409 | |
| Hyundai Department Store Co. Ltd. | 6,363 | 251,630 | |
| Hyundai Elevator Co. Ltd. (c) | 10,435 | 333,637 | |
| Hyundai Engineering & Construction Co. Ltd. | 29,194 | 722,961 | |
| Hyundai Glovis Co. Ltd. | 7,053 | 893,776 | |
| Hyundai Marine & Fire Insurance Co. Ltd. | 22,028 | 513,085 | |
| Hyundai Mipo Dockyard Co. Ltd. (a) | 9,076 | 467,015 | |
| Hyundai Mobis | 22,992 | 3,555,372 | |
| Hyundai Motor Co. Ltd. | 45,033 | 5,665,034 | |
| Hyundai Rotem Co. Ltd. (a) | 28,194 | 486,719 | |
| Hyundai Steel Co. | 33,008 | 801,512 | |
| Hyundai Wia Corp. | 6,550 | 272,258 | |
| I-Sens, Inc. | 9,696 | 165,093 | |
| Industrial Bank of Korea | 97,253 | 803,670 | |
| Innox Advanced Materials Co. Ltd. | 5,711 | 113,163 | |
| Intellian Technologies, Inc. (c) | 3,186 | 166,877 | |
| IS Dongseo Co. Ltd. (a) | 6,489 | 121,049 | |
| ISC Co. Ltd. | 3,952 | 203,718 | |
| Isu Specialty Chemical Co. Ltd. | 1,745 | 148,531 | |
| Isupetasys Co. Ltd. | 19,376 | 312,735 | |
| ITM Semiconductor Co. Ltd. (a) | 13,014 | 192,722 | |
| JB Financial Group Co. Ltd. | 46,538 | 347,591 | |
| Jeisys Medical, Inc. (a) | 31,276 | 243,792 | |
| JR Global (REIT) | 71,016 | 206,826 | |
| Jusung Engineering Co. Ltd. (c) | 14,282 | 260,804 | |
| JW Pharmaceutical Corp. | 7,510 | 145,776 | |
| JYP Entertainment Corp. | 10,694 | 812,818 | |
| Kakao Corp. | 115,108 | 3,239,605 | |
| Kakao Games Corp. (a) | 13,879 | 240,536 | |
| Kakao Pay Corp. (a) | 10,086 | 256,747 | |
| KakaoBank Corp. | 66,788 | 902,520 | |
| Kangwon Land, Inc. | 37,022 | 402,519 | |
| KB Financial Group, Inc. | 142,189 | 5,411,964 | |
| KCC Corp. | 1,752 | 308,325 | |
| KEPCO E&C (c) | 5,418 | 210,120 | |
| KEPCO Plant Service & Engineering Co. Ltd. | 10,358 | 250,243 | |
| Kia Corp. | 97,628 | 5,569,361 | |
| Kiwoom Securities Co. Ltd. | 5,647 | 337,129 | |
| Koh Young Technology, Inc. | 22,090 | 180,758 | |
| Kolmar Korea Co. Ltd. | 8,204 | 325,751 | |
| Kolon Industries, Inc. | 7,285 | 234,981 | |
| Komipharm International Co. Ltd. | 29,305 | 112,214 | |
| Korea Aerospace Industries Ltd. | 27,314 | 897,427 | |
| Korea Electric Power Corp. (a) | 100,712 | 1,258,736 | |
| Korea Gas Corp. (a) | 19,521 | 330,326 | |
| Korea Investment Holdings Co. Ltd. | 15,476 | 577,691 | |
| Korea Zinc Co. Ltd. | 3,037 | 1,053,850 | |
| Korean Air Lines Co. Ltd. | 78,122 | 1,186,878 | |
| Korean Reinsurance Co. | 42,831 | 281,301 | |
| KRAFTON, Inc. (a) | 12,353 | 1,501,528 | |
| KT Corp. | 26,092 | 630,287 | |
| KT&G Corp. | 39,518 | 2,489,230 | |
| Kum Yang Co. Ltd. (a) | 12,035 | 785,441 | |
| Kumho Petro Chemical Co. Ltd. | 6,572 | 616,764 | |
| Kumho Tire Co., Inc. (a) | 49,661 | 154,482 | |
| L&C Bio Co. Ltd. | 6,799 | 142,707 | |
| L&F Co. Ltd. | 9,669 | 939,138 | |
| Lake Materials Co. Ltd. (a) | 18,078 | 151,787 | |
| Leeno Industrial, Inc. | 3,850 | 393,418 | |
| LegoChem Biosciences, Inc. (a) | 9,706 | 266,046 | |
| LG Chemical Ltd. | 17,181 | 5,622,591 | |
| LG Corp. | 35,630 | 2,036,403 | |
| LG Display Co. Ltd. (a) | 85,434 | 771,923 | |
| LG Electronics, Inc. | 40,159 | 2,974,699 | |
| LG Energy Solution (a) | 17,355 | 4,967,761 | |
| LG H & H Co. Ltd. | 3,439 | 805,058 | |
| LG Innotek Co. Ltd. | 5,223 | 865,589 | |
| LG Uplus Corp. | 80,435 | 601,944 | |
| LIG Nex1 Co. Ltd. | 5,298 | 342,179 | |
| Lotte Chemical Corp. | 7,699 | 834,849 | |
| Lotte Energy Materials Corp. | 8,814 | 252,126 | |
| Lotte Fine Chemical Co. Ltd. | 6,413 | 265,996 | |
| Lotte REIT Co. Ltd. | 64,151 | 136,552 | |
| Lotte Shopping Co. Ltd. | 4,614 | 246,384 | |
| Lotte Tour Development Co. Ltd. (a) | 19,261 | 154,074 | |
| Lotte Wellfood Co. Ltd. | 3,436 | 289,961 | |
| LS Corp. | 6,737 | 391,125 | |
| LS Electric Co. Ltd. | 6,200 | 294,500 | |
| Lunit, Inc. | 2,346 | 227,418 | |
| LX Holdings Corp. | 57,352 | 286,430 | |
| LX International Corp. | 11,358 | 209,449 | |
| Lx Semicon Co. Ltd. | 4,333 | 231,102 | |
| Medytox, Inc. | 2,460 | 375,790 | |
| MegaStudyEdu Co. Ltd. | 4,093 | 187,857 | |
| Meritz Financial Holdings Co. | 39,275 | 1,459,555 | |
| Mezzion Pharma Co. Ltd. (a) | 9,835 | 269,825 | |
| Mirae Asset Securities Co. Ltd. | 101,518 | 496,569 | |
| Myoung Shin Industrial Co. Ltd. (a) | 17,684 | 206,443 | |
| NAVER Corp. | 49,443 | 6,902,042 | |
| NCSOFT Corp. | 5,561 | 959,332 | |
| Netmarble Corp. (a)(d) | 7,783 | 223,112 | |
| NH Investment & Securities Co. Ltd. | 55,448 | 397,218 | |
| NongShim Co. Ltd. | 1,237 | 406,240 | |
| Oci Co. Ltd. | 1,318 | 101,839 | |
| Oci Holdings Co. Ltd. | 7,169 | 517,208 | |
| Orion Corp./Republic of Korea | 8,948 | 790,770 | |
| Oscotec, Inc. (a)(c) | 12,929 | 182,754 | |
| Ottogi Corp. | 945 | 261,739 | |
| Pan Ocean Co., Ltd. (Korea) | 106,473 | 339,423 | |
| Paradise Co. Ltd. (a) | 20,029 | 217,586 | |
| Park Systems Corp. | 2,816 | 292,420 | |
| Partron Co. Ltd. | 76,888 | 494,421 | |
| Pearl Abyss Corp. (a) | 12,449 | 455,401 | |
| People & Technology, Inc. | 7,119 | 260,638 | |
| PharmaResearch Co. Ltd. | 3,383 | 291,673 | |
| Pharmicell Co. Ltd. (a) | 33,064 | 151,618 | |
| PI Advanced Materials Co. Ltd. | 6,522 | 118,447 | |
| POSCO | 26,599 | 8,130,554 | |
| POSCO Chemtech Co. Ltd. (c) | 11,524 | 2,027,784 | |
| POSCO ICT Co. Ltd. (c) | 20,648 | 752,184 | |
| Posco International Corp. | 19,588 | 729,552 | |
| Posco M-Tech Co. Ltd. | 9,214 | 145,439 | |
| Rainbow Robotics (a)(c) | 3,037 | 318,171 | |
| S&S Tech Corp. | 7,439 | 209,095 | |
| S-Oil Corp. | 18,826 | 927,734 | |
| S.M. Entertainment Co. Ltd. | 4,494 | 336,526 | |
| S1 Corp. | 8,238 | 332,462 | |
| Sam Chun Dang Pharm Co. Ltd. (a) | 6,295 | 286,457 | |
| Sambu Engineering & Constructi (a) | 84,354 | 161,319 | |
| Samsung Biologics Co. Ltd. (a)(d) | 6,486 | 3,404,680 | |
| Samsung C&T Corp. | 31,715 | 2,503,852 | |
| Samsung Electro-Mechanics Co. Ltd. | 22,328 | 2,061,412 | |
| Samsung Electronics Co. Ltd. | 1,776,123 | 88,275,254 | |
| Samsung Engineering Co. Ltd. (a) | 57,768 | 1,016,631 | |
| Samsung Fire & Marine Insurance Co. Ltd. | 11,795 | 2,252,127 | |
| Samsung Heavy Industries Co. Ltd. (a) | 260,750 | 1,319,908 | |
| Samsung Life Insurance Co. Ltd. | 31,030 | 1,658,863 | |
| Samsung SDI Co. Ltd. | 20,442 | 6,463,055 | |
| Samsung SDS Co. Ltd. | 14,512 | 1,485,346 | |
| Samsung Securities Co. Ltd. | 22,864 | 598,066 | |
| Samyang Foods Co. Ltd. | 2,162 | 293,335 | |
| Sang-A Frontec Co. Ltd. | 19,878 | 261,896 | |
| Seegene, Inc. | 14,376 | 203,344 | |
| Seojin System Co. Ltd. (a) | 12,164 | 150,827 | |
| Seoul Semiconductor Co. Ltd. | 25,684 | 191,904 | |
| SFA Engineering Corp. | 8,988 | 185,665 | |
| Shin Poong Pharmaceutical Co. (a)(c) | 16,301 | 140,594 | |
| Shinhan Financial Group Co. Ltd. | 163,226 | 4,189,377 | |
| Shinsegae Co. Ltd. | 2,945 | 368,317 | |
| SIMMTECH Co. Ltd. (c) | 9,322 | 228,343 | |
| SK Biopharmaceuticals Co. Ltd. (a) | 11,688 | 653,120 | |
| SK Bioscience Co. Ltd. (a)(c) | 11,408 | 512,682 | |
| SK Chemicals Co. Ltd. | 5,095 | 212,985 | |
| SK Hynix, Inc. | 201,700 | 17,490,091 | |
| SK IE Technology Co. Ltd. (a)(d) | 9,202 | 405,160 | |
| SK Innovation Co., Ltd. | 23,901 | 2,174,263 | |
| SK Networks Co. Ltd. (c) | 53,371 | 220,070 | |
| SK Oceanplant Co. Ltd. (a) | 12,495 | 148,597 | |
| SK Square Co. Ltd. (a) | 36,298 | 1,145,242 | |
| SK, Inc. | 15,856 | 1,669,235 | |
| SKC Co. Ltd. | 7,380 | 430,955 | |
| SOLUM Co. Ltd. (a) | 19,777 | 424,281 | |
| Solus Advanced Materials Co. Lt | 7,569 | 123,090 | |
| Soulbrain Co. Ltd. | 1,736 | 299,334 | |
| ST Pharm Co. Ltd. | 4,157 | 209,476 | |
| STCube (a) | 16,834 | 124,481 | |
| Studio Dragon Corp. (a) | 6,163 | 223,360 | |
| Taihan Electric Wire Co. Ltd. (a) | 22,609 | 186,236 | |
| TCC Steel | 7,222 | 279,906 | |
| Tokai Carbon Korea Co. Ltd. | 2,366 | 145,482 | |
| Voronoi, Inc. | 4,346 | 108,018 | |
| W-Scope Chungju Plant Co. Ltd. | 5,464 | 166,571 | |
| Webzen, Inc. | 12,597 | 128,136 | |
| WeMade Entertainment Co. Ltd. (c) | 7,090 | 206,936 | |
| Won Tech Co. Ltd. | 22,503 | 153,171 | |
| WONIK IPS Co. Ltd. | 12,292 | 274,431 | |
| Woori Financial Group, Inc. | 218,042 | 1,923,057 | |
| YG Entertainment, Inc. | 5,532 | 225,460 | |
| Young Poong Paper Manufacturing Co. Ltd. | 7,297 | 44,430 | |
| Youngone Corp. | 8,851 | 355,278 | |
| Yuhan Corp. | 19,969 | 849,980 | |
TOTAL KOREA (SOUTH) | 310,371,857 | ||
| Kuwait - 0.2% | |||
| Agility Public Warehousing Co. KSC (a) | 590,056 | 1,002,971 | |
| Al Ahli Bank of Kuwait KSCP | 725,097 | 501,440 | |
| Ali Alghanim Sons Automotive Co. KSSC | 75,445 | 262,089 | |
| Boubyan Bank KSC | 498,781 | 944,533 | |
| Boubyan Petrochemicals Co. KSCP | 163,927 | 324,729 | |
| Boursa Kuwait Securities Co. KPSC | 36,747 | 205,793 | |
| Burgan Bank SAK | 755,813 | 398,118 | |
| Commercial Real Estate Co. | 711,233 | 225,931 | |
| Gulf Bank | 706,792 | 541,314 | |
| Gulf Bank rights 11/12/23 (a) | 54,865 | 1,135 | |
| Gulf Cable & Electrical Industries Co. KSCP | 50,965 | 194,341 | |
| Human Soft Holding Co. KSCC | 38,710 | 380,282 | |
| Jazeera Airways Co. KSCP | 36,421 | 171,836 | |
| Kuwait Finance House KSCP | 2,907,580 | 6,426,837 | |
| Kuwait Projects Co. Holding KSCP (a) | 787,517 | 269,759 | |
| Mabanee Co. SAKC | 255,106 | 680,118 | |
| Mobile Telecommunication Co. | 716,449 | 1,113,627 | |
| National Bank of Kuwait | 2,733,063 | 7,745,666 | |
| National Industries Group Holding SAK | 758,072 | 436,054 | |
| Salhia Real Estate Co. KSCP | 221,046 | 286,442 | |
| Shamal Az-Zour Al-Oula for the First Phase of Az-Zour Power Plant KSC | 276,147 | 155,274 | |
| Warba Bank KSCP | 612,790 | 340,604 | |
TOTAL KUWAIT | 22,608,893 | ||
| Luxembourg - 0.1% | |||
| Aperam SA | 21,202 | 586,645 | |
| ArcelorMittal SA (Netherlands) | 190,943 | 4,218,528 | |
| Eurofins Scientific SA | 51,588 | 2,610,813 | |
| Reinet Investments SCA | 51,832 | 1,076,993 | |
| SES SA (France) (depositary receipt) | 141,087 | 821,809 | |
TOTAL LUXEMBOURG | 9,314,788 | ||
| Macau - 0.1% | |||
| Galaxy Entertainment Group Ltd. | 823,000 | 4,626,467 | |
| Sands China Ltd. (a) | 909,200 | 2,447,611 | |
| SJM Holdings Ltd. (a) | 996,250 | 345,782 | |
TOTAL MACAU | 7,419,860 | ||
| Malaysia - 0.4% | |||
| AFFIN Bank Bhd | 460,937 | 195,436 | |
| Agmo Holdings Bhd | 59 | 7 | |
| Alliance Bank Malaysia Bhd | 485,600 | 349,707 | |
| AMMB Holdings Bhd | 714,700 | 573,363 | |
| Axiata Group Bhd | 1,148,358 | 525,420 | |
| Axis (REIT) | 694,263 | 263,760 | |
| British American Tobacco (Malaysia) Bhd | 80,700 | 159,307 | |
| Bursa Malaysia Bhd | 323,400 | 460,917 | |
| Carlsberg Brewery Bhd | 84,600 | 356,531 | |
| CelcomDigi Bhd | 1,368,100 | 1,225,553 | |
| Chin Hin Group Bhd (a) | 272,800 | 218,285 | |
| CIMB Group Holdings Bhd | 2,377,748 | 2,848,773 | |
| CTOS Digital Bhd | 994,200 | 302,783 | |
| Dialog Group Bhd | 1,332,500 | 601,212 | |
| Fraser & Neave Holdings Bhd | 59,500 | 325,942 | |
| Frontken Corp. Bhd | 473,700 | 316,620 | |
| Gamuda Bhd | 740,218 | 727,363 | |
| Genting Bhd | 840,700 | 711,387 | |
| Genting Malaysia Bhd | 1,206,000 | 612,838 | |
| Hartalega Holdings Bhd (a) | 659,800 | 286,669 | |
| Heineken Malaysia Bhd | 71,400 | 360,478 | |
| Hibiscus Petroleum Bhd | 321,120 | 180,285 | |
| Hong Leong Bank Bhd | 247,400 | 1,007,364 | |
| Hong Leong Credit Bhd | 104,400 | 388,239 | |
| IHH Healthcare Bhd | 802,300 | 1,009,930 | |
| IJM Corp. Bhd | 1,118,100 | 446,100 | |
| Inari Amertron Bhd | 1,047,550 | 628,067 | |
| IOI Corp. Bhd | 1,008,400 | 832,022 | |
| IOI Properties Group Bhd | 791,500 | 307,366 | |
| Kossan Rubber Industries Bhd | 562,100 | 159,314 | |
| KPJ Healthcare Bhd | 918,300 | 246,662 | |
| Kuala Lumpur Kepong Bhd | 187,527 | 865,653 | |
| Malayan Banking Bhd | 1,940,318 | 3,674,104 | |
| Malaysia Airports Holdings Bhd | 351,151 | 544,814 | |
| Malaysian Pacific Industries Bhd | 37,100 | 200,540 | |
| Maxis Bhd | 911,700 | 758,069 | |
| MISC Bhd | 485,800 | 739,571 | |
| MR DIY Group M Sdn Bhd (d) | 1,412,100 | 438,716 | |
| My E.G.Services Bhd | 2,092,870 | 342,767 | |
| Nestle (Malaysia) Bhd | 26,700 | 693,883 | |
| Pentamaster Corp. Bhd | 254,500 | 267,319 | |
| Petronas Chemicals Group Bhd | 1,033,600 | 1,593,818 | |
| Petronas Dagangan Bhd | 122,900 | 594,979 | |
| Petronas Gas Bhd | 276,100 | 1,005,701 | |
| PPB Group Bhd | 243,540 | 782,917 | |
| Press Metal Aluminium Holdings | 1,431,100 | 1,479,295 | |
| Public Bank Bhd | 5,294,400 | 4,624,139 | |
| QL Resources Bhd | 456,675 | 530,018 | |
| RHB Bank Bhd | 583,693 | 683,682 | |
| Scientex Bhd | 515,900 | 395,041 | |
| Sime Darby Bhd | 1,167,689 | 561,212 | |
| Sime Darby Plantation Bhd | 809,271 | 737,756 | |
| Sunway (REIT) | 773,700 | 244,136 | |
| Telekom Malaysia Bhd | 463,415 | 493,317 | |
| Tenaga Nasional Bhd | 931,200 | 1,935,095 | |
| TIME dotCom Bhd | 469,100 | 524,304 | |
| Top Glove Corp. Bhd (a) | 1,895,800 | 288,578 | |
| V.S. Industry Bhd | 1,261,900 | 235,463 | |
| Yinson Holdings Bhd | 551,800 | 286,300 | |
| YTL Power International Bhd | 849,400 | 376,441 | |
TOTAL MALAYSIA | 42,525,328 | ||
| Malta - 0.0% | |||
| Kambi Group PLC (a) | 11,078 | 158,690 | |
| Kindred Group PLC (depository receipt) | 84,451 | 690,440 | |
TOTAL MALTA | 849,130 | ||
| Mexico - 0.7% | |||
| Alfa SA de CV Series A | 1,121,600 | 699,250 | |
| Alsea S.A.B. de CV (a)(c) | 208,711 | 691,574 | |
| America Movil S.A.B. de CV Series L | 7,064,096 | 5,834,178 | |
| Arca Continental S.A.B. de CV | 184,700 | 1,656,245 | |
| Banco del Bajio SA (d) | 284,400 | 870,442 | |
| Bolsa Mexicana de Valores S.A.B. de CV | 188,300 | 293,589 | |
| Borr Drilling Ltd. (a)(c) | 76,709 | 476,558 | |
| CEMEX S.A.B. de CV unit (a) | 5,517,032 | 3,314,075 | |
| Coca-Cola FEMSA S.A.B. de CV unit | 187,745 | 1,424,463 | |
| Controladora Vuela Compania de Aviacion S.A.B. de CV (a)(c) | 317,700 | 181,150 | |
| Corporacion Inmobiliaria Vesta S.A.B. de CV (c) | 323,300 | 1,013,708 | |
| FIBRA Macquarie Mexican (REIT) (d) | 273,578 | 423,971 | |
| Fibra Uno Administracion SA de CV | 1,067,635 | 1,620,787 | |
| Fomento Economico Mexicano S.A.B. de CV unit | 701,591 | 7,940,910 | |
| GCC S.A.B. de CV | 66,300 | 590,334 | |
| Genomma Lab Internacional SA de CV (c) | 283,500 | 212,597 | |
| Gentera S.A.B. de CV | 415,200 | 440,325 | |
| Gruma S.A.B. de CV Series B | 70,150 | 1,220,709 | |
| Grupo Aeroportuario del Pacifico S.A.B. de CV Series B | 148,396 | 1,731,053 | |
| Grupo Aeroportuario del Sureste S.A.B. de CV Series B | 74,365 | 1,602,669 | |
| Grupo Aeroportuario Norte S.A.B. de CV | 107,000 | 816,818 | |
| Grupo Bimbo S.A.B. de CV Series A | 487,277 | 1,983,271 | |
| Grupo Carso SA de CV Series A1 | 203,527 | 1,297,768 | |
| Grupo Financiero Banorte S.A.B. de CV Series O | 959,919 | 7,790,523 | |
| Grupo Financiero Inbursa S.A.B. de CV Series O (a) | 741,000 | 1,528,115 | |
| Grupo Mexico SA de CV Series B | 1,143,617 | 4,664,161 | |
| Grupo Televisa SA de CV | 998,770 | 458,141 | |
| Grupo Traxion S.A.B. de CV (a)(c)(d) | 138,400 | 204,503 | |
| Industrias Penoles SA de CV (a) | 73,780 | 823,656 | |
| Kimberly-Clark de Mexico SA de CV Series A | 560,667 | 1,027,791 | |
| La Comer S.A.B. de CV | 193,600 | 386,040 | |
| Megacable Holdings S.A.B. de CV unit | 124,800 | 244,076 | |
| Nemak S.A.B. de CV (a)(d) | 900,575 | 159,345 | |
| Operadora de Sites Mexicanos, SA de CV | 476,463 | 405,135 | |
| Orbia Advance Corp. S.A.B. de CV | 360,228 | 583,630 | |
| Prologis Property Mexico SA | 264,031 | 946,200 | |
| Promotora y Operadora de Infraestructura S.A.B. de CV | 73,480 | 601,485 | |
| Qualitas Controladora S.A.B. de CV | 74,900 | 618,634 | |
| Regional S.A.B. de CV | 91,900 | 699,101 | |
| Southern Copper Corp. | 31,635 | 2,242,922 | |
| Terrafina (c) | 279,571 | 453,727 | |
| Wal-Mart de Mexico SA de CV Series V | 1,869,530 | 6,691,484 | |
TOTAL MEXICO | 66,865,113 | ||
| Netherlands - 3.2% | |||
| Aalberts Industries NV | 36,442 | 1,134,414 | |
| ABN AMRO Bank NV GDR (Bearer) (d) | 146,689 | 1,968,860 | |
| Adyen BV (a)(d) | 8,106 | 5,467,384 | |
| AEGON NV | 619,726 | 3,005,876 | |
| Akzo Nobel NV | 61,663 | 4,127,438 | |
| Alfen Beheer BV (a)(c)(d) | 8,352 | 262,201 | |
| AMG Critical Materials NV | 11,821 | 307,442 | |
| Arcadis NV | 26,480 | 1,118,498 | |
| Argenx SE (a) | 20,830 | 9,798,049 | |
| ASM International NV (Netherlands) | 17,466 | 7,179,781 | |
| ASML Holding NV (Netherlands) | 148,614 | 89,334,909 | |
| ASR Nederland NV | 61,041 | 2,273,479 | |
| Basic-Fit NV (a)(c)(d) | 19,912 | 508,182 | |
| BE Semiconductor Industries NV | 28,213 | 2,904,617 | |
| Corbion NV | 22,588 | 390,293 | |
| Eurocommercial Properties NV | 16,089 | 344,561 | |
| Euronext NV (d) | 33,259 | 2,315,591 | |
| EXOR NV | 38,743 | 3,318,052 | |
| Flow Traders Ltd. (c) | 12,426 | 227,065 | |
| Fugro NV (Certificaten Van Aandelen) (a) | 43,274 | 713,838 | |
| Heineken Holding NV | 46,764 | 3,552,735 | |
| Heineken NV (Bearer) | 105,226 | 9,453,867 | |
| IMCD NV | 22,579 | 2,711,610 | |
| ING Groep NV (Certificaten Van Aandelen) | 1,328,913 | 17,037,368 | |
| JDE Peet's BV | 42,781 | 1,187,795 | |
| Koninklijke Ahold Delhaize NV | 351,944 | 10,426,974 | |
| Koninklijke BAM Groep NV | 126,325 | 260,913 | |
| Koninklijke KPN NV | 1,171,588 | 3,937,917 | |
| Koninklijke Philips Electronics NV (c) | 344,012 | 6,543,960 | |
| Koninklijke Vopak NV | 25,605 | 861,817 | |
| NN Group NV | 97,798 | 3,136,615 | |
| NSI NV | 9,172 | 165,565 | |
| OCI NV | 38,660 | 900,344 | |
| Pharming Group NV (a) | 290,093 | 342,553 | |
| PostNL NV | 134,569 | 250,388 | |
| Randstad NV | 40,406 | 2,088,085 | |
| Redcare Pharmacy NV (a)(d) | 5,486 | 610,949 | |
| SBM Offshore NV | 53,589 | 666,255 | |
| Shell PLC (London) | 2,458,856 | 79,241,191 | |
| Signify NV (d) | 48,031 | 1,243,096 | |
| Stellantis NV (Italy) | 813,395 | 15,147,497 | |
| TKH Group NV (bearer) (depositary receipt) | 16,305 | 594,860 | |
| TomTom Group BV (a)(c) | 29,325 | 175,313 | |
| Universal Music Group NV | 303,949 | 7,443,356 | |
| Van Lanschot Kempen NV (Bearer) | 13,943 | 373,991 | |
| Wereldhave NV | 14,371 | 216,381 | |
| Wolters Kluwer NV | 94,321 | 12,085,907 | |
TOTAL NETHERLANDS | 317,357,832 | ||
| New Zealand - 0.2% | |||
| Air New Zealand Ltd. | 677,149 | 264,279 | |
| Auckland International Airport Ltd. | 460,067 | 1,967,833 | |
| Contact Energy Ltd. | 284,206 | 1,290,997 | |
| Fisher & Paykel Healthcare Corp. | 212,890 | 2,582,274 | |
| Fletcher Building Ltd. | 315,521 | 795,179 | |
| Goodman Property Trust | 430,537 | 508,708 | |
| Infratil Ltd. | 301,248 | 1,724,956 | |
| Kiwi Property Group Ltd. | 650,654 | 296,424 | |
| Mercury Nz Ltd. | 259,456 | 892,514 | |
| Meridian Energy Ltd. | 486,337 | 1,369,701 | |
| Ryman Healthcare Ltd. | 216,927 | 719,180 | |
| Spark New Zealand Ltd. | 683,680 | 1,984,807 | |
| Summerset Group Holdings Ltd. | 91,739 | 520,987 | |
| The a2 Milk Co. Ltd. (a) | 275,452 | 670,929 | |
| Xero Ltd. (a) | 54,802 | 3,746,663 | |
TOTAL NEW ZEALAND | 19,335,431 | ||
| Nigeria - 0.0% | |||
| Airtel Africa PLC (d) | 357,374 | 492,141 | |
| Norway - 0.5% | |||
| Aker ASA (A Shares) | 8,323 | 499,189 | |
| Aker BP ASA | 122,201 | 3,512,570 | |
| Aker Solutions ASA | 98,843 | 393,923 | |
| Austevoll Seafood ASA | 36,887 | 251,946 | |
| BlueNord ASA (a) | 10,579 | 561,577 | |
| Bonheur A/S | 9,564 | 165,408 | |
| Borregaard ASA | 37,851 | 512,995 | |
| Crayon Group Holding A/S (a)(c)(d) | 28,278 | 163,021 | |
| DNB Bank ASA | 333,103 | 6,002,501 | |
| DNO ASA (A Shares) | 194,432 | 197,896 | |
| Elkem ASA (d) | 120,865 | 186,962 | |
| Entra ASA (d) | 28,259 | 220,462 | |
| Equinor ASA | 331,490 | 11,112,611 | |
| Europris ASA (d) | 68,102 | 385,594 | |
| FLEX LNG Ltd. | 11,711 | 358,534 | |
| Frontline PLC | 49,012 | 1,093,792 | |
| Gjensidige Forsikring ASA | 73,928 | 1,107,171 | |
| Golden Ocean Group Ltd. | 53,171 | 392,680 | |
| Grieg Seafood ASA (c) | 23,751 | 157,653 | |
| Hexagon Composites ASA (a) | 61,404 | 144,785 | |
| Hexagon Purus Holding A/S (a) | 61,299 | 56,191 | |
| Hoegh Autoliners ASA | 36,651 | 296,267 | |
| Kitron ASA | 68,107 | 179,246 | |
| Kongsberg Gruppen ASA | 33,233 | 1,356,576 | |
| Leroy Seafood Group ASA | 103,371 | 409,007 | |
| Mowi ASA | 160,332 | 2,602,124 | |
| MPC Container Ships ASA | 147,508 | 208,303 | |
| NEL ASA (a)(c) | 630,316 | 413,028 | |
| Nordic VLSI ASA (a)(c) | 60,654 | 489,534 | |
| Norsk Hydro ASA | 492,036 | 2,805,937 | |
| Norwegian Air Shuttle A/S (a) | 300,266 | 215,410 | |
| Orkla ASA | 270,705 | 1,864,483 | |
| PGS ASA (a) | 346,136 | 312,642 | |
| Protector Forsikring ASA | 25,625 | 401,432 | |
| Salmar ASA | 26,731 | 1,265,367 | |
| Schibsted ASA: | |||
| (A Shares) | 26,769 | 534,855 | |
| (B Shares) | 35,681 | 661,176 | |
| Sparebank 1 Sr Bank ASA (primary capital certificate) | 67,601 | 733,442 | |
| Sparebanken Midt-Norge | 50,284 | 609,478 | |
| Sparebanken Nord-Norge | 42,069 | 355,504 | |
| Stolt-Nielsen SA | 15,187 | 499,619 | |
| Storebrand ASA (A Shares) | 166,949 | 1,391,970 | |
| Telenor ASA | 253,413 | 2,589,493 | |
| TGS ASA | 47,774 | 650,903 | |
| Tomra Systems ASA | 87,147 | 688,847 | |
| Veidekke ASA | 50,909 | 439,321 | |
| Wallenius Wilhelmsen ASA | 40,073 | 336,305 | |
TOTAL NORWAY | 49,787,730 | ||
| Peru - 0.0% | |||
| Compania de Minas Buenaventura SAA sponsored ADR | 88,053 | 713,229 | |
| Credicorp Ltd. (United States) | 25,049 | 3,130,123 | |
TOTAL PERU | 3,843,352 | ||
| Philippines - 0.2% | |||
| Aboitiz Equity Ventures, Inc. | 645,430 | 519,839 | |
| Alliance Global Group, Inc. | 1,237,200 | 232,657 | |
| Ayala Corp. | 104,135 | 1,110,744 | |
| Ayala Land, Inc. | 2,550,300 | 1,251,900 | |
| Bank of the Philippine Islands (BPI) | 728,941 | 1,289,318 | |
| BDO Unibank, Inc. | 871,344 | 1,956,717 | |
| Bloomberry Resorts Corp. (a) | 1,510,300 | 241,757 | |
| Century Pacific Food, Inc. | 528,700 | 260,337 | |
| Converge ICT Solutions, Inc. (a) | 1,112,100 | 163,838 | |
| GT Capital Holdings, Inc. | 39,140 | 377,794 | |
| International Container Terminal Services, Inc. | 379,360 | 1,340,892 | |
| JG Summit Holdings, Inc. | 1,019,490 | 659,712 | |
| Jollibee Food Corp. | 169,160 | 610,028 | |
| Manila Electric Co. | 111,200 | 694,447 | |
| Megaworld Corp. | 4,538,000 | 158,135 | |
| Metropolitan Bank & Trust Co. | 694,868 | 639,216 | |
| PLDT, Inc. | 29,675 | 632,592 | |
| PUREGOLD Price Club, Inc. | 530,300 | 254,953 | |
| Robinsons Land Corp. | 804,656 | 197,341 | |
| Security Bank Corp. | 196,350 | 268,220 | |
| SM Investments Corp. | 88,785 | 1,251,846 | |
| SM Prime Holdings, Inc. | 3,754,600 | 1,981,769 | |
| TELUS International, Inc. (a) | 42,138 | 269,829 | |
| Universal Robina Corp. | 340,510 | 654,889 | |
| Wilcon Depot, Inc. | 632,300 | 222,105 | |
TOTAL PHILIPPINES | 17,240,875 | ||
| Poland - 0.3% | |||
| Alior Bank SA (a) | 34,229 | 537,808 | |
| Allegro.eu SA (a)(d) | 177,618 | 1,271,396 | |
| Asseco Poland SA | 20,532 | 375,587 | |
| Bank Millennium SA (a) | 245,005 | 425,787 | |
| Bank Polska Kasa Opieki SA | 68,042 | 2,062,882 | |
| Budimex SA | 4,820 | 537,838 | |
| CCC SA (a) | 18,882 | 178,418 | |
| CD Projekt RED SA | 24,214 | 603,618 | |
| Cyfrowy Polsat SA | 96,176 | 299,462 | |
| Dino Polska SA (a)(d) | 18,231 | 1,724,826 | |
| ENEA SA (a) | 115,950 | 200,818 | |
| Grupa Kety SA | 3,970 | 669,199 | |
| InPost SA (a) | 75,085 | 741,086 | |
| Jastrzebska Spolka Weglowa SA (a) | 23,265 | 275,841 | |
| KGHM Polska Miedz SA (Bearer) | 52,202 | 1,391,169 | |
| Kruk SA | 6,768 | 747,813 | |
| LPP SA | 409 | 1,316,708 | |
| mBank SA (a) | 5,675 | 700,340 | |
| Orange Polska SA | 258,486 | 478,918 | |
| Orlen SA | 205,752 | 3,248,420 | |
| PGE Polska Grupa Energetyczna SA (a) | 335,800 | 581,823 | |
| Powszechna Kasa Oszczednosci Bank SA (a) | 320,797 | 3,314,558 | |
| Powszechny Zaklad Ubezpieczen SA | 221,473 | 2,503,372 | |
| Santander Bank Polska SA (a) | 13,258 | 1,436,581 | |
| Tauron Polska Energia SA (a) | 435,078 | 382,083 | |
| Text SA | 8,417 | 226,609 | |
TOTAL POLAND | 26,232,960 | ||
| Portugal - 0.1% | |||
| Banco Comercial Portugues SA (Reg.) (a) | 3,105,024 | 951,459 | |
| CTT Correios de Portugal SA | 85,833 | 327,406 | |
| Energias de Portugal SA | 1,127,333 | 4,735,539 | |
| Galp Energia SGPS SA Class B | 178,173 | 2,678,938 | |
| Greenvolt-Energias Renovaveis SA (a)(c) | 34,377 | 229,522 | |
| Jeronimo Martins SGPS SA | 103,286 | 2,380,269 | |
| NOS SGPS | 102,774 | 375,606 | |
| REN - Redes Energeticas Nacionais SGPS SA | 198,801 | 517,464 | |
| Sonae SGPS SA | 414,044 | 406,995 | |
| The Navigator Co. SA | 92,808 | 369,233 | |
TOTAL PORTUGAL | 12,972,431 | ||
| Qatar - 0.2% | |||
| Barwa Real Estate Co. (a) | 780,715 | 542,491 | |
| Doha Bank | 1,041,389 | 433,316 | |
| Dukhan Bank | 685,514 | 682,690 | |
| Estithmar Holding QPSC (a) | 370,272 | 205,424 | |
| Gulf International Services QSC (a) | 393,685 | 296,264 | |
| Industries Qatar QSC (a) | 590,665 | 1,982,402 | |
| Masraf al Rayan | 2,036,045 | 1,174,319 | |
| Medicare Group | 110,295 | 163,277 | |
| Mesaieed Petrochemical Holding Co. (a) | 1,606,988 | 701,761 | |
| Ooredoo QSC | 298,947 | 812,026 | |
| Qatar Aluminum Manufacturing Co. (a) | 1,147,522 | 390,176 | |
| Qatar Electricity & Water Co. (a) | 165,399 | 751,359 | |
| Qatar Fuel Co. (a) | 231,813 | 945,461 | |
| Qatar Gas Transport Co. Ltd. (Nakilat) (a) | 918,555 | 888,029 | |
| Qatar International Islamic Bank QSC (a) | 375,916 | 955,019 | |
| Qatar Islamic Bank | 627,721 | 2,999,820 | |
| Qatar National Bank SAQ | 1,694,301 | 6,928,905 | |
| Qatar Navigation QPSC | 219,109 | 542,266 | |
| The Commercial Bank of Qatar (a) | 1,178,358 | 1,658,957 | |
| United Development Co. (a) | 737,213 | 197,009 | |
| Vodafone Qatar QSC (a) | 790,707 | 386,558 | |
TOTAL QATAR | 23,637,529 | ||
| Romania - 0.0% | |||
| NEPI Rockcastle PLC | 199,201 | 1,075,872 | |
| Russia - 0.0% | |||
| Aeroflot Pjsc (a)(b) | 402,869 | 28,687 | |
| Alrosa Co. Ltd. (b) | 739,283 | 123,020 | |
| Credit Bank of Moscow (a)(b) | 4,537,000 | 45,272 | |
| Detsky Mir PJSC (a)(b)(d) | 227,830 | 37,736 | |
| Gazprom OAO (b) | 3,442,771 | 360,339 | |
| Inter Rao Ues JSC (b) | 11,220,073 | 61,874 | |
| LUKOIL PJSC (b) | 120,075 | 37,175 | |
| MMC Norilsk Nickel PJSC (a)(b) | 18,318 | 121,855 | |
| Mobile TeleSystems OJSC sponsored ADR (a)(b) | 173,383 | 172,688 | |
| Moscow Exchange MICEX-RTS OAO (b) | 449,874 | 86,499 | |
| Novatek PJSC GDR (Reg. S) (a)(b) | 26,560 | 1,381,120 | |
| Novolipetsk Steel OJSC (a)(b) | 409,801 | 3,935 | |
| Ozon Holdings PLC ADR (a)(b) | 17,054 | 35,737 | |
| PhosAgro PJSC: | |||
| GDR (Reg. S) (a)(b) | 43,237 | 887 | |
| sponsored GDR (Reg. S) (a)(b) | 277 | 6 | |
| Polyus PJSC (a)(b) | 10,038 | 23,611 | |
| Rosneft Oil Co. OJSC (b) | 315,946 | 52,851 | |
| Rostelecom PJSC (b) | 298,140 | 66,578 | |
| Sberbank of Russia (b) | 3,156,853 | 19,414 | |
| Segezha Group PJSC (a)(b)(d) | 1,842,700 | 27,597 | |
| Severstal PAO (a)(b) | 63,766 | 1,424 | |
| Sistema JSFC GDR (Reg. S) (a)(b) | 40,315 | 71,280 | |
| Surgutneftegas OJSC (b) | 2,091,286 | 25,596 | |
| Tatneft PAO (b) | 399,435 | 49,693 | |
| TCS Group Holding PLC GDR (a)(b) | 36,283 | 46,213 | |
| Unipro PJSC (a)(b) | 8,778,000 | 28,008 | |
| United Co. RUSAL International PJSC (b) | 983,490 | 118,556 | |
| VK Co. Ltd. GDR (Reg. S) (a)(b) | 39,795 | 11,825 | |
| VTB Bank OJSC (a)(b) | 963,847,980 | 36,833 | |
| X5 Retail Group NV GDR (Reg. S) (a)(b) | 33,857 | 7,990 | |
| Yandex NV Class A (a)(b) | 90,012 | 336,143 | |
TOTAL RUSSIA | 3,420,442 | ||
| Saudi Arabia - 1.1% | |||
| Abdullah Al Othaim Markets Co. | 172,467 | 598,550 | |
| ACWA Power Co. | 36,473 | 2,206,891 | |
| Advanced Petrochemicals Co. | 51,029 | 507,352 | |
| Al Hammadi Co. for Development and Investment | 35,605 | 512,493 | |
| Al Masane Al Kobra Mining Co. | 19,605 | 275,398 | |
| Al Moammar Information Systems Co. | 8,136 | 294,940 | |
| Al Rajhi Bank | 716,121 | 12,808,327 | |
| Al Rajhi Co. for Co-operative Insurance (a) | 8,226 | 326,268 | |
| Al-Dawaa Medical Services Co. | 15,356 | 387,625 | |
| Aldrees Petroleum and Transport Services Co. | 15,114 | 473,773 | |
| Alinma Bank | 359,920 | 3,156,351 | |
| Alkhorayef Water & Power Technologies Co. | 8,171 | 297,951 | |
| Almarai Co. Ltd. | 93,119 | 1,387,502 | |
| Alujain Corp. (a) | 17,771 | 179,055 | |
| Arab National Bank | 249,180 | 1,578,131 | |
| Arabian Contracting Services Co. | 6,398 | 344,151 | |
| Arabian Internet and Communications Services Co. Ltd. | 9,054 | 754,902 | |
| Astra Industrial Group | 16,481 | 399,768 | |
| Bank Al-Jazira (a) | 158,697 | 692,047 | |
| Bank Albilad | 180,740 | 1,792,176 | |
| Banque Saudi Fransi | 218,163 | 2,084,749 | |
| Bupa Arabia for Cooperative Insurance Co. | 28,526 | 1,619,586 | |
| Catrion Catering Holding Co. | 16,821 | 468,097 | |
| Dallah Healthcare Co. | 13,475 | 531,587 | |
| Dar Al Arkan Real Estate Development Co. (a) | 194,604 | 783,271 | |
| Dr Sulaiman Al Habib Medical Services Group Co. | 32,688 | 2,195,697 | |
| Elm Co. | 8,826 | 1,649,640 | |
| Emaar The Economic City (a) | 153,197 | 298,913 | |
| Etihad Etisalat Co. | 141,631 | 1,740,375 | |
| Jadwa (REIT) Saudi Fund | 80,634 | 277,263 | |
| Jahez International Co. (a) | 2,306 | 271,070 | |
| Jarir Marketing Co. | 226,166 | 872,930 | |
| Leejam Sports Co. JSC | 12,432 | 508,998 | |
| Luberef | 19,630 | 674,984 | |
| Middle East Healthcare Co. (a) | 16,256 | 298,983 | |
| Mobile Telecommunications Co. Saudi Arabia | 170,541 | 627,323 | |
| Mouwasat Medical Services Co. | 36,419 | 970,759 | |
| Nahdi Medical Co. | 15,317 | 578,940 | |
| National Co. for Learning & Education | 7,289 | 191,570 | |
| National Gas & Industrialization Co. | 17,276 | 267,088 | |
| National Industrialization Co. (a) | 136,443 | 422,611 | |
| National Medical Care Co. | 10,833 | 354,016 | |
| Northern Region Cement Co. | 95,467 | 260,577 | |
| Power & Water Utility Co. for Jubail & Yanbu | 33,032 | 478,980 | |
| Qassim Cement Co. | 22,780 | 381,326 | |
| Rabigh Refining & Petrochemical Co. (a) | 166,857 | 448,320 | |
| Riyad (REIT) Fund | 94,785 | 205,659 | |
| Riyad Bank | 551,190 | 3,900,761 | |
| Riyadh Cables Group Co. | 15,964 | 311,484 | |
| Sabic Agriculture-Nutrients Co. | 86,618 | 3,089,212 | |
| Sahara International Petrochemical Co. | 134,712 | 1,158,029 | |
| Saudi Arabian Mining Co. | 476,522 | 4,572,660 | |
| Saudi Arabian Oil Co. (d) | 940,448 | 8,347,617 | |
| Saudi Automotive Services Co. | 17,530 | 266,342 | |
| Saudi Awwal Bank | 385,669 | 3,438,700 | |
| Saudi Basic Industries Corp. | 323,279 | 6,635,164 | |
| Saudi Cement Co. | 34,965 | 463,205 | |
| Saudi Chemical Co. Holding | 247,506 | 263,894 | |
| Saudi Dairy & Foodstuffs Co. | 6,560 | 524,576 | |
| Saudi Electricity Co. | 299,083 | 1,419,042 | |
| Saudi Ground Services Co. (a) | 38,010 | 295,338 | |
| Saudi Industrial Investment Group | 142,515 | 910,187 | |
| Saudi Investment Bank/The | 192,647 | 754,854 | |
| Saudi Kayan Petrochemical Co. (a) | 280,234 | 790,296 | |
| Saudi Pharmaceutical Industries & Medical Appliances Corp. (a) | 30,289 | 239,787 | |
| Saudi Real Estate Co. (a) | 77,781 | 247,964 | |
| Saudi Research & Marketing Group (a) | 14,103 | 530,047 | |
| Saudi Tadawul Group Holding Co. | 18,026 | 798,572 | |
| Saudi Telecom Co. | 737,438 | 7,548,145 | |
| Seera Group Holding (a) | 60,861 | 382,855 | |
| Southern Province Cement Co. | 31,635 | 343,199 | |
| The Co. for Cooperative Insurance | 24,697 | 795,233 | |
| The National Agriculture Development Co. (a) | 29,544 | 360,283 | |
| The Saudi National Bank | 1,087,539 | 9,725,699 | |
| The Savola Group | 101,749 | 987,222 | |
| United Electronics Co. | 17,671 | 377,292 | |
| United International Transportation Co. | 18,219 | 326,345 | |
| Yamama Cement Co. (a) | 46,569 | 359,980 | |
| Yanbu Cement Co. | 37,788 | 324,838 | |
| Yanbu National Petrochemical Co. | 104,658 | 1,055,898 | |
TOTAL SAUDI ARABIA | 109,981,683 | ||
| Singapore - 1.0% | |||
| AEM Holdings Ltd. | 98,100 | 247,981 | |
| AIMS APAC (REIT) | 342,800 | 300,413 | |
| BW LPG Ltd. (d) | 30,752 | 434,951 | |
| CapitaLand Ascendas REIT | 1,411,641 | 2,682,181 | |
| Capitaland Ascott Trust unit | 1,020,557 | 671,022 | |
| Capitaland India Trust | 459,924 | 322,381 | |
| CapitaLand Investment Ltd. | 1,008,725 | 2,165,919 | |
| CapitaMall Trust | 1,944,437 | 2,499,031 | |
| CapitaRetail China Trust | 506,874 | 292,421 | |
| CDL Hospitality Trusts unit | 346,124 | 244,727 | |
| City Developments Ltd. | 205,100 | 946,703 | |
| ComfortDelgro Corp. Ltd. | 829,600 | 801,281 | |
| DBS Group Holdings Ltd. | 656,775 | 15,777,924 | |
| Digital Core (REIT) | 323,500 | 163,523 | |
| ESR-LOGOS (REIT) | 3,352,097 | 672,367 | |
| Far East Hospitality Trust unit | 641,100 | 276,823 | |
| Frasers Centrepoint Trust | 350,783 | 530,649 | |
| Frasers Logistics & Industrial Trust | 1,107,465 | 841,239 | |
| Genting Singapore Ltd. | 2,273,300 | 1,428,213 | |
| Grab Holdings Ltd. (a)(c) | 708,924 | 2,176,397 | |
| Hafnia Ltd. | 107,229 | 703,600 | |
| iFast Corp. Ltd. | 56,900 | 274,666 | |
| Jardine Cycle & Carriage Ltd. | 36,500 | 751,892 | |
| Kenon Holdings Ltd. | 9,222 | 168,606 | |
| Keppel (REIT) (e) | 796,834 | 462,691 | |
| Keppel Corp. Ltd. | 529,200 | 2,402,222 | |
| Keppel DC (REIT) | 487,274 | 601,345 | |
| Keppel Infrastructure Trust | 1,307,835 | 419,851 | |
| Lendlease Global Commercial (REIT) | 844,700 | 314,615 | |
| Mapletree Industrial (REIT) | 823,027 | 1,293,719 | |
| Mapletree Logistics Trust (REIT) | 1,215,070 | 1,304,803 | |
| Mapletree Pan Asia Commercial Trust | 1,011,015 | 982,611 | |
| NetLink NBN Trust | 1,072,069 | 650,056 | |
| Olam Group Ltd. | 402,300 | 291,521 | |
| Oversea-Chinese Banking Corp. Ltd. | 1,204,378 | 11,165,928 | |
| PARAGON REIT | 640,700 | 371,856 | |
| Parkway Life REIT | 144,300 | 354,006 | |
| Raffles Medical Group Ltd. | 324,755 | 282,576 | |
| Sasseur (REIT) | 479,900 | 219,114 | |
| SATS Ltd. (a) | 408,737 | 735,287 | |
| Sea Ltd. ADR (a) | 137,115 | 5,717,696 | |
| Seatrium Ltd. (a) | 17,044,619 | 1,395,939 | |
| Sembcorp Industries Ltd. | 347,700 | 1,166,501 | |
| Sheng Siong Group Ltd. | 317,500 | 359,467 | |
| SIA Engineering Co. Ltd. | 118,400 | 198,151 | |
| Singapore Airlines Ltd. | 556,450 | 2,484,694 | |
| Singapore Exchange Ltd. | 306,600 | 2,122,795 | |
| Singapore Post Ltd. | 659,100 | 216,473 | |
| Singapore Technologies Engineering Ltd. | 558,900 | 1,534,325 | |
| Singapore Telecommunications Ltd. | 3,069,600 | 5,333,964 | |
| Starhill Global (REIT) | 725,783 | 236,117 | |
| StarHub Ltd. | 280,800 | 211,416 | |
| STMicroelectronics NV (France) | 254,376 | 9,696,841 | |
| Suntec (REIT) | 740,000 | 594,671 | |
| The Hour Glass Ltd. | 112,700 | 137,040 | |
| United Overseas Bank Ltd. | 457,314 | 9,020,382 | |
| UOL Group Ltd. | 194,531 | 837,813 | |
| Venture Corp. Ltd. | 105,400 | 899,940 | |
| Yangzijiang Financial Holding Ltd. | 964,400 | 225,792 | |
TOTAL SINGAPORE | 99,617,128 | ||
| South Africa - 0.9% | |||
| Absa Group Ltd. | 316,547 | 2,885,991 | |
| Aeci Ltd. | 50,517 | 299,267 | |
| African Rainbow Minerals Ltd. | 44,700 | 368,345 | |
| Anglo American Platinum Ltd. | 25,715 | 859,179 | |
| Anglo American PLC (United Kingdom) | 471,271 | 12,007,802 | |
| Aspen Pharmacare Holdings Ltd. | 135,977 | 1,235,120 | |
| Astral Foods Ltd. | 20,586 | 161,319 | |
| AVI Ltd. (c) | 129,839 | 484,941 | |
| Barloworld Ltd. | 64,748 | 272,332 | |
| Bid Corp. Ltd. | 121,977 | 2,587,712 | |
| Bidvest Group Ltd./The | 105,462 | 1,492,793 | |
| Burstone Group Ltd. | 385,772 | 153,170 | |
| Capitec Bank Holdings Ltd. | 33,061 | 2,935,604 | |
| Clicks Group Ltd. | 88,473 | 1,303,728 | |
| Coronation Fund Managers Ltd. | 100,861 | 163,488 | |
| DataTec Ltd. | 87,094 | 164,725 | |
| Dis-Chem Pharmacies Ltd. (d) | 197,680 | 258,906 | |
| Discovery Ltd. | 191,009 | 1,317,770 | |
| DRDGOLD Ltd. | 175,769 | 154,194 | |
| Equites Property Fund Ltd. | 307,798 | 189,097 | |
| Exxaro Resources Ltd. | 89,216 | 894,960 | |
| FirstRand Ltd. | 1,813,194 | 5,977,338 | |
| Fortress Real Estate Investmen Class A (a) | 608,081 | 427,084 | |
| Foschini Group Ltd./The | 127,552 | 689,243 | |
| Gold Fields Ltd. | 329,280 | 4,343,845 | |
| Growthpoint Properties Ltd. | 1,421,522 | 739,077 | |
| Harmony Gold Mining Co. Ltd. | 206,817 | 948,229 | |
| Hosken Consolidated Investment Ltd. | 22,337 | 233,731 | |
| Hyprop Investments Ltd. | 137,456 | 209,162 | |
| Impala Platinum Holdings Ltd. | 333,777 | 1,390,379 | |
| Investec Ltd. | 91,596 | 501,143 | |
| JSE Ltd. | 39,566 | 187,879 | |
| Kumba Iron Ore Ltd. | 24,039 | 636,938 | |
| Life Healthcare Group Holdings Ltd. | 515,962 | 514,093 | |
| Momentum Metropolitan Holdings | 479,476 | 539,483 | |
| Motus Holdings Ltd. | 70,893 | 351,926 | |
| Mr Price Group Ltd. | 97,216 | 702,668 | |
| MTN Group Ltd. | 630,203 | 3,076,371 | |
| MultiChoice Group Ltd. (a) | 129,275 | 484,222 | |
| Naspers Ltd. Class N | 71,946 | 11,230,833 | |
| Nedbank Group Ltd. | 162,860 | 1,752,640 | |
| Netcare Ltd. | 509,441 | 352,884 | |
| Ninety One Ltd. | 83,958 | 164,064 | |
| Northam Platinum Holdings Ltd. | 135,055 | 815,149 | |
| Old Mutual Ltd. | 1,729,670 | 1,099,750 | |
| Omnia Holdings Ltd. | 76,579 | 237,780 | |
| OUTsurance Group Ltd. | 311,498 | 673,889 | |
| Pepkor Holdings Ltd. (d) | 842,922 | 768,862 | |
| Pick 'n Pay Stores Ltd. | 144,486 | 193,811 | |
| PSG Financial Services Ltd. | 409,032 | 317,350 | |
| Redefine Properties Ltd. | 2,466,357 | 463,166 | |
| Remgro Ltd. | 185,240 | 1,432,026 | |
| Resilient Property Income Fund Ltd. | 110,308 | 219,876 | |
| Sanlam Ltd. | 633,912 | 2,223,411 | |
| Santam Ltd. | 18,132 | 265,683 | |
| Sappi Ltd. | 213,620 | 449,419 | |
| Sasol Ltd. | 215,370 | 2,722,221 | |
| Scatec Solar AS (d) | 44,400 | 223,770 | |
| Shoprite Holdings Ltd. | 181,704 | 2,328,444 | |
| Sibanye-Stillwater Ltd. | 1,073,215 | 1,368,942 | |
| Spar Group Ltd./The (c) | 71,876 | 433,859 | |
| Standard Bank Group Ltd. | 487,147 | 4,780,379 | |
| Super Group Ltd./South Africa | 143,483 | 244,662 | |
| Telkom SA Ltd. (a) | 116,367 | 136,425 | |
| Thungela Resources Ltd. | 49,913 | 445,474 | |
| Tiger Brands Ltd. | 60,746 | 561,878 | |
| Truworths International Ltd. | 146,327 | 592,767 | |
| Vodacom Group Ltd. | 221,495 | 1,205,788 | |
| Vukile Property Fund Ltd. | 343,462 | 229,067 | |
| Woolworths Holdings Ltd. | 352,319 | 1,311,733 | |
TOTAL SOUTH AFRICA | 91,389,256 | ||
| Spain - 1.5% | |||
| Acciona SA | 8,971 | 1,129,574 | |
| Acerinox SA | 73,764 | 717,901 | |
| ACS Actividades de Construccion y Servicios SA | 81,036 | 2,929,879 | |
| Aena SME SA (d) | 27,538 | 3,984,616 | |
| Almirall SA | 33,336 | 302,994 | |
| Amadeus IT Holding SA Class A | 164,858 | 9,388,159 | |
| AmRest Holdings NV (a) | 38,617 | 244,791 | |
| Applus Services SA | 52,826 | 556,157 | |
| Atresmedia Corporacion de Medios de Comunicacion SA | 49,558 | 185,523 | |
| Banco Bilbao Vizcaya Argentaria SA | 2,193,527 | 17,256,992 | |
| Banco de Sabadell SA | 2,083,822 | 2,581,929 | |
| Banco Santander SA (Spain) | 5,969,118 | 21,890,992 | |
| Bankinter SA | 250,581 | 1,580,763 | |
| Befesa SA (d) | 15,602 | 454,643 | |
| CaixaBank SA | 1,524,983 | 6,199,881 | |
| Cellnex Telecom SA (d) | 209,731 | 6,165,275 | |
| Cie Automotive SA | 20,111 | 511,984 | |
| Compania de Distribucion Integral Logista Holdings SA | 27,833 | 682,653 | |
| Construcciones y Auxiliar de Ferrocarriles | 7,697 | 229,666 | |
| Corp. ACCIONA Energias Renovables SA | 24,833 | 672,135 | |
| Ebro Foods SA | 28,580 | 486,267 | |
| EDP Renovaveis SA | 118,531 | 1,905,094 | |
| eDreams ODIGEO SA (a) | 66,548 | 426,712 | |
| Enagas SA | 95,481 | 1,595,744 | |
| Ence Energia y Celulosa SA | 63,839 | 190,621 | |
| Endesa SA | 115,769 | 2,176,127 | |
| Faes Farma SA | 135,093 | 423,823 | |
| Fluidra SA | 35,751 | 628,704 | |
| Gestamp Automocion SA (d) | 69,951 | 256,981 | |
| Global Dominion Access SA (d) | 64,248 | 208,701 | |
| Grifols SA (a) | 110,097 | 1,233,085 | |
| Iberdrola SA | 2,210,618 | 24,586,533 | |
| Indra Sistemas SA | 47,484 | 665,717 | |
| Industria de Diseno Textil SA (c) | 396,100 | 13,642,141 | |
| Inmobiliaria Colonial SA | 109,796 | 614,567 | |
| Laboratorios Farmaceuticos ROVI SA | 8,361 | 446,320 | |
| Lar Espana Real Estate Socimi SA | 32,223 | 186,841 | |
| Linea Directa Aseguradora SA Compania de Seguros y Reaseguros | 264,227 | 227,577 | |
| MAPFRE SA (Reg.) | 350,228 | 727,071 | |
| Melia Hotels International SA (a)(c) | 59,602 | 330,775 | |
| Merlin Properties Socimi SA | 118,638 | 986,673 | |
| Naturgy Energy Group SA | 42,996 | 1,214,692 | |
| Pharma Mar SA | 6,657 | 226,809 | |
| Prosegur Compania de Seguridad SA (Reg.) | 104,772 | 156,533 | |
| Redeia Corp. SA | 155,947 | 2,426,436 | |
| Repsol SA | 480,095 | 7,022,941 | |
| Sacyr SA | 179,090 | 516,564 | |
| Solaria Energia y Medio Ambiente SA (a)(c) | 33,263 | 498,017 | |
| Tecnicas Reunidas SA (a) | 20,159 | 177,361 | |
| Telefonica SA | 1,929,904 | 7,454,523 | |
| Unicaja Banco SA (d) | 537,601 | 558,597 | |
| Vidrala SA | 7,971 | 591,231 | |
| Vidrala SA rights 11/2/23 (a) | 7,971 | 29,393 | |
| Viscofan Envolturas Celulosicas SA | 15,033 | 868,490 | |
TOTAL SPAIN | 151,354,168 | ||
| Sweden - 1.9% | |||
| AAK AB | 65,445 | 1,242,948 | |
| AcadeMedia AB (d) | 44,637 | 184,907 | |
| Addlife AB | 41,572 | 270,755 | |
| AddTech AB (B Shares) | 95,049 | 1,391,362 | |
| AFRY AB (B Shares) | 35,240 | 369,371 | |
| Alfa Laval AB | 105,777 | 3,417,098 | |
| Alimak Group AB (d) | 30,366 | 178,456 | |
| Alleima AB | 86,141 | 523,987 | |
| Arjo AB | 87,910 | 293,442 | |
| ASSA ABLOY AB (B Shares) | 366,753 | 7,817,368 | |
| Atea ASA | 32,347 | 336,473 | |
| Atlas Copco AB: | |||
| (A Shares) | 966,982 | 12,521,471 | |
| (B Shares) | 593,133 | 6,644,713 | |
| Atrium Ljungberg AB (B Shares) | 21,555 | 330,978 | |
| Avanza Bank Holding AB | 45,506 | 766,420 | |
| Axfood AB | 39,543 | 873,581 | |
| Beijer Ref AB (B Shares) | 140,033 | 1,326,007 | |
| Betsson AB (B Shares) | 45,777 | 460,130 | |
| Bilia AB (A Shares) | 28,513 | 264,377 | |
| Billerud AB | 86,817 | 804,981 | |
| BioArctic AB (a)(c)(d) | 13,983 | 282,104 | |
| BioGaia AB | 32,934 | 293,863 | |
| Biotage AB (A Shares) | 25,065 | 255,535 | |
| Boliden AB | 103,958 | 2,661,244 | |
| BONESUPPORT Holding AB (a)(d) | 24,477 | 318,394 | |
| Boozt AB (a)(d) | 22,604 | 157,950 | |
| Bravida Holding AB (d) | 83,327 | 520,306 | |
| Bufab AB | 11,528 | 273,059 | |
| Bure Equity AB | 21,580 | 430,345 | |
| Camurus AB (a) | 11,959 | 358,263 | |
| Castellum AB | 159,554 | 1,523,006 | |
| Catena AB | 12,351 | 408,290 | |
| Cibus Nordic Real Estate AB | 20,208 | 189,273 | |
| Cloetta AB | 115,126 | 184,512 | |
| Coor Service Management Holding AB (d) | 46,173 | 159,171 | |
| Creades AB (A Shares) | 26,291 | 140,141 | |
| Dios Fastigheter AB | 39,135 | 211,584 | |
| Dometic Group AB (d) | 116,981 | 719,967 | |
| Electrolux AB (B Shares) | 80,186 | 672,380 | |
| Electrolux Professional AB | 88,895 | 358,847 | |
| Elekta AB (B Shares) | 129,414 | 879,961 | |
| Embracer Group AB (a) | 279,986 | 454,150 | |
| Epiroc AB: | |||
| (A Shares) | 233,382 | 3,844,903 | |
| (B Shares) | 153,134 | 2,122,279 | |
| EQT AB | 136,139 | 2,474,600 | |
| Ericsson (B Shares) | 1,102,278 | 4,937,908 | |
| Essity AB (B Shares) | 222,694 | 5,073,356 | |
| Evolution AB (d) | 67,414 | 5,990,436 | |
| Fabege AB | 95,525 | 710,803 | |
| Fastighets AB Balder (a) | 234,968 | 993,343 | |
| Fortnox AB | 179,766 | 710,854 | |
| Getinge AB (B Shares) | 83,422 | 1,497,679 | |
| Granges AB | 42,092 | 404,613 | |
| H&M Hennes & Mauritz AB (B Shares) (c) | 238,817 | 3,194,225 | |
| Hemnet Group AB | 36,659 | 636,137 | |
| Hexagon AB (B Shares) | 775,059 | 6,316,449 | |
| Hexatronic Group AB (c) | 61,092 | 142,134 | |
| HEXPOL AB (B Shares) | 97,587 | 862,878 | |
| HMS Networks AB | 10,866 | 359,395 | |
| Holmen AB (B Shares) | 39,331 | 1,482,341 | |
| Hufvudstaden AB (A Shares) | 40,063 | 426,383 | |
| Husqvarna AB (B Shares) | 146,774 | 948,036 | |
| Industrivarden AB: | |||
| (A Shares) | 48,296 | 1,246,940 | |
| (C Shares) | 50,364 | 1,295,821 | |
| Indutrade AB | 98,201 | 1,734,416 | |
| Instalco AB | 81,915 | 228,813 | |
| Intrum AB (c) | 30,834 | 158,003 | |
| Investment AB Latour (B Shares) | 52,446 | 905,623 | |
| Investor AB: | |||
| (A Shares) | 137,265 | 2,492,608 | |
| (B Shares) | 500,302 | 9,161,226 | |
| INVISIO AB | 16,126 | 242,126 | |
| Inwido AB | 22,216 | 226,689 | |
| JM AB (B Shares) | 24,522 | 260,983 | |
| Kinnevik AB (B Shares) (a) | 89,698 | 763,230 | |
| Know IT AB | 11,448 | 143,581 | |
| L E Lundbergforetagen AB | 26,568 | 1,082,242 | |
| Lifco AB | 84,236 | 1,537,951 | |
| Lindab International AB | 28,900 | 444,538 | |
| Loomis AB (B Shares) | 26,732 | 693,059 | |
| Medicover AB Class B | 25,344 | 285,625 | |
| Meko AB | 20,764 | 167,043 | |
| MIPS AB | 9,989 | 245,643 | |
| Modern Times Group MTG AB (B Shares) (a) | 34,943 | 279,702 | |
| Munters Group AB (d) | 48,031 | 584,335 | |
| Mycronic AB | 27,517 | 601,494 | |
| NCC AB (B Shares) | 31,840 | 325,746 | |
| New Wave Group AB (B Shares) | 34,752 | 226,368 | |
| Nibe Industrier AB (B Shares) | 575,703 | 3,310,081 | |
| Nolato AB (B Shares) | 75,555 | 333,696 | |
| Nordnet AB | 50,371 | 710,725 | |
| Nordnet AB (B Shares) (a)(b) | 492 | 0 | |
| Nyfosa AB | 59,729 | 287,878 | |
| OX2 AB (a) | 76,312 | 308,052 | |
| Pandox AB | 33,799 | 331,860 | |
| Paradox Interactive AB | 14,741 | 279,965 | |
| Peab AB | 69,106 | 256,800 | |
| Platzer Fastigheter Holding AB | 31,004 | 162,485 | |
| Ratos AB (B Shares) | 83,260 | 231,376 | |
| Saab AB (B Shares) | 29,436 | 1,508,396 | |
| Sagax AB | 79,681 | 1,438,369 | |
| Sandvik AB | 389,739 | 6,638,432 | |
| Scandic Hotels Group AB (a)(d) | 74,237 | 249,730 | |
| Sdiptech AB (a) | 11,324 | 221,764 | |
| Sectra AB (B Shares) | 50,619 | 546,892 | |
| Securitas AB (B Shares) | 178,009 | 1,423,440 | |
| Sinch AB (a)(d) | 257,422 | 405,973 | |
| Skandinaviska Enskilda Banken AB (A Shares) | 579,197 | 6,449,676 | |
| Skanska AB (B Shares) | 122,848 | 1,841,765 | |
| SKF AB (B Shares) | 126,653 | 2,043,477 | |
| SkiStar AB | 19,775 | 187,786 | |
| SSAB AB: | |||
| (A Shares) | 110,713 | 662,942 | |
| (B Shares) | 213,612 | 1,238,525 | |
| Stillfront Group AB (a) | 175,212 | 181,060 | |
| Storskogen Group AB | 505,890 | 298,482 | |
| Surgical Science Sweden AB (a) | 13,716 | 155,438 | |
| Svenska Cellulosa AB SCA (B Shares) | 222,227 | 3,044,996 | |
| Svenska Handelsbanken AB (A Shares) | 540,878 | 4,611,361 | |
| Sweco AB (B Shares) | 79,561 | 730,575 | |
| Swedbank AB (A Shares) | 315,133 | 5,159,311 | |
| Swedish Orphan Biovitrum AB (a) | 90,069 | 1,851,012 | |
| Tele2 AB (B Shares) | 197,139 | 1,397,684 | |
| Telia Co. AB | 911,440 | 1,932,205 | |
| Thule Group AB (d) | 38,323 | 869,631 | |
| Trelleborg AB (B Shares) | 84,986 | 2,143,979 | |
| Troax Group AB (c) | 16,150 | 258,112 | |
| Truecaller AB (B Shares) (a) | 89,587 | 216,214 | |
| Vestum AB (a)(c) | 316,644 | 98,320 | |
| Vimian Group AB (a)(c) | 65,187 | 147,748 | |
| Vitec Software Group AB | 11,534 | 459,605 | |
| Vitrolife AB (c) | 29,273 | 380,518 | |
| Volvo AB: | |||
| (A Shares) | 128,074 | 2,563,213 | |
| (B Shares) | 488,552 | 9,668,230 | |
| Volvo Car AB (a)(c) | 249,606 | 856,658 | |
| Wallenstam AB (B Shares) | 134,710 | 454,245 | |
| Wihlborgs Fastigheter AB | 101,522 | 656,201 | |
| Xvivo Perfusion AB (a) | 8,632 | 179,407 | |
TOTAL SWEDEN | 189,318,017 | ||
| Switzerland - 3.7% | |||
| ABB Ltd. (Reg.) | 584,560 | 19,639,882 | |
| Accelleron Industries Ltd. | 31,320 | 769,185 | |
| Adecco SA (Reg.) | 58,549 | 2,203,834 | |
| Alcon, Inc. (Switzerland) | 183,133 | 13,049,724 | |
| Allreal Holding AG | 5,352 | 857,826 | |
| ALSO Holding AG | 2,507 | 636,637 | |
| Arbonia AG | 24,221 | 206,091 | |
| Aryzta AG (a) | 401,243 | 733,543 | |
| Autoneum Holding AG (a)(c) | 1,400 | 158,523 | |
| Avolta AG (a) | 36,982 | 1,289,176 | |
| Bachem Holding AG (B Shares) | 12,419 | 895,604 | |
| Baloise Holdings AG | 16,775 | 2,401,039 | |
| Banque Cantonale Vaudoise | 10,974 | 1,237,764 | |
| Barry Callebaut AG | 1,311 | 1,981,669 | |
| Basilea Pharmaceutica AG (a) | 5,933 | 230,237 | |
| Belimo Holding AG (Reg.) | 3,628 | 1,519,560 | |
| Bell Food Group AG | 995 | 295,333 | |
| BKW AG | 8,158 | 1,368,560 | |
| Bossard Holding AG | 2,244 | 461,800 | |
| Bucher Industries AG | 2,500 | 888,803 | |
| Burckhardt Compression Holding AG | 1,195 | 604,298 | |
| Burkhalter Holding AG | 5,532 | 515,708 | |
| Bystronic AG | 565 | 269,565 | |
| Cembra Money Bank AG | 11,597 | 796,166 | |
| Clariant AG (Reg.) | 80,613 | 1,140,537 | |
| Comet Holding AG | 2,930 | 573,664 | |
| Compagnie Financiere Richemont SA Series A | 192,487 | 22,708,753 | |
| Daetwyler Holdings AG | 2,828 | 496,800 | |
| DKSH Holding AG | 13,144 | 804,838 | |
| DocMorris AG (a)(c) | 4,400 | 181,679 | |
| Dorma Kaba Holding AG | 1,250 | 568,900 | |
| Dottikon ES Holding AG (a) | 1,218 | 267,795 | |
| DSM-Firmenich AG | 69,869 | 6,327,531 | |
| EFG International | 35,765 | 427,772 | |
| Emmi AG | 826 | 779,100 | |
| Ems-Chemie Holding AG | 2,517 | 1,715,539 | |
| Flughafen Zuerich AG | 7,302 | 1,358,213 | |
| Forbo Holding AG (Reg.) | 381 | 418,842 | |
| Galenica AG (d) | 18,365 | 1,383,962 | |
| Geberit AG (Reg.) | 12,176 | 5,645,948 | |
| Georg Fischer AG (Reg.) | 30,243 | 1,559,942 | |
| Givaudan SA | 3,413 | 11,331,017 | |
| Helvetia Holding AG (Reg.) | 13,668 | 1,830,113 | |
| Huber+Suhner AG | 7,325 | 500,063 | |
| Idorsia Ltd. (a)(c) | 45,339 | 85,579 | |
| Implenia AG | 5,321 | 165,541 | |
| INFICON Holding AG | 651 | 704,925 | |
| Interroll Holding AG | 255 | 668,581 | |
| Intershop Holding AG | 414 | 274,437 | |
| IWG PLC (a) | 291,563 | 467,782 | |
| Julius Baer Group Ltd. | 76,931 | 4,559,062 | |
| Kardex AG | 2,411 | 464,892 | |
| Komax Holding AG (Reg.) (c) | 1,588 | 313,882 | |
| Kuehne & Nagel International AG | 19,869 | 5,340,483 | |
| Landis+Gyr Group AG | 8,580 | 633,844 | |
| LEM Holding SA | 226 | 457,143 | |
| Leonteq AG | 4,188 | 179,325 | |
| Lindt & Spruengli AG | 38 | 4,135,657 | |
| Lindt & Spruengli AG (participation certificate) | 375 | 4,143,077 | |
| Logitech International SA (Reg.) | 61,213 | 4,788,564 | |
| Lonza Group AG | 27,500 | 9,630,610 | |
| Medacta Group SA (d) | 2,949 | 337,807 | |
| Medartis Holding AG (a)(d) | 1,896 | 149,862 | |
| Medmix AG (d) | 10,044 | 208,245 | |
| Metall Zug AG | 188 | 269,708 | |
| Meyer Burger Technology AG (a)(c) | 1,203,386 | 321,997 | |
| Mobilezone Holding AG | 22,668 | 343,889 | |
| Mobimo Holding AG | 2,657 | 733,147 | |
| Novartis AG | 754,324 | 70,619,486 | |
| OC Oerlikon Corp. AG (Reg.) | 76,897 | 305,339 | |
| Orior AG | 3,675 | 299,769 | |
| Partners Group Holding AG | 8,443 | 8,880,627 | |
| PSP Swiss Property AG | 16,320 | 2,004,006 | |
| Sandoz Group AG | 150,864 | 3,922,315 | |
| Schindler Holding AG: | |||
| (participation certificate) | 13,142 | 2,646,748 | |
| (Reg.) | 10,770 | 2,089,710 | |
| Schweiter Technologies AG | 447 | 249,630 | |
| Sensirion Holding AG (a)(c)(d) | 3,764 | 281,374 | |
| SFS Group AG | 6,926 | 688,298 | |
| SGS SA (Reg.) | 54,101 | 4,399,925 | |
| Siegfried Holding AG | 1,458 | 1,153,225 | |
| Sig Group AG | 112,563 | 2,473,627 | |
| Sika AG | 54,153 | 12,912,423 | |
| SKAN Group AG | 3,910 | 292,718 | |
| Sonova Holding AG | 19,197 | 4,526,748 | |
| St.Galler Kantonalbank AG | 1,197 | 649,392 | |
| Stadler Rail AG (c) | 22,801 | 770,018 | |
| Straumann Holding AG | 41,752 | 4,908,895 | |
| Sulzer AG (Reg.) | 7,320 | 601,115 | |
| Swatch Group AG (Bearer) | 10,088 | 2,575,093 | |
| Swatch Group AG (Bearer) (Reg.) | 21,837 | 1,053,861 | |
| Swiss Life Holding AG | 11,182 | 7,151,858 | |
| Swiss Prime Site AG | 27,157 | 2,519,706 | |
| Swisscom AG | 9,235 | 5,522,827 | |
| Swissquote Group Holding SA | 4,269 | 816,115 | |
| Tecan Group AG | 4,700 | 1,345,441 | |
| Temenos Group AG | 23,322 | 1,670,087 | |
| u-blox Holding AG | 2,803 | 264,076 | |
| UBS Group AG | 1,210,442 | 28,236,772 | |
| Valiant Holding AG | 6,615 | 719,931 | |
| VAT Group AG (d) | 9,860 | 3,476,174 | |
| Vetropack Holding AG | 7,176 | 281,234 | |
| Vontobel Holdings AG | 10,668 | 621,562 | |
| Ypsomed Holding AG | 1,841 | 505,964 | |
| Zehnder Group AG | 4,531 | 234,109 | |
| Zurich Insurance Group Ltd. | 54,361 | 25,732,806 | |
TOTAL SWITZERLAND | 359,812,578 | ||
| Taiwan - 4.4% | |||
| Acbel Polytech, Inc. | 271,161 | 319,557 | |
| Accton Technology Corp. | 185,000 | 2,864,233 | |
| Acer, Inc. | 1,079,000 | 1,139,501 | |
| ADATA Technology Co. Ltd. | 131,333 | 396,192 | |
| Adimmune Corp. (a) | 181,000 | 177,791 | |
| Advanced Energy Solution Holding Co. Ltd. | 14,000 | 266,374 | |
| Advantech Co. Ltd. | 169,696 | 1,741,392 | |
| Alchip Technologies Ltd. | 26,000 | 2,130,784 | |
| Alexander Marine Co. Ltd. | 9,000 | 101,067 | |
| Allied Supreme Corp. | 18,341 | 176,831 | |
| Andes Technology Corp. | 15,000 | 179,344 | |
| AP Memory Technology Corp. | 37,000 | 410,846 | |
| Arcadyan Technology Corp. | 68,000 | 324,455 | |
| Ardentec Corp. | 326,000 | 655,589 | |
| ASE Technology Holding Co. Ltd. | 1,134,718 | 3,969,567 | |
| Asia Cement Corp. | 864,000 | 1,066,110 | |
| Asia Optical Co., Inc. | 119,000 | 222,678 | |
| Asia Pacific Telecom Co. Ltd. (a) | 1,075,723 | 225,313 | |
| Asia Vital Components Co. Ltd. | 120,132 | 1,060,695 | |
| ASMedia Technology, Inc. | 11,000 | 449,844 | |
| ASPEED Tech, Inc. | 12,000 | 958,274 | |
| ASUSTeK Computer, Inc. | 266,000 | 2,786,897 | |
| AUO Corp. | 2,425,800 | 1,173,292 | |
| AURAS Technology Co. Ltd. | 29,000 | 256,377 | |
| Bank of Kaohsiung Co. Ltd. | 24,676 | 8,866 | |
| BizLink Holding, Inc. | 52,847 | 411,498 | |
| Bora Pharmaceuticals Co. Ltd. | 20,782 | 415,954 | |
| Brighton-Best International Taiwan, Inc. | 195,000 | 200,245 | |
| Capital Securities Corp. | 854,490 | 376,341 | |
| Catcher Technology Co. Ltd. | 226,000 | 1,266,860 | |
| Cathay Financial Holding Co. Ltd. | 3,454,155 | 4,683,851 | |
| Center Laboratories, Inc. | 217,683 | 307,038 | |
| Century Iron & Steel Industrial Co. Ltd. | 68,000 | 316,294 | |
| Chailease Holding Co. Ltd. | 583,530 | 3,162,950 | |
| Chang Hwa Commercial Bank | 1,969,538 | 1,042,615 | |
| Chang Wah Technology Co. Ltd. | 220,000 | 219,647 | |
| Charoen Pokphand Enterprise Co. Ltd. | 110,000 | 307,317 | |
| Cheng Loong Corp. | 366,000 | 319,516 | |
| Cheng Shin Rubber Industry Co. Ltd. | 723,000 | 987,250 | |
| Cheng Uei Precision Industries Co. Ltd. | 199,000 | 236,303 | |
| Chicony Electronics Co. Ltd. | 226,125 | 869,853 | |
| Chicony Power Technology Co. Ltd. | 73,000 | 252,543 | |
| Chin-Poon Industrial Co. Ltd. | 206,000 | 221,446 | |
| China Airlines Ltd. | 1,065,000 | 637,929 | |
| China Bills Finance Corp. | 340,000 | 149,356 | |
| China Development Financial Ho (a) | 5,860,957 | 2,047,171 | |
| China Metals Products Co. Ltd. | 253,000 | 273,733 | |
| China Motor Co. Ltd. | 97,800 | 262,013 | |
| China Petrochemical Development Corp. (a) | 1,440,532 | 451,364 | |
| China Steel Chemical Corp. | 74,000 | 271,926 | |
| China Steel Corp. | 4,273,000 | 3,185,433 | |
| Chipbond Technology Corp. | 237,000 | 497,439 | |
| ChipMOS TECHNOLOGIES, Inc. | 243,000 | 307,756 | |
| Chroma ATE, Inc. | 142,000 | 958,840 | |
| Chung Hsin Electric & Machinery Manufacturing Corp. | 154,000 | 444,327 | |
| Chung Hung Steel Co. Ltd. | 406,000 | 270,223 | |
| Chunghwa Telecom Co. Ltd. | 1,354,000 | 4,838,909 | |
| Clevo Co. Ltd. | 218,000 | 210,339 | |
| Compal Electronics, Inc. | 1,647,000 | 1,431,515 | |
| Compeq Manufacturing Co. Ltd. | 401,000 | 655,166 | |
| Coretronic Corp. | 125,000 | 282,195 | |
| CTBC Financial Holding Co. Ltd. | 6,590,960 | 4,959,851 | |
| CTCI Corp. | 257,000 | 312,639 | |
| Delta Electronics, Inc. | 728,000 | 6,555,604 | |
| E Ink Holdings, Inc. | 315,000 | 1,637,722 | |
| E.SUN Financial Holdings Co. Ltd. | 5,117,802 | 3,768,093 | |
| ECLAT Textile Co. Ltd. | 71,060 | 1,130,137 | |
| Ecove Environment Corp. | 28,000 | 268,548 | |
| EirGenix, Inc. (a) | 79,000 | 259,916 | |
| Elan Microelectronics Corp. | 111,500 | 496,661 | |
| Elite Material Co. Ltd. | 101,000 | 1,126,085 | |
| Elite Semiconductor Memory Technology, Inc. | 110,000 | 286,283 | |
| eMemory Technology, Inc. | 24,000 | 1,502,477 | |
| Ennoconn Corp. | 33,920 | 261,624 | |
| ENNOSTAR, Inc. (a) | 252,000 | 321,344 | |
| Episil Technologies, Inc. | 113,398 | 239,812 | |
| Eternal Materials Co. Ltd. | 364,426 | 312,879 | |
| Etron Technology, Inc. | 129,169 | 163,374 | |
| EVA Airways Corp. | 948,040 | 803,332 | |
| Evergreen Aviation Technologies Corp. | 74,000 | 214,589 | |
| Evergreen International Storage & Transport Corp. | 246,000 | 226,957 | |
| Evergreen Marine Corp. (Taiwan) | 386,151 | 1,284,035 | |
| Everlight Electronics Co. Ltd. | 193,000 | 264,233 | |
| Far Eastern Department Stores Co. Ltd. | 352,000 | 260,132 | |
| Far Eastern International Bank | 1,239,000 | 439,884 | |
| Far Eastern New Century Corp. | 1,132,000 | 1,030,585 | |
| Far EasTone Telecommunications Co. Ltd. | 608,000 | 1,423,098 | |
| Faraday Technology Corp. | 85,000 | 800,774 | |
| Feng Hsin Iron & Steel Co. | 190,000 | 368,613 | |
| Feng Tay Enterprise Co. Ltd. | 184,168 | 1,016,160 | |
| First Financial Holding Co. Ltd. | 3,906,771 | 3,123,581 | |
| Fitipower Integrated Technology, Inc. | 34,553 | 285,801 | |
| FLEXium Interconnect, Inc. | 135,940 | 350,346 | |
| FocalTech Systems Co. Ltd. | 86,000 | 214,650 | |
| Formosa Chemicals & Fibre Corp. | 1,279,000 | 2,404,554 | |
| Formosa International Hotel Corp. | 31,000 | 193,436 | |
| Formosa Petrochemical Corp. | 399,000 | 974,021 | |
| Formosa Plastics Corp. | 1,341,000 | 3,186,674 | |
| Formosa Sumco Technology Corp. | 38,000 | 183,015 | |
| Formosa Taffeta Co. Ltd. | 334,000 | 259,591 | |
| Fortune Electric Co. Ltd. | 47,000 | 326,612 | |
| Foxconn Technology Co. Ltd. | 357,010 | 578,814 | |
| Fubon Financial Holding Co. Ltd. | 2,827,723 | 5,254,369 | |
| Fulgent Sun International Holding Co. Ltd. | 56,000 | 222,334 | |
| Fusheng Precision Co. Ltd. | 47,000 | 293,625 | |
| General Interface Solution Holding Ltd. | 132,000 | 227,415 | |
| Genius Electronic Optical Co. Ltd. | 35,792 | 422,212 | |
| Getac Holdings Corp. | 181,000 | 405,565 | |
| Giant Manufacturing Co. Ltd. | 118,734 | 599,925 | |
| Gigabyte Technology Co. Ltd. | 186,000 | 1,262,700 | |
| Global Brands Manufacture Ltd. | 204,000 | 388,822 | |
| Global Unichip Corp. | 32,000 | 1,429,076 | |
| GlobalWafers Co. Ltd. | 80,000 | 1,175,087 | |
| Gloria Material Technology Corp. | 174,000 | 239,992 | |
| Gold Circuit Electronics Ltd. | 132,400 | 723,914 | |
| Goldsun Development & Construction Co. Ltd. | 436,101 | 339,069 | |
| Grand Pacific Petrochemical Corp. | 492,000 | 240,044 | |
| Grape King Bio Ltd. | 57,000 | 260,320 | |
| Great Tree Pharmacy Co. Ltd. | 28,474 | 298,182 | |
| Great Wall Enterprise Co. Ltd. | 274,025 | 429,860 | |
| Greatek Electronics, Inc. | 155,000 | 278,674 | |
| Gudeng Precision Industrial Co. Ltd. | 23,000 | 239,280 | |
| Gudeng Precision Industrial Co. Ltd. rights 11/27/23 (a) | 1,130 | 1,253 | |
| HannStar Display Corp. (a) | 836,000 | 286,228 | |
| Highwealth Construction Corp. | 429,037 | 538,651 | |
| HIWIN Technologies Corp. | 107,218 | 649,256 | |
| Holtek Semiconductor, Inc. | 193,000 | 367,628 | |
| Holy Stone Enterprise Co. Ltd. | 82,950 | 243,019 | |
| Hon Hai Precision Industry Co. Ltd. (Foxconn) | 4,600,600 | 13,720,900 | |
| Hota Industrial Manufacturing Co. Ltd. | 131,014 | 250,548 | |
| Hotai Finance Co. Ltd. | 97,100 | 373,059 | |
| Hotai Motor Co. Ltd. | 112,160 | 2,091,197 | |
| HTC Corp. (a) | 269,000 | 367,997 | |
| Hua Nan Financial Holdings Co. Ltd. | 3,158,806 | 1,979,437 | |
| Huaku Development Co. Ltd. | 97,000 | 273,792 | |
| IBF Financial Holdings Co. Ltd. (a) | 976,081 | 346,162 | |
| Innodisk Corp. | 34,699 | 320,246 | |
| Innolux Corp. | 3,206,003 | 1,207,627 | |
| International CSRC Investment Holdings Co. | 387,579 | 228,356 | |
| International Games Systems Co. Ltd. | 44,000 | 847,444 | |
| Inventec Corp. | 984,000 | 1,231,771 | |
| ITE Tech, Inc. | 83,000 | 418,138 | |
| ITEQ Corp. | 96,931 | 227,950 | |
| Jentech Precision Industrial Co. Ltd. | 30,699 | 547,033 | |
| Kaori Heat Treatment Co. Ltd. | 33,000 | 214,477 | |
| Kenda Rubber Industrial Co. Ltd. | 267,855 | 241,275 | |
| King Slide Works Co. Ltd. | 24,000 | 523,398 | |
| King Yuan Electronics Co. Ltd. | 438,000 | 1,036,911 | |
| King's Town Bank Co. Ltd. | 341,000 | 390,759 | |
| Kinik Co. | 54,000 | 271,953 | |
| Kinpo Electronics, Inc. | 473,000 | 203,603 | |
| Kinsus Interconnect Technology Corp. | 117,000 | 344,191 | |
| L&K Engineering Co. Ltd. | 86,000 | 338,607 | |
| Largan Precision Co. Ltd. | 37,000 | 2,367,908 | |
| Lien Hwa Industrial Corp. | 340,704 | 651,424 | |
| Lite-On Technology Corp. | 768,009 | 2,389,364 | |
| Lotes Co. Ltd. | 32,182 | 821,163 | |
| Lotus Pharmaceutical Co. Ltd. | 42,000 | 327,528 | |
| LuxNet Corp. | 48,000 | 229,947 | |
| M31 Technology Corp. | 7,700 | 208,437 | |
| Macronix International Co. Ltd. | 707,380 | 590,644 | |
| Makalot Industrial Co. Ltd. | 82,701 | 924,914 | |
| Marketech International Corp. | 44,000 | 180,462 | |
| MediaTek, Inc. | 559,000 | 14,578,307 | |
| Medigen Vaccine Biologics Corp. (a) | 106,933 | 229,370 | |
| Mega Financial Holding Co. Ltd. | 4,192,218 | 4,753,390 | |
| Merida Industry Co. Ltd. | 84,000 | 430,052 | |
| Merry Electronics Co. Ltd. | 93,006 | 254,768 | |
| Micro-Star International Co. Ltd. | 287,000 | 1,468,117 | |
| Microbio Co. Ltd. | 198,126 | 313,600 | |
| MiTAC Holdings Corp. | 345,483 | 393,087 | |
| momo.com, Inc. | 32,384 | 533,485 | |
| Nan Ya Plastics Corp. | 1,697,000 | 3,244,408 | |
| Nan Ya Printed Circuit Board Corp. | 85,000 | 623,428 | |
| Nankang Rubber Tire Co. Ltd. (a) | 185,000 | 208,801 | |
| Nantex Industry Co. Ltd. | 150,000 | 159,303 | |
| Nanya Technology Corp. | 460,000 | 921,488 | |
| Nien Made Enterprise Co. Ltd. | 67,000 | 592,315 | |
| Novatek Microelectronics Corp. | 212,000 | 2,983,312 | |
| Nuvoton Technology Corp. | 88,000 | 346,969 | |
| OBI Pharma, Inc. (a) | 76,723 | 190,902 | |
| Oneness Biotech Co. Ltd. | 111,673 | 676,214 | |
| Orient Semiconductor Electronics Ltd. | 202,000 | 259,791 | |
| Pan Jit International, Inc. | 137,000 | 253,317 | |
| Pegatron Corp. | 728,000 | 1,697,569 | |
| PharmaEssentia Corp. (a) | 89,000 | 885,004 | |
| Phihong Technology Co. Ltd. (a) | 147,887 | 240,780 | |
| Phison Electronics Corp. | 62,000 | 894,170 | |
| PixArt Imaging, Inc. | 68,000 | 270,126 | |
| Polaris Group (a) | 113,000 | 255,553 | |
| Pou Chen Corp. | 860,000 | 765,982 | |
| Powerchip Semiconductor Manufacturing Corp. | 1,094,629 | 899,771 | |
| Powertech Technology, Inc. | 277,000 | 899,234 | |
| Poya International Co. Ltd. | 22,014 | 338,149 | |
| President Chain Store Corp. | 209,000 | 1,661,179 | |
| Primax Electronics Ltd. | 193,000 | 411,879 | |
| Qisda Corp. | 559,000 | 733,230 | |
| Quanta Computer, Inc. | 1,006,000 | 5,935,158 | |
| Quanta Storage, Inc. | 103,000 | 218,385 | |
| Radiant Opto-Electronics Corp. | 171,000 | 654,935 | |
| Raydium Semiconductor Corp. | 24,445 | 271,307 | |
| Realtek Semiconductor Corp. | 184,000 | 2,291,403 | |
| RichWave Technology Corp. (a) | 35,302 | 125,989 | |
| Ruentex Development Co. Ltd. | 568,395 | 569,591 | |
| Ruentex Industries Ltd. | 280,824 | 496,691 | |
| Sanyang Motor Co. Ltd. | 228,000 | 469,624 | |
| SDI Corp. | 55,000 | 171,467 | |
| SerComm Corp. | 99,000 | 345,148 | |
| Shihlin Electric & Engineering Corp. | 90,000 | 263,842 | |
| Shin Kong Financial Holding Co. Ltd. (a) | 4,974,410 | 1,335,337 | |
| Shin Zu Shing Co. Ltd. | 89,279 | 255,087 | |
| Shinkong Synthetic Fiber Co. | 574,000 | 266,519 | |
| Shiny Chemical Industrial Co. Ltd. | 56,250 | 218,194 | |
| Sigurd Microelectronics Corp. | 234,000 | 429,320 | |
| Simplo Technology Co. Ltd. | 66,000 | 679,453 | |
| SINBON Electronics Co. Ltd. | 87,000 | 744,431 | |
| Sino-American Silicon Products, Inc. | 183,000 | 925,705 | |
| Sinopac Financial Holdings Co. | 3,839,619 | 2,115,980 | |
| Sitronix Technology Corp. | 45,000 | 397,477 | |
| Solar Applied Materials Technology Corp. | 323,000 | 389,414 | |
| Sporton International, Inc. | 42,050 | 277,367 | |
| St. Shine Optical Co. Ltd. | 31,000 | 173,762 | |
| Standard Foods Corp. | 221,714 | 258,127 | |
| Sunonwealth Electric Machine Industry Co. Ltd. | 84,000 | 226,643 | |
| Supreme Electronics Co. Ltd. | 318,000 | 545,840 | |
| Synnex Technology International Corp. | 478,100 | 1,013,893 | |
| Systex Corp. | 76,000 | 235,242 | |
| Ta Chen Stainless Pipe Co. Ltd. | 685,758 | 784,546 | |
| Ta Ya Electric Wire & Cable Co. Ltd. | 319,122 | 316,631 | |
| Taichung Commercial Bank Co. Ltd. | 1,422,944 | 645,389 | |
| TaiDoc Technology Corp. | 31,000 | 136,251 | |
| TaiMed Biologics, Inc. (a) | 78,000 | 207,598 | |
| Tainan Spinning Co. Ltd. | 544,000 | 238,362 | |
| Taishin Financial Holdings Co. Ltd. | 4,081,557 | 2,175,290 | |
| Taiwan Business Bank | 2,296,084 | 904,568 | |
| Taiwan Cement Corp. | 2,333,387 | 2,323,235 | |
| Taiwan Cogeneration Corp. | 230,404 | 281,205 | |
| Taiwan Cooperative Financial Holding Co. Ltd. | 3,666,716 | 2,845,258 | |
| Taiwan Fertilizer Co. Ltd. | 287,000 | 525,455 | |
| Taiwan Glass Industry Corp. (a) | 432,000 | 243,584 | |
| Taiwan High Speed Rail Corp. | 716,000 | 649,585 | |
| Taiwan Hon Chuan Enterprise Co. Ltd. | 125,000 | 388,025 | |
| Taiwan Mask Corp. | 108,000 | 227,692 | |
| Taiwan Mobile Co. Ltd. | 628,000 | 1,854,479 | |
| Taiwan Paiho Ltd. | 150,000 | 265,874 | |
| Taiwan Secom Co. | 108,000 | 393,066 | |
| Taiwan Semiconductor Co. Ltd. | 95,000 | 229,483 | |
| Taiwan Semiconductor Manufacturing Co. Ltd. | 9,078,000 | 148,152,407 | |
| Taiwan Surface Mounting Technology Co. Ltd. | 109,000 | 307,799 | |
| Taiwan Union Technology Corp. | 109,000 | 359,479 | |
| Taiwan-Asia Semiconductor Corp. | 217,000 | 300,793 | |
| Tatung Co. Ltd. (a) | 630,000 | 697,671 | |
| TCI Co. Ltd. | 42,557 | 227,326 | |
| TECO Electric & Machinery Co. Ltd. | 485,000 | 691,716 | |
| The Shanghai Commercial & Savings Bank Ltd. | 1,400,437 | 1,854,138 | |
| Tong Hsing Electronics Industries Ltd. | 84,954 | 352,345 | |
| Tong Yang Industry Co. Ltd. | 176,000 | 398,952 | |
| Topco Scientific Co. Ltd. | 74,393 | 388,398 | |
| TPK Holding Co. Ltd. | 178,000 | 176,299 | |
| Transcend Information, Inc. | 118,000 | 267,413 | |
| Tripod Technology Corp. | 171,000 | 874,780 | |
| TSEC Corp. | 240,911 | 211,662 | |
| TSRC Corp. | 318,000 | 224,788 | |
| TTY Biopharm Co. Ltd. | 148,000 | 382,640 | |
| Tung Ho Steel Enterprise Corp. | 220,040 | 441,351 | |
| TXC Corp. | 147,000 | 435,606 | |
| U-Ming Marine Transport Corp. | 179,000 | 245,123 | |
| Uni-President Enterprises Corp. | 1,748,000 | 3,664,389 | |
| Unimicron Technology Corp. | 505,000 | 2,250,522 | |
| Union Bank of Taiwan | 886,689 | 361,020 | |
| United Integrated Services Co. | 67,000 | 497,047 | |
| United Microelectronics Corp. | 4,100,000 | 5,891,727 | |
| United Renewable Energy Co. Ltd. | 562,796 | 259,058 | |
| Universal Vision Biotchnology Co. Ltd. | 21,260 | 195,219 | |
| USI Corp. | 329,000 | 195,673 | |
| Vanguard International Semiconductor Corp. | 336,000 | 729,137 | |
| VIA Labs, Inc. | 42,000 | 262,624 | |
| Via Technologies, Inc. | 73,000 | 270,068 | |
| VisEra Technologies Co. Ltd. | 44,000 | 279,131 | |
| Visual Photonics Epitaxy Co. Ltd. | 65,000 | 296,170 | |
| Voltronic Power Technology Corp. | 25,075 | 1,004,832 | |
| Wafer Works Corp. | 252,511 | 340,470 | |
| Waffer Technology Corp. | 51,000 | 171,165 | |
| Walsin Lihwa Corp. | 1,025,457 | 1,090,536 | |
| Walsin Technology Corp. | 133,875 | 433,380 | |
| Wan Hai Lines Ltd. | 284,305 | 406,033 | |
| Win Semiconductors Corp. | 132,389 | 592,920 | |
| Winbond Electronics Corp. | 1,123,363 | 869,848 | |
| Winbond Electronics Corp. rights 11/3/23 (a) | 45,160 | 4,104 | |
| WinWay Technology Co. Ltd. | 9,000 | 177,874 | |
| Wisdom Marine Lines Co. Ltd. | 194,000 | 250,306 | |
| Wistron Corp. | 979,829 | 2,730,150 | |
| Wistron NeWeb Corp. | 119,460 | 471,563 | |
| Wiwynn Corp. | 32,000 | 1,515,093 | |
| Wowprime Corp. | 28,587 | 211,022 | |
| WPG Holding Co. Ltd. | 608,760 | 1,346,043 | |
| WT Microelectronics Co. Ltd. | 185,235 | 679,019 | |
| XinTec, Inc. | 74,000 | 265,178 | |
| Yageo Corp. | 132,061 | 2,151,404 | |
| Yang Ming Marine Transport Corp. | 659,000 | 858,265 | |
| YFY, Inc. | 454,000 | 417,723 | |
| Yieh Phui Enterprise Co. | 505,996 | 241,387 | |
| Yuanta Financial Holding Co. Ltd. | 3,675,301 | 2,759,190 | |
| Yulon Finance Corp. | 99,643 | 551,542 | |
| Yulon Motor Co. Ltd. | 229,248 | 526,080 | |
| Zhen Ding Technology Holding Ltd. | 251,000 | 758,299 | |
TOTAL TAIWAN | 427,426,536 | ||
| Tanzania - 0.0% | |||
| Helios Towers PLC (a) | 300,505 | 221,158 | |
| Thailand - 0.6% | |||
| Advanced Info Service PCL (For. Reg.) | 180,500 | 1,099,429 | |
| Advanced Information Service PCL NVDR | 272,600 | 1,660,412 | |
| Airports of Thailand PCL NVDR (a) | 1,566,200 | 2,891,742 | |
| Amata Corp. PCL NVDR | 679,200 | 447,341 | |
| AP Thailand PCL NVDR | 1,361,000 | 406,839 | |
| Asset World Corp. PCL (For. Reg.) | 2,400,600 | 229,718 | |
| B. Grimm Power PCL (For. Reg.) | 232,200 | 142,048 | |
| Bangchak Corp. PCL: | |||
| (For. Reg.) | 266,300 | 304,149 | |
| NVDR | 338,200 | 386,267 | |
| Bangkok Chain Hospital PCL (For. Reg.) | 273,800 | 152,374 | |
| Bangkok Commercial Asset Management PCL (For. Reg.) | 444,400 | 110,094 | |
| Bangkok Dusit Medical Services PCL: | |||
| (For. Reg.) | 1,755,900 | 1,287,224 | |
| NVDR | 2,355,300 | 1,726,636 | |
| Bangkok Expressway and Metro PCL (For. Reg.) | 2,773,700 | 605,952 | |
| Bangkok Life Assurance PCL NVDR | 375,800 | 241,273 | |
| Banpu PCL NVDR | 3,021,100 | 635,075 | |
| BEC World PCL NVDR | 623,300 | 93,108 | |
| Berli Jucker PCL (For. Reg.) | 296,700 | 232,125 | |
| Betagro PCL NVDR | 402,000 | 228,006 | |
| Beyond Securities PCL NVDR (a) | 665,200 | 75,470 | |
| BTS Group Holdings PCL: | |||
| (For. Reg.) | 1,364,900 | 283,877 | |
| NVDR | 1,890,200 | 389,754 | |
| Bumrungrad Hospital PCL: | |||
| (For. Reg.) | 93,900 | 674,907 | |
| NVDR | 134,300 | 965,282 | |
| Carabao Group PCL NVDR | 166,500 | 311,041 | |
| Central Pattana PCL: | |||
| (For. Reg.) | 494,900 | 856,185 | |
| NVDR | 278,600 | 481,983 | |
| Central Plaza Hotel PCL NVDR (a) | 262,600 | 326,966 | |
| Central Retail Corp. PCL (For. Reg.) | 570,683 | 580,425 | |
| CH. Karnchang PCL (For. Reg.) | 388,600 | 234,402 | |
| Charoen Pokphand Foods PCL: | |||
| (For. Reg.) | 726,960 | 376,062 | |
| NVDR | 876,800 | 453,575 | |
| Chularat Hospital PCL (For. Reg.) | 1,771,600 | 154,878 | |
| Com7 PCL NVDR | 606,200 | 449,205 | |
| CP ALL PCL: | |||
| (For. Reg.) | 1,152,900 | 1,762,053 | |
| NVDR | 1,038,400 | 1,587,055 | |
| CP Axtra PCL NVDR | 874,400 | 683,688 | |
| Delta Electronics PCL: | |||
| (For. Reg.) | 606,800 | 1,326,386 | |
| NVDR | 557,700 | 1,219,179 | |
| Dhipaya Group Holdings PCL NVDR | 221,500 | 208,458 | |
| Dohome PCL NVDR | 543,681 | 165,501 | |
| Eastern Polymer Group PCL NVDR | 1,498,500 | 273,883 | |
| Electricity Generating PCL (For. Reg.) | 81,000 | 273,438 | |
| Energy Absolute PCL: | |||
| (For. Reg.) | 372,400 | 432,877 | |
| NVDR | 285,400 | 331,748 | |
| Energy Earth PCL (For. Reg.) (a)(b) | 7,600 | 0 | |
| Global Power Synergy Public Co. Ltd. (For. Reg.) | 180,500 | 194,863 | |
| Gulf Energy Development PCL: | |||
| (For. Reg.) | 178,500 | 213,643 | |
| NVDR | 939,300 | 1,124,227 | |
| Gunkul Engineering PCL (For. Reg.) | 1,834,539 | 115,792 | |
| Hana Microelectronics PCL (For. Reg.) | 154,400 | 223,275 | |
| Home Product Center PCL: | |||
| (For. Reg.) | 1,427,700 | 470,071 | |
| NVDR | 1,244,100 | 409,621 | |
| i-Tail Corp. PCL | 430,700 | 228,864 | |
| Indorama Ventures PCL: | |||
| (For. Reg.) | 453,900 | 297,412 | |
| NVDR | 251,600 | 164,857 | |
| Intouch Holdings PCL (For. Reg.) | 287,200 | 564,158 | |
| IRPC PCL: | |||
| (For. Reg.) | 2,406,200 | 127,905 | |
| NVDR | 5,436,600 | 288,990 | |
| Jaymart Group Holdings PCL NVDR | 330,800 | 150,190 | |
| JMT Network Services PCL (For. Reg.) | 153,238 | 125,111 | |
| Kasikornbank PCL NVDR | 250,500 | 911,072 | |
| KCE Electronics PCL (For. Reg.) | 228,200 | 320,432 | |
| Krung Thai Bank PCL: | |||
| (For. Reg.) | 425,800 | 221,404 | |
| NVDR | 1,039,800 | 540,666 | |
| Krungthai Card PCL (For. Reg.) | 264,900 | 320,689 | |
| Land & House PCL: | |||
| (For. Reg.) | 1,721,500 | 359,627 | |
| NVDR | 2,093,500 | 437,339 | |
| MBK PCL NVDR unit | 533,000 | 236,246 | |
| Mega Lifesciences PCL NVDR | 199,000 | 224,496 | |
| Minor International PCL: | |||
| (For. Reg.) | 375,749 | 291,194 | |
| NVDR | 885,300 | 686,080 | |
| Muangthai Leasing PCL (For. Reg.) | 195,300 | 197,243 | |
| Ngern Tid Lor PCL NVDR | 552,300 | 293,501 | |
| Osotspa PCL NVDR | 661,000 | 429,855 | |
| Plan B Media PCL NVDR unit | 1,484,300 | 334,606 | |
| PTT Exploration and Production PCL: | |||
| (For. Reg.) | 318,800 | 1,447,849 | |
| NVDR | 199,200 | 904,679 | |
| PTT Global Chemical PCL: | |||
| (For. Reg.) | 432,200 | 412,799 | |
| NVDR | 449,600 | 429,418 | |
| PTT Oil & Retail Business PCL: | |||
| (For. Reg.) | 650,800 | 329,574 | |
| NVDR | 812,200 | 411,309 | |
| PTT PCL: | |||
| (For. Reg.) | 2,370,400 | 2,181,888 | |
| NVDR | 1,292,800 | 1,189,987 | |
| Ramkhamhaeng Hospital PCL NVDR | 210,700 | 235,287 | |
| Ratch Group PCL NVDR unit | 415,600 | 370,808 | |
| Sansiri PCL NVDR | 7,862,300 | 333,135 | |
| SCB X PCL: | |||
| (For. Reg.) | 185,500 | 505,780 | |
| NVDR | 184,600 | 503,326 | |
| SCG Packaging PCL NVDR | 520,800 | 518,947 | |
| SCGJWD Logistics PCL NVDR | 785,000 | 251,937 | |
| Siam Cement PCL: | �� | ||
| (For. Reg.) | 168,700 | 1,343,909 | |
| NVDR | 126,900 | 1,010,919 | |
| Sino-Thai Engineering & Construction PCL (For. Reg.) | 490,900 | 116,168 | |
| Srisawad Corp. PCL (For. Reg.) | 187,130 | 216,803 | |
| Star Petroleum Refining PCL NVDR | 1,326,900 | 272,052 | |
| STARK Corp. PCL NVDR (a)(b) | 4,002,200 | 2,215 | |
| Supalai PCL (For. Reg.) | 381,875 | 194,539 | |
| Thai Airways International PCL (For. Reg.) (a)(b) | 126,000 | 11,574 | |
| Thai Oil PCL: | |||
| (For. Reg.) | 277,997 | 361,968 | |
| NVDR | 242,200 | 315,358 | |
| Thai Union Frozen Products PCL (For. Reg.) | 817,400 | 305,312 | |
| Thonburi Healthcare Group PCL NVDR | 164,500 | 285,876 | |
| Thoresen Thai Agencies PCL NVDR | 1,131,200 | 161,166 | |
| TMBThanachart Bank PCL NVDR | 12,942,200 | 597,890 | |
| TOA Paint Thailand PCL NVDR | 275,000 | 164,483 | |
| True Corp. PCL | 1,902,194 | 319,025 | |
| True Corp. PCL NVDR | 1,999,923 | 335,415 | |
| VGI PCL (For. Reg.) | 1,548,930 | 82,362 | |
| Vibhavadi Medical Center PCL NVDR | 3,485,900 | 192,066 | |
| WHA Corp. PCL: | |||
| (For. Reg.) | 1,819,200 | 251,894 | |
| NVDR | 2,139,700 | 296,272 | |
TOTAL THAILAND | 55,125,508 | ||
| Turkey - 0.3% | |||
| Akbank TAS | 1,167,775 | 1,214,815 | |
| Aksa Akrilik Kimya Sanayii | 76,821 | 240,343 | |
| Alarko Holding AS | 85,453 | 305,370 | |
| Anadolu Efes Biracilik Ve Malt Sanayii A/S | 88,508 | 312,068 | |
| Aselsan A/S | 574,477 | 838,613 | |
| Bim Birlesik Magazalar A/S JSC | 171,525 | 1,647,459 | |
| Borusan Mannesmann Boru Sanayi ve Ticaret A/S (a) | 11,465 | 373,675 | |
| Dogan Sirketler Grubu Holding A/S | 623,557 | 301,218 | |
| Dogus Otomotiv Servis ve Ticaret A/S | 26,987 | 236,810 | |
| Eldorado Gold Corp. (a) | 86,058 | 930,860 | |
| Emlak Konut Gayrimenkul Yatirim Ortakligi A/S | 906,164 | 209,908 | |
| Enerjisa Enerji A/S (d) | 140,511 | 241,336 | |
| Eregli Demir ve Celik Fabrikalari T.A.S. (a) | 553,244 | 739,632 | |
| Europower Enerji VE Otomasyon Teknolojileri Sanayi Ticaret A/S | 28,976 | 188,062 | |
| Ford Otomotiv Sanayi A/S | 28,280 | 785,210 | |
| Girisim Elektrik Taahhut Ticaret Ve Sanayi A/S | 64,625 | 196,710 | |
| Haci Omer Sabanci Holding A/S | 421,130 | 795,588 | |
| Hektas Ticaret A/S (a) | 447,283 | 346,211 | |
| Is Yatirim Menkul Degerler A/S | 222,786 | 333,716 | |
| Kardemir Karabuk Demir Celik Sanayi ve Ticaret A/S Class D | 331,847 | 292,483 | |
| Koc Holding A/S | 285,441 | 1,378,862 | |
| Kontrolmatik Enerji Ve Muhendislik A/S | 38,682 | 358,556 | |
| Koza Altin Isletmeleri A/S | 382,571 | 296,662 | |
| Koza Anadolu Metal Madencilik Isletmeleri A/S (a) | 114,667 | 212,982 | |
| Mavi Jeans Class B (d) | 81,508 | 274,867 | |
| Migros Turk Ticaret A/S | 41,707 | 497,346 | |
| Odas Elektrik Uretim Ve Sanayi (a) | 584,915 | 243,928 | |
| Otokar Otomotiv ve Savunma Sanayi A.S. | 19,773 | 278,938 | |
| Oyak Cimento Fabrikalari A/S (a) | 144,117 | 363,101 | |
| Pegasus Hava Tasimaciligi A/S (a) | 19,832 | 493,712 | |
| Petkim Petrokimya Holding A/S (a) | 697,445 | 484,678 | |
| Reysas Logistics (a) | 130,493 | 144,228 | |
| Sarkuysan Elektrolitik Bakir Sanayi ve Ticaret A/S | 179,214 | 199,723 | |
| Sasa Polyester Sanayi A/S | 405,062 | 611,614 | |
| Smart Gunes Enerjisi Teknolojileri ArGE Uretim Sanayi ve Ticaret A/S | 67,556 | 164,481 | |
| Sok Marketler Ticaret A/S | 143,432 | 302,876 | |
| TAV Havalimanlari Holding A/S (a) | 89,845 | 363,577 | |
| Tofas Turk Otomobil Fabrikasi A/S | 54,676 | 464,720 | |
| Turk Hava Yollari AO (a) | 210,058 | 1,611,822 | |
| Turk Traktor ve Ziraat Makinalari A/S | 11,429 | 292,513 | |
| Turkcell Iletisim Hizmet A/S | 491,165 | 832,505 | |
| Turkiye Is Bankasi A/S Series C | 1,313,635 | 973,192 | |
| Turkiye Petrol Rafinerileri A/S | 365,503 | 1,831,435 | |
| Turkiye Sise ve Cam Fabrikalari A/S | 546,779 | 914,026 | |
| Yapi ve Kredi Bankasi A/S | 1,317,448 | 802,027 | |
TOTAL TURKEY | 24,922,458 | ||
| United Arab Emirates - 0.4% | |||
| Abu Dhabi Commercial Bank PJSC | 1,072,675 | 2,345,108 | |
| Abu Dhabi Islamic Bank (a) | 539,663 | 1,513,348 | |
| Abu Dhabi National Oil Co. for Distribution PJSC | 1,177,404 | 1,077,070 | |
| Air Arabia PJSC | 877,965 | 626,264 | |
| Ajman Bank PJSC (a) | 443,720 | 247,652 | |
| Al Yah Satellite Communications Co. PJSC (Yahsat) | 450,464 | 311,511 | |
| Aldar Properties PJSC | 1,409,649 | 1,995,691 | |
| Americana Restaurants International PLC | 935,034 | 941,907 | |
| Aramex Co. | 367,792 | 230,308 | |
| Dana Gas PJSC | 2,837,994 | 625,858 | |
| Dubai Financial Market PJSC (a) | 659,545 | 235,231 | |
| Dubai Investments Ltd. | 876,382 | 539,239 | |
| Dubai Islamic Bank Pakistan Ltd. | 1,070,443 | 1,573,752 | |
| Emaar Properties PJSC | 2,494,382 | 4,543,266 | |
| Emirates Central Cooling Systems Corp. | 938,963 | 457,594 | |
| Emirates NBD Bank PJSC | 693,319 | 3,199,498 | |
| Emirates Telecommunications Corp. | 1,294,344 | 6,505,197 | |
| First Abu Dhabi Bank PJSC | 1,664,586 | 5,746,515 | |
| Gulf Navigation Holding PJSC (a) | 135,622 | 265,853 | |
| Multiply Group (a) | 1,458,774 | 1,350,349 | |
| National Central Cooling Co. (a) | 404,795 | 385,729 | |
| Network International Holdings PLC (a)(d) | 183,026 | 862,696 | |
| NMC Health PLC (a)(b) | 17,953 | 3 | |
| Sharjah Islamic Bank | 673,479 | 429,061 | |
TOTAL UNITED ARAB EMIRATES | 36,008,700 | ||
| United Kingdom - 7.2% | |||
| 3i Group PLC | 351,447 | 8,286,273 | |
| 4Imprint Group PLC | 10,676 | 651,402 | |
| 888 Holdings PLC (a) | 155,482 | 154,208 | |
| A.G. Barr PLC | 46,121 | 275,524 | |
| Abrdn PLC | 733,520 | 1,396,624 | |
| Admiral Group PLC | 78,122 | 2,319,711 | |
| Advanced Medical Solutions Group PLC | 93,983 | 221,381 | |
| AJ Bell PLC | 122,125 | 375,842 | |
| Allfunds Group PLC | 127,322 | 649,078 | |
| Alpha Financial Markets Consulting PLC | 45,475 | 210,036 | |
| Alpha FX Group PLC | 13,404 | 254,154 | |
| Alphawave IP Group PLC (a) | 96,449 | 114,884 | |
| AngloGold Ashanti PLC | 155,194 | 2,868,643 | |
| Ascential PLC (a) | 175,606 | 558,787 | |
| Ashmore Group PLC | 184,727 | 380,572 | |
| Ashtead Group PLC | 160,572 | 9,180,667 | |
| Associated British Foods PLC | 126,513 | 3,115,385 | |
| Assura PLC | 1,130,963 | 562,773 | |
| Aston Martin Lagonda Global Holdings PLC (a)(c)(d) | 106,929 | 284,367 | |
| AstraZeneca PLC (United Kingdom) | 571,388 | 71,539,922 | |
| Auction Technology Group PLC (a) | 39,709 | 270,763 | |
| Auto Trader Group PLC (d) | 338,056 | 2,557,141 | |
| Aviva PLC | 1,002,043 | 4,853,466 | |
| B&M European Value Retail SA | 353,971 | 2,275,078 | |
| Babcock International Group PLC (a) | 99,927 | 474,651 | |
| BAE Systems PLC | 1,117,303 | 15,023,683 | |
| Balfour Beatty PLC | 217,214 | 816,327 | |
| Barclays PLC | 5,762,825 | 9,249,609 | |
| Barratt Developments PLC | 357,129 | 1,796,626 | |
| Beazley PLC | 250,826 | 1,568,538 | |
| Bellway PLC | 45,043 | 1,143,128 | |
| Berkeley Group Holdings PLC | 38,588 | 1,892,956 | |
| Big Yellow Group PLC | 65,668 | 762,244 | |
| Bodycote PLC | 73,109 | 510,058 | |
| BP PLC | 6,409,748 | 39,138,047 | |
| Breedon Group PLC | 123,605 | 469,487 | |
| Bridgepoint Group PLC (d) | 98,993 | 218,383 | |
| British American Tobacco PLC (United Kingdom) | 780,233 | 23,307,469 | |
| British Land Co. PLC | 323,095 | 1,168,300 | |
| Britvic PLC | 102,098 | 1,039,916 | |
| BT Group PLC | 2,507,354 | 3,436,128 | |
| Bunzl PLC | 123,909 | 4,415,744 | |
| Burberry Group PLC | 138,198 | 2,842,099 | |
| Bytes Technology Group PLC | 91,574 | 547,836 | |
| Capita Group PLC (a) | 675,738 | 137,736 | |
| Central Asia Metals PLC | 89,445 | 178,077 | |
| Centrica PLC | 2,060,320 | 3,939,132 | |
| Ceres Power Holdings PLC (a)(c) | 49,222 | 118,457 | |
| Chemring Group PLC | 120,308 | 408,708 | |
| CK Hutchison Holdings Ltd. | 976,500 | 4,943,323 | |
| Clarkson PLC | 13,426 | 431,628 | |
| Close Brothers Group PLC | 58,110 | 562,920 | |
| CNH Industrial NV | 381,908 | 4,228,874 | |
| Coats Group PLC | 624,216 | 512,883 | |
| Coca-Cola European Partners PLC | 75,643 | 4,425,872 | |
| Compass Group PLC | 631,105 | 15,911,032 | |
| Computacenter PLC | 30,097 | 938,679 | |
| ConvaTec Group PLC (d) | 600,586 | 1,490,624 | |
| Craneware PLC | 12,091 | 232,932 | |
| Cranswick PLC | 21,013 | 892,376 | |
| Crest Nicholson Holdings PLC | 93,336 | 181,512 | |
| Croda International PLC | 53,244 | 2,833,241 | |
| Currys PLC | 423,194 | 230,233 | |
| Custodian (REIT) PLC | 216,519 | 216,061 | |
| CVS Group PLC | 27,551 | 490,583 | |
| Darktrace PLC (a) | 134,639 | 572,764 | |
| DCC PLC (United Kingdom) | 36,035 | 1,999,413 | |
| Dechra Pharmaceuticals PLC | 41,687 | 1,929,455 | |
| Deliveroo PLC Class A (a)(d) | 361,396 | 571,036 | |
| Derwent London PLC | 34,844 | 772,061 | |
| Diageo PLC | 816,047 | 30,859,654 | |
| Diploma PLC | 48,981 | 1,691,955 | |
| Direct Line Insurance Group PLC (a) | 492,614 | 905,905 | |
| Discoverie Group PLC | 38,946 | 292,069 | |
| Domino's Pizza UK & IRL PLC | 141,490 | 589,871 | |
| Dowlais Group PLC | 503,895 | 612,459 | |
| Dr. Martens Ltd. | 249,044 | 352,343 | |
| Drax Group PLC | 152,619 | 783,926 | |
| DS Smith PLC | 512,573 | 1,776,816 | |
| Dunelm Group PLC | 48,178 | 571,233 | |
| easyJet PLC (a) | 112,984 | 502,615 | |
| Elementis PLC (a) | 250,280 | 360,176 | |
| Empiric Student Property PLC | 257,690 | 264,662 | |
| Entain PLC | 242,480 | 2,742,096 | |
| Ergomed PLC (a) | 18,205 | 296,948 | |
| Essentra PLC | 144,072 | 260,217 | |
| FD Technologies PLC (a) | 9,673 | 100,993 | |
| FDM Group Holdings PLC | 57,499 | 305,057 | |
| Fever-Tree Drinks PLC | 39,923 | 487,185 | |
| Firstgroup PLC | 275,167 | 528,099 | |
| Forterra PLC (d) | 121,148 | 198,198 | |
| Frasers Group PLC (a) | 55,760 | 544,221 | |
| Future PLC | 41,747 | 448,808 | |
| Games Workshop Group PLC | 12,221 | 1,466,834 | |
| Gamma Communications PLC | 37,615 | 478,222 | |
| GB Group PLC | 97,238 | 282,469 | |
| Genuit Group PLC | 99,832 | 322,160 | |
| Genus PLC | 25,177 | 654,258 | |
| Grafton Group PLC unit | 78,949 | 739,936 | |
| Grainger Trust PLC | 275,790 | 762,265 | |
| Great Portland Estates PLC | 95,369 | 452,073 | |
| Greggs PLC | 38,300 | 1,103,276 | |
| Halfords Group PLC | 97,780 | 238,406 | |
| Halma PLC | 138,293 | 3,101,228 | |
| Hammerson PLC | 1,479,385 | 396,305 | |
| Harbour Energy PLC | 253,275 | 781,306 | |
| Hargreaves Lansdown PLC | 131,378 | 1,128,323 | |
| Hays PLC | 627,130 | 732,518 | |
| Hill & Smith Holdings PLC | 32,939 | 659,788 | |
| Hilton Food Group PLC | 51,264 | 406,877 | |
| Hiscox Ltd. | 128,389 | 1,463,753 | |
| Home (REIT) PLC (b) | 386,246 | 178,631 | |
| Howden Joinery Group PLC | 202,240 | 1,567,301 | |
| HSBC Holdings PLC (United Kingdom) | 7,243,609 | 52,301,939 | |
| Ibstock PLC (d) | 174,679 | 260,084 | |
| IG Group Holdings PLC | 149,429 | 1,158,758 | |
| IMI PLC | 95,825 | 1,706,293 | |
| Impax Asset Management Group PLC | 40,517 | 189,599 | |
| Imperial Brands PLC | 315,682 | 6,725,350 | |
| Inchcape PLC | 138,048 | 1,117,484 | |
| Indivior PLC (a) | 49,073 | 939,421 | |
| Informa PLC | 523,907 | 4,531,346 | |
| IntegraFin Holdings PLC | 119,642 | 318,176 | |
| InterContinental Hotel Group PLC | 62,530 | 4,431,036 | |
| Intermediate Capital Group PLC | 106,656 | 1,691,089 | |
| International Distributions Services PLC (a) | 266,747 | 818,974 | |
| Intertek Group PLC | 58,308 | 2,709,378 | |
| Investec PLC | 239,273 | 1,326,450 | |
| IP Group PLC | 428,383 | 228,317 | |
| ITM Power PLC (a)(c) | 267,577 | 210,161 | |
| ITV PLC | 1,325,126 | 1,028,545 | |
| J Sainsbury PLC | 608,961 | 1,904,436 | |
| J.D. Wetherspoon PLC (a) | 35,205 | 270,432 | |
| JD Sports Fashion PLC | 968,569 | 1,500,990 | |
| Jet2 PLC | 63,909 | 778,336 | |
| John Wood Group PLC (a) | 256,304 | 442,054 | |
| Johnson Matthey PLC | 68,593 | 1,245,568 | |
| Johnson Service Group PLC | 194,842 | 302,657 | |
| Jupiter Fund Management PLC | 198,185 | 189,094 | |
| Just Eat Takeaway.com NV (a)(d) | 77,403 | 943,212 | |
| Just Group PLC | 393,617 | 361,687 | |
| Kainos Group PLC | 32,186 | 438,932 | |
| Keller Group PLC | 29,611 | 278,928 | |
| Kingfisher PLC | 716,940 | 1,830,720 | |
| Lancashire Holdings Ltd. | 93,589 | 646,116 | |
| Land Securities Group PLC | 259,817 | 1,796,871 | |
| Learning Technologies Group PLC | 240,690 | 180,940 | |
| Legal & General Group PLC | 2,246,443 | 5,772,148 | |
| Liontrust Asset Management PLC | 26,095 | 177,299 | |
| Lloyds Banking Group PLC | 23,907,240 | 11,635,654 | |
| London Stock Exchange Group PLC | 156,719 | 15,812,178 | |
| Londonmetric Properity PLC | 407,527 | 819,274 | |
| LXI REIT PLC | 622,258 | 648,547 | |
| M&G PLC | 838,998 | 2,021,165 | |
| Man Group PLC | 446,342 | 1,190,802 | |
| Marks & Spencer Group PLC (a) | 724,808 | 1,909,938 | |
| Marlowe PLC (a)(c) | 32,359 | 217,892 | |
| Marshalls PLC | 95,856 | 239,774 | |
| Melrose Industries PLC | 505,177 | 2,867,461 | |
| Mitchells & Butlers PLC (a) | 106,569 | 268,644 | |
| Mitie Group PLC | 524,198 | 627,579 | |
| Mobico Group PLC | 208,053 | 158,049 | |
| Molten Ventures PLC (a) | 54,093 | 154,769 | |
| Moneysupermarket.com Group PLC | 207,335 | 652,694 | |
| Moonpig Group PLC (a) | 133,657 | 267,886 | |
| Morgan Advanced Materials PLC | 125,752 | 343,902 | |
| Morgan Sindall PLC | 17,769 | 406,030 | |
| National Grid PLC | 1,317,061 | 15,703,288 | |
| NatWest Group PLC | 2,179,641 | 4,742,500 | |
| Next Fifteen Communications Group PLC | 34,075 | 261,752 | |
| Next PLC | 44,568 | 3,729,075 | |
| Ninety One PLC | 148,234 | 284,850 | |
| Ocado Group PLC (a) | 219,292 | 1,240,203 | |
| OSB Group PLC | 161,661 | 589,080 | |
| Oxford Instruments PLC | 23,851 | 522,394 | |
| Oxford Nanopore Technologies Ltd. (a) | 205,014 | 507,339 | |
| Pagegroup PLC | 125,437 | 572,649 | |
| Paragon Banking Group PLC | 93,969 | 506,656 | |
| Pearson PLC | 234,495 | 2,714,452 | |
| Pennon Group PLC | 98,180 | 866,953 | |
| Pepco Group NV (a) | 68,764 | 278,350 | |
| Persimmon PLC | 116,286 | 1,436,013 | |
| Petrofac Ltd. (a)(c) | 174,294 | 99,567 | |
| Pets At Home Group PLC | 197,265 | 673,262 | |
| Phoenix Group Holdings PLC | 273,501 | 1,508,553 | |
| Picton Property Income Ltd. | 255,133 | 201,566 | |
| Playtech Ltd. (a) | 93,279 | 445,114 | |
| Premier Foods PLC | 273,694 | 389,879 | |
| Primary Health Properties PLC | 519,558 | 566,768 | |
| PZ Cussons PLC Class L | 115,823 | 188,360 | |
| QinetiQ Group PLC | 203,187 | 817,450 | |
| Quilter PLC (d) | 538,164 | 522,635 | |
| Rathbone Brothers PLC | 24,763 | 450,871 | |
| Reckitt Benckiser Group PLC | 258,453 | 17,292,305 | |
| Redde Northgate PLC | 90,015 | 367,613 | |
| Redrow PLC | 114,897 | 679,544 | |
| RELX PLC (London Stock Exchange) | 689,017 | 24,065,790 | |
| Renew Holdings PLC | 50,829 | 442,963 | |
| Renewi PLC (a) | 36,786 | 262,457 | |
| Renishaw PLC | 14,105 | 528,719 | |
| Rentokil Initial PLC | 924,358 | 4,707,285 | |
| Rightmove PLC | 304,141 | 1,748,530 | |
| Rolls-Royce Holdings PLC (a) | 3,113,250 | 8,194,780 | |
| Rotork PLC | 329,610 | 1,173,028 | |
| RS GROUP PLC | 171,889 | 1,414,823 | |
| RWS Holdings PLC | 116,282 | 293,411 | |
| S4 Capital PLC (a)(c) | 197,957 | 152,665 | |
| Safestore Holdings PLC | 80,440 | 668,263 | |
| Sage Group PLC | 366,662 | 4,325,569 | |
| Savills PLC | 52,338 | 500,962 | |
| Schroders PLC | 330,612 | 1,484,004 | |
| Segro PLC | 434,619 | 3,765,421 | |
| Serco Group PLC | 424,277 | 737,433 | |
| Serica Energy PLC | 102,249 | 289,320 | |
| Severn Trent PLC | 94,560 | 3,052,619 | |
| Shaftesbury Capital PLC | 543,034 | 686,432 | |
| Smart Metering Systems PLC | 54,529 | 423,512 | |
| Smith & Nephew PLC | 323,894 | 3,624,741 | |
| Smiths Group PLC | 128,430 | 2,518,677 | |
| Softcat PLC | 48,592 | 747,124 | |
| Spectris PLC | 38,887 | 1,465,221 | |
| Spirax-Sarco Engineering PLC | 26,674 | 2,655,921 | |
| Spire Healthcare Group PLC (d) | 134,143 | 348,099 | |
| Spirent Communications PLC | 228,832 | 270,485 | |
| SSE PLC | 394,666 | 7,833,449 | |
| SSP Group PLC (a) | 304,920 | 667,107 | |
| St. James's Place PLC | 209,242 | 1,626,651 | |
| Standard Chartered PLC (United Kingdom) | 873,029 | 6,685,076 | |
| SThree PLC | 63,363 | 270,321 | |
| Subsea 7 SA | 83,040 | 1,088,274 | |
| Supermarket Income (REIT) PLC | 493,270 | 435,270 | |
| Target Healthcare (REIT) PLC | 531,523 | 465,795 | |
| Tate & Lyle PLC | 151,187 | 1,158,608 | |
| Taylor Wimpey PLC | 1,281,290 | 1,725,537 | |
| Team17 Group PLC (a) | 48,087 | 154,885 | |
| Telecom Plus PLC | 29,683 | 557,047 | |
| Tesco PLC | 2,637,795 | 8,656,089 | |
| The Weir Group PLC | 94,382 | 1,958,212 | |
| THG PLC (a) | 248,083 | 210,832 | |
| TORM PLC | 14,632 | 446,402 | |
| TP ICAP Group PLC | 297,552 | 568,167 | |
| Trainline PLC (a)(d) | 174,228 | 551,437 | |
| Travis Perkins PLC | 80,392 | 722,681 | |
| Tritax Big Box REIT PLC | 687,211 | 1,142,650 | |
| Tyman PLC | 86,255 | 254,758 | |
| Unilever PLC | 913,490 | 43,263,512 | |
| Unite Group PLC | 122,628 | 1,294,484 | |
| United Utilities Group PLC | 252,543 | 3,266,282 | |
| Urban Logistics REIT PLC | 198,223 | 251,049 | |
| Vesuvius PLC | 86,287 | 422,656 | |
| Victoria PLC (a)(c) | 22,703 | 88,854 | |
| Victrex PLC | 33,735 | 564,614 | |
| Virgin Money UK PLC | 443,172 | 802,324 | |
| Vistry Group PLC | 127,223 | 1,093,257 | |
| Vodafone Group PLC | 8,559,786 | 7,879,621 | |
| Volex PLC | 70,037 | 240,482 | |
| Volution Group PLC | 77,081 | 339,713 | |
| Warehouse (REIT) PLC | 195,802 | 172,541 | |
| Watches of Switzerland Group PLC (a)(d) | 89,869 | 547,249 | |
| WH Smith PLC | 50,967 | 718,595 | |
| Whitbread PLC | 72,924 | 2,949,789 | |
| Wickes Group PLC | 140,521 | 218,619 | |
| Wise PLC (a) | 234,270 | 1,895,253 | |
| Workspace Group PLC | 58,233 | 341,298 | |
| WPP PLC | 412,536 | 3,552,443 | |
| Yellow Cake PLC (a)(d) | 77,916 | 522,761 | |
| YouGov PLC | 37,558 | 388,024 | |
TOTAL UNITED KINGDOM | 712,413,978 | ||
| United States of America - 3.9% | |||
| Bausch Health Cos., Inc. (Canada) (a) | 106,148 | 723,930 | |
| Brookfield Renewable Corp. | 49,796 | 1,132,911 | |
| BRP, Inc. | 13,371 | 903,742 | |
| Burford Capital Ltd. | 68,798 | 850,421 | |
| Carnival PLC (a) | 50,915 | 522,559 | |
| CRH PLC | 268,487 | 14,427,161 | |
| CSL Ltd. | 178,493 | 26,379,860 | |
| CyberArk Software Ltd. (a) | 15,324 | 2,507,619 | |
| Diversified Gas & Oil PLC | 421,577 | 342,543 | |
| Energy Fuels, Inc. (a)(c) | 61,026 | 488,032 | |
| Experian PLC | 336,924 | 10,201,001 | |
| Ferrovial SE | 182,077 | 5,479,127 | |
| Ferrovial SE rights (a)(e) | 182,077 | 82,380 | |
| Fiverr International Ltd. (a)(c) | 12,068 | 255,480 | |
| GSK PLC | 1,502,120 | 26,777,954 | |
| Haleon PLC | 2,020,003 | 8,096,355 | |
| Holcim AG | 191,422 | 11,801,183 | |
| InMode Ltd. (a)(c) | 27,697 | 529,013 | |
| James Hardie Industries PLC CDI (a) | 163,661 | 4,083,249 | |
| JBS SA | 297,100 | 1,180,327 | |
| JS Global Lifestyle Co. Ltd. (c)(d) | 580,500 | 91,423 | |
| Legend Biotech Corp. ADR (a) | 21,854 | 1,443,894 | |
| Maxeon Solar Technologies Ltd. (a)(c) | 12,384 | 77,276 | |
| MDA Ltd. (a) | 44,400 | 367,239 | |
| Monday.com Ltd. (a) | 8,556 | 1,112,194 | |
| Nestle SA (Reg. S) | 979,907 | 105,671,976 | |
| Parade Technologies Ltd. | 29,000 | 950,087 | |
| PolyPeptide Group AG (a)(d) | 6,049 | 113,180 | |
| Primo Water Corp. | 62,317 | 813,860 | |
| QIAGEN NV (Germany) (a) | 85,599 | 3,180,899 | |
| REC Silicon ASA (a) | 114,194 | 148,276 | |
| Reliance Worldwide Corp. Ltd. | 295,752 | 659,220 | |
| Resolute Forest Products, Inc. rights (a)(b) | 19,734 | 0 | |
| RHI Magnesita NV | 11,055 | 344,788 | |
| Roche Holding AG: | |||
| (Bearer) | 18,545 | 5,039,657 | |
| (participation certificate) | 251,103 | 64,711,664 | |
| Sanofi SA | 419,219 | 38,067,693 | |
| Schneider Electric SA | 199,991 | 30,770,070 | |
| Sims Ltd. | 65,587 | 522,819 | |
| Swiss Re Ltd. | 110,510 | 12,041,721 | |
| Tenaris SA | 171,309 | 2,689,929 | |
| Titan Cement International Trading SA | 18,584 | 348,048 | |
| Vobile Group Ltd. (a) | 588,000 | 151,441 | |
TOTAL UNITED STATES OF AMERICA | 386,082,201 | ||
| Vietnam - 0.0% | |||
| XP Power PLC | 11,029 | 146,921 | |
| Zambia - 0.0% | |||
| First Quantum Minerals Ltd. | 219,618 | 2,544,987 | |
| TOTAL COMMON STOCKS (Cost $9,914,770,644) | 9,377,774,654 | ||
| Nonconvertible Preferred Stocks - 0.8% | |||
| Shares | Value ($) | ||
| Brazil - 0.4% | |||
| Alpargatas SA (PN) | 84,600 | 138,434 | |
| Azul SA (a) | 109,400 | 279,481 | |
| Banco ABC Brasil SA Series A | 50,089 | 185,881 | |
| Banco Bradesco SA (PN) | 1,815,952 | 5,038,958 | |
| Banco do Estado Rio Grande do Sul SA Class B | 98,700 | 213,384 | |
| Banco Pan SA | 175,500 | 244,710 | |
| Bradespar SA (PN) | 121,756 | 539,501 | |
| Centrais Eletricas Brasileiras SA (Electrobras) (PN-B) | 160,711 | 1,225,634 | |
| Companhia Energetica de Minas Gerais (CEMIG) (PN) | 516,394 | 1,202,453 | |
| Gerdau SA | 429,418 | 1,854,203 | |
| Itau Unibanco Holding SA | 1,767,260 | 9,401,084 | |
| Itausa-Investimentos Itau SA (PN) | 1,844,969 | 3,161,706 | |
| Marcopolo SA (PN) | 233,700 | 242,889 | |
| Metalurgica Gerdau SA (PN) | 274,200 | 561,806 | |
| Petroleo Brasileiro SA - Petrobras (PN) (non-vtg.) | 1,844,386 | 12,708,676 | |
| Unipar Carbocloro SA | 20,990 | 296,089 | |
| Usinas Siderurgicas de Minas Gerais SA - Usiminas (PN-A) (non-vtg.) | 229,200 | 300,493 | |
TOTAL BRAZIL | 37,595,382 | ||
| Chile - 0.0% | |||
| Embotelladora Andina SA Class B | 173,369 | 352,549 | |
| Sociedad Quimica y Minera de Chile SA (PN-B) | 53,559 | 2,591,178 | |
TOTAL CHILE | 2,943,727 | ||
| Colombia - 0.0% | |||
| Bancolombia SA (PN) | 157,123 | 1,007,786 | |
| Germany - 0.3% | |||
| Bayerische Motoren Werke AG (BMW) (non-vtg.) | 29,752 | 2,523,169 | |
| Dr. Ing. h.c. F. Porsche AG Series F (d) | 42,314 | 3,695,517 | |
| Draegerwerk AG & Co. KGaA (non-vtg.) | 4,700 | 236,469 | |
| Fuchs Petrolub AG | 25,725 | 1,043,056 | |
| Henkel AG & Co. KGaA | 57,610 | 4,149,962 | |
| Jungheinrich AG | 17,764 | 476,293 | |
| Porsche Automobil Holding SE (Germany) | 54,405 | 2,435,065 | |
| Sartorius AG (non-vtg.) | 9,871 | 2,466,992 | |
| Sixt SE Preference Shares | 3,957 | 227,349 | |
| Sto SE & Co. KGaA | 1,328 | 172,553 | |
| Volkswagen AG | 74,054 | 7,853,480 | |
TOTAL GERMANY | 25,279,905 | ||
| Italy - 0.0% | |||
| Danieli & C. Officine Meccaniche SpA | 21,368 | 430,937 | |
| Korea (South) - 0.1% | |||
| Daishin Securities Co. Ltd. | 17,082 | 168,041 | |
| Hyundai Motor Co. Ltd. | 6,122 | 451,421 | |
| Hyundai Motor Co. Ltd. Series 2 | 25,493 | 1,891,121 | |
| LG Chemical Ltd. | 4,548 | 948,469 | |
| LG H & H Co. Ltd. | 1,095 | 114,902 | |
| Samsung Electronics Co. Ltd. | 272,954 | 10,881,460 | |
TOTAL KOREA (SOUTH) | 14,455,414 | ||
| Russia - 0.0% | |||
| Surgutneftegas OJSC (b) | 1,961,555 | 34,136 | |
| TOTAL NONCONVERTIBLE PREFERRED STOCKS (Cost $96,645,180) | 81,747,287 | ||
| Government Obligations - 0.1% | |||
Principal Amount (f) | Value ($) | ||
| United States of America - 0.1% | |||
U.S. Treasury Bills, yield at date of purchase 5.42% 2/22/24 (g) (Cost $11,013,799) | 11,200,000 | 11,013,148 | |
| Money Market Funds - 4.6% | |||
| Shares | Value ($) | ||
| Fidelity Cash Central Fund 5.40% (h) | 342,319,651 | 342,388,114 | |
| Fidelity Securities Lending Cash Central Fund 5.40% (h)(i) | 105,462,569 | 105,473,115 | |
| TOTAL MONEY MARKET FUNDS (Cost $447,861,229) | 447,861,229 | ||
| TOTAL INVESTMENT IN SECURITIES - 100.8% (Cost $10,470,290,852) | 9,918,396,318 |
NET OTHER ASSETS (LIABILITIES) - (0.8)% | (73,985,895) |
| NET ASSETS - 100.0% | 9,844,410,423 |
| Futures Contracts | |||||
Number of contracts | Expiration Date | Notional Amount ($) | Value ($) | Unrealized Appreciation/ (Depreciation) ($) | |
| Purchased | |||||
| Equity Index Contracts | |||||
| ICE MSCI EAFE Index Contracts (United States) | 2,557 | Dec 2023 | 252,388,685 | (11,335,582) | (11,335,582) |
| ICE MSCI Emerging Markets Index Contracts (United States) | 2,451 | Dec 2023 | 112,647,960 | (5,508,458) | (5,508,458) |
| TME S&P/TSX 60 Index Contracts (Canada) | 178 | Dec 2023 | 29,137,191 | (1,387,036) | (1,387,036) |
| TOTAL FUTURES CONTRACTS | (18,231,076) | ||||
| The notional amount of futures purchased as a percentage of Net Assets is 4.0% | |||||
| (a) | Non-income producing |
| (b) | Level 3 security |
| (c) | Security or a portion of the security is on loan at period end. |
| (d) | Security exempt from registration under Rule 144A of the Securities Act of 1933. These securities may be resold in transactions exempt from registration, normally to qualified institutional buyers. At the end of the period, the value of these securities amounted to $238,289,593 or 2.4% of net assets. |
| (e) | Security or a portion of the security purchased on a delayed delivery or when-issued basis. |
| (f) | Amount is stated in United States dollars unless otherwise noted. |
| (g) | Security or a portion of the security was pledged to cover margin requirements for futures contracts. At period end, the value of securities pledged amounted to $11,013,148. |
| (h) | Affiliated fund that is generally available only to investment companies and other accounts managed by Fidelity Investments. The rate quoted is the annualized seven-day yield of the fund at period end. A complete unaudited listing of the fund's holdings as of its most recent quarter end is available upon request. In addition, each Fidelity Central Fund's financial statements, which are not covered by the Fund's Report of Independent Registered Public Accounting Firm, are available on the SEC's website or upon request. |
| (i) | Investment made with cash collateral received from securities on loan. |
| Affiliate | Value, beginning of period ($) | Purchases ($) | Sales Proceeds ($) | Dividend Income ($) | Realized Gain (loss) ($) | Change in Unrealized appreciation (depreciation) ($) | Value, end of period ($) | % ownership, end of period |
| Fidelity Cash Central Fund 5.40% | 50,479,298 | 1,739,261,267 | 1,447,352,451 | 9,053,534 | - | - | 342,388,114 | 0.8% |
| Fidelity Securities Lending Cash Central Fund 5.40% | 54,404,001 | 308,357,932 | 257,288,818 | 2,014,280 | - | - | 105,473,115 | 0.4% |
| Total | 104,883,299 | 2,047,619,199 | 1,704,641,269 | 11,067,814 | - | - | 447,861,229 | |
| Valuation Inputs at Reporting Date: | ||||
| Description | Total ($) | Level 1 ($) | Level 2 ($) | Level 3 ($) |
Investments in Securities: | ||||
| Equities: | ||||
Communication Services | 496,219,701 | 119,226,054 | 376,332,980 | 660,667 |
Consumer Discretionary | 1,116,164,985 | 338,032,045 | 778,059,467 | 73,473 |
Consumer Staples | 777,544,447 | 198,585,322 | 578,947,418 | 11,707 |
Energy | 560,293,960 | 238,177,573 | 320,175,350 | 1,941,037 |
Financials | 1,873,887,906 | 788,826,920 | 1,084,826,173 | 234,813 |
Health Care | 870,439,130 | 154,583,395 | 715,439,347 | 416,388 |
Industrials | 1,309,330,041 | 480,868,286 | 828,419,279 | 42,476 |
Information Technology | 1,088,330,410 | 139,207,377 | 949,123,032 | 1 |
Materials | 787,244,215 | 318,759,412 | 467,525,943 | 958,860 |
Real Estate | 280,043,500 | 98,499,991 | 181,354,589 | 188,920 |
Utilities | 300,023,646 | 125,044,282 | 174,855,089 | 124,275 |
| Government Obligations | 11,013,148 | - | 11,013,148 | - |
| Money Market Funds | 447,861,229 | 447,861,229 | - | - |
| Total Investments in Securities: | 9,918,396,318 | 3,447,671,886 | 6,466,071,815 | 4,652,617 |
Derivative Instruments: Liabilities | ||||
Futures Contracts | (18,231,076) | (18,231,076) | - | - |
| Total Liabilities | (18,231,076) | (18,231,076) | - | - |
| Total Derivative Instruments: | (18,231,076) | (18,231,076) | - | - |
Primary Risk Exposure / Derivative Type | Value | |
| Asset ($) | Liability ($) | |
| Equity Risk | ||
Futures Contracts (a) | 0 | (18,231,076) |
| Total Equity Risk | 0 | (18,231,076) |
| Total Value of Derivatives | 0 | (18,231,076) |
| Statement of Assets and Liabilities | ||||
| October 31, 2023 | ||||
| Assets | ||||
| Investment in securities, at value (including securities loaned of $99,738,846) - See accompanying schedule: | ||||
Unaffiliated issuers (cost $10,022,429,623) | $ | 9,470,535,089 | ||
Fidelity Central Funds (cost $447,861,229) | 447,861,229 | |||
| Total Investment in Securities (cost $10,470,290,852) | $ | 9,918,396,318 | ||
| Segregated cash with brokers for derivative instruments | 1,214,158 | |||
| Cash | 496,596 | |||
| Foreign currency held at value (cost $12,291,319) | 12,185,005 | |||
| Receivable for investments sold | 1,101,075 | |||
| Receivable for fund shares sold | 11,829,959 | |||
| Dividends receivable | 20,041,385 | |||
| Reclaims receivable | 16,684,113 | |||
| Distributions receivable from Fidelity Central Funds | 1,525,891 | |||
| Receivable for daily variation margin on futures contracts | 51,604 | |||
| Other receivables | 2,986 | |||
Total assets | 9,983,529,090 | |||
| Liabilities | ||||
| Payable for investments purchased | ||||
Regular delivery | $ | 2,056 | ||
Delayed delivery | 144,222 | |||
| Payable for fund shares redeemed | 18,954,859 | |||
| Accrued management fee | 499,264 | |||
| Deferred taxes | 14,039,314 | |||
| Other payables and accrued expenses | 4,554 | |||
| Collateral on securities loaned | 105,474,398 | |||
| Total Liabilities | 139,118,667 | |||
| Net Assets | $ | 9,844,410,423 | ||
| Net Assets consist of: | ||||
| Paid in capital | $ | 10,497,484,341 | ||
| Total accumulated earnings (loss) | (653,073,918) | |||
| Net Assets | $ | 9,844,410,423 | ||
Net Asset Value, offering price and redemption price per share ($9,844,410,423 ÷ 831,023,396 shares) | $ | 11.85 | ||
| Statement of Operations | ||||
Year ended October 31, 2023 | ||||
| Investment Income | ||||
| Dividends | $ | 321,438,569 | ||
| Interest | 528,773 | |||
| Income from Fidelity Central Funds (including $2,014,280 from security lending) | 11,067,814 | |||
| Income before foreign taxes withheld | $ | 333,035,156 | ||
| Less foreign taxes withheld | (31,810,788) | |||
| Total Income | 301,224,368 | |||
| Expenses | ||||
| Management fee | $ | 5,862,061 | ||
| Independent trustees' fees and expenses | 33,077 | |||
| Total expenses before reductions | 5,895,138 | |||
| Expense reductions | (64,151) | |||
| Total expenses after reductions | 5,830,987 | |||
| Net Investment income (loss) | 295,393,381 | |||
| Realized and Unrealized Gain (Loss) | ||||
| Net realized gain (loss) on: | ||||
| Investment Securities: | ||||
| Unaffiliated issuers (net of foreign taxes of $281,920) | (140,076,696) | |||
| Redemptions in-kind | 17,381,109 | |||
| Foreign currency transactions | (1,170,960) | |||
| Futures contracts | 21,721,656 | |||
| Total net realized gain (loss) | (102,144,891) | |||
| Change in net unrealized appreciation (depreciation) on: | ||||
| Investment Securities: | ||||
| Unaffiliated issuers(net of increase in deferred foreign taxes of $3,350,951) | 762,361,318 | |||
| Assets and liabilities in foreign currencies | 1,088,396 | |||
| Futures contracts | (20,969,354) | |||
| Total change in net unrealized appreciation (depreciation) | 742,480,360 | |||
| Net gain (loss) | 640,335,469 | |||
| Net increase (decrease) in net assets resulting from operations | $ | 935,728,850 | ||
| Statement of Changes in Net Assets | ||||
Year ended October 31, 2023 | Year ended October 31, 2022 | |||
| Increase (Decrease) in Net Assets | ||||
| Operations | ||||
| Net investment income (loss) | $ | 295,393,381 | $ | 257,868,708 |
| Net realized gain (loss) | (102,144,891) | (81,766,221) | ||
| Change in net unrealized appreciation (depreciation) | 742,480,360 | (2,621,790,004) | ||
| Net increase (decrease) in net assets resulting from operations | 935,728,850 | (2,445,687,517) | ||
| Distributions to shareholders | (218,213,495) | (217,671,505) | ||
| Share transactions | ||||
| Proceeds from sales of shares | 3,690,276,965 | 3,856,408,422 | ||
| Reinvestment of distributions | 204,119,321 | 206,193,841 | ||
| Cost of shares redeemed | (2,786,350,539) | (1,938,049,642) | ||
Net increase (decrease) in net assets resulting from share transactions | 1,108,045,747 | 2,124,552,621 | ||
| Total increase (decrease) in net assets | 1,825,561,102 | (538,806,401) | ||
| Net Assets | ||||
| Beginning of period | 8,018,849,321 | 8,557,655,722 | ||
| End of period | $ | 9,844,410,423 | $ | 8,018,849,321 |
| Other Information | ||||
| Shares | ||||
| Sold | 296,975,955 | 300,730,591 | ||
| Issued in reinvestment of distributions | 17,551,102 | 14,892,066 | ||
| Redeemed | (224,337,969) | (152,548,294) | ||
| Net increase (decrease) | 90,189,088 | 163,074,363 | ||
| Fidelity® Total International Index Fund |
| Years ended October 31, | 2023 | 2022 | 2021 | 2020 | 2019 | |||||
Selected Per-Share Data | ||||||||||
| Net asset value, beginning of period | $ | 10.82 | $ | 14.81 | $ | 11.54 | $ | 12.09 | $ | 11.14 |
| Income from Investment Operations | ||||||||||
Net investment income (loss) A,B | .38 | .38 | .35 | .27 | .37 | |||||
| Net realized and unrealized gain (loss) | .94 | (4.00) | 3.14 | (.50) | .81 | |||||
| Total from investment operations | 1.32 | (3.62) | 3.49 | (.23) | 1.18 | |||||
| Distributions from net investment income | (.29) | (.37) | (.22) | (.32) | (.23) | |||||
| Total distributions | (.29) | (.37) | (.22) | (.32) | (.23) | |||||
| Net asset value, end of period | $ | 11.85 | $ | 10.82 | $ | 14.81 | $ | 11.54 | $ | 12.09 |
Total Return C | 12.29% | (25.01)% | 30.47% | (1.97)% | 10.88% | |||||
Ratios to Average Net Assets B,D,E | ||||||||||
| Expenses before reductions | .06% | .06% | .06% | .06% | .06% | |||||
| Expenses net of fee waivers, if any | .06% | .06% | .06% | .06% | .06% | |||||
| Expenses net of all reductions | .06% | .06% | .06% | .06% | .06% | |||||
| Net investment income (loss) | 3.02% | 3.04% | 2.47% | 2.41% | 3.25% | |||||
| Supplemental Data | ||||||||||
| Net assets, end of period (000 omitted) | $ | 9,844,410 | $ | 8,018,849 | $ | 8,557,656 | $ | 4,656,266 | $ | 3,254,707 |
Portfolio turnover rate F | 4% G | 3% G | 5% | 4% | 4% |
| Fidelity Central Fund | Investment Manager | Investment Objective | Investment Practices | Expense RatioA |
| Fidelity Money Market Central Funds | Fidelity Management & Research Company LLC (FMR) | Each fund seeks to obtain a high level of current income consistent with the preservation of capital and liquidity. | Short-term Investments | Less than .005% |
| Gross unrealized appreciation | $1,241,031,281 |
| Gross unrealized depreciation | (1,884,910,157) |
| Net unrealized appreciation (depreciation) | $(643,878,876) |
| Tax Cost | $10,560,888,158 |
| Undistributed ordinary income | $267,547,117 |
| Capital loss carryforward | $(262,042,341) |
| Net unrealized appreciation (depreciation) on securities and other investments | $(644,598,338) |
| Short-term | $(67,451,012) |
| Long-term | (194,591,329) |
Total capital loss carryforward | $(262,042,341) |
| October 31, 2023 | October 31, 2022 | |
| Ordinary Income | $218,213,495 | $217,671,505 |
| Equity Risk | Equity risk relates to the fluctuations in the value of financial instruments as a result of changes in market prices (other than those arising from interest rate risk or foreign exchange risk), whether caused by factors specific to an individual investment, its issuer, or all factors affecting all instruments traded in a market or market segment. |
| Purchases ($) | Sales ($) | |
| Fidelity Total International Index Fund | 1,299,900,474 | 351,490,871 |
| Shares | Total net realized gain or loss ($) | Total Proceeds ($) | |
| Fidelity Total International Index Fund | 4,412,954 | 17,381,109 | 56,088,646 |
| Shares | Total net realized gain or loss ($) | Total Proceeds ($) | |
| Fidelity Total International Index Fund | 13,066,155 | 51,582,020 | 176,131,768 |
| Total Security Lending Fees Paid to NFS | Security Lending Income From Securities Loaned to NFS | Value of Securities Loaned to NFS at Period End | |
| Fidelity Total International Index Fund | $209,963 | $4,773 | $16,660 |
| The Example is based on an investment of $1,000 invested at the beginning of the period and held for the entire period (May 1, 2023 to October 31, 2023). |
Annualized Expense Ratio- A | Beginning Account Value May 1, 2023 | Ending Account Value October 31, 2023 | Expenses Paid During Period- C May 1, 2023 to October 31, 2023 | |||||||
| Fidelity® Total International Index Fund | .06% | |||||||||
| Actual | $ 1,000 | $ 931.60 | $ .29 | |||||||
Hypothetical-B | $ 1,000 | $ 1,024.90 | $ .31 | |||||||
| A special meeting of shareholders was held on October 18, 2023. The results of votes taken among shareholders on the proposal before them are reported below. Each vote reported represents one dollar of net asset value held on the record date for the meeting. | ||
| Proposal 1 | ||
| To elect a Board of Trustees. | ||
# of Votes | % of Votes | |
| Abigail P. Johnson | ||
| Affirmative | 378,729,502,260.010 | 97.580 |
| Withheld | 9,407,876,478.960 | 2.420 |
| TOTAL | 388,137,378,738.970 | 100.000 |
| Jennifer Toolin McAuliffe | ||
| Affirmative | 378,454,868,010.950 | 97.510 |
| Withheld | 9,682,510,728.020 | 2.490 |
| TOTAL | 388,137,378,738.970 | 100.000 |
| Christine J. Thompson | ||
| Affirmative | 378,837,121,274.520 | 97.600 |
| Withheld | 9,300,257,464.450 | 2.400 |
| TOTAL | 388,137,378,738.970 | 100.000 |
| Elizabeth S. Acton | ||
| Affirmative | 378,262,110,794.850 | 97.460 |
| Withheld | 9,875,267,944.120 | 2.540 |
| TOTAL | 388,137,378,738.970 | 100.000 |
| Laura M. Bishop | ||
| Affirmative | 380,482,113,171.060 | 98.030 |
| Withheld | 7,655,265,567.910 | 1.970 |
| TOTAL | 388,137,378,738.970 | 100.000 |
| Ann E. Dunwoody | ||
| Affirmative | 380,016,034,008.120 | 97.910 |
| Withheld | 8,121,344,730.850 | 2.090 |
| TOTAL | 388,137,378,738.970 | 100.000 |
| John Engler | ||
| Affirmative | 379,432,488,394.200 | 97.760 |
| Withheld | 8,704,890,344.770 | 2.240 |
| TOTAL | 388,137,378,738.970 | 100.000 |
| Robert F. Gartland | ||
| Affirmative | 378,741,819,600.600 | 97.580 |
| Withheld | 9,395,559,138.370 | 2.420 |
| TOTAL | 388,137,378,738.970 | 100.000 |
| Robert W. Helm | ||
| Affirmative | 380,389,324,755.070 | 98.000 |
| Withheld | 7,748,053,983.900 | 2.000 |
| TOTAL | 388,137,378,738.970 | 100.000 |
| Arthur E. Johnson | ||
| Affirmative | 378,427,694,151.670 | 97.500 |
| Withheld | 9,709,684,587.300 | 2.500 |
| TOTAL | 388,137,378,738.970 | 100.000 |
| Michael E. Kenneally | ||
| Affirmative | 377,842,228,145.180 | 97.350 |
| Withheld | 10,295,150,593.790 | 2.650 |
| TOTAL | 388,137,378,738.970 | 100.000 |
| Mark A. Murray | ||
| Affirmative | 380,158,432,703.370 | 97.940 |
| Withheld | 7,978,946,035.600 | 2.060 |
| TOTAL | 388,137,378,738.970 | 100.000 |
| Carol J. Zierhoffer | ||
| Affirmative | 380,522,113,360.240 | 98.040 |
| Withheld | 7,615,265,378.730 | 1.960 |
| TOTAL | 388,137,378,738.970 | 100.000 |
| Proposal 1 reflects trust wide proposal and voting results. | ||
 |


Contents
| Average Annual Total Returns | |||
Periods ended October 31, 2023 | Past 1 year | Life of Fund A |
| Fidelity® SAI International Quality Index Fund | 13.13% | 6.89% |
| $10,000 Over Life of Fund |
Let's say hypothetically that $10,000 was invested in Fidelity® SAI International Quality Index Fund on May 12, 2020, when the fund started. The chart shows how the value of your investment would have changed, and also shows how the Fidelity International Quality Focus Index℠ and MSCI ACWI (All Country World Index) ex USA Index performed over the same period. |
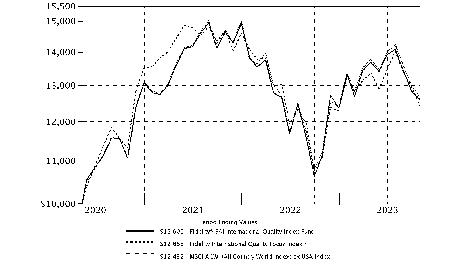 |
Top Holdings (% of Fund's net assets) | ||
| Novo Nordisk A/S Series B (Denmark, Pharmaceuticals) | 4.2 | |
| ASML Holding NV (Netherlands) (Netherlands, Semiconductors & Semiconductor Equipment) | 3.5 | |
| Novartis AG (Switzerland, Pharmaceuticals) | 3.4 | |
| TotalEnergies SE (France, Oil, Gas & Consumable Fuels) | 3.3 | |
| Roche Holding AG (participation certificate) (United States of America, Pharmaceuticals) | 3.1 | |
| BHP Group Ltd. (Australia, Metals & Mining) | 3.0 | |
| LVMH Moet Hennessy Louis Vuitton SE (France, Textiles, Apparel & Luxury Goods) | 2.9 | |
| Unilever PLC (United Kingdom, Personal Care Products) | 2.8 | |
| L'Oreal SA (France, Personal Care Products) | 2.7 | |
| Keyence Corp. (Japan, Electronic Equipment, Instruments & Components) | 2.5 | |
| 31.4 | ||
| Market Sectors (% of Fund's net assets) | ||
| Health Care | 19.2 | |
| Consumer Staples | 12.8 | |
| Industrials | 12.2 | |
| Consumer Discretionary | 11.7 | |
| Financials | 11.0 | |
| Materials | 10.7 | |
| Information Technology | 9.3 | |
| Communication Services | 5.6 | |
| Energy | 4.6 | |
| Real Estate | 1.0 | |
| Utilities | 1.0 | |
Asset Allocation (% of Fund's net assets) |
 |
Futures - 1% |
Geographic Diversification (% of Fund's net assets) |
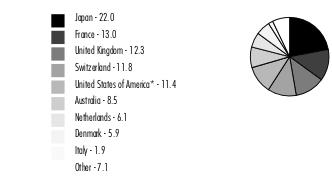 |
* Includes Short-Term investments and Net Other Assets (Liabilities). Percentages are adjusted for the effect of derivatives, if applicable. |
| Common Stocks - 99.1% | |||
| Shares | Value ($) | ||
| Australia - 8.5% | |||
| Altium Ltd. | 10,814 | 272,767 | |
| BHP Group Ltd. | 294,223 | 8,328,711 | |
| Fortescue Metals Group Ltd. | 151,160 | 2,150,376 | |
| JB Hi-Fi Ltd. | 9,760 | 280,551 | |
| Medibank Private Ltd. | 245,828 | 536,465 | |
| NIB Holdings Ltd. | 43,153 | 198,876 | |
| Pilbara Minerals Ltd. | 232,834 | 546,927 | |
| Pro Medicus Ltd. | 4,476 | 213,205 | |
| REA Group Ltd. | 4,599 | 422,210 | |
| Rio Tinto Ltd. | 33,136 | 2,475,196 | |
| Rio Tinto PLC | 94,701 | 6,041,973 | |
| Sonic Healthcare Ltd. | 41,929 | 767,765 | |
| Technology One Ltd. | 24,915 | 231,057 | |
| Telstra Group Ltd. | 357,180 | 866,119 | |
| Whitehaven Coal Ltd. | 77,958 | 367,205 | |
TOTAL AUSTRALIA | 23,699,403 | ||
| Denmark - 5.9% | |||
| Carlsberg A/S Series B | 8,421 | 1,003,558 | |
| Genmab A/S (a) | 5,890 | 1,665,002 | |
| Novo Nordisk A/S Series B | 120,346 | 11,610,524 | |
| Novozymes A/S Series B | 18,663 | 837,669 | |
| Pandora A/S | 7,945 | 899,054 | |
| Ringkjoebing Landbobank A/S | 2,454 | 334,158 | |
TOTAL DENMARK | 16,349,965 | ||
| Finland - 0.9% | |||
| Elisa Corp. (A Shares) | 13,444 | 570,142 | |
| Kone OYJ (B Shares) | 36,003 | 1,557,695 | |
| Orion Oyj (B Shares) | 9,560 | 379,733 | |
TOTAL FINLAND | 2,507,570 | ||
| France - 13.0% | |||
| Gaztransport et Technigaz SA | 1,953 | 249,423 | |
| Hermes International SCA | 3,110 | 5,790,300 | |
| Ipsen SA | 3,591 | 423,660 | |
| Kering SA | 5,453 | 2,217,744 | |
| L'Oreal SA | 17,708 | 7,443,216 | |
| La Francaise des Jeux SAEM (b) | 11,082 | 356,701 | |
| Legrand SA | 23,817 | 2,060,323 | |
| LVMH Moet Hennessy Louis Vuitton SE | 11,399 | 8,160,893 | |
| Remy Cointreau SA | 2,085 | 236,388 | |
| TotalEnergies SE | 135,297 | 9,045,617 | |
TOTAL FRANCE | 35,984,265 | ||
| Germany - 1.7% | |||
| Deutsche Borse AG | 16,961 | 2,791,721 | |
| Hannover Reuck SE | 5,382 | 1,186,205 | |
| Nemetschek SE | 4,949 | 368,652 | |
| Rational AG | 456 | 259,340 | |
| TeamViewer AG (a)(b) | 13,320 | 204,291 | |
TOTAL GERMANY | 4,810,209 | ||
| Hong Kong - 1.6% | |||
| CK Infrastructure Holdings Ltd. | 53,500 | 247,975 | |
| Hong Kong Exchanges and Clearing Ltd. | 106,400 | 3,722,154 | |
| Power Assets Holdings Ltd. | 122,000 | 583,261 | |
TOTAL HONG KONG | 4,553,390 | ||
| Israel - 0.5% | |||
| Mizrahi Tefahot Bank Ltd. | 13,325 | 412,079 | |
| NICE Ltd. (a) | 5,681 | 877,871 | |
TOTAL ISRAEL | 1,289,950 | ||
| Italy - 1.9% | |||
| Azimut Holding SpA | 10,230 | 215,188 | |
| Ferrari NV (Italy) | 11,425 | 3,451,350 | |
| FinecoBank SpA | 54,507 | 641,045 | |
| Snam SpA | 183,002 | 839,164 | |
TOTAL ITALY | 5,146,747 | ||
| Japan - 22.0% | |||
| Advantest Corp. | 64,500 | 1,661,432 | |
| Astellas Pharma, Inc. | 161,500 | 2,042,955 | |
| BayCurrent Consulting, Inc. | 12,200 | 306,302 | |
| Capcom Co. Ltd. | 14,300 | 460,307 | |
| Chugai Pharmaceutical Co. Ltd. | 57,000 | 1,690,424 | |
| Daito Trust Construction Co. Ltd. | 6,100 | 654,325 | |
| Daiwa House Industry Co. Ltd. | 59,500 | 1,636,588 | |
| Disco Corp. | 7,900 | 1,395,132 | |
| Fast Retailing Co. Ltd. | 16,700 | 3,697,320 | |
| GMO Payment Gateway, Inc. | 3,900 | 155,763 | |
| GOLDWIN, Inc. | 3,300 | 208,418 | |
| Hamamatsu Photonics K.K. | 13,100 | 486,574 | |
| Hoya Corp. | 31,800 | 3,061,342 | |
| Japan Exchange Group, Inc. | 47,200 | 933,370 | |
| Japan Tobacco, Inc. | 98,200 | 2,285,985 | |
| Keyence Corp. | 17,800 | 6,890,713 | |
| Kobayashi Pharmaceutical Co. Ltd. | 4,900 | 202,288 | |
| M3, Inc. | 38,200 | 588,326 | |
| Nexon Co. Ltd. | 40,300 | 739,475 | |
| Nintendo Co. Ltd. | 104,300 | 4,309,098 | |
| Nippon Shinyaku Co. Ltd. | 5,400 | 219,003 | |
| Nippon Telegraph & Telephone Corp. | 2,667,300 | 3,138,814 | |
| Nissan Chemical Corp. | 12,600 | 513,893 | |
| OBIC Co. Ltd. | 5,800 | 857,335 | |
| Ono Pharmaceutical Co. Ltd. | 42,500 | 733,953 | |
| Otsuka Holdings Co. Ltd. | 49,300 | 1,658,746 | |
| Recruit Holdings Co. Ltd. | 151,400 | 4,341,048 | |
| Rohto Pharmaceutical Co. Ltd. | 19,500 | 454,961 | |
| SG Holdings Co. Ltd. | 43,500 | 616,596 | |
| Shimadzu Corp. | 24,600 | 581,699 | |
| SHIMANO, Inc. | 7,400 | 1,064,905 | |
| Shin-Etsu Chemical Co. Ltd. | 180,700 | 5,403,541 | |
| Shionogi & Co. Ltd. | 25,000 | 1,164,116 | |
| Square Enix Holdings Co. Ltd. | 7,900 | 262,452 | |
| Sysmex Corp. | 15,200 | 728,123 | |
| TIS, Inc. | 19,800 | 424,014 | |
| Tokio Marine Holdings, Inc. | 178,800 | 4,000,156 | |
| Trend Micro, Inc. | 12,500 | 471,058 | |
| USS Co. Ltd. | 19,200 | 335,595 | |
| Yakult Honsha Co. Ltd. | 28,300 | 666,888 | |
TOTAL JAPAN | 61,043,033 | ||
| Netherlands - 6.1% | |||
| Adyen BV (a)(b) | 2,767 | 1,866,303 | |
| ASML Holding NV (Netherlands) | 16,070 | 9,660,005 | |
| BE Semiconductor Industries NV | 6,882 | 708,523 | |
| Universal Music Group NV | 68,260 | 1,671,608 | |
| Wolters Kluwer NV | 22,987 | 2,945,460 | |
TOTAL NETHERLANDS | 16,851,899 | ||
| New Zealand - 0.2% | |||
| Spark New Zealand Ltd. | 165,442 | 480,298 | |
| Norway - 1.2% | |||
| Equinor ASA | 93,539 | 3,135,728 | |
| Gjensidige Forsikring ASA | 16,961 | 254,014 | |
TOTAL NORWAY | 3,389,742 | ||
| Singapore - 0.4% | |||
| Frasers Logistics & Industrial Trust | 258,400 | 196,283 | |
| Genting Singapore Ltd. | 507,400 | 318,777 | |
| Singapore Exchange Ltd. | 73,500 | 508,889 | |
TOTAL SINGAPORE | 1,023,949 | ||
| Spain - 0.4% | |||
| Enagas SA | 22,217 | 371,306 | |
| Redeia Corp. SA | 38,640 | 601,214 | |
TOTAL SPAIN | 972,520 | ||
| Sweden - 0.2% | |||
| AddTech AB (B Shares) | 23,200 | 339,610 | |
| Fortnox AB | 42,998 | 170,028 | |
TOTAL SWEDEN | 509,638 | ||
| Switzerland - 11.8% | |||
| Belimo Holding AG (Reg.) | 878 | 367,744 | |
| Compagnie Financiere Richemont SA Series A | 46,595 | 5,497,069 | |
| Ems-Chemie Holding AG | 605 | 412,356 | |
| Geberit AG (Reg.) | 3,142 | 1,456,929 | |
| Georg Fischer AG (Reg.) | 7,321 | 377,619 | |
| Kuehne & Nagel International AG | 5,067 | 1,361,932 | |
| Novartis AG | 99,560 | 9,320,764 | |
| Partners Group Holding AG | 2,026 | 2,131,014 | |
| Sandoz Group AG | 19,912 | 517,692 | |
| SGS SA (Reg.) | 13,548 | 1,101,832 | |
| Sonova Holding AG | 4,585 | 1,081,166 | |
| Swisscom AG | 2,266 | 1,355,141 | |
| Temenos Group AG | 6,018 | 430,949 | |
| VAT Group AG (b) | 2,411 | 850,006 | |
| Zurich Insurance Group Ltd. | 13,430 | 6,357,344 | |
TOTAL SWITZERLAND | 32,619,557 | ||
| United Kingdom - 12.3% | |||
| 3i Group PLC | 86,877 | 2,048,350 | |
| Admiral Group PLC | 24,631 | 731,379 | |
| Auto Trader Group PLC (b) | 82,255 | 622,198 | |
| British American Tobacco PLC (United Kingdom) | 199,547 | 5,960,957 | |
| Britvic PLC | 23,054 | 234,816 | |
| Diageo PLC | 181,722 | 6,872,004 | |
| Games Workshop Group PLC | 2,938 | 352,635 | |
| Hargreaves Lansdown PLC | 31,331 | 269,082 | |
| Howden Joinery Group PLC | 51,826 | 401,636 | |
| IG Group Holdings PLC | 36,627 | 284,027 | |
| Man Group PLC | 123,129 | 328,497 | |
| RELX PLC (London Stock Exchange) | 176,955 | 6,180,634 | |
| Rightmove PLC | 74,271 | 426,990 | |
| Rotork PLC | 76,837 | 273,450 | |
| RS GROUP PLC | 42,203 | 347,374 | |
| Safestore Holdings PLC | 19,461 | 161,674 | |
| Schroders PLC | 81,159 | 364,295 | |
| St. James's Place PLC | 48,933 | 380,406 | |
| Unilever PLC | 161,366 | 7,642,404 | |
| Wise PLC (a) | 42,078 | 340,413 | |
TOTAL UNITED KINGDOM | 34,223,221 | ||
| United States of America - 10.5% | |||
| Experian PLC | 86,542 | 2,620,220 | |
| GSK PLC | 357,708 | 6,376,780 | |
| Haleon PLC | 453,365 | 1,817,128 | |
| Holcim AG | 50,581 | 3,118,323 | |
| Roche Holding AG (participation certificate) | 32,879 | 8,473,235 | |
| Schneider Electric SA | 44,087 | 6,783,106 | |
TOTAL UNITED STATES OF AMERICA | 29,188,792 | ||
| TOTAL COMMON STOCKS (Cost $263,202,579) | 274,644,148 | ||
| Government Obligations - 0.1% | |||
Principal Amount (c) | Value ($) | ||
| United States of America - 0.1% | |||
U.S. Treasury Bills, yield at date of purchase 5.42% 2/22/24 (d) (Cost $295,012) | 300,000 | 294,995 | |
| Money Market Funds - 0.0% | |||
| Shares | Value ($) | ||
Fidelity Cash Central Fund 5.40% (e) (Cost $77,319) | 77,303 | 77,319 | |
| TOTAL INVESTMENT IN SECURITIES - 99.2% (Cost $263,574,910) | 275,016,462 |
NET OTHER ASSETS (LIABILITIES) - 0.8% | 2,269,004 |
| NET ASSETS - 100.0% | 277,285,466 |
| Futures Contracts | |||||
Number of contracts | Expiration Date | Notional Amount ($) | Value ($) | Unrealized Appreciation/ (Depreciation) ($) | |
| Purchased | |||||
| Equity Index Contracts | |||||
| ICE MSCI EAFE Index Contracts (United States) | 28 | Dec 2023 | 2,763,740 | (121,537) | (121,537) |
| The notional amount of futures purchased as a percentage of Net Assets is 1.0% | |||||
| (a) | Non-income producing |
| (b) | Security exempt from registration under Rule 144A of the Securities Act of 1933. These securities may be resold in transactions exempt from registration, normally to qualified institutional buyers. At the end of the period, the value of these securities amounted to $3,899,499 or 1.4% of net assets. |
| (c) | Amount is stated in United States dollars unless otherwise noted. |
| (d) | Security or a portion of the security was pledged to cover margin requirements for futures contracts. At period end, the value of securities pledged amounted to $97,348. |
| (e) | Affiliated fund that is generally available only to investment companies and other accounts managed by Fidelity Investments. The rate quoted is the annualized seven-day yield of the fund at period end. A complete unaudited listing of the fund's holdings as of its most recent quarter end is available upon request. In addition, each Fidelity Central Fund's financial statements, which are not covered by the Fund's Report of Independent Registered Public Accounting Firm, are available on the SEC's website or upon request. |
| Affiliate | Value, beginning of period ($) | Purchases ($) | Sales Proceeds ($) | Dividend Income ($) | Realized Gain (loss) ($) | Change in Unrealized appreciation (depreciation) ($) | Value, end of period ($) | % ownership, end of period |
| Fidelity Cash Central Fund 5.40% | 3,034,111 | 37,372,083 | 40,328,875 | 77,510 | - | - | 77,319 | 0.0% |
| Fidelity Securities Lending Cash Central Fund 5.40% | 650,950 | 6,799,134 | 7,450,084 | 5,496 | - | - | - | 0.0% |
| Total | 3,685,061 | 44,171,217 | 47,778,959 | 83,006 | - | - | 77,319 | |
| Valuation Inputs at Reporting Date: | ||||
| Description | Total ($) | Level 1 ($) | Level 2 ($) | Level 3 ($) |
Investments in Securities: | ||||
| Equities: | ||||
Communication Services | 15,324,852 | 2,352,273 | 12,972,579 | - |
Consumer Discretionary | 32,631,312 | 10,850,040 | 21,781,272 | - |
Consumer Staples | 34,820,593 | 471,204 | 34,349,389 | - |
Energy | 12,797,973 | 249,423 | 12,548,550 | - |
Financials | 30,991,193 | 14,229,146 | 16,762,047 | - |
Health Care | 52,716,514 | 2,402,251 | 50,314,263 | - |
Industrials | 34,548,856 | 14,260,847 | 20,288,009 | - |
Information Technology | 25,692,100 | 2,760,314 | 22,931,786 | - |
Materials | 29,828,965 | 4,368,348 | 25,460,617 | - |
Real Estate | 2,648,870 | 161,674 | 2,487,196 | - |
Utilities | 2,642,920 | 972,520 | 1,670,400 | - |
| Government Obligations | 294,995 | - | 294,995 | - |
| Money Market Funds | 77,319 | 77,319 | - | - |
| Total Investments in Securities: | 275,016,462 | 53,155,359 | 221,861,103 | - |
Derivative Instruments: Liabilities | ||||
Futures Contracts | (121,537) | (121,537) | - | - |
| Total Liabilities | (121,537) | (121,537) | - | - |
| Total Derivative Instruments: | (121,537) | (121,537) | - | - |
Primary Risk Exposure / Derivative Type | Value | |
| Asset ($) | Liability ($) | |
| Equity Risk | ||
Futures Contracts (a) | 0 | (121,537) |
| Total Equity Risk | 0 | (121,537) |
| Total Value of Derivatives | 0 | (121,537) |
| Statement of Assets and Liabilities | ||||
| October 31, 2023 | ||||
| Assets | ||||
| Investment in securities, at value - See accompanying schedule: | ||||
Unaffiliated issuers (cost $263,497,591) | $ | 274,939,143 | ||
Fidelity Central Funds (cost $77,319) | 77,319 | |||
| Total Investment in Securities (cost $263,574,910) | $ | 275,016,462 | ||
| Cash | 38,012 | |||
| Foreign currency held at value (cost $119,381) | 118,008 | |||
| Receivable for fund shares sold | 81,239 | |||
| Dividends receivable | 549,704 | |||
| Reclaims receivable | 1,705,225 | |||
| Distributions receivable from Fidelity Central Funds | 2,339 | |||
| Receivable for daily variation margin on futures contracts | 8,260 | |||
| Prepaid expenses | 398 | |||
Total assets | 277,519,647 | |||
| Liabilities | ||||
| Payable for fund shares redeemed | $ | 129,620 | ||
| Accrued management fee | 35,030 | |||
| Audit fee payable | 42,295 | |||
| Custody fee payable | 21,809 | |||
| Other payables and accrued expenses | 5,427 | |||
| Total Liabilities | 234,181 | |||
| Net Assets | $ | 277,285,466 | ||
| Net Assets consist of: | ||||
| Paid in capital | $ | 284,785,046 | ||
| Total accumulated earnings (loss) | (7,499,580) | |||
| Net Assets | $ | 277,285,466 | ||
Net Asset Value, offering price and redemption price per share ($277,285,466 ÷ 25,453,910 shares) | $ | 10.89 | ||
| Statement of Operations | ||||
Year ended October 31, 2023 | ||||
| Investment Income | ||||
| Dividends | $ | 9,386,550 | ||
| Foreign Tax Reclaims | 732,541 | |||
| Interest | 18,978 | |||
| Income from Fidelity Central Funds (including $5,496 from security lending) | 83,006 | |||
| Income before foreign taxes withheld | $ | 10,221,075 | ||
| Less foreign taxes withheld | (1,452,018) | |||
| Total Income | 8,769,057 | |||
| Expenses | ||||
| Management fee | $ | 489,656 | ||
| Custodian fees and expenses | 74,004 | |||
| Independent trustees' fees and expenses | 1,148 | |||
| Registration fees | 22,561 | |||
| Audit | 48,795 | |||
| Legal | 401 | |||
| Interest | 8,797 | |||
| Miscellaneous | 6,306 | |||
| Total Expenses | 651,668 | |||
| Net Investment income (loss) | 8,117,389 | |||
| Realized and Unrealized Gain (Loss) | ||||
| Net realized gain (loss) on: | ||||
| Investment Securities: | ||||
| Unaffiliated issuers | 7,757,159 | |||
| Foreign currency transactions | 900 | |||
| Futures contracts | 772,137 | |||
| Total net realized gain (loss) | 8,530,196 | |||
| Change in net unrealized appreciation (depreciation) on: | ||||
| Investment Securities: | ||||
| Unaffiliated issuers | 30,007,523 | |||
| Assets and liabilities in foreign currencies | 112,869 | |||
| Futures contracts | (350,028) | |||
| Total change in net unrealized appreciation (depreciation) | 29,770,364 | |||
| Net gain (loss) | 38,300,560 | |||
| Net increase (decrease) in net assets resulting from operations | $ | 46,417,949 | ||
| Statement of Changes in Net Assets | ||||
Year ended October 31, 2023 | Year ended October 31, 2022 | |||
| Increase (Decrease) in Net Assets | ||||
| Operations | ||||
| Net investment income (loss) | $ | 8,117,389 | $ | 12,520,370 |
| Net realized gain (loss) | 8,530,196 | (31,334,908) | ||
| Change in net unrealized appreciation (depreciation) | 29,770,364 | (106,056,812) | ||
| Net increase (decrease) in net assets resulting from operations | 46,417,949 | (124,871,350) | ||
| Distributions to shareholders | (10,237,046) | (57,966,562) | ||
| Share transactions | ||||
| Proceeds from sales of shares | 27,624,215 | 58,623,756 | ||
| Reinvestment of distributions | 10,187,269 | 57,912,763 | ||
| Cost of shares redeemed | (112,997,465) | (205,609,251) | ||
Net increase (decrease) in net assets resulting from share transactions | (75,185,981) | (89,072,732) | ||
| Total increase (decrease) in net assets | (39,005,078) | (271,910,644) | ||
| Net Assets | ||||
| Beginning of period | 316,290,544 | 588,201,188 | ||
| End of period | $ | 277,285,466 | $ | 316,290,544 |
| Other Information | ||||
| Shares | ||||
| Sold | 2,453,321 | 4,925,582 | ||
| Issued in reinvestment of distributions | 930,344 | 4,434,362 | ||
| Redeemed | (9,827,124) | (18,012,279) | ||
| Net increase (decrease) | (6,443,459) | (8,652,335) | ||
| Fidelity® SAI International Quality Index Fund |
| Years ended October 31, | 2023 | 2022 | 2021 | 2020 A | ||||
Selected Per-Share Data | ||||||||
| Net asset value, beginning of period | $ | 9.92 | $ | 14.51 | $ | 11.07 | $ | 10.00 |
| Income from Investment Operations | ||||||||
Net investment income (loss) B,C | .28 | .32 | .24 | .08 | ||||
| Net realized and unrealized gain (loss) | 1.02 | (3.44) | 3.32 | .99 | ||||
| Total from investment operations | 1.30 | (3.12) | 3.56 | 1.07 | ||||
| Distributions from net investment income | (.33) | (.24) | (.10) | - | ||||
| Distributions from net realized gain | - | (1.24) | (.02) | - | ||||
| Total distributions | (.33) | (1.47) D | (.12) | - | ||||
| Net asset value, end of period | $ | 10.89 | $ | 9.92 | $ | 14.51 | $ | 11.07 |
Total Return E,F | 13.13% | (23.94)% | 32.28% | 10.70% | ||||
Ratios to Average Net Assets C,G,H | ||||||||
| Expenses before reductions | .20% | .19% | .19% | .23% I,J | ||||
| Expenses net of fee waivers, if any | .20% | .19% | .19% | .20% J | ||||
| Expenses net of all reductions | .20% | .19% | .19% | .20% J | ||||
| Net investment income (loss) | 2.49% | 2.70% | 1.78% | 1.55% J | ||||
| Supplemental Data | ||||||||
| Net assets, end of period (000 omitted) | $ | 277,285 | $ | 316,291 | $ | 588,201 | $ | 473,547 |
Portfolio turnover rate K | 38% | 47% | 78% | 30% L |
| Fidelity Central Fund | Investment Manager | Investment Objective | Investment Practices | Expense RatioA |
| Fidelity Money Market Central Funds | Fidelity Management & Research Company LLC (FMR) | Each fund seeks to obtain a high level of current income consistent with the preservation of capital and liquidity. | Short-term Investments | Less than .005% |
| Gross unrealized appreciation | $34,786,643 |
| Gross unrealized depreciation | (26,228,894) |
| Net unrealized appreciation (depreciation) | $8,557,749 |
| Tax Cost | $266,458,713 |
| Undistributed ordinary income | $7,477,234 |
| Capital loss carryforward | $(23,513,897) |
| Net unrealized appreciation (depreciation) on securities and other investments | $8,537,084 |
| Short-term | $(23,513,897) |
| Long-term | - |
| Total capital loss carryforward | $(23,513,897) |
| October 31, 2023 | October 31, 2022 | |
| Ordinary Income | $10,237,046 | $45,978,919 |
| Long-term Capital Gains | - | 11,987,643 |
| Total | $10,237,046 | $57,966,562 |
| Equity Risk | Equity risk relates to the fluctuations in the value of financial instruments as a result of changes in market prices (other than those arising from interest rate risk or foreign exchange risk), whether caused by factors specific to an individual investment, its issuer, or all factors affecting all instruments traded in a market or market segment. |
| Purchases ($) | Sales ($) | |
| Fidelity SAI International Quality Index Fund | 121,434,762 | 195,576,256 |
| Borrower or Lender | Average Loan Balance | Weighted Average Interest Rate | Interest Expense | |
Fidelity SAI International Quality Index Fund | Borrower | $6,404,000 | 5.50% | $8,797 |
| Amount | |
| Fidelity SAI International Quality Index Fund | $601 |
| Total Security Lending Fees Paid to NFS | Security Lending Income From Securities Loaned to NFS | Value of Securities Loaned to NFS at Period End | |
| Fidelity SAI International Quality Index Fund | $579 | $- | $- |
| Strategic Advisers Fidelity International Fund | |
| Fidelity SAI International Quality Index Fund | 35% |
| Fund | % of shares held |
| Fidelity SAI International Quality Index Fund | 36% |
| The Example is based on an investment of $1,000 invested at the beginning of the period and held for the entire period (May 1, 2023 to October 31, 2023). |
Annualized Expense Ratio- A | Beginning Account Value May 1, 2023 | Ending Account Value October 31, 2023 | Expenses Paid During Period- C May 1, 2023 to October 31, 2023 | |||||||
| Fidelity® SAI International Quality Index Fund | .21% | |||||||||
| Actual | $ 1,000 | $ 920.50 | $ 1.02 | |||||||
Hypothetical-B | $ 1,000 | $ 1,024.15 | $ 1.07 | |||||||
| A special meeting of shareholders was held on October 18, 2023. The results of votes taken among shareholders on the proposal before them are reported below. Each vote reported represents one dollar of net asset value held on the record date for the meeting. | ||
| Proposal 1 | ||
| To elect a Board of Trustees. | ||
# of Votes | % of Votes | |
| Abigail P. Johnson | ||
| Affirmative | 378,729,502,260.010 | 97.580 |
| Withheld | 9,407,876,478.960 | 2.420 |
| TOTAL | 388,137,378,738.970 | 100.000 |
| Jennifer Toolin McAuliffe | ||
| Affirmative | 378,454,868,010.950 | 97.510 |
| Withheld | 9,682,510,728.020 | 2.490 |
| TOTAL | 388,137,378,738.970 | 100.000 |
| Christine J. Thompson | ||
| Affirmative | 378,837,121,274.520 | 97.600 |
| Withheld | 9,300,257,464.450 | 2.400 |
| TOTAL | 388,137,378,738.970 | 100.000 |
| Elizabeth S. Acton | ||
| Affirmative | 378,262,110,794.850 | 97.460 |
| Withheld | 9,875,267,944.120 | 2.540 |
| TOTAL | 388,137,378,738.970 | 100.000 |
| Laura M. Bishop | ||
| Affirmative | 380,482,113,171.060 | 98.030 |
| Withheld | 7,655,265,567.910 | 1.970 |
| TOTAL | 388,137,378,738.970 | 100.000 |
| Ann E. Dunwoody | ||
| Affirmative | 380,016,034,008.120 | 97.910 |
| Withheld | 8,121,344,730.850 | 2.090 |
| TOTAL | 388,137,378,738.970 | 100.000 |
| John Engler | ||
| Affirmative | 379,432,488,394.200 | 97.760 |
| Withheld | 8,704,890,344.770 | 2.240 |
| TOTAL | 388,137,378,738.970 | 100.000 |
| Robert F. Gartland | ||
| Affirmative | 378,741,819,600.600 | 97.580 |
| Withheld | 9,395,559,138.370 | 2.420 |
| TOTAL | 388,137,378,738.970 | 100.000 |
| Robert W. Helm | ||
| Affirmative | 380,389,324,755.070 | 98.000 |
| Withheld | 7,748,053,983.900 | 2.000 |
| TOTAL | 388,137,378,738.970 | 100.000 |
| Arthur E. Johnson | ||
| Affirmative | 378,427,694,151.670 | 97.500 |
| Withheld | 9,709,684,587.300 | 2.500 |
| TOTAL | 388,137,378,738.970 | 100.000 |
| Michael E. Kenneally | ||
| Affirmative | 377,842,228,145.180 | 97.350 |
| Withheld | 10,295,150,593.790 | 2.650 |
| TOTAL | 388,137,378,738.970 | 100.000 |
| Mark A. Murray | ||
| Affirmative | 380,158,432,703.370 | 97.940 |
| Withheld | 7,978,946,035.600 | 2.060 |
| TOTAL | 388,137,378,738.970 | 100.000 |
| Carol J. Zierhoffer | ||
| Affirmative | 380,522,113,360.240 | 98.040 |
| Withheld | 7,615,265,378.730 | 1.960 |
| TOTAL | 388,137,378,738.970 | 100.000 |
| Proposal 1 reflects trust wide proposal and voting results. | ||
 |


Contents
| Average Annual Total Returns | |||
Periods ended October 31, 2023 | Past 1 year | Past 5 years | Life of Fund A |
| Fidelity® International Sustainability Index Fund | 12.68% | 3.37% | 2.59% |
| $10,000 Over Life of Fund |
Let's say hypothetically that $10,000 was invested in Fidelity® International Sustainability Index Fund, on May 9, 2017, when the fund started. The chart shows how the value of your investment would have changed, and also shows how the MSCI ACWI (All Country World Index) ex USA ESG Leaders Index (net) performed over the same period. |
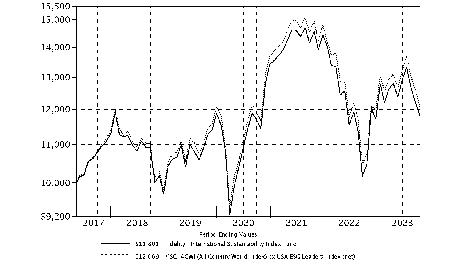 |
Top Holdings (% of Fund's net assets) | ||
| Taiwan Semiconductor Manufacturing Co. Ltd. (Taiwan, Semiconductors & Semiconductor Equipment) | 3.5 | |
| Novo Nordisk A/S Series B (Denmark, Pharmaceuticals) | 2.7 | |
| Tencent Holdings Ltd. (China, Interactive Media & Services) | 2.2 | |
| ASML Holding NV (Netherlands) (Netherlands, Semiconductors & Semiconductor Equipment) | 2.1 | |
| LVMH Moet Hennessy Louis Vuitton SE (France, Textiles, Apparel & Luxury Goods) | 1.7 | |
| AstraZeneca PLC (United Kingdom) (United Kingdom, Pharmaceuticals) | 1.7 | |
| Novartis AG (Switzerland, Pharmaceuticals) | 1.7 | |
| Alibaba Group Holding Ltd. (China, Broadline Retail) | 1.5 | |
| TotalEnergies SE (France, Oil, Gas & Consumable Fuels) | 1.3 | |
| HSBC Holdings PLC (United Kingdom) (United Kingdom, Banks) | 1.2 | |
| 19.6 | ||
| Market Sectors (% of Fund's net assets) | ||
| Financials | 21.3 | |
| Industrials | 11.9 | |
| Consumer Discretionary | 11.9 | |
| Information Technology | 11.0 | |
| Health Care | 9.5 | |
| Consumer Staples | 8.0 | |
| Communication Services | 7.5 | |
| Materials | 7.1 | |
| Energy | 5.1 | |
| Utilities | 2.8 | |
| Real Estate | 1.9 | |
Asset Allocation (% of Fund's net assets) |
 |
Futures - 2.1% |
Geographic Diversification (% of Fund's net assets) |
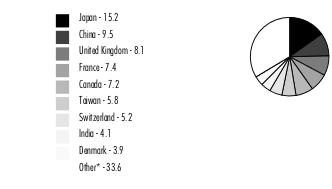 |
* Includes Short-Term investments and Net Other Assets (Liabilities). Percentages are adjusted for the effect of derivatives, if applicable. |
| Common Stocks - 97.2% | |||
| Shares | Value ($) | ||
| Australia - 3.6% | |||
| ANZ Group Holdings Ltd. | 95,208 | 1,501,333 | |
| APA Group unit | 39,936 | 209,342 | |
| Aristocrat Leisure Ltd. | 18,644 | 458,272 | |
| ASX Ltd. | 6,144 | 219,510 | |
| Aurizon Holdings Ltd. | 56,590 | 123,259 | |
| BlueScope Steel Ltd. | 14,480 | 173,578 | |
| Brambles Ltd. | 44,047 | 367,605 | |
| Cochlear Ltd. | 2,079 | 318,657 | |
| Coles Group Ltd. | 42,401 | 411,531 | |
| Computershare Ltd. | 18,165 | 286,679 | |
| DEXUS Property Group unit | 33,066 | 136,569 | |
| EBOS Group Ltd. | 5,081 | 103,725 | |
| Endeavour Group Ltd. | 45,423 | 142,694 | |
| Fortescue Metals Group Ltd. | 53,618 | 762,761 | |
| Goodman Group unit | 53,705 | 710,620 | |
| IDP Education Ltd. | 7,700 | 106,386 | |
| IGO Ltd. | 21,625 | 130,947 | |
| Lendlease Group unit | 22,692 | 89,872 | |
| Macquarie Group Ltd. | 11,620 | 1,194,420 | |
| Mineral Resources Ltd. | 5,550 | 204,558 | |
| Mirvac Group unit | 125,411 | 145,509 | |
| Northern Star Resources Ltd. | 36,476 | 267,106 | |
| Orica Ltd. | 14,001 | 130,824 | |
| Pilbara Minerals Ltd. | 85,478 | 200,788 | |
| QBE Insurance Group Ltd. | 47,267 | 468,705 | |
| Ramsay Health Care Ltd. | 5,835 | 180,676 | |
| REA Group Ltd. | 1,683 | 154,507 | |
| Scentre Group unit | 165,158 | 255,862 | |
| SEEK Ltd. | 11,339 | 149,592 | |
| Sonic Healthcare Ltd. | 14,176 | 259,578 | |
| Stockland Corp. Ltd. unit | 75,932 | 171,374 | |
| Suncorp Group Ltd. | 40,128 | 341,555 | |
| Telstra Group Ltd. | 128,207 | 310,887 | |
| The GPT Group | 58,890 | 135,908 | |
| Transurban Group unit | 97,598 | 734,766 | |
| Vicinity Centres unit | 118,838 | 128,717 | |
| Woodside Energy Group Ltd. | 60,089 | 1,308,727 | |
TOTAL AUSTRALIA | 12,997,399 | ||
| Austria - 0.2% | |||
| Mondi PLC | 11 | 178 | |
| Mondi PLC | 15,448 | 249,537 | |
| OMV AG | 4,662 | 204,023 | |
| Verbund AG | 2,161 | 187,497 | |
TOTAL AUSTRIA | 641,235 | ||
| Belgium - 0.2% | |||
| KBC Group NV | 7,925 | 435,204 | |
| Umicore SA | 6,439 | 153,202 | |
TOTAL BELGIUM | 588,406 | ||
| Brazil - 0.9% | |||
| Atacadao SA | 19,400 | 34,515 | |
| Banco Bradesco SA | 210 | 512 | |
| Banco Santander SA (Brasil) unit | 11,500 | 61,403 | |
| CCR SA | 34,700 | 82,453 | |
| Companhia de Saneamento Basico do Estado de Sao Paulo (SABESP) | 10,500 | 121,562 | |
| Companhia Siderurgica Nacional SA (CSN) | 20,400 | 47,583 | |
| Cosan SA | 37,444 | 116,972 | |
| Energisa SA unit | 6,600 | 61,016 | |
| Equatorial Energia SA | 31,315 | 196,272 | |
| Hapvida Participacoes e Investimentos SA (a)(b) | 162,200 | 118,712 | |
| Klabin SA unit | 23,300 | 98,898 | |
| Localiza Rent a Car SA | 28,650 | 289,071 | |
| Localiza Rent a Car SA rights 11/10/23 (a) | 203 | 282 | |
| Lojas Renner SA (a) | 31,965 | 77,729 | |
| Natura & Co. Holding SA | 29,613 | 74,888 | |
| Prio SA (a) | 25,300 | 239,363 | |
| Raia Drogasil SA | 40,980 | 209,706 | |
| Rede D'Oregon Sao Luiz SA (b) | 19,002 | 81,484 | |
| Rumo SA | 39,900 | 176,560 | |
| Telefonica Brasil SA | 12,800 | 114,855 | |
| TIM SA | 28,600 | 86,054 | |
| Totvs SA | 17,500 | 87,851 | |
| Ultrapar Participacoes SA | 24,000 | 97,347 | |
| Weg SA | 53,280 | 348,842 | |
| Wheaton Precious Metals Corp. | 14,353 | 606,205 | |
TOTAL BRAZIL | 3,430,135 | ||
| Burkina Faso - 0.0% | |||
| Endeavour Mining PLC | 5,706 | 117,901 | |
| Canada - 7.2% | |||
| Agnico Eagle Mines Ltd. (Canada) | 15,594 | 731,375 | |
| Algonquin Power & Utilities Corp. | 20,111 | 101,226 | |
| Alimentation Couche-Tard, Inc. Class A (multi-vtg.) | 24,730 | 1,346,218 | |
| Bank of Montreal | 22,573 | 1,705,733 | |
| Bank of Nova Scotia | 37,720 | 1,527,296 | |
| Brookfield Corp. (Canada) Class A | 44,552 | 1,297,927 | |
| CAE, Inc. (a) | 10,056 | 210,003 | |
| Cameco Corp. | 13,698 | 560,366 | |
| Canadian Apartment Properties (REIT) unit | 2,771 | 81,566 | |
| Canadian National Railway Co. | 17,824 | 1,885,932 | |
| Canadian Tire Ltd. Class A (non-vtg.) | 1,661 | 160,213 | |
| Dollarama, Inc. | 8,968 | 612,417 | |
| Enbridge, Inc. | 67,511 | 2,163,468 | |
| FirstService Corp. | 1,234 | 174,615 | |
| Fortis, Inc. | 15,354 | 609,621 | |
| Gildan Activewear, Inc. | 5,654 | 160,599 | |
| Hydro One Ltd. (b) | 10,464 | 271,343 | |
| Intact Financial Corp. | 5,551 | 779,922 | |
| Ivanhoe Mines Ltd. (a) | 19,333 | 142,479 | |
| Keyera Corp. | 7,254 | 168,698 | |
| Kinross Gold Corp. | 38,918 | 203,185 | |
| Magna International, Inc. Class A (sub. vtg.) | 8,605 | 413,512 | |
| Metro, Inc. | 7,343 | 372,988 | |
| National Bank of Canada | 10,700 | 665,263 | |
| Nutrien Ltd. | 15,700 | 843,220 | |
| Open Text Corp. | 8,548 | 285,396 | |
| Parkland Corp. | 4,317 | 130,654 | |
| Pembina Pipeline Corp. | 17,414 | 535,951 | |
| RB Global, Inc. | 5,761 | 376,769 | |
| RioCan (REIT) | 5,080 | 61,726 | |
| Rogers Communications, Inc. Class B (non-vtg.) | 11,223 | 415,820 | |
| Shopify, Inc. Class A (a) | 37,957 | 1,792,539 | |
| Sun Life Financial, Inc. | 18,564 | 847,913 | |
| TELUS Corp. | 14,917 | 240,522 | |
| The Toronto-Dominion Bank | 58,190 | 3,250,332 | |
| Thomson Reuters Corp. | 5,028 | 602,272 | |
| Toromont Industries Ltd. | 2,608 | 196,341 | |
| West Fraser Timber Co. Ltd. | 1,749 | 118,038 | |
TOTAL CANADA | 26,043,458 | ||
| Chile - 0.2% | |||
| Antofagasta PLC | 12,526 | 204,773 | |
| Cencosud SA | 42,754 | 69,266 | |
| Empresas CMPC SA | 34,584 | 61,826 | |
| Empresas COPEC SA | 12,924 | 85,558 | |
| Enel Americas SA (a) | 715,204 | 73,518 | |
| Falabella SA | 26,959 | 54,897 | |
| Lundin Mining Corp. | 20,193 | 126,102 | |
TOTAL CHILE | 675,940 | ||
| China - 9.5% | |||
| 37 Interactive Entertainment Network Technology Group Co. Ltd. (A Shares) | 4,100 | 11,600 | |
| 3SBio, Inc. (b) | 63,500 | 56,492 | |
| AAC Technology Holdings, Inc. | 22,000 | 39,601 | |
| Agricultural Bank of China Ltd.: | |||
| (A Shares) | 157,600 | 77,356 | |
| (H Shares) | 927,000 | 342,394 | |
| Air China Ltd.: | |||
| (A Shares) (a) | 21,400 | 23,473 | |
| (H Shares) (a) | 66,000 | 44,900 | |
| Airtac International Group | 4,000 | 131,409 | |
| Alibaba Group Holding Ltd. (a) | 519,600 | 5,349,323 | |
| Alibaba Health Information Technology Ltd. (a) | 166,000 | 97,787 | |
| Angel Yeast Co. Ltd. (A Shares) | 1,600 | 7,652 | |
| Anhui Conch Cement Co. Ltd.: | |||
| (A Shares) | 7,400 | 24,477 | |
| (H Shares) | 38,000 | 94,570 | |
| Anjoy Foods Group Co. Ltd. (A Shares) | 500 | 8,833 | |
| Baidu, Inc. Class A (a) | 71,312 | 936,242 | |
| Beijing Capital International Airport Co. Ltd. (H Shares) (a) | 58,000 | 21,364 | |
| Beijing Easpring Material Technology Co. Ltd. (A Shares) | 900 | 5,428 | |
| Beijing Enterprises Water Group Ltd. | 124,000 | 26,165 | |
| Beijing Tongrentang Co. Ltd. (A Shares) | 2,500 | 17,548 | |
| BOC Aviation Ltd. Class A (b) | 6,400 | 39,361 | |
| BOC Hong Kong (Holdings) Ltd. | 117,500 | 310,733 | |
| Bosideng International Holdings Ltd. | 118,000 | 46,590 | |
| By-Health Co. Ltd. (A Shares) | 3,100 | 7,763 | |
| BYD Co. Ltd.: | |||
| (A Shares) | 3,300 | 107,701 | |
| (H Shares) | 33,000 | 1,003,534 | |
| CECEP Solar Energy Co. Ltd. (A Shares) | 7,200 | 5,650 | |
| CECEP Wind-Power Corp. (A Shares) | 11,920 | 5,167 | |
| China Baoan Group Co. Ltd. (A Shares) | 4,800 | 6,782 | |
| China Communications Services Corp. Ltd. (H Shares) | 74,000 | 30,268 | |
| China Conch Venture Holdings Ltd. | 44,500 | 36,854 | |
| China Construction Bank Corp.: | |||
| (A Shares) | 200 | 171 | |
| (H Shares) | 3,040,000 | 1,719,297 | |
| China Eastern Airlines Corp. Ltd. (A Shares) (a) | 31,200 | 18,597 | |
| China Everbright International Ltd. | 112,962 | 38,563 | |
| China Feihe Ltd. (b) | 122,000 | 75,807 | |
| China Jinmao Holdings Group Ltd. | 186,917 | 22,927 | |
| China Jushi Co. Ltd. (A Shares) | 7,357 | 11,646 | |
| China Literature Ltd. (a)(b) | 12,600 | 42,430 | |
| China Medical System Holdings Ltd. | 45,000 | 71,959 | |
| China Mengniu Dairy Co. Ltd. | 100,000 | 326,514 | |
| China Merchants Bank Co. Ltd.: | |||
| (A Shares) | 38,100 | 160,328 | |
| (H Shares) | 124,000 | 470,369 | |
| China Overseas Land and Investment Ltd. | 118,000 | 222,679 | |
| China Resource Gas Group Ltd. | 30,700 | 90,753 | |
| China Resources Cement Holdings Ltd. | 76,000 | 19,542 | |
| China Resources Land Ltd. | 100,000 | 374,311 | |
| China Resources Pharmaceutical Group Ltd. (b) | 48,500 | 30,128 | |
| China Resources Sanjiu Medical & Pharmaceutical Co. Ltd. (A Shares) | 1,800 | 10,610 | |
| China Ruyi Holdings Ltd. (a) | 172,000 | 39,608 | |
| China Southern Airlines Ltd.: | |||
| (A Shares) (a) | 20,200 | 17,056 | |
| (H Shares) (a) | 58,000 | 27,445 | |
| China Three Gorges Renewables Group Co. Ltd. (A Shares) | 52,700 | 34,589 | |
| China Tourism Group Duty Free Corp. Ltd.: | |||
| (A Shares) | 3,600 | 46,571 | |
| (H Shares) (b) | 3,200 | 36,138 | |
| China Vanke Co. Ltd.: | |||
| (A Shares) | 17,800 | 27,539 | |
| (H Shares) | 78,100 | 73,067 | |
| Chow Tai Fook Jewellery Group Ltd. | 67,200 | 94,895 | |
| CITIC Pacific Ltd. | 179,000 | 152,139 | |
| Cmoc Group Ltd.: | |||
| (A Shares) | 32,500 | 24,647 | |
| (H Shares) | 129,000 | 76,937 | |
| CNGR Advanced Material Co. Ltd. | 1,200 | 8,928 | |
| Contemporary Amperex Technology Co. Ltd. | 8,140 | 206,734 | |
| COSCO SHIPPING Holdings Co. Ltd.: | |||
| (A Shares) (a) | 23,600 | 31,541 | |
| (H Shares) | 102,500 | 104,246 | |
| Country Garden Services Holdings Co. Ltd. | 72,000 | 62,893 | |
| CSPC Pharmaceutical Group Ltd. | 275,280 | 240,449 | |
| East Buy Holding Ltd. (a)(b) | 12,500 | 50,994 | |
| Ecovacs Robotics Co. Ltd. Class A | 1,100 | 6,495 | |
| ENN Energy Holdings Ltd. | 25,000 | 189,379 | |
| ENN Natural Gas Co. Ltd. (A Shares) | 4,800 | 11,330 | |
| Far East Horizon Ltd. | 40,000 | 28,145 | |
| Fosun International Ltd. | 75,500 | 45,235 | |
| Ganfeng Lithium Group Co. Ltd.: | |||
| (A Shares) | 3,020 | 18,301 | |
| (H Shares) (b) | 13,840 | 49,710 | |
| Geely Automobile Holdings Ltd. | 186,000 | 211,170 | |
| GEM Co. Ltd. (A Shares) | 9,500 | 7,614 | |
| Genscript Biotech Corp. (a) | 38,000 | 110,472 | |
| Ginlong Technologies Co. Ltd. (A Shares) | 700 | 6,423 | |
| Goldwind Science & Technology Co. Ltd.: | |||
| (A Shares) | 6,400 | 7,697 | |
| (H Shares) | 18 | 9 | |
| GoodWe Technologies Co. Ltd. (A Shares) | 282 | 4,505 | |
| Greentown China Holdings Ltd. | 31,000 | 30,074 | |
| Guangzhou Baiyunshan Pharma Health (A Shares) | 2,600 | 10,595 | |
| Guangzhou Kingmed Diagnostics Group Co. Ltd. (A Shares) | 900 | 7,618 | |
| Haier Smart Home Co. Ltd. | 76,600 | 218,488 | |
| Haier Smart Home Co. Ltd. (A Shares) | 11,600 | 35,252 | |
| Haitian International Holdings Ltd. | 20,000 | 47,712 | |
| Hangzhou Robam Appliances Co. Ltd. (A Shares) | 1,800 | 5,680 | |
| Hangzhou Tigermed Consulting Co. Ltd. (A Shares) | 700 | 6,388 | |
| Hansoh Pharmaceutical Group Co. Ltd. (b) | 40,000 | 75,260 | |
| Henan Shuanghui Investment & Development Co. Ltd. (A Shares) | 6,400 | 22,912 | |
| Huadong Medicine Co. Ltd. (A Shares) | 3,200 | 18,804 | |
| Huatai Securities Co. Ltd.: | |||
| (A Shares) | 13,500 | 29,592 | |
| (H Shares) (b) | 46,000 | 60,223 | |
| Industrial & Commercial Bank of China Ltd.: | |||
| (A Shares) | 116,600 | 75,414 | |
| (H Shares) | 2,062,000 | 988,203 | |
| Inner Mongoli Yili Industries Co. Ltd. (A Shares) | 11,700 | 43,871 | |
| JD Logistics, Inc. (a)(b) | 66,300 | 78,506 | |
| JD.com, Inc. Class A | 74,250 | 943,952 | |
| Jiangsu Eastern Shenghong Co. Ltd. | 12,200 | 17,751 | |
| Jiangsu Expressway Co. Ltd. (H Shares) | 38,000 | 34,547 | |
| Jiangsu Hengrui Medicine Co. Ltd. (A Shares) | 11,800 | 77,283 | |
| Jiangsu Zhongtian Technology Co. Ltd. (A Shares) | 6,300 | 12,068 | |
| Jiumaojiu International Holdings Ltd. (b) | 29,000 | 31,555 | |
| Joincare Pharmaceutical Group Industry Co. Ltd. (A Shares) | 3,500 | 5,673 | |
| Jointown Pharmaceutical Group (A Shares) | 7,140 | 6,950 | |
| Kanzhun Ltd. ADR (a) | 6,730 | 99,604 | |
| Kingdee International Software Group Co. Ltd. (a) | 91,000 | 120,745 | |
| Kuaishou Technology Class B (a)(b) | 73,300 | 472,041 | |
| Kuang-Chi Technologies Co. Ltd. (A Shares) | 4,000 | 7,652 | |
| Kunlun Energy Co. Ltd. | 128,000 | 106,637 | |
| Lenovo Group Ltd. | 230,000 | 267,658 | |
| Li Auto, Inc. Class A (a) | 35,530 | 600,941 | |
| Livzon Pharmaceutical Group, Inc. (A Shares) | 1,200 | 5,745 | |
| Longfor Properties Co. Ltd. (b) | 62,471 | 90,943 | |
| Microport Scientific Corp. (a) | 25,300 | 39,867 | |
| Ming Yang Smart Energy Group Ltd. (A Shares) | 4,200 | 8,030 | |
| MINISO Group Holding Ltd. ADR | 3,108 | 78,663 | |
| NetEase, Inc. | 61,200 | 1,309,775 | |
| NIO, Inc. sponsored ADR (a) | 43,831 | 319,966 | |
| Nongfu Spring Co. Ltd. (H Shares) (b) | 55,600 | 316,683 | |
| Offshore Oil Enginering Co. Ltd. (A Shares) | 8,100 | 6,883 | |
| Perfect World Co. Ltd. (A Shares) | 3,600 | 5,910 | |
| Pharmaron Beijing Co. Ltd. (A Shares) | 2,750 | 12,508 | |
| Ping An Healthcare and Technology Co. Ltd. (a)(b) | 17,200 | 40,178 | |
| Pop Mart International Group Ltd. (b) | 14,600 | 40,303 | |
| Postal Savings Bank of China Co. Ltd. | 54,000 | 33,738 | |
| Postal Savings Bank of China Co. Ltd. (H Shares) (b) | 244,000 | 111,369 | |
| Prosus NV | 48,357 | 1,352,332 | |
| Pylon Technologies Co. Ltd. (Series A) | 324 | 5,046 | |
| SF Holding Co. Ltd. (A Shares) | 9,000 | 48,298 | |
| Shandong Nanshan Aluminum Co. Ltd. (A Shares) | 21,600 | 9,155 | |
| Shandong Weigao Medical Polymer Co. Ltd. (H Shares) | 82,800 | 76,854 | |
| Shanghai Electric Group Co. Ltd. (A Shares) (a) | 23,300 | 14,147 | |
| Shanghai Fosun Pharmaceutical (Group) Co. Ltd.: | |||
| (A Shares) | 4,100 | 15,948 | |
| (H Shares) | 19,000 | 43,842 | |
| Shanghai M&G Stationery, Inc. (A Shares) | 1,700 | 9,008 | |
| Shanghai Pharmaceuticals Holding Co. Ltd.: | |||
| (A Shares) | 5,200 | 12,815 | |
| (H Shares) | 22,400 | 32,588 | |
| Shanghai Putailai New Energy Technology Co. Ltd. | 3,685 | 12,608 | |
| Shanghai Yuyuan Tourist Mart Group Co. Ltd. | 7,200 | 6,397 | |
| Shenzhen Capchem Technology Co. Ltd. (A Shares) | 1,400 | 8,450 | |
| Shenzhen Inovance Technology Co. Ltd. (A Shares) | 2,500 | 20,670 | |
| Shenzhen International Holdings Ltd. | 44,323 | 29,214 | |
| Shenzhen Mindray Bio-Medical Electronics Co. Ltd. (A Shares) (a) | 2,200 | 86,006 | |
| Shuangliang Eco-Energy Systems Ltd. (A Shares) | 3,500 | 4,480 | |
| Sinoma Science & Technology Co. Ltd. (A Shares) | 3,100 | 7,330 | |
| Sinopec Shanghai Petrochemical Co. Ltd. (A Shares) (a) | 13,400 | 5,482 | |
| Sinopharm Group Co. Ltd. (H Shares) | 41,200 | 98,521 | |
| Sinotruk Hong Kong Ltd. | 21,000 | 39,554 | |
| SKSHU Paint Co. Ltd. (A Shares) | 968 | 7,881 | |
| Sungrow Power Supply Co. Ltd. (A Shares) | 2,700 | 31,121 | |
| Sunwoda Electronic Co. Ltd. (A Shares) | 3,400 | 7,490 | |
| TCL Technology Group Corp. (A Shares) | 34,600 | 18,609 | |
| Tencent Holdings Ltd. | 212,000 | 7,845,856 | |
| Tianqi Lithium Corp. (A Shares) | 2,700 | 20,319 | |
| Titan Wind Energy Suzhou Co. Ltd. (A Shares) (a) | 3,300 | 6,020 | |
| Tongcheng Travel Holdings Ltd. (a) | 41,200 | 78,711 | |
| Topchoice Medical Corp. (a) | 600 | 7,353 | |
| Uni-President China Holdings Ltd. | 40,000 | 27,224 | |
| Vipshop Holdings Ltd. ADR (a) | 10,721 | 152,881 | |
| Want Want China Holdings Ltd. | 159,000 | 98,796 | |
| Weichai Power Co. Ltd.: | |||
| (A Shares) | 12,600 | 23,951 | |
| (H Shares) | 66,000 | 98,790 | |
| Western Mining Co. Ltd. (A Shares) | 4,400 | 7,566 | |
| WuXi AppTec Co. Ltd. | 4,776 | 56,479 | |
| WuXi AppTec Co. Ltd. (H Shares) (b) | 11,480 | 137,950 | |
| Wuxi Biologics (Cayman), Inc. (a)(b) | 120,500 | 749,238 | |
| XPeng, Inc. Class A (a) | 32,816 | 238,467 | |
| Yadea Group Holdings Ltd. (b) | 40,000 | 73,014 | |
| Yihai International Holding Ltd. | 16,000 | 29,118 | |
| Yihai Kerry Arawana Holdings Co. Ltd. (A Shares) | 2,700 | 12,915 | |
| Yum China Holdings, Inc. | 13,188 | 693,161 | |
| Yunnan Baiyao Group Co. Ltd. (A Shares) | 3,320 | 23,073 | |
| Yunnan Chihong Zinc & Germanium Co. Ltd. (A Shares) | 9,400 | 6,649 | |
| Yunnan Energy New Material Co. Ltd. | 1,800 | 16,525 | |
| Zai Lab Ltd. (a) | 28,700 | 73,244 | |
| Zai Lab Ltd. ADR (a) | 1 | 25 | |
| Zangge Mining Co. Ltd. (Series A) | 2,900 | 8,877 | |
| Zhangzhou Pientzehuang Pharmaceutical Co. Ltd. (A Shares) | 1,100 | 37,651 | |
| Zhejiang Chint Electric Co. Ltd. (A Shares) | 4,000 | 12,642 | |
| Zhejiang Expressway Co. Ltd. (H Shares) | 38,000 | 28,604 | |
| Zhejiang Huayou Cobalt Co. Ltd. (A Shares) | 2,958 | 14,890 | |
| Zhejiang Jiuzhou Pharmaceutical Co. Ltd. (A Shares) | 1,700 | 6,910 | |
| Zhejiang Weixing New Building Materials Co. Ltd. (A Shares) | 2,900 | 6,538 | |
| Zoomlion Heavy Industry Science and Technology Co. Ltd. (A Shares) | 13,000 | 11,410 | |
| ZTO Express, Inc. sponsored ADR | 13,500 | 318,195 | |
TOTAL CHINA | 34,583,647 | ||
| Colombia - 0.0% | |||
| Bancolombia SA | 9,271 | 66,109 | |
| Interconexion Electrica SA ESP | 13,619 | 47,978 | |
TOTAL COLOMBIA | 114,087 | ||
| Czech Republic - 0.0% | |||
| Komercni Banka A/S | 2,556 | 74,858 | |
| MONETA Money Bank A/S (b) | 12,015 | 46,418 | |
TOTAL CZECH REPUBLIC | 121,276 | ||
| Denmark - 3.9% | |||
| A.P. Moller - Maersk A/S: | |||
| Series A | 93 | 151,621 | |
| Series B | 154 | 256,600 | |
| Chr. Hansen Holding A/S | 3,344 | 227,793 | |
| Coloplast A/S Series B | 4,321 | 450,248 | |
| DSV A/S | 5,888 | 878,139 | |
| Genmab A/S (a) | 2,089 | 590,525 | |
| Novo Nordisk A/S Series B | 103,275 | 9,963,583 | |
| Novozymes A/S Series B | 6,482 | 290,938 | |
| ORSTED A/S (b) | 5,985 | 289,190 | |
| Pandora A/S | 2,675 | 302,702 | |
| Rockwool International A/S Series B | 301 | 66,910 | |
| Vestas Wind Systems A/S (a) | 31,985 | 693,268 | |
TOTAL DENMARK | 14,161,517 | ||
| Egypt - 0.0% | |||
| Commercial International Bank SAE | 77,922 | 152,064 | |
| Commercial International Bank SAE GDR | 4 | 5 | |
TOTAL EGYPT | 152,069 | ||
| Finland - 1.0% | |||
| Elisa Corp. (A Shares) | 4,530 | 192,111 | |
| Kesko Oyj | 8,664 | 146,357 | |
| Metso Corp. | 20,998 | 184,543 | |
| Neste OYJ | 13,391 | 449,300 | |
| Nokia Corp. | 169,424 | 564,298 | |
| Nordea Bank Abp | 102,067 | 1,072,566 | |
| Stora Enso Oyj (R Shares) | 18,452 | 221,110 | |
| UPM-Kymmene Corp. | 16,956 | 569,990 | |
| Wartsila Corp. | 14,993 | 178,312 | |
TOTAL FINLAND | 3,578,587 | ||
| France - 7.4% | |||
| Aeroports de Paris SA | 987 | 110,492 | |
| AXA SA | 58,078 | 1,720,876 | |
| BNP Paribas SA | 33,212 | 1,909,824 | |
| Bouygues SA | 6,047 | 212,489 | |
| Carrefour SA | 18,914 | 331,590 | |
| Compagnie Generale des Etablissements Michelin SCA Series B | 21,488 | 638,375 | |
| Credit Agricole SA | 38,330 | 462,831 | |
| Danone SA | 20,389 | 1,212,951 | |
| Dassault Systemes SA | 21,193 | 873,011 | |
| Eiffage SA | 2,330 | 211,282 | |
| Gecina SA | 1,413 | 138,446 | |
| Getlink SE | 10,992 | 177,193 | |
| Hermes International SCA | 1,003 | 1,867,418 | |
| Kering SA | 2,355 | 957,782 | |
| Klepierre SA | 6,851 | 166,003 | |
| L'Oreal SA | 7,629 | 3,206,703 | |
| LVMH Moet Hennessy Louis Vuitton SE | 8,739 | 6,256,517 | |
| Orange SA | 58,931 | 693,149 | |
| Societe Generale Series A | 23,025 | 517,412 | |
| Teleperformance | 1,870 | 213,991 | |
| TotalEnergies SE | 71,160 | 4,757,578 | |
| Valeo SA | 6,802 | 89,533 | |
| Worldline SA (a)(b) | 7,610 | 96,465 | |
TOTAL FRANCE | 26,821,911 | ||
| Germany - 2.9% | |||
| adidas AG | 5,128 | 907,217 | |
| Bayerische Motoren Werke AG (BMW) | 9,509 | 881,687 | |
| Beiersdorf AG | 3,188 | 418,448 | |
| Brenntag SE | 4,649 | 344,928 | |
| Commerzbank AG | 33,711 | 362,047 | |
| Covestro AG (a)(b) | 6,113 | 308,531 | |
| Deutsche Borse AG | 6,016 | 990,212 | |
| Deutsche Lufthansa AG (a) | 18,363 | 128,315 | |
| DHL Group | 31,378 | 1,220,471 | |
| Evonik Industries AG | 6,447 | 118,422 | |
| GEA Group AG | 4,872 | 166,148 | |
| HeidelbergCement AG | 4,599 | 333,238 | |
| HelloFresh AG (a) | 4,770 | 103,769 | |
| Henkel AG & Co. KGaA | 3,228 | 204,011 | |
| Knorr-Bremse AG | 2,230 | 123,971 | |
| LEG Immobilien AG (a) | 2,278 | 141,825 | |
| Merck KGaA | 4,089 | 615,887 | |
| Muenchener Rueckversicherungs-Gesellschaft AG in Muenchen | 4,322 | 1,730,921 | |
| Puma AG | 3,341 | 188,421 | |
| Symrise AG | 4,214 | 430,626 | |
| Telefonica Deutschland Holding AG | 27,397 | 46,483 | |
| Vonovia SE | 23,211 | 534,366 | |
| Zalando SE (a)(b) | 7,091 | 164,991 | |
TOTAL GERMANY | 10,464,935 | ||
| Greece - 0.1% | |||
| Alpha Bank SA (a) | 74,197 | 110,696 | |
| Eurobank Ergasias Services and Holdings SA (a) | 79,864 | 130,305 | |
| Hellenic Telecommunications Organization SA | 6,404 | 89,647 | |
| Motor Oil (HELLAS) Corinth Refineries SA | 2,043 | 48,638 | |
| Mytilineos SA | 3,294 | 121,919 | |
TOTAL GREECE | 501,205 | ||
| Hong Kong - 1.5% | |||
| AIA Group Ltd. | 365,400 | 3,173,063 | |
| Hang Seng Bank Ltd. | 24,200 | 276,681 | |
| HKT Trust/HKT Ltd. unit | 117,000 | 121,187 | |
| Hong Kong & China Gas Co. Ltd. | 355,356 | 247,366 | |
| MTR Corp. Ltd. | 49,656 | 185,623 | |
| Prudential PLC | 87,157 | 911,347 | |
| Sino Biopharmaceutical Ltd. | 317,750 | 123,439 | |
| Sino Land Ltd. | 112,219 | 112,031 | |
| Swire Pacific Ltd. (A Shares) | 13,000 | 83,042 | |
| Swire Properties Ltd. | 39,400 | 76,287 | |
| Vinda International Holdings Ltd. | 11,000 | 27,184 | |
| WH Group Ltd. (b) | 256,000 | 152,892 | |
TOTAL HONG KONG | 5,490,142 | ||
| Hungary - 0.1% | |||
| MOL Hungarian Oil and Gas PLC Series A (For. Reg.) | 13,852 | 110,218 | |
| OTP Bank PLC | 7,535 | 280,387 | |
| Richter Gedeon PLC | 4,629 | 108,537 | |
TOTAL HUNGARY | 499,142 | ||
| India - 4.1% | |||
| ABB India Ltd. | 1,760 | 86,778 | |
| Adani Green Energy Ltd. (a) | 9,736 | 107,533 | |
| Ashok Leyland Ltd. | 48,752 | 98,263 | |
| Asian Paints Ltd. | 12,152 | 437,600 | |
| Astral Ltd. | 3,978 | 88,403 | |
| AU Small Finance Bank Ltd. (b) | 5,111 | 41,067 | |
| Axis Bank Ltd. | 72,162 | 851,245 | |
| Bajaj Finance Ltd. | 8,633 | 776,907 | |
| Berger Paints India Ltd. | 10,272 | 68,902 | |
| Bharti Airtel Ltd. | 70,696 | 776,196 | |
| Britannia Industries Ltd. | 3,437 | 182,778 | |
| Colgate-Palmolive Ltd. | 4,061 | 103,075 | |
| Cummins India Ltd. | 4,591 | 92,446 | |
| Dabur India Ltd. | 19,063 | 121,064 | |
| DLF Ltd. | 19,022 | 128,824 | |
| Eicher Motors Ltd. | 4,352 | 172,192 | |
| GAIL India Ltd. | 70,836 | 101,678 | |
| Grasim Industries Ltd. | 8,387 | 190,026 | |
| Havells India Ltd. | 7,702 | 115,277 | |
| HCL Technologies Ltd. | 29,989 | 459,847 | |
| Hero Motocorp Ltd. | 3,378 | 125,318 | |
| Hindalco Industries Ltd. | 39,160 | 216,089 | |
| Hindustan Unilever Ltd. | 26,013 | 776,085 | |
| ICICI Prudential Life Insurance Co. Ltd. (b) | 11,881 | 74,951 | |
| Indraprastha Gas Ltd. | 9,674 | 44,425 | |
| Info Edge India Ltd. | 2,181 | 107,001 | |
| Infosys Ltd. | 105,078 | 1,727,575 | |
| Kotak Mahindra Bank Ltd. | 34,614 | 723,385 | |
| Lupin Ltd. | 6,785 | 91,916 | |
| Mahindra & Mahindra Ltd. | 29,557 | 517,841 | |
| Marico Ltd. | 15,895 | 102,394 | |
| Nestle India Ltd. | 1,072 | 312,062 | |
| PI Industries Ltd. | 2,564 | 104,687 | |
| Pidilite Industries Ltd. | 4,687 | 138,343 | |
| Reliance Industries Ltd. | 96,350 | 2,648,625 | |
| Shree Cement Ltd. | 300 | 92,436 | |
| Shriram Transport Finance Co. Ltd. | 8,903 | 200,838 | |
| Siemens Ltd. | 2,735 | 109,397 | |
| Supreme Industries Ltd. | 2,082 | 108,225 | |
| Tata Consultancy Services Ltd. | 28,954 | 1,171,814 | |
| The Indian Hotels Co. Ltd. | 26,236 | 120,801 | |
| Torrent Pharmaceuticals Ltd. | 3,369 | 77,853 | |
| Tvs Motor Co. Ltd. | 7,300 | 139,457 | |
| UPL Ltd. | 13,840 | 89,836 | |
| Vedanta Ltd. | 24,841 | 64,625 | |
| Zomato Ltd. (a) | 135,898 | 171,836 | |
TOTAL INDIA | 15,057,916 | ||
| Indonesia - 0.6% | |||
| PT Aneka Tambang Tbk | 258,300 | 27,675 | |
| PT Bank Central Asia Tbk | 1,754,800 | 966,756 | |
| PT Bank Rakyat Indonesia (Persero) Tbk | 2,155,800 | 674,084 | |
| PT Barito Pacific Tbk | 926,068 | 65,625 | |
| PT Kalbe Farma Tbk | 699,100 | 74,352 | |
| PT Merdeka Copper Gold Tbk (a) | 397,418 | 55,740 | |
| PT Sarana Menara Nusantara Tbk | 624,600 | 35,030 | |
| PT Telkom Indonesia Persero Tbk | 1,564,200 | 342,897 | |
| PT Unilever Indonesia Tbk | 234,500 | 53,468 | |
TOTAL INDONESIA | 2,295,627 | ||
| Ireland - 0.3% | |||
| Kerry Group PLC Class A | 5,048 | 389,273 | |
| Kingspan Group PLC (Ireland) | 4,888 | 328,318 | |
| Smurfit Kappa Group PLC | 8,251 | 268,372 | |
TOTAL IRELAND | 985,963 | ||
| Israel - 0.1% | |||
| Bank Leumi le-Israel BM | 48,463 | 311,616 | |
| Italy - 1.1% | |||
| Assicurazioni Generali SpA | 32,044 | 635,563 | |
| Coca-Cola HBC AG | 7,021 | 181,938 | |
| Enel SpA | 257,341 | 1,633,493 | |
| FinecoBank SpA | 19,328 | 227,312 | |
| Mediobanca SpA | 17,474 | 208,374 | |
| Moncler SpA | 6,514 | 337,317 | |
| Nexi SpA (a)(b) | 18,158 | 105,210 | |
| Poste Italiane SpA (b) | 16,482 | 162,886 | |
| Prysmian SpA | 8,336 | 311,269 | |
| Terna - Rete Elettrica Nazionale | 44,555 | 340,660 | |
TOTAL ITALY | 4,144,022 | ||
| Japan - 15.2% | |||
| Advantest Corp. | 24,200 | 623,359 | |
| AEON Co. Ltd. | 20,700 | 435,520 | |
| Ajinomoto Co., Inc. | 14,200 | 518,622 | |
| Ana Holdings, Inc. (a) | 4,900 | 96,196 | |
| Asahi Kasei Corp. | 39,900 | 245,297 | |
| Astellas Pharma, Inc. | 57,200 | 723,573 | |
| Azbil Corp. | 3,500 | 103,420 | |
| Bridgestone Corp. | 18,200 | 688,783 | |
| Brother Industries Ltd. | 7,400 | 115,442 | |
| Dai Nippon Printing Co. Ltd. | 7,000 | 182,611 | |
| Daifuku Co. Ltd. | 9,300 | 153,663 | |
| Daiichi Sankyo Kabushiki Kaisha | 58,500 | 1,508,375 | |
| Daikin Industries Ltd. | 8,300 | 1,196,685 | |
| Daiwa House Industry Co. Ltd. | 18,700 | 514,356 | |
| Daiwa Securities Group, Inc. | 42,300 | 243,922 | |
| Eisai Co. Ltd. | 8,000 | 423,827 | |
| FANUC Corp. | 30,100 | 746,974 | |
| Fast Retailing Co. Ltd. | 5,600 | 1,239,820 | |
| Fuji Electric Co. Ltd. | 4,100 | 156,106 | |
| FUJIFILM Holdings Corp. | 11,800 | 645,434 | |
| Fujitsu Ltd. | 5,500 | 712,512 | |
| Hankyu Hanshin Holdings, Inc. | 7,200 | 226,538 | |
| Hirose Electric Co. Ltd. | 1,000 | 113,299 | |
| Hitachi Construction Machinery Co. Ltd. | 3,500 | 90,425 | |
| Hitachi Ltd. | 29,700 | 1,882,583 | |
| Hoya Corp. | 11,200 | 1,078,209 | |
| Hulic Co. Ltd. | 11,800 | 108,184 | |
| Ibiden Co. Ltd. | 3,600 | 153,491 | |
| INPEX Corp. | 30,600 | 444,033 | |
| Isuzu Motors Ltd. | 18,600 | 207,402 | |
| Itochu Corp. | 37,600 | 1,354,391 | |
| JFE Holdings, Inc. | 15,600 | 217,353 | |
| JSR Corp. | 5,600 | 149,889 | |
| Kao Corp. | 14,700 | 536,313 | |
| KDDI Corp. | 47,400 | 1,417,959 | |
| Keio Corp. | 3,400 | 100,893 | |
| Kikkoman Corp. | 4,300 | 244,648 | |
| Komatsu Ltd. | 29,200 | 670,911 | |
| Kubota Corp. | 32,000 | 430,376 | |
| Kurita Water Industries Ltd. | 3,200 | 97,227 | |
| Kyowa Hakko Kirin Co., Ltd. | 8,300 | 130,180 | |
| LIXIL Group Corp. | 8,800 | 96,493 | |
| LY Corp. | 84,600 | 215,687 | |
| Marubeni Corp. | 45,700 | 668,215 | |
| MatsukiyoCocokara & Co. | 10,800 | 189,451 | |
| Mazda Motor Corp. | 18,100 | 174,954 | |
| McDonald's Holdings Co. (Japan) Ltd. | 2,800 | 108,942 | |
| Meiji Holdings Co. Ltd. | 7,400 | 182,144 | |
| Mitsubishi Chemical Holdings Corp. | 40,700 | 230,305 | |
| Mitsubishi Estate Co. Ltd. | 35,600 | 455,691 | |
| Mitsui Chemicals, Inc. | 5,600 | 141,145 | |
| Mitsui Fudosan Co. Ltd. | 28,200 | 611,231 | |
| Mizuho Financial Group, Inc. | 76,400 | 1,297,149 | |
| MS&AD Insurance Group Holdings, Inc. | 13,600 | 498,311 | |
| NEC Corp. | 7,800 | 375,575 | |
| Nintendo Co. Ltd. | 32,890 | 1,358,832 | |
| Nippon Express Holdings, Inc. | 2,200 | 113,070 | |
| Nippon Paint Holdings Co. Ltd. | 30,100 | 202,366 | |
| Nippon Prologis REIT, Inc. | 73 | 129,894 | |
| Nissin Food Holdings Co. Ltd. | 1,900 | 165,317 | |
| Nitori Holdings Co. Ltd. | 2,600 | 281,567 | |
| Nitto Denko Corp. | 4,500 | 291,176 | |
| Nomura Holdings, Inc. | 95,100 | 367,410 | |
| Nomura Real Estate Holdings, Inc. | 3,600 | 84,082 | |
| Nomura Research Institute Ltd. | 12,300 | 322,874 | |
| NTT Data Corp. | 20,000 | 246,598 | |
| OMRON Corp. | 5,500 | 197,050 | |
| Ono Pharmaceutical Co. Ltd. | 12,300 | 212,415 | |
| Open House Group Co. Ltd. | 2,600 | 85,697 | |
| Oriental Land Co. Ltd. | 34,500 | 1,115,915 | |
| ORIX Corp. | 37,200 | 676,532 | |
| Osaka Gas Co. Ltd. | 11,900 | 224,408 | |
| Pan Pacific International Holdings Ltd. | 12,000 | 232,390 | |
| Panasonic Holdings Corp. | 69,900 | 613,267 | |
| Rakuten Group, Inc. | 47,300 | 174,959 | |
| Recruit Holdings Co. Ltd. | 45,600 | 1,307,475 | |
| Renesas Electronics Corp. (a) | 40,200 | 528,052 | |
| Ricoh Co. Ltd. | 17,400 | 141,029 | |
| SCSK Corp. | 5,200 | 88,765 | |
| Secom Co. Ltd. | 6,700 | 465,347 | |
| Seiko Epson Corp. | 8,900 | 123,560 | |
| Sekisui Chemical Co. Ltd. | 12,200 | 167,102 | |
| Sekisui House Ltd. | 18,800 | 368,156 | |
| Seven & i Holdings Co. Ltd. | 23,900 | 875,665 | |
| SG Holdings Co. Ltd. | 9,800 | 138,911 | |
| Sharp Corp. (a) | 8,000 | 50,018 | |
| Shimadzu Corp. | 7,600 | 179,712 | |
| SHIMIZU Corp. | 17,100 | 121,692 | |
| Shin-Etsu Chemical Co. Ltd. | 57,700 | 1,725,425 | |
| Shionogi & Co. Ltd. | 8,200 | 381,830 | |
| SoftBank Corp. | 90,900 | 1,027,794 | |
| Sompo Holdings, Inc. | 9,300 | 402,876 | |
| Sony Group Corp. | 39,900 | 3,317,242 | |
| Sumitomo Chemical Co. Ltd. | 43,300 | 110,058 | |
| Sumitomo Electric Industries Ltd. | 22,700 | 238,310 | |
| Sumitomo Metal Mining Co. Ltd. | 7,900 | 221,926 | |
| Sumitomo Mitsui Financial Group, Inc. | 40,100 | 1,933,140 | |
| Sumitomo Mitsui Trust Holdings, Inc. | 10,400 | 389,967 | |
| Suntory Beverage & Food Ltd. | 4,500 | 135,419 | |
| Sysmex Corp. | 5,400 | 258,675 | |
| T&D Holdings, Inc. | 15,800 | 281,860 | |
| TDK Corp. | 12,400 | 463,949 | |
| Terumo Corp. | 21,300 | 582,729 | |
| TIS, Inc. | 7,000 | 149,904 | |
| Tobu Railway Co. Ltd. | 5,800 | 139,603 | |
| Tokio Marine Holdings, Inc. | 57,100 | 1,277,455 | |
| Tokyo Electron Ltd. | 14,900 | 1,968,852 | |
| Tokyo Gas Co. Ltd. | 12,400 | 278,469 | |
| Tokyu Corp. | 15,900 | 179,496 | |
| Toray Industries, Inc. | 44,000 | 212,865 | |
| Toto Ltd. | 4,400 | 106,091 | |
| Unicharm Corp. | 12,700 | 431,532 | |
| USS Co. Ltd. | 6,300 | 110,117 | |
| West Japan Railway Co. | 7,000 | 266,802 | |
| Yamaha Corp. | 4,300 | 114,853 | |
| Yamaha Motor Co. Ltd. | 9,500 | 232,150 | |
| Yamato Holdings Co. Ltd. | 8,200 | 136,579 | |
| Yaskawa Electric Corp. | 7,600 | 248,772 | |
| Yokogawa Electric Corp. | 7,000 | 127,087 | |
| ZOZO, Inc. | 4,600 | 87,468 | |
TOTAL JAPAN | 55,364,692 | ||
| Korea (South) - 1.7% | |||
| AMOREPACIFIC Corp. | 973 | 91,196 | |
| BGF Retail Co. Ltd. | 265 | 27,059 | |
| Celltrion Healthcare Co. Ltd. | 3,286 | 162,303 | |
| CJ CheilJedang Corp. | 255 | 53,342 | |
| Coway Co. Ltd. | 1,701 | 54,353 | |
| Doosan Bobcat, Inc. | 1,695 | 48,627 | |
| Doosan Heavy Industries & Construction Co. Ltd. (a) | 13,782 | 137,120 | |
| Hana Financial Group, Inc. | 9,357 | 271,668 | |
| Hanon Systems | 5,752 | 29,307 | |
| Hanwha Solutions Corp. (a) | 3,427 | 72,888 | |
| HD Hyundai Co. Ltd. | 1,335 | 56,777 | |
| HMM Co. Ltd. | 8,104 | 87,647 | |
| Hyundai Engineering & Construction Co. Ltd. | 2,685 | 66,491 | |
| Hyundai Glovis Co. Ltd. | 629 | 79,709 | |
| Hyundai Mipo Dockyard Co. Ltd. (a) | 737 | 37,923 | |
| Kakao Corp. | 9,835 | 276,797 | |
| KB Financial Group, Inc. | 12,122 | 461,385 | |
| Korea Zinc Co. Ltd. | 244 | 84,669 | |
| Korean Air Lines Co. Ltd. | 6,363 | 96,671 | |
| Kumho Petro Chemical Co. Ltd. | 540 | 50,678 | |
| LG Chemical Ltd. | 1,564 | 511,829 | |
| LG Corp. | 2,901 | 165,804 | |
| LG Display Co. Ltd. (a) | 7,169 | 64,774 | |
| LG Electronics, Inc. | 3,362 | 249,034 | |
| LG H & H Co. Ltd. | 312 | 73,038 | |
| LG Uplus Corp. | 6,599 | 49,384 | |
| Lotte Chemical Corp. | 592 | 64,194 | |
| Mirae Asset Securities Co. Ltd. | 8,367 | 40,927 | |
| NAVER Corp. | 4,150 | 579,323 | |
| NCSOFT Corp. | 476 | 82,115 | |
| Netmarble Corp. (a)(b) | 660 | 18,920 | |
| POSCO Chemtech Co. Ltd. | 981 | 172,619 | |
| Samsung Engineering Co. Ltd. (a) | 5,213 | 91,741 | |
| Samsung SDI Co. Ltd. | 1,741 | 550,444 | |
| Samsung SDS Co. Ltd. | 1,189 | 121,698 | |
| Samsung Securities Co. Ltd. | 1,920 | 50,222 | |
| Shinhan Financial Group Co. Ltd. | 13,914 | 357,118 | |
| SK Biopharmaceuticals Co. Ltd. (a) | 964 | 53,868 | |
| SK Bioscience Co. Ltd. (a) | 826 | 37,121 | |
| SK IE Technology Co. Ltd. (a)(b) | 767 | 33,771 | |
| SK Innovation Co., Ltd. | 1,958 | 178,118 | |
| SK Square Co. Ltd. (a) | 3,305 | 104,276 | |
| SK, Inc. | 1,125 | 118,434 | |
| SKC Co. Ltd. | 582 | 33,986 | |
| Woori Financial Group, Inc. | 18,710 | 165,016 | |
| Yuhan Corp. | 1,776 | 75,595 | |
TOTAL KOREA (SOUTH) | 6,289,979 | ||
| Kuwait - 0.2% | |||
| Kuwait Finance House KSCP | 255,768 | 565,343 | |
| Malaysia - 0.7% | |||
| AMMB Holdings Bhd | 50,700 | 40,674 | |
| Axiata Group Bhd | 84,704 | 38,756 | |
| CelcomDigi Bhd | 118,500 | 106,153 | |
| CIMB Group Holdings Bhd | 196,705 | 235,672 | |
| Dialog Group Bhd | 104,200 | 47,014 | |
| Gamuda Bhd | 58,169 | 57,159 | |
| Hong Leong Credit Bhd | 7,100 | 26,403 | |
| IHH Healthcare Bhd | 74,400 | 93,654 | |
| Kuala Lumpur Kepong Bhd | 16,300 | 75,243 | |
| Malayan Banking Bhd | 170,940 | 323,685 | |
| Malaysia Airports Holdings Bhd | 25,700 | 39,874 | |
| Maxis Bhd | 79,200 | 65,854 | |
| MISC Bhd | 45,400 | 69,116 | |
| MR DIY Group M Sdn Bhd (b) | 87,100 | 27,061 | |
| Nestle (Malaysia) Bhd | 2,200 | 57,174 | |
| Petronas Chemicals Group Bhd | 86,100 | 132,767 | |
| Petronas Dagangan Bhd | 9,200 | 44,539 | |
| Petronas Gas Bhd | 27,100 | 98,712 | |
| PPB Group Bhd | 22,000 | 70,724 | |
| Press Metal Aluminium Holdings | 114,000 | 117,839 | |
| Public Bank Bhd | 459,900 | 401,677 | |
| QL Resources Bhd | 33,700 | 39,112 | |
| RHB Bank Bhd | 46,118 | 54,018 | |
| Sime Darby Bhd | 83,900 | 40,324 | |
| Telekom Malaysia Bhd | 35,295 | 37,572 | |
TOTAL MALAYSIA | 2,340,776 | ||
| Mexico - 0.8% | |||
| America Movil S.A.B. de CV Series L | 599,100 | 494,792 | |
| Arca Continental S.A.B. de CV | 16,100 | 144,372 | |
| CEMEX S.A.B. de CV unit (a) | 479,500 | 288,035 | |
| Fomento Economico Mexicano S.A.B. de CV unit | 61,500 | 696,084 | |
| Gruma S.A.B. de CV Series B | 6,135 | 106,758 | |
| Grupo Aeroportuario del Sureste S.A.B. de CV Series B | 5,960 | 128,446 | |
| Grupo Bimbo S.A.B. de CV Series A | 40,800 | 166,060 | |
| Grupo Financiero Banorte S.A.B. de CV Series O | 82,100 | 666,308 | |
| Grupo Televisa SA de CV | 73,900 | 33,898 | |
| Industrias Penoles SA de CV (a) | 6,610 | 73,792 | |
| Orbia Advance Corp. S.A.B. de CV | 33,800 | 54,762 | |
TOTAL MEXICO | 2,853,307 | ||
| Netherlands - 3.5% | |||
| Akzo Nobel NV | 5,401 | 361,518 | |
| ASML Holding NV (Netherlands) | 12,759 | 7,669,695 | |
| ING Groep NV (Certificaten Van Aandelen) | 114,514 | 1,468,130 | |
| JDE Peet's BV | 4,142 | 115,001 | |
| Koninklijke Ahold Delhaize NV | 30,722 | 910,195 | |
| Koninklijke KPN NV | 102,071 | 343,079 | |
| NN Group NV | 7,931 | 254,366 | |
| Universal Music Group NV | 25,931 | 635,020 | |
| Wolters Kluwer NV | 8,148 | 1,044,051 | |
TOTAL NETHERLANDS | 12,801,055 | ||
| New Zealand - 0.2% | |||
| Mercury Nz Ltd. | 21,861 | 75,201 | |
| Meridian Energy Ltd. | 39,701 | 111,812 | |
| Spark New Zealand Ltd. | 59,108 | 171,598 | |
| Xero Ltd. (a) | 4,546 | 310,798 | |
TOTAL NEW ZEALAND | 669,409 | ||
| Norway - 0.8% | |||
| Aker BP ASA | 10,002 | 287,499 | |
| DNB Bank ASA | 29,309 | 528,147 | |
| Equinor ASA | 28,505 | 955,579 | |
| Gjensidige Forsikring ASA | 6,572 | 98,425 | |
| Mowi ASA | 13,890 | 225,429 | |
| Norsk Hydro ASA | 42,093 | 240,044 | |
| Orkla ASA | 23,762 | 163,661 | |
| Salmar ASA | 2,228 | 105,467 | |
| Telenor ASA | 22,118 | 226,012 | |
TOTAL NORWAY | 2,830,263 | ||
| Peru - 0.1% | |||
| Credicorp Ltd. (United States) | 2,145 | 268,039 | |
| Philippines - 0.1% | |||
| Ayala Corp. | 8,550 | 91,198 | |
| JG Summit Holdings, Inc. | 80,833 | 52,307 | |
| PLDT, Inc. | 2,320 | 49,456 | |
| SM Investments Corp. | 7,515 | 105,960 | |
| SM Prime Holdings, Inc. | 310,400 | 163,837 | |
| Universal Robina Corp. | 26,810 | 51,563 | |
TOTAL PHILIPPINES | 514,321 | ||
| Poland - 0.4% | |||
| Allegro.eu SA (a)(b) | 15,592 | 111,608 | |
| CD Projekt RED SA | 1,996 | 49,757 | |
| KGHM Polska Miedz SA (Bearer) | 4,304 | 114,700 | |
| mBank SA (a) | 458 | 56,521 | |
| Orlen SA | 18,428 | 290,942 | |
| Powszechna Kasa Oszczednosci Bank SA (a) | 27,835 | 287,598 | |
| Powszechny Zaklad Ubezpieczen SA | 19,289 | 218,029 | |
| Santander Bank Polska SA (a) | 1,099 | 119,083 | |
TOTAL POLAND | 1,248,238 | ||
| Portugal - 0.1% | |||
| Galp Energia SGPS SA Class B | 15,612 | 234,736 | |
| Jeronimo Martins SGPS SA | 8,981 | 206,971 | |
TOTAL PORTUGAL | 441,707 | ||
| Qatar - 0.2% | |||
| Qatar Fuel Co. (a) | 19,870 | 81,041 | |
| Qatar Gas Transport Co. Ltd. (Nakilat) (a) | 82,615 | 79,869 | |
| Qatar National Bank SAQ | 145,985 | 597,011 | |
TOTAL QATAR | 757,921 | ||
| Romania - 0.0% | |||
| NEPI Rockcastle PLC | 15,435 | 83,363 | |
| Russia - 0.1% | |||
| Gazprom OAO (c) | 372,050 | 38,941 | |
| LUKOIL PJSC (c) | 13,192 | 4,084 | |
| Mobile TeleSystems OJSC sponsored ADR (a)(c) | 14,384 | 14,326 | |
| Moscow Exchange MICEX-RTS OAO (c) | 49,350 | 9,489 | |
| Novatek PJSC GDR (Reg. S) (a)(c) | 2,894 | 150,488 | |
| Novolipetsk Steel OJSC (a)(c) | 47,040 | 452 | |
| PhosAgro PJSC: | |||
| GDR (Reg. S) (a)(c) | 4,171 | 86 | |
| sponsored GDR (Reg. S) (a)(c) | 26 | 1 | |
| Polyus PJSC (a)(c) | 1,031 | 2,425 | |
TOTAL RUSSIA | 220,292 | ||
| Saudi Arabia - 0.7% | |||
| ACWA Power Co. | 3,019 | 182,672 | |
| Alinma Bank | 31,057 | 272,357 | |
| Bank Albilad | 15,549 | 154,180 | |
| Dr Sulaiman Al Habib Medical Services Group Co. | 2,770 | 186,065 | |
| National Industrialization Co. (a) | 10,020 | 31,035 | |
| Sahara International Petrochemical Co. | 11,032 | 94,835 | |
| Saudi Arabian Oil Co. (b) | 84,206 | 747,430 | |
| Saudi Basic Industries Corp. | 28,500 | 584,950 | |
| Saudi Electricity Co. | 25,590 | 121,415 | |
| The Savola Group | 8,598 | 83,422 | |
TOTAL SAUDI ARABIA | 2,458,361 | ||
| Singapore - 0.7% | |||
| CapitaLand Investment Ltd. | 80,001 | 171,777 | |
| CapitaMall Trust | 169,609 | 217,985 | |
| City Developments Ltd. | 15,400 | 71,084 | |
| Keppel (REIT) (d) | 9,260 | 5,377 | |
| Keppel Corp. Ltd. | 46,300 | 210,172 | |
| Singapore Exchange Ltd. | 27,200 | 188,324 | |
| STMicroelectronics NV (France) | 21,642 | 824,995 | |
| United Overseas Bank Ltd. | 40,100 | 790,960 | |
TOTAL SINGAPORE | 2,480,674 | ||
| South Africa - 1.7% | |||
| Absa Group Ltd. | 26,876 | 245,031 | |
| Anglo American Platinum Ltd. | 2,179 | 72,804 | |
| Anglo American PLC (United Kingdom) | 40,246 | 1,025,452 | |
| Aspen Pharmacare Holdings Ltd. | 11,660 | 105,911 | |
| Bid Corp. Ltd. | 10,605 | 224,982 | |
| Bidvest Group Ltd./The | 8,897 | 125,935 | |
| Capitec Bank Holdings Ltd. | 2,759 | 244,981 | |
| Clicks Group Ltd. | 8,041 | 118,491 | |
| Discovery Ltd. | 16,533 | 114,061 | |
| FirstRand Ltd. | 159,647 | 526,289 | |
| Gold Fields Ltd. | 28,297 | 373,293 | |
| Growthpoint Properties Ltd. | 105,490 | 54,846 | |
| Impala Platinum Holdings Ltd. | 26,636 | 110,955 | |
| Kumba Iron Ore Ltd. | 1,981 | 52,489 | |
| MTN Group Ltd. | 53,622 | 261,759 | |
| Naspers Ltd. Class N | 6,200 | 967,825 | |
| Nedbank Group Ltd. | 13,519 | 145,487 | |
| Northam Platinum Holdings Ltd. | 11,736 | 70,835 | |
| Old Mutual Ltd. | 160,090 | 101,788 | |
| Sanlam Ltd. | 55,723 | 195,445 | |
| Sasol Ltd. | 18,080 | 228,526 | |
| Shoprite Holdings Ltd. | 15,896 | 203,699 | |
| Sibanye-Stillwater Ltd. | 86,968 | 110,932 | |
| Standard Bank Group Ltd. | 42,464 | 416,700 | |
| Vodacom Group Ltd. | 20,599 | 112,138 | |
| Woolworths Holdings Ltd. | 30,993 | 115,391 | |
TOTAL SOUTH AFRICA | 6,326,045 | ||
| Spain - 1.1% | |||
| ACS Actividades de Construccion y Servicios SA | 6,941 | 250,954 | |
| Amadeus IT Holding SA Class A | 14,257 | 811,893 | |
| Iberdrola SA | 192,771 | 2,144,002 | |
| Naturgy Energy Group SA | 3,875 | 109,474 | |
| Redeia Corp. SA | 12,944 | 201,400 | |
| Repsol SA | 40,414 | 591,185 | |
TOTAL SPAIN | 4,108,908 | ||
| Sweden - 1.8% | |||
| Alfa Laval AB | 9,177 | 296,461 | |
| ASSA ABLOY AB (B Shares) | 31,724 | 676,199 | |
| Atlas Copco AB: | |||
| (A Shares) | 85,162 | 1,102,765 | |
| (B Shares) | 49,240 | 551,623 | |
| Beijer Ref AB (B Shares) | 11,834 | 112,059 | |
| Boliden AB | 8,668 | 221,894 | |
| Epiroc AB: | |||
| (A Shares) | 21,178 | 348,902 | |
| (B Shares) | 11,984 | 166,086 | |
| EQT AB | 11,279 | 205,019 | |
| Essity AB (B Shares) | 19,277 | 439,164 | |
| H&M Hennes & Mauritz AB (B Shares) | 20,443 | 273,429 | |
| Holmen AB (B Shares) | 2,884 | 108,695 | |
| Husqvarna AB (B Shares) | 11,512 | 74,358 | |
| Nibe Industrier AB (B Shares) | 47,981 | 275,873 | |
| Sandvik AB | 33,783 | 575,426 | |
| SKF AB (B Shares) | 10,812 | 174,446 | |
| Svenska Cellulosa AB SCA (B Shares) | 19,260 | 263,904 | |
| Svenska Handelsbanken AB (A Shares) | 46,274 | 394,518 | |
| Tele2 AB (B Shares) | 16,424 | 116,444 | |
| Telia Co. AB | 75,080 | 159,166 | |
TOTAL SWEDEN | 6,536,431 | ||
| Switzerland - 5.2% | |||
| ABB Ltd. (Reg.) | 50,712 | 1,703,808 | |
| Baloise Holdings AG | 1,448 | 207,255 | |
| Banque Cantonale Vaudoise | 987 | 111,324 | |
| Clariant AG (Reg.) | 7,198 | 101,839 | |
| DSM-Firmenich AG | 5,888 | 533,234 | |
| Geberit AG (Reg.) | 1,056 | 489,662 | |
| Givaudan SA | 293 | 972,748 | |
| Julius Baer Group Ltd. | 6,518 | 386,268 | |
| Kuehne & Nagel International AG | 1,710 | 459,622 | |
| Lindt & Spruengli AG | 4 | 435,332 | |
| Lindt & Spruengli AG (participation certificate) | 30 | 331,446 | |
| Logitech International SA (Reg.) | 5,204 | 407,098 | |
| Lonza Group AG | 2,356 | 825,081 | |
| Novartis AG | 64,853 | 6,071,510 | |
| SGS SA (Reg.) | 4,740 | 385,495 | |
| Sig Group AG | 9,705 | 213,272 | |
| Sika AG | 4,633 | 1,104,708 | |
| Sonova Holding AG | 1,645 | 387,899 | |
| Swiss Life Holding AG | 933 | 596,734 | |
| Swisscom AG | 820 | 490,386 | |
| Temenos Group AG | 1,961 | 140,427 | |
| VAT Group AG (b) | 854 | 301,080 | |
| Zurich Insurance Group Ltd. | 4,762 | 2,254,183 | |
TOTAL SWITZERLAND | 18,910,411 | ||
| Taiwan - 5.8% | |||
| Acer, Inc. | 94,000 | 99,271 | |
| AUO Corp. | 214,400 | 103,699 | |
| Cathay Financial Holding Co. Ltd. | 300,751 | 407,820 | |
| China Airlines Ltd. | 89,000 | 53,311 | |
| China Steel Corp. | 375,000 | 279,555 | |
| Chunghwa Telecom Co. Ltd. | 121,000 | 432,428 | |
| CTBC Financial Holding Co. Ltd. | 557,000 | 419,155 | |
| Delta Electronics, Inc. | 61,000 | 549,302 | |
| E.SUN Financial Holdings Co. Ltd. | 444,635 | 327,372 | |
| EVA Airways Corp. | 85,000 | 72,026 | |
| Evergreen Marine Corp. (Taiwan) | 31,157 | 103,604 | |
| Far Eastern New Century Corp. | 99,000 | 90,131 | |
| Far EasTone Telecommunications Co. Ltd. | 49,000 | 114,690 | |
| First Financial Holding Co. Ltd. | 345,228 | 276,020 | |
| Fubon Financial Holding Co. Ltd. | 247,285 | 459,496 | |
| Hotai Motor Co. Ltd. | 9,180 | 171,159 | |
| Hua Nan Financial Holdings Co. Ltd. | 279,357 | 175,057 | |
| Lite-On Technology Corp. | 64,000 | 199,111 | |
| MediaTek, Inc. | 48,000 | 1,251,805 | |
| Mega Financial Holding Co. Ltd. | 355,844 | 403,477 | |
| momo.com, Inc. | 2,640 | 43,491 | |
| Nan Ya Plastics Corp. | 150,000 | 286,777 | |
| President Chain Store Corp. | 19,000 | 151,016 | |
| Sinopac Financial Holdings Co. | 333,806 | 183,958 | |
| Taishin Financial Holdings Co. Ltd. | 355,721 | 189,584 | |
| Taiwan Cement Corp. | 203,887 | 203,000 | |
| Taiwan Cooperative Financial Holding Co. Ltd. | 325,302 | 252,424 | |
| Taiwan High Speed Rail Corp. | 61,000 | 55,342 | |
| Taiwan Mobile Co. Ltd. | 54,000 | 159,462 | |
| Taiwan Semiconductor Manufacturing Co. Ltd. | 779,000 | 12,713,228 | |
| Uni-President Enterprises Corp. | 153,000 | 320,739 | |
| United Microelectronics Corp. | 356,000 | 511,574 | |
| Voltronic Power Technology Corp. | 2,000 | 80,146 | |
| Wan Hai Lines Ltd. | 21,460 | 30,648 | |
| Yang Ming Marine Transport Corp. | 57,000 | 74,235 | |
TOTAL TAIWAN | 21,244,113 | ||
| Thailand - 0.7% | |||
| Advanced Info Service PCL (For. Reg.) | 13,300 | 81,011 | |
| Advanced Information Service PCL NVDR | 24,200 | 147,403 | |
| Airports of Thailand PCL: | |||
| (For. Reg.) (a) | 33,200 | 61,299 | |
| NVDR (a) | 102,000 | 188,327 | |
| Asset World Corp. PCL NVDR | 247,500 | 23,684 | |
| B. Grimm Power PCL: | |||
| (For. Reg.) | 10,100 | 6,179 | |
| NVDR | 14,000 | 8,564 | |
| Bangkok Dusit Medical Services PCL: | |||
| (For. Reg.) | 106,700 | 78,220 | |
| NVDR | 244,700 | 179,386 | |
| Bangkok Expressway and Metro PCL NVDR | 234,900 | 51,317 | |
| Berli Jucker PCL NVDR | 30,800 | 24,097 | |
| BTS Group Holdings PCL: | |||
| (For. Reg.) | 90,133 | 18,746 | |
| NVDR | 151,100 | 31,156 | |
| Bumrungrad Hospital PCL: | |||
| (For. Reg.) | 6,200 | 44,563 | |
| NVDR | 11,700 | 84,094 | |
| Central Retail Corp. PCL NVDR | 60,700 | 61,736 | |
| Charoen Pokphand Foods PCL: | |||
| (For. Reg.) | 53,600 | 27,728 | |
| NVDR | 77,000 | 39,833 | |
| CP ALL PCL: | |||
| (For. Reg.) | 50,100 | 76,571 | |
| NVDR | 133,800 | 204,495 | |
| Delta Electronics PCL NVDR | 98,700 | 215,766 | |
| Energy Absolute PCL: | |||
| (For. Reg.) | 20,900 | 24,294 | |
| NVDR | 35,300 | 41,033 | |
| Home Product Center PCL: | |||
| (For. Reg.) | 25,200 | 8,297 | |
| NVDR | 174,600 | 57,487 | |
| Indorama Ventures PCL: | |||
| (For. Reg.) | 25,900 | 16,971 | |
| NVDR | 25,900 | 16,971 | |
| Intouch Holdings PCL: | |||
| (For. Reg.) | 4,800 | 9,429 | |
| NVDR | 27,900 | 54,805 | |
| Kasikornbank PCL NVDR | 19,800 | 72,013 | |
| Minor International PCL: | |||
| (For. Reg.) | 48,599 | 37,663 | |
| NVDR | 52,268 | 40,506 | |
| Muangthai Leasing PCL NVDR | 22,800 | 23,027 | |
| Osotspa PCL NVDR | 41,500 | 26,988 | |
| PTT Exploration and Production PCL: | |||
| (For. Reg.) | 16,400 | 74,482 | |
| NVDR | 27,400 | 124,439 | |
| PTT Global Chemical PCL: | |||
| (For. Reg.) | 11,900 | 11,366 | |
| NVDR | 63,200 | 60,363 | |
| PTT Oil & Retail Business PCL NVDR | 92,200 | 46,691 | |
| SCG Packaging PCL NVDR | 39,600 | 39,459 | |
| Siam Cement PCL: | |||
| (For. Reg.) | 4,600 | 36,645 | |
| NVDR | 19,400 | 154,546 | |
TOTAL THAILAND | 2,631,650 | ||
| Turkey - 0.2% | |||
| Haci Omer Sabanci Holding A/S | 33,431 | 63,157 | |
| Koc Holding A/S | 23,384 | 112,960 | |
| Turk Hava Yollari AO (a) | 16,968 | 130,199 | |
| Turkiye Is Bankasi A/S Series C | 114,119 | 84,544 | |
| Turkiye Sise ve Cam Fabrikalari A/S | 45,396 | 75,886 | |
| Yapi ve Kredi Bankasi A/S | 110,318 | 67,159 | |
TOTAL TURKEY | 533,905 | ||
| United Arab Emirates - 0.6% | |||
| Abu Dhabi Commercial Bank PJSC | 92,765 | 202,805 | |
| Abu Dhabi Islamic Bank (a) | 44,656 | 125,226 | |
| Aldar Properties PJSC | 122,005 | 172,727 | |
| Emaar Properties PJSC | 209,833 | 382,190 | |
| Emirates NBD Bank PJSC | 60,010 | 276,932 | |
| Emirates Telecommunications Corp. | 110,087 | 553,282 | |
| First Abu Dhabi Bank PJSC | 139,966 | 483,193 | |
| NMC Health PLC (a)(c) | 987 | 0 | |
TOTAL UNITED ARAB EMIRATES | 2,196,355 | ||
| United Kingdom - 8.1% | |||
| 3i Group PLC | 30,816 | 726,567 | |
| Abrdn PLC | 59,878 | 114,008 | |
| Admiral Group PLC | 6,728 | 199,777 | |
| Ashtead Group PLC | 13,875 | 793,300 | |
| Associated British Foods PLC | 11,025 | 271,491 | |
| AstraZeneca PLC (United Kingdom) | 49,050 | 6,141,244 | |
| Auto Trader Group PLC (b) | 29,325 | 221,822 | |
| Barratt Developments PLC | 30,947 | 155,687 | |
| Berkeley Group Holdings PLC | 3,388 | 166,200 | |
| BT Group PLC | 204,762 | 280,610 | |
| Burberry Group PLC | 11,940 | 245,551 | |
| CNH Industrial NV | 32,356 | 358,279 | |
| Coca-Cola European Partners PLC | 6,529 | 382,012 | |
| Croda International PLC | 4,429 | 235,678 | |
| DCC PLC (United Kingdom) | 3,147 | 174,612 | |
| HSBC Holdings PLC (United Kingdom) | 625,789 | 4,518,463 | |
| Informa PLC | 44,372 | 383,780 | |
| Intertek Group PLC | 5,124 | 238,095 | |
| J Sainsbury PLC | 52,545 | 164,327 | |
| Johnson Matthey PLC | 5,639 | 102,398 | |
| Kingfisher PLC | 58,557 | 149,526 | |
| Legal & General Group PLC | 189,531 | 486,993 | |
| Lloyds Banking Group PLC | 2,041,014 | 993,362 | |
| National Grid PLC | 116,616 | 1,390,410 | |
| Ocado Group PLC (a) | 17,800 | 100,668 | |
| Phoenix Group Holdings PLC | 23,081 | 127,308 | |
| Reckitt Benckiser Group PLC | 22,709 | 1,519,390 | |
| RELX PLC (London Stock Exchange) | 59,953 | 2,094,021 | |
| Sage Group PLC | 32,424 | 382,511 | |
| Schroders PLC | 25,956 | 116,508 | |
| Segro PLC | 37,051 | 321,000 | |
| Spirax-Sarco Engineering PLC | 2,337 | 232,694 | |
| St. James's Place PLC | 17,375 | 135,074 | |
| Taylor Wimpey PLC | 112,121 | 150,995 | |
| Tesco PLC | 227,080 | 745,177 | |
| Unilever PLC | 79,591 | 3,769,484 | |
| Vodafone Group PLC | 727,863 | 670,027 | |
| WPP PLC | 34,084 | 293,505 | |
TOTAL UNITED KINGDOM | 29,552,554 | ||
| United States of America - 1.6% | |||
| Brookfield Renewable Corp. | 4,492 | 102,198 | |
| CRH PLC | 22,979 | 1,234,778 | |
| James Hardie Industries PLC CDI (a) | 13,941 | 347,820 | |
| Schneider Electric SA | 17,248 | 2,653,730 | |
| Swiss Re Ltd. | 9,547 | 1,040,289 | |
| Tenaris SA | 14,942 | 234,622 | |
TOTAL UNITED STATES OF AMERICA | 5,613,437 | ||
| TOTAL COMMON STOCKS (Cost $389,570,565) | 353,619,685 | ||
| Nonconvertible Preferred Stocks - 0.7% | |||
| Shares | Value ($) | ||
| Brazil - 0.4% | |||
| Banco Bradesco SA (PN) | 168,355 | 467,157 | |
| Companhia Energetica de Minas Gerais (CEMIG) (PN) | 42,768 | 99,588 | |
| Gerdau SA | 35,525 | 153,395 | |
| Itau Unibanco Holding SA | 153,700 | 817,620 | |
TOTAL BRAZIL | 1,537,760 | ||
| Chile - 0.1% | |||
| Sociedad Quimica y Minera de Chile SA (PN-B) | 4,494 | 217,419 | |
| Colombia - 0.0% | |||
| Bancolombia SA (PN) | 14,054 | 90,142 | |
| Germany - 0.2% | |||
| Bayerische Motoren Werke AG (BMW) (non-vtg.) | 1,862 | 157,910 | |
| Henkel AG & Co. KGaA | 5,405 | 389,352 | |
TOTAL GERMANY | 547,262 | ||
| Korea (South) - 0.0% | |||
| LG Chemical Ltd. | 242 | 50,468 | |
| TOTAL NONCONVERTIBLE PREFERRED STOCKS (Cost $2,754,732) | 2,443,051 | ||
| Government Obligations - 0.1% | |||
Principal Amount (e) | Value ($) | ||
| United States of America - 0.1% | |||
U.S. Treasury Bills, yield at date of purchase 5.42% 2/22/24 (f) (Cost $196,675) | 200,000 | 196,663 | |
| Money Market Funds - 1.3% | |||
| Shares | Value ($) | ||
Fidelity Cash Central Fund 5.40% (g) (Cost $4,832,504) | 4,831,538 | 4,832,504 | |
| TOTAL INVESTMENT IN SECURITIES - 99.3% (Cost $397,354,476) | 361,091,903 |
NET OTHER ASSETS (LIABILITIES) - 0.7% | 2,605,107 |
| NET ASSETS - 100.0% | 363,697,010 |
| Futures Contracts | |||||
Number of contracts | Expiration Date | Notional Amount ($) | Value ($) | Unrealized Appreciation/ (Depreciation) ($) | |
| Purchased | |||||
| Equity Index Contracts | |||||
| ICE MSCI EAFE Index Contracts (United States) | 49 | Dec 2023 | 4,836,545 | (79,288) | (79,288) |
| ICE MSCI Emerging Markets Index Contracts (United States) | 47 | Dec 2023 | 2,160,120 | (39,227) | (39,227) |
| TME S&P/TSX 60 Index Contracts (Canada) | 3 | Dec 2023 | 491,076 | (11,809) | (11,809) |
| TOTAL FUTURES CONTRACTS | (130,324) | ||||
| The notional amount of futures purchased as a percentage of Net Assets is 2.1% | |||||
| (a) | Non-income producing |
| (b) | Security exempt from registration under Rule 144A of the Securities Act of 1933. These securities may be resold in transactions exempt from registration, normally to qualified institutional buyers. At the end of the period, the value of these securities amounted to $6,034,155 or 1.7% of net assets. |
| (c) | Level 3 security |
| (d) | Security or a portion of the security purchased on a delayed delivery or when-issued basis. |
| (e) | Amount is stated in United States dollars unless otherwise noted. |
| (f) | Security or a portion of the security was pledged to cover margin requirements for futures contracts. At period end, the value of securities pledged amounted to $196,663. |
| (g) | Affiliated fund that is generally available only to investment companies and other accounts managed by Fidelity Investments. The rate quoted is the annualized seven-day yield of the fund at period end. A complete unaudited listing of the fund's holdings as of its most recent quarter end is available upon request. In addition, each Fidelity Central Fund's financial statements, which are not covered by the Fund's Report of Independent Registered Public Accounting Firm, are available on the SEC's website or upon request. |
| Affiliate | Value, beginning of period ($) | Purchases ($) | Sales Proceeds ($) | Dividend Income ($) | Realized Gain (loss) ($) | Change in Unrealized appreciation (depreciation) ($) | Value, end of period ($) | % ownership, end of period |
| Fidelity Cash Central Fund 5.40% | 10,183,079 | 47,900,371 | 53,250,946 | 321,600 | - | - | 4,832,504 | 0.0% |
| Fidelity Securities Lending Cash Central Fund 5.40% | 4,676,936 | 2,702,083 | 7,379,019 | 7,598 | - | - | - | 0.0% |
| Total | 14,860,015 | 50,602,454 | 60,629,965 | 329,198 | - | - | 4,832,504 | |
| Valuation Inputs at Reporting Date: | ||||
| Description | Total ($) | Level 1 ($) | Level 2 ($) | Level 3 ($) |
Investments in Securities: | ||||
| Equities: | ||||
Communication Services | 26,474,235 | 4,287,954 | 22,171,955 | 14,326 |
Consumer Discretionary | 41,472,200 | 11,972,145 | 29,500,055 | - |
Consumer Staples | 28,946,885 | 9,331,750 | 19,615,135 | - |
Energy | 18,298,187 | 7,457,880 | 10,646,794 | 193,513 |
Financials | 75,559,808 | 30,438,537 | 45,111,782 | 9,489 |
Health Care | 35,248,345 | 2,054,768 | 33,193,577 | - |
Industrials | 44,922,953 | 16,786,626 | 28,136,327 | - |
Information Technology | 40,905,104 | 3,095,822 | 37,809,282 | - |
Materials | 25,976,579 | 12,863,188 | 13,110,427 | 2,964 |
Real Estate | 7,925,219 | 1,778,307 | 6,146,912 | - |
Utilities | 10,333,221 | 2,827,440 | 7,505,781 | - |
| Government Obligations | 196,663 | - | 196,663 | - |
| Money Market Funds | 4,832,504 | 4,832,504 | - | - |
| Total Investments in Securities: | 361,091,903 | 107,726,921 | 253,144,690 | 220,292 |
Derivative Instruments: Liabilities | ||||
Futures Contracts | (130,324) | (130,324) | - | - |
| Total Liabilities | (130,324) | (130,324) | - | - |
| Total Derivative Instruments: | (130,324) | (130,324) | - | - |
Primary Risk Exposure / Derivative Type | Value | |
| Asset ($) | Liability ($) | |
| Equity Risk | ||
Futures Contracts (a) | 0 | (130,324) |
| Total Equity Risk | 0 | (130,324) |
| Total Value of Derivatives | 0 | (130,324) |
| Statement of Assets and Liabilities | ||||
| October 31, 2023 | ||||
| Assets | ||||
| Investment in securities, at value - See accompanying schedule: | ||||
Unaffiliated issuers (cost $392,521,972) | $ | 356,259,399 | ||
Fidelity Central Funds (cost $4,832,504) | 4,832,504 | |||
| Total Investment in Securities (cost $397,354,476) | $ | 361,091,903 | ||
| Segregated cash with brokers for derivative instruments | 62,323 | |||
| Foreign currency held at value (cost $1,201,210) | 1,194,769 | |||
| Receivable for fund shares sold | 156,582 | |||
| Dividends receivable | 644,887 | |||
| Reclaims receivable | 858,381 | |||
| Distributions receivable from Fidelity Central Funds | 49,869 | |||
| Receivable for daily variation margin on futures contracts | 224 | |||
| Other receivables | 332 | |||
Total assets | 364,059,270 | |||
| Liabilities | ||||
| Payable for investments purchased on a delayed delivery basis | $ | 5,411 | ||
| Payable for fund shares redeemed | 101,436 | |||
| Accrued management fee | 61,639 | |||
| Deferred taxes | 188,680 | |||
| Other payables and accrued expenses | 5,094 | |||
| Total Liabilities | 362,260 | |||
| Net Assets | $ | 363,697,010 | ||
| Net Assets consist of: | ||||
| Paid in capital | $ | 425,001,238 | ||
| Total accumulated earnings (loss) | (61,304,228) | |||
| Net Assets | $ | 363,697,010 | ||
Net Asset Value, offering price and redemption price per share ($363,697,010 ÷ 34,445,805 shares) | $ | 10.56 | ||
| Statement of Operations | ||||
Year ended October 31, 2023 | ||||
| Investment Income | ||||
| Dividends | $ | 11,508,637 | ||
| Non-Cash dividends | 679,769 | |||
| Interest | 20,129 | |||
| Income from Fidelity Central Funds (including $7,598 from security lending) | 329,198 | |||
| Income before foreign taxes withheld | $ | 12,537,733 | ||
| Less foreign taxes withheld | (1,188,578) | |||
| Total Income | 11,349,155 | |||
| Expenses | ||||
| Management fee | $ | 763,919 | ||
| Independent trustees' fees and expenses | 1,312 | |||
| Miscellaneous | 5,088 | |||
| Total expenses before reductions | 770,319 | |||
| Expense reductions | (190) | |||
| Total expenses after reductions | 770,129 | |||
| Net Investment income (loss) | 10,579,026 | |||
| Realized and Unrealized Gain (Loss) | ||||
| Net realized gain (loss) on: | ||||
| Investment Securities: | ||||
| Unaffiliated issuers (net of foreign taxes of $60,481) | (10,180,589) | |||
| Foreign currency transactions | (32,229) | |||
| Futures contracts | 252,907 | |||
| Total net realized gain (loss) | (9,959,911) | |||
| Change in net unrealized appreciation (depreciation) on: | ||||
| Investment Securities: | ||||
| Unaffiliated issuers(net of decrease in deferred foreign taxes of $58,433) | 41,499,852 | |||
| Assets and liabilities in foreign currencies | 56,302 | |||
| Futures contracts | 53,756 | |||
| Total change in net unrealized appreciation (depreciation) | 41,609,910 | |||
| Net gain (loss) | 31,649,999 | |||
| Net increase (decrease) in net assets resulting from operations | $ | 42,229,025 | ||
| Statement of Changes in Net Assets | ||||
Year ended October 31, 2023 | Year ended October 31, 2022 | |||
| Increase (Decrease) in Net Assets | ||||
| Operations | ||||
| Net investment income (loss) | $ | 10,579,026 | $ | 10,010,817 |
| Net realized gain (loss) | (9,959,911) | (21,508,094) | ||
| Change in net unrealized appreciation (depreciation) | 41,609,910 | (120,661,320) | ||
| Net increase (decrease) in net assets resulting from operations | 42,229,025 | (132,158,597) | ||
| Distributions to shareholders | (8,331,104) | (7,834,340) | ||
| Share transactions | ||||
| Proceeds from sales of shares | 72,093,340 | 188,182,342 | ||
| Reinvestment of distributions | 7,520,386 | 7,154,872 | ||
| Cost of shares redeemed | (83,900,144) | (125,866,856) | ||
Net increase (decrease) in net assets resulting from share transactions | (4,286,418) | 69,470,358 | ||
| Total increase (decrease) in net assets | 29,611,503 | (70,522,579) | ||
| Net Assets | ||||
| Beginning of period | 334,085,507 | 404,608,086 | ||
| End of period | $ | 363,697,010 | $ | 334,085,507 |
| Other Information | ||||
| Shares | ||||
| Sold | 6,485,020 | 15,579,977 | ||
| Issued in reinvestment of distributions | 721,034 | 546,174 | ||
| Redeemed | (7,589,054) | (11,037,382) | ||
| Net increase (decrease) | (383,000) | 5,088,769 | ||
| Fidelity® International Sustainability Index Fund |
| Years ended October 31, | 2023 | 2022 | 2021 | 2020 | 2019 | |||||
Selected Per-Share Data | ||||||||||
| Net asset value, beginning of period | $ | 9.59 | $ | 13.60 | $ | 10.81 | $ | 10.89 | $ | 9.87 |
| Income from Investment Operations | ||||||||||
Net investment income (loss) A,B | .31 | .29 | .30 | .24 | .32 C | |||||
| Net realized and unrealized gain (loss) | .90 | (4.04) | 2.63 | (.08) | .91 | |||||
| Total from investment operations | 1.21 | (3.75) | 2.93 | .16 | 1.23 | |||||
| Distributions from net investment income | (.24) | (.26) | (.14) | (.24) | (.21) | |||||
| Total distributions | (.24) | (.26) | (.14) | (.24) | (.21) | |||||
| Net asset value, end of period | $ | 10.56 | $ | 9.59 | $ | 13.60 | $ | 10.81 | $ | 10.89 |
Total Return D | 12.68% | (28.11)% | 27.27% | 1.48% | 12.81% | |||||
Ratios to Average Net Assets B,E,F | ||||||||||
| Expenses before reductions | .20% | .20% | .20% | .20% | .20% | |||||
| Expenses net of fee waivers, if any | .20% | .20% | .20% | .20% | .20% | |||||
| Expenses net of all reductions | .20% | .20% | .20% | .20% | .20% | |||||
| Net investment income (loss) | 2.77% | 2.52% | 2.28% | 2.25% | 3.14% C | |||||
| Supplemental Data | ||||||||||
| Net assets, end of period (000 omitted) | $ | 363,697 | $ | 334,086 | $ | 404,608 | $ | 149,868 | $ | 71,875 |
Portfolio turnover rate G | 22% | 23% | 19% | 11% | 17% |
| Fidelity Central Fund | Investment Manager | Investment Objective | Investment Practices | Expense RatioA |
| Fidelity Money Market Central Funds | Fidelity Management & Research Company LLC (FMR) | Each fund seeks to obtain a high level of current income consistent with the preservation of capital and liquidity. | Short-term Investments | Less than .005% |
| Gross unrealized appreciation | $32,870,874 |
| Gross unrealized depreciation | (70,297,470) |
| Net unrealized appreciation (depreciation) | $(37,426,596) |
| Tax Cost | $398,506,690 |
| Undistributed ordinary income | $9,421,441 |
| Capital loss carryforward | $(33,084,088) |
| Net unrealized appreciation (depreciation) on securities and other investments | $(37,452,902) |
Short-term | $(13,590,977) |
Long-term | (19,493,111) |
| Total capital loss carryforward | $(33,084,088) |
| October 31, 2023 | October 31, 2022 | |
| Ordinary Income | $8,331,104 | $7,834,340 |
| Equity Risk | Equity risk relates to the fluctuations in the value of financial instruments as a result of changes in market prices (other than those arising from interest rate risk or foreign exchange risk), whether caused by factors specific to an individual investment, its issuer, or all factors affecting all instruments traded in a market or market segment. |
| Purchases ($) | Sales ($) | |
| Fidelity International Sustainability Index Fund | 83,811,839 | 80,767,555 |
| Amount ($) | |
| Fidelity International Sustainability Index Fund | 1,588 |
| Total Security Lending Fees Paid to NFS | Security Lending Income From Securities Loaned to NFS | Value of Securities Loaned to NFS at Period End | |
| Fidelity International Sustainability Index Fund | $814 | $- | $- |
| The Example is based on an investment of $1,000 invested at the beginning of the period and held for the entire period (May 1, 2023 to October 31, 2023). |
Annualized Expense Ratio- A | Beginning Account Value May 1, 2023 | Ending Account Value October 31, 2023 | Expenses Paid During Period- C May 1, 2023 to October 31, 2023 | |||||||
| Fidelity® International Sustainability Index Fund | .20% | |||||||||
| Actual | $ 1,000 | $ 921.50 | $ .97 | |||||||
Hypothetical-B | $ 1,000 | $ 1,024.20 | $ 1.02 | |||||||
| A special meeting of shareholders was held on October 18, 2023. The results of votes taken among shareholders on the proposal before them are reported below. Each vote reported represents one dollar of net asset value held on the record date for the meeting. | ||
| Proposal 1 | ||
| To elect a Board of Trustees. | ||
# of Votes | % of Votes | |
| Abigail P. Johnson | ||
| Affirmative | 378,729,502,260.010 | 97.580 |
| Withheld | 9,407,876,478.960 | 2.420 |
| TOTAL | 388,137,378,738.970 | 100.000 |
| Jennifer Toolin McAuliffe | ||
| Affirmative | 378,454,868,010.950 | 97.510 |
| Withheld | 9,682,510,728.020 | 2.490 |
| TOTAL | 388,137,378,738.970 | 100.000 |
| Christine J. Thompson | ||
| Affirmative | 378,837,121,274.520 | 97.600 |
| Withheld | 9,300,257,464.450 | 2.400 |
| TOTAL | 388,137,378,738.970 | 100.000 |
| Elizabeth S. Acton | ||
| Affirmative | 378,262,110,794.850 | 97.460 |
| Withheld | 9,875,267,944.120 | 2.540 |
| TOTAL | 388,137,378,738.970 | 100.000 |
| Laura M. Bishop | ||
| Affirmative | 380,482,113,171.060 | 98.030 |
| Withheld | 7,655,265,567.910 | 1.970 |
| TOTAL | 388,137,378,738.970 | 100.000 |
| Ann E. Dunwoody | ||
| Affirmative | 380,016,034,008.120 | 97.910 |
| Withheld | 8,121,344,730.850 | 2.090 |
| TOTAL | 388,137,378,738.970 | 100.000 |
| John Engler | ||
| Affirmative | 379,432,488,394.200 | 97.760 |
| Withheld | 8,704,890,344.770 | 2.240 |
| TOTAL | 388,137,378,738.970 | 100.000 |
| Robert F. Gartland | ||
| Affirmative | 378,741,819,600.600 | 97.580 |
| Withheld | 9,395,559,138.370 | 2.420 |
| TOTAL | 388,137,378,738.970 | 100.000 |
| Robert W. Helm | ||
| Affirmative | 380,389,324,755.070 | 98.000 |
| Withheld | 7,748,053,983.900 | 2.000 |
| TOTAL | 388,137,378,738.970 | 100.000 |
| Arthur E. Johnson | ||
| Affirmative | 378,427,694,151.670 | 97.500 |
| Withheld | 9,709,684,587.300 | 2.500 |
| TOTAL | 388,137,378,738.970 | 100.000 |
| Michael E. Kenneally | ||
| Affirmative | 377,842,228,145.180 | 97.350 |
| Withheld | 10,295,150,593.790 | 2.650 |
| TOTAL | 388,137,378,738.970 | 100.000 |
| Mark A. Murray | ||
| Affirmative | 380,158,432,703.370 | 97.940 |
| Withheld | 7,978,946,035.600 | 2.060 |
| TOTAL | 388,137,378,738.970 | 100.000 |
| Carol J. Zierhoffer | ||
| Affirmative | 380,522,113,360.240 | 98.040 |
| Withheld | 7,615,265,378.730 | 1.960 |
| TOTAL | 388,137,378,738.970 | 100.000 |
| Proposal 1 reflects trust wide proposal and voting results. | ||
 |
Item 2.
Code of Ethics
As of the end of the period, October 31, 2023, Fidelity Salem Street Trust (the trust) has adopted a code of ethics, as defined in Item 2 of Form N-CSR, that applies to its President and Treasurer and its Chief Financial Officer. A copy of the code of ethics is filed as an exhibit to this Form N-CSR.
Item 3.
Audit Committee Financial Expert
The Board of Trustees of the trust has determined that Elizabeth S. Acton is an audit committee financial expert, as defined in Item 3 of Form N-CSR. Ms. Acton is independent for purposes of Item 3 of Form N-CSR.
Item 4.
Principal Accountant Fees and Services
Fees and Services
The following table presents fees billed by Deloitte & Touche LLP, the member firms of Deloitte Touche Tohmatsu, and their respective affiliates (collectively, “Deloitte Entities”) in each of the last two fiscal years for services rendered to Fidelity Emerging Markets Index Fund, Fidelity Flex International Index Fund, Fidelity Global ex U.S. Index Fund, Fidelity International Sustainability Index Fund and Fidelity Series Global ex U.S. Index Fund (the “Fund(s)”):
Services Billed by Deloitte Entities
October 31, 2023 FeesA
Audit Fees | Audit-Related Fees | Tax Fees | All Other Fees | |
Fidelity Emerging Markets Index Fund | $47,200 | $- | $12,300 | $1,200 |
Fidelity Flex International Index Fund | $49,200 | $- | $10,000 | $1,200 |
Fidelity Global ex U.S. Index Fund | $52,600 | $- | $10,000 | $1,300 |
Fidelity International Sustainability Index Fund | $36,100 | $- | $10,000 | $1,000 |
Fidelity Series Global ex U.S. Index Fund | $57,500 | $- | $10,000 | $1,400 |
October 31, 2022 FeesA
Audit Fees | Audit-Related Fees | Tax Fees | All Other Fees | |
Fidelity Emerging Markets Index Fund | $46,700 | $- | $11,200 | $1,100 |
Fidelity Flex International Index Fund | $48,800 | $- | $9,100 | $1,100 |
Fidelity Global ex U.S. Index Fund | $53,000 | $- | $9,100 | $1,200 |
Fidelity International Sustainability Index Fund | $35,900 | $- | $9,100 | $900 |
Fidelity Series Global ex U.S. Index Fund | $57,500 | $- | $9,100 | $1,300 |
A Amounts may reflect rounding.
The following table presents fees billed by PricewaterhouseCoopers LLP (“PwC”) in each of the last two fiscal years for services rendered to Fidelity SAI Emerging Markets Index Fund, Fidelity SAI Emerging Markets Low Volatility Index Fund, Fidelity SAI Emerging Markets Value Index Fund, Fidelity SAI International Index Fund, Fidelity SAI International Low Volatility Index Fund, Fidelity SAI International Momentum Index Fund, Fidelity SAI International Quality Index Fund, Fidelity SAI International Value Index Fund, Fidelity SAI U.S. Low Volatility Index Fund, Fidelity Total International Index Fund and Fidelity U.S. Sustainability Index Fund (the “Fund(s)”):
Services Billed by PwC
October 31, 2023 FeesA
Audit Fees | Audit-Related Fees | Tax Fees | All Other Fees | |
Fidelity SAI Emerging Markets Index Fund | $40,900 | $3,700 | $35,800 | $1,600 |
Fidelity SAI Emerging Markets Low Volatility Index Fund | $36,100 | $3,300 | $10,900 | $1,400 |
Fidelity SAI Emerging Markets Value Index Fund | $38,100 | $3,500 | $10,000 | $1,500 |
Fidelity SAI International Index Fund | $40,900 | $3,700 | $46,500 | $1,600 |
Fidelity SAI International Low Volatility Index Fund | $36,200 | $3,300 | $12,900 | $1,400 |
Fidelity SAI International Momentum Index Fund | $38,000 | $3,500 | $10,000 | $1,500 |
Fidelity SAI International Quality Index Fund | $38,000 | $3,500 | $10,300 | $1,500 |
Fidelity SAI International Value Index Fund | $39,300 | $3,600 | $15,900 | $1,500 |
Fidelity SAI U.S. Low Volatility Index Fund | $37,200 | $3,400 | $9,800 | $1,400 |
Fidelity Total International Index Fund | $68,100 | $6,000 | $28,700 | $2,500 |
Fidelity U.S. Sustainability Index Fund | $31,500 | $2,800 | $6,600 | $1,200 |
October 31, 2022 FeesA
Audit Fees | Audit-Related Fees | Tax Fees | All Other Fees | |
Fidelity SAI Emerging Markets Index Fund | $38,900 | $3,600 | $9,900 | $1,600 |
Fidelity SAI Emerging Markets Low Volatility Index Fund | $34,400 | $3,200 | $10,900 | $1,400 |
Fidelity SAI Emerging Markets Value Index Fund | $36,400 | $3,300 | $9,500 | $1,500 |
Fidelity SAI International Index Fund | $45,000 | $3,600 | $9,900 | $1,600 |
Fidelity SAI International Low Volatility Index Fund | $34,500 | $3,200 | $15,500 | $1,400 |
Fidelity SAI International Momentum Index Fund | $36,400 | $3,300 | $9,500 | $1,500 |
Fidelity SAI International Quality Index Fund | $36,400 | $3,300 | $9,500 | $1,500 |
Fidelity International Value Index Fund | $37,300 | $3,400 | $13,300 | $1,500 |
Fidelity SAI U.S. Low Volatility Index Fund | $35,200 | $3,200 | $11,300 | $1,400 |
Fidelity Total International Index Fund | $62,200 | $5,700 | $30,900 | $2,500 |
Fidelity U.S. Sustainability Index Fund | $30,100 | $2,700 | $6,300 | $1,200 |
A Amounts may reflect rounding.
The following table(s) present(s) fees billed by Deloitte Entities and PwC that were required to be approved by the Audit Committee for services that relate directly to the operations and financial reporting of the Fund(s) and that are rendered on behalf of Fidelity Management & Research Company LLC ("FMR") and entities controlling, controlled by, or under common control with FMR (not including any sub-adviser whose role is primarily portfolio management and is subcontracted with or overseen by another investment adviser) that provide ongoing services to the Fund(s) (“Fund Service Providers”):
Services Billed by Deloitte Entities
October 31, 2023A | October 31, 2022A | |
Audit-Related Fees | $- | $- |
Tax Fees | $- | $- |
All Other Fees | $- | $- |
A Amounts may reflect rounding.
Services Billed by PwC
October 31, 2023A | October 31, 2022A | ||
Audit-Related Fees | $8,284,200 | $7,914,600 |
|
Tax Fees | $1,000 | $1,000 |
|
All Other Fees | $- | $- |
|
A Amounts may reflect rounding.
“Audit-Related Fees” represent fees billed for assurance and related services that are reasonably related to the performance of the fund audit or the review of the fund's financial statements and that are not reported under Audit Fees.
“Tax Fees” represent fees billed for tax compliance, tax advice or tax planning that relate directly to the operations and financial reporting of the fund.
“All Other Fees” represent fees billed for services provided to the fund or Fund Service Provider, a significant portion of which are assurance related, that relate directly to the operations and financial reporting of the fund, excluding those services that are reported under Audit Fees, Audit-Related Fees or Tax Fees.
Assurance services must be performed by an independent public accountant.
* * *
The aggregate non-audit fees billed by Deloitte Entities and PwC for services rendered to the Fund(s), FMR (not including any sub-adviser whose role is primarily portfolio management and is subcontracted with or overseen by another investment adviser), and any Fund Service Provider for each of the last two fiscal years of the Fund(s) are as follows:
Billed By | October 31, 2023A | October 31, 2022A |
Deloitte Entities | $301,000 | $510,800 |
PwC | $13,842,600 | $13,075,100 |
A Amounts may reflect rounding.
The trust's Audit Committee has considered non-audit services that were not pre-approved that were provided by Deloitte Entities and PwC to Fund Service Providers to be compatible with maintaining the independence of Deloitte Entities and PwC in its(their) audit of the Fund(s), taking into account representations from Deloitte Entities and PwC, in accordance with Public Company Accounting Oversight Board rules, regarding its independence from the Fund(s) and its(their) related entities and FMR’s review of the appropriateness and permissibility under applicable law of such non-audit services prior to their provision to the Fund(s) Service Providers.
Audit Committee Pre-Approval Policies and Procedures
The trust’s Audit Committee must pre-approve all audit and non-audit services provided by a fund’s independent registered public accounting firm relating to the operations or financial reporting of the fund. Prior to the commencement of any audit or non-audit services to a fund, the Audit Committee reviews the services to determine whether they are appropriate and permissible under applicable law.
The Audit Committee has adopted policies and procedures to, among other purposes, provide a framework for the Committee’s consideration of non-audit services by the audit firms that audit the Fidelity funds. The policies and procedures require that any non-audit service provided by a fund audit firm to a Fidelity fund and any non-audit service provided by a fund auditor to a Fund Service Provider that relates directly to the operations and financial reporting of a Fidelity fund (“Covered Service”) are subject to approval by the Audit Committee before such service is provided.
All Covered Services must be approved in advance of provision of the service either: (i) by formal resolution of the Audit Committee, or (ii) by oral or written approval of the service by the Chair of the Audit Committee (or if the Chair is unavailable, such other member of the Audit Committee as may be designated by the Chair to act in the Chair’s absence). The approval contemplated by (ii) above is permitted where the Treasurer determines that action on such an engagement is necessary before the next meeting of the Audit Committee.
Non-audit services provided by a fund audit firm to a Fund Service Provider that do not relate directly to the operations and financial reporting of a Fidelity fund are reported to the Audit Committee periodically.
Non-Audit Services Approved Pursuant to Rule 2-01(c)(7)(i)(C) and (ii) of Regulation S-X (“De Minimis Exception”)
There were no non-audit services approved or required to be approved by the Audit Committee pursuant to the De Minimis Exception during the Fund’s(s’) last two fiscal years relating to services provided to (i) the Fund(s) or (ii) any Fund Service Provider that relate directly to the operations and financial reporting of the Fund(s).
The Registrant has not retained, for the preparation of the audit report on the financial statements included in the Form N-CSR, a registered public accounting firm that has a branch or office that is located in a foreign jurisdiction and that the Public Company Accounting Oversight Board (the “PCAOB”) has determined that the PCAOB is unable to inspect or investigate completely because of a position taken by an authority in the foreign jurisdiction.
The Registrant is not a “foreign issuer,” as defined in 17 CFR 240.3b-4.
Item 5.
Audit Committee of Listed Registrants
Not applicable.
Item 6.
Investments
(a)
Not applicable.
(b)
Not applicable.
Item 7.
Disclosure of Proxy Voting Policies and Procedures for Closed-End Management Investment Companies
Not applicable.
Item 8.
Portfolio Managers of Closed-End Management Investment Companies
Not applicable.
Item 9.
Purchase of Equity Securities by Closed-End Management Investment Company and Affiliated Purchasers
Not applicable.
Item 10.
Submission of Matters to a Vote of Security Holders
There were no material changes to the procedures by which shareholders may recommend nominees to the trust’s Board of Trustees.
Item 11.
Controls and Procedures
(a)(i) The President and Treasurer and the Chief Financial Officer have concluded that the trust’s disclosure controls and procedures (as defined in Rule 30a-3(c) under the Investment Company Act) provide reasonable assurances that material information relating to the trust is made known to them by the appropriate persons, based on their evaluation of these controls and procedures as of a date within 90 days of the filing date of this report.
(a)(ii) There was no change in the trust’s internal control over financial reporting (as defined in Rule 30a-3(d) under the Investment Company Act) that occurred during the period covered by this report that has materially affected, or is reasonably likely to materially affect, the trust’s internal control over financial reporting.
Item 12.
Disclosure of Securities Lending Activities for Closed-End Management
Investment Companies
Not applicable.
Item 18.
Recovery of Erroneously Awarded Compensation
(a)
Not applicable.
(b)
Not applicable.
Item 19.
Exhibits
(a) | (1) | Code of Ethics pursuant to Item 2 of Form N-CSR is filed and attached hereto as EX-99.CODE ETH. |
(a) | (2) | |
(a) | (3) | Not applicable. |
(b) |
SIGNATURES
Pursuant to the requirements of the Securities Exchange Act of 1934 and the Investment Company Act of 1940, the registrant has duly caused this report to be signed on its behalf by the undersigned, thereunto duly authorized.
Fidelity Salem Street Trust
By: | /s/Laura M. Del Prato |
Laura M. Del Prato | |
President and Treasurer | |
Date: | December 21, 2023 |
Pursuant to the requirements of the Securities Exchange Act of 1934 and the Investment Company Act of 1940, this report has been signed below by the following persons on behalf of the registrant and in the capacities and on the dates indicated.
By: | /s/Laura M. Del Prato |
Laura M. Del Prato | |
President and Treasurer | |
Date: | December 21, 2023 |
By: | /s/John J. Burke III |
John J. Burke III | |
Chief Financial Officer | |
Date: | December 21, 2023 |