UNITED STATES
SECURITIES AND EXCHANGE COMMISSION
Washington, D.C. 20549
FORM N-CSR
CERTIFIED SHAREHOLDER REPORT OF REGISTERED
MANAGEMENT INVESTMENT COMPANIES
Investment Company Act file number 811-02105
Fidelity Salem Street Trust
(Exact name of registrant as specified in charter)
245 Summer St., Boston, Massachusetts 02210
(Address of principal executive offices) (Zip code)
Margaret Carey, Secretary
245 Summer St.
Boston, Massachusetts 02210
(Name and address of agent for service)
Registrant's telephone number, including area code:
617-563-7000
Date of fiscal year end: | January 31 |
Date of reporting period: | January 31, 2024 |
Item 1.
Reports to Stockholders


Contents
| Average Annual Total Returns | |||
Periods ended January 31, 2024 | Past 1 year | Past 5 years | Life of Fund A |
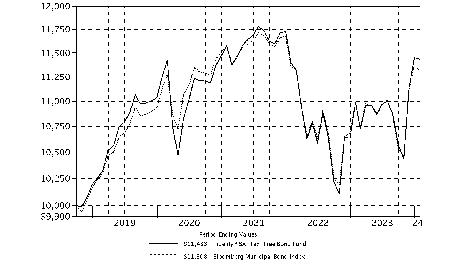
| Fidelity® SAI Tax-Free Bond Fund | 4.05% | 2.19% | 2.54% |
| $10,000 Over Life of Fund |
Let's say hypothetically that $10,000 was invested in Fidelity® SAI Tax-Free Bond Fund, on October 2, 2018, when the fund started. The chart shows how the value of your investment would have changed, and also shows how the Bloomberg Municipal Bond Index performed over the same period. |
 |
| Top Five States (% of Fund's net assets) | |
| Illinois | 14.3 |
| New York | 12.9 |
| Texas | 6.9 |
| Pennsylvania | 5.3 |
| Georgia | 4.9 |
| Revenue Sources (% of Fund's net assets) | ||
| Health Care | 21.6 | |
| General Obligations | 20.6 | |
| Transportation | 10.6 | |
| Special Tax | 10.4 | |
| Education | 10.3 | |
| Housing | 9.7 | |
| State G.O. | 6.1 | |
| Others* (Individually Less Than 5%) | 10.7 | |
| 100.0 | ||
| *Includes net other assets | ||
Quality Diversification (% of Fund's net assets) |
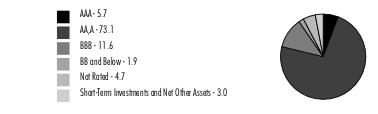 |
| We have used ratings from Moody's Investors Service, Inc. Where Moody's® ratings are not available, we have used S&P® ratings. All ratings are as of the date indicated and do not reflect subsequent changes. |
| Municipal Bonds - 97.1% | |||
Principal Amount (a) | Value ($) | ||
| Alabama - 1.8% | |||
| Black Belt Energy Gas District Bonds Series 2022 E, 5%, tender 6/1/28 (b) | 14,780,000 | 15,446,715 | |
| Homewood Edl. Bldg. Auth. Rev. Series 2019 A: | |||
| 4% 12/1/36 | 960,000 | 963,657 | |
| 4% 12/1/38 | 1,595,000 | 1,581,732 | |
| 4% 12/1/41 | 1,260,000 | 1,214,726 | |
| 4% 12/1/44 | 1,125,000 | 1,046,540 | |
| 4% 12/1/49 | 1,355,000 | 1,216,430 | |
| Huntsville Health Care Auth. Bonds Series 2023 A, 5%, tender 6/1/30 (b) | 6,710,000 | 7,407,490 | |
| Infirmary Health Systems Spl. Care Facilities Fing. Auth. Rev.: | |||
| Series 2016 A, 5% 2/1/26 | 3,585,000 | 3,678,818 | |
| Series 2021 A, 3% 2/1/46 | 4,230,000 | 3,198,968 | |
| Lower Alabama Gas District Bonds (No. 2 Proj.) Series 2020, 4%, tender 12/1/25 (b) | 7,960,000 | 7,967,580 | |
| Mobile Indl. Dev. Board Poll. Cont. Rev. Bonds (Alabama Pwr. Co. Barry Plant Proj.) Series 2007 C, 3.78%, tender 6/16/26 (b) | 1,510,000 | 1,517,945 | |
| Montgomery Med. Clinic Facilities Series 2015, 5% 3/1/36 | 1,310,000 | 1,081,214 | |
TOTAL ALABAMA | 46,321,815 | ||
| Alaska - 0.2% | |||
| Alaska Hsg. Fin. Corp. Series 2021 A: | |||
| 4% 6/1/30 | 1,030,000 | 1,090,636 | |
| 5% 6/1/27 | 700,000 | 746,896 | |
| 5% 12/1/27 | 935,000 | 1,007,663 | |
| 5% 6/1/28 | 1,230,000 | 1,338,907 | |
| Alaska Hsg. Fin. Corp. Mtg. Rev. Series 2022 A, 3% 6/1/51 | 590,000 | 568,013 | |
| Alaska Int'l. Arpts. Revs. Series 2016 A, 5% 10/1/26 | 1,325,000 | 1,360,169 | |
TOTAL ALASKA | 6,112,284 | ||
| Arizona - 2.0% | |||
| Arizona Health Facilities Auth. Rev. (Scottsdale Lincoln Hospitals Proj.) Series 2014 A, 5% 12/1/39 | 620,000 | 623,467 | |
| Arizona Indl. Dev. Auth. Rev. Series 2019 2, 3.625% 5/20/33 | 1,676,145 | 1,571,777 | |
| Chandler Indl. Dev. Auth. Indl. Dev. Rev. Bonds (Intel Corp. Proj.) Series 2005, 3.8%, tender 6/15/28 (b) | 8,905,000 | 9,039,444 | |
| Maricopa County Indl. Dev. Auth.: | |||
| (Creighton Univ. Proj.) Series 2020, 5% 7/1/47 | 560,000 | 591,571 | |
| Bonds Series 2019 B, 5%, tender 9/1/24 (b) | 610,000 | 615,037 | |
| Maricopa County Indl. Dev. Auth. Sr. Living Facilities Series 2016: | |||
| 5.75% 1/1/36 (c) | 910,000 | 740,016 | |
| 6% 1/1/48 (c) | 1,250,000 | 896,189 | |
| Maricopa County Rev.: | |||
| Bonds: | |||
Series 2023 A1, 5%, tender 5/15/26 (b) | 4,075,000 | 4,230,780 | |
Series 2023 A2, 5%, tender 5/15/28 (b) | 4,220,000 | 4,534,176 | |
| Series 2017 D, 3% 1/1/48 | 3,090,000 | 2,370,126 | |
| Series 2019 E, 3% 1/1/49 | 1,835,000 | 1,390,471 | |
| Maricopa County Spl. Health Care District Gen. Oblig. Series 2018 C, 5% 7/1/36 | 2,150,000 | 2,307,917 | |
| Phoenix Ariz Indl. Dev. Auth. Rev.: | |||
| (Guam Facilities Foundation, Inc. Projs.) Series 2014, 5.375% 2/1/41 | 2,245,000 | 2,116,528 | |
| (Guam Facilities Foundation, Inc. Proj.) Series 2014, 5.125% 2/1/34 | 1,625,000 | 1,585,364 | |
| Phoenix Civic Impt. Board Arpt. Rev. Series 2019 A, 5% 7/1/44 | 1,590,000 | 1,706,225 | |
| Phoenix Civic Impt. Corp. Series 2019 A: | |||
| 4% 7/1/45 | 5,000,000 | 4,899,872 | |
| 5% 7/1/32 | 810,000 | 889,487 | |
| 5% 7/1/39 | 470,000 | 503,159 | |
| 5% 7/1/45 | 2,400,000 | 2,517,885 | |
| Phoenix IDA Student Hsg. Rev. (Downtown Phoenix Student Hsg. II LLC Arizona State Univ. Proj.) Series 2019 A, 5% 7/1/59 | 1,000,000 | 981,007 | |
| Salt Verde Finl. Corp. Sr. Gas Rev. Series 2007, 5% 12/1/37 | 5,415,000 | 5,886,122 | |
| Tempe Indl. Dev. Auth. Rev. (Friendship Village of Tempe Proj.) Series 2021 A, 4% 12/1/46 | 2,020,000 | 1,541,833 | |
TOTAL ARIZONA | 51,538,453 | ||
| California - 1.8% | |||
| Alameda Corridor Trans. Auth. Rev. Series 2024 A, 0% 10/1/53 (Assured Guaranty Muni. Corp. Insured) (d) | 1,715,000 | 416,964 | |
| Bay Area Toll Auth. San Francisco Bay Toll Bridge Rev. Bonds Series 2021 A, 2%, tender 4/1/28 (b) | 1,635,000 | 1,515,862 | |
| California Edl. Facilities Auth. Rev. Series 2018 A, 5% 10/1/42 | 1,255,000 | 1,322,634 | |
| California Gen. Oblig. Series 2023, 5% 10/1/39 | 490,000 | 575,774 | |
| California Hsg. Fin. Agcy.: | |||
| Series 2021 1, 3.5% 11/20/35 | 4,395,164 | 4,141,237 | |
| Series 2023 A1, 4.375% 9/20/36 | 5,107,598 | 5,081,253 | |
| California Muni. Fin. Auth. Rev. Series 2017 A: | |||
| 5% 7/1/42 | 935,000 | 950,814 | |
| 5.25% 11/1/36 | 480,000 | 485,726 | |
| California Muni. Fin. Auth. Student Hsg. (CHF-Davis I, LLC - West Village Student Hsg. Proj.) Series 2018: | |||
| 5% 5/15/34 | 2,465,000 | 2,624,707 | |
| 5% 5/15/39 | 1,100,000 | 1,148,946 | |
| California Pub. Works Board Lease Rev. (Various Cap. Projs.) Series 2022 C, 5% 8/1/30 | 520,000 | 600,079 | |
| California Statewide Cmntys. Dev. Auth. Rev. Series 2015, 5% 2/1/45 (e) | 750,000 | 361,800 | |
| Golden State Tobacco Securitization Corp. Tobacco Settlement Rev. Series 2021 B2, 0% 6/1/66 | 41,760,000 | 4,832,597 | |
| Long Beach Arpt. Rev.: | |||
| Series 2022 A: | |||
5% 6/1/33 | 470,000 | 561,964 | |
5% 6/1/34 | 375,000 | 447,652 | |
5% 6/1/35 | 280,000 | 332,995 | |
5% 6/1/36 | 750,000 | 886,038 | |
5% 6/1/37 | 655,000 | 767,348 | |
5% 6/1/39 | 470,000 | 541,860 | |
| Series 2022 B: | |||
5% 6/1/33 | 420,000 | 502,180 | |
5% 6/1/34 | 375,000 | 447,652 | |
5% 6/1/35 | 280,000 | 332,995 | |
5% 6/1/36 | 280,000 | 330,788 | |
5% 6/1/37 | 470,000 | 550,616 | |
5% 6/1/38 | 280,000 | 325,189 | |
5% 6/1/39 | 530,000 | 611,034 | |
| Middle Fork Proj. Fin. Auth. Series 2020: | |||
| 5% 4/1/24 | 2,570,000 | 2,573,883 | |
| 5% 4/1/25 | 2,700,000 | 2,735,748 | |
| 5% 4/1/26 | 1,900,000 | 1,952,183 | |
| Mount Diablo Unified School District Series 2022 B, 4% 8/1/31 | 785,000 | 867,702 | |
| Poway Unified School District Series B, 0% 8/1/38 | 4,065,000 | 2,380,007 | |
| San Francisco City & County Arpts. Commission Int'l. Arpt. Rev. Series 2019 B, 5% 5/1/49 | 435,000 | 466,332 | |
| Univ. of California Revs. Series 2023 BM, 5% 5/15/36 | 670,000 | 810,990 | |
| Washington Township Health Care District Rev.: | |||
| Series 2017 A, 5% 7/1/35 | 750,000 | 770,829 | |
| Series 2017 B: | |||
5% 7/1/29 | 455,000 | 470,971 | |
5% 7/1/30 | 910,000 | 942,761 | |
TOTAL CALIFORNIA | 44,668,110 | ||
| Colorado - 2.1% | |||
| Colorado Health Facilities Auth. Rev. Bonds: | |||
| Bonds: | |||
Series 2018 B, 5%, tender 11/20/25 (b) | 935,000 | 962,263 | |
Series 2019 B, 5%, tender 8/1/26 (b) | 705,000 | 726,744 | |
Series 2022 C, 5%, tender 8/15/28 (b) | 2,425,000 | 2,634,504 | |
Series 2023 A1, 5%, tender 11/15/28 (b) | 5,520,000 | 5,968,541 | |
| Series 2018 A, 4% 11/15/48 | 900,000 | 873,990 | |
| Series 2019 A: | |||
4% 11/1/39 | 845,000 | 840,626 | |
5% 11/1/26 | 1,400,000 | 1,470,908 | |
5% 11/15/39 | 1,170,000 | 1,267,912 | |
| Series 2019 A1, 4% 8/1/44 | 13,820,000 | 13,260,023 | |
| Series 2019 A2: | |||
3.25% 8/1/49 | 2,195,000 | 1,637,355 | |
4% 8/1/49 | 3,360,000 | 3,165,537 | |
| Series 2019 B, 4% 1/1/40 | 1,560,000 | 1,575,880 | |
| Series 2020 A, 4% 9/1/50 | 805,000 | 765,340 | |
| Colorado Hsg. & Fin. Auth.: | |||
| Series 2019 F, 4.25% 11/1/49 | 225,000 | 225,709 | |
| Series 2019 H, 4.25% 11/1/49 | 135,000 | 135,531 | |
| Series 2021 E, 3% 11/1/51 | 1,085,000 | 1,050,396 | |
| Series 2022 F, 5.25% 11/1/52 | 1,735,000 | 1,794,549 | |
| Colorado State Bldg. Excellent Schools Today Ctfs. of Prtn. Series 2018 N, 5% 3/15/37 | 1,870,000 | 2,008,240 | |
| Denver City & County Gen. Oblig. Series 2020 A, 2% 8/1/36 | 3,240,000 | 2,631,634 | |
| Univ. of Colorado Enterprise Sys. Rev. Bonds: | |||
| Series 2019 C, 2%, tender 10/15/24 (b) | 6,295,000 | 6,242,843 | |
| Series 2021 C3A, 2%, tender 10/15/25 (b) | 830,000 | 808,197 | |
| Series 2021 C3B, 2%, tender 10/15/26 (b) | 700,000 | 670,896 | |
| Vauxmont Metropolitan District: | |||
| Series 2019, 5% 12/15/26 (Assured Guaranty Muni. Corp. Insured) | 126,000 | 131,829 | |
| Series 2020, 5% 12/1/50 (Assured Guaranty Muni. Corp. Insured) | 1,404,000 | 1,473,205 | |
TOTAL COLORADO | 52,322,652 | ||
| Connecticut - 2.7% | |||
| Bridgeport Gen. Oblig. Series 2019 A, 5% 2/1/25 (Build America Mutual Assurance Insured) | 625,000 | 637,055 | |
| Connecticut Gen. Oblig.: | |||
| Series 2015 B, 5% 6/15/32 | 250,000 | 256,360 | |
| Series 2016 B, 5% 5/15/26 | 510,000 | 535,260 | |
| Series 2017 A, 5% 4/15/33 | 230,000 | 245,076 | |
| Series 2019 A, 5% 4/15/26 | 615,000 | 644,224 | |
| Series 2021 A: | |||
3% 1/15/39 | 785,000 | 694,877 | |
3% 1/15/40 | 950,000 | 829,440 | |
| Connecticut Health & Edl. Facilities Auth. Rev.: | |||
| (Sacred Heart Univ., CT. Proj.) Series 2017 I-1, 5% 7/1/42 | 3,120,000 | 3,201,464 | |
| Bonds: | |||
Series 2017 B2, 3.2%, tender 7/1/26 (b) | 3,140,000 | 3,159,583 | |
Series 2017 C2, 2.8%, tender 2/3/26 (b) | 8,750,000 | 8,708,069 | |
Series 2020 B, 5%, tender 1/1/27 (b) | 1,665,000 | 1,737,893 | |
| Series 2019 A: | |||
4% 7/1/49 | 1,635,000 | 1,335,110 | |
5% 7/1/26 | 5,455,000 | 5,497,925 | |
5% 7/1/27 (c) | 555,000 | 547,463 | |
5% 7/1/34 (c) | 685,000 | 670,227 | |
| Series 2019 Q-1: | |||
5% 11/1/24 | 430,000 | 436,201 | |
5% 11/1/26 | 470,000 | 497,115 | |
| Series 2020 K: | |||
4% 7/1/45 | 2,680,000 | 2,660,199 | |
5% 7/1/40 | 985,000 | 1,052,363 | |
| Series 2021 G: | |||
4% 3/1/46 | 865,000 | 869,669 | |
4% 3/1/51 | 1,390,000 | 1,381,573 | |
| Series 2021 S, 4% 6/1/51 | 855,000 | 817,697 | |
| Series 2022 M: | |||
4% 7/1/39 | 1,040,000 | 1,052,941 | |
4% 7/1/40 | 1,075,000 | 1,081,978 | |
4% 7/1/52 | 5,490,000 | 5,165,897 | |
5% 7/1/32 | 1,485,000 | 1,651,993 | |
| Series 2023 E, 5.25% 7/15/48 | 3,700,000 | 4,037,171 | |
| Series A, 5% 7/1/26 | 935,000 | 940,781 | |
| Series K1: | |||
5% 7/1/32 | 985,000 | 1,016,877 | |
5% 7/1/33 | 765,000 | 788,590 | |
5% 7/1/35 | 1,030,000 | 1,057,065 | |
| Series K3, 5% 7/1/43 | 330,000 | 328,219 | |
| Series R: | |||
4% 7/1/36 | 935,000 | 951,531 | |
5% 6/1/32 | 515,000 | 578,122 | |
5% 6/1/33 | 350,000 | 391,683 | |
5% 6/1/34 | 540,000 | 604,650 | |
5% 6/1/35 | 815,000 | 908,225 | |
| Connecticut Hsg. Fin. Auth. Series 2021 B1, 3% 11/15/49 | 1,175,000 | 1,135,722 | |
| Connecticut Spl. Tax Oblig. Trans. Infrastructure Rev. Series A, 5% 9/1/33 | 4,680,000 | 4,713,453 | |
| Stratford Gen. Oblig. Series 2019, 5% 1/1/28 | 3,640,000 | 3,883,038 | |
| Univ. of Connecticut Gen. Oblig. Series 2019 A, 5% 11/1/25 | 465,000 | 481,780 | |
TOTAL CONNECTICUT | 67,184,559 | ||
| District Of Columbia - 1.4% | |||
| District of Columbia Gen. Oblig. Series 2017 D, 5% 6/1/42 | 470,000 | 493,306 | |
| District of Columbia Rev. Series 2018: | |||
| 5% 10/1/25 | 465,000 | 476,609 | |
| 5% 10/1/26 | 775,000 | 807,620 | |
| 5% 10/1/27 | 845,000 | 895,839 | |
| 5% 10/1/43 | 2,880,000 | 2,971,404 | |
| District of Columbia Wtr. & Swr. Auth. Pub. Util. Rev. Bonds Series 2019 C, 1.75%, tender 10/1/24 (b) | 3,020,000 | 2,969,872 | |
| Metropolitan Washington Arpts. Auth. Dulles Toll Road Rev.: | |||
| (Dulles Metrorail and Cap. Impt. Projs.): | |||
Series 2019 A: | |||
5% 10/1/38 | 1,405,000 | 1,495,051 | |
5% 10/1/44 | 7,485,000 | 7,873,670 | |
Series 2019 B, 3% 10/1/50 (Assured Guaranty Muni. Corp. Insured) | 6,425,000 | 4,930,483 | |
| (Dulles Metrorail And Cap. Impt. Projs.) Series 2019 B, 4% 10/1/49 | 4,490,000 | 4,179,239 | |
| (Dulles Metrorail and Cap. Impt. Projs.) Series 2019 B, 5% 10/1/47 | 7,020,000 | 7,258,100 | |
| Series 2009 B, 0% 10/1/32 (Assured Guaranty Corp. Insured) | 1,665,000 | 1,238,073 | |
TOTAL DISTRICT OF COLUMBIA | 35,589,266 | ||
| Florida - 3.7% | |||
| Atlantic Beach Health Care Facilities Series A, 5% 11/15/43 | 790,000 | 786,012 | |
| Cap. Projs. Fin. Auth. Student Hsg. Rev. (Cap. Projs. Ln. Prog. - Florida Univs.) Series 2020 A, 5% 10/1/30 | 750,000 | 786,497 | |
| Central Florida Expressway Auth. Sr. Lien Rev. Series 2021: | |||
| 4% 7/1/38 (Assured Guaranty Muni. Corp. Insured) | 1,065,000 | 1,105,662 | |
| 4% 7/1/39 (Assured Guaranty Muni. Corp. Insured) | 930,000 | 958,147 | |
| 5% 7/1/32 (Assured Guaranty Muni. Corp. Insured) | 2,810,000 | 3,268,867 | |
| 5% 7/1/33 (Assured Guaranty Muni. Corp. Insured) | 2,490,000 | 2,893,413 | |
| Escambia County Health Facilities Auth. Health Facilities Rev. Series 2020 A: | |||
| 3% 8/15/50 (Assured Guaranty Muni. Corp. Insured) | 1,805,000 | 1,387,312 | |
| 4% 8/15/45 | 3,670,000 | 3,341,332 | |
| Florida Higher Edl. Facilities Fing. Auth.: | |||
| (Rollins College Proj.) Series 2020 A, 3% 12/1/48 | 8,285,000 | 6,473,591 | |
| (St. Leo Univ. Proj.) Series 2019: | |||
5% 3/1/24 | 235,000 | 234,642 | |
5% 3/1/25 | 625,000 | 614,318 | |
| Florida Hsg. Fin. Corp. Multi-family Mtg. Rev. Bonds: | |||
| Series 2023 B, 5%, tender 2/1/26 (b) | 1,685,000 | 1,731,060 | |
| Series 2023 C, 5%, tender 12/1/25 (b) | 1,220,000 | 1,248,848 | |
| Florida Hsg. Fin. Corp. Rev. Series 2019 1, 4% 7/1/50 | 5,050,000 | 5,035,139 | |
| Florida Mid-Bay Bridge Auth. Rev. Series 2015 A: | |||
| 5% 10/1/29 | 2,315,000 | 2,361,616 | |
| 5% 10/1/35 | 935,000 | 950,326 | |
| Hillsborough County Aviation Auth. Rev. Series 2018 F: | |||
| 5% 10/1/37 | 1,415,000 | 1,538,786 | |
| 5% 10/1/43 | 1,870,000 | 1,993,502 | |
| Hillsborough County School Board Ctfs. of Prtn. (School Board of Hillsbrough County, Florida Master Lease Prog.) Series 2017 B, 5% 7/1/28 | 2,460,000 | 2,625,471 | |
| Jacksonville Spl. Rev. Series 2022 A: | |||
| 5% 10/1/24 | 465,000 | 471,234 | |
| 5% 10/1/25 | 360,000 | 373,070 | |
| 5% 10/1/26 | 255,000 | 269,202 | |
| 5% 10/1/27 | 205,000 | 221,456 | |
| 5% 10/1/28 | 405,000 | 447,543 | |
| 5% 10/1/29 | 350,000 | 395,195 | |
| 5% 10/1/30 | 330,000 | 380,003 | |
| 5% 10/1/32 | 305,000 | 362,515 | |
| Lee County School Board Ctfs. Series 2019 A, 5% 8/1/28 | 1,890,000 | 2,074,341 | |
| Lee Memorial Health Sys. Hosp. Rev. Series 2019 A1: | |||
| 5% 4/1/26 | 935,000 | 972,149 | |
| 5% 4/1/44 | 3,030,000 | 3,159,161 | |
| Manatee County School District Series 2017, 5% 10/1/28 (Assured Guaranty Muni. Corp. Insured) | 2,340,000 | 2,478,219 | |
| Miami Beach Health Facilities Auth. Hosp. Rev. Series 2021 B, 3% 11/15/51 | 2,475,000 | 1,892,467 | |
| Miami-Dade County Aviation Rev. Series 2020 A, 4% 10/1/37 | 1,870,000 | 1,899,887 | |
| Miami-Dade County School Board Ctfs. of Prtn. Series 2015 B, 5% 5/1/28 | 1,605,000 | 1,637,458 | |
| Miami-Dade County Wtr. & Swr. Rev. Series 2019 B, 4% 10/1/49 | 3,745,000 | 3,673,809 | |
| Orange County Health Facilities Auth. Series 2022, 4% 10/1/52 | 1,365,000 | 1,324,109 | |
| Orange County School Board Ctfs. of Prtn. Series 2015 D, 5% 8/1/30 (Pre-Refunded to 8/1/25 @ 100) | 820,000 | 845,287 | |
| Palm Beach County Health Facilities Auth. Hosp. Rev. (Jupiter Med. Ctr. Proj.) Series 2022, 5% 11/1/52 | 2,850,000 | 2,919,804 | |
| Palm Beach County Health Facilities Auth. Rev. Series 2019 B, 5% 5/15/53 | 1,425,000 | 1,064,956 | |
| Pasco County Tax Alloc Series 2023 A: | |||
| 5.25% 9/1/36 (Assured Guaranty Muni. Corp. Insured) | 500,000 | 580,221 | |
| 5.5% 9/1/40 (Assured Guaranty Muni. Corp. Insured) | 1,000,000 | 1,143,424 | |
| 5.5% 9/1/41 (Assured Guaranty Muni. Corp. Insured) | 500,000 | 568,541 | |
| Pasco County School Board Ctfs. of Prtn. Series 2018 A, 5% 8/1/35 (Build America Mutual Assurance Insured) | 1,870,000 | 2,041,439 | |
| Pinellas County Hsg. Fin. Auth. Bonds Series 2021 B, 0.65%, tender 7/1/24 (b) | 1,165,000 | 1,145,202 | |
| South Miami Health Facilities Auth. Hosp. Rev.: | |||
| (Baptist Med. Ctr., FL. Proj.) Series 2017, 5% 8/15/28 | 1,450,000 | 1,550,026 | |
| Series 2017, 4% 8/15/47 | 8,925,000 | 8,447,107 | |
| St. Johns County School Board (School Board of St. Johns County, Florida Master Lease Prog.) Series 2019 A, 5% 7/1/24 | 750,000 | 755,216 | |
| Tallahassee Health Facilities Rev.: | |||
| (Tallahassee Memorial Healthcare, Inc. Proj.) Series 2016 A, 5% 12/1/55 | 955,000 | 955,986 | |
| Series 2015 A, 5% 12/1/40 | 1,570,000 | 1,579,813 | |
| Tampa Hosp. Rev. (H. Lee Moffitt Cancer Ctr. Proj.): | |||
| Series 2016 B, 5% 7/1/37 | 900,000 | 924,745 | |
| Series 2020 B: | |||
4% 7/1/45 | 2,810,000 | 2,757,644 | |
5% 7/1/40 | 655,000 | 699,795 | |
| Tampa Tax Allocation (H. Lee Moffitt Cancer Ctr. Proj.) Series 2020 A: | |||
| 0% 9/1/38 | 935,000 | 508,316 | |
| 0% 9/1/39 | 795,000 | 408,558 | |
| 0% 9/1/40 | 935,000 | 455,411 | |
| 0% 9/1/41 | 935,000 | 431,791 | |
| 0% 9/1/42 | 935,000 | 408,308 | |
| 0% 9/1/45 | 1,730,000 | 642,437 | |
| Volusia County Edl. Facilities Auth. Rev. (Embry-Riddle Aeronautical Univ., Inc. Proj.) Series 2020 A: | |||
| 5% 10/15/44 | 230,000 | 243,337 | |
| 5% 10/15/49 | 425,000 | 445,464 | |
TOTAL FLORIDA | 92,889,187 | ||
| Georgia - 4.9% | |||
| Burke County Indl. Dev. Auth. Poll. Cont. Rev.: | |||
| (Georgia Transmission Corp. Proj.) Series 2012, 2.75% 1/1/52 (b) | 2,230,000 | 1,563,429 | |
| Bonds (Georgia Pwr. Co. Plant Vogtle Proj.): | |||
Series 1994 9, 3.8%, tender 5/21/26 (b) | 3,200,000 | 3,202,268 | |
Series 1994, 2.15%, tender 6/13/24 (b) | 5,950,000 | 5,903,679 | |
Series 2013 1st, 2.925%, tender 3/12/24 (b) | 2,170,000 | 2,166,815 | |
| Coweta County Dev. Auth. Rev. (Piedmont Healthcare, Inc. Proj.) Series 2019 A, 5% 7/1/44 | 4,680,000 | 4,865,111 | |
| Fayette County Hosp. Auth. Rev. Bonds (Piedmont Healthcare, Inc. Proj.) Series 2019 A, 5%, tender 7/1/24 (b) | 750,000 | 750,852 | |
| Fulton County Dev. Auth. Rev. Series 2019, 4% 6/15/49 | 180,000 | 174,426 | |
| Gainesville & Hall County Hosp. Auth. Rev. Series 2020 A, 3% 2/15/47 | 6,980,000 | 5,574,407 | |
| Georgia Muni. Elec. Auth. Pwr. Rev. Series 2019 A: | |||
| 4% 1/1/49 | 1,735,000 | 1,649,474 | |
| 5% 1/1/26 | 1,145,000 | 1,187,152 | |
| 5% 1/1/30 | 385,000 | 418,210 | |
| 5% 1/1/39 | 1,135,000 | 1,196,081 | |
| 5% 1/1/44 | 1,490,000 | 1,548,057 | |
| Hosp. Auth. of Savannah Auth. Rev. Series 2019 A: | |||
| 4% 7/1/36 | 1,385,000 | 1,400,037 | |
| 4% 7/1/43 | 1,445,000 | 1,416,066 | |
| Main Street Natural Gas, Inc. Bonds: | |||
| Series 2019 B, 4%, tender 12/2/24 (b) | 2,470,000 | 2,473,998 | |
| Series 2021 A, 4%, tender 9/1/27 (b) | 37,435,000 | 37,601,616 | |
| Series 2022 B, 5%, tender 6/1/29 (b) | 5,210,000 | 5,470,709 | |
| Series 2022 E, 4%, tender 12/1/29 (b) | 12,405,000 | 12,414,100 | |
| Series 2023 A, 5%, tender 6/1/30 (b) | 14,040,000 | 14,837,657 | |
| Series 2023 D, 5%, tender 12/1/30 (b) | 7,880,000 | 8,341,960 | |
| Monroe County Dev. Auth. Poll. Cont. Rev. (Georgia Pwr. Co. Plant Scherer Proj.) Series 1995, 2.25% 7/1/25 | 1,040,000 | 1,007,086 | |
| Paulding County Hosp. Auth. Rev. Series 2022 A: | |||
| 5% 4/1/26 | 200,000 | 207,606 | |
| 5% 4/1/27 | 165,000 | 174,242 | |
| 5% 4/1/28 | 375,000 | 404,551 | |
| 5% 4/1/29 | 325,000 | 356,444 | |
| 5% 4/1/30 | 235,000 | 261,529 | |
| 5% 4/1/31 | 280,000 | 315,078 | |
| 5% 4/1/32 | 185,000 | 210,062 | |
| Private Colleges & Univs. Auth. Rev.: | |||
| (The Savannah College of Art & Design Projs.) Series 2021: | |||
4% 4/1/38 | 815,000 | 831,751 | |
5% 4/1/27 | 375,000 | 398,214 | |
5% 4/1/31 | 560,000 | 633,621 | |
5% 4/1/36 | 450,000 | 502,385 | |
| Series 2020 B: | |||
4% 9/1/38 | 2,810,000 | 2,952,364 | |
4% 9/1/39 | 1,370,000 | 1,430,137 | |
| Series A, 5% 6/1/24 | 650,000 | 653,131 | |
TOTAL GEORGIA | 124,494,305 | ||
| Hawaii - 0.1% | |||
| Hawaii Gen. Oblig.: | |||
| Series 2020 C, 4% 7/1/40 | 870,000 | 885,628 | |
| Series FG, 5% 10/1/27 | 935,000 | 985,319 | |
| Honolulu City & County Gen. Oblig. Series 2019 A, 5% 9/1/24 | 715,000 | 723,130 | |
TOTAL HAWAII | 2,594,077 | ||
| Idaho - 0.3% | |||
| Idaho Hsg. & Fin. Assoc. Single Family Mtg.: | |||
| Series 2019 A, 4% 1/1/50 | 60,000 | 59,844 | |
| Series 2021 A: | |||
5% 7/15/29 | 2,810,000 | 3,143,367 | |
5% 7/15/30 | 935,000 | 1,060,163 | |
5% 7/15/31 | 600,000 | 688,983 | |
5% 7/15/32 | 1,170,000 | 1,341,850 | |
TOTAL IDAHO | 6,294,207 | ||
| Illinois - 14.3% | |||
| Champaign County Cmnty. Unit: | |||
| Series 2019: | |||
4% 6/1/26 | 95,000 | 97,159 | |
4% 6/1/27 | 775,000 | 801,481 | |
4% 6/1/28 | 585,000 | 610,192 | |
4% 6/1/29 | 1,450,000 | 1,526,335 | |
4% 6/1/30 | 935,000 | 982,952 | |
4% 6/1/31 | 1,170,000 | 1,228,087 | |
4% 6/1/34 | 935,000 | 973,783 | |
4% 6/1/35 | 1,205,000 | 1,246,369 | |
4% 6/1/36 | 1,475,000 | 1,513,611 | |
| Series 2020 A: | |||
5% 1/1/29 | 630,000 | 685,980 | |
5% 1/1/30 | 585,000 | 637,113 | |
5% 1/1/31 | 795,000 | 863,481 | |
5% 1/1/33 | 1,545,000 | 1,665,499 | |
| Chicago Board of Ed.: | |||
| Series 2012 A, 5% 12/1/42 | 50,000 | 49,936 | |
| Series 2015 C: | |||
5.25% 12/1/35 | 1,870,000 | 1,871,597 | |
5.25% 12/1/39 | 40,000 | 39,772 | |
| Series 2016 A, 7% 12/1/44 | 2,995,000 | 3,127,053 | |
| Series 2017 C, 5% 12/1/25 | 290,000 | 294,859 | |
| Series 2017 D, 5% 12/1/31 | 865,000 | 883,768 | |
| Series 2017 H, 5% 12/1/36 | 650,000 | 657,447 | |
| Series 2018 A, 5% 12/1/27 | 185,000 | 192,233 | |
| Series 2018 C: | |||
5% 12/1/24 | 100,000 | 100,700 | |
5% 12/1/25 | 505,000 | 513,462 | |
5% 12/1/27 | 505,000 | 524,744 | |
5% 12/1/46 | 4,695,000 | 4,702,658 | |
| Series 2019 A: | |||
5% 12/1/28 | 240,000 | 251,176 | |
5% 12/1/29 | 750,000 | 790,845 | |
5% 12/1/30 | 575,000 | 602,269 | |
5% 12/1/31 | 600,000 | 626,950 | |
| Series 2021 A, 5% 12/1/38 | 1,200,000 | 1,236,036 | |
| Series 2021 B, 5% 12/1/31 | 1,250,000 | 1,323,670 | |
| Series 2022 A, 5% 12/1/47 | 2,085,000 | 2,091,570 | |
| Series 2022 B: | |||
4% 12/1/35 | 1,760,000 | 1,744,436 | |
4% 12/1/36 | 2,915,000 | 2,860,076 | |
| Chicago Gen. Oblig.: | |||
| Series 2003 B, 5.5% 1/1/30 | 1,685,000 | 1,706,725 | |
| Series 2019 A: | |||
5% 1/1/28 | 1,070,000 | 1,127,614 | |
5% 1/1/28 (Escrowed to Maturity) | 180,000 | 195,708 | |
5% 1/1/40 | 2,200,000 | 2,276,132 | |
| Series 2020 A: | |||
5% 1/1/26 | 1,955,000 | 2,005,852 | |
5% 1/1/27 | 1,425,000 | 1,486,334 | |
5% 1/1/30 | 1,860,000 | 2,011,314 | |
5% 1/1/32 | 1,215,000 | 1,308,342 | |
| Series 2021 A: | |||
5% 1/1/31 | 1,400,000 | 1,530,885 | |
5% 1/1/32 | 4,485,000 | 4,898,102 | |
5% 1/1/34 | 795,000 | 867,186 | |
| Series 2021 B: | |||
4% 1/1/32 | 1,193,000 | 1,220,903 | |
4% 1/1/38 | 2,890,000 | 2,880,350 | |
| Chicago Midway Arpt. Rev. Series 2013 B, 5% 1/1/25 | 580,000 | 580,092 | |
| Chicago O'Hare Int'l. Arpt. Rev.: | |||
| Series 2015 B, 5% 1/1/32 | 935,000 | 948,012 | |
| Series 2018 B: | |||
4% 1/1/44 | 5,100,000 | 5,089,254 | |
5% 1/1/36 | 2,105,000 | 2,316,247 | |
5% 1/1/37 | 3,040,000 | 3,327,586 | |
5% 1/1/48 | 9,830,000 | 10,388,995 | |
5% 1/1/53 | 360,000 | 378,238 | |
| Series 2020 A: | |||
4% 1/1/37 | 3,105,000 | 3,222,713 | |
4% 1/1/38 | 655,000 | 660,647 | |
| Series 2022 D: | |||
5% 1/1/36 | 2,000,000 | 2,315,068 | |
5% 1/1/37 | 2,400,000 | 2,756,087 | |
| Cook County Cmnty. Consolidated School District No. 59 Series 2020: | |||
| 4% 3/1/24 | 840,000 | 840,558 | |
| 5% 3/1/25 | 795,000 | 812,131 | |
| 5% 3/1/28 | 1,265,000 | 1,379,346 | |
| Cook County Gen. Oblig.: | |||
| Series 2021 A: | |||
5% 11/15/31 | 3,415,000 | 3,865,114 | |
5% 11/15/32 | 2,245,000 | 2,522,675 | |
5% 11/15/33 | 2,200,000 | 2,458,897 | |
| Series 2021 B: | |||
4% 11/15/25 | 580,000 | 588,702 | |
4% 11/15/26 | 295,000 | 304,048 | |
4% 11/15/27 | 300,000 | 313,212 | |
4% 11/15/28 | 150,000 | 155,645 | |
| Series 2022 A, 5% 11/15/29 | 940,000 | 1,054,498 | |
| Cook County Sales Tax Rev. Series 2022 A, 5% 11/15/42 | 10,000,000 | 10,944,834 | |
| DuPage & Cook Counties Cmnty. Unit School District #205 Series 2022, 4% 9/15/42 | 7,900,000 | 7,963,551 | |
| Illinois Fin. Auth.: | |||
| (Bradley Univ. Proj.) Series 2021 A, 4% 8/1/38 | 1,125,000 | 1,114,396 | |
| Bonds Series 2021 B, 5%, tender 8/15/31 (b) | 740,000 | 823,667 | |
| Series 2016, 3.25% 5/15/39 | 2,075,000 | 1,846,155 | |
| Series 2020 A: | |||
3% 5/15/50 | 5,655,000 | 4,110,090 | |
3% 5/15/50 (Build America Mutual Assurance Insured) | 2,620,000 | 2,014,475 | |
3.25% 8/15/49 | 1,025,000 | 792,698 | |
| Series 2021 A, 3% 8/15/48 | 7,430,000 | 5,756,578 | |
| Series 2022 A: | |||
5.25% 10/1/52 | 4,525,000 | 4,567,021 | |
5.5% 10/1/47 | 1,445,000 | 1,495,462 | |
| Illinois Fin. Auth. Academic Facilities (Provident Group UIUC Properties LLC Univ. of Illinois at Urbana-Champaign Proj.) Series 2019 A: | |||
| 5% 10/1/27 | 225,000 | 239,498 | |
| 5% 10/1/28 | 185,000 | 200,453 | |
| 5% 10/1/44 | 935,000 | 966,711 | |
| 5% 10/1/49 | 1,170,000 | 1,198,867 | |
| 5% 10/1/51 | 935,000 | 955,820 | |
| Illinois Fin. Auth. Rev.: | |||
| (Bradley Univ. Proj.) Series 2017 C, 5% 8/1/31 | 200,000 | 209,506 | |
| (Northwestern Memorial Hosp.,IL. Proj.) Series 2017 A, 5% 7/15/25 | 280,000 | 287,663 | |
| (OSF Healthcare Sys.) Series 2018 A: | |||
4.125% 5/15/47 | 4,820,000 | 4,684,295 | |
5% 5/15/43 | 45,000 | 46,198 | |
| (Presence Health Proj.) Series 2016 C, 5% 2/15/36 | 935,000 | 970,912 | |
| Series 2015 A: | |||
4% 11/15/39 | 6,175,000 | 5,831,151 | |
5% 11/15/45 | 9,360,000 | 9,480,820 | |
| Series 2016 A: | |||
3% 10/1/37 | 1,455,000 | 1,287,674 | |
5% 2/15/24 | 795,000 | 795,454 | |
| Series 2016 C: | |||
4% 2/15/41 | 1,280,000 | 1,261,794 | |
5% 2/15/31 | 2,340,000 | 2,460,194 | |
| Series 2016: | |||
4% 12/1/35 | 335,000 | 335,089 | |
5% 12/1/40 | 2,010,000 | 2,041,187 | |
5% 12/1/46 | 11,605,000 | 11,703,424 | |
| Series 2019, 4% 9/1/35 | 420,000 | 371,841 | |
| Illinois Gen. Oblig.: | |||
| Series 2006, 5.5% 1/1/28 | 4,680,000 | 5,094,251 | |
| Series 2014, 5% 2/1/26 | 515,000 | 515,666 | |
| Series 2016: | |||
4% 2/1/30 (Assured Guaranty Muni. Corp. Insured) | 2,590,000 | 2,665,615 | |
5% 2/1/26 | 4,930,000 | 5,096,526 | |
5% 2/1/27 | 575,000 | 604,926 | |
| Series 2017 C, 5% 11/1/29 | 2,440,000 | 2,605,142 | |
| Series 2017 D, 5% 11/1/27 | 2,835,000 | 3,022,128 | |
| Series 2018 A: | |||
5% 10/1/24 | 470,000 | 474,781 | |
5% 10/1/28 | 935,000 | 1,011,730 | |
5% 10/1/29 | 1,495,000 | 1,619,182 | |
| Series 2018 B, 5% 10/1/26 | 935,000 | 978,978 | |
| Series 2019 B, 5% 9/1/24 | 470,000 | 474,152 | |
| Series 2020 B: | |||
4% 10/1/32 | 2,570,000 | 2,667,869 | |
5% 10/1/28 | 4,060,000 | 4,393,179 | |
| Series 2020, 5.5% 5/1/39 | 6,530,000 | 7,240,192 | |
| Series 2021 A: | |||
4% 3/1/39 | 2,135,000 | 2,132,544 | |
5% 3/1/28 | 4,000,000 | 4,285,793 | |
5% 3/1/32 | 180,000 | 200,935 | |
5% 3/1/33 | 935,000 | 1,043,711 | |
5% 3/1/34 | 935,000 | 1,040,304 | |
5% 3/1/46 | 1,870,000 | 1,979,280 | |
| Series 2021 B, 4% 12/1/34 | 1,655,000 | 1,698,437 | |
| Series 2022 A: | |||
5% 3/1/29 | 2,060,000 | 2,244,590 | |
5% 3/1/32 | 1,000,000 | 1,133,807 | |
5% 3/1/34 | 3,640,000 | 4,100,769 | |
5.25% 3/1/37 | 1,600,000 | 1,801,890 | |
| Series 2022 B, 5% 3/1/32 | 2,060,000 | 2,335,643 | |
| Series 2023 B: | |||
5% 5/1/37 | 4,730,000 | 5,240,493 | |
5.25% 5/1/40 | 1,160,000 | 1,286,528 | |
5.25% 5/1/41 | 1,520,000 | 1,678,674 | |
| Series 2023 D: | |||
5% 7/1/29 | 6,485,000 | 7,109,865 | |
5% 7/1/36 | 2,945,000 | 3,287,347 | |
| Illinois Hsg. Dev. Auth. Rev. Series 2019 D, 2.7% 10/1/34 | 415,000 | 379,537 | |
| Illinois Reg'l. Trans. Auth. Series 2003 B, 5.75% 6/1/33 | 10,000,000 | 11,808,097 | |
| Illinois Toll Hwy. Auth. Toll Hwy. Rev.: | |||
| Series 2019 A, 5% 1/1/44 | 460,000 | 493,939 | |
| Series 2024 A, 5% 1/1/30 | 765,000 | 864,414 | |
| Series A: | |||
5% 1/1/38 | 945,000 | 1,055,096 | |
5% 1/1/41 | 205,000 | 225,622 | |
| Kane County School District No. 131 Series 2020 A: | |||
| 4% 12/1/30 (Assured Guaranty Muni. Corp. Insured) | 430,000 | 453,306 | |
| 4% 12/1/31 (Assured Guaranty Muni. Corp. Insured) | 575,000 | 604,642 | |
| 4% 12/1/33 (Assured Guaranty Muni. Corp. Insured) | 240,000 | 251,200 | |
| 4% 12/1/35 (Assured Guaranty Muni. Corp. Insured) | 255,000 | 262,929 | |
| 4% 12/1/36 (Assured Guaranty Muni. Corp. Insured) | 235,000 | 240,552 | |
| 4% 12/1/38 (Assured Guaranty Muni. Corp. Insured) | 545,000 | 552,874 | |
| Metropolitan Pier & Exposition: | |||
| (McCormick Place Expansion Proj.) Series 2010 B1: | |||
0% 6/15/43 (Assured Guaranty Muni. Corp. Insured) | 2,995,000 | 1,310,375 | |
0% 6/15/46 (Assured Guaranty Muni. Corp. Insured) | 14,385,000 | 5,330,772 | |
0% 6/15/47 (Assured Guaranty Muni. Corp. Insured) | 2,365,000 | 823,175 | |
| Series 1994, 0% 6/15/29 (FGIC Insured) | 4,775,000 | 3,945,976 | |
| Series 2002 A, 0% 6/15/35 (Nat'l. Pub. Fin. Guarantee Corp. Insured) | 750,000 | 491,321 | |
| Series 2002: | |||
0% 12/15/31 (Nat'l. Pub. Fin. Guarantee Corp. Insured) | 625,000 | 471,766 | |
0% 12/15/36 (Nat'l. Pub. Fin. Guarantee Corp. Insured) | 7,050,000 | 4,270,394 | |
| Series 2010 B1, 0% 6/15/26 (Assured Guaranty Muni. Corp. Insured) | 1,055,000 | 972,736 | |
| Series 2017 A, 5% 6/15/57 | 6,200,000 | 6,311,638 | |
| Series 2020 A: | |||
4% 6/15/50 | 8,380,000 | 7,750,607 | |
5% 6/15/50 | 6,840,000 | 7,059,530 | |
| Series 2020 B, 5% 6/15/42 | 2,520,000 | 2,665,418 | |
| Series 2022 A: | |||
0% 12/15/35 | 730,000 | 461,779 | |
0% 12/15/36 | 970,000 | 581,656 | |
0% 12/15/37 | 1,175,000 | 666,490 | |
0% 6/15/40 | 985,000 | 488,073 | |
0% 6/15/41 | 1,355,000 | 635,891 | |
| Series 2023 A, 5% 12/15/28 | 3,070,000 | 3,265,916 | |
| Northern Illinois Univ. Revs. Series 2020 B: | |||
| 4% 4/1/36 (Build America Mutual Assurance Insured) | 1,215,000 | 1,250,974 | |
| 4% 4/1/38 (Build America Mutual Assurance Insured) | 1,215,000 | 1,230,603 | |
| 4% 4/1/40 (Build America Mutual Assurance Insured) | 815,000 | 816,702 | |
| Sales Tax Securitization Corp.: | |||
| Series 2023 A, 3% 1/1/27 | 1,420,000 | 1,400,771 | |
| Series 2023 C: | |||
5% 1/1/34 | 10,000,000 | 11,434,743 | |
5% 1/1/35 | 4,000,000 | 4,554,354 | |
| Series 2023 D, 5% 1/1/30 | 2,000,000 | 2,217,102 | |
| Univ. of Illinois Rev. Series 2018 A, 5% 4/1/29 | 95,000 | 102,808 | |
TOTAL ILLINOIS | 362,636,694 | ||
| Indiana - 1.0% | |||
| Indiana Fin. Auth. Health Sys. Rev.: | |||
| Bonds: | |||
Series 2019 B, 2.25%, tender 7/1/25 (b) | 545,000 | 535,630 | |
Series 2023 B1, 5%, tender 7/1/28 (b) | 11,235,000 | 12,083,805 | |
| Series 2016 A, 4% 11/1/51 | 4,400,000 | 4,099,300 | |
| Indiana Hsg. & Cmnty. Dev. Auth.: | |||
| (Glasswater Creek of Whitestown Proj.) Series 2020, 5.375% 10/1/40 (c) | 695,000 | 577,681 | |
| Series 2019 B, 3.5% 1/1/49 | 365,000 | 359,875 | |
| Series 2021 C1, 3% 1/1/52 | 480,000 | 462,493 | |
| Series A: | |||
3.75% 1/1/49 | 1,825,000 | 1,808,597 | |
5% 1/1/28 | 305,000 | 326,918 | |
5% 7/1/28 | 305,000 | 329,273 | |
5% 1/1/29 | 305,000 | 330,802 | |
5% 7/1/29 | 255,000 | 278,957 | |
| Purdue Univ. Rev. Series 2023 A, 5% 7/1/36 | 900,000 | 1,068,783 | |
| Saint Joseph County Econ. Dev. Auth. Rev. (St. Mary's College Proj.): | |||
| Series 2019, 5% 4/1/43 | 1,455,000 | 1,519,718 | |
| Series 2020, 5% 4/1/32 | 715,000 | 778,725 | |
TOTAL INDIANA | 24,560,557 | ||
| Iowa - 0.3% | |||
| Iowa Fin. Auth. Rev.: | |||
| Series 2018 B, 5% 2/15/48 | 935,000 | 966,747 | |
| Series 2019 A1, 5% 5/15/55 | 3,635,000 | 2,673,552 | |
| Series A, 5% 5/15/48 | 2,505,000 | 1,942,900 | |
| Tobacco Settlement Auth. Tobacco Settlement Rev.: | |||
| Series 2021 A2, 4% 6/1/49 | 1,125,000 | 1,054,997 | |
| Series 2021 B1, 4% 6/1/49 | 1,180,000 | 1,190,733 | |
TOTAL IOWA | 7,828,929 | ||
| Kentucky - 3.1% | |||
| Ashland Med. Ctr. Rev. Series 2019: | |||
| 3% 2/1/40 (Assured Guaranty Muni. Corp. Insured) | 1,350,000 | 1,108,104 | |
| 4% 2/1/36 | 710,000 | 711,270 | |
| 4% 2/1/37 | 540,000 | 537,338 | |
| 5% 2/1/24 | 1,105,000 | 1,105,000 | |
| 5% 2/1/25 | 885,000 | 894,501 | |
| Boyle County Edl. Facilities Rev. Series 2017, 5% 6/1/37 | 300,000 | 313,494 | |
| Carroll County Poll. Ctlr Rev. Bonds (Kentucky Utils. Co. Proj.) Series 2016 A, 1.55%, tender 9/1/26 (b) | 6,250,000 | 5,804,133 | |
| Kenton County Arpt. Board Arpt. Rev. Series 2019: | |||
| 5% 1/1/38 | 685,000 | 744,039 | |
| 5% 1/1/39 | 645,000 | 697,732 | |
| 5% 1/1/49 | 2,340,000 | 2,473,849 | |
| Kentucky Econ. Dev. Fin. Auth. Series 2019 A2, 5% 8/1/49 | 3,180,000 | 3,261,490 | |
| Kentucky Hsg. Corp. Single Family Mtg. Rev. Series 2023 A, 6% 7/1/54 | 13,350,000 | 14,750,774 | |
| Kentucky State Property & Buildings Commission Rev.: | |||
| (Proj. No. 119) Series 2018: | |||
5% 5/1/28 | 935,000 | 1,014,139 | |
5% 5/1/38 | 3,745,000 | 4,000,048 | |
| Series A: | |||
4% 11/1/34 | 1,170,000 | 1,197,799 | |
4% 11/1/35 | 375,000 | 382,654 | |
4% 11/1/36 | 935,000 | 948,960 | |
4% 11/1/37 | 1,170,000 | 1,182,257 | |
5% 8/1/27 | 375,000 | 385,670 | |
5% 11/1/29 | 1,035,000 | 1,134,294 | |
| Kentucky, Inc. Pub. Energy: | |||
| Bonds: | |||
Series A, 4%, tender 6/1/26 (b) | 10,775,000 | 10,790,442 | |
Series C1, 4%, tender 6/1/25 (b) | 1,870,000 | 1,872,923 | |
| Series A: | |||
4% 12/1/24 | 470,000 | 470,243 | |
4% 6/1/25 | 545,000 | 545,108 | |
| Louisville & Jefferson County: | |||
| Bonds: | |||
Series 2020 C, 5%, tender 10/1/26 (b) | 490,000 | 509,101 | |
Series 2020 D, 5%, tender 10/1/29 (b) | 590,000 | 644,677 | |
Series 2023 B, 5%, tender 10/1/29 (b) | 15,240,000 | 16,611,499 | |
| Series 2016 A, 5% 10/1/31 | 90,000 | 93,553 | |
| Series 2020 A: | |||
3% 10/1/43 | 4,495,000 | 3,523,671 | |
4% 10/1/39 | 1,405,000 | 1,389,286 | |
TOTAL KENTUCKY | 79,098,048 | ||
| Louisiana - 0.5% | |||
| Calcasieu Parish Memorial Hosp. (Lake Charles Memorial Hosp. Proj.) Series 2019, 4% 12/1/24 | 1,145,000 | 1,141,609 | |
| Louisiana Hsg. Corp. Single Fami (Home Ownership Prog.) Series 2023 C, 5.75% 12/1/53 | 975,000 | 1,063,996 | |
| Louisiana Pub. Facilities Auth. Hosp. Rev. (Franciscan Missionaries of Our Lady Health Sys. Proj.) Series 2017 A, 5% 7/1/47 | 1,890,000 | 1,924,796 | |
| Louisiana Pub. Facilities Auth. Rev.: | |||
| (Ochsner Clinic Foundation Proj.) Series 2017, 5% 5/15/27 | 830,000 | 872,828 | |
| Series 2018 E: | |||
5% 7/1/32 | 1,375,000 | 1,495,743 | |
5% 7/1/33 | 1,120,000 | 1,218,482 | |
5% 7/1/34 | 1,295,000 | 1,405,727 | |
| St. John Baptist Parish Rev.: | |||
| (Marathon Oil Corp.) Series 2017, 2.2% 6/1/37 (b) | 1,400,000 | 1,327,401 | |
| Bonds (Marathon Oil Corp.) Series 2017: | |||
2.1%, tender 7/1/24 (b) | 635,000 | 627,994 | |
4.05%, tender 7/1/26 (b) | 2,770,000 | 2,742,321 | |
TOTAL LOUISIANA | 13,820,897 | ||
| Maine - 0.4% | |||
| Brunswick Series 2020, 2.25% 11/1/35 | 685,000 | 590,584 | |
| Maine Health & Higher Edl. Facilities Auth. Rev.: | |||
| Series 2017 B, 5% 7/1/33 | 260,000 | 275,373 | |
| Series 2021 A, 4% 7/1/46 | 2,865,000 | 2,832,189 | |
| Maine Hsg. Auth. Mtg.: | |||
| Series 2022 E, 5% 11/15/52 | 1,070,000 | 1,103,714 | |
| Series C, 3.5% 11/15/46 | 580,000 | 576,649 | |
| Maine Tpk. Auth. Tpk. Rev. Series 2018, 5% 7/1/47 | 470,000 | 494,228 | |
| Univ. Sys. Rev. Series 2022, 5.5% 3/1/62 | 3,800,000 | 4,103,958 | |
TOTAL MAINE | 9,976,695 | ||
| Maryland - 1.4% | |||
| Hsg. Opportunities Commission of Montgomery County Series 2021 C, 0.8% 7/1/25 | 375,000 | 354,531 | |
| Maryland Cmnty. Dev. Admin Dept. Hsg. & Cmnty. Dev.: | |||
| Series 2019 B, 4% 9/1/49 | 300,000 | 299,166 | |
| Series 2019 C: | |||
3.5% 3/1/50 | 2,105,000 | 2,072,183 | |
5% 9/1/27 | 680,000 | 724,422 | |
5% 9/1/28 | 110,000 | 119,111 | |
| Series 2020 A, 2.5% 9/1/40 | 4,000,000 | 3,226,190 | |
| Series 2023 E, 6.25% 3/1/54 | 555,000 | 608,426 | |
| Maryland Econ. Dev. Auth. Rev. (Ports America Chesapeake LLC. Proj.) Series 2017 A, 5% 6/1/24 | 935,000 | 937,342 | |
| Maryland Health & Higher Edl.: | |||
| Series 2021 A: | |||
3% 7/1/51 | 3,325,000 | 2,432,656 | |
4% 6/1/55 | 585,000 | 489,118 | |
5% 6/1/31 | 330,000 | 353,770 | |
| Series 2023: | |||
5% 7/1/25 | 475,000 | 486,079 | |
5% 7/1/28 | 625,000 | 669,935 | |
5% 7/1/39 | 2,000,000 | 2,173,754 | |
| Maryland Health & Higher Edl. Facilities Auth. Rev. Series 2020 B: | |||
| 5% 4/15/24 | 660,000 | 662,171 | |
| 5% 4/15/25 | 860,000 | 878,759 | |
| Maryland Stadium Auth. Series 2022 A: | |||
| 5% 6/1/47 | 5,725,000 | 6,216,729 | |
| 5% 6/1/52 | 1,350,000 | 1,454,199 | |
| Maryland Stadium Auth. Built to Learn Rev.: | |||
| Series 2021, 4% 6/1/46 | 675,000 | 676,362 | |
| Series 2022 A, 4% 6/1/35 | 2,340,000 | 2,472,056 | |
| Maryland Trans. Auth. Trans. Facility Projs. Rev. Series 2021 A, 2.5% 7/1/47 | 1,650,000 | 1,153,967 | |
| Montgomery County Hsg. Opportunities Commission Series 2023 C, 5.75% 1/1/58 | 1,500,000 | 1,678,323 | |
| Prince Georges County Gen. Oblig. Series 2021 A, 2% 7/1/35 | 6,800,000 | 5,643,614 | |
TOTAL MARYLAND | 35,782,863 | ||
| Massachusetts - 1.6% | |||
| Massachusetts Dev. Fin. Agcy. Rev.: | |||
| (Newbridge On The Charles Proj.) Series 2017, 5% 10/1/47 (c) | 1,250,000 | 1,207,849 | |
| Series 2015: | |||
5% 7/1/25 | 360,000 | 368,397 | |
5% 7/1/25 (Escrowed to Maturity) | 925,000 | 950,452 | |
| Series 2016, 5% 10/1/41 | 1,000,000 | 1,006,122 | |
| Series 2017 A, 5% 1/1/36 | 2,260,000 | 2,342,770 | |
| Series 2017, 5% 7/1/47 | 885,000 | 889,405 | |
| Series 2018, 5% 1/1/43 | 1,250,000 | 1,268,408 | |
| Series 2019 A, 5% 7/1/26 | 1,640,000 | 1,668,261 | |
| Series 2019 K: | |||
5% 7/1/25 | 770,000 | 787,960 | |
5% 7/1/26 | 1,015,000 | 1,060,703 | |
5% 7/1/27 | 1,220,000 | 1,301,049 | |
| Series 2019: | |||
5% 7/1/25 | 615,000 | 625,080 | |
5% 7/1/26 | 345,000 | 354,213 | |
5% 7/1/28 | 515,000 | 541,844 | |
5% 7/1/29 | 470,000 | 498,980 | |
5% 9/1/59 | 1,375,000 | 1,454,653 | |
| Series 2020 A, 4% 7/1/45 | 3,425,000 | 3,067,813 | |
| Series 2021 V, 5% 7/1/55 | 4,980,000 | 5,899,688 | |
| Series J2, 5% 7/1/53 | 3,535,000 | 3,614,076 | |
| Series M: | |||
4% 10/1/50 | 3,485,000 | 2,977,768 | |
5% 10/1/45 | 2,625,000 | 2,653,968 | |
| Massachusetts Hsg. Fin. Auth. Series 2021 223, 3% 6/1/47 | 1,960,000 | 1,901,149 | |
| Somerville Gen. Oblig. Series 2020, 2% 10/15/37 | 1,000,000 | 784,237 | |
| Stoneham Gen. Oblig. Series 2022, 2.125% 1/15/38 | 1,000,000 | 793,916 | |
| Waltham Gen. Oblig. Series 2020, 2% 10/15/37 | 2,570,000 | 2,025,514 | |
TOTAL MASSACHUSETTS | 40,044,275 | ||
| Michigan - 2.6% | |||
| Detroit Gen. Oblig. Series 2021 A, 5% 4/1/50 | 800,000 | 811,339 | |
| Flint Hosp. Bldg. Auth. Rev. Series 2020: | |||
| 4% 7/1/41 | 990,000 | 884,971 | |
| 5% 7/1/25 | 435,000 | 437,836 | |
| 5% 7/1/26 | 400,000 | 405,884 | |
| 5% 7/1/27 | 620,000 | 634,814 | |
| 5% 7/1/28 | 865,000 | 893,355 | |
| Grand Rapids Pub. Schools Series 2019, 5% 11/1/26 (Assured Guaranty Muni. Corp. Insured) | 860,000 | 905,649 | |
| Grand Traverse County Hosp. Fin. Auth. Series 2021, 3% 7/1/51 | 1,020,000 | 737,538 | |
| Great Lakes Wtr. Auth. Sew Disp. Sys. Series 2022 A: | |||
| 5% 7/1/37 | 3,175,000 | 3,647,637 | |
| 5% 7/1/38 | 1,325,000 | 1,508,244 | |
| Great Lakes Wtr. Auth. Wtr. Supply Sys. Rev. Series 2022 A: | |||
| 5% 7/1/37 | 750,000 | 861,647 | |
| 5% 7/1/38 | 1,000,000 | 1,138,297 | |
| Lake Orion Cmnty. School District Series 2019, 5% 5/1/24 | 470,000 | 472,087 | |
| Lansing Board of Wtr. & Lt. Util. Rev. Bonds Series 2021 B, 2%, tender 7/1/26 (b) | 6,940,000 | 6,589,009 | |
| Michigan Fin. Auth. Rev.: | |||
| (Henry Ford Health Sys. Proj.) Series 2016, 5% 11/15/25 | 3,950,000 | 4,057,902 | |
| (Trinity Health Proj.) Series 2017, 5% 12/1/37 | 935,000 | 981,611 | |
| Bonds: | |||
Series 2019 B, 5%, tender 11/16/26 (b) | 1,235,000 | 1,284,904 | |
Series 2019 MI2, 5%, tender 2/1/25 (b) | 695,000 | 705,868 | |
| Series 2015, 5% 11/15/28 (Pre-Refunded to 5/15/25 @ 100) | 290,000 | 296,600 | |
| Series 2016, 5% 11/15/26 | 795,000 | 831,608 | |
| Series 2019 A: | |||
3% 12/1/49 | 2,045,000 | 1,577,010 | |
4% 12/1/49 | 745,000 | 718,563 | |
5% 11/15/48 | 270,000 | 279,963 | |
| Series 2020 A, 4% 6/1/49 | 810,000 | 744,516 | |
| Series 2020, 5% 6/1/40 | 470,000 | 495,038 | |
| Michigan Hsg. Dev. Auth. Single Family Mtg. Rev.: | |||
| Series 2016 B, 3.5% 6/1/47 | 1,160,000 | 1,148,931 | |
| Series 2023 B, 5.75% 6/1/54 | 8,000,000 | 8,590,317 | |
| Series A, 3.5% 12/1/50 | 2,355,000 | 2,314,819 | |
| Michigan State Hsg. Dev. Auth. Series 2021 A: | |||
| 2.45% 10/1/46 | 2,240,000 | 1,564,329 | |
| 2.7% 10/1/56 | 1,000,000 | 677,048 | |
| Oakland Univ. Rev.: | |||
| Series 2016, 5% 3/1/41 | 760,000 | 776,492 | |
| Series 2019 A, 5% 3/1/31 | 545,000 | 600,265 | |
| Series 2019: | |||
5% 3/1/32 | 610,000 | 669,788 | |
5% 3/1/33 | 585,000 | 639,347 | |
5% 3/1/34 | 655,000 | 715,012 | |
5% 3/1/35 | 655,000 | 714,230 | |
5% 3/1/36 | 750,000 | 814,385 | |
5% 3/1/37 | 840,000 | 904,212 | |
5% 3/1/38 | 1,240,000 | 1,322,128 | |
5% 3/1/39 | 840,000 | 891,482 | |
| Wayne County Arpt. Auth. Rev.: | |||
| Series 2023 A: | |||
5.25% 12/1/40 (Assured Guaranty Muni. Corp. Insured) | 2,200,000 | 2,576,534 | |
5.25% 12/1/41 (Assured Guaranty Muni. Corp. Insured) | 2,090,000 | 2,434,782 | |
5.25% 12/1/42 (Assured Guaranty Muni. Corp. Insured) | 1,800,000 | 2,087,766 | |
5.25% 12/1/43 (Assured Guaranty Muni. Corp. Insured) | 2,075,000 | 2,387,120 | |
| Series 2023 C, 5.25% 12/1/40 (Assured Guaranty Muni. Corp. Insured) | 2,055,000 | 2,406,717 | |
TOTAL MICHIGAN | 66,137,594 | ||
| Minnesota - 1.3% | |||
| City of White Bear Lake (YMCA of Greater Twin Cities Proj.) Series 2018, 5% 6/1/27 | 470,000 | 490,081 | |
| Duluth Econ. Dev. Auth. Health Care Facilities Rev. Series 2018 A, 5% 2/15/43 | 470,000 | 481,967 | |
| Minneapolis Health Care Sys. Rev. Bonds: | |||
| Series 2023 A, 5%, tender 11/15/28 (b) | 10,845,000 | 11,754,082 | |
| Series 2023 B, 5%, tender 11/15/30 (b) | 4,175,000 | 4,593,401 | |
| Minnesota Higher Ed. Facilities Auth. Rev.: | |||
| Series 2016 A, 5% 5/1/46 | 1,365,000 | 1,245,259 | |
| Series 2018 A, 5% 10/1/45 | 5,000 | 5,082 | |
| Minnesota Hsg. Fin. Agcy.: | |||
| Series 2023 E, 6.25% 7/1/54 | 500,000 | 548,572 | |
| Series 2023 F, 5.75% 7/1/53 | 620,000 | 663,840 | |
| Series 2023, 6% 7/1/53 | 3,075,000 | 3,332,701 | |
| Mounds View Independent School District #621 (Minnesota School District Cr. Enhancement Prog.) Series 2018 A: | |||
| 3.45% 2/1/37 | 1,155,000 | 1,150,290 | |
| 3.55% 2/1/38 | 1,205,000 | 1,184,769 | |
| Saint Cloud Health Care Rev. Series 2019: | |||
| 4% 5/1/49 | 505,000 | 477,160 | |
| 5% 5/1/48 | 630,000 | 660,109 | |
| Sauk Rapids Minn Independent School District # 47 Series 2020 A, 2.5% 2/1/38 | 1,855,000 | 1,560,816 | |
| Shakopee Sr. Hsg. Rev. Bonds Series 2018, 5.85%, tender 11/1/25 (b)(c) | 1,340,000 | 1,303,385 | |
| St. Paul Hsg. & Redev. Auth. Health Care Facilities Rev. Series 2015 A, 5% 7/1/29 | 2,095,000 | 2,133,461 | |
| West Saint Paul Independent School District #197 (Minnesota School District Cr. Enhancement Prog.) Series 2018 A: | |||
| 3.6% 2/1/37 | 845,000 | 847,640 | |
| 3.65% 2/1/38 | 885,000 | 874,024 | |
TOTAL MINNESOTA | 33,306,639 | ||
| Mississippi - 0.1% | |||
| Mississippi Hosp. Equip. & Facilities Auth.: | |||
| Bonds Series II, 5%, tender 3/1/27 (b) | 565,000 | 590,575 | |
| Series I: | |||
5% 10/1/24 | 500,000 | 504,725 | |
5% 10/1/26 | 610,000 | 635,992 | |
5% 10/1/28 | 935,000 | 1,005,100 | |
TOTAL MISSISSIPPI | 2,736,392 | ||
| Missouri - 0.8% | |||
| Kansas City Wtr. Rev. Series 2020 A: | |||
| 4% 12/1/32 | 630,000 | 682,619 | |
| 4% 12/1/34 | 375,000 | 402,720 | |
| 4% 12/1/36 | 655,000 | 690,514 | |
| 4% 12/1/37 | 470,000 | 489,985 | |
| 4% 12/1/40 | 470,000 | 481,306 | |
| 5% 12/1/28 | 545,000 | 605,475 | |
| 5% 12/1/29 | 330,000 | 374,334 | |
| 5% 12/1/30 | 620,000 | 716,035 | |
| 5% 12/1/35 | 560,000 | 647,420 | |
| Missouri Health & Edl. Facilities Rev. Series 2019 A: | |||
| 4% 10/1/48 | 4,480,000 | 4,394,248 | |
| 5% 10/1/46 | 430,000 | 455,191 | |
| Missouri Hsg. Dev. Commission Single Family Mtg. Rev.: | |||
| (First Place Homeownership Ln. Prog.) Series 2023 E, 6.5% 5/1/54 | 1,235,000 | 1,400,375 | |
| Series 2019, 4% 5/1/50 | 100,000 | 99,786 | |
| Series 2021 A, 3% 5/1/52 | 2,200,000 | 2,127,304 | |
| Saint Louis Arpt. Rev. Series 2019 C, 5% 7/1/27 | 2,275,000 | 2,439,913 | |
| Saint Louis County Indl. Dev. Auth. Sr. Living Facilities Rev. Series 2018 A: | |||
| 5.125% 9/1/48 | 55,000 | 50,571 | |
| 5.25% 9/1/53 | 3,910,000 | 3,597,028 | |
TOTAL MISSOURI | 19,654,824 | ||
| Montana - 0.2% | |||
| Montana Board Hsg. Single Family Series 2019 B, 4% 6/1/50 | 50,000 | 49,828 | |
| Montana Facility Fin. Auth.: | |||
| Series 2018 B, 5% 7/1/28 | 645,000 | 677,547 | |
| Series 2021 A, 3% 6/1/50 | 4,950,000 | 3,596,009 | |
TOTAL MONTANA | 4,323,384 | ||
| Nebraska - 1.0% | |||
| Central Plains Energy Proj. Rev. Bonds: | |||
| (Proj. No. 4) Series 2023 A1, 5%, tender 11/1/29 (b) | 9,755,000 | 10,307,971 | |
| Series 2019, 4%, tender 8/1/25 (b) | 12,540,000 | 12,587,945 | |
| Douglas County Neb Edl. Facilities Rev. (Creighton Univ. Projs.) Series 2021 A, 3% 7/1/51 | 940,000 | 679,367 | |
| Nebraska Invt. Fin. Auth. Single Family Hsg. Rev. Series 2020 A, 3.5% 9/1/50 | 2,895,000 | 2,849,314 | |
TOTAL NEBRASKA | 26,424,597 | ||
| Nevada - 0.5% | |||
| Clark County Arpt. Rev. Series 2014 A2, 5% 7/1/30 | 395,000 | 397,111 | |
| Clark County School District Series 2017 A: | |||
| 5% 6/15/24 | 235,000 | 236,527 | |
| 5% 6/15/26 | 200,000 | 209,610 | |
| Las Vegas Valley Wtr. District Wtr. Impt. Gen. Oblig. Series 2022 A, 4% 6/1/40 | 1,245,000 | 1,278,220 | |
| Nevada Hsg. Division Single Family Mtg. Rev.: | |||
| Series 2019 A, 4% 4/1/49 | 1,340,000 | 1,336,554 | |
| Series 2019 B, 4% 10/1/49 | 145,000 | 144,632 | |
| Series 2021 A, 3% 4/1/51 | 1,500,000 | 1,452,700 | |
| Series 2021 B, 3% 10/1/51 | 6,295,000 | 6,059,625 | |
| Nevada Hwy. Impt. Rev. Series 2020 A, 2% 12/1/32 | 3,020,000 | 2,676,269 | |
TOTAL NEVADA | 13,791,248 | ||
| New Hampshire - 0.8% | |||
| Nat'l. Fin. Auth. Hosp. Rev. (St. Luke's Univ. Health Network Proj.) Series 2021 B, 3% 8/15/51 (Assured Guaranty Muni. Corp. Insured) | 1,755,000 | 1,340,416 | |
| Nat'l. Finnance Auth.: | |||
| Series 2020 1, 4.125% 1/20/34 | 1,596,972 | 1,564,097 | |
| Series 2022 1, 4.375% 9/20/36 | 2,253,819 | 2,235,947 | |
| Series 2023 2A, 3.875% 1/20/38 | 6,255,792 | 5,897,791 | |
| New Hampshire Health & Ed. Facilities Auth.: | |||
| (Dartmouth-Hitchcock Oblgtd Grp Proj.) Series 2018 A, 5% 8/1/34 | 295,000 | 311,209 | |
| Series 2017, 5% 7/1/44 | 2,185,000 | 2,118,236 | |
| New Hampshire Nat'l. Fin. Auth. Series 2022 2, 4% 10/20/36 | 7,610,709 | 7,309,490 | |
TOTAL NEW HAMPSHIRE | 20,777,186 | ||
| New Jersey - 4.7% | |||
| Camden County Impt. Auth. Health Care Redev. Rev. Series 2014 A, 5% 2/15/26 (Pre-Refunded to 2/15/24 @ 100) | 935,000 | 935,481 | |
| New Jersey Econ. Dev. Auth.: | |||
| (White Horse HMT Urban Renewal LLC Proj.) Series 2020, 5% 1/1/40 (c) | 310,000 | 214,298 | |
| Series 2024 SSS: | |||
5% 6/15/33 (d) | 750,000 | 870,700 | |
5.25% 6/15/36 (d) | 1,055,000 | 1,245,741 | |
| Series A, 5% 11/1/31 | 2,560,000 | 2,859,087 | |
| Series QQQ, 4% 6/15/46 | 740,000 | 727,360 | |
| New Jersey Econ. Dev. Auth. Lease Rev. (State House Proj.) Series 2017 B: | |||
| 5% 6/15/26 | 935,000 | 978,833 | |
| 5% 6/15/35 | 545,000 | 591,062 | |
| New Jersey Econ. Dev. Auth. Rev.: | |||
| (Black Horse EHT Urban Renewal LLC Proj.) Series 2019 A, 5% 10/1/39 (c) | 220,000 | 145,171 | |
| (Provident Montclair Proj.) Series 2017, 5% 6/1/25 (Assured Guaranty Muni. Corp. Insured) | 970,000 | 991,746 | |
| Series 2014 RR, 5% 6/15/32 (Pre-Refunded to 6/15/24 @ 100) | 195,000 | 196,089 | |
| Series 2014 UU, 5% 6/15/30 (Pre-Refunded to 6/15/24 @ 100) | 245,000 | 246,686 | |
| Series 2016 A, 5% 7/15/27 | 935,000 | 975,122 | |
| Series 2018 EEE, 5% 6/15/28 | 550,000 | 598,935 | |
| Series LLL: | |||
4% 6/15/44 | 2,745,000 | 2,742,897 | |
4% 6/15/49 | 2,515,000 | 2,423,545 | |
| Series MMM: | |||
4% 6/15/35 | 1,085,000 | 1,123,721 | |
4% 6/15/36 | 420,000 | 432,790 | |
| New Jersey Edl. Facility Series A: | |||
| 5% 7/1/38 | 1,980,000 | 2,094,440 | |
| 5% 7/1/39 | 2,080,000 | 2,188,324 | |
| New Jersey Gen. Oblig. Series 2020 A, 5% 6/1/28 | 935,000 | 1,025,387 | |
| New Jersey Health Care Facilities Fing. Auth. Rev.: | |||
| Bonds Series 2019 B3, 5%, tender 7/1/26 (b) | 1,585,000 | 1,645,869 | |
| Series 2016: | |||
4% 7/1/48 | 3,355,000 | 3,055,834 | |
5% 7/1/28 | 1,095,000 | 1,120,982 | |
5% 7/1/41 | 85,000 | 85,817 | |
| Series 2021, 3% 7/1/39 | 1,910,000 | 1,606,512 | |
| New Jersey Higher Ed. Student Assistance Auth. Student Ln. Rev. Series 2019 A, 5% 12/1/25 | 200,000 | 206,848 | |
| New Jersey Tobacco Settlement Fing. Corp.: | |||
| Series 2018 A, 5% 6/1/28 | 935,000 | 1,005,257 | |
| Series 2018 B, 5% 6/1/46 | 4,855,000 | 4,937,998 | |
| New Jersey Tpk. Auth. Tpk. Rev.: | |||
| Series 2015 E, 5% 1/1/34 | 630,000 | 640,392 | |
| Series D, 5% 1/1/28 | 1,000,000 | 1,048,636 | |
| New Jersey Trans. Trust Fund Auth.: | |||
| (Trans. Prog.) Series 2019 AA, 5.25% 6/15/43 | 1,820,000 | 1,934,267 | |
| Series 2006 C: | |||
0% 12/15/25 | 5,025,000 | 4,701,394 | |
0% 12/15/29 (Assured Guaranty Muni. Corp. Insured) | 1,310,000 | 1,083,781 | |
0% 12/15/30 (FGIC Insured) | 2,100,000 | 1,674,045 | |
0% 12/15/31 (FGIC Insured) | 5,400,000 | 4,146,006 | |
0% 12/15/33 (Assured Guaranty Muni. Corp. Insured) | 3,190,000 | 2,297,624 | |
| Series 2010 A: | |||
0% 12/15/27 | 1,130,000 | 992,903 | |
0% 12/15/30 | 1,000,000 | 794,476 | |
| Series 2018 A: | |||
5% 12/15/32 | 630,000 | 688,176 | |
5% 12/15/34 | 1,915,000 | 2,078,267 | |
| Series 2019 BB, 4% 6/15/50 | 1,360,000 | 1,314,073 | |
| Series 2021 A: | |||
4% 6/15/34 | 550,000 | 577,946 | |
4% 6/15/38 | 750,000 | 771,691 | |
5% 6/15/32 | 1,095,000 | 1,258,436 | |
5% 6/15/33 | 4,230,000 | 4,853,144 | |
| Series 2022 A, 4% 6/15/40 | 3,125,000 | 3,170,258 | |
| Series 2022 AA: | |||
5% 6/15/30 | 1,845,000 | 2,089,112 | |
5% 6/15/31 | 4,485,000 | 5,159,708 | |
5% 6/15/33 | 1,250,000 | 1,456,377 | |
| Series 2022 BB: | |||
4% 6/15/46 | 5,350,000 | 5,274,019 | |
4% 6/15/50 | 3,600,000 | 3,484,003 | |
| Series A: | |||
0% 12/15/31 | 1,615,000 | 1,237,088 | |
4% 12/15/39 | 935,000 | 943,806 | |
4.25% 12/15/38 | 2,355,000 | 2,394,462 | |
| Series AA: | |||
4% 6/15/39 | 975,000 | 993,832 | |
4% 6/15/45 | 5,915,000 | 5,869,933 | |
4% 6/15/50 | 6,105,000 | 5,908,289 | |
5% 6/15/36 | 1,075,000 | 1,206,664 | |
5% 6/15/50 | 470,000 | 498,456 | |
| Series BB, 4% 6/15/44 | 1,215,000 | 1,207,371 | |
| Newark Port Auth. Hsg. Auth. Rev. Series 2007, 5.25% 1/1/26 (Nat'l. Pub. Fin. Guarantee Corp. Insured) | 935,000 | 965,624 | |
| Ocean City Gen. Oblig. Series 2020 B, 2% 10/15/30 | 635,000 | 575,171 | |
| Port Auth. of New York & New Jersey Series 2023 243, 5% 12/1/37 | 4,750,000 | 5,590,815 | |
| South Jersey Trans. Auth. Trans. Sys. Rev. Series 2022 A: | |||
| 5% 11/1/38 | 1,000,000 | 1,091,038 | |
| 5% 11/1/40 | 1,350,000 | 1,456,398 | |
TOTAL NEW JERSEY | 118,700,213 | ||
| New Mexico - 0.7% | |||
| Albuquerque Wtr. Util. Auth. Series 2018, 5% 7/1/28 | 935,000 | 983,037 | |
| New Mexico Hosp. Equip. Ln. Council Rev. Bonds Series 2019 B, 5%, tender 8/1/25 (b) | 1,365,000 | 1,397,206 | |
| New Mexico Mtg. Fin. Auth.: | |||
| Series 2018 A1, 4% 1/1/49 | 1,000,000 | 996,613 | |
| Series 2019 C, 4% 1/1/50 | 550,000 | 548,622 | |
| Series 2019 D, 3.75% 1/1/50 | 205,000 | 203,036 | |
| Series 2021 C, 3% 1/1/52 | 2,585,000 | 2,493,815 | |
| Series 2021 D, 3% 7/1/52 | 3,135,000 | 3,021,404 | |
| Series 2023 C, I 5.75% 3/1/54 | 1,915,000 | 2,067,425 | |
| New Mexico Muni. Energy Acquisition Auth. Gas Supply Rev.: | |||
| Bonds Series 2019 A, 5%, tender 5/1/25 (b) | 4,680,000 | 4,748,156 | |
| Series 2019 A, 4% 5/1/24 | 630,000 | 630,499 | |
| Santa Fe Retirement Fac. Series 2019 A: | |||
| 5% 5/15/34 | 65,000 | 62,715 | |
| 5% 5/15/39 | 45,000 | 41,166 | |
| 5% 5/15/44 | 45,000 | 39,757 | |
| 5% 5/15/49 | 100,000 | 84,209 | |
TOTAL NEW MEXICO | 17,317,660 | ||
| New York - 12.9% | |||
| Long Island Pwr. Auth. Elec. Sys. Rev.: | |||
| Bonds Series 2019 B, 1.65%, tender 9/1/24 (b) | 2,435,000 | 2,401,702 | |
| Series 2018, 5% 9/1/36 | 235,000 | 256,930 | |
| MTA Hudson Rail Yards Trust Oblig. Series 2016 A, 5% 11/15/56 | 280,000 | 277,463 | |
| Nassau County Gen. Oblig. Series 2023 B: | |||
| 5% 4/1/38 | 2,000,000 | 2,343,032 | |
| 5% 4/1/39 | 1,800,000 | 2,096,119 | |
| New York City Edl. Construction Fund Series 2021 B, 5% 4/1/46 | 2,055,000 | 2,191,591 | |
| New York City Gen. Oblig.: | |||
| Bonds Series 2015 F4, 5%, tender 12/1/25 (f) | 990,000 | 1,013,965 | |
| Series 2021 A1, 5% 8/1/31 | 3,990,000 | 4,584,003 | |
| Series 2022 A1, 5% 9/1/39 | 9,105,000 | 10,393,019 | |
| Series 2023 1, 5% 8/1/28 | 1,000,000 | 1,103,333 | |
| Series 2023 E1: | |||
5% 4/1/38 | 2,000,000 | 2,315,081 | |
5% 4/1/39 | 2,800,000 | 3,219,365 | |
5% 4/1/40 | 9,000,000 | 10,272,996 | |
5% 4/1/41 | 1,000,000 | 1,134,018 | |
| Series 2024 A: | |||
5% 8/1/39 | 2,635,000 | 3,042,123 | |
5% 8/1/42 | 2,000,000 | 2,263,217 | |
| New York City Hsg. Dev. Corp. Bonds Series 2023 E2, 3.8%, tender 1/3/28 (b) | 650,000 | 653,261 | |
| New York City Hsg. Dev. Corp. Multifamily Hsg.: | |||
| Bonds: | |||
Series 2021 C2, 0.7%, tender 7/1/25 (b) | 1,185,000 | 1,124,810 | |
Series 2021 K2, 0.9%, tender 1/1/26 (b) | 6,590,000 | 6,131,066 | |
Series 2021, 0.6%, tender 7/1/25 (b) | 1,545,000 | 1,466,803 | |
Series 2022 F 2B, 3.4%, tender 12/22/26 (b) | 8,400,000 | 8,373,676 | |
Series 2023 A2: | |||
3.7%, tender 12/30/27 (b) | 3,955,000 | 3,973,600 | |
3.73%, tender 12/29/28 (b) | 4,410,000 | 4,432,147 | |
Series 2023 D, 4.3%, tender 11/1/28 (b) | 2,140,000 | 2,181,559 | |
| Series 2019 J, 3.05% 11/1/49 | 1,145,000 | 903,240 | |
| Series 2021 C1, 2.5% 11/1/51 | 4,155,000 | 2,802,238 | |
| Series 2021 F1: | |||
2.25% 11/1/41 | 6,515,000 | 4,765,018 | |
2.4% 11/1/46 | 1,445,000 | 1,022,448 | |
| New York City Transitional Fin. Auth. Series 2024 B: | |||
| 5% 5/1/37 | 2,500,000 | 2,954,978 | |
| 5% 5/1/38 | 5,000,000 | 5,855,293 | |
| 5% 5/1/39 | 3,600,000 | 4,185,049 | |
| 5% 5/1/40 | 8,665,000 | 9,980,673 | |
| New York City Transitional Fin. Auth. Bldg. Aid Rev. (New York State Gen. Oblig. Proj.) Series 2015 S-1, 5% 7/15/35 | 6,550,000 | 6,653,951 | |
| New York City Transitional Fin. Auth. Rev. Series 2022 B1, 5.25% 11/1/37 | 5,880,000 | 6,957,564 | |
| New York City Trust Cultural Resources Rev. Series 2021, 5% 7/1/31 | 3,370,000 | 3,921,429 | |
| New York Dorm. Auth. Rev.: | |||
| Bonds: | |||
Series 2019 B2, 5%, tender 5/1/24 (b) | 825,000 | 826,000 | |
Series 2019 B3, 5%, tender 5/1/26 (b) | 595,000 | 610,933 | |
| Series 2022 A: | |||
5% 7/1/36 | 750,000 | 841,473 | |
5% 7/15/37 | 380,000 | 399,998 | |
5% 7/1/40 | 935,000 | 1,013,838 | |
5% 7/1/41 | 935,000 | 1,009,064 | |
5% 7/15/42 | 1,075,000 | 1,098,825 | |
5% 7/15/50 | 2,775,000 | 2,780,034 | |
| Series 2022: | |||
5% 7/1/30 | 1,540,000 | 1,640,371 | |
5% 7/1/31 | 1,615,000 | 1,730,274 | |
5% 7/1/38 | 780,000 | 810,372 | |
5% 7/1/39 | 1,225,000 | 1,264,978 | |
5% 7/1/40 | 2,760,000 | 2,836,994 | |
5% 7/1/41 | 2,900,000 | 2,969,227 | |
5% 7/1/42 | 1,520,000 | 1,549,298 | |
5% 7/1/57 | 6,385,000 | 6,266,313 | |
| New York Dorm. Auth. Sales Tax Rev. Series 2023 A1, 5% 3/15/41 | 15,720,000 | 18,004,690 | |
| New York Metropolitan Trans. Auth. Dedicated Tax Fund Rev. Series 2012 A, 0% 11/15/32 | 5,160,000 | 3,917,792 | |
| New York Metropolitan Trans. Auth. Rev.: | |||
| Series 2015 A1, 5% 11/15/29 | 400,000 | 406,235 | |
| Series 2015 D1, 5% 11/15/28 | 2,310,000 | 2,367,106 | |
| Series 2017 C1, 5% 11/15/34 | 2,230,000 | 2,388,660 | |
| Series 2017 D: | |||
5% 11/15/30 | 8,760,000 | 9,440,895 | |
5% 11/15/35 | 1,870,000 | 1,995,575 | |
| Series 2020 D, 4% 11/15/46 | 12,660,000 | 12,184,774 | |
| New York State Dorm. Auth.: | |||
| Series 2017 A, 5% 2/15/31 | 935,000 | 994,772 | |
| Series 2019 D, 3% 2/15/49 | 3,920,000 | 3,166,379 | |
| Series 2021 A, 4% 3/15/38 | 4,000,000 | 4,132,866 | |
| Series 2021 E: | |||
3% 3/15/50 | 2,340,000 | 1,874,914 | |
4% 3/15/39 | 4,000,000 | 4,115,984 | |
4% 3/15/45 | 5,435,000 | 5,397,341 | |
4% 3/15/47 | 3,830,000 | 3,784,022 | |
| Series 2022 A, 5% 3/15/41 | 12,850,000 | 14,469,144 | |
| Series 2023 A: | |||
5% 3/15/30 | 7,705,000 | 8,805,420 | |
5% 3/15/40 | 4,000,000 | 4,573,717 | |
| New York State Hsg. Fin. Agcy. Rev. Bonds: | |||
| Series 2021 J2: | |||
1%, tender 11/1/26 (b) | 960,000 | 884,867 | |
1.1%, tender 5/1/27 (b) | 3,545,000 | 3,215,603 | |
| Series 2023 C2, 3.8%, tender 5/1/29 (b) | 12,625,000 | 12,666,904 | |
| New York State Mtg. Agcy. Homeowner Mtg. Series 2020 225, 2.45% 10/1/45 | 10,000,000 | 7,190,909 | |
| New York State Urban Dev. Corp.: | |||
| Series 2020 A: | |||
4% 3/15/45 | 1,170,000 | 1,163,538 | |
4% 3/15/49 | 7,380,000 | 7,264,970 | |
| Series 2020 C, 4% 3/15/39 | 3,315,000 | 3,417,070 | |
| Series 2020 E: | |||
3% 3/15/50 | 1,525,000 | 1,208,016 | |
4% 3/15/44 | 8,705,000 | 8,691,198 | |
4% 3/15/45 | 7,020,000 | 6,981,226 | |
| New York Trans. Dev. Corp. (Term. 4 JFK Int'l. Arpt. Proj.) Series 2020 C, 5% 12/1/33 | 325,000 | 355,365 | |
| Niagara Area Dev. Corp. Rev. (Catholic Health Sys., Inc. Proj.) Series 2022, 4.5% 7/1/52 | 1,775,000 | 1,308,375 | |
| Oneida County Local Dev. Corp. Rev. (Mohawk Valley Health Sys. Proj.) Series 2019 A, 5% 12/1/26 (Assured Guaranty Muni. Corp. Insured) | 1,520,000 | 1,521,170 | |
| Suffolk County Econ. Dev. Corp. Rev. Series 2021: | |||
| 4.625% 11/1/31 (c) | 250,000 | 226,616 | |
| 5.375% 11/1/54 (c) | 935,000 | 728,594 | |
| Triborough Bridge & Tunnel Auth. Series 2021 B, 4% 5/15/56 | 1,645,000 | 1,613,787 | |
| Triborough Bridge & Tunnel Auth. Revs.: | |||
| Series 2022 A: | |||
5% 11/15/40 | 2,280,000 | 2,602,207 | |
5% 11/15/41 | 1,750,000 | 1,986,177 | |
| Series 2023 B1: | |||
5% 11/15/39 | 1,130,000 | 1,316,350 | |
5% 11/15/40 | 1,000,000 | 1,155,087 | |
5% 11/15/41 | 1,750,000 | 2,009,099 | |
5% 11/15/42 | 1,000,000 | 1,142,113 | |
5% 11/15/43 | 1,000,000 | 1,135,445 | |
TOTAL NEW YORK | 326,699,724 | ||
| North Carolina - 1.5% | |||
| Charlotte Ctfs. of Prtn. (Convention Facility Projs.) Series 2019 A, 4% 6/1/39 | 820,000 | 837,799 | |
| Charlotte Int'l. Arpt. Rev. Series 2023 A: | |||
| 5% 7/1/37 | 775,000 | 910,500 | |
| 5% 7/1/38 | 785,000 | 911,530 | |
| Charlotte-Mecklenburg Hosp. Auth. Health Care Sys. Rev. Bonds Series 2018 C, 3.45%, tender 10/31/25 (b) | 5,130,000 | 5,144,930 | |
| New Hanover County Hosp. Rev. Series 2017, 5% 10/1/27 (Escrowed to Maturity) | 50,000 | 53,796 | |
| North Carolina Hsg. Fin. Agcy. Home Ownership Rev.: | |||
| Series 2020 45, 3% 7/1/51 | 12,990,000 | 12,579,706 | |
| Series 2023 52A, 6.25% 1/1/55 | 1,105,000 | 1,211,825 | |
| North Carolina Med. Care Commission Health Care Facilities Rev.: | |||
| Bonds Series 2019 C, 2.55%, tender 6/1/26 (b) | 1,260,000 | 1,239,167 | |
| Series 2020 A, 3% 7/1/45 | 1,335,000 | 1,059,716 | |
| North Carolina Tpk. Auth. Triangle Expressway Sys. Series 2019, 5% 1/1/49 | 13,100,000 | 13,632,878 | |
TOTAL NORTH CAROLINA | 37,581,847 | ||
| North Dakota - 0.3% | |||
| Grand Forks Health Care Sys. Rev. Series 2021, 4% 12/1/46 | 1,060,000 | 942,111 | |
| North Dakota Hsg. Fin. Agcy.: | |||
| Series 2021 A, 3% 1/1/52 | 705,000 | 682,706 | |
| Series 2021 B, 3% 7/1/52 | 1,940,000 | 1,864,329 | |
| Series 2022, 5% 1/1/53 | 2,645,000 | 2,728,268 | |
| Series 2023 F, 6.25% 1/1/54 | 390,000 | 427,981 | |
| Univ. of North Dakota Series 2021 A, 3% 6/1/61 (Assured Guaranty Muni. Corp. Insured) | 2,865,000 | 1,980,686 | |
TOTAL NORTH DAKOTA | 8,626,081 | ||
| Ohio - 2.6% | |||
| Akron Bath Copley Hosp. District Rev.: | |||
| Series 2016, 5.25% 11/15/46 | 3,495,000 | 3,540,996 | |
| Series 2020, 5% 11/15/31 | 360,000 | 391,995 | |
| American Muni. Pwr., Inc. Rev.: | |||
| (Greenup Hydroelectric Proj.): | |||
Series 2016 A, 5% 2/15/41 | 935,000 | 954,079 | |
Series 2016, 5% 2/15/46 | 1,625,000 | 1,654,017 | |
| Series 2023 A: | |||
5% 2/15/30 | 1,725,000 | 1,937,483 | |
5% 2/15/31 | 1,425,000 | 1,625,992 | |
5% 2/15/32 | 1,900,000 | 2,200,764 | |
| Buckeye Tobacco Settlement Fing. Auth.: | |||
| Series 2020 A2: | |||
3% 6/1/48 | 2,030,000 | 1,540,096 | |
4% 6/1/48 | 660,000 | 609,630 | |
5% 6/1/36 | 2,045,000 | 2,212,764 | |
| Series 2020 B2, 5% 6/1/55 | 5,430,000 | 5,126,582 | |
| Chillicothe Hosp. Facilities Rev. (Adena Health Sys. Oblig. Group Proj.) Series 2017, 5% 12/1/47 | 935,000 | 947,072 | |
| Cleveland Arpt. Sys. Rev. Series 2016 A, 5% 1/1/25 (Assured Guaranty Muni. Corp. Insured) | 685,000 | 696,209 | |
| Cleveland-Cuyahoga County Port Auth. Rev. (Euclid Avenue Dev. Corp. Proj.) Series 2022 A: | |||
| 5% 8/1/39 | 1,250,000 | 1,316,401 | |
| 5.25% 8/1/40 | 1,320,000 | 1,414,693 | |
| 5.25% 8/1/41 | 1,390,000 | 1,482,827 | |
| 5.25% 8/1/42 | 1,465,000 | 1,556,847 | |
| Cuyahoga County Hosp. Rev. Series 2017, 5.5% 2/15/52 | 3,720,000 | 3,778,520 | |
| Fairfield County Hosp. Facilities Rev. (Fairfield Med. Ctr. Proj.) Series 2013, 4.25% 6/15/24 | 360,000 | 359,081 | |
| Hamilton County Healthcare Rev. (Life Enriching Cmntys. Proj.) Series 2016, 5% 1/1/51 | 935,000 | 850,200 | |
| Hamilton County Hosp. Facilities Rev. (Trihealth, Inc. Obligated Group Proj.) Series 2017 A, 5% 8/15/33 | 770,000 | 813,499 | |
| Miami County Hosp. Facilities Rev. (Kettering Health Network Obligated Group Proj.) Series 2019, 5% 8/1/45 | 3,320,000 | 3,422,956 | |
| Middleburg Heights Hosp. Rev. Series 2021 A, 4% 8/1/41 | 1,590,000 | 1,506,184 | |
| Ohio Higher Edl. Facility Commission Rev.: | |||
| (Kenyon College 2020 Proj.) Series 2020: | |||
4% 7/1/40 | 685,000 | 691,776 | |
5% 7/1/35 | 2,455,000 | 2,725,706 | |
5% 7/1/42 | 4,235,000 | 4,551,577 | |
| (Kenyon College, Oh. Proj.) Series 2017, 5% 7/1/42 | 1,590,000 | 1,652,030 | |
| Ohio Hosp. Rev.: | |||
| Bonds Series 2019 C, 2.75%, tender 5/1/28 (b) | 1,255,000 | 1,234,274 | |
| Series 2020 A, 4% 1/15/50 | 265,000 | 247,450 | |
| Ohio Hsg. Fin. Agcy. Residential Mtg. Rev.: | |||
| (Mtg. Backed Securities Prog.) Series 2019 B, 4.5% 3/1/50 | 75,000 | 75,525 | |
| (Mtg.-Backed Securities Prog.) Series 2023 B, 6% 3/1/55 | 1,580,000 | 1,743,847 | |
| Ohio Major New State Infrastructure Rev. Series 2021 1A, 5% 12/15/31 | 1,310,000 | 1,544,006 | |
| Ohio Spl. Oblig. (Trans. Bldg. Fund Projs.) Series 2023 A, 5% 4/1/36 | 1,000,000 | 1,163,810 | |
| Ohio Tpk. Commission Tpk. Rev. (Infrastructure Projs.) Series 2022 A, 5% 2/15/39 | 590,000 | 667,625 | |
| Ross County Hosp. Facilities Rev. (Adena Health Sys. Obligated Group Proj.) Series 2019: | |||
| 5% 12/1/24 | 490,000 | 495,939 | |
| 5% 12/1/25 | 430,000 | 442,708 | |
| 5% 12/1/26 | 560,000 | 587,514 | |
| Scioto County Hosp. Facilities Rev.: | |||
| Series 2016: | |||
5% 2/15/26 | 1,815,000 | 1,866,831 | |
5% 2/15/27 | 1,510,000 | 1,557,234 | |
| Series 2019, 5% 2/15/29 | 505,000 | 524,816 | |
| Washington County Hosp. Rev. Series 2022: | |||
| 6% 12/1/28 | 830,000 | 847,196 | |
| 6% 12/1/29 | 880,000 | 904,784 | |
| 6% 12/1/30 | 930,000 | 959,458 | |
| 6% 12/1/31 | 995,000 | 1,029,035 | |
TOTAL OHIO | 65,452,028 | ||
| Oklahoma - 0.1% | |||
| Oklahoma Dev. Fin. Auth. Rev. (Oklahoma City Univ. Proj.) Series 2019: | |||
| 5% 8/1/26 | 335,000 | 341,149 | |
| 5% 8/1/44 | 620,000 | 619,578 | |
| Oklahoma Hsg. Fin. Agcy. Single Family Mtg. Rev.: | |||
| (Homeownership Ln. Prog.) Series 2023 C, 6% 3/1/54 | 295,000 | 325,733 | |
| (Homeownership Load Prog.) Series 2023 D, 6.5% 9/1/54 | 285,000 | 322,733 | |
TOTAL OKLAHOMA | 1,609,193 | ||
| Oregon - 0.6% | |||
| Medford Hosp. Facilities Auth. Rev. (Asante Projs.) Series 2020 A: | |||
| 5% 8/15/36 | 1,215,000 | 1,329,693 | |
| 5% 8/15/38 | 3,465,000 | 3,737,780 | |
| Oregon Gen. Oblig. Series 2022 A, 5% 12/1/52 | 1,825,000 | 1,882,941 | |
| Oregon State Hsg. & Cmnty. Svcs. Dept.: | |||
| (Single-Family Mtg. Prog.) Series 2019 A, 2.65% 7/1/39 | 570,000 | 476,506 | |
| Series 2019 A, 4% 7/1/50 | 6,000,000 | 5,982,088 | |
| Salem Hosp. Facility Auth. Rev. (Salem Health Projs.) Series 2019 A, 3% 5/15/49 | 3,125,000 | 2,365,428 | |
TOTAL OREGON | 15,774,436 | ||
| Pennsylvania - 5.3% | |||
| Allegheny County Arpt. Auth. Rev.: | |||
| Series 2021 B, 5% 1/1/51 | 7,525,000 | 7,954,309 | |
| Series 2023 B: | |||
5.25% 1/1/48 | 850,000 | 950,452 | |
5.25% 1/1/53 | 1,000,000 | 1,108,132 | |
| Allegheny County Higher Ed. Bldg. Auth. Series 2024 A, 5% 8/1/27 | 3,940,000 | 4,261,785 | |
| Allegheny County Indl. Dev. Auth. Rev. Series 2021: | |||
| 3.5% 12/1/31 | 445,000 | 365,250 | |
| 4% 12/1/41 | 995,000 | 695,119 | |
| 4.25% 12/1/50 | 1,110,000 | 720,442 | |
| Bucks County Indl. Dev. Auth. Hosp. Rev. Series 2021, 5% 7/1/36 | 565,000 | 517,053 | |
| Commonwealth Fing. Auth. Rev.: | |||
| Series 2019 B, 5% 6/1/26 | 635,000 | 665,230 | |
| Series 2020 A: | |||
5% 6/1/29 | 1,640,000 | 1,824,705 | |
5% 6/1/32 | 2,810,000 | 3,190,976 | |
| Dauphin County Gen. Auth. (Pinnacle Health Sys. Proj.) Series 2016 A, 5% 6/1/34 | 1,065,000 | 1,103,437 | |
| Delaware County Auth. Rev.: | |||
| (Cabrini College) Series 2017, 5% 7/1/47 | 1,640,000 | 1,653,362 | |
| Series 2017, 5% 7/1/30 | 1,345,000 | 1,401,728 | |
| Doylestown Hosp. Auth. Hosp. Rev. Series 2019 A: | |||
| 5% 7/1/49 | 860,000 | 799,247 | |
| 5% 7/1/49 (Pre-Refunded to 7/1/29 @ 100) | 95,000 | 105,677 | |
| Geisinger Auth. Health Sys. Rev. Bonds Series 2020 C, 5%, tender 4/1/30 (b) | 3,675,000 | 3,993,739 | |
| Lancaster Muni. Auth. Rev. Series 2023 B, 5% 6/1/29 | 2,515,000 | 2,794,293 | |
| Lehigh County Gen. Purp. Hosp. Rev. Series 2019 A: | |||
| 5% 7/1/24 | 1,590,000 | 1,599,812 | |
| 5% 7/1/26 | 1,780,000 | 1,848,358 | |
| 5% 7/1/27 | 1,870,000 | 1,973,668 | |
| 5% 7/1/28 | 1,945,000 | 2,085,666 | |
| Monroeville Fin. Auth. UPMC Rev. Series 2023 C, 5% 5/15/35 | 380,000 | 436,631 | |
| Montgomery County Higher Ed. & Health Auth. Rev.: | |||
| Series 2016 A, 5% 10/1/40 | 2,515,000 | 2,414,287 | |
| Series 2019: | |||
4% 9/1/36 | 700,000 | 707,325 | |
4% 9/1/37 | 700,000 | 707,080 | |
4% 9/1/38 | 1,590,000 | 1,602,324 | |
4% 9/1/39 | 1,030,000 | 1,035,105 | |
4% 9/1/44 | 235,000 | 227,508 | |
5% 9/1/24 | 630,000 | 634,515 | |
| Series 2020: | |||
5% 4/1/24 | 340,000 | 340,390 | |
5% 4/1/25 | 260,000 | 262,496 | |
5% 4/1/26 | 310,000 | 310,761 | |
5% 4/1/27 | 590,000 | 593,808 | |
| Pennsylvania Econ. Dev. Fing. Auth.: | |||
| Series 2020 A: | |||
5% 4/15/24 | 515,000 | 516,694 | |
5% 4/15/25 | 700,000 | 715,269 | |
| Series 2023 A2, 5% 5/15/35 | 500,000 | 576,692 | |
| Series 2023 B, 5% 5/15/35 | 500,000 | 576,692 | |
| Pennsylvania Econ. Dev. Fing. Auth. Indl. Dev. Rev. (Presbyterian Sr. Living Proj.): | |||
| Series 2023 B1, 5.25% 7/1/49 | 900,000 | 923,339 | |
| Series 2023 B2, 5.25% 7/1/46 | 965,000 | 997,428 | |
| Pennsylvania Gen. Oblig. Series 2018: | |||
| 3.2% 3/1/29 | 3,750,000 | 3,780,421 | |
| 3.35% 3/1/30 | 5,580,000 | 5,644,515 | |
| Pennsylvania Higher Edl. Facilities Auth. Rev.: | |||
| Series 2012, 5% 11/1/42 | 1,280,000 | 1,280,411 | |
| Series 2016, 5% 5/1/34 | 1,495,000 | 1,532,735 | |
| Pennsylvania Hsg. Fin. Agcy.: | |||
| Series 2021 137, 3% 10/1/51 | 2,880,000 | 2,759,939 | |
| Series 2023 142A: | |||
4.5% 10/1/38 | 1,940,000 | 2,024,163 | |
5% 10/1/43 | 1,400,000 | 1,472,102 | |
| Pennsylvania State Univ. Series 2020 A, 4% 9/1/50 | 1,385,000 | 1,359,147 | |
| Pennsylvania Tpk. Commission Tpk. Rev.: | |||
| Series 2016, 5% 6/1/36 | 1,870,000 | 1,934,968 | |
| Series 2021 A: | |||
4% 12/1/43 | 2,810,000 | 2,799,054 | |
4% 12/1/46 | 4,680,000 | 4,591,013 | |
4% 12/1/50 | 935,000 | 906,271 | |
| Philadelphia Auth. for Indl. Dev.: | |||
| Series 2015 1, 5% 4/1/33 | 495,000 | 503,863 | |
| Series 2017, 5% 11/1/47 | 975,000 | 989,586 | |
| Philadelphia Gen. Oblig.: | |||
| Series 2019 A, 5% 8/1/26 | 1,090,000 | 1,144,548 | |
| Series 2019 B: | |||
5% 2/1/34 | 2,105,000 | 2,323,110 | |
5% 2/1/35 | 2,575,000 | 2,834,949 | |
5% 2/1/36 | 2,260,000 | 2,474,760 | |
| Philadelphia School District: | |||
| Series 2018 A, 5% 9/1/26 | 1,310,000 | 1,367,072 | |
| Series 2019 A: | |||
4% 9/1/35 | 1,170,000 | 1,199,416 | |
5% 9/1/26 | 1,870,000 | 1,961,410 | |
5% 9/1/30 | 1,250,000 | 1,375,095 | |
5% 9/1/32 | 935,000 | 1,026,560 | |
5% 9/1/34 (Assured Guaranty Muni. Corp. Insured) | 580,000 | 634,080 | |
5% 9/1/44 | 1,355,000 | 1,433,987 | |
| Series 2019 B, 5% 9/1/26 | 1,035,000 | 1,080,091 | |
| Philadelphia Wtr. & Wastewtr. Rev.: | |||
| Series 2022 C: | |||
5% 6/1/33 | 650,000 | 764,296 | |
5% 6/1/34 | 800,000 | 938,726 | |
| Series 2023 B: | |||
5% 9/1/38 (Assured Guaranty Muni. Corp. Insured) | 1,500,000 | 1,734,675 | |
5% 9/1/41 (Assured Guaranty Muni. Corp. Insured) | 4,330,000 | 4,916,578 | |
5% 9/1/42 (Assured Guaranty Muni. Corp. Insured) | 3,500,000 | 3,944,543 | |
5.5% 9/1/53 (Assured Guaranty Muni. Corp. Insured) | 2,755,000 | 3,147,444 | |
| Pittsburgh Wtr. & Swr. Auth. Wtr. & Swr. Sys. Rev. Series 2019 A, 5% 9/1/44 (Assured Guaranty Muni. Corp. Insured) | 420,000 | 448,089 | |
| Southcentral Pennsylvania Gen. Auth. Rev.: | |||
| Series 2019 A: | |||
4% 6/1/44 | 220,000 | 214,561 | |
4% 6/1/49 | 520,000 | 490,849 | |
5% 6/1/44 | 380,000 | 397,477 | |
5% 6/1/49 | 605,000 | 626,472 | |
| Series 2023 A, 5% 6/1/29 | 8,050,000 | 8,943,961 | |
| State Pub. School Bldg. Auth. Lease Rev. (The School District of Philadelphia Proj.) Series 2016 A, 5% 6/1/32 (Assured Guaranty Muni. Corp. Insured) | 830,000 | 867,886 | |
| Union County Hosp. Auth. Rev. Series 2018 B, 5% 8/1/48 | 1,340,000 | 1,378,612 | |
TOTAL PENNSYLVANIA | 134,438,219 | ||
| Puerto Rico - 1.4% | |||
| Puerto Rico Commonwealth Aqueduct & Swr. Auth.: | |||
| Series 2021 B: | |||
4% 7/1/42 (c) | 1,750,000 | 1,584,035 | |
5% 7/1/33 (c) | 835,000 | 864,233 | |
5% 7/1/37 (c) | 3,500,000 | 3,567,143 | |
| Series 2022 A, 4% 7/1/42 (c) | 1,750,000 | 1,584,035 | |
| Puerto Rico Commonwealth Pub. Impt. Gen. Oblig. Series 2021 A1: | |||
| 0% 7/1/33 | 8,638,773 | 5,493,608 | |
| 4% 7/1/33 | 5,651,810 | 5,483,155 | |
| 4% 7/1/35 | 2,035,000 | 1,941,382 | |
| 5.625% 7/1/27 | 589,592 | 622,557 | |
| 5.625% 7/1/29 | 4,000,136 | 4,331,806 | |
| Puerto Rico Sales Tax Fing. Corp. Sales Tax Rev. Series 2019 A2, 4.329% 7/1/40 | 9,120,000 | 9,063,025 | |
TOTAL PUERTO RICO | 34,534,979 | ||
| Rhode Island - 0.6% | |||
| Pub. Bldgs Authr (Cap. Impt. Prog. Projs.) Series 2020 A, 5% 9/15/39 (Assured Guaranty Muni. Corp. Insured) | 1,490,000 | 1,573,780 | |
| Rhode Island Health & Edl. Bldg. Corp. Higher Ed. Facilities Rev. Series 2016 B: | |||
| 5% 9/1/31 | 855,000 | 850,505 | |
| 5% 9/1/36 | 1,670,000 | 1,624,659 | |
| Rhode Island Health and Edl. Bldg. Corp. Higher Ed. Facility Rev. Series 2023: | |||
| 5% 11/1/36 | 225,000 | 259,824 | |
| 5% 11/1/39 | 255,000 | 287,877 | |
| 5% 11/1/41 | 750,000 | 839,212 | |
| 5% 11/1/42 | 1,000,000 | 1,114,602 | |
| 5% 11/1/43 | 1,300,000 | 1,444,489 | |
| 5% 11/1/47 | 5,500,000 | 6,026,754 | |
| Rhode Island Hsg. & Mtg. Fin. Corp. Series 2019 70, 4% 10/1/49 | 115,000 | 114,679 | |
| Rhode Island Hsg. & Mtg. Fin. Corp. Rev. Series 72 A, 3.5% 10/1/50 | 830,000 | 818,919 | |
TOTAL RHODE ISLAND | 14,955,300 | ||
| South Carolina - 0.8% | |||
| Charleston County Arpt. District Series 2019, 5% 7/1/48 | 1,755,000 | 1,867,524 | |
| South Carolina Hsg. Fin. & Dev. Auth. Mtg. Rev.: | |||
| Series 2019 A, 4% 1/1/50 | 200,000 | 199,437 | |
| Series 2023 B, 6% 1/1/54 | 980,000 | 1,084,703 | |
| South Carolina Jobs-Econ. Dev. Auth.: | |||
| Series 2019 C, 5% 7/1/33 | 1,220,000 | 1,320,230 | |
| Series 2023: | |||
4% 2/1/42 | 2,110,000 | 2,124,393 | |
4% 2/1/43 | 2,500,000 | 2,510,583 | |
5% 2/1/40 | 1,460,000 | 1,618,734 | |
5% 2/1/41 | 2,000,000 | 2,203,320 | |
| South Carolina Jobs-Econ. Dev. Auth. Econ. Dev. Rev. Series 2022 A, 4% 4/1/52 | 2,900,000 | 2,828,625 | |
| South Carolina Pub. Svc. Auth. Rev.: | |||
| Series 2014 C, 5% 12/1/26 | 95,000 | 95,570 | |
| Series 2016 A, 5% 12/1/33 | 205,000 | 211,341 | |
| Series 2020 A, 5% 12/1/32 | 1,580,000 | 1,771,785 | |
| Spartanburg County Reg'l. Health Series 2017 A, 5% 4/15/48 | 2,310,000 | 2,388,557 | |
TOTAL SOUTH CAROLINA | 20,224,802 | ||
| South Dakota - 0.1% | |||
| South Dakota Health & Edl. Facilities Auth. Rev.: | |||
| Bonds Series 2019 A, 5%, tender 7/1/24 (b) | 1,495,000 | 1,497,978 | |
| Series 2020 A, 3% 9/1/45 | 1,730,000 | 1,346,737 | |
| South Dakota Hsg. Dev. Auth. Series 2023 G, 6.25% 5/1/55 | 560,000 | 614,828 | |
TOTAL SOUTH DAKOTA | 3,459,543 | ||
| Tennessee - 1.2% | |||
| Chattanooga Health Ed. & Hsg. Facility Board Rev.: | |||
| Series 2019 A1: | |||
4% 8/1/44 | 7,770,000 | 7,455,165 | |
5% 8/1/25 | 575,000 | 586,625 | |
| Series 2019 A2, 5% 8/1/44 | 2,105,000 | 2,177,039 | |
| Jackson Hosp. Rev. Series 2018 A: | |||
| 5% 4/1/27 | 560,000 | 582,445 | |
| 5% 4/1/27 (Escrowed to Maturity) | 30,000 | 31,904 | |
| 5% 4/1/28 | 375,000 | 392,413 | |
| 5% 4/1/28 (Escrowed to Maturity) | 20,000 | 21,699 | |
| 5% 4/1/41 | 445,000 | 462,726 | |
| 5% 4/1/41 (Pre-Refunded to 10/1/28 @ 100) | 25,000 | 27,396 | |
| Johnson City Health & Edl. Hosp. Rev. Series 2023 A, 5% 7/1/24 | 1,250,000 | 1,255,861 | |
| Metropolitan Govt. of Nashville & Davidson County Series 2023: | |||
| 5% 5/1/43 | 2,000,000 | 2,178,373 | |
| 5.25% 5/1/48 | 5,000,000 | 5,458,448 | |
| Nashville and Davidson County Metropolitan Govt. Health & Edl. Facilities Board Rev. (Lipscomb Univ. Proj.) Series 2019 A: | |||
| 4% 10/1/49 | 2,150,000 | 1,919,510 | |
| 5.25% 10/1/58 | 1,145,000 | 1,171,556 | |
| Tennergy Corp. Gas Rev. Bonds Series 2019 A, 5%, tender 10/1/24 (b) | 1,895,000 | 1,909,385 | |
| Tennessee Hsg. Dev. Agcy. Series 2015 A, 3.5% 7/1/45 | 590,000 | 584,321 | |
| Tennessee Hsg. Dev. Agcy. Residential: | |||
| Series 2019 3: | |||
2.6% 7/1/39 | 265,000 | 216,322 | |
2.8% 7/1/44 | 325,000 | 255,866 | |
| Series 2019 4, 2.9% 7/1/39 | 195,000 | 167,531 | |
| Series 2021 1, 3% 7/1/51 | 2,330,000 | 2,261,135 | |
| Series 2021 3A, 3% 1/1/52 | 770,000 | 741,882 | |
TOTAL TENNESSEE | 29,857,602 | ||
| Texas - 6.9% | |||
| Bell County Gen. Oblig. Series 2021: | |||
| 2% 2/15/34 | 2,500,000 | 2,120,368 | |
| 2% 2/15/35 | 1,000,000 | 832,921 | |
| Brazos County Gen. Oblig. Series 2020: | |||
| 1.75% 9/1/33 | 1,355,000 | 1,125,730 | |
| 1.875% 9/1/35 | 705,000 | 570,075 | |
| Central Reg'l. Mobility Auth.: | |||
| Series 2020 B: | |||
4% 1/1/34 | 260,000 | 271,502 | |
4% 1/1/35 | 210,000 | 218,854 | |
4% 1/1/36 | 230,000 | 238,339 | |
4% 1/1/37 | 330,000 | 339,290 | |
4% 1/1/38 | 435,000 | 444,063 | |
4% 1/1/39 | 560,000 | 568,876 | |
4% 1/1/40 | 215,000 | 217,527 | |
5% 1/1/27 | 185,000 | 194,411 | |
5% 1/1/28 | 215,000 | 229,795 | |
5% 1/1/29 | 795,000 | 863,766 | |
5% 1/1/30 | 375,000 | 414,422 | |
5% 1/1/31 | 185,000 | 204,510 | |
5% 1/1/32 | 185,000 | 204,100 | |
5% 1/1/33 | 280,000 | 308,863 | |
| Series 2021 B: | |||
5% 1/1/30 | 935,000 | 1,033,292 | |
5% 1/1/32 | 1,195,000 | 1,337,130 | |
5% 1/1/39 | 1,215,000 | 1,322,238 | |
5% 1/1/46 | 3,275,000 | 3,483,758 | |
| Series 2021 C, 5% 1/1/27 | 3,525,000 | 3,631,333 | |
| Clear Creek Independent School District Bonds Series 2013 B, 3.6%, tender 8/15/25 (b) | 1,600,000 | 1,610,379 | |
| Coppell Tex Series 2020, 1.625% 2/1/37 | 1,495,000 | 1,098,566 | |
| Cypress-Fairbanks Independent School District Series 2019 A, 3% 2/15/33 | 2,765,000 | 2,731,772 | |
| Dallas Fort Worth Int'l. Arpt. Rev.: | |||
| Series 2020 B: | |||
4% 11/1/34 | 1,320,000 | 1,388,948 | |
4% 11/1/35 | 1,175,000 | 1,223,931 | |
| Series 2023 B, 5% 11/1/39 | 2,600,000 | 3,008,290 | |
| Dallas Independent School District Series 2019, 5% 2/15/24 | 655,000 | 655,410 | |
| Dallas Wtrwks. & Swr. Sys. Rev. Series 2017, 5% 10/1/46 | 470,000 | 493,021 | |
| Denton Independent School District Bonds Series 2014 B: | |||
| 2%, tender 8/1/24 (b) | 85,000 | 84,526 | |
| 2%, tender 8/1/24 (b) | 455,000 | 451,864 | |
| 2%, tender 8/1/24 (b) | 90,000 | 89,498 | |
| Frisco Texas: | |||
| Series 2020: | |||
2% 2/15/34 | 1,545,000 | 1,319,756 | |
2% 2/15/35 | 1,575,000 | 1,316,868 | |
2% 2/15/36 | 1,610,000 | 1,309,337 | |
2% 2/15/37 | 1,640,000 | 1,288,478 | |
| Series 2022: | |||
2% 2/15/35 | 4,460,000 | 3,729,036 | |
2% 2/15/36 | 4,550,000 | 3,700,300 | |
| Grand Parkway Trans. Corp. Bonds Series 2023, 5%, tender 4/1/28 (b) | 10,230,000 | 10,938,440 | |
| Harris County Cultural Ed. Facilities Fin. Corp. Med. Facilities Rev. Series 2024, 5% 5/15/29 (d) | 2,250,000 | 2,480,397 | |
| Harris County Toll Road Rev. Series 2018 A, 5% 8/15/43 | 470,000 | 495,118 | |
| Hays Consolidated Independent School District Series 2022: | |||
| 4% 2/15/38 | 1,000,000 | 1,044,237 | |
| 4% 2/15/39 | 2,000,000 | 2,075,243 | |
| 4% 2/15/40 | 2,000,000 | 2,063,083 | |
| 4% 2/15/41 | 2,000,000 | 2,053,462 | |
| Houston Arpt. Sys. Rev. Series 2018 D, 5% 7/1/39 | 2,035,000 | 2,185,596 | |
| Houston Convention and Entertainment Facilities Dept. Hotel Occupancy Tax and Spl. Rev. Series 2019, 5% 9/1/33 | 715,000 | 775,887 | |
| Houston Gen. Oblig. Series 2017 A, 5% 3/1/31 | 1,170,000 | 1,246,796 | |
| Houston Util. Sys. Rev. Series 2021 A: | |||
| 5% 11/15/26 | 355,000 | 375,916 | |
| 5% 11/15/28 | 1,480,000 | 1,631,392 | |
| Irving Hosp. Auth. Hosp. Rev. Series 2017 A, 5% 10/15/35 | 385,000 | 395,505 | |
| Katy Independent School District Series 2023: | |||
| 5% 2/15/38 | 500,000 | 567,170 | |
| 5% 2/15/39 | 1,500,000 | 1,694,189 | |
| 5% 2/15/40 | 330,000 | 371,073 | |
| Lower Colorado River Auth. Rev. (LCRA Transmission Svcs. Corp. Proj.): | |||
| Series 2018: | |||
5% 5/15/43 | 1,405,000 | 1,481,506 | |
5% 5/15/48 | 1,590,000 | 1,660,769 | |
| Series 2020, 5% 5/15/28 | 2,105,000 | 2,289,348 | |
| Series 2023: | |||
5% 5/15/36 | 3,000,000 | 3,451,953 | |
5% 5/15/37 | 1,400,000 | 1,596,447 | |
5% 5/15/38 | 1,500,000 | 1,695,666 | |
5% 5/15/39 | 1,915,000 | 2,153,663 | |
5% 5/15/40 | 2,500,000 | 2,788,800 | |
| Midlothian Independent School District Bonds Series 2013 C, 2%, tender 8/1/24 (b) | 530,000 | 526,348 | |
| Newark Higher Ed. Fin. Corp. (Abilene Christian Univ. Proj.) Series 2016 A, 5% 4/1/28 | 1,450,000 | 1,503,841 | |
| North East Texas Independent School District Bonds Series 2019, 2.2%, tender 8/1/24 (b) | 325,000 | 321,709 | |
| North Texas Tollway Auth. Rev.: | |||
| Series 2016 A, 5% 1/1/30 | 700,000 | 727,285 | |
| Series 2018: | |||
4% 1/1/38 | 1,715,000 | 1,735,091 | |
5% 1/1/35 | 470,000 | 507,896 | |
| Series 2019 B, 5% 1/1/25 | 605,000 | 615,119 | |
| Series 2021 B, 4% 1/1/33 | 1,870,000 | 1,967,363 | |
| Northside Independent School District Bonds: | |||
| Series 2020, 0.7%, tender 6/1/25 (b) | 1,510,000 | 1,461,176 | |
| Series 2023 B, 3%, tender 8/1/26 (b) | 10,345,000 | 10,252,143 | |
| Pasadena Independent School District Bonds Series 2015 B, 1.5%, tender 8/15/24 (b) | 2,175,000 | 2,153,078 | |
| Plano Gen. Oblig.: | |||
| Series 2018, 3.37% 9/1/37 | 840,000 | 825,205 | |
| Series 2023, 5% 9/1/40 | 1,000,000 | 1,126,957 | |
| Prosper Independent School District: | |||
| Bonds Series 2019 B, 4%, tender 8/15/26 (b) | 1,825,000 | 1,854,393 | |
| Series 2021 A, 3% 2/15/37 | 1,480,000 | 1,384,031 | |
| San Antonio Elec. & Gas Sys. Rev.: | |||
| Bonds Series 2020, 1.75%, tender 12/1/25 (b) | 10,060,000 | 9,679,515 | |
| Series 2021 A, 5% 2/1/46 | 3,690,000 | 3,955,758 | |
| Tarrant County Cultural Ed. Facilities Fin. Corp. Hosp. Rev.: | |||
| Series 2020, 5% 12/1/24 | 515,000 | 522,810 | |
| Series 2022: | |||
4% 10/1/42 | 1,185,000 | 1,166,716 | |
4% 10/1/47 | 1,265,000 | 1,224,655 | |
4% 10/1/52 | 2,810,000 | 2,645,225 | |
5% 10/1/36 | 515,000 | 579,085 | |
5% 10/1/40 | 1,870,000 | 2,044,308 | |
| Tarrant County Cultural Ed. Facilities Fin. Corp. Retirement Facility Rev. (Buckner Retirement Svcs., Inc.) Series 2016 B, 5% 11/15/40 | 890,000 | 894,851 | |
| Tarrant County Cultural Ed. Facilities Fin. Corp. Rev. Series 2016 A, 5% 2/15/47 | 7,485,000 | 7,651,196 | |
| Texas Dept. of Hsg. & Cmnty. Affairs Multi-family Hsg. Rev. Series 2019, 2.95% 7/1/36 | 698,168 | 620,855 | |
| Texas Dept. of Hsg. & Cmnty. Affairs Residential Mtg. Rev. Series 2023 B, 6% 1/1/54 | 4,040,000 | 4,462,178 | |
| Texas Dept. of Hsg. & Cmnty. Affairs Single Family Mtg. Rev.: | |||
| Series 2019 A, 4% 3/1/50 | 555,000 | 552,753 | |
| Series 2023, 6% 3/1/54 | 2,400,000 | 2,655,094 | |
| Texas Muni. Gas Acquisition & Supply Corp. Bonds Series 2023 B, 5.5%, tender 1/1/34 (b) | 1,090,000 | 1,219,313 | |
| Texas Private Activity Bond Surface Trans. Corp. (LBJ Infrastructure Group LLC I-635 Managed Lanes Proj.) Series 2020 A: | |||
| 4% 6/30/36 | 770,000 | 778,452 | |
| 4% 6/30/38 | 1,965,000 | 1,981,527 | |
| 4% 12/31/39 | 1,640,000 | 1,650,932 | |
| Texas Trans. Commission Series 2019 A, 0% 8/1/41 | 1,405,000 | 619,705 | |
| Texas Trans. Commission Hwy. Impt. Gen. Oblig. Bonds Series 2014 B, 0.65%, tender 4/1/26 (b) | 8,695,000 | 8,078,810 | |
| Waco Gen. Oblig. Series 2020: | |||
| 2.25% 2/1/36 | 1,935,000 | 1,604,660 | |
| 2.375% 2/1/40 | 710,000 | 535,021 | |
TOTAL TEXAS | 175,271,853 | ||
| Utah - 0.5% | |||
| Salt Lake City Arpt. Rev. Series 2021 B: | |||
| 5% 7/1/46 | 2,305,000 | 2,513,697 | |
| 5% 7/1/51 | 9,285,000 | 10,020,380 | |
TOTAL UTAH | 12,534,077 | ||
| Vermont - 0.1% | |||
| Vermont Hsg. Fin. Agcy.: | |||
| Series 2021 B, 3% 11/1/51 | 961,000 | 921,678 | |
| Series 2022 A, 5.25% 11/1/52 | 1,000,000 | 1,045,005 | |
| Series A, 3.75% 11/1/50 | 1,131,000 | 1,120,461 | |
TOTAL VERMONT | 3,087,144 | ||
| Virginia - 0.5% | |||
| Arlington County IDA Hosp. Facilities Bonds Series 2023 A, 5%, tender 7/1/31 (b) | 4,425,000 | 4,901,507 | |
| Lynchburg Econ. Dev. Series 2021, 3% 1/1/51 | 1,550,000 | 1,145,059 | |
| Roanoke Econ. Dev. Auth. Edl. Facilities Series 2018 A, 5% 9/1/27 | 470,000 | 487,917 | |
| Salem Econ. Dev. Auth. Series 2020: | |||
| 4% 4/1/38 | 260,000 | 249,941 | |
| 4% 4/1/39 | 235,000 | 223,201 | |
| 4% 4/1/40 | 260,000 | 244,432 | |
| 4% 4/1/45 | 700,000 | 627,480 | |
| 5% 4/1/24 | 280,000 | 280,460 | |
| 5% 4/1/26 | 330,000 | 338,371 | |
| 5% 4/1/27 | 330,000 | 342,826 | |
| 5% 4/1/28 | 410,000 | 430,812 | |
| 5% 4/1/29 | 540,000 | 573,619 | |
| 5% 4/1/49 | 935,000 | 945,065 | |
| Virginia Port Auth. Commonwealth Port Rev. Series 2023 A, 5% 7/1/40 | 1,165,000 | 1,343,893 | |
TOTAL VIRGINIA | 12,134,583 | ||
| Washington - 2.3% | |||
| King County Gen. Oblig. Series 2021 A, 2% 1/1/36 | 2,200,000 | 1,816,778 | |
| King County Hsg. Auth. Rev. Series 2021, 4% 12/1/29 | 675,000 | 698,828 | |
| King County Swr. Rev. Bonds Series 2020 B, 0.875%, tender 1/1/26 (b) | 2,150,000 | 1,993,815 | |
| King County Wash Hsg. Auth. Afford (Kirkland Heights Proj.) Series 2023 A3: | |||
| 4.5% 1/1/40 | 1,000,000 | 1,040,588 | |
| 4.625% 1/1/41 | 2,400,000 | 2,510,470 | |
| Port of Seattle Rev. Series 2015 B, 5% 3/1/25 | 235,000 | 237,602 | |
| Seattle Hsg. Auth. Rev. (Juniper Apts. Proj.) Series 2023, 4.375% 12/1/30 | 2,020,000 | 2,075,150 | |
| Spokane County School District #81 (WA State School District Cr. Enhancement Prog.) Series 2017 B, 5% 12/1/29 | 2,995,000 | 3,238,099 | |
| Spokane Pub. Facilities District Hotel/Motel Tax & Sales/Use Tax Rev. Series 2017, 5% 12/1/38 | 1,100,000 | 1,130,841 | |
| Washington Convention Ctr. Pub. Facilities: | |||
| Series 2021 B, 3% 7/1/43 | 500,000 | 396,702 | |
| Series 2021, 4% 7/1/31 | 9,195,000 | 9,123,536 | |
| Washington Gen. Oblig. Series 2017 D, 5% 2/1/35 | 470,000 | 498,593 | |
| Washington Health Care Facilities Auth. Rev.: | |||
| (Overlake Hosp. Med. Ctr., WA. Proj.) Series 2017 B: | |||
5% 7/1/27 | 810,000 | 833,244 | |
5% 7/1/31 | 40,000 | 41,490 | |
5% 7/1/42 | 525,000 | 533,190 | |
| (Virginia Mason Med. Ctr. Proj.) Series 2017: | |||
5% 8/15/25 | 230,000 | 233,790 | |
5% 8/15/26 | 210,000 | 215,462 | |
| Series 2015 B, 5% 10/1/38 | 3,950,000 | 4,349,927 | |
| Series 2017 A, 4% 7/1/42 | 5,410,000 | 4,947,112 | |
| Series 2017: | |||
4% 8/15/42 | 6,550,000 | 5,912,002 | |
5% 8/15/36 | 470,000 | 482,499 | |
| Series 2020: | |||
5% 9/1/38 | 1,870,000 | 2,015,344 | |
5% 9/1/45 | 2,105,000 | 2,229,531 | |
5% 9/1/50 | 2,340,000 | 2,455,360 | |
| Washington Higher Ed. Facilities Auth. Rev.: | |||
| (Gonzaga Univ. Proj.) Series 2019 A, 3% 4/1/49 | 2,645,000 | 1,945,398 | |
| (Whitworth Univ. Proj.): | |||
Series 2016 A: | |||
5% 10/1/25 | 400,000 | 408,229 | |
5% 10/1/26 | 1,880,000 | 1,946,012 | |
5% 10/1/34 | 1,415,000 | 1,460,058 | |
Series 2019, 4% 10/1/49 | 2,470,000 | 2,165,184 | |
TOTAL WASHINGTON | 56,934,834 | ||
| West Virginia - 0.9% | |||
| West Virginia Hosp. Fin. Auth. Hosp. Rev.: | |||
| Series 2023 A: | |||
5% 6/1/37 | 1,400,000 | 1,567,710 | |
5% 6/1/38 | 500,000 | 553,524 | |
5% 6/1/40 | 1,970,000 | 2,158,710 | |
5% 6/1/41 | 1,970,000 | 2,150,584 | |
5% 6/1/43 | 3,505,000 | 3,804,656 | |
| Series 2023 B, 6% 9/1/53 | 4,500,000 | 5,164,859 | |
| Series 2023, 6% 9/1/48 | 5,560,000 | 6,441,300 | |
TOTAL WEST VIRGINIA | 21,841,343 | ||
| Wisconsin - 2.1% | |||
| Howard Suamico Scd Series 2021, 2% 3/1/38 | 1,065,000 | 816,844 | |
| Pub. Fin. Auth. Edl. Facilities: | |||
| Series 2018 A: | |||
5.25% 10/1/43 | 495,000 | 491,749 | |
5.25% 10/1/48 | 495,000 | 477,571 | |
| Series 2022 A: | |||
5.25% 3/1/42 | 1,320,000 | 1,373,767 | |
5.25% 3/1/47 | 6,175,000 | 6,335,187 | |
| Pub. Fin. Auth. Hosp. Rev.: | |||
| (Renown Reg'l. Med. Ctr. Proj.) Series 2020 A: | |||
4% 6/1/45 | 5,040,000 | 4,737,313 | |
5% 6/1/30 | 765,000 | 826,352 | |
| Series 2019 A, 5% 10/1/44 | 1,350,000 | 1,406,969 | |
| Series 2020 A, 3% 6/1/45 | 4,855,000 | 3,777,503 | |
| Pub. Fin. Auth. Sr. Living Rev. (Mary's Woods At Marylhurst, Inc. Proj.) Series 2017 A: | |||
| 5.25% 5/15/37 (c) | 2,235,000 | 2,162,176 | |
| 5.25% 5/15/42 (c) | 840,000 | 786,470 | |
| 5.25% 5/15/47 (c) | 1,225,000 | 1,106,155 | |
| Roseman Univ. of Health: | |||
| Series 2020, 5% 4/1/50 (c) | 395,000 | 360,104 | |
| Series 2021 A: | |||
3% 7/1/50 | 1,385,000 | 1,025,362 | |
4.5% 6/1/56 (c) | 5,935,000 | 4,672,766 | |
| Series 2021 B, 6.5% 6/1/56 (c) | 1,815,000 | 1,527,333 | |
| Wisconsin Gen. Oblig. Series 2021 A, 5% 5/1/33 | 475,000 | 520,371 | |
| Wisconsin Health & Edl. Facilities: | |||
| Series 2013 B1, 4% 11/15/43 | 1,000,000 | 984,541 | |
| Series 2016, 4% 12/1/46 | 2,500,000 | 2,445,224 | |
| Series 2018, 5% 4/1/34 | 1,870,000 | 2,012,756 | |
| Series 2019 A: | |||
5% 11/1/25 | 225,000 | 222,836 | |
5% 11/1/29 | 160,000 | 153,956 | |
5% 12/1/30 | 280,000 | 304,989 | |
5% 12/1/31 | 280,000 | 304,721 | |
5% 12/1/32 | 330,000 | 359,438 | |
5% 12/1/33 | 330,000 | 359,024 | |
5% 12/1/34 | 330,000 | 359,073 | |
5% 12/1/35 | 420,000 | 455,771 | |
5% 7/1/44 | 470,000 | 481,962 | |
5% 11/1/46 | 1,350,000 | 1,098,670 | |
5% 7/1/49 | 1,870,000 | 1,908,383 | |
| Series 2019 B, 5% 7/1/38 | 330,000 | 341,354 | |
| Series 2019 B1, 2.825% 11/1/28 | 200,000 | 180,392 | |
| Series 2019: | |||
5% 10/1/24 | 255,000 | 257,745 | |
5% 10/1/26 | 515,000 | 540,570 | |
| Wisconsin Health & Edl. Facilities Auth. Rev. Series 2021: | |||
| 3% 10/15/37 | 1,700,000 | 1,488,192 | |
| 3% 8/15/51 | 3,200,000 | 2,362,236 | |
| 5% 8/15/35 | 1,550,000 | 1,700,731 | |
| Wisconsin Hsg. & Econ. Dev. Auth.: | |||
| Series 2021 A, 3% 3/1/52 | 725,000 | 700,424 | |
| Series 2021 C, 3% 9/1/52 | 1,120,000 | 1,081,417 | |
| Wisconsin Hsg. & Econ. Dev. Auth. Hsg. Rev. Bonds Series 2021 C: | |||
| 0.61%, tender 5/1/24 (b) | 185,000 | 183,057 | |
| 0.81%, tender 5/1/25 (b) | 715,000 | 684,033 | |
TOTAL WISCONSIN | 53,375,487 | ||
| Wyoming - 0.1% | |||
| Wyoming Cmnty. Dev. Auth. Hsg. Rev. Series 2019 3, 3.75% 12/1/49 | 1,375,000 | 1,366,026 | |
| TOTAL MUNICIPAL BONDS (Cost $2,478,765,077) | 2,456,686,711 | ||
| Money Market Funds - 2.2% | |||
| Shares | Value ($) | ||
Fidelity Tax-Free Cash Central Fund 4.41% (g)(h) (Cost $55,689,340) | 55,673,381 | 55,695,648 | |
| TOTAL INVESTMENT IN SECURITIES - 99.3% (Cost $2,534,454,417) | 2,512,382,359 |
NET OTHER ASSETS (LIABILITIES) - 0.7% | 18,322,443 |
| NET ASSETS - 100.0% | 2,530,704,802 |
| (a) | Amount is stated in United States dollars unless otherwise noted. |
| (b) | Coupon rates for floating and adjustable rate securities reflect the rates in effect at period end. |
| (c) | Security exempt from registration under Rule 144A of the Securities Act of 1933. These securities may be resold in transactions exempt from registration, normally to qualified institutional buyers. At the end of the period, the value of these securities amounted to $25,471,939 or 1.0% of net assets. |
| (d) | Security or a portion of the security purchased on a delayed delivery or when-issued basis. |
| (e) | Level 3 security |
| (f) | Security initially issued at one coupon which converts to a higher coupon at a specified date. The rate shown is the rate at period end. |
| (g) | Information in this report regarding holdings by state and security types does not reflect the holdings of the Fidelity Tax-Free Cash Central Fund. |
| (h) | Affiliated fund that is generally available only to investment companies and other accounts managed by Fidelity Investments. The rate quoted is the annualized seven-day yield of the fund at period end. A complete unaudited listing of the fund's holdings as of its most recent quarter end is available upon request. In addition, each Fidelity Central Fund's financial statements, which are not covered by the Fund's Report of Independent Registered Public Accounting Firm, are available on the SEC's website or upon request. |
| Affiliate | Value, beginning of period ($) | Purchases ($) | Sales Proceeds ($) | Dividend Income ($) | Realized Gain (loss) ($) | Change in Unrealized appreciation (depreciation) ($) | Value, end of period ($) | % ownership, end of period |
| Fidelity Tax-Free Cash Central Fund 4.41% | 198,073,458 | 808,517,023 | 950,905,000 | 4,532,574 | 5,893 | 4,274 | 55,695,648 | 5.4% |
| Total | 198,073,458 | 808,517,023 | 950,905,000 | 4,532,574 | 5,893 | 4,274 | 55,695,648 | |
| Valuation Inputs at Reporting Date: | ||||
| Description | Total ($) | Level 1 ($) | Level 2 ($) | Level 3 ($) |
Investments in Securities: | ||||
| Municipal Securities | 2,456,686,711 | - | 2,456,324,911 | 361,800 |
| Money Market Funds | 55,695,648 | 55,695,648 | - | - |
| Total Investments in Securities: | 2,512,382,359 | 55,695,648 | 2,456,324,911 | 361,800 |
| Statement of Assets and Liabilities | ||||
| January 31, 2024 | ||||
| Assets | ||||
| Investment in securities, at value - See accompanying schedule: | ||||
Unaffiliated issuers (cost $2,478,765,077) | $ | 2,456,686,711 | ||
Fidelity Central Funds (cost $55,689,340) | 55,695,648 | |||
| Total Investment in Securities (cost $2,534,454,417) | $ | 2,512,382,359 | ||
| Cash | 107,762 | |||
| Receivable for fund shares sold | 7,747,078 | |||
| Interest receivable | 25,062,737 | |||
| Distributions receivable from Fidelity Central Funds | 200,515 | |||
| Prepaid expenses | 2,024 | |||
| Receivable from investment adviser for expense reductions | 253,901 | |||
| Other receivables | 854 | |||
Total assets | 2,545,757,230 | |||
| Liabilities | ||||
| Payable for investments purchased on a delayed delivery basis | $ | 4,835,303 | ||
| Payable for fund shares redeemed | 2,869,475 | |||
| Distributions payable | 6,427,722 | |||
| Accrued management fee | 734,244 | |||
| Other payables and accrued expenses | 185,684 | |||
| Total Liabilities | 15,052,428 | |||
| Net Assets | $ | 2,530,704,802 | ||
| Net Assets consist of: | ||||
| Paid in capital | $ | 2,625,396,295 | ||
| Total accumulated earnings (loss) | (94,691,493) | |||
| Net Assets | $ | 2,530,704,802 | ||
Net Asset Value, offering price and redemption price per share ($2,530,704,802 ÷ 250,395,938 shares) | $ | 10.11 | ||
| Statement of Operations | ||||
Year ended January 31, 2024 | ||||
| Investment Income | ||||
| Interest | $ | 78,625,413 | ||
| Income from Fidelity Central Funds | 4,531,715 | |||
| Total Income | 83,157,128 | |||
| Expenses | ||||
| Management fee | $ | 9,007,813 | ||
| Custodian fees and expenses | 25,928 | |||
| Independent trustees' fees and expenses | 8,691 | |||
| Registration fees | 225,520 | |||
| Audit | 66,049 | |||
| Legal | 6,467 | |||
| Miscellaneous | 12,289 | |||
| Total expenses before reductions | 9,352,757 | |||
| Expense reductions | (2,944,018) | |||
| Total expenses after reductions | 6,408,739 | |||
| Net Investment income (loss) | 76,748,389 | |||
| Realized and Unrealized Gain (Loss) | ||||
| Net realized gain (loss) on: | ||||
| Investment Securities: | ||||
| Unaffiliated issuers | (44,780,886) | |||
| Fidelity Central Funds | 5,893 | |||
| Capital gain distributions from Fidelity Central Funds | 859 | |||
| Total net realized gain (loss) | (44,774,134) | |||
| Change in net unrealized appreciation (depreciation) on: | ||||
| Investment Securities: | ||||
| Unaffiliated issuers | 50,990,229 | |||
| Fidelity Central Funds | 4,274 | |||
| Total change in net unrealized appreciation (depreciation) | 50,994,503 | |||
| Net gain (loss) | 6,220,369 | |||
| Net increase (decrease) in net assets resulting from operations | $ | 82,968,758 | ||
| Statement of Changes in Net Assets | ||||
Year ended January 31, 2024 | Year ended January 31, 2023 | |||
| Increase (Decrease) in Net Assets | ||||
| Operations | ||||
| Net investment income (loss) | $ | 76,748,389 | $ | 50,574,529 |
| Net realized gain (loss) | (44,774,134) | (40,035,448) | ||
| Change in net unrealized appreciation (depreciation) | 50,994,503 | (91,702,603) | ||
| Net increase (decrease) in net assets resulting from operations | 82,968,758 | (81,163,522) | ||
| Distributions to shareholders | (74,855,846) | (50,249,974) | ||
| Share transactions | ||||
| Proceeds from sales of shares | 2,201,937,433 | 7,092,031,431 | ||
| Reinvestment of distributions | 1,678 | 1,421,586 | ||
| Cost of shares redeemed | (2,089,472,684) | (6,717,430,416) | ||
Net increase (decrease) in net assets resulting from share transactions | 112,466,427 | 376,022,601 | ||
| Total increase (decrease) in net assets | 120,579,339 | 244,609,105 | ||
| Net Assets | ||||
| Beginning of period | 2,410,125,463 | 2,165,516,358 | ||
| End of period | $ | 2,530,704,802 | $ | 2,410,125,463 |
| Other Information | ||||
| Shares | ||||
| Sold | 228,418,341 | 715,122,762 | ||
| Issued in reinvestment of distributions | 171 | 141,280 | ||
| Redeemed | (219,027,209) | (678,388,942) | ||
| Net increase (decrease) | 9,391,303 | 36,875,100 | ||
| Fidelity® SAI Tax-Free Bond Fund |
| Years ended January 31, | 2024 | 2023 | 2022 | 2021 | 2020 | |||||
Selected Per-Share Data | ||||||||||
| Net asset value, beginning of period | $ | 10.00 | $ | 10.61 | $ | 10.97 | $ | 10.89 | $ | 10.19 |
| Income from Investment Operations | ||||||||||
Net investment income (loss) A,B | .289 | .230 | .194 | .215 | .241 | |||||
| Net realized and unrealized gain (loss) | .103 | (.613) | (.359) | .085 | .735 | |||||
| Total from investment operations | .392 | (.383) | (.165) | .300 | .976 | |||||
| Distributions from net investment income | (.282) | (.227) | (.194) | (.216) | (.248) | |||||
| Distributions from net realized gain | - | - | (.001) | (.004) | (.028) | |||||
| Total distributions | (.282) | (.227) | (.195) | (.220) | (.276) | |||||
| Net asset value, end of period | $ | 10.11 | $ | 10.00 | $ | 10.61 | $ | 10.97 | $ | 10.89 |
Total Return C,D | 4.05% | (3.55)% | (1.53)% | 2.83% | 9.68% | |||||
Ratios to Average Net Assets B,E,F | ||||||||||
| Expenses before reductions | .36% | .38% | .36% | .36% | .43% | |||||
| Expenses net of fee waivers, if any | .25% | .25% | .25% | .25% | .25% | |||||
| Expenses net of all reductions | .25% | .25% | .25% | .25% | .25% | |||||
| Net investment income (loss) | 2.95% | 2.33% | 1.78% | 2.02% | 2.28% | |||||
| Supplemental Data | ||||||||||
| Net assets, end of period (000 omitted) | $ | 2,530,705 | $ | 2,410,125 | $ | 2,165,516 | $ | 1,797,621 | $ | 1,603,522 |
Portfolio turnover rate G | 27% | 23% H | 6% | 32% | 12% |
| Fidelity Central Fund | Investment Manager | Investment Objective | Investment Practices | Expense RatioA |
| Fidelity Money Market Central Funds | Fidelity Management & Research Company LLC (FMR) | Each fund seeks to obtain a high level of current income consistent with the preservation of capital and liquidity. | Short-term Investments | Less than .005% |
| Gross unrealized appreciation | $55,796,483 |
| Gross unrealized depreciation | (75,694,363) |
| Net unrealized appreciation (depreciation) | $(19,897,880) |
| Tax Cost | $2,532,280,239 |
| Capital loss carryforward | $(74,784,918) |
| Net unrealized appreciation (depreciation) on securities and other investments | $(19,897,880) |
Short-term | $(12,351,691) |
Long-term | (62,433,227) |
| Total capital loss carryforward | $(74,784,918) |
| January 31, 2024 | January 31, 2023 | |
| Tax-exempt Income | $74,855,846 | $50,249,974 |
| Purchases ($) | Sales ($) | |
| Fidelity SAI Tax-Free Bond Fund | 940,860,681 | 671,386,618 |
| Shares | Total net realized gain or loss ($) | Total Proceeds ($) | ||
| Fidelity SAI Tax-Free Bond Fund | 13,577,568 | (10,160,414) | 131,430,855 |
| Amount | |
| Fidelity SAI Tax-Free Bond Fund | $4,503 |
| The Example is based on an investment of $1,000 invested at the beginning of the period and held for the entire period (August 1, 2023 to January 31, 2024). |
Annualized Expense Ratio- A | Beginning Account Value August 1, 2023 | Ending Account Value January 31, 2024 | Expenses Paid During Period- C August 1, 2023 to January 31, 2024 | |||||||
| Fidelity® SAI Tax-Free Bond Fund | .25% | |||||||||
| Actual | $ 1,000 | $ 1,038.80 | $ 1.28 | |||||||
Hypothetical-B | $ 1,000 | $ 1,023.95 | $ 1.28 | |||||||
- Highly liquid investments - cash or convertible to cash within three business days or less
- Moderately liquid investments - convertible to cash in three to seven calendar days
- Less liquid investments - can be sold or disposed of, but not settled, within seven calendar days
- Illiquid investments - cannot be sold or disposed of within seven calendar days
| A special meeting of shareholders was held on October 18, 2023. The results of votes taken among shareholders on the proposal before them are reported below. Each vote reported represents one dollar of net asset value held on the record date for the meeting. | ||
| Proposal 1 | ||
| To elect a Board of Trustees. | ||
# of Votes | % of Votes | |
| Abigail P. Johnson | ||
| Affirmative | 378,729,502,260.01 | 97.58 |
| Withheld | 9,407,876,478.96 | 2.42 |
| TOTAL | 388,137,378,738.97 | 100.00 |
| Jennifer Toolin McAuliffe | ||
| Affirmative | 378,454,868,010.95 | 97.51 |
| Withheld | 9,682,510,728.02 | 2.49 |
| TOTAL | 388,137,378,738.97 | 100.00 |
| Christine J. Thompson | ||
| Affirmative | 378,837,121,274.52 | 97.60 |
| Withheld | 9,300,257,464.45 | 2.40 |
| TOTAL | 388,137,378,738.97 | 100.00 |
| Elizabeth S. Acton | ||
| Affirmative | 378,262,110,794.85 | 97.46 |
| Withheld | 9,875,267,944.12 | 2.54 |
| TOTAL | 388,137,378,738.97 | 100.00 |
| Laura M. Bishop | ||
| Affirmative | 380,482,113,171.06 | 98.03 |
| Withheld | 7,655,265,567.91 | 1.97 |
| TOTAL | 388,137,378,738.97 | 100.00 |
| Ann E. Dunwoody | ||
| Affirmative | 380,016,034,008.12 | 97.91 |
| Withheld | 8,121,344,730.85 | 2.09 |
| TOTAL | 388,137,378,738.97 | 100.00 |
| John Engler | ||
| Affirmative | 379,432,488,394.20 | 97.76 |
| Withheld | 8,704,890,344.77 | 2.24 |
| TOTAL | 388,137,378,738.97 | 100.00 |
| Robert F. Gartland | ||
| Affirmative | 378,741,819,600.60 | 97.58 |
| Withheld | 9,395,559,138.37 | 2.42 |
| TOTAL | 388,137,378,738.97 | 100.00 |
| Robert W. Helm | ||
| Affirmative | 380,389,324,755.07 | 98.00 |
| Withheld | 7,748,053,983.90 | 2.00 |
| TOTAL | 388,137,378,738.97 | 100.00 |
| Arthur E. Johnson | ||
| Affirmative | 378,427,694,151.67 | 97.50 |
| Withheld | 9,709,684,587.30 | 2.50 |
| TOTAL | 388,137,378,738.97 | 100.00 |
| Michael E. Kenneally | ||
| Affirmative | 377,842,228,145.18 | 97.35 |
| Withheld | 10,295,150,593.79 | 2.65 |
| TOTAL | 388,137,378,738.97 | 100.00 |
| Mark A. Murray | ||
| Affirmative | 380,158,432,703.37 | 97.94 |
| Withheld | 7,978,946,035.60 | 2.06 |
| TOTAL | 388,137,378,738.97 | 100.00 |
| Carol J. Zierhoffer | ||
| Affirmative | 380,522,113,360.24 | 98.04 |
| Withheld | 7,615,265,378.73 | 1.96 |
| TOTAL | 388,137,378,738.97 | 100.00 |
| Proposal 1 reflects trust wide proposal and voting results. | ||
 |


Contents
| Average Annual Total Returns | |||
Periods ended January 31, 2024 | Past 1 year | Life of Fund A |
Class A (incl. 4.00% sales charge) | -1.02% | 1.20% |
Class M (incl. 4.00% sales charge) | -1.02% | 1.20% |
Class C (incl. contingent deferred sales charge) | 1.40% | 2.79% |
| Fidelity® Sustainable Intermediate Municipal Income Fund | 3.36% | 3.78% |
| Class I | 3.36% | 3.78% |
| Class Z | 3.42% | 3.84% |
| $10,000 Over Life of Fund |
Let's say hypothetically that $10,000 was invested in Fidelity® Sustainable Intermediate Municipal Income Fund, a class of the fund, on April 13, 2022, when the fund started. The chart shows how the value of your investment would have changed, and also shows how the Bloomberg Municipal Bond Index performed over the same period. |
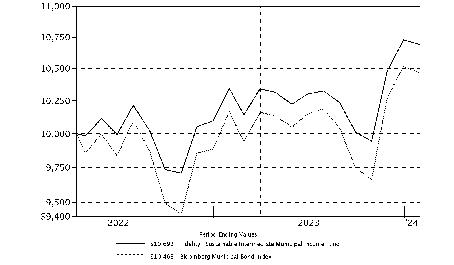 |
| Top Five States (% of Fund's net assets) | |
| New York | 9.5 |
| Illinois | 8.7 |
| Florida | 7.1 |
| California | 6.6 |
| Massachusetts | 6.1 |
| Revenue Sources (% of Fund's net assets) | ||
| General Obligations | 25.7 | |
| Health Care | 15.5 | |
| Education | 15.1 | |
| Electric Utilities | 11.8 | |
| Housing | 6.9 | |
| Special Tax | 6.1 | |
| State G.O. | 6.0 | |
| Transportation | 5.3 | |
| Others* (Individually Less Than 5%) | 7.6 | |
| 100.0 | ||
| *Includes net other assets | ||
Quality Diversification (% of Fund's net assets) |
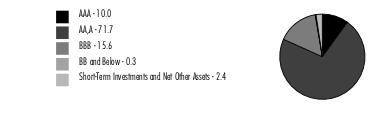 |
| We have used ratings from Moody's Investors Service, Inc. Where Moody's® ratings are not available, we have used S&P® ratings. All ratings are as of the date indicated and do not reflect subsequent changes. |
| Municipal Bonds - 97.6% | |||
Principal Amount (a) | Value ($) | ||
| Alabama - 4.1% | |||
| Black Belt Energy Gas District Bonds: | |||
| Series 2022 D1, 4%, tender 6/1/27 (b) | 10,000 | 10,041 | |
| Series 2022 F, 5.5%, tender 12/1/28 (b) | 100,000 | 106,432 | |
| Mobile Indl. Dev. Board Poll. Cont. Rev. Bonds: | |||
| (Alabama Pwr. Co. Barry Plant Proj.) Series 2007 C, 3.78%, tender 6/16/26 (b) | 100,000 | 100,526 | |
| Series 2009 E, 1%, tender 6/26/25 (b) | 205,000 | 197,844 | |
| Southeast Energy Auth. Coop. Dis Bonds (Proj. No. 6) Series 2023 B, 5%, tender 6/1/30 (b) | 140,000 | 148,602 | |
| Southeast Energy Auth. Rev. Bonds Series 2022 B1, 5%, tender 8/1/28 (b) | 20,000 | 20,843 | |
TOTAL ALABAMA | 584,288 | ||
| Arizona - 3.8% | |||
| Arizona Indl. Dev. Auth. Rev. Series 2019 2, 3.625% 5/20/33 | 92,317 | 86,569 | |
| Chandler Indl. Dev. Auth. Indl. Dev. Rev.: | |||
| (Intel Corp. Proj.) Series 2022 2, 5%, tender 9/1/27 (b)(c) | 50,000 | 51,740 | |
| Bonds (Intel Corp. Proj.) Series 2007, 4.1%, tender 6/15/28 (b)(c) | 100,000 | 101,129 | |
| Maricopa County Unified School District #48 Scottsdale Series D, 4% 7/1/24 | 80,000 | 80,303 | |
| Phoenix Civic Impt. Corp. Wastewtr. Sys. Rev. Series 2016, 5% 7/1/30 | 50,000 | 52,495 | |
| Salt Verde Finl. Corp. Sr. Gas Rev. Series 2007 1, 5% 12/1/32 | 165,000 | 176,412 | |
TOTAL ARIZONA | 548,648 | ||
| California - 6.6% | |||
| California Health Facilities Fing. Auth. Rev. Bonds Series 2019 C, 5%, tender 10/1/25 (b) | 150,000 | 153,086 | |
| California Hsg. Fin. Agcy.: | |||
| Series 2019 A, 4% 3/20/33 | 93,345 | 93,849 | |
| Series 2021 1, 3.5% 11/20/35 | 105,331 | 99,245 | |
| California Muni. Fin. Auth. Rev. Series 2018, 5% 10/1/25 | 15,000 | 15,333 | |
| California Muni. Fin. Auth. Solid Waste Disp. Rev. Bonds Series 2023 A, 4.375%, tender 9/1/33 (b)(c) | 140,000 | 146,044 | |
| California Statewide Cmntys. Dev. Auth. Rev. Series 2016, 5% 10/1/33 | 25,000 | 25,868 | |
| Elk Grove Unified School District Series 2019, 3.25% 8/1/38 | 10,000 | 9,551 | |
| Los Angeles Dept. Arpt. Rev. Series 2023 A, 5.25% 5/15/39 (c) | 300,000 | 339,049 | |
| Los Angeles Dept. of Wtr. & Pwr. Wtrwks. Rev.: | |||
| Series 2017 A, 5% 7/1/32 | 15,000 | 16,092 | |
| Series 2022 B, 5% 7/1/31 | 30,000 | 35,848 | |
| Riverside Elec. Rev. Series 2019 A, 5% 10/1/43 | 5,000 | 5,430 | |
| San Francisco Bay Area Rapid Transit District Sales Tax Rev. Series 2015 A, 5% 7/1/27 | 10,000 | 10,290 | |
TOTAL CALIFORNIA | 949,685 | ||
| Colorado - 4.4% | |||
| Colorado Ctfs. of Prtn. Series 2020 A, 4% 12/15/38 | 10,000 | 10,337 | |
| Colorado Health Facilities Auth. Rev. Bonds: | |||
| Bonds Series 2022 B, 5%, tender 8/17/26 (b) | 130,000 | 135,760 | |
| Series 2019 A2, 5% 8/1/33 | 125,000 | 135,458 | |
| Vauxmont Metropolitan District Series 2020, 5% 12/1/28 (Assured Guaranty Muni. Corp. Insured) | 325,000 | 354,264 | |
TOTAL COLORADO | 635,819 | ||
| Connecticut - 3.7% | |||
| Connecticut Gen. Oblig.: | |||
| Series 2019 A, 5% 4/15/33 | 25,000 | 27,910 | |
| Series 2020 A, 3% 1/15/39 | 25,000 | 22,642 | |
| Series 2021 D, 5% 7/15/28 | 75,000 | 82,569 | |
| Connecticut Health & Edl. Facilities Auth. Rev.: | |||
| Bonds Series 2017 C2, 2.8%, tender 2/3/26 (b) | 150,000 | 149,281 | |
| Series 2016 A, 2%, tender 7/1/26 (b) | 35,000 | 33,960 | |
| Connecticut Hsg. Fin. Auth. Series 2021 D1: | |||
| 5% 11/15/27 | 10,000 | 10,712 | |
| 5% 11/15/28 | 25,000 | 27,171 | |
| Connecticut Spl. Tax Oblig. Trans. Infrastructure Rev.: | |||
| Series 2021 A, 4% 5/1/36 | 130,000 | 137,910 | |
| Series A, 5% 5/1/29 | 20,000 | 22,371 | |
| South Central Reg'l. Wtr. Auth. Wtr. Sys. Rev. Series 32 B, 5% 8/1/32 | 25,000 | 26,368 | |
TOTAL CONNECTICUT | 540,894 | ||
| District Of Columbia - 0.2% | |||
| District of Columbia Univ. Rev. Series 2017: | |||
| 5% 4/1/29 | 20,000 | 21,124 | |
| 5% 4/1/33 | 10,000 | 10,532 | |
TOTAL DISTRICT OF COLUMBIA | 31,656 | ||
| Florida - 7.1% | |||
| Broward County School Board Ctfs. of Prtn.: | |||
| Series 2015 A, 5% 7/1/26 | 30,000 | 30,773 | |
| Series 2020 A, 5% 7/1/33 | 25,000 | 28,248 | |
| Duval County School Board Ctfs. of Prtn. Series 2022 A, 5% 7/1/34 (Assured Guaranty Muni. Corp. Insured) | 250,000 | 281,995 | |
| Escambia County Health Facilities Auth. Health Facilities Rev. Series 2020 A, 5% 8/15/34 | 200,000 | 211,000 | |
| Florida Hsg. Fin. Corp. Rev. Series 2020 1, 3.5% 7/1/51 | 65,000 | 64,044 | |
| Hernando County School Board Ctfs. (School Board of Hernando County, Florida Master Lease Prog.) Series 2016 A, 3% 7/1/34 (Assured Guaranty Muni. Corp. Insured) | 30,000 | 28,762 | |
| JEA Wtr. & Swr. Sys. Rev.: | |||
| Series 2017 A, 5% 10/1/29 | 25,000 | 27,031 | |
| Series 2020 A, 3% 10/1/36 | 20,000 | 18,631 | |
| Miami-Dade County Wtr. & Swr. Rev. Series 2017 B, 5% 10/1/27 | 60,000 | 64,795 | |
| Palm Beach County Health Facilities Auth. Hosp. Rev. (Jupiter Med. Ctr. Proj.) Series 2022, 5% 11/1/35 | 100,000 | 107,960 | |
| Palm Beach County School Board Ctfs. of Prtn.: | |||
| Series 2018 A, 5% 8/1/24 | 20,000 | 20,175 | |
| Series 2021 A, 5% 8/1/38 | 125,000 | 140,363 | |
TOTAL FLORIDA | 1,023,777 | ||
| Georgia - 4.2% | |||
| Bartow County Dev. Auth. Poll. Cont. Rev. Bonds (Georgia Pwr. Co. Plant Bowen Proj.): | |||
| Series 2009, 3.95%, tender 3/8/28 (b) | 100,000 | 100,424 | |
| Series 2013, 2.875%, tender 8/19/25 (b) | 100,000 | 98,090 | |
| Fulton County Dev. Auth. Rev. Series 2019, 5% 6/15/44 | 10,000 | 10,581 | |
| Main Street Natural Gas, Inc. Bonds: | |||
| Series 2019 B, 4%, tender 12/2/24 (b) | 135,000 | 135,219 | |
| Series 2021 A, 4%, tender 9/1/27 (b) | 100,000 | 100,445 | |
| Series 2022 B, 5%, tender 6/1/29 (b) | 15,000 | 15,751 | |
| Monroe County Dev. Auth. Poll. Cont. Rev. Bonds (Georgia Pwr. Co. Plant Scherer Proj.) Series 2009, 3.875%, tender 3/6/26 (b) | 100,000 | 100,216 | |
| Private Colleges & Univs. Auth. Rev. Series 2016 B, 3% 10/1/43 | 60,000 | 49,430 | |
TOTAL GEORGIA | 610,156 | ||
| Hawaii - 0.1% | |||
| Honolulu City & County Gen. Oblig. Series 2019 A, 5% 9/1/27 | 10,000 | 10,830 | |
| Illinois - 8.7% | |||
| Illinois Fin. Auth.: | |||
| Series 2022 A, 5% 10/1/32 | 100,000 | 107,037 | |
| Series 2023 A, 5% 5/15/38 | 150,000 | 171,417 | |
| Illinois Fin. Auth. Academic Facilities: | |||
| (Provident Group - UIUC Properties LLC - Univ. of Illinois at Urbana-Champaign Proj.) Series 2019 A, 5% 10/1/29 | 250,000 | 274,799 | |
| (Provident Group UIUC Properties LLC Univ. of Illinois at Urbana-Champaign Proj.) Series 2019 A: | |||
5% 10/1/32 | 10,000 | 10,924 | |
5% 10/1/38 | 100,000 | 105,342 | |
| Illinois Fin. Auth. Rev.: | |||
| (Presence Health Proj.) Series 2016 C, 5% 2/15/36 | 30,000 | 31,152 | |
| Series 2014 A, 5% 10/1/26 | 40,000 | 40,422 | |
| Series 2016 C, 4% 2/15/41 | 50,000 | 49,289 | |
| Series 2016, 3.125% 5/15/37 | 65,000 | 61,027 | |
| Illinois Gen. Oblig.: | |||
| Series 2014, 5% 2/1/39 | 100,000 | 100,049 | |
| Series 2016, 5% 1/1/35 | 80,000 | 81,950 | |
| Series 2017 D, 5% 11/1/25 | 100,000 | 102,987 | |
| Series 2023 C, 5% 5/1/29 | 50,000 | 54,620 | |
| Illinois Hsg. Dev. Auth. Rev. Series D, 3.75% 4/1/50 | 20,000 | 19,803 | |
| McHenry County Conservation District Gen. Oblig. Series 2014, 5% 2/1/24 | 40,000 | 40,000 | |
TOTAL ILLINOIS | 1,250,818 | ||
| Indiana - 1.9% | |||
| Indiana Dev. Fin. Auth. Envir. Rev. Bonds Series 2022 A1, 4.5%, tender 6/1/32 (b)(c) | 100,000 | 101,604 | |
| Indiana Hsg. & Cmnty. Dev. Auth.: | |||
| Series 2021 B, Series 2021 B, 5% 1/1/28 | 15,000 | 16,078 | |
| Series 2021 B, 5% 7/1/28 | 115,000 | 124,152 | |
| Series A, 5% 7/1/28 | 25,000 | 26,990 | |
TOTAL INDIANA | 268,824 | ||
| Iowa - 1.5% | |||
| Iowa Student Ln. Liquidity Corp. Student Ln. Rev.: | |||
| Series 2022 B, 5% 12/1/29 (c) | 100,000 | 107,200 | |
| Series 2023 B, 5% 12/1/29 (c) | 100,000 | 107,200 | |
TOTAL IOWA | 214,400 | ||
| Kentucky - 2.1% | |||
| Ashland Med. Ctr. Rev. Series 2019, 4% 2/1/33 | 50,000 | 50,613 | |
| Kentucky Bond Dev. Corp. Edl. Facilities Series 2021: | |||
| 4% 6/1/33 | 5,000 | 5,186 | |
| 4% 6/1/35 | 15,000 | 15,466 | |
| Kentucky State Property & Buildings Commission Rev.: | |||
| Series A: | |||
5% 11/1/31 | 30,000 | 32,847 | |
5% 11/1/33 | 15,000 | 16,378 | |
| Series B, 5% 8/1/26 | 75,000 | 78,790 | |
| Kentucky, Inc. Pub. Energy Bonds Series 2024 A1, 5.25%, tender 2/1/32 (b) | 100,000 | 108,615 | |
TOTAL KENTUCKY | 307,895 | ||
| Louisiana - 0.7% | |||
| St. John Baptist Parish Rev. Bonds (Marathon Oil Corp.) Series 2017, 4.05%, tender 7/1/26 (b) | 100,000 | 99,001 | |
| Maine - 0.1% | |||
| Maine Health & Higher Edl. Facilities Auth. Rev. Series 2017 B, 5% 7/1/28 | 10,000 | 10,599 | |
| Maryland - 2.2% | |||
| Baltimore Proj. Rev.: | |||
| (Wtr. Projs.) Series 2014 A, 5% 7/1/24 | 150,000 | 151,167 | |
| Series 2017 A, 5% 7/1/28 | 45,000 | 47,624 | |
| Maryland Dept. of Trans.: | |||
| Series 2016, 4% 9/1/27 | 15,000 | 15,719 | |
| Series 2021 A, 2% 10/1/34 | 15,000 | 12,643 | |
| Maryland Gen. Oblig. Series A, 5% 8/1/34 | 15,000 | 17,270 | |
| Montgomery County Gen. Oblig. Ctfs. of Prtn. Series 2020 A, 5% 10/1/27 | 50,000 | 54,305 | |
| Univ. of Maryland Sys. Auxiliary Facility & Tuition Rev. Series 2018 A, 3.125% 4/1/35 | 15,000 | 14,662 | |
TOTAL MARYLAND | 313,390 | ||
| Massachusetts - 6.1% | |||
| Arlington Gen. Oblig. Series 2021: | |||
| 2% 9/15/34 | 275,000 | 233,416 | |
| 2% 9/15/35 | 100,000 | 83,142 | |
| Billerica Gen. Oblig. Series 2017, 3.125% 2/1/34 | 100,000 | 98,147 | |
| Foxborough Gen. Oblig. Series 2016, 3% 5/15/46 | 25,000 | 21,065 | |
| Mansfield Gen. Oblig. Series 2017, 3.5% 5/15/42 | 20,000 | 19,190 | |
| Massachusetts Bay Trans. Auth. Sales Tax Rev.: | |||
| Series 2015 B, 5% 7/1/26 (Pre-Refunded to 7/1/25 @ 100) | 10,000 | 10,296 | |
| Series 2016 A, 0% 7/1/29 | 5,000 | 4,097 | |
| Series 2021 A1, 5% 7/1/35 | 45,000 | 52,145 | |
| Massachusetts Dev. Fin. Agcy. Rev.: | |||
| (Partners Healthcare Sys., Inc. Proj.) Series 2017 S, 5% 7/1/32 | 15,000 | 16,205 | |
| Bonds Series A1, 5%, tender 1/31/30 (b) | 20,000 | 22,532 | |
| Series 2015 O1, 4% 7/1/45 | 30,000 | 28,903 | |
| Series 2018 L, 5% 10/1/33 | 35,000 | 36,794 | |
| Series 2020 A: | |||
5% 10/15/29 | 35,000 | 40,032 | |
5% 10/15/30 | 20,000 | 23,341 | |
| Series 2021 G, 4% 7/1/46 | 75,000 | 70,880 | |
| Massachusetts Gen. Oblig.: | |||
| Series 2017 A, 5% 4/1/36 | 15,000 | 15,914 | |
| Series 2017 D, 5% 7/1/27 | 25,000 | 27,007 | |
| Series A, 5% 7/1/31 | 10,000 | 10,519 | |
| Massachusetts School Bldg. Auth. Dedicated Sales Tax Rev. Series A, 5% 8/15/32 | 10,000 | 11,526 | |
| Univ. of Massachusetts Bldg. Auth. Rev. Series 2021 1, 5% 11/1/32 | 50,000 | 58,330 | |
TOTAL MASSACHUSETTS | 883,481 | ||
| Michigan - 1.8% | |||
| Grand Rapids San. Swr. Sys. Rev.: | |||
| Series 2018, 5% 1/1/35 | 5,000 | 5,415 | |
| Series 2018, 5% 1/1/29 | 25,000 | 27,338 | |
| Great Lakes Wtr. Auth. Sew Disp. Sys. Series 2018 B, 5% 7/1/29 | 45,000 | 50,322 | |
| Kalamazoo Hosp. Fin. Auth. Hosp. Facilities Rev. Series 2016, 4% 5/15/36 | 10,000 | 10,070 | |
| Lake Orion Cmnty. School District Series 2016, 5% 5/1/25 | 10,000 | 10,247 | |
| Michigan Fin. Auth. Rev.: | |||
| Bonds Series 2019 B, 5%, tender 11/16/26 (b) | 10,000 | 10,404 | |
| Series 2016: | |||
5% 11/15/28 | 15,000 | 15,714 | |
5% 11/15/30 | 35,000 | 36,691 | |
5% 11/15/34 | 15,000 | 15,668 | |
| Series 2022, 5% 12/1/32 | 25,000 | 25,209 | |
| Michigan Hosp. Fin. Auth. Rev.: | |||
| Series 2010 F, 4% 11/15/47 | 25,000 | 23,978 | |
| Series 2010 F4, 5% 11/15/47 | 10,000 | 10,485 | |
| Univ. of Michigan Rev. Series 2020 A, 5% 4/1/39 | 10,000 | 11,181 | |
TOTAL MICHIGAN | 252,722 | ||
| Minnesota - 2.5% | |||
| Anoka-Hennepin Independent School District #11 Series 2020 A, 4% 2/1/29 | 10,000 | 10,503 | |
| Minneapolis Multi-family Rev. (Gateway Northeast Proj.) Series 2019, 2.46% 1/1/38 | 98,930 | 78,678 | |
| Minnesota Gen. Oblig. Series 2019 A, 5% 8/1/30 | 15,000 | 16,998 | |
| Minnesota Higher Ed. Facilities Auth. Rev. Series 2017, 4% 10/1/41 | 20,000 | 20,039 | |
| Minnesota Hsg. Fin. Agcy.: | |||
| Series 2022 A, 5% 8/1/32 | 100,000 | 117,040 | |
| Series B, 4% 8/1/36 | 15,000 | 15,247 | |
| Waconia Independent School District #110 (MN School District Cr. Enhancement Prog.) Series 2015 B, 3.25% 2/1/39 | 110,000 | 103,558 | |
TOTAL MINNESOTA | 362,063 | ||
| Nebraska - 1.3% | |||
| Central Plains Energy Proj. Rev. Bonds Series 2019, 4%, tender 8/1/25 (b) | 50,000 | 50,191 | |
| Douglas County Hosp. Auth. #2 Health Facilities Rev. Series 2020 A, 5% 11/15/30 | 125,000 | 139,943 | |
TOTAL NEBRASKA | 190,134 | ||
| New Hampshire - 1.2% | |||
| New Hampshire Health & Ed. Facilities Auth.: | |||
| (Concord Hosp.) Series 2017, 5% 10/1/42 | 15,000 | 15,496 | |
| (Partners Healthcare Sys., Inc. Proj.) Series 2017, 5% 7/1/25 | 5,000 | 5,138 | |
| Series 2023 B, 5.5% 11/1/31 (c) | 50,000 | 56,100 | |
| New Hampshire Nat'l. Fin. Auth. Series 2022 2, 4% 10/20/36 | 98,330 | 94,438 | |
TOTAL NEW HAMPSHIRE | 171,172 | ||
| New Jersey - 4.8% | |||
| New Jersey Econ. Dev. Auth. Series 2024 SSS, 5% 6/15/27 (d) | 100,000 | 106,432 | |
| New Jersey Edl. Facility Series A, 5% 7/1/36 | 15,000 | 16,115 | |
| New Jersey Health Care Facilities Fing. Auth. Rev. Series 2016 A, 5% 7/1/33 | 10,000 | 10,514 | |
| New Jersey Trans. Trust Fund Auth.: | |||
| Series 2018 A, 5% 12/15/32 | 100,000 | 109,234 | |
| Series 2021 A, 5% 6/15/33 | 95,000 | 108,995 | |
| Series 2022 A, 4% 6/15/39 | 30,000 | 30,688 | |
| Series 2022 BB, 5% 6/15/31 | 135,000 | 155,309 | |
| Series 2022 CC, 5% 6/15/33 | 100,000 | 117,381 | |
| Series A, 0% 12/15/31 | 50,000 | 38,300 | |
TOTAL NEW JERSEY | 692,968 | ||
| New York - 9.5% | |||
| Dutchess County Local Dev. Corp. Rev. (Vassar College Proj.) Series 2020, 5% 7/1/45 | 25,000 | 26,617 | |
| Long Island Pwr. Auth. Elec. Sys. Rev.: | |||
| Series 2018, 5% 9/1/27 | 15,000 | 16,266 | |
| Series 2020 A, 5% 9/1/38 | 165,000 | 185,473 | |
| Monroe County Indl. Dev. Corp. (Univ. of Rochester Proj.) Series 2017 A, 3.875% 7/1/42 | 10,000 | 9,728 | |
| New York City Hsg. Dev. Corp. Bonds Series 2023 E2, 3.8%, tender 1/3/28 (b) | 50,000 | 50,251 | |
| New York City Transitional Fin. Auth. Bldg. Aid Rev. Series 2017 S1, 5% 7/15/28 | 50,000 | 53,501 | |
| New York Dorm. Auth. Rev. Series 2022 A, 5% 7/1/34 | 200,000 | 220,116 | |
| New York Dorm. Auth. Sales Tax Rev. Series 2015 A, 5% 3/15/24 (Escrowed to Maturity) | 25,000 | 25,060 | |
| New York Metropolitan Trans. Auth. Rev.: | |||
| Series 2017 C1: | |||
5% 11/15/27 | 20,000 | 21,460 | |
5% 11/15/29 | 50,000 | 53,990 | |
5% 11/15/31 | 140,000 | 150,647 | |
| Series 2019 C, 5% 11/15/39 | 70,000 | 74,567 | |
| New York State Dorm. Auth.: | |||
| Series 2017 A, 5% 2/15/31 | 10,000 | 10,639 | |
| Series 2019 D, 4% 2/15/36 | 15,000 | 15,761 | |
| New York State Hsg. Fin. Agcy. Rev. Bonds Series 2023 E2, 3.875%, tender 5/1/28 (b) | 20,000 | 20,094 | |
| New York State Urban Dev. Corp. Series 2020 E, 4% 3/15/35 | 30,000 | 31,806 | |
| New York State Urban Eev Corp. Series 2019 A, 5% 3/15/37 | 80,000 | 88,943 | |
| New York Trans. Dev. Corp. (Delta Air Lines, Inc. - Laguardia Arpt. Terminals C&D Redev. Proj.) Series 2023, 6% 4/1/35 (c) | 100,000 | 112,205 | |
| Saratoga County Cap. Resources Rev. (Skidmore College Proj.) Series 2020 A, 5% 7/1/45 | 85,000 | 91,599 | |
| Triborough Bridge & Tunnel Auth. Series 2023 A, 4% 11/15/34 | 100,000 | 108,574 | |
TOTAL NEW YORK | 1,367,297 | ||
| North Carolina - 0.2% | |||
| Charlotte-Mecklenburg Hosp. Auth. Health Care Sys. Rev. Bonds Series 2021 C, 5%, tender 12/1/28 (b) | 25,000 | 27,322 | |
| Ohio - 3.8% | |||
| Cuyahoga Cmnty. College District Series 2018, 3.5% 12/1/39 | 30,000 | 29,215 | |
| Muskingum County Hosp. Facilities (Genesis Healthcare Sys. Obligated Group Proj.) Series 2013, 5% 2/15/48 | 50,000 | 45,679 | |
| Ohio Air Quality Dev. Auth. Rev. Bonds Series 2022 B, 4.25%, tender 6/1/27 (b)(c) | 150,000 | 151,455 | |
| Ohio Gen. Oblig. Series 2019 A, 5% 5/1/30 | 20,000 | 21,410 | |
| Ohio Higher Edl. Facility Commission Rev. (Univ. of Dayton Proj.) Series 2018 B, 5% 12/1/29 | 25,000 | 27,128 | |
| Ohio Hsg. Fin. Agcy. Residential Mtg. Rev. (Mtg. Backed Securities Prog.) Series 2019 B, 4.5% 3/1/50 | 80,000 | 80,560 | |
| Ohio Spl. Oblig. Series 2021 A, 5% 4/1/41 | 20,000 | 21,851 | |
| Ohio State Univ. Gen. Receipts (Multiyear Debt Issuance Prog.) Series 2020 A, 5% 12/1/29 | 10,000 | 11,361 | |
| Perrysburg Exmp Vlg School Dis Series 2015, 3.75% 12/1/43 | 50,000 | 47,725 | |
| Port Gtr Cincinnati Dev. Auth. O (Mariemont City School District Proj.) Series 2019, 3.25% 12/1/35 | 115,000 | 114,185 | |
TOTAL OHIO | 550,569 | ||
| Oklahoma - 0.4% | |||
| Grand River Dam Auth. Rev. Series 2014 A, 5% 6/1/26 | 40,000 | 40,203 | |
| Oklahoma State Univ. Agricultural And Mechanical College Series 2020 A, 5% 9/1/32 | 10,000 | 11,462 | |
TOTAL OKLAHOMA | 51,665 | ||
| Oregon - 1.5% | |||
| Medford Hosp. Facilities Auth. Rev. (Asante Projs.) Series 2020 A, 5% 8/15/38 | 10,000 | 10,787 | |
| Oregon Facilities Auth. Rev. Series 2022 B, 5% 6/1/30 | 30,000 | 33,248 | |
| Salem Hosp. Facility Auth. Rev. Series 2016 A, 4% 5/15/41 | 25,000 | 24,846 | |
| Union County Hosp. Facility Auth. (Grande Ronde Hosp. Proj.) Series 2022, 5% 7/1/25 | 150,000 | 152,314 | |
TOTAL OREGON | 221,195 | ||
| Pennsylvania - 1.5% | |||
| Council Rock School District Series 2016 A, 3.125% 11/15/34 | 25,000 | 23,967 | |
| Cumberland County Muni. Auth. Rev. (Dickinson Proj.) Series 2017, 5% 5/1/37 | 5,000 | 5,297 | |
| Delaware County Auth. College Rev. Series 2017 A, 3.75% 10/1/46 | 85,000 | 80,503 | |
| Dubois Hosp. Auth. Hosp. Rev. (Penn Highlands Healthcare Proj.) Series 2018: | |||
| 5% 7/15/27 | 50,000 | 52,390 | |
| 5% 7/15/28 | 35,000 | 37,022 | |
| Montgomery County Higher Ed. & Health Auth. Rev. Series 2019, 5% 9/1/31 | 10,000 | 10,875 | |
TOTAL PENNSYLVANIA | 210,054 | ||
| Rhode Island - 0.8% | |||
| Rhode Island Student Ln. Auth. Student Ln. Rev. Series 2021 A, 5% 12/1/30 (c) | 100,000 | 109,057 | |
| Tennessee - 0.8% | |||
| Knox County Health Edl. & Hsg. Facilities Board Rev. Series 2017, 5% 4/1/27 | 20,000 | 20,814 | |
| Nashville and Davidson County Metropolitan Govt. Gen. Oblig. Series 2021 C, 5% 1/1/28 | 50,000 | 54,558 | |
| Shelby County Health Edl. & Hsg. Facilities Board Rev. Series 2017 A, 3.375% 5/1/32 | 45,000 | 44,828 | |
TOTAL TENNESSEE | 120,200 | ||
| Texas - 2.6% | |||
| Alvin Independent School District Series 2016 A, 5% 2/15/28 | 25,000 | 26,078 | |
| Cypress-Fairbanks Independent School District Series 2016, 5% 2/15/25 | 15,000 | 15,314 | |
| Georgetown Util. Sys. Rev. Series 2022, 5% 8/15/27 (Assured Guaranty Muni. Corp. Insured) | 100,000 | 107,072 | |
| Harris County Cultural Ed. Facilities Fin. Corp. Rev. Series 2014 A, 5% 12/1/26 | 90,000 | 91,339 | |
| San Antonio Wtr. Sys. Rev.: | |||
| Series 2018 A, 5% 5/15/33 | 5,000 | 5,431 | |
| Series 2020 A, 5% 5/15/27 | 10,000 | 10,719 | |
| Tarrant Reg'l. Wtr. District (City of Dallas Proj.) Series 2021 A, 4% 9/1/25 | 45,000 | 45,769 | |
| Univ. of Houston Univ. Revs. Series 2021 A, 2% 2/15/33 | 25,000 | 22,004 | |
| Wichita Falls Independent School District Series 2021, 4% 2/1/28 | 50,000 | 52,345 | |
TOTAL TEXAS | 376,071 | ||
| Virginia - 2.9% | |||
| Fairfax County Redev. & Hsg. Auth. Rev. Bonds (Dominion Square North Proj.) Series 2023, 5%, tender 1/1/28 (b) | 100,000 | 105,021 | |
| Louisa Indl. Dev. Auth. Poll. Cont. Rev. Bonds (Virginia Elec. and Pwr. Co. Proj.) Series 2008 B, 0.75%, tender 9/2/25 (b) | 105,000 | 97,857 | |
| Virginia College Bldg. Auth. Edl. Facilities Rev.: | |||
| (21st Century College and Equip. Progs.) Series 2017 E, 5% 2/1/31 | 10,000 | 10,934 | |
| (Virginia Gen. Oblig.) Series 2017 E, 5% 2/1/30 | 15,000 | 16,413 | |
| Series 2019 A, 3% 2/1/36 | 15,000 | 14,282 | |
| Virginia Commonwealth Trans. Board Rev.: | |||
| (Virginia Gen. Oblig. Proj.) Series 2017 A, 5% 5/15/29 | 60,000 | 65,075 | |
| (Virginia Gen. Oblig.) Series 2017 A, 5% 5/15/27 | 15,000 | 16,137 | |
| Series 2019, 3% 5/15/33 | 100,000 | 98,761 | |
TOTAL VIRGINIA | 424,480 | ||
| Washington - 3.5% | |||
| Energy Northwest Elec. Rev. Series 2020 A, 5% 7/1/34 | 95,000 | 108,295 | |
| Washington Gen. Oblig.: | |||
| Series 2018 A, 5% 8/1/27 | 50,000 | 54,049 | |
| Series 2018 C, 5% 8/1/30 | 25,000 | 26,846 | |
| Series 2018 D, 5% 8/1/33 | 20,000 | 21,435 | |
| Series 2020 A, 5% 8/1/27 | 65,000 | 70,263 | |
| Series 2020 C, 5% 2/1/37 | 15,000 | 16,767 | |
| Series R-2017 A, 5% 8/1/30 | 10,000 | 10,506 | |
| Washington Health Care Facilities Auth. Rev.: | |||
| (Overlake Hosp. Med. Ctr., WA. Proj.) Series 2017 B, 5% 7/1/27 | 25,000 | 25,717 | |
| (Providence Health Systems Proj.) Series 2018 B, 5% 10/1/33 | 45,000 | 47,681 | |
| Series 2017 A, 4% 7/1/37 | 125,000 | 118,664 | |
| Series 2019 A2, 5% 8/1/33 | 10,000 | 10,837 | |
TOTAL WASHINGTON | 511,060 | ||
| West Virginia - 0.4% | |||
| West Virginia Hosp. Fin. Auth. Hosp. Rev. Series 2016 A, 3.25% 6/1/39 | 60,000 | 55,105 | |
| Wisconsin - 0.6% | |||
| Wisconsin Health & Edl. Facilities Series 2013 B2, 4% 11/15/43 | 55,000 | 54,150 | |
| Wisconsin St Gen. Fund Annual Appropriation Series 2019 A: | |||
| 5% 5/1/25 (Escrowed to Maturity) | 10,000 | 10,258 | |
| 5% 5/1/26 (Escrowed to Maturity) | 20,000 | 20,994 | |
TOTAL WISCONSIN | 85,402 | ||
| TOTAL MUNICIPAL BONDS (Cost $13,747,933) | 14,062,697 | ||
| Municipal Notes - 2.1% | |||
Principal Amount (a) | Value ($) | ||
| Delaware - 0.7% | |||
| Delaware Econ. Dev. Auth. Rev. (Delmarva Pwr. & Lt. Co. Proj.) Series 1994, 3.93% 2/1/24, VRDN (b)(c) | 100,000 | 100,000 | |
| Georgia - 1.4% | |||
| Burke County Indl. Dev. Auth. Poll. Cont. Rev. (Georgia Pwr. Co. Plant Vogtle Proj.) Series 2018, 4.25% 2/1/24, VRDN (b) | 200,000 | 200,000 | |
| TOTAL MUNICIPAL NOTES (Cost $300,000) | 300,000 | ||
| Money Market Funds - 0.3% | |||
| Shares | Value ($) | ||
Fidelity Municipal Cash Central Fund 4.36% (e)(f) (Cost $49,000) | 48,990 | 49,005 | |
| TOTAL INVESTMENT IN SECURITIES - 100.0% (Cost $14,096,933) | 14,411,702 |
NET OTHER ASSETS (LIABILITIES) - 0.0% | 1,956 |
| NET ASSETS - 100.0% | 14,413,658 |
| VRDN | - | VARIABLE RATE DEMAND NOTE (A debt instrument that is payable upon demand, either daily, weekly or monthly) |
| (a) | Amount is stated in United States dollars unless otherwise noted. |
| (b) | Coupon rates for floating and adjustable rate securities reflect the rates in effect at period end. |
| (c) | Private activity obligations whose interest is subject to the federal alternative minimum tax for individuals. |
| (d) | Security or a portion of the security purchased on a delayed delivery or when-issued basis. |
| (e) | Information in this report regarding holdings by state and security types does not reflect the holdings of the Fidelity Municipal Cash Central Fund. |
| (f) | Affiliated fund that is generally available only to investment companies and other accounts managed by Fidelity Investments. The rate quoted is the annualized seven-day yield of the fund at period end. A complete unaudited listing of the fund's holdings as of its most recent quarter end is available upon request. In addition, each Fidelity Central Fund's financial statements, which are not covered by the Fund's Report of Independent Registered Public Accounting Firm, are available on the SEC's website or upon request. |
| Affiliate | Value, beginning of period ($) | Purchases ($) | Sales Proceeds ($) | Dividend Income ($) | Realized Gain (loss) ($) | Change in Unrealized appreciation (depreciation) ($) | Value, end of period ($) | % ownership, end of period |
| Fidelity Municipal Cash Central Fund 4.36% | 385,996 | 2,883,997 | 3,221,000 | 7,743 | - | 12 | 49,005 | 0.0% |
| Total | 385,996 | 2,883,997 | 3,221,000 | 7,743 | - | 12 | 49,005 | |
| Valuation Inputs at Reporting Date: | ||||
| Description | Total ($) | Level 1 ($) | Level 2 ($) | Level 3 ($) |
Investments in Securities: | ||||
| Municipal Securities | 14,362,697 | - | 14,362,697 | - |
| Money Market Funds | 49,005 | 49,005 | - | - |
| Total Investments in Securities: | 14,411,702 | 49,005 | 14,362,697 | - |
| Statement of Assets and Liabilities | ||||
| January 31, 2024 | ||||
| Assets | ||||
| Investment in securities, at value - See accompanying schedule: | ||||
Unaffiliated issuers (cost $14,047,933) | $ | 14,362,697 | ||
Fidelity Central Funds (cost $49,000) | 49,005 | |||
| Total Investment in Securities (cost $14,096,933) | $ | 14,411,702 | ||
| Cash | 13,719 | |||
| Receivable for fund shares sold | 1,398 | |||
| Interest receivable | 143,246 | |||
| Distributions receivable from Fidelity Central Funds | 234 | |||
| Prepaid expenses | 10 | |||
| Receivable from investment adviser for expense reductions | 6,520 | |||
| Other receivables | 28 | |||
Total assets | 14,576,857 | |||
| Liabilities | ||||
| Payable for investments purchased on a delayed delivery basis | $ | 103,754 | ||
| Payable for fund shares redeemed | 1,616 | |||
| Distributions payable | 4,005 | |||
| Accrued management fee | 4,132 | |||
| Distribution and service plan fees payable | 1,487 | |||
| Other affiliated payables | 1,645 | |||
| Audit fee payable | 44,890 | |||
| Other payables and accrued expenses | 1,670 | |||
| Total Liabilities | 163,199 | |||
| Net Assets | $ | 14,413,658 | ||
| Net Assets consist of: | ||||
| Paid in capital | $ | 14,158,853 | ||
| Total accumulated earnings (loss) | 254,805 | |||
| Net Assets | $ | 14,413,658 | ||
| Net Asset Value and Maximum Offering Price | ||||
| Class A : | ||||
Net Asset Value and redemption price per share ($1,613,225 ÷ 158,423 shares)(a) | $ | 10.18 | ||
| Maximum offering price per share (100/96.00 of $10.18) | $ | 10.60 | ||
| Class M : | ||||
Net Asset Value and redemption price per share ($1,179,526 ÷ 115,831 shares)(a) | $ | 10.18 | ||
| Maximum offering price per share (100/96.00 of $10.18) | $ | 10.60 | ||
| Class C : | ||||
Net Asset Value and offering price per share ($1,089,821 ÷ 108,476 shares)(a) | $ | 10.05 | ||
| Fidelity Sustainable Intermediate Municipal Income Fund : | ||||
Net Asset Value, offering price and redemption price per share ($8,337,437 ÷ 818,728 shares) | $ | 10.18 | ||
| Class I : | ||||
Net Asset Value, offering price and redemption price per share ($1,069,508 ÷ 105,024 shares) | $ | 10.18 | ||
| Class Z : | ||||
Net Asset Value, offering price and redemption price per share ($1,124,141 ÷ 110,388 shares) | $ | 10.18 | ||
(a)Redemption price per share is equal to net asset value less any applicable contingent deferred sales charge. | ||||
| Statement of Operations | ||||
Year ended January 31, 2024 | ||||
| Investment Income | ||||
| Interest | $ | 448,341 | ||
| Income from Fidelity Central Funds | 7,743 | |||
| Total Income | 456,084 | |||
| Expenses | ||||
| Management fee | $ | 47,010 | ||
| Transfer agent fees | 14,374 | |||
| Distribution and service plan fees | 17,222 | |||
| Accounting fees and expenses | 3,517 | |||
| Custodian fees and expenses | 3,442 | |||
| Independent trustees' fees and expenses | 45 | |||
| Registration fees | 101,954 | |||
| Audit | 53,899 | |||
| Legal | 34 | |||
| Miscellaneous | 108 | |||
| Total expenses before reductions | 241,605 | |||
| Expense reductions | (175,268) | |||
| Total expenses after reductions | 66,337 | |||
| Net Investment income (loss) | 389,747 | |||
| Realized and Unrealized Gain (Loss) | ||||
| Net realized gain (loss) on: | ||||
| Investment Securities: | ||||
| Unaffiliated issuers | (53,195) | |||
| Total net realized gain (loss) | (53,195) | |||
| Change in net unrealized appreciation (depreciation) on: | ||||
| Investment Securities: | ||||
| Unaffiliated issuers | 110,440 | |||
| Fidelity Central Funds | 12 | |||
| Total change in net unrealized appreciation (depreciation) | 110,452 | |||
| Net gain (loss) | 57,257 | |||
| Net increase (decrease) in net assets resulting from operations | $ | 447,004 | ||
| Statement of Changes in Net Assets | ||||
Year ended January 31, 2024 | For the period April 13, 2022 (commencement of operations) through January 31, 2023 | |||
| Increase (Decrease) in Net Assets | ||||
| Operations | ||||
| Net investment income (loss) | $ | 389,747 | $ | 215,330 |
| Net realized gain (loss) | (53,195) | (4,493) | ||
| Change in net unrealized appreciation (depreciation) | 110,452 | 204,317 | ||
| Net increase (decrease) in net assets resulting from operations | 447,004 | 415,154 | ||
| Distributions to shareholders | (387,038) | (220,316) | ||
| Share transactions - net increase (decrease) | 1,227,145 | 12,931,709 | ||
| Total increase (decrease) in net assets | 1,287,111 | 13,126,547 | ||
| Net Assets | ||||
| Beginning of period | 13,126,547 | - | ||
| End of period | $ | 14,413,658 | $ | 13,126,547 |
| Fidelity Advisor® Sustainable Intermediate Municipal Income Fund Class A |
| Years ended January 31, | 2024 | 2023 A | ||
Selected Per-Share Data | ||||
| Net asset value, beginning of period | $ | 10.14 | $ | 10.00 |
| Income from Investment Operations | ||||
Net investment income (loss) B,C | .273 | .181 | ||
| Net realized and unrealized gain (loss) | .032 | .137 | ||
| Total from investment operations | .305 | .318 | ||
| Distributions from net investment income | (.265) | (.178) | ||
| Total distributions | (.265) | (.178) | ||
| Net asset value, end of period | $ | 10.18 | $ | 10.14 |
Total Return D,E,F | 3.10% | 3.24% | ||
Ratios to Average Net Assets C,G,H | ||||
| Expenses before reductions | 1.93% | 2.34% I,J | ||
| Expenses net of fee waivers, if any | .62% | .62% I | ||
| Expenses net of all reductions | .62% | .61% I | ||
| Net investment income (loss) | 2.74% | 2.26% I | ||
| Supplemental Data | ||||
| Net assets, end of period (000 omitted) | $ | 1,613 | $ | 1,563 |
Portfolio turnover rate K | 30% | 14% I |
| Fidelity Advisor® Sustainable Intermediate Municipal Income Fund Class M |
| Years ended January 31, | 2024 | 2023 A | ||
Selected Per-Share Data | ||||
| Net asset value, beginning of period | $ | 10.14 | $ | 10.00 |
| Income from Investment Operations | ||||
Net investment income (loss) B,C | .273 | .181 | ||
| Net realized and unrealized gain (loss) | .032 | .137 | ||
| Total from investment operations | .305 | .318 | ||
| Distributions from net investment income | (.265) | (.178) | ||
| Total distributions | (.265) | (.178) | ||
| Net asset value, end of period | $ | 10.18 | $ | 10.14 |
Total Return D,E,F | 3.10% | 3.24% | ||
Ratios to Average Net Assets C,G,H | ||||
| Expenses before reductions | 1.97% | 2.36% I,J | ||
| Expenses net of fee waivers, if any | .62% | .62% I | ||
| Expenses net of all reductions | .62% | .61% I | ||
| Net investment income (loss) | 2.74% | 2.26% I | ||
| Supplemental Data | ||||
| Net assets, end of period (000 omitted) | $ | 1,180 | $ | 1,122 |
Portfolio turnover rate K | 30% | 14% I |
| Fidelity Advisor® Sustainable Intermediate Municipal Income Fund Class C |
| Years ended January 31, | 2024 | 2023 A | ||
Selected Per-Share Data | ||||
| Net asset value, beginning of period | $ | 10.08 | $ | 10.00 |
| Income from Investment Operations | ||||
Net investment income (loss) B,C | .196 | .120 | ||
| Net realized and unrealized gain (loss) | .036 | .137 | ||
| Total from investment operations | .232 | .257 | ||
| Distributions from net investment income | (.262) | (.177) | ||
| Total distributions | (.262) | (.177) | ||
| Net asset value, end of period | $ | 10.05 | $ | 10.08 |
Total Return D,E,F | 2.39% | 2.62% | ||
Ratios to Average Net Assets B,G,H | ||||
| Expenses before reductions | 2.73% | 3.08% I,J | ||
| Expenses net of fee waivers, if any | 1.37% | 1.37% I | ||
| Expenses net of all reductions | 1.37% | 1.36% I | ||
| Net investment income (loss) | 1.99% | 1.51% I | ||
| Supplemental Data | ||||
| Net assets, end of period (000 omitted) | $ | 1,090 | $ | 1,065 |
Portfolio turnover rate K | 30% | 14% I |
| Fidelity® Sustainable Intermediate Municipal Income Fund |
| Years ended January 31, | 2024 | 2023 A | ||
Selected Per-Share Data | ||||
| Net asset value, beginning of period | $ | 10.14 | $ | 10.00 |
| Income from Investment Operations | ||||
Net investment income (loss) B,C | .298 | .200 | ||
| Net realized and unrealized gain (loss) | .032 | .138 | ||
| Total from investment operations | .330 | .338 | ||
| Distributions from net investment income | (.290) | (.198) | ||
| Total distributions | (.290) | (.198) | ||
| Net asset value, end of period | $ | 10.18 | $ | 10.14 |
Total Return D,E | 3.36% | 3.44% | ||
Ratios to Average Net Assets C,F,G | ||||
| Expenses before reductions | 1.62% | 2.03% H,I | ||
| Expenses net of fee waivers, if any | .37% | .37% I | ||
| Expenses net of all reductions | .37% | .36% I | ||
| Net investment income (loss) | 2.99% | 2.51% I | ||
| Supplemental Data | ||||
| Net assets, end of period (000 omitted) | $ | 8,337 | $ | 7,307 |
Portfolio turnover rate J | 30% | 14% I |
| Fidelity Advisor® Sustainable Intermediate Municipal Income Fund Class I |
| Years ended January 31, | 2024 | 2023 A | ||
Selected Per-Share Data | ||||
| Net asset value, beginning of period | $ | 10.14 | $ | 10.00 |
| Income from Investment Operations | ||||
Net investment income (loss) B,C | .298 | .201 | ||
| Net realized and unrealized gain (loss) | .032 | .137 | ||
| Total from investment operations | .330 | .338 | ||
| Distributions from net investment income | (.290) | (.198) | ||
| Total distributions | (.290) | (.198) | ||
| Net asset value, end of period | $ | 10.18 | $ | 10.14 |
Total Return D,E | 3.36% | 3.44% | ||
Ratios to Average Net Assets C,F,G | ||||
| Expenses before reductions | 1.74% | 2.12% H,I | ||
| Expenses net of fee waivers, if any | .37% | .37% I | ||
| Expenses net of all reductions | .37% | .36% I | ||
| Net investment income (loss) | 2.99% | 2.51% I | ||
| Supplemental Data | ||||
| Net assets, end of period (000 omitted) | $ | 1,070 | $ | 1,035 |
Portfolio turnover rate J | 30% | 14% I |
| Fidelity Advisor® Sustainable Intermediate Municipal Income Fund Class Z |
| Years ended January 31, | 2024 | 2023 A | ||
Selected Per-Share Data | ||||
| Net asset value, beginning of period | $ | 10.14 | $ | 10.00 |
| Income from Investment Operations | ||||
Net investment income (loss) B,C | .304 | .205 | ||
| Net realized and unrealized gain (loss) | .032 | .137 | ||
| Total from investment operations | .336 | .342 | ||
| Distributions from net investment income | (.296) | (.202) | ||
| Total distributions | (.296) | (.202) | ||
| Net asset value, end of period | $ | 10.18 | $ | 10.14 |
Total Return D,E | 3.42% | 3.49% | ||
Ratios to Average Net Assets C,F,G | ||||
| Expenses before reductions | 1.61% | 2.04% H,I | ||
| Expenses net of fee waivers, if any | .31% | .31% I | ||
| Expenses net of all reductions | .31% | .30% I | ||
| Net investment income (loss) | 3.05% | 2.57% I | ||
| Supplemental Data | ||||
| Net assets, end of period (000 omitted) | $ | 1,124 | $ | 1,035 |
Portfolio turnover rate J | 30% | 14% I |
| Fidelity Central Fund | Investment Manager | Investment Objective | Investment Practices | Expense RatioA |
| Fidelity Money Market Central Funds | Fidelity Management & Research Company LLC (FMR) | Each fund seeks to obtain a high level of current income consistent with the preservation of capital and liquidity. | Short-term Investments | Less than .005% |
| Gross unrealized appreciation | $382,075 |
| Gross unrealized depreciation | (55,717) |
| Net unrealized appreciation (depreciation) | $326,358 |
| Tax Cost | $14,085,344 |
| Capital loss carryforward | $(57,685) |
| Net unrealized appreciation (depreciation) on securities and other investments | $326,358 |
| Short-term | $(5,120) |
| Long-term | (52,565) |
| Total capital loss carryforward | $(57,685) |
| January 31, 2024 | January 31, 2023 A | |
| Tax-exempt Income | 387,038 | 220,316 |
| Purchases ($) | Sales ($) | |
| Fidelity Sustainable Intermediate Municipal Income Fund | 5,876,497 | 3,868,300 |
| Distribution Fee | Service Fee | Total Fees | Retained by FDC | |
| Class A | - % | .25% | $3,890 | $2,656 |
| Class M | - % | .25% | 2,789 | 2,565 |
| Class C | .75% | .25% | 10,543 | 10,480 |
| $17,222 | $15,701 |
| Retained by FDC | |
| Class A | $73 |
| % of Class-Level Average Net Assets | |
| Class A | .1367 |
| Class M | .1709 |
| Class C | .1788 |
| Fidelity Sustainable Intermediate Municipal Income Fund | .0890 |
| Class I | .1800 |
| Amount | % of Class-Level Average Net Assets | |
| Class A | $1,928 | .12 |
| Class M | 1,702 | .15 |
| Class C | 1,685 | .16 |
| Fidelity Sustainable Intermediate Municipal Income Fund | 6,774 | .09 |
| Class I | 1,764 | .17 |
| Class Z | 521 | .05 |
| $14,374 |
| % of Average Net Assets | |
| Fidelity Sustainable Intermediate Municipal Income Fund | .0259 |
| % of Average Net Assets | |
| Fidelity Sustainable Intermediate Municipal Income Fund | .03 |
| Maximum Management Fee Rate % | |
| Class A | .48 |
| Class M | .51 |
| Class C | .52 |
| Fidelity Sustainable Intermediate Municipal Income Fund | .43 |
| Class I | .52 |
| Class Z | .39 |
| Amount | |
| Fidelity Sustainable Intermediate Municipal Income Fund | $18 |
| Expense Limitations | Reimbursement | |
| Class A | .62% | $20,429 |
| Class M | .62% | 15,019 |
| Class C | 1.37% | 14,297 |
| Fidelity Sustainable Intermediate Municipal Income Fund | .37% | 97,333 |
| Class I | .37% | 14,078 |
| Class Z | .31% | 13,495 |
| $174,651 |
Year ended January 31, 2024 | Year ended January 31, 2023 A | |
| Fidelity Sustainable Intermediate Municipal Income Fund | ||
| Distributions to shareholders | ||
| Class A | $41,437 | $20,582 |
| Class M | 29,702 | 18,384 |
| Class C | 28,066 | 17,991 |
| Fidelity Sustainable Intermediate Municipal Income Fund | 226,843 | 123,006 |
| Class I | 29,994 | 19,937 |
| Class Z | 30,996 | 20,416 |
Total | $387,038 | $220,316 |
| Shares | Shares | Dollars | Dollars | |
Year ended January 31, 2024 | Year ended January 31, 2023 A | Year ended January 31, 2024 | Year ended January 31, 2023 A | |
| Fidelity Sustainable Intermediate Municipal Income Fund | ||||
| Class A | ||||
| Shares sold | 3,854 | 152,415 | $38,433 | $1,510,973 |
| Reinvestment of distributions | 4,164 | 2,073 | 41,424 | 20,582 |
| Shares redeemed | (3,755) | (328) | (37,261) | (3,253) |
| Net increase (decrease) | 4,263 | 154,160 | $42,596 | $1,528,302 |
| Class M | ||||
| Shares sold | 3,418 | 108,784 | $35,000 | $1,085,981 |
| Reinvestment of distributions | 2,985 | 1,853 | 29,702 | 18,384 |
| Shares redeemed | (1,209) | - | (12,000) | - |
| Net increase (decrease) | 5,194 | 110,637 | $52,702 | $1,104,365 |
| Class C | ||||
| Shares sold | 4 | 104,646 | $42 | $1,046,011 |
| Reinvestment of distributions | 2,850 | 1,821 | 28,066 | 17,991 |
| Shares redeemed | (9) | (836) | (88) | (8,058) |
| Net increase (decrease) | 2,845 | 105,631 | $28,020 | $1,055,944 |
| Fidelity Sustainable Intermediate Municipal Income Fund | ||||
| Shares sold | 134,915 | 731,710 | $1,348,159 | $7,308,238 |
| Reinvestment of distributions | 18,304 | 10,931 | 182,095 | 108,350 |
| Shares redeemed | (54,911) | (22,221) | (540,026) | (213,843) |
| Net increase (decrease) | 98,308 | 720,420 | $990,228 | $7,202,745 |
| Class I | ||||
| Shares sold | 299 | 100,000 | $3,000 | $1,000,000 |
| Reinvestment of distributions | 3,015 | 2,010 | 29,994 | 19,937 |
| Shares redeemed | (300) | - | (3,012) | - |
| Net increase (decrease) | 3,014 | 102,010 | $29,982 | $1,019,937 |
| Class Z | ||||
| Shares sold | 5,498 | 100,000 | $55,473 | $1,000,000 |
| Reinvestment of distributions | 3,078 | 2,059 | 30,627 | 20,416 |
| Shares redeemed | (247) | - | (2,483) | - |
| Net increase (decrease) | 8,329 | 102,059 | $83,617 | $1,020,416 |
| Fund | Affiliated % |
Fidelity Sustainable Intermediate Municipal Income Fund | 74% |
| The Example is based on an investment of $1,000 invested at the beginning of the period and held for the entire period (August 1, 2023 to January 31, 2024). |
Annualized Expense Ratio- A | Beginning Account Value August 1, 2023 | Ending Account Value January 31, 2024 | Expenses Paid During Period- C August 1, 2023 to January 31, 2024 | |||||||
| Fidelity® Sustainable Intermediate Municipal Income Fund | ||||||||||
| Class A | .62% | |||||||||
| Actual | $ 1,000 | $ 1,034.30 | $ 3.18 | |||||||
Hypothetical-B | $ 1,000 | $ 1,022.08 | $ 3.16 | |||||||
| Class M | .62% | |||||||||
| Actual | $ 1,000 | $ 1,034.30 | $ 3.18 | |||||||
Hypothetical-B | $ 1,000 | $ 1,022.08 | $ 3.16 | |||||||
| Class C | 1.37% | |||||||||
| Actual | $ 1,000 | $ 1,031.40 | $ 7.01 | |||||||
Hypothetical-B | $ 1,000 | $ 1,018.30 | $ 6.97 | |||||||
| Fidelity® Sustainable Intermediate Municipal Income Fund | .37% | |||||||||
| Actual | $ 1,000 | $ 1,035.60 | $ 1.90 | |||||||
Hypothetical-B | $ 1,000 | $ 1,023.34 | $ 1.89 | |||||||
| Class I | .37% | |||||||||
| Actual | $ 1,000 | $ 1,035.60 | $ 1.90 | |||||||
Hypothetical-B | $ 1,000 | $ 1,023.34 | $ 1.89 | |||||||
| Class Z | .31% | |||||||||
| Actual | $ 1,000 | $ 1,035.90 | $ 1.59 | |||||||
Hypothetical-B | $ 1,000 | $ 1,023.64 | $ 1.58 | |||||||
- Highly liquid investments - cash or convertible to cash within three business days or less
- Moderately liquid investments - convertible to cash in three to seven calendar days
- Less liquid investments - can be sold or disposed of, but not settled, within seven calendar days
- Illiquid investments - cannot be sold or disposed of within seven calendar days
| A special meeting of shareholders was held on October 18, 2023. The results of votes taken among shareholders on the proposal before them are reported below. Each vote reported represents one dollar of net asset value held on the record date for the meeting. | ||
| Proposal 1 | ||
| To elect a Board of Trustees. | ||
# of Votes | % of Votes | |
| Abigail P. Johnson | ||
| Affirmative | 378,729,502,260.01 | 97.58 |
| Withheld | 9,407,876,478.96 | 2.42 |
| TOTAL | 388,137,378,738.97 | 100.00 |
| Jennifer Toolin McAuliffe | ||
| Affirmative | 378,454,868,010.95 | 97.51 |
| Withheld | 9,682,510,728.02 | 2.49 |
| TOTAL | 388,137,378,738.97 | 100.00 |
| Christine J. Thompson | ||
| Affirmative | 378,837,121,274.52 | 97.60 |
| Withheld | 9,300,257,464.45 | 2.40 |
| TOTAL | 388,137,378,738.97 | 100.00 |
| Elizabeth S. Acton | ||
| Affirmative | 378,262,110,794.85 | 97.46 |
| Withheld | 9,875,267,944.12 | 2.54 |
| TOTAL | 388,137,378,738.97 | 100.00 |
| Laura M. Bishop | ||
| Affirmative | 380,482,113,171.06 | 98.03 |
| Withheld | 7,655,265,567.91 | 1.97 |
| TOTAL | 388,137,378,738.97 | 100.00 |
| Ann E. Dunwoody | ||
| Affirmative | 380,016,034,008.12 | 97.91 |
| Withheld | 8,121,344,730.85 | 2.09 |
| TOTAL | 388,137,378,738.97 | 100.00 |
| John Engler | ||
| Affirmative | 379,432,488,394.20 | 97.76 |
| Withheld | 8,704,890,344.77 | 2.24 |
| TOTAL | 388,137,378,738.97 | 100.00 |
| Robert F. Gartland | ||
| Affirmative | 378,741,819,600.60 | 97.58 |
| Withheld | 9,395,559,138.37 | 2.42 |
| TOTAL | 388,137,378,738.97 | 100.00 |
| Robert W. Helm | ||
| Affirmative | 380,389,324,755.07 | 98.00 |
| Withheld | 7,748,053,983.90 | 2.00 |
| TOTAL | 388,137,378,738.97 | 100.00 |
| Arthur E. Johnson | ||
| Affirmative | 378,427,694,151.67 | 97.50 |
| Withheld | 9,709,684,587.30 | 2.50 |
| TOTAL | 388,137,378,738.97 | 100.00 |
| Michael E. Kenneally | ||
| Affirmative | 377,842,228,145.18 | 97.35 |
| Withheld | 10,295,150,593.79 | 2.65 |
| TOTAL | 388,137,378,738.97 | 100.00 |
| Mark A. Murray | ||
| Affirmative | 380,158,432,703.37 | 97.94 |
| Withheld | 7,978,946,035.60 | 2.06 |
| TOTAL | 388,137,378,738.97 | 100.00 |
| Carol J. Zierhoffer | ||
| Affirmative | 380,522,113,360.24 | 98.04 |
| Withheld | 7,615,265,378.73 | 1.96 |
| TOTAL | 388,137,378,738.97 | 100.00 |
| Proposal 1 reflects trust wide proposal and voting results. | ||
 |


Contents
| Average Annual Total Returns | |||
Periods ended January 31, 2024 | Past 1 year | Past 5 years | Past 10 years |
| Fidelity® Tax-Free Bond Fund | 3.71% | 2.28% | 3.11% |
| $25,000 Over 10 Years |
Let's say hypothetically that $25,000 was invested in Fidelity® Tax-Free Bond Fund on January 31, 2014. The chart shows how the value of your investment would have changed, and also shows how the Bloomberg 3+ Year Non-AMT Municipal Bond Index performed over the same period. |
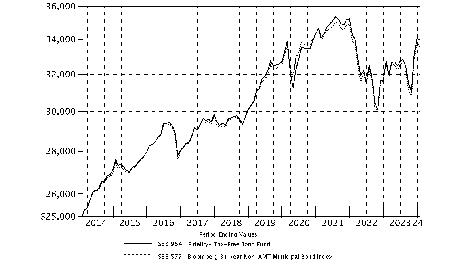 |
| Top Five States (% of Fund's net assets) | |
| Illinois | 14.6 |
| New York | 6.8 |
| Texas | 6.7 |
| Pennsylvania | 6.6 |
| New Jersey | 5.3 |
| Revenue Sources (% of Fund's net assets) | ||
| Health Care | 23.5 | |
| General Obligations | 21.5 | |
| Transportation | 15.6 | |
| Special Tax | 8.6 | |
| Education | 7.7 | |
| Electric Utilities | 6.2 | |
| State G.O. | 5.8 | |
| Others* (Individually Less Than 5%) | 11.1 | |
| 100.0 | ||
| *Includes net other assets | ||
Quality Diversification (% of Fund's net assets) |
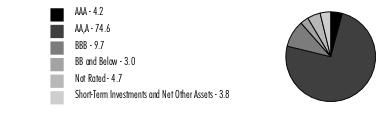 |
| We have used ratings from Moody's Investors Service, Inc. Where Moody's® ratings are not available, we have used S&P® ratings. All ratings are as of the date indicated and do not reflect subsequent changes. |
| Municipal Bonds - 96.3% | |||
Principal Amount (a) | Value ($) | ||
| Alabama - 2.1% | |||
| Auburn Univ. Gen. Fee Rev. Series 2018 A, 5% 6/1/43 | 1,700,000 | 1,800,334 | |
| Homewood Edl. Bldg. Auth. Rev. Series 2019 A: | |||
| 4% 12/1/33 | 270,000 | 274,857 | |
| 4% 12/1/35 | 880,000 | 889,202 | |
| 4% 12/1/37 | 1,180,000 | 1,180,218 | |
| 4% 12/1/38 | 225,000 | 223,128 | |
| 4% 12/1/39 | 1,605,000 | 1,573,247 | |
| 4% 12/1/41 | 3,845,000 | 3,706,844 | |
| 4% 12/1/44 | 2,265,000 | 2,107,034 | |
| 4% 12/1/49 | 530,000 | 475,799 | |
| Jefferson County Swr. Rev. Series 2024, 5% 10/1/29 | 1,555,000 | 1,716,055 | |
| Lower Alabama Gas District Bonds (No. 2 Proj.) Series 2020, 4%, tender 12/1/25 (b) | 23,020,000 | 23,041,922 | |
| Mobile Indl. Dev. Board Poll. Cont. Rev. Bonds (Alabama Pwr. Co. Barry Plant Proj.) Series 2007 C, 3.78%, tender 6/16/26 (b) | 1,615,000 | 1,623,497 | |
| Montgomery Med. Clinic Facilities Series 2015: | |||
| 5% 3/1/26 | 55,000 | 52,567 | |
| 5% 3/1/27 | 110,000 | 103,439 | |
| 5% 3/1/28 | 120,000 | 111,088 | |
| 5% 3/1/29 | 100,000 | 91,289 | |
| 5% 3/1/30 | 120,000 | 108,161 | |
| 5% 3/1/36 | 2,315,000 | 1,910,696 | |
| Southeast Energy Auth. Rev.: | |||
| (Proj. No. 2) Series 2021 B1: | |||
4% 6/1/29 | 1,260,000 | 1,269,852 | |
4% 6/1/30 | 955,000 | 962,812 | |
4% 6/1/31 | 825,000 | 821,255 | |
| Bonds (Proj. No. 2) Series 2021 B1, 4%, tender 12/1/31 (b) | 20,155,000 | 19,960,067 | |
| Univ. of Alabama Gen. Rev. Series 2019 C, 5% 7/1/31 | 2,755,000 | 3,080,224 | |
TOTAL ALABAMA | 67,083,587 | ||
| Alaska - 0.1% | |||
| Alaska Int'l. Arpts. Revs. Series 2016 B, 5% 10/1/33 | 2,075,000 | 2,126,492 | |
| Arizona - 3.2% | |||
| Arizona Board of Regents Ctfs. of Prtn. (Univ. of Arizona Univ. Revs.) Series 2018 B: | |||
| 5% 6/1/27 | 470,000 | 502,414 | |
| 5% 6/1/30 | 1,390,000 | 1,517,064 | |
| Arizona Health Facilities Auth. Rev. (Banner Health Sys. Proj.) Series 2007 B, S&P Municipal Bond 7 Day High Grade Rate Index + 0.810% 4.97%, tender 1/1/37 (b)(c) | 945,000 | 877,183 | |
| Arizona Indl. Dev. Auth. Hosp. Rev. Series 2021 A: | |||
| 4% 2/1/38 | 1,415,000 | 1,440,739 | |
| 4% 2/1/39 | 1,415,000 | 1,433,489 | |
| Arizona Indl. Dev. Auth. Lease Rev. Series 2020 A: | |||
| 4% 9/1/37 | 385,000 | 385,948 | |
| 4% 9/1/38 | 420,000 | 418,433 | |
| 4% 9/1/39 | 380,000 | 375,224 | |
| 4% 9/1/40 | 410,000 | 403,375 | |
| 4% 9/1/46 | 1,000,000 | 942,185 | |
| 5% 9/1/31 | 185,000 | 203,791 | |
| 5% 9/1/32 | 285,000 | 313,505 | |
| 5% 9/1/33 | 390,000 | 428,533 | |
| 5% 9/1/34 | 330,000 | 361,714 | |
| Arizona Indl. Dev. Auth. Rev.: | |||
| (Provident Group-Eastern Michigan Univ. Parking Proj.) Series 2018: | |||
5% 5/1/37 | 1,030,000 | 566,500 | |
5% 5/1/43 | 945,000 | 519,750 | |
| Series 2019 2, 3.625% 5/20/33 | 1,752,456 | 1,643,335 | |
| Arizona State Univ. Revs. Series 2021 C: | |||
| 5% 7/1/32 | 1,150,000 | 1,336,107 | |
| 5% 7/1/34 | 1,180,000 | 1,365,913 | |
| 5% 7/1/35 | 945,000 | 1,088,974 | |
| Glendale Indl. Dev. Auth. (Terraces of Phoenix Proj.) Series 2018 A: | |||
| 5% 7/1/38 | 145,000 | 140,363 | |
| 5% 7/1/48 | 190,000 | 168,688 | |
| Maricopa County Indl. Dev. Auth. (Creighton Univ. Proj.) Series 2020, 5% 7/1/47 | 1,890,000 | 1,996,553 | |
| Maricopa County Indl. Dev. Auth. Sr. Living Facilities Series 2016: | |||
| 5.75% 1/1/36 (d) | 1,735,000 | 1,410,909 | |
| 6% 1/1/48 (d) | 3,290,000 | 2,358,770 | |
| Maricopa County Rev.: | |||
| Series 2017 D, 3% 1/1/48 | 4,000,000 | 3,068,124 | |
| Series 2019 E, 3% 1/1/49 | 2,375,000 | 1,799,656 | |
| Maricopa County Unified School District #48 Scottsdale Series 2017 B: | |||
| 5% 7/1/31 | 755,000 | 811,030 | |
| 5% 7/1/32 | 3,070,000 | 3,291,606 | |
| Phoenix Ariz Indl. Dev. Auth. Rev.: | |||
| (Guam Facilities Foundation, Inc. Projs.) Series 2014, 5.375% 2/1/41 | 2,445,000 | 2,305,083 | |
| (Guam Facilities Foundation, Inc. Proj.) Series 2014, 5.125% 2/1/34 | 1,710,000 | 1,668,291 | |
| Phoenix Civic Impt. Board Arpt. Rev.: | |||
| Series 2017 B: | |||
5% 7/1/30 | 2,475,000 | 2,665,847 | |
5% 7/1/34 | 1,890,000 | 2,019,907 | |
5% 7/1/35 | 1,890,000 | 2,016,269 | |
| Series 2019 A, 5% 7/1/44 | 5,300,000 | 5,687,416 | |
| Phoenix Civic Impt. Corp. Series 2019 A: | |||
| 5% 7/1/30 | 1,040,000 | 1,143,662 | |
| 5% 7/1/32 | 335,000 | 367,874 | |
| 5% 7/1/36 | 560,000 | 607,940 | |
| 5% 7/1/37 | 490,000 | 528,562 | |
| 5% 7/1/38 | 785,000 | 842,031 | |
| 5% 7/1/45 | 6,800,000 | 7,134,006 | |
| Phoenix Civic Impt. Corp. District Rev. (Plaza Expansion Proj.) Series 2005 B, 5.5% 7/1/38 (Nat'l. Pub. Fin. Guarantee Corp. Insured) | 4,720,000 | 5,842,042 | |
| Phoenix IDA Student Hsg. Rev. (Downtown Phoenix Student Hsg. II LLC Arizona State Univ. Proj.) Series 2019 A: | |||
| 5% 7/1/49 | 1,060,000 | 1,059,199 | |
| 5% 7/1/54 | 3,335,000 | 3,300,690 | |
| Salt River Proj. Agricultural Impt. & Pwr. District Elec. Sys. Rev. Series 2023 B, 5.25% 1/1/53 | 30,000,000 | 33,808,635 | |
TOTAL ARIZONA | 102,167,329 | ||
| California - 3.4% | |||
| Alameda Corridor Trans. Auth. Rev. Series 2024 A: | |||
| 0% 10/1/52 (Assured Guaranty Muni. Corp. Insured) (e) | 485,000 | 124,460 | |
| 0% 10/1/53 (Assured Guaranty Muni. Corp. Insured) (e) | 1,665,000 | 404,808 | |
| California Gen. Oblig. Series 2004: | |||
| 5.25% 12/1/33 | 35,000 | 35,042 | |
| 5.5% 4/1/30 | 5,000 | 5,009 | |
| California Hsg. Fin. Agcy.: | |||
| Series 2021 1, 3.5% 11/20/35 | 2,352,705 | 2,216,780 | |
| Series 2023 A1, 4.375% 9/20/36 | 5,744,803 | 5,715,172 | |
| California Muni. Fin. Auth. Student Hsg. (CHF-Davis I, LLC - West Village Student Hsg. Proj.) Series 2018: | |||
| 5% 5/15/35 | 2,020,000 | 2,146,113 | |
| 5% 5/15/38 | 2,830,000 | 2,963,403 | |
| 5% 5/15/43 | 3,775,000 | 3,897,274 | |
| California Pub. Works Board Lease Rev. (Various Cap. Projs.) Series 2022 C, 5% 8/1/32 | 2,190,000 | 2,564,049 | |
| California Statewide Cmntys. Dev. Auth. Series 2016: | |||
| 5% 5/15/25 | 945,000 | 956,569 | |
| 5% 5/15/26 | 945,000 | 966,058 | |
| 5% 5/15/27 | 945,000 | 966,687 | |
| 5% 5/15/28 | 945,000 | 967,354 | |
| 5% 5/15/32 | 1,180,000 | 1,205,773 | |
| 5% 5/15/33 | 1,415,000 | 1,445,099 | |
| 5% 5/15/40 | 945,000 | 953,745 | |
| California Statewide Cmntys. Dev. Auth. Rev. Series 2015, 5% 2/1/45 (f) | 2,150,000 | 1,037,160 | |
| Golden State Tobacco Securitization Corp. Tobacco Settlement Rev. Series 2021 B2, 0% 6/1/66 | 44,735,000 | 5,176,873 | |
| Los Angeles Unified School District Ctfs. of Prtn. Series 2023 A, 5% 10/1/32 | 8,225,000 | 9,882,193 | |
| Mount Diablo Unified School District Series 2022 B: | |||
| 4% 8/1/29 | 1,800,000 | 1,955,575 | |
| 4% 8/1/33 | 1,425,000 | 1,577,777 | |
| Poway Unified School District: | |||
| (District #2007-1 School Facilities Proj.) Series 2008 A, 0% 8/1/32 | 1,225,000 | 940,182 | |
| Series B: | |||
0% 8/1/33 | 4,105,000 | 3,037,291 | |
0% 8/1/37 | 7,555,000 | 4,669,411 | |
0% 8/1/38 | 8,400,000 | 4,918,096 | |
0% 8/1/39 | 6,815,000 | 3,803,646 | |
0% 8/1/41 | 4,625,000 | 2,307,615 | |
| Poway Unified School District Pub. Fing. Series 2015 A: | |||
| 5% 9/1/27 | 990,000 | 1,013,700 | |
| 5% 9/1/30 | 1,295,000 | 1,327,296 | |
| Sacramento City Fing. Auth. Rev. Series A, 0% 12/1/26 (Nat'l. Pub. Fin. Guarantee Corp. Insured) | 1,510,000 | 1,371,359 | |
| San Diego Cmnty. College District Series 2011, 0% 8/1/35 | 2,830,000 | 1,963,233 | |
| San Diego Unified School District: | |||
| Series 2008 C: | |||
0% 7/1/34 | 1,225,000 | 884,944 | |
0% 7/1/37 | 4,820,000 | 3,034,418 | |
| Series 2008 E, 0% 7/1/47 (g) | 2,455,000 | 1,911,214 | |
| San Francisco City & County Arpts. Commission Int'l. Arpt. Rev.: | |||
| Series 2019 B, 5% 5/1/49 | 2,765,000 | 2,964,154 | |
| Series 2022 B, 5% 5/1/52 | 14,945,000 | 16,453,829 | |
| San Marcos Unified School District Series 2010 B, 0% 8/1/47 | 3,495,000 | 1,268,241 | |
| Tobacco Securitization Auth. Southern California Tobacco Settlement Series 2019 A1: | |||
| 5% 6/1/27 | 945,000 | 1,000,133 | |
| 5% 6/1/28 | 1,425,000 | 1,534,122 | |
| 5% 6/1/29 | 945,000 | 1,032,168 | |
| Univ. of California Revs.: | |||
| Series 2017 AV, 5% 5/15/36 | 1,520,000 | 1,637,022 | |
| Series 2021 Q, 3% 5/15/51 | 4,325,000 | 3,453,075 | |
TOTAL CALIFORNIA | 107,688,122 | ||
| Colorado - 0.8% | |||
| Arkansas River Pwr. Auth. Rev. Series 2018 A: | |||
| 5% 10/1/38 | 1,370,000 | 1,415,272 | |
| 5% 10/1/43 | 5,485,000 | 5,621,250 | |
| Colorado Health Facilities Auth. Rev. Bonds: | |||
| (Parkview Episcopal Med. Ctr., Co. Proj.) Series 2017: | |||
5% 9/1/24 | 210,000 | 211,481 | |
5% 9/1/25 | 245,000 | 249,969 | |
5% 9/1/28 | 2,075,000 | 2,234,715 | |
| (Parkview Med. Ctr., Inc. Proj.) Series 2016, 5% 9/1/46 | 3,495,000 | 3,557,681 | |
| Series 2019 A, 4% 11/1/39 | 2,815,000 | 2,800,429 | |
| Series 2019 A2: | |||
3.25% 8/1/49 | 2,700,000 | 2,014,059 | |
4% 8/1/49 | 4,390,000 | 4,135,925 | |
| Series 2020 A, 4% 9/1/50 | 1,020,000 | 969,748 | |
| Series 2021 A, 3% 11/15/51 | 2,600,000 | 1,971,022 | |
| Colorado Hsg. & Fin. Auth.: | |||
| Series 2019 H, 4.25% 11/1/49 | 675,000 | 677,654 | |
| Series 2021 E, 3% 11/1/51 | 1,170,000 | 1,132,685 | |
TOTAL COLORADO | 26,991,890 | ||
| Connecticut - 2.1% | |||
| Connecticut Gen. Oblig.: | |||
| Series 2018 F, 5% 9/15/27 | 945,000 | 1,022,615 | |
| Series 2020 A, 4% 1/15/34 | 6,615,000 | 7,060,903 | |
| Series 2021 A: | |||
3% 1/15/35 | 1,000,000 | 962,813 | |
3% 1/15/39 | 960,000 | 849,786 | |
3% 1/15/40 | 1,230,000 | 1,073,907 | |
| Series 2021 B, 3% 6/1/40 | 1,000,000 | 871,735 | |
| Series 2022 B, 3% 1/15/40 | 2,625,000 | 2,314,795 | |
| Connecticut Health & Edl. Facilities Auth. Rev.: | |||
| (Sacred Heart Univ., CT. Proj.) Series 2017 I-1: | |||
5% 7/1/34 | 990,000 | 1,043,904 | |
5% 7/1/35 | 1,135,000 | 1,190,380 | |
5% 7/1/36 | 380,000 | 397,163 | |
5% 7/1/37 | 1,470,000 | 1,529,480 | |
5% 7/1/42 | 3,570,000 | 3,663,213 | |
| Bonds Series 2020 B, 5%, tender 1/1/27 (b) | 4,445,000 | 4,639,600 | |
| Series 2016 K, 4% 7/1/46 | 4,215,000 | 3,876,030 | |
| Series 2019 A: | |||
5% 7/1/34 (d) | 1,325,000 | 1,296,425 | |
5% 7/1/49 (d) | 1,925,000 | 1,665,383 | |
| Series 2020 A, 4% 7/1/39 | 2,830,000 | 2,839,505 | |
| Series 2020 C, 4% 7/1/45 | 3,985,000 | 3,844,776 | |
| Series 2020 K: | |||
5% 7/1/37 | 945,000 | 1,026,016 | |
5% 7/1/38 | 1,415,000 | 1,526,337 | |
5% 7/1/39 | 1,465,000 | 1,573,221 | |
5% 7/1/44 (d) | 1,295,000 | 1,232,066 | |
| Series 2021 S, 4% 6/1/51 | 1,120,000 | 1,071,136 | |
| Series 2022 M: | |||
4% 7/1/37 | 3,305,000 | 3,326,692 | |
4% 7/1/52 | 1,680,000 | 1,580,821 | |
| Series G, 5% 7/1/50 (d) | 1,100,000 | 1,006,231 | |
| Series K1: | |||
5% 7/1/31 | 1,415,000 | 1,462,874 | |
5% 7/1/35 | 1,210,000 | 1,241,795 | |
| Series N: | |||
4% 7/1/39 | 1,165,000 | 981,040 | |
4% 7/1/49 | 1,395,000 | 1,037,269 | |
5% 7/1/32 | 520,000 | 523,407 | |
5% 7/1/33 | 470,000 | 472,191 | |
5% 7/1/34 | 235,000 | 235,542 | |
| Connecticut Hsg. Fin. Auth. Series 2019 B1, 4% 5/15/49 | 915,000 | 911,426 | |
| Connecticut State Revolving Fund Gen. Rev. Series 2017 A, 5% 5/1/35 | 2,195,000 | 2,342,753 | |
| Hbr. Point Infrastructure Impt. District Series 2017: | |||
| 5% 4/1/30 (d) | 2,095,000 | 2,143,579 | |
| 5% 4/1/39 (d) | 2,950,000 | 2,984,760 | |
| New Haven Gen. Oblig. Series 2016 A, 5% 8/15/25 (Assured Guaranty Muni. Corp. Insured) | 540,000 | 553,850 | |
TOTAL CONNECTICUT | 67,375,419 | ||
| District Of Columbia - 1.0% | |||
| District of Columbia Gen. Oblig. Series 2017 A, 5% 6/1/33 | 2,170,000 | 2,320,627 | |
| District of Columbia Hosp. Rev. Series 2015: | |||
| 5% 7/15/29 | 3,775,000 | 3,899,496 | |
| 5% 7/15/30 | 6,130,000 | 6,323,922 | |
| Metropolitan Washington Arpts. Auth. Dulles Toll Road Rev.: | |||
| (Dulles Metrorail and Cap. Impt. Projs.): | |||
Series 2019 A: | |||
5% 10/1/33 | 1,180,000 | 1,280,901 | |
5% 10/1/34 | 1,890,000 | 2,047,776 | |
5% 10/1/36 | 1,890,000 | 2,030,724 | |
Series 2019 B, 3% 10/1/50 (Assured Guaranty Muni. Corp. Insured) | 4,210,000 | 3,230,714 | |
| (Dulles Metrorail And Cap. Impt. Projs.) Series 2019 B, 4% 10/1/49 | 4,975,000 | 4,630,671 | |
| (Dulles Metrorail and Cap. Impts. Projs.) Series 2022 A, 3% 10/1/53 (Assured Guaranty Muni. Corp. Insured) | 2,400,000 | 1,777,195 | |
| Washington D.C. Metropolitan Transit Auth. Rev. Series 2017 B, 5% 7/1/33 | 4,290,000 | 4,590,185 | |
TOTAL DISTRICT OF COLUMBIA | 32,132,211 | ||
| Florida - 5.1% | |||
| Brevard County Health Facilities Auth. Rev. Series 2023 A, 5% 4/1/32 | 2,220,000 | 2,527,613 | |
| Broward County School Board Ctfs. of Prtn.: | |||
| (Broward County School District Proj.) Series 2016 A, 5% 7/1/28 | 1,505,000 | 1,577,289 | |
| Series 2016, 5% 7/1/32 | 965,000 | 999,931 | |
| Cap. Projs. Fin. Auth. Student Hsg. Rev. (Cap. Projs. Ln. Prog. - Florida Univs.) Series 2020 A, 5% 10/1/29 | 1,650,000 | 1,721,127 | |
| Central Florida Expressway Auth. Sr. Lien Rev. Series 2021: | |||
| 4% 7/1/34 (Assured Guaranty Muni. Corp. Insured) | 4,015,000 | 4,265,272 | |
| 4% 7/1/35 (Assured Guaranty Muni. Corp. Insured) | 3,890,000 | 4,117,294 | |
| 4% 7/1/37 (Assured Guaranty Muni. Corp. Insured) | 4,320,000 | 4,524,831 | |
| 4% 7/1/38 (Assured Guaranty Muni. Corp. Insured) | 2,700,000 | 2,803,088 | |
| 4% 7/1/39 (Assured Guaranty Muni. Corp. Insured) | 2,175,000 | 2,240,827 | |
| Duval County School Board Ctfs. of Prtn. Series 2015 B, 5% 7/1/29 | 6,025,000 | 6,180,878 | |
| Escambia County Health Facilities Auth. Health Facilities Rev. Series 2020 A, 4% 8/15/45 | 2,255,000 | 2,053,053 | |
| Florida Dept. of Trans. Tpk. Rev. Series 2021 C, 3% 7/1/46 | 1,000,000 | 822,650 | |
| Florida Dev. Fin. Corp. Healthcare Facility Rev. Bonds (Tampa Gen. Hosp. Proj.) Series 2024 B, 5%, tender 10/1/31 (b)(e) | 4,730,000 | 5,268,442 | |
| Florida Higher Edl. Facilities Fing. Auth.: | |||
| (St. Leo Univ. Proj.) Series 2019, 5% 3/1/49 | 4,530,000 | 3,359,491 | |
| Series 2019, 5% 10/1/27 | 615,000 | 640,548 | |
| Florida Hsg. Fin. Corp. Multi-family Mtg. Rev. Bonds Series 2023 C, 5%, tender 12/1/25 (b) | 1,305,000 | 1,335,858 | |
| Florida Hsg. Fin. Corp. Rev. Series 2019 1, 4% 7/1/50 | 2,455,000 | 2,447,776 | |
| Florida Mid-Bay Bridge Auth. Rev.: | |||
| Series 2015 A, 5% 10/1/35 | 2,455,000 | 2,495,240 | |
| Series 2015 C, 5% 10/1/35 | 1,890,000 | 1,919,455 | |
| Florida Muni. Pwr. Agcy. Rev.: | |||
| (Pwr. Supply Proj.) Series 2017 A, 5% 10/1/28 | 380,000 | 414,503 | |
| (Requirements Pwr. Supply Proj.) Series 2016 A: | |||
5% 10/1/30 | 930,000 | 970,161 | |
5% 10/1/31 | 1,015,000 | 1,057,777 | |
| Series 2015 B, 5% 10/1/29 | 1,180,000 | 1,212,205 | |
| Gainesville Utils. Sys. Rev. Series 2017 A, 5% 10/1/35 | 4,720,000 | 5,024,401 | |
| Halifax Hosp. Med. Ctr. Rev. Series 2015: | |||
| 5% 6/1/24 | 790,000 | 793,100 | |
| 5% 6/1/28 (Pre-Refunded to 6/1/25 @ 100) | 620,000 | 635,531 | |
| Hillsborough County School Board Ctfs. of Prtn. Series 2015 A, 5% 7/1/26 | 7,555,000 | 7,713,617 | |
| Jacksonville Health Care Facilities (Baptist Med. Ctr. Proj.) Series 2017: | |||
| 5% 8/15/26 | 1,890,000 | 1,984,364 | |
| 5% 8/15/34 | 2,595,000 | 2,732,071 | |
| Miami Beach Health Facilities Auth. Hosp. Rev. Series 2014 A, 5% 11/15/39 | 1,445,000 | 1,454,105 | |
| Miami-Dade County Aviation Rev. Series 2020 A: | |||
| 4% 10/1/35 | 1,510,000 | 1,572,817 | |
| 4% 10/1/41 | 1,135,000 | 1,144,657 | |
| 5% 10/1/31 | 2,020,000 | 2,302,272 | |
| Miami-Dade County Expressway Auth.: | |||
| Series 2010 A, 5% 7/1/40 | 3,115,000 | 3,127,821 | |
| Series 2014 A: | |||
5% 7/1/25 | 1,350,000 | 1,358,647 | |
5% 7/1/27 | 945,000 | 950,831 | |
5% 7/1/28 | 2,100,000 | 2,113,651 | |
5% 7/1/29 | 955,000 | 961,366 | |
| Series 2014 B, 5% 7/1/30 | 2,360,000 | 2,375,829 | |
| Miami-Dade County Gen. Oblig. Series 2020, 2.25% 7/1/38 | 1,000,000 | 784,040 | |
| Miami-Dade County School Board Ctfs. of Prtn.: | |||
| Series 2015 A, 5% 5/1/29 | 11,680,000 | 11,910,459 | |
| Series 2016 A, 5% 5/1/32 | 9,440,000 | 9,833,312 | |
| Series 2016 B, 5% 8/1/26 | 4,255,000 | 4,454,326 | |
| Palm Beach County Health Facilities Auth. Hosp. Rev. Series 2019, 4% 8/15/49 | 3,205,000 | 3,016,226 | |
| Palm Beach County Health Facilities Auth. Rev. Series 2019 B, 5% 5/15/53 | 3,690,000 | 2,757,676 | |
| Palm Beach County School Board Ctfs. of Prtn. Series 2015 D, 5% 8/1/28 | 1,870,000 | 1,917,267 | |
| Pinellas County Idr (Drs. Kiran & Pallavi Patel 2017 Foundation for Global Understanding, Inc. Proj.) Series 2019: | |||
| 5% 7/1/29 | 200,000 | 205,058 | |
| 5% 7/1/39 | 400,000 | 402,054 | |
| South Florida Wtr. Mgmt. District Ctfs. of Prtn. Series 2015: | |||
| 5% 10/1/27 | 470,000 | 491,627 | |
| 5% 10/1/28 | 3,775,000 | 3,949,519 | |
| 5% 10/1/30 | 1,890,000 | 1,971,298 | |
| 5% 10/1/32 | 3,125,000 | 3,257,417 | |
| South Miami Health Facilities Auth. Hosp. Rev. (Baptist Med. Ctr., FL. Proj.) Series 2017: | |||
| 5% 8/15/29 | 1,395,000 | 1,482,121 | |
| 5% 8/15/32 | 3,700,000 | 3,907,059 | |
| 5% 8/15/35 | 665,000 | 698,588 | |
| 5% 8/15/37 | 4,720,000 | 4,918,847 | |
| 5% 8/15/42 | 3,210,000 | 3,296,752 | |
| 5% 8/15/47 | 4,910,000 | 5,018,926 | |
| Tallahassee Health Facilities Rev.: | |||
| (Tallahassee Memorial Healthcare, Inc. Proj.) Series 2016 A: | |||
5% 12/1/29 | 1,345,000 | 1,379,248 | |
5% 12/1/36 | 1,040,000 | 1,055,761 | |
| Series 2015 A, 5% 12/1/40 | 945,000 | 950,906 | |
| Volusia County Edl. Facilities Auth. Rev. (Embry-Riddle Aeronautical Univ., Inc. Proj.) Series 2020 A: | |||
| 5% 10/15/44 | 720,000 | 761,749 | |
| 5% 10/15/49 | 1,340,000 | 1,404,523 | |
| Volusia County School Board Ctfs. of Prtn. (Florida Master Lease Prog.) Series 2016 A, 5% 8/1/31 (Build America Mutual Assurance Insured) | 2,090,000 | 2,162,186 | |
TOTAL FLORIDA | 163,187,334 | ||
| Georgia - 4.6% | |||
| Atlanta Arpt. Rev. Series 2023 B1: | |||
| 5% 7/1/37 | 1,450,000 | 1,703,515 | |
| 5% 7/1/39 | 1,000,000 | 1,153,311 | |
| 5% 7/1/40 | 1,125,000 | 1,287,867 | |
| Burke County Indl. Dev. Auth. Poll. Cont. Rev.: | |||
| (Georgia Transmission Corp. Proj.) Series 2012, 2.75% 1/1/52 (b) | 2,900,000 | 2,033,158 | |
| Bonds (Georgia Pwr. Co. Plant Vogtle Proj.) Series 2013 1st, 2.925%, tender 3/12/24 (b) | 9,065,000 | 9,051,695 | |
| Coweta County Dev. Auth. Rev. (Piedmont Healthcare, Inc. Proj.) Series 2019 A, 5% 7/1/44 | 6,080,000 | 6,320,486 | |
| DeKalb Private Hosp. Auth. Rev. Series 2019 B, 5% 7/1/35 | 1,285,000 | 1,424,239 | |
| Fulton County Dev. Auth. Rev.: | |||
| Series 2019 C, 5% 7/1/38 | 1,160,000 | 1,261,562 | |
| Series 2019, 4% 6/15/49 | 1,115,000 | 1,080,474 | |
| Gainesville & Hall County Hosp. Auth. Rev. Series 2020 A, 3% 2/15/47 | 9,015,000 | 7,199,611 | |
| Georgia Hsg. & Fin. Auth. Series 2019 B, 3.25% 12/1/49 | 1,750,000 | 1,399,659 | |
| Georgia Muni. Elec. Auth. Pwr. Rev. Series 2019 A: | |||
| 4% 1/1/49 | 5,760,000 | 5,476,063 | |
| 5% 1/1/30 | 390,000 | 423,641 | |
| 5% 1/1/32 | 885,000 | 957,436 | |
| 5% 1/1/34 | 1,815,000 | 1,957,849 | |
| 5% 1/1/35 | 875,000 | 942,310 | |
| 5% 1/1/36 | 1,075,000 | 1,153,749 | |
| 5% 1/1/37 | 1,055,000 | 1,126,388 | |
| 5% 1/1/38 | 1,085,000 | 1,148,053 | |
| 5% 1/1/44 | 2,825,000 | 2,935,074 | |
| Hosp. Auth. of Savannah Auth. Rev. Series 2019 A: | |||
| 4% 7/1/35 | 4,620,000 | 4,673,493 | |
| 4% 7/1/39 | 2,360,000 | 2,371,897 | |
| 4% 7/1/43 | 2,470,000 | 2,420,542 | |
| Main Street Natural Gas, Inc.: | |||
| Bonds: | |||
Series 2021 A, 4%, tender 9/1/27 (b) | 21,715,000 | 21,811,649 | |
Series 2021 C, 4%, tender 12/1/28 (b) | 20,380,000 | 20,428,044 | |
Series 2023 D, 5%, tender 12/1/30 (b) | 19,695,000 | 20,849,608 | |
Series 2024 A1, 5%, tender 9/1/31 (b) | 6,450,000 | 6,902,216 | |
| Series 2024 A1: | |||
5% 3/1/29 | 2,675,000 | 2,805,679 | |
5% 9/1/29 | 2,240,000 | 2,359,920 | |
5% 3/1/30 | 2,940,000 | 3,106,946 | |
5% 9/1/30 | 2,350,000 | 2,492,426 | |
| Private Colleges & Univs. Auth. Rev.: | |||
| (The Savannah College of Art & Design Projs.) Series 2021: | |||
4% 4/1/38 | 500,000 | 510,277 | |
4% 4/1/40 | 1,320,000 | 1,332,321 | |
5% 4/1/36 | 1,060,000 | 1,183,395 | |
| Series 2020 B, 5% 9/1/33 | 2,360,000 | 2,709,716 | |
TOTAL GEORGIA | 145,994,269 | ||
| Hawaii - 0.1% | |||
| Hawaii Gen. Oblig. Series 2020 C: | |||
| 4% 7/1/37 | 1,040,000 | 1,078,704 | |
| 4% 7/1/38 | 1,180,000 | 1,212,757 | |
TOTAL HAWAII | 2,291,461 | ||
| Idaho - 0.2% | |||
| Idaho Health Facilities Auth. Rev. Series 2015 ID: | |||
| 5% 12/1/24 | 470,000 | 476,663 | |
| 5.5% 12/1/27 | 3,070,000 | 3,159,216 | |
| Idaho Hsg. & Fin. Assoc. Single Family Mtg.: | |||
| (Idaho St Garvee Proj.) Series 2017 A: | |||
5% 7/15/24 | 665,000 | 670,331 | |
5% 7/15/25 | 665,000 | 683,677 | |
5% 7/15/26 | 470,000 | 494,636 | |
| Series 2019 A, 4% 1/1/50 | 1,380,000 | 1,376,411 | |
TOTAL IDAHO | 6,860,934 | ||
| Illinois - 14.6% | |||
| Chicago Board of Ed.: | |||
| Series 2012 A, 5% 12/1/42 | 2,660,000 | 2,656,598 | |
| Series 2015 C, 5.25% 12/1/39 | 755,000 | 750,691 | |
| Series 2016 B, 6.5% 12/1/46 | 400,000 | 419,180 | |
| Series 2017 A, 7% 12/1/46 (d) | 1,400,000 | 1,518,770 | |
| Series 2017 C: | |||
5% 12/1/24 | 1,735,000 | 1,746,254 | |
5% 12/1/25 | 2,670,000 | 2,714,739 | |
5% 12/1/26 | 500,000 | 514,612 | |
| Series 2017 D: | |||
5% 12/1/24 | 1,705,000 | 1,716,060 | |
5% 12/1/31 | 1,845,000 | 1,885,031 | |
| Series 2017 H, 5% 12/1/36 | 440,000 | 445,041 | |
| Series 2018 A: | |||
5% 12/1/24 | 1,590,000 | 1,601,129 | |
5% 12/1/29 | 4,195,000 | 4,348,970 | |
5% 12/1/31 | 850,000 | 872,882 | |
| Series 2018 C, 5% 12/1/46 | 8,210,000 | 8,223,391 | |
| Series 2019 A: | |||
5% 12/1/25 | 2,360,000 | 2,399,544 | |
5% 12/1/26 | 1,985,000 | 2,043,010 | |
5% 12/1/29 | 2,920,000 | 3,079,023 | |
5% 12/1/30 | 3,820,000 | 4,001,162 | |
5% 12/1/32 | 1,700,000 | 1,775,944 | |
| Chicago Gen. Oblig.: | |||
| Series 2020 A: | |||
5% 1/1/26 | 1,565,000 | 1,605,707 | |
5% 1/1/27 | 7,225,000 | 7,535,973 | |
5% 1/1/29 | 3,645,000 | 3,899,767 | |
5% 1/1/30 | 7,320,000 | 7,915,495 | |
| Series 2021 A, 5% 1/1/32 | 4,405,000 | 4,810,733 | |
| Chicago Midway Arpt. Rev. Series 2016 B: | |||
| 4% 1/1/35 | 770,000 | 778,315 | |
| 5% 1/1/36 | 4,250,000 | 4,357,435 | |
| 5% 1/1/37 | 5,005,000 | 5,120,375 | |
| Chicago O'Hare Int'l. Arpt. Rev.: | |||
| Series 2016 B, 5% 1/1/34 | 2,675,000 | 2,765,980 | |
| Series 2016 C: | |||
5% 1/1/32 | 4,485,000 | 4,638,942 | |
5% 1/1/33 | 1,230,000 | 1,272,152 | |
5% 1/1/34 | 1,425,000 | 1,473,466 | |
| Series 2017 B: | |||
5% 1/1/34 | 1,430,000 | 1,502,933 | |
5% 1/1/35 | 2,400,000 | 2,519,823 | |
5% 1/1/36 | 1,560,000 | 1,632,207 | |
5% 1/1/37 | 6,045,000 | 6,304,350 | |
5% 1/1/38 | 2,125,000 | 2,209,211 | |
| Series 2018 B: | |||
4% 1/1/44 | 5,880,000 | 5,867,610 | |
5% 1/1/48 | 1,055,000 | 1,114,994 | |
5% 1/1/53 | 1,060,000 | 1,113,701 | |
| Series 2020 A, 4% 1/1/37 | 6,305,000 | 6,544,028 | |
| Chicago Transit Auth. Series 2017, 5% 12/1/46 | 1,795,000 | 1,838,668 | |
| Chicago Transit Auth. Cap. Grant Receipts Rev. Series 2017: | |||
| 5% 6/1/25 | 705,000 | 718,495 | |
| 5% 6/1/26 | 1,505,000 | 1,559,413 | |
| Cook County Ccsd 034 Glenview Series 2021 A, 2% 12/1/37 | 2,010,000 | 1,578,320 | |
| Cook County Gen. Oblig. Series 2016 A, 5% 11/15/29 | 5,770,000 | 6,076,186 | |
| Grundy & Will Counties Cmnty. School Gen. Oblig. Series 2018: | |||
| 5% 2/1/29 | 500,000 | 529,584 | |
| 5% 2/1/29 (Pre-Refunded to 2/1/27 @ 100) | 135,000 | 143,697 | |
| Illinois Fin. Auth.: | |||
| Series 2020 A: | |||
3% 5/15/50 | 7,190,000 | 5,225,738 | |
3% 5/15/50 (Build America Mutual Assurance Insured) | 3,390,000 | 2,606,516 | |
3.25% 8/15/49 | 1,340,000 | 1,036,308 | |
| Series 2020, 5% 7/1/36 | 4,150,000 | 4,720,898 | |
| Illinois Fin. Auth. Academic Facilities (Provident Group UIUC Properties LLC Univ. of Illinois at Urbana-Champaign Proj.) Series 2019 A: | |||
| 5% 10/1/31 | 190,000 | 208,462 | |
| 5% 10/1/32 | 275,000 | 300,410 | |
| 5% 10/1/33 | 470,000 | 509,862 | |
| 5% 10/1/35 | 285,000 | 307,048 | |
| 5% 10/1/36 | 285,000 | 304,589 | |
| 5% 10/1/37 | 330,000 | 349,941 | |
| 5% 10/1/38 | 355,000 | 373,963 | |
| 5% 10/1/39 | 610,000 | 639,021 | |
| Illinois Fin. Auth. Rev.: | |||
| (Bradley Univ. Proj.) Series 2017 C, 5% 8/1/31 | 2,230,000 | 2,335,988 | |
| (Depaul Univ. Proj.) Series 2016 A: | |||
4% 10/1/31 | 1,395,000 | 1,419,252 | |
5% 10/1/33 | 1,415,000 | 1,481,708 | |
| (Northwestern Memorial Hosp.,IL. Proj.) Series 2017 A: | |||
5% 7/15/25 | 750,000 | 770,525 | |
5% 7/15/30 | 1,405,000 | 1,518,890 | |
| (OSF Healthcare Sys.) Series 2018 A: | |||
4.125% 5/15/47 | 10,465,000 | 10,170,363 | |
5% 5/15/43 | 9,440,000 | 9,691,375 | |
| (Presence Health Proj.) Series 2016 C: | |||
5% 2/15/29 | 3,260,000 | 3,431,042 | |
5% 2/15/36 | 2,255,000 | 2,341,612 | |
| (Rosalind Franklin Univ. Research Bldg. Proj.) Series 2017 C, 5% 8/1/49 | 465,000 | 467,590 | |
| (Rush Univ. Med. Ctr. Proj.) Series 2015 A, 5% 11/15/34 | 1,135,000 | 1,153,847 | |
| Series 2015 A, 5% 11/15/31 | 3,305,000 | 3,384,206 | |
| Series 2015 C, 5% 8/15/44 | 12,435,000 | 12,595,663 | |
| Series 2016 A, 5.25% 8/15/29 (Pre-Refunded to 8/15/26 @ 100) | 960,000 | 1,011,930 | |
| Series 2016 B: | |||
5% 8/15/30 | 2,830,000 | 2,992,613 | |
5% 8/15/33 | 4,330,000 | 4,546,238 | |
5% 8/15/34 | 2,280,000 | 2,392,627 | |
| Series 2016 C: | |||
3.75% 2/15/34 | 685,000 | 687,547 | |
4% 2/15/36 | 2,915,000 | 2,963,934 | |
4% 2/15/41 | 8,645,000 | 8,522,036 | |
5% 2/15/31 | 1,965,000 | 2,065,932 | |
| Series 2016: | |||
4% 2/15/41 (Pre-Refunded to 2/15/27 @ 100) | 20,000 | 20,608 | |
5% 12/1/29 | 970,000 | 1,003,934 | |
5% 12/1/46 | 2,510,000 | 2,531,288 | |
| Series 2017 A, 5% 8/1/47 | 405,000 | 408,001 | |
| Series 2017: | |||
5% 7/1/33 | 3,175,000 | 3,384,514 | |
5% 7/1/34 | 2,610,000 | 2,780,322 | |
5% 7/1/35 | 530,000 | 563,708 | |
| Series 2019: | |||
4% 9/1/37 | 380,000 | 322,374 | |
4% 9/1/39 | 945,000 | 776,264 | |
5% 9/1/30 | 180,000 | 181,037 | |
5% 9/1/38 | 850,000 | 801,211 | |
| Illinois Gen. Oblig.: | |||
| Series 2006, 5.5% 1/1/31 | 1,835,000 | 2,115,587 | |
| Series 2014: | |||
5% 2/1/25 | 2,120,000 | 2,122,599 | |
5% 2/1/27 | 1,155,000 | 1,156,462 | |
5% 4/1/28 | 550,000 | 551,367 | |
5% 5/1/28 | 3,140,000 | 3,151,879 | |
5% 5/1/32 | 1,320,000 | 1,324,150 | |
5% 5/1/33 | 1,510,000 | 1,514,023 | |
5.25% 2/1/29 | 2,830,000 | 2,833,979 | |
5.25% 2/1/30 | 2,550,000 | 2,553,394 | |
5.25% 2/1/31 | 1,230,000 | 1,231,572 | |
| Series 2016: | |||
5% 2/1/26 | 945,000 | 976,920 | |
5% 6/1/26 | 575,000 | 598,149 | |
5% 2/1/27 | 3,535,000 | 3,718,980 | |
5% 2/1/28 | 3,300,000 | 3,475,773 | |
5% 2/1/29 | 3,100,000 | 3,269,022 | |
| Series 2017 A, 5% 12/1/26 | 3,165,000 | 3,324,885 | |
| Series 2018 A: | |||
5% 10/1/26 | 1,415,000 | 1,481,555 | |
5% 10/1/28 | 3,305,000 | 3,576,221 | |
| Series 2020 B, 4% 10/1/32 | 5,055,000 | 5,247,501 | |
| Series 2021 A: | |||
5% 3/1/32 | 100,000 | 111,631 | |
5% 3/1/35 | 710,000 | 786,577 | |
5% 3/1/36 | 565,000 | 622,872 | |
5% 3/1/37 | 710,000 | 778,727 | |
5% 3/1/46 | 2,830,000 | 2,995,380 | |
| Series 2021 B, 4% 12/1/34 | 3,355,000 | 3,443,055 | |
| Series 2022 A: | |||
5% 3/1/32 | 1,755,000 | 1,989,831 | |
5% 3/1/36 | 7,365,000 | 8,212,319 | |
5.25% 3/1/37 | 1,605,000 | 1,807,521 | |
| Series 2022 B: | |||
5% 3/1/29 | 3,495,000 | 3,808,176 | |
5% 3/1/32 | 1,550,000 | 1,757,401 | |
| Series 2023 B: | |||
5% 5/1/36 | 1,450,000 | 1,619,318 | |
5.25% 5/1/38 | 6,750,000 | 7,562,739 | |
5.25% 5/1/40 | 3,005,000 | 3,332,774 | |
| Series 2023 C, 5% 5/1/29 | 3,945,000 | 4,309,504 | |
| Series 2023 D, 5% 7/1/28 | 3,305,000 | 3,564,278 | |
| Illinois Hsg. Dev. Auth. Series 2021, 3% 4/1/51 | 5,855,000 | 5,656,524 | |
| Illinois Hsg. Dev. Auth. Multi-family Hsg. Rev. Series 2019, 2.9% 7/1/35 | 4,455,724 | 4,010,964 | |
| Illinois Hsg. Dev. Auth. Rev.: | |||
| Series 2016 C, 2.9% 8/1/31 | 490,000 | 460,286 | |
| Series 2019 D, 2.7% 10/1/34 | 485,000 | 443,555 | |
| Illinois Muni. Elec. Agcy. Pwr. Supply Series 2015 A, 5% 2/1/31 | 1,785,000 | 1,824,731 | |
| Illinois Sales Tax Rev.: | |||
| Series 2021 A, 3% 6/15/33 (Build America Mutual Assurance Insured) | 2,720,000 | 2,565,055 | |
| Series 2024 A: | |||
5% 6/15/31 (e) | 4,535,000 | 5,168,954 | |
5% 6/15/32 (e) | 3,805,000 | 4,398,660 | |
5% 6/15/34 (e) | 5,495,000 | 6,511,661 | |
| Illinois Toll Hwy. Auth. Toll Hwy. Rev.: | |||
| Series 2016 A, 5% 12/1/31 | 890,000 | 923,164 | |
| Series 2019 A, 5% 1/1/44 | 1,060,000 | 1,138,208 | |
| Kane, McHenry, Cook & DeKalb Counties Unit School District #300: | |||
| Series 2015 5% 1/1/28 | 2,625,000 | 2,656,184 | |
| Series 2017, 5% 1/1/29 | 970,000 | 1,034,852 | |
| Kendall, Kane & Will Counties Cmnty. Unit School District #308 Series 2016, 5% 2/1/33 | 10,270,000 | 10,534,525 | |
| Lake County Cmnty. Consolidated School District #73 Gen. Oblig. Series 2021, 2.25% 1/1/40 | 1,245,000 | 966,152 | |
| McHenry County Cmnty. School District #200 Series 2006 B: | |||
| 0% 1/15/25 | 4,190,000 | 4,050,362 | |
| 0% 1/15/26 | 3,150,000 | 2,944,344 | |
| Metropolitan Pier & Exposition: | |||
| (McCormick Place Expansion Proj.): | |||
Series 2010 B1: | |||
0% 6/15/43 (Assured Guaranty Muni. Corp. Insured) | 30,875,000 | 13,508,455 | |
0% 6/15/44 (Assured Guaranty Muni. Corp. Insured) | 7,170,000 | 2,981,076 | |
0% 6/15/45 (Assured Guaranty Muni. Corp. Insured) | 11,465,000 | 4,520,097 | |
0% 6/15/47 (Assured Guaranty Muni. Corp. Insured) | 10,015,000 | 3,485,876 | |
Series 2012 B, 0% 12/15/51 | 5,570,000 | 1,415,944 | |
| Series 1994, 0% 6/15/29 (FGIC Insured) | 5,735,000 | 4,739,304 | |
| Series 2002 A, 0% 6/15/35 (Nat'l. Pub. Fin. Guarantee Corp. Insured) | 1,310,000 | 858,175 | |
| Series 2002: | |||
0% 12/15/31 (Nat'l. Pub. Fin. Guarantee Corp. Insured) | 775,000 | 584,990 | |
0% 12/15/36 (Nat'l. Pub. Fin. Guarantee Corp. Insured) | 12,285,000 | 7,441,389 | |
| Series 2017 B: | |||
5% 12/15/28 | 1,890,000 | 2,010,613 | |
5% 12/15/32 | 850,000 | 900,803 | |
| Series 2020 A, 5% 6/15/50 | 21,945,000 | 22,649,325 | |
| Series 2022 A, 4% 12/15/42 | 5,405,000 | 5,272,335 | |
| Sales Tax Securitization Corp. Series 2023 C, 5% 1/1/32 | 4,695,000 | 5,346,084 | |
| Schaumburg Village Gen. Oblig. Series 2023, 4% 12/1/30 | 2,940,000 | 3,102,208 | |
| Univ. of Illinois Rev. Series 2018 A, 5% 4/1/29 | 3,720,000 | 4,025,754 | |
| Will County Cmnty. Unit School District #365-U Series 2007 B, 0% 11/1/26 (Pre-Refunded to 11/1/26 @ 100) | 3,000,000 | 2,737,438 | |
TOTAL ILLINOIS | 467,234,694 | ||
| Indiana - 0.9% | |||
| Beech Grove School Bldg. Corp. Series 1996, 5.625% 7/5/24 (Escrowed to Maturity) | 65,000 | 65,648 | |
| Indiana Fin. Auth. Health Sys. Rev. Series 2016 A, 4% 11/1/51 | 3,790,000 | 3,530,988 | |
| Indiana Fin. Auth. Hosp. Rev. (Parkview Health Sys. Proj.) Series 2017 A: | |||
| 5% 11/1/28 | 425,000 | 463,933 | |
| 5% 11/1/29 | 1,320,000 | 1,468,468 | |
| 5% 11/1/30 | 295,000 | 333,548 | |
| Indiana Fin. Auth. Rev.: | |||
| (Butler Univ. Proj.) Series 2019, 4% 2/1/44 | 2,450,000 | 2,363,120 | |
| Series 2016, 5% 9/1/31 | 1,735,000 | 1,824,421 | |
| Indiana Hsg. & Cmnty. Dev. Auth.: | |||
| (Glasswater Creek of Whitestown Proj.) Series 2020, 5.375% 10/1/40 (d) | 1,660,000 | 1,379,784 | |
| Series 2021 B, 3% 7/1/50 | 925,000 | 895,483 | |
| Indiana Muni. Pwr. Agcy. Pwr. Supply Sys. Rev. Series 2017 A: | |||
| 5% 1/1/32 | 3,775,000 | 4,085,961 | |
| 5% 1/1/34 | 1,890,000 | 2,045,936 | |
| Indianapolis Local Pub. Impt. (Courthouse and Jail Proj.) Series 2019 A, 5% 2/1/49 | 3,090,000 | 3,235,116 | |
| Saint Joseph County Econ. Dev. Auth. Rev. (St. Mary's College Proj.): | |||
| Series 2019: | |||
4% 4/1/39 | 945,000 | 934,001 | |
4% 4/1/46 | 2,115,000 | 1,976,138 | |
5% 4/1/40 | 2,115,000 | 2,224,525 | |
| Series 2020: | |||
4% 4/1/37 | 1,565,000 | 1,571,358 | |
5% 4/1/29 | 970,000 | 1,052,235 | |
TOTAL INDIANA | 29,450,663 | ||
| Iowa - 0.3% | |||
| Iowa Fin. Auth. Rev.: | |||
| Series 2018 B, 5% 2/15/48 | 2,360,000 | 2,440,132 | |
| Series A: | |||
5% 5/15/43 | 775,000 | 633,448 | |
5% 5/15/48 | 1,355,000 | 1,050,950 | |
| Tobacco Settlement Auth. Tobacco Settlement Rev.: | |||
| Series 2021 A2, 4% 6/1/49 | 2,645,000 | 2,480,416 | |
| Series 2021 B1, 4% 6/1/49 | 2,765,000 | 2,790,150 | |
TOTAL IOWA | 9,395,096 | ||
| Kentucky - 2.8% | |||
| Ashland Med. Ctr. Rev.: | |||
| (Ashland Hosp. Corp. d/b/a King's Daughters Med. Ctr. Proj.) Series 2016 A, 5% 2/1/40 | 1,135,000 | 1,148,838 | |
| Series 2019: | |||
3% 2/1/40 (Assured Guaranty Muni. Corp. Insured) | 1,665,000 | 1,366,662 | |
5% 2/1/28 | 45,000 | 47,390 | |
5% 2/1/32 | 60,000 | 63,738 | |
| Boyle County Edl. Facilities Rev. Series 2017, 5% 6/1/37 | 1,585,000 | 1,656,291 | |
| Kenton County Arpt. Board Arpt. Rev.: | |||
| Series 2016, 5% 1/1/33 | 1,225,000 | 1,266,980 | |
| Series 2019, 5% 1/1/44 | 2,120,000 | 2,261,839 | |
| Kentucky Econ. Dev. Fin. Auth.: | |||
| Series 2019 A1: | |||
5% 8/1/33 | 945,000 | 1,024,064 | |
5% 8/1/44 | 945,000 | 977,341 | |
| Series 2019 A2, 5% 8/1/49 | 2,360,000 | 2,420,477 | |
| Kentucky Econ. Dev. Fin. Auth. Hosp. Rev.: | |||
| Series 2015 A: | |||
5% 6/1/25 | 45,000 | 45,290 | |
5% 6/1/26 | 50,000 | 50,431 | |
5% 6/1/27 | 50,000 | 50,506 | |
5% 6/1/28 | 55,000 | 55,601 | |
5% 6/1/29 | 60,000 | 60,700 | |
5% 6/1/30 | 60,000 | 60,726 | |
| Series 2017 B: | |||
5% 8/15/32 | 2,530,000 | 2,674,577 | |
5% 8/15/33 | 1,250,000 | 1,318,051 | |
5% 8/15/35 | 1,415,000 | 1,482,367 | |
| Kentucky State Property & Buildings Commission Rev.: | |||
| (Proj. No. 119) Series 2018: | |||
5% 5/1/29 | 1,760,000 | 1,910,457 | |
5% 5/1/30 | 1,180,000 | 1,282,895 | |
5% 5/1/31 | 505,000 | 548,999 | |
5% 5/1/32 | 265,000 | 287,816 | |
5% 5/1/33 | 595,000 | 645,843 | |
5% 5/1/34 | 680,000 | 735,600 | |
5% 5/1/35 | 400,000 | 431,289 | |
5% 5/1/36 | 340,000 | 365,234 | |
| Series A: | |||
4% 11/1/38 | 600,000 | 604,416 | |
5% 11/1/29 | 3,625,000 | 3,972,767 | |
5% 11/1/30 | 2,030,000 | 2,225,131 | |
| Kentucky, Inc. Pub. Energy Bonds Series A, 4%, tender 6/1/26 (b) | 29,720,000 | 29,762,592 | |
| Louisville & Jefferson County: | |||
| Bonds: | |||
Series 2020 C, 5%, tender 10/1/26 (b) | 1,360,000 | 1,413,016 | |
Series 2020 D, 5%, tender 10/1/29 (b) | 1,635,000 | 1,786,520 | |
| Series 2016 A: | |||
5% 10/1/31 | 6,045,000 | 6,283,659 | |
5% 10/1/32 | 7,310,000 | 7,593,970 | |
5% 10/1/33 | 4,155,000 | 4,313,121 | |
| Series 2020 A: | |||
3% 10/1/43 | 5,800,000 | 4,546,672 | |
4% 10/1/40 | 1,090,000 | 1,070,295 | |
5% 10/1/37 | 2,715,000 | 2,882,373 | |
TOTAL KENTUCKY | 90,694,534 | ||
| Louisiana - 0.1% | |||
| Louisiana Hsg. Corp. Single Fami (Home Ownership Prog.) Series 2023 C, 5.75% 12/1/53 | 995,000 | 1,085,822 | |
| Louisiana Pub. Facilities Auth. Hosp. Rev. (Franciscan Missionaries of Our Lady Health Sys. Proj.) Series 2017 A, 5% 7/1/47 | 1,605,000 | 1,634,549 | |
| Louisiana Pub. Facilities Auth. Rev. (Tulane Univ. of Louisiana Proj.) Series 2016 A, 5% 12/15/29 | 1,135,000 | 1,198,455 | |
TOTAL LOUISIANA | 3,918,826 | ||
| Maine - 1.1% | |||
| Brunswick Series 2020: | |||
| 2.375% 11/1/37 | 130,000 | 108,735 | |
| 2.5% 11/1/39 | 335,000 | 274,431 | |
| Lewiston 52850C Series 2021: | |||
| 1.25% 2/15/31 | 2,455,000 | 2,049,449 | |
| 1.25% 2/15/32 | 2,595,000 | 2,107,862 | |
| Maine Health & Higher Edl. Facilities Auth. Rev.: | |||
| Series 2016 A: | |||
4% 7/1/41 | 1,120,000 | 1,020,306 | |
4% 7/1/46 | 1,665,000 | 1,429,364 | |
5% 7/1/41 | 455,000 | 455,049 | |
5% 7/1/46 | 310,000 | 288,748 | |
| Series 2018 A: | |||
5% 7/1/30 | 1,120,000 | 1,198,457 | |
5% 7/1/31 | 1,040,000 | 1,110,943 | |
5% 7/1/34 | 1,890,000 | 2,020,953 | |
5% 7/1/35 | 2,590,000 | 2,764,898 | |
5% 7/1/36 | 3,070,000 | 3,262,980 | |
5% 7/1/37 | 2,830,000 | 2,993,144 | |
5% 7/1/38 | 2,150,000 | 2,262,434 | |
5% 7/1/43 | 4,250,000 | 4,430,565 | |
| Maine Tpk. Auth. Tpk. Rev. Series 2018: | |||
| 5% 7/1/33 | 660,000 | 721,763 | |
| 5% 7/1/34 | 945,000 | 1,029,285 | |
| 5% 7/1/35 | 1,040,000 | 1,129,989 | |
| 5% 7/1/36 | 1,890,000 | 2,045,001 | |
| Univ. Sys. Rev. Series 2022, 5.5% 3/1/62 | 3,800,000 | 4,103,958 | |
TOTAL MAINE | 36,808,314 | ||
| Maryland - 1.2% | |||
| Anne Arundel County Gen. Oblig.: | |||
| Series 2012, 3% 10/1/36 | 2,595,000 | 2,506,908 | |
| Series 2021, 3% 10/1/37 | 1,000,000 | 947,712 | |
| Baltimore County Gen. Oblig. Series 2021, 3% 3/1/37 | 825,000 | 791,398 | |
| Baltimore Gen. Oblig. Series 2022 A, 5% 10/15/37 | 735,000 | 857,185 | |
| City of Westminster Series 2016, 5% 11/1/31 | 1,865,000 | 1,938,799 | |
| Maryland Cmnty. Dev. Admin Dept. Hsg. & Cmnty. Dev.: | |||
| Series 2019 B, 4% 9/1/49 | 1,550,000 | 1,545,690 | |
| Series 2019 C, 3.5% 3/1/50 | 1,620,000 | 1,594,744 | |
| Maryland Health & Higher Edl. Series 2021 A, 3% 7/1/51 | 4,320,000 | 3,160,623 | |
| Maryland Health & Higher Edl. Facilities Auth. Rev.: | |||
| Series 2015, 5% 7/1/40 | 1,890,000 | 1,908,192 | |
| Series 2016 A: | |||
4% 7/1/42 | 735,000 | 692,891 | |
5% 7/1/35 | 1,940,000 | 1,998,187 | |
5% 7/1/38 | 1,060,000 | 1,081,437 | |
| Maryland Stadium Auth. Built to Learn Rev.: | |||
| Series 2021, 4% 6/1/46 | 850,000 | 851,715 | |
| Series 2022 A: | |||
4% 6/1/37 | 2,240,000 | 2,333,785 | |
4% 6/1/38 | 2,455,000 | 2,533,478 | |
| Prince Georges County Gen. Oblig. Series 2021 A, 2% 7/1/35 | 7,055,000 | 5,855,250 | |
| Washington Metropolitan Area Transit Auth. Series 2020 A, 5% 7/15/38 | 7,100,000 | 7,875,554 | |
TOTAL MARYLAND | 38,473,548 | ||
| Massachusetts - 1.5% | |||
| Massachusetts Dev. Fin. Agcy. Rev.: | |||
| (Lesley Univ. Proj.) Series 2016, 5% 7/1/39 | 960,000 | 976,127 | |
| (Univ. of Massachusetts Health Cr., Inc. Proj.) Series 2017 L, 4% 7/1/44 | 9,440,000 | 8,771,581 | |
| (Wentworth Institute of Technology Proj.) Series 2017: | |||
5% 10/1/30 | 1,100,000 | 1,135,186 | |
5% 10/1/33 | 1,280,000 | 1,317,205 | |
| Series 2015 D, 5% 7/1/44 | 2,430,000 | 2,433,003 | |
| Series 2019, 5% 9/1/59 | 4,445,000 | 4,702,495 | |
| Series 2020 A, 4% 7/1/45 | 9,790,000 | 8,769,018 | |
| Series 2024 D: | |||
5% 7/1/32 | 800,000 | 943,686 | |
5% 7/1/42 | 1,750,000 | 1,973,061 | |
| Series J2, 5% 7/1/53 | 2,360,000 | 2,412,792 | |
| Series M: | |||
4% 10/1/50 | 9,975,000 | 8,523,166 | |
5% 10/1/45 | 7,515,000 | 7,597,930 | |
TOTAL MASSACHUSETTS | 49,555,250 | ||
| Michigan - 2.3% | |||
| Detroit Gen. Oblig. Series 2021 A, 5% 4/1/46 | 1,840,000 | 1,877,921 | |
| Grand Traverse County Hosp. Fin. Auth. Series 2021, 3% 7/1/51 | 1,860,000 | 1,344,922 | |
| Great Lakes Wtr. Auth. Sew Disp. Sys. Series 2018 A: | |||
| 5% 7/1/43 | 1,415,000 | 1,487,408 | |
| 5% 7/1/48 | 6,135,000 | 6,386,845 | |
| Jackson County Series 2019: | |||
| 4% 5/1/32 (Build America Mutual Assurance Insured) | 2,050,000 | 2,165,291 | |
| 4% 5/1/33 (Build America Mutual Assurance Insured) | 2,110,000 | 2,221,769 | |
| Kalamazoo Hosp. Fin. Auth. Hosp. Facilities Rev. Series 2016: | |||
| 5% 5/15/28 | 1,365,000 | 1,416,105 | |
| 5% 5/15/28 (Pre-Refunded to 5/15/26 @ 100) | 10,000 | 10,460 | |
| Lansing Board of Wtr. & Lt. Util. Rev. Series 2024 A: | |||
| 5% 7/1/32 | 3,155,000 | 3,724,274 | |
| 5% 7/1/36 | 6,000,000 | 7,103,236 | |
| 5% 7/1/37 | 1,675,000 | 1,966,571 | |
| 5% 7/1/38 | 1,250,000 | 1,453,947 | |
| 5% 7/1/39 | 675,000 | 780,012 | |
| Michigan Fin. Auth. Rev.: | |||
| (Charter County of Wayne Criminal Justice Ctr. Proj.) Series 2018, 5% 11/1/43 | 1,740,000 | 1,844,953 | |
| Series 2016, 5% 11/15/32 | 4,545,000 | 4,757,099 | |
| Series 2019 A: | |||
3% 12/1/49 | 2,645,000 | 2,039,703 | |
5% 11/15/48 | 1,555,000 | 1,612,380 | |
| Series 2020 A, 4% 6/1/49 | 2,070,000 | 1,902,653 | |
| Michigan Hosp. Fin. Auth. Rev. Series 2008 C: | |||
| 5% 12/1/32 | 290,000 | 309,679 | |
| 5% 12/1/32 (Pre-Refunded to 12/1/27 @ 100) | 40,000 | 43,411 | |
| Michigan Hsg. Dev. Auth. Rental Hsg. Rev. Series 2019 A1, 3.35% 10/1/49 | 1,750,000 | 1,424,215 | |
| Michigan State Hsg. Dev. Auth. Series 2021 A, 2.45% 10/1/46 | 3,400,000 | 2,374,427 | |
| Portage Pub. Schools Series 2016: | |||
| 5% 11/1/33 | 945,000 | 981,295 | |
| 5% 11/1/36 | 1,180,000 | 1,220,649 | |
| 5% 11/1/37 | 945,000 | 977,139 | |
| Warren Consolidated School District Series 2016: | |||
| 5% 5/1/28 | 3,870,000 | 4,045,192 | |
| 5% 5/1/29 | 3,995,000 | 4,171,414 | |
| Wayne County Arpt. Auth. Rev.: | |||
| Series 2015 D: | |||
5% 12/1/30 | 1,225,000 | 1,259,949 | |
5% 12/1/31 | 2,170,000 | 2,231,562 | |
| Series 2015 G: | |||
5% 12/1/31 | 1,415,000 | 1,455,143 | |
5% 12/1/32 | 1,415,000 | 1,455,056 | |
5% 12/1/33 | 1,890,000 | 1,941,378 | |
| Series 2015, 5% 12/1/29 | 1,510,000 | 1,553,048 | |
| Series 2017 A: | |||
5% 12/1/28 | 565,000 | 605,929 | |
5% 12/1/29 | 520,000 | 557,773 | |
5% 12/1/30 | 660,000 | 707,972 | |
5% 12/1/33 | 330,000 | 353,676 | |
5% 12/1/37 | 470,000 | 496,852 | |
5% 12/1/37 | 255,000 | 269,381 | |
| Series 2017 C, 5% 12/1/28 | 1,040,000 | 1,118,461 | |
TOTAL MICHIGAN | 73,649,150 | ||
| Minnesota - 1.6% | |||
| Duluth Econ. Dev. Auth. Health Care Facilities Rev. Series 2018 A: | |||
| 5% 2/15/48 | 6,685,000 | 6,798,682 | |
| 5% 2/15/58 | 11,185,000 | 11,312,443 | |
| Maple Grove Health Care Sys. Rev.: | |||
| Series 2015, 5% 9/1/27 | 1,215,000 | 1,241,452 | |
| Series 2017, 5% 5/1/24 | 1,135,000 | 1,138,315 | |
| Minneapolis & Saint Paul Hsg. & Redev. Auth. Health Care Sys. Rev. (Allina Health Sys. Proj.) Series 2017 A, 5% 11/15/25 | 1,290,000 | 1,336,594 | |
| Minnesota Higher Ed. Facilities Auth. Rev. Series 2018 A: | |||
| 5% 10/1/29 | 945,000 | 1,011,458 | |
| 5% 10/1/32 | 675,000 | 720,616 | |
| 5% 10/1/33 | 825,000 | 879,631 | |
| 5% 10/1/45 | 975,000 | 991,005 | |
| Minnesota Hsg. Fin. Agcy.: | |||
| Series 2023 F, 5.75% 7/1/53 | 660,000 | 706,668 | |
| Series B, 4% 8/1/41 | 1,270,000 | 1,254,805 | |
| Series D: | |||
4% 8/1/38 | 2,265,000 | 2,272,475 | |
4% 8/1/40 | 2,455,000 | 2,434,546 | |
4% 8/1/41 | 1,610,000 | 1,590,737 | |
4% 8/1/43 | 1,820,000 | 1,791,040 | |
| Mounds View Independent School District #621 (Minnesota School District Cr. Enhancement Prog.) Series 2018 A: | |||
| 3.45% 2/1/37 | 1,235,000 | 1,229,964 | |
| 3.55% 2/1/38 | 1,290,000 | 1,268,342 | |
| Saint Cloud Health Care Rev. Series 2019: | |||
| 4% 5/1/49 | 3,265,000 | 3,085,006 | |
| 5% 5/1/48 | 4,085,000 | 4,280,230 | |
| Sauk Rapids Minn Independent School District # 47 Series 2020 A, 2% 2/1/33 | 2,545,000 | 2,225,355 | |
| Shakopee Sr. Hsg. Rev. Bonds Series 2018, 5.85%, tender 11/1/25 (b)(d) | 3,150,000 | 3,063,928 | |
| West Saint Paul Independent School District #197 (Minnesota School District Cr. Enhancement Prog.) Series 2018 A: | |||
| 3.6% 2/1/37 | 900,000 | 902,812 | |
| 3.65% 2/1/38 | 945,000 | 933,280 | |
TOTAL MINNESOTA | 52,469,384 | ||
| Mississippi - 0.1% | |||
| Mississippi Home Corp. Series 2021 B: | |||
| 3% 6/1/51 | 2,510,000 | 2,431,452 | |
| 5% 6/1/28 | 705,000 | 759,959 | |
TOTAL MISSISSIPPI | 3,191,411 | ||
| Missouri - 1.1% | |||
| Cape Girardeau County Indl. Dev. Auth. Series 2017 A: | |||
| 5% 3/1/27 | 30,000 | 31,833 | |
| 5% 3/1/29 | 1,390,000 | 1,462,425 | |
| Kansas City San. Swr. Sys. Rev. Series 2018 B: | |||
| 5% 1/1/26 | 225,000 | 234,478 | |
| 5% 1/1/28 | 470,000 | 512,112 | |
| 5% 1/1/33 | 450,000 | 491,197 | |
| Kansas City Wtr. Rev. Series 2020 A, 4% 12/1/39 | 1,190,000 | 1,223,271 | |
| Missouri Health & Edl. Facilities Rev.: | |||
| Series 2015 B: | |||
3.125% 2/1/27 | 380,000 | 380,097 | |
3.25% 2/1/28 | 380,000 | 380,811 | |
5% 2/1/34 | 2,940,000 | 3,006,604 | |
5% 2/1/36 | 1,135,000 | 1,159,686 | |
| Series 2019 A: | |||
4% 10/1/48 | 2,030,000 | 1,991,144 | |
5% 10/1/46 | 3,990,000 | 4,223,751 | |
| Series 2023 A, 5% 5/1/33 | 9,100,000 | 10,726,015 | |
| Missouri Hsg. Dev. Commission Single Family Mtg. Rev. Series 2019, 4% 5/1/50 | 395,000 | 394,155 | |
| Saint Louis Arpt. Rev. Series 2019 A: | |||
| 5% 7/1/44 | 1,320,000 | 1,395,800 | |
| 5% 7/1/49 | 1,085,000 | 1,137,042 | |
| Saint Louis County Indl. Dev. Auth. Sr. Living Facilities Rev. Series 2018 A, 5.125% 9/1/48 | 2,510,000 | 2,307,861 | |
| The Indl. Dev. Auth. of Hannibal (Hannibal Reg'l. Healthcare Sys. Proj.) Series 2017: | |||
| 5% 10/1/42 | 3,235,000 | 3,302,115 | |
| 5% 10/1/47 | 2,005,000 | 2,029,115 | |
TOTAL MISSOURI | 36,389,512 | ||
| Montana - 0.1% | |||
| Montana Board Hsg. Single Family Series 2019 B, 4% 6/1/50 | 235,000 | 234,190 | |
| Montana Facility Fin. Auth. Series 2021 A, 3% 6/1/50 | 2,665,000 | 1,936,033 | |
TOTAL MONTANA | 2,170,223 | ||
| Nebraska - 1.3% | |||
| Central Plains Energy Proj. Rev. Bonds: | |||
| (Proj. No. 4) Series 2023 A1, 5%, tender 11/1/29 (b) | 9,795,000 | 10,350,238 | |
| Series 2019, 4%, tender 8/1/25 (b) | 13,495,000 | 13,546,597 | |
| Douglas County Neb Edl. Facilities Rev. (Creighton Univ. Projs.): | |||
| Series 2017, 4% 7/1/33 | 730,000 | 751,903 | |
| Series 2021 A, 3% 7/1/51 | 1,190,000 | 860,050 | |
| Lincoln Elec. Sys. Rev. Series 2018: | |||
| 5% 9/1/31 | 1,890,000 | 2,017,549 | |
| 5% 9/1/32 | 3,525,000 | 3,760,825 | |
| 5% 9/1/33 | 2,115,000 | 2,252,650 | |
| Nebraska Invt. Fin. Auth. Single Family Hsg. Rev. Series 2020 A, 3.5% 9/1/50 | 1,030,000 | 1,013,745 | |
| Nebraska Pub. Pwr. District Rev.: | |||
| Series 2016 A: | |||
5% 1/1/32 | 1,575,000 | 1,625,326 | |
5% 1/1/34 | 945,000 | 973,422 | |
| Series 2016 B, 5% 1/1/32 | 4,720,000 | 4,870,819 | |
TOTAL NEBRASKA | 42,023,124 | ||
| Nevada - 0.5% | |||
| Carson City Hosp. Rev. (Carson Tahoe Hosp. Proj.) Series 2017: | |||
| 5% 9/1/37 | 2,555,000 | 2,619,077 | |
| 5% 9/1/42 | 6,295,000 | 6,429,746 | |
| Clark County School District Series 2020 B, 3% 6/15/39 | 2,630,000 | 2,308,472 | |
| Nevada Hsg. Division Single Family Mtg. Rev.: | |||
| Series 2019 A, 3.4% 10/1/49 | 1,210,000 | 1,007,777 | |
| Series 2019 B, 4% 10/1/49 | 615,000 | 613,440 | |
| Tahoe-Douglas Visitors Auth. Series 2020, 5% 7/1/51 | 2,830,000 | 2,839,853 | |
TOTAL NEVADA | 15,818,365 | ||
| New Hampshire - 1.4% | |||
| Nat'l. Fin. Auth. Hosp. Rev. (St. Luke's Univ. Health Network Proj.) Series 2021 B, 3% 8/15/51 (Assured Guaranty Muni. Corp. Insured) | 2,300,000 | 1,756,670 | |
| Nat'l. Finnance Auth.: | |||
| Series 2020 1, 4.125% 1/20/34 | 4,618,907 | 4,523,822 | |
| Series 2023 2A, 3.875% 1/20/38 | 6,723,236 | 6,338,484 | |
| New Hampshire Health & Ed. Facilities Auth.: | |||
| (Dartmouth-Hitchcock Oblgtd Grp Proj.): | |||
Series 2018 A: | |||
5% 8/1/31 | 1,225,000 | 1,300,121 | |
5% 8/1/32 | 235,000 | 248,909 | |
5% 8/1/34 | 2,830,000 | 2,985,495 | |
5% 8/1/36 | 1,890,000 | 1,982,471 | |
5% 8/1/37 | 2,265,000 | 2,366,021 | |
Series 2018, 5% 8/1/35 | 2,595,000 | 2,732,059 | |
| (Partners Healthcare Sys., Inc. Proj.) Series 2017, 5% 7/1/41 | 1,985,000 | 2,085,911 | |
| Series 2017: | |||
5% 7/1/36 | 1,135,000 | 1,161,476 | |
5% 7/1/44 | 1,790,000 | 1,735,305 | |
| New Hampshire Health & Ed. Facilities Auth. Rev.: | |||
| Series 2012, 4% 7/1/32 | 850,000 | 850,047 | |
| Series 2016: | |||
4% 10/1/38 | 1,100,000 | 1,067,727 | |
5% 10/1/28 | 2,830,000 | 2,927,211 | |
5% 10/1/32 | 4,870,000 | 4,995,474 | |
5% 10/1/38 | 3,555,000 | 3,640,105 | |
| Portsmouth Tan Series 2021, 1.625% 4/1/34 | 1,260,000 | 1,016,020 | |
TOTAL NEW HAMPSHIRE | 43,713,328 | ||
| New Jersey - 5.3% | |||
| New Jersey Econ. Dev. Auth.: | |||
| (White Horse HMT Urban Renewal LLC Proj.) Series 2020, 5% 1/1/40 (d) | 855,000 | 591,048 | |
| Series A, 5% 11/1/36 | 4,895,000 | 5,351,708 | |
| Series QQQ: | |||
4% 6/15/34 | 755,000 | 791,034 | |
4% 6/15/36 | 1,040,000 | 1,079,699 | |
4% 6/15/39 | 945,000 | 963,253 | |
4% 6/15/41 | 945,000 | 953,263 | |
4% 6/15/46 | 1,415,000 | 1,390,831 | |
4% 6/15/50 | 1,890,000 | 1,808,752 | |
5% 6/15/31 | 1,040,000 | 1,185,400 | |
5% 6/15/33 | 190,000 | 215,883 | |
| New Jersey Econ. Dev. Auth. Rev.: | |||
| (Black Horse EHT Urban Renewal LLC Proj.) Series 2019 A, 5% 10/1/39 (d) | 750,000 | 494,899 | |
| (Provident Montclair Proj.) Series 2017: | |||
5% 6/1/27 (Assured Guaranty Muni. Corp. Insured) | 40,000 | 42,614 | |
5% 6/1/28 (Assured Guaranty Muni. Corp. Insured) | 55,000 | 58,078 | |
5% 6/1/29 (Assured Guaranty Muni. Corp. Insured) | 40,000 | 42,314 | |
| Series LLL, 4% 6/15/49 | 2,655,000 | 2,558,454 | |
| Series MMM, 4% 6/15/36 | 755,000 | 777,991 | |
| New Jersey Edl. Facility Series 2016 A, 5% 7/1/29 | 2,480,000 | 2,565,692 | |
| New Jersey Gen. Oblig.: | |||
| Series 2020 A, 5% 6/1/29 | 3,000,000 | 3,356,837 | |
| Series 2021: | |||
2% 6/1/34 | 4,435,000 | 3,737,354 | |
2% 6/1/36 | 1,140,000 | 918,883 | |
| New Jersey Health Care Facilities Fing. Auth. Rev.: | |||
| Series 2016 A: | |||
5% 7/1/25 (Escrowed to Maturity) | 995,000 | 1,022,378 | |
5% 7/1/28 (Pre-Refunded to 7/1/26 @ 100) | 35,000 | 36,759 | |
5% 7/1/30 | 945,000 | 993,143 | |
| Series 2016: | |||
4% 7/1/48 | 1,700,000 | 1,548,410 | |
5% 7/1/41 | 2,070,000 | 2,089,888 | |
| New Jersey Tobacco Settlement Fing. Corp. Series 2018 B, 5% 6/1/46 | 2,605,000 | 2,649,534 | |
| New Jersey Tpk. Auth. Tpk. Rev. Series 2022 B: | |||
| 4.25% 1/1/43 | 6,000,000 | 6,135,084 | |
| 5% 1/1/46 | 8,000,000 | 8,819,272 | |
| New Jersey Trans. Trust Fund Auth.: | |||
| (Trans. Prog.) Series 2019 AA, 5.25% 6/15/43 | 15,160,000 | 16,111,805 | |
| Series 2006 C: | |||
0% 12/15/29 (Assured Guaranty Muni. Corp. Insured) | 1,275,000 | 1,054,825 | |
0% 12/15/31 (FGIC Insured) | 5,300,000 | 4,069,228 | |
0% 12/15/36 (AMBAC Insured) | 10,000,000 | 6,251,591 | |
| Series 2008 A, 0% 12/15/38 (Build America Mutual Assurance Insured) | 3,575,000 | 2,019,419 | |
| Series 2010 A, 0% 12/15/27 | 6,980,000 | 6,133,150 | |
| Series 2014 BB2, 5% 6/15/34 | 5,370,000 | 6,136,397 | |
| Series 2016 A: | |||
5% 6/15/27 | 890,000 | 927,850 | |
5% 6/15/29 | 3,350,000 | 3,497,079 | |
| Series 2018 A: | |||
5% 12/15/32 | 3,025,000 | 3,304,338 | |
5% 12/15/34 | 945,000 | 1,025,568 | |
| Series 2019 BB, 4% 6/15/50 | 1,770,000 | 1,710,228 | |
| Series 2021 A: | |||
4% 6/15/38 | 510,000 | 524,750 | |
5% 6/15/32 | 3,360,000 | 3,861,503 | |
5% 6/15/33 | 945,000 | 1,084,213 | |
| Series 2022 A: | |||
4% 6/15/41 | 4,625,000 | 4,659,792 | |
4% 6/15/42 | 3,105,000 | 3,111,642 | |
| Series 2022 AA: | |||
5% 6/15/29 | 7,555,000 | 8,400,624 | |
5% 6/15/35 | 590,000 | 680,752 | |
5% 6/15/36 | 6,915,000 | 7,919,395 | |
5% 6/15/37 | 3,195,000 | 3,633,697 | |
| Series A: | |||
4% 12/15/39 | 945,000 | 953,900 | |
4.25% 12/15/38 | 2,345,000 | 2,384,294 | |
| Series AA: | |||
4% 6/15/38 | 2,660,000 | 2,724,761 | |
4% 6/15/45 | 6,365,000 | 6,316,504 | |
4% 6/15/50 | 895,000 | 866,162 | |
5% 6/15/37 | 2,830,000 | 3,156,120 | |
5% 6/15/50 | 3,160,000 | 3,351,323 | |
| Port Auth. of New York & New Jersey Series 2023 243, 5% 12/1/38 | 5,500,000 | 6,417,599 | |
| South Jersey Trans. Auth. Trans. Sys. Rev. Series 2022 A: | |||
| 4.5% 11/1/42 | 1,500,000 | 1,545,965 | |
| 4.625% 11/1/47 | 2,500,000 | 2,562,712 | |
TOTAL NEW JERSEY | 168,575,641 | ||
| New Mexico - 0.1% | |||
| New Mexico Mtg. Fin. Auth. Series 2019 D, 3.75% 1/1/50 | 885,000 | 876,522 | |
| Santa Fe Retirement Fac. Series 2019 A: | |||
| 5% 5/15/34 | 215,000 | 207,441 | |
| 5% 5/15/39 | 160,000 | 146,367 | |
| 5% 5/15/44 | 170,000 | 150,191 | |
| 5% 5/15/49 | 335,000 | 282,101 | |
TOTAL NEW MEXICO | 1,662,622 | ||
| New York - 6.8% | |||
| Dorm. Auth. New York Univ. Rev.: | |||
| (Memorial Sloan-Kettring Cancer Ctr.) Series 2017 1, 5% 7/1/42 | 1,470,000 | 1,537,902 | |
| Series 2016 A: | |||
5% 7/1/25 | 65,000 | 66,453 | |
5% 7/1/32 | 2,360,000 | 2,457,122 | |
| Hempstead Local Dev. Corp. Rev. (Hofstra Univ. Proj.) Series 2021 A, 3% 7/1/51 | 2,285,000 | 1,651,441 | |
| Hudson Yards Infrastructure Corp. New York Rev. Series 2017 A, 5% 2/15/33 | 3,395,000 | 3,599,677 | |
| Long Island Pwr. Auth. Elec. Sys. Rev. Series 2017: | |||
| 5% 9/1/33 | 470,000 | 508,513 | |
| 5% 9/1/35 | 1,890,000 | 2,041,930 | |
| 5% 9/1/36 | 1,070,000 | 1,151,994 | |
| MTA Hudson Rail Yards Trust Oblig. Series 2016 A, 5% 11/15/56 | 16,100,000 | 15,954,137 | |
| New York City Edl. Construction Fund Series 2021 B, 5% 4/1/46 | 4,505,000 | 4,804,437 | |
| New York City Gen. Oblig.: | |||
| Series 2021 A1, 5% 8/1/31 | 6,010,000 | 6,904,727 | |
| Series 2022 B1, 5% 8/1/32 | 1,000,000 | 1,187,069 | |
| Series 2024 A: | |||
5% 8/1/40 | 2,470,000 | 2,830,364 | |
5% 8/1/41 | 2,365,000 | 2,691,895 | |
| New York City Hsg. Dev. Corp. Bonds Series 2023 E2, 3.8%, tender 1/3/28 (b) | 780,000 | 783,913 | |
| New York City Hsg. Dev. Corp. Multifamily Hsg.: | |||
| Series 2019 J, 3.05% 11/1/49 | 1,235,000 | 974,237 | |
| Series 2021 F1, 2.4% 11/1/46 | 1,725,000 | 1,220,569 | |
| New York City Transitional Fin. Auth. Rev.: | |||
| Series 2019 B1, 5% 8/1/34 | 1,890,000 | 2,069,621 | |
| Series 2024 A1, 5% 5/1/42 | 5,130,000 | 5,820,263 | |
| New York Convention Ctr. Dev. Corp. Rev. Series 2015: | |||
| 5% 11/15/28 | 6,805,000 | 6,952,635 | |
| 5% 11/15/29 | 4,720,000 | 4,827,781 | |
| New York Dorm. Auth. Rev. Series 2022 A: | |||
| 5% 7/1/33 | 660,000 | 757,046 | |
| 5% 7/1/34 | 1,370,000 | 1,559,320 | |
| 5% 7/15/37 | 570,000 | 599,997 | |
| 5% 7/1/38 | 1,785,000 | 1,964,419 | |
| 5% 7/1/42 | 1,180,000 | 1,267,893 | |
| 5% 7/15/42 | 1,605,000 | 1,640,571 | |
| 5% 7/15/50 | 4,150,000 | 4,157,528 | |
| New York Dorm. Auth. Sales Tax Rev.: | |||
| Series 2018 C, 5% 3/15/38 | 7,820,000 | 8,348,015 | |
| Series 2023 A1, 5% 3/15/41 | 16,795,000 | 19,235,927 | |
| New York Metropolitan Trans. Auth. Rev.: | |||
| Series 2016 C1, 5% 11/15/56 | 1,890,000 | 1,906,968 | |
| Series 2017 C-2: | |||
0% 11/15/29 | 2,150,000 | 1,776,985 | |
0% 11/15/33 | 5,285,000 | 3,759,253 | |
| Series 2017 D, 5% 11/15/30 | 4,720,000 | 5,086,875 | |
| Series 2020 D: | |||
4% 11/15/46 | 31,520,000 | 30,336,815 | |
4% 11/15/47 | 2,205,000 | 2,109,590 | |
| New York State Dorm. Auth.: | |||
| Series 2019 D, 3% 2/15/49 | 5,070,000 | 4,095,291 | |
| Series 2021 E, 3% 3/15/50 | 5,030,000 | 4,030,263 | |
| New York State Hsg. Fin. Agcy. Rev. Bonds Series 2023 C2, 3.8%, tender 5/1/29 (b) | 13,520,000 | 13,564,874 | |
| New York State Urban Dev. Corp. Series 2020 E: | |||
| 4% 3/15/44 | 22,920,000 | 22,883,660 | |
| 4% 3/15/45 | 8,600,000 | 8,552,500 | |
| New York Urban Dev. Corp. Rev.: | |||
| (New York State Gen. Oblig. Proj.) Series 2017 A, 5% 3/15/34 | 3,495,000 | 3,713,412 | |
| Gen. Oblig. (New York State Gen. Oblig. Proj.) Series 2017 A, 5% 3/15/32 | 2,955,000 | 3,146,195 | |
| Oneida County Local Dev. Corp. Rev. (Mohawk Valley Health Sys. Proj.) Series 2019 A: | |||
| 4% 12/1/32 (Assured Guaranty Muni. Corp. Insured) | 945,000 | 965,214 | |
| 5% 12/1/25 (Assured Guaranty Muni. Corp. Insured) | 595,000 | 595,443 | |
| 5% 12/1/30 (Assured Guaranty Muni. Corp. Insured) | 1,415,000 | 1,563,136 | |
| Suffolk County Econ. Dev. Corp. Rev. Series 2021: | |||
| 5.125% 11/1/41 (d) | 600,000 | 499,958 | |
| 5.375% 11/1/54 (d) | 1,020,000 | 794,829 | |
TOTAL NEW YORK | 218,948,657 | ||
| North Carolina - 1.4% | |||
| Charlotte Ctfs. of Prtn. (Convention Facility Projs.) Series 2019 A, 5% 6/1/46 | 2,245,000 | 2,395,282 | |
| Charlotte Int'l. Arpt. Rev.: | |||
| Series 2017 A: | |||
5% 7/1/35 | 1,890,000 | 2,028,996 | |
5% 7/1/42 | 2,715,000 | 2,854,793 | |
| Series 2017 C: | |||
4% 7/1/36 | 1,415,000 | 1,450,500 | |
4% 7/1/37 | 1,415,000 | 1,444,986 | |
| New Hanover County Hosp. Rev. Series 2017, 5% 10/1/27 (Escrowed to Maturity) | 210,000 | 225,945 | |
| North Carolina Grant Anticipation Rev. Series 2021, 2% 3/1/36 | 3,505,000 | 2,834,985 | |
| North Carolina Med. Care Commission Health Care Facilities Rev.: | |||
| Series 2019 A: | |||
5% 12/1/29 | 1,310,000 | 1,423,061 | |
5% 12/1/30 | 1,360,000 | 1,478,517 | |
5% 12/1/32 | 1,035,000 | 1,124,676 | |
5% 12/1/33 | 755,000 | 819,261 | |
| Series 2020 A, 3% 7/1/45 | 1,730,000 | 1,373,265 | |
| Series 2021 A: | |||
4% 3/1/36 | 850,000 | 760,025 | |
4% 3/1/51 | 1,790,000 | 1,313,614 | |
| North Carolina Muni. Pwr. Agcy. #1 Catawba Elec. Rev. Series 2015 C, 5% 1/1/29 | 7,555,000 | 7,828,297 | |
| North Carolina Tpk. Auth. Triangle Expressway Sys. Series 2019: | |||
| 4% 1/1/55 | 3,045,000 | 2,793,769 | |
| 5% 1/1/43 | 4,250,000 | 4,470,899 | |
| 5% 1/1/44 | 5,295,000 | 5,561,197 | |
| 5% 1/1/49 | 1,890,000 | 1,966,881 | |
TOTAL NORTH CAROLINA | 44,148,949 | ||
| North Dakota - 0.1% | |||
| Univ. of North Dakota Series 2021 A, 3% 6/1/61 (Assured Guaranty Muni. Corp. Insured) | 3,620,000 | 2,502,647 | |
| Ohio - 2.4% | |||
| Akron Bath Copley Hosp. District Rev. Series 2016, 5.25% 11/15/46 | 3,965,000 | 4,017,181 | |
| American Muni. Pwr., Inc. (Solar Electricity Prepayment Proj.) Series 2019 A: | |||
| 5% 2/15/38 | 1,415,000 | 1,514,972 | |
| 5% 2/15/39 | 945,000 | 1,008,442 | |
| 5% 2/15/44 | 2,975,000 | 3,127,740 | |
| American Muni. Pwr., Inc. Rev. (Greenup Hydroelectric Proj.): | |||
| Series 2016 A, 5% 2/15/41 | 3,775,000 | 3,852,030 | |
| Series 2016, 5% 2/15/46 | 1,210,000 | 1,231,606 | |
| Buckeye Tobacco Settlement Fing. Auth.: | |||
| Series 2020 A2: | |||
3% 6/1/48 | 2,570,000 | 1,949,777 | |
4% 6/1/48 | 850,000 | 785,130 | |
5% 6/1/27 | 2,125,000 | 2,233,850 | |
5% 6/1/29 | 3,870,000 | 4,190,972 | |
5% 6/1/34 | 1,140,000 | 1,243,729 | |
| Series 2020 B2, 5% 6/1/55 | 7,005,000 | 6,613,575 | |
| Cleveland Arpt. Sys. Rev. Series 2016 A: | |||
| 5% 1/1/26 (Assured Guaranty Muni. Corp. Insured) | 470,000 | 477,867 | |
| 5% 1/1/31 (Assured Guaranty Muni. Corp. Insured) | 945,000 | 958,910 | |
| Cleveland Income Tax Rev. Series 2018 A: | |||
| 5% 10/1/35 | 1,890,000 | 2,045,146 | |
| 5% 10/1/37 | 1,180,000 | 1,265,327 | |
| 5% 10/1/38 | 1,415,000 | 1,511,357 | |
| Columbus City School District Series 2016 A: | |||
| 5% 12/1/32 | 795,000 | 832,401 | |
| 5% 12/1/32 (Pre-Refunded to 6/1/26 @ 100) | 150,000 | 157,072 | |
| Fairfield County Hosp. Facilities Rev. (Fairfield Med. Ctr. Proj.) Series 2013: | |||
| 5% 6/15/25 | 65,000 | 65,006 | |
| 5% 6/15/26 | 70,000 | 70,007 | |
| 5% 6/15/27 | 75,000 | 75,005 | |
| 5% 6/15/28 | 80,000 | 80,001 | |
| 5.25% 6/15/43 | 4,720,000 | 4,386,999 | |
| Lake County Hosp. Facilities Rev. Series 2015, 5% 8/15/27 (Pre-Refunded to 8/15/25 @ 100) | 60,000 | 61,714 | |
| Lancaster Port Auth. Gas Rev. Bonds Series 2019, 5%, tender 2/1/25 (b) | 10,450,000 | 10,572,082 | |
| Muskingum County Hosp. Facilities (Genesis Healthcare Sys. Obligated Group Proj.) Series 2013, 5% 2/15/27 | 160,000 | 160,014 | |
| Ohio Higher Edl. Facility Commission Rev. Series 2019, 4% 10/1/44 | 1,675,000 | 1,631,796 | |
| Ohio Hosp. Facilities Rev. Series 2017 A, 5% 1/1/31 | 130,000 | 141,047 | |
| Ohio Hosp. Rev. Series 2020 A, 4% 1/15/50 | 780,000 | 728,343 | |
| Ohio Hsg. Fin. Agcy. Residential Mtg. Rev.: | |||
| (Mtg. Backed Securities Prog.) Series 2019 B, 4.5% 3/1/50 | 300,000 | 302,099 | |
| (Mtg.-Backed Securities Prog.) Series 2023 B, 6% 3/1/55 | 1,620,000 | 1,787,995 | |
| Ohio Tpk. Commission Tpk. Rev. (Infrastructure Proj.) Series 2005 A, 0% 2/15/42 | 5,475,000 | 2,578,307 | |
| Scioto County Hosp. Facilities Rev.: | |||
| Series 2016, 5% 2/15/29 | 1,195,000 | 1,228,192 | |
| Series 2019, 5% 2/15/29 | 2,230,000 | 2,317,506 | |
| Univ. of Akron Gen. Receipts Series 2019 A: | |||
| 4% 1/1/28 | 3,495,000 | 3,620,735 | |
| 5% 1/1/30 | 1,700,000 | 1,895,268 | |
| Washington County Hosp. Rev. Series 2022: | |||
| 6% 12/1/28 | 1,075,000 | 1,097,272 | |
| 6% 12/1/29 | 1,140,000 | 1,172,106 | |
| 6% 12/1/30 | 1,205,000 | 1,243,169 | |
| 6% 12/1/31 | 1,280,000 | 1,323,784 | |
TOTAL OHIO | 75,555,531 | ||
| Oklahoma - 0.1% | |||
| Oklahoma City Pub. Property Auth. Hotel Tax Rev. Series 2015, 5% 10/1/32 | 1,040,000 | 1,073,165 | |
| Oklahoma Dev. Fin. Auth. Rev. (Oklahoma City Univ. Proj.) Series 2019, 5% 8/1/44 | 1,590,000 | 1,588,918 | |
| Oklahoma Hsg. Fin. Agcy. Single Family Mtg. Rev. (Homeownership Ln. Prog.) Series 2023 C, 6% 3/1/54 | 300,000 | 331,254 | |
TOTAL OKLAHOMA | 2,993,337 | ||
| Oregon - 0.8% | |||
| Clackamas County Series 2020, 1.625% 6/1/36 | 1,050,000 | 805,880 | |
| Lake Oswego Ore Series 2019 A, 2.8% 6/1/39 | 2,075,000 | 1,780,486 | |
| Oregon Gen. Oblig. (Article XI-M, XI-N and XI-P State Grant Programs) Series 2023 D, 5% 6/1/42 | 1,410,000 | 1,612,150 | |
| Oregon Health and Science Univ. Spl. Rev. Series 2021 A, 3% 7/1/51 | 5,290,000 | 4,006,238 | |
| Oregon State Hsg. & Cmnty. Svcs. Dept.: | |||
| (Single-Family Mtg. Prog.) Series 2019 A, 2.65% 7/1/39 | 685,000 | 572,643 | |
| Series 2019 A, 4% 7/1/50 | 3,525,000 | 3,514,477 | |
| Polk Marion & Benton School District # 13J Series B, 0% 12/15/38 | 1,995,000 | 1,108,988 | |
| Salem Hosp. Facility Auth. Rev. (Salem Health Projs.) Series 2019 A, 3% 5/15/49 | 3,960,000 | 2,997,471 | |
| Washington, Multnomah & Yamhill County School District #1J Series 2017: | |||
| 5% 6/15/33 | 1,020,000 | 1,088,911 | |
| 5% 6/15/35 | 2,960,000 | 3,152,133 | |
| 5% 6/15/36 | 2,830,000 | 3,004,351 | |
| 5% 6/15/38 | 2,830,000 | 2,982,068 | |
TOTAL OREGON | 26,625,796 | ||
| Pennsylvania - 6.6% | |||
| Allegheny County Arpt. Auth. Rev. Series 2021 B: | |||
| 5% 1/1/51 | 5,350,000 | 5,655,223 | |
| 5% 1/1/56 | 11,795,000 | 12,358,316 | |
| Allegheny County Hosp. Dev. Auth. Rev. Series 2019 A, 4% 7/15/36 | 2,360,000 | 2,420,251 | |
| Allegheny County Indl. Dev. Auth. Rev. Series 2021: | |||
| 3.5% 12/1/31 | 1,160,000 | 952,111 | |
| 4% 12/1/41 | 2,135,000 | 1,491,536 | |
| 4.25% 12/1/50 | 2,375,000 | 1,541,487 | |
| Bucks County Indl. Dev. Auth. Hosp. Rev. Series 2021: | |||
| 5% 7/1/37 | 1,390,000 | 1,257,453 | |
| 5% 7/1/39 | 2,765,000 | 2,451,406 | |
| Cap. Region Wtr. Wtr. Rev. Series 2018: | |||
| 5% 7/15/26 | 945,000 | 992,240 | |
| 5% 7/15/38 | 945,000 | 1,002,248 | |
| Dauphin County Gen. Auth. (Pinnacle Health Sys. Proj.) Series 2016 A, 5% 6/1/29 | 1,255,000 | 1,301,693 | |
| Delaware County Auth. Rev. Series 2017, 5% 7/1/26 | 1,115,000 | 1,145,293 | |
| Doylestown Hosp. Auth. Hosp. Rev. Series 2016 A: | |||
| 5% 7/1/46 | 640,000 | 597,470 | |
| 5% 7/1/46 (Pre-Refunded to 7/1/26 @ 100) | 145,000 | 152,116 | |
| Lancaster County Hosp. Auth. Health Ctr. Rev. Series 2021, 5% 11/1/51 | 3,110,000 | 3,230,848 | |
| Lancaster Muni. Auth. Rev. Series 2023 B, 5% 6/1/29 | 3,005,000 | 3,338,708 | |
| Lehigh County Gen. Purp. Hosp. Rev. Series 2019 A: | |||
| 4% 7/1/37 | 1,890,000 | 1,901,168 | |
| 4% 7/1/38 | 2,060,000 | 2,071,929 | |
| 4% 7/1/39 | 2,360,000 | 2,366,177 | |
| 5% 7/1/44 | 2,360,000 | 2,466,817 | |
| Monroeville Fin. Auth. UPMC Rev. Series 2012, 5% 2/15/26 | 1,605,000 | 1,664,920 | |
| Montgomery County Higher Ed. & Health Auth. Rev.: | |||
| Series 2016 A: | |||
5% 10/1/28 | 40,000 | 39,713 | |
5% 10/1/29 | 40,000 | 39,788 | |
5% 10/1/30 | 4,105,000 | 4,082,800 | |
5% 10/1/32 | 130,000 | 128,830 | |
5% 10/1/36 | 4,395,000 | 4,334,652 | |
5% 10/1/40 | 2,405,000 | 2,308,692 | |
| Series 2019, 4% 9/1/44 | 4,875,000 | 4,719,575 | |
| Northampton County Gen. Purp. Auth. Hosp. Rev. (St. Luke's Univ. Health Network Proj.) Series 2018 A, 4% 8/15/48 | 6,835,000 | 6,223,816 | |
| Pennsylvania Ctfs. Prtn. Series 2018 A: | |||
| 5% 7/1/35 | 710,000 | 762,219 | |
| 5% 7/1/37 | 755,000 | 802,788 | |
| 5% 7/1/38 | 710,000 | 750,084 | |
| 5% 7/1/43 | 1,890,000 | 1,977,525 | |
| Pennsylvania Econ. Dev. Fing. Auth. Indl. Dev. Rev. (Presbyterian Sr. Living Proj.): | |||
| Series 2023 B1, 5.25% 7/1/49 | 925,000 | 948,988 | |
| Series 2023 B2, 5% 7/1/38 | 1,040,000 | 1,084,933 | |
| Pennsylvania Higher Edl. Facilities Auth. Rev.: | |||
| (Drexel Univ. Proj.) Series 2016, 5% 5/1/35 | 1,495,000 | 1,532,723 | |
| Series 2016: | |||
5% 5/1/29 | 945,000 | 972,437 | |
5% 5/1/31 | 945,000 | 971,805 | |
| Pennsylvania Hsg. Fin. Agcy. Series 2023 142A: | |||
| 4.5% 10/1/38 | 2,075,000 | 2,165,020 | |
| 5% 10/1/43 | 1,495,000 | 1,571,994 | |
| Pennsylvania Pub. School Bldg. Auth. School Rev. (The School District of The City of Harrisburg Proj.) Series 2016 A: | |||
| 5% 12/1/29 | 4,595,000 | 4,846,766 | |
| 5% 12/1/29 (Pre-Refunded to 12/1/26 @ 100) | 720,000 | 764,408 | |
| Pennsylvania State Univ. Series 2020 A, 4% 9/1/50 | 2,050,000 | 2,011,734 | |
| Pennsylvania Tpk. Commission Tpk. Rev.: | |||
| Series 2021 A, 4% 12/1/50 | 16,995,000 | 16,472,810 | |
| Series 2024, 5% 12/1/40 | 2,650,000 | 3,021,675 | |
| Philadelphia Arpt. Rev. Series 2017 A: | |||
| 5% 7/1/28 | 470,000 | 503,460 | |
| 5% 7/1/29 | 470,000 | 502,624 | |
| 5% 7/1/30 | 520,000 | 555,707 | |
| 5% 7/1/31 | 565,000 | 603,624 | |
| 5% 7/1/32 | 520,000 | 554,568 | |
| 5% 7/1/33 | 565,000 | 602,417 | |
| 5% 7/1/42 | 2,255,000 | 2,347,462 | |
| Philadelphia Auth. for Indl. Dev. Series 2017, 5% 11/1/47 | 10,470,000 | 10,626,628 | |
| Philadelphia Gas Works Rev.: | |||
| Series 16 A, 4% 8/1/45 (Assured Guaranty Muni. Corp. Insured) | 2,185,000 | 2,190,534 | |
| Series 2015: | |||
5% 8/1/26 | 945,000 | 966,312 | |
5% 8/1/27 | 945,000 | 966,728 | |
5% 8/1/28 | 1,890,000 | 1,934,012 | |
| Philadelphia Gen. Oblig. Series 2019 B: | |||
| 5% 2/1/33 | 1,510,000 | 1,672,499 | |
| 5% 2/1/36 | 1,400,000 | 1,533,037 | |
| 5% 2/1/37 | 1,810,000 | 1,969,304 | |
| Philadelphia School District: | |||
| Series 2016 F, 5% 9/1/29 | 3,280,000 | 3,410,959 | |
| Series 2018 A: | |||
5% 9/1/34 | 1,370,000 | 1,467,048 | |
5% 9/1/35 | 945,000 | 1,008,209 | |
| Series 2018 B, 5% 9/1/43 | 1,315,000 | 1,370,731 | |
| Series 2019 A: | |||
4% 9/1/35 | 2,175,000 | 2,229,683 | |
4% 9/1/36 | 1,890,000 | 1,928,859 | |
5% 9/1/31 | 1,100,000 | 1,203,882 | |
5% 9/1/33 | 6,485,000 | 7,171,278 | |
5% 9/1/33 (Assured Guaranty Muni. Corp. Insured) | 1,945,000 | 2,155,055 | |
| Philadelphia Wtr. & Wastewtr. Rev. Series 2023 B: | |||
| 5% 9/1/39 (Assured Guaranty Muni. Corp. Insured) | 4,275,000 | 4,922,410 | |
| 5% 9/1/40 (Assured Guaranty Muni. Corp. Insured) | 4,750,000 | 5,428,977 | |
| 5.5% 9/1/53 (Assured Guaranty Muni. Corp. Insured) | 2,720,000 | 3,107,459 | |
| Pittsburgh & Allegheny County Parking Sys. Series 2017: | |||
| 5% 12/15/35 | 1,060,000 | 1,121,279 | |
| 5% 12/15/37 | 470,000 | 493,589 | |
| Pittsburgh Wtr. & Swr. Auth. Wtr. & Swr. Sys. Rev. Series 2019 B, 5% 9/1/32 (Assured Guaranty Muni. Corp. Insured) | 1,890,000 | 2,240,192 | |
| Pocono Mountains Indl. Park Auth. (St. Luke's Hosp. - Monroe Proj.) Series 2015 A, 5% 8/15/40 | 1,695,000 | 1,699,067 | |
| Southcentral Pennsylvania Gen. Auth. Rev.: | |||
| Series 2019 A: | |||
4% 6/1/44 | 1,405,000 | 1,370,265 | |
4% 6/1/49 | 3,345,000 | 3,157,483 | |
5% 6/1/44 | 2,450,000 | 2,562,679 | |
5% 6/1/49 | 3,915,000 | 4,053,946 | |
| Series 2023 A, 5% 6/1/29 | 9,600,000 | 10,666,090 | |
| State Pub. School Bldg. Auth. Lease Rev. (The School District of Philadelphia Proj.) Series 2015 A, 5% 6/1/26 | 695,000 | 709,723 | |
| Union County Hosp. Auth. Rev. Series 2018 B: | |||
| 5% 8/1/33 | 945,000 | 982,628 | |
| 5% 8/1/38 | 3,025,000 | 3,143,732 | |
| 5% 8/1/48 | 2,690,000 | 2,767,512 | |
TOTAL PENNSYLVANIA | 210,796,836 | ||
| Puerto Rico - 1.2% | |||
| Puerto Rico Commonwealth Aqueduct & Swr. Auth.: | |||
| Series 2021 B: | |||
4% 7/1/42 (d) | 2,165,000 | 1,959,677 | |
5% 7/1/33 (d) | 1,030,000 | 1,066,060 | |
5% 7/1/37 (d) | 4,335,000 | 4,418,162 | |
| Series 2022 A, 4% 7/1/42 (d) | 2,165,000 | 1,959,677 | |
| Puerto Rico Commonwealth Pub. Impt. Gen. Oblig. Series 2021 A1: | |||
| 0% 7/1/33 | 10,912,493 | 6,939,523 | |
| 4% 7/1/33 | 8,345,792 | 8,096,747 | |
| 4% 7/1/35 | 3,005,000 | 2,866,759 | |
| 5.625% 7/1/27 | 1,085,763 | 1,146,470 | |
| 5.625% 7/1/29 | 1,260,915 | 1,365,463 | |
| Puerto Rico Sales Tax Fing. Corp. Sales Tax Rev. Series 2019 A2, 4.329% 7/1/40 | 10,165,000 | 10,101,496 | |
TOTAL PUERTO RICO | 39,920,034 | ||
| Rhode Island - 0.4% | |||
| Rhode Island Health & Edl. Bldg. Corp. Higher Ed. Facilities Rev.: | |||
| Series 2016 B: | |||
5% 9/1/31 | 4,605,000 | 4,580,792 | |
5% 9/1/36 | 185,000 | 179,977 | |
| Series 2016, 5% 5/15/39 | 3,100,000 | 3,127,163 | |
| Rhode Island Hsg. & Mtg. Fin. Corp.: | |||
| Series 2019 70, 4% 10/1/49 | 600,000 | 598,323 | |
| Series 2021 74, 3% 4/1/49 | 4,315,000 | 4,199,560 | |
| Rhode Island Hsg. & Mtg. Fin. Corp. Rev. Series 72 A, 3.5% 10/1/50 | 885,000 | 873,185 | |
TOTAL RHODE ISLAND | 13,559,000 | ||
| South Carolina - 1.8% | |||
| Charleston County Arpt. District Series 2019: | |||
| 5% 7/1/43 | 1,510,000 | 1,623,592 | |
| 5% 7/1/48 | 11,330,000 | 12,056,437 | |
| South Carolina Hsg. Fin. & Dev. Auth. Mtg. Rev.: | |||
| Series 2019 A, 4% 1/1/50 | 1,045,000 | 1,042,059 | |
| Series 2022 A: | |||
5% 1/1/29 | 285,000 | 309,111 | |
5% 7/1/29 | 470,000 | 514,156 | |
5% 1/1/30 | 470,000 | 517,271 | |
5% 7/1/30 | 520,000 | 574,724 | |
5% 1/1/31 | 520,000 | 574,986 | |
5% 7/1/31 | 535,000 | 595,026 | |
| Series 2023 B, 6% 1/1/54 | 1,000,000 | 1,106,840 | |
| South Carolina Jobs-Econ. Dev. Auth. Series 2019 C, 5% 7/1/32 | 4,080,000 | 4,425,197 | |
| South Carolina Pub. Svc. Auth. Rev.: | |||
| Series 2016 B: | |||
5% 12/1/35 | 3,425,000 | 3,542,280 | |
5% 12/1/36 | 5,140,000 | 5,299,790 | |
| Series 2016 C: | |||
5% 12/1/24 | 485,000 | 490,322 | |
5% 12/1/25 | 565,000 | 580,279 | |
5% 12/1/26 | 945,000 | 990,384 | |
| Spartanburg County Reg'l. Health Series 2017 A: | |||
| 4% 4/15/43 | 9,360,000 | 9,075,614 | |
| 4% 4/15/48 | 6,530,000 | 6,116,147 | |
| 5% 4/15/48 | 8,855,000 | 9,156,135 | |
TOTAL SOUTH CAROLINA | 58,590,350 | ||
| South Dakota - 0.1% | |||
| South Dakota Health & Edl. Facilities Auth. Rev.: | |||
| Series 2017: | |||
5% 7/1/30 | 805,000 | 865,867 | |
5% 7/1/35 | 685,000 | 725,539 | |
| Series 2020 A, 3% 9/1/45 | 2,245,000 | 1,747,644 | |
TOTAL SOUTH DAKOTA | 3,339,050 | ||
| Tennessee - 1.4% | |||
| Chattanooga Health Ed. & Hsg. Facility Board Rev.: | |||
| Series 2019 A1, 4% 8/1/44 | 1,700,000 | 1,631,117 | |
| Series 2019 A2: | |||
5% 8/1/37 | 810,000 | 862,067 | |
5% 8/1/44 | 1,125,000 | 1,163,501 | |
| Metropolitan Govt. Nashville & Davidson County Elec. Rev.: | |||
| Series 2024 A: | |||
5% 5/15/29 (e) | 1,000,000 | 1,123,346 | |
5% 5/15/31 (e) | 6,285,000 | 7,310,810 | |
5% 5/15/32 (e) | 2,000,000 | 2,360,978 | |
5% 5/15/41 (e) | 2,000,000 | 2,309,800 | |
5% 5/15/43 (e) | 1,660,000 | 1,895,277 | |
5% 5/15/44 (e) | 1,665,000 | 1,892,982 | |
| Series 2024 B: | |||
5% 5/15/29 (e) | 2,690,000 | 3,021,801 | |
5% 5/15/30 (e) | 4,160,000 | 4,754,808 | |
| Nashville and Davidson County Metropolitan Govt. Health & Edl. Facilities Board Rev. (Lipscomb Univ. Proj.) Series 2019 A: | |||
| 4% 10/1/49 | 2,445,000 | 2,182,885 | |
| 5.25% 10/1/58 | 7,340,000 | 7,510,237 | |
| Shelby County Health Edl. & Hsg. Facilities Board Rev. (Methodist Le Bonheur Health Proj.) Series 2017 A: | |||
| 5% 5/1/27 | 1,160,000 | 1,225,683 | |
| 5% 5/1/29 | 1,170,000 | 1,236,716 | |
| 5% 5/1/30 | 2,260,000 | 2,388,407 | |
| 5% 5/1/31 | 1,190,000 | 1,255,193 | |
| Tennessee Hsg. Dev. Agcy. Series 2015 A, 3.5% 7/1/45 | 630,000 | 623,936 | |
| Tennessee Hsg. Dev. Agcy. Residential: | |||
| Series 2019 3: | |||
2.6% 7/1/39 | 270,000 | 220,403 | |
2.8% 7/1/44 | 325,000 | 255,866 | |
| Series 2019 4, 2.9% 7/1/39 | 195,000 | 167,531 | |
TOTAL TENNESSEE | 45,393,344 | ||
| Texas - 6.7% | |||
| Board of Regents of The Texas A&M Univ. Sys. Permanent Univ. Fund Series 2023, 5% 7/1/38 | 4,245,000 | 4,845,022 | |
| Bryan Tex For Previous Issuess Series 2020, 2.125% 8/15/34 | 740,000 | 623,429 | |
| Central Reg'l. Mobility Auth.: | |||
| Series 2020 A, 5% 1/1/49 | 3,720,000 | 3,907,072 | |
| Series 2020 B, 5% 1/1/45 | 1,650,000 | 1,745,573 | |
| Collin County Series 2022, 4% 2/15/39 | 1,275,000 | 1,315,314 | |
| Conroe Independent School District Series 2024: | |||
| 5% 2/15/36 (e) | 2,785,000 | 3,327,669 | |
| 5% 2/15/37 (e) | 4,950,000 | 5,860,801 | |
| 5% 2/15/38 (e) | 2,195,000 | 2,570,885 | |
| Coppell Tex Series 2020, 1.375% 2/1/35 | 1,470,000 | 1,116,610 | |
| Dallas Area Rapid Transit Sales Tax Rev. Series 2020 A, 5% 12/1/45 | 1,355,000 | 1,466,250 | |
| Dallas Fort Worth Int'l. Arpt. Rev.: | |||
| Series 2020 B: | |||
4% 11/1/34 | 3,220,000 | 3,388,191 | |
4% 11/1/35 | 2,860,000 | 2,979,100 | |
| Series 2023 B, 5% 11/1/38 | 2,750,000 | 3,197,118 | |
| Fort Bend Grand Parkway Toll Road Auth. Series 2021, 3% 3/1/46 | 1,600,000 | 1,276,236 | |
| Garland Elec. Util. Sys. Rev. Series 2021 A: | |||
| 4% 3/1/46 | 1,700,000 | 1,679,904 | |
| 4% 3/1/51 | 2,125,000 | 2,037,699 | |
| Grand Parkway Trans. Corp.: | |||
| Series 2018 A: | |||
5% 10/1/36 | 4,720,000 | 5,080,052 | |
5% 10/1/37 | 9,440,000 | 10,114,995 | |
5% 10/1/43 | 5,195,000 | 5,477,477 | |
| Series 2020 C, 4% 10/1/49 | 2,740,000 | 2,648,560 | |
| Greenville Gen. Oblig. Series 2021, 2% 2/15/33 | 1,055,000 | 904,433 | |
| Harris County Cultural Ed. Facilities Fin. Corp. Med. Facilities Rev. Series 2024, 5% 5/15/29 (e) | 2,785,000 | 3,070,180 | |
| Harris County Toll Road Rev. (Harris County Toll Road Auth. Proj.) Series 2018 A, 5% 8/15/33 | 1,890,000 | 2,062,064 | |
| Houston Arpt. Sys. Rev. Series 2018 D: | |||
| 5% 7/1/29 | 1,795,000 | 1,963,239 | |
| 5% 7/1/30 | 2,360,000 | 2,583,026 | |
| 5% 7/1/31 | 2,125,000 | 2,324,974 | |
| 5% 7/1/32 | 1,890,000 | 2,067,355 | |
| 5% 7/1/39 | 6,685,000 | 7,179,709 | |
| Houston Util. Sys. Rev. Series 2016 B, 5% 11/15/33 | 1,320,000 | 1,380,013 | |
| Irving Hosp. Auth. Hosp. Rev. Series 2017 A: | |||
| 5% 10/15/33 | 995,000 | 1,025,668 | |
| 5% 10/15/34 | 1,575,000 | 1,621,143 | |
| 5% 10/15/35 | 1,145,000 | 1,176,241 | |
| 5% 10/15/44 | 790,000 | 797,936 | |
| Lamar Consolidated Independent School District Series 2021, 3% 2/15/56 | 2,000,000 | 1,501,100 | |
| Lower Colorado River Auth. Rev. (LCRA Transmission Svcs. Corp. Proj.) Series 2018: | |||
| 5% 5/15/33 | 4,260,000 | 4,640,753 | |
| 5% 5/15/35 | 2,005,000 | 2,175,408 | |
| Mansfield Tex Series 2020: | |||
| 2.125% 2/15/34 | 1,355,000 | 1,154,282 | |
| 2.375% 2/15/36 | 850,000 | 716,187 | |
| New Hope Cultural Ed. Facilities Fin. Corp. (Childrens Med. Ctr. of Dallas) Series 2017 A: | |||
| 5% 8/15/28 | 1,415,000 | 1,516,054 | |
| 5% 8/15/47 | 1,140,000 | 1,172,822 | |
| Newark Higher Ed. Fin. Corp. (Abilene Christian Univ. Proj.) Series 2016 A, 5% 4/1/29 | 1,985,000 | 2,061,163 | |
| North Texas Tollway Auth. Rev.: | |||
| (Sr. Lien Proj.) Series 2017 A: | |||
5% 1/1/34 | 945,000 | 1,000,270 | |
5% 1/1/35 | 1,225,000 | 1,293,561 | |
5% 1/1/36 | 1,135,000 | 1,194,688 | |
5% 1/1/37 | 4,440,000 | 4,658,151 | |
| (Sub Lien Proj.) Series 2017 B: | |||
5% 1/1/30 | 250,000 | 259,079 | |
5% 1/1/31 | 350,000 | 362,413 | |
5% 1/1/33 | 1,415,000 | 1,496,318 | |
| Series 2015 A, 5% 1/1/32 | 1,465,000 | 1,487,009 | |
| Series 2018, 0% 1/1/29 (Assured Guaranty Corp. Insured) | 14,265,000 | 12,187,662 | |
| Series 2021 B: | |||
3% 1/1/46 | 4,000,000 | 3,204,294 | |
3% 1/1/51 | 10,685,000 | 8,156,311 | |
| Northwest Independent School District Series 2023: | |||
| 5% 2/15/40 | 4,000,000 | 4,485,824 | |
| 5% 2/15/41 | 5,500,000 | 6,140,440 | |
| Plano Gen. Oblig. Series 2018, 3.37% 9/1/37 | 900,000 | 884,148 | |
| Prosper Independent School District Series 2021 A, 3% 2/15/37 | 1,585,000 | 1,482,223 | |
| San Antonio Elec. & Gas Sys. Rev. Series 2017: | |||
| 5% 2/1/32 | 1,180,000 | 1,268,462 | |
| 5% 2/1/34 | 1,415,000 | 1,515,358 | |
| Southwest Higher Ed. Auth. Rev. (Southern Methodist Univ., TX. Proj.) Series 2017: | |||
| 5% 10/1/32 | 710,000 | 759,343 | |
| 5% 10/1/41 | 1,415,000 | 1,474,262 | |
| Tarrant County Cultural Ed. Facilities Fin. Corp. Rev.: | |||
| Series 2016 A, 5% 2/15/41 | 7,620,000 | 7,826,653 | |
| Series 2018 B, 5% 7/1/43 | 1,320,000 | 1,381,251 | |
| Texas Dept. of Hsg. & Cmnty. Affairs Multi-family Hsg. Rev. Series 2019, 2.95% 7/1/36 | 3,439,295 | 3,058,438 | |
| Texas Dept. of Hsg. & Cmnty. Affairs Residential Mtg. Rev. Series 2023 B, 6% 1/1/54 | 4,150,000 | 4,583,673 | |
| Texas Dept. of Hsg. & Cmnty. Affairs Single Family Mtg. Rev.: | |||
| Series 2019 A, 4% 3/1/50 | 2,365,000 | 2,355,427 | |
| Series 2023, 6% 3/1/54 | 2,865,000 | 3,169,518 | |
| Series A, 3.5% 3/1/51 | 2,220,000 | 2,175,804 | |
| Texas Private Activity Bond Surface Trans. Corp. (LBJ Infrastructure Group LLC I-635 Managed Lanes Proj.) Series 2020 A: | |||
| 4% 12/31/36 | 1,920,000 | 1,940,901 | |
| 4% 6/30/37 | 2,830,000 | 2,857,648 | |
| 4% 12/31/37 | 3,775,000 | 3,812,377 | |
| 4% 12/31/38 | 2,125,000 | 2,141,319 | |
| Texas State Univ. Sys. Fing. Rev.: | |||
| Series 2017 A, 5% 3/15/31 | 1,890,000 | 2,014,865 | |
| Series 2019 A: | |||
4% 3/15/34 | 2,125,000 | 2,211,431 | |
4% 3/15/35 | 1,890,000 | 1,955,545 | |
| Texas Wtr. Dev. Board Rev. Series 2021, 2.5% 10/15/39 | 2,000,000 | 1,609,548 | |
| Univ. of Houston Univ. Revs. Series 2017 A, 5% 2/15/33 | 3,305,000 | 3,427,554 | |
| Univ. of Texas Permanent Univ. Fund Rev.: | |||
| Series 2016 B, 5% 7/1/29 | 885,000 | 926,000 | |
| Series 2023 A, 5% 7/1/40 | 1,880,000 | 2,152,170 | |
| Waco Gen. Oblig. Series 2020: | |||
| 2.125% 2/1/35 | 1,230,000 | 1,030,814 | |
| 2.25% 2/1/36 | 1,610,000 | 1,335,144 | |
TOTAL TEXAS | 213,027,603 | ||
| Utah - 1.1% | |||
| Salt Lake City Arpt. Rev.: | |||
| Series 2017 B: | |||
5% 7/1/34 | 1,550,000 | 1,648,744 | |
5% 7/1/35 | 1,415,000 | 1,502,435 | |
5% 7/1/36 | 1,415,000 | 1,497,775 | |
5% 7/1/37 | 945,000 | 996,523 | |
| Series 2021 B: | |||
5% 7/1/46 | 5,225,000 | 5,698,077 | |
5% 7/1/51 | 21,060,000 | 22,727,971 | |
| Weber School District Utah (Utah School District Bond Guaranty Prog.) Series 2019, 2.375% 6/15/36 | 730,000 | 636,789 | |
TOTAL UTAH | 34,708,314 | ||
| Vermont - 0.1% | |||
| Vermont Edl. & Health Bldg. Fin. Agcy. Rev. (Champlain College Proj.) Series 2016 A: | |||
| 5% 10/15/41 | 2,265,000 | 2,151,644 | |
| 5% 10/15/46 | 2,645,000 | 2,414,615 | |
TOTAL VERMONT | 4,566,259 | ||
| Virginia - 1.5% | |||
| Arlington County IDA Hosp. Facilities Bonds Series 2023 A, 5%, tender 7/1/31 (b) | 1,280,000 | 1,417,837 | |
| Chesapeake Gen. Oblig. Series 2020 A: | |||
| 5% 8/1/34 | 1,120,000 | 1,286,995 | |
| 5% 8/1/35 | 1,230,000 | 1,409,363 | |
| Fredericksburg Econ. Dev. Auth. Rev. Series 2014, 5% 6/15/26 | 1,850,000 | 1,858,427 | |
| Lynchburg Econ. Dev. Series 2021, 3% 1/1/51 | 2,010,000 | 1,484,883 | |
| Stafford County Econ. Dev. Auth. Hosp. Facilities Rev.: | |||
| (Mary Washington Hosp. Proj.) Series 2016, 3% 6/15/29 | 350,000 | 346,228 | |
| Series 2016: | |||
4% 6/15/37 | 325,000 | 325,306 | |
5% 6/15/28 | 945,000 | 978,408 | |
5% 6/15/33 | 210,000 | 216,435 | |
5% 6/15/36 | 945,000 | 969,346 | |
| Virginia College Bldg. Auth. Edl. Facilities Rev.: | |||
| (21St Century Collage and Equip. Programs) Series 2021 A, 4% 2/1/35 | 16,100,000 | 17,198,926 | |
| (21st Century College and Equip. Programs): | |||
Series 2023 A, 5% 2/1/37 | 2,750,000 | 3,218,906 | |
Series 2023 B, 5% 2/1/34 | 6,750,000 | 8,081,311 | |
| Virginia Commonwealth Trans. Board Rev. (Virginia Gen. Oblig. Proj.) Series 2017 A: | |||
| 5% 5/15/32 | 450,000 | 486,085 | |
| 5% 5/15/33 | 1,890,000 | 2,038,311 | |
| Virginia St Pub. School Auth. Spl. O Series 2023, 5% 8/1/38 | 2,810,000 | 3,292,539 | |
| Winchester Econ. Dev. Auth. Series 2015, 5% 1/1/44 | 2,360,000 | 2,403,777 | |
TOTAL VIRGINIA | 47,013,083 | ||
| Washington - 2.8% | |||
| Chelan County Pub. Util. District #1 Columbia River-Rock Island Hydro-Elec. Sys. Rev. Series A, 0% 6/1/28 (Nat'l. Pub. Fin. Guarantee Corp. Insured) | 1,395,000 | 1,224,500 | |
| King County Gen. Oblig. Series 2021 A, 2% 1/1/37 | 535,000 | 429,159 | |
| King County Wash Hsg. Auth. Afford (Kirkland Heights Proj.) Series 2023 A3, 4.625% 1/1/41 | 3,480,000 | 3,640,181 | |
| Pierce County Gen. Oblig. Series 2019 A, 2.35% 7/1/33 | 3,795,000 | 3,465,297 | |
| Tacoma Elec. Sys. Rev. Series 2017: | |||
| 5% 1/1/37 | 945,000 | 993,109 | |
| 5% 1/1/38 | 945,000 | 989,885 | |
| Washington Convention Ctr. Pub. Facilities: | |||
| Series 2021 B, 3% 7/1/43 | 550,000 | 436,372 | |
| Series 2021, 4% 7/1/31 | 11,755,000 | 11,663,639 | |
| Washington Gen. Oblig.: | |||
| Series 2015 C, 5% 2/1/34 | 905,000 | 921,646 | |
| Series 2017 D, 5% 2/1/33 | 1,985,000 | 2,109,284 | |
| Series 2021 A: | |||
5% 6/1/35 | 4,000,000 | 4,539,808 | |
5% 8/1/35 | 1,000,000 | 1,136,844 | |
| Series R-2017 A: | |||
5% 8/1/28 | 890,000 | 936,601 | |
5% 8/1/30 | 890,000 | 935,063 | |
| Washington Health Care Facilities Auth. Rev.: | |||
| (Overlake Hosp. Med. Ctr., WA. Proj.) Series 2017 B: | |||
5% 7/1/29 | 380,000 | 393,893 | |
5% 7/1/31 | 810,000 | 840,171 | |
5% 7/1/34 | 2,495,000 | 2,577,066 | |
5% 7/1/35 | 2,220,000 | 2,286,758 | |
5% 7/1/36 | 2,125,000 | 2,179,719 | |
5% 7/1/42 | 8,705,000 | 8,840,793 | |
| (Providence Health Systems Proj.) Series 2018 B: | |||
5% 10/1/30 | 1,135,000 | 1,205,670 | |
5% 10/1/31 | 1,415,000 | 1,500,874 | |
5% 10/1/32 | 975,000 | 1,033,547 | |
5% 10/1/33 | 2,360,000 | 2,500,610 | |
| (Virginia Mason Med. Ctr. Proj.) Series 2017: | |||
5% 8/15/29 | 2,125,000 | 2,209,727 | |
5% 8/15/30 | 945,000 | 981,724 | |
| Series 2017 B, 4% 8/15/41 | 6,845,000 | 6,648,364 | |
| Series 2019 A1: | |||
5% 8/1/34 | 1,790,000 | 1,937,676 | |
5% 8/1/37 | 945,000 | 1,005,745 | |
| Series 2019 A2: | |||
5% 8/1/35 | 2,695,000 | 2,901,097 | |
5% 8/1/39 | 1,055,000 | 1,113,925 | |
| Series 2020, 5% 9/1/55 | 9,515,000 | 9,933,729 | |
| Washington Higher Ed. Facilities Auth. Rev.: | |||
| (Gonzaga Univ. Proj.) Series 2019 A, 3% 4/1/49 | 3,265,000 | 2,401,408 | |
| (Whitworth Univ. Proj.) Series 2016 A: | |||
5% 10/1/34 | 1,510,000 | 1,558,083 | |
5% 10/1/35 | 945,000 | 973,693 | |
5% 10/1/40 | 1,535,000 | 1,559,911 | |
| Washington Hsg. Fin. Commission Nonprofit Hsg. Rev. (Judson Park Proj.) Series 2018: | |||
| 4% 7/1/28 (d) | 100,000 | 96,810 | |
| 5% 7/1/33 (d) | 325,000 | 323,539 | |
| 5% 7/1/38 (d) | 100,000 | 95,638 | |
| 5% 7/1/48 (d) | 300,000 | 262,138 | |
TOTAL WASHINGTON | 90,783,696 | ||
| West Virginia - 0.1% | |||
| West Virginia Hosp. Fin. Auth. Hosp. Rev. Series 2018 A, 5% 1/1/33 | 1,735,000 | 1,773,596 | |
| Wisconsin - 1.9% | |||
| Blue Ridge Healthcare Pub. Fin. Auth. Series 2020 A, 4% 1/1/45 | 1,415,000 | 1,349,372 | |
| Howard Suamico Scd Series 2021, 2% 3/1/38 | 1,165,000 | 893,543 | |
| Kohler Wis School District Series 2021, 2% 3/1/38 | 620,000 | 474,827 | |
| Mauston School District Series 2021, 1.8% 3/1/37 | 2,840,000 | 2,144,072 | |
| Pub. Fin. Auth. Edl. Facilities Series 2018 A: | |||
| 5.25% 10/1/43 | 575,000 | 571,224 | |
| 5.25% 10/1/48 | 575,000 | 554,754 | |
| Pub. Fin. Auth. Hosp. Rev.: | |||
| (Renown Reg'l. Med. Ctr. Proj.) Series 2020 A, 4% 6/1/45 | 1,430,000 | 1,344,118 | |
| Series 2019 A, 5% 10/1/44 | 5,820,000 | 6,065,601 | |
| Series 2020 A, 3% 6/1/45 | 3,000,000 | 2,334,194 | |
| Pub. Fin. Auth. Sr. Living Rev. (Mary's Woods At Marylhurst, Inc. Proj.) Series 2017 A: | |||
| 5% 5/15/25 (d) | 500,000 | 496,834 | |
| 5% 5/15/28 (d) | 550,000 | 543,289 | |
| 5.25% 5/15/37 (d) | 230,000 | 222,506 | |
| 5.25% 5/15/42 (d) | 220,000 | 205,980 | |
| 5.25% 5/15/47 (d) | 220,000 | 198,656 | |
| 5.25% 5/15/52 (d) | 410,000 | 362,269 | |
| Pub. Fin. Auth. Wisconsin Retirement Facility Rev. Series 2018: | |||
| 5% 10/1/43 (d) | 620,000 | 545,675 | |
| 5% 10/1/48 (d) | 705,000 | 598,755 | |
| 5% 10/1/53 (d) | 1,615,000 | 1,340,144 | |
| Roseman Univ. of Health: | |||
| Series 2020: | |||
5% 4/1/50 (d) | 985,000 | 897,981 | |
5% 4/1/50 (Pre-Refunded to 4/1/30 @ 100) (d) | 100,000 | 113,457 | |
| Series 2021 A: | |||
3% 7/1/50 | 4,070,000 | 3,013,158 | |
4.5% 6/1/56 (d) | 12,205,000 | 9,609,285 | |
| Series 2021 B, 6.5% 6/1/56 (d) | 3,990,000 | 3,357,609 | |
| Westosha Cent High School District Series 2021: | |||
| 1.75% 3/1/34 | 1,850,000 | 1,489,454 | |
| 2% 3/1/41 | 1,575,000 | 1,108,689 | |
| Wisconsin Health & Edl. Facilities: | |||
| Series 2013 B2, 4% 11/15/43 | 2,480,000 | 2,441,662 | |
| Series 2014: | |||
4% 5/1/33 | 1,395,000 | 1,397,765 | |
5% 5/1/25 | 730,000 | 733,224 | |
| Series 2016, 4% 12/1/46 | 2,785,000 | 2,723,979 | |
| Series 2017 A: | |||
4% 4/1/39 | 1,365,000 | 1,352,646 | |
5% 9/1/30 (Pre-Refunded to 9/1/27 @ 100) | 1,200,000 | 1,286,818 | |
5% 9/1/32 (Pre-Refunded to 9/1/27 @ 100) | 1,040,000 | 1,115,242 | |
| Series 2019 A, 5% 11/1/39 | 3,975,000 | 3,466,814 | |
| Series 2019 B1, 2.825% 11/1/28 | 670,000 | 604,312 | |
| Wisconsin Health & Edl. Facilities Auth. Rev.: | |||
| Bonds Series 2018 C4, 5%, tender 6/22/29 (b) | 1,355,000 | 1,496,356 | |
| Series 2012, 5% 6/1/39 | 1,125,000 | 1,125,696 | |
| Series 2018, 5%, tender 6/22/29 (b) | 1,960,000 | 2,166,014 | |
| Wisconsin Rapids School District Series 2021, 2% 4/1/36 | 1,110,000 | 845,468 | |
TOTAL WISCONSIN | 60,591,442 | ||
| TOTAL MUNICIPAL BONDS (Cost $3,143,051,133) | 3,083,930,257 | ||
| Money Market Funds - 4.7% | |||
| Shares | Value ($) | ||
Fidelity Tax-Free Cash Central Fund 4.41% (h)(i) (Cost $149,764,162) | 149,708,719 | 149,768,605 | |
| TOTAL INVESTMENT IN SECURITIES - 101.0% (Cost $3,292,815,295) | 3,233,698,862 |
NET OTHER ASSETS (LIABILITIES) - (1.0)% | (31,946,397) |
| NET ASSETS - 100.0% | 3,201,752,465 |
| (a) | Amount is stated in United States dollars unless otherwise noted. |
| (b) | Coupon rates for floating and adjustable rate securities reflect the rates in effect at period end. |
| (c) | Coupon is indexed to a floating interest rate which may be multiplied by a specified factor and/or subject to caps or floors. |
| (d) | Security exempt from registration under Rule 144A of the Securities Act of 1933. These securities may be resold in transactions exempt from registration, normally to qualified institutional buyers. At the end of the period, the value of these securities amounted to $51,115,480 or 1.6% of net assets. |
| (e) | Security or a portion of the security purchased on a delayed delivery or when-issued basis. |
| (f) | Level 3 security |
| (g) | Security initially issued in zero coupon form which converts to coupon form at a specified rate and date. The rate shown is the rate at period end. |
| (h) | Information in this report regarding holdings by state and security types does not reflect the holdings of the Fidelity Tax-Free Cash Central Fund. |
| (i) | Affiliated fund that is generally available only to investment companies and other accounts managed by Fidelity Investments. The rate quoted is the annualized seven-day yield of the fund at period end. A complete unaudited listing of the fund's holdings as of its most recent quarter end is available upon request. In addition, each Fidelity Central Fund's financial statements, which are not covered by the Fund's Report of Independent Registered Public Accounting Firm, are available on the SEC's website or upon request. |
| Affiliate | Value, beginning of period ($) | Purchases ($) | Sales Proceeds ($) | Dividend Income ($) | Realized Gain (loss) ($) | Change in Unrealized appreciation (depreciation) ($) | Value, end of period ($) | % ownership, end of period |
| Fidelity Tax-Free Cash Central Fund 4.41% | 93,599,434 | 516,170,975 | 460,012,700 | 3,173,185 | 7,234 | 3,662 | 149,768,605 | 14.5% |
| Total | 93,599,434 | 516,170,975 | 460,012,700 | 3,173,185 | 7,234 | 3,662 | 149,768,605 | |
| Valuation Inputs at Reporting Date: | ||||
| Description | Total ($) | Level 1 ($) | Level 2 ($) | Level 3 ($) |
Investments in Securities: | ||||
| Municipal Securities | 3,083,930,257 | - | 3,082,893,097 | 1,037,160 |
| Money Market Funds | 149,768,605 | 149,768,605 | - | - |
| Total Investments in Securities: | 3,233,698,862 | 149,768,605 | 3,082,893,097 | 1,037,160 |
| Statement of Assets and Liabilities | ||||
| January 31, 2024 | ||||
| Assets | ||||
| Investment in securities, at value - See accompanying schedule: | ||||
Unaffiliated issuers (cost $3,143,051,133) | $ | 3,083,930,257 | ||
Fidelity Central Funds (cost $149,764,162) | 149,768,605 | |||
| Total Investment in Securities (cost $3,292,815,295) | $ | 3,233,698,862 | ||
| Cash | 113,316 | |||
| Receivable for fund shares sold | 4,479,732 | |||
| Interest receivable | 30,832,185 | |||
| Distributions receivable from Fidelity Central Funds | 386,771 | |||
| Prepaid expenses | 2,182 | |||
| Receivable from investment adviser for expense reductions | 535,330 | |||
| Other receivables | 707 | |||
Total assets | 3,270,049,085 | |||
| Liabilities | ||||
| Payable for investments purchased on a delayed delivery basis | $ | 61,097,538 | ||
| Payable for fund shares redeemed | 2,412,107 | |||
| Distributions payable | 3,332,542 | |||
| Accrued management fee | 910,912 | |||
| Other affiliated payables | 285,171 | |||
| Other payables and accrued expenses | 258,350 | |||
| Total Liabilities | 68,296,620 | |||
| Net Assets | $ | 3,201,752,465 | ||
| Net Assets consist of: | ||||
| Paid in capital | $ | 3,311,477,610 | ||
| Total accumulated earnings (loss) | (109,725,145) | |||
| Net Assets | $ | 3,201,752,465 | ||
Net Asset Value, offering price and redemption price per share ($3,201,752,465 ÷ 290,179,700 shares) | $ | 11.03 | ||
| Statement of Operations | ||||
Year ended January 31, 2024 | ||||
| Investment Income | ||||
| Interest | $ | 92,984,653 | ||
| Income from Fidelity Central Funds | 3,172,190 | |||
| Total Income | 96,156,843 | |||
| Expenses | ||||
| Management fee | $ | 10,061,420 | ||
| Transfer agent fees | 2,657,773 | |||
| Accounting fees and expenses | 505,079 | |||
| Custodian fees and expenses | 27,336 | |||
| Independent trustees' fees and expenses | 9,650 | |||
| Registration fees | 154,076 | |||
| Audit | 67,046 | |||
| Legal | 7,464 | |||
| Miscellaneous | 22,210 | |||
| Total expenses before reductions | 13,512,054 | |||
| Expense reductions | (6,344,732) | |||
| Total expenses after reductions | 7,167,322 | |||
| Net Investment income (loss) | 88,989,521 | |||
| Realized and Unrealized Gain (Loss) | ||||
| Net realized gain (loss) on: | ||||
| Investment Securities: | ||||
| Unaffiliated issuers | (6,400,911) | |||
| Fidelity Central Funds | 7,234 | |||
| Capital gain distributions from Fidelity Central Funds | 995 | |||
| Total net realized gain (loss) | (6,392,682) | |||
| Change in net unrealized appreciation (depreciation) on: | ||||
| Investment Securities: | ||||
| Unaffiliated issuers | 29,968,751 | |||
| Fidelity Central Funds | 3,662 | |||
| Total change in net unrealized appreciation (depreciation) | 29,972,413 | |||
| Net gain (loss) | 23,579,731 | |||
| Net increase (decrease) in net assets resulting from operations | $ | 112,569,252 | ||
| Statement of Changes in Net Assets | ||||
Year ended January 31, 2024 | Year ended January 31, 2023 | |||
| Increase (Decrease) in Net Assets | ||||
| Operations | ||||
| Net investment income (loss) | $ | 88,989,521 | $ | 90,309,171 |
| Net realized gain (loss) | (6,392,682) | (56,391,120) | ||
| Change in net unrealized appreciation (depreciation) | 29,972,413 | (252,367,742) | ||
| Net increase (decrease) in net assets resulting from operations | 112,569,252 | (218,449,691) | ||
| Distributions to shareholders | (87,316,305) | (90,744,332) | ||
| Share transactions | ||||
| Proceeds from sales of shares | 967,358,461 | 1,285,693,354 | ||
| Reinvestment of distributions | 51,813,569 | 50,620,037 | ||
| Cost of shares redeemed | (720,048,957) | (2,668,009,654) | ||
Net increase (decrease) in net assets resulting from share transactions | 299,123,073 | (1,331,696,263) | ||
| Total increase (decrease) in net assets | 324,376,020 | (1,640,890,286) | ||
| Net Assets | ||||
| Beginning of period | 2,877,376,445 | 4,518,266,731 | ||
| End of period | $ | 3,201,752,465 | $ | 2,877,376,445 |
| Other Information | ||||
| Shares | ||||
| Sold | 90,041,387 | 118,888,176 | ||
| Issued in reinvestment of distributions | 4,825,956 | 4,670,605 | ||
| Redeemed | (67,294,452) | (244,286,870) | ||
| Net increase (decrease) | 27,572,891 | (120,728,089) | ||
| Fidelity® Tax-Free Bond Fund |
| Years ended January 31, | 2024 | 2023 | 2022 | 2021 | 2020 | |||||
Selected Per-Share Data | ||||||||||
| Net asset value, beginning of period | $ | 10.96 | $ | 11.79 | $ | 12.25 | $ | 12.13 | $ | 11.37 |
| Income from Investment Operations | ||||||||||
Net investment income (loss) A,B | .329 | .304 | .291 | .312 | .337 | |||||
| Net realized and unrealized gain (loss) | .064 | (.828) | (.427) | .152 | .772 | |||||
| Total from investment operations | .393 | (.524) | (.136) | .464 | 1.109 | |||||
| Distributions from net investment income | (.323) | (.304) | (.291) | (.312) | (.337) | |||||
| Distributions from net realized gain | - | (.002) | (.033) | (.032) | (.012) | |||||
| Total distributions | (.323) | (.306) | (.324) | (.344) | (.349) | |||||
| Net asset value, end of period | $ | 11.03 | $ | 10.96 | $ | 11.79 | $ | 12.25 | $ | 12.13 |
Total Return C | 3.71% | (4.38)% | (1.16)% | 3.94% | 9.87% | |||||
Ratios to Average Net Assets B,D,E | ||||||||||
| Expenses before reductions | .46% | .46% | .46% | .46% | .46% | |||||
| Expenses net of fee waivers, if any | .25% | .25% | .25% | .25% | .25% | |||||
| Expenses net of all reductions | .25% | .25% | .25% | .25% | .25% | |||||
| Net investment income (loss) | 3.06% | 2.78% | 2.39% | 2.62% | 2.86% | |||||
| Supplemental Data | ||||||||||
| Net assets, end of period (000 omitted) | $ | 3,201,752 | $ | 2,877,376 | $ | 4,518,267 | $ | 4,474,910 | $ | 4,458,835 |
Portfolio turnover rate F | 7% | 11% G | 8% | 19% | 8% |
| Fidelity Central Fund | Investment Manager | Investment Objective | Investment Practices | Expense RatioA |
| Fidelity Money Market Central Funds | Fidelity Management & Research Company LLC (FMR) | Each fund seeks to obtain a high level of current income consistent with the preservation of capital and liquidity. | Short-term Investments | Less than .005% |
| Gross unrealized appreciation | $56,446,065 |
| Gross unrealized depreciation | (113,555,103) |
| Net unrealized appreciation (depreciation) | $(57,109,038) |
| Tax Cost | $3,290,807,900 |
| Capital loss carryforward | $(52,574,361) |
| Net unrealized appreciation (depreciation) on securities and other investments | $(57,109,038) |
| Short-term | $(35,796,166) |
| Long-term | (16,778,195) |
| Total capital loss carryforward | $(52,574,361) |
| January 31, 2024 | January 31, 2023 | |
| Tax-exempt Income | $87,316,305 | $90,014,082 |
| Long-term Capital Gains | - | 730,250 |
| Total | $87,316,305 | $90,744,332 |
| Purchases ($) | Sales ($) | |
| Fidelity Tax-Free Bond Fund | 528,682,405 | 186,692,064 |
| % of Average Net Assets | |
| Fidelity Tax-Free Bond Fund | .0173 |
| % of Average Net Assets | |
| Fidelity Tax-Free Bond Fund | .02 |
| Maximum Management Fee Rate % | |
| Fidelity Tax-Free Bond Fund | .43 |
| Purchases ($) | Sales ($) | Realized Gain(Loss) ($) | |
| Fidelity Tax-Free Bond Fund | - | 5,300,000 | - |
| Shares | Total net realized gain or loss($) | Total Proceeds($) | |
| Fidelity Tax-Free Bond Fund | 16,954,008 | (10,197,768) | 180,390,645 |
| Amount | |
| Fidelity Tax-Free Bond Fund | $5,048 |
| The Example is based on an investment of $1,000 invested at the beginning of the period and held for the entire period (August 1, 2023 to January 31, 2024). |
Annualized Expense Ratio- A | Beginning Account Value August 1, 2023 | Ending Account Value January 31, 2024 | Expenses Paid During Period- C August 1, 2023 to January 31, 2024 | |||||||
| Fidelity® Tax-Free Bond Fund | .25% | |||||||||
| Actual | $ 1,000 | $ 1,034.20 | $ 1.28 | |||||||
Hypothetical-B | $ 1,000 | $ 1,023.95 | $ 1.28 | |||||||
- Highly liquid investments - cash or convertible to cash within three business days or less
- Moderately liquid investments - convertible to cash in three to seven calendar days
- Less liquid investments - can be sold or disposed of, but not settled, within seven calendar days
- Illiquid investments - cannot be sold or disposed of within seven calendar days
| A special meeting of shareholders was held on October 18, 2023. The results of votes taken among shareholders on the proposal before them are reported below. Each vote reported represents one dollar of net asset value held on the record date for the meeting. | ||
| Proposal 1 | ||
| To elect a Board of Trustees. | ||
# of Votes | % of Votes | |
| Abigail P. Johnson | ||
| Affirmative | 378,729,502,260.01 | 97.58 |
| Withheld | 9,407,876,478.96 | 2.42 |
| TOTAL | 388,137,378,738.97 | 100.00 |
| Jennifer Toolin McAuliffe | ||
| Affirmative | 378,454,868,010.95 | 97.51 |
| Withheld | 9,682,510,728.02 | 2.49 |
| TOTAL | 388,137,378,738.97 | 100.00 |
| Christine J. Thompson | ||
| Affirmative | 378,837,121,274.52 | 97.60 |
| Withheld | 9,300,257,464.45 | 2.40 |
| TOTAL | 388,137,378,738.97 | 100.00 |
| Elizabeth S. Acton | ||
| Affirmative | 378,262,110,794.85 | 97.46 |
| Withheld | 9,875,267,944.12 | 2.54 |
| TOTAL | 388,137,378,738.97 | 100.00 |
| Laura M. Bishop | ||
| Affirmative | 380,482,113,171.06 | 98.03 |
| Withheld | 7,655,265,567.91 | 1.97 |
| TOTAL | 388,137,378,738.97 | 100.00 |
| Ann E. Dunwoody | ||
| Affirmative | 380,016,034,008.12 | 97.91 |
| Withheld | 8,121,344,730.85 | 2.09 |
| TOTAL | 388,137,378,738.97 | 100.00 |
| John Engler | ||
| Affirmative | 379,432,488,394.20 | 97.76 |
| Withheld | 8,704,890,344.77 | 2.24 |
| TOTAL | 388,137,378,738.97 | 100.00 |
| Robert F. Gartland | ||
| Affirmative | 378,741,819,600.60 | 97.58 |
| Withheld | 9,395,559,138.37 | 2.42 |
| TOTAL | 388,137,378,738.97 | 100.00 |
| Robert W. Helm | ||
| Affirmative | 380,389,324,755.07 | 98.00 |
| Withheld | 7,748,053,983.90 | 2.00 |
| TOTAL | 388,137,378,738.97 | 100.00 |
| Arthur E. Johnson | ||
| Affirmative | 378,427,694,151.67 | 97.50 |
| Withheld | 9,709,684,587.30 | 2.50 |
| TOTAL | 388,137,378,738.97 | 100.00 |
| Michael E. Kenneally | ||
| Affirmative | 377,842,228,145.18 | 97.35 |
| Withheld | 10,295,150,593.79 | 2.65 |
| TOTAL | 388,137,378,738.97 | 100.00 |
| Mark A. Murray | ||
| Affirmative | 380,158,432,703.37 | 97.94 |
| Withheld | 7,978,946,035.60 | 2.06 |
| TOTAL | 388,137,378,738.97 | 100.00 |
| Carol J. Zierhoffer | ||
| Affirmative | 380,522,113,360.24 | 98.04 |
| Withheld | 7,615,265,378.73 | 1.96 |
| TOTAL | 388,137,378,738.97 | 100.00 |
| Proposal 1 reflects trust wide proposal and voting results. | ||
 |


Contents
| $10,000 Over Life of Fund |
Let's say hypothetically that $10,000 was invested in Fidelity Municipal Core Plus Bond Fund, a class of the fund, on February 16, 2023, when the fund started. The chart shows how the value of your investment would have changed, and also shows how the Bloomberg Municipal Bond Index performed over the same period. |
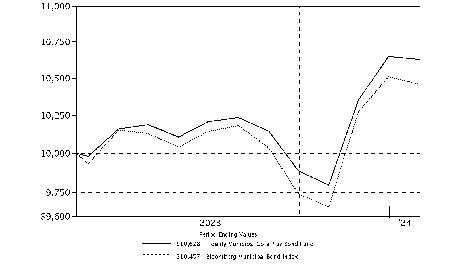 |
| Top Five States (% of Fund's net assets) | |
| New Jersey | 9.3 |
| New York | 8.8 |
| Illinois | 8.1 |
| California | 5.1 |
| Pennsylvania | 4.8 |
| Revenue Sources (% of Fund's net assets) | ||
| General Obligations | 25.6 | |
| Health Care | 18.1 | |
| Education | 9.5 | |
| Transportation | 9.2 | |
| Housing | 7.7 | |
| Special Tax | 7.3 | |
| State G.O. | 6.4 | |
| Electric Utilities | 5.3 | |
| Others* (Individually Less Than 5%) | 10.9 | |
| 100.0 | ||
| *Includes net other assets | ||
Quality Diversification (% of Fund's net assets) |
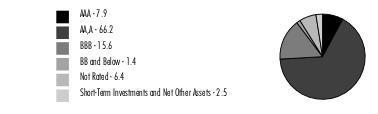 |
| We have used ratings from Moody's Investors Service, Inc. Where Moody's® ratings are not available, we have used S&P® ratings. All ratings are as of the date indicated and do not reflect subsequent changes. |
| Municipal Bonds - 97.5% | |||
Principal Amount (a) | Value ($) | ||
| Alabama - 3.1% | |||
| Black Belt Energy Gas District Bonds: | |||
| Series 2022 C1, 5.25%, tender 6/1/29 (b) | 630,000 | 671,758 | |
| Series 2022 E, 5%, tender 6/1/28 (b) | 65,000 | 67,932 | |
| Jefferson County Swr. Rev. Series 2024, 5% 10/1/38 | 500,000 | 557,775 | |
| Southeast Energy Auth. Coop. Dis Bonds (Proj. No. 6) Series 2023 B, 5%, tender 6/1/30 (b) | 380,000 | 403,348 | |
TOTAL ALABAMA | 1,700,813 | ||
| Arizona - 2.0% | |||
| Arizona Indl. Dev. Auth. Lease Rev. Series 2020 A, 4% 9/1/36 | 105,000 | 105,361 | |
| Arizona Indl. Dev. Auth. Rev. Series 2019 2, 3.625% 5/20/33 | 92,317 | 86,569 | |
| Chandler Indl. Dev. Auth. Indl. Dev. Rev. Bonds (Intel Corp. Proj.): | |||
| Series 2005, 3.8%, tender 6/15/28 (b) | 125,000 | 126,887 | |
| Series 2007, 4.1%, tender 6/15/28 (b)(c) | 55,000 | 55,621 | |
| Coconino County Poll. Cont. Corp. Rev. Bonds (Navada Pwr. Co. Proj.) Series 2017 B, 3.75%, tender 3/31/26 (b) | 100,000 | 99,896 | |
| Phoenix Ariz Indl. Dev. Auth. Rev.: | |||
| (Guam Facilities Foundation, Inc. Projs.) Series 2014, 5.375% 2/1/41 | 100,000 | 94,277 | |
| (Guam Facilities Foundation, Inc. Proj.) Series 2014, 5.125% 2/1/34 | 100,000 | 97,561 | |
| Phoenix Civic Impt. Board Arpt. Rev. Series 2023, 5% 7/1/24 (c) | 100,000 | 100,551 | |
| Salt Verde Finl. Corp. Sr. Gas Rev. Series 2007, 5% 12/1/37 | 260,000 | 282,621 | |
| Univ. of Arizona Univ. Revs. Series 2016, 3% 6/1/34 | 50,000 | 48,362 | |
TOTAL ARIZONA | 1,097,706 | ||
| California - 5.1% | |||
| Alameda Corridor Trans. Auth. Rev. Series 2024 A, 0% 10/1/52 (Assured Guaranty Muni. Corp. Insured) (d) | 100,000 | 25,662 | |
| California Gen. Oblig.: | |||
| Series 2020, 4% 11/1/37 | 50,000 | 53,076 | |
| Series 2022, 4.75% 12/1/42 | 250,000 | 263,667 | |
| California Hsg. Fin. Agcy.: | |||
| Series 2021 1, 3.5% 11/20/35 | 574,531 | 541,338 | |
| Series 2023 A1, 4.375% 9/20/36 | 99,563 | 99,050 | |
| California Muni. Fin. Auth. Rev. Series 2017 A: | |||
| 3.5% 6/1/34 | 50,000 | 49,793 | |
| 3.75% 6/1/37 | 40,000 | 39,553 | |
| California Muni. Fin. Auth. Solid Waste Disp. Rev. Bonds Series 2023 A, 4.375%, tender 9/1/33 (b)(c) | 500,000 | 521,586 | |
| Elk Grove Unified School Distr. Ctfs. of Prtn. (Cap. Facilities Proj.) Series 2016, 3% 2/1/34 | 50,000 | 49,172 | |
| Fresno Arpt. Rev. Series 2023 A, 5% 7/1/53 (Build America Mutual Assurance Insured) (c) | 500,000 | 526,148 | |
| Golden State Tobacco Securitization Corp. Tobacco Settlement Rev. Series 2021 B2, 0% 6/1/66 | 500,000 | 57,862 | |
| Los Angeles Dept. Arpt. Rev.: | |||
| Series 2019 A, 5% 5/15/35 (c) | 10,000 | 10,784 | |
| Series 2019 C, 5% 5/15/25 (Escrowed to Maturity) | 25,000 | 25,713 | |
| Los Angeles Unified School District: | |||
| Series 2016 B, 2% 7/1/29 | 10,000 | 9,334 | |
| Series 2020 C, 3% 7/1/35 | 5,000 | 4,884 | |
| Los Angeles Unified School District Ctfs. of Prtn. Series 2023 A, 5% 10/1/30 | 400,000 | 463,802 | |
| Poway Unified School District Series B, 0% 8/1/38 | 60,000 | 35,129 | |
| San Diego Unified School District Series 2012 R1, 0% 7/1/31 | 10,000 | 7,953 | |
| San Mateo County Cmnty. College District Series 2019, 5% 9/1/38 | 5,000 | 5,584 | |
TOTAL CALIFORNIA | 2,790,090 | ||
| Colorado - 1.4% | |||
| Colorado Health Facilities Auth. Rev. Bonds: | |||
| (Parkview Med. Ctr., Inc. Proj.) Series 2016, 4% 9/1/36 | 15,000 | 15,165 | |
| (Parkview Med. Ctr., INC. Proj.) Series 2017, 5% 9/1/26 | 325,000 | 343,707 | |
| Bonds Series 2023 A1, 5%, tender 11/15/28 (b) | 90,000 | 97,313 | |
| Series 2019 A, 4% 11/1/39 | 45,000 | 44,767 | |
| Series 2019 A1, 4% 8/1/39 | 185,000 | 182,423 | |
| Denver City & County Arpt. Rev. Series 2018 A, 5% 12/1/27 (c) | 90,000 | 95,548 | |
TOTAL COLORADO | 778,923 | ||
| Connecticut - 4.3% | |||
| Connecticut Gen. Oblig.: | |||
| Series 2016 A, 5% 3/15/26 | 50,000 | 52,276 | |
| Series 2018 A, 5% 4/15/37 | 1,000,000 | 1,074,065 | |
| Series 2021 A, 3% 1/15/36 | 20,000 | 18,936 | |
| Connecticut Health & Edl. Facilities Auth. Rev.: | |||
| Bonds Series 2010 A3, 2.95%, tender 7/1/27 (b)(d) | 100,000 | 100,192 | |
| Series 2019 A: | |||
5% 7/1/25 | 190,000 | 191,965 | |
5% 7/1/26 | 500,000 | 503,935 | |
| Series 2020 A: | |||
4% 7/1/36 | 5,000 | 5,051 | |
5% 7/1/32 | 5,000 | 5,473 | |
| Series R, 5% 6/1/40 | 30,000 | 32,231 | |
| Connecticut Hsg. Fin. Auth. Series 2023 A, 5.25% 11/15/53 | 255,000 | 270,513 | |
| Stamford Gen. Oblig. Series 2016, 4% 8/1/26 | 5,000 | 5,084 | |
| Steelpointe Hbr. Infrastructure Impt. District (Steelpointe Hbr. Proj.) Series 2021, 4% 4/1/51 (e) | 100,000 | 77,582 | |
TOTAL CONNECTICUT | 2,337,303 | ||
| District Of Columbia - 0.8% | |||
| District of Columbia Gen. Oblig. Series 2016 A, 3% 6/1/41 | 145,000 | 125,319 | |
| District of Columbia Income Tax Rev. Series 2019 A, 5% 3/1/35 | 15,000 | 16,825 | |
| Metropolitan Washington DC Arpts. Auth. Sys. Rev. Series 2021 A: | |||
| 4% 10/1/40 (c) | 100,000 | 99,925 | |
| 5% 10/1/26 (c) | 200,000 | 208,626 | |
TOTAL DISTRICT OF COLUMBIA | 450,695 | ||
| Florida - 4.2% | |||
| Central Florida Expressway Auth. Sr. Lien Rev. Series 2017, 3% 7/1/34 | 395,000 | 381,020 | |
| Florida Higher Edl. Facilities Fing. Auth. (Rollins College Proj.) Series 2020 A, 3% 12/1/48 | 100,000 | 78,136 | |
| Florida Hsg. Fin. Corp. Multi-family Mtg. Rev. Bonds Series 2023 C, 5%, tender 12/1/25 (b) | 15,000 | 15,355 | |
| Florida Muni. Pwr. Agcy. Rev. Series 2021 A, 3% 10/1/32 | 100,000 | 96,950 | |
| JEA Wtr. & Swr. Sys. Rev. Series 2024 A: | |||
| 5% 10/1/28 (d) | 50,000 | 55,469 | |
| 5% 10/1/30 (d) | 50,000 | 57,562 | |
| Miami-Dade County Aviation Rev. Series 2020 A, 4% 10/1/41 | 200,000 | 201,702 | |
| Palm Beach County Health Facilities Auth. Rev.: | |||
| Series 2019 B, 5% 5/15/53 | 75,000 | 56,050 | |
| Series 2023 C, 7.625% 5/15/58 | 50,000 | 51,755 | |
| South Miami Health Facilities Auth. Hosp. Rev. Series 2017, 4% 8/15/47 | 1,000,000 | 946,455 | |
| Tallahassee Health Facilities Rev. Series 2015 A, 4% 12/1/35 | 365,000 | 358,149 | |
TOTAL FLORIDA | 2,298,603 | ||
| Georgia - 3.5% | |||
| Atlanta Arpt. Rev. Series 2023 G, 5% 7/1/25 (c) | 800,000 | 817,546 | |
| Burke County Indl. Dev. Auth. Poll. Cont. Rev. Bonds (Georgia Pwr. Co. Plant Vogtle Proj.) Series 1994 4, 3.8%, tender 5/21/26 (b) | 340,000 | 340,241 | |
| Main Street Natural Gas, Inc. Bonds: | |||
| Series 2022 E, 4%, tender 12/1/29 (b) | 200,000 | 200,147 | |
| Series 2023 A, 5%, tender 6/1/30 (b) | 200,000 | 211,363 | |
| Series 2023 B, 5%, tender 3/1/30 (b) | 250,000 | 265,063 | |
| Series 2023 C, 5%, tender 9/1/30 (b) | 55,000 | 58,500 | |
| Private Colleges & Univs. Auth. Rev. (The Savannah College of Art & Design Projs.) Series 2021, 4% 4/1/38 | 5,000 | 5,103 | |
TOTAL GEORGIA | 1,897,963 | ||
| Hawaii - 1.6% | |||
| Honolulu City & County Gen. Oblig. Series 2020 F, 5% 7/1/34 | 5,000 | 5,690 | |
| Honolulu City & County Multi-family housing Rev. Bonds Series 2023, 5%, tender 6/1/26 (b) | 340,000 | 351,906 | |
| Honolulu City and County Wastewtr. Sys. Series 2016 B, 5% 7/1/27 | 500,000 | 525,090 | |
TOTAL HAWAII | 882,686 | ||
| Illinois - 8.1% | |||
| Chicago Board of Ed.: | |||
| Series 2017 D, 5% 12/1/31 | 100,000 | 102,170 | |
| Series 2022 B, 4% 12/1/41 | 100,000 | 92,589 | |
| Chicago Midway Arpt. Rev. Series 2016 A, 5% 1/1/29 (c) | 20,000 | 20,380 | |
| Chicago O'Hare Int'l. Arpt. Rev.: | |||
| Series 2015 A, 5% 1/1/28 (c) | 5,000 | 5,043 | |
| Series 2016 G, 5% 1/1/42 (c) | 5,000 | 5,099 | |
| Illinois Fin. Auth. (Bradley Univ. Proj.) Series 2021 A, 4% 8/1/37 | 100,000 | 100,341 | |
| Illinois Fin. Auth. Academic Facilities (Provident Group UIUC Properties LLC Univ. of Illinois at Urbana-Champaign Proj.) Series 2019 A, 5% 10/1/38 | 350,000 | 368,696 | |
| Illinois Fin. Auth. Rev.: | |||
| Series 2015 A, 5% 11/15/25 | 60,000 | 61,440 | |
| Series 2016 A, 3% 10/1/37 | 20,000 | 17,700 | |
| Series 2016: | |||
3.125% 5/15/37 | 35,000 | 32,861 | |
4% 5/15/35 | 10,000 | 10,006 | |
5% 12/1/46 | 5,000 | 5,042 | |
| Series 2017 C, 5% 3/1/26 | 15,000 | 15,402 | |
| Series 2019, 5% 4/1/35 | 15,000 | 16,015 | |
| Illinois Gen. Oblig.: | |||
| Series 2017 D, 5% 11/1/28 | 25,000 | 26,674 | |
| Series 2021 A, 5% 3/1/30 | 120,000 | 132,748 | |
| Series 2022 A, 5% 3/1/36 | 40,000 | 44,602 | |
| Series 2023 B, 5% 5/1/37 | 500,000 | 553,963 | |
| Series 2023 D, 4% 7/1/37 | 300,000 | 301,962 | |
| Series June 2016, 3.5% 6/1/29 | 500,000 | 502,459 | |
| Illinois Hsg. Dev. Auth. Multi-family Hsg. Rev. Bonds Series 2023, 4%, tender 6/1/25 (b) | 350,000 | 351,241 | |
| Illinois Hsg. Dev. Auth. Rev. Series 2019 D, 2.7% 10/1/34 | 115,000 | 105,173 | |
| Illinois Sales Tax Rev. Series 2016 A: | |||
| 3% 6/15/33 | 115,000 | 107,868 | |
| 3% 6/15/34 | 220,000 | 204,842 | |
| Illinois Toll Hwy. Auth. Toll Hwy. Rev. Series A, 5% 1/1/45 | 20,000 | 21,637 | |
| Metropolitan Pier & Exposition: | |||
| (McCormick Place Expansion Proj.): | |||
Series 2010 B1, 0% 6/15/46 (Assured Guaranty Muni. Corp. Insured) | 100,000 | 37,058 | |
Series A, 0% 12/15/38 (Nat'l. Pub. Fin. Guarantee Corp. Insured) | 15,000 | 8,158 | |
| Series 2002 A, 0% 12/15/33 (Nat'l. Pub. Fin. Guarantee Corp. Insured) | 20,000 | 13,978 | |
| Series 2022 A, 0% 6/15/41 | 300,000 | 140,788 | |
| Series 2023 A, 5% 12/15/28 | 300,000 | 319,145 | |
| Railsplitter Tobacco Settlement Auth. Rev. Series 2017: | |||
| 5% 6/1/26 (Escrowed to Maturity) | 5,000 | 5,241 | |
| 5% 6/1/27 (Pre-Refunded to 6/1/26 @ 100) | 300,000 | 314,489 | |
| Sales Tax Securitization Corp. Series 2023 A, 3% 1/1/27 | 264,000 | 260,425 | |
| Schaumburg Village Gen. Oblig. Series 2023, 4% 12/1/30 | 100,000 | 105,517 | |
TOTAL ILLINOIS | 4,410,752 | ||
| Indiana - 1.0% | |||
| Indiana Fin. Auth. Edl. Facilities Rev. (Butler Univ. Proj.) Series 2021, 4% 2/1/30 | 10,000 | 10,439 | |
| Indiana Fin. Auth. Health Sys. Rev. Series 2016 A, 4% 11/1/51 | 555,000 | 517,071 | |
TOTAL INDIANA | 527,510 | ||
| Iowa - 0.5% | |||
| Des Moines Iowa Series 2020 A, 2% 6/1/31 | 10,000 | 8,940 | |
| Iowa Fin. Auth. Single Family Mtg. (Mtg.-Backed Securities Prog.) Series 2023 A, 5.25% 7/1/53 | 260,000 | 272,215 | |
TOTAL IOWA | 281,155 | ||
| Kentucky - 4.3% | |||
| Ashland Med. Ctr. Rev.: | |||
| (Ashland Hosp. Corp. D/B/A Kings Daughters Med. Ctr. Proj.) Series 2016 A, 4% 2/1/36 | 350,000 | 350,225 | |
| Series 2019, 4% 2/1/33 | 200,000 | 202,450 | |
| Kentucky Econ. Dev. Fin. Auth. Hosp. Rev. Series 2017 A, 5.25% 6/1/41 | 200,000 | 204,558 | |
| Kentucky, Inc. Pub. Energy: | |||
| Bonds Series A, 4%, tender 6/1/26 (b) | 95,000 | 95,136 | |
| Series 2024 A1: | |||
5% 8/1/28 | 490,000 | 505,240 | |
5% 2/1/29 | 400,000 | 414,951 | |
| Louisville & Jefferson County: | |||
| Bonds Series 2020 C, 5%, tender 10/1/26 (b) | 350,000 | 363,644 | |
| Series 2020 A, 3% 10/1/43 | 90,000 | 70,552 | |
| Louisville & Jefferson County Visitors & Convention Commission Rev. (Kentucky Int'l. Convention Ctr. Expansion Proj.) Series 2016, 3.125% 6/1/46 (Assured Guaranty Muni. Corp. Insured) | 20,000 | 16,438 | |
| Trimble County Envirl Facilities Re Bonds Series 2023, 4.7%, tender 6/1/27 (b)(c) | 100,000 | 101,353 | |
TOTAL KENTUCKY | 2,324,547 | ||
| Louisiana - 0.6% | |||
| New Orleans Aviation Board Rev. Series 2017 D2, 5% 1/1/38 (c) | 60,000 | 61,608 | |
| St. John Baptist Parish Rev. Bonds (Marathon Oil Corp.) Series 2017, 4.05%, tender 7/1/26 (b) | 260,000 | 257,402 | |
TOTAL LOUISIANA | 319,010 | ||
| Maryland - 1.2% | |||
| Maryland Health & Higher Edl. Bonds Series 2020, 5%, tender 7/1/25 (b) | 300,000 | 304,339 | |
| Maryland Health & Higher Edl. Facilities Auth. Rev. Series 2016 A, 4% 7/1/42 | 100,000 | 94,271 | |
| Univ. of Maryland Sys. Auxiliary Facility & Tuition Rev. Series 2014 A, 5% 4/1/25 | 255,000 | 255,814 | |
TOTAL MARYLAND | 654,424 | ||
| Massachusetts - 2.0% | |||
| Amesbury Gen. Oblig. Series 2020, 2% 6/1/34 | 25,000 | 20,940 | |
| Massachusetts Dev. Fin. Agcy. Rev.: | |||
| Series 2016, 5% 7/1/28 | 30,000 | 31,019 | |
| Series 2019 K, 5% 7/1/35 | 15,000 | 16,316 | |
| Series 2021 G, 4% 7/1/46 | 510,000 | 481,983 | |
| Massachusetts Edl. Fing. Auth. Rev. Series 2020 C, 5% 7/1/26 (c) | 100,000 | 103,160 | |
| Massachusetts Hsg. Fin. Agcy. Multi-Family Rev. Series 2018 A, 3.7% 12/1/38 | 370,000 | 355,277 | |
| Massachusetts Port Auth. Rev. Series 2019 A, 5% 7/1/34 (c) | 30,000 | 32,709 | |
| Worcester Gen. Oblig. Series 2021, 2% 2/15/35 (Assured Guaranty Muni. Corp. Insured) | 60,000 | 49,596 | |
TOTAL MASSACHUSETTS | 1,091,000 | ||
| Michigan - 0.3% | |||
| Detroit Gen. Oblig. Series 2021 A, 5% 4/1/38 | 100,000 | 104,781 | |
| Michigan Fin. Auth. Rev. Series 2022, 5% 12/1/32 | 25,000 | 25,209 | |
| Michigan State Hsg. Dev. Auth. Series 2021 A, 2.45% 10/1/46 | 30,000 | 20,951 | |
| Rochester Cmnty. School District Series 2019 II, 3% 5/1/31 | 5,000 | 4,925 | |
TOTAL MICHIGAN | 155,866 | ||
| Minnesota - 1.7% | |||
| Minneapolis Health Care Sys. Rev. Bonds Series 2023 A, 5%, tender 11/15/28 (b) | 315,000 | 341,405 | |
| Minnesota Agric. & Econ. Dev. Board Rev. Series 2024, 5.25% 1/1/54 (d) | 100,000 | 110,103 | |
| Minnesota Higher Ed. Facilities Auth. Rev.: | |||
| Series 2018 A, 5% 10/1/33 | 150,000 | 159,933 | |
| Series 2023, 4.25% 10/1/38 | 300,000 | 301,621 | |
| Saint Cloud Health Care Rev. Series 2016 A, 3% 5/1/32 | 15,000 | 14,424 | |
TOTAL MINNESOTA | 927,486 | ||
| Mississippi - 0.1% | |||
| Mississippi Bus. finance Corp. Exempt Facilities Rev. Bonds (Enviva, Inc. Proj.) Series 2022, 7.75%, tender 7/15/32 (b)(c) | 110,000 | 79,617 | |
| Missouri - 0.2% | |||
| Missouri Hsg. Dev. Commission Single Family Mtg. Rev. (First Place Homeownership Ln. Prog.) Series 2023 E, 6.5% 5/1/54 | 100,000 | 113,391 | |
| Nebraska - 0.3% | |||
| Central Plains Energy Proj. Rev. Bonds (Proj. No. 4) Series 2023 A1, 5%, tender 11/1/29 (b) | 135,000 | 142,653 | |
| Nevada - 3.3% | |||
| Clark County Arpt. Rev. Series 2021 B, 5% 7/1/25 (c) | 1,740,000 | 1,775,504 | |
| New Hampshire - 0.4% | |||
| Nat'l. Finnance Auth. Series 2023 2A, 3.875% 1/20/38 | 99,456 | 93,765 | |
| New Hampshire Health & Ed. Facilities Auth. Series 2023 B: | |||
| 5% 11/1/43 (c) | 30,000 | 32,439 | |
| 5.5% 11/1/27 (c) | 20,000 | 21,379 | |
| New Hampshire St Hsg. Fin. Series 2023 4: | |||
| 3.625% 4/1/26 | 10,000 | 10,011 | |
| 3.7% 1/1/27 | 35,000 | 35,009 | |
TOTAL NEW HAMPSHIRE | 192,603 | ||
| New Jersey - 9.3% | |||
| Essex County Gen. Oblig. Series 2021 B, 2% 8/15/33 | 450,000 | 390,780 | |
| New Jersey Econ. Dev. Auth. Series 2024 SSS, 5.25% 6/15/38 (d) | 1,000,000 | 1,159,700 | |
| New Jersey Econ. Dev. Auth. Motor Vehicle Rev. Series 2017 A, 4% 7/1/34 | 10,000 | 10,111 | |
| New Jersey Econ. Dev. Auth. Wtr. Facilities Rev. Bonds (New Jersey- American Wtr. Co., INC. Proj.) Series 2020 B, 3.75%, tender 6/1/28 (b)(c) | 340,000 | 341,278 | |
| New Jersey Gen. Oblig. Series 2020, 2.375% 6/1/36 | 55,000 | 47,147 | |
| New Jersey Higher Ed. Student Assistance Auth. Student Ln. Rev.: | |||
| Series 2021 B, 5% 12/1/25 (c) | 655,000 | 670,839 | |
| Series 2023 A, 5% 12/1/30 (c) | 300,000 | 324,708 | |
| New Jersey Hsg. & Mtg. Fin. Agcy. Multi-family Rev. Series 2023 C, 5% 11/1/26 (c) | 500,000 | 511,263 | |
| New Jersey Tobacco Settlement Fing. Corp. Series 2018 B, 5% 6/1/46 | 560,000 | 569,573 | |
| New Jersey Trans. Trust Fund Auth.: | |||
| Series 2006 C: | |||
0% 12/15/24 | 150,000 | 145,501 | |
0% 12/15/31 (FGIC Insured) | 15,000 | 11,517 | |
0% 12/15/34 | 80,000 | 55,459 | |
| Series 2022 AA, 5% 6/15/25 | 250,000 | 256,655 | |
| Series AA, 5% 6/15/38 | 35,000 | 38,819 | |
| Salem County Indl. Poll. Cont. Fing. Auth. Poll. Cont. Rev. Bonds (Philadelphia Elec. Co. Proj.) Series 1993 A, 4.45%, tender 3/1/25 (b)(c) | 500,000 | 501,029 | |
TOTAL NEW JERSEY | 5,034,379 | ||
| New Mexico - 0.2% | |||
| New Mexico Mtg. Fin. Auth. Series 2021 D, 3% 7/1/52 | 100,000 | 96,377 | |
| New York - 8.8% | |||
| Genesee County Fdg. Corp. (Rochester Reg'l. Health Proj.) Series 2022 A, 5% 12/1/30 | 250,000 | 267,157 | |
| Long Island Pwr. Auth. Elec. Sys. Rev. Series 2020 A, 5% 9/1/34 | 5,000 | 5,771 | |
| New York City Gen. Oblig.: | |||
| Bonds Series 2015 F4, 5%, tender 12/1/25 (f) | 100,000 | 102,421 | |
| Series 2018 C, 3% 8/1/33 | 160,000 | 159,382 | |
| Series 2023 1, 5% 8/1/28 | 1,000,000 | 1,103,333 | |
| Series 2023 D, 5% 8/1/25 | 1,000,000 | 1,031,581 | |
| New York City Hsg. Dev. Corp. Multifamily Hsg. Series 2019 J, 3.05% 11/1/49 | 15,000 | 11,833 | |
| New York City Transitional Fin. Auth. Rev. Series 2016 A1, 3.125% 8/1/31 | 595,000 | 591,329 | |
| New York Metropolitan Trans. Auth. Rev. Series 2020 D, 4% 11/15/47 | 15,000 | 14,351 | |
| New York State Hsg. Fin. Agcy. Rev. Bonds: | |||
| Series 2023 C2, 3.8%, tender 5/1/29 (b) | 370,000 | 371,228 | |
| Series 2023 E2, 3.8%, tender 5/1/27 (b) | 35,000 | 35,065 | |
| New York State Urban Dev. Corp. Series 2020 C, 4% 3/15/37 | 5,000 | 5,232 | |
| New York State Urban Eev Corp. Series 2019 A, 3% 3/15/49 | 1,000,000 | 805,599 | |
| New York Trans. Dev. Corp.: | |||
| (Delta Air Lines, Inc. - LaGuardia Arpt. Termindals C&D Redev. Proj.) Series 2020, 4% 10/1/30 (c) | 20,000 | 19,965 | |
| (Term. 4 JFK Int'l. Arpt. Proj.) Series 2020 A, 5% 12/1/28 (c) | 20,000 | 21,337 | |
| (Term. 4 John F. Kennedy Int'l. Arpt. Proj.) Series 2022, 5% 12/1/34 (c) | 35,000 | 38,433 | |
| Suffolk Tobacco Asset Securitization Corp. Series 2021 B1, 4% 6/1/50 | 225,000 | 227,272 | |
TOTAL NEW YORK | 4,811,289 | ||
| North Carolina - 1.8% | |||
| Charlotte-Mecklenburg Hosp. Auth. Health Care Sys. Rev. Bonds Series 2018 C, 3.45%, tender 10/31/25 (b) | 45,000 | 45,131 | |
| North Carolina State Ed. Assistance Auth. Student Ln. Rev. Series 2023 A: | |||
| 5% 6/1/43 (c) | 100,000 | 102,735 | |
| 5.5% 6/1/28 (c) | 550,000 | 587,138 | |
| North Carolina Tpk. Auth. Triangle Expressway Sys. Series 2024 B, 5% 1/1/53 (Assured Guaranty Muni. Corp. Insured) | 250,000 | 268,643 | |
TOTAL NORTH CAROLINA | 1,003,647 | ||
| North Dakota - 1.3% | |||
| Grand Forks Health Care Sys. Rev. Series 2021: | |||
| 4% 12/1/46 | 60,000 | 53,327 | |
| 5% 12/1/28 | 500,000 | 518,545 | |
| North Dakota Hsg. Fin. Agcy. Series 2023 F, 6.25% 1/1/54 | 100,000 | 109,739 | |
TOTAL NORTH DAKOTA | 681,611 | ||
| Ohio - 3.6% | |||
| American Muni. Pwr., Inc. Rev.: | |||
| Series 2016 A, 3% 2/15/36 | 10,000 | 9,465 | |
| Series 2023 A: | |||
5% 2/15/28 | 500,000 | 540,109 | |
5% 2/15/32 | 500,000 | 579,149 | |
| Buckeye Tobacco Settlement Fing. Auth.: | |||
| Series 2020 A2, 3% 6/1/48 | 200,000 | 151,734 | |
| Series 2020 B2, 5% 6/1/55 | 250,000 | 236,031 | |
| Cuyahoga County Econ. Dev. Rev. (The Cleveland Orchestra Proj.) Series 2019, 5% 1/1/34 | 5,000 | 5,501 | |
| Montgomery County Hosp. Rev. (Kettering Health Network Obligated Group Proj.) Series 2021, 5% 8/1/32 | 25,000 | 27,812 | |
| Muskingum County Hosp. Facilities (Genesis Healthcare Sys. Obligated Group Proj.) Series 2013, 5% 2/15/48 | 200,000 | 182,716 | |
| Northeast Ohio Reg'l. Swr. District Wastewtr. Rev. Series 2019, 3% 11/15/38 | 200,000 | 180,657 | |
| Ohio Higher Edl. Facility Commission Rev.: | |||
| (Kenyon College 2020 Proj.) Series 2020, 5% 7/1/35 | 30,000 | 33,308 | |
| (Xavier Univ. 2015 Proj.) Series 2015 C, 3.75% 5/1/38 | 5,000 | 4,869 | |
TOTAL OHIO | 1,951,351 | ||
| Oklahoma - 0.2% | |||
| Oklahoma Hsg. Fin. Agcy. Single Family Mtg. Rev. (Homeownership Load Prog.) Series 2023 D, 6.5% 9/1/54 | 100,000 | 113,240 | |
| Oregon - 0.0% | |||
| Medford Hosp. Facilities Auth. Rev. (Asante Projs.) Series 2020 A, 5% 8/15/36 | 10,000 | 10,944 | |
| Oregon State Hsg. & Cmnty. Svcs. Dept. (Single-Family Mtg. Prog.) Series 2019 A, 2.65% 7/1/39 | 10,000 | 8,360 | |
TOTAL OREGON | 19,304 | ||
| Pennsylvania - 4.8% | |||
| Centre County Pennsylvania Hosp. Auth. Rev. (Mount Nittany Med. Ctr. Proj.) Series 2018 A, 3.375% 11/15/31 | 10,000 | 10,068 | |
| Dubois Hosp. Auth. Hosp. Rev. (Penn Highlands Healthcare Proj.) Series 2018: | |||
| 5% 7/15/28 | 580,000 | 613,512 | |
| 5% 7/15/29 | 220,000 | 232,391 | |
| Geisinger Auth. Health Sys. Rev.: | |||
| Bonds Series 2020 B, 5%, tender 2/15/27 (b) | 50,000 | 51,925 | |
| Series 2017 A2, 5% 2/15/31 | 10,000 | 10,549 | |
| Northampton County Gen. Purp. Auth. Hosp. Rev. (St Luke's Univ. Health Network Proj.) Series 2016 A, 3% 8/15/32 | 100,000 | 97,120 | |
| Pennsylvania Gen. Oblig.: | |||
| Series 2020 1, 3% 5/1/36 | 310,000 | 295,300 | |
| Series 2021, 3% 5/15/34 | 40,000 | 39,118 | |
| Series 2023, 5% 9/1/31 | 1,000,000 | 1,168,355 | |
| Pennsylvania Tpk. Commission Tpk. Rev.: | |||
| Series 2016 A1, 5% 12/1/27 | 5,000 | 5,162 | |
| Series 2021 B, 5% 12/1/33 | 25,000 | 29,000 | |
| Philadelphia Gas Works Rev. Series 15, 5% 8/1/24 | 50,000 | 50,406 | |
| Southcentral Pennsylvania Gen. Auth. Rev. Series 2019 A, 5% 6/1/39 | 10,000 | 10,611 | |
TOTAL PENNSYLVANIA | 2,613,517 | ||
| Puerto Rico - 3.8% | |||
| Puerto Rico Commonwealth Aqueduct & Swr. Auth. Series 2021 A, 5% 7/1/37 (e) | 250,000 | 254,796 | |
| Puerto Rico Commonwealth Pub. Impt. Gen. Oblig. Series 2021 A1: | |||
| 0% 7/1/33 | 500,000 | 317,962 | |
| 4% 7/1/37 | 250,000 | 234,384 | |
| Puerto Rico Sales Tax Fing. Corp. Sales Tax Rev. Series 2019 A2, 4.329% 7/1/40 | 1,250,000 | 1,242,191 | |
TOTAL PUERTO RICO | 2,049,333 | ||
| Rhode Island - 2.3% | |||
| Rhode Island Health & Edl. Bldg. Corp. Higher Ed. Facilities Rev. Series 2016 B, 5% 9/1/36 | 100,000 | 97,285 | |
| Rhode Island Health and Edl. Bldg. Corp. Higher Ed. Facility Rev. Series 2023, 5% 11/1/47 | 500,000 | 547,887 | |
| Rhode Island Student Ln. Auth. Student Ln. Rev. Series 2019 A, 5% 12/1/25 (c) | 600,000 | 615,581 | |
TOTAL RHODE ISLAND | 1,260,753 | ||
| South Carolina - 0.2% | |||
| Patriots Energy Group Fing. Agcy. Bonds Series 2018 A, 4%, tender 2/1/24 (b) | 100,000 | 100,000 | |
| South Dakota - 0.2% | |||
| South Dakota Hsg. Dev. Auth. Series 2023 G, 6.25% 5/1/55 | 100,000 | 109,791 | |
| Tennessee - 1.1% | |||
| Memphis-Shelby County Arpt. Auth. Arpt. Rev. Series 2018, 5% 7/1/38 (c) | 5,000 | 5,198 | |
| Metropolitan Govt. Nashville & Davidson County Elec. Rev.: | |||
| Series 2024 A, 5.25% 5/15/49 (d) | 100,000 | 113,800 | |
| Series 2024 B, 5% 5/15/27 (d) | 100,000 | 107,495 | |
| Nashville and Davidson County Metropolitan Govt. Gen. Oblig. Series 2021 C, 3% 1/1/35 | 350,000 | 335,756 | |
| Shelby County Health Edl. & Hsg. Facilities Board Rev. Series 2017 A, 3.375% 5/1/32 | 5,000 | 4,981 | |
| Tennessee Hsg. Dev. Agcy. Residential Series 2019 4, 2.9% 7/1/39 | 5,000 | 4,296 | |
TOTAL TENNESSEE | 571,526 | ||
| Texas - 4.1% | |||
| Dallas Gen. Oblig. Series 2024 A, 5% 2/15/28 | 500,000 | 547,698 | |
| Grand Parkway Trans. Corp. Bonds Series 2023, 5%, tender 4/1/28 (b) | 145,000 | 155,041 | |
| Harris County Cultural Ed. Facilities Fin. Corp. Med. Facilities Rev. Series 2024, 5% 5/15/29 (d) | 100,000 | 110,240 | |
| Houston Hsg. Fin. Corp. Multi-family Hsg. Rev. Bonds Series 2023, 5%, tender 8/1/26 (b) | 25,000 | 25,638 | |
| Lower Colorado River Auth. Rev. (LCRA Transmission Svcs. Corp. Proj.) Series 2019, 5% 5/15/34 | 5,000 | 5,531 | |
| Northside Independent School District Bonds Series 2023 B, 3%, tender 8/1/26 (b) | 1,000,000 | 991,024 | |
| Southwest Higher Ed. Auth. Rev. (Southern Methodist Univ., TX. Proj.) Series 2017, 5% 10/1/39 | 5,000 | 5,238 | |
| Tarrant County Cultural Ed. Facilities Fin. Corp. Hosp. Rev. Series 2022, 5% 10/1/40 | 50,000 | 54,661 | |
| Texas Wtr. Dev. Board Rev.: | |||
| Series 2019, 5% 8/1/35 | 5,000 | 5,586 | |
| Series 2020, 3% 10/15/38 | 250,000 | 224,038 | |
| Univ. of Houston Univ. Revs. Series 2017 C, 3.125% 2/15/36 | 50,000 | 47,681 | |
| Waco Gen. Oblig. Series 2020, 2.375% 2/1/40 | 40,000 | 30,142 | |
TOTAL TEXAS | 2,202,518 | ||
| Virginia - 0.0% | |||
| Fairfax County Redev. & Hsg. Auth. Rev. Bonds (Dominion Square North Proj.) Series 2023, 5%, tender 1/1/28 (b) | 20,000 | 21,004 | |
| Washington - 3.7% | |||
| King County Hsg. Auth. Rev. Series 2018, 3.25% 5/1/33 | 1,000,000 | 965,665 | |
| Port of Seattle Rev.: | |||
| Series 2018 A, 5% 5/1/37 (c) | 5,000 | 5,171 | |
| Series 2019: | |||
5% 4/1/35 (c) | 30,000 | 32,135 | |
5% 4/1/36 (c) | 5,000 | 5,332 | |
| Washington Gen. Oblig.: | |||
| Series 2021 A, 5% 6/1/38 | 15,000 | 16,727 | |
| Series 2024 C: | |||
5% 2/1/31 (d) | 50,000 | 57,865 | |
5% 6/1/32 (d) | 50,000 | 59,175 | |
| Washington Health Care Facilities Auth. Rev.: | |||
| (Overlake Hosp. Med. Ctr., WA. Proj.) Series 2017 B: | |||
5% 7/1/27 | 150,000 | 154,304 | |
5% 7/1/36 | 155,000 | 158,991 | |
| (Providence Health Systems Proj.) Series 2018 B, 5% 10/1/33 | 15,000 | 15,894 | |
| (Virginia Mason Med. Ctr. Proj.) Series 2017, 5% 8/15/27 | 75,000 | 77,921 | |
| Series 2015 A, 5% 8/15/27 | 5,000 | 5,114 | |
| Series 2019 A1, 5% 8/1/36 | 10,000 | 10,707 | |
| Washington Hsg. Fin. Commission Multi-family Hsg. Rev. Bonds (Ardea At Totem Lake Apts. Proj.) Series 2023, 5%, tender 2/1/27 (b) | 45,000 | 46,490 | |
| Washington Hsg. Fin. Commission Nonprofit Rev. (Seattle Academy of Arts and Sciences Proj.) Series 2023, 5% 7/1/28 (e) | 365,000 | 384,633 | |
TOTAL WASHINGTON | 1,996,124 | ||
| West Virginia - 1.0% | |||
| Monongalia Cty W Bld Cm Rev. Series 2015, 5% 7/1/29 | 220,000 | 221,929 | |
| West Virginia Hosp. Fin. Auth. Hosp. Rev. Series 2016 A: | |||
| 3% 6/1/33 | 240,000 | 233,971 | |
| 3.25% 6/1/39 | 80,000 | 73,474 | |
TOTAL WEST VIRGINIA | 529,374 | ||
| Wisconsin - 1.1% | |||
| Howard Suamico Scd Series 2021, 2% 3/1/38 | 15,000 | 11,505 | |
| Milwaukee Gen. Oblig. Series 2017 N4, 5% 4/1/26 | 5,000 | 5,160 | |
| Pub. Fin. Auth. Hosp. Rev.: | |||
| (Renown Reg'l. Med. Ctr. Proj.) Series 2020 A, 4% 6/1/45 | 100,000 | 93,994 | |
| Series 2020 A, 3% 6/1/45 | 100,000 | 77,806 | |
| Roseman Univ. of Health Series 2021 A, 4.5% 6/1/56 (e) | 115,000 | 90,542 | |
| Wisconsin Health & Edl. Facilities: | |||
| Series 2013 B2, 4% 11/15/43 | 55,000 | 54,150 | |
| Series 2015, 3.15% 8/15/27 | 80,000 | 78,747 | |
| Series 2016 A, 3.5% 2/15/46 | 210,000 | 164,347 | |
| Wisconsin Hsg. & Econ. Dev. Auth. Hsg. Rev. Bonds Series 2023 E, 3.875%, tender 5/1/27 (b) | 40,000 | 40,086 | |
TOTAL WISCONSIN | 616,337 | ||
| TOTAL MUNICIPAL BONDS (Cost $51,557,663) | 53,011,775 | ||
| Money Market Funds - 4.9% | |||
| Shares | Value ($) | ||
Fidelity Municipal Cash Central Fund 4.36% (g)(h) (Cost $2,652,161) | 2,651,630 | 2,652,426 | |
| TOTAL INVESTMENT IN SECURITIES - 102.4% (Cost $54,209,824) | 55,664,201 |
NET OTHER ASSETS (LIABILITIES) - (2.4)% | (1,292,794) |
| NET ASSETS - 100.0% | 54,371,407 |
| (a) | Amount is stated in United States dollars unless otherwise noted. |
| (b) | Coupon rates for floating and adjustable rate securities reflect the rates in effect at period end. |
| (c) | Private activity obligations whose interest is subject to the federal alternative minimum tax for individuals. |
| (d) | Security or a portion of the security purchased on a delayed delivery or when-issued basis. |
| (e) | Security exempt from registration under Rule 144A of the Securities Act of 1933. These securities may be resold in transactions exempt from registration, normally to qualified institutional buyers. At the end of the period, the value of these securities amounted to $807,553 or 1.5% of net assets. |
| (f) | Security initially issued at one coupon which converts to a higher coupon at a specified date. The rate shown is the rate at period end. |
| (g) | Information in this report regarding holdings by state and security types does not reflect the holdings of the Fidelity Municipal Cash Central Fund. |
| (h) | Affiliated fund that is generally available only to investment companies and other accounts managed by Fidelity Investments. The rate quoted is the annualized seven-day yield of the fund at period end. A complete unaudited listing of the fund's holdings as of its most recent quarter end is available upon request. In addition, each Fidelity Central Fund's financial statements, which are not covered by the Fund's Report of Independent Registered Public Accounting Firm, are available on the SEC's website or upon request. |
| Affiliate | Value, beginning of period ($) | Purchases ($) | Sales Proceeds ($) | Dividend Income ($) | Realized Gain (loss) ($) | Change in Unrealized appreciation (depreciation) ($) | Value, end of period ($) | % ownership, end of period |
| Fidelity Municipal Cash Central Fund 4.36% | - | 46,179,000 | 43,527,000 | 105,687 | 161 | 265 | 2,652,426 | 0.1% |
| Total | - | 46,179,000 | 43,527,000 | 105,687 | 161 | 265 | 2,652,426 | |
| Valuation Inputs at Reporting Date: | ||||
| Description | Total ($) | Level 1 ($) | Level 2 ($) | Level 3 ($) |
Investments in Securities: | ||||
| Municipal Securities | 53,011,775 | - | 53,011,775 | - |
| Money Market Funds | 2,652,426 | 2,652,426 | - | - |
| Total Investments in Securities: | 55,664,201 | 2,652,426 | 53,011,775 | - |
| Statement of Assets and Liabilities | ||||
| January 31, 2024 | ||||
| Assets | ||||
| Investment in securities, at value - See accompanying schedule: | ||||
Unaffiliated issuers (cost $51,557,663) | $ | 53,011,775 | ||
Fidelity Central Funds (cost $2,652,161) | 2,652,426 | |||
| Total Investment in Securities (cost $54,209,824) | $ | 55,664,201 | ||
| Cash | 100,046 | |||
| Interest receivable | 493,904 | |||
| Distributions receivable from Fidelity Central Funds | 9,771 | |||
| Prepaid expenses | 28 | |||
| Receivable from investment adviser for expense reductions | 74,392 | |||
Total assets | 56,342,342 | |||
| Liabilities | ||||
| Payable for investments purchased on a delayed delivery basis | $ | 1,857,159 | ||
| Payable for fund shares redeemed | 618 | |||
| Distributions payable | 38,270 | |||
| Accrued management fee | 15,570 | |||
| Distribution and service plan fees payable | 3,039 | |||
| Other affiliated payables | 4,428 | |||
| Other payables and accrued expenses | 51,851 | |||
| Total Liabilities | 1,970,935 | |||
| Net Assets | $ | 54,371,407 | ||
| Net Assets consist of: | ||||
| Paid in capital | $ | 52,868,611 | ||
| Total accumulated earnings (loss) | 1,502,796 | |||
| Net Assets | $ | 54,371,407 | ||
| Net Asset Value and Maximum Offering Price | ||||
| Class A : | ||||
Net Asset Value and redemption price per share ($2,439,928 ÷ 237,296 shares)(a) | $ | 10.28 | ||
| Maximum offering price per share (100/96.00 of $10.28) | $ | 10.71 | ||
| Class M : | ||||
Net Asset Value and redemption price per share ($2,121,005 ÷ 206,278 shares)(a) | $ | 10.28 | ||
| Maximum offering price per share (100/96.00 of $10.28) | $ | 10.71 | ||
| Class C : | ||||
Net Asset Value and offering price per share ($2,528,510 ÷ 247,674 shares)(a) | $ | 10.21 | ||
| Fidelity Municipal Core Plus Bond Fund : | ||||
Net Asset Value, offering price and redemption price per share ($32,501,908 ÷ 3,161,093 shares) | $ | 10.28 | ||
| Class I : | ||||
Net Asset Value, offering price and redemption price per share ($2,190,639 ÷ 213,050 shares) | $ | 10.28 | ||
| Class Z : | ||||
Net Asset Value, offering price and redemption price per share ($12,589,417 ÷ 1,224,428 shares) | $ | 10.28 | ||
(a)Redemption price per share is equal to net asset value less any applicable contingent deferred sales charge. | ||||
| Statement of Operations | ||||
| For the period February 16, 2023 (commencement of operations) through January 31, 2024 | ||||
| Investment Income | ||||
| Interest | $ | 1,361,573 | ||
| Income from Fidelity Central Funds | 105,687 | |||
| Total Income | 1,467,260 | |||
| Expenses | ||||
| Management fee | $ | 127,683 | ||
| Transfer agent fees | 29,142 | |||
| Distribution and service plan fees | 30,913 | |||
| Accounting fees and expenses | 9,546 | |||
| Custodian fees and expenses | 1,432 | |||
| Independent trustees' fees and expenses | 106 | |||
| Registration fees | 182,104 | |||
| Audit | 55,534 | |||
| Legal | 67 | |||
| Miscellaneous | 245 | |||
| Total expenses before reductions | 436,772 | |||
| Expense reductions | (272,889) | |||
| Total expenses after reductions | 163,883 | |||
| Net Investment income (loss) | 1,303,377 | |||
| Realized and Unrealized Gain (Loss) | ||||
| Net realized gain (loss) on: | ||||
| Investment Securities: | ||||
| Unaffiliated issuers | 30,012 | |||
| Fidelity Central Funds | 161 | |||
| Total net realized gain (loss) | 30,173 | |||
| Change in net unrealized appreciation (depreciation) on: | ||||
| Investment Securities: | ||||
| Unaffiliated issuers | 1,454,112 | |||
| Fidelity Central Funds | 265 | |||
| Total change in net unrealized appreciation (depreciation) | 1,454,377 | |||
| Net gain (loss) | 1,484,550 | |||
| Net increase (decrease) in net assets resulting from operations | $ | 2,787,927 | ||
| Statement of Changes in Net Assets | ||
| For the period February 16, 2023 (commencement of operations) through January 31, 2024 | ||
| Increase (Decrease) in Net Assets | ||
| Operations | ||
| Net investment income (loss) | $ | 1,303,377 |
| Net realized gain (loss) | 30,173 | |
| Change in net unrealized appreciation (depreciation) | 1,454,377 | |
| Net increase (decrease) in net assets resulting from operations | 2,787,927 | |
| Distributions to shareholders | (1,285,132) | |
| Share transactions - net increase (decrease) | 52,868,612 | |
| Total increase (decrease) in net assets | 54,371,407 | |
| Net Assets | ||
| Beginning of period | - | |
| End of period | $ | 54,371,407 |
| Fidelity Advisor Municipal Core Plus Bond Fund Class A |
| Years ended January 31, | 2024 A | |
Selected Per-Share Data | ||
| Net asset value, beginning of period | $ | 10.00 |
| Income from Investment Operations | ||
Net investment income (loss) B,C | .320 | |
| Net realized and unrealized gain (loss) | .270 D | |
| Total from investment operations | .590 | |
| Distributions from net investment income | (.307) | |
| Distributions from net realized gain | (.003) | |
| Total distributions | (.310) | |
| Net asset value, end of period | $ | 10.28 |
Total Return E,F,G | 6.03% D | |
Ratios to Average Net Assets C,H,I | ||
| Expenses before reductions | 1.41% J,K | |
| Expenses net of fee waivers, if any | .62% J,K | |
| Expenses net of all reductions | .61% J,K | |
| Net investment income (loss) | 3.33% J,K | |
| Supplemental Data | ||
| Net assets, end of period (000 omitted) | $ | 2,440 |
Portfolio turnover rate L | 25% J |
| Fidelity Advisor Municipal Core Plus Bond Fund Class M |
| Years ended January 31, | 2024 A | |
Selected Per-Share Data | ||
| Net asset value, beginning of period | $ | 10.00 |
| Income from Investment Operations | ||
Net investment income (loss) B,C | .320 | |
| Net realized and unrealized gain (loss) | .270 D | |
| Total from investment operations | .590 | |
| Distributions from net investment income | (.307) | |
| Distributions from net realized gain | (.003) | |
| Total distributions | (.310) | |
| Net asset value, end of period | $ | 10.28 |
Total Return E,F,G | 6.03% D | |
Ratios to Average Net Assets C,H,I | ||
| Expenses before reductions | 1.42% J,K | |
| Expenses net of fee waivers, if any | .62% J,K | |
| Expenses net of all reductions | .61% J,K | |
| Net investment income (loss) | 3.33% J,K | |
| Supplemental Data | ||
| Net assets, end of period (000 omitted) | $ | 2,121 |
Portfolio turnover rate L | 25% J |
| Fidelity Advisor Municipal Core Plus Bond Fund Class C |
| Years ended January 31, | 2024 A | |
Selected Per-Share Data | ||
| Net asset value, beginning of period | $ | 10.00 |
| Income from Investment Operations | ||
Net investment income (loss) B,C | .247 | |
| Net realized and unrealized gain (loss) | .271 D | |
| Total from investment operations | .518 | |
| Distributions from net investment income | (.305) | |
| Distributions from net realized gain | (.003) | |
| Total distributions | (.308) | |
| Net asset value, end of period | $ | 10.21 |
Total Return E,F,G | 5.30% D | |
Ratios to Average Net Assets C,H,I | ||
| Expenses before reductions | 2.16% J,K | |
| Expenses net of fee waivers, if any | 1.37% J,K | |
| Expenses net of all reductions | 1.36% J,K | |
| Net investment income (loss) | 2.58% J,K | |
| Supplemental Data | ||
| Net assets, end of period (000 omitted) | $ | 2,529 |
Portfolio turnover rate L | 25% J |
| Fidelity Municipal Core Plus Bond Fund |
| Years ended January 31, | 2024 A | |
Selected Per-Share Data | ||
| Net asset value, beginning of period | $ | 10.00 |
| Income from Investment Operations | ||
Net investment income (loss) B,C | .343 | |
| Net realized and unrealized gain (loss) | .271 D | |
| Total from investment operations | .614 | |
| Distributions from net investment income | (.331) | |
| Distributions from net realized gain | (.003) | |
| Total distributions | (.334) | |
| Net asset value, end of period | $ | 10.28 |
Total Return E,F | 6.28% D | |
Ratios to Average Net Assets C,G,H | ||
| Expenses before reductions | 1.04% I,J | |
| Expenses net of fee waivers, if any | .37% I,J | |
| Expenses net of all reductions | .36% I,J | |
| Net investment income (loss) | 3.58% I,J | |
| Supplemental Data | ||
| Net assets, end of period (000 omitted) | $ | 32,502 |
Portfolio turnover rate K | 25% I |
| Fidelity Advisor Municipal Core Plus Bond Fund Class I |
| Years ended January 31, | 2024 A | |
Selected Per-Share Data | ||
| Net asset value, beginning of period | $ | 10.00 |
| Income from Investment Operations | ||
Net investment income (loss) B,C | .344 | |
| Net realized and unrealized gain (loss) | .270 D | |
| Total from investment operations | .614 | |
| Distributions from net investment income | (.331) | |
| Distributions from net realized gain | (.003) | |
| Total distributions | (.334) | |
| Net asset value, end of period | $ | 10.28 |
Total Return E,F | 6.28% D | |
Ratios to Average Net Assets C,G,H | ||
| Expenses before reductions | 1.17% I,J | |
| Expenses net of fee waivers, if any | .37% I,J | |
| Expenses net of all reductions | .36% I,J | |
| Net investment income (loss) | 3.58% I,J | |
| Supplemental Data | ||
| Net assets, end of period (000 omitted) | $ | 2,191 |
Portfolio turnover rate K | 25% I |
| Fidelity Advisor Municipal Core Plus Bond Fund Class Z |
| Years ended January 31, | 2024 A | |
Selected Per-Share Data | ||
| Net asset value, beginning of period | $ | 10.00 |
| Income from Investment Operations | ||
Net investment income (loss) B,C | .353 | |
| Net realized and unrealized gain (loss) | .267 D | |
| Total from investment operations | .620 | |
| Distributions from net investment income | (.337) | |
| Distributions from net realized gain | (.003) | |
| Total distributions | (.340) | |
| Net asset value, end of period | $ | 10.28 |
Total Return E,F | 6.34% D | |
Ratios to Average Net Assets C,G,H | ||
| Expenses before reductions | 1.17% I,J | |
| Expenses net of fee waivers, if any | .31% I,J | |
| Expenses net of all reductions | .30% I,J | |
| Net investment income (loss) | 3.64% I,J | |
| Supplemental Data | ||
| Net assets, end of period (000 omitted) | $ | 12,589 |
Portfolio turnover rate K | 25% I |
| Fidelity Central Fund | Investment Manager | Investment Objective | Investment Practices | Expense RatioA |
| Fidelity Money Market Central Funds | Fidelity Management & Research Company LLC (FMR) | Each fund seeks to obtain a high level of current income consistent with the preservation of capital and liquidity. | Short-term Investments | Less than .005% |
| Gross unrealized appreciation | $1,566,695 |
| Gross unrealized depreciation | (64,186) |
| Net unrealized appreciation (depreciation) | $1,502,509 |
| Tax Cost | $54,161,692 |
| Undistributed tax-exempt income | $- |
| Undistributed ordinary income | $14,971 |
| Net unrealized appreciation (depreciation) on securities and other investments | $1,502,509 |
| January 31, 2024 | |
| Tax-exempt Income | 1,269,856 |
| Ordinary Income | $15,276 |
| Total | $1,285,132 |
| Purchases ($) | Sales ($) | |
| Fidelity Municipal Core Plus Bond Fund | 60,520,831 | 8,887,352 |
| Distribution Fee | Service Fee | Total Fees | Retained by FDC | |
| Class A | - % | .25% | $5,319 | $ 4,829 |
| Class M | - % | .25% | 4,834 | 4,834 |
| Class C | .75% | .25% | 20,760 | 20,752 |
| $30,913 | $30,415 |
| Retained by FDC | |
| Class A | $ 5 |
| % of Class-Level Average Net Assets | |
| Class A | .1654 |
| Class M | .1800 |
| Class C | .1799 |
| Fidelity Municipal Core Plus Bond Fund | .0515 |
| Class I | .1807 |
| Amount | % of Class-Level Average Net AssetsA | |
| Class A | $ 3,638 | .17 |
| Class M | 3,481 | .18 |
| Class C | 3,613 | .17 |
| Fidelity Municipal Core Plus Bond Fund | 12,739 | .05 |
| Class I | 3,542 | .18 |
| Class Z | 2,129 | .05 |
$ 29,142 |
| % of Average Net Assets | |
| Fidelity Municipal Core Plus Bond Fund | .0258 |
| % of Average Net Assets | |
| Fidelity Municipal Core Plus Bond Fund | .03 |
| Maximum Management Fee Rate % | |
| Class A | 0.51 |
| Class M | 0.52 |
| Class C | 0.52 |
| Fidelity Municipal Core Plus Bond Fund | 0.39 |
| Class I | 0.52 |
| Class Z | 0.39 |
| Purchases ($) | Sales ($) | Realized Gain (Loss) ($) | |
| Fidelity Municipal Core Plus Bond Fund | - | 131,974 | (482) |
| Amount | |
| Fidelity Municipal Core Plus Bond Fund | $51 |
| Expense Limitations | Reimbursement | |
| Class A | .62% | $ 17,033 |
| Class M | .62% | 15,692 |
| Class C | 1.37% | 16,722 |
| Fidelity Municipal Core Plus Bond Fund | .37% | 168,096 |
| Class I | .37% | 15,982 |
| Class Z | .31% | 37,073 |
$ 270,598 |
Year ended January 31, 2024A | |
| Fidelity Municipal Core Plus Bond Fund | |
| Distributions to shareholders | |
| Class A | $ 69,315 |
| Class M | 62,894 |
| Class C | 67,546 |
| Fidelity Municipal Core Plus Bond Fund | 862,906 |
| Class I | 68,814 |
| Class Z | 153,657 |
Total | $ 1,285,132 |
| Shares | Dollars | |
Year ended January 31, 2024A | Year ended January 31, 2024A | |
| Fidelity Municipal Core Plus Bond Fund | ||
| Class A | ||
| Shares sold | 236,175 | $2,360,171 |
| Reinvestment of distributions | 6,920 | 69,315 |
| Shares redeemed | (5,799) | (58,736) |
| Net increase (decrease) | 237,296 | $2,370,750 |
| Class M | ||
| Shares sold | 200,000 | $2,000,000 |
| Reinvestment of distributions | 6,278 | 62,894 |
| Net increase (decrease) | 206,278 | $2,062,894 |
| Class C | ||
| Shares sold | 240,903 | $2,403,000 |
| Reinvestment of distributions | 6,771 | 67,546 |
| Net increase (decrease) | 247,674 | $2,470,546 |
| Fidelity Municipal Core Plus Bond Fund | ||
| Shares sold | 3,341,983 | $33,538,835 |
| Reinvestment of distributions | 79,689 | 798,337 |
| Shares redeemed | (260,579) | (2,578,317) |
| Net increase (decrease) | 3,161,093 | $31,758,855 |
| Class I | ||
| Shares sold | 219,506 | $2,192,457 |
| Reinvestment of distributions | 6,807 | 68,205 |
| Shares redeemed | (13,263) | (136,739) |
| Net increase (decrease) | 213,050 | $2,123,923 |
| Class Z | ||
| Shares sold | 1,242,463 | $12,261,746 |
| Reinvestment of distributions | 7,157 | 71,731 |
| Shares redeemed | (25,192) | (251,833) |
| Net increase (decrease) | 1,224,428 | $12,081,644 |
| Fund | Affiliated % |
Fidelity Municipal Core Plus Bond Fund | 39% |
| The Example is based on an investment of $1,000 invested at the beginning of the period and held for the entire period (August 1, 2023 to January 31, 2024). |
Annualized Expense Ratio- A | Beginning Account Value August 1, 2023 | Ending Account Value January 31, 2024 | Expenses Paid During Period- C August 1, 2023 to January 31, 2024 | |||||||
| Fidelity® Municipal Core Plus Bond Fund | ||||||||||
| Class A | .62% | |||||||||
| Actual | $ 1,000 | $ 1,036.90 | $ 3.18 | |||||||
Hypothetical-B | $ 1,000 | $ 1,022.08 | $ 3.16 | |||||||
| Class M | .62% | |||||||||
| Actual | $ 1,000 | $ 1,036.90 | $ 3.18 | |||||||
Hypothetical-B | $ 1,000 | $ 1,022.08 | $ 3.16 | |||||||
| Class C | 1.37% | |||||||||
| Actual | $ 1,000 | $ 1,032.90 | $ 7.02 | |||||||
Hypothetical-B | $ 1,000 | $ 1,018.30 | $ 6.97 | |||||||
| Fidelity® Municipal Core Plus Bond Fund | .37% | |||||||||
| Actual | $ 1,000 | $ 1,038.20 | $ 1.90 | |||||||
Hypothetical-B | $ 1,000 | $ 1,023.34 | $ 1.89 | |||||||
| Class I | .37% | |||||||||
| Actual | $ 1,000 | $ 1,038.20 | $ 1.90 | |||||||
Hypothetical-B | $ 1,000 | $ 1,023.34 | $ 1.89 | |||||||
| Class Z | .31% | |||||||||
| Actual | $ 1,000 | $ 1,038.60 | $ 1.59 | |||||||
Hypothetical-B | $ 1,000 | $ 1,023.64 | $ 1.58 | |||||||
- Highly liquid investments - cash or convertible to cash within three business days or less
- Moderately liquid investments - convertible to cash in three to seven calendar days
- Less liquid investments - can be sold or disposed of, but not settled, within seven calendar days
- Illiquid investments - cannot be sold or disposed of within seven calendar days
| A special meeting of shareholders was held on October 18, 2023. The results of votes taken among shareholders on the proposal before them are reported below. Each vote reported represents one dollar of net asset value held on the record date for the meeting. | ||
| Proposal 1 | ||
| To elect a Board of Trustees. | ||
# of Votes | % of Votes | |
| Abigail P. Johnson | ||
| Affirmative | 378,729,502,260.01 | 97.58 |
| Withheld | 9,407,876,478.96 | 2.42 |
| TOTAL | 388,137,378,738.97 | 100.00 |
| Jennifer Toolin McAuliffe | ||
| Affirmative | 378,454,868,010.95 | 97.51 |
| Withheld | 9,682,510,728.02 | 2.49 |
| TOTAL | 388,137,378,738.97 | 100.00 |
| Christine J. Thompson | ||
| Affirmative | 378,837,121,274.52 | 97.60 |
| Withheld | 9,300,257,464.45 | 2.40 |
| TOTAL | 388,137,378,738.97 | 100.00 |
| Elizabeth S. Acton | ||
| Affirmative | 378,262,110,794.85 | 97.46 |
| Withheld | 9,875,267,944.12 | 2.54 |
| TOTAL | 388,137,378,738.97 | 100.00 |
| Laura M. Bishop | ||
| Affirmative | 380,482,113,171.06 | 98.03 |
| Withheld | 7,655,265,567.91 | 1.97 |
| TOTAL | 388,137,378,738.97 | 100.00 |
| Ann E. Dunwoody | ||
| Affirmative | 380,016,034,008.12 | 97.91 |
| Withheld | 8,121,344,730.85 | 2.09 |
| TOTAL | 388,137,378,738.97 | 100.00 |
| John Engler | ||
| Affirmative | 379,432,488,394.20 | 97.76 |
| Withheld | 8,704,890,344.77 | 2.24 |
| TOTAL | 388,137,378,738.97 | 100.00 |
| Robert F. Gartland | ||
| Affirmative | 378,741,819,600.60 | 97.58 |
| Withheld | 9,395,559,138.37 | 2.42 |
| TOTAL | 388,137,378,738.97 | 100.00 |
| Robert W. Helm | ||
| Affirmative | 380,389,324,755.07 | 98.00 |
| Withheld | 7,748,053,983.90 | 2.00 |
| TOTAL | 388,137,378,738.97 | 100.00 |
| Arthur E. Johnson | ||
| Affirmative | 378,427,694,151.67 | 97.50 |
| Withheld | 9,709,684,587.30 | 2.50 |
| TOTAL | 388,137,378,738.97 | 100.00 |
| Michael E. Kenneally | ||
| Affirmative | 377,842,228,145.18 | 97.35 |
| Withheld | 10,295,150,593.79 | 2.65 |
| TOTAL | 388,137,378,738.97 | 100.00 |
| Mark A. Murray | ||
| Affirmative | 380,158,432,703.37 | 97.94 |
| Withheld | 7,978,946,035.60 | 2.06 |
| TOTAL | 388,137,378,738.97 | 100.00 |
| Carol J. Zierhoffer | ||
| Affirmative | 380,522,113,360.24 | 98.04 |
| Withheld | 7,615,265,378.73 | 1.96 |
| TOTAL | 388,137,378,738.97 | 100.00 |
| Proposal 1 reflects trust wide proposal and voting results. | ||
 |


Contents
| Average Annual Total Returns | |||
Periods ended January 31, 2024 | Past 1 year | Life of Fund A |
| Fidelity® SAI Sustainable Conservative Income Municipal Bond Fund | 3.38% | 2.74% |
| $10,000 Over Life of Fund |
Let's say hypothetically that $10,000 was invested in Fidelity® SAI Sustainable Conservative Income Municipal Bond Fund, on June 16, 2022, when the fund started. The chart shows how the value of your investment would have changed, and also shows how the Bloomberg Municipal Bond 1 Year (1-2 Y) Index performed over the same period. |
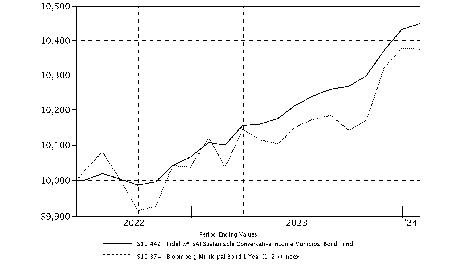 |
| Top Five States (% of Fund's net assets) | |
| New York | 13.0 |
| Alabama | 9.5 |
| Pennsylvania | 7.2 |
| Tennessee | 5.2 |
| Florida | 4.6 |
| Revenue Sources (% of Fund's net assets) | ||
| Health Care | 20.8 | |
| Synthetics | 18.7 | |
| General Obligations | 13.9 | |
| Resource Recovery | 10.4 | |
| Electric Utilities | 9.3 | |
| Industrial Development | 6.4 | |
| Education | 6.1 | |
| Housing | 5.3 | |
| Others* (Individually Less Than 5%) | 9.1 | |
| 100.0 | ||
| *Includes net other assets | ||
Quality Diversification (% of Fund's net assets) |
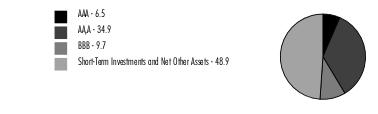 |
| We have used ratings from Moody's Investors Service, Inc. Where Moody's® ratings are not available, we have used S&P® ratings. All ratings are as of the date indicated and do not reflect subsequent changes. |
| Maturity Diversification (% of Fund's Investments) | ||
| Days | ||
| 1 - 7 | 39.7 | |
| 8 - 30 | 4.8 | |
| 31 - 60 | 3.0 | |
| 61 - 90 | 2.2 | |
| 91 - 180 | 7.7 | |
| > 180 | 42.6 | |
| The date shown for securities represents the date when principal payments must be paid, taking into account any call options exercised by the issuer and any permissible maturity shortening features other than interest rate resets. | ||
| Municipal Bonds - 51.5% | |||
Principal Amount (a) | Value ($) | ||
| Alabama - 2.6% | |||
| Black Belt Energy Gas District: | |||
| Series 2022 C1: | |||
5.25% 12/1/24 | 5,000 | 5,059 | |
5.25% 12/1/25 | 5,000 | 5,136 | |
| Series 2022 E: | |||
5% 6/1/24 | 50,000 | 50,200 | |
5% 6/1/25 | 50,000 | 50,794 | |
5% 6/1/26 | 50,000 | 51,412 | |
| Mobile Indl. Dev. Board Poll. Cont. Rev. Bonds (Alabama Pwr. Co. Barry Plant Proj.) Series 2008, 3.65%, tender 1/10/25 (b) | 150,000 | 150,036 | |
| Southeast Alabama Gas Supply District Bonds (Proj. No. 2) Series 2018 A, 4%, tender 6/1/24 (b) | 35,000 | 35,011 | |
TOTAL ALABAMA | 347,648 | ||
| Arizona - 2.1% | |||
| Chandler Indl. Dev. Auth. Indl. Dev. Rev.: | |||
| (Intel Corp. Proj.) Series 2022 2, 5%, tender 9/1/27 (b)(c) | 50,000 | 51,740 | |
| Bonds (Intel Corp. Proj.) Series 2019, 5%, tender 6/3/24 (b)(c) | 80,000 | 80,199 | |
| Salt River Proj. Agricultural Impt. & Pwr. District Elec. Sys. Rev. Series 2017 A, 5% 1/1/25 | 140,000 | 142,647 | |
TOTAL ARIZONA | 274,586 | ||
| California - 4.2% | |||
| California Health Facilities Fing. Auth. Rev. Bonds Series 2016 B2, 4%, tender 10/1/24 (b) | 50,000 | 50,030 | |
| California Muni. Fin. Auth. Solid Waste Disp. Rev. Bonds: | |||
| (Republic Svcs., Inc. Proj.) Series 2021 A, 4.7%, tender 4/1/24 (b)(c) | 100,000 | 99,999 | |
| (Waste Mgmt., Inc. Proj.) Series 2017 A, 4.25%, tender 12/2/24 (b)(c) | 100,000 | 99,712 | |
| California Poll. Cont. Fing. Auth. Solid Waste Disp. Rev. Bonds (Republic Svcs. INC. Proj.) Series 2023, 4.25%, tender 2/15/24 (b)(c)(d) | 100,000 | 99,976 | |
| Los Angeles Dept. Arpt. Rev. Series 2023 A, 5% 5/15/26 (c) | 200,000 | 207,204 | |
TOTAL CALIFORNIA | 556,921 | ||
| Connecticut - 2.7% | |||
| Connecticut Gen. Oblig. Series 2016 B, 5% 5/15/25 | 10,000 | 10,257 | |
| Connecticut Health & Edl. Facilities Auth. Rev. Bonds: | |||
| Series 2010 A3: | |||
0.25%, tender 2/9/24 (b) | 50,000 | 49,953 | |
2.95%, tender 7/1/27 (b)(e) | 150,000 | 150,288 | |
| Series 2017 C2, 2.8%, tender 2/3/26 (b) | 150,000 | 149,281 | |
TOTAL CONNECTICUT | 359,779 | ||
| District Of Columbia - 0.8% | |||
| Washington Metropolitan Area Transit Auth. Series 2023 A, 5% 7/15/24 | 100,000 | 100,869 | |
| Florida - 3.1% | |||
| Duval County School Board Ctfs. of Prtn. Series 2022 A, 5% 7/1/26 (Assured Guaranty Muni. Corp. Insured) | 100,000 | 105,003 | |
| Miami Dade County Hsg. Multifamily Hsg. Rev. Bonds Series 2023, 3.55%, tender 1/1/26 (b) | 50,000 | 49,885 | |
| Miami-Dade County Indl. Dev. Auth. Solid Waste Disp. Rev. Bonds Series 2011, 5%, tender 11/1/24 (b)(c) | 50,000 | 50,176 | |
| Orange County Health Facilities Auth. Bonds Series 2021 C, 5%, tender 11/15/26 (b) | 100,000 | 105,041 | |
| Polk County Hsg. Fin. Auth. Multi-family Hsg. Rev. Bonds Series 2023, 4.15%, tender 6/1/26 (b) | 100,000 | 101,502 | |
TOTAL FLORIDA | 411,607 | ||
| Georgia - 2.9% | |||
| Bartow County Dev. Auth. Poll. Cont. Rev. Bonds (Georgia Pwr. Co. Plant Bowen Proj.) Series 2013, 2.875%, tender 8/19/25 (b) | 100,000 | 98,090 | |
| Burke County Indl. Dev. Auth. Poll. Cont. Rev. Bonds (Georgia Pwr. Co. Plant Vogtle Proj.) Series 1994 9, 3.8%, tender 5/21/26 (b) | 100,000 | 100,071 | |
| Main Street Natural Gas, Inc. Series 2024 A1, 5% 3/1/27 | 100,000 | 103,129 | |
| Monroe County Dev. Auth. Poll. Cont. Rev. Bonds (Georgia Pwr. Co. Plant Scherer Proj.) Series 2009, 3.875%, tender 3/6/26 (b) | 90,000 | 90,194 | |
TOTAL GEORGIA | 391,484 | ||
| Hawaii - 0.8% | |||
| Honolulu City & County Multi-family housing Rev. Bonds Series 2023, 5%, tender 6/1/26 (b) | 100,000 | 103,502 | |
| Illinois - 4.4% | |||
| Illinois Fin. Auth. Series 2022 A, 5% 10/1/24 | 100,000 | 100,265 | |
| Illinois Gen. Oblig.: | |||
| Series 2016, 5% 2/1/27 | 80,000 | 84,164 | |
| Series 2017 D: | |||
5% 11/1/24 | 200,000 | 202,320 | |
5% 11/1/26 | 5,000 | 5,244 | |
| Series 2022 B, 5% 3/1/25 | 100,000 | 101,738 | |
| Series 2023 C, 5% 5/1/25 | 100,000 | 102,035 | |
TOTAL ILLINOIS | 595,766 | ||
| Kentucky - 0.1% | |||
| Kentucky, Inc. Pub. Energy Bonds Series 2018 A, 4%, tender 3/15/24 (b) | 15,000 | 15,020 | |
| Maine - 0.3% | |||
| Maine Hsg. Auth. Mtg. Bonds Series 2023 B, 3.125%, tender 5/1/24 (b) | 45,000 | 44,884 | |
| Maryland - 0.4% | |||
| Maryland Cmnty. Dev. Admin Dept. Hsg. & Cmnty. Dev. Series 2023 D, 3.5% 1/1/26 | 50,000 | 49,995 | |
| Massachusetts - 1.5% | |||
| Massachusetts Edl. Fing. Auth. Rev.: | |||
| Series 2014 I, 5% 1/1/25 (c) | 100,000 | 101,464 | |
| Series 2018 B, 5% 7/1/25 (c) | 100,000 | 102,374 | |
TOTAL MASSACHUSETTS | 203,838 | ||
| Michigan - 1.9% | |||
| Coopersville Area Pub. Schools Series 2022 I: | |||
| 4% 5/1/26 | 30,000 | 30,716 | |
| 5% 5/1/25 | 110,000 | 112,633 | |
| Michigan Hosp. Fin. Auth. Rev. Series 1999 B3, 4% 11/15/26 | 110,000 | 113,076 | |
TOTAL MICHIGAN | 256,425 | ||
| Nebraska - 0.8% | |||
| Central Plains Energy Proj. Rev. Bonds Series 2019, 4%, tender 8/1/25 (b) | 105,000 | 105,401 | |
| Nevada - 0.7% | |||
| Nevada Dept. of Bus. & Industry Bonds (Republic Svcs., Inc. Proj.) Series 2001, 4.5%, tender 6/3/24 (b)(c)(d) | 100,000 | 100,007 | |
| New Hampshire - 1.5% | |||
| Nat'l. Fin. Auth. Solid Bonds (Waste Mgmt., Inc. Proj.) Series 2019 A1, 2.15%, tender 7/1/24 (b)(c) | 100,000 | 99,345 | |
| New Hampshire St Hsg. Fin. Series 2023 3, 3.85% 1/1/27 | 100,000 | 100,921 | |
TOTAL NEW HAMPSHIRE | 200,266 | ||
| New Jersey - 3.8% | |||
| New Jersey Econ. Dev. Auth. Series 2024 SSS, 5% 6/15/26 (e) | 100,000 | 104,246 | |
| New Jersey Econ. Dev. Auth. Rev. Series 2019, 5.25% 9/1/24 (d) | 100,000 | 101,202 | |
| New Jersey Edl. Facility: | |||
| (Stevens Institute of Techonolgy Proj.) Series 2017 A, 5% 7/1/25 | 75,000 | 76,229 | |
| Series 2016 A, 5% 7/1/24 | 100,000 | 100,675 | |
| New Jersey Trans. Trust Fund Auth.: | |||
| Series 2006 C, 0% 12/15/26 (AMBAC Insured) | 80,000 | 72,533 | |
| Series A, 0% 12/15/26 | 60,000 | 54,400 | |
TOTAL NEW JERSEY | 509,285 | ||
| New York - 4.2% | |||
| Monroe County Indl. Dev. Agcy. Bonds (Andrews Terrace Cmnty. Partners, L.P. Proj.) Series 2023 B1, 5%, tender 7/1/27 (b) | 50,000 | 52,245 | |
| New York City Gen. Oblig. Series 2016 A, 5% 8/1/27 | 155,000 | 159,560 | |
| New York City Hsg. Dev. Corp. Multifamily Hsg. Bonds Series 2021 K2, 0.9%, tender 1/1/26 (b) | 165,000 | 153,509 | |
| New York Metropolitan Trans. Auth. Rev. Bonds: | |||
| Series 2019 A1, 5%, tender 11/15/24 (b) | 100,000 | 100,561 | |
| Series 2020 A2, 5%, tender 5/15/24 (b) | 100,000 | 100,171 | |
TOTAL NEW YORK | 566,046 | ||
| Oregon - 1.0% | |||
| Union County Hosp. Facility Auth. Series 2022, 5% 7/1/24 | 135,000 | 135,550 | |
| Pennsylvania - 4.1% | |||
| Pennsylvania Econ. Dev. Fing. Auth. Solid Waste Disp. Rev. Bonds: | |||
| (Republic Svcs., Inc. Proj.) Series 2019 A, 4%, tender 4/15/24 (b)(c) | 100,000 | 100,003 | |
| (Republic Svcs., Inc. Proj.): | |||
Series 2014, 4.3%, tender 4/1/24 (b)(c) | 100,000 | 99,974 | |
Series 2019 B2, 4%, tender 7/15/24 (b)(c) | 100,000 | 100,007 | |
| (Waste Mgmt., Inc. Proj.) Series 2013, 4.875%, tender 2/1/24 (b)(c) | 100,000 | 100,000 | |
| (Waste Mgmt., Inc. Proj.) Series 2021 A2, 4.6%, tender 10/1/26 (b)(c) | 150,000 | 151,362 | |
TOTAL PENNSYLVANIA | 551,346 | ||
| South Carolina - 0.4% | |||
| Patriots Energy Group Fing. Agcy. Bonds Series 2018 A, 4%, tender 2/1/24 (b) | 50,000 | 50,000 | |
| Tennessee - 0.7% | |||
| Tennergy Corp. Gas Rev. Bonds Series 2019 A, 5%, tender 10/1/24 (b) | 95,000 | 95,721 | |
| Texas - 2.7% | |||
| Magnolia Independent School District Series 2023, 5% 8/15/24 | 150,000 | 151,548 | |
| Mission Econ. Dev. Corp. Solid Waste Disp. Rev. Bonds: | |||
| (Republic Svcs., Inc. Proj.) Series 2020 A, 4.9%, tender 2/1/24 (b)(c) | 100,000 | 100,000 | |
| (Waste Mgmt., Inc. Proj.) Series 2020 A, 4.5%, tender 3/1/24 (b)(c) | 100,000 | 99,996 | |
| Tarrant County Cultural Ed. Facilities Fin. Corp. Hosp. Rev. Bonds (Baylor Scott & White Health Proj.) Series 2022 E, 5%, tender 5/15/26 (b) | 15,000 | 15,521 | |
TOTAL TEXAS | 367,065 | ||
| Virginia - 1.4% | |||
| Gloucester County Indl. Dev. Auth. Bonds Series 2003 A, 3.95%, tender 5/1/24 (b)(c) | 100,000 | 99,781 | |
| Louisa Indl. Dev. Auth. Poll. Cont. Rev. Bonds (Virginia Elec. and Pwr. Co. Proj.) Series 2008 B, 0.75%, tender 9/2/25 (b) | 95,000 | 88,538 | |
TOTAL VIRGINIA | 188,319 | ||
| Washington - 0.9% | |||
| Seattle Hsg. Auth. Rev. (Juniper Apts. Proj.) Series 2023, 5% 6/1/27 | 50,000 | 51,935 | |
| Washington Ctfs. of Prtn. Series 2016 A, 5% 7/1/27 | 70,000 | 73,312 | |
TOTAL WASHINGTON | 125,247 | ||
| Wisconsin - 1.5% | |||
| Pub. Fin. Auth. Health Care Sys. Rev. Series 2023 A, 5% 10/1/24 | 200,000 | 202,443 | |
| TOTAL MUNICIPAL BONDS (Cost $6,905,789) | 6,909,020 | ||
| Municipal Notes - 47.5% | |||
Principal Amount (a) | Value ($) | ||
| Alabama - 6.9% | |||
| Black Belt Energy Gas District Participating VRDN Series ZL 03 97, 4.85% 2/7/24 (Liquidity Facility Morgan Stanley Bank, West Valley City Utah) (b)(f)(g) | 330,000 | 330,000 | |
| Health Care Auth. for Baptist Health Series 2013 B, 5.97% 2/7/24, VRDN (b) | 300,000 | 300,000 | |
| Southeast Energy Auth. Rev. Participating VRDN Series XG 04 10, 4.85% 2/7/24 (Liquidity Facility Morgan Stanley Bank, West Valley City Utah) (b)(f)(g) | 300,000 | 300,000 | |
TOTAL ALABAMA | 930,000 | ||
| Delaware - 3.6% | |||
| Delaware Econ. Dev. Auth. Rev. (Delmarva Pwr. & Lt. Co. Proj.) Series 1994, 3.93% 2/1/24, VRDN (b)(c) | 480,000 | 480,000 | |
| Florida - 1.5% | |||
| Orlando Health Participating VRDN Series 026, 4.85% 3/13/24 (Liquidity Facility Barclays Bank PLC) (b)(f)(g) | 200,000 | 200,000 | |
| Georgia - 0.7% | |||
| Burke County Indl. Dev. Auth. Poll. Cont. Rev. (Georgia Pwr. Co. Plant Vogtle Proj.) Series 2012, 4.2% 2/1/24, VRDN (b)(c) | 100,000 | 100,000 | |
| Kentucky - 2.2% | |||
| Meade County Indl. Bldg. Rev. (Nucor Steel Brandenburg Proj.): | |||
| Series 2020 A1, 4.56% 2/1/24, VRDN (b)(c) | 200,000 | 200,000 | |
| Series 2020 B1, 4.56% 2/1/24, VRDN (b)(c) | 100,000 | 100,000 | |
TOTAL KENTUCKY | 300,000 | ||
| Louisiana - 3.2% | |||
| Saint James Parish Gen. Oblig. (Nucor Steel Louisiana LLC Proj.): | |||
| Series 2010 A1, 5.27% 2/7/24, VRDN (b) | 100,000 | 100,000 | |
| Series 2010 B1, 4.95% 2/7/24, VRDN (b) | 330,000 | 330,000 | |
TOTAL LOUISIANA | 430,000 | ||
| Minnesota - 3.1% | |||
| Minneapolis Health Care Sys. Rev. Participating VRDN Series XM 08 72, 4.75% 2/7/24 (Liquidity Facility JPMorgan Chase Bank) (b)(f)(g) | 410,000 | 410,000 | |
| New York - 8.8% | |||
| Liberty Dev. Corp. Rev. Participating VRDN Series MS 1207, 4.9% 2/7/24 (Liquidity Facility Morgan Stanley Bank, West Valley City Utah) (b)(f)(g) | 380,000 | 380,000 | |
| New York City Gen. Oblig. Series 2012 2, 4.5% 2/8/24, VRDN (b) | 400,000 | 400,000 | |
| New York Metropolitan Trans. Auth. Rev. Participating VRDN: | |||
| Series XF 13 55, 4.87% 2/7/24 (Liquidity Facility JPMorgan Chase Bank) (b)(f)(g) | 300,000 | 300,000 | |
| Series XF 16 49, 4.87% 2/7/24 (Liquidity Facility JPMorgan Chase Bank) (b)(f)(g) | 100,000 | 100,000 | |
TOTAL NEW YORK | 1,180,000 | ||
| Ohio - 3.7% | |||
| Allen County Hosp. Facilities Rev. Series 2012 B, 4.95% 2/7/24 (Liquidity Facility Ohio Gen. Oblig.), VRDN (b) | 500,000 | 500,000 | |
| Pennsylvania - 3.1% | |||
| Montgomery County Higher Ed. & Health Auth. Rev. Series 2018 D, 5.2% 2/8/27, VRDN (b) | 410,000 | 410,000 | |
| South Carolina - 0.7% | |||
| South Carolina Jobs-Econ. Dev. Auth. Series 2018 C, 5.23% 2/8/27, VRDN (b) | 100,000 | 100,000 | |
| Tennessee - 4.5% | |||
| Chattanooga Health Ed. & Hsg. Facility Board Rev. (Catholic Health Initiatives Proj.) Series C, 5% 2/7/24, VRDN (b) | 600,000 | 599,997 | |
| Texas - 1.5% | |||
| Harris County Cultural Ed. Facilities Fin. Corp. Med. Facilities Rev. Participating VRDN Series 2022 006, 4.85% 3/13/24 (Liquidity Facility Barclays Bank PLC) (b)(f)(g) | 200,000 | 200,000 | |
| Virginia - 2.1% | |||
| Lynchburg Econ. Dev. Participating VRDN Series XL 00 75, 4.85% 2/7/24 (Liquidity Facility JPMorgan Chase Bank) (b)(f)(g) | 285,000 | 285,000 | |
| West Virginia - 1.9% | |||
| West Virginia Hosp. Fin. Auth. Hosp. Rev. Series 2018 E, 5.16% 2/8/27, VRDN (b) | 250,000 | 250,000 | |
| TOTAL MUNICIPAL NOTES (Cost $6,374,998) | 6,374,997 | ||
| Money Market Funds - 2.5% | |||
| Shares | Value ($) | ||
Fidelity Municipal Cash Central Fund 4.36% (h)(i) (Cost $343,000) | 342,931 | 343,034 | |
| TOTAL INVESTMENT IN SECURITIES - 101.5% (Cost $13,623,787) | 13,627,051 |
NET OTHER ASSETS (LIABILITIES) - (1.5)% | (202,275) |
| NET ASSETS - 100.0% | 13,424,776 |
| VRDN | - | VARIABLE RATE DEMAND NOTE (A debt instrument that is payable upon demand, either daily, weekly or monthly) |
| (a) | Amount is stated in United States dollars unless otherwise noted. |
| (b) | Coupon rates for floating and adjustable rate securities reflect the rates in effect at period end. |
| (c) | Private activity obligations whose interest is subject to the federal alternative minimum tax for individuals. |
| (d) | Security exempt from registration under Rule 144A of the Securities Act of 1933. These securities may be resold in transactions exempt from registration, normally to qualified institutional buyers. At the end of the period, the value of these securities amounted to $301,185 or 2.2% of net assets. |
| (e) | Security or a portion of the security purchased on a delayed delivery or when-issued basis. |
| (f) | Provides evidence of ownership in one or more underlying municipal bonds. |
| (g) | Coupon rates are determined by re-marketing agents based on current market conditions. |
| (h) | Information in this report regarding holdings by state and security types does not reflect the holdings of the Fidelity Municipal Cash Central Fund. |
| (i) | Affiliated fund that is generally available only to investment companies and other accounts managed by Fidelity Investments. The rate quoted is the annualized seven-day yield of the fund at period end. A complete unaudited listing of the fund's holdings as of its most recent quarter end is available upon request. In addition, each Fidelity Central Fund's financial statements, which are not covered by the Fund's Report of Independent Registered Public Accounting Firm, are available on the SEC's website or upon request. |
| Affiliate | Value, beginning of period ($) | Purchases ($) | Sales Proceeds ($) | Dividend Income ($) | Realized Gain (loss) ($) | Change in Unrealized appreciation (depreciation) ($) | Value, end of period ($) | % ownership, end of period |
| Fidelity Municipal Cash Central Fund 4.36% | - | 1,143,000 | 800,000 | 3,749 | - | 34 | 343,034 | 0.0% |
| Total | - | 1,143,000 | 800,000 | 3,749 | - | 34 | 343,034 | |
| Valuation Inputs at Reporting Date: | ||||
| Description | Total ($) | Level 1 ($) | Level 2 ($) | Level 3 ($) |
Investments in Securities: | ||||
| Municipal Securities | 13,284,017 | - | 13,284,017 | - |
| Money Market Funds | 343,034 | 343,034 | - | - |
| Total Investments in Securities: | 13,627,051 | 343,034 | 13,284,017 | - |
| Statement of Assets and Liabilities | ||||
| January 31, 2024 | ||||
| Assets | ||||
| Investment in securities, at value - See accompanying schedule: | ||||
Unaffiliated issuers (cost $13,280,787) | $ | 13,284,017 | ||
Fidelity Central Funds (cost $343,000) | 343,034 | |||
| Total Investment in Securities (cost $13,623,787) | $ | 13,627,051 | ||
| Cash | 1,175 | |||
| Receivable for fund shares sold | 1,576 | |||
| Interest receivable | 94,398 | |||
| Distributions receivable from Fidelity Central Funds | 996 | |||
| Prepaid expenses | 8 | |||
| Receivable from investment adviser for expense reductions | 5,088 | |||
| Other receivables | 5 | |||
Total assets | 13,730,297 | |||
| Liabilities | ||||
| Payable for investments purchased on a delayed delivery basis | $ | 252,520 | ||
| Distributions payable | 7,231 | |||
| Accrued management fee | 2,179 | |||
| Audit fee payable | 42,162 | |||
| Other payables and accrued expenses | 1,429 | |||
| Total Liabilities | 305,521 | |||
| Net Assets | $ | 13,424,776 | ||
| Net Assets consist of: | ||||
| Paid in capital | $ | 13,419,647 | ||
| Total accumulated earnings (loss) | 5,129 | |||
| Net Assets | $ | 13,424,776 | ||
Net Asset Value, offering price and redemption price per share ($13,424,776 ÷ 1,342,597 shares) | $ | 10.00 | ||
| Statement of Operations | ||||
Year ended January 31, 2024 | ||||
| Investment Income | ||||
| Interest | $ | 385,766 | ||
| Income from Fidelity Central Funds | 3,749 | |||
| Total Income | 389,515 | |||
| Expenses | ||||
| Management fee | $ | 24,332 | ||
| Transfer agent fees | 17 | |||
| Custodian fees and expenses | 6,367 | |||
| Independent trustees' fees and expenses | 37 | |||
| Registration fees | 28,077 | |||
| Audit | 52,577 | |||
| Legal | 28 | |||
| Miscellaneous | 38 | |||
| Total expenses before reductions | 111,473 | |||
| Expense reductions | (88,000) | |||
| Total expenses after reductions | 23,473 | |||
| Net Investment income (loss) | 366,042 | |||
| Realized and Unrealized Gain (Loss) | ||||
| Net realized gain (loss) on: | ||||
| Investment Securities: | ||||
| Unaffiliated issuers | 930 | |||
| Total net realized gain (loss) | 930 | |||
| Change in net unrealized appreciation (depreciation) on: | ||||
| Investment Securities: | ||||
| Unaffiliated issuers | 10,748 | |||
| Fidelity Central Funds | 34 | |||
| Total change in net unrealized appreciation (depreciation) | 10,782 | |||
| Net gain (loss) | 11,712 | |||
| Net increase (decrease) in net assets resulting from operations | $ | 377,754 | ||
| Statement of Changes in Net Assets | ||||
Year ended January 31, 2024 | For the period June 16, 2022 (commencement of operations) through January 31, 2023 | |||
| Increase (Decrease) in Net Assets | ||||
| Operations | ||||
| Net investment income (loss) | $ | 366,042 | $ | 118,510 |
| Net realized gain (loss) | 930 | 103 | ||
| Change in net unrealized appreciation (depreciation) | 10,782 | (7,518) | ||
| Net increase (decrease) in net assets resulting from operations | 377,754 | 111,095 | ||
| Distributions to shareholders | (365,890) | (117,828) | ||
| Share transactions | ||||
| Proceeds from sales of shares | 2,831,754 | 10,386,249 | ||
| Reinvestment of distributions | 330,794 | 116,752 | ||
| Cost of shares redeemed | (241,411) | (4,493) | ||
Net increase (decrease) in net assets resulting from share transactions | 2,921,137 | 10,498,508 | ||
| Total increase (decrease) in net assets | 2,933,001 | 10,491,775 | ||
| Net Assets | ||||
| Beginning of period | 10,491,775 | - | ||
| End of period | $ | 13,424,776 | $ | 10,491,775 |
| Other Information | ||||
| Shares | ||||
| Sold | 283,722 | 1,038,704 | ||
| Issued in reinvestment of distributions | 33,176 | 11,709 | ||
| Redeemed | (24,264) | (450) | ||
| Net increase (decrease) | 292,634 | 1,049,963 | ||
| Fidelity® SAI Sustainable Conservative Income Municipal Bond Fund |
| Years ended January 31, | 2024 | 2023 A | ||
Selected Per-Share Data | ||||
| Net asset value, beginning of period | $ | 9.99 | $ | 10.00 |
| Income from Investment Operations | ||||
Net investment income (loss) B,C | .323 | .117 | ||
| Net realized and unrealized gain (loss) | .009 | (.011) | ||
| Total from investment operations | .332 | .106 | ||
| Distributions from net investment income | (.321) | (.116) | ||
| Distributions from net realized gain | (.001) | - | ||
| Total distributions | (.322) | (.116) | ||
| Net asset value, end of period | $ | 10.00 | $ | 9.99 |
Total Return D,E | 3.38% | 1.07% | ||
Ratios to Average Net Assets C,F,G | ||||
| Expenses before reductions | .99% | 1.03% H,I | ||
| Expenses net of fee waivers, if any | .21% | .25% I | ||
| Expenses net of all reductions | .21% | .24% I | ||
| Net investment income (loss) | 3.24% | 1.86% I | ||
| Supplemental Data | ||||
| Net assets, end of period (000 omitted) | $ | 13,425 | $ | 10,492 |
Portfolio turnover rate J | 79% | 42% I |
| Fidelity Central Fund | Investment Manager | Investment Objective | Investment Practices | Expense RatioA |
| Fidelity Money Market Central Funds | Fidelity Management & Research Company LLC (FMR) | Each fund seeks to obtain a high level of current income consistent with the preservation of capital and liquidity. | Short-term Investments | Less than .005% |
| Gross unrealized appreciation | $21,919 |
| Gross unrealized depreciation | (16,636) |
| Net unrealized appreciation (depreciation) | $5,283 |
| Tax Cost | $13,621,768 |
| Net unrealized appreciation (depreciation) on securities and other investments | $5,283 |
| January 31, 2024 | January 31, 2023A | |
| Tax-exempt Income | $364,694 | $117,828 |
| Ordinary Income | 1,196 | - |
| Total | $365,890 | $117,828 |
| Purchases ($) | Sales ($) | |
| Fidelity SAI Sustainable Conservative Income Municipal Bond Fund | 6,990,680 | 4,280,007 |
| Purchases ($) | Sales ($) | Realized Gain (Loss) ($) | |
| Fidelity SAI Sustainable Conservative Income Municipal Bond Fund | 202,791 | 400,000 | - |
| Amount | |
| Fidelity SAI Sustainable Conservative Income Municipal Bond Fund | $15 |
| Fund | Affiliated % |
| Fidelity SAI Sustainable Conservative Income Municipal Bond Fund. | 78% |
| The Example is based on an investment of $1,000 invested at the beginning of the period and held for the entire period (August 1, 2023 to January 31, 2024). |
Annualized Expense Ratio- A | Beginning Account Value August 1, 2023 | Ending Account Value January 31, 2024 | Expenses Paid During Period- C August 1, 2023 to January 31, 2024 | |||||||
| Fidelity® SAI Sustainable Conservative Income Municipal Bond Fund | .20% | |||||||||
| Actual | $ 1,000 | $ 1,020.40 | $ 1.02 | |||||||
Hypothetical-B | $ 1,000 | $ 1,024.20 | $ 1.02 | |||||||
- Highly liquid investments - cash or convertible to cash within three business days or less
- Moderately liquid investments - convertible to cash in three to seven calendar days
- Less liquid investments - can be sold or disposed of, but not settled, within seven calendar days
- Illiquid investments - cannot be sold or disposed of within seven calendar days
| A special meeting of shareholders was held on October 18, 2023. The results of votes taken among shareholders on the proposal before them are reported below. Each vote reported represents one dollar of net asset value held on the record date for the meeting. | ||
| Proposal 1 | ||
| To elect a Board of Trustees. | ||
# of Votes | % of Votes | |
| Abigail P. Johnson | ||
| Affirmative | 378,729,502,260.01 | 97.58 |
| Withheld | 9,407,876,478.96 | 2.42 |
| TOTAL | 388,137,378,738.97 | 100.00 |
| Jennifer Toolin McAuliffe | ||
| Affirmative | 378,454,868,010.95 | 97.51 |
| Withheld | 9,682,510,728.02 | 2.49 |
| TOTAL | 388,137,378,738.97 | 100.00 |
| Christine J. Thompson | ||
| Affirmative | 378,837,121,274.52 | 97.60 |
| Withheld | 9,300,257,464.45 | 2.40 |
| TOTAL | 388,137,378,738.97 | 100.00 |
| Elizabeth S. Acton | ||
| Affirmative | 378,262,110,794.85 | 97.46 |
| Withheld | 9,875,267,944.12 | 2.54 |
| TOTAL | 388,137,378,738.97 | 100.00 |
| Laura M. Bishop | ||
| Affirmative | 380,482,113,171.06 | 98.03 |
| Withheld | 7,655,265,567.91 | 1.97 |
| TOTAL | 388,137,378,738.97 | 100.00 |
| Ann E. Dunwoody | ||
| Affirmative | 380,016,034,008.12 | 97.91 |
| Withheld | 8,121,344,730.85 | 2.09 |
| TOTAL | 388,137,378,738.97 | 100.00 |
| John Engler | ||
| Affirmative | 379,432,488,394.20 | 97.76 |
| Withheld | 8,704,890,344.77 | 2.24 |
| TOTAL | 388,137,378,738.97 | 100.00 |
| Robert F. Gartland | ||
| Affirmative | 378,741,819,600.60 | 97.58 |
| Withheld | 9,395,559,138.37 | 2.42 |
| TOTAL | 388,137,378,738.97 | 100.00 |
| Robert W. Helm | ||
| Affirmative | 380,389,324,755.07 | 98.00 |
| Withheld | 7,748,053,983.90 | 2.00 |
| TOTAL | 388,137,378,738.97 | 100.00 |
| Arthur E. Johnson | ||
| Affirmative | 378,427,694,151.67 | 97.50 |
| Withheld | 9,709,684,587.30 | 2.50 |
| TOTAL | 388,137,378,738.97 | 100.00 |
| Michael E. Kenneally | ||
| Affirmative | 377,842,228,145.18 | 97.35 |
| Withheld | 10,295,150,593.79 | 2.65 |
| TOTAL | 388,137,378,738.97 | 100.00 |
| Mark A. Murray | ||
| Affirmative | 380,158,432,703.37 | 97.94 |
| Withheld | 7,978,946,035.60 | 2.06 |
| TOTAL | 388,137,378,738.97 | 100.00 |
| Carol J. Zierhoffer | ||
| Affirmative | 380,522,113,360.24 | 98.04 |
| Withheld | 7,615,265,378.73 | 1.96 |
| TOTAL | 388,137,378,738.97 | 100.00 |
| Proposal 1 reflects trust wide proposal and voting results. | ||
 |


Contents
| Average Annual Total Returns | |||
Periods ended January 31, 2024 | Past 1 year | Life of Fund A |
| Fidelity® SAI Sustainable Municipal Income Fund | 4.25% | 4.34% |
| $10,000 Over Life of Fund |
Let's say hypothetically that $10,000 was invested in Fidelity® SAI Sustainable Municipal Income Fund, on April 13, 2022, when the fund started. The chart shows how the value of your investment would have changed, and also shows how the Bloomberg Municipal Bond Index performed over the same period. |
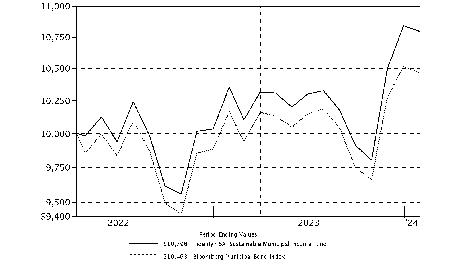 |
| Top Five States (% of Fund's net assets) | |
| California | 14.1 |
| Massachusetts | 9.9 |
| New York | 7.3 |
| Illinois | 7.3 |
| Georgia | 6.1 |
| Revenue Sources (% of Fund's net assets) | ||
| General Obligations | 30.4 | |
| Health Care | 22.8 | |
| Education | 13.4 | |
| Water & Sewer | 7.2 | |
| Special Tax | 5.8 | |
| Electric Utilities | 5.4 | |
| Others* (Individually Less Than 5%) | 15.0 | |
| 100.0 | ||
| *Includes net other assets | ||
Quality Diversification (% of Fund's net assets) |
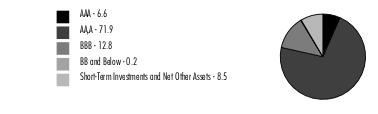 |
| We have used ratings from Moody's Investors Service, Inc. Where Moody's® ratings are not available, we have used S&P® ratings. All ratings are as of the date indicated and do not reflect subsequent changes. |
| Municipal Bonds - 91.5% | |||
Principal Amount (a) | Value ($) | ||
| Alabama - 1.6% | |||
| Black Belt Energy Gas District Bonds Series 2022 F, 5.5%, tender 12/1/28 (b) | 100,000 | 106,432 | |
| Southeast Energy Auth. Coop. Dis Bonds (Proj. No. 6) Series 2023 B, 5%, tender 6/1/30 (b) | 110,000 | 116,759 | |
| Southeast Energy Auth. Rev. Bonds Series 2022 A1, 5.5%, tender 12/1/29 (b) | 100,000 | 108,411 | |
TOTAL ALABAMA | 331,602 | ||
| Arizona - 3.1% | |||
| Arizona Indl. Dev. Auth. Rev. Series 2019 2, 3.625% 5/20/33 | 92,317 | 86,569 | |
| Chandler Indl. Dev. Auth. Indl. Dev. Rev. Bonds (Intel Corp. Proj.) Series 2007, 4.1%, tender 6/15/28 (b)(c) | 120,000 | 121,355 | |
| Goodyear Ariz Series 2016, 3% 7/1/37 | 25,000 | 23,306 | |
| Phoenix Civic Impt. Corp. Wtr. Sys. Rev. Series 2021 A, 5% 7/1/45 | 195,000 | 213,793 | |
| Salt Verde Finl. Corp. Sr. Gas Rev. Series 2007 1, 5% 12/1/32 | 170,000 | 181,758 | |
TOTAL ARIZONA | 626,781 | ||
| California - 14.1% | |||
| California Edl. Facilities Auth. Rev. Series T1, 5% 3/15/39 | 30,000 | 37,421 | |
| California Gen. Oblig. Series 2023, 5% 9/1/30 | 1,000,000 | 1,157,724 | |
| California Hsg. Fin. Agcy. Series 2021 1, 3.5% 11/20/35 | 95,755 | 90,223 | |
| California Infrastructure and Econ. Dev. Bank Rev. Series 2017, 5% 5/15/47 | 25,000 | 26,523 | |
| California Muni. Fin. Auth. Rev.: | |||
| (Pomona College Proj.) Series 2017, 5% 1/1/33 (Pre-Refunded to 1/1/28 @ 100) | 25,000 | 27,465 | |
| Series 2017 A, 3.5% 6/1/34 | 10,000 | 9,959 | |
| Series 2018: | |||
5% 10/1/25 | 15,000 | 15,333 | |
5% 10/1/35 | 5,000 | 5,283 | |
| California Muni. Fin. Auth. Solid Waste Disp. Rev. Bonds Series 2023 A, 4.375%, tender 9/1/33 (b)(c) | 120,000 | 125,181 | |
| California Statewide Cmntys. Dev. Auth. Rev. Series 2016, 5% 10/1/33 | 20,000 | 20,694 | |
| Elk Grove Unified School Distr. Ctfs. of Prtn. (Cap. Facilities Proj.) Series 2016, 3% 2/1/34 | 15,000 | 14,752 | |
| Fontana Unified School District Gen. Oblig. Series 2008, 0% 8/1/30 (Assured Guaranty Muni. Corp. Insured) | 125,000 | 101,560 | |
| Los Angeles Dept. of Wtr. & Pwr. Wtrwks. Rev.: | |||
| Series 2017 A, 5% 7/1/32 | 10,000 | 10,728 | |
| Series 2020 A, 5% 7/1/40 | 400,000 | 451,681 | |
| Series 2020 B, 4% 7/1/29 | 55,000 | 59,730 | |
| Poway Unified School District: | |||
| Series 2009, 0% 8/1/31 | 110,000 | 87,453 | |
| Series B, 0% 8/1/39 | 100,000 | 55,813 | |
| San Diego Unified School District: | |||
| (Convention Ctr. Proj.) Series 2012, 0% 7/1/45 | 10,000 | 4,191 | |
| Series 2010 C, 0% 7/1/44 | 100,000 | 44,095 | |
| San Jose Evergreen Cmnty. College District Series 2016 B, 3% 9/1/36 | 20,000 | 18,947 | |
| San Mateo County Joint Powers Fing. Auth. Series 2021 A1, 3% 6/15/46 | 25,000 | 20,652 | |
| Sanger Unified School District Series 2018 C, 3% 8/1/48 | 200,000 | 160,647 | |
| Santa Clara County Fing. Auth. Lease Rev. Series 2019 A, 3% 5/1/37 | 300,000 | 282,785 | |
| Univ. of California Revs. Series 2020 BE, 5% 5/15/42 | 10,000 | 11,138 | |
TOTAL CALIFORNIA | 2,839,978 | ||
| Colorado - 1.2% | |||
| Colorado Ctfs. of Prtn. Series 2020 A, 4% 12/15/38 | 10,000 | 10,337 | |
| Colorado Health Facilities Auth. Rev. Bonds: | |||
| Series 2019 A1, 5% 8/1/36 | 15,000 | 16,060 | |
| Series 2019 A2: | |||
5% 8/1/33 | 125,000 | 135,458 | |
5% 8/1/39 | 10,000 | 10,559 | |
| Series 2021 A, 3% 11/15/51 | 100,000 | 75,809 | |
TOTAL COLORADO | 248,223 | ||
| Connecticut - 4.2% | |||
| Connecticut Gen. Oblig.: | |||
| Series 2019 A, 5% 4/15/33 | 30,000 | 33,492 | |
| Series 2021 B, 4% 6/1/34 | 10,000 | 10,805 | |
| Series 2021 D, 5% 7/15/28 | 75,000 | 82,569 | |
| Connecticut Health & Edl. Facilities Auth. Rev.: | |||
| Bonds Series 2010 A3, 2.95%, tender 7/1/27 (b)(d) | 150,000 | 150,288 | |
| Series 2017 R, 3.25% 7/1/35 | 125,000 | 122,151 | |
| Series 2022 M, 4% 7/1/52 | 50,000 | 47,048 | |
| Connecticut Hsg. Fin. Auth. Series 2021 D1, 5% 11/15/28 | 25,000 | 27,171 | |
| Connecticut Spl. Tax Oblig. Trans. Infrastructure Rev.: | |||
| Series 2016 A, 5% 9/1/28 | 150,000 | 158,087 | |
| Series 2021 A, 4% 5/1/36 | 130,000 | 137,910 | |
| Series A, 5% 5/1/29 | 15,000 | 16,778 | |
| South Central Reg'l. Wtr. Auth. Wtr. Sys. Rev. Series 32 B, 5% 8/1/32 | 25,000 | 26,368 | |
| Univ. of Connecticut Gen. Oblig. Series 2016 A, 3% 3/15/34 | 15,000 | 14,319 | |
| Univ. of Connecticut Rev. Series 2018 A, 3.625% 11/15/36 | 30,000 | 29,755 | |
TOTAL CONNECTICUT | 856,741 | ||
| District Of Columbia - 0.1% | |||
| District of Columbia Univ. Rev. Series 2017, 5% 4/1/33 | 10,000 | 10,532 | |
| Florida - 4.2% | |||
| Broward County School Board Ctfs. of Prtn.: | |||
| Series 2015 A, 5% 7/1/26 | 30,000 | 30,773 | |
| Series 2020 A, 5% 7/1/33 | 30,000 | 33,898 | |
| Escambia County Health Facilities Auth. Health Facilities Rev. Series 2020 A, 5% 8/15/34 | 195,000 | 205,725 | |
| Florida Higher Edl. Facilities Fing. Auth. (Rollins College Proj.) Series 2020 A, 3% 12/1/48 | 50,000 | 39,068 | |
| Hernando County School Board Ctfs. (School Board of Hernando County, Florida Master Lease Prog.) Series 2016 A, 3% 7/1/35 (Assured Guaranty Muni. Corp. Insured) | 45,000 | 42,800 | |
| Jacksonville Trans. Rev. Series 2015: | |||
| 3.5% 10/1/36 | 30,000 | 29,771 | |
| 3.5% 10/1/37 | 15,000 | 14,618 | |
| JEA Wtr. & Swr. Sys. Rev. Series 2017 A, 5% 10/1/29 | 25,000 | 27,031 | |
| Lakeland Hosp. Sys. Rev. Series 2016, 5% 11/15/29 | 15,000 | 15,667 | |
| Miami-Dade County Health Facilities Auth. Hosp. Rev. (Nicklaus Children's Hosp. Proj.) Series 2021 A, 5% 8/1/30 | 40,000 | 43,693 | |
| Miami-Dade County Wtr. & Swr. Rev. Series 2017 B, 5% 10/1/27 | 55,000 | 59,395 | |
| Palm Beach County Health Facilities Auth. Hosp. Rev. (Jupiter Med. Ctr. Proj.) Series 2022, 5% 11/1/35 | 150,000 | 161,940 | |
| Palm Beach County School Board Ctfs. of Prtn. Series 2021 A, 5% 8/1/38 | 130,000 | 145,977 | |
TOTAL FLORIDA | 850,356 | ||
| Georgia - 4.1% | |||
| Burke County Indl. Dev. Auth. Poll. Cont. Rev. Bonds (Georgia Pwr. Co. Plant Vogtle Proj.) Series 1995 4, 3.8%, tender 5/21/26 (b) | 300,000 | 300,213 | |
| Fulton County Dev. Auth. Rev.: | |||
| Series 2019 A, 3% 7/1/44 | 175,000 | 136,308 | |
| Series 2019, 5% 6/15/44 | 15,000 | 15,871 | |
| Glynn-Brunswick Memorial Hosp. Auth. Rev. (Southeast Georgia Health Sys. Proj.) Series 2017, 4% 8/1/43 | 65,000 | 60,303 | |
| Main Street Natural Gas, Inc. Bonds Series 2021 A, 4%, tender 9/1/27 (b) | 100,000 | 100,445 | |
| Private Colleges & Univs. Auth. Rev.: | |||
| Series 2016 B, 3% 10/1/43 | 125,000 | 102,980 | |
| Series 2019 A, 5% 9/1/39 | 100,000 | 108,962 | |
TOTAL GEORGIA | 825,082 | ||
| Illinois - 7.3% | |||
| Illinois Fin. Auth. Series 2022 A: | |||
| 5% 10/1/35 | 150,000 | 158,868 | |
| 5% 8/15/47 | 70,000 | 74,673 | |
| Illinois Fin. Auth. Academic Facilities (Provident Group UIUC Properties LLC Univ. of Illinois at Urbana-Champaign Proj.) Series 2019 A: | |||
| 5% 10/1/32 | 15,000 | 16,386 | |
| 5% 10/1/38 | 300,000 | 316,025 | |
| Illinois Fin. Auth. Health Svcs. Facility Lease Rev. (Provident Group - UIC Surgery Ctr. LLC - Univ. of Illinois Health Svcs. Facility Proj.) Series 2020, 4% 10/1/55 | 100,000 | 87,682 | |
| Illinois Fin. Auth. Rev.: | |||
| (Presence Health Proj.) Series 2016 C, 5% 2/15/36 | 30,000 | 31,152 | |
| Series 2015 A, 5% 10/1/35 | 5,000 | 5,124 | |
| Series 2016 C, 4% 2/15/41 | 70,000 | 69,004 | |
| Series 2016, 3.125% 5/15/37 | 60,000 | 56,333 | |
| Illinois Gen. Oblig.: | |||
| Series 2016, 5% 1/1/35 | 110,000 | 112,682 | |
| Series 2017 C, 5% 11/1/29 | 125,000 | 133,460 | |
| Series 2021 A, 5% 3/1/46 | 50,000 | 52,922 | |
| Series 2023 D, 4% 7/1/37 | 200,000 | 201,308 | |
| Illinois Sales Tax Rev. Series 2024 A, 5% 6/15/26 (d) | 150,000 | 156,370 | |
TOTAL ILLINOIS | 1,471,989 | ||
| Indiana - 0.2% | |||
| Indiana Hsg. & Cmnty. Dev. Auth.: | |||
| Series 2021 B, Series 2021 B, 5% 1/1/28 | 15,000 | 16,078 | |
| Series A, 5% 7/1/28 | 25,000 | 26,990 | |
TOTAL INDIANA | 43,068 | ||
| Iowa - 0.8% | |||
| Iowa Student Ln. Liquidity Corp. Student Ln. Rev. Series 2023 B, 5% 12/1/33 (c) | 155,000 | 167,461 | |
| Kentucky - 1.0% | |||
| Ashland Med. Ctr. Rev. Series 2019: | |||
| 3% 2/1/40 (Assured Guaranty Muni. Corp. Insured) | 20,000 | 16,416 | |
| 4% 2/1/33 | 50,000 | 50,613 | |
| Kentucky Bond Dev. Corp. Edl. Facilities Series 2021, 4% 6/1/35 | 20,000 | 20,621 | |
| Kentucky Econ. Dev. Fin. Auth. Hosp. Rev. Series 2017 A: | |||
| 5% 6/1/26 | 20,000 | 20,372 | |
| 5% 6/1/31 | 60,000 | 61,885 | |
| Kentucky State Property & Buildings Commission Rev. Series A, 5% 11/1/33 | 20,000 | 21,837 | |
TOTAL KENTUCKY | 191,744 | ||
| Louisiana - 1.5% | |||
| Louisiana Pub. Facilities Auth. Hosp. Rev. Series 2020 A, 3% 6/1/50 (Assured Guaranty Muni. Corp. Insured) | 415,000 | 305,675 | |
| Maine - 1.5% | |||
| Maine Health & Higher Edl. Facilities Auth. Rev.: | |||
| Series 2017 B: | |||
5% 7/1/28 | 30,000 | 31,797 | |
5% 7/1/29 | 10,000 | 10,580 | |
| Series 2018 A, 5% 7/1/30 | 250,000 | 267,513 | |
TOTAL MAINE | 309,890 | ||
| Maryland - 0.4% | |||
| Baltimore Proj. Rev. (Wastewtr. Projs.) Series 2017 B, 5% 7/1/32 | 25,000 | 26,429 | |
| Maryland Dept. of Trans.: | |||
| Series 2016, 4% 9/1/27 | 10,000 | 10,479 | |
| Series 2020, 5% 10/1/33 | 10,000 | 11,532 | |
| Series 2021 A, 2% 10/1/34 | 10,000 | 8,429 | |
| Montgomery County Gen. Oblig. Ctfs. of Prtn. Series 2020 A, 5% 10/1/27 | 15,000 | 16,292 | |
| Univ. of Maryland Sys. Auxiliary Facility & Tuition Rev. Series 2016 A, 3% 4/1/35 | 15,000 | 14,544 | |
TOTAL MARYLAND | 87,705 | ||
| Massachusetts - 9.9% | |||
| Arlington Gen. Oblig. Series 2021, 2% 9/15/35 | 100,000 | 83,142 | |
| Billerica Gen. Oblig. Series 2017, 3.25% 2/1/36 | 10,000 | 9,809 | |
| Foxborough Gen. Oblig. Series 2016, 3% 5/15/46 | 25,000 | 21,065 | |
| Lunenburg Gen. Oblig. Series 2015, 3.125% 1/15/39 | 25,000 | 23,584 | |
| Massachusetts Bay Trans. Auth. Sales Tax Rev. Series 2021 A1, 5% 7/1/35 | 45,000 | 52,145 | |
| Massachusetts Commonwealth Trans. Fund Rev. (Rail Enhancement & Accelerated Bridge Programs) Series 2019 A, 5% 6/1/49 | 215,000 | 227,599 | |
| Massachusetts Dev. Fin. Agcy. Rev.: | |||
| (Partners Healthcare Sys., Inc. Proj.) Series 2017 S, 5% 7/1/32 | 15,000 | 16,205 | |
| (Univ. of Massachusetts Health Cr., Inc. Proj.) Series 2017 L, 4% 7/1/44 | 265,000 | 246,236 | |
| Bonds Series A1, 5%, tender 1/31/30 (b) | 20,000 | 22,532 | |
| Series 2015 O1, 4% 7/1/45 | 50,000 | 48,172 | |
| Series 2016 I, 4% 7/1/36 | 75,000 | 73,151 | |
| Series 2018 L, 5% 10/1/33 | 35,000 | 36,794 | |
| Series 2020 A: | |||
5% 10/15/29 | 30,000 | 34,313 | |
5% 10/15/30 | 25,000 | 29,177 | |
| Series 2021 G, 4% 7/1/46 | 75,000 | 70,880 | |
| Massachusetts Gen. Oblig.: | |||
| Series 2017 A, 5% 4/1/36 | 15,000 | 15,914 | |
| Series 2017 D, 5% 7/1/27 | 25,000 | 27,007 | |
| Series 2020 D, 5% 7/1/48 | 10,000 | 10,699 | |
| Series D, 5% 7/1/45 | 340,000 | 367,776 | |
| Series E, 5% 11/1/45 | 375,000 | 407,038 | |
| Massachusetts School Bldg. Auth. Dedicated Sales Tax Rev. Series A: | |||
| 5% 8/15/34 | 5,000 | 5,741 | |
| 5% 8/15/45 | 100,000 | 108,310 | |
| Univ. of Massachusetts Bldg. Auth. Rev. Series 2021 1, 5% 11/1/32 | 50,000 | 58,330 | |
TOTAL MASSACHUSETTS | 1,995,619 | ||
| Michigan - 3.5% | |||
| Grand Rapids San. Swr. Sys. Rev.: | |||
| Series 2018, 5% 1/1/35 | 15,000 | 16,244 | |
| Series 2018, 5% 1/1/29 | 30,000 | 32,806 | |
| Great Lakes Wtr. Auth. Wtr. Supply Sys. Rev. Series 2020 B, 5% 7/1/45 | 430,000 | 460,586 | |
| Michigan Fin. Auth. Rev.: | |||
| (Kalamazoo College Proj.) Series 2018, 4% 12/1/47 | 50,000 | 47,229 | |
| Series 2016: | |||
5% 11/15/26 | 20,000 | 20,921 | |
5% 11/15/30 | 30,000 | 31,449 | |
5% 11/15/34 | 15,000 | 15,668 | |
| Series 2019 A, 3% 12/1/49 | 40,000 | 30,846 | |
| Series 2022, 5% 12/1/32 | 25,000 | 25,209 | |
| Michigan Hosp. Fin. Auth. Rev. Series 2010 F4, 5% 11/15/47 | 10,000 | 10,485 | |
| Univ. of Michigan Rev. Series 2020 A, 5% 4/1/39 | 15,000 | 16,772 | |
TOTAL MICHIGAN | 708,215 | ||
| Minnesota - 2.6% | |||
| Bemidji City Series 2017 A, 3% 2/1/34 (Assured Guaranty Muni. Corp. Insured) | 10,000 | 9,659 | |
| Maple Grove Health Care Sys. Rev. Series 2017, 3.375% 5/1/33 | 50,000 | 47,926 | |
| Minneapolis Multi-family Rev. (Gateway Northeast Proj.) Series 2019, 2.46% 1/1/38 | 98,930 | 78,678 | |
| Minnesota Agric. & Econ. Dev. Board Rev. Series 2024, 5.25% 1/1/54 (d) | 200,000 | 220,205 | |
| Minnesota Gen. Oblig. Series 2019 A, 5% 8/1/30 | 10,000 | 11,332 | |
| Minnesota Hsg. Fin. Agcy. Series B, 4% 8/1/36 | 15,000 | 15,247 | |
| Saint Cloud Health Care Rev. Series 2016 A, 3% 5/1/32 | 40,000 | 38,464 | |
| St. Paul Hsg. & Redev. Auth. Health Care Facilities Rev. Series 2017 A, 3.125% 11/15/32 | 105,000 | 100,955 | |
TOTAL MINNESOTA | 522,466 | ||
| Nebraska - 0.9% | |||
| Central Plains Energy Proj. Rev. Bonds Series 2019, 4%, tender 8/1/25 (b) | 50,000 | 50,191 | |
| Douglas County Hosp. Auth. #2 Health Facilities Rev. Series 2020 A, 5% 11/15/30 | 125,000 | 139,943 | |
TOTAL NEBRASKA | 190,134 | ||
| New Hampshire - 0.3% | �� | ||
| New Hampshire Health & Ed. Facilities Auth. Series 2023 B, 5.5% 11/1/31 (c) | 50,000 | 56,100 | |
| New Jersey - 2.8% | |||
| Mercer County Gen. Oblig. Series 2021: | |||
| 2% 2/15/32 | 115,000 | 102,347 | |
| 2.375% 2/15/30 | 15,000 | 14,255 | |
| New Jersey Trans. Trust Fund Auth.: | |||
| Series 2018 A, 5% 12/15/32 | 100,000 | 109,234 | |
| Series 2021 A, 5% 6/15/33 | 95,000 | 108,995 | |
| Series 2022 A, 4% 6/15/39 | 50,000 | 51,147 | |
| Series 2022 BB, 5% 6/15/31 | 130,000 | 149,557 | |
| Series A, 0% 12/15/31 | 50,000 | 38,300 | |
TOTAL NEW JERSEY | 573,835 | ||
| New York - 7.3% | |||
| Dorm. Auth. New York Univ. Rev. Series 2018 A, 5% 7/1/36 | 10,000 | 10,885 | |
| Dutchess County Local Dev. Corp. Rev. (Vassar College Proj.) Series 2020, 5% 7/1/45 | 60,000 | 63,880 | |
| Long Island Pwr. Auth. Elec. Sys. Rev.: | |||
| Series 2020 A: | |||
5% 9/1/35 | 10,000 | 11,500 | |
5% 9/1/38 | 170,000 | 191,094 | |
| Series 2021 A1, 4% 9/1/37 | 75,000 | 78,966 | |
| Monroe County Indl. Dev. Corp. (Univ. of Rochester Proj.): | |||
| Series 2017 A, 3.875% 7/1/42 | 15,000 | 14,593 | |
| Series 2017 D, 4% 7/1/43 | 45,000 | 45,234 | |
| New York Dorm. Auth. Rev.: | |||
| Series 2015 A, 3.75% 7/1/46 | 10,000 | 8,639 | |
| Series 2022 A: | |||
5% 7/1/29 | 110,000 | 120,622 | |
5% 7/1/34 | 200,000 | 220,116 | |
| New York Metropolitan Trans. Auth. Rev.: | |||
| Series 2017 C1: | |||
5% 11/15/27 | 20,000 | 21,460 | |
5% 11/15/29 | 50,000 | 53,990 | |
5% 11/15/31 | 135,000 | 145,267 | |
| Series 2019 C, 5% 11/15/39 | 70,000 | 74,567 | |
| New York State Dorm. Auth.: | |||
| Series 2017 A, 5% 2/15/31 | 15,000 | 15,959 | |
| Series 2021 E, 3% 3/15/50 | 100,000 | 80,125 | |
| New York State Urban Dev. Corp. Series 2020 E, 4% 3/15/35 | 30,000 | 31,806 | |
| New York State Urban Eev Corp. Series 2019 A, 5% 3/15/37 | 85,000 | 94,502 | |
| Saratoga County Cap. Resources Rev. (Skidmore College Proj.) Series 2020 A, 5% 7/1/45 | 90,000 | 96,987 | |
| Suffolk County Gen. Oblig. Series 2017 D, 4% 2/1/28 (Build America Mutual Assurance Insured) | 100,000 | 105,117 | |
TOTAL NEW YORK | 1,485,309 | ||
| North Carolina - 0.7% | |||
| Charlotte-Mecklenburg Hosp. Auth. Health Care Sys. Rev. Bonds Series 2021 C, 5%, tender 12/1/28 (b) | 25,000 | 27,322 | |
| Univ. of North Carolina at Chapel Hill Rev. Series 2021 B, 5% 12/1/38 | 100,000 | 115,713 | |
TOTAL NORTH CAROLINA | 143,035 | ||
| Ohio - 0.9% | |||
| Allen County Hosp. Facilities Rev. (Mercy Health) Series 2017 A, 5% 8/1/29 | 10,000 | 10,783 | |
| Fairfield County Gen. Oblig. Series 2015, 3.5% 12/1/37 | 10,000 | 9,932 | |
| Forest Hills Local School District Series 2015, 3.25% 12/1/38 | 15,000 | 13,713 | |
| Muskingum County Hosp. Facilities (Genesis Healthcare Sys. Obligated Group Proj.) Series 2013, 5% 2/15/48 | 50,000 | 45,679 | |
| Northeast Ohio Reg'l. Swr. District Wastewtr. Rev. Series 2019, 3% 11/15/33 | 20,000 | 19,837 | |
| Ohio Gen. Oblig. Series 2019 A, 5% 5/1/30 | 20,000 | 21,410 | |
| Ohio Higher Edl. Facility Commission Rev. (Univ. of Dayton Proj.) Series 2018 B, 5% 12/1/29 | 25,000 | 27,128 | |
| Ohio Hsg. Fin. Agcy. Residential Mtg. Rev. (Mtg.-Backed Securities Prog.) Series 2022 A, 5% 3/1/30 | 15,000 | 16,507 | |
| Willoughby-Eastlake City School District Series 2016, 3.375% 12/1/36 | 20,000 | 19,316 | |
TOTAL OHIO | 184,305 | ||
| Oklahoma - 0.1% | |||
| Oklahoma State Univ. Agricultural And Mechanical College Series 2020 A, 5% 9/1/32 | 15,000 | 17,193 | |
| Oregon - 2.2% | |||
| Medford Hosp. Facilities Auth. Rev. (Asante Projs.) Series 2020 A, 5% 8/15/38 | 15,000 | 16,181 | |
| Oregon Facilities Auth. Rev. Series 2022 B, 5% 6/1/30 | 140,000 | 155,157 | |
| Salem Hosp. Facility Auth. Rev. (Salem Health Projs.) Series 2019 A, 3% 5/15/49 | 350,000 | 264,928 | |
TOTAL OREGON | 436,266 | ||
| Pennsylvania - 1.9% | |||
| Allegheny County Series 2020 C78, 3% 11/1/36 | 20,000 | 18,566 | |
| Allegheny County Higher Ed. Bldg. Auth. Series 2024 A, 5% 8/1/27 | 100,000 | 108,167 | |
| Bethlehem Area School District Series 2016 B, 3% 2/1/36 | 40,000 | 37,582 | |
| Dubois Hosp. Auth. Hosp. Rev. (Penn Highlands Healthcare Proj.) Series 2018: | |||
| 5% 7/15/27 | 45,000 | 47,151 | |
| 5% 7/15/28 | 30,000 | 31,733 | |
| Lackawanna County Gen. Oblig. Series 2017, 3.375% 9/1/35 | 70,000 | 68,731 | |
| Montgomery County Higher Ed. & Health Auth. Rev. Series 2019, 5% 9/1/31 | 10,000 | 10,875 | |
| Penn Hills School District Series 2020, 3% 10/1/37 | 75,000 | 68,019 | |
TOTAL PENNSYLVANIA | 390,824 | ||
| South Carolina - 0.2% | |||
| Greenwood Fifty School Facilities Installment (Greenwood School District No. 50, South Carolina Proect) Series 2016, 3% 12/1/30 | 45,000 | 43,971 | |
| Tennessee - 0.6% | |||
| Knox County Health Edl. & Hsg. Facilities Board Rev. Series 2017, 5% 4/1/27 | 25,000 | 26,017 | |
| Shelby County Health Edl. & Hsg. Facilities Board Rev. Series 2017 A, 3.375% 5/1/32 | 95,000 | 94,636 | |
TOTAL TENNESSEE | 120,653 | ||
| Texas - 2.8% | |||
| Joya Independent School District Series 2013, 3% 2/15/36 | 10,000 | 9,403 | |
| Alvin Independent School District Series 2016 A, 5% 2/15/28 | 20,000 | 20,863 | |
| Collin County Series 2019, 3.25% 2/15/37 | 150,000 | 139,222 | |
| Cypress-Fairbanks Independent School District Series 2016, 5% 2/15/25 | 15,000 | 15,314 | |
| Denton County Gen. Oblig. Series 2016, 3% 7/15/34 | 50,000 | 46,409 | |
| Harris County Cultural Ed. Facilities Fin. Corp. Med. Facilities Rev. Series 2016, 3% 11/15/32 | 135,000 | 126,983 | |
| Houston City of Higher Ed. Fin. Corp. (Houston Baptist Univ. Proj.) Series 2021, 3.375% 10/1/37 | 20,000 | 16,745 | |
| North Texas Tollway Auth. Rev. Series 2021 B, 3% 1/1/46 | 25,000 | 20,027 | |
| San Antonio Wtr. Sys. Rev.: | |||
| Series 2018 A, 5% 5/15/33 | 15,000 | 16,292 | |
| Series 2020 A, 5% 5/15/27 | 10,000 | 10,719 | |
| Univ. of Houston Univ. Revs.: | |||
| Series 2017 C, 3.125% 2/15/36 | 70,000 | 66,753 | |
| Series 2021 A, 2% 2/15/33 | 35,000 | 30,806 | |
| Wichita Falls Independent School District Series 2021, 4% 2/1/28 | 50,000 | 52,345 | |
TOTAL TEXAS | 571,881 | ||
| Utah - 0.2% | |||
| Utah County Hosp. Rev. Series 2016 B, 3% 5/15/47 | 40,000 | 32,190 | |
| Virginia - 2.5% | |||
| Virginia College Bldg. Auth. Edl. Facilities Rev. (21st Century College and Equip. Progs.): | |||
| Series 2017 E, 5% 2/1/31 | 10,000 | 10,934 | |
| Series 2021 A, 3% 2/1/39 | 20,000 | 17,766 | |
| Virginia Commonwealth Trans. Board Rev.: | |||
| (Virginia Gen. Oblig. Proj.) Series 2017 A, 5% 5/15/29 | 60,000 | 65,075 | |
| (Virginia Gen. Oblig.) Series 2017 A, 5% 5/15/27 | 20,000 | 21,516 | |
| Series 2019, 3% 5/15/33 | 225,000 | 222,212 | |
| Virginia Commonwealth Univ. Health Sys. Auth. Series 2017 A, 5% 7/1/28 | 5,000 | 5,344 | |
| Virginia Pub. Bldg. Auth. Pub. Facilities Rev. Series 2019 A, 4% 8/1/36 | 150,000 | 156,291 | |
TOTAL VIRGINIA | 499,138 | ||
| Washington - 4.3% | |||
| Energy Northwest Elec. Rev. Series 2020 A, 5% 7/1/34 | 100,000 | 113,995 | |
| King County Wash Hsg. Auth. Afford (Kirkland Heights Proj.) Series 2023 A3, 4.625% 1/1/41 | 120,000 | 125,523 | |
| Washington Gen. Oblig.: | |||
| Series 2016 D, 5% 2/1/28 | 130,000 | 135,464 | |
| Series 2018 A, 5% 8/1/27 | 50,000 | 54,049 | |
| Series 2018 C, 5% 8/1/30 | 30,000 | 32,215 | |
| Series 2020 A, 5% 8/1/27 | 60,000 | 64,858 | |
| Series 2020 C, 5% 2/1/37 | 10,000 | 11,178 | |
| Series 2021 A, 5% 8/1/43 | 85,000 | 93,001 | |
| Series 2022 A, 5% 8/1/42 | 40,000 | 44,592 | |
| Washington Health Care Facilities Auth. Rev.: | |||
| (Overlake Hosp. Med. Ctr., WA. Proj.) Series 2017 B, 5% 7/1/27 | 25,000 | 25,717 | |
| (Providence Health Systems Proj.) Series 2018 B, 5% 10/1/33 | 40,000 | 42,383 | |
| Series 2017 A, 4% 7/1/37 | 130,000 | 123,411 | |
TOTAL WASHINGTON | 866,386 | ||
| West Virginia - 0.5% | |||
| West Virginia Hosp. Fin. Auth. Hosp. Rev. Series 2016 A, 3.25% 6/1/39 | 100,000 | 91,842 | |
| Wisconsin - 2.0% | |||
| Sun Prairie Area School District Series 2017, 3.5% 3/1/37 | 20,000 | 19,546 | |
| Wisconsin Health & Edl. Facilities: | |||
| Series 2013 B2, 4% 11/15/43 | 60,000 | 59,072 | |
| Series 2016 A, 3.5% 2/15/46 | 330,000 | 258,259 | |
| Wisconsin Health & Edl. Facilities Auth. Rev. Series 2021, 5% 8/15/35 | 50,000 | 54,862 | |
| Wisconsin St Gen. Fund Annual Appropriation Series 2019 A, 5% 5/1/26 (Escrowed to Maturity) | 15,000 | 15,745 | |
TOTAL WISCONSIN | 407,484 | ||
| TOTAL MUNICIPAL BONDS (Cost $17,865,179) | 18,503,673 | ||
| Municipal Notes - 4.0% | |||
Principal Amount (a) | Value ($) | ||
| Georgia - 2.0% | |||
| Bartow County Dev. Auth. (Georgia Pwr. Co. Plant Bowen Proj.) Series 2022, 4.2% 2/1/24, VRDN (b)(c) | 400,000 | 400,000 | |
| Kentucky - 2.0% | |||
| Meade County Indl. Bldg. Rev. (Nucor Steel Brandenburg Proj.): | |||
| Series 2020 A1, 4.56% 2/1/24, VRDN (b)(c) | 200,000 | 200,000 | |
| Series 2020 B1, 4.56% 2/1/24, VRDN (b)(c) | 200,000 | 200,000 | |
TOTAL KENTUCKY | 400,000 | ||
| TOTAL MUNICIPAL NOTES (Cost $800,000) | 800,000 | ||
| Money Market Funds - 5.5% | |||
| Shares | Value ($) | ||
Fidelity Municipal Cash Central Fund 4.36% (e)(f) (Cost $1,119,002) | 1,118,776 | 1,119,112 | |
| TOTAL INVESTMENT IN SECURITIES - 101.0% (Cost $19,784,181) | 20,422,785 |
NET OTHER ASSETS (LIABILITIES) - (1.0)% | (207,696) |
| NET ASSETS - 100.0% | 20,215,089 |
| VRDN | - | VARIABLE RATE DEMAND NOTE (A debt instrument that is payable upon demand, either daily, weekly or monthly) |
| (a) | Amount is stated in United States dollars unless otherwise noted. |
| (b) | Coupon rates for floating and adjustable rate securities reflect the rates in effect at period end. |
| (c) | Private activity obligations whose interest is subject to the federal alternative minimum tax for individuals. |
| (d) | Security or a portion of the security purchased on a delayed delivery or when-issued basis. |
| (e) | Information in this report regarding holdings by state and security types does not reflect the holdings of the Fidelity Municipal Cash Central Fund. |
| (f) | Affiliated fund that is generally available only to investment companies and other accounts managed by Fidelity Investments. The rate quoted is the annualized seven-day yield of the fund at period end. A complete unaudited listing of the fund's holdings as of its most recent quarter end is available upon request. In addition, each Fidelity Central Fund's financial statements, which are not covered by the Fund's Report of Independent Registered Public Accounting Firm, are available on the SEC's website or upon request. |
| Affiliate | Value, beginning of period ($) | Purchases ($) | Sales Proceeds ($) | Dividend Income ($) | Realized Gain (loss) ($) | Change in Unrealized appreciation (depreciation) ($) | Value, end of period ($) | % ownership, end of period |
| Fidelity Municipal Cash Central Fund 4.36% | 232,000 | 5,846,000 | 4,959,000 | 18,412 | - | 112 | 1,119,112 | 0.0% |
| Total | 232,000 | 5,846,000 | 4,959,000 | 18,412 | - | 112 | 1,119,112 | |
| Valuation Inputs at Reporting Date: | ||||
| Description | Total ($) | Level 1 ($) | Level 2 ($) | Level 3 ($) |
Investments in Securities: | ||||
| Municipal Securities | 19,303,673 | - | 19,303,673 | - |
| Money Market Funds | 1,119,112 | 1,119,112 | - | - |
| Total Investments in Securities: | 20,422,785 | 1,119,112 | 19,303,673 | - |
| Statement of Assets and Liabilities | ||||
| January 31, 2024 | ||||
| Assets | ||||
| Investment in securities, at value - See accompanying schedule: | ||||
Unaffiliated issuers (cost $18,665,179) | $ | 19,303,673 | ||
Fidelity Central Funds (cost $1,119,002) | 1,119,112 | |||
| Total Investment in Securities (cost $19,784,181) | $ | 20,422,785 | ||
| Cash | 181,778 | |||
| Receivable for investments sold | 165 | |||
| Receivable for fund shares sold | 20,020 | |||
| Interest receivable | 183,055 | |||
| Distributions receivable from Fidelity Central Funds | 2,859 | |||
| Prepaid expenses | 9 | |||
| Receivable from investment adviser for expense reductions | 5,507 | |||
| Other receivables | 57 | |||
Total assets | 20,816,235 | |||
| Liabilities | ||||
| Payable for investments purchased on a delayed delivery basis | $ | 523,825 | ||
| Distributions payable | 23,267 | |||
| Accrued management fee | 5,666 | |||
| Audit fee payable | 46,102 | |||
| Other payables and accrued expenses | 2,286 | |||
| Total Liabilities | 601,146 | |||
| Net Assets | $ | 20,215,089 | ||
| Net Assets consist of: | ||||
| Paid in capital | $ | 19,561,833 | ||
| Total accumulated earnings (loss) | 653,256 | |||
| Net Assets | $ | 20,215,089 | ||
Net Asset Value, offering price and redemption price per share ($20,215,089 ÷ 1,975,775 shares) | $ | 10.23 | ||
| Statement of Operations | ||||
Year ended January 31, 2024 | ||||
| Investment Income | ||||
| Interest | $ | 465,568 | ||
| Income from Fidelity Central Funds | 18,412 | |||
| Total Income | 483,980 | |||
| Expenses | ||||
| Management fee | $ | 46,320 | ||
| Transfer agent fees | 17 | |||
| Custodian fees and expenses | 3,410 | |||
| Independent trustees' fees and expenses | 41 | |||
| Registration fees | 25,798 | |||
| Audit | 57,170 | |||
| Legal | 30 | |||
| Miscellaneous | 41 | |||
| Total expenses before reductions | 132,827 | |||
| Expense reductions | (85,199) | |||
| Total expenses after reductions | 47,628 | |||
| Net Investment income (loss) | 436,352 | |||
| Realized and Unrealized Gain (Loss) | ||||
| Net realized gain (loss) on: | ||||
| Investment Securities: | ||||
| Unaffiliated issuers | 6,726 | |||
| Total net realized gain (loss) | 6,726 | |||
| Change in net unrealized appreciation (depreciation) on: | ||||
| Investment Securities: | ||||
| Unaffiliated issuers | 485,267 | |||
| Fidelity Central Funds | 110 | |||
| Total change in net unrealized appreciation (depreciation) | 485,377 | |||
| Net gain (loss) | 492,103 | |||
| Net increase (decrease) in net assets resulting from operations | $ | 928,455 | ||
| Statement of Changes in Net Assets | ||||
Year ended January 31, 2024 | For the period April 13, 2022 (commencement of operations) through January 31, 2023 | |||
| Increase (Decrease) in Net Assets | ||||
| Operations | ||||
| Net investment income (loss) | $ | 436,352 | $ | 223,541 |
| Net realized gain (loss) | 6,726 | 139 | ||
| Change in net unrealized appreciation (depreciation) | 485,377 | 153,227 | ||
| Net increase (decrease) in net assets resulting from operations | 928,455 | 376,907 | ||
| Distributions to shareholders | (428,831) | (223,275) | ||
| Share transactions | ||||
| Proceeds from sales of shares | 9,011,427 | 11,106,399 | ||
| Reinvestment of distributions | 326,849 | 219,718 | ||
| Cost of shares redeemed | (1,088,890) | (13,670) | ||
Net increase (decrease) in net assets resulting from share transactions | 8,249,386 | 11,312,447 | ||
| Total increase (decrease) in net assets | 8,749,010 | 11,466,079 | ||
| Net Assets | ||||
| Beginning of period | 11,466,079 | - | ||
| End of period | $ | 20,215,089 | $ | 11,466,079 |
| Other Information | ||||
| Shares | ||||
| Sold | 923,173 | 1,111,389 | ||
| Issued in reinvestment of distributions | 33,010 | 22,288 | ||
| Redeemed | (112,714) | (1,371) | ||
| Net increase (decrease) | 843,469 | 1,132,306 | ||
| Fidelity® SAI Sustainable Municipal Income Fund |
| Years ended January 31, | 2024 | 2023 A | ||
Selected Per-Share Data | ||||
| Net asset value, beginning of period | $ | 10.13 | $ | 10.00 |
| Income from Investment Operations | ||||
Net investment income (loss) B,C | .323 | .218 | ||
| Net realized and unrealized gain (loss) | .092 | .130 | ||
| Total from investment operations | .415 | .348 | ||
| Distributions from net investment income | (.310) | (.218) | ||
| Distributions from net realized gain | (.005) | - | ||
| Total distributions | (.315) | (.218) | ||
| Net asset value, end of period | $ | 10.23 | $ | 10.13 |
Total Return D,E | 4.25% | 3.56% | ||
Ratios to Average Net Assets C,F,G | ||||
| Expenses before reductions | .99% | 1.18% H,I | ||
| Expenses net of fee waivers, if any | .36% | .36% H | ||
| Expenses net of all reductions | .36% | .35% H | ||
| Net investment income (loss) | 3.26% | 2.74% H | ||
| Supplemental Data | ||||
| Net assets, end of period (000 omitted) | $ | 20,215 | $ | 11,466 |
Portfolio turnover rate J | 2% | -% H |
| Fidelity Central Fund | Investment Manager | Investment Objective | Investment Practices | Expense RatioA |
| Fidelity Money Market Central Funds | Fidelity Management & Research Company LLC (FMR) | Each fund seeks to obtain a high level of current income consistent with the preservation of capital and liquidity. | Short-term Investments | Less than .005% |
| Gross unrealized appreciation | $737,999 |
| Gross unrealized depreciation | (82,877) |
| Net unrealized appreciation (depreciation) | $655,122 |
| Tax Cost | $19,767,663 |
| Net unrealized appreciation (depreciation) on securities and other investments | $655,122 |
| January 31, 2024 | January 31, 2023A | |
| Tax-exempt Income | $420,320 | $223,275 |
| Ordinary Income | 8,511 | - |
| Total | $428,831 | $223,275 |
| Purchases ($) | Sales ($) | |
| Fidelity SAI Sustainable Municipal Income Fund | 8,025,868 | 297,204 |
| Amount | |
| Fidelity SAI Sustainable Municipal Income Fund | $17 |
| Fund | Affiliated % |
Fidelity SAI Sustainable Municipal Income Fund | 53% |
| The Example is based on an investment of $1,000 invested at the beginning of the period and held for the entire period (August 1, 2023 to January 31, 2024). |
Annualized Expense Ratio- A | Beginning Account Value August 1, 2023 | Ending Account Value January 31, 2024 | Expenses Paid During Period- C August 1, 2023 to January 31, 2024 | |||||||
| Fidelity® SAI Sustainable Municipal Income Fund | .36% | |||||||||
| Actual | $ 1,000 | $ 1,045.40 | $ 1.86 | |||||||
Hypothetical-B | $ 1,000 | $ 1,023.39 | $ 1.84 | |||||||
- Highly liquid investments - cash or convertible to cash within three business days or less
- Moderately liquid investments - convertible to cash in three to seven calendar days
- Less liquid investments - can be sold or disposed of, but not settled, within seven calendar days
- Illiquid investments - cannot be sold or disposed of within seven calendar days
| A special meeting of shareholders was held on October 18, 2023. The results of votes taken among shareholders on the proposal before them are reported below. Each vote reported represents one dollar of net asset value held on the record date for the meeting. | ||
| Proposal 1 | ||
| To elect a Board of Trustees. | ||
# of Votes | % of Votes | |
| Abigail P. Johnson | ||
| Affirmative | 378,729,502,260.01 | 97.58 |
| Withheld | 9,407,876,478.96 | 2.42 |
| TOTAL | 388,137,378,738.97 | 100.00 |
| Jennifer Toolin McAuliffe | ||
| Affirmative | 378,454,868,010.95 | 97.51 |
| Withheld | 9,682,510,728.02 | 2.49 |
| TOTAL | 388,137,378,738.97 | 100.00 |
| Christine J. Thompson | ||
| Affirmative | 378,837,121,274.52 | 97.60 |
| Withheld | 9,300,257,464.45 | 2.40 |
| TOTAL | 388,137,378,738.97 | 100.00 |
| Elizabeth S. Acton | ||
| Affirmative | 378,262,110,794.85 | 97.46 |
| Withheld | 9,875,267,944.12 | 2.54 |
| TOTAL | 388,137,378,738.97 | 100.00 |
| Laura M. Bishop | ||
| Affirmative | 380,482,113,171.06 | 98.03 |
| Withheld | 7,655,265,567.91 | 1.97 |
| TOTAL | 388,137,378,738.97 | 100.00 |
| Ann E. Dunwoody | ||
| Affirmative | 380,016,034,008.12 | 97.91 |
| Withheld | 8,121,344,730.85 | 2.09 |
| TOTAL | 388,137,378,738.97 | 100.00 |
| John Engler | ||
| Affirmative | 379,432,488,394.20 | 97.76 |
| Withheld | 8,704,890,344.77 | 2.24 |
| TOTAL | 388,137,378,738.97 | 100.00 |
| Robert F. Gartland | ||
| Affirmative | 378,741,819,600.60 | 97.58 |
| Withheld | 9,395,559,138.37 | 2.42 |
| TOTAL | 388,137,378,738.97 | 100.00 |
| Robert W. Helm | ||
| Affirmative | 380,389,324,755.07 | 98.00 |
| Withheld | 7,748,053,983.90 | 2.00 |
| TOTAL | 388,137,378,738.97 | 100.00 |
| Arthur E. Johnson | ||
| Affirmative | 378,427,694,151.67 | 97.50 |
| Withheld | 9,709,684,587.30 | 2.50 |
| TOTAL | 388,137,378,738.97 | 100.00 |
| Michael E. Kenneally | ||
| Affirmative | 377,842,228,145.18 | 97.35 |
| Withheld | 10,295,150,593.79 | 2.65 |
| TOTAL | 388,137,378,738.97 | 100.00 |
| Mark A. Murray | ||
| Affirmative | 380,158,432,703.37 | 97.94 |
| Withheld | 7,978,946,035.60 | 2.06 |
| TOTAL | 388,137,378,738.97 | 100.00 |
| Carol J. Zierhoffer | ||
| Affirmative | 380,522,113,360.24 | 98.04 |
| Withheld | 7,615,265,378.73 | 1.96 |
| TOTAL | 388,137,378,738.97 | 100.00 |
| Proposal 1 reflects trust wide proposal and voting results. | ||
 |


Contents
| Top Five States (% of Fund's net assets) | |
| California | 12.0 |
| Texas | 11.5 |
| Alabama | 6.2 |
| Illinois | 5.9 |
| Other | 5.8 |
| Revenue Sources (% of Fund's net assets) | ||
| Synthetics | 23.1 | |
| General Obligations | 13.4 | |
| Industrial Development | 10.6 | |
| Transportation | 9.6 | |
| Resource Recovery | 8.1 | |
| Electric Utilities | 7.5 | |
| Health Care | 6.3 | |
| Other* | 5.7 | |
| Others (Individually Less Than 5%) | 15.7 | |
| 100.0 | ||
| *Includes net other assets | ||
Quality Diversification (% of Fund's net assets) |
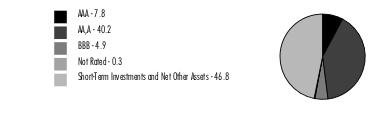 |
| We have used ratings from Moody's Investors Service, Inc. Where Moody's® ratings are not available, we have used S&P® ratings. All ratings are as of the date indicated and do not reflect subsequent changes. |
| Maturity Diversification (% of Fund's Investments) | ||
| Days | ||
| 1 - 7 | 41.7 | |
| 8 - 30 | 1.6 | |
| 31 - 60 | 5.9 | |
| 61 - 90 | 1.5 | |
| 91 - 180 | 6.9 | |
| > 180 | 42.4 | |
| The date shown for securities represents the date when principal payments must be paid, taking into account any call options exercised by the issuer and any permissible maturity shortening features other than interest rate resets. | ||
| Municipal Bonds - 53.2% | |||
Principal Amount (a) | Value ($) | ||
| Alabama - 1.4% | |||
| Black Belt Energy Gas District: | |||
| Bonds Series 2022 D1, 4%, tender 6/1/27 (b) | 2,055,000 | 2,063,509 | |
| Series 2022 C, 5.25% 6/1/24 | 55,000 | 55,240 | |
| Series 2022 C1: | |||
5.25% 12/1/24 | 150,000 | 151,777 | |
5.25% 12/1/25 | 195,000 | 200,292 | |
5.25% 6/1/26 | 445,000 | 460,024 | |
| Series 2022 E: | |||
5% 6/1/24 | 555,000 | 557,215 | |
5% 6/1/25 | 580,000 | 589,211 | |
5% 6/1/26 | 795,000 | 817,444 | |
| Series 2023 C: | |||
5.5% 6/1/26 | 430,000 | 441,762 | |
5.5% 6/1/27 | 140,000 | 145,351 | |
| Jefferson County Swr. Rev. Series 2024: | |||
| 5% 10/1/24 | 115,000 | 116,352 | |
| 5% 10/1/25 | 520,000 | 535,707 | |
| 5% 10/1/26 | 310,000 | 325,229 | |
| 5% 10/1/27 | 290,000 | 310,139 | |
| Mobile Indl. Dev. Board Poll. Cont. Rev. Bonds (Alabama Pwr. Co. Barry Plant Proj.): | |||
| Series 2007 C, 3.78%, tender 6/16/26 (b) | 505,000 | 507,657 | |
| Series 2008, 3.65%, tender 1/10/25 (b) | 3,865,000 | 3,865,938 | |
| Southeast Alabama Gas Supply District Bonds: | |||
| (Proj. No. 2) Series 2018 A, 4%, tender 6/1/24 (b) | 3,615,000 | 3,616,165 | |
| Series 2018 A, 4%, tender 4/1/24 (b) | 430,000 | 430,478 | |
| Southeast Energy Auth. Rev. (Proj. No. 2) Series 2021 B1: | |||
| 4% 6/1/24 | 185,000 | 184,992 | |
| 4% 6/1/25 | 225,000 | 225,392 | |
TOTAL ALABAMA | 15,599,874 | ||
| Alaska - 0.1% | |||
| Alaska Int'l. Arpts. Revs. Series 2021 C, 5% 10/1/25 (c) | 620,000 | 634,368 | |
| Arizona - 3.3% | |||
| Arizona Health Facilities Auth. Rev. (Scottsdale Lincoln Hospitals Proj.) Series 2014 A, 5% 12/1/24 | 365,000 | 370,024 | |
| Chandler Indl. Dev. Auth. Indl. Dev. Rev.: | |||
| (Intel Corp. Proj.) Series 2022 2, 5%, tender 9/1/27 (b)(c) | 7,300,000 | 7,554,095 | |
| Bonds (Intel Corp. Proj.) Series 2019, 5%, tender 6/3/24 (b)(c) | 17,675,000 | 17,718,968 | |
| Coconino County Poll. Cont. Corp. Rev. Bonds (Navada Pwr. Co. Projs.) Series 2017 A, 4.125%, tender 3/31/26 (b)(c) | 940,000 | 944,137 | |
| Maricopa County Rev. Bonds: | |||
| Series 2023 A1, 5%, tender 5/15/26 (b) | 1,370,000 | 1,422,373 | |
| Series C, 5%, tender 10/18/24 (b) | 345,000 | 348,958 | |
| Phoenix Civic Impt. Board Arpt. Rev.: | |||
| Series 2018: | |||
5% 7/1/24 (c) | 285,000 | 286,571 | |
5% 7/1/25 (c) | 1,460,000 | 1,491,007 | |
| Series 2019 B, 5% 7/1/25 (c) | 1,500,000 | 1,531,856 | |
| Series 2023: | |||
5% 7/1/24 (c) | 330,000 | 331,819 | |
5% 7/1/26 (c) | 730,000 | 758,035 | |
| Phoenix Indl. Solid Waste Disp. Rev. Bonds (Republic Svc., Inc. Proj.) Series 2013, 4.9%, tender 2/1/24 (b)(c) | 2,930,000 | 2,930,000 | |
| Yuma Pledged Rev. Series 2021, 4% 7/1/24 | 110,000 | 110,362 | |
TOTAL ARIZONA | 35,798,205 | ||
| California - 4.6% | |||
| Anaheim Pub. Fing. Auth. Lease Rev. Series 1997, 0% 9/1/25 (Assured Guaranty Muni. Corp. Insured) | 3,645,000 | 3,464,971 | |
| California Health Facilities Fing. Auth. Rev. Bonds Series 2016 B2, 4%, tender 10/1/24 (b) | 4,770,000 | 4,772,898 | |
| California Muni. Fin. Auth. Envir. Bonds (Aymium Williams Proj.) Series 2023, 4%, tender 6/26/24 (b)(c)(d) | 2,555,000 | 2,553,381 | |
| California Muni. Fin. Auth. Solid Waste Disp. Rev. Bonds: | |||
| (Republic Svcs., Inc. Proj.): | |||
Series 2021 A, 4.7%, tender 4/1/24 (b)(c) | 4,850,000 | 4,849,934 | |
Series 2021 B, 4%, tender 7/15/24 (b)(c) | 5,545,000 | 5,545,391 | |
| (Waste Mgmt., Inc. Proj.): | |||
Series 2009 A, 1.3%, tender 2/3/25 (b)(d) | 275,000 | 267,248 | |
Series 2017 A, 4.25%, tender 12/2/24 (b)(c) | 4,595,000 | 4,581,751 | |
Series 2020, 4.5%, tender 3/1/24 (b)(c) | 4,775,000 | 4,774,797 | |
| California Poll. Cont. Fing. Auth. Solid Waste Disp. Rev. Bonds (Republic Svcs. INC. Proj.) Series 2023, 4.25%, tender 2/15/24 (b)(c)(d) | 6,965,000 | 6,963,314 | |
| California Pub. Works Board Lease Rev. (Various Cap. Projs.) Series 2022 C, 5% 8/1/24 | 700,000 | 706,790 | |
| Los Angeles Dept. Arpt. Rev.: | |||
| Series 2019 A, 5% 5/15/24 (c) | 255,000 | 256,091 | |
| Series 2020 C, 5% 5/15/24 (c) | 180,000 | 180,770 | |
| Series 2022 C: | |||
5% 5/15/25 (c) | 540,000 | 551,653 | |
5% 5/15/26 (c) | 1,310,000 | 1,357,183 | |
| Series 2022 G, 5% 5/15/25 (c) | 365,000 | 372,877 | |
| Series 2023 A: | |||
5% 5/15/24 (c) | 255,000 | 256,091 | |
5% 5/15/25 (c) | 170,000 | 173,669 | |
5% 5/15/26 (c) | 295,000 | 305,625 | |
| Series B, 5% 5/15/24 (c) | 390,000 | 391,668 | |
| Port of Oakland Rev. Series H, 5% 5/1/26 (c) | 1,005,000 | 1,041,579 | |
| San Diego County Reg'l. Arpt. Auth. Arpt. Rev. Series 2019 B, 5% 7/1/24 (c) | 180,000 | 181,029 | |
| San Francisco City & County Arpts. Commission Int'l. Arpt. Rev.: | |||
| Series 2017 D, 5% 5/1/24 (c) | 365,000 | 366,339 | |
| Series 2019 H: | |||
5% 5/1/24 (Escrowed to Maturity) (c) | 200,000 | 200,709 | |
5% 5/1/27 (c) | 2,190,000 | 2,302,936 | |
| Series 2023 A: | |||
5% 5/1/24 (c) | 910,000 | 913,338 | |
5% 5/1/25 (c) | 550,000 | 561,466 | |
5% 5/1/26 (c) | 2,160,000 | 2,236,244 | |
| San Jose Int. Arpt. Rev. Series 2021 B, 5% 3/1/25 | 135,000 | 138,199 | |
TOTAL CALIFORNIA | 50,267,941 | ||
| Colorado - 1.0% | |||
| Colorado Health Facilities Auth. Rev. Bonds: | |||
| Series 2016 B, 5% 11/15/27 | 2,370,000 | 2,485,237 | |
| Series 2022 A: | |||
5% 11/1/24 | 155,000 | 156,443 | |
5% 11/1/25 | 145,000 | 148,461 | |
| Colorado Univ. Co. Hosp. Auth. Rev. Bonds Series 2019 C, 5%, tender 11/15/24 (b) | 255,000 | 256,010 | |
| Denver City & County Arpt. Rev.: | |||
| Series 2017 A, 5% 11/15/24 (c) | 300,000 | 303,306 | |
| Series 2018 A, 5% 12/1/27 (c) | 1,625,000 | 1,725,177 | |
| Series 2022 A: | |||
5% 11/15/24 (c) | 365,000 | 369,022 | |
5% 11/15/25 (c) | 995,000 | 1,022,703 | |
| Series 2022 D: | |||
5% 11/15/25 (c) | 1,460,000 | 1,500,650 | |
5.25% 11/15/26 (c) | 1,820,000 | 1,914,835 | |
| Maiker Hsg. Partners Colo Multi Bonds Series 2023, 4.5%, tender 5/1/26 (b) | 1,158,000 | 1,158,993 | |
TOTAL COLORADO | 11,040,837 | ||
| Connecticut - 2.0% | |||
| Connecticut Gen. Oblig.: | |||
| Series 2013 A, 5.54% 3/1/25 (b) | 390,000 | 391,850 | |
| Series 2016 B, 5% 5/15/25 | 185,000 | 189,746 | |
| Series 2021 D, 5% 7/15/24 | 640,000 | 645,477 | |
| Series A, 3% 4/15/24 | 180,000 | 179,871 | |
| Connecticut Health & Edl. Facilities Auth. Rev.: | |||
| Bonds: | |||
Series 1999 U2, 1.1%, tender 2/11/25 (b) | 1,315,000 | 1,278,915 | |
Series 2010 A3: | |||
0.25%, tender 2/9/24 (b) | 4,305,000 | 4,300,972 | |
2.95%, tender 7/1/27 (b)(e) | 1,600,000 | 1,603,071 | |
Series 2010 A4, 1.1%, tender 2/11/25 (b) | 3,300,000 | 3,209,445 | |
Series 2014 B, 1.8%, tender 7/1/24 (b) | 355,000 | 351,506 | |
Series 2017 B2, 3.2%, tender 7/1/26 (b) | 1,135,000 | 1,142,078 | |
Series 2017 C2, 2.8%, tender 2/3/26 (b) | 6,410,000 | 6,379,283 | |
| Series 2022 L, 5% 7/1/25 | 165,000 | 169,079 | |
| Connecticut Spl. Tax Oblig. Trans. Infrastructure Rev.: | |||
| Series 2015 A, 5% 8/1/26 | 365,000 | 376,401 | |
| Series 2021 A, 5% 5/1/26 | 465,000 | 487,590 | |
| Hartford Gen. Oblig. Series 2015 C, 5% 7/15/25 (Assured Guaranty Muni. Corp. Insured) | 695,000 | 715,120 | |
| New Haven Gen. Oblig. Series 2023: | |||
| 5% 8/1/24 | 220,000 | 221,483 | |
| 5% 8/1/25 | 180,000 | 184,088 | |
| 5% 8/1/26 (Build America Mutual Assurance Insured) | 255,000 | 267,008 | |
| 5% 8/1/27 (Build America Mutual Assurance Insured) | 235,000 | 250,539 | |
TOTAL CONNECTICUT | 22,343,522 | ||
| Delaware - 0.0% | |||
| Delaware Econ. Dev. Auth. Rev. Bonds (Delmarva Pwr. & Lt. Co. Proj.) Series A, 1.05%, tender 7/1/25 (b) | 210,000 | 201,770 | |
| Delaware Trans. Auth. Grant Series 2020, 5% 9/1/24 | 310,000 | 313,525 | |
TOTAL DELAWARE | 515,295 | ||
| District Of Columbia - 0.8% | |||
| District of Columbia Gen. Oblig. Series 2021 D, 4% 2/1/24 | 120,000 | 120,000 | |
| Metropolitan Washington DC Arpts. Auth. Sys. Rev.: | |||
| Series 2014 A, 5% 10/1/26 (c) | 345,000 | 346,783 | |
| Series 2018 A, 5% 10/1/24 (c) | 2,070,000 | 2,089,561 | |
| Series 2019 A: | |||
5% 10/1/24 (c) | 1,095,000 | 1,105,347 | |
5% 10/1/26 (c) | 610,000 | 636,309 | |
| Series 2020 A, 5% 10/1/24 (c) | 2,625,000 | 2,649,805 | |
| Series 2022 A, 5% 10/1/24 (c) | 475,000 | 479,489 | |
| Series 2023 A, 5% 10/1/26 (c) | 715,000 | 745,837 | |
| Washington Metropolitan Area Transit Auth. Series 2023 A, 5% 7/15/25 | 365,000 | 376,040 | |
TOTAL DISTRICT OF COLUMBIA | 8,549,171 | ||
| Florida - 2.4% | |||
| Broward County Arpt. Sys. Rev. Series 2017, 5% 10/1/24 (c) | 180,000 | 181,417 | |
| Broward County Fin. Auth. Multi-family Hsg. Rev. Bonds Series 2023, 4.05%, tender 3/1/26 (b) | 684,000 | 690,405 | |
| Broward County Port Facilities Rev. Series 2022, 5% 9/1/27 (c) | 730,000 | 766,802 | |
| Broward County School Board Ctfs. of Prtn. Series 2022 A, 5% 7/1/25 | 580,000 | 596,366 | |
| Citizens Property Ins. Corp. Series 2015 A1, 5% 6/1/25 (Pre-Refunded to 12/1/24 @ 100) | 1,715,000 | 1,740,726 | |
| Duval County School Board Ctfs. of Prtn. Series 2022 A: | |||
| 5% 7/1/25 (Assured Guaranty Muni. Corp. Insured) | 1,020,000 | 1,048,066 | |
| 5% 7/1/26 (Assured Guaranty Muni. Corp. Insured) | 1,785,000 | 1,874,304 | |
| Florida Dev. Fin. Corp. Healthcare Facility Rev. (Tampa Gen. Hosp. Proj.): | |||
| Series 2024 A: | |||
5% 8/1/26 (e) | 440,000 | 460,184 | |
5% 8/1/27 (e) | 1,000,000 | 1,064,146 | |
| Series 2024 B, 5% 8/1/25 (e) | 435,000 | 445,954 | |
| Florida Hsg. Fin. Corp. Multi-family Mtg. Rev. Bonds: | |||
| Series 2023 B, 5%, tender 2/1/26 (b) | 565,000 | 580,444 | |
| Series 2023 C, 5%, tender 12/1/25 (b) | 405,000 | 414,577 | |
| Greater Orlando Aviation Auth. Arpt. Facilities Rev. Series 2016 A, 5% 10/1/25 (Escrowed to Maturity) (c) | 210,000 | 215,209 | |
| Hillsborough Co. Sldwst and Resource Receivables Series 2016 A, 5% 9/1/26 (c) | 825,000 | 859,279 | |
| Hillsborough County Aviation Auth. Rev. Series 2022 A: | |||
| 5% 10/1/24 (c) | 1,665,000 | 1,680,734 | |
| 5% 10/1/25 (c) | 780,000 | 800,620 | |
| Jacksonville Spl. Rev. Series 2022 A: | |||
| 5% 10/1/24 | 210,000 | 212,815 | |
| 5% 10/1/25 | 165,000 | 170,991 | |
| Lee County Arpt. Rev. Series 2021 A, 5% 10/1/24 (c) | 560,000 | 564,703 | |
| Lee County Hsg. Fin. Auth. Multi-family Hsg. Rev. Bonds Series 2023 A, 3.55%, tender 8/1/27 (b) | 912,000 | 909,870 | |
| Miami Dade County Hsg. Multifamily Hsg. Rev. Bonds: | |||
| Series 2023 B, 4.05%, tender 9/1/25 (b) | 395,000 | 397,241 | |
| Series 2023: | |||
3.55%, tender 1/1/26 (b) | 1,755,000 | 1,750,947 | |
5%, tender 9/1/25 (b) | 1,390,000 | 1,416,476 | |
5%, tender 9/1/25 (b) | 760,000 | 776,118 | |
5%, tender 10/1/25 (b) | 2,330,000 | 2,391,977 | |
| Miami-Dade County Aviation Rev. Series 2012 A, 5% 10/1/24 | 325,000 | 325,457 | |
| Miami-Dade County Indl. Dev. Auth. Solid Waste Disp. Rev. Bonds Series 2011, 5%, tender 11/1/24 (b)(c) | 1,370,000 | 1,374,811 | |
| Okeechobee County Solid Waste Rev. Bonds (Waste Mgmt., Inc.-Okeechobee Landfill Proj.) Series 2004 A, 0.55%, tender 7/1/24 (b) | 545,000 | 535,595 | |
| Orange County Health Facilities Auth. Bonds Series 2021 C, 5%, tender 11/15/26 (b) | 1,045,000 | 1,097,676 | |
| Orlando Utils. Commission Util. Sys. Rev. Series 2013 A, 5% 10/1/24 | 180,000 | 182,318 | |
| Pasco County Tax Alloc Series 2023 A, 5.25% 9/1/25 (Assured Guaranty Muni. Corp. Insured) | 90,000 | 92,797 | |
| Pasco County School Board Ctfs. of Prtn. Series 2022 A, 5% 8/1/26 | 380,000 | 399,017 | |
| Polk County Hsg. Fin. Auth. Multi-family Hsg. Rev. Bonds Series 2023, 4.15%, tender 6/1/26 (b) | 844,000 | 856,676 | |
TOTAL FLORIDA | 26,874,718 | ||
| Georgia - 0.8% | |||
| Atlanta Arpt. Rev. Series 2020 B, 5% 7/1/25 (c) | 405,000 | 413,883 | |
| Burke County Indl. Dev. Auth. Poll. Cont. Rev. Bonds (Georgia Pwr. Co. Plant Vogtle Proj.): | |||
| Series 1994 4, 3.8%, tender 5/21/26 (b) | 1,085,000 | 1,085,769 | |
| Series 2012, 2.875%, tender 8/19/25 (b) | 1,305,000 | 1,280,077 | |
| Fayette County Hosp. Auth. Rev. Bonds (Piedmont Healthcare, Inc. Proj.) Series 2019 A, 5%, tender 7/1/24 (b) | 415,000 | 415,471 | |
| Georgia Muni. Elec. Auth. Pwr. Rev.: | |||
| Series 2021 A, 5% 1/1/25 (Assured Guaranty Muni. Corp. Insured) | 75,000 | 76,180 | |
| Series 2022 A: | |||
5% 7/1/24 (Assured Guaranty Muni. Corp. Insured) | 120,000 | 120,706 | |
5% 7/1/25 (Assured Guaranty Muni. Corp. Insured) | 130,000 | 132,924 | |
5% 7/1/26 (Assured Guaranty Muni. Corp. Insured) | 135,000 | 141,561 | |
| Main Street Natural Gas, Inc.: | |||
| Bonds Series 2019 B, 4%, tender 12/2/24 (b) | 1,070,000 | 1,071,732 | |
| Series 2022 A, 4% 12/1/25 | 460,000 | 459,176 | |
| Series 2023 B: | |||
5% 9/1/25 | 130,000 | 131,977 | |
5% 9/1/26 | 245,000 | 251,755 | |
| Series 2023 D: | |||
5% 12/1/24 | 110,000 | 110,713 | |
5% 12/1/25 | 200,000 | 203,309 | |
5% 12/1/26 | 110,000 | 112,940 | |
| Series 2024 A1: | |||
5% 3/1/25 | 195,000 | 196,857 | |
5% 9/1/25 | 180,000 | 182,737 | |
5% 3/1/26 | 250,000 | 255,247 | |
5% 9/1/26 | 200,000 | 205,514 | |
5% 3/1/27 | 400,000 | 412,516 | |
5% 9/1/27 | 355,000 | 368,172 | |
| Monroe County Dev. Auth. Poll. Cont. Rev. Bonds (Georgia Pwr. Co. Plant Scherer Proj.) Series 2012, 3.875%, tender 3/6/26 (b) | 990,000 | 992,138 | |
TOTAL GEORGIA | 8,621,354 | ||
| Guam - 0.1% | |||
| Guam Pwr. Auth. Rev. Series 2022 A: | |||
| 5% 10/1/24 | 450,000 | 453,072 | |
| 5% 10/1/25 | 565,000 | 575,983 | |
TOTAL GUAM | 1,029,055 | ||
| Hawaii - 0.2% | |||
| Honolulu City & County Multi-family housing Rev. Bonds Series 2023, 5%, tender 6/1/26 (b) | 2,000,000 | 2,070,036 | |
| Illinois - 4.5% | |||
| Chicago Midway Arpt. Rev. Series 2023, 5% 1/1/27 (Build America Mutual Assurance Insured) (c) | 365,000 | 380,980 | |
| Chicago O'Hare Int'l. Arpt. Rev.: | |||
| Series 2022 A, 5% 1/1/25 (c) | 400,000 | 404,775 | |
| Series 2022 C: | |||
5% 1/1/25 (c) | 820,000 | 829,790 | |
5% 1/1/26 (c) | 440,000 | 452,309 | |
| Chicago Transit Auth. Cap. Grant Receipts Rev. Series 2021, 5% 6/1/24 | 230,000 | 230,956 | |
| Chicago Wtr. Rev.: | |||
| Series 2017 2, 5% 11/1/24 | 365,000 | 369,072 | |
| Series 2023 B: | |||
5% 11/1/24 | 745,000 | 753,312 | |
5% 11/1/25 | 415,000 | 426,967 | |
| Cook County Gen. Oblig.: | |||
| Series 2021 A, 5% 11/15/24 | 165,000 | 167,139 | |
| Series 2022 A: | |||
5% 11/15/24 | 2,235,000 | 2,263,979 | |
5% 11/15/25 | 1,605,000 | 1,656,736 | |
| Cook County Sales Tax Rev. Series 2022 A, 5% 11/15/25 | 245,000 | 253,329 | |
| Illinois Dev. Fin. Auth. Solid Waste Disp. Rev. Bonds (Waste Mgmt., Inc. Proj.) Series 2019, 5%, tender 11/1/24 (b)(c) | 4,760,000 | 4,776,715 | |
| Illinois Fin. Auth. Series 2022 A, 5% 10/1/24 | 60,000 | 60,159 | |
| Illinois Fin. Auth. Rev. Series 2016, 5% 7/1/27 | 2,030,000 | 2,112,093 | |
| Illinois Gen. Oblig.: | |||
| Series 2016, 5% 11/1/24 | 290,000 | 293,364 | |
| Series 2017 D: | |||
5% 11/1/24 | 9,650,000 | 9,761,948 | |
5% 11/1/26 | 530,000 | 555,844 | |
5% 11/1/27 | 540,000 | 575,643 | |
| Series 2019 B, 5% 9/1/25 | 215,000 | 220,727 | |
| Series 2022 A, 5% 3/1/25 | 755,000 | 768,118 | |
| Series 2022 B: | |||
5% 3/1/24 | 1,495,000 | 1,496,697 | |
5% 3/1/25 | 5,930,000 | 6,033,036 | |
5% 3/1/26 | 2,405,000 | 2,490,040 | |
| Series 2023 C, 5% 5/1/26 | 1,460,000 | 1,516,355 | |
| Series 2023 D, 5% 7/1/25 | 4,580,000 | 4,687,464 | |
| Illinois Hsg. Dev. Auth. Multi-family Hsg. Rev. Bonds Series 2023: | |||
| 4%, tender 6/1/25 (b) | 1,072,000 | 1,075,802 | |
| 5%, tender 2/1/26 (b) | 512,000 | 524,902 | |
| 5%, tender 2/1/26 (b) | 554,000 | 567,960 | |
| Illinois Sales Tax Rev.: | |||
| Series 2021 A, 4% 6/15/24 | 1,165,000 | 1,168,246 | |
| Series 2021 C, 5% 6/15/25 | 100,000 | 102,443 | |
| McHenry County Conservation District Gen. Oblig. Series 2014, 5% 2/1/25 | 730,000 | 743,359 | |
| Metropolitan Pier & Exposition: | |||
| Series 2010 B1, 0% 6/15/26 (Assured Guaranty Muni. Corp. Insured) | 410,000 | 378,030 | |
| Series 2022 A, 3% 6/15/24 | 680,000 | 676,975 | |
| Railsplitter Tobacco Settlement Auth. Rev. Series 2017: | |||
| 5% 6/1/24 (Escrowed to Maturity) | 560,000 | 563,255 | |
| 5% 6/1/26 (Escrowed to Maturity) | 365,000 | 382,629 | |
| Univ. of Illinois Rev. Series 2023, 5% 10/1/27 | 145,000 | 154,550 | |
TOTAL ILLINOIS | 49,875,698 | ||
| Indiana - 0.8% | |||
| Indianapolis Local Pub. Impt.: | |||
| (Indianapolis Arpt. Auth. Proj.) Series 2019 D, 5% 1/1/25 (c) | 2,100,000 | 2,124,693 | |
| Indianapolis Arpt. Auth. Proj. Series 2019 D, 5% 1/1/26 (c) | 1,740,000 | 1,786,727 | |
| Series 2016, 5% 1/1/26 (c) | 730,000 | 749,604 | |
| Series 2022 G2: | |||
5% 1/1/25 (c) | 30,000 | 30,353 | |
5% 1/1/26 (c) | 150,000 | 154,028 | |
| Indianapolis Local Pub. Impt. Bond Bank (Indianapolis Arpt. Auth. Proj.) Series 2023 I2: | |||
| 5% 1/1/25 (c) | 625,000 | 632,349 | |
| 5% 1/1/26 (c) | 385,000 | 395,339 | |
| 5% 1/1/27 (c) | 765,000 | 799,573 | |
| Whiting Envir. Facilities Rev. Bonds (BP Products North America, Inc. Proj.) Series 2017, 5%, tender 11/1/24 (b)(c) | 2,240,000 | 2,252,410 | |
TOTAL INDIANA | 8,925,076 | ||
| Iowa - 0.0% | |||
| Iowa Student Ln. Liquidity Corp. Student Ln. Rev.: | |||
| Series 2015 A, 5% 12/1/24 (c) | 180,000 | 181,666 | |
| Series 2023 B, 5% 12/1/26 (c) | 220,000 | 227,549 | |
TOTAL IOWA | 409,215 | ||
| Kansas - 0.0% | |||
| Olathe Gen. Oblig. Series 2017 230, 2.5% 10/1/27 | 410,000 | 393,895 | |
| Kentucky - 0.8% | |||
| Kentucky Asset/Liability Commission Gen. Fund Rev. Series 2021 A, 5% 11/1/24 | 365,000 | 369,613 | |
| Kentucky, Inc. Pub. Energy Bonds: | |||
| Series 2018 A, 4%, tender 3/15/24 (b) | 1,450,000 | 1,451,916 | |
| Series C1, 4%, tender 6/1/25 (b) | 1,850,000 | 1,852,892 | |
| Trimble County Envirl Facilities Re Bonds Series 2023, 4.7%, tender 6/1/27 (b)(c) | 4,740,000 | 4,804,152 | |
TOTAL KENTUCKY | 8,478,573 | ||
| Louisiana - 0.1% | |||
| St. John Baptist Parish Rev. Bonds (Marathon Oil Corp.) Series 2017, 4.05%, tender 7/1/26 (b) | 1,040,000 | 1,029,608 | |
| Maine - 0.2% | |||
| Maine Hsg. Auth. Mtg. Bonds Series 2023 B, 3.125%, tender 5/1/24 (b) | 1,965,000 | 1,959,915 | |
| Maryland - 0.5% | |||
| Maryland Cmnty. Dev. Admin Dept. Hsg. & Cmnty. Dev. Series 2023 D, 3.5% 1/1/26 | 2,760,000 | 2,759,697 | |
| Maryland Dept. of Trans. Series 2022 A, 5% 12/1/24 | 200,000 | 203,281 | |
| Maryland Health & Higher Edl. Bonds Series 2020, 5%, tender 7/1/25 (b) | 1,005,000 | 1,019,536 | |
| Maryland Stadium Auth. Built to Learn Rev. Series 2022 A: | |||
| 5% 6/1/24 | 265,000 | 266,531 | |
| 5% 6/1/25 | 330,000 | 338,440 | |
| Maryland Trans. Auth. Passenger Facility Charge Rev. Series 2019, 5% 6/1/24 (c) | 365,000 | 366,191 | |
TOTAL MARYLAND | 4,953,676 | ||
| Massachusetts - 1.0% | |||
| Massachusetts Dev. Fin. Agcy. Rev.: | |||
| Series 2016 I, 5% 7/1/25 | 420,000 | 429,796 | |
| Series 2021 I, 5% 10/1/24 | 330,000 | 333,227 | |
| Massachusetts Edl. Fing. Auth. Rev.: | |||
| Series 2014 I, 5% 1/1/25 (c) | 1,240,000 | 1,258,159 | |
| Series 2017 A, 5% 7/1/25 (c) | 2,900,000 | 2,968,853 | |
| Series 2018 B, 5% 7/1/25 (c) | 2,010,000 | 2,057,722 | |
| Series 2019 B, 5% 7/1/25 (c) | 365,000 | 373,666 | |
| Series 2020 C, 5% 7/1/24 (c) | 220,000 | 221,376 | |
| Series 2022 B: | |||
5% 7/1/24 (c) | 190,000 | 191,188 | |
5% 7/1/25 (c) | 1,120,000 | 1,146,592 | |
| Massachusetts School Bldg. Auth. Dedicated Sales Tax Rev. Series 2015 C, 5% 8/15/27 | 1,680,000 | 1,735,896 | |
TOTAL MASSACHUSETTS | 10,716,475 | ||
| Michigan - 0.7% | |||
| Michigan Fin. Auth. Rev.: | |||
| (Detroit Reg'l. Convention Facility Auth. Local Proj.) Series 2014 H1, 5% 10/1/24 | 310,000 | 310,436 | |
| Series 2015 D1, 0.55% 10/15/24 | 620,000 | 607,203 | |
| Series 2022: | |||
5% 4/15/25 | 1,085,000 | 1,107,892 | |
5% 4/15/26 | 1,725,000 | 1,799,443 | |
| Michigan Gen. Oblig. Series 2016, 5% 3/15/24 | 255,000 | 255,576 | |
| Michigan Hsg. Dev. Auth. Single Family Mtg. Rev. Series 2022 A, 2.5% 6/1/25 | 445,000 | 435,891 | |
| Oakland Univ. Rev.: | |||
| Series 2022 A: | |||
5% 3/1/24 | 65,000 | 65,086 | |
5% 3/1/25 | 75,000 | 76,496 | |
| Series 2022 B: | |||
5% 3/1/24 | 130,000 | 130,171 | |
5% 3/1/25 | 430,000 | 438,575 | |
| Southfield Pub. Schools Series 2023: | |||
| 5% 5/1/25 | 730,000 | 748,194 | |
| 5% 5/1/26 | 850,000 | 890,536 | |
| Wayne County Arpt. Auth. Rev.: | |||
| Series 2015 F, 5% 12/1/26 (c) | 325,000 | 330,263 | |
| Series 2017 E, 4% 12/1/25 (c)(d) | 630,000 | 633,068 | |
TOTAL MICHIGAN | 7,828,830 | ||
| Minnesota - 0.3% | |||
| Minneapolis & Saint Paul Metropolitan Arpts. Commission Arpt. Rev. Series 2022 B: | |||
| 5% 1/1/25 (c) | 500,000 | 506,284 | |
| 5% 1/1/26 (c) | 330,000 | 338,862 | |
| Minnesota Hsg. Fin. Agcy.: | |||
| Series 2022 A, 5% 8/1/24 | 330,000 | 332,957 | |
| Series 2022 B: | |||
5% 8/1/24 | 420,000 | 423,763 | |
5% 8/1/25 | 625,000 | 642,883 | |
5% 8/1/26 | 620,000 | 651,333 | |
| Series H, 0.7% 7/1/24 (c) | 75,000 | 73,726 | |
| Northern Muni. Pwr. Agcy. Elec. Sys. Rev. Series 2023: | |||
| 5% 1/1/25 | 120,000 | 121,822 | |
| 5% 1/1/26 | 135,000 | 139,588 | |
| 5% 1/1/27 | 210,000 | 221,342 | |
TOTAL MINNESOTA | 3,452,560 | ||
| Missouri - 0.1% | |||
| Kansas City Planned Indl. Expansion Bonds Series 2023, 5%, tender 7/1/27 (b) | 877,000 | 913,618 | |
| Nebraska - 0.1% | |||
| Central Plains Energy Proj. Rev. Bonds Series 2019, 2.5%, tender 8/1/25 (b) | 1,280,000 | 1,250,822 | |
| Nebraska Pub. Pwr. District Rev. Series 2017 B, 5% 1/1/25 | 235,000 | 239,122 | |
TOTAL NEBRASKA | 1,489,944 | ||
| Nevada - 0.6% | |||
| Clark County Arpt. Rev. Series 2021 B, 5% 7/1/24 (c) | 1,355,000 | 1,362,133 | |
| Clark County Poll. Cont. Rev. Bonds (Nevada Pwr. Co. Proj.) Series 2017, 3.75%, tender 3/31/26 (b) | 525,000 | 524,231 | |
| Clark County School District: | |||
| Series 2015 C, 5% 6/15/27 | 655,000 | 680,531 | |
| Series 2016 F, 4% 6/15/24 | 180,000 | 180,112 | |
| Series 2020 A, 3% 6/15/25 (Assured Guaranty Muni. Corp. Insured) | 180,000 | 179,748 | |
| Series 2021 C, 5% 6/15/25 | 1,780,000 | 1,827,026 | |
| Nevada Dept. of Bus. & Industry Bonds (Republic Svcs., Inc. Proj.) Series 2001, 4.5%, tender 6/3/24 (b)(c)(d) | 1,600,000 | 1,600,115 | |
TOTAL NEVADA | 6,353,896 | ||
| New Hampshire - 0.3% | |||
| Nat'l. Fin. Auth. Solid Bonds (Waste Mgmt., Inc. Proj.) Series 2019 A2, 2.15%, tender 7/1/24 (b)(c) | 1,460,000 | 1,447,188 | |
| New Hampshire Health & Ed. Facilities Auth. Series 2023 B, 5.5% 11/1/26 (c) | 110,000 | 115,762 | |
| New Hampshire St Hsg. Fin.: | |||
| Series 2023 3: | |||
3.8% 7/1/26 | 390,000 | 392,750 | |
3.85% 1/1/27 | 620,000 | 625,713 | |
| Series 2023 4: | |||
3.625% 4/1/26 | 210,000 | 210,224 | |
3.7% 1/1/27 | 675,000 | 675,171 | |
TOTAL NEW HAMPSHIRE | 3,466,808 | ||
| New Jersey - 3.4% | |||
| Camden County Improvment Auth. Mult-Family Hsg. Bonds (Northgate I Apts. Proj.) Series 2024, 5%, tender 3/1/26 (b) | 3,450,000 | 3,555,833 | |
| Harrison Township Series 2023, 5% 11/27/24 | 1,657,000 | 1,679,122 | |
| Millburn Township Board of Ed. Series 2023, 0.05% 8/15/25 | 420,000 | 398,071 | |
| New Jersey Econ. Dev. Auth.: | |||
| Series 2022 A: | |||
5% 11/1/24 | 300,000 | 304,163 | |
5% 11/1/25 | 365,000 | 377,665 | |
| Series 2023 RRR: | |||
5% 3/1/25 | 2,570,000 | 2,622,909 | |
5% 3/1/26 | 2,005,000 | 2,089,051 | |
| Series 2024 SSS, 5% 6/15/26 (e) | 1,320,000 | 1,376,041 | |
| New Jersey Econ. Dev. Auth. Rev.: | |||
| Series 2015 XX: | |||
4% 6/15/24 | 490,000 | 491,455 | |
5% 6/15/24 | 1,310,000 | 1,318,653 | |
| Series 2019: | |||
5.25% 9/1/24 (d) | 4,630,000 | 4,685,631 | |
5.25% 9/1/26 (d) | 1,060,000 | 1,121,051 | |
| New Jersey Edl. Facility: | |||
| Series 2016 A, 5% 7/1/24 | 1,730,000 | 1,741,675 | |
| Series 2016 C, 5% 7/1/24 (Assured Guaranty Muni. Corp. Insured) | 365,000 | 367,689 | |
| New Jersey Gen. Oblig.: | |||
| Series 2020 A: | |||
5% 6/1/24 | 395,000 | 397,361 | |
5% 6/1/25 | 1,715,000 | 1,760,902 | |
| Series 2021, 2% 6/1/25 | 580,000 | 567,932 | |
| New Jersey Higher Ed. Student Assistance Auth. Student Ln. Rev.: | |||
| Series 2016 1A, 5% 12/1/24 (c) | 1,605,000 | 1,626,168 | |
| Series 2017 1A: | |||
5% 12/1/24 (c) | 545,000 | 552,188 | |
5% 12/1/25 (c) | 1,045,000 | 1,070,269 | |
| Series 2018 B, 5% 12/1/26 (c) | 365,000 | 377,723 | |
| Series 2019 A, 5% 12/1/24 | 200,000 | 202,852 | |
| Series 2020, 5% 12/1/24 (c) | 400,000 | 403,930 | |
| Series 2021 A, 5% 12/1/24 (c) | 120,000 | 121,583 | |
| Series 2022 A: | |||
5% 12/1/24 (c) | 155,000 | 156,523 | |
5% 12/1/25 (c) | 200,000 | 204,836 | |
| Series 2022 B: | |||
5% 12/1/24 (c) | 645,000 | 650,969 | |
5% 12/1/25 (c) | 955,000 | 978,093 | |
| New Jersey Tobacco Settlement Fing. Corp. Series 2018 A: | |||
| 5% 6/1/24 | 1,840,000 | 1,848,536 | |
| 5% 6/1/25 | 910,000 | 928,504 | |
| 5% 6/1/27 | 1,120,000 | 1,183,565 | |
| New Jersey Trans. Trust Fund Auth.: | |||
| Series 2006 C, 0% 12/15/24 | 60,000 | 58,101 | |
| Series 2008 A, 0% 12/15/25 | 890,000 | 832,685 | |
| Series 2010 A, 0% 12/15/25 | 385,000 | 360,206 | |
| Series 2016 A1, 5% 6/15/24 | 355,000 | 357,189 | |
| Series 2018 A, 5% 6/15/24 | 440,000 | 442,713 | |
| Series 2022 AA: | |||
5% 6/15/24 | 395,000 | 397,609 | |
5% 6/15/25 | 155,000 | 159,126 | |
TOTAL NEW JERSEY | 37,768,572 | ||
| New Mexico - 0.2% | |||
| New Mexico Edl. Assistance Foundation Series 2021 1A: | |||
| 5% 9/1/25 (c) | 2,080,000 | 2,133,462 | |
| 5% 9/1/27 (c) | 80,000 | 83,841 | |
TOTAL NEW MEXICO | 2,217,303 | ||
| New York - 2.3% | |||
| East Hampton Union Free School District Series 2017, 2.1% 6/1/27 | 735,000 | 703,819 | |
| Long Island Pwr. Auth. Elec. Sys. Rev.: | |||
| Bonds Series 2019 B, 1.65%, tender 9/1/24 (b) | 1,075,000 | 1,060,300 | |
| Series 2021, 1% 9/1/25 | 800,000 | 760,939 | |
| Monroe County Indl. Dev. Agcy. Bonds (Andrews Terrace Cmnty. Partners, L.P. Proj.) Series 2023 B1, 5%, tender 7/1/27 (b) | 593,000 | 619,628 | |
| New York City Gen. Oblig. Bonds Series 2015 F4, 5%, tender 12/1/25 (f) | 330,000 | 337,988 | |
| New York City Hsg. Dev. Corp. Multifamily Hsg. Bonds Series 2021 K2, 0.9%, tender 1/1/26 (b) | 455,000 | 423,313 | |
| New York City Indl. Dev. Agcy. Rev. Series 2021 A, 5% 1/1/26 (Assured Guaranty Muni. Corp. Insured) | 220,000 | 227,891 | |
| New York City Transitional Fin. Auth. Rev. Series 2015 C, 5% 11/1/27 | 1,095,000 | 1,121,503 | |
| New York Metropolitan Trans. Auth. Rev.: | |||
| Bonds: | |||
Series 2019 A1, 5%, tender 11/15/24 (b) | 8,655,000 | 8,703,567 | |
Series 2020 A2, 5%, tender 5/15/24 (b) | 935,000 | 936,595 | |
| Series 2015 C1, 5% 11/15/26 | 910,000 | 937,276 | |
| Series 2017 B, 5% 11/15/26 | 730,000 | 770,515 | |
| Series 2017 C1, 5% 11/15/25 | 380,000 | 392,758 | |
| New York State Hsg. Fin. Agcy. Rev. Bonds Series 2023 E2, 3.8%, tender 5/1/27 (b) | 675,000 | 676,244 | |
| New York Trans. Dev. Corp.: | |||
| (Term. 4 JFK Int'l. Arpt. Proj.): | |||
Series 2020 A, 5% 12/1/25 (c) | 1,080,000 | 1,104,190 | |
Series 2020 C, 5% 12/1/24 | 365,000 | 369,694 | |
| (Term. 4 John F. Kennedy Int'l. Arpt. Proj.) Series 2022, 5% 12/1/26 (c) | 1,825,000 | 1,892,096 | |
| St. Lawrence County Indl. Dev. (St. Lawrence Univ. Proj.) Series 2022: | |||
| 5% 7/1/25 | 150,000 | 153,813 | |
| 5% 7/1/26 | 145,000 | 151,598 | |
| Syracuse Reg'l. Arpt. Auth. Series 2021, 5% 7/1/24 (c) | 280,000 | 281,198 | |
| Tobacco Settlement Asset Securitization Corp. Series 2017 A, 5% 6/1/25 | 1,135,000 | 1,153,737 | |
| Triborough Bridge & Tunnel Auth. Bonds Series 2021 A2, 2%, tender 5/15/26 (b) | 365,000 | 350,287 | |
| Westchester County Indl. Dev. Bonds (Armory Plaza Hsg., L.P. Proj.) Series 2023, 3.625%, tender 6/1/24 (b) | 2,480,000 | 2,477,640 | |
TOTAL NEW YORK | 25,606,589 | ||
| New York And New Jersey - 1.3% | |||
| Port Auth. of New York & New Jersey: | |||
| Series 188, 5% 5/1/24 (c) | 725,000 | 727,659 | |
| Series 2013, 5% 7/15/25 (c) | 370,000 | 370,499 | |
| Series 2014 186, 5% 10/15/26 (c) | 1,905,000 | 1,919,638 | |
| Series 2016 195, 5% 10/1/25 (c) | 705,000 | 724,560 | |
| Series 2018, 5% 9/15/25 (c) | 2,670,000 | 2,741,847 | |
| Series 2020 221, 5% 7/15/25 (c) | 730,000 | 747,361 | |
| Series 2023 242: | |||
5% 12/1/24 (c) | 465,000 | 470,942 | |
5% 12/1/25 (c) | 1,535,000 | 1,576,510 | |
5% 12/1/26 (c) | 3,155,000 | 3,296,073 | |
| Series 223: | |||
5% 7/15/24 (c) | 1,185,000 | 1,193,006 | |
5% 7/15/25 (c) | 190,000 | 194,519 | |
TOTAL NEW YORK AND NEW JERSEY | 13,962,614 | ||
| North Carolina - 0.6% | |||
| Charlotte-Mecklenburg Hosp. Auth. Health Care Sys. Rev. Bonds: | |||
| Series 2018 C, 3.45%, tender 10/31/25 (b) | 1,965,000 | 1,970,719 | |
| Series 2021 B, 5%, tender 12/2/24 (b) | 920,000 | 931,498 | |
| Series 2023 D, 3.625%, tender 6/15/27 (b) | 1,635,000 | 1,642,307 | |
| North Carolina Med. Care Commission Hosp. Rev. Bonds Series 2021 B, 5%, tender 2/1/26 (b) | 1,450,000 | 1,499,547 | |
TOTAL NORTH CAROLINA | 6,044,071 | ||
| Ohio - 0.8% | |||
| American Muni. Pwr., Inc. Rev. Series 2023 A: | |||
| 5% 2/15/25 | 320,000 | 326,268 | |
| 5% 2/15/26 | 1,795,000 | 1,864,174 | |
| 5% 2/15/27 | 2,820,000 | 2,989,774 | |
| Columbus-Franklin County Fin. Auth. Bonds (Dering Family Homes Proj.) Series 2023, 5%, tender 2/1/27 (b) | 765,000 | 792,210 | |
| Lancaster Port Auth. Gas Rev. Bonds Series 2019, 5%, tender 2/1/25 (b) | 740,000 | 748,645 | |
| Montgomery County Hosp. Rev. (Kettering Health Network Obligated Group Proj.) Series 2021, 5% 8/1/24 | 75,000 | 75,543 | |
| Northeast Ohio Med. Univ. Series 2022: | |||
| 5% 12/1/24 (Build America Mutual Assurance Insured) | 90,000 | 91,276 | |
| 5% 12/1/25 (Build America Mutual Assurance Insured) | 95,000 | 97,688 | |
| Ohio Higher Edl. Facility Commission Rev.: | |||
| (Xavier Univ. 2020 Proj.) Series 2020, 5% 5/1/26 | 400,000 | 417,830 | |
| Bonds (Case Western Reserve Univ. Proj.) Series 2019 C, 1.625%, tender 12/1/26 (b) | 420,000 | 399,056 | |
| Ohio Tpk. Commission Tpk. Rev. (Infrastructure Projs.) Series 2022 A, 5% 2/15/25 | 670,000 | 684,226 | |
TOTAL OHIO | 8,486,690 | ||
| Oklahoma - 0.4% | |||
| Oklahoma County Independent School District #89 Oklahoma City Series 2023 A, 3% 7/1/26 | 4,095,000 | 4,101,590 | |
| Oregon - 0.6% | |||
| Gilliam County Solid Waste Disp. Rev. Bonds (Waste Mgmt., Inc. Proj.): | |||
| Series 2000 A, 3.95%, tender 5/1/24 (b)(c) | 1,915,000 | 1,909,415 | |
| Series 2003 A, 3.95%, tender 5/1/24 (b)(c) | 1,825,000 | 1,822,031 | |
| Port of Portland Arpt. Rev.: | |||
| Series 2020 26B, 5% 7/1/26 | 685,000 | 706,852 | |
| Series 2022: | |||
5% 7/1/24 (c) | 730,000 | 734,053 | |
5% 7/1/25 (c) | 1,125,000 | 1,149,049 | |
| Series 24B, 5% 7/1/25 (c) | 365,000 | 372,802 | |
TOTAL OREGON | 6,694,202 | ||
| Pennsylvania - 5.1% | |||
| Allegheny County Arpt. Auth. Rev.: | |||
| Series 2021 A, 5% 1/1/27 (c) | 375,000 | 390,254 | |
| Series 2023 A, 5% 1/1/27 (Assured Guaranty Muni. Corp. Insured) (c) | 310,000 | 324,185 | |
| Geisinger Auth. Health Sys. Rev. Bonds Series 2020 B, 5%, tender 2/15/27 (b) | 2,280,000 | 2,367,782 | |
| Pennsylvania Econ. Dev. Fing. Auth.: | |||
| Series 2021 A, 4% 10/15/24 | 310,000 | 311,636 | |
| Series 2022 A: | |||
5% 2/15/25 | 60,000 | 61,114 | |
5% 2/15/26 | 75,000 | 77,800 | |
| Pennsylvania Econ. Dev. Fing. Auth. Indl. Dev. Rev. Series 2016, 5% 3/15/24 | 455,000 | 455,868 | |
| Pennsylvania Econ. Dev. Fing. Auth. Solid Waste Disp. Rev. Bonds: | |||
| (Republic Svcs., Inc. Proj.): | |||
Series 2019 A, 4%, tender 4/15/24 (b)(c) | 510,000 | 510,015 | |
Series 2019 B1, 4%, tender 4/15/24 (b)(c) | 675,000 | 675,020 | |
| (Republic Svcs., Inc. Proj.): | |||
Series 2014, 4.3%, tender 4/1/24 (b)(c) | 8,240,000 | 8,237,842 | |
Series 2019 B2, 4%, tender 7/15/24 (b)(c) | 3,755,000 | 3,755,265 | |
| (Waste Mgmt., Inc. Proj.) Series 2013, 4.875%, tender 2/1/24 (b)(c) | 7,770,000 | 7,770,000 | |
| (Waste Mgmt., Inc. Proj.): | |||
Series 2017 A, 0.58%, tender 8/1/24 (b)(c) | 800,000 | 783,605 | |
Series 2021 A, SIFMA Municipal Swap Index + 0.400% 4.95%, tender 2/1/24 (b)(c)(g) | 1,040,000 | 1,037,977 | |
Series 2021 A2, 4.6%, tender 10/1/26 (b)(c) | 9,115,000 | 9,197,760 | |
| Series 2011, 2.15%, tender 7/1/24 (b)(c) | 310,000 | 305,351 | |
| Pennsylvania Gen. Oblig.: | |||
| Series 2019, 5% 7/15/26 | 1,150,000 | 1,212,240 | |
| Series 2023: | |||
5% 9/1/26 | 4,640,000 | 4,905,884 | |
5% 9/1/27 | 10,670,000 | 11,540,242 | |
| Pennsylvania Hsg. Fin. Agcy.: | |||
| Series 2021 135 B: | |||
5% 4/1/24 (c) | 85,000 | 85,133 | |
5% 4/1/25 (c) | 140,000 | 141,822 | |
| Series 2022 138: | |||
5% 4/1/24 | 385,000 | 386,048 | |
5% 10/1/24 | 720,000 | 727,277 | |
5% 10/1/25 | 400,000 | 411,229 | |
| Philadelphia Arpt. Rev. Series 2021: | |||
| 5% 7/1/24 (c) | 345,000 | 346,689 | |
| 5% 7/1/26 (c) | 365,000 | 377,045 | |
TOTAL PENNSYLVANIA | 56,395,083 | ||
| Rhode Island - 0.0% | |||
| Rhode Island Student Ln. Auth. Student Ln. Rev. Series 2018 A, 5% 12/1/25 (c) | 320,000 | 327,738 | |
| South Carolina - 1.6% | |||
| Patriots Energy Group Fing. Agcy. Bonds Series 2018 A, 4%, tender 2/1/24 (b) | 14,430,000 | 14,430,000 | |
| South Carolina Ports Auth. Ports Rev.: | |||
| Series 2015 (AMT), 5% 7/1/45 (Pre-Refunded to 7/1/25 @ 100) (c) | 950,000 | 970,176 | |
| Series 2015: | |||
5.25% 7/1/50 (Pre-Refunded to 7/1/25 @ 100) (c) | 1,650,000 | 1,690,685 | |
5.25% 7/1/55 (Pre-Refunded to 7/1/25 @ 100) (c) | 790,000 | 809,479 | |
TOTAL SOUTH CAROLINA | 17,900,340 | ||
| South Dakota - 0.3% | |||
| South Dakota Health & Edl. Facilities Auth. Rev. Bonds Series 2019 A, 5%, tender 7/1/24 (b) | 365,000 | 365,727 | |
| South Dakota Hsg. Dev. Auth. Bonds Series 2023 J, 3.875%, tender 12/12/24 (b) | 2,675,000 | 2,684,699 | |
TOTAL SOUTH DAKOTA | 3,050,426 | ||
| Tennessee - 0.8% | |||
| Memphis-Shelby County Arpt. Auth. Arpt. Rev. Series 2021 C, 1.875% 7/1/25 (c) | 455,000 | 437,202 | |
| Metropolitan Gov Nashvle&David Ind. Bonds (Waste Mgmt., Inc. Proj.) Series 2001, 0.58%, tender 8/1/24 (b)(c) | 330,000 | 323,237 | |
| Metropolitan Nashville Arpt. Auth. Rev. Series 2022 B: | |||
| 5% 7/1/26 (c) | 245,000 | 254,409 | |
| 5% 7/1/27 (c) | 375,000 | 395,169 | |
| Tennergy Corp. Gas Rev. Bonds Series 2019 A, 5%, tender 10/1/24 (b) | 7,750,000 | 7,808,831 | |
TOTAL TENNESSEE | 9,218,848 | ||
| Texas - 5.7% | |||
| Austin Arpt. Sys. Rev.: | |||
| Series 2019, 5% 11/15/24 (c) | 500,000 | 504,231 | |
| Series 2022, 5% 11/15/25 (c) | 695,000 | 710,347 | |
| Bexar County Gen. Oblig. Series 2014, 5% 6/15/25 | 670,000 | 675,336 | |
| Clear Creek Independent School District Bonds Series 2013 B, 3.6%, tender 8/15/25 (b) | 530,000 | 533,438 | |
| Crandall Independent School District Series 2021 A, 0% 8/15/24 | 280,000 | 274,996 | |
| Cuero Independent School District Series 2017, 5% 8/15/26 | 715,000 | 753,207 | |
| Dallas Gen. Oblig.: | |||
| Series 2023 A, 5% 2/15/25 | 1,355,000 | 1,382,236 | |
| Series 2023, 5% 2/15/25 | 2,015,000 | 2,055,503 | |
| Series 2024 A: | |||
5% 2/15/25 | 5,450,000 | 5,559,549 | |
5% 2/15/26 | 5,450,000 | 5,683,073 | |
5% 2/15/27 | 5,450,000 | 5,835,480 | |
| Dallas Hsg. Fin. Corp. Multi-family Hsg. Rev. Bonds Series 2023: | |||
| 5%, tender 12/1/25 (b) | 857,000 | 878,489 | |
| 5%, tender 3/1/26 (b) | 1,069,000 | 1,093,090 | |
| 5%, tender 7/1/27 (b) | 1,138,000 | 1,185,836 | |
| Hays Consolidated Independent School District Series 2022: | |||
| 5% 2/15/25 | 180,000 | 183,544 | |
| 5% 2/15/26 | 255,000 | 266,111 | |
| Houston Convention and Entertainment Facilities Dept. Hotel Occupancy Tax and Spl. Rev. Series 2014, 5% 9/1/26 | 545,000 | 548,820 | |
| Houston Hsg. Fin. Corp. Multi-family Hsg. Rev. Bonds Series 2023, 5%, tender 8/1/26 (b) | 620,000 | 635,813 | |
| Houston Independent School District Bonds: | |||
| Series 2014 A2, 3.5%, tender 6/1/25 (b) | 3,510,000 | 3,523,451 | |
| Series 2023 C, 4%, tender 6/1/25 (b) | 2,930,000 | 2,960,150 | |
| Lower Colorado River Auth. Rev.: | |||
| (LCRA Transmission Svcs. Corp. Proj.): | |||
Series 2015, 5% 5/15/24 | 435,000 | 437,111 | |
Series 2018, 5% 5/15/24 | 765,000 | 768,712 | |
Series 2020, 5% 5/15/25 | 210,000 | 215,066 | |
| Series 2020, 5% 5/15/24 | 350,000 | 351,698 | |
| Series 2022, 5% 5/15/24 (Assured Guaranty Muni. Corp. Insured) | 595,000 | 597,887 | |
| Mission Econ. Dev. Corp. Solid Waste Disp. Rev. Bonds: | |||
| (Republic Svcs., Inc. Proj.) Series 2020 A, 4.9%, tender 2/1/24 (b)(c) | 8,205,000 | 8,205,000 | |
| (Waste Mgmt., Inc. Proj.): | |||
Series 2018, 0.000% x SIFMA Municipal Swap Index 4.925%, tender 2/1/24 (b)(c)(g) | 2,495,000 | 2,484,096 | |
Series 2020 A, 4.5%, tender 3/1/24 (b)(c) | 300,000 | 299,987 | |
| North East Texas Independent School District Series 2015, 3% 8/1/27 | 625,000 | 621,914 | |
| North Texas Tollway Auth. Rev. Series 2021 B, 5% 1/1/26 | 420,000 | 435,939 | |
| Northside Independent School District Bonds Series 2023 B, 3%, tender 8/1/26 (b) | 3,460,000 | 3,428,943 | |
| Port Arthur Independent School District Series 2015 A, 5% 2/15/25 | 225,000 | 229,777 | |
| Prosper Independent School District Bonds Series 2019 B, 4%, tender 8/15/26 (b) | 605,000 | 614,744 | |
| San Antonio Elec. & Gas Sys. Rev.: | |||
| Bonds: | |||
Series 2018, SIFMA Municipal Swap Index + 0.870% 5.42%, tender 12/1/25 (b)(g) | 3,090,000 | 3,084,804 | |
Series 2023, 3.65%, tender 12/1/26 (b) | 500,000 | 502,468 | |
| Series 2022, 5% 2/1/26 | 330,000 | 343,682 | |
| Tarrant County Cultural Ed. Facilities Fin. Corp. Hosp. Rev. Bonds (Baylor Scott & White Health Proj.) Series 2022 E, 5%, tender 5/15/26 (b) | 1,545,000 | 1,598,699 | |
| Texas Affordable Hsg. Corp. Multi-family Hsg. Rev. Bonds Series 2023, 3.625%, tender 1/1/27 (b) | 785,000 | 785,135 | |
| Texas Gen. Oblig. Series 2016, 5.5% 8/1/26 (c) | 370,000 | 389,379 | |
| Texas Muni. Gas Acquisition & Supply Corp.: | |||
| Series 2023 A: | |||
5.25% 1/1/25 | 320,000 | 323,210 | |
5.25% 1/1/26 | 365,000 | 373,416 | |
5.25% 1/1/27 | 465,000 | 481,626 | |
| Series 2023 B: | |||
5.25% 1/1/25 | 220,000 | 222,207 | |
5.25% 1/1/26 | 440,000 | 450,145 | |
| Travis County Hsg. Fin. Corp. Bonds Series 2023, 3.75%, tender 8/1/25 (b) | 180,000 | 180,258 | |
TOTAL TEXAS | 62,668,603 | ||
| Utah - 0.4% | |||
| Salt Lake City Arpt. Rev.: | |||
| Series 2018 A, 5% 7/1/24 (c) | 1,000,000 | 1,005,429 | |
| Series 2021 A: | |||
5% 7/1/24 (c) | 365,000 | 366,982 | |
5% 7/1/25 (c) | 485,000 | 495,165 | |
| Series 2023 A: | |||
5% 7/1/25 (c) | 360,000 | 367,545 | |
5% 7/1/26 (c) | 365,000 | 378,330 | |
5% 7/1/27 (c) | 345,000 | 363,783 | |
| Utah County Hosp. Rev. Bonds: | |||
| Series 2018 B2, 5%, tender 8/1/24 (b) | 355,000 | 355,277 | |
| Series 2020 B2, 5%, tender 8/1/26 (b) | 900,000 | 937,094 | |
TOTAL UTAH | 4,269,605 | ||
| Vermont - 0.1% | |||
| Vermont Student Assistant Corp. Ed. Ln. Rev. Series 2016 A, 5% 6/15/26 (c) | 620,000 | 640,007 | |
| Virginia - 0.5% | |||
| Gloucester County Indl. Dev. Auth. Bonds Series 2003 A, 3.95%, tender 5/1/24 (b)(c) | 630,000 | 628,618 | |
| Southampton County Indl. Bonds (PRTA-Virginia One, LLC Proj.) Series 2023, 4.875%, tender 12/12/24 (b)(c) | 4,660,000 | 4,666,693 | |
| Wise County Indl. Dev. Auth. Waste & Sewage Rev. Bonds (Virginia Elec. and Pwr. Co. Proj.) Series 2010 A, 1.2%, tender 5/31/24 (b) | 685,000 | 676,037 | |
TOTAL VIRGINIA | 5,971,348 | ||
| Washington - 1.4% | |||
| King County Swr. Rev. Bonds Series 2020 B, 0.875%, tender 1/1/26 (b) | 1,965,000 | 1,822,254 | |
| Port of Seattle Rev.: | |||
| Series 2015 C, 5% 4/1/24 (c) | 440,000 | 440,884 | |
| Series 2016 B, 5% 10/1/27 (c) | 365,000 | 377,130 | |
| Series 2018 A, 5% 5/1/27 (c) | 1,500,000 | 1,569,345 | |
| Series 2018 B: | |||
5% 5/1/24 (c) | 320,000 | 320,991 | |
5% 5/1/26 (c) | 3,225,000 | 3,329,645 | |
| Series 2019: | |||
5% 4/1/24 (c) | 275,000 | 275,552 | |
5% 4/1/25 (c) | 420,000 | 427,001 | |
| Series 2021 C, 5% 8/1/24 (c) | 1,705,000 | 1,716,242 | |
| Series 2021, 5% 9/1/24 (c) | 810,000 | 816,177 | |
| Series 2022 B: | |||
5% 8/1/24 (c) | 975,000 | 981,429 | |
5% 8/1/25 (c) | 915,000 | 935,378 | |
5% 8/1/26 (c) | 575,000 | 596,599 | |
| Seattle Hsg. Auth. Rev. (Juniper Apts. Proj.) Series 2023, 5% 6/1/27 | 440,000 | 457,029 | |
| Washington Hsg. Fin. Commission Multi-family Hsg. Rev. Bonds (Ardea At Totem Lake Apts. Proj.) Series 2023, 5%, tender 2/1/27 (b) | 808,000 | 834,749 | |
TOTAL WASHINGTON | 14,900,405 | ||
| West Virginia - 0.4% | |||
| West Virginia Econ. Dev. Auth. Solid Waste Disp. Facilities Rev. Bonds (Allegheny Metallurgical Proj.) Series 2023, 4.75%, tender 8/1/24 (b)(c) | 4,015,000 | 4,023,602 | |
| Wisconsin - 0.6% | |||
| Milwaukee County Arpt. Rev.: | |||
| Series 2023 A: | |||
5% 12/1/24 (c) | 85,000 | 85,898 | |
5% 12/1/26 (c) | 290,000 | 303,447 | |
| Series 2023 B, 5% 12/1/24 (c) | 600,000 | 606,338 | |
| Milwaukee Gen. Oblig. Series 2016, 2% 3/1/27 | 1,125,000 | 1,064,054 | |
| Pub. Fin. Auth. Health Care Sys. Rev. Series 2023 A, 5% 10/1/24 | 1,620,000 | 1,639,791 | |
| Wisconsin Health & Edl. Facilities Auth. Rev. Series 2022: | |||
| 5% 10/1/24 | 1,630,000 | 1,647,548 | |
| 5% 10/1/25 | 335,000 | 344,954 | |
| Wisconsin Hsg. & Econ. Dev. Auth. Hsg. Rev. Bonds: | |||
| Series 2021 C, 0.61%, tender 5/1/24 (b) | 95,000 | 94,002 | |
| Series 2023 E, 3.875%, tender 5/1/27 (b) | 690,000 | 691,486 | |
TOTAL WISCONSIN | 6,477,518 | ||
| TOTAL MUNICIPAL BONDS (Cost $583,198,956) | 584,317,317 | ||
| Municipal Notes - 41.1% | |||
Principal Amount (a) | Value ($) | ||
| Alabama - 4.8% | |||
| Black Belt Energy Gas District Participating VRDN: | |||
| Series XF 30 73, 4.85% 2/7/24 (Liquidity Facility Morgan Stanley Bank, West Valley City Utah) (b)(h)(i) | 7,185,000 | 7,185,000 | |
| Series XM 11 10, 4.85% 2/7/24 (Liquidity Facility Royal Bank of Canada) (b)(h)(i) | 4,375,000 | 4,375,000 | |
| Series ZL 03 96, 4.85% 2/7/24 (Liquidity Facility Morgan Stanley Bank, West Valley City Utah) (b)(h)(i) | 1,605,000 | 1,605,000 | |
| Series ZL 03 97, 4.85% 2/7/24 (Liquidity Facility Morgan Stanley Bank, West Valley City Utah) (b)(h)(i) | 1,635,000 | 1,635,000 | |
| Decatur Indl. Dev. Board Exempt Facilities Rev. (Nucor Steel Decatur LLC Proj.) Series 2003 A, 5.42% 2/7/24, VRDN (b)(c) | 1,410,000 | 1,410,000 | |
| Health Care Auth. for Baptist Health Series 2013 B, 5.97% 2/7/24, VRDN (b) | 1,678,000 | 1,678,000 | |
| Southeast Energy Auth. Rev. Participating VRDN: | |||
| Series XG 04 10, 4.85% 2/7/24 (Liquidity Facility Morgan Stanley Bank, West Valley City Utah) (b)(h)(i) | 16,804,000 | 16,804,000 | |
| Series XM 10 62, 4.9% 2/7/24 (Liquidity Facility Morgan Stanley Bank, West Valley City Utah) (b)(h)(i) | 3,535,000 | 3,535,000 | |
| West Jefferson Indl. Dev. Board Solid Waste Disp. Rev. (Alabama Pwr. Co. Miller Plant Proj.) Series 2008, 4.05% 2/1/24, VRDN (b)(c) | 14,800,000 | 14,800,000 | |
TOTAL ALABAMA | 53,027,000 | ||
| Arizona - 1.0% | |||
| Arizona St Indl. Dev. Auth. Multi Participating VRDN Series XF 31 74, 4.92% 2/7/24 (Liquidity Facility Mizuho Cap. Markets LLC) (b)(h)(i) | 695,000 | 695,000 | |
| Maricopa County Poll. Cont. Rev. Series 2009 D, 4.75% 2/7/24, VRDN (b) | 8,750,000 | 8,750,000 | |
| Mizuho Floater / Residual Trust V Participating VRDN Series Floater 91 57, 4.95% 3/6/24 (Liquidity Facility Mizuho Cap. Markets LLC) (b)(h)(i) | 1,094,031 | 1,094,031 | |
TOTAL ARIZONA | 10,539,031 | ||
| Arkansas - 0.1% | |||
| Blytheville Indl. Dev. Rev. (Nucor Corp. Proj.) Series 1998, 5.42% 2/7/24, VRDN (b)(c) | 900,000 | 900,000 | |
| California - 7.4% | |||
| California Cmnty. Choice Fing. Auth. Clean Energy Proj. Rev. Participating VRDN Series XF 30 07, 4.85% 2/7/24 (Liquidity Facility Morgan Stanley Bank, West Valley City Utah) (b)(h)(i) | 14,350,000 | 14,350,000 | |
| California Health Facilities Fing. Auth. Rev. Participating VRDN Series MS 3389, 4.95% 2/7/24 (Liquidity Facility Toronto-Dominion Bank) (b)(h)(i) | 1,860,000 | 1,860,000 | |
| California Hsg. Fin. Agcy. Ltd. Obl Participating VRDN Series XF 31 27, 4.92% 2/7/24 (Liquidity Facility Mizuho Cap. Markets LLC) (b)(h)(i) | 1,010,000 | 1,010,000 | |
| California Statewide Cmntys. Dev. Auth. Multi-family Hsg. Rev. Participating VRDN: | |||
| Series MIZ 91 21, 4.3% 2/1/24 (Liquidity Facility Mizuho Cap. Markets LLC) (b)(c)(h)(i) | 3,610,000 | 3,610,000 | |
| Series MIZ 91 22, 4.3% 2/1/24 (Liquidity Facility Mizuho Cap. Markets LLC) (b)(c)(h)(i) | 7,559,756 | 7,559,756 | |
| Los Angeles Cmnty. Redev. Agcy. Multi-family Hsg. Rev. Participating VRDN: | |||
| Series 2022 MIZ 90 89, 4.3% 2/1/24 (Liquidity Facility Mizuho Cap. Markets LLC) (b)(c)(h)(i) | 18,695,000 | 18,695,000 | |
| Series 2022 MIZ 90 90, 4.3% 2/1/24 (Liquidity Facility Mizuho Cap. Markets LLC) (b)(c)(h)(i) | 14,095,000 | 14,095,000 | |
| Mizuho Floater / Residual Trust V Participating VRDN: | |||
| Series Floater MIZ 90 97, 4.95% 2/7/24, LOC Mizuho Cap. Markets LLC (b)(h)(i) | 1,059,387 | 1,059,387 | |
| Series Floater MIZ 91 62, 4.95% 3/6/24 (Liquidity Facility Mizuho Cap. Markets LLC) (b)(h)(i) | 660,000 | 660,000 | |
| San Diego County Reg'l. Arpt. Auth. Arpt. Rev. Participating VRDN Series XM 10 54, 4.85% 2/6/24 (Liquidity Facility Morgan Stanley Bank, West Valley City Utah) (b)(c)(h)(i) | 2,980,000 | 2,980,000 | |
| San Francisco City & County Arpts. Commission Int'l. Arpt. Rev. Participating VRDN Series 2022 XF 30 51, 4.85% 2/7/24 (Liquidity Facility Morgan Stanley Bank, West Valley City Utah) (b)(c)(h)(i) | 840,000 | 840,000 | |
| San Francisco City & County Multi-family Hsg. Rev. Participating VRDN Series MIZ 91 15, 4.95% 3/6/24 (Liquidity Facility Mizuho Cap. Markets LLC) (b)(h)(i)(j) | 14,585,000 | 14,585,000 | |
TOTAL CALIFORNIA | 81,304,143 | ||
| Colorado - 1.1% | |||
| Colorado Edl. & Cultural Facilities Auth. Rev. (Mesivta of Greater Los Angeles Proj.) Series 2005, 4.9% 2/7/24, LOC Deutsche Bank AG, VRDN (b) | 530,000 | 530,000 | |
| Colorado Health Facilities Auth. Rev. Bonds Participating VRDN: | |||
| Series XM 10 59, 4.85% 2/7/24 (Liquidity Facility JPMorgan Chase Bank) (b)(h)(i) | 920,000 | 920,000 | |
| Series XM 10 61, 4.85% 2/7/24 (Liquidity Facility JPMorgan Chase Bank) (b)(h)(i) | 1,525,000 | 1,525,000 | |
| Denver City & County Arpt. Rev. Participating VRDN: | |||
| Series Floaters XM 07 15, 4.85% 2/7/24 (Liquidity Facility Morgan Stanley Bank, West Valley City Utah) (b)(c)(h)(i) | 7,470,000 | 7,470,000 | |
| Series XM 10 20, 4.85% 2/7/24 (Liquidity Facility Morgan Stanley Bank, West Valley City Utah) (b)(c)(h)(i) | 1,665,000 | 1,665,000 | |
TOTAL COLORADO | 12,110,000 | ||
| Florida - 1.9% | |||
| Florida Ins. Assistance Interlo Series 2023 A2, 5.44% 2/7/24 (Liquidity Facility Florida Gen. Oblig.), VRDN (b) | 8,460,000 | 8,460,000 | |
| Greater Orlando Aviation Auth. Arpt. Facilities Rev. Participating VRDN Series XM 10 93, 4.2% 2/1/24 (Liquidity Facility JPMorgan Chase Bank) (b)(c)(h)(i) | 4,240,000 | 4,240,000 | |
| Lee Memorial Health Sys. Hosp. Rev. Series 2019 B, 5.14% 2/7/24, VRDN (b) | 7,255,000 | 7,255,000 | |
| Miami Dade County Hsg. Multifamily Hsg. Rev. Participating VRDN Series Floater MIZ 90 87, 4.95% 3/6/24 (Liquidity Facility Mizuho Cap. Markets LLC) (b)(h)(i)(j) | 585,000 | 585,000 | |
TOTAL FLORIDA | 20,540,000 | ||
| Georgia - 0.1% | |||
| Buford Hsg. Auth. Multifamily Participating VRDN Series XF 31 18, 4.92% 2/7/24 (Liquidity Facility Mizuho Cap. Markets LLC) (b)(h)(i) | 1,064,857 | 1,064,857 | |
| Hawaii - 0.4% | |||
| Hawaii Arpts. Sys. Rev. Participating VRDN: | |||
| Series XG 03 86, 4.85% 2/7/24 (Liquidity Facility Morgan Stanley Bank, West Valley City Utah) (b)(c)(h)(i) | 3,501,000 | 3,501,000 | |
| Series XM 10 55, 4.85% 2/6/24 (Liquidity Facility Morgan Stanley Bank, West Valley City Utah) (b)(c)(h)(i) | 1,165,000 | 1,165,000 | |
TOTAL HAWAII | 4,666,000 | ||
| Illinois - 1.4% | |||
| Chicago O'Hare Int'l. Arpt. Rev. Participating VRDN: | |||
| Series XM 10 43, 4.85% 2/7/24 (Liquidity Facility JPMorgan Chase Bank) (b)(c)(h)(i) | 3,365,000 | 3,365,000 | |
| Series XM 10 78, 4.8% 2/7/24 (Liquidity Facility JPMorgan Chase Bank) (b)(c)(h)(i) | 11,900,000 | 11,900,000 | |
TOTAL ILLINOIS | 15,265,000 | ||
| Iowa - 0.7% | |||
| Louisa County Poll. Cont. Rev. Series 1994, 4.6% 2/7/24, VRDN (b) | 8,000,000 | 8,000,000 | |
| Kentucky - 1.8% | |||
| Meade County Indl. Bldg. Rev. (Nucor Steel Brandenburg Proj.): | |||
| Series 2020 A1, 4.56% 2/1/24, VRDN (b)(c) | 7,525,000 | 7,525,000 | |
| Series 2020 B1, 4.56% 2/1/24, VRDN (b)(c) | 12,735,000 | 12,735,000 | |
TOTAL KENTUCKY | 20,260,000 | ||
| Louisiana - 1.3% | |||
| Saint James Parish Gen. Oblig. (Nucor Steel Louisiana LLC Proj.): | |||
| Series 2010 A1, 5.27% 2/7/24, VRDN (b) | 14,015,000 | 14,015,000 | |
| Series 2010 B1, 4.95% 2/7/24, VRDN (b) | 600,000 | 600,000 | |
TOTAL LOUISIANA | 14,615,000 | ||
| Maryland - 0.3% | |||
| Baltimore County Gen. Oblig. Participating VRDN Series 2022 032, 4.9% 3/13/24 (Liquidity Facility Barclays Bank PLC) (b)(h)(i) | 1,175,000 | 1,175,000 | |
| Integrace Obligated Group Participating VRDN Series 2022 024, 4.9% 3/13/24 (Liquidity Facility Barclays Bank PLC) (b)(h)(i) | 2,515,000 | 2,515,000 | |
TOTAL MARYLAND | 3,690,000 | ||
| Mississippi - 0.9% | |||
| Mississippi Bus. Fin. Corp. Mississippi Pwr. Co. Proj.) Series 2022, 4.1% 2/1/24, VRDN (b)(c) | 3,100,000 | 3,100,000 | |
| Mississippi Bus. Fin. Corp. Solid Waste Disp. Rev. (Mississippi Pwr. Co. Proj.) Series 1998, 4.2% 2/1/24, VRDN (b)(c) | 6,400,000 | 6,400,000 | |
TOTAL MISSISSIPPI | 9,500,000 | ||
| Missouri - 0.5% | |||
| Kansas City Indl. Dev. Auth. Participating VRDN: | |||
| Series XL 03 3, 4.85% 2/7/24 (Liquidity Facility JPMorgan Chase Bank) (b)(c)(h)(i) | 3,500,000 | 3,500,000 | |
| Series XM 11 08, 4.2% 2/1/24 (Liquidity Facility JPMorgan Chase Bank) (b)(c)(h)(i) | 910,000 | 910,000 | |
| Mizuho Floater / Residual Trust V Participating VRDN Series Floater MIZ 91 53, 5.6% 3/6/24 (Liquidity Facility Mizuho Cap. Markets LLC) (b)(h)(i) | 1,130,499 | 1,130,499 | |
TOTAL MISSOURI | 5,540,499 | ||
| Nebraska - 0.2% | |||
| Stanton County Indl. Dev. Rev. (Nucor Corp. Proj.) Series 1996, 5.42% 2/7/24, VRDN (b)(c) | 2,100,000 | 2,100,000 | |
| New Jersey - 1.6% | |||
| Clifton Gen. Oblig. BAN Series 2023, 5% 11/26/24 | 136,000 | 137,776 | |
| Elmwood Park BAN Series 2023, 5% 10/9/24 | 1,825,000 | 1,842,305 | |
| Hazlet Township NJ BAN Series 2023, 5% 11/8/24 | 2,715,000 | 2,746,851 | |
| Manasquan N J BAN Series 2023, 5% 10/3/24 | 1,605,000 | 1,621,025 | |
| New Jersey Trans. Trust Fund Auth. Participating VRDN: | |||
| Series XL 04 50, 4.75% 2/7/24 (Liquidity Facility JPMorgan Chase Bank) (b)(h)(i) | 840,000 | 840,000 | |
| Series XM 09 29, 4.75% 2/7/24 (Liquidity Facility JPMorgan Chase Bank) (b)(h)(i) | 2,295,000 | 2,295,000 | |
| Series XM 10 47, 4.75% 2/7/24 (Liquidity Facility JPMorgan Chase Bank) (b)(h)(i) | 3,655,000 | 3,655,000 | |
| Ridgewood Gen. Oblig. BAN Series 2023 B, 5% 10/11/24 | 4,121,000 | 4,160,660 | |
TOTAL NEW JERSEY | 17,298,617 | ||
| New Mexico - 0.1% | |||
| New Mexico St Hosp. Equip. Ln. Co. Participating VRDN Series 2022 034, 4.9% 3/13/24 (Liquidity Facility Barclays Bank PLC) (b)(h)(i) | 1,530,000 | 1,530,000 | |
| New York - 2.3% | |||
| Albany City School District BAN Series 2023 B, 4.75% 6/27/24 | 2,260,000 | 2,271,965 | |
| Liberty Dev. Corp. Rev. Participating VRDN Series MS 1207, 4.9% 2/7/24 (Liquidity Facility Morgan Stanley Bank, West Valley City Utah) (b)(h)(i) | 791,500 | 791,500 | |
| New York Metropolitan Trans. Auth. Rev. Participating VRDN: | |||
| Series XF 13 21, 4.87% 2/7/24 (Liquidity Facility JPMorgan Chase Bank) (b)(h)(i) | 1,450,000 | 1,450,000 | |
| Series XF 13 55, 4.87% 2/7/24 (Liquidity Facility JPMorgan Chase Bank) (b)(h)(i) | 2,555,000 | 2,555,000 | |
| Series XF 16 49, 4.87% 2/7/24 (Liquidity Facility JPMorgan Chase Bank) (b)(h)(i) | 2,570,000 | 2,570,000 | |
| New York State Hsg. Fin. Agcy. Rev. Participating VRDN Series Floater 2022 007, 5% 3/13/24 (Liquidity Facility Barclays Bank PLC) (b)(c)(h)(i) | 16,010,000 | 16,010,000 | |
TOTAL NEW YORK | 25,648,465 | ||
| Ohio - 1.3% | |||
| Allen County Hosp. Facilities Rev. Series 2012 B, 4.95% 2/7/24 (Liquidity Facility Ohio Gen. Oblig.), VRDN (b) | 2,115,000 | 2,115,000 | |
| Middletown Hosp. Facilities Rev. Participating VRDN Series Floaters 003, 4.85% 3/13/24 (Liquidity Facility Barclays Bank PLC) (b)(h)(i) | 5,390,000 | 5,390,000 | |
| Ohio Hosp. Rev.: | |||
| Series 2013 B, 5.08% 2/7/24, VRDN (b) | 3,645,000 | 3,645,000 | |
| Series 2015 B, 5.08% 2/8/27, VRDN (b) | 2,870,000 | 2,870,000 | |
TOTAL OHIO | 14,020,000 | ||
| Oklahoma - 0.6% | |||
| Oklahoma Dev. Fin. Auth. Health Sys. Rev. Series 2020 B, 5.19% 2/8/27, VRDN (b) | 5,325,000 | 5,325,000 | |
| Steele Duncan Plaza, LLC Participating VRDN Series MIZ 91 03, 4.95% 3/6/24 (Liquidity Facility Mizuho Cap. Markets LLC) (b)(h)(i)(j) | 948,160 | 948,160 | |
TOTAL OKLAHOMA | 6,273,160 | ||
| Pennsylvania - 0.7% | |||
| Montgomery County Higher Ed. & Health Auth. Rev. Series 2018 D, 5.2% 2/8/27, VRDN (b) | 4,520,000 | 4,520,000 | |
| Philadelphia Auth. for Indl. Dev.: | |||
| Participating VRDN Series MIZ 90 51, 4.95% 3/6/24 (Liquidity Facility Mizuho Cap. Markets LLC) (b)(h)(i)(j) | 340,000 | 340,000 | |
| Series 2017 B, 5.21% 2/8/27, VRDN (b) | 2,590,000 | 2,590,000 | |
TOTAL PENNSYLVANIA | 7,450,000 | ||
| South Carolina - 2.1% | |||
| Berkeley County Indl. Dev. Rev. (Nucor Corp. Proj.) Series 1995, 5.42% 2/7/24, VRDN (b)(c) | 700,000 | 700,000 | |
| South Carolina Jobs-Econ. Dev. Auth. Series 2018 C, 5.23% 2/8/27, VRDN (b) | 650,000 | 650,000 | |
| South Carolina Pub. Svc. Auth. Rev. Participating VRDN: | |||
| Series 2021 XF 12 43, 4.85% 2/7/24 (Liquidity Facility JPMorgan Chase Bank) (b)(h)(i) | 2,235,000 | 2,235,000 | |
| Series Floaters XM 03 84, 4.85% 2/7/24 (Liquidity Facility JPMorgan Chase Bank) (b)(h)(i) | 19,000,000 | 19,000,000 | |
TOTAL SOUTH CAROLINA | 22,585,000 | ||
| Tennessee - 0.3% | |||
| Chattanooga Health Ed. & Hsg. Facility Board Rev. (Catholic Health Initiatives Proj.) Series C, 5% 2/7/24, VRDN (b) | 2,015,000 | 2,015,000 | |
| Mizuho Floater / Residual Trust V Participating VRDN Series Floater MIZ 91 63, 4.95% 3/6/24 (Liquidity Facility Mizuho Cap. Markets LLC) (b)(h)(i) | 884,342 | 884,342 | |
TOTAL TENNESSEE | 2,899,342 | ||
| Texas - 5.8% | |||
| Austin Arpt. Sys. Rev. Participating VRDN Series XG 04 27, 4.85% 2/7/24 (Liquidity Facility Morgan Stanley Bank, West Valley City Utah) (b)(c)(h)(i) | 250,000 | 250,000 | |
| Brazos County Tex Hsg. Fin. Corp. M Participating VRDN Series XF 31 29, 4.92% 2/7/24 (Liquidity Facility Mizuho Cap. Markets LLC) (b)(h)(i) | 911,693 | 911,693 | |
| Ep Machuca Lp Participating VRDN Series MIZ 91 04, 4.95% 3/6/24 (Liquidity Facility Mizuho Cap. Markets LLC) (b)(h)(i)(j) | 1,334,718 | 1,334,718 | |
| Mizuho Floater / Residual Trust V Participating VRDN: | |||
| Series Floater MIZ 91 50, 4.95% 3/6/24 (Liquidity Facility Mizuho Cap. Markets LLC) (b)(h)(i)(j) | 5,397,221 | 5,397,221 | |
| Series MIZ 91 24, 4.95% 3/6/24 (Liquidity Facility Mizuho Cap. Markets LLC) (b)(h)(i)(j) | 7,603,517 | 7,603,517 | |
| Port Arthur Navigation District Envir. Facilities Rev. (Motiva Enterprises LLC Proj.): | |||
| Series 2001 A, 4.4% 2/1/24, VRDN (b) | 6,365,000 | 6,365,000 | |
| Series 2004, 4.88% 2/7/24, VRDN (b)(c) | 27,600,000 | 27,600,000 | |
| Series 2010 B, 4.4% 2/1/24, VRDN (b) | 220,000 | 220,000 | |
| Series 2010 C, 4.4% 2/1/24, VRDN (b) | 800,000 | 800,000 | |
| Series 2010 D: | |||
4.82% 2/7/24, VRDN (b) | 1,355,000 | 1,355,000 | |
4.85% 2/7/24, VRDN (b) | 12,210,000 | 12,210,000 | |
TOTAL TEXAS | 64,047,149 | ||
| Utah - 1.1% | |||
| Salt Lake City Arpt. Rev. Participating VRDN: | |||
| Series XM 11 07, 4.2% 2/1/24 (Liquidity Facility JPMorgan Chase Bank) (b)(c)(h)(i) | 3,610,000 | 3,610,000 | |
| Series XM 11 47, 4.85% 2/7/24 (Liquidity Facility JPMorgan Chase Bank) (b)(c)(h)(i) | 8,630,000 | 8,630,000 | |
TOTAL UTAH | 12,240,000 | ||
| Virginia - 0.2% | |||
| Nat'l. Sr. Campuses Participating VRDN Series 2022 028, 4.9% 3/13/24 (Liquidity Facility Barclays Bank PLC) (b)(h)(i) | 1,755,000 | 1,755,000 | |
| West Virginia - 0.3% | |||
| West Virginia Hosp. Fin. Auth. Hosp. Rev. Series 2018 E, 5.16% 2/8/27, VRDN (b) | 3,005,000 | 3,005,000 | |
| Wyoming - 0.8% | |||
| Lincoln County Envir. (PacifiCorp Proj.) Series 1995, 5.85% 2/7/24, VRDN (b)(c) | 5,100,000 | 5,100,000 | |
| Lincoln County Poll. Cont. Rev. (PacifiCorp Proj.) Series 1994, 5.75% 2/7/24, VRDN (b) | 400,000 | 400,000 | |
| Sweetwater County Env Imp Rev. (Pacificorp Proj.) Series 1995, 4.3% 2/1/24, VRDN (b)(c) | 1,600,000 | 1,600,000 | |
| Sweetwater County Poll. Cont. Rev. (PacifiCorp Proj.) Series 1994, 5.75% 2/7/24, VRDN (b) | 2,260,000 | 2,260,000 | |
TOTAL WYOMING | 9,360,000 | ||
| TOTAL MUNICIPAL NOTES (Cost $451,234,875) | 451,233,263 | ||
| Money Market Funds - 5.8% | |||
| Shares | Value ($) | ||
Fidelity Municipal Cash Central Fund 4.36% (k)(l) (Cost $64,082,462) | 64,069,645 | 64,088,860 | |
| TOTAL INVESTMENT IN SECURITIES - 100.1% (Cost $1,098,516,293) | 1,099,639,440 |
NET OTHER ASSETS (LIABILITIES) - (0.1)% | (1,502,015) |
| NET ASSETS - 100.0% | 1,098,137,425 |
| BAN | - | BOND ANTICIPATION NOTE |
| VRDN | - | VARIABLE RATE DEMAND NOTE (A debt instrument that is payable upon demand, either daily, weekly or monthly) |
| (a) | Amount is stated in United States dollars unless otherwise noted. |
| (b) | Coupon rates for floating and adjustable rate securities reflect the rates in effect at period end. |
| (c) | Private activity obligations whose interest is subject to the federal alternative minimum tax for individuals. |
| (d) | Security exempt from registration under Rule 144A of the Securities Act of 1933. These securities may be resold in transactions exempt from registration, normally to qualified institutional buyers. At the end of the period, the value of these securities amounted to $17,823,808 or 1.6% of net assets. |
| (e) | Security or a portion of the security purchased on a delayed delivery or when-issued basis. |
| (f) | Security initially issued at one coupon which converts to a higher coupon at a specified date. The rate shown is the rate at period end. |
| (g) | Coupon is indexed to a floating interest rate which may be multiplied by a specified factor and/or subject to caps or floors. |
| (h) | Provides evidence of ownership in one or more underlying municipal bonds. |
| (i) | Coupon rates are determined by re-marketing agents based on current market conditions. |
| (j) | Restricted securities (including private placements) - Investment in securities not registered under the Securities Act of 1933 (excluding 144A issues). At the end of the period, the value of restricted securities (excluding 144A issues) amounted to $30,793,616 or 2.8% of net assets. |
| (k) | Information in this report regarding holdings by state and security types does not reflect the holdings of the Fidelity Municipal Cash Central Fund. |
| (l) | Affiliated fund that is generally available only to investment companies and other accounts managed by Fidelity Investments. The rate quoted is the annualized seven-day yield of the fund at period end. A complete unaudited listing of the fund's holdings as of its most recent quarter end is available upon request. In addition, each Fidelity Central Fund's financial statements, which are not covered by the Fund's Report of Independent Registered Public Accounting Firm, are available on the SEC's website or upon request. |
| Additional information on each restricted holding is as follows: | ||
| Security | Acquisition Date | Acquisition Cost ($) |
| Ep Machuca Lp Participating VRDN Series MIZ 91 04, 4.95% 3/6/24 (Liquidity Facility Mizuho Cap. Markets LLC) | 1/19/24 | 1,334,718 |
| Miami Dade County Hsg. Multifamily Hsg. Rev. Participating VRDN Series Floater MIZ 90 87, 4.95% 3/6/24 (Liquidity Facility Mizuho Cap. Markets LLC) | 1/19/24 | 585,000 |
| Mizuho Floater / Residual Trust V Participating VRDN Series Floater MIZ 91 50, 4.95% 3/6/24 (Liquidity Facility Mizuho Cap. Markets LLC) | 1/19/24 | 5,397,221 |
| Mizuho Floater / Residual Trust V Participating VRDN Series MIZ 91 24, 4.95% 3/6/24 (Liquidity Facility Mizuho Cap. Markets LLC) | 1/19/24 | 7,603,517 |
| Philadelphia Auth. for Indl. Dev. Participating VRDN Series MIZ 90 51, 4.95% 3/6/24 (Liquidity Facility Mizuho Cap. Markets LLC) | 1/19/24 | 340,000 |
| San Francisco City & County Multi-family Hsg. Rev. Participating VRDN Series MIZ 91 15, 4.95% 3/6/24 (Liquidity Facility Mizuho Cap. Markets LLC) | 1/19/24 | 14,585,000 |
| Steele Duncan Plaza, LLC Participating VRDN Series MIZ 91 03, 4.95% 3/6/24 (Liquidity Facility Mizuho Cap. Markets LLC) | 1/19/24 | 948,160 |
| Affiliate | Value, beginning of period ($) | Purchases ($) | Sales Proceeds ($) | Dividend Income ($) | Realized Gain (loss) ($) | Change in Unrealized appreciation (depreciation) ($) | Value, end of period ($) | % ownership, end of period |
| Fidelity Municipal Cash Central Fund 4.36% | - | 70,725,228 | 6,643,000 | 90,264 | 234 | 6,398 | 64,088,860 | 2.5% |
| Total | - | 70,725,228 | 6,643,000 | 90,264 | 234 | 6,398 | 64,088,860 | |
| Valuation Inputs at Reporting Date: | ||||
| Description | Total ($) | Level 1 ($) | Level 2 ($) | Level 3 ($) |
Investments in Securities: | ||||
| Municipal Securities | 1,035,550,580 | - | 1,035,550,580 | - |
| Money Market Funds | 64,088,860 | 64,088,860 | - | - |
| Total Investments in Securities: | 1,099,639,440 | 64,088,860 | 1,035,550,580 | - |
| Statement of Assets and Liabilities | ||||
| January 31, 2024 | ||||
| Assets | ||||
| Investment in securities, at value - See accompanying schedule: | ||||
Unaffiliated issuers (cost $1,034,433,831) | $ | 1,035,550,580 | ||
Fidelity Central Funds (cost $64,082,462) | 64,088,860 | |||
| Total Investment in Securities (cost $1,098,516,293) | $ | 1,099,639,440 | ||
| Cash | 126,309 | |||
| Receivable for fund shares sold | 10,335,553 | |||
| Interest receivable | 7,936,018 | |||
| Distributions receivable from Fidelity Central Funds | 82,386 | |||
| Prepaid expenses | 21,796 | |||
| Receivable from investment adviser for expense reductions | 111,811 | |||
| Other receivables | 20 | |||
Total assets | 1,118,253,333 | |||
| Liabilities | ||||
| Payable for investments purchased | ||||
Regular delivery | $ | 12,679,768 | ||
Delayed delivery | 4,933,803 | |||
| Payable for fund shares redeemed | 1,251,014 | |||
| Distributions payable | 1,060,744 | |||
| Accrued management fee | 67,433 | |||
| Other payables and accrued expenses | 123,146 | |||
| Total Liabilities | 20,115,908 | |||
| Net Assets | $ | 1,098,137,425 | ||
| Net Assets consist of: | ||||
| Paid in capital | $ | 1,096,918,209 | ||
| Total accumulated earnings (loss) | 1,219,216 | |||
| Net Assets | $ | 1,098,137,425 | ||
Net Asset Value, offering price and redemption price per share ($1,098,137,425 ÷ 109,258,163 shares) | $ | 10.05 | ||
| Statement of Operations | ||||
| For the period November 6, 2023 (commencement of operations) through January 31, 2024 | ||||
| Investment Income | ||||
| Interest | $ | 1,216,639 | ||
| Income from Fidelity Central Funds | 90,264 | |||
| Total Income | 1,306,903 | |||
| Expenses | ||||
| Management fee | $ | 70,542 | ||
| Custodian fees and expenses | 711 | |||
| Independent trustees' fees and expenses | 4 | |||
| Registration fees | 94,790 | |||
| Audit | 37,047 | |||
| Miscellaneous | 200 | |||
| Total expenses before reductions | 203,294 | |||
| Expense reductions | (141,282) | |||
| Total expenses after reductions | 62,012 | |||
| Net Investment income (loss) | 1,244,891 | |||
| Realized and Unrealized Gain (Loss) | ||||
| Net realized gain (loss) on: | ||||
| Investment Securities: | ||||
| Unaffiliated issuers | 587 | |||
| Fidelity Central Funds | 234 | |||
| Total net realized gain (loss) | 821 | |||
| Change in net unrealized appreciation (depreciation) on: | ||||
| Investment Securities: | ||||
| Unaffiliated issuers | 1,116,749 | |||
| Fidelity Central Funds | 6,398 | |||
| Total change in net unrealized appreciation (depreciation) | 1,123,147 | |||
| Net gain (loss) | 1,123,968 | |||
| Net increase (decrease) in net assets resulting from operations | $ | 2,368,859 | ||
| Statement of Changes in Net Assets | ||
| For the period November 6, 2023 (commencement of operations) through January 31, 2024 | ||
| Increase (Decrease) in Net Assets | ||
| Operations | ||
| Net investment income (loss) | $ | 1,244,891 |
| Net realized gain (loss) | 821 | |
| Change in net unrealized appreciation (depreciation) | 1,123,147 | |
| Net increase (decrease) in net assets resulting from operations | 2,368,859 | |
| Distributions to shareholders | (1,149,642) | |
| Share transactions | ||
| Proceeds from sales of shares | 1,106,832,162 | |
| Reinvestment of distributions | 85,971 | |
| Cost of shares redeemed | (9,999,925) | |
Net increase (decrease) in net assets resulting from share transactions | 1,096,918,208 | |
| Total increase (decrease) in net assets | 1,098,137,425 | |
| Net Assets | ||
| Beginning of period | - | |
| End of period | $ | 1,098,137,425 |
| Other Information | ||
| Shares | ||
| Sold | 110,245,491 | |
| Issued in reinvestment of distributions | 8,556 | |
| Redeemed | (995,884) | |
| Net increase (decrease) | 109,258,163 | |
| Fidelity® SAI Conservative Income Municipal Bond Fund |
| Years ended January 31, | 2024 A | |
Selected Per-Share Data | ||
| Net asset value, beginning of period | $ | 10.00 |
| Income from Investment Operations | ||
Net investment income (loss) B,C | .074 | |
| Net realized and unrealized gain (loss) | .062 | |
| Total from investment operations | .136 | |
| Distributions from net investment income | (.086) | |
| Total distributions | (.086) | |
| Net asset value, end of period | $ | 10.05 |
Total Return D,E | 1.36% | |
Ratios to Average Net Assets C,F,G | ||
| Expenses before reductions | .56% H,I | |
| Expenses net of fee waivers, if any | .20% I | |
| Expenses net of all reductions | .20% I | |
| Net investment income (loss) | 4.01% I | |
| Supplemental Data | ||
| Net assets, end of period (000 omitted) | $ | 1,098,137 |
Portfolio turnover rate J | 14% K,L |
| Fidelity Central Fund | Investment Manager | Investment Objective | Investment Practices | Expense RatioA |
| Fidelity Money Market Central Funds | Fidelity Management & Research Company LLC (FMR) | Each fund seeks to obtain a high level of current income consistent with the preservation of capital and liquidity. | Short-term Investments | Less than .005% |
| Gross unrealized appreciation | $1,143,394 |
| Gross unrealized depreciation | (15,134) |
| Net unrealized appreciation (depreciation) | $1,128,260 |
| Tax Cost | $1,098,511,180 |
| Undistributed tax-exempt income | $90,135 |
| Undistributed ordinary income | $821 |
| Net unrealized appreciation (depreciation) on securities and other investments | $1,128,260 |
January 31, 2024A | |
| Tax-exempt Income | $1,149,642 |
| Total | $1,149,642 |
| Purchases ($) | Sales ($) | |
| Fidelity SAI Conservative Income Municipal Bond Fund | 28,355,928 | 1,785,000 |
| Purchases ($) | Sales ($) | Realized Gain (Loss) ($) | |
| Fidelity SAI Conservative Income Municipal Bond Fund | 22,400,000 | - | - |
| Shares | Total Proceeds ($) | |
| Fidelity SAI Conservative Income Municipal Bond Fund | 96,535,634 | 969,217,761 |
| The actual expense Example is based on an investment of $1,000 invested at the beginning of the period and held for the entire period (November 6, 2023 to January 31, 2024). The hypothetical expense Example is based on an investment of $1,000 invested for the one-half year period (August 1, 2023 to January 31, 2024). |
Annualized Expense Ratio- A | Beginning Account Value | Ending Account Value January 31, 2024 | Expenses Paid During Period | |||||||
| Fidelity® SAI Conservative Income Municipal Bond Fund | .20% | |||||||||
| Actual | $ 1,000 | $ 1,013.60 | $ .48C | |||||||
Hypothetical-B | $ 1,000 | $ 1,024.20 | $ 1.02D | |||||||
- Highly liquid investments - cash or convertible to cash within three business days or less
- Moderately liquid investments - convertible to cash in three to seven calendar days
- Less liquid investments - can be sold or disposed of, but not settled, within seven calendar days
- Illiquid investments - cannot be sold or disposed of within seven calendar days
 |


Contents
| Average Annual Total Returns | |||
Periods ended January 31, 2024 | Past 1 year | Past 5 years | Past 10 years |
| Fidelity® Series Large Cap Value Index Fund | 6.12% | 9.32% | 8.81% |
| $10,000 Over 10 Years |
Let's say hypothetically that $10,000 was invested in Fidelity® Series Large Cap Value Index Fund on January 31, 2014. The chart shows how the value of your investment would have changed, and also shows how the Russell 1000® Value Index performed over the same period. |
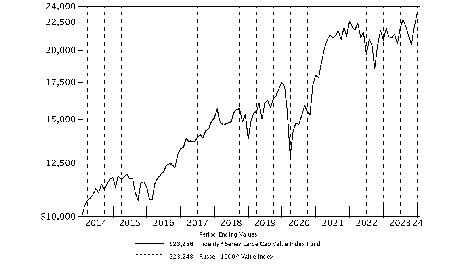 |
Top Holdings (% of Fund's net assets) | ||
| Berkshire Hathaway, Inc. Class B | 3.5 | |
| JPMorgan Chase & Co. | 2.5 | |
| Exxon Mobil Corp. | 2.1 | |
| Johnson & Johnson | 1.9 | |
| Procter & Gamble Co. | 1.5 | |
| Chevron Corp. | 1.3 | |
| Merck & Co., Inc. | 1.2 | |
| Walmart, Inc. | 1.2 | |
| Bank of America Corp. | 1.2 | |
| Cisco Systems, Inc. | 1.0 | |
| 17.4 | ||
| Market Sectors (% of Fund's net assets) | ||
| Financials | 22.2 | |
| Health Care | 14.8 | |
| Industrials | 13.6 | |
| Information Technology | 9.5 | |
| Consumer Staples | 7.9 | |
| Energy | 7.7 | |
| Consumer Discretionary | 5.0 | |
| Communication Services | 4.9 | |
| Real Estate | 4.8 | |
| Utilities | 4.7 | |
| Materials | 4.6 | |
Asset Allocation (% of Fund's net assets) |
 |
Futures - 0.3% |
| Common Stocks - 99.7% | |||
| Shares | Value ($) | ||
| COMMUNICATION SERVICES - 4.9% | |||
| Diversified Telecommunication Services - 1.5% | |||
| AT&T, Inc. | 2,254,051 | 39,874,162 | |
| Frontier Communications Parent, Inc. (a)(b) | 76,164 | 1,875,919 | |
| GCI Liberty, Inc. Class A (Escrow) (c) | 30,220 | 0 | |
| Iridium Communications, Inc. | 2,373 | 86,045 | |
| Verizon Communications, Inc. | 1,324,760 | 56,103,586 | |
| 97,939,712 | |||
| Entertainment - 1.5% | |||
| AMC Entertainment Holdings, Inc. Class A (b) | 62,277 | 252,222 | |
| Electronic Arts, Inc. | 85,090 | 11,706,682 | |
| Liberty Media Corp. Liberty Formula One: | |||
| Class A | 7,432 | 454,021 | |
| Class C | 61,161 | 4,113,077 | |
| Liberty Media Corp. Liberty Live: | |||
| Class C | 14,220 | 529,979 | |
| Series A | 6,428 | 236,743 | |
| Live Nation Entertainment, Inc. (a) | 38,344 | 3,406,864 | |
| Madison Square Garden Sports Corp. (a)(b) | 5,772 | 1,068,397 | |
| Playtika Holding Corp. (a) | 1,102 | 7,956 | |
| Roku, Inc. Class A (a) | 34,230 | 3,014,294 | |
| Take-Two Interactive Software, Inc. (a) | 51,866 | 8,554,259 | |
| The Walt Disney Co. | 575,457 | 55,272,645 | |
| Warner Bros Discovery, Inc. (a) | 693,624 | 6,950,112 | |
| 95,567,251 | |||
| Interactive Media & Services - 0.1% | |||
| IAC, Inc. (a) | 22,984 | 1,154,027 | |
| Match Group, Inc. (a) | 8,650 | 331,987 | |
| TripAdvisor, Inc. (a)(b) | 33,480 | 723,168 | |
| Zoominfo Technologies, Inc. (a) | 45,236 | 725,585 | |
| 2,934,767 | |||
| Media - 1.4% | |||
| Cable One, Inc. (b) | 1,606 | 881,582 | |
| Comcast Corp. Class A | 1,255,998 | 58,454,147 | |
| Fox Corp.: | |||
| Class A | 78,163 | 2,524,665 | |
| Class B | 42,191 | 1,266,152 | |
| Interpublic Group of Companies, Inc. | 121,693 | 4,014,652 | |
| Liberty Broadband Corp.: | |||
| Class A (a) | 4,163 | 323,965 | |
| Class C (a) | 28,693 | 2,250,966 | |
| Liberty Media Corp. Liberty SiriusXM | 49,700 | 1,508,892 | |
| Liberty Media Corp. Liberty SiriusXM Class A | 23,007 | 699,183 | |
| News Corp.: | |||
| Class A | 120,952 | 2,980,257 | |
| Class B | 36,084 | 922,668 | |
| Nexstar Media Group, Inc. Class A | 6,806 | 1,209,494 | |
| Omnicom Group, Inc. | 62,031 | 5,606,362 | |
| Paramount Global: | |||
| Class A (b) | 3,185 | 74,306 | |
| Class B (b) | 183,682 | 2,679,920 | |
| Sirius XM Holdings, Inc. (b) | 199,949 | 1,017,740 | |
| The New York Times Co. Class A (b) | 51,417 | 2,496,810 | |
| 88,911,761 | |||
| Wireless Telecommunication Services - 0.4% | |||
| T-Mobile U.S., Inc. | 164,614 | 26,540,715 | |
TOTAL COMMUNICATION SERVICES | 311,894,206 | ||
| CONSUMER DISCRETIONARY - 5.0% | |||
| Automobile Components - 0.3% | |||
| Aptiv PLC (a) | 85,163 | 6,926,307 | |
| BorgWarner, Inc. | 74,256 | 2,517,278 | |
| Gentex Corp. | 74,645 | 2,472,989 | |
| Lear Corp. | 18,462 | 2,453,600 | |
| Phinia, Inc. (b) | 14,614 | 441,927 | |
| QuantumScape Corp. Class A (a)(b) | 105,092 | 715,677 | |
| 15,527,778 | |||
| Automobiles - 0.6% | |||
| Ford Motor Co. | 1,235,421 | 14,479,134 | |
| General Motors Co. | 432,085 | 16,764,898 | |
| Harley-Davidson, Inc. (b) | 40,053 | 1,299,720 | |
| Lucid Group, Inc. Class A (a)(b) | 231,558 | 782,666 | |
| Rivian Automotive, Inc. (a)(b) | 210,035 | 3,215,636 | |
| Thor Industries, Inc. (b) | 15,930 | 1,800,409 | |
| 38,342,463 | |||
| Broadline Retail - 0.2% | |||
| eBay, Inc. | 158,146 | 6,495,056 | |
| Etsy, Inc. (a) | 16,796 | 1,117,942 | |
| Kohl's Corp. (b) | 34,332 | 884,392 | |
| Macy's, Inc. (b) | 84,198 | 1,539,981 | |
| Nordstrom, Inc. (b) | 35,559 | 645,396 | |
| Ollie's Bargain Outlet Holdings, Inc. (a) | 13,002 | 935,234 | |
| 11,618,001 | |||
| Distributors - 0.2% | |||
| Genuine Parts Co. | 44,176 | 6,194,800 | |
| LKQ Corp. | 84,109 | 3,925,367 | |
| 10,120,167 | |||
| Diversified Consumer Services - 0.1% | |||
| ADT, Inc. (b) | 64,867 | 423,582 | |
| Bright Horizons Family Solutions, Inc. (a)(b) | 15,655 | 1,538,104 | |
| Grand Canyon Education, Inc. (a) | 6,669 | 870,905 | |
| H&R Block, Inc. (b) | 15,967 | 747,894 | |
| Mister Car Wash, Inc. (a)(b) | 23,387 | 194,112 | |
| Service Corp. International | 29,929 | 2,008,834 | |
| 5,783,431 | |||
| Hotels, Restaurants & Leisure - 1.4% | |||
| Aramark | 72,814 | 2,117,431 | |
| Boyd Gaming Corp. (b) | 22,453 | 1,425,541 | |
| Caesars Entertainment, Inc. (a) | 37,815 | 1,658,944 | |
| Carnival Corp. (a) | 312,824 | 5,186,622 | |
| Cava Group, Inc. (b) | 1,106 | 51,761 | |
| Darden Restaurants, Inc. (b) | 20,383 | 3,313,868 | |
| Doordash, Inc. (a) | 20,653 | 2,152,043 | |
| Expedia, Inc. (a) | 11,467 | 1,700,900 | |
| Hilton Worldwide Holdings, Inc. | 42,583 | 8,131,650 | |
| Hyatt Hotels Corp. Class A | 13,694 | 1,757,899 | |
| Las Vegas Sands Corp. | 7,822 | 382,652 | |
| Marriott Vacations Worldwide Corp. (b) | 11,161 | 936,296 | |
| McDonald's Corp. | 134,749 | 39,443,727 | |
| MGM Resorts International (a) | 89,145 | 3,866,219 | |
| Norwegian Cruise Line Holdings Ltd. (a) | 99,798 | 1,776,404 | |
| Penn Entertainment, Inc. (a) | 46,419 | 1,046,748 | |
| Planet Fitness, Inc. (a) | 13,843 | 938,002 | |
| Royal Caribbean Cruises Ltd. (a) | 51,504 | 6,566,760 | |
| Travel+Leisure Co. | 12,025 | 486,051 | |
| Vail Resorts, Inc. (b) | 10,583 | 2,349,426 | |
| Wyndham Hotels & Resorts, Inc. (b) | 23,462 | 1,828,394 | |
| Wynn Resorts Ltd. | 30,961 | 2,923,647 | |
| Yum! Brands, Inc. | 10,660 | 1,380,363 | |
| 91,421,348 | |||
| Household Durables - 0.9% | |||
| D.R. Horton, Inc. | 97,897 | 13,990,460 | |
| Garmin Ltd. | 48,350 | 5,777,342 | |
| Leggett & Platt, Inc. | 41,121 | 954,418 | |
| Lennar Corp.: | |||
| Class A | 76,928 | 11,527,661 | |
| Class B (b) | 4,429 | 614,524 | |
| Mohawk Industries, Inc. (a) | 16,451 | 1,715,017 | |
| Newell Brands, Inc. | 118,118 | 982,742 | |
| NVR, Inc. (a) | 848 | 5,999,846 | |
| PulteGroup, Inc. | 67,382 | 7,045,462 | |
| Tempur Sealy International, Inc. (b) | 41,342 | 2,062,552 | |
| Toll Brothers, Inc. | 33,924 | 3,370,349 | |
| TopBuild Corp. (a) | 9,371 | 3,459,117 | |
| Whirlpool Corp. | 16,637 | 1,822,084 | |
| 59,321,574 | |||
| Leisure Products - 0.1% | |||
| Brunswick Corp. (b) | 19,880 | 1,603,918 | |
| Hasbro, Inc. | 40,627 | 1,988,692 | |
| Mattel, Inc. (a) | 109,442 | 1,957,917 | |
| Polaris, Inc. (b) | 15,307 | 1,377,018 | |
| 6,927,545 | |||
| Specialty Retail - 0.7% | |||
| Advance Auto Parts, Inc. (b) | 18,423 | 1,231,578 | |
| AutoNation, Inc. (a) | 8,851 | 1,236,131 | |
| AutoZone, Inc. (a) | 904 | 2,496,966 | |
| Bath & Body Works, Inc. | 72,617 | 3,097,841 | |
| Best Buy Co., Inc. | 53,115 | 3,850,306 | |
| CarMax, Inc. (a) | 47,196 | 3,359,411 | |
| Dick's Sporting Goods, Inc. | 17,697 | 2,638,092 | |
| GameStop Corp. Class A (a)(b) | 83,471 | 1,187,792 | |
| Gap, Inc. | 60,585 | 1,132,334 | |
| Lithia Motors, Inc. Class A (sub. vtg.) | 8,609 | 2,538,364 | |
| Lowe's Companies, Inc. | 48,523 | 10,327,635 | |
| Murphy U.S.A., Inc. | 322 | 113,511 | |
| O'Reilly Automotive, Inc. (a) | 2,854 | 2,919,785 | |
| Penske Automotive Group, Inc. (b) | 6,077 | 901,644 | |
| Petco Health & Wellness Co., Inc. (a)(b) | 24,855 | 59,403 | |
| RH (a) | 4,035 | 1,022,792 | |
| Ross Stores, Inc. | 6,994 | 981,118 | |
| Valvoline, Inc. (a)(b) | 31,697 | 1,156,624 | |
| Victoria's Secret & Co. (a)(b) | 13,342 | 347,559 | |
| Wayfair LLC Class A (a)(b) | 16,610 | 834,653 | |
| Williams-Sonoma, Inc. (b) | 17,563 | 3,396,509 | |
| 44,830,048 | |||
| Textiles, Apparel & Luxury Goods - 0.5% | |||
| Birkenstock Holding PLC (b) | 6,639 | 307,983 | |
| Capri Holdings Ltd. (a) | 35,151 | 1,713,260 | |
| Carter's, Inc. (b) | 11,178 | 845,504 | |
| Columbia Sportswear Co. (b) | 10,979 | 870,196 | |
| NIKE, Inc. Class B | 174,853 | 17,752,825 | |
| PVH Corp. (b) | 19,164 | 2,304,663 | |
| Ralph Lauren Corp. | 12,417 | 1,783,950 | |
| Skechers U.S.A., Inc. Class A (sub. vtg.) (a)(b) | 39,411 | 2,460,823 | |
| Tapestry, Inc. | 68,182 | 2,644,780 | |
| Under Armour, Inc.: | |||
| Class A (sub. vtg.) (a) | 62,598 | 476,997 | |
| Class C (non-vtg.) (a) | 58,379 | 432,005 | |
| VF Corp. | 108,745 | 1,789,943 | |
| 33,382,929 | |||
TOTAL CONSUMER DISCRETIONARY | 317,275,284 | ||
| CONSUMER STAPLES - 7.9% | |||
| Beverages - 1.3% | |||
| Boston Beer Co., Inc. Class A (a) | 220 | 76,839 | |
| Brown-Forman Corp.: | |||
| Class A (b) | 3,121 | 175,931 | |
| Class B (non-vtg.) | 11,799 | 647,765 | |
| Constellation Brands, Inc. Class A (sub. vtg.) | 45,648 | 11,187,412 | |
| Keurig Dr. Pepper, Inc. | 300,391 | 9,444,293 | |
| Molson Coors Beverage Co. Class B | 55,315 | 3,417,914 | |
| PepsiCo, Inc. | 133,917 | 22,569,032 | |
| The Coca-Cola Co. | 617,429 | 36,730,851 | |
| 84,250,037 | |||
| Consumer Staples Distribution & Retail - 1.7% | |||
| Albertsons Companies, Inc. | 121,175 | 2,571,334 | |
| BJ's Wholesale Club Holdings, Inc. (a) | 27,058 | 1,740,912 | |
| Casey's General Stores, Inc. | 10,132 | 2,749,420 | |
| Dollar Tree, Inc. (a) | 65,668 | 8,577,554 | |
| Grocery Outlet Holding Corp. (a)(b) | 29,526 | 731,654 | |
| Kroger Co. | 205,283 | 9,471,758 | |
| Maplebear, Inc. (NASDAQ) (b) | 2,000 | 48,940 | |
| Performance Food Group Co. (a)(b) | 25,259 | 1,835,824 | |
| U.S. Foods Holding Corp. (a) | 71,739 | 3,300,711 | |
| Walgreens Boots Alliance, Inc. | 225,700 | 5,094,049 | |
| Walmart, Inc. | 449,070 | 74,208,818 | |
| 110,330,974 | |||
| Food Products - 1.7% | |||
| Archer Daniels Midland Co. | 167,989 | 9,336,829 | |
| Bunge Global SA | 45,669 | 4,022,982 | |
| Campbell Soup Co. | 59,473 | 2,654,280 | |
| Conagra Brands, Inc. | 150,003 | 4,372,587 | |
| Darling Ingredients, Inc. (a) | 50,616 | 2,191,673 | |
| Flowers Foods, Inc. | 58,535 | 1,334,598 | |
| Freshpet, Inc. (a)(b) | 9,760 | 840,336 | |
| General Mills, Inc. | 182,976 | 11,876,972 | |
| Hormel Foods Corp. | 91,976 | 2,793,311 | |
| Ingredion, Inc. (b) | 21,059 | 2,265,317 | |
| Kellanova | 81,933 | 4,486,651 | |
| Lamb Weston Holdings, Inc. | 2,513 | 257,432 | |
| McCormick & Co., Inc. (non-vtg.) | 79,186 | 5,397,318 | |
| Mondelez International, Inc. | 427,740 | 32,195,990 | |
| Pilgrim's Pride Corp. (a) | 12,858 | 349,352 | |
| Post Holdings, Inc. (a) | 15,992 | 1,485,177 | |
| Seaboard Corp. | 66 | 237,798 | |
| The Hershey Co. | 12,033 | 2,328,867 | |
| The J.M. Smucker Co. | 32,384 | 4,260,115 | |
| The Kraft Heinz Co. | 252,566 | 9,377,776 | |
| Tyson Foods, Inc. Class A | 87,565 | 4,795,059 | |
| WK Kellogg Co. | 20,221 | 262,671 | |
| 107,123,091 | |||
| Household Products - 1.9% | |||
| Church & Dwight Co., Inc. | 7,910 | 789,814 | |
| Colgate-Palmolive Co. | 258,398 | 21,757,112 | |
| Kimberly-Clark Corp. | 6,189 | 748,683 | |
| Procter & Gamble Co. | 601,563 | 94,529,610 | |
| Reynolds Consumer Products, Inc. | 16,761 | 455,396 | |
| Spectrum Brands Holdings, Inc. (b) | 10,858 | 853,656 | |
| 119,134,271 | |||
| Personal Care Products - 0.2% | |||
| Coty, Inc. Class A (a)(b) | 117,245 | 1,416,320 | |
| Estee Lauder Companies, Inc. Class A | 49,689 | 6,558,451 | |
| Kenvue, Inc. | 361,179 | 7,498,076 | |
| Olaplex Holdings, Inc. (a)(b) | 39,488 | 88,848 | |
| 15,561,695 | |||
| Tobacco - 1.1% | |||
| Altria Group, Inc. | 561,735 | 22,536,808 | |
| Philip Morris International, Inc. | 488,315 | 44,363,418 | |
| 66,900,226 | |||
TOTAL CONSUMER STAPLES | 503,300,294 | ||
| ENERGY - 7.7% | |||
| Energy Equipment & Services - 0.7% | |||
| Baker Hughes Co. Class A | 318,701 | 9,082,979 | |
| Halliburton Co. | 226,149 | 8,062,212 | |
| NOV, Inc. (b) | 124,975 | 2,438,262 | |
| Schlumberger Ltd. | 448,488 | 21,841,366 | |
| TechnipFMC PLC (b) | 134,605 | 2,603,261 | |
| 44,028,080 | |||
| Oil, Gas & Consumable Fuels - 7.0% | |||
| Antero Midstream GP LP (b) | 70,183 | 859,040 | |
| Antero Resources Corp. (a)(b) | 87,935 | 1,964,468 | |
| APA Corp. | 10,909 | 341,779 | |
| Chesapeake Energy Corp. (b) | 39,703 | 3,061,498 | |
| Chevron Corp. | 541,511 | 79,834,967 | |
| ConocoPhillips Co. | 377,060 | 42,181,702 | |
| Coterra Energy, Inc. | 235,090 | 5,849,039 | |
| Devon Energy Corp. | 201,931 | 8,485,141 | |
| Diamondback Energy, Inc. | 56,114 | 8,626,966 | |
| DT Midstream, Inc. (b) | 30,181 | 1,620,418 | |
| EOG Resources, Inc. | 184,996 | 21,050,695 | |
| EQT Corp. | 113,783 | 4,027,918 | |
| Exxon Mobil Corp. | 1,274,038 | 130,983,847 | |
| Hess Corp. | 38,701 | 5,438,652 | |
| HF Sinclair Corp. | 46,053 | 2,601,534 | |
| Kinder Morgan, Inc. | 617,062 | 10,440,689 | |
| Marathon Oil Corp. | 190,502 | 4,352,971 | |
| Marathon Petroleum Corp. | 119,406 | 19,773,634 | |
| Occidental Petroleum Corp. | 216,308 | 12,452,852 | |
| ONEOK, Inc. | 173,058 | 11,811,209 | |
| Ovintiv, Inc. | 44,475 | 1,886,630 | |
| Phillips 66 Co. | 140,048 | 20,210,327 | |
| Pioneer Natural Resources Co. | 73,233 | 16,831,140 | |
| Range Resources Corp. (b) | 72,783 | 2,113,618 | |
| Southwestern Energy Co. (a) | 341,062 | 2,199,850 | |
| The Williams Companies, Inc. | 383,077 | 13,277,449 | |
| Valero Energy Corp. | 106,835 | 14,839,382 | |
| 447,117,415 | |||
TOTAL ENERGY | 491,145,495 | ||
| FINANCIALS - 22.2% | |||
| Banks - 7.2% | |||
| Bank of America Corp. | 2,168,686 | 73,757,011 | |
| Bank OZK | 33,140 | 1,494,945 | |
| BOK Financial Corp. | 8,817 | 739,217 | |
| Citigroup, Inc. | 601,851 | 33,805,971 | |
| Citizens Financial Group, Inc. | 146,590 | 4,793,493 | |
| Columbia Banking Systems, Inc. | 64,685 | 1,304,050 | |
| Comerica, Inc. | 41,987 | 2,207,676 | |
| Commerce Bancshares, Inc. | 38,415 | 2,002,190 | |
| Cullen/Frost Bankers, Inc. | 18,404 | 1,953,032 | |
| East West Bancorp, Inc. (b) | 44,469 | 3,237,788 | |
| Fifth Third Bancorp | 213,971 | 7,326,367 | |
| First Citizens Bancshares, Inc. | 3,046 | 4,599,460 | |
| First Hawaiian, Inc. | 39,526 | 857,319 | |
| First Horizon National Corp. (b) | 176,885 | 2,518,842 | |
| FNB Corp., Pennsylvania | 111,239 | 1,466,130 | |
| Huntington Bancshares, Inc. | 453,400 | 5,771,782 | |
| JPMorgan Chase & Co. | 908,435 | 158,394,727 | |
| KeyCorp | 293,732 | 4,267,926 | |
| M&T Bank Corp. | 52,150 | 7,201,915 | |
| New York Community Bancorp, Inc. (b) | 221,425 | 1,432,620 | |
| Nu Holdings Ltd. (a) | 229,078 | 1,972,362 | |
| Pinnacle Financial Partners, Inc. | 24,041 | 2,124,744 | |
| PNC Financial Services Group, Inc. | 125,397 | 18,961,280 | |
| Popular, Inc. | 21,884 | 1,869,988 | |
| Prosperity Bancshares, Inc. | 27,085 | 1,731,002 | |
| Regions Financial Corp. | 294,453 | 5,497,438 | |
| Synovus Financial Corp. | 44,982 | 1,694,022 | |
| TFS Financial Corp. (b) | 15,442 | 205,687 | |
| Truist Financial Corp. | 417,660 | 15,478,480 | |
| U.S. Bancorp | 490,441 | 20,372,919 | |
| Webster Financial Corp. | 54,298 | 2,686,665 | |
| Wells Fargo & Co. | 1,155,036 | 57,959,706 | |
| Western Alliance Bancorp. (b) | 33,613 | 2,149,887 | |
| Wintrust Financial Corp. | 18,912 | 1,834,086 | |
| Zions Bancorporation NA | 45,244 | 1,895,724 | |
| 455,566,451 | |||
| Capital Markets - 5.3% | |||
| Affiliated Managers Group, Inc. | 10,769 | 1,602,858 | |
| Bank of New York Mellon Corp. | 242,280 | 13,436,849 | |
| BlackRock, Inc. Class A | 46,772 | 36,216,027 | |
| Blue Owl Capital, Inc. Class A | 120,576 | 1,873,751 | |
| Carlyle Group LP (b) | 67,060 | 2,683,741 | |
| Cboe Global Markets, Inc. | 33,064 | 6,078,816 | |
| Charles Schwab Corp. | 466,513 | 29,352,998 | |
| CME Group, Inc. | 112,966 | 23,252,921 | |
| Coinbase Global, Inc. (a)(b) | 53,287 | 6,831,393 | |
| Evercore, Inc. Class A | 10,938 | 1,878,383 | |
| Franklin Resources, Inc. | 90,698 | 2,415,288 | |
| Goldman Sachs Group, Inc. | 100,346 | 38,533,867 | |
| Houlihan Lokey | 14,574 | 1,745,674 | |
| Interactive Brokers Group, Inc. (b) | 32,891 | 2,919,076 | |
| Intercontinental Exchange, Inc. | 178,087 | 22,675,818 | |
| Invesco Ltd. | 112,941 | 1,787,856 | |
| Janus Henderson Group PLC | 41,515 | 1,193,971 | |
| Jefferies Financial Group, Inc. | 57,778 | 2,355,031 | |
| KKR & Co. LP (b) | 157,400 | 13,627,692 | |
| Lazard, Inc. Class A (b) | 34,095 | 1,329,023 | |
| Moody's Corp. | 4,350 | 1,705,374 | |
| Morgan Stanley | 378,431 | 33,014,320 | |
| MSCI, Inc. | 12,087 | 7,235,520 | |
| NASDAQ, Inc. | 107,610 | 6,216,630 | |
| Northern Trust Corp. | 64,471 | 5,134,470 | |
| Raymond James Financial, Inc. | 59,618 | 6,568,711 | |
| Robinhood Markets, Inc. (a) | 209,037 | 2,245,057 | |
| S&P Global, Inc. | 92,549 | 41,494,344 | |
| SEI Investments Co. | 31,232 | 1,975,112 | |
| State Street Corp. | 97,067 | 7,170,339 | |
| Stifel Financial Corp. | 31,650 | 2,308,868 | |
| T. Rowe Price Group, Inc. | 69,486 | 7,535,757 | |
| TPG, Inc. | 14,214 | 591,729 | |
| Tradeweb Markets, Inc. Class A | 23,304 | 2,222,969 | |
| Virtu Financial, Inc. Class A | 27,508 | 461,859 | |
| XP, Inc. Class A | 92,084 | 2,263,425 | |
| 339,935,517 | |||
| Consumer Finance - 1.0% | |||
| Ally Financial, Inc. (b) | 85,730 | 3,144,576 | |
| American Express Co. | 122,656 | 24,621,965 | |
| Capital One Financial Corp. | 119,284 | 16,141,511 | |
| Credit Acceptance Corp. (a)(b) | 1,945 | 1,052,381 | |
| Discover Financial Services | 78,536 | 8,287,119 | |
| OneMain Holdings, Inc. (b) | 34,891 | 1,660,812 | |
| SLM Corp. | 42,394 | 842,793 | |
| SoFi Technologies, Inc. (a)(b) | 297,263 | 2,327,569 | |
| Synchrony Financial | 129,645 | 5,039,301 | |
| 63,118,027 | |||
| Financial Services - 4.5% | |||
| Affirm Holdings, Inc. (a)(b) | 71,413 | 2,892,941 | |
| Berkshire Hathaway, Inc. Class B (a) | 576,214 | 221,116,346 | |
| Block, Inc. Class A (a) | 107,215 | 6,970,047 | |
| Corebridge Financial, Inc. | 71,159 | 1,719,913 | |
| Euronet Worldwide, Inc. (a) | 7,376 | 735,018 | |
| Fidelity National Information Services, Inc. | 186,583 | 11,616,658 | |
| Fiserv, Inc. (a) | 136,623 | 19,382,705 | |
| FleetCor Technologies, Inc. (a) | 1,553 | 450,261 | |
| Global Payments, Inc. | 81,205 | 10,818,942 | |
| Jack Henry & Associates, Inc. | 15,800 | 2,620,114 | |
| MGIC Investment Corp. | 85,660 | 1,699,494 | |
| NCR Atleos Corp. | 20,163 | 451,450 | |
| PayPal Holdings, Inc. (a) | 32,126 | 1,970,930 | |
| Rocket Companies, Inc. (a)(b) | 23,734 | 292,166 | |
| The Western Union Co. (b) | 96,351 | 1,211,132 | |
| UWM Holdings Corp. Class A | 18,549 | 124,278 | |
| Voya Financial, Inc. (b) | 31,277 | 2,263,516 | |
| WEX, Inc. (a)(b) | 7,216 | 1,474,878 | |
| 287,810,789 | |||
| Insurance - 4.1% | |||
| AFLAC, Inc. | 185,416 | 15,637,985 | |
| Allstate Corp. | 82,529 | 12,812,627 | |
| American Financial Group, Inc. | 23,109 | 2,782,324 | |
| American International Group, Inc. | 223,741 | 15,552,237 | |
| Aon PLC | 62,363 | 18,610,990 | |
| Arch Capital Group Ltd. (a) | 96,665 | 7,968,096 | |
| Arthur J. Gallagher & Co. | 62,837 | 14,588,238 | |
| Assurant, Inc. | 16,795 | 2,820,720 | |
| Assured Guaranty Ltd. | 17,489 | 1,418,883 | |
| Axis Capital Holdings Ltd. | 24,209 | 1,440,920 | |
| Brighthouse Financial, Inc. (a) | 18,091 | 936,571 | |
| Brown & Brown, Inc. | 45,749 | 3,548,292 | |
| Chubb Ltd. | 127,680 | 31,281,600 | |
| Cincinnati Financial Corp. | 48,286 | 5,350,089 | |
| CNA Financial Corp. | 8,142 | 358,818 | |
| Everest Re Group Ltd. | 11,683 | 4,497,605 | |
| Fidelity National Financial, Inc. | 81,853 | 4,095,106 | |
| First American Financial Corp. (b) | 31,162 | 1,880,627 | |
| Globe Life, Inc. | 27,801 | 3,414,519 | |
| Hanover Insurance Group, Inc. | 11,050 | 1,458,711 | |
| Hartford Financial Services Group, Inc. | 92,705 | 8,061,627 | |
| Kemper Corp. | 18,700 | 1,122,000 | |
| Lincoln National Corp. | 47,740 | 1,310,463 | |
| Loews Corp. | 57,747 | 4,207,446 | |
| Markel Group, Inc. (a)(b) | 4,132 | 6,187,381 | |
| Marsh & McLennan Companies, Inc. | 30,975 | 6,004,194 | |
| MetLife, Inc. | 199,256 | 13,812,426 | |
| Old Republic International Corp. | 81,207 | 2,277,044 | |
| Primerica, Inc. (b) | 3,878 | 908,072 | |
| Principal Financial Group, Inc. | 76,156 | 6,023,940 | |
| Progressive Corp. | 46,142 | 8,224,812 | |
| Prudential Financial, Inc. | 114,161 | 11,978,914 | |
| Reinsurance Group of America, Inc. | 21,021 | 3,655,342 | |
| RenaissanceRe Holdings Ltd. (b) | 11,754 | 2,689,668 | |
| RLI Corp. | 9,757 | 1,330,562 | |
| The Travelers Companies, Inc. | 71,671 | 15,148,383 | |
| Unum Group (b) | 62,358 | 3,014,386 | |
| W.R. Berkley Corp. | 62,918 | 5,151,726 | |
| White Mountains Insurance Group Ltd. (b) | 772 | 1,216,649 | |
| Willis Towers Watson PLC | 28,474 | 7,013,146 | |
| 259,793,139 | |||
| Mortgage Real Estate Investment Trusts - 0.1% | |||
| AGNC Investment Corp. (b) | 200,914 | 1,904,665 | |
| Annaly Capital Management, Inc. (b) | 156,826 | 3,009,491 | |
| Rithm Capital Corp. (b) | 149,904 | 1,603,973 | |
| Starwood Property Trust, Inc. (b) | 91,642 | 1,863,082 | |
| 8,381,211 | |||
TOTAL FINANCIALS | 1,414,605,134 | ||
| HEALTH CARE - 14.8% | |||
| Biotechnology - 1.8% | |||
| Alnylam Pharmaceuticals, Inc. (a) | 7,597 | 1,313,597 | |
| Amgen, Inc. | 53,765 | 16,896,189 | |
| Biogen, Inc. (a) | 45,314 | 11,177,151 | |
| BioMarin Pharmaceutical, Inc. (a) | 52,009 | 4,580,953 | |
| Exact Sciences Corp. (a) | 37,172 | 2,431,049 | |
| Exelixis, Inc. (a) | 25,698 | 559,188 | |
| Gilead Sciences, Inc. | 393,295 | 30,779,267 | |
| Incyte Corp. (a) | 15,002 | 881,668 | |
| Ionis Pharmaceuticals, Inc. (a) | 6,099 | 313,428 | |
| Karuna Therapeutics, Inc. (a) | 1,182 | 370,462 | |
| Moderna, Inc. (a) | 104,628 | 10,572,659 | |
| Regeneron Pharmaceuticals, Inc. (a) | 30,053 | 28,333,367 | |
| Repligen Corp. (a)(b) | 9,638 | 1,825,437 | |
| Roivant Sciences Ltd. (a) | 5,796 | 57,960 | |
| United Therapeutics Corp. (a) | 14,318 | 3,075,220 | |
| Vertex Pharmaceuticals, Inc. (a) | 6,953 | 3,013,291 | |
| 116,180,886 | |||
| Health Care Equipment & Supplies - 3.6% | |||
| Abbott Laboratories | 510,507 | 57,763,867 | |
| Baxter International, Inc. | 159,289 | 6,162,891 | |
| Becton, Dickinson & Co. | 91,150 | 21,767,532 | |
| Boston Scientific Corp. (a) | 460,347 | 29,121,551 | |
| Dentsply Sirona, Inc. | 65,725 | 2,283,944 | |
| Enovis Corp. (a)(b) | 16,290 | 956,223 | |
| Envista Holdings Corp. (a)(b) | 50,783 | 1,193,401 | |
| GE Healthcare Holding LLC | 113,434 | 8,321,518 | |
| Globus Medical, Inc. (a)(b) | 26,413 | 1,394,342 | |
| Hologic, Inc. (a) | 76,476 | 5,692,873 | |
| ICU Medical, Inc. (a) | 6,306 | 577,188 | |
| Integra LifeSciences Holdings Corp. (a) | 21,183 | 850,497 | |
| Medtronic PLC | 418,067 | 36,597,585 | |
| QuidelOrtho Corp. (a)(b) | 16,572 | 1,135,348 | |
| STERIS PLC | 31,238 | 6,839,560 | |
| Stryker Corp. | 83,418 | 27,985,071 | |
| Tandem Diabetes Care, Inc. (a) | 17,450 | 397,860 | |
| Teleflex, Inc. | 14,856 | 3,607,482 | |
| The Cooper Companies, Inc. | 15,307 | 5,709,970 | |
| Zimmer Biomet Holdings, Inc. | 66,137 | 8,306,807 | |
| 226,665,510 | |||
| Health Care Providers & Services - 3.1% | |||
| Acadia Healthcare Co., Inc. (a) | 27,886 | 2,290,556 | |
| agilon health, Inc. (a)(b) | 9,589 | 56,479 | |
| Amedisys, Inc. (a)(b) | 9,950 | 937,987 | |
| Cardinal Health, Inc. | 38,008 | 4,150,094 | |
| Centene Corp. (a) | 167,906 | 12,645,001 | |
| Chemed Corp. | 1,301 | 771,220 | |
| Cigna Group | 85,082 | 25,605,428 | |
| CVS Health Corp. | 402,985 | 29,969,994 | |
| Elevance Health, Inc. | 64,672 | 31,911,752 | |
| Encompass Health Corp. | 29,447 | 2,091,915 | |
| HCA Holdings, Inc. | 49,629 | 15,131,882 | |
| Henry Schein, Inc. (a) | 41,331 | 3,093,212 | |
| Humana, Inc. | 22,253 | 8,412,969 | |
| Laboratory Corp. of America Holdings | 26,662 | 5,926,963 | |
| McKesson Corp. | 26,376 | 13,185,099 | |
| Molina Healthcare, Inc. (a) | 8,363 | 2,980,908 | |
| Premier, Inc. | 36,866 | 797,043 | |
| Quest Diagnostics, Inc. | 35,302 | 4,533,836 | |
| R1 RCM, Inc. (a)(b) | 47,809 | 489,564 | |
| Tenet Healthcare Corp. (a) | 32,108 | 2,656,616 | |
| UnitedHealth Group, Inc. | 46,485 | 23,788,234 | |
| Universal Health Services, Inc. Class B | 19,024 | 3,021,201 | |
| 194,447,953 | |||
| Health Care Technology - 0.0% | |||
| Certara, Inc. (a) | 23,835 | 385,174 | |
| Doximity, Inc. (a)(b) | 21,059 | 567,540 | |
| Teladoc Health, Inc. (a)(b) | 51,176 | 994,350 | |
| 1,947,064 | |||
| Life Sciences Tools & Services - 1.7% | |||
| Agilent Technologies, Inc. | 17,004 | 2,212,220 | |
| Avantor, Inc. (a)(b) | 212,430 | 4,883,766 | |
| Azenta, Inc. (a) | 18,391 | 1,199,093 | |
| Bio-Rad Laboratories, Inc. Class A (a) | 6,397 | 2,052,733 | |
| Bio-Techne Corp. | 2,741 | 192,747 | |
| Charles River Laboratories International, Inc. (a) | 16,051 | 3,471,510 | |
| Danaher Corp. | 207,188 | 49,706,473 | |
| Fortrea Holdings, Inc. (b) | 27,500 | 851,400 | |
| ICON PLC (a) | 21,839 | 5,697,140 | |
| Illumina, Inc. (a) | 34,980 | 5,002,490 | |
| IQVIA Holdings, Inc. (a) | 4,128 | 859,573 | |
| Maravai LifeSciences Holdings, Inc. (a) | 14,445 | 83,781 | |
| QIAGEN NV (b) | 70,916 | 3,096,193 | |
| Revvity, Inc. | 39,109 | 4,191,703 | |
| Sotera Health Co. (a)(b) | 9,127 | 134,349 | |
| Thermo Fisher Scientific, Inc. | 46,639 | 25,137,488 | |
| 108,772,659 | |||
| Pharmaceuticals - 4.6% | |||
| Bristol-Myers Squibb Co. | 640,753 | 31,313,599 | |
| Catalent, Inc. (a) | 57,059 | 2,946,527 | |
| Elanco Animal Health, Inc. (a)(b) | 156,328 | 2,304,275 | |
| Jazz Pharmaceuticals PLC (a) | 9,130 | 1,120,434 | |
| Johnson & Johnson | 758,400 | 120,509,760 | |
| Merck & Co., Inc. | 652,222 | 78,775,373 | |
| Organon & Co. (b) | 79,617 | 1,325,623 | |
| Perrigo Co. PLC | 42,000 | 1,347,360 | |
| Pfizer, Inc. | 1,778,432 | 48,159,939 | |
| Royalty Pharma PLC | 117,576 | 3,337,983 | |
| Viatris, Inc. | 377,126 | 4,438,773 | |
| 295,579,646 | |||
TOTAL HEALTH CARE | 943,593,718 | ||
| INDUSTRIALS - 13.6% | |||
| Aerospace & Defense - 2.6% | |||
| BWX Technologies, Inc. | 23,540 | 1,918,039 | |
| Curtiss-Wright Corp. | 12,127 | 2,699,106 | |
| General Dynamics Corp. | 77,005 | 20,405,555 | |
| HEICO Corp. | 1,516 | 272,258 | |
| HEICO Corp. Class A | 2,302 | 325,664 | |
| Hexcel Corp. (b) | 26,210 | 1,740,082 | |
| Howmet Aerospace, Inc. | 119,308 | 6,712,268 | |
| Huntington Ingalls Industries, Inc. | 12,419 | 3,215,527 | |
| L3Harris Technologies, Inc. | 59,546 | 12,410,577 | |
| Mercury Systems, Inc. (a)(b) | 16,765 | 497,250 | |
| Northrop Grumman Corp. | 42,485 | 18,980,599 | |
| RTX Corp. | 452,644 | 41,244,921 | |
| Spirit AeroSystems Holdings, Inc. Class A (a)(b) | 29,154 | 800,569 | |
| Textron, Inc. | 61,565 | 5,215,171 | |
| The Boeing Co. (a) | 151,635 | 32,001,050 | |
| TransDigm Group, Inc. | 13,851 | 15,134,711 | |
| Woodward, Inc. | 19,028 | 2,621,488 | |
| 166,194,835 | |||
| Air Freight & Logistics - 0.8% | |||
| C.H. Robinson Worldwide, Inc. | 7,913 | 665,404 | |
| Expeditors International of Washington, Inc. | 40,082 | 5,063,559 | |
| FedEx Corp. | 72,941 | 17,599,934 | |
| GXO Logistics, Inc. (a) | 37,463 | 2,037,238 | |
| United Parcel Service, Inc. Class B | 164,718 | 23,373,484 | |
| 48,739,619 | |||
| Building Products - 1.1% | |||
| A.O. Smith Corp. (b) | 33,613 | 2,608,705 | |
| Allegion PLC | 2,031 | 251,621 | |
| Armstrong World Industries, Inc. (b) | 9,641 | 956,484 | |
| Builders FirstSource, Inc. (a) | 38,656 | 6,715,707 | |
| Carlisle Companies, Inc. | 15,238 | 4,788,694 | |
| Carrier Global Corp. | 262,184 | 14,344,087 | |
| Fortune Brands Innovations, Inc. (b) | 40,049 | 3,107,402 | |
| Hayward Holdings, Inc. (a)(b) | 41,337 | 517,539 | |
| Johnson Controls International PLC | 214,027 | 11,277,083 | |
| Lennox International, Inc. | 10,074 | 4,313,284 | |
| Masco Corp. | 70,808 | 4,764,670 | |
| Owens Corning | 27,935 | 4,232,991 | |
| The AZEK Co., Inc. (a) | 41,047 | 1,582,772 | |
| Trane Technologies PLC | 50,481 | 12,723,736 | |
| 72,184,775 | |||
| Commercial Services & Supplies - 0.5% | |||
| Cintas Corp. | 2,966 | 1,793,155 | |
| Clean Harbors, Inc. (a) | 16,081 | 2,700,965 | |
| Driven Brands Holdings, Inc. (a) | 19,189 | 251,568 | |
| MSA Safety, Inc. | 9,528 | 1,572,406 | |
| RB Global, Inc. | 13,268 | 848,754 | |
| Republic Services, Inc. | 64,841 | 11,095,592 | |
| Stericycle, Inc. (a)(b) | 28,673 | 1,376,304 | |
| Tetra Tech, Inc. (b) | 13,859 | 2,192,217 | |
| Veralto Corp. | 69,141 | 5,302,423 | |
| Vestis Corp. | 36,434 | 779,688 | |
| Waste Management, Inc. | 12,791 | 2,374,393 | |
| 30,287,465 | |||
| Construction & Engineering - 0.3% | |||
| AECOM (b) | 41,381 | 3,649,390 | |
| EMCOR Group, Inc. (b) | 9,435 | 2,152,218 | |
| MasTec, Inc. (a)(b) | 19,368 | 1,271,897 | |
| MDU Resources Group, Inc. | 62,658 | 1,222,458 | |
| Quanta Services, Inc. | 33,406 | 6,482,434 | |
| Valmont Industries, Inc. (b) | 6,033 | 1,361,708 | |
| Willscot Mobile Mini Holdings (a) | 44,613 | 2,110,195 | |
| 18,250,300 | |||
| Electrical Equipment - 1.3% | |||
| Acuity Brands, Inc. (b) | 9,707 | 2,311,819 | |
| AMETEK, Inc. | 72,350 | 11,724,318 | |
| Eaton Corp. PLC | 125,316 | 30,837,761 | |
| Emerson Electric Co. | 179,616 | 16,476,176 | |
| Generac Holdings, Inc. (a) | 18,911 | 2,149,613 | |
| Hubbell, Inc. Class B | 9,238 | 3,099,996 | |
| nVent Electric PLC | 52,126 | 3,129,645 | |
| Plug Power, Inc. (a)(b) | 164,575 | 732,359 | |
| Regal Rexnord Corp. | 20,995 | 2,801,993 | |
| Sensata Technologies, Inc. PLC | 46,934 | 1,697,603 | |
| Sunrun, Inc. (a)(b) | 65,493 | 948,339 | |
| Vertiv Holdings Co. | 100,022 | 5,634,239 | |
| 81,543,861 | |||
| Ground Transportation - 1.3% | |||
| Avis Budget Group, Inc. (b) | 4,066 | 665,645 | |
| CSX Corp. | 551,796 | 19,699,117 | |
| Hertz Global Holdings, Inc. (a)(b) | 41,114 | 343,302 | |
| J.B. Hunt Transport Services, Inc. | 20,847 | 4,189,830 | |
| Knight-Swift Transportation Holdings, Inc. Class A (b) | 49,581 | 2,844,958 | |
| Landstar System, Inc. | 2,283 | 437,697 | |
| Norfolk Southern Corp. | 71,532 | 16,827,188 | |
| Old Dominion Freight Lines, Inc. | 2,118 | 828,180 | |
| Ryder System, Inc. | 13,612 | 1,545,915 | |
| Saia, Inc. (a) | 7,481 | 3,370,789 | |
| Schneider National, Inc. Class B (b) | 16,866 | 413,554 | |
| U-Haul Holding Co. (a)(b) | 1,478 | 97,932 | |
| U-Haul Holding Co. (non-vtg.) | 19,153 | 1,223,302 | |
| Union Pacific Corp. | 109,668 | 26,751,315 | |
| XPO, Inc. (a)(b) | 36,114 | 3,085,580 | |
| 82,324,304 | |||
| Industrial Conglomerates - 1.5% | |||
| 3M Co. | 173,202 | 16,341,609 | |
| General Electric Co. | 341,203 | 45,182,101 | |
| Honeywell International, Inc. | 182,526 | 36,917,709 | |
| 98,441,419 | |||
| Machinery - 2.6% | |||
| AGCO Corp. | 19,453 | 2,379,685 | |
| Allison Transmission Holdings, Inc. | 25,092 | 1,519,070 | |
| Caterpillar, Inc. | 40,126 | 12,050,239 | |
| CNH Industrial NV | 308,903 | 3,706,836 | |
| Crane Co. | 14,923 | 1,852,094 | |
| Cummins, Inc. | 44,621 | 10,677,805 | |
| Deere & Co. | 5,363 | 2,110,770 | |
| Donaldson Co., Inc. | 22,055 | 1,424,532 | |
| Dover Corp. | 43,955 | 6,583,580 | |
| ESAB Corp. | 17,558 | 1,509,812 | |
| Flowserve Corp. (b) | 40,695 | 1,624,951 | |
| Fortive Corp. | 111,310 | 8,702,216 | |
| Gates Industrial Corp. PLC (a) | 34,903 | 449,551 | |
| Graco, Inc. | 31,403 | 2,678,676 | |
| IDEX Corp. | 21,892 | 4,630,158 | |
| Illinois Tool Works, Inc. | 17,468 | 4,557,401 | |
| Ingersoll Rand, Inc. | 127,305 | 10,166,577 | |
| ITT, Inc. (b) | 26,179 | 3,161,900 | |
| Lincoln Electric Holdings, Inc. | 1,119 | 248,664 | |
| Middleby Corp. (a) | 16,947 | 2,390,713 | |
| Nordson Corp. | 18,020 | 4,535,994 | |
| Oshkosh Corp. | 20,264 | 2,231,066 | |
| Otis Worldwide Corp. | 122,338 | 10,819,573 | |
| PACCAR, Inc. | 161,241 | 16,186,984 | |
| Parker Hannifin Corp. | 40,191 | 18,668,720 | |
| Pentair PLC | 51,840 | 3,793,133 | |
| RBC Bearings, Inc. (a)(b) | 9,008 | 2,419,008 | |
| Snap-On, Inc. | 16,393 | 4,752,822 | |
| Stanley Black & Decker, Inc. | 48,246 | 4,501,352 | |
| Timken Co. (b) | 19,029 | 1,558,665 | |
| Westinghouse Air Brake Tech Co. | 56,100 | 7,381,077 | |
| Xylem, Inc. | 65,773 | 7,395,516 | |
| 166,669,140 | |||
| Marine Transportation - 0.0% | |||
| Kirby Corp. (a) | 18,349 | 1,443,332 | |
| Passenger Airlines - 0.3% | |||
| Alaska Air Group, Inc. (a) | 39,034 | 1,398,588 | |
| American Airlines Group, Inc. (a) | 127,110 | 1,808,775 | |
| Delta Air Lines, Inc. | 192,008 | 7,515,193 | |
| Southwest Airlines Co. | 187,237 | 5,596,514 | |
| United Airlines Holdings, Inc. (a) | 103,030 | 4,263,381 | |
| 20,582,451 | |||
| Professional Services - 0.7% | |||
| Automatic Data Processing, Inc. | 18,534 | 4,555,287 | |
| Broadridge Financial Solutions, Inc. | 5,994 | 1,223,975 | |
| CACI International, Inc. Class A (a) | 7,032 | 2,417,109 | |
| Clarivate PLC (a)(b) | 146,582 | 1,310,443 | |
| Concentrix Corp. (b) | 13,675 | 1,215,297 | |
| Dayforce, Inc. (a) | 42,778 | 2,973,927 | |
| Dun & Bradstreet Holdings, Inc. (b) | 84,580 | 980,282 | |
| Equifax, Inc. | 11,915 | 2,911,311 | |
| FTI Consulting, Inc. (a) | 8,438 | 1,616,805 | |
| Genpact Ltd. (b) | 41,376 | 1,485,398 | |
| Jacobs Solutions, Inc. | 39,566 | 5,332,310 | |
| KBR, Inc. | 26,499 | 1,380,863 | |
| Leidos Holdings, Inc. | 42,995 | 4,749,658 | |
| Manpower, Inc. | 15,254 | 1,130,932 | |
| Paycor HCM, Inc. (a)(b) | 10,850 | 210,816 | |
| Robert Half, Inc. | 32,845 | 2,612,491 | |
| Science Applications International Corp. | 16,839 | 2,149,667 | |
| SS&C Technologies Holdings, Inc. | 68,543 | 4,182,494 | |
| TransUnion (b) | 60,929 | 4,215,678 | |
| 46,654,743 | |||
| Trading Companies & Distributors - 0.6% | |||
| Air Lease Corp. Class A (b) | 32,228 | 1,347,453 | |
| Core & Main, Inc. (a) | 50,779 | 2,097,680 | |
| Fastenal Co. | 45,458 | 3,101,599 | |
| Ferguson PLC (b) | 60,745 | 11,411,556 | |
| MSC Industrial Direct Co., Inc. Class A (b) | 14,609 | 1,441,616 | |
| SiteOne Landscape Supply, Inc. (a)(b) | 9,380 | 1,449,679 | |
| United Rentals, Inc. | 16,922 | 10,583,019 | |
| Watsco, Inc. (b) | 7,904 | 3,090,306 | |
| WESCO International, Inc. | 14,097 | 2,446,111 | |
| 36,969,019 | |||
TOTAL INDUSTRIALS | 870,285,263 | ||
| INFORMATION TECHNOLOGY - 9.5% | |||
| Communications Equipment - 1.2% | |||
| Ciena Corp. (a)(b) | 47,254 | 2,504,462 | |
| Cisco Systems, Inc. | 1,275,897 | 64,024,511 | |
| F5, Inc. (a) | 18,707 | 3,436,476 | |
| Juniper Networks, Inc. | 100,599 | 3,718,139 | |
| Lumentum Holdings, Inc. (a)(b) | 20,743 | 1,139,620 | |
| Motorola Solutions, Inc. | 4,121 | 1,316,660 | |
| Ubiquiti, Inc. (b) | 194 | 24,394 | |
| ViaSat, Inc. (a)(b) | 36,305 | 807,060 | |
| 76,971,322 | |||
| Electronic Equipment, Instruments & Components - 0.8% | |||
| Amphenol Corp. Class A | 91,290 | 9,229,419 | |
| Arrow Electronics, Inc. (a)(b) | 17,221 | 1,914,114 | |
| Avnet, Inc. | 28,295 | 1,281,764 | |
| CDW Corp. | 2,447 | 554,784 | |
| Cognex Corp. (b) | 53,709 | 1,941,043 | |
| Coherent Corp. (a) | 40,385 | 1,919,903 | |
| Corning, Inc. | 239,862 | 7,793,116 | |
| Crane Nxt Co. (b) | 14,957 | 871,694 | |
| IPG Photonics Corp. (a) | 9,314 | 911,747 | |
| Jabil, Inc. | 14,431 | 1,808,060 | |
| Keysight Technologies, Inc. (a) | 41,684 | 6,388,490 | |
| Littelfuse, Inc. | 7,525 | 1,820,298 | |
| TD SYNNEX Corp. | 18,066 | 1,806,239 | |
| Teledyne Technologies, Inc. (a) | 14,703 | 6,152,764 | |
| Trimble, Inc. (a) | 77,785 | 3,956,145 | |
| Vontier Corp. | 31,975 | 1,106,015 | |
| Zebra Technologies Corp. Class A (a) | 13,291 | 3,183,859 | |
| 52,639,454 | |||
| IT Services - 1.4% | |||
| Akamai Technologies, Inc. (a) | 46,938 | 5,784,170 | |
| Amdocs Ltd. | 37,082 | 3,399,678 | |
| Cognizant Technology Solutions Corp. Class A | 159,800 | 12,323,776 | |
| DXC Technology Co. (a) | 63,722 | 1,389,140 | |
| GoDaddy, Inc. (a) | 17,992 | 1,919,027 | |
| IBM Corp. | 285,909 | 52,510,047 | |
| Kyndryl Holdings, Inc. (a) | 70,688 | 1,450,518 | |
| Okta, Inc. (a) | 45,203 | 3,736,028 | |
| Twilio, Inc. Class A (a) | 44,776 | 3,149,096 | |
| VeriSign, Inc. (a) | 26,479 | 5,266,144 | |
| 90,927,624 | |||
| Semiconductors & Semiconductor Equipment - 4.0% | |||
| Advanced Micro Devices, Inc. (a) | 217,425 | 36,459,998 | |
| Analog Devices, Inc. | 156,747 | 30,151,853 | |
| Applied Materials, Inc. | 40,758 | 6,696,539 | |
| Cirrus Logic, Inc. (a) | 17,188 | 1,326,914 | |
| Entegris, Inc. | 44,534 | 5,241,652 | |
| First Solar, Inc. (a) | 33,506 | 4,901,928 | |
| GlobalFoundries, Inc. (a)(b) | 24,420 | 1,342,612 | |
| Intel Corp. | 1,328,110 | 57,214,979 | |
| Lam Research Corp. | 2,171 | 1,791,444 | |
| Marvell Technology, Inc. | 268,914 | 18,205,478 | |
| Microchip Technology, Inc. | 48,721 | 4,150,055 | |
| Micron Technology, Inc. | 343,968 | 29,495,256 | |
| MKS Instruments, Inc. | 21,175 | 2,254,079 | |
| ON Semiconductor Corp. (a) | 135,751 | 9,655,969 | |
| Qorvo, Inc. (a) | 31,037 | 3,095,630 | |
| Qualcomm, Inc. | 44,927 | 6,672,109 | |
| Skyworks Solutions, Inc. | 50,029 | 5,226,029 | |
| Teradyne, Inc. | 8,004 | 773,106 | |
| Texas Instruments, Inc. | 169,126 | 27,080,455 | |
| Universal Display Corp. | 7,970 | 1,353,067 | |
| Wolfspeed, Inc. (a)(b) | 38,627 | 1,257,309 | |
| 254,346,461 | |||
| Software - 1.7% | |||
| ANSYS, Inc. (a) | 4,730 | 1,550,636 | |
| AppLovin Corp. (a) | 48,536 | 1,996,286 | |
| Aspen Technology, Inc. (a) | 8,545 | 1,640,555 | |
| Bentley Systems, Inc. Class B | 4,463 | 224,935 | |
| Bill Holdings, Inc. (a) | 32,660 | 2,549,113 | |
| CCC Intelligent Solutions Holdings, Inc. Class A (a) | 62,654 | 688,567 | |
| Dolby Laboratories, Inc. Class A (b) | 18,416 | 1,531,843 | |
| Dropbox, Inc. Class A (a) | 8,976 | 284,360 | |
| Gen Digital, Inc. | 147,886 | 3,472,363 | |
| Guidewire Software, Inc. (a)(b) | 25,877 | 2,889,943 | |
| HashiCorp, Inc. (a) | 9,547 | 208,697 | |
| Informatica, Inc. (a) | 12,075 | 362,250 | |
| nCino, Inc. (a)(b) | 19,805 | 623,461 | |
| NCR Voyix Corp. (a) | 40,247 | 591,631 | |
| Nutanix, Inc. Class A (a) | 58,256 | 3,273,987 | |
| Oracle Corp. | 285,992 | 31,945,306 | |
| PTC, Inc. (a) | 17,316 | 3,128,135 | |
| Roper Technologies, Inc. | 33,230 | 17,844,510 | |
| Salesforce, Inc. (a) | 73,246 | 20,588,718 | |
| SentinelOne, Inc. (a) | 62,975 | 1,687,730 | |
| Tyler Technologies, Inc. (a) | 3,164 | 1,337,581 | |
| UiPath, Inc. Class A (a) | 27,642 | 635,213 | |
| Unity Software, Inc. (a)(b) | 54,891 | 1,778,468 | |
| Zoom Video Communications, Inc. Class A (a) | 80,065 | 5,173,000 | |
| 106,007,288 | |||
| Technology Hardware, Storage & Peripherals - 0.4% | |||
| Hewlett Packard Enterprise Co. | 402,988 | 6,161,687 | |
| HP, Inc. | 216,347 | 6,211,322 | |
| NetApp, Inc. | 40,146 | 3,500,731 | |
| Pure Storage, Inc. Class A (a) | 19,329 | 772,967 | |
| Western Digital Corp. (a) | 101,990 | 5,838,928 | |
| 22,485,635 | |||
TOTAL INFORMATION TECHNOLOGY | 603,377,784 | ||
| MATERIALS - 4.6% | |||
| Chemicals - 2.7% | |||
| Air Products & Chemicals, Inc. | 69,798 | 17,848,047 | |
| Albemarle Corp. (b) | 36,916 | 4,235,742 | |
| Ashland, Inc. (b) | 14,709 | 1,377,057 | |
| Axalta Coating Systems Ltd. (a) | 61,437 | 1,991,788 | |
| Celanese Corp. Class A (b) | 31,132 | 4,554,300 | |
| CF Industries Holdings, Inc. | 60,642 | 4,579,077 | |
| Corteva, Inc. | 224,616 | 10,215,536 | |
| Dow, Inc. | 222,848 | 11,944,653 | |
| DuPont de Nemours, Inc. | 144,457 | 8,927,443 | |
| Eastman Chemical Co. | 37,573 | 3,139,224 | |
| Ecolab, Inc. | 17,465 | 3,461,912 | |
| Element Solutions, Inc. (b) | 69,450 | 1,543,874 | |
| FMC Corp. | 33,058 | 1,857,860 | |
| Ginkgo Bioworks Holdings, Inc. Class A (a)(b) | 441,437 | 534,139 | |
| Huntsman Corp. | 52,706 | 1,293,405 | |
| International Flavors & Fragrances, Inc. | 80,422 | 6,488,447 | |
| Linde PLC | 138,149 | 55,926,860 | |
| LyondellBasell Industries NV Class A | 81,418 | 7,663,062 | |
| NewMarket Corp. (b) | 1,933 | 1,078,247 | |
| Olin Corp. | 38,066 | 1,982,097 | |
| PPG Industries, Inc. | 55,311 | 7,801,063 | |
| RPM International, Inc. (b) | 32,552 | 3,471,996 | |
| Sherwin-Williams Co. | 12,558 | 3,822,404 | |
| The Chemours Co. LLC | 46,288 | 1,396,509 | |
| The Mosaic Co. | 104,799 | 3,218,377 | |
| Westlake Corp. | 10,077 | 1,394,153 | |
| 171,747,272 | |||
| Construction Materials - 0.3% | |||
| Eagle Materials, Inc. | 3,675 | 831,579 | |
| Martin Marietta Materials, Inc. | 19,382 | 9,854,196 | |
| Vulcan Materials Co. | 32,432 | 7,329,956 | |
| 18,015,731 | |||
| Containers & Packaging - 0.6% | |||
| Amcor PLC | 454,410 | 4,285,086 | |
| Aptargroup, Inc. | 20,802 | 2,701,764 | |
| Ardagh Group SA | 5,448 | 31,081 | |
| Ardagh Metal Packaging SA | 3,091 | 11,406 | |
| Avery Dennison Corp. | 17,154 | 3,421,365 | |
| Ball Corp. | 96,890 | 5,372,551 | |
| Berry Global Group, Inc. | 37,970 | 2,485,516 | |
| Crown Holdings, Inc. | 33,650 | 2,978,025 | |
| Graphic Packaging Holding Co. | 43,929 | 1,120,629 | |
| International Paper Co. | 109,373 | 3,918,835 | |
| Packaging Corp. of America | 27,880 | 4,624,734 | |
| Sealed Air Corp. | 20,013 | 691,449 | |
| Silgan Holdings, Inc. (b) | 25,917 | 1,190,627 | |
| Sonoco Products Co. | 30,409 | 1,730,272 | |
| WestRock Co. | 80,450 | 3,238,917 | |
| 37,802,257 | |||
| Metals & Mining - 1.0% | |||
| Alcoa Corp. | 55,341 | 1,646,395 | |
| Cleveland-Cliffs, Inc. (a)(b) | 157,849 | 3,164,872 | |
| Freeport-McMoRan, Inc. | 449,626 | 17,845,656 | |
| MP Materials Corp. (a)(b) | 32,489 | 513,651 | |
| Newmont Corp. | 363,075 | 12,529,718 | |
| Nucor Corp. | 78,187 | 14,615,496 | |
| Reliance Steel & Aluminum Co. | 18,159 | 5,182,942 | |
| Royal Gold, Inc. (b) | 20,384 | 2,331,726 | |
| SSR Mining, Inc. | 63,402 | 597,881 | |
| Steel Dynamics, Inc. | 49,095 | 5,925,276 | |
| United States Steel Corp. (b) | 70,108 | 3,296,478 | |
| 67,650,091 | |||
| Paper & Forest Products - 0.0% | |||
| Louisiana-Pacific Corp. | 20,009 | 1,331,599 | |
TOTAL MATERIALS | 296,546,950 | ||
| REAL ESTATE - 4.8% | |||
| Equity Real Estate Investment Trusts (REITs) - 4.5% | |||
| Agree Realty Corp. | 30,822 | 1,837,299 | |
| Alexandria Real Estate Equities, Inc. | 54,026 | 6,531,743 | |
| American Homes 4 Rent Class A | 105,271 | 3,689,749 | |
| Americold Realty Trust | 83,967 | 2,309,093 | |
| Apartment Income (REIT) Corp. | 46,291 | 1,513,253 | |
| AvalonBay Communities, Inc. | 44,577 | 7,979,729 | |
| Boston Properties, Inc. | 49,630 | 3,300,395 | |
| Brixmor Property Group, Inc. | 93,072 | 2,088,536 | |
| Camden Property Trust (SBI) | 32,901 | 3,087,430 | |
| Cousins Properties, Inc. (b) | 46,948 | 1,075,579 | |
| Crown Castle, Inc. | 121,721 | 13,176,298 | |
| CubeSmart | 70,928 | 3,065,508 | |
| Digital Realty Trust, Inc. | 95,014 | 13,345,666 | |
| EastGroup Properties, Inc. | 14,564 | 2,584,091 | |
| EPR Properties | 23,029 | 1,019,494 | |
| Equinix, Inc. | 14,619 | 12,130,408 | |
| Equity Lifestyle Properties, Inc. | 37,186 | 2,517,120 | |
| Equity Residential (SBI) | 117,395 | 7,066,005 | |
| Essex Property Trust, Inc. | 20,115 | 4,692,226 | |
| Extra Space Storage, Inc. | 65,805 | 9,504,874 | |
| Federal Realty Investment Trust (SBI) | 25,720 | 2,616,496 | |
| First Industrial Realty Trust, Inc. | 41,043 | 2,114,535 | |
| Gaming & Leisure Properties | 80,879 | 3,692,126 | |
| Healthcare Trust of America, Inc. | 118,098 | 1,902,559 | |
| Healthpeak Properties, Inc. | 173,386 | 3,207,641 | |
| Highwoods Properties, Inc. (SBI) | 32,374 | 743,631 | |
| Host Hotels & Resorts, Inc. | 222,940 | 4,284,907 | |
| Invitation Homes, Inc. | 192,342 | 6,333,822 | |
| Iron Mountain, Inc. | 46,379 | 3,131,510 | |
| Kilroy Realty Corp. | 36,311 | 1,298,481 | |
| Kimco Realty Corp. | 206,987 | 4,181,137 | |
| Lamar Advertising Co. Class A | 6,201 | 649,121 | |
| Medical Properties Trust, Inc. (b) | 185,199 | 574,117 | |
| Mid-America Apartment Communities, Inc. | 36,579 | 4,622,854 | |
| National Storage Affiliates Trust | 25,046 | 935,468 | |
| Net Lease Office Properties (b) | 4,347 | 107,719 | |
| NNN (REIT), Inc. | 56,420 | 2,275,983 | |
| Omega Healthcare Investors, Inc. | 76,106 | 2,207,074 | |
| Park Hotels & Resorts, Inc. | 66,273 | 999,397 | |
| Prologis, Inc. | 290,311 | 36,779,501 | |
| Public Storage | 20,642 | 5,845,608 | |
| Rayonier, Inc. | 45,696 | 1,384,589 | |
| Realty Income Corp. | 261,572 | 14,226,901 | |
| Regency Centers Corp. | 57,147 | 3,581,402 | |
| Rexford Industrial Realty, Inc. | 66,580 | 3,501,442 | |
| SBA Communications Corp. Class A | 30,396 | 6,804,449 | |
| Simon Property Group, Inc. | 79,783 | 11,058,722 | |
| Stag Industrial, Inc. | 56,520 | 2,087,849 | |
| Sun Communities, Inc. | 30,373 | 3,807,256 | |
| UDR, Inc. | 97,974 | 3,529,023 | |
| Ventas, Inc. | 125,850 | 5,838,182 | |
| VICI Properties, Inc. | 325,190 | 9,794,723 | |
| Vornado Realty Trust | 55,011 | 1,495,749 | |
| Welltower, Inc. | 168,835 | 14,605,916 | |
| Weyerhaeuser Co. | 230,344 | 7,548,373 | |
| WP Carey, Inc. | 66,899 | 4,145,062 | |
| 284,427,821 | |||
| Real Estate Management & Development - 0.3% | |||
| CBRE Group, Inc. (a) | 95,543 | 8,246,316 | |
| CoStar Group, Inc. (a) | 72,450 | 6,048,126 | |
| Howard Hughes Holdings, Inc. (b) | 10,462 | 837,797 | |
| Jones Lang LaSalle, Inc. (a)(b) | 15,069 | 2,668,117 | |
| Zillow Group, Inc.: | |||
| Class A (a) | 17,215 | 948,374 | |
| Class C (a) | 49,079 | 2,789,650 | |
| 21,538,380 | |||
TOTAL REAL ESTATE | 305,966,201 | ||
| UTILITIES - 4.7% | |||
| Electric Utilities - 3.0% | |||
| Alliant Energy Corp. | 79,383 | 3,862,777 | |
| American Electric Power Co., Inc. | 162,196 | 12,673,995 | |
| Avangrid, Inc. | 22,110 | 671,702 | |
| Constellation Energy Corp. | 101,206 | 12,347,132 | |
| Duke Energy Corp. | 242,463 | 23,235,229 | |
| Edison International | 119,013 | 8,030,997 | |
| Entergy Corp. | 66,651 | 6,649,104 | |
| Evergy, Inc. | 70,432 | 3,575,833 | |
| Eversource Energy | 110,001 | 5,964,254 | |
| Exelon Corp. | 312,910 | 10,892,397 | |
| FirstEnergy Corp. | 171,668 | 6,296,782 | |
| Hawaiian Electric Industries, Inc. (b) | 34,309 | 444,988 | |
| IDACORP, Inc. (b) | 15,716 | 1,454,987 | |
| NextEra Energy, Inc. | 637,249 | 37,361,909 | |
| NRG Energy, Inc. | 71,912 | 3,814,212 | |
| OGE Energy Corp. (b) | 62,157 | 2,066,099 | |
| PG&E Corp. | 640,689 | 10,808,423 | |
| Pinnacle West Capital Corp. | 35,205 | 2,425,625 | |
| PPL Corp. | 232,462 | 6,090,504 | |
| Southern Co. | 342,680 | 23,823,114 | |
| Xcel Energy, Inc. | 173,521 | 10,388,702 | |
| 192,878,765 | |||
| Gas Utilities - 0.1% | |||
| Atmos Energy Corp. | 46,661 | 5,316,554 | |
| National Fuel Gas Co. (b) | 27,664 | 1,304,634 | |
| UGI Corp. | 65,041 | 1,440,008 | |
| 8,061,196 | |||
| Independent Power and Renewable Electricity Producers - 0.1% | |||
| Brookfield Renewable Corp. (b) | 41,317 | 1,153,571 | |
| Clearway Energy, Inc.: | |||
| Class A | 11,491 | 258,088 | |
| Class C | 24,766 | 600,328 | |
| The AES Corp. | 80,925 | 1,349,829 | |
| Vistra Corp. | 81,572 | 3,346,899 | |
| 6,708,715 | |||
| Multi-Utilities - 1.3% | |||
| Ameren Corp. | 82,489 | 5,738,760 | |
| CenterPoint Energy, Inc. | 198,513 | 5,546,453 | |
| CMS Energy Corp. | 91,531 | 5,231,912 | |
| Consolidated Edison, Inc. | 108,870 | 9,896,283 | |
| Dominion Energy, Inc. | 263,121 | 12,029,892 | |
| DTE Energy Co. | 64,787 | 6,829,846 | |
| NiSource, Inc. | 130,854 | 3,398,278 | |
| Public Service Enterprise Group, Inc. | 156,040 | 9,048,760 | |
| Sempra | 198,005 | 14,169,238 | |
| WEC Energy Group, Inc. | 99,342 | 8,022,860 | |
| 79,912,282 | |||
| Water Utilities - 0.2% | |||
| American Water Works Co., Inc. | 61,403 | 7,615,200 | |
| Essential Utilities, Inc. (b) | 77,143 | 2,766,348 | |
| 10,381,548 | |||
TOTAL UTILITIES | 297,942,506 | ||
| TOTAL COMMON STOCKS (Cost $4,728,136,034) | 6,355,932,835 | ||
| U.S. Treasury Obligations - 0.0% | |||
Principal Amount (d) | Value ($) | ||
U.S. Treasury Bills, yield at date of purchase 5.42% 2/22/24 (e) (Cost $996,910) | 1,000,000 | 996,931 | |
| Money Market Funds - 2.6% | |||
| Shares | Value ($) | ||
| Fidelity Cash Central Fund 5.39% (f) | 8,855,637 | 8,857,408 | |
| Fidelity Securities Lending Cash Central Fund 5.39% (f)(g) | 153,074,498 | 153,089,806 | |
| TOTAL MONEY MARKET FUNDS (Cost $161,946,837) | 161,947,214 | ||
| TOTAL INVESTMENT IN SECURITIES - 102.3% (Cost $4,891,079,781) | 6,518,876,980 |
NET OTHER ASSETS (LIABILITIES) - (2.3)% | (146,139,883) |
| NET ASSETS - 100.0% | 6,372,737,097 |
| Futures Contracts | |||||
Number of contracts | Expiration Date | Notional Amount ($) | Value ($) | Unrealized Appreciation/ (Depreciation) ($) | |
| Purchased | |||||
| Equity Index Contracts | |||||
| CME E-mini S&P MidCap 400 Index Contracts (United States) | 40 | Mar 2024 | 10,973,200 | 207,411 | 207,411 |
| CME Micro E-mini S&P 500 Index Contracts (United States) | 40 | Mar 2024 | 9,741,000 | 284,244 | 284,244 |
| TOTAL FUTURES CONTRACTS | 491,655 | ||||
| The notional amount of futures purchased as a percentage of Net Assets is 0.3% | |||||
| (a) | Non-income producing |
| (b) | Security or a portion of the security is on loan at period end. |
| (c) | Level 3 security |
| (d) | Amount is stated in United States dollars unless otherwise noted. |
| (e) | Security or a portion of the security was pledged to cover margin requirements for futures contracts. At period end, the value of securities pledged amounted to $702,836. |
| (f) | Affiliated fund that is generally available only to investment companies and other accounts managed by Fidelity Investments. The rate quoted is the annualized seven-day yield of the fund at period end. A complete unaudited listing of the fund's holdings as of its most recent quarter end is available upon request. In addition, each Fidelity Central Fund's financial statements, which are not covered by the Fund's Report of Independent Registered Public Accounting Firm, are available on the SEC's website or upon request. |
| (g) | Investment made with cash collateral received from securities on loan. |
| Affiliate | Value, beginning of period ($) | Purchases ($) | Sales Proceeds ($) | Dividend Income ($) | Realized Gain (loss) ($) | Change in Unrealized appreciation (depreciation) ($) | Value, end of period ($) | % ownership, end of period |
| Fidelity Cash Central Fund 5.39% | 26,168,658 | 982,949,169 | 1,000,260,419 | 1,168,404 | - | - | 8,857,408 | 0.0% |
| Fidelity Securities Lending Cash Central Fund 5.39% | 159,869,302 | 934,775,759 | 941,555,255 | 1,299,331 | - | - | 153,089,806 | 0.6% |
| Total | 186,037,960 | 1,917,724,928 | 1,941,815,674 | 2,467,735 | - | - | 161,947,214 | |
| Valuation Inputs at Reporting Date: | ||||
| Description | Total ($) | Level 1 ($) | Level 2 ($) | Level 3 ($) |
Investments in Securities: | ||||
| Equities: | ||||
Communication Services | 311,894,206 | 311,894,206 | - | - |
Consumer Discretionary | 317,275,284 | 317,275,284 | - | - |
Consumer Staples | 503,300,294 | 503,300,294 | - | - |
Energy | 491,145,495 | 491,145,495 | - | - |
Financials | 1,414,605,134 | 1,414,605,134 | - | - |
Health Care | 943,593,718 | 943,593,718 | - | - |
Industrials | 870,285,263 | 870,285,263 | - | - |
Information Technology | 603,377,784 | 603,377,784 | - | - |
Materials | 296,546,950 | 296,546,950 | - | - |
Real Estate | 305,966,201 | 305,966,201 | - | - |
Utilities | 297,942,506 | 297,942,506 | - | - |
| U.S. Government and Government Agency Obligations | 996,931 | - | 996,931 | - |
| Money Market Funds | 161,947,214 | 161,947,214 | - | - |
| Total Investments in Securities: | 6,518,876,980 | 6,517,880,049 | 996,931 | - |
Derivative Instruments: Assets | ||||
Futures Contracts | 491,655 | 491,655 | - | - |
| Total Assets | 491,655 | 491,655 | - | - |
| Total Derivative Instruments: | 491,655 | 491,655 | - | - |
Primary Risk Exposure / Derivative Type | Value | |
| Asset ($) | Liability ($) | |
| Equity Risk | ||
Futures Contracts (a) | 491,655 | 0 |
| Total Equity Risk | 491,655 | 0 |
| Total Value of Derivatives | 491,655 | 0 |
| Statement of Assets and Liabilities | ||||
| January 31, 2024 | ||||
| Assets | ||||
| Investment in securities, at value (including securities loaned of $146,146,070) - See accompanying schedule: | ||||
Unaffiliated issuers (cost $4,729,132,944) | $ | 6,356,929,766 | ||
Fidelity Central Funds (cost $161,946,837) | 161,947,214 | |||
| Total Investment in Securities (cost $4,891,079,781) | $ | 6,518,876,980 | ||
| Cash | 93,549 | |||
| Receivable for fund shares sold | 80,235,974 | |||
| Dividends receivable | 6,572,781 | |||
| Distributions receivable from Fidelity Central Funds | 159,665 | |||
| Other receivables | 13,888 | |||
Total assets | 6,605,952,837 | |||
| Liabilities | ||||
| Payable for investments purchased | $ | 69,422,377 | ||
| Payable for fund shares redeemed | 10,387,976 | |||
| Payable for daily variation margin on futures contracts | 276,494 | |||
| Other payables and accrued expenses | 49,893 | |||
| Collateral on securities loaned | 153,079,000 | |||
| Total Liabilities | 233,215,740 | |||
| Net Assets | $ | 6,372,737,097 | ||
| Net Assets consist of: | ||||
| Paid in capital | $ | 4,786,678,732 | ||
| Total accumulated earnings (loss) | 1,586,058,365 | |||
| Net Assets | $ | 6,372,737,097 | ||
Net Asset Value, offering price and redemption price per share ($6,372,737,097 ÷ 432,594,730 shares) | $ | 14.73 | ||
| Statement of Operations | ||||
Year ended January 31, 2024 | ||||
| Investment Income | ||||
| Dividends | $ | 135,608,100 | ||
| Interest | 82,921 | |||
| Income from Fidelity Central Funds (including $1,299,331 from security lending) | 2,467,735 | |||
| Total Income | 138,158,756 | |||
| Expenses | ||||
| Custodian fees and expenses | $ | 106,499 | ||
| Independent trustees' fees and expenses | 19,229 | |||
| Interest | 22,178 | |||
| Miscellaneous | 61 | |||
| Total expenses before reductions | 147,967 | |||
| Expense reductions | (2,344) | |||
| Total expenses after reductions | 145,623 | |||
| Net Investment income (loss) | 138,013,133 | |||
| Realized and Unrealized Gain (Loss) | ||||
| Net realized gain (loss) on: | ||||
| Investment Securities: | ||||
| Unaffiliated issuers | 128,368,538 | |||
| Futures contracts | 5,087,237 | |||
| Total net realized gain (loss) | 133,455,775 | |||
| Change in net unrealized appreciation (depreciation) on: | ||||
| Investment Securities: | ||||
| Unaffiliated issuers | 120,008,759 | |||
| Futures contracts | (1,422,324) | |||
| Total change in net unrealized appreciation (depreciation) | 118,586,435 | |||
| Net gain (loss) | 252,042,210 | |||
| Net increase (decrease) in net assets resulting from operations | $ | 390,055,343 | ||
| Statement of Changes in Net Assets | ||||
Year ended January 31, 2024 | Year ended January 31, 2023 | |||
| Increase (Decrease) in Net Assets | ||||
| Operations | ||||
| Net investment income (loss) | $ | 138,013,133 | $ | 121,301,361 |
| Net realized gain (loss) | 133,455,775 | 134,542,912 | ||
| Change in net unrealized appreciation (depreciation) | 118,586,435 | (292,840,981) | ||
| Net increase (decrease) in net assets resulting from operations | 390,055,343 | (36,996,708) | ||
| Distributions to shareholders | (262,036,110) | (223,483,250) | ||
| Share transactions | ||||
| Proceeds from sales of shares | 1,228,765,162 | 1,009,067,447 | ||
| Reinvestment of distributions | 262,036,110 | 223,483,250 | ||
| Cost of shares redeemed | (902,616,659) | (1,275,321,799) | ||
Net increase (decrease) in net assets resulting from share transactions | 588,184,613 | (42,771,102) | ||
| Total increase (decrease) in net assets | 716,203,846 | (303,251,060) | ||
| Net Assets | ||||
| Beginning of period | 5,656,533,251 | 5,959,784,311 | ||
| End of period | $ | 6,372,737,097 | $ | 5,656,533,251 |
| Other Information | ||||
| Shares | ||||
| Sold | 86,831,860 | 71,082,789 | ||
| Issued in reinvestment of distributions | 18,679,553 | 15,931,648 | ||
| Redeemed | (62,880,091) | (89,125,886) | ||
| Net increase (decrease) | 42,631,322 | (2,111,449) | ||
| Fidelity® Series Large Cap Value Index Fund |
| Years ended January 31, | 2024 | 2023 | 2022 | 2021 | 2020 | |||||
Selected Per-Share Data | ||||||||||
| Net asset value, beginning of period | $ | 14.51 | $ | 15.20 | $ | 13.09 | $ | 12.91 | $ | 12.02 |
| Income from Investment Operations | ||||||||||
Net investment income (loss) A,B | .34 | .32 | .30 | .29 | .33 | |||||
| Net realized and unrealized gain (loss) | .52 | (.40) | 2.76 | .23 | 1.46 | |||||
| Total from investment operations | .86 | (.08) | 3.06 | .52 | 1.79 | |||||
| Distributions from net investment income | (.33) | (.33) | (.30) | (.29) | (.34) | |||||
| Distributions from net realized gain | (.31) | (.28) | (.65) | (.05) | (.57) | |||||
| Total distributions | (.64) | (.61) | (.95) | (.34) | (.90) C | |||||
| Net asset value, end of period | $ | 14.73 | $ | 14.51 | $ | 15.20 | $ | 13.09 | $ | 12.91 |
Total Return D | 6.12% | (.40)% | 23.41% | 4.14% | 14.94% | |||||
Ratios to Average Net Assets B,E,F | ||||||||||
Expenses before reductions G | -% | -% | -% | -% | -% | |||||
Expenses net of fee waivers, if any G | -% | -% | -% | -% | -% | |||||
Expenses net of all reductions G | -% | -% | -% | -% | -% | |||||
| Net investment income (loss) | 2.37% | 2.21% | 1.93% | 2.49% | 2.58% | |||||
| Supplemental Data | ||||||||||
| Net assets, end of period (000 omitted) | $ | 6,372,737 | $ | 5,656,533 | $ | 5,959,784 | $ | 5,344,271 | $ | 4,036,878 |
Portfolio turnover rate H | 19% | 24% | 27% | 21% | 31% |
| Fidelity Central Fund | Investment Manager | Investment Objective | Investment Practices | Expense RatioA |
| Fidelity Money Market Central Funds | Fidelity Management & Research Company LLC (FMR) | Each fund seeks to obtain a high level of current income consistent with the preservation of capital and liquidity. | Short-term Investments | Less than .005% |
| Gross unrealized appreciation | $1,910,269,475 |
| Gross unrealized depreciation | (335,920,025) |
| Net unrealized appreciation (depreciation) | $1,574,349,450 |
| Tax Cost | $4,944,527,530 |
| Undistributed ordinary income | $7,858,700 |
| Undistributed long-term capital gain | $3,850,214 |
| Net unrealized appreciation (depreciation) on securities and other investments | $1,574,349,450 |
| January 31, 2024 | January 31, 2023 | |
| Ordinary Income | $208,643,595 | $124,055,936 |
| Long-term Capital Gains | 53,392,515 | 99,427,314 |
| Total | $262,036,110 | $223,483,250 |
| Equity Risk | Equity risk relates to the fluctuations in the value of financial instruments as a result of changes in market prices (other than those arising from interest rate risk or foreign exchange risk), whether caused by factors specific to an individual investment, its issuer, or all factors affecting all instruments traded in a market or market segment. |
| Purchases ($) | Sales ($) | |
| Fidelity Series Large Cap Value Index Fund | 1,637,194,978 | 1,120,923,478 |
| Borrower or Lender | Average Loan Balance | Weighted Average Interest Rate | Interest Expense | |
Fidelity Series Large Cap Value Index Fund | Borrower | $23,978,000 | 5.55% | $22,178 |
| Total Security Lending Fees Paid to NFS | Security Lending Income From Securities Loaned to NFS | Value of Securities Loaned to NFS at Period End | |
| Fidelity Series Large Cap Value Index Fund | $136,681 | $6,988 | $- |
| The Example is based on an investment of $1,000 invested at the beginning of the period and held for the entire period (August 1, 2023 to January 31, 2024). |
Annualized Expense Ratio- A | Beginning Account Value August 1, 2023 | Ending Account Value January 31, 2024 | Expenses Paid During Period- C August 1, 2023 to January 31, 2024 | |||||||
| Fidelity® Series Large Cap Value Index Fund | -%-D | |||||||||
| Actual | $ 1,000 | $ 1,025.40 | $-E | |||||||
Hypothetical-B | $ 1,000 | $ 1,025.21 | $-E | |||||||
- Highly liquid investments - cash or convertible to cash within three business days or less
- Moderately liquid investments - convertible to cash in three to seven calendar days
- Less liquid investments - can be sold or disposed of, but not settled, within seven calendar days
- Illiquid investments - cannot be sold or disposed of within seven calendar days
| A special meeting of shareholders was held on October 18, 2023. The results of votes taken among shareholders on the proposal before them are reported below. Each vote reported represents one dollar of net asset value held on the record date for the meeting. | ||
| Proposal 1 | ||
| To elect a Board of Trustees. | ||
# of Votes | % of Votes | |
| Abigail P. Johnson | ||
| Affirmative | 378,729,502,260.01 | 97.58 |
| Withheld | 9,407,876,478.96 | 2.42 |
| TOTAL | 388,137,378,738.97 | 100.00 |
| Jennifer Toolin McAuliffe | ||
| Affirmative | 378,454,868,010.95 | 97.51 |
| Withheld | 9,682,510,728.02 | 2.49 |
| TOTAL | 388,137,378,738.97 | 100.00 |
| Christine J. Thompson | ||
| Affirmative | 378,837,121,274.52 | 97.60 |
| Withheld | 9,300,257,464.45 | 2.40 |
| TOTAL | 388,137,378,738.97 | 100.00 |
| Elizabeth S. Acton | ||
| Affirmative | 378,262,110,794.85 | 97.46 |
| Withheld | 9,875,267,944.12 | 2.54 |
| TOTAL | 388,137,378,738.97 | 100.00 |
| Laura M. Bishop | ||
| Affirmative | 380,482,113,171.06 | 98.03 |
| Withheld | 7,655,265,567.91 | 1.97 |
| TOTAL | 388,137,378,738.97 | 100.00 |
| Ann E. Dunwoody | ||
| Affirmative | 380,016,034,008.12 | 97.91 |
| Withheld | 8,121,344,730.85 | 2.09 |
| TOTAL | 388,137,378,738.97 | 100.00 |
| John Engler | ||
| Affirmative | 379,432,488,394.20 | 97.76 |
| Withheld | 8,704,890,344.77 | 2.24 |
| TOTAL | 388,137,378,738.97 | 100.00 |
| Robert F. Gartland | ||
| Affirmative | 378,741,819,600.60 | 97.58 |
| Withheld | 9,395,559,138.37 | 2.42 |
| TOTAL | 388,137,378,738.97 | 100.00 |
| Robert W. Helm | ||
| Affirmative | 380,389,324,755.07 | 98.00 |
| Withheld | 7,748,053,983.90 | 2.00 |
| TOTAL | 388,137,378,738.97 | 100.00 |
| Arthur E. Johnson | ||
| Affirmative | 378,427,694,151.67 | 97.50 |
| Withheld | 9,709,684,587.30 | 2.50 |
| TOTAL | 388,137,378,738.97 | 100.00 |
| Michael E. Kenneally | ||
| Affirmative | 377,842,228,145.18 | 97.35 |
| Withheld | 10,295,150,593.79 | 2.65 |
| TOTAL | 388,137,378,738.97 | 100.00 |
| Mark A. Murray | ||
| Affirmative | 380,158,432,703.37 | 97.94 |
| Withheld | 7,978,946,035.60 | 2.06 |
| TOTAL | 388,137,378,738.97 | 100.00 |
| Carol J. Zierhoffer | ||
| Affirmative | 380,522,113,360.24 | 98.04 |
| Withheld | 7,615,265,378.73 | 1.96 |
| TOTAL | 388,137,378,738.97 | 100.00 |
| Proposal 1 reflects trust wide proposal and voting results. | ||
 |
Item 2.
Code of Ethics
As of the end of the period, January 31, 2024, Fidelity Salem Street Trust (the trust) has adopted a code of ethics, as defined in Item 2 of Form N-CSR, that applies to its President and Treasurer and its Chief Financial Officer. A copy of the code of ethics is filed as an exhibit to this Form N-CSR.
Item 3.
Audit Committee Financial Expert
The Board of Trustees of the trust has determined that Elizabeth S. Acton is an audit committee financial expert, as defined in Item 3 of Form N-CSR. Ms. Acton is independent for purposes of Item 3 of Form N-CSR.
Item 4.
Principal Accountant Fees and Services
Fees and Services
The following table presents fees billed by Deloitte & Touche LLP, the member firms of Deloitte Touche Tohmatsu, and their respective affiliates (collectively, “Deloitte Entities”) in each of the last two fiscal years for services rendered to Fidelity SAI Conservative Income Municipal Bond Fund, Fidelity SAI Tax-Free Bond Fund, Fidelity Series Large Cap Value Index Fund, and Fidelity Tax-Free Bond Fund (the “Funds”):
Services Billed by Deloitte Entities
January 31, 2024 FeesA,B
Audit Fees | Audit-Related Fees | Tax Fees | All Other Fees | |
Fidelity SAI Conservative Income Municipal Bond Fund | $28,700 | $- | $7,600 | $100 |
Fidelity SAI Tax-Free Bond Fund | $53,600 | $- | $7,600 | $1,200 |
Fidelity Series Large Cap Value Index Fund | $44,500 | $- | $9,200 | $1,100 |
Fidelity Tax-Free Bond Fund | $53,600 | $- | $7,200 | $1,200 |
January 31, 2023 FeesA,B
Audit Fees | Audit-Related Fees | Tax Fees | All Other Fees | |
Fidelity SAI Conservative Income Municipal Bond Fund | $- | $- | $- | $- |
Fidelity SAI Tax-Free Bond Fund | $48,800 | $- | $9,600 | $1,100 |
Fidelity Series Large Cap Value Index Fund | $44,500 | $- | $9,700 | $1,100 |
Fidelity Tax-Free Bond Fund | $50,200 | $- | $9,200 | $1,100 |
A Amounts may reflect rounding.
B Fidelity SAI Conservative Income Municipal Bond Fund commenced operations on November 06, 2023.
The following table presents fees billed by PricewaterhouseCoopers LLP (“PwC”) in each of the last two fiscal years for services rendered to Fidelity Municipal Core Plus Bond Fund, Fidelity SAI Sustainable Conservative Income Municipal Bond Fund, Fidelity SAI Sustainable Municipal Income Fund, and Fidelity Sustainable Intermediate Municipal Income Fund (the “Funds”):
Services Billed by PwC
January 31, 2024 FeesA,B
Audit Fees | Audit-Related Fees | Tax Fees | All Other Fees | |
Fidelity Municipal Core Plus Bond Fund | $43,700 | $3,400 | $6,300 | $1,400 |
Fidelity SAI Sustainable Conservative Income Municipal Bond Fund | $44,600 | $3,300 | $5,400 | $1,400 |
Fidelity SAI Sustainable Municipal Income Fund | $49,000 | $3,600 | $5,400 | $1,500 |
Fidelity Sustainable Intermediate Municipal Income Fund | $47,600 | $3,500 | $5,400 | $1,500 |
January 31, 2023 FeesA,B,C
Audit Fees | Audit-Related Fees | Tax Fees | All Other Fees | |
Fidelity Municipal Core Plus Bond Fund | $- | $- | $- | $- |
Fidelity SAI Sustainable Conservative Income Municipal Bond Fund | $39,500 | $1,800 | $5,400 | $800 |
Fidelity SAI Sustainable Municipal Income Fund | $43,400 | $2,500 | $5,400 | $1,100 |
Fidelity Sustainable Intermediate Municipal Income Fund | $42,200 | $2,600 | $5,400 | $1,100 |
A Amounts may reflect rounding.
B Fidelity Municipal Core Plus Bond Fund commenced operations on February 16, 2023.
C Fidelity SAI Sustainable Municipal Income Fund, and Fidelity Sustainable Intermediate Municipal Income Fund commenced operations on April 13, 2022. Fidelity SAI Sustainable Conservative Income Municipal Bond Fund commenced operations on June 16, 2022.
The following table(s) present(s) fees billed by Deloitte Entities and PwC that were required to be approved by the Audit Committee for services that relate directly to the operations and financial reporting of the Fund(s) and that are rendered on behalf of Fidelity Management & Research Company LLC ("FMR") and entities controlling, controlled by, or under common control with FMR (not including any sub-adviser whose role is primarily portfolio management and is subcontracted with or overseen by another investment adviser) that provide ongoing services to the Fund(s) (“Fund Service Providers”):
Services Billed by Deloitte Entities
January 31, 2024A,B | January 31, 2023A,B | |
Audit-Related Fees | $- | $- |
Tax Fees | $- | $- |
All Other Fees | $935,000 | $- |
A Amounts may reflect rounding.
B May include amounts billed prior to the SAI Conservative Income Municipal Bond Fund’s commencement of operations.
Services Billed by PwC
January 31, 2024A,B | January 31, 2023A,B,C | |
Audit-Related Fees | $8,284,200 | $7,884,000 |
Tax Fees | $61,000 | $1,000 |
All Other Fees | $- | $- |
A Amounts may reflect rounding.
B May include amounts billed prior to the Fidelity Municipal Core Plus Bond Fund’s commencement of operations.
C May include amounts billed prior to the Fidelity SAI Sustainable Conservative Income Municipal Bond Fund, Fidelity SAI Sustainable Municipal Income Fund, and Fidelity Sustainable Intermediate Municipal Income Funds’ commencement of operations.
“Audit-Related Fees” represent fees billed for assurance and related services that are reasonably related to the performance of the fund audit or the review of the fund's financial statements and that are not reported under Audit Fees.
“Tax Fees” represent fees billed for tax compliance, tax advice or tax planning that relate directly to the operations and financial reporting of the fund.
“All Other Fees” represent fees billed for services provided to the fund or Fund Service Provider, a significant portion of which are assurance related, that relate directly to the operations and financial reporting of the fund, excluding those services that are reported under Audit Fees, Audit-Related Fees or Tax Fees.
Assurance services must be performed by an independent public accountant.
* * *
The aggregate non-audit fees billed by Deloitte Entities and PwC for services rendered to the Fund(s), FMR (not including any sub-adviser whose role is primarily portfolio management and is subcontracted with or overseen by another investment adviser), and any Fund Service Provider for each of the last two fiscal years of the Fund(s) are as follows:
Billed By | January 31, 2024A,B | January 31, 2023A,B,C |
Deloitte Entities | $1,225,200 | $274,400 |
PwC | $13,530,600 | $13,183,700 |
A Amounts may reflect rounding.
B May include amounts billed prior to the Fidelity Municipal Core Plus Bond Fund and Fidelity SAI Conservative Income Municipal Bond Funds’ commencement of operations.
C May include amounts billed prior to the Fidelity SAI Sustainable Conservative Income Municipal Bond Fund, Fidelity SAI Sustainable Municipal Income Fund, and Fidelity Sustainable Intermediate Municipal Income Funds’ commencement of operations.
The trust's Audit Committee has considered non-audit services that were not pre-approved that were provided by Deloitte Entities and PwC to Fund Service Providers to be compatible with maintaining the independence of Deloitte Entities and PwC in
its(their) audit of the Fund(s), taking into account representations from Deloitte Entities and PwC, in accordance with Public Company Accounting Oversight Board rules, regarding its independence from the Fund(s) and its(their) related entities and FMR’s review of the appropriateness and permissibility under applicable law of such non-audit services prior to their provision to the Fund(s) Service Providers.
Audit Committee Pre-Approval Policies and Procedures
The trust’s Audit Committee must pre-approve all audit and non-audit services provided by a fund’s independent registered public accounting firm relating to the operations or financial reporting of the fund. Prior to the commencement of any audit or non-audit services to a fund, the Audit Committee reviews the services to determine whether they are appropriate and permissible under applicable law.
The Audit Committee has adopted policies and procedures to, among other purposes, provide a framework for the Committee’s consideration of non-audit services by the audit firms that audit the Fidelity funds. The policies and procedures require that any non-audit service provided by a fund audit firm to a Fidelity fund and any non-audit service provided by a fund auditor to a Fund Service Provider that relates directly to the operations and financial reporting of a Fidelity fund (“Covered Service”) are subject to approval by the Audit Committee before such service is provided.
All Covered Services must be approved in advance of provision of the service either: (i) by formal resolution of the Audit Committee, or (ii) by oral or written approval of the service by the Chair of the Audit Committee (or if the Chair is unavailable, such other member of the Audit Committee as may be designated by the Chair to act in the Chair’s absence). The approval contemplated by (ii) above is permitted where the Treasurer determines that action on such an engagement is necessary before the next meeting of the Audit Committee.
Non-audit services provided by a fund audit firm to a Fund Service Provider that do not relate directly to the operations and financial reporting of a Fidelity fund are reported to the Audit Committee periodically.
Non-Audit Services Approved Pursuant to Rule 2-01(c)(7)(i)(C) and (ii) of Regulation S-X (“De Minimis Exception”)
There were no non-audit services approved or required to be approved by the Audit Committee pursuant to the De Minimis Exception during the Fund’s(s’) last two fiscal years relating to services provided to (i) the Fund(s) or (ii) any Fund Service Provider that relate directly to the operations and financial reporting of the Fund(s).
The Registrant has not retained, for the preparation of the audit report on the financial statements included in the Form N-CSR, a registered public accounting firm that has a branch or office that is located in a foreign jurisdiction and that the Public Company Accounting Oversight Board (the “PCAOB”) has determined that the PCAOB is unable
to inspect or investigate completely because of a position taken by an authority in the foreign jurisdiction.
The Registrant is not a “foreign issuer,” as defined in 17 CFR 240.3b-4.
Item 5.
Audit Committee of Listed Registrants
Not applicable.
Item 6.
Investments
(a)
Not applicable.
(b)
Not applicable.
Item 7.
Disclosure of Proxy Voting Policies and Procedures for Closed-End Management Investment Companies
Not applicable.
Item 8.
Portfolio Managers of Closed-End Management Investment Companies
Not applicable.
Item 9.
Purchase of Equity Securities by Closed-End Management Investment Company and Affiliated Purchasers
Not applicable.
Item 10.
Submission of Matters to a Vote of Security Holders
There were no material changes to the procedures by which shareholders may recommend nominees to the trust’s Board of Trustees.
Item 11.
Controls and Procedures
(a)(i) The President and Treasurer and the Chief Financial Officer have concluded that the trust’s disclosure controls and procedures (as defined in Rule 30a-3(c) under the Investment Company Act) provide reasonable assurances that material information relating to the trust is made known to them by the appropriate persons, based on their evaluation of these controls and procedures as of a date within 90 days of the filing date of this report.
(a)(ii) There was no change in the trust’s internal control over financial reporting (as defined in Rule 30a-3(d) under the Investment Company Act) that occurred during the period covered by this report that has materially affected, or is reasonably likely to materially affect, the trust’s internal control over financial reporting.
Item 12.
Disclosure of Securities Lending Activities for Closed-End Management
Investment Companies
Not applicable.
Item 18.
Recovery of Erroneously Awarded Compensation
(a)
Not applicable.
(b)
Not applicable.
Item 19.
Exhibits
(a) | (1) | Code of Ethics pursuant to Item 2 of Form N-CSR is filed and attached hereto as EX-99.CODE ETH. |
(a) | (2) | |
(a) | (3) | Not applicable. |
(b) |
SIGNATURES
Pursuant to the requirements of the Securities Exchange Act of 1934 and the Investment Company Act of 1940, the registrant has duly caused this report to be signed on its behalf by the undersigned, thereunto duly authorized.
Fidelity Salem Street Trust
By: | /s/Laura M. Del Prato |
Laura M. Del Prato | |
President and Treasurer | |
Date: | March 21, 2024 |
Pursuant to the requirements of the Securities Exchange Act of 1934 and the Investment Company Act of 1940, this report has been signed below by the following persons on behalf of the registrant and in the capacities and on the dates indicated.
By: | /s/Laura M. Del Prato |
Laura M. Del Prato | |
President and Treasurer | |
Date: | March 21, 2024 |
By: | /s/John J. Burke III |
John J. Burke III | |
Chief Financial Officer | |
Date: | March 21, 2024 |