UNITED STATES
SECURITIES AND EXCHANGE COMMISSION
Washington, D.C. 20549
FORM N-CSR
CERTIFIED SHAREHOLDER REPORT OF REGISTERED
MANAGEMENT INVESTMENT COMPANIES
Investment Company Act file number 811-02105
Fidelity Salem Street Trust
(Exact name of registrant as specified in charter)
245 Summer St., Boston, MA 02210
(Address of principal executive offices) (Zip code)
Margaret Carey, Secretary
245 Summer St.
Boston, Massachusetts 02210
(Name and address of agent for service)
Registrant's telephone number, including area code:
617-563-7000
Date of fiscal year end: | November 30 |
Date of reporting period: | May 31, 2024 |
Item 1.
Reports to Stockholders
SEMI-ANNUAL SHAREHOLDER REPORT | AS OF MAY 31, 2024 | ||
| | Fidelity® Strategic Dividend & Income® Fund Fidelity Advisor® Strategic Dividend & Income® Fund Class I : FSIDX | |
| Costs of a $10,000 investment | Costs paid as a percentage of a $10,000 investment | ||
| Class I | $ 36 | 0.69% |
KEY FACTS | ||
| Fund Size | $5,200,751,501 | |
| Number of Holdings | 594 | |
| Portfolio Turnover | 29% |
(as of May 31, 2024)
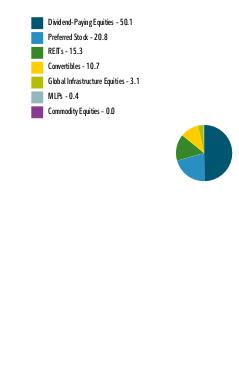
MARKET SECTORS (% of Fund's net assets) | ||
| Real Estate | 16.4 | |
| Financials | 13.1 | |
| Industrials | 8.9 | |
| Consumer Staples | 7.6 | |
| Information Technology | 6.7 | |
| Energy | 5.8 | |
| Health Care | 5.8 | |
| Utilities | 5.2 | |
| Communication Services | 3.3 | |
| Consumer Discretionary | 2.9 | |
| Materials | 1.8 | |
| Dividend-Paying Equities | 50.1 |
| Preferred Stock | 20.8 |
| REITs | 15.3 |
| Convertibles | 10.7 |
| Global Infrastructure Equities | 3.1 |
| MLPs | 0.4 |
| Commodity Equities | 0.0 |
ASSET ALLOCATION (% of Fund's net assets) |
 |
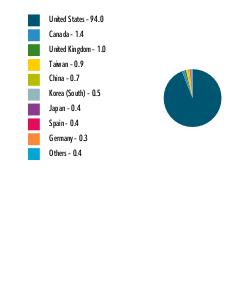
| Short-Term Investments and Net Other Assets (Liabilities) - (0.4)% |
| United States | 94.0 |
| Canada | 1.4 |
| United Kingdom | 1.0 |
| Taiwan | 0.9 |
| China | 0.7 |
| Korea (South) | 0.5 |
| Japan | 0.4 |
| Spain | 0.4 |
| Germany | 0.3 |
| Others | 0.4 |
GEOGRAPHIC DIVERSIFICATION (% of Fund's net assets) |
 |
TOP HOLDINGS (% of Fund's net assets) | ||
| Exxon Mobil Corp | 2.9 | |
| Procter & Gamble Co/The | 2.4 | |
| Prologis Inc | 2.1 | |
| Coca-Cola Co/The | 1.8 | |
| Eaton Corp PLC | 1.7 | |
| Johnson & Johnson | 1.6 | |
| Equinix Inc | 1.5 | |
| McDonald's Corp | 1.5 | |
| US Treasury Bonds | 1.4 | |
| Cisco Systems Inc | 1.4 | |
| 18.3 | ||
| Fidelity, the Fidelity Investments Logo and all other Fidelity trademarks or service marks used herein are trademarks or service marks of FMR LLC. Any third-party marks that are used herein are trademarks or service marks of their respective owners. © 2024 FMR LLC. All rights reserved. | ||
1.9915914.100 1325-TSRS-0724 |  | For additional information about the Fund; including its prospectus, financial information, holdings and proxy information, scan the QR code or visit fundresearch.fidelity.com/prospectus/sec |
SEMI-ANNUAL SHAREHOLDER REPORT | AS OF MAY 31, 2024 | ||
| | Fidelity® Strategic Dividend & Income® Fund Fidelity Advisor® Strategic Dividend & Income® Fund Class C : FCSDX | |
| Costs of a $10,000 investment | Costs paid as a percentage of a $10,000 investment | ||
| Class C | $ 88 | 1.69% |
KEY FACTS | ||
| Fund Size | $5,200,751,501 | |
| Number of Holdings | 594 | |
| Portfolio Turnover | 29% |
(as of May 31, 2024)
MARKET SECTORS (% of Fund's net assets) | ||
| Real Estate | 16.4 | |
| Financials | 13.1 | |
| Industrials | 8.9 | |
| Consumer Staples | 7.6 | |
| Information Technology | 6.7 | |
| Energy | 5.8 | |
| Health Care | 5.8 | |
| Utilities | 5.2 | |
| Communication Services | 3.3 | |
| Consumer Discretionary | 2.9 | |
| Materials | 1.8 | |
| Dividend-Paying Equities | 50.1 |
| Preferred Stock | 20.8 |
| REITs | 15.3 |
| Convertibles | 10.7 |
| Global Infrastructure Equities | 3.1 |
| MLPs | 0.4 |
| Commodity Equities | 0.0 |
ASSET ALLOCATION (% of Fund's net assets) |
|
| Short-Term Investments and Net Other Assets (Liabilities) - (0.4)% |
| United States | 94.0 |
| Canada | 1.4 |
| United Kingdom | 1.0 |
| Taiwan | 0.9 |
| China | 0.7 |
| Korea (South) | 0.5 |
| Japan | 0.4 |
| Spain | 0.4 |
| Germany | 0.3 |
| Others | 0.4 |
GEOGRAPHIC DIVERSIFICATION (% of Fund's net assets) |
|
TOP HOLDINGS (% of Fund's net assets) | ||
| Exxon Mobil Corp | 2.9 | |
| Procter & Gamble Co/The | 2.4 | |
| Prologis Inc | 2.1 | |
| Coca-Cola Co/The | 1.8 | |
| Eaton Corp PLC | 1.7 | |
| Johnson & Johnson | 1.6 | |
| Equinix Inc | 1.5 | |
| McDonald's Corp | 1.5 | |
| US Treasury Bonds | 1.4 | |
| Cisco Systems Inc | 1.4 | |
| 18.3 | ||
| Fidelity, the Fidelity Investments Logo and all other Fidelity trademarks or service marks used herein are trademarks or service marks of FMR LLC. Any third-party marks that are used herein are trademarks or service marks of their respective owners. © 2024 FMR LLC. All rights reserved. | ||
1.9915912.100 1323-TSRS-0724 | | For additional information about the Fund; including its prospectus, financial information, holdings and proxy information, scan the QR code or visit fundresearch.fidelity.com/prospectus/sec |
SEMI-ANNUAL SHAREHOLDER REPORT | AS OF MAY 31, 2024 | ||
| | Fidelity® Strategic Dividend & Income® Fund Fidelity Advisor® Strategic Dividend & Income® Fund Class M : FTSDX | |
| Costs of a $10,000 investment | Costs paid as a percentage of a $10,000 investment | ||
| Class M | $ 62 | 1.19% |
KEY FACTS | ||
| Fund Size | $5,200,751,501 | |
| Number of Holdings | 594 | |
| Portfolio Turnover | 29% |
(as of May 31, 2024)
MARKET SECTORS (% of Fund's net assets) | ||
| Real Estate | 16.4 | |
| Financials | 13.1 | |
| Industrials | 8.9 | |
| Consumer Staples | 7.6 | |
| Information Technology | 6.7 | |
| Energy | 5.8 | |
| Health Care | 5.8 | |
| Utilities | 5.2 | |
| Communication Services | 3.3 | |
| Consumer Discretionary | 2.9 | |
| Materials | 1.8 | |
| Dividend-Paying Equities | 50.1 |
| Preferred Stock | 20.8 |
| REITs | 15.3 |
| Convertibles | 10.7 |
| Global Infrastructure Equities | 3.1 |
| MLPs | 0.4 |
| Commodity Equities | 0.0 |
ASSET ALLOCATION (% of Fund's net assets) |
|
| Short-Term Investments and Net Other Assets (Liabilities) - (0.4)% |
| United States | 94.0 |
| Canada | 1.4 |
| United Kingdom | 1.0 |
| Taiwan | 0.9 |
| China | 0.7 |
| Korea (South) | 0.5 |
| Japan | 0.4 |
| Spain | 0.4 |
| Germany | 0.3 |
| Others | 0.4 |
GEOGRAPHIC DIVERSIFICATION (% of Fund's net assets) |
|
TOP HOLDINGS (% of Fund's net assets) | ||
| Exxon Mobil Corp | 2.9 | |
| Procter & Gamble Co/The | 2.4 | |
| Prologis Inc | 2.1 | |
| Coca-Cola Co/The | 1.8 | |
| Eaton Corp PLC | 1.7 | |
| Johnson & Johnson | 1.6 | |
| Equinix Inc | 1.5 | |
| McDonald's Corp | 1.5 | |
| US Treasury Bonds | 1.4 | |
| Cisco Systems Inc | 1.4 | |
| 18.3 | ||
| Fidelity, the Fidelity Investments Logo and all other Fidelity trademarks or service marks used herein are trademarks or service marks of FMR LLC. Any third-party marks that are used herein are trademarks or service marks of their respective owners. © 2024 FMR LLC. All rights reserved. | ||
1.9915913.100 1324-TSRS-0724 | | For additional information about the Fund; including its prospectus, financial information, holdings and proxy information, scan the QR code or visit fundresearch.fidelity.com/prospectus/sec |
SEMI-ANNUAL SHAREHOLDER REPORT | AS OF MAY 31, 2024 | ||
| | Fidelity® Strategic Dividend & Income® Fund Fidelity Advisor® Strategic Dividend & Income® Fund Class A : FASDX | |
| Costs of a $10,000 investment | Costs paid as a percentage of a $10,000 investment | ||
| Class A | $ 49 | 0.94% |
KEY FACTS | ||
| Fund Size | $5,200,751,501 | |
| Number of Holdings | 594 | |
| Portfolio Turnover | 29% |
(as of May 31, 2024)
MARKET SECTORS (% of Fund's net assets) | ||
| Real Estate | 16.4 | |
| Financials | 13.1 | |
| Industrials | 8.9 | |
| Consumer Staples | 7.6 | |
| Information Technology | 6.7 | |
| Energy | 5.8 | |
| Health Care | 5.8 | |
| Utilities | 5.2 | |
| Communication Services | 3.3 | |
| Consumer Discretionary | 2.9 | |
| Materials | 1.8 | |
| Dividend-Paying Equities | 50.1 |
| Preferred Stock | 20.8 |
| REITs | 15.3 |
| Convertibles | 10.7 |
| Global Infrastructure Equities | 3.1 |
| MLPs | 0.4 |
| Commodity Equities | 0.0 |
ASSET ALLOCATION (% of Fund's net assets) |
|
| Short-Term Investments and Net Other Assets (Liabilities) - (0.4)% |
| United States | 94.0 |
| Canada | 1.4 |
| United Kingdom | 1.0 |
| Taiwan | 0.9 |
| China | 0.7 |
| Korea (South) | 0.5 |
| Japan | 0.4 |
| Spain | 0.4 |
| Germany | 0.3 |
| Others | 0.4 |
GEOGRAPHIC DIVERSIFICATION (% of Fund's net assets) |
|
TOP HOLDINGS (% of Fund's net assets) | ||
| Exxon Mobil Corp | 2.9 | |
| Procter & Gamble Co/The | 2.4 | |
| Prologis Inc | 2.1 | |
| Coca-Cola Co/The | 1.8 | |
| Eaton Corp PLC | 1.7 | |
| Johnson & Johnson | 1.6 | |
| Equinix Inc | 1.5 | |
| McDonald's Corp | 1.5 | |
| US Treasury Bonds | 1.4 | |
| Cisco Systems Inc | 1.4 | |
| 18.3 | ||
| Fidelity, the Fidelity Investments Logo and all other Fidelity trademarks or service marks used herein are trademarks or service marks of FMR LLC. Any third-party marks that are used herein are trademarks or service marks of their respective owners. © 2024 FMR LLC. All rights reserved. | ||
1.9915911.100 1321-TSRS-0724 | | For additional information about the Fund; including its prospectus, financial information, holdings and proxy information, scan the QR code or visit fundresearch.fidelity.com/prospectus/sec |
SEMI-ANNUAL SHAREHOLDER REPORT | AS OF MAY 31, 2024 | ||
| | Fidelity® Strategic Dividend & Income® Fund Fidelity® Strategic Dividend & Income® Fund : FSDIX | |
| Costs of a $10,000 investment | Costs paid as a percentage of a $10,000 investment | ||
| Fidelity® Strategic Dividend & Income® Fund | $ 34 | 0.66% |
KEY FACTS | ||
| Fund Size | $5,200,751,501 | |
| Number of Holdings | 594 | |
| Portfolio Turnover | 29% |
(as of May 31, 2024)
MARKET SECTORS (% of Fund's net assets) | ||
| Real Estate | 16.4 | |
| Financials | 13.1 | |
| Industrials | 8.9 | |
| Consumer Staples | 7.6 | |
| Information Technology | 6.7 | |
| Energy | 5.8 | |
| Health Care | 5.8 | |
| Utilities | 5.2 | |
| Communication Services | 3.3 | |
| Consumer Discretionary | 2.9 | |
| Materials | 1.8 | |
| Dividend-Paying Equities | 50.1 |
| Preferred Stock | 20.8 |
| REITs | 15.3 |
| Convertibles | 10.7 |
| Global Infrastructure Equities | 3.1 |
| MLPs | 0.4 |
| Commodity Equities | 0.0 |
ASSET ALLOCATION (% of Fund's net assets) |
|
| Short-Term Investments and Net Other Assets (Liabilities) - (0.4)% |
| United States | 94.0 |
| Canada | 1.4 |
| United Kingdom | 1.0 |
| Taiwan | 0.9 |
| China | 0.7 |
| Korea (South) | 0.5 |
| Japan | 0.4 |
| Spain | 0.4 |
| Germany | 0.3 |
| Others | 0.4 |
GEOGRAPHIC DIVERSIFICATION (% of Fund's net assets) |
|
TOP HOLDINGS (% of Fund's net assets) | ||
| Exxon Mobil Corp | 2.9 | |
| Procter & Gamble Co/The | 2.4 | |
| Prologis Inc | 2.1 | |
| Coca-Cola Co/The | 1.8 | |
| Eaton Corp PLC | 1.7 | |
| Johnson & Johnson | 1.6 | |
| Equinix Inc | 1.5 | |
| McDonald's Corp | 1.5 | |
| US Treasury Bonds | 1.4 | |
| Cisco Systems Inc | 1.4 | |
| 18.3 | ||
| Fidelity, the Fidelity Investments Logo and all other Fidelity trademarks or service marks used herein are trademarks or service marks of FMR LLC. Any third-party marks that are used herein are trademarks or service marks of their respective owners. © 2024 FMR LLC. All rights reserved. | ||
1.9915915.100 1329-TSRS-0724 | | For additional information about the Fund; including its prospectus, financial information, holdings and proxy information, scan the QR code or visit fundresearch.fidelity.com/prospectus/sec |
SEMI-ANNUAL SHAREHOLDER REPORT | AS OF MAY 31, 2024 | ||
| | Fidelity® Strategic Dividend & Income® Fund Fidelity Advisor® Strategic Dividend & Income® Fund Class Z : FIQWX | |
| Costs of a $10,000 investment | Costs paid as a percentage of a $10,000 investment | ||
| Class Z | $ 30 | 0.57% |
KEY FACTS | ||
| Fund Size | $5,200,751,501 | |
| Number of Holdings | 594 | |
| Portfolio Turnover | 29% |
(as of May 31, 2024)
MARKET SECTORS (% of Fund's net assets) | ||
| Real Estate | 16.4 | |
| Financials | 13.1 | |
| Industrials | 8.9 | |
| Consumer Staples | 7.6 | |
| Information Technology | 6.7 | |
| Energy | 5.8 | |
| Health Care | 5.8 | |
| Utilities | 5.2 | |
| Communication Services | 3.3 | |
| Consumer Discretionary | 2.9 | |
| Materials | 1.8 | |
| Dividend-Paying Equities | 50.1 |
| Preferred Stock | 20.8 |
| REITs | 15.3 |
| Convertibles | 10.7 |
| Global Infrastructure Equities | 3.1 |
| MLPs | 0.4 |
| Commodity Equities | 0.0 |
ASSET ALLOCATION (% of Fund's net assets) |
|
| Short-Term Investments and Net Other Assets (Liabilities) - (0.4)% |
| United States | 94.0 |
| Canada | 1.4 |
| United Kingdom | 1.0 |
| Taiwan | 0.9 |
| China | 0.7 |
| Korea (South) | 0.5 |
| Japan | 0.4 |
| Spain | 0.4 |
| Germany | 0.3 |
| Others | 0.4 |
GEOGRAPHIC DIVERSIFICATION (% of Fund's net assets) |
|
TOP HOLDINGS (% of Fund's net assets) | ||
| Exxon Mobil Corp | 2.9 | |
| Procter & Gamble Co/The | 2.4 | |
| Prologis Inc | 2.1 | |
| Coca-Cola Co/The | 1.8 | |
| Eaton Corp PLC | 1.7 | |
| Johnson & Johnson | 1.6 | |
| Equinix Inc | 1.5 | |
| McDonald's Corp | 1.5 | |
| US Treasury Bonds | 1.4 | |
| Cisco Systems Inc | 1.4 | |
| 18.3 | ||
| Fidelity, the Fidelity Investments Logo and all other Fidelity trademarks or service marks used herein are trademarks or service marks of FMR LLC. Any third-party marks that are used herein are trademarks or service marks of their respective owners. © 2024 FMR LLC. All rights reserved. | ||
1.9915916.100 3281-TSRS-0724 | | For additional information about the Fund; including its prospectus, financial information, holdings and proxy information, scan the QR code or visit fundresearch.fidelity.com/prospectus/sec |
Item 2.
Code of Ethics
Not applicable.
Item 3.
Audit Committee Financial Expert
Not applicable.
Item 4.
Principal Accountant Fees and Services
Not applicable.
Item 5.
Audit Committee of Listed Registrants
Not applicable.
Item 6.
Investments
(a)
Not applicable.
(b)
Not applicable
Item 7.
Financial Statements and Financial Highlights for Open-End Management Investment Companies


Contents
| Corporate Bonds - 9.7% | |||
Principal Amount (a) | Value ($) | ||
| Convertible Bonds - 8.7% | |||
| COMMUNICATION SERVICES - 0.7% | |||
| Entertainment - 0.2% | |||
| Liberty Media Corp. 2.375% 9/30/53 (b) | 2,269,000 | 2,424,427 | |
| Liberty Media Corp. Liberty Formula One 2.25% 8/15/27 | 2,467,000 | 2,663,222 | |
| Live Nation Entertainment, Inc. 3.125% 1/15/29 | 3,290,000 | 3,636,437 | |
| Sphere Entertainment Co. 3.5% 12/1/28 (b) | 391,000 | 486,219 | |
| Zynga, Inc. 0% 12/15/26 | 1,969,000 | 1,724,349 | |
| 10,934,654 | |||
| Interactive Media & Services - 0.2% | |||
| Liberty TripAdvisor Holdings, Inc. 0.5% 6/30/51 (b) | 859,000 | 795,692 | |
| Snap, Inc.: | |||
| 0% 5/1/27 | 2,640,000 | 2,165,664 | |
| 0.125% 3/1/28 | 4,236,000 | 3,314,082 | |
| 0.25% 5/1/25 | 1,118,000 | 1,155,272 | |
| 0.75% 8/1/26 | 1,190,000 | 1,228,237 | |
| TripAdvisor, Inc. 0.25% 4/1/26 | 1,081,000 | 979,927 | |
| 9,638,874 | |||
| Media - 0.3% | |||
| Cardlytics, Inc. 4.25% 4/1/29 (b) | 542,000 | 458,935 | |
| DISH Network Corp.: | |||
| 0% 12/15/25 | 4,517,000 | 3,435,255 | |
| 3.375% 8/15/26 | 8,477,000 | 5,424,640 | |
| Liberty Broadband Corp. 3.125% 3/31/53 (b) | 2,830,000 | 2,672,086 | |
| Liberty Media Corp. 3.75% 3/15/28 | 1,850,000 | 1,927,700 | |
| Magnite, Inc. 0.25% 3/15/26 | 415,000 | 371,951 | |
| 14,290,567 | |||
TOTAL COMMUNICATION SERVICES | 34,864,095 | ||
| CONSUMER DISCRETIONARY - 1.0% | |||
| Automobiles - 0.2% | |||
| Ford Motor Co. 0% 3/15/26 | 4,719,000 | 4,697,765 | |
| Rivian Automotive, Inc.: | |||
| 3.625% 10/15/30(b) | 4,845,000 | 3,283,601 | |
| 4.625% 3/15/29 | 3,345,000 | 2,597,393 | |
| Winnebago Industries, Inc. 3.25% 1/15/30 (b) | 1,232,000 | 1,210,440 | |
| 11,789,199 | |||
| Broadline Retail - 0.1% | |||
| Alibaba Group Holding Ltd. 0.5% 6/1/31 (Reg. S) (b) | 1,400,000 | 1,382,963 | |
| Etsy, Inc.: | |||
| 0.125% 10/1/26 | 1,460,000 | 1,479,161 | |
| 0.125% 9/1/27 | 1,299,000 | 1,066,250 | |
| 0.25% 6/15/28 | 1,390,000 | 1,086,583 | |
| 5,014,957 | |||
| Diversified Consumer Services - 0.0% | |||
| Stride, Inc. 1.125% 9/1/27 | 1,269,000 | 1,777,869 | |
| Hotels, Restaurants & Leisure - 0.4% | |||
| Booking Holdings, Inc. 0.75% 5/1/25 | 1,861,000 | 3,725,841 | |
| Carnival Corp.: | |||
| 5.75% 10/1/24 | 972,000 | 1,479,518 | |
| 5.75% 12/1/27 | 2,475,000 | 3,489,148 | |
| Cracker Barrel Old Country Store, Inc. 0.625% 6/15/26 | 991,000 | 867,621 | |
| NCL Corp. Ltd. 5.375% 8/1/25 | 1,000,000 | 1,152,310 | |
| Penn Entertainment, Inc. 2.75% 5/15/26 | 2,550,000 | 2,692,878 | |
| Royal Caribbean Cruises Ltd. 6% 8/15/25 | 2,462,000 | 7,387,231 | |
| 20,794,547 | |||
| Household Durables - 0.0% | |||
| Meritage Homes Corp. 1.75% 5/15/28 (b) | 2,647,000 | 2,706,558 | |
| Leisure Products - 0.1% | |||
| Peloton Interactive, Inc.: | |||
| 0% 2/15/26 | 1,046,000 | 925,650 | |
| 5.5% 12/1/29(b) | 683,000 | 704,009 | |
| Topgolf Callaway Brands Corp. 2.75% 5/1/26 | 1,456,000 | 1,627,080 | |
| 3,256,739 | |||
| Specialty Retail - 0.2% | |||
| The RealReal, Inc.: | |||
| 1% 3/1/28 | 1,813,000 | 870,059 | |
| 3% 6/15/25 | 420,000 | 380,100 | |
| Wayfair LLC 0.625% 10/1/25 | 7,702,000 | 7,220,625 | |
| 8,470,784 | |||
TOTAL CONSUMER DISCRETIONARY | 53,810,653 | ||
| CONSUMER STAPLES - 0.1% | |||
| Food Products - 0.1% | |||
| Freshpet, Inc. 3% 4/1/28 | 750,000 | 1,500,750 | |
| Post Holdings, Inc. 2.5% 8/15/27 | 1,250,000 | 1,396,875 | |
| 2,897,625 | |||
| ENERGY - 0.3% | |||
| Energy Equipment & Services - 0.0% | |||
| Transocean, Inc.: | |||
| 4% 12/15/25 | 683,000 | 962,006 | |
| 4.625% 9/30/29 | 500,000 | 1,007,250 | |
| 1,969,256 | |||
| Oil, Gas & Consumable Fuels - 0.3% | |||
| CNX Resources Corp. 2.25% 5/1/26 | 918,000 | 1,910,083 | |
| Northern Oil & Gas, Inc. 3.625% 4/15/29 | 2,146,000 | 2,593,441 | |
| Peabody Energy Corp. 3.25% 3/1/28 | 864,000 | 1,229,861 | |
| Permian Resources Operating LLC 3.25% 4/1/28 | 735,000 | 2,067,188 | |
| Pioneer Natural Resources Co. 0.25% 5/15/25 | 1,403,000 | 4,193,441 | |
| World Kinect Corp. 3.25% 7/1/28 (b) | 1,110,000 | 1,203,240 | |
| 13,197,254 | |||
TOTAL ENERGY | 15,166,510 | ||
| FINANCIALS - 0.4% | |||
| Capital Markets - 0.1% | |||
| Coinbase Global, Inc.: | |||
| 0.25% 4/1/30(b) | 2,680,000 | 2,578,160 | |
| 0.5% 6/1/26 | 2,785,000 | 2,862,980 | |
| 5,441,140 | |||
| Consumer Finance - 0.1% | |||
| Bread Financial Holdings, Inc. 4.25% 6/15/28 (b) | 935,000 | 1,182,775 | |
| LendingTree, Inc. 0.5% 7/15/25 | 3,833,000 | 3,545,525 | |
| SoFi Technologies, Inc.: | |||
| 0% 10/15/26(b) | 1,880,000 | 1,616,800 | |
| 1.25% 3/15/29(b) | 789,000 | 747,972 | |
| 7,093,072 | |||
| Financial Services - 0.2% | |||
| Affirm Holdings, Inc. 0% 11/15/26 | 2,090,000 | 1,731,565 | |
| Block, Inc. 0.125% 3/1/25 | 2,044,000 | 1,958,561 | |
| Global Payments, Inc. 1.5% 3/1/31 (b) | 4,517,000 | 4,145,189 | |
| Shift4 Payments, Inc.: | |||
| 0% 12/15/25 | 1,117,000 | 1,222,780 | |
| 0.5% 8/1/27 | 739,000 | 679,511 | |
| 9,737,606 | |||
TOTAL FINANCIALS | 22,271,818 | ||
| HEALTH CARE - 1.3% | |||
| Biotechnology - 0.4% | |||
| Alnylam Pharmaceuticals, Inc. 1% 9/15/27 | 1,675,000 | 1,559,760 | |
| BridgeBio Pharma, Inc. 2.25% 2/1/29 | 4,190,000 | 3,343,620 | |
| Cytokinetics, Inc. 3.5% 7/1/27 | 1,503,000 | 1,839,672 | |
| Dynavax Technologies Corp. 2.5% 5/15/26 | 100,000 | 128,340 | |
| Exact Sciences Corp.: | |||
| 0.375% 3/15/27 | 468,000 | 405,044 | |
| 0.375% 3/1/28 | 486,000 | 399,096 | |
| 1% 1/15/25 | 399,000 | 387,651 | |
| 2% 3/1/30(b) | 2,988,000 | 2,680,972 | |
| Immunocore Holdings PLC 2.5% 2/1/30 (b) | 1,289,000 | 1,172,406 | |
| Insmed, Inc. 0.75% 6/1/28 | 1,200,000 | 2,135,400 | |
| Mirum Pharmaceuticals, Inc. 4% 5/1/29 | 960,000 | 1,058,832 | |
| Natera, Inc. 2.25% 5/1/27 | 578,000 | 1,626,612 | |
| Novavax, Inc. 5% 12/15/27 | 437,000 | 585,799 | |
| Sarepta Therapeutics, Inc.: | |||
| 1.25% 9/15/27 | 2,387,000 | 2,751,495 | |
| 1.5% 11/15/24 | 270,000 | 479,588 | |
| 20,554,287 | |||
| Health Care Equipment & Supplies - 0.6% | |||
| CONMED Corp. 2.25% 6/15/27 | 1,080,000 | 971,028 | |
| DexCom, Inc.: | |||
| 0.25% 11/15/25 | 1,976,000 | 2,012,556 | |
| 0.375% 5/15/28 | 1,959,000 | 1,927,656 | |
| Enovis Corp. 3.875% 10/15/28 (b) | 1,040,000 | 1,153,880 | |
| Envista Holdings Corp. 2.375% 6/1/25 | 1,399,000 | 1,527,568 | |
| Glaukos Corp. 2.75% 6/15/27 | 830,000 | 1,748,810 | |
| Haemonetics Corp. 2.5% 6/1/29 (b) | 890,000 | 869,975 | |
| Insulet Corp. 0.375% 9/1/26 | 2,489,000 | 2,578,267 | |
| Integer Holdings Corp. 2.125% 2/15/28 | 1,862,000 | 2,762,277 | |
| iRhythm Technologies, Inc. 1.5% 9/1/29 (b) | 1,050,000 | 951,626 | |
| Lantheus Holdings, Inc. 2.625% 12/15/27 | 1,200,000 | 1,512,000 | |
| LivaNova U.S.A., Inc.: | |||
| 2.5% 3/15/29(b) | 789,000 | 882,102 | |
| 3% 12/15/25 | 1,360,000 | 1,597,592 | |
| Merit Medical Systems, Inc. 3% 2/1/29 (b) | 1,749,000 | 1,975,496 | |
| NuVasive, Inc. 0.375% 3/15/25 | 1,750,000 | 1,666,875 | |
| Omnicell, Inc. 0.25% 9/15/25 | 959,000 | 902,663 | |
| Shockwave Medical, Inc. 1% 8/15/28 (b) | 2,774,000 | 3,572,912 | |
| TransMedics Group, Inc. 1.5% 6/1/28 | 1,489,000 | 2,395,486 | |
| 31,008,769 | |||
| Health Care Providers & Services - 0.1% | |||
| Accolade, Inc. 0.5% 4/1/26 | 2,029,000 | 1,768,882 | |
| Guardant Health, Inc. 0% 11/15/27 | 5,545,000 | 4,099,419 | |
| Opko Health, Inc. 3.75% 1/15/29 (b) | 312,000 | 385,258 | |
| 6,253,559 | |||
| Health Care Technology - 0.1% | |||
| Evolent Health, Inc. 3.5% 12/1/29 (b) | 1,563,000 | 1,442,649 | |
| Health Catalyst, Inc. 2.5% 4/15/25 | 724,000 | 698,660 | |
| Teladoc Health, Inc. 1.25% 6/1/27 | 2,204,000 | 1,840,340 | |
| Veradigm, Inc. 0.875% 1/1/27 | 69,000 | 72,657 | |
| 4,054,306 | |||
| Life Sciences Tools & Services - 0.0% | |||
| Repligen Corp. 1% 12/15/28 (b) | 1,537,000 | 1,523,936 | |
| Pharmaceuticals - 0.1% | |||
| Amphastar Pharmaceuticals, Inc. 2% 3/15/29 (b) | 830,000 | 813,815 | |
| Jazz Investments I Ltd. 2% 6/15/26 | 1,726,000 | 1,646,604 | |
| Pacira Biosciences, Inc. 2.125% 5/15/29 (b) | 664,000 | 677,612 | |
| 3,138,031 | |||
TOTAL HEALTH CARE | 66,532,888 | ||
| INDUSTRIALS - 0.8% | |||
| Aerospace & Defense - 0.1% | |||
| Axon Enterprise, Inc. 0.5% 12/15/27 | 2,217,000 | 2,951,936 | |
| Rocket Lab U.S.A., Inc. 4.25% 2/1/29 (b) | 1,110,000 | 1,210,594 | |
| Spirit Aerosystems, Inc. 3.25% 11/1/28 (b) | 2,188,000 | 2,714,652 | |
| 6,877,182 | |||
| Commercial Services & Supplies - 0.1% | |||
| GEO Corrections Holdings, Inc. 6.5% 2/23/26 | 857,000 | 1,498,036 | |
| Tetra Tech, Inc. 2.25% 8/15/28 (b) | 1,590,000 | 1,882,878 | |
| 3,380,914 | |||
| Construction & Engineering - 0.1% | |||
| Fluor Corp. 1.125% 8/15/29 (b) | 1,616,000 | 1,830,928 | |
| Granite Construction, Inc. 3.75% 5/15/28 | 1,550,000 | 2,256,800 | |
| 4,087,728 | |||
| Electrical Equipment - 0.1% | |||
| Array Technologies, Inc. 1% 12/1/28 | 1,292,000 | 1,191,224 | |
| Bloom Energy Corp.: | |||
| 3% 6/1/28(b) | 1,110,000 | 1,236,318 | |
| 3% 6/1/29(b) | 1,690,000 | 1,738,165 | |
| Stem, Inc. 4.25% 4/1/30 (b) | 2,133,000 | 914,336 | |
| Sunrun, Inc. 4% 3/1/30 (b) | 1,110,000 | 1,188,810 | |
| 6,268,853 | |||
| Ground Transportation - 0.2% | |||
| Lyft, Inc. 1.5% 5/15/25 | 2,051,000 | 1,958,705 | |
| Uber Technologies, Inc.: | |||
| 0% 12/15/25 | 1,824,000 | 1,865,396 | |
| 0.875% 12/1/28(b) | 5,102,000 | 5,621,672 | |
| 9,445,773 | |||
| Machinery - 0.0% | |||
| John Bean Technologies Corp. 0.25% 5/15/26 | 1,444,000 | 1,318,228 | |
| Middleby Corp. 1% 9/1/25 | 1,400,000 | 1,537,900 | |
| 2,856,128 | |||
| Passenger Airlines - 0.1% | |||
| American Airlines Group, Inc. 6.5% 7/1/25 | 2,342,000 | 2,420,116 | |
| JetBlue Airways Corp. 0.5% 4/1/26 | 2,740,000 | 2,402,067 | |
| Southwest Airlines Co. 1.25% 5/1/25 | 2,056,000 | 2,028,557 | |
| Spirit Airlines, Inc. 1% 5/15/26 | 770,000 | 390,005 | |
| 7,240,745 | |||
| Professional Services - 0.1% | |||
| CSG Systems International, Inc. 3.875% 9/15/28 (b) | 840,000 | 775,740 | |
| Parsons Corp. 2.625% 3/1/29 (b) | 2,776,000 | 2,857,731 | |
| 3,633,471 | |||
TOTAL INDUSTRIALS | 43,790,794 | ||
| INFORMATION TECHNOLOGY - 2.6% | |||
| Communications Equipment - 0.1% | |||
| Lumentum Holdings, Inc.: | |||
| 0.5% 12/15/26 | 2,633,000 | 2,307,825 | |
| 0.5% 6/15/28 | 2,140,000 | 1,630,252 | |
| 1.5% 12/15/29(b) | 1,220,000 | 1,084,580 | |
| 5,022,657 | |||
| Electronic Equipment, Instruments & Components - 0.1% | |||
| Advanced Energy Industries, Inc. 2.5% 9/15/28 (b) | 675,000 | 693,495 | |
| Insight Enterprises, Inc. 0.75% 2/15/25 | 1,204,000 | 3,445,246 | |
| Par Technology Corp. 1.5% 10/15/27 | 98,000 | 89,665 | |
| Vishay Intertechnology, Inc. 2.25% 9/15/30 (b) | 1,280,000 | 1,240,320 | |
| 5,468,726 | |||
| IT Services - 0.5% | |||
| Akamai Technologies, Inc.: | |||
| 0.125% 5/1/25 | 2,571,000 | 2,736,830 | |
| 0.375% 9/1/27 | 2,716,000 | 2,648,100 | |
| 1.125% 2/15/29(b) | 2,800,000 | 2,650,200 | |
| BigCommerce Holdings, Inc. 0.25% 10/1/26 | 1,820,000 | 1,567,566 | |
| Cloudflare, Inc. 0% 8/15/26 | 2,792,000 | 2,486,276 | |
| Digitalocean Holdings, Inc. 0% 12/1/26 | 3,337,000 | 2,803,080 | |
| MongoDB, Inc. 0.25% 1/15/26 | 2,446,000 | 3,085,629 | |
| Okta, Inc.: | |||
| 0.125% 9/1/25 | 1,386,000 | 1,301,454 | |
| 0.375% 6/15/26 | 1,204,000 | 1,088,898 | |
| Perficient, Inc. 0.125% 11/15/26 | 1,910,000 | 1,832,645 | |
| Wix.com Ltd. 0% 8/15/25 | 2,407,000 | 2,228,882 | |
| 24,429,560 | |||
| Semiconductors & Semiconductor Equipment - 0.5% | |||
| MACOM Technology Solutions Holdings, Inc. 0.25% 3/15/26 | 1,250,000 | 1,633,750 | |
| Microchip Technology, Inc.: | |||
| 0.125% 11/15/24 | 1,927,000 | 2,122,591 | |
| 0.75% 6/1/30(b) | 4,490,000 | 4,581,568 | |
| MKS Instruments, Inc. 1.25% 6/1/30 (b) | 3,321,000 | 3,400,704 | |
| ON Semiconductor Corp.: | |||
| 0% 5/1/27 | 2,254,000 | 3,307,277 | |
| 0.5% 3/1/29 | 3,943,000 | 3,878,828 | |
| Semtech Corp.: | |||
| 1.625% 11/1/27 | 393,000 | 481,818 | |
| 4% 11/1/28(b) | 313,000 | 647,239 | |
| Veeco Instruments, Inc. 2.875% 6/1/29 | 370,000 | 572,390 | |
| Wolfspeed, Inc.: | |||
| 0.25% 2/15/28 | 2,281,000 | 1,349,212 | |
| 1.75% 5/1/26 | 639,000 | 583,727 | |
| 1.875% 12/1/29 | 7,345,000 | 4,083,820 | |
| 26,642,924 | |||
| Software - 1.2% | |||
| Altair Engineering, Inc. 1.75% 6/15/27 | 1,400,000 | 1,856,820 | |
| Bentley Systems, Inc.: | |||
| 0.125% 1/15/26 | 1,522,000 | 1,498,409 | |
| 0.375% 7/1/27 | 1,400,000 | 1,246,700 | |
| BlackLine, Inc. 1% 6/1/29 (b) | 2,179,000 | 2,077,677 | |
| Box, Inc. 0% 1/15/26 | 907,000 | 1,064,148 | |
| Confluent, Inc. 0% 1/15/27 | 1,963,000 | 1,657,754 | |
| CyberArk Software Ltd. 0% 11/15/24 | 1,108,000 | 1,627,098 | |
| Datadog, Inc. 0.125% 6/15/25 | 1,480,000 | 1,899,580 | |
| Dropbox, Inc.: | |||
| 0% 3/1/26 | 797,000 | 742,007 | |
| 0% 3/1/28 | 811,000 | 734,969 | |
| Everbridge, Inc.: | |||
| 0% 3/15/26 | 942,000 | 925,515 | |
| 0.125% 12/15/24 | 1,506,000 | 1,479,645 | |
| Five9, Inc. 1% 3/15/29 (b) | 1,996,000 | 1,796,346 | |
| Guidewire Software, Inc. 1.25% 3/15/25 | 1,087,000 | 1,203,309 | |
| HubSpot, Inc. 0.375% 6/1/25 | 1,108,000 | 2,397,158 | |
| InterDigital, Inc. 3.5% 6/1/27 | 1,150,000 | 1,748,690 | |
| LivePerson, Inc. 0% 12/15/26 | 1,121,000 | 470,820 | |
| MicroStrategy, Inc.: | |||
| 0% 2/15/27 | 2,265,000 | 2,903,277 | |
| 0.625% 3/15/30(b) | 1,681,000 | 2,039,389 | |
| 0.75% 12/15/25 | 1,147,000 | 4,405,627 | |
| 0.875% 3/15/31(b) | 1,278,000 | 1,184,067 | |
| Pagerduty, Inc.: | |||
| 1.25% 7/1/25 | 645,000 | 599,592 | |
| 1.5% 10/15/28(b) | 1,220,000 | 1,184,864 | |
| Palo Alto Networks, Inc. 0.375% 6/1/25 | 2,371,000 | 7,025,273 | |
| Pegasystems, Inc. 0.75% 3/1/25 | 3,274,000 | 3,141,403 | |
| Progress Software Corp.: | |||
| 1% 4/15/26 | 1,457,000 | 1,465,660 | |
| 3.5% 3/1/30(b) | 1,815,000 | 1,774,868 | |
| Q2 Holdings, Inc. 0.75% 6/1/26 | 1,070,000 | 1,063,045 | |
| Rapid7, Inc.: | |||
| 0.25% 3/15/27 | 95,000 | 83,125 | |
| 1.25% 3/15/29(b) | 1,610,000 | 1,422,113 | |
| Tyler Technologies, Inc. 0.25% 3/15/26 | 2,670,000 | 2,827,530 | |
| Varonis Systems, Inc. 1.25% 8/15/25 | 911,000 | 1,343,270 | |
| Vertex, Inc. 0.75% 5/1/29 (b) | 1,080,000 | 1,209,060 | |
| Workiva, Inc. 1.25% 8/15/28 (b) | 1,812,000 | 1,611,774 | |
| Zscaler, Inc. 0.125% 7/1/25 | 2,474,000 | 3,054,153 | |
| 62,764,735 | |||
| Technology Hardware, Storage & Peripherals - 0.2% | |||
| Seagate HDD Cayman 3.5% 6/1/28 (b) | 3,390,000 | 4,269,705 | |
| Super Micro Computer, Inc. 0% 3/1/29 (b) | 2,236,000 | 2,180,100 | |
| Western Digital Corp. 3% 11/15/28 (b) | 3,770,000 | 5,964,140 | |
| 12,413,945 | |||
TOTAL INFORMATION TECHNOLOGY | 136,742,547 | ||
| MATERIALS - 0.1% | |||
| Chemicals - 0.0% | |||
| Livent Corp. 4.125% 7/15/25 | 447,000 | 615,462 | |
| Metals & Mining - 0.1% | |||
| ATI, Inc. 3.5% 6/15/25 | 688,000 | 2,729,296 | |
| Equinox Gold Corp. 4.75% 10/15/28 (b) | 700,000 | 822,133 | |
| MP Materials Corp.: | |||
| 0.25% 4/1/26(b) | 1,143,000 | 1,013,498 | |
| 3% 3/1/30(b) | 537,000 | 540,813 | |
| United States Steel Corp. 5% 11/1/26 | 528,000 | 1,520,640 | |
| 6,626,380 | |||
TOTAL MATERIALS | 7,241,842 | ||
| REAL ESTATE - 0.4% | |||
| Equity Real Estate Investment Trusts (REITs) - 0.2% | |||
| Federal Realty OP LP 3.25% 1/15/29 (b) | 585,000 | 558,413 | |
| Rexford Industrial Realty LP: | |||
| 4.125% 3/15/29(b) | 1,527,000 | 1,486,790 | |
| 4.375% 3/15/27(b) | 1,514,000 | 1,488,039 | |
| Ventas Realty LP 3.75% 6/1/26 (b) | 3,419,000 | 3,550,632 | |
| Welltower OP LLC 2.75% 5/15/28 (b) | 3,975,000 | 4,695,668 | |
| 11,779,542 | |||
| Real Estate Management & Development - 0.2% | |||
| Realogy Group LLC/Realogy Co-Issuer Corp. 0.25% 6/15/26 | 2,142,000 | 1,776,618 | |
| Redfin Corp.: | |||
| 0% 10/15/25 | 992,000 | 893,990 | |
| 0.5% 4/1/27 | 5,056,000 | 2,780,800 | |
| Zillow Group, Inc.: | |||
| 0.75% 9/1/24 | 1,321,000 | 1,357,988 | |
| 1.375% 9/1/26 | 2,220,000 | 2,508,427 | |
| 9,317,823 | |||
TOTAL REAL ESTATE | 21,097,365 | ||
| UTILITIES - 1.0% | |||
| Electric Utilities - 0.7% | |||
| Alliant Energy Corp. 3.875% 3/15/26 | 1,160,000 | 1,142,020 | |
| Duke Energy Corp. 4.125% 4/15/26 | 3,940,000 | 3,959,700 | |
| Evergy, Inc. 4.5% 12/15/27 (b) | 3,200,000 | 3,258,034 | |
| FirstEnergy Corp. 4% 5/1/26 | 4,865,000 | 4,860,135 | |
| NextEra Energy Capital Holdings, Inc. 3% 3/1/27 (b) | 1,766,000 | 2,173,178 | |
| NRG Energy, Inc. 2.75% 6/1/48 | 1,054,000 | 2,098,735 | |
| PG&E Corp. 4.25% 12/1/27 (b) | 7,600,000 | 7,830,471 | |
| PPL Capital Funding, Inc. 2.875% 3/15/28 | 2,360,000 | 2,301,000 | |
| Southern Co.: | |||
| 3.875% 12/15/25 | 3,839,000 | 3,959,929 | |
| 4.5% 6/15/27(b) | 3,321,000 | 3,382,439 | |
| 34,965,641 | |||
| Independent Power and Renewable Electricity Producers - 0.1% | |||
| NextEra Energy Partners LP 0% 11/15/25 (b) | 4,537,000 | 4,076,495 | |
| Ormat Technologies, Inc. 2.5% 7/15/27 | 690,000 | 700,695 | |
| Sunnova Energy International, Inc.: | |||
| 0.25% 12/1/26 | 1,109,000 | 483,524 | |
| 2.625% 2/15/28 | 3,100,000 | 1,065,368 | |
| 6,326,082 | |||
| Multi-Utilities - 0.1% | |||
| CenterPoint Energy, Inc. 4.25% 8/15/26 (b) | 2,040,000 | 2,040,000 | |
| CMS Energy Corp. 3.375% 5/1/28 (b) | 1,905,000 | 1,892,618 | |
| WEC Energy Group, Inc.: | |||
| 4.375% 6/1/27(b) | 1,399,000 | 1,398,408 | |
| 4.375% 6/1/29(b) | 1,399,000 | 1,392,213 | |
| 6,723,239 | |||
| Water Utilities - 0.1% | |||
| American Water Capital Corp. 3.625% 6/15/26 (b) | 2,639,000 | 2,594,137 | |
TOTAL UTILITIES | 50,609,099 | ||
| TOTAL CONVERTIBLE BONDS | 455,025,236 | ||
| Nonconvertible Bonds - 1.0% | |||
| COMMUNICATION SERVICES - 0.1% | |||
| Media - 0.1% | |||
| Gannett Holdings LLC 6% 11/1/26 (b) | 3,180,000 | 3,001,083 | |
| CONSUMER DISCRETIONARY - 0.1% | |||
| Broadline Retail - 0.1% | |||
| Match Group Holdings II LLC 3.625% 10/1/31 (b) | 2,610,000 | 2,173,863 | |
| ENERGY - 0.0% | |||
| Oil, Gas & Consumable Fuels - 0.0% | |||
| Energy Transfer LP 8% 5/15/54 (c) | 1,045,000 | 1,087,887 | |
| FINANCIALS - 0.5% | |||
| Capital Markets - 0.0% | |||
| Deutsche Bank AG New York Branch 6.72% 1/18/29 (c) | 750,000 | 774,423 | |
| Financial Services - 0.2% | |||
| ILFC E-Capital Trust I CME Term SOFR 3 Month Index + 1.810% 7.1446% 12/21/65 (b)(c)(d) | 14,050,000 | 11,252,665 | |
| Insurance - 0.3% | |||
| MetLife, Inc. 6.4% 12/15/66 (c) | 8,000,000 | 8,061,464 | |
| Prudential Financial, Inc.: | |||
| 3.7% 10/1/50(c) | 2,500,000 | 2,149,708 | |
| 5.125% 3/1/52(c) | 2,350,000 | 2,182,565 | |
| 6.75% 3/1/53(c) | 2,750,000 | 2,815,684 | |
| 15,209,421 | |||
TOTAL FINANCIALS | 27,236,509 | ||
| INFORMATION TECHNOLOGY - 0.0% | |||
| Software - 0.0% | |||
| Veritas U.S., Inc./Veritas Bermuda Ltd. 7.5% 9/1/25 (b) | 650,000 | 593,767 | |
| UTILITIES - 0.3% | |||
| Electric Utilities - 0.1% | |||
| Southern Co. 4% 1/15/51 (c) | 5,900,000 | 5,689,436 | |
| Multi-Utilities - 0.2% | |||
| CMS Energy Corp.: | |||
| 3.75% 12/1/50(c) | 450,000 | 371,789 | |
| 4.75% 6/1/50(c) | 3,500,000 | 3,215,579 | |
| Sempra 4.125% 4/1/52 (c) | 7,865,000 | 7,225,833 | |
| 10,813,201 | |||
TOTAL UTILITIES | 16,502,637 | ||
| TOTAL NONCONVERTIBLE BONDS | 50,595,746 | ||
| TOTAL CORPORATE BONDS (Cost $468,941,088) | 505,620,982 | ||
| U.S. Treasury Obligations - 1.4% | |||
Principal Amount (a) | Value ($) | ||
| U.S. Treasury Bonds: | |||
| 3.875% 2/15/43 | 66,000,000 | 58,997,813 | |
| 3.875% 5/15/43 | 10,000,000 | 8,918,750 | |
| 4.25% 2/15/54 | 5,950,000 | 5,580,914 | |
| 4.5% 2/15/44 | 1,450,000 | 1,407,180 | |
| TOTAL U.S. TREASURY OBLIGATIONS (Cost $73,780,715) | 74,904,657 | ||
| Common Stocks - 54.0% | |||
| Shares | Value ($) | ||
| COMMUNICATION SERVICES - 3.0% | |||
| Diversified Telecommunication Services - 1.2% | |||
| AT&T, Inc. | 166,600 | 3,035,452 | |
| Cellnex Telecom SA (b) | 153,499 | 5,607,329 | |
| Helios Towers PLC (e) | 2,591,490 | 4,194,358 | |
| Verizon Communications, Inc. | 1,175,519 | 48,372,607 | |
| 61,209,746 | |||
| Entertainment - 0.2% | |||
| The Walt Disney Co. | 117,500 | 12,209,425 | |
| Interactive Media & Services - 0.1% | |||
| Alphabet, Inc. Class C | 7,800 | 1,356,888 | |
| Meta Platforms, Inc. Class A | 2,800 | 1,307,124 | |
| 2,664,012 | |||
| Media - 1.2% | |||
| Comcast Corp. Class A | 1,334,912 | 53,436,527 | |
| EchoStar Corp. Class A (e) | 37,600 | 721,920 | |
| Interpublic Group of Companies, Inc. | 340,700 | 10,687,759 | |
| 64,846,206 | |||
| Wireless Telecommunication Services - 0.3% | |||
| T-Mobile U.S., Inc. | 77,654 | 13,586,344 | |
TOTAL COMMUNICATION SERVICES | 154,515,733 | ||
| CONSUMER DISCRETIONARY - 3.0% | |||
| Broadline Retail - 0.0% | |||
| Amazon.com, Inc. (e) | 7,400 | 1,305,656 | |
| Diversified Consumer Services - 0.2% | |||
| H&R Block, Inc. | 246,800 | 12,251,152 | |
| Hotels, Restaurants & Leisure - 1.4% | |||
| Churchill Downs, Inc. | 7,000 | 906,500 | |
| Genius Sports Ltd. (e) | 94,800 | 496,752 | |
| McDonald's Corp. | 277,178 | 71,758,612 | |
| Norwegian Cruise Line Holdings Ltd. (e) | 24,800 | 411,680 | |
| Super Group SGHC Ltd. (e) | 316,995 | 1,150,692 | |
| 74,724,236 | |||
| Specialty Retail - 1.2% | |||
| Burlington Stores, Inc. (e) | 75,600 | 18,147,780 | |
| Dick's Sporting Goods, Inc. | 1,500 | 341,460 | |
| Lowe's Companies, Inc. | 45,000 | 9,958,050 | |
| TJX Companies, Inc. | 299,100 | 30,837,210 | |
| 59,284,500 | |||
| Textiles, Apparel & Luxury Goods - 0.2% | |||
| Columbia Sportswear Co. (f) | 50,300 | 4,306,686 | |
| Tapestry, Inc. | 72,200 | 3,139,978 | |
| 7,446,664 | |||
TOTAL CONSUMER DISCRETIONARY | 155,012,208 | ||
| CONSUMER STAPLES - 7.6% | |||
| Beverages - 2.2% | |||
| Keurig Dr. Pepper, Inc. | 636,652 | 21,805,331 | |
| The Coca-Cola Co. | 1,480,847 | 93,189,702 | |
| 114,995,033 | |||
| Consumer Staples Distribution & Retail - 2.0% | |||
| Albertsons Companies, Inc. | 128,400 | 2,650,176 | |
| Alimentation Couche-Tard, Inc. Class A (multi-vtg.) | 272,200 | 15,887,237 | |
| BJ's Wholesale Club Holdings, Inc. (e) | 237,500 | 20,916,625 | |
| Costco Wholesale Corp. | 8,800 | 7,127,032 | |
| Dollar Tree, Inc. (e) | 197,000 | 23,236,150 | |
| Metro, Inc. | 151,500 | 8,073,257 | |
| Target Corp. | 75,000 | 11,712,000 | |
| Walmart, Inc. | 235,800 | 15,506,208 | |
| 105,108,685 | |||
| Food Products - 0.2% | |||
| Bunge Global SA | 70,300 | 7,563,577 | |
| Lamb Weston Holdings, Inc. | 6,900 | 609,201 | |
| 8,172,778 | |||
| Household Products - 2.4% | |||
| Procter & Gamble Co. | 768,060 | 126,376,592 | |
| Personal Care Products - 0.8% | |||
| Estee Lauder Companies, Inc. Class A | 44,700 | 5,514,192 | |
| Kenvue, Inc. | 1,453,045 | 28,043,769 | |
| Unilever PLC | 120,400 | 6,593,475 | |
| 40,151,436 | |||
TOTAL CONSUMER STAPLES | 394,804,524 | ||
| ENERGY - 5.8% | |||
| Energy Equipment & Services - 0.0% | |||
| Archrock, Inc. | 38,750 | 784,300 | |
| Kodiak Gas Services, Inc. | 31,860 | 877,743 | |
| U.S.A. Compression Partners LP | 46,280 | 1,133,860 | |
| 2,795,903 | |||
| Oil, Gas & Consumable Fuels - 5.8% | |||
| Canadian Natural Resources Ltd. | 189,338 | 14,544,692 | |
| Canadian Natural Resources Ltd. | 10,800 | 829,764 | |
| Cenovus Energy, Inc. | 76,810 | 1,599,184 | |
| Cheniere Energy Partners LP | 14,630 | 704,727 | |
| Cheniere Energy, Inc. | 47,993 | 7,572,815 | |
| ConocoPhillips Co. | 93,588 | 10,901,130 | |
| DHT Holdings, Inc. | 736,346 | 8,909,787 | |
| Energy Transfer LP | 385,094 | 6,034,423 | |
| EnLink Midstream LLC | 79,190 | 1,004,921 | |
| Exxon Mobil Corp. | 1,245,206 | 146,012,829 | |
| Frontline PLC (NY Shares) | 72,300 | 2,047,536 | |
| Global Partners LP | 12,450 | 601,709 | |
| Hess Corp. | 46,800 | 7,211,880 | |
| Hess Midstream LP | 30,170 | 1,048,408 | |
| Imperial Oil Ltd. | 339,531 | 23,989,754 | |
| Keyera Corp. | 11,760 | 311,397 | |
| Kinetik Holdings, Inc. | 30,240 | 1,239,538 | |
| Mach Natural Resources LP | 71,750 | 1,379,753 | |
| MEG Energy Corp. (e) | 12,970 | 281,582 | |
| MPLX LP | 12,066 | 490,845 | |
| Phillips 66 Co. | 138,424 | 19,671,435 | |
| Plains All American Pipeline LP | 289,178 | 4,918,918 | |
| Scorpio Tankers, Inc. | 26,000 | 2,133,820 | |
| Sunoco Logistics Partners, LP | 25,469 | 1,298,919 | |
| Targa Resources Corp. | 73,575 | 8,698,772 | |
| The Williams Companies, Inc. | 168,586 | 6,998,005 | |
| Valero Energy Corp. | 109,038 | 17,134,231 | |
| Western Midstream Partners LP | 81,489 | 3,041,169 | |
| 300,611,943 | |||
TOTAL ENERGY | 303,407,846 | ||
| FINANCIALS - 6.8% | |||
| Banks - 3.2% | |||
| Bank of America Corp. | 849,345 | 33,965,307 | |
| JPMorgan Chase & Co. | 132,200 | 26,787,686 | |
| M&T Bank Corp. | 116,057 | 17,594,241 | |
| PNC Financial Services Group, Inc. | 242,102 | 38,104,434 | |
| U.S. Bancorp | 662,600 | 26,868,430 | |
| Wells Fargo & Co. | 383,912 | 23,004,007 | |
| 166,324,105 | |||
| Capital Markets - 0.7% | |||
| BlackRock, Inc. Class A | 46,000 | 35,513,380 | |
| Consumer Finance - 0.4% | |||
| Capital One Financial Corp. | 149,490 | 20,574,309 | |
| Financial Services - 0.2% | |||
| MasterCard, Inc. Class A | 1,700 | 760,019 | |
| Toast, Inc. (e) | 20,200 | 489,446 | |
| Visa, Inc. Class A | 32,600 | 8,882,196 | |
| 10,131,661 | |||
| Insurance - 2.3% | |||
| American Financial Group, Inc. | 91,700 | 11,912,747 | |
| Chubb Ltd. | 172,336 | 46,672,036 | |
| Hartford Financial Services Group, Inc. | 201,736 | 20,869,589 | |
| Marsh & McLennan Companies, Inc. | 46,500 | 9,652,470 | |
| The Travelers Companies, Inc. | 157,292 | 33,927,884 | |
| 123,034,726 | |||
TOTAL FINANCIALS | 355,578,181 | ||
| HEALTH CARE - 5.8% | |||
| Biotechnology - 0.7% | |||
| AbbVie, Inc. | 145,600 | 23,476,544 | |
| Gilead Sciences, Inc. | 204,700 | 13,156,069 | |
| Moderna, Inc. (e) | 10,000 | 1,425,500 | |
| 38,058,113 | |||
| Health Care Providers & Services - 0.4% | |||
| UnitedHealth Group, Inc. | 36,904 | 18,281,134 | |
| Life Sciences Tools & Services - 0.5% | |||
| Danaher Corp. | 108,470 | 27,855,096 | |
| Pharmaceuticals - 4.2% | |||
| AstraZeneca PLC sponsored ADR | 416,924 | 32,528,410 | |
| Eli Lilly & Co. | 26,933 | 22,094,217 | |
| GSK PLC | 306,200 | 6,870,521 | |
| Johnson & Johnson | 548,962 | 80,516,257 | |
| Merck & Co., Inc. | 221,581 | 27,817,279 | |
| Roche Holding AG (participation certificate) | 69,433 | 17,727,419 | |
| Royalty Pharma PLC | 293,300 | 8,039,353 | |
| Sanofi SA sponsored ADR | 474,055 | 23,242,917 | |
| 218,836,373 | |||
TOTAL HEALTH CARE | 303,030,716 | ||
| INDUSTRIALS - 8.7% | |||
| Aerospace & Defense - 1.7% | |||
| General Dynamics Corp. | 80,400 | 24,101,508 | |
| General Electric Co. | 152,475 | 25,179,722 | |
| Huntington Ingalls Industries, Inc. | 71,094 | 17,993,891 | |
| Northrop Grumman Corp. | 26,602 | 11,991,384 | |
| The Boeing Co. (e) | 48,499 | 8,613,907 | |
| 87,880,412 | |||
| Air Freight & Logistics - 0.7% | |||
| United Parcel Service, Inc. Class B | 265,029 | 36,820,479 | |
| Building Products - 0.4% | |||
| Johnson Controls International PLC | 320,890 | 23,075,200 | |
| Commercial Services & Supplies - 0.6% | |||
| GFL Environmental, Inc. | 229,900 | 7,237,983 | |
| GFL Environmental, Inc. | 176,031 | 5,539,696 | |
| Republic Services, Inc. | 18,510 | 3,427,867 | |
| Veralto Corp. | 38,190 | 3,764,770 | |
| Waste Connections, Inc. (United States) | 26,697 | 4,386,851 | |
| Waste Management, Inc. | 42,400 | 8,934,952 | |
| 33,292,119 | |||
| Construction & Engineering - 0.2% | |||
| Comfort Systems U.S.A., Inc. | 3,500 | 1,145,690 | |
| EMCOR Group, Inc. | 1,700 | 660,722 | |
| Ferrovial SE | 80,025 | 3,162,647 | |
| Ferrovial SE rights (e)(f)(g) | 80,025 | 26,336 | |
| MDU Resources Group, Inc. | 168,700 | 4,257,988 | |
| 9,253,383 | |||
| Electrical Equipment - 1.8% | |||
| AMETEK, Inc. | 39,900 | 6,766,242 | |
| Eaton Corp. PLC | 243,703 | 81,116,544 | |
| Fluence Energy, Inc. (e)(f) | 33,052 | 830,597 | |
| GE Vernova LLC | 38,118 | 6,704,956 | |
| 95,418,339 | |||
| Ground Transportation - 0.5% | |||
| Canadian Pacific Kansas City Ltd. | 23,839 | 1,891,863 | |
| CSX Corp. | 80,184 | 2,706,210 | |
| Norfolk Southern Corp. | 79,375 | 17,843,500 | |
| Union Pacific Corp. | 15,019 | 3,496,724 | |
| 25,938,297 | |||
| Industrial Conglomerates - 0.5% | |||
| Hitachi Ltd. | 132,100 | 13,604,674 | |
| Siemens AG | 72,500 | 13,973,741 | |
| 27,578,415 | |||
| Machinery - 1.0% | |||
| Chart Industries, Inc. (e) | 25,100 | 3,941,453 | |
| Fortive Corp. | 34,800 | 2,590,512 | |
| Hillenbrand, Inc. | 117,800 | 5,476,522 | |
| ITT, Inc. | 281,600 | 37,419,008 | |
| 49,427,495 | |||
| Professional Services - 0.7% | |||
| Experian PLC | 434,100 | 20,115,391 | |
| KBR, Inc. | 187,900 | 12,337,514 | |
| Paychex, Inc. | 39,800 | 4,782,368 | |
| 37,235,273 | |||
| Trading Companies & Distributors - 0.3% | |||
| Watsco, Inc. | 32,356 | 15,365,864 | |
| Transportation Infrastructure - 0.3% | |||
| Aena SME SA (b) | 63,529 | 12,423,902 | |
| Athens International Airport SA | 91,741 | 822,998 | |
| 13,246,900 | |||
TOTAL INDUSTRIALS | 454,532,176 | ||
| INFORMATION TECHNOLOGY - 6.6% | |||
| Communications Equipment - 1.3% | |||
| Cisco Systems, Inc. | 1,487,380 | 69,163,170 | |
| IT Services - 1.1% | |||
| Accenture PLC Class A | 80,102 | 22,611,994 | |
| Amdocs Ltd. | 274,039 | 21,649,081 | |
| Capgemini SA | 66,400 | 13,452,780 | |
| 57,713,855 | |||
| Semiconductors & Semiconductor Equipment - 2.5% | |||
| Analog Devices, Inc. | 199,000 | 46,663,510 | |
| NVIDIA Corp. | 1,700 | 1,863,761 | |
| NXP Semiconductors NV | 132,000 | 35,917,200 | |
| Taiwan Semiconductor Manufacturing Co. Ltd. sponsored ADR | 298,107 | 45,026,081 | |
| 129,470,552 | |||
| Software - 0.9% | |||
| Gen Digital, Inc. | 286,100 | 7,103,863 | |
| Microsoft Corp. | 74,567 | 30,954,999 | |
| MicroStrategy, Inc. Class A (e) | 1,100 | 1,676,939 | |
| Roper Technologies, Inc. | 13,500 | 7,192,260 | |
| Workiva, Inc. (e) | 3,500 | 269,395 | |
| Zoom Video Communications, Inc. Class A (e) | 21,900 | 1,343,346 | |
| 48,540,802 | |||
| Technology Hardware, Storage & Peripherals - 0.8% | |||
| Apple, Inc. | 39,041 | 7,505,632 | |
| FUJIFILM Holdings Corp. | 180,300 | 4,117,290 | |
| Samsung Electronics Co. Ltd. | 517,883 | 27,474,130 | |
| 39,097,052 | |||
TOTAL INFORMATION TECHNOLOGY | 343,985,431 | ||
| MATERIALS - 1.7% | |||
| Chemicals - 0.6% | |||
| Linde PLC | 74,318 | 32,366,975 | |
| Containers & Packaging - 0.5% | |||
| Ball Corp. | 110,300 | 7,658,129 | |
| Crown Holdings, Inc. | 193,332 | 16,276,621 | |
| 23,934,750 | |||
| Metals & Mining - 0.6% | |||
| Agnico Eagle Mines Ltd. (United States) | 20,000 | 1,364,200 | |
| Freeport-McMoRan, Inc. | 575,500 | 30,346,115 | |
| 31,710,315 | |||
TOTAL MATERIALS | 88,012,040 | ||
| REAL ESTATE - 0.8% | |||
| Equity Real Estate Investment Trusts (REITs) - 0.8% | |||
| American Tower Corp. | 67,925 | 13,295,640 | |
| Equinix, Inc. | 4,558 | 3,477,663 | |
| Lamar Advertising Co. Class A | 131,468 | 15,527,685 | |
| Prologis, Inc. | 24,457 | 2,702,254 | |
| Segro PLC | 367,155 | 4,311,619 | |
| 39,314,861 | |||
| Real Estate Management & Development - 0.0% | |||
| Corporacion Inmobiliaria Vesta S.A.B. de CV ADR | 19,621 | 683,596 | |
TOTAL REAL ESTATE | 39,998,457 | ||
| UTILITIES - 4.2% | |||
| Electric Utilities - 2.8% | |||
| Constellation Energy Corp. | 170,014 | 36,935,542 | |
| Exelon Corp. | 153,900 | 5,778,945 | |
| Iberdrola SA | 129,553 | 1,709,940 | |
| Kansai Electric Power Co., Inc. | 164,986 | 2,985,787 | |
| NextEra Energy, Inc. | 565,081 | 45,217,782 | |
| NRG Energy, Inc. | 30,124 | 2,440,044 | |
| PG&E Corp. | 285,600 | 5,295,024 | |
| Southern Co. | 318,928 | 25,558,890 | |
| SSE PLC | 175,711 | 3,952,823 | |
| Xcel Energy, Inc. | 278,726 | 15,455,357 | |
| 145,330,134 | |||
| Gas Utilities - 0.1% | |||
| Southwest Gas Holdings, Inc. | 95,100 | 7,378,809 | |
| Suburban Propane Partners LP | 30,130 | 612,543 | |
| 7,991,352 | |||
| Independent Power and Renewable Electricity Producers - 0.6% | |||
| RWE AG | 83,951 | 3,190,491 | |
| The AES Corp. | 94,357 | 2,037,168 | |
| Vistra Corp. | 239,315 | 23,711,330 | |
| 28,938,989 | |||
| Multi-Utilities - 0.7% | |||
| Ameren Corp. | 143,305 | 10,514,288 | |
| National Grid PLC | 443,795 | 5,028,194 | |
| National Grid PLC rights 6/10/24 (e) | 159,565 | 400,613 | |
| Sempra | 78,713 | 6,063,262 | |
| WEC Energy Group, Inc. | 152,667 | 12,370,607 | |
| 34,376,964 | |||
TOTAL UTILITIES | 216,637,439 | ||
| TOTAL COMMON STOCKS (Cost $2,005,013,959) | 2,809,514,751 | ||
| Preferred Stocks - 8.4% | |||
| Shares | Value ($) | ||
| Convertible Preferred Stocks - 1.1% | |||
| FINANCIALS - 0.9% | |||
| Banks - 0.8% | |||
| Bank of America Corp. 7.25% | 9,662 | 11,496,331 | |
| Wells Fargo & Co. 7.50% | 24,485 | 28,564,009 | |
| 40,060,340 | |||
| Financial Services - 0.1% | |||
| Apollo Global Management, Inc. Series A, 6.75% | 88,100 | 5,723,857 | |
TOTAL FINANCIALS | 45,784,197 | ||
| HEALTH CARE - 0.0% | |||
| Health Care Providers & Services - 0.0% | |||
| BrightSpring Health Services, Inc. 6.75% | 19,900 | 897,092 | |
| INDUSTRIALS - 0.0% | |||
| Machinery - 0.0% | |||
| RBC Bearings, Inc. | 6,000 | 792,855 | |
| MATERIALS - 0.1% | |||
| Chemicals - 0.1% | |||
| Albemarle Corp. 7.25% | 103,300 | 5,662,906 | |
| UTILITIES - 0.1% | |||
| Electric Utilities - 0.1% | |||
| NextEra Energy, Inc. 6.296% | 118,224 | 5,353,183 | |
| TOTAL CONVERTIBLE PREFERRED STOCKS | 58,490,233 | ||
| Nonconvertible Preferred Stocks - 7.3% | |||
| COMMUNICATION SERVICES - 0.3% | |||
| Diversified Telecommunication Services - 0.3% | |||
| AT&T, Inc.: | |||
| 4.75% | 250,000 | 5,045,000 | |
| 5.125% | 85,000 | 1,802,000 | |
| 5.35% | 300,000 | 6,936,000 | |
| 13,783,000 | |||
| CONSUMER DISCRETIONARY - 0.0% | |||
| Leisure Products - 0.0% | |||
| Brunswick Corp. 6.375% | 8,000 | 196,880 | |
| ENERGY - 0.0% | |||
| Oil, Gas & Consumable Fuels - 0.0% | |||
| Enbridge, Inc. Series L, U.S. TREASURY 5 YEAR INDEX + 3.150% 4.959% (c)(d) | 62,800 | 1,309,380 | |
| FINANCIALS - 5.3% | |||
| Banks - 3.6% | |||
| Bank of America Corp.: | |||
| 4.25% | 665,000 | 12,422,200 | |
| 4.375% | 681,200 | 13,188,032 | |
| 4.75% | 125,000 | 2,595,000 | |
| 5.00% | 500,000 | 10,895,000 | |
| Series HH, 5.875% | 150,000 | 3,735,000 | |
| Series KK, 5.375% | 455,400 | 10,478,754 | |
| Series PP, 4.125% | 675,000 | 12,352,500 | |
| JPMorgan Chase & Co.: | |||
| 4.55% | 583,400 | 11,930,530 | |
| 4.625% | 650,000 | 13,429,000 | |
| 4.75% | 325,000 | 6,922,500 | |
| Series DD, 5.75% | 384,100 | 9,529,521 | |
| Series EE, 6.00% | 175,000 | 4,385,500 | |
| Series MM, 4.20% | 716,400 | 13,654,584 | |
| Truist Financial Corp. 4.75% | 250,000 | 5,105,000 | |
| U.S. Bancorp: | |||
| 4.50% | 150,000 | 2,977,500 | |
| Series K, 5.50% | 100,000 | 2,394,000 | |
| Series L, 3.75% | 150,000 | 2,475,000 | |
| Series M, 4.00% | 240,500 | 4,211,155 | |
| Wells Fargo & Co.: | |||
| 4.25% | 515,000 | 9,615,050 | |
| 4.70% | 400,000 | 8,136,000 | |
| Series CC, 4.375% | 350,000 | 6,730,500 | |
| Series Y, 5.625% | 200,000 | 4,718,000 | |
| Series Z, 4.75% | 638,900 | 13,046,338 | |
| 184,926,664 | |||
| Capital Markets - 0.7% | |||
| Brookfield Oaktree Holdings Ll: | |||
| 6.55% | 140,300 | 2,963,136 | |
| Series A, 6.625% | 105,197 | 2,261,736 | |
| Charles Schwab Corp. 4.45% | 200,000 | 4,070,000 | |
| Morgan Stanley: | |||
| Series E, 3 month U.S. LIBOR + 0.000% 7.125%(c)(d) | 25,000 | 634,000 | |
| Series I, 6.375%(c) | 30,000 | 757,200 | |
| Series K, 5.85%(c) | 429,000 | 10,506,210 | |
| Series L, 4.875% | 175,000 | 3,890,250 | |
| Series O, 4.50% | 483,000 | 9,177,000 | |
| Northern Trust Corp. Series E, 4.70% | 90,000 | 1,912,500 | |
| State Street Corp. Series G, 5.35% (c) | 20,000 | 491,000 | |
| Stifel Financial Corp. Series D, 4.50% | 114,900 | 2,113,586 | |
| 38,776,618 | |||
| Financial Services - 0.1% | |||
| Apollo Global Management, Inc. (c) | 30,000 | 796,200 | |
| Carlyle Finance LLC 4.625% | 165,000 | 2,991,450 | |
| Equitable Holdings, Inc.: | |||
| 4.30% | 76,000 | 1,420,440 | |
| Series A 5.25% | 84,500 | 1,886,885 | |
| 7,094,975 | |||
| Insurance - 0.9% | |||
| Allstate Corp.: | |||
| 5.10% | 491,000 | 10,856,010 | |
| Series I, 4.75% | 125,000 | 2,598,750 | |
| Series J, 7.375% | 35,000 | 954,100 | |
| American Financial Group, Inc. 4.50% | 54,000 | 997,380 | |
| Athene Holding Ltd.: | |||
| Series A, 6.35%(c) | 185,000 | 4,489,950 | |
| Series C, 6.375%(c) | 199,500 | 4,985,505 | |
| Series D, 4.875% | 340,000 | 6,528,000 | |
| MetLife, Inc. Series F 4.75% | 150,000 | 3,057,000 | |
| Prudential Financial, Inc. 4.125% | 100,000 | 1,904,000 | |
| RenaissanceRe Holdings Ltd. Series G, 4.20% | 40,000 | 696,000 | |
| W.R. Berkley Corp.: | |||
| 4.125% | 200,000 | 3,676,000 | |
| 4.25% | 152,000 | 2,846,960 | |
| 5.10% | 100,000 | 2,139,000 | |
| 45,728,655 | |||
TOTAL FINANCIALS | 276,526,912 | ||
| REAL ESTATE - 0.6% | |||
| Equity Real Estate Investment Trusts (REITs) - 0.6% | |||
| Pebblebrook Hotel Trust 6.375% | 54,000 | 1,091,070 | |
| Public Storage: | |||
| 3.875% | 100,000 | 1,750,000 | |
| 3.95% | 100,000 | 1,766,000 | |
| 4.00% | 224,000 | 4,036,480 | |
| 4.00% | 150,000 | 2,737,500 | |
| Series I, 4.875% | 75,000 | 1,677,000 | |
| Series J, 4.70% | 85,000 | 1,786,700 | |
| Series K, 4.75% | 75,000 | 1,599,750 | |
| Series L, 4.625% | 180,000 | 3,740,400 | |
| Series M, 4.125% | 70,000 | 1,308,300 | |
| Series O, 3.90% | 100,000 | 1,746,000 | |
| Series S, 4.10% | 100,000 | 1,841,000 | |
| Summit Hotel Properties, Inc.: | |||
| Series E, 6.25% | 21,400 | 454,964 | |
| Series F, 5.875% | 69,598 | 1,363,077 | |
| Sunstone Hotel Investors, Inc. Series H, 6.125% | 20,000 | 427,400 | |
| 27,325,641 | |||
| UTILITIES - 1.1% | |||
| Electric Utilities - 0.7% | |||
| Brookfield Infrastructure Finance ULC 5.00% | 40,000 | 697,200 | |
| Duke Energy Corp. 5.625% | 50,000 | 1,231,500 | |
| Entergy Louisiana LLC 4.875% | 30,500 | 652,395 | |
| Entergy New Orleans LLC 5.50% | 23,717 | 538,850 | |
| Georgia Power Co. 5.00% | 40,000 | 933,900 | |
| NextEra Energy Capital Holdings, Inc. 5.65% | 115,000 | 2,816,350 | |
| SCE Trust VII: | |||
| 6.95% | 600,000 | 15,120,000 | |
| 7.75% | 150,000 | 4,009,500 | |
| Southern Co.: | |||
| 4.20% | 221,000 | 4,395,690 | |
| 5.25% | 41,487 | 972,040 | |
| Series A, 4.95% | 309,588 | 6,857,374 | |
| 38,224,799 | |||
| Independent Power and Renewable Electricity Producers - 0.1% | |||
| Brookfield Renewable Partners LP 5.25% | 125,000 | 2,300,000 | |
| Multi-Utilities - 0.3% | |||
| Brookfield Infrastructure Partners LP: | |||
| 5.125% | 53,000 | 968,310 | |
| Class A 5.00% | 59,100 | 1,010,610 | |
| CMS Energy Corp.: | |||
| 5.625% | 43,258 | 1,035,164 | |
| 5.875% | 63,130 | 1,544,791 | |
| 5.875% | 157,943 | 3,821,431 | |
| DTE Energy Co.: | |||
| 4.375% | 100,000 | 1,976,000 | |
| 4.375% | 85,000 | 1,708,500 | |
| Series E, 5.25% | 75,000 | 1,743,000 | |
| Sempra 5.75% | 170,459 | 4,004,082 | |
| 17,811,888 | |||
TOTAL UTILITIES | 58,336,687 | ||
| TOTAL NONCONVERTIBLE PREFERRED STOCKS | 377,478,500 | ||
| TOTAL PREFERRED STOCKS (Cost $471,028,765) | 435,968,733 | ||
| Equity Funds - 15.2% | |||
| Shares | Value ($) | ||
Fidelity Real Estate Equity Central Fund (h) (Cost $729,244,855) | 6,351,725 | 791,170,920 | |
| Preferred Securities - 10.9% | |||
Principal Amount (a) | Value ($) | ||
| ENERGY - 0.6% | |||
| Oil, Gas & Consumable Fuels - 0.6% | |||
| BP Capital Markets PLC 6.45% (c)(i) | 6,985,000 | 7,253,797 | |
| Energy Transfer LP: | |||
| CME Term SOFR 3 Month Index + 4.280% 9.612% (c)(d)(i) | 15,960,000 | 15,958,283 | |
| 6.75% (c)(i) | 500,000 | 494,927 | |
| 7.125% (c)(i) | 6,625,000 | 6,504,358 | |
| Summit Midstream Partners LP 3 month U.S. LIBOR + 7.430% 13.0209% (c)(d)(i)(j) | 191,000 | 229,200 | |
| 30,440,565 | |||
| FINANCIALS - 9.5% | |||
| Banks - 6.8% | |||
| Bank of America Corp.: | |||
| 4.375% (c)(i) | 32,000,000 | 30,049,918 | |
| 5.875% (c)(i) | 33,400,000 | 33,207,332 | |
| 6.1% (c)(i) | 13,710,000 | 13,895,778 | |
| 6.125% (c)(i) | 16,000,000 | 16,048,753 | |
| 6.3% (c)(i) | 8,000,000 | 8,148,658 | |
| Citigroup, Inc. 3.875% (c)(i) | 7,000,000 | 6,594,427 | |
| JPMorgan Chase & Co.: | |||
| 3.65% (c)(i) | 28,500,000 | 27,010,833 | |
| 4.6% (c)(i) | 35,390,000 | 35,274,767 | |
| 5% (c)(i) | 21,468,000 | 21,764,119 | |
| 6.1% (c)(i) | 21,000,000 | 21,286,958 | |
| 6.875% (c)(i) | 19,000,000 | 19,893,756 | |
| PNC Financial Services Group, Inc.: | |||
| 3.4% (c)(i) | 10,000,000 | 8,960,657 | |
| 5% (c)(i) | 10,580,000 | 10,246,670 | |
| 6% (c)(i) | 6,100,000 | 5,953,181 | |
| 6.2% (c)(i) | 2,600,000 | 2,588,773 | |
| 6.25% (c)(i) | 7,135,000 | 6,903,673 | |
| Truist Financial Corp.: | |||
| 4.8% (c)(i) | 12,000,000 | 11,867,828 | |
| 4.95% (c)(i) | 6,250,000 | 6,270,560 | |
| 5.1% (c)(i) | 6,850,000 | 6,436,261 | |
| U.S. Bancorp: | |||
| 3.7% (c)(i) | 7,000,000 | 6,263,610 | |
| 5.3% (c)(i) | 1,500,000 | 1,444,467 | |
| Wells Fargo & Co.: | |||
| 3.9% (c)(i) | 29,400,000 | 28,029,175 | |
| 5.9% (c)(i) | 20,700,000 | 21,224,320 | |
| 7.625% (c)(i) | 3,125,000 | 3,341,177 | |
| 352,705,651 | |||
| Capital Markets - 2.1% | |||
| Bank of New York Mellon Corp.: | |||
| 3.7% (c)(i) | 6,725,000 | 6,439,585 | |
| 3.75% (c)(i) | 8,500,000 | 7,865,661 | |
| 4.625% (c)(i) | 8,100,000 | 7,730,440 | |
| 4.7% (c)(i) | 4,925,000 | 4,873,934 | |
| Charles Schwab Corp.: | |||
| 4% (c)(i) | 20,515,000 | 17,291,327 | |
| 4% (c)(i) | 16,800,000 | 15,795,229 | |
| 5% (c)(i) | 6,670,000 | 6,435,796 | |
| 5.375% (c)(i) | 14,875,000 | 14,839,774 | |
| Goldman Sachs Group, Inc.: | |||
| 3.65% (c)(i) | 2,250,000 | 2,089,998 | |
| 4.125% (c)(i) | 5,400,000 | 5,017,921 | |
| Morgan Stanley 5.875% (c)(i) | 6,770,000 | 6,667,563 | |
| Northern Trust Corp. 4.6% (c)(i) | 4,100,000 | 3,971,991 | |
| State Street Corp. CME Term SOFR 3 Month Index + 2.800% 8.1299% (c)(d)(i) | 6,915,000 | 7,078,068 | |
| 106,097,287 | |||
| Consumer Finance - 0.4% | |||
| Ally Financial, Inc.: | |||
| 4.7% (c)(i) | 7,885,000 | 6,958,725 | |
| 4.7% (c)(i) | 4,915,000 | 3,941,278 | |
| American Express Co. 3.55% (c)(i) | 12,250,000 | 11,260,672 | |
| 22,160,675 | |||
| Financial Services - 0.0% | |||
| Equitable Holdings, Inc. 4.95% (c)(i) | 1,250,000 | 1,255,449 | |
| Insurance - 0.2% | |||
| Allianz SE 3.2% (b)(c)(i) | 3,000,000 | 2,479,595 | |
| MetLife, Inc. 3.85% (c)(i) | 9,500,000 | 9,211,813 | |
| 11,691,408 | |||
TOTAL FINANCIALS | 493,910,470 | ||
| INDUSTRIALS - 0.1% | |||
| Trading Companies & Distributors - 0.1% | |||
| Aircastle Ltd. 5.25% (b)(c)(i) | 5,870,000 | 5,641,895 | |
| UTILITIES - 0.7% | |||
| Electric Utilities - 0.4% | |||
| Duke Energy Corp. 4.875% (c)(i) | 8,058,000 | 8,023,825 | |
| Edison International: | |||
| 5% (c)(i) | 5,470,000 | 5,265,703 | |
| 5.375% (c)(i) | 4,500,000 | 4,437,429 | |
| 17,726,957 | |||
| Independent Power and Renewable Electricity Producers - 0.1% | |||
| Vistra Corp.: | |||
| 7% (b)(c)(i) | 3,495,000 | 3,582,004 | |
| 8% (b)(c)(i) | 3,000,000 | 3,080,332 | |
| 6,662,336 | |||
| Multi-Utilities - 0.2% | |||
| Dominion Energy, Inc.: | |||
| 4.35% (c)(i) | 1,935,000 | 1,839,312 | |
| 4.65% (c)(i) | 4,111,000 | 4,180,991 | |
| Sempra 4.875% (c)(i) | 4,000,000 | 3,928,205 | |
| 9,948,508 | |||
TOTAL UTILITIES | 34,337,801 | ||
| TOTAL PREFERRED SECURITIES (Cost $569,303,322) | 564,330,731 | ||
| Money Market Funds - 0.3% | |||
| Shares | Value ($) | ||
| Fidelity Cash Central Fund 5.39% (k) | 9,901,778 | 9,903,759 | |
| Fidelity Securities Lending Cash Central Fund 5.39% (k)(l) | 3,868,539 | 3,868,926 | |
| TOTAL MONEY MARKET FUNDS (Cost $13,772,102) | 13,772,685 | ||
| TOTAL INVESTMENT IN SECURITIES - 99.9% (Cost $4,331,084,806) | 5,195,283,459 |
NET OTHER ASSETS (LIABILITIES) - 0.1% | 5,468,042 |
| NET ASSETS - 100.0% | 5,200,751,501 |
| (a) | Amount is stated in United States dollars unless otherwise noted. |
| (b) | Security exempt from registration under Rule 144A of the Securities Act of 1933. These securities may be resold in transactions exempt from registration, normally to qualified institutional buyers. At the end of the period, the value of these securities amounted to $202,716,152 or 3.9% of net assets. |
| (c) | Coupon rates for floating and adjustable rate securities reflect the rates in effect at period end. |
| (d) | Coupon is indexed to a floating interest rate which may be multiplied by a specified factor and/or subject to caps or floors. |
| (e) | Non-income producing |
| (f) | Security or a portion of the security is on loan at period end. |
| (g) | Security or a portion of the security purchased on a delayed delivery or when-issued basis. |
| (h) | Affiliated fund that is generally available only to investment companies and other accounts managed by Fidelity Investments. A complete unaudited schedule of portfolio holdings for each Fidelity Central Fund is filed with the SEC for the first and third quarters of each fiscal year on Form N-PORT and is available upon request or at the SEC's website at www.sec.gov. An unaudited holdings listing for the Fund, which presents direct holdings as well as the pro-rata share of securities and other investments held indirectly through its investment in underlying non-money market Fidelity Central Funds, is available at fidelity.com and/or institutional.fidelity.com, as applicable. In addition, each Fidelity Central Fund's financial statements are available on the SEC's website or upon request. |
| (i) | Security is perpetual in nature with no stated maturity date. |
| (j) | Non-income producing - Security is in default. |
| (k) | Affiliated fund that is generally available only to investment companies and other accounts managed by Fidelity Investments. The rate quoted is the annualized seven-day yield of the fund at period end. A complete unaudited listing of the fund's holdings as of its most recent quarter end is available upon request. In addition, each Fidelity Central Fund's financial statements are available on the SEC's website or upon request. |
| (l) | Investment made with cash collateral received from securities on loan. |
| Affiliate | Value, beginning of period ($) | Purchases ($) | Sales Proceeds ($) | Dividend Income ($) | Realized Gain (loss) ($) | Change in Unrealized appreciation (depreciation) ($) | Value, end of period ($) | % ownership, end of period |
| Fidelity Cash Central Fund 5.39% | 206,297,684 | 648,680,417 | 845,074,404 | 2,332,460 | 62 | - | 9,903,759 | 0.0% |
| Fidelity Real Estate Equity Central Fund | 756,216,801 | 75,491,420 | 73,447,825 | 11,740,282 | 1,114,728 | 31,795,796 | 791,170,920 | 80.6% |
| Fidelity Securities Lending Cash Central Fund 5.39% | 2,596,800 | 63,997,900 | 62,725,774 | 7,746 | - | - | 3,868,926 | 0.0% |
| Total | 965,111,285 | 788,169,737 | 981,248,003 | 14,080,488 | 1,114,790 | 31,795,796 | 804,943,605 | |
| Valuation Inputs at Reporting Date: | ||||
| Description | Total ($) | Level 1 ($) | Level 2 ($) | Level 3 ($) |
Investments in Securities: | ||||
| Equities: | ||||
Communication Services | 168,298,733 | 158,497,046 | 9,801,687 | - |
Consumer Discretionary | 155,209,088 | 155,209,088 | - | - |
Consumer Staples | 394,804,524 | 388,211,049 | 6,593,475 | - |
Energy | 304,717,226 | 304,717,226 | - | - |
Financials | 677,889,290 | 632,105,093 | 45,784,197 | - |
Health Care | 303,927,808 | 278,432,776 | 25,495,032 | - |
Industrials | 455,325,031 | 390,428,823 | 64,896,208 | - |
Information Technology | 343,985,431 | 298,941,231 | 45,044,200 | - |
Materials | 93,674,946 | 88,012,040 | 5,662,906 | - |
Real Estate | 67,324,098 | 63,012,479 | 4,311,619 | - |
Utilities | 280,327,309 | 257,706,278 | 22,621,031 | - |
| Corporate Bonds | 505,620,982 | - | 505,620,982 | - |
| U.S. Government and Government Agency Obligations | 74,904,657 | - | 74,904,657 | - |
| Equity Funds | 791,170,920 | 791,170,920 | - | - |
| Preferred Securities | 564,330,731 | - | 564,330,731 | - |
| Money Market Funds | 13,772,685 | 13,772,685 | - | - |
| Total Investments in Securities: | 5,195,283,459 | 3,820,216,734 | 1,375,066,725 | - |
| Statement of Assets and Liabilities | ||||
May 31, 2024 (Unaudited) | ||||
| Assets | ||||
| Investment in securities, at value (including securities loaned of $3,854,145) - See accompanying schedule: | ||||
Unaffiliated issuers (cost $3,588,067,849) | $ | 4,390,339,854 | ||
Fidelity Central Funds (cost $743,016,957) | 804,943,605 | |||
| Total Investment in Securities (cost $4,331,084,806) | $ | 5,195,283,459 | ||
| Foreign currency held at value (cost $214,178) | 214,182 | |||
| Receivable for investments sold | 534,580 | |||
| Receivable for fund shares sold | 2,268,544 | |||
| Dividends receivable | 8,930,557 | |||
| Interest receivable | 3,767,636 | |||
| Distributions receivable from Fidelity Central Funds | 167,313 | |||
| Prepaid expenses | 782 | |||
Total assets | 5,211,167,053 | |||
| Liabilities | ||||
| Payable to custodian bank | $ | 524,141 | ||
| Payable for investments purchased | ||||
Regular delivery | 144,155 | |||
Delayed delivery | 26,336 | |||
| Payable for fund shares redeemed | 2,573,223 | |||
| Accrued management fee | 2,786,755 | |||
| Distribution and service plan fees payable | 429,378 | |||
| Other payables and accrued expenses | 62,638 | |||
| Collateral on securities loaned | 3,868,926 | |||
| Total liabilities | 10,415,552 | |||
| Net Assets | $ | 5,200,751,501 | ||
| Net Assets consist of: | ||||
| Paid in capital | $ | 4,245,627,775 | ||
| Total accumulated earnings (loss) | 955,123,726 | |||
| Net Assets | $ | 5,200,751,501 | ||
| Net Asset Value and Maximum Offering Price | ||||
| Class A : | ||||
Net Asset Value and redemption price per share ($905,102,885 ÷ 54,939,225 shares)(a) | $ | 16.47 | ||
| Maximum offering price per share (100/94.25 of $16.47) | $ | 17.47 | ||
| Class M : | ||||
Net Asset Value and redemption price per share ($297,800,676 ÷ 18,086,731 shares)(a) | $ | 16.47 | ||
| Maximum offering price per share (100/96.50 of $16.47) | $ | 17.07 | ||
| Class C : | ||||
Net Asset Value and offering price per share ($140,269,972 ÷ 8,547,521 shares)(a) | $ | 16.41 | ||
| Strategic Dividend and Income : | ||||
Net Asset Value, offering price and redemption price per share ($2,995,032,448 ÷ 180,086,435 shares) | $ | 16.63 | ||
| Class I : | ||||
Net Asset Value, offering price and redemption price per share ($616,718,104 ÷ 37,226,235 shares) | $ | 16.57 | ||
| Class Z : | ||||
Net Asset Value, offering price and redemption price per share ($245,827,416 ÷ 14,838,543 shares) | $ | 16.57 | ||
(a)Redemption price per share is equal to net asset value less any applicable contingent deferred sales charge. | ||||
| Statement of Operations | ||||
Six months ended May 31, 2024 (Unaudited) | ||||
| Investment Income | ||||
| Dividends | $ | 60,353,886 | ||
| Interest | 12,134,567 | |||
| Income from Fidelity Central Funds (including $7,746 from security lending) | 14,080,488 | |||
| Total income | 86,568,941 | |||
| Expenses | ||||
| Management fee | $ | 15,020,735 | ||
| Transfer agent fees | 1,860,199 | |||
| Distribution and service plan fees | 2,591,970 | |||
| Accounting fees | 318,159 | |||
| Custodian fees and expenses | 29,182 | |||
| Independent trustees' fees and expenses | 7,276 | |||
| Registration fees | 65,586 | |||
| Audit | 39,544 | |||
| Legal | 3,099 | |||
| Miscellaneous | 13,950 | |||
| Total expenses before reductions | 19,949,700 | |||
| Expense reductions | (260,520) | |||
| Total expenses after reductions | 19,689,180 | |||
| Net Investment income (loss) | 66,879,761 | |||
| Realized and Unrealized Gain (Loss) | ||||
| Net realized gain (loss) on: | ||||
| Investment Securities: | ||||
| Unaffiliated issuers | 86,716,093 | |||
| Fidelity Central Funds | 1,114,790 | |||
| Foreign currency transactions | (101,220) | |||
| Total net realized gain (loss) | 87,729,663 | |||
| Change in net unrealized appreciation (depreciation) on: | ||||
| Investment Securities: | ||||
| Unaffiliated issuers | 290,734,973 | |||
| Fidelity Central Funds | 31,795,796 | |||
| Assets and liabilities in foreign currencies | (26,970) | |||
| Total change in net unrealized appreciation (depreciation) | 322,503,799 | |||
| Net gain (loss) | 410,233,462 | |||
| Net increase (decrease) in net assets resulting from operations | $ | 477,113,223 | ||
| Statement of Changes in Net Assets | ||||
Six months ended May 31, 2024 (Unaudited) | Year ended November 30, 2023 | |||
| Increase (Decrease) in Net Assets | ||||
| Operations | ||||
| Net investment income (loss) | $ | 66,879,761 | $ | 142,820,487 |
| Net realized gain (loss) | 87,729,663 | 155,396,854 | ||
| Change in net unrealized appreciation (depreciation) | 322,503,799 | (232,267,813) | ||
| Net increase (decrease) in net assets resulting from operations | 477,113,223 | 65,949,528 | ||
| Distributions to shareholders | (216,879,187) | (215,699,144) | ||
| Share transactions - net increase (decrease) | (52,147,442) | (192,298,975) | ||
| Total increase (decrease) in net assets | 208,086,594 | (342,048,591) | ||
| Net Assets | ||||
| Beginning of period | 4,992,664,907 | 5,334,713,498 | ||
| End of period | $ | 5,200,751,501 | $ | 4,992,664,907 |
Fidelity Advisor® Strategic Dividend & Income® Fund Class A |
Six months ended (Unaudited) May 31, 2024 | Years ended November 30, 2023 | 2022 | 2021 | 2020 | 2019 | |||||||
Selected Per-Share Data | ||||||||||||
| Net asset value, beginning of period | $ | 15.67 | $ | 16.12 | $ | 17.88 | $ | 16.11 | $ | 15.77 | $ | 15.18 |
| Income from Investment Operations | ||||||||||||
Net investment income (loss) A,B | .19 | .41 | .34 | .25 | .33 | .34 | ||||||
| Net realized and unrealized gain (loss) | 1.29 | (.23) | (.64) | 2.39 | 1.01 | 1.23 | ||||||
| Total from investment operations | 1.48 | .18 | (.30) | 2.64 | 1.34 | 1.57 | ||||||
| Distributions from net investment income | (.22) | (.39) | (.36) | (.38) | (.30) | (.33) | ||||||
| Distributions from net realized gain | (.46) | (.24) | (1.10) | (.49) | (.70) | (.65) | ||||||
| Total distributions | (.68) | (.63) | (1.46) | (.87) | (1.00) | (.98) | ||||||
| Net asset value, end of period | $ | 16.47 | $ | 15.67 | $ | 16.12 | $ | 17.88 | $ | 16.11 | $ | 15.77 |
Total Return C,D,E | 9.62 % | 1.28% | (2.09)% | 16.99% | 9.04% | 11.44% | ||||||
Ratios to Average Net Assets B,F,G | ||||||||||||
| Expenses before reductions | .95% H | .98% | .97% | .97% | .99% | 1.00% | ||||||
| Expenses net of fee waivers, if any | .94 % H | .97% | .97% | .97% | .99% | 1.00% | ||||||
| Expenses net of all reductions | .94% H | .97% | .97% | .97% | .99% | 1.00% | ||||||
| Net investment income (loss) | 2.42% H | 2.61% | 2.07% | 1.45% | 2.20% | 2.28% | ||||||
| Supplemental Data | ||||||||||||
| Net assets, end of period (000 omitted) | $ | 905,103 | $ | 856,477 | $ | 880,711 | $ | 867,690 | $ | 666,152 | $ | 661,327 |
Portfolio turnover rate I | 29 % H | 34% | 29% | 37% | 55% | 58% |
Fidelity Advisor® Strategic Dividend & Income® Fund Class M |
Six months ended (Unaudited) May 31, 2024 | Years ended November 30, 2023 | 2022 | 2021 | 2020 | 2019 | |||||||
Selected Per-Share Data | ||||||||||||
| Net asset value, beginning of period | $ | 15.66 | $ | 16.11 | $ | 17.86 | $ | 16.10 | $ | 15.76 | $ | 15.17 |
| Income from Investment Operations | ||||||||||||
Net investment income (loss) A,B | .17 | .37 | .30 | .21 | .29 | .30 | ||||||
| Net realized and unrealized gain (loss) | 1.30 | (.23) | (.63) | 2.38 | 1.01 | 1.23 | ||||||
| Total from investment operations | 1.47 | .14 | (.33) | 2.59 | 1.30 | 1.53 | ||||||
| Distributions from net investment income | (.20) | (.35) | (.32) | (.34) | (.26) | (.29) | ||||||
| Distributions from net realized gain | (.46) | (.24) | (1.10) | (.49) | (.70) | (.65) | ||||||
| Total distributions | (.66) | (.59) | (1.42) | (.83) | (.96) | (.94) | ||||||
| Net asset value, end of period | $ | 16.47 | $ | 15.66 | $ | 16.11 | $ | 17.86 | $ | 16.10 | $ | 15.76 |
Total Return C,D,E | 9.55 % | 1.03% | (2.29)% | 16.65% | 8.77% | 11.16% | ||||||
Ratios to Average Net Assets B,F,G | ||||||||||||
| Expenses before reductions | 1.20% H | 1.22% | 1.22% | 1.22% | 1.24% | 1.25% | ||||||
| Expenses net of fee waivers, if any | 1.19 % H | 1.22% | 1.21% | 1.22% | 1.24% | 1.25% | ||||||
| Expenses net of all reductions | 1.19% H | 1.22% | 1.21% | 1.22% | 1.23% | 1.25% | ||||||
| Net investment income (loss) | 2.17% H | 2.37% | 1.82% | 1.21% | 1.96% | 2.04% | ||||||
| Supplemental Data | ||||||||||||
| Net assets, end of period (000 omitted) | $ | 297,801 | $ | 287,670 | $ | 307,028 | $ | 316,442 | $ | 275,209 | $ | 275,564 |
Portfolio turnover rate I | 29 % H | 34% | 29% | 37% | 55% | 58% |
Fidelity Advisor® Strategic Dividend & Income® Fund Class C |
Six months ended (Unaudited) May 31, 2024 | Years ended November 30, 2023 | 2022 | 2021 | 2020 | 2019 | |||||||
Selected Per-Share Data | ||||||||||||
| Net asset value, beginning of period | $ | 15.61 | $ | 16.05 | $ | 17.80 | $ | 16.03 | $ | 15.69 | $ | 15.10 |
| Income from Investment Operations | ||||||||||||
Net investment income (loss) A,B | .13 | .29 | .21 | .12 | .21 | .23 | ||||||
| Net realized and unrealized gain (loss) | 1.28 | (.22) | (.63) | 2.38 | 1.01 | 1.22 | ||||||
| Total from investment operations | 1.41 | .07 | (.42) | 2.50 | 1.22 | 1.45 | ||||||
| Distributions from net investment income | (.15) | (.27) | (.23) | (.24) | (.19) | (.21) | ||||||
| Distributions from net realized gain | (.46) | (.24) | (1.10) | (.49) | (.70) | (.65) | ||||||
| Total distributions | (.61) | (.51) | (1.33) | (.73) | (.88) C | (.86) | ||||||
| Net asset value, end of period | $ | 16.41 | $ | 15.61 | $ | 16.05 | $ | 17.80 | $ | 16.03 | $ | 15.69 |
Total Return D,E,F | 9.23 % | .55% | (2.85)% | 16.12% | 8.22% | 10.61% | ||||||
Ratios to Average Net Assets B,G,H | ||||||||||||
| Expenses before reductions | 1.70% I | 1.74% | 1.73% | 1.73% | 1.75% | 1.75% | ||||||
| Expenses net of fee waivers, if any | 1.69 % I | 1.73% | 1.72% | 1.73% | 1.74% | 1.75% | ||||||
| Expenses net of all reductions | 1.69% I | 1.73% | 1.72% | 1.73% | 1.74% | 1.75% | ||||||
| Net investment income (loss) | 1.67% I | 1.85% | 1.31% | .70% | 1.45% | 1.53% | ||||||
| Supplemental Data | ||||||||||||
| Net assets, end of period (000 omitted) | $ | 140,270 | $ | 150,576 | $ | 192,698 | $ | 233,431 | $ | 278,672 | $ | 316,896 |
Portfolio turnover rate J | 29 % I | 34% | 29% | 37% | 55% | 58% |
Fidelity® Strategic Dividend & Income® Fund |
Six months ended (Unaudited) May 31, 2024 | Years ended November 30, 2023 | 2022 | 2021 | 2020 | 2019 | |||||||
Selected Per-Share Data | ||||||||||||
| Net asset value, beginning of period | $ | 15.81 | $ | 16.26 | $ | 18.02 | $ | 16.23 | $ | 15.88 | $ | 15.27 |
| Income from Investment Operations | ||||||||||||
Net investment income (loss) A,B | .22 | .45 | .39 | .31 | .37 | .39 | ||||||
| Net realized and unrealized gain (loss) | 1.30 | (.22) | (.64) | 2.40 | 1.02 | 1.24 | ||||||
| Total from investment operations | 1.52 | .23 | (.25) | 2.71 | 1.39 | 1.63 | ||||||
| Distributions from net investment income | (.24) | (.43) | (.41) | (.43) | (.34) | (.37) | ||||||
| Distributions from net realized gain | (.46) | (.24) | (1.10) | (.49) | (.70) | (.65) | ||||||
| Total distributions | (.70) | (.68) C | (1.51) | (.92) | (1.04) | (1.02) | ||||||
| Net asset value, end of period | $ | 16.63 | $ | 15.81 | $ | 16.26 | $ | 18.02 | $ | 16.23 | $ | 15.88 |
Total Return D,E | 9.81 % | 1.55% | (1.79)% | 17.30% | 9.35% | 11.81% | ||||||
Ratios to Average Net Assets B,F,G | ||||||||||||
| Expenses before reductions | .66% H | .70% | .68% | .68% | .70% | .71% | ||||||
| Expenses net of fee waivers, if any | .66 % H | .69% | .68% | .68% | .70% | .71% | ||||||
| Expenses net of all reductions | .65% H | .69% | .68% | .68% | .70% | .71% | ||||||
| Net investment income (loss) | 2.71% H | 2.89% | 2.35% | 1.74% | 2.49% | 2.57% | ||||||
| Supplemental Data | ||||||||||||
| Net assets, end of period (000 omitted) | $ | 2,995,032 | $ | 2,863,292 | $ | 3,093,655 | $ | 3,514,906 | $ | 2,751,272 | $ | 3,142,639 |
Portfolio turnover rate I | 29 % H | 34% | 29% | 37% | 55% | 58% |
Fidelity Advisor® Strategic Dividend & Income® Fund Class I |
Six months ended (Unaudited) May 31, 2024 | Years ended November 30, 2023 | 2022 | 2021 | 2020 | 2019 | |||||||
Selected Per-Share Data | ||||||||||||
| Net asset value, beginning of period | $ | 15.75 | $ | 16.20 | $ | 17.96 | $ | 16.18 | $ | 15.84 | $ | 15.23 |
| Income from Investment Operations | ||||||||||||
Net investment income (loss) A,B | .22 | .45 | .38 | .30 | .36 | .38 | ||||||
| Net realized and unrealized gain (loss) | 1.30 | (.23) | (.64) | 2.39 | 1.02 | 1.24 | ||||||
| Total from investment operations | 1.52 | .22 | (.26) | 2.69 | 1.38 | 1.62 | ||||||
| Distributions from net investment income | (.24) | (.43) | (.40) | (.42) | (.34) | (.36) | ||||||
| Distributions from net realized gain | (.46) | (.24) | (1.10) | (.49) | (.70) | (.65) | ||||||
| Total distributions | (.70) | (.67) | (1.50) | (.91) | (1.04) | (1.01) | ||||||
| Net asset value, end of period | $ | 16.57 | $ | 15.75 | $ | 16.20 | $ | 17.96 | $ | 16.18 | $ | 15.84 |
Total Return C,D | 9.83 % | 1.53% | (1.83)% | 17.25% | 9.28% | 11.82% | ||||||
Ratios to Average Net Assets B,E,F | ||||||||||||
| Expenses before reductions | .70% G | .73% | .72% | .72% | .73% | .74% | ||||||
| Expenses net of fee waivers, if any | .69 % G | .72% | .71% | .72% | .73% | .74% | ||||||
| Expenses net of all reductions | .69% G | .72% | .71% | .72% | .73% | .74% | ||||||
| Net investment income (loss) | 2.67% G | 2.87% | 2.32% | 1.71% | 2.46% | 2.54% | ||||||
| Supplemental Data | ||||||||||||
| Net assets, end of period (000 omitted) | $ | 616,718 | $ | 603,173 | $ | 658,828 | $ | 647,384 | $ | 537,336 | $ | 545,366 |
Portfolio turnover rate H | 29 % G | 34% | 29% | 37% | 55% | 58% |
Fidelity Advisor® Strategic Dividend & Income® Fund Class Z |
Six months ended (Unaudited) May 31, 2024 | Years ended November 30, 2023 | 2022 | 2021 | 2020 | 2019 | |||||||
Selected Per-Share Data | ||||||||||||
| Net asset value, beginning of period | $ | 15.75 | $ | 16.20 | $ | 17.96 | $ | 16.18 | $ | 15.84 | $ | 15.24 |
| Income from Investment Operations | ||||||||||||
Net investment income (loss) A,B | .23 | .47 | .40 | .32 | .38 | .40 | ||||||
| Net realized and unrealized gain (loss) | 1.30 | (.23) | (.63) | 2.39 | 1.01 | 1.23 | ||||||
| Total from investment operations | 1.53 | .24 | (.23) | 2.71 | 1.39 | 1.63 | ||||||
| Distributions from net investment income | (.25) | (.45) | (.43) | (.45) | (.36) | (.38) | ||||||
| Distributions from net realized gain | (.46) | (.24) | (1.10) | (.49) | (.70) | (.65) | ||||||
| Total distributions | (.71) | (.69) | (1.53) | (.93) C | (1.05) C | (1.03) | ||||||
| Net asset value, end of period | $ | 16.57 | $ | 15.75 | $ | 16.20 | $ | 17.96 | $ | 16.18 | $ | 15.84 |
Total Return D,E | 9.90 % | 1.66% | (1.70)% | 17.40% | 9.43% | 11.90% | ||||||
Ratios to Average Net Assets B,F,G | ||||||||||||
| Expenses before reductions | .58% H | .60% | .59% | .59% | .61% | .61% | ||||||
| Expenses net of fee waivers, if any | .57 % H | .59% | .59% | .59% | .61% | .61% | ||||||
| Expenses net of all reductions | .57% H | .59% | .59% | .59% | .60% | .61% | ||||||
| Net investment income (loss) | 2.79% H | 2.99% | 2.44% | 1.83% | 2.59% | 2.67% | ||||||
| Supplemental Data | ||||||||||||
| Net assets, end of period (000 omitted) | $ | 245,827 | $ | 231,477 | $ | 201,793 | $ | 179,880 | $ | 140,035 | $ | 127,236 |
Portfolio turnover rate I | 29 % H | 34% | 29% | 37% | 55% | 58% |
| Fidelity Central Fund | Investment Manager | Investment Objective | Investment Practices | Expense RatioA |
| Fidelity Real Estate Equity Central Fund | Fidelity Management & Research Company LLC (FMR) | Seeks above-average income and long-term capital growth by investing primarily in equity securities of issuers in the real estate industry. | Less than .005% | |
| Fidelity Money Market Central Funds | Fidelity Management & Research Company LLC (FMR) | Each fund seeks to obtain a high level of current income consistent with the preservation of capital and liquidity. | Short-term Investments | Less than .005% |
| Gross unrealized appreciation | $1,047,056,847 |
| Gross unrealized depreciation | (176,531,118) |
| Net unrealized appreciation (depreciation) | $870,525,729 |
| Tax cost | $4,324,757,730 |
| Purchases ($) | Sales ($) | |
| Fidelity Strategic Dividend & Income Fund | 711,393,277 | 755,677,575 |
| Maximum Management Fee Rate % | |
| Class A | .69 |
| Class M | .68 |
| Class C | .69 |
| Strategic Dividend and Income | .66 |
| Class I | .68 |
| Class Z | .56 |
| Total Management Fee Rate % | |
| Class A | .67 |
| Class M | .67 |
| Class C | .67 |
| Strategic Dividend and Income | .63 |
| Class I | .67 |
| Class Z | .56 |
| Distribution Fee | Service Fee | Total Fees ($) | Retained by FDC ($) | |
| Class A | - % | .25% | 1,113,751 | 20,231 |
| Class M | .25% | .25% | 742,970 | - |
| Class C | .75% | .25% | 735,249 | 52,895 |
| 2,591,970 | 73,126 |
| Retained by FDC ($) | |
| Class A | 115,265 |
| Class M | 8,095 |
Class CA | 856 |
| 124,216 |
| % of Class-Level Average Net Assets | |
| Class A | .1698 |
| Class M | .1647 |
| Class C | .1754 |
| Strategic Dividend and Income | .1376 |
| Class I | .1671 |
| Amount ($) | % of Class-Level Average Net AssetsA | |
| Class A | 376,568 | .17 |
| Class M | 122,657 | .17 |
| Class C | 65,851 | .18 |
| Strategic Dividend and Income | 1,012,849 | .14 |
| Class I | 257,351 | .17 |
| Class Z | 24,923 | .04 |
| 1,860,199 |
| % of Average Net Assets | |
| Fidelity Strategic Dividend & Income Fund | .0249 |
| % of Average Net Assets | |
| Fidelity Strategic Dividend & Income Fund | .02 |
| Amount ($) | |
| Fidelity Strategic Dividend & Income Fund | 6,560 |
| Purchases ($) | Sales ($) | Realized Gain (Loss)($) | |
| Fidelity Strategic Dividend & Income Fund | 12,372,834 | 26,924,647 | 8,259,710 |
| Amount ($) | |
| Fidelity Strategic Dividend & Income Fund | 4,765 |
| Total Security Lending Fees Paid to NFS ($) | Security Lending Income From Securities Loaned to NFS ($) | Value of Securities Loaned to NFS at Period End ($) | |
| Fidelity Strategic Dividend & Income Fund | 815 | - | - |
Six months ended May 31, 2024 | Year ended November 30, 2023 | |
| Fidelity Strategic Dividend & Income Fund | ||
| Distributions to shareholders | ||
| Class A | $36,811,299 | $34,896,865 |
| Class M | 11,958,072 | 11,232,837 |
| Class C | 5,749,140 | 5,885,537 |
| Strategic Dividend and Income | 126,060,593 | 127,313,172 |
| Class I | 26,133,775 | 27,077,704 |
| Class Z | 10,166,308 | 9,293,029 |
Total | $216,879,187 | $215,699,144 |
| Shares | Shares | Dollars | Dollars | |
Six months ended May 31, 2024 | Year ended November 30, 2023 | Six months ended May 31, 2024 | Year ended November 30, 2023 | |
| Fidelity Strategic Dividend & Income Fund | ||||
| Class A | ||||
| Shares sold | 3,360,698 | 7,561,678 | $54,022,885 | $117,453,014 |
| Reinvestment of distributions | 2,261,288 | 2,211,255 | 35,679,528 | 33,782,563 |
| Shares redeemed | (5,344,347) | (9,745,137) | (85,711,575) | (150,986,608) |
| Net increase (decrease) | 277,639 | 27,796 | $3,990,838 | $248,969 |
| Class M | ||||
| Shares sold | 1,067,122 | 1,968,340 | $17,104,444 | $30,561,012 |
| Reinvestment of distributions | 751,679 | 729,348 | 11,854,164 | 11,141,435 |
| Shares redeemed | (2,102,604) | (3,385,051) | (33,770,191) | (52,479,665) |
| Net increase (decrease) | (283,803) | (687,363) | $(4,811,583) | $(10,777,218) |
| Class C | ||||
| Shares sold | 400,627 | 1,285,125 | $6,410,988 | $19,977,665 |
| Reinvestment of distributions | 361,557 | 381,448 | 5,680,622 | 5,807,925 |
| Shares redeemed | (1,861,516) | (4,023,040) | (29,798,180) | (62,146,234) |
| Net increase (decrease) | (1,099,332) | (2,356,467) | $(17,706,570) | $(36,360,644) |
| Strategic Dividend and Income | ||||
| Shares sold | 9,683,433 | 15,206,763 | $157,022,694 | $238,823,522 |
| Reinvestment of distributions | 6,864,769 | 7,211,435 | 109,334,885 | 111,124,928 |
| Shares redeemed | (17,567,510) | (31,571,198) | (284,345,552) | (493,891,504) |
| Net increase (decrease) | (1,019,308) | (9,153,000) | $(17,987,973) | $(143,943,054) |
| Class I | ||||
| Shares sold | 2,951,181 | 6,813,633 | $47,658,538 | $106,609,218 |
| Reinvestment of distributions | 1,560,550 | 1,658,668 | 24,758,082 | 25,466,578 |
| Shares redeemed | (5,580,982) | (10,837,665) | (90,089,599) | (168,888,581) |
| Net increase (decrease) | (1,069,251) | (2,365,364) | $(17,672,979) | $(36,812,785) |
| Class Z | ||||
| Shares sold | 1,824,806 | 4,712,904 | $29,345,504 | $73,832,941 |
| Reinvestment of distributions | 550,144 | 522,283 | 8,729,786 | 8,014,190 |
| Shares redeemed | (2,232,245) | (2,992,888) | (36,034,465) | (46,501,374) |
| Net increase (decrease) | 142,705 | 2,242,299 | $2,040,825 | $35,345,757 |
 |
Item 8.
Changes in and Disagreements with Accountants for Open-End Management Investment Companies
See Item 7.
Item 9.
Proxy Disclosures for Open-End Management Investment Companies
See Item 7.
Item 10.
Remuneration Paid to Directors, Officers, and Others of Open-End Management Investment Companies
See Item 7.
Item 11.
Statement Regarding Basis for Approval of Investment Advisory Contract
See Item 7.
Item 12.
Disclosure of Proxy Voting Policies and Procedures for Closed-End Management Investment Companies
Not applicable.
Item 13.
Portfolio Managers of Closed-End Management Investment Companies
Not applicable.
Item 14.
Purchases of Equity Securities by Closed-End Management Investment Company and Affiliated Purchasers
Not applicable.
Item 15.
Submission of Matters to a Vote of Security Holders
There were no material changes to the procedures by which shareholders may recommend nominees to the Fidelity Salem Street Trust’s Board of Trustees.
Item 16.
Controls and Procedures
(a)(i) The President and Treasurer and the Chief Financial Officer have concluded that the Fidelity Salem Street Trust’s (the “Trust”) disclosure controls and procedures (as defined in Rule 30a-3(c) under the Investment Company Act) provide reasonable assurances that material information relating to the Trust is made known to them by the appropriate persons, based on their evaluation of these controls and procedures as of a date within 90 days of the filing date of this report.
(a)(ii) There was no change in the Trust’s internal control over financial reporting (as defined in Rule 30a-3(d) under the Investment Company Act) that occurred during the period covered by this report that has materially affected, or is reasonably likely to materially affect, the Trust’s internal control over financial reporting.
Item 17.
Disclosure of Securities Lending Activities for Closed-End Management Investment Companies
Not applicable.
Item 18.
Recovery of Erroneously Awarded Compensation
(a)
Not applicable.
(b)
Not applicable.
Item 19.
Exhibits
(a) | (1) | Not applicable. |
(a) | (2) | |
(a) | (3) | Not applicable. |
(b) |
SIGNATURES
Pursuant to the requirements of the Securities Exchange Act of 1934 and the Investment Company Act of 1940, the registrant has duly caused this report to be signed on its behalf by the undersigned, thereunto duly authorized.
Fidelity Salem Street Trust
By: | /s/Laura M. Del Prato |
Laura M. Del Prato | |
President and Treasurer (Principal Executive Officer) | |
Date: | July 23, 2024 |
Pursuant to the requirements of the Securities Exchange Act of 1934 and the Investment Company Act of 1940, this report has been signed below by the following persons on behalf of the registrant and in the capacities and on the dates indicated.
By: | /s/Laura M. Del Prato |
Laura M. Del Prato | |
President and Treasurer (Principal Executive Officer) | |
Date: | July 23, 2024 |
By: | /s/John J. Burke III |
John J. Burke III | |
Chief Financial Officer (Principal Financial Officer) | |
Date: | July 23, 2024 |