UNITED STATES
SECURITIES AND EXCHANGE COMMISSION
Washington, D.C. 20549
FORM N-CSR
CERTIFIED SHAREHOLDER REPORT OF REGISTERED
MANAGEMENT INVESTMENT COMPANIES
Investment Company Act file number 811-02105
Fidelity Salem Street Trust
(Exact name of registrant as specified in charter)
245 Summer St., Boston, MA 02210
(Address of principal executive offices) (Zip code)
Margaret Carey, Secretary
245 Summer St.
Boston, Massachusetts 02210
(Name and address of agent for service)
Registrant's telephone number, including area code:
617-563-7000
Date of fiscal year end: | December 31 |
Date of reporting period: | June 30, 2024 |
Item 1.
Reports to Stockholders
SEMI-ANNUAL SHAREHOLDER REPORT | AS OF JUNE 30, 2024 | ||
| | Fidelity® Inflation-Protected Bond Index Fund Fidelity® Inflation-Protected Bond Index Fund : FIPDX | |
| Costs of a $10,000 investment | Costs paid as a percentage of a $10,000 investment | ||
| Fidelity® Inflation-Protected Bond Index Fund | $ 3 | 0.05% |
KEY FACTS | ||
| Fund Size | $9,175,415,932 | |
| Number of Holdings | 50 | |
| Portfolio Turnover | 22% |
(as of June 30, 2024)
COUPON DISTRIBUTION (% of Fund's net assets) | ||
| 0.01 - 0.99% | 62.0 | |
| 1 - 1.99% | 20.2 | |
| 2 - 2.99% | 12.6 | |
| 3 - 3.99% | 4.5 | |
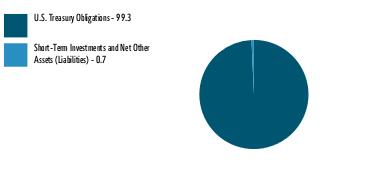
| U.S. Treasury Obligations | 99.3 |
| Short-Term Investments and Net Other Assets (Liabilities) | 0.7 |
ASSET ALLOCATION (% of Fund's net assets) |
 |
TOP HOLDINGS (% of Fund's net assets) | ||
| US Treasury Notes | 74.9 | |
| US Treasury Bonds | 24.4 | |
| 99.3 | ||
| Fidelity, the Fidelity Investments Logo and all other Fidelity trademarks or service marks used herein are trademarks or service marks of FMR LLC. Any third-party marks that are used herein are trademarks or service marks of their respective owners. © 2024 FMR LLC. All rights reserved. | ||
 | For additional information about the Fund; including its prospectus, financial information, holdings and proxy information, scan the QR code or visit fundresearch.fidelity.com/prospectus/sec 1.9916145.100 2418-TSRS-0824 | |
SEMI-ANNUAL SHAREHOLDER REPORT | AS OF JUNE 30, 2024 | ||
| | Fidelity® SAI International Credit Fund Fidelity® SAI International Credit Fund : FSNDX | |
| Costs of a $10,000 investment | Costs paid as a percentage of a $10,000 investment | ||
| Fidelity® SAI International Credit Fund | $ 21 | 0.41% |
KEY FACTS | ||
| Fund Size | $389,358,067 | |
| Number of Holdings | 232 | |
| Portfolio Turnover | 73% |
(as of June 30, 2024)
| U.S. Government and U.S. Government Agency Obligations | 25.2 |
| AAA | 6.3 |
| AA | 0.3 |
| A | 12.2 |
| BBB | 34.9 |
| BB | 4.3 |
| B | 0.7 |
| CCC,CC,C | 0.6 |
| D | 0.1 |
| Not Rated | 9.6 |
| Short-Term Investments and Net Other Assets (Liabilities) | 5.8 |
QUALITY DIVERSIFICATION (% of Fund's net assets) |
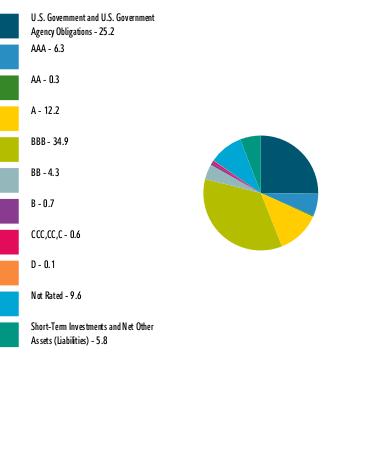 |
| We have used ratings from Moody's Investors Service, Inc. Where Moody's® ratings are not available, we have used S&P® ratings. All ratings are as of the date indicated and do not reflect subsequent changes. |
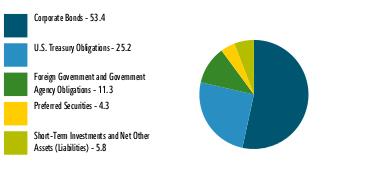
| Corporate Bonds | 53.4 |
| U.S. Treasury Obligations | 25.2 |
| Foreign Government and Government Agency Obligations | 11.3 |
| Preferred Securities | 4.3 |
| Short-Term Investments and Net Other Assets (Liabilities) | 5.8 |
ASSET ALLOCATION (% of Fund's net assets) |
 |
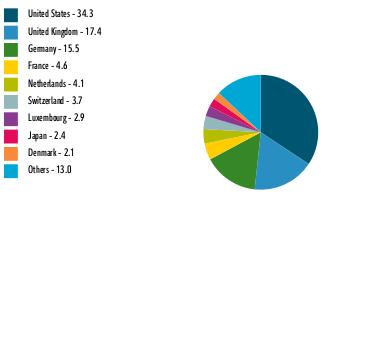
| United States | 34.3 |
| United Kingdom | 17.4 |
| Germany | 15.5 |
| France | 4.6 |
| Netherlands | 4.1 |
| Switzerland | 3.7 |
| Luxembourg | 2.9 |
| Japan | 2.4 |
| Denmark | 2.1 |
| Others | 13.0 |
GEOGRAPHIC DIVERSIFICATION (% of Fund's net assets) |
 |
TOP HOLDINGS (% of Fund's net assets) | ||
| US Treasury Notes | 12.9 | |
| US Treasury Bonds | 12.3 | |
| German Federal Republic | 6.8 | |
| Japan Government | 2.4 | |
| Canadian Government | 2.1 | |
| UBS Group AG | 2.0 | |
| HSBC Holdings PLC | 2.0 | |
| Lloyds Banking Group PLC | 1.9 | |
| NatWest Group PLC | 1.9 | |
| Danske Bank A/S | 1.7 | |
| 46.0 | ||
| Fidelity, the Fidelity Investments Logo and all other Fidelity trademarks or service marks used herein are trademarks or service marks of FMR LLC. Any third-party marks that are used herein are trademarks or service marks of their respective owners. © 2024 FMR LLC. All rights reserved. | ||
 | For additional information about the Fund; including its prospectus, financial information, holdings and proxy information, scan the QR code or visit fundresearch.fidelity.com/prospectus/sec 1.9916216.100 7328-TSRS-0824 | |
SEMI-ANNUAL SHAREHOLDER REPORT | AS OF JUNE 30, 2024 | ||
| | Fidelity® Series 0-5 Year Inflation-Protected Bond Index Fund Fidelity® Series 0-5 Year Inflation-Protected Bond Index Fund : FSTZX | |
| Costs of a $10,000 investment | Costs paid as a percentage of a $10,000 investment | ||
| Fidelity® Series 0-5 Year Inflation-Protected Bond Index Fund | $ 0 A | 0.00%B |
KEY FACTS | ||
| Fund Size | $7,539,073,797 | |
| Number of Holdings | 28 | |
| Portfolio Turnover | 24% |
(as of June 30, 2024)
COUPON DISTRIBUTION (% of Fund's net assets) | ||
| 0.01 - 0.99% | 66.3 | |
| 1 - 1.99% | 13.2 | |
| 2 - 2.99% | 18.2 | |
| 3 - 3.99% | 1.6 | |
| U.S. Treasury Obligations | 99.3 |
| Short-Term Investments and Net Other Assets (Liabilities) | 0.7 |
ASSET ALLOCATION (% of Fund's net assets) |
 |
TOP HOLDINGS (% of Fund's net assets) | ||
| US Treasury Notes | 88.0 | |
| US Treasury Bonds | 11.3 | |
| 99.3 | ||
| Fidelity, the Fidelity Investments Logo and all other Fidelity trademarks or service marks used herein are trademarks or service marks of FMR LLC. Any third-party marks that are used herein are trademarks or service marks of their respective owners. © 2024 FMR LLC. All rights reserved. | ||
 | For additional information about the Fund; including its prospectus, financial information, holdings and proxy information, scan the QR code or visit fundresearch.fidelity.com/prospectus/sec 1.9916198.100 6398-TSRS-0824 | |
SEMI-ANNUAL SHAREHOLDER REPORT | AS OF JUNE 30, 2024 | ||
| | Fidelity® Series 5+ Year Inflation-Protected Bond Index Fund Fidelity® Series 5+ Year Inflation-Protected Bond Index Fund : FSTDX | |
| Costs of a $10,000 investment | Costs paid as a percentage of a $10,000 investment | ||
| Fidelity® Series 5+ Year Inflation-Protected Bond Index Fund | $ 0 A | 0.00%B |
KEY FACTS | ||
| Fund Size | $10,496,299,874 | |
| Number of Holdings | 27 | |
| Portfolio Turnover | 32% |
(as of June 30, 2024)
COUPON DISTRIBUTION (% of Fund's net assets) | ||
| 0.01 - 0.99% | 59.2 | |
| 1 - 1.99% | 33.5 | |
| 2 - 2.99% | 5.0 | |
| 3 - 3.99% | 1.9 | |
| U.S. Treasury Obligations | 99.6 |
| Short-Term Investments and Net Other Assets (Liabilities) | 0.4 |
ASSET ALLOCATION (% of Fund's net assets) |
 |
TOP HOLDINGS (% of Fund's net assets) | ||
| US Treasury Notes | 68.0 | |
| US Treasury Bonds | 31.6 | |
| 99.6 | ||
| Fidelity, the Fidelity Investments Logo and all other Fidelity trademarks or service marks used herein are trademarks or service marks of FMR LLC. Any third-party marks that are used herein are trademarks or service marks of their respective owners. © 2024 FMR LLC. All rights reserved. | ||
 | For additional information about the Fund; including its prospectus, financial information, holdings and proxy information, scan the QR code or visit fundresearch.fidelity.com/prospectus/sec 1.9916199.100 6399-TSRS-0824 | |
SEMI-ANNUAL SHAREHOLDER REPORT | AS OF JUNE 30, 2024 | ||
| | Fidelity® SAI Municipal Income Fund Fidelity® SAI Municipal Income Fund : FSMNX | |
| Costs of a $10,000 investment | Costs paid as a percentage of a $10,000 investment | ||
| Fidelity® SAI Municipal Income Fund | $ 17 | 0.34% |
KEY FACTS | ||
| Fund Size | $2,103,556,992 | |
| Number of Holdings | 1,862 | |
| Portfolio Turnover | 7% |
(as of June 30, 2024)
REVENUE SOURCES (% of Fund's net assets) | ||
| General Obligations | 20.0 | |
| Transportation | 16.5 | |
| Health Care | 14.8 | |
| Education | 8.1 | |
| Special Tax | 8.0 | |
| Housing | 7.7 | |
| State G.O. | 6.5 | |
| Water & Sewer | 5.4 | |
| Others(Individually Less Than 5%) | 13.0 | |
| 100.0 | ||
| AAA | 10.8 |
| AA | 33.2 |
| A | 37.2 |
| BBB | 7.9 |
| BB | 1.1 |
| B | 0.2 |
| CCC,CC,C | 0.0 |
| Not Rated | 4.1 |
| Short-Term Investments and Net Other Assets (Liabilities) | 5.5 |
QUALITY DIVERSIFICATION (% of Fund's net assets) |
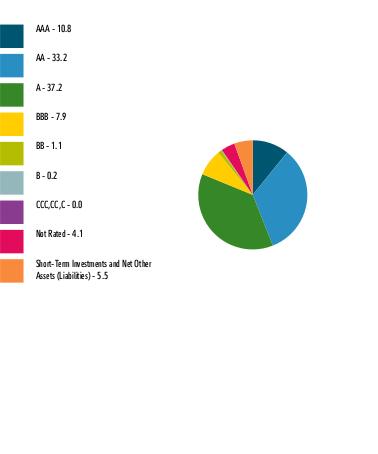 |
| We have used ratings from Moody's Investors Service, Inc. Where Moody's® ratings are not available, we have used S&P® ratings. All ratings are as of the date indicated and do not reflect subsequent changes. |
TOP STATES (% of Fund's net assets) | |
| Illinois | 10.0 |
| New York | 8.1 |
| New Jersey | 7.2 |
| Texas | 7.2 |
| Pennsylvania | 6.0 |
| Fidelity, the Fidelity Investments Logo and all other Fidelity trademarks or service marks used herein are trademarks or service marks of FMR LLC. Any third-party marks that are used herein are trademarks or service marks of their respective owners. © 2024 FMR LLC. All rights reserved. | ||
 | For additional information about the Fund; including its prospectus, financial information, holdings and proxy information, scan the QR code or visit fundresearch.fidelity.com/prospectus/sec 1.9916184.100 3307-TSRS-0824 | |
SEMI-ANNUAL SHAREHOLDER REPORT | AS OF JUNE 30, 2024 | ||
| | Fidelity® International Bond Index Fund Fidelity® International Bond Index Fund : FBIIX | |
| Costs of a $10,000 investment | Costs paid as a percentage of a $10,000 investment | ||
| Fidelity® International Bond Index Fund | $ 3 | 0.06% |
KEY FACTS | ||
| Fund Size | $802,782,572 | |
| Number of Holdings | 1,785 | |
| Portfolio Turnover | 22% |
(as of June 30, 2024)
| AAA | 16.7 |
| AA | 11.8 |
| A | 12.2 |
| BBB | 11.2 |
| BB | 0.2 |
| B | 0.0 |
| CCC,CC,C | 0.0 |
| Not Rated | 46.6 |
| Short-Term Investments and Net Other Assets (Liabilities) | 1.3 |
QUALITY DIVERSIFICATION (% of Fund's net assets) |
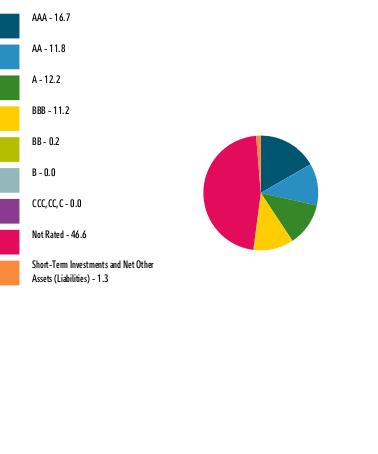 |
| We have used ratings from Moody's Investors Service, Inc. Where Moody's® ratings are not available, we have used S&P® ratings. All ratings are as of the date indicated and do not reflect subsequent changes. |
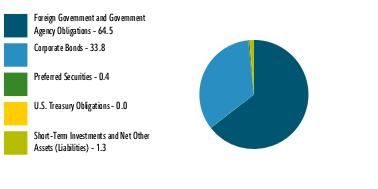
| Foreign Government and Government Agency Obligations | 64.5 |
| Corporate Bonds | 33.8 |
| Preferred Securities | 0.4 |
| U.S. Treasury Obligations | 0.0 |
| Short-Term Investments and Net Other Assets (Liabilities) | 1.3 |
ASSET ALLOCATION (% of Fund's net assets) |
 |
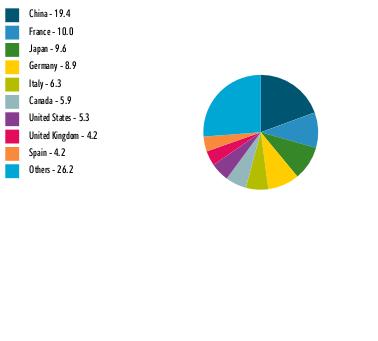
| China | 19.4 |
| France | 10.0 |
| Japan | 9.6 |
| Germany | 8.9 |
| Italy | 6.3 |
| Canada | 5.9 |
| United States | 5.3 |
| United Kingdom | 4.2 |
| Spain | 4.2 |
| Others | 26.2 |
GEOGRAPHIC DIVERSIFICATION (% of Fund's net assets) |
 |
TOP HOLDINGS (% of Fund's net assets) | ||
| Peoples Republic of China | 11.5 | |
| Japan Government | 9.2 | |
| Italian Republic | 5.6 | |
| French Government | 5.6 | |
| German Federal Republic | 5.0 | |
| China Development Bank | 4.2 | |
| Spanish Kingdom | 3.5 | |
| United Kingdom of Great Britain and Northern Ireland | 2.6 | |
| Korean Republic | 2.1 | |
| Agricultural Development Bank of China | 2.1 | |
| 51.4 | ||
| Fidelity, the Fidelity Investments Logo and all other Fidelity trademarks or service marks used herein are trademarks or service marks of FMR LLC. Any third-party marks that are used herein are trademarks or service marks of their respective owners. © 2024 FMR LLC. All rights reserved. | ||
 | For additional information about the Fund; including its prospectus, financial information, holdings and proxy information, scan the QR code or visit fundresearch.fidelity.com/prospectus/sec 1.9916194.100 4506-TSRS-0824 | |
Item 2.
Code of Ethics
Not applicable.
Item 3.
Audit Committee Financial Expert
Not applicable.
Item 4.
Principal Accountant Fees and Services
Not applicable.
Item 5.
Audit Committee of Listed Registrants
Not applicable.
Item 6.
Investments
(a)
Not applicable.
(b)
Not applicable
Item 7.
Financial Statements and Financial Highlights for Open-End Management Investment Companies


Contents
| Nonconvertible Bonds - 53.2% | |||
Principal Amount (a) | Value ($) | ||
| Australia - 0.9% | |||
| Leighton Finance U.S.A. Pty Ltd. 1.5% 5/28/29 (Reg. S) | EUR | 1,719,000 | 1,603,789 |
| QBE Insurance Group Ltd.: | |||
| 2.5% 9/13/38 (Reg. S) (b) | GBP | 1,529,000 | 1,664,748 |
| 6.75% 12/2/44 (Reg. S) (b) | 298,000 | 297,628 | |
TOTAL AUSTRALIA | 3,566,165 | ||
| Belgium - 0.7% | |||
| KBC Group NV 6.324% 9/21/34 (b)(c) | 2,725,000 | 2,828,489 | |
| Czech Republic - 0.3% | |||
| CPI Property Group SA 7% 5/7/29 (Reg. S) | EUR | 950,000 | 998,662 |
| Denmark - 2.1% | |||
| Danske Bank A/S: | |||
| 2.25% 1/14/28 (Reg. S) (b) | GBP | 2,540,000 | 2,964,313 |
| 4.75% 6/21/30 (Reg. S) (b) | EUR | 3,225,000 | 3,594,405 |
| Jyske Bank A/S: | |||
| 5% 10/26/28 (b) | EUR | 810,000 | 893,995 |
| 5.125% 5/1/35 (Reg. S) (b) | EUR | 773,000 | 844,935 |
TOTAL DENMARK | 8,297,648 | ||
| Finland - 0.6% | |||
| Nordea Bank Abp 4.125% 5/5/28 (Reg. S) | EUR | 2,090,000 | 2,280,413 |
| France - 4.6% | |||
| BNP Paribas SA: | |||
| 2.159% 9/15/29 (b)(c) | 2,555,000 | 2,229,787 | |
| 2.5% 3/31/32 (Reg. S) (b) | EUR | 1,700,000 | 1,730,136 |
| 4.125% 5/24/33 (Reg. S) | EUR | 1,000,000 | 1,109,009 |
| BPCE SA 5.716% 1/18/30 (b)(c) | 1,050,000 | 1,047,795 | |
| Electricite de France SA: | |||
| 4.75% 10/12/34 (Reg. S) | EUR | 2,000,000 | 2,247,710 |
| 5.5% 1/25/35 (Reg. S) | GBP | 700,000 | 851,407 |
| Engie SA: | |||
| 3.875% 3/6/36 (Reg. S) | EUR | 1,600,000 | 1,694,183 |
| 4.25% 9/6/34 (Reg. S) | EUR | 1,900,000 | 2,076,116 |
| RCI Banque SA 5.5% 10/9/34 (Reg. S) (b)(d) | EUR | 800,000 | 854,672 |
| Societe Generale: | |||
| 4.75% 11/24/25 (c) | 255,000 | 249,918 | |
| 6.691% 1/10/34 (b)(c) | 3,470,000 | 3,578,304 | |
| Technip Energies NV 1.125% 5/28/28 | EUR | 263,000 | 254,553 |
TOTAL FRANCE | 17,923,590 | ||
| Germany - 7.2% | |||
| AGPS BondCo PLC: | |||
| 4.625% 1/14/26 (Reg. S) (b) | EUR | 700,000 | 243,641 |
| 5% 4/27/27 (Reg. S) (b) | EUR | 100,000 | 34,592 |
| Amprion GmbH 3.625% 5/21/31 (Reg. S) | EUR | 500,000 | 534,437 |
| Aroundtown SA: | |||
| 3% 10/16/29 (Reg. S) | GBP | 200,000 | 201,336 |
| 3.625% 4/10/31 (Reg. S) | GBP | 1,630,000 | 1,609,855 |
| Bayer AG 4.625% 5/26/33 (Reg. S) | EUR | 940,000 | 1,033,592 |
| Bayer U.S. Finance LLC: | |||
| 6.375% 11/21/30 (c) | 1,750,000 | 1,793,351 | |
| 6.5% 11/21/33 (c) | 2,755,000 | 2,818,374 | |
| Commerzbank AG: | |||
| 4.875% 10/16/34 (Reg. S) (b) | EUR | 700,000 | 747,206 |
| 8.625% 2/28/33 (Reg. S) (b) | GBP | 800,000 | 1,071,655 |
| Deutsche Bank AG: | |||
| 3.25% 5/24/28 (Reg. S) (b) | EUR | 100,000 | 105,066 |
| 4% 6/24/32 (Reg. S) (b) | EUR | 2,300,000 | 2,402,137 |
| 6.125% 12/12/30 (Reg. S) (b) | GBP | 1,700,000 | 2,174,316 |
| E.ON SE 3.375% 1/15/31 (Reg. S) | EUR | 1,105,000 | 1,171,417 |
| EnBW Energie Baden-Wuerttemberg AG 1.375% 8/31/81 (Reg. S) (b) | EUR | 2,200,000 | 2,060,344 |
| KfW 0.75% 1/15/29 (Reg. S) | EUR | 2,400,000 | 2,338,608 |
| Robert Bosch GmbH 4.375% 6/2/43 (Reg. S) | EUR | 700,000 | 763,720 |
| RWE Finance U.S. LLC 5.875% 4/16/34 (c) | 1,916,000 | 1,918,140 | |
| Schaeffler AG 4.75% 8/14/29 (Reg. S) | EUR | 1,800,000 | 1,940,240 |
| Sirius Real Estate Ltd. 1.125% 6/22/26 (Reg. S) | EUR | 1,300,000 | 1,304,636 |
| ZF Europe Finance BV 2% 2/23/26 (Reg. S) | EUR | 900,000 | 925,648 |
| ZF Finance GmbH 2% 5/6/27 (Reg. S) | EUR | 700,000 | 699,512 |
TOTAL GERMANY | 27,891,823 | ||
| Hong Kong - 0.4% | |||
| Prudential Funding Asia PLC 2.95% 11/3/33 (Reg. S) (b) | 1,828,000 | 1,621,573 | |
| Ireland - 1.8% | |||
| AIB Group PLC: | |||
| 2.25% 4/4/28 (Reg. S) (b) | EUR | 3,392,000 | 3,483,062 |
| 5.25% 10/23/31 (Reg. S) (b) | EUR | 1,830,000 | 2,094,254 |
| 6.608% 9/13/29 (b)(c) | 204,000 | 210,573 | |
| Bank of Ireland Group PLC 5.601% 3/20/30 (b)(c) | 1,352,000 | 1,344,140 | |
TOTAL IRELAND | 7,132,029 | ||
| Italy - 0.9% | |||
| ENEL Finance International NV 5.5% 6/26/34 (c) | 1,150,000 | 1,120,599 | |
| Enel SpA 3.375% (Reg. S) (b)(e) | EUR | 600,000 | 624,096 |
| Intesa Sanpaolo SpA 6.625% 6/20/33 (c) | 1,820,000 | 1,876,128 | |
TOTAL ITALY | 3,620,823 | ||
| Luxembourg - 2.9% | |||
| Blackstone Property Partners Europe LP: | |||
| 1% 5/4/28 (Reg. S) | EUR | 5,434,000 | 5,122,906 |
| 1.75% 3/12/29 (Reg. S) | EUR | 1,422,000 | 1,342,629 |
| CBRE Global Investors Pan European Core Fund 4.75% 3/27/34 (Reg. S) | EUR | 1,045,000 | 1,134,453 |
| Logicor Financing SARL: | |||
| 1.625% 1/17/30 (Reg. S) | EUR | 600,000 | 552,019 |
| 2% 1/17/34 (Reg. S) | EUR | 2,925,000 | 2,474,478 |
| Prologis International Funding II SA 4.375% 7/1/36 (Reg. S) (d) | EUR | 500,000 | 533,813 |
TOTAL LUXEMBOURG | 11,160,298 | ||
| Mexico - 0.7% | |||
| Petroleos Mexicanos 5.95% 1/28/31 | 3,405,000 | 2,736,769 | |
| Netherlands - 4.1% | |||
| ABN AMRO Bank NV 3.875% 1/15/32 (Reg. S) | EUR | 1,600,000 | 1,717,643 |
| Cooperatieve Rabobank UA: | |||
| 3.822% 7/26/34 (Reg. S) | EUR | 300,000 | 321,231 |
| 4% 1/10/30 (Reg. S) | EUR | 1,300,000 | 1,421,973 |
| CTP BV 1.25% 6/21/29 (Reg. S) | EUR | 2,760,000 | 2,560,658 |
| ING Groep NV: | |||
| 4.5% 5/23/29 (Reg. S) (b) | EUR | 1,400,000 | 1,535,663 |
| 4.75% 5/23/34 (Reg. S) (b) | EUR | 3,800,000 | 4,306,164 |
| Koninklijke KPN NV 3.875% 2/16/36 (Reg. S) | EUR | 900,000 | 951,896 |
| REWE International Finance 4.875% 9/13/30 (Reg. S) | EUR | 1,700,000 | 1,891,757 |
| Universal Music Group NV 4% 6/13/31 (Reg. S) | EUR | 1,000,000 | 1,093,317 |
TOTAL NETHERLANDS | 15,800,302 | ||
| Norway - 0.2% | |||
| DNB Bank ASA 0.25% 2/23/29 (Reg. S) (b) | EUR | 1,010,000 | 955,880 |
| Poland - 0.5% | |||
| GTC Aurora Luxembourg SA 2.25% 6/23/26 (Reg. S) | EUR | 2,018,000 | 1,866,176 |
| Portugal - 0.3% | |||
| Fidelidade-Companhia de Seguros SA 4.25% 9/4/31 (Reg. S) (b) | EUR | 1,300,000 | 1,345,184 |
| Spain - 1.1% | |||
| Banco Bilbao Vizcaya Argentaria SA 6.033% 3/13/35 (b) | 1,600,000 | 1,595,606 | |
| Werfenlife SA 4.625% 6/6/28 (Reg. S) | EUR | 2,300,000 | 2,514,747 |
TOTAL SPAIN | 4,110,353 | ||
| Sweden - 0.9% | |||
| Heimstaden AB 4.375% 3/6/27 (Reg. S) | EUR | 2,000,000 | 1,493,157 |
| Samhallsbyggnadsbolaget I Norden AB 2.25% 8/12/27 (Reg. S) | EUR | 2,715,000 | 2,055,694 |
TOTAL SWEDEN | 3,548,851 | ||
| Switzerland - 3.6% | |||
| Argentum Netherlands BV: | |||
| 5.625% 8/15/52 (Reg. S) (b) | 3,590,000 | 3,534,804 | |
| 5.75% 8/15/50 (Reg. S) (b) | 382,000 | 378,180 | |
| Cloverie PLC 4.5% 9/11/44 (Reg. S) (b) | 441,000 | 437,723 | |
| UBS Group AG: | |||
| 2.125% 11/15/29 (Reg. S) (b) | GBP | 728,000 | 807,091 |
| 4.125% 6/9/33 (Reg. S) (b) | EUR | 1,760,000 | 1,901,470 |
| 4.75% 3/17/32 (Reg. S) (b) | EUR | 2,870,000 | 3,212,770 |
| 7.375% 9/7/33 (Reg. S) (b) | GBP | 1,099,000 | 1,549,812 |
| Zurich Finance (Ireland) DAC 3.5% 5/2/52 (Reg. S) (b) | 2,615,000 | 2,170,973 | |
TOTAL SWITZERLAND | 13,992,823 | ||
| United Kingdom - 16.1% | |||
| Admiral Group PLC 8.5% 1/6/34 (Reg. S) | GBP | 1,595,000 | 2,234,179 |
| Anglian Water (Osprey) Financing PLC 2% 7/31/28 (Reg. S) | GBP | 715,000 | 731,427 |
| Anglian Water Services Financing PLC: | |||
| 5.875% 6/20/31 (Reg. S) | GBP | 565,000 | 723,064 |
| 6.293% 7/30/30 (Reg. S) | GBP | 555,000 | 727,499 |
| Barclays PLC: | |||
| 5.262% 1/29/34 (Reg. S) (b) | EUR | 3,880,000 | 4,438,677 |
| 8.407% 11/14/32 (Reg. S) (b) | GBP | 945,000 | 1,259,072 |
| BAT Capital Corp.: | |||
| 2.125% 8/15/25 | GBP | 101,000 | 122,975 |
| 5.834% 2/20/31 | 272,000 | 275,835 | |
| BAT International Finance PLC 4.125% 4/12/32 (Reg. S) | EUR | 1,995,000 | 2,095,955 |
| Heathrow Funding Ltd. 6% 3/5/32 (Reg. S) | GBP | 1,700,000 | 2,132,337 |
| HSBC Holdings PLC: | |||
| 4.787% 3/10/32 (Reg. S) (b) | EUR | 1,495,000 | 1,676,949 |
| 4.856% 5/23/33 (Reg. S) (b) | EUR | 1,630,000 | 1,840,647 |
| 6.254% 3/9/34 (b) | 1,200,000 | 1,249,446 | |
| 6.8% 9/14/31 (b) | GBP | 1,300,000 | 1,755,628 |
| 7.39% 11/3/28 (b) | 460,000 | 486,457 | |
| 8.201% 11/16/34 (Reg. S) (b) | GBP | 485,000 | 664,903 |
| Imperial Brands Finance Netherlands BV 5.25% 2/15/31 (Reg. S) | EUR | 1,495,000 | 1,679,939 |
| Imperial Brands Finance PLC 4.875% 6/7/32 (Reg. S) | GBP | 1,495,000 | 1,773,057 |
| John Lewis PLC 6.125% 1/21/25 | GBP | 2,031,000 | 2,569,775 |
| Lloyds Banking Group PLC: | |||
| 1.985% 12/15/31 (b) | GBP | 1,172,000 | 1,355,596 |
| 4.5% 1/11/29 (Reg. S) (b) | EUR | 2,015,000 | 2,212,647 |
| 4.75% 9/21/31 (Reg. S) (b) | EUR | 3,535,000 | 3,947,368 |
| Mobico Group PLC 4.875% 9/26/31 (Reg. S) | EUR | 2,825,000 | 2,870,816 |
| NatWest Group PLC: | |||
| 2.105% 11/28/31 (Reg. S) (b) | GBP | 2,314,000 | 2,683,448 |
| 4.771% 2/16/29 (Reg. S) (b) | EUR | 2,410,000 | 2,658,497 |
| 7.416% 6/6/33 (Reg. S) (b) | GBP | 1,455,000 | 1,907,134 |
| NGG Finance PLC 2.125% 9/5/82 (Reg. S) (b) | EUR | 2,006,000 | 1,977,899 |
| Reckitt Benckiser Treasury Services PLC 3.875% 9/14/33 (Reg. S) | EUR | 1,240,000 | 1,334,339 |
| Santander UK Group Holdings PLC 3.625% 1/14/26 (Reg. S) | GBP | 550,000 | 679,425 |
| Severn Trent Utilities Finance PLC 4.625% 11/30/34 (Reg. S) | GBP | 1,265,000 | 1,482,711 |
| Southern Water Services Finance Ltd.: | |||
| 1.625% 3/30/27 (Reg. S) | GBP | 345,000 | 375,054 |
| 2.375% 5/28/28 (Reg. S) | GBP | 865,000 | 937,159 |
| SW Finance I PLC 7.375% 12/12/41 (Reg. S) | GBP | 891,000 | 1,094,652 |
| Tesco Corporate Treasury Services PLC 2.75% 4/27/30 (Reg. S) | GBP | 500,000 | 560,884 |
| The Berkeley Group PLC 2.5% 8/11/31 (Reg. S) | GBP | 2,607,000 | 2,566,377 |
| Travis Perkins PLC 3.75% 2/17/26 (Reg. S) | GBP | 900,000 | 1,078,644 |
| Tritax EuroBox PLC 0.95% 6/2/26 (Reg. S) | EUR | 765,000 | 773,590 |
| Virgin Money UK PLC 7.625% 8/23/29 (Reg. S) (b) | GBP | 2,095,000 | 2,854,254 |
| Vodafone Group PLC 4.875% 10/3/78 (Reg. S) (b) | GBP | 525,000 | 652,370 |
| Whitbread PLC 2.375% 5/31/27 (Reg. S) | GBP | 235,000 | 270,884 |
TOTAL UNITED KINGDOM | 62,711,569 | ||
| United States of America - 3.3% | |||
| Blackstone Private Credit Fund 4.875% 4/14/26 | GBP | 1,069,000 | 1,310,449 |
| Carrier Global Corp. 4.5% 11/29/32 | EUR | 800,000 | 895,624 |
| Citigroup, Inc. 5.875% 7/1/24 (Reg. S) | GBP | 500,000 | 632,050 |
| Duke Energy Corp. 3.85% 6/15/34 | EUR | 1,238,000 | 1,282,023 |
| Ford Motor Credit Co. LLC: | |||
| 4.445% 2/14/30 | EUR | 850,000 | 916,330 |
| 6.86% 6/5/26 | GBP | 1,000,000 | 1,293,885 |
| General Motors Financial Co., Inc. 2.25% 9/6/24 (Reg. S) | GBP | 540,000 | 678,774 |
| JPMorgan Chase & Co. 3.761% 3/21/34 (Reg. S) (b) | EUR | 900,000 | 958,076 |
| Morgan Stanley 3.955% 3/21/35 (Reg. S) (b) | EUR | 950,000 | 1,011,084 |
| Southern Co. 1.875% 9/15/81 (b) | EUR | 1,211,000 | 1,154,539 |
| Verizon Communications, Inc. 3.75% 2/28/36 | EUR | 775,000 | 819,709 |
| Warnermedia Holdings, Inc. 4.693% 5/17/33 (Reg. S) | EUR | 1,350,000 | 1,437,915 |
| WP Carey, Inc. 4.25% 7/23/32 | EUR | 300,000 | 320,207 |
TOTAL UNITED STATES OF AMERICA | 12,710,665 | ||
| TOTAL NONCONVERTIBLE BONDS (Cost $203,061,451) | 207,100,085 | ||
| U.S. Government and Government Agency Obligations - 25.2% | |||
Principal Amount (a) | Value ($) | ||
| U.S. Treasury Obligations - 25.2% | |||
| U.S. Treasury Bonds: | |||
| 1.125% 8/15/40 | 700,000 | 426,234 | |
| 2.25% 5/15/41 | 16,900,000 | 12,227,414 | |
| 3.25% 5/15/42 | 580,200 | 482,473 | |
| 3.625% 5/15/53 | 1,600,000 | 1,361,563 | |
| 4% 11/15/42 (f) | 6,000,000 | 5,529,375 | |
| 4.5% 2/15/44 | 6,500,000 | 6,376,094 | |
| 4.625% 5/15/44 | 1,870,000 | 1,866,494 | |
| 6.25% 5/15/30 (g) | 18,050,000 | 19,800,003 | |
| U.S. Treasury Notes: | |||
| 1% 7/31/28 | 15,000,000 | 13,102,148 | |
| 3.5% 2/15/33 | 200,000 | 187,453 | |
| 3.75% 12/31/28 | 700,000 | 682,117 | |
| 3.75% 12/31/30 | 1,600,000 | 1,545,625 | |
| 4% 2/15/34 | 3,500,000 | 3,397,188 | |
| 4.25% 2/28/29 | 6,420,000 | 6,391,160 | |
| 4.375% 11/30/28 | 3,700,000 | 3,699,422 | |
| 4.5% 11/15/33 | 4,250,000 | 4,289,180 | |
| 4.625% 9/30/28 | 4,000,000 | 4,033,906 | |
| 4.625% 4/30/29 | 12,350,000 | 12,491,832 | |
| TOTAL U.S. GOVERNMENT AND GOVERNMENT AGENCY OBLIGATIONS (Cost $100,004,295) | 97,889,681 | ||
| Foreign Government and Government Agency Obligations - 11.4% | |||
Principal Amount (a) | Value ($) | ||
| Canada - 2.1% | |||
| Canadian Government: | |||
| 2.75% 6/1/33 | CAD | 780,000 | 537,234 |
| 3% 6/1/34 | CAD | 4,500,000 | 3,151,365 |
| 3.25% 12/1/33 | CAD | 6,200,000 | 4,438,526 |
TOTAL CANADA | 8,127,125 | ||
| Germany - 6.9% | |||
| German Federal Republic: | |||
| 2.1% 11/15/29(Reg. S) (g) | EUR | 11,800,000 | 12,415,490 |
| 2.4% 11/15/30(Reg. S) | EUR | 500,000 | 534,052 |
| 2.5% 7/4/44 | EUR | 5,660,000 | 5,874,001 |
| 3.25% 7/4/42 (g) | EUR | 6,750,000 | 7,784,816 |
TOTAL GERMANY | 26,608,359 | ||
| Japan - 2.4% | |||
| Japan Government: | |||
| 0.005% 2/1/25 | JPY | 1,050,850,000 | 6,527,432 |
| 0.8% 3/20/34 | JPY | 161,800,000 | 982,968 |
| 2.1% 3/20/25 | JPY | 303,300,000 | 1,911,738 |
TOTAL JAPAN | 9,422,138 | ||
| TOTAL FOREIGN GOVERNMENT AND GOVERNMENT AGENCY OBLIGATIONS (Cost $44,747,199) | 44,157,622 | ||
| Supranational Obligations - 0.1% | |||
Principal Amount (a) | Value ($) | ||
European Investment Bank 3% 11/15/28 (Reg. S) (Cost $543,804) | EUR | 500,000 | 537,308 |
| Preferred Securities - 4.3% | |||
Principal Amount (a) | Value ($) | ||
| Australia - 0.3% | |||
| QBE Insurance Group Ltd. 5.25% (Reg. S) (b)(e) | 1,045,000 | 1,030,818 | |
| Czech Republic - 0.3% | |||
| CPI Property Group SA 3.75% (Reg. S) (b)(e) | EUR | 1,740,000 | 978,800 |
| Finland - 0.1% | |||
| Citycon Oyj 7.875% (Reg. S) (b)(e) | EUR | 637,000 | 532,466 |
| Germany - 1.5% | |||
| Aroundtown Finance Sarl 7.875% (b)(e) | 250,000 | 180,442 | |
| Aroundtown SA 3.375% (Reg. S) (b)(e) | EUR | 2,700,000 | 1,898,055 |
| Grand City Properties SA 1.5% (Reg. S) (b)(e) | EUR | 800,000 | 548,885 |
| Volkswagen International Finance NV: | |||
| 3.748% (Reg. S) (b)(e) | EUR | 100,000 | 103,799 |
| 3.875% (Reg. S) (b)(e) | EUR | 3,300,000 | 3,294,649 |
TOTAL GERMANY | 6,025,830 | ||
| Ireland - 0.3% | |||
| AerCap Holdings NV 5.875% 10/10/79 (b) | 718,000 | 724,023 | |
| AIB Group PLC 6.25% (Reg. S) (b)(e) | EUR | 410,000 | 439,450 |
TOTAL IRELAND | 1,163,473 | ||
| Sweden - 0.5% | |||
| Heimstaden Bostad AB: | |||
| 3.248% (Reg. S) (b)(e) | EUR | 275,000 | 224,322 |
| 3.625% (Reg. S) (b)(e) | EUR | 2,155,000 | 1,567,947 |
| Samhallsbyggnadsbolaget I Norden AB 2.624% (Reg. S) (b)(e) | EUR | 647,000 | 247,953 |
TOTAL SWEDEN | 2,040,222 | ||
| Switzerland - 0.1% | |||
| Credit Suisse Group AG Claim (e)(h)(i) | 611,000 | 67,210 | |
| UBS Group AG 7% (Reg. S) (b)(e) | 250,000 | 256,001 | |
TOTAL SWITZERLAND | 323,211 | ||
| United Kingdom - 1.2% | |||
| Barclays PLC 7.125% (b)(e) | GBP | 425,000 | 534,006 |
| British American Tobacco PLC 3% (Reg. S) (b)(e) | EUR | 3,367,000 | 3,453,431 |
| Mobico Group PLC 4.25% (Reg. S) (b)(e) | GBP | 340,000 | 395,321 |
| SSE PLC 3.74% (Reg. S) (b)(e) | GBP | 337,000 | 413,652 |
TOTAL UNITED KINGDOM | 4,796,410 | ||
| TOTAL PREFERRED SECURITIES (Cost $15,620,719) | 16,891,230 | ||
| Money Market Funds - 4.6% | |||
| Shares | Value ($) | ||
Fidelity Cash Central Fund 5.38% (j) (Cost $17,936,825) | 17,933,238 | 17,936,825 | |
| TOTAL INVESTMENT IN SECURITIES - 98.8% (Cost $381,914,293) | 384,512,751 |
NET OTHER ASSETS (LIABILITIES) - 1.2% | 4,845,316 |
| NET ASSETS - 100.0% | 389,358,067 |
| Futures Contracts | |||||
Number of contracts | Expiration Date | Notional Amount ($) | Value ($) | Unrealized Appreciation/ (Depreciation) ($) | |
| Purchased | |||||
| Bond Index Contracts | |||||
| ASX 10 Year Treasury Bond Index Contracts (Australia) | 42 | Sep 2024 | 3,181,998 | 2,548 | 2,548 |
| TME 10 Year Canadian Note Contracts (Canada) | 39 | Sep 2024 | 3,422,923 | 27,401 | 27,401 |
| TOTAL BOND INDEX CONTRACTS | 29,949 | ||||
| Treasury Contracts | |||||
| CBOT 2-Year U.S. Treasury Note Contracts (United States) | 39 | Sep 2024 | 7,964,531 | 12,730 | 12,730 |
| CBOT 5-Year U.S. Treasury Note Contracts (United States) | 3 | Sep 2024 | 319,734 | 1,378 | 1,378 |
| TOTAL TREASURY CONTRACTS | 14,108 | ||||
| TOTAL PURCHASED | 44,057 | ||||
| Sold | |||||
| Bond Index Contracts | |||||
| ICE Long Gilt Contracts (United Kingdom) | 37 | Sep 2024 | 4,563,515 | (13,647) | (13,647) |
| TOTAL FUTURES CONTRACTS | 30,410 | ||||
| The notional amount of futures purchased as a percentage of Net Assets is 3.8% | |||||
| The notional amount of futures sold as a percentage of Net Assets is 1.2% | |||||
| Forward Foreign Currency Contracts | ||||||
Currency Purchased | Currency Sold | Counterparty | Settlement Date | Unrealized Appreciation/ (Depreciation) ($) | ||
| JPY | 10,430 | USD | 65 | Brown Brothers Harriman & Co | 7/01/24 | 0 |
| CAD | 800,000 | USD | 584,398 | JPMorgan Chase Bank, N.A. | 7/02/24 | 376 |
| USD | 696,574 | GBP | 551,000 | Citibank, N. A. | 7/02/24 | 55 |
| EUR | 643,000 | USD | 702,019 | Brown Brothers Harriman & Co | 8/22/24 | (11,652) |
| EUR | 400,000 | USD | 434,528 | Brown Brothers Harriman & Co | 8/22/24 | (5,062) |
| EUR | 243,000 | USD | 261,779 | Brown Brothers Harriman & Co | 8/22/24 | (878) |
| EUR | 181,000 | USD | 196,206 | Canadian Imperial Bk. of Comm. | 8/22/24 | (1,873) |
| EUR | 216,000 | USD | 232,965 | JPMorgan Chase Bank, N.A. | 8/22/24 | (1,053) |
| EUR | 1,479,000 | USD | 1,586,037 | JPMorgan Chase Bank, N.A. | 8/22/24 | 1,915 |
| GBP | 115,000 | USD | 147,110 | Brown Brothers Harriman & Co | 8/22/24 | (1,683) |
| GBP | 489,000 | USD | 618,413 | Citibank, N. A. | 8/22/24 | (36) |
| GBP | 90,000 | USD | 114,929 | JPMorgan Chase Bank, N.A. | 8/22/24 | (1,118) |
| GBP | 475,000 | USD | 600,715 | JPMorgan Chase Bank, N.A. | 8/22/24 | (42) |
| USD | 91,311 | AUD | 137,000 | Brown Brothers Harriman & Co | 8/22/24 | (211) |
| USD | 372,500 | CAD | 507,000 | Brown Brothers Harriman & Co | 8/22/24 | 1,445 |
| USD | 6,887,852 | CAD | 9,398,000 | Citibank, N. A. | 8/22/24 | 9,799 |
| USD | 452,319 | CAD | 615,000 | Citibank, N. A. | 8/22/24 | 2,223 |
| USD | 664,071 | CAD | 908,000 | JPMorgan Chase Bank, N.A. | 8/22/24 | (461) |
| USD | 1,448,203 | EUR | 1,329,000 | BNP Paribas S.A. | 8/22/24 | 21,301 |
| USD | 654,468 | EUR | 600,000 | BNP Paribas S.A. | 8/22/24 | 10,269 |
| USD | 289,910 | EUR | 266,000 | Bank of America, N.A. | 8/22/24 | 4,315 |
| USD | 2,572,967 | EUR | 2,367,000 | Brown Brothers Harriman & Co | 8/22/24 | 31,599 |
| USD | 1,639,679 | EUR | 1,505,000 | Brown Brothers Harriman & Co | 8/22/24 | 23,812 |
| USD | 206,766 | EUR | 192,000 | Brown Brothers Harriman & Co | 8/22/24 | 622 |
| USD | 152,619,622 | EUR | 141,140,000 | Goldman Sachs Bank USA | 8/22/24 | 1,082,388 |
| USD | 657,626 | EUR | 612,000 | JPMorgan Chase Bank, N.A. | 8/22/24 | 542 |
| USD | 10,084,369 | EUR | 9,237,000 | JPMorgan Chase Bank, N.A. | 8/22/24 | 166,915 |
| USD | 381,759 | EUR | 350,000 | JPMorgan Chase Bank, N.A. | 8/22/24 | 5,976 |
| USD | 245,299 | EUR | 225,000 | JPMorgan Chase Bank, N.A. | 8/22/24 | 3,724 |
| USD | 48,521,810 | GBP | 38,746,000 | Bank of America, N.A. | 8/22/24 | (475,413) |
| USD | 4,663,031 | GBP | 3,675,000 | Brown Brothers Harriman & Co | 8/22/24 | 15,718 |
| USD | 178,980 | GBP | 140,000 | Brown Brothers Harriman & Co | 8/22/24 | 1,940 |
| USD | 3,516,592 | JPY | 538,750,000 | Brown Brothers Harriman & Co | 8/22/24 | 140,834 |
| USD | 328,136 | JPY | 51,650,000 | Brown Brothers Harriman & Co | 8/22/24 | 4,502 |
| USD | 6,042,043 | JPY | 927,500,000 | Citibank, N. A. | 8/22/24 | 230,413 |
| TOTAL FORWARD FOREIGN CURRENCY CONTRACTS | 1,261,201 | |||||
| Unrealized Appreciation | 1,760,683 | |||||
| Unrealized Depreciation | (499,482) | |||||
| Credit Default Swaps | ||||||||||
| Underlying Reference | Maturity Date | Clearinghouse / Counterparty | Fixed Payment Received/ (Paid) | Payment Frequency | Notional Amount(1) | Value ($) | Upfront Premium Received/ (Paid) ($) | Unrealized Appreciation/ (Depreciation) ($) | ||
| Buy Protection | ||||||||||
| AXA SA | Jun 2029 | Goldman Sachs Bank USA | (1%) | Quarterly | EUR | 800,000 | (1,165) | 9,866 | 8,701 | |
| AXA SA | Jun 2029 | Goldman Sachs Bank USA | (1%) | Quarterly | EUR | 800,000 | (1,165) | 9,866 | 8,701 | |
| AXA SA | Jun 2029 | Goldman Sachs Bank USA | (1%) | Quarterly | EUR | 1,700,000 | (2,475) | 20,969 | 18,494 | |
| Assicurazioni Generali SpA | Jun 2029 | BNP Paribas S.A. | (1%) | Quarterly | EUR | 1,900,000 | 27,202 | (18,160) | 9,042 | |
| BMW Finance NV | Jun 2029 | BNP Paribas S.A. | (1%) | Quarterly | EUR | 1,600,000 | (33,201) | 40,529 | 7,328 | |
| BMW Finance NV | Jun 2029 | BNP Paribas S.A. | (1%) | Quarterly | EUR | 750,000 | (15,563) | 19,072 | 3,509 | |
| BMW Finance NV | Jun 2029 | BNP Paribas S.A. | (1%) | Quarterly | EUR | 1,150,000 | (23,863) | 29,258 | 5,395 | |
| BMW Finance NV | Jun 2029 | BNP Paribas S.A. | (1%) | Quarterly | EUR | 1,150,000 | (23,863) | 29,250 | 5,387 | |
| Heidelberg Materials AG | Jun 2029 | BNP Paribas S.A. | (5%) | Quarterly | EUR | 1,600,000 | (322,608) | 336,317 | 13,709 | |
| Heidelberg Materials AG | Jun 2029 | BNP Paribas S.A. | (5%) | Quarterly | EUR | 550,000 | (110,896) | 115,131 | 4,235 | |
| Intesa Sanpaolo SpA | Jun 2029 | JPMorgan Chase Bank, N.A. | (1%) | Quarterly | EUR | 2,000,000 | 60,164 | (44,865) | 15,299 | |
| Societe Generale | Jun 2029 | Goldman Sachs Bank USA | (1%) | Quarterly | EUR | 2,200,000 | 47,466 | (15,026) | 32,440 | |
| UniCredit SpA | Jun 2029 | Goldman Sachs Bank USA | (1%) | Quarterly | EUR | 1,800,000 | 55,466 | (39,137) | 16,329 | |
| TOTAL CREDIT DEFAULT SWAPS | (344,501) | 493,070 | 148,569 | |||||||
| AUD | - | Australian dollar |
| CAD | - | Canadian dollar |
| EUR | - | European Monetary Unit |
| GBP | - | British pound sterling |
| JPY | - | Japanese yen |
| USD | - | U.S. dollar |
| (a) | Amount is stated in United States dollars unless otherwise noted. |
| (b) | Coupon rates for floating and adjustable rate securities reflect the rates in effect at period end. |
| (c) | Security exempt from registration under Rule 144A of the Securities Act of 1933. These securities may be resold in transactions exempt from registration, normally to qualified institutional buyers. At the end of the period, the value of these securities amounted to $21,015,598 or 5.4% of net assets. |
| (d) | Security or a portion of the security purchased on a delayed delivery or when-issued basis. |
| (e) | Security is perpetual in nature with no stated maturity date. |
| (f) | Security or a portion of the security was pledged to cover margin requirements for futures contracts. At period end, the value of securities pledged amounted to $443,719. |
| (g) | Security or a portion of the security has been segregated as collateral for open forward foreign currency contracts and bi-lateral over the counter (OTC) swaps. At period end, the value of securities pledged amounted to $1,086,116. |
| (h) | Non-income producing - Security is in default. |
| (i) | Coupon is indexed to a floating interest rate which may be multiplied by a specified factor and/or subject to caps or floors. |
| (j) | Affiliated fund that is generally available only to investment companies and other accounts managed by Fidelity Investments. The rate quoted is the annualized seven-day yield of the fund at period end. A complete unaudited listing of the fund's holdings as of its most recent quarter end is available upon request. In addition, each Fidelity Central Fund's financial statements are available on the SEC's website or upon request. |
| Affiliate | Value, beginning of period ($) | Purchases ($) | Sales Proceeds ($) | Dividend Income ($) | Realized Gain (loss) ($) | Change in Unrealized appreciation (depreciation) ($) | Value, end of period ($) | % ownership, end of period |
| Fidelity Cash Central Fund 5.38% | 12,171,582 | 83,516,510 | 77,751,417 | 383,182 | 150 | - | 17,936,825 | 0.0% |
| Total | 12,171,582 | 83,516,510 | 77,751,417 | 383,182 | 150 | - | 17,936,825 | |
| Valuation Inputs at Reporting Date: | ||||
| Description | Total ($) | Level 1 ($) | Level 2 ($) | Level 3 ($) |
Investments in Securities: | ||||
| Corporate Bonds | 207,100,085 | - | 207,100,085 | - |
| U.S. Government and Government Agency Obligations | 97,889,681 | - | 97,889,681 | - |
| Foreign Government and Government Agency Obligations | 44,157,622 | - | 44,157,622 | - |
| Supranational Obligations | 537,308 | - | 537,308 | - |
| Preferred Securities | 16,891,230 | - | 16,891,230 | - |
| Money Market Funds | 17,936,825 | 17,936,825 | - | - |
| Total Investments in Securities: | 384,512,751 | 17,936,825 | 366,575,926 | - |
Derivative Instruments: Assets | ||||
Futures Contracts | 44,057 | 44,057 | - | - |
Forward Foreign Currency Contracts | 1,760,683 | - | 1,760,683 | - |
Swaps | 190,298 | - | 190,298 | - |
| Total Assets | 1,995,038 | 44,057 | 1,950,981 | - |
| Liabilities | ||||
Futures Contracts | (13,647) | (13,647) | - | - |
Forward Foreign Currency Contracts | (499,482) | - | (499,482) | - |
Swaps | (534,799) | - | (534,799) | - |
| Total Liabilities | (1,047,928) | (13,647) | (1,034,281) | - |
| Total Derivative Instruments: | 947,110 | 30,410 | 916,700 | - |
Primary Risk Exposure / Derivative Type | Value | |
| Asset ($) | Liability ($) | |
| Credit Risk | ||
Swaps (a) | 190,298 | (534,799) |
| Total Credit Risk | 190,298 | (534,799) |
| Foreign Exchange Risk | ||
Forward Foreign Currency Contracts (b) | 1,760,683 | (499,482) |
| Total Foreign Exchange Risk | 1,760,683 | (499,482) |
| Interest Rate Risk | ||
Futures Contracts (c) | 44,057 | (13,647) |
| Total Interest Rate Risk | 44,057 | (13,647) |
| Total Value of Derivatives | 1,995,038 | (1,047,928) |
| Statement of Assets and Liabilities | ||||
June 30, 2024 (Unaudited) | ||||
| Assets | ||||
| Investment in securities, at value - See accompanying schedule: | ||||
Unaffiliated issuers (cost $363,977,468) | $ | 366,575,926 | ||
Fidelity Central Funds (cost $17,936,825) | 17,936,825 | |||
| Total Investment in Securities (cost $381,914,293) | $ | 384,512,751 | ||
| Cash | 5,601 | |||
| Foreign currency held at value (cost $2,883,651) | 2,882,141 | |||
| Unrealized appreciation on forward foreign currency contracts | 1,760,683 | |||
| Dividends receivable | 63,449 | |||
| Interest receivable | 4,768,858 | |||
| Distributions receivable from Fidelity Central Funds | 71,820 | |||
| Receivable for daily variation margin on futures contracts | 9,159 | |||
| Bi-lateral OTC swaps, at value | 190,298 | |||
| Receivable from investment adviser for expense reductions | 10,828 | |||
Total assets | 394,275,588 | |||
| Liabilities | ||||
| Payable for investments purchased | ||||
Regular delivery | $ | 2,282,358 | ||
Delayed delivery | 1,388,711 | |||
| Unrealized depreciation on forward foreign currency contracts | 499,482 | |||
| Bi-lateral OTC swaps, at value | 534,799 | |||
| Accrued management fee | 129,744 | |||
| Other payables and accrued expenses | 82,427 | |||
| Total liabilities | 4,917,521 | |||
| Net Assets | $ | 389,358,067 | ||
| Net Assets consist of: | ||||
| Paid in capital | $ | 377,032,505 | ||
| Total accumulated earnings (loss) | 12,325,562 | |||
| Net Assets | $ | 389,358,067 | ||
Net Asset Value, offering price and redemption price per share ($389,358,067 ÷ 37,410,284 shares) | $ | 10.41 | ||
| Statement of Operations | ||||
Six months ended June 30, 2024 (Unaudited) | ||||
| Investment Income | ||||
| Dividends | $ | 432,197 | ||
| Interest | 7,198,468 | |||
| Income from Fidelity Central Funds | 383,182 | |||
| Total income | 8,013,847 | |||
| Expenses | ||||
| Management fee | $ | 689,315 | ||
| Custodian fees and expenses | 29,346 | |||
| Independent trustees' fees and expenses | 443 | |||
| Registration fees | 29,595 | |||
| Audit | 50,627 | |||
| Legal | 149 | |||
| Miscellaneous | 562 | |||
| Total expenses before reductions | 800,037 | |||
| Expense reductions | (94,372) | |||
| Total expenses after reductions | 705,665 | |||
| Net Investment income (loss) | 7,308,182 | |||
| Realized and Unrealized Gain (Loss) | ||||
| Net realized gain (loss) on: | ||||
| Investment Securities: | ||||
| Unaffiliated issuers | 1,582,393 | |||
| Fidelity Central Funds | 150 | |||
| Forward foreign currency contracts | 3,203,039 | |||
| Foreign currency transactions | 34,679 | |||
| Futures contracts | (24,712) | |||
| Swaps | (85,951) | |||
| Total net realized gain (loss) | 4,709,598 | |||
| Change in net unrealized appreciation (depreciation) on: | ||||
| Investment Securities: | ||||
| Unaffiliated issuers | (9,355,232) | |||
| Forward foreign currency contracts | 4,399,991 | |||
| Assets and liabilities in foreign currencies | (97,930) | |||
| Futures contracts | (688,097) | |||
| Swaps | 175,453 | |||
| Total change in net unrealized appreciation (depreciation) | (5,565,815) | |||
| Net gain (loss) | (856,217) | |||
| Net increase (decrease) in net assets resulting from operations | $ | 6,451,965 | ||
| Statement of Changes in Net Assets | ||||
Six months ended June 30, 2024 (Unaudited) | For the period March 1, 2023 (commencement of operations) through December 31, 2023 | |||
| Increase (Decrease) in Net Assets | ||||
| Operations | ||||
| Net investment income (loss) | $ | 7,308,182 | $ | 8,810,788 |
| Net realized gain (loss) | 4,709,598 | (1,129,203) | ||
| Change in net unrealized appreciation (depreciation) | (5,565,815) | 9,584,117 | ||
| Net increase (decrease) in net assets resulting from operations | 6,451,965 | 17,265,702 | ||
| Distributions to shareholders | (3,949,829) | (7,442,276) | ||
| Share transactions | ||||
| Proceeds from sales of shares | 65,000,000 | 300,640,551 | ||
| Reinvestment of distributions | 3,949,829 | 7,442,276 | ||
| Cost of shares redeemed | - | (151) | ||
Net increase (decrease) in net assets resulting from share transactions | 68,949,829 | 308,082,676 | ||
| Total increase (decrease) in net assets | 71,451,965 | 317,906,102 | ||
| Net Assets | ||||
| Beginning of period | 317,906,102 | - | ||
| End of period | $ | 389,358,067 | $ | 317,906,102 |
| Other Information | ||||
| Shares | ||||
| Sold | 6,271,872 | 30,012,002 | ||
| Issued in reinvestment of distributions | 383,601 | 742,824 | ||
| Redeemed | - | (15) | ||
| Net increase (decrease) | 6,655,473 | 30,754,811 | ||
Fidelity® SAI International Credit Fund |
Six months ended (Unaudited) June 30, 2024 | Years ended December 31, 2023 A | |||
Selected Per-Share Data | ||||
| Net asset value, beginning of period | $ | 10.34 | $ | 10.00 |
| Income from Investment Operations | ||||
Net investment income (loss) B,C | .219 | .369 | ||
| Net realized and unrealized gain (loss) | (.029) | .241 | ||
| Total from investment operations | .190 | .610 | ||
| Distributions from net investment income | (.106) | (.270) | ||
| Distributions from net realized gain | (.014) | - | ||
| Total distributions | (.120) | (.270) | ||
| Net asset value, end of period | $ | 10.41 | $ | 10.34 |
Total Return D,E | 1.85 % | 6.21% | ||
Ratios to Average Net Assets C,F,G | ||||
| Expenses before reductions | .47% H | .46% H,I | ||
| Expenses net of fee waivers, if any | .41 % H | .41% H,I | ||
| Expenses net of all reductions | .41% H | .41% H,I | ||
| Net investment income (loss) | 4.27% H | 4.43% H,I | ||
| Supplemental Data | ||||
| Net assets, end of period (000 omitted) | $ | 389,358 | $ | 317,906 |
Portfolio turnover rate J | 73 % H | 95% H,K |
| Fidelity Central Fund | Investment Manager | Investment Objective | Investment Practices | Expense RatioA |
| Fidelity Money Market Central Funds | Fidelity Management & Research Company LLC (FMR) | Each fund seeks to obtain a high level of current income consistent with the preservation of capital and liquidity. | Short-term Investments | Less than .005% |
| Gross unrealized appreciation | $12,038,392 |
| Gross unrealized depreciation | (5,351,700) |
| Net unrealized appreciation (depreciation) | $6,686,692 |
| Tax cost | $379,266,239 |
| Credit Risk | Credit risk relates to the ability of the issuer of a financial instrument to make further principal or interest payments on an obligation or commitment that it has to a fund. |
| Foreign Exchange Risk | Foreign exchange rate risk relates to fluctuations in the value of an asset or liability due to changes in currency exchange rates. |
| Interest Rate Risk | Interest rate risk relates to the fluctuations in the value of interest-bearing securities due to changes in the prevailing levels of market interest rates. |
| Primary Risk Exposure / Derivative Type | Net Realized Gain (Loss)($) | Change in Net Unrealized Appreciation (Depreciation)($) |
| Fidelity SAI International Credit Fund | ||
| Credit Risk | ||
| Swaps | (85,951) | 175,453 |
| Total Credit Risk | (85,951) | 175,453 |
| Foreign Exchange Risk | ||
| Forward Foreign Currency Contracts | 3,203,039 | 4,399,991 |
| Total Foreign Exchange Risk | 3,203,039 | 4,399,991 |
| Interest Rate Risk | ||
| Futures Contracts | (24,712) | (688,097) |
| Total Interest Rate Risk | (24,712) | (688,097) |
| Totals | 3,092,376 | 3,887,347 |
| Purchases ($) | Sales ($) | |
| Fidelity SAI International Credit Fund | 135,273,988 | 90,664,493 |
| Shares | Total Proceeds ($) | |
| Fidelity SAI International Credit Fund | 2,565,606 | 25,630,401 |
| Amount ($) | |
| Fidelity SAI International Credit Fund | 288 |
| Strategic Advisers Fidelity Core Income Fund | |
| Fidelity SAI International Credit Fund | 100% |
 |


Contents
| U.S. Treasury Inflation-Protected Obligations - 99.3% | |||
Principal Amount (a) | Value ($) | ||
| U.S. Treasury Inflation-Indexed Bonds: | |||
| 1.75% 1/15/28 | 172,266,717 | 169,504,260 | |
| 2% 1/15/26 | 190,333,849 | 187,965,690 | |
| 2.375% 1/15/25 | 194,788,139 | 192,970,197 | |
| 2.375% 1/15/27 | 108,898,192 | 108,824,114 | |
| 2.5% 1/15/29 | 70,683,360 | 71,914,557 | |
| 3.625% 4/15/28 | 2,132,449 | 2,240,838 | |
| 3.875% 4/15/29 | 110,241,940 | 119,067,510 | |
| U.S. Treasury Inflation-Indexed Notes: | |||
| 0.125% 7/15/24 | 332,520,387 | 332,179,314 | |
| 0.125% 10/15/24 | 298,305,200 | 295,217,034 | |
| 0.125% 4/15/25 | 254,892,258 | 247,868,999 | |
| 0.125% 10/15/25 | 541,043,953 | 523,107,945 | |
| 0.125% 4/15/26 | 266,059,213 | 254,103,619 | |
| 0.125% 7/15/26 | 293,714,714 | 280,711,931 | |
| 0.125% 10/15/26 | 320,014,131 | 304,535,638 | |
| 0.125% 4/15/27 | 471,855,699 | 443,886,731 | |
| 0.25% 1/15/25 | 303,617,237 | 297,238,470 | |
| 0.375% 7/15/25 | 343,665,873 | 334,934,524 | |
| 0.375% 1/15/27 | 260,369,832 | 247,438,754 | |
| 0.375% 7/15/27 | 383,957,199 | 364,302,122 | |
| 0.5% 1/15/28 | 173,956,878 | 163,893,692 | |
| 0.625% 1/15/26 | 318,677,646 | 308,230,144 | |
| 0.75% 7/15/28 | 338,883,543 | 321,988,143 | |
| 0.875% 1/15/29 | 295,911,408 | 280,304,738 | |
| 1.25% 4/15/28 | 536,468,488 | 518,052,082 | |
| 1.625% 10/15/27 | 317,752,694 | 312,520,778 | |
| 2.125% 4/15/29 | 378,738,275 | 379,149,501 | |
| 2.375% 10/15/28 | 421,551,424 | 427,013,562 | |
| TOTAL U.S. TREASURY INFLATION-PROTECTED OBLIGATIONS (Cost $7,709,295,883) | 7,489,164,887 | ||
| Money Market Funds - 0.6% | |||
| Shares | Value ($) | ||
Fidelity Cash Central Fund 5.38% (b) (Cost $42,905,702) | 42,897,122 | 42,905,702 | |
| TOTAL INVESTMENT IN SECURITIES - 99.9% (Cost $7,752,201,585) | 7,532,070,589 |
NET OTHER ASSETS (LIABILITIES) - 0.1% | 7,003,208 |
| NET ASSETS - 100.0% | 7,539,073,797 |
| (a) | Amount is stated in United States dollars unless otherwise noted. |
| (b) | Affiliated fund that is generally available only to investment companies and other accounts managed by Fidelity Investments. The rate quoted is the annualized seven-day yield of the fund at period end. A complete unaudited listing of the fund's holdings as of its most recent quarter end is available upon request. In addition, each Fidelity Central Fund's financial statements are available on the SEC's website or upon request. |
| Affiliate | Value, beginning of period ($) | Purchases ($) | Sales Proceeds ($) | Dividend Income ($) | Realized Gain (loss) ($) | Change in Unrealized appreciation (depreciation) ($) | Value, end of period ($) | % ownership, end of period |
| Fidelity Cash Central Fund 5.38% | 86,324,413 | 842,780,340 | 886,198,947 | 3,426,826 | (104) | - | 42,905,702 | 0.1% |
| Total | 86,324,413 | 842,780,340 | 886,198,947 | 3,426,826 | (104) | - | 42,905,702 | |
| Valuation Inputs at Reporting Date: | ||||
| Description | Total ($) | Level 1 ($) | Level 2 ($) | Level 3 ($) |
Investments in Securities: | ||||
| U.S. Government and Government Agency Obligations | 7,489,164,887 | - | 7,489,164,887 | - |
| Money Market Funds | 42,905,702 | 42,905,702 | - | - |
| Total Investments in Securities: | 7,532,070,589 | 42,905,702 | 7,489,164,887 | - |
| Statement of Assets and Liabilities | ||||
June 30, 2024 (Unaudited) | ||||
| Assets | ||||
| Investment in securities, at value - See accompanying schedule: | ||||
Unaffiliated issuers (cost $7,709,295,883) | $ | 7,489,164,887 | ||
Fidelity Central Funds (cost $42,905,702) | 42,905,702 | |||
| Total Investment in Securities (cost $7,752,201,585) | $ | 7,532,070,589 | ||
| Receivable for fund shares sold | 126,116,074 | |||
| Interest receivable | 20,557,593 | |||
| Distributions receivable from Fidelity Central Funds | 275,755 | |||
Total assets | 7,679,020,011 | |||
| Liabilities | ||||
| Payable for investments purchased | $ | 139,679,141 | ||
| Payable for fund shares redeemed | 251,148 | |||
| Other payables and accrued expenses | 15,925 | |||
| Total liabilities | 139,946,214 | |||
| Net Assets | $ | 7,539,073,797 | ||
| Net Assets consist of: | ||||
| Paid in capital | $ | 7,758,062,191 | ||
| Total accumulated earnings (loss) | (218,988,394) | |||
| Net Assets | $ | 7,539,073,797 | ||
Net Asset Value, offering price and redemption price per share ($7,539,073,797 ÷ 778,562,547 shares) | $ | 9.68 | ||
| Statement of Operations | ||||
Six months ended June 30, 2024 (Unaudited) | ||||
| Investment Income | ||||
| Interest | $ | 154,466,033 | ||
| Income from Fidelity Central Funds | 3,426,826 | |||
| Total income | 157,892,859 | |||
| Expenses | ||||
| Custodian fees and expenses | $ | 13,783 | ||
| Independent trustees' fees and expenses | 9,617 | |||
| Miscellaneous | 1 | |||
| Total expenses | 23,401 | |||
| Net Investment income (loss) | 157,869,458 | |||
| Realized and Unrealized Gain (Loss) | ||||
| Net realized gain (loss) on: | ||||
| Investment Securities: | ||||
| Unaffiliated issuers | (20,368,722) | |||
| Fidelity Central Funds | (104) | |||
| Total net realized gain (loss) | (20,368,826) | |||
| Change in net unrealized appreciation (depreciation) on investment securities | 28,640,975 | |||
| Net gain (loss) | 8,272,149 | |||
| Net increase (decrease) in net assets resulting from operations | $ | 166,141,607 | ||
| Statement of Changes in Net Assets | ||||
Six months ended June 30, 2024 (Unaudited) | Year ended December 31, 2023 | |||
| Increase (Decrease) in Net Assets | ||||
| Operations | ||||
| Net investment income (loss) | $ | 157,869,458 | $ | 190,535,717 |
| Net realized gain (loss) | (20,368,826) | (80,571,468) | ||
| Change in net unrealized appreciation (depreciation) | 28,640,975 | 194,932,184 | ||
| Net increase (decrease) in net assets resulting from operations | 166,141,607 | 304,896,433 | ||
| Distributions to shareholders | (5,747,804) | (172,713,221) | ||
| Share transactions | ||||
| Proceeds from sales of shares | 891,642,312 | 1,554,558,912 | ||
| Reinvestment of distributions | 5,747,803 | 172,713,220 | ||
| Cost of shares redeemed | (658,953,567) | (1,226,661,924) | ||
Net increase (decrease) in net assets resulting from share transactions | 238,436,548 | 500,610,208 | ||
| Total increase (decrease) in net assets | 398,830,351 | 632,793,420 | ||
| Net Assets | ||||
| Beginning of period | 7,140,243,446 | 6,507,450,026 | ||
| End of period | $ | 7,539,073,797 | $ | 7,140,243,446 |
| Other Information | ||||
| Shares | ||||
| Sold | 85,501,204 | 164,186,153 | ||
| Issued in reinvestment of distributions | 602,691 | 18,315,070 | ||
| Redeemed | (61,353,422) | (129,737,211) | ||
| Net increase (decrease) | 24,750,473 | 52,764,012 | ||
Fidelity® Series 0-5 Year Inflation-Protected Bond Index Fund |
Six months ended (Unaudited) June 30, 2024 | Years ended December 31, 2023 | 2022 | 2021 A | |||||
Selected Per-Share Data | ||||||||
| Net asset value, beginning of period | $ | 9.47 | $ | 9.28 | $ | 10.05 | $ | 10.00 |
| Income from Investment Operations | ||||||||
Net investment income (loss) B,C | .207 | .265 | .531 | .127 | ||||
| Net realized and unrealized gain (loss) | .011 | .166 | (.814) | .005 | ||||
| Total from investment operations | .218 | .431 | (.283) | .132 | ||||
| Distributions from net investment income | (.008) | (.241) | (.477) | (.071) | ||||
| Distributions from tax return of capital | - | - | (.010) | (.011) | ||||
| Total distributions | (.008) | (.241) | (.487) | (.082) | ||||
| Net asset value, end of period | $ | 9.68 | $ | 9.47 | $ | 9.28 | $ | 10.05 |
Total Return D,E | 2.30 % | 4.65% | (2.84)% | 1.33% | ||||
Ratios to Average Net Assets C,F,G | ||||||||
Expenses before reductions H | -% I,J | -% | -% | -% I | ||||
Expenses net of fee waivers, if any H | - % I,J | -% | -% | -% I | ||||
Expenses net of all reductions H | -% I,J | -% | -% | -% I | ||||
| Net investment income (loss) | 4.37% I,J | 2.81% | 5.38% | 3.33% I | ||||
| Supplemental Data | ||||||||
| Net assets, end of period (000 omitted) | $ | 7,539,074 | $ | 7,140,243 | $ | 6,507,450 | $ | 4,199,988 |
Portfolio turnover rate K | 24 % I | 31% | 21% L | 33% L |
| U.S. Treasury Inflation-Protected Obligations - 99.6% | |||
Principal Amount (a) | Value ($) | ||
| U.S. Treasury Inflation-Indexed Bonds: | |||
| 0.125% 2/15/51 | 295,852,095 | 171,248,103 | |
| 0.125% 2/15/52 | 459,325,530 | 261,087,147 | |
| 0.25% 2/15/50 | 200,045,268 | 122,246,009 | |
| 0.625% 2/15/43 | 255,157,783 | 191,729,568 | |
| 0.75% 2/15/42 | 408,661,028 | 319,467,580 | |
| 0.75% 2/15/45 | 384,592,242 | 288,291,238 | |
| 0.875% 2/15/47 | 285,591,342 | 214,602,463 | |
| 1% 2/15/46 | 389,723,760 | 304,318,700 | |
| 1% 2/15/48 | 211,623,374 | 162,144,269 | |
| 1% 2/15/49 | 148,323,617 | 112,745,433 | |
| 1.375% 2/15/44 | 303,400,206 | 260,187,651 | |
| 2.125% 2/15/40 | 136,709,690 | 135,383,551 | |
| 2.125% 2/15/41 | 243,771,999 | 241,829,530 | |
| 2.125% 2/15/54 | 154,677,810 | 150,494,342 | |
| 3.375% 4/15/32 | 181,388,205 | 198,034,371 | |
| U.S. Treasury Inflation-Indexed Notes: | |||
| 0.125% 1/15/30 | 597,708,948 | 537,926,158 | |
| 0.125% 7/15/30 | 771,782,318 | 690,570,885 | |
| 0.125% 1/15/31 | 739,296,570 | 652,582,122 | |
| 0.125% 7/15/31 | 735,404,880 | 645,801,279 | |
| 0.125% 1/15/32 | 931,604,818 | 806,608,990 | |
| 0.25% 7/15/29 | 623,860,118 | 572,823,783 | |
| 0.625% 7/15/32 | 833,543,184 | 747,481,713 | |
| 1.125% 1/15/33 | 810,614,961 | 750,047,793 | |
| 1.375% 7/15/33 | 881,463,120 | 832,408,651 | |
| 1.5% 2/15/53 | 240,182,514 | 201,918,102 | |
| 1.75% 1/15/34 | 903,848,583 | 877,142,372 | |
| TOTAL U.S. TREASURY INFLATION-PROTECTED OBLIGATIONS (Cost $12,117,985,435) | 10,449,121,803 | ||
| Money Market Funds - 0.0% | |||
| Shares | Value ($) | ||
Fidelity Cash Central Fund 5.38% (b) (Cost $1,568,748) | 1,568,434 | 1,568,748 | |
| TOTAL INVESTMENT IN SECURITIES - 99.6% (Cost $12,119,554,183) | 10,450,690,551 |
NET OTHER ASSETS (LIABILITIES) - 0.4% | 45,609,323 |
| NET ASSETS - 100.0% | 10,496,299,874 |
| (a) | Amount is stated in United States dollars unless otherwise noted. |
| (b) | Affiliated fund that is generally available only to investment companies and other accounts managed by Fidelity Investments. The rate quoted is the annualized seven-day yield of the fund at period end. A complete unaudited listing of the fund's holdings as of its most recent quarter end is available upon request. In addition, each Fidelity Central Fund's financial statements are available on the SEC's website or upon request. |
| Affiliate | Value, beginning of period ($) | Purchases ($) | Sales Proceeds ($) | Dividend Income ($) | Realized Gain (loss) ($) | Change in Unrealized appreciation (depreciation) ($) | Value, end of period ($) | % ownership, end of period |
| Fidelity Cash Central Fund 5.38% | 1,277,209 | 261,897,724 | 261,604,607 | 219,788 | (1,578) | - | 1,568,748 | 0.0% |
| Total | 1,277,209 | 261,897,724 | 261,604,607 | 219,788 | (1,578) | - | 1,568,748 | |
| Valuation Inputs at Reporting Date: | ||||
| Description | Total ($) | Level 1 ($) | Level 2 ($) | Level 3 ($) |
Investments in Securities: | ||||
| U.S. Government and Government Agency Obligations | 10,449,121,803 | - | 10,449,121,803 | - |
| Money Market Funds | 1,568,748 | 1,568,748 | - | - |
| Total Investments in Securities: | 10,450,690,551 | 1,568,748 | 10,449,121,803 | - |
| Statement of Assets and Liabilities | ||||
June 30, 2024 (Unaudited) | ||||
| Assets | ||||
| Investment in securities, at value - See accompanying schedule: | ||||
Unaffiliated issuers (cost $12,117,985,435) | $ | 10,449,121,803 | ||
Fidelity Central Funds (cost $1,568,748) | 1,568,748 | |||
| Total Investment in Securities (cost $12,119,554,183) | $ | 10,450,690,551 | ||
| Receivable for fund shares sold | 124,422,305 | |||
| Interest receivable | 37,557,052 | |||
| Distributions receivable from Fidelity Central Funds | 21,017 | |||
Total assets | 10,612,690,925 | |||
| Liabilities | ||||
| Payable for investments purchased | $ | 83,592,066 | ||
| Payable for fund shares redeemed | 32,776,604 | |||
| Other payables and accrued expenses | 22,381 | |||
| Total liabilities | 116,391,051 | |||
| Net Assets | $ | 10,496,299,874 | ||
| Net Assets consist of: | ||||
| Paid in capital | $ | 12,769,494,229 | ||
| Total accumulated earnings (loss) | (2,273,194,355) | |||
| Net Assets | $ | 10,496,299,874 | ||
Net Asset Value, offering price and redemption price per share ($10,496,299,874 ÷ 1,376,388,575 shares) | $ | 7.63 | ||
| Statement of Operations | ||||
Six months ended June 30, 2024 (Unaudited) | ||||
| Investment Income | ||||
| Interest | $ | 260,051,070 | ||
| Income from Fidelity Central Funds | 219,788 | |||
| Total income | 260,270,858 | |||
| Expenses | ||||
| Custodian fees and expenses | $ | 19,417 | ||
| Independent trustees' fees and expenses | 13,361 | |||
| Miscellaneous | 2 | |||
| Total expenses before reductions | 32,780 | |||
| Expense reductions | (2) | |||
| Total expenses after reductions | 32,778 | |||
| Net Investment income (loss) | 260,238,080 | |||
| Realized and Unrealized Gain (Loss) | ||||
| Net realized gain (loss) on: | ||||
| Investment Securities: | ||||
| Unaffiliated issuers | (219,183,048) | |||
| Fidelity Central Funds | (1,578) | |||
| Total net realized gain (loss) | (219,184,626) | |||
| Change in net unrealized appreciation (depreciation) on investment securities | (73,661,805) | |||
| Net gain (loss) | (292,846,431) | |||
| Net increase (decrease) in net assets resulting from operations | $ | (32,608,351) | ||
| Statement of Changes in Net Assets | ||||
Six months ended June 30, 2024 (Unaudited) | Year ended December 31, 2023 | |||
| Increase (Decrease) in Net Assets | ||||
| Operations | ||||
| Net investment income (loss) | $ | 260,238,080 | $ | 339,995,932 |
| Net realized gain (loss) | (219,184,626) | (467,469,438) | ||
| Change in net unrealized appreciation (depreciation) | (73,661,805) | 375,327,641 | ||
| Net increase (decrease) in net assets resulting from operations | (32,608,351) | 247,854,135 | ||
| Distributions to shareholders | (7,904,683) | (314,692,881) | ||
| Share transactions | ||||
| Proceeds from sales of shares | 1,511,399,946 | 2,245,894,953 | ||
| Reinvestment of distributions | 7,904,683 | 314,692,850 | ||
| Cost of shares redeemed | (866,986,793) | (1,193,542,124) | ||
Net increase (decrease) in net assets resulting from share transactions | 652,317,836 | 1,367,045,679 | ||
| Total increase (decrease) in net assets | 611,804,802 | 1,300,206,933 | ||
| Net Assets | ||||
| Beginning of period | 9,884,495,072 | 8,584,288,139 | ||
| End of period | $ | 10,496,299,874 | $ | 9,884,495,072 |
| Other Information | ||||
| Shares | ||||
| Sold | 199,461,401 | 288,482,846 | ||
| Issued in reinvestment of distributions | 1,042,016 | 41,460,846 | ||
| Redeemed | (114,685,279) | (153,699,188) | ||
| Net increase (decrease) | 85,818,138 | 176,244,504 | ||
Fidelity® Series 5+ Year Inflation-Protected Bond Index Fund |
Six months ended (Unaudited) June 30, 2024 | Years ended December 31, 2023 | 2022 | 2021 A | |||||
Selected Per-Share Data | ||||||||
| Net asset value, beginning of period | $ | 7.66 | $ | 7.70 | $ | 10.13 | $ | 10.00 |
| Income from Investment Operations | ||||||||
Net investment income (loss) B,C | .194 | .290 | .579 | .158 | ||||
| Net realized and unrealized gain (loss) | (.218) | (.077) | (2.494) | .061 | ||||
| Total from investment operations | (.024) | .213 | (1.915) | .219 | ||||
| Distributions from net investment income | (.006) | (.253) | (.514) | (.089) | ||||
| Distributions from net realized gain | - | - | (.001) | - | ||||
| Total distributions | (.006) | (.253) | (.515) | (.089) | ||||
| Net asset value, end of period | $ | 7.63 | $ | 7.66 | $ | 7.70 | $ | 10.13 |
Total Return D,E | (.31) % | 2.81% | (19.04)% | 2.21% | ||||
Ratios to Average Net Assets C,F,G | ||||||||
Expenses before reductions H | -% I,J | -% | -% | -% I | ||||
Expenses net of fee waivers, if any H | - % I,J | -% | -% | -% I | ||||
Expenses net of all reductions H | -% I,J | -% | -% | -% I | ||||
| Net investment income (loss) | 5.18% I,J | 3.73% | 6.57% | 4.16% I | ||||
| Supplemental Data | ||||||||
| Net assets, end of period (000 omitted) | $ | 10,496,300 | $ | 9,884,495 | $ | 8,584,288 | $ | 7,218,254 |
Portfolio turnover rate K | 32 % I | 31% | 31% L | 31% L |
| Fidelity Central Fund | Investment Manager | Investment Objective | Investment Practices | Expense RatioA |
| Fidelity Money Market Central Funds | Fidelity Management & Research Company LLC (FMR) | Each fund seeks to obtain a high level of current income consistent with the preservation of capital and liquidity. | Short-term Investments | Less than .005% |
| Tax cost ($) | Gross unrealized appreciation ($) | Gross unrealized depreciation ($) | Net unrealized appreciation (depreciation) ($) | |
Fidelity Series 0-5 Year Inflation-Protected Bond Index Fund | 7,753,144,719 | 6,473,577 | (227,547,707) | (221,074,130) |
Fidelity Series 5+ Year Inflation-Protected Bond Index Fund | 12,177,969,269 | 12,724,134 | (1,740,002,852) | (1,727,278,718) |
| Short-term ($) | Long-term ($) | Total capital loss carryforward ($) | |
Fidelity Series 0-5 Year Inflation-Protected Bond Index Fund | (72,850,801) | (68,720,056) | (141,570,857) |
Fidelity Series 5+ Year Inflation-Protected Bond Index Fund | (197,360,285) | (398,067,633) | (595,427,918) |
| Custodian credits ($) | |
Fidelity Series 5+ Year Inflation-Protected Bond Index Fund | 2 |
 |


Contents
| Municipal Bonds - 94.5% | |||
Principal Amount (a) | Value ($) | ||
| Alabama - 3.2% | |||
| Auburn Univ. Gen. Fee Rev. Series 2018 A, 5% 6/1/43 | 155,000 | 161,482 | |
| Black Belt Energy Gas District Bonds: | |||
| Series 2022 B1, 4%, tender 10/1/27 (b) | 4,705,000 | 4,719,404 | |
| Series 2022 C1, 5.25%, tender 6/1/29 (b) | 19,000,000 | 20,051,394 | |
| Series 2022 E, 5%, tender 6/1/28 (b) | 2,605,000 | 2,713,139 | |
| Series 2022 F, 5.5%, tender 12/1/28 (b) | 15,000,000 | 15,921,000 | |
| Energy Southeast Ala Coop. District Bonds Series 2023 B1, 5.75%, tender 11/1/31 (b) | 1,460,000 | 1,604,176 | |
| Homewood Ala Edl. Bldg. Auth. Lea (CHF - Horizons II, L.L.C. Student Hsg. & Proj. at Samford Univ.) Series 2024 A: | |||
| 5.25% 10/1/37 | 635,000 | 684,996 | |
| 5.5% 10/1/54 | 825,000 | 865,797 | |
| Homewood Edl. Bldg. Auth. Rev.: | |||
| (CHF - Horizons II, L.L.C. Student Hsg. & Proj. at Samford Univ.) Series 2024 C, 5.5% 10/1/49 | 670,000 | 709,431 | |
| Series 2019 A, 4% 12/1/49 | 4,220,000 | 3,745,214 | |
| Huntsville Health Care Auth. Bonds Series 2023 A, 5%, tender 6/1/30 (b) | 915,000 | 976,599 | |
| Infirmary Health Systems Spl. Care Facilities Fing. Auth. Rev.: | |||
| Series 2016 A, 5% 2/1/26 | 1,840,000 | 1,865,281 | |
| Series 2021 A, 3% 2/1/46 | 1,000,000 | 767,179 | |
| Jefferson County Gen. Oblig. Series 2018 A, 5% 4/1/26 | 145,000 | 148,970 | |
| Lower Alabama Gas District Bonds (No. 2 Proj.) Series 2020, 4%, tender 12/1/25 (b) | 2,080,000 | 2,081,187 | |
| Mobile Indl. Dev. Board Poll. Cont. Rev. Bonds (Alabama Pwr. Co. Barry Plant Proj.) Series 2007 C, 3.78%, tender 6/16/26 (b) | 795,000 | 795,848 | |
| Montgomery Med. Clinic Facilities Series 2015: | |||
| 5% 3/1/33 | 255,000 | 189,392 | |
| 5% 3/1/36 | 460,000 | 340,178 | |
| Southeast Energy Auth. Rev. Bonds: | |||
| Series 2022 A1, 5.5%, tender 12/1/29 (b) | 7,400,000 | 7,930,859 | |
| Series 2022 B1, 5%, tender 8/1/28 (b) | 1,970,000 | 2,046,693 | |
TOTAL ALABAMA | 68,318,219 | ||
| Alaska - 0.1% | |||
| Alaska Hsg. Fin. Corp. Series 2021 A: | |||
| 4% 6/1/26 | 175,000 | 176,683 | |
| 4% 12/1/29 | 290,000 | 297,563 | |
| 5% 12/1/28 | 400,000 | 427,985 | |
| 5% 6/1/29 | 300,000 | 323,202 | |
| Alaska Hsg. Fin. Corp. Mtg. Rev. Series 2022 A, 3% 6/1/51 | 190,000 | 182,477 | |
| Alaska Muni. Bond Bank Series 2016 4, 5% 12/1/29 (c) | 1,690,000 | 1,730,654 | |
TOTAL ALASKA | 3,138,564 | ||
| Arizona - 3.6% | |||
| Arizona Health Facilities Auth. Rev.: | |||
| (Banner Health Sys. Proj.) Series 2007 B, S&P Municipal Bond 7 Day High Grade Rate Index + 0.810% 4.52%, tender 1/1/37 (b)(d) | 150,000 | 146,580 | |
| (Scottsdale Lincoln Hospitals Proj.) Series 2014 A, 5% 12/1/39 | 230,000 | 231,358 | |
| Arizona Indl. Dev. Auth. Hosp. Rev.: | |||
| Series 2020 A, 3% 2/1/45 | 4,525,000 | 3,680,856 | |
| Series 2021 A, 5% 2/1/29 | 410,000 | 440,420 | |
| Arizona Indl. Dev. Auth. Rev.: | |||
| (Provident Group-Eastern Michigan Univ. Parking Proj.) Series 2018: | |||
5% 5/1/48 | 55,000 | 30,250 | |
5% 5/1/51 | 55,000 | 30,250 | |
| Series 2019 2, 3.625% 5/20/33 | 912,633 | 857,111 | |
| Arizona State Univ. Revs. Series 2021 C: | |||
| 5% 7/1/37 | 340,000 | 377,552 | |
| 5% 7/1/38 | 550,000 | 606,686 | |
| Chandler Indl. Dev. Auth. Indl. Dev. Rev. Bonds (Intel Corp. Proj.): | |||
| Series 2005, 3.8%, tender 6/15/28 (b) | 4,930,000 | 4,953,127 | |
| Series 2007, 4.1%, tender 6/15/28 (b)(c) | 2,080,000 | 2,091,764 | |
| Series 2022 2, 5%, tender 9/1/27 (b)(c) | 17,910,000 | 18,385,713 | |
| Coconino County Poll. Cont. Corp. Rev. Bonds: | |||
| (Navada Pwr. Co. Proj.) Series 2017 B, 3.75%, tender 3/31/26 (b) | 900,000 | 892,322 | |
| (Navada Pwr. Co. Projs.) Series 2017 A, 4.125%, tender 3/31/26 (b)(c) | 545,000 | 541,312 | |
| Glendale Gen. Oblig. Series 2017: | |||
| 5% 7/1/30 | 130,000 | 136,390 | |
| 5% 7/1/31 | 190,000 | 199,063 | |
| Glendale Indl. Dev. Auth. (Terraces of Phoenix Proj.) Series 2018 A: | |||
| 5% 7/1/38 | 15,000 | 14,836 | |
| 5% 7/1/48 | 20,000 | 18,279 | |
| Indl. Dev. Auth. of The City of Glendale Sr. Living Rev. (Royal Oaks Inspirata Pointe Proj.) Series 2020 A, 5% 5/15/56 | 3,615,000 | 3,239,976 | |
| Maricopa County Indl. Dev. Auth.: | |||
| (Creighton Univ. Proj.) Series 2020, 5% 7/1/47 | 175,000 | 181,536 | |
| Series 2021 A: | |||
3% 9/1/51 | 4,875,000 | 3,816,965 | |
4% 9/1/51 | 295,000 | 277,604 | |
| Maricopa County Indl. Dev. Auth. Sr. Living Facilities Series 2016: | |||
| 5.75% 1/1/36 (e) | 250,000 | 212,563 | |
| 6% 1/1/48 (e) | 395,000 | 298,788 | |
| Maricopa County Rev.: | |||
| Bonds: | |||
Series 2023 A1, 5%, tender 5/15/26 (b) | 2,110,000 | 2,161,435 | |
Series 2023 A2, 5%, tender 5/15/28 (b) | 2,180,000 | 2,296,767 | |
| Series 2016 A, 5% 1/1/33 | 305,000 | 313,794 | |
| Series 2017 D, 3% 1/1/48 | 1,260,000 | 992,222 | |
| Series 2019 E, 3% 1/1/49 | 745,000 | 581,201 | |
| Phoenix Ariz Indl. Dev. Auth. Rev.: | |||
| (Guam Facilities Foundation, Inc. Projs.) Series 2014, 5.375% 2/1/41 | 1,460,000 | 1,337,704 | |
| (Guam Facilities Foundation, Inc. Proj.) Series 2014, 5.125% 2/1/34 | 990,000 | 931,960 | |
| Phoenix Civic Impt. Board Arpt. Rev.: | |||
| Series 2017 A: | |||
5% 7/1/33 (c) | 55,000 | 56,451 | |
5% 7/1/36 (c) | 90,000 | 92,244 | |
5% 7/1/37 (c) | 65,000 | 66,537 | |
| Series 2017 B: | |||
5% 7/1/29 | 125,000 | 131,319 | |
5% 7/1/33 | 175,000 | 182,734 | |
5% 7/1/36 | 205,000 | 213,755 | |
5% 7/1/37 | 125,000 | 130,174 | |
| Series 2019 B: | |||
5% 7/1/35 (c) | 720,000 | 758,824 | |
5% 7/1/49 (c) | 2,315,000 | 2,373,789 | |
| Phoenix Civic Impt. Corp. Wtr. Sys. Rev. Series 2021 A, 5% 7/1/45 | 410,000 | 442,906 | |
| Pima County Indl. Dev. Auth. Rev. Series 2021 A: | |||
| 3% 4/1/51 | 16,380,000 | 12,661,660 | |
| 4% 4/1/46 | 1,905,000 | 1,811,507 | |
| Pima County Unified School District #1 Tucson Series 2024 A: | |||
| 5% 7/1/33 (Assured Guaranty Muni. Corp. Insured) | 1,395,000 | 1,599,285 | |
| 5% 7/1/35 (Assured Guaranty Muni. Corp. Insured) | 1,300,000 | 1,486,156 | |
| 5% 7/1/39 (Assured Guaranty Muni. Corp. Insured) | 1,500,000 | 1,685,524 | |
| Salt Verde Finl. Corp. Sr. Gas Rev. Series 2007, 5.5% 12/1/29 | 450,000 | 480,132 | |
| Tempe Indl. Dev. Auth. Rev. (Friendship Village of Tempe Proj.) Series 2021 A, 4% 12/1/46 | 480,000 | 404,823 | |
TOTAL ARIZONA | 74,854,204 | ||
| California - 2.9% | |||
| ABC Unified School District Series 1997 C, 0% 8/1/28 (Nat'l. Pub. Fin. Guarantee Corp. Insured) | 200,000 | 174,460 | |
| Alameda Corridor Trans. Auth. Rev. Series 2024 A, 0% 10/1/52 (Assured Guaranty Muni. Corp. Insured) | 1,350,000 | 355,854 | |
| Bay Area Toll Auth. San Francisco Bay Toll Bridge Rev. Bonds Series 2021 A, 2%, tender 4/1/28 (b) | 1,000,000 | 927,815 | |
| California Gen. Oblig.: | |||
| Series 2004, 5.25% 12/1/33 | 10,000 | 10,012 | |
| Series 2016, 5% 9/1/29 | 110,000 | 113,813 | |
| Series 2020, 4% 11/1/37 | 575,000 | 593,060 | |
| Series 2022, 4.75% 12/1/42 | 1,825,000 | 1,905,545 | |
| California Hsg. Fin. Agcy.: | |||
| Series 2021 1, 3.5% 11/20/35 | 1,826,595 | 1,745,743 | |
| Series 2023 A1, 4.375% 9/20/36 | 2,709,942 | 2,816,964 | |
| California Pub. Works Board Lease Rev. (Various Cap. Projs.) Series 2022 C: | |||
| 5% 8/1/31 | 190,000 | 214,184 | |
| 5% 8/1/34 | 350,000 | 394,431 | |
| California Statewide Cmntys. Dev. Auth. Rev. Series 2015, 5% 2/1/45 (f)(g) | 177,847 | 78,253 | |
| Castaic Lake Wtr. Agcy. Ctfs. of Prtn. Series 1999, 0% 8/1/26 (AMBAC Insured) | 10,445,000 | 9,760,295 | |
| Folsom Cordova Union School District No. 4 Series A, 0% 10/1/31 (Nat'l. Pub. Fin. Guarantee Corp. Insured) | 90,000 | 70,169 | |
| Foothill/Eastern Trans. Corridor Agcy. Toll Road Rev. Series 2013 B1, 3.95% 1/15/53 (b) | 1,000,000 | 930,751 | |
| Fresno Arpt. Rev. Series 2023 A, 5% 7/1/33 (Build America Mutual Assurance Insured) (c) | 1,000,000 | 1,094,975 | |
| Golden State Tobacco Securitization Corp. Tobacco Settlement Rev. Series 2021 B2, 0% 6/1/66 | 26,290,000 | 2,922,525 | |
| Kern Cmnty. College District Gen. Oblig. Series 2006: | |||
| 0% 11/1/28 (Assured Guaranty Muni. Corp. Insured) | 250,000 | 215,816 | |
| 0% 11/1/30 (Assured Guaranty Muni. Corp. Insured) | 255,000 | 205,621 | |
| Long Beach Unified School District Series 2009, 5.5% 8/1/29 | 10,000 | 10,014 | |
| Los Angeles Dept. Arpt. Rev. Series 2019 F, 5% 5/15/31 (c) | 1,330,000 | 1,409,201 | |
| Los Angeles Dept. of Wtr. & Pwr. Rev. Series B, 5% 7/1/50 | 1,435,000 | 1,533,131 | |
| Los Angeles Dept. of Wtr. & Pwr. Wtrwks. Rev. Series 2020 A, 5% 7/1/40 | 30,000 | 32,904 | |
| Los Angeles Hbr. Dept. Rev. Series 2019 A, 5% 8/1/25 (c) | 255,000 | 259,052 | |
| Los Angeles Unified School District Ctfs. of Prtn. Series 2023 A, 5% 10/1/37 | 1,225,000 | 1,403,253 | |
| Monrovia Unified School District Series B, 0% 8/1/29 (Nat'l. Pub. Fin. Guarantee Corp. Insured) | 230,000 | 192,259 | |
| Mount Diablo Unified School District Series 2022 B, 4% 8/1/31 | 285,000 | 304,076 | |
| Poway Unified School District: | |||
| (District #2007-1 School Facilities Proj.) Series 2008 A, 0% 8/1/32 | 300,000 | 227,640 | |
| Series 2011, 0% 8/1/46 | 60,000 | 21,939 | |
| Series B: | |||
0% 8/1/37 | 395,000 | 244,804 | |
0% 8/1/38 | 2,625,000 | 1,544,620 | |
0% 8/1/39 | 1,410,000 | 788,620 | |
0% 8/1/41 | 200,000 | 100,157 | |
| Poway Unified School District Pub. Fing. Series 2015 A: | |||
| 5% 9/1/24 | 50,000 | 50,087 | |
| 5% 9/1/26 | 65,000 | 65,894 | |
| 5% 9/1/29 | 135,000 | 136,781 | |
| 5% 9/1/31 | 60,000 | 60,800 | |
| Sacramento City Fing. Auth. Rev. Series A, 0% 12/1/26 (Nat'l. Pub. Fin. Guarantee Corp. Insured) | 255,000 | 233,566 | |
| San Diego County Reg'l. Arpt. Auth. Arpt. Rev. Series 2023 B: | |||
| 5.25% 7/1/36 (c) | 4,000,000 | 4,510,661 | |
| 5.25% 7/1/38 (c) | 2,500,000 | 2,793,149 | |
| San Diego County Wtr. Auth. Rev. Series 2022 A: | |||
| 5% 5/1/47 | 685,000 | 759,410 | |
| 5% 5/1/52 | 1,160,000 | 1,274,149 | |
| San Diego Unified School District: | |||
| Series 2008 C, 0% 7/1/34 | 180,000 | 128,451 | |
| Series 2008 E, 0% 7/1/47 (h) | 440,000 | 343,759 | |
| San Francisco City & County Arpts. Commission Int'l. Arpt. Rev.: | |||
| Series 2019 A: | |||
5% 1/1/35 (c) | 360,000 | 378,479 | |
5% 5/1/49 (c) | 3,960,000 | 4,041,766 | |
| Series 2019 B, 5% 5/1/49 | 275,000 | 288,339 | |
| Series 2019 E, 5% 5/1/50 (c) | 395,000 | 402,847 | |
| Series 2022 A: | |||
5% 5/1/26 (c) | 920,000 | 943,695 | |
5% 5/1/27 (c) | 930,000 | 959,779 | |
5% 5/1/28 (c) | 1,245,000 | 1,300,116 | |
5% 5/1/29 (c) | 835,000 | 883,019 | |
| Series 2022 B, 5% 5/1/52 | 2,525,000 | 2,730,222 | |
| Series 2024 A: | |||
5.25% 5/1/44 (c) | 2,200,000 | 2,404,803 | |
5.25% 5/1/49 (c) | 1,840,000 | 1,986,794 | |
| San Marcos Unified School District Series 2010 B, 0% 8/1/47 | 1,075,000 | 400,159 | |
| San Mateo County Cmnty. College District Series A, 0% 9/1/26 (Nat'l. Pub. Fin. Guarantee Corp. Insured) | 275,000 | 256,106 | |
| Washington Township Health Care District Gen. Oblig. Series 2013 A, 5.5% 8/1/38 | 230,000 | 230,202 | |
TOTAL CALIFORNIA | 60,164,989 | ||
| Colorado - 2.7% | |||
| Arkansas River Pwr. Auth. Rev. Series 2018 A: | |||
| 5% 10/1/38 | 125,000 | 128,056 | |
| 5% 10/1/43 | 160,000 | 162,717 | |
| Colorado Health Facilities Auth. Rev. Bonds: | |||
| (Parkview Med. Ctr., Inc. Proj.) Series 2016: | |||
4% 9/1/35 | 85,000 | 85,237 | |
4% 9/1/36 | 65,000 | 65,123 | |
| Bonds Series 2023 A1, 5%, tender 11/15/28 (b) | 6,390,000 | 6,783,528 | |
| Series 2019 A: | |||
5% 11/1/25 | 540,000 | 550,004 | |
5% 11/15/39 | 700,000 | 742,809 | |
| Series 2019 A1, 4% 8/1/44 | 4,960,000 | 4,825,257 | |
| Series 2019 A2: | |||
3.25% 8/1/49 | 1,070,000 | 839,070 | |
4% 8/1/49 | 1,240,000 | 1,176,098 | |
5% 8/1/44 | 4,585,000 | 4,721,063 | |
| Series 2020 A, 4% 9/1/50 | 305,000 | 292,725 | |
| Series 2022 A, 5% 5/15/47 | 2,030,000 | 2,179,321 | |
| Colorado Hsg. & Fin. Auth.: | |||
| Series 2019 F, 4.25% 11/1/49 | 115,000 | 114,868 | |
| Series 2019 H, 4.25% 11/1/49 | 190,000 | 189,835 | |
| Series 2021 E, 3% 11/1/51 | 515,000 | 497,919 | |
| Series 2022 F, 5.25% 11/1/52 | 545,000 | 561,417 | |
| Colorado Reg'l. Trans. District Sales Tax Rev. (Fastracks Proj.) Series 2021 B, 5% 11/1/28 | 1,030,000 | 1,110,483 | |
| Denver City & County Arpt. Rev.: | |||
| Series 2017 A: | |||
5% 11/15/26 (c) | 175,000 | 180,650 | |
5% 11/15/27 (c) | 150,000 | 155,803 | |
| Series 2018 A: | |||
4% 12/1/43 (c) | 9,260,000 | 9,010,476 | |
5% 12/1/27 (c) | 3,220,000 | 3,346,319 | |
5% 12/1/30 (c) | 390,000 | 417,830 | |
5% 12/1/34 (c) | 260,000 | 287,833 | |
5% 12/1/36 (c) | 255,000 | 265,043 | |
5% 12/1/37 (c) | 505,000 | 523,629 | |
| Series 2022 A, 5% 11/15/33 (c) | 3,815,000 | 4,161,672 | |
| Denver City & County Board Wtr. Rev.: | |||
| Series 2020 A: | |||
5% 9/15/45 | 1,550,000 | 1,662,083 | |
5% 9/15/46 | 2,375,000 | 2,537,342 | |
| Series 2020 B: | |||
5% 9/15/28 | 770,000 | 830,776 | |
5% 9/15/29 | 1,430,000 | 1,571,692 | |
| Denver Health & Hosp. Auth. Healthcare Rev. Series 2019 A: | |||
| 4% 12/1/38 | 1,250,000 | 1,152,581 | |
| 4% 12/1/39 | 1,720,000 | 1,571,307 | |
| E-470 Pub. Hwy. Auth. Rev. Series 2020 A: | |||
| 5% 9/1/36 | 705,000 | 766,883 | |
| 5% 9/1/40 | 820,000 | 821,772 | |
| Maiker Hsg. Partners Colo Multi Bonds Series 2023, 4.5%, tender 5/1/26 (b) | 2,050,000 | 2,050,855 | |
| Univ. of Colorado Enterprise Sys. Rev. Bonds: | |||
| Series 2021 C3A, 2%, tender 10/15/25 (b) | 305,000 | 297,283 | |
| Series 2021 C3B, 2%, tender 10/15/26 (b) | 260,000 | 247,998 | |
| Vauxmont Metropolitan District: | |||
| Series 2019, 5% 12/15/32 (Assured Guaranty Muni. Corp. Insured) | 47,000 | 48,664 | |
| Series 2020, 5% 12/1/33 (Assured Guaranty Muni. Corp. Insured) | 75,000 | 80,932 | |
TOTAL COLORADO | 57,014,953 | ||
| Connecticut - 1.7% | |||
| Connecticut Gen. Oblig.: | |||
| Series 2015 B, 5% 6/15/32 | 145,000 | 146,756 | |
| Series 2016 B, 5% 5/15/26 | 365,000 | 377,043 | |
| Series 2018 A, 5% 4/15/37 | 680,000 | 715,989 | |
| Series 2018 F: | |||
5% 9/15/24 | 165,000 | 165,506 | |
5% 9/15/25 | 165,000 | 168,539 | |
| Series 2021 A: | |||
3% 1/15/39 | 380,000 | 337,140 | |
3% 1/15/40 | 295,000 | 256,741 | |
| Series 2021 D, 5% 7/15/24 | 335,000 | 335,185 | |
| Series 2022 B, 4% 1/15/36 | 535,000 | 553,729 | |
| Series 2022 D, 5% 9/15/28 | 295,000 | 317,394 | |
| Connecticut Health & Edl. Facilities Auth. Rev.: | |||
| (Sacred Heart Univ., CT. Proj.) Series 2017 I-1: | |||
5% 7/1/26 | 25,000 | 25,732 | |
5% 7/1/27 | 20,000 | 20,871 | |
5% 7/1/28 | 30,000 | 31,123 | |
5% 7/1/29 | 20,000 | 20,790 | |
| Bonds: | |||
Series 2010 A3, 2.95%, tender 7/1/27 (b) | 3,115,000 | 3,062,274 | |
Series 2017 B2, 3.2%, tender 7/1/26 (b) | 1,640,000 | 1,631,682 | |
Series 2017 C2, 2.8%, tender 2/3/26 (b) | 5,250,000 | 5,176,057 | |
| Series 2016 K, 4% 7/1/46 | 445,000 | 397,192 | |
| Series 2019 A: | |||
4% 7/1/49 | 1,000,000 | 906,129 | |
5% 7/1/26 (e) | 350,000 | 343,222 | |
5% 7/1/26 | 2,875,000 | 2,892,231 | |
5% 7/1/27 (e) | 205,000 | 199,719 | |
5% 7/1/49 (e) | 420,000 | 351,336 | |
| Series 2019 Q-1, 5% 11/1/26 | 255,000 | 264,576 | |
| Series 2020 A, 4% 7/1/40 | 390,000 | 373,906 | |
| Series 2021 G: | |||
4% 3/1/46 | 305,000 | 305,532 | |
4% 3/1/51 | 490,000 | 489,901 | |
| Series 2021 S, 4% 6/1/51 | 380,000 | 365,862 | |
| Series 2022 M: | |||
4% 7/1/39 | 585,000 | 573,373 | |
4% 7/1/52 | 570,000 | 541,394 | |
| Series 2023 E, 5% 7/15/41 | 1,750,000 | 1,846,651 | |
| Series K1: | |||
5% 7/1/27 | 25,000 | 25,389 | |
5% 7/1/29 | 65,000 | 66,373 | |
5% 7/1/30 | 50,000 | 51,049 | |
5% 7/1/31 | 410,000 | 418,300 | |
5% 7/1/33 | 80,000 | 81,429 | |
5% 7/1/34 | 580,000 | 589,997 | |
| Series K3, 5% 7/1/43 | 605,000 | 599,567 | |
| Connecticut Hsg. Fin. Auth.: | |||
| Series 2021 B1, 3% 11/15/49 | 320,000 | 308,754 | |
| Series 2023 A, 5.25% 11/15/53 | 6,590,000 | 6,906,385 | |
| Series C: | |||
5% 11/15/24 (c) | 295,000 | 295,985 | |
5% 11/15/25 (c) | 260,000 | 263,698 | |
| Connecticut Spl. Tax Oblig. Trans. Infrastructure Rev. Series 2016 A, 5% 9/1/28 | 425,000 | 438,314 | |
| Connecticut State Revolving Fund Gen. Rev. Series 2017 A, 5% 5/1/35 | 190,000 | 199,151 | |
| Hbr. Point Infrastructure Impt. District Series 2017: | |||
| 5% 4/1/30 (e) | 130,000 | 130,816 | |
| 5% 4/1/39 (e) | 295,000 | 296,077 | |
| New Britain Gen. Oblig. Series 2017 C, 5% 3/1/29 (Assured Guaranty Muni. Corp. Insured) | 55,000 | 57,290 | |
| Steelpointe Hbr. Infrastructure Impt. District: | |||
| (Steelpointe Hbr. Proj.) Series 2024, 6% 4/1/52 (e) | 405,000 | 429,911 | |
| (Steelpointe Hbr. Proj.) Series 2021, 4% 4/1/51 (e) | 655,000 | 545,402 | |
| Univ. of Connecticut Gen. Oblig. Series 2019 A: | |||
| 5% 11/1/25 | 260,000 | 266,148 | |
| 5% 11/1/36 | 1,500,000 | 1,591,648 | |
TOTAL CONNECTICUT | 36,755,258 | ||
| Delaware - 0.0% | |||
| Delaware Gen. Oblig.: | |||
| Series 2019, 5% 2/1/30 | 294,000 | 320,622 | |
| Series 2020 A, 5% 1/1/31 | 294,000 | 326,432 | |
TOTAL DELAWARE | 647,054 | ||
| District Of Columbia - 0.6% | |||
| District of Columbia Gen. Oblig.: | |||
| Series 2021 D: | |||
4% 2/1/27 | 380,000 | 388,029 | |
5% 2/1/28 | 380,000 | 404,554 | |
5% 2/1/29 | 505,000 | 547,087 | |
| Series 2021 E: | |||
5% 2/1/27 | 1,285,000 | 1,343,791 | |
5% 2/1/29 | 1,070,000 | 1,159,175 | |
| District of Columbia Rev. Series 2018, 5% 10/1/48 | 2,100,000 | 2,122,966 | |
| Metropolitan Washington Arpts. Auth. Dulles Toll Road Rev.: | |||
| (Dulles Metrorail and Cap. Impt. Projs.): | |||
Series 2019 A: | |||
5% 10/1/31 | 210,000 | 222,901 | |
5% 10/1/32 | 265,000 | 281,178 | |
Series 2019 B, 3% 10/1/50 (Assured Guaranty Muni. Corp. Insured) | 1,290,000 | 973,235 | |
| (Dulles Metrorail And Cap. Impt. Projs.) Series 2019 B, 4% 10/1/49 | 3,010,000 | 2,828,155 | |
| Metropolitan Washington DC Arpts. Auth. Sys. Rev.: | |||
| Series 2017 A: | |||
5% 10/1/28 (c) | 335,000 | 347,208 | |
5% 10/1/30 (c) | 415,000 | 430,066 | |
5% 10/1/31 (c) | 75,000 | 77,646 | |
5% 10/1/32 (c) | 115,000 | 119,050 | |
5% 10/1/33 (c) | 55,000 | 56,935 | |
5% 10/1/35 (c) | 125,000 | 129,321 | |
5% 10/1/42 (c) | 255,000 | 260,551 | |
| Series 2019 A, 5% 10/1/25 (c) | 180,000 | 182,939 | |
| Series 2020 A: | |||
5% 10/1/26 (c) | 650,000 | 668,784 | |
5% 10/1/27 (c) | 225,000 | 233,370 | |
5% 10/1/28 (c) | 115,000 | 120,475 | |
TOTAL DISTRICT OF COLUMBIA | 12,897,416 | ||
| Florida - 4.0% | |||
| Brevard County School Board Ctfs. of Prtn. Series 2015 C, 5% 7/1/28 | 90,000 | 91,280 | |
| Broward County Arpt. Sys. Rev.: | |||
| Series 2012 Q1, 5% 10/1/25 | 265,000 | 265,266 | |
| Series 2015 C, 5% 10/1/24 (c) | 130,000 | 130,272 | |
| Series 2017: | |||
5% 10/1/25 (c) | 15,000 | 15,212 | |
5% 10/1/26 (c) | 50,000 | 51,282 | |
5% 10/1/27 (c) | 50,000 | 51,860 | |
5% 10/1/29 (c) | 135,000 | 139,809 | |
5% 10/1/30 (c) | 35,000 | 36,271 | |
5% 10/1/32 (c) | 175,000 | 180,569 | |
5% 10/1/33 (c) | 65,000 | 67,066 | |
5% 10/1/34 (c) | 65,000 | 67,065 | |
5% 10/1/35 (c) | 75,000 | 77,338 | |
5% 10/1/36 (c) | 100,000 | 102,984 | |
5% 10/1/37 (c) | 115,000 | 118,238 | |
5% 10/1/42 (c) | 655,000 | 666,075 | |
5% 10/1/47 (c) | 305,000 | 307,967 | |
| Series 2019 A: | |||
5% 10/1/29 (c) | 1,120,000 | 1,185,428 | |
5% 10/1/49 (c) | 705,000 | 720,668 | |
| Series A: | |||
5% 10/1/28 (c) | 150,000 | 151,883 | |
5% 10/1/30 (c) | 175,000 | 177,359 | |
5% 10/1/31 (c) | 150,000 | 151,906 | |
5% 10/1/32 (c) | 140,000 | 141,690 | |
| Broward County School Board Ctfs. of Prtn.: | |||
| (Broward County School District Proj.) Series 2016 A, 5% 7/1/28 | 35,000 | 35,913 | |
| Series 2015 A, 5% 7/1/27 | 50,000 | 50,731 | |
| Series 2015 B, 5% 7/1/24 | 140,000 | 140,000 | |
| Series 2016, 5% 7/1/32 | 110,000 | 111,891 | |
| Cap. Projs. Fin. Auth. Student Hsg. Rev. (Cap. Projs. Ln. Prog. - Florida Univs.) Series 2020 A, 5% 10/1/30 | 220,000 | 227,072 | |
| Duval County School Board Ctfs. of Prtn.: | |||
| Series 2015 B: | |||
5% 7/1/28 | 105,000 | 106,576 | |
5% 7/1/32 | 620,000 | 628,571 | |
| Series 2016 A, 5% 7/1/33 | 70,000 | 71,623 | |
| Escambia County Health Facilities Auth. Health Facilities Rev. Series 2020 A: | |||
| 3% 8/15/50 (Assured Guaranty Muni. Corp. Insured) | 710,000 | 528,937 | |
| 4% 8/15/45 | 3,620,000 | 3,266,744 | |
| Florida Dev. Fin. Corp. Healthcare Facility Rev. Bonds (Tampa Gen. Hosp. Proj.) Series 2024 B, 5%, tender 10/1/31 (b) | 2,965,000 | 3,187,685 | |
| Florida Dev. Fin. Corp. Rev. (Brightline Florida Passenger Rail Proj.) Series 2024: | |||
| 5.25% 7/1/53 (Assured Guaranty Muni. Corp. Insured) (c) | 5,260,000 | 5,502,020 | |
| 5.5% 7/1/53 (c) | 1,000,000 | 1,041,520 | |
| Florida Dev. Fin. Corp. Student H (SFP - Tampa I - The Henry Proj.) Series 2024 A1, 5% 6/1/44 (e) | 1,700,000 | 1,733,233 | |
| Florida Hsg. Fin. Corp. Multi-family Mtg. Rev. Bonds: | |||
| Series 2023 B, 5%, tender 2/1/26 (b) | 1,000,000 | 1,016,590 | |
| Series 2023 C, 5%, tender 12/1/25 (b) | 625,000 | 632,646 | |
| Florida Mid-Bay Bridge Auth. Rev.: | |||
| Series 2015 A, 5% 10/1/35 | 325,000 | 329,396 | |
| Series 2015 C: | |||
5% 10/1/30 | 165,000 | 167,044 | |
5% 10/1/40 | 100,000 | 100,860 | |
| Florida Muni. Pwr. Agcy. Rev.: | |||
| (Requirements Pwr. Supply Proj.) Series 2016 A: | |||
5% 10/1/30 | 110,000 | 113,028 | |
5% 10/1/31 | 120,000 | 123,173 | |
| Series 2015 B: | |||
5% 10/1/28 | 50,000 | 50,795 | |
5% 10/1/30 | 90,000 | 91,321 | |
| Greater Orlando Aviation Auth. Arpt. Facilities Rev.: | |||
| Series 2016 A, 5% 10/1/46 (c) | 50,000 | 51,444 | |
| Series 2016: | |||
5% 10/1/24 (c) | 150,000 | 150,389 | |
5% 10/1/26 (c) | 85,000 | 87,364 | |
5% 10/1/27 (c) | 50,000 | 51,860 | |
| Series 2017 A: | |||
5% 10/1/25 (c) | 15,000 | 15,249 | |
5% 10/1/25 (Escrowed to Maturity) (c) | 35,000 | 35,537 | |
5% 10/1/27 (c) | 25,000 | 25,930 | |
5% 10/1/27 (Escrowed to Maturity) (c) | 80,000 | 83,471 | |
5% 10/1/29 (Pre-Refunded to 10/1/27 @ 100) (c) | 150,000 | 156,275 | |
5% 10/1/30 (Pre-Refunded to 10/1/27 @ 100) (c) | 165,000 | 171,902 | |
5% 10/1/31 (c) | 435,000 | 448,872 | |
5% 10/1/34 (c) | 305,000 | 314,689 | |
5% 10/1/37 (c) | 315,000 | 323,870 | |
| Series 2019 A, 5% 10/1/54 (c) | 2,460,000 | 2,507,994 | |
| Hillsborough County Indl. Dev. (Tampa Gen. Hosp. Proj.) Series 2020 A, 3.5% 8/1/55 | 580,000 | 459,158 | |
| Hillsborough County Port District Series 2018 B, 5% 6/1/38 (c) | 155,000 | 160,390 | |
| JEA Wtr. & Swr. Sys. Rev. Series 2024 A: | |||
| 5% 10/1/28 | 950,000 | 1,022,188 | |
| 5% 10/1/29 | 750,000 | 820,639 | |
| 5% 10/1/30 | 4,950,000 | 5,494,633 | |
| 5% 10/1/31 | 3,400,000 | 3,819,932 | |
| Miami-Dade County Aviation Rev.: | |||
| Series 2015 A: | |||
5% 10/1/29 (c) | 80,000 | 80,648 | |
5% 10/1/31 (c) | 70,000 | 70,592 | |
5% 10/1/35 (c) | 275,000 | 275,332 | |
5% 10/1/38 (c) | 95,000 | 95,574 | |
| Series 2016 A: | |||
5% 10/1/29 | 75,000 | 76,883 | |
5% 10/1/31 | 90,000 | 92,512 | |
| Series 2017 B, 5% 10/1/40 (c) | 875,000 | 890,129 | |
| Series 2020 A, 4% 10/1/39 | 490,000 | 490,253 | |
| Miami-Dade County Cap. Asset Acquisition Series 2009, 0% 10/1/37 | 3,000,000 | 1,755,783 | |
| Miami-Dade County Expressway Auth.: | |||
| Series 2014 B, 5% 7/1/28 | 50,000 | 50,038 | |
| Series 2016 A: | |||
5% 7/1/32 | 215,000 | 219,235 | |
5% 7/1/33 | 185,000 | 188,573 | |
| Miami-Dade County Indl. Dev. Auth. Solid Waste Disp. Rev. Bonds (Waste Mgmt., Inc. of Florida Proj.) Series 2007, 4.625%, tender 11/1/24 (b) | 7,325,000 | 7,336,565 | |
| Miami-Dade County School Board Ctfs. of Prtn.: | |||
| Series 2015 A, 5% 5/1/29 | 205,000 | 207,039 | |
| Series 2016 A: | |||
5% 5/1/30 | 380,000 | 389,554 | |
5% 5/1/32 | 505,000 | 517,787 | |
| Miami-Dade County Wtr. & Swr. Rev. Series 2021, 5% 10/1/32 | 205,000 | 228,025 | |
| Orange County Health Facilities Auth. Series 2016 A, 5% 10/1/44 | 115,000 | 116,371 | |
| Osceola County Trans. Impt. Rev. Series 2019 A2: | |||
| 0% 10/1/50 | 5,175,000 | 1,331,159 | |
| 0% 10/1/51 | 2,600,000 | 630,042 | |
| Palm Beach County Arpt. Sys. Rev. Series 2016: | |||
| 5% 10/1/24 (c) | 70,000 | 70,146 | |
| 5% 10/1/27 (c) | 50,000 | 51,040 | |
| 5% 10/1/29 (c) | 55,000 | 56,262 | |
| 5% 10/1/30 (c) | 95,000 | 97,225 | |
| 5% 10/1/31 (c) | 65,000 | 66,462 | |
| 5% 10/1/32 (c) | 100,000 | 102,136 | |
| 5% 10/1/33 (c) | 215,000 | 219,586 | |
| 5% 10/1/34 (c) | 230,000 | 234,655 | |
| 5% 10/1/35 (c) | 240,000 | 244,499 | |
| Palm Beach County Health Facilities Auth. Hosp. Rev.: | |||
| (Jupiter Med. Ctr. Proj.) Series 2022: | |||
5% 11/1/31 | 200,000 | 209,707 | |
5% 11/1/33 | 350,000 | 368,843 | |
5% 11/1/36 | 370,000 | 388,137 | |
5% 11/1/38 | 400,000 | 413,262 | |
5% 11/1/40 | 400,000 | 410,091 | |
5% 11/1/42 | 500,000 | 509,062 | |
| Series 2019, 4% 8/15/49 | 5,725,000 | 5,225,826 | |
| Palm Beach County Health Facilities Auth. Rev.: | |||
| Series 2021 C, 4% 5/15/28 | 1,280,000 | 1,238,441 | |
| Series 2023 C, 7.625% 5/15/58 | 1,450,000 | 1,615,687 | |
| Palm Beach County School Board Ctfs. of Prtn. Series 2015 D: | |||
| 5% 8/1/28 | 240,000 | 243,437 | |
| 5% 8/1/29 | 300,000 | 304,105 | |
| Pinellas County Hsg. Fin. Auth. Bonds Series 2021 B, 0.65%, tender 7/1/24 (b) | 430,000 | 430,000 | |
| South Florida Wtr. Mgmt. District Ctfs. of Prtn. Series 2015: | |||
| 5% 10/1/29 | 255,000 | 262,151 | |
| 5% 10/1/32 | 315,000 | 322,215 | |
| South Miami Health Facilities Auth. Hosp. Rev.: | |||
| (Baptist Med. Ctr., FL. Proj.) Series 2017: | |||
4% 8/15/33 | 125,000 | 125,609 | |
5% 8/15/26 | 170,000 | 174,961 | |
5% 8/15/27 | 115,000 | 120,212 | |
5% 8/15/28 | 75,000 | 78,394 | |
5% 8/15/30 | 165,000 | 172,144 | |
5% 8/15/31 | 160,000 | 166,728 | |
5% 8/15/32 | 115,000 | 119,657 | |
5% 8/15/34 | 325,000 | 337,673 | |
5% 8/15/35 | 215,000 | 222,947 | |
5% 8/15/42 | 335,000 | 340,957 | |
5% 8/15/47 | 495,000 | 500,886 | |
| Series 2017, 4% 8/15/47 | 10,390,000 | 9,670,628 | |
| Tallahassee Health Facilities Rev.: | |||
| (Tallahassee Memorial Healthcare, Inc. Proj.) Series 2016 A, 5% 12/1/41 | 55,000 | 55,139 | |
| Series 2015 A, 5% 12/1/40 | 110,000 | 110,199 | |
| Tampa Hosp. Rev. (H. Lee Moffitt Cancer Ctr. Proj.) Series 2020 B: | |||
| 4% 7/1/45 | 1,230,000 | 1,178,336 | |
| 5% 7/1/50 | 1,320,000 | 1,358,119 | |
| Tampa Tax Allocation (H. Lee Moffitt Cancer Ctr. Proj.) Series 2020 A: | |||
| 0% 9/1/35 | 1,575,000 | 984,488 | |
| 0% 9/1/37 | 235,000 | 133,397 | |
| 0% 9/1/49 | 765,000 | 221,930 | |
| Volusia County Edl. Facilities Auth. Rev. (Embry-Riddle Aeronautical Univ., Inc. Proj.) Series 2020 A: | |||
| 5% 10/15/44 | 65,000 | 67,540 | |
| 5% 10/15/49 | 125,000 | 129,148 | |
| Volusia County School Board Ctfs. of Prtn. (Florida Master Lease Prog.) Series 2016 A: | |||
| 5% 8/1/29 (Build America Mutual Assurance Insured) | 50,000 | 51,067 | |
| 5% 8/1/32 (Build America Mutual Assurance Insured) | 255,000 | 260,046 | |
TOTAL FLORIDA | 85,061,917 | ||
| Georgia - 2.6% | |||
| Atlanta Arpt. Rev.: | |||
| Series 2019 B, 5% 7/1/25 (c) | 140,000 | 141,845 | |
| Series 2022 B, 5% 7/1/34 (c) | 1,005,000 | 1,093,005 | |
| Burke County Indl. Dev. Auth. Poll. Cont. Rev.: | |||
| (Georgia Transmission Corp. Proj.) Series 2012, 2.75% 1/1/52 (b) | 930,000 | 623,953 | |
| Bonds (Georgia Pwr. Co. Plant Vogtle Proj.) Series 1994 9, 3.8%, tender 5/21/26 (b) | 1,700,000 | 1,704,326 | |
| Columbus Med. Ctr. Hosp. Auth. Bonds (Piedmont Healthcare, Inc. Proj.) Series 2019 B, 5%, tender 7/1/29 (b) | 500,000 | 527,972 | |
| Coweta County Dev. Auth. Rev. (Piedmont Healthcare, Inc. Proj.) Series 2019 A, 5% 7/1/44 | 1,470,000 | 1,504,544 | |
| Fayette County Hosp. Auth. Rev. Bonds (Piedmont Healthcare, Inc. Proj.) Series 2019 A, 5%, tender 7/1/24 (b) | 265,000 | 265,000 | |
| Fulton County Dev. Auth. Rev. Series 2019, 4% 6/15/49 | 110,000 | 104,051 | |
| Gainesville & Hall County Hosp. Auth. Rev. Series 2020 A, 3% 2/15/47 | 2,845,000 | 2,323,327 | |
| Georgia Gen. Oblig. Series 2022 A, 5% 7/1/33 | 1,025,000 | 1,175,492 | |
| Georgia Muni. Elec. Auth. Pwr. Rev. Series 2021 A: | |||
| 4% 1/1/35 (Assured Guaranty Muni. Corp. Insured) | 325,000 | 330,567 | |
| 4% 1/1/37 (Assured Guaranty Muni. Corp. Insured) | 190,000 | 192,587 | |
| 4% 1/1/39 (Assured Guaranty Muni. Corp. Insured) | 295,000 | 296,554 | |
| 4% 1/1/39 (Assured Guaranty Muni. Corp. Insured) | 180,000 | 181,392 | |
| 4% 1/1/40 (Assured Guaranty Muni. Corp. Insured) | 210,000 | 210,290 | |
| 4% 1/1/41 (Assured Guaranty Muni. Corp. Insured) | 150,000 | 150,216 | |
| 5% 1/1/31 (Assured Guaranty Muni. Corp. Insured) | 155,000 | 167,015 | |
| 5% 1/1/33 (Assured Guaranty Muni. Corp. Insured) | 295,000 | 317,896 | |
| 5% 1/1/33 (Assured Guaranty Muni. Corp. Insured) | 175,000 | 188,582 | |
| 5% 1/1/34 (Assured Guaranty Muni. Corp. Insured) | 260,000 | 280,180 | |
| 5% 1/1/34 (Assured Guaranty Muni. Corp. Insured) | 180,000 | 193,971 | |
| Georgia Road & Thruway Auth. Rev. Series 2020: | |||
| 5% 6/1/31 | 585,000 | 647,136 | |
| 5% 6/1/32 | 880,000 | 973,430 | |
| Glynn-Brunswick Memorial Hosp. Auth. Rev. (Southeast Georgia Health Sys. Proj.) Series 2017: | |||
| 4% 8/1/43 | 115,000 | 102,862 | |
| 5% 8/1/39 | 105,000 | 105,236 | |
| 5% 8/1/43 | 140,000 | 140,213 | |
| Hosp. Auth. of Savannah Auth. Rev. Series 2019 A: | |||
| 4% 7/1/36 | 415,000 | 415,215 | |
| 4% 7/1/43 | 435,000 | 424,004 | |
| Main Street Natural Gas, Inc. Bonds: | |||
| Series 2021 A, 4%, tender 9/1/27 (b) | 16,725,000 | 16,793,315 | |
| Series 2021 C, 4%, tender 12/1/28 (b) | 1,390,000 | 1,394,416 | |
| Series 2022 B, 5%, tender 6/1/29 (b) | 1,790,000 | 1,876,666 | |
| Series 2022 E, 4%, tender 12/1/29 (b) | 5,470,000 | 5,488,295 | |
| Series 2023 A, 5%, tender 6/1/30 (b) | 6,860,000 | 7,251,840 | |
| Series 2023 C, 5%, tender 9/1/30 (b) | 5,550,000 | 5,892,330 | |
| Private Colleges & Univs. Auth. Rev.: | |||
| (The Savannah College of Art & Design Projs.) Series 2021: | |||
4% 4/1/37 | 295,000 | 298,562 | |
5% 4/1/30 | 160,000 | 172,579 | |
5% 4/1/36 | 165,000 | 179,654 | |
| Series 2020 B: | |||
4% 9/1/37 | 395,000 | 405,330 | |
4% 9/1/38 | 515,000 | 524,350 | |
5% 9/1/25 | 365,000 | 371,718 | |
TOTAL GEORGIA | 55,429,916 | ||
| Hawaii - 0.5% | |||
| Hawaii Arpts. Sys. Rev. Series 2018 A: | |||
| 5% 7/1/29 (c) | 65,000 | 67,946 | |
| 5% 7/1/30 (c) | 75,000 | 78,473 | |
| 5% 7/1/31 (c) | 75,000 | 77,909 | |
| 5% 7/1/32 (c) | 75,000 | 77,904 | |
| 5% 7/1/33 (c) | 75,000 | 77,896 | |
| 5% 7/1/48 (c) | 4,170,000 | 4,242,702 | |
| Hawaii Gen. Oblig. Series 2020 A, 4% 7/1/36 (c) | 60,000 | 60,119 | |
| Honolulu City & County Gen. Oblig. Series 2022 A: | |||
| 5% 11/1/24 | 250,000 | 251,318 | |
| 5% 11/1/25 | 110,000 | 112,604 | |
| Honolulu City & County Multi-family housing Rev. Bonds Series 2023, 5%, tender 6/1/26 (b) | 3,130,000 | 3,192,181 | |
| Honolulu City and County Wastewtr. Sys. Series 2016 B, 5% 7/1/27 | 1,680,000 | 1,734,278 | |
TOTAL HAWAII | 9,973,330 | ||
| Idaho - 0.0% | |||
| Idaho Hsg. & Fin. Assoc. Single Family Mtg. Series 2019 A, 4% 1/1/50 | 30,000 | 29,816 | |
| Illinois - 10.0% | |||
| Chicago Board of Ed.: | |||
| Series 2012 A, 5% 12/1/42 | 465,000 | 464,962 | |
| Series 2015 C, 5.25% 12/1/39 | 85,000 | 85,013 | |
| Series 2016 B, 6.5% 12/1/46 | 100,000 | 103,917 | |
| Series 2017 A, 7% 12/1/46 (e) | 140,000 | 150,775 | |
| Series 2017 C: | |||
5% 12/1/24 | 290,000 | 291,013 | |
5% 12/1/25 | 165,000 | 167,131 | |
5% 12/1/26 | 100,000 | 102,282 | |
5% 12/1/30 | 130,000 | 133,357 | |
| Series 2017 D: | |||
5% 12/1/24 | 100,000 | 100,349 | |
5% 12/1/31 | 150,000 | 153,439 | |
| Series 2018 A: | |||
5% 12/1/25 | 100,000 | 101,292 | |
5% 12/1/26 | 100,000 | 102,282 | |
5% 12/1/28 | 240,000 | 249,388 | |
5% 12/1/30 | 350,000 | 362,967 | |
5% 12/1/32 | 100,000 | 103,318 | |
5% 12/1/35 | 100,000 | 102,865 | |
| Series 2018 C, 5% 12/1/46 | 900,000 | 902,435 | |
| Series 2019 A: | |||
5% 12/1/28 | 165,000 | 171,454 | |
5% 12/1/30 | 340,000 | 354,325 | |
5% 12/1/31 | 190,000 | 197,489 | |
5% 12/1/33 | 455,000 | 472,836 | |
| Series 2022 A: | |||
4% 12/1/47 | 1,500,000 | 1,315,307 | |
5% 12/1/47 | 780,000 | 786,700 | |
| Series 2022 B: | |||
4% 12/1/35 | 585,000 | 574,862 | |
4% 12/1/36 | 1,005,000 | 981,622 | |
| Series 2023 A, 6% 12/1/49 | 12,500,000 | 13,754,438 | |
| Chicago Gen. Oblig.: | |||
| Series 2017 A, 6% 1/1/38 | 295,000 | 306,841 | |
| Series 2019 A, 5% 1/1/40 | 700,000 | 719,564 | |
| Series 2020 A: | |||
5% 1/1/29 | 870,000 | 917,598 | |
5% 1/1/30 | 1,605,000 | 1,707,302 | |
| Series 2021 A: | |||
5% 1/1/32 | 1,530,000 | 1,640,424 | |
5% 1/1/34 | 260,000 | 278,218 | |
| Series 2023 A: | |||
5.25% 1/1/37 | 1,950,000 | 2,111,447 | |
5.25% 1/1/38 | 2,290,000 | 2,469,244 | |
5.5% 1/1/40 | 2,250,000 | 2,434,177 | |
5.5% 1/1/43 | 5,725,000 | 6,032,029 | |
| Chicago Midway Arpt. Rev.: | |||
| Series 2016 A: | |||
4% 1/1/33 (c) | 375,000 | 372,452 | |
5% 1/1/28 (c) | 100,000 | 101,107 | |
| Series 2016 B: | |||
4% 1/1/35 | 80,000 | 79,934 | |
5% 1/1/36 | 100,000 | 101,738 | |
5% 1/1/37 | 135,000 | 137,260 | |
| Chicago O'Hare Int'l. Arpt. Rev.: | |||
| Series 2015 A, 5% 1/1/31 (c) | 305,000 | 306,049 | |
| Series 2015 C, 5% 1/1/46 (c) | 120,000 | 120,043 | |
| Series 2016 B, 5% 1/1/34 | 310,000 | 315,621 | |
| Series 2016 C: | |||
5% 1/1/33 | 140,000 | 142,539 | |
5% 1/1/34 | 160,000 | 162,901 | |
| Series 2016 G: | |||
5% 1/1/37 (c) | 100,000 | 101,949 | |
5% 1/1/42 (c) | 100,000 | 100,833 | |
5.25% 1/1/29 (c) | 20,000 | 20,608 | |
5.25% 1/1/31 (c) | 20,000 | 20,638 | |
| Series 2017 A, 5% 1/1/31 | 180,000 | 186,639 | |
| Series 2017 B: | |||
5% 1/1/35 | 105,000 | 108,536 | |
5% 1/1/37 | 430,000 | 443,742 | |
| Series 2017 C: | |||
5% 1/1/30 | 30,000 | 31,093 | |
5% 1/1/31 | 30,000 | 31,107 | |
5% 1/1/32 | 30,000 | 31,051 | |
| Series 2017 D: | |||
5% 1/1/28 (c) | 150,000 | 153,891 | |
5% 1/1/29 (c) | 125,000 | 128,066 | |
5% 1/1/32 (c) | 135,000 | 138,042 | |
5% 1/1/34 (c) | 205,000 | 209,608 | |
5% 1/1/35 (c) | 150,000 | 153,178 | |
5% 1/1/36 (c) | 190,000 | 193,902 | |
5% 1/1/37 (c) | 100,000 | 101,949 | |
| Series 2018 A: | |||
5% 1/1/37 (c) | 1,030,000 | 1,068,993 | |
5% 1/1/39 (c) | 1,005,000 | 1,035,177 | |
5% 1/1/48 (c) | 165,000 | 166,929 | |
5% 1/1/53 (c) | 285,000 | 286,856 | |
| Series 2018 B, 4% 1/1/44 | 2,005,000 | 1,959,828 | |
| Series 2022 A: | |||
4.5% 1/1/48 (c) | 4,700,000 | 4,694,018 | |
5% 1/1/30 (c) | 225,000 | 238,682 | |
5% 1/1/31 (c) | 230,000 | 246,483 | |
| Series 2022 C: | |||
5% 1/1/28 (c) | 690,000 | 716,648 | |
5% 1/1/29 (c) | 500,000 | 524,396 | |
5% 1/1/30 (c) | 810,000 | 859,256 | |
5% 1/1/31 (c) | 600,000 | 642,999 | |
| Chicago O'Hare Int'l. Arpt. Spl. Facilities Rev. Series 2018: | |||
| 5% 7/1/38 (c) | 135,000 | 137,793 | |
| 5% 7/1/48 (c) | 1,140,000 | 1,146,979 | |
| Chicago Transit Auth. Series 2022 A, 4% 12/1/49 | 6,000,000 | 5,750,095 | |
| Chicago Transit Auth. Cap. Grant Receipts Rev. Series 2017: | |||
| 5% 6/1/25 | 15,000 | 15,152 | |
| 5% 6/1/26 | 10,000 | 10,225 | |
| Cook County Gen. Oblig.: | |||
| Series 2016 A: | |||
5% 11/15/26 | 290,000 | 301,008 | |
5% 11/15/27 | 140,000 | 144,234 | |
5% 11/15/28 | 185,000 | 190,681 | |
5% 11/15/29 | 230,000 | 237,009 | |
5% 11/15/30 | 255,000 | 263,182 | |
| Series 2021 A, 5% 11/15/33 | 550,000 | 600,549 | |
| Series 2021 B: | |||
4% 11/15/25 | 215,000 | 216,564 | |
4% 11/15/26 | 110,000 | 111,611 | |
4% 11/15/27 | 110,000 | 112,080 | |
4% 11/15/28 | 55,000 | 56,212 | |
| Cook County Ill High School District # Series 2021 A: | |||
| 2% 12/15/33 | 175,000 | 142,649 | |
| 2% 12/15/34 | 180,000 | 144,725 | |
| DuPage & Cook Counties Cmnty. Unit School District #205 Series 2022, 4% 9/15/42 | 1,000,000 | 964,812 | |
| Illinois Fin. Auth.: | |||
| Bonds Series 2022 B1, 5%, tender 8/15/25 (b) | 2,905,000 | 2,937,381 | |
| Series 2020 A: | |||
3% 5/15/50 | 2,650,000 | 2,064,175 | |
3% 5/15/50 (Build America Mutual Assurance Insured) | 1,045,000 | 818,059 | |
3.25% 8/15/49 | 465,000 | 361,081 | |
4% 5/15/50 | 1,760,000 | 1,624,576 | |
| Series 2021 A, 3% 8/15/48 | 4,100,000 | 3,119,487 | |
| Series 2022 A: | |||
5% 10/1/35 | 330,000 | 342,255 | |
5.5% 10/1/39 | 750,000 | 789,028 | |
| Series 2023 A: | |||
5% 5/15/33 | 400,000 | 457,934 | |
5% 5/15/34 | 450,000 | 516,015 | |
| Illinois Fin. Auth. Health Svcs. Facility Lease Rev. (Provident Group - UIC Surgery Ctr. LLC - Univ. of Illinois Health Svcs. Facility Proj.) Series 2020, 4% 10/1/55 | 2,785,000 | 2,411,455 | |
| Illinois Fin. Auth. Rev.: | |||
| (Bradley Univ. Proj.) Series 2017 C: | |||
5% 8/1/29 | 60,000 | 62,614 | |
5% 8/1/30 | 45,000 | 46,967 | |
5% 8/1/32 | 60,000 | 62,582 | |
| (Depaul Univ. Proj.) Series 2016 A: | |||
4% 10/1/34 | 50,000 | 50,206 | |
5% 10/1/29 | 50,000 | 51,434 | |
5% 10/1/30 | 50,000 | 51,434 | |
| (OSF Healthcare Sys.) Series 2018 A: | |||
4.125% 5/15/47 | 1,585,000 | 1,520,864 | |
5% 5/15/43 | 2,105,000 | 2,129,000 | |
| (Presence Health Proj.) Series 2016 C: | |||
3.625% 2/15/32 | 60,000 | 58,019 | |
4% 2/15/33 | 15,000 | 15,091 | |
5% 2/15/29 | 310,000 | 321,023 | |
5% 2/15/36 | 70,000 | 72,531 | |
| (Rosalind Franklin Univ. Research Bldg. Proj.) Series 2017 C, 5% 8/1/46 | 50,000 | 50,359 | |
| (Rush Univ. Med. Ctr. Proj.) Series 2015 A, 5% 11/15/34 | 25,000 | 25,144 | |
| Series 2013: | |||
5% 11/15/28 | 145,000 | 145,053 | |
5% 11/15/29 | 70,000 | 70,029 | |
| Series 2015 A, 4% 11/15/39 | 3,825,000 | 3,639,081 | |
| Series 2015 C, 4.125% 8/15/37 | 45,000 | 42,857 | |
| Series 2016 A: | |||
5% 2/15/29 | 260,000 | 265,693 | |
5% 2/15/30 | 275,000 | 281,043 | |
5% 7/1/30 (Pre-Refunded to 7/1/26 @ 100) | 35,000 | 36,162 | |
5% 2/15/31 | 220,000 | 224,865 | |
5% 2/15/32 | 215,000 | 219,742 | |
5% 7/1/33 (Pre-Refunded to 7/1/26 @ 100) | 30,000 | 30,996 | |
5% 8/15/35 (Pre-Refunded to 8/15/26 @ 100) | 25,000 | 25,752 | |
5% 7/1/36 (Pre-Refunded to 7/1/26 @ 100) | 130,000 | 134,316 | |
5% 8/15/36 (Pre-Refunded to 8/15/26 @ 100) | 105,000 | 108,160 | |
5.25% 8/15/31 (Pre-Refunded to 8/15/26 @ 100) | 30,000 | 31,055 | |
| Series 2016 B: | |||
5% 8/15/31 | 375,000 | 388,344 | |
5% 8/15/32 | 305,000 | 314,999 | |
5% 8/15/34 | 380,000 | 392,169 | |
5% 8/15/36 | 530,000 | 545,391 | |
| Series 2016 C: | |||
3.75% 2/15/34 | 75,000 | 72,650 | |
4% 2/15/36 | 315,000 | 312,821 | |
4% 2/15/41 | 1,855,000 | 1,811,859 | |
5% 2/15/31 | 1,415,000 | 1,465,812 | |
5% 2/15/32 | 225,000 | 233,058 | |
5% 2/15/34 | 180,000 | 186,570 | |
| Series 2016: | |||
4% 2/15/41 (Pre-Refunded to 2/15/27 @ 100) | 5,000 | 5,066 | |
5% 5/15/29 | 65,000 | 66,341 | |
5% 12/1/29 | 85,000 | 86,708 | |
5% 5/15/30 | 135,000 | 137,568 | |
5% 12/1/33 | 115,000 | 117,110 | |
| Series 2017 A, 5% 8/1/42 | 45,000 | 45,570 | |
| Series 2017: | |||
5% 1/1/29 | 170,000 | 176,447 | |
5% 7/1/34 | 285,000 | 295,784 | |
5% 7/1/35 | 240,000 | 249,073 | |
| Series 2019, 4% 9/1/35 | 145,000 | 129,918 | |
| Illinois Gen. Oblig.: | |||
| Series 2014: | |||
5% 2/1/25 | 185,000 | 185,175 | |
5% 2/1/26 | 140,000 | 140,133 | |
5% 4/1/28 | 115,000 | 115,089 | |
5% 5/1/28 | 110,000 | 110,077 | |
5% 2/1/39 | 865,000 | 864,981 | |
5.25% 2/1/31 | 20,000 | 20,017 | |
| Series 2016: | |||
5% 6/1/26 | 60,000 | 61,577 | |
5% 2/1/27 | 340,000 | 351,864 | |
| Series 2017 C, 5% 11/1/29 | 870,000 | 906,467 | |
| Series 2017 D, 5% 11/1/27 | 1,050,000 | 1,098,216 | |
| Series 2020 C, 4.125% 10/1/36 | 3,000,000 | 3,042,041 | |
| Series 2020, 5.5% 5/1/39 | 6,230,000 | 6,819,810 | |
| Series 2021 A: | |||
4% 3/1/39 | 1,180,000 | 1,155,597 | |
5% 3/1/34 | 1,035,000 | 1,120,494 | |
5% 3/1/46 | 2,165,000 | 2,257,484 | |
| Series 2022 A: | |||
5% 3/1/29 | 645,000 | 685,655 | |
5% 3/1/31 | 705,000 | 765,930 | |
5% 3/1/36 | 1,820,000 | 1,988,774 | |
| Series 2023 B: | |||
5.25% 5/1/39 | 3,810,000 | 4,208,035 | |
5.25% 5/1/41 | 1,330,000 | 1,455,850 | |
| Series 2023 D: | |||
4% 7/1/37 | 9,500,000 | 9,410,061 | |
5% 7/1/29 | 3,210,000 | 3,424,751 | |
| Series 2024 B: | |||
5% 5/1/35 | 1,875,000 | 2,092,595 | |
5% 5/1/40 | 1,415,000 | 1,549,618 | |
5.25% 5/1/44 | 1,250,000 | 1,371,857 | |
5.25% 5/1/49 | 925,000 | 998,154 | |
| Series June 2016, 3.5% 6/1/29 | 1,375,000 | 1,336,942 | |
| Illinois Hsg. Dev. Auth. Series 2021, 3% 4/1/51 | 725,000 | 699,285 | |
| Illinois Hsg. Dev. Auth. Multi-family Hsg. Rev.: | |||
| Bonds Series 2023, 4%, tender 6/1/25 (b) | 1,665,000 | 1,665,005 | |
| Series 2019, 2.9% 7/1/35 | 424,996 | 367,913 | |
| Illinois Hsg. Dev. Auth. Rev.: | |||
| Series 2019 D, 2.7% 10/1/34 | 310,000 | 273,008 | |
| Series D, 3.75% 4/1/50 | 55,000 | 54,325 | |
| Illinois Muni. Elec. Agcy. Pwr. Supply Series 2015 A, 5% 2/1/31 | 205,000 | 207,284 | |
| Illinois Sales Tax Rev. Series 2024 A: | |||
| 5% 6/15/31 | 2,845,000 | 3,110,467 | |
| 5% 6/15/32 | 2,385,000 | 2,635,524 | |
| 5% 6/15/33 | 3,445,000 | 3,845,041 | |
| Illinois Toll Hwy. Auth. Toll Hwy. Rev.: | |||
| Series 2016 A, 5% 12/1/31 | 355,000 | 361,384 | |
| Series 2019 A, 5% 1/1/44 | 140,000 | 145,928 | |
| Series 2021 A, 5% 1/1/43 | 4,670,000 | 5,073,164 | |
| Series A: | |||
5% 1/1/40 | 335,000 | 366,243 | |
5% 1/1/41 | 880,000 | 957,540 | |
5% 1/1/45 | 2,975,000 | 3,162,905 | |
| Kendall, Kane & Will Counties Cmnty. Unit School District #308 Series 2016: | |||
| 5% 2/1/34 | 355,000 | 360,387 | |
| 5% 2/1/35 | 255,000 | 258,635 | |
| 5% 2/1/36 | 435,000 | 440,600 | |
| Metropolitan Pier & Exposition: | |||
| (McCormick Place Expansion Proj.): | |||
Series 2010 B1: | |||
0% 6/15/43 (Assured Guaranty Muni. Corp. Insured) | 3,150,000 | 1,364,098 | |
0% 6/15/44 (Assured Guaranty Muni. Corp. Insured) | 15,000,000 | 6,088,215 | |
0% 6/15/45 (Assured Guaranty Muni. Corp. Insured) | 1,540,000 | 588,249 | |
0% 6/15/47 (Assured Guaranty Muni. Corp. Insured) | 185,000 | 62,670 | |
Series 2012 B, 0% 12/15/51 | 660,000 | 162,382 | |
| Series 1994: | |||
0% 6/15/28 (Nat'l. Pub. Fin. Guarantee Corp. Insured) | 335,000 | 285,397 | |
0% 6/15/29 (FGIC Insured) | 445,000 | 364,268 | |
| Series 2002 A, 0% 6/15/35 (Nat'l. Pub. Fin. Guarantee Corp. Insured) | 260,000 | 166,410 | |
| Series 2002: | |||
0% 12/15/31 (Nat'l. Pub. Fin. Guarantee Corp. Insured) | 485,000 | 358,296 | |
0% 12/15/36 (Nat'l. Pub. Fin. Guarantee Corp. Insured) | 2,445,000 | 1,460,702 | |
| Series 2017 B: | |||
0% 12/15/56 (Assured Guaranty Muni. Corp. Insured) | 5,000,000 | 1,023,928 | |
5% 12/15/25 | 50,000 | 50,868 | |
5% 12/15/26 | 165,000 | 169,710 | |
5% 12/15/27 | 20,000 | 20,833 | |
5% 12/15/31 | 35,000 | 36,469 | |
5% 12/15/34 | 20,000 | 20,835 | |
| Series 2020 A, 5% 6/15/50 | 560,000 | 578,700 | |
| Series 2020 B, 5% 6/15/42 | 675,000 | 713,713 | |
| Series 2022 A: | |||
0% 12/15/36 | 65,000 | 38,362 | |
0% 12/15/39 | 515,000 | 258,504 | |
0% 12/15/40 | 430,000 | 203,750 | |
0% 12/15/41 | 1,225,000 | 549,159 | |
4% 6/15/52 | 5,875,000 | 5,436,415 | |
| Northern Illinois Univ. Revs. Series 2020 B, 5% 4/1/34 (Build America Mutual Assurance Insured) | 395,000 | 417,900 | |
| Peoria County Gen. Oblig. Series 2023 A, 4% 1/1/39 (Assured Guaranty Muni. Corp. Insured) | 1,145,000 | 1,126,766 | |
| Railsplitter Tobacco Settlement Auth. Rev. Series 2017: | |||
| 5% 6/1/27 (Pre-Refunded to 6/1/26 @ 100) | 1,275,000 | 1,313,039 | |
| 5% 6/1/28 (Pre-Refunded to 6/1/26 @ 100) | 140,000 | 144,177 | |
| Sales Tax Securitization Corp.: | |||
| Series 2023 C, 5% 1/1/33 | 2,235,000 | 2,497,153 | |
| Series 2023 D, 5% 1/1/35 | 1,255,000 | 1,400,323 | |
| Schaumburg Village Gen. Oblig. Series 2023, 4% 12/1/30 | 1,505,000 | 1,569,643 | |
| Univ. of Illinois Rev.: | |||
| Series 2018 A, 5% 4/1/30 | 210,000 | 222,366 | |
| Series 2023: | |||
5% 10/1/28 | 475,000 | 500,053 | |
5% 10/1/29 | 970,000 | 1,030,854 | |
5% 10/1/30 | 1,150,000 | 1,234,567 | |
5% 10/1/31 | 1,825,000 | 1,972,836 | |
5% 10/1/32 | 1,350,000 | 1,470,087 | |
5.5% 10/1/39 | 1,360,000 | 1,521,455 | |
5.5% 10/1/40 | 615,000 | 684,769 | |
5.5% 10/1/41 | 1,660,000 | 1,845,947 | |
| Will County Cmnty. Unit School District #365-U Series 2007: | |||
| 0% 11/1/26 | 45,000 | 41,530 | |
| 0% 11/1/26 (Assured Guaranty Muni. Corp. Insured) | 265,000 | 242,332 | |
TOTAL ILLINOIS | 210,889,351 | ||
| Indiana - 0.5% | |||
| Indiana Fin. Auth. Edl. Facilities Rev. (Depauw Univ. Proj.) Series 2022 A, 5% 7/1/32 | 1,005,000 | 1,070,133 | |
| Indiana Fin. Auth. Envir. Facilities Rev. Bonds (Indianapolis Pwr. & Lt. Co. Proj.): | |||
| Series 2020 A, 0.75%, tender 4/1/26 (b) | 90,000 | 83,444 | |
| Series 2020 B, 0.95%, tender 4/1/26 (b)(c) | 140,000 | 130,501 | |
| Indiana Fin. Auth. Health Sys. Rev.: | |||
| Bonds Series 2023 B1, 5%, tender 7/1/28 (b) | 2,010,000 | 2,121,451 | |
| Series 2016 A, 4% 11/1/51 | 3,100,000 | 2,908,920 | |
| Indiana Fin. Auth. Rev.: | |||
| Series 2015 A, 5.25% 2/1/32 | 355,000 | 360,976 | |
| Series 2016: | |||
5% 9/1/26 | 65,000 | 66,926 | |
5% 9/1/27 | 30,000 | 30,894 | |
5% 9/1/28 | 155,000 | 159,370 | |
5% 9/1/29 | 75,000 | 77,199 | |
5% 9/1/30 | 70,000 | 72,063 | |
| Indiana Fin. Auth. Wastewtr. Util. Rev. Series 2021 2, 5% 10/1/41 | 515,000 | 562,051 | |
| Indiana Hsg. & Cmnty. Dev. Auth.: | |||
| (Glasswater Creek of Whitestown Proj.) Series 2020, 5.375% 10/1/40 (e) | 180,000 | 153,565 | |
| Series 2021 B, 3% 7/1/50 | 120,000 | 116,330 | |
| Indianapolis Local Pub. Impt.: | |||
| (Courthouse and Jail Proj.) Series 2019 A, 5% 2/1/49 | 340,000 | 352,858 | |
| Series 2016: | |||
4% 1/1/32 (c) | 50,000 | 49,765 | |
4% 1/1/33 (c) | 50,000 | 49,660 | |
4% 1/1/34 (c) | 65,000 | 64,515 | |
4% 1/1/35 (c) | 140,000 | 138,819 | |
5% 1/1/26 (c) | 55,000 | 55,946 | |
| Purdue Univ. Rev. Series 2018 DD: | |||
| 5% 7/1/34 | 60,000 | 63,919 | |
| 5% 7/1/35 | 120,000 | 127,600 | |
| 5% 7/1/36 | 130,000 | 138,019 | |
| 5% 7/1/37 | 120,000 | 127,148 | |
| Saint Joseph County Econ. Dev. Auth. Rev. (St. Mary's College Proj.): | |||
| Series 2019, 5% 4/1/43 | 495,000 | 507,833 | |
| Series 2020, 4% 4/1/37 | 245,000 | 241,503 | |
TOTAL INDIANA | 9,831,408 | ||
| Iowa - 0.4% | |||
| Iowa Fin. Auth. Rev.: | |||
| Series 2019 A1, 4% 5/15/55 | 1,205,000 | 907,528 | |
| Series A: | |||
5% 5/15/43 | 70,000 | 66,947 | |
5% 5/15/48 | 710,000 | 655,991 | |
| Iowa Fin. Auth. Single Family Mtg. (Mtg.-Backed Securities Prog.) Series 2023 A, 5.25% 7/1/53 | 4,580,000 | 4,754,472 | |
| Iowa Student Ln. Liquidity Corp. Student Ln. Rev. Series 2019 B, 5% 12/1/29 (c) | 310,000 | 325,421 | |
| Tobacco Settlement Auth. Tobacco Settlement Rev.: | |||
| Series 2021 A2: | |||
4% 6/1/34 | 295,000 | 299,566 | |
4% 6/1/36 | 295,000 | 296,557 | |
4% 6/1/39 | 295,000 | 288,562 | |
5% 6/1/32 | 265,000 | 285,955 | |
| Series 2021 B1, 4% 6/1/49 | 50,000 | 49,584 | |
TOTAL IOWA | 7,930,583 | ||
| Kentucky - 2.4% | |||
| Ashland Med. Ctr. Rev. Series 2019, 3% 2/1/40 (Assured Guaranty Muni. Corp. Insured) | 655,000 | 557,702 | |
| Boyle County Edl. Facilities Rev. Series 2023 A, 5% 6/1/39 | 6,010,000 | 6,467,684 | |
| Kenton County Arpt. Board Arpt. Rev. Series 2016: | |||
| 5% 1/1/28 | 80,000 | 81,738 | |
| 5% 1/1/31 | 75,000 | 76,468 | |
| 5% 1/1/32 | 75,000 | 76,472 | |
| Kentucky Econ. Dev. Fin. Auth. Series 2019 A2, 5% 8/1/49 | 930,000 | 955,180 | |
| Kentucky Econ. Dev. Fin. Auth. Hosp. Rev. Series 2017 A, 5.25% 6/1/41 | 1,750,000 | 1,772,074 | |
| Kentucky State Property & Buildings Commission Rev. (Proj. No. 119) Series 2018: | |||
| 5% 5/1/26 | 50,000 | 51,532 | |
| 5% 5/1/29 | 275,000 | 289,719 | |
| 5% 5/1/32 | 70,000 | 74,056 | |
| 5% 5/1/33 | 55,000 | 58,202 | |
| 5% 5/1/34 | 65,000 | 68,930 | |
| 5% 5/1/35 | 40,000 | 42,189 | |
| 5% 5/1/36 | 30,000 | 31,631 | |
| Kentucky, Inc. Pub. Energy: | |||
| Bonds: | |||
Series 2024 A, 5%, tender 7/1/30 (b) | 3,015,000 | 3,160,460 | |
Series 2024 A1, 5.25%, tender 2/1/32 (b) | 5,465,000 | 5,900,198 | |
Series A, 4%, tender 6/1/26 (b) | 2,760,000 | 2,771,754 | |
| Series 2024 A1: | |||
5% 8/1/29 | 2,405,000 | 2,499,244 | |
5% 8/1/30 | 2,400,000 | 2,511,000 | |
5% 8/1/31 | 2,605,000 | 2,737,538 | |
| Louisville & Jefferson County: | |||
| Bonds: | |||
Series 2020 C, 5%, tender 10/1/26 (b) | 130,000 | 132,878 | |
Series 2020 D, 5%, tender 10/1/29 (b) | 155,000 | 165,111 | |
Series 2023 B, 5%, tender 10/1/29 (b) | 8,260,000 | 8,790,689 | |
| Series 2020 A: | |||
3% 10/1/43 | 1,950,000 | 1,526,515 | |
5% 10/1/37 | 360,000 | 377,626 | |
| Trimble County Envirl Facilities Re Bonds Series 2023, 4.7%, tender 6/1/27 (b)(c) | 9,375,000 | 9,428,899 | |
TOTAL KENTUCKY | 50,605,489 | ||
| Louisiana - 0.5% | |||
| Louisiana Hsg. Corp. Single Fami (Home Ownership Prog.) Series 2023 C, 5.75% 12/1/53 | 520,000 | 559,907 | |
| Louisiana Pub. Facilities Auth. Hosp. Rev. (Franciscan Missionaries of Our Lady Health Sys. Proj.) Series 2017 A, 5% 7/1/47 | 145,000 | 146,197 | |
| Louisiana Pub. Facilities Auth. Rev.: | |||
| (Ochsner Clinic Foundation Proj.) Series 2020 A, 4% 5/15/49 | 6,440,000 | 6,047,106 | |
| (Tulane Univ. of Louisiana Proj.) Series 2016 A: | |||
5% 12/15/28 | 100,000 | 103,531 | |
5% 12/15/29 | 70,000 | 72,441 | |
5% 12/15/30 | 140,000 | 144,791 | |
| New Orleans Aviation Board Rev.: | |||
| (North Term. Proj.): | |||
Series 2015 B: | |||
5% 1/1/29 (c) | 265,000 | 266,064 | |
5% 1/1/31 (c) | 125,000 | 125,461 | |
Series 2017 B: | |||
5% 1/1/27 (c) | 20,000 | 20,555 | |
5% 1/1/28 (c) | 10,000 | 10,233 | |
5% 1/1/32 (c) | 20,000 | 20,427 | |
5% 1/1/33 (c) | 35,000 | 35,745 | |
5% 1/1/34 (c) | 10,000 | 10,213 | |
5% 1/1/35 (c) | 20,000 | 20,424 | |
5% 1/1/37 (c) | 295,000 | 300,750 | |
| Series 2017 D2: | |||
5% 1/1/27 (c) | 25,000 | 25,694 | |
5% 1/1/28 (c) | 35,000 | 35,816 | |
5% 1/1/31 (c) | 30,000 | 30,673 | |
5% 1/1/33 (c) | 50,000 | 51,064 | |
5% 1/1/34 (c) | 60,000 | 61,277 | |
5% 1/1/36 (c) | 45,000 | 45,924 | |
5% 1/1/37 (c) | 80,000 | 81,559 | |
| St. John Baptist Parish Rev. Bonds (Marathon Oil Corp.) Series 2017, 4.05%, tender 7/1/26 (b) | 1,470,000 | 1,470,000 | |
TOTAL LOUISIANA | 9,685,852 | ||
| Maine - 0.3% | |||
| Brunswick Series 2020, 2.25% 11/1/35 | 380,000 | 313,941 | |
| City of South Portland Series 2022 C, 2.5% 7/15/32 | 1,355,000 | 1,209,848 | |
| Lewiston 52850C Series 2021: | |||
| 1.5% 2/15/34 | 1,435,000 | 1,082,961 | |
| 1.75% 2/15/40 | 1,270,000 | 836,271 | |
| Maine Health & Higher Edl. Facilities Auth. Rev.: | |||
| Series 2016 A: | |||
4% 7/1/41 | 120,000 | 104,545 | |
4% 7/1/46 | 165,000 | 135,017 | |
5% 7/1/41 | 525,000 | 511,539 | |
5% 7/1/46 | 1,400,000 | 1,305,264 | |
| Series 2017 B: | |||
4% 7/1/25 | 20,000 | 20,049 | |
4% 7/1/31 | 35,000 | 35,204 | |
4% 7/1/32 | 25,000 | 25,095 | |
4% 7/1/34 | 50,000 | 50,148 | |
5% 7/1/26 | 15,000 | 15,381 | |
5% 7/1/28 | 25,000 | 25,936 | |
5% 7/1/29 | 20,000 | 20,721 | |
5% 7/1/33 | 50,000 | 51,949 | |
5% 7/1/35 | 40,000 | 41,573 | |
| Maine Hsg. Auth. Mtg. Series 2022 E, 5% 11/15/52 | 370,000 | 379,285 | |
| Maine Tpk. Auth. Tpk. Rev. Series 2015: | |||
| 5% 7/1/32 | 55,000 | 55,766 | |
| 5% 7/1/36 | 130,000 | 131,401 | |
| 5% 7/1/38 | 35,000 | 35,268 | |
TOTAL MAINE | 6,387,162 | ||
| Maryland - 1.4% | |||
| Anne Arundel County Gen. Oblig. Series 2021: | |||
| 3% 10/1/37 | 1,710,000 | 1,569,859 | |
| 5% 4/1/28 | 1,240,000 | 1,326,728 | |
| Baltimore Proj. Rev. (Wtr. Projs.) Series 2020 A: | |||
| 4% 7/1/45 | 585,000 | 578,584 | |
| 5% 7/1/50 | 645,000 | 679,148 | |
| City of Westminster Series 2016: | |||
| 5% 11/1/27 | 130,000 | 132,784 | |
| 5% 11/1/28 | 140,000 | 143,082 | |
| 5% 11/1/29 | 145,000 | 148,389 | |
| 5% 11/1/30 | 155,000 | 158,521 | |
| Hsg. Opportunities Commission of Montgomery County Series 2021 C, 0.8% 7/1/25 | 145,000 | 139,236 | |
| Maryland Cmnty. Dev. Admin Dept. Hsg. & Cmnty. Dev.: | |||
| Series 2019 B, 4% 9/1/49 | 485,000 | 482,118 | |
| Series 2019 C, 3.5% 3/1/50 | 995,000 | 978,861 | |
| Series 2023 E, 6.25% 3/1/54 | 410,000 | 444,609 | |
| Maryland Dept. of Trans. Series 2021 B: | |||
| 4% 8/1/51 (c) | 530,000 | 490,046 | |
| 5% 8/1/46 (c) | 1,175,000 | 1,223,578 | |
| Maryland Econ. Dev. Auth. Rev. (Ports America Chesapeake LLC. Proj.) Series 2017 A: | |||
| 5% 6/1/30 | 65,000 | 67,960 | |
| 5% 6/1/35 | 100,000 | 104,518 | |
| Maryland Gen. Oblig.: | |||
| Series 2022 2C, 4% 3/1/29 | 1,260,000 | 1,313,308 | |
| Series 2022 2D, 4% 8/1/28 | 2,500,000 | 2,591,739 | |
| Maryland Health & Higher Edl.: | |||
| Bonds Series 2020, 5%, tender 7/1/25 (b) | 1,540,000 | 1,549,542 | |
| Series 2021 A: | |||
3% 7/1/46 | 3,970,000 | 3,267,278 | |
3% 7/1/51 | 1,385,000 | 1,094,663 | |
4% 6/1/55 | 200,000 | 172,730 | |
5% 6/1/29 | 55,000 | 57,075 | |
5% 6/1/33 | 130,000 | 135,970 | |
| Series 2023, 5% 7/1/26 | 600,000 | 614,176 | |
| Maryland Health & Higher Edl. Facilities Auth. Rev. Series 2016 A: | |||
| 4% 7/1/42 | 85,000 | 77,988 | |
| 5% 7/1/35 | 35,000 | 35,622 | |
| Maryland Stadium Auth. Series 2022 A: | |||
| 5% 6/1/47 | 1,935,000 | 2,057,823 | |
| 5% 6/1/52 | 455,000 | 480,764 | |
| Maryland Stadium Auth. Built to Learn Rev. Series 2021, 4% 6/1/46 | 260,000 | 253,014 | |
| Maryland Stadium Auth. Rev. Series 2018 A, 5% 5/1/33 | 1,000,000 | 1,059,568 | |
| Maryland Trans. Auth. Passenger Facility Charge Rev. Series 2012 B: | |||
| 2.5% 6/1/26 (c) | 1,940,000 | 1,856,596 | |
| 2.625% 6/1/27 (c) | 1,590,000 | 1,499,407 | |
| Prince Georges County Ctfs. of Prtn. Series 2021: | |||
| 5% 10/1/27 | 720,000 | 759,210 | |
| 5% 10/1/28 | 1,055,000 | 1,130,063 | |
TOTAL MARYLAND | 28,674,557 | ||
| Massachusetts - 4.8% | |||
| Massachusetts Bay Trans. Auth. Sales Tax Rev.: | |||
| Series 2016 A, 0% 7/1/32 | 2,230,000 | 1,688,992 | |
| Series 2021 A1, 5% 7/1/34 | 1,100,000 | 1,230,890 | |
| Massachusetts Clean Wtr. Trust Series 2023 25B: | |||
| 5% 2/1/38 | 1,200,000 | 1,374,174 | |
| 5% 2/1/39 | 1,210,000 | 1,376,039 | |
| 5% 2/1/41 | 1,000,000 | 1,126,073 | |
| 5% 2/1/43 | 1,000,000 | 1,116,986 | |
| Massachusetts Commonwealth Trans. Fund Rev.: | |||
| (Rail Enhancement Prog.) Series 2021 B, 5% 6/1/37 | 1,500,000 | 1,590,574 | |
| Series 2022 B, 5% 6/1/52 | 20,000,000 | 21,469,836 | |
| Massachusetts Dev. Fin. Agcy. Rev.: | |||
| (Lesley Univ. Proj.) Series 2016, 5% 7/1/39 | 85,000 | 85,951 | |
| (Newbridge On The Charles Proj.) Series 2017, 5% 10/1/57 (e) | 1,750,000 | 1,750,904 | |
| (Partners Healthcare Sys., Inc. Proj.): | |||
Series 2017 S: | |||
5% 7/1/30 | 195,000 | 205,925 | |
5% 7/1/34 | 215,000 | 226,522 | |
Series 2017, 4% 7/1/41 | 505,000 | 495,834 | |
| (Univ. of Massachusetts Health Cr., Inc. Proj.) Series 2017 L, 4% 7/1/44 | 50,000 | 44,835 | |
| (Wentworth Institute of Technology Proj.) Series 2017: | |||
5% 10/1/27 | 50,000 | 50,868 | |
5% 10/1/28 | 55,000 | 55,973 | |
5% 10/1/29 | 55,000 | 56,001 | |
5% 10/1/31 | 60,000 | 61,052 | |
5% 10/1/32 | 65,000 | 66,095 | |
| Series 2016: | |||
5% 10/1/29 | 50,000 | 51,369 | |
5% 10/1/30 | 75,000 | 77,021 | |
5% 7/1/31 | 85,000 | 86,712 | |
5% 10/1/31 | 80,000 | 82,120 | |
5% 10/1/43 | 440,000 | 440,576 | |
| Series 2019 A, 5% 7/1/26 | 795,000 | 798,260 | |
| Series 2019, 5% 9/1/59 | 465,000 | 483,487 | |
| Series 2020 A: | |||
4% 7/1/45 | 930,000 | 822,592 | |
5% 10/15/29 | 1,470,000 | 1,620,072 | |
| Series 2021 V, 5% 7/1/55 | 1,595,000 | 1,874,970 | |
| Series 2022, 5% 10/1/38 | 2,500,000 | 2,791,598 | |
| Series J2, 5% 7/1/53 | 2,055,000 | 2,085,682 | |
| Series M: | |||
4% 10/1/50 | 930,000 | 783,283 | |
5% 10/1/45 | 700,000 | 702,718 | |
| Massachusetts Edl. Fing. Auth. Rev.: | |||
| Series 2016, 5% 7/1/24 (c) | 410,000 | 410,000 | |
| Series 2017 A, 5% 7/1/25 (c) | 1,140,000 | 1,156,020 | |
| Series 2019 B, 5% 7/1/27 (c) | 200,000 | 205,644 | |
| Massachusetts Gen. Oblig.: | |||
| Series 2019 A, 5% 1/1/49 | 295,000 | 308,173 | |
| Series 2019 C, 5% 5/1/49 | 460,000 | 481,487 | |
| Series D, 5% 7/1/45 | 4,525,000 | 4,829,988 | |
| Series E, 5% 11/1/45 | 13,710,000 | 14,678,924 | |
| Massachusetts Hsg. Fin. Auth. Series 2021 223, 3% 6/1/47 | 730,000 | 706,151 | |
| Massachusetts Port Auth. Rev.: | |||
| Series 2016 A: | |||
5% 7/1/33 | 105,000 | 108,327 | |
5% 7/1/34 | 55,000 | 56,746 | |
5% 7/1/38 | 80,000 | 82,255 | |
| Series 2016 B, 5% 7/1/43 (c) | 435,000 | 439,982 | |
| Series 2019 A, 5% 7/1/40 (c) | 145,000 | 151,231 | |
| Series 2021 E: | |||
5% 7/1/37 (c) | 1,205,000 | 1,300,394 | |
5% 7/1/41 (c) | 2,040,000 | 2,164,646 | |
5% 7/1/46 (c) | 390,000 | 409,319 | |
5% 7/1/51 (c) | 2,645,000 | 2,751,996 | |
| Massachusetts Port Auth. Spl. Facilities Rev. (Bosfuel Proj.) Series 2019 A, 5% 7/1/49 (c) | 435,000 | 444,286 | |
| Massachusetts St Dev. Fin. Agcy. R Series 2024 B, 5% 2/15/34 | 20,000,000 | 23,580,060 | |
TOTAL MASSACHUSETTS | 101,039,613 | ||
| Michigan - 1.0% | |||
| Detroit Gen. Oblig. Series 2021 A, 5% 4/1/46 | 160,000 | 163,241 | |
| Grand Traverse County Hosp. Fin. Auth. Series 2021, 3% 7/1/51 | 605,000 | 476,539 | |
| Great Lakes Wtr. Auth. Sew Disp. Sys. Series 2018 A: | |||
| 5% 7/1/43 | 125,000 | 129,682 | |
| 5% 7/1/48 | 535,000 | 549,789 | |
| Great Lakes Wtr. Auth. Wtr. Supply Sys. Rev. Series 2023 B, 5.25% 7/1/53 | 2,750,000 | 3,024,083 | |
| Kalamazoo Hosp. Fin. Auth. Hosp. Facilities Rev. Series 2016, 5% 5/15/28 | 120,000 | 122,676 | |
| Lansing Board of Wtr. & Lt. Util. Rev. Bonds Series 2021 B, 2%, tender 7/1/26 (b) | 3,560,000 | 3,394,888 | |
| Michigan Bldg. Auth. Rev. Series 2015 I: | |||
| 5% 4/15/30 | 240,000 | 243,285 | |
| 5% 4/15/30 (Pre-Refunded to 10/15/25 @ 100) | 10,000 | 10,202 | |
| Michigan Fin. Auth. Rev.: | |||
| (Charter County of Wayne Criminal Justice Ctr. Proj.) Series 2018, 5% 11/1/43 | 155,000 | 160,251 | |
| Series 2015 MI, 5% 12/1/24 | 225,000 | 226,226 | |
| Series 2019 A, 3% 12/1/49 | 815,000 | 636,460 | |
| Series 2020 A, 4% 6/1/49 | 1,725,000 | 1,563,550 | |
| Series 2021: | |||
4% 9/1/39 | 175,000 | 171,247 | |
4% 9/1/40 | 175,000 | 169,331 | |
4% 9/1/41 | 145,000 | 139,317 | |
| Michigan Hosp. Fin. Auth. Rev. Series 2008 C: | |||
| 5% 12/1/32 | 70,000 | 73,169 | |
| 5% 12/1/32 (Pre-Refunded to 12/1/27 @ 100) | 5,000 | 5,295 | |
| Michigan Hsg. Dev. Auth. Rental Hsg. Rev. Series 2019 A1, 3.6% 10/1/60 | 4,335,000 | 3,562,590 | |
| Michigan Hsg. Dev. Auth. Single Family Mtg. Rev. Series A, 3.5% 12/1/50 | 1,190,000 | 1,168,764 | |
| Michigan State Hsg. Dev. Auth. Series 2021 A, 2.45% 10/1/46 | 1,280,000 | 889,110 | |
| Oakland Univ. Rev. Series 2019: | |||
| 5% 3/1/40 | 300,000 | 314,709 | |
| 5% 3/1/41 | 315,000 | 329,266 | |
| 5% 3/1/44 | 615,000 | 637,245 | |
| 5% 3/1/50 | 1,000,000 | 1,030,380 | |
| Portage Pub. Schools Series 2016: | |||
| 5% 11/1/30 | 145,000 | 148,789 | |
| 5% 11/1/31 | 130,000 | 133,141 | |
| 5% 11/1/36 | 15,000 | 15,293 | |
| Univ. of Michigan Rev. Series 2020 A, 4% 4/1/45 | 440,000 | 435,872 | |
| Wayne County Arpt. Auth. Rev.: | |||
| Series 2017 A: | |||
4% 12/1/33 (Assured Guaranty Muni. Corp. Insured) | 75,000 | 75,844 | |
4% 12/1/34 (Assured Guaranty Muni. Corp. Insured) | 60,000 | 60,670 | |
4% 12/1/35 (Assured Guaranty Muni. Corp. Insured) | 60,000 | 60,622 | |
4% 12/1/36 (Assured Guaranty Muni. Corp. Insured) | 65,000 | 65,625 | |
5% 12/1/31 | 20,000 | 20,962 | |
5% 12/1/32 | 20,000 | 20,961 | |
5% 12/1/34 | 35,000 | 36,620 | |
5% 12/1/35 | 30,000 | 31,364 | |
5% 12/1/37 | 20,000 | 20,828 | |
| Series 2017 B: | |||
5% 12/1/29 (c) | 30,000 | 30,989 | |
5% 12/1/30 (c) | 35,000 | 36,052 | |
5% 12/1/31 (c) | 40,000 | 41,144 | |
5% 12/1/32 (c) | 25,000 | 25,834 | |
5% 12/1/32 (c) | 30,000 | 30,856 | |
5% 12/1/34 (c) | 30,000 | 30,998 | |
5% 12/1/35 (c) | 30,000 | 30,974 | |
5% 12/1/37 (c) | 45,000 | 46,309 | |
5% 12/1/42 (c) | 50,000 | 50,887 | |
| Series 2018 B, 5% 12/1/48 (c) | 295,000 | 299,437 | |
| Series 2018 D, 5% 12/1/29 (c) | 235,000 | 245,992 | |
TOTAL MICHIGAN | 21,187,358 | ||
| Minnesota - 1.2% | |||
| Maple Grove Health Care Sys. Rev.: | |||
| Series 2015, 5% 9/1/29 | 140,000 | 141,358 | |
| Series 2017, 5% 5/1/25 | 40,000 | 40,250 | |
| Minneapolis Multi-family Rev. (Gateway Northeast Proj.) Series 2019, 2.46% 1/1/38 | 1,082,777 | 859,782 | |
| Minnesota Agric. & Econ. Dev. Board Rev. Series 2024, 5.25% 1/1/54 | 7,700,000 | 8,305,025 | |
| Minnesota Higher Ed. Facilities Auth. Rev. Series 2018 A: | |||
| 5% 10/1/30 | 40,000 | 41,374 | |
| 5% 10/1/45 | 85,000 | 85,298 | |
| Minnesota Hsg. Fin. Agcy.: | |||
| Series 2022 M, 6% 1/1/53 | 7,065,000 | 7,488,732 | |
| Series 2023 E, 6.25% 7/1/54 | 370,000 | 401,551 | |
| Series 2023 F, 5.75% 7/1/53 | 310,000 | 328,464 | |
| Minnesota Office of Higher Ed. Series 2023: | |||
| 5% 11/1/27 (c) | 1,125,000 | 1,152,321 | |
| 5% 11/1/28 (c) | 1,400,000 | 1,442,621 | |
| 5% 11/1/29 (c) | 2,000,000 | 2,091,012 | |
| Moorhead Edl. Facilities Rev. (The Concordia College Corp. Proj.) Series 2016, 5% 12/1/25 | 30,000 | 30,000 | |
| Sauk Rapids Minn Independent School District # 47 Series 2020 A: | |||
| 2.5% 2/1/37 | 2,785,000 | 2,317,420 | |
| 2.5% 2/1/38 | 1,000,000 | 811,788 | |
| Shakopee Sr. Hsg. Rev. Bonds Series 2018, 5.85%, tender 11/1/25 (b)(e) | 370,000 | 362,344 | |
TOTAL MINNESOTA | 25,899,340 | ||
| Mississippi - 0.1% | |||
| Mississippi Bus. finance Corp. Exempt Facilities Rev. Bonds (Enviva, Inc. Proj.) Series 2022, 7.75%, tender 7/15/32 (b)(c) | 1,743,701 | 836,977 | |
| Mississippi Home Corp. Series 2021 B: | |||
| 3% 6/1/51 | 330,000 | 318,759 | |
| 5% 6/1/27 | 210,000 | 218,526 | |
TOTAL MISSISSIPPI | 1,374,262 | ||
| Missouri - 0.2% | |||
| Cape Girardeau County Indl. Dev. Auth.: | |||
| (Southeast Hosp. Proj.) Series 2017 A: | |||
5% 3/1/30 | 35,000 | 36,116 | |
5% 3/1/31 | 80,000 | 82,316 | |
5% 3/1/36 | 155,000 | 158,860 | |
| Series 2021, 4% 3/1/46 | 650,000 | 620,082 | |
| Kansas City Indl. Dev. Auth. (Kansas City Int'l. Arpt. Term. Modernization Proj.) Series 2019 B, 5% 3/1/38 (c) | 145,000 | 150,555 | |
| Missouri Health & Edl. Facilities Rev. Series 2015 B: | |||
| 3.125% 2/1/27 | 50,000 | 49,261 | |
| 3.25% 2/1/28 | 50,000 | 49,428 | |
| 5% 2/1/29 | 65,000 | 65,737 | |
| 5% 2/1/31 | 130,000 | 131,433 | |
| 5% 2/1/33 | 145,000 | 146,396 | |
| 5% 2/1/36 | 135,000 | 136,386 | |
| Missouri Hsg. Dev. Commission Single Family Mtg. Rev.: | |||
| (First Place Homeownership Ln. Prog.): | |||
Series 2021 C, 3.25% 11/1/52 | 380,000 | 369,040 | |
Series 2023 E, 6.5% 5/1/54 | 940,000 | 1,050,566 | |
| Series 2019, 4% 5/1/50 | 30,000 | 29,809 | |
| Series 2021 A, 3% 5/1/52 | 635,000 | 613,207 | |
| Saint Louis County Indl. Dev. Auth. Sr. Living Facilities Rev. Series 2018 A: | |||
| 5.125% 9/1/48 | 75,000 | 73,719 | |
| 5.25% 9/1/53 | 1,335,000 | 1,317,235 | |
TOTAL MISSOURI | 5,080,146 | ||
| Montana - 0.2% | |||
| Montana Board Hsg. Single Family: | |||
| Series 2017 B, 4% 12/1/48 (c) | 5,000 | 4,978 | |
| Series 2019 B, 4% 6/1/50 | 20,000 | 19,871 | |
| Series 2022 C, 6% 6/1/53 | 2,125,000 | 2,254,810 | |
| Montana Facility Fin. Auth. Series 2021 A, 3% 6/1/50 | 2,510,000 | 1,997,561 | |
TOTAL MONTANA | 4,277,220 | ||
| Nebraska - 0.7% | |||
| Central Plains Energy Proj. Rev. Bonds: | |||
| (Proj. No. 4) Series 2023 A1, 5%, tender 11/1/29 (b) | 5,025,000 | 5,293,114 | |
| Series 2019, 4%, tender 8/1/25 (b) | 6,790,000 | 6,797,079 | |
| Douglas County Neb Edl. Facilities Rev.: | |||
| (Creighton Univ. Proj.) Series 2017: | |||
4% 7/1/34 | 50,000 | 50,572 | |
5% 7/1/36 | 35,000 | 36,404 | |
| (Creighton Univ. Projs.) Series 2021 A, 3% 7/1/51 | 440,000 | 329,509 | |
| Nebraska Invt. Fin. Auth. Single Family Hsg. Rev.: | |||
| Series 2019 B, 4% 9/1/49 (c) | 75,000 | 73,861 | |
| Series 2019 E, 3.75% 9/1/49 (c) | 80,000 | 78,821 | |
| Series 2020 A, 3.5% 9/1/50 | 1,315,000 | 1,291,302 | |
| Nebraska Pub. Pwr. District Rev. Series 2016 B: | |||
| 5% 1/1/37 | 125,000 | 126,722 | |
| 5% 1/1/40 | 55,000 | 55,566 | |
| Omaha Arpt. Auth. Arpt. Rev. Series 2017 A: | |||
| 5% 12/15/25 (c) | 15,000 | 15,292 | |
| 5% 12/15/25 (Escrowed to Maturity) (c) | 5,000 | 5,094 | |
| 5% 12/15/26 (c) | 40,000 | 41,362 | |
| 5% 12/15/26 (Escrowed to Maturity) (c) | 35,000 | 36,154 | |
| 5% 12/15/27 (c) | 30,000 | 30,706 | |
| 5% 12/15/27 (Pre-Refunded to 12/15/26 @ 100) (c) | 20,000 | 20,660 | |
| 5% 12/15/30 (c) | 40,000 | 41,050 | |
| 5% 12/15/30 (Pre-Refunded to 12/15/26 @ 100) (c) | 35,000 | 36,154 | |
| 5% 12/15/31 (c) | 20,000 | 20,513 | |
| 5% 12/15/31 (Pre-Refunded to 12/15/26 @ 100) (c) | 20,000 | 20,660 | |
| 5% 12/15/33 (c) | 20,000 | 20,465 | |
| 5% 12/15/33 (Pre-Refunded to 12/15/26 @ 100) (c) | 20,000 | 20,660 | |
| 5% 12/15/35 (c) | 55,000 | 56,112 | |
| 5% 12/15/35 (Pre-Refunded to 12/15/26 @ 100) (c) | 45,000 | 46,484 | |
| 5% 12/15/36 (c) | 15,000 | 15,288 | |
| 5% 12/15/36 (Pre-Refunded to 12/15/26 @ 100) (c) | 10,000 | 10,330 | |
TOTAL NEBRASKA | 14,569,934 | ||
| Nevada - 0.1% | |||
| Clark County Arpt. Rev.: | |||
| Series 2014 A2, 5% 7/1/30 | 140,000 | 140,000 | |
| Series 2019 A, 5% 7/1/26 | 570,000 | 589,037 | |
| Nevada Hsg. Division Single Family Mtg. Rev.: | |||
| Series 2019 B, 4% 10/1/49 | 45,000 | 44,722 | |
| Series 2021 B, 3% 10/1/51 | 2,200,000 | 2,113,983 | |
TOTAL NEVADA | 2,887,742 | ||
| New Hampshire - 0.7% | |||
| Nat'l. Fin. Auth. Hosp. Rev. (St. Luke's Univ. Health Network Proj.) Series 2021 B: | |||
| 3% 8/15/51 (Assured Guaranty Muni. Corp. Insured) | 780,000 | 613,862 | |
| 5% 8/15/26 | 190,000 | 195,623 | |
| Nat'l. Fin. Auth. Rev. (Presbyterian Sr. Living Proj.) Series 2023 A, 5.25% 7/1/48 | 520,000 | 544,892 | |
| Nat'l. Finnance Auth.: | |||
| Series 2020 1, 4.125% 1/20/34 | 413,233 | 405,408 | |
| Series 2023 2A, 3.875% 1/20/38 | 3,548,629 | 3,342,365 | |
| New Hampshire Health & Ed. Facilities Auth.: | |||
| (Dartmouth-Hitchcock Oblgtd Grp Proj.) Series 2018 A: | |||
5% 8/1/28 | 60,000 | 62,985 | |
5% 8/1/29 | 55,000 | 57,508 | |
5% 8/1/30 | 50,000 | 52,139 | |
| (Partners Healthcare Sys., Inc. Proj.) Series 2017: | |||
5% 7/1/30 | 130,000 | 137,283 | |
5% 7/1/32 | 195,000 | 205,716 | |
5% 7/1/33 | 175,000 | 184,302 | |
5% 7/1/34 | 270,000 | 284,470 | |
5% 7/1/35 | 285,000 | 300,452 | |
5% 7/1/36 | 300,000 | 315,731 | |
5% 7/1/37 | 260,000 | 272,886 | |
| Series 2017, 5% 7/1/44 | 665,000 | 617,992 | |
| Series 2023 B, 5% 11/1/43 (c) | 1,205,000 | 1,254,596 | |
| New Hampshire Health & Ed. Facilities Auth. Rev.: | |||
| Series 2012: | |||
4% 7/1/32 | 140,000 | 135,380 | |
5% 7/1/24 | 50,000 | 50,000 | |
5% 7/1/25 | 60,000 | 60,000 | |
5% 7/1/27 | 25,000 | 24,986 | |
| Series 2016: | |||
4% 10/1/38 | 120,000 | 113,772 | |
5% 10/1/24 | 105,000 | 105,211 | |
5% 10/1/25 | 105,000 | 106,547 | |
5% 10/1/29 | 340,000 | 346,657 | |
5% 10/1/31 | 265,000 | 270,015 | |
5% 10/1/33 | 205,000 | 208,643 | |
| New Hampshire Nat'l. Fin. Auth. Series 2022 2, 4% 10/20/36 | 2,375,394 | 2,287,408 | |
| New Hampshire St Hsg. Fin. Series 2023 4: | |||
| 3.625% 4/1/26 | 415,000 | 416,898 | |
| 3.7% 1/1/27 | 1,335,000 | 1,339,330 | |
TOTAL NEW HAMPSHIRE | 14,313,057 | ||
| New Jersey - 7.2% | |||
| Atlantic County Impt. Auth. (Atlantic City Campus Proj.) Series 2016 A: | |||
| 5% 7/1/28 (Assured Guaranty Muni. Corp. Insured) | 55,000 | 56,683 | |
| 5% 7/1/30 (Assured Guaranty Muni. Corp. Insured) | 130,000 | 133,698 | |
| 5% 7/1/32 (Assured Guaranty Muni. Corp. Insured) | 65,000 | 66,758 | |
| 5% 7/1/33 (Assured Guaranty Muni. Corp. Insured) | 65,000 | 66,717 | |
| New Jersey Econ. Dev. Auth.: | |||
| (White Horse HMT Urban Renewal LLC Proj.) Series 2020, 5% 1/1/40 (e) | 100,000 | 68,377 | |
| Series 2015, 5.25% 6/15/27 | 400,000 | 405,165 | |
| Series 2020 A, 4% 11/1/44 | 1,015,000 | 997,127 | |
| Series 2023 RRR, 5% 3/1/25 | 3,750,000 | 3,782,103 | |
| Series A: | |||
5% 11/1/31 | 665,000 | 716,124 | |
5% 11/1/36 | 745,000 | 798,743 | |
| Series QQQ: | |||
4% 6/15/46 | 850,000 | 830,833 | |
4% 6/15/50 | 4,215,000 | 4,026,217 | |
| New Jersey Econ. Dev. Auth. Rev.: | |||
| (Black Horse EHT Urban Renewal LLC Proj.) Series 2019 A, 5% 10/1/39 (e) | 100,000 | 72,715 | |
| Series LLL, 5% 6/15/44 | 335,000 | 350,561 | |
| New Jersey Econ. Dev. Auth. Wtr. Facilities Rev. Bonds (New Jersey- American Wtr. Co., INC. Proj.) Series 2020 B, 3.75%, tender 6/1/28 (b)(c) | 6,160,000 | 6,077,531 | |
| New Jersey Edl. Facility Series 2016 A: | |||
| 5% 7/1/31 | 105,000 | 107,298 | |
| 5% 7/1/32 | 120,000 | 122,553 | |
| New Jersey Gen. Oblig.: | |||
| Series 2020 A: | |||
5% 6/1/26 | 4,305,000 | 4,448,183 | |
5% 6/1/29 | 325,000 | 352,708 | |
| Series 2021, 2% 6/1/36 | 525,000 | 402,046 | |
| New Jersey Health Care Facilities Fing. Auth. Rev.: | |||
| Series 2016 A: | |||
5% 7/1/27 | 40,000 | 41,156 | |
5% 7/1/28 | 20,000 | 20,559 | |
5% 7/1/28 (Pre-Refunded to 7/1/26 @ 100) | 2,730,000 | 2,807,295 | |
5% 7/1/29 (Pre-Refunded to 7/1/26 @ 100) | 35,000 | 36,025 | |
5% 7/1/30 | 50,000 | 51,337 | |
| Series 2016: | |||
4% 7/1/48 | 1,610,000 | 1,444,853 | |
5% 7/1/41 | 185,000 | 185,522 | |
| Series 2021, 3% 7/1/39 | 590,000 | 528,216 | |
| New Jersey Higher Ed. Student Assistance Auth. Student Ln. Rev.: | |||
| Series 2016 1A, 5% 12/1/25 (c) | 1,000,000 | 1,015,591 | |
| Series 2017 1A: | |||
5% 12/1/24 (c) | 2,600,000 | 2,613,092 | |
5% 12/1/25 (c) | 2,500,000 | 2,538,977 | |
5% 12/1/26 (c) | 1,970,000 | 2,011,476 | |
| Series 2018 B: | |||
5% 12/1/25 (c) | 215,000 | 218,352 | |
5% 12/1/26 (c) | 305,000 | 311,421 | |
5% 12/1/27 (c) | 750,000 | 772,101 | |
5% 12/1/28 (c) | 1,000,000 | 1,030,155 | |
| Series 2019 A, 5% 12/1/25 | 95,000 | 96,942 | |
| Series 2020: | |||
5% 12/1/24 (c) | 425,000 | 427,140 | |
5% 12/1/24 (c) | 205,000 | 206,032 | |
5% 12/1/27 (c) | 165,000 | 169,862 | |
5% 12/1/28 (c) | 295,000 | 305,169 | |
| Series 2022 A: | |||
5% 12/1/25 (c) | 550,000 | 558,575 | |
5% 12/1/26 (c) | 205,000 | 209,316 | |
| Series 2022 B, 5% 12/1/26 (c) | 2,100,000 | 2,144,213 | |
| Series 2023 A, 5% 12/1/31 (c) | 2,375,000 | 2,523,761 | |
| Series 2023 B, 5% 12/1/31 (c) | 7,590,000 | 8,065,407 | |
| New Jersey Hsg. & Mtg. Fin. Agcy. Multi-family Rev. Series 2023 C: | |||
| 5% 5/1/26 (c) | 1,675,000 | 1,686,885 | |
| 5% 5/1/27 (c) | 1,765,000 | 1,779,684 | |
| 5% 11/1/27 (c) | 1,795,000 | 1,812,805 | |
| 5% 5/1/28 (c) | 1,835,000 | 1,853,769 | |
| New Jersey Tobacco Settlement Fing. Corp.: | |||
| Series 2018 A, 5.25% 6/1/46 | 3,225,000 | 3,334,236 | |
| Series 2018 B, 5% 6/1/46 | 5,765,000 | 5,817,735 | |
| New Jersey Tpk. Auth. Tpk. Rev.: | |||
| Series 2015 E, 5% 1/1/34 | 235,000 | 236,245 | |
| Series 2022 B, 5% 1/1/46 | 7,000,000 | 7,609,679 | |
| Series 2024 C: | |||
5% 1/1/42 (i) | 1,915,000 | 2,113,871 | |
5% 1/1/43 (i) | 2,015,000 | 2,214,158 | |
5% 1/1/44 (i) | 2,685,000 | 2,940,317 | |
5% 1/1/45 (i) | 2,395,000 | 2,613,927 | |
| Series 2024, 5% 1/1/30 (i) | 2,380,000 | 2,617,453 | |
| Series D, 5% 1/1/28 | 245,000 | 250,907 | |
| New Jersey Trans. Trust Fund Auth.: | |||
| (Trans. Prog.) Series 2019 AA, 5.25% 6/15/43 | 1,460,000 | 1,524,925 | |
| Series 2006 C: | |||
0% 12/15/25 | 2,500,000 | 2,370,429 | |
0% 12/15/30 (FGIC Insured) | 2,420,000 | 1,900,635 | |
0% 12/15/33 (Assured Guaranty Muni. Corp. Insured) | 1,650,000 | 1,159,546 | |
0% 12/15/36 (AMBAC Insured) | 3,000,000 | 1,856,869 | |
| Series 2010 A: | |||
0% 12/15/27 | 690,000 | 607,030 | |
0% 12/15/36 | 5,000,000 | 3,094,781 | |
| Series 2014 BB2, 5% 6/15/33 | 1,280,000 | 1,411,777 | |
| Series 2016 A: | |||
5% 6/15/27 | 135,000 | 138,540 | |
5% 6/15/29 | 115,000 | 117,958 | |
| Series 2018 A, 5% 12/15/34 | 195,000 | 206,035 | |
| Series 2019 BB, 4% 6/15/50 | 3,540,000 | 3,370,788 | |
| Series 2021 A: | |||
4% 6/15/34 | 170,000 | 173,857 | |
5% 6/15/32 | 360,000 | 397,345 | |
| Series 2022 A: | |||
4% 6/15/40 | 220,000 | 219,420 | |
4% 6/15/41 | 945,000 | 935,591 | |
| Series 2022 AA: | |||
5% 6/15/29 | 295,000 | 317,681 | |
5% 6/15/30 | 1,625,000 | 1,772,624 | |
5% 6/15/33 | 380,000 | 424,044 | |
| Series 2022 BB: | |||
4% 6/15/46 | 1,750,000 | 1,705,614 | |
4% 6/15/50 | 1,205,000 | 1,147,401 | |
| Series 2023 BB, 5.25% 6/15/50 | 25,000,000 | 27,321,220 | |
| Series AA: | |||
4% 6/15/36 | 280,000 | 283,487 | |
4% 6/15/45 | 2,510,000 | 2,428,672 | |
4% 6/15/50 | 3,210,000 | 3,056,562 | |
5% 6/15/38 | 315,000 | 340,664 | |
| Series BB, 5% 6/15/33 | 1,265,000 | 1,336,783 | |
| South Jersey Trans. Auth. Trans. Sys. Rev. Series 2022 A, 5% 11/1/39 | 750,000 | 804,333 | |
TOTAL NEW JERSEY | 151,520,967 | ||
| New Mexico - 1.1% | |||
| New Mexico Edl. Assistance Foundation Series 2021 1A: | |||
| 5% 9/1/24 (c) | 295,000 | 295,439 | |
| 5% 9/1/26 (c) | 945,000 | 964,231 | |
| 5% 9/1/27 (c) | 445,000 | 457,074 | |
| 5% 9/1/29 (c) | 175,000 | 183,285 | |
| New Mexico Mtg. Fin. Auth.: | |||
| Series 2019 D, 3.75% 1/1/50 | 75,000 | 74,101 | |
| Series 2021 C, 3% 1/1/52 | 1,955,000 | 1,885,501 | |
| Series 2021 D, 3% 7/1/52 | 9,410,000 | 9,051,238 | |
| Series 2023 C, I 5.75% 3/1/54 | 1,045,000 | 1,114,250 | |
| Series 2023, 6.5% 9/1/54 | 7,465,000 | 8,201,634 | |
| Santa Fe Retirement Fac. Series 2019 A: | |||
| 5% 5/15/34 | 20,000 | 20,171 | |
| 5% 5/15/39 | 15,000 | 14,875 | |
| 5% 5/15/44 | 15,000 | 14,326 | |
| 5% 5/15/49 | 30,000 | 27,711 | |
TOTAL NEW MEXICO | 22,303,836 | ||
| New York - 7.5% | |||
| Dorm. Auth. New York Univ. Rev.: | |||
| (Fordham Univ. Proj.) Series 2017: | |||
4% 7/1/33 | 65,000 | 65,756 | |
4% 7/1/34 | 65,000 | 65,762 | |
| Series 2017: | |||
5% 12/1/24 (e) | 100,000 | 99,842 | |
5% 12/1/25 (e) | 100,000 | 99,637 | |
| Long Island Pwr. Auth. Elec. Sys. Rev. Bonds Series 2021 B, 1.5%, tender 9/1/26 (b) | 630,000 | 592,984 | |
| MTA Hudson Rail Yards Trust Oblig. Series 2016 A, 5% 11/15/56 | 1,300,000 | 1,299,974 | |
| New York City Edl. Construction Fund Series 2021 B, 5% 4/1/46 | 760,000 | 812,440 | |
| New York City Gen. Oblig.: | |||
| Bonds Series 2015 F4, 5%, tender 12/1/25 (j) | 500,000 | 505,544 | |
| Series 2016 E, 5% 8/1/28 | 220,000 | 227,190 | |
| Series 2023 C, 5% 8/1/25 | 3,000,000 | 3,054,722 | |
| Series 2023 D, 5% 8/1/25 | 2,000,000 | 2,036,481 | |
| Series A, 5% 8/1/26 | 295,000 | 305,842 | |
| New York City Hsg. Dev. Corp. Multifamily Hsg.: | |||
| Bonds: | |||
Series 2021 C2, 0.7%, tender 7/1/25 (b) | 220,000 | 211,526 | |
Series 2021 K2, 0.9%, tender 1/1/26 (b) | 2,435,000 | 2,294,902 | |
Series 2021, 0.6%, tender 7/1/25 (b) | 490,000 | 473,067 | |
Series 2022 F 2B, 3.4%, tender 12/22/26 (b) | 4,100,000 | 4,037,915 | |
Series 2023 A2: | |||
3.7%, tender 12/30/27 (b) | 2,045,000 | 2,041,848 | |
3.73%, tender 12/29/28 (b) | 2,280,000 | 2,284,091 | |
Series 2023 D, 4.3%, tender 11/1/28 (b) | 1,635,000 | 1,666,069 | |
| Series 2019 J, 3.05% 11/1/49 | 650,000 | 503,134 | |
| New York City Muni. Wtr. Fin. Auth. Wtr. & Swr. Sys. Rev.: | |||
| Series 2022 EE, 5% 6/15/45 | 3,785,000 | 4,111,457 | |
| Series 2024 BB2, 5.25% 6/15/47 | 10,515,000 | 11,714,358 | |
| Series GG 1, 5% 6/15/48 | 5,265,000 | 5,581,689 | |
| New York City Transitional Fin. Auth. Series 2024: | |||
| 5% 11/1/30 | 7,000,000 | 7,796,965 | |
| 5% 11/1/32 | 5,005,000 | 5,715,277 | |
| New York City Transitional Fin. Auth. Bldg. Aid Rev. Series 2015 S2, 5% 7/15/35 | 90,000 | 91,411 | |
| New York City Transitional Fin. Auth. Rev.: | |||
| Series 2018 A2, 5% 8/1/39 | 585,000 | 605,713 | |
| Series 2018 B, 5% 8/1/45 | 1,860,000 | 1,910,322 | |
| New York City Trust Cultural Resources Rev. Series 2021, 5% 7/1/31 | 1,000,000 | 1,120,293 | |
| New York Dorm. Auth. Rev.: | |||
| Series 2022 A: | |||
5% 7/15/37 | 120,000 | 125,102 | |
5% 7/15/42 | 340,000 | 346,680 | |
5% 7/15/50 | 880,000 | 881,932 | |
| Series 2022: | |||
4% 7/1/36 | 445,000 | 456,208 | |
4% 7/1/38 | 140,000 | 142,423 | |
4% 7/1/40 | 235,000 | 236,841 | |
5% 7/1/34 | 295,000 | 328,345 | |
5% 7/1/35 | 295,000 | 326,954 | |
5% 7/1/37 | 485,000 | 535,051 | |
5% 7/1/39 | 145,000 | 158,481 | |
5% 7/1/41 | 260,000 | 281,343 | |
5% 7/1/57 | 3,730,000 | 3,615,068 | |
| New York Metropolitan Trans. Auth. Rev.: | |||
| Series 2015 A1: | |||
5% 11/15/29 | 145,000 | 146,480 | |
5% 11/15/45 | 375,000 | 378,008 | |
| Series 2017 C1, 5% 11/15/30 | 990,000 | 1,048,219 | |
| Series 2017 D, 5% 11/15/30 | 2,120,000 | 2,244,671 | |
| Series 2020 D, 4% 11/15/46 | 3,440,000 | 3,336,076 | |
| Series 2024 A: | |||
5% 11/15/32 | 10,555,000 | 11,731,071 | |
5.25% 11/15/49 | 2,915,000 | 3,172,971 | |
| New York State Dorm. Auth.: | |||
| Series 2018 A, 5.25% 3/15/38 | 585,000 | 628,209 | |
| Series 2019 D, 3% 2/15/49 | 4,140,000 | 3,189,863 | |
| Series 2021 A, 4% 3/15/39 | 9,000,000 | 9,018,071 | |
| Series 2021 E, 3% 3/15/50 | 675,000 | 516,776 | |
| Series 2022 A, 5% 3/15/41 | 295,000 | 325,255 | |
| New York State Hsg. Fin. Agcy. Rev.: | |||
| Bonds: | |||
Series 2021 J2: | |||
1%, tender 11/1/26 (b) | 355,000 | 327,877 | |
1.1%, tender 5/1/27 (b) | 1,310,000 | 1,182,860 | |
Series 2023 C2, 3.8%, tender 5/1/29 (b) | 6,565,000 | 6,573,366 | |
Series 2023 E2, 3.8%, tender 5/1/27 (b) | 1,335,000 | 1,337,714 | |
| Series J, 0.75% 5/1/25 | 210,000 | 203,162 | |
| New York State Mtg. Agcy. Homeowner Mtg.: | |||
| Series 2020 226, 1.8% 4/1/28 (c) | 1,000,000 | 895,866 | |
| Series 221, 3.5% 10/1/32 (c) | 45,000 | 43,889 | |
| New York State Urban Dev. Corp.: | |||
| Series 2020 A, 3% 3/15/50 | 7,910,000 | 6,078,319 | |
| Series 2020 E: | |||
3% 3/15/48 | 8,915,000 | 6,947,832 | |
3% 3/15/50 | 955,000 | 733,855 | |
| Series 2022 A, 5% 3/15/40 | 12,000,000 | 13,353,124 | |
| New York State Urban Eev Corp. Series 2019 A: | |||
| 3% 3/15/49 | 1,000,000 | 777,008 | |
| 5% 3/15/37 | 1,315,000 | 1,427,468 | |
| New York Trans. Dev. Corp.: | |||
| (Delta Air Lines, Inc. - Laguardia Arpt. Terminals C&D Redev. Proj.) Series 2020, 5% 10/1/40 (c) | 1,705,000 | 1,773,902 | |
| (Laguardia Arpt. Term. Redev. Proj.) Series 2016 A, 5% 7/1/41 (c) | 215,000 | 215,001 | |
| (Term. 4 John F. Kennedy Int'l. Arpt. Proj.) Series 2022: | |||
5% 12/1/32 (c) | 415,000 | 447,624 | |
5% 12/1/33 (c) | 640,000 | 690,282 | |
5% 12/1/34 (c) | 700,000 | 753,280 | |
5% 12/1/35 (c) | 350,000 | 376,003 | |
5% 12/1/36 (c) | 240,000 | 257,054 | |
5% 12/1/37 (c) | 635,000 | 677,274 | |
5% 12/1/38 (c) | 1,550,000 | 1,644,703 | |
5% 12/1/39 (c) | 1,185,000 | 1,253,338 | |
5% 12/1/40 (c) | 1,000,000 | 1,051,793 | |
5% 12/1/41 (c) | 910,000 | 953,276 | |
5% 12/1/42 (c) | 455,000 | 474,881 | |
| New York Urban Dev. Corp. Rev. Gen. Oblig. (New York State Gen. Oblig. Proj.) Series 2017 A, 5% 3/15/32 | 275,000 | 285,865 | |
| Niagara Area Dev. Corp. Rev. (Catholic Health Sys., Inc. Proj.) Series 2022, 4.5% 7/1/52 | 600,000 | 457,475 | |
| Onondaga Civic Dev. Corp. (Le Moyne College Proj.) Series 2018, 5% 1/1/43 | 50,000 | 50,216 | |
| Schenectady County Cap. Resources Corp. Rev. (Union College Proj.) Series 2017, 5% 1/1/40 | 785,000 | 806,877 | |
| Suffolk County Econ. Dev. Corp. Rev. Series 2021: | |||
| 4.625% 11/1/31 (e) | 100,000 | 92,828 | |
| 5.375% 11/1/54 (e) | 260,000 | 215,812 | |
TOTAL NEW YORK | 156,856,133 | ||
| New York And New Jersey - 0.6% | |||
| Port Auth. of New York & New Jersey: | |||
| Series 2021 227, 2% 10/1/34 (c) | 2,390,000 | 1,832,035 | |
| Series 2022 236, 5% 1/15/47 (c) | 10,480,000 | 11,028,306 | |
TOTAL NEW YORK AND NEW JERSEY | 12,860,341 | ||
| North Carolina - 1.4% | |||
| Charlotte Int'l. Arpt. Rev.: | |||
| Series 2017 A: | |||
5% 7/1/30 | 80,000 | 83,988 | |
5% 7/1/33 | 75,000 | 78,620 | |
5% 7/1/37 | 180,000 | 188,182 | |
| Series 2017 B: | |||
5% 7/1/25 (c) | 5,000 | 5,066 | |
5% 7/1/26 (c) | 5,000 | 5,131 | |
5% 7/1/27 (c) | 10,000 | 10,343 | |
5% 7/1/28 (c) | 10,000 | 10,320 | |
5% 7/1/29 (c) | 10,000 | 10,338 | |
5% 7/1/30 (c) | 15,000 | 15,518 | |
5% 7/1/31 (c) | 25,000 | 25,820 | |
5% 7/1/32 (c) | 25,000 | 25,819 | |
5% 7/1/33 (c) | 25,000 | 25,817 | |
5% 7/1/34 (c) | 30,000 | 30,982 | |
5% 7/1/35 (c) | 20,000 | 20,648 | |
5% 7/1/36 (c) | 15,000 | 15,468 | |
5% 7/1/37 (c) | 20,000 | 20,598 | |
5% 7/1/42 (c) | 60,000 | 61,216 | |
| Series 2017 C, 4% 7/1/32 | 75,000 | 75,901 | |
| Charlotte-Mecklenburg Hosp. Auth. Health Care Sys. Rev. Bonds Series 2018 C, 3.45%, tender 10/31/25 (b) | 2,620,000 | 2,614,530 | |
| New Hanover County Hosp. Rev. Series 2017, 5% 10/1/27 (Escrowed to Maturity) | 20,000 | 21,025 | |
| North Carolina Hsg. Fin. Agcy. Home Ownership Rev.: | |||
| Series 2020 45, 3% 7/1/51 | 6,710,000 | 6,508,175 | |
| Series 2023 52A, 6.25% 1/1/55 | 825,000 | 894,971 | |
| North Carolina Med. Care Commission Health Care Facilities Rev.: | |||
| Bonds Series 2019 C, 2.55%, tender 6/1/26 (b) | 875,000 | 856,125 | |
| Series 2020 A, 3% 7/1/45 | 565,000 | 444,369 | |
| North Carolina State Ed. Assistance Auth. Student Ln. Rev. Series 2023 A, 5% 6/1/43 (c) | 425,000 | 424,250 | |
| North Carolina Tpk. Auth. Triangle Expressway Sys. Series 2024 B, 5% 1/1/54 (Assured Guaranty Muni. Corp. Insured) | 16,075,000 | 17,027,088 | |
TOTAL NORTH CAROLINA | 29,500,308 | ||
| North Dakota - 0.4% | |||
| Grand Forks Health Care Sys. Rev. Series 2021: | |||
| 4% 12/1/35 | 530,000 | 501,387 | |
| 4% 12/1/36 | 545,000 | 516,441 | |
| 4% 12/1/37 | 405,000 | 382,495 | |
| 4% 12/1/38 | 365,000 | 340,535 | |
| 5% 12/1/33 | 550,000 | 567,658 | |
| 5% 12/1/34 | 660,000 | 681,065 | |
| North Dakota Hsg. Fin. Agcy.: | |||
| Series 2019 C, 3.2% 7/1/39 | 2,765,000 | 2,433,169 | |
| Series 2021 A, 3% 1/1/52 | 205,000 | 198,664 | |
| Series 2021 B, 3% 7/1/52 | 685,000 | 658,269 | |
| Series 2022, 5% 1/1/53 | 905,000 | 927,668 | |
| Series 2023 F, 6.25% 1/1/54 | 300,000 | 325,789 | |
| Univ. of North Dakota Series 2021 A, 3% 6/1/61 (Assured Guaranty Muni. Corp. Insured) | 1,345,000 | 936,761 | |
TOTAL NORTH DAKOTA | 8,469,901 | ||
| Ohio - 1.9% | |||
| Akron Bath Copley Hosp. District Rev. Series 2016, 5.25% 11/15/46 | 715,000 | 723,908 | |
| Allen County Hosp. Facilities Rev.: | |||
| (Mercy Health) Series 2017 A: | |||
5% 8/1/25 | 150,000 | 152,223 | |
5% 8/1/26 | 100,000 | 103,104 | |
5% 8/1/27 | 125,000 | 130,966 | |
5% 8/1/28 | 145,000 | 153,166 | |
5% 8/1/29 | 265,000 | 278,812 | |
5% 8/1/30 | 215,000 | 226,336 | |
| Series 2020 A, 4% 12/1/40 | 1,175,000 | 1,149,619 | |
| American Muni. Pwr., Inc. Rev.: | |||
| (Greenup Hydroelectric Proj.) Series 2016, 5% 2/15/46 | 320,000 | 323,258 | |
| Series 2023 A: | |||
5% 2/15/28 | 2,535,000 | 2,684,443 | |
5% 2/15/29 | 3,195,000 | 3,432,204 | |
5% 2/15/30 | 1,275,000 | 1,387,642 | |
5% 2/15/31 | 1,055,000 | 1,160,843 | |
5% 2/15/32 | 1,400,000 | 1,559,411 | |
| Buckeye Tobacco Settlement Fing. Auth. Series 2020 A2: | |||
| 3% 6/1/48 | 9,705,000 | 7,361,610 | |
| 4% 6/1/48 | 260,000 | 239,635 | |
| 5% 6/1/32 | 685,000 | 737,064 | |
| 5% 6/1/33 | 2,275,000 | 2,445,120 | |
| Chillicothe Hosp. Facilities Rev. (Adena Health Sys. Oblig. Group Proj.) Series 2017, 5% 12/1/47 | 295,000 | 298,280 | |
| Columbus City School District Series 2016 A, 5% 12/1/29 | 105,000 | 108,268 | |
| Cuyahoga County Hosp. Rev. Series 2017, 5.5% 2/15/52 | 2,455,000 | 2,499,101 | |
| Franklin County Convention Facilities Auth. (Greater Columbus Convention Ctr. Hotel Expansion Proj.) Series 2019: | |||
| 5% 12/1/46 | 325,000 | 339,264 | |
| 5% 12/1/51 | 485,000 | 504,587 | |
| Lancaster Port Auth. Gas Rev. Bonds Series 2019, 5%, tender 2/1/25 (b) | 685,000 | 688,737 | |
| Middleburg Heights Hosp. Rev. Series 2021 A, 4% 8/1/41 | 645,000 | 620,783 | |
| Montgomery County Hosp. Rev. (Kettering Health Network Obligated Group Proj.) Series 2021, 5% 8/1/30 | 410,000 | 440,142 | |
| Muskingum County Hosp. Facilities (Genesis Healthcare Sys. Obligated Group Proj.) Series 2013, 5% 2/15/33 | 1,000,000 | 990,578 | |
| Ohio Gen. Oblig.: | |||
| Series 2021 A: | |||
5% 3/1/29 | 195,000 | 211,561 | |
5% 3/1/29 | 260,000 | 282,081 | |
5% 3/1/30 | 240,000 | 264,894 | |
5% 3/1/30 | 355,000 | 391,822 | |
| Series 2021 B: | |||
5% 2/1/29 | 475,000 | 514,565 | |
5% 2/1/30 | 395,000 | 435,376 | |
| Series 2021 C: | |||
5% 3/15/29 | 595,000 | 645,990 | |
5% 3/15/30 | 595,000 | 657,137 | |
| Ohio Higher Edl. Facility Commission Rev. (Univ. of Dayton Proj.) Series 2018 B, 5% 12/1/36 | 345,000 | 362,527 | |
| Ohio Hosp. Facilities Rev. Series 2021 B: | |||
| 5% 1/1/26 | 415,000 | 425,679 | |
| 5% 1/1/27 | 955,000 | 995,418 | |
| Ohio Hosp. Rev.: | |||
| Bonds Series 2019 C, 2.75%, tender 5/1/28 (b) | 635,000 | 612,746 | |
| Series 2020 A, 4% 1/15/50 | 75,000 | 69,635 | |
| Ohio Hsg. Fin. Agcy. Residential Mtg. Rev.: | |||
| (Mtg. Backed Securities Prog.) Series 2019 B, 4.5% 3/1/50 | 25,000 | 25,080 | |
| (Mtg.-Backed Securities Prog.) Series 2023 B, 6% 3/1/55 | 845,000 | 920,054 | |
| Ohio Major New State Infrastructure Rev. Series 2021 1A: | |||
| 5% 12/15/29 | 585,000 | 642,823 | |
| 5% 12/15/30 | 530,000 | 591,714 | |
| Ohio Tpk. Commission Tpk. Rev.: | |||
| (Infrastructure Proj.) Series 2005 A, 0% 2/15/42 | 130,000 | 59,719 | |
| (Infrastructure Projs.) Series 2022 A, 5% 2/15/39 | 195,000 | 220,101 | |
| Scioto County Hosp. Facilities Rev.: | |||
| Series 2016: | |||
5% 2/15/29 | 110,000 | 111,754 | |
5% 2/15/34 | 20,000 | 20,228 | |
| Series 2019, 5% 2/15/29 | 145,000 | 148,763 | |
| Univ. of Akron Gen. Receipts Series 2016 A, 5% 1/1/35 | 230,000 | 234,333 | |
| Washington County Hosp. Rev. Series 2022: | |||
| 6% 12/1/28 | 260,000 | 268,154 | |
| 6% 12/1/29 | 270,000 | 280,749 | |
| 6% 12/1/30 | 290,000 | 303,667 | |
| 6% 12/1/31 | 310,000 | 326,591 | |
TOTAL OHIO | 40,762,265 | ||
| Oklahoma - 0.1% | |||
| Norman Reg'l. Hosp. Auth. Hosp. Rev. Series 2019, 3.25% 9/1/38 | 2,015,000 | 1,513,962 | |
| Oklahoma City Arpt. Trust Series 33, 5% 7/1/47 (c) | 115,000 | 116,573 | |
| Oklahoma City Pub. Property Auth. Hotel Tax Rev. Series 2015: | |||
| 5% 10/1/28 | 65,000 | 66,217 | |
| 5% 10/1/29 | 70,000 | 71,268 | |
| 5% 10/1/36 | 50,000 | 50,618 | |
| 5% 10/1/39 | 100,000 | 100,507 | |
| Oklahoma Dev. Fin. Auth. Rev. (Oklahoma City Univ. Proj.) Series 2019, 5% 8/1/44 | 180,000 | 178,641 | |
| Oklahoma Hsg. Fin. Agcy. Single Family Mtg. Rev.: | |||
| (Homeownership Ln. Prog.) Series 2023 C, 6% 3/1/54 | 150,000 | 163,378 | |
| (Homeownership Load Prog.) Series 2023 D, 6.5% 9/1/54 | 215,000 | 240,213 | |
TOTAL OKLAHOMA | 2,501,377 | ||
| Oregon - 1.9% | |||
| Beaverton School District Series 2022 A: | |||
| 0% 6/15/41 | 4,250,000 | 1,950,573 | |
| 0% 6/15/42 | 4,155,000 | 1,804,501 | |
| Oregon Gen. Oblig. Series 2022 A: | |||
| 5% 5/1/40 | 3,330,000 | 3,713,044 | |
| 5% 12/1/52 | 595,000 | 611,295 | |
| Oregon State Hsg. & Cmnty. Svcs. Dept.: | |||
| (Single Family Mtg. Prog.) Series A, 3.5% 1/1/51 | 200,000 | 196,453 | |
| (Single-Family Mtg. Prog.): | |||
Series 2015 A, 3.5% 7/1/36 | 1,405,000 | 1,400,482 | |
Series 2019 A, 2.65% 7/1/39 | 440,000 | 365,549 | |
| Series 2019 A, 4% 7/1/50 | 335,000 | 333,120 | |
| Series 2020 A, 3% 7/1/52 | 1,115,000 | 1,068,838 | |
| Port of Portland Arpt. Rev.: | |||
| Series 2020 27A, 5% 7/1/45 (c) | 785,000 | 812,294 | |
| Series 2022 28: | |||
5% 7/1/32 (c) | 2,560,000 | 2,780,478 | |
5% 7/1/41 (c) | 1,760,000 | 1,867,171 | |
5% 7/1/52 (c) | 1,480,000 | 1,531,238 | |
| Series 2023 29: | |||
5% 7/1/34 (c) | 4,270,000 | 4,683,359 | |
5% 7/1/35 (c) | 3,650,000 | 4,000,028 | |
5% 7/1/37 (c) | 2,910,000 | 3,161,674 | |
| Salem Hosp. Facility Auth. Rev.: | |||
| (Salem Health Projs.) Series 2019 A, 3% 5/15/49 | 1,380,000 | 1,079,525 | |
| Series 2016 A, 4% 5/15/41 | 260,000 | 253,869 | |
| Univ. of Oregon Gen. Rev. Series 2021 A, 3.5% 4/1/52 | 10,000,000 | 8,527,108 | |
TOTAL OREGON | 40,140,599 | ||
| Pennsylvania - 6.0% | |||
| Allegheny County Arpt. Auth. Rev.: | |||
| Series 2021 A: | |||
4% 1/1/46 (Assured Guaranty Muni. Corp. Insured) (c) | 4,145,000 | 3,979,691 | |
5% 1/1/32 (c) | 3,940,000 | 4,223,333 | |
5% 1/1/33 (c) | 4,640,000 | 4,973,088 | |
5% 1/1/51 (c) | 2,730,000 | 2,811,887 | |
5% 1/1/56 (c) | 1,655,000 | 1,699,668 | |
| Series 2023 A: | |||
5% 1/1/28 (Assured Guaranty Muni. Corp. Insured) (c) | 1,000,000 | 1,040,283 | |
5.25% 1/1/38 (Assured Guaranty Muni. Corp. Insured) (c) | 1,000,000 | 1,103,354 | |
5.25% 1/1/39 (Assured Guaranty Muni. Corp. Insured) (c) | 1,400,000 | 1,533,537 | |
5.25% 1/1/40 (Assured Guaranty Muni. Corp. Insured) (c) | 1,600,000 | 1,742,831 | |
5.5% 1/1/41 (Assured Guaranty Muni. Corp. Insured) (c) | 1,000,000 | 1,115,618 | |
5.5% 1/1/42 (Assured Guaranty Muni. Corp. Insured) (c) | 1,000,000 | 1,111,503 | |
5.5% 1/1/43 (Assured Guaranty Muni. Corp. Insured) (c) | 1,500,000 | 1,660,305 | |
| Allegheny County Higher Ed. Bldg. Auth. Series 2024 A, 5% 8/1/27 | 3,040,000 | 3,205,837 | |
| Allegheny County Indl. Dev. Auth. Rev. Series 2021: | |||
| 3.5% 12/1/31 | 220,000 | 105,600 | |
| 4% 12/1/41 | 335,000 | 160,800 | |
| 4.25% 12/1/50 | 375,000 | 180,000 | |
| Butler County Hosp. Auth. Hosp. Rev. (Butler Health Sys. Proj.) Series 2015 A, 5% 7/1/35 | 730,000 | 729,620 | |
| Cap. Region Wtr. Wtr. Rev. Series 2018: | |||
| 5% 7/15/27 | 50,000 | 52,462 | |
| 5% 7/15/29 | 80,000 | 85,058 | |
| 5% 7/15/32 | 50,000 | 53,073 | |
| Commonwealth Fing. Auth. Rev. Series 2020 A: | |||
| 5% 6/1/26 | 515,000 | 530,558 | |
| 5% 6/1/28 | 275,000 | 291,944 | |
| Dauphin County Gen. Auth. (Pinnacle Health Sys. Proj.) Series 2016 A: | |||
| 5% 6/1/28 | 55,000 | 56,201 | |
| 5% 6/1/29 | 60,000 | 61,265 | |
| Delaware County Auth. Rev.: | |||
| (Cabrini College) Series 2017, 5% 7/1/47 | 815,000 | 814,799 | |
| Series 2017: | |||
5% 7/1/28 | 105,000 | 107,253 | |
5% 7/1/29 | 400,000 | 408,952 | |
| Doylestown Hosp. Auth. Hosp. Rev.: | |||
| Series 2016 A: | |||
5% 7/1/46 | 60,000 | 58,362 | |
5% 7/1/46 (Pre-Refunded to 7/1/26 @ 100) | 15,000 | 15,469 | |
| Series 2019 A: | |||
5% 7/1/49 | 255,000 | 247,563 | |
5% 7/1/49 (Pre-Refunded to 7/1/29 @ 100) | 30,000 | 32,362 | |
| Dubois Hosp. Auth. Hosp. Rev. (Penn Highlands Healthcare Proj.) Series 2018: | |||
| 4% 7/15/33 | 125,000 | 122,221 | |
| 4% 7/15/35 | 130,000 | 124,992 | |
| 4% 7/15/37 | 255,000 | 248,232 | |
| 5% 7/15/25 | 20,000 | 20,186 | |
| 5% 7/15/26 | 65,000 | 66,237 | |
| 5% 7/15/27 | 105,000 | 107,889 | |
| 5% 7/15/28 | 80,000 | 82,587 | |
| 5% 7/15/29 | 85,000 | 87,327 | |
| 5% 7/15/30 | 110,000 | 112,927 | |
| 5% 7/15/31 | 75,000 | 76,994 | |
| 5% 7/15/32 | 80,000 | 82,070 | |
| 5% 7/15/34 | 85,000 | 87,226 | |
| 5% 7/15/36 | 255,000 | 261,049 | |
| 5% 7/15/38 | 305,000 | 310,733 | |
| 5% 7/15/43 | 355,000 | 356,866 | |
| Geisinger Auth. Health Sys. Rev. Bonds Series 2020 B, 5%, tender 2/15/27 (b) | 1,890,000 | 1,944,678 | |
| Lehigh County Gen. Purp. Auth. Rev.: | |||
| (Muhlenberg College Proj.) Series 2017, 5% 2/1/39 | 130,000 | 132,493 | |
| Series 2021 A, 4% 11/1/51 | 3,835,000 | 3,254,713 | |
| Lehigh County Gen. Purp. Hosp. Rev. Series 2019 A, 4% 7/1/49 | 6,500,000 | 6,100,362 | |
| Monroe County Hosp. Auth. Rev. Series 2016: | |||
| 5% 7/1/26 | 50,000 | 51,124 | |
| 5% 7/1/27 | 50,000 | 51,241 | |
| 5% 7/1/28 | 50,000 | 51,144 | |
| 5% 7/1/34 | 185,000 | 187,371 | |
| 5% 7/1/36 | 100,000 | 101,255 | |
| Montgomery County Higher Ed. & Health Auth. Rev.: | |||
| Series 2014 A: | |||
5% 10/1/24 | 60,000 | 59,909 | |
5% 10/1/25 | 55,000 | 54,819 | |
5% 10/1/27 | 25,000 | 24,762 | |
| Series 2016 A: | |||
5% 10/1/28 | 75,000 | 73,022 | |
5% 10/1/29 | 130,000 | 126,243 | |
5% 10/1/31 | 230,000 | 221,552 | |
5% 10/1/36 | 415,000 | 396,666 | |
5% 10/1/40 | 205,000 | 190,920 | |
| Northampton County Gen. Purp. Auth. Hosp. Rev. (St. Luke's Univ. Health Network Proj.): | |||
| Series 2016 A, 5% 8/15/36 | 40,000 | 40,737 | |
| Series 2018 A, 4% 8/15/48 | 645,000 | 579,749 | |
| Pennsylvania Econ. Dev. Fing. Auth. Indl. Dev. Rev. (Presbyterian Sr. Living Proj.) Series 2023 B2, 5% 7/1/38 | 555,000 | 590,723 | |
| Pennsylvania Econ. Dev. Fing. Auth. Solid Waste Disp. Rev. Bonds Series 2011, 2.15%, tender 7/1/24 (b)(c) | 935,000 | 935,000 | |
| Pennsylvania Gen. Oblig.: | |||
| Series 2018: | |||
3.2% 3/1/29 | 2,795,000 | 2,741,708 | |
3.35% 3/1/30 | 4,160,000 | 4,114,832 | |
| Series 2023: | |||
5% 9/1/29 | 10,000,000 | 10,961,012 | |
5% 9/1/31 | 2,500,000 | 2,812,119 | |
| Pennsylvania Higher Ed. Assistance Agcy. Rev. Series 2024 1A, 5% 6/1/29 (c) | 1,140,000 | 1,193,733 | |
| Pennsylvania Higher Edl. Facilities Auth. Rev.: | |||
| (Drexel Univ. Proj.): | |||
Series 2016, 5% 5/1/35 | 175,000 | 177,240 | |
Series 2017: | |||
5% 5/1/35 | 65,000 | 66,470 | |
5% 5/1/37 | 80,000 | 81,603 | |
5% 5/1/41 | 360,000 | 363,389 | |
| Series 2016: | |||
5% 5/1/28 | 25,000 | 25,376 | |
5% 5/1/32 | 65,000 | 65,912 | |
5% 5/1/33 | 85,000 | 86,128 | |
| Pennsylvania Hsg. Fin. Agcy.: | |||
| Series 2020 13 2A, 3.5% 4/1/51 | 65,000 | 64,188 | |
| Series 2021 134 A, 3% 10/1/49 | 3,855,000 | 3,760,405 | |
| Series 2021 134B, 5% 4/1/27 (c) | 395,000 | 402,516 | |
| Series 2021 137, 3% 10/1/51 | 1,045,000 | 998,901 | |
| Series 2023 142A: | |||
4.5% 10/1/38 | 985,000 | 1,003,800 | |
5% 10/1/43 | 710,000 | 737,185 | |
5% 10/1/50 | 2,425,000 | 2,499,026 | |
| Pennsylvania Tpk. Commission Tpk. Rev.: | |||
| Series 2021 B, 5% 12/1/46 | 2,645,000 | 2,834,379 | |
| Series 2021 C: | |||
5% 12/1/27 | 220,000 | 233,748 | |
5% 12/1/28 | 215,000 | 232,018 | |
| Series 2023: | |||
5% 12/1/36 | 620,000 | 693,946 | |
5% 12/1/38 | 2,500,000 | 2,769,832 | |
5% 12/1/39 | 3,000,000 | 3,314,846 | |
5% 12/1/40 | 2,375,000 | 2,616,472 | |
| Series 2024, 5% 12/1/40 | 1,650,000 | 1,849,294 | |
| Philadelphia Arpt. Rev.: | |||
| Series 2017 A: | |||
5% 7/1/25 | 50,000 | 50,777 | |
5% 7/1/26 | 50,000 | 51,611 | |
5% 7/1/27 | 40,000 | 41,926 | |
| Series 2017 B: | |||
5% 7/1/26 (c) | 150,000 | 153,228 | |
5% 7/1/27 (c) | 125,000 | 129,284 | |
5% 7/1/28 (c) | 150,000 | 154,666 | |
5% 7/1/29 (c) | 115,000 | 118,455 | |
5% 7/1/32 (c) | 805,000 | 828,826 | |
5% 7/1/33 (c) | 115,000 | 118,394 | |
5% 7/1/34 (c) | 205,000 | 210,775 | |
5% 7/1/37 (c) | 230,000 | 235,177 | |
5% 7/1/47 (c) | 1,165,000 | 1,175,597 | |
| Series 2021: | |||
4% 7/1/46 (Assured Guaranty Muni. Corp. Insured) (c) | 1,620,000 | 1,545,589 | |
5% 7/1/26 (c) | 3,765,000 | 3,846,019 | |
5% 7/1/27 (c) | 5,190,000 | 5,367,880 | |
5% 7/1/28 (c) | 550,000 | 574,044 | |
5% 7/1/34 (c) | 1,100,000 | 1,184,376 | |
5% 7/1/35 (c) | 590,000 | 634,830 | |
5% 7/1/51 (c) | 1,000,000 | 1,031,966 | |
| Philadelphia Auth. for Indl. Dev. Series 2017, 5% 11/1/47 | 400,000 | 402,474 | |
| Philadelphia School District: | |||
| Series 2016 D: | |||
5% 9/1/25 | 445,000 | 452,179 | |
5% 9/1/26 | 465,000 | 480,690 | |
5% 9/1/27 | 490,000 | 503,212 | |
5% 9/1/28 | 410,000 | 421,313 | |
| Series 2016 F: | |||
5% 9/1/28 | 710,000 | 729,591 | |
5% 9/1/29 | 460,000 | 472,017 | |
| Series 2018 A: | |||
5% 9/1/36 | 95,000 | 99,537 | |
5% 9/1/37 | 55,000 | 57,620 | |
5% 9/1/38 | 90,000 | 94,136 | |
| Series 2018 B, 5% 9/1/43 | 130,000 | 133,544 | |
| Series 2019 A: | |||
4% 9/1/35 | 385,000 | 390,155 | |
5% 9/1/30 | 400,000 | 426,779 | |
5% 9/1/31 | 320,000 | 340,279 | |
5% 9/1/34 (Assured Guaranty Muni. Corp. Insured) | 185,000 | 197,282 | |
| Series F, 5% 9/1/30 | 345,000 | 353,145 | |
| Philadelphia Wtr. & Wastewtr. Rev. Series 2018 A, 5% 10/1/34 | 1,055,000 | 1,130,450 | |
| Pittsburgh Wtr. & Swr. Auth. Wtr. & Swr. Sys. Rev. Series 2019 A, 5% 9/1/38 (Assured Guaranty Muni. Corp. Insured) | 200,000 | 215,603 | |
| Southcentral Pennsylvania Gen. Auth. Rev. Series 2019 A: | |||
| 4% 6/1/44 | 140,000 | 134,088 | |
| 4% 6/1/49 | 335,000 | 316,931 | |
| 5% 6/1/44 | 245,000 | 252,237 | |
| 5% 6/1/49 | 390,000 | 398,889 | |
| State Pub. School Bldg. Auth. Lease Rev. (The School District of Philadelphia Proj.) Series 2015 A, 5% 6/1/26 | 65,000 | 65,791 | |
| Union County Hosp. Auth. Rev. Series 2018 B: | |||
| 5% 8/1/43 | 280,000 | 287,803 | |
| 5% 8/1/48 | 1,225,000 | 1,251,630 | |
TOTAL PENNSYLVANIA | 125,269,168 | ||
| Puerto Rico - 1.6% | |||
| Puerto Rico Commonwealth Aqueduct & Swr. Auth.: | |||
| Series 2021 A, 5% 7/1/37 (e) | 3,250,000 | 3,390,317 | |
| Series 2021 B: | |||
5% 7/1/33 (e) | 400,000 | 421,934 | |
5% 7/1/37 (e) | 1,695,000 | 1,768,181 | |
| Series 2022 A, 4% 7/1/42 (e) | 1,690,000 | 1,582,540 | |
| Puerto Rico Commonwealth Pub. Impt. Gen. Oblig. Series 2021 A1: | |||
| 0% 7/1/33 | 8,240,022 | 5,498,235 | |
| 4% 7/1/33 | 1,927,686 | 1,930,578 | |
| 4% 7/1/35 | 695,000 | 682,255 | |
| 4% 7/1/37 | 850,000 | 818,242 | |
| 5.625% 7/1/27 | 201,149 | 209,864 | |
| 5.625% 7/1/29 | 1,000,434 | 1,072,981 | |
| Puerto Rico Sales Tax Fing. Corp. Sales Tax Rev.: | |||
| Series 2018 A1: | |||
0% 7/1/31 | 8,088,000 | 6,139,423 | |
0% 7/1/46 | 4,500,000 | 1,447,129 | |
4.55% 7/1/40 | 2,175,000 | 2,183,127 | |
5% 7/1/58 | 2,510,000 | 2,500,229 | |
| Series 2019 A2, 4.329% 7/1/40 | 3,250,000 | 3,206,427 | |
TOTAL PUERTO RICO | 32,851,462 | ||
| Rhode Island - 1.4% | |||
| Rhode Island Health & Edl. Bldg. Corp. Higher Ed. Facilities Rev.: | |||
| Series 2016 B: | |||
5% 9/1/31 | 420,000 | 421,485 | |
5% 9/1/36 | 1,235,000 | 1,237,770 | |
| Series 2016, 5% 5/15/39 | 320,000 | 323,454 | |
| Rhode Island Health and Edl. Bldg. Corp. Higher Ed. Facility Rev.: | |||
| Series 2022 A, 5% 9/1/33 | 7,000,000 | 7,998,192 | |
| Series 2024: | |||
5% 6/1/40 | 1,000,000 | 1,093,686 | |
5% 6/1/45 | 2,550,000 | 2,741,356 | |
5% 6/1/48 | 3,005,000 | 3,196,766 | |
| Rhode Island Hsg. & Mtg. Fin. Corp.: | |||
| Series 2019 70, 4% 10/1/49 | 45,000 | 44,732 | |
| Series 2021 74, 3% 4/1/49 | 465,000 | 452,432 | |
| Rhode Island Hsg. & Mtg. Fin. Corp. Rev. Series 72 A, 3.5% 10/1/50 | 495,000 | 486,248 | |
| Rhode Island Student Ln. Auth. Student Ln. Rev.: | |||
| Series 2023 A: | |||
5% 12/1/28 (c) | 2,940,000 | 3,076,375 | |
5% 12/1/29 (c) | 4,380,000 | 4,621,914 | |
5% 12/1/30 (c) | 1,605,000 | 1,693,148 | |
| Series 2024 A, 5% 12/1/29 (c) | 1,825,000 | 1,925,798 | |
| Series A: | |||
3.5% 12/1/34 (c) | 70,000 | 64,944 | |
5% 12/1/24 (c) | 225,000 | 226,003 | |
5% 12/1/28 (c) | 500,000 | 522,986 | |
TOTAL RHODE ISLAND | 30,127,289 | ||
| South Carolina - 0.3% | |||
| Charleston County Arpt. District Series 2019, 5% 7/1/43 | 145,000 | 152,895 | |
| Scago Edl. Facilities Corp. for Colleton School District (School District of Colleton County Proj.) Series 2015: | |||
| 5% 12/1/25 | 140,000 | 141,630 | |
| 5% 12/1/28 | 285,000 | 287,994 | |
| South Carolina Hsg. Fin. & Dev. Auth. Mtg. Rev.: | |||
| Series 2019 A, 4% 1/1/50 | 85,000 | 84,449 | |
| Series 2023 B, 6% 1/1/54 | 515,000 | 560,932 | |
| South Carolina Jobs-Econ. Dev. Auth. Series 2019 C, 5% 7/1/33 | 365,000 | 384,827 | |
| South Carolina Ports Auth. Ports Rev. Series 2015, 5.25% 7/1/55 (Pre-Refunded to 7/1/25 @ 100) (c) | 55,000 | 55,859 | |
| South Carolina Pub. Svc. Auth. Rev.: | |||
| Series 2016 A: | |||
5% 12/1/29 | 150,000 | 153,092 | |
5% 12/1/38 | 15,000 | 15,162 | |
| Series 2016 B, 5% 12/1/31 | 55,000 | 56,359 | |
| Spartanburg County Reg'l. Health Series 2017 A: | |||
| 4% 4/15/43 | 945,000 | 905,365 | |
| 4% 4/15/48 | 660,000 | 610,868 | |
| 5% 4/15/48 | 2,265,000 | 2,313,134 | |
TOTAL SOUTH CAROLINA | 5,722,566 | ||
| South Dakota - 0.1% | |||
| South Dakota Health & Edl. Facilities Auth. Rev.: | |||
| (Avera Health Proj.) Series 2017, 5% 7/1/31 | 35,000 | 36,705 | |
| Series 2017: | |||
5% 7/1/26 | 15,000 | 15,404 | |
5% 7/1/28 | 15,000 | 15,718 | |
5% 7/1/29 | 30,000 | 31,499 | |
| Series 2020 A, 3% 9/1/45 | 730,000 | 576,321 | |
| South Dakota Hsg. Dev. Auth. Series 2023 G, 6.25% 5/1/55 | 425,000 | 461,558 | |
TOTAL SOUTH DAKOTA | 1,137,205 | ||
| Tennessee - 2.0% | |||
| Chattanooga Health Ed. & Hsg. Facility Board Rev. Series 2019 A1, 4% 8/1/44 | 610,000 | 593,429 | |
| Chattanooga-Hamilton County Hosp. Auth. Rev. Series 2014 A, 5% 10/1/44 | 2,350,000 | 2,337,989 | |
| Jackson Hosp. Rev. Series 2018 A: | |||
| 5% 4/1/41 | 560,000 | 574,541 | |
| 5% 4/1/41 (Pre-Refunded to 10/1/28 @ 100) | 30,000 | 31,973 | |
| Memphis-Shelby County Arpt. Auth. Arpt. Rev. Series 2018, 5% 7/1/37 (c) | 235,000 | 243,224 | |
| Metropolitan Govt. Nashville & Davidson County Elec. Rev.: | |||
| Series 2024 A: | |||
5% 5/15/28 | 1,000,000 | 1,070,734 | |
5% 5/15/40 | 1,750,000 | 1,987,462 | |
5% 5/15/44 | 1,585,000 | 1,769,139 | |
| Series 2024 B: | |||
5% 5/15/28 | 3,000,000 | 3,212,202 | |
5% 5/15/31 | 4,365,000 | 4,904,573 | |
5% 5/15/33 | 1,755,000 | 2,026,772 | |
| Metropolitan Nashville Arpt. Auth. Rev.: | |||
| Series 2015 B, 4% 7/1/25 (c) | 130,000 | 130,131 | |
| Series 2019 B: | |||
5% 7/1/38 (c) | 965,000 | 1,019,406 | |
5% 7/1/54 (c) | 300,000 | 307,554 | |
| Series 2022 B: | |||
5% 7/1/52 (c) | 3,250,000 | 3,362,517 | |
5.5% 7/1/39 (c) | 2,000,000 | 2,234,169 | |
5.5% 7/1/40 (c) | 2,000,000 | 2,220,902 | |
5.5% 7/1/42 (c) | 3,500,000 | 3,860,615 | |
| Nashville and Davidson County Metropolitan Govt. Gen. Oblig. Series 2021 C, 5% 1/1/27 | 3,010,000 | 3,144,443 | |
| Nashville and Davidson County Metropolitan Govt. Health & Edl. Facilities Board Rev. (Lipscomb Univ. Proj.) Series 2019 A: | |||
| 4% 10/1/49 | 485,000 | 417,202 | |
| 5.25% 10/1/58 | 4,700,000 | 4,739,000 | |
| Tennessee Hsg. Dev. Agcy. Residential: | |||
| Series 2019 3: | |||
2.6% 7/1/39 | 140,000 | 115,324 | |
2.8% 7/1/44 | 165,000 | 129,915 | |
| Series 2019 4, 2.9% 7/1/39 | 375,000 | 315,901 | |
| Series 2021 1, 3% 7/1/51 | 690,000 | 669,986 | |
| Series 2021 3A, 3% 1/1/52 | 265,000 | 255,501 | |
TOTAL TENNESSEE | 41,674,604 | ||
| Texas - 7.1% | |||
| Austin Arpt. Sys. Rev.: | |||
| Series 2014: | |||
5% 11/15/26 (c) | 50,000 | 50,080 | |
5% 11/15/27 (c) | 65,000 | 65,120 | |
5% 11/15/28 (c) | 75,000 | 75,152 | |
5% 11/15/39 (c) | 275,000 | 275,231 | |
| Series 2017 B: | |||
5% 11/15/28 (c) | 50,000 | 51,155 | |
5% 11/15/30 (c) | 80,000 | 81,974 | |
5% 11/15/32 (c) | 60,000 | 61,349 | |
5% 11/15/35 (c) | 65,000 | 66,275 | |
5% 11/15/36 (c) | 105,000 | 106,955 | |
5% 11/15/37 (c) | 70,000 | 71,210 | |
5% 11/15/41 (c) | 290,000 | 293,346 | |
| Austin Wtr. & Wastewtr. Sys. Rev. Series 2022: | |||
| 5% 11/15/37 | 1,000,000 | 1,125,342 | |
| 5% 11/15/38 | 1,250,000 | 1,400,684 | |
| 5% 11/15/39 | 1,750,000 | 1,958,466 | |
| 5% 11/15/40 | 2,000,000 | 2,223,107 | |
| 5% 11/15/41 | 2,000,000 | 2,210,746 | |
| 5% 11/15/42 | 3,000,000 | 3,300,929 | |
| Bell County Gen. Oblig. Series 2021, 2% 2/15/35 | 1,500,000 | 1,188,227 | |
| Birdville Independent School District Series 2020, 2.375% 2/15/36 | 1,785,000 | 1,494,719 | |
| Board of Regents of The Texas A&M Univ. Sys. Permanent Univ. Fund Series 2023, 5% 7/1/38 | 1,785,000 | 1,994,580 | |
| Central Reg'l. Mobility Auth.: | |||
| Series 2015 A: | |||
5% 1/1/28 | 65,000 | 65,911 | |
5% 1/1/31 (Pre-Refunded to 7/1/25 @ 100) | 25,000 | 25,416 | |
5% 1/1/40 (Pre-Refunded to 7/1/25 @ 100) | 295,000 | 299,905 | |
| Series 2021 C, 5% 1/1/27 | 1,055,000 | 1,077,708 | |
| City of Denton: | |||
| Series 2020, 2% 2/15/38 | 1,530,000 | 1,130,052 | |
| Series 2023, 5% 2/15/41 | 2,185,000 | 2,423,687 | |
| Conroe Independent School District Series 2024: | |||
| 5% 2/15/36 | 1,715,000 | 1,978,178 | |
| 5% 2/15/37 | 3,050,000 | 3,505,940 | |
| 5% 2/15/38 | 1,355,000 | 1,549,248 | |
| Coppell Tex Series 2020, 1.5% 2/1/36 | 1,485,000 | 1,059,405 | |
| Corpus Christi Gen. Oblig. Series 2023: | |||
| 5% 3/1/39 | 2,110,000 | 2,344,084 | |
| 5% 3/1/40 | 2,215,000 | 2,445,302 | |
| Dallas Fort Worth Int'l. Arpt. Rev. Series 2022 B, 5% 11/1/37 | 3,000,000 | 3,356,945 | |
| Dallas Gen. Oblig. Series 2024 A: | |||
| 5% 2/15/28 | 3,365,000 | 3,571,900 | |
| 5% 2/15/29 | 2,710,000 | 2,919,894 | |
| 5% 2/15/30 | 3,435,000 | 3,751,770 | |
| 5% 2/15/31 | 1,445,000 | 1,596,493 | |
| 5% 2/15/32 | 2,855,000 | 3,188,667 | |
| 5% 2/15/33 | 1,445,000 | 1,632,855 | |
| Dallas Wtrwks. & Swr. Sys. Rev. Series 2017, 5% 10/1/46 | 585,000 | 603,124 | |
| El Paso Independent School District Series 2020: | |||
| 5% 8/15/25 | 220,000 | 224,116 | |
| 5% 8/15/26 | 380,000 | 393,858 | |
| El Paso Wtr. & Swr. Rev. Series 2022, 5% 3/1/36 | 1,000,000 | 1,097,914 | |
| Fort Bend Independent School District Bonds Series 2021 B, 0.72%, tender 8/1/26 (b) | 515,000 | 475,564 | |
| Grand Parkway Trans. Corp.: | |||
| Bonds Series 2023, 5%, tender 4/1/28 (b) | 5,825,000 | 6,122,385 | |
| Series 2018 A, 5% 10/1/38 | 160,000 | 168,268 | |
| Harris County Cultural Ed. Facilities Fin. Corp. Med. Facilities Rev. Series 2024, 5% 5/15/29 | 1,725,000 | 1,847,907 | |
| Harris County Cultural Ed. Facilities Fin. Corp. Rev.: | |||
| (Texas Childrens Hosp., Proj.) Series 2015-1 5% 10/1/29 | 70,000 | 71,201 | |
| Series 2021 A, 3% 10/1/51 | 1,000,000 | 748,400 | |
| Harris County Flood Cont. District Series 2021 A: | |||
| 5% 10/1/28 | 500,000 | 537,994 | |
| 5% 10/1/29 | 500,000 | 546,839 | |
| Harris County Gen. Oblig. Series 2002: | |||
| 0% 8/15/25 (Nat'l. Pub. Fin. Guarantee Corp. Insured) | 150,000 | 144,089 | |
| 0% 8/15/28 (Nat'l. Pub. Fin. Guarantee Corp. Insured) | 255,000 | 220,184 | |
| Harris County Toll Road Rev. Series 2018 A, 5% 8/15/43 | 585,000 | 606,476 | |
| Houston Arpt. Sys. Rev.: | |||
| Series 2018 A, 5% 7/1/41 (c) | 880,000 | 905,038 | |
| Series 2018 C: | |||
5% 7/1/29 (c) | 100,000 | 104,532 | |
5% 7/1/30 (c) | 105,000 | 109,863 | |
5% 7/1/31 (c) | 75,000 | 77,909 | |
5% 7/1/32 (c) | 90,000 | 93,485 | |
| Houston Gen. Oblig.: | |||
| Series 2017 A: | |||
5% 3/1/31 | 235,000 | 243,861 | |
5% 3/1/32 | 100,000 | 103,750 | |
| Series 2023 A: | |||
5% 3/1/34 | 3,000,000 | 3,398,404 | |
5% 3/1/35 | 275,000 | 310,932 | |
5% 3/1/36 | 1,000,000 | 1,128,048 | |
5% 3/1/37 | 900,000 | 1,012,043 | |
5% 3/1/38 | 1,450,000 | 1,622,755 | |
5.25% 3/1/39 | 2,000,000 | 2,260,567 | |
5.25% 3/1/40 | 1,800,000 | 2,026,117 | |
5.25% 3/1/41 | 1,000,000 | 1,120,134 | |
5.25% 3/1/42 | 2,750,000 | 3,071,223 | |
5.25% 3/1/43 | 3,350,000 | 3,728,526 | |
| Houston Hsg. Fin. Corp. Multi-family Hsg. Rev. Bonds Series 2023, 5%, tender 8/1/26 (b) | 1,035,000 | 1,052,655 | |
| Houston Util. Sys. Rev. Series 2020 C: | |||
| 4% 11/15/43 | 1,030,000 | 1,007,580 | |
| 5% 11/15/45 | 1,030,000 | 1,102,501 | |
| Irving Hosp. Auth. Hosp. Rev. Series 2017 A: | |||
| 5% 10/15/28 | 25,000 | 25,480 | |
| 5% 10/15/30 | 95,000 | 96,770 | |
| 5% 10/15/32 | 50,000 | 50,810 | |
| 5% 10/15/36 | 35,000 | 35,418 | |
| 5% 10/15/37 | 55,000 | 55,553 | |
| 5% 10/15/38 | 80,000 | 80,647 | |
| 5% 10/15/44 | 80,000 | 80,324 | |
| Katy Independent School District Series 2023, 5% 2/15/40 | 1,170,000 | 1,291,343 | |
| Love Field Arpt. Modernization Rev.: | |||
| Series 2015: | |||
5% 11/1/26 (c) | 50,000 | 50,614 | |
5% 11/1/27 (c) | 110,000 | 111,312 | |
5% 11/1/28 (c) | 165,000 | 166,941 | |
5% 11/1/29 (c) | 100,000 | 101,242 | |
5% 11/1/32 (c) | 185,000 | 186,781 | |
| Series 2017: | |||
5% 11/1/24 (c) | 50,000 | 50,146 | |
5% 11/1/25 (c) | 50,000 | 50,756 | |
5% 11/1/26 (c) | 50,000 | 51,336 | |
5% 11/1/27 (c) | 50,000 | 51,081 | |
5% 11/1/28 (c) | 90,000 | 92,041 | |
5% 11/1/29 (c) | 65,000 | 66,475 | |
5% 11/1/30 (c) | 50,000 | 51,046 | |
5% 11/1/31 (c) | 115,000 | 117,164 | |
5% 11/1/32 (c) | 130,000 | 132,440 | |
5% 11/1/33 (c) | 50,000 | 50,826 | |
5% 11/1/34 (c) | 50,000 | 50,824 | |
5% 11/1/36 (c) | 50,000 | 50,751 | |
| Lower Colorado River Auth. Rev.: | |||
| (LCRA Transmission Svcs. Corp. Proj.) Series 2020: | |||
5% 5/15/25 | 295,000 | 299,076 | |
5% 5/15/26 | 370,000 | 381,663 | |
5% 5/15/27 | 440,000 | 460,409 | |
| Series 2015 D, 5% 5/15/28 | 110,000 | 111,222 | |
| Mansfield Tex Series 2020, 2.5% 2/15/38 | 1,150,000 | 920,858 | |
| New Braunfels Independent School District Series 2022, 2.5% 2/1/35 | 1,850,000 | 1,596,281 | |
| New Hope Cultural Ed. Facilities Fin. Corp. (Childrens Med. Ctr. of Dallas) Series 2017 A: | |||
| 5% 8/15/27 | 40,000 | 41,885 | |
| 5% 8/15/29 | 100,000 | 104,614 | |
| 5% 8/15/47 | 115,000 | 117,037 | |
| Newark Higher Ed. Fin. Corp. (Abilene Christian Univ. Proj.) Series 2016 A: | |||
| 5% 4/1/27 | 35,000 | 35,735 | |
| 5% 4/1/30 | 175,000 | 179,007 | |
| North Texas Tollway Auth. Rev.: | |||
| (Sr. Lien Proj.) Series 2017 A: | |||
5% 1/1/31 | 50,000 | 50,833 | |
5% 1/1/33 | 60,000 | 62,280 | |
5% 1/1/34 | 75,000 | 77,887 | |
5% 1/1/34 | 150,000 | 172,146 | |
5% 1/1/35 | 110,000 | 114,263 | |
5% 1/1/36 | 305,000 | 316,617 | |
5% 1/1/37 | 405,000 | 419,994 | |
| (Sub Lien Proj.) Series 2017 B: | |||
5% 1/1/30 | 20,000 | 20,329 | |
5% 1/1/31 | 30,000 | 30,478 | |
| Series 2015 A, 5% 1/1/32 | 170,000 | 170,819 | |
| Series 2016 A, 5% 1/1/36 | 65,000 | 66,107 | |
| Series 2017 A, 5% 1/1/39 | 1,650,000 | 1,727,316 | |
| Series 2018: | |||
4% 1/1/37 | 625,000 | 628,713 | |
4% 1/1/38 | 1,280,000 | 1,283,696 | |
| Series 2021 B, 3% 1/1/46 | 9,330,000 | 7,415,042 | |
| Northside Independent School District Bonds: | |||
| Series 2020, 0.7%, tender 6/1/25 (b) | 730,000 | 710,884 | |
| Series 2023 B, 3%, tender 8/1/26 (b) | 5,165,000 | 5,087,231 | |
| Series 2024 B, 3.45%, tender 8/1/27 (b) | 4,345,000 | 4,343,418 | |
| Prosper Independent School District Bonds Series 2019 B, 4%, tender 8/15/26 (b) | 1,010,000 | 1,013,360 | |
| San Antonio Elec. & Gas Sys. Rev. Series 2021 A, 5% 2/1/46 | 2,010,000 | 2,129,623 | |
| San Antonio Wtr. Sys. Rev. Series 2020 A, 5% 5/15/50 | 625,000 | 657,178 | |
| Southwest Higher Ed. Auth. Rev. (Southern Methodist Univ., TX. Proj.) Series 2017: | |||
| 5% 10/1/29 | 20,000 | 20,983 | |
| 5% 10/1/30 | 35,000 | 36,659 | |
| 5% 10/1/31 | 30,000 | 31,410 | |
| 5% 10/1/39 | 65,000 | 67,261 | |
| 5% 10/1/40 | 50,000 | 51,567 | |
| Tarrant County Cultural Ed. Facilities Fin. Corp. Rev. Series 2016 A, 4% 2/15/35 | 255,000 | 256,073 | |
| Tarrant County Tex Hosp. District Series 2023, 5% 8/15/33 | 1,000,000 | 1,125,730 | |
| Texas Dept. of Hsg. & Cmnty. Affairs Multi-family Hsg. Rev. Series 2019, 2.95% 7/1/36 | 1,051,687 | 905,269 | |
| Texas Dept. of Hsg. & Cmnty. Affairs Residential Mtg. Rev. Series 2023 B, 6% 1/1/54 | 2,145,000 | 2,339,087 | |
| Texas Dept. of Hsg. & Cmnty. Affairs Single Family Mtg. Rev.: | |||
| Series 2018 A, 4.25% 9/1/48 | 3,195,000 | 3,058,586 | |
| Series 2019 A, 4% 3/1/50 | 190,000 | 188,744 | |
| Series 2023, 6% 3/1/54 | 1,775,000 | 1,939,947 | |
| Series A, 3.5% 3/1/51 | 230,000 | 225,095 | |
| Texas Private Activity Bond Surface Trans. Corp. (LBJ Infrastructure Group LLC I-635 Managed Lanes Proj.) Series 2020 A: | |||
| 4% 6/30/36 | 210,000 | 211,938 | |
| 4% 6/30/39 | 530,000 | 527,651 | |
| 4% 6/30/40 | 440,000 | 436,878 | |
| Texas State Univ. Sys. Fing. Rev. Series 2017 A, 5% 3/15/31 | 165,000 | 172,265 | |
| Texas Trans. Commission Hwy. Impt. Gen. Oblig. Bonds Series 2014 B, 0.65%, tender 4/1/26 (b) | 3,195,000 | 2,986,194 | |
| Texas Wtr. Dev. Board Rev.: | |||
| Series 2020: | |||
3% 10/15/38 | 1,000,000 | 916,314 | |
5% 8/1/30 | 295,000 | 326,492 | |
| Series 2022, 4.45% 10/15/36 | 3,000,000 | 3,247,064 | |
| Univ. of Houston Univ. Revs. Series 2017 A: | |||
| 5% 2/15/33 | 205,000 | 209,531 | |
| 5% 2/15/34 | 255,000 | 260,515 | |
| 5% 2/15/36 | 150,000 | 152,864 | |
| Univ. of North Texas Univ. Rev. Series 2017 A, 5% 4/15/32 | 105,000 | 109,477 | |
| Univ. of Texas Board of Regents Sys. Rev. Series 2020 C, 5% 8/15/31 | 880,000 | 989,435 | |
| Univ. of Texas Permanent Univ. Fund Rev. Series 2016 B, 5% 7/1/29 | 105,000 | 108,160 | |
| Waco Gen. Oblig. Series 2020, 2.375% 2/1/40 | 1,460,000 | 1,059,101 | |
| Weatherford Independent School District Series 2002, 0% 2/15/33 | 350,000 | 252,442 | |
TOTAL TEXAS | 150,413,103 | ||
| Utah - 0.5% | |||
| Salt Lake City Arpt. Rev.: | |||
| Series 2017 A: | |||
5% 7/1/25 (c) | 100,000 | 101,121 | |
5% 7/1/27 (c) | 215,000 | 222,369 | |
5% 7/1/29 (c) | 190,000 | 196,251 | |
5% 7/1/30 (c) | 140,000 | 144,711 | |
5% 7/1/31 (c) | 265,000 | 272,856 | |
5% 7/1/33 (c) | 205,000 | 211,051 | |
5% 7/1/35 (c) | 205,000 | 210,709 | |
5% 7/1/36 (c) | 275,000 | 282,324 | |
5% 7/1/37 (c) | 690,000 | 707,488 | |
5% 7/1/42 (c) | 1,240,000 | 1,259,537 | |
| Series 2018 A: | |||
5% 7/1/33 (c) | 485,000 | 503,726 | |
5.25% 7/1/48 (c) | 355,000 | 364,535 | |
| Series 2023 A: | |||
5.25% 7/1/37 (c) | 815,000 | 916,688 | |
5.25% 7/1/42 (c) | 2,500,000 | 2,737,550 | |
5.25% 7/1/43 (c) | 2,715,000 | 2,959,924 | |
| Utah County Hosp. Rev. Series 2020 A, 5% 5/15/50 | 295,000 | 307,210 | |
TOTAL UTAH | 11,398,050 | ||
| Vermont - 0.1% | |||
| Vermont Edl. & Health Bldg. Fin. Agcy. Rev.: | |||
| (Champlain College Proj.) Series 2016 A: | |||
5% 10/15/41 | 230,000 | 221,993 | |
5% 10/15/46 | 290,000 | 269,519 | |
| (Middlebury College Proj.) Series 2020, 5% 11/1/49 | 625,000 | 652,960 | |
| Vermont Hsg. Fin. Agcy. Series 2021 B, 3% 11/1/51 | 340,000 | 325,400 | |
| Vermont Student Assistant Corp. Ed. Ln. Rev.: | |||
| Series 2019 A: | |||
5% 6/15/27 (c) | 295,000 | 301,275 | |
5% 6/15/29 (c) | 500,000 | 511,585 | |
| Series 2020 A, 5% 6/15/28 (c) | 295,000 | 302,593 | |
TOTAL VERMONT | 2,585,325 | ||
| Virginia - 0.5% | |||
| Arlington County Series 2021, 5% 6/15/28 | 1,340,000 | 1,439,903 | |
| Chesapeake Wtr. & Swr. Sys. Series 2021: | |||
| 2% 7/1/35 | 1,345,000 | 1,083,263 | |
| 2% 7/1/36 | 1,370,000 | 1,080,906 | |
| Fairfax County Redev. & Hsg. Auth. Rev. Bonds (Dominion Square North Proj.) Series 2023, 5%, tender 1/1/28 (b) | 740,000 | 761,646 | |
| Fredericksburg Econ. Dev. Auth. Rev. Series 2014, 5% 6/15/30 | 65,000 | 65,020 | |
| Lynchburg Econ. Dev. Series 2021, 3% 1/1/51 | 2,250,000 | 1,703,802 | |
| Stafford County Econ. Dev. Auth. Hosp. Facilities Rev.: | |||
| (Mary Washington Hosp. Proj.) Series 2016, 3% 6/15/29 | 30,000 | 28,691 | |
| Series 2016: | |||
4% 6/15/37 | 35,000 | 34,231 | |
5% 6/15/27 | 75,000 | 76,666 | |
5% 6/15/30 | 30,000 | 30,576 | |
5% 6/15/33 | 20,000 | 20,374 | |
5% 6/15/34 | 40,000 | 40,742 | |
5% 6/15/35 | 110,000 | 111,976 | |
| Virginia Commonwealth Trans. Board Rev. (Virginia Gen. Oblig. Proj.) Series 2017 A, 5% 5/15/32 | 45,000 | 47,337 | |
| Virginia Pub. Bldg. Auth. Pub. Facilities Rev. Series 2019 A, 4% 8/1/36 | 675,000 | 687,117 | |
| Virginia Small Bus. Fing. Auth. (Elizabeth River Crossings OpCo, LLC Proj.) Series 2022: | |||
| 4% 1/1/35 (c) | 955,000 | 963,659 | |
| 4% 7/1/35 (c) | 720,000 | 726,257 | |
| Virginia St Pub. School Auth. Spl. O Series 2023, 5% 8/1/39 | 1,235,000 | 1,405,479 | |
| Winchester Econ. Dev. Auth. Series 2015: | |||
| 5% 1/1/31 | 125,000 | 127,053 | |
| 5% 1/1/34 | 75,000 | 76,075 | |
| 5% 1/1/35 | 75,000 | 76,033 | |
| 5% 1/1/44 | 50,000 | 50,318 | |
TOTAL VIRGINIA | 10,637,124 | ||
| Washington - 3.5% | |||
| City of Olympia Series 2019, 2% 12/1/30 | 1,265,000 | 1,110,311 | |
| King County Hsg. Auth. Rev. Series 2021: | |||
| 4% 6/1/26 | 165,000 | 165,351 | |
| 4% 6/1/28 | 105,000 | 105,754 | |
| Port of Seattle Rev.: | |||
| Series 2015 B, 5% 3/1/25 | 85,000 | 85,201 | |
| Series 2016 B: | |||
5% 10/1/28 (c) | 175,000 | 178,439 | |
5% 10/1/30 (c) | 100,000 | 101,761 | |
| Series 2019 A, 4% 4/1/44 (c) | 185,000 | 172,944 | |
| Series 2019: | |||
5% 4/1/35 (c) | 2,200,000 | 2,316,015 | |
5% 4/1/44 (c) | 440,000 | 450,062 | |
| Series 2021 C: | |||
5% 8/1/24 (c) | 575,000 | 575,431 | |
5% 8/1/25 (c) | 465,000 | 470,913 | |
5% 8/1/26 (c) | 640,000 | 655,660 | |
5% 8/1/27 (c) | 395,000 | 409,462 | |
5% 8/1/28 (c) | 1,105,000 | 1,155,992 | |
| Seattle Hsg. Auth. Rev.: | |||
| (Hinoki Apts. Proj.) Series 2020 A, 3% 6/1/52 | 3,325,000 | 2,446,915 | |
| (Juniper Apts. Proj.) Series 2023: | |||
4.375% 12/1/30 | 1,080,000 | 1,085,948 | |
5% 6/1/27 | 725,000 | 741,187 | |
| (Northgate Plaza Proj.) Series 2021, 1% 6/1/26 | 255,000 | 237,534 | |
| (Sawara Apts. Proj.) Series 2021, 3% 6/1/46 | 1,010,000 | 767,941 | |
| Spokane County School District #81 (WA State School District Cr. Enhancement Prog.) Series 2017 B, 5% 12/1/29 | 2,325,000 | 2,459,804 | |
| Washington Convention Ctr. Pub. Facilities: | |||
| Series 2021 B: | |||
3% 7/1/43 | 335,000 | 264,524 | |
3% 7/1/58 (Assured Guaranty Muni. Corp. Insured) | 1,940,000 | 1,417,940 | |
| Series 2021, 4% 7/1/31 | 4,190,000 | 4,136,631 | |
| Washington Gen. Oblig.: | |||
| Series 2015 C, 5% 2/1/34 | 210,000 | 211,699 | |
| Series 2016 D, 5% 2/1/28 | 1,000,000 | 1,025,546 | |
| Series 2017 D, 5% 2/1/33 | 180,000 | 187,166 | |
| Series 2018 C, 5% 8/1/30 | 340,000 | 357,477 | |
| Series 2022 C, 5% 2/1/41 | 3,225,000 | 3,548,522 | |
| Series 2022 D: | |||
4% 7/1/36 | 850,000 | 886,525 | |
4% 7/1/37 | 590,000 | 610,522 | |
| Series 2023 A, 5% 8/1/41 | 2,985,000 | 3,302,715 | |
| Series 2024 C: | |||
5% 2/1/30 | 12,740,000 | 14,028,496 | |
5% 2/1/31 | 6,630,000 | 7,395,334 | |
5% 6/1/32 | 3,875,000 | 4,403,320 | |
| Series R-2017 A, 5% 8/1/30 | 105,000 | 108,334 | |
| Washington Health Care Facilities Auth. Rev.: | |||
| (Overlake Hosp. Med. Ctr., WA. Proj.) Series 2017 B: | |||
5% 7/1/25 | 40,000 | 40,214 | |
5% 7/1/27 | 80,000 | 80,775 | |
5% 7/1/28 | 95,000 | 96,151 | |
5% 7/1/29 | 35,000 | 35,495 | |
5% 7/1/30 | 45,000 | 45,674 | |
5% 7/1/31 | 55,000 | 55,842 | |
5% 7/1/32 | 100,000 | 101,460 | |
5% 7/1/33 | 145,000 | 147,009 | |
5% 7/1/34 | 35,000 | 35,443 | |
5% 7/1/42 | 485,000 | 484,775 | |
| (Providence Health Systems Proj.) Series 2012 A, 5% 10/1/25 | 260,000 | 260,101 | |
| Series 2015 B, 5% 10/1/38 | 2,050,000 | 2,223,858 | |
| Series 2017, 4% 8/15/42 | 605,000 | 528,605 | |
| Series 2019 A2, 5% 8/1/44 | 340,000 | 350,090 | |
| Washington Higher Ed. Facilities Auth. Rev.: | |||
| (Gonzaga Univ. Proj.) Series 2019 A, 3% 4/1/49 | 1,280,000 | 1,000,620 | |
| (Whitman College Proj.) Series 2024, 4% 1/1/43 | 865,000 | 837,576 | |
| (Whitworth Univ. Proj.): | |||
Series 2016 A: | |||
5% 10/1/27 | 110,000 | 112,171 | |
5% 10/1/28 | 110,000 | 112,207 | |
5% 10/1/35 | 115,000 | 116,933 | |
5% 10/1/36 | 175,000 | 177,779 | |
5% 10/1/40 | 170,000 | 171,640 | |
Series 2019, 4% 10/1/49 | 1,280,000 | 1,096,139 | |
| Washington Hsg. Fin. Commission Multi-family Hsg. Rev. Bonds (Ardea At Totem Lake Apts. Proj.) Series 2023, 5%, tender 2/1/27 (b) | 1,600,000 | 1,628,206 | |
| Washington Hsg. Fin. Commission Nonprofit Rev. (Seattle Academy of Arts and Sciences Proj.) Series 2023: | |||
| 5.625% 7/1/38 (e) | 1,215,000 | 1,336,051 | |
| 5.875% 7/1/43 (e) | 1,350,000 | 1,478,107 | |
| 6.125% 7/1/53 (e) | 3,000,000 | 3,288,176 | |
TOTAL WASHINGTON | 73,418,473 | ||
| West Virginia - 1.2% | |||
| West Virginia Hosp. Fin. Auth. Hosp. Rev.: | |||
| Series 2018 A: | |||
5% 1/1/31 | 80,000 | 80,105 | |
5% 1/1/32 | 70,000 | 70,104 | |
5% 1/1/43 | 985,000 | 978,632 | |
| Series 2023 A: | |||
5% 6/1/39 | 1,125,000 | 1,219,763 | |
5% 6/1/40 | 1,030,000 | 1,107,066 | |
5% 6/1/41 | 1,030,000 | 1,103,835 | |
5% 6/1/43 | 1,830,000 | 1,942,235 | |
| Series 2023 B, 6% 9/1/53 | 11,390,000 | 12,845,954 | |
| Series 2023, 6% 9/1/48 | 3,440,000 | 3,907,235 | |
| West Virginia Parkways Auth. Series 2021: | |||
| 5% 6/1/25 | 295,000 | 299,056 | |
| 5% 6/1/26 | 295,000 | 303,979 | |
| 5% 6/1/27 | 295,000 | 309,061 | |
| 5% 6/1/28 | 440,000 | 468,276 | |
TOTAL WEST VIRGINIA | 24,635,301 | ||
| Wisconsin - 1.7% | |||
| Blue Ridge Healthcare Pub. Fin. Auth. Series 2020 A, 3% 1/1/50 | 1,290,000 | 982,455 | |
| Howard Suamico Scd Series 2021, 2% 3/1/37 | 585,000 | 449,537 | |
| Madison Gen. Oblig. Series 2019 B, 3% 10/1/36 | 1,385,000 | 1,301,086 | |
| Pub. Fin. Auth. Edl. Facilities: | |||
| Series 2018 A: | |||
5.25% 10/1/43 | 470,000 | 451,572 | |
5.25% 10/1/48 | 470,000 | 439,501 | |
| Series 2022 A: | |||
5.25% 3/1/42 | 500,000 | 515,766 | |
5.25% 3/1/47 | 2,175,000 | 2,210,294 | |
| Pub. Fin. Auth. Hosp. Rev.: | |||
| (Renown Reg'l. Med. Ctr. Proj.) Series 2020 A: | |||
4% 6/1/45 | 900,000 | 835,417 | |
5% 6/1/34 | 1,750,000 | 1,863,699 | |
| Series 2019 A, 5% 10/1/44 | 690,000 | 711,506 | |
| Series 2020 A, 3% 6/1/45 | 2,645,000 | 2,085,225 | |
| Pub. Fin. Auth. Sr. Living Rev. (Mary's Woods At Marylhurst, Inc. Proj.) Series 2017 A: | |||
| 5% 5/15/25 (e) | 45,000 | 44,986 | |
| 5% 5/15/28 (e) | 70,000 | 70,536 | |
| 5.25% 5/15/37 (e) | 50,000 | 50,474 | |
| 5.25% 5/15/42 (e) | 415,000 | 415,630 | |
| 5.25% 5/15/47 (e) | 25,000 | 24,381 | |
| 5.25% 5/15/52 (e) | 45,000 | 42,971 | |
| Pub. Fin. Auth. Wisconsin Retirement Facility Rev. Series 2018: | |||
| 5% 10/1/43 (e) | 130,000 | 127,470 | |
| 5% 10/1/48 (e) | 110,000 | 104,508 | |
| 5% 10/1/53 (e) | 90,000 | 83,855 | |
| Roseman Univ. of Health: | |||
| Series 2018 A, 5% 12/1/27 | 820,000 | 826,058 | |
| Series 2020, 5% 4/1/40 (e) | 100,000 | 103,320 | |
| Series 2021 A: | |||
3% 7/1/50 | 655,000 | 476,540 | |
4.5% 6/1/56 (e) | 2,640,000 | 2,125,375 | |
| Series 2021 B, 6.5% 6/1/56 (e) | 625,000 | 526,276 | |
| Wisconsin Gen. Oblig. Series 2021 A, 5% 5/1/36 | 1,840,000 | 1,955,640 | |
| Wisconsin Health & Edl. Facilities: | |||
| (Ascension Health Cr. Group Proj.) Series 2016 A, 5% 11/15/36 | 255,000 | 260,769 | |
| Series 2015, 3.15% 8/15/27 | 1,000,000 | 972,408 | |
| Series 2016 A: | |||
5% 2/15/28 | 120,000 | 121,379 | |
5% 2/15/29 | 155,000 | 156,792 | |
5% 2/15/30 | 170,000 | 171,937 | |
| Series 2016, 4% 12/1/46 | 1,610,000 | 1,547,420 | |
| Series 2017 A: | |||
5% 9/1/29 (Pre-Refunded to 9/1/27 @ 100) | 295,000 | 309,266 | |
5% 9/1/31 (Pre-Refunded to 9/1/27 @ 100) | 50,000 | 52,418 | |
5% 9/1/33 (Pre-Refunded to 9/1/27 @ 100) | 85,000 | 89,110 | |
5% 9/1/35 (Pre-Refunded to 9/1/27 @ 100) | 95,000 | 99,594 | |
| Series 2018, 5% 4/1/34 | 585,000 | 615,687 | |
| Series 2019 A: | |||
5% 11/1/26 | 105,000 | 103,880 | |
5% 11/1/46 | 300,000 | 263,328 | |
| Series 2019 B1, 2.825% 11/1/28 | 30,000 | 27,817 | |
| Series 2019: | |||
5% 10/1/30 | 120,000 | 128,768 | |
5% 10/1/32 | 250,000 | 267,585 | |
| Wisconsin Health & Edl. Facilities Auth. Rev.: | |||
| Bonds: | |||
Series 2018 C4, 5%, tender 6/22/29 (b) | 850,000 | 911,313 | |
Series 2018, 5%, tender 6/22/29 (b) | 1,235,000 | 1,324,668 | |
| Series 2021, 3% 8/15/51 | 6,800,000 | 5,093,998 | |
| Series 2024 A: | |||
4.5% 2/15/54 | 795,000 | 787,738 | |
5.5% 2/15/54 | 850,000 | 903,700 | |
| Wisconsin Hsg. & Econ. Dev. Auth. Series 2021 C, 3% 9/1/52 | 390,000 | 376,115 | |
| Wisconsin Hsg. & Econ. Dev. Auth. Hsg. Rev. Bonds: | |||
| Series 2021 C, 0.81%, tender 5/1/25 (b) | 265,000 | 255,522 | |
| Series 2023 E, 3.875%, tender 5/1/27 (b) | 1,365,000 | 1,360,052 | |
TOTAL WISCONSIN | 35,025,342 | ||
| TOTAL MUNICIPAL BONDS (Cost $1,977,431,349) | 1,988,729,449 | ||
| Money Market Funds - 5.0% | |||
| Shares | Value ($) | ||
Fidelity Municipal Cash Central Fund 4.33% (k)(l) (Cost $104,717,647) | 104,696,705 | 104,717,623 | |
| TOTAL INVESTMENT IN SECURITIES - 99.5% (Cost $2,082,148,996) | 2,093,447,072 |
NET OTHER ASSETS (LIABILITIES) - 0.5% | 10,109,920 |
| NET ASSETS - 100.0% | 2,103,556,992 |
| (a) | Amount is stated in United States dollars unless otherwise noted. |
| (b) | Coupon rates for floating and adjustable rate securities reflect the rates in effect at period end. |
| (c) | Private activity obligations whose interest is subject to the federal alternative minimum tax for individuals. |
| (d) | Coupon is indexed to a floating interest rate which may be multiplied by a specified factor and/or subject to caps or floors. |
| (e) | Security exempt from registration under Rule 144A of the Securities Act of 1933. These securities may be resold in transactions exempt from registration, normally to qualified institutional buyers. At the end of the period, the value of these securities amounted to $24,592,954 or 1.2% of net assets. |
| (f) | Non-income producing - Security is in default. |
| (g) | Level 3 security |
| (h) | Security initially issued in zero coupon form which converts to coupon form at a specified rate and date. The rate shown is the rate at period end. |
| (i) | Security or a portion of the security purchased on a delayed delivery or when-issued basis. |
| (j) | Security initially issued at one coupon which converts to a higher coupon at a specified date. The rate shown is the rate at period end. |
| (k) | Information in this report regarding holdings by state and security types does not reflect the holdings of the Fidelity Municipal Cash Central Fund. |
| (l) | Affiliated fund that is generally available only to investment companies and other accounts managed by Fidelity Investments. The rate quoted is the annualized seven-day yield of the fund at period end. A complete unaudited listing of the fund's holdings as of its most recent quarter end is available upon request. In addition, each Fidelity Central Fund's financial statements are available on the SEC's website or upon request. |
| Affiliate | Value, beginning of period ($) | Purchases ($) | Sales Proceeds ($) | Dividend Income ($) | Realized Gain (loss) ($) | Change in Unrealized appreciation (depreciation) ($) | Value, end of period ($) | % ownership, end of period |
| Fidelity Municipal Cash Central Fund 4.33% | 158,260,767 | 389,722,565 | 443,269,351 | 1,644,902 | 3,655 | (13) | 104,717,623 | 5.5% |
| Total | 158,260,767 | 389,722,565 | 443,269,351 | 1,644,902 | 3,655 | (13) | 104,717,623 | |
| Valuation Inputs at Reporting Date: | ||||
| Description | Total ($) | Level 1 ($) | Level 2 ($) | Level 3 ($) |
Investments in Securities: | ||||
| Municipal Securities | 1,988,729,449 | - | 1,988,651,196 | 78,253 |
| Money Market Funds | 104,717,623 | 104,717,623 | - | - |
| Total Investments in Securities: | 2,093,447,072 | 104,717,623 | 1,988,651,196 | 78,253 |
| Statement of Assets and Liabilities | ||||
June 30, 2024 (Unaudited) | ||||
| Assets | ||||
| Investment in securities, at value - See accompanying schedule: | ||||
Unaffiliated issuers (cost $1,977,431,349) | $ | 1,988,729,449 | ||
Fidelity Central Funds (cost $104,717,647) | 104,717,623 | |||
| Total Investment in Securities (cost $2,082,148,996) | $ | 2,093,447,072 | ||
| Cash | 9,510 | |||
| Receivable for fund shares sold | 7,510,836 | |||
| Interest receivable | 24,201,361 | |||
| Distributions receivable from Fidelity Central Funds | 194,978 | |||
| Other receivables | 1,033 | |||
Total assets | 2,125,364,790 | |||
| Liabilities | ||||
| Payable for investments purchased | ||||
Regular delivery | $ | 1,678,545 | ||
Delayed delivery | 12,364,370 | |||
| Payable for fund shares redeemed | 1,770,449 | |||
| Distributions payable | 5,378,005 | |||
| Accrued management fee | 567,027 | |||
| Other payables and accrued expenses | 49,402 | |||
| Total liabilities | 21,807,798 | |||
| Net Assets | $ | 2,103,556,992 | ||
| Net Assets consist of: | ||||
| Paid in capital | $ | 2,100,966,174 | ||
| Total accumulated earnings (loss) | 2,590,818 | |||
| Net Assets | $ | 2,103,556,992 | ||
Net Asset Value, offering price and redemption price per share ($2,103,556,992 ÷ 213,267,415 shares) | $ | 9.86 | ||
| Statement of Operations | ||||
Six months ended June 30, 2024 (Unaudited) | ||||
| Investment Income | ||||
| Interest | $ | 35,163,653 | ||
| Income from Fidelity Central Funds | 1,644,902 | |||
| Total income | 36,808,555 | |||
| Expenses | ||||
| Management fee | $ | 3,364,666 | ||
| Custodian fees and expenses | 13,170 | |||
| Independent trustees' fees and expenses | 2,629 | |||
| Registration fees | 32,475 | |||
| Audit | 35,091 | |||
| Legal | 916 | |||
| Miscellaneous | 9,065 | |||
| Total expenses before reductions | 3,458,012 | |||
| Expense reductions | (45,810) | |||
| Total expenses after reductions | 3,412,202 | |||
| Net Investment income (loss) | 33,396,353 | |||
| Realized and Unrealized Gain (Loss) | ||||
| Net realized gain (loss) on: | ||||
| Investment Securities: | ||||
| Unaffiliated issuers | (411,615) | |||
| Fidelity Central Funds | 3,655 | |||
| Total net realized gain (loss) | (407,960) | |||
| Change in net unrealized appreciation (depreciation) on: | ||||
| Investment Securities: | ||||
| Unaffiliated issuers | (24,609,153) | |||
| Fidelity Central Funds | (13) | |||
| Total change in net unrealized appreciation (depreciation) | (24,609,166) | |||
| Net gain (loss) | (25,017,126) | |||
| Net increase (decrease) in net assets resulting from operations | $ | 8,379,227 | ||
| Statement of Changes in Net Assets | ||||
Six months ended June 30, 2024 (Unaudited) | Year ended December 31, 2023 | |||
| Increase (Decrease) in Net Assets | ||||
| Operations | ||||
| Net investment income (loss) | $ | 33,396,353 | $ | 46,560,140 |
| Net realized gain (loss) | (407,960) | 3,794,109 | ||
| Change in net unrealized appreciation (depreciation) | (24,609,166) | 77,889,625 | ||
| Net increase (decrease) in net assets resulting from operations | 8,379,227 | 128,243,874 | ||
| Distributions to shareholders | (32,197,264) | (45,020,842) | ||
| Share transactions | ||||
| Proceeds from sales of shares | 552,370,638 | 1,739,362,521 | ||
| Reinvestment of distributions | 11,501 | 27,360 | ||
| Cost of shares redeemed | (347,936,501) | (1,006,088,915) | ||
Net increase (decrease) in net assets resulting from share transactions | 204,445,638 | 733,300,966 | ||
| Total increase (decrease) in net assets | 180,627,601 | 816,523,998 | ||
| Net Assets | ||||
| Beginning of period | 1,922,929,391 | 1,106,405,393 | ||
| End of period | $ | 2,103,556,992 | $ | 1,922,929,391 |
| Other Information | ||||
| Shares | ||||
| Sold | 55,967,762 | 183,901,067 | ||
| Issued in reinvestment of distributions | 1,167 | 2,825 | ||
| Redeemed | (35,257,527) | (106,852,724) | ||
| Net increase (decrease) | 20,711,402 | 77,051,168 | ||
Fidelity® SAI Municipal Income Fund |
Six months ended (Unaudited) June 30, 2024 | Years ended December 31, 2023 | 2022 | 2021 | 2020 | 2019 | |||||||
Selected Per-Share Data | ||||||||||||
| Net asset value, beginning of period | $ | 9.99 | $ | 9.58 | $ | 10.88 | $ | 10.85 | $ | 10.70 | $ | 10.20 |
| Income from Investment Operations | ||||||||||||
Net investment income (loss) A,B | .164 | .310 | .218 | .203 | .265 | .296 | ||||||
| Net realized and unrealized gain (loss) | (.135) | .399 | (1.297) | .048 | .183 | .564 | ||||||
| Total from investment operations | .029 | .709 | (1.079) | .251 | .448 | .860 | ||||||
| Distributions from net investment income | (.159) | (.299) | (.221) | (.207) | (.266) | (.296) | ||||||
| Distributions from net realized gain | - | - | - | (.014) | (.032) | (.064) | ||||||
| Total distributions | (.159) | (.299) | (.221) | (.221) | (.298) | (.360) | ||||||
| Net asset value, end of period | $ | 9.86 | $ | 9.99 | $ | 9.58 | $ | 10.88 | $ | 10.85 | $ | 10.70 |
Total Return C,D | .30 % | 7.55% | (9.94)% | 2.33% | 4.27% | 8.51% | ||||||
Ratios to Average Net Assets B,E,F | ||||||||||||
| Expenses before reductions | .35% G | .37% | .38% | .36% | .37% | .44% | ||||||
| Expenses net of fee waivers, if any | .34 % G | .36% | .36% | .36% | .36% | .36% | ||||||
| Expenses net of all reductions | .34% G | .36% | .36% | .36% | .36% | .36% | ||||||
| Net investment income (loss) | 3.35% G | 3.22% | 2.16% | 1.87% | 2.49% | 2.80% | ||||||
| Supplemental Data | ||||||||||||
| Net assets, end of period (000 omitted) | $ | 2,103,557 | $ | 1,922,929 | $ | 1,106,405 | $ | 2,513,106 | $ | 1,586,052 | $ | 1,258,733 |
Portfolio turnover rate H | 7 % G | 14% | 26% I | 4% | 17% | 21% |
| Fidelity Central Fund | Investment Manager | Investment Objective | Investment Practices | Expense RatioA |
| Fidelity Money Market Central Funds | Fidelity Management & Research Company LLC (FMR) | Each fund seeks to obtain a high level of current income consistent with the preservation of capital and liquidity. | Short-term Investments | Less than .005% |
| Gross unrealized appreciation | $55,368,835 |
| Gross unrealized depreciation | (41,181,562) |
| Net unrealized appreciation (depreciation) | $14,187,273 |
| Tax cost | $2,079,259,799 |
Short-term | $(4,259,870) |
Long-term | (7,041,077) |
| Total capital loss carryforward | $(11,300,947) |
| Purchases ($) | Sales ($) | |
| Fidelity SAI Municipal Income Fund | 316,563,565 | 61,832,213 |
| Purchases ($) | Sales ($) | Realized Gain (Loss)($) | |
| Fidelity SAI Municipal Income Fund | 33,503,019 | - | - |
| Amount ($) | |
| Fidelity SAI Municipal Income Fund | 1,747 |
 |


Contents
| U.S. Treasury Inflation-Protected Obligations - 99.3% | |||
Principal Amount (a) | Value ($) | ||
| U.S. Treasury Inflation-Indexed Bonds: | |||
| 0.125% 2/15/51 | 153,525,580 | 88,865,229 | |
| 0.125% 2/15/52 | 150,705,630 | 85,663,218 | |
| 0.25% 2/15/50 | 157,077,026 | 95,988,471 | |
| 0.625% 2/15/43 | 120,541,787 | 90,576,993 | |
| 0.75% 2/15/42 | 158,316,341 | 123,762,568 | |
| 0.75% 2/15/45 | 191,429,967 | 143,496,348 | |
| 0.875% 2/15/47 | 127,045,088 | 95,465,740 | |
| 1% 2/15/46 | 63,270,943 | 49,405,587 | |
| 1% 2/15/48 | 80,468,149 | 61,654,102 | |
| 1% 2/15/49 | 13,387,454 | 10,176,223 | |
| 1.375% 2/15/44 | 167,525,573 | 143,665,312 | |
| 1.75% 1/15/28 | 96,219,418 | 94,676,450 | |
| 2% 1/15/26 | 117,218,934 | 115,760,481 | |
| 2.125% 2/15/40 | 84,408,685 | 83,589,886 | |
| 2.125% 2/15/41 | 66,305,732 | 65,777,382 | |
| 2.125% 2/15/54 | 73,763,130 | 71,768,108 | |
| 2.375% 1/15/27 | 171,530,200 | 171,413,517 | |
| 2.5% 1/15/29 | 160,533,010 | 163,329,251 | |
| 3.375% 4/15/32 | 20,925,604 | 22,845,966 | |
| 3.625% 4/15/28 | 271,666,248 | 285,474,576 | |
| 3.875% 4/15/29 | 105,786,487 | 114,255,370 | |
| U.S. Treasury Inflation-Indexed Notes: | |||
| 0.125% 10/15/25 | 317,596,944 | 307,068,370 | |
| 0.125% 4/15/26 | 190,189,270 | 181,642,955 | |
| 0.125% 7/15/26 | 172,868,004 | 165,215,119 | |
| 0.125% 10/15/26 | 289,245,528 | 275,255,255 | |
| 0.125% 4/15/27 | 327,600,450 | 308,182,127 | |
| 0.125% 1/15/30 | 298,023,327 | 268,215,064 | |
| 0.125% 7/15/30 | 310,402,870 | 277,740,471 | |
| 0.125% 1/15/31 | 280,157,147 | 247,296,624 | |
| 0.125% 7/15/31 | 347,812,246 | 305,433,918 | |
| 0.125% 1/15/32 | 302,571,925 | 261,975,067 | |
| 0.25% 7/15/29 | 284,176,255 | 260,928,552 | |
| 0.375% 7/15/25 | 254,986,986 | 248,508,658 | |
| 0.375% 1/15/27 | 255,256,931 | 242,579,782 | |
| 0.375% 7/15/27 | 220,136,743 | 208,867,766 | |
| 0.5% 1/15/28 | 325,800,830 | 306,953,663 | |
| 0.625% 1/15/26 | 360,478,906 | 348,660,994 | |
| 0.625% 7/15/32 | 399,720,864 | 358,450,580 | |
| 0.75% 7/15/28 | 238,301,458 | 226,420,685 | |
| 0.875% 1/15/29 | 182,590,874 | 172,960,844 | |
| 1.125% 1/15/33 | 331,045,845 | 306,310,909 | |
| 1.25% 4/15/28 | 180,321,150 | 174,130,912 | |
| 1.375% 7/15/33 | 367,224,680 | 346,788,190 | |
| 1.5% 2/15/53 | 85,756,866 | 72,094,606 | |
| 1.625% 10/15/27 | 238,473,291 | 234,546,740 | |
| 1.75% 1/15/34 | 362,314,656 | 351,609,266 | |
| 2.375% 10/15/28 | 214,768,064 | 217,550,863 | |
| U.S. Treasury Notes U.S. Treasury Inflation-Indexed Notes 2.125% 4/15/29 | 253,169,004 | 253,443,889 | |
| TOTAL U.S. TREASURY INFLATION-PROTECTED OBLIGATIONS (Cost $9,842,219,429) | 9,106,442,647 | ||
| Money Market Funds - 0.0% | |||
| Shares | Value ($) | ||
Fidelity Cash Central Fund 5.38% (b) (Cost $642,477) | 642,349 | 642,477 | |
| TOTAL INVESTMENT IN SECURITIES - 99.3% (Cost $9,842,861,906) | 9,107,085,124 |
NET OTHER ASSETS (LIABILITIES) - 0.7% | 68,330,808 |
| NET ASSETS - 100.0% | 9,175,415,932 |
| (a) | Amount is stated in United States dollars unless otherwise noted. |
| (b) | Affiliated fund that is generally available only to investment companies and other accounts managed by Fidelity Investments. The rate quoted is the annualized seven-day yield of the fund at period end. A complete unaudited listing of the fund's holdings as of its most recent quarter end is available upon request. In addition, each Fidelity Central Fund's financial statements are available on the SEC's website or upon request. |
| Affiliate | Value, beginning of period ($) | Purchases ($) | Sales Proceeds ($) | Dividend Income ($) | Realized Gain (loss) ($) | Change in Unrealized appreciation (depreciation) ($) | Value, end of period ($) | % ownership, end of period |
| Fidelity Cash Central Fund 5.38% | 1,490,620 | 400,578,256 | 401,427,560 | 214,087 | 1,161 | - | 642,477 | 0.0% |
| Fidelity Securities Lending Cash Central Fund 5.38% | - | 255,522,126 | 255,522,126 | 946 | - | - | - | 0.0% |
| Total | 1,490,620 | 656,100,382 | 656,949,686 | 215,033 | 1,161 | - | 642,477 | |
| Valuation Inputs at Reporting Date: | ||||
| Description | Total ($) | Level 1 ($) | Level 2 ($) | Level 3 ($) |
Investments in Securities: | ||||
| U.S. Government and Government Agency Obligations | 9,106,442,647 | - | 9,106,442,647 | - |
| Money Market Funds | 642,477 | 642,477 | - | - |
| Total Investments in Securities: | 9,107,085,124 | 642,477 | 9,106,442,647 | - |
| Statement of Assets and Liabilities | ||||
June 30, 2024 (Unaudited) | ||||
| Assets | ||||
| Investment in securities, at value - See accompanying schedule: | ||||
Unaffiliated issuers (cost $9,842,219,429) | $ | 9,106,442,647 | ||
Fidelity Central Funds (cost $642,477) | 642,477 | |||
| Total Investment in Securities (cost $9,842,861,906) | $ | 9,107,085,124 | ||
| Receivable for investments sold | 130,518,874 | |||
| Receivable for fund shares sold | 15,681,151 | |||
| Interest receivable | 32,455,882 | |||
| Distributions receivable from Fidelity Central Funds | 23,160 | |||
| Other receivables | 45,513 | |||
Total assets | 9,285,809,704 | |||
| Liabilities | ||||
| Payable for investments purchased | $ | 102,702,258 | ||
| Payable for fund shares redeemed | 7,262,177 | |||
| Accrued management fee | 383,824 | |||
| Other payables and accrued expenses | 45,513 | |||
| Total liabilities | 110,393,772 | |||
| Net Assets | $ | 9,175,415,932 | ||
| Net Assets consist of: | ||||
| Paid in capital | $ | 10,397,583,002 | ||
| Total accumulated earnings (loss) | (1,222,167,070) | |||
| Net Assets | $ | 9,175,415,932 | ||
Net Asset Value, offering price and redemption price per share ($9,175,415,932 ÷ 1,007,664,514 shares) | $ | 9.11 | ||
| Statement of Operations | ||||
Six months ended June 30, 2024 (Unaudited) | ||||
| Investment Income | ||||
| Interest | $ | 231,242,202 | ||
| Income from Fidelity Central Funds (including $946 from security lending) | 215,033 | |||
| Total income | 231,457,235 | |||
| Expenses | ||||
| Management fee | $ | 2,345,247 | ||
| Independent trustees' fees and expenses | 12,646 | |||
| Total expenses | 2,357,893 | |||
| Net Investment income (loss) | 229,099,342 | |||
| Realized and Unrealized Gain (Loss) | ||||
| Net realized gain (loss) on: | ||||
| Investment Securities: | ||||
| Unaffiliated issuers | (159,862,440) | |||
| Fidelity Central Funds | 1,161 | |||
| Total net realized gain (loss) | (159,861,279) | |||
| Change in net unrealized appreciation (depreciation) on investment securities | 8,233,755 | |||
| Net gain (loss) | (151,627,524) | |||
| Net increase (decrease) in net assets resulting from operations | $ | 77,471,818 | ||
| Statement of Changes in Net Assets | ||||
Six months ended June 30, 2024 (Unaudited) | Year ended December 31, 2023 | |||
| Increase (Decrease) in Net Assets | ||||
| Operations | ||||
| Net investment income (loss) | $ | 229,099,342 | $ | 352,666,349 |
| Net realized gain (loss) | (159,861,279) | (253,420,844) | ||
| Change in net unrealized appreciation (depreciation) | 8,233,755 | 244,668,807 | ||
| Net increase (decrease) in net assets resulting from operations | 77,471,818 | 343,914,312 | ||
| Distributions to shareholders | (15,907,379) | (341,253,951) | ||
| Share transactions | ||||
| Proceeds from sales of shares | 1,133,490,854 | 3,806,760,471 | ||
| Reinvestment of distributions | 14,434,167 | 309,979,635 | ||
| Cost of shares redeemed | (1,810,971,803) | (3,598,552,766) | ||
Net increase (decrease) in net assets resulting from share transactions | (663,046,782) | 518,187,340 | ||
| Total increase (decrease) in net assets | (601,482,343) | 520,847,701 | ||
| Net Assets | ||||
| Beginning of period | 9,776,898,275 | 9,256,050,574 | ||
| End of period | $ | 9,175,415,932 | $ | 9,776,898,275 |
| Other Information | ||||
| Shares | ||||
| Sold | 125,456,804 | 414,265,082 | ||
| Issued in reinvestment of distributions | 1,606,897 | 34,208,107 | ||
| Redeemed | (200,817,678) | (393,122,773) | ||
| Net increase (decrease) | (73,753,977) | 55,350,416 | ||
Fidelity® Inflation-Protected Bond Index Fund |
Six months ended (Unaudited) June 30, 2024 | Years ended December 31, 2023 | 2022 | 2021 | 2020 | 2019 | |||||||
Selected Per-Share Data | ||||||||||||
| Net asset value, beginning of period | $ | 9.04 | $ | 9.02 | $ | 11.16 | $ | 11.04 | $ | 10.08 | $ | 9.49 |
| Income from Investment Operations | ||||||||||||
Net investment income (loss) A,B | .220 | .346 | .748 | .593 | .157 | .233 | ||||||
| Net realized and unrealized gain (loss) | (.135) | (.005) | (2.088) | .058 | .940 | .555 | ||||||
| Total from investment operations | .085 | .341 | (1.340) | .651 | 1.097 | .788 | ||||||
| Distributions from net investment income | (.015) | (.321) | (.800) | (.531) | (.027) | (.041) | ||||||
| Distributions from net realized gain | - | - | - | - | (.110) | (.157) | ||||||
| Total distributions | (.015) | (.321) | (.800) | (.531) | (.137) | (.198) | ||||||
| Net asset value, end of period | $ | 9.11 | $ | 9.04 | $ | 9.02 | $ | 11.16 | $ | 11.04 | $ | 10.08 |
Total Return C,D | .94 % | 3.78% | (12.05)% | 5.93% | 10.90% | 8.31% | ||||||
Ratios to Average Net Assets B,E,F | ||||||||||||
| Expenses before reductions | .05% G | .05% | .05% | .05% | .05% | .05% | ||||||
| Expenses net of fee waivers, if any | .05 % G | .05% | .05% | .05% | .05% | .05% | ||||||
| Expenses net of all reductions | .05% G | .05% | .05% | .05% | .05% | .05% | ||||||
| Net investment income (loss) | 4.91% G | 3.78% | 7.22% | 5.27% | 1.47% | 2.34% | ||||||
| Supplemental Data | ||||||||||||
| Net assets, end of period (000 omitted) | $ | 9,175,416 | $ | 9,776,898 | $ | 9,256,051 | $ | 11,771,837 | $ | 8,950,534 | $ | 7,066,927 |
Portfolio turnover rate H | 22 % G | 31% | 28% | 22% | 31% | 33% |
| Fidelity Central Fund | Investment Manager | Investment Objective | Investment Practices | Expense RatioA |
| Fidelity Money Market Central Funds | Fidelity Management & Research Company LLC (FMR) | Each fund seeks to obtain a high level of current income consistent with the preservation of capital and liquidity. | Short-term Investments | Less than .005% |
| Fidelity Inflation-Protected Bond Index Fund | $45,513 |
| Gross unrealized appreciation | $10,126,483 |
| Gross unrealized depreciation | (739,809,962) |
| Net unrealized appreciation (depreciation) | $(729,683,479) |
| Tax cost | $9,836,768,603 |
Short-term | $(170,169,911) |
Long-term | (311,726,373) |
| Total capital loss carryforward | $(481,896,284) |
| Total Security Lending Fees Paid to NFS ($) | Security Lending Income From Securities Loaned to NFS ($) | Value of Securities Loaned to NFS at Period End ($) | |
| Fidelity Inflation-Protected Bond Index Fund | 104 | - | - |
 |


Contents
| Nonconvertible Bonds - 24.9% | |||
Principal Amount (a) | Value ($) | ||
| Australia - 0.9% | |||
| Amcor UK Finance PLC 1.125% 6/23/27 | EUR | 1,384,000 | 1,377,448 |
| APA Infrastructure Ltd. 2% 7/15/30 (Reg. S) | EUR | 110,000 | 105,578 |
| AusNet Services Holdings Pty Ltd. 1.625% 3/11/81 (Reg. S) (b) | EUR | 100,000 | 99,481 |
| Australia & New Zealand Banking Group Ltd.: | |||
| 1.125% 11/21/29 (Reg. S) (b) | EUR | 260,000 | 274,716 |
| 1.65% 1/16/25 | AUD | 160,000 | 104,905 |
| 5.906% 8/12/32 (b) | AUD | 330,000 | 221,779 |
| Australian Capital Territory 5.25% 10/23/36 | AUD | 110,000 | 73,046 |
| Commonwealth Bank of Australia: | |||
| Australian Bank Bill 3 Months Rate + 2.700% 6.86% 11/9/32 (Reg. S) (b)(c) | AUD | 230,000 | 159,085 |
| 0.125% 10/15/29 (Reg. S) | EUR | 120,000 | 109,420 |
| 4.2% 8/18/25 | AUD | 580,000 | 383,981 |
| Glencore Capital Finance DAC 0.75% 3/1/29 (Reg. S) | EUR | 100,000 | 93,247 |
| Macquarie Bank Ltd. 1.125% 12/15/25 (Reg. S) | GBP | 110,000 | 130,940 |
| Macquarie Group Ltd. 0.943% 1/19/29 (Reg. S) | EUR | 120,000 | 113,917 |
| National Australia Bank Ltd.: | |||
| 2.125% 5/24/28 (Reg. S) | EUR | 160,000 | 163,802 |
| 2.347% 8/30/29 | EUR | 130,000 | 133,382 |
| 6.163% 3/9/33 (b) | AUD | 120,000 | 81,177 |
| NBN Co. Ltd. 4.125% 3/15/29 (Reg. S) | EUR | 100,000 | 110,224 |
| New South Wales Treasury Corp.: | |||
| 1.75% 3/20/34 (Reg. S) | AUD | 840,000 | 420,287 |
| 2% 3/20/31 | AUD | 1,106,000 | 624,949 |
| 3% 4/20/29 (Reg. S) | AUD | 860,000 | 538,262 |
| Sydney Airport Finance Co. Property Ltd. 1.75% 4/26/28 (Reg. S) | EUR | 100,000 | 99,951 |
| Telstra Group Ltd. 4.9% 3/8/28 | AUD | 220,000 | 146,240 |
| Transurban Finance Co. Pty Ltd. 3.713% 3/12/32 (Reg. S) | EUR | 100,000 | 106,643 |
| Treasury Corp. of Victoria 5.25% 9/15/38 | AUD | 410,000 | 266,642 |
| Western Australia Treasury Corp. 3% 10/21/26 | AUD | 1,842,000 | 1,192,032 |
| Westpac Banking Corp.: | |||
| 4.6% 2/16/26 | AUD | 300,000 | 198,900 |
| 5.754% 4/3/34 (b) | AUD | 100,000 | 66,456 |
TOTAL AUSTRALIA | 7,396,490 | ||
| Austria - 0.3% | |||
| Autobahn Schnell AG 0.1% 7/16/35 (Reg. S) | EUR | 710,000 | 546,025 |
| BAWAG PSK Bank fuer Arbeit und Wirtschaft und Oesterreichische Postsparkasse AG 0.1% 5/12/31 | EUR | 300,000 | 259,202 |
| Erste Group Bank AG: | |||
| 0.01% 9/11/29 (Reg. S) | EUR | 400,000 | 362,757 |
| 0.25% 9/14/29 (Reg. S) | EUR | 100,000 | 91,209 |
| 1% 6/10/30 (Reg. S) (b) | EUR | 100,000 | 103,403 |
| Oesterreichische Kontrollbank AG 0.5% 12/15/25 (Reg. S) | GBP | 152,000 | 180,265 |
| OMV AG 2.375% 4/9/32 (Reg. S) | EUR | 76,000 | 76,384 |
| Raiffeisen International Bank-Holding AG: | |||
| 1.5% 3/12/30 (Reg. S) (b) | EUR | 100,000 | 102,864 |
| 4.75% 1/26/27 (Reg. S) (b) | EUR | 200,000 | 215,994 |
| Raiffeisenlandesbank Niederoes 2.375% 8/31/32 (Reg. S) | EUR | 100,000 | 99,983 |
TOTAL AUSTRIA | 2,038,086 | ||
| Belgium - 0.3% | |||
| Anheuser-Busch InBev SA NV: | |||
| 1.5% 4/18/30 (Reg. S) | EUR | 49,000 | 47,717 |
| 2% 3/17/28 (Reg. S) | EUR | 23,000 | 23,642 |
| 2.25% 5/24/29 (Reg. S) | GBP | 53,000 | 60,653 |
| 2.85% 5/25/37 (Reg. S) | GBP | 200,000 | 203,413 |
| 3.7% 4/2/40 (Reg. S) | EUR | 231,000 | 240,814 |
| Belfius Bank SA/NV: | |||
| 0% 8/28/26 (Reg. S) | EUR | 100,000 | 99,198 |
| 5.25% 4/19/33 (Reg. S) (b) | EUR | 100,000 | 109,614 |
| Communaute Francaise 1.625% 5/3/32 (Reg. S) | EUR | 100,000 | 94,568 |
| Dexia SA: | |||
| 0.625% 1/17/26 (Reg. S) | EUR | 500,000 | 513,507 |
| 1% 10/18/27 (Reg. S) | EUR | 100,000 | 100,075 |
| 1.25% 7/21/25 (Reg. S) | GBP | 200,000 | 242,733 |
| Elia Transmission Belgium SA 0.875% 4/28/30 (Reg. S) | EUR | 100,000 | 91,912 |
| Fluvius System Operator CVBA 0.25% 6/14/28 (Reg. S) | EUR | 200,000 | 189,345 |
| KBC Group NV: | |||
| 0.125% 1/14/29 (Reg. S) (b) | EUR | 200,000 | 188,804 |
| 0.5% 12/3/29 (b) | EUR | 100,000 | 105,221 |
| 4.375% 4/19/30 (Reg. S) (b) | EUR | 100,000 | 109,808 |
| Walloon Region 1.25% 5/3/34 (Reg. S) | EUR | 400,000 | 348,731 |
TOTAL BELGIUM | 2,769,755 | ||
| Canada - 2.4% | |||
| 407 International, Inc.: | |||
| 2.84% 3/7/50 | CAD | 73,000 | 37,544 |
| 3.65% 9/8/44 | CAD | 295,000 | 180,903 |
| Allied Properties (REIT) 3.113% 4/8/27 | CAD | 110,000 | 73,971 |
| Altalink LP 3.717% 12/3/46 | CAD | 338,000 | 208,512 |
| Bank of Montreal: | |||
| 3.19% 3/1/28 | CAD | 585,000 | 412,534 |
| 6.034% 9/7/33 (b) | CAD | 60,000 | 45,551 |
| Bank of Nova Scotia: | |||
| 0.01% 1/14/27 (Reg. S) | EUR | 500,000 | 492,793 |
| 0.25% 11/1/28 (Reg. S) | EUR | 140,000 | 129,981 |
| 3.1% 2/2/28 | CAD | 85,000 | 59,819 |
| 5.5% 12/29/25 | CAD | 840,000 | 620,177 |
| 5.679% 8/2/33 (b) | CAD | 80,000 | 59,950 |
| Bell Canada 4.45% 2/27/47 | CAD | 40,000 | 25,301 |
| Brookfield Corp. 3.8% 3/16/27 | CAD | 260,000 | 186,758 |
| Brookfield Infrastructure Finance ULC 5.98% 2/14/33 | CAD | 90,000 | 69,151 |
| Brookfield Renewable Partners ULC 5.84% 11/5/36 | CAD | 80,000 | 61,150 |
| Canada Housing Trust No. 1: | |||
| 1.6% 12/15/31 (d) | CAD | 320,000 | 201,120 |
| 1.9% 9/15/26 (d) | CAD | 480,000 | 335,904 |
| Canadian Imperial Bank of Commerce: | |||
| 0.01% 4/30/29 (Reg. S) | EUR | 3,019,000 | 2,770,890 |
| 1.7% 7/15/26 | CAD | 498,000 | 344,532 |
| 5.33% 1/20/33 (b) | CAD | 150,000 | 110,676 |
| Canadian National Railway Co. 3.6% 8/1/47 | CAD | 229,000 | 136,966 |
| Choice Properties REIT: | |||
| 4.178% 3/8/28 | CAD | 128,000 | 91,963 |
| 5.03% 2/28/31 | CAD | 60,000 | 44,147 |
| City of Montreal 4.4% 12/1/43 | CAD | 50,000 | 35,277 |
| CPPIB Capital, Inc.: | |||
| 1.25% 12/7/27 (Reg. S) | GBP | 544,000 | 616,792 |
| 3% 6/15/28 | CAD | 1,310,000 | 928,141 |
| 4.2% 5/2/28 (Reg. S) | AUD | 90,000 | 58,900 |
| CU, Inc. 3.548% 11/22/47 | CAD | 280,000 | 166,287 |
| Enbridge Gas, Inc. 3.65% 4/1/50 | CAD | 290,000 | 171,982 |
| Enbridge Pipelines, Inc. 4.13% 8/9/46 | CAD | 406,000 | 245,315 |
| EPCOR Utilities, Inc. 3.554% 11/27/47 | CAD | 571,000 | 339,607 |
| Fairfax Financial Holdings Ltd. 4.7% 12/16/26 | CAD | 234,000 | 170,390 |
| Federation des caisses Desjardin: | |||
| 5.279% 5/15/34 (b) | CAD | 50,000 | 36,971 |
| 5.467% 11/17/28 | CAD | 80,000 | 60,352 |
| FortisAlberta, Inc. 2.632% 6/8/51 | CAD | 50,000 | 24,475 |
| FortisBC Energy., Inc. 2.82% 8/9/49 | CAD | 70,000 | 36,080 |
| Great-West Lifeco, Inc. 5.998% 11/16/39 | CAD | 50,000 | 40,164 |
| Greater Toronto Airports Authority 2.75% 10/17/39 | CAD | 516,000 | 293,577 |
| Hydro One, Inc.: | |||
| 1.69% 1/16/31 | CAD | 417,000 | 259,695 |
| 3.02% 4/5/29 | CAD | 30,000 | 20,767 |
| 4.46% 1/27/53 | CAD | 110,000 | 75,224 |
| 5.36% 5/20/36 | CAD | 50,000 | 38,096 |
| Hydro-Quebec: | |||
| 2.1% 2/15/60 | CAD | 70,000 | 30,753 |
| 4% 2/15/55 | CAD | 220,000 | 150,916 |
| 4% 2/15/63 | CAD | 500,000 | 344,315 |
| 5% 2/15/50 | CAD | 170,000 | 136,328 |
| Intact Financial Corp. 4.653% 5/16/34 (b) | CAD | 190,000 | 140,170 |
| Inter Pipeline Ltd. 4.232% 6/1/27 | CAD | 1,526,000 | 1,090,113 |
| Keyera Corp. 3.959% 5/29/30 | CAD | 761,000 | 530,122 |
| Manulife Financial Corp. 2.237% 5/12/30 (b) | CAD | 460,000 | 328,300 |
| National Bank of Canada 2.237% 11/4/26 | CAD | 360,000 | 249,512 |
| North West Redwater Partnership/NWR Financing Co. Ltd. 4.35% 1/10/39 | CAD | 591,000 | 399,956 |
| Nova Scotia Power, Inc. 5.67% 11/14/35 | CAD | 90,000 | 67,380 |
| Nova Scotia Province 3.45% 6/1/45 | CAD | 150,000 | 94,020 |
| Ontario Power Generation, Inc.: | |||
| 2.893% 4/8/25 | CAD | 390,000 | 280,947 |
| 3.215% 4/8/30 | CAD | 100,000 | 68,514 |
| 4.248% 1/18/49 | CAD | 50,000 | 32,507 |
| Ontario Teachers' Finance Trust 0.95% 11/24/51 (Reg. S) | EUR | 110,000 | 63,588 |
| Pembina Pipeline Corp. 4.74% 1/21/47 | CAD | 402,000 | 259,748 |
| PSP Capital, Inc. 1.5% 3/15/28 (Reg. S) | CAD | 340,000 | 228,378 |
| Rogers Communications, Inc. 2.9% 12/9/30 | CAD | 968,000 | 628,979 |
| Royal Bank of Canada: | |||
| 0.01% 1/27/31 (Reg. S) | EUR | 120,000 | 104,420 |
| 0.625% 9/10/25 (Reg. S) | EUR | 756,000 | 784,264 |
| 2.088% 6/30/30 (b) | CAD | 710,000 | 504,253 |
| 2.125% 4/26/29 (Reg. S) | EUR | 110,000 | 110,527 |
| 2.609% 11/1/24 | CAD | 102,000 | 74,004 |
| 4.612% 7/26/27 | CAD | 530,000 | 388,707 |
| 5.01% 2/1/33 (b) | CAD | 80,000 | 58,689 |
| Saskatchewan Province 3.3% 6/2/48 | CAD | 150,000 | 92,030 |
| SmartCentres (REIT) 2.307% 12/18/28 | CAD | 100,000 | 64,642 |
| Sun Life Financial, Inc.: | |||
| 2.06% 10/1/35 (b) | CAD | 110,000 | 68,426 |
| 2.58% 5/10/32 (b) | CAD | 50,000 | 34,470 |
| 2.8% 11/21/33 (b) | CAD | 50,000 | 33,788 |
| TELUS Corp. 3.95% 2/16/50 | CAD | 33,000 | 18,922 |
| The Toronto-Dominion Bank: | |||
| 1.707% 7/28/25 (Reg. S) | EUR | 360,000 | 378,718 |
| 1.943% 3/13/25 | CAD | 252,000 | 180,476 |
| 2.496% 12/2/24 | CAD | 60,000 | 43,424 |
| 3.631% 12/13/29 (Reg. S) | EUR | 320,000 | 341,216 |
| 4.68% 1/8/29 | CAD | 350,000 | 256,598 |
| 5.177% 4/9/34 (b) | CAD | 80,000 | 59,037 |
| Toronto Hydro Corp. 2.43% 12/11/29 | CAD | 80,000 | 53,395 |
| TransCanada PipeLines Ltd.: | |||
| 3% 9/18/29 | CAD | 30,000 | 20,443 |
| 4.18% 7/3/48 | CAD | 33,000 | 19,963 |
| 4.35% 6/6/46 | CAD | 456,000 | 285,756 |
TOTAL CANADA | 19,419,099 | ||
| China - 2.9% | |||
| Agricultural Development Bank of China: | |||
| 2.99% 8/11/26 | CNY | 31,790,000 | 4,467,702 |
| 3.52% 5/24/31 | CNY | 38,250,000 | 5,692,398 |
| Export-Import Bank of China: | |||
| 3.22% 5/14/26 | CNY | 57,740,000 | 8,130,242 |
| 3.38% 7/16/31 | CNY | 32,570,000 | 4,812,013 |
| State Grid Overseas Investment Ltd. 0.797% 8/5/26 (Reg. S) | EUR | 160,000 | 161,681 |
TOTAL CHINA | 23,264,036 | ||
| Czech Republic - 0.0% | |||
| CPI Property Group SA 2.75% 5/12/26 (Reg. S) | EUR | 153,000 | 152,921 |
| Denmark - 0.2% | |||
| Danske Bank A/S: | |||
| 0.5% 8/27/25 (Reg. S) (b) | EUR | 140,000 | 149,132 |
| 1.5% 9/2/30 (Reg. S) (b) | EUR | 110,000 | 113,954 |
| 4% 1/12/27 (Reg. S) (b) | EUR | 210,000 | 225,842 |
| 4.5% 11/9/28 (Reg. S) (b) | EUR | 110,000 | 120,240 |
| 4.625% 4/13/27 (Reg. S) (b) | GBP | 100,000 | 125,285 |
| Jyske Bank A/S 0.25% 2/17/28 (Reg. S) (b) | EUR | 100,000 | 98,204 |
| KommuneKredit: | |||
| 0% 11/17/29 | EUR | 240,000 | 219,826 |
| 0.125% 9/26/40 (Reg. S) | EUR | 100,000 | 65,414 |
| Nykredit Realkredit A/S: | |||
| 0.5% 7/10/25 (Reg. S) | EUR | 144,000 | 149,389 |
| 0.75% 1/20/27 | EUR | 130,000 | 129,631 |
| ORSTED A/S: | |||
| 2.125% 5/17/27 (Reg. S) | GBP | 104,000 | 120,459 |
| 2.5% 5/16/33 (Reg. S) | GBP | 104,000 | 106,045 |
| 5.125% 9/13/34 (Reg. S) | GBP | 290,000 | 358,713 |
TOTAL DENMARK | 1,982,134 | ||
| Finland - 0.2% | |||
| Finnvera OYJ 2.875% 8/30/29 (Reg. S) | EUR | 200,000 | 213,535 |
| Kuntarahoitus OYJ: | |||
| 0.25% 2/25/32 (Reg. S) | EUR | 140,000 | 121,865 |
| 2.75% 2/2/34 (Reg. S) | EUR | 110,000 | 114,239 |
| 5.125% 7/22/27 (Reg. S) | GBP | 120,000 | 154,078 |
| Nordea Bank Abp: | |||
| 0.5% 3/19/31 (Reg. S) | EUR | 120,000 | 106,063 |
| 0.625% 8/18/31 (Reg. S) (b) | EUR | 100,000 | 100,120 |
| 2.5% 5/23/29 (Reg. S) | EUR | 144,000 | 147,069 |
| Nordea Mortgage Bank PLC 2.5% 9/14/32 (Reg. S) | EUR | 110,000 | 112,504 |
| OP Corporate Bank PLC: | |||
| 0.1% 11/16/27 (Reg. S) | EUR | 130,000 | 125,133 |
| 1.375% 9/4/26 (Reg. S) | GBP | 160,000 | 185,973 |
| OP Mortgage Bank PLC: | |||
| 0.01% 11/19/30 (Reg. S) | EUR | 180,000 | 158,419 |
| 1% 11/28/24 (Reg. S) | EUR | 170,000 | 180,104 |
TOTAL FINLAND | 1,719,102 | ||
| France - 3.7% | |||
| Action Logement Services 0.375% 10/5/31 (Reg. S) | EUR | 600,000 | 519,636 |
| Aeroports de Paris SA 2.125% 10/2/26 (Reg. S) | EUR | 500,000 | 520,712 |
| Agence France Locale 3.125% 3/20/34 (Reg. S) | EUR | 100,000 | 103,364 |
| Airbus Group NV 2.375% 6/9/40 (Reg. S) | EUR | 166,000 | 146,073 |
| APRA SA 1.875% 1/6/31 (Reg. S) | EUR | 200,000 | 193,727 |
| Arkea Public Sector SCF SA 0.875% 3/31/28 (Reg. S) | EUR | 200,000 | 196,654 |
| Autoroutes du Sud de la France 2.75% 9/2/32 (Reg. S) | EUR | 300,000 | 301,924 |
| AXA SA: | |||
| 1.875% 7/10/42 (Reg. S) (b) | EUR | 253,000 | 224,245 |
| 3.375% 7/6/47 (Reg. S) (b) | EUR | 100,000 | 105,033 |
| Ayvens SA 4% 7/5/27 (Reg. S) | EUR | 200,000 | 216,067 |
| Banque Federative du Credit Mutuel SA: | |||
| 0.625% 11/19/27 (Reg. S) | EUR | 100,000 | 96,657 |
| 0.75% 1/17/30 (Reg. S) | EUR | 200,000 | 181,412 |
| 0.875% 12/7/27 (Reg. S) | GBP | 600,000 | 663,425 |
| 1% 7/16/26 (Reg. S) | GBP | 100,000 | 116,395 |
| 1.125% 11/19/31 (Reg. S) | EUR | 100,000 | 85,543 |
| 1.25% 5/26/27 (Reg. S) | EUR | 100,000 | 100,289 |
| 1.25% 6/3/30 (Reg. S) | EUR | 100,000 | 92,184 |
| 2.5% 5/25/28 (Reg. S) | EUR | 300,000 | 305,390 |
| 2.625% 11/6/29 (Reg. S) | EUR | 100,000 | 100,649 |
| 3.875% 6/16/32 (Reg. S) (b) | EUR | 100,000 | 105,610 |
| 4.375% 5/2/30 (Reg. S) | EUR | 100,000 | 109,383 |
| 4.75% 11/10/31 (Reg. S) | EUR | 100,000 | 111,785 |
| BNP Paribas SA: | |||
| 0.5% 2/19/28 (Reg. S) (b) | EUR | 100,000 | 98,239 |
| 0.5% 1/19/30 (Reg. S) (b) | EUR | 300,000 | 275,667 |
| 0.625% 12/3/32 (Reg. S) | EUR | 100,000 | 82,250 |
| 0.875% 7/11/30 (Reg. S) (b) | EUR | 100,000 | 92,111 |
| 1.25% 7/13/31 (Reg. S) | GBP | 100,000 | 96,924 |
| 1.625% 7/2/31 (Reg. S) | EUR | 100,000 | 90,516 |
| 1.875% 12/14/27 (Reg. S) | GBP | 200,000 | 226,697 |
| 2% 5/24/31 (Reg. S) (b) | GBP | 200,000 | 234,739 |
| 2% 9/13/36 (Reg. S) | GBP | 100,000 | 89,684 |
| 2.5% 3/31/32 (Reg. S) (b) | EUR | 100,000 | 101,773 |
| 2.538% 7/13/29 (b) | CAD | 250,000 | 167,169 |
| 3.375% 1/23/26 (Reg. S) | GBP | 550,000 | 674,470 |
| 4.75% 11/13/32 (Reg. S) (b) | EUR | 100,000 | 111,746 |
| Bouygues SA: | |||
| 0.5% 2/11/30 (Reg. S) | EUR | 100,000 | 90,984 |
| 2.25% 6/29/29 (Reg. S) | EUR | 100,000 | 101,098 |
| 4.625% 6/7/32 (Reg. S) | EUR | 100,000 | 113,510 |
| BPCE SA: | |||
| 0.25% 1/15/26 (Reg. S) | EUR | 100,000 | 101,564 |
| 0.25% 1/14/31 (Reg. S) | EUR | 200,000 | 172,088 |
| 0.5% 9/15/27 (Reg. S) (b) | EUR | 600,000 | 596,356 |
| 1% 1/14/32 (Reg. S) | EUR | 200,000 | 173,894 |
| 1.375% 12/23/26 (Reg. S) | GBP | 100,000 | 115,146 |
| 1.625% 1/31/28 (Reg. S) | EUR | 100,000 | 99,463 |
| 2.25% 3/2/32 (Reg. S) (b) | EUR | 100,000 | 101,323 |
| 2.5% 11/30/32 (Reg. S) (b) | GBP | 100,000 | 111,798 |
| 5.75% 6/1/33 (Reg. S) (b) | EUR | 100,000 | 112,243 |
| BPCE SFH: | |||
| 0.01% 10/16/28 (Reg. S) | EUR | 500,000 | 467,835 |
| 3.375% 6/27/33 (Reg. S) | EUR | 400,000 | 433,241 |
| Bpifrance SACA: | |||
| 0.05% 9/26/29 (Reg. S) | EUR | 300,000 | 272,137 |
| 0.125% 3/25/25 (Reg. S) | EUR | 200,000 | 208,727 |
| 0.25% 3/29/30 (Reg. S) | EUR | 100,000 | 90,371 |
| 0.625% 5/25/26 (Reg. S) | EUR | 200,000 | 203,526 |
| 0.75% 11/25/24 | EUR | 200,000 | 211,643 |
| 2.125% 11/29/27 (Reg. S) | EUR | 200,000 | 206,364 |
| 3% 9/10/26 (Reg. S) | EUR | 500,000 | 531,995 |
| Caisse Francaise de Finance: | |||
| 0.125% 6/30/31 (Reg. S) | EUR | 1,200,000 | 1,038,259 |
| 0.125% 2/15/36 (Reg. S) | EUR | 900,000 | 672,086 |
| Caisse Refinance L'habit 0.01% 10/8/29 (Reg. S) | EUR | 600,000 | 545,679 |
| Carrefour Banque SA 4.079% 5/5/27 (Reg. S) | EUR | 100,000 | 107,765 |
| CNP Assurances 2.5% 6/30/51 (Reg. S) (b) | EUR | 100,000 | 93,030 |
| Compagnie de Financement Foncier 0.01% 4/16/29 (Reg. S) | EUR | 1,000,000 | 921,837 |
| Compagnie de St.-Gobain 3.875% 11/29/30 (Reg. S) | EUR | 200,000 | 215,998 |
| Compagnie Financiere du Credit Mutuel: | |||
| 0.375% 10/3/28 (Reg. S) | EUR | 200,000 | 187,321 |
| 0.875% 10/25/31 (Reg. S) | EUR | 100,000 | 86,836 |
| 1.875% 10/25/29 (b) | EUR | 100,000 | 106,177 |
| Credit Agricole Assurances SA: | |||
| 1.5% 10/6/31 (Reg. S) | EUR | 100,000 | 87,475 |
| 2% 7/17/30 (Reg. S) | EUR | 100,000 | 92,900 |
| Credit Agricole Home Loan SFH: | |||
| 0.05% 12/6/29 (Reg. S) | EUR | 200,000 | 181,214 |
| 1.5% 9/28/38 | EUR | 300,000 | 253,150 |
| Credit Agricole SA: | |||
| 0.375% 4/20/28 (Reg. S) | EUR | 100,000 | 94,715 |
| 0.5% 9/21/29 (Reg. S) (b) | EUR | 100,000 | 93,184 |
| 1% 9/18/25 (Reg. S) | EUR | 200,000 | 207,560 |
| 1.125% 7/12/32 (Reg. S) | EUR | 300,000 | 263,686 |
| 1.625% 6/5/30 (Reg. S) (b) | EUR | 100,000 | 104,336 |
| 1.874% 12/9/31 (b) | GBP | 200,000 | 229,088 |
| 2.625% 3/17/27 (Reg. S) | EUR | 107,000 | 111,062 |
| 3.875% 11/28/34 (Reg. S) | EUR | 100,000 | 108,352 |
| 4% 1/18/33 (Reg. S) | EUR | 100,000 | 109,506 |
| 4.875% 10/23/29 (Reg. S) | GBP | 100,000 | 125,672 |
| CTE Co. 1.5% 7/29/28 (Reg.S) | EUR | 100,000 | 98,569 |
| Electricite de France SA: | |||
| 1% 11/29/33 (Reg. S) | EUR | 100,000 | 81,882 |
| 2% 12/9/49 (Reg. S) | EUR | 400,000 | 265,168 |
| 5.5% 1/25/35 (Reg. S) | GBP | 200,000 | 243,259 |
| Engie SA 5.625% 4/3/53 (Reg. S) | GBP | 100,000 | 121,903 |
| Gecina SA 1.375% 1/26/28 (Reg. S) | EUR | 200,000 | 198,055 |
| HSBC Continental Europe SA: | |||
| 0.1% 9/3/27 (Reg. S) | EUR | 200,000 | 193,649 |
| 1.375% 9/4/28 (Reg. S) | EUR | 300,000 | 296,131 |
| ICADE 1.625% 2/28/28 (Reg. S) | EUR | 100,000 | 98,058 |
| Ile-de-France Mobilites: | |||
| 0.4% 5/28/31 (Reg. S) | EUR | 100,000 | 87,705 |
| 3.7% 6/14/38 (Reg. S) | EUR | 100,000 | 106,018 |
| Kering SA 3.625% 3/11/36 (Reg. S) | EUR | 100,000 | 104,659 |
| Klepierre SA 0.875% 2/17/31 (Reg. S) | EUR | 100,000 | 88,730 |
| La Banque Postale: | |||
| 1% 2/9/28 (Reg. S) (b) | EUR | 200,000 | 197,929 |
| 5.625% 9/21/28 (Reg. S) (b) | GBP | 100,000 | 126,014 |
| La Mondiale 0.75% 4/20/26 (Reg. S) | EUR | 100,000 | 100,973 |
| La Poste 1.375% 4/21/32 (Reg. S) | EUR | 400,000 | 364,667 |
| MACIF 0.625% 6/21/27 (Reg. S) | EUR | 200,000 | 193,882 |
| Orange SA: | |||
| 0.75% 6/29/34 (Reg. S) | EUR | 500,000 | 410,123 |
| 8.125% 1/28/33 | EUR | 70,000 | 99,869 |
| Pernod Ricard SA 3.625% 5/7/34 (Reg. S) | EUR | 100,000 | 105,453 |
| RCI Banque SA: | |||
| 1.625% 5/26/26 (Reg. S) | EUR | 37,000 | 38,106 |
| 4.875% 10/2/29 (Reg. S) | EUR | 150,000 | 166,470 |
| RTE EdF Transport SA: | |||
| 0% 9/9/27 (Reg. S) | EUR | 100,000 | 95,939 |
| 0.625% 7/8/32 (Reg. S) | EUR | 200,000 | 171,437 |
| SNCF Reseau: | |||
| 0.875% 1/22/29 (Reg. S) | EUR | 300,000 | 288,143 |
| 1.125% 5/19/27 (Reg. S) | EUR | 1,100,000 | 1,106,337 |
| Societe du Grand Paris EPIC: | |||
| 0% 11/25/30 (Reg. S) | EUR | 200,000 | 173,959 |
| 1.7% 5/25/50 (Reg. S) | EUR | 500,000 | 345,583 |
| Societe Generale: | |||
| 0.875% 9/22/28 (Reg. S) (b) | EUR | 200,000 | 194,297 |
| 0.875% 9/24/29 (Reg. S) | EUR | 100,000 | 91,647 |
| 1% 11/24/30 (b) | EUR | 200,000 | 204,121 |
| 1.125% 6/30/31 (Reg. S) (b) | EUR | 100,000 | 100,003 |
| 1.25% 12/7/27 | GBP | 300,000 | 332,263 |
| 1.25% 6/12/30 (Reg. S) | EUR | 100,000 | 91,520 |
| 4.25% 11/16/32 (Reg. S) | EUR | 100,000 | 110,875 |
| Societe Generale SFH 3.125% 2/24/26 (Reg. S) | EUR | 1,000,000 | 1,067,393 |
| Societe Nationale des Chemins de Fer Francais 0.625% 4/17/30 (Reg. S) | EUR | 300,000 | 275,650 |
| Suez SACA: | |||
| 1.875% 5/24/27 (Reg. S) | EUR | 100,000 | 101,687 |
| 2.375% 5/24/30 (Reg. S) | EUR | 100,000 | 98,617 |
| 4.625% 11/3/28 (Reg. S) | EUR | 100,000 | 110,257 |
| TotalEnergies Capital International SA: | |||
| 1.25% 12/16/24 (Reg. S) | GBP | 100,000 | 124,223 |
| 1.491% 4/8/27 (Reg. S) | EUR | 100,000 | 101,876 |
| UNEDIC: | |||
| 0% 11/25/28 (Reg. S) | EUR | 200,000 | 186,768 |
| 0.25% 11/25/29 (Reg. S) | EUR | 600,000 | 551,515 |
| 0.25% 7/16/35 (Reg. S) | EUR | 400,000 | 307,582 |
| 0.875% 5/25/28 (Reg. S) | EUR | 400,000 | 392,990 |
| 1.25% 10/21/27 (Reg. S) | EUR | 100,000 | 100,610 |
| 1.5% 4/20/32 (Reg. S) | EUR | 100,000 | 94,733 |
| Unibail-Rodamco-Westfield SE: | |||
| 0.75% 10/25/28 (Reg. S) | EUR | 300,000 | 282,807 |
| 1% 2/27/27 (Reg. S) | EUR | 600,000 | 600,700 |
| 1.5% 5/29/29 (Reg. S) | EUR | 120,000 | 116,282 |
| Veolia Environnement SA: | |||
| 0.664% 1/15/31 (Reg. S) | EUR | 100,000 | 88,665 |
| 1.25% 4/15/28 (Reg. S) | EUR | 100,000 | 98,722 |
| 1.25% 5/14/35 (Reg. S) | EUR | 100,000 | 84,551 |
TOTAL FRANCE | 29,369,360 | ||
| Germany - 2.8% | |||
| Aareal Bank AG: | |||
| 0.01% 2/1/28 (Reg. S) | EUR | 100,000 | 94,939 |
| 0.05% 9/2/26 (Reg. S) | EUR | 100,000 | 97,742 |
| Allianz Finance II BV 1.5% 1/15/30 (Reg. S) | EUR | 200,000 | 194,817 |
| Allianz SE: | |||
| 1.301% 9/25/49 (Reg. S) (b) | EUR | 100,000 | 92,383 |
| 4.252% 7/5/52 (Reg. S) (b) | EUR | 100,000 | 105,837 |
| Amprion GmbH: | |||
| 3.45% 9/22/27 (Reg. S) | EUR | 100,000 | 106,415 |
| 3.971% 9/22/32 (Reg. S) | EUR | 100,000 | 108,571 |
| Aroundtown SA: | |||
| 0.375% 4/15/27 (Reg. S) | EUR | 200,000 | 185,671 |
| 1.45% 7/9/28 (Reg. S) | EUR | 100,000 | 91,165 |
| BASF AG 4.25% 3/8/32 (Reg. S) | EUR | 100,000 | 111,205 |
| Bayer AG 1.375% 7/6/32 (Reg. S) | EUR | 300,000 | 260,129 |
| Berlin Hannoversche Hypothekenbank AG 0.25% 5/19/33 (Reg. S) | EUR | 1,020,000 | 851,995 |
| BMV Finance NV: | |||
| 1.5% 2/6/29 (Reg. S) | EUR | 86,000 | 85,401 |
| 3.25% 7/22/30 (Reg. S) | EUR | 250,000 | 268,314 |
| Bremen Freie Hansestadt: | |||
| 0.15% 10/24/31 | EUR | 50,000 | 43,842 |
| 0.4% 8/20/49 (Reg. S) | EUR | 29,000 | 15,711 |
| Commerzbank AG: | |||
| 0.01% 3/11/30 | EUR | 183,000 | 164,670 |
| 0.5% 12/4/26 (Reg. S) | EUR | 58,000 | 57,991 |
| 1.25% 1/9/34 | EUR | 58,000 | 52,430 |
| 1.5% 8/28/28 (Reg. S) | EUR | 100,000 | 99,313 |
| 1.875% 2/28/28 (Reg. S) | EUR | 100,000 | 101,236 |
| Daimler International Finance BV: | |||
| 0.375% 11/8/26 (Reg. S) | EUR | 23,000 | 23,008 |
| 1.375% 6/26/26 (Reg. S) | EUR | 44,000 | 45,372 |
| Deutsche Bahn Finance BV: | |||
| 0.375% 12/3/26 (Reg. S) | GBP | 214,000 | 245,035 |
| 0.625% 4/15/36 (Reg. S) | EUR | 170,000 | 132,394 |
| 0.625% 12/8/50 (Reg. S) | EUR | 144,000 | 77,092 |
| 0.875% 6/23/39 (Reg. S) | EUR | 198,000 | 146,089 |
| 1.375% 7/7/25 (Reg. S) | GBP | 28,000 | 34,119 |
| 1.875% 2/13/26 (Reg. S) | GBP | 171,000 | 206,645 |
| Deutsche Bank AG: | |||
| 0.75% 2/17/27 (Reg. S) (b) | EUR | 100,000 | 101,900 |
| 1.375% 9/3/26 (Reg. S) (b) | EUR | 200,000 | 207,913 |
| 1.625% 1/20/27 (Reg. S) | EUR | 300,000 | 304,023 |
| 1.875% 2/23/28 (Reg. S) (b) | EUR | 200,000 | 202,923 |
| 3.25% 5/24/28 (Reg. S) (b) | EUR | 100,000 | 105,066 |
| 4% 6/24/26 (Reg. S) (b) | GBP | 200,000 | 248,526 |
| 4% 6/24/32 (Reg. S) (b) | EUR | 100,000 | 104,441 |
| Deutsche Borse AG: | |||
| 0.125% 2/22/31 (Reg. S) | EUR | 100,000 | 87,517 |
| 1.5% 4/4/32 (Reg. S) | EUR | 100,000 | 93,812 |
| Deutsche Telekom AG: | |||
| 3.125% 2/6/34 (Reg. S) | GBP | 60,000 | 64,597 |
| 3.25% 3/20/36 (Reg. S) | EUR | 130,000 | 133,879 |
| DZ HYP AG 0.5% 6/16/26 (Reg. S) | EUR | 1,200,000 | 1,217,439 |
| E.ON International Finance BV: | |||
| 1.5% 7/31/29 (Reg. S) | EUR | 115,000 | 112,321 |
| 5.75% 2/14/33 (Reg. S) | EUR | 130,000 | 159,353 |
| E.ON SE: | |||
| 0.25% 10/24/26 (Reg. S) | EUR | 69,000 | 68,887 |
| 0.35% 2/28/30 (Reg. S) | EUR | 90,000 | 81,626 |
| 0.75% 2/20/28 (Reg. S) | EUR | 99,000 | 97,912 |
| 0.875% 8/20/31 (Reg. S) | EUR | 100,000 | 89,484 |
| 0.875% 10/18/34 (Reg. S) | EUR | 117,000 | 97,321 |
| 3.5% 1/12/28 (Reg. S) | EUR | 140,000 | 150,792 |
| 4.125% 3/25/44 (Reg. S) | EUR | 50,000 | 52,906 |
| EnBW Energie Baden-Wuerttemberg AG 1.375% 8/31/81 (Reg. S) (b) | EUR | 100,000 | 93,652 |
| EnBW International Finance BV 0.5% 3/1/33 (Reg. S) | EUR | 161,000 | 131,630 |
| Eurogrid GmbH 3.598% 2/1/29 (Reg. S) | EUR | 200,000 | 213,229 |
| Grand City Properties SA 1.375% 8/3/26 (Reg. S) | EUR | 400,000 | 400,193 |
| Hamburg Commercial Bank AG 0.01% 1/19/27 (Reg. S) | EUR | 100,000 | 97,993 |
| Hannover Reuck SE 1.75% 10/8/40 (Reg. S) (b) | EUR | 100,000 | 93,033 |
| Heidelberg Materials Finance Luxembourg SA 4.875% 11/21/33 (Reg. S) | EUR | 50,000 | 56,752 |
| KfW: | |||
| 0% 9/30/26 (Reg. S) | EUR | 273,000 | 273,514 |
| 0% 9/15/28 (Reg. S) | EUR | 442,000 | 419,965 |
| 0% 9/17/30 (Reg. S) | EUR | 261,000 | 234,144 |
| 0.01% 5/5/27 (Reg. S) | EUR | 38,000 | 37,484 |
| 0.05% 9/29/34 (Reg. S) | EUR | 1,284,000 | 1,021,157 |
| 0.125% 12/30/26 (Reg. S) | GBP | 1,064,000 | 1,207,514 |
| 0.625% 2/22/27 | EUR | 283,000 | 285,303 |
| 0.625% 1/7/28 | EUR | 1,834,000 | 1,815,252 |
| 0.75% 12/7/27 (Reg. S) | GBP | 320,000 | 358,419 |
| 0.75% 6/28/28 | EUR | 72,000 | 70,973 |
| 0.875% 9/15/26 (Reg. S) | GBP | 43,000 | 50,158 |
| 0.875% 7/4/39 (Reg. S) | EUR | 110,000 | 86,285 |
| 1.375% 12/9/24 (Reg. S) | GBP | 151,000 | 187,781 |
| 1.375% 2/2/28 | SEK | 310,000 | 27,793 |
| 1.5% 7/24/24 | AUD | 82,000 | 54,606 |
| 2.15% 8/25/25 | AUD | 1,210,000 | 785,127 |
| 2.875% 12/28/29 (Reg. S) | EUR | 740,000 | 792,588 |
| 3.2% 9/11/26 | AUD | 118,000 | 76,461 |
| Landesbank Baden-Wurttemberg 0.375% 5/7/29 (Reg. S) | EUR | 100,000 | 91,922 |
| LEG Immobilien AG: | |||
| 0.375% 1/17/26 (Reg. S) | EUR | 100,000 | 101,528 |
| 0.875% 11/28/27 (Reg. S) | EUR | 100,000 | 98,010 |
| 0.875% 1/17/29 (Reg. S) | EUR | 100,000 | 94,005 |
| Mercedes-Benz Group AG: | |||
| 1.125% 8/8/34 (Reg. S) | EUR | 267,000 | 229,207 |
| 1.5% 7/3/29 (Reg. S) | EUR | 44,000 | 43,233 |
| Merck KGaA 1.625% 6/25/79 (Reg. S) (b) | EUR | 100,000 | 105,756 |
| Muenchener Hypothekenbank eG 1.875% 8/25/32 (Reg. S) | EUR | 60,000 | 58,678 |
| Muenchener Rueckversicherungs-Gesellschaft AG in Muenchen 1.25% 5/26/41 (Reg. S) (b) | EUR | 100,000 | 89,363 |
| NRW.BANK: | |||
| 0.5% 6/17/41 (Reg. S) | EUR | 50,000 | 34,002 |
| 0.875% 4/12/34 | EUR | 387,000 | 338,619 |
| Robert Bosch GmbH 4.375% 6/2/43 (Reg. S) | EUR | 100,000 | 109,103 |
| RWE AG: | |||
| 2.5% 8/24/25 (Reg. S) | EUR | 430,000 | 454,656 |
| 2.75% 5/24/30 (Reg. S) | EUR | 120,000 | 122,646 |
| Siemens Financieringsmaatschappij NV: | |||
| 0.125% 9/5/29 (Reg. S) | EUR | 24,000 | 22,390 |
| 1.75% 2/28/39 (Reg. S) | EUR | 23,000 | 19,272 |
| 3% 9/8/33 (Reg. S) | EUR | 100,000 | 103,666 |
| 3.125% 5/22/32 (Reg. S) | EUR | 200,000 | 210,944 |
| 3.625% 2/24/43 (Reg. S) | EUR | 100,000 | 104,682 |
| Traton Finance Luxembourg SA 4.5% 11/23/26 (Reg. S) | EUR | 200,000 | 217,039 |
| UniCredit Bank AG: | |||
| 0.25% 1/15/32 (Reg. S) | EUR | 39,000 | 33,833 |
| 0.375% 1/17/33 (Reg. S) | EUR | 200,000 | 170,467 |
| 0.85% 5/22/34 (Reg. S) | EUR | 102,000 | 87,822 |
| Vier Gas Transport GmbH 1.5% 9/25/28 (Reg. S) | EUR | 100,000 | 98,656 |
| Volkswagen Bank GmbH 2.5% 7/31/26 (Reg. S) | EUR | 100,000 | 104,291 |
| Volkswagen Financial Services AG: | |||
| 0.375% 2/12/30 (Reg. S) | EUR | 70,000 | 62,329 |
| 0.875% 1/31/28 (Reg. S) | EUR | 630,000 | 613,951 |
| 1.125% 7/5/26 (Reg. S) | GBP | 100,000 | 116,248 |
| 1.5% 10/1/24 (Reg. S) | EUR | 36,000 | 38,313 |
| 2.25% 4/12/25 (Reg. S) | GBP | 26,000 | 32,100 |
| 3.375% 4/6/28 (Reg. S) | EUR | 32,000 | 34,112 |
| Volkswagen International Finance NV: | |||
| 1.625% 1/16/30 (Reg. S) | EUR | 45,000 | 43,118 |
| 3.25% 11/18/30 (Reg. S) | EUR | 200,000 | 208,214 |
| 4.125% 11/16/38 (Reg. S) | EUR | 200,000 | 215,313 |
| Volkswagen Leasing GmbH: | |||
| 0.625% 7/19/29 (Reg. S) | EUR | 50,000 | 45,834 |
| 4% 4/11/31 (Reg. S) | EUR | 140,000 | 150,778 |
| Vonovia SE: | |||
| 0.625% 10/7/27 (Reg. S) | EUR | 200,000 | 193,737 |
| 0.75% 9/1/32 (Reg. S) | EUR | 100,000 | 82,392 |
| 1% 6/16/33 (Reg. S) | EUR | 400,000 | 325,412 |
TOTAL GERMANY | 22,058,816 | ||
| Hong Kong - 0.0% | |||
| Hongkong & Shanghai Banking Corp. Ltd. (Sydney Branch) 5.1% 3/3/28 (Reg. S) | AUD | 250,000 | 166,677 |
| Ireland - 0.1% | |||
| AIB Group PLC 4.625% 7/23/29 (Reg. S) (b) | EUR | 100,000 | 110,234 |
| Bank of Ireland Group PLC: | |||
| 0.375% 5/10/27 (Reg. S) (b) | EUR | 140,000 | 141,026 |
| 1% 11/25/25 (Reg. S) (b) | EUR | 340,000 | 359,904 |
| 1.375% 8/11/31 (Reg. S) (b) | EUR | 100,000 | 101,164 |
| ESB Finance Ltd. 1.125% 6/11/30 (Reg. S) | EUR | 135,000 | 126,281 |
| Smurfit Kappa Treasury ULC 1.5% 9/15/27 (Reg. S) | EUR | 100,000 | 100,454 |
TOTAL IRELAND | 939,063 | ||
| Italy - 0.7% | |||
| A2A SpA 0.625% 7/15/31 (Reg. S) | EUR | 140,000 | 119,814 |
| ACEA SpA 1.5% 6/8/27 (Reg. S) | EUR | 117,000 | 118,579 |
| Amco - Asset Management Co. SpA 1.375% 1/27/25 (Reg. S) | EUR | 110,000 | 116,030 |
| Assicurazioni Generali SpA: | |||
| 1.713% 6/30/32 (Reg. S) | EUR | 100,000 | 88,645 |
| 2.124% 10/1/30 (Reg. S) | EUR | 130,000 | 123,394 |
| 5.5% 10/27/47 (Reg. S) (b) | EUR | 100,000 | 110,521 |
| Autostrade per L'italia SpA 1.875% 9/26/29 (Reg. S) | EUR | 320,000 | 308,593 |
| Credit Agricole Italia SpA 0.375% 1/20/32 (Reg. S) | EUR | 200,000 | 172,295 |
| ENEL Finance International NV: | |||
| 0.375% 6/17/27 (Reg. S) | EUR | 220,000 | 215,243 |
| 0.5% 6/17/30 (Reg. S) | EUR | 110,000 | 99,736 |
| 2.875% 4/11/29 (Reg. S) | GBP | 636,000 | 729,524 |
| 4% 2/20/31 (Reg. S) | EUR | 300,000 | 326,338 |
| Eni SpA: | |||
| 3.625% 5/19/27 (Reg. S) | EUR | 100,000 | 107,585 |
| 4.25% 5/19/33 (Reg. S) | EUR | 120,000 | 131,591 |
| Ferrovie dello Stato FS SpA: | |||
| 1.125% 7/9/26 (Reg. S) | EUR | 230,000 | 234,755 |
| 1.5% 6/27/25 (Reg. S) | EUR | 144,000 | 151,025 |
| Hera SpA 0.875% 7/5/27 (Reg. S) | EUR | 190,000 | 187,499 |
| Iccrea Banca SpA 4% 11/8/27 (Reg. S) | EUR | 140,000 | 151,800 |
| Intesa Sanpaolo SpA: | |||
| 0.75% 3/16/28 (Reg. S) | EUR | 360,000 | 346,721 |
| 4.875% 5/19/30 (Reg. S) | EUR | 100,000 | 112,864 |
| 5.125% 8/29/31 (Reg. S) | EUR | 100,000 | 114,668 |
| Italgas SpA 1% 12/11/31 (Reg. S) | EUR | 110,000 | 96,801 |
| Mediobanca SpA: | |||
| 2.375% 6/30/27 (Reg. S) | EUR | 160,000 | 165,690 |
| 4.75% 3/14/28 (Reg. S) (b) | EUR | 100,000 | 109,741 |
| Snam SpA 0.75% 6/20/29 (Reg. S) | EUR | 290,000 | 270,311 |
| Terna - Rete Elettrica Nazionale: | |||
| 0.375% 6/23/29 (Reg. S) | EUR | 120,000 | 110,314 |
| 1.375% 7/26/27 (Reg. S) | EUR | 150,000 | 151,001 |
| UniCredit SpA: | |||
| 2.2% 7/22/27 (Reg. S) (b) | EUR | 490,000 | 507,526 |
| 4.45% 2/16/29 (Reg. S) (b) | EUR | 170,000 | 184,756 |
TOTAL ITALY | 5,663,360 | ||
| Japan - 0.4% | |||
| East Japan Railway Co. 1.104% 9/15/39 (Reg. S) | EUR | 160,000 | 119,734 |
| JT International Financial Services BV 2.375% 4/7/81 (Reg. S) (b) | EUR | 120,000 | 123,534 |
| Mizuho Financial Group, Inc.: | |||
| 0.797% 4/15/30 (Reg. S) | EUR | 300,000 | 274,189 |
| 1.412% 7/13/33 | JPY | 12,000,000 | 71,930 |
| NTT Finance Corp. 0.18% 12/19/25 | JPY | 200,000,000 | 1,237,118 |
| Sumitomo Mitsui Financial Group, Inc. 0.632% 10/23/29 (Reg. S) | EUR | 110,000 | 101,153 |
| Takeda Pharmaceutical Co. Ltd. 2% 7/9/40 | EUR | 157,000 | 127,624 |
| Toyota Finance Corp. 0.37% 10/13/26 | JPY | 100,000,000 | 618,224 |
| Toyota Motor Finance (Netherlands) BV 3.5% 1/13/28 (Reg. S) | EUR | 300,000 | 322,019 |
TOTAL JAPAN | 2,995,525 | ||
| Korea (South) - 0.0% | |||
| Korea Housing Finance Corp. 0.01% 7/7/25 (Reg. S) | EUR | 160,000 | 165,368 |
| Luxembourg - 0.1% | |||
| Blackstone Property Partners Europe LP 1.25% 4/26/27 (Reg. S) | EUR | 153,000 | 150,390 |
| CBRE Global Investors Pan European Core Fund 0.5% 1/27/28 (Reg. S) | EUR | 100,000 | 94,372 |
| JAB Holdings BV: | |||
| 1% 7/14/31 (Reg. S) | EUR | 100,000 | 89,172 |
| 2.5% 6/25/29 | EUR | 100,000 | 101,710 |
| Logicor Financing SARL 1.625% 7/15/27 (Reg. S) | EUR | 170,000 | 167,952 |
| Prologis International Funding II SA 1.75% 3/15/28 (Reg. S) | EUR | 304,000 | 303,138 |
| SELP Finance SARL 1.5% 11/20/25 (Reg. S) | EUR | 100,000 | 103,518 |
TOTAL LUXEMBOURG | 1,010,252 | ||
| Mexico - 0.1% | |||
| America Movil S.A.B. de CV: | |||
| 0.75% 6/26/27 | EUR | 100,000 | 98,862 |
| 2.125% 3/10/28 | EUR | 200,000 | 203,363 |
| Petroleos Mexicanos 4.75% 2/26/29 (Reg. S) | EUR | 100,000 | 93,307 |
TOTAL MEXICO | 395,532 | ||
| Multi-National - 0.1% | |||
| EUROFIMA 0.15% 10/10/34 (Reg. S) | EUR | 191,000 | 152,571 |
| International Finance Corp. 4.5% 10/2/28 | GBP | 370,000 | 471,375 |
TOTAL MULTI-NATIONAL | 623,946 | ||
| Netherlands - 1.2% | |||
| ABN AMRO Bank NV: | |||
| 0.375% 1/14/35 (Reg. S) | EUR | 200,000 | 160,292 |
| 0.5% 9/23/29 (Reg. S) | EUR | 100,000 | 90,978 |
| 0.6% 1/15/27 (Reg. S) | EUR | 300,000 | 298,008 |
| 1.375% 1/12/37 (Reg. S) | EUR | 400,000 | 344,623 |
| 4.5% 11/21/34 (Reg. S) | EUR | 100,000 | 112,580 |
| ASR Nederland NV 3.375% 5/2/49 (Reg. S) (b) | EUR | 100,000 | 100,561 |
| Bank Nederlandse Gemeenten NV: | |||
| 0.75% 1/24/29 (Reg. S) | EUR | 2,004,000 | 1,942,552 |
| 3.3% 7/17/28 (Reg. S) | AUD | 1,267,000 | 802,139 |
| Cooperatieve Rabobank UA: | |||
| 0.25% 10/30/26 (Reg. S) | EUR | 500,000 | 497,085 |
| 0.625% 2/25/33 (Reg. S) | EUR | 100,000 | 83,429 |
| 1.125% 5/7/31 (Reg. S) | EUR | 100,000 | 91,332 |
| 1.25% 3/23/26 (Reg. S) | EUR | 79,000 | 81,645 |
| 3.202% 5/6/36 (Reg. S) | EUR | 400,000 | 427,003 |
| CTP BV: | |||
| 0.625% 9/27/26 (Reg. S) | EUR | 110,000 | 109,475 |
| 0.75% 2/18/27 (Reg. S) | EUR | 108,000 | 106,333 |
| EXOR NV 1.75% 1/18/28 (Reg. S) | EUR | 170,000 | 172,376 |
| Heineken NV 1.75% 5/7/40 (Reg. S) | EUR | 160,000 | 130,189 |
| ING Bank NV 3% 5/21/34 (Reg. S) | EUR | 300,000 | 316,347 |
| ING Groep NV: | |||
| 0.25% 2/18/29 (Reg. S) (b) | EUR | 500,000 | 471,531 |
| 0.25% 2/1/30 (Reg. S) (b) | EUR | 200,000 | 182,638 |
| 2.125% 5/26/31 (Reg. S) (b) | EUR | 400,000 | 411,998 |
| 3% 2/18/26 (Reg. S) | GBP | 100,000 | 122,195 |
| 4.875% 11/14/27 (Reg. S) (b) | EUR | 200,000 | 219,401 |
| JDE Peet's BV 0.5% 1/16/29 (Reg. S) | EUR | 130,000 | 120,593 |
| Koninklijke KPN NV 3.875% 7/3/31 (Reg. S) | EUR | 100,000 | 108,424 |
| Koninklijke Philips Electronics NV 2.125% 11/5/29 (Reg. S) | EUR | 110,000 | 109,573 |
| LeasePlan Corp. NV 2.125% 5/6/25 (Reg. S) | EUR | 130,000 | 137,259 |
| Nationale-Nederlanden Bank NV 1% 9/25/28 (Reg. S) | EUR | 700,000 | 684,934 |
| Nederlandse Waterschapsbank NV: | |||
| 0.75% 10/4/41 (Reg. S) | EUR | 748,000 | 523,581 |
| 3.3% 5/2/29 (Reg. S) | AUD | 40,000 | 25,020 |
| NN Group NV 4.625% 1/13/48 (Reg. S) (b) | EUR | 180,000 | 194,346 |
| Royal Schiphol Group NV 2% 4/6/29 (Reg. S) | EUR | 117,000 | 117,577 |
| Stedin Holding NV 0% 11/16/26 (Reg. S) | EUR | 117,000 | 115,279 |
| TenneT Holding BV 0.875% 6/16/35 (Reg. S) | EUR | 234,000 | 190,524 |
TOTAL NETHERLANDS | 9,601,820 | ||
| New Zealand - 0.1% | |||
| Westpac Securities NZ Ltd. London Branch 0.01% 6/8/28 (Reg. S) | EUR | 998,000 | 937,340 |
| Norway - 0.3% | |||
| DNB Bank ASA: | |||
| 3.125% 9/21/27 (Reg. S) (b) | EUR | 170,000 | 180,114 |
| 4% 8/17/27 (Reg. S) (b) | GBP | 100,000 | 122,995 |
| Equinor ASA 1.375% 5/22/32 (Reg. S) | EUR | 241,000 | 222,297 |
| Kommunalbanken A/S 0.6% 6/1/26 | AUD | 500,000 | 308,404 |
| Sparebank 1 Boligkreditt A/S 0.01% 9/22/27 (Reg. S) | EUR | 1,151,000 | 1,116,479 |
| Telenor ASA: | |||
| 0.75% 5/31/26 (Reg. S) | EUR | 100,000 | 101,787 |
| 1.125% 5/31/29 (Reg. S) | EUR | 157,000 | 151,503 |
TOTAL NORWAY | 2,203,579 | ||
| Portugal - 0.1% | |||
| Banco Santander Totta SA: | |||
| 3.25% 2/15/31 (Reg. S) | EUR | 100,000 | 106,615 |
| 3.375% 4/19/28 (Reg. S) | EUR | 400,000 | 428,427 |
| EDP Finance BV 1.875% 9/21/29 (Reg. S) | EUR | 100,000 | 98,261 |
TOTAL PORTUGAL | 633,303 | ||
| South Africa - 0.0% | |||
| Anglo American Capital PLC 3.75% 6/15/29 (Reg. S) | EUR | 140,000 | 148,707 |
| Spain - 0.6% | |||
| Abertis Infraestructuras SA 2.375% 9/27/27 (Reg. S) | EUR | 400,000 | 411,108 |
| Banco Bilbao Vizcaya Argentaria SA: | |||
| 4.375% 10/14/29 (Reg. S) | EUR | 300,000 | 334,336 |
| 5.75% 9/15/33 (Reg. S) (b) | EUR | 100,000 | 111,704 |
| Banco Santander SA: | |||
| 0.2% 2/11/28 (Reg. S) | EUR | 300,000 | 285,462 |
| 0.5% 3/24/27 (Reg. S) (b) | EUR | 100,000 | 101,307 |
| 1.375% 1/5/26 (Reg. S) | EUR | 300,000 | 310,761 |
| 2.125% 2/8/28 (Reg. S) | EUR | 100,000 | 101,003 |
| 3.125% 1/19/27 (Reg. S) | EUR | 100,000 | 105,549 |
| 3.5% 1/9/30 (Reg. S) (b) | EUR | 100,000 | 106,306 |
| 3.75% 1/9/34 (Reg. S) | EUR | 100,000 | 107,050 |
| 5.125% 1/25/30 (Reg. S) | GBP | 100,000 | 126,080 |
| 5.75% 8/23/33 (Reg. S) (b) | EUR | 100,000 | 111,685 |
| CaixaBank SA: | |||
| 0.5% 2/9/29 (Reg. S) (b) | EUR | 100,000 | 95,271 |
| 0.75% 5/26/28 (Reg. S) (b) | EUR | 300,000 | 296,321 |
| 1.5% 12/3/26 (Reg. S) (b) | GBP | 200,000 | 238,352 |
| 2.25% 4/17/30 (Reg. S) (b) | EUR | 100,000 | 104,819 |
| 5% 7/19/29 (Reg. S) (b) | EUR | 100,000 | 111,473 |
| 6.25% 2/23/33 (Reg. S) (b) | EUR | 100,000 | 112,659 |
| Cellnex Finance Co. SA 1% 9/15/27 (Reg. S) | EUR | 400,000 | 393,405 |
| Comunidad de Madrid 1.571% 4/30/29 (Reg. S) | EUR | 316,000 | 313,486 |
| Iberdrola Finanzas SAU 3.375% 11/22/32 (Reg. S) | EUR | 100,000 | 105,988 |
| Naturgy Finance BV: | |||
| 1.25% 1/15/26 (Reg. S) | EUR | 200,000 | 206,404 |
| 1.5% 1/29/28 (Reg. S) | EUR | 100,000 | 100,039 |
| Telefonica Emisiones S.A.U. 1.93% 10/17/31 (Reg. S) | EUR | 300,000 | 286,480 |
TOTAL SPAIN | 4,577,048 | ||
| Sweden - 1.1% | |||
| Akelius Residential Property Financing BV 1% 1/17/28 (Reg. S) | EUR | 100,000 | 94,854 |
| Fastighets AB Balder 1.25% 1/28/28 (Reg. S) | EUR | 108,000 | 100,804 |
| Heimstaden Bostad Treasury BV: | |||
| 0.625% 7/24/25 (Reg. S) | EUR | 160,000 | 159,695 |
| 1.375% 7/24/28 (Reg. S) | EUR | 135,000 | 117,795 |
| Investor AB 1.5% 9/12/30 (Reg. S) | EUR | 120,000 | 115,599 |
| Kommuninvest I Sverige AB 1% 11/12/26 (Reg. S) | SEK | 6,710,000 | 606,081 |
| Lansforsakringar Hypotek AB: | |||
| 1.25% 9/17/25 | SEK | 400,000 | 36,802 |
| 1.5% 9/16/26 (Reg. S) | SEK | 5,600,000 | 511,259 |
| Nordea Hypotek AB: | |||
| 0.5% 9/16/26 (Reg. S) | SEK | 15,200,000 | 1,357,927 |
| 1% 9/17/25 | SEK | 1,700,000 | 156,138 |
| Sagax AB 2.25% 3/13/25 (Reg. S) | EUR | 120,000 | 126,676 |
| Samhallsbyggnadsbolaget I Norden AB 2.25% 8/12/27 (Reg. S) | EUR | 108,000 | 81,773 |
| Skandinaviska Enskilda Banken AB: | |||
| 0.75% 11/15/27 (Reg. S) | EUR | 100,000 | 98,764 |
| 1.75% 11/11/26 (Reg. S) | EUR | 210,000 | 216,473 |
| 3% 11/6/28 (Reg. S) | SEK | 4,000,000 | 378,148 |
| 3.25% 5/4/28 (Reg. S) | EUR | 250,000 | 268,158 |
| 3.75% 2/7/28 (Reg. S) | EUR | 160,000 | 172,176 |
| Stadshypotek AB: | |||
| 0.375% 3/13/26 (Reg. S) | EUR | 500,000 | 509,494 |
| 2% 9/1/28 (Reg. S) | SEK | 10,000,000 | 909,039 |
| Svenska Handelsbanken AB: | |||
| 0.5% 2/18/30 (Reg. S) | EUR | 100,000 | 90,815 |
| 1.375% 2/23/29 (Reg. S) | EUR | 110,000 | 107,555 |
| Swedbank AB: | |||
| 0.3% 5/20/27 (Reg. S) (b) | EUR | 240,000 | 241,787 |
| 2.1% 5/25/27 (Reg. S) | EUR | 108,000 | 111,652 |
| Swedbank Hypotek AB: | |||
| 1% 9/18/24 (Reg. S) | SEK | 800,000 | 75,052 |
| 3% 3/28/29 (Reg. S) | SEK | 1,900,000 | 179,609 |
| 3.125% 7/5/28 (Reg. S) | EUR | 390,000 | 416,768 |
| Swedish Covered Bond Corp. 2% 6/17/26 (Reg. S) | SEK | 11,000,000 | 1,017,128 |
| Telia Co. AB 0.125% 11/27/30 (Reg. S) | EUR | 310,000 | 270,194 |
| Vattenfall AB 0.125% 2/12/29 (Reg. S) | EUR | 108,000 | 99,547 |
TOTAL SWEDEN | 8,627,762 | ||
| Switzerland - 0.7% | |||
| Argentum Netherlands BV for Zurich Insurance Co. Ltd. 2.75% 2/19/49 (Reg. S) (b) | EUR | 120,000 | 121,128 |
| Holcim Finance Luxembourg SA 0.5% 4/23/31 (Reg. S) | EUR | 130,000 | 111,639 |
| Pfandbrief Schweiz Hypo: | |||
| 0% 7/29/24 (Reg. S) | CHF | 40,000 | 44,475 |
| 0% 10/26/29 (Reg. S) | CHF | 50,000 | 52,357 |
| 0% 8/26/49 (Reg. S) | CHF | 520,000 | 430,860 |
| 0.125% 12/19/31 (Reg. S) | CHF | 1,270,000 | 1,305,709 |
| Pfandbriefbank Schweizerischer Hypothekarinstitute AG: | |||
| 0% 3/13/28 (Reg. S) | CHF | 600,000 | 640,509 |
| 0% 7/25/31 (Reg. S) | CHF | 340,000 | 348,238 |
| 0.1% 12/3/31 (Reg. S) | CHF | 795,000 | 816,787 |
| 0.5% 11/24/28 (Reg. S) | CHF | 40,000 | 43,300 |
| Swisscom Finance BV 0.375% 11/14/28 (Reg. S) | EUR | 430,000 | 406,259 |
| UBS AG Australia BRH 5.808% 11/24/28 (Reg. S) | AUD | 90,000 | 61,311 |
| UBS AG London Branch 0.25% 9/1/28 (Reg. S) | EUR | 390,000 | 365,524 |
| UBS Group AG: | |||
| 0.65% 1/14/28 (Reg. S) (b) | EUR | 100,000 | 99,052 |
| 1% 6/24/27 (Reg. S) (b) | EUR | 150,000 | 151,945 |
| 1.25% 7/17/25 (Reg. S) (b) | EUR | 307,000 | 328,376 |
| 2.125% 11/15/29 (Reg. S) (b) | GBP | 130,000 | 144,123 |
| 2.875% 4/2/32 (Reg. S) (b) | EUR | 270,000 | 270,375 |
| 7.75% 3/1/29 (Reg. S) (b) | EUR | 100,000 | 120,968 |
| Zurich Finance (Ireland) DAC 1.625% 6/17/39 (Reg. S) | EUR | 100,000 | 83,310 |
TOTAL SWITZERLAND | 5,946,245 | ||
| United Kingdom - 1.6% | |||
| AA Bond Co. Ltd.: | |||
| 7.375% 7/31/50 (Reg. S) | GBP | 120,000 | 157,036 |
| 8.45% 7/31/50 (Reg. S) | GBP | 130,000 | 173,094 |
| Anglian Water Services Financing PLC 1.625% 8/10/25 (Reg. S) | GBP | 240,000 | 289,962 |
| Annington Funding PLC 2.308% 10/6/32 (Reg. S) | GBP | 104,000 | 101,194 |
| Aviva PLC 6.875% 11/27/53 (Reg. S) (b) | GBP | 100,000 | 130,563 |
| Barclays PLC: | |||
| 0.577% 8/9/29 (Reg. S) (b) | EUR | 120,000 | 112,574 |
| 1.106% 5/12/32 (Reg. S) (b) | EUR | 110,000 | 97,220 |
| 1.125% 3/22/31 (Reg. S) (b) | EUR | 230,000 | 232,201 |
| 3.25% 1/17/33 | GBP | 299,000 | 317,436 |
| BAT International Finance PLC 2.25% 6/26/28 (Reg. S) | GBP | 240,000 | 269,710 |
| BAT Netherlands Finance BV: | |||
| 3.125% 4/7/28 (Reg. S) | EUR | 100,000 | 105,198 |
| 5.375% 2/16/31 (Reg. S) | EUR | 110,000 | 125,078 |
| British Telecommunications PLC 3.75% 5/13/31 (Reg. S) | EUR | 170,000 | 182,572 |
| Cadent Finance PLC 3.125% 3/21/40 (Reg. S) | GBP | 100,000 | 90,628 |
| CCEP Finance Ireland DAC 0.875% 5/6/33 (Reg. S) | EUR | 110,000 | 93,492 |
| CK Hutchison Group Telecom Finance SA 1.125% 10/17/28 (Reg. S) | EUR | 100,000 | 96,176 |
| Clarion Funding PLC 1.25% 11/13/32 (Reg. S) | GBP | 120,000 | 111,565 |
| Gatwick Funding Ltd. 2.5% 4/15/32 (Reg. S) | GBP | 220,000 | 241,436 |
| GlaxoSmithKline Capital PLC 1.625% 5/12/35 (Reg. S) | GBP | 140,000 | 127,520 |
| Heathrow Funding Ltd.: | |||
| 2.625% 3/16/28 (Reg. S) | GBP | 190,000 | 215,488 |
| 3.661% 1/13/33 | CAD | 215,000 | 145,935 |
| HSBC Holdings PLC: | |||
| Eur Swap Annual 5Y Index + 3.300% 6.364% 11/16/32 (Reg. S) (b)(c) | EUR | 270,000 | 306,582 |
| 3% 7/22/28 (b) | GBP | 110,000 | 129,686 |
| 3% 5/29/30 (b) | GBP | 130,000 | 147,887 |
| 8.201% 11/16/34 (Reg. S) (b) | GBP | 150,000 | 205,640 |
| Land Securities Capital Markets PLC 2.375% 3/29/29 (Reg. S) | GBP | 160,000 | 187,328 |
| LCR Finance PLC 5.1% 3/7/51 | GBP | 93,000 | 122,585 |
| Legal & General Group PLC 5.125% 11/14/48 (Reg. S) (b) | GBP | 100,000 | 122,964 |
| Lloyds Bank PLC 0.125% 9/23/29 (Reg. S) | EUR | 100,000 | 91,213 |
| Lloyds Banking Group PLC: | |||
| 0.5% 11/12/25 (Reg. S) (b) | EUR | 130,000 | 137,548 |
| 1.985% 12/15/31 (b) | GBP | 104,000 | 120,292 |
| 2% 4/12/28 (Reg. S) (b) | GBP | 140,000 | 161,374 |
| 2.25% 10/16/24 | GBP | 100,000 | 125,144 |
| 3.5% 4/1/26 (Reg. S) (b) | EUR | 404,000 | 431,466 |
| 5.802% 3/17/29 (b) | AUD | 100,000 | 66,767 |
| London & Quadrant Housing Trust 2% 3/31/32 (Reg. S) | GBP | 112,000 | 112,077 |
| London Stock Exchange Group PLC 1.75% 9/19/29 (Reg. S) | EUR | 110,000 | 108,076 |
| M&G PLC 5.625% 10/20/51 (Reg. S) (b) | GBP | 104,000 | 124,882 |
| Motability Operations Group PLC 1.5% 1/20/41 (Reg. S) | GBP | 220,000 | 161,871 |
| National Grid Electricity Transmission PLC: | |||
| 0.19% 1/20/25 (Reg. S) | EUR | 160,000 | 168,004 |
| 0.823% 7/7/32 (Reg. S) | EUR | 140,000 | 119,071 |
| 1.375% 9/16/26 (Reg. S) | GBP | 200,000 | 232,578 |
| National Grid PLC: | |||
| 0.25% 9/1/28 (Reg. S) | EUR | 130,000 | 121,246 |
| 2.179% 6/30/26 (Reg. S) | EUR | 430,000 | 447,633 |
| Nationwide Building Society: | |||
| 0.625% 3/25/27 (Reg. S) | EUR | 903,000 | 900,379 |
| 6.178% 12/7/27 (Reg. S) (b) | GBP | 110,000 | 141,148 |
| NatWest Group PLC: | |||
| 3 month EURIBOR EURO INTER + 1.080% 1.75% 3/2/26 (Reg. S) (b)(c) | EUR | 110,000 | 116,154 |
| 3.622% 8/14/30 (Reg. S) (b) | GBP | 411,000 | 508,271 |
| 4.771% 2/16/29 (Reg. S) (b) | EUR | 120,000 | 132,373 |
| NatWest Markets PLC 6.375% 11/8/27 (Reg. S) | GBP | 280,000 | 366,679 |
| NIE Finance PLC 2.5% 10/27/25 (Reg. S) | GBP | 200,000 | 242,830 |
| Northumbrian Water Finance PLC 5.5% 10/2/37 (Reg. S) | GBP | 100,000 | 120,445 |
| Pension Insurance Corp. PLC 5.625% 9/20/30 (Reg. S) | GBP | 100,000 | 120,627 |
| Phoenix Group Holdings PLC 5.867% 6/13/29 (Reg. S) | GBP | 100,000 | 123,591 |
| Santander UK Group Holdings PLC 7.098% 11/16/27 (Reg. S) (b) | GBP | 110,000 | 143,039 |
| Santander UK PLC 0.05% 1/12/27 (Reg. S) | EUR | 200,000 | 197,158 |
| Segro Capital SARL 1.25% 3/23/26 (Reg. S) | EUR | 160,000 | 164,448 |
| Severn Trent Utilities Finance PLC: | |||
| 2.625% 2/22/33 (Reg. S) | GBP | 100,000 | 101,980 |
| 4.625% 11/30/34 (Reg. S) | GBP | 100,000 | 117,210 |
| Southern Water Services Finance Ltd.: | |||
| 1.625% 3/30/27 (Reg. S) | GBP | 150,000 | 163,067 |
| 2.375% 5/28/28 (Reg. S) | GBP | 200,000 | 216,684 |
| Standard Chartered PLC: | |||
| 0.8% 11/17/29 (Reg. S) (b) | EUR | 110,000 | 103,279 |
| 0.85% 1/27/28 (Reg. S) (b) | EUR | 107,000 | 106,412 |
| 2.5% 9/9/30 (Reg. S) (b) | EUR | 130,000 | 136,460 |
| Unilever Finance Netherlands BV 3.5% 2/15/37 (Reg. S) | EUR | 170,000 | 181,279 |
| United Utilities Water Finance PLC 0.875% 10/28/29 (Reg. S) | GBP | 200,000 | 204,036 |
| Vodafone International Financing DAC 3.75% 12/2/34 (Reg. S) | EUR | 330,000 | 352,646 |
| WPP Finance SAS 4.125% 5/30/28 (Reg. S) | EUR | 170,000 | 184,541 |
| Yorkshire Water Finance PLC 1.75% 10/27/32 (Reg. S) | GBP | 100,000 | 92,419 |
TOTAL UNITED KINGDOM | 12,605,147 | ||
| United States of America - 4.0% | |||
| Air Products & Chemicals, Inc. 0.5% 5/5/28 | EUR | 1,223,000 | 1,176,214 |
| Altria Group, Inc.: | |||
| 2.2% 6/15/27 | EUR | 398,000 | 409,011 |
| 3.125% 6/15/31 | EUR | 174,000 | 173,299 |
| American Tower Corp. 1% 1/15/32 | EUR | 140,000 | 120,913 |
| Apple, Inc. 0.5% 11/15/31 | EUR | 911,000 | 813,013 |
| AT&T, Inc.: | |||
| 0.25% 3/4/26 | EUR | 100,000 | 101,537 |
| 2.05% 5/19/32 | EUR | 110,000 | 104,671 |
| 2.9% 12/4/26 | GBP | 2,720,000 | 3,259,310 |
| Athene Global Funding 0.832% 1/8/27 (Reg. S) | EUR | 140,000 | 139,045 |
| Bank of America Corp.: | |||
| 0.694% 3/22/31 (Reg. S) (b) | EUR | 486,000 | 438,457 |
| 1.667% 6/2/29 (Reg. S) (b) | GBP | 100,000 | 110,771 |
| Becton Dickinson Euro Finance SARL 1.208% 6/4/26 | EUR | 1,553,000 | 1,588,856 |
| Berkshire Hathaway, Inc. 2.15% 3/15/28 | EUR | 797,000 | 819,181 |
| Booking Holdings, Inc.: | |||
| 4.125% 5/12/33 | EUR | 110,000 | 121,342 |
| 4.5% 11/15/31 | EUR | 150,000 | 169,437 |
| BP Capital Markets BV 0.933% 12/4/40 (Reg. S) | EUR | 290,000 | 195,316 |
| BP Capital Markets PLC 1.637% 6/26/29 (Reg. S) | EUR | 100,000 | 98,047 |
| Chubb INA Holdings, Inc. 1.55% 3/15/28 | EUR | 639,000 | 638,597 |
| Citigroup, Inc. 4.112% 9/22/33 (Reg. S) (b) | EUR | 220,000 | 239,247 |
| Comcast Corp. 1.875% 2/20/36 | GBP | 405,000 | 367,425 |
| CRH SMW Finance DAC 4% 7/11/31 (Reg. S) | EUR | 120,000 | 130,487 |
| DH Europe Finance II SARL: | |||
| 0.2% 3/18/26 | EUR | 2,894,000 | 2,930,174 |
| 0.75% 9/18/31 | EUR | 456,000 | 404,690 |
| 1.35% 9/18/39 | EUR | 192,000 | 148,884 |
| Digital Dutch Finco BV 1.5% 3/15/30 (Reg. S) | EUR | 100,000 | 93,599 |
| Digital Intrepid Holding BV 0.625% 7/15/31 (Reg. S) | EUR | 100,000 | 84,201 |
| Duke Energy Corp. 3.1% 6/15/28 | EUR | 100,000 | 104,504 |
| DXC Technology Co. 1.75% 1/15/26 | EUR | 914,000 | 950,966 |
| FedEx Corp. 0.95% 5/4/33 | EUR | 371,000 | 313,301 |
| Fidelity National Information Services, Inc. 1.5% 5/21/27 | EUR | 758,000 | 765,890 |
| Fiserv, Inc. 2.25% 7/1/25 | GBP | 925,000 | 1,133,021 |
| Ford Motor Credit Co. LLC: | |||
| 2.33% 11/25/25 | EUR | 100,000 | 104,688 |
| 6.125% 5/15/28 | EUR | 130,000 | 148,841 |
| General Electric Co. 2.125% 5/17/37 | EUR | 230,000 | 203,496 |
| General Motors Financial Co., Inc. 3.9% 1/12/28 (Reg. S) | EUR | 100,000 | 107,441 |
| Goldman Sachs Group, Inc.: | |||
| 0.75% 3/23/32 (Reg. S) | EUR | 70,000 | 60,210 |
| 1% 3/18/33 (Reg. S) | EUR | 70,000 | 60,158 |
| 1.25% 2/7/29 (Reg. S) | EUR | 50,000 | 48,202 |
| 1.875% 12/16/30 (Reg. S) | GBP | 100,000 | 104,276 |
| 2% 11/1/28 (Reg. S) | EUR | 51,000 | 51,309 |
| 3.125% 7/25/29 (Reg. S) | GBP | 27,000 | 31,384 |
| Honeywell International, Inc. 0.75% 3/10/32 | EUR | 150,000 | 130,628 |
| IBM Corp. 1.2% 2/11/40 | EUR | 272,000 | 201,414 |
| JPMorgan Chase & Co.: | |||
| 0.389% 2/24/28 (Reg. S) (b) | EUR | 792,000 | 780,298 |
| 0.991% 4/28/26 (Reg. S) (b) | GBP | 100,000 | 121,890 |
| 1.001% 7/25/31 (Reg. S) (b) | EUR | 100,000 | 91,766 |
| 1.638% 5/18/28 (Reg. S) (b) | EUR | 210,000 | 213,122 |
| Linde PLC 0.375% 9/30/33 (Reg. S) | EUR | 200,000 | 164,681 |
| Marsh & McLennan Companies, Inc. 1.349% 9/21/26 | EUR | 768,000 | 783,509 |
| McDonald's Corp. 1.6% 3/15/31 (Reg. S) | EUR | 200,000 | 189,647 |
| McKesson Corp. 3.125% 2/17/29 | GBP | 573,000 | 673,246 |
| Medtronic Global Holdings SCA: | |||
| 0.25% 7/2/25 | EUR | 100,000 | 103,577 |
| 1.75% 7/2/49 (Reg. S) | EUR | 227,000 | 158,988 |
| Metropolitan Life Global Funding I: | |||
| 0.5% 5/25/29 (Reg. S) | EUR | 100,000 | 93,559 |
| 1.625% 10/12/28 (Reg. S) | GBP | 110,000 | 121,762 |
| Mondelez International Holdings Netherlands BV 0.875% 10/1/31 (Reg. S) | EUR | 110,000 | 97,774 |
| Morgan Stanley: | |||
| 0.495% 10/26/29 (b) | EUR | 100,000 | 93,578 |
| 1.102% 4/29/33 (b) | EUR | 243,000 | 212,202 |
| 5.789% 11/18/33 (b) | GBP | 170,000 | 221,090 |
| MSD Netherlands Capital BV 3.7% 5/30/44 | EUR | 100,000 | 104,411 |
| NASDAQ, Inc. 0.875% 2/13/30 | EUR | 100,000 | 92,783 |
| Nestle Finance International Ltd.: | |||
| 0% 6/14/26 (Reg. S) | EUR | 540,000 | 544,366 |
| 0.25% 6/14/29 (Reg. S) | EUR | 120,000 | 112,124 |
| 1.25% 11/2/29 (Reg. S) | EUR | 30,000 | 29,238 |
| 3.25% 1/23/37 (Reg. S) | EUR | 190,000 | 197,248 |
| Nestle Holdings, Inc. 1.375% 6/23/33 (Reg. S) | GBP | 120,000 | 115,524 |
| Netflix, Inc. 3.625% 6/15/30 (Reg. S) | EUR | 100,000 | 106,785 |
| New York Life Global Funding 0.125% 7/23/30 (Reg. S) | CHF | 215,000 | 221,529 |
| Philip Morris International, Inc.: | |||
| 1.45% 8/1/39 | EUR | 100,000 | 71,411 |
| 2% 5/9/36 | EUR | 210,000 | 179,111 |
| PPG Industries, Inc. 0.875% 11/3/25 | EUR | 744,000 | 767,395 |
| Procter & Gamble Co.: | |||
| 1.375% 5/3/25 | GBP | 221,000 | 271,098 |
| 1.8% 5/3/29 | GBP | 381,000 | 430,804 |
| Prologis LP 2.25% 6/30/29 | GBP | 619,000 | 689,713 |
| Public Storage Operating Co. 0.875% 1/24/32 | EUR | 245,000 | 215,230 |
| Realty Income Corp. 1.75% 7/13/33 | GBP | 413,000 | 387,043 |
| Schlumberger Finance BV 2% 5/6/32 (Reg. S) | EUR | 230,000 | 220,280 |
| Shell International Finance BV 0.5% 11/8/31 (Reg. S) | EUR | 310,000 | 270,247 |
| Stellantis NV 2.75% 4/1/32 (Reg. S) | EUR | 200,000 | 196,947 |
| Tapestry, Inc. 5.35% 11/27/25 | EUR | 140,000 | 152,318 |
| The Coca-Cola Co. 0.375% 3/15/33 | EUR | 906,000 | 758,849 |
| The Dow Chemical Co. 1.875% 3/15/40 | EUR | 232,000 | 185,749 |
| Thermo Fisher Scientific Finance I BV 1.625% 10/18/41 | EUR | 150,000 | 115,067 |
| Thermo Fisher Scientific, Inc.: | |||
| 0.125% 3/1/25 | EUR | 100,000 | 104,531 |
| 1.875% 10/1/49 | EUR | 106,000 | 76,551 |
| Upjohn Finance BV 1.362% 6/23/27 (Reg. S) | EUR | 150,000 | 149,719 |
| Verizon Communications, Inc.: | |||
| 1.125% 9/19/35 | EUR | 100,000 | 81,154 |
| 1.3% 5/18/33 | EUR | 120,000 | 105,611 |
| 2.1% 5/6/26 (Reg. S) | AUD | 200,000 | 126,125 |
| 3.375% 10/27/36 | GBP | 486,000 | 504,999 |
| VF Corp. 0.25% 2/25/28 | EUR | 606,000 | 547,102 |
| Wells Fargo & Co. 2.125% 9/24/31 (Reg. S) | GBP | 350,000 | 361,271 |
| Whirlpool EMEA Finance SARL 0.5% 2/20/28 | EUR | 170,000 | 162,773 |
| WPC Eurobond BV 2.25% 4/9/26 | EUR | 110,000 | 114,508 |
TOTAL UNITED STATES OF AMERICA | 32,285,756 | ||
| TOTAL NONCONVERTIBLE BONDS (Cost $218,200,232) | 199,696,229 | ||
| Government Obligations - 70.0% | |||
Principal Amount (a) | Value ($) | ||
| Australia - 1.9% | |||
| Australian Commonwealth: | |||
| 0.25% 11/21/25 (Reg. S) | AUD | 2,151,000 | 1,357,694 |
| 1% 12/21/30 (Reg. S) | AUD | 542,000 | 297,314 |
| 1.25% 5/21/32 | AUD | 1,576,000 | 841,764 |
| 1.75% 11/21/32 (Reg. S) | AUD | 1,280,000 | 702,888 |
| 1.75% 6/21/51 (Reg. S) | AUD | 809,000 | 298,597 |
| 2.25% 5/21/28 (Reg. S) | AUD | 1,320,000 | 823,596 |
| 2.75% 11/21/28 | AUD | 1,329,000 | 840,150 |
| 2.75% 11/21/29 (Reg. S) | AUD | 1,280,000 | 798,607 |
| 2.75% 5/21/41(Reg. S) | AUD | 954,000 | 500,158 |
| 3% 11/21/33(Reg. S) | AUD | 3,690,000 | 2,215,228 |
| 3% 3/21/47 | AUD | 468,000 | 239,564 |
| 3.25% 4/21/25 (Reg. S) | AUD | 56,000 | 37,015 |
| 3.25% 4/21/29(Reg. S) | AUD | 70,000 | 45,019 |
| 4.5% 4/21/33 | AUD | 1,080,000 | 731,497 |
| 4.75% 4/21/27(Reg. S) | AUD | 370,000 | 251,120 |
| New South Wales Treasury Corp.: | |||
| 1.25% 11/20/30 | AUD | 670,000 | 365,423 |
| 3% 5/20/27 (Reg. S) | AUD | 620,000 | 398,392 |
| 4.25% 2/20/36 (Reg. S) | AUD | 470,000 | 286,829 |
| Queensland Treasury Corp.: | |||
| 1.75% 8/21/31 (Reg. S) (d) | AUD | 2,631,000 | 1,439,383 |
| 1.75% 7/20/34 (Reg. S) (d) | AUD | 450,000 | 221,746 |
| 2.25% 11/20/41 (Reg. S) (d) | AUD | 70,000 | 29,816 |
| 3.25% 7/21/26 (Reg. S) (d) | AUD | 247,000 | 161,084 |
| 3.25% 7/21/28 (Reg. S) (d) | AUD | 154,000 | 98,295 |
| 3.5% 8/21/30 (Reg. S) (d) | AUD | 58,000 | 36,392 |
| South Australian Government Financing Authority: | |||
| 1.75% 5/24/32 (Reg. S) | AUD | 490,000 | 260,539 |
| 2% 5/23/36 (Reg. S) | AUD | 150,000 | 70,693 |
| Treasury Corp. of Victoria: | |||
| 0.5% 11/20/25 | AUD | 110,000 | 69,499 |
| 1.25% 11/19/27 | AUD | 952,000 | 572,185 |
| 1.5% 11/20/30 | AUD | 1,347,000 | 740,971 |
| 2% 11/20/37 | AUD | 260,000 | 116,397 |
| 2.25% 11/20/34 | AUD | 350,000 | 179,041 |
| 2.25% 11/20/42 | AUD | 330,000 | 134,561 |
| 2.5% 10/22/29 | AUD | 424,000 | 255,597 |
| 4.75% 9/15/36 | AUD | 50,000 | 31,582 |
| Western Australia Treasury Corp. 4.25% 7/20/33 | AUD | 150,000 | 95,992 |
TOTAL AUSTRALIA | 15,544,628 | ||
| Austria - 0.9% | |||
| Austrian Republic: | |||
| 0% 10/20/28(Reg. S) (d) | EUR | 600,000 | 568,374 |
| 0% 2/20/30 (Reg. S) (d) | EUR | 542,000 | 493,615 |
| 0% 10/20/40 (Reg. S) (d) | EUR | 788,000 | 502,176 |
| 0.5% 4/20/27 (Reg. S) (d) | EUR | 1,281,000 | 1,281,919 |
| 0.5% 2/20/29 (Reg. S) (d) | EUR | 677,000 | 650,865 |
| 0.7% 4/20/71(Reg. S) (d) | EUR | 80,000 | 36,943 |
| 0.75% 10/20/26 (Reg. S) (d) | EUR | 185,000 | 188,364 |
| 0.75% 2/20/28 (Reg. S) (d) | EUR | 355,000 | 352,197 |
| 0.75% 3/20/51 (Reg. S) (d) | EUR | 1,200,000 | 720,550 |
| 0.85% 6/30/20 (Reg. S) (d) | EUR | 220,000 | 103,411 |
| 0.9% 2/20/32 (Reg. S) (d) | EUR | 394,000 | 363,007 |
| 1.2% 10/20/25 (Reg. S) (d) | EUR | 77,000 | 80,364 |
| 1.5% 2/20/47 (Reg. S) (d) | EUR | 403,000 | 310,269 |
| 2% 7/15/26(Reg. S) (d) | EUR | 1,070,000 | 1,122,102 |
| 2.4% 5/23/34(Reg. S) (d) | EUR | 40,000 | 40,516 |
| 2.9% 2/20/33(Reg. S) (d) | EUR | 140,000 | 148,512 |
| 2.9% 2/20/34(Reg. S) (d) | EUR | 200,000 | 211,542 |
| 3.15% 6/20/44(Reg. S) (d) | EUR | 10,000 | 10,518 |
| 4.15% 3/15/37 (d) | EUR | 20,000 | 23,547 |
TOTAL AUSTRIA | 7,208,791 | ||
| Belgium - 1.3% | |||
| Belgian Kingdom: | |||
| 0% 10/22/27 (Reg. S) (d) | EUR | 1,690,000 | 1,649,367 |
| 0% 10/22/31 (d) | EUR | 882,000 | 763,882 |
| 0.1% 6/22/30 (Reg. S) (d) | EUR | 675,000 | 614,385 |
| 0.35% 6/22/32 (d) | EUR | 549,000 | 478,651 |
| 0.4% 6/22/40 (d) | EUR | 1,212,000 | 823,250 |
| 0.65% 6/22/71 (Reg. S) (d) | EUR | 330,000 | 142,884 |
| 0.8% 6/22/25 (Reg. S) (d) | EUR | 105,000 | 109,713 |
| 0.8% 6/22/27 (d) | EUR | 39,000 | 39,361 |
| 0.9% 6/22/29 (d) | EUR | 1,373,000 | 1,340,844 |
| 1% 6/22/26 (Reg. S) (d) | EUR | 161,000 | 165,898 |
| 1.25% 4/22/33 (Reg. S) (d) | EUR | 1,521,000 | 1,411,105 |
| 1.4% 6/22/53 (Reg. S) (d) | EUR | 932,000 | 610,655 |
| 1.45% 6/22/37 (Reg. S) (d) | EUR | 84,000 | 72,548 |
| 1.6% 6/22/47 (d) | EUR | 38,000 | 28,538 |
| 1.7% 6/22/50 (d) | EUR | 23,000 | 16,945 |
| 1.9% 6/22/38(Reg. S) (d) | EUR | 101,000 | 91,109 |
| 2.25% 6/22/57 (Reg. S) (d) | EUR | 124,000 | 98,972 |
| 2.85% 10/22/34(Reg. S) (d) | EUR | 390,000 | 407,131 |
| 3.3% 6/22/54 (Reg. S) (d) | EUR | 360,000 | 362,826 |
| 3.75% 6/22/45(Reg. S) | EUR | 20,000 | 22,217 |
| 4% 3/28/32 | EUR | 30,000 | 34,334 |
| 4.25% 3/28/41 (d) | EUR | 545,000 | 644,323 |
| 5.5% 3/28/28 | EUR | 40,000 | 46,807 |
| Flemish Community: | |||
| 1.875% 6/2/42 | EUR | 100,000 | 82,799 |
| 3.125% 6/22/34 (Reg. S) | EUR | 100,000 | 105,272 |
| 3.25% 4/5/33 (Reg. S) | EUR | 300,000 | 319,450 |
| Walloon Region 1.05% 6/22/40 (Reg. S) | EUR | 100,000 | 72,024 |
TOTAL BELGIUM | 10,555,290 | ||
| Bulgaria - 0.0% | |||
| Bulgarian Republic: | |||
| 4.5% 1/27/33 (Reg. S) | EUR | 50,000 | 55,673 |
| 4.625% 9/23/34(Reg. S) | EUR | 190,000 | 212,891 |
TOTAL BULGARIA | 268,564 | ||
| Canada - 3.4% | |||
| Alberta Province: | |||
| 0.5% 4/16/25 (Reg. S) | EUR | 100,000 | 104,597 |
| 2.05% 6/1/30 | CAD | 260,000 | 171,943 |
| 3.05% 12/1/48 | CAD | 724,000 | 423,355 |
| 3.1% 6/1/50 | CAD | 231,000 | 135,675 |
| British Columbia Province: | |||
| 2.3% 6/18/26 | CAD | 210,000 | 148,609 |
| 2.75% 6/18/52 | CAD | 140,000 | 75,979 |
| 2.95% 6/18/50 | CAD | 924,000 | 525,918 |
| Canada Housing Trust No. 1: | |||
| 1.75% 6/15/30 (d) | CAD | 730,000 | 478,149 |
| 2.1% 9/15/29 (d) | CAD | 70,000 | 47,327 |
| 3.6% 12/15/27 (d) | CAD | 1,910,000 | 1,388,692 |
| 4.25% 3/15/34 (d) | CAD | 780,000 | 586,330 |
| Canadian Government: | |||
| 0.25% 3/1/26 | CAD | 548,000 | 376,716 |
| 0.5% 12/1/30 | CAD | 491,000 | 298,300 |
| 1% 9/1/26 | CAD | 390,000 | 268,466 |
| 1% 6/1/27 | CAD | 58,000 | 39,379 |
| 1.25% 3/1/27 | CAD | 100,000 | 68,601 |
| 1.25% 6/1/30 | CAD | 16,000 | 10,325 |
| 1.5% 9/1/24 | CAD | 18,000 | 13,090 |
| 1.5% 6/1/31 | CAD | 1,380,000 | 885,811 |
| 1.75% 12/1/53 | CAD | 1,050,000 | 532,180 |
| 2% 6/1/28 | CAD | 50,000 | 34,544 |
| 2% 6/1/32 | CAD | 540,000 | 353,723 |
| 2% 12/1/51 | CAD | 410,000 | 224,239 |
| 2.5% 12/1/32 | CAD | 2,160,000 | 1,463,757 |
| 2.75% 6/1/33 | CAD | 430,000 | 296,167 |
| 2.75% 12/1/48 | CAD | 310,000 | 201,373 |
| 2.75% 12/1/64 | CAD | 550,000 | 352,868 |
| 3% 6/1/34 | CAD | 1,940,000 | 1,358,589 |
| 3.25% 9/1/28 | CAD | 510,000 | 368,495 |
| 3.25% 12/1/33 | CAD | 1,640,000 | 1,174,062 |
| 3.5% 3/1/28 | CAD | 855,000 | 623,040 |
| City of Montreal: | |||
| 2.3% 9/1/29 | CAD | 140,000 | 94,395 |
| 2.4% 12/1/41 | CAD | 70,000 | 37,473 |
| City of Ottawa 4.6% 7/14/42 | CAD | 70,000 | 50,929 |
| City of Toronto: | |||
| 2.15% 8/25/40 | CAD | 70,000 | 36,893 |
| 2.8% 11/22/49 | CAD | 180,000 | 95,772 |
| Manitoba Province: | |||
| 3% 6/2/28 | CAD | 320,000 | 226,679 |
| 3.2% 3/5/50 | CAD | 256,000 | 150,428 |
| 3.4% 9/5/48 | CAD | 380,000 | 232,064 |
| New Brunswick Province: | |||
| 3.05% 8/14/50 | CAD | 227,000 | 129,770 |
| 3.55% 6/3/43 | CAD | 100,000 | 64,225 |
| 4.8% 9/26/39 | CAD | 90,000 | 67,965 |
| Newfoundland Province: | |||
| 2.65% 10/17/50 | CAD | 167,000 | 85,133 |
| 3.3% 10/17/46 | CAD | 50,000 | 29,506 |
| 3.7% 10/17/48 | CAD | 70,000 | 43,870 |
| Nova Scotia Province 3.15% 12/1/51 | CAD | 80,000 | 46,634 |
| Ontario Province: | |||
| 0.25% 12/15/26 (Reg. S) | GBP | 638,000 | 723,420 |
| 0.375% 4/8/27 (Reg. S) | EUR | 283,000 | 280,740 |
| 1.05% 9/8/27 | CAD | 2,770,000 | 1,856,460 |
| 1.75% 9/8/25 | CAD | 401,000 | 284,606 |
| 1.9% 12/2/51 | CAD | 210,000 | 94,391 |
| 2.05% 6/2/30 | CAD | 59,000 | 39,022 |
| 2.15% 6/2/31 | CAD | 170,000 | 110,807 |
| 2.3% 9/8/24 | CAD | 53,000 | 38,579 |
| 2.4% 6/2/26 | CAD | 49,000 | 34,749 |
| 2.65% 12/2/50 | CAD | 49,000 | 26,331 |
| 2.7% 6/2/29 | CAD | 1,703,000 | 1,183,405 |
| 2.8% 6/2/48 | CAD | 1,868,000 | 1,047,353 |
| 2.9% 12/2/46 | CAD | 480,000 | 276,130 |
| 2.9% 6/2/49 | CAD | 885,000 | 502,556 |
| 3.65% 6/2/33 | CAD | 1,050,000 | 739,862 |
| 3.75% 12/2/53 | CAD | 160,000 | 105,815 |
| 4.7% 6/2/37 | CAD | 190,000 | 143,696 |
| Quebec Province: | |||
| 0% 10/29/30 (Reg. S) | EUR | 1,050,000 | 924,273 |
| 0.5% 1/25/32 (Reg. S) | EUR | 330,000 | 290,219 |
| 0.75% 12/13/24 (Reg. S) | GBP | 192,000 | 237,984 |
| 1.5% 9/1/31 | CAD | 1,966,000 | 1,216,648 |
| 1.9% 9/1/30 | CAD | 131,000 | 85,412 |
| 2.25% 9/15/26 (Reg. S) | GBP | 112,000 | 134,069 |
| 2.3% 9/1/29 | CAD | 1,179,000 | 801,303 |
| 2.5% 9/1/26 | CAD | 423,000 | 299,722 |
| 2.85% 12/1/53 | CAD | 110,000 | 60,577 |
| 3.1% 12/1/51 | CAD | 230,000 | 134,671 |
| 3.5% 12/1/45 | CAD | 130,000 | 82,950 |
| 3.5% 12/1/48 | CAD | 80,000 | 50,600 |
| 3.6% 9/1/33 | CAD | 300,000 | 209,944 |
| 3.65% 5/20/32 | CAD | 410,000 | 292,105 |
| 4.4% 12/1/55 | CAD | 260,000 | 192,020 |
| 5% 12/1/38 | CAD | 90,000 | 69,959 |
| 5% 12/1/41 | CAD | 420,000 | 328,227 |
| Saskatchewan Province: | |||
| 3.1% 6/2/50 | CAD | 293,000 | 172,534 |
| 3.9% 6/2/33 | CAD | 70,000 | 50,255 |
TOTAL CANADA | 27,543,429 | ||
| Chile - 0.1% | |||
| Chilean Republic: | |||
| 1.25% 1/29/40 | EUR | 114,000 | 84,012 |
| 1.875% 5/27/30 | EUR | 100,000 | 96,954 |
| 2.3% 10/1/28(Reg. S) (d) | CLP | 245,000,000 | 225,980 |
| 5.1% 7/15/50 | CLP | 120,000,000 | 110,392 |
| 6% 1/1/43 | CLP | 200,000,000 | 210,336 |
| 7% 5/1/34(Reg. S) (d) | CLP | 105,000,000 | 118,342 |
TOTAL CHILE | 846,016 | ||
| China - 16.3% | |||
| Agricultural Development Bank of China 3.3% 11/5/31 | CNY | 42,520,000 | 6,257,720 |
| China Development Bank: | |||
| 2.83% 9/10/26 | CNY | 59,070,000 | 8,283,187 |
| 3% 1/17/32 | CNY | 10,000,000 | 1,445,489 |
| 3.02% 3/6/33 | CNY | 16,400,000 | 2,378,123 |
| 3.34% 7/14/25 | CNY | 19,020,000 | 2,659,916 |
| 3.41% 6/7/31 | CNY | 2,540,000 | 375,906 |
| 3.48% 1/8/29 | CNY | 62,240,000 | 9,078,482 |
| 3.5% 11/4/46 | CNY | 820,000 | 133,582 |
| 3.68% 2/26/26 | CNY | 27,100,000 | 3,834,425 |
| 3.7% 10/20/30 | CNY | 17,030,000 | 2,547,764 |
| 3.8% 1/25/36 | CNY | 550,000 | 86,732 |
| 3.9% 8/3/40 | CNY | 12,690,000 | 2,081,489 |
| Peoples Republic of China: | |||
| 0.5% 11/12/31 (Reg. S) | EUR | 110,000 | 97,999 |
| 0.625% 11/25/35 (Reg. S) | EUR | 150,000 | 120,181 |
| 2% 6/15/25 | CNY | 21,150,000 | 2,922,767 |
| 2.04% 2/25/27 | CNY | 24,640,000 | 3,409,539 |
| 2.05% 4/15/29 | CNY | 12,080,000 | 1,668,292 |
| 2.18% 8/25/25 | CNY | 20,460,000 | 2,833,066 |
| 2.27% 5/25/34 | CNY | 21,170,000 | 2,928,588 |
| 2.35% 2/25/34 | CNY | 19,030,000 | 2,643,661 |
| 2.37% 1/20/27 | CNY | 5,670,000 | 790,945 |
| 2.37% 1/15/29 | CNY | 28,050,000 | 3,925,137 |
| 2.39% 11/15/26 | CNY | 14,910,000 | 2,080,754 |
| 2.4% 7/15/28 | CNY | 50,010,000 | 6,998,007 |
| 2.44% 10/15/27 | CNY | 4,120,000 | 577,045 |
| 2.48% 4/15/27 | CNY | 6,860,000 | 961,304 |
| 2.5% 7/25/27 | CNY | 21,290,000 | 2,987,417 |
| 2.52% 8/25/33 | CNY | 35,920,000 | 5,055,247 |
| 2.55% 10/15/28 | CNY | 36,740,000 | 5,174,517 |
| 2.6% 9/15/30 | CNY | 1,630,000 | 230,598 |
| 2.6% 9/1/32 | CNY | 15,220,000 | 2,150,515 |
| 2.62% 4/15/28 | CNY | 12,130,000 | 1,709,956 |
| 2.62% 9/25/29 | CNY | 13,690,000 | 1,940,258 |
| 2.64% 1/15/28 | CNY | 20,000,000 | 2,821,258 |
| 2.67% 11/25/33 | CNY | 25,000,000 | 3,562,966 |
| 2.68% 5/21/30 | CNY | 1,760,000 | 249,717 |
| 2.7% 11/3/26 | CNY | 20,270,000 | 2,851,459 |
| 2.75% 6/15/29 | CNY | 11,830,000 | 1,685,801 |
| 2.75% 2/17/32 | CNY | 9,650,000 | 1,381,309 |
| 2.76% 5/15/32 | CNY | 20,700,000 | 2,963,230 |
| 2.79% 12/15/29 | CNY | 8,320,000 | 1,188,942 |
| 2.8% 3/24/29 | CNY | 7,560,000 | 1,078,279 |
| 2.8% 11/15/32 | CNY | 12,110,000 | 1,740,316 |
| 2.88% 2/25/33 | CNY | 5,620,000 | 812,963 |
| 3.02% 10/22/25 | CNY | 15,570,000 | 2,182,376 |
| 3.02% 5/27/31 | CNY | 2,210,000 | 321,573 |
| 3.12% 10/25/52 | CNY | 9,420,000 | 1,462,362 |
| 3.19% 4/15/53 | CNY | 2,170,000 | 341,998 |
| 3.27% 11/19/30 | CNY | 40,000 | 5,908 |
| 3.27% 3/25/73 | CNY | 6,040,000 | 1,015,643 |
| 3.32% 4/15/52 | CNY | 19,390,000 | 3,115,449 |
| 3.53% 10/18/51 | CNY | 2,230,000 | 369,130 |
| 3.73% 5/25/70 | CNY | 1,050,000 | 192,761 |
| 3.81% 9/14/50 | CNY | 36,960,000 | 6,379,966 |
| 3.82% 11/19/68 | CNY | 5,380,000 | 1,006,684 |
| 3.86% 7/22/49 | CNY | 17,330,000 | 3,005,136 |
| 4% 6/24/69 | CNY | 1,080,000 | 209,794 |
| 4.12% 8/2/42 | CNY | 3,320,000 | 575,426 |
TOTAL CHINA | 130,889,054 | ||
| Colombia - 0.3% | |||
| Colombian Republic: | |||
| 5.75% 11/3/27 | COP | 2,000,000,000 | 426,357 |
| 7% 3/26/31 | COP | 3,780,000,000 | 761,992 |
| 7% 6/30/32 | COP | 873,300,000 | 170,307 |
| 7.25% 10/18/34 | COP | 1,541,500,000 | 290,292 |
| 7.5% 8/26/26 | COP | 4,005,000,000 | 928,203 |
TOTAL COLOMBIA | 2,577,151 | ||
| Croatia - 0.1% | |||
| Croatia Republic: | |||
| 1.125% 6/19/29 (Reg. S) | EUR | 151,000 | 146,300 |
| 1.75% 3/4/41(Reg. S) | EUR | 100,000 | 80,221 |
| 2.7% 6/15/28 | EUR | 200,000 | 211,039 |
TOTAL CROATIA | 437,560 | ||
| Cyprus - 0.1% | |||
| Republic of Cyprus: | |||
| 2.25% 4/16/50 (Reg. S) | EUR | 59,000 | 46,676 |
| 2.375% 9/25/28 (Reg. S) | EUR | 84,000 | 87,377 |
| 4.125% 4/13/33 (Reg. S) | EUR | 290,000 | 327,406 |
TOTAL CYPRUS | 461,459 | ||
| Czech Republic - 0.3% | |||
| Czech Republic: | |||
| 0.25% 2/10/27 | CZK | 27,960,000 | 1,080,504 |
| 1.2% 3/13/31 | CZK | 5,250,000 | 186,970 |
| 1.25% 2/14/25 | CZK | 170,000 | 7,115 |
| 1.5% 4/24/40 | CZK | 10,600,000 | 309,394 |
| 1.75% 6/23/32 | CZK | 7,650,000 | 274,802 |
| 2% 10/13/33 | CZK | 2,230,000 | 79,341 |
| 4.85% 11/26/57 (Reg. S) | CZK | 1,830,000 | 82,488 |
| 5.5% 12/12/28 | CZK | 7,560,000 | 341,430 |
TOTAL CZECH REPUBLIC | 2,362,044 | ||
| Denmark - 0.3% | |||
| Danish Kingdom: | |||
| 0% 11/15/31 | DKK | 610,000 | 73,570 |
| 0.25% 11/15/52 (Reg. S) | DKK | 1,761,000 | 133,253 |
| 0.5% 11/15/27 | DKK | 3,050,000 | 409,964 |
| 0.5% 11/15/29(Reg. S) | DKK | 7,384,000 | 959,824 |
| 4.5% 11/15/39 | DKK | 3,960,000 | 695,404 |
TOTAL DENMARK | 2,272,015 | ||
| Finland - 0.4% | |||
| Finnish Government: | |||
| 0% 9/15/24 (d) | EUR | 84,000 | 89,283 |
| 0% 9/15/30 (Reg. S) (d) | EUR | 260,000 | 232,988 |
| 0.125% 4/15/36 (Reg. S) (d) | EUR | 452,000 | 341,008 |
| 0.125% 4/15/52 (Reg. S) (d) | EUR | 294,000 | 141,135 |
| 0.25% 9/15/40 (Reg. S) (d) | EUR | 433,000 | 290,001 |
| 0.5% 4/15/26 (Reg. S) (d) | EUR | 44,000 | 45,046 |
| 0.5% 9/15/28 (Reg. S) (d) | EUR | 400,000 | 388,189 |
| 0.5% 4/15/43(Reg. S) (d) | EUR | 63,000 | 41,561 |
| 1.125% 4/15/34 (Reg. S) (d) | EUR | 166,000 | 149,148 |
| 1.5% 9/15/32(Reg. S) (d) | EUR | 270,000 | 258,100 |
| 2.625% 7/4/42 (d) | EUR | 20,000 | 19,581 |
| 2.875% 4/15/29(Reg. S) (d) | EUR | 290,000 | 310,223 |
| 3% 9/15/33(Reg. S) (d) | EUR | 200,000 | 213,545 |
| 4% 7/4/25 (d) | EUR | 710,000 | 766,077 |
TOTAL FINLAND | 3,285,885 | ||
| France - 5.9% | |||
| Caisse d'Amort de la Dette Sociale: | |||
| 0% 2/25/28 (Reg. S) | EUR | 600,000 | 573,277 |
| 0% 11/25/30 (Reg. S) | EUR | 900,000 | 789,003 |
| 0% 5/25/31 (Reg. S) | EUR | 300,000 | 258,715 |
| 0.125% 12/15/25 (Reg. S) | GBP | 400,000 | 471,787 |
| 1.75% 11/25/27 (Reg. S) | EUR | 500,000 | 511,002 |
| 3% 11/25/31 (Reg. S) | EUR | 200,000 | 211,234 |
| City of Paris, France 1.375% 11/20/34 (Reg. S) | EUR | 100,000 | 86,014 |
| French Government: | |||
| 0% 3/25/25(Reg. S) (d) | EUR | 14,000 | 14,621 |
| 0% 2/25/26 (Reg. S) (d) | EUR | 5,043,000 | 5,129,060 |
| 0% 2/25/27 (Reg. S) (d) | EUR | 315,000 | 311,384 |
| 0% 11/25/29 (Reg. S) (d) | EUR | 3,307,000 | 3,016,670 |
| 0% 11/25/30 (Reg. S) (d) | EUR | 1,209,000 | 1,068,244 |
| 0% 11/25/31 (Reg. S) (d) | EUR | 1,517,000 | 1,296,436 |
| 0% 5/25/32 (Reg. S) (d) | EUR | 883,000 | 741,710 |
| 0.25% 11/25/26(Reg. S) (d) | EUR | 1,615,000 | 1,617,559 |
| 0.5% 5/25/26 (d) | EUR | 33,000 | 33,652 |
| 0.5% 5/25/29 (Reg. S) (d) | EUR | 1,326,000 | 1,259,007 |
| 0.5% 5/25/40 (Reg. S) (d) | EUR | 3,197,000 | 2,179,595 |
| 0.5% 6/25/44(Reg. S) (d) | EUR | 690,000 | 418,621 |
| 0.5% 5/25/72 (d) | EUR | 690,000 | 259,920 |
| 0.75% 2/25/28(Reg. S) (d) | EUR | 3,330,000 | 3,289,529 |
| 0.75% 5/25/28 (Reg. S) (d) | EUR | 473,000 | 465,021 |
| 0.75% 5/25/52 (Reg. S) (d) | EUR | 2,316,000 | 1,240,643 |
| 0.75% 5/25/53 (Reg. S) (d) | EUR | 2,348,000 | 1,225,923 |
| 1% 11/25/25(Reg. S) (d) | EUR | 36,000 | 37,394 |
| 1% 5/25/27 (d) | EUR | 3,126,000 | 3,160,303 |
| 1.25% 5/25/34(Reg. S) (d) | EUR | 137,000 | 122,059 |
| 1.25% 5/25/36(Reg. S) (d) | EUR | 2,368,000 | 2,014,073 |
| 1.25% 5/25/38(Reg. S) (d) | EUR | 390,000 | 316,184 |
| 1.5% 5/25/31(Reg. S) (d) | EUR | 1,913,000 | 1,851,845 |
| 1.5% 5/25/50 (Reg. S) (d) | EUR | 354,000 | 243,928 |
| 1.75% 6/25/39 (Reg. S) (d) | EUR | 655,000 | 562,209 |
| 1.75% 5/25/66 (d) | EUR | 33,000 | 21,703 |
| 2% 11/25/32(Reg. S) (d) | EUR | 2,970,000 | 2,910,678 |
| 2% 5/25/48 (d) | EUR | 124,000 | 98,340 |
| 2.5% 9/24/26(Reg. S) (d) | EUR | 420,000 | 443,806 |
| 2.5% 5/25/30 (d) | EUR | 840,000 | 873,829 |
| 2.5% 5/25/43(Reg. S) (d) | EUR | 1,800,000 | 1,635,869 |
| 2.75% 2/25/29(Reg. S) (d) | EUR | 1,570,000 | 1,660,216 |
| 3% 5/25/33 (Reg. S) (d) | EUR | 870,000 | 917,250 |
| 3% 5/25/54(Reg. S) (d) | EUR | 610,000 | 568,683 |
| 3.5% 11/25/33(Reg. S) (d) | EUR | 2,300,000 | 2,513,212 |
| 4% 4/25/60 (d) | EUR | 230,000 | 261,023 |
| 4.75% 4/25/35 (d) | EUR | 100,000 | 120,841 |
| La Banque Postale 0.75% 8/2/32 (Reg. S) (b) | EUR | 100,000 | 95,534 |
TOTAL FRANCE | 46,897,606 | ||
| Germany - 6.1% | |||
| Bundeslaender Bundesrepublik 0.01% 2/4/31 (Reg. S) | EUR | 50,000 | 44,251 |
| Free & Hanseatic City of Hamburg 0.25% 2/18/41 (Reg. S) | EUR | 190,000 | 125,789 |
| Free State of Saxony 0.01% 12/17/35 (Reg. S) | EUR | 490,000 | 372,148 |
| German Federal Republic: | |||
| 0% 4/11/25 (Reg. S) | EUR | 5,000 | 5,223 |
| 0% 4/10/26 (Reg. S) | EUR | 260,000 | 265,133 |
| 0% 8/15/26(Reg. S) | EUR | 57,000 | 57,670 |
| 0% 10/9/26 (Reg. S) | EUR | 2,560,000 | 2,580,424 |
| 0% 4/16/27 (Reg. S) | EUR | 5,560,000 | 5,543,339 |
| 0% 2/15/30 (Reg. S) | EUR | 61,000 | 57,173 |
| 0% 8/15/30 (Reg. S) (e) | EUR | 3,241,000 | 3,006,244 |
| 0% 2/15/32 (Reg. S) | EUR | 8,000 | 7,156 |
| 0% 8/15/52 (Reg. S) | EUR | 150,000 | 77,473 |
| 0.25% 2/15/29 | EUR | 6,000 | 5,826 |
| 0.5% 2/15/28 | EUR | 7,000 | 6,986 |
| 1.25% 8/15/48 (f) | EUR | 1,163,000 | 932,851 |
| 1.8% 8/15/53(Reg. S) | EUR | 1,740,000 | 1,538,064 |
| 2.1% 4/12/29(Reg. S) | EUR | 530,000 | 558,254 |
| 2.1% 11/15/29(Reg. S) | EUR | 2,540,000 | 2,672,487 |
| 2.2% 2/15/34(Reg. S) | EUR | 4,140,000 | 4,328,494 |
| 2.3% 2/15/33(Reg. S) | EUR | 1,000,000 | 1,059,217 |
| 2.4% 11/15/30(Reg. S) | EUR | 5,990,000 | 6,397,938 |
| 2.5% 3/19/26(Reg. S) | EUR | 1,190,000 | 1,266,100 |
| 2.5% 7/4/44 | EUR | 800,000 | 830,248 |
| 2.5% 8/15/54(Reg. S) | EUR | 860,000 | 887,308 |
| 2.6% 8/15/33(Reg. S) | EUR | 860,000 | 931,279 |
| 3.1% 12/12/25 (Reg. S) | EUR | 2,130,000 | 2,284,198 |
| 3.25% 7/4/42 | EUR | 3,520,000 | 4,059,637 |
| 4% 1/4/37 | EUR | 40,000 | 49,162 |
| 4.75% 7/4/40 | EUR | 20,000 | 27,135 |
| Investitionsbank Berlin 0.01% 7/15/27 | EUR | 300,000 | 293,259 |
| Land Berlin: | |||
| 0.125% 11/24/45 (Reg. S) | EUR | 270,000 | 150,571 |
| 2.75% 2/14/33 | EUR | 340,000 | 358,405 |
| Land Brandenburg 0.05% 7/1/31 (Reg. S) | EUR | 110,000 | 96,654 |
| Land Hessen: | |||
| 0.01% 6/18/31 (Reg. S) | EUR | 450,000 | 394,685 |
| 0.125% 10/10/31 | EUR | 80,000 | 70,092 |
| Land Niedersachsen: | |||
| 0.01% 11/25/27 (Reg. S) | EUR | 430,000 | 416,616 |
| 0.01% 1/10/31 (Reg. S) | EUR | 130,000 | 115,283 |
| 0.125% 1/9/32 (Reg. S) | EUR | 200,000 | 173,731 |
| 0.75% 3/21/31 | EUR | 90,000 | 83,643 |
| 1.125% 9/12/33 (Reg. S) | EUR | 70,000 | 63,856 |
| Land Nordrhein-Westfalen: | |||
| 0.2% 3/31/27 (Reg. S) | EUR | 1,513,000 | 1,500,020 |
| 0.2% 4/9/30 (Reg. S) | EUR | 725,000 | 665,837 |
| 0.2% 1/27/51 (Reg. S) | EUR | 50,000 | 24,425 |
| 0.5% 11/25/39 (Reg. S) | EUR | 72,000 | 51,721 |
| 0.625% 7/21/31 (Reg. S) | EUR | 24,000 | 21,946 |
| 0.8% 7/30/49 (Reg. S) | EUR | 104,000 | 64,382 |
| 1.25% 5/12/36 (Reg. S) | EUR | 226,000 | 197,993 |
| 1.375% 1/15/20 (Reg. S) | EUR | 70,000 | 37,572 |
| 1.55% 6/16/48 (Reg. S) | EUR | 178,000 | 136,382 |
| 1.65% 2/22/38 (Reg. S) | EUR | 607,000 | 540,711 |
| 1.95% 9/26/78 (Reg. S) | EUR | 270,000 | 200,927 |
| 2.15% 3/21/19 (Reg. S) | EUR | 70,000 | 53,464 |
| Land Rheinland Pfalz: | |||
| 0.01% 1/21/31 (Reg. S) | EUR | 160,000 | 141,945 |
| 0.75% 2/23/32 | EUR | 130,000 | 118,574 |
| Land Sachsen-Anhalt 3.15% 2/6/54 | EUR | 50,000 | 52,697 |
| Land Schleswig-Holstein 0.05% 7/8/31 (Reg. S) | EUR | 300,000 | 262,869 |
| Landesbank Baden-Wurttemberg 3% 4/26/27 (Reg. S) | EUR | 200,000 | 213,211 |
| Landwirtschaftliche Rentenbank: | |||
| 0.05% 12/18/29 (Reg. S) | EUR | 42,000 | 38,566 |
| 0.05% 1/31/31 (Reg. S) | EUR | 370,000 | 328,329 |
| 0.875% 12/15/26 (Reg. S) | GBP | 19,000 | 21,977 |
| 1.375% 9/8/25 (Reg. S) | GBP | 1,512,000 | 1,832,162 |
| 2.6% 3/23/27 (Reg. S) | AUD | 60,000 | 38,029 |
| 4% 1/19/28 | AUD | 350,000 | 229,039 |
TOTAL GERMANY | 48,966,780 | ||
| Greece - 0.2% | |||
| Greek Government: | |||
| 1.875% 1/24/52(Reg. S) (d) | EUR | 320,000 | 217,350 |
| 3.9% 1/30/33(Reg. S) | EUR | 1,280,000 | 1,396,398 |
| 4.2% 1/30/42(Reg. S) | EUR | 110,000 | 119,018 |
TOTAL GREECE | 1,732,766 | ||
| Hong Kong - 0.0% | |||
| Hong Kong Government SAR 1.59% 3/4/36 | HKD | 1,050,000 | 108,807 |
| Hungary - 0.2% | |||
| Hungarian Republic: | |||
| 1% 11/26/25 | HUF | 30,380,000 | 76,398 |
| 1.5% 4/22/26 | HUF | 43,280,000 | 107,409 |
| 1.625% 4/28/32 (Reg. S) | EUR | 246,000 | 217,432 |
| 1.75% 10/10/27(Reg. S) | EUR | 150,000 | 150,753 |
| 1.75% 6/5/35 (Reg. S) | EUR | 80,000 | 64,766 |
| 2.5% 10/24/24 | HUF | 3,780,000 | 10,126 |
| 2.75% 12/22/26 | HUF | 30,520,000 | 75,610 |
| 3% 8/21/30 | HUF | 64,320,000 | 142,273 |
| 3% 4/25/41 | HUF | 227,580,000 | 383,551 |
| 4.5% 3/23/28 | HUF | 112,000,000 | 282,435 |
TOTAL HUNGARY | 1,510,753 | ||
| Indonesia - 0.8% | |||
| Indonesian Republic: | |||
| 1.45% 9/18/26 | EUR | 430,000 | 436,332 |
| 2.15% 7/18/24 (Reg. S) | EUR | 129,000 | 137,755 |
| 5.125% 4/15/27 | IDR | 9,200,000,000 | 539,921 |
| 5.5% 4/15/26 | IDR | 1,000,000 | 60 |
| 6.375% 8/15/28 | IDR | 6,111,000,000 | 368,230 |
| 6.375% 4/15/42 | IDR | 900,000,000 | 50,647 |
| 6.5% 6/15/25 | IDR | 717,000,000 | 43,677 |
| 6.5% 2/15/31 | IDR | 4,193,000,000 | 247,735 |
| 6.625% 2/15/34 | IDR | 11,657,000,000 | 689,611 |
| 6.875% 8/15/51 | IDR | 528,000,000 | 31,309 |
| 7% 9/15/30 | IDR | 15,924,000,000 | 972,780 |
| 7% 2/15/33 | IDR | 24,508,000,000 | 1,496,117 |
| 7.125% 6/15/42 | IDR | 2,600,000,000 | 158,823 |
| 7.375% 5/15/48 | IDR | 8,728,000,000 | 547,976 |
| 7.5% 6/15/35 | IDR | 1,449,000,000 | 91,262 |
| 7.5% 5/15/38 | IDR | 1,631,000,000 | 102,840 |
| 7.5% 4/15/40 | IDR | 9,622,000,000 | 607,079 |
| 8.375% 4/15/39 | IDR | 1,794,000,000 | 122,156 |
TOTAL INDONESIA | 6,644,310 | ||
| Ireland - 0.4% | |||
| Irish Republic: | |||
| 0.2% 5/15/27 (Reg. S) | EUR | 225,000 | 223,760 |
| 0.2% 10/18/30 (Reg. S) | EUR | 86,000 | 78,428 |
| 0.35% 10/18/32 (Reg. S) | EUR | 290,000 | 253,909 |
| 0.4% 5/15/35 (Reg. S) | EUR | 355,000 | 289,387 |
| 0.55% 4/22/41 (Reg. S) | EUR | 130,000 | 91,996 |
| 0.9% 5/15/28 (Reg. S) | EUR | 132,000 | 131,760 |
| 1% 5/15/26(Reg. S) | EUR | 188,000 | 194,195 |
| 1.1% 5/15/29 (Reg. S) | EUR | 689,000 | 682,750 |
| 1.3% 5/15/33 | EUR | 570,000 | 536,020 |
| 1.5% 5/15/50 (Reg. S) | EUR | 310,000 | 231,234 |
| 1.7% 5/15/37 | EUR | 550,000 | 502,672 |
TOTAL IRELAND | 3,216,111 | ||
| Israel - 0.2% | |||
| Israeli State: | |||
| 1% 3/31/30 | ILS | 1,812,000 | 391,695 |
| 1.3% 4/30/32 | ILS | 840,000 | 172,111 |
| 1.5% 1/16/29 (Reg. S) | EUR | 335,000 | 317,717 |
| 1.5% 5/31/37 | ILS | 738,000 | 129,005 |
| 1.75% 8/31/25 | ILS | 1,890,000 | 486,423 |
| 2.8% 11/29/52 | ILS | 930,000 | 151,092 |
| 3.75% 3/31/47 | ILS | 476,000 | 98,642 |
| 4% 3/30/35 | ILS | 710,000 | 172,900 |
TOTAL ISRAEL | 1,919,585 | ||
| Italy - 5.5% | |||
| Cassa Depositi e Prestiti SpA 1% 2/11/30 (Reg. S) | EUR | 100,000 | 91,328 |
| Italian Republic: | |||
| 0.45% 2/15/29(Reg. S) | EUR | 190,000 | 177,354 |
| 0.5% 7/15/28(Reg. S) | EUR | 540,000 | 515,023 |
| 0.85% 1/15/27 (Reg. S) | EUR | 81,000 | 81,483 |
| 0.9% 4/1/31 | EUR | 82,000 | 73,266 |
| 0.95% 9/15/27 (Reg. S) | EUR | 1,948,000 | 1,933,500 |
| 0.95% 8/1/30 (Reg. S) | EUR | 142,000 | 129,826 |
| 0.95% 6/1/32 (Reg. S) | EUR | 701,000 | 606,012 |
| 1.1% 4/1/27 (Reg. S) | EUR | 2,024,000 | 2,038,847 |
| 1.35% 4/1/30 (Reg. S) | EUR | 1,950,000 | 1,846,120 |
| 1.45% 5/15/25 | EUR | 80,000 | 84,198 |
| 1.45% 3/1/36 (Reg. S) (d) | EUR | 1,347,000 | 1,089,127 |
| 1.6% 6/1/26 | EUR | 179,000 | 185,392 |
| 1.65% 3/1/32 (d) | EUR | 575,000 | 530,084 |
| 1.7% 9/1/51 (Reg. S) (d) | EUR | 536,000 | 335,233 |
| 1.8% 3/1/41 (Reg. S) (d) | EUR | 2,851,000 | 2,138,822 |
| 2.05% 8/1/27 | EUR | 213,000 | 219,330 |
| 2.1% 7/15/26 | EUR | 1,186,000 | 1,238,200 |
| 2.15% 9/1/52 (Reg. S) (d) | EUR | 962,000 | 656,066 |
| 2.15% 3/1/72 (Reg. S) (d) | EUR | 189,000 | 118,032 |
| 2.2% 6/1/27 (Reg. S) | EUR | 1,612,000 | 1,671,159 |
| 2.25% 9/1/36 (Reg. S) (d) | EUR | 639,000 | 562,046 |
| 2.45% 9/1/33 (d) | EUR | 897,000 | 854,028 |
| 2.45% 9/1/50 (Reg. S) (d) | EUR | 77,000 | 57,342 |
| 2.5% 11/15/25 | EUR | 2,093,000 | 2,214,152 |
| 2.5% 12/1/32(Reg. S) | EUR | 260,000 | 251,774 |
| 2.65% 12/1/27(Reg. S) | EUR | 640,000 | 669,241 |
| 2.7% 3/1/47 (d) | EUR | 116,000 | 93,996 |
| 2.8% 6/15/29(Reg. S) | EUR | 1,740,000 | 1,801,905 |
| 2.8% 3/1/67 (d) | EUR | 120,000 | 90,286 |
| 2.95% 9/1/38 (d) | EUR | 433,000 | 399,079 |
| 3% 8/1/29 | EUR | 2,038,000 | 2,129,192 |
| 3.1% 3/1/40 (Reg. S) (d) | EUR | 1,208,000 | 1,112,420 |
| 3.35% 3/1/35 (d) | EUR | 1,808,000 | 1,816,422 |
| 3.45% 3/1/48 (d) | EUR | 1,000 | 917 |
| 3.5% 2/15/31 (Reg. S) (d) | EUR | 330,000 | 348,784 |
| 3.6% 9/29/25(Reg. S) | EUR | 3,700,000 | 3,965,685 |
| 3.7% 6/15/30(Reg. S) | EUR | 1,220,000 | 1,309,178 |
| 3.75% 9/1/24 | EUR | 80,000 | 85,685 |
| 3.8% 4/15/26(Reg. S) | EUR | 630,000 | 678,841 |
| 3.85% 12/15/29(Reg. S) | EUR | 1,770,000 | 1,919,413 |
| 3.85% 7/1/34(Reg. S) | EUR | 870,000 | 918,458 |
| 3.85% 9/1/49 (d) | EUR | 679,000 | 658,093 |
| 4% 11/15/30(Reg. S) | EUR | 2,510,000 | 2,733,048 |
| 4.1% 2/1/29 (Reg. S) | EUR | 130,000 | 142,694 |
| 4.15% 10/1/39 (Reg. S) (d) | EUR | 50,000 | 52,300 |
| 4.2% 3/1/34(Reg. S) | EUR | 590,000 | 642,017 |
| 4.4% 5/1/33(Reg. S) | EUR | 760,000 | 843,956 |
| 4.45% 9/1/43(Reg. S) (d) | EUR | 1,320,000 | 1,410,417 |
| 4.5% 3/1/26 (d) | EUR | 50,000 | 54,461 |
| 4.5% 10/1/53(Reg. S) (d) | EUR | 390,000 | 413,916 |
| 5% 3/1/25 (d) | EUR | 80,000 | 86,429 |
| 5% 8/1/34 (d) | EUR | 20,000 | 23,156 |
| 5% 8/1/39 (d) | EUR | 20,000 | 22,929 |
| 6.5% 11/1/27 | EUR | 50,000 | 58,780 |
TOTAL ITALY | 44,179,442 | ||
| Japan - 9.2% | |||
| Development Bank of Japan 3.125% 4/13/28 (Reg. S) | EUR | 140,000 | 149,407 |
| Japan Government: | |||
| 0.005% 1/1/25 | JPY | 34,300,000 | 213,085 |
| 0.005% 3/20/27 | JPY | 121,200,000 | 745,777 |
| 0.005% 6/20/27 | JPY | 230,000,000 | 1,413,480 |
| 0.1% 12/20/24 | JPY | 4,300,000 | 26,727 |
| 0.1% 3/20/25 | JPY | 50,000 | 311 |
| 0.1% 9/20/25 | JPY | 15,500,000 | 96,222 |
| 0.1% 3/20/26 | JPY | 19,900,000 | 123,263 |
| 0.1% 9/20/26 | JPY | 63,300,000 | 391,218 |
| 0.1% 12/20/26 | JPY | 70,150,000 | 433,182 |
| 0.1% 3/20/27 | JPY | 295,100,000 | 1,820,508 |
| 0.1% 6/20/27 | JPY | 32,450,000 | 199,974 |
| 0.1% 9/20/27 | JPY | 13,700,000 | 84,328 |
| 0.1% 9/20/27 | JPY | 177,000,000 | 1,089,492 |
| 0.1% 12/20/27 | JPY | 75,800,000 | 465,810 |
| 0.1% 3/20/28 | JPY | 53,650,000 | 329,106 |
| 0.1% 6/20/28 | JPY | 30,400,000 | 186,130 |
| 0.1% 9/20/28 | JPY | 231,650,000 | 1,415,284 |
| 0.1% 12/20/28 | JPY | 69,800,000 | 425,355 |
| 0.1% 3/20/29 | JPY | 23,050,000 | 140,140 |
| 0.1% 6/20/29 | JPY | 119,650,000 | 725,976 |
| 0.1% 12/20/29 | JPY | 617,250,000 | 3,732,696 |
| 0.1% 3/20/30 | JPY | 15,400,000 | 92,872 |
| 0.1% 6/20/30 | JPY | 393,950,000 | 2,370,776 |
| 0.1% 9/20/30 | JPY | 362,600,000 | 2,175,713 |
| 0.1% 12/20/30 | JPY | 83,550,000 | 499,799 |
| 0.1% 3/20/31 | JPY | 407,600,000 | 2,430,754 |
| 0.2% 12/20/27 | JPY | 169,000,000 | 1,042,172 |
| 0.2% 6/20/28 | JPY | 54,650,000 | 335,916 |
| 0.2% 12/20/28 | JPY | 46,550,000 | 284,933 |
| 0.2% 3/20/32 | JPY | 28,000,000 | 165,842 |
| 0.2% 6/20/32 | JPY | 84,300,000 | 497,920 |
| 0.2% 9/20/32 | JPY | 53,150,000 | 312,894 |
| 0.2% 6/20/36 | JPY | 308,050,000 | 1,685,707 |
| 0.3% 12/20/25 | JPY | 821,250,000 | 5,108,860 |
| 0.3% 6/20/39 | JPY | 158,200,000 | 820,685 |
| 0.3% 9/20/39 | JPY | 56,150,000 | 289,810 |
| 0.3% 12/20/39 | JPY | 900,000 | 4,617 |
| 0.3% 6/20/46 | JPY | 137,800,000 | 606,486 |
| 0.4% 6/20/25 | JPY | 12,550,000 | 78,174 |
| 0.4% 9/20/25 | JPY | 44,650,000 | 278,193 |
| 0.4% 3/20/36 | JPY | 192,500,000 | 1,084,887 |
| 0.4% 3/20/40 | JPY | 51,800,000 | 268,681 |
| 0.4% 6/20/40 | JPY | 10,450,000 | 53,880 |
| 0.4% 9/20/40 | JPY | 73,150,000 | 375,307 |
| 0.4% 9/20/49 | JPY | 5,450,000 | 22,913 |
| 0.4% 3/20/50 | JPY | 35,400,000 | 147,103 |
| 0.4% 3/20/56 | JPY | 505,000,000 | 1,861,460 |
| 0.5% 3/20/33 | JPY | 20,850,000 | 124,948 |
| 0.5% 9/20/36 | JPY | 93,750,000 | 530,463 |
| 0.5% 12/20/38 | JPY | 15,550,000 | 84,178 |
| 0.5% 3/20/49 | JPY | 10,450,000 | 45,665 |
| 0.6% 12/20/33 | JPY | 301,400,000 | 1,803,848 |
| 0.6% 6/20/37 | JPY | 204,850,000 | 1,157,494 |
| 0.6% 12/20/37 | JPY | 6,700,000 | 37,540 |
| 0.6% 6/20/50 | JPY | 27,350,000 | 119,795 |
| 0.7% 3/20/37 | JPY | 22,050,000 | 126,830 |
| 0.7% 9/20/38 | JPY | 1,033,250,000 | 5,782,642 |
| 0.7% 6/20/48 | JPY | 13,100,000 | 61,274 |
| 0.7% 12/20/48 | JPY | 10,800,000 | 49,989 |
| 0.8% 9/20/33 | JPY | 83,150,000 | 508,776 |
| 0.8% 3/20/34 | JPY | 190,550,000 | 1,157,631 |
| 0.8% 3/20/42 | JPY | 149,000,000 | 796,343 |
| 0.8% 9/20/47 | JPY | 10,200,000 | 49,490 |
| 0.9% 6/20/42 | JPY | 345,000,000 | 1,867,319 |
| 0.9% 9/20/48 | JPY | 249,150,000 | 1,218,727 |
| 0.9% 3/20/57 | JPY | 212,650,000 | 923,995 |
| 1% 12/20/35 | JPY | 647,550,000 | 3,925,387 |
| 1% 3/20/52 | JPY | 170,000,000 | 809,183 |
| 1.1% 9/20/42 | JPY | 219,650,000 | 1,226,007 |
| 1.1% 3/20/43 | JPY | 45,600,000 | 252,675 |
| 1.1% 6/20/43 | JPY | 110,150,000 | 607,999 |
| 1.2% 3/20/35 | JPY | 19,650,000 | 122,620 |
| 1.2% 6/20/53 | JPY | 98,900,000 | 490,830 |
| 1.3% 12/20/43 | JPY | 398,750,000 | 2,267,366 |
| 1.3% 6/20/52 | JPY | 232,000,000 | 1,190,858 |
| 1.3% 3/20/63 | JPY | 47,600,000 | 219,024 |
| 1.4% 12/20/42 | JPY | 193,650,000 | 1,134,349 |
| 1.4% 12/20/45 | JPY | 307,650,000 | 1,739,564 |
| 1.4% 9/20/52 | JPY | 52,050,000 | 273,356 |
| 1.4% 3/20/53 | JPY | 110,700,000 | 578,545 |
| 1.4% 3/20/55 | JPY | 5,500,000 | 28,325 |
| 1.5% 9/20/43 | JPY | 51,950,000 | 306,385 |
| 1.6% 6/20/30 | JPY | 4,600,000 | 30,180 |
| 1.6% 3/20/33 | JPY | 4,300,000 | 28,226 |
| 1.6% 3/20/44 | JPY | 163,650,000 | 976,316 |
| 1.6% 12/20/52 | JPY | 170,150,000 | 935,809 |
| 1.6% 12/20/53 | JPY | 171,100,000 | 935,483 |
| 1.8% 9/20/53 | JPY | 32,000,000 | 183,662 |
| 1.9% 3/20/53 | JPY | 42,450,000 | 250,175 |
| 2% 3/20/42 | JPY | 110,000,000 | 712,583 |
| 2.2% 3/20/64 | JPY | 121,150,000 | 723,978 |
| 2.3% 5/20/32 | JPY | 1,000,000 | 6,903 |
TOTAL JAPAN | 73,506,560 | ||
| Korea (South) - 2.2% | |||
| Korean Republic: | |||
| 1.125% 9/10/25 | KRW | 359,480,000 | 253,902 |
| 1.125% 9/10/39 | KRW | 321,370,000 | 173,165 |
| 1.25% 3/10/26 | KRW | 2,172,900,000 | 1,522,494 |
| 1.375% 12/10/29 | KRW | 41,420,000 | 27,243 |
| 1.375% 6/10/30 | KRW | 902,510,000 | 588,381 |
| 1.5% 12/10/26 | KRW | 32,000,000 | 22,251 |
| 1.5% 12/10/30 | KRW | 1,681,130,000 | 1,095,148 |
| 1.5% 9/10/40 | KRW | 2,069,710,000 | 1,166,447 |
| 1.875% 3/10/51 | KRW | 2,378,220,000 | 1,306,224 |
| 2% 6/10/31 | KRW | 1,103,570,000 | 737,713 |
| 2% 3/10/49 | KRW | 381,850,000 | 218,430 |
| 2.125% 6/10/27 | KRW | 1,520,000,000 | 1,067,829 |
| 2.125% 3/10/47 | KRW | 29,200,000 | 17,338 |
| 2.25% 6/10/25 | KRW | 150,000,000 | 107,621 |
| 2.375% 12/10/27 | KRW | 50,660,000 | 35,711 |
| 2.375% 12/10/28 | KRW | 514,930,000 | 360,058 |
| 2.375% 12/10/31 | KRW | 600,000,000 | 409,482 |
| 2.375% 9/10/38 | KRW | 415,730,000 | 270,401 |
| 2.5% 3/10/52 | KRW | 1,402,900,000 | 881,316 |
| 2.625% 6/10/28 | KRW | 940,310,000 | 666,426 |
| 2.625% 3/10/48 | KRW | 622,670,000 | 404,744 |
| 3.25% 3/10/26 | KRW | 617,000,000 | 446,930 |
| 3.25% 3/10/28 | KRW | 1,690,020,000 | 1,225,915 |
| 3.25% 6/10/33 | KRW | 800,600,000 | 578,847 |
| 3.25% 9/10/42 | KRW | 1,205,650,000 | 870,440 |
| 3.25% 3/10/53 | KRW | 1,849,990,000 | 1,346,683 |
| 3.375% 6/10/32 | KRW | 838,210,000 | 611,925 |
| 3.625% 9/10/53 | KRW | 490,000,000 | 381,950 |
| 3.875% 9/10/43 | KRW | 589,180,000 | 463,202 |
TOTAL KOREA (SOUTH) | 17,258,216 | ||
| Latvia - 0.1% | |||
| Latvian Republic: | |||
| 1.125% 5/30/28 (Reg. S) | EUR | 330,000 | 324,851 |
| 1.375% 9/23/25 (Reg. S) | EUR | 100,000 | 103,940 |
| 1.375% 5/16/36 (Reg. S) | EUR | 490,000 | 411,700 |
TOTAL LATVIA | 840,491 | ||
| Lithuania - 0.0% | |||
| Lithuanian Republic: | |||
| 0.5% 6/19/29 (Reg. S) | EUR | 32,000 | 29,632 |
| 2.1% 5/26/47 (Reg. S) | EUR | 110,000 | 87,838 |
| 2.125% 10/22/35 (Reg. S) | EUR | 57,000 | 52,841 |
| 3.875% 6/14/33(Reg. S) | EUR | 90,000 | 98,313 |
TOTAL LITHUANIA | 268,624 | ||
| Luxembourg - 0.1% | |||
| Grand Duchy of Luxembourg: | |||
| 0% 4/28/25 (Reg. S) | EUR | 35,000 | 36,453 |
| 0% 11/13/26 (Reg. S) | EUR | 230,000 | 229,625 |
| 0% 9/14/32 (Reg. S) | EUR | 210,000 | 177,417 |
TOTAL LUXEMBOURG | 443,495 | ||
| Malaysia - 0.8% | |||
| Malaysian Government: | |||
| 3.519% 4/20/28 | MYR | 4,960,000 | 1,047,251 |
| 3.582% 7/15/32 | MYR | 2,240,000 | 465,649 |
| 3.757% 5/22/40 | MYR | 2,310,000 | 471,206 |
| 3.828% 7/5/34 | MYR | 420,000 | 88,548 |
| 3.885% 8/15/29 | MYR | 1,820,000 | 389,698 |
| 3.899% 11/16/27 | MYR | 3,032,000 | 649,558 |
| 3.9% 11/30/26 | MYR | 2,999,000 | 642,196 |
| 3.906% 7/15/26 | MYR | 171,000 | 36,558 |
| 4.065% 6/15/50 | MYR | 2,823,000 | 582,792 |
| 4.119% 11/30/34 | MYR | 831,000 | 179,519 |
| 4.128% 8/15/25 | MYR | 405,000 | 86,614 |
| 4.504% 4/30/29 | MYR | 560,000 | 123,182 |
| 4.642% 11/7/33 | MYR | 2,170,000 | 487,704 |
| 4.696% 10/15/42 | MYR | 2,150,000 | 489,293 |
| 4.724% 6/15/33 | MYR | 2,083,000 | 470,071 |
| 4.736% 3/15/46 | MYR | 90,000 | 20,452 |
| 4.921% 7/6/48 | MYR | 50,000 | 11,669 |
| 4.935% 9/30/43 | MYR | 150,000 | 34,874 |
TOTAL MALAYSIA | 6,276,834 | ||
| Mexico - 0.8% | |||
| United Mexican States: | |||
| 1.125% 1/17/30 | EUR | 100,000 | 90,361 |
| 2.125% 10/25/51 | EUR | 100,000 | 60,843 |
| 2.25% 8/12/36 | EUR | 130,000 | 105,810 |
| 2.875% 4/8/39 | EUR | 185,000 | 153,981 |
| 5.5% 3/4/27 | MXN | 45,500,000 | 2,211,264 |
| 5.75% 3/5/26 | MXN | 26,769,000 | 1,353,799 |
| 7.5% 6/3/27 | MXN | 2,000,000 | 101,793 |
| 7.5% 5/26/33 | MXN | 10,860,000 | 510,099 |
| 7.75% 11/23/34 | MXN | 4,000,000 | 188,106 |
| 7.75% 11/13/42 | MXN | 14,660,000 | 647,019 |
| 8% 11/7/47 | MXN | 13,363,000 | 597,455 |
| 8.5% 5/31/29 | MXN | 10,000,000 | 515,146 |
TOTAL MEXICO | 6,535,676 | ||
| Multi-National - 0.3% | |||
| European Stability Mechanism 0.5% 3/5/29 (Reg. S) | EUR | 2,229,000 | 2,138,841 |
| Netherlands - 1.2% | |||
| Dutch Government: | |||
| 0% 1/15/27 (Reg. S) (d) | EUR | 1,052,000 | 1,050,877 |
| 0% 7/15/30 (Reg. S) (d) | EUR | 408,000 | 372,157 |
| 0% 1/15/52 (Reg. S) (d) | EUR | 575,000 | 286,710 |
| 0.25% 7/15/25 (d) | EUR | 91,000 | 94,591 |
| 0.25% 7/15/29(Reg. S) (d) | EUR | 1,336,000 | 1,269,296 |
| 0.5% 7/15/26(Reg. S) (d) | EUR | 714,000 | 729,887 |
| 0.5% 7/15/32 (Reg. S) (d) | EUR | 1,061,000 | 954,163 |
| 0.5% 1/15/40 (Reg. S) (d) | EUR | 1,722,000 | 1,293,337 |
| 0.75% 7/15/27 (Reg. S) (d) | EUR | 866,000 | 874,771 |
| 0.75% 7/15/28 (d) | EUR | 740,000 | 734,425 |
| 2% 1/15/54(Reg. S) (d) | EUR | 250,000 | 220,131 |
| 2.5% 1/15/33 (d) | EUR | 80,000 | 84,116 |
| 2.5% 7/15/33(Reg. S) (d) | EUR | 540,000 | 565,465 |
| 3.75% 1/15/42 (d) | EUR | 530,000 | 629,905 |
| 4% 1/15/37 (d) | EUR | 30,000 | 35,798 |
TOTAL NETHERLANDS | 9,195,629 | ||
| New Zealand - 0.3% | |||
| New Zealand Government: | |||
| 0.5% 5/15/26 | NZD | 1,590,000 | 893,296 |
| 1.5% 5/15/31 | NZD | 2,032,000 | 1,015,575 |
| 1.75% 5/15/41 | NZD | 582,000 | 225,371 |
| 2.75% 4/15/25 | NZD | 485,000 | 289,356 |
| 2.75% 4/15/37 (Reg. S) | NZD | 410,000 | 200,437 |
| New Zealand Local Government Funding Agency 5.1% 11/28/30 | AUD | 50,000 | 33,701 |
TOTAL NEW ZEALAND | 2,657,736 | ||
| Norway - 0.3% | |||
| Kingdom of Norway: | |||
| 1.5% 2/19/26 (Reg. S) (d) | NOK | 9,430,000 | 848,673 |
| 1.75% 2/17/27 (Reg. S) (d) | NOK | 16,010,000 | 1,425,872 |
| 3% 8/15/33(Reg. S) (d) | NOK | 2,060,000 | 183,542 |
| 3.5% 10/6/42(Reg. S) (d) | NOK | 1,290,000 | 120,456 |
TOTAL NORWAY | 2,578,543 | ||
| Peru - 0.1% | |||
| Peruvian Republic: | |||
| 5.4% 8/12/34(Reg. S) | PEN | 550,000 | 125,915 |
| 6.15% 8/12/32 | PEN | 2,364,000 | 592,078 |
| 6.7142% 2/12/55 | PEN | 500,000 | 119,559 |
| 9.3311% 8/12/39 (Reg. S) (d)(g) | PEN | 964,000 | 252,781 |
TOTAL PERU | 1,090,333 | ||
| Poland - 0.7% | |||
| Bank Gospodarstwa Krajowego 4% 3/13/32 (Reg. S) | EUR | 160,000 | 171,318 |
| Polish Government: | |||
| 0% 2/10/25 (Reg. S) | EUR | 41,000 | 42,960 |
| 0.75% 4/25/25 | PLN | 830,000 | 199,556 |
| 1% 3/7/29 (Reg. S) | EUR | 309,000 | 301,236 |
| 1.25% 10/25/30 | PLN | 396,000 | 76,404 |
| 1.75% 4/25/32 | PLN | 3,150,000 | 595,432 |
| 2% 3/8/49 (Reg. S) | EUR | 17,000 | 12,690 |
| 2.5% 7/25/26 | PLN | 6,990,000 | 1,649,061 |
| 2.5% 7/25/27 | PLN | 3,047,000 | 698,438 |
| 2.75% 10/25/29 | PLN | 2,390,000 | 520,519 |
| 3.25% 7/25/25 | PLN | 3,810,000 | 929,641 |
| 3.875% 2/14/33 (Reg. S) | EUR | 220,000 | 242,482 |
| 4% 4/25/47 | PLN | 96,000 | 18,122 |
| 4.125% 1/11/44(Reg. S) | EUR | 50,000 | 53,123 |
| 5.75% 4/25/29 | PLN | 1,320,000 | 330,611 |
TOTAL POLAND | 5,841,593 | ||
| Portugal - 0.5% | |||
| Portugal Obrigacoes Do Tesouro: | |||
| 0.475% 10/18/30 (Reg. S) (d) | EUR | 258,000 | 238,587 |
| 0.7% 10/15/27 (Reg. S) (d) | EUR | 350,000 | 349,981 |
| 0.9% 10/12/35 (Reg. S) (d) | EUR | 734,000 | 609,084 |
| 1% 4/12/52 (Reg. S) (d) | EUR | 220,000 | 126,051 |
| 1.65% 7/16/32 (Reg. S) (d) | EUR | 3,000 | 2,899 |
| 1.95% 6/15/29 (Reg. S) (d) | EUR | 458,000 | 470,839 |
| 2.875% 10/15/25 (Reg. S) (d) | EUR | 22,000 | 23,462 |
| 2.875% 7/21/26(Reg. S) (d) | EUR | 33,000 | 35,271 |
| 2.875% 10/20/34(Reg. S) (d) | EUR | 390,000 | 404,247 |
| 3.625% 6/12/54 (Reg. S) (d) | EUR | 150,000 | 154,823 |
| 3.875% 2/15/30(Reg. S) (d) | EUR | 760,000 | 855,920 |
| 4.125% 4/14/27 (Reg. S) (d) | EUR | 524,000 | 579,866 |
| Portuguese Republic 2.25% 4/18/34 (d) | EUR | 260,000 | 256,840 |
| Republic of Portugal 2.125% 10/17/28 (d) | EUR | 70,000 | 72,982 |
TOTAL PORTUGAL | 4,180,852 | ||
| Romania - 0.5% | |||
| Romanian Republic: | |||
| 1.375% 12/2/29(Reg. S) | EUR | 567,000 | 502,102 |
| 2.125% 3/7/28(Reg. S) | EUR | 470,000 | 464,180 |
| 2.5% 10/25/27 | RON | 2,330,000 | 446,328 |
| 2.875% 5/26/28 (Reg. S) | EUR | 32,000 | 32,268 |
| 2.875% 4/13/42(Reg. S) | EUR | 60,000 | 41,679 |
| 3.375% 2/8/38 (Reg. S) | EUR | 330,000 | 269,809 |
| 3.375% 1/28/50 (Reg. S) | EUR | 54,000 | 38,404 |
| 3.5% 11/25/25 | RON | 4,230,000 | 880,576 |
| 3.75% 2/7/34(Reg. S) | EUR | 110,000 | 101,165 |
| 4.125% 3/11/39 | EUR | 145,000 | 128,792 |
| 4.75% 10/11/34 | RON | 1,110,000 | 201,957 |
| 4.85% 7/25/29 | RON | 1,570,000 | 312,038 |
| 7.2% 10/30/33 | RON | 1,360,000 | 299,724 |
TOTAL ROMANIA | 3,719,022 | ||
| Russia - 0.0% | |||
| Ministry of Finance of the Russian Federation 7.6% (h)(i) | RUB | 4,237,000 | 0 |
| Saudi Arabia - 0.0% | |||
| Kingdom of Saudi Arabia 2% 7/9/39 (Reg. S) | EUR | 163,000 | 131,033 |
| Singapore - 0.4% | |||
| Republic of Singapore: | |||
| , yield at date of purchase 0.1871% to 2.7941% 4/1/29 to 10/1/51 | SGD | 850,000 | 569,023 |
| 1.625% 7/1/31 | SGD | 520,000 | 345,670 |
| 2.125% 6/1/26 | SGD | 271,000 | 195,036 |
| 2.25% 8/1/36 | SGD | 768,000 | 512,283 |
| 2.375% 7/1/39 | SGD | 325,000 | 215,598 |
| 2.625% 5/1/28 | SGD | 1,016,000 | 732,929 |
| 2.625% 8/1/32 | SGD | 310,000 | 219,012 |
| 2.75% 4/1/42 | SGD | 260,000 | 181,386 |
| 2.75% 3/1/46 | SGD | 20,000 | 13,883 |
| 3% 8/1/72(Reg. S) | SGD | 80,000 | 58,112 |
TOTAL SINGAPORE | 3,042,932 | ||
| Slovakia - 0.2% | |||
| Slovakia Republic: | |||
| 0.125% 6/17/27 (Reg. S) | EUR | 288,000 | 282,082 |
| 0.25% 5/14/25 (Reg. S) | EUR | 84,000 | 87,373 |
| 0.75% 4/9/30 (Reg. S) | EUR | 400,000 | 372,155 |
| 1% 10/9/30 (Reg. S) | EUR | 110,000 | 101,910 |
| 1% 10/13/51 (Reg. S) | EUR | 160,000 | 92,655 |
| 1.625% 1/21/31 (Reg. S) | EUR | 348,000 | 331,834 |
| 1.875% 3/9/37 (Reg. S) | EUR | 515,000 | 441,823 |
| 3.75% 3/6/34(Reg. S) | EUR | 180,000 | 193,655 |
TOTAL SLOVAKIA | 1,903,487 | ||
| Slovenia - 0.1% | |||
| Republic of Slovenia: | |||
| 0.125% 7/1/31(Reg. S) | EUR | 288,000 | 250,489 |
| 1.1875% 3/14/29 (Reg. S) | EUR | 110,000 | 108,707 |
| 1.25% 3/22/27 (Reg. S) | EUR | 84,000 | 85,901 |
| 1.75% 11/3/40 (Reg. S) | EUR | 89,000 | 74,150 |
| 2.125% 7/28/25 (Reg. S) | EUR | 64,000 | 67,617 |
| 2.25% 3/3/32 (Reg. S) | EUR | 230,000 | 230,585 |
| 3.625% 3/11/33(Reg. S) | EUR | 110,000 | 121,145 |
TOTAL SLOVENIA | 938,594 | ||
| Spain - 3.6% | |||
| Basque Country 1.45% 4/30/28 (Reg. S) | EUR | 260,000 | 261,334 |
| Comunidad de Madrid 0.827% 7/30/27 (Reg. S) | EUR | 50,000 | 49,848 |
| Regional Government of Andalusia (Junta de Andalucia) 0.5% 4/30/31 (Reg. S) | EUR | 180,000 | 158,425 |
| Spanish Kingdom: | |||
| 0% 1/31/26 | EUR | 3,427,000 | 3,492,221 |
| 0% 1/31/27 | EUR | 880,000 | 870,993 |
| 0% 1/31/28 | EUR | 680,000 | 654,163 |
| 0.1% 4/30/31 (d) | EUR | 1,410,000 | 1,233,563 |
| 0.5% 4/30/30 (Reg. S) (d) | EUR | 143,000 | 132,517 |
| 0.5% 10/31/31 (Reg. S) (d) | EUR | 976,000 | 866,198 |
| 0.6% 10/31/29 (Reg. S) (d) | EUR | 574,000 | 541,598 |
| 0.7% 4/30/32 (Reg. S) (d) | EUR | 140,000 | 124,414 |
| 0.8% 7/30/27 (Reg. S) (d) | EUR | 1,203,000 | 1,204,176 |
| 0.85% 7/30/37 (Reg. S) (d) | EUR | 1,098,000 | 841,801 |
| 1% 7/30/42(Reg. S) (d) | EUR | 171,000 | 117,245 |
| 1% 10/31/50 (Reg. S) (d) | EUR | 1,856,000 | 1,055,742 |
| 1.2% 10/31/40 (Reg. S) (d) | EUR | 2,179,000 | 1,610,884 |
| 1.25% 10/31/30 (Reg. S) (d) | EUR | 1,376,000 | 1,318,852 |
| 1.3% 10/31/26 (d) | EUR | 150,000 | 154,317 |
| 1.4% 4/30/28 (Reg. S) (d) | EUR | 100,000 | 100,902 |
| 1.45% 10/31/27 (d) | EUR | 100,000 | 101,806 |
| 1.45% 4/30/29 (Reg. S) (d) | EUR | 2,226,000 | 2,217,894 |
| 1.45% 10/31/71 (Reg. S) (d) | EUR | 100,000 | 50,915 |
| 1.5% 4/30/27 (Reg. S) (d) | EUR | 157,000 | 161,150 |
| 1.85% 7/30/35 (Reg. S) (d) | EUR | 480,000 | 439,158 |
| 1.9% 10/31/52 (Reg. S) (d) | EUR | 960,000 | 674,544 |
| 1.95% 4/30/26 (Reg. S) (d) | EUR | 2,222,000 | 2,329,302 |
| 1.95% 7/30/30 (Reg. S) (d) | EUR | 26,000 | 26,142 |
| 2.15% 10/31/25 (Reg. S) (d) | EUR | 44,000 | 46,457 |
| 2.35% 7/30/33 (Reg. S) (d) | EUR | 292,000 | 289,742 |
| 2.55% 10/31/32(Reg. S) (d) | EUR | 2,490,000 | 2,534,330 |
| 2.7% 10/31/48 (d) | EUR | 189,000 | 165,005 |
| 2.8% 5/31/26 | EUR | 530,000 | 563,801 |
| 3.15% 4/30/33 (Reg. S) (d) | EUR | 510,000 | 540,655 |
| 3.25% 4/30/34(Reg. S) (d) | EUR | 1,110,000 | 1,176,988 |
| 3.45% 7/30/43(Reg. S) (d) | EUR | 1,450,000 | 1,468,690 |
| 3.5% 5/31/29(Reg. S) | EUR | 900,000 | 983,209 |
| 3.55% 10/31/33(Reg. S) (d) | EUR | 290,000 | 315,858 |
| 5.15% 10/31/28 (d) | EUR | 80,000 | 92,974 |
TOTAL SPAIN | 28,967,813 | ||
| Sweden - 0.1% | |||
| Sweden Kingdom: | |||
| 0.125% 5/12/31 (Reg. S) | SEK | 3,600,000 | 296,182 |
| 0.5% 11/24/45 | SEK | 2,680,000 | 177,248 |
| 1.375% 6/23/71 | SEK | 580,000 | 37,447 |
| 1.75% 11/11/33(Reg. S) | SEK | 2,500,000 | 226,811 |
| 3.5% 3/30/39 | SEK | 760,000 | 82,174 |
TOTAL SWEDEN | 819,862 | ||
| Switzerland - 0.5% | |||
| Switzerland Confederation: | |||
| 0% 6/22/29 (Reg. S) | CHF | 492,000 | 530,521 |
| 0% 6/26/34 (Reg. S) | CHF | 824,000 | 866,972 |
| 0% 7/24/39 (Reg. S) | CHF | 273,000 | 279,124 |
| 0.5% 5/24/55(Reg. S) | CHF | 180,000 | 197,875 |
| 1.25% 6/28/43(Reg. S) | CHF | 150,000 | 186,503 |
| 1.5% 4/30/42 | CHF | 200,000 | 257,410 |
| 3.5% 4/8/33 | CHF | 1,085,000 | 1,511,085 |
TOTAL SWITZERLAND | 3,829,490 | ||
| Thailand - 0.7% | |||
| Kingdom of Thailand: | |||
| 1.45% 12/17/24 | THB | 5,595,000 | 151,693 |
| 1.6% 12/17/29 | THB | 12,408,000 | 321,703 |
| 1.6% 6/17/35 | THB | 14,678,000 | 355,980 |
| 2% 6/17/42 | THB | 7,800,000 | 179,067 |
| 2.125% 12/17/26 | THB | 69,582,000 | 1,880,589 |
| 2.5% 6/17/71 | THB | 6,480,000 | 121,185 |
| 2.75% 6/17/52 | THB | 21,057,000 | 500,942 |
| 2.875% 6/17/46 | THB | 9,832,000 | 246,242 |
| 3.3% 6/17/38 | THB | 13,193,000 | 374,526 |
| 3.4% 6/17/36 | THB | 3,260,000 | 93,513 |
| 3.45% 6/17/43 | THB | 9,230,000 | 258,807 |
| 3.65% 6/20/31 | THB | 6,884,000 | 199,829 |
| 3.775% 6/25/32 | THB | 13,170,000 | 387,283 |
| 3.85% 12/12/25 | THB | 1,091,000 | 30,277 |
| 4.85% 6/17/61 | THB | 1,660,000 | 54,778 |
TOTAL THAILAND | 5,156,414 | ||
| United Kingdom - 2.6% | |||
| United Kingdom, Great Britain and Northern Ireland: | |||
| 0.25% 7/31/31 (Reg. S) | GBP | 2,137,000 | 2,077,970 |
| 0.375% 10/22/30 (Reg. S) | GBP | 497,000 | 503,008 |
| 0.5% 1/31/29(Reg. S) | GBP | 1,230,000 | 1,326,786 |
| 0.625% 7/31/35 (Reg. S) | GBP | 2,162,000 | 1,865,808 |
| 0.625% 10/22/50 (Reg. S) | GBP | 1,885,000 | 951,225 |
| 0.875% 1/31/46 (Reg. S) | GBP | 665,000 | 414,522 |
| 1.125% 10/22/73(Reg. S) | GBP | 1,770,000 | 806,702 |
| 1.25% 7/22/27 | GBP | 42,000 | 48,737 |
| 1.25% 10/22/41 (Reg. S) | GBP | 4,399,076 | 3,392,688 |
| 1.25% 7/31/51(Reg. S) | GBP | 2,070,000 | 1,264,121 |
| 1.5% 7/22/47 | GBP | 195,000 | 137,695 |
| 1.625% 10/22/54 (Reg. S) | GBP | 409,000 | 266,884 |
| 1.75% 9/7/37 (Reg. S) | GBP | 7,000 | 6,558 |
| 1.75% 1/22/49(Reg. S) | GBP | 742,000 | 544,018 |
| 1.75% 7/22/57 (Reg. S) | GBP | 1,444,000 | 956,712 |
| 3.25% 1/31/33(Reg. S) | GBP | 2,090,000 | 2,475,932 |
| 3.25% 1/22/44 | GBP | 450,000 | 469,411 |
| 3.75% 10/22/53(Reg. S) | GBP | 1,670,000 | 1,805,578 |
| 4% 10/22/63(Reg. S) | GBP | 330,000 | 372,768 |
| 4.25% 9/7/39 | GBP | 13,000 | 16,032 |
| 4.25% 12/7/40 | GBP | 19,000 | 23,271 |
| 4.25% 12/7/55 | GBP | 30,000 | 35,504 |
| 4.5% 6/7/28(Reg. S) | GBP | 40,000 | 51,140 |
| 4.5% 12/7/42 | GBP | 920,000 | 1,151,924 |
| 4.625% 1/31/34(Reg. S) | GBP | 150,000 | 196,179 |
TOTAL UNITED KINGDOM | 21,161,173 | ||
| TOTAL GOVERNMENT OBLIGATIONS (Cost $644,744,337) | 561,911,289 | ||
| Supranational Obligations - 3.5% | |||
Principal Amount (a) | Value ($) | ||
| African Development Bank: | |||
| 0.125% 10/7/26 | EUR | 41,000 | 41,064 |
| 0.875% 5/24/28 | EUR | 87,000 | 85,980 |
| 1.1% 12/16/26 | AUD | 260,000 | 159,257 |
| 1.125% 6/18/25 (Reg. S) | GBP | 80,000 | 97,452 |
| Agence Francaise de Developpement 0.125% 9/29/31 | EUR | 200,000 | 169,718 |
| Asian Development Bank: | |||
| 1.125% 12/15/25 | GBP | 32,000 | 38,331 |
| 1.375% 3/7/25 | GBP | 25,000 | 30,873 |
| 1.625% 1/28/25 | CAD | 290,000 | 208,915 |
| 3.3% 8/8/28 (Reg. S) | AUD | 55,000 | 34,943 |
| 3.875% 7/22/27 | GBP | 310,000 | 385,721 |
| 4.65% 2/16/27 | CAD | 700,000 | 520,923 |
| Corporacion Andina de Fomento 1.625% 6/3/25 (Reg. S) | EUR | 198,000 | 207,799 |
| Council of Europe Development Bank 0% 4/9/27 (Reg. S) | EUR | 33,000 | 32,533 |
| European Financial Stability Facility: | |||
| 0% 10/13/27 (Reg. S) | EUR | 85,000 | 82,652 |
| 0.05% 10/17/29 (Reg. S) | EUR | 23,000 | 21,175 |
| 0.05% 1/18/52 (Reg. S) | EUR | 225,000 | 102,008 |
| 0.625% 10/16/26 (Reg. S) | EUR | 466,000 | 472,638 |
| 0.7% 1/20/50 (Reg. S) | EUR | 176,000 | 105,965 |
| 0.75% 5/3/27 (Reg. S) | EUR | 43,000 | 43,314 |
| 0.875% 4/10/35 (Reg. S) | EUR | 610,000 | 520,265 |
| 1.25% 5/24/33 (Reg. S) | EUR | 299,000 | 276,240 |
| 1.45% 9/5/40 (Reg. S) | EUR | 1,125,000 | 929,343 |
| European Investment Bank: | |||
| 0% 6/17/27 | EUR | 215,000 | 211,262 |
| 0% 9/9/30 (Reg. S) | EUR | 109,000 | 97,667 |
| 0.01% 5/15/41 (Reg. S) | EUR | 330,000 | 207,450 |
| 0.05% 11/15/29 (Reg. S) | EUR | 2,750,000 | 2,533,150 |
| 0.05% 10/13/34 (Reg. S) | EUR | 1,627,000 | 1,286,954 |
| 0.125% 6/20/29 (Reg. S) | EUR | 578,000 | 540,283 |
| 0.375% 7/16/25 | EUR | 577,000 | 600,033 |
| 0.375% 4/14/26 (Reg. S) | EUR | 413,000 | 421,814 |
| 0.75% 7/15/27 | AUD | 340,000 | 202,554 |
| 1% 9/21/26 (Reg. S) | GBP | 226,000 | 264,446 |
| 1% 4/14/32 | EUR | 736,000 | 683,473 |
| 1.125% 4/13/33 (Reg. S) | EUR | 265,000 | 243,222 |
| 1.75% 7/30/24 (Reg. S) | CAD | 69,000 | 50,351 |
| 1.75% 11/12/26 (Reg. S) | SEK | 240,000 | 22,027 |
| 3.625% 1/12/32 (Reg. S) | GBP | 550,000 | 668,244 |
| European Stability Mechanism: | |||
| 0.01% 3/4/30 | EUR | 35,000 | 31,878 |
| 0.75% 3/15/27 | EUR | 184,000 | 185,790 |
| 0.75% 9/5/28 (Reg. S) | EUR | 48,000 | 47,071 |
| 0.875% 7/18/42 (Reg. S) | EUR | 266,000 | 191,369 |
| 1.125% 5/3/32 (Reg. S) | EUR | 47,000 | 44,047 |
| 1.2% 5/23/33 (Reg. S) | EUR | 37,000 | 34,301 |
| 1.625% 11/17/36 (Reg. S) | EUR | 218,000 | 197,593 |
| 1.85% 12/1/55 (Reg. S) | EUR | 186,000 | 142,981 |
| European Union: | |||
| 0% 11/4/25 (Reg. S) | EUR | 1,426,000 | 1,464,660 |
| 0% 10/4/30 (Reg. S) | EUR | 169,000 | 151,062 |
| 0% 7/4/35 (Reg. S) | EUR | 1,357,000 | 1,035,519 |
| 0.1% 10/4/40 (Reg. S) | EUR | 946,000 | 613,261 |
| 0.25% 4/22/36 (Reg. S) | EUR | 380,000 | 291,448 |
| 0.3% 11/4/50 (Reg. S) | EUR | 562,000 | 290,702 |
| 0.45% 7/4/41 (Reg. S) | EUR | 162,000 | 108,296 |
| 0.45% 5/2/46 (Reg. S) | EUR | 170,000 | 101,980 |
| 0.7% 7/6/51 (Reg. S) | EUR | 1,070,000 | 611,553 |
| 0.8% 7/4/25 (Reg. S) | EUR | 1,760,000 | 1,838,257 |
| 0.875% 3/11/37 (Reg. S) | EUR | 100,000 | 81,756 |
| 1.125% 4/4/36 (Reg. S) | EUR | 94,000 | 80,960 |
| 1.25% 4/4/33 (Reg. S) | EUR | 1,418,000 | 1,316,256 |
| 1.25% 2/4/43 (Reg. S) | EUR | 172,000 | 129,674 |
| 2% 10/4/27 (Reg. S) | EUR | 860,000 | 893,947 |
| 2.5% 10/4/52 (Reg. S) | EUR | 380,000 | 334,510 |
| 3% 3/4/53 (Reg. S) | EUR | 840,000 | 817,587 |
| 3.375% 10/5/54 (Reg. S) | EUR | 160,000 | 165,585 |
| Inter-American Development Bank: | |||
| 1.25% 12/15/25 | GBP | 308,000 | 369,591 |
| 1.7% 10/10/24 | CAD | 100,000 | 72,513 |
| 3.15% 6/26/29 | AUD | 120,000 | 74,769 |
| 3.875% 2/15/29 | GBP | 130,000 | 161,283 |
| International Bank for Reconstruction & Development: | |||
| 0% 1/15/27 | EUR | 1,828,000 | 1,815,724 |
| 0.01% 4/24/28 | EUR | 687,000 | 658,766 |
| 1% 12/21/29 | GBP | 248,000 | 265,015 |
| 1.2% 8/8/34 | EUR | 23,000 | 20,738 |
| 1.25% 12/13/28 | GBP | 100,000 | 111,230 |
| 1.8% 7/26/24 | CAD | 7,000 | 5,119 |
| 3.3% 8/14/28 | AUD | 210,000 | 133,458 |
| International Development Association: | |||
| 0.7% 1/17/42 (Reg. S) | EUR | 207,000 | 144,434 |
| 4.75% 10/14/31 (Reg. S) | GBP | 230,000 | 299,362 |
| International Finance Corp. 3.15% 6/26/29 (Reg. S) | AUD | 90,000 | 56,110 |
| TOTAL SUPRANATIONAL OBLIGATIONS (Cost $33,180,060) | 27,990,194 | ||
| Preferred Securities - 0.4% | |||
Principal Amount (a) | Value ($) | ||
| France - 0.3% | |||
| Engie SA: | |||
| 1.5% (Reg. S) (b)(j) | EUR | 300,000 | 286,631 |
| 1.625% (Reg. S) (b)(j) | EUR | 1,300,000 | 1,376,340 |
| TotalEnergies SE: | |||
| 2% (Reg. S) (b)(j) | EUR | 120,000 | 120,559 |
| 2.125% (Reg. S) (b)(j) | EUR | 160,000 | 142,970 |
| Veolia Environnement SA 1.625% (Reg. S) (b)(j) | EUR | 100,000 | 101,918 |
TOTAL FRANCE | 2,028,418 | ||
| Italy - 0.0% | |||
| Enel SpA: | |||
| 1.375% (Reg. S) (b)(j) | EUR | 150,000 | 146,137 |
| 6.375% (Reg. S) (b)(j) | EUR | 100,000 | 119,253 |
| Eni SpA 3.375% (Reg. S) (b)(j) | EUR | 110,000 | 111,970 |
TOTAL ITALY | 377,360 | ||
| Spain - 0.1% | |||
| Iberdrola Finanzas SAU 1.575% (Reg. S) (b)(j) | EUR | 100,000 | 98,778 |
| Iberdrola International BV: | |||
| 1.825% (Reg. S) (b)(j) | EUR | 100,000 | 93,597 |
| 3.25% (Reg. S) (b)(j) | EUR | 100,000 | 107,623 |
| Repsol International Finance BV 4.247% (b)(j) | EUR | 100,000 | 107,832 |
TOTAL SPAIN | 407,830 | ||
| United Kingdom - 0.0% | |||
| SSE PLC 3.74% (Reg. S) (b)(j) | GBP | 216,000 | 265,130 |
| TOTAL PREFERRED SECURITIES (Cost $2,923,211) | 3,078,738 | ||
| Money Market Funds - 0.3% | |||
| Shares | Value ($) | ||
Fidelity Cash Central Fund 5.38% (k) (Cost $2,863,899) | 2,863,326 | 2,863,899 | |
| TOTAL INVESTMENT IN SECURITIES - 99.1% (Cost $901,911,739) | 795,540,349 |
NET OTHER ASSETS (LIABILITIES) - 0.9% | 7,242,223 |
| NET ASSETS - 100.0% | 802,782,572 |
| Futures Contracts | |||||
Number of contracts | Expiration Date | Notional Amount ($) | Value ($) | Unrealized Appreciation/ (Depreciation) ($) | |
| Purchased | |||||
| Bond Index Contracts | |||||
| Eurex Euro-Bobl Contracts (Germany) | 23 | Sep 2024 | 2,868,133 | 26,525 | 26,525 |
| ICE Long Gilt Contracts (United Kingdom) | 12 | Sep 2024 | 1,480,059 | 6,012 | 6,012 |
| TOTAL FUTURES CONTRACTS | 32,537 | ||||
| The notional amount of futures purchased as a percentage of Net Assets is 0.6% | |||||
| Forward Foreign Currency Contracts | ||||||
Currency Purchased | Currency Sold | Counterparty | Settlement Date | Unrealized Appreciation/ (Depreciation) ($) | ||
| AUD | 35,814,519 | USD | 23,870,377 | Bank of America, N.A. | 7/02/24 | 21,489 |
| CAD | 64,000 | USD | 46,542 | HSBC Bank | 7/02/24 | 240 |
| CAD | 55,697,932 | USD | 40,697,013 | Royal Bank of Canada | 7/02/24 | 16,362 |
| CHF | 8,855,125 | USD | 9,874,136 | State Street Bank and Trust Co | 7/02/24 | (18,134) |
| CLP | 644,458,000 | USD | 680,346 | Citibank, N. A. | 7/02/24 | 4,482 |
| CNH | 991,780,000 | USD | 135,893,782 | Bank of America, N.A. | 7/02/24 | (40,952) |
| CNH | 128,380,000 | USD | 17,589,120 | JPMorgan Chase Bank, N.A. | 7/02/24 | (3,783) |
| CNY | 21,349,607 | USD | 2,926,331 | Citibank, N. A. | 7/02/24 | 11,452 |
| CNY | 1,524,421 | USD | 209,133 | Citibank, N. A. | 7/02/24 | 633 |
| COP | 7,229,300,000 | USD | 1,750,436 | Citibank, N. A. | 7/02/24 | (8,761) |
| COP | 7,229,300,000 | USD | 1,738,607 | Goldman Sachs Bank USA | 7/02/24 | 3,068 |
| CZK | 55,210,125 | USD | 2,369,267 | Bank of America, N.A. | 7/02/24 | (8,992) |
| DKK | 15,866,000 | USD | 2,279,598 | Bank of America, N.A. | 7/02/24 | (1,277) |
| EUR | 1,487,000 | USD | 1,608,188 | BNP Paribas S.A. | 7/02/24 | (15,686) |
| EUR | 337,046,000 | USD | 361,448,130 | Bank of America, N.A. | 7/02/24 | (488,717) |
| GBP | 41,586,000 | USD | 52,598,347 | State Street Bank and Trust Co | 7/02/24 | (29,485) |
| HKD | 821,000 | USD | 105,134 | Brown Brothers Harriman & Co | 7/02/24 | 0 |
| HUF | 394,398,000 | USD | 1,065,829 | BNP Paribas S.A. | 7/02/24 | 3,557 |
| IDR | 101,079,800,000 | USD | 6,165,658 | BNP Paribas S.A. | 7/02/24 | 7,154 |
| IDR | 101,079,800,000 | USD | 6,154,771 | BNP Paribas S.A. | 7/02/24 | 18,041 |
| ILS | 6,210,970 | USD | 1,654,721 | Canadian Imperial Bk. of Comm. | 7/02/24 | (10,390) |
| JPY | 201,350,000 | USD | 1,286,188 | Citibank, N. A. | 7/02/24 | (34,712) |
| JPY | 312,355,640 | USD | 1,945,559 | JPMorgan Chase Bank, N.A. | 7/02/24 | (4,136) |
| JPY | 54,550,000 | USD | 346,519 | JPMorgan Chase Bank, N.A. | 7/02/24 | (7,467) |
| JPY | 11,809,740,441 | USD | 73,507,659 | Royal Bank of Canada | 7/02/24 | (105,083) |
| KRW | 22,327,200,000 | USD | 16,151,042 | BNP Paribas S.A. | 7/02/24 | 27,678 |
| KRW | 22,327,200,000 | USD | 16,040,231 | BNP Paribas S.A. | 7/02/24 | 138,489 |
| MXN | 1,214,000 | USD | 65,149 | Goldman Sachs Bank USA | 7/02/24 | 1,208 |
| MXN | 102,094,000 | USD | 5,555,864 | Royal Bank of Canada | 7/02/24 | 24,568 |
| MYR | 28,077,000 | USD | 5,948,391 | Goldman Sachs Bank USA | 7/02/24 | 3,278 |
| MYR | 28,077,000 | USD | 5,942,222 | Goldman Sachs Bank USA | 7/02/24 | 9,447 |
| NOK | 20,359,000 | USD | 1,911,518 | HSBC Bank | 7/02/24 | (4,709) |
| NZD | 4,285,000 | USD | 2,612,136 | HSBC Bank | 7/02/24 | (2,143) |
| PEN | 4,244,000 | USD | 1,110,704 | Citibank, N. A. | 7/02/24 | (6,516) |
| PLN | 13,793,000 | USD | 3,423,825 | Canadian Imperial Bk. of Comm. | 7/02/24 | 2,454 |
| PLN | 6,803,996 | USD | 1,688,529 | State Street Bank and Trust Co | 7/02/24 | 1,632 |
| RON | 9,284,000 | USD | 1,998,374 | BNP Paribas S.A. | 7/02/24 | (676) |
| RON | 978,704 | USD | 210,286 | Brown Brothers Harriman & Co | 7/02/24 | 308 |
| SEK | 264,000 | USD | 25,207 | Bank of America, N.A. | 7/02/24 | (299) |
| SEK | 92,492,025 | USD | 8,727,639 | Citibank, N. A. | 7/02/24 | (1,153) |
| SGD | 519,325 | USD | 383,031 | Canadian Imperial Bk. of Comm. | 7/02/24 | (48) |
| SGD | 3,561,916 | USD | 2,624,401 | State Street Bank and Trust Co | 7/02/24 | 2,381 |
| THB | 218,923,000 | USD | 5,930,783 | JPMorgan Chase Bank, N.A. | 7/02/24 | 29,549 |
| USD | 510,832 | AUD | 767,000 | Bank of America, N.A. | 7/02/24 | (834) |
| USD | 284,527 | AUD | 426,852 | Citibank, N. A. | 7/02/24 | (226) |
| USD | 199,001 | AUD | 301,000 | Citibank, N. A. | 7/02/24 | (1,796) |
| USD | 23,098,264 | AUD | 34,769,000 | JPMorgan Chase Bank, N.A. | 7/02/24 | (96,136) |
| USD | 7,270 | CAD | 10,000 | Bank of America, N.A. | 7/02/24 | (39) |
| USD | 1,076,885 | CAD | 1,483,000 | JPMorgan Chase Bank, N.A. | 7/02/24 | (7,140) |
| USD | 38,637,467 | CAD | 52,827,000 | Royal Bank of Canada | 7/02/24 | 22,651 |
| USD | 1,144,723 | CAD | 1,560,000 | Royal Bank of Canada | 7/02/24 | 4,414 |
| USD | 8,827,160 | CHF | 7,959,000 | Citibank, N. A. | 7/02/24 | (31,430) |
| USD | 360,168 | CHF | 324,000 | JPMorgan Chase Bank, N.A. | 7/02/24 | (453) |
| USD | 640,899 | CHF | 574,000 | JPMorgan Chase Bank, N.A. | 7/02/24 | 2,021 |
| USD | 709,756 | CLP | 644,458,000 | Goldman Sachs Bank USA | 7/02/24 | 24,927 |
| USD | 135,186,768 | CNH | 980,780,000 | Bank of America, N.A. | 7/02/24 | 840,705 |
| USD | 1,514,734 | CNH | 11,000,000 | Bank of America, N.A. | 7/02/24 | 7,967 |
| USD | 15,129,056 | CNH | 109,720,000 | JPMorgan Chase Bank, N.A. | 7/02/24 | 99,743 |
| USD | 2,577,934 | CNH | 18,660,000 | JPMorgan Chase Bank, N.A. | 7/02/24 | 21,910 |
| USD | 2,287,643 | CNY | 16,706,316 | Citibank, N. A. | 7/02/24 | (11,206) |
| USD | 1,738,607 | COP | 7,229,300,000 | Citibank, N. A. | 7/02/24 | (3,068) |
| USD | 1,860,943 | COP | 7,229,300,000 | Goldman Sachs Bank USA | 7/02/24 | 119,269 |
| USD | 2,424,616 | CZK | 55,344,000 | HSBC Bank | 7/02/24 | 58,619 |
| USD | 2,308,445 | DKK | 15,866,000 | HSBC Bank | 7/02/24 | 30,124 |
| USD | 141,192 | EUR | 132,000 | BNP Paribas S.A. | 7/02/24 | (174) |
| USD | 466,038 | EUR | 429,000 | Bank of America, N.A. | 7/02/24 | 6,601 |
| USD | 4,563,630 | EUR | 4,236,000 | JPMorgan Chase Bank, N.A. | 7/02/24 | 27,086 |
| USD | 360,274,633 | EUR | 332,088,000 | State Street Bank and Trust Co | 7/02/24 | 4,624,990 |
| USD | 2,454,125 | EUR | 2,283,000 | State Street Bank and Trust Co | 7/02/24 | 9,146 |
| USD | 51,689,350 | GBP | 40,583,000 | Bank of America, N.A. | 7/02/24 | 388,380 |
| USD | 599,075 | GBP | 470,000 | Bank of America, N.A. | 7/02/24 | 4,948 |
| USD | 762,665 | GBP | 599,000 | Bank of America, N.A. | 7/02/24 | 5,469 |
| USD | 105,104 | HKD | 821,000 | Brown Brothers Harriman & Co | 7/02/24 | (30) |
| USD | 1,095,920 | HUF | 394,398,000 | BNP Paribas S.A. | 7/02/24 | 26,535 |
| USD | 6,165,658 | IDR | 101,079,800,000 | BNP Paribas S.A. | 7/02/24 | (7,154) |
| USD | 6,221,827 | IDR | 101,079,800,000 | BNP Paribas S.A. | 7/02/24 | 49,015 |
| USD | 1,678,392 | ILS | 6,211,000 | HSBC Bank | 7/02/24 | 34,053 |
| USD | 693,648 | JPY | 108,600,000 | Bank of America, N.A. | 7/02/24 | 18,652 |
| USD | 76,602,165 | JPY | 11,957,100,000 | Royal Bank of Canada | 7/02/24 | 2,283,686 |
| USD | 16,151,042 | KRW | 22,327,200,000 | BNP Paribas S.A. | 7/02/24 | (27,678) |
| USD | 16,328,572 | KRW | 22,327,200,000 | BNP Paribas S.A. | 7/02/24 | 149,852 |
| USD | 6,050,955 | MXN | 103,308,000 | Royal Bank of Canada | 7/02/24 | 404,166 |
| USD | 5,948,391 | MYR | 28,077,000 | Goldman Sachs Bank USA | 7/02/24 | (3,278) |
| USD | 5,987,844 | MYR | 28,077,000 | Goldman Sachs Bank USA | 7/02/24 | 36,175 |
| USD | 1,934,159 | NOK | 20,359,000 | Bank of America, N.A. | 7/02/24 | 27,350 |
| USD | 2,624,957 | NZD | 4,285,000 | Bank of America, N.A. | 7/02/24 | 14,963 |
| USD | 1,128,153 | PEN | 4,244,000 | Goldman Sachs Bank USA | 7/02/24 | 23,966 |
| USD | 3,484,970 | PLN | 13,793,000 | State Street Bank and Trust Co | 7/02/24 | 58,691 |
| USD | 2,019,777 | RON | 9,284,000 | BNP Paribas S.A. | 7/02/24 | 22,079 |
| USD | 2,911,770 | SEK | 30,512,000 | JPMorgan Chase Bank, N.A. | 7/02/24 | 33,008 |
| USD | 5,877,635 | SEK | 62,252,000 | State Street Bank and Trust Co | 7/02/24 | 4,251 |
| USD | 2,647,818 | SGD | 3,570,000 | State Street Bank and Trust Co | 7/02/24 | 15,075 |
| USD | 5,951,340 | THB | 218,923,000 | JPMorgan Chase Bank, N.A. | 7/02/24 | (8,993) |
| AUD | 348,000 | USD | 232,158 | Citibank, N. A. | 8/02/24 | 195 |
| USD | 23,958,845 | AUD | 35,916,000 | Bank of America, N.A. | 8/02/24 | (21,590) |
| USD | 40,831,965 | CAD | 55,844,000 | Royal Bank of Canada | 8/02/24 | (18,148) |
| USD | 9,921,901 | CHF | 8,865,000 | State Street Bank and Trust Co | 8/02/24 | 16,831 |
| USD | 683,188 | CLP | 647,327,000 | Citibank, N. A. | 8/02/24 | (4,539) |
| USD | 2,355,954 | CNH | 17,157,000 | Bank of America, N.A. | 8/02/24 | (254) |
| USD | 136,760,587 | CNH | 996,000,000 | Bank of America, N.A. | 8/02/24 | (22,278) |
| USD | 17,712,165 | CNH | 129,000,000 | JPMorgan Chase Bank, N.A. | 8/02/24 | (3,688) |
| USD | 1,724,731 | COP | 7,164,100,000 | Citibank, N. A. | 8/02/24 | 8,628 |
| USD | 2,380,479 | CZK | 55,438,000 | Bank of America, N.A. | 8/02/24 | 9,006 |
| USD | 2,287,631 | DKK | 15,894,000 | Bank of America, N.A. | 8/02/24 | 1,109 |
| USD | 1,471,807 | EUR | 1,374,000 | BNP Paribas S.A. | 8/02/24 | (1,901) |
| USD | 362,213,415 | EUR | 337,269,000 | Bank of America, N.A. | 8/02/24 | 469,671 |
| USD | 52,726,075 | GBP | 41,680,000 | State Street Bank and Trust Co | 8/02/24 | 28,315 |
| USD | 108,312 | HKD | 845,000 | Brown Brothers Harriman & Co | 8/02/24 | (3) |
| USD | 1,089,405 | HUF | 403,595,000 | BNP Paribas S.A. | 8/02/24 | (3,595) |
| USD | 6,218,725 | IDR | 102,223,400,000 | BNP Paribas S.A. | 8/02/24 | (21,094) |
| USD | 1,635,907 | ILS | 6,133,000 | Canadian Imperial Bk. of Comm. | 8/02/24 | 10,071 |
| USD | 1,920,309 | JPY | 306,850,000 | JPMorgan Chase Bank, N.A. | 8/02/24 | 3,789 |
| USD | 73,820,351 | JPY | 11,804,450,000 | Royal Bank of Canada | 8/02/24 | 92,259 |
| USD | 16,185,330 | KRW | 22,496,800,000 | BNP Paribas S.A. | 8/02/24 | (145,052) |
| USD | 5,569,299 | MXN | 102,829,000 | Royal Bank of Canada | 8/02/24 | (23,818) |
| USD | 5,926,216 | MYR | 28,031,000 | Goldman Sachs Bank USA | 8/02/24 | (28,421) |
| USD | 1,922,244 | NOK | 20,457,000 | HSBC Bank | 8/02/24 | 4,673 |
| USD | 2,632,214 | NZD | 4,318,000 | HSBC Bank | 8/02/24 | 2,094 |
| USD | 1,127,715 | PEN | 4,309,000 | Citibank, N. A. | 8/02/24 | 8,200 |
| USD | 3,442,609 | PLN | 13,873,000 | Canadian Imperial Bk. of Comm. | 8/02/24 | (2,387) |
| USD | 1,719,985 | PLN | 6,933,000 | State Street Bank and Trust Co | 8/02/24 | (1,644) |
| USD | 2,009,520 | RON | 9,339,000 | BNP Paribas S.A. | 8/02/24 | 807 |
| USD | 217,578 | RON | 1,013,000 | Brown Brothers Harriman & Co | 8/02/24 | (307) |
| USD | 8,772,976 | SEK | 92,833,000 | Citibank, N. A. | 8/02/24 | 337 |
| USD | 413,643 | SGD | 560,000 | Canadian Imperial Bk. of Comm. | 8/02/24 | 33 |
| USD | 2,650,424 | SGD | 3,592,000 | State Street Bank and Trust Co | 8/02/24 | (2,591) |
| USD | 5,874,858 | THB | 216,606,000 | JPMorgan Chase Bank, N.A. | 8/02/24 | (37,618) |
| TOTAL FORWARD FOREIGN CURRENCY CONTRACTS | 9,152,293 | |||||
| Unrealized Appreciation | 10,483,975 | |||||
| Unrealized Depreciation | (1,331,682) | |||||
| AUD | - | Australian dollar |
| CAD | - | Canadian dollar |
| CHF | - | Swiss franc |
| CLP | - | Chilean peso |
| CNH | - | Chinese Offshore Currency |
| CNY | - | Chinese yuan |
| COP | - | Colombian peso |
| CZK | - | Czech koruna |
| DKK | - | Danish krone |
| EUR | - | European Monetary Unit |
| GBP | - | British pound sterling |
| HKD | - | Hong Kong dollar |
| HUF | - | Hungarian forint |
| IDR | - | Indonesian rupiah |
| ILS | - | Israeli shekel |
| JPY | - | Japanese yen |
| KRW | - | Korean won |
| MXN | - | Mexican peso |
| MYR | - | Malaysian ringgit |
| NOK | - | Norwegian krone |
| NZD | - | New Zealand dollar |
| PEN | - | Peruvian new sol |
| PLN | - | Polish zloty |
| RON | - | Romanian leu |
| RUB | - | Russian ruble |
| SEK | - | Swedish krona |
| SGD | - | Singapore dollar |
| THB | - | Thai baht |
| USD | - | U.S. dollar |
| (a) | Amount is stated in United States dollars unless otherwise noted. |
| (b) | Coupon rates for floating and adjustable rate securities reflect the rates in effect at period end. |
| (c) | Coupon is indexed to a floating interest rate which may be multiplied by a specified factor and/or subject to caps or floors. |
| (d) | Security exempt from registration under Rule 144A of the Securities Act of 1933. These securities may be resold in transactions exempt from registration, normally to qualified institutional buyers. At the end of the period, the value of these securities amounted to $120,920,022 or 15.1% of net assets. |
| (e) | Security or a portion of the security has been segregated as collateral for open forward foreign currency contracts. At period end, the value of securities pledged amounted to $159,449. |
| (f) | Security or a portion of the security was pledged to cover margin requirements for futures contracts. At period end, the value of securities pledged amounted to $183,253. |
| (g) | Security initially issued at one coupon which converts to a higher coupon at a specified date. The rate shown is the rate at period end. |
| (h) | Non-income producing - Security is in default. |
| (i) | Level 3 security |
| (j) | Security is perpetual in nature with no stated maturity date. |
| (k) | Affiliated fund that is generally available only to investment companies and other accounts managed by Fidelity Investments. The rate quoted is the annualized seven-day yield of the fund at period end. A complete unaudited listing of the fund's holdings as of its most recent quarter end is available upon request. In addition, each Fidelity Central Fund's financial statements are available on the SEC's website or upon request. |
| Affiliate | Value, beginning of period ($) | Purchases ($) | Sales Proceeds ($) | Dividend Income ($) | Realized Gain (loss) ($) | Change in Unrealized appreciation (depreciation) ($) | Value, end of period ($) | % ownership, end of period |
| Fidelity Cash Central Fund 5.38% | 20,006,063 | 77,574,483 | 94,717,292 | 94,658 | 645 | - | 2,863,899 | 0.0% |
| Total | 20,006,063 | 77,574,483 | 94,717,292 | 94,658 | 645 | - | 2,863,899 | |
| Valuation Inputs at Reporting Date: | ||||
| Description | Total ($) | Level 1 ($) | Level 2 ($) | Level 3 ($) |
Investments in Securities: | ||||
| Corporate Bonds | 199,696,229 | - | 199,696,229 | - |
| Government Obligations | 561,911,289 | - | 561,911,289 | - |
| Supranational Obligations | 27,990,194 | - | 27,990,194 | - |
| Preferred Securities | 3,078,738 | - | 3,078,738 | - |
| Money Market Funds | 2,863,899 | 2,863,899 | - | - |
| Total Investments in Securities: | 795,540,349 | 2,863,899 | 792,676,450 | - |
Derivative Instruments: Assets | ||||
Futures Contracts | 32,537 | 32,537 | - | - |
Forward Foreign Currency Contracts | 10,483,975 | - | 10,483,975 | - |
| Total Assets | 10,516,512 | 32,537 | 10,483,975 | - |
| Liabilities | ||||
Forward Foreign Currency Contracts | (1,331,682) | - | (1,331,682) | - |
| Total Liabilities | (1,331,682) | - | (1,331,682) | - |
| Total Derivative Instruments: | 9,184,830 | 32,537 | 9,152,293 | - |
Primary Risk Exposure / Derivative Type | Value | |
| Asset ($) | Liability ($) | |
| Foreign Exchange Risk | ||
Forward Foreign Currency Contracts (a) | 10,483,975 | (1,331,682) |
| Total Foreign Exchange Risk | 10,483,975 | (1,331,682) |
| Interest Rate Risk | ||
Futures Contracts (b) | 32,537 | 0 |
| Total Interest Rate Risk | 32,537 | 0 |
| Total Value of Derivatives | 10,516,512 | (1,331,682) |
| Counterparty | Value of Derivative Assets ($) | Value of Derivative Liabilities ($) | Collateral Received(a) ($) | Collateral Pledged(a) ($) | Net(b) ($) | |||||
| Bank of America, N.A. | 1,816,310 | (585,232) | (1,231,078) | - | - | |||||
| BNP Paribas S.A. | 443,207 | (223,010) | (220,197) | - | - | |||||
| Brown Brothers Harriman & Co | 308 | (340) | - | - | (32) | |||||
| Canadian Imperial Bk. of Comm. | 12,558 | (12,825) | - | - | (267) | |||||
| Citibank, N.A. | 33,927 | (103,407) | - | 69,480 | - | |||||
| Goldman Sachs Bank USA | 221,338 | (31,699) | - | - | 189,639 | |||||
| HSBC Bank | 129,803 | (6,852) | - | - | 122,951 | |||||
| JPMorgan Chase Bank, N.A. | 217,106 | (169,414) | - | - | 47,692 | |||||
| Royal Bank of Canada | 2,848,106 | (147,049) | (2,670,959) | - | 30,098 | |||||
| State Street Bank and Trust Co | 4,761,312 | (51,854) | (4,709,458) | - | - | |||||
| Total | $ | 10,483,975 | $ | (1,331,682) | $ | (8,831,692) | $ | 69,480 | $ | 390,081 |
| Statement of Assets and Liabilities | ||||
June 30, 2024 (Unaudited) | ||||
| Assets | ||||
| Investment in securities, at value - See accompanying schedule: | ||||
Unaffiliated issuers (cost $899,047,840) | $ | 792,676,450 | ||
Fidelity Central Funds (cost $2,863,899) | 2,863,899 | |||
| Total Investment in Securities (cost $901,911,739) | $ | 795,540,349 | ||
| Foreign currency held at value (cost $843,835) | 843,693 | |||
| Receivable for investments sold | 11,460,582 | |||
| Unrealized appreciation on forward foreign currency contracts | 10,483,975 | |||
| Receivable for fund shares sold | 1,838,551 | |||
| Dividends receivable | 61,542 | |||
| Interest receivable | 6,215,960 | |||
| Distributions receivable from Fidelity Central Funds | 17,327 | |||
| Other receivables | 9 | |||
Total assets | 826,461,988 | |||
| Liabilities | ||||
| Payable for investments purchased | $ | 21,691,656 | ||
| Unrealized depreciation on forward foreign currency contracts | 1,331,682 | |||
| Payable for fund shares redeemed | 597,116 | |||
| Accrued management fee | 39,851 | |||
| Payable for daily variation margin on futures contracts | 8,778 | |||
| Other payables and accrued expenses | 10,333 | |||
| Total liabilities | 23,679,416 | |||
| Net Assets | $ | 802,782,572 | ||
| Net Assets consist of: | ||||
| Paid in capital | $ | 858,366,241 | ||
| Total accumulated earnings (loss) | (55,583,669) | |||
| Net Assets | $ | 802,782,572 | ||
Net Asset Value, offering price and redemption price per share ($802,782,572 ÷ 87,822,074 shares) | $ | 9.14 | ||
| Statement of Operations | ||||
Six months ended June 30, 2024 (Unaudited) | ||||
| Investment Income | ||||
| Dividends | $ | 19,203 | ||
| Interest | 8,521,722 | |||
| Income from Fidelity Central Funds | 94,658 | |||
| Total income | 8,635,583 | |||
| Expenses | ||||
| Management fee | $ | 232,647 | ||
| Independent trustees' fees and expenses | 1,027 | |||
| Interest | 1,684 | |||
| Miscellaneous | 476 | |||
| Total expenses before reductions | 235,834 | |||
| Expense reductions | (31) | |||
| Total expenses after reductions | 235,803 | |||
| Net Investment income (loss) | 8,399,780 | |||
| Realized and Unrealized Gain (Loss) | ||||
| Net realized gain (loss) on: | ||||
| Investment Securities: | ||||
| Unaffiliated issuers | (6,384,505) | |||
| Fidelity Central Funds | 645 | |||
| Forward foreign currency contracts | 12,459,217 | |||
| Foreign currency transactions | (133,444) | |||
| Futures contracts | (75,230) | |||
| Total net realized gain (loss) | 5,866,683 | |||
| Change in net unrealized appreciation (depreciation) on: | ||||
| Investment Securities: | ||||
| Unaffiliated issuers (net of decrease in deferred foreign taxes of $5,266) | (34,312,640) | |||
| Forward foreign currency contracts | 23,971,110 | |||
| Assets and liabilities in foreign currencies | (161,098) | |||
| Futures contracts | (106,819) | |||
| Total change in net unrealized appreciation (depreciation) | (10,609,447) | |||
| Net gain (loss) | (4,742,764) | |||
| Net increase (decrease) in net assets resulting from operations | $ | 3,657,016 | ||
| Statement of Changes in Net Assets | ||||
Six months ended June 30, 2024 (Unaudited) | Year ended December 31, 2023 | |||
| Increase (Decrease) in Net Assets | ||||
| Operations | ||||
| Net investment income (loss) | $ | 8,399,780 | $ | 13,209,808 |
| Net realized gain (loss) | 5,866,683 | (16,905,309) | ||
| Change in net unrealized appreciation (depreciation) | (10,609,447) | 53,048,267 | ||
| Net increase (decrease) in net assets resulting from operations | 3,657,016 | 49,352,766 | ||
| Distributions to shareholders | (7,751,148) | (20,544,715) | ||
| Share transactions | ||||
| Proceeds from sales of shares | 127,490,466 | 232,402,472 | ||
| Reinvestment of distributions | 7,317,267 | 19,585,468 | ||
| Cost of shares redeemed | (77,619,637) | (157,170,529) | ||
Net increase (decrease) in net assets resulting from share transactions | 57,188,096 | 94,817,411 | ||
| Total increase (decrease) in net assets | 53,093,964 | 123,625,462 | ||
| Net Assets | ||||
| Beginning of period | 749,688,608 | 626,063,146 | ||
| End of period | $ | 802,782,572 | $ | 749,688,608 |
| Other Information | ||||
| Shares | ||||
| Sold | 14,000,059 | 25,821,303 | ||
| Issued in reinvestment of distributions | 806,934 | 2,162,484 | ||
| Redeemed | (8,514,537) | (17,516,244) | ||
| Net increase (decrease) | 6,292,456 | 10,467,543 | ||
Fidelity® International Bond Index Fund |
Six months ended (Unaudited) June 30, 2024 | Years ended December 31, 2023 | 2022 | 2021 | 2020 | 2019 A | |||||||
Selected Per-Share Data | ||||||||||||
| Net asset value, beginning of period | $ | 9.20 | $ | 8.81 | $ | 9.98 | $ | 10.22 | $ | 9.87 | $ | 10.00 |
| Income from Investment Operations | ||||||||||||
Net investment income (loss) B,C | .099 | .171 | .113 | .079 | .054 | .010 | ||||||
| Net realized and unrealized gain (loss) | (.067) | .481 | (1.193) | (.257) | .372 | (.123) | ||||||
| Total from investment operations | .032 | .652 | (1.080) | (.178) | .426 | (.113) | ||||||
| Distributions from net investment income | (.092) | (.262) | (.090) | (.062) | (.076) | (.009) | ||||||
| Distributions from net realized gain | - | - | - | - | - | (.008) | ||||||
| Total distributions | (.092) | (.262) | (.090) | (.062) | (.076) | (.017) | ||||||
| Net asset value, end of period | $ | 9.14 | $ | 9.20 | $ | 8.81 | $ | 9.98 | $ | 10.22 | $ | 9.87 |
Total Return D,E | .36 % | 7.48% | (10.84)% | (1.74)% | 4.33% | (1.13)% | ||||||
Ratios to Average Net Assets C,F,G | ||||||||||||
| Expenses before reductions | .06% H,I | .06% | .06% | .06% | .06% | .06% I | ||||||
| Expenses net of fee waivers, if any | .06 % H,I | .06% | .06% | .06% | .06% | .06% I | ||||||
| Expenses net of all reductions | .06% H,I | .06% | .06% | .06% | .06% | .06% I | ||||||
| Net investment income (loss) | 2.18% H,I | 1.91% | 1.23% | .79% | .54% | .45% I | ||||||
| Supplemental Data | ||||||||||||
| Net assets, end of period (000 omitted) | $ | 802,783 | $ | 749,689 | $ | 626,063 | $ | 598,137 | $ | 184,632 | $ | 16,121 |
Portfolio turnover rate J | 22 % I | 22% | 22% | 18% | 5% | 3% I,K |
| Fidelity Central Fund | Investment Manager | Investment Objective | Investment Practices | Expense RatioA |
| Fidelity Money Market Central Funds | Fidelity Management & Research Company LLC (FMR) | Each fund seeks to obtain a high level of current income consistent with the preservation of capital and liquidity. | Short-term Investments | Less than .005% |
| Gross unrealized appreciation | $9,373,613 |
| Gross unrealized depreciation | (110,855,577) |
| Net unrealized appreciation (depreciation) | $(101,481,964) |
| Tax cost | $897,022,313 |
Short-term | $(5,237,480) |
Long-term | (7,130,608) |
| Total capital loss carryforward | $(12,368,088) |
| Foreign Exchange Risk | Foreign exchange rate risk relates to fluctuations in the value of an asset or liability due to changes in currency exchange rates. |
| Interest Rate Risk | Interest rate risk relates to the fluctuations in the value of interest-bearing securities due to changes in the prevailing levels of market interest rates. |
| Primary Risk Exposure / Derivative Type | Net Realized Gain (Loss)($) | Change in Net Unrealized Appreciation (Depreciation)($) |
| Fidelity International Bond Index Fund | ||
| Foreign Exchange Risk | ||
| Forward Foreign Currency Contracts | 12,459,217 | 23,971,110 |
| Total Foreign Exchange Risk | 12,459,217 | 23,971,110 |
| Interest Rate Risk | ||
| Futures Contracts | (75,230) | (106,819) |
| Total Interest Rate Risk | (75,230) | (106,819) |
| Totals | 12,383,987 | 23,864,291 |
| Purchases ($) | Sales ($) | |
| Fidelity International Bond Index Fund | 176,536,674 | 84,848,692 |
| Borrower or Lender | Average Loan Balance ($) | Weighted Average Interest Rate | Interest Expense ($) | |
| Fidelity International Bond Index Fund | Borrower | 5,428,000 | 5.58% | 1,684 |
| Fidelity Multi-Asset Index Fund | |
| Fidelity International Bond Index Fund | 31% |
| Fund | % of shares held |
| Fidelity International Bond Index Fund | 44% |
 |
Item 8.
Changes in and Disagreements with Accountants for Open-End Management Investment Companies
See Item 7.
Item 9.
Proxy Disclosures for Open-End Management Investment Companies
See Item 7.
Item 10.
Remuneration Paid to Directors, Officers, and Others of Open-End Management Investment Companies
See Item 7.
Item 11.
Statement Regarding Basis for Approval of Investment Advisory Contract
See Item 7.
Item 12.
Disclosure of Proxy Voting Policies and Procedures for Closed-End Management Investment Companies
Not applicable.
Item 13.
Portfolio Managers of Closed-End Management Investment Companies
Not applicable.
Item 14.
Purchases of Equity Securities by Closed-End Management Investment Company and Affiliated Purchasers
Not applicable.
Item 15.
Submission of Matters to a Vote of Security Holders
There were no material changes to the procedures by which shareholders may recommend nominees to the Fidelity Salem Street Trust’s Board of Trustees.
Item 16.
Controls and Procedures
(a)(i) The President and Treasurer and the Chief Financial Officer have concluded that the Fidelity Salem Street Trust’s (the “Trust”) disclosure controls and procedures (as defined in Rule 30a-3(c) under the Investment Company Act) provide reasonable assurances that material information relating to the Trust is made known to them by the appropriate persons, based on their evaluation of these controls and procedures as of a date within 90 days of the filing date of this report.
(a)(ii) There was no change in the Trust’s internal control over financial reporting (as defined in Rule 30a-3(d) under the Investment Company Act) that occurred during the period covered by this report that has materially affected, or is reasonably likely to materially affect, the Trust’s internal control over financial reporting.
Item 17.
Disclosure of Securities Lending Activities for Closed-End Management Investment Companies
Not applicable.
Item 18.
Recovery of Erroneously Awarded Compensation
(a)
Not applicable.
(b)
Not applicable.
Item 19.
Exhibits
(a) | (1) | Not applicable. |
(a) | (2) | |
(a) | (3) | Not applicable. |
(b) |
SIGNATURES
Pursuant to the requirements of the Securities Exchange Act of 1934 and the Investment Company Act of 1940, the registrant has duly caused this report to be signed on its behalf by the undersigned, thereunto duly authorized.
Fidelity Salem Street Trust
By: | /s/Laura M. Del Prato |
Laura M. Del Prato | |
President and Treasurer (Principal Executive Officer) | |
Date: | August 22, 2024 |
Pursuant to the requirements of the Securities Exchange Act of 1934 and the Investment Company Act of 1940, this report has been signed below by the following persons on behalf of the registrant and in the capacities and on the dates indicated.
By: | /s/Laura M. Del Prato |
Laura M. Del Prato | |
President and Treasurer (Principal Executive Officer) | |
Date: | August 22, 2024 |
By: | /s/John J. Burke III |
John J. Burke III | |
Chief Financial Officer (Principal Financial Officer) | |
Date: | August 22, 2024 |