UNITED STATES
SECURITIES AND EXCHANGE COMMISSION
Washington, D.C. 20549
FORM N-CSR
CERTIFIED SHAREHOLDER REPORT OF REGISTERED
MANAGEMENT INVESTMENT COMPANIES
Investment Company Act file number 811-01352
Fidelity Devonshire Trust
(Exact name of registrant as specified in charter)
245 Summer St., Boston, Massachusetts 02210
(Address of principal executive offices) (Zip code)
Cynthia Lo Bessette, Secretary
245 Summer St.
Boston, Massachusetts 02210
(Name and address of agent for service)
Registrant's telephone number, including area code:
617-563-7000
Date of fiscal year end: | January 31 |
Date of reporting period: | January 31, 2021 |
Item 1.
Reports to Stockholders
Fidelity® Equity-Income Fund
January 31, 2021

Contents
To view a fund's proxy voting guidelines and proxy voting record for the 12-month period ended June 30, visit http://www.fidelity.com/proxyvotingresults or visit the Securities and Exchange Commission's (SEC) web site at http://www.sec.gov.
You may also call 1-800-544-8544 if you’re an individual investing directly with Fidelity, call 1-800-835-5092 if you’re a plan sponsor or participant with Fidelity as your recordkeeper or call 1-877-208-0098 on institutional accounts or if you’re an advisor or invest through one to request a free copy of the proxy voting guidelines.
Standard & Poor's, S&P and S&P 500 are registered service marks of The McGraw-Hill Companies, Inc. and have been licensed for use by Fidelity Distributors Corporation.
Other third-party marks appearing herein are the property of their respective owners.
All other marks appearing herein are registered or unregistered trademarks or service marks of FMR LLC or an affiliated company. © 2021 FMR LLC. All rights reserved.
This report and the financial statements contained herein are submitted for the general information of the shareholders of the Fund. This report is not authorized for distribution to prospective investors in the Fund unless preceded or accompanied by an effective prospectus.
A fund files its complete schedule of portfolio holdings with the SEC for the first and third quarters of each fiscal year on Form N-PORT. Forms N-PORT are available on the SEC’s web site at http://www.sec.gov. A fund's Forms N-PORT may be reviewed and copied at the SEC’s Public Reference Room in Washington, DC. Information regarding the operation of the SEC's Public Reference Room may be obtained by calling 1-800-SEC-0330.
For a complete list of a fund's portfolio holdings, view the most recent holdings listing, semiannual report, or annual report on Fidelity's web site at http://www.fidelity.com, http://www.institutional.fidelity.com, or http://www.401k.com, as applicable.
NOT FDIC INSURED •MAY LOSE VALUE •NO BANK GUARANTEE
Neither the Fund nor Fidelity Distributors Corporation is a bank.
Note to Shareholders:
Early in 2020, the outbreak and spread of a new coronavirus emerged as a public health emergency that had a major influence on financial markets, primarily based on its impact on the global economy and the outlook for corporate earnings. The virus causes a respiratory disease known as COVID-19. On March 11, the World Health Organization declared the COVID-19 outbreak a pandemic, citing sustained risk of further global spread.
In the weeks following, as the crisis worsened, we witnessed an escalating human tragedy with wide-scale social and economic consequences from coronavirus-containment measures. The outbreak of COVID-19 prompted a number of measures to limit the spread, including travel and border restrictions, quarantines, and restrictions on large gatherings. In turn, these resulted in lower consumer activity, diminished demand for a wide range of products and services, disruption in manufacturing and supply chains, and – given the wide variability in outcomes regarding the outbreak – significant market uncertainty and volatility. Amid the turmoil, global governments and central banks took unprecedented action to help support consumers, businesses, and the broader economies, and to limit disruption to financial systems.
The situation continues to unfold, and the extent and duration of its impact on financial markets and the economy remain highly uncertain. Extreme events such as the coronavirus crisis are “exogenous shocks” that can have significant adverse effects on mutual funds and their investments. Although multiple asset classes may be affected by market disruption, the duration and impact may not be the same for all types of assets.
Fidelity is committed to helping you stay informed amid news about COVID-19 and during increased market volatility, and we’re taking extra steps to be responsive to customer needs. We encourage you to visit our websites, where we offer ongoing updates, commentary, and analysis on the markets and our funds.
Performance: The Bottom Line
Average annual total return reflects the change in the value of an investment, assuming reinvestment of distributions from dividend income and capital gains (the profits earned upon the sale of securities that have grown in value, if any) and assuming a constant rate of performance each year. The hypothetical investment and the average annual total returns do not reflect the deduction of taxes that a shareholder would pay on fund distributions or the redemption of fund shares. During periods of reimbursement by Fidelity, a fund’s total return will be greater than it would be had the reimbursement not occurred. How a fund did yesterday is no guarantee of how it will do tomorrow.
Average Annual Total Returns
| For the periods ended January 31, 2021 | Past 1 year | Past 5 years | Past 10 years |
| Fidelity® Equity-Income Fund | 7.93% | 11.63% | 9.13% |
| Class K | 8.04% | 11.74% | 9.25% |
$10,000 Over 10 Years
Let's say hypothetically that $10,000 was invested in Fidelity® Equity-Income Fund, a class of the fund, on January 31, 2011.
The chart shows how the value of your investment would have changed, and also shows how the Russell 3000® Value Index performed over the same period.
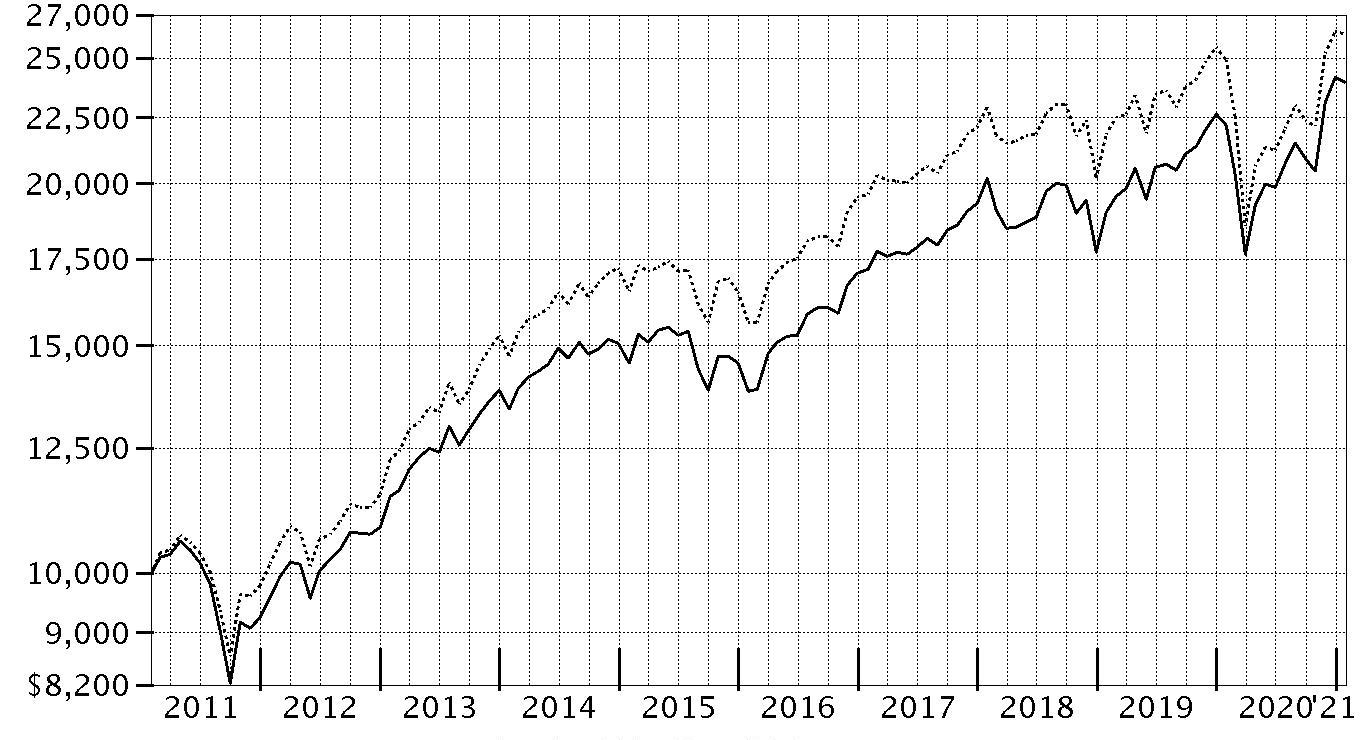
| Period Ending Values | ||
| $23,948 | Fidelity® Equity-Income Fund | |
| $26,108 | Russell 3000® Value Index | |
Management's Discussion of Fund Performance
Market Recap: The S&P 500® index gained 17.25% for the 12 months ending January 31, 2021, a volatile but productive period for U.S. risk assets. The early-2020 outbreak and spread of COVID-19 resulted in stocks suffering one of the quickest declines on record, through March 23, followed by a historic rebound. The crisis and containment efforts caused broad contraction in economic activity, along with extreme uncertainty and dislocation in financial markets. A rapid and expansive U.S. monetary/fiscal-policy response partially offset the economic disruption and fueled the market surge, as did resilient corporate earnings. The rally slowed in September, when the S&P 500 began a two-month retreat amid Congress’s inability to reach a deal on additional fiscal stimulus, as well as concerns about election uncertainty, indications the U.S. economic recovery could be slowing and a new wave of COVID-19 cases. A shift in momentum began in October and accelerated following the U.S. elections, with the approval of two breakthrough COVID-19 vaccines and prospects for additional government stimulus fueling the “reflation trade.” Small-cap value stocks rallied strongly late in 2020, usurping longstanding market leadership from growth shares – especially large tech and internet-related names – amid hopes of a broad economic recovery in 2021. By sector for the full 12 months, information technology (+37%) and consumer discretionary (+33%) led all gainers. In contrast, energy (-23%) struggled along with global oil demand and pricing.Comments from Portfolio Manager Ramona Persaud: For the fiscal year, the fund's share classes gained about 8%, outperforming the 4.82% result of the benchmark, the Russell 3000® Value Index. I believe my focus on risk-adjusted return helped to limit fund losses when the stock market sold off in late February and March while still participating in market upside thereafter. Security selection contributed the most to the fund’s relative result, led by stock choices in the information technology and consumer staples sectors. Within tech, the fund held stocks of firms I thought could benefit from longer-term trends, such as globalization. I also sought to own the stock of tech companies with strong growth in free-cash-flow (FCF) and expanding margins that I thought seemed likely to run less capital-intensive businesses over time. A cash position of 4% of assets, on average, also added value this period by helping to limit the fund’s losses when the market declined. Non-benchmark investments in consumer electronics giant Apple (+71%) and chipmaker Taiwan Semiconductor Manufacturing (+131%) boosted the fund’s performance versus the benchmark. Conversely, overweightings in Wells Fargo and ConocoPhillips hurt the fund’s relative result. Wells Fargo was among the largest holdings at period end. Notable positioning changes for the period included a higher allocation to the consumer discretionary and information technology sectors.The views expressed above reflect those of the portfolio manager(s) only through the end of the period as stated on the cover of this report and do not necessarily represent the views of Fidelity or any other person in the Fidelity organization. Any such views are subject to change at any time based upon market or other conditions and Fidelity disclaims any responsibility to update such views. These views may not be relied on as investment advice and, because investment decisions for a Fidelity fund are based on numerous factors, may not be relied on as an indication of trading intent on behalf of any Fidelity fund.
Investment Summary (Unaudited)
Top Ten Stocks as of January 31, 2021
| % of fund's net assets | |
| JPMorgan Chase & Co. | 3.6 |
| The Walt Disney Co. | 2.9 |
| Johnson & Johnson | 2.4 |
| Bank of America Corp. | 2.4 |
| Danaher Corp. | 1.8 |
| Capital One Financial Corp. | 1.7 |
| NextEra Energy, Inc. | 1.7 |
| Citigroup, Inc. | 1.7 |
| Wells Fargo & Co. | 1.7 |
| Comcast Corp. Class A | 1.6 |
| 21.5 |
Top Five Market Sectors as of January 31, 2021
| % of fund's net assets | |
| Financials | 19.0 |
| Health Care | 14.0 |
| Industrials | 11.2 |
| Information Technology | 10.9 |
| Consumer Discretionary | 10.8 |
Asset Allocation (% of fund's net assets)
| As of January 31, 2021 * | ||
| Stocks | 97.7% | |
| Other Investments | 0.1% | |
| Short-Term Investments and Net Other Assets (Liabilities) | 2.2% | |

* Foreign investments - 13.3%
Schedule of Investments January 31, 2021
Showing Percentage of Net Assets
| Common Stocks - 97.7% | |||
| Shares | Value (000s) | ||
| COMMUNICATION SERVICES - 8.7% | |||
| Diversified Telecommunication Services - 0.9% | |||
| AT&T, Inc. | 670,734 | $19,203 | |
| Verizon Communications, Inc. | 765,598 | 41,916 | |
| 61,119 | |||
| Entertainment - 3.6% | |||
| Activision Blizzard, Inc. | 527,133 | 47,969 | |
| The Walt Disney Co. | 1,116,164 | 187,705 | |
| 235,674 | |||
| Interactive Media & Services - 1.0% | |||
| Alphabet, Inc. Class A (a) | 38,293 | 69,975 | |
| Media - 2.1% | |||
| Comcast Corp. Class A | 2,172,719 | 107,702 | |
| Interpublic Group of Companies, Inc. | 1,196,662 | 28,804 | |
| 136,506 | |||
| Wireless Telecommunication Services - 1.1% | |||
| T-Mobile U.S., Inc. | 565,670 | 71,320 | |
| TOTAL COMMUNICATION SERVICES | 574,594 | ||
| CONSUMER DISCRETIONARY - 10.8% | |||
| Hotels, Restaurants & Leisure - 2.1% | |||
| McDonald's Corp. | 377,882 | 78,539 | |
| Starbucks Corp. | 620,188 | 60,040 | |
| 138,579 | |||
| Household Durables - 0.7% | |||
| Lennar Corp. Class A | 403,839 | 33,579 | |
| Tempur Sealy International, Inc. (a) | 389,200 | 10,275 | |
| 43,854 | |||
| Internet & Direct Marketing Retail - 0.3% | |||
| eBay, Inc. | 410,893 | 23,220 | |
| Multiline Retail - 2.8% | |||
| Dollar General Corp. | 269,543 | 52,456 | |
| Dollar Tree, Inc. (a) | 320,432 | 32,575 | |
| Nordstrom, Inc. (b) | 996,700 | 35,333 | |
| Target Corp. | 354,830 | 64,285 | |
| 184,649 | |||
| Specialty Retail - 3.8% | |||
| Best Buy Co., Inc. | 199,000 | 21,655 | |
| Burlington Stores, Inc. (a) | 129,673 | 32,276 | |
| Lowe's Companies, Inc. | 237,850 | 39,685 | |
| Ross Stores, Inc. | 179,762 | 20,006 | |
| The Home Depot, Inc. | 235,250 | 63,710 | |
| TJX Companies, Inc. | 1,102,567 | 70,608 | |
| 247,940 | |||
| Textiles, Apparel & Luxury Goods - 1.1% | |||
| Columbia Sportswear Co. | 281,005 | 24,577 | |
| PVH Corp. | 223,100 | 19,022 | |
| Tapestry, Inc. | 945,500 | 29,897 | |
| 73,496 | |||
| TOTAL CONSUMER DISCRETIONARY | 711,738 | ||
| CONSUMER STAPLES - 7.4% | |||
| Beverages - 1.4% | |||
| Diageo PLC | 369,522 | 14,835 | |
| Keurig Dr. Pepper, Inc. | 567,380 | 18,043 | |
| The Coca-Cola Co. | 1,195,797 | 57,578 | |
| 90,456 | |||
| Food & Staples Retailing - 3.5% | |||
| Alimentation Couche-Tard, Inc. Class B (sub. vtg.) | 407,014 | 12,413 | |
| BJ's Wholesale Club Holdings, Inc. (a) | 547,014 | 23,013 | |
| Costco Wholesale Corp. | 60,587 | 21,353 | |
| Kroger Co. | 1,041,580 | 35,935 | |
| Sysco Corp. | 541,021 | 38,688 | |
| Walmart, Inc. | 690,935 | 97,069 | |
| 228,471 | |||
| Food Products - 1.0% | |||
| Mondelez International, Inc. | 868,244 | 48,135 | |
| Nestle SA (Reg. S) | 190,896 | 21,399 | |
| 69,534 | |||
| Household Products - 1.2% | |||
| Procter & Gamble Co. | 610,781 | 78,308 | |
| Personal Products - 0.3% | |||
| Estee Lauder Companies, Inc. Class A | 72,485 | 17,154 | |
| TOTAL CONSUMER STAPLES | 483,923 | ||
| ENERGY - 6.7% | |||
| Oil, Gas & Consumable Fuels - 6.7% | |||
| BP PLC (a) | 4,616,025 | 17,153 | |
| Chevron Corp. | 1,191,159 | 101,487 | |
| ConocoPhillips Co. | 1,005,160 | 40,237 | |
| Enterprise Products Partners LP | 1,588,264 | 32,131 | |
| Exxon Mobil Corp. | 2,307,465 | 103,467 | |
| Imperial Oil Ltd. (b) | 2,121,736 | 40,369 | |
| Phillips 66 Co. | 576,131 | 39,062 | |
| Suncor Energy, Inc. | 2,400,629 | 40,156 | |
| Valero Energy Corp. | 517,576 | 29,207 | |
| 443,269 | |||
| FINANCIALS - 19.0% | |||
| Banks - 11.2% | |||
| Bank of America Corp. | 5,196,387 | 154,073 | |
| Citigroup, Inc. | 1,964,433 | 113,917 | |
| Huntington Bancshares, Inc. | 1,123,885 | 14,863 | |
| JPMorgan Chase & Co. | 1,849,217 | 237,939 | |
| M&T Bank Corp. | 471,638 | 62,478 | |
| PNC Financial Services Group, Inc. | 286,100 | 41,061 | |
| Wells Fargo & Co. | 3,723,466 | 111,257 | |
| 735,588 | |||
| Capital Markets - 2.6% | |||
| BlackRock, Inc. Class A | 94,372 | 66,179 | |
| KKR & Co. LP | 943,466 | 36,748 | |
| Raymond James Financial, Inc. | 351,836 | 35,159 | |
| The Blackstone Group LP | 451,337 | 30,325 | |
| 168,411 | |||
| Consumer Finance - 1.7% | |||
| Capital One Financial Corp. | 1,105,302 | 115,239 | |
| Insurance - 3.5% | |||
| American International Group, Inc. | 406,900 | 15,234 | |
| Chubb Ltd. | 557,282 | 81,179 | |
| Marsh & McLennan Companies, Inc. | 402,615 | 44,251 | |
| The Travelers Companies, Inc. | 659,782 | 89,928 | |
| 230,592 | |||
| TOTAL FINANCIALS | 1,249,830 | ||
| HEALTH CARE - 14.0% | |||
| Biotechnology - 2.1% | |||
| AbbVie, Inc. | 512,453 | 52,516 | |
| Amgen, Inc. | 344,727 | 83,227 | |
| 135,743 | |||
| Health Care Equipment & Supplies - 2.6% | |||
| Becton, Dickinson & Co. | 206,156 | 53,970 | |
| Danaher Corp. | 494,606 | 117,637 | |
| 171,607 | |||
| Health Care Providers & Services - 1.7% | |||
| Cigna Corp. | 232,251 | 50,410 | |
| UnitedHealth Group, Inc. | 183,861 | 61,332 | |
| 111,742 | |||
| Pharmaceuticals - 7.6% | |||
| AstraZeneca PLC (United Kingdom) | 370,225 | 37,767 | |
| Bristol-Myers Squibb Co. | 1,568,101 | 96,328 | |
| Eli Lilly & Co. | 477,999 | 99,409 | |
| Johnson & Johnson | 990,856 | 161,638 | |
| Roche Holding AG (participation certificate) | 115,932 | 40,010 | |
| Royalty Pharma PLC | 90,581 | 4,258 | |
| Sanofi SA | 684,408 | 64,367 | |
| 503,777 | |||
| TOTAL HEALTH CARE | 922,869 | ||
| INDUSTRIALS - 11.2% | |||
| Aerospace & Defense - 1.3% | |||
| General Dynamics Corp. | 265,744 | 38,979 | |
| Northrop Grumman Corp. | 176,163 | 50,490 | |
| 89,469 | |||
| Air Freight & Logistics - 1.1% | |||
| Deutsche Post AG | 431,600 | 21,319 | |
| United Parcel Service, Inc. Class B | 331,249 | 51,344 | |
| 72,663 | |||
| Commercial Services & Supplies - 0.3% | |||
| Waste Connection, Inc. (Canada) | 175,908 | 17,330 | |
| Electrical Equipment - 0.9% | |||
| AMETEK, Inc. | 531,188 | 60,162 | |
| Siemens Energy AG (a) | 42,243 | 1,568 | |
| 61,730 | |||
| Industrial Conglomerates - 2.5% | |||
| General Electric Co. | 7,193,136 | 76,823 | |
| Roper Technologies, Inc. | 163,066 | 64,070 | |
| Siemens AG | 171,086 | 26,563 | |
| 167,456 | |||
| Machinery - 1.9% | |||
| Fortive Corp. | 357,025 | 23,592 | |
| ITT, Inc. | 427,882 | 31,967 | |
| Otis Worldwide Corp. | 214,347 | 13,858 | |
| Snap-On, Inc. | 73,683 | 13,262 | |
| Stanley Black & Decker, Inc. | 230,361 | 39,965 | |
| 122,644 | |||
| Marine - 0.4% | |||
| A.P. Moller - Maersk A/S Series B | 13,598 | 27,933 | |
| Professional Services - 1.0% | |||
| Clarivate Analytics PLC (a) | 583,077 | 16,874 | |
| Equifax, Inc. | 118,675 | 21,019 | |
| IHS Markit Ltd. | 320,449 | 27,905 | |
| 65,798 | |||
| Road & Rail - 1.0% | |||
| Norfolk Southern Corp. | 272,348 | 64,443 | |
| Trading Companies & Distributors - 0.8% | |||
| Watsco, Inc. | 214,465 | 51,148 | |
| TOTAL INDUSTRIALS | 740,614 | ||
| INFORMATION TECHNOLOGY - 10.9% | |||
| Communications Equipment - 1.5% | |||
| Cisco Systems, Inc. | 2,259,953 | 100,749 | |
| Electronic Equipment & Components - 0.4% | |||
| TE Connectivity Ltd. | 163,597 | 19,697 | |
| Vontier Corp. (a) | 72,672 | 2,357 | |
| 22,054 | |||
| IT Services - 2.4% | |||
| Amdocs Ltd. | 484,198 | 34,194 | |
| Black Knight, Inc. (a) | 68,985 | 5,635 | |
| Fidelity National Information Services, Inc. | 604,772 | 74,665 | |
| Genpact Ltd. | 399,616 | 15,297 | |
| Visa, Inc. Class A | 150,668 | 29,117 | |
| 158,908 | |||
| Semiconductors & Semiconductor Equipment - 2.3% | |||
| NXP Semiconductors NV | 356,205 | 57,160 | |
| Qualcomm, Inc. | 260,508 | 40,712 | |
| Taiwan Semiconductor Manufacturing Co. Ltd. sponsored ADR | 454,004 | 55,171 | |
| 153,043 | |||
| Software - 1.9% | |||
| Microsoft Corp. | 385,709 | 89,469 | |
| Open Text Corp. | 425,810 | 19,074 | |
| SAP SE | 94,880 | 12,039 | |
| 120,582 | |||
| Technology Hardware, Storage & Peripherals - 2.4% | |||
| Apple, Inc. | 723,120 | 95,423 | |
| Samsung Electronics Co. Ltd. | 867,340 | 63,593 | |
| 159,016 | |||
| TOTAL INFORMATION TECHNOLOGY | 714,352 | ||
| MATERIALS - 2.9% | |||
| Chemicals - 1.1% | |||
| Linde PLC | 303,436 | 74,463 | |
| Containers & Packaging - 1.5% | |||
| Crown Holdings, Inc. (a) | 540,203 | 48,699 | |
| WestRock Co. | 1,205,935 | 49,962 | |
| 98,661 | |||
| Metals & Mining - 0.3% | |||
| Anglo American PLC (United Kingdom) | 610,700 | 20,199 | |
| TOTAL MATERIALS | 193,323 | ||
| REAL ESTATE - 1.1% | |||
| Equity Real Estate Investment Trusts (REITs) - 1.1% | |||
| American Tower Corp. | 180,463 | 41,030 | |
| Public Storage | 143,570 | 32,679 | |
| 73,709 | |||
| UTILITIES - 5.0% | |||
| Electric Utilities - 3.1% | |||
| Exelon Corp. | 1,071,212 | 44,520 | |
| NextEra Energy, Inc. | 1,416,516 | 114,554 | |
| NRG Energy, Inc. | 962,472 | 39,856 | |
| PG&E Corp. (a) | 754,041 | 8,619 | |
| 207,549 | |||
| Independent Power and Renewable Electricity Producers - 0.6% | |||
| Vistra Corp. | 1,825,970 | 36,465 | |
| Multi-Utilities - 1.3% | |||
| Ameren Corp. | 463,961 | 33,739 | |
| CenterPoint Energy, Inc. | 1,178,651 | 24,858 | |
| WEC Energy Group, Inc. | 326,331 | 29,011 | |
| 87,608 | |||
| TOTAL UTILITIES | 331,622 | ||
| TOTAL COMMON STOCKS | |||
| (Cost $4,637,522) | 6,439,843 | ||
| Other - 0.1% | |||
| Energy - 0.1% | |||
| Oil, Gas & Consumable Fuels - 0.1% | |||
| Utica Shale Drilling Program (non-operating revenue interest) (c)(d)(e) | |||
| (Cost $22,679) | 22,678,929 | 9,722 | |
| Money Market Funds - 2.4% | |||
| Fidelity Cash Central Fund 0.09% (f) | 137,914,149 | 137,942 | |
| Fidelity Securities Lending Cash Central Fund 0.09% (f)(g) | 19,577,815 | 19,580 | |
| TOTAL MONEY MARKET FUNDS | |||
| (Cost $157,522) | 157,522 | ||
| TOTAL INVESTMENT IN SECURITIES - 100.2% | |||
| (Cost $4,817,723) | 6,607,087 | ||
| NET OTHER ASSETS (LIABILITIES) - (0.2)% | (12,123) | ||
| NET ASSETS - 100% | $6,594,964 |
Legend
(a) Non-income producing
(b) Security or a portion of the security is on loan at period end.
(c) Investment is owned by a wholly-owned subsidiary (Subsidiary) that is treated as a corporation for U.S. tax purposes.
(d) Restricted securities (including private placements) - Investment in securities not registered under the Securities Act of 1933 (excluding 144A issues). At the end of the period, the value of restricted securities (excluding 144A issues) amounted to $9,722,000 or 0.1% of net assets.
(e) Level 3 security
(f) Affiliated fund that is generally available only to investment companies and other accounts managed by Fidelity Investments. The rate quoted is the annualized seven-day yield of the fund at period end. A complete unaudited listing of the fund's holdings as of its most recent quarter end is available upon request. In addition, each Fidelity Central Fund's financial statements, which are not covered by the Fund's Report of Independent Registered Public Accounting Firm, are available on the SEC's website or upon request.
(g) Investment made with cash collateral received from securities on loan.
Additional information on each restricted holding is as follows:
| Security | Acquisition Date | Acquisition Cost (000s) |
| Utica Shale Drilling Program (non-operating revenue interest) | 10/5/16 - 9/1/17 | $22,679 |
Affiliated Central Funds
Information regarding fiscal year to date income earned by the Fund from investments in Fidelity Central Funds is as follows:
| Fund | Income earned |
| (Amounts in thousands) | |
| Fidelity Cash Central Fund | $551 |
| Fidelity Securities Lending Cash Central Fund | 145 |
| Total | $696 |
Amounts in the income column in the above table include any capital gain distributions from underlying funds, which are presented in the corresponding line-item in the Statement of Operations, if applicable. Amount for Fidelity Securities Lending Cash Central Fund represents the income earned on investing cash collateral, less rebates paid to borrowers and any lending agent fees associated with the loan, plus any premium payments received for lending certain types of securities.
Investment Valuation
The following is a summary of the inputs used, as of January 31, 2021, involving the Fund's assets and liabilities carried at fair value. The inputs or methodology used for valuing securities may not be an indication of the risk associated with investing in those securities. For more information on valuation inputs, and their aggregation into the levels used below, please refer to the Investment Valuation section in the accompanying Notes to Financial Statements.
| Valuation Inputs at Reporting Date: | ||||
| Description | Total | Level 1 | Level 2 | Level 3 |
| (Amounts in thousands) | ||||
| Investments in Securities: | ||||
| Equities: | ||||
| Communication Services | $574,594 | $574,594 | $-- | $-- |
| Consumer Discretionary | 711,738 | 711,738 | -- | -- |
| Consumer Staples | 483,923 | 447,689 | 36,234 | -- |
| Energy | 443,269 | 426,116 | 17,153 | -- |
| Financials | 1,249,830 | 1,249,830 | -- | -- |
| Health Care | 922,869 | 780,725 | 142,144 | -- |
| Industrials | 740,614 | 691,362 | 49,252 | -- |
| Information Technology | 714,352 | 702,313 | 12,039 | -- |
| Materials | 193,323 | 193,323 | -- | -- |
| Real Estate | 73,709 | 73,709 | -- | -- |
| Utilities | 331,622 | 331,622 | -- | -- |
| Other | 9,722 | -- | -- | 9,722 |
| Money Market Funds | 157,522 | 157,522 | -- | -- |
| Total Investments in Securities: | $6,607,087 | $6,340,543 | $256,822 | $9,722 |
Other Information
Distribution of investments by country or territory of incorporation, as a percentage of Total Net Assets, is as follows (Unaudited):
| United States of America | 86.7% |
| Switzerland | 2.4% |
| Canada | 2.0% |
| United Kingdom | 1.4% |
| Ireland | 1.1% |
| France | 1.0% |
| Korea (South) | 1.0% |
| Others (Individually Less Than 1%) | 4.4% |
| 100.0% |
See accompanying notes which are an integral part of the financial statements.
Financial Statements
Statement of Assets and Liabilities
| Amounts in thousands (except per-share amounts) | January 31, 2021 | |
| Assets | ||
| Investment in securities, at value (including securities loaned of $18,439) — See accompanying schedule: Unaffiliated issuers (cost $4,660,201) | $6,449,565 | |
| Fidelity Central Funds (cost $157,522) | 157,522 | |
| Total Investment in Securities (cost $4,817,723) | $6,607,087 | |
| Restricted cash | 30 | |
| Receivable for fund shares sold | 3,989 | |
| Dividends receivable | 11,075 | |
| Distributions receivable from Fidelity Central Funds | 20 | |
| Prepaid expenses | 6 | |
| Other receivables | 1,127 | |
| Total assets | 6,623,334 | |
| Liabilities | ||
| Payable for fund shares redeemed | $4,466 | |
| Accrued management fee | 2,426 | |
| Other affiliated payables | 764 | |
| Other payables and accrued expenses | 1,134 | |
| Collateral on securities loaned | 19,580 | |
| Total liabilities | 28,370 | |
| Net Assets | $6,594,964 | |
| Net Assets consist of: | ||
| Paid in capital | $4,740,591 | |
| Total accumulated earnings (loss) | 1,854,373 | |
| Net Assets | $6,594,964 | |
| Net Asset Value and Maximum Offering Price | ||
| Equity-Income: | ||
| Net Asset Value, offering price and redemption price per share ($5,940,327 ÷ 96,213 shares) | $61.74 | |
| Class K: | ||
| Net Asset Value, offering price and redemption price per share ($654,637 ÷ 10,611 shares) | $61.69 |
See accompanying notes which are an integral part of the financial statements.
Statement of Operations
| Amounts in thousands | Year ended January 31, 2021 | |
| Investment Income | ||
| Dividends | $132,761 | |
| Income from Fidelity Central Funds (including $145 from security lending) | 696 | |
| Total income | 133,457 | |
| Expenses | ||
| Management fee | $24,623 | |
| Transfer agent fees | 7,248 | |
| Accounting fees | 1,111 | |
| Custodian fees and expenses | 96 | |
| Independent trustees' fees and expenses | 32 | |
| Registration fees | 130 | |
| Audit | 100 | |
| Legal | 13 | |
| Miscellaneous | 79 | |
| Total expenses before reductions | 33,432 | |
| Expense reductions | (267) | |
| Total expenses after reductions | 33,165 | |
| Net investment income (loss) | 100,292 | |
| Realized and Unrealized Gain (Loss) | ||
| Net realized gain (loss) on: | ||
| Investment securities: | ||
| Unaffiliated issuers | 200,859 | |
| Fidelity Central Funds | (3) | |
| Foreign currency transactions | (465) | |
| Total net realized gain (loss) | 200,391 | |
| Change in net unrealized appreciation (depreciation) on: | ||
| Investment securities: | ||
| Unaffiliated issuers | 155,885 | |
| Assets and liabilities in foreign currencies | 152 | |
| Total change in net unrealized appreciation (depreciation) | 156,037 | |
| Net gain (loss) | 356,428 | |
| Net increase (decrease) in net assets resulting from operations | $456,720 |
See accompanying notes which are an integral part of the financial statements.
Statement of Changes in Net Assets
| Amounts in thousands | Year ended January 31, 2021 | Year ended January 31, 2020 |
| Increase (Decrease) in Net Assets | ||
| Operations | ||
| Net investment income (loss) | $100,292 | $126,303 |
| Net realized gain (loss) | 200,391 | 338,662 |
| Change in net unrealized appreciation (depreciation) | 156,037 | 479,728 |
| Net increase (decrease) in net assets resulting from operations | 456,720 | 944,693 |
| Distributions to shareholders | (219,443) | (445,556) |
| Share transactions - net increase (decrease) | 191,539 | (156,322) |
| Total increase (decrease) in net assets | 428,816 | 342,815 |
| Net Assets | ||
| Beginning of period | 6,166,148 | 5,823,333 |
| End of period | $6,594,964 | $6,166,148 |
See accompanying notes which are an integral part of the financial statements.
Financial Highlights
Fidelity Equity-Income Fund
| Years ended January 31, | 2021 | 2020 | 2019 | 2018 | 2017 |
| Selected Per–Share Data | |||||
| Net asset value, beginning of period | $59.36 | $54.70 | $63.45 | $57.76 | $48.57 |
| Income from Investment Operations | |||||
| Net investment income (loss)A | .97 | 1.19 | 1.44 | 1.30 | 1.22 |
| Net realized and unrealized gain (loss) | 3.52 | 7.81 | (5.22) | 8.52 | 10.43 |
| Total from investment operations | 4.49 | 9.00 | (3.78) | 9.82 | 11.65 |
| Distributions from net investment income | (.94) | (1.10) | (1.39) | (1.20)B | (1.36) |
| Distributions from net realized gain | (1.17) | (3.24) | (3.58) | (2.93)B | (1.10) |
| Total distributions | (2.11) | (4.34) | (4.97) | (4.13) | (2.46) |
| Net asset value, end of period | $61.74 | $59.36 | $54.70 | $63.45 | $57.76 |
| Total ReturnC | 7.93% | 16.69% | (5.91)% | 17.57% | 24.42% |
| Ratios to Average Net AssetsD,E | |||||
| Expenses before reductions | .60% | .60% | .61% | .61% | .63% |
| Expenses net of fee waivers, if any | .60% | .60% | .61% | .61% | .63% |
| Expenses net of all reductions | .59% | .60% | .60% | .61% | .62% |
| Net investment income (loss) | 1.75% | 2.04% | 2.50% | 2.18% | 2.27% |
| Supplemental Data | |||||
| Net assets, end of period (in millions) | $5,940 | $5,378 | $5,016 | $5,921 | $6,686 |
| Portfolio turnover rateF | 50%G | 32%G | 24%G | 33% | 36% |
A Calculated based on average shares outstanding during the period.
B The amounts shown reflect certain reclassifications related to book to tax differences that were made in the year shown.
C Total returns would have been lower if certain expenses had not been reduced during the applicable periods shown.
D Fees and expenses of any underlying mutual funds or exchange-traded funds (ETFs) are not included in the Fund's expense ratio. The Fund indirectly bears its proportionate share of these expenses. For additional expense information related to investments in Fidelity Central Funds, please refer to the "Investments in Fidelity Central Funds" note found in the Notes to Financial Statements section of the most recent Annual or Semi-Annual report.
E Expense ratios reflect operating expenses of the class. Expenses before reductions do not reflect amounts reimbursed, waived, or reduced through arrangements with the investment adviser, brokerage services, or other offset arrangements, if applicable, and do not represent the amount paid by the class during periods when reimbursements, waivers or reductions occur.
F Amount does not include the portfolio activity of any underlying mutual funds or exchange-traded funds (ETFs).
G Portfolio turnover rate excludes securities received or delivered in-kind.
See accompanying notes which are an integral part of the financial statements.
Fidelity Equity-Income Fund Class K
| Years ended January 31, | 2021 | 2020 | 2019 | 2018 | 2017 |
| Selected Per–Share Data | |||||
| Net asset value, beginning of period | $59.31 | $54.67 | $63.41 | $57.73 | $48.55 |
| Income from Investment Operations | |||||
| Net investment income (loss)A | 1.02 | 1.24 | 1.51 | 1.36 | 1.28 |
| Net realized and unrealized gain (loss) | 3.52 | 7.80 | (5.22) | 8.51 | 10.42 |
| Total from investment operations | 4.54 | 9.04 | (3.71) | 9.87 | 11.70 |
| Distributions from net investment income | (.99) | (1.16) | (1.45) | (1.26)B | (1.42) |
| Distributions from net realized gain | (1.17) | (3.24) | (3.58) | (2.93)B | (1.10) |
| Total distributions | (2.16) | (4.40) | (5.03) | (4.19) | (2.52) |
| Net asset value, end of period | $61.69 | $59.31 | $54.67 | $63.41 | $57.73 |
| Total ReturnC | 8.04% | 16.77% | (5.81)% | 17.68% | 24.56% |
| Ratios to Average Net AssetsD,E | |||||
| Expenses before reductions | .50% | .51% | .51% | .51% | .52% |
| Expenses net of fee waivers, if any | .50% | .51% | .51% | .51% | .52% |
| Expenses net of all reductions | .50% | .50% | .50% | .51% | .51% |
| Net investment income (loss) | 1.84% | 2.13% | 2.60% | 2.28% | 2.39% |
| Supplemental Data | |||||
| Net assets, end of period (in millions) | $655 | $788 | $807 | $1,623 | $1,791 |
| Portfolio turnover rateF | 50%G | 32%G | 24%G | 33% | 36% |
A Calculated based on average shares outstanding during the period.
B The amounts shown reflect certain reclassifications related to book to tax differences that were made in the year shown.
C Total returns would have been lower if certain expenses had not been reduced during the applicable periods shown.
D Fees and expenses of any underlying mutual funds or exchange-traded funds (ETFs) are not included in the Fund's expense ratio. The Fund indirectly bears its proportionate share of these expenses. For additional expense information related to investments in Fidelity Central Funds, please refer to the "Investments in Fidelity Central Funds" note found in the Notes to Financial Statements section of the most recent Annual or Semi-Annual report.
E Expense ratios reflect operating expenses of the class. Expenses before reductions do not reflect amounts reimbursed, waived, or reduced through arrangements with the investment adviser, brokerage services, or other offset arrangements, if applicable, and do not represent the amount paid by the class during periods when reimbursements, waivers or reductions occur.
F Amount does not include the portfolio activity of any underlying mutual funds or exchange-traded funds (ETFs).
G Portfolio turnover rate excludes securities received or delivered in-kind.
See accompanying notes which are an integral part of the financial statements.
Notes to Financial Statements
For the period ended January 31, 2021
(Amounts in thousands except percentages)
1. Organization.
Fidelity Equity-Income Fund (the Fund) is a fund of Fidelity Devonshire Trust (the Trust) and is authorized to issue an unlimited number of shares. The Trust is registered under the Investment Company Act of 1940, as amended (the 1940 Act), as an open-end management investment company organized as a Massachusetts business trust. The Fund offers Equity-Income and Class K shares, each of which has equal rights as to assets and voting privileges. Each class has exclusive voting rights with respect to matters that affect that class.
2. Investments in Fidelity Central Funds.
The Fund invests in Fidelity Central Funds, which are open-end investment companies generally available only to other investment companies and accounts managed by the investment adviser and its affiliates. The Fund's Schedule of Investments lists each of the Fidelity Central Funds held as of period end, if any, as an investment of the Fund, but does not include the underlying holdings of each Fidelity Central Fund. As an Investing Fund, the Fund indirectly bears its proportionate share of the expenses of the underlying Fidelity Central Funds.
The Money Market Central Funds seek preservation of capital and current income and are managed by the investment adviser. Annualized expenses of the Money Market Central Funds as of their most recent shareholder report date ranged from less than .005% to .01%.
A complete unaudited list of holdings for each Fidelity Central Fund is available upon request or at the Securities and Exchange Commission (the SEC) website at www.sec.gov. In addition, the financial statements of the Fidelity Central Funds, which are not covered by the Fund's Report of Independent Registered Public Accounting Firm, are available on the SEC website or upon request.
3. Significant Accounting Policies.
The Fund is an investment company and applies the accounting and reporting guidance of the Financial Accounting Standards Board (FASB) Accounting Standards Codification Topic 946 Financial Services - Investment Companies. The financial statements have been prepared in conformity with accounting principles generally accepted in the United States of America (GAAP), which require management to make certain estimates and assumptions at the date of the financial statements. Actual results could differ from those estimates. Subsequent events, if any, through the date that the financial statements were issued have been evaluated in the preparation of the financial statements. The following summarizes the significant accounting policies of the Fund:
Investment Valuation. Investments are valued as of 4:00 p.m. Eastern time on the last calendar day of the period. The Board of Trustees (the Board) has delegated the day to day responsibility for the valuation of the Fund's investments to the Fair Value Committee (the Committee) established by the Fund's investment adviser. In accordance with valuation policies and procedures approved by the Board, the Fund attempts to obtain prices from one or more third party pricing vendors or brokers to value its investments. When current market prices, quotations or currency exchange rates are not readily available or reliable, investments will be fair valued in good faith by the Committee, in accordance with procedures adopted by the Board. Factors used in determining fair value vary by investment type and may include market or investment specific events. The frequency with which these procedures are used cannot be predicted and they may be utilized to a significant extent. The Committee oversees the Fund's valuation policies and procedures and reports to the Board on the Committee's activities and fair value determinations. The Board monitors the appropriateness of the procedures used in valuing the Fund's investments and ratifies the fair value determinations of the Committee.
The Fund categorizes the inputs to valuation techniques used to value its investments into a disclosure hierarchy consisting of three levels as shown below:
- Level 1 – quoted prices in active markets for identical investments
- Level 2 – other significant observable inputs (including quoted prices for similar investments, interest rates, prepayment speeds, etc.)
- Level 3 – unobservable inputs (including the Fund's own assumptions based on the best information available)
Valuation techniques used to value the Fund's investments by major category are as follows:
Equity securities, including restricted securities, for which market quotations are readily available, are valued at the last reported sale price or official closing price as reported by a third party pricing vendor on the primary market or exchange on which they are traded and are categorized as Level 1 in the hierarchy. In the event there were no sales during the day or closing prices are not available, securities are valued at the last quoted bid price or may be valued using the last available price and are generally categorized as Level 2 in the hierarchy. For foreign equity securities, when market or security specific events arise, comparisons to the valuation of American Depositary Receipts (ADRs), futures contracts, Exchange-Traded Funds (ETFs) and certain indexes as well as quoted prices for similar securities may be used and would be categorized as Level 2 in the hierarchy. For equity securities, including restricted securities, where observable inputs are limited, assumptions about market activity and risk are used and these securities may be categorized as Level 3 in the hierarchy.
Investments in open-end mutual funds, including the Fidelity Central Funds, are valued at their closing net asset value (NAV) each business day and are categorized as Level 1 in the hierarchy.
Changes in valuation techniques may result in transfers in or out of an assigned level within the disclosure hierarchy. The aggregate value of investments by input level as of January 31, 2021 is included at the end of the Fund's Schedule of Investments.
Foreign Currency. Certain Funds may use foreign currency contracts to facilitate transactions in foreign-denominated securities. Gains and losses from these transactions may arise from changes in the value of the foreign currency or if the counterparties do not perform under the contracts' terms.
Foreign-denominated assets, including investment securities, and liabilities are translated into U.S. dollars at the exchange rates at period end. Purchases and sales of investment securities, income and dividends received, and expenses denominated in foreign currencies are translated into U.S. dollars at the exchange rate in effect on the transaction date.
The effects of exchange rate fluctuations on investments are included with the net realized and unrealized gain (loss) on investment securities. Other foreign currency transactions resulting in realized and unrealized gain (loss) are disclosed separately.
Investment Transactions and Income. For financial reporting purposes, the Fund's investment holdings and NAV include trades executed through the end of the last business day of the period. The NAV per share for processing shareholder transactions is calculated as of the close of business of the New York Stock Exchange (NYSE), normally 4:00 p.m. Eastern time and includes trades executed through the end of the prior business day. Gains and losses on securities sold are determined on the basis of identified cost and include proceeds received from litigation. Dividend income is recorded on the ex-dividend date, except for certain dividends from foreign securities where the ex-dividend date may have passed, which are recorded as soon as the Fund is informed of the ex-dividend date. Non-cash dividends included in dividend income, if any, are recorded at the fair market value of the securities received. Income and capital gain distributions from Fidelity Central Funds, if any, are recorded on the ex-dividend date. Certain distributions received by the Fund represent a return of capital or capital gain. The Fund determines the components of these distributions subsequent to the ex-dividend date, based upon receipt of tax filings or other correspondence relating to the underlying investment. These distributions are recorded as a reduction of cost of investments and/or as a realized gain. Investment income is recorded net of foreign taxes withheld where recovery of such taxes is uncertain.
Class Allocations and Expenses. Investment income, realized and unrealized capital gains and losses, common expenses of the Fund, and certain fund-level expense reductions, if any, are allocated daily on a pro-rata basis to each class based on the relative net assets of each class to the total net assets of the Fund. Each class differs with respect to transfer agent fees incurred. Certain expense reductions may also differ by class. For the reporting period, the allocated portion of income and expenses to each class as a percent of its average net assets may vary due to the timing of recording these transactions in relation to fluctuating net assets of the classes. Expenses directly attributable to a fund are charged to that fund. Expenses attributable to more than one fund are allocated among the respective funds on the basis of relative net assets or other appropriate methods. Expense estimates are accrued in the period to which they relate and adjustments are made when actual amounts are known.
Deferred Trustee Compensation. Under a Deferred Compensation Plan (the Plan) for certain Funds, certain independent Trustees have elected to defer receipt of a portion of their annual compensation. Deferred amounts are invested in affiliated mutual funds, are marked-to-market and remain in a fund until distributed in accordance with the Plan. The investment of deferred amounts and the offsetting payable to the Trustees presented below are included in the accompanying Statement of Assets and Liabilities in other receivables and other payables and accrued expenses, as applicable.
| Fidelity Equity-Income Fund | $1,026 |
Income Tax Information and Distributions to Shareholders. Each year, the Fund intends to qualify as a regulated investment company under Subchapter M of the Internal Revenue Code, including distributing substantially all of its taxable income and realized gains. As a result, no provision for U.S. Federal income taxes is required. As of January 31, 2021, the Fund did not have any unrecognized tax benefits in the financial statements; nor is the Fund aware of any tax positions for which it is reasonably possible that the total amounts of unrecognized tax benefits will significantly change in the next twelve months. The Fund files a U.S. federal tax return, in addition to state and local tax returns as required. The Fund's federal income tax returns are subject to examination by the Internal Revenue Service (IRS) for a period of three fiscal years after they are filed. State and local tax returns may be subject to examination for an additional fiscal year depending on the jurisdiction. Foreign taxes are provided for based on the Fund's understanding of the tax rules and rates that exist in the foreign markets in which it invests.
Distributions are declared and recorded on the ex-dividend date. Income and capital gain distributions are declared separately for each class. Income and capital gain distributions are determined in accordance with income tax regulations, which may differ from GAAP. In addition, the Fund claimed a portion of the payment made to redeeming shareholders as a distribution for income tax purposes.
Capital accounts within the financial statements are adjusted for permanent book-tax differences. These adjustments have no impact on net assets or the results of operations. Capital accounts are not adjusted for temporary book-tax differences which will reverse in a subsequent period.
Book-tax differences are primarily due to foreign currency transactions, passive foreign investment companies (PFIC), redemptions in kind, partnerships, deferred trustees compensation and losses deferred due to wash sales.
As of period end, the cost and unrealized appreciation (depreciation) in securities, and derivatives if applicable, for federal income tax purposes were as follows:
| Gross unrealized appreciation | $1,931,452 |
| Gross unrealized depreciation | (176,756) |
| Net unrealized appreciation (depreciation) | $1,754,696 |
| Tax Cost | $4,852,391 |
The tax-based components of distributable earnings as of period end were as follows:
| Undistributed ordinary income | $6,634 |
| Undistributed long-term capital gain | $107,146 |
| Net unrealized appreciation (depreciation) on securities and other investments | $1,741,619 |
The tax character of distributions paid was as follows:
| January 31, 2021 | January 31, 2020 | |
| Ordinary Income | $96,353 | $ 116,646 |
| Long-term Capital Gains | 123,090 | 328,910 |
| Total | $219,443 | $ 445,556 |
Restricted Securities (including Private Placements). The Fund may invest in securities that are subject to legal or contractual restrictions on resale. These securities generally may be resold in transactions exempt from registration or to the public if the securities are registered. Disposal of these securities may involve time-consuming negotiations and expense, and prompt sale at an acceptable price may be difficult. Information regarding restricted securities is included at the end of the Fund's Schedule of Investments.
Consolidated Subsidiary. The Funds included in the table below hold certain investments through a wholly-owned subsidiary ("Subsidiary"), which may be subject to federal and state taxes upon disposition.
As of period end, investments in Subsidiaries were as follows:
| $ Amount | % of Net Assets | |
| Fidelity Equity-Income Fund | 9,752 | .15 |
The financial statements have been consolidated to include the Subsidiary accounts where applicable. Accordingly, all inter-company transactions and balances have been eliminated.
At period end, any estimated tax liability for these investments is presented as "Deferred taxes" in the Statement of Assets and Liabilities and included in "Change in net unrealized appreciation (depreciation) on investment securities" in the Statement of Operations. The tax liability incurred may differ materially depending on conditions when these investments are disposed. Any cash held by a Subsidiary is restricted as to its use and is presented as "Restricted cash" in the Statement of Assets and Liabilities, if applicable.
4. Purchases and Sales of Investments.
Purchases and sales of securities, other than short-term securities and in-kind transactions, are noted in the table below.
| Purchases ($) | Sales ($) | |
| Fidelity Equity-Income Fund | 2,740,873 | 2,780,644 |
Unaffiliated Redemptions In-Kind. During the period, 20 shares of the Fund were redeemed in-kind for investments, and cash with a value of $1,116. The net realized gain of $379 on investments delivered through in-kind redemptions is included in the accompanying Statement of Operations. The amount of the in-kind redemptions is included in share transactions in the accompanying Statement of Changes in Net Assets as well as the Notes to Financial Statements. The Fund recognized no gain or loss for federal income tax purposes.
Prior Fiscal Year Unaffiliated Redemptions In-Kind. During the prior period, 578 shares of the Fund were redeemed in-kind for investments and cash with a value of $33,732. The Fund had a net realized gain of $11,289 on investments delivered through in-kind redemptions. The amount of the in-kind redemptions is included in share transactions in the accompanying Statement of Changes in Net Assets as well as the Notes to Financial Statements. The Fund recognized no gain or loss for federal income tax purposes.
5. Fees and Other Transactions with Affiliates.
Management Fee. Fidelity Management & Research Company LLC (the investment adviser) and its affiliates provide the Fund with investment management related services for which the Fund pays a monthly management fee. The management fee is the sum of an individual fund fee rate that is based on an annual rate of .20% of the Fund's average net assets and an annualized group fee rate that averaged .23% during the period. The group fee rate is based upon the monthly average net assets of a group of registered investment companies with which the investment adviser has management contracts. The group fee rate decreases as assets under management increase and increases as assets under management decrease. For the reporting period, the total annual management fee rate was .43% of the Fund's average net assets.
Transfer Agent Fees. Fidelity Investments Institutional Operations Company LLC (FIIOC), an affiliate of the investment adviser, is the transfer, dividend disbursing and shareholder servicing agent for each class of the Fund. FIIOC receives account fees and asset-based fees that vary according to the account size and type of account of the shareholders of the respective classes of the Fund, except for Class K. FIIOC receives an asset-based fee of Class K's average net assets. FIIOC pays for typesetting, printing and mailing of shareholder reports, except proxy statements.
For the period, transfer agent fees for each class were as follows:
| Amount | % of Class-Level Average Net Assets | |
| Equity-Income | $6,963 | .14 |
| Class K | 285 | .04 |
| $7,248 |
Accounting Fees. Fidelity Service Company, Inc. (FSC), an affiliate of the investment adviser, maintains the Fund's accounting records. The accounting fee is based on the level of average net assets for each month. For the period, the fees were equivalent to the following annual rates:
| % of Average Net Assets | |
| Fidelity Equity-Income Fund | .02 |
Brokerage Commissions. A portion of portfolio transactions were placed with brokerage firms which are affiliates of the investment adviser. Brokerage commissions are included in net realized gain (loss) and change in net unrealized appreciation (depreciation) in the Statement of Operations. The commissions paid to these affiliated firms were as follows:
| Amount | |
| Fidelity Equity-Income Fund | $72 |
Interfund Trades. Funds may purchase from or sell securities to other Fidelity Funds under procedures adopted by the Board. The procedures have been designed to ensure these interfund trades are executed in accordance with Rule 17a-7 of the 1940 Act. Interfund trades are included within the respective purchases and sales amounts shown in the Purchases and Sales of Investments note, and amounted to $421,633 and $219,794, respectively.
Prior Fiscal Year Affiliated Redemptions In-Kind. During the prior period, 674 shares of the Fund were redeemed in-kind for investments and cash with a value of $38,317. The Fund had a net realized gain of $11,545 on investments delivered through in-kind redemptions. The amount of the in-kind redemptions is included in share transactions in the accompanying Statement of Changes in Net Assets as well as the Notes to Financial Statements. The Fund recognized no gain or loss for federal income tax purposes.
6. Committed Line of Credit.
Certain Funds participate with other funds managed by the investment adviser or an affiliate in a $4.25 billion credit facility (the "line of credit") to be utilized for temporary or emergency purposes to fund shareholder redemptions or for other short-term liquidity purposes. The participating funds have agreed to pay commitment fees on their pro-rata portion of the line of credit, which are reflected in Miscellaneous expenses on the Statement of Operations, and are listed below.
| Amount | |
| Fidelity Equity-Income Fund | $13 |
During the period, there were no borrowings on this line of credit.
7. Security Lending.
Funds lend portfolio securities from time to time in order to earn additional income. Lending agents are used, including National Financial Services (NFS), an affiliate of the investment adviser. Pursuant to a securities lending agreement, NFS will receive a fee, which is capped at 9.9% of a fund's daily lending revenue, for its services as lending agent. A fund may lend securities to certain qualified borrowers, including NFS. On the settlement date of the loan, a fund receives collateral (in the form of U.S. Treasury obligations, letters of credit and/or cash) against the loaned securities and maintains collateral in an amount not less than 100% of the market value of the loaned securities during the period of the loan. The market value of the loaned securities is determined at the close of business of a fund and any additional required collateral is delivered to a fund on the next business day. A fund or borrower may terminate the loan at any time, and if the borrower defaults on its obligation to return the securities loaned because of insolvency or other reasons, a fund may apply collateral received from the borrower against the obligation. A fund may experience delays and costs in recovering the securities loaned. Any cash collateral received is invested in the Fidelity Securities Lending Cash Central Fund. Any loaned securities are identified as such in the Schedule of Investments, and the value of loaned securities and cash collateral at period end, as applicable, are presented in the Statement of Assets and Liabilities. Security lending income represents the income earned on investing cash collateral, less rebates paid to borrowers and any lending agent fees associated with the loan, plus any premium payments received for lending certain types of securities. Security lending income is presented in the Statement of Operations as a component of income from Fidelity Central Funds. Affiliated security lending activity, if any, was as follows:
| Total Security Lending Income Fees Paid to NFS | Security Lending Income From Securities Loaned to NFS | Value of Securities Loaned to NFS at Period End | |
| Fidelity Equity-Income Fund | $9 | $– | $– |
8. Expense Reductions.
Commissions paid to certain brokers with whom the investment adviser, or its affiliates, places trades on behalf of the Fund include an amount in addition to trade execution, which may be rebated back to the Fund to offset expenses. This amount totaled $244 for the period.
In addition, during the period the investment adviser or an affiliate reimbursed and/or waived a portion of fund-level operating expenses in the amount of $23.
9. Distributions to Shareholders.
Distributions to shareholders of each class were as follows:
| Year ended January 31, 2021 | Year ended January 31, 2020 | |
| Distributions to shareholders | ||
| Equity-Income | $194,422 | $384,187 |
| Class K | 25,021 | 61,369 |
| Total | $219,443 | $445,556 |
10. Share Transactions.
Share transactions for each class were as follows and may contain automatic conversions between classes or exchanges between affiliated funds:
| Shares | Shares | Dollars | Dollars | |
| Year ended January 31, 2021 | Year ended January 31, 2020 | Year ended January 31, 2021 | Year ended January 31, 2020 | |
| Equity-Income | ||||
| Shares sold | 16,474 | 3,785 | $933,030 | $221,414 |
| Reinvestment of distributions | 3,211 | 6,120 | 182,273 | 359,151 |
| Shares redeemed | (14,077) | (11,001) | (770,384) | (643,179) |
| Net increase (decrease) | 5,608 | (1,096) | $344,919 | $(62,614) |
| Class K | ||||
| Shares sold | 2,059 | 6,683 | $115,985 | $382,177 |
| Reinvestment of distributions | 445 | 1,048 | 25,021 | 61,369 |
| Shares redeemed | (5,183)(a) | (9,205)(b),(c) | (294,386)(a) | (537,254)(b),(c) |
| Net increase (decrease) | (2,679) | (1,474) | $(153,380) | $(93,708) |
(a) Amount includes in-kind redemptions (see the Unaffiliated Redemptions In-Kind note for additional details)
(b) Amount includes in-kind redemptions (see the Prior Fiscal Year Unaffiliated Redemptions In-Kind note for additional details)
(c) Amount includes in-kind redemptions (see the Prior Fiscal Year Affiliated Redemptions In-Kind note for additional details)
11. Other.
The Fund's organizational documents provide former and current trustees and officers with a limited indemnification against liabilities arising in connection with the performance of their duties to the Fund. In the normal course of business, the Fund may also enter into contracts that provide general indemnifications. The Fund's maximum exposure under these arrangements is unknown as this would be dependent on future claims that may be made against the Fund. The risk of material loss from such claims is considered remote.
12. Coronavirus (COVID-19) Pandemic.
An outbreak of COVID-19 first detected in China during December 2019 has since spread globally and was declared a pandemic by the World Health Organization during March 2020. Developments that disrupt global economies and financial markets, such as the COVID-19 pandemic, may magnify factors that affect the Fund's performance.
Report of Independent Registered Public Accounting Firm
To the Board of Trustees of Fidelity Devonshire Trust and Shareholders of Fidelity Equity-Income Fund
Opinion on the Financial Statements
We have audited the accompanying statement of assets and liabilities, including the schedule of investments, of Fidelity Equity-Income Fund (one of the funds constituting Fidelity Devonshire Trust, referred to hereafter as the “Fund”) as of January 31, 2021, the related statement of operations for the year ended January 31, 2021, the statement of changes in net assets for each of the two years in the period ended January 31, 2021, including the related notes, and the financial highlights for each of the five years in the period ended January 31, 2021 (collectively referred to as the “financial statements”). In our opinion, the financial statements present fairly, in all material respects, the financial position of the Fund as of January 31, 2021, the results of its operations for the year then ended, the changes in its net assets for each of the two years in the period ended January 31, 2021 and the financial highlights for each of the five years in the period ended January 31, 2021 in conformity with accounting principles generally accepted in the United States of America.
Basis for Opinion
These financial statements are the responsibility of the Fund’s management. Our responsibility is to express an opinion on the Fund’s financial statements based on our audits. We are a public accounting firm registered with the Public Company Accounting Oversight Board (United States) (PCAOB) and are required to be independent with respect to the Fund in accordance with the U.S. federal securities laws and the applicable rules and regulations of the Securities and Exchange Commission and the PCAOB.
We conducted our audits of these financial statements in accordance with the standards of the PCAOB. Those standards require that we plan and perform the audit to obtain reasonable assurance about whether the financial statements are free of material misstatement, whether due to error or fraud.
Our audits included performing procedures to assess the risks of material misstatement of the financial statements, whether due to error or fraud, and performing procedures that respond to those risks. Such procedures included examining, on a test basis, evidence regarding the amounts and disclosures in the financial statements. Our audits also included evaluating the accounting principles used and significant estimates made by management, as well as evaluating the overall presentation of the financial statements. Our procedures included confirmation of securities owned as of January 31, 2021 by correspondence with the custodian and issuers of privately offered securities. We believe that our audits provide a reasonable basis for our opinion.
/s/ PricewaterhouseCoopers LLP
Boston, Massachusetts
March 12, 2021
We have served as the auditor of one or more investment companies in the Fidelity group of funds since 1932.
Trustees and Officers
The Trustees, Members of the Advisory Board (if any), and officers of the trust and fund, as applicable, are listed below. The Board of Trustees governs the fund and is responsible for protecting the interests of shareholders. The Trustees are experienced executives who meet periodically throughout the year to oversee the fund's activities, review contractual arrangements with companies that provide services to the fund, oversee management of the risks associated with such activities and contractual arrangements, and review the fund's performance. Each of the Trustees oversees 309 funds.
The Trustees hold office without limit in time except that (a) any Trustee may resign; (b) any Trustee may be removed by written instrument, signed by at least two-thirds of the number of Trustees prior to such removal; (c) any Trustee who requests to be retired or who has become incapacitated by illness or injury may be retired by written instrument signed by a majority of the other Trustees; and (d) any Trustee may be removed at any special meeting of shareholders by a two-thirds vote of the outstanding voting securities of the trust. Each Trustee who is not an interested person (as defined in the 1940 Act) of the trust and the fund is referred to herein as an Independent Trustee. Each Independent Trustee shall retire not later than the last day of the calendar year in which his or her 75th birthday occurs. The Independent Trustees may waive this mandatory retirement age policy with respect to individual Trustees. Officers and Advisory Board Members hold office without limit in time, except that any officer or Advisory Board Member may resign or may be removed by a vote of a majority of the Trustees at any regular meeting or any special meeting of the Trustees. Except as indicated, each individual has held the office shown or other offices in the same company for the past five years.
The fund's Statement of Additional Information (SAI) includes more information about the Trustees. To request a free copy, call Fidelity at 1-800-544-8544 if you’re an individual investing directly with Fidelity, call 1-800-835-5092 if you’re a plan sponsor or participant with Fidelity as your recordkeeper or call 1-877-208-0098 on institutional accounts or if you’re an advisor or invest through one.
Experience, Skills, Attributes, and Qualifications of the Trustees. The Governance and Nominating Committee has adopted a statement of policy that describes the experience, qualifications, attributes, and skills that are necessary and desirable for potential Independent Trustee candidates (Statement of Policy). The Board believes that each Trustee satisfied at the time he or she was initially elected or appointed a Trustee, and continues to satisfy, the standards contemplated by the Statement of Policy. The Governance and Nominating Committee also engages professional search firms to help identify potential Independent Trustee candidates who have the experience, qualifications, attributes, and skills consistent with the Statement of Policy. From time to time, additional criteria based on the composition and skills of the current Independent Trustees, as well as experience or skills that may be appropriate in light of future changes to board composition, business conditions, and regulatory or other developments, have also been considered by the professional search firms and the Governance and Nominating Committee. In addition, the Board takes into account the Trustees' commitment and participation in Board and committee meetings, as well as their leadership of standing and ad hoc committees throughout their tenure.
In determining that a particular Trustee was and continues to be qualified to serve as a Trustee, the Board has considered a variety of criteria, none of which, in isolation, was controlling. The Board believes that, collectively, the Trustees have balanced and diverse experience, qualifications, attributes, and skills, which allow the Board to operate effectively in governing the fund and protecting the interests of shareholders. Information about the specific experience, skills, attributes, and qualifications of each Trustee, which in each case led to the Board's conclusion that the Trustee should serve (or continue to serve) as a trustee of the fund, is provided below.
Board Structure and Oversight Function. Robert A. Lawrence is an interested person and currently serves as Acting Chairman. The Trustees have determined that an interested Chairman is appropriate and benefits shareholders because an interested Chairman has a personal and professional stake in the quality and continuity of services provided to the fund. Independent Trustees exercise their informed business judgment to appoint an individual of their choosing to serve as Chairman, regardless of whether the Trustee happens to be independent or a member of management. The Independent Trustees have determined that they can act independently and effectively without having an Independent Trustee serve as Chairman and that a key structural component for assuring that they are in a position to do so is for the Independent Trustees to constitute a substantial majority for the Board. The Independent Trustees also regularly meet in executive session. David M. Thomas serves as Lead Independent Trustee and as such (i) acts as a liaison between the Independent Trustees and management with respect to matters important to the Independent Trustees and (ii) with management prepares agendas for Board meetings.
Fidelity® funds are overseen by different Boards of Trustees. The fund's Board oversees Fidelity's high income and certain equity funds, and other Boards oversee Fidelity's investment-grade bond, money market, asset allocation, and other equity funds. The asset allocation funds may invest in Fidelity® funds overseen by the fund's Board. The use of separate Boards, each with its own committee structure, allows the Trustees of each group of Fidelity® funds to focus on the unique issues of the funds they oversee, including common research, investment, and operational issues. On occasion, the separate Boards establish joint committees to address issues of overlapping consequences for the Fidelity® funds overseen by each Board.
The Trustees operate using a system of committees to facilitate the timely and efficient consideration of all matters of importance to the Trustees, the fund, and fund shareholders and to facilitate compliance with legal and regulatory requirements and oversight of the fund's activities and associated risks. The Board, acting through its committees, has charged FMR and its affiliates with (i) identifying events or circumstances the occurrence of which could have demonstrably adverse effects on the fund's business and/or reputation; (ii) implementing processes and controls to lessen the possibility that such events or circumstances occur or to mitigate the effects of such events or circumstances if they do occur; and (iii) creating and maintaining a system designed to evaluate continuously business and market conditions in order to facilitate the identification and implementation processes described in (i) and (ii) above. Because the day-to-day operations and activities of the fund are carried out by or through FMR, its affiliates, and other service providers, the fund's exposure to risks is mitigated but not eliminated by the processes overseen by the Trustees. While each of the Board's committees has responsibility for overseeing different aspects of the fund's activities, oversight is exercised primarily through the Operations, Audit, and Compliance Committees. Appropriate personnel, including but not limited to the fund's Chief Compliance Officer (CCO), FMR's internal auditor, the independent accountants, the fund's Treasurer and portfolio management personnel, make periodic reports to the Board's committees, as appropriate, including an annual review of Fidelity's risk management program for the Fidelity® funds. The responsibilities of each standing committee, including their oversight responsibilities, are described further under "Standing Committees of the Trustees."
Interested Trustees*:
Correspondence intended for a Trustee who is an interested person may be sent to Fidelity Investments, 245 Summer Street, Boston, Massachusetts 02210.
Name, Year of Birth; Principal Occupations and Other Relevant Experience+
Bettina Doulton (1964)
Year of Election or Appointment: 2020
Trustee
Ms. Doulton also serves as Trustee of other Fidelity® funds. Prior to her retirement, Ms. Doulton served in a variety of positions at Fidelity Investments, including as a managing director of research (2006-2007), portfolio manager to certain Fidelity® funds (1993-2005), equity analyst and portfolio assistant (1990-1993), and research assistant (1987-1990). Ms. Doulton currently owns and operates Phi Builders + Architects and Cellardoor Winery. Previously, Ms. Doulton served as a member of the Board of Brown Capital Management, LLC (2013-2018).
Robert A. Lawrence (1952)
Year of Election or Appointment: 2020
Trustee
Acting Chairman of the Board of Trustees
Mr. Lawrence also serves as Trustee of other funds. Previously, Mr. Lawrence served as a Member of the Advisory Board of certain funds. Prior to his retirement in 2008, Mr. Lawrence served as Vice President of certain Fidelity® funds (2006-2008), Senior Vice President, Head of High Income Division of Fidelity Management & Research Company (investment adviser firm, 2006-2008), and President of Fidelity Strategic Investments (investment adviser firm, 2002-2005).
* Determined to be an “Interested Trustee” by virtue of, among other things, his or her affiliation with the trust or various entities under common control with FMR.
+ The information includes the Trustee's principal occupation during the last five years and other information relating to the experience, attributes, and skills relevant to the Trustee's qualifications to serve as a Trustee, which led to the conclusion that the Trustee should serve as a Trustee for the fund.
Independent Trustees:
Correspondence intended for an Independent Trustee may be sent to Fidelity Investments, P.O. Box 55235, Boston, Massachusetts 02205-5235.
Name, Year of Birth; Principal Occupations and Other Relevant Experience+
Dennis J. Dirks (1948)
Year of Election or Appointment: 2005
Trustee
Mr. Dirks also serves as Trustee of other Fidelity® funds. Prior to his retirement in May 2003, Mr. Dirks served as Chief Operating Officer and as a member of the Board of The Depository Trust & Clearing Corporation (financial markets infrastructure), President, Chief Operating Officer and a member of the Board of The Depository Trust Company (DTC), President and a member of the Board of the National Securities Clearing Corporation (NSCC), Chief Executive Officer and a member of the Board of the Government Securities Clearing Corporation and Chief Executive Officer and a member of the Board of the Mortgage-Backed Securities Clearing Corporation. Mr. Dirks currently serves as a member of the Finance Committee (2016-present) and Board (2017-present) and is Treasurer (2018-present) of the Asolo Repertory Theatre.
Donald F. Donahue (1950)
Year of Election or Appointment: 2018
Trustee
Mr. Donahue also serves as Trustee of other Fidelity® funds. Mr. Donahue serves as President and Chief Executive Officer of Miranda Partners, LLC (risk consulting for the financial services industry, 2012-present). Previously, Mr. Donahue served as Chief Executive Officer (2006-2012), Chief Operating Officer (2003-2006) and Managing Director, Customer Marketing and Development (1999-2003) of The Depository Trust & Clearing Corporation (financial markets infrastructure). Mr. Donahue currently serves as a member (2007-present) and Co-Chairman (2016-present) of the Board of United Way of New York, a member of the Board of NYC Leadership Academy (2012-present) and a member of the Board of Advisors of Ripple Labs, Inc. (financial services, 2015-present). Mr. Donahue previously served as a member of the Advisory Board of certain Fidelity® funds (2015-2018).
Vicki L. Fuller (1957)
Year of Election or Appointment: 2020
Trustee
Ms. Fuller also serves as Trustee of other Fidelity® funds. Previously, Ms. Fuller served as a member of the Advisory Board of certain Fidelity® funds (2018-2020), Chief Investment Officer of the New York State Common Retirement Fund (2012-2018) and held a variety of positions at AllianceBernstein L.P. (global asset management, 1985-2012), including Managing Director (2006-2012) and Senior Vice President and Senior Portfolio Manager (2001-2006). Ms. Fuller currently serves as a member of the Board, Audit Committee and Nominating and Governance Committee of The Williams Companies, Inc. (natural gas infrastructure, 2018-present), as a member of the Board, Audit Committee and Nominating and Governance Committee of two Blackstone business development companies (2020-present) and as a member of the Board of Treliant, LLC (consulting, 2019-present).
Patricia L. Kampling (1959)
Year of Election or Appointment: 2020
Trustee
Ms. Kampling also serves as Trustee of other Fidelity® funds. Prior to her retirement, Ms. Kampling served as Chairman of the Board and Chief Executive Officer (2012-2019), President and Chief Operating Officer (2011-2012) and Executive Vice President and Chief Financial Officer (2010-2011) of Alliant Energy Corporation. Ms. Kampling currently serves as a member of the Board, Compensation Committee and Executive Committee and as Chair of the Audit Committee of Briggs & Stratton Corporation (manufacturing, 2011-present) and as a member of the Board, Audit, Finance and Risk Committee and Safety, Environmental, Technology and Operations Committee of American Water Works Company, Inc. (utilities company, 2019-present). In addition, Ms. Kampling currently serves as a member of the Board of the Nature Conservancy, Wisconsin Chapter (2019-present). Previously, Ms. Kampling served as a Member of the Advisory Board of certain Fidelity® funds (2020), a member of the Board of Interstate Power and Light Company (2012-2019) and Wisconsin Power and Light Company (2012-2019) (each a subsidiary of Alliant Energy Corporation) and as a member of the Board and Workforce Development Committee of the Business Roundtable (2018-2019).
Thomas A. Kennedy (1955)
Year of Election or Appointment: 2021
Trustee
Mr. Kennedy also serves as Trustee of other Fidelity® funds. Previously, Mr. Kennedy served as a Member of the Advisory Board of certain Fidelity® funds (2020) and held a variety of positions at Raytheon Company (aerospace and defense, 1983-2020), including Chairman and Chief Executive Officer (2014-2020) and Executive Vice President and Chief Operating Officer (2013-2014). Mr. Kennedy currently serves as Executive Chairman of the Board of Directors of Raytheon Technologies Corporation (aerospace and defense, 2020-present). He is also a member of the Rutgers School of Engineering Industry Advisory Board (2011-present) and a member of the UCLA Engineering Dean’s Executive Board (2016-present).
Garnett A. Smith (1947)
Year of Election or Appointment: 2018
Trustee
Mr. Smith also serves as Trustee of other Fidelity® funds. Prior to his retirement, Mr. Smith served as Chairman and Chief Executive Officer (1990-1997) and President (1986-1990) of Inbrand Corp. (manufacturer of personal absorbent products). Prior to his employment with Inbrand Corp., he was employed by a retail fabric chain and North Carolina National Bank (now Bank of America). Mr. Smith previously served as a member of the Advisory Board of certain Fidelity® funds (2012-2013).
David M. Thomas (1949)
Year of Election or Appointment: 2008
Trustee
Lead Independent Trustee
Mr. Thomas also serves as Trustee of other Fidelity® funds. Previously, Mr. Thomas served as Executive Chairman (2005-2006) and Chairman and Chief Executive Officer (2000-2005) of IMS Health, Inc. (pharmaceutical and healthcare information solutions). Mr. Thomas currently serves as Non-Executive Chairman of the Board of Fortune Brands Home and Security (home and security products, 2011-present), and a member of the Board (2004-present) and Presiding Director (2013-present) of Interpublic Group of Companies, Inc. (marketing communication).
Susan Tomasky (1953)
Year of Election or Appointment: 2020
Trustee
Ms. Tomasky also serves as Trustee of other Fidelity® funds. Prior to her retirement, Ms. Tomasky served in various executive officer positions at American Electric Power Company, Inc. (1998-2011), including most recently as President of AEP Transmission (2007-2011). Ms. Tomasky currently serves as a member of the Board and Sustainability Committee and as Chair of the Audit Committee of Marathon Petroleum Corporation (2018-present) and as a member of the Board, Corporate Governance Committee and Organization and Compensation Committee and as Chair of the Audit Committee of Public Service Enterprise Group, Inc. (utilities company, 2012-present). In addition, Ms. Tomasky currently serves as a member of the Board of the Columbus Regional Airport Authority (2007-present), as a member of the Board of the Royal Shakespeare Company – America (2009-present), as a member of the Board of the Columbus Association for the Performing Arts (2011-present) and as a member of the Board of Kenyon College (2016-present). Previously, Ms. Tomasky served as a Member of the Advisory Board of certain Fidelity® funds (2020), a member of the Board (2011-2019) and as Lead Independent Director (2015-2018) of Andeavor Corporation (previously Tesoro Corporation) (independent oil refiner and marketer) and as a member of the Board of Summit Midstream Partners LP (energy, 2012-2018).
Michael E. Wiley (1950)
Year of Election or Appointment: 2018
Trustee
Mr. Wiley also serves as Trustee of other Fidelity® funds. Previously, Mr. Wiley served as a member of the Advisory Board of certain Fidelity® funds (2018-2020), Chairman, President and CEO of Baker Hughes, Inc. (oilfield services, 2000-2004). Mr. Wiley also previously served as a member of the Board of Andeavor Corporation (independent oil refiner and marketer, 2005-2018), a member of the Board of Andeavor Logistics LP (natural resources logistics, 2015-2018) and a member of the Board of High Point Resources (exploration and production, 2005-2020).
+ The information includes the Trustee's principal occupation during the last five years and other information relating to the experience, attributes, and skills relevant to the Trustee's qualifications to serve as a Trustee, which led to the conclusion that the Trustee should serve as a Trustee for the fund.
Advisory Board Members and Officers:
Correspondence intended for a Member of the Advisory Board (if any) may be sent to Fidelity Investments, P.O. Box 55235, Boston, Massachusetts 02205-5235. Correspondence intended for an officer or Peter S. Lynch may be sent to Fidelity Investments, 245 Summer Street, Boston, Massachusetts 02210. Officers appear below in alphabetical order.
Name, Year of Birth; Principal Occupation
Ned C. Lautenbach (1944)
Year of Election or Appointment: 2021
Member of the Advisory Board
Mr. Lautenbach also serves as a Member of the Advisory Board of other Fidelity® funds. Mr. Lautenbach currently serves as Chair of the Board of Governors, State University System of Florida (2013-present) and is a member of the Council on Foreign Relations (1994-present). He is also a member and has in the past served as Chairman of the Board of Directors of Artis-Naples (2012-present). Previously, Mr. Lautenbach served as a Trustee of certain Fidelity® funds (2000-2020) and a member and then Lead Director of the Board of Directors of Eaton Corporation (diversified industrial, 1997-2016). He was also a Partner at Clayton, Dubilier & Rice, LLC (private equity investment, 1998-2010); as well as Director of Sony Corporation (2006-2007). In addition, Mr. Lautenbach had a 30-year career with IBM (technology company), during which time he served as Senior Vice President and as a member of the Corporate Executive Committee (1968-1998).
Peter S. Lynch (1944)
Year of Election or Appointment: 2003
Member of the Advisory Board
Mr. Lynch also serves as a Member of the Advisory Board of other Fidelity® funds. Mr. Lynch is Vice Chairman and a Director of Fidelity Management & Research Company LLC (investment adviser firm). In addition, Mr. Lynch serves as a Trustee of Boston College and as the Chairman of the Inner-City Scholarship Fund. Previously, Mr. Lynch served as Vice Chairman and a Director of FMR Co., Inc. (investment adviser firm) and on the Special Olympics International Board of Directors (1997-2006).
Craig S. Brown (1977)
Year of Election or Appointment: 2019
Assistant Treasurer
Mr. Brown also serves as Assistant Treasurer of other funds. Mr. Brown is an employee of Fidelity Investments (2013-present).
John J. Burke III (1964)
Year of Election or Appointment: 2018
Chief Financial Officer
Mr. Burke also serves as Chief Financial Officer of other funds. Mr. Burke serves as Head of Investment Operations for Fidelity Fund and Investment Operations (2018-present) and is an employee of Fidelity Investments (1998-present). Previously Mr. Burke served as head of Asset Management Investment Operations (2012-2018).
William C. Coffey (1969)
Year of Election or Appointment: 2019
Assistant Secretary
Mr. Coffey also serves as Assistant Secretary of other funds. He is Senior Vice President and Deputy General Counsel of FMR LLC (diversified financial services company, 2010-present), and is an employee of Fidelity Investments. Previously, Mr. Coffey served as Secretary and CLO of certain funds (2018-2019); CLO, Secretary, and Senior Vice President of Fidelity Management & Research Company and FMR Co., Inc. (investment adviser firms, 2018-2019); Secretary of Fidelity SelectCo, LLC and Fidelity Investments Money Management, Inc. (investment adviser firms, 2018-2019); CLO of Fidelity Management & Research (Hong Kong) Limited, FMR Investment Management (UK) Limited, and Fidelity Management & Research (Japan) Limited (investment adviser firms, 2018-2019); and Assistant Secretary of certain funds (2009-2018).
Timothy M. Cohen (1969)
Year of Election or Appointment: 2018
Vice President
Mr. Cohen also serves as Vice President of other funds. Mr. Cohen serves as Co-Head of Equity (2018-present), a Director of Fidelity Management & Research (Japan) Limited (investment adviser firm, 2016-present), and is an employee of Fidelity Investments. Previously, Mr. Cohen served as Executive Vice President of Fidelity SelectCo, LLC (2019), Head of Global Equity Research (2016-2018), Chief Investment Officer - Equity and a Director of Fidelity Management & Research (U.K.) Inc. (investment adviser firm, 2013-2015) and as a Director of Fidelity Management & Research (Hong Kong) Limited (investment adviser firm, 2017).
Jonathan Davis (1968)
Year of Election or Appointment: 2010
Assistant Treasurer
Mr. Davis also serves as Assistant Treasurer of other funds. Mr. Davis serves as Assistant Treasurer of FMR Capital, Inc. (2017-present) and is an employee of Fidelity Investments. Previously, Mr. Davis served as Vice President and Associate General Counsel of FMR LLC (diversified financial services company, 2003-2010).
Laura M. Del Prato (1964)
Year of Election or Appointment: 2018
Assistant Treasurer
Ms. Del Prato also serves as an officer of other funds. Ms. Del Prato is an employee of Fidelity Investments (2017-present). Previously, Ms. Del Prato served as President and Treasurer of The North Carolina Capital Management Trust: Cash Portfolio and Term Portfolio (2018-2020). Prior to joining Fidelity Investments, Ms. Del Prato served as a Managing Director and Treasurer of the JPMorgan Mutual Funds (2014-2017). Prior to JPMorgan, Ms. Del Prato served as a partner at Cohen Fund Audit Services (accounting firm, 2012-2013) and KPMG LLP (accounting firm, 2004-2012).
Colm A. Hogan (1973)
Year of Election or Appointment: 2020
Assistant Treasurer
Mr. Hogan also serves as an officer of other funds. Mr. Hogan serves as Assistant Treasurer of FMR Capital, Inc. (2017-present) and is an employee of Fidelity Investments (2005-present). Previously, Mr. Hogan served as Deputy Treasurer of certain Fidelity® funds (2016-2020) and Assistant Treasurer of certain Fidelity® funds (2016-2018).
Pamela R. Holding (1964)
Year of Election or Appointment: 2018
Vice President
Ms. Holding also serves as Vice President of other funds. Ms. Holding serves as Co-Head of Equity (2018-present) and is an employee of Fidelity Investments (2013-present). Previously, Ms. Holding served as Executive Vice President of Fidelity SelectCo, LLC (2019) and as Chief Investment Officer of Fidelity Institutional Asset Management (2013-2018).
Cynthia Lo Bessette (1969)
Year of Election or Appointment: 2019
Secretary and Chief Legal Officer (CLO)
Ms. Lo Bessette also serves as an officer of other funds. Ms. Lo Bessette serves as CLO, Secretary, and Senior Vice President of Fidelity Management & Research Company LLC (investment adviser firm, 2019-present); and CLO of Fidelity Management & Research (Hong Kong) Limited, FMR Investment Management (UK) Limited, and Fidelity Management & Research (Japan) Limited (investment adviser firms, 2019-present). She is a Senior Vice President and Deputy General Counsel of FMR LLC (diversified financial services company, 2019-present), and is an employee of Fidelity Investments. Previously, Ms. Lo Bessette served as CLO, Secretary, and Senior Vice President of FMR Co., Inc. (investment adviser firm, 2019); Secretary of Fidelity SelectCo, LLC and Fidelity Investments Money Management, Inc. (investment adviser firms, 2019). Prior to joining Fidelity Investments, Ms. Lo Bessette was Executive Vice President, General Counsel (2016-2019) and Senior Vice President, Deputy General Counsel (2015-2016) of OppenheimerFunds (investment management company) and Deputy Chief Legal Officer (2013-2015) of Jennison Associates LLC (investment adviser firm).
Chris Maher (1972)
Year of Election or Appointment: 2020
Deputy Treasurer
Mr. Maher also serves as an officer of other funds. Mr. Maher serves as Assistant Treasurer of FMR Capital, Inc. (2017-present), and is an employee of Fidelity Investments (2008-present). Previously, Mr. Maher served as Assistant Treasurer of certain funds (2013-2020); Vice President of Asset Management Compliance (2013), Vice President of the Program Management Group of FMR (investment adviser firm, 2010-2013), and Vice President of Valuation Oversight (2008-2010).
Jason P. Pogorelec (1975)
Year of Election or Appointment: 2020
Chief Compliance Officer
Mr. Pogorelec also serves as Chief Compliance Officer of other funds. Mr. Pogorelec is a senior Vice President of Asset Management Compliance for Fidelity Investments and is an employee of Fidelity Investments (2006-present). Previously, Mr. Pogorelec served as Vice President, Associate General Counsel for Fidelity Investments (2010-2020) and Assistant Secretary of certain Fidelity funds (2015-2020).
Brett Segaloff (1972)
Year of Election or Appointment: 2021
Anti-Money Laundering (AML) Officer
Mr. Segaloff also serves as an AML Officer of other funds and other related entities. He is Director, Anti-Money Laundering (2007-present) of FMR LLC (diversified financial services company) and is an employee of Fidelity Investments (1996-present).
Stacie M. Smith (1974)
Year of Election or Appointment: 2016
President and Treasurer
Ms. Smith also serves as an officer of other funds. Ms. Smith serves as Assistant Treasurer of FMR Capital, Inc. (2017-present), is an employee of Fidelity Investments (2009-present), and has served in other fund officer roles. Prior to joining Fidelity Investments, Ms. Smith served as Senior Audit Manager of Ernst & Young LLP (accounting firm, 1996-2009). Previously, Ms. Smith served as Assistant Treasurer (2013-2019) and Deputy Treasurer (2013-2016) of certain Fidelity® funds.
Marc L. Spector (1972)
Year of Election or Appointment: 2016
Assistant Treasurer
Mr. Spector also serves as an officer of other funds. Mr. Spector serves as Assistant Treasurer of FMR Capital, Inc. (2017-present) and is an employee of Fidelity Investments (2016-present). Prior to joining Fidelity Investments, Mr. Spector served as Director at the Siegfried Group (accounting firm, 2013-2016), and prior to Siegfried Group as audit senior manager at Deloitte & Touche LLP (accounting firm, 2005-2013).
Jim Wegmann (1979)
Year of Election or Appointment: 2019
Assistant Treasurer
Mr. Wegmann also serves as Assistant Treasurer of other funds. Mr. Wegmann is an employee of Fidelity Investments (2011-present).
Shareholder Expense Example
As a shareholder, you incur two types of costs: (1) transaction costs, which may include sales charges (loads) on purchase payments or redemption proceeds, as applicable and (2) ongoing costs, which generally include management fees, distribution and/or service (12b-1) fees and other Fund expenses. This Example is intended to help you understand your ongoing costs (in dollars) of investing in a fund and to compare these costs with the ongoing costs of investing in other mutual funds.
The Example is based on an investment of $1,000 invested at the beginning of the period and held for the entire period (August 1, 2020 to January 31, 2021).
Actual Expenses
The first line of the accompanying table provides information about actual account values and actual expenses. You may use the information in this line, together with the amount you invested, to estimate the expenses that you paid over the period. Simply divide your account value by $1,000.00 (for example, an $8,600 account value divided by $1,000.00 = 8.6), then multiply the result by the number in the first line for a class/Fund under the heading entitled "Expenses Paid During Period" to estimate the expenses you paid on your account during this period. If any fund is a shareholder of any underlying mutual funds or exchange-traded funds (ETFs) (the Underlying Funds), such fund indirectly bears its proportional share of the expenses of the Underlying Funds in addition to the direct expenses incurred presented in the table. These fees and expenses are not included in the annualized expense ratio used to calculate the expense estimate in the table below.
Hypothetical Example for Comparison Purposes
The second line of the accompanying table provides information about hypothetical account values and hypothetical expenses based on the actual expense ratio and an assumed rate of return of 5% per year before expenses, which is not the actual return. The hypothetical account values and expenses may not be used to estimate the actual ending account balance or expenses you paid for the period. You may use this information to compare the ongoing costs of investing in the Fund and other funds. To do so, compare this 5% hypothetical example with the 5% hypothetical examples that appear in the shareholder reports of the other funds. If any fund is a shareholder of any Underlying Funds, such fund indirectly bears its proportional share of the expenses of the Underlying Funds in addition to the direct expenses as presented in the table. These fees and expenses are not included in the annualized expense ratio used to calculate the expense estimate in the table below.
Please note that the expenses shown in the table are meant to highlight your ongoing costs only and do not reflect any transaction costs. Therefore, the second line of the table is useful in comparing ongoing costs only, and will not help you determine the relative total costs of owning different funds.
| Annualized Expense Ratio-A | Beginning Account Value August 1, 2020 | Ending Account Value January 31, 2021 | Expenses Paid During Period-B August 1, 2020 to January 31, 2021 | |
| Fidelity Equity-Income Fund | ||||
| Equity-Income | .59% | |||
| Actual | $1,000.00 | $1,155.10 | $3.20 | |
| Hypothetical-C | $1,000.00 | $1,022.17 | $3.00 | |
| Class K | .50% | |||
| Actual | $1,000.00 | $1,155.60 | $2.71 | |
| Hypothetical-C | $1,000.00 | $1,022.62 | $2.54 |
A Annualized expense ratio reflects expenses net of applicable fee waivers.
B Expenses are equal to the annualized expense ratio, multiplied by the average account value over the period, multiplied by 184/ 366 (to reflect the one-half year period). The fees and expenses of any Underlying Funds are not included in each annualized expense ratio.
C 5% return per year before expenses
Distributions (Unaudited)
The Board of Trustees of Fidelity Equity-Income Fund voted to pay to shareholders of record at the opening of business on record date, the following distributions per share derived from capital gains realized from sales of portfolio securities:
| Pay Date | Record Date | Capital Gains | |
| Fidelity Equity-Income Fund | |||
| Equity-Income | 03/08/21 | 03/05/21 | $1.004 |
| Class K | 03/08/21 | 03/05/21 | $1.004 |
The fund hereby designates as a capital gain dividend with respect to the taxable year ended January 31, 2021, $230,079,681, or, if subsequently determined to be different, the net capital gain of such year.
A total of 0.17% of the dividends distributed during the fiscal year was derived from interest on U.S. Government securities which is generally exempt from state income tax.
Equity-Income and Class K designate 100% of the dividends distributed in April, July, October, and December, during the fiscal year as qualifying for the dividends–received deduction for corporate shareholders.
Equity-Income and Class K designate 100% of the dividends distributed during the fiscal year as amounts which may be taken into account as a dividend for purposes of the maximum rate under section 1(h)(11) of the Internal Revenue Code.
The fund will notify shareholders in January 2022 of amounts for use in preparing 2021 income tax returns.
Board Approval of Investment Advisory Contracts
Fidelity Equity-Income Fund
At its January 2021 meeting, the Board of Trustees, including the Independent Trustees (together, the Board), voted to continue the management contract with Fidelity Management & Research Company LLC (FMR), and the sub-advisory agreements and sub-subadvisory agreements, in each case, where applicable (together, the Advisory Contracts) for the fund for four months from February 1, 2021 through May 31, 2021, in connection with changes to the Board's meeting calendar.The Board considered that the approval of the fund's Advisory Contracts will not result in any changes in (i) the investment process or strategies employed in the management of the fund's assets; (ii) the fees and expenses paid by shareholders; (iii) the nature, extent or quality of services provided under the fund's Advisory Contracts; or (iv) the day-to-day management of the fund or the persons primarily responsible for such management. The Board also considered that since its last approval of the fund's Advisory Contracts, FMR had provided additional information on the fund in support of the annual contract renewal process, including competitive analyses on total expenses and management fees and in-depth reviews of fund performance and fund profitability information. The Board also considered the findings of certain ad hoc committees that had been previously formed to discuss matters relevant to all of the Fidelity funds, including economies of scale, fall-out benefits and retail vs. institutional funds. The Board concluded that the fund's Advisory Contracts are fair and reasonable, and that the fund's Advisory Contracts should be renewed, without modification, through May 31, 2021, with the understanding that the Board will consider the annual renewal for a full one year period in May 2021.In connection with its consideration of future renewals of the fund's Advisory Contracts, the Board will consider: (i) the nature, extent and quality of services provided to the funds, including shareholder and administrative services and investment performance; (ii) the competitiveness of the management fee and total expenses for the fund; (iii) the costs of the services and profitability, including the revenues earned and the expenses incurred in conducting the business of developing, marketing, distributing, managing, administering, and servicing the fund and its shareholders, to the extent applicable; and (iv) whether there have been economies of scale in respect of the Fidelity funds, whether the Fidelity funds (including the fund) have appropriately benefited from any such economies of scale, and whether there is the potential for realization of any further economies.Based on its evaluation of all of the conclusions noted above, and after considering all factors it believed relevant, the Board ultimately concluded that the fund's management fee structure is fair and reasonable, and that the continuation of the fund's Advisory Contracts should be approved for four months from February 1, 2021 through May 31, 2021.Proxy Voting Results
A special meeting of shareholders was held on June 9, 2020. The results of votes taken among shareholders on the proposals before them are reported below. Each vote reported represents one dollar of net asset value held on the record date for the meeting.
PROPOSAL 1
To elect a Board of Trustees.
| # of Votes | % of Votes | |
| Dennis J. Dirks | ||
| Affirmative | 20,677,600,881.166 | 98.531 |
| Withheld | 308,216,367.332 | 1.469 |
| TOTAL | 20,985,817,248.498 | 100.000 |
| Donald F. Donahue | ||
| Affirmative | 20,685,205,663.711 | 98.568 |
| Withheld | 300,611,584.787 | 1.432 |
| TOTAL | 20,985,817,248.498 | 100.000 |
| Bettina Doulton | ||
| Affirmative | 20,701,129,729.034 | 98.643 |
| Withheld | 284,687,519.464 | 1.357 |
| TOTAL | 20,985,817,248.498 | 100.000 |
| Vicki L. Fuller | ||
| Affirmative | 20,713,892,146.063 | 98.704 |
| Withheld | 271,925,102.435 | 1.296 |
| TOTAL | 20,985,817,248.498 | 100.000 |
| Patricia L. Kampling | ||
| Affirmative | 20,693,289,719.327 | 98.606 |
| Withheld | 292,527,529.171 | 1.394 |
| TOTAL | 20,985,817,248.498 | 100.000 |
| Alan J. Lacy | ||
| Affirmative | 20,659,591,158.873 | 98.445 |
| Withheld | 326,226,089.625 | 1.555 |
| TOTAL | 20,985,817,248.498 | 100.000 |
| Ned C. Lautenbach | ||
| Affirmative | 20,634,244,420.039 | 98.325 |
| Withheld | 351,572,828.459 | 1.675 |
| TOTAL | 20,985,817,248.498 | 100.000 |
| Robert A. Lawrence | ||
| Affirmative | 20,672,781,907.548 | 98.508 |
| Withheld | 313,035,340.950 | 1.492 |
| TOTAL | 20,985,817,248.498 | 100.000 |
| Joseph Mauriello | ||
| Affirmative | 20,652,465,304.654 | 98.412 |
| Withheld | 333,351,943.843 | 1.588 |
| TOTAL | 20,985,817,248.498 | 100.000 |
| Cornelia M. Small | ||
| Affirmative | 20,671,641,667.984 | 98.503 |
| Withheld | 314,175,580.514 | 1.497 |
| TOTAL | 20,985,817,248.498 | 100.000 |
| Garnett A. Smith | ||
| Affirmative | 20,655,644,270.628 | 98.427 |
| Withheld | 330,172,977.870 | 1.573 |
| TOTAL | 20,985,817,248.498 | 100.000 |
| David M. Thomas | ||
| Affirmative | 20,654,595,907.599 | 98.422 |
| Withheld | 331,221,340.899 | 1.578 |
| TOTAL | 20,985,817,248.498 | 100.000 |
| Susan Tomasky | ||
| Affirmative | 20,686,662,870.375 | 98.574 |
| Withheld | 299,154,378.123 | 1.426 |
| TOTAL | 20,985,817,248.498 | 100.000 |
| Michael E. Wiley | ||
| Affirmative | 20,662,847,882.871 | 98.461 |
| Withheld | 322,969,365.626 | 1.539 |
| TOTAL | 20,985,817,248.498 | 100.000 |
PROPOSAL 2
To convert a fundamental investment policy to a non-fundamental investment policy.
| # of Votes | % of Votes | |
| Affirmative | 2,178,390,909.147 | 71.113 |
| Against | 474,103,439.581 | 15.477 |
| Abstain | 299,421,153.908 | 9.775 |
| Broker Non-Vote | 111,367,556.580 | 3.636 |
| TOTAL | 3,063,283,059.215 | 100.000 |
PROPOSAL 5
For the fund, a shareholder proposal requesting that the Board of Trustees institute procedures to avoid holding investments in companies that, in management's judgement, substantially contribute to genocide or crimes against humanity.
| # of Votes | % of Votes | |
| Affirmative | 871,058,302.497 | 28.435 |
| Against | 1,831,775,305.446 | 59.798 |
| Abstain | 243,613,306.263 | 7.953 |
| Broker Non-Vote | 116,836,145.009 | 3.814 |
| TOTAL | 3,063,283,059.215 | 100.000 |
| Proposal 1 reflects trust wide proposal and voting results. | ||
| Proposal 5 was not approved by shareholders. |
![]()
EQU-ANN-0321
1.471443.124
Fidelity® Equity-Income K6 Fund
January 31, 2021
Contents
To view a fund's proxy voting guidelines and proxy voting record for the 12-month period ended June 30, visit http://www.fidelity.com/proxyvotingresults or visit the Securities and Exchange Commission's (SEC) web site at http://www.sec.gov.
You may also call 1-800-835-5092 to request a free copy of the proxy voting guidelines.
Standard & Poor's, S&P and S&P 500 are registered service marks of The McGraw-Hill Companies, Inc. and have been licensed for use by Fidelity Distributors Corporation.
Other third-party marks appearing herein are the property of their respective owners.
All other marks appearing herein are registered or unregistered trademarks or service marks of FMR LLC or an affiliated company. © 2021 FMR LLC. All rights reserved.
This report and the financial statements contained herein are submitted for the general information of the shareholders of the Fund. This report is not authorized for distribution to prospective investors in the Fund unless preceded or accompanied by an effective prospectus.
A fund files its complete schedule of portfolio holdings with the SEC for the first and third quarters of each fiscal year on Form N-PORT. Forms N-PORT are available on the SEC’s web site at http://www.sec.gov. A fund's Forms N-PORT may be reviewed and copied at the SEC’s Public Reference Room in Washington, DC. Information regarding the operation of the SEC's Public Reference Room may be obtained by calling 1-800-SEC-0330.
For a complete list of a fund's portfolio holdings, view the most recent holdings listing, semiannual report, or annual report on Fidelity's web site at http://www.fidelity.com, http://www.institutional.fidelity.com, or http://www.401k.com, as applicable.
NOT FDIC INSURED •MAY LOSE VALUE •NO BANK GUARANTEE
Neither the Fund nor Fidelity Distributors Corporation is a bank.
Note to Shareholders:
Early in 2020, the outbreak and spread of a new coronavirus emerged as a public health emergency that had a major influence on financial markets, primarily based on its impact on the global economy and the outlook for corporate earnings. The virus causes a respiratory disease known as COVID-19. On March 11, the World Health Organization declared the COVID-19 outbreak a pandemic, citing sustained risk of further global spread.
In the weeks following, as the crisis worsened, we witnessed an escalating human tragedy with wide-scale social and economic consequences from coronavirus-containment measures. The outbreak of COVID-19 prompted a number of measures to limit the spread, including travel and border restrictions, quarantines, and restrictions on large gatherings. In turn, these resulted in lower consumer activity, diminished demand for a wide range of products and services, disruption in manufacturing and supply chains, and – given the wide variability in outcomes regarding the outbreak – significant market uncertainty and volatility. Amid the turmoil, global governments and central banks took unprecedented action to help support consumers, businesses, and the broader economies, and to limit disruption to financial systems.
The situation continues to unfold, and the extent and duration of its impact on financial markets and the economy remain highly uncertain. Extreme events such as the coronavirus crisis are “exogenous shocks” that can have significant adverse effects on mutual funds and their investments. Although multiple asset classes may be affected by market disruption, the duration and impact may not be the same for all types of assets.
Fidelity is committed to helping you stay informed amid news about COVID-19 and during increased market volatility, and we’re taking extra steps to be responsive to customer needs. We encourage you to visit our websites, where we offer ongoing updates, commentary, and analysis on the markets and our funds.
Performance: The Bottom Line
Average annual total return reflects the change in the value of an investment, assuming reinvestment of distributions from dividend income and capital gains (the profits earned upon the sale of securities that have grown in value, if any) and assuming a constant rate of performance each year. The hypothetical investment and the average annual total returns do not reflect the deduction of taxes that a shareholder would pay on fund distributions or the redemption of fund shares. During periods of reimbursement by Fidelity, a fund’s total return will be greater than it would be had the reimbursement not occurred. How a fund did yesterday is no guarantee of how it will do tomorrow.
Average Annual Total Returns
| For the periods ended January 31, 2021 | Past 1 year | Life of fundA |
| Fidelity® Equity-Income K6 Fund | 7.97% | 10.54% |
A From June 13, 2019
$10,000 Over Life of Fund
Let's say hypothetically that $10,000 was invested in Fidelity® Equity-Income K6 Fund on June 13, 2019, when the fund started.
The chart shows how the value of your investment would have changed, and also shows how the Russell 3000® Value Index performed over the same period.
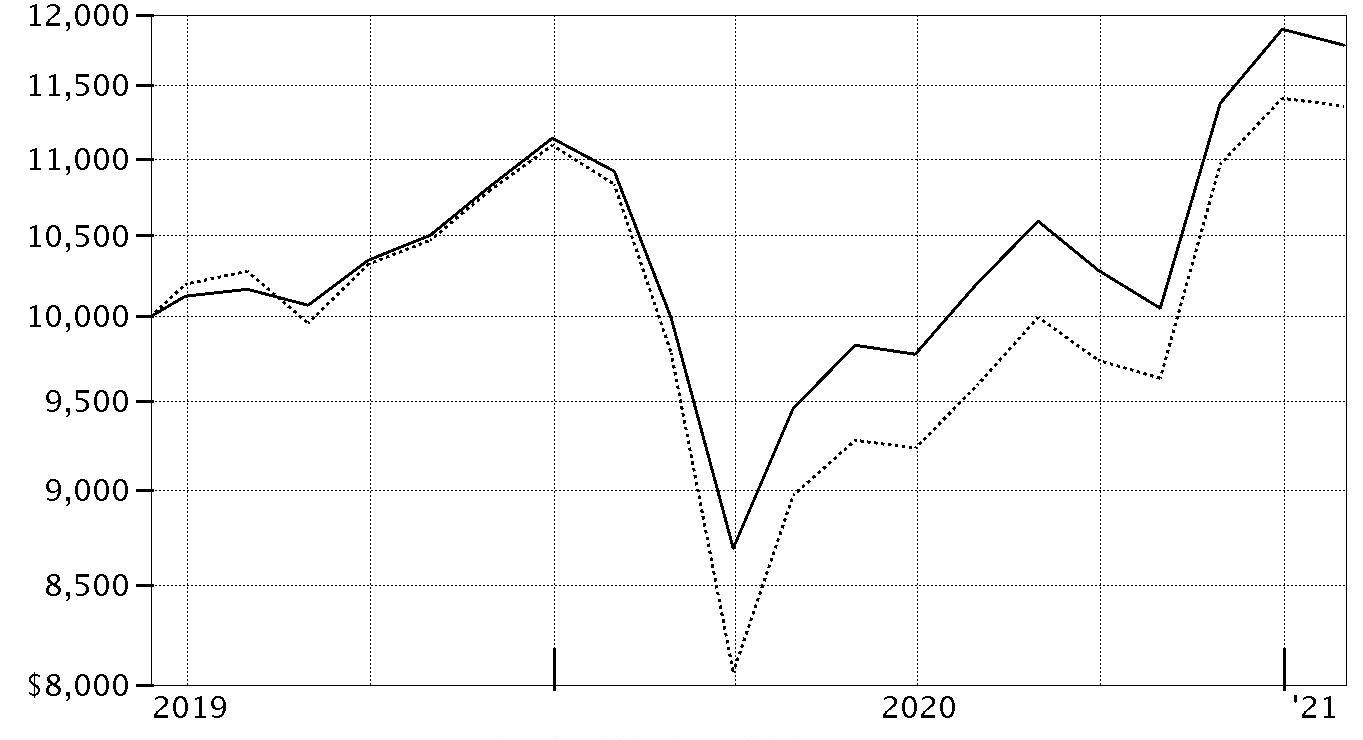
| Period Ending Values | ||
| $11,784 | Fidelity® Equity-Income K6 Fund | |
| $11,352 | Russell 3000® Value Index | |
Management's Discussion of Fund Performance
Market Recap: The S&P 500® index gained 17.25% for the 12 months ending January 31, 2021, a volatile but productive period for U.S. risk assets. The early-2020 outbreak and spread of COVID-19 resulted in stocks suffering one of the quickest declines on record, through March 23, followed by a historic rebound. The crisis and containment efforts caused broad contraction in economic activity, along with extreme uncertainty and dislocation in financial markets. A rapid and expansive U.S. monetary/fiscal-policy response partially offset the economic disruption and fueled the market surge, as did resilient corporate earnings. The rally slowed in September, when the S&P 500 began a two-month retreat amid Congress’s inability to reach a deal on additional fiscal stimulus, as well as concerns about election uncertainty, indications the U.S. economic recovery could be slowing and a new wave of COVID-19 cases. A shift in momentum began in October and accelerated following the U.S. elections, with the approval of two breakthrough COVID-19 vaccines and prospects for additional government stimulus fueling the “reflation trade.” Small-cap value stocks rallied strongly late in 2020, usurping longstanding market leadership from growth shares – especially large tech and internet-related names – amid hopes of a broad economic recovery in 2021. By sector for the full 12 months, information technology (+37%) and consumer discretionary (+33%) led all gainers. In contrast, energy (-23%) struggled along with global oil demand and pricing.Comments from Portfolio Manager Ramona Persaud: For the fiscal year, the fund gained 7.97%, outperforming the 4.82% result of the benchmark, the Russell 3000® Value Index. I believe my focus on risk-adjusted return helped to limit fund losses when the stock market sold off in late February and March while still participating in market upside thereafter. Security selection contributed the most to the fund’s relative result, led by stock choices in the information technology and consumer staples sectors. Within tech, the fund held stocks of firms I thought could benefit from longer-term trends, such as globalization. I also sought to own the stock of tech companies with strong growth in free-cash-flow (FCF) and expanding margins that I thought seemed likely to run less capital-intensive businesses over time. A cash position of about 3% of assets, on average, also added value this period by helping to limit the fund’s losses when the market declined. Non-benchmark investments in consumer electronics giant Apple (+70%) and chipmaker Taiwan Semiconductor Manufacturing (+132%) boosted the fund’s performance versus the benchmark. Conversely, overweightings in Wells Fargo and ConocoPhillips hurt the fund’s relative result. Wells Fargo was among the largest holdings at period end. Notable positioning changes for the period included a higher allocation to the consumer discretionary and information technology sectors.The views expressed above reflect those of the portfolio manager(s) only through the end of the period as stated on the cover of this report and do not necessarily represent the views of Fidelity or any other person in the Fidelity organization. Any such views are subject to change at any time based upon market or other conditions and Fidelity disclaims any responsibility to update such views. These views may not be relied on as investment advice and, because investment decisions for a Fidelity fund are based on numerous factors, may not be relied on as an indication of trading intent on behalf of any Fidelity fund.
Investment Summary (Unaudited)
Top Ten Stocks as of January 31, 2021
| % of fund's net assets | |
| JPMorgan Chase & Co. | 3.6 |
| The Walt Disney Co. | 2.9 |
| Johnson & Johnson | 2.4 |
| Bank of America Corp. | 2.4 |
| Danaher Corp. | 1.8 |
| Capital One Financial Corp. | 1.8 |
| NextEra Energy, Inc. | 1.7 |
| Citigroup, Inc. | 1.7 |
| Wells Fargo & Co. | 1.7 |
| Comcast Corp. Class A | 1.7 |
| 21.7 |
Top Five Market Sectors as of January 31, 2021
| % of fund's net assets | |
| Financials | 19.0 |
| Health Care | 14.1 |
| Industrials | 11.2 |
| Information Technology | 10.9 |
| Consumer Discretionary | 10.8 |
Asset Allocation (% of fund's net assets)
| As of January 31, 2021* | ||
| Stocks | 97.8% | |
| Short-Term Investments and Net Other Assets (Liabilities) | 2.2% | |

* Foreign investments - 13.4%
Schedule of Investments January 31, 2021
Showing Percentage of Net Assets
| Common Stocks - 97.8% | |||
| Shares | Value | ||
| COMMUNICATION SERVICES - 8.7% | |||
| Diversified Telecommunication Services - 0.9% | |||
| AT&T, Inc. | 6,342 | $181,571 | |
| Verizon Communications, Inc. | 7,356 | 402,741 | |
| 584,312 | |||
| Entertainment - 3.6% | |||
| Activision Blizzard, Inc. | 5,065 | 460,915 | |
| The Walt Disney Co. | 10,825 | 1,820,440 | |
| 2,281,355 | |||
| Interactive Media & Services - 1.0% | |||
| Alphabet, Inc. Class A (a) | 368 | 672,468 | |
| Media - 2.1% | |||
| Comcast Corp. Class A | 21,177 | 1,049,744 | |
| Interpublic Group of Companies, Inc. | 11,441 | 275,385 | |
| 1,325,129 | |||
| Wireless Telecommunication Services - 1.1% | |||
| T-Mobile U.S., Inc. | 5,435 | 685,245 | |
| TOTAL COMMUNICATION SERVICES | 5,548,509 | ||
| CONSUMER DISCRETIONARY - 10.8% | |||
| Hotels, Restaurants & Leisure - 2.1% | |||
| McDonald's Corp. | 3,731 | 775,451 | |
| Starbucks Corp. | 5,959 | 576,891 | |
| 1,352,342 | |||
| Household Durables - 0.7% | |||
| Lennar Corp. Class A | 4,038 | 335,760 | |
| Tempur Sealy International, Inc. (a) | 3,600 | 95,040 | |
| 430,800 | |||
| Internet & Direct Marketing Retail - 0.4% | |||
| eBay, Inc. | 4,014 | 226,831 | |
| Multiline Retail - 2.8% | |||
| Dollar General Corp. | 2,590 | 504,040 | |
| Dollar Tree, Inc. (a) | 3,079 | 313,011 | |
| Nordstrom, Inc. (b) | 9,577 | 339,505 | |
| Target Corp. | 3,509 | 635,726 | |
| 1,792,282 | |||
| Specialty Retail - 3.7% | |||
| Best Buy Co., Inc. | 1,940 | 211,111 | |
| Burlington Stores, Inc. (a) | 1,263 | 314,361 | |
| Lowe's Companies, Inc. | 2,286 | 381,419 | |
| Ross Stores, Inc. | 1,727 | 192,198 | |
| The Home Depot, Inc. | 2,261 | 612,324 | |
| TJX Companies, Inc. | 10,794 | 691,248 | |
| 2,402,661 | |||
| Textiles, Apparel & Luxury Goods - 1.1% | |||
| Columbia Sportswear Co. | 2,767 | 242,002 | |
| PVH Corp. | 2,194 | 187,060 | |
| Tapestry, Inc. | 9,151 | 289,355 | |
| 718,417 | |||
| TOTAL CONSUMER DISCRETIONARY | 6,923,333 | ||
| CONSUMER STAPLES - 7.3% | |||
| Beverages - 1.4% | |||
| Diageo PLC | 3,689 | 148,103 | |
| Keurig Dr. Pepper, Inc. | 5,536 | 176,045 | |
| The Coca-Cola Co. | 11,791 | 567,737 | |
| 891,885 | |||
| Food & Staples Retailing - 3.4% | |||
| Alimentation Couche-Tard, Inc. Class B (sub. vtg.) | 3,875 | 118,182 | |
| BJ's Wholesale Club Holdings, Inc. (a) | 5,304 | 223,139 | |
| Costco Wholesale Corp. | 564 | 198,771 | |
| Kroger Co. | 10,014 | 345,483 | |
| Sysco Corp. | 5,199 | 371,780 | |
| Walmart, Inc. | 6,739 | 946,762 | |
| 2,204,117 | |||
| Food Products - 1.1% | |||
| Mondelez International, Inc. | 8,405 | 465,973 | |
| Nestle SA (Reg. S) | 1,861 | 208,612 | |
| 674,585 | |||
| Household Products - 1.2% | |||
| Procter & Gamble Co. | 5,969 | 765,285 | |
| Personal Products - 0.2% | |||
| Estee Lauder Companies, Inc. Class A | 672 | 159,029 | |
| TOTAL CONSUMER STAPLES | 4,694,901 | ||
| ENERGY - 6.8% | |||
| Oil, Gas & Consumable Fuels - 6.8% | |||
| BP PLC | 45,312 | 168,377 | |
| Chevron Corp. | 11,645 | 992,154 | |
| ConocoPhillips Co. | 9,958 | 398,619 | |
| Enterprise Products Partners LP | 15,798 | 319,594 | |
| Exxon Mobil Corp. | 22,472 | 1,007,644 | |
| Imperial Oil Ltd. | 20,638 | 392,667 | |
| Phillips 66 Co. | 5,660 | 383,748 | |
| Suncor Energy, Inc. | 23,320 | 390,080 | |
| Valero Energy Corp. | 4,993 | 281,755 | |
| 4,334,638 | |||
| FINANCIALS - 19.0% | |||
| Banks - 11.2% | |||
| Bank of America Corp. | 50,730 | 1,504,145 | |
| Citigroup, Inc. | 19,176 | 1,112,016 | |
| Huntington Bancshares, Inc. | 10,551 | 139,537 | |
| JPMorgan Chase & Co. | 17,968 | 2,311,938 | |
| M&T Bank Corp. | 4,632 | 613,601 | |
| PNC Financial Services Group, Inc. | 2,820 | 404,726 | |
| Wells Fargo & Co. | 36,377 | 1,086,945 | |
| 7,172,908 | |||
| Capital Markets - 2.5% | |||
| BlackRock, Inc. Class A | 907 | 636,043 | |
| KKR & Co. LP | 9,204 | 358,496 | |
| Raymond James Financial, Inc. | 3,398 | 339,562 | |
| The Blackstone Group LP | 4,364 | 293,217 | |
| 1,627,318 | |||
| Consumer Finance - 1.8% | |||
| Capital One Financial Corp. | 10,821 | 1,128,197 | |
| Insurance - 3.5% | |||
| American International Group, Inc. | 4,015 | 150,322 | |
| Chubb Ltd. | 5,455 | 794,630 | |
| Marsh & McLennan Companies, Inc. | 3,852 | 423,373 | |
| The Travelers Companies, Inc. | 6,440 | 877,772 | |
| 2,246,097 | |||
| TOTAL FINANCIALS | 12,174,520 | ||
| HEALTH CARE - 14.1% | |||
| Biotechnology - 2.1% | |||
| AbbVie, Inc. | 5,069 | 519,471 | |
| Amgen, Inc. | 3,316 | 800,582 | |
| 1,320,053 | |||
| Health Care Equipment & Supplies - 2.6% | |||
| Becton, Dickinson & Co. | 1,975 | 517,035 | |
| Danaher Corp. | 4,853 | 1,154,238 | |
| 1,671,273 | |||
| Health Care Providers & Services - 1.7% | |||
| Cigna Corp. | 2,300 | 499,215 | |
| UnitedHealth Group, Inc. | 1,767 | 589,436 | |
| 1,088,651 | |||
| Pharmaceuticals - 7.7% | |||
| AstraZeneca PLC (United Kingdom) | 3,557 | 362,854 | |
| Bristol-Myers Squibb Co. | 15,367 | 943,995 | |
| Eli Lilly & Co. | 4,693 | 976,003 | |
| Johnson & Johnson | 9,621 | 1,569,474 | |
| Roche Holding AG (participation certificate) | 1,142 | 394,118 | |
| Royalty Pharma PLC | 919 | 43,202 | |
| Sanofi SA | 6,776 | 637,271 | |
| 4,926,917 | |||
| TOTAL HEALTH CARE | 9,006,894 | ||
| INDUSTRIALS - 11.2% | |||
| Aerospace & Defense - 1.3% | |||
| General Dynamics Corp. | 2,554 | 374,621 | |
| Northrop Grumman Corp. | 1,693 | 485,231 | |
| 859,852 | |||
| Air Freight & Logistics - 1.1% | |||
| Deutsche Post AG | 4,306 | 212,695 | |
| United Parcel Service, Inc. Class B | 3,209 | 497,395 | |
| 710,090 | |||
| Commercial Services & Supplies - 0.3% | |||
| Waste Connection, Inc. (Canada) | 1,724 | 169,845 | |
| Electrical Equipment - 0.9% | |||
| AMETEK, Inc. | 5,104 | 578,079 | |
| Siemens Energy AG (a) | 357 | 13,248 | |
| 591,327 | |||
| Industrial Conglomerates - 2.5% | |||
| General Electric Co. | 70,316 | 750,975 | |
| Roper Technologies, Inc. | 1,567 | 615,690 | |
| Siemens AG | 1,667 | 258,821 | |
| 1,625,486 | |||
| Machinery - 1.9% | |||
| Fortive Corp. | 3,508 | 231,809 | |
| ITT, Inc. | 4,111 | 307,133 | |
| Otis Worldwide Corp. | 2,009 | 129,882 | |
| Snap-On, Inc. | 769 | 138,412 | |
| Stanley Black & Decker, Inc. | 2,214 | 384,107 | |
| 1,191,343 | |||
| Marine - 0.4% | |||
| A.P. Moller - Maersk A/S Series B | 127 | 260,879 | |
| Professional Services - 1.0% | |||
| Clarivate Analytics PLC (a) | 5,865 | 169,733 | |
| Equifax, Inc. | 1,148 | 203,322 | |
| IHS Markit Ltd. | 3,122 | 271,864 | |
| 644,919 | |||
| Road & Rail - 1.0% | |||
| Norfolk Southern Corp. | 2,631 | 622,547 | |
| Trading Companies & Distributors - 0.8% | |||
| Watsco, Inc. | 2,144 | 511,323 | |
| TOTAL INDUSTRIALS | 7,187,611 | ||
| INFORMATION TECHNOLOGY - 10.9% | |||
| Communications Equipment - 1.6% | |||
| Cisco Systems, Inc. | 22,015 | 981,429 | |
| Electronic Equipment & Components - 0.3% | |||
| TE Connectivity Ltd. | 1,572 | 189,269 | |
| Vontier Corp. (a) | 700 | 22,701 | |
| 211,970 | |||
| IT Services - 2.4% | |||
| Amdocs Ltd. | 4,785 | 337,917 | |
| Black Knight, Inc. (a) | 591 | 48,279 | |
| Fidelity National Information Services, Inc. | 5,811 | 717,426 | |
| Genpact Ltd. | 4,084 | 156,336 | |
| Visa, Inc. Class A | 1,452 | 280,599 | |
| 1,540,557 | |||
| Semiconductors & Semiconductor Equipment - 2.3% | |||
| NXP Semiconductors NV | 3,523 | 565,336 | |
| Qualcomm, Inc. | 2,503 | 391,169 | |
| Taiwan Semiconductor Manufacturing Co. Ltd. sponsored ADR | 4,362 | 530,070 | |
| 1,486,575 | |||
| Software - 1.9% | |||
| Microsoft Corp. | 3,806 | 882,840 | |
| Open Text Corp. | 4,171 | 186,835 | |
| SAP SE | 891 | 113,057 | |
| 1,182,732 | |||
| Technology Hardware, Storage & Peripherals - 2.4% | |||
| Apple, Inc. | 7,048 | 930,054 | |
| Samsung Electronics Co. Ltd. | 8,526 | 625,124 | |
| 1,555,178 | |||
| TOTAL INFORMATION TECHNOLOGY | 6,958,441 | ||
| MATERIALS - 2.9% | |||
| Chemicals - 1.1% | |||
| Linde PLC | 2,929 | 718,777 | |
| Containers & Packaging - 1.5% | |||
| Crown Holdings, Inc. (a) | 5,191 | 467,969 | |
| WestRock Co. | 11,887 | 492,478 | |
| 960,447 | |||
| Metals & Mining - 0.3% | |||
| Anglo American PLC (United Kingdom) | 5,977 | 197,692 | |
| TOTAL MATERIALS | 1,876,916 | ||
| REAL ESTATE - 1.1% | |||
| Equity Real Estate Investment Trusts (REITs) - 1.1% | |||
| American Tower Corp. | 1,754 | 398,789 | |
| Public Storage | 1,392 | 316,847 | |
| 715,636 | |||
| UTILITIES - 5.0% | |||
| Electric Utilities - 3.1% | |||
| Exelon Corp. | 10,304 | 428,234 | |
| NextEra Energy, Inc. | 13,811 | 1,116,896 | |
| NRG Energy, Inc. | 9,257 | 383,332 | |
| PG&E Corp. (a) | 7,657 | 87,520 | |
| 2,015,982 | |||
| Independent Power and Renewable Electricity Producers - 0.6% | |||
| Vistra Corp. | 18,121 | 361,876 | |
| Multi-Utilities - 1.3% | |||
| Ameren Corp. | 4,458 | 324,186 | |
| CenterPoint Energy, Inc. | 11,523 | 243,020 | |
| WEC Energy Group, Inc. | 3,159 | 280,835 | |
| 848,041 | |||
| TOTAL UTILITIES | 3,225,899 | ||
| TOTAL COMMON STOCKS | |||
| (Cost $51,977,876) | 62,647,298 | ||
| Money Market Funds - 2.6% | |||
| Fidelity Cash Central Fund 0.09% (c) | 1,322,510 | 1,322,775 | |
| Fidelity Securities Lending Cash Central Fund 0.09% (c)(d) | 338,941 | 338,975 | |
| TOTAL MONEY MARKET FUNDS | |||
| (Cost $1,661,750) | 1,661,750 | ||
| TOTAL INVESTMENT IN SECURITIES - 100.4% | |||
| (Cost $53,639,626) | 64,309,048 | ||
| NET OTHER ASSETS (LIABILITIES) - (0.4)% | (251,453) | ||
| NET ASSETS - 100% | $64,057,595 |
Legend
(a) Non-income producing
(b) Security or a portion of the security is on loan at period end.
(c) Affiliated fund that is generally available only to investment companies and other accounts managed by Fidelity Investments. The rate quoted is the annualized seven-day yield of the fund at period end. A complete unaudited listing of the fund's holdings as of its most recent quarter end is available upon request. In addition, each Fidelity Central Fund's financial statements, which are not covered by the Fund's Report of Independent Registered Public Accounting Firm, are available on the SEC's website or upon request.
(d) Investment made with cash collateral received from securities on loan.
Affiliated Central Funds
Information regarding fiscal year to date income earned by the Fund from investments in Fidelity Central Funds is as follows:
| Fund | Income earned |
| Fidelity Cash Central Fund | $4,493 |
| Fidelity Securities Lending Cash Central Fund | 1,052 |
| Total | $5,545 |
Amounts in the income column in the above table include any capital gain distributions from underlying funds, which are presented in the corresponding line-item in the Statement of Operations, if applicable. Amount for Fidelity Securities Lending Cash Central Fund represents the income earned on investing cash collateral, less rebates paid to borrowers and any lending agent fees associated with the loan, plus any premium payments received for lending certain types of securities.
Investment Valuation
The following is a summary of the inputs used, as of January 31, 2021, involving the Fund's assets and liabilities carried at fair value. The inputs or methodology used for valuing securities may not be an indication of the risk associated with investing in those securities. For more information on valuation inputs, and their aggregation into the levels used below, please refer to the Investment Valuation section in the accompanying Notes to Financial Statements.
| Valuation Inputs at Reporting Date: | ||||
| Description | Total | Level 1 | Level 2 | Level 3 |
| Investments in Securities: | ||||
| Equities: | ||||
| Communication Services | $5,548,509 | $5,548,509 | $-- | $-- |
| Consumer Discretionary | 6,923,333 | 6,923,333 | -- | -- |
| Consumer Staples | 4,694,901 | 4,338,186 | 356,715 | -- |
| Energy | 4,334,638 | 4,166,261 | 168,377 | -- |
| Financials | 12,174,520 | 12,174,520 | -- | -- |
| Health Care | 9,006,894 | 7,612,651 | 1,394,243 | -- |
| Industrials | 7,187,611 | 6,714,037 | 473,574 | -- |
| Information Technology | 6,958,441 | 6,845,384 | 113,057 | -- |
| Materials | 1,876,916 | 1,876,916 | -- | -- |
| Real Estate | 715,636 | 715,636 | -- | -- |
| Utilities | 3,225,899 | 3,225,899 | -- | -- |
| Money Market Funds | 1,661,750 | 1,661,750 | -- | -- |
| Total Investments in Securities: | $64,309,048 | $61,803,082 | $2,505,966 | $-- |
Other Information
Distribution of investments by country or territory of incorporation, as a percentage of Total Net Assets, is as follows (Unaudited):
| United States of America | 86.6% |
| Switzerland | 2.4% |
| Canada | 2.0% |
| United Kingdom | 1.4% |
| Ireland | 1.1% |
| France | 1.0% |
| Korea (South) | 1.0% |
| Others (Individually Less Than 1%) | 4.5% |
| 100.0% |
See accompanying notes which are an integral part of the financial statements.
Financial Statements
Statement of Assets and Liabilities
| January 31, 2021 | ||
| Assets | ||
| Investment in securities, at value (including securities loaned of $322,595) — See accompanying schedule: Unaffiliated issuers (cost $51,977,876) | $62,647,298 | |
| Fidelity Central Funds (cost $1,661,750) | 1,661,750 | |
| Total Investment in Securities (cost $53,639,626) | $64,309,048 | |
| Receivable for fund shares sold | 14,799 | |
| Dividends receivable | 93,607 | |
| Distributions receivable from Fidelity Central Funds | 182 | |
| Other receivables | 544 | |
| Total assets | 64,418,180 | |
| Liabilities | ||
| Payable for fund shares redeemed | $2,959 | |
| Accrued management fee | 18,651 | |
| Collateral on securities loaned | 338,975 | |
| Total liabilities | 360,585 | |
| Net Assets | $64,057,595 | |
| Net Assets consist of: | ||
| Paid in capital | $54,905,921 | |
| Total accumulated earnings (loss) | 9,151,674 | |
| Net Assets | $64,057,595 | |
| Net Asset Value, offering price and redemption price per share ($64,057,595 ÷ 5,600,193 shares) | $11.44 |
See accompanying notes which are an integral part of the financial statements.
Statement of Operations
| Year ended January 31, 2021 | ||
| Investment Income | ||
| Dividends | $1,229,862 | |
| Income from Fidelity Central Funds (including $1,052 from security lending) | 5,545 | |
| Total income | 1,235,407 | |
| Expenses | ||
| Management fee | $181,467 | |
| Independent trustees' fees and expenses | 287 | |
| Miscellaneous | 906 | |
| Total expenses before reductions | 182,660 | |
| Expense reductions | (3,761) | |
| Total expenses after reductions | 178,899 | |
| Net investment income (loss) | 1,056,508 | |
| Realized and Unrealized Gain (Loss) | ||
| Net realized gain (loss) on: | ||
| Investment securities: | ||
| Unaffiliated issuers | (1,599,440) | |
| Fidelity Central Funds | 37 | |
| Foreign currency transactions | (1,926) | |
| Total net realized gain (loss) | (1,601,329) | |
| Change in net unrealized appreciation (depreciation) on: | ||
| Investment securities: | ||
| Unaffiliated issuers | 6,731,178 | |
| Assets and liabilities in foreign currencies | 477 | |
| Total change in net unrealized appreciation (depreciation) | 6,731,655 | |
| Net gain (loss) | 5,130,326 | |
| Net increase (decrease) in net assets resulting from operations | $6,186,834 |
See accompanying notes which are an integral part of the financial statements.
Statement of Changes in Net Assets
| Year ended January 31, 2021 | For the period June 13, 2019 (commencement of operations) to January 31, 2020 | |
| Increase (Decrease) in Net Assets | ||
| Operations | ||
| Net investment income (loss) | $1,056,508 | $373,637 |
| Net realized gain (loss) | (1,601,329) | 60,096 |
| Change in net unrealized appreciation (depreciation) | 6,731,655 | 3,938,244 |
| Net increase (decrease) in net assets resulting from operations | 6,186,834 | 4,371,977 |
| Distributions to shareholders | (1,074,032) | (333,105) |
| Share transactions | ||
| Proceeds from sales of shares | 23,475,441 | 47,694,819 |
| Reinvestment of distributions | 1,074,032 | 333,105 |
| Cost of shares redeemed | (14,135,739) | (3,535,737) |
| Net increase (decrease) in net assets resulting from share transactions | 10,413,734 | 44,492,187 |
| Total increase (decrease) in net assets | 15,526,536 | 48,531,059 |
| Net Assets | ||
| Beginning of period | 48,531,059 | – |
| End of period | $64,057,595 | $48,531,059 |
| Other Information | ||
| Shares | ||
| Sold | 2,433,324 | 4,782,107 |
| Issued in reinvestment of distributions | 110,007 | 31,108 |
| Redeemed | (1,423,790) | (332,563) |
| Net increase (decrease) | 1,119,541 | 4,480,652 |
See accompanying notes which are an integral part of the financial statements.
Financial Highlights
Fidelity Equity-Income K6 Fund
| Years ended January 31, | 2021 | 2020 A |
| Selected Per–Share Data | ||
| Net asset value, beginning of period | $10.83 | $10.00 |
| Income from Investment Operations | ||
| Net investment income (loss)B | .20 | .12 |
| Net realized and unrealized gain (loss) | .62 | .79 |
| Total from investment operations | .82 | .91 |
| Distributions from net investment income | (.20) | (.08) |
| Distributions from net realized gain | (.01) | –C |
| Total distributions | (.21) | (.08) |
| Net asset value, end of period | $11.44 | $10.83 |
| Total ReturnD,E | 7.97% | 9.14% |
| Ratios to Average Net AssetsF,G | ||
| Expenses before reductions | .34% | .34%H |
| Expenses net of fee waivers, if any | .34% | .34%H |
| Expenses net of all reductions | .34% | .34%H |
| Net investment income (loss) | 1.98% | 1.78%H |
| Supplemental Data | ||
| Net assets, end of period (000 omitted) | $64,058 | $48,531 |
| Portfolio turnover rateI | 70%J | 21%H,J |
A For the period June 13, 2019 (commencement of operations) to January 31, 2020.
B Calculated based on average shares outstanding during the period.
C Amount represents less than $.005 per share.
D Total returns for periods of less than one year are not annualized.
E Total returns would have been lower if certain expenses had not been reduced during the applicable periods shown.
F Fees and expenses of any underlying mutual funds or exchange-traded funds (ETFs) are not included in the Fund's expense ratio. The Fund indirectly bears its proportionate share of these expenses. For additional expense information related to investments in Fidelity Central Funds, please refer to the "Investments in Fidelity Central Funds" note found in the Notes to Financial Statements section of the most recent Annual or Semi-Annual report.
G Expense ratios reflect operating expenses of the class. Expenses before reductions do not reflect amounts reimbursed, waived, or reduced through arrangements with the investment advisor, brokerage services, or other offset arrangements, if applicable, and do not represent the amount paid by the class during periods when reimbursements, waivers or reductions occur.
H Annualized
I Amount does not include the portfolio activity of any underlying mutual funds or exchange-traded funds (ETFs).
J Portfolio turnover rate excludes securities received or delivered in-kind.
See accompanying notes which are an integral part of the financial statements.
Notes to Financial Statements
For the period ended January 31, 2021
1. Organization.
Fidelity Equity-Income K6 Fund (the Fund) is a fund of Fidelity Devonshire Trust (the Trust) and is authorized to issue an unlimited number of shares. Share transactions on the Statement of Changes in Net Assets may contain exchanges between affiliated funds. The Trust is registered under the Investment Company Act of 1940, as amended (the 1940 Act), as an open-end management investment company organized as a Massachusetts business trust. Shares generally are available only to employer-sponsored retirement plans that are recordkept by Fidelity, or to certain employer-sponsored retirement plans that are not recordkept by Fidelity.
2. Investments in Fidelity Central Funds.
The Fund invests in Fidelity Central Funds, which are open-end investment companies generally available only to other investment companies and accounts managed by the investment adviser and its affiliates. The Fund's Schedule of Investments lists each of the Fidelity Central Funds held as of period end, if any, as an investment of the Fund, but does not include the underlying holdings of each Fidelity Central Fund. As an Investing Fund, the Fund indirectly bears its proportionate share of the expenses of the underlying Fidelity Central Funds.
The Money Market Central Funds seek preservation of capital and current income and are managed by the investment adviser. Annualized expenses of the Money Market Central Funds as of their most recent shareholder report date ranged from less than .005% to .01%.
A complete unaudited list of holdings for each Fidelity Central Fund is available upon request or at the Securities and Exchange Commission (the SEC) website at www.sec.gov. In addition, the financial statements of the Fidelity Central Funds, which are not covered by the Fund's Report of Independent Registered Public Accounting Firm, are available on the SEC website or upon request.
3. Significant Accounting Policies.
The Fund is an investment company and applies the accounting and reporting guidance of the Financial Accounting Standards Board (FASB) Accounting Standards Codification Topic 946 Financial Services - Investment Companies. The financial statements have been prepared in conformity with accounting principles generally accepted in the United States of America (GAAP), which require management to make certain estimates and assumptions at the date of the financial statements. Actual results could differ from those estimates. Subsequent events, if any, through the date that the financial statements were issued have been evaluated in the preparation of the financial statements. The following summarizes the significant accounting policies of the Fund:
Investment Valuation. Investments are valued as of 4:00 p.m. Eastern time on the last calendar day of the period. The Board of Trustees (the Board) has delegated the day to day responsibility for the valuation of the Fund's investments to the Fair Value Committee (the Committee) established by the Fund's investment adviser. In accordance with valuation policies and procedures approved by the Board, the Fund attempts to obtain prices from one or more third party pricing vendors or brokers to value its investments. When current market prices, quotations or currency exchange rates are not readily available or reliable, investments will be fair valued in good faith by the Committee, in accordance with procedures adopted by the Board. Factors used in determining fair value vary by investment type and may include market or investment specific events. The frequency with which these procedures are used cannot be predicted and they may be utilized to a significant extent. The Committee oversees the Fund's valuation policies and procedures and reports to the Board on the Committee's activities and fair value determinations. The Board monitors the appropriateness of the procedures used in valuing the Fund's investments and ratifies the fair value determinations of the Committee.
The Fund categorizes the inputs to valuation techniques used to value its investments into a disclosure hierarchy consisting of three levels as shown below:
- Level 1 – quoted prices in active markets for identical investments
- Level 2 – other significant observable inputs (including quoted prices for similar investments, interest rates, prepayment speeds, etc.)
- Level 3 – unobservable inputs (including the Fund's own assumptions based on the best information available)
Valuation techniques used to value the Fund's investments by major category are as follows:
Equity securities, including restricted securities, for which market quotations are readily available, are valued at the last reported sale price or official closing price as reported by a third party pricing vendor on the primary market or exchange on which they are traded and are categorized as Level 1 in the hierarchy. In the event there were no sales during the day or closing prices are not available, securities are valued at the last quoted bid price or may be valued using the last available price and are generally categorized as Level 2 in the hierarchy. For foreign equity securities, when market or security specific events arise, comparisons to the valuation of American Depositary Receipts (ADRs), futures contracts, Exchange-Traded Funds (ETFs) and certain indexes as well as quoted prices for similar securities may be used and would be categorized as Level 2 in the hierarchy. For equity securities, including restricted securities, where observable inputs are limited, assumptions about market activity and risk are used and these securities may be categorized as Level 3 in the hierarchy.
Investments in open-end mutual funds, including the Fidelity Central Funds, are valued at their closing net asset value (NAV) each business day and are categorized as Level 1 in the hierarchy.
Changes in valuation techniques may result in transfers in or out of an assigned level within the disclosure hierarchy. The aggregate value of investments by input level as of January 31, 2021 is included at the end of the Fund's Schedule of Investments.
Foreign Currency. Certain Funds may use foreign currency contracts to facilitate transactions in foreign-denominated securities. Gains and losses from these transactions may arise from changes in the value of the foreign currency or if the counterparties do not perform under the contracts' terms.
Foreign-denominated assets, including investment securities, and liabilities are translated into U.S. dollars at the exchange rates at period end. Purchases and sales of investment securities, income and dividends received, and expenses denominated in foreign currencies are translated into U.S. dollars at the exchange rate in effect on the transaction date.
The effects of exchange rate fluctuations on investments are included with the net realized and unrealized gain (loss) on investment securities. Other foreign currency transactions resulting in realized and unrealized gain (loss) are disclosed separately.
Investment Transactions and Income. For financial reporting purposes, the Fund's investment holdings and NAV include trades executed through the end of the last business day of the period. The NAV per share for processing shareholder transactions is calculated as of the close of business of the New York Stock Exchange (NYSE), normally 4:00 p.m. Eastern time and includes trades executed through the end of the prior business day. Gains and losses on securities sold are determined on the basis of identified cost. Dividend income is recorded on the ex-dividend date, except for certain dividends from foreign securities where the ex-dividend date may have passed, which are recorded as soon as the Fund is informed of the ex-dividend date. Non-cash dividends included in dividend income, if any, are recorded at the fair market value of the securities received. Income and capital gain distributions from Fidelity Central Funds, if any, are recorded on the ex-dividend date. Certain distributions received by the Fund represent a return of capital or capital gain. The Fund determines the components of these distributions subsequent to the ex-dividend date, based upon receipt of tax filings or other correspondence relating to the underlying investment. These distributions are recorded as a reduction of cost of investments and/or as a realized gain. Investment income is recorded net of foreign taxes withheld where recovery of such taxes is uncertain.
Expenses. Expenses directly attributable to a fund are charged to that fund. Expenses attributable to more than one fund are allocated among the respective funds on the basis of relative net assets or other appropriate methods. Expense estimates are accrued in the period to which they relate and adjustments are made when actual amounts are known.
Income Tax Information and Distributions to Shareholders. Each year, the Fund intends to qualify as a regulated investment company under Subchapter M of the Internal Revenue Code, including distributing substantially all of its taxable income and realized gains. As a result, no provision for U.S. Federal income taxes is required. As of January 31, 2021, the Fund did not have any unrecognized tax benefits in the financial statements; nor is the Fund aware of any tax positions for which it is reasonably possible that the total amounts of unrecognized tax benefits will significantly change in the next twelve months. The Fund files a U.S. federal tax return, in addition to state and local tax returns as required. The Fund's federal income tax returns are subject to examination by the Internal Revenue Service (IRS) for a period of three fiscal years after they are filed. State and local tax returns may be subject to examination for an additional fiscal year depending on the jurisdiction. Foreign taxes are provided for based on the Fund's understanding of the tax rules and rates that exist in the foreign markets in which it invests.
Distributions are declared and recorded on the ex-dividend date. Income and capital gain distributions are determined in accordance with income tax regulations, which may differ from GAAP.
Capital accounts within the financial statements are adjusted for permanent book-tax differences. These adjustments have no impact on net assets or the results of operations. Capital accounts are not adjusted for temporary book-tax differences which will reverse in a subsequent period.
Book-tax differences are primarily due to foreign currency transactions, passive foreign investment companies (PFIC), partnerships, capital loss carryforwards and losses deferred due to wash sales.
As of period end, the cost and unrealized appreciation (depreciation) in securities, and derivatives if applicable, for federal income tax purposes were as follows:
| Gross unrealized appreciation | $11,782,451 |
| Gross unrealized depreciation | (1,681,811) |
| Net unrealized appreciation (depreciation) | $10,100,640 |
| Tax Cost | $54,208,408 |
The tax-based components of distributable earnings as of period end were as follows:
| Undistributed ordinary income | $90,163 |
| Capital loss carryforward | $(994,971) |
| Net unrealized appreciation (depreciation) on securities and other investments | $10,056,482 |
Capital loss carryforwards are only available to offset future capital gains of the Fund to the extent provided by regulations and may be limited. The capital loss carryforward information presented below, including any applicable limitation, is estimated as of fiscal period end and is subject to adjustment.
| No expiration | |
| Short-term | $(994,971) |
The tax character of distributions paid was as follows:
| January 31, 2021 | January 31, 2020(a) | |
| Ordinary Income | $1,069,601 | $ 333,105 |
| Long-term Capital Gains | 4,431 | – |
| Total | $1,074,032 | $ 333,105 |
(a) For the period June13, 2019 (commencement of operations) to January 31, 2020.
4. Purchases and Sales of Investments.
Purchases and sales of securities, other than short-term securities and in-kind transactions, are noted in the table below.
| Purchases ($) | Sales ($) | |
| Fidelity Equity-Income K6 Fund | 44,382,649 | 36,075,337 |
Unaffiliated Exchanges In-Kind. During the period, the Fund received investments and cash valued at $1,115,704 in exchange for 109,169 shares of the Fund. The amount of in-kind exchanges is included in share transactions in the accompanying Statement of Changes in Net Assets.
Prior Fiscal Year Unaffiliated Exchanges In-Kind. During the prior period, the Fund received investments and cash valued at $6,437,242 in exchange for 631,721 shares of the Fund. The amount of in-kind exchanges is included in share transactions in the accompanying Statement of Changes in Net Assets.
5. Fees and Other Transactions with Affiliates.
Management Fee. Fidelity Management & Research Company LLC (the investment adviser) and its affiliates provide the Fund with investment management related services for which the Fund pays a monthly management fee that is based on an annual rate of .34% of average net assets. Under the management contract, the investment adviser or an affiliate pays all other expenses of the Fund, excluding fees and expenses of the independent Trustees, and certain miscellaneous expenses such as proxy and shareholder meeting expenses.
Brokerage Commissions. A portion of portfolio transactions were placed with brokerage firms which are affiliates of the investment adviser. Brokerage commissions are included in net realized gain (loss) and change in net unrealized appreciation (depreciation) in the Statement of Operations. The commissions paid to these affiliated firms were as follows:
| Amount | |
| Fidelity Equity-Income K6 Fund | $924 |
Interfund Trades. Funds may purchase from or sell securities to other Fidelity Funds under procedures adopted by the Board. The procedures have been designed to ensure these interfund trades are executed in accordance with Rule 17a-7 of the 1940 Act. Interfund trades are included within the respective purchases and sales amounts shown in the Purchases and Sales of Investments note, and amounted to $4,443,340 and $2,874,343, respectively.
Prior Fiscal Year Affiliated Exchanges In-Kind. During the prior period, the Fund received investments, and cash valued at $38,316,698 in exchange for 3,870,373 shares of the Fund. The amount of in-kind exchanges is included in share transactions in the accompanying Statement of Changes in Net Assets.
6. Committed Line of Credit.
Certain Funds participate with other funds managed by the investment adviser or an affiliate in a $4.25 billion credit facility (the "line of credit") to be utilized for temporary or emergency purposes to fund shareholder redemptions or for other short-term liquidity purposes. The participating funds have agreed to pay commitment fees on their pro-rata portion of the line of credit, which are reflected in Miscellaneous expenses on the Statement of Operations, and are listed below. Effective during January 2021, commitment fees are borne by the investment advisor.
| Amount | |
| Fidelity Equity-Income K6 Fund | $91 |
During the period, there were no borrowings on this line of credit.
7. Security Lending.
Funds lend portfolio securities from time to time in order to earn additional income. Lending agents are used, including National Financial Services (NFS), an affiliate of the investment adviser. Pursuant to a securities lending agreement, NFS will receive a fee, which is capped at 9.9% of a fund's daily lending revenue, for its services as lending agent. A fund may lend securities to certain qualified borrowers, including NFS. On the settlement date of the loan, a fund receives collateral (in the form of U.S. Treasury obligations, letters of credit and/or cash) against the loaned securities and maintains collateral in an amount not less than 100% of the market value of the loaned securities during the period of the loan. The market value of the loaned securities is determined at the close of business of a fund and any additional required collateral is delivered to a fund on the next business day. A fund or borrower may terminate the loan at any time, and if the borrower defaults on its obligation to return the securities loaned because of insolvency or other reasons, a fund may apply collateral received from the borrower against the obligation. A fund may experience delays and costs in recovering the securities loaned. Any cash collateral received is invested in the Fidelity Securities Lending Cash Central Fund. Any loaned securities are identified as such in the Schedule of Investments, and the value of loaned securities and cash collateral at period end, as applicable, are presented in the Statement of Assets and Liabilities. Security lending income represents the income earned on investing cash collateral, less rebates paid to borrowers and any lending agent fees associated with the loan, plus any premium payments received for lending certain types of securities. Security lending income is presented in the Statement of Operations as a component of income from Fidelity Central Funds. Affiliated security lending activity, if any, was as follows:
| Total Security Lending Income Fees Paid to NFS | Security Lending Income From Securities Loaned to NFS | Value of Securities Loaned to NFS at Period End | |
| Fidelity Equity-Income K6 Fund | $80 | $– | $– |
8. Expense Reductions.
Commissions paid to certain brokers with whom the investment adviser, or its affiliates, places trades on behalf of the Fund include an amount in addition to trade execution, which may be rebated back to the Fund to offset expenses. This amount totaled $3,702 for the period. In addition, through arrangements with the Fund's custodian, credits realized as a result of certain uninvested cash balances were used to reduce the Fund's expenses by $59.
9. Other.
The Fund's organizational documents provide former and current trustees and officers with a limited indemnification against liabilities arising in connection with the performance of their duties to the Fund. In the normal course of business, the Fund may also enter into contracts that provide general indemnifications. The Fund's maximum exposure under these arrangements is unknown as this would be dependent on future claims that may be made against the Fund. The risk of material loss from such claims is considered remote.
10. Coronavirus (COVID-19) Pandemic.
An outbreak of COVID-19 first detected in China during December 2019 has since spread globally and was declared a pandemic by the World Health Organization during March 2020. Developments that disrupt global economies and financial markets, such as the COVID-19 pandemic, may magnify factors that affect the Fund's performance.
Report of Independent Registered Public Accounting Firm
To the Board of Trustees of Fidelity Devonshire Trust and Shareholders of Fidelity Equity-Income K6 Fund
Opinion on the Financial Statements and Financial Highlights
We have audited the accompanying statement of assets and liabilities of Fidelity Equity-Income K6 Fund (the "Fund"), a fund of Fidelity Devonshire Trust, including the schedule of investments, as of January 31, 2021, the related statement of operations for the year then ended, the statement of changes in net assets and the financial highlights for the year then ended and for the period from June 13, 2019 (commencement of operations) through January 31, 2020, and the related notes. In our opinion, the financial statements and financial highlights present fairly, in all material respects, the financial position of the Fund as of January 31, 2021, the results of its operations for the year then ended, the changes in its net assets and the financial highlights for the year then ended and for the period from June 13, 2019 (commencement of operations) through January 31, 2020, in conformity with accounting principles generally accepted in the United States of America.
Basis for Opinion
These financial statements and financial highlights are the responsibility of the Fund's management. Our responsibility is to express an opinion on the Fund's financial statements and financial highlights based on our audits. We are a public accounting firm registered with the Public Company Accounting Oversight Board (United States) (PCAOB) and are required to be independent with respect to the Fund in accordance with the U.S. federal securities laws and the applicable rules and regulations of the Securities and Exchange Commission and the PCAOB.
We conducted our audits in accordance with the standards of the PCAOB. Those standards require that we plan and perform the audit to obtain reasonable assurance about whether the financial statements and financial highlights are free of material misstatement, whether due to error or fraud. The Fund is not required to have, nor were we engaged to perform, an audit of its internal control over financial reporting. As part of our audits we are required to obtain an understanding of internal control over financial reporting but not for the purpose of expressing an opinion on the effectiveness of the Fund’s internal control over financial reporting. Accordingly, we express no such opinion.
Our audits included performing procedures to assess the risks of material misstatement of the financial statements and financial highlights, whether due to error or fraud, and performing procedures that respond to those risks. Such procedures included examining, on a test basis, evidence regarding the amounts and disclosures in the financial statements and financial highlights. Our audits also included evaluating the accounting principles used and significant estimates made by management, as well as evaluating the overall presentation of the financial statements and financial highlights. Our procedures included confirmation of securities owned as of January 31, 2021, by correspondence with the custodian and brokers; when replies were not received from brokers, we performed other auditing procedures. We believe that our audits provide a reasonable basis for our opinion.
/s/ Deloitte & Touche LLP
Boston, Massachusetts
March 16, 2021
We have served as the auditor of one or more of the Fidelity investment companies since 1999.
Trustees and Officers
The Trustees, Members of the Advisory Board (if any), and officers of the trust and fund, as applicable, are listed below. The Board of Trustees governs the fund and is responsible for protecting the interests of shareholders. The Trustees are experienced executives who meet periodically throughout the year to oversee the fund's activities, review contractual arrangements with companies that provide services to the fund, oversee management of the risks associated with such activities and contractual arrangements, and review the fund's performance. Each of the Trustees oversees 309 funds.
The Trustees hold office without limit in time except that (a) any Trustee may resign; (b) any Trustee may be removed by written instrument, signed by at least two-thirds of the number of Trustees prior to such removal; (c) any Trustee who requests to be retired or who has become incapacitated by illness or injury may be retired by written instrument signed by a majority of the other Trustees; and (d) any Trustee may be removed at any special meeting of shareholders by a two-thirds vote of the outstanding voting securities of the trust. Each Trustee who is not an interested person (as defined in the 1940 Act) of the trust and the fund is referred to herein as an Independent Trustee. Each Independent Trustee shall retire not later than the last day of the calendar year in which his or her 75th birthday occurs. The Independent Trustees may waive this mandatory retirement age policy with respect to individual Trustees. Officers and Advisory Board Members hold office without limit in time, except that any officer or Advisory Board Member may resign or may be removed by a vote of a majority of the Trustees at any regular meeting or any special meeting of the Trustees. Except as indicated, each individual has held the office shown or other offices in the same company for the past five years.
The fund’s Statement of Additional Information (SAI) includes more information about the Trustees. To request a free copy, call Fidelity at 1-800-835-5092.
Experience, Skills, Attributes, and Qualifications of the Trustees. The Governance and Nominating Committee has adopted a statement of policy that describes the experience, qualifications, attributes, and skills that are necessary and desirable for potential Independent Trustee candidates (Statement of Policy). The Board believes that each Trustee satisfied at the time he or she was initially elected or appointed a Trustee, and continues to satisfy, the standards contemplated by the Statement of Policy. The Governance and Nominating Committee also engages professional search firms to help identify potential Independent Trustee candidates who have the experience, qualifications, attributes, and skills consistent with the Statement of Policy. From time to time, additional criteria based on the composition and skills of the current Independent Trustees, as well as experience or skills that may be appropriate in light of future changes to board composition, business conditions, and regulatory or other developments, have also been considered by the professional search firms and the Governance and Nominating Committee. In addition, the Board takes into account the Trustees' commitment and participation in Board and committee meetings, as well as their leadership of standing and ad hoc committees throughout their tenure.
In determining that a particular Trustee was and continues to be qualified to serve as a Trustee, the Board has considered a variety of criteria, none of which, in isolation, was controlling. The Board believes that, collectively, the Trustees have balanced and diverse experience, qualifications, attributes, and skills, which allow the Board to operate effectively in governing the fund and protecting the interests of shareholders. Information about the specific experience, skills, attributes, and qualifications of each Trustee, which in each case led to the Board's conclusion that the Trustee should serve (or continue to serve) as a trustee of the fund, is provided below.
Board Structure and Oversight Function. Robert A. Lawrence is an interested person and currently serves as Acting Chairman. The Trustees have determined that an interested Chairman is appropriate and benefits shareholders because an interested Chairman has a personal and professional stake in the quality and continuity of services provided to the fund. Independent Trustees exercise their informed business judgment to appoint an individual of their choosing to serve as Chairman, regardless of whether the Trustee happens to be independent or a member of management. The Independent Trustees have determined that they can act independently and effectively without having an Independent Trustee serve as Chairman and that a key structural component for assuring that they are in a position to do so is for the Independent Trustees to constitute a substantial majority for the Board. The Independent Trustees also regularly meet in executive session. David M. Thomas serves as Lead Independent Trustee and as such (i) acts as a liaison between the Independent Trustees and management with respect to matters important to the Independent Trustees and (ii) with management prepares agendas for Board meetings.
Fidelity® funds are overseen by different Boards of Trustees. The fund's Board oversees Fidelity's high income and certain equity funds, and other Boards oversee Fidelity's investment-grade bond, money market, asset allocation, and other equity funds. The asset allocation funds may invest in Fidelity® funds overseen by the fund's Board. The use of separate Boards, each with its own committee structure, allows the Trustees of each group of Fidelity® funds to focus on the unique issues of the funds they oversee, including common research, investment, and operational issues. On occasion, the separate Boards establish joint committees to address issues of overlapping consequences for the Fidelity® funds overseen by each Board.
The Trustees operate using a system of committees to facilitate the timely and efficient consideration of all matters of importance to the Trustees, the fund, and fund shareholders and to facilitate compliance with legal and regulatory requirements and oversight of the fund's activities and associated risks. The Board, acting through its committees, has charged FMR and its affiliates with (i) identifying events or circumstances the occurrence of which could have demonstrably adverse effects on the fund's business and/or reputation; (ii) implementing processes and controls to lessen the possibility that such events or circumstances occur or to mitigate the effects of such events or circumstances if they do occur; and (iii) creating and maintaining a system designed to evaluate continuously business and market conditions in order to facilitate the identification and implementation processes described in (i) and (ii) above. Because the day-to-day operations and activities of the fund are carried out by or through FMR, its affiliates, and other service providers, the fund's exposure to risks is mitigated but not eliminated by the processes overseen by the Trustees. While each of the Board's committees has responsibility for overseeing different aspects of the fund's activities, oversight is exercised primarily through the Operations, Audit, and Compliance Committees. Appropriate personnel, including but not limited to the fund's Chief Compliance Officer (CCO), FMR's internal auditor, the independent accountants, the fund's Treasurer and portfolio management personnel, make periodic reports to the Board's committees, as appropriate, including an annual review of Fidelity's risk management program for the Fidelity® funds. The responsibilities of each standing committee, including their oversight responsibilities, are described further under "Standing Committees of the Trustees."
Interested Trustees*:
Correspondence intended for a Trustee who is an interested person may be sent to Fidelity Investments, 245 Summer Street, Boston, Massachusetts 02210.
Name, Year of Birth; Principal Occupations and Other Relevant Experience+
Bettina Doulton (1964)
Year of Election or Appointment: 2020
Trustee
Ms. Doulton also serves as Trustee of other Fidelity® funds. Prior to her retirement, Ms. Doulton served in a variety of positions at Fidelity Investments, including as a managing director of research (2006-2007), portfolio manager to certain Fidelity® funds (1993-2005), equity analyst and portfolio assistant (1990-1993), and research assistant (1987-1990). Ms. Doulton currently owns and operates Phi Builders + Architects and Cellardoor Winery. Previously, Ms. Doulton served as a member of the Board of Brown Capital Management, LLC (2013-2018).
Robert A. Lawrence (1952)
Year of Election or Appointment: 2020
Trustee
Acting Chairman of the Board of Trustees
Mr. Lawrence also serves as Trustee of other funds. Previously, Mr. Lawrence served as a Member of the Advisory Board of certain funds. Prior to his retirement in 2008, Mr. Lawrence served as Vice President of certain Fidelity® funds (2006-2008), Senior Vice President, Head of High Income Division of Fidelity Management & Research Company (investment adviser firm, 2006-2008), and President of Fidelity Strategic Investments (investment adviser firm, 2002-2005).
* Determined to be an “Interested Trustee” by virtue of, among other things, his or her affiliation with the trust or various entities under common control with FMR.
+ The information includes the Trustee's principal occupation during the last five years and other information relating to the experience, attributes, and skills relevant to the Trustee's qualifications to serve as a Trustee, which led to the conclusion that the Trustee should serve as a Trustee for the fund.
Independent Trustees:
Correspondence intended for an Independent Trustee may be sent to Fidelity Investments, P.O. Box 55235, Boston, Massachusetts 02205-5235.
Name, Year of Birth; Principal Occupations and Other Relevant Experience+
Dennis J. Dirks (1948)
Year of Election or Appointment: 2005
Trustee
Mr. Dirks also serves as Trustee of other Fidelity® funds. Prior to his retirement in May 2003, Mr. Dirks served as Chief Operating Officer and as a member of the Board of The Depository Trust & Clearing Corporation (financial markets infrastructure), President, Chief Operating Officer and a member of the Board of The Depository Trust Company (DTC), President and a member of the Board of the National Securities Clearing Corporation (NSCC), Chief Executive Officer and a member of the Board of the Government Securities Clearing Corporation and Chief Executive Officer and a member of the Board of the Mortgage-Backed Securities Clearing Corporation. Mr. Dirks currently serves as a member of the Finance Committee (2016-present) and Board (2017-present) and is Treasurer (2018-present) of the Asolo Repertory Theatre.
Donald F. Donahue (1950)
Year of Election or Appointment: 2018
Trustee
Mr. Donahue also serves as Trustee of other Fidelity® funds. Mr. Donahue serves as President and Chief Executive Officer of Miranda Partners, LLC (risk consulting for the financial services industry, 2012-present). Previously, Mr. Donahue served as Chief Executive Officer (2006-2012), Chief Operating Officer (2003-2006) and Managing Director, Customer Marketing and Development (1999-2003) of The Depository Trust & Clearing Corporation (financial markets infrastructure). Mr. Donahue currently serves as a member (2007-present) and Co-Chairman (2016-present) of the Board of United Way of New York, a member of the Board of NYC Leadership Academy (2012-present) and a member of the Board of Advisors of Ripple Labs, Inc. (financial services, 2015-present). Mr. Donahue previously served as a member of the Advisory Board of certain Fidelity® funds (2015-2018).
Vicki L. Fuller (1957)
Year of Election or Appointment: 2020
Trustee
Ms. Fuller also serves as Trustee of other Fidelity® funds. Previously, Ms. Fuller served as a member of the Advisory Board of certain Fidelity® funds (2018-2020), Chief Investment Officer of the New York State Common Retirement Fund (2012-2018) and held a variety of positions at AllianceBernstein L.P. (global asset management, 1985-2012), including Managing Director (2006-2012) and Senior Vice President and Senior Portfolio Manager (2001-2006). Ms. Fuller currently serves as a member of the Board, Audit Committee and Nominating and Governance Committee of The Williams Companies, Inc. (natural gas infrastructure, 2018-present), as a member of the Board, Audit Committee and Nominating and Governance Committee of two Blackstone business development companies (2020-present) and as a member of the Board of Treliant, LLC (consulting, 2019-present).
Patricia L. Kampling (1959)
Year of Election or Appointment: 2020
Trustee
Ms. Kampling also serves as Trustee of other Fidelity® funds. Prior to her retirement, Ms. Kampling served as Chairman of the Board and Chief Executive Officer (2012-2019), President and Chief Operating Officer (2011-2012) and Executive Vice President and Chief Financial Officer (2010-2011) of Alliant Energy Corporation. Ms. Kampling currently serves as a member of the Board, Compensation Committee and Executive Committee and as Chair of the Audit Committee of Briggs & Stratton Corporation (manufacturing, 2011-present) and as a member of the Board, Audit, Finance and Risk Committee and Safety, Environmental, Technology and Operations Committee of American Water Works Company, Inc. (utilities company, 2019-present). In addition, Ms. Kampling currently serves as a member of the Board of the Nature Conservancy, Wisconsin Chapter (2019-present). Previously, Ms. Kampling served as a Member of the Advisory Board of certain Fidelity® funds (2020), a member of the Board of Interstate Power and Light Company (2012-2019) and Wisconsin Power and Light Company (2012-2019) (each a subsidiary of Alliant Energy Corporation) and as a member of the Board and Workforce Development Committee of the Business Roundtable (2018-2019).
Thomas A. Kennedy (1955)
Year of Election or Appointment: 2021
Trustee
Mr. Kennedy also serves as Trustee of other Fidelity® funds. Previously, Mr. Kennedy served as a Member of the Advisory Board of certain Fidelity® funds (2020) and held a variety of positions at Raytheon Company (aerospace and defense, 1983-2020), including Chairman and Chief Executive Officer (2014-2020) and Executive Vice President and Chief Operating Officer (2013-2014). Mr. Kennedy currently serves as Executive Chairman of the Board of Directors of Raytheon Technologies Corporation (aerospace and defense, 2020-present). He is also a member of the Rutgers School of Engineering Industry Advisory Board (2011-present) and a member of the UCLA Engineering Dean’s Executive Board (2016-present).
Garnett A. Smith (1947)
Year of Election or Appointment: 2018
Trustee
Mr. Smith also serves as Trustee of other Fidelity® funds. Prior to his retirement, Mr. Smith served as Chairman and Chief Executive Officer (1990-1997) and President (1986-1990) of Inbrand Corp. (manufacturer of personal absorbent products). Prior to his employment with Inbrand Corp., he was employed by a retail fabric chain and North Carolina National Bank (now Bank of America). Mr. Smith previously served as a member of the Advisory Board of certain Fidelity® funds (2012-2013).
David M. Thomas (1949)
Year of Election or Appointment: 2008
Trustee
Lead Independent Trustee
Mr. Thomas also serves as Trustee of other Fidelity® funds. Previously, Mr. Thomas served as Executive Chairman (2005-2006) and Chairman and Chief Executive Officer (2000-2005) of IMS Health, Inc. (pharmaceutical and healthcare information solutions). Mr. Thomas currently serves as Non-Executive Chairman of the Board of Fortune Brands Home and Security (home and security products, 2011-present), and a member of the Board (2004-present) and Presiding Director (2013-present) of Interpublic Group of Companies, Inc. (marketing communication).
Susan Tomasky (1953)
Year of Election or Appointment: 2020
Trustee
Ms. Tomasky also serves as Trustee of other Fidelity® funds. Prior to her retirement, Ms. Tomasky served in various executive officer positions at American Electric Power Company, Inc. (1998-2011), including most recently as President of AEP Transmission (2007-2011). Ms. Tomasky currently serves as a member of the Board and Sustainability Committee and as Chair of the Audit Committee of Marathon Petroleum Corporation (2018-present) and as a member of the Board, Corporate Governance Committee and Organization and Compensation Committee and as Chair of the Audit Committee of Public Service Enterprise Group, Inc. (utilities company, 2012-present). In addition, Ms. Tomasky currently serves as a member of the Board of the Columbus Regional Airport Authority (2007-present), as a member of the Board of the Royal Shakespeare Company – America (2009-present), as a member of the Board of the Columbus Association for the Performing Arts (2011-present) and as a member of the Board of Kenyon College (2016-present). Previously, Ms. Tomasky served as a Member of the Advisory Board of certain Fidelity® funds (2020), a member of the Board (2011-2019) and as Lead Independent Director (2015-2018) of Andeavor Corporation (previously Tesoro Corporation) (independent oil refiner and marketer) and as a member of the Board of Summit Midstream Partners LP (energy, 2012-2018).
Michael E. Wiley (1950)
Year of Election or Appointment: 2018
Trustee
Mr. Wiley also serves as Trustee of other Fidelity® funds. Previously, Mr. Wiley served as a member of the Advisory Board of certain Fidelity® funds (2018-2020), Chairman, President and CEO of Baker Hughes, Inc. (oilfield services, 2000-2004). Mr. Wiley also previously served as a member of the Board of Andeavor Corporation (independent oil refiner and marketer, 2005-2018), a member of the Board of Andeavor Logistics LP (natural resources logistics, 2015-2018) and a member of the Board of High Point Resources (exploration and production, 2005-2020).
+ The information includes the Trustee's principal occupation during the last five years and other information relating to the experience, attributes, and skills relevant to the Trustee's qualifications to serve as a Trustee, which led to the conclusion that the Trustee should serve as a Trustee for the fund.
Advisory Board Members and Officers:
Correspondence intended for a Member of the Advisory Board (if any) may be sent to Fidelity Investments, P.O. Box 55235, Boston, Massachusetts 02205-5235. Correspondence intended for an officer or Peter S. Lynch may be sent to Fidelity Investments, 245 Summer Street, Boston, Massachusetts 02210. Officers appear below in alphabetical order.
Name, Year of Birth; Principal Occupation
Ned C. Lautenbach (1944)
Year of Election or Appointment: 2021
Member of the Advisory Board
Mr. Lautenbach also serves as a Member of the Advisory Board of other Fidelity® funds. Mr. Lautenbach currently serves as Chair of the Board of Governors, State University System of Florida (2013-present) and is a member of the Council on Foreign Relations (1994-present). He is also a member and has in the past served as Chairman of the Board of Directors of Artis-Naples (2012-present). Previously, Mr. Lautenbach served as a Trustee of certain Fidelity® funds (2000-2020) and a member and then Lead Director of the Board of Directors of Eaton Corporation (diversified industrial, 1997-2016). He was also a Partner at Clayton, Dubilier & Rice, LLC (private equity investment, 1998-2010); as well as Director of Sony Corporation (2006-2007). In addition, Mr. Lautenbach had a 30-year career with IBM (technology company), during which time he served as Senior Vice President and as a member of the Corporate Executive Committee (1968-1998).
Peter S. Lynch (1944)
Year of Election or Appointment: 2003
Member of the Advisory Board
Mr. Lynch also serves as a Member of the Advisory Board of other Fidelity® funds. Mr. Lynch is Vice Chairman and a Director of Fidelity Management & Research Company LLC (investment adviser firm). In addition, Mr. Lynch serves as a Trustee of Boston College and as the Chairman of the Inner-City Scholarship Fund. Previously, Mr. Lynch served as Vice Chairman and a Director of FMR Co., Inc. (investment adviser firm) and on the Special Olympics International Board of Directors (1997-2006).
Craig S. Brown (1977)
Year of Election or Appointment: 2019
Assistant Treasurer
Mr. Brown also serves as Assistant Treasurer of other funds. Mr. Brown is an employee of Fidelity Investments (2013-present).
John J. Burke III (1964)
Year of Election or Appointment: 2018
Chief Financial Officer
Mr. Burke also serves as Chief Financial Officer of other funds. Mr. Burke serves as Head of Investment Operations for Fidelity Fund and Investment Operations (2018-present) and is an employee of Fidelity Investments (1998-present). Previously Mr. Burke served as head of Asset Management Investment Operations (2012-2018).
William C. Coffey (1969)
Year of Election or Appointment: 2019
Assistant Secretary
Mr. Coffey also serves as Assistant Secretary of other funds. He is Senior Vice President and Deputy General Counsel of FMR LLC (diversified financial services company, 2010-present), and is an employee of Fidelity Investments. Previously, Mr. Coffey served as Secretary and CLO of certain funds (2018-2019); CLO, Secretary, and Senior Vice President of Fidelity Management & Research Company and FMR Co., Inc. (investment adviser firms, 2018-2019); Secretary of Fidelity SelectCo, LLC and Fidelity Investments Money Management, Inc. (investment adviser firms, 2018-2019); CLO of Fidelity Management & Research (Hong Kong) Limited, FMR Investment Management (UK) Limited, and Fidelity Management & Research (Japan) Limited (investment adviser firms, 2018-2019); and Assistant Secretary of certain funds (2009-2018).
Timothy M. Cohen (1969)
Year of Election or Appointment: 2018
Vice President
Mr. Cohen also serves as Vice President of other funds. Mr. Cohen serves as Co-Head of Equity (2018-present), a Director of Fidelity Management & Research (Japan) Limited (investment adviser firm, 2016-present), and is an employee of Fidelity Investments. Previously, Mr. Cohen served as Executive Vice President of Fidelity SelectCo, LLC (2019), Head of Global Equity Research (2016-2018), Chief Investment Officer - Equity and a Director of Fidelity Management & Research (U.K.) Inc. (investment adviser firm, 2013-2015) and as a Director of Fidelity Management & Research (Hong Kong) Limited (investment adviser firm, 2017).
Jonathan Davis (1968)
Year of Election or Appointment: 2010
Assistant Treasurer
Mr. Davis also serves as Assistant Treasurer of other funds. Mr. Davis serves as Assistant Treasurer of FMR Capital, Inc. (2017-present) and is an employee of Fidelity Investments. Previously, Mr. Davis served as Vice President and Associate General Counsel of FMR LLC (diversified financial services company, 2003-2010).
Laura M. Del Prato (1964)
Year of Election or Appointment: 2018
Assistant Treasurer
Ms. Del Prato also serves as an officer of other funds. Ms. Del Prato is an employee of Fidelity Investments (2017-present). Previously, Ms. Del Prato served as President and Treasurer of The North Carolina Capital Management Trust: Cash Portfolio and Term Portfolio (2018-2020). Prior to joining Fidelity Investments, Ms. Del Prato served as a Managing Director and Treasurer of the JPMorgan Mutual Funds (2014-2017). Prior to JPMorgan, Ms. Del Prato served as a partner at Cohen Fund Audit Services (accounting firm, 2012-2013) and KPMG LLP (accounting firm, 2004-2012).
Colm A. Hogan (1973)
Year of Election or Appointment: 2020
Assistant Treasurer
Mr. Hogan also serves as an officer of other funds. Mr. Hogan serves as Assistant Treasurer of FMR Capital, Inc. (2017-present) and is an employee of Fidelity Investments (2005-present). Previously, Mr. Hogan served as Deputy Treasurer of certain Fidelity® funds (2016-2020) and Assistant Treasurer of certain Fidelity® funds (2016-2018).
Pamela R. Holding (1964)
Year of Election or Appointment: 2018
Vice President
Ms. Holding also serves as Vice President of other funds. Ms. Holding serves as Co-Head of Equity (2018-present) and is an employee of Fidelity Investments (2013-present). Previously, Ms. Holding served as Executive Vice President of Fidelity SelectCo, LLC (2019) and as Chief Investment Officer of Fidelity Institutional Asset Management (2013-2018).
Cynthia Lo Bessette (1969)
Year of Election or Appointment: 2019
Secretary and Chief Legal Officer (CLO)
Ms. Lo Bessette also serves as an officer of other funds. Ms. Lo Bessette serves as CLO, Secretary, and Senior Vice President of Fidelity Management & Research Company LLC (investment adviser firm, 2019-present); and CLO of Fidelity Management & Research (Hong Kong) Limited, FMR Investment Management (UK) Limited, and Fidelity Management & Research (Japan) Limited (investment adviser firms, 2019-present). She is a Senior Vice President and Deputy General Counsel of FMR LLC (diversified financial services company, 2019-present), and is an employee of Fidelity Investments. Previously, Ms. Lo Bessette served as CLO, Secretary, and Senior Vice President of FMR Co., Inc. (investment adviser firm, 2019); Secretary of Fidelity SelectCo, LLC and Fidelity Investments Money Management, Inc. (investment adviser firms, 2019). Prior to joining Fidelity Investments, Ms. Lo Bessette was Executive Vice President, General Counsel (2016-2019) and Senior Vice President, Deputy General Counsel (2015-2016) of OppenheimerFunds (investment management company) and Deputy Chief Legal Officer (2013-2015) of Jennison Associates LLC (investment adviser firm).
Chris Maher (1972)
Year of Election or Appointment: 2020
Deputy Treasurer
Mr. Maher also serves as an officer of other funds. Mr. Maher serves as Assistant Treasurer of FMR Capital, Inc. (2017-present), and is an employee of Fidelity Investments (2008-present). Previously, Mr. Maher served as Assistant Treasurer of certain funds (2013-2020); Vice President of Asset Management Compliance (2013), Vice President of the Program Management Group of FMR (investment adviser firm, 2010-2013), and Vice President of Valuation Oversight (2008-2010).
Jason P. Pogorelec (1975)
Year of Election or Appointment: 2020
Chief Compliance Officer
Mr. Pogorelec also serves as Chief Compliance Officer of other funds. Mr. Pogorelec is a senior Vice President of Asset Management Compliance for Fidelity Investments and is an employee of Fidelity Investments (2006-present). Previously, Mr. Pogorelec served as Vice President, Associate General Counsel for Fidelity Investments (2010-2020) and Assistant Secretary of certain Fidelity funds (2015-2020).
Brett Segaloff (1972)
Year of Election or Appointment: 2021
Anti-Money Laundering (AML) Officer
Mr. Segaloff also serves as an AML Officer of other funds and other related entities. He is Director, Anti-Money Laundering (2007-present) of FMR LLC (diversified financial services company) and is an employee of Fidelity Investments (1996-present).
Stacie M. Smith (1974)
Year of Election or Appointment: 2016
President and Treasurer
Ms. Smith also serves as an officer of other funds. Ms. Smith serves as Assistant Treasurer of FMR Capital, Inc. (2017-present), is an employee of Fidelity Investments (2009-present), and has served in other fund officer roles. Prior to joining Fidelity Investments, Ms. Smith served as Senior Audit Manager of Ernst & Young LLP (accounting firm, 1996-2009). Previously, Ms. Smith served as Assistant Treasurer (2013-2019) and Deputy Treasurer (2013-2016) of certain Fidelity® funds.
Marc L. Spector (1972)
Year of Election or Appointment: 2016
Assistant Treasurer
Mr. Spector also serves as an officer of other funds. Mr. Spector serves as Assistant Treasurer of FMR Capital, Inc. (2017-present) and is an employee of Fidelity Investments (2016-present). Prior to joining Fidelity Investments, Mr. Spector served as Director at the Siegfried Group (accounting firm, 2013-2016), and prior to Siegfried Group as audit senior manager at Deloitte & Touche LLP (accounting firm, 2005-2013).
Jim Wegmann (1979)
Year of Election or Appointment: 2019
Assistant Treasurer
Mr. Wegmann also serves as Assistant Treasurer of other funds. Mr. Wegmann is an employee of Fidelity Investments (2011-present).
Shareholder Expense Example
As a shareholder, you incur two types of costs: (1) transaction costs, which may include sales charges (loads) on purchase payments or redemption proceeds, as applicable and (2) ongoing costs, which generally include management fees, distribution and/or service (12b-1) fees and other Fund expenses. This Example is intended to help you understand your ongoing costs (in dollars) of investing in a fund and to compare these costs with the ongoing costs of investing in other mutual funds.
The Example is based on an investment of $1,000 invested at the beginning of the period and held for the entire period (August 1, 2020 to January 31, 2021).
Actual Expenses
The first line of the accompanying table provides information about actual account values and actual expenses. You may use the information in this line, together with the amount you invested, to estimate the expenses that you paid over the period. Simply divide your account value by $1,000.00 (for example, an $8,600 account value divided by $1,000.00 = 8.6), then multiply the result by the number in the first line for a class/Fund under the heading entitled "Expenses Paid During Period" to estimate the expenses you paid on your account during this period. If any fund is a shareholder of any underlying mutual funds or exchange-traded funds (ETFs) (the Underlying Funds), such fund indirectly bears its proportional share of the expenses of the Underlying Funds in addition to the direct expenses incurred presented in the table. These fees and expenses are not included in the annualized expense ratio used to calculate the expense estimate in the table below.
Hypothetical Example for Comparison Purposes
The second line of the accompanying table provides information about hypothetical account values and hypothetical expenses based on the actual expense ratio and an assumed rate of return of 5% per year before expenses, which is not the actual return. The hypothetical account values and expenses may not be used to estimate the actual ending account balance or expenses you paid for the period. You may use this information to compare the ongoing costs of investing in the Fund and other funds. To do so, compare this 5% hypothetical example with the 5% hypothetical examples that appear in the shareholder reports of the other funds. If any fund is a shareholder of any Underlying Funds, such fund indirectly bears its proportional share of the expenses of the Underlying Funds in addition to the direct expenses as presented in the table. These fees and expenses are not included in the annualized expense ratio used to calculate the expense estimate in the table below.
Please note that the expenses shown in the table are meant to highlight your ongoing costs only and do not reflect any transaction costs. Therefore, the second line of the table is useful in comparing ongoing costs only, and will not help you determine the relative total costs of owning different funds.
| Annualized Expense Ratio-A | Beginning Account Value August 1, 2020 | Ending Account Value January 31, 2021 | Expenses Paid During Period-B August 1, 2020 to January 31, 2021 | |
| Fidelity Equity-Income K6 Fund | .34% | |||
| Actual | $1,000.00 | $1,155.00 | $1.84 | |
| Hypothetical-C | $1,000.00 | $1,023.43 | $1.73 |
A Annualized expense ratio reflects expenses net of applicable fee waivers.
B Expenses are equal to the annualized expense ratio, multiplied by the average account value over the period, multiplied by 184/ 366 (to reflect the one-half year period). The fees and expenses of any Underlying Funds are not included in each annualized expense ratio.
C 5% return per year before expenses
Distributions (Unaudited)
A total of 0.15% of the dividends distributed during the fiscal year was derived from interest on U.S. Government securities which is generally exempt from state income tax.
The fund designates 70%, 90%, 94%, 94%, and 94% of the dividends distributed in March, April, July, October, and December, respectively during the fiscal year as qualifying for the dividends–received deduction for corporate shareholders.
The fund designates 89%, 98%, 100%, 100%, and 100% of the dividends distributed in March, April, July, October, and December, respectively during the fiscal year as amounts which may be taken into account as a dividend for the purposes of the maximum rate under section 1(h)(11) of the Internal Revenue Code.
The fund designates 9% and 2% of the dividends distributed in March and April, respectively during the fiscal year as a section 199A dividend.
The fund will notify shareholders in January 2022 of amounts for use in preparing 2021 income tax returns.
Board Approval of Investment Advisory Contracts
Fidelity Equity-Income K6 Fund
At its January 2021 meeting, the Board of Trustees, including the Independent Trustees (together, the Board), voted to continue the management contract with Fidelity Management & Research Company LLC (FMR), and the sub-advisory agreements and sub-subadvisory agreements, in each case, where applicable (together, the Advisory Contracts) for the fund for four months from February 1, 2021 through May 31, 2021, in connection with changes to the Board's meeting calendar.The Board considered that the approval of the fund's Advisory Contracts will not result in any changes in (i) the investment process or strategies employed in the management of the fund's assets; (ii) the fees and expenses paid by shareholders; (iii) the nature, extent or quality of services provided under the fund's Advisory Contracts; or (iv) the day-to-day management of the fund or the persons primarily responsible for such management. The Board also considered that since its last approval of the fund's Advisory Contracts, FMR had provided additional information on the fund in support of the annual contract renewal process, including competitive analyses on total expenses and management fees and in-depth reviews of fund performance and fund profitability information. The Board also considered the findings of certain ad hoc committees that had been previously formed to discuss matters relevant to all of the Fidelity funds, including economies of scale, fall-out benefits and retail vs. institutional funds. The Board concluded that the fund's Advisory Contracts are fair and reasonable, and that the fund's Advisory Contracts should be renewed, without modification, through May 31, 2021, with the understanding that the Board will consider the annual renewal for a full one year period in May 2021.In connection with its consideration of future renewals of the fund's Advisory Contracts, the Board will consider: (i) the nature, extent and quality of services provided to the funds, including shareholder and administrative services and investment performance; (ii) the competitiveness of the management fee and total expenses for the fund; (iii) the costs of the services and profitability, including the revenues earned and the expenses incurred in conducting the business of developing, marketing, distributing, managing, administering, and servicing the fund and its shareholders, to the extent applicable; and (iv) whether there have been economies of scale in respect of the Fidelity funds, whether the Fidelity funds (including the fund) have appropriately benefited from any such economies of scale, and whether there is the potential for realization of any further economies.Based on its evaluation of all of the conclusions noted above, and after considering all factors it believed relevant, the Board ultimately concluded that the fund's management fee structure is fair and reasonable, and that the continuation of the fund's Advisory Contracts should be approved for four months from February 1, 2021 through May 31, 2021.Proxy Voting Results
A special meeting of shareholders was held on June 9, 2020. The results of votes taken among shareholders on the proposal before them are reported below. Each vote reported represents one dollar of net asset value held on the record date for the meeting.
PROPOSAL 1
To elect a Board of Trustees.
| # of Votes | % of Votes | |
| Dennis J. Dirks | ||
| Affirmative | 20,677,600,881.166 | 98.531 |
| Withheld | 308,216,367.332 | 1.469 |
| TOTAL | 20,985,817,248.498 | 100.000 |
| Donald F. Donahue | ||
| Affirmative | 20,685,205,663.711 | 98.568 |
| Withheld | 300,611,584.787 | 1.432 |
| TOTAL | 20,985,817,248.498 | 100.000 |
| Bettina Doulton | ||
| Affirmative | 20,701,129,729.034 | 98.643 |
| Withheld | 284,687,519.464 | 1.357 |
| TOTAL | 20,985,817,248.498 | 100.000 |
| Vicki L. Fuller | ||
| Affirmative | 20,713,892,146.063 | 98.704 |
| Withheld | 271,925,102.435 | 1.296 |
| TOTAL | 20,985,817,248.498 | 100.000 |
| Patricia L. Kampling | ||
| Affirmative | 20,693,289,719.327 | 98.606 |
| Withheld | 292,527,529.171 | 1.394 |
| TOTAL | 20,985,817,248.498 | 100.000 |
| Alan J. Lacy | ||
| Affirmative | 20,659,591,158.873 | 98.445 |
| Withheld | 326,226,089.625 | 1.555 |
| TOTAL | 20,985,817,248.498 | 100.000 |
| Ned C. Lautenbach | ||
| Affirmative | 20,634,244,420.039 | 98.325 |
| Withheld | 351,572,828.459 | 1.675 |
| TOTAL | 20,985,817,248.498 | 100.000 |
| Robert A. Lawrence | ||
| Affirmative | 20,672,781,907.548 | 98.508 |
| Withheld | 313,035,340.950 | 1.492 |
| TOTAL | 20,985,817,248.498 | 100.000 |
| Joseph Mauriello | ||
| Affirmative | 20,652,465,304.654 | 98.412 |
| Withheld | 333,351,943.843 | 1.588 |
| TOTAL | 20,985,817,248.498 | 100.000 |
| Cornelia M. Small | ||
| Affirmative | 20,671,641,667.984 | 98.503 |
| Withheld | 314,175,580.514 | 1.497 |
| TOTAL | 20,985,817,248.498 | 100.000 |
| Garnett A. Smith | ||
| Affirmative | 20,655,644,270.628 | 98.427 |
| Withheld | 330,172,977.870 | 1.573 |
| TOTAL | 20,985,817,248.498 | 100.000 |
| David M. Thomas | ||
| Affirmative | 20,654,595,907.599 | 98.422 |
| Withheld | 331,221,340.899 | 1.578 |
| TOTAL | 20,985,817,248.498 | 100.000 |
| Susan Tomasky | ||
| Affirmative | 20,686,662,870.375 | 98.574 |
| Withheld | 299,154,378.123 | 1.426 |
| TOTAL | 20,985,817,248.498 | 100.000 |
| Michael E. Wiley | ||
| Affirmative | 20,662,847,882.871 | 98.461 |
| Withheld | 322,969,365.626 | 1.539 |
| TOTAL | 20,985,817,248.498 | 100.000 |
| Proposal 1 reflects trust wide proposal and voting results. |
![]()
EQU-K6-ANN-0321
1.9893876.101
Fidelity Flex® Funds
Fidelity Flex® Mid Cap Value Fund
January 31, 2021
Contents
To view a fund's proxy voting guidelines and proxy voting record for the 12-month period ended June 30, visit http://www.fidelity.com/proxyvotingresults or visit the Securities and Exchange Commission's (SEC) web site at http://www.sec.gov.
You may also call 1-800-544-3455 (for managed account clients) or 1-800-835-5092 (for retirement plan participants) to request a free copy of the proxy voting guidelines.
Standard & Poor's, S&P and S&P 500 are registered service marks of The McGraw-Hill Companies, Inc. and have been licensed for use by Fidelity Distributors Corporation.
Other third-party marks appearing herein are the property of their respective owners.
All other marks appearing herein are registered or unregistered trademarks or service marks of FMR LLC or an affiliated company. © 2021 FMR LLC. All rights reserved.
This report and the financial statements contained herein are submitted for the general information of the shareholders of the Fund. This report is not authorized for distribution to prospective investors in the Fund unless preceded or accompanied by an effective prospectus.
A fund files its complete schedule of portfolio holdings with the SEC for the first and third quarters of each fiscal year on Form N-PORT. Forms N-PORT are available on the SEC’s web site at http://www.sec.gov. A fund's Forms N-PORT may be reviewed and copied at the SEC’s Public Reference Room in Washington, DC. Information regarding the operation of the SEC's Public Reference Room may be obtained by calling 1-800-SEC-0330.
For a complete list of a fund's portfolio holdings, view the most recent holdings listing, semiannual report, or annual report on Fidelity's web site at http://www.fidelity.com, http://www.institutional.fidelity.com, or http://www.401k.com, as applicable.
NOT FDIC INSURED •MAY LOSE VALUE •NO BANK GUARANTEE
Neither the Fund nor Fidelity Distributors Corporation is a bank.
Note to Shareholders:
Early in 2020, the outbreak and spread of a new coronavirus emerged as a public health emergency that had a major influence on financial markets, primarily based on its impact on the global economy and the outlook for corporate earnings. The virus causes a respiratory disease known as COVID-19. On March 11, the World Health Organization declared the COVID-19 outbreak a pandemic, citing sustained risk of further global spread.
In the weeks following, as the crisis worsened, we witnessed an escalating human tragedy with wide-scale social and economic consequences from coronavirus-containment measures. The outbreak of COVID-19 prompted a number of measures to limit the spread, including travel and border restrictions, quarantines, and restrictions on large gatherings. In turn, these resulted in lower consumer activity, diminished demand for a wide range of products and services, disruption in manufacturing and supply chains, and – given the wide variability in outcomes regarding the outbreak – significant market uncertainty and volatility. Amid the turmoil, global governments and central banks took unprecedented action to help support consumers, businesses, and the broader economies, and to limit disruption to financial systems.
The situation continues to unfold, and the extent and duration of its impact on financial markets and the economy remain highly uncertain. Extreme events such as the coronavirus crisis are “exogenous shocks” that can have significant adverse effects on mutual funds and their investments. Although multiple asset classes may be affected by market disruption, the duration and impact may not be the same for all types of assets.
Fidelity is committed to helping you stay informed amid news about COVID-19 and during increased market volatility, and we’re taking extra steps to be responsive to customer needs. We encourage you to visit our websites, where we offer ongoing updates, commentary, and analysis on the markets and our funds.
Performance: The Bottom Line
Average annual total return reflects the change in the value of an investment, assuming reinvestment of distributions from dividend income and capital gains (the profits earned upon the sale of securities that have grown in value, if any) and assuming a constant rate of performance each year. The hypothetical investment and the average annual total returns do not reflect the deduction of taxes that a shareholder would pay on fund distributions or the redemption of fund shares. During periods of reimbursement by Fidelity, a fund’s total return will be greater than it would be had the reimbursement not occurred. How a fund did yesterday is no guarantee of how it will do tomorrow.
Average Annual Total Returns
| For the periods ended January 31, 2021 | Past 1 year | Life of fundA |
| Fidelity Flex® Mid Cap Value Fund | 13.69% | 8.23% |
A From March 8, 2017
$10,000 Over Life of Fund
Let's say hypothetically that $10,000 was invested in Fidelity Flex® Mid Cap Value Fund on March 8, 2017, when the fund started.
The chart shows how the value of your investment would have changed, and also shows how the Russell Midcap® Value Index performed over the same period.
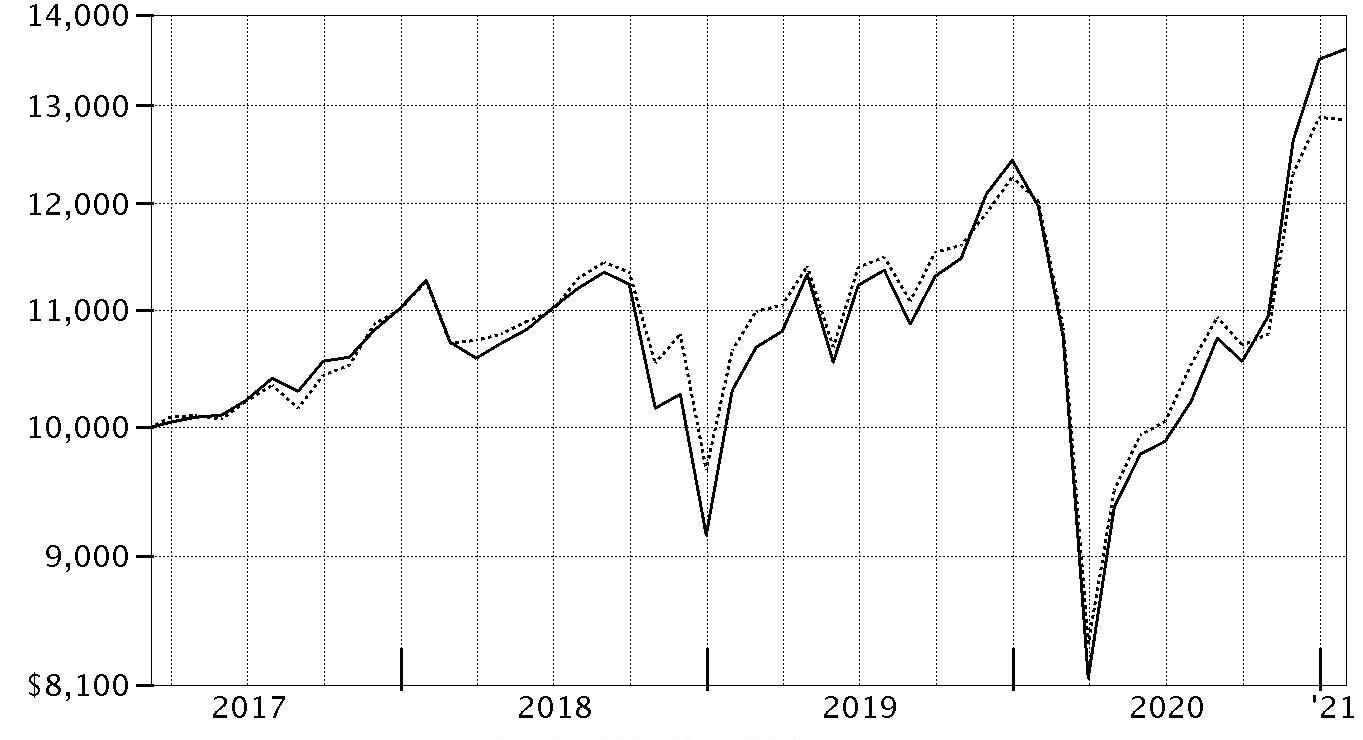
| Period Ending Values | ||
| $13,618 | Fidelity Flex® Mid Cap Value Fund | |
| $12,846 | Russell Midcap® Value Index | |
Management's Discussion of Fund Performance
Market Recap: The S&P 500® index gained 17.25% for the 12 months ending January 31, 2021, a volatile but productive period for U.S. risk assets. The early-2020 outbreak and spread of COVID-19 resulted in stocks suffering one of the quickest declines on record, through March 23, followed by a historic rebound. The crisis and containment efforts caused broad contraction in economic activity, along with extreme uncertainty and dislocation in financial markets. A rapid and expansive U.S. monetary/fiscal-policy response partially offset the economic disruption and fueled the market surge, as did resilient corporate earnings. The rally slowed in September, when the S&P 500 began a two-month retreat amid Congress’s inability to reach a deal on additional fiscal stimulus, as well as concerns about election uncertainty, indications the U.S. economic recovery could be slowing and a new wave of COVID-19 cases. A shift in momentum began in October and accelerated following the U.S. elections, with the approval of two breakthrough COVID-19 vaccines and prospects for additional government stimulus fueling the “reflation trade.” Small-cap value stocks rallied strongly late in 2020, usurping longstanding market leadership from growth shares – especially large tech and internet-related names – amid hopes of a broad economic recovery in 2021. By sector for the full 12 months, information technology (+37%) and consumer discretionary (+33%) led all gainers. In contrast, energy (-23%) struggled along with global oil demand and pricing.Comments from Portfolio Manager Matt Friedman: For the fiscal year ending January 31, 2021, the fund gained 13.69%, outperforming the 6.80% result of the benchmark Russell Midcap® Value Index. Versus the benchmark, security selection was the primary contributor, especially within the real estate sector. Strong picks in the financials sector, primarily driven by the diversified financials industry, also boosted the fund's relative result. Also bolstering the fund's relative result was security selection in the consumer discretionary sector, especially within the retailing industry. Darling Ingredients, the fund's biggest individual contributor, advanced 124% this period. We decreased our stake in the company the past year. Our second-largest contributor was Tronox Holdings, which gained roughly 81% the past 12 months. Another contributor this period was eBay. The fund's investment in the stock of eBay gained about 68% the past 12 months. All of these contributors were non-benchmark positions. Conversely, the biggest detractor from performance versus the benchmark was an underweighting and stock selection in information technology. Stock picking and an underweighting in the communication services sector, primarily within the media & entertainment industry, also hampered the fund's relative performance. Also hampering the fund's relative performance was stock selection and an overweighting in energy. Not owning Newmont, a benchmark component that gained roughly 33%, was the largest individual relative detractor. The fund's non-benchmark stake in AerCap Holdings, a position not held at period end, returned -49%. Also hampering performance was our overweighting in Capri Holdings, which returned approximately -52%. Capri Holdings was not held at period end. Notable changes in positioning include increased exposure to the materials sector and a lower allocation to information technology.The views expressed above reflect those of the portfolio manager(s) only through the end of the period as stated on the cover of this report and do not necessarily represent the views of Fidelity or any other person in the Fidelity organization. Any such views are subject to change at any time based upon market or other conditions and Fidelity disclaims any responsibility to update such views. These views may not be relied on as investment advice and, because investment decisions for a Fidelity fund are based on numerous factors, may not be relied on as an indication of trading intent on behalf of any Fidelity fund.
Investment Summary (Unaudited)
Top Ten Stocks as of January 31, 2021
| % of fund's net assets | |
| Cigna Corp. | 2.5 |
| The AES Corp. | 2.0 |
| CubeSmart | 2.0 |
| CBRE Group, Inc. | 1.8 |
| Ameriprise Financial, Inc. | 1.7 |
| Capital One Financial Corp. | 1.6 |
| Tapestry, Inc. | 1.6 |
| American Tower Corp. | 1.6 |
| CenterPoint Energy, Inc. | 1.6 |
| SLM Corp. | 1.6 |
| 18.0 |
Top Five Market Sectors as of January 31, 2021
| % of fund's net assets | |
| Financials | 18.8 |
| Industrials | 17.7 |
| Consumer Discretionary | 11.0 |
| Real Estate | 9.3 |
| Utilities | 8.6 |
Asset Allocation (% of fund's net assets)
| As of January 31, 2021 * | ||
| Stocks | 98.8% | |
| Short-Term Investments and Net Other Assets (Liabilities) | 1.2% | |

* Foreign investments - 9.4%
Schedule of Investments January 31, 2021
Showing Percentage of Net Assets
| Common Stocks - 98.8% | |||
| Shares | Value | ||
| COMMUNICATION SERVICES - 3.0% | |||
| Diversified Telecommunication Services - 0.7% | |||
| Liberty Global PLC Class C (a) | 9,311 | $224,954 | |
| Media - 2.3% | |||
| Interpublic Group of Companies, Inc. | 17,302 | 416,459 | |
| Nexstar Broadcasting Group, Inc. Class A | 3,123 | 354,991 | |
| 771,450 | |||
| TOTAL COMMUNICATION SERVICES | 996,404 | ||
| CONSUMER DISCRETIONARY - 11.0% | |||
| Distributors - 1.2% | |||
| LKQ Corp. (a) | 11,368 | 398,903 | |
| Diversified Consumer Services - 0.8% | |||
| Laureate Education, Inc. Class A (a) | 21,022 | 273,496 | |
| Hotels, Restaurants & Leisure - 1.5% | |||
| Caesars Entertainment, Inc. (a) | 7,273 | 511,946 | |
| Household Durables - 1.4% | |||
| Mohawk Industries, Inc. (a) | 3,200 | 459,520 | |
| Internet & Direct Marketing Retail - 2.4% | |||
| eBay, Inc. | 8,572 | 484,404 | |
| Expedia, Inc. | 2,443 | 303,176 | |
| 787,580 | |||
| Leisure Products - 1.3% | |||
| Mattel, Inc. (a) | 23,541 | 426,563 | |
| Specialty Retail - 0.8% | |||
| Lowe's Companies, Inc. | 1,580 | 263,623 | |
| Textiles, Apparel & Luxury Goods - 1.6% | |||
| Tapestry, Inc. | 17,339 | 548,259 | |
| TOTAL CONSUMER DISCRETIONARY | 3,669,890 | ||
| CONSUMER STAPLES - 5.4% | |||
| Food & Staples Retailing - 1.3% | |||
| BJ's Wholesale Club Holdings, Inc. (a) | 4,459 | 187,590 | |
| U.S. Foods Holding Corp. (a) | 8,220 | 254,738 | |
| 442,328 | |||
| Food Products - 1.3% | |||
| Darling Ingredients, Inc. (a) | 6,794 | 421,296 | |
| Household Products - 1.8% | |||
| Energizer Holdings, Inc. | 5,812 | 254,798 | |
| Spectrum Brands Holdings, Inc. | 4,772 | 360,620 | |
| 615,418 | |||
| Tobacco - 1.0% | |||
| Altria Group, Inc. | 7,958 | 326,915 | |
| TOTAL CONSUMER STAPLES | 1,805,957 | ||
| ENERGY - 4.8% | |||
| Oil, Gas & Consumable Fuels - 4.8% | |||
| Cheniere Energy, Inc. (a) | 7,494 | 474,595 | |
| Hess Corp. | 8,169 | 440,963 | |
| The Williams Companies, Inc. | 16,018 | 340,062 | |
| Valero Energy Corp. | 5,914 | 333,727 | |
| 1,589,347 | |||
| FINANCIALS - 18.8% | |||
| Banks - 3.1% | |||
| First Citizens Bancshares, Inc. | 545 | 324,815 | |
| M&T Bank Corp. | 3,228 | 427,613 | |
| Signature Bank | 1,668 | 275,537 | |
| 1,027,965 | |||
| Capital Markets - 3.8% | |||
| Ameriprise Financial, Inc. | 2,803 | 554,630 | |
| Lazard Ltd. Class A | 8,205 | 338,046 | |
| LPL Financial | 3,390 | 367,273 | |
| 1,259,949 | |||
| Consumer Finance - 6.1% | |||
| Capital One Financial Corp. | 5,259 | 548,303 | |
| Discover Financial Services | 3,485 | 291,137 | |
| OneMain Holdings, Inc. | 9,771 | 454,938 | |
| SLM Corp. | 37,729 | 523,679 | |
| Synchrony Financial | 7,152 | 240,665 | |
| 2,058,722 | |||
| Diversified Financial Services - 1.1% | |||
| Voya Financial, Inc. | 6,484 | 359,603 | |
| Insurance - 4.7% | |||
| American International Group, Inc. | 6,931 | 259,497 | |
| Assurant, Inc. | 3,081 | 417,383 | |
| Fairfax Financial Holdings Ltd. (sub. vtg.) | 510 | 185,024 | |
| Reinsurance Group of America, Inc. | 2,712 | 284,896 | |
| The Travelers Companies, Inc. | 3,085 | 420,486 | |
| 1,567,286 | |||
| TOTAL FINANCIALS | 6,273,525 | ||
| HEALTH CARE - 7.4% | |||
| Health Care Equipment & Supplies - 1.0% | |||
| Hologic, Inc. (a) | 4,270 | 340,447 | |
| Health Care Providers & Services - 5.5% | |||
| Centene Corp. (a) | 8,527 | 514,178 | |
| Cigna Corp. | 3,903 | 847,144 | |
| Laboratory Corp. of America Holdings (a) | 1,975 | 452,097 | |
| 1,813,419 | |||
| Pharmaceuticals - 0.9% | |||
| Jazz Pharmaceuticals PLC (a) | 1,951 | 303,381 | |
| TOTAL HEALTH CARE | 2,457,247 | ||
| INDUSTRIALS - 17.7% | |||
| Air Freight & Logistics - 0.6% | |||
| FedEx Corp. | 854 | 200,980 | |
| Building Products - 1.7% | |||
| Builders FirstSource, Inc. (a) | 6,630 | 253,598 | |
| Jeld-Wen Holding, Inc. (a) | 11,878 | 308,709 | |
| 562,307 | |||
| Commercial Services & Supplies - 1.3% | |||
| The Brink's Co. | 6,219 | 423,700 | |
| Construction & Engineering - 3.5% | |||
| AECOM (a) | 7,572 | 379,357 | |
| Fluor Corp. | 22,626 | 391,204 | |
| Willscot Mobile Mini Holdings (a) | 16,443 | 389,864 | |
| 1,160,425 | |||
| Machinery - 1.3% | |||
| Allison Transmission Holdings, Inc. | 10,522 | 428,245 | |
| Marine - 0.5% | |||
| Kirby Corp. (a) | 3,394 | 172,279 | |
| Professional Services - 3.6% | |||
| ASGN, Inc. (a) | 3,818 | 316,550 | |
| Manpower, Inc. | 4,319 | 381,972 | |
| Nielsen Holdings PLC | 23,347 | 521,339 | |
| 1,219,861 | |||
| Road & Rail - 2.6% | |||
| Ryder System, Inc. | 6,845 | 428,429 | |
| TFI International, Inc. (Canada) | 6,871 | 456,401 | |
| 884,830 | |||
| Trading Companies & Distributors - 2.6% | |||
| Beacon Roofing Supply, Inc. (a) | 9,643 | 383,502 | |
| Univar, Inc. (a) | 25,371 | 471,647 | |
| 855,149 | |||
| TOTAL INDUSTRIALS | 5,907,776 | ||
| INFORMATION TECHNOLOGY - 4.3% | |||
| Electronic Equipment & Components - 1.0% | |||
| Flex Ltd. (a) | 18,114 | 319,531 | |
| IT Services - 0.9% | |||
| DXC Technology Co. | 10,748 | 303,094 | |
| Semiconductors & Semiconductor Equipment - 1.3% | |||
| ON Semiconductor Corp. (a) | 12,916 | 445,473 | |
| Software - 1.1% | |||
| SS&C Technologies Holdings, Inc. | 5,965 | 375,079 | |
| TOTAL INFORMATION TECHNOLOGY | 1,443,177 | ||
| MATERIALS - 8.5% | |||
| Chemicals - 5.3% | |||
| Axalta Coating Systems Ltd. (a) | 11,886 | 320,803 | |
| Element Solutions, Inc. | 9,269 | 157,851 | |
| Olin Corp. | 19,176 | 458,498 | |
| Tronox Holdings PLC | 29,680 | 455,588 | |
| W.R. Grace & Co. | 6,426 | 372,837 | |
| 1,765,577 | |||
| Construction Materials - 1.2% | |||
| Eagle Materials, Inc. | 3,470 | 381,804 | |
| Containers & Packaging - 2.0% | |||
| Crown Holdings, Inc. (a) | 4,252 | 383,318 | |
| O-I Glass, Inc. | 22,315 | 282,062 | |
| 665,380 | |||
| TOTAL MATERIALS | 2,812,761 | ||
| REAL ESTATE - 9.3% | |||
| Equity Real Estate Investment Trusts (REITs) - 7.5% | |||
| American Tower Corp. | 2,317 | 526,793 | |
| CubeSmart | 19,095 | 665,270 | |
| Douglas Emmett, Inc. | 10,750 | 297,883 | |
| Equinix, Inc. | 688 | 509,092 | |
| Equity Lifestyle Properties, Inc. | 8,044 | 489,397 | |
| 2,488,435 | |||
| Real Estate Management & Development - 1.8% | |||
| CBRE Group, Inc. (a) | 10,083 | 614,861 | |
| TOTAL REAL ESTATE | 3,103,296 | ||
| UTILITIES - 8.6% | |||
| Electric Utilities - 2.8% | |||
| Edison International | 8,139 | 473,364 | |
| PG&E Corp. (a) | 40,001 | 457,211 | |
| 930,575 | |||
| Independent Power and Renewable Electricity Producers - 3.4% | |||
| The AES Corp. | 27,335 | 666,701 | |
| Vistra Corp. | 24,020 | 479,679 | |
| 1,146,380 | |||
| Multi-Utilities - 2.4% | |||
| CenterPoint Energy, Inc. | 24,965 | 526,512 | |
| NiSource, Inc. | 11,873 | 262,987 | |
| 789,499 | |||
| TOTAL UTILITIES | 2,866,454 | ||
| TOTAL COMMON STOCKS | |||
| (Cost $26,184,318) | 32,925,834 | ||
| Principal Amount | Value | ||
| U.S. Treasury Obligations - 0.3% | |||
| U.S. Treasury Bills, yield at date of purchase 0.08% to 0.09% 3/18/21 to 4/15/21 | |||
| (Cost $99,985) | 100,000 | 99,989 | |
| Shares | Value | ||
| Money Market Funds - 0.8% | |||
| Fidelity Cash Central Fund 0.09% (b) | |||
| (Cost $256,574) | 256,523 | 256,574 | |
| TOTAL INVESTMENT IN SECURITIES - 99.9% | |||
| (Cost $26,540,877) | 33,282,397 | ||
| NET OTHER ASSETS (LIABILITIES) - 0.1% | 44,309 | ||
| NET ASSETS - 100% | $33,326,706 |
Legend
(a) Non-income producing
(b) Affiliated fund that is generally available only to investment companies and other accounts managed by Fidelity Investments. The rate quoted is the annualized seven-day yield of the fund at period end. A complete unaudited listing of the fund's holdings as of its most recent quarter end is available upon request. In addition, each Fidelity Central Fund's financial statements, which are not covered by the Fund's Report of Independent Registered Public Accounting Firm, are available on the SEC's website or upon request.
Affiliated Central Funds
Information regarding fiscal year to date income earned by the Fund from investments in Fidelity Central Funds is as follows:
| Fund | Income earned |
| Fidelity Cash Central Fund | $1,261 |
| Fidelity Securities Lending Cash Central Fund | 109 |
| Total | $1,370 |
Amounts in the income column in the above table include any capital gain distributions from underlying funds, which are presented in the corresponding line-item in the Statement of Operations, if applicable. Amount for Fidelity Securities Lending Cash Central Fund represents the income earned on investing cash collateral, less rebates paid to borrowers and any lending agent fees associated with the loan, plus any premium payments received for lending certain types of securities.
Investment Valuation
The following is a summary of the inputs used, as of January 31, 2021, involving the Fund's assets and liabilities carried at fair value. The inputs or methodology used for valuing securities may not be an indication of the risk associated with investing in those securities. For more information on valuation inputs, and their aggregation into the levels used below, please refer to the Investment Valuation section in the accompanying Notes to Financial Statements.
| Valuation Inputs at Reporting Date: | ||||
| Description | Total | Level 1 | Level 2 | Level 3 |
| Investments in Securities: | ||||
| Equities: | ||||
| Communication Services | $996,404 | $996,404 | $-- | $-- |
| Consumer Discretionary | 3,669,890 | 3,669,890 | -- | -- |
| Consumer Staples | 1,805,957 | 1,805,957 | -- | -- |
| Energy | 1,589,347 | 1,589,347 | -- | -- |
| Financials | 6,273,525 | 6,273,525 | -- | -- |
| Health Care | 2,457,247 | 2,457,247 | -- | -- |
| Industrials | 5,907,776 | 5,907,776 | -- | -- |
| Information Technology | 1,443,177 | 1,443,177 | -- | -- |
| Materials | 2,812,761 | 2,812,761 | -- | -- |
| Real Estate | 3,103,296 | 3,103,296 | -- | -- |
| Utilities | 2,866,454 | 2,866,454 | -- | -- |
| U.S. Government and Government Agency Obligations | 99,989 | -- | 99,989 | -- |
| Money Market Funds | 256,574 | 256,574 | -- | -- |
| Total Investments in Securities: | $33,282,397 | $33,182,408 | $99,989 | $-- |
See accompanying notes which are an integral part of the financial statements.
Financial Statements
Statement of Assets and Liabilities
| January 31, 2021 | ||
| Assets | ||
| Investment in securities, at value — See accompanying schedule: Unaffiliated issuers (cost $26,284,303) | $33,025,823 | |
| Fidelity Central Funds (cost $256,574) | 256,574 | |
| Total Investment in Securities (cost $26,540,877) | $33,282,397 | |
| Foreign currency held at value (cost $142) | 157 | |
| Receivable for fund shares sold | 34,869 | |
| Dividends receivable | 13,283 | |
| Distributions receivable from Fidelity Central Funds | 78 | |
| Total assets | 33,330,784 | |
| Liabilities | ||
| Payable to custodian bank | $1,779 | |
| Payable for fund shares redeemed | 2,299 | |
| Total liabilities | 4,078 | |
| Net Assets | $33,326,706 | |
| Net Assets consist of: | ||
| Paid in capital | $29,233,857 | |
| Total accumulated earnings (loss) | 4,092,849 | |
| Net Assets | $33,326,706 | |
| Net Asset Value, offering price and redemption price per share ($33,326,706 ÷ 2,731,424 shares) | $12.20 |
See accompanying notes which are an integral part of the financial statements.
Statement of Operations
| Year ended January 31, 2021 | ||
| Investment Income | ||
| Dividends | $560,313 | |
| Interest | 112 | |
| Income from Fidelity Central Funds (including $109 from security lending) | 1,370 | |
| Total income | 561,795 | |
| Expenses | ||
| Independent trustees' fees and expenses | $167 | |
| Miscellaneous | 1,244 | |
| Total expenses | 1,411 | |
| Net investment income (loss) | 560,384 | |
| Realized and Unrealized Gain (Loss) | ||
| Net realized gain (loss) on: | ||
| Investment securities: | ||
| Unaffiliated issuers | (2,481,671) | |
| Fidelity Central Funds | (3) | |
| Foreign currency transactions | (1,316) | |
| Futures contracts | 99,234 | |
| Total net realized gain (loss) | (2,383,756) | |
| Change in net unrealized appreciation (depreciation) on: | ||
| Investment securities: | ||
| Unaffiliated issuers | 5,383,752 | |
| Assets and liabilities in foreign currencies | 4 | |
| Futures contracts | 2,832 | |
| Total change in net unrealized appreciation (depreciation) | 5,386,588 | |
| Net gain (loss) | 3,002,832 | |
| Net increase (decrease) in net assets resulting from operations | $3,563,216 |
See accompanying notes which are an integral part of the financial statements.
Statement of Changes in Net Assets
| Year ended January 31, 2021 | Year ended January 31, 2020 | |
| Increase (Decrease) in Net Assets | ||
| Operations | ||
| Net investment income (loss) | $560,384 | $223,967 |
| Net realized gain (loss) | (2,383,756) | 77,641 |
| Change in net unrealized appreciation (depreciation) | 5,386,588 | 1,454,826 |
| Net increase (decrease) in net assets resulting from operations | 3,563,216 | 1,756,434 |
| Distributions to shareholders | (809,255) | (209,901) |
| Share transactions | ||
| Proceeds from sales of shares | 18,921,702 | 36,549,568 |
| Reinvestment of distributions | 809,255 | 209,901 |
| Cost of shares redeemed | (25,603,734) | (4,581,492) |
| Net increase (decrease) in net assets resulting from share transactions | (5,872,777) | 32,177,977 |
| Total increase (decrease) in net assets | (3,118,816) | 33,724,510 |
| Net Assets | ||
| Beginning of period | 36,445,522 | 2,721,012 |
| End of period | $33,326,706 | $36,445,522 |
| Other Information | ||
| Shares | ||
| Sold | 1,990,765 | 3,433,071 |
| Issued in reinvestment of distributions | 73,321 | 18,893 |
| Redeemed | (2,649,563) | (421,308) |
| Net increase (decrease) | (585,477) | 3,030,656 |
See accompanying notes which are an integral part of the financial statements.
Financial Highlights
Fidelity Flex Mid Cap Value Fund
| Years ended January 31, | 2021 | 2020 | 2019 | 2018 A |
| Selected Per–Share Data | ||||
| Net asset value, beginning of period | $10.99 | $9.51 | $11.14 | $10.00 |
| Income from Investment Operations | ||||
| Net investment income (loss)B | .19 | .18 | .20 | .17 |
| Net realized and unrealized gain (loss) | 1.29 | 1.37 | (1.18) | 1.10 |
| Total from investment operations | 1.48 | 1.55 | (.98) | 1.27 |
| Distributions from net investment income | (.20) | (.07) | (.21) | (.10) |
| Distributions from net realized gain | (.07) | – | (.44) | (.03) |
| Total distributions | (.27) | (.07) | (.65) | (.13) |
| Net asset value, end of period | $12.20 | $10.99 | $9.51 | $11.14 |
| Total ReturnC | 13.69% | 16.26% | (8.60)% | 12.72% |
| Ratios to Average Net AssetsD,E | ||||
| Expenses before reductionsF | -% | -% | -% | - %G |
| Expenses net of fee waivers, if anyF | -% | -% | -% | - %G |
| Expenses net of all reductionsF | -% | -% | -% | - %G |
| Net investment income (loss) | 1.88% | 1.71% | 1.88% | 1.76%G |
| Supplemental Data | ||||
| Net assets, end of period (000 omitted) | $33,327 | $36,446 | $2,721 | $2,869 |
| Portfolio turnover rateH | 119% | 89% | 218% | 137%G |
A For the period March 8, 2017 (commencement of operations) to January 31, 2018.
B Calculated based on average shares outstanding during the period.
C Total returns for periods of less than one year are not annualized.
D Fees and expenses of any underlying mutual funds or exchange-traded funds (ETFs) are not included in the Fund's expense ratio. The Fund indirectly bears its proportionate share of these expenses. For additional expense information related to investments in Fidelity Central Funds, please refer to the "Investments in Fidelity Central Funds" note found in the Notes to Financial Statements section of the most recent Annual or Semi-Annual report.
E Expense ratios reflect operating expenses of the class. Expenses before reductions do not reflect amounts reimbursed, waived, or reduced through arrangements with the investment advisor, brokerage services, or other offset arrangements, if applicable, and do not represent the amount paid by the class during periods when reimbursements, waivers or reductions occur.
F Amount represents less than .005%.
G Annualized
H Amount does not include the portfolio activity of any underlying mutual funds or exchange-traded funds (ETFs).
See accompanying notes which are an integral part of the financial statements.
Notes to Financial Statements
For the period ended January 31, 2021
1. Organization.
Fidelity Flex Mid Cap Value Fund (the Fund) is a fund of Fidelity Devonshire Trust (the Trust) and is authorized to issue an unlimited number of shares. Share transactions on the Statement of Changes in Net Assets may contain exchanges between affiliated funds. The Trust is registered under the Investment Company Act of 1940, as amended (the 1940 Act), as an open-end management investment company organized as a Massachusetts business trust. The Fund is available only to certain fee-based accounts and advisory programs offered by Fidelity.
2. Investments in Fidelity Central Funds.
The Fund invests in Fidelity Central Funds, which are open-end investment companies generally available only to other investment companies and accounts managed by the investment adviser and its affiliates. The Fund's Schedule of Investments lists each of the Fidelity Central Funds held as of period end, if any, as an investment of the Fund, but does not include the underlying holdings of each Fidelity Central Fund. As an Investing Fund, the Fund indirectly bears its proportionate share of the expenses of the underlying Fidelity Central Funds.
The Money Market Central Funds seek preservation of capital and current income and are managed by the investment adviser. Annualized expenses of the Money Market Central Funds as of their most recent shareholder report date ranged from less than .005% to .01%.
A complete unaudited list of holdings for each Fidelity Central Fund is available upon request or at the Securities and Exchange Commission (the SEC) website at www.sec.gov. In addition, the financial statements of the Fidelity Central Funds, which are not covered by the Fund's Report of Independent Registered Public Accounting Firm, are available on the SEC website or upon request.
3. Significant Accounting Policies.
The Fund is an investment company and applies the accounting and reporting guidance of the Financial Accounting Standards Board (FASB) Accounting Standards Codification Topic 946 Financial Services - Investment Companies. The financial statements have been prepared in conformity with accounting principles generally accepted in the United States of America (GAAP), which require management to make certain estimates and assumptions at the date of the financial statements. Actual results could differ from those estimates. Subsequent events, if any, through the date that the financial statements were issued have been evaluated in the preparation of the financial statements. The following summarizes the significant accounting policies of the Fund:
Investment Valuation. Investments are valued as of 4:00 p.m. Eastern time on the last calendar day of the period. The Board of Trustees (the Board) has delegated the day to day responsibility for the valuation of the Fund's investments to the Fair Value Committee (the Committee) established by the Fund's investment adviser. In accordance with valuation policies and procedures approved by the Board, the Fund attempts to obtain prices from one or more third party pricing vendors or brokers to value its investments. When current market prices, quotations or currency exchange rates are not readily available or reliable, investments will be fair valued in good faith by the Committee, in accordance with procedures adopted by the Board. Factors used in determining fair value vary by investment type and may include market or investment specific events, changes in interest rates and credit quality. The frequency with which these procedures are used cannot be predicted and they may be utilized to a significant extent. The Committee oversees the Fund's valuation policies and procedures and reports to the Board on the Committee's activities and fair value determinations. The Board monitors the appropriateness of the procedures used in valuing the Fund's investments and ratifies the fair value determinations of the Committee.
The Fund categorizes the inputs to valuation techniques used to value its investments into a disclosure hierarchy consisting of three levels as shown below:
- Level 1 – quoted prices in active markets for identical investments
- Level 2 – other significant observable inputs (including quoted prices for similar investments, interest rates, prepayment speeds, etc.)
- Level 3 – unobservable inputs (including the Fund's own assumptions based on the best information available)
Valuation techniques used to value the Fund's investments by major category are as follows:
Equity securities, including restricted securities, for which market quotations are readily available, are valued at the last reported sale price or official closing price as reported by a third party pricing vendor on the primary market or exchange on which they are traded and are categorized as Level 1 in the hierarchy. In the event there were no sales during the day or closing prices are not available, securities are valued at the last quoted bid price or may be valued using the last available price and are generally categorized as Level 2 in the hierarchy. For foreign equity securities, when market or security specific events arise, comparisons to the valuation of American Depositary Receipts (ADRs), futures contracts, Exchange-Traded Funds (ETFs) and certain indexes as well as quoted prices for similar securities may be used and would be categorized as Level 2 in the hierarchy. For equity securities, including restricted securities, where observable inputs are limited, assumptions about market activity and risk are used and these securities may be categorized as Level 3 in the hierarchy.
Debt securities, including restricted securities, are valued based on evaluated prices received from third party pricing vendors or from brokers who make markets in such securities. U.S. government and government agency obligations are valued by pricing vendors who utilize matrix pricing which considers yield or price of bonds of comparable quality, coupon, maturity and type or by broker-supplied prices. When independent prices are unavailable or unreliable, debt securities may be valued utilizing pricing methodologies which consider similar factors that would be used by third party pricing vendors. Debt securities are generally categorized as Level 2 in the hierarchy but may be Level 3 depending on the circumstances.
Investments in open-end mutual funds, including the Fidelity Central Funds, are valued at their closing net asset value (NAV) each business day and are categorized as Level 1 in the hierarchy.
Changes in valuation techniques may result in transfers in or out of an assigned level within the disclosure hierarchy. The aggregate value of investments by input level as of January 31, 2021 is included at the end of the Fund's Schedule of Investments.
Foreign Currency. Certain Funds may use foreign currency contracts to facilitate transactions in foreign-denominated securities. Gains and losses from these transactions may arise from changes in the value of the foreign currency or if the counterparties do not perform under the contracts' terms.
Foreign-denominated assets, including investment securities, and liabilities are translated into U.S. dollars at the exchange rates at period end. Purchases and sales of investment securities, income and dividends received, and expenses denominated in foreign currencies are translated into U.S. dollars at the exchange rate in effect on the transaction date.
The effects of exchange rate fluctuations on investments are included with the net realized and unrealized gain (loss) on investment securities. Other foreign currency transactions resulting in realized and unrealized gain (loss) are disclosed separately.
Investment Transactions and Income. For financial reporting purposes, the Fund's investment holdings and NAV include trades executed through the end of the last business day of the period. The NAV per share for processing shareholder transactions is calculated as of the close of business of the New York Stock Exchange (NYSE), normally 4:00 p.m. Eastern time and includes trades executed through the end of the prior business day. Gains and losses on securities sold are determined on the basis of identified cost and include proceeds received from litigation. Dividend income is recorded on the ex-dividend date. Non-cash dividends included in dividend income, if any, are recorded at the fair market value of the securities received. Income and capital gain distributions from Fidelity Central Funds, if any, are recorded on the ex-dividend date. Certain distributions received by the Fund represent a return of capital or capital gain. The Fund determines the components of these distributions subsequent to the ex-dividend date, based upon receipt of tax filings or other correspondence relating to the underlying investment. These distributions are recorded as a reduction of cost of investments and/or as a realized gain. Interest income is accrued as earned and includes coupon interest and amortization of premium and accretion of discount on debt securities as applicable. Investment income is recorded net of foreign taxes withheld where recovery of such taxes is uncertain.
Expenses. Expenses directly attributable to a fund are charged to that fund. Expenses attributable to more than one fund are allocated among the respective funds on the basis of relative net assets or other appropriate methods. Expense estimates are accrued in the period to which they relate and adjustments are made when actual amounts are known.
Income Tax Information and Distributions to Shareholders. Each year, the Fund intends to qualify as a regulated investment company under Subchapter M of the Internal Revenue Code, including distributing substantially all of its taxable income and realized gains. As a result, no provision for U.S. Federal income taxes is required. As of January 31, 2021, the Fund did not have any unrecognized tax benefits in the financial statements; nor is the Fund aware of any tax positions for which it is reasonably possible that the total amounts of unrecognized tax benefits will significantly change in the next twelve months. The Fund files a U.S. federal tax return, in addition to state and local tax returns as required. The Fund's federal income tax returns are subject to examination by the Internal Revenue Service (IRS) for a period of three fiscal years after they are filed. State and local tax returns may be subject to examination for an additional fiscal year depending on the jurisdiction. Foreign taxes are provided for based on the Fund's understanding of the tax rules and rates that exist in the foreign markets in which it invests.
Distributions are declared and recorded on the ex-dividend date. Income and capital gain distributions are determined in accordance with income tax regulations, which may differ from GAAP.
Capital accounts within the financial statements are adjusted for permanent book-tax differences. These adjustments have no impact on net assets or the results of operations. Capital accounts are not adjusted for temporary book-tax differences which will reverse in a subsequent period.
Book-tax differences are primarily due to capital loss carryforwards, futures contracts, foreign currency transactions, partnerships and losses deferred due to wash sales and excise tax regulations.
As of period end, the cost and unrealized appreciation (depreciation) in securities, and derivatives if applicable, for federal income tax purposes were as follows:
| Gross unrealized appreciation | $7,124,220 |
| Gross unrealized depreciation | (730,621) |
| Net unrealized appreciation (depreciation) | $6,393,599 |
| Tax Cost | $26,888,798 |
The tax-based components of distributable earnings as of period end were as follows:
| Capital loss carryforward | $(2,277,305) |
| Net unrealized appreciation (depreciation) on securities and other investments | $ 6,393,614 |
The Fund intends to elect to defer to its next fiscal year $23,461 of ordinary losses recognized during the period January 1, 2021 to January 31, 2021.
Capital loss carryforwards are only available to offset future capital gains of the Fund to the extent provided by regulations and may be limited. The capital loss carryforward information presented below, including any applicable limitation, is estimated as of fiscal period end and is subject to adjustment.
| No expiration | |
| Short-term | $(2,277,305) |
| Total capital loss carryforward | $(2,277,305) |
The tax character of distributions paid was as follows:
| January 31, 2021 | January 31, 2020 | |
| Ordinary Income | $793,877 | $ 209,901 |
| Long-term Capital Gains | 15,378 | – |
| Total | $809,255 | $ 209,901 |
4. Derivative Instruments.
Risk Exposures and the Use of Derivative Instruments. The Fund's investment objective allows the Fund to enter into various types of derivative contracts, including futures contracts. Derivatives are investments whose value is primarily derived from underlying assets, indices or reference rates and may be transacted on an exchange or over-the-counter (OTC). Derivatives may involve a future commitment to buy or sell a specified asset based on specified terms, to exchange future cash flows at periodic intervals based on a notional principal amount, or for one party to make one or more payments upon the occurrence of specified events in exchange for periodic payments from the other party.
The Fund used derivatives to increase returns and to manage exposure to certain risks as defined below. The success of any strategy involving derivatives depends on analysis of numerous economic factors, and if the strategies for investment do not work as intended, the Fund may not achieve its objectives.
The Fund's use of derivatives increased or decreased its exposure to the following risk:
| Equity Risk | Equity risk relates to the fluctuations in the value of financial instruments as a result of changes in market prices (other than those arising from interest rate risk or foreign exchange risk), whether caused by factors specific to an individual investment, its issuer, or all factors affecting all instruments traded in a market or market segment. |
The Fund is also exposed to additional risks from investing in derivatives, such as liquidity risk and counterparty credit risk. Liquidity risk is the risk that the Fund will be unable to close out the derivative in the open market in a timely manner. Counterparty credit risk is the risk that the counterparty will not be able to fulfill its obligation to the Fund. Counterparty credit risk related to exchange-traded futures contracts may be mitigated by the protection provided by the exchange on which they trade.
Investing in derivatives may involve greater risks than investing in the underlying assets directly and, to varying degrees, may involve risk of loss in excess of any initial investment and collateral received and amounts recognized in the Statement of Assets and Liabilities. In addition, there may be the risk that the change in value of the derivative contract does not correspond to the change in value of the underlying instrument.
Futures Contracts. A futures contract is an agreement between two parties to buy or sell a specified underlying instrument for a fixed price at a specified future date. The Fund used futures contracts to manage its exposure to the stock market.
Upon entering into a futures contract, a fund is required to deposit either cash or securities (initial margin) with a clearing broker in an amount equal to a certain percentage of the face value of the contract. Futures contracts are marked-to-market daily and subsequent daily payments (variation margin) are made or received by a fund depending on the daily fluctuations in the value of the futures contracts and are recorded as unrealized appreciation or (depreciation). This receivable and/or payable, if any, is included in daily variation margin on futures contracts in the Statement of Assets and Liabilities. Realized gain or (loss) is recorded upon the expiration or closing of a futures contract. The net realized gain (loss) and change in net unrealized appreciation (depreciation) on futures contracts during the period is presented in the Statement of Operations.
Any open futures contracts at period end are presented in the Schedule of Investments under the caption "Futures Contracts". The notional amount at value reflects each contract's exposure to the underlying instrument or index at period end and is representative of volume of activity during the period.
5. Purchases and Sales of Investments.
Purchases and sales of securities, other than short-term securities are noted in the table below.
| Purchases ($) | Sales ($) | |
| Fidelity Flex Mid Cap Value Fund | 35,080,323 | 40,949,949 |
6. Fees and Other Transactions with Affiliates.
Management Fee. Fidelity Management & Research Company LLC (the investment adviser) and its affiliates provide the Fund with investment management related services and the Fund does not pay any fees for these services. Under the management contract, the investment adviser or an affiliate pays all other expenses of the Fund, excluding fees and expenses of the independent Trustees, and certain miscellaneous expenses such as proxy and shareholder meeting expenses.
Brokerage Commissions. A portion of portfolio transactions were placed with brokerage firms which are affiliates of the investment adviser. Brokerage commissions are included in net realized gain (loss) and change in net unrealized appreciation (depreciation) in the Statement of Operations. The commissions paid to these affiliated firms were as follows:
| Amount | |
| Fidelity Flex Mid Cap Value Fund | $988 |
Interfund Trades. Funds may purchase from or sell securities to other Fidelity Funds under procedures adopted by the Board. The procedures have been designed to ensure these interfund trades are executed in accordance with Rule 17a-7 of the 1940 Act. Interfund trades are included within the respective purchases and sales amounts shown in the Purchases and Sales of Investments note, and amounted to $2,345,613 and $2,197,072, respectively.
7. Committed Line of Credit.
Certain Funds participate with other funds managed by the investment adviser or an affiliate in a $4.25 billion credit facility (the "line of credit") to be utilized for temporary or emergency purposes to fund shareholder redemptions or for other short-term liquidity purposes. The participating funds have agreed to pay commitment fees on their pro-rata portion of the line of credit, which are reflected in Miscellaneous expenses on the Statement of Operations, and are listed below. Effective during January 2021, commitment fees are borne by the investment advisor.
| Amount | |
| Fidelity Flex Mid Cap Value Fund | $69 |
During the period, there were no borrowings on this line of credit.
8. Security Lending.
Funds lend portfolio securities through a lending agent from time to time in order to earn additional income. A fund may lend securities to certain qualified borrowers, including NFS. On the settlement date of the loan, a fund receives collateral (in the form of U.S. Treasury obligations, letters of credit and/or cash) against the loaned securities and maintains collateral in an amount not less than 100% of the market value of the loaned securities during the period of the loan. The market value of the loaned securities is determined at the close of business of a fund and any additional required collateral is delivered to a fund on the next business day. The Fund or borrower may terminate the loan at any time, and if the borrower defaults on its obligation to return the securities loaned because of insolvency or other reasons, a fund may apply collateral received from the borrower against the obligation. A fund may experience delays and costs in recovering the securities loaned. Any cash collateral received is invested in the Fidelity Securities Lending Cash Central Fund. Any loaned securities are identified as such in the Schedule of Investments, and the value of loaned securities and cash collateral at period end, as applicable, are presented in the Statement of Assets and Liabilities. Security lending income represents the income earned on investing cash collateral, less rebates paid to borrowers and any lending agent fees associated with the loan, plus any premium payments received for lending certain types of securities. Security lending income is presented in the Statement of Operations as a component of income from Fidelity Central Funds.
| Security Lending Income From Securities Loaned to NFS | Value of Securities Loaned to NFS at Period End | |
| Fidelity Flex Mid Cap Value Fund | $– | $– |
9. Other.
The Fund's organizational documents provide former and current trustees and officers with a limited indemnification against liabilities arising in connection with the performance of their duties to the Fund. In the normal course of business, the Fund may also enter into contracts that provide general indemnifications. The Fund's maximum exposure under these arrangements is unknown as this would be dependent on future claims that may be made against the Fund. The risk of material loss from such claims is considered remote.
10. Coronavirus (COVID-19) Pandemic.
An outbreak of COVID-19 first detected in China during December 2019 has since spread globally and was declared a pandemic by the World Health Organization during March 2020. Developments that disrupt global economies and financial markets, such as the COVID-19 pandemic, may magnify factors that affect the Fund's performance.
Report of Independent Registered Public Accounting Firm
To the Board of Trustees of Fidelity Devonshire Trust and Shareholders of Fidelity Flex Mid Cap Value Fund
Opinion on the Financial Statements and Financial Highlights
We have audited the accompanying statement of assets and liabilities of Fidelity Flex Mid Cap Value Fund (the "Fund"), a fund of Fidelity Devonshire Trust, including the schedule of investments, as of January 31, 2021, the related statement of operations for the year then ended, the statement of changes in net assets for each of the two years in the period then ended, the financial highlights for each of the three years in the period then ended and for the period from March 8, 2017 (commencement of operations) through January 31, 2018, and the related notes. In our opinion, the financial statements and financial highlights present fairly, in all material respects, the financial position of the Fund as of January 31, 2021, and the results of its operations for the year then ended, the changes in its net assets for each of the two years in the period then ended, and the financial highlights for each of the three years in the period then ended and for the period from March 8, 2017 (commencement of operations) through January 31, 2018 in conformity with accounting principles generally accepted in the United States of America.
Basis for Opinion
These financial statements and financial highlights are the responsibility of the Fund's management. Our responsibility is to express an opinion on the Fund's financial statements and financial highlights based on our audits. We are a public accounting firm registered with the Public Company Accounting Oversight Board (United States) (PCAOB) and are required to be independent with respect to the Fund in accordance with the U.S. federal securities laws and the applicable rules and regulations of the Securities and Exchange Commission and the PCAOB.
We conducted our audits in accordance with the standards of -the PCAOB. Those standards require that we plan and perform the audit to obtain reasonable assurance about whether the financial statements and financial highlights are free of material misstatement, whether due to error or fraud. The Fund is not required to have, nor were we engaged to perform, an audit of its internal control over financial reporting. As part of our audits we are required to obtain an understanding of internal control over financial reporting but not for the purpose of expressing an opinion on the effectiveness of the Fund’s internal control over financial reporting. Accordingly, we express no such opinion.
Our audits included performing procedures to assess the risks of material misstatement of the financial statements and financial highlights, whether due to error or fraud, and performing procedures that respond to those risks. Such procedures included examining, on a test basis, evidence regarding the amounts and disclosures in the financial statements and financial highlights. Our audits also included evaluating the accounting principles used and significant estimates made by management, as well as evaluating the overall presentation of the financial statements and financial highlights. Our procedures included confirmation of securities owned as of January 31, 2021, by correspondence with the custodian and brokers; when replies were not received from brokers, we performed other auditing procedures. We believe that our audits provide a reasonable basis for our opinion.
/s/ Deloitte & Touche LLP
Boston, Massachusetts
March 16, 2021
We have served as the auditor of one or more of the Fidelity investment companies since 1999.
Trustees and Officers
The Trustees, Members of the Advisory Board (if any), and officers of the trust and fund, as applicable, are listed below. The Board of Trustees governs the fund and is responsible for protecting the interests of shareholders. The Trustees are experienced executives who meet periodically throughout the year to oversee the fund's activities, review contractual arrangements with companies that provide services to the fund, oversee management of the risks associated with such activities and contractual arrangements, and review the fund's performance. Each of the Trustees oversees 309 funds.
The Trustees hold office without limit in time except that (a) any Trustee may resign; (b) any Trustee may be removed by written instrument, signed by at least two-thirds of the number of Trustees prior to such removal; (c) any Trustee who requests to be retired or who has become incapacitated by illness or injury may be retired by written instrument signed by a majority of the other Trustees; and (d) any Trustee may be removed at any special meeting of shareholders by a two-thirds vote of the outstanding voting securities of the trust. Each Trustee who is not an interested person (as defined in the 1940 Act) of the trust and the fund is referred to herein as an Independent Trustee. Each Independent Trustee shall retire not later than the last day of the calendar year in which his or her 75th birthday occurs. The Independent Trustees may waive this mandatory retirement age policy with respect to individual Trustees. Officers and Advisory Board Members hold office without limit in time, except that any officer or Advisory Board Member may resign or may be removed by a vote of a majority of the Trustees at any regular meeting or any special meeting of the Trustees. Except as indicated, each individual has held the office shown or other offices in the same company for the past five years.
The fund’s Statement of Additional Information (SAI) includes more information about the Trustees. To request a free copy, call Fidelity at 1-800-544-3455 (for managed account clients) or 1-800-835-5092 (for retirement plan participants).
Experience, Skills, Attributes, and Qualifications of the Trustees. The Governance and Nominating Committee has adopted a statement of policy that describes the experience, qualifications, attributes, and skills that are necessary and desirable for potential Independent Trustee candidates (Statement of Policy). The Board believes that each Trustee satisfied at the time he or she was initially elected or appointed a Trustee, and continues to satisfy, the standards contemplated by the Statement of Policy. The Governance and Nominating Committee also engages professional search firms to help identify potential Independent Trustee candidates who have the experience, qualifications, attributes, and skills consistent with the Statement of Policy. From time to time, additional criteria based on the composition and skills of the current Independent Trustees, as well as experience or skills that may be appropriate in light of future changes to board composition, business conditions, and regulatory or other developments, have also been considered by the professional search firms and the Governance and Nominating Committee. In addition, the Board takes into account the Trustees' commitment and participation in Board and committee meetings, as well as their leadership of standing and ad hoc committees throughout their tenure.
In determining that a particular Trustee was and continues to be qualified to serve as a Trustee, the Board has considered a variety of criteria, none of which, in isolation, was controlling. The Board believes that, collectively, the Trustees have balanced and diverse experience, qualifications, attributes, and skills, which allow the Board to operate effectively in governing the fund and protecting the interests of shareholders. Information about the specific experience, skills, attributes, and qualifications of each Trustee, which in each case led to the Board's conclusion that the Trustee should serve (or continue to serve) as a trustee of the fund, is provided below.
Board Structure and Oversight Function. Robert A. Lawrence is an interested person and currently serves as Acting Chairman. The Trustees have determined that an interested Chairman is appropriate and benefits shareholders because an interested Chairman has a personal and professional stake in the quality and continuity of services provided to the fund. Independent Trustees exercise their informed business judgment to appoint an individual of their choosing to serve as Chairman, regardless of whether the Trustee happens to be independent or a member of management. The Independent Trustees have determined that they can act independently and effectively without having an Independent Trustee serve as Chairman and that a key structural component for assuring that they are in a position to do so is for the Independent Trustees to constitute a substantial majority for the Board. The Independent Trustees also regularly meet in executive session. David M. Thomas serves as Lead Independent Trustee and as such (i) acts as a liaison between the Independent Trustees and management with respect to matters important to the Independent Trustees and (ii) with management prepares agendas for Board meetings.
Fidelity® funds are overseen by different Boards of Trustees. The fund's Board oversees Fidelity's high income and certain equity funds, and other Boards oversee Fidelity's investment-grade bond, money market, asset allocation, and other equity funds. The asset allocation funds may invest in Fidelity® funds overseen by the fund's Board. The use of separate Boards, each with its own committee structure, allows the Trustees of each group of Fidelity® funds to focus on the unique issues of the funds they oversee, including common research, investment, and operational issues. On occasion, the separate Boards establish joint committees to address issues of overlapping consequences for the Fidelity® funds overseen by each Board.
The Trustees operate using a system of committees to facilitate the timely and efficient consideration of all matters of importance to the Trustees, the fund, and fund shareholders and to facilitate compliance with legal and regulatory requirements and oversight of the fund's activities and associated risks. The Board, acting through its committees, has charged FMR and its affiliates with (i) identifying events or circumstances the occurrence of which could have demonstrably adverse effects on the fund's business and/or reputation; (ii) implementing processes and controls to lessen the possibility that such events or circumstances occur or to mitigate the effects of such events or circumstances if they do occur; and (iii) creating and maintaining a system designed to evaluate continuously business and market conditions in order to facilitate the identification and implementation processes described in (i) and (ii) above. Because the day-to-day operations and activities of the fund are carried out by or through FMR, its affiliates, and other service providers, the fund's exposure to risks is mitigated but not eliminated by the processes overseen by the Trustees. While each of the Board's committees has responsibility for overseeing different aspects of the fund's activities, oversight is exercised primarily through the Operations, Audit, and Compliance Committees. Appropriate personnel, including but not limited to the fund's Chief Compliance Officer (CCO), FMR's internal auditor, the independent accountants, the fund's Treasurer and portfolio management personnel, make periodic reports to the Board's committees, as appropriate, including an annual review of Fidelity's risk management program for the Fidelity® funds. The responsibilities of each standing committee, including their oversight responsibilities, are described further under "Standing Committees of the Trustees."
Interested Trustees*:
Correspondence intended for a Trustee who is an interested person may be sent to Fidelity Investments, 245 Summer Street, Boston, Massachusetts 02210.
Name, Year of Birth; Principal Occupations and Other Relevant Experience+
Bettina Doulton (1964)
Year of Election or Appointment: 2020
Trustee
Ms. Doulton also serves as Trustee of other Fidelity® funds. Prior to her retirement, Ms. Doulton served in a variety of positions at Fidelity Investments, including as a managing director of research (2006-2007), portfolio manager to certain Fidelity® funds (1993-2005), equity analyst and portfolio assistant (1990-1993), and research assistant (1987-1990). Ms. Doulton currently owns and operates Phi Builders + Architects and Cellardoor Winery. Previously, Ms. Doulton served as a member of the Board of Brown Capital Management, LLC (2013-2018).
Robert A. Lawrence (1952)
Year of Election or Appointment: 2020
Trustee
Acting Chairman of the Board of Trustees
Mr. Lawrence also serves as Trustee of other funds. Previously, Mr. Lawrence served as a Member of the Advisory Board of certain funds. Prior to his retirement in 2008, Mr. Lawrence served as Vice President of certain Fidelity® funds (2006-2008), Senior Vice President, Head of High Income Division of Fidelity Management & Research Company (investment adviser firm, 2006-2008), and President of Fidelity Strategic Investments (investment adviser firm, 2002-2005).
* Determined to be an “Interested Trustee” by virtue of, among other things, his or her affiliation with the trust or various entities under common control with FMR.
+ The information includes the Trustee's principal occupation during the last five years and other information relating to the experience, attributes, and skills relevant to the Trustee's qualifications to serve as a Trustee, which led to the conclusion that the Trustee should serve as a Trustee for the fund.
Independent Trustees:
Correspondence intended for an Independent Trustee may be sent to Fidelity Investments, P.O. Box 55235, Boston, Massachusetts 02205-5235.
Name, Year of Birth; Principal Occupations and Other Relevant Experience+
Dennis J. Dirks (1948)
Year of Election or Appointment: 2005
Trustee
Mr. Dirks also serves as Trustee of other Fidelity® funds. Prior to his retirement in May 2003, Mr. Dirks served as Chief Operating Officer and as a member of the Board of The Depository Trust & Clearing Corporation (financial markets infrastructure), President, Chief Operating Officer and a member of the Board of The Depository Trust Company (DTC), President and a member of the Board of the National Securities Clearing Corporation (NSCC), Chief Executive Officer and a member of the Board of the Government Securities Clearing Corporation and Chief Executive Officer and a member of the Board of the Mortgage-Backed Securities Clearing Corporation. Mr. Dirks currently serves as a member of the Finance Committee (2016-present) and Board (2017-present) and is Treasurer (2018-present) of the Asolo Repertory Theatre.
Donald F. Donahue (1950)
Year of Election or Appointment: 2018
Trustee
Mr. Donahue also serves as Trustee of other Fidelity® funds. Mr. Donahue serves as President and Chief Executive Officer of Miranda Partners, LLC (risk consulting for the financial services industry, 2012-present). Previously, Mr. Donahue served as Chief Executive Officer (2006-2012), Chief Operating Officer (2003-2006) and Managing Director, Customer Marketing and Development (1999-2003) of The Depository Trust & Clearing Corporation (financial markets infrastructure). Mr. Donahue currently serves as a member (2007-present) and Co-Chairman (2016-present) of the Board of United Way of New York, a member of the Board of NYC Leadership Academy (2012-present) and a member of the Board of Advisors of Ripple Labs, Inc. (financial services, 2015-present). Mr. Donahue previously served as a member of the Advisory Board of certain Fidelity® funds (2015-2018).
Vicki L. Fuller (1957)
Year of Election or Appointment: 2020
Trustee
Ms. Fuller also serves as Trustee of other Fidelity® funds. Previously, Ms. Fuller served as a member of the Advisory Board of certain Fidelity® funds (2018-2020), Chief Investment Officer of the New York State Common Retirement Fund (2012-2018) and held a variety of positions at AllianceBernstein L.P. (global asset management, 1985-2012), including Managing Director (2006-2012) and Senior Vice President and Senior Portfolio Manager (2001-2006). Ms. Fuller currently serves as a member of the Board, Audit Committee and Nominating and Governance Committee of The Williams Companies, Inc. (natural gas infrastructure, 2018-present), as a member of the Board, Audit Committee and Nominating and Governance Committee of two Blackstone business development companies (2020-present) and as a member of the Board of Treliant, LLC (consulting, 2019-present).
Patricia L. Kampling (1959)
Year of Election or Appointment: 2020
Trustee
Ms. Kampling also serves as Trustee of other Fidelity® funds. Prior to her retirement, Ms. Kampling served as Chairman of the Board and Chief Executive Officer (2012-2019), President and Chief Operating Officer (2011-2012) and Executive Vice President and Chief Financial Officer (2010-2011) of Alliant Energy Corporation. Ms. Kampling currently serves as a member of the Board, Compensation Committee and Executive Committee and as Chair of the Audit Committee of Briggs & Stratton Corporation (manufacturing, 2011-present) and as a member of the Board, Audit, Finance and Risk Committee and Safety, Environmental, Technology and Operations Committee of American Water Works Company, Inc. (utilities company, 2019-present). In addition, Ms. Kampling currently serves as a member of the Board of the Nature Conservancy, Wisconsin Chapter (2019-present). Previously, Ms. Kampling served as a Member of the Advisory Board of certain Fidelity® funds (2020), a member of the Board of Interstate Power and Light Company (2012-2019) and Wisconsin Power and Light Company (2012-2019) (each a subsidiary of Alliant Energy Corporation) and as a member of the Board and Workforce Development Committee of the Business Roundtable (2018-2019).
Thomas A. Kennedy (1955)
Year of Election or Appointment: 2021
Trustee
Mr. Kennedy also serves as Trustee of other Fidelity® funds. Previously, Mr. Kennedy served as a Member of the Advisory Board of certain Fidelity® funds (2020) and held a variety of positions at Raytheon Company (aerospace and defense, 1983-2020), including Chairman and Chief Executive Officer (2014-2020) and Executive Vice President and Chief Operating Officer (2013-2014). Mr. Kennedy currently serves as Executive Chairman of the Board of Directors of Raytheon Technologies Corporation (aerospace and defense, 2020-present). He is also a member of the Rutgers School of Engineering Industry Advisory Board (2011-present) and a member of the UCLA Engineering Dean’s Executive Board (2016-present).
Garnett A. Smith (1947)
Year of Election or Appointment: 2018
Trustee
Mr. Smith also serves as Trustee of other Fidelity® funds. Prior to his retirement, Mr. Smith served as Chairman and Chief Executive Officer (1990-1997) and President (1986-1990) of Inbrand Corp. (manufacturer of personal absorbent products). Prior to his employment with Inbrand Corp., he was employed by a retail fabric chain and North Carolina National Bank (now Bank of America). Mr. Smith previously served as a member of the Advisory Board of certain Fidelity® funds (2012-2013).
David M. Thomas (1949)
Year of Election or Appointment: 2008
Trustee
Lead Independent Trustee
Mr. Thomas also serves as Trustee of other Fidelity® funds. Previously, Mr. Thomas served as Executive Chairman (2005-2006) and Chairman and Chief Executive Officer (2000-2005) of IMS Health, Inc. (pharmaceutical and healthcare information solutions). Mr. Thomas currently serves as Non-Executive Chairman of the Board of Fortune Brands Home and Security (home and security products, 2011-present), and a member of the Board (2004-present) and Presiding Director (2013-present) of Interpublic Group of Companies, Inc. (marketing communication).
Susan Tomasky (1953)
Year of Election or Appointment: 2020
Trustee
Ms. Tomasky also serves as Trustee of other Fidelity® funds. Prior to her retirement, Ms. Tomasky served in various executive officer positions at American Electric Power Company, Inc. (1998-2011), including most recently as President of AEP Transmission (2007-2011). Ms. Tomasky currently serves as a member of the Board and Sustainability Committee and as Chair of the Audit Committee of Marathon Petroleum Corporation (2018-present) and as a member of the Board, Corporate Governance Committee and Organization and Compensation Committee and as Chair of the Audit Committee of Public Service Enterprise Group, Inc. (utilities company, 2012-present). In addition, Ms. Tomasky currently serves as a member of the Board of the Columbus Regional Airport Authority (2007-present), as a member of the Board of the Royal Shakespeare Company – America (2009-present), as a member of the Board of the Columbus Association for the Performing Arts (2011-present) and as a member of the Board of Kenyon College (2016-present). Previously, Ms. Tomasky served as a Member of the Advisory Board of certain Fidelity® funds (2020), a member of the Board (2011-2019) and as Lead Independent Director (2015-2018) of Andeavor Corporation (previously Tesoro Corporation) (independent oil refiner and marketer) and as a member of the Board of Summit Midstream Partners LP (energy, 2012-2018).
Michael E. Wiley (1950)
Year of Election or Appointment: 2018
Trustee
Mr. Wiley also serves as Trustee of other Fidelity® funds. Previously, Mr. Wiley served as a member of the Advisory Board of certain Fidelity® funds (2018-2020), Chairman, President and CEO of Baker Hughes, Inc. (oilfield services, 2000-2004). Mr. Wiley also previously served as a member of the Board of Andeavor Corporation (independent oil refiner and marketer, 2005-2018), a member of the Board of Andeavor Logistics LP (natural resources logistics, 2015-2018) and a member of the Board of High Point Resources (exploration and production, 2005-2020).
+ The information includes the Trustee's principal occupation during the last five years and other information relating to the experience, attributes, and skills relevant to the Trustee's qualifications to serve as a Trustee, which led to the conclusion that the Trustee should serve as a Trustee for the fund.
Advisory Board Members and Officers:
Correspondence intended for a Member of the Advisory Board (if any) may be sent to Fidelity Investments, P.O. Box 55235, Boston, Massachusetts 02205-5235. Correspondence intended for an officer or Peter S. Lynch may be sent to Fidelity Investments, 245 Summer Street, Boston, Massachusetts 02210. Officers appear below in alphabetical order.
Name, Year of Birth; Principal Occupation
Ned C. Lautenbach (1944)
Year of Election or Appointment: 2021
Member of the Advisory Board
Mr. Lautenbach also serves as a Member of the Advisory Board of other Fidelity® funds. Mr. Lautenbach currently serves as Chair of the Board of Governors, State University System of Florida (2013-present) and is a member of the Council on Foreign Relations (1994-present). He is also a member and has in the past served as Chairman of the Board of Directors of Artis-Naples (2012-present). Previously, Mr. Lautenbach served as a Trustee of certain Fidelity® funds (2000-2020) and a member and then Lead Director of the Board of Directors of Eaton Corporation (diversified industrial, 1997-2016). He was also a Partner at Clayton, Dubilier & Rice, LLC (private equity investment, 1998-2010); as well as Director of Sony Corporation (2006-2007). In addition, Mr. Lautenbach had a 30-year career with IBM (technology company), during which time he served as Senior Vice President and as a member of the Corporate Executive Committee (1968-1998).
Peter S. Lynch (1944)
Year of Election or Appointment: 2003
Member of the Advisory Board
Mr. Lynch also serves as a Member of the Advisory Board of other Fidelity® funds. Mr. Lynch is Vice Chairman and a Director of Fidelity Management & Research Company LLC (investment adviser firm). In addition, Mr. Lynch serves as a Trustee of Boston College and as the Chairman of the Inner-City Scholarship Fund. Previously, Mr. Lynch served as Vice Chairman and a Director of FMR Co., Inc. (investment adviser firm) and on the Special Olympics International Board of Directors (1997-2006).
Craig S. Brown (1977)
Year of Election or Appointment: 2019
Assistant Treasurer
Mr. Brown also serves as Assistant Treasurer of other funds. Mr. Brown is an employee of Fidelity Investments (2013-present).
John J. Burke III (1964)
Year of Election or Appointment: 2018
Chief Financial Officer
Mr. Burke also serves as Chief Financial Officer of other funds. Mr. Burke serves as Head of Investment Operations for Fidelity Fund and Investment Operations (2018-present) and is an employee of Fidelity Investments (1998-present). Previously Mr. Burke served as head of Asset Management Investment Operations (2012-2018).
William C. Coffey (1969)
Year of Election or Appointment: 2019
Assistant Secretary
Mr. Coffey also serves as Assistant Secretary of other funds. He is Senior Vice President and Deputy General Counsel of FMR LLC (diversified financial services company, 2010-present), and is an employee of Fidelity Investments. Previously, Mr. Coffey served as Secretary and CLO of certain funds (2018-2019); CLO, Secretary, and Senior Vice President of Fidelity Management & Research Company and FMR Co., Inc. (investment adviser firms, 2018-2019); Secretary of Fidelity SelectCo, LLC and Fidelity Investments Money Management, Inc. (investment adviser firms, 2018-2019); CLO of Fidelity Management & Research (Hong Kong) Limited, FMR Investment Management (UK) Limited, and Fidelity Management & Research (Japan) Limited (investment adviser firms, 2018-2019); and Assistant Secretary of certain funds (2009-2018).
Timothy M. Cohen (1969)
Year of Election or Appointment: 2018
Vice President
Mr. Cohen also serves as Vice President of other funds. Mr. Cohen serves as Co-Head of Equity (2018-present), a Director of Fidelity Management & Research (Japan) Limited (investment adviser firm, 2016-present), and is an employee of Fidelity Investments. Previously, Mr. Cohen served as Executive Vice President of Fidelity SelectCo, LLC (2019), Head of Global Equity Research (2016-2018), Chief Investment Officer - Equity and a Director of Fidelity Management & Research (U.K.) Inc. (investment adviser firm, 2013-2015) and as a Director of Fidelity Management & Research (Hong Kong) Limited (investment adviser firm, 2017).
Jonathan Davis (1968)
Year of Election or Appointment: 2010
Assistant Treasurer
Mr. Davis also serves as Assistant Treasurer of other funds. Mr. Davis serves as Assistant Treasurer of FMR Capital, Inc. (2017-present) and is an employee of Fidelity Investments. Previously, Mr. Davis served as Vice President and Associate General Counsel of FMR LLC (diversified financial services company, 2003-2010).
Laura M. Del Prato (1964)
Year of Election or Appointment: 2018
Assistant Treasurer
Ms. Del Prato also serves as an officer of other funds. Ms. Del Prato is an employee of Fidelity Investments (2017-present). Previously, Ms. Del Prato served as President and Treasurer of The North Carolina Capital Management Trust: Cash Portfolio and Term Portfolio (2018-2020). Prior to joining Fidelity Investments, Ms. Del Prato served as a Managing Director and Treasurer of the JPMorgan Mutual Funds (2014-2017). Prior to JPMorgan, Ms. Del Prato served as a partner at Cohen Fund Audit Services (accounting firm, 2012-2013) and KPMG LLP (accounting firm, 2004-2012).
Colm A. Hogan (1973)
Year of Election or Appointment: 2020
Assistant Treasurer
Mr. Hogan also serves as an officer of other funds. Mr. Hogan serves as Assistant Treasurer of FMR Capital, Inc. (2017-present) and is an employee of Fidelity Investments (2005-present). Previously, Mr. Hogan served as Deputy Treasurer of certain Fidelity® funds (2016-2020) and Assistant Treasurer of certain Fidelity® funds (2016-2018).
Pamela R. Holding (1964)
Year of Election or Appointment: 2018
Vice President
Ms. Holding also serves as Vice President of other funds. Ms. Holding serves as Co-Head of Equity (2018-present) and is an employee of Fidelity Investments (2013-present). Previously, Ms. Holding served as Executive Vice President of Fidelity SelectCo, LLC (2019) and as Chief Investment Officer of Fidelity Institutional Asset Management (2013-2018).
Cynthia Lo Bessette (1969)
Year of Election or Appointment: 2019
Secretary and Chief Legal Officer (CLO)
Ms. Lo Bessette also serves as an officer of other funds. Ms. Lo Bessette serves as CLO, Secretary, and Senior Vice President of Fidelity Management & Research Company LLC (investment adviser firm, 2019-present); and CLO of Fidelity Management & Research (Hong Kong) Limited, FMR Investment Management (UK) Limited, and Fidelity Management & Research (Japan) Limited (investment adviser firms, 2019-present). She is a Senior Vice President and Deputy General Counsel of FMR LLC (diversified financial services company, 2019-present), and is an employee of Fidelity Investments. Previously, Ms. Lo Bessette served as CLO, Secretary, and Senior Vice President of FMR Co., Inc. (investment adviser firm, 2019); Secretary of Fidelity SelectCo, LLC and Fidelity Investments Money Management, Inc. (investment adviser firms, 2019). Prior to joining Fidelity Investments, Ms. Lo Bessette was Executive Vice President, General Counsel (2016-2019) and Senior Vice President, Deputy General Counsel (2015-2016) of OppenheimerFunds (investment management company) and Deputy Chief Legal Officer (2013-2015) of Jennison Associates LLC (investment adviser firm).
Chris Maher (1972)
Year of Election or Appointment: 2020
Deputy Treasurer
Mr. Maher also serves as an officer of other funds. Mr. Maher serves as Assistant Treasurer of FMR Capital, Inc. (2017-present), and is an employee of Fidelity Investments (2008-present). Previously, Mr. Maher served as Assistant Treasurer of certain funds (2013-2020); Vice President of Asset Management Compliance (2013), Vice President of the Program Management Group of FMR (investment adviser firm, 2010-2013), and Vice President of Valuation Oversight (2008-2010).
Jason P. Pogorelec (1975)
Year of Election or Appointment: 2020
Chief Compliance Officer
Mr. Pogorelec also serves as Chief Compliance Officer of other funds. Mr. Pogorelec is a senior Vice President of Asset Management Compliance for Fidelity Investments and is an employee of Fidelity Investments (2006-present). Previously, Mr. Pogorelec served as Vice President, Associate General Counsel for Fidelity Investments (2010-2020) and Assistant Secretary of certain Fidelity funds (2015-2020).
Brett Segaloff (1972)
Year of Election or Appointment: 2021
Anti-Money Laundering (AML) Officer
Mr. Segaloff also serves as an AML Officer of other funds and other related entities. He is Director, Anti-Money Laundering (2007-present) of FMR LLC (diversified financial services company) and is an employee of Fidelity Investments (1996-present).
Stacie M. Smith (1974)
Year of Election or Appointment: 2016
President and Treasurer
Ms. Smith also serves as an officer of other funds. Ms. Smith serves as Assistant Treasurer of FMR Capital, Inc. (2017-present), is an employee of Fidelity Investments (2009-present), and has served in other fund officer roles. Prior to joining Fidelity Investments, Ms. Smith served as Senior Audit Manager of Ernst & Young LLP (accounting firm, 1996-2009). Previously, Ms. Smith served as Assistant Treasurer (2013-2019) and Deputy Treasurer (2013-2016) of certain Fidelity® funds.
Marc L. Spector (1972)
Year of Election or Appointment: 2016
Assistant Treasurer
Mr. Spector also serves as an officer of other funds. Mr. Spector serves as Assistant Treasurer of FMR Capital, Inc. (2017-present) and is an employee of Fidelity Investments (2016-present). Prior to joining Fidelity Investments, Mr. Spector served as Director at the Siegfried Group (accounting firm, 2013-2016), and prior to Siegfried Group as audit senior manager at Deloitte & Touche LLP (accounting firm, 2005-2013).
Jim Wegmann (1979)
Year of Election or Appointment: 2019
Assistant Treasurer
Mr. Wegmann also serves as Assistant Treasurer of other funds. Mr. Wegmann is an employee of Fidelity Investments (2011-present).
Shareholder Expense Example
As a shareholder, you incur two types of costs: (1) transaction costs, which may include sales charges (loads) on purchase payments or redemption proceeds, as applicable and (2) ongoing costs, which generally include management fees, distribution and/or service (12b-1) fees and other Fund expenses. This Example is intended to help you understand your ongoing costs (in dollars) of investing in a fund and to compare these costs with the ongoing costs of investing in other mutual funds.
The Example is based on an investment of $1,000 invested at the beginning of the period and held for the entire period (August 1, 2020 to January 31, 2021).
Actual Expenses
The first line of the accompanying table provides information about actual account values and actual expenses. You may use the information in this line, together with the amount you invested, to estimate the expenses that you paid over the period. Simply divide your account value by $1,000.00 (for example, an $8,600 account value divided by $1,000.00 = 8.6), then multiply the result by the number in the first line for a class/Fund under the heading entitled "Expenses Paid During Period" to estimate the expenses you paid on your account during this period. If any fund is a shareholder of any underlying mutual funds or exchange-traded funds (ETFs) (the Underlying Funds), such fund indirectly bears its proportional share of the expenses of the Underlying Funds in addition to the direct expenses incurred presented in the table. These fees and expenses are not included in the annualized expense ratio used to calculate the expense estimate in the table below.
Hypothetical Example for Comparison Purposes
The second line of the accompanying table provides information about hypothetical account values and hypothetical expenses based on the actual expense ratio and an assumed rate of return of 5% per year before expenses, which is not the actual return. The hypothetical account values and expenses may not be used to estimate the actual ending account balance or expenses you paid for the period. You may use this information to compare the ongoing costs of investing in the Fund and other funds. To do so, compare this 5% hypothetical example with the 5% hypothetical examples that appear in the shareholder reports of the other funds. If any fund is a shareholder of any Underlying Funds, such fund indirectly bears its proportional share of the expenses of the Underlying Funds in addition to the direct expenses as presented in the table. These fees and expenses are not included in the annualized expense ratio used to calculate the expense estimate in the table below.
Please note that the expenses shown in the table are meant to highlight your ongoing costs only and do not reflect any transaction costs. Therefore, the second line of the table is useful in comparing ongoing costs only, and will not help you determine the relative total costs of owning different funds.
| Annualized Expense Ratio-A | Beginning Account Value August 1, 2020 | Ending Account Value January 31, 2021 | Expenses Paid During Period-B August 1, 2020 to January 31, 2021 | ||
| Fidelity Flex Mid Cap Value Fund | - %-C | $--D | |||
| Actual | $1,000.00 | $1,333.70 | $--D | ||
| Hypothetical-E | $1,000.00 | $1,025.14 |
A Annualized expense ratio reflects expenses net of applicable fee waivers.
B Expenses are equal to the annualized expense ratio, multiplied by the average account value over the period, multiplied by 184/ 366 (to reflect the one-half year period). The fees and expenses of any Underlying Funds are not included in each annualized expense ratio.
C Amount represents less than .005%.
D Amount represents less than $.005.
E 5% return per year before expenses
Distributions (Unaudited)
The fund designates 2% and 76% of the dividends distributed in March and December, respectively during the fiscal year as qualifying for the dividends–received deduction for corporate shareholders.
The fund designates 1% and 80% of the dividends distributed in March and December, respectively during the fiscal year as amounts which may be taken into account as a dividend for the purposes of the maximum rate under section 1(h)(11) of the Internal Revenue Code.
The fund designates 3% and 13% of the dividends distributed in March and December, respectively during the fiscal year as a section 199A dividend.
The fund will notify shareholders in January 2022 of amounts for use in preparing 2021 income tax returns.
Board Approval of Investment Advisory Contracts
Fidelity Flex Mid Cap Value Fund
At its January 2021 meeting, the Board of Trustees, including the Independent Trustees (together, the Board), voted to continue the management contract with Fidelity Management & Research Company LLC (FMR), and the sub-advisory agreements and sub-subadvisory agreements, in each case, where applicable (together, the Advisory Contracts) for the fund for four months from February 1, 2021 through May 31, 2021, in connection with changes to the Board's meeting calendar.The Board considered that the approval of the fund's Advisory Contracts will not result in any changes in (i) the investment process or strategies employed in the management of the fund's assets; (ii) the fees and expenses paid by shareholders; (iii) the nature, extent or quality of services provided under the fund's Advisory Contracts; or (iv) the day-to-day management of the fund or the persons primarily responsible for such management. The Board also considered that since its last approval of the fund's Advisory Contracts, FMR had provided additional information on the fund in support of the annual contract renewal process, including competitive analyses on total expenses and management fees and in-depth reviews of fund performance and fund profitability information. The Board also considered the findings of certain ad hoc committees that had been previously formed to discuss matters relevant to all of the Fidelity funds, including economies of scale, fall-out benefits and retail vs. institutional funds. The Board concluded that the fund's Advisory Contracts are fair and reasonable, and that the fund's Advisory Contracts should be renewed, without modification, through May 31, 2021, with the understanding that the Board will consider the annual renewal for a full one year period in May 2021.In connection with its consideration of future renewals of the fund's Advisory Contracts, the Board will consider: (i) the nature, extent and quality of services provided to the funds, including shareholder and administrative services and investment performance; (ii) the competitiveness of the management fee and total expenses for the fund; (iii) the costs of the services and profitability, including the revenues earned and the expenses incurred in conducting the business of developing, marketing, distributing, managing, administering, and servicing the fund and its shareholders, to the extent applicable; and (iv) whether there have been economies of scale in respect of the Fidelity funds, whether the Fidelity funds (including the fund) have appropriately benefited from any such economies of scale, and whether there is the potential for realization of any further economies.Based on its evaluation of all of the conclusions noted above, and after considering all factors it believed relevant, the Board ultimately concluded that the fund's management fee structure is fair and reasonable, and that the continuation of the fund's Advisory Contracts should be approved for four months from February 1, 2021 through May 31, 2021.Proxy Voting Results
A special meeting of shareholders was held on June 9, 2020. The results of votes taken among shareholders on the proposal before them are reported below. Each vote reported represents one dollar of net asset value held on the record date for the meeting.
PROPOSAL 1
To elect a Board of Trustees.
| # of Votes | % of Votes | |
| Dennis J. Dirks | ||
| Affirmative | 20,677,600,881.166 | 98.531 |
| Withheld | 308,216,367.332 | 1.469 |
| TOTAL | 20,985,817,248.498 | 100.000 |
| Donald F. Donahue | ||
| Affirmative | 20,685,205,663.711 | 98.568 |
| Withheld | 300,611,584.787 | 1.432 |
| TOTAL | 20,985,817,248.498 | 100.000 |
| Bettina Doulton | ||
| Affirmative | 20,701,129,729.034 | 98.643 |
| Withheld | 284,687,519.464 | 1.357 |
| TOTAL | 20,985,817,248.498 | 100.000 |
| Vicki L. Fuller | ||
| Affirmative | 20,713,892,146.063 | 98.704 |
| Withheld | 271,925,102.435 | 1.296 |
| TOTAL | 20,985,817,248.498 | 100.000 |
| Patricia L. Kampling | ||
| Affirmative | 20,693,289,719.327 | 98.606 |
| Withheld | 292,527,529.171 | 1.394 |
| TOTAL | 20,985,817,248.498 | 100.000 |
| Alan J. Lacy | ||
| Affirmative | 20,659,591,158.873 | 98.445 |
| Withheld | 326,226,089.625 | 1.555 |
| TOTAL | 20,985,817,248.498 | 100.000 |
| Ned C. Lautenbach | ||
| Affirmative | 20,634,244,420.039 | 98.325 |
| Withheld | 351,572,828.459 | 1.675 |
| TOTAL | 20,985,817,248.498 | 100.000 |
| Robert A. Lawrence | ||
| Affirmative | 20,672,781,907.548 | 98.508 |
| Withheld | 313,035,340.950 | 1.492 |
| TOTAL | 20,985,817,248.498 | 100.000 |
| Joseph Mauriello | ||
| Affirmative | 20,652,465,304.654 | 98.412 |
| Withheld | 333,351,943.843 | 1.588 |
| TOTAL | 20,985,817,248.498 | 100.000 |
| Cornelia M. Small | ||
| Affirmative | 20,671,641,667.984 | 98.503 |
| Withheld | 314,175,580.514 | 1.497 |
| TOTAL | 20,985,817,248.498 | 100.000 |
| Garnett A. Smith | ||
| Affirmative | 20,655,644,270.628 | 98.427 |
| Withheld | 330,172,977.870 | 1.573 |
| TOTAL | 20,985,817,248.498 | 100.000 |
| David M. Thomas | ||
| Affirmative | 20,654,595,907.599 | 98.422 |
| Withheld | 331,221,340.899 | 1.578 |
| TOTAL | 20,985,817,248.498 | 100.000 |
| Susan Tomasky | ||
| Affirmative | 20,686,662,870.375 | 98.574 |
| Withheld | 299,154,378.123 | 1.426 |
| TOTAL | 20,985,817,248.498 | 100.000 |
| Michael E. Wiley | ||
| Affirmative | 20,662,847,882.871 | 98.461 |
| Withheld | 322,969,365.626 | 1.539 |
| TOTAL | 20,985,817,248.498 | 100.000 |
| Proposal 1 reflects trust wide proposal and voting results. |
![]()
ZMV-ANN-0321
1.9881567.103
Fidelity® Mid Cap Value Fund
January 31, 2021
Includes Fidelity and Fidelity Advisor share classes
Contents
To view a fund's proxy voting guidelines and proxy voting record for the 12-month period ended June 30, visit http://www.fidelity.com/proxyvotingresults or visit the Securities and Exchange Commission's (SEC) web site at http://www.sec.gov.
You may also call 1-800-544-8544 if you’re an individual investing directly with Fidelity, call 1-800-835-5092 if you’re a plan sponsor or participant with Fidelity as your recordkeeper or call 1-877-208-0098 on institutional accounts or if you’re an advisor or invest through one to request a free copy of the proxy voting guidelines.
Standard & Poor's, S&P and S&P 500 are registered service marks of The McGraw-Hill Companies, Inc. and have been licensed for use by Fidelity Distributors Corporation.
Other third-party marks appearing herein are the property of their respective owners.
All other marks appearing herein are registered or unregistered trademarks or service marks of FMR LLC or an affiliated company. © 2021 FMR LLC. All rights reserved.
This report and the financial statements contained herein are submitted for the general information of the shareholders of the Fund. This report is not authorized for distribution to prospective investors in the Fund unless preceded or accompanied by an effective prospectus.
A fund files its complete schedule of portfolio holdings with the SEC for the first and third quarters of each fiscal year on Form N-PORT. Forms N-PORT are available on the SEC’s web site at http://www.sec.gov. A fund's Forms N-PORT may be reviewed and copied at the SEC’s Public Reference Room in Washington, DC. Information regarding the operation of the SEC's Public Reference Room may be obtained by calling 1-800-SEC-0330.
For a complete list of a fund's portfolio holdings, view the most recent holdings listing, semiannual report, or annual report on Fidelity's web site at http://www.fidelity.com, http://www.institutional.fidelity.com, or http://www.401k.com, as applicable.
NOT FDIC INSURED •MAY LOSE VALUE •NO BANK GUARANTEE
Neither the Fund nor Fidelity Distributors Corporation is a bank.
Note to Shareholders:
Early in 2020, the outbreak and spread of a new coronavirus emerged as a public health emergency that had a major influence on financial markets, primarily based on its impact on the global economy and the outlook for corporate earnings. The virus causes a respiratory disease known as COVID-19. On March 11, the World Health Organization declared the COVID-19 outbreak a pandemic, citing sustained risk of further global spread.
In the weeks following, as the crisis worsened, we witnessed an escalating human tragedy with wide-scale social and economic consequences from coronavirus-containment measures. The outbreak of COVID-19 prompted a number of measures to limit the spread, including travel and border restrictions, quarantines, and restrictions on large gatherings. In turn, these resulted in lower consumer activity, diminished demand for a wide range of products and services, disruption in manufacturing and supply chains, and – given the wide variability in outcomes regarding the outbreak – significant market uncertainty and volatility. Amid the turmoil, global governments and central banks took unprecedented action to help support consumers, businesses, and the broader economies, and to limit disruption to financial systems.
The situation continues to unfold, and the extent and duration of its impact on financial markets and the economy remain highly uncertain. Extreme events such as the coronavirus crisis are “exogenous shocks” that can have significant adverse effects on mutual funds and their investments. Although multiple asset classes may be affected by market disruption, the duration and impact may not be the same for all types of assets.
Fidelity is committed to helping you stay informed amid news about COVID-19 and during increased market volatility, and we’re taking extra steps to be responsive to customer needs. We encourage you to visit our websites, where we offer ongoing updates, commentary, and analysis on the markets and our funds.
Performance: The Bottom Line
Average annual total return reflects the change in the value of an investment, assuming reinvestment of distributions from dividend income and capital gains (the profits earned upon the sale of securities that have grown in value, if any) and assuming a constant rate of performance each year. The hypothetical investment and the average annual total returns do not reflect the deduction of taxes that a shareholder would pay on fund distributions or the redemption of fund shares. During periods of reimbursement by Fidelity, a fund’s total return will be greater than it would be had the reimbursement not occurred. How a fund did yesterday is no guarantee of how it will do tomorrow.
Average Annual Total Returns
| For the periods ended January 31, 2021 | Past 1 year | Past 5 years | Past 10 years |
| Class A (incl. 5.75% sales charge) | 0.01% | 6.02% | 7.81% |
| Class M (incl. 3.50% sales charge) | 2.06% | 6.21% | 7.77% |
| Class C (incl. contingent deferred sales charge) | 4.26% | 6.48% | 7.64% |
| Fidelity® Mid Cap Value Fund | 6.37% | 7.58% | 8.78% |
| Class I | 6.41% | 7.58% | 8.76% |
| Class Z | 6.54% | 7.70% | 8.82% |
Class C shares' contingent deferred sales charges included in the past one year, past five years and past ten years total return figures are 1%, 0% and 0%, respectively.
The initial offering of Class Z shares took place on February 1, 2017. Returns prior to February 1, 2017, are those of Class I.
$10,000 Over 10 Years
Let's say hypothetically that $10,000 was invested in Fidelity® Mid Cap Value Fund, a class of the fund, on January 31, 2011.
The chart shows how the value of your investment would have changed, and also shows how the Russell Midcap® Value Index performed over the same period.
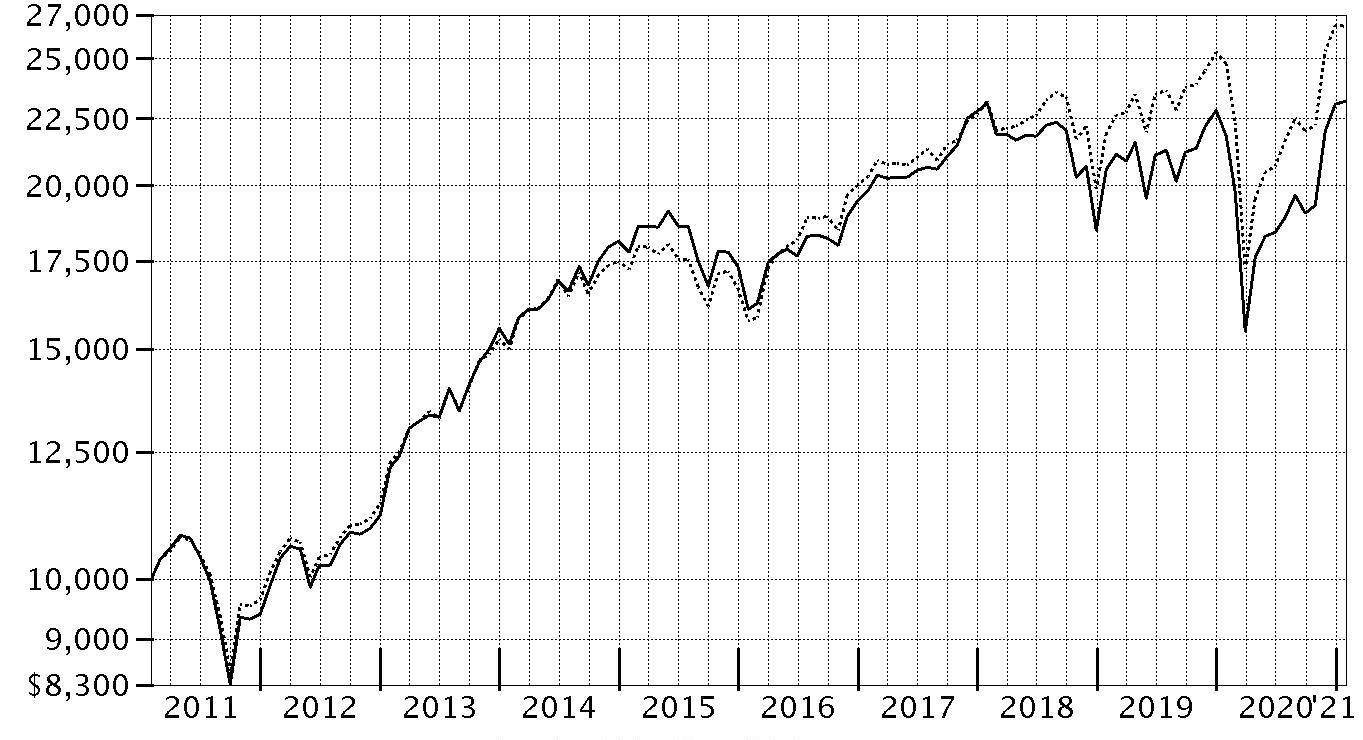
| Period Ending Values | ||
| $23,193 | Fidelity® Mid Cap Value Fund | |
| $26,458 | Russell Midcap® Value Index | |
Management's Discussion of Fund Performance
Market Recap: The S&P 500® index gained 17.25% for the 12 months ending January 31, 2021, a volatile but productive period for U.S. risk assets. The early-2020 outbreak and spread of COVID-19 resulted in stocks suffering one of the quickest declines on record, through March 23, followed by a historic rebound. The crisis and containment efforts caused broad contraction in economic activity, along with extreme uncertainty and dislocation in financial markets. A rapid and expansive U.S. monetary/fiscal-policy response partially offset the economic disruption and fueled the market surge, as did resilient corporate earnings. The rally slowed in September, when the S&P 500 began a two-month retreat amid Congress’s inability to reach a deal on additional fiscal stimulus, as well as concerns about election uncertainty, indications the U.S. economic recovery could be slowing and a new wave of COVID-19 cases. A shift in momentum began in October and accelerated following the U.S. elections, with the approval of two breakthrough COVID-19 vaccines and prospects for additional government stimulus fueling the “reflation trade.” Small-cap value stocks rallied strongly late in 2020, usurping longstanding market leadership from growth shares – especially large tech and internet-related names – amid hopes of a broad economic recovery in 2021. By sector for the full 12 months, information technology (+37%) and consumer discretionary (+33%) led all gainers. In contrast, energy (-23%) struggled along with global oil demand and pricing.Comments from Portfolio Manager Kevin Walenta: For the fiscal year ending January 31, 2021, the fund's share classes (excluding sales charges, if applicable) gained roughly 5% to 6.6%, trailing the 6.80% result of the benchmark Russell Midcap® Value Index. Stock picking in the materials and financials sectors, especially banks, detracted most versus the benchmark. Positioning in the communication services and consumer staples sectors and security selection in information technology also hampered relative performance. The biggest individual relative detractors were overweight positions in OGE Energy (-30%) and Jones Lang LaSalle (-14%), each among the fund's biggest holdings this period. Avoiding Newmont, a benchmark component that gained roughly 33%, also hindered performance. Conversely, security selection and an overweighting in the consumer discretionary sector, especially within the retailing industry, aided relative performance. The fund's cash position also helped. The biggest individual relative contributor was Williams-Sonoma (+89%), an overweight position and top holding at period end. Further aiding performance was Synnex, a new addition and outsized stake that gained 36%. Notable changes in positioning this period include a higher allocation to the consumer discretionary and industrials sectors.The views expressed above reflect those of the portfolio manager(s) only through the end of the period as stated on the cover of this report and do not necessarily represent the views of Fidelity or any other person in the Fidelity organization. Any such views are subject to change at any time based upon market or other conditions and Fidelity disclaims any responsibility to update such views. These views may not be relied on as investment advice and, because investment decisions for a Fidelity fund are based on numerous factors, may not be relied on as an indication of trading intent on behalf of any Fidelity fund.
Investment Summary (Unaudited)
Top Ten Stocks as of January 31, 2021
| % of fund's net assets | |
| Williams-Sonoma, Inc. | 5.2 |
| CBRE Group, Inc. | 5.2 |
| Best Buy Co., Inc. | 4.9 |
| Reliance Steel & Aluminum Co. | 4.5 |
| Jones Lang LaSalle, Inc. | 3.9 |
| Synchrony Financial | 3.8 |
| Amdocs Ltd. | 3.0 |
| NRG Energy, Inc. | 2.8 |
| MDU Resources Group, Inc. | 2.7 |
| M&T Bank Corp. | 2.5 |
| 38.5 |
Top Five Market Sectors as of January 31, 2021
| % of fund's net assets | |
| Industrials | 17.1 |
| Financials | 14.8 |
| Consumer Discretionary | 13.1 |
| Real Estate | 11.4 |
| Utilities | 9.8 |
Asset Allocation (% of fund's net assets)
| As of January 31, 2021* | ||
| Stocks | 99.1% | |
| Short-Term Investments and Net Other Assets (Liabilities) | 0.9% | |

* Foreign investments - 6.2%
Schedule of Investments January 31, 2021
Showing Percentage of Net Assets
| Common Stocks - 99.1% | |||
| Shares | Value | ||
| COMMUNICATION SERVICES - 3.6% | |||
| Entertainment - 1.2% | |||
| Electronic Arts, Inc. | 102,700 | $14,706,640 | |
| Media - 2.4% | |||
| Interpublic Group of Companies, Inc. | 1,222,569 | 29,427,236 | |
| TOTAL COMMUNICATION SERVICES | 44,133,876 | ||
| CONSUMER DISCRETIONARY - 13.1% | |||
| Auto Components - 1.5% | |||
| BorgWarner, Inc. | 454,690 | 19,092,433 | |
| Distributors - 0.3% | |||
| LKQ Corp. (a) | 104,300 | 3,659,887 | |
| Household Durables - 1.2% | |||
| PulteGroup, Inc. | 259,600 | 11,292,600 | |
| Whirlpool Corp. | 20,500 | 3,794,345 | |
| 15,086,945 | |||
| Specialty Retail - 10.1% | |||
| Best Buy Co., Inc. | 549,212 | 59,765,250 | |
| Williams-Sonoma, Inc. (b) | 496,939 | 64,065,376 | |
| 123,830,626 | |||
| TOTAL CONSUMER DISCRETIONARY | 161,669,891 | ||
| CONSUMER STAPLES - 4.1% | |||
| Food & Staples Retailing - 0.7% | |||
| Kroger Co. | 241,800 | 8,342,100 | |
| Food Products - 3.4% | |||
| Ingredion, Inc. (b) | 277,793 | 20,965,038 | |
| The J.M. Smucker Co. (b) | 179,784 | 20,928,655 | |
| 41,893,693 | |||
| TOTAL CONSUMER STAPLES | 50,235,793 | ||
| ENERGY - 2.3% | |||
| Energy Equipment & Services - 1.8% | |||
| Baker Hughes Co. Class A | 1,086,400 | 21,825,776 | |
| Oil, Gas & Consumable Fuels - 0.5% | |||
| Antero Midstream GP LP | 95,100 | 770,310 | |
| Black Stone Minerals LP | 33,500 | 285,755 | |
| EOG Resources, Inc. | 50,900 | 2,593,864 | |
| Sunoco Logistics Partners, LP | 29,600 | 925,888 | |
| Teekay LNG Partners LP | 70,600 | 874,734 | |
| World Fuel Services Corp. | 27,700 | 847,343 | |
| 6,297,894 | |||
| TOTAL ENERGY | 28,123,670 | ||
| FINANCIALS - 14.8% | |||
| Banks - 3.2% | |||
| M&T Bank Corp. | 237,500 | 31,461,625 | |
| Popular, Inc. | 146,300 | 8,302,525 | |
| 39,764,150 | |||
| Capital Markets - 1.9% | |||
| Federated Hermes, Inc. Class B (non-vtg.) | 235,500 | 6,358,500 | |
| State Street Corp. | 234,800 | 16,436,000 | |
| 22,794,500 | |||
| Consumer Finance - 3.8% | |||
| Synchrony Financial | 1,377,546 | 46,354,423 | |
| Insurance - 5.9% | |||
| Allstate Corp. | 113,700 | 12,186,366 | |
| American National Group, Inc. | 4,200 | 371,196 | |
| Hartford Financial Services Group, Inc. | 411,700 | 19,769,834 | |
| MetLife, Inc. | 451,880 | 21,758,022 | |
| Old Republic International Corp. | 918,900 | 16,632,090 | |
| Unum Group | 77,521 | 1,800,813 | |
| 72,518,321 | |||
| TOTAL FINANCIALS | 181,431,394 | ||
| HEALTH CARE - 7.6% | |||
| Biotechnology - 2.5% | |||
| Alexion Pharmaceuticals, Inc. (a) | 73,500 | 11,269,755 | |
| Amgen, Inc. | 33,668 | 8,128,465 | |
| Exelixis, Inc. (a) | 64,800 | 1,439,208 | |
| Regeneron Pharmaceuticals, Inc. (a) | 16,300 | 8,212,592 | |
| United Therapeutics Corp. (a) | 13,600 | 2,227,952 | |
| 31,277,972 | |||
| Health Care Equipment & Supplies - 0.9% | |||
| Hologic, Inc. (a) | 133,900 | 10,675,847 | |
| Health Care Providers & Services - 2.2% | |||
| Cigna Corp. | 40,400 | 8,768,820 | |
| Universal Health Services, Inc. Class B | 147,221 | 18,355,514 | |
| 27,124,334 | |||
| Pharmaceuticals - 2.0% | |||
| Jazz Pharmaceuticals PLC (a) | 158,013 | 24,571,022 | |
| TOTAL HEALTH CARE | 93,649,175 | ||
| INDUSTRIALS - 17.1% | |||
| Building Products - 2.1% | |||
| Fortune Brands Home & Security, Inc. | 101,200 | 8,728,500 | |
| Masco Corp. | 184,100 | 9,998,471 | |
| Simpson Manufacturing Co. Ltd. | 23,500 | 2,162,000 | |
| UFP Industries, Inc. | 98,200 | 5,296,908 | |
| 26,185,879 | |||
| Construction & Engineering - 1.3% | |||
| EMCOR Group, Inc. | 182,700 | 16,132,410 | |
| Electrical Equipment - 3.5% | |||
| Acuity Brands, Inc. | 171,951 | 20,675,388 | |
| Encore Wire Corp. | 100,100 | 5,780,775 | |
| Hubbell, Inc. Class B (b) | 107,400 | 16,711,440 | |
| 43,167,603 | |||
| Machinery - 5.5% | |||
| Allison Transmission Holdings, Inc. | 575,100 | 23,406,570 | |
| Crane Co. | 273,067 | 20,665,711 | |
| Dover Corp. | 60,000 | 6,989,400 | |
| ITT, Inc. | 138,100 | 10,317,451 | |
| Mueller Industries, Inc. | 188,400 | 6,433,860 | |
| 67,812,992 | |||
| Professional Services - 1.8% | |||
| Manpower, Inc. | 247,326 | 21,873,511 | |
| Road & Rail - 1.9% | |||
| Knight-Swift Transportation Holdings, Inc. Class A | 72,500 | 2,900,000 | |
| Landstar System, Inc. | 132,700 | 18,498,380 | |
| Werner Enterprises, Inc. | 47,000 | 1,844,280 | |
| 23,242,660 | |||
| Trading Companies & Distributors - 1.0% | |||
| Boise Cascade Co. | 19,700 | 938,311 | |
| MSC Industrial Direct Co., Inc. Class A | 137,000 | 10,627,090 | |
| 11,565,401 | |||
| TOTAL INDUSTRIALS | 209,980,456 | ||
| INFORMATION TECHNOLOGY - 8.8% | |||
| Communications Equipment - 0.3% | |||
| Juniper Networks, Inc. | 173,300 | 4,231,986 | |
| Electronic Equipment & Components - 2.1% | |||
| Avnet, Inc. | 169,900 | 5,999,169 | |
| CDW Corp. | 23,600 | 3,107,176 | |
| Sanmina Corp. (a) | 131,000 | 4,074,100 | |
| SYNNEX Corp. | 148,400 | 12,112,408 | |
| 25,292,853 | |||
| IT Services - 4.1% | |||
| Accenture PLC Class A | 22,600 | 5,467,392 | |
| Amdocs Ltd. | 518,197 | 36,595,072 | |
| CACI International, Inc. Class A (a) | 30,100 | 7,260,722 | |
| Sykes Enterprises, Inc. (a) | 31,900 | 1,231,021 | |
| 50,554,207 | |||
| Software - 1.0% | |||
| Citrix Systems, Inc. | 65,200 | 8,691,812 | |
| SS&C Technologies Holdings, Inc. | 49,200 | 3,093,696 | |
| 11,785,508 | |||
| Technology Hardware, Storage & Peripherals - 1.3% | |||
| HP, Inc. | 328,900 | 8,005,426 | |
| Xerox Holdings Corp. | 393,400 | 8,273,202 | |
| 16,278,628 | |||
| TOTAL INFORMATION TECHNOLOGY | 108,143,182 | ||
| MATERIALS - 6.5% | |||
| Chemicals - 1.6% | |||
| Minerals Technologies, Inc. | 44,800 | 2,761,024 | |
| NewMarket Corp. | 43,900 | 17,217,141 | |
| 19,978,165 | |||
| Containers & Packaging - 0.1% | |||
| Berry Global Group, Inc. (a) | 33,600 | 1,658,832 | |
| Metals & Mining - 4.5% | |||
| Reliance Steel & Aluminum Co. | 475,138 | 55,154,019 | |
| Paper & Forest Products - 0.3% | |||
| Schweitzer-Mauduit International, Inc. | 92,600 | 3,439,164 | |
| TOTAL MATERIALS | 80,230,180 | ||
| REAL ESTATE - 11.4% | |||
| Equity Real Estate Investment Trusts (REITs) - 2.3% | |||
| Equity Commonwealth | 189,800 | 5,411,198 | |
| Essex Property Trust, Inc. | 10,200 | 2,444,022 | |
| Gaming & Leisure Properties | 249,642 | 10,267,775 | |
| Highwoods Properties, Inc. (SBI) | 207,800 | 7,790,422 | |
| PS Business Parks, Inc. | 19,000 | 2,586,280 | |
| 28,499,697 | |||
| Real Estate Management & Development - 9.1% | |||
| CBRE Group, Inc. (a) | 1,043,656 | 63,642,143 | |
| Jones Lang LaSalle, Inc. (a) | 330,619 | 48,339,804 | |
| 111,981,947 | |||
| TOTAL REAL ESTATE | 140,481,644 | ||
| UTILITIES - 9.8% | |||
| Electric Utilities - 6.1% | |||
| Exelon Corp. | 256,084 | 10,642,851 | |
| NRG Energy, Inc. | 837,939 | 34,699,054 | |
| OGE Energy Corp. | 968,574 | 29,560,878 | |
| 74,902,783 | |||
| Independent Power and Renewable Electricity Producers - 1.0% | |||
| Vistra Corp. | 612,700 | 12,235,619 | |
| Multi-Utilities - 2.7% | |||
| MDU Resources Group, Inc. | 1,266,472 | 33,295,549 | |
| TOTAL UTILITIES | 120,433,951 | ||
| TOTAL COMMON STOCKS | |||
| (Cost $1,074,339,211) | 1,218,513,212 | ||
| Money Market Funds - 5.4% | |||
| Fidelity Cash Central Fund 0.09% (c) | 27,995,576 | 28,001,175 | |
| Fidelity Securities Lending Cash Central Fund 0.09% (c)(d) | 37,707,148 | 37,710,919 | |
| TOTAL MONEY MARKET FUNDS | |||
| (Cost $65,712,094) | 65,712,094 | ||
| TOTAL INVESTMENT IN SECURITIES - 104.5% | |||
| (Cost $1,140,051,305) | 1,284,225,306 | ||
| NET OTHER ASSETS (LIABILITIES) - (4.5)% | (54,751,831) | ||
| NET ASSETS - 100% | $1,229,473,475 |
Legend
(a) Non-income producing
(b) Security or a portion of the security is on loan at period end.
(c) Affiliated fund that is generally available only to investment companies and other accounts managed by Fidelity Investments. The rate quoted is the annualized seven-day yield of the fund at period end. A complete unaudited listing of the fund's holdings as of its most recent quarter end is available upon request. In addition, each Fidelity Central Fund's financial statements, which are not covered by the Fund's Report of Independent Registered Public Accounting Firm, are available on the SEC's website or upon request.
(d) Investment made with cash collateral received from securities on loan.
Affiliated Central Funds
Information regarding fiscal year to date income earned by the Fund from investments in Fidelity Central Funds is as follows:
| Fund | Income earned |
| Fidelity Cash Central Fund | $95,828 |
| Fidelity Securities Lending Cash Central Fund | 24,281 |
| Total | $120,109 |
Amounts in the income column in the above table include any capital gain distributions from underlying funds, which are presented in the corresponding line-item in the Statement of Operations, if applicable. Amount for Fidelity Securities Lending Cash Central Fund represents the income earned on investing cash collateral, less rebates paid to borrowers and any lending agent fees associated with the loan, plus any premium payments received for lending certain types of securities.
Investment Valuation
The following is a summary of the inputs used, as of January 31, 2021, involving the Fund's assets and liabilities carried at fair value. The inputs or methodology used for valuing securities may not be an indication of the risk associated with investing in those securities. For more information on valuation inputs, and their aggregation into the levels used below, please refer to the Investment Valuation section in the accompanying Notes to Financial Statements.
| Valuation Inputs at Reporting Date: | ||||
| Description | Total | Level 1 | Level 2 | Level 3 |
| Investments in Securities: | ||||
| Equities: | ||||
| Communication Services | $44,133,876 | $44,133,876 | $-- | $-- |
| Consumer Discretionary | 161,669,891 | 161,669,891 | -- | -- |
| Consumer Staples | 50,235,793 | 50,235,793 | -- | -- |
| Energy | 28,123,670 | 28,123,670 | -- | -- |
| Financials | 181,431,394 | 181,431,394 | -- | -- |
| Health Care | 93,649,175 | 93,649,175 | -- | -- |
| Industrials | 209,980,456 | 209,980,456 | -- | -- |
| Information Technology | 108,143,182 | 108,143,182 | -- | -- |
| Materials | 80,230,180 | 80,230,180 | -- | -- |
| Real Estate | 140,481,644 | 140,481,644 | -- | -- |
| Utilities | 120,433,951 | 120,433,951 | -- | -- |
| Money Market Funds | 65,712,094 | 65,712,094 | -- | -- |
| Total Investments in Securities: | $1,284,225,306 | $1,284,225,306 | $-- | $-- |
See accompanying notes which are an integral part of the financial statements.
Financial Statements
Statement of Assets and Liabilities
| January 31, 2021 | ||
| Assets | ||
| Investment in securities, at value (including securities loaned of $35,982,641) — See accompanying schedule: Unaffiliated issuers (cost $1,074,339,211) | $1,218,513,212 | |
| Fidelity Central Funds (cost $65,712,094) | 65,712,094 | |
| Total Investment in Securities (cost $1,140,051,305) | $1,284,225,306 | |
| Receivable for fund shares sold | 467,484 | |
| Dividends receivable | 628,336 | |
| Distributions receivable from Fidelity Central Funds | 3,700 | |
| Prepaid expenses | 1,318 | |
| Other receivables | 15,092 | |
| Total assets | 1,285,341,236 | |
| Liabilities | ||
| Payable for fund shares redeemed | $17,564,759 | |
| Accrued management fee | 258,433 | |
| Distribution and service plan fees payable | 77,644 | |
| Other affiliated payables | 219,273 | |
| Other payables and accrued expenses | 48,452 | |
| Collateral on securities loaned | 37,699,200 | |
| Total liabilities | 55,867,761 | |
| Net Assets | $1,229,473,475 | |
| Net Assets consist of: | ||
| Paid in capital | $1,279,752,028 | |
| Total accumulated earnings (loss) | (50,278,553) | |
| Net Assets | $1,229,473,475 | |
| Net Asset Value and Maximum Offering Price | ||
| Class A: | ||
| Net Asset Value and redemption price per share ($122,837,554 ÷ 5,419,655 shares)(a) | $22.67 | |
| Maximum offering price per share (100/94.25 of $22.67) | $24.05 | |
| Class M: | ||
| Net Asset Value and redemption price per share ($30,548,821 ÷ 1,355,160 shares)(a) | $22.54 | |
| Maximum offering price per share (100/96.50 of $22.54) | $23.36 | |
| Class C: | ||
| Net Asset Value and offering price per share ($43,128,345 ÷ 1,974,566 shares)(a) | $21.84 | |
| Mid Cap Value: | ||
| Net Asset Value, offering price and redemption price per share ($920,385,891 ÷ 39,962,749 shares) | $23.03 | |
| Class I: | ||
| Net Asset Value, offering price and redemption price per share ($94,585,796 ÷ 4,144,420 shares) | $22.82 | |
| Class Z: | ||
| Net Asset Value, offering price and redemption price per share ($17,987,068 ÷ 789,043 shares) | $22.80 |
(a) Redemption price per share is equal to net asset value less any applicable contingent deferred sales charge.
See accompanying notes which are an integral part of the financial statements.
Statement of Operations
| Year ended January 31, 2021 | ||
| Investment Income | ||
| Dividends | $29,708,871 | |
| Income from Fidelity Central Funds (including $24,281 from security lending) | 120,109 | |
| Total income | 29,828,980 | |
| Expenses | ||
| Management fee | ||
| Basic fee | $6,318,245 | |
| Performance adjustment | (3,992,321) | |
| Transfer agent fees | 2,257,964 | |
| Distribution and service plan fees | 867,532 | |
| Accounting fees | 384,584 | |
| Custodian fees and expenses | 10,673 | |
| Independent trustees' fees and expenses | 7,002 | |
| Registration fees | 100,481 | |
| Audit | 80,072 | |
| Legal | 7,324 | |
| Interest | 79 | |
| Miscellaneous | 42,135 | |
| Total expenses before reductions | 6,083,770 | |
| Expense reductions | (118,211) | |
| Total expenses after reductions | 5,965,559 | |
| Net investment income (loss) | 23,863,421 | |
| Realized and Unrealized Gain (Loss) | ||
| Net realized gain (loss) on: | ||
| Investment securities: | ||
| Unaffiliated issuers | (67,385,101) | |
| Fidelity Central Funds | 3,986 | |
| Foreign currency transactions | 20,505 | |
| Total net realized gain (loss) | (67,360,610) | |
| Change in net unrealized appreciation (depreciation) on: | ||
| Investment securities: | ||
| Unaffiliated issuers | 69,180,069 | |
| Assets and liabilities in foreign currencies | (421) | |
| Total change in net unrealized appreciation (depreciation) | 69,179,648 | |
| Net gain (loss) | 1,819,038 | |
| Net increase (decrease) in net assets resulting from operations | $25,682,459 |
See accompanying notes which are an integral part of the financial statements.
Statement of Changes in Net Assets
| Year ended January 31, 2021 | Year ended January 31, 2020 | |
| Increase (Decrease) in Net Assets | ||
| Operations | ||
| Net investment income (loss) | $23,863,421 | $35,686,237 |
| Net realized gain (loss) | (67,360,610) | (65,998,712) |
| Change in net unrealized appreciation (depreciation) | 69,179,648 | 137,720,740 |
| Net increase (decrease) in net assets resulting from operations | 25,682,459 | 107,408,265 |
| Distributions to shareholders | (23,901,751) | (30,653,496) |
| Share transactions - net increase (decrease) | (328,621,412) | (557,574,102) |
| Total increase (decrease) in net assets | (326,840,704) | (480,819,333) |
| Net Assets | ||
| Beginning of period | 1,556,314,179 | 2,037,133,512 |
| End of period | $1,229,473,475 | $1,556,314,179 |
See accompanying notes which are an integral part of the financial statements.
Financial Highlights
Fidelity Mid Cap Value Fund Class A
| Years ended January 31, | 2021 | 2020 | 2019 | 2018 | 2017 |
| Selected Per–Share Data | |||||
| Net asset value, beginning of period | $21.75 | $20.91 | $26.62 | $24.94 | $20.52 |
| Income from Investment Operations | |||||
| Net investment income (loss)A | .35 | .38 | .39 | .44B | .29 |
| Net realized and unrealized gain (loss) | .97 | .83 | (3.35) | 3.54 | 4.40 |
| Total from investment operations | 1.32 | 1.21 | (2.96) | 3.98 | 4.69 |
| Distributions from net investment income | (.40) | (.37) | (.40) | (.43) | (.27) |
| Distributions from net realized gain | – | – | (2.35) | (1.87) | – |
| Total distributions | (.40) | (.37) | (2.75) | (2.30) | (.27) |
| Redemption fees added to paid in capitalA | – | – | – | – | –C |
| Net asset value, end of period | $22.67 | $21.75 | $20.91 | $26.62 | $24.94 |
| Total ReturnD,E | 6.12% | 5.72% | (11.23)% | 16.13% | 22.87% |
| Ratios to Average Net AssetsF,G | |||||
| Expenses before reductions | .73% | .76% | .82% | .98% | 1.01% |
| Expenses net of fee waivers, if any | .73% | .76% | .82% | .98% | 1.01% |
| Expenses net of all reductions | .72% | .75% | .81% | .97% | 1.00% |
| Net investment income (loss) | 1.79% | 1.77% | 1.66% | 1.67%B | 1.25% |
| Supplemental Data | |||||
| Net assets, end of period (000 omitted) | $122,838 | $141,439 | $173,538 | $255,907 | $299,124 |
| Portfolio turnover rateH | 67% | 83%I | 80%I | 138%I | 83% |
A Calculated based on average shares outstanding during the period.
B Net investment income per share reflects one or more large, non-recurring dividend(s) which amounted to $.17 per share. Excluding such non-recurring dividend(s), the ratio of net investment income (loss) to average net assets would have been 1.18%.
C Amount represents less than $.005 per share.
D Total returns would have been lower if certain expenses had not been reduced during the applicable periods shown.
E Total returns do not include the effect of the sales charges.
F Fees and expenses of any underlying mutual funds or exchange-traded funds (ETFs) are not included in the Fund's expense ratio. The Fund indirectly bears its proportionate share of these expenses. For additional expense information related to investments in Fidelity Central Funds, please refer to the "Investments in Fidelity Central Funds" note found in the Notes to Financial Statements section of the most recent Annual or Semi-Annual report.
G Expense ratios reflect operating expenses of the class. Expenses before reductions do not reflect amounts reimbursed, waived, or reduced through arrangements with the investment adviser, brokerage services, or other offset arrangements, if applicable, and do not represent the amount paid by the class during periods when reimbursements, waivers or reductions occur.
H Amount does not include the portfolio activity of any underlying mutual funds or exchange-traded funds (ETFs).
I Portfolio turnover rate excludes securities received or delivered in-kind.
See accompanying notes which are an integral part of the financial statements.
Fidelity Mid Cap Value Fund Class M
| Years ended January 31, | 2021 | 2020 | 2019 | 2018 | 2017 |
| Selected Per–Share Data | |||||
| Net asset value, beginning of period | $21.65 | $20.82 | $26.51 | $24.84 | $20.46 |
| Income from Investment Operations | |||||
| Net investment income (loss)A | .29 | .32 | .32 | .36B | .22 |
| Net realized and unrealized gain (loss) | .95 | .82 | (3.33) | 3.54 | 4.38 |
| Total from investment operations | 1.24 | 1.14 | (3.01) | 3.90 | 4.60 |
| Distributions from net investment income | (.35) | (.31) | (.33) | (.35) | (.22) |
| Distributions from net realized gain | – | – | (2.35) | (1.87) | – |
| Total distributions | (.35) | (.31) | (2.68) | (2.23)C | (.22) |
| Redemption fees added to paid in capitalA | – | – | – | – | –D |
| Net asset value, end of period | $22.54 | $21.65 | $20.82 | $26.51 | $24.84 |
| Total ReturnE,F | 5.76% | 5.44% | (11.48)% | 15.84% | 22.48% |
| Ratios to Average Net AssetsG,H | |||||
| Expenses before reductions | 1.01% | 1.03% | 1.10% | 1.25% | 1.29% |
| Expenses net of fee waivers, if any | 1.01% | 1.03% | 1.10% | 1.25% | 1.29% |
| Expenses net of all reductions | 1.00% | 1.02% | 1.09% | 1.24% | 1.29% |
| Net investment income (loss) | 1.51% | 1.50% | 1.39% | 1.40%B | .96% |
| Supplemental Data | |||||
| Net assets, end of period (000 omitted) | $30,549 | $35,684 | $41,540 | $57,807 | $60,761 |
| Portfolio turnover rateI | 67% | 83%J | 80%J | 138%J | 83% |
A Calculated based on average shares outstanding during the period.
B Net investment income per share reflects one or more large, non-recurring dividend(s) which amounted to $.17 per share. Excluding such non-recurring dividend(s), the ratio of net investment income (loss) to average net assets would have been .76%.
C Total distributions per share do not sum due to rounding.
D Amount represents less than $.005 per share.
E Total returns would have been lower if certain expenses had not been reduced during the applicable periods shown.
F Total returns do not include the effect of the sales charges.
G Fees and expenses of any underlying mutual funds or exchange-traded funds (ETFs) are not included in the Fund's expense ratio. The Fund indirectly bears its proportionate share of these expenses. For additional expense information related to investments in Fidelity Central Funds, please refer to the "Investments in Fidelity Central Funds" note found in the Notes to Financial Statements section of the most recent Annual or Semi-Annual report.
H Expense ratios reflect operating expenses of the class. Expenses before reductions do not reflect amounts reimbursed, waived, or reduced through arrangements with the investment adviser, brokerage services, or other offset arrangements, if applicable, and do not represent the amount paid by the class during periods when reimbursements, waivers or reductions occur.
I Amount does not include the portfolio activity of any underlying mutual funds or exchange-traded funds (ETFs).
J Portfolio turnover rate excludes securities received or delivered in-kind.
See accompanying notes which are an integral part of the financial statements.
Fidelity Mid Cap Value Fund Class C
| Years ended January 31, | 2021 | 2020 | 2019 | 2018 | 2017 |
| Selected Per–Share Data | |||||
| Net asset value, beginning of period | $20.99 | $20.19 | $25.76 | $24.22 | $19.95 |
| Income from Investment Operations | |||||
| Net investment income (loss)A | .19 | .21 | .21 | .23B | .11 |
| Net realized and unrealized gain (loss) | .91 | .80 | (3.23) | 3.43 | 4.27 |
| Total from investment operations | 1.10 | 1.01 | (3.02) | 3.66 | 4.38 |
| Distributions from net investment income | (.25) | (.21) | (.20) | (.25) | (.11) |
| Distributions from net realized gain | – | – | (2.35) | (1.87) | – |
| Total distributions | (.25) | (.21) | (2.55) | (2.12) | (.11) |
| Redemption fees added to paid in capitalA | – | – | – | – | –C |
| Net asset value, end of period | $21.84 | $20.99 | $20.19 | $25.76 | $24.22 |
| Total ReturnD,E | 5.26% | 4.96% | (11.89)% | 15.28% | 21.97% |
| Ratios to Average Net AssetsF,G | |||||
| Expenses before reductions | 1.49% | 1.51% | 1.56% | 1.72% | 1.76% |
| Expenses net of fee waivers, if any | 1.49% | 1.51% | 1.56% | 1.72% | 1.76% |
| Expenses net of all reductions | 1.48% | 1.50% | 1.55% | 1.71% | 1.75% |
| Net investment income (loss) | 1.04% | 1.02% | .92% | .93%B | .50% |
| Supplemental Data | |||||
| Net assets, end of period (000 omitted) | $43,128 | $60,685 | $85,519 | $138,506 | $144,503 |
| Portfolio turnover rateH | 67% | 83%I | 80%I | 138%I | 83% |
A Calculated based on average shares outstanding during the period.
B Net investment income per share reflects one or more large, non-recurring dividend(s) which amounted to $.16 per share. Excluding such non-recurring dividend(s), the ratio of net investment income (loss) to average net assets would have been .44%.
C Amount represents less than $.005 per share.
D Total returns would have been lower if certain expenses had not been reduced during the applicable periods shown.
E Total returns do not include the effect of the contingent deferred sales charge.
F Fees and expenses of any underlying mutual funds or exchange-traded funds (ETFs) are not included in the Fund's expense ratio. The Fund indirectly bears its proportionate share of these expenses. For additional expense information related to investments in Fidelity Central Funds, please refer to the "Investments in Fidelity Central Funds" note found in the Notes to Financial Statements section of the most recent Annual or Semi-Annual report.
G Expense ratios reflect operating expenses of the class. Expenses before reductions do not reflect amounts reimbursed, waived, or reduced through arrangements with the investment adviser, brokerage services, or other offset arrangements, if applicable, and do not represent the amount paid by the class during periods when reimbursements, waivers or reductions occur.
H Amount does not include the portfolio activity of any underlying mutual funds or exchange-traded funds (ETFs).
I Portfolio turnover rate excludes securities received or delivered in-kind.
See accompanying notes which are an integral part of the financial statements.
Fidelity Mid Cap Value Fund
| Years ended January 31, | 2021 | 2020 | 2019 | 2018 | 2017 |
| Selected Per–Share Data | |||||
| Net asset value, beginning of period | $22.09 | $21.23 | $26.99 | $25.24 | $20.76 |
| Income from Investment Operations | |||||
| Net investment income (loss)A | .41 | .45 | .47 | .52B | .35 |
| Net realized and unrealized gain (loss) | .99 | .84 | (3.41) | 3.60 | 4.46 |
| Total from investment operations | 1.40 | 1.29 | (2.94) | 4.12 | 4.81 |
| Distributions from net investment income | (.46) | (.43) | (.47) | (.50) | (.33) |
| Distributions from net realized gain | – | – | (2.35) | (1.87) | – |
| Total distributions | (.46) | (.43) | (2.82) | (2.37) | (.33) |
| Redemption fees added to paid in capitalA | – | – | – | – | –C |
| Net asset value, end of period | $23.03 | $22.09 | $21.23 | $26.99 | $25.24 |
| Total ReturnD | 6.37% | 6.03% | (10.97)% | 16.51% | 23.19% |
| Ratios to Average Net AssetsE,F | |||||
| Expenses before reductions | .44% | .46% | .53% | .69% | .73% |
| Expenses net of fee waivers, if any | .43% | .46% | .53% | .69% | .73% |
| Expenses net of all reductions | .43% | .45% | .52% | .68% | .72% |
| Net investment income (loss) | 2.09% | 2.07% | 1.96% | 1.96%B | 1.53% |
| Supplemental Data | |||||
| Net assets, end of period (000 omitted) | $920,386 | $1,156,286 | $1,456,510 | $2,332,143 | $2,426,359 |
| Portfolio turnover rateG | 67% | 83%H | 80%H | 138%H | 83% |
A Calculated based on average shares outstanding during the period.
B Net investment income per share reflects one or more large, non-recurring dividend(s) which amounted to $.17 per share. Excluding such non-recurring dividend(s), the ratio of net investment income (loss) to average net assets would have been 1.47%.
C Amount represents less than $.005 per share.
D Total returns would have been lower if certain expenses had not been reduced during the applicable periods shown.
E Fees and expenses of any underlying mutual funds or exchange-traded funds (ETFs) are not included in the Fund's expense ratio. The Fund indirectly bears its proportionate share of these expenses. For additional expense information related to investments in Fidelity Central Funds, please refer to the "Investments in Fidelity Central Funds" note found in the Notes to Financial Statements section of the most recent Annual or Semi-Annual report.
F Expense ratios reflect operating expenses of the class. Expenses before reductions do not reflect amounts reimbursed, waived, or reduced through arrangements with the investment adviser, brokerage services, or other offset arrangements, if applicable, and do not represent the amount paid by the class during periods when reimbursements, waivers or reductions occur.
G Amount does not include the portfolio activity of any underlying mutual funds or exchange-traded funds (ETFs).
H Portfolio turnover rate excludes securities received or delivered in-kind.
See accompanying notes which are an integral part of the financial statements.
Fidelity Mid Cap Value Fund Class I
| Years ended January 31, | 2021 | 2020 | 2019 | 2018 | 2017 |
| Selected Per–Share Data | |||||
| Net asset value, beginning of period | $21.88 | $21.03 | $26.77 | $25.05 | $20.61 |
| Income from Investment Operations | |||||
| Net investment income (loss)A | .41 | .45 | .46 | .51B | .35 |
| Net realized and unrealized gain (loss) | .98 | .83 | (3.38) | 3.58 | 4.43 |
| Total from investment operations | 1.39 | 1.28 | (2.92) | 4.09 | 4.78 |
| Distributions from net investment income | (.45) | (.43) | (.47) | (.50) | (.34) |
| Distributions from net realized gain | – | – | (2.35) | (1.87) | – |
| Total distributions | (.45) | (.43) | (2.82) | (2.37) | (.34) |
| Redemption fees added to paid in capitalA | – | – | – | – | –C |
| Net asset value, end of period | $22.82 | $21.88 | $21.03 | $26.77 | $25.05 |
| Total ReturnD | 6.41% | 6.01% | (10.99)% | 16.52% | 23.19% |
| Ratios to Average Net AssetsE,F | |||||
| Expenses before reductions | .42% | .46% | .53% | .69% | .73% |
| Expenses net of fee waivers, if any | .42% | .46% | .53% | .69% | .73% |
| Expenses net of all reductions | .41% | .45% | .52% | .68% | .73% |
| Net investment income (loss) | 2.10% | 2.07% | 1.95% | 1.95%B | 1.53% |
| Supplemental Data | |||||
| Net assets, end of period (000 omitted) | $94,586 | $127,647 | $244,054 | $410,868 | $363,949 |
| Portfolio turnover rateG | 67% | 83%H | 80%H | 138%H | 83% |
A Calculated based on average shares outstanding during the period.
B Net investment income per share reflects one or more large, non-recurring dividend(s) which amounted to $.17 per share. Excluding such non-recurring dividend(s), the ratio of net investment income (loss) to average net assets would have been 1.47%.
C Amount represents less than $.005 per share.
D Total returns would have been lower if certain expenses had not been reduced during the applicable periods shown.
E Fees and expenses of any underlying mutual funds or exchange-traded funds (ETFs) are not included in the Fund's expense ratio. The Fund indirectly bears its proportionate share of these expenses. For additional expense information related to investments in Fidelity Central Funds, please refer to the "Investments in Fidelity Central Funds" note found in the Notes to Financial Statements section of the most recent Annual or Semi-Annual report.
F Expense ratios reflect operating expenses of the class. Expenses before reductions do not reflect amounts reimbursed, waived, or reduced through arrangements with the investment adviser, brokerage services, or other offset arrangements, if applicable, and do not represent the amount paid by the class during periods when reimbursements, waivers or reductions occur.
G Amount does not include the portfolio activity of any underlying mutual funds or exchange-traded funds (ETFs).
H Portfolio turnover rate excludes securities received or delivered in-kind.
See accompanying notes which are an integral part of the financial statements.
Fidelity Mid Cap Value Fund Class Z
| Years ended January 31, | 2021 | 2020 | 2019 | 2018 A |
| Selected Per–Share Data | ||||
| Net asset value, beginning of period | $21.86 | $21.01 | $26.76 | $25.03 |
| Income from Investment Operations | ||||
| Net investment income (loss)B | .43 | .48 | .49 | .56C |
| Net realized and unrealized gain (loss) | .99 | .83 | (3.38) | 3.59 |
| Total from investment operations | 1.42 | 1.31 | (2.89) | 4.15 |
| Distributions from net investment income | (.48) | (.46) | (.51) | (.54) |
| Distributions from net realized gain | – | – | (2.35) | (1.87) |
| Total distributions | (.48) | (.46) | (2.86) | (2.42)D |
| Net asset value, end of period | $22.80 | $21.86 | $21.01 | $26.76 |
| Total ReturnE | 6.54% | 6.19% | (10.86)% | 16.74% |
| Ratios to Average Net AssetsF,G | ||||
| Expenses before reductions | .29% | .33% | .40% | .56% |
| Expenses net of fee waivers, if any | .29% | .33% | .40% | .56% |
| Expenses net of all reductions | .28% | .32% | .39% | .55% |
| Net investment income (loss) | 2.23% | 2.20% | 2.09% | 2.09%C |
| Supplemental Data | ||||
| Net assets, end of period (000 omitted) | $17,987 | $34,573 | $35,972 | $32,974 |
| Portfolio turnover rateH | 67% | 83%I | 80%I | 138%I |
A For the period February 1, 2017 (commencement of sale of shares) to January 31, 2018.
B Calculated based on average shares outstanding during the period.
C Net investment income per share reflects one or more large, non-recurring dividend(s) which amounted to $.17 per share. Excluding such non-recurring dividend(s), the ratio of net investment income (loss) to average net assets would have been 1.60%.
D Total distributions per share do not sum due to rounding.
E Total returns would have been lower if certain expenses had not been reduced during the applicable periods shown.
F Fees and expenses of any underlying mutual funds or exchange-traded funds (ETFs) are not included in the Fund's expense ratio. The Fund indirectly bears its proportionate share of these expenses. For additional expense information related to investments in Fidelity Central Funds, please refer to the "Investments in Fidelity Central Funds" note found in the Notes to Financial Statements section of the most recent Annual or Semi-Annual report.
G Expense ratios reflect operating expenses of the class. Expenses before reductions do not reflect amounts reimbursed, waived, or reduced through arrangements with the investment adviser, brokerage services, or other offset arrangements, if applicable, and do not represent the amount paid by the class during periods when reimbursements, waivers or reductions occur.
H Amount does not include the portfolio activity of any underlying mutual funds or exchange-traded funds (ETFs).
I Portfolio turnover rate excludes securities received or delivered in-kind.
See accompanying notes which are an integral part of the financial statements.
Notes to Financial Statements
For the period ended January 31, 2021
1. Organization.
Fidelity Mid Cap Value Fund (the Fund) is a fund of Fidelity Devonshire Trust (the Trust) and is authorized to issue an unlimited number of shares. The Trust is registered under the Investment Company Act of 1940, as amended (the 1940 Act), as an open-end management investment company organized as a Massachusetts business trust. The Fund offers Class A, Class M, Class C, Mid Cap Value, Class I and Class Z shares, each of which has equal rights as to assets and voting privileges. Each class has exclusive voting rights with respect to matters that affect that class. Class C shares will automatically convert to Class A shares after a holding period of ten years from the initial date of purchase, with certain exceptions.
2. Investments in Fidelity Central Funds.
The Fund invests in Fidelity Central Funds, which are open-end investment companies generally available only to other investment companies and accounts managed by the investment adviser and its affiliates. The Fund's Schedule of Investments lists each of the Fidelity Central Funds held as of period end, if any, as an investment of the Fund, but does not include the underlying holdings of each Fidelity Central Fund. As an Investing Fund, the Fund indirectly bears its proportionate share of the expenses of the underlying Fidelity Central Funds.
The Money Market Central Funds seek preservation of capital and current income and are managed by the investment adviser. Annualized expenses of the Money Market Central Funds as of their most recent shareholder report date ranged from less than .005% to .01%.
A complete unaudited list of holdings for each Fidelity Central Fund is available upon request or at the Securities and Exchange Commission (the SEC) website at www.sec.gov. In addition, the financial statements of the Fidelity Central Funds, which are not covered by the Fund's Report of Independent Registered Public Accounting Firm, are available on the SEC website or upon request.
3. Significant Accounting Policies.
The Fund is an investment company and applies the accounting and reporting guidance of the Financial Accounting Standards Board (FASB) Accounting Standards Codification Topic 946 Financial Services - Investment Companies. The financial statements have been prepared in conformity with accounting principles generally accepted in the United States of America (GAAP), which require management to make certain estimates and assumptions at the date of the financial statements. Actual results could differ from those estimates. Subsequent events, if any, through the date that the financial statements were issued have been evaluated in the preparation of the financial statements. The following summarizes the significant accounting policies of the Fund:
Investment Valuation. Investments are valued as of 4:00 p.m. Eastern time on the last calendar day of the period. The Board of Trustees (the Board) has delegated the day to day responsibility for the valuation of the Fund's investments to the Fair Value Committee (the Committee) established by the Fund's investment adviser. In accordance with valuation policies and procedures approved by the Board, the Fund attempts to obtain prices from one or more third party pricing vendors or brokers to value its investments. When current market prices, quotations or currency exchange rates are not readily available or reliable, investments will be fair valued in good faith by the Committee, in accordance with procedures adopted by the Board. Factors used in determining fair value vary by investment type and may include market or investment specific events. The frequency with which these procedures are used cannot be predicted and they may be utilized to a significant extent. The Committee oversees the Fund's valuation policies and procedures and reports to the Board on the Committee's activities and fair value determinations. The Board monitors the appropriateness of the procedures used in valuing the Fund's investments and ratifies the fair value determinations of the Committee.
The Fund categorizes the inputs to valuation techniques used to value its investments into a disclosure hierarchy consisting of three levels as shown below:
- Level 1 – quoted prices in active markets for identical investments
- Level 2 – other significant observable inputs (including quoted prices for similar investments, interest rates, prepayment speeds, etc.)
- Level 3 – unobservable inputs (including the Fund's own assumptions based on the best information available)
Valuation techniques used to value the Fund's investments by major category are as follows:
Equity securities, including restricted securities, for which market quotations are readily available, are valued at the last reported sale price or official closing price as reported by a third party pricing vendor on the primary market or exchange on which they are traded and are categorized as Level 1 in the hierarchy. In the event there were no sales during the day or closing prices are not available, securities are valued at the last quoted bid price or may be valued using the last available price and are generally categorized as Level 2 in the hierarchy. For foreign equity securities, when market or security specific events arise, comparisons to the valuation of American Depositary Receipts (ADRs), futures contracts, Exchange-Traded Funds (ETFs) and certain indexes as well as quoted prices for similar securities may be used and would be categorized as Level 2 in the hierarchy. For equity securities, including restricted securities, where observable inputs are limited, assumptions about market activity and risk are used and these securities may be categorized as Level 3 in the hierarchy.
Investments in open-end mutual funds, including the Fidelity Central Funds, are valued at their closing net asset value (NAV) each business day and are categorized as Level 1 in the hierarchy.
Changes in valuation techniques may result in transfers in or out of an assigned level within the disclosure hierarchy. The aggregate value of investments by input level as of January 31, 2021 is included at the end of the Fund's Schedule of Investments.
Foreign Currency. Certain Funds may use foreign currency contracts to facilitate transactions in foreign-denominated securities. Gains and losses from these transactions may arise from changes in the value of the foreign currency or if the counterparties do not perform under the contracts' terms.
Foreign-denominated assets, including investment securities, and liabilities are translated into U.S. dollars at the exchange rates at period end. Purchases and sales of investment securities, income and dividends received, and expenses denominated in foreign currencies are translated into U.S. dollars at the exchange rate in effect on the transaction date.
The effects of exchange rate fluctuations on investments are included with the net realized and unrealized gain (loss) on investment securities. Other foreign currency transactions resulting in realized and unrealized gain (loss) are disclosed separately.
Investment Transactions and Income. For financial reporting purposes, the Fund's investment holdings and NAV include trades executed through the end of the last business day of the period. The NAV per share for processing shareholder transactions is calculated as of the close of business of the New York Stock Exchange (NYSE), normally 4:00 p.m. Eastern time and includes trades executed through the end of the prior business day. Gains and losses on securities sold are determined on the basis of identified cost and include proceeds received from litigation. Dividend income is recorded on the ex-dividend date, except for certain dividends from foreign securities where the ex-dividend date may have passed, which are recorded as soon as the Fund is informed of the ex-dividend date. Non-cash dividends included in dividend income, if any, are recorded at the fair market value of the securities received. Income and capital gain distributions from Fidelity Central Funds, if any, are recorded on the ex-dividend date. Certain distributions received by the Fund represent a return of capital or capital gain. The Fund determines the components of these distributions subsequent to the ex-dividend date, based upon receipt of tax filings or other correspondence relating to the underlying investment. These distributions are recorded as a reduction of cost of investments and/or as a realized gain. Investment income is recorded net of foreign taxes withheld where recovery of such taxes is uncertain.
Class Allocations and Expenses. Investment income, realized and unrealized capital gains and losses, common expenses of the Fund, and certain fund-level expense reductions, if any, are allocated daily on a pro-rata basis to each class based on the relative net assets of each class to the total net assets of the Fund. Each class differs with respect to transfer agent and distribution and service plan fees incurred. Certain expense reductions may also differ by class. For the reporting period, the allocated portion of income and expenses to each class as a percent of its average net assets may vary due to the timing of recording these transactions in relation to fluctuating net assets of the classes. Expenses directly attributable to a fund are charged to that fund. Expenses attributable to more than one fund are allocated among the respective funds on the basis of relative net assets or other appropriate methods. Expense estimates are accrued in the period to which they relate and adjustments are made when actual amounts are known.
Income Tax Information and Distributions to Shareholders. Each year, the Fund intends to qualify as a regulated investment company under Subchapter M of the Internal Revenue Code, including distributing substantially all of its taxable income and realized gains. As a result, no provision for U.S. Federal income taxes is required. As of January 31, 2021, the Fund did not have any unrecognized tax benefits in the financial statements; nor is the Fund aware of any tax positions for which it is reasonably possible that the total amounts of unrecognized tax benefits will significantly change in the next twelve months. The Fund files a U.S. federal tax return, in addition to state and local tax returns as required. The Fund's federal income tax returns are subject to examination by the Internal Revenue Service (IRS) for a period of three fiscal years after they are filed. State and local tax returns may be subject to examination for an additional fiscal year depending on the jurisdiction. Foreign taxes are provided for based on the Fund's understanding of the tax rules and rates that exist in the foreign markets in which it invests.
Distributions are declared and recorded on the ex-dividend date. Income and capital gain distributions are declared separately for each class. Income and capital gain distributions are determined in accordance with income tax regulations, which may differ from GAAP.
Capital accounts within the financial statements are adjusted for permanent book-tax differences. These adjustments have no impact on net assets or the results of operations. Capital accounts are not adjusted for temporary book-tax differences which will reverse in a subsequent period.
Book-tax differences are primarily due to foreign currency transactions, partnerships, capital loss carryforwards, and losses deferred due to wash sales and excise tax regulations.
As of period end, the cost and unrealized appreciation (depreciation) in securities, and derivatives if applicable, for federal income tax purposes were as follows:
| Gross unrealized appreciation | $199,934,814 |
| Gross unrealized depreciation | (55,927,918) |
| Net unrealized appreciation (depreciation) | $144,006,896 |
| Tax Cost | $1,140,218,410 |
The tax-based components of distributable earnings as of period end were as follows:
| Capital loss carryforward | $(194,279,033) |
| Net unrealized appreciation (depreciation) on securities and other investments | $144,006,896 |
Capital loss carryforwards are only available to offset future capital gains of the Fund to the extent provided by regulations and may be limited. The capital loss carryforward information presented below, including any applicable limitation, is estimated as of fiscal period end and is subject to adjustment.
| No expiration | |
| Short-term | $(76,084,154) |
| Long-term | (118,194,879) |
| Total capital loss carryforward | $(194,279,033) |
The Fund intends to elect to defer to its next fiscal year $6,416 of ordinary losses recognized during the period January 1,2021 to January 31, 2021.
The tax character of distributions paid was as follows:
| January 31, 2021 | January 31, 2020 | |
| Ordinary Income | $23,901,751 | $ 30,653,496 |
4. Purchases and Sales of Investments.
Purchases and sales of securities, other than short-term securities, are noted in the table below.
| Purchases ($) | Sales ($) | |
| Fidelity Mid Cap Value Fund | 782,164,788 | 1,037,028,151 |
Prior Fiscal Year Unaffiliated Redemptions In-Kind. During the prior period, 357,313 shares of the Fund were redeemed in-kind for investments and cash with a value of $7,769,327. The Fund had a net realized gain of $953,056 on investments delivered through in-kind redemptions. The amount of the in-kind redemptions is included in share transactions in the accompanying Statement of Changes in Net Assets as well as the Notes to Financial Statements. The Fund recognized no gain or loss for federal income tax purposes.
5. Fees and Other Transactions with Affiliates.
Management Fee. Fidelity Management & Research Company LLC (the investment adviser) and its affiliates provide the Fund with investment management related services for which the Fund pays a monthly management fee. The management fee is the sum of an individual fund fee rate that is based on an annual rate of .30% of the Fund's average net assets and an annualized group fee rate that averaged .23% during the period. The group fee rate is based upon the monthly average net assets of a group of registered investment companies with which the investment adviser has management contracts. The group fee rate decreases as assets under management increase and increases as assets under management decrease. In addition, the management fee is subject to a performance adjustment (up to a maximum of +/-.20% of the Fund's average net assets over a 36 month performance period). The upward or downward adjustment to the management fee is based on the relative investment performance of Midcap Value as compared to its benchmark index, the Russell Midcap Value Index, over the same 36 month performance period. For the reporting period, the total annual management fee rate, including the performance adjustment, was .20% of the Fund's average net assets. The performance adjustment included in the management fee rate may be higher or lower than the maximum performance adjustment rate due to the difference between the average net assets for the reporting and performance periods.
Distribution and Service Plan Fees. In accordance with Rule 12b-1 of the 1940 Act, the Fund has adopted separate Distribution and Service Plans for each class of shares. Certain classes pay Fidelity Distributors Company LLC (FDC), an affiliate of the investment adviser, separate Distribution and Service Fees, each of which is based on an annual percentage of each class' average net assets. In addition, FDC may pay financial intermediaries for selling shares of the Fund and providing shareholder support services. For the period, the Distribution and Service Fee rates, total fees and amounts retained by FDC were as follows:
| Distribution Fee | Service Fee | Total Fees | Retained by FDC | |
| Class A | -% | .25% | $283,042 | $5,623 |
| Class M | .25% | .25% | 139,388 | 1,122 |
| Class C | .75% | .25% | 445,102 | 19,811 |
| $867,532 | $26,556 |
Sales Load. FDC may receive a front-end sales charge of up to 5.75% for selling Class A shares and 3.50% for selling Class M shares, some of which is paid to financial intermediaries for selling shares of the Fund. Depending on the holding period, FDC may receive contingent deferred sales charges levied on Class A, Class M and Class C redemptions. The deferred sales charges are 1.00% for Class C shares, 1.00% for certain purchases of Class A shares and .25% for certain purchases of Class M shares.
For the period, sales charge amounts retained by FDC were as follows:
| Retained by FDC | |
| Class A | $27,557 |
| Class M | 3,399 |
| Class C(a) | 1,663 |
| $32,619 |
(a) When Class C shares are initially sold, FDC pays commissions from its own resources to financial intermediaries through which the sales are made.
Transfer Agent Fees. Fidelity Investments Institutional Operations Company LLC (FIIOC), an affiliate of the investment adviser, is the transfer, dividend disbursing and shareholder servicing agent for each class of the Fund. FIIOC receives account fees and asset-based fees that vary according to the account size and type of account of the shareholders of the respective classes of the Fund, except for Class Z. FIIOC receives an asset-based fee of Class Z's average net assets. FIIOC pays for typesetting, printing and mailing of shareholder reports, except proxy statements.
For the period, transfer agent fees for each class were as follows:
| Amount | % of Class-Level Average Net Assets | |
| Class A | $261,986 | .23 |
| Class M | 71,658 | .26 |
| Class C | 103,855 | .23 |
| Mid Cap Value | 1,654,595 | .19 |
| Class I | 154,853 | .18 |
| Class Z | 11,017 | .04 |
| $2,257,964 |
Accounting Fees. Fidelity Service Company, Inc. (FSC), an affiliate of the investment adviser, maintains the Fund's accounting records. The accounting fee is based on the level of average net assets for each month. For the period, the fees were equivalent to the following annual rates:
| % of Average Net Assets | |
| Fidelity Mid Cap Value Fund | .03 |
Brokerage Commissions. A portion of portfolio transactions were placed with brokerage firms which are affiliates of the investment adviser. Brokerage commissions are included in net realized gain (loss) and change in net unrealized appreciation (depreciation) in the Statement of Operations. The commissions paid to these affiliated firms were as follows:
| Amount | |
| Fidelity Mid Cap Value Fund | $27,971 |
Interfund Lending Program. Pursuant to an Exemptive Order issued by the SEC, the Fund, along with other registered investment companies having management contracts with Fidelity Management & Research Company LLC (FMR), or other affiliated entities of FMR, may participate in an interfund lending program. This program provides an alternative credit facility allowing the Fund to borrow from, or lend money to, other participating affiliated funds. At period end, there were no interfund loans outstanding. Activity in this program during the period for which loans were outstanding was as follows:
| Borrower or Lender | Average Loan Balance | Weighted Average Interest Rate | Interest Expense | |
| Fidelity Mid Cap Value Fund | Borrower | $8,405,000 | .34% | $79 |
Interfund Trades. Funds may purchase from or sell securities to other Fidelity Funds under procedures adopted by the Board. The procedures have been designed to ensure these interfund trades are executed in accordance with Rule 17a-7 of the 1940 Act. Interfund trades are included within the respective purchases and sales amounts shown in the Purchases and Sales of Investments note, and amounted to $61,085,923 and $87,287,615, respectively.
6. Committed Line of Credit.
Certain Funds participate with other funds managed by the investment adviser or an affiliate in a $4.25 billion credit facility (the "line of credit") to be utilized for temporary or emergency purposes to fund shareholder redemptions or for other short-term liquidity purposes. The participating funds have agreed to pay commitment fees on their pro-rata portion of the line of credit, which are reflected in Miscellaneous expenses on the Statement of Operations, and are listed below.
| Amount | |
| Fidelity Mid Cap Value Fund | $2,804 |
During the period, there were no borrowings on this line of credit.
7. Security Lending.
Funds lend portfolio securities from time to time in order to earn additional income. Lending agents are used, including National Financial Services (NFS), an affiliate of the investment adviser. Pursuant to a securities lending agreement, NFS will receive a fee, which is capped at 9.9% of a fund's daily lending revenue, for its services as lending agent. A fund may lend securities to certain qualified borrowers, including NFS. On the settlement date of the loan, a fund receives collateral (in the form of U.S. Treasury obligations, letters of credit and/or cash) against the loaned securities and maintains collateral in an amount not less than 100% of the market value of the loaned securities during the period of the loan. The market value of the loaned securities is determined at the close of business of a fund and any additional required collateral is delivered to a fund on the next business day. A fund or borrower may terminate the loan at any time, and if the borrower defaults on its obligation to return the securities loaned because of insolvency or other reasons, a fund may apply collateral received from the borrower against the obligation. A fund may experience delays and costs in recovering the securities loaned. Any cash collateral received is invested in the Fidelity Securities Lending Cash Central Fund. Any loaned securities are identified as such in the Schedule of Investments, and the value of loaned securities and cash collateral at period end, as applicable, are presented in the Statement of Assets and Liabilities. Security lending income represents the income earned on investing cash collateral, less rebates paid to borrowers and any lending agent fees associated with the loan, plus any premium payments received for lending certain types of securities. Security lending income is presented in the Statement of Operations as a component of income from Fidelity Central Funds. Affiliated security lending activity, if any, was as follows:
| Total Security Lending Income Fees Paid to NFS | Security Lending Income From Securities Loaned to NFS | Value of Securities Loaned to NFS at Period End | |
| Fidelity Mid Cap Value Fund | $2,557 | $– | $– |
8. Expense Reductions.
Commissions paid to certain brokers with whom the investment adviser, or its affiliates, places trades on behalf of the Fund include an amount in addition to trade execution, which may be rebated back to the Fund to offset expenses. This amount totaled $112,347 for the period. In addition, through arrangements with the Fund's custodian, credits realized as a result of certain uninvested cash balances were used to reduce the Fund's expenses. During the period, custodian credits reduced the Fund's expenses by $591.
In addition, during the period the investment adviser or an affiliate reimbursed and/or waived a portion of fund-level operating expenses in the amount of $5,273.
9. Distributions to Shareholders.
Distributions to shareholders of each class were as follows:
| Year ended January 31, 2021 | Year ended January 31, 2020 | |
| Distributions to shareholders | ||
| Class A | $2,163,678 | $2,394,766 |
| Class M | 465,254 | 510,699 |
| Class C | 513,185 | 616,126 |
| Mid Cap Value | 18,752,263 | 23,731,890 |
| Class I | 1,638,592 | 2,698,882 |
| Class Z | 368,779 | 701,133 |
| Total | $23,901,751 | $30,653,496 |
10. Share Transactions.
Share transactions for each class were as follows and may contain automatic conversions between classes or exchanges between affiliated funds:
| Shares | Shares | Dollars | Dollars | |
| Year ended January 31, 2021 | Year ended January 31, 2020 | Year ended January 31, 2021 | Year ended January 31, 2020 | |
| Class A | ||||
| Shares sold | 917,329 | 1,004,356 | $17,574,702 | $21,578,476 |
| Reinvestment of distributions | 95,063 | 105,481 | 2,107,549 | 2,363,773 |
| Shares redeemed | (2,094,919) | (2,904,976) | (40,636,481) | (62,269,422) |
| Net increase (decrease) | (1,082,527) | (1,795,139) | $(20,954,230) | $(38,327,173) |
| Class M | ||||
| Shares sold | 153,342 | 154,682 | $3,056,204 | $3,319,054 |
| Reinvestment of distributions | 20,936 | 22,710 | 461,857 | 506,671 |
| Shares redeemed | (467,588) | (524,041) | (8,724,533) | (11,218,534) |
| Net increase (decrease) | (293,310) | (346,649) | $(5,206,472) | $(7,392,809) |
| Class C | ||||
| Shares sold | 119,309 | 182,381 | $2,185,949 | $3,784,548 |
| Reinvestment of distributions | 23,849 | 27,336 | 510,123 | 591,589 |
| Shares redeemed | (1,060,142) | (1,553,063) | (19,578,112) | (32,022,085) |
| Net increase (decrease) | (916,984) | (1,343,346) | $(16,882,040) | $(27,645,948) |
| Mid Cap Value | ||||
| Shares sold | 3,482,266 | 2,687,666 | $69,370,479 | $58,799,714 |
| Reinvestment of distributions | 796,192 | 997,660 | 17,930,244 | 22,686,785 |
| Shares redeemed | (16,671,262) | (19,943,038)(a) | (327,351,759) | (438,331,615)(a) |
| Net increase (decrease) | (12,392,804) | (16,257,712) | $(240,051,036) | $(356,845,116) |
| Class I | ||||
| Shares sold | 2,174,158 | 1,766,654 | $44,402,514 | $37,972,577 |
| Reinvestment of distributions | 72,727 | 113,719 | 1,622,550 | 2,563,218 |
| Shares redeemed | (3,935,478) | (7,651,428) | (75,322,550) | (165,254,663) |
| Net increase (decrease) | (1,688,593) | (5,771,055) | $(29,297,486) | $(124,718,868) |
| Class Z | ||||
| Shares sold | 1,066,509 | 781,177 | $19,594,806 | $17,085,406 |
| Reinvestment of distributions | 15,261 | 24,328 | 340,157 | 547,372 |
| Shares redeemed | (1,874,633) | (935,595) | (36,165,111) | (20,276,966) |
| Net increase (decrease) | (792,863) | (130,090) | $(16,230,148) | $(2,644,188) |
(a) Amount includes in-kind redemptions (see the Prior Fiscal Year Unaffiliated Redemptions In-Kind note for additional details).
11. Other.
The Fund's organizational documents provide former and current trustees and officers with a limited indemnification against liabilities arising in connection with the performance of their duties to the Fund. In the normal course of business, the Fund may also enter into contracts that provide general indemnifications. The Fund's maximum exposure under these arrangements is unknown as this would be dependent on future claims that may be made against the Fund. The risk of material loss from such claims is considered remote.
12. Coronavirus (COVID-19) Pandemic.
An outbreak of COVID-19 first detected in China during December 2019 has since spread globally and was declared a pandemic by the World Health Organization during March 2020. Developments that disrupt global economies and financial markets, such as the COVID-19 pandemic, may magnify factors that affect the Fund's performance.
Report of Independent Registered Public Accounting Firm
To the Board of Trustees of Fidelity Devonshire Trust and Shareholders of Fidelity Mid Cap Value Fund
Opinion on the Financial Statements
We have audited the accompanying statement of assets and liabilities, including the schedule of investments, of Fidelity Mid Cap Value Fund (one of the funds constituting Fidelity Devonshire Trust, referred to hereafter as the “Fund”) as of January 31, 2021, the related statement of operations for the year ended January 31, 2021, the statement of changes in net assets for each of the two years in the period ended January 31, 2021, including the related notes, and the financial highlights for each of the periods indicated therein (collectively referred to as the “financial statements”). In our opinion, the financial statements present fairly, in all material respects, the financial position of the Fund as of January 31, 2021, the results of its operations for the year then ended, the changes in its net assets for each of the two years in the period ended January 31, 2021 and the financial highlights for each of the periods indicated therein in conformity with accounting principles generally accepted in the United States of America.
Basis for Opinion
These financial statements are the responsibility of the Fund’s management. Our responsibility is to express an opinion on the Fund’s financial statements based on our audits. We are a public accounting firm registered with the Public Company Accounting Oversight Board (United States) (PCAOB) and are required to be independent with respect to the Fund in accordance with the U.S. federal securities laws and the applicable rules and regulations of the Securities and Exchange Commission and the PCAOB.
We conducted our audits of these financial statements in accordance with the standards of the PCAOB. Those standards require that we plan and perform the audit to obtain reasonable assurance about whether the financial statements are free of material misstatement, whether due to error or fraud.
Our audits included performing procedures to assess the risks of material misstatement of the financial statements, whether due to error or fraud, and performing procedures that respond to those risks. Such procedures included examining, on a test basis, evidence regarding the amounts and disclosures in the financial statements. Our audits also included evaluating the accounting principles used and significant estimates made by management, as well as evaluating the overall presentation of the financial statements. Our procedures included confirmation of securities owned as of January 31, 2021 by correspondence with the custodian. We believe that our audits provide a reasonable basis for our opinion.
/s/ PricewaterhouseCoopers LLP
Boston, Massachusetts
March 12, 2021
We have served as the auditor of one or more investment companies in the Fidelity group of funds since 1932.
Trustees and Officers
The Trustees, Members of the Advisory Board (if any), and officers of the trust and fund, as applicable, are listed below. The Board of Trustees governs the fund and is responsible for protecting the interests of shareholders. The Trustees are experienced executives who meet periodically throughout the year to oversee the fund's activities, review contractual arrangements with companies that provide services to the fund, oversee management of the risks associated with such activities and contractual arrangements, and review the fund's performance. Each of the Trustees oversees 309 funds.
The Trustees hold office without limit in time except that (a) any Trustee may resign; (b) any Trustee may be removed by written instrument, signed by at least two-thirds of the number of Trustees prior to such removal; (c) any Trustee who requests to be retired or who has become incapacitated by illness or injury may be retired by written instrument signed by a majority of the other Trustees; and (d) any Trustee may be removed at any special meeting of shareholders by a two-thirds vote of the outstanding voting securities of the trust. Each Trustee who is not an interested person (as defined in the 1940 Act) of the trust and the fund is referred to herein as an Independent Trustee. Each Independent Trustee shall retire not later than the last day of the calendar year in which his or her 75th birthday occurs. The Independent Trustees may waive this mandatory retirement age policy with respect to individual Trustees. Officers and Advisory Board Members hold office without limit in time, except that any officer or Advisory Board Member may resign or may be removed by a vote of a majority of the Trustees at any regular meeting or any special meeting of the Trustees. Except as indicated, each individual has held the office shown or other offices in the same company for the past five years.
The fund's Statement of Additional Information (SAI) includes more information about the Trustees. To request a free copy, call Fidelity at 1-800-544-8544 if you’re an individual investing directly with Fidelity, call 1-800-835-5092 if you’re a plan sponsor or participant with Fidelity as your recordkeeper or call 1-877-208-0098 on institutional accounts or if you’re an advisor or invest through one.
Experience, Skills, Attributes, and Qualifications of the Trustees. The Governance and Nominating Committee has adopted a statement of policy that describes the experience, qualifications, attributes, and skills that are necessary and desirable for potential Independent Trustee candidates (Statement of Policy). The Board believes that each Trustee satisfied at the time he or she was initially elected or appointed a Trustee, and continues to satisfy, the standards contemplated by the Statement of Policy. The Governance and Nominating Committee also engages professional search firms to help identify potential Independent Trustee candidates who have the experience, qualifications, attributes, and skills consistent with the Statement of Policy. From time to time, additional criteria based on the composition and skills of the current Independent Trustees, as well as experience or skills that may be appropriate in light of future changes to board composition, business conditions, and regulatory or other developments, have also been considered by the professional search firms and the Governance and Nominating Committee. In addition, the Board takes into account the Trustees' commitment and participation in Board and committee meetings, as well as their leadership of standing and ad hoc committees throughout their tenure.
In determining that a particular Trustee was and continues to be qualified to serve as a Trustee, the Board has considered a variety of criteria, none of which, in isolation, was controlling. The Board believes that, collectively, the Trustees have balanced and diverse experience, qualifications, attributes, and skills, which allow the Board to operate effectively in governing the fund and protecting the interests of shareholders. Information about the specific experience, skills, attributes, and qualifications of each Trustee, which in each case led to the Board's conclusion that the Trustee should serve (or continue to serve) as a trustee of the fund, is provided below.
Board Structure and Oversight Function. Robert A. Lawrence is an interested person and currently serves as Acting Chairman. The Trustees have determined that an interested Chairman is appropriate and benefits shareholders because an interested Chairman has a personal and professional stake in the quality and continuity of services provided to the fund. Independent Trustees exercise their informed business judgment to appoint an individual of their choosing to serve as Chairman, regardless of whether the Trustee happens to be independent or a member of management. The Independent Trustees have determined that they can act independently and effectively without having an Independent Trustee serve as Chairman and that a key structural component for assuring that they are in a position to do so is for the Independent Trustees to constitute a substantial majority for the Board. The Independent Trustees also regularly meet in executive session. David M. Thomas serves as Lead Independent Trustee and as such (i) acts as a liaison between the Independent Trustees and management with respect to matters important to the Independent Trustees and (ii) with management prepares agendas for Board meetings.
Fidelity® funds are overseen by different Boards of Trustees. The fund's Board oversees Fidelity's high income and certain equity funds, and other Boards oversee Fidelity's investment-grade bond, money market, asset allocation, and other equity funds. The asset allocation funds may invest in Fidelity® funds overseen by the fund's Board. The use of separate Boards, each with its own committee structure, allows the Trustees of each group of Fidelity® funds to focus on the unique issues of the funds they oversee, including common research, investment, and operational issues. On occasion, the separate Boards establish joint committees to address issues of overlapping consequences for the Fidelity® funds overseen by each Board.
The Trustees operate using a system of committees to facilitate the timely and efficient consideration of all matters of importance to the Trustees, the fund, and fund shareholders and to facilitate compliance with legal and regulatory requirements and oversight of the fund's activities and associated risks. The Board, acting through its committees, has charged FMR and its affiliates with (i) identifying events or circumstances the occurrence of which could have demonstrably adverse effects on the fund's business and/or reputation; (ii) implementing processes and controls to lessen the possibility that such events or circumstances occur or to mitigate the effects of such events or circumstances if they do occur; and (iii) creating and maintaining a system designed to evaluate continuously business and market conditions in order to facilitate the identification and implementation processes described in (i) and (ii) above. Because the day-to-day operations and activities of the fund are carried out by or through FMR, its affiliates, and other service providers, the fund's exposure to risks is mitigated but not eliminated by the processes overseen by the Trustees. While each of the Board's committees has responsibility for overseeing different aspects of the fund's activities, oversight is exercised primarily through the Operations, Audit, and Compliance Committees. Appropriate personnel, including but not limited to the fund's Chief Compliance Officer (CCO), FMR's internal auditor, the independent accountants, the fund's Treasurer and portfolio management personnel, make periodic reports to the Board's committees, as appropriate, including an annual review of Fidelity's risk management program for the Fidelity® funds. The responsibilities of each standing committee, including their oversight responsibilities, are described further under "Standing Committees of the Trustees."
Interested Trustees*:
Correspondence intended for a Trustee who is an interested person may be sent to Fidelity Investments, 245 Summer Street, Boston, Massachusetts 02210.
Name, Year of Birth; Principal Occupations and Other Relevant Experience+
Bettina Doulton (1964)
Year of Election or Appointment: 2020
Trustee
Ms. Doulton also serves as Trustee of other Fidelity® funds. Prior to her retirement, Ms. Doulton served in a variety of positions at Fidelity Investments, including as a managing director of research (2006-2007), portfolio manager to certain Fidelity® funds (1993-2005), equity analyst and portfolio assistant (1990-1993), and research assistant (1987-1990). Ms. Doulton currently owns and operates Phi Builders + Architects and Cellardoor Winery. Previously, Ms. Doulton served as a member of the Board of Brown Capital Management, LLC (2013-2018).
Robert A. Lawrence (1952)
Year of Election or Appointment: 2020
Trustee
Acting Chairman of the Board of Trustees
Mr. Lawrence also serves as Trustee of other funds. Previously, Mr. Lawrence served as a Member of the Advisory Board of certain funds. Prior to his retirement in 2008, Mr. Lawrence served as Vice President of certain Fidelity® funds (2006-2008), Senior Vice President, Head of High Income Division of Fidelity Management & Research Company (investment adviser firm, 2006-2008), and President of Fidelity Strategic Investments (investment adviser firm, 2002-2005).
* Determined to be an “Interested Trustee” by virtue of, among other things, his or her affiliation with the trust or various entities under common control with FMR.
+ The information includes the Trustee's principal occupation during the last five years and other information relating to the experience, attributes, and skills relevant to the Trustee's qualifications to serve as a Trustee, which led to the conclusion that the Trustee should serve as a Trustee for the fund.
Independent Trustees:
Correspondence intended for an Independent Trustee may be sent to Fidelity Investments, P.O. Box 55235, Boston, Massachusetts 02205-5235.
Name, Year of Birth; Principal Occupations and Other Relevant Experience+
Dennis J. Dirks (1948)
Year of Election or Appointment: 2005
Trustee
Mr. Dirks also serves as Trustee of other Fidelity® funds. Prior to his retirement in May 2003, Mr. Dirks served as Chief Operating Officer and as a member of the Board of The Depository Trust & Clearing Corporation (financial markets infrastructure), President, Chief Operating Officer and a member of the Board of The Depository Trust Company (DTC), President and a member of the Board of the National Securities Clearing Corporation (NSCC), Chief Executive Officer and a member of the Board of the Government Securities Clearing Corporation and Chief Executive Officer and a member of the Board of the Mortgage-Backed Securities Clearing Corporation. Mr. Dirks currently serves as a member of the Finance Committee (2016-present) and Board (2017-present) and is Treasurer (2018-present) of the Asolo Repertory Theatre.
Donald F. Donahue (1950)
Year of Election or Appointment: 2018
Trustee
Mr. Donahue also serves as Trustee of other Fidelity® funds. Mr. Donahue serves as President and Chief Executive Officer of Miranda Partners, LLC (risk consulting for the financial services industry, 2012-present). Previously, Mr. Donahue served as Chief Executive Officer (2006-2012), Chief Operating Officer (2003-2006) and Managing Director, Customer Marketing and Development (1999-2003) of The Depository Trust & Clearing Corporation (financial markets infrastructure). Mr. Donahue currently serves as a member (2007-present) and Co-Chairman (2016-present) of the Board of United Way of New York, a member of the Board of NYC Leadership Academy (2012-present) and a member of the Board of Advisors of Ripple Labs, Inc. (financial services, 2015-present). Mr. Donahue previously served as a member of the Advisory Board of certain Fidelity® funds (2015-2018).
Vicki L. Fuller (1957)
Year of Election or Appointment: 2020
Trustee
Ms. Fuller also serves as Trustee of other Fidelity® funds. Previously, Ms. Fuller served as a member of the Advisory Board of certain Fidelity® funds (2018-2020), Chief Investment Officer of the New York State Common Retirement Fund (2012-2018) and held a variety of positions at AllianceBernstein L.P. (global asset management, 1985-2012), including Managing Director (2006-2012) and Senior Vice President and Senior Portfolio Manager (2001-2006). Ms. Fuller currently serves as a member of the Board, Audit Committee and Nominating and Governance Committee of The Williams Companies, Inc. (natural gas infrastructure, 2018-present), as a member of the Board, Audit Committee and Nominating and Governance Committee of two Blackstone business development companies (2020-present) and as a member of the Board of Treliant, LLC (consulting, 2019-present).
Patricia L. Kampling (1959)
Year of Election or Appointment: 2020
Trustee
Ms. Kampling also serves as Trustee of other Fidelity® funds. Prior to her retirement, Ms. Kampling served as Chairman of the Board and Chief Executive Officer (2012-2019), President and Chief Operating Officer (2011-2012) and Executive Vice President and Chief Financial Officer (2010-2011) of Alliant Energy Corporation. Ms. Kampling currently serves as a member of the Board, Compensation Committee and Executive Committee and as Chair of the Audit Committee of Briggs & Stratton Corporation (manufacturing, 2011-present) and as a member of the Board, Audit, Finance and Risk Committee and Safety, Environmental, Technology and Operations Committee of American Water Works Company, Inc. (utilities company, 2019-present). In addition, Ms. Kampling currently serves as a member of the Board of the Nature Conservancy, Wisconsin Chapter (2019-present). Previously, Ms. Kampling served as a Member of the Advisory Board of certain Fidelity® funds (2020), a member of the Board of Interstate Power and Light Company (2012-2019) and Wisconsin Power and Light Company (2012-2019) (each a subsidiary of Alliant Energy Corporation) and as a member of the Board and Workforce Development Committee of the Business Roundtable (2018-2019).
Thomas A. Kennedy (1955)
Year of Election or Appointment: 2021
Trustee
Mr. Kennedy also serves as Trustee of other Fidelity® funds. Previously, Mr. Kennedy served as a Member of the Advisory Board of certain Fidelity® funds (2020) and held a variety of positions at Raytheon Company (aerospace and defense, 1983-2020), including Chairman and Chief Executive Officer (2014-2020) and Executive Vice President and Chief Operating Officer (2013-2014). Mr. Kennedy currently serves as Executive Chairman of the Board of Directors of Raytheon Technologies Corporation (aerospace and defense, 2020-present). He is also a member of the Rutgers School of Engineering Industry Advisory Board (2011-present) and a member of the UCLA Engineering Dean’s Executive Board (2016-present).
Garnett A. Smith (1947)
Year of Election or Appointment: 2018
Trustee
Mr. Smith also serves as Trustee of other Fidelity® funds. Prior to his retirement, Mr. Smith served as Chairman and Chief Executive Officer (1990-1997) and President (1986-1990) of Inbrand Corp. (manufacturer of personal absorbent products). Prior to his employment with Inbrand Corp., he was employed by a retail fabric chain and North Carolina National Bank (now Bank of America). Mr. Smith previously served as a member of the Advisory Board of certain Fidelity® funds (2012-2013).
David M. Thomas (1949)
Year of Election or Appointment: 2008
Trustee
Lead Independent Trustee
Mr. Thomas also serves as Trustee of other Fidelity® funds. Previously, Mr. Thomas served as Executive Chairman (2005-2006) and Chairman and Chief Executive Officer (2000-2005) of IMS Health, Inc. (pharmaceutical and healthcare information solutions). Mr. Thomas currently serves as Non-Executive Chairman of the Board of Fortune Brands Home and Security (home and security products, 2011-present), and a member of the Board (2004-present) and Presiding Director (2013-present) of Interpublic Group of Companies, Inc. (marketing communication).
Susan Tomasky (1953)
Year of Election or Appointment: 2020
Trustee
Ms. Tomasky also serves as Trustee of other Fidelity® funds. Prior to her retirement, Ms. Tomasky served in various executive officer positions at American Electric Power Company, Inc. (1998-2011), including most recently as President of AEP Transmission (2007-2011). Ms. Tomasky currently serves as a member of the Board and Sustainability Committee and as Chair of the Audit Committee of Marathon Petroleum Corporation (2018-present) and as a member of the Board, Corporate Governance Committee and Organization and Compensation Committee and as Chair of the Audit Committee of Public Service Enterprise Group, Inc. (utilities company, 2012-present). In addition, Ms. Tomasky currently serves as a member of the Board of the Columbus Regional Airport Authority (2007-present), as a member of the Board of the Royal Shakespeare Company – America (2009-present), as a member of the Board of the Columbus Association for the Performing Arts (2011-present) and as a member of the Board of Kenyon College (2016-present). Previously, Ms. Tomasky served as a Member of the Advisory Board of certain Fidelity® funds (2020), a member of the Board (2011-2019) and as Lead Independent Director (2015-2018) of Andeavor Corporation (previously Tesoro Corporation) (independent oil refiner and marketer) and as a member of the Board of Summit Midstream Partners LP (energy, 2012-2018).
Michael E. Wiley (1950)
Year of Election or Appointment: 2018
Trustee
Mr. Wiley also serves as Trustee of other Fidelity® funds. Previously, Mr. Wiley served as a member of the Advisory Board of certain Fidelity® funds (2018-2020), Chairman, President and CEO of Baker Hughes, Inc. (oilfield services, 2000-2004). Mr. Wiley also previously served as a member of the Board of Andeavor Corporation (independent oil refiner and marketer, 2005-2018), a member of the Board of Andeavor Logistics LP (natural resources logistics, 2015-2018) and a member of the Board of High Point Resources (exploration and production, 2005-2020).
+ The information includes the Trustee's principal occupation during the last five years and other information relating to the experience, attributes, and skills relevant to the Trustee's qualifications to serve as a Trustee, which led to the conclusion that the Trustee should serve as a Trustee for the fund.
Advisory Board Members and Officers:
Correspondence intended for a Member of the Advisory Board (if any) may be sent to Fidelity Investments, P.O. Box 55235, Boston, Massachusetts 02205-5235. Correspondence intended for an officer or Peter S. Lynch may be sent to Fidelity Investments, 245 Summer Street, Boston, Massachusetts 02210. Officers appear below in alphabetical order.
Name, Year of Birth; Principal Occupation
Ned C. Lautenbach (1944)
Year of Election or Appointment: 2021
Member of the Advisory Board
Mr. Lautenbach also serves as a Member of the Advisory Board of other Fidelity® funds. Mr. Lautenbach currently serves as Chair of the Board of Governors, State University System of Florida (2013-present) and is a member of the Council on Foreign Relations (1994-present). He is also a member and has in the past served as Chairman of the Board of Directors of Artis-Naples (2012-present). Previously, Mr. Lautenbach served as a Trustee of certain Fidelity® funds (2000-2020) and a member and then Lead Director of the Board of Directors of Eaton Corporation (diversified industrial, 1997-2016). He was also a Partner at Clayton, Dubilier & Rice, LLC (private equity investment, 1998-2010); as well as Director of Sony Corporation (2006-2007). In addition, Mr. Lautenbach had a 30-year career with IBM (technology company), during which time he served as Senior Vice President and as a member of the Corporate Executive Committee (1968-1998).
Peter S. Lynch (1944)
Year of Election or Appointment: 2003
Member of the Advisory Board
Mr. Lynch also serves as a Member of the Advisory Board of other Fidelity® funds. Mr. Lynch is Vice Chairman and a Director of Fidelity Management & Research Company LLC (investment adviser firm). In addition, Mr. Lynch serves as a Trustee of Boston College and as the Chairman of the Inner-City Scholarship Fund. Previously, Mr. Lynch served as Vice Chairman and a Director of FMR Co., Inc. (investment adviser firm) and on the Special Olympics International Board of Directors (1997-2006).
Craig S. Brown (1977)
Year of Election or Appointment: 2019
Assistant Treasurer
Mr. Brown also serves as Assistant Treasurer of other funds. Mr. Brown is an employee of Fidelity Investments (2013-present).
John J. Burke III (1964)
Year of Election or Appointment: 2018
Chief Financial Officer
Mr. Burke also serves as Chief Financial Officer of other funds. Mr. Burke serves as Head of Investment Operations for Fidelity Fund and Investment Operations (2018-present) and is an employee of Fidelity Investments (1998-present). Previously Mr. Burke served as head of Asset Management Investment Operations (2012-2018).
William C. Coffey (1969)
Year of Election or Appointment: 2019
Assistant Secretary
Mr. Coffey also serves as Assistant Secretary of other funds. He is Senior Vice President and Deputy General Counsel of FMR LLC (diversified financial services company, 2010-present), and is an employee of Fidelity Investments. Previously, Mr. Coffey served as Secretary and CLO of certain funds (2018-2019); CLO, Secretary, and Senior Vice President of Fidelity Management & Research Company and FMR Co., Inc. (investment adviser firms, 2018-2019); Secretary of Fidelity SelectCo, LLC and Fidelity Investments Money Management, Inc. (investment adviser firms, 2018-2019); CLO of Fidelity Management & Research (Hong Kong) Limited, FMR Investment Management (UK) Limited, and Fidelity Management & Research (Japan) Limited (investment adviser firms, 2018-2019); and Assistant Secretary of certain funds (2009-2018).
Timothy M. Cohen (1969)
Year of Election or Appointment: 2018
Vice President
Mr. Cohen also serves as Vice President of other funds. Mr. Cohen serves as Co-Head of Equity (2018-present), a Director of Fidelity Management & Research (Japan) Limited (investment adviser firm, 2016-present), and is an employee of Fidelity Investments. Previously, Mr. Cohen served as Executive Vice President of Fidelity SelectCo, LLC (2019), Head of Global Equity Research (2016-2018), Chief Investment Officer - Equity and a Director of Fidelity Management & Research (U.K.) Inc. (investment adviser firm, 2013-2015) and as a Director of Fidelity Management & Research (Hong Kong) Limited (investment adviser firm, 2017).
Jonathan Davis (1968)
Year of Election or Appointment: 2010
Assistant Treasurer
Mr. Davis also serves as Assistant Treasurer of other funds. Mr. Davis serves as Assistant Treasurer of FMR Capital, Inc. (2017-present) and is an employee of Fidelity Investments. Previously, Mr. Davis served as Vice President and Associate General Counsel of FMR LLC (diversified financial services company, 2003-2010).
Laura M. Del Prato (1964)
Year of Election or Appointment: 2018
Assistant Treasurer
Ms. Del Prato also serves as an officer of other funds. Ms. Del Prato is an employee of Fidelity Investments (2017-present). Previously, Ms. Del Prato served as President and Treasurer of The North Carolina Capital Management Trust: Cash Portfolio and Term Portfolio (2018-2020). Prior to joining Fidelity Investments, Ms. Del Prato served as a Managing Director and Treasurer of the JPMorgan Mutual Funds (2014-2017). Prior to JPMorgan, Ms. Del Prato served as a partner at Cohen Fund Audit Services (accounting firm, 2012-2013) and KPMG LLP (accounting firm, 2004-2012).
Colm A. Hogan (1973)
Year of Election or Appointment: 2020
Assistant Treasurer
Mr. Hogan also serves as an officer of other funds. Mr. Hogan serves as Assistant Treasurer of FMR Capital, Inc. (2017-present) and is an employee of Fidelity Investments (2005-present). Previously, Mr. Hogan served as Deputy Treasurer of certain Fidelity® funds (2016-2020) and Assistant Treasurer of certain Fidelity® funds (2016-2018).
Pamela R. Holding (1964)
Year of Election or Appointment: 2018
Vice President
Ms. Holding also serves as Vice President of other funds. Ms. Holding serves as Co-Head of Equity (2018-present) and is an employee of Fidelity Investments (2013-present). Previously, Ms. Holding served as Executive Vice President of Fidelity SelectCo, LLC (2019) and as Chief Investment Officer of Fidelity Institutional Asset Management (2013-2018).
Cynthia Lo Bessette (1969)
Year of Election or Appointment: 2019
Secretary and Chief Legal Officer (CLO)
Ms. Lo Bessette also serves as an officer of other funds. Ms. Lo Bessette serves as CLO, Secretary, and Senior Vice President of Fidelity Management & Research Company LLC (investment adviser firm, 2019-present); and CLO of Fidelity Management & Research (Hong Kong) Limited, FMR Investment Management (UK) Limited, and Fidelity Management & Research (Japan) Limited (investment adviser firms, 2019-present). She is a Senior Vice President and Deputy General Counsel of FMR LLC (diversified financial services company, 2019-present), and is an employee of Fidelity Investments. Previously, Ms. Lo Bessette served as CLO, Secretary, and Senior Vice President of FMR Co., Inc. (investment adviser firm, 2019); Secretary of Fidelity SelectCo, LLC and Fidelity Investments Money Management, Inc. (investment adviser firms, 2019). Prior to joining Fidelity Investments, Ms. Lo Bessette was Executive Vice President, General Counsel (2016-2019) and Senior Vice President, Deputy General Counsel (2015-2016) of OppenheimerFunds (investment management company) and Deputy Chief Legal Officer (2013-2015) of Jennison Associates LLC (investment adviser firm).
Chris Maher (1972)
Year of Election or Appointment: 2020
Deputy Treasurer
Mr. Maher also serves as an officer of other funds. Mr. Maher serves as Assistant Treasurer of FMR Capital, Inc. (2017-present), and is an employee of Fidelity Investments (2008-present). Previously, Mr. Maher served as Assistant Treasurer of certain funds (2013-2020); Vice President of Asset Management Compliance (2013), Vice President of the Program Management Group of FMR (investment adviser firm, 2010-2013), and Vice President of Valuation Oversight (2008-2010).
Jason P. Pogorelec (1975)
Year of Election or Appointment: 2020
Chief Compliance Officer
Mr. Pogorelec also serves as Chief Compliance Officer of other funds. Mr. Pogorelec is a senior Vice President of Asset Management Compliance for Fidelity Investments and is an employee of Fidelity Investments (2006-present). Previously, Mr. Pogorelec served as Vice President, Associate General Counsel for Fidelity Investments (2010-2020) and Assistant Secretary of certain Fidelity funds (2015-2020).
Brett Segaloff (1972)
Year of Election or Appointment: 2021
Anti-Money Laundering (AML) Officer
Mr. Segaloff also serves as an AML Officer of other funds and other related entities. He is Director, Anti-Money Laundering (2007-present) of FMR LLC (diversified financial services company) and is an employee of Fidelity Investments (1996-present).
Stacie M. Smith (1974)
Year of Election or Appointment: 2016
President and Treasurer
Ms. Smith also serves as an officer of other funds. Ms. Smith serves as Assistant Treasurer of FMR Capital, Inc. (2017-present), is an employee of Fidelity Investments (2009-present), and has served in other fund officer roles. Prior to joining Fidelity Investments, Ms. Smith served as Senior Audit Manager of Ernst & Young LLP (accounting firm, 1996-2009). Previously, Ms. Smith served as Assistant Treasurer (2013-2019) and Deputy Treasurer (2013-2016) of certain Fidelity® funds.
Marc L. Spector (1972)
Year of Election or Appointment: 2016
Assistant Treasurer
Mr. Spector also serves as an officer of other funds. Mr. Spector serves as Assistant Treasurer of FMR Capital, Inc. (2017-present) and is an employee of Fidelity Investments (2016-present). Prior to joining Fidelity Investments, Mr. Spector served as Director at the Siegfried Group (accounting firm, 2013-2016), and prior to Siegfried Group as audit senior manager at Deloitte & Touche LLP (accounting firm, 2005-2013).
Jim Wegmann (1979)
Year of Election or Appointment: 2019
Assistant Treasurer
Mr. Wegmann also serves as Assistant Treasurer of other funds. Mr. Wegmann is an employee of Fidelity Investments (2011-present).
Shareholder Expense Example
As a shareholder, you incur two types of costs: (1) transaction costs, which may include sales charges (loads) on purchase payments or redemption proceeds, as applicable and (2) ongoing costs, which generally include management fees, distribution and/or service (12b-1) fees and other Fund expenses. This Example is intended to help you understand your ongoing costs (in dollars) of investing in a fund and to compare these costs with the ongoing costs of investing in other mutual funds.
The Example is based on an investment of $1,000 invested at the beginning of the period and held for the entire period (August 1, 2020 to January 31, 2021).
Actual Expenses
The first line of the accompanying table provides information about actual account values and actual expenses. You may use the information in this line, together with the amount you invested, to estimate the expenses that you paid over the period. Simply divide your account value by $1,000.00 (for example, an $8,600 account value divided by $1,000.00 = 8.6), then multiply the result by the number in the first line for a class/Fund under the heading entitled "Expenses Paid During Period" to estimate the expenses you paid on your account during this period. If any fund is a shareholder of any underlying mutual funds or exchange-traded funds (ETFs) (the Underlying Funds), such fund indirectly bears its proportional share of the expenses of the Underlying Funds in addition to the direct expenses incurred presented in the table. These fees and expenses are not included in the annualized expense ratio used to calculate the expense estimate in the table below.
Hypothetical Example for Comparison Purposes
The second line of the accompanying table provides information about hypothetical account values and hypothetical expenses based on the actual expense ratio and an assumed rate of return of 5% per year before expenses, which is not the actual return. The hypothetical account values and expenses may not be used to estimate the actual ending account balance or expenses you paid for the period. You may use this information to compare the ongoing costs of investing in the Fund and other funds. To do so, compare this 5% hypothetical example with the 5% hypothetical examples that appear in the shareholder reports of the other funds. If any fund is a shareholder of any Underlying Funds, such fund indirectly bears its proportional share of the expenses of the Underlying Funds in addition to the direct expenses as presented in the table. These fees and expenses are not included in the annualized expense ratio used to calculate the expense estimate in the table below.
Please note that the expenses shown in the table are meant to highlight your ongoing costs only and do not reflect any transaction costs. Therefore, the second line of the table is useful in comparing ongoing costs only, and will not help you determine the relative total costs of owning different funds. In addition, if these transactional costs were included, your costs would have been higher.
| Annualized Expense Ratio-A | Beginning Account Value August 1, 2020 | Ending Account Value January 31, 2021 | Expenses Paid During Period-B August 1, 2020 to January 31, 2021 | |
| Fidelity Mid Cap Value Fund | ||||
| Class A | .72% | |||
| Actual | $1,000.00 | $1,224.40 | $4.03 | |
| Hypothetical-C | $1,000.00 | $1,021.52 | $3.66 | |
| Class M | .99% | |||
| Actual | $1,000.00 | $1,222.50 | $5.53 | |
| Hypothetical-C | $1,000.00 | $1,020.16 | $5.03 | |
| Class C | 1.47% | |||
| Actual | $1,000.00 | $1,219.30 | $8.20 | |
| Hypothetical-C | $1,000.00 | $1,017.75 | $7.46 | |
| Mid Cap Value | .42% | |||
| Actual | $1,000.00 | $1,225.70 | $2.35 | |
| Hypothetical-C | $1,000.00 | $1,023.03 | $2.14 | |
| Class I | .41% | |||
| Actual | $1,000.00 | $1,226.10 | $2.29 | |
| Hypothetical-C | $1,000.00 | $1,023.08 | $2.08 | |
| Class Z | .28% | |||
| Actual | $1,000.00 | $1,227.10 | $1.57 | |
| Hypothetical-C | $1,000.00 | $1,023.73 | $1.42 |
A Annualized expense ratio reflects expenses net of applicable fee waivers.
B Expenses are equal to the annualized expense ratio, multiplied by the average account value over the period, multiplied by 184/ 366 (to reflect the one-half year period). The fees and expenses of any Underlying Funds are not included in each annualized expense ratio.
C 5% return per year before expenses
Distributions (Unaudited)
Class A designates 100%; Class M designates 100%; Class C designates 100%; Mid Cap Value designates 98%; Class I designates 99% and Class Z designates 93% of the dividends distributed during the fiscal year during the fiscal year as qualifying for the dividends–received deduction for corporate shareholders.
Class A, Class M, Class C, Mid Cap Value, Class I, and Class Z designate 100% of the dividend distributed during the fiscal year as amounts which may be taken into account as a dividend for purposes of the maximum rate under section 1(h)(11) of the Internal Revenue Code.
The fund will notify shareholders in January 2022 of amounts for use in preparing 2021 income tax returns.
Board Approval of Investment Advisory Contracts
Fidelity Mid Cap Value Fund
At its January 2021 meeting, the Board of Trustees, including the Independent Trustees (together, the Board), voted to continue the management contract with Fidelity Management & Research Company LLC (FMR), and the sub-advisory agreements and sub-subadvisory agreements, in each case, where applicable (together, the Advisory Contracts) for the fund for four months from February 1, 2021 through May 31, 2021, in connection with changes to the Board's meeting calendar.The Board considered that the approval of the fund's Advisory Contracts will not result in any changes in (i) the investment process or strategies employed in the management of the fund's assets; (ii) the fees and expenses paid by shareholders; (iii) the nature, extent or quality of services provided under the fund's Advisory Contracts; or (iv) the day-to-day management of the fund or the persons primarily responsible for such management. The Board also considered that since its last approval of the fund's Advisory Contracts, FMR had provided additional information on the fund in support of the annual contract renewal process, including competitive analyses on total expenses and management fees and in-depth reviews of fund performance and fund profitability information. The Board also considered the findings of certain ad hoc committees that had been previously formed to discuss matters relevant to all of the Fidelity funds, including economies of scale, fall-out benefits and retail vs. institutional funds. The Board concluded that the fund's Advisory Contracts are fair and reasonable, and that the fund's Advisory Contracts should be renewed, without modification, through May 31, 2021, with the understanding that the Board will consider the annual renewal for a full one year period in May 2021.In connection with its consideration of future renewals of the fund's Advisory Contracts, the Board will consider: (i) the nature, extent and quality of services provided to the funds, including shareholder and administrative services and investment performance; (ii) the competitiveness of the management fee and total expenses for the fund; (iii) the costs of the services and profitability, including the revenues earned and the expenses incurred in conducting the business of developing, marketing, distributing, managing, administering, and servicing the fund and its shareholders, to the extent applicable; and (iv) whether there have been economies of scale in respect of the Fidelity funds, whether the Fidelity funds (including the fund) have appropriately benefited from any such economies of scale, and whether there is the potential for realization of any further economies.Based on its evaluation of all of the conclusions noted above, and after considering all factors it believed relevant, the Board ultimately concluded that the fund's management fee structure is fair and reasonable, and that the continuation of the fund's Advisory Contracts should be approved for four months from February 1, 2021 through May 31, 2021.Proxy Voting Results
A special meeting of shareholders was held on June 9, 2020. The results of votes taken among shareholders on the proposal before them are reported below. Each vote reported represents one dollar of net asset value held on the record date for the meeting.
PROPOSAL 1
To elect a Board of Trustees.
| # of Votes | % of Votes | |
| Dennis J. Dirks | ||
| Affirmative | 20,677,600,881.166 | 98.531 |
| Withheld | 308,216,367.332 | 1.469 |
| TOTAL | 20,985,817,248.498 | 100.000 |
| Donald F. Donahue | ||
| Affirmative | 20,685,205,663.711 | 98.568 |
| Withheld | 300,611,584.787 | 1.432 |
| TOTAL | 20,985,817,248.498 | 100.000 |
| Bettina Doulton | ||
| Affirmative | 20,701,129,729.034 | 98.643 |
| Withheld | 284,687,519.464 | 1.357 |
| TOTAL | 20,985,817,248.498 | 100.000 |
| Vicki L. Fuller | ||
| Affirmative | 20,713,892,146.063 | 98.704 |
| Withheld | 271,925,102.435 | 1.296 |
| TOTAL | 20,985,817,248.498 | 100.000 |
| Patricia L. Kampling | ||
| Affirmative | 20,693,289,719.327 | 98.606 |
| Withheld | 292,527,529.171 | 1.394 |
| TOTAL | 20,985,817,248.498 | 100.000 |
| Alan J. Lacy | ||
| Affirmative | 20,659,591,158.873 | 98.445 |
| Withheld | 326,226,089.625 | 1.555 |
| TOTAL | 20,985,817,248.498 | 100.000 |
| Ned C. Lautenbach | ||
| Affirmative | 20,634,244,420.039 | 98.325 |
| Withheld | 351,572,828.459 | 1.675 |
| TOTAL | 20,985,817,248.498 | 100.000 |
| Robert A. Lawrence | ||
| Affirmative | 20,672,781,907.548 | 98.508 |
| Withheld | 313,035,340.950 | 1.492 |
| TOTAL�� | 20,985,817,248.498 | 100.000 |
| Joseph Mauriello | ||
| Affirmative | 20,652,465,304.654 | 98.412 |
| Withheld | 333,351,943.843 | 1.588 |
| TOTAL | 20,985,817,248.498 | 100.000 |
| Cornelia M. Small | ||
| Affirmative | 20,671,641,667.984 | 98.503 |
| Withheld | 314,175,580.514 | 1.497 |
| TOTAL | 20,985,817,248.498 | 100.000 |
| Garnett A. Smith | ||
| Affirmative | 20,655,644,270.628 | 98.427 |
| Withheld | 330,172,977.870 | 1.573 |
| TOTAL | 20,985,817,248.498 | 100.000 |
| David M. Thomas | ||
| Affirmative | 20,654,595,907.599 | 98.422 |
| Withheld | 331,221,340.899 | 1.578 |
| TOTAL | 20,985,817,248.498 | 100.000 |
| Susan Tomasky | ||
| Affirmative | 20,686,662,870.375 | 98.574 |
| Withheld | 299,154,378.123 | 1.426 |
| TOTAL | 20,985,817,248.498 | 100.000 |
| Michael E. Wiley | ||
| Affirmative | 20,662,847,882.871 | 98.461 |
| Withheld | 322,969,365.626 | 1.539 |
| TOTAL | 20,985,817,248.498 | 100.000 |
PROPOSAL 2
To convert a fundamental investment policy to a non-fundamental investment policy.
| # of Votes | % of Votes | |
| Affirmative | 453,663,724.005 | 64.976 |
| Against | 95,057,229.492 | 13.615 |
| Abstain | 67,323,742.831 | 9.642 |
| Broker Non-Vote | 82,159,043.990 | 11.767 |
| TOTAL | 698,203,740.318 | 100.000 |
| Proposal 1 reflects trust wide proposal and voting results. | ||
| Proposal 2 was not approved by shareholders. |
![]()
MCV-ANN-0321
1.900180.111
Fidelity® Mid Cap Value K6 Fund
January 31, 2021
Contents
To view a fund's proxy voting guidelines and proxy voting record for the 12-month period ended June 30, visit http://www.fidelity.com/proxyvotingresults or visit the Securities and Exchange Commission's (SEC) web site at http://www.sec.gov.
You may also call 1-800-835-5092 to request a free copy of the proxy voting guidelines.
Standard & Poor's, S&P and S&P 500 are registered service marks of The McGraw-Hill Companies, Inc. and have been licensed for use by Fidelity Distributors Corporation.
Other third-party marks appearing herein are the property of their respective owners.
All other marks appearing herein are registered or unregistered trademarks or service marks of FMR LLC or an affiliated company. © 2021 FMR LLC. All rights reserved.
This report and the financial statements contained herein are submitted for the general information of the shareholders of the Fund. This report is not authorized for distribution to prospective investors in the Fund unless preceded or accompanied by an effective prospectus.
A fund files its complete schedule of portfolio holdings with the SEC for the first and third quarters of each fiscal year on Form N-PORT. Forms N-PORT are available on the SEC’s web site at http://www.sec.gov. A fund's Forms N-PORT may be reviewed and copied at the SEC’s Public Reference Room in Washington, DC. Information regarding the operation of the SEC's Public Reference Room may be obtained by calling 1-800-SEC-0330.
For a complete list of a fund's portfolio holdings, view the most recent holdings listing, semiannual report, or annual report on Fidelity's web site at http://www.fidelity.com, http://www.institutional.fidelity.com, or http://www.401k.com, as applicable.
NOT FDIC INSURED •MAY LOSE VALUE •NO BANK GUARANTEE
Neither the Fund nor Fidelity Distributors Corporation is a bank.
Note to Shareholders:
Early in 2020, the outbreak and spread of a new coronavirus emerged as a public health emergency that had a major influence on financial markets, primarily based on its impact on the global economy and the outlook for corporate earnings. The virus causes a respiratory disease known as COVID-19. On March 11, the World Health Organization declared the COVID-19 outbreak a pandemic, citing sustained risk of further global spread.
In the weeks following, as the crisis worsened, we witnessed an escalating human tragedy with wide-scale social and economic consequences from coronavirus-containment measures. The outbreak of COVID-19 prompted a number of measures to limit the spread, including travel and border restrictions, quarantines, and restrictions on large gatherings. In turn, these resulted in lower consumer activity, diminished demand for a wide range of products and services, disruption in manufacturing and supply chains, and – given the wide variability in outcomes regarding the outbreak – significant market uncertainty and volatility. Amid the turmoil, global governments and central banks took unprecedented action to help support consumers, businesses, and the broader economies, and to limit disruption to financial systems.
The situation continues to unfold, and the extent and duration of its impact on financial markets and the economy remain highly uncertain. Extreme events such as the coronavirus crisis are “exogenous shocks” that can have significant adverse effects on mutual funds and their investments. Although multiple asset classes may be affected by market disruption, the duration and impact may not be the same for all types of assets.
Fidelity is committed to helping you stay informed amid news about COVID-19 and during increased market volatility, and we’re taking extra steps to be responsive to customer needs. We encourage you to visit our websites, where we offer ongoing updates, commentary, and analysis on the markets and our funds.
Performance: The Bottom Line
Average annual total return reflects the change in the value of an investment, assuming reinvestment of distributions from dividend income and capital gains (the profits earned upon the sale of securities that have grown in value, if any) and assuming a constant rate of performance each year. The hypothetical investment and the average annual total returns do not reflect the deduction of taxes that a shareholder would pay on fund distributions or the redemption of fund shares. During periods of reimbursement by Fidelity, a fund’s total return will be greater than it would be had the reimbursement not occurred. How a fund did yesterday is no guarantee of how it will do tomorrow.
Average Annual Total Returns
| For the periods ended January 31, 2021 | Past 1 year | Life of fundA |
| Fidelity® Mid Cap Value K6 Fund | 5.83% | 3.76% |
A From May 25, 2017
$10,000 Over Life of Fund
Let's say hypothetically that $10,000 was invested in Fidelity® Mid Cap Value K6 Fund on May 25, 2017, when the fund started.
The chart shows how the value of your investment would have changed, and also shows how the Russell Midcap® Value Index performed over the same period.
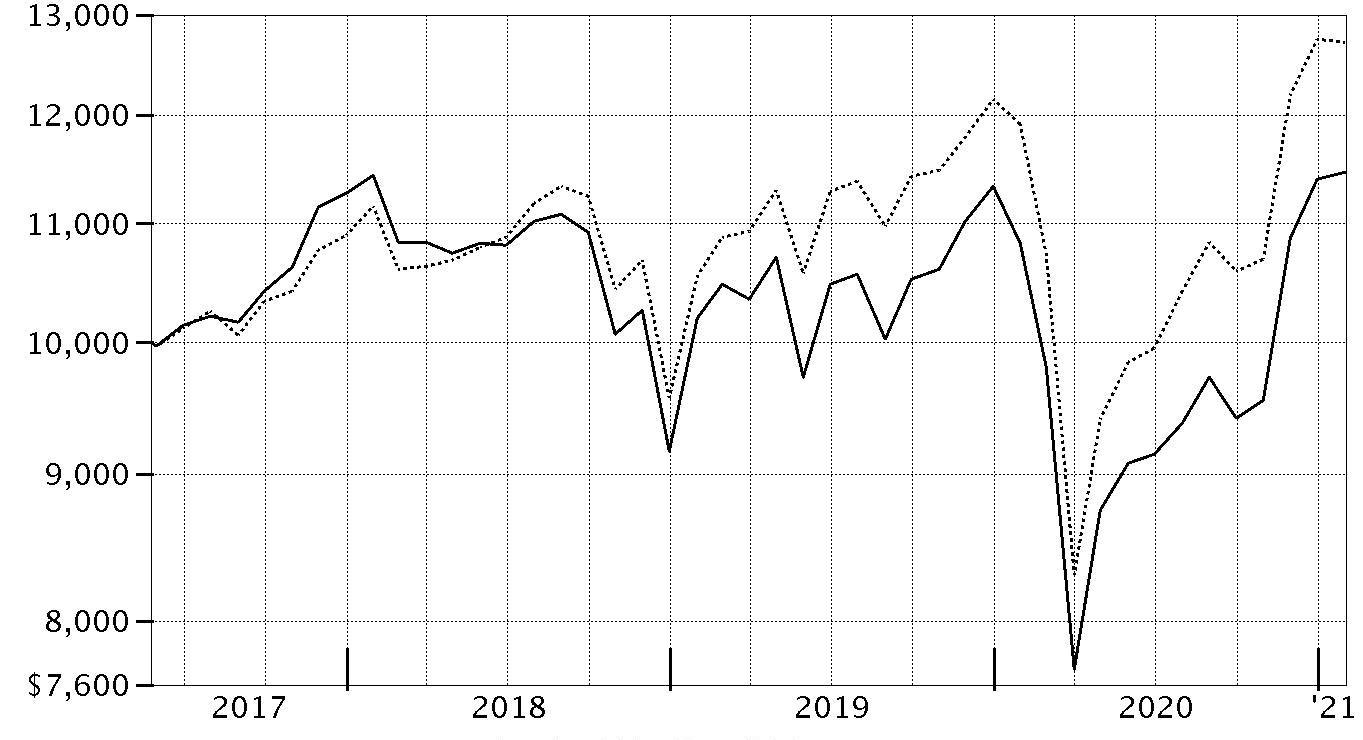
| Period Ending Values | ||
| $11,458 | Fidelity® Mid Cap Value K6 Fund | |
| $12,723 | Russell Midcap® Value Index | |
Management's Discussion of Fund Performance
Market Recap: The S&P 500® index gained 17.25% for the 12 months ending January 31, 2021, a volatile but productive period for U.S. risk assets. The early-2020 outbreak and spread of COVID-19 resulted in stocks suffering one of the quickest declines on record, through March 23, followed by a historic rebound. The crisis and containment efforts caused broad contraction in economic activity, along with extreme uncertainty and dislocation in financial markets. A rapid and expansive U.S. monetary/fiscal-policy response partially offset the economic disruption and fueled the market surge, as did resilient corporate earnings. The rally slowed in September, when the S&P 500 began a two-month retreat amid Congress’s inability to reach a deal on additional fiscal stimulus, as well as concerns about election uncertainty, indications the U.S. economic recovery could be slowing and a new wave of COVID-19 cases. A shift in momentum began in October and accelerated following the U.S. elections, with the approval of two breakthrough COVID-19 vaccines and prospects for additional government stimulus fueling the “reflation trade.” Small-cap value stocks rallied strongly late in 2020, usurping longstanding market leadership from growth shares – especially large tech and internet-related names – amid hopes of a broad economic recovery in 2021. By sector for the full 12 months, information technology (+37%) and consumer discretionary (+33%) led all gainers. In contrast, energy (-23%) struggled along with global oil demand and pricing.Comments from Portfolio Manager Kevin Walenta: For the fiscal year ending January 31, 2021, the fund gained 5.83%, underperforming the 6.80% result of the benchmark Russell Midcap® Value Index. Stock picking in the materials and financials sectors, especially banks, detracted most versus the benchmark. Positioning in the communication services and consumer staples sectors and security selection in information technology also hampered relative performance. The biggest individual relative detractors were overweight positions in OGE Energy (-30%) and Jones Lang LaSalle (-13%), each among the fund's biggest holdings this period. Avoiding Newmont, a benchmark component that gained roughly 33%, also hindered performance. Conversely, security selection and an overweighting in the consumer discretionary sector, especially within the retailing industry, aided relative performance. The fund's cash position also helped. The biggest individual relative contributor was Williams-Sonoma (+88%), an overweight position and top holding at period end. Further aiding performance was Synnex, a new addition and outsized stake that gained 37%. Notable changes in positioning this period include a higher allocation to the consumer discretionary and industrials sectors.The views expressed above reflect those of the portfolio manager(s) only through the end of the period as stated on the cover of this report and do not necessarily represent the views of Fidelity or any other person in the Fidelity organization. Any such views are subject to change at any time based upon market or other conditions and Fidelity disclaims any responsibility to update such views. These views may not be relied on as investment advice and, because investment decisions for a Fidelity fund are based on numerous factors, may not be relied on as an indication of trading intent on behalf of any Fidelity fund.
Investment Summary (Unaudited)
Top Ten Stocks as of January 31, 2021
| % of fund's net assets | |
| Williams-Sonoma, Inc. | 5.2 |
| CBRE Group, Inc. | 5.2 |
| Best Buy Co., Inc. | 4.9 |
| Reliance Steel & Aluminum Co. | 4.5 |
| Jones Lang LaSalle, Inc. | 4.0 |
| Synchrony Financial | 3.8 |
| Amdocs Ltd. | 3.0 |
| NRG Energy, Inc. | 2.8 |
| MDU Resources Group, Inc. | 2.7 |
| M&T Bank Corp. | 2.5 |
| 38.6 |
Top Five Market Sectors as of January 31, 2021
| % of fund's net assets | |
| Industrials | 17.1 |
| Financials | 14.8 |
| Consumer Discretionary | 13.2 |
| Real Estate | 11.5 |
| Utilities | 9.8 |
Asset Allocation (% of fund's net assets)
| As of January 31, 2021* | ||
| Stocks | 99.5% | |
| Short-Term Investments and Net Other Assets (Liabilities) | 0.5% | |

* Foreign investments - 6.2%
Schedule of Investments January 31, 2021
Showing Percentage of Net Assets
| Common Stocks - 99.5% | |||
| Shares | Value | ||
| COMMUNICATION SERVICES - 3.6% | |||
| Entertainment - 1.2% | |||
| Electronic Arts, Inc. | 2,335 | $334,372 | |
| Media - 2.4% | |||
| Interpublic Group of Companies, Inc. | 27,349 | 658,290 | |
| TOTAL COMMUNICATION SERVICES | 992,662 | ||
| CONSUMER DISCRETIONARY - 13.2% | |||
| Auto Components - 1.6% | |||
| BorgWarner, Inc. | 10,207 | 428,592 | |
| Distributors - 0.3% | |||
| LKQ Corp. (a) | 2,300 | 80,707 | |
| Household Durables - 1.2% | |||
| PulteGroup, Inc. | 5,777 | 251,300 | |
| Whirlpool Corp. | 467 | 86,437 | |
| 337,737 | |||
| Specialty Retail - 10.1% | |||
| Best Buy Co., Inc. | 12,310 | 1,339,574 | |
| Williams-Sonoma, Inc. | 11,128 | 1,434,618 | |
| 2,774,192 | |||
| TOTAL CONSUMER DISCRETIONARY | 3,621,228 | ||
| CONSUMER STAPLES - 4.1% | |||
| Food & Staples Retailing - 0.7% | |||
| Kroger Co. | 5,405 | 186,473 | |
| Food Products - 3.4% | |||
| Ingredion, Inc. | 6,250 | 471,688 | |
| The J.M. Smucker Co. | 4,028 | 468,899 | |
| 940,587 | |||
| TOTAL CONSUMER STAPLES | 1,127,060 | ||
| ENERGY - 2.3% | |||
| Energy Equipment & Services - 1.8% | |||
| Baker Hughes Co. Class A | 24,314 | 488,468 | |
| Oil, Gas & Consumable Fuels - 0.5% | |||
| Antero Midstream GP LP | 2,100 | 17,010 | |
| Black Stone Minerals LP | 600 | 5,118 | |
| EOG Resources, Inc. | 1,100 | 56,056 | |
| Sunoco Logistics Partners, LP | 600 | 18,768 | |
| Teekay LNG Partners LP | 1,600 | 19,824 | |
| World Fuel Services Corp. | 658 | 20,128 | |
| 136,904 | |||
| TOTAL ENERGY | 625,372 | ||
| FINANCIALS - 14.8% | |||
| Banks - 3.2% | |||
| M&T Bank Corp. | 5,219 | 691,361 | |
| Popular, Inc. | 3,200 | 181,600 | |
| 872,961 | |||
| Capital Markets - 1.9% | |||
| Federated Hermes, Inc. Class B (non-vtg.) | 5,228 | 141,156 | |
| State Street Corp. | 5,237 | 366,590 | |
| 507,746 | |||
| Consumer Finance - 3.8% | |||
| Synchrony Financial | 30,827 | 1,037,329 | |
| Insurance - 5.9% | |||
| Allstate Corp. | 2,558 | 274,166 | |
| American National Group, Inc. | 95 | 8,396 | |
| Hartford Financial Services Group, Inc. | 9,228 | 443,129 | |
| MetLife, Inc. | 10,090 | 485,834 | |
| Old Republic International Corp. | 20,578 | 372,462 | |
| Unum Group | 1,759 | 40,862 | |
| 1,624,849 | |||
| TOTAL FINANCIALS | 4,042,885 | ||
| HEALTH CARE - 7.7% | |||
| Biotechnology - 2.6% | |||
| Alexion Pharmaceuticals, Inc. (a) | 1,678 | 257,288 | |
| Amgen, Inc. | 779 | 188,074 | |
| Exelixis, Inc. (a) | 1,400 | 31,094 | |
| Regeneron Pharmaceuticals, Inc. (a) | 400 | 201,536 | |
| United Therapeutics Corp. (a) | 277 | 45,378 | |
| 723,370 | |||
| Health Care Equipment & Supplies - 0.9% | |||
| Hologic, Inc. (a) | 3,000 | 239,190 | |
| Health Care Providers & Services - 2.2% | |||
| Cigna Corp. | 900 | 195,345 | |
| Universal Health Services, Inc. Class B | 3,298 | 411,195 | |
| 606,540 | |||
| Pharmaceuticals - 2.0% | |||
| Jazz Pharmaceuticals PLC (a) | 3,491 | 542,851 | |
| TOTAL HEALTH CARE | 2,111,951 | ||
| INDUSTRIALS - 17.1% | |||
| Building Products - 2.1% | |||
| Fortune Brands Home & Security, Inc. | 2,278 | 196,478 | |
| Masco Corp. | 4,100 | 222,671 | |
| Simpson Manufacturing Co. Ltd. | 500 | 46,000 | |
| UFP Industries, Inc. | 2,145 | 115,701 | |
| 580,850 | |||
| Construction & Engineering - 1.3% | |||
| EMCOR Group, Inc. | 4,104 | 362,383 | |
| Electrical Equipment - 3.5% | |||
| Acuity Brands, Inc. | 3,806 | 457,633 | |
| Encore Wire Corp. | 2,240 | 129,360 | |
| Hubbell, Inc. Class B | 2,426 | 377,486 | |
| 964,479 | |||
| Machinery - 5.5% | |||
| Allison Transmission Holdings, Inc. | 12,873 | 523,931 | |
| Crane Co. | 6,089 | 460,816 | |
| Dover Corp. | 1,300 | 151,437 | |
| ITT, Inc. | 3,074 | 229,659 | |
| Mueller Industries, Inc. | 4,204 | 143,567 | |
| 1,509,410 | |||
| Professional Services - 1.8% | |||
| Manpower, Inc. | 5,575 | 493,053 | |
| Road & Rail - 1.9% | |||
| Knight-Swift Transportation Holdings, Inc. Class A | 1,600 | 64,000 | |
| Landstar System, Inc. | 2,984 | 415,970 | |
| Werner Enterprises, Inc. | 1,000 | 39,240 | |
| 519,210 | |||
| Trading Companies & Distributors - 1.0% | |||
| Boise Cascade Co. | 400 | 19,052 | |
| MSC Industrial Direct Co., Inc. Class A | 3,074 | 238,450 | |
| 257,502 | |||
| TOTAL INDUSTRIALS | 4,686,887 | ||
| INFORMATION TECHNOLOGY - 8.8% | |||
| Communications Equipment - 0.3% | |||
| Juniper Networks, Inc. | 3,827 | 93,455 | |
| Electronic Equipment & Components - 2.1% | |||
| Avnet, Inc. | 3,732 | 131,777 | |
| CDW Corp. | 500 | 65,830 | |
| Sanmina Corp. (a) | 2,893 | 89,972 | |
| SYNNEX Corp. | 3,360 | 274,243 | |
| 561,822 | |||
| IT Services - 4.1% | |||
| Accenture PLC Class A | 462 | 111,767 | |
| Amdocs Ltd. | 11,590 | 818,486 | |
| CACI International, Inc. Class A (a) | 700 | 168,854 | |
| Sykes Enterprises, Inc. (a) | 700 | 27,013 | |
| 1,126,120 | |||
| Software - 1.0% | |||
| Citrix Systems, Inc. | 1,500 | 199,965 | |
| SS&C Technologies Holdings, Inc. | 1,100 | 69,168 | |
| 269,133 | |||
| Technology Hardware, Storage & Peripherals - 1.3% | |||
| HP, Inc. | 7,500 | 182,550 | |
| Xerox Holdings Corp. | 8,756 | 184,139 | |
| 366,689 | |||
| TOTAL INFORMATION TECHNOLOGY | 2,417,219 | ||
| MATERIALS - 6.6% | |||
| Chemicals - 1.7% | |||
| Minerals Technologies, Inc. | 1,029 | 63,417 | |
| NewMarket Corp. | 1,029 | 403,564 | |
| 466,981 | |||
| Containers & Packaging - 0.1% | |||
| Berry Global Group, Inc. (a) | 700 | 34,559 | |
| Metals & Mining - 4.5% | |||
| Reliance Steel & Aluminum Co. | 10,613 | 1,231,957 | |
| Paper & Forest Products - 0.3% | |||
| Schweitzer-Mauduit International, Inc. | 2,054 | 76,286 | |
| TOTAL MATERIALS | 1,809,783 | ||
| REAL ESTATE - 11.5% | |||
| Equity Real Estate Investment Trusts (REITs) - 2.3% | |||
| Equity Commonwealth | 4,199 | 119,713 | |
| Essex Property Trust, Inc. | 200 | 47,922 | |
| Gaming & Leisure Properties | 5,633 | 231,685 | |
| Highwoods Properties, Inc. (SBI) | 4,661 | 174,741 | |
| PS Business Parks, Inc. | 439 | 59,757 | |
| 633,818 | |||
| Real Estate Management & Development - 9.2% | |||
| CBRE Group, Inc. (a) | 23,298 | 1,420,712 | |
| Jones Lang LaSalle, Inc. (a) | 7,420 | 1,084,878 | |
| 2,505,590 | |||
| TOTAL REAL ESTATE | 3,139,408 | ||
| UTILITIES - 9.8% | |||
| Electric Utilities - 6.1% | |||
| Exelon Corp. | 5,757 | 239,261 | |
| NRG Energy, Inc. | 18,723 | 775,319 | |
| OGE Energy Corp. | 21,672 | 661,429 | |
| 1,676,009 | |||
| Independent Power and Renewable Electricity Producers - 1.0% | |||
| Vistra Corp. | 13,703 | 273,649 | |
| Multi-Utilities - 2.7% | |||
| MDU Resources Group, Inc. | 28,333 | 744,875 | |
| TOTAL UTILITIES | 2,694,533 | ||
| TOTAL COMMON STOCKS | |||
| (Cost $23,804,732) | 27,268,988 | ||
| Money Market Funds - 1.0% | |||
| Fidelity Cash Central Fund 0.09% (b) | |||
| (Cost $264,532) | 264,479 | 264,532 | |
| TOTAL INVESTMENT IN SECURITIES - 100.5% | |||
| (Cost $24,069,264) | 27,533,520 | ||
| NET OTHER ASSETS (LIABILITIES) - (0.5)% | (129,220) | ||
| NET ASSETS - 100% | $27,404,300 |
Legend
(a) Non-income producing
(b) Affiliated fund that is generally available only to investment companies and other accounts managed by Fidelity Investments. The rate quoted is the annualized seven-day yield of the fund at period end. A complete unaudited listing of the fund's holdings as of its most recent quarter end is available upon request. In addition, each Fidelity Central Fund's financial statements, which are not covered by the Fund's Report of Independent Registered Public Accounting Firm, are available on the SEC's website or upon request.
Affiliated Central Funds
Information regarding fiscal year to date income earned by the Fund from investments in Fidelity Central Funds is as follows:
| Fund | Income earned |
| Fidelity Cash Central Fund | $3,588 |
| Fidelity Securities Lending Cash Central Fund | 297 |
| Total | $3,885 |
Amounts in the income column in the above table include any capital gain distributions from underlying funds, which are presented in the corresponding line-item in the Statement of Operations, if applicable. Amount for Fidelity Securities Lending Cash Central Fund represents the income earned on investing cash collateral, less rebates paid to borrowers and any lending agent fees associated with the loan, plus any premium payments received for lending certain types of securities.
Investment Valuation
The following is a summary of the inputs used, as of January 31, 2021, involving the Fund's assets and liabilities carried at fair value. The inputs or methodology used for valuing securities may not be an indication of the risk associated with investing in those securities. For more information on valuation inputs, and their aggregation into the levels used below, please refer to the Investment Valuation section in the accompanying Notes to Financial Statements.
| Valuation Inputs at Reporting Date: | ||||
| Description | Total | Level 1 | Level 2 | Level 3 |
| Investments in Securities: | ||||
| Equities: | ||||
| Communication Services | $992,662 | $992,662 | $-- | $-- |
| Consumer Discretionary | 3,621,228 | 3,621,228 | -- | -- |
| Consumer Staples | 1,127,060 | 1,127,060 | -- | -- |
| Energy | 625,372 | 625,372 | -- | -- |
| Financials | 4,042,885 | 4,042,885 | -- | -- |
| Health Care | 2,111,951 | 2,111,951 | -- | -- |
| Industrials | 4,686,887 | 4,686,887 | -- | -- |
| Information Technology | 2,417,219 | 2,417,219 | -- | -- |
| Materials | 1,809,783 | 1,809,783 | -- | -- |
| Real Estate | 3,139,408 | 3,139,408 | -- | -- |
| Utilities | 2,694,533 | 2,694,533 | -- | -- |
| Money Market Funds | 264,532 | 264,532 | -- | -- |
| Total Investments in Securities: | $27,533,520 | $27,533,520 | $-- | $-- |
See accompanying notes which are an integral part of the financial statements.
Financial Statements
Statement of Assets and Liabilities
| January 31, 2021 | ||
| Assets | ||
| Investment in securities, at value — See accompanying schedule: Unaffiliated issuers (cost $23,804,732) | $27,268,988 | |
| Fidelity Central Funds (cost $264,532) | 264,532 | |
| Total Investment in Securities (cost $24,069,264) | $27,533,520 | |
| Receivable for fund shares sold | 18,399 | |
| Dividends receivable | 14,181 | |
| Distributions receivable from Fidelity Central Funds | 19 | |
| Other receivables | 489 | |
| Total assets | 27,566,608 | |
| Liabilities | ||
| Payable for fund shares redeemed | $151,612 | |
| Accrued management fee | 10,696 | |
| Total liabilities | 162,308 | |
| Net Assets | $27,404,300 | |
| Net Assets consist of: | ||
| Paid in capital | $32,461,262 | |
| Total accumulated earnings (loss) | (5,056,962) | |
| Net Assets | $27,404,300 | |
| Net Asset Value, offering price and redemption price per share ($27,404,300 ÷ 2,574,825 shares) | $10.64 |
See accompanying notes which are an integral part of the financial statements.
Statement of Operations
| Year ended January 31, 2021 | ||
| Investment Income | ||
| Dividends | $974,859 | |
| Income from Fidelity Central Funds (including $297 from security lending) | 3,885 | |
| Total income | 978,744 | |
| Expenses | ||
| Management fee | $175,458 | |
| Independent trustees' fees and expenses | 237 | |
| Miscellaneous | 542 | |
| Total expenses before reductions | 176,237 | |
| Expense reductions | (4,160) | |
| Total expenses after reductions | 172,077 | |
| Net investment income (loss) | 806,667 | |
| Realized and Unrealized Gain (Loss) | ||
| Net realized gain (loss) on: | ||
| Investment securities: | ||
| Unaffiliated issuers | (2,436,339) | |
| Fidelity Central Funds | 49 | |
| Foreign currency transactions | 689 | |
| Total net realized gain (loss) | (2,435,601) | |
| Change in net unrealized appreciation (depreciation) on: | ||
| Investment securities: | ||
| Unaffiliated issuers | 1,921,034 | |
| Assets and liabilities in foreign currencies | (14) | |
| Total change in net unrealized appreciation (depreciation) | 1,921,020 | |
| Net gain (loss) | (514,581) | |
| Net increase (decrease) in net assets resulting from operations | $292,086 |
See accompanying notes which are an integral part of the financial statements.
Statement of Changes in Net Assets
| Year ended January 31, 2021 | Year ended January 31, 2020 | |
| Increase (Decrease) in Net Assets | ||
| Operations | ||
| Net investment income (loss) | $806,667 | $1,051,757 |
| Net realized gain (loss) | (2,435,601) | (1,226,520) |
| Change in net unrealized appreciation (depreciation) | 1,921,020 | 3,245,984 |
| Net increase (decrease) in net assets resulting from operations | 292,086 | 3,071,221 |
| Distributions to shareholders | (859,404) | (925,927) |
| Share transactions | ||
| Proceeds from sales of shares | 5,595,450 | 12,851,209 |
| Reinvestment of distributions | 859,404 | 925,927 |
| Cost of shares redeemed | (31,670,830) | (11,658,955) |
| Net increase (decrease) in net assets resulting from share transactions | (25,215,976) | 2,118,181 |
| Total increase (decrease) in net assets | (25,783,294) | 4,263,475 |
| Net Assets | ||
| Beginning of period | 53,187,594 | 48,924,119 |
| End of period | $27,404,300 | $53,187,594 |
| Other Information | ||
| Shares | ||
| Sold | 622,935 | 1,265,042 |
| Issued in reinvestment of distributions | 83,383 | 87,517 |
| Redeemed | (3,306,292) | (1,146,724) |
| Net increase (decrease) | (2,599,974) | 205,835 |
See accompanying notes which are an integral part of the financial statements.
Financial Highlights
Fidelity Mid Cap Value K6 Fund
| Years ended January 31, | 2021 | 2020 | 2019 | 2018 A |
| Selected Per–Share Data | ||||
| Net asset value, beginning of period | $10.28 | $9.85 | $11.35 | $10.00 |
| Income from Investment Operations | ||||
| Net investment income (loss)B | .19 | .21 | .21 | .11 |
| Net realized and unrealized gain (loss) | .40C | .40 | (1.44) | 1.33 |
| Total from investment operations | .59 | .61 | (1.23) | 1.44 |
| Distributions from net investment income | (.23) | (.18) | (.22) | (.09) |
| Distributions from net realized gain | – | – | (.05) | – |
| Total distributions | (.23) | (.18) | (.27) | (.09) |
| Net asset value, end of period | $10.64 | $10.28 | $9.85 | $11.35 |
| Total ReturnD,E | 5.83% | 6.15% | (10.82)% | 14.38% |
| Ratios to Average Net AssetsF,G | ||||
| Expenses before reductions | .45% | .45% | .45% | .45%H |
| Expenses net of fee waivers, if any | .45% | .45% | .45% | .45%H |
| Expenses net of all reductions | .44% | .44% | .44% | .45%H |
| Net investment income (loss) | 2.07% | 2.05% | 2.05% | 1.52%H |
| Supplemental Data | ||||
| Net assets, end of period (000 omitted) | $27,404 | $53,188 | $48,924 | $67,563 |
| Portfolio turnover rateI | 73%J | 102%J | 89%J | 142%H,J |
A For the period May 25, 2017 (commencement of operations) to January 31, 2018.
B Calculated based on average shares outstanding during the period.
C The amount shown for a share outstanding does not correspond with the aggregate net gain (loss) on investments for the period due to the timing of sales and repurchases of shares in relation to fluctuating market values of the investments of the Fund.
D Total returns for periods of less than one year are not annualized.
E Total returns would have been lower if certain expenses had not been reduced during the applicable periods shown.
F Fees and expenses of any underlying mutual funds or exchange-traded funds (ETFs) are not included in the Fund's expense ratio. The Fund indirectly bears its proportionate share of these expenses. For additional expense information related to investments in Fidelity Central Funds, please refer to the "Investments in Fidelity Central Funds" note found in the Notes to Financial Statements section of the most recent Annual or Semi-Annual report.
G Expense ratios reflect operating expenses of the class. Expenses before reductions do not reflect amounts reimbursed, waived, or reduced through arrangements with the investment advisor, brokerage services, or other offset arrangements, if applicable, and do not represent the amount paid by the class during periods when reimbursements, waivers or reductions occur.
H Annualized
I Amount does not include the portfolio activity of any underlying mutual funds or exchange-traded funds (ETFs).
J Portfolio turnover rate excludes securities received or delivered in-kind.
See accompanying notes which are an integral part of the financial statements.
Notes to Financial Statements
For the period ended January 31, 2021
1. Organization.
Fidelity Mid Cap Value K6 Fund (the Fund) is a fund of Fidelity Devonshire Trust (the Trust) and is authorized to issue an unlimited number of shares. Share transactions on the Statement of Changes in Net Assets may contain exchanges between affiliated funds. The Trust is registered under the Investment Company Act of 1940, as amended (the 1940 Act), as an open-end management investment company organized as a Massachusetts business trust. Shares generally are available only to employer-sponsored retirement plans that are recordkept by Fidelity, or to certain employer-sponsored retirement plans that are not recordkept by Fidelity.
2. Investments in Fidelity Central Funds.
The Fund invests in Fidelity Central Funds, which are open-end investment companies generally available only to other investment companies and accounts managed by the investment adviser and its affiliates. The Fund's Schedule of Investments lists each of the Fidelity Central Funds held as of period end, if any, as an investment of the Fund, but does not include the underlying holdings of each Fidelity Central Fund. As an Investing Fund, the Fund indirectly bears its proportionate share of the expenses of the underlying Fidelity Central Funds.
The Money Market Central Funds seek preservation of capital and current income and are managed by the investment adviser. Annualized expenses of the Money Market Central Funds as of their most recent shareholder report date ranged from less than .005% to .01%.
A complete unaudited list of holdings for each Fidelity Central Fund is available upon request or at the Securities and Exchange Commission (the SEC) website at www.sec.gov. In addition, the financial statements of the Fidelity Central Funds, which are not covered by the Fund's Report of Independent Registered Public Accounting Firm, are available on the SEC website or upon request.
3. Significant Accounting Policies.
The Fund is an investment company and applies the accounting and reporting guidance of the Financial Accounting Standards Board (FASB) Accounting Standards Codification Topic 946 Financial Services - Investment Companies. The financial statements have been prepared in conformity with accounting principles generally accepted in the United States of America (GAAP), which require management to make certain estimates and assumptions at the date of the financial statements. Actual results could differ from those estimates. Subsequent events, if any, through the date that the financial statements were issued have been evaluated in the preparation of the financial statements. The following summarizes the significant accounting policies of the Fund:
Investment Valuation. Investments are valued as of 4:00 p.m. Eastern time on the last calendar day of the period. The Board of Trustees (the Board) has delegated the day to day responsibility for the valuation of the Fund's investments to the Fair Value Committee (the Committee) established by the Fund's investment adviser. In accordance with valuation policies and procedures approved by the Board, the Fund attempts to obtain prices from one or more third party pricing vendors or brokers to value its investments. When current market prices, quotations or currency exchange rates are not readily available or reliable, investments will be fair valued in good faith by the Committee, in accordance with procedures adopted by the Board. Factors used in determining fair value vary by investment type and may include market or investment specific events. The frequency with which these procedures are used cannot be predicted and they may be utilized to a significant extent. The Committee oversees the Fund's valuation policies and procedures and reports to the Board on the Committee's activities and fair value determinations. The Board monitors the appropriateness of the procedures used in valuing the Fund's investments and ratifies the fair value determinations of the Committee.
The Fund categorizes the inputs to valuation techniques used to value its investments into a disclosure hierarchy consisting of three levels as shown below:
- Level 1 – quoted prices in active markets for identical investments
- Level 2 – other significant observable inputs (including quoted prices for similar investments, interest rates, prepayment speeds, etc.)
- Level 3 – unobservable inputs (including the Fund's own assumptions based on the best information available)
Valuation techniques used to value the Fund's investments by major category are as follows:
Equity securities, including restricted securities, for which market quotations are readily available, are valued at the last reported sale price or official closing price as reported by a third party pricing vendor on the primary market or exchange on which they are traded and are categorized as Level 1 in the hierarchy. In the event there were no sales during the day or closing prices are not available, securities are valued at the last quoted bid price or may be valued using the last available price and are generally categorized as Level 2 in the hierarchy. For foreign equity securities, when market or security specific events arise, comparisons to the valuation of American Depositary Receipts (ADRs), futures contracts, Exchange-Traded Funds (ETFs) and certain indexes as well as quoted prices for similar securities may be used and would be categorized as Level 2 in the hierarchy. For equity securities, including restricted securities, where observable inputs are limited, assumptions about market activity and risk are used and these securities may be categorized as Level 3 in the hierarchy.
Investments in open-end mutual funds, including the Fidelity Central Funds, are valued at their closing net asset value (NAV) each business day and are categorized as Level 1 in the hierarchy.
Changes in valuation techniques may result in transfers in or out of an assigned level within the disclosure hierarchy. The aggregate value of investments by input level as of January 31, 2021 is included at the end of the Fund's Schedule of Investments.
Foreign Currency. Certain Funds may use foreign currency contracts to facilitate transactions in foreign-denominated securities. Gains and losses from these transactions may arise from changes in the value of the foreign currency or if the counterparties do not perform under the contracts' terms.
Foreign-denominated assets, including investment securities, and liabilities are translated into U.S. dollars at the exchange rates at period end. Purchases and sales of investment securities, income and dividends received, and expenses denominated in foreign currencies are translated into U.S. dollars at the exchange rate in effect on the transaction date.
The effects of exchange rate fluctuations on investments are included with the net realized and unrealized gain (loss) on investment securities. Other foreign currency transactions resulting in realized and unrealized gain (loss) are disclosed separately.
Investment Transactions and Income. For financial reporting purposes, the Fund's investment holdings and NAV include trades executed through the end of the last business day of the period. The NAV per share for processing shareholder transactions is calculated as of the close of business of the New York Stock Exchange (NYSE), normally 4:00 p.m. Eastern time and includes trades executed through the end of the prior business day. Gains and losses on securities sold are determined on the basis of identified cost. Dividend income is recorded on the ex-dividend date, except for certain dividends from foreign securities where the ex-dividend date may have passed, which are recorded as soon as the Fund is informed of the ex-dividend date. Non-cash dividends included in dividend income, if any, are recorded at the fair market value of the securities received. Income and capital gain distributions from Fidelity Central Funds, if any, are recorded on the ex-dividend date. Certain distributions received by the Fund represent a return of capital or capital gain. The Fund determines the components of these distributions subsequent to the ex-dividend date, based upon receipt of tax filings or other correspondence relating to the underlying investment. These distributions are recorded as a reduction of cost of investments and/or as a realized gain. Investment income is recorded net of foreign taxes withheld where recovery of such taxes is uncertain.
Expenses. Expenses directly attributable to a fund are charged to that fund. Expenses attributable to more than one fund are allocated among the respective funds on the basis of relative net assets or other appropriate methods. Expense estimates are accrued in the period to which they relate and adjustments are made when actual amounts are known.
Income Tax Information and Distributions to Shareholders. Each year, the Fund intends to qualify as a regulated investment company under Subchapter M of the Internal Revenue Code, including distributing substantially all of its taxable income and realized gains. As a result, no provision for U.S. Federal income taxes is required. As of January 31, 2021, the Fund did not have any unrecognized tax benefits in the financial statements; nor is the Fund aware of any tax positions for which it is reasonably possible that the total amounts of unrecognized tax benefits will significantly change in the next twelve months. The Fund files a U.S. federal tax return, in addition to state and local tax returns as required. The Fund's federal income tax returns are subject to examination by the Internal Revenue Service (IRS) for a period of three fiscal years after they are filed. State and local tax returns may be subject to examination for an additional fiscal year depending on the jurisdiction. Foreign taxes are provided for based on the Fund's understanding of the tax rules and rates that exist in the foreign markets in which it invests.
Distributions are declared and recorded on the ex-dividend date. Income and capital gain distributions are determined in accordance with income tax regulations, which may differ from GAAP.
Capital accounts within the financial statements are adjusted for permanent book-tax differences. These adjustments have no impact on net assets or the results of operations. Capital accounts are not adjusted for temporary book-tax differences which will reverse in a subsequent period.
Book-tax differences are primarily due to foreign currency transactions, redemptions in kind, partnerships, capital loss carryforwards and losses deferred due to wash sales and excise tax regulations.
As of period end, the cost and unrealized appreciation (depreciation) in securities, and derivatives if applicable, for federal income tax purposes were as follows:
| Gross unrealized appreciation | $4,378,028 |
| Gross unrealized depreciation | (958,789) |
| Net unrealized appreciation (depreciation) | $3,419,239 |
| Tax Cost | $24,114,281 |
The Fund intends to elect to defer to its next fiscal year $19,474 of ordinary losses recognized during the period January 1, 2021 to January 31, 2021.
The tax-based components of distributable earnings as of period end were as follows:
| Capital loss carryforward | $(8,456,727) |
| Net unrealized appreciation (depreciation) on securities and other investments | $3,419,239 |
Capital loss carryforwards are only available to offset future capital gains of the Fund to the extent provided by regulations and may be limited. The capital loss carryforward information presented below, including any applicable limitation, is estimated as of fiscal period end and is subject to adjustment.
| No expiration | |
| Short-term | $(5,583,144) |
| Long-term | (2,873,583) |
| Total capital loss carryforward | $(8,456,727) |
Due to large redemptions in a prior period, approximately $1,849,024 of the Fund's realized capital losses are subject to limitation. Due to this limitation, the Fund will only be permitted to use approximately $1,170,413 of those capital losses per year to offset capital gains.
The tax character of distributions paid was as follows:
| January 31, 2021 | January 31. 2020 | |
| Ordinary Income | $859,404 | $ 925,927 |
4. Purchases and Sales of Investments.
Purchases and sales of securities, other than short-term securities and in-kind transactions, are noted in the table below.
| Purchases ($) | Sales ($) | |
| Fidelity Mid Cap Value K6 Fund | 27,355,935 | 48,183,924 |
Unaffiliated Redemptions In-Kind. During the period, 198,493 shares of the Fund were redeemed in-kind for investments and cash with a value of $1,794,378. The net realized gain of $102,357 on investments delivered through in-kind redemptions is included in the accompanying Statement of Operations. The amount of the in-kind redemptions is included in share transactions in the accompanying Statement of Changes in Net Assets.
Prior Fiscal Year Unaffiliated Exchanges In-Kind. During the prior period, the Fund received investments and cash valued at $7,769,327 in exchange for 769,274 shares of the Fund. The amount of in-kind exchanges is included in share transactions in the accompanying Statement of Changes in Net Assets.
5. Fees and Other Transactions with Affiliates.
Management Fee. Fidelity Management & Research Company LLC (the investment adviser) and its affiliates provide the Fund with investment management related services for which the Fund pays a monthly management fee that is based on an annual rate of .45% of average net assets. Under the management contract, the investment adviser or an affiliate pays all other expenses of the Fund, excluding fees and expenses of the independent Trustees, and certain miscellaneous expenses such as proxy and shareholder meeting expenses.
Brokerage Commissions. A portion of portfolio transactions were placed with brokerage firms which are affiliates of the investment adviser. Brokerage commissions are included in net realized gain (loss) and change in net unrealized appreciation (depreciation) in the Statement of Operations. The commissions paid to these affiliated firms were as follows:
| Amount | |
| Fidelity Mid Cap Value K6 Fund | $968 |
Interfund Trades. Funds may purchase from or sell securities to other Fidelity Funds under procedures adopted by the Board. The procedures have been designed to ensure these interfund trades are executed in accordance with Rule 17a-7 of the 1940 Act. Interfund trades are included within the respective purchases and sales amounts shown in the Purchases and Sales of Investments note, and amounted to $1,875,712 and $2,944,136, respectively.
6. Committed Line of Credit.
Certain Funds participate with other funds managed by the investment adviser or an affiliate in a $4.25 billion credit facility (the "line of credit") to be utilized for temporary or emergency purposes to fund shareholder redemptions or for other short-term liquidity purposes. The participating funds have agreed to pay commitment fees on their pro-rata portion of the line of credit, which are reflected in Miscellaneous expenses on the Statement of Operations, and are listed below. Effective during January 2021, commitment fees are borne by the investment advisor.
| Amount | |
| Fidelity Mid Cap Value K6 Fund | $95 |
During the period, there were no borrowings on this line of credit.
7. Security Lending.
Funds lend portfolio securities from time to time in order to earn additional income. Lending agents are used, including National Financial Services (NFS), an affiliate of the investment adviser. Pursuant to a securities lending agreement, NFS will receive a fee, which is capped at 9.9% of a fund's daily lending revenue, for its services as lending agent. A fund may lend securities to certain qualified borrowers, including NFS. On the settlement date of the loan, a fund receives collateral (in the form of U.S. Treasury obligations, letters of credit and/or cash) against the loaned securities and maintains collateral in an amount not less than 100% of the market value of the loaned securities during the period of the loan. The market value of the loaned securities is determined at the close of business of a fund and any additional required collateral is delivered to a fund on the next business day. A fund or borrower may terminate the loan at any time, and if the borrower defaults on its obligation to return the securities loaned because of insolvency or other reasons, a fund may apply collateral received from the borrower against the obligation. A fund may experience delays and costs in recovering the securities loaned. Any cash collateral received is invested in the Fidelity Securities Lending Cash Central Fund. Any loaned securities are identified as such in the Schedule of Investments, and the value of loaned securities and cash collateral at period end, as applicable, are presented in the Statement of Assets and Liabilities. Security lending income represents the income earned on investing cash collateral, less rebates paid to borrowers and any lending agent fees associated with the loan, plus any premium payments received for lending certain types of securities. Security lending income is presented in the Statement of Operations as a component of income from Fidelity Central Funds. Affiliated security lending activity, if any, was as follows:
| Total Security Lending Income Fees Paid to NFS | Security Lending Income From Securities Loaned to NFS | Value of Securities Loaned to NFS at Period End | |
| Fidelity Mid Cap Value K6 Fund | $29 | $– | $– |
8. Expense Reductions.
Commissions paid to certain brokers with whom the investment adviser, or its affiliates, places trades on behalf of the Fund include an amount in addition to trade execution, which may be rebated back to the Fund to offset expenses. This amount totaled $4,134 for the period. In addition, through arrangements with the Fund's custodian, credits realized as a result of certain uninvested cash balances were used to reduce the Fund's expenses by $26.
9. Other.
The Fund's organizational documents provide former and current trustees and officers with a limited indemnification against liabilities arising in connection with the performance of their duties to the Fund. In the normal course of business, the Fund may also enter into contracts that provide general indemnifications. The Fund's maximum exposure under these arrangements is unknown as this would be dependent on future claims that may be made against the Fund. The risk of material loss from such claims is considered remote.
10. Coronavirus (COVID-19) Pandemic.
An outbreak of COVID-19 first detected in China during December 2019 has since spread globally and was declared a pandemic by the World Health Organization during March 2020. Developments that disrupt global economies and financial markets, such as the COVID-19 pandemic, may magnify factors that affect the Fund's performance.
Report of Independent Registered Public Accounting Firm
To the Board of Trustees of Fidelity Devonshire Trust and Shareholders of Fidelity Mid Cap Value K6 Fund
Opinion on the Financial Statements and Financial Highlights
We have audited the accompanying statement of assets and liabilities of Fidelity Mid Cap Value K6 Fund (the "Fund"), a fund of Fidelity Devonshire Trust, including the schedule of investments, as of January 31, 2021, the related statement of operations for the year then ended, the statement of changes in net assets for each of the two years in the period then ended, the financial highlights for each of the three years in the period then ended and for the period from May 25, 2017 (commencement of operations) through January 31, 2018, and the related notes. In our opinion, the financial statements and financial highlights present fairly, in all material respects, the financial position of the Fund as of January 31, 2021, and the results of its operations for the year then ended, the changes in its net assets for each of the two years in the period then ended, and the financial highlights for each of the three years in the period then ended and for the period from May 25, 2017 (commencement of operations) through January 31, 2018, in conformity with accounting principles generally accepted in the United States of America.
Basis for Opinion
These financial statements and financial highlights are the responsibility of the Fund's management. Our responsibility is to express an opinion on the Fund's financial statements and financial highlights based on our audits. We are a public accounting firm registered with the Public Company Accounting Oversight Board (United States) (PCAOB) and are required to be independent with respect to the Fund in accordance with the U.S. federal securities laws and the applicable rules and regulations of the Securities and Exchange Commission and the PCAOB.
We conducted our audits in accordance with the standards of the PCAOB. Those standards require that we plan and perform the audit to obtain reasonable assurance about whether the financial statements and financial highlights are free of material misstatement, whether due to error or fraud. The Fund is not required to have, nor were we engaged to perform, an audit of its internal control over financial reporting. As part of our audits we are required to obtain an understanding of internal control over financial reporting but not for the purpose of expressing an opinion on the effectiveness of the Fund’s internal control over financial reporting. Accordingly, we express no such opinion.
Our audits included performing procedures to assess the risks of material misstatement of the financial statements and financial highlights, whether due to error or fraud, and performing procedures that respond to those risks. Such procedures included examining, on a test basis, evidence regarding the amounts and disclosures in the financial statements and financial highlights. Our audits also included evaluating the accounting principles used and significant estimates made by management, as well as evaluating the overall presentation of the financial statements and financial highlights. Our procedures included confirmation of securities owned as of January 31, 2021, by correspondence with the custodian and brokers; when replies were not received from brokers, we performed other auditing procedures. We believe that our audits provide a reasonable basis for our opinion.
/s/ Deloitte & Touche LLP
Boston, Massachusetts
March 16, 2021
We have served as the auditor of one or more of the Fidelity investment companies since 1999.
Trustees and Officers
The Trustees, Members of the Advisory Board (if any), and officers of the trust and fund, as applicable, are listed below. The Board of Trustees governs the fund and is responsible for protecting the interests of shareholders. The Trustees are experienced executives who meet periodically throughout the year to oversee the fund's activities, review contractual arrangements with companies that provide services to the fund, oversee management of the risks associated with such activities and contractual arrangements, and review the fund's performance. Each of the Trustees oversees 309 funds.
The Trustees hold office without limit in time except that (a) any Trustee may resign; (b) any Trustee may be removed by written instrument, signed by at least two-thirds of the number of Trustees prior to such removal; (c) any Trustee who requests to be retired or who has become incapacitated by illness or injury may be retired by written instrument signed by a majority of the other Trustees; and (d) any Trustee may be removed at any special meeting of shareholders by a two-thirds vote of the outstanding voting securities of the trust. Each Trustee who is not an interested person (as defined in the 1940 Act) of the trust and the fund is referred to herein as an Independent Trustee. Each Independent Trustee shall retire not later than the last day of the calendar year in which his or her 75th birthday occurs. The Independent Trustees may waive this mandatory retirement age policy with respect to individual Trustees. Officers and Advisory Board Members hold office without limit in time, except that any officer or Advisory Board Member may resign or may be removed by a vote of a majority of the Trustees at any regular meeting or any special meeting of the Trustees. Except as indicated, each individual has held the office shown or other offices in the same company for the past five years.
The fund’s Statement of Additional Information (SAI) includes more information about the Trustees. To request a free copy, call Fidelity at 1-800-835-5092.
Experience, Skills, Attributes, and Qualifications of the Trustees. The Governance and Nominating Committee has adopted a statement of policy that describes the experience, qualifications, attributes, and skills that are necessary and desirable for potential Independent Trustee candidates (Statement of Policy). The Board believes that each Trustee satisfied at the time he or she was initially elected or appointed a Trustee, and continues to satisfy, the standards contemplated by the Statement of Policy. The Governance and Nominating Committee also engages professional search firms to help identify potential Independent Trustee candidates who have the experience, qualifications, attributes, and skills consistent with the Statement of Policy. From time to time, additional criteria based on the composition and skills of the current Independent Trustees, as well as experience or skills that may be appropriate in light of future changes to board composition, business conditions, and regulatory or other developments, have also been considered by the professional search firms and the Governance and Nominating Committee. In addition, the Board takes into account the Trustees' commitment and participation in Board and committee meetings, as well as their leadership of standing and ad hoc committees throughout their tenure.
In determining that a particular Trustee was and continues to be qualified to serve as a Trustee, the Board has considered a variety of criteria, none of which, in isolation, was controlling. The Board believes that, collectively, the Trustees have balanced and diverse experience, qualifications, attributes, and skills, which allow the Board to operate effectively in governing the fund and protecting the interests of shareholders. Information about the specific experience, skills, attributes, and qualifications of each Trustee, which in each case led to the Board's conclusion that the Trustee should serve (or continue to serve) as a trustee of the fund, is provided below.
Board Structure and Oversight Function. Robert A. Lawrence is an interested person and currently serves as Acting Chairman. The Trustees have determined that an interested Chairman is appropriate and benefits shareholders because an interested Chairman has a personal and professional stake in the quality and continuity of services provided to the fund. Independent Trustees exercise their informed business judgment to appoint an individual of their choosing to serve as Chairman, regardless of whether the Trustee happens to be independent or a member of management. The Independent Trustees have determined that they can act independently and effectively without having an Independent Trustee serve as Chairman and that a key structural component for assuring that they are in a position to do so is for the Independent Trustees to constitute a substantial majority for the Board. The Independent Trustees also regularly meet in executive session. David M. Thomas serves as Lead Independent Trustee and as such (i) acts as a liaison between the Independent Trustees and management with respect to matters important to the Independent Trustees and (ii) with management prepares agendas for Board meetings.
Fidelity® funds are overseen by different Boards of Trustees. The fund's Board oversees Fidelity's high income and certain equity funds, and other Boards oversee Fidelity's investment-grade bond, money market, asset allocation, and other equity funds. The asset allocation funds may invest in Fidelity® funds overseen by the fund's Board. The use of separate Boards, each with its own committee structure, allows the Trustees of each group of Fidelity® funds to focus on the unique issues of the funds they oversee, including common research, investment, and operational issues. On occasion, the separate Boards establish joint committees to address issues of overlapping consequences for the Fidelity® funds overseen by each Board.
The Trustees operate using a system of committees to facilitate the timely and efficient consideration of all matters of importance to the Trustees, the fund, and fund shareholders and to facilitate compliance with legal and regulatory requirements and oversight of the fund's activities and associated risks. The Board, acting through its committees, has charged FMR and its affiliates with (i) identifying events or circumstances the occurrence of which could have demonstrably adverse effects on the fund's business and/or reputation; (ii) implementing processes and controls to lessen the possibility that such events or circumstances occur or to mitigate the effects of such events or circumstances if they do occur; and (iii) creating and maintaining a system designed to evaluate continuously business and market conditions in order to facilitate the identification and implementation processes described in (i) and (ii) above. Because the day-to-day operations and activities of the fund are carried out by or through FMR, its affiliates, and other service providers, the fund's exposure to risks is mitigated but not eliminated by the processes overseen by the Trustees. While each of the Board's committees has responsibility for overseeing different aspects of the fund's activities, oversight is exercised primarily through the Operations, Audit, and Compliance Committees. Appropriate personnel, including but not limited to the fund's Chief Compliance Officer (CCO), FMR's internal auditor, the independent accountants, the fund's Treasurer and portfolio management personnel, make periodic reports to the Board's committees, as appropriate, including an annual review of Fidelity's risk management program for the Fidelity® funds. The responsibilities of each standing committee, including their oversight responsibilities, are described further under "Standing Committees of the Trustees."
Interested Trustees*:
Correspondence intended for a Trustee who is an interested person may be sent to Fidelity Investments, 245 Summer Street, Boston, Massachusetts 02210.
Name, Year of Birth; Principal Occupations and Other Relevant Experience+
Bettina Doulton (1964)
Year of Election or Appointment: 2020
Trustee
Ms. Doulton also serves as Trustee of other Fidelity® funds. Prior to her retirement, Ms. Doulton served in a variety of positions at Fidelity Investments, including as a managing director of research (2006-2007), portfolio manager to certain Fidelity® funds (1993-2005), equity analyst and portfolio assistant (1990-1993), and research assistant (1987-1990). Ms. Doulton currently owns and operates Phi Builders + Architects and Cellardoor Winery. Previously, Ms. Doulton served as a member of the Board of Brown Capital Management, LLC (2013-2018).
Robert A. Lawrence (1952)
Year of Election or Appointment: 2020
Trustee
Acting Chairman of the Board of Trustees
Mr. Lawrence also serves as Trustee of other funds. Previously, Mr. Lawrence served as a Member of the Advisory Board of certain funds. Prior to his retirement in 2008, Mr. Lawrence served as Vice President of certain Fidelity® funds (2006-2008), Senior Vice President, Head of High Income Division of Fidelity Management & Research Company (investment adviser firm, 2006-2008), and President of Fidelity Strategic Investments (investment adviser firm, 2002-2005).
* Determined to be an “Interested Trustee” by virtue of, among other things, his or her affiliation with the trust or various entities under common control with FMR.
+ The information includes the Trustee's principal occupation during the last five years and other information relating to the experience, attributes, and skills relevant to the Trustee's qualifications to serve as a Trustee, which led to the conclusion that the Trustee should serve as a Trustee for the fund.
Independent Trustees:
Correspondence intended for an Independent Trustee may be sent to Fidelity Investments, P.O. Box 55235, Boston, Massachusetts 02205-5235.
Name, Year of Birth; Principal Occupations and Other Relevant Experience+
Dennis J. Dirks (1948)
Year of Election or Appointment: 2005
Trustee
Mr. Dirks also serves as Trustee of other Fidelity® funds. Prior to his retirement in May 2003, Mr. Dirks served as Chief Operating Officer and as a member of the Board of The Depository Trust & Clearing Corporation (financial markets infrastructure), President, Chief Operating Officer and a member of the Board of The Depository Trust Company (DTC), President and a member of the Board of the National Securities Clearing Corporation (NSCC), Chief Executive Officer and a member of the Board of the Government Securities Clearing Corporation and Chief Executive Officer and a member of the Board of the Mortgage-Backed Securities Clearing Corporation. Mr. Dirks currently serves as a member of the Finance Committee (2016-present) and Board (2017-present) and is Treasurer (2018-present) of the Asolo Repertory Theatre.
Donald F. Donahue (1950)
Year of Election or Appointment: 2018
Trustee
Mr. Donahue also serves as Trustee of other Fidelity® funds. Mr. Donahue serves as President and Chief Executive Officer of Miranda Partners, LLC (risk consulting for the financial services industry, 2012-present). Previously, Mr. Donahue served as Chief Executive Officer (2006-2012), Chief Operating Officer (2003-2006) and Managing Director, Customer Marketing and Development (1999-2003) of The Depository Trust & Clearing Corporation (financial markets infrastructure). Mr. Donahue currently serves as a member (2007-present) and Co-Chairman (2016-present) of the Board of United Way of New York, a member of the Board of NYC Leadership Academy (2012-present) and a member of the Board of Advisors of Ripple Labs, Inc. (financial services, 2015-present). Mr. Donahue previously served as a member of the Advisory Board of certain Fidelity® funds (2015-2018).
Vicki L. Fuller (1957)
Year of Election or Appointment: 2020
Trustee
Ms. Fuller also serves as Trustee of other Fidelity® funds. Previously, Ms. Fuller served as a member of the Advisory Board of certain Fidelity® funds (2018-2020), Chief Investment Officer of the New York State Common Retirement Fund (2012-2018) and held a variety of positions at AllianceBernstein L.P. (global asset management, 1985-2012), including Managing Director (2006-2012) and Senior Vice President and Senior Portfolio Manager (2001-2006). Ms. Fuller currently serves as a member of the Board, Audit Committee and Nominating and Governance Committee of The Williams Companies, Inc. (natural gas infrastructure, 2018-present), as a member of the Board, Audit Committee and Nominating and Governance Committee of two Blackstone business development companies (2020-present) and as a member of the Board of Treliant, LLC (consulting, 2019-present).
Patricia L. Kampling (1959)
Year of Election or Appointment: 2020
Trustee
Ms. Kampling also serves as Trustee of other Fidelity® funds. Prior to her retirement, Ms. Kampling served as Chairman of the Board and Chief Executive Officer (2012-2019), President and Chief Operating Officer (2011-2012) and Executive Vice President and Chief Financial Officer (2010-2011) of Alliant Energy Corporation. Ms. Kampling currently serves as a member of the Board, Compensation Committee and Executive Committee and as Chair of the Audit Committee of Briggs & Stratton Corporation (manufacturing, 2011-present) and as a member of the Board, Audit, Finance and Risk Committee and Safety, Environmental, Technology and Operations Committee of American Water Works Company, Inc. (utilities company, 2019-present). In addition, Ms. Kampling currently serves as a member of the Board of the Nature Conservancy, Wisconsin Chapter (2019-present). Previously, Ms. Kampling served as a Member of the Advisory Board of certain Fidelity® funds (2020), a member of the Board of Interstate Power and Light Company (2012-2019) and Wisconsin Power and Light Company (2012-2019) (each a subsidiary of Alliant Energy Corporation) and as a member of the Board and Workforce Development Committee of the Business Roundtable (2018-2019).
Thomas A. Kennedy (1955)
Year of Election or Appointment: 2021
Trustee
Mr. Kennedy also serves as Trustee of other Fidelity® funds. Previously, Mr. Kennedy served as a Member of the Advisory Board of certain Fidelity® funds (2020) and held a variety of positions at Raytheon Company (aerospace and defense, 1983-2020), including Chairman and Chief Executive Officer (2014-2020) and Executive Vice President and Chief Operating Officer (2013-2014). Mr. Kennedy currently serves as Executive Chairman of the Board of Directors of Raytheon Technologies Corporation (aerospace and defense, 2020-present). He is also a member of the Rutgers School of Engineering Industry Advisory Board (2011-present) and a member of the UCLA Engineering Dean’s Executive Board (2016-present).
Garnett A. Smith (1947)
Year of Election or Appointment: 2018
Trustee
Mr. Smith also serves as Trustee of other Fidelity® funds. Prior to his retirement, Mr. Smith served as Chairman and Chief Executive Officer (1990-1997) and President (1986-1990) of Inbrand Corp. (manufacturer of personal absorbent products). Prior to his employment with Inbrand Corp., he was employed by a retail fabric chain and North Carolina National Bank (now Bank of America). Mr. Smith previously served as a member of the Advisory Board of certain Fidelity® funds (2012-2013).
David M. Thomas (1949)
Year of Election or Appointment: 2008
Trustee
Lead Independent Trustee
Mr. Thomas also serves as Trustee of other Fidelity® funds. Previously, Mr. Thomas served as Executive Chairman (2005-2006) and Chairman and Chief Executive Officer (2000-2005) of IMS Health, Inc. (pharmaceutical and healthcare information solutions). Mr. Thomas currently serves as Non-Executive Chairman of the Board of Fortune Brands Home and Security (home and security products, 2011-present), and a member of the Board (2004-present) and Presiding Director (2013-present) of Interpublic Group of Companies, Inc. (marketing communication).
Susan Tomasky (1953)
Year of Election or Appointment: 2020
Trustee
Ms. Tomasky also serves as Trustee of other Fidelity® funds. Prior to her retirement, Ms. Tomasky served in various executive officer positions at American Electric Power Company, Inc. (1998-2011), including most recently as President of AEP Transmission (2007-2011). Ms. Tomasky currently serves as a member of the Board and Sustainability Committee and as Chair of the Audit Committee of Marathon Petroleum Corporation (2018-present) and as a member of the Board, Corporate Governance Committee and Organization and Compensation Committee and as Chair of the Audit Committee of Public Service Enterprise Group, Inc. (utilities company, 2012-present). In addition, Ms. Tomasky currently serves as a member of the Board of the Columbus Regional Airport Authority (2007-present), as a member of the Board of the Royal Shakespeare Company – America (2009-present), as a member of the Board of the Columbus Association for the Performing Arts (2011-present) and as a member of the Board of Kenyon College (2016-present). Previously, Ms. Tomasky served as a Member of the Advisory Board of certain Fidelity® funds (2020), a member of the Board (2011-2019) and as Lead Independent Director (2015-2018) of Andeavor Corporation (previously Tesoro Corporation) (independent oil refiner and marketer) and as a member of the Board of Summit Midstream Partners LP (energy, 2012-2018).
Michael E. Wiley (1950)
Year of Election or Appointment: 2018
Trustee
Mr. Wiley also serves as Trustee of other Fidelity® funds. Previously, Mr. Wiley served as a member of the Advisory Board of certain Fidelity® funds (2018-2020), Chairman, President and CEO of Baker Hughes, Inc. (oilfield services, 2000-2004). Mr. Wiley also previously served as a member of the Board of Andeavor Corporation (independent oil refiner and marketer, 2005-2018), a member of the Board of Andeavor Logistics LP (natural resources logistics, 2015-2018) and a member of the Board of High Point Resources (exploration and production, 2005-2020).
+ The information includes the Trustee's principal occupation during the last five years and other information relating to the experience, attributes, and skills relevant to the Trustee's qualifications to serve as a Trustee, which led to the conclusion that the Trustee should serve as a Trustee for the fund.
Advisory Board Members and Officers:
Correspondence intended for a Member of the Advisory Board (if any) may be sent to Fidelity Investments, P.O. Box 55235, Boston, Massachusetts 02205-5235. Correspondence intended for an officer or Peter S. Lynch may be sent to Fidelity Investments, 245 Summer Street, Boston, Massachusetts 02210. Officers appear below in alphabetical order.
Name, Year of Birth; Principal Occupation
Ned C. Lautenbach (1944)
Year of Election or Appointment: 2021
Member of the Advisory Board
Mr. Lautenbach also serves as a Member of the Advisory Board of other Fidelity® funds. Mr. Lautenbach currently serves as Chair of the Board of Governors, State University System of Florida (2013-present) and is a member of the Council on Foreign Relations (1994-present). He is also a member and has in the past served as Chairman of the Board of Directors of Artis-Naples (2012-present). Previously, Mr. Lautenbach served as a Trustee of certain Fidelity® funds (2000-2020) and a member and then Lead Director of the Board of Directors of Eaton Corporation (diversified industrial, 1997-2016). He was also a Partner at Clayton, Dubilier & Rice, LLC (private equity investment, 1998-2010); as well as Director of Sony Corporation (2006-2007). In addition, Mr. Lautenbach had a 30-year career with IBM (technology company), during which time he served as Senior Vice President and as a member of the Corporate Executive Committee (1968-1998).
Peter S. Lynch (1944)
Year of Election or Appointment: 2003
Member of the Advisory Board
Mr. Lynch also serves as a Member of the Advisory Board of other Fidelity® funds. Mr. Lynch is Vice Chairman and a Director of Fidelity Management & Research Company LLC (investment adviser firm). In addition, Mr. Lynch serves as a Trustee of Boston College and as the Chairman of the Inner-City Scholarship Fund. Previously, Mr. Lynch served as Vice Chairman and a Director of FMR Co., Inc. (investment adviser firm) and on the Special Olympics International Board of Directors (1997-2006).
Craig S. Brown (1977)
Year of Election or Appointment: 2019
Assistant Treasurer
Mr. Brown also serves as Assistant Treasurer of other funds. Mr. Brown is an employee of Fidelity Investments (2013-present).
John J. Burke III (1964)
Year of Election or Appointment: 2018
Chief Financial Officer
Mr. Burke also serves as Chief Financial Officer of other funds. Mr. Burke serves as Head of Investment Operations for Fidelity Fund and Investment Operations (2018-present) and is an employee of Fidelity Investments (1998-present). Previously Mr. Burke served as head of Asset Management Investment Operations (2012-2018).
William C. Coffey (1969)
Year of Election or Appointment: 2019
Assistant Secretary
Mr. Coffey also serves as Assistant Secretary of other funds. He is Senior Vice President and Deputy General Counsel of FMR LLC (diversified financial services company, 2010-present), and is an employee of Fidelity Investments. Previously, Mr. Coffey served as Secretary and CLO of certain funds (2018-2019); CLO, Secretary, and Senior Vice President of Fidelity Management & Research Company and FMR Co., Inc. (investment adviser firms, 2018-2019); Secretary of Fidelity SelectCo, LLC and Fidelity Investments Money Management, Inc. (investment adviser firms, 2018-2019); CLO of Fidelity Management & Research (Hong Kong) Limited, FMR Investment Management (UK) Limited, and Fidelity Management & Research (Japan) Limited (investment adviser firms, 2018-2019); and Assistant Secretary of certain funds (2009-2018).
Timothy M. Cohen (1969)
Year of Election or Appointment: 2018
Vice President
Mr. Cohen also serves as Vice President of other funds. Mr. Cohen serves as Co-Head of Equity (2018-present), a Director of Fidelity Management & Research (Japan) Limited (investment adviser firm, 2016-present), and is an employee of Fidelity Investments. Previously, Mr. Cohen served as Executive Vice President of Fidelity SelectCo, LLC (2019), Head of Global Equity Research (2016-2018), Chief Investment Officer - Equity and a Director of Fidelity Management & Research (U.K.) Inc. (investment adviser firm, 2013-2015) and as a Director of Fidelity Management & Research (Hong Kong) Limited (investment adviser firm, 2017).
Jonathan Davis (1968)
Year of Election or Appointment: 2010
Assistant Treasurer
Mr. Davis also serves as Assistant Treasurer of other funds. Mr. Davis serves as Assistant Treasurer of FMR Capital, Inc. (2017-present) and is an employee of Fidelity Investments. Previously, Mr. Davis served as Vice President and Associate General Counsel of FMR LLC (diversified financial services company, 2003-2010).
Laura M. Del Prato (1964)
Year of Election or Appointment: 2018
Assistant Treasurer
Ms. Del Prato also serves as an officer of other funds. Ms. Del Prato is an employee of Fidelity Investments (2017-present). Previously, Ms. Del Prato served as President and Treasurer of The North Carolina Capital Management Trust: Cash Portfolio and Term Portfolio (2018-2020). Prior to joining Fidelity Investments, Ms. Del Prato served as a Managing Director and Treasurer of the JPMorgan Mutual Funds (2014-2017). Prior to JPMorgan, Ms. Del Prato served as a partner at Cohen Fund Audit Services (accounting firm, 2012-2013) and KPMG LLP (accounting firm, 2004-2012).
Colm A. Hogan (1973)
Year of Election or Appointment: 2020
Assistant Treasurer
Mr. Hogan also serves as an officer of other funds. Mr. Hogan serves as Assistant Treasurer of FMR Capital, Inc. (2017-present) and is an employee of Fidelity Investments (2005-present). Previously, Mr. Hogan served as Deputy Treasurer of certain Fidelity® funds (2016-2020) and Assistant Treasurer of certain Fidelity® funds (2016-2018).
Pamela R. Holding (1964)
Year of Election or Appointment: 2018
Vice President
Ms. Holding also serves as Vice President of other funds. Ms. Holding serves as Co-Head of Equity (2018-present) and is an employee of Fidelity Investments (2013-present). Previously, Ms. Holding served as Executive Vice President of Fidelity SelectCo, LLC (2019) and as Chief Investment Officer of Fidelity Institutional Asset Management (2013-2018).
Cynthia Lo Bessette (1969)
Year of Election or Appointment: 2019
Secretary and Chief Legal Officer (CLO)
Ms. Lo Bessette also serves as an officer of other funds. Ms. Lo Bessette serves as CLO, Secretary, and Senior Vice President of Fidelity Management & Research Company LLC (investment adviser firm, 2019-present); and CLO of Fidelity Management & Research (Hong Kong) Limited, FMR Investment Management (UK) Limited, and Fidelity Management & Research (Japan) Limited (investment adviser firms, 2019-present). She is a Senior Vice President and Deputy General Counsel of FMR LLC (diversified financial services company, 2019-present), and is an employee of Fidelity Investments. Previously, Ms. Lo Bessette served as CLO, Secretary, and Senior Vice President of FMR Co., Inc. (investment adviser firm, 2019); Secretary of Fidelity SelectCo, LLC and Fidelity Investments Money Management, Inc. (investment adviser firms, 2019). Prior to joining Fidelity Investments, Ms. Lo Bessette was Executive Vice President, General Counsel (2016-2019) and Senior Vice President, Deputy General Counsel (2015-2016) of OppenheimerFunds (investment management company) and Deputy Chief Legal Officer (2013-2015) of Jennison Associates LLC (investment adviser firm).
Chris Maher (1972)
Year of Election or Appointment: 2020
Deputy Treasurer
Mr. Maher also serves as an officer of other funds. Mr. Maher serves as Assistant Treasurer of FMR Capital, Inc. (2017-present), and is an employee of Fidelity Investments (2008-present). Previously, Mr. Maher served as Assistant Treasurer of certain funds (2013-2020); Vice President of Asset Management Compliance (2013), Vice President of the Program Management Group of FMR (investment adviser firm, 2010-2013), and Vice President of Valuation Oversight (2008-2010).
Jason P. Pogorelec (1975)
Year of Election or Appointment: 2020
Chief Compliance Officer
Mr. Pogorelec also serves as Chief Compliance Officer of other funds. Mr. Pogorelec is a senior Vice President of Asset Management Compliance for Fidelity Investments and is an employee of Fidelity Investments (2006-present). Previously, Mr. Pogorelec served as Vice President, Associate General Counsel for Fidelity Investments (2010-2020) and Assistant Secretary of certain Fidelity funds (2015-2020).
Brett Segaloff (1972)
Year of Election or Appointment: 2021
Anti-Money Laundering (AML) Officer
Mr. Segaloff also serves as an AML Officer of other funds and other related entities. He is Director, Anti-Money Laundering (2007-present) of FMR LLC (diversified financial services company) and is an employee of Fidelity Investments (1996-present).
Stacie M. Smith (1974)
Year of Election or Appointment: 2016
President and Treasurer
Ms. Smith also serves as an officer of other funds. Ms. Smith serves as Assistant Treasurer of FMR Capital, Inc. (2017-present), is an employee of Fidelity Investments (2009-present), and has served in other fund officer roles. Prior to joining Fidelity Investments, Ms. Smith served as Senior Audit Manager of Ernst & Young LLP (accounting firm, 1996-2009). Previously, Ms. Smith served as Assistant Treasurer (2013-2019) and Deputy Treasurer (2013-2016) of certain Fidelity® funds.
Marc L. Spector (1972)
Year of Election or Appointment: 2016
Assistant Treasurer
Mr. Spector also serves as an officer of other funds. Mr. Spector serves as Assistant Treasurer of FMR Capital, Inc. (2017-present) and is an employee of Fidelity Investments (2016-present). Prior to joining Fidelity Investments, Mr. Spector served as Director at the Siegfried Group (accounting firm, 2013-2016), and prior to Siegfried Group as audit senior manager at Deloitte & Touche LLP (accounting firm, 2005-2013).
Jim Wegmann (1979)
Year of Election or Appointment: 2019
Assistant Treasurer
Mr. Wegmann also serves as Assistant Treasurer of other funds. Mr. Wegmann is an employee of Fidelity Investments (2011-present).
Shareholder Expense Example
As a shareholder, you incur two types of costs: (1) transaction costs, which may include sales charges (loads) on purchase payments or redemption proceeds, as applicable and (2) ongoing costs, which generally include management fees, distribution and/or service (12b-1) fees and other Fund expenses. This Example is intended to help you understand your ongoing costs (in dollars) of investing in a fund and to compare these costs with the ongoing costs of investing in other mutual funds.
The Example is based on an investment of $1,000 invested at the beginning of the period and held for the entire period (August 1, 2020 to January 31, 2021).
Actual Expenses
The first line of the accompanying table provides information about actual account values and actual expenses. You may use the information in this line, together with the amount you invested, to estimate the expenses that you paid over the period. Simply divide your account value by $1,000.00 (for example, an $8,600 account value divided by $1,000.00 = 8.6), then multiply the result by the number in the first line for a class/Fund under the heading entitled "Expenses Paid During Period" to estimate the expenses you paid on your account during this period. If any fund is a shareholder of any underlying mutual funds or exchange-traded funds (ETFs) (the Underlying Funds), such fund indirectly bears its proportional share of the expenses of the Underlying Funds in addition to the direct expenses incurred presented in the table. These fees and expenses are not included in the annualized expense ratio used to calculate the expense estimate in the table below.
Hypothetical Example for Comparison Purposes
The second line of the accompanying table provides information about hypothetical account values and hypothetical expenses based on the actual expense ratio and an assumed rate of return of 5% per year before expenses, which is not the actual return. The hypothetical account values and expenses may not be used to estimate the actual ending account balance or expenses you paid for the period. You may use this information to compare the ongoing costs of investing in the Fund and other funds. To do so, compare this 5% hypothetical example with the 5% hypothetical examples that appear in the shareholder reports of the other funds. If any fund is a shareholder of any Underlying Funds, such fund indirectly bears its proportional share of the expenses of the Underlying Funds in addition to the direct expenses as presented in the table. These fees and expenses are not included in the annualized expense ratio used to calculate the expense estimate in the table below.
Please note that the expenses shown in the table are meant to highlight your ongoing costs only and do not reflect any transaction costs. Therefore, the second line of the table is useful in comparing ongoing costs only, and will not help you determine the relative total costs of owning different funds.
| Annualized Expense Ratio-A | Beginning Account Value August 1, 2020 | Ending Account Value January 31, 2021 | Expenses Paid During Period-B August 1, 2020 to January 31, 2021 | |
| Fidelity Mid Cap Value K6 Fund | .45% | |||
| Actual | $1,000.00 | $1,222.00 | $2.51 | |
| Hypothetical-C | $1,000.00 | $1,022.87 | $2.29 |
A Annualized expense ratio reflects expenses net of applicable fee waivers.
B Expenses are equal to the annualized expense ratio, multiplied by the average account value over the period, multiplied by 184/ 366 (to reflect the one-half year period). The fees and expenses of any Underlying Funds are not included in each annualized expense ratio.
C 5% return per year before expenses
Distributions (Unaudited)
The fund designates 100% of the dividends distributed during the fiscal year as qualifying for the dividends–received deduction for corporate shareholders.
The fund designates 100%, of the dividends distributed during the fiscal year as amounts which may be taken into account as a dividend for the purposes of the maximum rate under section 1(h)(11) of the Internal Revenue Code.
The fund will notify shareholders in January 2022 of amounts for use in preparing 2021 income tax returns.
Board Approval of Investment Advisory Contracts
Fidelity Mid Cap Value K6 Fund
At its January 2021 meeting, the Board of Trustees, including the Independent Trustees (together, the Board), voted to continue the management contract with Fidelity Management & Research Company LLC (FMR), and the sub-advisory agreements and sub-subadvisory agreements, in each case, where applicable (together, the Advisory Contracts) for the fund for four months from February 1, 2021 through May 31, 2021, in connection with changes to the Board's meeting calendar.The Board considered that the approval of the fund's Advisory Contracts will not result in any changes in (i) the investment process or strategies employed in the management of the fund's assets; (ii) the fees and expenses paid by shareholders; (iii) the nature, extent or quality of services provided under the fund's Advisory Contracts; or (iv) the day-to-day management of the fund or the persons primarily responsible for such management. The Board also considered that since its last approval of the fund's Advisory Contracts, FMR had provided additional information on the fund in support of the annual contract renewal process, including competitive analyses on total expenses and management fees and in-depth reviews of fund performance and fund profitability information. The Board also considered the findings of certain ad hoc committees that had been previously formed to discuss matters relevant to all of the Fidelity funds, including economies of scale, fall-out benefits and retail vs. institutional funds. The Board concluded that the fund's Advisory Contracts are fair and reasonable, and that the fund's Advisory Contracts should be renewed, without modification, through May 31, 2021, with the understanding that the Board will consider the annual renewal for a full one year period in May 2021.In connection with its consideration of future renewals of the fund's Advisory Contracts, the Board will consider: (i) the nature, extent and quality of services provided to the funds, including shareholder and administrative services and investment performance; (ii) the competitiveness of the management fee and total expenses for the fund; (iii) the costs of the services and profitability, including the revenues earned and the expenses incurred in conducting the business of developing, marketing, distributing, managing, administering, and servicing the fund and its shareholders, to the extent applicable; and (iv) whether there have been economies of scale in respect of the Fidelity funds, whether the Fidelity funds (including the fund) have appropriately benefited from any such economies of scale, and whether there is the potential for realization of any further economies.Based on its evaluation of all of the conclusions noted above, and after considering all factors it believed relevant, the Board ultimately concluded that the fund's management fee structure is fair and reasonable, and that the continuation of the fund's Advisory Contracts should be approved for four months from February 1, 2021 through May 31, 2021.Proxy Voting Results
A special meeting of shareholders was held on June 9, 2020. The results of votes taken among shareholders on the proposal before them are reported below. Each vote reported represents one dollar of net asset value held on the record date for the meeting.
PROPOSAL 1
To elect a Board of Trustees.
| # of Votes | % of Votes | |
| Dennis J. Dirks | ||
| Affirmative | 20,677,600,881.166 | 98.531 |
| Withheld | 308,216,367.332 | 1.469 |
| TOTAL | 20,985,817,248.498 | 100.000 |
| Donald F. Donahue | ||
| Affirmative | 20,685,205,663.711 | 98.568 |
| Withheld | 300,611,584.787 | 1.432 |
| TOTAL | 20,985,817,248.498 | 100.000 |
| Bettina Doulton | ||
| Affirmative | 20,701,129,729.034 | 98.643 |
| Withheld | 284,687,519.464 | 1.357 |
| TOTAL | 20,985,817,248.498 | 100.000 |
| Vicki L. Fuller | ||
| Affirmative | 20,713,892,146.063 | 98.704 |
| Withheld | 271,925,102.435 | 1.296 |
| TOTAL | 20,985,817,248.498 | 100.000 |
| Patricia L. Kampling | ||
| Affirmative | 20,693,289,719.327 | 98.606 |
| Withheld | 292,527,529.171 | 1.394 |
| TOTAL | 20,985,817,248.498 | 100.000 |
| Alan J. Lacy | ||
| Affirmative | 20,659,591,158.873 | 98.445 |
| Withheld | 326,226,089.625 | 1.555 |
| TOTAL | 20,985,817,248.498 | 100.000 |
| Ned C. Lautenbach | ||
| Affirmative | 20,634,244,420.039 | 98.325 |
| Withheld | 351,572,828.459 | 1.675 |
| TOTAL | 20,985,817,248.498 | 100.000 |
| Robert A. Lawrence | ||
| Affirmative | 20,672,781,907.548 | 98.508 |
| Withheld | 313,035,340.950 | 1.492 |
| TOTAL | 20,985,817,248.498 | 100.000 |
| Joseph Mauriello | ||
| Affirmative | 20,652,465,304.654 | 98.412 |
| Withheld | 333,351,943.843 | 1.588 |
| TOTAL | 20,985,817,248.498 | 100.000 |
| Cornelia M. Small | ||
| Affirmative | 20,671,641,667.984 | 98.503 |
| Withheld | 314,175,580.514 | 1.497 |
| TOTAL | 20,985,817,248.498 | 100.000 |
| Garnett A. Smith | ||
| Affirmative | 20,655,644,270.628 | 98.427 |
| Withheld | 330,172,977.870 | 1.573 |
| TOTAL | 20,985,817,248.498 | 100.000 |
| David M. Thomas | ||
| Affirmative | 20,654,595,907.599 | 98.422 |
| Withheld | 331,221,340.899 | 1.578 |
| TOTAL | 20,985,817,248.498 | 100.000 |
| Susan Tomasky | ||
| Affirmative | 20,686,662,870.375 | 98.574 |
| Withheld | 299,154,378.123 | 1.426 |
| TOTAL | 20,985,817,248.498 | 100.000 |
| Michael E. Wiley | ||
| Affirmative | 20,662,847,882.871 | 98.461 |
| Withheld | 322,969,365.626 | 1.539 |
| TOTAL | 20,985,817,248.498 | 100.000 |
| Proposal 1 reflects trust wide proposal and voting results. |
![]()
MCVK6-ANN-0321
1.9883983.103
Fidelity® Series All-Sector Equity Fund
Fidelity® Series Stock Selector Large Cap Value Fund
Fidelity® Series Value Discovery Fund
January 31, 2021
Contents
Fidelity® Series All-Sector Equity Fund | |
Fidelity® Series Stock Selector Large Cap Value Fund | |
Fidelity® Series Value Discovery Fund | |
To view a fund's proxy voting guidelines and proxy voting record for the 12-month period ended June 30, visit http://www.fidelity.com/proxyvotingresults or visit the Securities and Exchange Commission's (SEC) web site at http://www.sec.gov.
You may also call 1-800-544-8544 to request a free copy of the proxy voting guidelines.
Standard & Poor's, S&P and S&P 500 are registered service marks of The McGraw-Hill Companies, Inc. and have been licensed for use by Fidelity Distributors Corporation.
Other third-party marks appearing herein are the property of their respective owners.
All other marks appearing herein are registered or unregistered trademarks or service marks of FMR LLC or an affiliated company. © 2021 FMR LLC. All rights reserved.
This report and the financial statements contained herein are submitted for the general information of the shareholders of the Funds. This report is not authorized for distribution to prospective investors in the Funds unless preceded or accompanied by an effective prospectus.
A fund files its complete schedule of portfolio holdings with the SEC for the first and third quarters of each fiscal year on Form N-PORT. Forms N-PORT are available on the SEC’s web site at http://www.sec.gov. A fund's Forms N-PORT may be reviewed and copied at the SEC’s Public Reference Room in Washington, DC. Information regarding the operation of the SEC's Public Reference Room may be obtained by calling 1-800-SEC-0330.
For a complete list of a fund's portfolio holdings, view the most recent holdings listing, semiannual report, or annual report on Fidelity's web site at http://www.fidelity.com, http://www.institutional.fidelity.com, or http://www.401k.com, as applicable.
NOT FDIC INSURED •MAY LOSE VALUE •NO BANK GUARANTEE
Neither the Funds nor Fidelity Distributors Corporation is a bank.
Note to Shareholders:
Early in 2020, the outbreak and spread of a new coronavirus emerged as a public health emergency that had a major influence on financial markets, primarily based on its impact on the global economy and the outlook for corporate earnings. The virus causes a respiratory disease known as COVID-19. On March 11, the World Health Organization declared the COVID-19 outbreak a pandemic, citing sustained risk of further global spread.
In the weeks following, as the crisis worsened, we witnessed an escalating human tragedy with wide-scale social and economic consequences from coronavirus-containment measures. The outbreak of COVID-19 prompted a number of measures to limit the spread, including travel and border restrictions, quarantines, and restrictions on large gatherings. In turn, these resulted in lower consumer activity, diminished demand for a wide range of products and services, disruption in manufacturing and supply chains, and – given the wide variability in outcomes regarding the outbreak – significant market uncertainty and volatility. Amid the turmoil, global governments and central banks took unprecedented action to help support consumers, businesses, and the broader economies, and to limit disruption to financial systems.
The situation continues to unfold, and the extent and duration of its impact on financial markets and the economy remain highly uncertain. Extreme events such as the coronavirus crisis are “exogenous shocks” that can have significant adverse effects on mutual funds and their investments. Although multiple asset classes may be affected by market disruption, the duration and impact may not be the same for all types of assets.
Fidelity is committed to helping you stay informed amid news about COVID-19 and during increased market volatility, and we’re taking extra steps to be responsive to customer needs. We encourage you to visit our websites, where we offer ongoing updates, commentary, and analysis on the markets and our funds.
Fidelity® Series All-Sector Equity Fund
Performance: The Bottom Line
Average annual total return reflects the change in the value of an investment, assuming reinvestment of distributions from dividend income and capital gains (the profits earned upon the sale of securities that have grown in value, if any) and assuming a constant rate of performance each year. The hypothetical investment and the average annual total returns do not reflect the deduction of taxes that a shareholder would pay on fund distributions or the redemption of fund shares. During periods of reimbursement by Fidelity, a fund’s total return will be greater than it would be had the reimbursement not occurred. How a fund did yesterday is no guarantee of how it will do tomorrow.
Average Annual Total Returns
| For the periods ended January 31, 2021 | Past 1 year | Past 5 years | Past 10 years |
| Fidelity® Series All-Sector Equity Fund | 24.94% | 17.40% | 13.33% |
$10,000 Over 10 Years
Let's say hypothetically that $10,000 was invested in Fidelity® Series All-Sector Equity Fund on January 31, 2011.
The chart shows how the value of your investment would have changed, and also shows how the Russell 1000® Index performed over the same period.
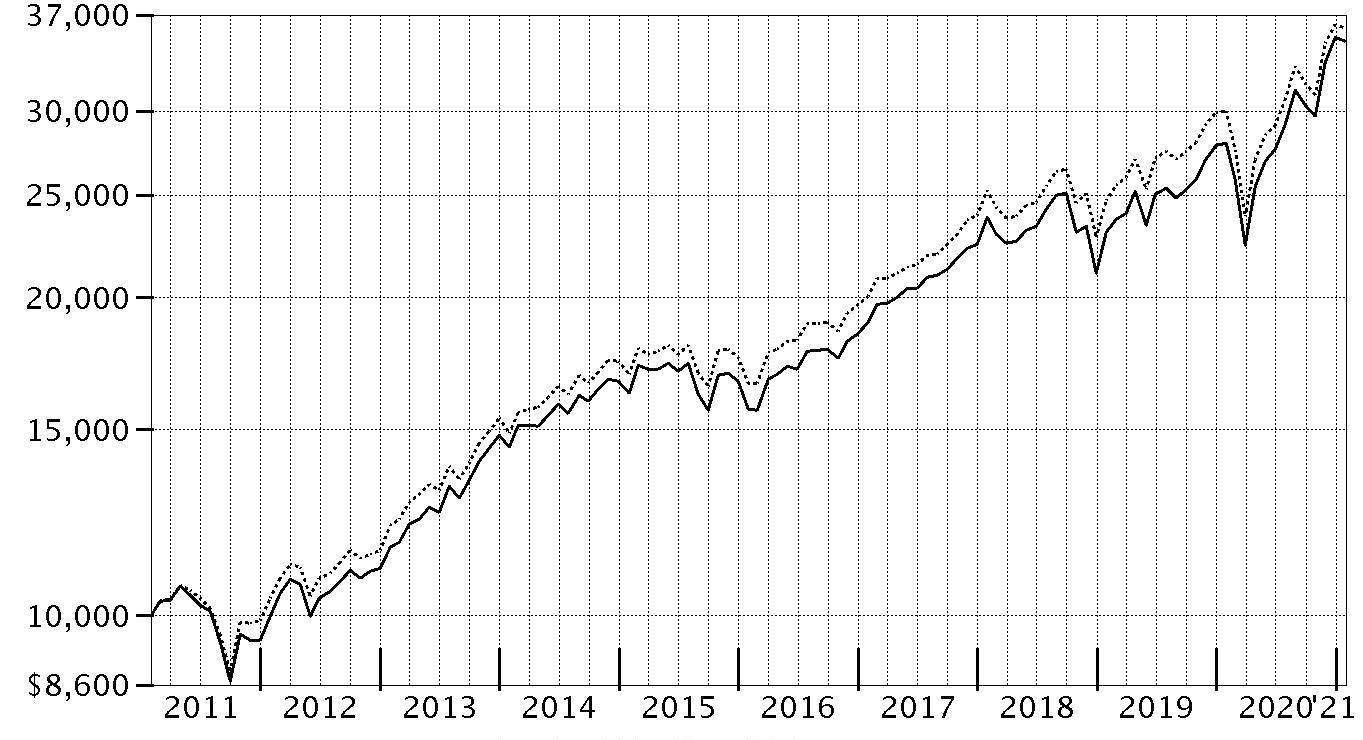
| Period Ending Values | ||
| $34,957 | Fidelity® Series All-Sector Equity Fund | |
| $35,932 | Russell 1000® Index | |
Fidelity® Series All-Sector Equity Fund
Management's Discussion of Fund Performance
Market Recap: The S&P 500® index gained 17.25% for the 12 months ending January 31, 2021, a volatile but productive period for U.S. risk assets. The early-2020 outbreak and spread of COVID-19 resulted in stocks suffering one of the quickest declines on record, through March 23, followed by a historic rebound. The crisis and containment efforts caused broad contraction in economic activity, along with extreme uncertainty and dislocation in financial markets. A rapid and expansive U.S. monetary/fiscal-policy response partially offset the economic disruption and fueled the market surge, as did resilient corporate earnings. The rally slowed in September, when the S&P 500 began a two-month retreat amid Congress’s inability to reach a deal on additional fiscal stimulus, as well as concerns about election uncertainty, indications the U.S. economic recovery could be slowing and a new wave of COVID-19 cases. A shift in momentum began in October and accelerated following the U.S. elections, with the approval of two breakthrough COVID-19 vaccines and prospects for additional government stimulus fueling the “reflation trade.” Small-cap value stocks rallied strongly late in 2020, usurping longstanding market leadership from growth shares – especially large tech and internet-related names – amid hopes of a broad economic recovery in 2021. By sector for the full 12 months, information technology (+37%) and consumer discretionary (+33%) led all gainers. In contrast, energy (-23%) struggled along with global oil demand and pricing.Comments from Co-Portfolio Manager Robert Stansky: For the fiscal year ending January 31, 2021, the fund gained 24.94%, outperforming the 19.84% gain of the benchmark, the Russell 1000® Index. Versus the benchmark, security selection was the primary contributor, especially within the information technology sector. Stock selection in communication services and financials also helped. Activision Blizzard, the fund's top individual relative contributor, rose 61% this period, and we reduced our stake in the company. Also bolstering performance was our overweighting in Fedex, which gained about 64%. Another notable relative contributor was an overweight position in Twilio (+183%). In contrast, consumer discretionary was the only sector that detracted versus the benchmark this period. The fund's position in cash, averaging about 1% of assets, also was a notable detractor in a rising market. The biggest individual relative detractor was an overweight position in General Electric (-15%), and we reduced our position in this company. A second notable relative detractor was our outsized stake in Royal Caribbean Cruises (-68%), a position that was sold the past year. Another notable relative detractor was an overweighting in Capital One Financial (+7%), which was among our largest holdings this period. Notable changes in positioning include increased exposure to the consumer discretionary sector and a lower allocation to financials.The views expressed above reflect those of the portfolio manager(s) only through the end of the period as stated on the cover of this report and do not necessarily represent the views of Fidelity or any other person in the Fidelity organization. Any such views are subject to change at any time based upon market or other conditions and Fidelity disclaims any responsibility to update such views. These views may not be relied on as investment advice and, because investment decisions for a Fidelity fund are based on numerous factors, may not be relied on as an indication of trading intent on behalf of any Fidelity fund.
Fidelity® Series All-Sector Equity Fund
Investment Summary (Unaudited)
Top Ten Stocks as of January 31, 2021
| % of fund's net assets | |
| Apple, Inc. | 5.1 |
| Microsoft Corp. | 5.0 |
| Amazon.com, Inc. | 3.4 |
| Alphabet, Inc. Class C | 3.2 |
| Facebook, Inc. Class A | 2.1 |
| MasterCard, Inc. Class A | 1.6 |
| UnitedHealth Group, Inc. | 1.4 |
| The Walt Disney Co. | 1.3 |
| Jabil, Inc. | 1.3 |
| Capital One Financial Corp. | 1.2 |
| 25.6 |
Top Five Market Sectors as of January 31, 2021
| % of fund's net assets | |
| Information Technology | 26.8 |
| Health Care | 13.4 |
| Consumer Discretionary | 12.1 |
| Financials | 10.3 |
| Communication Services | 10.3 |
Asset Allocation (% of fund's net assets)
| As of January 31, 2021* | ||
| Stocks and Equity Futures | 99.5% | |
| Short-Term Investments and Net Other Assets (Liabilities) | 0.5% | |

* Foreign investments - 5.1%
Fidelity® Series All-Sector Equity Fund
Schedule of Investments January 31, 2021
Showing Percentage of Net Assets
| Common Stocks - 98.5% | |||
| Shares | Value | ||
| COMMUNICATION SERVICES - 10.3% | |||
| Diversified Telecommunication Services - 0.0% | |||
| Vonage Holdings Corp. (a) | 81,500 | $1,017,120 | |
| Entertainment - 2.4% | |||
| Activision Blizzard, Inc. | 73,321 | 6,672,211 | |
| Cinemark Holdings, Inc. | 101,900 | 2,062,456 | |
| Electronic Arts, Inc. | 38,300 | 5,484,560 | |
| Live Nation Entertainment, Inc. (a) | 157,100 | 10,439,295 | |
| Netflix, Inc. (a) | 10,500 | 5,590,095 | |
| Spotify Technology SA (a) | 19,200 | 6,048,000 | |
| Take-Two Interactive Software, Inc. (a) | 10,700 | 2,144,815 | |
| The Walt Disney Co. | 290,317 | 48,822,610 | |
| World Wrestling Entertainment, Inc. Class A (b) | 15,400 | 867,482 | |
| 88,131,524 | |||
| Interactive Media & Services - 6.0% | |||
| Alphabet, Inc.: | |||
| Class A (a) | 4,400 | 8,040,384 | |
| Class C (a) | 64,666 | 118,709,963 | |
| Facebook, Inc. Class A (a) | 302,600 | 78,170,658 | |
| InterActiveCorp (a) | 30,900 | 6,487,455 | |
| Match Group, Inc. (a) | 31,115 | 4,351,744 | |
| TripAdvisor, Inc. (a) | 12,500 | 387,125 | |
| Twitter, Inc. (a) | 50,900 | 2,571,977 | |
| Zoominfo Technologies, Inc. | 56,000 | 2,688,560 | |
| 221,407,866 | |||
| Media - 0.9% | |||
| Altice U.S.A., Inc. Class A (a) | 139,100 | 4,947,787 | |
| Comcast Corp. Class A | 326,548 | 16,186,984 | |
| Discovery Communications, Inc. Class A (a)(b) | 27,700 | 1,147,334 | |
| Interpublic Group of Companies, Inc. | 35,000 | 842,450 | |
| Liberty Media Corp.: | |||
| Liberty Formula One Group Series C (a) | 66,800 | 2,687,364 | |
| Liberty SiriusXM Series A (a) | 30,900 | 1,248,978 | |
| Liberty SiriusXM Series C (a) | 3,165 | 128,372 | |
| Nexstar Broadcasting Group, Inc. Class A | 12,200 | 1,386,774 | |
| ViacomCBS, Inc. Class B | 71,392 | 3,462,512 | |
| 32,038,555 | |||
| Wireless Telecommunication Services - 1.0% | |||
| Boingo Wireless, Inc. (a) | 433,200 | 4,999,128 | |
| T-Mobile U.S., Inc. | 244,612 | 30,840,681 | |
| 35,839,809 | |||
| TOTAL COMMUNICATION SERVICES | 378,434,874 | ||
| CONSUMER DISCRETIONARY - 12.1% | |||
| Auto Components - 0.5% | |||
| Aptiv PLC | 139,400 | 18,623,840 | |
| Automobiles - 1.2% | |||
| Tesla, Inc. (a) | 53,600 | 42,533,208 | |
| Diversified Consumer Services - 0.2% | |||
| Service Corp. International | 164,100 | 8,275,563 | |
| Hotels, Restaurants & Leisure - 1.3% | |||
| Las Vegas Sands Corp. | 341,300 | 16,413,117 | |
| Marriott International, Inc. Class A | 157,100 | 18,272,301 | |
| McDonald's Corp. | 56,000 | 11,639,040 | |
| 46,324,458 | |||
| Household Durables - 0.3% | |||
| Lennar Corp. Class A | 135,200 | 11,241,880 | |
| Internet & Direct Marketing Retail - 4.0% | |||
| Amazon.com, Inc. (a) | 39,920 | 127,991,504 | |
| The Booking Holdings, Inc. (a) | 10,890 | 21,173,754 | |
| 149,165,258 | |||
| Multiline Retail - 0.4% | |||
| Dollar Tree, Inc. (a) | 164,300 | 16,702,738 | |
| Specialty Retail - 3.3% | |||
| Best Buy Co., Inc. | 163,300 | 17,770,306 | |
| Burlington Stores, Inc. (a) | 73,360 | 18,259,304 | |
| The Home Depot, Inc. | 157,979 | 42,783,873 | |
| TJX Companies, Inc. | 341,296 | 21,856,596 | |
| Ulta Beauty, Inc. (a) | 70,100 | 19,611,176 | |
| 120,281,255 | |||
| Textiles, Apparel & Luxury Goods - 0.9% | |||
| Columbia Sportswear Co. | 103,200 | 9,025,872 | |
| NIKE, Inc. Class B | 190,300 | 25,422,177 | |
| 34,448,049 | |||
| TOTAL CONSUMER DISCRETIONARY | 447,596,249 | ||
| CONSUMER STAPLES - 5.6% | |||
| Beverages - 1.9% | |||
| Boston Beer Co., Inc. Class A (a) | 3,500 | 3,209,115 | |
| Constellation Brands, Inc. Class A (sub. vtg.) | 47,900 | 10,103,547 | |
| Keurig Dr. Pepper, Inc. | 149,243 | 4,745,927 | |
| Molson Coors Beverage Co. Class B | 65,200 | 3,270,432 | |
| Monster Beverage Corp. (a) | 110,198 | 9,568,492 | |
| PepsiCo, Inc. | 168,800 | 23,053,016 | |
| The Coca-Cola Co. | 351,600 | 16,929,540 | |
| 70,880,069 | |||
| Food & Staples Retailing - 1.5% | |||
| Costco Wholesale Corp. | 59,600 | 21,004,828 | |
| Performance Food Group Co. (a) | 30,200 | 1,415,776 | |
| Sysco Corp. | 46,300 | 3,310,913 | |
| U.S. Foods Holding Corp. (a) | 11,100 | 343,989 | |
| Walgreens Boots Alliance, Inc. | 119,500 | 6,004,875 | |
| Walmart, Inc. | 157,100 | 22,070,979 | |
| 54,151,360 | |||
| Food Products - 0.7% | |||
| Beyond Meat, Inc. (a)(b) | 7,100 | 1,264,368 | |
| Darling Ingredients, Inc. (a) | 46,500 | 2,883,465 | |
| Freshpet, Inc. (a) | 29,800 | 4,151,438 | |
| Lamb Weston Holdings, Inc. | 71,300 | 5,326,110 | |
| Mondelez International, Inc. | 253,400 | 14,048,496 | |
| 27,673,877 | |||
| Household Products - 1.2% | |||
| Clorox Co. | 23,100 | 4,838,526 | |
| Procter & Gamble Co. | 294,200 | 37,719,382 | |
| 42,557,908 | |||
| Personal Products - 0.3% | |||
| Estee Lauder Companies, Inc. Class A | 46,000 | 10,885,900 | |
| TOTAL CONSUMER STAPLES | 206,149,114 | ||
| ENERGY - 2.2% | |||
| Energy Equipment & Services - 0.1% | |||
| Baker Hughes Co. Class A | 126,100 | 2,533,349 | |
| Oceaneering International, Inc. (a) | 145,944 | 1,233,227 | |
| 3,766,576 | |||
| Oil, Gas & Consumable Fuels - 2.1% | |||
| Apache Corp. | 534,700 | 7,635,516 | |
| Cheniere Energy, Inc. (a) | 57,200 | 3,622,476 | |
| Chevron Corp. | 23,929 | 2,038,751 | |
| EQT Corp. | 23,100 | 376,761 | |
| Exxon Mobil Corp. | 724,224 | 32,474,204 | |
| Hess Corp. | 238,800 | 12,890,424 | |
| Kosmos Energy Ltd. | 869,979 | 1,931,353 | |
| Magellan Midstream Partners LP | 26,100 | 1,160,406 | |
| Marathon Petroleum Corp. | 32,000 | 1,381,120 | |
| Phillips 66 Co. | 139,300 | 9,444,540 | |
| The Williams Companies, Inc. | 25,000 | 530,750 | |
| Valero Energy Corp. | 96,800 | 5,462,424 | |
| 78,948,725 | |||
| TOTAL ENERGY | 82,715,301 | ||
| FINANCIALS - 10.3% | |||
| Banks - 3.2% | |||
| Bank of America Corp. | 782,687 | 23,206,670 | |
| Citigroup, Inc. | 325,884 | 18,898,013 | |
| Comerica, Inc. | 136,900 | 7,830,680 | |
| First Horizon National Corp. | 347,800 | 4,830,942 | |
| Huntington Bancshares, Inc. | 285,057 | 3,769,879 | |
| JPMorgan Chase & Co. | 166,600 | 21,436,422 | |
| KeyCorp | 309,500 | 5,218,170 | |
| M&T Bank Corp. | 32,500 | 4,305,275 | |
| Signature Bank | 27,700 | 4,575,763 | |
| Truist Financial Corp. | 18,683 | 896,410 | |
| Wells Fargo & Co. | 861,200 | 25,732,656 | |
| 120,700,880 | |||
| Capital Markets - 2.6% | |||
| Bank of New York Mellon Corp. | 578,400 | 23,037,672 | |
| BlackRock, Inc. Class A | 26,300 | 18,443,138 | |
| Cboe Global Markets, Inc. | 42,200 | 3,871,006 | |
| Intercontinental Exchange, Inc. | 86,300 | 9,523,205 | |
| Morgan Stanley | 306,700 | 20,564,235 | |
| State Street Corp. | 146,100 | 10,227,000 | |
| StepStone Group, Inc. Class A | 50,800 | 1,784,096 | |
| Virtu Financial, Inc. Class A | 290,432 | 8,065,297 | |
| 95,515,649 | |||
| Consumer Finance - 2.0% | |||
| Ally Financial, Inc. | 161,500 | 6,111,160 | |
| American Express Co. | 153,600 | 17,857,536 | |
| Capital One Financial Corp. | 444,005 | 46,291,961 | |
| SLM Corp. | 297,200 | 4,125,136 | |
| 74,385,793 | |||
| Diversified Financial Services - 0.7% | |||
| Berkshire Hathaway, Inc. Class B (a) | 74,900 | 17,067,463 | |
| Voya Financial, Inc. | 151,900 | 8,424,374 | |
| 25,491,837 | |||
| Insurance - 1.8% | |||
| American International Group, Inc. | 236,400 | 8,850,816 | |
| Arch Capital Group Ltd. (a) | 169,700 | 5,330,277 | |
| Arthur J. Gallagher & Co. | 45,600 | 5,262,696 | |
| Hartford Financial Services Group, Inc. | 203,500 | 9,772,070 | |
| Reinsurance Group of America, Inc. | 33,800 | 3,550,690 | |
| The Travelers Companies, Inc. | 182,100 | 24,820,230 | |
| Willis Towers Watson PLC | 39,000 | 7,914,660 | |
| 65,501,439 | |||
| TOTAL FINANCIALS | 381,595,598 | ||
| HEALTH CARE - 13.4% | |||
| Biotechnology - 1.9% | |||
| Alexion Pharmaceuticals, Inc. (a) | 32,700 | 5,013,891 | |
| Amgen, Inc. | 110,603 | 26,702,882 | |
| Biogen, Inc. (a) | 9,700 | 2,741,317 | |
| Blueprint Medicines Corp. (a) | 30,000 | 2,902,500 | |
| Neurocrine Biosciences, Inc. (a) | 60,800 | 6,672,800 | |
| PTC Therapeutics, Inc. (a) | 19,324 | 1,117,314 | |
| Regeneron Pharmaceuticals, Inc. (a) | 37,400 | 18,843,616 | |
| Sarepta Therapeutics, Inc. (a) | 5,600 | 500,640 | |
| Vertex Pharmaceuticals, Inc. (a) | 24,000 | 5,497,920 | |
| 69,992,880 | |||
| Health Care Equipment & Supplies - 3.1% | |||
| Abbott Laboratories | 282,800 | 34,951,252 | |
| Becton, Dickinson & Co. | 20,200 | 5,288,158 | |
| Boston Scientific Corp. (a) | 701,810 | 24,872,146 | |
| Danaher Corp. | 21,000 | 4,994,640 | |
| DexCom, Inc. (a) | 18,500 | 6,934,725 | |
| Intuitive Surgical, Inc. (a) | 25,100 | 18,765,764 | |
| Masimo Corp. (a) | 16,800 | 4,299,456 | |
| Stryker Corp. | 68,000 | 15,028,680 | |
| 115,134,821 | |||
| Health Care Providers & Services - 3.6% | |||
| AmerisourceBergen Corp. | 92,200 | 9,607,240 | |
| Cigna Corp. | 69,700 | 15,128,385 | |
| Guardant Health, Inc. (a) | 24,000 | 3,732,000 | |
| HCA Holdings, Inc. | 109,700 | 17,824,056 | |
| Humana, Inc. | 58,400 | 22,373,624 | |
| Surgery Partners, Inc. (a) | 296,200 | 11,042,336 | |
| UnitedHealth Group, Inc. | 156,700 | 52,271,986 | |
| 131,979,627 | |||
| Health Care Technology - 0.1% | |||
| Health Catalyst, Inc. (a) | 105,000 | 5,216,400 | |
| Life Sciences Tools & Services - 1.2% | |||
| Thermo Fisher Scientific, Inc. | 83,300 | 42,458,010 | |
| Pharmaceuticals - 3.5% | |||
| Bristol-Myers Squibb Co. | 553,400 | 33,995,362 | |
| Eli Lilly & Co. | 204,766 | 42,585,185 | |
| Horizon Therapeutics PLC (a) | 198,200 | 14,365,536 | |
| Merck & Co., Inc. | 159,100 | 12,261,837 | |
| Royalty Pharma PLC | 140,400 | 6,600,204 | |
| Zoetis, Inc. Class A | 129,800 | 20,021,650 | |
| 129,829,774 | |||
| TOTAL HEALTH CARE | 494,611,512 | ||
| INDUSTRIALS - 9.5% | |||
| Aerospace & Defense - 1.9% | |||
| General Dynamics Corp. | 106,100 | 15,562,748 | |
| Northrop Grumman Corp. | 57,900 | 16,594,719 | |
| Raytheon Technologies Corp. | 354,748 | 23,672,334 | |
| The Boeing Co. | 73,500 | 14,272,965 | |
| 70,102,766 | |||
| Air Freight & Logistics - 0.5% | |||
| FedEx Corp. | 84,699 | 19,933,063 | |
| Construction & Engineering - 0.5% | |||
| AECOM (a) | 376,100 | 18,842,610 | |
| Electrical Equipment - 1.5% | |||
| Sensata Technologies, Inc. PLC (a) | 526,039 | 28,669,126 | |
| Sunrun, Inc. (a) | 376,395 | 26,072,882 | |
| 54,742,008 | |||
| Industrial Conglomerates - 1.0% | |||
| 3M Co. | 36,100 | 6,341,326 | |
| General Electric Co. | 2,261,819 | 24,156,227 | |
| Honeywell International, Inc. | 22,000 | 4,298,140 | |
| 34,795,693 | |||
| Machinery - 1.4% | |||
| Allison Transmission Holdings, Inc. | 655,100 | 26,662,570 | |
| Caterpillar, Inc. | 140,400 | 25,670,736 | |
| 52,333,306 | |||
| Marine - 0.5% | |||
| Kirby Corp. (a) | 361,100 | 18,329,436 | |
| Professional Services - 0.9% | |||
| Nielsen Holdings PLC | 1,481,584 | 33,083,771 | |
| Road & Rail - 1.3% | |||
| Norfolk Southern Corp. | 98,518 | 23,311,329 | |
| Uber Technologies, Inc. (a) | 415,600 | 21,166,508 | |
| Union Pacific Corp. | 24,400 | 4,818,268 | |
| 49,296,105 | |||
| TOTAL INDUSTRIALS | 351,458,758 | ||
| INFORMATION TECHNOLOGY - 26.8% | |||
| Communications Equipment - 0.0% | |||
| CommScope Holding Co., Inc. (a) | 15,900 | 233,571 | |
| Electronic Equipment & Components - 1.4% | |||
| Avnet, Inc. | 20,700 | 730,917 | |
| Corning, Inc. | 147,900 | 5,305,173 | |
| Jabil, Inc. | 1,138,417 | 47,096,311 | |
| 53,132,401 | |||
| IT Services - 5.5% | |||
| Alliance Data Systems Corp. | 8,400 | 568,260 | |
| Cognizant Technology Solutions Corp. Class A | 66,200 | 5,160,290 | |
| DXC Technology Co. | 34,600 | 975,720 | |
| Euronet Worldwide, Inc. (a) | 15,200 | 1,899,392 | |
| Fidelity National Information Services, Inc. | 117,558 | 14,513,711 | |
| Fiserv, Inc. (a) | 47,100 | 4,836,699 | |
| FleetCor Technologies, Inc. (a) | 6,900 | 1,674,975 | |
| Genpact Ltd. | 417,300 | 15,974,244 | |
| Global Payments, Inc. | 73,400 | 12,956,568 | |
| GoDaddy, Inc. (a) | 53,905 | 4,235,855 | |
| MasterCard, Inc. Class A | 189,300 | 59,873,697 | |
| MongoDB, Inc. Class A (a) | 18,000 | 6,652,980 | |
| PayPal Holdings, Inc. (a) | 156,600 | 36,692,946 | |
| Sabre Corp. | 195,600 | 2,108,568 | |
| Square, Inc. (a) | 37,600 | 8,120,096 | |
| Twilio, Inc. Class A (a) | 17,100 | 6,146,253 | |
| Visa, Inc. Class A | 94,100 | 18,184,825 | |
| WEX, Inc. (a) | 5,700 | 1,075,020 | |
| 201,650,099 | |||
| Semiconductors & Semiconductor Equipment - 4.4% | |||
| Advanced Micro Devices, Inc. (a) | 73,112 | 6,261,312 | |
| Applied Materials, Inc. | 158,900 | 15,362,452 | |
| Array Technologies, Inc. | 19,675 | 801,953 | |
| Lam Research Corp. | 35,530 | 17,194,744 | |
| Marvell Technology Group Ltd. | 458,400 | 23,589,264 | |
| Micron Technology, Inc. (a) | 309,260 | 24,205,780 | |
| NVIDIA Corp. | 71,280 | 37,036,375 | |
| ON Semiconductor Corp. (a) | 579,468 | 19,985,851 | |
| Qualcomm, Inc. | 90,904 | 14,206,477 | |
| Semtech Corp. (a) | 10,900 | 773,355 | |
| Xilinx, Inc. | 23,000 | 3,003,110 | |
| 162,420,673 | |||
| Software - 10.0% | |||
| Adobe, Inc. (a) | 14,100 | 6,468,657 | |
| Autodesk, Inc. (a) | 79,435 | 22,037,652 | |
| Elastic NV (a) | 117,500 | 17,855,300 | |
| FireEye, Inc. (a) | 67,800 | 1,423,800 | |
| Five9, Inc. (a) | 20,800 | 3,458,000 | |
| HubSpot, Inc. (a) | 5,000 | 1,861,000 | |
| LivePerson, Inc. (a) | 50,895 | 3,224,707 | |
| Microsoft Corp. | 801,700 | 185,962,332 | |
| NortonLifeLock, Inc. | 676,900 | 14,262,283 | |
| Nuance Communications, Inc. (a) | 356,901 | 16,253,272 | |
| Nutanix, Inc. Class A (a) | 11,700 | 357,084 | |
| Palo Alto Networks, Inc. (a) | 29,100 | 10,206,825 | |
| PTC, Inc. (a) | 28,500 | 3,787,935 | |
| Rapid7, Inc. (a) | 35,400 | 3,073,428 | |
| RealPage, Inc. (a) | 6,900 | 597,333 | |
| RingCentral, Inc. (a) | 12,200 | 4,549,624 | |
| Salesforce.com, Inc. (a) | 90,463 | 20,404,834 | |
| Slack Technologies, Inc. Class A (a) | 26,800 | 1,130,156 | |
| Splunk, Inc. (a) | 48,300 | 7,970,949 | |
| SS&C Technologies Holdings, Inc. | 77,400 | 4,866,912 | |
| SVMK, Inc. (a) | 381,740 | 9,623,665 | |
| VMware, Inc. Class A (a)(b) | 19,400 | 2,674,290 | |
| Workday, Inc. Class A (a) | 69,600 | 15,836,088 | |
| Yext, Inc. (a) | 302,849 | 5,109,063 | |
| Zendesk, Inc. (a) | 52,800 | 7,615,872 | |
| 370,611,061 | |||
| Technology Hardware, Storage & Peripherals - 5.5% | |||
| Apple, Inc. | 1,419,236 | 187,282,382 | |
| HP, Inc. | 282,000 | 6,863,880 | |
| Pure Storage, Inc. Class A (a) | 36,400 | 841,932 | |
| Western Digital Corp. | 106,500 | 6,009,795 | |
| Xerox Holdings Corp. | 24,700 | 519,441 | |
| 201,517,430 | |||
| TOTAL INFORMATION TECHNOLOGY | 989,565,235 | ||
| MATERIALS - 2.7% | |||
| Chemicals - 1.3% | |||
| Air Products & Chemicals, Inc. | 20,477 | 5,462,445 | |
| Albemarle Corp. U.S. | 24,900 | 4,050,234 | |
| DuPont de Nemours, Inc. | 90,974 | 7,227,884 | |
| Ecolab, Inc. | 21,882 | 4,475,088 | |
| FMC Corp. | 27,848 | 3,015,660 | |
| Linde PLC | 44,386 | 10,892,324 | |
| LyondellBasell Industries NV Class A | 30,000 | 2,572,800 | |
| Olin Corp. | 237,200 | 5,671,452 | |
| Sherwin-Williams Co. | 5,585 | 3,863,703 | |
| 47,231,590 | |||
| Construction Materials - 0.4% | |||
| Martin Marietta Materials, Inc. | 25,339 | 7,282,682 | |
| Vulcan Materials Co. | 45,800 | 6,830,612 | |
| 14,113,294 | |||
| Containers & Packaging - 0.2% | |||
| Crown Holdings, Inc. (a) | 78,000 | 7,031,700 | |
| Metals & Mining - 0.8% | |||
| Freeport-McMoRan, Inc. | 804,034 | 21,636,555 | |
| Newmont Corp. | 91,300 | 5,441,480 | |
| Reliance Steel & Aluminum Co. | 22,469 | 2,608,202 | |
| Royal Gold, Inc. | 18,800 | 2,009,344 | |
| 31,695,581 | |||
| TOTAL MATERIALS | 100,072,165 | ||
| REAL ESTATE - 2.9% | |||
| Equity Real Estate Investment Trusts (REITs) - 2.6% | |||
| Alexandria Real Estate Equities, Inc. | 27,200 | 4,545,392 | |
| American Tower Corp. | 57,600 | 13,095,936 | |
| Corporate Office Properties Trust (SBI) | 91,300 | 2,398,451 | |
| CubeSmart | 109,500 | 3,814,980 | |
| Digital Realty Trust, Inc. | 38,200 | 5,498,890 | |
| Douglas Emmett, Inc. | 144,900 | 4,015,179 | |
| Equinix, Inc. | 6,200 | 4,587,752 | |
| Equity Lifestyle Properties, Inc. | 33,500 | 2,038,140 | |
| Invitation Homes, Inc. | 169,300 | 4,990,964 | |
| Kilroy Realty Corp. | 115,200 | 6,523,776 | |
| Mid-America Apartment Communities, Inc. | 71,300 | 9,465,075 | |
| Prologis (REIT), Inc. | 92,400 | 9,535,680 | |
| SBA Communications Corp. Class A | 12,900 | 3,465,843 | |
| Ventas, Inc. | 168,500 | 7,762,795 | |
| VICI Properties, Inc. | 131,400 | 3,321,792 | |
| Weyerhaeuser Co. | 335,800 | 10,473,602 | |
| 95,534,247 | |||
| Real Estate Management & Development - 0.3% | |||
| Jones Lang LaSalle, Inc. (a) | 66,500 | 9,722,965 | |
| TOTAL REAL ESTATE | 105,257,212 | ||
| UTILITIES - 2.7% | |||
| Electric Utilities - 2.0% | |||
| American Electric Power Co., Inc. | 12,000 | 970,920 | |
| Edison International | 155,400 | 9,038,064 | |
| Entergy Corp. | 22,200 | 2,116,326 | |
| Evergy, Inc. | 90,400 | 4,857,192 | |
| Exelon Corp. | 178,693 | 7,426,481 | |
| FirstEnergy Corp. | 191,300 | 5,884,388 | |
| NextEra Energy, Inc. | 260,540 | 21,069,870 | |
| NRG Energy, Inc. | 46,200 | 1,913,142 | |
| PG&E Corp. (a) | 645,493 | 7,377,985 | |
| Southern Co. | 204,900 | 12,072,708 | |
| 72,727,076 | |||
| Independent Power and Renewable Electricity Producers - 0.2% | |||
| Shoals Technologies Group, Inc. | 5,700 | 193,401 | |
| The AES Corp. | 143,500 | 3,499,965 | |
| Vistra Corp. | 151,000 | 3,015,470 | |
| 6,708,836 | |||
| Multi-Utilities - 0.5% | |||
| CenterPoint Energy, Inc. | 103,790 | 2,188,931 | |
| Dominion Energy, Inc. | 115,041 | 8,385,338 | |
| Sempra Energy | 61,644 | 7,629,061 | |
| 18,203,330 | |||
| TOTAL UTILITIES | 97,639,242 | ||
| TOTAL COMMON STOCKS | |||
| (Cost $2,187,835,562) | 3,635,095,260 | ||
| Principal Amount | Value | ||
| U.S. Treasury Obligations - 0.1% | |||
| U.S. Treasury Bills, yield at date of purchase 0.06% 4/1/21 (c) | |||
| (Cost $3,609,645) | 3,610,000 | 3,609,667 | |
| Shares | Value | ||
| Money Market Funds - 2.1% | |||
| Fidelity Cash Central Fund 0.09% (d) | 72,377,905 | $72,392,381 | |
| Fidelity Securities Lending Cash Central Fund 0.09% (d)(e) | 5,783,776 | 5,784,355 | |
| TOTAL MONEY MARKET FUNDS | |||
| (Cost $78,175,615) | 78,176,736 | ||
| TOTAL INVESTMENT IN SECURITIES - 100.7% | |||
| (Cost $2,269,620,822) | 3,716,881,663 | ||
| NET OTHER ASSETS (LIABILITIES) - (0.7)% | (27,487,551) | ||
| NET ASSETS - 100% | $3,689,394,112 |
| Futures Contracts | |||||
| Number of contracts | Expiration Date | Notional Amount | Value | Unrealized Appreciation/(Depreciation) | |
| Purchased | |||||
| Equity Index Contracts | |||||
| CME E-mini S&P 500 Index Contracts (United States) | 195 | March 2021 | $36,125,700 | $(402,990) | $(402,990) |
The notional amount of futures purchased as a percentage of Net Assets is 1.0%
Legend
(a) Non-income producing
(b) Security or a portion of the security is on loan at period end.
(c) Security or a portion of the security was pledged to cover margin requirements for futures contracts. At period end, the value of securities pledged amounted to $2,268,791.
(d) Affiliated fund that is generally available only to investment companies and other accounts managed by Fidelity Investments. The rate quoted is the annualized seven-day yield of the fund at period end. A complete unaudited listing of the fund's holdings as of its most recent quarter end is available upon request. In addition, each Fidelity Central Fund's financial statements, which are not covered by the Fund's Report of Independent Registered Public Accounting Firm, are available on the SEC's website or upon request.
(e) Investment made with cash collateral received from securities on loan.
Affiliated Central Funds
Information regarding fiscal year to date income earned by the Fund from investments in Fidelity Central Funds is as follows:
| Fund | Income earned |
| Fidelity Cash Central Fund | $188,166 |
| Fidelity Securities Lending Cash Central Fund | 23,052 |
| Total | $211,218 |
Amounts in the income column in the above table include any capital gain distributions from underlying funds, which are presented in the corresponding line-item in the Statement of Operations, if applicable. Amount for Fidelity Securities Lending Cash Central Fund represents the income earned on investing cash collateral, less rebates paid to borrowers and any lending agent fees associated with the loan, plus any premium payments received for lending certain types of securities.
Investment Valuation
The following is a summary of the inputs used, as of January 31, 2021, involving the Fund's assets and liabilities carried at fair value. The inputs or methodology used for valuing securities may not be an indication of the risk associated with investing in those securities. For more information on valuation inputs, and their aggregation into the levels used below, please refer to the Investment Valuation section in the accompanying Notes to Financial Statements.
| Valuation Inputs at Reporting Date: | ||||
| Description | Total | Level 1 | Level 2 | Level 3 |
| Investments in Securities: | ||||
| Equities: | ||||
| Communication Services | $378,434,874 | $378,434,874 | $-- | $-- |
| Consumer Discretionary | 447,596,249 | 447,596,249 | -- | -- |
| Consumer Staples | 206,149,114 | 206,149,114 | -- | -- |
| Energy | 82,715,301 | 82,715,301 | -- | -- |
| Financials | 381,595,598 | 381,595,598 | -- | -- |
| Health Care | 494,611,512 | 494,611,512 | -- | -- |
| Industrials | 351,458,758 | 351,458,758 | -- | -- |
| Information Technology | 989,565,235 | 989,565,235 | -- | -- |
| Materials | 100,072,165 | 100,072,165 | -- | -- |
| Real Estate | 105,257,212 | 105,257,212 | -- | -- |
| Utilities | 97,639,242 | 97,639,242 | -- | -- |
| U.S. Government and Government Agency Obligations | 3,609,667 | -- | 3,609,667 | -- |
| Money Market Funds | 78,176,736 | 78,176,736 | -- | -- |
| Total Investments in Securities: | $3,716,881,663 | $3,713,271,996 | $3,609,667 | $-- |
| Derivative Instruments: | ||||
| Liabilities | ||||
| Futures Contracts | $(402,990) | $(402,990) | $-- | $-- |
| Total Liabilities | $(402,990) | $(402,990) | $-- | $-- |
| Total Derivative Instruments: | $(402,990) | $(402,990) | $-- | $-- |
Value of Derivative Instruments
The following table is a summary of the Fund's value of derivative instruments by primary risk exposure as of January 31, 2021. For additional information on derivative instruments, please refer to the Derivative Instruments section in the accompanying Notes to Financial Statements.
| Primary Risk Exposure / Derivative Type | Value | |
| Asset | Liability | |
| Equity Risk | ||
| Futures Contracts(a) | $0 | $(402,990) |
| Total Equity Risk | 0 | (402,990) |
| Total Value of Derivatives | $0 | $(402,990) |
(a) Reflects gross cumulative appreciation (depreciation) on futures contracts as presented in the Schedule of Investments. In the Statement of Assets and Liabilities, the period end daily variation margin is included in receivable or payable for daily variation margin on futures contracts, and the net cumulative appreciation (depreciation) is included in Total accumulated earnings (loss).
See accompanying notes which are an integral part of the financial statements.
Fidelity® Series All-Sector Equity Fund
Financial Statements
Statement of Assets and Liabilities
| January 31, 2021 | ||
| Assets | ||
| Investment in securities, at value (including securities loaned of $5,613,035) — See accompanying schedule: Unaffiliated issuers (cost $2,191,445,207) | $3,638,704,927 | |
| Fidelity Central Funds (cost $78,175,615) | 78,176,736 | |
| Total Investment in Securities (cost $2,269,620,822) | $3,716,881,663 | |
| Receivable for investments sold | 17,463,107 | |
| Receivable for fund shares sold | 1,698,316 | |
| Dividends receivable | 2,002,177 | |
| Distributions receivable from Fidelity Central Funds | 7,126 | |
| Other receivables | 103,173 | |
| Total assets | 3,738,155,562 | |
| Liabilities | ||
| Payable to custodian bank | $3,392,213 | |
| Payable for investments purchased | 22,943,916 | |
| Payable for fund shares redeemed | 15,881,761 | |
| Payable for daily variation margin on futures contracts | 722,475 | |
| Other payables and accrued expenses | 36,260 | |
| Collateral on securities loaned | 5,784,825 | |
| Total liabilities | 48,761,450 | |
| Net Assets | $3,689,394,112 | |
| Net Assets consist of: | ||
| Paid in capital | $2,076,135,669 | |
| Total accumulated earnings (loss) | 1,613,258,443 | |
| Net Assets | $3,689,394,112 | |
| Net Asset Value, offering price and redemption price per share ($3,689,394,112 ÷ 323,884,246 shares) | $11.39 |
See accompanying notes which are an integral part of the financial statements.
Statement of Operations
| Year ended January 31, 2021 | ||
| Investment Income | ||
| Dividends | $44,392,124 | |
| Special dividends | 5,382,000 | |
| Interest | 13,085 | |
| Income from Fidelity Central Funds (including $23,052 from security lending) | 211,218 | |
| Total income | 49,998,427 | |
| Expenses | ||
| Custodian fees and expenses | $86,295 | |
| Independent trustees' fees and expenses | 18,893 | |
| Interest | 2,185 | |
| Miscellaneous | 7,654 | |
| Total expenses | 115,027 | |
| Net investment income (loss) | 49,883,400 | |
| Realized and Unrealized Gain (Loss) | ||
| Net realized gain (loss) on: | ||
| Investment securities: | ||
| Unaffiliated issuers | 376,395,503 | |
| Fidelity Central Funds | 1,889 | |
| Foreign currency transactions | (19,108) | |
| Futures contracts | (1,182,097) | |
| Total net realized gain (loss) | 375,196,187 | |
| Change in net unrealized appreciation (depreciation) on: | ||
| Investment securities: | ||
| Unaffiliated issuers | 330,898,477 | |
| Assets and liabilities in foreign currencies | (1,800) | |
| Futures contracts | (473,732) | |
| Total change in net unrealized appreciation (depreciation) | 330,422,945 | |
| Net gain (loss) | 705,619,132 | |
| Net increase (decrease) in net assets resulting from operations | $755,502,532 |
See accompanying notes which are an integral part of the financial statements.
Statement of Changes in Net Assets
| Year ended January 31, 2021 | Year ended January 31, 2020 | |
| Increase (Decrease) in Net Assets | ||
| Operations | ||
| Net investment income (loss) | $49,883,400 | $61,136,416 |
| Net realized gain (loss) | 375,196,187 | 394,908,482 |
| Change in net unrealized appreciation (depreciation) | 330,422,945 | 246,625,555 |
| Net increase (decrease) in net assets resulting from operations | 755,502,532 | 702,670,453 |
| Distributions to shareholders | (440,518,195) | (301,301,401) |
| Share transactions | ||
| Proceeds from sales of shares | 172,524,328 | 401,081,505 |
| Reinvestment of distributions | 440,518,195 | 301,301,401 |
| Cost of shares redeemed | (719,507,203) | (1,221,330,518) |
| Net increase (decrease) in net assets resulting from share transactions | (106,464,680) | (518,947,612) |
| Total increase (decrease) in net assets | 208,519,657 | (117,578,560) |
| Net Assets | ||
| Beginning of period | 3,480,874,455 | 3,598,453,015 |
| End of period | $3,689,394,112 | $3,480,874,455 |
| Other Information | ||
| Shares | ||
| Sold | 17,312,431 | 39,640,867 |
| Issued in reinvestment of distributions | 43,606,246 | 30,042,877 |
| Redeemed | (71,429,879) | (120,330,645) |
| Net increase (decrease) | (10,511,202) | (50,646,901) |
See accompanying notes which are an integral part of the financial statements.
Financial Highlights
Fidelity Series All-Sector Equity Fund
| Years ended January 31, | 2021 | 2020 | 2019 | 2018 | 2017 |
| Selected Per–Share Data | |||||
| Net asset value, beginning of period | $10.41 | $9.35 | $13.46 | $12.33 | $12.02 |
| Income from Investment Operations | |||||
| Net investment income (loss)A | .15B | .17 | .21 | .18 | .12 |
| Net realized and unrealized gain (loss) | 2.22 | 1.78 | (.79) | 2.80 | 2.33 |
| Total from investment operations | 2.37 | 1.95 | (.58) | 2.98 | 2.45 |
| Distributions from net investment income | (.17) | (.18) | (.22) | (.19) | (.18) |
| Distributions from net realized gain | (1.23) | (.71) | (3.31) | (1.66) | (1.96) |
| Total distributions | (1.39)C | (.89) | (3.53) | (1.85) | (2.14) |
| Net asset value, end of period | $11.39 | $10.41 | $9.35 | $13.46 | $12.33 |
| Total ReturnD | 24.94% | 21.33% | (3.23)% | 25.62% | 21.03% |
| Ratios to Average Net AssetsE,F | |||||
| Expenses before reductions | - %G | - %G | - %G | .20% | .68% |
| Expenses net of fee waivers, if any | - %G | - %G | - %G | .20% | .68% |
| Expenses net of all reductions | - %G | - %G | - %G | .20% | .67% |
| Net investment income (loss) | 1.47%B | 1.68% | 1.68% | 1.37% | .95% |
| Supplemental Data | |||||
| Net assets, end of period (000 omitted) | $3,689,394 | $3,480,874 | $3,598,453 | $6,550,143 | $2,736,748 |
| Portfolio turnover rateH | 64% | 59% | 65% | 61% | 43% |
A Calculated based on average shares outstanding during the period.
B Net investment income per share reflects one or more large, non-recurring dividend(s) which amounted to $.02 per share. Excluding such non-recurring dividend(s), the ratio of net investment income (loss) to average net assets would have been 1.32%.
C Total distributions per share do not sum due to rounding.
D Total returns would have been lower if certain expenses had not been reduced during the applicable periods shown.
E Fees and expenses of any underlying mutual funds or exchange-traded funds (ETFs) are not included in the Fund's expense ratio. The Fund indirectly bears its proportionate share of these expenses. For additional expense information related to investments in Fidelity Central Funds, please refer to the "Investments in Fidelity Central Funds" note found in the Notes to Financial Statements section of the most recent Annual or Semi-Annual report.
F Expense ratios reflect operating expenses of the class. Expenses before reductions do not reflect amounts reimbursed, waived, or reduced through arrangements with the investment advisor, brokerage services, or other offset arrangements, if applicable, and do not represent the amount paid by the class during periods when reimbursements, waivers or reductions occur.
G Amount represents less than .005%.
H Amount does not include the portfolio activity of any underlying mutual funds or exchange-traded funds (ETFs).
See accompanying notes which are an integral part of the financial statements.
Fidelity® Series Stock Selector Large Cap Value Fund
Performance: The Bottom Line
Average annual total return reflects the change in the value of an investment, assuming reinvestment of distributions from dividend income and capital gains (the profits earned upon the sale of securities that have grown in value, if any) and assuming a constant rate of performance each year. The hypothetical investment and the average annual total returns do not reflect the deduction of taxes that a shareholder would pay on fund distributions or the redemption of fund shares. During periods of reimbursement by Fidelity, a fund’s total return will be greater than it would be had the reimbursement not occurred. How a fund did yesterday is no guarantee of how it will do tomorrow.
Average Annual Total Returns
| For the periods ended January 31, 2021 | Past 1 year | Past 5 years | Life of fundA |
| Fidelity® Series Stock Selector Large Cap Value Fund | 5.74% | 10.31% | 10.20% |
A From December 6, 2012
$10,000 Over Life of Fund
Let's say hypothetically that $10,000 was invested in Fidelity® Series Stock Selector Large Cap Value Fund on December 6, 2012, when the fund started.
The chart shows how the value of your investment would have changed, and also shows how the Russell 1000® Value Index performed over the same period.
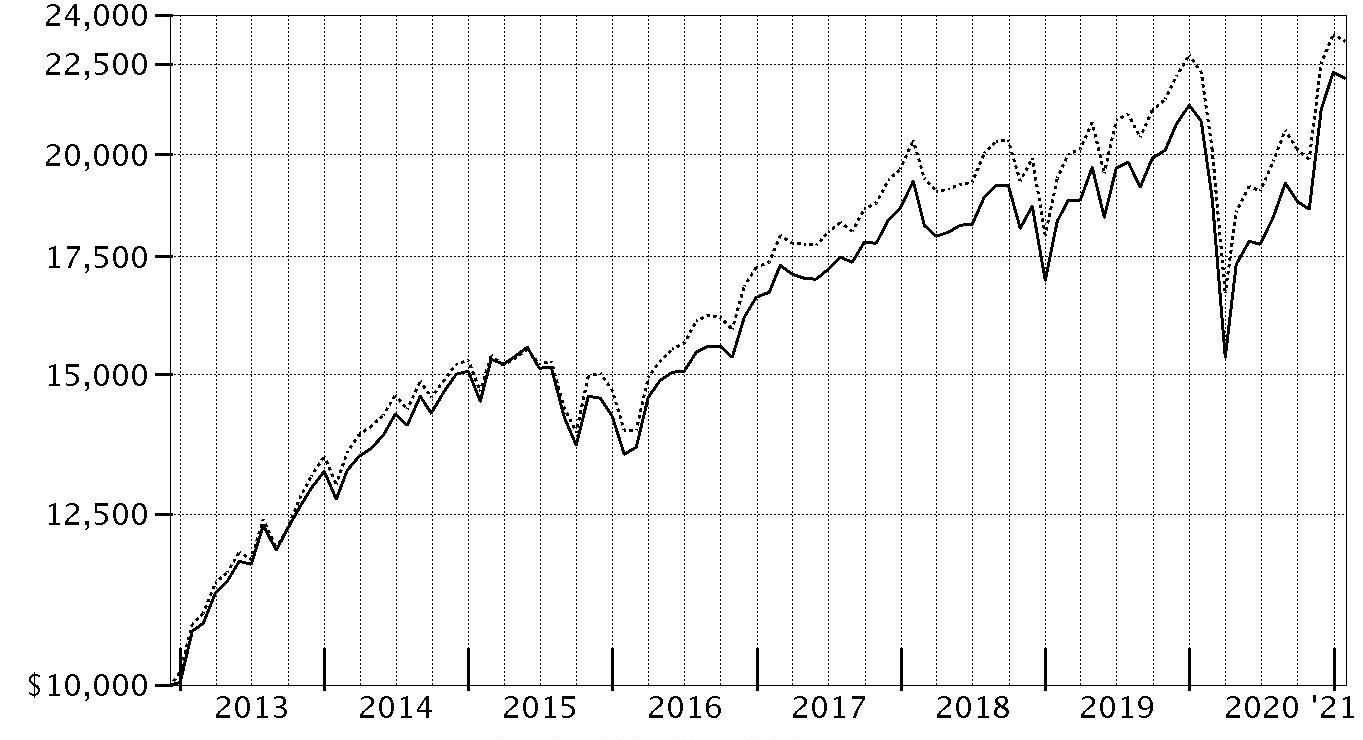
| Period Ending Values | ||
| $22,085 | Fidelity® Series Stock Selector Large Cap Value Fund | |
| $23,189 | Russell 1000® Value Index | |
Fidelity® Series Stock Selector Large Cap Value Fund
Management's Discussion of Fund Performance
Market Recap: The S&P 500® index gained 17.25% for the 12 months ending January 31, 2021, a volatile but productive period for U.S. risk assets. The early-2020 outbreak and spread of COVID-19 resulted in stocks suffering one of the quickest declines on record, through March 23, followed by a historic rebound. The crisis and containment efforts caused broad contraction in economic activity, along with extreme uncertainty and dislocation in financial markets. A rapid and expansive U.S. monetary/fiscal-policy response partially offset the economic disruption and fueled the market surge, as did resilient corporate earnings. The rally slowed in September, when the S&P 500 began a two-month retreat amid Congress’s inability to reach a deal on additional fiscal stimulus, as well as concerns about election uncertainty, indications the U.S. economic recovery could be slowing and a new wave of COVID-19 cases. A shift in momentum began in October and accelerated following the U.S. elections, with the approval of two breakthrough COVID-19 vaccines and prospects for additional government stimulus fueling the “reflation trade.” Small-cap value stocks rallied strongly late in 2020, usurping longstanding market leadership from growth shares – especially large tech and internet-related names – amid hopes of a broad economic recovery in 2021. By sector for the full 12 months, information technology (+37%) and consumer discretionary (+33%) led all gainers. In contrast, energy (-23%) struggled along with global oil demand and pricing.Comments from Lead Manager Matt Friedman: For the fiscal year ending January 31, 2021, the fund gained 5.74%, outperforming the 4.09% result of the benchmark Russell 1000® Value Index. Versus the benchmark, security selection was the primary contributor, especially within the financials sector. Strong picks in real estate also helped. Also bolstering the fund's relative result was stock selection in the industrials sector, primarily driven by the transportation industry. The fund's largest individual relative contributor was an outsized stake in FedEx, which gained 65% the past 12 months. Also adding value was our overweighting in Discover Financial Services, which gained roughly 249%. Discover Financial Services was not held at period end. Another notable relative contributor was an overweighting in Aptiv (+68%). In contrast, the largest detractor from performance versus the benchmark were stock picks in the consumer discretionary sector, primarily within the consumer services industry. Weak picks in the information technology sector, especially within the semiconductors & semiconductor equipment industry, also hurt the fund's relative performance. Also detracting from the fund's relative result was stock selection in the communication services sector, primarily within the media & entertainment industry. The fund's largest individual relative detractor was an underweighting in Royal Caribbean Cruises, which returned -44% the past year. Royal Caribbean Cruises was not held at period end. Another key detractor was our out-of-benchmark position in Cenovus Energy (-31%). Also hampering performance was our outsized stake in General Electric, which returned about -15%. Notable changes in positioning include increased exposure to the information technology sector and a lower allocation to energy.The views expressed above reflect those of the portfolio manager(s) only through the end of the period as stated on the cover of this report and do not necessarily represent the views of Fidelity or any other person in the Fidelity organization. Any such views are subject to change at any time based upon market or other conditions and Fidelity disclaims any responsibility to update such views. These views may not be relied on as investment advice and, because investment decisions for a Fidelity fund are based on numerous factors, may not be relied on as an indication of trading intent on behalf of any Fidelity fund.
Fidelity® Series Stock Selector Large Cap Value Fund
Investment Summary (Unaudited)
Top Ten Stocks as of January 31, 2021
| % of fund's net assets | |
| Capital One Financial Corp. | 2.6 |
| Alphabet, Inc. Class A | 2.2 |
| Verizon Communications, Inc. | 2.2 |
| Johnson & Johnson | 2.0 |
| Cisco Systems, Inc. | 1.8 |
| The Walt Disney Co. | 1.7 |
| Nielsen Holdings PLC | 1.7 |
| Berkshire Hathaway, Inc. Class B | 1.6 |
| Sensata Technologies, Inc. PLC | 1.6 |
| Wells Fargo & Co. | 1.6 |
| 19.0 |
Top Five Market Sectors as of January 31, 2021
| % of fund's net assets | |
| Financials | 19.3 |
| Industrials | 13.2 |
| Health Care | 13.0 |
| Information Technology | 9.3 |
| Communication Services | 9.2 |
Asset Allocation (% of fund's net assets)
| As of January 31, 2021* | ||
| Stocks | 97.1% | |
| Short-Term Investments and Net Other Assets (Liabilities) | 2.9% | |

* Foreign investments - 9.7%
Fidelity® Series Stock Selector Large Cap Value Fund
Schedule of Investments January 31, 2021
Showing Percentage of Net Assets
| Common Stocks - 95.9% | |||
| Shares | Value | ||
| COMMUNICATION SERVICES - 9.2% | |||
| Diversified Telecommunication Services - 3.5% | |||
| AT&T, Inc. | 3,431,125 | $98,233,109 | |
| Liberty Global PLC Class C (a) | 1,930,534 | 46,641,701 | |
| Verizon Communications, Inc. | 4,247,045 | 232,525,714 | |
| 377,400,524 | |||
| Entertainment - 1.7% | |||
| The Walt Disney Co. | 1,135,800 | 191,007,486 | |
| Interactive Media & Services - 2.4% | |||
| Alphabet, Inc. Class A (a) | 133,744 | 244,398,436 | |
| Facebook, Inc. Class A (a) | 61,300 | 15,835,629 | |
| 260,234,065 | |||
| Media - 1.6% | |||
| Comcast Corp. Class A | 1,539,197 | 76,297,995 | |
| Discovery Communications, Inc. Class A (a)(b) | 296,181 | 12,267,817 | |
| Interpublic Group of Companies, Inc. | 3,508,520 | 84,450,076 | |
| 173,015,888 | |||
| TOTAL COMMUNICATION SERVICES | 1,001,657,963 | ||
| CONSUMER DISCRETIONARY - 7.3% | |||
| Auto Components - 1.0% | |||
| Aptiv PLC | 838,400 | 112,010,240 | |
| Hotels, Restaurants & Leisure - 2.5% | |||
| Las Vegas Sands Corp. | 1,632,300 | 78,497,307 | |
| Marriott International, Inc. Class A | 617,600 | 71,833,056 | |
| McDonald's Corp. | 601,260 | 124,965,878 | |
| 275,296,241 | |||
| Household Durables - 0.6% | |||
| Lennar Corp. Class A | 767,600 | 63,825,940 | |
| Multiline Retail - 0.8% | |||
| Dollar Tree, Inc. (a) | 814,800 | 82,832,568 | |
| Specialty Retail - 2.4% | |||
| Best Buy Co., Inc. | 837,300 | 91,114,986 | |
| Burlington Stores, Inc. (a) | 369,790 | 92,040,731 | |
| Ulta Beauty, Inc. (a) | 290,160 | 81,175,162 | |
| 264,330,879 | |||
| TOTAL CONSUMER DISCRETIONARY | 798,295,868 | ||
| CONSUMER STAPLES - 6.6% | |||
| Beverages - 1.9% | |||
| Constellation Brands, Inc. Class A (sub. vtg.) | 100,000 | 21,093,000 | |
| Diageo PLC | 219,400 | 8,808,294 | |
| Keurig Dr. Pepper, Inc. (b) | 1,496,900 | 47,601,420 | |
| Monster Beverage Corp. (a) | 147,300 | 12,790,059 | |
| PepsiCo, Inc. | 218,300 | 29,813,231 | |
| The Coca-Cola Co. | 1,730,500 | 83,323,575 | |
| 203,429,579 | |||
| Food & Staples Retailing - 1.4% | |||
| Walgreens Boots Alliance, Inc. | 478,500 | 24,044,625 | |
| Walmart, Inc. | 884,371 | 124,245,282 | |
| 148,289,907 | |||
| Food Products - 1.0% | |||
| General Mills, Inc. | 323,900 | 18,818,590 | |
| Lamb Weston Holdings, Inc. | 32,948 | 2,461,216 | |
| Mondelez International, Inc. | 1,669,352 | 92,548,875 | |
| 113,828,681 | |||
| Household Products - 1.6% | |||
| Kimberly-Clark Corp. | 196,500 | 25,957,650 | |
| Procter & Gamble Co. | 1,199,572 | 153,797,126 | |
| 179,754,776 | |||
| Tobacco - 0.7% | |||
| Philip Morris International, Inc. | 932,446 | 74,269,324 | |
| TOTAL CONSUMER STAPLES | 719,572,267 | ||
| ENERGY - 4.3% | |||
| Oil, Gas & Consumable Fuels - 4.3% | |||
| BP PLC sponsored ADR | 1,105,800 | 24,570,876 | |
| Cenovus Energy, Inc. (Canada) | 10,723,647 | 63,314,592 | |
| Cheniere Energy, Inc. (a) | 1,351,300 | 85,577,829 | |
| Exxon Mobil Corp. | 2,587,500 | 116,023,500 | |
| Hess Corp. | 1,194,200 | 64,462,916 | |
| Marathon Petroleum Corp. | 1,716,800 | 74,097,088 | |
| Royal Dutch Shell PLC Class A (United Kingdom) | 2,588,600 | 47,900,224 | |
| 475,947,025 | |||
| FINANCIALS - 19.3% | |||
| Banks - 6.6% | |||
| Bank of America Corp. | 5,571,600 | 165,197,940 | |
| Citigroup, Inc. | 2,020,600 | 117,174,594 | |
| Comerica, Inc. | 587,900 | 33,627,880 | |
| First Horizon National Corp. | 2,478,400 | 34,424,976 | |
| JPMorgan Chase & Co. | 1,065,600 | 137,110,752 | |
| KeyCorp | 2,388,800 | 40,275,168 | |
| Societe Generale Series A | 1,166,500 | 21,747,067 | |
| Wells Fargo & Co. | 5,693,200 | 170,112,816 | |
| 719,671,193 | |||
| Capital Markets - 4.5% | |||
| Bank of New York Mellon Corp. | 3,730,400 | 148,581,832 | |
| BlackRock, Inc. Class A | 184,400 | 129,312,344 | |
| Cboe Global Markets, Inc. | 264,300 | 24,244,239 | |
| Morgan Stanley | 2,195,300 | 147,194,865 | |
| Virtu Financial, Inc. Class A | 1,399,798 | 38,872,390 | |
| 488,205,670 | |||
| Consumer Finance - 3.4% | |||
| American Express Co. | 761,600 | 88,543,616 | |
| Capital One Financial Corp. | 2,709,600 | 282,502,896 | |
| 371,046,512 | |||
| Diversified Financial Services - 2.2% | |||
| Berkshire Hathaway, Inc. Class B (a) | 785,000 | 178,877,950 | |
| Voya Financial, Inc. | 1,177,500 | 65,304,150 | |
| 244,182,100 | |||
| Insurance - 2.6% | |||
| American International Group, Inc. | 1,570,676 | 58,806,109 | |
| Arthur J. Gallagher & Co. | 96,500 | 11,137,065 | |
| Hartford Financial Services Group, Inc. | 1,417,900 | 68,087,558 | |
| The Travelers Companies, Inc. | 1,114,864 | 151,955,963 | |
| 289,986,695 | |||
| TOTAL FINANCIALS | 2,113,092,170 | ||
| HEALTH CARE - 13.0% | |||
| Biotechnology - 0.2% | |||
| Regeneron Pharmaceuticals, Inc. (a) | 36,400 | 18,339,776 | |
| Health Care Equipment & Supplies - 4.8% | |||
| Abbott Laboratories | 682,700 | 84,374,893 | |
| Baxter International, Inc. | 473,500 | 36,379,005 | |
| Becton, Dickinson & Co. | 378,900 | 99,192,231 | |
| Boston Scientific Corp. (a) | 1,178,500 | 41,766,040 | |
| Danaher Corp. | 638,500 | 151,860,840 | |
| Medtronic PLC | 848,964 | 94,515,162 | |
| Stryker Corp. | 105,000 | 23,206,050 | |
| 531,294,221 | |||
| Health Care Providers & Services - 2.8% | |||
| AmerisourceBergen Corp. | 111,200 | 11,587,040 | |
| Cardinal Health, Inc. | 565,900 | 30,405,807 | |
| Cigna Corp. | 433,100 | 94,004,355 | |
| CVS Health Corp. | 679,836 | 48,710,249 | |
| Humana, Inc. | 131,900 | 50,532,209 | |
| UnitedHealth Group, Inc. | 209,200 | 69,784,936 | |
| 305,024,596 | |||
| Life Sciences Tools & Services - 1.2% | |||
| Bio-Rad Laboratories, Inc. Class A (a) | 24,400 | 13,999,988 | |
| Thermo Fisher Scientific, Inc. | 225,300 | 114,835,410 | |
| 128,835,398 | |||
| Pharmaceuticals - 4.0% | |||
| Bristol-Myers Squibb Co. | 994,800 | 61,110,564 | |
| Catalent, Inc. (a) | 221,100 | 25,437,555 | |
| Johnson & Johnson | 1,330,906 | 217,110,696 | |
| Merck & Co., Inc. | 175,900 | 13,556,613 | |
| Pfizer, Inc. | 3,354,736 | 120,435,022 | |
| 437,650,450 | |||
| TOTAL HEALTH CARE | 1,421,144,441 | ||
| INDUSTRIALS - 13.2% | |||
| Aerospace & Defense - 3.0% | |||
| General Dynamics Corp. | 545,400 | 79,999,272 | |
| Northrop Grumman Corp. | 142,700 | 40,899,247 | |
| Raytheon Technologies Corp. | 1,929,579 | 128,760,807 | |
| The Boeing Co. | 419,600 | 81,482,124 | |
| 331,141,450 | |||
| Air Freight & Logistics - 0.7% | |||
| FedEx Corp. | 336,521 | 79,196,852 | |
| Construction & Engineering - 0.9% | |||
| AECOM (a) | 2,013,520 | 100,877,352 | |
| Electrical Equipment - 1.6% | |||
| Sensata Technologies, Inc. PLC (a) | 3,168,884 | 172,704,178 | |
| Industrial Conglomerates - 1.5% | |||
| General Electric Co. | 12,316,145 | 131,536,429 | |
| Honeywell International, Inc. | 138,900 | 27,136,893 | |
| 158,673,322 | |||
| Machinery - 1.2% | |||
| Caterpillar, Inc. | 708,000 | 129,450,720 | |
| Marine - 1.0% | |||
| A.P. Moller - Maersk A/S Series B | 28,630 | 58,810,828 | |
| Kirby Corp. (a) | 997,500 | 50,633,100 | |
| 109,443,928 | |||
| Professional Services - 1.7% | |||
| Nielsen Holdings PLC | 8,042,578 | 179,590,767 | |
| Road & Rail - 1.1% | |||
| Norfolk Southern Corp. | 517,844 | 122,532,247 | |
| Trading Companies & Distributors - 0.5% | |||
| Univar, Inc. (a) | 3,188,000 | 59,264,920 | |
| TOTAL INDUSTRIALS | 1,442,875,736 | ||
| INFORMATION TECHNOLOGY - 9.3% | |||
| Communications Equipment - 2.5% | |||
| Cisco Systems, Inc. | 4,502,061 | 200,701,879 | |
| F5 Networks, Inc. (a) | 383,761 | 75,197,968 | |
| 275,899,847 | |||
| IT Services - 4.4% | |||
| Amdocs Ltd. | 2,098,507 | 148,196,564 | |
| CACI International, Inc. Class A (a) | 220,200 | 53,116,644 | |
| Capgemini SA | 367,692 | 53,322,409 | |
| Fiserv, Inc. (a) | 1,069,259 | 109,802,207 | |
| IBM Corp. | 976,028 | 116,254,695 | |
| 480,692,519 | |||
| Semiconductors & Semiconductor Equipment - 1.1% | |||
| Broadcom, Inc. | 35,686 | 16,076,543 | |
| Intel Corp. | 1,842,308 | 102,266,517 | |
| 118,343,060 | |||
| Software - 1.3% | |||
| NortonLifeLock, Inc. | 3,141,581 | 66,193,112 | |
| SS&C Technologies Holdings, Inc. | 1,169,439 | 73,534,324 | |
| 139,727,436 | |||
| TOTAL INFORMATION TECHNOLOGY | 1,014,662,862 | ||
| MATERIALS - 4.2% | |||
| Chemicals - 2.7% | |||
| DuPont de Nemours, Inc. | 185,721 | 14,755,533 | |
| Huntsman Corp. | 1,892,241 | 49,993,007 | |
| Olin Corp. | 4,148,251 | 99,184,681 | |
| The Chemours Co. LLC | 2,792,800 | 73,562,352 | |
| W.R. Grace & Co. | 1,003,700 | 58,234,674 | |
| 295,730,247 | |||
| Construction Materials - 0.5% | |||
| Eagle Materials, Inc. | 451,900 | 49,722,557 | |
| Containers & Packaging - 1.0% | |||
| Crown Holdings, Inc. (a) | 1,146,300 | 103,338,945 | |
| O-I Glass, Inc. | 475,490 | 6,010,194 | |
| 109,349,139 | |||
| TOTAL MATERIALS | 454,801,943 | ||
| REAL ESTATE - 4.1% | |||
| Equity Real Estate Investment Trusts (REITs) - 3.7% | |||
| Corporate Office Properties Trust (SBI) | 1,260,677 | 33,117,985 | |
| Digital Realty Trust, Inc. | 309,100 | 44,494,945 | |
| Douglas Emmett, Inc. | 718,300 | 19,904,093 | |
| Invitation Homes, Inc. | 947,200 | 27,923,456 | |
| Mid-America Apartment Communities, Inc. | 558,300 | 74,114,325 | |
| Prologis (REIT), Inc. | 622,063 | 64,196,902 | |
| Welltower, Inc. | 1,015,100 | 61,515,060 | |
| Weyerhaeuser Co. | 2,644,600 | 82,485,074 | |
| 407,751,840 | |||
| Real Estate Management & Development - 0.4% | |||
| Cushman & Wakefield PLC (a) | 2,752,500 | 39,443,325 | |
| TOTAL REAL ESTATE | 447,195,165 | ||
| UTILITIES - 5.4% | |||
| Electric Utilities - 3.3% | |||
| Edison International | 1,355,100 | 78,812,616 | |
| Exelon Corp. | 2,264,400 | 94,108,464 | |
| FirstEnergy Corp. | 1,745,100 | 53,679,276 | |
| PG&E Corp. (a) | 6,575,648 | 75,159,657 | |
| Southern Co. | 998,000 | 58,802,160 | |
| 360,562,173 | |||
| Independent Power and Renewable Electricity Producers - 1.3% | |||
| The AES Corp. | 3,523,400 | 85,935,726 | |
| Vistra Corp. | 2,939,633 | 58,704,471 | |
| 144,640,197 | |||
| Multi-Utilities - 0.8% | |||
| CenterPoint Energy, Inc. | 3,827,800 | 80,728,302 | |
| TOTAL UTILITIES | 585,930,672 | ||
| TOTAL COMMON STOCKS | |||
| (Cost $8,526,820,071) | 10,475,176,112 | ||
| Money Market Funds - 3.2% | |||
| Fidelity Cash Central Fund 0.09% (c) | 305,970,615 | 306,031,809 | |
| Fidelity Securities Lending Cash Central Fund 0.09% (c)(d) | 45,623,216 | 45,627,778 | |
| TOTAL MONEY MARKET FUNDS | |||
| (Cost $351,658,726) | 351,659,587 | ||
| Equity Funds - 1.2% | |||
| Domestic Equity Funds - 1.2% | |||
| iShares Russell 1000 Value Index ETF | |||
| (Cost $112,244,695) | 987,572 | 133,756,752 | |
| TOTAL INVESTMENT IN SECURITIES - 100.3% | |||
| (Cost $8,990,723,492) | 10,960,592,451 | ||
| NET OTHER ASSETS (LIABILITIES) - (0.3)% | (29,536,674) | ||
| NET ASSETS - 100% | $10,931,055,777 |
Security Type Abbreviations
ETF – Exchange-Traded Fund
Legend
(a) Non-income producing
(b) Security or a portion of the security is on loan at period end.
(c) Affiliated fund that is generally available only to investment companies and other accounts managed by Fidelity Investments. The rate quoted is the annualized seven-day yield of the fund at period end. A complete unaudited listing of the fund's holdings as of its most recent quarter end is available upon request. In addition, each Fidelity Central Fund's financial statements, which are not covered by the Fund's Report of Independent Registered Public Accounting Firm, are available on the SEC's website or upon request.
(d) Investment made with cash collateral received from securities on loan.
Affiliated Central Funds
Information regarding fiscal year to date income earned by the Fund from investments in Fidelity Central Funds is as follows:
| Fund | Income earned |
| Fidelity Cash Central Fund | $768,565 |
| Fidelity Securities Lending Cash Central Fund | 248,308 |
| Total | $1,016,873 |
Amounts in the income column in the above table include any capital gain distributions from underlying funds, which are presented in the corresponding line-item in the Statement of Operations, if applicable. Amount for Fidelity Securities Lending Cash Central Fund represents the income earned on investing cash collateral, less rebates paid to borrowers and any lending agent fees associated with the loan, plus any premium payments received for lending certain types of securities.
Investment Valuation
The following is a summary of the inputs used, as of January 31, 2021, involving the Fund's assets and liabilities carried at fair value. The inputs or methodology used for valuing securities may not be an indication of the risk associated with investing in those securities. For more information on valuation inputs, and their aggregation into the levels used below, please refer to the Investment Valuation section in the accompanying Notes to Financial Statements.
| Valuation Inputs at Reporting Date: | ||||
| Description | Total | Level 1 | Level 2 | Level 3 |
| Investments in Securities: | ||||
| Equities: | ||||
| Communication Services | $1,001,657,963 | $1,001,657,963 | $-- | $-- |
| Consumer Discretionary | 798,295,868 | 798,295,868 | -- | -- |
| Consumer Staples | 719,572,267 | 710,763,973 | 8,808,294 | -- |
| Energy | 475,947,025 | 428,046,801 | 47,900,224 | -- |
| Financials | 2,113,092,170 | 2,091,345,103 | 21,747,067 | -- |
| Health Care | 1,421,144,441 | 1,421,144,441 | -- | -- |
| Industrials | 1,442,875,736 | 1,384,064,908 | 58,810,828 | -- |
| Information Technology | 1,014,662,862 | 1,014,662,862 | -- | -- |
| Materials | 454,801,943 | 454,801,943 | -- | -- |
| Real Estate | 447,195,165 | 447,195,165 | -- | -- |
| Utilities | 585,930,672 | 585,930,672 | -- | -- |
| Money Market Funds | 351,659,587 | 351,659,587 | -- | -- |
| Equity Funds | 133,756,752 | 133,756,752 | -- | -- |
| Total Investments in Securities: | $10,960,592,451 | $10,823,326,038 | $137,266,413 | $-- |
See accompanying notes which are an integral part of the financial statements.
Fidelity® Series Stock Selector Large Cap Value Fund
Financial Statements
Statement of Assets and Liabilities
| January 31, 2021 | ||
| Assets | ||
| Investment in securities, at value (including securities loaned of $43,920,644) — See accompanying schedule: Unaffiliated issuers (cost $8,639,064,766) | $10,608,932,864 | |
| Fidelity Central Funds (cost $351,658,726) | 351,659,587 | |
| Total Investment in Securities (cost $8,990,723,492) | $10,960,592,451 | |
| Foreign currency held at value (cost $606) | 612 | |
| Receivable for investments sold | 75,588,043 | |
| Receivable for fund shares sold | 52,470,429 | |
| Dividends receivable | 14,981,386 | |
| Distributions receivable from Fidelity Central Funds | 23,083 | |
| Total assets | 11,103,656,004 | |
| Liabilities | ||
| Payable for investments purchased | $97,745,748 | |
| Payable for fund shares redeemed | 29,196,198 | |
| Other payables and accrued expenses | 30,503 | |
| Collateral on securities loaned | 45,627,778 | |
| Total liabilities | 172,600,227 | |
| Net Assets | $10,931,055,777 | |
| Net Assets consist of: | ||
| Paid in capital | $9,157,087,039 | |
| Total accumulated earnings (loss) | 1,773,968,738 | |
| Net Assets | $10,931,055,777 | |
| Net Asset Value, offering price and redemption price per share ($10,931,055,777 ÷ 865,016,902 shares) | $12.64 |
See accompanying notes which are an integral part of the financial statements.
Statement of Operations
| Year ended January 31, 2021 | ||
| Investment Income | ||
| Dividends | $209,487,061 | |
| Special dividends | 28,862,400 | |
| Interest | 23,511 | |
| Income from Fidelity Central Funds (including $248,308 from security lending) | 1,016,873 | |
| Total income | 239,389,845 | |
| Expenses | ||
| Custodian fees and expenses | $80,735 | |
| Independent trustees' fees and expenses | 52,239 | |
| Interest | 1,404 | |
| Miscellaneous | 21,207 | |
| Total expenses | 155,585 | |
| Net investment income (loss) | 239,234,260 | |
| Realized and Unrealized Gain (Loss) | ||
| Net realized gain (loss) on: | ||
| Investment securities: | ||
| Unaffiliated issuers | (144,513,316) | |
| Fidelity Central Funds | 27,098 | |
| Foreign currency transactions | (361,780) | |
| Futures contracts | (24,869,774) | |
| Total net realized gain (loss) | (169,717,772) | |
| Change in net unrealized appreciation (depreciation) on: | ||
| Investment securities: | ||
| Unaffiliated issuers | 580,014,487 | |
| Assets and liabilities in foreign currencies | 20,274 | |
| Futures contracts | 1,012,358 | |
| Total change in net unrealized appreciation (depreciation) | 581,047,119 | |
| Net gain (loss) | 411,329,347 | |
| Net increase (decrease) in net assets resulting from operations | $650,563,607 |
See accompanying notes which are an integral part of the financial statements.
Statement of Changes in Net Assets
| Year ended January 31, 2021 | Year ended January 31, 2020 | |
| Increase (Decrease) in Net Assets | ||
| Operations | ||
| Net investment income (loss) | $239,234,260 | $241,637,306 |
| Net realized gain (loss) | (169,717,772) | 437,023,377 |
| Change in net unrealized appreciation (depreciation) | 581,047,119 | 718,904,431 |
| Net increase (decrease) in net assets resulting from operations | 650,563,607 | 1,397,565,114 |
| Distributions to shareholders | (403,310,833) | (570,671,464) |
| Share transactions | ||
| Proceeds from sales of shares | 1,765,293,646 | 1,185,143,827 |
| Reinvestment of distributions | 403,310,832 | 570,671,463 |
| Cost of shares redeemed | (1,458,449,071) | (3,140,079,084) |
| Net increase (decrease) in net assets resulting from share transactions | 710,155,407 | (1,384,263,794) |
| Total increase (decrease) in net assets | 957,408,181 | (557,370,144) |
| Net Assets | ||
| Beginning of period | 9,973,647,596 | 10,531,017,740 |
| End of period | $10,931,055,777 | $9,973,647,596 |
| Other Information | ||
| Shares | ||
| Sold | 160,242,895 | 96,419,816 |
| Issued in reinvestment of distributions | 34,324,353 | 46,089,849 |
| Redeemed | (129,885,545) | (252,732,221) |
| Net increase (decrease) | 64,681,703 | (110,222,556) |
See accompanying notes which are an integral part of the financial statements.
Financial Highlights
Fidelity Series Stock Selector Large Cap Value Fund
| Years ended January 31, | 2021 | 2020 | 2019 | 2018 | 2017 |
| Selected Per–Share Data | |||||
| Net asset value, beginning of period | $12.46 | $11.57 | $13.47 | $12.49 | $10.38 |
| Income from Investment Operations | |||||
| Net investment income (loss)A | .28B | .28 | .29 | .28C | .17 |
| Net realized and unrealized gain (loss) | .39 | 1.33 | (1.01) | 1.63 | 2.25 |
| Total from investment operations | .67 | 1.61 | (.72) | 1.91 | 2.42 |
| Distributions from net investment income | (.28) | (.31) | (.27) | (.28) | (.16) |
| Distributions from net realized gain | (.21) | (.41) | (.90) | (.65) | (.14) |
| Total distributions | (.49) | (.72) | (1.18)D | (.93) | (.31)D |
| Net asset value, end of period | $12.64 | $12.46 | $11.57 | $13.47 | $12.49 |
| Total ReturnE | 5.74% | 13.98% | (5.07)% | 15.62% | 23.49% |
| Ratios to Average Net AssetsF,G | |||||
| Expenses before reductions | - %H | - %H | - %H | .20% | .67% |
| Expenses net of fee waivers, if any | - %H | - %H | - %H | .20% | .67% |
| Expenses net of all reductions | - %H | - %H | - %H | .20% | .66% |
| Net investment income (loss) | 2.54%B | 2.32% | 2.33% | 2.13%C | 1.51% |
| Supplemental Data | |||||
| Net assets, end of period (000 omitted) | $10,931,056 | $9,973,648 | $10,531,018 | $10,485,796 | $3,615,123 |
| Portfolio turnover rateI | 94% | 65%J | 87%K | 61% | 54% |
A Calculated based on average shares outstanding during the period.
B Net investment income per share reflects one or more large, non-recurring dividend(s) which amounted to $.03 per share. Excluding such non-recurring dividend(s), the ratio of net investment income (loss) to average net assets would have been 2.23%.
C Net investment income per share reflects one or more large, non-recurring dividend(s) which amounted to $.03 per share. Excluding such non-recurring dividend(s), the ratio of net investment income (loss) to average net assets would have been 1.87%.
D Total distributions per share do not sum due to rounding.
E Total returns would have been lower if certain expenses had not been reduced during the applicable periods shown.
F Fees and expenses of any underlying mutual funds or exchange-traded funds (ETFs) are not included in the Fund's expense ratio. The Fund indirectly bears its proportionate share of these expenses. For additional expense information related to investments in Fidelity Central Funds, please refer to the "Investments in Fidelity Central Funds" note found in the Notes to Financial Statements section of the most recent Annual or Semi-Annual report.
G Expense ratios reflect operating expenses of the class. Expenses before reductions do not reflect amounts reimbursed, waived, or reduced through arrangements with the investment advisor, brokerage services, or other offset arrangements, if applicable, and do not represent the amount paid by the class during periods when reimbursements, waivers or reductions occur.
H Amount represents less than .005%.
I Amount does not include the portfolio activity of any underlying mutual funds or exchange-traded funds (ETFs).
J Portfolio turnover rate excludes securities received or delivered in-kind.
K The portfolio turnover rate does not include the assets acquired in the merger.
See accompanying notes which are an integral part of the financial statements.
Fidelity® Series Value Discovery Fund
Performance: The Bottom Line
Average annual total return reflects the change in the value of an investment, assuming reinvestment of distributions from dividend income and capital gains (the profits earned upon the sale of securities that have grown in value, if any) and assuming a constant rate of performance each year. The hypothetical investment and the average annual total returns do not reflect the deduction of taxes that a shareholder would pay on fund distributions or the redemption of fund shares. During periods of reimbursement by Fidelity, a fund’s total return will be greater than it would be had the reimbursement not occurred. How a fund did yesterday is no guarantee of how it will do tomorrow.
Average Annual Total Returns
| For the periods ended January 31, 2021 | Past 1 year | Past 5 years | Life of fundA |
| Fidelity® Series Value Discovery Fund | 13.45% | 11.26% | 10.23% |
A From December 6, 2012
$10,000 Over Life of Fund
Let's say hypothetically that $10,000 was invested in Fidelity® Series Value Discovery Fund on December 6, 2012, when the fund started.
The chart shows how the value of your investment would have changed, and also shows how the Russell 3000® Value Index performed over the same period.
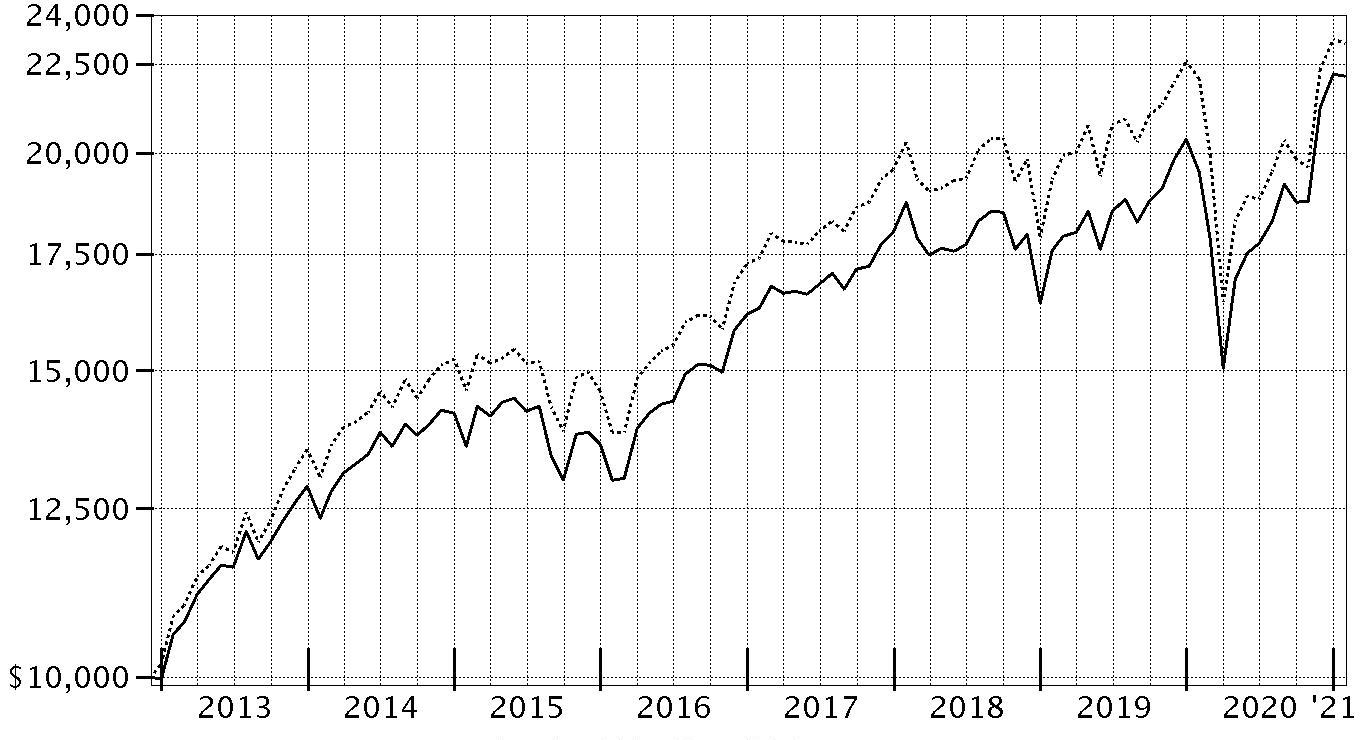
| Period Ending Values | ||
| $22,132 | Fidelity® Series Value Discovery Fund | |
| $23,117 | Russell 3000® Value Index | |
Fidelity® Series Value Discovery Fund
Management's Discussion of Fund Performance
Market Recap: The S&P 500® index gained 17.25% for the 12 months ending January 31, 2021, a volatile but productive period for U.S. risk assets. The early-2020 outbreak and spread of COVID-19 resulted in stocks suffering one of the quickest declines on record, through March 23, followed by a historic rebound. The crisis and containment efforts caused broad contraction in economic activity, along with extreme uncertainty and dislocation in financial markets. A rapid and expansive U.S. monetary/fiscal-policy response partially offset the economic disruption and fueled the market surge, as did resilient corporate earnings. The rally slowed in September, when the S&P 500 began a two-month retreat amid Congress’s inability to reach a deal on additional fiscal stimulus, as well as concerns about election uncertainty, indications the U.S. economic recovery could be slowing and a new wave of COVID-19 cases. A shift in momentum began in October and accelerated following the U.S. elections, with the approval of two breakthrough COVID-19 vaccines and prospects for additional government stimulus fueling the “reflation trade.” Small-cap value stocks rallied strongly late in 2020, usurping longstanding market leadership from growth shares – especially large tech and internet-related names – amid hopes of a broad economic recovery in 2021. By sector for the full 12 months, information technology (+37%) and consumer discretionary (+33%) led all gainers. In contrast, energy (-23%) struggled along with global oil demand and pricing.Comments from Portfolio Manager Sean Gavin: For the fiscal year ending January 31, 2021, the fund gained 13.45%, outperforming the 4.82% result of the benchmark Russell 3000® Value Index. The primary contributor to performance versus the benchmark was stock selection and an underweighting in the industrials sector, especially within the capital goods industry. Our non-benchmark stake in Samsung Electronics was the fund's top individual relative contributor, driven by a 70% rise. This was among the largest holdings as of January 31. The fund's non-benchmark stake in Vestas Wind Systems gained roughly 116%. We reduced our position in the company the past 12 months. Another notable relative contributor was our overweighting in DuPont de Nemours (+92%), a stake we established this period. The fund's foreign holdings also contributed overall, aided in part by a generally weaker U.S. dollar. Conversely, the largest detractor from performance versus the benchmark was our security selection in the health care sector, especially within the pharmaceuticals, biotechnology & life sciences industry. An underweighting and stock selection in utilities and an underweighting in energy also hurt relative performance. The biggest individual relative detractor was an overweight position in Wells Fargo (-48%), which was a position that was not held at the end of this period. Also hampering performance was an underweighting in Procter & Gamble, which gained about 5%. This was a stake we established the past year. The fund's non-benchmark stake in BP, a position not held at period end, returned approximately -53%. Notable changes in positioning include a higher allocation to the utilities and industrials sectors.The views expressed above reflect those of the portfolio manager(s) only through the end of the period as stated on the cover of this report and do not necessarily represent the views of Fidelity or any other person in the Fidelity organization. Any such views are subject to change at any time based upon market or other conditions and Fidelity disclaims any responsibility to update such views. These views may not be relied on as investment advice and, because investment decisions for a Fidelity fund are based on numerous factors, may not be relied on as an indication of trading intent on behalf of any Fidelity fund.
Fidelity® Series Value Discovery Fund
Investment Summary (Unaudited)
Top Ten Stocks as of January 31, 2021
| % of fund's net assets | |
| Berkshire Hathaway, Inc. Class B | 4.0 |
| Comcast Corp. Class A | 3.1 |
| Cigna Corp. | 2.3 |
| Samsung Electronics Co. Ltd. | 2.3 |
| Bank of America Corp. | 2.2 |
| Cisco Systems, Inc. | 2.1 |
| Procter & Gamble Co. | 2.0 |
| JPMorgan Chase & Co. | 2.0 |
| Bristol-Myers Squibb Co. | 2.0 |
| UnitedHealth Group, Inc. | 2.0 |
| 24.0 |
Top Five Market Sectors as of January 31, 2021
| % of fund's net assets | |
| Financials | 18.4 |
| Health Care | 16.2 |
| Industrials | 11.6 |
| Communication Services | 10.9 |
| Utilities | 10.1 |
Asset Allocation (% of fund's net assets)
| As of January 31, 2021* | ||
| Stocks | 99.1% | |
| Other Investments | 0.2% | |
| Short-Term Investments and Net Other Assets (Liabilities) | 0.7% | |

* Foreign investments - 17.1%
Fidelity® Series Value Discovery Fund
Schedule of Investments January 31, 2021
Showing Percentage of Net Assets
| Common Stocks - 96.8% | |||
| Shares | Value | ||
| COMMUNICATION SERVICES - 10.9% | |||
| Diversified Telecommunication Services - 1.7% | |||
| Verizon Communications, Inc. | 2,779,200 | $152,161,200 | |
| Entertainment - 0.6% | |||
| Electronic Arts, Inc. | 174,200 | 24,945,440 | |
| Lions Gate Entertainment Corp. Class B (a) | 2,308,734 | 28,535,952 | |
| 53,481,392 | |||
| Interactive Media & Services - 2.2% | |||
| Alphabet, Inc. Class A (a) | 80,791 | 147,634,242 | |
| Facebook, Inc. Class A (a) | 203,600 | 52,595,988 | |
| 200,230,230 | |||
| Media - 5.3% | |||
| Comcast Corp. Class A | 5,686,304 | 281,870,089 | |
| Fox Corp. Class A | 895,210 | 27,912,648 | |
| Interpublic Group of Companies, Inc. | 4,914,114 | 118,282,724 | |
| WPP PLC | 4,970,162 | 51,936,306 | |
| 480,001,767 | |||
| Wireless Telecommunication Services - 1.1% | |||
| T-Mobile U.S., Inc. | 750,053 | 94,566,682 | |
| TOTAL COMMUNICATION SERVICES | 980,441,271 | ||
| CONSUMER DISCRETIONARY - 7.3% | |||
| Auto Components - 0.8% | |||
| Lear Corp. | 494,813 | 74,598,008 | |
| Household Durables - 0.8% | |||
| Newell Brands, Inc. | 1,178,700 | 28,312,374 | |
| Whirlpool Corp. | 236,524 | 43,778,227 | |
| 72,090,601 | |||
| Multiline Retail - 0.8% | |||
| Dollar General Corp. | 385,039 | 74,932,440 | |
| Specialty Retail - 2.7% | |||
| Best Buy Co., Inc. | 886,000 | 96,414,520 | |
| Dick's Sporting Goods, Inc. (b) | 598,600 | 40,112,186 | |
| Lowe's Companies, Inc. | 494,300 | 82,473,955 | |
| Williams-Sonoma, Inc. | 202,700 | 26,132,084 | |
| 245,132,745 | |||
| Textiles, Apparel & Luxury Goods - 2.2% | |||
| PVH Corp. | 1,398,185 | 119,209,253 | |
| Tapestry, Inc. | 2,295,755 | 72,591,773 | |
| 191,801,026 | |||
| TOTAL CONSUMER DISCRETIONARY | 658,554,820 | ||
| CONSUMER STAPLES - 6.6% | |||
| Beverages - 0.4% | |||
| C&C Group PLC (United Kingdom) (a) | 769,754 | 2,436,307 | |
| Coca-Cola European Partners PLC (b) | 749,200 | 34,815,324 | |
| 37,251,631 | |||
| Food & Staples Retailing - 1.8% | |||
| Kroger Co. | 2,793,900 | 96,389,550 | |
| U.S. Foods Holding Corp. (a) | 2,050,730 | 63,552,123 | |
| 159,941,673 | |||
| Food Products - 1.8% | |||
| Mondelez International, Inc. | 2,473,200 | 137,114,208 | |
| Tyson Foods, Inc. Class A | 337,300 | 21,691,763 | |
| 158,805,971 | |||
| Household Products - 2.6% | |||
| Procter & Gamble Co. | 1,439,600 | 184,571,116 | |
| Reckitt Benckiser Group PLC | 285,650 | 24,216,954 | |
| Spectrum Brands Holdings, Inc. | 314,427 | 23,761,248 | |
| 232,549,318 | |||
| TOTAL CONSUMER STAPLES | 588,548,593 | ||
| ENERGY - 2.2% | |||
| Energy Equipment & Services - 0.2% | |||
| Hoegh LNG Partners LP | 1,278,754 | 18,784,896 | |
| Oil, Gas & Consumable Fuels - 2.0% | |||
| Cabot Oil & Gas Corp. | 2,476,300 | 45,390,579 | |
| Dynagas LNG Partners LP (a) | 994,300 | 2,615,009 | |
| Golar LNG Ltd. (a) | 1,412,233 | 15,294,483 | |
| Parex Resources, Inc. (a) | 4,970,641 | 75,215,565 | |
| Teekay LNG Partners LP | 2,988,567 | 37,028,345 | |
| 175,543,981 | |||
| TOTAL ENERGY | 194,328,877 | ||
| FINANCIALS - 18.4% | |||
| Banks - 6.9% | |||
| Bank of America Corp. | 6,681,700 | 198,112,405 | |
| Cullen/Frost Bankers, Inc. | 255,900 | 23,604,216 | |
| JPMorgan Chase & Co. | 1,404,400 | 180,704,148 | |
| M&T Bank Corp. | 766,644 | 101,557,331 | |
| PNC Financial Services Group, Inc. | 790,700 | 113,481,264 | |
| 617,459,364 | |||
| Capital Markets - 1.6% | |||
| Affiliated Managers Group, Inc. (b) | 533,831 | 58,822,838 | |
| BlackRock, Inc. Class A | 44,900 | 31,486,574 | |
| Invesco Ltd. | 1,420,824 | 29,254,766 | |
| State Street Corp. | 317,239 | 22,206,730 | |
| 141,770,908 | |||
| Consumer Finance - 2.7% | |||
| Capital One Financial Corp. | 989,974 | 103,214,689 | |
| Discover Financial Services | 1,682,134 | 140,525,474 | |
| 243,740,163 | |||
| Diversified Financial Services - 4.0% | |||
| Berkshire Hathaway, Inc. Class B (a) | 1,572,866 | 358,408,977 | |
| Insurance - 3.2% | |||
| Allstate Corp. | 232,803 | 24,951,826 | |
| American International Group, Inc. | 1,147,800 | 42,973,632 | |
| Chubb Ltd. | 708,039 | 103,140,041 | |
| The Travelers Companies, Inc. | 838,870 | 114,337,981 | |
| 285,403,480 | |||
| TOTAL FINANCIALS | 1,646,782,892 | ||
| HEALTH CARE - 16.2% | |||
| Biotechnology - 3.4% | |||
| Alexion Pharmaceuticals, Inc. (a) | 678,900 | 104,095,737 | |
| Amgen, Inc. | 556,498 | 134,355,312 | |
| Regeneron Pharmaceuticals, Inc. (a) | 134,700 | 67,867,248 | |
| 306,318,297 | |||
| Health Care Providers & Services - 8.6% | |||
| Anthem, Inc. | 320,426 | 95,160,113 | |
| Centene Corp. (a) | 2,659,803 | 160,386,121 | |
| Cigna Corp. | 946,907 | 205,526,164 | |
| CVS Health Corp. | 1,396,234 | 100,040,166 | |
| Humana, Inc. | 71,422 | 27,362,482 | |
| UnitedHealth Group, Inc. | 535,744 | 178,713,484 | |
| 767,188,530 | |||
| Pharmaceuticals - 4.2% | |||
| Bristol-Myers Squibb Co. | 2,909,648 | 178,739,677 | |
| Roche Holding AG (participation certificate) | 353,939 | 122,148,626 | |
| Sanofi SA sponsored ADR | 1,705,078 | 80,496,732 | |
| 381,385,035 | |||
| TOTAL HEALTH CARE | 1,454,891,862 | ||
| INDUSTRIALS - 11.6% | |||
| Aerospace & Defense - 0.4% | |||
| L3Harris Technologies, Inc. | 100,596 | 17,253,220 | |
| Northrop Grumman Corp. | 62,700 | 17,970,447 | |
| 35,223,667 | |||
| Air Freight & Logistics - 0.6% | |||
| Deutsche Post AG | 592,300 | 29,256,718 | |
| XPO Logistics, Inc. (a) | 250,000 | 27,602,500 | |
| 56,859,218 | |||
| Building Products - 2.1% | |||
| Carrier Global Corp. | 718,900 | 27,677,650 | |
| Owens Corning | 1,091,900 | 84,731,440 | |
| Trane Technologies PLC | 522,171 | 74,853,213 | |
| 187,262,303 | |||
| Electrical Equipment - 1.3% | |||
| Regal Beloit Corp. | 640,800 | 80,407,584 | |
| Vestas Wind Systems A/S | 188,668 | 40,510,365 | |
| 120,917,949 | |||
| Industrial Conglomerates - 2.8% | |||
| 3M Co. | 707,200 | 124,226,752 | |
| Siemens AG | 835,100 | 129,658,951 | |
| 253,885,703 | |||
| Machinery - 3.9% | |||
| ITT, Inc. | 928,900 | 69,398,119 | |
| Oshkosh Corp. | 1,194,100 | 109,367,619 | |
| Otis Worldwide Corp. | 711,400 | 45,992,010 | |
| Pentair PLC (b) | 1,202,200 | 65,471,812 | |
| Stanley Black & Decker, Inc. | 319,100 | 55,360,659 | |
| 345,590,219 | |||
| Trading Companies & Distributors - 0.5% | |||
| Beacon Roofing Supply, Inc. (a) | 298,600 | 11,875,322 | |
| United Rentals, Inc. (a) | 126,800 | 30,813,668 | |
| 42,688,990 | |||
| TOTAL INDUSTRIALS | 1,042,428,049 | ||
| INFORMATION TECHNOLOGY - 7.0% | |||
| Communications Equipment - 2.3% | |||
| Cisco Systems, Inc. | 4,274,175 | 190,542,722 | |
| CommScope Holding Co., Inc. (a) | 1,000,100 | 14,691,469 | |
| 205,234,191 | |||
| Electronic Equipment & Components - 1.4% | |||
| TE Connectivity Ltd. | 1,062,738 | 127,953,655 | |
| IT Services - 2.1% | |||
| Amdocs Ltd. | 757,838 | 53,518,520 | |
| Capgemini SA | 281,600 | 40,837,414 | |
| Cognizant Technology Solutions Corp. Class A | 1,132,079 | 88,245,558 | |
| 182,601,492 | |||
| Semiconductors & Semiconductor Equipment - 0.7% | |||
| NXP Semiconductors NV | 337,200 | 54,110,484 | |
| ON Semiconductor Corp. (a) | 269,300 | 9,288,157 | |
| 63,398,641 | |||
| Software - 0.5% | |||
| NortonLifeLock, Inc. | 2,185,128 | 46,040,647 | |
| TOTAL INFORMATION TECHNOLOGY | 625,228,626 | ||
| MATERIALS - 3.8% | |||
| Chemicals - 1.5% | |||
| Albemarle Corp. U.S. | 54,600 | 8,881,236 | |
| DuPont de Nemours, Inc. | 1,610,500 | 127,954,225 | |
| 136,835,461 | |||
| Metals & Mining - 2.3% | |||
| BHP Billiton Ltd. sponsored ADR | 173,800 | 11,606,364 | |
| Lundin Mining Corp. | 9,480,400 | 84,517,349 | |
| Newmont Corp. | 1,783,729 | 106,310,248 | |
| 202,433,961 | |||
| TOTAL MATERIALS | 339,269,422 | ||
| REAL ESTATE - 2.7% | |||
| Equity Real Estate Investment Trusts (REITs) - 0.9% | |||
| American Tower Corp. | 124,900 | 28,397,264 | |
| Simon Property Group, Inc. | 599,694 | 55,729,563 | |
| 84,126,827 | |||
| Real Estate Management & Development - 1.8% | |||
| CBRE Group, Inc. (a) | 2,669,472 | 162,784,403 | |
| TOTAL REAL ESTATE | 246,911,230 | ||
| UTILITIES - 10.1% | |||
| Electric Utilities - 7.3% | |||
| Duke Energy Corp. | 1,154,200 | 108,494,800 | |
| Evergy, Inc. | 1,582,300 | 85,016,979 | |
| Exelon Corp. | 2,665,806 | 110,790,897 | |
| FirstEnergy Corp. | 243,900 | 7,502,364 | |
| PG&E Corp. (a) | 8,402,300 | 96,038,289 | |
| Portland General Electric Co. | 1,121,268 | 47,418,424 | |
| PPL Corp. | 1,757,000 | 48,616,190 | |
| Southern Co. | 2,645,276 | 155,859,662 | |
| 659,737,605 | |||
| Gas Utilities - 0.3% | |||
| Atmos Energy Corp. | 291,500 | 25,943,500 | |
| Independent Power and Renewable Electricity Producers - 0.9% | |||
| The AES Corp. | 937,000 | 22,853,430 | |
| Vistra Corp. | 2,861,600 | 57,146,152 | |
| 79,999,582 | |||
| Multi-Utilities - 1.6% | |||
| Dominion Energy, Inc. | 1,401,000 | 102,118,890 | |
| NiSource, Inc. | 1,846,700 | 40,904,405 | |
| 143,023,295 | |||
| TOTAL UTILITIES | 908,703,982 | ||
| TOTAL COMMON STOCKS | |||
| (Cost $7,046,787,034) | 8,686,089,624 | ||
| Nonconvertible Preferred Stocks - 2.3% | |||
| ENERGY - 0.0% | |||
| Oil, Gas & Consumable Fuels - 0.0% | |||
| Dynagas LNG Partners LP 9.00% | 188,872 | 4,627,364 | |
| INFORMATION TECHNOLOGY - 2.3% | |||
| Technology Hardware, Storage & Peripherals - 2.3% | |||
| Samsung Electronics Co. Ltd. | 3,092,580 | 202,136,641 | |
| TOTAL NONCONVERTIBLE PREFERRED STOCKS | |||
| (Cost $129,498,539) | 206,764,005 | ||
| Other - 0.2% | |||
| ENERGY - 0.2% | |||
| Oil, Gas & Consumable Fuels – 0.2% | |||
| Utica Shale Drilling Program (non-operating revenue interest) (c)(d)(e) | |||
| (Cost $39,369,027) | 39,369,027 | 16,877,502 | |
| Money Market Funds - 1.7% | |||
| Fidelity Cash Central Fund 0.09% (f) | 135,434,488 | 135,461,575 | |
| Fidelity Securities Lending Cash Central Fund 0.09% (f)(g) | 15,409,854 | 15,411,395 | |
| TOTAL MONEY MARKET FUNDS | |||
| (Cost $150,872,970) | 150,872,970 | ||
| TOTAL INVESTMENT IN SECURITIES - 101.0% | |||
| (Cost $7,366,527,570) | 9,060,604,101 | ||
| NET OTHER ASSETS (LIABILITIES) - (1.0)% | (88,894,043) | ||
| NET ASSETS - 100% | $8,971,710,058 |
Legend
(a) Non-income producing
(b) Security or a portion of the security is on loan at period end.
(c) Investment is owned by a wholly-owned subsidiary (Subsidiary) that is treated as a corporation for U.S. tax purposes.
(d) Restricted securities (including private placements) - Investment in securities not registered under the Securities Act of 1933 (excluding 144A issues). At the end of the period, the value of restricted securities (excluding 144A issues) amounted to $16,877,502 or 0.2% of net assets.
(e) Level 3 security
(f) Affiliated fund that is generally available only to investment companies and other accounts managed by Fidelity Investments. The rate quoted is the annualized seven-day yield of the fund at period end. A complete unaudited listing of the fund's holdings as of its most recent quarter end is available upon request. In addition, each Fidelity Central Fund's financial statements, which are not covered by the Fund's Report of Independent Registered Public Accounting Firm, are available on the SEC's website or upon request.
(g) Investment made with cash collateral received from securities on loan.
Additional information on each restricted holding is as follows:
| Security | Acquisition Date | Acquisition Cost |
| Utica Shale Drilling Program (non-operating revenue interest) | 10/5/16 - 10/30/18 | $39,369,027 |
Affiliated Central Funds
Information regarding fiscal year to date income earned by the Fund from investments in Fidelity Central Funds is as follows:
| Fund | Income earned |
| Fidelity Cash Central Fund | $269,837 |
| Fidelity Securities Lending Cash Central Fund | 573,898 |
| Total | $843,735 |
Amounts in the income column in the above table include any capital gain distributions from underlying funds, which are presented in the corresponding line-item in the Statement of Operations, if applicable. Amount for Fidelity Securities Lending Cash Central Fund represents the income earned on investing cash collateral, less rebates paid to borrowers and any lending agent fees associated with the loan, plus any premium payments received for lending certain types of securities.
Other Affiliated Issuers
An affiliated company is a company in which the Fund has ownership of at least 5% of the voting securities. Fiscal year to date transactions with companies which are or were affiliates are as follows:
| Affiliate | Value, beginning of period | Purchases | Sales Proceeds | Dividend Income | Realized Gain (loss) | Change in Unrealized appreciation (depreciation) | Value, end of period |
| Golar LNG Partners LP | $28,557,220 | $-- | $16,734,380 | $1,763,145 | $(67,056,307) | $55,233,467 | $-- |
| Total | $28,557,220 | $-- | $16,734,380 | $1,763,145 | $(67,056,307) | $55,233,467 | $-- |
Investment Valuation
The following is a summary of the inputs used, as of January 31, 2021, involving the Fund's assets and liabilities carried at fair value. The inputs or methodology used for valuing securities may not be an indication of the risk associated with investing in those securities. For more information on valuation inputs, and their aggregation into the levels used below, please refer to the Investment Valuation section in the accompanying Notes to Financial Statements.
| Valuation Inputs at Reporting Date: | ||||
| Description | Total | Level 1 | Level 2 | Level 3 |
| Investments in Securities: | ||||
| Equities: | ||||
| Communication Services | $980,441,271 | $928,504,965 | $51,936,306 | $-- |
| Consumer Discretionary | 658,554,820 | 658,554,820 | -- | -- |
| Consumer Staples | 588,548,593 | 564,331,639 | 24,216,954 | -- |
| Energy | 198,956,241 | 198,956,241 | -- | -- |
| Financials | 1,646,782,892 | 1,646,782,892 | -- | -- |
| Health Care | 1,454,891,862 | 1,332,743,236 | 122,148,626 | -- |
| Industrials | 1,042,428,049 | 972,660,966 | 69,767,083 | -- |
| Information Technology | 827,365,267 | 827,365,267 | -- | -- |
| Materials | 339,269,422 | 339,269,422 | -- | -- |
| Real Estate | 246,911,230 | 246,911,230 | -- | -- |
| Utilities | 908,703,982 | 908,703,982 | -- | -- |
| Other | 16,877,502 | -- | -- | 16,877,502 |
| Money Market Funds | 150,872,970 | 150,872,970 | -- | -- |
| Total Investments in Securities: | $9,060,604,101 | $8,775,657,630 | $268,068,969 | $16,877,502 |
Other Information
Distribution of investments by country or territory of incorporation, as a percentage of Total Net Assets, is as follows (Unaudited):
| United States of America | 82.9% |
| Switzerland | 3.8% |
| Korea (South) | 2.3% |
| Canada | 2.2% |
| Germany | 1.7% |
| Ireland | 1.6% |
| France | 1.4% |
| Others (Individually Less Than 1%) | 4.1% |
| 100.0% |
See accompanying notes which are an integral part of the financial statements.
Fidelity® Series Value Discovery Fund
Financial Statements
Statement of Assets and Liabilities
| January 31, 2021 | ||
| Assets | ||
| Investment in securities, at value (including securities loaned of $14,652,074) — See accompanying schedule: Unaffiliated issuers (cost $7,215,654,600) | $8,909,731,131 | |
| Fidelity Central Funds (cost $150,872,970) | 150,872,970 | |
| Total Investment in Securities (cost $7,366,527,570) | $9,060,604,101 | |
| Restricted cash | 51,788 | |
| Foreign currency held at value (cost $4,505) | 4,503 | |
| Receivable for investments sold | 29,005,800 | |
| Receivable for fund shares sold | 21,421,585 | |
| Dividends receivable | 14,850,886 | |
| Distributions receivable from Fidelity Central Funds | 12,343 | |
| Receivable from investment adviser for expense reductions | 105 | |
| Other receivables | 66 | |
| Total assets | 9,125,951,177 | |
| Liabilities | ||
| Payable for investments purchased | $91,149,517 | |
| Payable for fund shares redeemed | 47,538,000 | |
| Other payables and accrued expenses | 141,841 | |
| Collateral on securities loaned | 15,411,761 | |
| Total liabilities | 154,241,119 | |
| Net Assets | $8,971,710,058 | |
| Net Assets consist of: | ||
| Paid in capital | $7,524,010,729 | |
| Total accumulated earnings (loss) | 1,447,699,329 | |
| Net Assets | $8,971,710,058 | |
| Net Asset Value, offering price and redemption price per share ($8,971,710,058 ÷ 627,653,859 shares) | $14.29 |
See accompanying notes which are an integral part of the financial statements.
Statement of Operations
| Year ended January 31, 2021 | ||
| Investment Income | ||
| Dividends (including $1,763,145 earned from other affiliated issuers) | $170,199,872 | |
| Special dividends | 22,436,736 | |
| Income from Fidelity Central Funds (including $573,898 from security lending) | 843,735 | |
| Total income | 193,480,343 | |
| Expenses | ||
| Custodian fees and expenses | $219,442 | |
| Independent trustees' fees and expenses | 41,455 | |
| Interest | 1,389 | |
| Miscellaneous | 16,900 | |
| Total expenses before reductions | 279,186 | |
| Expense reductions | (21,534) | |
| Total expenses after reductions | 257,652 | |
| Net investment income (loss) | 193,222,691 | |
| Realized and Unrealized Gain (Loss) | ||
| Net realized gain (loss) on: | ||
| Investment securities: | ||
| Unaffiliated issuers | (172,850,676) | |
| Fidelity Central Funds | 2,775 | |
| Other affiliated issuers | (67,056,307) | |
| Foreign currency transactions | (94,414) | |
| Total net realized gain (loss) | (239,998,622) | |
| Change in net unrealized appreciation (depreciation) on: | ||
| Investment securities: | ||
| Unaffiliated issuers (net of increase in deferred foreign taxes of $67) | 1,064,059,935 | |
| Affiliated issuers | 55,233,467 | |
| Assets and liabilities in foreign currencies | 84,748 | |
| Total change in net unrealized appreciation (depreciation) | 1,119,378,150 | |
| Net gain (loss) | 879,379,528 | |
| Net increase (decrease) in net assets resulting from operations | $1,072,602,219 |
See accompanying notes which are an integral part of the financial statements.
Statement of Changes in Net Assets
| Year ended January 31, 2021 | Year ended January 31, 2020 | |
| Increase (Decrease) in Net Assets | ||
| Operations | ||
| Net investment income (loss) | $193,222,691 | $193,538,697 |
| Net realized gain (loss) | (239,998,622) | 203,465,815 |
| Change in net unrealized appreciation (depreciation) | 1,119,378,150 | 420,482,433 |
| Net increase (decrease) in net assets resulting from operations | 1,072,602,219 | 817,486,945 |
| Distributions to shareholders | (259,945,106) | (296,535,267) |
| Share transactions | ||
| Proceeds from sales of shares | 1,507,960,345 | 1,277,932,118 |
| Reinvestment of distributions | 259,945,106 | 296,535,267 |
| Cost of shares redeemed | (1,165,843,350) | (2,280,713,430) |
| Net increase (decrease) in net assets resulting from share transactions | 602,062,101 | (706,246,045) |
| Total increase (decrease) in net assets | 1,414,719,214 | (185,294,367) |
| Net Assets | ||
| Beginning of period | 7,556,990,844 | 7,742,285,211 |
| End of period | $8,971,710,058 | $7,556,990,844 |
| Other Information | ||
| Shares | ||
| Sold | 121,271,306 | 97,940,472 |
| Issued in reinvestment of distributions | 19,586,697 | 22,195,753 |
| Redeemed | (93,992,823) | (174,379,368) |
| Net increase (decrease) | 46,865,180 | (54,243,143) |
See accompanying notes which are an integral part of the financial statements.
Financial Highlights
Fidelity Series Value Discovery Fund
| Years ended January 31, | 2021 | 2020 | 2019 | 2018 | 2017 |
| Selected Per–Share Data | |||||
| Net asset value, beginning of period | $13.01 | $12.19 | $13.89 | $13.03 | $10.83 |
| Income from Investment Operations | |||||
| Net investment income (loss)A | .32B | .32 | .32 | .31 | .27 |
| Net realized and unrealized gain (loss) | 1.39 | 1.03 | (1.20) | 1.58 | 2.44 |
| Total from investment operations | 1.71 | 1.35 | (.88) | 1.89 | 2.71 |
| Distributions from net investment income | (.30) | (.34) | (.30) | (.25)C | (.26) |
| Distributions from net realized gain | (.13) | (.19) | (.52) | (.78)C | (.25) |
| Total distributions | (.43) | (.53) | (.82) | (1.03) | (.51) |
| Net asset value, end of period | $14.29 | $13.01 | $12.19 | $13.89 | $13.03 |
| Total ReturnD | 13.45% | 10.95% | (6.12)% | 15.05% | 25.40% |
| Ratios to Average Net AssetsE,F | |||||
| Expenses before reductions | - %G | - %G | - %G | .27% | .62% |
| Expenses net of fee waivers, if any | - %G | - %G | - %G | .27% | .62% |
| Expenses net of all reductions | - %G | - %G | - %G | .26% | .62% |
| Net investment income (loss) | 2.54%B | 2.49% | 2.47% | 2.29% | 2.21% |
| Supplemental Data | |||||
| Net assets, end of period (000 omitted) | $8,971,710 | $7,556,991 | $7,742,285 | $7,430,718 | $5,063,707 |
| Portfolio turnover rateH | 75% | 47%I | 40%J | 74%I | 42% |
A Calculated based on average shares outstanding during the period.
B Net investment income per share reflects one or more large, non-recurring dividend(s) which amounted to $.04 per share. Excluding such non-recurring dividend(s), the ratio of net investment income (loss) to average net assets would have been 2.25%.
C The amounts shown reflect certain reclassifications related to book to tax differences that were made in the year shown.
D Total returns would have been lower if certain expenses had not been reduced during the applicable periods shown.
E Fees and expenses of any underlying mutual funds or exchange-traded funds (ETFs) are not included in the Fund's expense ratio. The Fund indirectly bears its proportionate share of these expenses. For additional expense information related to investments in Fidelity Central Funds, please refer to the "Investments in Fidelity Central Funds" note found in the Notes to Financial Statements section of the most recent Annual or Semi-Annual report.
F Expense ratios reflect operating expenses of the class. Expenses before reductions do not reflect amounts reimbursed, waived, or reduced through arrangements with the investment advisor, brokerage services, or other offset arrangements, if applicable, and do not represent the amount paid by the class during periods when reimbursements, waivers or reductions occur.
G Amount represents less than .005%.
H Amount does not include the portfolio activity of any underlying mutual funds or exchange-traded funds (ETFs).
I Portfolio turnover rate excludes securities received or delivered in-kind.
J The portfolio turnover rate does not include the assets acquired in the merger.
See accompanying notes which are an integral part of the financial statements.
Notes to Financial Statements
For the period ended January 31, 2021
1. Organization.
Fidelity Series All-Sector Equity Fund, Fidelity Series Stock Selector Large Cap Value Fund and Fidelity Series Value Discovery Fund (the Funds) are funds of Fidelity Devonshire Trust (the Trust). The Trust is registered under the Investment Company Act of 1940, as amended (the 1940 Act), as an open-end management investment company organized as a Massachusetts business trust. Each Fund is authorized to issue an unlimited number of shares. Shares are offered only to certain other Fidelity funds and Fidelity managed 529 plans.
2. Investments in Fidelity Central Funds.
The Funds invest in Fidelity Central Funds, which are open-end investment companies generally available only to other investment companies and accounts managed by the investment adviser and its affiliates. The Funds' Schedules of Investments list each of the Fidelity Central Funds held as of period end, if any, as an investment of each Fund, but do not include the underlying holdings of each Fidelity Central Fund. As an Investing Fund, each Fund indirectly bears its proportionate share of the expenses of the underlying Fidelity Central Funds.
The Money Market Central Funds seek preservation of capital and current income and are managed by the investment adviser. Annualized expenses of the Money Market Central Funds as of their most recent shareholder report date ranged from less than .005% to .01%.
A complete unaudited list of holdings for each Fidelity Central Fund is available upon request or at the Securities and Exchange Commission (the SEC) website at www.sec.gov. In addition, the financial statements of the Fidelity Central Funds, which are not covered by the Funds' Report of Independent Registered Public Accounting Firm, are available on the SEC website or upon request.
3. Significant Accounting Policies.
Each Fund is an investment company and applies the accounting and reporting guidance of the Financial Accounting Standards Board (FASB) Accounting Standards Codification Topic 946 Financial Services - Investment Companies. The financial statements have been prepared in conformity with accounting principles generally accepted in the United States of America (GAAP), which require management to make certain estimates and assumptions at the date of the financial statements. Actual results could differ from those estimates. Subsequent events, if any, through the date that the financial statements were issued have been evaluated in the preparation of the financial statements. The following summarizes the significant accounting policies of the Funds:
Investment Valuation. Investments are valued as of 4:00 p.m. Eastern time on the last calendar day of the period. The Board of Trustees (the Board) has delegated the day to day responsibility for the valuation of each Fund's investments to the Fair Value Committee (the Committee) established by each Fund's investment adviser. In accordance with valuation policies and procedures approved by the Board, each Fund attempts to obtain prices from one or more third party pricing vendors or brokers to value its investments. When current market prices, quotations or currency exchange rates are not readily available or reliable, investments will be fair valued in good faith by the Committee, in accordance with procedures adopted by the Board. Factors used in determining fair value vary by investment type and may include market or investment specific events, changes in interest rates and credit quality. The frequency with which these procedures are used cannot be predicted and they may be utilized to a significant extent. The Committee oversees each Fund's valuation policies and procedures and reports to the Board on the Committee's activities and fair value determinations. The Board monitors the appropriateness of the procedures used in valuing each Fund's investments and ratifies the fair value determinations of the Committee.
Each Fund categorizes the inputs to valuation techniques used to value its investments into a disclosure hierarchy consisting of three levels as shown below:
- Level 1 – quoted prices in active markets for identical investments
- Level 2 – other significant observable inputs (including quoted prices for similar investments, interest rates, prepayment speeds, etc.)
- Level 3 – unobservable inputs (including the Fund's own assumptions based on the best information available)
Valuation techniques used to value each Fund's investments by major category are as follows:
Equity securities, including restricted securities, for which market quotations are readily available, are valued at the last reported sale price or official closing price as reported by a third party pricing vendor on the primary market or exchange on which they are traded and are categorized as Level 1 in the hierarchy. In the event there were no sales during the day or closing prices are not available, securities are valued at the last quoted bid price or may be valued using the last available price and are generally categorized as Level 2 in the hierarchy. For foreign equity securities, when market or security specific events arise, comparisons to the valuation of American Depositary Receipts (ADRs), futures contracts, Exchange-Traded Funds (ETFs) and certain indexes as well as quoted prices for similar securities may be used and would be categorized as Level 2 in the hierarchy. For equity securities, including restricted securities, where observable inputs are limited, assumptions about market activity and risk are used and these securities may be categorized as Level 3 in the hierarchy.
Debt securities, including restricted securities, are valued based on evaluated prices received from third party pricing vendors or from brokers who make markets in such securities. U.S. government and government agency obligations are valued by pricing vendors who utilize matrix pricing which considers yield or price of bonds of comparable quality, coupon, maturity and type or by broker-supplied prices. When independent prices are unavailable or unreliable, debt securities may be valued utilizing pricing methodologies which consider similar factors that would be used by third party pricing vendors. Debt securities are generally categorized as Level 2 in the hierarchy but may be Level 3 depending on the circumstances. ETFs are valued at their last sale price or official closing price as reported by a third party pricing vendor on the primary market or exchange on which they are traded and are categorized as Level 1 in the hierarchy. In the event there were no sales during the day but the exchange reports a closing bid level, ETFs are valued at the closing bid and would be categorized as Level 1 in the hierarchy. In the event there was no closing bid, ETFs may be valued by another method that the Board believes reflects fair value in accordance with the Board's fair value pricing policies and may be categorized as Level 2 in the hierarchy.
Futures contracts are valued at the settlement price established each day by the board of trade or exchange on which they are traded and are categorized as Level 1 in the hierarchy. Investments in open-end mutual funds, including the Fidelity Central Funds, are valued at their closing net asset value (NAV) each business day and are categorized as Level 1 in the hierarchy.
Changes in valuation techniques may result in transfers in or out of an assigned level within the disclosure hierarchy. The aggregate value of investments by input level as of January 31, 2021 is included at the end of each Fund's Schedule of Investments.
Foreign Currency. Certain Funds may use foreign currency contracts to facilitate transactions in foreign-denominated securities. Gains and losses from these transactions may arise from changes in the value of the foreign currency or if the counterparties do not perform under the contracts' terms.
Foreign-denominated assets, including investment securities, and liabilities are translated into U.S. dollars at the exchange rates at period end. Purchases and sales of investment securities, income and dividends received, and expenses denominated in foreign currencies are translated into U.S. dollars at the exchange rate in effect on the transaction date.
The effects of exchange rate fluctuations on investments are included with the net realized and unrealized gain (loss) on investment securities. Other foreign currency transactions resulting in realized and unrealized gain (loss) are disclosed separately.
Investment Transactions and Income. For financial reporting purposes, the Funds' investment holdings and NAV include trades executed through the end of the last business day of the period. The NAV per share for processing shareholder transactions is calculated as of the close of business of the New York Stock Exchange (NYSE), normally 4:00 p.m. Eastern time and includes trades executed through the end of the prior business day. Gains and losses on securities sold are determined on the basis of identified cost and for certain Funds include proceeds received from litigation. Dividend income is recorded on the ex-dividend date, except for certain dividends from foreign securities where the ex-dividend date may have passed, which are recorded as soon as the Funds are informed of the ex-dividend date. Non-cash dividends included in dividend income, if any, are recorded at the fair market value of the securities received. Income and capital gain distributions from Fidelity Central Funds, if any, are recorded on the ex-dividend date. Certain distributions received by the Funds represent a return of capital or capital gain. The Funds determine the components of these distributions subsequent to the ex-dividend date, based upon receipt of tax filings or other correspondence relating to the underlying investment. These distributions are recorded as a reduction of cost of investments and/or as a realized gain. Large, non-recurring dividends recognized by the Funds are presented separately on the Statement of Operations as "Special Dividends" and the impact of these dividends is presented in the Financial Highlights. Interest income is accrued as earned and includes coupon interest and amortization of premium and accretion of discount on debt securities as applicable. Investment income is recorded net of foreign taxes withheld where recovery of such taxes is uncertain.
Expenses. Expenses directly attributable to a fund are charged to that fund. Expenses attributable to more than one fund are allocated among the respective funds on the basis of relative net assets or other appropriate methods. Expense estimates are accrued in the period to which they relate and adjustments are made when actual amounts are known.
Income Tax Information and Distributions to Shareholders. Each year, each Fund intends to qualify as a regulated investment company under Subchapter M of the Internal Revenue Code, including distributing substantially all of its taxable income and realized gains. As a result, no provision for U.S. Federal income taxes is required. As of January 31, 2021, each Fund did not have any unrecognized tax benefits in the financial statements; nor is each Fund aware of any tax positions for which it is reasonably possible that the total amounts of unrecognized tax benefits will significantly change in the next twelve months. Each Fund files a U.S. federal tax return, in addition to state and local tax returns as required. Each Fund's federal income tax returns are subject to examination by the Internal Revenue Service (IRS) for a period of three fiscal years after they are filed. State and local tax returns may be subject to examination for an additional fiscal year depending on the jurisdiction. Foreign taxes are provided for based on each Fund's understanding of the tax rules and rates that exist in the foreign markets in which it invests.
Distributions are declared and recorded on the ex-dividend date. Income and capital gain distributions are determined in accordance with income tax regulations, which may differ from GAAP.
Capital accounts within the financial statements are adjusted for permanent book-tax differences. These adjustments have no impact on net assets or the results of operations. Capital accounts are not adjusted for temporary book-tax differences which will reverse in a subsequent period.
Book-tax differences are primarily due to futures contracts, foreign currency transactions, certain foreign taxes, passive foreign investment companies (PFIC), market discount, partnerships, capital loss carryforwards, losses deferred due to wash sales and excise tax regulations.
As of period end, the cost and unrealized appreciation (depreciation) in securities, and derivatives if applicable, for federal income tax purposes were as follows for each Fund:
| Tax cost | Gross unrealized appreciation | Gross unrealized depreciation | Net unrealized appreciation (depreciation) | |
| Fidelity Series All-Sector Equity Fund | $2,282,335,324 | $1,487,677,144 | $(53,130,805) | $1,434,546,339 |
| Fidelity Series Stock Selector Large Cap Value Fund | 9,072,807,713 | 2,128,855,185 | (241,070,447) | 1,887,784,738 |
| Fidelity Series Value Discovery Fund | 7,386,016,401 | 1,898,784,838 | (224,197,138) | 1,674,587,700 |
The tax-based components of distributable earnings as of period end were as follows for each Fund:
| Undistributed ordinary income | Undistributed long-term capital gain | Capital loss carryforward | Net unrealized appreciation (depreciation) on securities and other investments | |
| Fidelity Series All-Sector Equity Fund | $67,796,363 | $110,980,282 | $– | $1,434,481,797 |
| Fidelity Series Stock Selector Large Cap Value Fund | 10,102,389 | – | (123,937,337) | 1,887,803,686 |
| Fidelity Series Value Discovery Fund | 8,145,185 | – | (235,113,596) | 1,674,667,739 |
Capital loss carryforwards are only available to offset future capital gains of the Funds to the extent provided by regulations and may be limited. The capital loss carryforward information presented below, including any applicable limitation, is estimated as of fiscal period end and is subject to adjustment.
| No expiration | |||
| Short-term | Long-term | Total capital loss carryfoward | |
| Fidelity Series Stock Selector Large Cap Value Fund | $(96,982,484) | $(26,954,853) | $(123,937,337) |
| Fidelity Series Value Discovery Fund | (18,792,169) | (216,321,427) | (235,113,596) |
The tax character of distributions paid was as follows:
| January 31, 2021 | |||
| Ordinary Income | Long-term Capital Gains | Total | |
| Fidelity Series All-Sector Equity Fund | $73,473,264 | $367,044,931 | $440,518,195 |
| Fidelity Series Stock Selector Large Cap Value Fund | 281,407,788 | 121,903,045 | 403,310,833 |
| Fidelity Series Value Discovery Fund | 184,315,738 | 75,629,368 | 259,945,106 |
| January 31, 2020 | |||
| Ordinary Income | Long-term Capital Gains | Total | |
| Fidelity Series All-Sector Equity Fund | $69,838,128 | $231,463,273 | $301,301,401 |
| Fidelity Series Stock Selector Large Cap Value Fund | 243,933,376 | 326,738,088 | 570,671,464 |
| Fidelity Series Value Discovery Fund | 267,386,243 | 29,149,024 | 296,535,267 |
Restricted Securities (including Private Placements). The Funds may invest in securities that are subject to legal or contractual restrictions on resale. These securities generally may be resold in transactions exempt from registration or to the public if the securities are registered. Disposal of these securities may involve time-consuming negotiations and expense, and prompt sale at an acceptable price may be difficult. Information regarding restricted securities is included at the end of each applicable Fund's Schedule of Investments.
Consolidated Subsidiary. The Funds included in the table below hold certain investments through a wholly-owned subsidiary ("Subsidiary"), which may be subject to federal and state taxes upon disposition.
As of period end, investments in Subsidiaries were as follows:
| $ Amount | % of Net Assets | |
| Fidelity Series Value Discovery Fund | 16,929,290 | .19 |
The financial statements have been consolidated to include the Subsidiary accounts where applicable. Accordingly, all inter-company transactions and balances have been eliminated.
At period end, any estimated tax liability for these investments is presented as "Deferred taxes" in the Statement of Assets and Liabilities and included in "Change in net unrealized appreciation (depreciation) on investment securities" in the Statement of Operations. The tax liability incurred may differ materially depending on conditions when these investments are disposed. Any cash held by a Subsidiary is restricted as to its use and is presented as "Restricted cash" in the Statement of Assets and Liabilities, if applicable.
4. Derivative Instruments.
Risk Exposures and the Use of Derivative Instruments. The Funds' investment objective allows the Funds to enter into various types of derivative contracts, including futures contracts. Derivatives are investments whose value is primarily derived from underlying assets, indices or reference rates and may be transacted on an exchange or over-the-counter (OTC). Derivatives may involve a future commitment to buy or sell a specified asset based on specified terms, to exchange future cash flows at periodic intervals based on a notional principal amount, or for one party to make one or more payments upon the occurrence of specified events in exchange for periodic payments from the other party.
The Funds used derivatives to increase returns and to manage exposure to certain risks as defined below. The success of any strategy involving derivatives depends on analysis of numerous economic factors, and if the strategies for investment do not work as intended, the Funds may not achieve their objectives.
The Funds' use of derivatives increased or decreased their exposure to the following risk:
| Equity Risk | Equity risk relates to the fluctuations in the value of financial instruments as a result of changes in market prices (other than those arising from interest rate risk or foreign exchange risk), whether caused by factors specific to an individual investment, its issuer, or all factors affecting all instruments traded in a market or market segment. |
The Funds are also exposed to additional risks from investing in derivatives, such as liquidity risk and counterparty credit risk. Liquidity risk is the risk that the Funds will be unable to close out the derivative in the open market in a timely manner. Counterparty credit risk is the risk that the counterparty will not be able to fulfill its obligation to the Funds. Counterparty credit risk related to exchange-traded futures contracts may be mitigated by the protection provided by the exchange on which they trade.
Investing in derivatives may involve greater risks than investing in the underlying assets directly and, to varying degrees, may involve risk of loss in excess of any initial investment and collateral received and amounts recognized in the Statement of Assets and Liabilities. In addition, there may be the risk that the change in value of the derivative contract does not correspond to the change in value of the underlying instrument.
Futures Contracts. A futures contract is an agreement between two parties to buy or sell a specified underlying instrument for a fixed price at a specified future date. The Funds used futures contracts to manage their exposure to the stock market.
Upon entering into a futures contract, a fund is required to deposit either cash or securities (initial margin) with a clearing broker in an amount equal to a certain percentage of the face value of the contract. Futures contracts are marked-to-market daily and subsequent daily payments (variation margin) are made or received by a fund depending on the daily fluctuations in the value of the futures contracts and are recorded as unrealized appreciation or (depreciation). This receivable and/or payable, if any, is included in daily variation margin on futures contracts in the Statement of Assets and Liabilities. Realized gain or (loss) is recorded upon the expiration or closing of a futures contract. The net realized gain (loss) and change in net unrealized appreciation (depreciation) on futures contracts during the period is presented in the Statement of Operations.
Any open futures contracts at period end are presented in the Schedule of Investments under the caption "Futures Contracts". The notional amount at value reflects each contract's exposure to the underlying instrument or index at period end and is representative of volume of activity during the period. Securities deposited to meet initial margin requirements are identified in the Schedule of Investments.
5. Purchases and Sales of Investments.
Purchases and sales of securities, other than short-term securities, are noted in the table below.
| Purchases ($) | Sales ($) | |
| Fidelity Series All-Sector Equity Fund | 2,113,015,660 | 2,593,467,977 |
| Fidelity Series Stock Selector Large Cap Value Fund | 9,273,290,059 | 8,678,776,776 |
| Fidelity Series Value Discovery Fund | 6,383,238,460 | 5,613,179,204 |
6. Fees and Other Transactions with Affiliates.
Management Fee. Fidelity Management & Research Company LLC (the investment adviser) and its affiliates provide the Funds with investment management related services for which the Funds do not pay a management fee. Under the management contract, the investment adviser or an affiliate pays all ordinary operating expenses of the Funds, except custody fees, fees and expenses of the independent Trustees, and certain miscellaneous expenses such as proxy and shareholder meeting expenses.
Brokerage Commissions. A portion of portfolio transactions were placed with brokerage firms which are affiliates of the investment adviser. Brokerage commissions are included in net realized gain (loss) and change in net unrealized appreciation (depreciation) in the Statement of Operations. The commissions paid to these affiliated firms were as follows:
| Amount | |
| Fidelity Series All-Sector Equity Fund | $58,921 |
| Fidelity Series Stock Selector Large Cap Value Fund | 212,076 |
| Fidelity Series Value Discovery Fund | 155,458 |
Interfund Lending Program. Pursuant to an Exemptive Order issued by the SEC, each Fund, along with other registered investment companies having management contracts with Fidelity Management & Research Company LLC (FMR), or other affiliated entities of FMR, may participate in an interfund lending program. This program provides an alternative credit facility allowing each Fund to borrow from, or lend money to, other participating affiliated funds. At period end, there were no interfund loans outstanding. Activity in this program during the period for which loans were outstanding was as follows:
| Borrower or Lender | Average Loan Balance | Weighted Average Interest Rate | Interest Expense | |
| Fidelity Series All-Sector Equity Fund | Borrower | $45,851,667 | .57% | $2,185 |
| Fidelity Series Stock Selector Large Cap Value Fund | Borrower | $153,185,000 | .33% | $1,404 |
| Fidelity Series Value Discovery Fund | Borrower | $38,092,000 | .44% | $1,389 |
Interfund Trades. Funds may purchase from or sell securities to other Fidelity Funds under procedures adopted by the Board. The procedures have been designed to ensure these interfund trades are executed in accordance with Rule 17a-7 of the 1940 Act. Interfund trades are included within the respective purchases and sales amounts shown in the Purchases and Sales of Investments note and are noted in the table below.
| Purchases ($) | Sales ($) | |
| Fidelity Series All-Sector Equity Fund | 156,364,781 | 183,526,196 |
| Fidelity Series Stock Selector Large Cap Value Fund | 732,020,144 | 602,648,567 |
| Fidelity Series Value Discovery Fund | 679,154,333 | 376,307,624 |
Prior Fiscal Year Affiliated Exchanges In-Kind. During the prior period, Fidelity Series Stock Selector Large Cap Value Fund and Fidelity Series Value Discovery Fund received investments and cash in exchange for shares of the Fund. The amount of in-kind exchanges is included in the Fund's share transactions in the accompanying Statement of Changes in Net Assets as well as the Notes to Financial Statements.
| Shares | Value of investments and cash | |
| Fidelity Series Stock Selector Large Cap Value Fund | 37,578,396 | $463,341,627 |
| Fidelity Series Value Discovery Fund | 23,888,120 | $321,493,726 |
Other. During the period, the investment adviser reimbursed the Funds for certain losses as follows:
| Amount | |
| Fidelity Series Value Discovery Fund | $ 1,146 |
7. Committed Line of Credit.
Certain Funds participate with other funds managed by the investment adviser or an affiliate in a $4.25 billion credit facility (the "line of credit") to be utilized for temporary or emergency purposes to fund shareholder redemptions or for other short-term liquidity purposes. The participating funds have agreed to pay commitment fees on their pro-rata portion of the line of credit, which are reflected in Miscellaneous expenses on the Statement of Operations, and are listed below. Effective during January 2021, commitment fees are borne by the investment advisor.
| Amount | |
| Fidelity Series All-Sector Equity Fund | $7,627 |
| Fidelity Series Stock Selector Large Cap Value Fund | 21,180 |
| Fidelity Series Value Discovery Fund | 16,835 |
During the period, there were no borrowings on this line of credit.
8. Security Lending.
Funds lend portfolio securities from time to time in order to earn additional income. Lending agents are used, including National Financial Services (NFS), an affiliate of the investment adviser. Pursuant to a securities lending agreement, NFS will receive a fee, which is capped at 9.9% of a fund's daily lending revenue, for its services as lending agent. A fund may lend securities to certain qualified borrowers, including NFS. On the settlement date of the loan, a fund receives collateral (in the form of U.S. Treasury obligations, letters of credit and/or cash) against the loaned securities and maintains collateral in an amount not less than 100% of the market value of the loaned securities during the period of the loan. The market value of the loaned securities is determined at the close of business of a fund and any additional required collateral is delivered to a fund on the next business day. A fund or borrower may terminate the loan at any time, and if the borrower defaults on its obligation to return the securities loaned because of insolvency or other reasons, a fund may apply collateral received from the borrower against the obligation. A fund may experience delays and costs in recovering the securities loaned. Any cash collateral received is invested in the Fidelity Securities Lending Cash Central Fund. Any loaned securities are identified as such in the Schedule of Investments, and the value of loaned securities and cash collateral at period end, as applicable, are presented in the Statement of Assets and Liabilities. Security lending income represents the income earned on investing cash collateral, less rebates paid to borrowers and any lending agent fees associated with the loan, plus any premium payments received for lending certain types of securities. Security lending income is presented in the Statement of Operations as a component of income from Fidelity Central Funds. Affiliated security lending activity, if any, was as follows:
| Total Security Lending Income Fees Paid to NFS | Security Lending Income From Securities Loaned to NFS | Value of Securities Loaned to NFS at Period End | |
| Fidelity Series All-Sector Equity Fund | $2,442 | $– | $– |
| Fidelity Series Stock Selector Large Cap Value Fund | $6,160 | $– | $– |
| Fidelity Series Value Discovery Fund | $61,068 | $1 | $– |
9. Expense Reductions.
The investment adviser contractually agreed to reimburse each Fund to the extent annual operating expenses exceeded certain levels of average net assets as noted in the table below. This reimbursement will remain in place through May 31, 2024. Some expenses, for example the compensation of the independent Trustees, and certain other expenses such as interest expense, are excluded from this reimbursement.
The following Funds were in reimbursement during the period:
| Expense Limitations | Reimbursement | |
| Fidelity Series Value Discovery Fund | .003%(a) | $19,487 |
(a) Expense limitation effective August 1, 2020. Prior to August 1, 2020 the limitation was .014%.
In addition, through arrangements with each applicable Fund's custodian, credits realized as a result of certain uninvested cash balances were used to reduce each applicable Fund's expenses. All of the applicable expense reductions are noted in the table below.
| Custodian credits | |
| Fidelity Series Value Discovery Fund | $2,047 |
10. Other.
The Funds' organizational documents provide former and current trustees and officers with a limited indemnification against liabilities arising in connection with the performance of their duties to the Funds. In the normal course of business, the Funds may also enter into contracts that provide general indemnifications. The Funds' maximum exposure under these arrangements is unknown as this would be dependent on future claims that may be made against the Funds. The risk of material loss from such claims is considered remote.
At the end of the period, mutual funds and accounts managed by the investment adviser or its affiliates were the owners of record of all of the outstanding shares of the Funds.
11. Coronavirus (COVID-19) Pandemic.
An outbreak of COVID-19 first detected in China during December 2019 has since spread globally and was declared a pandemic by the World Health Organization during March 2020. Developments that disrupt global economies and financial markets, such as the COVID-19 pandemic, may magnify factors that affect the Funds' performance.
Report of Independent Registered Public Accounting Firm
To the Board of Trustees of Fidelity Devonshire Trust and Shareholders of Fidelity Series All-Sector Equity Fund and Fidelity Series Value Discovery Fund
Opinion on the Financial Statements and Financial Highlights
We have audited the accompanying statements of assets and liabilities of Fidelity Series All-Sector Equity Fund and Fidelity Series Value Discovery Fund (the "Funds"), each a fund of Fidelity Devonshire Trust, including the schedules of investments, as of January 31, 2021, the related statements of operations for the year then ended, the statements of changes in net assets for each of the two years in the period then ended, the financial highlights for each of the five years in the period then ended, and the related notes. In our opinion, the financial statements and financial highlights present fairly, in all material respects, the financial position of each of the Funds as of January 31, 2021, and the results of their operations for the year then ended, the changes in their net assets for each of the two years in the period then ended, and the financial highlights for each of the five years in the period then ended in conformity with accounting principles generally accepted in the United States of America.
Basis for Opinion
These financial statements and financial highlights are the responsibility of the Funds’ management. Our responsibility is to express an opinion on the Funds’ financial statements and financial highlights based on our audits. We are a public accounting firm registered with the Public Company Accounting Oversight Board (United States) (PCAOB) and are required to be independent with respect to the Funds in accordance with the U.S. federal securities laws and the applicable rules and regulations of the Securities and Exchange Commission and the PCAOB.
We conducted our audits in accordance with the standards of the PCAOB. Those standards require that we plan and perform the audit to obtain reasonable assurance about whether the financial statements and financial highlights are free of material misstatement, whether due to error or fraud. The Funds are not required to have, nor were we engaged to perform, an audit of their internal control over financial reporting. As part of our audits we are required to obtain an understanding of internal control over financial reporting but not for the purpose of expressing an opinion on the effectiveness of the Funds’ internal control over financial reporting. Accordingly, we express no such opinion.
Our audits included performing procedures to assess the risks of material misstatement of the financial statements and financial highlights, whether due to error or fraud, and performing procedures that respond to those risks. Such procedures included examining, on a test basis, evidence regarding the amounts and disclosures in the financial statements and financial highlights. Our audits also included evaluating the accounting principles used and significant estimates made by management, as well as evaluating the overall presentation of the financial statements and financial highlights. Our procedures included confirmation of securities owned as of January 31, 2021, by correspondence with the custodian and brokers; when replies were not received from brokers, we performed other auditing procedures. We believe that our audits provide a reasonable basis for our opinion.
/s/ Deloitte & Touche LLP
Boston, Massachusetts
March 12, 2021
We have served as the auditor of one or more of the Fidelity investment companies since 1999.
Report of Independent Registered Public Accounting Firm
To the Board Trustees of Fidelity Devonshire Trust and the Shareholders of Fidelity Series Stock Selector Large Cap Value Fund
Opinion on the Financial Statements
We have audited the accompanying statement of assets and liabilities, including the schedule of investments, of Fidelity Series Stock Selector Large Cap Value Fund (one of the funds constituting Fidelity Devonshire Trust, referred to hereafter as the “Fund”) as of January 31, 2021, the related statement of operations for the year ended January 31, 2021, the statement of changes in net assets for each of the two years in the period ended January 31, 2021, including the related notes, and the financial highlights for each of the five years in the period ended January 31, 2021 (collectively referred to as the “financial statements”). In our opinion, the financial statements present fairly, in all material respects, the financial position of the Fund as of January 31, 2021, the results of its operations for the year then ended, the changes in its net assets for each of the two years in the period ended January 31, 2021 and the financial highlights for each of the five years in the period ended January 31, 2021 in conformity with accounting principles generally accepted in the United States of America.
Basis for Opinion
These financial statements are the responsibility of the Fund’s management. Our responsibility is to express an opinion on the Fund’s financial statements based on our audits. We are a public accounting firm registered with the Public Company Accounting Oversight Board (United States) (PCAOB) and are required to be independent with respect to the Fund in accordance with the U.S. federal securities laws and the applicable rules and regulations of the Securities and Exchange Commission and the PCAOB.
We conducted our audits of these financial statements in accordance with the standards of the PCAOB. Those standards require that we plan and perform the audit to obtain reasonable assurance about whether the financial statements are free of material misstatement, whether due to error or fraud.
Our audits included performing procedures to assess the risks of material misstatement of the financial statements, whether due to error or fraud, and performing procedures that respond to those risks. Such procedures included examining, on a test basis, evidence regarding the amounts and disclosures in the financial statements. Our audits also included evaluating the accounting principles used and significant estimates made by management, as well as evaluating the overall presentation of the financial statements. Our procedures included confirmation of securities owned as of January 31, 2021 by correspondence with the custodian and brokers; when replies were not received from brokers, we performed other auditing procedures. We believe that our audits provide a reasonable basis for our opinion.
/s/ PricewaterhouseCoopers LLP
Boston, Massachusetts
March 12, 2021
We have served as the auditor of one or more investment companies in the Fidelity group of funds since 1932.
Trustees and Officers
The Trustees, Members of the Advisory Board (if any), and officers of the trust and funds, as applicable, are listed below. The Board of Trustees governs each fund and is responsible for protecting the interests of shareholders. The Trustees are experienced executives who meet periodically throughout the year to oversee each fund's activities, review contractual arrangements with companies that provide services to each fund, oversee management of the risks associated with such activities and contractual arrangements, and review each fund's performance. Each of the Trustees oversees 309 funds.
The Trustees hold office without limit in time except that (a) any Trustee may resign; (b) any Trustee may be removed by written instrument, signed by at least two-thirds of the number of Trustees prior to such removal; (c) any Trustee who requests to be retired or who has become incapacitated by illness or injury may be retired by written instrument signed by a majority of the other Trustees; and (d) any Trustee may be removed at any special meeting of shareholders by a two-thirds vote of the outstanding voting securities of the trust. Each Trustee who is not an interested person (as defined in the 1940 Act) of the trust and the funds is referred to herein as an Independent Trustee. Each Independent Trustee shall retire not later than the last day of the calendar year in which his or her 75th birthday occurs. The Independent Trustees may waive this mandatory retirement age policy with respect to individual Trustees. Officers and Advisory Board Members hold office without limit in time, except that any officer or Advisory Board Member may resign or may be removed by a vote of a majority of the Trustees at any regular meeting or any special meeting of the Trustees. Except as indicated, each individual has held the office shown or other offices in the same company for the past five years.
Each fund’s Statement of Additional Information (SAI) includes more information about the Trustees. To request a free copy, call Fidelity at 1-800-544-8544.
Experience, Skills, Attributes, and Qualifications of the Trustees. The Governance and Nominating Committee has adopted a statement of policy that describes the experience, qualifications, attributes, and skills that are necessary and desirable for potential Independent Trustee candidates (Statement of Policy). The Board believes that each Trustee satisfied at the time he or she was initially elected or appointed a Trustee, and continues to satisfy, the standards contemplated by the Statement of Policy. The Governance and Nominating Committee also engages professional search firms to help identify potential Independent Trustee candidates who have the experience, qualifications, attributes, and skills consistent with the Statement of Policy. From time to time, additional criteria based on the composition and skills of the current Independent Trustees, as well as experience or skills that may be appropriate in light of future changes to board composition, business conditions, and regulatory or other developments, have also been considered by the professional search firms and the Governance and Nominating Committee. In addition, the Board takes into account the Trustees' commitment and participation in Board and committee meetings, as well as their leadership of standing and ad hoc committees throughout their tenure.
In determining that a particular Trustee was and continues to be qualified to serve as a Trustee, the Board has considered a variety of criteria, none of which, in isolation, was controlling. The Board believes that, collectively, the Trustees have balanced and diverse experience, qualifications, attributes, and skills, which allow the Board to operate effectively in governing each fund and protecting the interests of shareholders. Information about the specific experience, skills, attributes, and qualifications of each Trustee, which in each case led to the Board's conclusion that the Trustee should serve (or continue to serve) as a trustee of the funds, is provided below.
Board Structure and Oversight Function. Robert A. Lawrence is an interested person and currently serves as Acting Chairman. The Trustees have determined that an interested Chairman is appropriate and benefits shareholders because an interested Chairman has a personal and professional stake in the quality and continuity of services provided to the funds. Independent Trustees exercise their informed business judgment to appoint an individual of their choosing to serve as Chairman, regardless of whether the Trustee happens to be independent or a member of management. The Independent Trustees have determined that they can act independently and effectively without having an Independent Trustee serve as Chairman and that a key structural component for assuring that they are in a position to do so is for the Independent Trustees to constitute a substantial majority for the Board. The Independent Trustees also regularly meet in executive session. David M. Thomas serves as Lead Independent Trustee and as such (i) acts as a liaison between the Independent Trustees and management with respect to matters important to the Independent Trustees and (ii) with management prepares agendas for Board meetings.
Fidelity® funds are overseen by different Boards of Trustees. The funds' Board oversees Fidelity's high income and certain equity funds, and other Boards oversee Fidelity's investment-grade bond, money market, asset allocation, and other equity funds. The asset allocation funds may invest in Fidelity® funds overseen by the funds' Board. The use of separate Boards, each with its own committee structure, allows the Trustees of each group of Fidelity® funds to focus on the unique issues of the funds they oversee, including common research, investment, and operational issues. On occasion, the separate Boards establish joint committees to address issues of overlapping consequences for the Fidelity® funds overseen by each Board.
The Trustees operate using a system of committees to facilitate the timely and efficient consideration of all matters of importance to the Trustees, each fund, and fund shareholders and to facilitate compliance with legal and regulatory requirements and oversight of the funds' activities and associated risks. The Board, acting through its committees, has charged FMR and its affiliates with (i) identifying events or circumstances the occurrence of which could have demonstrably adverse effects on the funds' business and/or reputation; (ii) implementing processes and controls to lessen the possibility that such events or circumstances occur or to mitigate the effects of such events or circumstances if they do occur; and (iii) creating and maintaining a system designed to evaluate continuously business and market conditions in order to facilitate the identification and implementation processes described in (i) and (ii) above. Because the day-to-day operations and activities of the funds are carried out by or through FMR, its affiliates, and other service providers, the funds' exposure to risks is mitigated but not eliminated by the processes overseen by the Trustees. While each of the Board's committees has responsibility for overseeing different aspects of the funds' activities, oversight is exercised primarily through the Operations, Audit, and Compliance Committees. Appropriate personnel, including but not limited to the funds' Chief Compliance Officer (CCO), FMR's internal auditor, the independent accountants, the funds' Treasurer and portfolio management personnel, make periodic reports to the Board's committees, as appropriate, including an annual review of Fidelity's risk management program for the Fidelity® funds. The responsibilities of each standing committee, including their oversight responsibilities, are described further under "Standing Committees of the Trustees."
Interested Trustees*:
Correspondence intended for a Trustee who is an interested person may be sent to Fidelity Investments, 245 Summer Street, Boston, Massachusetts 02210.
Name, Year of Birth; Principal Occupations and Other Relevant Experience+
Bettina Doulton (1964)
Year of Election or Appointment: 2020
Trustee
Ms. Doulton also serves as Trustee of other Fidelity® funds. Prior to her retirement, Ms. Doulton served in a variety of positions at Fidelity Investments, including as a managing director of research (2006-2007), portfolio manager to certain Fidelity® funds (1993-2005), equity analyst and portfolio assistant (1990-1993), and research assistant (1987-1990). Ms. Doulton currently owns and operates Phi Builders + Architects and Cellardoor Winery. Previously, Ms. Doulton served as a member of the Board of Brown Capital Management, LLC (2013-2018).
Robert A. Lawrence (1952)
Year of Election or Appointment: 2020
Trustee
Acting Chairman of the Board of Trustees
Mr. Lawrence also serves as Trustee of other funds. Previously, Mr. Lawrence served as a Member of the Advisory Board of certain funds. Prior to his retirement in 2008, Mr. Lawrence served as Vice President of certain Fidelity® funds (2006-2008), Senior Vice President, Head of High Income Division of Fidelity Management & Research Company (investment adviser firm, 2006-2008), and President of Fidelity Strategic Investments (investment adviser firm, 2002-2005).
* Determined to be an “Interested Trustee” by virtue of, among other things, his or her affiliation with the trust or various entities under common control with FMR.
+ The information includes the Trustee's principal occupation during the last five years and other information relating to the experience, attributes, and skills relevant to the Trustee's qualifications to serve as a Trustee, which led to the conclusion that the Trustee should serve as a Trustee for each fund.
Independent Trustees:
Correspondence intended for an Independent Trustee may be sent to Fidelity Investments, P.O. Box 55235, Boston, Massachusetts 02205-5235.
Name, Year of Birth; Principal Occupations and Other Relevant Experience+
Dennis J. Dirks (1948)
Year of Election or Appointment: 2005
Trustee
Mr. Dirks also serves as Trustee of other Fidelity® funds. Prior to his retirement in May 2003, Mr. Dirks served as Chief Operating Officer and as a member of the Board of The Depository Trust & Clearing Corporation (financial markets infrastructure), President, Chief Operating Officer and a member of the Board of The Depository Trust Company (DTC), President and a member of the Board of the National Securities Clearing Corporation (NSCC), Chief Executive Officer and a member of the Board of the Government Securities Clearing Corporation and Chief Executive Officer and a member of the Board of the Mortgage-Backed Securities Clearing Corporation. Mr. Dirks currently serves as a member of the Finance Committee (2016-present) and Board (2017-present) and is Treasurer (2018-present) of the Asolo Repertory Theatre.
Donald F. Donahue (1950)
Year of Election or Appointment: 2018
Trustee
Mr. Donahue also serves as Trustee of other Fidelity® funds. Mr. Donahue serves as President and Chief Executive Officer of Miranda Partners, LLC (risk consulting for the financial services industry, 2012-present). Previously, Mr. Donahue served as Chief Executive Officer (2006-2012), Chief Operating Officer (2003-2006) and Managing Director, Customer Marketing and Development (1999-2003) of The Depository Trust & Clearing Corporation (financial markets infrastructure). Mr. Donahue currently serves as a member (2007-present) and Co-Chairman (2016-present) of the Board of United Way of New York, a member of the Board of NYC Leadership Academy (2012-present) and a member of the Board of Advisors of Ripple Labs, Inc. (financial services, 2015-present). Mr. Donahue previously served as a member of the Advisory Board of certain Fidelity® funds (2015-2018).
Vicki L. Fuller (1957)
Year of Election or Appointment: 2020
Trustee
Ms. Fuller also serves as Trustee of other Fidelity® funds. Previously, Ms. Fuller served as a member of the Advisory Board of certain Fidelity® funds (2018-2020), Chief Investment Officer of the New York State Common Retirement Fund (2012-2018) and held a variety of positions at AllianceBernstein L.P. (global asset management, 1985-2012), including Managing Director (2006-2012) and Senior Vice President and Senior Portfolio Manager (2001-2006). Ms. Fuller currently serves as a member of the Board, Audit Committee and Nominating and Governance Committee of The Williams Companies, Inc. (natural gas infrastructure, 2018-present), as a member of the Board, Audit Committee and Nominating and Governance Committee of two Blackstone business development companies (2020-present) and as a member of the Board of Treliant, LLC (consulting, 2019-present).
Patricia L. Kampling (1959)
Year of Election or Appointment: 2020
Trustee
Ms. Kampling also serves as Trustee of other Fidelity® funds. Prior to her retirement, Ms. Kampling served as Chairman of the Board and Chief Executive Officer (2012-2019), President and Chief Operating Officer (2011-2012) and Executive Vice President and Chief Financial Officer (2010-2011) of Alliant Energy Corporation. Ms. Kampling currently serves as a member of the Board, Compensation Committee and Executive Committee and as Chair of the Audit Committee of Briggs & Stratton Corporation (manufacturing, 2011-present) and as a member of the Board, Audit, Finance and Risk Committee and Safety, Environmental, Technology and Operations Committee of American Water Works Company, Inc. (utilities company, 2019-present). In addition, Ms. Kampling currently serves as a member of the Board of the Nature Conservancy, Wisconsin Chapter (2019-present). Previously, Ms. Kampling served as a Member of the Advisory Board of certain Fidelity® funds (2020), a member of the Board of Interstate Power and Light Company (2012-2019) and Wisconsin Power and Light Company (2012-2019) (each a subsidiary of Alliant Energy Corporation) and as a member of the Board and Workforce Development Committee of the Business Roundtable (2018-2019).
Thomas A. Kennedy (1955)
Year of Election or Appointment: 2021
Trustee
Mr. Kennedy also serves as Trustee of other Fidelity® funds. Previously, Mr. Kennedy served as a Member of the Advisory Board of certain Fidelity® funds (2020) and held a variety of positions at Raytheon Company (aerospace and defense, 1983-2020), including Chairman and Chief Executive Officer (2014-2020) and Executive Vice President and Chief Operating Officer (2013-2014). Mr. Kennedy currently serves as Executive Chairman of the Board of Directors of Raytheon Technologies Corporation (aerospace and defense, 2020-present). He is also a member of the Rutgers School of Engineering Industry Advisory Board (2011-present) and a member of the UCLA Engineering Dean’s Executive Board (2016-present).
Garnett A. Smith (1947)
Year of Election or Appointment: 2018
Trustee
Mr. Smith also serves as Trustee of other Fidelity® funds. Prior to his retirement, Mr. Smith served as Chairman and Chief Executive Officer (1990-1997) and President (1986-1990) of Inbrand Corp. (manufacturer of personal absorbent products). Prior to his employment with Inbrand Corp., he was employed by a retail fabric chain and North Carolina National Bank (now Bank of America). Mr. Smith previously served as a member of the Advisory Board of certain Fidelity® funds (2012-2013).
David M. Thomas (1949)
Year of Election or Appointment: 2008
Trustee
Lead Independent Trustee
Mr. Thomas also serves as Trustee of other Fidelity® funds. Previously, Mr. Thomas served as Executive Chairman (2005-2006) and Chairman and Chief Executive Officer (2000-2005) of IMS Health, Inc. (pharmaceutical and healthcare information solutions). Mr. Thomas currently serves as Non-Executive Chairman of the Board of Fortune Brands Home and Security (home and security products, 2011-present), and a member of the Board (2004-present) and Presiding Director (2013-present) of Interpublic Group of Companies, Inc. (marketing communication).
Susan Tomasky (1953)
Year of Election or Appointment: 2020
Trustee
Ms. Tomasky also serves as Trustee of other Fidelity® funds. Prior to her retirement, Ms. Tomasky served in various executive officer positions at American Electric Power Company, Inc. (1998-2011), including most recently as President of AEP Transmission (2007-2011). Ms. Tomasky currently serves as a member of the Board and Sustainability Committee and as Chair of the Audit Committee of Marathon Petroleum Corporation (2018-present) and as a member of the Board, Corporate Governance Committee and Organization and Compensation Committee and as Chair of the Audit Committee of Public Service Enterprise Group, Inc. (utilities company, 2012-present). In addition, Ms. Tomasky currently serves as a member of the Board of the Columbus Regional Airport Authority (2007-present), as a member of the Board of the Royal Shakespeare Company – America (2009-present), as a member of the Board of the Columbus Association for the Performing Arts (2011-present) and as a member of the Board of Kenyon College (2016-present). Previously, Ms. Tomasky served as a Member of the Advisory Board of certain Fidelity® funds (2020), a member of the Board (2011-2019) and as Lead Independent Director (2015-2018) of Andeavor Corporation (previously Tesoro Corporation) (independent oil refiner and marketer) and as a member of the Board of Summit Midstream Partners LP (energy, 2012-2018).
Michael E. Wiley (1950)
Year of Election or Appointment: 2018
Trustee
Mr. Wiley also serves as Trustee of other Fidelity® funds. Previously, Mr. Wiley served as a member of the Advisory Board of certain Fidelity® funds (2018-2020), Chairman, President and CEO of Baker Hughes, Inc. (oilfield services, 2000-2004). Mr. Wiley also previously served as a member of the Board of Andeavor Corporation (independent oil refiner and marketer, 2005-2018), a member of the Board of Andeavor Logistics LP (natural resources logistics, 2015-2018) and a member of the Board of High Point Resources (exploration and production, 2005-2020).
+ The information includes the Trustee's principal occupation during the last five years and other information relating to the experience, attributes, and skills relevant to the Trustee's qualifications to serve as a Trustee, which led to the conclusion that the Trustee should serve as a Trustee for each fund.
Advisory Board Members and Officers:
Correspondence intended for a Member of the Advisory Board (if any) may be sent to Fidelity Investments, P.O. Box 55235, Boston, Massachusetts 02205-5235. Correspondence intended for an officer or Peter S. Lynch may be sent to Fidelity Investments, 245 Summer Street, Boston, Massachusetts 02210. Officers appear below in alphabetical order.
Name, Year of Birth; Principal Occupation
Ned C. Lautenbach (1944)
Year of Election or Appointment: 2021
Member of the Advisory Board
Mr. Lautenbach also serves as a Member of the Advisory Board of other Fidelity® funds. Mr. Lautenbach currently serves as Chair of the Board of Governors, State University System of Florida (2013-present) and is a member of the Council on Foreign Relations (1994-present). He is also a member and has in the past served as Chairman of the Board of Directors of Artis-Naples (2012-present). Previously, Mr. Lautenbach served as a Trustee of certain Fidelity® funds (2000-2020) and a member and then Lead Director of the Board of Directors of Eaton Corporation (diversified industrial, 1997-2016). He was also a Partner at Clayton, Dubilier & Rice, LLC (private equity investment, 1998-2010); as well as Director of Sony Corporation (2006-2007). In addition, Mr. Lautenbach had a 30-year career with IBM (technology company), during which time he served as Senior Vice President and as a member of the Corporate Executive Committee (1968-1998).
Peter S. Lynch (1944)
Year of Election or Appointment: 2003
Member of the Advisory Board
Mr. Lynch also serves as a Member of the Advisory Board of other Fidelity® funds. Mr. Lynch is Vice Chairman and a Director of Fidelity Management & Research Company LLC (investment adviser firm). In addition, Mr. Lynch serves as a Trustee of Boston College and as the Chairman of the Inner-City Scholarship Fund. Previously, Mr. Lynch served as Vice Chairman and a Director of FMR Co., Inc. (investment adviser firm) and on the Special Olympics International Board of Directors (1997-2006).
Craig S. Brown (1977)
Year of Election or Appointment: 2019
Assistant Treasurer
Mr. Brown also serves as Assistant Treasurer of other funds. Mr. Brown is an employee of Fidelity Investments (2013-present).
John J. Burke III (1964)
Year of Election or Appointment: 2018
Chief Financial Officer
Mr. Burke also serves as Chief Financial Officer of other funds. Mr. Burke serves as Head of Investment Operations for Fidelity Fund and Investment Operations (2018-present) and is an employee of Fidelity Investments (1998-present). Previously Mr. Burke served as head of Asset Management Investment Operations (2012-2018).
William C. Coffey (1969)
Year of Election or Appointment: 2019
Assistant Secretary
Mr. Coffey also serves as Assistant Secretary of other funds. He is Senior Vice President and Deputy General Counsel of FMR LLC (diversified financial services company, 2010-present), and is an employee of Fidelity Investments. Previously, Mr. Coffey served as Secretary and CLO of certain funds (2018-2019); CLO, Secretary, and Senior Vice President of Fidelity Management & Research Company and FMR Co., Inc. (investment adviser firms, 2018-2019); Secretary of Fidelity SelectCo, LLC and Fidelity Investments Money Management, Inc. (investment adviser firms, 2018-2019); CLO of Fidelity Management & Research (Hong Kong) Limited, FMR Investment Management (UK) Limited, and Fidelity Management & Research (Japan) Limited (investment adviser firms, 2018-2019); and Assistant Secretary of certain funds (2009-2018).
Timothy M. Cohen (1969)
Year of Election or Appointment: 2018
Vice President
Mr. Cohen also serves as Vice President of other funds. Mr. Cohen serves as Co-Head of Equity (2018-present), a Director of Fidelity Management & Research (Japan) Limited (investment adviser firm, 2016-present), and is an employee of Fidelity Investments. Previously, Mr. Cohen served as Executive Vice President of Fidelity SelectCo, LLC (2019), Head of Global Equity Research (2016-2018), Chief Investment Officer - Equity and a Director of Fidelity Management & Research (U.K.) Inc. (investment adviser firm, 2013-2015) and as a Director of Fidelity Management & Research (Hong Kong) Limited (investment adviser firm, 2017).
Jonathan Davis (1968)
Year of Election or Appointment: 2010
Assistant Treasurer
Mr. Davis also serves as Assistant Treasurer of other funds. Mr. Davis serves as Assistant Treasurer of FMR Capital, Inc. (2017-present) and is an employee of Fidelity Investments. Previously, Mr. Davis served as Vice President and Associate General Counsel of FMR LLC (diversified financial services company, 2003-2010).
Laura M. Del Prato (1964)
Year of Election or Appointment: 2018
Assistant Treasurer
Ms. Del Prato also serves as an officer of other funds. Ms. Del Prato is an employee of Fidelity Investments (2017-present). Previously, Ms. Del Prato served as President and Treasurer of The North Carolina Capital Management Trust: Cash Portfolio and Term Portfolio (2018-2020). Prior to joining Fidelity Investments, Ms. Del Prato served as a Managing Director and Treasurer of the JPMorgan Mutual Funds (2014-2017). Prior to JPMorgan, Ms. Del Prato served as a partner at Cohen Fund Audit Services (accounting firm, 2012-2013) and KPMG LLP (accounting firm, 2004-2012).
Colm A. Hogan (1973)
Year of Election or Appointment: 2020
Assistant Treasurer
Mr. Hogan also serves as an officer of other funds. Mr. Hogan serves as Assistant Treasurer of FMR Capital, Inc. (2017-present) and is an employee of Fidelity Investments (2005-present). Previously, Mr. Hogan served as Deputy Treasurer of certain Fidelity® funds (2016-2020) and Assistant Treasurer of certain Fidelity® funds (2016-2018).
Pamela R. Holding (1964)
Year of Election or Appointment: 2018
Vice President
Ms. Holding also serves as Vice President of other funds. Ms. Holding serves as Co-Head of Equity (2018-present) and is an employee of Fidelity Investments (2013-present). Previously, Ms. Holding served as Executive Vice President of Fidelity SelectCo, LLC (2019) and as Chief Investment Officer of Fidelity Institutional Asset Management (2013-2018).
Cynthia Lo Bessette (1969)
Year of Election or Appointment: 2019
Secretary and Chief Legal Officer (CLO)
Ms. Lo Bessette also serves as an officer of other funds. Ms. Lo Bessette serves as CLO, Secretary, and Senior Vice President of Fidelity Management & Research Company LLC (investment adviser firm, 2019-present); and CLO of Fidelity Management & Research (Hong Kong) Limited, FMR Investment Management (UK) Limited, and Fidelity Management & Research (Japan) Limited (investment adviser firms, 2019-present). She is a Senior Vice President and Deputy General Counsel of FMR LLC (diversified financial services company, 2019-present), and is an employee of Fidelity Investments. Previously, Ms. Lo Bessette served as CLO, Secretary, and Senior Vice President of FMR Co., Inc. (investment adviser firm, 2019); Secretary of Fidelity SelectCo, LLC and Fidelity Investments Money Management, Inc. (investment adviser firms, 2019). Prior to joining Fidelity Investments, Ms. Lo Bessette was Executive Vice President, General Counsel (2016-2019) and Senior Vice President, Deputy General Counsel (2015-2016) of OppenheimerFunds (investment management company) and Deputy Chief Legal Officer (2013-2015) of Jennison Associates LLC (investment adviser firm).
Chris Maher (1972)
Year of Election or Appointment: 2020
Deputy Treasurer
Mr. Maher also serves as an officer of other funds. Mr. Maher serves as Assistant Treasurer of FMR Capital, Inc. (2017-present), and is an employee of Fidelity Investments (2008-present). Previously, Mr. Maher served as Assistant Treasurer of certain funds (2013-2020); Vice President of Asset Management Compliance (2013), Vice President of the Program Management Group of FMR (investment adviser firm, 2010-2013), and Vice President of Valuation Oversight (2008-2010).
Jason P. Pogorelec (1975)
Year of Election or Appointment: 2020
Chief Compliance Officer
Mr. Pogorelec also serves as Chief Compliance Officer of other funds. Mr. Pogorelec is a senior Vice President of Asset Management Compliance for Fidelity Investments and is an employee of Fidelity Investments (2006-present). Previously, Mr. Pogorelec served as Vice President, Associate General Counsel for Fidelity Investments (2010-2020) and Assistant Secretary of certain Fidelity funds (2015-2020).
Brett Segaloff (1972)
Year of Election or Appointment: 2021
Anti-Money Laundering (AML) Officer
Mr. Segaloff also serves as an AML Officer of other funds and other related entities. He is Director, Anti-Money Laundering (2007-present) of FMR LLC (diversified financial services company) and is an employee of Fidelity Investments (1996-present).
Stacie M. Smith (1974)
Year of Election or Appointment: 2016
President and Treasurer
Ms. Smith also serves as an officer of other funds. Ms. Smith serves as Assistant Treasurer of FMR Capital, Inc. (2017-present), is an employee of Fidelity Investments (2009-present), and has served in other fund officer roles. Prior to joining Fidelity Investments, Ms. Smith served as Senior Audit Manager of Ernst & Young LLP (accounting firm, 1996-2009). Previously, Ms. Smith served as Assistant Treasurer (2013-2019) and Deputy Treasurer (2013-2016) of certain Fidelity® funds.
Marc L. Spector (1972)
Year of Election or Appointment: 2016
Assistant Treasurer
Mr. Spector also serves as an officer of other funds. Mr. Spector serves as Assistant Treasurer of FMR Capital, Inc. (2017-present) and is an employee of Fidelity Investments (2016-present). Prior to joining Fidelity Investments, Mr. Spector served as Director at the Siegfried Group (accounting firm, 2013-2016), and prior to Siegfried Group as audit senior manager at Deloitte & Touche LLP (accounting firm, 2005-2013).
Jim Wegmann (1979)
Year of Election or Appointment: 2019
Assistant Treasurer
Mr. Wegmann also serves as Assistant Treasurer of other funds. Mr. Wegmann is an employee of Fidelity Investments (2011-present).
Shareholder Expense Example
As a shareholder, you incur two types of costs: (1) transaction costs, which may include sales charges (loads) on purchase payments or redemption proceeds, as applicable and (2) ongoing costs, which generally include management fees, distribution and/or service (12b-1) fees and other Fund expenses. This Example is intended to help you understand your ongoing costs (in dollars) of investing in a fund and to compare these costs with the ongoing costs of investing in other mutual funds.
The Example is based on an investment of $1,000 invested at the beginning of the period and held for the entire period (August 1, 2020 to January 31, 2021).
Actual Expenses
The first line of the accompanying table provides information about actual account values and actual expenses. You may use the information in this line, together with the amount you invested, to estimate the expenses that you paid over the period. Simply divide your account value by $1,000.00 (for example, an $8,600 account value divided by $1,000.00 = 8.6), then multiply the result by the number in the first line for a class/Fund under the heading entitled "Expenses Paid During Period" to estimate the expenses you paid on your account during this period. If any fund is a shareholder of any underlying mutual funds or exchange-traded funds (ETFs) (the Underlying Funds), such fund indirectly bears its proportional share of the expenses of the Underlying Funds in addition to the direct expenses incurred presented in the table. These fees and expenses are not included in the annualized expense ratio used to calculate the expense estimate in the table below.
Hypothetical Example for Comparison Purposes
The second line of the accompanying table provides information about hypothetical account values and hypothetical expenses based on the actual expense ratio and an assumed rate of return of 5% per year before expenses, which is not the actual return. The hypothetical account values and expenses may not be used to estimate the actual ending account balance or expenses you paid for the period. You may use this information to compare the ongoing costs of investing in the Fund and other funds. To do so, compare this 5% hypothetical example with the 5% hypothetical examples that appear in the shareholder reports of the other funds. If any fund is a shareholder of any Underlying Funds, such fund indirectly bears its proportional share of the expenses of the Underlying Funds in addition to the direct expenses as presented in the table. These fees and expenses are not included in the annualized expense ratio used to calculate the expense estimate in the table below.
Please note that the expenses shown in the table are meant to highlight your ongoing costs only and do not reflect any transaction costs. Therefore, the second line of the table is useful in comparing ongoing costs only, and will not help you determine the relative total costs of owning different funds.
| Annualized Expense Ratio-A | Beginning Account Value August 1, 2020 | Ending Account Value January 31, 2021 | Expenses Paid During Period-B August 1, 2020 to January 31, 2021 | |
| Fidelity Series All-Sector Equity Fund | - %-C | |||
| Actual | $1,000.00 | $1,198.50 | $--D | |
| Hypothetical-E | $1,000.00 | $1,025.14 | $--D | |
| Fidelity Series Stock Selector Large Cap Value Fund | - %-C | |||
| Actual | $1,000.00 | $1,198.20 | $--D | |
| Hypothetical-E | $1,000.00 | $1,025.14 | $--D | |
| Fidelity Series Value Discovery Fund | - %-C | |||
| Actual | $1,000.00 | $1,211.40 | $--D | |
| Hypothetical-E | $1,000.00 | $1,025.14 | $--D |
A Annualized expense ratio reflects expenses net of applicable fee waivers.
B Expenses are equal to the annualized expense ratio, multiplied by the average account value over the period, multiplied by 184/ 366 (to reflect the one-half year period). The fees and expenses of any Underlying Funds are not included in each annualized expense ratio.
C Amount represents less than .005%.
D Amount represents less than $.005.
E 5% return per year before expenses
Distributions (Unaudited)
The Board of Trustees of each fund voted to pay to shareholders of record at the opening of business on record date, the following distributions per share derived from capital gains realized from sales of portfolio securities, and dividends derived from net investment income:
| Pay Date | Record Date | Dividends | Capital Gains | |
| Fidelity Series All-Sector Equity Fund | 03/08/21 | 03/05/21 | $0.004 | $0.553 |
| Fidelity Series Stock Selector Large Cap Value Fund | 03/08/21 | 03/05/21 | $0.014 | $0.000 |
| Fidelity Series Value Discovery Fund | 03/08/21 | 03/05/21 | $0.015 | $0.000 |
The funds hereby designate as capital gain dividend the amounts noted below for the taxable year ended January 31, 2021, or, if subsequently determined to be different, the net capital gain of such year.
| Fidelity Series All-Sector Equity Fund | $314,097,858 |
A percentage of the dividends distributed during the fiscal year for the following funds qualify for the dividends–received deduction for corporate shareholders:
| Fidelity Series All-Sector Equity Fund | |
| March, 2020 | 8% |
| December, 2020 | 89% |
| Fidelity Series Stock Selector Large Cap Value Fund | |
| March, 2020 | 18% |
| December, 2020 | 86% |
| Fidelity Series Value Discovery Fund | |
| December, 2020 | 73% |
A percentage of the dividends distributed during the fiscal year for the following funds may be taken into account as a dividend for purposes of the maximum rate under section 1(h)(11) of the Internal Revenue Code.
| Fidelity Series All-Sector Equity Fund | |
| March, 2020 | 9% |
| December, 2020 | 91% |
| Fidelity Series Stock Selector Large Cap Value Fund | |
| March, 2020 | 26% |
| December, 2020 | 92% |
| Fidelity Series Value Discovery Fund | |
| December, 2020 | 95% |
A percentage of the dividends distributed during the fiscal year for the following funds qualify as a section 199A dividend:
| Fidelity Series All-Sector Equity Fund | |
| March, 2020 | 1% |
| December, 2020 | 5% |
| Fidelity Series Stock Selector Large Cap Value Fund | |
| March, 2020 | 1% |
| December, 2020 | 5% |
| Fidelity Series Value Discovery Fund | |
| December, 2020 | 3% |
The funds will notify shareholders in January 2022 of amounts for use in preparing 2021 income tax returns.
Board Approval of Investment Advisory Contracts
Fidelity Series All-Sector Equity Fund
Fidelity Series Value Discovery Fund
Fidelity Series Stock Selector Large Cap Value Fund
![]()
EDT-LDT-ANN-0321
1.956971.108
Fidelity® Stock Selector Large Cap Value Fund
January 31, 2021
Includes Fidelity and Fidelity Advisor share classes
Contents
To view a fund's proxy voting guidelines and proxy voting record for the 12-month period ended June 30, visit http://www.fidelity.com/proxyvotingresults or visit the Securities and Exchange Commission's (SEC) web site at http://www.sec.gov.
You may also call 1-800-544-8544 if you’re an individual investing directly with Fidelity, call 1-800-835-5092 if you’re a plan sponsor or participant with Fidelity as your recordkeeper or call 1-877-208-0098 on institutional accounts or if you’re an advisor or invest through one to request a free copy of the proxy voting guidelines.
Standard & Poor's, S&P and S&P 500 are registered service marks of The McGraw-Hill Companies, Inc. and have been licensed for use by Fidelity Distributors Corporation.
Other third-party marks appearing herein are the property of their respective owners.
All other marks appearing herein are registered or unregistered trademarks or service marks of FMR LLC or an affiliated company. © 2021 FMR LLC. All rights reserved.
This report and the financial statements contained herein are submitted for the general information of the shareholders of the Fund. This report is not authorized for distribution to prospective investors in the Fund unless preceded or accompanied by an effective prospectus.
A fund files its complete schedule of portfolio holdings with the SEC for the first and third quarters of each fiscal year on Form N-PORT. Forms N-PORT are available on the SEC’s web site at http://www.sec.gov. A fund's Forms N-PORT may be reviewed and copied at the SEC’s Public Reference Room in Washington, DC. Information regarding the operation of the SEC's Public Reference Room may be obtained by calling 1-800-SEC-0330.
For a complete list of a fund's portfolio holdings, view the most recent holdings listing, semiannual report, or annual report on Fidelity's web site at http://www.fidelity.com, http://www.institutional.fidelity.com, or http://www.401k.com, as applicable.
NOT FDIC INSURED •MAY LOSE VALUE •NO BANK GUARANTEE
Neither the Fund nor Fidelity Distributors Corporation is a bank.
Note to Shareholders:
Early in 2020, the outbreak and spread of a new coronavirus emerged as a public health emergency that had a major influence on financial markets, primarily based on its impact on the global economy and the outlook for corporate earnings. The virus causes a respiratory disease known as COVID-19. On March 11, the World Health Organization declared the COVID-19 outbreak a pandemic, citing sustained risk of further global spread.
In the weeks following, as the crisis worsened, we witnessed an escalating human tragedy with wide-scale social and economic consequences from coronavirus-containment measures. The outbreak of COVID-19 prompted a number of measures to limit the spread, including travel and border restrictions, quarantines, and restrictions on large gatherings. In turn, these resulted in lower consumer activity, diminished demand for a wide range of products and services, disruption in manufacturing and supply chains, and – given the wide variability in outcomes regarding the outbreak – significant market uncertainty and volatility. Amid the turmoil, global governments and central banks took unprecedented action to help support consumers, businesses, and the broader economies, and to limit disruption to financial systems.
The situation continues to unfold, and the extent and duration of its impact on financial markets and the economy remain highly uncertain. Extreme events such as the coronavirus crisis are “exogenous shocks” that can have significant adverse effects on mutual funds and their investments. Although multiple asset classes may be affected by market disruption, the duration and impact may not be the same for all types of assets.
Fidelity is committed to helping you stay informed amid news about COVID-19 and during increased market volatility, and we’re taking extra steps to be responsive to customer needs. We encourage you to visit our websites, where we offer ongoing updates, commentary, and analysis on the markets and our funds.
Performance: The Bottom Line
Average annual total return reflects the change in the value of an investment, assuming reinvestment of distributions from dividend income and capital gains (the profits earned upon the sale of securities that have grown in value, if any) and assuming a constant rate of performance each year. The hypothetical investment and the average annual total returns do not reflect the deduction of taxes that a shareholder would pay on fund distributions or the redemption of fund shares. During periods of reimbursement by Fidelity, a fund’s total return will be greater than it would be had the reimbursement not occurred. How a fund did yesterday is no guarantee of how it will do tomorrow.
Average Annual Total Returns
| For the periods ended January 31, 2021 | Past 1 year | Past 5 years | Past 10 years |
| Class A (incl. 5.75% sales charge) | (1.01)% | 8.28% | 8.58% |
| Class M (incl. 3.50% sales charge) | 1.03% | 8.45% | 8.49% |
| Class C (incl. contingent deferred sales charge) | 3.19% | 8.66% | 8.34% |
| Fidelity® Stock Selector Large Cap Value Fund | 5.31% | 9.89% | 9.53% |
| Class I | 5.31% | 9.85% | 9.50% |
| Class Z | 5.43% | 9.98% | 9.57% |
Class C shares' contingent deferred sales charges included in the past one year, past five years and past ten years total return figures are 1%, 0% and 0%, respectively.
The initial offering of Class Z shares took place on February 1, 2017. Returns prior to February 1, 2017, are those of Class I.
$10,000 Over 10 Years
Let's say hypothetically that $10,000 was invested in Fidelity® Stock Selector Large Cap Value Fund, a class of the fund, on January 31, 2011.
The chart shows how the value of your investment would have changed, and also shows how the Russell 1000® Value Index performed over the same period.
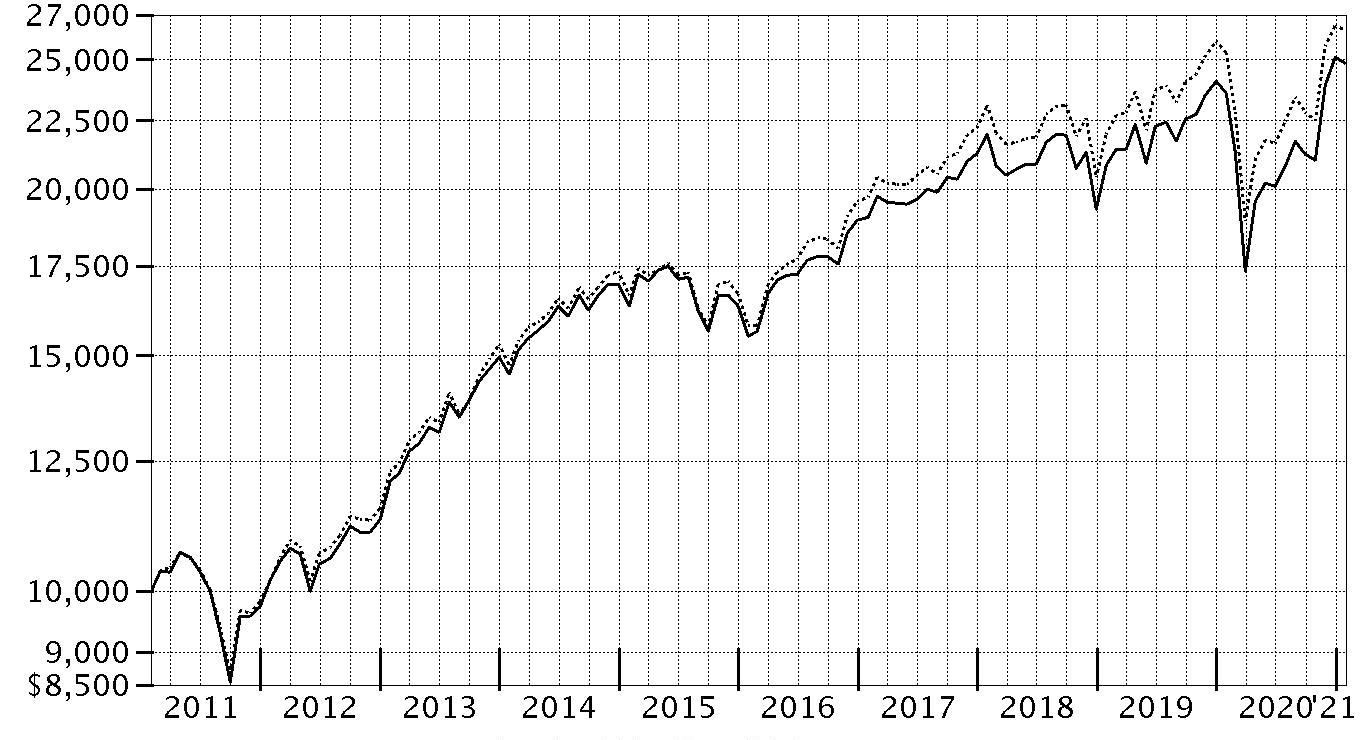
| Period Ending Values | ||
| $24,860 | Fidelity® Stock Selector Large Cap Value Fund | |
| $26,304 | Russell 1000® Value Index | |
Management's Discussion of Fund Performance
Market Recap: The S&P 500® index gained 17.25% for the 12 months ending January 31, 2021, a volatile but productive period for U.S. risk assets. The early-2020 outbreak and spread of COVID-19 resulted in stocks suffering one of the quickest declines on record, through March 23, followed by a historic rebound. The crisis and containment efforts caused broad contraction in economic activity, along with extreme uncertainty and dislocation in financial markets. A rapid and expansive U.S. monetary/fiscal-policy response partially offset the economic disruption and fueled the market surge, as did resilient corporate earnings. The rally slowed in September, when the S&P 500 began a two-month retreat amid Congress’s inability to reach a deal on additional fiscal stimulus, as well as concerns about election uncertainty, indications the U.S. economic recovery could be slowing and a new wave of COVID-19 cases. A shift in momentum began in October and accelerated following the U.S. elections, with the approval of two breakthrough COVID-19 vaccines and prospects for additional government stimulus fueling the “reflation trade.” Small-cap value stocks rallied strongly late in 2020, usurping longstanding market leadership from growth shares – especially large tech and internet-related names – amid hopes of a broad economic recovery in 2021. By sector for the full 12 months, information technology (+37%) and consumer discretionary (+33%) led all gainers. In contrast, energy (-23%) struggled along with global oil demand and pricing.Comments from Lead Manager Matt Friedman: For the fiscal year ending January 31, 2021, the fund's share classes (excluding sales charges, if applicable) gained about 4% to 5%, roughly in line with the 4.09% result of the benchmark Russell 1000® Value Index. Versus the benchmark, security selection was the primary contributor, especially within the diversified financials area of the financials sector. Strong picks in real estate also helped. Also bolstering performance were stock picks in the industrials sector, primarily driven by the transportation industry. The fund's largest individual relative contributor was an overweighting in FedEx, which gained 65% the past 12 months. Also lifting performance was an underweighting in Berkshire Hathaway, which gained roughly 2%. The company was among the fund's biggest holdings. Another notable relative contributor was our overweighting in Discover Financial Services (+248%), a position not held at period end. In contrast, the largest detractor from performance versus the benchmark was stock selection in the consumer discretionary sector, primarily within the consumer services industry. Weak picks in the information technology sector, especially within the semiconductors & semiconductor equipment industry, also hindered the fund's relative performance. Also hurting the fund's relative result were stock picks in the communication services sector, primarily within the media & entertainment industry. The fund's largest individual relative detractor was an underweighting in Royal Caribbean Cruises, which returned -44% the past year. Royal Caribbean Cruises was not held at period end. Also hindering performance was our outsized stake in General Electric, which returned -15%. Another key detractor was our out-of-benchmark position in Cenovus Energy (-31%). Notable changes in positioning include increased exposure to the information technology sector and a lower allocation to energy.The views expressed above reflect those of the portfolio manager(s) only through the end of the period as stated on the cover of this report and do not necessarily represent the views of Fidelity or any other person in the Fidelity organization. Any such views are subject to change at any time based upon market or other conditions and Fidelity disclaims any responsibility to update such views. These views may not be relied on as investment advice and, because investment decisions for a Fidelity fund are based on numerous factors, may not be relied on as an indication of trading intent on behalf of any Fidelity fund.
Investment Summary (Unaudited)
Top Ten Stocks as of January 31, 2021
| % of fund's net assets | |
| Capital One Financial Corp. | 2.6 |
| Alphabet, Inc. Class A | 2.2 |
| Verizon Communications, Inc. | 2.2 |
| Johnson & Johnson | 2.1 |
| Cisco Systems, Inc. | 1.9 |
| The Walt Disney Co. | 1.7 |
| Berkshire Hathaway, Inc. Class B | 1.6 |
| Nielsen Holdings PLC | 1.6 |
| Wells Fargo & Co. | 1.6 |
| Sensata Technologies, Inc. PLC | 1.5 |
| 19.0 |
Top Five Market Sectors as of January 31, 2021
| % of fund's net assets | |
| Financials | 19.3 |
| Health Care | 13.4 |
| Industrials | 12.9 |
| Information Technology | 9.6 |
| Communication Services | 9.2 |
Asset Allocation (% of fund's net assets)
| As of January 31, 2021* | ||
| Stocks | 97.4% | |
| Short-Term Investments and Net Other Assets (Liabilities) | 2.6% | |

* Foreign investments - 9.8%
Schedule of Investments January 31, 2021
Showing Percentage of Net Assets
| Common Stocks - 96.8% | |||
| Shares | Value | ||
| COMMUNICATION SERVICES - 9.2% | |||
| Diversified Telecommunication Services - 3.5% | |||
| AT&T, Inc. | 140,493 | $4,022,315 | |
| Liberty Global PLC Class C (a) | 79,051 | 1,909,872 | |
| Verizon Communications, Inc. | 173,894 | 9,520,697 | |
| 15,452,884 | |||
| Entertainment - 1.7% | |||
| The Walt Disney Co. | 46,507 | 7,821,082 | |
| Interactive Media & Services - 2.4% | |||
| Alphabet, Inc. Class A (a) | 5,419 | 9,902,464 | |
| Facebook, Inc. Class A (a) | 2,487 | 642,467 | |
| 10,544,931 | |||
| Media - 1.6% | |||
| Comcast Corp. Class A | 63,025 | 3,124,149 | |
| Discovery Communications, Inc. Class A (a) | 12,010 | 497,454 | |
| Interpublic Group of Companies, Inc. | 143,614 | 3,456,789 | |
| 7,078,392 | |||
| TOTAL COMMUNICATION SERVICES | 40,897,289 | ||
| CONSUMER DISCRETIONARY - 7.5% | |||
| Auto Components - 1.0% | |||
| Aptiv PLC | 35,020 | 4,678,672 | |
| Hotels, Restaurants & Leisure - 2.6% | |||
| Las Vegas Sands Corp. | 68,320 | 3,285,509 | |
| Marriott International, Inc. Class A | 25,810 | 3,001,961 | |
| McDonald's Corp. | 25,100 | 5,216,784 | |
| 11,504,254 | |||
| Household Durables - 0.6% | |||
| Lennar Corp. Class A | 32,070 | 2,666,621 | |
| Multiline Retail - 0.8% | |||
| Dollar Tree, Inc. (a) | 34,030 | 3,459,490 | |
| Specialty Retail - 2.5% | |||
| Best Buy Co., Inc. | 35,000 | 3,808,700 | |
| Burlington Stores, Inc. (a) | 15,491 | 3,855,710 | |
| Ulta Beauty, Inc. (a) | 12,170 | 3,404,679 | |
| 11,069,089 | |||
| TOTAL CONSUMER DISCRETIONARY | 33,378,126 | ||
| CONSUMER STAPLES - 6.8% | |||
| Beverages - 1.9% | |||
| Constellation Brands, Inc. Class A (sub. vtg.) | 4,160 | 877,469 | |
| Diageo PLC | 9,100 | 365,339 | |
| Keurig Dr. Pepper, Inc. (b) | 62,207 | 1,978,183 | |
| Monster Beverage Corp. (a) | 6,100 | 529,663 | |
| PepsiCo, Inc. | 9,000 | 1,229,130 | |
| The Coca-Cola Co. | 71,856 | 3,459,866 | |
| 8,439,650 | |||
| Food & Staples Retailing - 1.4% | |||
| Walgreens Boots Alliance, Inc. | 19,900 | 999,975 | |
| Walmart, Inc. | 36,746 | 5,162,446 | |
| 6,162,421 | |||
| Food Products - 1.1% | |||
| General Mills, Inc. | 13,400 | 778,540 | |
| Lamb Weston Holdings, Inc. | 1,500 | 112,050 | |
| Mondelez International, Inc. | 69,243 | 3,838,832 | |
| 4,729,422 | |||
| Household Products - 1.7% | |||
| Kimberly-Clark Corp. | 8,354 | 1,103,563 | |
| Procter & Gamble Co. | 49,833 | 6,389,089 | |
| 7,492,652 | |||
| Tobacco - 0.7% | |||
| Philip Morris International, Inc. | 38,711 | 3,083,331 | |
| TOTAL CONSUMER STAPLES | 29,907,476 | ||
| ENERGY - 4.5% | |||
| Oil, Gas & Consumable Fuels - 4.5% | |||
| BP PLC sponsored ADR | 45,700 | 1,015,454 | |
| Cenovus Energy, Inc. (Canada) | 443,700 | 2,619,695 | |
| Cheniere Energy, Inc. (a) | 55,900 | 3,540,147 | |
| Exxon Mobil Corp. | 107,000 | 4,797,880 | |
| Hess Corp. | 49,400 | 2,666,612 | |
| Marathon Petroleum Corp. | 71,000 | 3,064,360 | |
| Royal Dutch Shell PLC Class A (United Kingdom) | 107,100 | 1,981,810 | |
| 19,685,958 | |||
| FINANCIALS - 19.3% | |||
| Banks - 6.6% | |||
| Bank of America Corp. | 224,800 | 6,665,320 | |
| Citigroup, Inc. | 81,600 | 4,731,984 | |
| Comerica, Inc. | 23,800 | 1,361,360 | |
| First Horizon National Corp. | 100,000 | 1,389,000 | |
| JPMorgan Chase & Co. | 43,000 | 5,532,810 | |
| KeyCorp | 96,400 | 1,625,304 | |
| Societe Generale Series A | 47,000 | 876,221 | |
| Wells Fargo & Co. | 229,700 | 6,863,436 | |
| 29,045,435 | |||
| Capital Markets - 4.5% | |||
| Bank of New York Mellon Corp. | 150,600 | 5,998,398 | |
| BlackRock, Inc. Class A | 7,400 | 5,189,324 | |
| Cboe Global Markets, Inc. | 10,700 | 981,511 | |
| Morgan Stanley | 88,600 | 5,940,630 | |
| Virtu Financial, Inc. Class A | 56,500 | 1,569,005 | |
| 19,678,868 | |||
| Consumer Finance - 3.4% | |||
| American Express Co. | 30,700 | 3,569,182 | |
| Capital One Financial Corp. | 109,400 | 11,406,042 | |
| 14,975,224 | |||
| Diversified Financial Services - 2.2% | |||
| Berkshire Hathaway, Inc. Class B (a) | 31,657 | 7,213,681 | |
| Voya Financial, Inc. | 47,500 | 2,634,350 | |
| 9,848,031 | |||
| Insurance - 2.6% | |||
| American International Group, Inc. | 63,370 | 2,372,573 | |
| Arthur J. Gallagher & Co. | 3,900 | 450,099 | |
| Hartford Financial Services Group, Inc. | 57,200 | 2,746,744 | |
| The Travelers Companies, Inc. | 45,000 | 6,133,500 | |
| 11,702,916 | |||
| TOTAL FINANCIALS | 85,250,474 | ||
| HEALTH CARE - 13.4% | |||
| Biotechnology - 0.2% | |||
| Regeneron Pharmaceuticals, Inc. (a) | 1,500 | 755,760 | |
| Health Care Equipment & Supplies - 5.0% | |||
| Abbott Laboratories | 28,400 | 3,509,956 | |
| Baxter International, Inc. | 19,700 | 1,513,551 | |
| Becton, Dickinson & Co. | 15,700 | 4,110,103 | |
| Boston Scientific Corp. (a) | 49,000 | 1,736,560 | |
| Danaher Corp. | 26,600 | 6,326,544 | |
| Medtronic PLC | 35,320 | 3,932,176 | |
| Stryker Corp. | 4,400 | 972,444 | |
| 22,101,334 | |||
| Health Care Providers & Services - 2.9% | |||
| AmerisourceBergen Corp. | 4,600 | 479,320 | |
| Cardinal Health, Inc. | 23,500 | 1,262,655 | |
| Cigna Corp. | 18,000 | 3,906,900 | |
| CVS Health Corp. | 28,334 | 2,030,131 | |
| Humana, Inc. | 5,500 | 2,107,105 | |
| UnitedHealth Group, Inc. | 8,700 | 2,902,146 | |
| 12,688,257 | |||
| Life Sciences Tools & Services - 1.2% | |||
| Bio-Rad Laboratories, Inc. Class A (a) | 1,000 | 573,770 | |
| Thermo Fisher Scientific, Inc. | 9,400 | 4,791,180 | |
| 5,364,950 | |||
| Pharmaceuticals - 4.1% | |||
| Bristol-Myers Squibb Co. | 41,400 | 2,543,202 | |
| Catalent, Inc. (a) | 9,200 | 1,058,460 | |
| Johnson & Johnson | 55,385 | 9,034,955 | |
| Merck & Co., Inc. | 7,300 | 562,611 | |
| Pfizer, Inc. | 139,571 | 5,010,599 | |
| 18,209,827 | |||
| TOTAL HEALTH CARE | 59,120,128 | ||
| INDUSTRIALS - 12.9% | |||
| Aerospace & Defense - 3.0% | |||
| General Dynamics Corp. | 21,653 | 3,176,062 | |
| Northrop Grumman Corp. | 5,665 | 1,623,646 | |
| Raytheon Technologies Corp. | 76,608 | 5,112,052 | |
| The Boeing Co. | 16,615 | 3,226,467 | |
| 13,138,227 | |||
| Air Freight & Logistics - 0.7% | |||
| FedEx Corp. | 13,360 | 3,144,142 | |
| Construction & Engineering - 0.9% | |||
| AECOM (a) | 79,940 | 4,004,994 | |
| Electrical Equipment - 1.5% | |||
| Sensata Technologies, Inc. PLC (a) | 125,810 | 6,856,645 | |
| Industrial Conglomerates - 1.4% | |||
| General Electric Co. | 488,973 | 5,222,232 | |
| Honeywell International, Inc. | 5,515 | 1,077,466 | |
| 6,299,698 | |||
| Machinery - 1.2% | |||
| Caterpillar, Inc. | 28,113 | 5,140,181 | |
| Marine - 1.0% | |||
| A.P. Moller - Maersk A/S Series B | 1,137 | 2,335,589 | |
| Kirby Corp. (a) | 39,603 | 2,010,248 | |
| 4,345,837 | |||
| Professional Services - 1.6% | |||
| Nielsen Holdings PLC | 319,304 | 7,130,058 | |
| Road & Rail - 1.1% | |||
| Norfolk Southern Corp. | 20,534 | 4,858,755 | |
| Trading Companies & Distributors - 0.5% | |||
| Univar, Inc. (a) | 122,800 | 2,282,852 | |
| TOTAL INDUSTRIALS | 57,201,389 | ||
| INFORMATION TECHNOLOGY - 9.6% | |||
| Communications Equipment - 2.6% | |||
| Cisco Systems, Inc. | 189,355 | 8,441,446 | |
| F5 Networks, Inc. (a) | 16,113 | 3,157,342 | |
| 11,598,788 | |||
| IT Services - 4.6% | |||
| Amdocs Ltd. | 88,327 | 6,237,653 | |
| CACI International, Inc. Class A (a) | 9,300 | 2,243,346 | |
| Capgemini SA | 15,511 | 2,249,393 | |
| Fiserv, Inc. (a) | 44,841 | 4,604,722 | |
| IBM Corp. | 41,033 | 4,887,441 | |
| 20,222,555 | |||
| Semiconductors & Semiconductor Equipment - 1.1% | |||
| Broadcom, Inc. | 1,506 | 678,453 | |
| Intel Corp. | 77,481 | 4,300,970 | |
| 4,979,423 | |||
| Software - 1.3% | |||
| NortonLifeLock, Inc. | 132,176 | 2,784,948 | |
| SS&C Technologies Holdings, Inc. | 49,203 | 3,093,885 | |
| 5,878,833 | |||
| TOTAL INFORMATION TECHNOLOGY | 42,679,599 | ||
| MATERIALS - 4.0% | |||
| Chemicals - 2.6% | |||
| DuPont de Nemours, Inc. | 6,780 | 538,671 | |
| Huntsman Corp. | 79,512 | 2,100,707 | |
| Olin Corp. | 159,986 | 3,825,265 | |
| The Chemours Co. LLC | 107,740 | 2,837,872 | |
| W.R. Grace & Co. | 38,733 | 2,247,289 | |
| 11,549,804 | |||
| Construction Materials - 0.4% | |||
| Eagle Materials, Inc. | 17,457 | 1,920,794 | |
| Containers & Packaging - 1.0% | |||
| Crown Holdings, Inc. (a) | 44,495 | 4,011,224 | |
| O-I Glass, Inc. | 28,919 | 365,536 | |
| 4,376,760 | |||
| TOTAL MATERIALS | 17,847,358 | ||
| REAL ESTATE - 4.4% | |||
| Equity Real Estate Investment Trusts (REITs) - 4.0% | |||
| Corporate Office Properties Trust (SBI) | 54,000 | 1,418,580 | |
| Digital Realty Trust, Inc. | 13,200 | 1,900,140 | |
| Douglas Emmett, Inc. | 29,900 | 828,529 | |
| Invitation Homes, Inc. | 40,600 | 1,196,888 | |
| Mid-America Apartment Communities, Inc. | 23,900 | 3,172,725 | |
| Prologis (REIT), Inc. | 26,700 | 2,755,440 | |
| Welltower, Inc. | 43,500 | 2,636,100 | |
| Weyerhaeuser Co. | 113,200 | 3,530,708 | |
| 17,439,110 | |||
| Real Estate Management & Development - 0.4% | |||
| Cushman & Wakefield PLC (a) | 133,500 | 1,913,055 | |
| TOTAL REAL ESTATE | 19,352,165 | ||
| UTILITIES - 5.2% | |||
| Electric Utilities - 3.2% | |||
| Edison International | 53,297 | 3,099,754 | |
| Exelon Corp. | 89,038 | 3,700,419 | |
| FirstEnergy Corp. | 68,632 | 2,111,120 | |
| PG&E Corp. (a) | 258,600 | 2,955,798 | |
| Southern Co. | 39,300 | 2,315,556 | |
| 14,182,647 | |||
| Independent Power and Renewable Electricity Producers - 1.3% | |||
| The AES Corp. | 138,519 | 3,378,478 | |
| Vistra Corp. | 115,563 | 2,307,793 | |
| 5,686,271 | |||
| Multi-Utilities - 0.7% | |||
| CenterPoint Energy, Inc. | 150,523 | 3,174,530 | |
| TOTAL UTILITIES | 23,043,448 | ||
| TOTAL COMMON STOCKS | |||
| (Cost $364,249,324) | 428,363,410 | ||
| Money Market Funds - 2.7% | |||
| Fidelity Cash Central Fund 0.09% (c) | 11,655,473 | 11,657,805 | |
| Fidelity Securities Lending Cash Central Fund 0.09% (c)(d) | 548,570 | 548,625 | |
| TOTAL MONEY MARKET FUNDS | |||
| (Cost $12,206,353) | 12,206,430 | ||
| Equity Funds - 0.6% | |||
| Domestic Equity Funds - 0.6% | |||
| iShares Russell 1000 Value Index ETF | |||
| (Cost $2,617,625) | 18,500 | 2,505,640 | |
| TOTAL INVESTMENT IN SECURITIES - 100.1% | |||
| (Cost $379,073,302) | 443,075,480 | ||
| NET OTHER ASSETS (LIABILITIES) - (0.1)% | (662,713) | ||
| NET ASSETS - 100% | $442,412,767 |
Security Type Abbreviations
ETF – Exchange-Traded Fund
Legend
(a) Non-income producing
(b) Security or a portion of the security is on loan at period end.
(c) Affiliated fund that is generally available only to investment companies and other accounts managed by Fidelity Investments. The rate quoted is the annualized seven-day yield of the fund at period end. A complete unaudited listing of the fund's holdings as of its most recent quarter end is available upon request. In addition, each Fidelity Central Fund's financial statements, which are not covered by the Fund's Report of Independent Registered Public Accounting Firm, are available on the SEC's website or upon request.
(d) Investment made with cash collateral received from securities on loan.
Affiliated Central Funds
Information regarding fiscal year to date income earned by the Fund from investments in Fidelity Central Funds is as follows:
| Fund | Income earned |
| Fidelity Cash Central Fund | $27,395 |
| Fidelity Securities Lending Cash Central Fund | 11,284 |
| Total | $38,679 |
Amounts in the income column in the above table include any capital gain distributions from underlying funds, which are presented in the corresponding line-item in the Statement of Operations, if applicable. Amount for Fidelity Securities Lending Cash Central Fund represents the income earned on investing cash collateral, less rebates paid to borrowers and any lending agent fees associated with the loan, plus any premium payments received for lending certain types of securities.
Investment Valuation
The following is a summary of the inputs used, as of January 31, 2021, involving the Fund's assets and liabilities carried at fair value. The inputs or methodology used for valuing securities may not be an indication of the risk associated with investing in those securities. For more information on valuation inputs, and their aggregation into the levels used below, please refer to the Investment Valuation section in the accompanying Notes to Financial Statements.
| Valuation Inputs at Reporting Date: | ||||
| Description | Total | Level 1 | Level 2 | Level 3 |
| Investments in Securities: | ||||
| Equities: | ||||
| Communication Services | $40,897,289 | $40,897,289 | $-- | $-- |
| Consumer Discretionary | 33,378,126 | 33,378,126 | -- | -- |
| Consumer Staples | 29,907,476 | 29,542,137 | 365,339 | -- |
| Energy | 19,685,958 | 17,704,148 | 1,981,810 | -- |
| Financials | 85,250,474 | 84,374,253 | 876,221 | -- |
| Health Care | 59,120,128 | 59,120,128 | -- | -- |
| Industrials | 57,201,389 | 54,865,800 | 2,335,589 | -- |
| Information Technology | 42,679,599 | 42,679,599 | -- | -- |
| Materials | 17,847,358 | 17,847,358 | -- | -- |
| Real Estate | 19,352,165 | 19,352,165 | -- | -- |
| Utilities | 23,043,448 | 23,043,448 | -- | -- |
| Money Market Funds | 12,206,430 | 12,206,430 | -- | -- |
| Equity Funds | 2,505,640 | 2,505,640 | -- | -- |
| Total Investments in Securities: | $443,075,480 | $437,516,521 | $5,558,959 | $-- |
See accompanying notes which are an integral part of the financial statements.
Financial Statements
Statement of Assets and Liabilities
| January 31, 2021 | ||
| Assets | ||
| Investment in securities, at value (including securities loaned of $524,700) — See accompanying schedule: Unaffiliated issuers (cost $366,866,949) | $430,869,050 | |
| Fidelity Central Funds (cost $12,206,353) | 12,206,430 | |
| Total Investment in Securities (cost $379,073,302) | $443,075,480 | |
| Receivable for investments sold | 3,515,601 | |
| Receivable for fund shares sold | 405,341 | |
| Dividends receivable | 628,460 | |
| Distributions receivable from Fidelity Central Funds | 795 | |
| Prepaid expenses | 444 | |
| Other receivables | 10,249 | |
| Total assets | 447,636,370 | |
| Liabilities | ||
| Payable to custodian bank | $63,136 | |
| Payable for investments purchased | 3,943,496 | |
| Payable for fund shares redeemed | 330,323 | |
| Accrued management fee | 193,269 | |
| Distribution and service plan fees payable | 14,843 | |
| Other affiliated payables | 76,236 | |
| Other payables and accrued expenses | 53,675 | |
| Collateral on securities loaned | 548,625 | |
| Total liabilities | 5,223,603 | |
| Net Assets | $442,412,767 | |
| Net Assets consist of: | ||
| Paid in capital | $411,432,186 | |
| Total accumulated earnings (loss) | 30,980,581 | |
| Net Assets | $442,412,767 | |
| Net Asset Value and Maximum Offering Price | ||
| Class A: | ||
| Net Asset Value and redemption price per share ($22,580,028 ÷ 1,048,963 shares)(a) | $21.53 | |
| Maximum offering price per share (100/94.25 of $21.53) | $22.84 | |
| Class M: | ||
| Net Asset Value and redemption price per share ($9,526,295 ÷ 443,521 shares)(a) | $21.48 | |
| Maximum offering price per share (100/96.50 of $21.48) | $22.26 | |
| Class C: | ||
| Net Asset Value and offering price per share ($6,723,270 ÷ 320,377 shares)(a) | $20.99 | |
| Stock Selector Large Cap Value: | ||
| Net Asset Value, offering price and redemption price per share ($373,321,991 ÷ 17,177,323 shares) | $21.73 | |
| Class I: | ||
| Net Asset Value, offering price and redemption price per share ($9,420,033 ÷ 431,708 shares) | $21.82 | |
| Class Z: | ||
| Net Asset Value, offering price and redemption price per share ($20,841,150 ÷ 965,554 shares) | $21.58 |
(a) Redemption price per share is equal to net asset value less any applicable contingent deferred sales charge.
See accompanying notes which are an integral part of the financial statements.
Statement of Operations
| Year ended January 31, 2021 | ||
| Investment Income | ||
| Dividends | $9,328,304 | |
| Special dividends | 1,448,400 | |
| Interest | 373 | |
| Income from Fidelity Central Funds (including $11,284 from security lending) | 38,679 | |
| Total income | 10,815,756 | |
| Expenses | ||
| Management fee | ||
| Basic fee | $2,207,469 | |
| Performance adjustment | (604,828) | |
| Transfer agent fees | 711,068 | |
| Distribution and service plan fees | 161,953 | |
| Accounting fees | 161,919 | |
| Custodian fees and expenses | 27,547 | |
| Independent trustees' fees and expenses | 2,382 | |
| Registration fees | 95,949 | |
| Audit | 59,878 | |
| Legal | 6,208 | |
| Interest | 377 | |
| Miscellaneous | 10,471 | |
| Total expenses before reductions | 2,840,393 | |
| Expense reductions | (45,466) | |
| Total expenses after reductions | 2,794,927 | |
| Net investment income (loss) | 8,020,829 | |
| Realized and Unrealized Gain (Loss) | ||
| Net realized gain (loss) on: | ||
| Investment securities: | ||
| Unaffiliated issuers | (27,398,222) | |
| Fidelity Central Funds | 1,249 | |
| Foreign currency transactions | (15,999) | |
| Futures contracts | (439,872) | |
| Total net realized gain (loss) | (27,852,844) | |
| Change in net unrealized appreciation (depreciation) on: | ||
| Investment securities: | ||
| Unaffiliated issuers | 35,294,916 | |
| Fidelity Central Funds | (153) | |
| Assets and liabilities in foreign currencies | 1,335 | |
| Futures contracts | 43,942 | |
| Total change in net unrealized appreciation (depreciation) | 35,340,040 | |
| Net gain (loss) | 7,487,196 | |
| Net increase (decrease) in net assets resulting from operations | $15,508,025 |
See accompanying notes which are an integral part of the financial statements.
Statement of Changes in Net Assets
| Year ended January 31, 2021 | Year ended January 31, 2020 | |
| Increase (Decrease) in Net Assets | ||
| Operations | ||
| Net investment income (loss) | $8,020,829 | $14,093,575 |
| Net realized gain (loss) | (27,852,844) | 52,984,207 |
| Change in net unrealized appreciation (depreciation) | 35,340,040 | 27,658,452 |
| Net increase (decrease) in net assets resulting from operations | 15,508,025 | 94,736,234 |
| Distributions to shareholders | (10,445,347) | (7,816,909) |
| Share transactions - net increase (decrease) | (61,933,907) | (537,512,895) |
| Total increase (decrease) in net assets | (56,871,229) | (450,593,570) |
| Net Assets | ||
| Beginning of period | 499,283,996 | 949,877,566 |
| End of period | $442,412,767 | $499,283,996 |
See accompanying notes which are an integral part of the financial statements.
Financial Highlights
Fidelity Stock Selector Large Cap Value Fund Class A
| Years ended January 31, | 2021 | 2020 | 2019 | 2018 | 2017 |
| Selected Per–Share Data | |||||
| Net asset value, beginning of period | $20.92 | $18.80 | $21.26 | $18.63 | $15.37 |
| Income from Investment Operations | |||||
| Net investment income (loss)A | .32B | .29 | .26 | .25C | .19 |
| Net realized and unrealized gain (loss) | .71 | 2.14 | (1.45) | 2.54 | 3.27 |
| Total from investment operations | 1.03 | 2.43 | (1.19) | 2.79 | 3.46 |
| Distributions from net investment income | (.42) | (.31) | (.24) | (.16) | (.20) |
| Distributions from net realized gain | – | – | (1.03) | – | – |
| Total distributions | (.42) | (.31) | (1.27) | (.16) | (.20) |
| Net asset value, end of period | $21.53 | $20.92 | $18.80 | $21.26 | $18.63 |
| Total ReturnD,E | 5.03% | 12.92% | (5.46)% | 15.02% | 22.48% |
| Ratios to Average Net AssetsF,G | |||||
| Expenses before reductions | .94% | .93% | .96% | 1.02% | 1.05% |
| Expenses net of fee waivers, if any | .94% | .93% | .96% | 1.02% | 1.05% |
| Expenses net of all reductions | .93% | .93% | .95% | 1.01% | 1.05% |
| Net investment income (loss) | 1.67%B | 1.45% | 1.28% | 1.27%C | 1.10% |
| Supplemental Data | |||||
| Net assets, end of period (000 omitted) | $22,580 | $25,576 | $25,204 | $27,297 | $31,054 |
| Portfolio turnover rateH | 104% | 68%I | 92% | 90% | 51% |
A Calculated based on average shares outstanding during the period.
B Net investment income per share reflects one or more large, non-recurring dividend(s) which amounted to $.07 per share. Excluding such non-recurring dividend(s), the ratio of net investment income (loss) to average net assets would have been 1.32%.
C Net investment income per share reflects one or more large, non-recurring dividend(s) which amounted to $.07 per share. Excluding such non-recurring dividend(s), the ratio of net investment income (loss) to average net assets would have been .90%.
D Total returns would have been lower if certain expenses had not been reduced during the applicable periods shown.
E Total returns do not include the effect of the sales charges.
F Fees and expenses of any underlying mutual funds or exchange-traded funds (ETFs) are not included in the Fund's expense ratio. The Fund indirectly bears its proportionate share of these expenses. For additional expense information related to investments in Fidelity Central Funds, please refer to the "Investments in Fidelity Central Funds" note found in the Notes to Financial Statements section of the most recent Annual or Semi-Annual report.
G Expense ratios reflect operating expenses of the class. Expenses before reductions do not reflect amounts reimbursed, waived, or reduced through arrangements with the investment adviser, brokerage services, or other offset arrangements, if applicable, and do not represent the amount paid by the class during periods when reimbursements, waivers or reductions occur.
H Amount does not include the portfolio activity of any underlying mutual funds or exchange-traded funds (ETFs).
I Portfolio turnover rate excludes securities received or delivered in-kind.
See accompanying notes which are an integral part of the financial statements.
Fidelity Stock Selector Large Cap Value Fund Class M
| Years ended January 31, | 2021 | 2020 | 2019 | 2018 | 2017 |
| Selected Per–Share Data | |||||
| Net asset value, beginning of period | $20.88 | $18.77 | $21.24 | $18.61 | $15.36 |
| Income from Investment Operations | |||||
| Net investment income (loss)A | .26B | .23 | .19 | .19C | .13 |
| Net realized and unrealized gain (loss) | .70 | 2.13 | (1.44) | 2.54 | 3.26 |
| Total from investment operations | .96 | 2.36 | (1.25) | 2.73 | 3.39 |
| Distributions from net investment income | (.36) | (.25) | (.18) | (.10) | (.14) |
| Distributions from net realized gain | – | – | (1.03) | – | – |
| Total distributions | (.36) | (.25) | (1.22)D | (.10) | (.14) |
| Net asset value, end of period | $21.48 | $20.88 | $18.77 | $21.24 | $18.61 |
| Total ReturnE,F | 4.70% | 12.59% | (5.78)% | 14.70% | 22.04% |
| Ratios to Average Net AssetsG,H | |||||
| Expenses before reductions | 1.23% | 1.24% | 1.28% | 1.34% | 1.39% |
| Expenses net of fee waivers, if any | 1.23% | 1.23% | 1.28% | 1.34% | 1.39% |
| Expenses net of all reductions | 1.22% | 1.23% | 1.27% | 1.33% | 1.39% |
| Net investment income (loss) | 1.38%B | 1.15% | .96% | .95%C | .76% |
| Supplemental Data | |||||
| Net assets, end of period (000 omitted) | $9,526 | $10,385 | $9,542 | $10,615 | $10,704 |
| Portfolio turnover rateI | 104% | 68%J | 92% | 90% | 51% |
A Calculated based on average shares outstanding during the period.
B Net investment income per share reflects one or more large, non-recurring dividend(s) which amounted to $.07 per share. Excluding such non-recurring dividend(s), the ratio of net investment income (loss) to average net assets would have been 1.03%.
C Net investment income per share reflects one or more large, non-recurring dividend(s) which amounted to $.07 per share. Excluding such non-recurring dividend(s), the ratio of net investment income (loss) to average net assets would have been .58%.
D Total distributions per share do not sum due to rounding.
E Total returns would have been lower if certain expenses had not been reduced during the applicable periods shown.
F Total returns do not include the effect of the sales charges.
G Fees and expenses of any underlying mutual funds or exchange-traded funds (ETFs) are not included in the Fund's expense ratio. The Fund indirectly bears its proportionate share of these expenses. For additional expense information related to investments in Fidelity Central Funds, please refer to the "Investments in Fidelity Central Funds" note found in the Notes to Financial Statements section of the most recent Annual or Semi-Annual report.
H Expense ratios reflect operating expenses of the class. Expenses before reductions do not reflect amounts reimbursed, waived, or reduced through arrangements with the investment adviser, brokerage services, or other offset arrangements, if applicable, and do not represent the amount paid by the class during periods when reimbursements, waivers or reductions occur.
I Amount does not include the portfolio activity of any underlying mutual funds or exchange-traded funds (ETFs).
J Portfolio turnover rate excludes securities received or delivered in-kind.
See accompanying notes which are an integral part of the financial statements.
Fidelity Stock Selector Large Cap Value Fund Class C
| Years ended January 31, | 2021 | 2020 | 2019 | 2018 | 2017 |
| Selected Per–Share Data | |||||
| Net asset value, beginning of period | $20.40 | $18.37 | $20.81 | $18.25 | $15.09 |
| Income from Investment Operations | |||||
| Net investment income (loss)A | .16B | .12 | .09 | .08C | .05 |
| Net realized and unrealized gain (loss) | .68 | 2.08 | (1.42) | 2.49 | 3.18 |
| Total from investment operations | .84 | 2.20 | (1.33) | 2.57 | 3.23 |
| Distributions from net investment income | (.25) | (.17) | (.08) | (.01) | (.07) |
| Distributions from net realized gain | – | – | (1.03) | – | – |
| Total distributions | (.25) | (.17) | (1.11) | (.01) | (.07) |
| Net asset value, end of period | $20.99 | $20.40 | $18.37 | $20.81 | $18.25 |
| Total ReturnD,E | 4.19% | 11.96% | (6.26)% | 14.07% | 21.43% |
| Ratios to Average Net AssetsF,G | |||||
| Expenses before reductions | 1.76% | 1.78% | 1.80% | 1.86% | 1.88% |
| Expenses net of fee waivers, if any | 1.76% | 1.77% | 1.80% | 1.85% | 1.88% |
| Expenses net of all reductions | 1.75% | 1.77% | 1.79% | 1.85% | 1.87% |
| Net investment income (loss) | .86%B | .61% | .44% | .43%C | .27% |
| Supplemental Data | |||||
| Net assets, end of period (000 omitted) | $6,723 | $8,813 | $9,813 | $10,703 | $10,802 |
| Portfolio turnover rateH | 104% | 68%I | 92% | 90% | 51% |
A Calculated based on average shares outstanding during the period.
B Net investment income per share reflects one or more large, non-recurring dividend(s) which amounted to $.06 per share. Excluding such non-recurring dividend(s), the ratio of net investment income (loss) to average net assets would have been .51%.
C Net investment income per share reflects one or more large, non-recurring dividend(s) which amounted to $.07 per share. Excluding such non-recurring dividend(s), the ratio of net investment income (loss) to average net assets would have been .06%.
D Total returns would have been lower if certain expenses had not been reduced during the applicable periods shown.
E Total returns do not include the effect of the contingent deferred sales charge.
F Fees and expenses of any underlying mutual funds or exchange-traded funds (ETFs) are not included in the Fund's expense ratio. The Fund indirectly bears its proportionate share of these expenses. For additional expense information related to investments in Fidelity Central Funds, please refer to the "Investments in Fidelity Central Funds" note found in the Notes to Financial Statements section of the most recent Annual or Semi-Annual report.
G Expense ratios reflect operating expenses of the class. Expenses before reductions do not reflect amounts reimbursed, waived, or reduced through arrangements with the investment adviser, brokerage services, or other offset arrangements, if applicable, and do not represent the amount paid by the class during periods when reimbursements, waivers or reductions occur.
H Amount does not include the portfolio activity of any underlying mutual funds or exchange-traded funds (ETFs).
I Portfolio turnover rate excludes securities received or delivered in-kind.
See accompanying notes which are an integral part of the financial statements.
Fidelity Stock Selector Large Cap Value Fund
| Years ended January 31, | 2021 | 2020 | 2019 | 2018 | 2017 |
| Selected Per–Share Data | |||||
| Net asset value, beginning of period | $21.11 | $18.94 | $21.41 | $18.76 | $15.47 |
| Income from Investment Operations | |||||
| Net investment income (loss)A | .38B | .35 | .32 | .31C | .24 |
| Net realized and unrealized gain (loss) | .72 | 2.16 | (1.46) | 2.57 | 3.29 |
| Total from investment operations | 1.10 | 2.51 | (1.14) | 2.88 | 3.53 |
| Distributions from net investment income | (.48) | (.34) | (.29) | (.23) | (.24) |
| Distributions from net realized gain | – | – | (1.03) | – | – |
| Total distributions | (.48) | (.34) | (1.33)D | (.23) | (.24) |
| Net asset value, end of period | $21.73 | $21.11 | $18.94 | $21.41 | $18.76 |
| Total ReturnE | 5.31% | 13.24% | (5.20)% | 15.39% | 22.82% |
| Ratios to Average Net AssetsF,G | |||||
| Expenses before reductions | .64% | .64% | .67% | .73% | .77% |
| Expenses net of fee waivers, if any | .64% | .64% | .67% | .73% | .77% |
| Expenses net of all reductions | .63% | .64% | .66% | .72% | .76% |
| Net investment income (loss) | 1.97%B | 1.74% | 1.57% | 1.56%C | 1.38% |
| Supplemental Data | |||||
| Net assets, end of period (000 omitted) | $373,322 | $432,154 | $806,342 | $989,001 | $703,722 |
| Portfolio turnover rateH | 104% | 68%I | 92% | 90% | 51% |
A Calculated based on average shares outstanding during the period.
B Net investment income per share reflects one or more large, non-recurring dividend(s) which amounted to $.07 per share. Excluding such non-recurring dividend(s), the ratio of net investment income (loss) to average net assets would have been 1.62%.
C Net investment income per share reflects one or more large, non-recurring dividend(s) which amounted to $.07 per share. Excluding such non-recurring dividend(s), the ratio of net investment income (loss) to average net assets would have been 1.19%.
D Total distributions per share do not sum due to rounding.
E Total returns would have been lower if certain expenses had not been reduced during the applicable periods shown.
F Fees and expenses of any underlying mutual funds or exchange-traded funds (ETFs) are not included in the Fund's expense ratio. The Fund indirectly bears its proportionate share of these expenses. For additional expense information related to investments in Fidelity Central Funds, please refer to the "Investments in Fidelity Central Funds" note found in the Notes to Financial Statements section of the most recent Annual or Semi-Annual report.
G Expense ratios reflect operating expenses of the class. Expenses before reductions do not reflect amounts reimbursed, waived, or reduced through arrangements with the investment adviser, brokerage services, or other offset arrangements, if applicable, and do not represent the amount paid by the class during periods when reimbursements, waivers or reductions occur.
H Amount does not include the portfolio activity of any underlying mutual funds or exchange-traded funds (ETFs).
I Portfolio turnover rate excludes securities received or delivered in-kind.
See accompanying notes which are an integral part of the financial statements.
Fidelity Stock Selector Large Cap Value Fund Class I
| Years ended January 31, | 2021 | 2020 | 2019 | 2018 | 2017 |
| Selected Per–Share Data | |||||
| Net asset value, beginning of period | $21.22 | $18.82 | $21.28 | $18.66 | $15.40 |
| Income from Investment Operations | |||||
| Net investment income (loss)A | .38B | .34 | .31 | .30C | .23 |
| Net realized and unrealized gain (loss) | .72 | 2.14 | (1.45) | 2.55 | 3.27 |
| Total from investment operations | 1.10 | 2.48 | (1.14) | 2.85 | 3.50 |
| Distributions from net investment income | (.50) | (.08) | (.29) | (.23) | (.24) |
| Distributions from net realized gain | – | – | (1.03) | – | – |
| Total distributions | (.50) | (.08) | (1.32) | (.23) | (.24) |
| Net asset value, end of period | $21.82 | $21.22 | $18.82 | $21.28 | $18.66 |
| Total ReturnD | 5.31% | 13.20% | (5.20)% | 15.33% | 22.72% |
| Ratios to Average Net AssetsE,F | |||||
| Expenses before reductions | .67% | .67% | .69% | .76% | .84% |
| Expenses net of fee waivers, if any | .67% | .66% | .69% | .76% | .84% |
| Expenses net of all reductions | .66% | .66% | .68% | .75% | .84% |
| Net investment income (loss) | 1.94%B | 1.72% | 1.55% | 1.53%C | 1.30% |
| Supplemental Data | |||||
| Net assets, end of period (000 omitted) | $9,420 | $9,450 | $98,119 | $118,319 | $11,273 |
| Portfolio turnover rateG | 104% | 68%H | 92% | 90% | 51% |
A Calculated based on average shares outstanding during the period.
B Net investment income per share reflects one or more large, non-recurring dividend(s) which amounted to $.07 per share. Excluding such non-recurring dividend(s), the ratio of net investment income (loss) to average net assets would have been 1.59%.
C Net investment income per share reflects one or more large, non-recurring dividend(s) which amounted to $.07 per share. Excluding such non-recurring dividend(s), the ratio of net investment income (loss) to average net assets would have been 1.16%.
D Total returns would have been lower if certain expenses had not been reduced during the applicable periods shown.
E Fees and expenses of any underlying mutual funds or exchange-traded funds (ETFs) are not included in the Fund's expense ratio. The Fund indirectly bears its proportionate share of these expenses. For additional expense information related to investments in Fidelity Central Funds, please refer to the "Investments in Fidelity Central Funds" note found in the Notes to Financial Statements section of the most recent Annual or Semi-Annual report.
F Expense ratios reflect operating expenses of the class. Expenses before reductions do not reflect amounts reimbursed, waived, or reduced through arrangements with the investment adviser, brokerage services, or other offset arrangements, if applicable, and do not represent the amount paid by the class during periods when reimbursements, waivers or reductions occur.
G Amount does not include the portfolio activity of any underlying mutual funds or exchange-traded funds (ETFs).
H Portfolio turnover rate excludes securities received or delivered in-kind.
See accompanying notes which are an integral part of the financial statements.
Fidelity Stock Selector Large Cap Value Fund Class Z
| Years ended January 31, | 2021 | 2020 | 2019 | 2018 A |
| Selected Per–Share Data | ||||
| Net asset value, beginning of period | $20.97 | $18.84 | $21.30 | $18.64 |
| Income from Investment Operations | ||||
| Net investment income (loss)B | .41C | .38 | .34 | .34D |
| Net realized and unrealized gain (loss) | .71 | 2.14 | (1.45) | 2.57 |
| Total from investment operations | 1.12 | 2.52 | (1.11) | 2.91 |
| Distributions from net investment income | (.51) | (.39) | (.32) | (.25) |
| Distributions from net realized gain | – | – | (1.03) | – |
| Total distributions | (.51) | (.39) | (1.35) | (.25) |
| Net asset value, end of period | $21.58 | $20.97 | $18.84 | $21.30 |
| Total ReturnE | 5.43% | 13.38% | (5.04)% | 15.65% |
| Ratios to Average Net AssetsF,G | ||||
| Expenses before reductions | .52% | .52% | .55% | .60% |
| Expenses net of fee waivers, if any | .52% | .52% | .55% | .60% |
| Expenses net of all reductions | .51% | .51% | .54% | .59% |
| Net investment income (loss) | 2.10%C | 1.86% | 1.70% | 1.68%D |
| Supplemental Data | ||||
| Net assets, end of period (000 omitted) | $20,841 | $12,905 | $858 | $888 |
| Portfolio turnover rateH | 104% | 68%I | 92% | 90% |
A For the period February 1, 2017 (commencement of sale of shares) to January 31, 2018.
B Calculated based on average shares outstanding during the period.
C Net investment income per share reflects one or more large, non-recurring dividend(s) which amounted to $.07 per share. Excluding such non-recurring dividend(s), the ratio of net investment income (loss) to average net assets would have been 1.75%.
D Net investment income per share reflects one or more large, non-recurring dividend(s) which amounted to $.07 per share. Excluding such non-recurring dividend(s), the ratio of net investment income (loss) to average net assets would have been 1.31%.
E Total returns would have been lower if certain expenses had not been reduced during the applicable periods shown.
F Fees and expenses of any underlying mutual funds or exchange-traded funds (ETFs) are not included in the Fund's expense ratio. The Fund indirectly bears its proportionate share of these expenses. For additional expense information related to investments in Fidelity Central Funds, please refer to the "Investments in Fidelity Central Funds" note found in the Notes to Financial Statements section of the most recent Annual or Semi-Annual report.
G Expense ratios reflect operating expenses of the class. Expenses before reductions do not reflect amounts reimbursed, waived, or reduced through arrangements with the investment adviser, brokerage services, or other offset arrangements, if applicable, and do not represent the amount paid by the class during periods when reimbursements, waivers or reductions occur.
H Amount does not include the portfolio activity of any underlying mutual funds or exchange-traded funds (ETFs).
I Portfolio turnover rate excludes securities received or delivered in-kind.
See accompanying notes which are an integral part of the financial statements.
Notes to Financial Statements
For the period ended January 31, 2021
1. Organization.
Fidelity Stock Selector Large Cap Value Fund (the Fund) is a fund of Fidelity Devonshire Trust (the Trust) and is authorized to issue an unlimited number of shares. The Trust is registered under the Investment Company Act of 1940, as amended (the 1940 Act), as an open-end management investment company organized as a Massachusetts business trust. The Fund offers Class A, Class M, Class C, Stock Selector Large Cap Value, Class I and Class Z shares, each of which has equal rights as to assets and voting privileges. Each class has exclusive voting rights with respect to matters that affect that class. Class C shares will automatically convert to Class A shares after a holding period of ten years from the initial date of purchase, with certain exceptions.
2. Investments in Fidelity Central Funds.
The Fund invests in Fidelity Central Funds, which are open-end investment companies generally available only to other investment companies and accounts managed by the investment adviser and its affiliates. The Fund's Schedule of Investments lists each of the Fidelity Central Funds held as of period end, if any, as an investment of the Fund, but does not include the underlying holdings of each Fidelity Central Fund. As an Investing Fund, the Fund indirectly bears its proportionate share of the expenses of the underlying Fidelity Central Funds.
The Money Market Central Funds seek preservation of capital and current income and are managed by the investment adviser. Annualized expenses of the Money Market Central Funds as of their most recent shareholder report date ranged from less than .005% to .01%.
A complete unaudited list of holdings for each Fidelity Central Fund is available upon request or at the Securities and Exchange Commission (the SEC) website at www.sec.gov. In addition, the financial statements of the Fidelity Central Funds, which are not covered by the Fund's Report of Independent Registered Public Accounting Firm, are available on the SEC website or upon request.
3. Significant Accounting Policies.
The Fund is an investment company and applies the accounting and reporting guidance of the Financial Accounting Standards Board (FASB) Accounting Standards Codification Topic 946 Financial Services - Investment Companies. The financial statements have been prepared in conformity with accounting principles generally accepted in the United States of America (GAAP), which require management to make certain estimates and assumptions at the date of the financial statements. Actual results could differ from those estimates. Subsequent events, if any, through the date that the financial statements were issued have been evaluated in the preparation of the financial statements. The following summarizes the significant accounting policies of the Fund:
Investment Valuation. Investments are valued as of 4:00 p.m. Eastern time on the last calendar day of the period. The Board of Trustees (the Board) has delegated the day to day responsibility for the valuation of the Fund's investments to the Fair Value Committee (the Committee) established by the Fund's investment adviser. In accordance with valuation policies and procedures approved by the Board, the Fund attempts to obtain prices from one or more third party pricing vendors or brokers to value its investments. When current market prices, quotations or currency exchange rates are not readily available or reliable, investments will be fair valued in good faith by the Committee, in accordance with procedures adopted by the Board. Factors used in determining fair value vary by investment type and may include market or investment specific events. The frequency with which these procedures are used cannot be predicted and they may be utilized to a significant extent. The Committee oversees the Fund's valuation policies and procedures and reports to the Board on the Committee's activities and fair value determinations. The Board monitors the appropriateness of the procedures used in valuing the Fund's investments and ratifies the fair value determinations of the Committee.
The Fund categorizes the inputs to valuation techniques used to value its investments into a disclosure hierarchy consisting of three levels as shown below:
- Level 1 – quoted prices in active markets for identical investments
- Level 2 – other significant observable inputs (including quoted prices for similar investments, interest rates, prepayment speeds, etc.)
- Level 3 – unobservable inputs (including the Fund's own assumptions based on the best information available)
Valuation techniques used to value the Fund's investments by major category are as follows:
Equity securities, including restricted securities, for which market quotations are readily available, are valued at the last reported sale price or official closing price as reported by a third party pricing vendor on the primary market or exchange on which they are traded and are categorized as Level 1 in the hierarchy. In the event there were no sales during the day or closing prices are not available, securities are valued at the last quoted bid price or may be valued using the last available price and are generally categorized as Level 2 in the hierarchy. For foreign equity securities, when market or security specific events arise, comparisons to the valuation of American Depositary Receipts (ADRs), futures contracts, Exchange-Traded Funds (ETFs) and certain indexes as well as quoted prices for similar securities may be used and would be categorized as Level 2 in the hierarchy. For equity securities, including restricted securities, where observable inputs are limited, assumptions about market activity and risk are used and these securities may be categorized as Level 3 in the hierarchy.
ETFs are valued at their last sale price or official closing price as reported by a third party pricing vendor on the primary market or exchange on which they are traded and are categorized as Level 1 in the hierarchy. In the event there were no sales during the day but the exchange reports a closing bid level, ETFs are valued at the closing bid and would be categorized as Level 1 in the hierarchy. In the event there was no closing bid, ETFs may be valued by another method that the Board believes reflects fair value in accordance with the Board's fair value pricing policies and may be categorized as Level 2 in the hierarchy.
Investments in open-end mutual funds, including the Fidelity Central Funds, are valued at their closing net asset value (NAV) each business day and are categorized as Level 1 in the hierarchy. If an unaffiliated open-end mutual fund's NAV is unavailable, shares of that fund may be valued by another method that the Board believes reflects fair value in accordance with the Board's fair value pricing policies and is categorized as Level 2 in the hierarchy.
Changes in valuation techniques may result in transfers in or out of an assigned level within the disclosure hierarchy. The aggregate value of investments by input level as of January 31, 2021 is included at the end of the Fund's Schedule of Investments.
Foreign Currency. Certain Funds may use foreign currency contracts to facilitate transactions in foreign-denominated securities. Gains and losses from these transactions may arise from changes in the value of the foreign currency or if the counterparties do not perform under the contracts' terms.
Foreign-denominated assets, including investment securities, and liabilities are translated into U.S. dollars at the exchange rates at period end. Purchases and sales of investment securities, income and dividends received, and expenses denominated in foreign currencies are translated into U.S. dollars at the exchange rate in effect on the transaction date.
The effects of exchange rate fluctuations on investments are included with the net realized and unrealized gain (loss) on investment securities. Other foreign currency transactions resulting in realized and unrealized gain (loss) are disclosed separately.
Investment Transactions and Income. For financial reporting purposes, the Fund's investment holdings and NAV include trades executed through the end of the last business day of the period. The NAV per share for processing shareholder transactions is calculated as of the close of business of the New York Stock Exchange (NYSE), normally 4:00 p.m. Eastern time and includes trades executed through the end of the prior business day. Gains and losses on securities sold are determined on the basis of identified cost and include proceeds received from litigation. Dividend income is recorded on the ex-dividend date, except for certain dividends from foreign securities where the ex-dividend date may have passed, which are recorded as soon as the Fund is informed of the ex-dividend date. Non-cash dividends included in dividend income, if any, are recorded at the fair market value of the securities received. Income and capital gain distributions from Fidelity Central Funds, if any, are recorded on the ex-dividend date. Certain distributions received by the Fund represent a return of capital or capital gain. The Fund determines the components of these distributions subsequent to the ex-dividend date, based upon receipt of tax filings or other correspondence relating to the underlying investment. These distributions are recorded as a reduction of cost of investments and/or as a realized gain. Large, non-recurring dividends recognized by the Fund are presented separately on the Statement of Operations as "Special Dividends" and the impact of these dividends is presented in the Financial Highlights. Interest income is accrued as earned and includes coupon interest and amortization of premium and accretion of discount on debt securities as applicable. Investment income is recorded net of foreign taxes withheld where recovery of such taxes is uncertain.
Class Allocations and Expenses. Investment income, realized and unrealized capital gains and losses, common expenses of the Fund, and certain fund-level expense reductions, if any, are allocated daily on a pro-rata basis to each class based on the relative net assets of each class to the total net assets of the Fund. Each class differs with respect to transfer agent and distribution and service plan fees incurred. Certain expense reductions may also differ by class. For the reporting period, the allocated portion of income and expenses to each class as a percent of its average net assets may vary due to the timing of recording these transactions in relation to fluctuating net assets of the classes. Expenses directly attributable to a fund are charged to that fund. Expenses attributable to more than one fund are allocated among the respective funds on the basis of relative net assets or other appropriate methods. Expense estimates are accrued in the period to which they relate and adjustments are made when actual amounts are known.
Income Tax Information and Distributions to Shareholders. Each year, the Fund intends to qualify as a regulated investment company under Subchapter M of the Internal Revenue Code, including distributing substantially all of its taxable income and realized gains. As a result, no provision for U.S. Federal income taxes is required. As of January 31, 2021, the Fund did not have any unrecognized tax benefits in the financial statements; nor is the Fund aware of any tax positions for which it is reasonably possible that the total amounts of unrecognized tax benefits will significantly change in the next twelve months. The Fund files a U.S. federal tax return, in addition to state and local tax returns as required. The Fund's federal income tax returns are subject to examination by the Internal Revenue Service (IRS) for a period of three fiscal years after they are filed. State and local tax returns may be subject to examination for an additional fiscal year depending on the jurisdiction. Foreign taxes are provided for based on the Fund's understanding of the tax rules and rates that exist in the foreign markets in which it invests.
Distributions are declared and recorded on the ex-dividend date. Income and capital gain distributions are declared separately for each class. Income and capital gain distributions are determined in accordance with income tax regulations, which may differ from GAAP. In addition, the Fund claimed a portion of the payment made to redeeming shareholders as a distribution for income tax purposes.
Capital accounts within the financial statements are adjusted for permanent book-tax differences. These adjustments have no impact on net assets or the results of operations. Capital accounts are not adjusted for temporary book-tax differences which will reverse in a subsequent period.
Book-tax differences are primarily due to futures contracts, foreign currency transactions, passive foreign investment companies (PFIC), market discount, capital loss carryforwards and losses deferred due to wash sales.
As of period end, the cost and unrealized appreciation (depreciation) in securities, and derivatives if applicable, for federal income tax purposes were as follows:
| Gross unrealized appreciation | $73,911,782 |
| Gross unrealized depreciation | (14,107,923) |
| Net unrealized appreciation (depreciation) | $59,803,859 |
| Tax Cost | $383,271,621 |
The tax-based components of distributable earnings as of period end were as follows:
| Capital loss carryforward | $(28,824,505) |
| Net unrealized appreciation (depreciation) on securities and other investments | $59,805,085 |
Capital loss carryforwards are only available to offset future capital gains of the Fund to the extent provided by regulations and may be limited. The capital loss carryforward information presented below, including any applicable limitation, is estimated as of fiscal period end and is subject to adjustment.
| No expiration | |
| Short-term | $(5,680,937) |
| Long-term | (23,143,568) |
| Total capital loss carryforward | $(28,824,505) |
The tax character of distributions paid was as follows:
| January 31, 2021 | January 31, 2020 | |
| Ordinary Income | $10,445,347 | $ 7,816,909 |
4. Derivative Instruments.
Risk Exposures and the Use of Derivative Instruments. The Fund's investment objective allows the Fund to enter into various types of derivative contracts, including futures contracts. Derivatives are investments whose value is primarily derived from underlying assets, indices or reference rates and may be transacted on an exchange or over-the-counter (OTC). Derivatives may involve a future commitment to buy or sell a specified asset based on specified terms, to exchange future cash flows at periodic intervals based on a notional principal amount, or for one party to make one or more payments upon the occurrence of specified events in exchange for periodic payments from the other party.
The Fund used derivatives to increase returns and to manage exposure to certain risks as defined below. The success of any strategy involving derivatives depends on analysis of numerous economic factors, and if the strategies for investment do not work as intended, the Fund may not achieve its objectives.
The Fund's use of derivatives increased or decreased its exposure to the following risk:
| Equity Risk | Equity risk relates to the fluctuations in the value of financial instruments as a result of changes in market prices (other than those arising from interest rate risk or foreign exchange risk), whether caused by factors specific to an individual investment, its issuer, or all factors affecting all instruments traded in a market or market segment. |
The Fund is also exposed to additional risks from investing in derivatives, such as liquidity risk and counterparty credit risk. Liquidity risk is the risk that the Fund will be unable to close out the derivative in the open market in a timely manner. Counterparty credit risk is the risk that the counterparty will not be able to fulfill its obligation to the Fund. Counterparty credit risk related to exchange-traded futures contracts may be mitigated by the protection provided by the exchange on which they trade.
Investing in derivatives may involve greater risks than investing in the underlying assets directly and, to varying degrees, may involve risk of loss in excess of any initial investment and collateral received and amounts recognized in the Statement of Assets and Liabilities. In addition, there may be the risk that the change in value of the derivative contract does not correspond to the change in value of the underlying instrument.
Futures Contracts. A futures contract is an agreement between two parties to buy or sell a specified underlying instrument for a fixed price at a specified future date. The Fund used futures contracts to manage its exposure to the stock market.
Upon entering into a futures contract, a fund is required to deposit either cash or securities (initial margin) with a clearing broker in an amount equal to a certain percentage of the face value of the contract. Futures contracts are marked-to-market daily and subsequent daily payments (variation margin) are made or received by a fund depending on the daily fluctuations in the value of the futures contracts and are recorded as unrealized appreciation or (depreciation). This receivable and/or payable, if any, is included in daily variation margin on futures contracts in the Statement of Assets and Liabilities. Realized gain or (loss) is recorded upon the expiration or closing of a futures contract. The net realized gain (loss) and change in net unrealized appreciation (depreciation) on futures contracts during the period is presented in the Statement of Operations.
Any open futures contracts at period end are presented in the Schedule of Investments under the caption "Futures Contracts". The notional amount at value reflects each contract's exposure to the underlying instrument or index at period end and is representative of volume of activity during the period.
5. Purchases and Sales of Investments.
Purchases and sales of securities, other than short-term securities are noted in the table below.
| Purchases ($) | Sales ($) | |
| Fidelity Stock Selector Large Cap Value Fund | 426,483,761 | 487,736,260 |
6. Fees and Other Transactions with Affiliates.
Management Fee. Fidelity Management & Research Company LLC (the investment adviser) and its affiliates provide the Fund with investment management related services for which the Fund pays a monthly management fee. The management fee is the sum of an individual fund fee rate that is based on an annual rate of .30% of the Fund's average net assets and an annualized group fee rate that averaged .23% during the period. The group fee rate is based upon the monthly average net assets of a group of registered investment companies with which the investment adviser has management contracts. The group fee rate decreases as assets under management increase and increases as assets under management decrease. In addition, the management fee is subject to a performance adjustment (up to a maximum of +/- .20% of the Fund's average net assets over a 36 month performance period). The upward or downward adjustment to the management fee is based on the relative investment performance of Stock Selector Large Cap Value as compared to its benchmark index, the Russell 1000 Value Index, over the same 36 month performance period. For the reporting period, the total annual management fee rate, including the performance adjustment, was .39% of the Fund's average net assets. The performance adjustment included in the management fee rate may be higher or lower than the maximum performance adjustment rate due to the difference between the average net assets for the reporting and performance periods.
Distribution and Service Plan Fees. In accordance with Rule 12b-1 of the 1940 Act, the Fund has adopted separate Distribution and Service Plans for each class of shares. Certain classes pay Fidelity Distributors Company LLC (FDC), an affiliate of the investment adviser, separate Distribution and Service Fees, each of which is based on an annual percentage of each class' average net assets. In addition, FDC may pay financial intermediaries for selling shares of the Fund and providing shareholder support services. For the period, the Distribution and Service Fee rates, total fees and amounts retained by FDC were as follows:
| Distribution Fee | Service Fee | Total Fees | Retained by FDC | |
| Class A | -% | .25% | $53,174 | $1,004 |
| Class M | .25% | .25% | 43,768 | 413 |
| Class C | .75% | .25% | 65,011 | 6,164 |
| $161,953 | $7,581 |
Sales Load. FDC may receive a front-end sales charge of up to 5.75% for selling Class A shares and 3.50% for selling Class M shares, some of which is paid to financial intermediaries for selling shares of the Fund. Depending on the holding period, FDC may receive contingent deferred sales charges levied on Class A, Class M and Class C redemptions. The deferred sales charges are 1.00% for Class C shares, 1.00% for certain purchases of Class A shares and .25% for certain purchases of Class M shares.
For the period, sales charge amounts retained by FDC were as follows:
| Retained by FDC | |
| Class A | $7,332 |
| Class M | 1,448 |
| Class C(a) | 455 |
| $9,235 |
(a) When Class C shares are initially sold, FDC pays commissions from its own resources to financial intermediaries through which the sales are made.
Transfer Agent Fees. Fidelity Investments Institutional Operations Company LLC (FIIOC), an affiliate of the investment adviser, is the transfer, dividend disbursing and shareholder servicing agent for each class of the Fund. FIIOC receives account fees and asset-based fees that vary according to the account size and type of account of the shareholders of the respective classes of the Fund, except for Class Z. FIIOC receives an asset-based fee of Class Z's average net assets. FIIOC pays for typesetting, printing and mailing of shareholder reports, except proxy statements.
For the period, transfer agent fees for each class were as follows:
| Amount | % of Class-Level Average Net Assets | |
| Class A | $46,459 | .22 |
| Class M | 22,560 | .26 |
| Class C | 18,200 | .28 |
| Stock Selector Large Cap Value | 601,575 | .17 |
| Class I | 15,652 | .20 |
| Class Z | 6,622 | .04 |
| $711,068 |
Accounting Fees. Fidelity Service Company, Inc. (FSC), an affiliate of the investment adviser, maintains the Fund's accounting records. The accounting fee is based on the level of average net assets for each month. For the period, the fees were equivalent to the following annual rates:
| % of Average Net Assets | |
| Fidelity Stock Selector Large Cap Value Fund | .04 |
Brokerage Commissions. A portion of portfolio transactions were placed with brokerage firms which are affiliates of the investment adviser. Brokerage commissions are included in net realized gain (loss) and change in net unrealized appreciation (depreciation) in the Statement of Operations. The commissions paid to these affiliated firms were as follows:
| Amount | |
| Fidelity Stock Selector Large Cap Value Fund | $9,457 |
Interfund Lending Program. Pursuant to an Exemptive Order issued by the SEC, the Fund, along with other registered investment companies having management contracts with Fidelity Management & Research Company LLC (FMR), or other affiliated entities of FMR, may participate in an interfund lending program. This program provides an alternative credit facility allowing the Fund to borrow from, or lend money to, other participating affiliated funds. At period end, were no interfund loans outstanding. Activity in this program during the period for which loans were outstanding was as follows:
| Borrower or Lender | Average Loan Balance | Weighted Average Interest Rate | Interest Expense | |
| Fidelity Stock Selector Large Cap Value Fund | Borrower | $4,926,143 | .33% | $321 |
Interfund Trades. Funds may purchase from or sell securities to other Fidelity Funds under procedures adopted by the Board. The procedures have been designed to ensure these interfund trades are executed in accordance with Rule 17a-7 of the 1940 Act. Interfund trades are included within the respective purchases and sales amounts shown in the Purchases and Sales of Investments note, and amounted to $51,165,789 and $35,638,508, respectively.
Prior Fiscal Year Affiliated Redemptions In-Kind. During the prior period, 22,911,566 shares of the Fund were redeemed in-kind for investments and cash with a value of $463,341,627. The Fund had a net realized gain of $45,639,734 on investments delivered through in-kind redemptions. The amount of the in-kind redemptions is included in share transactions in the accompanying Statement of Changes in Net Assets as well as the Notes to Financial Statements. The Fund recognized no gain or loss for federal income tax purposes.
7. Committed Line of Credit.
Certain Funds participate with other funds managed by the investment adviser or an affiliate in a $4.25 billion credit facility (the "line of credit") to be utilized for temporary or emergency purposes to fund shareholder redemptions or for other short-term liquidity purposes. The participating funds have agreed to pay commitment fees on their pro-rata portion of the line of credit, which are reflected in Miscellaneous expenses on the Statement of Operations, and are listed below.
| Amount | |
| Fidelity Stock Selector Large Cap Value Fund | $959 |
During the period, there were no borrowings on this line of credit.
8. Security Lending.
Funds lend portfolio securities from time to time in order to earn additional income. Lending agents are used, including National Financial Services (NFS), an affiliate of the investment adviser. Pursuant to a securities lending agreement, NFS will receive a fee, which is capped at 9.9% of a fund's daily lending revenue, for its services as lending agent. A fund may lend securities to certain qualified borrowers, including NFS. On the settlement date of the loan, a fund receives collateral (in the form of U.S. Treasury obligations, letters of credit and/or cash) against the loaned securities and maintains collateral in an amount not less than 100% of the market value of the loaned securities during the period of the loan. The market value of the loaned securities is determined at the close of business of a fund and any additional required collateral is delivered to a fund on the next business day. A fund or borrower may terminate the loan at any time, and if the borrower defaults on its obligation to return the securities loaned because of insolvency or other reasons, a fund may apply collateral received from the borrower against the obligation. A fund may experience delays and costs in recovering the securities loaned. Any cash collateral received is invested in the Fidelity Securities Lending Cash Central Fund. Any loaned securities are identified as such in the Schedule of Investments, and the value of loaned securities and cash collateral at period end, as applicable, are presented in the Statement of Assets and Liabilities. Security lending income represents the income earned on investing cash collateral, less rebates paid to borrowers and any lending agent fees associated with the loan, plus any premium payments received for lending certain types of securities. Security lending income is presented in the Statement of Operations as a component of income from Fidelity Central Funds. Affiliated security lending activity, if any, was as follows:
| Total Security Lending Income Fees Paid to NFS | Security Lending Income From Securities Loaned to NFS | Value of Securities Loaned to NFS at Period End | |
| Fidelity Stock Selector Large Cap Value Fund | $227 | $– | $– |
9. Bank Borrowings.
The Fund is permitted to have bank borrowings for temporary or emergency purposes to fund shareholder redemptions or for other short-term liquidity requirements. The Fund has established borrowing arrangements with certain banks. The interest rate on the borrowings is the bank's base rate, as revised from time to time. Any open loans, including accrued interest, at period end are presented under the caption "Notes payable" in the Statement of Assets and Liabilities, if applicable. Activity in this program during the period for which loans were outstanding was as follows:
| Average Loan Balance | Weighted Average Interest Rate | Interest Expense | |
| Fidelity Stock Selector Large Cap Value Fund | $3,425,000 | .59% | $56 |
10. Expense Reductions.
Commissions paid to certain brokers with whom the investment adviser, or its affiliates, places trades on behalf of the Fund include an amount in addition to trade execution, which may be rebated back to the Fund to offset expenses. This amount totaled $43,739 for the period.
In addition, during the period the investment adviser or an affiliate reimbursed and/or waived a portion of fund-level operating expenses in the amount of $1,727.
11. Distributions to Shareholders.
Distributions to shareholders of each class were as follows:
| Year ended January 31, 2021 | Year ended January 31, 2020 | |
| Distributions to shareholders | ||
| Class A | $486,919 | $376,526 |
| Class M | 166,759 | 124,103 |
| Class C | 89,164 | 73,576 |
| Stock Selector Large Cap Value | 8,684,384 | 6,974,541 |
| Class I | 353,431 | 38,278 |
| Class Z | 664,690 | 229,885 |
| Total | $10,445,347 | $7,816,909 |
12. Share Transactions.
Share transactions for each class were as follows and may contain automatic conversions between classes or exchanges between affiliated funds:
| Shares | Shares | Dollars | Dollars | |
| Year ended January 31, 2021 | Year ended January 31, 2020 | Year ended January 31, 2021 | Year ended January 31, 2020 | |
| Class A | ||||
| Shares sold | 232,147 | 272,583 | $4,461,724 | $5,444,751 |
| Reinvestment of distributions | 20,946 | 16,942 | 429,721 | 356,457 |
| Shares redeemed | (426,592) | (407,710) | (8,148,341) | (8,121,788) |
| Net increase (decrease) | (173,499) | (118,185) | $(3,256,896) | $(2,320,580) |
| Class M | ||||
| Shares sold | 42,288 | 52,572 | $792,314 | $1,061,174 |
| Reinvestment of distributions | 8,161 | 5,893 | 166,631 | 123,762 |
| Shares redeemed | (104,335) | (69,435) | (1,906,589) | (1,393,986) |
| Net increase (decrease) | (53,886) | (10,970) | $(947,644) | $(209,050) |
| Class C | ||||
| Shares sold | 49,121 | 117,640 | $906,243 | $2,317,618 |
| Reinvestment of distributions | 4,543 | 3,552 | 89,038 | 72,960 |
| Shares redeemed | (165,220) | (223,436) | (2,804,394) | (4,307,137) |
| Net increase (decrease) | (111,556) | (102,244) | $(1,809,113) | $(1,916,559) |
| Stock Selector Large Cap Value | ||||
| Shares sold | 1,689,962 | 3,286,805 | $32,116,561 | $65,276,805 |
| Reinvestment of distributions | 397,914 | 312,906 | 8,258,831 | 6,639,858 |
| Shares redeemed | (5,381,493) | (25,706,426)(a) | (102,662,962) | (519,914,728)(a) |
| Net increase (decrease) | (3,293,617) | (22,106,715) | $(62,287,570) | $(447,998,065) |
| Class I | ||||
| Shares sold | 805,395 | 584,249 | $16,819,328 | $11,412,152 |
| Reinvestment of distributions | 9,970 | 871 | 211,831 | 18,584 |
| Shares redeemed | (828,944) | (5,353,625)(a) | (17,024,870) | (107,597,098)(a) |
| Net increase (decrease) | (13,579) | (4,768,505) | $6,289 | $(96,166,362) |
| Class Z | ||||
| Shares sold | 1,113,226 | 614,598 | $22,107,144 | $11,995,991 |
| Reinvestment of distributions | 26,137 | 10,810 | 549,160 | 227,875 |
| Shares redeemed | (789,221) | (55,521) | (16,295,277) | (1,126,145) |
| Net increase (decrease) | 350,142 | 569,887 | $6,361,027 | $11,097,721 |
(a) Amount includes in-kind redemptions (see the Prior Fiscal Year Affiliated Redemptions In-Kind note for additional details).
13. Other.
The Fund's organizational documents provide former and current trustees and officers with a limited indemnification against liabilities arising in connection with the performance of their duties to the Fund. In the normal course of business, the Fund may also enter into contracts that provide general indemnifications. The Fund's maximum exposure under these arrangements is unknown as this would be dependent on future claims that may be made against the Fund. The risk of material loss from such claims is considered remote.
14. Coronavirus (COVID-19) Pandemic.
An outbreak of COVID-19 first detected in China during December 2019 has since spread globally and was declared a pandemic by the World Health Organization during March 2020. Developments that disrupt global economies and financial markets, such as the COVID-19 pandemic, may magnify factors that affect the Fund's performance.
Report of Independent Registered Public Accounting Firm
To the Board of Trustees of Fidelity Devonshire Trust and Shareholders of Fidelity Stock Selector Large Cap Value Fund
Opinion on the Financial Statements
We have audited the accompanying statement of assets and liabilities, including the schedule of investments, of Fidelity Stock Selector Large Cap Value Fund (one of the funds constituting Fidelity Devonshire Trust, referred to hereafter as the “Fund”) as of January 31, 2021, the related statement of operations for the year ended January 31, 2021, the statement of changes in net assets for each of the two years in the period ended January 31, 2021, including the related notes, and the financial highlights for each of the periods indicated therein (collectively referred to as the “financial statements”). In our opinion, the financial statements present fairly, in all material respects, the financial position of the Fund as of January 31, 2021, the results of its operations for the year then ended, the changes in its net assets for each of the two years in the period ended January 31, 2021 and the financial highlights for each of the periods indicated therein in conformity with accounting principles generally accepted in the United States of America.
Basis for Opinion
These financial statements are the responsibility of the Fund’s management. Our responsibility is to express an opinion on the Fund’s financial statements based on our audits. We are a public accounting firm registered with the Public Company Accounting Oversight Board (United States) (PCAOB) and are required to be independent with respect to the Fund in accordance with the U.S. federal securities laws and the applicable rules and regulations of the Securities and Exchange Commission and the PCAOB.
We conducted our audits of these financial statements in accordance with the standards of the PCAOB. Those standards require that we plan and perform the audit to obtain reasonable assurance about whether the financial statements are free of material misstatement, whether due to error or fraud.
Our audits included performing procedures to assess the risks of material misstatement of the financial statements, whether due to error or fraud, and performing procedures that respond to those risks. Such procedures included examining, on a test basis, evidence regarding the amounts and disclosures in the financial statements. Our audits also included evaluating the accounting principles used and significant estimates made by management, as well as evaluating the overall presentation of the financial statements. Our procedures included confirmation of securities owned as of January 31, 2021 by correspondence with the custodian and brokers; when replies were not received from brokers, we performed other auditing procedures. We believe that our audits provide a reasonable basis for our opinion.
/s/ PricewaterhouseCoopers LLP
Boston, Massachusetts
March 12, 2021
We have served as the auditor of one or more investment companies in the Fidelity group of funds since 1932.
Trustees and Officers
The Trustees, Members of the Advisory Board (if any), and officers of the trust and fund, as applicable, are listed below. The Board of Trustees governs the fund and is responsible for protecting the interests of shareholders. The Trustees are experienced executives who meet periodically throughout the year to oversee the fund's activities, review contractual arrangements with companies that provide services to the fund, oversee management of the risks associated with such activities and contractual arrangements, and review the fund's performance. Each of the Trustees oversees 309 funds.
The Trustees hold office without limit in time except that (a) any Trustee may resign; (b) any Trustee may be removed by written instrument, signed by at least two-thirds of the number of Trustees prior to such removal; (c) any Trustee who requests to be retired or who has become incapacitated by illness or injury may be retired by written instrument signed by a majority of the other Trustees; and (d) any Trustee may be removed at any special meeting of shareholders by a two-thirds vote of the outstanding voting securities of the trust. Each Trustee who is not an interested person (as defined in the 1940 Act) of the trust and the fund is referred to herein as an Independent Trustee. Each Independent Trustee shall retire not later than the last day of the calendar year in which his or her 75th birthday occurs. The Independent Trustees may waive this mandatory retirement age policy with respect to individual Trustees. Officers and Advisory Board Members hold office without limit in time, except that any officer or Advisory Board Member may resign or may be removed by a vote of a majority of the Trustees at any regular meeting or any special meeting of the Trustees. Except as indicated, each individual has held the office shown or other offices in the same company for the past five years.
The fund's Statement of Additional Information (SAI) includes more information about the Trustees. To request a free copy, call Fidelity at 1-800-544-8544 if you’re an individual investing directly with Fidelity, call 1-800-835-5092 if you’re a plan sponsor or participant with Fidelity as your recordkeeper or call 1-877-208-0098 on institutional accounts or if you’re an advisor or invest through one.
Experience, Skills, Attributes, and Qualifications of the Trustees. The Governance and Nominating Committee has adopted a statement of policy that describes the experience, qualifications, attributes, and skills that are necessary and desirable for potential Independent Trustee candidates (Statement of Policy). The Board believes that each Trustee satisfied at the time he or she was initially elected or appointed a Trustee, and continues to satisfy, the standards contemplated by the Statement of Policy. The Governance and Nominating Committee also engages professional search firms to help identify potential Independent Trustee candidates who have the experience, qualifications, attributes, and skills consistent with the Statement of Policy. From time to time, additional criteria based on the composition and skills of the current Independent Trustees, as well as experience or skills that may be appropriate in light of future changes to board composition, business conditions, and regulatory or other developments, have also been considered by the professional search firms and the Governance and Nominating Committee. In addition, the Board takes into account the Trustees' commitment and participation in Board and committee meetings, as well as their leadership of standing and ad hoc committees throughout their tenure.
In determining that a particular Trustee was and continues to be qualified to serve as a Trustee, the Board has considered a variety of criteria, none of which, in isolation, was controlling. The Board believes that, collectively, the Trustees have balanced and diverse experience, qualifications, attributes, and skills, which allow the Board to operate effectively in governing the fund and protecting the interests of shareholders. Information about the specific experience, skills, attributes, and qualifications of each Trustee, which in each case led to the Board's conclusion that the Trustee should serve (or continue to serve) as a trustee of the fund, is provided below.
Board Structure and Oversight Function. Robert A. Lawrence is an interested person and currently serves as Acting Chairman. The Trustees have determined that an interested Chairman is appropriate and benefits shareholders because an interested Chairman has a personal and professional stake in the quality and continuity of services provided to the fund. Independent Trustees exercise their informed business judgment to appoint an individual of their choosing to serve as Chairman, regardless of whether the Trustee happens to be independent or a member of management. The Independent Trustees have determined that they can act independently and effectively without having an Independent Trustee serve as Chairman and that a key structural component for assuring that they are in a position to do so is for the Independent Trustees to constitute a substantial majority for the Board. The Independent Trustees also regularly meet in executive session. David M. Thomas serves as Lead Independent Trustee and as such (i) acts as a liaison between the Independent Trustees and management with respect to matters important to the Independent Trustees and (ii) with management prepares agendas for Board meetings.
Fidelity® funds are overseen by different Boards of Trustees. The fund's Board oversees Fidelity's high income and certain equity funds, and other Boards oversee Fidelity's investment-grade bond, money market, asset allocation, and other equity funds. The asset allocation funds may invest in Fidelity® funds overseen by the fund's Board. The use of separate Boards, each with its own committee structure, allows the Trustees of each group of Fidelity® funds to focus on the unique issues of the funds they oversee, including common research, investment, and operational issues. On occasion, the separate Boards establish joint committees to address issues of overlapping consequences for the Fidelity® funds overseen by each Board.
The Trustees operate using a system of committees to facilitate the timely and efficient consideration of all matters of importance to the Trustees, the fund, and fund shareholders and to facilitate compliance with legal and regulatory requirements and oversight of the fund's activities and associated risks. The Board, acting through its committees, has charged FMR and its affiliates with (i) identifying events or circumstances the occurrence of which could have demonstrably adverse effects on the fund's business and/or reputation; (ii) implementing processes and controls to lessen the possibility that such events or circumstances occur or to mitigate the effects of such events or circumstances if they do occur; and (iii) creating and maintaining a system designed to evaluate continuously business and market conditions in order to facilitate the identification and implementation processes described in (i) and (ii) above. Because the day-to-day operations and activities of the fund are carried out by or through FMR, its affiliates, and other service providers, the fund's exposure to risks is mitigated but not eliminated by the processes overseen by the Trustees. While each of the Board's committees has responsibility for overseeing different aspects of the fund's activities, oversight is exercised primarily through the Operations, Audit, and Compliance Committees. Appropriate personnel, including but not limited to the fund's Chief Compliance Officer (CCO), FMR's internal auditor, the independent accountants, the fund's Treasurer and portfolio management personnel, make periodic reports to the Board's committees, as appropriate, including an annual review of Fidelity's risk management program for the Fidelity® funds. The responsibilities of each standing committee, including their oversight responsibilities, are described further under "Standing Committees of the Trustees."
Interested Trustees*:
Correspondence intended for a Trustee who is an interested person may be sent to Fidelity Investments, 245 Summer Street, Boston, Massachusetts 02210.
Name, Year of Birth; Principal Occupations and Other Relevant Experience+
Bettina Doulton (1964)
Year of Election or Appointment: 2020
Trustee
Ms. Doulton also serves as Trustee of other Fidelity® funds. Prior to her retirement, Ms. Doulton served in a variety of positions at Fidelity Investments, including as a managing director of research (2006-2007), portfolio manager to certain Fidelity® funds (1993-2005), equity analyst and portfolio assistant (1990-1993), and research assistant (1987-1990). Ms. Doulton currently owns and operates Phi Builders + Architects and Cellardoor Winery. Previously, Ms. Doulton served as a member of the Board of Brown Capital Management, LLC (2013-2018).
Robert A. Lawrence (1952)
Year of Election or Appointment: 2020
Trustee
Acting Chairman of the Board of Trustees
Mr. Lawrence also serves as Trustee of other funds. Previously, Mr. Lawrence served as a Member of the Advisory Board of certain funds. Prior to his retirement in 2008, Mr. Lawrence served as Vice President of certain Fidelity® funds (2006-2008), Senior Vice President, Head of High Income Division of Fidelity Management & Research Company (investment adviser firm, 2006-2008), and President of Fidelity Strategic Investments (investment adviser firm, 2002-2005).
* Determined to be an “Interested Trustee” by virtue of, among other things, his or her affiliation with the trust or various entities under common control with FMR.
+ The information includes the Trustee's principal occupation during the last five years and other information relating to the experience, attributes, and skills relevant to the Trustee's qualifications to serve as a Trustee, which led to the conclusion that the Trustee should serve as a Trustee for the fund.
Independent Trustees:
Correspondence intended for an Independent Trustee may be sent to Fidelity Investments, P.O. Box 55235, Boston, Massachusetts 02205-5235.
Name, Year of Birth; Principal Occupations and Other Relevant Experience+
Dennis J. Dirks (1948)
Year of Election or Appointment: 2005
Trustee
Mr. Dirks also serves as Trustee of other Fidelity® funds. Prior to his retirement in May 2003, Mr. Dirks served as Chief Operating Officer and as a member of the Board of The Depository Trust & Clearing Corporation (financial markets infrastructure), President, Chief Operating Officer and a member of the Board of The Depository Trust Company (DTC), President and a member of the Board of the National Securities Clearing Corporation (NSCC), Chief Executive Officer and a member of the Board of the Government Securities Clearing Corporation and Chief Executive Officer and a member of the Board of the Mortgage-Backed Securities Clearing Corporation. Mr. Dirks currently serves as a member of the Finance Committee (2016-present) and Board (2017-present) and is Treasurer (2018-present) of the Asolo Repertory Theatre.
Donald F. Donahue (1950)
Year of Election or Appointment: 2018
Trustee
Mr. Donahue also serves as Trustee of other Fidelity® funds. Mr. Donahue serves as President and Chief Executive Officer of Miranda Partners, LLC (risk consulting for the financial services industry, 2012-present). Previously, Mr. Donahue served as Chief Executive Officer (2006-2012), Chief Operating Officer (2003-2006) and Managing Director, Customer Marketing and Development (1999-2003) of The Depository Trust & Clearing Corporation (financial markets infrastructure). Mr. Donahue currently serves as a member (2007-present) and Co-Chairman (2016-present) of the Board of United Way of New York, a member of the Board of NYC Leadership Academy (2012-present) and a member of the Board of Advisors of Ripple Labs, Inc. (financial services, 2015-present). Mr. Donahue previously served as a member of the Advisory Board of certain Fidelity® funds (2015-2018).
Vicki L. Fuller (1957)
Year of Election or Appointment: 2020
Trustee
Ms. Fuller also serves as Trustee of other Fidelity® funds. Previously, Ms. Fuller served as a member of the Advisory Board of certain Fidelity® funds (2018-2020), Chief Investment Officer of the New York State Common Retirement Fund (2012-2018) and held a variety of positions at AllianceBernstein L.P. (global asset management, 1985-2012), including Managing Director (2006-2012) and Senior Vice President and Senior Portfolio Manager (2001-2006). Ms. Fuller currently serves as a member of the Board, Audit Committee and Nominating and Governance Committee of The Williams Companies, Inc. (natural gas infrastructure, 2018-present), as a member of the Board, Audit Committee and Nominating and Governance Committee of two Blackstone business development companies (2020-present) and as a member of the Board of Treliant, LLC (consulting, 2019-present).
Patricia L. Kampling (1959)
Year of Election or Appointment: 2020
Trustee
Ms. Kampling also serves as Trustee of other Fidelity® funds. Prior to her retirement, Ms. Kampling served as Chairman of the Board and Chief Executive Officer (2012-2019), President and Chief Operating Officer (2011-2012) and Executive Vice President and Chief Financial Officer (2010-2011) of Alliant Energy Corporation. Ms. Kampling currently serves as a member of the Board, Compensation Committee and Executive Committee and as Chair of the Audit Committee of Briggs & Stratton Corporation (manufacturing, 2011-present) and as a member of the Board, Audit, Finance and Risk Committee and Safety, Environmental, Technology and Operations Committee of American Water Works Company, Inc. (utilities company, 2019-present). In addition, Ms. Kampling currently serves as a member of the Board of the Nature Conservancy, Wisconsin Chapter (2019-present). Previously, Ms. Kampling served as a Member of the Advisory Board of certain Fidelity® funds (2020), a member of the Board of Interstate Power and Light Company (2012-2019) and Wisconsin Power and Light Company (2012-2019) (each a subsidiary of Alliant Energy Corporation) and as a member of the Board and Workforce Development Committee of the Business Roundtable (2018-2019).
Thomas A. Kennedy (1955)
Year of Election or Appointment: 2021
Trustee
Mr. Kennedy also serves as Trustee of other Fidelity® funds. Previously, Mr. Kennedy served as a Member of the Advisory Board of certain Fidelity® funds (2020) and held a variety of positions at Raytheon Company (aerospace and defense, 1983-2020), including Chairman and Chief Executive Officer (2014-2020) and Executive Vice President and Chief Operating Officer (2013-2014). Mr. Kennedy currently serves as Executive Chairman of the Board of Directors of Raytheon Technologies Corporation (aerospace and defense, 2020-present). He is also a member of the Rutgers School of Engineering Industry Advisory Board (2011-present) and a member of the UCLA Engineering Dean’s Executive Board (2016-present).
Garnett A. Smith (1947)
Year of Election or Appointment: 2018
Trustee
Mr. Smith also serves as Trustee of other Fidelity® funds. Prior to his retirement, Mr. Smith served as Chairman and Chief Executive Officer (1990-1997) and President (1986-1990) of Inbrand Corp. (manufacturer of personal absorbent products). Prior to his employment with Inbrand Corp., he was employed by a retail fabric chain and North Carolina National Bank (now Bank of America). Mr. Smith previously served as a member of the Advisory Board of certain Fidelity® funds (2012-2013).
David M. Thomas (1949)
Year of Election or Appointment: 2008
Trustee
Lead Independent Trustee
Mr. Thomas also serves as Trustee of other Fidelity® funds. Previously, Mr. Thomas served as Executive Chairman (2005-2006) and Chairman and Chief Executive Officer (2000-2005) of IMS Health, Inc. (pharmaceutical and healthcare information solutions). Mr. Thomas currently serves as Non-Executive Chairman of the Board of Fortune Brands Home and Security (home and security products, 2011-present), and a member of the Board (2004-present) and Presiding Director (2013-present) of Interpublic Group of Companies, Inc. (marketing communication).
Susan Tomasky (1953)
Year of Election or Appointment: 2020
Trustee
Ms. Tomasky also serves as Trustee of other Fidelity® funds. Prior to her retirement, Ms. Tomasky served in various executive officer positions at American Electric Power Company, Inc. (1998-2011), including most recently as President of AEP Transmission (2007-2011). Ms. Tomasky currently serves as a member of the Board and Sustainability Committee and as Chair of the Audit Committee of Marathon Petroleum Corporation (2018-present) and as a member of the Board, Corporate Governance Committee and Organization and Compensation Committee and as Chair of the Audit Committee of Public Service Enterprise Group, Inc. (utilities company, 2012-present). In addition, Ms. Tomasky currently serves as a member of the Board of the Columbus Regional Airport Authority (2007-present), as a member of the Board of the Royal Shakespeare Company – America (2009-present), as a member of the Board of the Columbus Association for the Performing Arts (2011-present) and as a member of the Board of Kenyon College (2016-present). Previously, Ms. Tomasky served as a Member of the Advisory Board of certain Fidelity® funds (2020), a member of the Board (2011-2019) and as Lead Independent Director (2015-2018) of Andeavor Corporation (previously Tesoro Corporation) (independent oil refiner and marketer) and as a member of the Board of Summit Midstream Partners LP (energy, 2012-2018).
Michael E. Wiley (1950)
Year of Election or Appointment: 2018
Trustee
Mr. Wiley also serves as Trustee of other Fidelity® funds. Previously, Mr. Wiley served as a member of the Advisory Board of certain Fidelity® funds (2018-2020), Chairman, President and CEO of Baker Hughes, Inc. (oilfield services, 2000-2004). Mr. Wiley also previously served as a member of the Board of Andeavor Corporation (independent oil refiner and marketer, 2005-2018), a member of the Board of Andeavor Logistics LP (natural resources logistics, 2015-2018) and a member of the Board of High Point Resources (exploration and production, 2005-2020).
+ The information includes the Trustee's principal occupation during the last five years and other information relating to the experience, attributes, and skills relevant to the Trustee's qualifications to serve as a Trustee, which led to the conclusion that the Trustee should serve as a Trustee for the fund.
Advisory Board Members and Officers:
Correspondence intended for a Member of the Advisory Board (if any) may be sent to Fidelity Investments, P.O. Box 55235, Boston, Massachusetts 02205-5235. Correspondence intended for an officer or Peter S. Lynch may be sent to Fidelity Investments, 245 Summer Street, Boston, Massachusetts 02210. Officers appear below in alphabetical order.
Name, Year of Birth; Principal Occupation
Ned C. Lautenbach (1944)
Year of Election or Appointment: 2021
Member of the Advisory Board
Mr. Lautenbach also serves as a Member of the Advisory Board of other Fidelity® funds. Mr. Lautenbach currently serves as Chair of the Board of Governors, State University System of Florida (2013-present) and is a member of the Council on Foreign Relations (1994-present). He is also a member and has in the past served as Chairman of the Board of Directors of Artis-Naples (2012-present). Previously, Mr. Lautenbach served as a Trustee of certain Fidelity® funds (2000-2020) and a member and then Lead Director of the Board of Directors of Eaton Corporation (diversified industrial, 1997-2016). He was also a Partner at Clayton, Dubilier & Rice, LLC (private equity investment, 1998-2010); as well as Director of Sony Corporation (2006-2007). In addition, Mr. Lautenbach had a 30-year career with IBM (technology company), during which time he served as Senior Vice President and as a member of the Corporate Executive Committee (1968-1998).
Peter S. Lynch (1944)
Year of Election or Appointment: 2003
Member of the Advisory Board
Mr. Lynch also serves as a Member of the Advisory Board of other Fidelity® funds. Mr. Lynch is Vice Chairman and a Director of Fidelity Management & Research Company LLC (investment adviser firm). In addition, Mr. Lynch serves as a Trustee of Boston College and as the Chairman of the Inner-City Scholarship Fund. Previously, Mr. Lynch served as Vice Chairman and a Director of FMR Co., Inc. (investment adviser firm) and on the Special Olympics International Board of Directors (1997-2006).
Craig S. Brown (1977)
Year of Election or Appointment: 2019
Assistant Treasurer
Mr. Brown also serves as Assistant Treasurer of other funds. Mr. Brown is an employee of Fidelity Investments (2013-present).
John J. Burke III (1964)
Year of Election or Appointment: 2018
Chief Financial Officer
Mr. Burke also serves as Chief Financial Officer of other funds. Mr. Burke serves as Head of Investment Operations for Fidelity Fund and Investment Operations (2018-present) and is an employee of Fidelity Investments (1998-present). Previously Mr. Burke served as head of Asset Management Investment Operations (2012-2018).
William C. Coffey (1969)
Year of Election or Appointment: 2019
Assistant Secretary
Mr. Coffey also serves as Assistant Secretary of other funds. He is Senior Vice President and Deputy General Counsel of FMR LLC (diversified financial services company, 2010-present), and is an employee of Fidelity Investments. Previously, Mr. Coffey served as Secretary and CLO of certain funds (2018-2019); CLO, Secretary, and Senior Vice President of Fidelity Management & Research Company and FMR Co., Inc. (investment adviser firms, 2018-2019); Secretary of Fidelity SelectCo, LLC and Fidelity Investments Money Management, Inc. (investment adviser firms, 2018-2019); CLO of Fidelity Management & Research (Hong Kong) Limited, FMR Investment Management (UK) Limited, and Fidelity Management & Research (Japan) Limited (investment adviser firms, 2018-2019); and Assistant Secretary of certain funds (2009-2018).
Timothy M. Cohen (1969)
Year of Election or Appointment: 2018
Vice President
Mr. Cohen also serves as Vice President of other funds. Mr. Cohen serves as Co-Head of Equity (2018-present), a Director of Fidelity Management & Research (Japan) Limited (investment adviser firm, 2016-present), and is an employee of Fidelity Investments. Previously, Mr. Cohen served as Executive Vice President of Fidelity SelectCo, LLC (2019), Head of Global Equity Research (2016-2018), Chief Investment Officer - Equity and a Director of Fidelity Management & Research (U.K.) Inc. (investment adviser firm, 2013-2015) and as a Director of Fidelity Management & Research (Hong Kong) Limited (investment adviser firm, 2017).
Jonathan Davis (1968)
Year of Election or Appointment: 2010
Assistant Treasurer
Mr. Davis also serves as Assistant Treasurer of other funds. Mr. Davis serves as Assistant Treasurer of FMR Capital, Inc. (2017-present) and is an employee of Fidelity Investments. Previously, Mr. Davis served as Vice President and Associate General Counsel of FMR LLC (diversified financial services company, 2003-2010).
Laura M. Del Prato (1964)
Year of Election or Appointment: 2018
Assistant Treasurer
Ms. Del Prato also serves as an officer of other funds. Ms. Del Prato is an employee of Fidelity Investments (2017-present). Previously, Ms. Del Prato served as President and Treasurer of The North Carolina Capital Management Trust: Cash Portfolio and Term Portfolio (2018-2020). Prior to joining Fidelity Investments, Ms. Del Prato served as a Managing Director and Treasurer of the JPMorgan Mutual Funds (2014-2017). Prior to JPMorgan, Ms. Del Prato served as a partner at Cohen Fund Audit Services (accounting firm, 2012-2013) and KPMG LLP (accounting firm, 2004-2012).
Colm A. Hogan (1973)
Year of Election or Appointment: 2020
Assistant Treasurer
Mr. Hogan also serves as an officer of other funds. Mr. Hogan serves as Assistant Treasurer of FMR Capital, Inc. (2017-present) and is an employee of Fidelity Investments (2005-present). Previously, Mr. Hogan served as Deputy Treasurer of certain Fidelity® funds (2016-2020) and Assistant Treasurer of certain Fidelity® funds (2016-2018).
Pamela R. Holding (1964)
Year of Election or Appointment: 2018
Vice President
Ms. Holding also serves as Vice President of other funds. Ms. Holding serves as Co-Head of Equity (2018-present) and is an employee of Fidelity Investments (2013-present). Previously, Ms. Holding served as Executive Vice President of Fidelity SelectCo, LLC (2019) and as Chief Investment Officer of Fidelity Institutional Asset Management (2013-2018).
Cynthia Lo Bessette (1969)
Year of Election or Appointment: 2019
Secretary and Chief Legal Officer (CLO)
Ms. Lo Bessette also serves as an officer of other funds. Ms. Lo Bessette serves as CLO, Secretary, and Senior Vice President of Fidelity Management & Research Company LLC (investment adviser firm, 2019-present); and CLO of Fidelity Management & Research (Hong Kong) Limited, FMR Investment Management (UK) Limited, and Fidelity Management & Research (Japan) Limited (investment adviser firms, 2019-present). She is a Senior Vice President and Deputy General Counsel of FMR LLC (diversified financial services company, 2019-present), and is an employee of Fidelity Investments. Previously, Ms. Lo Bessette served as CLO, Secretary, and Senior Vice President of FMR Co., Inc. (investment adviser firm, 2019); Secretary of Fidelity SelectCo, LLC and Fidelity Investments Money Management, Inc. (investment adviser firms, 2019). Prior to joining Fidelity Investments, Ms. Lo Bessette was Executive Vice President, General Counsel (2016-2019) and Senior Vice President, Deputy General Counsel (2015-2016) of OppenheimerFunds (investment management company) and Deputy Chief Legal Officer (2013-2015) of Jennison Associates LLC (investment adviser firm).
Chris Maher (1972)
Year of Election or Appointment: 2020
Deputy Treasurer
Mr. Maher also serves as an officer of other funds. Mr. Maher serves as Assistant Treasurer of FMR Capital, Inc. (2017-present), and is an employee of Fidelity Investments (2008-present). Previously, Mr. Maher served as Assistant Treasurer of certain funds (2013-2020); Vice President of Asset Management Compliance (2013), Vice President of the Program Management Group of FMR (investment adviser firm, 2010-2013), and Vice President of Valuation Oversight (2008-2010).
Jason P. Pogorelec (1975)
Year of Election or Appointment: 2020
Chief Compliance Officer
Mr. Pogorelec also serves as Chief Compliance Officer of other funds. Mr. Pogorelec is a senior Vice President of Asset Management Compliance for Fidelity Investments and is an employee of Fidelity Investments (2006-present). Previously, Mr. Pogorelec served as Vice President, Associate General Counsel for Fidelity Investments (2010-2020) and Assistant Secretary of certain Fidelity funds (2015-2020).
Brett Segaloff (1972)
Year of Election or Appointment: 2021
Anti-Money Laundering (AML) Officer
Mr. Segaloff also serves as an AML Officer of other funds and other related entities. He is Director, Anti-Money Laundering (2007-present) of FMR LLC (diversified financial services company) and is an employee of Fidelity Investments (1996-present).
Stacie M. Smith (1974)
Year of Election or Appointment: 2016
President and Treasurer
Ms. Smith also serves as an officer of other funds. Ms. Smith serves as Assistant Treasurer of FMR Capital, Inc. (2017-present), is an employee of Fidelity Investments (2009-present), and has served in other fund officer roles. Prior to joining Fidelity Investments, Ms. Smith served as Senior Audit Manager of Ernst & Young LLP (accounting firm, 1996-2009). Previously, Ms. Smith served as Assistant Treasurer (2013-2019) and Deputy Treasurer (2013-2016) of certain Fidelity® funds.
Marc L. Spector (1972)
Year of Election or Appointment: 2016
Assistant Treasurer
Mr. Spector also serves as an officer of other funds. Mr. Spector serves as Assistant Treasurer of FMR Capital, Inc. (2017-present) and is an employee of Fidelity Investments (2016-present). Prior to joining Fidelity Investments, Mr. Spector served as Director at the Siegfried Group (accounting firm, 2013-2016), and prior to Siegfried Group as audit senior manager at Deloitte & Touche LLP (accounting firm, 2005-2013).
Jim Wegmann (1979)
Year of Election or Appointment: 2019
Assistant Treasurer
Mr. Wegmann also serves as Assistant Treasurer of other funds. Mr. Wegmann is an employee of Fidelity Investments (2011-present).
Shareholder Expense Example
As a shareholder, you incur two types of costs: (1) transaction costs, which may include sales charges (loads) on purchase payments or redemption proceeds, as applicable and (2) ongoing costs, which generally include management fees, distribution and/or service (12b-1) fees and other Fund expenses. This Example is intended to help you understand your ongoing costs (in dollars) of investing in a fund and to compare these costs with the ongoing costs of investing in other mutual funds.
The Example is based on an investment of $1,000 invested at the beginning of the period and held for the entire period (August 1, 2020 to January 31, 2021).
Actual Expenses
The first line of the accompanying table provides information about actual account values and actual expenses. You may use the information in this line, together with the amount you invested, to estimate the expenses that you paid over the period. Simply divide your account value by $1,000.00 (for example, an $8,600 account value divided by $1,000.00 = 8.6), then multiply the result by the number in the first line for a class/Fund under the heading entitled "Expenses Paid During Period" to estimate the expenses you paid on your account during this period. If any fund is a shareholder of any underlying mutual funds or exchange-traded funds (ETFs) (the Underlying Funds), such fund indirectly bears its proportional share of the expenses of the Underlying Funds in addition to the direct expenses incurred presented in the table. These fees and expenses are not included in the annualized expense ratio used to calculate the expense estimate in the table below.
Hypothetical Example for Comparison Purposes
The second line of the accompanying table provides information about hypothetical account values and hypothetical expenses based on the actual expense ratio and an assumed rate of return of 5% per year before expenses, which is not the actual return. The hypothetical account values and expenses may not be used to estimate the actual ending account balance or expenses you paid for the period. You may use this information to compare the ongoing costs of investing in the Fund and other funds. To do so, compare this 5% hypothetical example with the 5% hypothetical examples that appear in the shareholder reports of the other funds. If any fund is a shareholder of any Underlying Funds, such fund indirectly bears its proportional share of the expenses of the Underlying Funds in addition to the direct expenses as presented in the table. These fees and expenses are not included in the annualized expense ratio used to calculate the expense estimate in the table below.
Please note that the expenses shown in the table are meant to highlight your ongoing costs only and do not reflect any transaction costs. Therefore, the second line of the table is useful in comparing ongoing costs only, and will not help you determine the relative total costs of owning different funds. In addition, if these transactional costs were included, your costs would have been higher.
| Annualized Expense Ratio-A | Beginning Account Value August 1, 2020 | Ending Account Value January 31, 2021 | Expenses Paid During Period-B August 1, 2020 to January 31, 2021 | |
| Fidelity Stock Selector Large Cap Value Fund | ||||
| Class A | .97% | |||
| Actual | $1,000.00 | $1,194.30 | $5.35 | |
| Hypothetical-C | $1,000.00 | $1,020.26 | $4.93 | |
| Class M | 1.26% | |||
| Actual | $1,000.00 | $1,192.40 | $6.94 | |
| Hypothetical-C | $1,000.00 | $1,018.80 | $6.39 | |
| Class C | 1.79% | |||
| Actual | $1,000.00 | $1,189.20 | $9.85 | |
| Hypothetical-C | $1,000.00 | $1,016.14 | $9.07 | |
| Stock Selector Large Cap Value | .67% | |||
| Actual | $1,000.00 | $1,195.40 | $3.70 | |
| Hypothetical-C | $1,000.00 | $1,021.77 | $3.40 | |
| Class I | .67% | |||
| Actual | $1,000.00 | $1,195.40 | $3.70 | |
| Hypothetical-C | $1,000.00 | $1,021.77 | $3.40 | |
| Class Z | .54% | |||
| Actual | $1,000.00 | $1,195.90 | $2.98 | |
| Hypothetical-C | $1,000.00 | $1,022.42 | $2.75 |
A Annualized expense ratio reflects expenses net of applicable fee waivers.
B Expenses are equal to the annualized expense ratio, multiplied by the average account value over the period, multiplied by 184/ 366 (to reflect the one-half year period). The fees and expenses of any Underlying Funds are not included in each annualized expense ratio.
C 5% return per year before expenses
Distributions (Unaudited)
Class A, Class M, Class C, Stock Selector Large Cap Value, Class I, and Class Z designate 100% of the dividends distributed during the fiscal year as qualifying for the dividends–received deduction for corporate shareholders.
Class A, Class M, Class C, Stock Selector Large Cap Value, Class I, and Class Z designate 100% of the dividends distributed during the fiscal year as amounts which may be taken into account as a dividend for purposes of the maximum rate under section 1(h)(11) of the Internal Revenue Code.
The fund will notify shareholders in January 2022 of amounts for use in preparing 2021 income tax returns.
Board Approval of Investment Advisory Contracts
Fidelity Stock Selector Large Cap Value Fund
At its January 2021 meeting, the Board of Trustees, including the Independent Trustees (together, the Board), voted to continue the management contract with Fidelity Management & Research Company LLC (FMR), and the sub-advisory agreements and sub-subadvisory agreements, in each case, where applicable (together, the Advisory Contracts) for the fund for four months from February 1, 2021 through May 31, 2021, in connection with changes to the Board's meeting calendar.The Board considered that the approval of the fund's Advisory Contracts will not result in any changes in (i) the investment process or strategies employed in the management of the fund's assets; (ii) the fees and expenses paid by shareholders; (iii) the nature, extent or quality of services provided under the fund's Advisory Contracts; or (iv) the day-to-day management of the fund or the persons primarily responsible for such management. The Board also considered that since its last approval of the fund's Advisory Contracts, FMR had provided additional information on the fund in support of the annual contract renewal process, including competitive analyses on total expenses and management fees and in-depth reviews of fund performance and fund profitability information. The Board also considered the findings of certain ad hoc committees that had been previously formed to discuss matters relevant to all of the Fidelity funds, including economies of scale, fall-out benefits and retail vs. institutional funds. The Board concluded that the fund's Advisory Contracts are fair and reasonable, and that the fund's Advisory Contracts should be renewed, without modification, through May 31, 2021, with the understanding that the Board will consider the annual renewal for a full one year period in May 2021.In connection with its consideration of future renewals of the fund's Advisory Contracts, the Board will consider: (i) the nature, extent and quality of services provided to the funds, including shareholder and administrative services and investment performance; (ii) the competitiveness of the management fee and total expenses for the fund; (iii) the costs of the services and profitability, including the revenues earned and the expenses incurred in conducting the business of developing, marketing, distributing, managing, administering, and servicing the fund and its shareholders, to the extent applicable; and (iv) whether there have been economies of scale in respect of the Fidelity funds, whether the Fidelity funds (including the fund) have appropriately benefited from any such economies of scale, and whether there is the potential for realization of any further economies.Based on its evaluation of all of the conclusions noted above, and after considering all factors it believed relevant, the Board ultimately concluded that the fund's management fee structure is fair and reasonable, and that the continuation of the fund's Advisory Contracts should be approved for four months from February 1, 2021 through May 31, 2021.Proxy Voting Results
A special meeting of shareholders was held on June 9, 2020. The results of votes taken among shareholders on the proposals before them are reported below. Each vote reported represents one dollar of net asset value held on the record date for the meeting.
PROPOSAL 1
To elect a Board of Trustees.
| # of Votes | % of Votes | |
| Dennis J. Dirks | ||
| Affirmative | 20,677,600,881.166 | 98.531 |
| Withheld | 308,216,367.332 | 1.469 |
| TOTAL | 20,985,817,248.498 | 100.000 |
| Donald F. Donahue | ||
| Affirmative | 20,685,205,663.711 | 98.568 |
| Withheld | 300,611,584.787 | 1.432 |
| TOTAL | 20,985,817,248.498 | 100.000 |
| Bettina Doulton | ||
| Affirmative | 20,701,129,729.034 | 98.643 |
| Withheld | 284,687,519.464 | 1.357 |
| TOTAL | 20,985,817,248.498 | 100.000 |
| Vicki L. Fuller | ||
| Affirmative | 20,713,892,146.063 | 98.704 |
| Withheld | 271,925,102.435 | 1.296 |
| TOTAL | 20,985,817,248.498 | 100.000 |
| Patricia L. Kampling | ||
| Affirmative | 20,693,289,719.327 | 98.606 |
| Withheld | 292,527,529.171 | 1.394 |
| TOTAL | 20,985,817,248.498 | 100.000 |
| Alan J. Lacy | ||
| Affirmative | 20,659,591,158.873 | 98.445 |
| Withheld | 326,226,089.625 | 1.555 |
| TOTAL | 20,985,817,248.498 | 100.000 |
| Ned C. Lautenbach | ||
| Affirmative | 20,634,244,420.039 | 98.325 |
| Withheld | 351,572,828.459 | 1.675 |
| TOTAL | 20,985,817,248.498 | 100.000 |
| Robert A. Lawrence | ||
| Affirmative | 20,672,781,907.548 | 98.508 |
| Withheld | 313,035,340.950 | 1.492 |
| TOTAL | 20,985,817,248.498 | 100.000 |
| Joseph Mauriello | ||
| Affirmative | 20,652,465,304.654 | 98.412 |
| Withheld | 333,351,943.843 | 1.588 |
| TOTAL | 20,985,817,248.498 | 100.000 |
| Cornelia M. Small | ||
| Affirmative | 20,671,641,667.984 | 98.503 |
| Withheld | 314,175,580.514 | 1.497 |
| TOTAL | 20,985,817,248.498 | 100.000 |
| Garnett A. Smith | ||
| Affirmative | 20,655,644,270.628 | 98.427 |
| Withheld | 330,172,977.870 | 1.573 |
| TOTAL | 20,985,817,248.498 | 100.000 |
| David M. Thomas | ||
| Affirmative | 20,654,595,907.599 | 98.422 |
| Withheld | 331,221,340.899 | 1.578 |
| TOTAL | 20,985,817,248.498 | 100.000 |
| Susan Tomasky | ||
| Affirmative | 20,686,662,870.375 | 98.574 |
| Withheld | 299,154,378.123 | 1.426 |
| TOTAL | 20,985,817,248.498 | 100.000 |
| Michael E. Wiley | ||
| Affirmative | 20,662,847,882.871 | 98.461 |
| Withheld | 322,969,365.626 | 1.539 |
| TOTAL | 20,985,817,248.498 | 100.000 |
PROPOSAL 2
To convert a fundamental investment policy to a non-fundamental investment policy.
| # of Votes | % of Votes | |
| Affirmative | 125,285,703.333 | 60.522 |
| Against | 44,817,009.108 | 21.650 |
| Abstain | 25,570,812.547 | 12.352 |
| Broker Non-Vote | 11,336,617.650 | 5.476 |
| TOTAL | 207,010,142.638 | 100.000 |
| Proposal 1 reflects trust wide proposal and voting results. | ||
| Proposal 2 was not approved by shareholders. |
![]()
LCV-ANN-0321
1.900194.111
Item 2.
Code of Ethics
As of the end of the period, January 31, 2021, Fidelity Devonshire Trust (the trust) has adopted a code of ethics, as defined in Item 2 of Form N-CSR, that applies to its President and Treasurer and its Chief Financial Officer. A copy of the code of ethics is filed as an exhibit to this Form N-CSR.
Item 3.
Audit Committee Financial Expert
The Board of Trustees of the trust has determined that Donald F. Donahue is an audit committee financial expert, as defined in Item 3 of Form N-CSR. Mr. Donahue is independent for purposes of Item 3 of Form N-CSR.
Item 4.
Principal Accountant Fees and Services
Fees and Services
The following table presents fees billed by Deloitte & Touche LLP, the member firms of Deloitte Touche Tohmatsu, and their respective affiliates (collectively, “Deloitte Entities”) in each of the last two fiscal years for services rendered to Fidelity Equity-Income K6 Fund, Fidelity Flex Mid Cap Value Fund, Fidelity Mid Cap Value K6 Fund, Fidelity Series All-Sector Equity Fund and Fidelity Series Value Discovery Fund (the “Funds”):
Services Billed by Deloitte Entities
January 31, 2021 FeesA
Audit Fees | Audit-Related Fees | Tax Fees | All Other Fees | |
Fidelity Equity-Income K6 Fund | $ 45,200 | $- | $9,200 | $1,000 |
Fidelity Flex Mid Cap Value Fund | $34,200 | $- | $7,500 | $900 |
Fidelity Mid Cap Value K6 Fund | $42,900 | $- | $7,400 | $900 |
Fidelity Series All-Sector Equity Fund | $40,600 | $- | $7,400 | $1,000 |
Fidelity Series Value Discovery Fund | $45,200 | $- | $9,400 | $1,100 |
January 31, 2020 FeesA,B
Audit Fees | Audit-Related Fees | Tax Fees | All Other Fees | |
Fidelity Equity-Income K6 Fund | $36,700 | $- | $9,000 | $500 |
Fidelity Flex Mid Cap Value Fund | $35,100 | $100 | $7,300 | $900 |
Fidelity Mid Cap Value K6 Fund | $37,400 | $100 | $7,100 | $900 |
Fidelity Series All-Sector Equity Fund | $41,600 | $100 | $7,600 | $1,000 |
Fidelity Series Value Discovery Fund | $54,700 | $100 | $9,400 | $1,100 |
A Amounts may reflect rounding.
B Fidelity Equity-Income K6 Fund commenced operations on June 13, 2019.
The following table presents fees billed by PricewaterhouseCoopers LLP (“PwC”) in each of the last two fiscal years for services rendered to Fidelity Equity-Income Fund, Fidelity Mid Cap Value Fund, Fidelity Series Stock Selector Large Cap Value Fund and Fidelity Stock Selector Large Cap Value Fund (the “Funds”):
Services Billed by PwC
January 31, 2021 FeesA
Audit Fees | Audit-Related Fees | Tax Fees | All Other Fees | |
Fidelity Equity-Income Fund | $69,100 | $5,100 | $14,400 | $2,100 |
Fidelity Mid Cap Value Fund | $67,000 | $3,900 | $7,800 | $1,600 |
Fidelity Series Stock Selector Large Cap Value Fund | $39,500 | $3,400 | $7,200 | $1,400 |
Fidelity Stock Selector Large Cap Value Fund | $46,900 | $3,900 | $7,800 | $1,600 |
January 31, 2020 FeesA
Audit Fees | Audit-Related Fees | Tax Fees | All Other Fees | |
Fidelity Equity-Income Fund | $60,000 | $5,200 | $17,400 | $2,200 |
Fidelity Mid Cap Value Fund | $47,900 | $4,000 | $8,100 | $1,700 |
Fidelity Series Stock Selector Large Cap Value Fund | $42,800 | $3,500 | $9,300 | $1,500 |
Fidelity Stock Selector Large Cap Value Fund | $42,700 | $4,000 | $8,100 | $1,700 |
A Amounts may reflect rounding.
The following table(s) present(s) fees billed by Deloitte Entities and PwC that were required to be approved by the Audit Committee for services that relate directly to the operations and financial reporting of the Fund(s) and that are rendered on behalf of Fidelity Management & Research Company LLC ("FMR") and entities controlling, controlled by, or under common control with FMR (not including any sub-adviser whose role is primarily portfolio management and is subcontracted with or overseen by another investment adviser) that provide ongoing services to the Fund(s) (“Fund Service Providers”):
Services Billed by Deloitte Entities
January 31, 2021A | January 31, 2020A,B | |
Audit-Related Fees | $- | $287,500 |
Tax Fees | $- | $3,000 |
All Other Fees | $- | $- |
A Amounts may reflect rounding.
B May include amounts billed prior to the Fidelity Equity-Income K6 Fund’s commencement of operations.
Services Billed by PwC
January 31, 2021A | January 31, 2020A | |
Audit-Related Fees | $9,436,200 | $7,927,700 |
Tax Fees | $18,800 | $23,500 |
All Other Fees | $- | $- |
A Amounts may reflect rounding.
“Audit-Related Fees” represent fees billed for assurance and related services that are reasonably related to the performance of the fund audit or the review of the fund's financial statements and that are not reported under Audit Fees.
“Tax Fees” represent fees billed for tax compliance, tax advice or tax planning that relate directly to the operations and financial reporting of the fund.
“All Other Fees” represent fees billed for services provided to the fund or Fund Service Provider, a significant portion of which are assurance related, that relate directly to the operations and financial reporting of the fund, excluding those services that are reported under Audit Fees, Audit-Related Fees or Tax Fees.
Assurance services must be performed by an independent public accountant.
* * *
The aggregate non-audit fees billed by Deloitte Entities and PwC for services rendered to the Fund(s), FMR (not including any sub-adviser whose role is primarily portfolio management and is subcontracted with or overseen by another investment adviser), and any Fund Service Provider for each of the last two fiscal years of the Fund(s) are as follows:
Billed By | January 31, 2021A | January 31, 2020A,B |
Deloitte Entities | $547,400 | $614,700 |
PwC | $14,590,100 | $12,655,600 |
A Amounts may reflect rounding.
B May include amounts billed prior to the Fidelity Equity-Income K6 Fund’s commencement of operations.
The trust's Audit Committee has considered non-audit services that were not pre-approved that were provided by Deloitte Entities and PwC to Fund Service Providers to be compatible with maintaining the independence of Deloitte Entities and PwC in its(their) audit of the Fund(s), taking into account representations from Deloitte Entities and PwC, in accordance with Public Company Accounting Oversight Board rules, regarding its independence from the Fund(s) and its(their) related entities and FMR’s review of the appropriateness and permissibility under applicable law of such non-audit services prior to their provision to the Fund(s) Service Providers.
Audit Committee Pre-Approval Policies and Procedures
The trust’s Audit Committee must pre-approve all audit and non-audit services provided by a fund’s independent registered public accounting firm relating to the operations or financial reporting of the fund. Prior to the commencement of any audit or non-audit
services to a fund, the Audit Committee reviews the services to determine whether they are appropriate and permissible under applicable law.
The Audit Committee has adopted policies and procedures to, among other purposes, provide a framework for the Committee’s consideration of non-audit services by the audit firms that audit the Fidelity funds. The policies and procedures require that any non-audit service provided by a fund audit firm to a Fidelity fund and any non-audit service provided by a fund auditor to a Fund Service Provider that relates directly to the operations and financial reporting of a Fidelity fund (“Covered Service”) are subject to approval by the Audit Committee before such service is provided.
All Covered Services must be approved in advance of provision of the service either: (i) by formal resolution of the Audit Committee, or (ii) by oral or written approval of the service by the Chair of the Audit Committee (or if the Chair is unavailable, such other member of the Audit Committee as may be designated by the Chair to act in the Chair’s absence). The approval contemplated by (ii) above is permitted where the Treasurer determines that action on such an engagement is necessary before the next meeting of the Audit Committee.
Non-audit services provided by a fund audit firm to a Fund Service Provider that do not relate directly to the operations and financial reporting of a Fidelity fund are reported to the Audit Committee periodically.
Non-Audit Services Approved Pursuant to Rule 2-01(c)(7)(i)(C) and (ii) of Regulation S-X (“De Minimis Exception”)
There were no non-audit services approved or required to be approved by the Audit Committee pursuant to the De Minimis Exception during the Fund’s(s’) last two fiscal years relating to services provided to (i) the Fund(s) or (ii) any Fund Service Provider that relate directly to the operations and financial reporting of the Fund(s).
Item 5.
Audit Committee of Listed Registrants
Not applicable.
Item 6.
Investments
(a)
Not applicable.
(b)
Not applicable.
Item 7.
Disclosure of Proxy Voting Policies and Procedures for Closed-End Management Investment Companies
Not applicable.
Item 8.
Portfolio Managers of Closed-End Management Investment Companies
Not applicable.
Item 9.
Purchase of Equity Securities by Closed-End Management Investment Company and Affiliated Purchasers
Not applicable.
Item 10.
Submission of Matters to a Vote of Security Holders
There were no material changes to the procedures by which shareholders may recommend nominees to the trust’s Board of Trustees.
Item 11.
Controls and Procedures
(a)(i) The President and Treasurer and the Chief Financial Officer have concluded that the trust’s disclosure controls and procedures (as defined in Rule 30a-3(c) under the Investment Company Act) provide reasonable assurances that material information relating to the trust is made known to them by the appropriate persons, based on their evaluation of these controls and procedures as of a date within 90 days of the filing date of this report.
(a)(ii) There was no change in the trust’s internal control over financial reporting (as defined in Rule 30a-3(d) under the Investment Company Act) that occurred during the period covered by this report that has materially affected, or is reasonably likely to materially affect, the trust’s internal control over financial reporting.
Item 12.
Disclosure of Securities Lending Activities for Closed-End Management
Investment Companies
Not applicable.
Item 13.
Exhibits
(a) | (1) | Code of Ethics pursuant to Item 2 of Form N-CSR is filed and attached hereto as EX-99.CODE ETH. |
(a) | (2) | |
(a) | (3) | Not applicable. |
(b) |
SIGNATURES
Pursuant to the requirements of the Securities Exchange Act of 1934 and the Investment Company Act of 1940, the registrant has duly caused this report to be signed on its behalf by the undersigned, thereunto duly authorized.
Fidelity Devonshire Trust
By: | /s/Stacie M. Smith |
Stacie M. Smith | |
President and Treasurer | |
Date: | March 23, 2021 |
Pursuant to the requirements of the Securities Exchange Act of 1934 and the Investment Company Act of 1940, this report has been signed below by the following persons on behalf of the registrant and in the capacities and on the dates indicated.
By: | /s/Stacie M. Smith |
Stacie M. Smith | |
President and Treasurer | |
Date: | March 23, 2021 |
By: | /s/John J. Burke III |
John J. Burke III | |
Chief Financial Officer | |
Date: | March 23, 2021 |