Exhibit 99.1
WELLS FARGO ENERGY & POWER SYMPOSIUM December 9, 2015
Regarding Forward - Looking Statements Certain statements contained in this presentation are forward - looking statements within the meaning of the Private Securities Litigation Reform Act of 1995 . New Jersey Resources (NJR or the Company) cautions readers that the assumptions forming the basis for forward - looking statements include many factors that are beyond NJR’s ability to control or estimate precisely, such as estimates of future market conditions and the behavior of other market participants . Words such as “anticipates,” “estimates,” “expects,” “projects,” “may,” “will,” “intends,” “plans,” “believes,” “should” and similar expressions may identify forward - looking information and such forward - looking statements are made based upon management’s current expectations and beliefs as of this date concerning future developments and their potential effect upon NJR . There can be no assurance that future developments will be in accordance with management’s expectations or that the effect of future developments on NJR will be those anticipated by management . Forward - looking information in this presentation includes, but is not limited to, certain statements regarding NJR’s NFE guidance for fiscal 2015 and NFE growth beyond 2015 , forecasted contribution of business segments to fiscal 2015 NFE and to NFE beyond fiscal 2015 , forecasted dividend growth, future NJNG customer growth, future capital expenditures and infrastructure investments, NJNG’s base rate case, NJR’s cash flow and balance sheet forecast, the long - term outlook for NJRCEV, diversification of NJRCEV’s strategy, NJRCEV’s future solar and wind projects, and the PennEast Pipeline project . The factors that could cause actual results to differ materially from NJR’s expectations include, but are not limited to, weather and economic conditions ; changes in the rate of NJNG’s customer growth ; volatility of natural gas and other commodity prices ; changes in rating agency requirements and/or credit ratings ; the impact of volatility in the credit markets ; the ability to comply with debt covenants ; the impact to the asset values and resulting higher costs and funding obligations of NJR’s pension and post - employment benefit plans as a result of downturns in the financial markets, lower discount rates, revised actuarial assumptions or impacts associated with the Patient Protection and Affordable Care Act ; accounting effects and other risks associated with hedging activities and use of derivatives contracts ; commercial and wholesale credit risks, including the availability of creditworthy customers and counterparties and liquidity in the wholesale energy trading market ; the ability to obtain governmental and regulatory approvals, land - use rights, electrical grid connection and/or financing for the construction, development and operation of NJR’s non - regulated energy investments and NJNG’s planned infrastructure projects in a timely manner ; risks associated with the management of the company’s joint ventures, partnerships and investment in a master limited partnership ; risks associated with our investments in renewable energy projects, including the availability of regulatory and tax incentives, the availability of viable projects and NJR’s eligibility for ITCs and PTCs, the future market for SRECs and operational risks related to projects in service ; timing of qualifying for ITCs and PTCs due to delays or failures to complete planned solar and wind energy projects ; the level and rate at which NJNG’s costs and expenses are incurred and the extent to which they are allowed to be recovered from customers through the regulatory process, including through the base rate case filing ; access to adequate supplies of natural gas and dependence on third - party storage and transportation facilities for natural gas supply ; operating risks incidental to handling, storing, transporting and providing customers with natural gas ; risks related to our employee workforce ; the regulatory and pricing policies of federal and state regulatory agencies ; the costs of compliance with present and future environmental laws, including potential climate change - related legislation ; risks related to changes in accounting standards ; the disallowance of recovery of environmental - related expenditures and other regulatory changes ; environmental - related and other litigation and other uncertainties ; risks related to cyber - attack or failure of information technology systems ; and the impact of natural disasters, terrorist activities, and other extreme events on our operations and customers . The aforementioned factors are detailed in the “Risk Factors” sections of our Annual Report on Form 10 - K filed with the Securities and Exchange Commission (SEC) on November 24 , 2015 , which is available on the SEC’s website at sec . gov . Information included in this presentation is representative as of today only and while NJR periodically reassesses material trends and uncertainties affecting NJR’s results of operations and financial condition in connection with its preparation of management’s discussion and analysis of results of operations and financial condition contained in its Quarterly and Annual Reports filed with the SEC, NJR does not, by including this statement, assume any obligation to review or revise any particular forward - looking statement referenced herein in light of future events . 2 2015 Wells Fargo Energy & Power Symposium
Disclaimer Regarding Non - GAAP Financial Measures This presentation includes the non - GAAP measures net financial earnings (NFE), utility gross margin and financial margin . As indicators of the Company’s operating performance, these measures should not be considered alternatives to, or more meaningful than, GAAP measures, such as cash flow, net income, operating income or earnings per share . NFE (loss) and financial margin exclude unrealized gains or losses on derivative instruments related to the company’s unregulated subsidiaries and certain realized gains and losses on derivative instruments related to natural gas that has been placed into storage at NJRES . Volatility associated with the change in value of these financial and physical commodity contracts is reported in the income statement in the current period . In order to manage its business, NJR views its results without the impacts of the unrealized gains and losses, and certain realized gains and losses, caused by changes in value of these financial instruments and physical commodity contracts prior to the completion of the planned transaction because it shows changes in value currently as opposed to when the planned transaction ultimately is settled . An annual estimated effective tax rate is calculated for NFE purposes and any necessary quarterly tax adjustment is applied to NJRCEV, as such adjustment is related to tax credits generated by NJRCEV . NJNG’s utility gross margin represents the results of revenues less natural gas costs, sales and other taxes and regulatory rider expenses, which are key components of the company’s operations that move in relation to each other . Natural gas costs, sales and other taxes and regulatory rider expenses are passed through to customers and, therefore, have no effect on gross margin . Management uses NFE, utility gross margin and financial margin as supplemental measures to other GAAP results to provide a more complete understanding of the Company’s performance . Management believes these non - GAAP measures are more reflective of the Company’s business model, provide transparency to investors and enable period - to - period comparability of financial performance . For a full discussion of our non - GAAP financial measures, please see NJR’s most recent Form 10 - K, Item 7 . This information has been provided pursuant to the requirements of SEC Regulation G . 3 2015 Wells Fargo Energy & Power Symposium
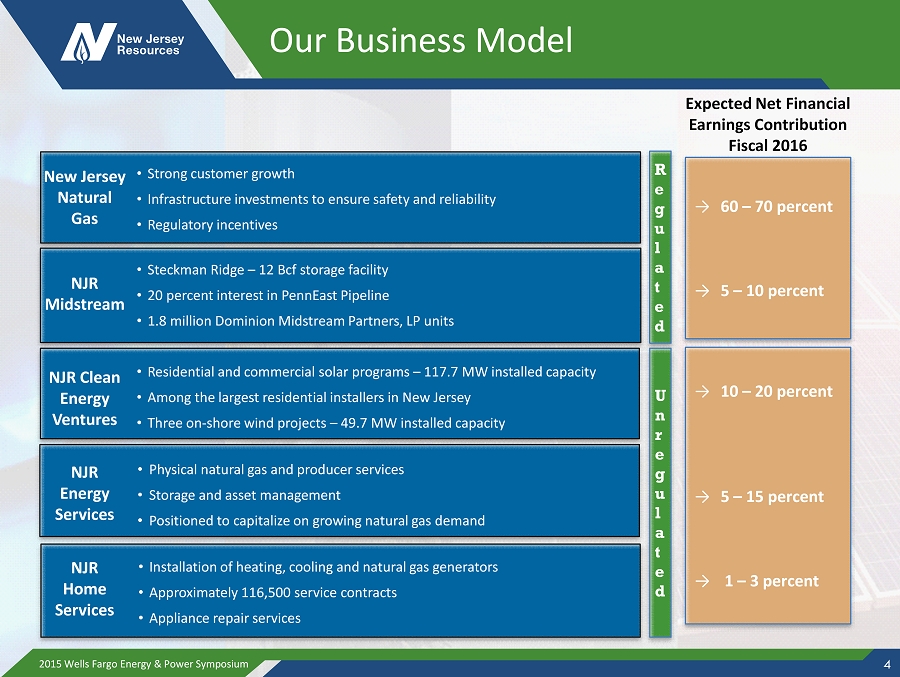
Our Business Model 4 R e g u l a t e d New Jersey Natural Gas • Strong customer growth • Infrastructure investments to ensure safety and reliability • Regulatory incentives NJR Midstream • Steckman Ridge – 12 Bcf storage facility • 20 percent interest in PennEast Pipeline • 1.8 million Dominion Midstream Partners, LP units NJR Clean Energy Ventures • Residential and commercial solar programs – 117.7 MW installed capacity • Among the largest residential installers in New Jersey • Three o n - shore wind projects – 4 9.7 MW installed capacity NJR Energy Services • Physical natural gas and producer services • Storage and asset management • Positioned to capitalize on growing natural gas demand NJR Home Services • Installation of heating, cooling and natural gas generators • Approximately 116,500 service contracts • Appliance repair services U n r e g u l a t e d → 60 – 70 percent → 5 – 10 percent → 10 – 20 percent → 5 – 15 percent → 1 – 3 percent Expected Net Financial Earnings Contribution Fiscal 2016 2015 Wells Fargo Energy & Power Symposium
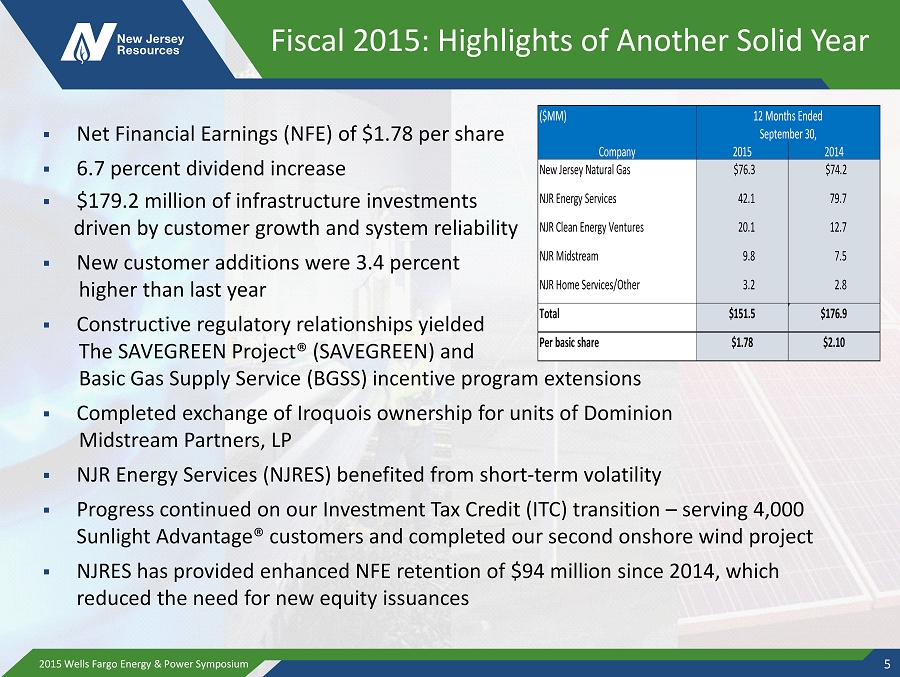
Fiscal 2015: Highlights of Another Solid Year ▪ Net Financial Earnings (NFE) of $1.78 per share ▪ 6.7 percent dividend increase ▪ $179.2 million of infrastructure investments driven by customer growth and system reliability ▪ New customer additions were 3.4 percent higher than last year ▪ Constructive regulatory relationships yielded The SAVEGREEN Project® (SAVEGREEN) and Basic Gas Supply Service (BGSS ) incentive program extensions ▪ Completed exchange of Iroquois ownership for units of Dominion Midstream Partners, LP ▪ NJR Energy Services ( NJRES) benefited from short - term volatility ▪ P rogress continued on our Investment Tax Credit (ITC) transition – serving 4,000 Sunlight Advantage® customers and completed our second onshore wind project ▪ NJRES has provided enhanced NFE retention of $94 million since 2014, which reduced the need for new equity issuances 2015 Wells Fargo Energy & Power Symposium 5 ($MM) Company 2015 2014 New Jersey Natural Gas $76.3 $74.2 NJR Energy Services 42.1 79.7 NJR Clean Energy Ventures 20.1 12.7 NJR Midstream 9.8 7.5 NJR Home Services/Other 3.2 2.8 Total $151.5 $176.9 Per basic share $1.78 $2.10 12 Months Ended September 30,
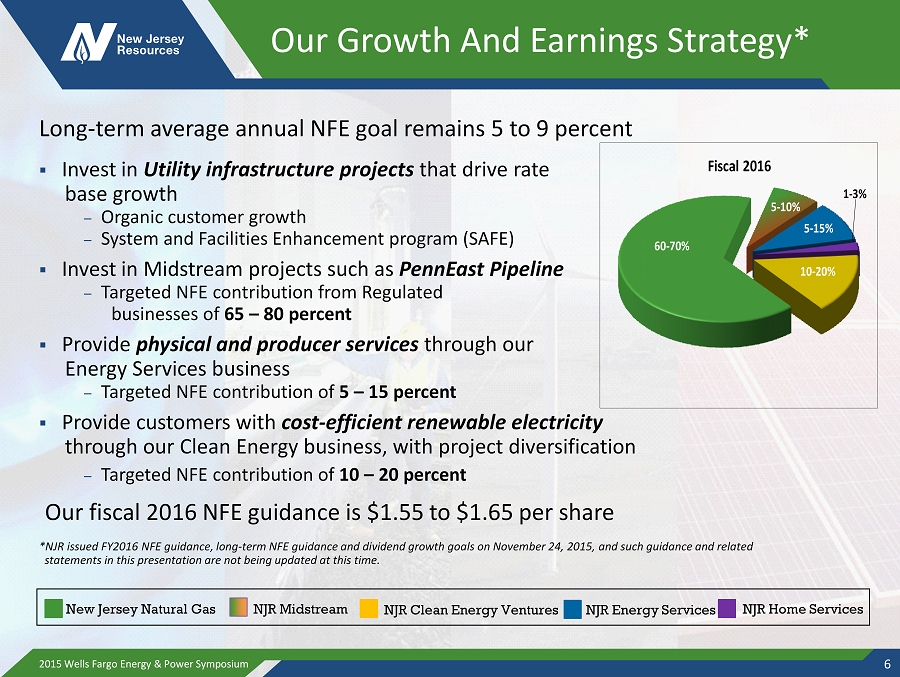
Our Growth And Earnings Strategy* Long - term average annual NFE goal remains 5 to 9 percent ▪ Invest in Utility infrastructure projects that drive rate base growth – Organic customer growth – System and Facilities E nhancement program (SAFE) ▪ Invest in Midstream projects such as PennEast Pipeline – Targeted NFE contribution from Regulated businesses of 65 – 80 percent ▪ Provide physical and producer services through our Energy Services business – Targeted NFE contribution of 5 – 15 percent ▪ Provide customers with cost - efficient renewable electricity through our Clean Energy business, with project diversification – Targeted NFE contribution of 10 – 20 percent Our fiscal 2016 NFE guidance is $1.55 to $1.65 per share * NJR issued FY2016 NFE guidance, long - term NFE guidance and dividend growth goals on November 24, 2015, and such guidance and rel ated statements in this presentation are not being updated at this time. 2015 Wells Fargo Energy & Power Symposium 6 Fiscal 2016 60 - 70% 10 - 20% 5 - 15% 5 - 10% 1 - 3% New Jersey Natural Gas NJR Clean Energy Ventures NJR Energy Services NJR Midstream NJR Home Services
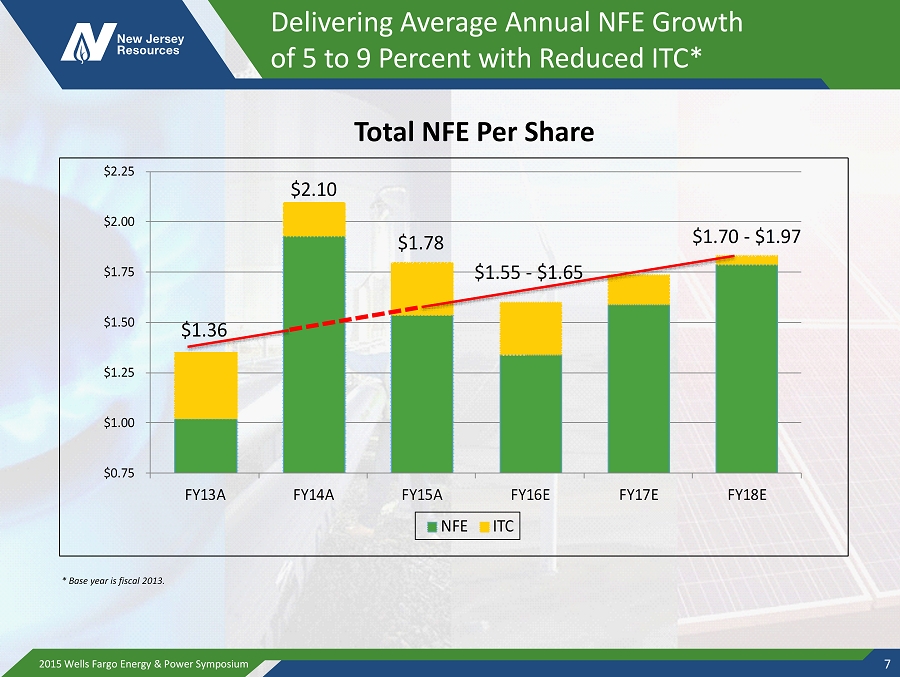
Delivering Average Annual NFE Growth of 5 to 9 Percent with Reduced ITC * $1.36 $2.10 $1.78 $1.55 - $1.65 $1.70 - $1.97 $0.75 $1.00 $1.25 $1.50 $1.75 $2.00 $2.25 FY13A FY14A FY15A FY16E FY17E FY18E NFE ITC 2015 Wells Fargo Energy & Power Symposium 7 * Base year is fiscal 2013. Total NFE Per Share
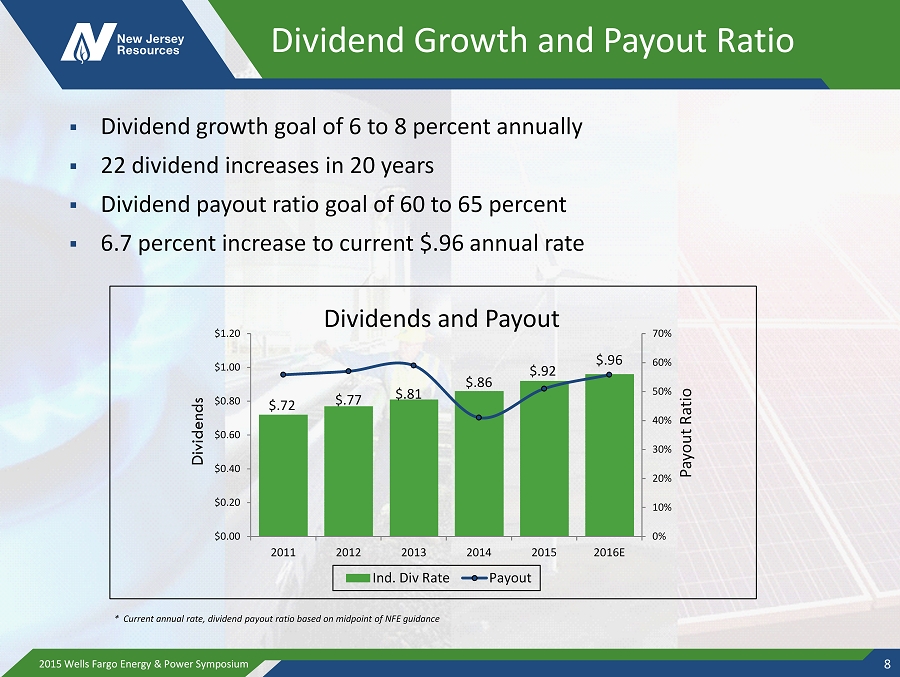
Dividend Growth and Payout Ratio ▪ Dividend growth goal of 6 to 8 percent annually ▪ 22 dividend increases in 20 years ▪ Dividend payout ratio goal of 60 to 65 percent ▪ 6.7 percent increase to current $.96 annual rate 8 $.72 $.77 $.81 $.86 $.92 $.96 0% 10% 20% 30% 40% 50% 60% 70% $0.00 $0.20 $0.40 $0.60 $0.80 $1.00 $1.20 2011 2012 2013 2014 2015 2016E Payout Ratio Dividends Dividends and Payout Ind. Div Rate Payout * Current annual rate, dividend payout ratio based on midpoint of NFE guidance 2015 Wells Fargo Energy & Power Symposium

We Expect 60 - 70 Percent of Estimated Capital Expenditures to Be At Regulated Businesses $336 $550 $540 $338 $0.0 $100.0 $200.0 $300.0 $400.0 $500.0 $600.0 FY15A FY16E FY17E FY18E Millions NJNG PennEast Solar Wind 2015 Wells Fargo Energy & Power Symposium 9
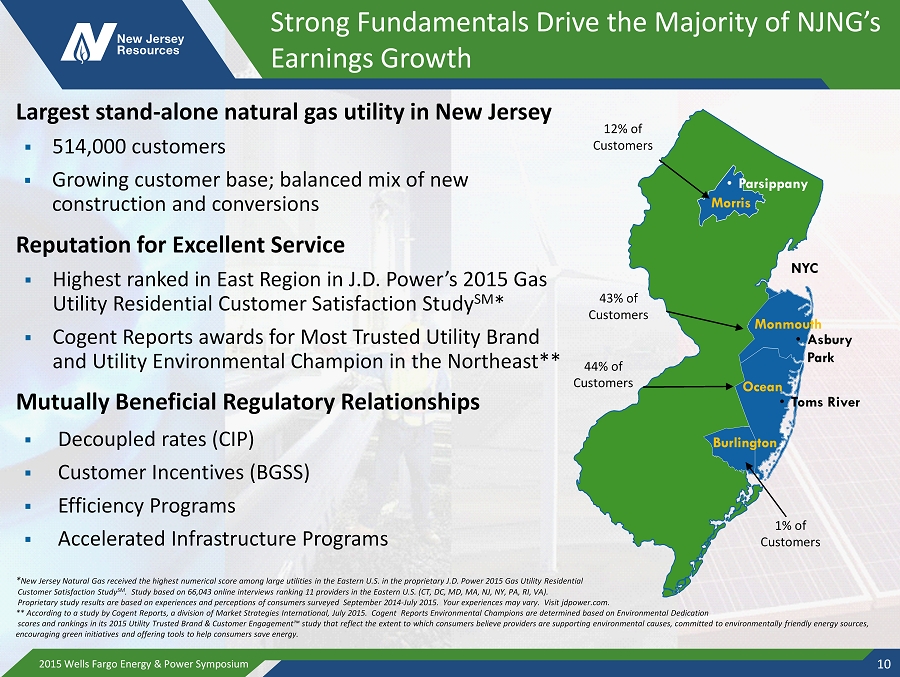
Strong Fundamentals Drive the Majority of NJNG’s Earnings Growth Largest stand - alone natural gas utility in New Jersey ▪ 514,000 customers ▪ Growing customer base; balanced mix of new construction and conversions Reputation for Excellent Service ▪ Highest ranked in East Region in J.D. Power’s 2015 Gas Utility Residential Customer Satisfaction Study SM * ▪ Cogent Reports awards for Most Trusted Utility Brand and Utility Environmental Champion in the Northeast** Mutually Beneficial Regulatory Relationships ▪ Decoupled rates (CIP) ▪ Customer Incentives (BGSS) ▪ Efficiency Programs ▪ Accelerated Infrastructure Programs 2015 Wells Fargo Energy & Power Symposium 10 12% of Customers 43% of Customers 44% of Customers Morris • Parsippany NYC Monmouth • Asbury Park Ocean • Toms River Burlington 1% of Customers * New Jersey Natural Gas received the highest numerical score among large utilities in the Eastern U.S. in the proprietary J.D. Power 2015 Gas Utility Residential Customer Satisfaction Study SM . Study based on 66,043 online interviews ranking 11 providers in the Eastern U.S . (CT, DC, MD, MA, NJ, NY, PA, RI, VA). Proprietary study results are based on experiences and perceptions of consumers surveyed September 2014 - July 2015. Your experiences may vary. Visit jdpower.com. ** According to a study by Cogent Reports, a division of Market Strategies International, July 2015. Cogent Reports Environmental Champions are determined based on Environmental Dedication scores and rankings in its 2015 Utility Trusted Brand & Customer Engagement™ study that reflect the extent to which consumers believe providers are supporting environmental causes, committed to environmentally friendly energy sources, encouraging green initiatives and offering tools to help consumers save energy.
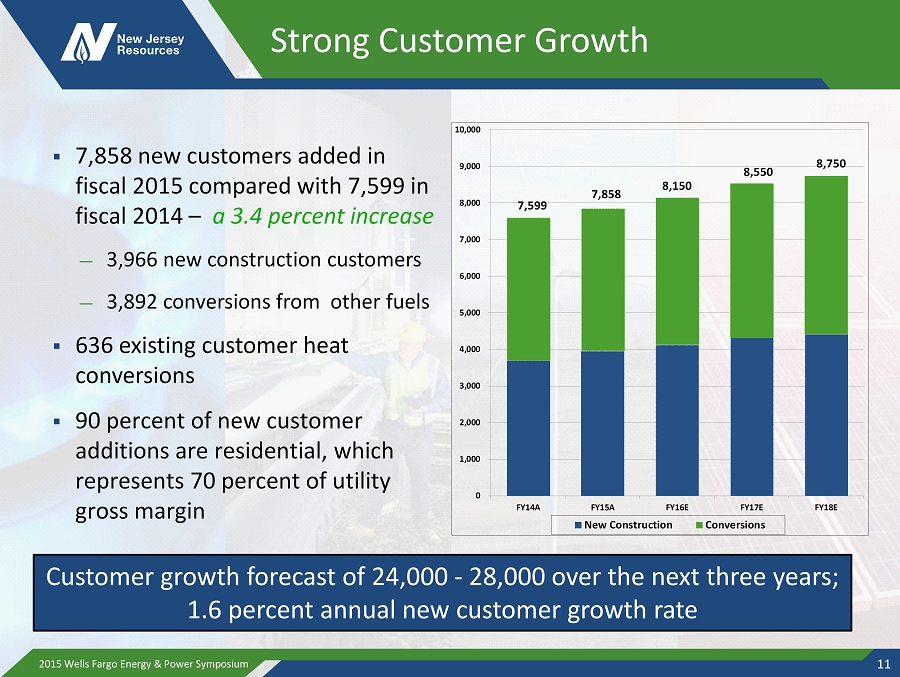
Strong Customer Growth ▪ 7,858 new customers added in fiscal 2015 compared with 7,599 in fiscal 2014 – a 3.4 percent increase — 3,966 new construction customers — 3,892 conversions from other fuels ▪ 636 existing customer heat conversions ▪ 90 percent of new customer additions are residential, which represents 70 percent of utility gross margin 2015 Wells Fargo Energy & Power Symposium 11 7,599 7,858 8,150 8,550 8,750 0 1,000 2,000 3,000 4,000 5,000 6,000 7,000 8,000 9,000 10,000 FY14A FY15A FY16E FY17E FY18E New Construction Conversions Customer growth forecast of 24,000 - 28,000 over the next three years; 1.6 percent annual new customer growth rate

Key Trends Support Future Customer Growth 0.0% 5.0% 10.0% 15.0% Morris Monmouth Ocean 6.3% 2.3% 14.1% Population Change 2000 - 2014 1 1. Source: US Census data, 2014 estimates 2015 Wells Fargo Energy & Power Symposium 12 $0.00 $1.00 $2.00 $3.00 $4.00 $5.00 NJNG Fuel Oil Propane Electricity $0.88 $1.90 $3.84 $4.10 Equivalent Customer Cost 2 2 . Source: US Energy Information Administration data as of October 2015. Based on 100,000 comparable BTUs 2015 - 2017, [VALUE] 2018 - Buildout, [VALUE] New Construction 3 = 85,842 3. Source: A.D. Little On Main, [VALUE] Near Main, [VALUE] Off Main, [VALUE] Non Heat, [VALUE] Conversions 4 4. Source: NJNG Marketing
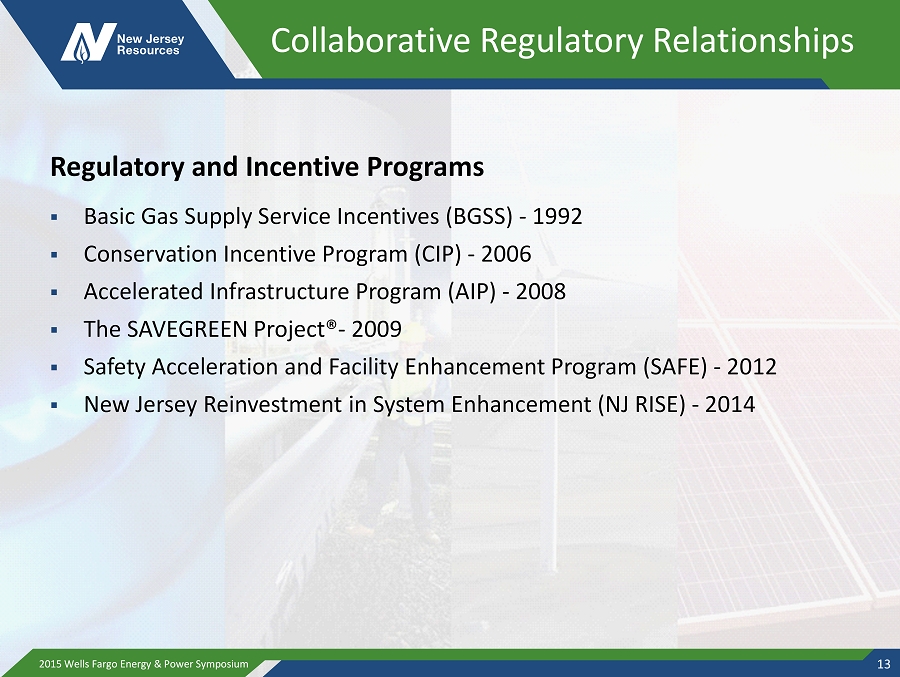
Collaborative Regulatory Relationships 2015 Wells Fargo Energy & Power Symposium 13 Regulatory and Incentive Programs ▪ Basic Gas Supply Service Incentives (BGSS) - 1992 ▪ Conservation Incentive Program (CIP) - 2006 ▪ Accelerated Infrastructure Program (AIP) - 2008 ▪ The SAVEGREEN Project® - 2009 ▪ Safety Acceleration and Facility Enhancement Program (SAFE) - 2012 ▪ New Jersey Reinvestment in System Enhancement (NJ RISE) - 2014
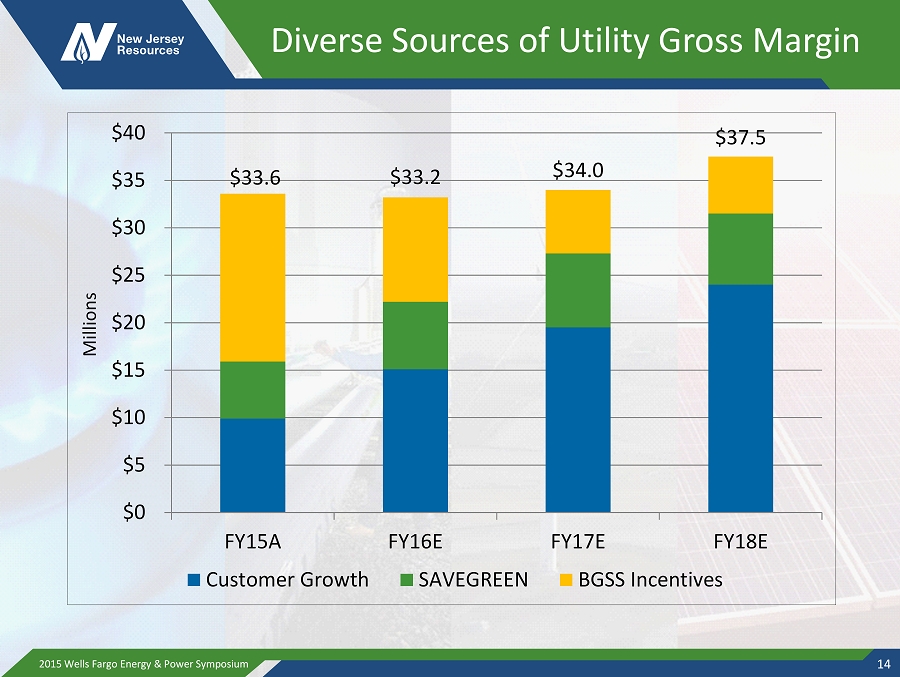
Diverse Sources of Utility Gross Margin $33.6 $33.2 $34.0 $37.5 $0 $5 $10 $15 $20 $25 $30 $35 $40 FY15A FY16E FY17E FY18E Millions Customer Growth SAVEGREEN BGSS Incentives 2015 Wells Fargo Energy & Power Symposium 14
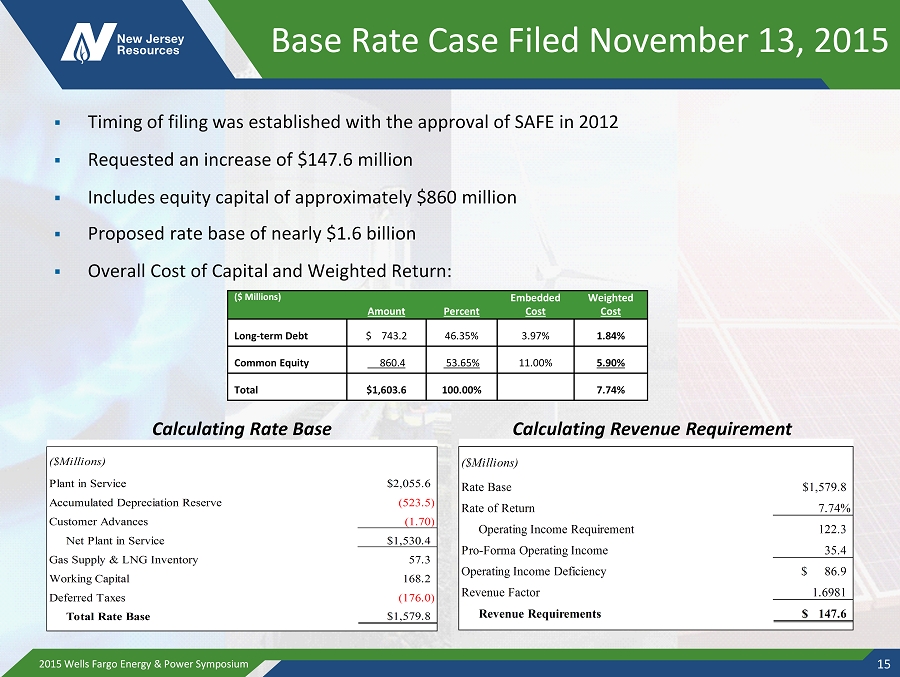
Base Rate Case Filed November 13, 2015 ▪ Timing of filing was established with the approval of SAFE in 2012 ▪ Requested an increase of $ 147.6 million ▪ Includes equity capital of approximately $860 million ▪ Proposed rate base of nearly $1.6 billion ▪ Overall Cost of Capital and Weighted Return: 2015 Wells Fargo Energy & Power Symposium 15 ($ Millions) Amount Percent Embedded Cost Weighted Cost Long - term Debt $ 743.2 46.35% 3.97% 1.84% Common Equity 860.4 53.65% 11.00% 5.90% Total $1,603.6 100.00% 7.74% ($Millions) Rate Base $1,579.8 Rate of Return 7.74% Operating Income Requirement 122.3 Pro-Forma Operating Income 35.4 Operating Income Deficiency $ 86.9 Revenue Factor 1.6981 Revenue Requirements $ 147.6 ($Millions) Plant in Service $2,055.6 Accumulated Depreciation Reserve (523.5) Customer Advances (1.70) Net Plant in Service $1,530.4 Gas Supply & LNG Inventory 57.3 Working Capital 168.2 Deferred Taxes (176.0) Total Rate Base $1,579.8 Calculating Revenue Requirement Calculating Rate Base
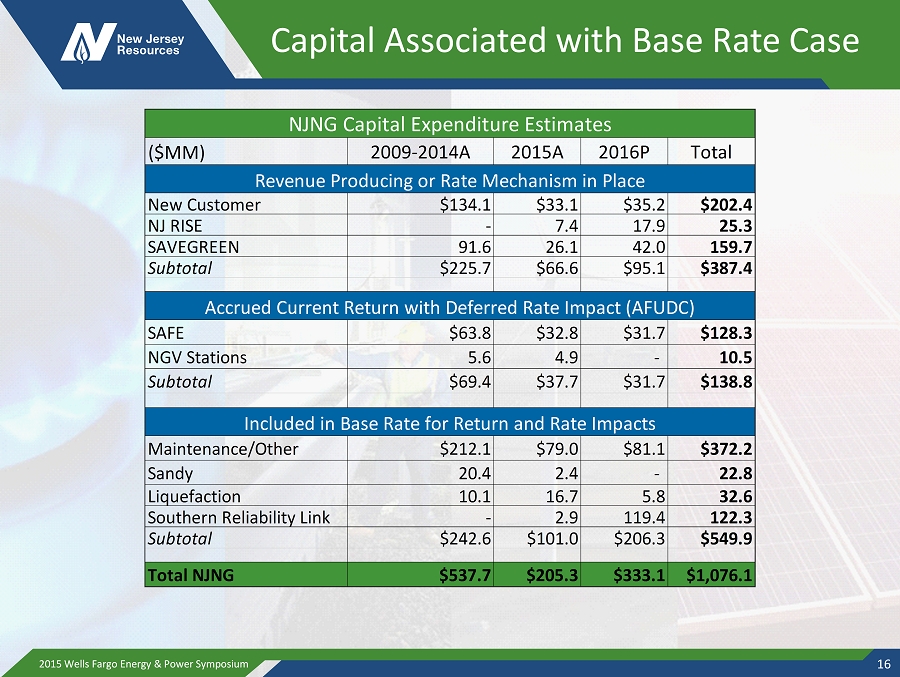
Capital Associated with Base Rate Case ($MM) 2009-2014A 2015A 2016P Total New Customer $134.1 $33.1 $35.2 $202.4 NJ RISE - 7.4 17.9 25.3 SAVEGREEN 91.6 26.1 42.0 159.7 Subtotal $225.7 $66.6 $95.1 $387.4 SAFE $63.8 $32.8 $31.7 $128.3 NGV Stations 5.6 4.9 - 10.5 Subtotal $69.4 $37.7 $31.7 $138.8 Maintenance/Other $212.1 $79.0 $81.1 $372.2 Sandy 20.4 2.4 - 22.8 Liquefaction 10.1 16.7 5.8 32.6 Southern Reliability Link - 2.9 119.4 122.3 Subtotal $242.6 $101.0 $206.3 $549.9 Total NJNG $537.7 $205.3 $333.1 $1,076.1 Included in Base Rate for Return and Rate Impacts NJNG Capital Expenditure Estimates Revenue Producing or Rate Mechanism in Place Accrued Current Return with Deferred Rate Impact (AFUDC) 2015 Wells Fargo Energy & Power Symposium 16
Regulatory Agenda – Post Base Rate Case Following the conclusion of the base r ate case ▪ Continue strong customer growth ▪ Continue existing programs – CIP – SAVEGREEN – BGSS Incentives ▪ NJ RISE – Complete “hardening” projects ▪ File for SAFE Extension – Approximately $200 million – Would complete the replacement of bare steel pipe – Will seek regulatory treatment to provide a real - time return similar to NJ RISE 2015 Wells Fargo Energy & Power Symposium 17
NJNG Key Messages Infrastructure projects improve safety, reliability and resiliency Customer growth outlook remains strong Collaborative regulatory programs generate earnings and customer savings NFE contribution expected to be 60 - 70 percent in fiscal 2016 and beyond 2015 Wells Fargo Energy & Power Symposium 18
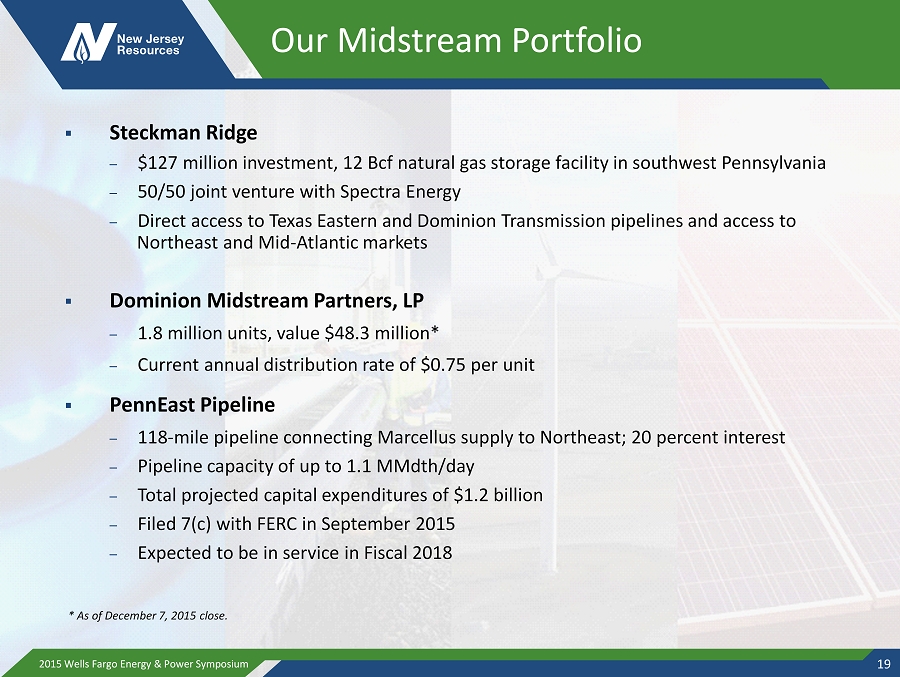
Our Midstream Portfolio ▪ Steckman Ridge – $127 million investment, 12 Bcf natural gas storage facility in southwest Pennsylvania – 50/50 joint venture with Spectra Energy – Direct access to Texas Eastern and Dominion Transmission pipelines and access to Northeast and Mid - Atlantic markets ▪ Dominion Midstream Partners, LP – 1.8 million units, value $48.3 million* – Current annual distribution rate of $0.75 per unit ▪ PennEast Pipeline – 118 - mile pipeline connecting Marcellus supply to Northeast; 20 percent interest – Pipeline capacity of up to 1.1 MMdth/day – Total projected capital expenditures of $1.2 billion – Filed 7(c) with FERC in September 2015 – Expected to be in service in Fiscal 2018 2015 Wells Fargo Energy & Power Symposium 19 * As of December 7, 2015 close.

PennEast Pipeline ▪ Signed precedent agreements for 990 Mdth/day ▪ Current ownership: NJR, GAS, SJI, UGI at 20 percent and PSEG and SEP at 10 percent 2015 Wells Fargo Energy & Power Symposium 20
Midstream Key Messages Steckman Ridge storage facility provides steady annual earnings Dominion Midstream Partners diversifies portfolio PennEast investment development ongoing NFE contribution expected to be 5 - 10 percent in fiscal 2016 and beyond 2015 Wells Fargo Energy & Power Symposium 21
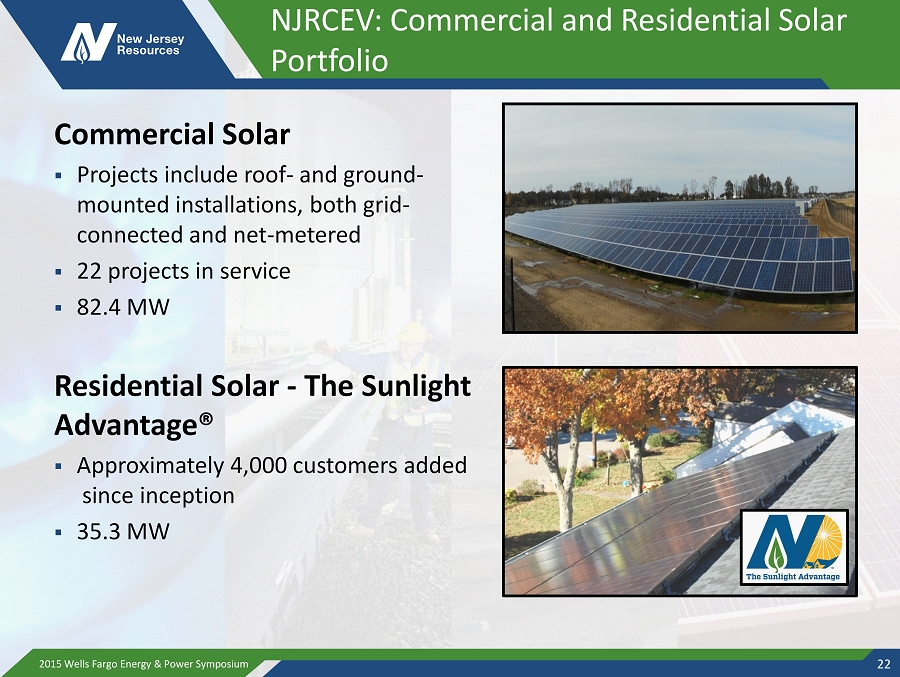
NJRCEV: Commercial and Residential Solar Portfolio Commercial Solar ▪ Projects include roof - and ground - mounted installations, both grid - connected and net - metered ▪ 22 projects in service ▪ 82.4 MW Residential Solar - The Sunlight Advantage® ▪ Approximately 4,000 customers added since inception ▪ 35.3 MW 2015 Wells Fargo Energy & Power Symposium 22
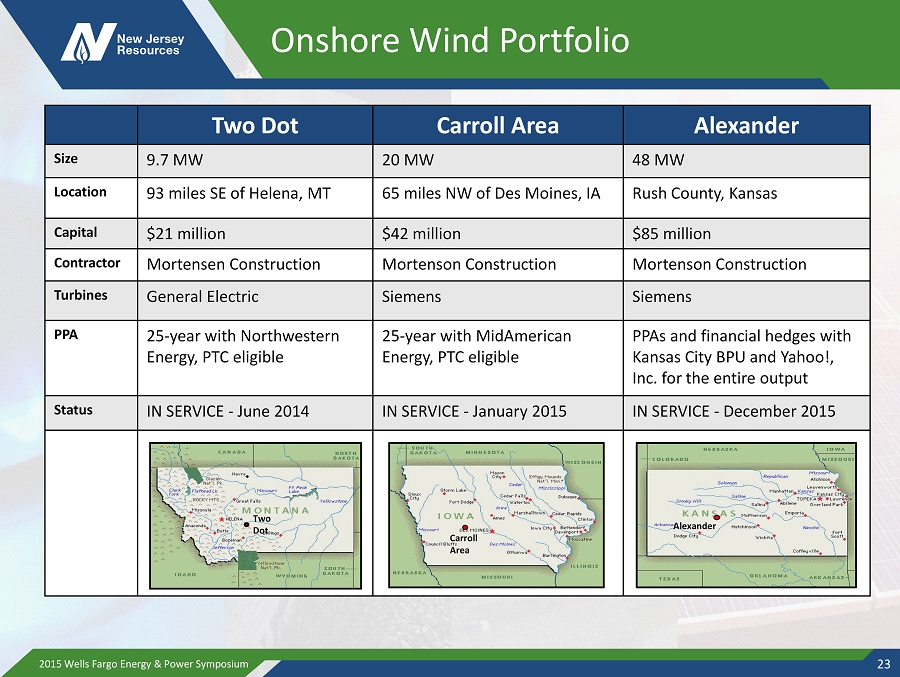
Onshore Wind Portfolio Two Dot Carroll Area Alexander Size 9.7 MW 20 MW 48 MW Location 93 miles SE of Helena, MT 65 miles NW of Des Moines, IA Rush County, Kansas Capital $21 million $42 million $85 million Contractor Mortensen Construction Mortenson Construction Mortenson Construction Turbines General Electric Siemens Siemens PPA 25 - year with Northwestern Energy , PTC eligible 25 - year with MidAmerican Energy, PTC eligible PPAs and financial hedges with Kansas City BPU and Yahoo!, Inc. for the entire output Status IN SERVICE - June 2014 IN SERVICE - January 2015 IN SERVICE - December 2015 Two Dot Carroll Area Alexander 23 2015 Wells Fargo Energy & Power Symposium
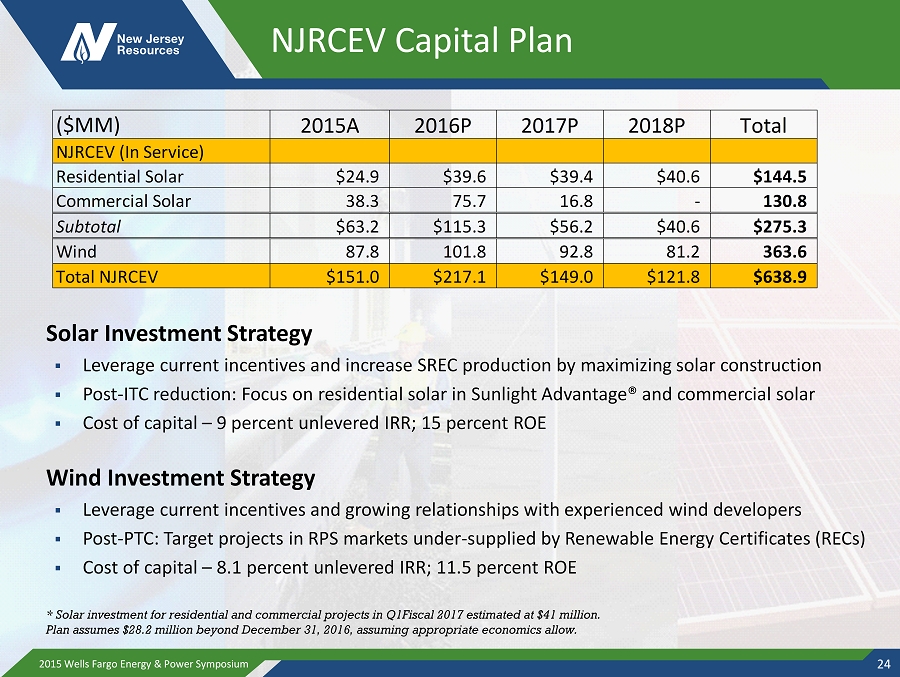
NJRCEV Capital Plan Solar Investment Strategy ▪ Leverage current incentives and increase SREC production by maximizing solar construction ▪ Post - ITC reduction: Focus on residential solar in Sunlight Advantage® and commercial solar ▪ Cost of capital – 9 percent unlevered IRR; 15 percent ROE Wind Investment Strategy ▪ Leverage current incentives and growing relationships with experienced wind developers ▪ Post - PTC: T arget projects in RPS markets under - supplied by Renewable Energy Certificates (RECs) ▪ Cost of capital – 8.1 percent unlevered IRR; 11.5 percent ROE 2015 Wells Fargo Energy & Power Symposium 24 ($MM) 2015A 2016P 2017P 2018P Total NJRCEV (In Service) Residential Solar $24.9 $39.6 $39.4 $40.6 $144.5 Commercial Solar 38.3 75.7 16.8 - 130.8 Subtotal $63.2 $115.3 $56.2 $40.6 $275.3 Wind 87.8 101.8 92.8 81.2 363.6 Total NJRCEV $151.0 $217.1 $149.0 $121.8 $638.9 * Solar investment for residential and commercial projects in Q1Fiscal 2017 estimated at $41 million . Plan assumes $ 28.2 million beyond December 31, 2016, assuming appropriate economics allow.
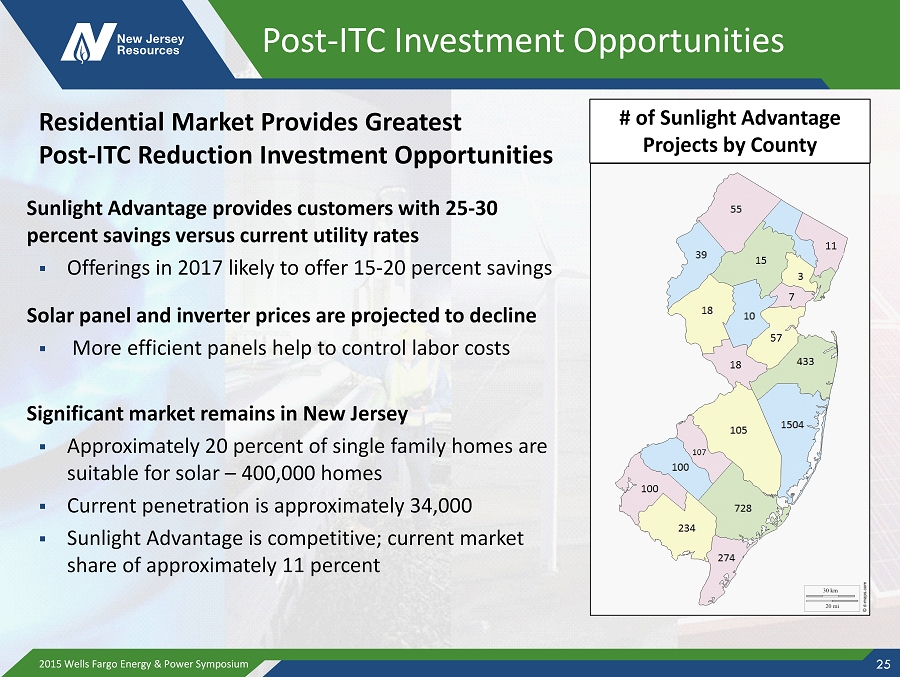
Post - ITC Investment Opportunities Sunlight Advantage provides customers with 25 - 30 percent savings versus current utility rates ▪ O fferings in 2017 likely to offer 15 - 20 percent savings Solar panel and inverter prices are projected to decline ▪ More efficient panels help to control labor costs Significant market remains in New Jersey ▪ Approximately 20 percent of single family homes are suitable for solar – 400,000 homes ▪ Current penetration is approximately 34,000 ▪ Sunlight Advantage is competitive; current market share of approximately 11 percent 2015 Wells Fargo Energy & Power Symposium 25 # of Sunlight Advantage Projects by County Residential Market Provides Greatest Post - ITC Reduction Investment Opportunities
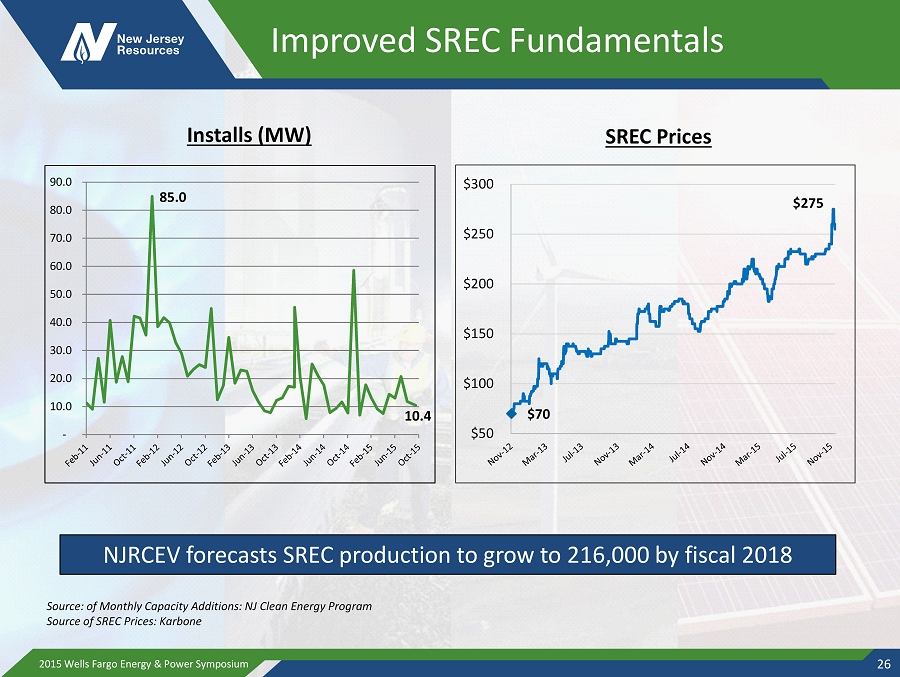
Improved SREC Fundamentals 10.4 - 10.0 20.0 30.0 40.0 50.0 60.0 70.0 80.0 90.0 85.0 2015 Wells Fargo Energy & Power Symposium 26 $70 $50 $100 $150 $200 $250 $300 $275 Installs (MW) SREC Prices NJRCEV forecasts SREC production to grow to 216,000 by fiscal 2018 Source: of Monthly Capacity Additions: NJ Clean Energy Program Source of SREC Prices: Karbone

NJRCEV Is Actively Hedging SRECs to Reduce Future Price Uncertainty 153 103 79 172 195 216 0 50 100 150 200 250 FY16 FY17E FY18E Thousands of SRECs Hedged Expected Generated Current Generation 2015 Wells Fargo Energy & Power Symposium 27 Pct. Hedged: 89% 53% 37% Average Price: $208 $218 $229 As of November 12 , 2015
NJRCEV Key Messages Long - term prospects for wind and solar are solid NJ SREC market has stabilized and moving towards balance Regulatory Outlook ▪ State RPS policies will drive project development post - tax credits ▪ Clean Power Plan favors renewables, but impact appears to be long term even if legal challenges can be overcome ▪ Federal PTC and ITC extensions being considered, but outcome uncertain NFE contribution expected to be 10 – 20 percent in fiscal 2016 and beyond 2015 Wells Fargo Energy & Power Symposium 28
NJR Energy Services Strategy ▪ Create value from a diverse portfolio of physical gas assets and services ▪ Provide physical, producer and asset management services to wholesale customers across North America Business Lines ▪ Firm storage (40 Bcf in the US and Canada) ▪ Firm transportation (1.4 Bcf/d) ▪ Producer services ▪ Utility asset management ▪ Electric generation management Create significant upside potential while managing downside risk ▪ Contract or acquire physical assets in opportunistic locations and execute revenue - generating strategies based on market fluctuations ▪ Develop strong customer relationships within the marketplace to provide services from these options ▪ Arbitrage financial markets versus physical positions 29 2015 Wells Fargo Energy & Power Symposium
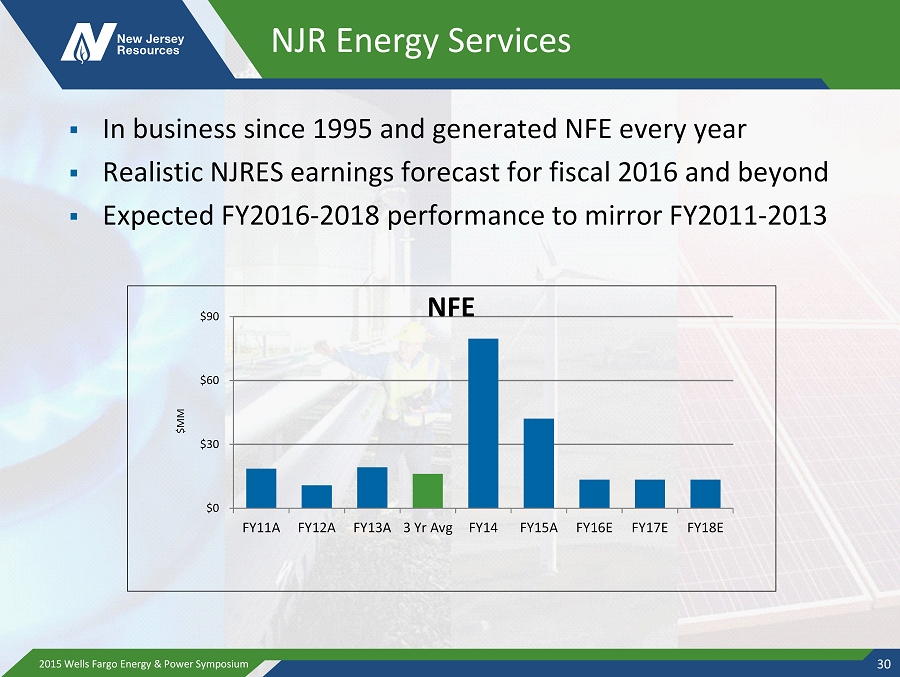
NJR Energy Services ▪ In business since 1995 and generated NFE every year ▪ Realistic NJRES earnings forecast for fiscal 2016 and beyond ▪ Expected FY2016 - 2018 performance to mirror FY2011 - 2013 2015 Wells Fargo Energy & Power Symposium 30 $0 $30 $60 $90 FY11A FY12A FY13A 3 Yr Avg FY14 FY15A FY16E FY17E FY18E $MM NFE
NJRES Key Messages Potential upside, while managing downside risk NFE not assumed to match record fiscal 2014 and 2015 performance NFE contribution expected to be 5 – 15 percent in fiscal 2016 and beyond 2015 Wells Fargo Energy & Power Symposium 31
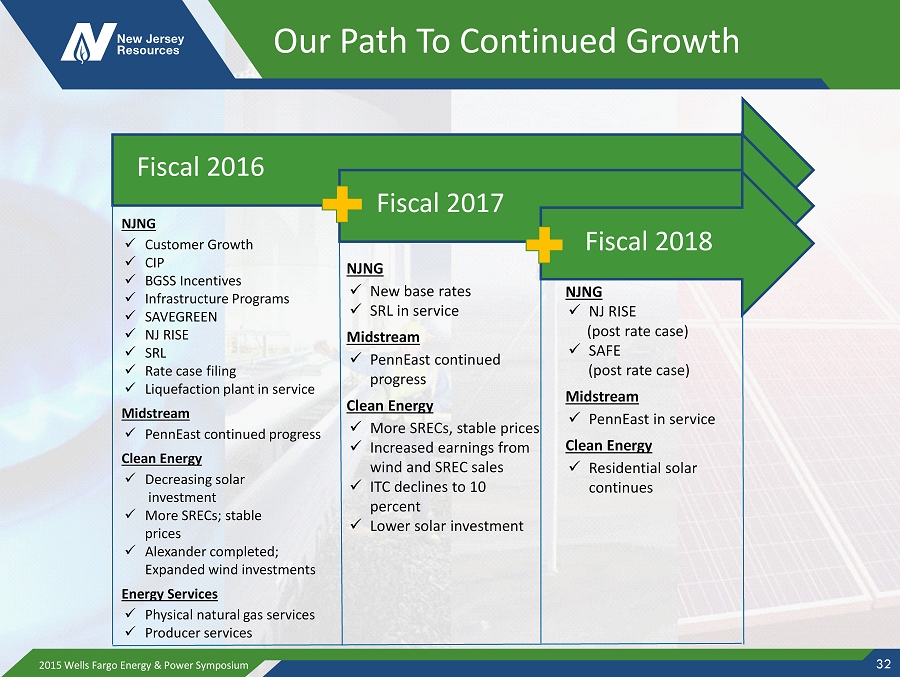
Our Path To Continued Growth 2015 Wells Fargo Energy & Power Symposium 32 Fiscal 2016 NJNG x Customer Growth x CIP x BGSS Incentives x Infrastructure Programs x SAVEGREEN x NJ RISE x SRL x Rate case filing x Liquefaction plant in service Midstream x PennEast continued progress Clean Energy x Decreasing solar investment x More SRECs; stable prices x Alexander completed; Expanded wind investments Energy Services x Physical natural gas services x Producer services Fiscal 2017 NJNG x New base rates x SRL in service Midstream x PennEast continued progress Clean Energy x More SRECs, stable prices x Increased earnings from wind and SREC sales x ITC declines to 10 percent x Lower solar investment Fiscal 2018 NJNG x NJ RISE (post rate case) x SAFE (post rate case ) Midstream x PennEast in service Clean Energy x Residential solar continues
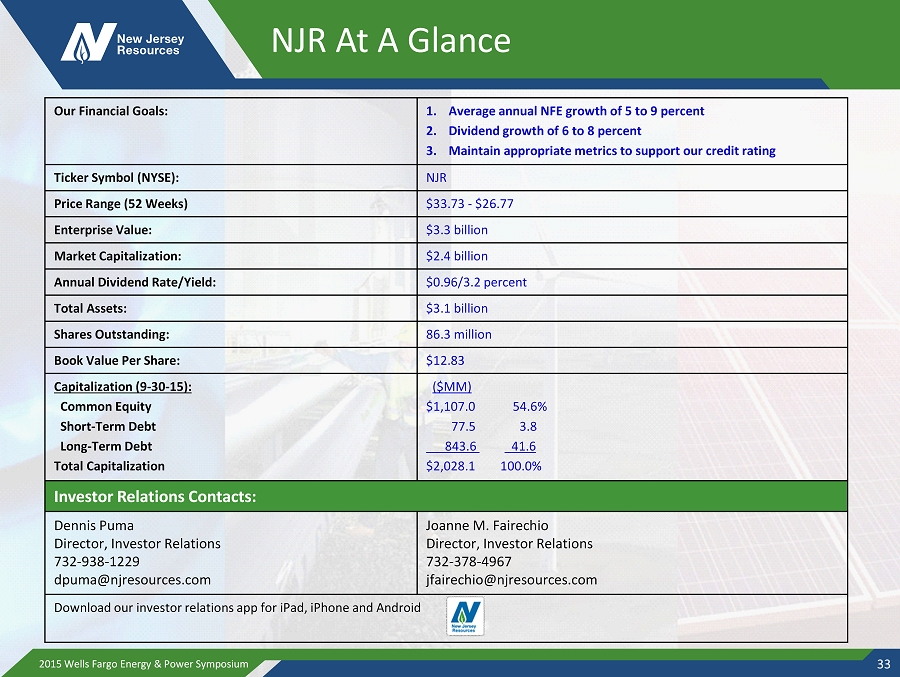
NJR At A Glance Our Financial Goals: 1. Average annual NFE growth of 5 to 9 percent 2. Dividend growth of 6 to 8 percent 3. Maintain appropriate metrics to support our credit rating Ticker Symbol (NYSE): NJR Price Range (52 Weeks) $33.73 - $26.77 Enterprise Value: $3.3 billion Market Capitalization: $2.4 billion Annual Dividend Rate/Yield: $0.96/3.2 percent Total Assets: $3.1 billion Shares Outstanding: 86.3 million Book Value Per Share: $12.83 Capitalization (9 - 30 - 15): Common Equity Short - Term Debt Long - Term Debt Total Capitalization ($MM) $1,107.0 54.6% 77.5 3.8 843.6 _ 41.6 $2,028.1 100.0% Investor Relations Contacts: Dennis Puma Director, Investor Relations 732 - 938 - 1229 dpuma@njresources.com Joanne M. Fairechio Director, Investor Relations 732 - 378 - 4967 jfairechio@njresources.com Download our investor relations app for iPad, iPhone and Android 2015 Wells Fargo Energy & Power Symposium 33
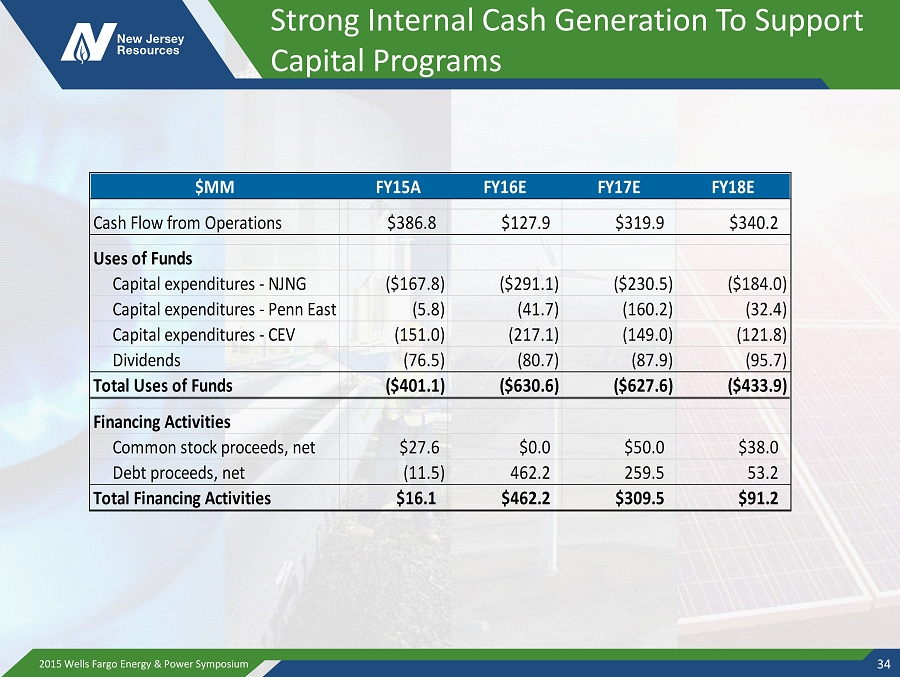
Strong Internal Cash Generation To Support Capital Programs $MM FY15A FY16E FY17E FY18E Cash Flow from Operations $386.8 $127.9 $319.9 $340.2 Uses of Funds Capital expenditures - NJNG ($167.8) ($291.1) ($230.5) ($184.0) Capital expenditures - Penn East (5.8) (41.7) (160.2) (32.4) Capital expenditures - CEV (151.0) (217.1) (149.0) (121.8) Dividends (76.5) (80.7) (87.9) (95.7) Total Uses of Funds ($401.1) ($630.6) ($627.6) ($433.9) Financing Activities Common stock proceeds, net $27.6 $0.0 $50.0 $38.0 Debt proceeds, net (11.5) 462.2 259.5 53.2 Total Financing Activities $16.1 $462.2 $309.5 $91.2 2015 Wells Fargo Energy & Power Symposium 34
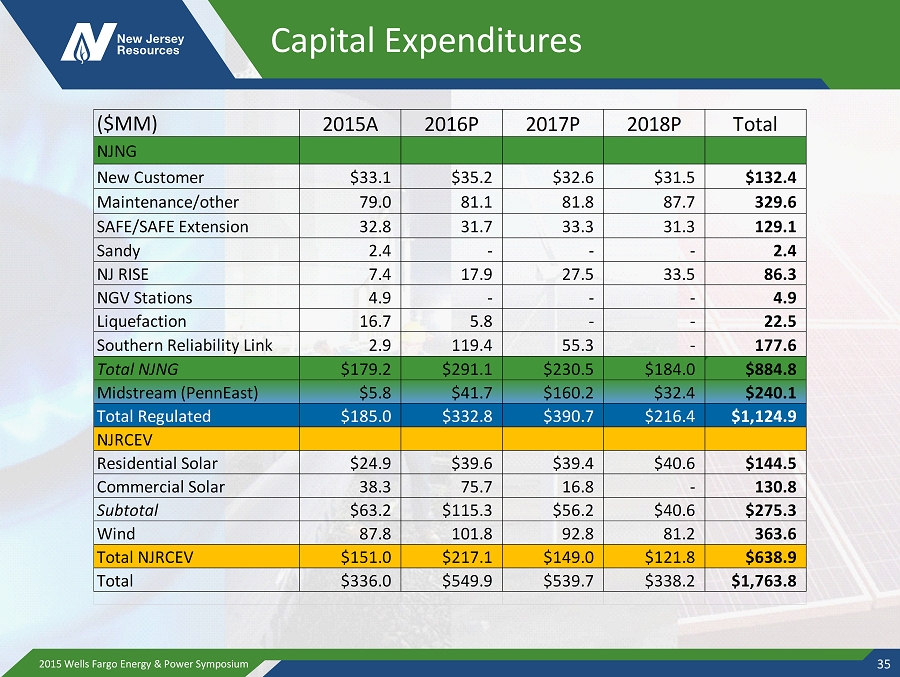
Capital Expenditures ($MM) 2015A 2016P 2017P 2018P Total NJNG New Customer $33.1 $35.2 $32.6 $31.5 $132.4 Maintenance/other 79.0 81.1 81.8 87.7 329.6 SAFE/SAFE Extension 32.8 31.7 33.3 31.3 129.1 Sandy 2.4 - - - 2.4 NJ RISE 7.4 17.9 27.5 33.5 86.3 NGV Stations 4.9 - - - 4.9 Liquefaction 16.7 5.8 - - 22.5 Southern Reliability Link 2.9 119.4 55.3 - 177.6 Total NJNG $179.2 $291.1 $230.5 $184.0 $884.8 Midstream (PennEast) $5.8 $41.7 $160.2 $32.4 $240.1 Total Regulated $185.0 $332.8 $390.7 $216.4 $1,124.9 NJRCEV Residential Solar $24.9 $39.6 $39.4 $40.6 $144.5 Commercial Solar 38.3 75.7 16.8 - 130.8 Subtotal $63.2 $115.3 $56.2 $40.6 $275.3 Wind 87.8 101.8 92.8 81.2 363.6 Total NJRCEV $151.0 $217.1 $149.0 $121.8 $638.9 Total $336.0 $549.9 $539.7 $338.2 $1,763.8 2015 Wells Fargo Energy & Power Symposium 35