Exhibit 99.1

Exhibit 99.1
New York Financial Community
October 23, 2013

Regarding Forward-Looking Statements
Certain statements contained in this presentation are forward-looking statements within the meaning of the Private Securities Litigation Reform Act of 1995. Words such as “anticipates,” “estimates,” “expects,” “projects,” “may,” “will,” “intends,” “expects,” “believes,” or “should” and similar expressions may identify forward-looking information and such forward-looking statements are made based upon management’s current expectations and beliefs as of this date concerning future developments and their potential effect upon New Jersey Resources (NJR or the Company). There can be no assurance that future developments will be in accordance with management’s expectations or that the effect of future developments on NJR will be those anticipated by management. NJR cautions persons reading or hearing this presentation that the assumptions that form the basis for forward-looking statements regarding NJR’s net financial earnings (NFE) for fiscal 2013 through fiscal 2017, forecasted contribution of business segments to fiscal 2013 and long-term NFE, long-term financial goals of NJR, expected contribution by new customers of New Jersey Natural Gas Company (NJNG) to utility gross margin, expected number of new customers of NJNG, new sources of utility gross margin at NJNG for 2013 through 2017, Solar Renewable Energy Certificate (SREC) prices, NJR’s effective tax rate, estimated capital expenditures in fiscal 2013 and beyond by NJNG and NJRCEV, planned natural gas vehicle (NGV) stations, the diversification of NJRCEV’s strategy, the impact of the Two Dot Wind farm on earnings, and expected dividend payout ratio include many factors that are beyond the Company’s ability to control or estimate precisely, such as estimates of future market conditions and the behavior of other market participants.
The factors that could cause actual results to differ materially from NJR’s expectations include, but are not limited to, weather and economic conditions; demographic changes in the NJNG service territory and their effect on NJNG’s customer growth; volatility of natural gas and other commodity prices and their impact on NJNG customer usage, NJNG’s Basic Gas Supply Service incentive programs, NJRES’ operations and on the Company’s risk management efforts; changes in rating agency requirements and/or credit ratings and their effect on availability and cost of capital to the Company; the impact of volatility in the credit markets; the ability to comply with debt covenants; the impact to the asset values and resulting higher costs and funding obligations of NJR’s pension and postemployment benefit plans as a result of downturns in the financial markets, a lower discount rate, and impacts associated with the Patient Protection and Affordable Care Act; accounting effects and other risks associated with hedging activities and use of derivatives contracts; commercial and wholesale credit risks, including the availability of creditworthy customers and counterparties and liquidity in the wholesale energy trading market; the ability to obtain governmental approvals and/or financing for the construction, development and operation of certain non-regulated energy investments; risks associated with the management of the Company’s joint ventures and partnerships; risks associated with our investments in renewable energy projects and our investment in an on-shore wind developer, including the availability of regulatory and tax incentives, logistical risks and potential delays related to construction, permitting, regulatory approvals and electric grid interconnection, the availability of viable projects and NJR’s eligibility for federal investment tax credits (ITC), and production tax credits (PTC), the future market for SRECs and operational risks related to projects in service; timing of qualifying for ITCs due to delays or failures to complete planned solar energy projects and the resulting effect on our effective tax rate and earnings; the level and rate at which NJNG’s costs and expenses (including those related to restoration efforts resulting from Superstorm Sandy) are incurred and the extent to which they are allowed to be recovered from customers through the regulatory process; access to adequate supplies of natural gas and dependence on third-party storage and transportation facilities for natural gas supply; operating risks incidental to handling, storing, transporting and providing customers with natural gas; risks related to our employee workforce, including a work stoppage; the regulatory and pricing policies of federal and state regulatory agencies; the possible expiration of the NJNG Conservation Incentive Program (CIP), the costs of compliance with the proposed regulatory framework for over-the-counter derivatives; the costs of compliance with present and future environmental laws, including potential climate change-related legislation; risks related to changes in accounting standards; the disallowance of recovery of environmental-related expenditures and other regulatory changes; environmental-related and other litigation and other uncertainties; risks related to cyber-attack of failure of information technology systems; and the impact of natural disasters, terrorist activities, and other extreme events on our operations and customers, including any impacts to utility gross margin, and restoration costs resulting from Superstorm Sandy. The aforementioned factors are detailed in the “Risk Factors” sections of our Annual Report on Form 10-K filed on November 28, 2012, as filed with the Securities and Exchange Commission (SEC) and our Quarterly Report on Form 10-Q, filed with the SEC on May 3, 2013, each of which is available on the SEC’s website at sec.gov. Information included in this presentation is representative as of today only and while NJR periodically reassesses material trends and uncertainties affecting NJR’s results of operations and financial condition in connection with its preparation of management’s discussion and analysis of results of operations and financial condition contained in its Quarterly and Annual Reports filed with the SEC, NJR does not, by including this statement, assume any obligation to review or revise any particular forward-looking statement referenced herein in light of future events.
Disclaimer Regarding Non-GAAP Financial Measures
This presentation includes the non-GAAP measures net financial earnings (losses), financial margin and utility gross margin. As an indicator of the Company’s operating performance, these measures should not be considered an alternative to, or more meaningful than, GAAP measures, such as cash flow, net income, operating income or earnings per share. Net financial earnings (losses) and financial margin exclude unrealized gains or losses on derivative instruments related to the Company’s unregulated subsidiaries and certain realized gains and losses on derivative instruments related to natural gas that has been placed into storage at NJRES. Volatility associated with the change in value of these financial and physical commodity contracts is reported in the income statement in the current period. In order to manage its business, NJR views its results without the impacts of the unrealized gains and losses, and certain realized gains and losses, caused by changes in value of these financial instruments and physical commodity contracts prior to the completion of the planned transaction because it shows changes in value currently as opposed to when the planned transaction ultimately is settled. NJNG’s utility gross margin represents the results of revenues less natural gas costs, sales and other taxes and regulatory rider expenses, which are key components of the Company’s operations that move in relation to each other.
Management uses net financial earnings (NFE), financial margin and utility gross margin as supplemental measures to other GAAP results to provide a more complete understanding of the Company’s performance. Management believes these non-GAAP measures are more reflective of the Company’s business model, provide transparency to investors and enable period-to-period comparability of financial performance. For a full discussion of our non-GAAP financial measures, please see Item 7 of our Annual Report on Form 10-K for the fiscal year ended September 30, 2012, filed on November 28, 2012. This information has been provided pursuant to the requirements of SEC Regulation G.

New Jersey Resources: Growth Initiatives
Infrastructure Growth – Specific plans to nearly double plant investment by fiscal 2017
Customer and Gross Margin Growth – Diversified and sustainable gross margin growth
Non-Regulated Investments – Long-term plan to diversify clean energy portfolio to reduce reliance on Investment Tax Credits (ITCs) Financial Goals – Above-average earnings and dividend growth
4
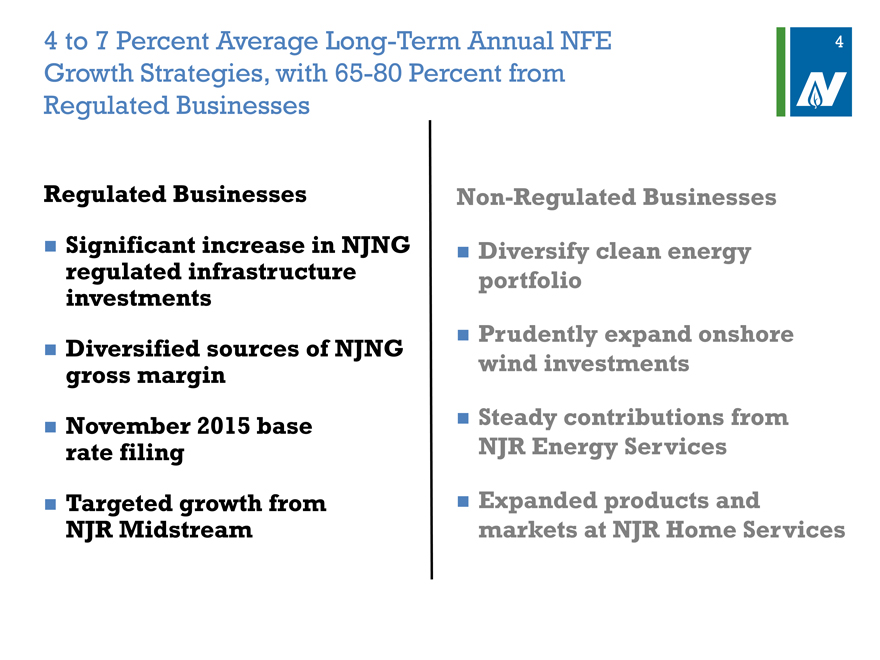
4 to 7 Percent Average Long-Term Annual NFE Growth Strategies, with 65-80 Percent from Regulated Businesses
Regulated Businesses
Significant increase in NJNG regulated infrastructure investments
Diversified sources of NJNG gross margin November 2015 base rate filing
Targeted growth from NJR Midstream
Non-Regulated Businesses
Diversify clean energy portfolio
Prudently expand onshore wind investments
Steady contributions from NJR Energy Services
Expanded products and markets at NJR Home Services
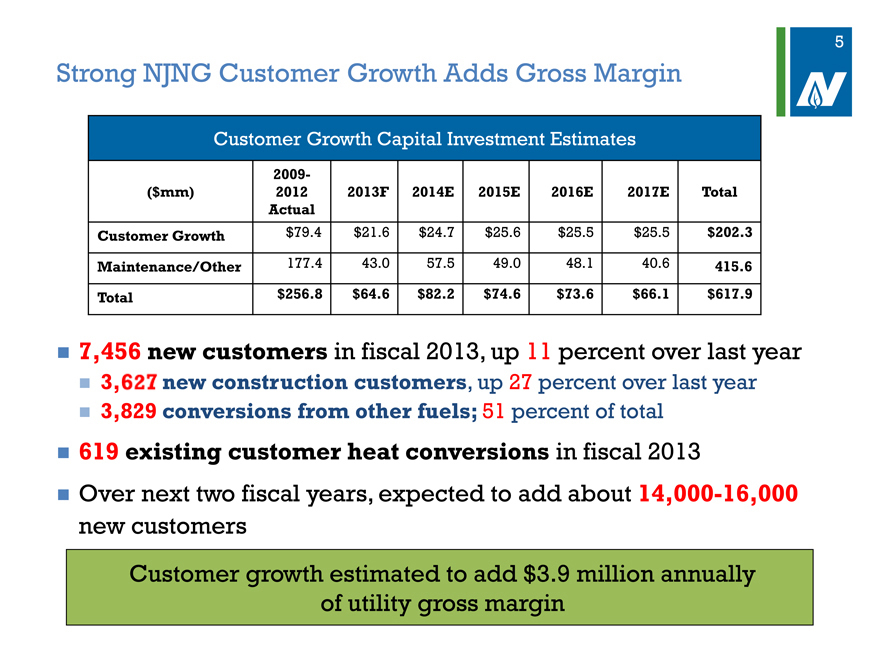
Strong NJNG Customer Growth Adds Gross Margin
Customer Growth Capital Investment Estimates
2009-
($mm) 2012 2013F 2014E 2015E 2016E 2017E Total
Actual
Customer Growth $79.4 $21.6 $24.7 $25.6 $25.5 $25.5 $202.3
Maintenance/Other 177.4 43.0 57.5 49.0 48.1 40.6 415.6
Total $256.8 $64.6 $82.2 $74.6 $73.6 $66.1 $617.9
7,456 new customers in fiscal 2013, up 11 percent over last year
3,627 new construction customers, up 27 percent over last year
3,829 conversions from other fuels; 51 percent of total
619 existing customer heat conversions in fiscal 2013
Over next two fiscal years, expected to add about 14,000-16,000 new customers
Customer growth estimated to add $3.9 million annually of utility gross margin
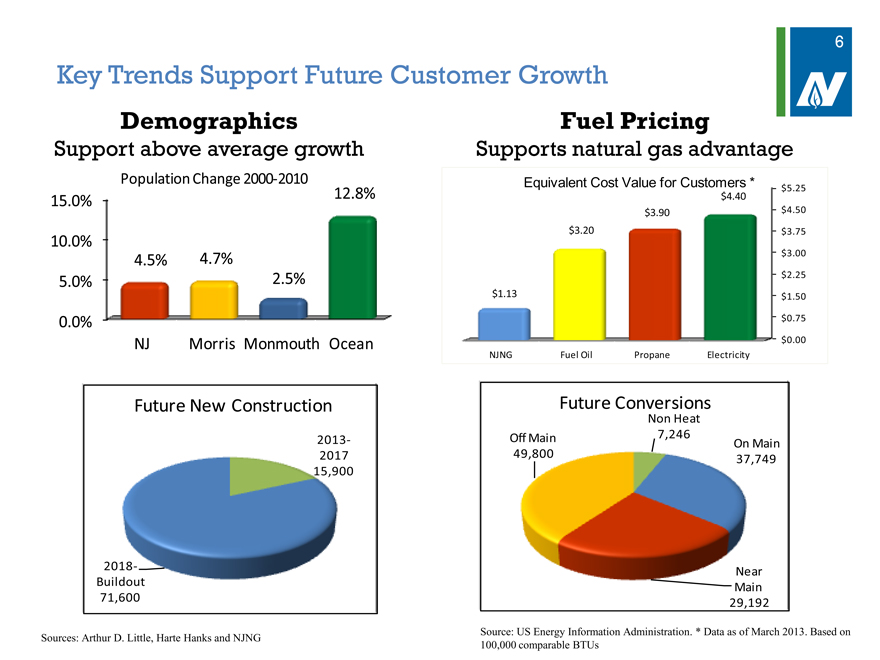
Key Trends Support Future Customer Growth
Demographics
Support above average growth
Population Change 2000-2010
15.0% 12.8%
10.0%
4.5% 4.7%
5.0% 2.5%
0.0%
NJ Morris Monmouth Ocean
Fuel Pricing
Supports natural gas advantage
Equivalent Cost Value for Customers * $ 5.25
$4.40
$3.90 $ 4.50
$3.20 $ 3.75
$ 3.00
$ 2.25
$1.13 $ 1.50
$ 0.75
$ 0.00
NJNG Fuel Oil Propane Electricity
Future New Construction
2013-
2017
15,900
2018-
Buildout
71,600
Source: Arthur D. Little, Harte Hanks and NJNG
Future Conversions
Non Heat
Off Main 7,246
On Main
49,800 37,749
Near
Main
29,192
Source: US Energy Information Administration. * Data as of March 2013. Based on
100,000 comparable BTUs
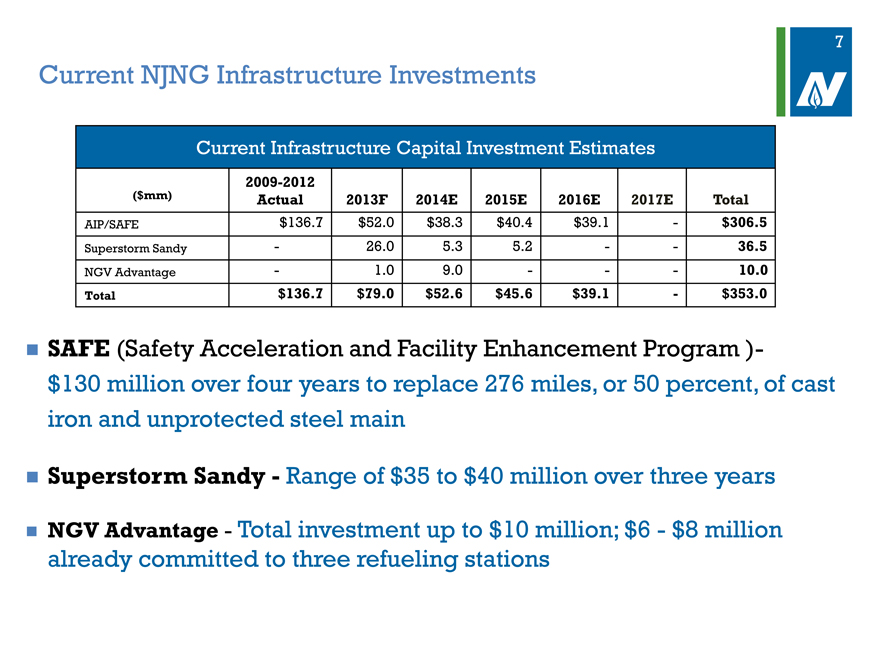
Current NJNG Infrastructure Investments
Current Infrastructure Capital Investment Estimates
2009-2012
($mm) Actual 2013F 2014E 2015E 2016E 2017E Total
AIP/SAFE $136.7 $52.0 $38.3 $40.4 $39.1 - $306.5
Superstorm Sandy - 26.0 5.3 5.2 - - 36.5
NGV Advantage - 1.0 9.0 - - - 10.0
Total $136.7 $79.0 $52.6 $45.6 $39.1 - $353.0
SAFE (Safety Acceleration and Facility Enhancement Program )- $130 million over four years to replace 276 miles, or 50 percent, of cast iron and unprotected steel main
Superstorm Sandy-Range of $35 to $40 million over three years
NGV Advantage-Total investment up to $10 million; $6-$8 million already committed to three refueling stations
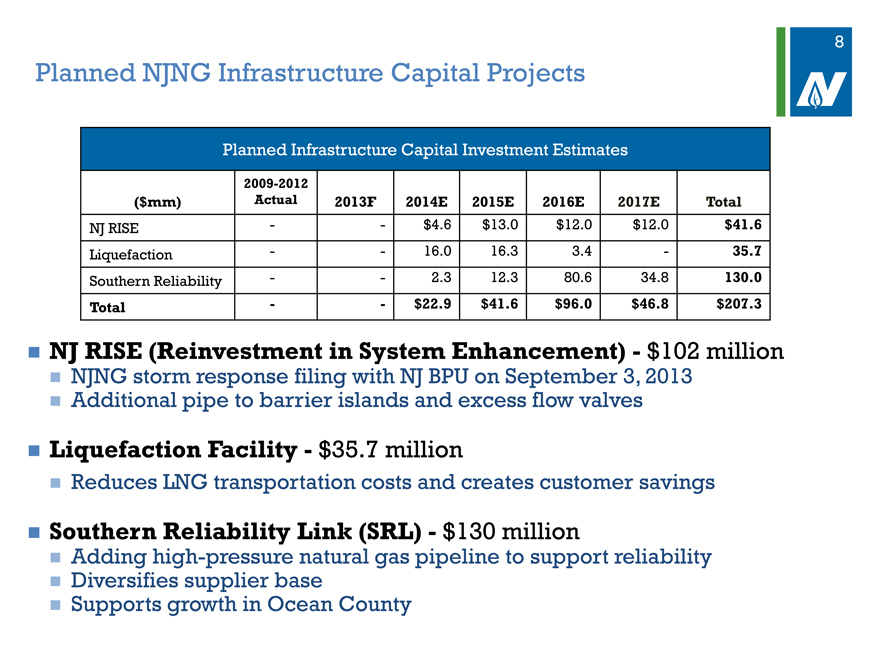
Planned NJNG Infrastructure Capital Projects
Planned Infrastructure Capital Investment Estimates
2009-2012
($mm) Actual 2013F 2014E 2015E 2016E 2017E Total
NJ RISE - - $4.6 $13.0 $12.0 $12.0 $41.6
Liquefaction - - 16.0 16.3 3.4 - 35.7
Southern Reliability - - 2.3 12.3 80.6 34.8 130.0
Total - - $22.9 $41.6 $96.0 $46.8 $207.3
NJ RISE (Reinvestment in System Enhancement) - $102 million
NJNG storm response filing with NJ BPU on September 3, 2013
Additional pipe to barrier islands and excess flow valves
Liquefaction Facility - $35.7 million
Reduces LNG transportation costs and creates customer savings
Southern Reliability Link (SRL) - $130 million
Adding high-pressure natural gas pipeline to support reliability
Diversifies supplier base
Supports growth in Ocean County
9
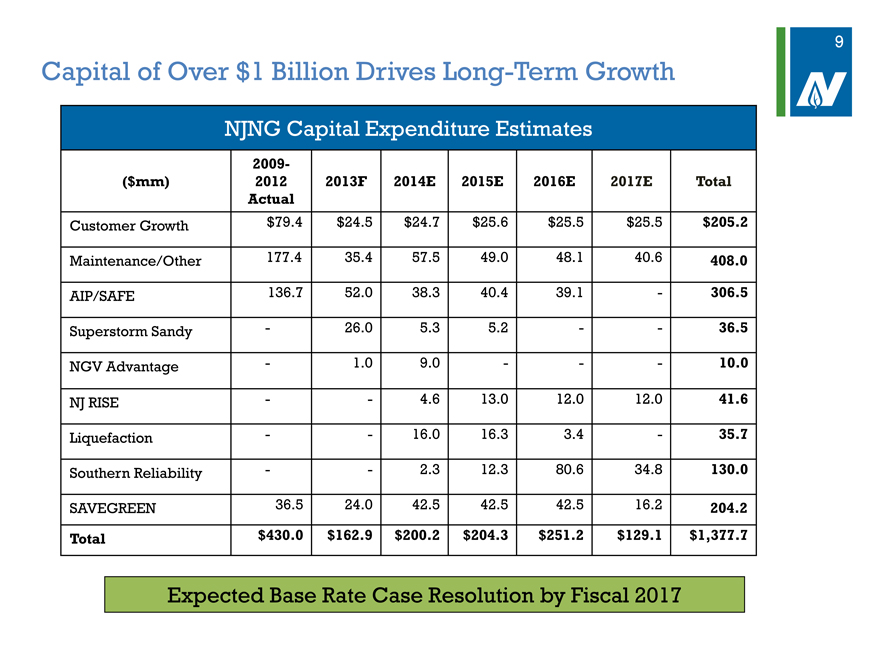
Capital of Over $1 Billion Drives Long-Term Growth
NJNG Capital Expenditure Estimates
2009-
($mm) 2012 2013F 2014E 2015E 2016E 2017E Total
Actual
Customer Growth $79.4 $24.5 $24.7 $25.6 $25.5 $25.5 $205.2
Maintenance/Other 177.4 35.4 57.5 49.0 48.1 40.6 408.0
AIP/SAFE 136.7 52.0 38.3 40.4 39.1 - 306.5
Superstorm Sandy - 26.0 5.3 5.2 - - 36.5
NGV Advantage - 1.0 9.0 - - - 10.0
NJ RISE - - 4.6 13.0 12.0 12.0 41.6
Liquefaction - - 16.0 16.3 3.4 - 35.7
Southern Reliability - - 2.3 12.3 80.6 34.8 130.0
SAVEGREEN 36.5 24.0 42.5 42.5 42.5 16.2 204.2
Total $430.0 $162.9 $200.2 $204.3 $251.2 $129.1 $1,377.7
Expected Base Rate Case Resolution by Fiscal 2017
10
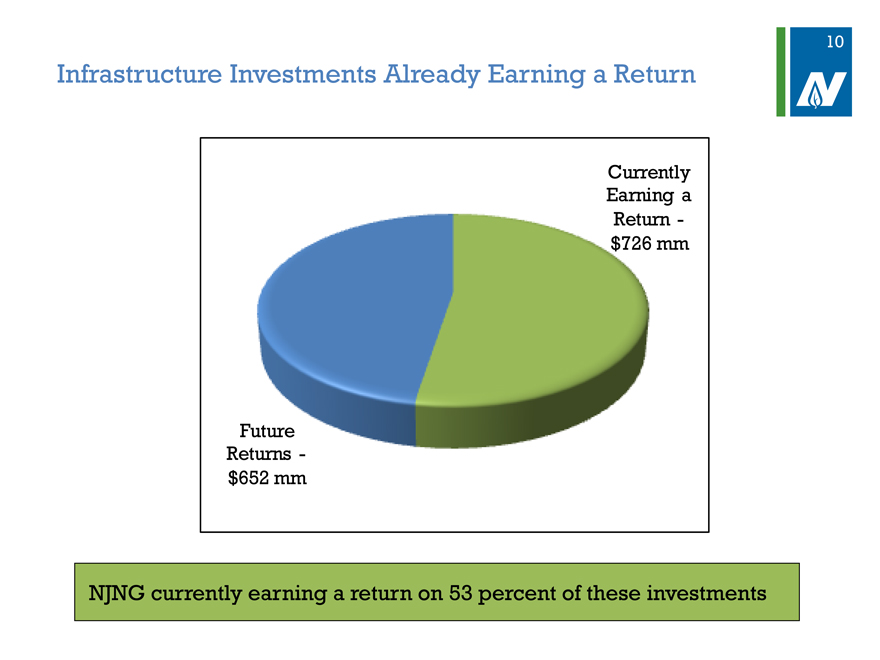
Infrastructure Investments Already Earning a Return
Currently
Earning a
Return -
$726 mm
Future
Returns -
$652 mm
NJNG currently earning a return on 53 percent of these investments
11
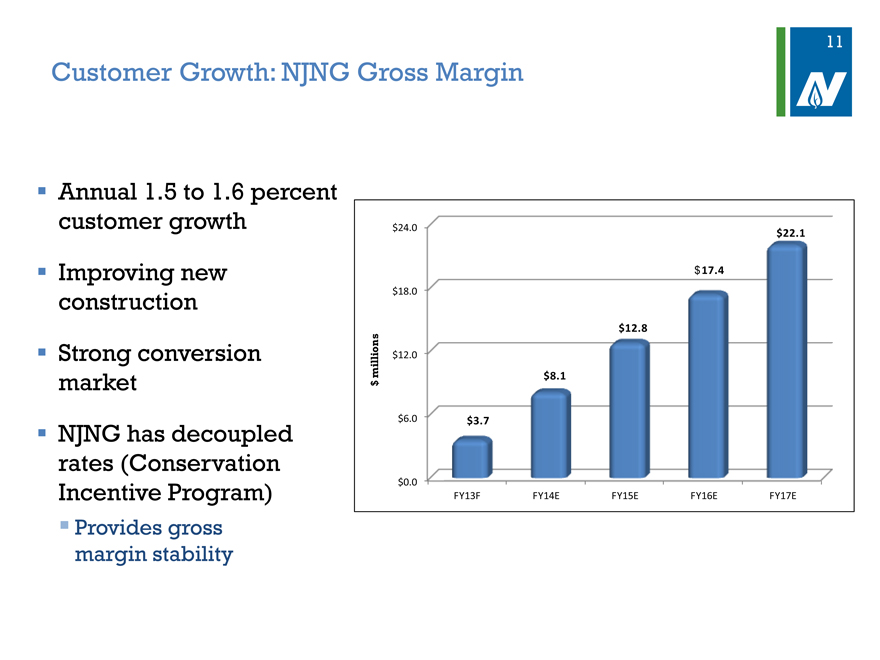
Customer Growth: NJNG Gross Margin
Annual 1.5 to 1.6 percent customer growth Improving new construction Strong conversion market NJNG has decoupled rates (Conservation Incentive Program)
Provides gross margin stability
$24.0 $22.1
$ 17.4
$18.0
$12.8
millions $12.0
$8.1
$
$6.0 $3.7
$0.0
FY13F FY14E FY15E FY16E FY17E
12
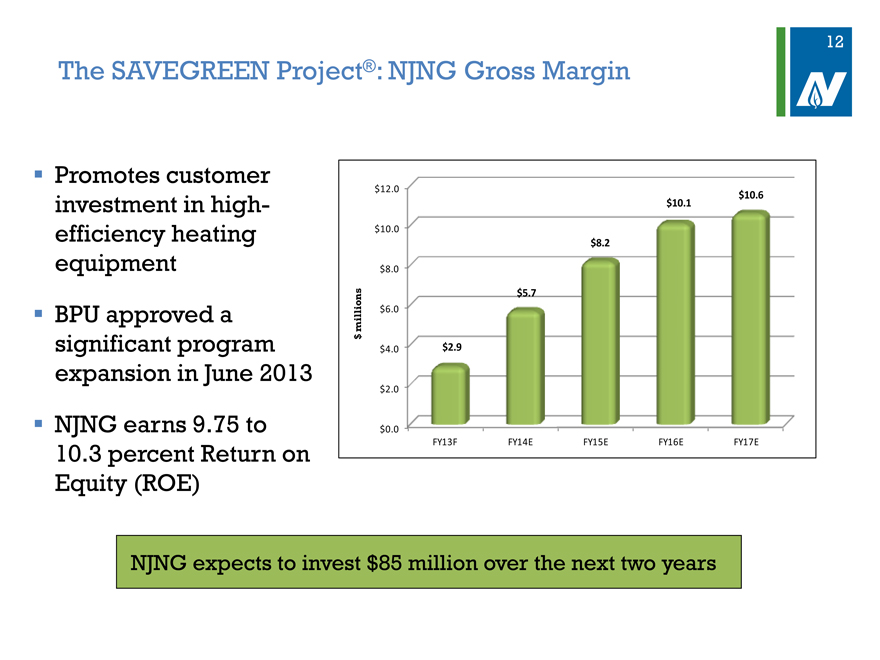
The SAVEGREEN Project®: NJNG Gross Margin
Promotes customer investment in high-efficiency heating equipment
BPU approved a significant program expansion in June 2013
NJNG earns 9.75 to 10.3 percent Return on Equity (ROE)
$12.0 $10.6
$10.1
$10.0
$8.2
$8.0
$5.7
millions $6.0
$
$4.0 $2.9
$2.0
$0.0
FY13F FY14E FY15E FY16E FY17E
NJNG expects to invest $85 million over the next two years
13
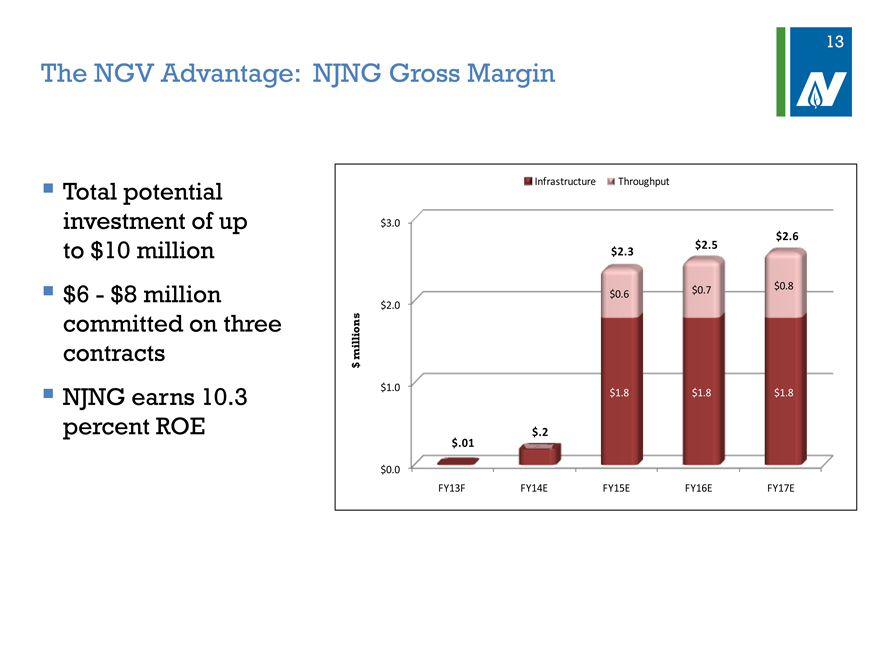
The NGV Advantage: NJNG Gross Margin
Total potential investment of up to $10 million
$6—$8 million committed on three contracts
NJNG earns 10.3 percent ROE
Infrastructure Throughput
$3.0
$2.6
$2.3 $2.5
$0.7 $0.8
$0.6
$2.0
millions $
$1.0 $1.8 $1.8 $1.8
$.2
$ .01
$0.0
FY13F FY14E FY15E FY16E FY17E
14
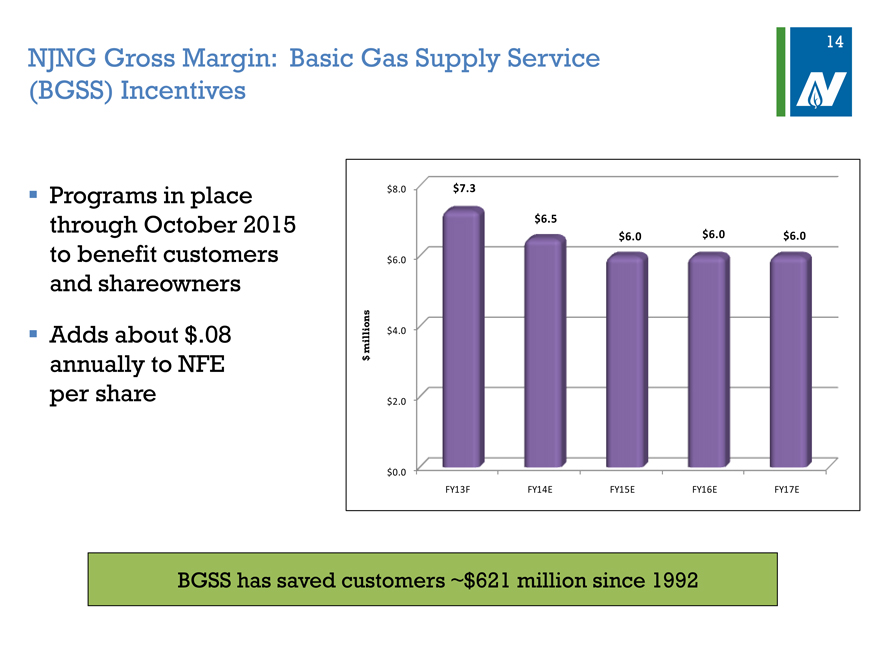
NJNG Gross Margin: Basic Gas Supply Service (BGSS) Incentives
Programs in place through October 2015 to benefit customers and shareowners
Adds about $.08 annually to NFE per share
$ 8.0 $7.3
$6.5
$6.0 $6.0 $6.0
$ 6.0
$ 4.0
millions $
$ 2.0
$ 0.0
FY13F FY14E FY15E FY16E FY17E
BGSS has saved customers ~$621 million since 1992
15
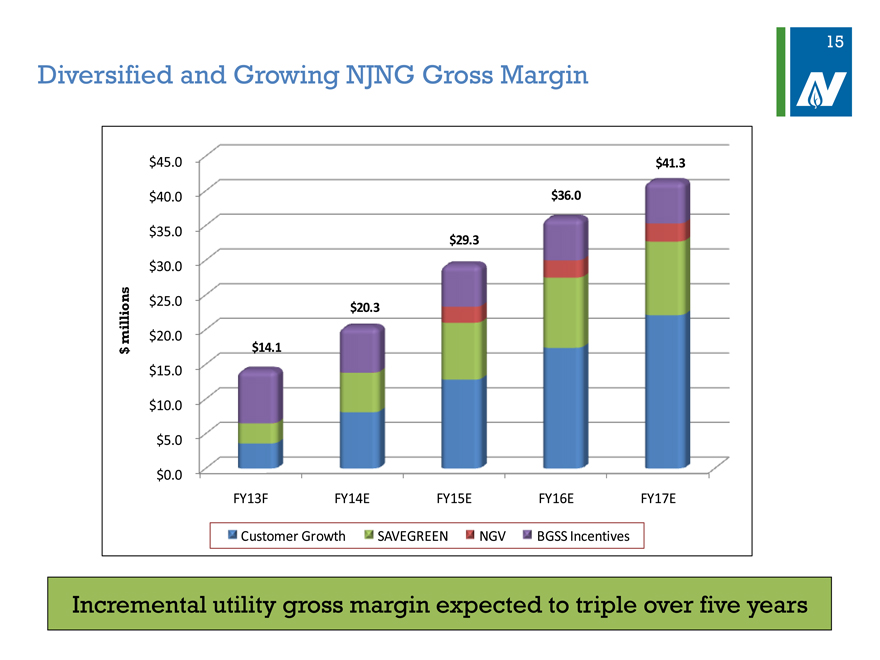
Diversified and Growing NJNG Gross Margin
$45.0 $41.3
$40.0 $36.0
$35.0
$29.3
$30.0
millions $
$25.0 $20.3
$20.0
$14.1
$15.0
$10.0
$5.0
$0.0
FY13F FY14E FY15E FY16E FY17E
Customer Growth SAVEGREEN NGV BGSS Incentives
Incremental utility gross margin expected to triple over five years
16
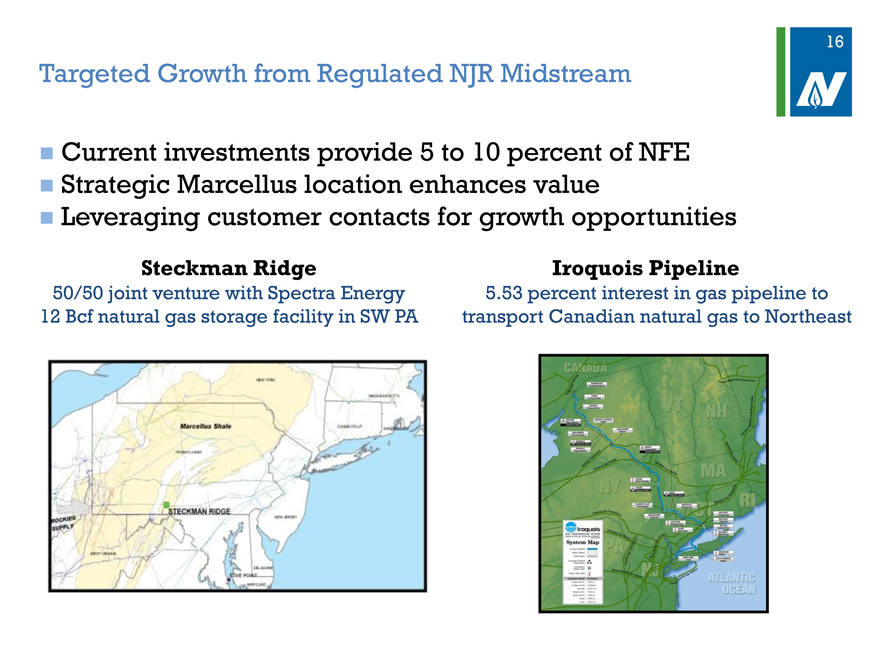
Targeted Growth from Regulated NJR Midstream
Current investments provide 5 to 10 percent of NFE
Strategic Marcellus location enhances value
Leveraging customer contacts for growth opportunities
Steckman Ridge
50/50 joint venture with Spectra Energy
12 Bcf natural gas storage facility in SW PA
Iroquois Pipeline
5.53 percent interest in gas pipeline to transport Canadian natural gas to Northeast
17
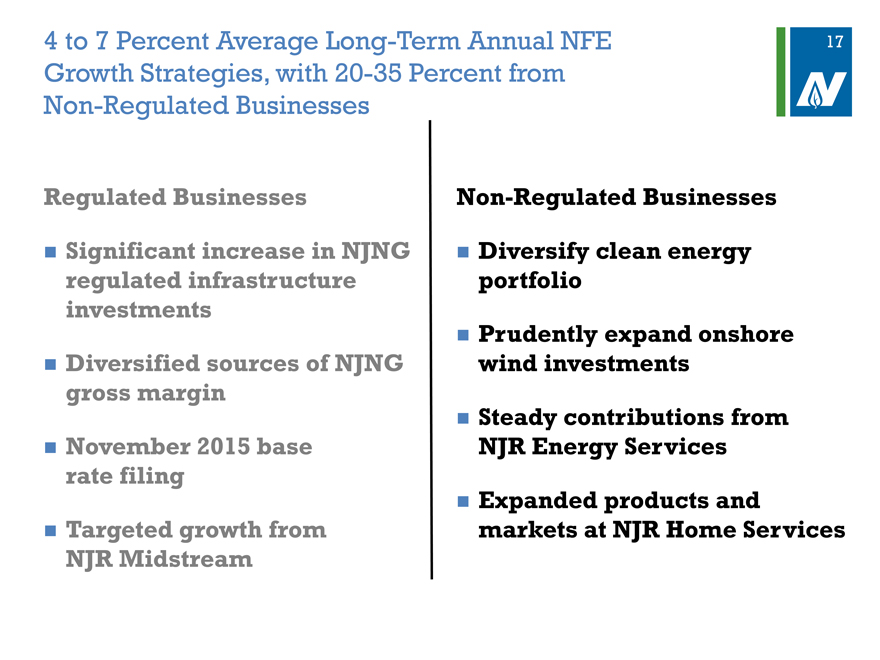
4 | | to 7 Percent Average Long-Term Annual NFE Growth Strategies, with 20-35 Percent from Non-Regulated Businesses |
Regulated Businesses
Significant increase in NJNG
regulated infrastructure
investments
Diversified sources of NJNG
gross margin
November 2015 base
rate filing
Targeted growth from
NJR Midstream
Non-Regulated Businesses
Diversify clean energy portfolio
Prudently expand onshore wind investments
Steady contributions from NJR Energy Services
Expanded products and markets at NJR Home Services

18
Clean Energy Portfolio Strategy
Renewable Portfolio Standard (RPS) provides a growing source of demand
62 MW inventory of grid-connected projects over next four years Sunlight Advantage residential solar program
Gradual decline in solar capital spending by 2017
ITCs reduce to 10 percent in January 2017
How will growth continue?
Increase SREC revenue; higher prices and volume
Invest in onshore wind projects and other clean energy investments; e.g. ,Combined Heat and Power (CHP) Grow regulated earnings contribution
Long-term goal to maintain NJRCEV at 10 to 20 percent of NFE
19
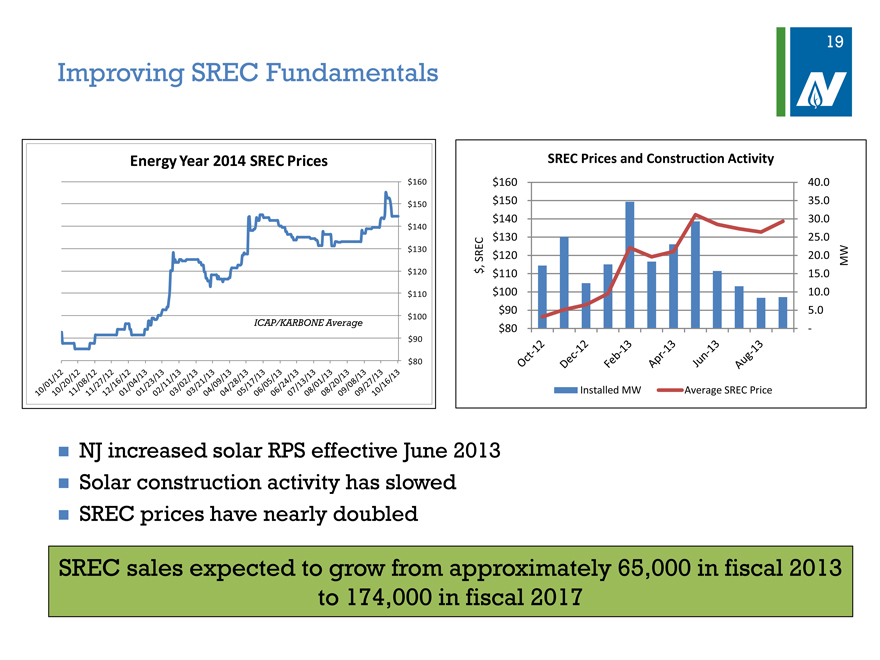
Improving SREC Fundamentals
Energy Year 2014 SREC Prices SREC Prices and Construction Activity
$ 160 $160 40.0
$ 150 $150 35.0
$140 30.0
$ 140
$130 25.0
$ 130 SREC $120 20.0 MW,
$ 120 $ $110 15.0
$ 110 $100 10.0
$90 5.0
$ 100
ICAP/KARBONE Average $80 —
$90
$80
Installed MW Average SREC Price
NJ increased solar RPS effective June 2013
Solar construction activity has slowed
SREC prices have nearly doubled
SREC sales expected to grow from approximately 65,000 in fiscal 2013 to 174,000 in fiscal 2017
20
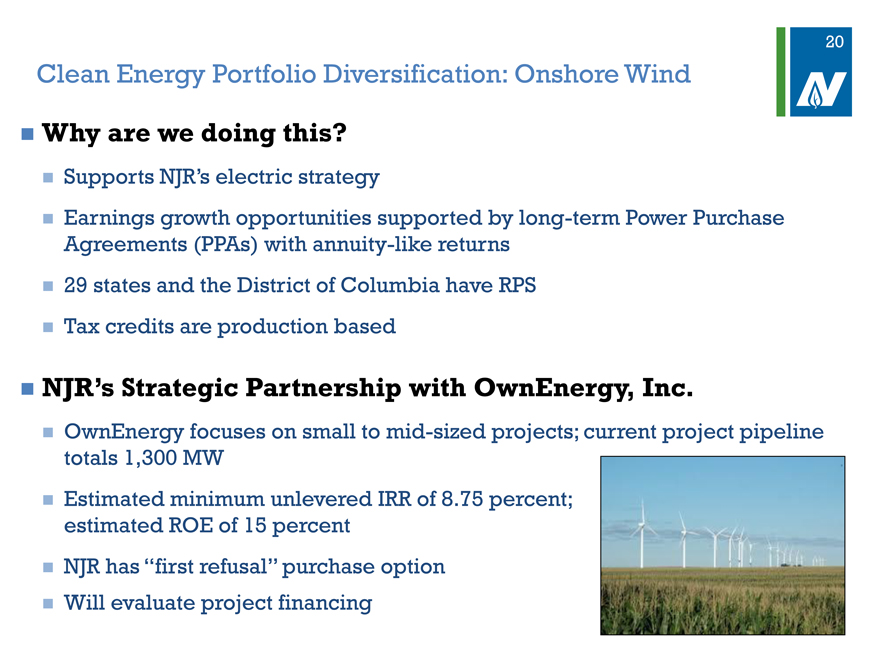
Clean Energy Portfolio Diversification: Onshore Wind
Why are we doing this?
Supports NJR’s electric strategy
Earnings growth opportunities supported by long-term Power Purchase Agreements (PPAs) with annuity-like returns
29 states and the District of Columbia have RPS
Tax credits are production based
NJR’s Strategic Partnership with OwnEnergy, Inc.
OwnEnergy focuses on small to mid-sized projects; current project pipeline totals 1,300 MW
Estimated minimum unlevered IRR of 8.75 percent; estimated ROE of 15 percent
NJR has “first refusal” purchase option
Will evaluate project financing

21
Clean Energy Portfolio Diversification: Two Dot Wind Farm
Purchased from OwnEnergy, Inc.
9.7 MW utility scale wind farm project located in Montana, east of Helena
Approximately $22 million investment
25-year PPA in place to sell power Two Dot to NorthWestern Energy
Start up expected summer 2014
Strong partners—GE, Mortenson Construction, etc.
Expected to contribute $.02-$.04 per share annually beginning in fiscal 2015
22
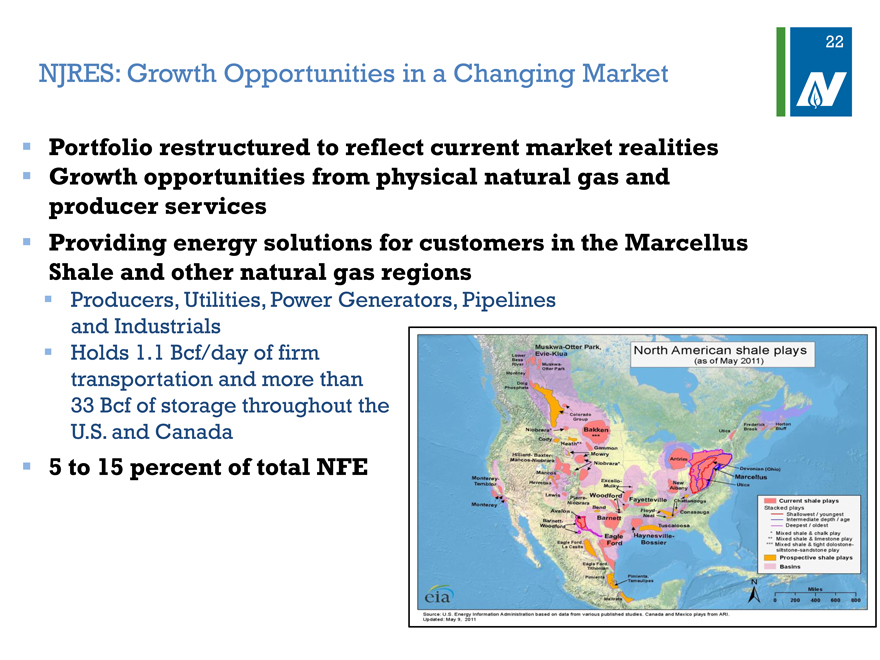
NJRES: Growth Opportunities in a Changing Market
Portfolio restructured to reflect current market realities
Growth opportunities from physical natural gas and producer services
Providing energy solutions for customers in the Marcellus Shale and other natural gas regions
Producers, Utilities, Power Generators, Pipelines and Industrials
Holds 1.1 Bcf/day of firm transportation and more than
33 Bcf of storage throughout the U.S. and Canada
5 to 15 percent of total NFE
23
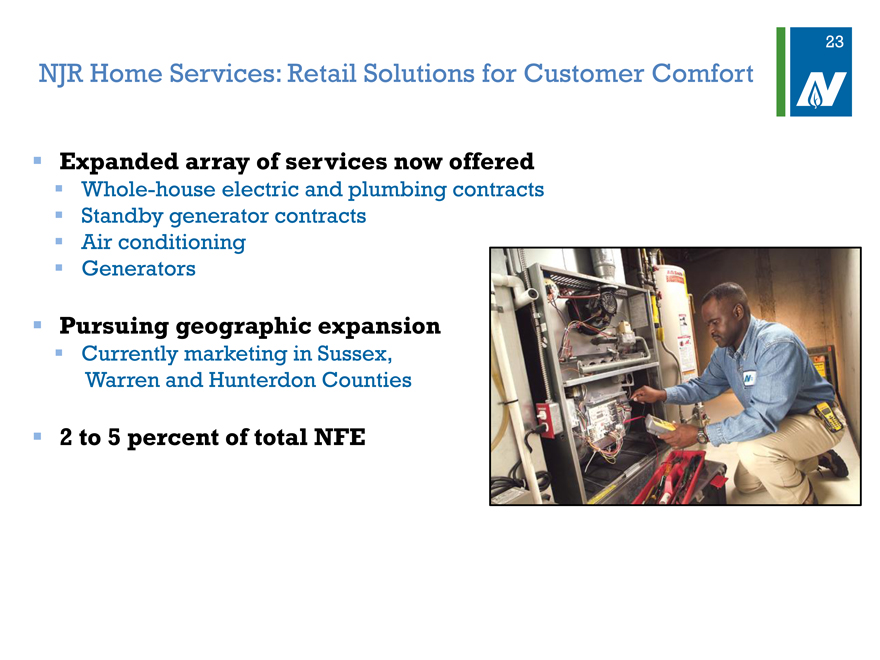
NJR Home Services: Retail Solutions for Customer Comfort
Expanded array of services now offered
Whole-house electric and plumbing contracts
Standby generator contracts
Air conditioning
Generators
Pursuing geographic expansion
Currently marketing in Sussex, Warren and Hunterdon Counties
2 to 5 percent of total NFE
24
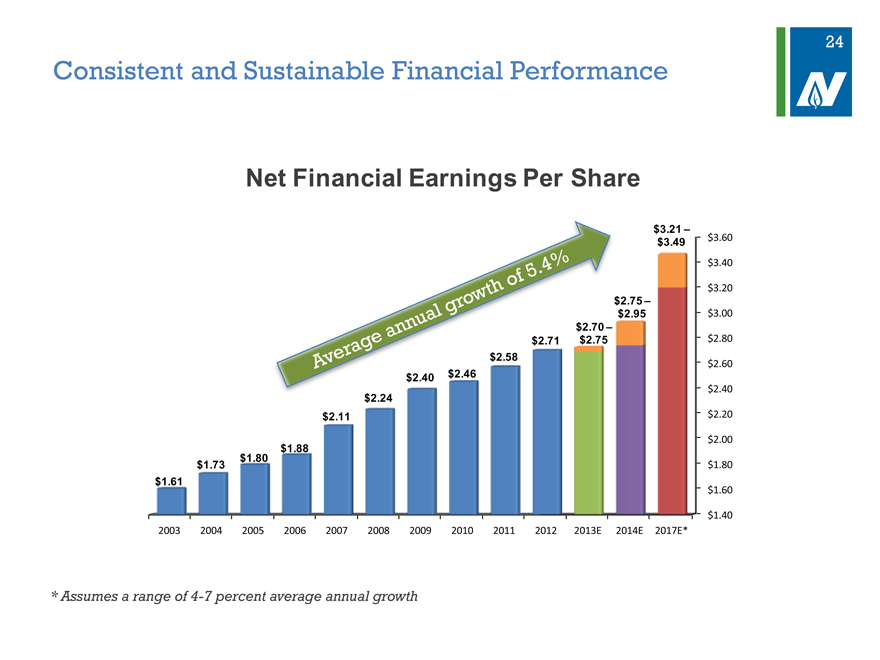
Consistent and Sustainable Financial Performance
Net Financial Earnings Per Share
$3.21 –
$3.49 $3.60
$3.40
$3.20
$2.75 –
$2.95 $3.00
$2.80
$2.60
$2.40
$2.11 $2.20
$2.00
$1.88
$1.80
$1.73 $1.80
$1.61
$1.60
$1.40
$2.24 $2.40 $2.46 $2.58 $2.71 $2.70–$2.75
2003 2004 2005 2006 2007 2008 2009 2010 2011 2012 2013E 2014E 2017E*
* | | Assumes a range of 4-7 percent average annual growth |
25
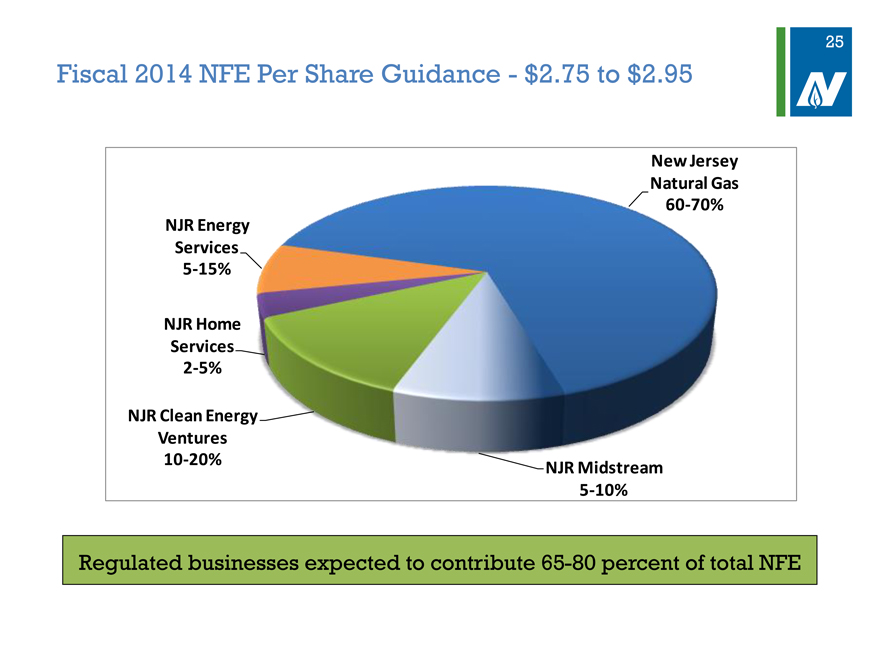
Fiscal 2014 NFE Per Share Guidance—$2.75 to $2.95
New Jersey
Natural Gas
60-70%
NJR Energy
Services
5-15%
NJR Home
Services
2-5%
NJR Clean Energy
Ventures
10-20% NJR Midstream
5-10%
Regulated businesses expected to contribute 65-80 percent of total NFE
26
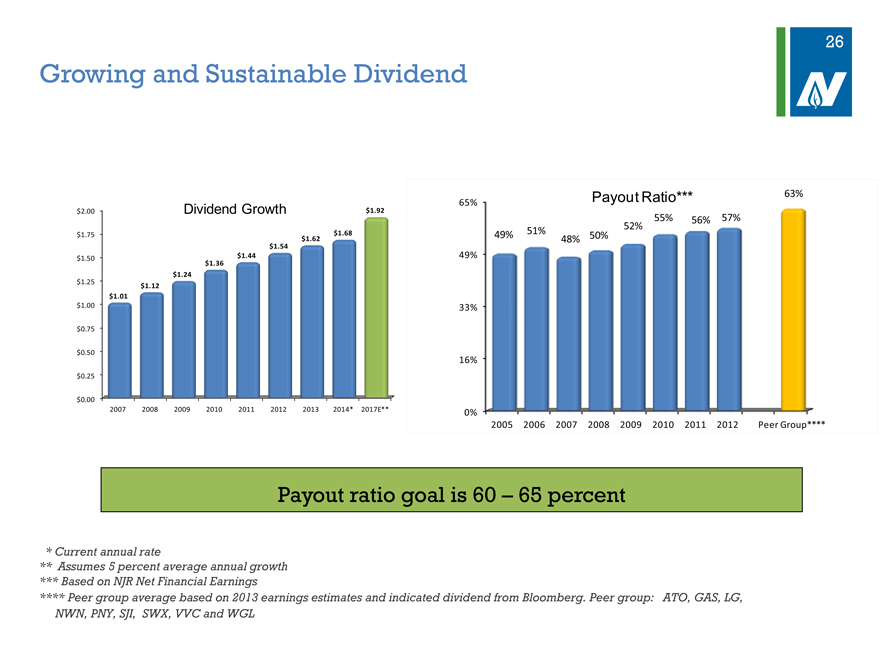
Growing and Sustainable Dividend
$ 2.00 Dividend Growth $1.92
$ 1.75 $1.68
$1.62
$1.54
$ 1.50 $1.44
$1.36
$1.24
$ 1.25 $1.12
$ 1.01
$ 1.00
$ 0.75
$ 0.50
$ 0.25
$ 0.00
2007 2008 2009 2010 2011 2012 2013 2014* 2017E**
Payout Ratio*** 63%
65%
55% 56% 57%
49% 51% 50% 52%
48%
49%
33%
16%
0%
2005 2006 2007 2008 2009 2010 2011 2012 Peer Group****
Payout ratio goal is 60-65 percent
* Current annual rate
** Assumes 5 percent average annual growth
*** Based on NJR Net Financial Earnings
**** Peer group average based on 2013 earnings estimates and indicated dividend from Bloomberg. Peer group: ATO, GAS, LG, NWN, PNY, SJI, SWX, VVC and WGL
27
NJR’s Long-Term Financial Goals
Achieve average long-term NFE growth of 4 to 7 percent
Significant capital investment in regulated business to support customer growth and maintain safe, reliable and resilient service
New customers and regulatory initiatives generate significant NJNG gross margin growth
Provide annual dividend growth of at least 5 percent
Targeted payout ratio of 60 to 65 percent
Expect at least 65 to 80 percent of earnings from Regulated Businesses
Supported by constructive and collaborative regulatory relationships

New York Financial Community
October 23, 2013