UNITED STATES
SECURITIES AND EXCHANGE COMMISSION
Washington, D.C. 20549
FORM N-CSR
CERTIFIED SHAREHOLDER REPORT OF REGISTERED
MANAGEMENT INVESTMENT COMPANIES
Investment Company Act file number: 811-3334
CALVERT SOCIAL INVESTMENT FUND
(Exact name of registrant as specified in charter)
4550 Montgomery Avenue
Suite 1000N
Bethesda, Maryland 20814
(Address of Principal Executive Offices)
William M. Tartikoff, Esq.
4550 Montgomery Avenue
Suite 1000N
Bethesda, Maryland 20814
(Name and Address of Agent for Service)
Registrant's telephone number, including area code: (301) 951-4800
Date of fiscal year end: September 30
Date of reporting period: Twelve months ended September 30, 2011
<PAGE>
Item 1. Report to Stockholders.
[Calvert Asset Allocation Funds Annual Report]
INFORMATION REGARDING CALVERT OPERATING COMPANY
NAME CHANGES
Effective on April 30, 2011, the following Calvert operating companies changed their names as indicated:
| Old Name | New Name | Company Description |
| Calvert Group, Ltd. | Calvert Investments, Inc. | Corporate parent of each |
| operating company listed | ||
| below | ||
| Calvert Asset Management | Calvert Investment | Investment advisor to the |
| Company, Inc. | Management, Inc. | Calvert Funds |
| Calvert Distributors, Inc. | Calvert Investment Distributors, | Principal underwriter |
| Inc. | and distributor for the | |
| Calvert Funds | ||
| Calvert Administrative | Calvert Investment | Administrative services |
| Services Company | Administrative Services, Inc. | provider for the Calvert |
| Funds | ||
| Calvert Shareholder | Calvert Investment Services, | Shareholder servicing |
| Services, Inc. | Inc. | provider for the Calvert |
| Funds | ||
Choose Planet-friendly E-delivery!
Sign up now for on-line statements, prospectuses, and fund reports. In less than five minutes you can help reduce paper mail and lower fund costs.
Just go to www.calvert.com. If you already have an online account at Calvert, click on My Account, and select the documents you would like to receive via e-mail.
If you’re new to online account access, click on Login/Register to open an online account. Once you’re in, click on the E-delivery sign-up at the bottom of the Account Portfolio page and follow the quick, easy steps. Note: if your shares are not held directly at Calvert but through a brokerage firm, you must contact your broker for electronic delivery options available through their firm.

TABLE
OF CONTENTS
| 4 | President’s Letter |
| 7 | SRI Update |
| 10 | Portfolio Management Discussion |
| 19 | Shareholder Expense Example |
| 22 | Report of Independent Registered Public Accounting Firm |
| 23 | Statements of Net Assets |
| 26 | Statements of Operations |
| 27 | Statements of Changes in Net Assets |
| 32 | Notes to Financial Statements |
| 40 | Financial Highlights |
| 49 | Explanation of Financial Tables |
| 51 | Proxy Voting and |
| Availability of Quarterly Portfolio Holdings | |
| 52 | Trustee and Officer Information Table |
Dear Shareholder:
After a strong finish to 2010 and start of the new year, the U.S. economy lost its footing in the summer of 2011. Hope for a second-half rebound gave way to concerns we were heading into another recession as consumer insecurity, a weak job market, the looming sovereign debt crisis in Europe, and uncertainty about the direction of U.S. and European policy weighed on economic growth and turned markets into a roller coaster.
The final months of the reporting period were particularly difficult for equities amid significant market volatility in the financial markets. After U.S. government debt lost its Standard & Poor’s triple A rating for the first time in history, already anxious investors flocked to the relative safety of cash and Treasuries, despite very low short-term yields. In the end, third-quarter market turmoil more than erased stock market gains made through the first six months of 2011. In fact, the -13.87% third-quarter return for the Standard & Poor’s 500 Index was the biggest quarterly drop for that index since the financial meltdown in the fourth quarter of 2008.
The 2008-2009 Financial Crisis -- Where Are We Now?
There have been many media comparisons to the third quarter of 2008 recently, so I think it’s worth noting some key differences. Despite third-quarter events, equity markets are still generally ahead of where they were in the depths of the financial crisis, as the S&P 500 Index and Russell Mid-Cap Index returned an annualized 1.23% and 3.96% for the three-year period ended September 30, 2011. Also, unlike 2008, the stock market seems to be rebounding quickly, having regained much of the lost ground in the first two weeks of October.
While still high, the unemployment rate has decreased a full percentage point from its recession peak. And in a direct month-to-month comparison, the United States added 103,000 jobs in September 2011 (58,000 if you exclude the return of striking Verizon workers) versus losing 434,000 jobs in September 2008.1 In housing, builder confidence in the current market for new single-family homes as measured by the National Association of Home Builders/Wells Fargo Housing Market Index (HMI) rose four points to 18 for October 2011--a sign that pockets of recovery in housing may be starting to emerge across the country. The HMI index is also four points higher than it was in October 2008.
www.calvert.com CALVERT ASSET ALLOCATION FUNDS ANNUAL REPORT 4
Energy prices have fallen, too--after soaring to $150 a barrel, crude oil hovered around $80 a barrel at the end of September 2011. While prices at the pump did not decrease proportionately, they are lower, which is good for consumers’ wallets and oil-dependent industries. In fact, reports show retail sales have notched up in recent weeks--a sign that consumers are starting to spend a bit more freely now. And although household debt still exceeds consumers’ after-tax income, it fell 12% between its record high in September 2007 and June of this year.2 The bottom line is that economic recovery may continue to be more two-steps-forward-one-step-back rather than the straight line progress we’d all prefer, but the recovery is happening. In the meantime, your Calvert fund managers will help guide your investments through the ups and downs that may lie ahead.
Board Diversity and Company Competitiveness
As always, we filed several shareholder resolutions this year asking companies to consider diverse candidates during their board selection. Most were successfully withdrawn after the companies agreed to add specific considerations of race, gender and ethnicity to their selection process. However, Urban Outfitters was one of two companies that opposed the resolution that we filed.
Unlike its five biggest apparel-industry competitors, Urban Outfitters doesn’t have any women or minorities on its board. This is particularly disconcerting since 53% of its North American net retail store sales in fiscal 2011 came from its Anthropologie and Free People stores for women. Of course, the Urban Outfitters flagship store heavily caters to women too. Smart companies understand the importance of having management that reflects their target audiences and Urban Outfitters is certainly missing the mark.
We pressed on and 22% of shareholders voted in favor of the resolution. The battle received a good deal of attention in the press, although it remains to be seen if the company will heed the call of its shareholders.
Your Financial Advisor Is Always Available
It’s easy to be a long-term investor when markets are strong. The challenge is to remain one when markets are going through a protracted period of uncertainty. While it may take longer than we’d like, markets have always recovered in the past and I am confident they will do so again. These cycles are simply the nature of the market.
In times like these, it’s best to stay the course, maintaining a well-diversified mix of U.S. and international stocks, bonds, and cash appropriate for your goals and risk tolerance. However, if you think your financial needs or risk tolerance have changed, your financial advisor is always available to discuss your concerns.
www.calvert.com CALVERT ASSET ALLOCATION FUNDS ANNUAL REPORT 5
We also invite you to visit our website, www.calvert.com, for fund information, portfolio updates, and commentary from Calvert professionals. As always, we thank you for entrusting your investments to Calvert.
Sincerely,

Barbara J. Krumsiek
President and CEO
Calvert Investments, Inc.
October 2011
1 Bureau of Labor Statistics
2 Center for American Progress, Economic Snapshot for September 2011
www.calvert.com CALVERT ASSET ALLOCATION FUNDS ANNUAL REPORT 6
 | As always, Calvert continues to work hard to ensure you have a say in the responsible man- agement of environmental, social, and governance (ESG) factors for the companies in which we invest. Below are highlights of our accomplishments during the reporting period. | |
Climate Change
As the impacts of climate change become increasingly apparent, the consequences on vulnerable, impoverished communities around the world cannot be ignored. Even with aggressive mitigation efforts, many will still experience dire effects from more severe weather-related disasters, increased food and water insecurity, increased scarcity of natural resources, and negative health effects. While many communities have begun to prepare, businesses can contribute to--and benefit from--preparation as well.
To that end, Calvert has joined with leading companies such as Entergy, Green Mountain Coffee Roasters, Levi Strauss, Limited Brands, Starbucks, and Swiss Re to launch the Partnership for Resilience and Environmental Preparedness (PREP) to promote business practices that help companies and communities gear up for the impact of climate change. It also advocates for public policies to mitigate climate variability, weather extremes, and other consequences of a changing climate.
Overall Shareholder Advocacy Efforts
Calvert filed 38 resolutions in the 2011 proxy season, 28 of which were successfully withdrawn after companies agreed to the terms of the resolution. The most popular topics were sustainability reporting, climate change risks, and climate principles.
Majority Vote in Director Elections
Shareholders’ role in electing a board of directors is a fundamental part of ensuring accountability. Unfortunately, many companies weaken this role by conducting elections under a plurality rather than a majority standard—which essentially means a director nominee can be elected with only his or her own affirmative vote.
Calvert filed four shareholder proposals calling for companies to adopt majority voting this year. Those at Plains Exploration and Production, Global Payments, and Agco were withdrawn after the companies agreed to the requested changes. Hansen Natural responded with minor improvements to their election process. But we felt they were insufficient, so we kept the resolution on the ballot and 48% of shareholders voted in favor of it.
www.calvert.com CALVERT ASSET ALLOCATION FUNDS ANNUAL REPORT 7
Update on Board Diversity
Persuading companies to make their boards more representative of their customers, employees, and other target audiences continues to be an important initiative. In August, Calvert Senior Sustainability Analyst Aditi Mohapatra published an article in Forbes magazine, “Are There Really Boards With No Women?” The article highlighted the fact that women still hold only 18% of corporate board posts at S&P 100 companies, despite a growing body of evidence proving the business case for diverse boards.
Also, five resolutions seeking a proactive commitment to include women and minorities as part of every board director search were filed this year. Three were successfully withdrawn before the annual meeting. The remaining two—at Urban Outfitters and American Financial Group—received strong support with 22% and 27% of shareholders votes.
First U.S. Automaker Added to Calvert Social Index
Another notable event was Ford Motor becoming the first U.S. automaker to qualify for Calvert Signature Funds and be added to the Calvert Social Index. Ford has emerged in recent years as the fuel efficiency leader among the big three U.S. auto manufacturers. A review of Ford’s key industry impacts, as well as our engagement with the company over the past four years, ensured that it met our environment, social, and governance (ESG) criteria for investment.
While we remain concerned about the overall impact of automobile companies on issues such as greenhouse emissions, we believe Ford and the foreign automakers Calvert invests in are taking meaningful steps to reduce the negative environmental impacts of their products. Of course, we will continue to seek improvement on key issues by working with senior management of all these companies.
Community Investments
Many of our Funds participate in Calvert’s High Social Impact Investing program, which is administered through the Calvert Foundation. This community investment program may allocate a small percentage of Fund assets at below-market interest rates to investments that provide economic opportunity for struggling populations.1 One such company receiving funding through the Foundation is Seedco Financial Services, which supports small businesses in under-served communities and those owned by women and minorities such as Telecom Transport Services in Birmingham, Alabama. Last year, owner Sue Watkins landed a large contract to transport costly telecommunication equipment that required the company to move to a new warehouse, lease new equipment, and hire additional staff. A $25,000 microloan from Seedco allowed her to make the necessary investments. Now the company enjoys continued growth and is creating jobs in her community.
www.calvert.com CALVERT ASSET ALLOCATION FUNDS ANNUAL REPORT 8
Special Equities
A modest but important portion of certain funds is allocated to small private companies that aim to provide market-rate returns while developing products or services that address important sustainability or environmental issues.
One recent investment was PresenceLearning, a firm that provides live, online speech therapy to students via web-based video conference technology.2 A national shortage of speech therapists prevents many students with severe communication disorders from receiving therapy. Now, the company’s distributed network technology enables specialists to serve more students in a more cost-efficient manner.
Another investment was DBL Equity Fund–BAEF II, L.P.2 DBL is a women-led firm with a “Double Bottom Line” strategy to invest in companies that aim to deliver top-tier venture capital returns while working with these companies to create social, environmental, and economic improvement in the regions where they operate.
1 As of September 30, 2011, Calvert Social Investment Foundation (“Calvert Foundation” or “Foundation”) Community Investment Notes represented the following percentages of Fund net assets: Calvert Capital Accumulation Fund 0.79%, Calvert International Equity Fund 1.48%, and Calvert Small Cap Fund 0.57%. The Calvert Foundation is a 501(c)(3) nonprofit organization. The Foundation’s Community Investment Note Program is not a mutual fund and should not be confused with any Calvert Investment-sponsored investment product.
2 As of September 30, 2011, PresenceLearning and DBL Equity Fund represented 0.01% and 0.02% of Calvert Equity Portfolio. All holdings are subject to change without notice.
As of September 30, 2011, the following companies represented the following percentages of net assets: Entergy 0% of all funds, Green Mountain Coffee Roasters 0.17% of Calvert Social Index Fund, Levi Strauss 0% of all funds, Limited 0.15% of Calvert Social Index Fund, Starbucks 0.41% of Calvert Social Index Fund, Swiss Re 0% of all funds, Plains Exploration 0.05% of Calvert Social Index Fund, Global Payments 0.05% of Calvert Social Index Fund, Agco 0.05% of Calvert Social Index Fund, Hansen Natural 0.09% of Calvert Social Index Fund, Urban Outfitters 0% of all funds and American Financial Group 0.04% of Calvert Social Index Fund, and Ford 0.53% of Calvert Social Index Fund. All holdings are subject to change without notice.
www.calvert.com CALVERT ASSET ALLOCATION FUNDS ANNUAL REPORT 9
 | |||||
| CALVERT | |||||
| CONSERVATIVE | |||||
| ALLOCATION FUND | |||||
| September 30, 2011 | |||||
| % of Total | |||||
| Asset Allocation | Investments | ||||
| Domestic Equity Mutual Funds | 23 | % | |||
| International and Global | |||||
| Equity Mutual Funds | 8 | % | |||
| Fixed Income Mutual Funds | 69 | % | |||
| Total | 100 | % | |||
| Performance | |||||
| Investment | 6 months | 12 months | |||
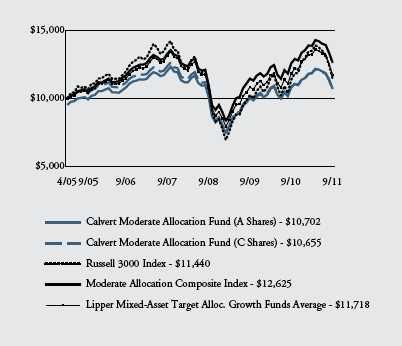
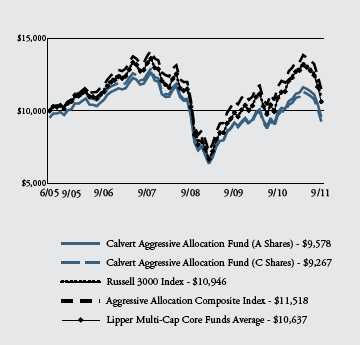
| For the 12-month period ended September 30, 2011, Calvert Conservative Allocation Fund's Class A shares (at NAV) returned 1.86%, underperforming its benchmark, the Barclays Capital U.S. Credit Index, which returned 4.56% for the period. Calvert Moderate Allocation Fund's Class A shares (at NAV) returned -1.03%, while Calvert Aggressive Allocation Fund's Class A shares (at NAV) returned -3.19%--both underperform- ing their common benchmark, the Russell 3000 Index, which returned 0.55%.*† In the Portfolio Strategy discussion below, we provide analyses of the performance relative to secondary benchmarks that are more rep- resentative of the stock and bond allocations of these Funds. All three Funds invest in both | Performance† | ended | ended | ||
| (Total Return at NAV*) | 9/30/11 | 9/30/11 | |||
| Class A | -2.47 | % | 1.86 | % | |
| Class C | -2.99 | % | 0.67 | % | |
| Barclays Capital U.S. | |||||
| Credit Index | 5.60 | % | 4.56 | % | |
| Conservative Allocation | |||||
| Composite Index** | -1.40 | % | 2.19 | % | |
| Lipper Mixed-Asset | |||||
| Target Alloc. | |||||
| Conservative | |||||
| Funds Avg. | -4.33 | % | 0.97 | % | |
| stocks and bonds through investments in a variety of Calvert mutual funds. | |||||
* Investment performance/return at NAV does not reflect the deduction of the Fund’s maximum 4.75% front-end sales charge or any deferred sales charge.
** Calvert Conservative Allocation Composite Index: 60% Barclays Capital U.S. Credit Index, 22% Russell 3000 Index, 8% MSCI EAFE IMI Index, 10% 3-month Barclays Capital T-Bill Bellwether Index.
† Performance shown in this annual report to shareholders is calculated based on the net asset value of the Funds at year-end which was adjusted subsequent to year-end due to adjustments made to the prices of certain portfolio holdings in one of the underlying funds of the Funds held as of September 30, 2011 and during the fiscal period then ended. See Note E to Notes to Financial Statements.
www.calvert.com CALVERT ASSET ALLOCATION FUNDS ANNUAL REPORT 10
CALVERT MODERATE
ALLOCATION FUND
September 30, 2011
| % of Total |
|
Asset Allocation | Investments |
|
Domestic Equity Mutual Funds | 48% |
|
International and Global |
|
|
Equity Mutual Funds | 18% |
|
Fixed Income Mutual Funds | 34% |
|
Total | 100% |
|
|
|
|
Investment |
|
|
Performance† | 6 Months | 12 Months |
(TOTAL RETURN AT NAV*) | Ended | Ended |
9/30/11 | 9/30/11 | |
Class A | -9.82% | -1.03% |
Class C | -10.14% | -1.79% |
Class I | -9.55% | -0.50% |
Russell 3000 Index | -15.30% | 0.55% |
Moderate Allocation |
|
|
Composite Index** | -8.66% | 0.10% |
Lipper Mixed-Asset |
|
|
Target Alloc. Growth |
|
|
Funds Avg. | -11.86% | -1.43% |
(see † footnote on page 10)
CALVERT AGGRESSIVE
ALLOCATION FUND
September 30, 2011
| % of Total |
|
Asset Allocation | Investments |
|
Domestic Equity Mutual Funds | 64% |
|
International and Global |
|
|
Equity Mutual Funds | 26% |
|
Fixed Income Mutual Funds | 10% |
|
Total | 100% |
|
|
|
|
Investment |
|
|
Performance † | 6 Months | 12 Months |
(TOTAL RETURN AT NAV*) | Ended | Ended |
| 9/30/11 | 9/30/11 |
Class A | -15.02% | -3.19% |
Class C | -15.58% | -4.45% |
Class I†† | -14.89% | -3.02% |
Russell 3000 Index | -15.30% | 0.55% |
Aggressive Allocation |
|
|
Composite Index*** | -13.78% | -1.40% |
Lipper Multi-Cap |
|
|
Core Funds Avg. | -17.04% | -2.36% |
(see † footnote on page 10)
| * | Investment performance/return at NAV does not reflect the deduction of the Fund’s maximum 4.75% front-end sales charge or any deferred sales charge. |
| ** | Calvert Moderate Allocation Composite Index: 30% Barclays Capital U.S. Credit Index, 47% Russell 3000 Index, 18% MSCI EAFE IMI Index, 5% 3-month Barclays Capital T-Bill Bellwether Index. |
| *** | Calvert Aggressive Allocation Composite Index: 10% Barclays Capital U.S. Credit Index, 64% Russell 3000 Index, 26% MSCI EAFE IMI Index. |
| †† | The Calvert Aggressive Allocation Fund first offered Class I shares beginning on January 31, 2008 and ending on February 24, 2011. Performance results for Class I prior to January 31, 2008 and subsequent to February 24, 2011, reflect the performance of Class A shares at net asset value (NAV). Actual Class I share performance would have been higher due to class specific expenses. |
www.calvert.com CALVERT ASSET ALLOCATION FUNDS ANNUAL REPORT 11
Investment Climate
The 12-month period that ended September 30, 2011 was marked by unexpected turns and financial market volatility. U.S. economic growth slowed to an estimated 1.5% annual rate during the reporting period,1 sparking fears of a double-dip recession, while inflation rose to a 2.0% annual rate by August 2011.2 The eurozone crisis continued to unfold, weighed down by struggling peripheral economies as the fear of contagion intensified. While we don’t see a high probability of a Greek default driving the U.S. into recession, the possibility still seemed to drive market sentiment. Policy tightening by central banks in emerging countries, where stronger growth has pushed inflation higher, also contributed to global growth concerns. U.S. legislators’ mid-year brinkmanship surrounding the raising of the U.S. government debt ceiling, followed by the Standard & Poor’s downgrade of U.S. government debt on August 5, dealt more blows to investor confidence and tipped the scales toward a global sell-off of riskier assets.
The Federal Reserve (Fed) was expected to move to the sidelines after completing QE2. However, in August it promised to keep interest rates low for the next two years. Also, in September the Fed introduced “operation twist,” a program to sell $400 billion of shorter-maturity Treasuries and buy longer-maturity Treasuries with the proceeds. The move could boost investment and refinancing in the U.S. by reducing long-term interest rates.
Overall, a strong performance by equity markets in the fourth quarter of 2010 and modest gains in the first half of 2011 were largely erased by stocks’ dismal performance in the third quarter of 2011. Despite healthy earnings from U.S. companies, macroeconomic troubles became the focus of attention and weighed on investor sentiment. U.S. investors moved toward more defensive sectors with Utilities and Consumer Staples sectors led in the Russell 1000 Index, while the more cyclical Financials and Materials sectors lagged.
In the meantime, major U.S. bond market sectors delivered positive returns for the period3 as government bonds outperformed both corporate bonds and high-yield bonds--the latter were hit particularly hard as investors sought more safety in recent months. Interest rates generally moved lower throughout the year, with the 10-year Treasury note yield declining to 1.92% by the end of September 2011.4
Investment Performance
Calvert Conservative Allocation Fund underperformed the Barclays Capital U.S. Credit Index due to the poor performance in general of stocks relative to bonds, since the Fund allocates approximately 30% of assets to stocks. It slightly underperformed a blended return from a mix of market indices (Composite Index) that more closely reflects how Calvert manages the Fund, which returned 2.19%.
The Fund benefited from modest but well-timed shifts in the stock and bond allocations as well as good relative performance of the U.S. equity holdings. However, the small holding in international stocks with Calvert International Equity Fund hurt relative performance.
www.calvert.com CALVERT ASSET ALLOCATION FUNDS ANNUAL REPORT 12
| CALVERT | Calvert Moderate Allocation Fund under- performed its benchmark, the Russell 3000 Index, despite its exposure to the better-performing bond market. It also underperformed the blended return from a mix of market indices (Composite Index) that more closely reflects how Calvert manages the Fund, which returned 0.10%. | ||
| CONSERVATIVE | |||
| ALLOCATION FUND | |||
| September 30, 2011 | |||
| Average Annual Total Returns† | |||
| Class A Shares | (with max. load) | ||
| One year | -3.00 | % | It benefited from modest but well-timed shifts in the stock and bond allocations as well as good relative performance of the U.S. equity holdings such as Calvert Capital Accumulation Fund. However, international stock exposure, largely through Calvert International Equity Fund, hurt relative performance. |
| Five year | 1.92 | % | |
| Since inception (4/29/2005) | 2.85 | % | |
| Class C Shares | (with max. load) | ||
| One year | -0.26 | % | |
| Five year | 1.54 | % | |
| Since inception (4/29/2005) | 2.31 | % | |
(see † footnote on page 10)
Calvert Aggressive Allocation Fund underperformed its benchmark, the Russell 3000 Index, despite its exposure to the better-performing bond market.
It also underperformed a blended return from a mix of market indices (Composite Index) that more closely reflects how Calvert manages the Fund, which returned -1.40%.
Again, it benefited from modest but well-timed shifts in the stock and bond allocations as well as good relative performance of U.S. equity holdings such as Calvert Capital Accumulation Fund. However, international stock exposure, largely through Calvert International Equity Fund, hurt relative performance.
Outlook
While we may see further volatility in the equity markets, those who step in to buy the dips in a time of uncertainty could have the potential for greater returns. Combined with generally positive U.S. economic data and attractive equity valuations--the 12-month forward price/earnings ratio for the S&P 500 Index was 10.61 after market close on September 30--as well as signs that China’s growth momentum has not stalled, we continue to believe the market can see a healthy recovery in the next few months. We remain cautiously optimistic on U.S. economic growth, albeit less so on European and global growth.
www.calvert.com CALVERT ASSET ALLOCATION FUNDS ANNUAL REPORT 13
Growth of $10,000
The graph below shows the value of a hypothetical $10,000 investment in the fund over the past 10 fiscal year periods or since inception (for funds without 10-year records). The results shown are for Classes A and C shares and reflect the deduction of the maximum front-end Class A sales charge of 4.75%, or deferred sales charge, as applicable and assume the reinvestment of dividends. The result is compared with benchmarks that include a broad based market index and a Lipper peer group average. Market indexes are unmanaged and their results do not reflect the effect of expenses or sales charges. The Lipper average reflects the deduction of the category’s average front-end sales charge. The value of an investment in a different share class would be different.
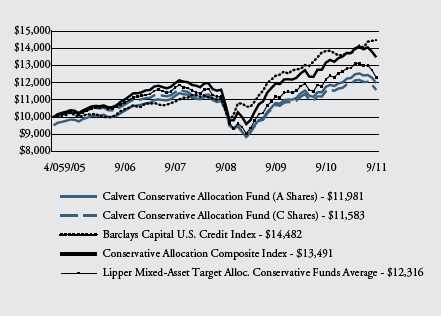
All performance data shown, including the graph above and the adjacent table, represents past performance, does not guarantee future results, assumes reinvestment of dividends and distributions and does not reflect the deduction of taxes that a shareholder would pay on the Fund’s distributions or the redemption of the Fund shares. The investment return and principal value of an investment will fluctuate so that an investor’s shares, when redeemed, may be worth more or less than their original cost. Current performance may be lower or higher than the performance data quoted; for current performance data visit www.calvert.com. The gross expense ratio from the current prospectus for Class A shares is 1.50%. This number may differ from the expense ratio shown elsewhere in this report because it is based on a different time period and, if applicable, does not include fee or expense waivers. Performance data quoted already reflects the deduction of the Fund’s operating expenses.
www.calvert.com CALVERT ASSET ALLOCATION FUNDS ANNUAL REPORT 14
| CALVERT MODERATE |
| ALLOCATION FUND |
| September 30, 2011 |
| Average Annual Total Returns† |
| Class A Shares | (with max. load) | |
| One year | -5.72 | % |
| Five year | -1.15 | % |
| Since inception (4/29/2005) | 1.06 | % |
| Class C Shares | (with max. load) | |
| One year | -2.71 | % |
| Five year | -0.93 | % |
| Since inception (4/29/2005) | 0.99 | % |
| Class I Shares* | ||
| One year | -0.50 | % |
| Five year | 0.21 | % |
| Since inception (4/29/2005) | 2.14 | % |
* The Calvert Moderate Allocation Fund first offered Class I shares beginning on January 31, 2008. Performance results for Class I prior to January 31, 2008 reflect the performance of Class A shares at net asset value (NAV). Actual Class I share performance would have been higher due to class specific expenses.
(see † footnote on page 10)
We also believe the U.S. earnings season that started in October is likely to provide positive earnings surprises and serve as a positive catalyst for the U.S. and possibly global equity markets, especially given current valuation levels, which may present some of the best buying opportunities in the equity markets.
October 2011
1 Calculated based on data from the Commerce Department and the Wall Street Journal Survey of Economic Forecasters.
2 Core consumer price index (CPI), Bureau of Labor Statistics
3 Barclays Capital
4 Source for all interest rates: Federal Reserve H.15 report
www.calvert.com CALVERT ASSET ALLOCATION FUNDS ANNUAL REPORT 15
Growth of $10,000
The graph below shows the value of a hypothetical $10,000 investment in the fund over the past 10 fiscal year periods or since inception (for funds without 10-year records). The results shown are for Classes A and C shares and reflect the deduction of the maximum front-end Class A sales charge of 4.75%, or deferred sales charge, as applicable and assume the reinvestment of dividends. The result is compared with benchmarks that include a broad based market index and a Lipper peer group average. Market indexes are unmanaged and their results do not reflect the effect of expenses or sales charges. The Lipper average reflects the deduction of the category’s average front-end sales charge. The value of an investment in a different share class would be different.
All performance data shown, including the graph above and the adjacent table, represents past performance, does not guarantee future results, assumes reinvestment of dividends and distributions and does not reflect the deduction of taxes that a shareholder would pay on the Fund’s distributions or the redemption of the Fund shares. The investment return and principal value of an investment will fluctuate so that an investor’s shares, when redeemed, may be worth more or less than their original cost. Current performance may be lower or higher than the performance data quoted; for current performance data visit www.calvert.com. The gross expense ratio from the current prospectus for Class A shares is 1.50%. This number may differ from the expense ratio shown elsewhere in this report because it is based on a different time period and, if applicable, does not include fee or expense waivers. Performance data quoted already reflects the deduction of the Fund’s operating expenses.
www.calvert.com CALVERT ASSET ALLOCATION FUNDS ANNUAL REPORT 16
| CALVERT AGGRESSIVE |
| ALLOCATION FUND |
| STATISTICS |
| September 30, 2011 |
| Average Annual Total ReturnS† |
| Class A Shares | (with max. load) | |
| One year | -7.82 | % |
| Five year | -3.26 | % |
| Since inception (6/30/2005) | -0.69 | % |
| Class C Shares | (with max. load) | |
| One year | -5.40 | % |
| Five year | -3.66 | % |
| Since inception (6/30/2005) | -1.21 | % |
| Class I Shares † † | ||
| One year | -3.02 | % |
| Five year | -2.18 | % |
| Since inception (6/30/2005) | -3.91 | % |
| (see † footnote on page 10) | ||
(† †see footnote on page 11 about Aggressive Allocation Fund Class I performance. )
www.calvert.com CALVERT ASSET ALLOCATION FUNDS ANNUAL REPORT 17
Growth of $10,000
The graph below shows the value of a hypothetical $10,000 investment in the fund over the past 10 fiscal year periods or since inception (for funds without 10-year records). The results shown are for Classes A and C shares and reflect the deduction of the maximum front-end Class A sales charge of 4.75%, or deferred sales charge, as applicable and assume the reinvestment of dividends. The result is compared with benchmarks that include a broad based market index and a Lipper peer group average. Market indexes are unmanaged and their results do not reflect the effect of expenses or sales charges. The Lipper average reflects the deduction of the category’s average front-end sales charge. The value of an investment in a different share class would be different.
All performance data shown, including the graph above and the adjacent table, represents past performance, does not guarantee future results, assumes reinvestment of dividends and distributions and does not reflect the deduction of taxes that a shareholder would pay on the Fund’s/Portfolio’s distributions or the redemption of the Fund/Portfolio shares. The investment return and principal value of an investment will fluctuate so that an investor’s shares, when redeemed, may be worth more or less than their original cost. Current performance may be lower or higher than the performance data quoted; for current performance data visit www.calvert.com. The gross expense ratio from the current prospectus for Class A shares is 1.76%. This number may differ from the expense ratio shown elsewhere in this report because it is based on a different time period and, if applicable, does not include fee or expense waivers. Performance data quoted already reflects the deduction of the Fund’s/ Portfolio’s operating expenses.
www.calvert.com CALVERT ASSET ALLOCATION FUNDS ANNUAL REPORT 18
SHAREHOLDER EXPENSE EXAMPLE
As a shareholder of the Fund, you incur two types of costs: (1) transaction costs, including sales charges and redemption fees; and (2) ongoing costs, including management fees; distribution (12b-1) fees; and other Fund expenses. This Example is intended to help you understand your ongoing costs (in dollars) of investing in the Fund and to compare these costs with the ongoing costs of investing in other mutual funds.
This Example is based on an investment of $1,000 invested at the beginning of the period and held for the entire period (April 1, 2011 to September 30, 2011).
Actual Expenses
The first line of the table below provides information about actual account values and actual expenses. You may use the information in this line, together with the amount you invested, to estimate the expenses that you paid over the period. Simply divide your account value by $1,000 (for example, an $8,600 account value divided by $1,000 = 8.6), then multiply the result by the number in the first line under the heading entitled “Expenses Paid During Period” to estimate the expenses you paid on your account during this period. In addition, each Fund, as a shareholder in underlying Calvert funds, will indirectly bear its pro rata share of the fees and expenses incurred by the underlying Calvert funds. These fees and expenses are not included in each Fund’s annualized expense ratio used to calculate the expense estimates in the table below. If they were, the estimate of expense you paid during the period would be higher, and your ending account value lower.
Hypothetical Example for Comparison Purposes
The second line of the table below provides information about hypothetical account values and hypothetical expenses based on the Fund’s actual expense ratio and an assumed rate of return of 5% per year before expenses, which is not the Fund’s actual return. The hypothetical account values and expenses may not be used to estimate the actual ending account balance or expenses you paid for the period. You may use this information to compare the ongoing costs of investing in the Fund and other funds. To do so, compare the 5% hypothetical example with the 5% hypothetical examples that appear in the shareholder reports of the other funds. In addition, each Fund, as a shareholder in underlying Calvert funds, will indirectly bear its pro rata share of the fees and expenses incurred by the underlying Calvert funds. These fees and expenses are not included in each Fund’s annualized expense ratio used to calculate the expense estimates in the table below. If they were, the estimate of expense you paid during the period would be higher, and your ending account value lower.
Please note that the expenses shown in the table are meant to highlight your ongoing costs only and do not reflect any transactional costs, such as sales charges (loads), or redemption fees. Therefore, the second line of the table is useful in comparing ongoing costs only, and will not help you determine the relative total costs of owning different funds. In addition, if these transactional costs were included, your costs would have been higher.
www.calvert.com CALVERT ASSET ALLOCATION FUNDS ANNUAL REPORT 19
| BEGINNING | ENDING | EXPENSES PAID | |
| ACCOUNT VALUE | ACCOUNT VALUE | DURING PERIOD* | |
| CONSERVATIVE | 4/1/11 | 9/30/11 | 4/1/11 - 9/30/11 |
| Class A | |||
| Actual | $1,000.00 | $975.30 | $2.18 |
| Hypothetical | $1,000.00 | $1,022.86 | $2.23 |
| (5% return per | |||
| year before expenses) | |||
| Class C | |||
| Actual | $1,000.00 | $970.10 | $7.76 |
| Hypothetical | $1,000.00 | $1,017.19 | $7.94 |
| (5% return per | |||
| year before expenses) | |||
*Expenses for Conservative are equal to the annualized expense ratios of 0.44% and 1.57% for Class A and Class C respectively, multiplied by the average account value over the period, multiplied by 183/365 (to reflect the one-half year period). The fees and expenses of the underlying Calvert funds in which the Fund invests are not included in the annualized expense ratios.
| BEGINNING | ENDING | EXPENSES PAID | |
| ACCOUNT VALUE | ACCOUNT VALUE | DURING PERIOD* | |
| MODERATE | 4/1/11 | 9/30/11 | 4/1/11 - 9/30/11 |
| Class A | |||
| Actual | $1,000.00 | $901.80 | $3.48 |
| Hypothetical | $1,000.00 | $1,021.41 | $3.70 |
| (5% return per | |||
| year before expenses) | |||
| Class C | |||
| Actual | $1,000.00 | $898.60 | $7.00 |
| Hypothetical | $1,000.00 | $1,017.70 | $7.43 |
| (5% return per | |||
| year before expenses) | |||
www.calvert.com CALVERT ASSET ALLOCATION FUNDS ANNUAL REPORT 20
| BEGINNING | ENDING | EXPENSES PAID | |
| ACCOUNT VALUE | ACCOUNT VALUE | DURING PERIOD* | |
| MODERATE | 4/1/11 | 9/30/11 | 4/1/11 - 9/30/11 |
| Class I | |||
| Actual | $1,000.00 | $904.50 | $1.10 |
| Hypothetical | $1,000.00 | $1,023.92 | $1.17 |
| (5% return per | |||
| year before expenses) | |||
*Expenses for Moderate are equal to the annualized expense ratios of 0.73%, 1.47% and 0.23% for Class A, Class C and Class I respectively, multiplied by the average account value over the period, multiplied by 183/365 (to reflect the one-half year period). The fees and expenses of the underlying Calvert funds in which the Fund invests are not included in the annualized expense ratios.
| BEGINNING | ENDING | EXPENSES PAID | |
| ACCOUNT VALUE | ACCOUNT VALUE | DURING PERIOD* | |
| AGGRESSIVE | 4/1/11 | 9/30/11 | 4/1/11 - 9/30/11 |
| Class A | |||
| Actual | $1,000.00 | $849.80 | $1.99 |
| Hypothetical | $1,000.00 | $1,022.91 | $2.18 |
| (5% return per | |||
| year before expenses) | |||
| Class C | |||
| Actual | $1,000.00 | $844.20 | $7.83 |
| Hypothetical | $1,000.00 | $1,016.57 | $8.57 |
| (5% return per | |||
| year before expenses) | |||
*Expenses for Aggressive are equal to the annualized expense ratios of 0.43% and 1.69% for Class A and Class C respectively, multiplied by the average account value over the period, multiplied by 183/365 (to reflect the one-half year period). The fees and expenses of the underlying Calvert funds in which the Fund invests are not included in the annualized expense ratios.
www.calvert.com CALVERT ASSET ALLOCATION FUNDS ANNUAL REPORT 21
REPORT OF INDEPENDENT REGISTERED PUBLIC ACCOUNTING FIRM
The Board of Trustees of Calvert Social Investment Fund and Shareholders of the Calvert Allocation Funds: We have audited the accompanying statements of net assets of the Calvert Conservative Allocation Fund, Calvert Moderate Allocation Fund, and Calvert Aggressive Allocation Fund (collectively the Funds), each a series of the Calvert Social Investment Fund, as of September 30, 2011, and the related statements of operations for the year then ended, the statements of changes in net assets for each of the years in the two-year period then ended, and the financial highlights for each of the years or periods in the five-year period then ended. These financial statements and financial highlights are the responsibility of the Funds’ management. Our responsibility is to express an opinion on these financial statements and financial highlights based on our audits.
We conducted our audits in accordance with the standards of the Public Company Accounting Oversight Board (United States). Those standards require that we plan and perform the audit to obtain reasonable assurance about whether the financial statements and financial highlights are free of material misstatement. An audit includes examining, on a test basis, evidence supporting the amounts and disclosures in the financial statements. Our procedures included confirmation of securities owned as of September 30, 2011, by correspondence with the custodian and brokers or other appropriate auditing procedures. An audit also includes assessing the accounting principles used and significant estimates made by management, as well as evaluating the overall financial statement presentation. We believe that our audits provide a reasonable basis for our opinion.
In our opinion, the financial statements and financial highlights referred to above present fairly, in all material respects, the financial position of the Calvert Conservative Allocation Fund, Calvert Moderate Allocation Fund, and Calvert Aggressive Allocation Fund as of September 30, 2011, the results of their operations for the year then ended, the changes in their net assets for each of the years in the two-year period then ended, and the financial highlights for each of the years or periods in the five-year period then ended, in conformity with U.S. generally accepted accounting principles.

www.calvert.com CALVERT ASSET ALLOCATION FUNDS ANNUAL REPORT 22
| CONSERVATIVE ALLOCATION FUND | ||||
| STATEMENT OF NET ASSETS | ||||
| SEPTEMBER 30, 2011 | ||||
| MUTUAL FUNDS - 100.2% | SHARES | VALUE | ||
| Calvert Impact Fund, Inc.: | ||||
| Calvert Small Cap Fund, Class I | 31,913 | $ | 504,230 | |
| Calvert Social Index Series, Inc.: | ||||
| Calvert Social Index Fund, Class I | 191,211 | 2,011,535 | ||
| Calvert Social Investment Fund: | ||||
| Bond Portfolio, Class I (a) | 2,133,877 | 33,821,951 | ||
| Enhanced Equity Portfolio, Class I | 260,308 | 4,019,150 | ||
| Equity Portfolio, Class I* | 85,574 | 3,014,784 | ||
| Calvert World Values Fund, Inc.: | ||||
| Calvert Capital Accumulation Fund, Class I* | 53,960 | 1,507,632 | ||
| International Equity Fund, Class I | 316,405 | 4,018,349 | ||
| Total Mutual Funds (Cost $47,186,834) | 48,897,631 | |||
| TOTAL INVESTMENTS (Cost $47,186,834) - 100.2% | 48,897,631 | |||
| Other assets and liabilities, net - (0.2%) | (76,390 | ) | ||
| NET ASSETS - 100% | $ | 48,821,241 | ||
| NET ASSETS CONSIST OF: | ||||
| Paid-in capital applicable to the following shares of beneficial interest, | ||||
| unlimited number of no par value shares authorized: | ||||
| Class A: 2,553,285 shares outstanding | $ | 38,385,073 | ||
| Class C: 704,262 shares outstanding | 10,516,911 | |||
| Accumulated net realized gain (loss) on investments | (1,791,540 | ) | ||
| Net unrealized appreciation (depreciation) on investments | 1,710,797 | |||
| NET ASSETS | $ | 48,821,241 | ||
| NET ASSET VALUE PER SHARE | ||||
| Class A (based on net assets of $38,328,914) | $ | 15.01 | ||
| Class C (based on net assets of $10,492,327) | $ | 14.90 | ||
| (a) | The Fund’s investment in the Calvert Social Investment Fund Bond Portfolio, Class I represents 69% of the Fund’s total investments. The Calvert Conservative Allocation Fund seeks current income and capital appreciation, consistent with the preservation of capital. For further financial information, available upon request at no charge, on the Calvert Social Investment Fund Bond Portfolio please go to the U.S. Securities and Exchange Commission’s website at http://www.sec.gov or call 1-800-368-2745. |
| * | Non-income producing security. |
See notes to financial statements.
www.calvert.com CALVERT ASSET ALLOCATION FUNDS ANNUAL REPORT 23
| MODERATE ALLOCATION FUND | ||||
| STATEMENT OF NET ASSETS | ||||
| SEPTEMBER 30, 2011 | ||||
| MUTUAL FUNDS - 100.1% | SHARES | VALUE | ||
| Calvert Impact Fund, Inc.: | ||||
| Calvert Global Alternative Energy Fund, Class I* | 427,222 | $ | 2,388,173 | |
| Calvert Small Cap Fund, Class I | 453,378 | 7,163,380 | ||
| Calvert Social Index Series, Inc.: | ||||
| Calvert Social Index Fund, Class I | 453,988 | 4,775,957 | ||
| Calvert Social Investment Fund: | ||||
| Bond Portfolio, Class I | 2,538,762 | 40,239,377 | ||
| Enhanced Equity Portfolio, Class I | 1,082,536 | 16,714,357 | ||
| Equity Portfolio, Class I* | 643,876 | 22,683,739 | ||
| Calvert World Values Fund, Inc.: | ||||
| Calvert Capital Accumulation Fund, Class I* | 170,935 | 4,775,935 | ||
| Calvert International Opportunities Fund, Class I | 230,519 | 2,388,172 | ||
| International Equity Fund, Class I | 1,316,132 | 16,714,874 | ||
| Total Mutual Funds (Cost $123,617,197) | 117,843,964 | |||
| TOTAL INVESTMENTS (Cost $123,617,197) - 100.1% | 117,843,964 | |||
| Other assets and liabilities, net - (0.1%) | (77,775 | ) | ||
| NET ASSETS - 100% | $ | 117,766,189 | ||
| NET ASSETS CONSIST OF: | ||||
| Paid-in capital applicable to the following shares of beneficial interest, unlimited number of no par value shares authorized: | ||||
| Class A: 6,609,138 shares outstanding | $ | 106,715,957 | ||
| Class C: 1,461,475 shares outstanding | 23,199,368 | |||
| Class I: 68,209 shares outstanding | 988,475 | |||
| Accumulated net realized gain (loss) on investments | (7,364,378 | ) | ||
| Net unrealized appreciation (depreciation) on investments | (5,773,233 | ) | ||
| NET ASSETS | $ | 117,766,189 | ||
| NET ASSET VALUE PER SHARE | ||||
| Class A (based on net assets of $95,929,873) | $ | 14.51 | ||
| Class C (based on net assets of $20,841,715) | $ | 14.26 | ||
| Class I (based on net assets of $994,601) | $ | 14.58 | ||
* Non-income producing security.
See notes to financial statements.
www.calvert.com CALVERT ASSET ALLOCATION FUNDS ANNUAL REPORT 24
| AGGRESSIVE ALLOCATION FUND | ||||
| STATEMENT OF NET ASSETS | ||||
| SEPTEMBER 30, 2011 | ||||
| MUTUAL FUNDS - 100.1% | SHARES | VALUE | ||
| Calvert Impact Fund, Inc.: | ||||
| Calvert Global Alternative Energy Fund, Class I* | 315,382 | $ | 1,762,984 | |
| Calvert Small Cap Fund, Class I | 446,410 | 7,053,279 | ||
| Calvert Social Index Series, Inc.: | ||||
| Calvert Social Index Fund, Class I | 223,455 | 2,350,746 | ||
| Calvert Social Investment Fund: | ||||
| Bond Portfolio, Class I | 344,947 | 5,467,410 | ||
| Enhanced Equity Portfolio, Class I | 666,224 | 10,286,497 | ||
| Equity Portfolio, Class I* | 417,133 | 14,695,591 | ||
| Calvert World Values Fund, Inc.: | ||||
| Calvert Capital Accumulation Fund, Class I* | 115,705 | 3,232,802 | ||
| Calvert International Opportunities Fund, Class I | 170,236 | 1,763,641 | ||
| International Equity Fund, Class I | 925,648 | 11,755,726 | ||
| Total Mutual Funds (Cost $65,880,711) | 58,368,676 | |||
| TOTAL INVESTMENTS (Cost $65,880,711) - 100.1% | 58,368,676 | |||
| Other assets and liabilities, net - (0.1%) | (36,589 | ) | ||
| NET ASSETS - 100% | $ | 58,332,087 | ||
| NET ASSETS CONSIST OF: | ||||
| Paid-in capital applicable to the following shares of beneficial interest, unlimited number of no par value shares authorized: | ||||
| Class A: 3,794,735 shares outstanding | $ | 61,787,342 | ||
| Class C: 574,905 shares outstanding | 8,781,587 | |||
| Accumulated net realized gain (loss) on investments | (4,724,807 | ) | ||
| Net unrealized appreciation (depreciation) on investments | (7,512,035 | ) | ||
| NET ASSETS | $ | 58,332,087 | ||
| NET ASSET VALUE PER SHARE | ||||
| Class A (based on net assets of $51,102,901) | $ | 13.47 | ||
| Class C (based on net assets of $7,229,186) | $ | 12.57 | ||
*Non-income producing security.
See notes to financial statements.
www.calvert.com CALVERT ASSET ALLOCATION FUNDS ANNUAL REPORT 25
| STATEMENTS OF OPERATIONS | |||||||||
| YEAR ENDED SEPTEMBER 30, 2011 | |||||||||
| CONSERVATIVE | MODERATE | AGGRESSIVE | |||||||
| ALLOCATION | ALLOCATION | ALLOCATION | |||||||
| NET INVESTMENT INCOME | FUND | FUND | FUND | ||||||
| Investment Income: | |||||||||
| Dividend income | $ | 1,443,042 | $ | 2,178,601 | $ | 504,782 | |||
| Total investment income | 1,443,042 | 2,178,601 | 504,782 | ||||||
| Expenses: | |||||||||
| Transfer agency fees and expenses | 95,873 | 254,799 | 178,301 | ||||||
| Administrative fees | 70,158 | 191,028 | 99,719 | ||||||
| Distribution Plan expenses: | |||||||||
| Class A | 91,999 | 256,935 | 144,720 | ||||||
| Class C | 99,720 | 227,234 | 85,910 | ||||||
| Trustees' fees and expenses | 4,785 | 12,694 | 6,613 | ||||||
| Registration fees | 25,963 | 36,975 | 28,292 | ||||||
| Reports to shareholders | 16,039 | 49,665 | 33,717 | ||||||
| Professional fees | 22,543 | 25,904 | 22,376 | ||||||
| Accounting fees | 32,800 | 37,539 | 37,399 | ||||||
| Miscellaneous | 7,453 | 12,207 | 10,367 | ||||||
| Total expenses | 467,333 | 1,104,980 | 647,414 | ||||||
| Reimbursement from Advisor: | |||||||||
| Class A | (146,744 | ) | — | (247,550 | ) | ||||
| Class I | — | (11,585 | ) | (4,533 | ) | ||||
| Net expenses | 320,589 | 1,093,395 | 395,331 | ||||||
| NET INVESTMENT INCOME | 1,122,453 | 1,085,206 | 109,451 | ||||||
| REALIZED AND UNREALIZED | |||||||||
| GAIN (LOSS) ON INVESTMENTS | |||||||||
| Net realized gain (loss) | (5,587 | ) | (1,715,077 | ) | (1,335,519 | ) | |||
| Change in unrealized appreciation (depreciation) | (535,664 | ) | (962,417 | ) | (771,227 | ) | |||
| NET REALIZED AND UNREALIZED | |||||||||
| GAIN (LOSS) ON INVESTMENTS | (541,251 | ) | (2,677,494 | ) | (2,106,746 | ) | |||
| INCREASE (DECREASE) IN NET ASSETS | |||||||||
| RESULTING FROM OPERATIONS | $ | 581,202 | ($ | 1,592,288 | ) | ($ | 1,997,295 | ) | |
See notes to financial statements.
www.calvert.com CALVERT ASSET ALLOCATION FUNDS ANNUAL REPORT 26
| CONSERVATIVE ALLOCATION FUND STATEMENTS OF CHANGES IN NET ASSETS | ||||||
| Year ended | Year ended | |||||
| September 30, | September 30, | |||||
| INCREASE (DECREASE) IN NET ASSETS | 2011 | 2010 | ||||
| Operations: | ||||||
| Net investment income | $ | 1,122,453 | $ | 741,120 | ||
| Net realized gain (loss) | (5,587 | ) | (385,951 | ) | ||
| Change in unrealized appreciation (depreciation) | (535,664 | ) | 2,504,779 | |||
| INCREASE (DECREASE) IN NET ASSETS | ||||||
| RESULTING FROM OPERATIONS | 581,202 | 2,859,948 | ||||
| Distributions to shareholders from: | ||||||
| Net investment income: | ||||||
| Class A shares | (1,054,986 | ) | (656,513 | ) | ||
| Class C shares | (190,929 | ) | (78,949 | ) | ||
| Total distributions | (1,245,915 | ) | (735,462 | ) | ||
| Capital share transactions: | ||||||
| Shares sold: | ||||||
| Class A shares | 14,958,241 | 11,882,987 | ||||
| Class C shares | 3,623,591 | 3,632,683 | ||||
| Reinvestment of distributions: | ||||||
| Class A shares | 995,395 | 621,525 | ||||
| Class C shares | 151,048 | 63,679 | ||||
| Redemption fees: | ||||||
| Class A shares | 103 | 828 | ||||
| Class C shares | 5 | 12 | ||||
| Shares redeemed: | ||||||
| Class A shares | (9,697,385 | ) | (4,932,114 | ) | ||
| Class C shares | (1,502,063 | ) | (1,483,747 | ) | ||
| Total capital share transactions | 8,528,935 | 9,785,853 | ||||
| TOTAL INCREASE (DECREASE) IN NET ASSETS | 7,864,222 | 11,910,339 | ||||
| NET ASSETS | ||||||
| Beginning of year | 40,957,019 | 29,046,680 | ||||
| End of year (including undistributed net investment income of | ||||||
| $0 and $10,496, respectively) | $ | 48,821,241 | $ | 40,957,019 | ||
| CAPITAL SHARE ACTIVITY | ||||||
| Shares sold: | ||||||
| Class A shares | 970,978 | 809,864 | ||||
| Class C shares | 236,173 | 249,259 | ||||
| Reinvestment of distributions: | ||||||
| Class A shares | 64,984 | 42,444 | ||||
| Class C shares | 9,895 | 4,396 | ||||
| Shares redeemed: | ||||||
| Class A shares | (628,955 | ) | (336,498 | ) | ||
| Class C shares | (97,739 | ) | (101,602 | ) | ||
| Total capital share activity | 555,336 | 667,863 | ||||
See notes to financial statements.
www.calvert.com CALVERT ASSET ALLOCATION FUNDS ANNUAL REPORT 27
| MODERATE ALLOCATION FUND STATEMENTS OF CHANGES IN NET ASSETS | ||||||
| Year ended | Year ended | |||||
| September 30, | September 30, | |||||
| INCREASE (DECREASE) IN NET ASSETS | 2011 | 2010 | ||||
| Operations: | ||||||
| Net investment income | $ | 1,085,206 | $ | 996,208 | ||
| Net realized gain (loss) | (1,715,077 | ) | (1,170,179 | ) | ||
| Change in unrealized appreciation (depreciation) | (962,417 | ) | 7,924,482 | |||
| INCREASE (DECREASE) IN NET ASSETS | ||||||
| RESULTING FROM OPERATIONS | (1,592,288 | ) | 7,750,511 | |||
| Distributions to shareholders from: | ||||||
| Net investment income: | ||||||
| Class A shares | (1,251,345 | ) | (848,373 | ) | ||
| Class C shares | (276,709 | ) | (123,248 | ) | ||
| Class I shares | (12,914 | ) | (19,899 | ) | ||
| Return of capital: | ||||||
| Class A shares | (124,053 | ) | — | |||
| Class C shares | (27,432 | ) | — | |||
| Class I shares | (1,280 | ) | — | |||
| Total distributions | (1,693,733 | ) | (991,520 | ) | ||
| Capital share transactions: | ||||||
| Shares sold: | ||||||
| Class A shares | 22,021,107 | 21,283,912 | ||||
| Class C shares | 4,752,287 | 5,340,143 | ||||
| Class I shares | 142,205 | 824,403 | ||||
| Reinvestment of distributions: | ||||||
| Class A shares | 1,379,190 | 802,909 | ||||
| Class C shares | 170,885 | 103,495 | ||||
| Class I shares | 36,393 | 19,899 | ||||
| Redemption fees: | ||||||
| Class A shares | 406 | 545 | ||||
| Class C shares | 102 | 1,285 | ||||
| Shares redeemed: | ||||||
| Class A shares | (17,660,817 | ) | (12,481,452 | ) | ||
| Class C shares | (4,404,778 | ) | (3,304,227 | ) | ||
| Class I shares | (972,417 | ) | (76,535 | ) | ||
| Total capital share transactions | 5,464,563 | 12,514,377 | ||||
| TOTAL INCREASE (DECREASE) IN NET ASSETS | 2,178,542 | 19,273,368 | ||||
| NET ASSETS | ||||||
| Beginning of year | 115,587,647 | 96,314,279 | ||||
| End of year (including undistributed net investment income of | ||||||
| $0 and $14,110, respectively) | $ | 117,766,189 | $ | 115,587,647 | ||
See notes to financial statements.
www.calvert.com CALVERT ASSET ALLOCATION FUNDS ANNUAL REPORT 28
| MODERATE ALLOCATION FUND STATEMENTS OF CHANGES IN NET ASSETS | ||||
| Year ended | Year ended | |||
| September 30, | September 30, | |||
| CAPITAL SHARE ACTIVITY | 2011 | 2010 | ||
| Shares sold: | ||||
| Class A shares | 1,400,913 | 1,483,778 | ||
| Class C shares | 308,140 | 377,822 | ||
| Class I shares | 9,315 | 57,656 | ||
| Reinvestment of distributions: | ||||
| Class A shares | 87,097 | 56,169 | ||
| Class C shares | 10,985 | 7,350 | ||
| Class I shares | 2,290 | 1,379 | ||
| Shares redeemed: | ||||
| Class A shares | (1,126,122 | ) | (872,779 | ) |
| Class C shares | (283,594 | ) | (234,491 | ) |
| Class I shares | (63,430 | ) | (5,300 | ) |
| Total capital share activity | 345,594 | 871,584 | ||
See notes to financial statements.
www.calvert.com CALVERT ASSET ALLOCATION FUNDS ANNUAL REPORT 29
| AGGRESSIVE ALLOCATION FUND STATEMENTS OF CHANGES IN NET ASSETS | ||||||
| Year ended | Year ended | |||||
| September 30, | September 30, | |||||
| INCREASE (DECREASE) IN NET ASSETS | 2011 | 2010 | ||||
| Operations: | ||||||
| Net investment income | $ | 109,451 | $ | 272,242 | ||
| Net realized gain (loss) | (1,335,519 | ) | (1,323,550 | ) | ||
| Change in unrealized appreciation (depreciation) | (771,227 | ) | 5,062,653 | |||
| INCREASE (DECREASE) IN NET ASSETS | ||||||
| RESULTING FROM OPERATIONS | (1,997,295 | ) | 4,011,345 | |||
| Distributions to shareholders from: | ||||||
| Net investment income: | ||||||
| Class A shares | (107,567 | ) | (278,521 | ) | ||
| Class C shares | (16,457 | ) | (46,455 | ) | ||
| Class I shares | (2 | ) | (5 | ) | ||
| Total distributions | (124,026 | ) | (324,981 | ) | ||
| Capital share transactions: | ||||||
| Shares sold: | ||||||
| Class A shares | 10,037,159 | 10,383,948 | ||||
| Class C shares | 1,380,077 | 2,141,584 | ||||
| Reinvestment of distributions: | ||||||
| Class A shares | 101,258 | 264,841 | ||||
| Class C shares | 14,993 | 41,061 | ||||
| Class I shares | 2 | 5 | ||||
| Redemption fees: | ||||||
| Class A shares | 126 | 133 | ||||
| Class C shares | 210 | 525 | ||||
| Shares redeemed: | ||||||
| Class A shares | (9,362,001 | ) | (7,088,093 | ) | ||
| Class C shares | (2,024,424 | ) | (1,876,181 | ) | ||
| Class I shares | (990 | ) | — | |||
| Total capital share transactions | 146,410 | 3,867,823 | ||||
| TOTAL INCREASE (DECREASE) IN NET ASSETS | (1,974,911 | ) | 7,554,187 | |||
| NET ASSETS | ||||||
| Beginning of year | 60,306,998 | 52,752,811 | ||||
| End of year | $ | 58,332,087 | $ | 60,306,998 | ||
See notes to financial statements.
www.calvert.com CALVERT ASSET ALLOCATION FUNDS ANNUAL REPORT 30
| AGGRESSIVE ALLOCATION FUND STATEMENTS OF CHANGES IN NET ASSETS | ||||
| Year ended | Year ended | |||
| September 30, | September 30, | |||
| CAPITAL SHARE ACTIVITY | 2011 | 2010 | ||
| Shares sold: | ||||
| Class A shares | 661,914 | 773,899 | ||
| Class C shares | 96,274 | 167,164 | ||
| Reinvestment of distributions: | ||||
| Class A shares | 6,728 | 19,691 | ||
| Class C shares | 1,057 | 3,195 | ||
| Shares redeemed: | ||||
| Class A shares | (612,445 | ) | (531,155 | ) |
| Class C shares | (142,396 | ) | (146,477 | ) |
| Class I shares | (64 | ) | — | |
| Total capital share activity | 11,068 | 286,317 | ||
See notes to financial statements.
www.calvert.com CALVERT ASSET ALLOCATION FUNDS ANNUAL REPORT 31
NOTES TO FINANCIAL STATEMENTS
NOTE A — SIGNIFICANT ACCOUNTING POLICIES
General: The Calvert Conservative Allocation Fund, Calvert Moderate Allocation Fund, and Calvert Aggressive Allocation Fund (the “Funds”), each a series of the Calvert Social Investment Fund, are registered under the Investment Company Act of 1940 as non-diversified, open-end management investment companies. The operations of each series are accounted for separately. The Funds invest primarily in a combination of other Calvert equity and fixed income funds (the “Underlying Funds”). Each Fund offers Class A and Class C shares. Effective January 31, 2008, Moderate and Aggressive began to offer Class I shares. The last remaining shareholder in Aggressive Class I shares redeemed on February 24, 2011. Shares are still available for public sale and operations will resume upon shareholder investment. Class A shares are sold with a maximum front-end sales charge of 4.75%. Class C shares are sold without a front-end sales charge. With certain exceptions, the Funds will impose a deferred sales charge on shares sold within one year of purchase. Class C shares have higher levels of expenses than Class A shares. Class I shares require a minimum account balance of $1,000,000. The $1 million minimum initial investment may be waived for certain institutional accounts, where it is believed to be in the best interest of the Funds and its shareholders. Class I shares have no front-end or deferred sales charge and have lower levels of expenses than Class A shares. Each class has different: (a) dividend rates, due to differences in Distribution Plan expenses and other class-specific expenses, (b) exchange privileges and (c) class-specific voting rights.
Security Valuation: Net asset value per share is determined every business day as of the close of the regular session of the New York Stock Exchange (generally 4:00 p.m. Eastern time). The Funds use independent pricing services approved by the Board of Trustees to value its investments wherever possible. Investments for which market quotations are not available or deemed not reliable are fair valued in good faith under the direction of the Board of Trustees. In determining fair value, the Board considers all relevant qualitative and quantitative information available. These factors are subject to change over time and are reviewed periodically. The values assigned to fair value investments are based on available information and do not necessarily represent amounts that might ultimately be realized. Further, because of the inherent uncertainty of valuation, those estimated values may differ significantly from the values that would have been used had a ready market for the investments existed, and the differences could be material.
At September 30, 2011, no securities were fair valued in good faith under the direction of the Board of Trustees.
The Funds utilize various methods to measure the fair value of its investments. Generally Accepted Accounting Principles (GAAP) establishes a disclosure hierarchy that categorizes the inputs to valuation techniques used to value assets and liabilities at measurement date. These inputs are summarized in the three broad levels listed below:
Level 1 – quoted prices in active markets for identical securities
Level 2 – other significant observable inputs (including quoted prices for similar securi-
www.calvert.com CALVERT ASSET ALLOCATION FUNDS ANNUAL REPORT 32
ties, interest rates, prepayment speeds, credit risk, etc.)
Level 3 – significant unobservable inputs (including the Fund’s own assumptions in determining the fair value of investments)
The inputs or methodology used for valuing securities are not necessarily an indication of the risk associated with investing in those securities.
Changes in valuation techniques may result in transfers in or out of an investment’s assigned level within the hierarchy during the period. Valuation techniques used to value the Fund's investments by major category are as follows.
Investments in the Underlying Funds are valued at their closing net asset value each business day and are categorized as Level 1 in the hierarchy.
The following is a summary of the inputs used to value the Funds’ net assets as of September 30, 2011:
| CONSERVATIVE | Valuation Inputs | |||
| Investments in Securities | level 1 | level 2 | level 3 | total |
| Mutual Funds | $48,897,631 | - | - | $48,897,631 |
| TOTAL | $48,897,631 | - | - | $48,897,631 |
| MODERATE | Valuation Inputs | |||
| Investments in Securities | level 1 | level 2 | level 3 | total |
| Mutual Funds | $117,843,964 | - | - | $117,843,964 |
| TOTAL | $117,843,964 | - | - | $117,843,964 |
| AGGRESSIVE | Valuation Inputs | |||
| Investments in Securities | level 1 | level 2 | level 3 | total |
| Mutual Funds | $58,368,676 | - | - | $58,368,676 |
| TOTAL | $58,368,676 | - | - | $58,368,676 |
Security Transactions and Net Investment Income: Security transactions, normally shares of the Underlying Funds, are accounted for on trade date. Realized gains and losses are recorded on an identified cost basis. Income and capital gain distributions from the Underlying Funds, if any, are recorded on the ex-dividend date. Interest income, which includes amortization of premium and accretion of discount on debt securities, is accrued as earned. Investment income and realized and unrealized gains and losses are allocated to separate classes of shares based upon the relative net assets of each class. Expenses arising in connection with a class are charged directly to that class. Expenses common to the classes are allocated to each class in proportion to their relative net assets. Expenses included in the accompanying financial statements reflect the expenses of each Fund and do not include any expenses associated with the Underlying Funds.
Distributions to Shareholders: Distributions to shareholders are recorded by the Funds on ex-dividend date. Dividends from net investment income are paid quarterly. Distributions from net realized capital gains, if any, are paid at least annually. Distributions are determined in accordance with income tax regulations which may differ
www.calvert.com CALVERT ASSET ALLOCATION FUNDS ANNUAL REPORT 33
from generally accepted accounting principles; accordingly, periodic reclassifications are made within the Funds’ capital accounts to reflect income and gains available for distribution under income tax regulations.
Estimates: The preparation of the financial statements in conformity with accounting principles generally accepted in the United States requires management to make estimates and assumptions that affect the reported amounts of assets and liabilities and disclosure of contingent assets and liabilities at the date of the financial statements and the reported amounts of income and expenses during the reported period. Actual results could differ from those estimates.
Redemption Fees: The Funds charge a 2% redemption fee on redemptions, including exchanges, made within 30 days of purchase in the same Fund (within seven days for Class I shares). The redemption fee is accounted for as an addition to paid-in capital. The fee is intended to discourage market-timers by ensuring that short-term trading costs are borne by the investors making the transactions and not the shareholders already in the Fund.
Expense Offset Arrangements: The Funds have an arrangement with their custodian bank whereby the custodian’s fees may be paid indirectly by credits earned on each Fund’s cash on deposit with the bank. These credits are used to reduce the Fund’s expenses. Such a deposit arrangement may be an alternative to overnight investments.
Federal Income Taxes: No provision for federal income or excise tax is required since the Fund intends to continue to qualify as a regulated investment company under the Internal Revenue Code and to distribute substantially all of its taxable earnings.
Management has analyzed the Fund’s tax positions taken for all open federal income tax years and has concluded that no provision for federal income tax is required in the Fund’s financial statements. A Fund’s federal tax return is subject to examination by the Internal Revenue Service for a period of three years.
New Accounting Pronouncements: In May 2011, the Financial Accounting Standards Board (“FASB”) issued Accounting Standards Update (“ASU”) No. 2011-04, “Amendments to Achieve Common Fair Value Measurement and Disclosure Requirements in U.S. GAAP and IFRSs.” ASU No. 2011-04 requires disclosure of the amounts of any transfers between Level 1 and Level 2, and the reasons for the transfers. For Level 3 fair value measurements, ASU No. 2011-04 requires disclosure of quantitative information about the significant unobservable inputs used. In addition for Level 3 fair value measurements, ASU No. 2011-04 requires a description of the valuation processes used by the reporting entity and ASU No. 2011-04 requires a narrative description of the sensitivity of the fair value measurement to changes in unobservable inputs if a change in those inputs to a different amount might result in a significantly higher or lower fair value measurement. ASU No. 2011-04 is effective for financial statements issued for fiscal years and interim periods beginning after December 15, 2011. Management is currently evaluating the impact the adoption of ASU No. 2011-04 will have on the Funds' financial statements and related disclosures.
www.calvert.com CALVERT ASSET ALLOCATION FUNDS ANNUAL REPORT 34
NOTE B — RELATED PARTY TRANSACTIONS
Calvert Investment Management, Inc. (the “Advisor”) (formerly known as Calvert Asset Management Company, Inc.) is wholly-owned by Calvert Investments, Inc. (“Calvert”) (formerly known as Calvert Group, Ltd.), which is indirectly wholly owned by UNIFI Mutual Holding Company. The Advisor provides investment advisory services for the Funds and the Underlying Funds in which the Funds invest. The Advisor also pays the salaries and fees of officers and Trustees of the Funds who are employees of the Advisor or its affiliates. The Funds do not pay advisory fees to the Advisor for performing investment advisory services. The Advisor, however, will receive advisory fees from managing the Underlying Funds. At year end, $6,691, $28,719 and $4,984 was payable to the Advisor from Conservative, Moderate and Aggressive, respectively, for operating expenses paid by the Advisor during September 2011.
The Advisor has contractually agreed to limit direct ordinary operating expenses through January 31, 2012. The contractual expense cap is .44%, .80%, and .43% for Class A shares of Conservative, Moderate, and Aggressive, respectively. The contractual expense cap is 2.00% for Class C shares of each Fund. The contractual expense cap is .23% for Class I Shares of both Moderate and Aggressive. This expense limitation does not include the Underlying Fund expenses indirectly incurred by the Funds. For the purpose of this expense limit, operating expenses do not include interest expense, brokerage commissions, taxes, and extraordinary expenses. To the extent any expense offset credits are earned, the Advisor’s obligation under the contractual limitation may be reduced and the Advisor may benefit from the expense offset arrangement.
Calvert Investment Administrative Services, Inc. ("CIAS") (formerly known as Calvert Administrative Services Company), an affiliate of the Advisor, provides administrative services to the Funds for an annual fee. Class A, Class C and Class I of each Fund pay an annual rate of .15%, based on their average daily net assets. Under the terms of the agreement, $6,131, $15,042 and $7,493 was payable at year end for Conservative, Moderate, and Aggressive, respectively.
Calvert Investment Distributors, Inc. ("CID") (formerly known as Calvert Distributors, Inc.), an affiliate of the Advisor, is the distributor and principal underwriter for the Funds. Distribution Plans, adopted by Class A and Class C shares, allow the Funds to pay the CID for expenses and services associated with distribution of shares. The expenses paid may not exceed .35% and 1.00% annually of average daily net assets of Class A and Class C, respectively, for each Fund. The amount actually paid by the Funds is an annualized fee, payable monthly of .25% and 1.00% of the Funds’ average daily net assets of Class A and Class C, respectively. Class I shares do not have Distribution Plan expenses. Under the terms of the agreement, $16,830, $38,053, and $17,163 was payable at year end for Conservative, Moderate, and Aggressive, respectively.
CID received $45,431, $93,644, and $48,973 as its portion of the commissions charged on the sales of Conservative, Moderate, and Aggressive Class A shares, respectively, for the year ended September 30, 2011.
www.calvert.com CALVERT ASSET ALLOCATION FUNDS ANNUAL REPORT 35
Calvert Investment Services, Inc. ("CIS") (formerly known as Calvert Shareholder Services, Inc.), an affiliate of the Advisor, acts as shareholder servicing agent for the Funds. For its services, CIS received fees of $15,798, $56,362 and $41,108 for the year ended September 30, 2011 for Conservative, Moderate, and Aggressive, respectively. Under the terms of the agreement, $1,343, $4,614 and $3,325 was payable at year end for Conservative, Moderate and Aggressive, respectively. Boston Financial Data Services, Inc. is the transfer and dividend disbursing agent.
Each Trustee of the Funds who is not an employee of the Advisor or its affiliates receives an annual retainer of $44,000 plus a meeting fee of $2,000 for each Board meeting attended. Additional fees of up to $5,000 annually may be paid to the Board chair and Committee chairs ($10,000 for Special Equities Committee chair) and $2,500 annually may be paid to Committee members, plus a Committee meeting fee of $500 for each Committee meeting attended. Trustee’s fees are allocated to each of the funds served.
NOTE C – INVESTMENT ACTIVITY
During the year, the cost of purchases and proceeds from sales of the Underlying Funds were:
| CONSERVATIVE | MODERATE | AGGRESSIVE | |||
| Purchases | $18,809,691 | $28,294,620 | $10,780,313 | ||
| Sales | $10,357,856 | 23,472,917 | 10,648,706 | ||
| CAPITAL LOSS CARRYFORWARDS | |||||
| EXPIRATION DATE | CONSERVATIVE | MODERATE | AGGRESSIVE | ||
| 30-Sep-17 | — | ($63,978 | ) | ($102,434 | ) |
| 30-Sep-18 | — | (244,394 | ) | (2,287 | ) |
Capital loss carryforwards may be utilized to offset future capital gains until expiration. Under the Regulated Investment Company Modernization Act of 2010, the Funds will soon be permitted to carry forward capital losses incurred in taxable years beginning after December 22, 2010 for an unlimited period. Losses incurred during those future years will be required to be utilized prior to the losses incurred in pre-enactment taxable years. As a result of this ordering rule, pre-enactment capital loss carryforwards may more likely expire unused. Also, post-enactment capital losses that are carried forward will retain their character as either short-term or long-term capital losses rather than being considered all short-term as under previous law.
www.calvert.com CALVERT ASSET ALLOCATION FUNDS ANNUAL REPORT 36
The tax character of dividends and distributions paid during the years ended September 30, 2011 and September 30, 2010 was as follows:
| CONSERVATIVE | ||
| Distributions paid from: | 2011 | 2010 |
| Ordinary income | $1,132,949 | $735,462 |
| Long term capital gain | 112,966 | - |
| Total | $1,245,915 | $735,462 |
| MODERATE | ||
| Distributions paid from: | 2011 | 2010 |
| Ordinary income | $1,540,968 | $991,520 |
| Return of capital | 152,765 | - |
| Total | $1,693,733 | $991,520 |
| AGGRESSIVE | ||
| Distributions paid from: | 2011 | 2010 |
| Ordinary income | $124,026 | $324,981 |
| Total | $124,026 | $324,981 |
As of September 30, 2011, the tax basis components of distributable earnings/(accumulated losses) and the federal tax cost were as follows:
| CONSERVATIVE | MODERATE | AGGRESSIVE | ||||
| Unrealized appreciation | $763,424 | $624,827 | $93,772 | |||
| Unrealized (depreciation) | (989,273 | ) | (13,454,066 | ) | (12,225,893 | ) |
| Net unrealized appreciation/(depreciation) | ($225,849 | ) | ($12,829,239 | ) | ($12,132,121 | ) |
| Undistributed long term capital gain | $145,105 | - | - | |||
| Capital loss carryforward | - | ($308,372 | ) | ($104,721 | ) | |
| Federal income tax cost of investments | $49,123,480 | $130,673,203 | $70,500,797 | |||
The differences between the components of distributable earnings on a tax basis and the amounts reflected in the statements of net assets are primarily due to temporary book-tax differences that will reverse in a subsequent period. These differences are mainly due to wash sales for all funds.
Reclassifications, as shown in the table below, have been made to the Fund's components of net assets to reflect income and gains available for distribution (or available capital loss carryovers, as applicable) under income tax law and regulations. These
www.calvert.com CALVERT ASSET ALLOCATION FUNDS ANNUAL REPORT 37
reclassifications are due to permanent book-tax differences and have no impact on net assets. The primary permanent differences causing such reclassifications are due to excess distributions, redesignation of dividends, and return of capital.
| CONSERVATIVE | MODERATE | AGGRESSIVE | ||||
| Undistributed net investment income | $112,966 | $594,417 | $14,575 | |||
| Accumulated net realized gain (loss) | (112,966 | ) | - | - | ||
| Paid-in capital | - | (594,417 | ) | (14,575 | ) |
NOTE D – LINE OF CREDIT
A financing agreement is in place with all Calvert Funds and State Street Corporation (“SSC”). Under the agreement, SSC provides an unsecured line of credit facility, in the aggregate amount of $50 million ($25 million committed and $25 million uncommitted), accessible by the Funds for temporary or emergency purposes only. Borrowings under the committed facility bear interest at the higher of the London Interbank Offered Rate, (LIBOR) or the overnight Federal Funds Rate plus 1.25% per annum. A commitment fee of .125% per annum is incurred on the unused portion of the committed facility, which is allocated to all participating funds. The Funds had no borrowings under the agreement during the year ended September 30, 2011.
NOTE E – SUBSEQUENT EVENTS
On December 27, 2011, Conservative, Moderate and Aggressive recorded receivables due from the Advisor in the amounts of $161,779, $154,365, and $19,812, respectively, resulting from a settlement between the Advisor and certain underlying funds regarding differences in the underlying fund’s NAV at the Funds’ fiscal year end and throughout certain fiscal years. These NAV differences resulted from valuation differences detected in certain of the underlying fund’s portfolio holdings. The Advisor settled the recorded receivable balances on the same day.
www.calvert.com CALVERT ASSET ALLOCATION FUNDS ANNUAL REPORT 38
NOTICE TO SHAREHOLDERS (UNAUDITED)
For the fiscal year ended September 30, 2011, in order to meet certain requirements of the Internal Revenue Code, we are advising you that certain distributions paid during the year from the following funds are designated as:
| Fund Name | (a) | (b) | (c) | |
| Qualified | (for corporate | |||
| Dividend | shareholders) | |||
| Income % | Dividends Received | |||
| Deduction % | ||||
| Conservative | $ | 112,966 | 7.6% | 5.7% |
| Allocation Fund | ||||
| Moderate Allocation | - | 35.6% | 25.0% | |
| Fund | ||||
| Aggressive Allocation | - | 100.0% | 100.0% | |
| Fund |
(a) Each Fund designates the maximum amount allowable but not less than the amounts shown above as a capital gain dividend in accordance with Section 852(b)(3)(C) of the Internal Revenue Code.
(b) Each Fund designates the maximum amount allowable, but not less than the percentages shown above as ordinary income dividends paid during the year as qualified dividend income in accordance with Section 854 of the Internal Revenue Code.
(c) Each Fund designates the maximum amount allowable but not less than the percentages shown above of ordinary income dividends paid during the year as eligible for the corporate dividends received deduction in accordance with Section 854 of the Internal Revenue Code.
Additional information will be provided to shareholders in January 2012 for use in preparing 2011 income tax returns.
www.calvert.com CALVERT ASSET ALLOCATION FUNDS ANNUAL REPORT 39
| CONSERVATIVE ALLOCATION FUND FINANCIAL HIGHLIGHTS | |||||||||
| Years ended | |||||||||
| September 30, | September 30, | September 30, | |||||||
| Class A Shares | 2011 | 2010 | 2009 | ||||||
| Net asset value, beginning | $ | 15.17 | $ | 14.29 | $ | 14.52 | |||
| Income from investment operations: | |||||||||
| Net investment income | .42 | .35 | .45 | ||||||
| Net realized and unrealized gain (loss) | (.13 | ) | .88 | (.04 | ) | ||||
| Total from investment operations | .29 | 1.23 | .41 | ||||||
| Distributions from: | |||||||||
| Net investment income | (.45 | ) | (.35 | ) | (.45 | ) | |||
| Net realized gain | — | — | (.19 | ) | |||||
| Total distributions | (.45 | ) | (.35 | ) | (.64 | ) | |||
| Total increase (decrease) in net asset value | (.16 | ) | .88 | (.23 | ) | ||||
| Net asset value, ending | $ | 15.01 | $ | 15.17 | $ | 14.29 | |||
| Total return* | 1.86 | % | 8.69 | % | 3.48 | % | |||
| Ratios to average net assets:A,B | |||||||||
| Net investment income | 2.65 | % | 2.37 | % | 3.41 | % | |||
| Total expenses | .84 | % | .90 | % | 1.04 | % | |||
| Expenses before offsets | .44 | % | .44 | % | .44 | % | |||
| Net expenses | .44 | % | .44 | % | .44 | % | |||
| Portfolio turnover | 22 | % | 9 | % | 24 | % | |||
| Net assets, ending (in thousands) | $ | 38,329 | $ | 32,565 | $ | 23,300 | |||
| Years ended | |||||||||
| September 30, | September 30, | ||||||||
| Class A Shares | 2008 | 2007 | |||||||
| Net asset value, beginning | $ | 16.45 | $ | 15.81 | |||||
| Income from investment operations: | |||||||||
| Net investment income | .62 | .55 | |||||||
| Net realized and unrealized gain (loss) | (1.70 | ) | .74 | ||||||
| Total from investment operations | (1.08 | ) | 1.29 | ||||||
| Distributions from: | |||||||||
| Net investment income | (.62 | ) | (.55 | ) | |||||
| Net realized gain | (.23 | ) | (.10 | ) | |||||
| Total distributions | (.85 | ) | (.65 | ) | |||||
| Total increase (decrease) in net asset value | (1.93 | ) | .64 | ||||||
| Net asset value, ending | $ | 14.52 | $ | 16.45 | |||||
| Total return* | (6.90 | %) | 8.27 | % | |||||
| Ratios to average net assets:A,B | |||||||||
| Net investment income | 3.92 | % | 3.55 | % | |||||
| Total expenses | 1.07 | % | 1.35 | % | |||||
| Expenses before offsets | .44 | % | .44 | % | |||||
| Net expenses | .44 | % | .44 | % | |||||
| Portfolio turnover | 13 | % | 11 | % | |||||
| Net assets, ending (in thousands) | $ | 17,551 | $ | 12,265 | |||||
See notes to financial highlights.
www.calvert.com CALVERT ASSET ALLOCATION FUNDS ANNUAL REPORT 40
| CONSERVATIVE ALLOCATION FUND | |||||||||
| FINANCIAL HIGHLIGHTS | |||||||||
| Years ended | |||||||||
| September 30, | September 30, | September 30, | |||||||
| Class C Shares | 2011 | 2010 | 2009 | ||||||
| Net asset value, beginning | $ | 15.10 | $ | 14.23 | $ | 14.45 | |||
| Income from investment operations: | |||||||||
| Net investment income | .25 | .17 | .26 | ||||||
| Net realized and unrealized gain (loss) | (.14 | ) | .87 | (.03 | ) | ||||
| Total from investment operations | .11 | 1.04 | .23 | ||||||
| Distributions from: | |||||||||
| Net investment income | (.31 | ) | (.17 | ) | (.26 | ) | |||
| Net realized gain | — | — | (.19 | ) | |||||
| Total distributions | (.31 | ) | (.17 | ) | (.45 | ) | |||
| Total increase (decrease) in net asset value | (.20 | ) | .87 | (.22 | ) | ||||
| Net asset value, ending | $ | 14.90 | $ | 15.10 | $ | 14.23 | |||
| Total return* | 0.67 | % | 7.39 | % | 2.05 | % | |||
| Ratios to average net assets:A,B | |||||||||
| Net investment income | 1.47 | % | 1.12 | % | 1.99 | % | |||
| Total expenses | 1.59 | % | 1.68 | % | 1.88 | % | |||
| Expenses before offsets | 1.59 | % | 1.68 | % | 1.88 | % | |||
| Net expenses | 1.59 | % | 1.68 | % | 1.88 | % | |||
| Portfolio turnover | 22 | % | 9 | % | 24 | % | |||
| Net assets, ending (in thousands) | $ | 10,492 | $ | 8,393 | $ | 5,747 | |||
| Years ended | |||||||||
| September 30, | September 30, | ||||||||
| Class C Shares | 2008 | 2007 | |||||||
| Net asset value, beginning | $ | 16.40 | $ | 15.77 | |||||
| Income from investment operations: | |||||||||
| Net investment income | .41 | .31 | |||||||
| Net realized and unrealized gain (loss) | (1.72 | ) | .73 | ||||||
| Total from investment operations | (1.31 | ) | 1.04 | ||||||
| Distributions from: | |||||||||
| Net investment income | (.41 | ) | (.31 | ) | |||||
| Net realized gain | (.23 | ) | (.10 | ) | |||||
| Total distributions | (.64 | ) | (.41 | ) | |||||
| Total increase (decrease) in net asset value | (1.95 | ) | .63 | ||||||
| Net asset value, ending | $ | 14.45 | $ | 16.40 | |||||
| Total return* | (8.28 | %) | 6.67 | % | |||||
| Ratios to average net assets:A,B | |||||||||
| Net investment income | 2.54 | % | 1.99 | % | |||||
| Total expenses | 1.85 | % | 2.09 | % | |||||
| Expenses before offsets | 1.85 | % | 2.00 | % | |||||
| Net expenses | 1.85 | % | 2.00 | % | |||||
| Portfolio turnover | 13 | % | 11 | % | |||||
| Net assets, ending (in thousands) | $ | 4,408 | $ | 4,036 | |||||
See notes to financial highlights.
www.calvert.com CALVERT ASSET ALLOCATION FUNDS ANNUAL REPORT 41
| MODERATE ALLOCATION FUND | |||||||||
| FINANCIAL HIGHLIGHTS | |||||||||
| Years ended | |||||||||
| September 30, | September 30, | September 30, | |||||||
| Class A Shares | 2011 | 2010 | 2009 | ||||||
| Net asset value, beginning | $ | 14.87 | $ | 13.94 | $ | 14.83 | |||
| Income from investment operations: | |||||||||
| Net investment income | .15 | .16 | .23 | ||||||
| Net realized and unrealized gain (loss) | (.29 | ) | .92 | (.51 | ) | ||||
| Total from investment operations | (.14 | ) | 1.08 | (.28 | ) | ||||
| Distributions from: | |||||||||
| Net investment income | (.20 | ) | (.15 | ) | (.22 | ) | |||
| Net realized gain | — | — | (.39 | ) | |||||
| In excess of net investment income | (.02 | ) | — | — | |||||
| Total distributions | (.22 | ) | (.15 | ) | (.61 | ) | |||
| Total increase (decrease) in net asset value | (.36 | ) | .93 | (.89 | ) | ||||
| Net asset value, ending | $ | 14.51 | $ | 14.87 | $ | 13.94 | |||
| Total return* | (1.03 | %) | 7.76 | % | (.95 | %) | |||
| Ratios to average net assets:A,B | |||||||||
| Net investment income | .97 | % | 1.06 | % | 1.85 | % | |||
| Total expenses | .73 | % | .76 | % | .83 | % | |||
| Expenses before offsets | .73 | % | .76 | % | .80 | % | |||
| Net expenses | .73 | % | .76 | % | .80 | % | |||
| Portfolio turnover | 18 | % | 7 | % | 25 | % | |||
| Net assets, ending (in thousands) | $ | 95,930 | $ | 92,913 | $ | 77,805 | |||
| Years ended | |||||||||
| September 30, | September 30, | ||||||||
| Class A Shares | 2008 | 2007 | |||||||
| Net asset value, beginning | $ | 18.30 | $ | 16.81 | |||||
| Income from investment operations: | |||||||||
| Net investment income | .37 | .32 | |||||||
| Net realized and unrealized gain (loss) | (3.17 | ) | 1.59 | ||||||
| Total from investment operations | (2.80 | ) | 1.91 | ||||||
| Distributions from: | |||||||||
| Net investment income | (.37 | ) | (.32 | ) | |||||
| Net realized gain | (.30 | ) | (.10 | ) | |||||
| Total distributions | (.67 | ) | (.42 | ) | |||||
| Total increase (decrease) in net asset value | (3.47 | ) | 1.49 | ||||||
| Net asset value, ending | $ | 14.83 | $ | 18.30 | |||||
| Total return* | (15.82 | %) | 11.46 | % | |||||
| Ratios to average net assets:A,B | |||||||||
| Net investment income | 2.12 | % | 1.71 | % | |||||
| Total expenses | .71 | % | .75 | % | |||||
| Expenses before offsets | .71 | % | .75 | % | |||||
| Net expenses | .71 | % | .75 | % | |||||
| Portfolio turnover | 5 | % | 3 | % | |||||
| Net assets, ending (in thousands) | $ | 74,972 | $ | 71,746 | |||||
See notes to financial highlights.
www.calvert.com CALVERT ASSET ALLOCATION FUNDS ANNUAL REPORT 42
| MODERATE ALLOCATION FUND | |||||||||
| FINANCIAL HIGHLIGHTS | |||||||||
| Years ended | |||||||||
| September 30, | September 30, | September 30, | |||||||
| Class C Shares | 2011 | 2010 | 2009 | ||||||
| Net asset value, beginning | $ | 14.65 | $ | 13.79 | $ | 14.72 | |||
| Income from investment operations: | |||||||||
| Net investment income | .04 | .05 | .13 | ||||||
| Net realized and unrealized gain (loss) | (.29 | ) | .90 | (.52 | ) | ||||
| Total from investment operations | (.25 | ) | .95 | (.39 | ) | ||||
| Distributions from: | |||||||||
| Net investment income | (.13 | ) | (.09 | ) | (.15 | ) | |||
| Net realized gain | — | — | (.39 | ) | |||||
| In excess of net investment income | (.01 | ) | — | — | |||||
| Total distributions | (.14 | ) | (.09 | ) | (.54 | ) | |||
| Total increase (decrease) in net asset value | (.39 | ) | .86 | (.93 | ) | ||||
| Net asset value, ending | $ | 14.26 | $ | 14.65 | $ | 13.79 | |||
| Total return* | (1.79 | %) | 6.95 | % | (1.79 | %) | |||
| Ratios to average net assets:A,B | |||||||||
| Net investment income | .24 | % | .30 | % | 1.03 | % | |||
| Total expenses | 1.48 | % | 1.52 | % | 1.60 | % | |||
| Expenses before offsets | 1.48 | % | 1.52 | % | 1.60 | % | |||
| Net expenses | 1.48 | % | 1.52 | % | 1.60 | % | |||
| Portfolio turnover | 18 | % | 7 | % | 25 | % | |||
| Net assets, ending (in thousands) | $ | 20,842 | $ | 20,883 | $ | 17,582 | |||
| Years ended | |||||||||
| September 30, | September 30, | ||||||||
| Class C Shares | 2008 | 2007 | |||||||
| Net asset value, beginning | $ | 18.16 | $ | 16.69 | |||||
| Income from investment operations: | |||||||||
| Net investment income | .24 | .20 | |||||||
| Net realized and unrealized gain (loss) | (3.14 | ) | 1.56 | ||||||
| Total from investment operations | (2.90 | ) | 1.76 | ||||||
| Distributions from: | |||||||||
| Net investment income | (.24 | ) | (.19 | ) | |||||
| Net realized gain | (.30 | ) | (.10 | ) | |||||
| Total distributions | (.54 | ) | (.29 | ) | |||||
| Total increase (decrease) in net asset value | (3.44 | ) | 1.47 | ||||||
| Net asset value, ending | $ | 14.72 | $ | 18.16 | |||||
| Total return* | (16.43 | %) | 10.62 | % | |||||
| Ratios to average net assets:A,B | |||||||||
| Net investment income | 1.38 | % | .97 | % | |||||
| Total expenses | 1.48 | % | 1.50 | % | |||||
| Expenses before offsets | 1.48 | % | 1.50 | % | |||||
| Net expenses | 1.48 | % | 1.50 | % | |||||
| Portfolio turnover | 5 | % | 3 | % | |||||
| Net assets, ending (in thousands) | $ | 16,835 | $ | 17,564 | |||||
See notes to financial highlights.
www.calvert.com CALVERT ASSET ALLOCATION FUNDS ANNUAL REPORT 43
| MODERATE ALLOCATION FUND | ||||||
| FINANCIAL HIGHLIGHTS | ||||||
| Years ended | ||||||
| September 30, | September 30, | |||||
| Class I Shares | 2011 | 2010 | ||||
| Net asset value, beginning | $ | 14.92 | $ | 13.99 | ||
| Income from investment operations: | ||||||
| Net investment income | .18 | .23 | ||||
| Net realized and unrealized gain (loss) | (.23 | ) | .92 | |||
| Total from investment operations | (.05 | ) | 1.15 | |||
| Distributions from: | ||||||
| Net investment income | (.26 | ) | (.22 | ) | ||
| In excess of net investment income | (.03 | ) | — | |||
| Total distributions | (.29 | ) | (.22 | ) | ||
| Total increase (decrease) in net asset value | (.34 | ) | .93 | |||
| Net asset value, ending | $ | 14.58 | $ | 14.92 | ||
| Total return* | (.50 | %) | 8.29 | % | ||
| Ratios to average net assets:A,B | ||||||
| Net investment income | 1.52 | % | 1.37 | % | ||
| Total expenses | .85 | % | 1.02 | % | ||
| Expenses before offsets | .23 | % | .23 | % | ||
| Net expenses | .23 | % | .23 | % | ||
| Portfolio turnover | 18 | % | 7 | % | ||
| Net assets, ending (in thousands) | $ | 995 | $ | 1,791 | ||
| Periods ended | ||||||
| September 30, | September 30, | |||||
| Class I Shares | 2009 | 2008 | ### | |||
| Net asset value, beginning | $ | 14.88 | $ | 16.73 | ||
| Income from investment operations: | ||||||
| Net investment income | .30 | .13 | ||||
| Net realized and unrealized gain (loss) | (.51 | ) | (1.85 | ) | ||
| Total from investment operations | (.21 | ) | (1.72 | ) | ||
| Distributions from: | ||||||
| Net investment income | (.29 | ) | (.13 | ) | ||
| Net realized gain | (.39 | ) | — | |||
| Total distributions | (.68 | ) | (.13 | ) | ||
| Total increase (decrease) in net asset value | (.89 | ) | (1.85 | ) | ||
| Net asset value, ending | $ | 13.99 | $ | 14.88 | ||
| Total return* | (.38 | %) | (10.34 | %) | ||
| Ratios to average net assets:A,B | ||||||
| Net investment income | 2.45 | % | 2.04 | % (a) | ||
| Total expenses | 2.08 | % | 20.84 | % (a) | ||
| Expenses before offsets | .23 | % | .23 | % (a) | ||
| Net expenses | .23 | % | .23 | % (a) | ||
| Portfolio turnover | 25 | % | 4 | % | ||
| Net assets, ending (in thousands) | $ | 927 | $ | 960 | ||
See notes to financial highlights.
www.calvert.com CALVERT ASSET ALLOCATION FUNDS ANNUAL REPORT 44
| AGGRESSIVE ALLOCATION FUND | |||||||||
| FINANCIAL HIGHLIGHTS | |||||||||
| Years ended | |||||||||
| September 30, | September 30, | September 30, | |||||||
| Class A Shares | 2011 | (z) | 2010 | 2009 | |||||
| Net asset value, beginning | $ | 13.94 | $ | 13.03 | $ | 14.45 | |||
| Income from investment operations: | |||||||||
| Net investment income | .05 | .09 | .15 | ||||||
| Net realized and unrealized gain (loss) | (.49 | ) | .90 | (1.00 | ) | ||||
| Total from investment operations | (.44 | ) | .99 | (.85 | ) | ||||
| Distributions from: | |||||||||
| Net investment income | (.03 | ) | (.08 | ) | (.12 | ) | |||
| Net realized gain | — | — | (.45 | ) | |||||
| Total distributions | (.03 | ) | (.08 | ) | (.57 | ) | |||
| Total increase (decrease) in net asset value | (.47 | ) | .91 | (1.42 | ) | ||||
| Net asset value, ending | $ | 13.47 | $ | 13.94 | $ | 13.03 | |||
| Total return* | (3.19 | %) | 7.61 | % | (4.67 | %) | |||
| Ratios to average net assets:A,B | |||||||||
| Net investment income | .33 | % | .66 | % | 1.35 | % | |||
| Total expenses | .86 | % | .92 | % | 1.06 | % | |||
| Expenses before offsets | .43 | % | .43 | % | .43 | % | |||
| Net expenses | .43 | % | .43 | % | .43 | % | |||
| Portfolio turnover | 16 | % | 8 | % | 15 | % | |||
| Net assets, ending (in thousands) | $ | 51,103 | $ | 52,132 | $ | 45,307 | |||
| Years ended | |||||||||
| September 30, | September 30, | ||||||||
| Class A Shares | 2008 | 2007 | |||||||
| Net asset value, beginning | $ | 19.00 | $ | 16.91 | |||||
| Income from investment operations: | |||||||||
| Net investment income | .23 | .22 | |||||||
| Net realized and unrealized gain (loss) | (4.21 | ) | 2.16 | ||||||
| Total from investment operations | (3.98 | ) | 2.38 | ||||||
| Distributions from: | |||||||||
| Net investment income | (.21 | ) | (.21 | ) | |||||
| Net realized gain | (.36 | ) | (.08 | ) | |||||
| Total distributions | (.57 | ) | (.29 | ) | |||||
| Total increase (decrease) in net asset value | (4.55 | ) | 2.09 | ||||||
| Net asset value, ending | $ | 14.45 | $ | 19.00 | |||||
| Total return* | (21.59 | %) | 14.18 | % | |||||
| Ratios to average net assets:A,B | |||||||||
| Net investment income | 1.27 | % | .96 | % | |||||
| Total expenses | .87 | % | .98 | % | |||||
| Expenses before offsets | .43 | % | .43 | % | |||||
| Net expenses | .43 | % | .43 | % | |||||
| Portfolio turnover | 4 | % | 2 | % | |||||
| Net assets, ending (in thousands) | $ | 43,632 | $ | 44,004 | |||||
See notes to financial highlights.
www.calvert.com CALVERT ASSET ALLOCATION FUNDS ANNUAL REPORT 45
| AGGRESSIVE ALLOCATION FUND | |||||||||
| FINANCIAL HIGHLIGHTS | |||||||||
| Years ended | |||||||||
| September 30 | September 30, | September 30, | |||||||
| Class C Shares | 2011 | (z) | 2010 | 2009 | |||||
| Net asset value, beginning | $ | 13.18 | $ | 12.49 | $ | 14.02 | |||
| Income from investment operations: | |||||||||
| Net investment income (loss) | (.14 | ) | (.08 | ) | (.01 | ) | |||
| Net realized and unrealized gain (loss) | (.44 | ) | .85 | (.99 | ) | ||||
| Total from investment operations | (.58 | ) | .77 | (1.00 | ) | ||||
| Distributions from: | |||||||||
| Net investment income | (.03 | ) | (.08 | ) | (.08 | ) | |||
| Net realized gain | — | — | (.45 | ) | |||||
| Total distributions | (.03 | ) | (.08 | ) | (.53 | ) | |||
| Total increase (decrease) in net asset value | (.61 | ) | .69 | (1.53 | ) | ||||
| Net asset value, ending | $ | 12.57 | $ | 13.18 | $ | 12.49 | |||
| Total return* | (4.45 | %) | 6.14 | % | (6.06 | %) | |||
| Ratios to average net assets:A,B | |||||||||
| Net investment income (loss) | (.93 | %) | (.66 | %) | (.19 | %) | |||
| Total expenses | 1.70 | % | 1.77 | % | 1.94 | % | |||
| Expenses before offsets | 1.70 | % | 1.77 | % | 1.92 | % | |||
| Net expenses | 1.70 | % | 1.77 | % | 1.92 | % | |||
| Portfolio turnover | 16 | % | 8 | % | 15 | % | |||
| Net assets, ending (in thousands) | $ | 7,229 | $ | 8,174 | $ | 7,445 | |||
| Years ended | |||||||||
| September 30, | September 30, | ||||||||
| Class C Shares | 2008 | 2007 | |||||||
| Net asset value, beginning | $ | 18.63 | $ | 16.74 | |||||
| Income from investment operations: | |||||||||
| Net investment income | .02 | ** | |||||||
| Net realized and unrealized gain (loss) | (4.12 | ) | 2.09 | ||||||
| Total from investment operations | (4.10 | ) | 2.09 | ||||||
| Distributions from: | |||||||||
| Net investment income | (.15 | ) | (.12 | ) | |||||
| Net realized gain | (.36 | ) | (.08 | ) | |||||
| Total distributions | (.51 | ) | (.20 | ) | |||||
| Total increase (decrease) in net asset value | (4.61 | ) | 1.89 | ||||||
| Net asset value, ending | $ | 14.02 | $ | 18.63 | |||||
| Total return* | (22.62 | %) | 12.56 | % | |||||
| Ratios to average net assets:A,B | |||||||||
| Net investment income (loss) | (.01 | %) | (.32 | %) | |||||
| Total expenses | 1.72 | % | 1.77 | % | |||||
| Expenses before offsets | 1.72 | % | 1.77 | % | |||||
| Net expenses | 1.72 | % | 1.77 | % | |||||
| Portfolio turnover | 4 | % | 2 | % | |||||
| Net assets, ending (in thousands) | $ | 6,709 | $ | 7,605 | |||||
See notes to financial highlights.
www.calvert.com CALVERT ASSET ALLOCATION FUNDS ANNUAL REPORT 46
| AGGRESSIVE ALLOCATION FUND | ||||||
| FINANCIAL HIGHLIGHTS | ||||||
| Periods ended | ||||||
| February 24, | September 30, | |||||
| Class I Shares | 2011 | (y)(z) | 2010 | |||
| Net asset value, beginning | $ | 14.00 | $ | 13.06 | ||
| Income from investment operations: | ||||||
| Net investment income | .11 | .12 | ||||
| Net realized and unrealized gain (loss) | 1.45 | .90 | ||||
| Total from investment operations | 1.56 | 1.02 | ||||
| Distributions from: | ||||||
| Net investment income | (.03 | ) | (.08 | ) | ||
| Net realized gain | — | — | ||||
| Total distributions | (.03 | ) | (.08 | ) | ||
| Total increase (decrease) in net asset value | 1.53 | .94 | ||||
| Net asset value, ending | $ | 15.53 | $ | 14.00 | ||
| Total return* | 11.14 | % | 7.83 | % | ||
| Ratios to average net assets:A,B | ||||||
| Net investment income | 1.29 | % (a) | .89 | % | ||
| Total expenses | 1,182.62 | % (a) | 1,348 | % | ||
| Expenses before offsets | .23 | % (a) | .23 | % | ||
| Net expenses | .23 | % (a) | .23 | % | ||
| Portfolio turnover | 3 | % | 8 | % | ||
| Net assets, ending (in thousands) | $ | 0 | $ | 1 | ||
| Periods ended | ||||||
| September 30, | September 30, | |||||
| Class I Shares | 2009 | 2008 | ### | |||
| Net asset value, beginning | $ | 14.46 | $ | 16.73 | ||
| Income from investment operations: | ||||||
| Net investment income | .18 | .03 | ||||
| Net realized and unrealized gain (loss) | (.99 | ) | (2.30 | ) | ||
| Total from investment operations | (.81 | ) | (2.27 | ) | ||
| Distributions from: | ||||||
| Net investment income | (.14 | ) | — | |||
| Net realized gain | (.45 | ) | — | |||
| Total distributions | (.59 | ) | — | |||
| Total increase (decrease) in net asset value | (1.40 | ) | (2.27 | ) | ||
| Net asset value, ending | $ | 13.06 | $ | 14.46 | ||
| Total return* | (4.41 | %) | (13.57 | %) | ||
| Ratios to average net assets:A,B | ||||||
| Net investment income | 1.59 | % | .30 | % (a) | ||
| Total expenses | 2,098.82 | % | 1,924.45 | %(a) | ||
| Expenses before offsets | .23 | % | .23 | % (a) | ||
| Net expenses | .23 | % | .23 | % (a) | ||
| Portfolio turnover | 15 | % | 2 | % | ||
| Net assets, ending (in thousands) | $ | 1 | $ | 1 | ||
See notes to financial highlights.
www.calvert.com CALVERT ASSET ALLOCATION FUNDS ANNUAL REPORT 47
| A | Total expenses do not reflect amounts reimbursed and/or waived by the Advisor or reductions from expense offset arrangements. Expenses before offsets reflect expenses after reimbursement and/or waiver by the Advisor but prior to reductions from expense offset arrangements. Net expenses are net of all reductions and represent the net expenses paid by the Fund. |
| B | Amounts do not include the activity of the underlying funds. |
| (a) | Annualized. |
| (y) | Class I was liquidated on February 24, 2011. Shares are still available for public sale and operations will resume upon shareholder investment. |
| (z) | Per share figures calculated using the Average Shares Method. |
| * | Total return is not annualized for periods less than one year and does not reflect deduction of any front-end or deferred sales charge. |
| ** | Less than $.01 per share. |
| ### | From January 31, 2008 inception. |
See notes to financial statements.
www.calvert.com CALVERT ASSET ALLOCATION FUNDS ANNUAL REPORT 48
EXPLANATION OF FINANCIAL TABLES
SCHEDULE OF INVESTMENTS
The Schedule of Investments is a snapshot of all securities held in the fund at their market value, on the last day of the reporting period. Securities are listed by asset type (e.g., common stock, corporate bonds, U.S. government obligations) and may be further broken down into sub-groups and by industry classification.
STATEMENT OF ASSETS AND LIABILITIES
The Statement of Assets and Liabilities is often referred to as the fund’s balance sheet. It lists the value of what the fund owns, is due and owes on the last day of the reporting period. The fund’s assets include the market value of securities owned, cash, receivables for securities sold and shareholder subscriptions, and receivables for dividends and interest payments that have been earned, but not yet received. The fund’s liabilities include payables for securities purchased and shareholder redemptions, and expenses owed but not yet paid. The statement also reports the fund’s net asset value (NAV) per share on the last day of the reporting period. The NAV is calculated by dividing the fund’s net assets (assets minus liabilities) by the number of shares outstanding. This statement is accompanied by a Schedule of Investments. Alternatively, if certain conditions are met, a Statement of Net Assets may be presented in lieu of this statement and the Schedule of Investments.
STATEMENT OF NET ASSETS
The Statement of Net Assets provides a detailed list of the fund’s holdings, including each security’s market value on the last day of the reporting period. The Statement of Net Assets includes a Schedule of Investments. Other assets are added and other liabilities subtracted from the investments total to calculate the fund’s net assets. Finally, net assets are divided by the outstanding shares of the fund to arrive at its share price, or Net Asset Value (NAV) per share.
At the end of the Statement of Net Assets is a table displaying the composition of the fund’s net assets. Paid in Capital is the money invested by shareholders and represents the bulk of net assets. Undistributed Net Investment Income and Accumulated Net Realized Gains usually approximate the amounts the fund had available to distribute to shareholders as of the statement date. Accumulated Realized Losses will appear as negative balances. Unrealized Appreciation (Depreciation) is the difference between the market value of the fund’s investments and their cost, and reflects the gains (losses) that would be realized if the fund were to sell all of its investments at their statement-date values.
STATEMENT OF OPERATIONS
The Statement of Operations summarizes the fund’s investment income earned and expenses incurred in operating the fund. Investment income includes dividends earned from stocks and interest earned from interest-bearing securities in the fund. Expenses
| www. | calvert.com CALVERT ASSET ALLOCATION FUNDS ANNUAL REPORT (UNAUDITED) 49 |
incurred in operating the fund include the advisory fee paid to the investment advisor (not applicable to the Asset Allocation Funds), administrative services fees, distribution plan expenses (if applicable), transfer agent fees, shareholder servicing expenses, custodial, legal, and audit fees, and the printing and postage expenses related to shareholder reports. Expense offsets (fees paid indirectly) are also shown. Credits earned from offset arrangements are used to reduce the fund’s expenses. This statement also shows net gains (losses) realized on the sale of investments and the increase or decrease in the unrealized appreciation (depreciation) on investments held during the period.
STATEMENT OF CHANGES IN NET ASSETS
The Statement of Changes in Net Assets shows how the fund’s total net assets changed during the two most recent reporting periods. Changes in the fund’s net assets are attributable to investment operations, distributions and capital share transactions.
The Operations section of the report summarizes information detailed in the Statement of Operations. The Distribution section shows the dividend and capital gain distributions made to shareholders. The amounts shown as distributions in this section may not match the net investment income and realized gains amounts shown in the Operations section because distributions are determined on a tax basis and certain investments or transactions may be treated differently for financial statement and tax purposes. The Capital Share Transactions section shows the amount shareholders invested in the fund, either by purchasing shares or by reinvesting distributions, and the amounts redeemed. The corresponding numbers of shares issued, reinvested and redeemed are shown at the end of the report.
FINANCIAL HIGHLIGHTS
The Financial Highlights table provides a per-share breakdown per class of the components that affect the fund’s net asset value for current and past reporting periods. The table provides total return, total distributions, expense ratios, portfolio turnover and net assets for the applicable period. Total return is a measure of a fund’s performance that encompasses all elements of return: dividends, capital gain distributions and changes in net asset value. Total return is the change in value of an investment over a given period, assuming reinvestment of any dividends and capital gain distributions, expressed as a percentage of the initial investment. Total distributions include distributions from net investment income and net realized gains. Long-term gains are earned on securities held in the fund more than one year. Short-term gains, on the sale of securities held less than one year, are treated as ordinary dividend income for tax purposes. The expense ratio is a fund’s cost of doing business, expressed as a percentage of net assets. These expenses directly reduce returns to shareholders. Portfolio turnover measures the trading activity in a fund’s investment portfolio – how often securities are bought and sold by a fund. Portfolio turnover is affected by market conditions, changes in the size of the fund, the nature of the fund’s investments and the investment style of the portfolio manager.
www.calvert.com CALVERT ASSET ALLOCATION FUNDS ANNUAL REPORT (UNAUDITED) 50
PROXY VOTING
The Proxy Voting Guidelines of the Calvert Funds that the Fund uses to determine how to vote proxies relating to portfolio securities are provided as an Appendix to the Fund’s Statement of Additional Information. The Statement of Additional Information can be obtained free of charge by calling the Fund at 1-800-368-2745, by visiting the Calvert website at www.calvert.com; or by visiting the SEC’s website at www.sec.gov.
Information regarding how the Fund voted proxies relating to portfolio securities during the most recent 12-month period ended June 30 is available on the Fund’s website at www.calvert.com and on the SEC’s website at www.sec.gov.
AVAILABILITY OF QUARTERLY PORTFOLIO HOLDINGS
The Fund files its complete schedule of portfolio holdings with the SEC for the first and third quarters of each fiscal year on Form N-Q. The Fund’s Form N-Q is available on the SEC’s website at www.sec.gov. The Fund’s Form N-Q may be reviewed and copied at the SEC’s Public Reference Room in Washington, DC; information on the operation of the Public Reference Room may be obtained by calling 1-800-SEC-0330.
| www. | calvert.com CALVERT ASSET ALLOCATION FUNDS ANNUAL REPORT (UNAUDITED) 51 |
TRUSTEE AND OFFICER INFORMATION TABLE
(Not Applicable to Officers) | |||||||
Position | Position | # of Calvert | |||||
Name & | with | Start | Principal Occupation | Portfolios | Other | ||
Age | Fund | Date | During Last 5 Years | Overseen | Directorships | ||
INDEPENDENT TRUSTEES/DIRECTORS | |||||||
REBECCA L. ADAMSON AGE: 62 | Trustee
Director
Director
Director | 1989 CSIF
2000 IMPACT
2000 CSIS
2005 CWVF
| President of the national non-profit, First People’s Worldwide, formerly First Nations Financial Project. Founded by her in 1980, First People’s Worldwide is the only American Indian alternative development institute in the country. | 15 | · Bay & Paul Foundation
| ||
RICHARD L. BAIRD, JR. AGE: 63 | Trustee & Chair
Director & Chair
Director & Chair
Director & Chair
| 1982 CSIF
2000 CSIS
2005 CWVF
2005 Impact | President and CEO of Adagio Health Inc. in Pittsburgh, PA, a non-profit corporation which provides family planning services, nutrition, maternal/child health care, and various health screening services and community preventive health programs. | 25 | None | ||
JOHN G. GUFFEY, JR. AGE: 63 | Director
Trustee
Director
Director
| 1992 CWVF
1982 CSIF
2000 CSIS
2005 IMPACT
| President of Aurora Press Inc., a privately held publisher of trade paperbacks.
| 25 | · Ariel Funds (3) · Calvert Social Investment Foundation · Calvert Ventures, LLC
| ||
MILES DOUGLAS HARPER, III AGE: 48 | Director
Trustee
Director
Director | 2000 Impact
2005 CSIF
2005 CSIS
2005 CWVF | Partner, Gainer Donnelly & Desroches (public accounting firm) since January 1999. | 15 | · Bridgeway Funds (14) | ||
JOY V. JONES AGE: 61 | Director
Trustee
Director
Director | 2000 Impact
1990 CSIF
2000 CSIS
2005 CWVF | Attorney.
| 15 | · Director, Conduit Street Restaurants Limited | ||
TERRENCE J. MOLLNER, Ed.D. AGE: 66 | Director
Trustee
Director
Director | 1992 CWVF
1982 CSIF
2000 CSIS
2005 IMPACT | Founder, Chairperson, and President of Trusteeship Institute, Inc., a diverse foundation known principally for its consultation to corporations converting to cooperative employee-ownership and the development of socially and spiritually responsible investment vehicles. Chairperson, Stakeholders Capital, Inc., an asset management firm and financial services provider in Amherst, MA. | 15 | · Calvert Social Investment Foundation · Ben & Jerry's Homemade, Inc. · ArtNOW, Inc. · Yourolivebranch.org | ||
SYDNEY AMARA MORRIS AGE: 62 | Trustee
Director
Director
Director | 1982 CSIF
2000 CSIS
2005 CWVF
2005 IMPACT | Rev. Morris currently serves as Parish Minister to the Keweenaw Unitarian Universalist Fellowship in Houghton, MI. Rev. Morris is a graduate of Harvard Divinity School. She currently chairs the Umbrian Universalist Committee on Socially Responsible Investing. | 15 | None | ||
INTERESTED TRUSTEES/DIRECTORS | |||||||
BARBARA J. KRUMSIEK AGE: 59 | Director & President
Trustee & Senior Vice President
Director & Senior Vice President
Director & President | 1997 CWVF
1997 CSIF
2000 CSIS
2000 Impact | President, Chief Executive Officer and Chair of Calvert Investments, Inc.
| 42 | · Calvert Social Investment Foundation · Pepco Holdings, Inc. · Acacia Life Insurance Company (Chair) · Griffin Realty Corp. | ||
D. Wayne Silby, Esq. AGE: 63 | Director
Trustee & President
Director & President
Director | 1992 CWVF
1982 CSIF
2000 CSIS
2000 Impact | Mr. Silby is the founding Chair of the Calvert Funds. He is the Chair-Elect and a principal of Syntao.com, a Beijing-based company promoting corporate social responsibility. | 25 | · UNIFI Mutual Holding Company · Calvert Social Investment Foundation · Studio School Fund · Syntao.com China · The Ice Organization · Impact Assets | ||
OFFICERS | |||||||
KAREN BECKERAge: 58 | Chief Compliance Officer | 2005
| Chief Compliance Officer for the Calvert Funds. In March 2009, Ms. Becker also became Head of the Securities Operations Department for Calvert Investment Management, Inc. | ||||
SUSAN walker Bender, E sq. AGE: 52 | Assistant Vice-President & Assistant Secretary | 1988 CSIF
2000 CSIS
1992 CWVF 2000 Impact | Assistant Vice President, Assistant Secretary and Associate General Counsel of Calvert Investments, Inc. | ||||
THOMAS DAILEY AGE: 47 | Vice President | 2004
| Vice President of Calvert Investment Management, Inc.
| ||||
IVY WAFFORD DUKE, Esq. AGE: 43 | Assistant Vice-President & Assistant Secretary | 1996 CSIF
2000 CSIS
1996 CWVF 2000 Impact | Assistant Vice President, Assistant Secretary and Deputy General Counsel of Calvert Investments, Inc., and Chief Compliance Officer for Calvert Investment Management, Inc. and Calvert Investment Distributors, Inc.
| ||||
patrick faul AGE: 46 | Vice President | 2010 | Vice President of Calvert Investment Management, Inc. since 2008, and Head of Credit Research since 2009. Prior to 2009, Mr. Faul was Co-Head of Credit Research (2008) and a Senior Securities Analyst (prior to 2008). | ||||
TRACI L. GOLDT AGE: 37 | Assistant Secretary | 2004
| Electronic Filing Manager and Executive Assistant to General Counsel, Calvert Investments, Inc.
| ||||
GREGORY B. HABEEB AGE: 61 | Vice President (CSIF and CSIS ) | 2004 | Senior Vice President of Calvert Investment Management, Inc. | ||||
HUI PING HO, CPA AGE: 46 | Assistant Treasurer
| 2000
| Tax Compliance Manager of Calvert Investments, Inc.
| ||||
LANCELOT A. KING, Esq. AGE: 41 | Assistant Vice President & Assistant Secretary
| 2002
| Assistant Vice President, Assistant Secretary and Associate General Counsel of Calvert Investments, Inc.
| ||||
edith lillie aGE: 54 | Assistant Secretary
| 2007 | Assistant Secretary (since 2007) and Regulatory Matters Manager of Calvert Investments, Inc. | ||||
AUGUSTO DIVO MACEDO, Esq. AGE: 48 | Assistant Vice President & Assistant Secretary | 2007 | Assistant Vice President, Assistant Secretary, and Assistant Counsel Compliance of Calvert Investments, Inc. | ||||
JANE B. MAXWELL, Esq. AGE: 59 | Assistant Vice President & Assistant Secretary
| 2005 | Assistant Vice President, Assistant Secretary & Assistant General Counsel of Calvert Investments, Inc.
| ||||
ANDREW K. NIEBLER, Esq. AGE: 44 | Assistant Vice President & Assistant Secretary | 2006 | Assistant Vice President, Assistant Secretary & Associate General Counsel of Calvert Investments, Inc. | ||||
CATHERINE P. ROY AGE: 55
| Vice President | 2004
| Senior Vice President of Calvert Investment Management, Inc. and Chief Investment Officer – Fixed Income. | ||||
William M. Tartikoff, Esq. AGE: 64 | Vice President and Secretary | 1990 CSIF
2000 CSIS
1992 CWVF
2000 Impact
| Senior Vice President, Secretary, and General Counsel of Calvert Investments, Inc. | ||||
NATALIE TRUNOW AGE: 43 | Vice President | 2008 | Senior Vice President of Calvert Investment Management, Inc., and Chief Investment Officer - Equities. Prior to joining Calvert in August 2008, Ms. Trunow was the Section Head (2005-2008) and Portfolio Manager (2001-2008) for the Global Public Markets Group of General Motors Asset Management. | ||||
Ronald M. WolfsheimeRCPA AGE: 59 | Treasurer | 1982 CSIF
2000 CSIS
1992 CWVF 2000 Impact | Executive Vice President and Chief Financial and Administrative Officer of Calvert Investments, Inc. | ||||
MICHAEL V. YUHAS, JR., CPA AGE: 50 | Fund Controller | 1999 CSIF
2000 CSIS
1999 CWVF
2000 Impact | Vice President of Fund Administration of Calvert Investment Administrative Services, Inc. | ||||
The address of Trustees/Directors and Officers is 4550 Montgomery Avenue, Suite 1000N, Bethesda, Maryland 20814, except Mr. Silby’s address is 1715 18th Street, N.W., Washington, DC 20009. Ms. Krumsiek is an interested person of the Fund since she is an officer and director of the Fund’s advisor and certain affiliates. Mr. Silby is an interested person of the Fund since he is a director of the parent com- pany of the Fund’s advisor. Additional information about the Fund’s Trustees/Directors can be found in the Statement of Additional Information (SAI). You can get a free copy of the SAI at www.calvert.com, or by contacting your broker, or the Fund at 1-800-368-2745. |
To Open an Account
800-368-2748
Yields and Prices
Calvert Information Network
(24 hours, 7 days a week)
800-368-2745
Service for Existing Account
Shareholders: 800-368-2745
Brokers: 800-368-2746
TDD for Hearing Impaired
800-541-1524
Branch Office
4550 Montgomery Avenue
Suite 1000 North
Bethesda, Maryland 20814
Registered, Certified or Overnight Mail
Calvert Investments
c/o BFDS,
330 West 9th Street
Kansas City, MO 64105
Web Site
www.calvert.com
Principal Underwriter
Calvert Investment Distributors, Inc.
4550 Montgomery Avenue
Suite 1000 North
Bethesda, Maryland 20814
| CALVERT | CALVERT’S | Equity Funds |
| ASSET | FAMILY OF FUNDS | Enhanced Equity Portfolio |
| ALLOCATION | Equity Portfolio | |
| FUNDS | Tax-Exempt Money | Large Cap Value Fund |
| Market Funds | Social Index Fund | |
| CTFR Money Market Portfolio | Capital Accumulation Fund | |
| International Equity Fund | ||
| Taxable Money Market | Small Cap Fund | |
| Funds | Global Alternative Energy Fund | |
| First Government Money Market | Global Water Fund | |
| Fund | International Opportunities Fund | |
| Money Market Portfolio | Equity Income Fund | |
| Municipal Funds | Balanced and Asset | |
| Tax-Free Bond Fund | Allocation Funds | |
| Balanced Portfolio | ||
| Taxable Bond Funds | Conservative Allocation Fund | |
| Bond Portfolio | Moderate Allocation Fund | |
| Income Fund | Aggressive Allocation Fund | |
| Short Duration Income Fund | ||
| Long-Term Income Fund | ||
| Ultra-Short Income Fund | ||
| Government Fund | ||
| High-Yield Bond Fund | ||
This report is intended to provide fund information to shareholders. It is not authorized for distribution to prospective investors unless preceded or accompanied by a prospectus.
Note: The information on our website is not incorporated by reference into this report; our website address is included as an inactive textual reference only.
Investors should carefully consider the investment objectives, risks, charges and expenses of the Calvert Funds. This and other important information is contained in the fund’s summary prospectus and prospectus, which can be obtained from your financial professional and should be read carefully before investing. You may also call Calvert at 800/368-2745 or visit www. calvert.com.
Item 2. Code of Ethics.
(a) The registrant has adopted a code of ethics (the "Code of Ethics") that applies to its principal executive officer and principal financial officer (also referred to as “principal accounting officer”).
(b) No information need be disclosed under this paragraph.
(c) The registrant has not amended its Code of Ethics during the period covered by the shareholder report presented in Item 1 hereto.
(d) The registrant has not granted a waiver or implicit waiver from a provision of its Code of Ethics during the period covered by the shareholder report presented in Item 1 hereto.
(e) Not applicable.
(f) The registrant's Code of Ethics is attached as an Exhibit hereto.
Item 3. Audit Committee Financial Expert.
The registrant's Board of Trustees has determined that Miles D. Harper, III, an "independent" Trustee serving on the registrant's audit committee, is an "audit committee financial expert," as defined in Item 3 of Form N-CSR. Under applicable securities laws, a person who is determined to be an audit committee financial expert will not be deemed an "expert" for any purpose, including without limitation for the purposes of Section 11 of the Securities Act of 1933, as a result of being designated or identified as an audit committee financial expert. The designation or identification of a person as an audit committee financial expert does not impose on such person any duties, obligations, or liabilities that are greater than the duties, obligations, and liabilities imposed on such person as a member of the audit committee and Board of Trustees in the absence of such designation or identification.
Item 4. Principal Accountant Fees and Services.
Services fees paid to auditing firm:
| Fiscal Year | Fiscal Year | ||
| $ | %* | $ | % * |
(a) Audit Fees | $130,680 |
| $141,075 |
|
(b) Audit-Related Fees | $0 | 0% | $0 | 0% |
(c) Tax Fees (tax return preparation and filing for the registrant) | $23,980 | 0% | $22,560 | 0% |
(d) All Other Fees | $0 | 0% | $0 | 0% |
Total | $154,660 | 0% | $163,635 | 0% |
* Percentage of fees approved by the Audit Committee pursuant to (c)(7)(i)(C) of Rule 2-01 of Reg. S-X (statutory de minimis waiver of Committee’s requirement to pre-approve)
(e) Audit Committee pre-approval policies and procedures:
The Audit Committee is required to pre-approve all audit and non-audit services provided to the registrant by the auditors, and to the registrant’s investment advisor, and any entity controlling, controlled by, or under common control with the advisor that provides ongoing services to the registrant. In determining whether to pre-approve non-audit services, the Audit Committee considers whether the services are consistent with maintaining the independence of the auditors. The Committee may delegate its authority to pre-approve certain matters to one or more of its members. In this regard, the Committee has delegated authority jointly to the Audit Committee Chair together with another Committee member with respect to non-audit services not exceeding $25,000 in each instance. In addition, the Committee has pre-approved the retention of the auditors to provide tax-related services related to the tax treatment and tax accounting of newly acquired securities, upon request by the investment advisor in each instance.
(f) Not applicable.
(g) Aggregate non-audit fees billed by the registrant’s accountant for services rendered to the registrant, and rendered to the registrant’s investment advisor, and any entity controlling, controlled by, or under common control with the advisor that provides ongoing services to the registrant for each of the last two fiscal years of the registrant:
Fiscal Year | Fiscal Year | ||
$ | %* | $ | % * |
|
|
|
|
$11,000 | 0%* | $42,500 | 0%* |
* Percentage of fees approved by the Audit Committee pursuant to (c)(7)(i)(C) of Rule 2-01 of Reg. S-X (statutory de minimis waiver of Committee’s requirement to pre-approve)
(h) The registrant’s Audit Committee of the Board of Trustees has considered whether the provision of non-audit services that were rendered to the registrant’s investment advisor, and any entity controlling, controlled by, or under common control with the investment advisor that provides ongoing services to the registrant that were not pre-approved pursuant to paragraph (c) (7)(ii) of Rule 2-01 of Reg. S-X is compatible with maintaining the principal accountant’s independence and found that the provision of such services is compatible with maintaining the principal accountant’s independence.
Item 5. Audit Committee of Listed Registrants.
Not applicable.
Item 6. Schedule of Investments.
(a) This Schedule is included as part of the report to shareholders filed under Item 1 of this Form.
(b) Not applicable.
Item 7. Disclosure of Proxy Voting Policies and Procedures for Closed-End Management Investment Companies.
Not applicable.
Item 8. Portfolio Managers of Closed-End Management Investment Companies
Not applicable.
Item 9. Purchases of Equity Securities by Closed-End Management Investment Company and Affiliated Purchasers.
Not applicable.
Item 10. Submission of Matters to a Vote of Security Holders.
No material changes were made to the procedures by which shareholders may recommend nominees to the registrant’s Board of Trustees since registrant last provided disclosure in response to this Item.
Item 11. Controls and Procedures.
(a) The principal executive and financial officers concluded that the registrant's disclosure controls and procedures (as defined in Rule 30a-3(c) under the 1940 Act) are effective, based on the evaluation of these controls and procedures required by Rule 30a-3(b) under the 1940 Act and Rules 13a-15(b) or 15d-15(b) under the Exchange Act, as of a date within 90 days of the filing date of this report. This determination is based on the change to the registrant’s internal control over financial reporting described in Item 11(b) below.
(b) There was no change in the registrant's internal control over financial reporting (as defined in Rule 30a-3(d) under the 1940 Act) that occurred during the registrant's second fiscal quarter of the period covered by this report that has materially affected, or is reasonably likely to materially affect, the registrant's internal control over financial reporting. However, a change to the internal control over financial reporting was made subsequent to the end of the reporting period. This change provides for (1) the remodeling and testing of the models used for all fixed income securities that are being priced under fair value procedures by the Advisor; (2) conducting of back-testing that reasonably supports the assumptions used in fair valuing the securities; (3) modifying the internal compliance monitoring system to report the asset weighting of each fixed income security, providing the percentage of any security owned in an individual Fund and across the Fund complex; (4) implementing a manual control to monitor for and report to the internal pricing committee on any security where the primary and/or secondary pricing vendor has been overridden for more than seven days; and (5) developing enhanced escalation procedures to address any fair valuation concerns—these enhanced escalation procedures are expected to be completed by the registrant’s next filing on this Form.
Item 12. Exhibits.
(a)(1) A copy of the Registrant’s Code of Ethics.
Attached hereto.
(a)(2) A separate certification for each principal executive officer and principal financial officer of the registrant as required by Rule 30a-2 under the Act (17 CFR 270.30a-2).
Attached hereto.
(a)(3) Not applicable.
(b) A certification for the registrant's Principal Executive Officer and Principal Financial Officer, as required by Rule 30a-2(b) under the Investment Company Act of 1940, is attached hereto. The certification furnished pursuant to this paragraph is not deemed to be "filed" for purposes of Section 18 of the Securities Exchange Act of 1934, or otherwise subject to the liability of that section. Such certification is not deemed to be incorporated by reference into any filing under the Securities Act of 1933 or the Securities Exchange Act of 1934, except to the extent that the registrant specifically incorporates it by reference.
Pursuant to the requirements of the Securities Exchange Act of 1934 and the Investment Act of 1940, the registrant has duly caused this report to be signed on its behalf by the undersigned, thereunto duly authorized.
CALVERT SOCIAL INVESTMENT FUND
By: /s/ Barbara J. Krumsiek
Barbara J. Krumsiek
Senior Vice President -- Principal Executive Officer
Date: December 27, 2011
Pursuant to the requirements of the Securities Exchange Act of 1934 and the Investment Act of 1940, this report has been signed below by the following persons on behalf of the registrant and in the capacities and on the dates indicated.
/s/ Barbara J. Krumsiek
Barbara J. Krumsiek
Senior Vice President -- Principal Executive Officer
Date: December 27, 2011
/s/ D. Wayne Silby
D. Wayne Silby
President -- Principal Executive Officer
Date: December 27, 2011
/s/ Ronald M. Wolfsheimer
Ronald M. Wolfsheimer
Treasurer -- Principal Financial Officer
Date: December 27, 2011