UNITED STATES SECURITIES AND EXCHANGE COMMISSION
Washington, D.C. 20549
FORM N-CSR
CERTIFIED SHAREHOLDER REPORT OF REGISTERED MANAGEMENT
INVESTMENT COMPANIES
| Investment Company Act file number: | 811-03363 |
| Exact name of registrant as specified in charter: | Delaware Group® Limited-Term |
| Government Funds | |
| Address of principal executive offices: | 2005 Market Street |
| Philadelphia, PA 19103 | |
| Name and address of agent for service: | David F. Connor, Esq. |
| 2005 Market Street | |
| Philadelphia, PA 19103 | |
| Registrant’s telephone number, including area code: | (800) 523-1918 |
| Date of fiscal year end: | December 31 |
| Date of reporting period: | December 31, 2014 |
Item 1. Reports to Stockholders
Table of Contents
 |
|

Annual report
Fixed income mutual fund
Delaware Limited-Term Diversified Income Fund
December 31, 2014
Carefully consider the Fund’s investment objectives, risk factors, charges, and expenses before investing. This and other information can be found in the Fund’s prospectus and its summary prospectus, which may be obtained by visiting delawareinvestments.com or calling 800 523-1918. Investors should read the prospectus and the summary prospectus carefully before investing.
You can obtain shareholder reports and prospectuses online instead of in the mail.
Visit delawareinvestments.com/edelivery.
Table of Contents
Experience Delaware Investments
Delaware Investments is committed to the pursuit of consistently superior asset management and unparalleled client service. We believe in our investment processes, which seek to deliver consistent results, and in convenient services that help add value for our clients.
If you are interested in learning more about creating an investment plan, contact your financial advisor.
You can learn more about Delaware Investments or obtain a prospectus for Delaware Limited-Term Diversified Income Fund at delawareinvestments.com.
Manage your investments online
| — | 24-hour access to your account information |
| — | Obtain share prices |
| — | Check your account balance and recent transactions |
| — | Request statements or literature |
| — | Make purchases and redemptions |
Delaware Management Holdings, Inc. and its subsidiaries (collectively known by the marketing name of Delaware Investments) are wholly owned subsidiaries of Macquarie Group Limited, a global provider of banking, financial, advisory, investment, and funds management services.
Investments in Delaware Limited-Term Diversified Income Fund are not and will not be deposits with or liabilities of Macquarie Bank Limited ABN 46 008 583 542 and its holding companies, including their subsidiaries or related companies (Macquarie Group), and are subject to investment risk, including possible delays in repayment and loss of income and capital invested. No Macquarie Group company guarantees or will guarantee the performance of the Fund, the repayment of capital from the Fund, or any particular rate of return.
| 1 | ||||
| 4 | ||||
| 8 | ||||
| 10 | ||||
| 12 | ||||
| 34 | ||||
| 36 | ||||
| 38 | ||||
| 40 | ||||
| 48 | ||||
| 66 | ||||
| 67 | ||||
| 70 | ||||
| 78 |
Unless otherwise noted, views expressed herein are current as of Dec. 31, 2014, and subject to change for events occurring after such date.
Funds are not FDIC insured and are not guaranteed. It is possible to lose the principal amount invested.
Mutual fund advisory services provided by Delaware Management Company, a series of Delaware Management Business Trust, which is a registered investment advisor. Delaware Investments, a member of Macquarie Group, refers to Delaware Management Holdings, Inc. and its subsidiaries, including the Fund’s distributor, Delaware Distributors, L.P. Macquarie Group refers to Macquarie Group Limited and its subsidiaries and affiliates worldwide.
© 2015 Delaware Management Holdings, Inc.
All third-party marks cited are the property of their respective owners.
Table of Contents
| Delaware Limited-Term Diversified Income Fund | January 6, 2015 |
Performance preview (for the year ended December 31, 2014) | ||||
Delaware Limited-Term Diversified Income Fund (Class A shares) | 1-year return | +1.28% | ||
Barclays 1–3 Year U.S. Government/Credit Index (benchmark) | 1-year return | +0.77% |
Past performance does not guarantee future results.
For complete, annualized performance for Delaware Limited-Term Diversified Income Fund, please see the table on page 4.
The performance of Class A shares excludes the applicable sales charge and reflects the reinvestment of all distributions. For a description of the index, please see page 6.
Index performance returns do not reflect any management fees, transaction costs, or expenses. Indices are unmanaged and one cannot invest directly in an index.
Unusually severe winter weather in early 2014 held back U.S. economic growth. Key global events included the Russia-Ukraine confrontation and deflationary and recessionary pressure on the euro zone. At the U.S. Federal Reserve’s March meeting, policy makers started to discuss a potential liftoff of short-term rates. However, the yield on 10-year U.S. Treasury notes moved lower throughout the year, contrary to expectations.
While U.S. economic data were solid as the year progressed and short rates began to rise in anticipation of the Fed’s raising rates, global pressures pushed long-term interest rates lower. Oil prices started to sell off in July and continued through the rest of the fiscal year. Central bank policies began to diverge. As the Fed talked about raising rates, other global central banks, notably the European Central Bank and the Bank of Japan, planned to introduce or continue quantitative easing.
The key development during the latter part of the fiscal year was mounting pressure on global oil prices. Risk assets came under pressure, and the long end of the yield curve rallied. The 10-year Treasury rate fell while the short end did not, flattening the curve throughout the year. Growing economic concerns in Asia and Europe added to the flight toward safe-haven U.S. Treasurys. The fiscal year ended with the deterioration of Greece’s political situation, raising fresh questions about that country’s future in the euro zone. This added to market volatility during this period.
For the fiscal year, yields on the 10-year U.S. Treasury note dropped by 0.86 percentage points, as the safe-haven bond provided an advantage over low-yielding foreign government bonds, which ended the year at historic lows. However, yields on 2-year and 3-year Treasurys rose by about 0.30 percentage points as investors began to sense the approach of the date of the Fed’s first increase in short-term rates, likely sometime in 2015. This led to a flattening of the yield curve between shorter-term and intermediate- to longer-term Treasurys.
Fund performance
For the fiscal year ended Dec. 31, 2014, Delaware Limited-Term Diversified Income Fund (Class A shares) returned +1.28% at net asset value and -1.48% at maximum offer price (both returns reflect all distributions reinvested). For the same period, the Barclays 1–3 Year U.S. Government/ Credit Index returned +0.77%. Complete annualized performance for Delaware Limited-Term Diversified Income Fund is shown in the table on page 4.
The Fund maintained its “barbell” portfolio structure throughout its fiscal year. (The barbell investment strategy combines short-maturity assets with long-maturity assets in an attempt to get better risk-adjusted returns.) We replaced 2-year Treasurys, which would be in alignment with the Fund’s benchmark, with a combination of intermediate-term corporate bonds and floating-rate, high-quality asset-backed securities (ABS) and, to a lesser degree, some mortgage-backed
1
Table of Contents
Portfolio management review
Delaware Limited-Term Diversified Income Fund
securities (MBS). This barbell approach allowed the Fund to outperform the market by avoiding areas where rates were rising and having exposure to areas where rates were falling.
In our view, this barbell structure has worked consistently well over time in short-term and limited-term portfolios as it can provide additional income along with broader opportunities. We believe that the floating-rate position provides an anchor that attempts to balance the risk of rate volatility created by the portfolio’s intermediate-term securities.
During the fiscal year, the Fund’s overweight to BBB-rated corporate bonds returned 4.48% versus the benchmark’s BBB component, which gained 1.42% for the same period. These BBB-rated bonds averaged close to 25% of the Fund’s portfolio.
The Fund’s corporate bond performance was strong because of strong security selection and its emphasis on the 4–5 year maturity area. Our research team identified individual securities that maintained good credit quality overall and outperformed the broader market. The Fund’s 8% allocation to MBS, an out-of-benchmark sector, also contributed to returns, driven in part by strong security selection.
In 2014, we found value in intermediate-term bonds. Our barbell positioning allowed us to own holdings in this part of the yield curve by combining these holdings with an allocation of close to 40% of the portfolio in AAA-rated floating-rate ABS.
The Fund also gained from its underweight in 2-year Treasurys and minimal exposure to the 2–3 year maturity range.
The Fund’s allocation to AAA-rated floating-rate ABS averaged about 38% during the fiscal year and returned 0.60%. While it lagged the benchmark, it provided a relatively strong return for a floating-rate instrument and fared better than
short-term Treasurys. That also worked as a cash surrogate with low sensitivity to interest rates.
A small position in high yield bonds detracted from the Fund’s returns. Overall, high yield returns were negative for the fiscal year; accordingly, having even a small allocation there was a detractor. Although the Fund held some strong-performing lower-quality corporate bonds (particularly in the first half of the fiscal year) high yield bonds experienced volatility as global risks developed, including conflict in Russia-Ukraine, euro-zone deflation, and a drop in oil prices.
The Fund employed two types of derivatives as a hedge: Treasury futures and high yield credit default swaps (CDX). Overall, the use of derivatives didn’t have a material effect on performance during the fiscal year, costing the Fund 0.25% in total return for the year while lowering risk exposure.
We used Treasury financial futures to create a slight negative duration in the first half of 2014. As geopolitical risks increased, including the increased tension in the Russia-Ukraine conflict when a plane was shot down over Ukraine, we removed that hedge. We felt that in the event of war, Treasurys would likely be the only asset performing well and would be risky to short. We then added a half-year of duration in Treasury futures as a hedge against geopolitical risk. We maintained a hedge in long Treasury futures for the rest of the fiscal year, with an overall duration just below the Fund’s 3-year maximum.
At several points during the fiscal year, we also bought protection against the Fund’s high yield bond exposure in the CDX market as an on-and-off trade in an attempt to protect the Fund when markets became nervous. These CDX positions generally have been neutral to slightly positive for the Fund.
2
Table of Contents
This page intentionally left blank.
Table of Contents
| Performance summary | ||
Delaware Limited-Term Diversified Income Fund | December 31, 2014 |
The performance data quoted represent past performance; past performance does not guarantee future results. Investment return and principal value will fluctuate so your shares, when redeemed, may be worth more or less than their original cost. Please obtain the performance data current for the most recent month end by calling 800 523-1918 or visiting our website at delawareinvestments.com/performance. Current performance may be lower or higher than the performance data quoted.
Fund and benchmark performance1,2 | Average annual total returns through December 31, 2014 | |||||||||||||
| 1 year | 5 years | 10 years | ||||||||||||
Class A (Est. Nov. 24, 1985) | ||||||||||||||
Excluding sales charge | +1.28 | % | +1.67 | % | +3.48 | % | ||||||||
Including sales charge | -1.48 | % | +1.11 | % | +3.19 | % | ||||||||
Class C (Est. Nov. 28, 1995) | ||||||||||||||
Excluding sales charge | +0.55 | % | +0.83 | % | +2.60 | % | ||||||||
Including sales charge | -0.45 | % | +0.83 | % | +2.60 | % | ||||||||
Class R (Est. June 2, 2003) | ||||||||||||||
Excluding sales charge | +0.93 | % | +1.31 | % | +3.11 | % | ||||||||
Including sales charge | +0.93 | % | +1.31 | % | +3.11 | % | ||||||||
Institutional Class (Est. June 1, 1992) | ||||||||||||||
Excluding sales charge | +1.43 | % | +1.84 | % | +3.63 | % | ||||||||
Including sales charge | +1.43 | % | +1.84 | % | +3.63 | % | ||||||||
| Barclays 1–3 Year U.S. Government/Credit Index | +0.77 | % | +1.41 | % | +2.86 | % | ||||||||
1 Returns reflect the reinvestment of all distributions and are presented both with and without the applicable sales charges described below. Returns do not reflect the deduction of taxes the shareholder would pay on Fund distributions or redemptions of Fund shares.
Expense limitations were in effect for certain classes during some or all of the periods shown in the “Fund and benchmark performance” table. Expenses for each class are listed on the “Fund expense ratios” table on page 5. Performance would have been lower had expense limitations not been in effect.
Class A shares are sold with a maximum front-end sales charge of 2.75%, and have an annual distribution and service fee of 0.25% of average daily net assets. This fee was contractually limited to 0.15% of average daily net assets from
Jan. 1, 2014 through Dec. 31, 2014.* Performance for Class A shares, excluding sales charges, assumes that no front-end sales charge applied.
Class C shares are sold with a contingent deferred sales charge of 1.00% if redeemed during the first 12 months. They are also subject to an annual distribution and service fee of 1.00% of average daily net assets. Performance for C shares, excluding sales charges, assumes either that contingent deferred sales charges did not apply or that the investment was not redeemed.
Class R shares are available only for certain retirement plan products. They are sold without a sales charge and have an annual distribution and service fee of 0.50% of average daily net assets.
4
Table of Contents
Institutional Class shares are available without sales or asset-based distribution charges only to certain eligible institutional accounts.
The “Fund and benchmark performance” table does not reflect the deduction of taxes the shareholder would pay on Fund distributions or redemptions of Fund shares.
Fixed income securities and bond funds can lose value, and investors can lose principal, as interest rates rise. They also may be affected by economic conditions that hinder an issuer’s ability to make interest and principal payments on its debt.
The Fund may also be subject to prepayment risk, the risk that the principal of a fixed income security that is held by the Fund may be prepaid prior to maturity, potentially forcing the Fund to reinvest that money at a lower interest rate.
If and when the Fund invests in forward foreign currency contracts or uses other investments to hedge against currency risks, the Fund will be subject to special risks, including counterparty risk.
High yielding, noninvestment grade bonds (junk bonds) involve higher risk than investment grade bonds. The high yield secondary market is particularly susceptible to liquidity problems when institutional investors, such as mutual funds and
certain other financial institutions, temporarily stop buying bonds for regulatory, financial, or other reasons. In addition, a less liquid secondary market makes it more difficult for the Fund to obtain precise valuations of the high yield securities in its portfolio.
The Fund may invest in derivatives, which may involve additional expenses and are subject to risk, including the risk that an underlying security or securities index moves in the opposite direction from what the portfolio manager anticipated. A derivative transaction depends upon the counterparties’ ability to fulfill their contractual obligations.
International investments entail risks not ordinarily associated with U.S. investments including fluctuation in currency values, differences in accounting principles, or economic or political instability in other nations.
Investing in emerging markets can be riskier than investing in established foreign markets due to increased volatility and lower trading volume.
Diversification may not protect against market risk.
* The contractual waiver period is April 30, 2013 through April 30, 2015.
2 The Fund’s expense ratios, as described in the most recent prospectus, are disclosed in the following “Fund expense ratios” table.
Fund expense ratios | Class A | Class C | Class R | Institutional Class | ||||
Total annual operating expenses | 0.92% | 1.67% | 1.17% | 0.67% | ||||
(without fee waivers) | ||||||||
Net expenses | 0.82% | 1.67% | 1.17% | 0.67% | ||||
(including fee waivers, if any) | ||||||||
Type of waiver | Contractual | n/a | n/a | n/a |
5
Table of Contents
Performance summary
Delaware Limited-Term Diversified Income Fund
Performance of a $10,000 investment1
Average annual total returns from Dec. 31, 2004, through Dec. 31, 2014
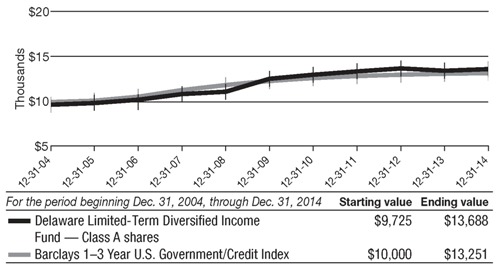
1 The “Performance of a $10,000 investment” graph assumes $10,000 invested in Class A shares of the Fund on Dec. 31, 2004, and includes the effect of a 2.75% front-end sales charge and the reinvestment of all distributions. The graph does not reflect the deduction of taxes the shareholders would pay on Fund distributions or redemptions of Fund shares. Expense limitations were in effect for some or all of the periods shown. Performance would have been lower had expense limitations not been in effect. Expenses are listed in the “Fund expense ratios” table on page 5. Please note additional details on pages 4 through 7.
The graph also assumes $10,000 invested in the Barclays 1–3 Year U.S. Government/Credit Index
as of Dec. 31, 2004. The Barclays 1–3 Year U.S. Government/Credit Index is a market value-weighted index of government fixed-rate debt securities and investment grade U.S. and foreign fixed-rate debt securities with average maturities of one to three years.
Index performance returns do not reflect any management fees, transaction costs, or expenses. Indices are unmanaged and one cannot invest directly in an index. Past performance is not a guarantee of future results.
Performance of other Fund classes will vary due to different charges and expenses.
6
Table of Contents
| Nasdaq symbols | CUSIPs | |||||
Class A | DTRIX | 245912308 | ||||
Class C | DTICX | 245912704 | ||||
Class R | DLTRX | 245912803 | ||||
Institutional Class | DTINX | 245912506 |
7
Table of Contents
For the six-month period from July 1, 2014 to December 31, 2014 (Unaudited)
As a shareholder of the Fund, you incur two types of costs: (1) transaction costs, including sales charges (loads) on purchase payments, reinvested dividends, or other distributions; redemption fees; and exchange fees; and (2) ongoing costs, including management fees; distribution and/or service (12b-1) fees; and other Fund expenses. This example is intended to help you understand your ongoing costs (in dollars) of investing in the Fund and to compare these costs with the ongoing costs of investing in other mutual funds.
The example is based on an investment of $1,000 invested at the beginning of the period and held for the entire six-month period from July 1, 2014 to Dec. 31, 2014.
Actual expenses
The first section of the table shown, “Actual Fund return,” provides information about actual account values and actual expenses. You may use the information in this section of the table, together with the amount you invested, to estimate the expenses that you paid over the period. Simply divide your account value by $1,000 (for example, an $8,600 account value divided by $1,000 = 8.6), then multiply the result by the number in the first section under the heading entitled “Expenses Paid During Period” to estimate the expenses you paid on your account during this period.
Hypothetical example for comparison purposes
The second section of the table shown, “Hypothetical 5% return,” provides information about hypothetical account values and hypothetical expenses based on the Fund’s actual expense ratio and an assumed rate of return of 5% per year before expenses, which is not the Fund’s actual return. The hypothetical account values and expenses may not be used to estimate the actual ending account balance or expenses you paid for the period. You may use this information to compare the ongoing costs of investing in the Fund and other funds. To do so, compare this 5% hypothetical example with the 5% hypothetical examples that appear in the shareholder reports of the other funds.
Please note that the expenses shown in the table are meant to highlight your ongoing costs only and do not reflect any transactional costs, such as sales charges (loads), redemption fees, or exchange fees. Therefore, the second section of the table is useful in comparing ongoing costs only, and will not help you determine the relative total costs of owning different funds. In addition, if these transactional costs were included, your costs would have been higher. The Fund’s expenses shown in the table reflect fee waivers in effect. The expenses shown in the table assume reinvestment of all dividends and distributions.
8
Table of Contents
Delaware Limited-Term Diversified Income Fund
Expense analysis of an investment of $1,000
| Beginning | Ending | Expenses | ||||||||||||||||||
| Account Value | Account Value | Annualized | Paid During Period | |||||||||||||||||
| 7/1/14 | 12/31/14 | Expense Ratio | 7/1/14 to 12/31/14* | |||||||||||||||||
Actual Fund return† | ||||||||||||||||||||
Class A | $1,000.00 | $1,000.10 | 0.81 | % | $4.08 | |||||||||||||||
Class C | 1,000.00 | 995.90 | 1.66 | % | 8.35 | |||||||||||||||
Class R | 1,000.00 | 998.40 | 1.16 | % | 5.84 | |||||||||||||||
Institutional Class | 1,000.00 | 1,000.90 | 0.66 | % | 3.33 | |||||||||||||||
Hypothetical 5% return (5% return before expenses) | ||||||||||||||||||||
Class A | $1,000.00 | $1,021.12 | 0.81 | % | $4.13 | |||||||||||||||
Class C | 1,000.00 | 1,016.84 | 1.66 | % | 8.44 | |||||||||||||||
Class R | 1,000.00 | 1,019.36 | 1.16 | % | 5.90 | |||||||||||||||
Institutional Class | 1,000.00 | 1,021.88 | 0.66 | % | 3.36 | |||||||||||||||
| * | “Expenses Paid During Period” are equal to the Fund’s annualized expense ratio, multiplied by the average account value over the period, multiplied by 184/365 (to reflect the one-half year period). |
| † | Because actual returns reflect only the most recent six-month period, the returns shown may differ significantly from fiscal year returns. |
9
Table of Contents
Security type / sector allocation
| Delaware Limited-Term Diversified Income Fund | As of December 31, 2014 (Unaudited) |
Sector designations may be different than the sector designations presented in other Fund materials. The sector designations may represent the investment manager’s internal sector classifications, which may result in the sector designations for one fund being different than another fund’s sector designations.
Security type / sector |
| Percentage of net assets
|
| |
Agency Asset-Backed Securities | 0.02% | |||
Agency Collateralized Mortgage Obligations | 2.07% | |||
Agency Mortgage-Backed Securities | 4.22% | |||
Collateralized Debt Obligations | 0.56% | |||
Commercial Mortgage-Backed Securities | 0.93% | |||
Convertible Bond | 0.12% | |||
Corporate Bonds | 50.42% | |||
Automotive | 0.17% | |||
Banking | 9.35% | |||
Basic Industry | 3.26% | |||
Brokerage | 0.37% | |||
Capital Goods | 0.92% | |||
Communications | 4.31% | |||
Consumer Cyclical | 6.13% | |||
Consumer Non-Cyclical | 7.89% | |||
Electric | 4.94% | |||
Energy | 4.19% | |||
Finance Companies | 1.02% | |||
Healthcare | 0.27% | |||
Industrial | 0.04% | |||
Insurance | 2.06% | |||
Media | 0.09% | |||
Natural Gas | 0.47% | |||
Real Estate | 0.24% | |||
REITs | 0.11% | |||
Services | 0.21% | |||
Technology | 2.86% | |||
Technology & Electronics | 0.05% | |||
Telecommunications | 0.06% | |||
Transportation | 1.41% | |||
Municipal Bonds | 0.88% | |||
Non-Agency Asset-Backed Securities | 36.71% | |||
Non-Agency Collateralized Mortgage Obligations | 0.04% | |||
Senior Secured Loans | 0.64% | |||
Sovereign Bonds | 0.52% | |||
Supranational Bank | 0.04% |
10
Table of Contents
Security type / sector |
| Percentage of net assets
|
| |
U.S. Treasury Obligations | 0.29% | |||
Preferred Stock | 0.09% | |||
Short-Term Investments | 1.96% | |||
Total Value of Securities | 99.51% | |||
Receivables and Other Assets Net of Liabilities | 0.49% | |||
Total Net Assets | 100.00% |
11
Table of Contents
Delaware Limited-Term Diversified Income Fund | December 31, 2014 |
| Principal amount° | Value (U.S. $) | |||||||
| ||||||||
Agency Asset-Backed Securities – 0.02% | ||||||||
| ||||||||
Fannie Mae Grantor Trust | ||||||||
Series 2003-T4 2A5 5.407% 9/26/33 | 212,664 | $ | 231,548 | |||||
Fannie Mae Whole Loan | ||||||||
Series 2001-W2 AS5 6.473% 10/25/31 | 2,802 | 2,908 | ||||||
Freddie Mac Structured Pass Through Securities | ||||||||
Series T-30 A5 7.602% 12/25/30 ¿— | 5,460 | 5,758 | ||||||
SLM Student Loan Trust | ||||||||
Series 2004-4 A4 0.364% 1/25/19 — | 3,767 | 3,763 | ||||||
|
| |||||||
| Total Agency Asset-Backed Securities (cost $223,269) | 243,977 | |||||||
|
| |||||||
| ||||||||
Agency Collateralized Mortgage Obligations – 2.07% | ||||||||
| ||||||||
E.F. Hutton Trust III | ||||||||
Series 1 A 1.005% 10/25/17 — | 255 | 252 | ||||||
Fannie Mae Grantor Trust | ||||||||
Series 2001-T5 A2 6.99% 6/19/41 — | 37,634 | 42,597 | ||||||
Series 2002-T1 A2 7.00% 11/25/31 | 85,413 | 100,541 | ||||||
Fannie Mae REMICs | ||||||||
Series 2002-90 A1 6.50% 6/25/42 | 1,111 | 1,265 | ||||||
Series 2002-W1 2A 6.527% 2/25/42 — | 106,920 | 124,605 | ||||||
Series 2003-52 NA 4.00% 6/25/23 | 166,702 | 175,276 | ||||||
Series 2003-120 BL 3.50% 12/25/18 | 513,615 | 532,195 | ||||||
Series 2004-36 FA 0.57% 5/25/34 — | 442,259 | 444,873 | ||||||
Series 2004-49 EB 5.00% 7/25/24 | 50,390 | 54,984 | ||||||
Series 2005-66 FD 0.47% 7/25/35 — | 1,930,507 | 1,934,266 | ||||||
Series 2005-110 MB 5.50% 9/25/35 | 19,358 | 20,851 | ||||||
Series 2006-105 FB 0.59% 11/25/36 — | 114,471 | 115,255 | ||||||
Series 2010-29 PA 4.50% 10/25/38 | 147,276 | 152,512 | ||||||
Series 2010-75 NA 4.00% 9/25/28 | 497,721 | 513,349 | ||||||
Series 2011-88 AB 2.50% 9/25/26 | 262,580 | 267,883 | ||||||
Series 2011-105 FP 0.57% 6/25/41 — | 3,537,448 | 3,549,436 | ||||||
Series 2011-113 MC 4.00% 12/25/40 | 431,927 | 453,464 | ||||||
Freddie Mac REMICs | ||||||||
Series 2901 CA 4.50% 11/15/19 | 197,954 | 206,102 | ||||||
Series 2931 GC 5.00% 1/15/34 | 87,111 | 88,850 | ||||||
Series 3016 FL 0.551% 8/15/35 — | 110,264 | 110,899 | ||||||
Series 3027 DE 5.00% 9/15/25 | 51,679 | 56,191 | ||||||
Series 3067 FA 0.511% 11/15/35 — | 4,205,729 | 4,220,563 | ||||||
Series 3232 KF 0.611% 10/15/36 — | 124,123 | 125,230 | ||||||
Series 3241 FM 0.541% 11/15/36 — | 48,742 | 48,986 | ||||||
Series 3297 BF 0.401% 4/15/37 — | 1,313,488 | 1,318,518 | ||||||
Series 3316 FB 0.461% 8/15/35 — | 222,213 | 222,700 | ||||||
Series 3416 GK 4.00% 7/15/22 | 626 | 634 | ||||||
Series 3737 NA 3.50% 6/15/25 | 224,865 | 233,133 | ||||||
12
Table of Contents
| Principal amount° | Value (U.S. $) | |||||||
| ||||||||
Agency Collateralized Mortgage Obligations (continued) | ||||||||
| ||||||||
Freddie Mac REMICs | ||||||||
Series 3780 LF 0.561% 3/15/29 — | 684,181 | $ | 685,092 | |||||
Series 3800 AF 0.661% 2/15/41 — | 2,770,556 | 2,793,792 | ||||||
Series 3803 TF 0.561% 11/15/28 — | 641,730 | 645,010 | ||||||
Series 4163 CW 3.50% 4/15/40 | 4,155,213 | 4,340,498 | ||||||
Freddie Mac Structured Pass Through Securities | ||||||||
Series T-42 A5 7.50% 2/25/42 ¿ | 45,052 | 52,411 | ||||||
Series T-54 2A 6.50% 2/25/43 ¿ | 1,026 | 1,182 | ||||||
Series T-58 2A 6.50% 9/25/43 ¿ | 728,846 | 833,158 | ||||||
Series T-60 1A4C 4.686% 3/25/44 ¿— | 231,787 | 232,660 | ||||||
|
| |||||||
Total Agency Collateralized Mortgage Obligations (cost $24,510,635) | 24,699,213 | |||||||
|
| |||||||
| ||||||||
Agency Mortgage-Backed Securities – 4.22% | ||||||||
| ||||||||
Fannie Mae | ||||||||
6.50% 8/1/17 | 24,526 | 25,556 | ||||||
9.00% 11/1/15 | 6,537 | 6,598 | ||||||
10.00% 10/1/30 | 97,764 | 108,917 | ||||||
10.50% 6/1/30 | 26,059 | 26,631 | ||||||
Fannie Mae ARM | ||||||||
2.057% 8/1/34 — | 161,449 | 170,494 | ||||||
2.088% 9/1/38 — | 2,272,060 | 2,450,900 | ||||||
2.09% 3/1/38 — | 7,814 | 8,321 | ||||||
2.193% 8/1/36 — | 53,055 | 57,002 | ||||||
2.227% 11/1/39 — | 349,812 | 371,895 | ||||||
2.238% 4/1/36 — | 42,780 | 46,120 | ||||||
2.259% 6/1/36 — | 216,113 | 232,687 | ||||||
2.268% 7/1/36 — | 115,084 | 125,635 | ||||||
2.271% 11/1/35 — | 521,690 | 558,927 | ||||||
2.274% 12/1/33 — | 148,122 | 157,285 | ||||||
2.277% 6/1/34 — | 90,859 | 97,031 | ||||||
2.277% 7/1/36 — | 136,748 | 148,236 | ||||||
2.315% 11/1/35 — | 42,801 | 45,870 | ||||||
2.317% 4/1/36 — | 5,867 | 6,256 | ||||||
2.336% 4/1/36 — | 653,623 | 701,911 | ||||||
3.474% 1/1/41 — | 271,779 | 285,532 | ||||||
4.527% 11/1/39 — | 2,485,190 | 2,626,050 | ||||||
5.141% 8/1/35 — | 36,712 | 39,234 | ||||||
Fannie Mae FHAVA | ||||||||
7.50% 3/1/25 | 1,492 | 1,506 | ||||||
10.00% 1/1/19 | 30,819 | 31,312 | ||||||
Fannie Mae S.F. 15 yr | ||||||||
4.00% 5/1/27 | 1,428,415 | 1,530,162 | ||||||
4.50% 9/1/20 | 1,303,754 | 1,373,269 | ||||||
13
Table of Contents
Schedule of investments
Delaware Limited-Term Diversified Income Fund
| Principal amount° | Value (U.S. $) | |||||||
| ||||||||
Agency Mortgage-Backed Securities (continued) | ||||||||
| ||||||||
Fannie Mae S.F. 15 yr | ||||||||
5.00% 9/1/18 | 124,094 | $ | 130,920 | |||||
5.00% 10/1/18 | 1,537 | 1,644 | ||||||
5.00% 2/1/19 | 3,230 | 3,461 | ||||||
5.00% 5/1/21 | 17,107 | 18,389 | ||||||
5.00% 9/1/25 | 9,559,870 | 10,459,502 | ||||||
5.50% 1/1/23 | 10,354 | 11,308 | ||||||
5.50% 4/1/23 | 36,196 | 39,401 | ||||||
6.00% 3/1/18 | 575,596 | 597,576 | ||||||
6.00% 8/1/22 | 29,761 | 32,517 | ||||||
8.00% 10/1/16 | 14,707 | 15,078 | ||||||
Fannie Mae S.F. 20 yr | ||||||||
5.50% 12/1/29 | 122,810 | 137,489 | ||||||
6.00% 9/1/29 | 494,970 | 560,400 | ||||||
6.50% 2/1/22 | 74,503 | 84,845 | ||||||
Fannie Mae S.F. 30 yr | ||||||||
4.50% 11/1/40 | 1,001,626 | 1,088,318 | ||||||
4.50% 2/1/41 | 483,310 | 525,160 | ||||||
4.50% 4/1/41 | 1,206,948 | 1,312,121 | ||||||
5.00% 4/1/33 | 337,780 | 374,258 | ||||||
5.00% 3/1/34 | 4,688 | 5,194 | ||||||
5.00% 8/1/37 | 424,336 | 469,903 | ||||||
5.50% 12/1/32 | 37,175 | 41,895 | ||||||
5.50% 3/1/35 | 110,785 | 123,795 | ||||||
5.50% 7/1/36 | 55,599 | 62,486 | ||||||
5.50% 2/1/37 | 466,287 | 521,526 | ||||||
5.50% 4/1/37 | 469,240 | 524,519 | ||||||
5.50% 6/1/38 | 1,292,717 | 1,444,520 | ||||||
6.00% 9/1/34 | 348 | 397 | ||||||
6.00% 11/1/34 | 1,280 | 1,450 | ||||||
6.00% 4/1/36 | 9,899 | 11,219 | ||||||
6.00% 12/1/36 | 728,860 | 836,318 | ||||||
6.00% 2/1/37 | 146,772 | 166,619 | ||||||
6.00% 5/1/38 | 52,759 | 59,869 | ||||||
6.00% 1/1/39 | 368,505 | 418,307 | ||||||
6.50% 6/1/29 | 1,526 | 1,738 | ||||||
6.50% 1/1/34 | 1,919 | 2,186 | ||||||
6.50% 4/1/36 | 3,026 | 3,446 | ||||||
6.50% 6/1/36 | 9,308 | 11,133 | ||||||
6.50% 10/1/36 | 7,335 | 8,354 | ||||||
6.50% 8/1/37 | 1,350 | 1,537 | ||||||
7.00% 12/1/34 | 1,788 | 2,055 | ||||||
7.00% 12/1/35 | 1,544 | 1,741 | ||||||
14
Table of Contents
| Principal amount° | Value (U.S. $) | |||||||
| ||||||||
Agency Mortgage-Backed Securities (continued) |
| |||||||
| ||||||||
Fannie Mae S.F. 30 yr | ||||||||
7.00% 4/1/37 | 718,141 | $ | 806,631 | |||||
7.00% 12/1/37 | 4,689 | 5,001 | ||||||
7.50% 6/1/31 | 940 | 1,138 | ||||||
7.50% 11/1/31 | 9,911 | 11,482 | ||||||
7.50% 4/1/32 | 497 | 583 | ||||||
7.50% 5/1/33 | 1,289 | 1,307 | ||||||
7.50% 6/1/34 | 608 | 697 | ||||||
8.00% 11/1/21 | 221 | 243 | ||||||
8.00% 7/1/23 | 1,415 | 1,463 | ||||||
8.00% 5/1/24 | 40,574 | 42,219 | ||||||
9.00% 8/1/22 | 18,981 | 19,895 | ||||||
9.25% 6/1/16 | 1,818 | 1,825 | ||||||
9.25% 8/1/16 | 8,271 | 8,305 | ||||||
10.00% 2/1/25 | 91,052 | 100,093 | ||||||
11.00% 8/1/20 | 2,971 | 3,018 | ||||||
Freddie Mac | ||||||||
6.50% 3/1/16 | 87,820 | 89,581 | ||||||
Freddie Mac ARM | ||||||||
2.249% 7/1/36 — | 54,376 | 58,484 | ||||||
2.25% 2/1/37 — | 6,916 | 7,384 | ||||||
2.265% 10/1/36 — | 8,263 | 8,788 | ||||||
2.275% 10/1/37 — | 287,415 | 304,394 | ||||||
2.307% 4/1/34 — | 19,545 | 20,775 | ||||||
2.35% 4/1/33 — | 81,609 | 84,501 | ||||||
2.375% 2/1/35 — | 114,293 | 122,339 | ||||||
2.385% 7/1/38 — | 1,413,889 | 1,520,606 | ||||||
2.495% 6/1/37 — | 366,682 | 386,722 | ||||||
2.534% 1/1/44 — | 854,780 | 876,535 | ||||||
3.47% 5/1/42 — | 5,120,440 | 5,371,548 | ||||||
4.884% 8/1/38 — | 35,004 | 36,958 | ||||||
Freddie Mac S.F. 15 yr | ||||||||
4.00% 5/1/25 | 106,734 | 113,930 | ||||||
4.50% 6/1/26 | 298,073 | 322,100 | ||||||
5.00% 6/1/18 | 822 | 864 | ||||||
5.00% 4/1/20 | 128,738 | 136,593 | ||||||
5.00% 12/1/22 | 22,349 | 24,074 | ||||||
8.00% 7/1/16 | 4,753 | 4,803 | ||||||
Freddie Mac S.F. 30 yr | ||||||||
4.50% 10/1/39 | 539,660 | 585,124 | ||||||
4.50% 10/1/43 | 394,945 | 428,336 | ||||||
5.50% 6/1/36 | 51,738 | 58,040 | ||||||
5.50% 11/1/36 | 118,232 | 132,191 | ||||||
15
Table of Contents
Schedule of investments
Delaware Limited-Term Diversified Income Fund
| Principal amount° | Value (U.S. $) | |||||||
| ||||||||
Agency Mortgage-Backed Securities (continued) |
| |||||||
| ||||||||
Freddie Mac S.F. 30 yr | ||||||||
5.50% 3/1/40 | 288,335 | $ | 322,436 | |||||
6.00% 1/1/38 | 109,890 | 124,213 | ||||||
6.00% 6/1/38 | 298,797 | 338,311 | ||||||
6.00% 8/1/38 | 3,739,204 | 4,244,108 | ||||||
7.00% 11/1/33 | 594 | 708 | ||||||
8.00% 5/1/31 | 75,279 | 86,258 | ||||||
9.00% 9/1/30 | 73,085 | 79,168 | ||||||
11.00% 5/1/20 | 1,776 | 2,002 | ||||||
11.50% 6/1/15 | 255 | 256 | ||||||
11.50% 8/1/15 | 336 | 338 | ||||||
11.50% 2/1/16 | 930 | 943 | ||||||
11.50% 3/1/16 | 1,096 | 1,106 | ||||||
GNMA I S.F. 15 yr | ||||||||
6.00% 1/15/22 | 1,757,049 | 1,905,941 | ||||||
GNMA I S.F. 30 yr | ||||||||
7.50% 12/15/23 | 43,007 | 49,520 | ||||||
7.50% 12/15/31 | 70,206 | 86,486 | ||||||
7.50% 1/15/32 | 1,547 | 1,911 | ||||||
8.00% 6/15/30 | 7,420 | 7,714 | ||||||
9.00% 5/15/16 | 544 | 545 | ||||||
9.00% 8/15/16 | 297 | 304 | ||||||
9.00% 9/15/16 | 987 | 1,002 | ||||||
9.00% 2/15/17 | 1,016 | 1,021 | ||||||
9.50% 12/15/16 | 896 | 934 | ||||||
11.00% 10/15/15 | 7 | 7 | ||||||
11.00% 11/15/15 | 742 | 746 | ||||||
11.00% 1/15/16 | 658 | 668 | ||||||
11.00% 2/15/16 | 4,702 | 4,727 | ||||||
11.00% 9/15/16 | 280 | 281 | ||||||
11.00% 12/15/17 | 4,247 | 4,273 | ||||||
11.00% 4/15/19 | 3,550 | 3,572 | ||||||
11.00% 5/15/19 | 1,852 | 1,863 | ||||||
11.00% 6/15/19 | 9,271 | 9,367 | ||||||
11.00% 8/15/19 | 4,939 | 5,077 | ||||||
GNMA II GPM 30 yr | ||||||||
9.75% 12/20/16 | 3,015 | 3,030 | ||||||
9.75% 9/20/17 | 2,689 | 2,703 | ||||||
GNMA II S.F. 30 yr | ||||||||
9.50% 11/20/20 | 895 | 911 | ||||||
9.50% 9/20/21 | 6,675 | 7,530 | ||||||
9.50% 10/20/21 | 24,513 | 27,766 | ||||||
9.50% 11/20/21 | 18,807 | 21,294 | ||||||
16
Table of Contents
| Principal amount° | Value (U.S. $) | |||||||
| ||||||||
Agency Mortgage-Backed Securities (continued) |
| |||||||
| ||||||||
GNMA II S.F. 30 yr | ||||||||
10.50% 6/20/20 | 1,401 | $ | 1,409 | |||||
11.00% 9/20/15 | 2,340 | 2,363 | ||||||
11.00% 10/20/15 | 340 | 344 | ||||||
11.50% 1/20/18 | 5,704 | 5,822 | ||||||
11.50% 8/20/18 | 8,487 | 8,541 | ||||||
12.00% 4/20/15 | 191 | 191 | ||||||
12.00% 5/20/15 | 65 | 65 | ||||||
12.00% 7/20/15 | 36 | 36 | ||||||
12.00% 8/20/15 | 296 | 297 | ||||||
12.00% 9/20/15 | 920 | 931 | ||||||
12.00% 10/20/15 | 804 | 808 | ||||||
|
| |||||||
Total Agency Mortgage-Backed Securities (cost $49,402,138) | 50,414,348 | |||||||
|
| |||||||
| ||||||||
Collateralized Debt Obligations – 0.56% | ||||||||
| ||||||||
Acis CLO |
| |||||||
Series 2014-3A AX 144A 1.582% 2/1/26 #— | 1,750,000 | 1,750,000 | ||||||
Harbourview CLO VII |
| |||||||
144A 1.581% 11/18/26 #— | 5,000,000 | 4,987,500 | ||||||
|
| |||||||
Total Collateralized Debt Obligations (cost $6,737,500) | 6,737,500 | |||||||
|
| |||||||
| ||||||||
Commercial Mortgage-Backed Securities – 0.93% | ||||||||
| ||||||||
Banc of America Commercial Mortgage Trust | ||||||||
Series 2006-1 AM 5.421% 9/10/45 — | 255,000 | 264,919 | ||||||
CD Commercial Mortgage Trust | ||||||||
Series 2005-CD1 AM 5.226% 7/15/44 — | 1,130,000 | 1,160,042 | ||||||
Credit Suisse Commercial Mortgage Trust | ||||||||
Series 2006-C1 AAB 5.467% 2/15/39 — | 330 | 330 | ||||||
DB-UBS Mortgage Trust |
| |||||||
Series 2011-LC1A A3 144A 5.002% 11/10/46 # | 1,285,000 | 1,449,021 | ||||||
FREMF Mortgage Trust |
| |||||||
Series 2011-K15 B 144A 4.931% 8/25/44 #— | 95,000 | 103,735 | ||||||
Series 2011-K703 B 144A 4.884% 7/25/44 #— | 815,000 | 870,057 | ||||||
Series 2012-K708 B 144A 3.759% 2/25/45 #— | 2,010,000 | 2,069,713 | ||||||
Series 2012-K711 B 144A 3.562% 8/25/45 #— | 100,000 | 102,188 | ||||||
Series 2013-K712 B 144A 3.368% 5/25/45 #— | 980,000 | 983,243 | ||||||
Goldman Sachs Mortgage Securities Trust | ||||||||
Series 2006-GG6 A4 5.553% 4/10/38 — | 1,160,000 | 1,190,348 | ||||||
JPMBB Commercial Mortgage Securities Trust | ||||||||
Series 2014-C18 A1 1.254% 2/15/47 | 1,311,388 | 1,306,327 | ||||||
JPMorgan Chase Commercial Mortgage Securities Trust | ||||||||
Series 2006-LDP8 AM 5.44% 5/15/45 | 1,065,000 | 1,127,667 | ||||||
17
Table of Contents
Schedule of investments
Delaware Limited-Term Diversified Income Fund
| Principal amount° | Value (U.S. $) | |||||||
| ||||||||
Commercial Mortgage-Backed Securities (continued) | ||||||||
| ||||||||
Morgan Stanley Capital I Trust | ||||||||
Series 2005-HQ7 AJ 5.206% 11/14/42 — | 500,000 | $ | 511,465 | |||||
|
| |||||||
Total Commercial Mortgage-Backed Securities (cost $11,053,663) | 11,139,055 | |||||||
|
| |||||||
| ||||||||
Convertible Bond – 0.12% | ||||||||
| ||||||||
Jefferies Group 3.875% exercise price $45.06, expiration date 10/31/29 | 1,355,000 | 1,404,966 | ||||||
|
| |||||||
Total Convertible Bond (cost $1,443,922) | 1,404,966 | |||||||
|
| |||||||
| ||||||||
Corporate Bonds – 50.42% | ||||||||
| ||||||||
Automotive – 0.17% | ||||||||
International Automotive Components Group 144A | ||||||||
9.125% 6/1/18 # | 1,000,000 | 1,050,000 | ||||||
Schaeffler Holding Finance 144A PIK 6.25% 11/15/19 #T | 1,000,000 | 1,035,000 | ||||||
|
| |||||||
| 2,085,000 | ||||||||
|
| |||||||
Banking – 9.35% | ||||||||
ANZ New Zealand International 144A 2.60% 9/23/19 # | 3,900,000 | 3,943,017 | ||||||
Banco Daycoval 144A 5.75% 3/19/19 # | 500,000 | 498,750 | ||||||
Bank Nederlandse Gemeenten 144A 1.75% 10/6/15 # | 2,000 | 2,021 | ||||||
Bank of America 4.25% 10/22/26 | 3,430,000 | 3,427,023 | ||||||
Bank of Georgia 144A 7.75% 7/5/17 # | 300,000 | 310,500 | ||||||
Bank of Montreal 2.375% 1/25/19 | 4,580,000 | 4,628,470 | ||||||
Barclays 2.75% 11/8/19 | 5,000,000 | 4,974,075 | ||||||
BBVA International Preferred SAU 5.919% 4/29/49 — | 500,000 | 511,400 | ||||||
Branch Banking & Trust 3.80% 10/30/26 | 1,610,000 | 1,645,327 | ||||||
Citizens Bank 2.45% 12/4/19 | 4,385,000 | 4,362,606 | ||||||
Compass Bank 2.75% 9/29/19 | 7,305,000 | 7,320,399 | ||||||
Cooperatieve Centrale Raiffeisen-Boerenleenbank | ||||||||
2.25% 1/14/19 | 5,690,000 | 5,737,864 | ||||||
Credit Suisse | ||||||||
2.30% 5/28/19 | 4,890,000 | 4,886,680 | ||||||
3.00% 10/29/21 | 475,000 | 473,507 | ||||||
Finansbank 144A 5.15% 11/1/17 # | 250,000 | 257,075 | ||||||
Goldman Sachs Group 6.15% 4/1/18 | 3,155,000 | 3,542,809 | ||||||
HBOS 144A 6.75% 5/21/18 # | 2,555,000 | 2,853,925 | ||||||
HSBC Holdings 5.625% 12/29/49 — | 3,535,000 | 3,551,791 | ||||||
JPMorgan Chase | ||||||||
4.125% 12/15/26 | 1,510,000 | 1,515,068 | ||||||
6.75% 8/29/49 — | 2,375,000 | 2,517,500 | ||||||
7.90% 4/29/49 — | 1,000,000 | 1,081,300 | ||||||
JPMorgan Chase Bank 0.571% 6/13/16 — | 1,750,000 | 1,743,207 | ||||||
Manufacturers & Traders Trust 2.25% 7/25/19 | 5,255,000 | 5,247,922 | ||||||
Morgan Stanley 4.35% 9/8/26 | 1,930,000 | 1,944,182 | ||||||
18
Table of Contents
| Principal amount° | Value (U.S. $) | |||||||
| ||||||||
Corporate Bonds (continued) | ||||||||
| ||||||||
Banking (continued) | ||||||||
Northern Trust 3.95% 10/30/25 | 1,135,000 | $ | 1,183,861 | |||||
Oversea-Chinese Banking 144A 4.00% 10/15/24 #— | 2,095,000 | 2,147,752 | ||||||
PNC Preferred Funding Trust II 144A 1.463% 3/31/49 #— | 2,200,000 | 2,079,000 | ||||||
Popular 7.00% 7/1/19 | 1,000,000 | 1,005,000 | ||||||
RBS Capital Trust III 2.095% 9/29/49 — | 1,000,000 | 999,500 | ||||||
Santander Holdings USA 4.625% 4/19/16 | 2,090,000 | 2,177,839 | ||||||
Skandinaviska Enskilda Banken 144A 2.375% 3/25/19 # | 4,580,000 | 4,617,006 | ||||||
State Street 3.30% 12/16/24 | 705,000 | 717,048 | ||||||
SunTrust Bank | ||||||||
2.35% 11/1/18 | 3,850,000 | 3,877,177 | ||||||
2.50% 5/1/19 | 6,230,000 | 6,277,198 | ||||||
Swedbank 144A 2.375% 2/27/19 # | 2,000,000 | 2,014,068 | ||||||
Toronto-Dominion Bank 2.25% 11/5/19 | 3,580,000 | 3,591,205 | ||||||
Turkiye Is Bankasi 144A 3.75% 10/10/18 # | 500,000 | 498,750 | ||||||
USB Capital IX 3.50% 10/29/49 — | 6,960,000 | 5,637,600 | ||||||
USB Realty 144A 1.378% 12/22/49 #— | 400,000 | 362,000 | ||||||
Wells Fargo | ||||||||
2.15% 1/15/19 | 3,580,000 | 3,592,917 | ||||||
3.00% 1/22/21 | 3,000,000 | 3,060,582 | ||||||
4.10% 6/3/26 | 310,000 | 317,269 | ||||||
Yapi ve Kredi Bankasi 144A 5.25% 12/3/18 # | 500,000 | 518,200 | ||||||
|
| |||||||
| 111,650,390 | ||||||||
|
| |||||||
Basic Industry – 3.26% | ||||||||
Arch Coal 144A 8.00% 1/15/19 # | 1,000,000 | 560,000 | ||||||
Celanese U.S. Holdings 4.625% 11/15/22 | 1,175,000 | 1,169,125 | ||||||
CF Industries 6.875% 5/1/18 | 7,410,000 | 8,430,246 | ||||||
Consolidated Energy Finance 144A 6.75% 10/15/19 # | 1,250,000 | 1,228,125 | ||||||
Eastman Chemical 2.70% 1/15/20 | 1,135,000 | 1,142,755 | ||||||
FMG Resources August 2006 144A 8.25% 11/1/19 # | 1,000,000 | 913,750 | ||||||
Freeport-McMoRan 4.00% 11/14/21 | 465,000 | 461,407 | ||||||
Freeport-McMoRan Oil & Gas 6.50% 11/15/20 | 459,000 | 498,001 | ||||||
Georgia-Pacific | ||||||||
144A 2.539% 11/15/19 # | 1,000,000 | 1,000,790 | ||||||
144A 5.40% 11/1/20 # | 5,750,000 | 6,478,289 | ||||||
HD Supply 11.50% 7/15/20 | 1,000,000 | 1,150,000 | ||||||
Headwaters 7.25% 1/15/19 | 750,000 | 783,750 | ||||||
International Paper | ||||||||
5.25% 4/1/16 | 550,000 | 578,053 | ||||||
7.50% 8/15/21 | 3,000,000 | 3,744,744 | ||||||
INVISTA Finance 144A 4.25% 10/15/19 # | 1,330,000 | 1,336,650 | ||||||
Kissner Milling 144A 7.25% 6/1/19 # | 750,000 | 751,875 | ||||||
LSB Industries 7.75% 8/1/19 | 500,000 | 522,500 | ||||||
19
Table of Contents
Schedule of investments
Delaware Limited-Term Diversified Income Fund
| Principal amount° | Value (U.S. $) | |||||||
| ||||||||
Corporate Bonds (continued) | ||||||||
| ||||||||
Basic Industry (continued) | ||||||||
Methanex 4.25% 12/1/24 | 1,120,000 | $ | 1,117,346 | |||||
MMC Finance 4.375% 4/30/18 | 500,000 | 465,000 | ||||||
Polymer Group 144A 6.875% 6/1/19 # | 1,000,000 | 963,750 | ||||||
PPG Industries 2.30% 11/15/19 | 940,000 | 936,932 | ||||||
Rock-Tenn | ||||||||
3.50% 3/1/20 | 1,010,000 | 1,026,135 | ||||||
4.45% 3/1/19 | 945,000 | 1,006,839 | ||||||
Rockwood Specialties Group 4.625% 10/15/20 | 835,000 | 865,269 | ||||||
TPC Group 144A 8.75% 12/15/20 # | 1,000,000 | 977,500 | ||||||
Vedanta Resources 144A 6.00% 1/31/19 # | 250,000 | 245,000 | ||||||
Wise Metals Group 144A 8.75% 12/15/18 # | 500,000 | 527,500 | ||||||
|
| |||||||
| 38,881,331 | ||||||||
|
| |||||||
Brokerage – 0.37% | ||||||||
Jefferies Group 5.125% 1/20/23 | 2,415,000 | 2,458,912 | ||||||
Lazard Group 6.85% 6/15/17 | 1,762,000 | 1,962,576 | ||||||
|
| |||||||
| 4,421,488 | ||||||||
|
| |||||||
Capital Goods – 0.92% | ||||||||
Accudyne Industries 144A 7.75% 12/15/20 # | 1,000,000 | 950,000 | ||||||
Beverage Packaging Holdings Luxembourg II 144A | ||||||||
6.00% 6/15/17 # | 1,000,000 | 977,500 | ||||||
Cemex 144A 4.981% 10/15/18 #— | 500,000 | 515,450 | ||||||
Crane 2.75% 12/15/18 | 1,805,000 | 1,826,167 | ||||||
Ingersoll-Rand Global Holding 2.875% 1/15/19 | 4,630,000 | 4,707,478 | ||||||
Ingersoll-Rand Luxembourg Finance 2.625% 5/1/20 | 145,000 | 144,239 | ||||||
OAS Investments 144A 8.25% 10/19/19 # | 300,000 | 109,500 | ||||||
PaperWorks Industries 144A 9.50% 8/15/19 # | 1,000,000 | 1,003,750 | ||||||
TransDigm 7.50% 7/15/21 | 750,000 | 802,500 | ||||||
|
| |||||||
| 11,036,584 | ||||||||
|
| |||||||
Communications – 4.31% | ||||||||
American Tower Trust I 144A 1.551% 3/15/43 # | 3,775,000 | 3,733,718 | ||||||
British Sky Broadcasting Group 144A 3.75% 9/16/24 # | 2,060,000 | 2,076,803 | ||||||
CC Holdings GS V 3.849% 4/15/23 | 1,165,000 | 1,159,243 | ||||||
Columbus International 144A 7.375% 3/30/21 # | 500,000 | 521,875 | ||||||
Cox Communications 144A 3.85% 2/1/25 # | 2,175,000 | 2,199,947 | ||||||
Digicel Group 144A 8.25% 9/30/20 # | 1,500,000 | 1,462,500 | ||||||
DIRECTV Holdings 3.95% 1/15/25 | 2,935,000 | 2,964,186 | ||||||
Interpublic Group 2.25% 11/15/17 | 1,600,000 | 1,604,133 | ||||||
MTS International Funding 144A 8.625% 6/22/20 # | 300,000 | 295,500 | ||||||
SBA Tower Trust 144A 2.24% 4/16/18 # | 1,995,000 | 1,980,087 | ||||||
SES 144A 3.60% 4/4/23 # | 3,111,000 | 3,150,581 | ||||||
SES Global Americas Holdings 144A 2.50% 3/25/19 # | 1,695,000 | 1,688,161 | ||||||
SK Telecom 144A 2.125% 5/1/18 # | 500,000 | 500,164 | ||||||
20
Table of Contents
| Principal amount° | Value (U.S. $) | |||||||
| ||||||||
Corporate Bonds (continued) | ||||||||
| ||||||||
Communications (continued) | ||||||||
TBG Global PTE 144A 4.625% 4/3/18 # | 500,000 | $ | 492,500 | |||||
Telefonica Emisiones 4.57% 4/27/23 | 3,240,000 | 3,474,910 | ||||||
Telemar Norte Leste 144A 5.50% 10/23/20 # | 500,000 | 467,500 | ||||||
Time Warner 8.25% 4/1/19 | 6,300,000 | 7,719,201 | ||||||
Verizon Communications | ||||||||
3.00% 11/1/21 | 1,470,000 | 1,451,982 | ||||||
4.50% 9/15/20 | 3,165,000 | 3,439,019 | ||||||
5.15% 9/15/23 | 4,530,000 | 5,005,713 | ||||||
Viacom 2.50% 9/1/18 | 5,560,000 | 5,614,038 | ||||||
VimpelCom Holdings 144A 6.255% 3/1/17 # | 500,000 | 457,325 | ||||||
|
| |||||||
| 51,459,086 | ||||||||
|
| |||||||
Consumer Cyclical – 6.13% | ||||||||
Alibaba Group Holding | ||||||||
144A 3.125% 11/28/21 # | 1,065,000 | 1,053,814 | ||||||
144A 3.60% 11/28/24 # | 1,300,000 | 1,292,061 | ||||||
CVS Health 2.25% 12/5/18 | 8,960,000 | 9,048,489 | ||||||
Daimler Finance North America 144A 2.25% 9/3/19 # | 9,000,000 | 8,979,570 | ||||||
Delphi 4.15% 3/15/24 | 1,090,000 | 1,128,820 | ||||||
Ford Motor Credit | ||||||||
3.00% 6/12/17 | 1,000,000 | 1,026,609 | ||||||
4.25% 2/3/17 | 1,800,000 | 1,891,066 | ||||||
5.00% 5/15/18 | 5,055,000 | 5,496,772 | ||||||
Gajah Tunggal 144A 7.75% 2/6/18 # | 500,000 | 465,000 | ||||||
General Motors 3.50% 10/2/18 | 1,665,000 | 1,706,625 | ||||||
General Motors Financial | ||||||||
3.00% 9/25/17 | 185,000 | 187,318 | ||||||
4.375% 9/25/21 | 990,000 | 1,034,550 | ||||||
Home Depot 2.25% 9/10/18 | 6,675,000 | 6,808,140 | ||||||
Host Hotels & Resorts 3.75% 10/15/23 | 1,365,000 | 1,364,046 | ||||||
Hyundai Capital America | ||||||||
144A 2.125% 10/2/17 # | 255,000 | 256,413 | ||||||
144A 2.55% 2/6/19 # | 1,000,000 | 1,001,102 | ||||||
144A 2.875% 8/9/18 # | 500,000 | 510,532 | ||||||
International Game Technology 5.35% 10/15/23 | 1,975,000 | 1,992,583 | ||||||
K. Hovnanian Enterprises 144A 8.00% 11/1/19 # | 500,000 | 482,500 | ||||||
Landry’s 144A 9.375% 5/1/20 # | 500,000 | 532,500 | ||||||
Magna International 3.625% 6/15/24 | 1,910,000 | 1,917,621 | ||||||
Marriott International 3.375% 10/15/20 | 1,200,000 | 1,230,079 | ||||||
NPC International 10.50% 1/15/20 | 1,000,000 | 1,042,500 | ||||||
PC Nextco Holdings 8.75% 8/15/19 | 1,000,000 | 1,010,000 | ||||||
PF Chang’s China Bistro 144A 10.25% 6/30/20 # | 500,000 | 501,250 | ||||||
Target 2.30% 6/26/19 | 3,500,000 | 3,546,802 | ||||||
21
Table of Contents
Schedule of investments
Delaware Limited-Term Diversified Income Fund
| Principal amount° | Value (U.S. $) | |||||||
| ||||||||
Corporate Bonds (continued) | ||||||||
| ||||||||
Consumer Cyclical (continued) | ||||||||
Toyota Motor Credit | ||||||||
2.00% 10/24/18 | 5,055,000 | $ | 5,108,462 | |||||
2.125% 7/18/19 | 7,375,000 | 7,404,832 | ||||||
Volkswagen Group of America Finance 144A | ||||||||
2.125% 5/23/19 # | 5,180,000 | 5,158,177 | ||||||
|
| |||||||
| 73,178,233 | ||||||||
|
| |||||||
Consumer Non-Cyclical – 7.89% | ||||||||
Amgen 2.20% 5/22/19 | 5,635,000 | 5,614,810 | ||||||
Anheuser-Busch Inbev Finance 2.15% 2/1/19 | 8,000,000 | 8,040,048 | ||||||
Bayer U.S. Finance 144A 2.375% 10/8/19 # | 6,000,000 | 6,030,552 | ||||||
Becton Dickinson | ||||||||
2.675% 12/15/19 | 4,270,000 | 4,331,142 | ||||||
3.734% 12/15/24 | 1,475,000 | 1,521,704 | ||||||
Boston Scientific 2.65% 10/1/18 | 2,390,000 | 2,394,928 | ||||||
CareFusion 6.375% 8/1/19 | 2,160,000 | 2,501,632 | ||||||
Celgene 2.30% 8/15/18 | 5,810,000 | 5,863,045 | ||||||
Dr. Pepper Snapple Group 2.00% 1/15/20 | 6,060,000 | 5,927,262 | ||||||
Express Scripts Holding 2.25% 6/15/19 | 5,500,000 | 5,446,821 | ||||||
Gilead Sciences 2.35% 2/1/20 | 7,000,000 | 7,046,046 | ||||||
Ingredion 1.80% 9/25/17 | 3,545,000 | 3,537,148 | ||||||
JBS Finance II 144A 8.25% 1/29/18 # | 500,000 | 516,250 | ||||||
Kroger 3.30% 1/15/21 | 2,490,000 | 2,530,223 | ||||||
Mattel 1.70% 3/15/18 | 5,010,000 | 4,950,912 | ||||||
McKesson 2.284% 3/15/19 | 6,685,000 | 6,677,673 | ||||||
Medtronic 144A 2.50% 3/15/20 # | 4,760,000 | 4,778,269 | ||||||
Pernod-Ricard 144A 5.75% 4/7/21 # | 1,060,000 | 1,219,223 | ||||||
Perrigo 2.30% 11/8/18 | 1,425,000 | 1,425,180 | ||||||
Perrigo Finance 3.50% 12/15/21 | 885,000 | 896,128 | ||||||
Quest Diagnostics 2.70% 4/1/19 | 2,000,000 | 2,019,076 | ||||||
Thermo Fisher Scientific 2.40% 2/1/19 | 6,305,000 | 6,320,491 | ||||||
Tyson Foods 2.65% 8/15/19 | 4,560,000 | 4,606,430 | ||||||
|
| |||||||
| 94,194,993 | ||||||||
|
| |||||||
Electric – 4.94% | ||||||||
Abengoa Yield 144A 7.00% 11/15/19 # | 750,000 | 742,500 | ||||||
Berkshire Hathaway Energy 2.00% 11/15/18 | 5,510,000 | 5,503,597 | ||||||
CenterPoint Energy 5.95% 2/1/17 | 2,365,000 | 2,579,971 | ||||||
Commonwealth Edison 2.15% 1/15/19 | 1,550,000 | 1,563,079 | ||||||
DPL 7.25% 10/15/21 | 1,000,000 | 1,025,000 | ||||||
DTE Energy 2.40% 12/1/19 | 1,725,000 | 1,727,270 | ||||||
Dynegy Finance I/II 144A 6.75% 11/1/19 # | 1,000,000 | 1,018,750 | ||||||
Electricite de France | ||||||||
144A 2.15% 1/22/19 # | 5,410,000 | 5,428,551 | ||||||
22
Table of Contents
| Principal amount° | Value (U.S. $) | |||||||
| ||||||||
Corporate Bonds (continued) | ||||||||
| ||||||||
Electric (continued) | ||||||||
Electricite de France | ||||||||
144A 5.25% 12/29/49 #— | 280,000 | $ | 287,700 | |||||
Israel Electric 144A 5.625% 6/21/18 # | 500,000 | 531,000 | ||||||
Jersey Central Power & Light 5.625% 5/1/16 | 4,560,000 | 4,818,707 | ||||||
Korea East-West Power 144A 2.625% 11/27/18 # | 500,000 | 505,101 | ||||||
Majapahit Holding 144A 8.00% 8/7/19 # | 500,000 | 582,000 | ||||||
National Rural Utilities Cooperative Finance 2.15% 2/1/19 | 6,030,000 | 6,039,051 | ||||||
NextEra Energy Capital Holdings 2.70% 9/15/19 | 6,980,000 | 7,059,544 | ||||||
NV Energy 6.25% 11/15/20 | 2,960,000 | 3,481,981 | ||||||
PPL Capital Funding 1.90% 6/1/18 | 3,810,000 | 3,806,647 | ||||||
Southern 2.45% 9/1/18 | 9,405,000 | 9,606,417 | ||||||
State Grid Overseas Investment 2014 144A | ||||||||
2.75% 5/7/19 # | 2,720,000 | 2,734,204 | ||||||
|
| |||||||
| 59,041,070 | ||||||||
|
| |||||||
Energy – 4.19% | ||||||||
CHC Helicopter 9.25% 10/15/20 | 900,000 | 884,250 | ||||||
CNOOC Nexen Finance 2014 | ||||||||
1.625% 4/30/17 | 500,000 | 497,840 | ||||||
4.25% 4/30/24 | 2,725,000 | 2,824,918 | ||||||
Comstock Resources 7.75% 4/1/19 | 1,000,000 | 715,000 | ||||||
ConocoPhillips 3.35% 11/15/24 | 2,060,000 | 2,085,573 | ||||||
Continental Resources 4.50% 4/15/23 | 3,785,000 | 3,606,219 | ||||||
Dominion Gas Holdings 2.50% 12/15/19 | 4,880,000 | 4,897,768 | ||||||
El Paso Pipeline Partners Operating 6.50% 4/1/20 | 2,975,000 | 3,367,849 | ||||||
EOG Resources 2.45% 4/1/20 | 2,580,000 | 2,569,752 | ||||||
KazMunayGas National 144A 9.125% 7/2/18 # | 500,000 | 548,900 | ||||||
Kinder Morgan 144A 5.00% 2/15/21 # | 665,000 | 692,733 | ||||||
MIE Holdings 144A 7.50% 4/25/19 # | 500,000 | 378,750 | ||||||
Ocean Rig UDW 144A 7.25% 4/1/19 # | 1,000,000 | 710,000 | ||||||
ONGC Videsh 2.50% 5/7/18 | 500,000 | 495,855 | ||||||
Pacific Rubiales Energy 144A 5.375% 1/26/19 # | 500,000 | 432,000 | ||||||
Petrobras Global Finance 3.123% 3/17/20 — | 500,000 | 452,750 | ||||||
Petroleos Mexicanos 3.50% 7/18/18 | 500,000 | 507,500 | ||||||
Shell International Finance BV 2.00% 11/15/18 | 9,800,000 | 9,875,911 | ||||||
Statoil 3.25% 11/10/24 | 1,690,000 | 1,699,107 | ||||||
Sunoco Logistics Partners Operations 3.45% 1/15/23 | 1,870,000 | 1,796,389 | ||||||
Williams Partners 7.25% 2/1/17 | 7,945,000 | 8,761,381 | ||||||
Woodside Finance 144A 8.75% 3/1/19 # | 1,365,000 | 1,692,578 | ||||||
YPF 144A 8.875% 12/19/18 # | 500,000 | 519,550 | ||||||
|
| |||||||
| 50,012,573 | ||||||||
|
| |||||||
23
Table of Contents
Schedule of investments
Delaware Limited-Term Diversified Income Fund
| Principal amount° | Value (U.S. $) | |||||||
| ||||||||
Corporate Bonds (continued) | ||||||||
| ||||||||
Finance Companies – 1.02% | ||||||||
Corporacion Financiera de Desarrollo 144A | ||||||||
3.25% 7/15/19 # | 500,000 | $ | 501,250 | |||||
General Electric Capital | ||||||||
144A 3.80% 6/18/19 # | 2,235,000 | 2,376,884 | ||||||
5.55% 5/4/20 | 2,175,000 | 2,505,535 | ||||||
6.00% 8/7/19 | 1,445,000 | 1,682,499 | ||||||
7.125% 12/15/49 — | 2,500,000 | 2,918,750 | ||||||
Legg Mason 2.70% 7/15/19 | 2,220,000 | 2,233,087 | ||||||
|
| |||||||
| 12,218,005 | ||||||||
|
| |||||||
Healthcare – 0.27% | ||||||||
Iasis Healthcare 8.375% 5/15/19 | 1,000,000 | 1,052,500 | ||||||
Immucor 11.125% 8/15/19 | 1,000,000 | 1,085,000 | ||||||
Kinetic Concepts 10.50% 11/1/18 | 500,000 | 545,000 | ||||||
Salix Pharmaceuticals 144A 6.00% 1/15/21 # | 500,000 | 511,250 | ||||||
|
| |||||||
| 3,193,750 | ||||||||
|
| |||||||
Industrial – 0.04% | ||||||||
Hutchison Whampoa International 144A | ||||||||
1.625% 10/31/17 # | 500,000 | 496,219 | ||||||
|
| |||||||
| 496,219 | ||||||||
|
| |||||||
Insurance – 2.06% | ||||||||
American International Group | ||||||||
6.40% 12/15/20 | 2,585,000 | 3,086,433 | ||||||
8.175% 5/15/58 — | 500,000 | 680,000 | ||||||
Chubb 6.375% 3/29/67 — | 2,030,000 | 2,186,411 | ||||||
MetLife 1.756% 12/15/17 | 5,105,000 | 5,125,502 | ||||||
MetLife Capital Trust X 144A 9.25% 4/8/38 # | 500,000 | 717,500 | ||||||
Metropolitan Life Global Funding I 144A 1.875% 6/22/18 # | 5,265,000 | 5,245,914 | ||||||
Pricoa Global Funding I | ||||||||
144A 1.60% 5/29/18 # | 1,050,000 | 1,036,438 | ||||||
144A 2.20% 5/16/19 # | 3,855,000 | 3,840,436 | ||||||
Prudential Financial 5.625% 6/15/43 — | 1,200,000 | 1,232,760 | ||||||
TIAA Asset Management Finance | ||||||||
144A 2.95% 11/1/19 # | 975,000 | 977,978 | ||||||
144A 4.125% 11/1/24 # | 460,000 | 472,180 | ||||||
|
| |||||||
| 24,601,552 | ||||||||
|
| |||||||
Media – 0.09% | ||||||||
WideOpenWest Finance 10.25% 7/15/19 | 1,000,000 | 1,046,250 | ||||||
|
| |||||||
| 1,046,250 | ||||||||
|
| |||||||
Natural Gas – 0.47% | ||||||||
Sempra Energy 2.30% 4/1/17 | 5,490,000 | 5,593,975 | ||||||
|
| |||||||
| 5,593,975 | ||||||||
|
| |||||||
24
Table of Contents
| Principal amount° | Value (U.S. $) | |||||||
| ||||||||
Corporate Bonds (continued) | ||||||||
| ||||||||
Real Estate – 0.24% | ||||||||
WEA Finance | ||||||||
144A 2.70% 9/17/19 # | 2,625,000 | $ | 2,627,113 | |||||
144A 3.75% 9/17/24 # | 200,000 | 203,364 | ||||||
|
| |||||||
| 2,830,477 | ||||||||
|
| |||||||
REITs – 0.11% | ||||||||
Alexandria Real Estate Equities 3.90% 6/15/23 | 645,000 | 648,211 | ||||||
Healthcare Trust of America Holdings 3.375% 7/15/21 | 670,000 | 669,760 | ||||||
|
| |||||||
| 1,317,971 | ||||||||
|
| |||||||
Services – 0.21% | ||||||||
Algeco Scotsman Global Finance 144A 10.75% 10/15/19 # | 500,000 | 432,500 | ||||||
Interactive Data 144A 5.875% 4/15/19 # | 1,000,000 | 1,005,000 | ||||||
Pinnacle Entertainment 6.375% 8/1/21 | 1,000,000 | 1,035,000 | ||||||
|
| |||||||
| 2,472,500 | ||||||||
|
| |||||||
Technology – 2.86% | ||||||||
Amphenol 3.125% 9/15/21 | 5,975,000 | 6,040,384 | ||||||
Baidu | ||||||||
2.75% 6/9/19 | 2,000,000 | 1,995,328 | ||||||
3.25% 8/6/18 | 500,000 | 511,969 | ||||||
Motorola Solutions 4.00% 9/1/24 | 1,705,000 | 1,718,681 | ||||||
National Semiconductor 6.60% 6/15/17 | 3,325,000 | 3,743,405 | ||||||
NetApp | ||||||||
3.25% 12/15/22 | 400,000 | 395,195 | ||||||
3.375% 6/15/21 | 2,415,000 | 2,424,694 | ||||||
Oracle | ||||||||
2.25% 10/8/19 | 5,480,000 | 5,522,865 | ||||||
3.40% 7/8/24 | 40,000 | 40,931 | ||||||
Seagate HDD Cayman 144A 4.75% 1/1/25 # | 2,305,000 | 2,379,242 | ||||||
Tencent Holdings 144A 3.375% 5/2/19 # | 1,250,000 | 1,271,819 | ||||||
Xerox | ||||||||
5.625% 12/15/19 | 3,300,000 | 3,712,820 | ||||||
6.35% 5/15/18 | 3,890,000 | 4,401,870 | ||||||
|
| |||||||
| 34,159,203 | ||||||||
|
| |||||||
Technology & Electronics – 0.05% | ||||||||
First Data 12.625% 1/15/21 | 500,000 | 595,000 | ||||||
|
| |||||||
| 595,000 | ||||||||
|
| |||||||
Telecommunications – 0.06% | ||||||||
Zayo Group 10.125% 7/1/20 | 650,000 | 734,858 | ||||||
|
| |||||||
| 734,858 | ||||||||
|
| |||||||
Transportation – 1.41% | ||||||||
AP Moeller - Maersk 144A 2.55% 9/22/19 # | 1,755,000 | 1,761,866 | ||||||
DP World Sukuk 144A 6.25% 7/2/17 # | 500,000 | 543,750 | ||||||
ERAC USA Finance 144A 2.80% 11/1/18 # | 3,355,000 | 3,430,021 | ||||||
25
Table of Contents
Schedule of investments
Delaware Limited-Term Diversified Income Fund
| Principal amount° | Value (U.S. $) | |||||||
| ||||||||
Corporate Bonds (continued) | ||||||||
| ||||||||
Transportation (continued) | ||||||||
Penske Truck Leasing 144A 2.50% 6/15/19 # | 5,200,000 | $ | 5,173,688 | |||||
Union Pacific 2.25% 2/15/19 | 3,260,000 | 3,304,737 | ||||||
United Parcel Service 5.125% 4/1/19 | 2,340,000 | 2,631,529 | ||||||
|
| |||||||
| 16,845,591 | ||||||||
|
| |||||||
Total Corporate Bonds (cost $598,620,867) | 602,066,099 | |||||||
|
| |||||||
| ||||||||
Municipal Bonds – 0.88% | ||||||||
| ||||||||
Railsplitter Tobacco Settlement Authority, Illinois Revenue | ||||||||
5.00% 6/1/15 | 3,995,000 | 4,069,866 | ||||||
University of California | ||||||||
0.67% 7/1/41 — | 6,385,000 | 6,384,808 | ||||||
|
| |||||||
Total Municipal Bonds (cost $10,402,374) | 10,454,674 | |||||||
|
| |||||||
| ||||||||
Non-Agency Asset-Backed Securities – 36.71% | ||||||||
| ||||||||
Ally Master Owner Trust | ||||||||
Series 2013-1 A2 1.00% 2/15/18 | 745,000 | 745,898 | ||||||
Series 2013-2 A 0.611% 4/15/18 — | 5,050,000 | 5,046,712 | ||||||
Series 2014-2 A 0.531% 1/16/18 — | 4,000,000 | 3,996,632 | ||||||
American Express Credit Account Master Trust | ||||||||
Series 2012-1 A 0.431% 1/15/20 — | 3,500,000 | 3,497,921 | ||||||
Series 2013-1 A 0.581% 2/16/21 — | 5,185,000 | 5,206,118 | ||||||
Series 2013-2 A 0.581% 5/17/21 — | 8,070,000 | 8,087,932 | ||||||
Series 2014-1 A 0.531% 12/15/21 — | 2,100,000 | 2,093,618 | ||||||
ARI Fleet Lease Trust | ||||||||
Series 2012-B A 144A 0.461% 1/15/21 #— | 5,256,999 | 5,255,012 | ||||||
Avis Budget Rental Car Funding AESOP | ||||||||
Series 2011-3A A 144A 3.41% 11/20/17 # | 820,000 | 849,267 | ||||||
Series 2013-2A A 144A 2.97% 2/20/20 # | 6,500,000 | 6,664,119 | ||||||
Bank of America Credit Card Trust | ||||||||
Series 2007-A4 A4 0.201% 11/15/19 — | 6,495,000 | 6,448,626 | ||||||
Barclays Dryrock Issuance Trust | ||||||||
Series 2014-2 A 0.501% 3/16/20 — | 2,500,000 | 2,497,123 | ||||||
BMW Floorplan Master Owner Trust | ||||||||
Series 2012-1A A 144A 0.561% 9/15/17 #— | 10,300,000 | 10,314,945 | ||||||
Cabela’s Master Credit Card Trust | ||||||||
Series 2012-1A A2 144A 0.691% 2/18/20 #— | 4,600,000 | 4,631,933 | ||||||
Series 2012-2A A2 144A 0.641% 6/15/20 #— | 6,000,000 | 6,039,870 | ||||||
Series 2014-1 A 0.511% 3/16/20 — | 6,700,000 | 6,698,137 | ||||||
Series 2014-2 A 0.611% 7/15/22 — | 6,000,000 | 5,979,348 | ||||||
California Republic Auto Receivables Trust | ||||||||
Series 2013-2 A2 1.23% 3/15/19 | 1,914,693 | 1,921,695 | ||||||
26
Table of Contents
| Principal amount° | Value (U.S. $) | |||||||
| ||||||||
Non-Agency Asset-Backed Securities (continued) | ||||||||
| ||||||||
Capital One Multi-Asset Execution Trust | ||||||||
Series 2007-A1 A1 0.211% 11/15/19 — | 14,085,000 | $ | 14,018,477 | |||||
Series 2007-A2 A2 0.241% 12/16/19 — | 5,000,000 | 4,971,115 | ||||||
Series 2013-A2 A2 0.341% 2/15/19 — | 7,500,000 | 7,500,255 | ||||||
Series 2014-A3 A3 0.541% 1/18/22 — | 5,250,000 | 5,244,209 | ||||||
Chase Issuance Trust | ||||||||
Series 2007-B1 B1 0.411% 4/15/19 — | 2,000,000 | 1,987,324 | ||||||
Series 2012-A2 A2 0.431% 5/15/19 — | 12,000,000 | 12,007,356 | ||||||
Series 2012-A10 A10 0.421% 12/16/19 — | 6,041,000 | 6,030,603 | ||||||
Series 2013-A3 A3 0.441% 4/15/20 — | 15,000,000 | 14,950,590 | ||||||
Series 2013-A6 A6 0.581% 7/15/20 — | 4,000,000 | 4,006,372 | ||||||
Series 2013-A9 A 0.581% 11/16/20 — | 8,900,000 | 8,917,302 | ||||||
Series 2014-A8 A 0.411% 11/15/18 — | 945,000 | 945,086 | ||||||
Chesapeake Funding | ||||||||
Series 2012-2A A 144A 0.618% 5/7/24 #— | 5,806,242 | 5,814,893 | ||||||
Series 2014-1A A 144A 0.577% 3/7/26 #— | 12,000,000 | 11,994,636 | ||||||
CIFC Funding | ||||||||
Series 2014-4A X 144A 1.285% 10/17/26 #— | 4,000,000 | 3,998,000 | ||||||
Citibank Credit Card Issuance Trust | ||||||||
Series 2013-A2 A2 0.447% 5/26/20 — | 8,995,000 | 8,980,869 | ||||||
Series 2013-A4 A4 0.587% 7/24/20 — | 800,000 | 801,374 | ||||||
Series 2013-A7 A7 0.592% 9/10/20 — | 3,100,000 | 3,099,312 | ||||||
Conseco Financial | ||||||||
Series 1997-6 A8 7.07% 1/15/29 | 113,865 | 115,887 | ||||||
Dell Equipment Finance Trust | ||||||||
Series 2014-1 A3 144A 0.94% 6/22/20 # | 770,000 | 769,235 | ||||||
Discover Card Execution Note Trust | ||||||||
Series 2011-A4 A4 0.511% 5/15/19 — | 7,810,000 | 7,836,242 | ||||||
Series 2012-A4 A4 0.531% 11/15/19 — | 13,755,000 | 13,812,578 | ||||||
Series 2013-A1 A1 0.461% 8/17/20 — | 9,300,000 | 9,311,132 | ||||||
Series 2013-A5 A5 1.04% 4/15/19 | 5,000,000 | 4,995,075 | ||||||
Series 2013-A6 A6 0.611% 4/15/21 — | 1,290,000 | 1,293,630 | ||||||
Series 2014-A1 A1 0.591% 7/15/21 — | 4,465,000 | 4,474,662 | ||||||
Series 2014-A3 A3 1.22% 10/15/19 | 1,175,000 | 1,172,995 | ||||||
Enterprise Fleet Financing | ||||||||
Series 2013-2 A2 144A 1.06% 3/20/19 # | 2,993,827 | 2,999,566 | ||||||
Series 2014-1 A2 144A 0.87% 9/20/19 # | 2,490,494 | 2,489,582 | ||||||
Ford Credit Auto Owner Trust | ||||||||
Series 2014-2 A 144A 2.31% 4/15/26 # | 580,000 | 581,494 | ||||||
Ford Credit Floorplan Master Owner Trust | ||||||||
Series 2013-1 A1 0.85% 1/15/18 | 4,000,000 | 3,999,756 | ||||||
Series 2013-1 A2 0.541% 1/15/18 — | 8,500,000 | 8,503,128 | ||||||
Series 2014-1 A2 0.561% 2/15/19 — | 2,590,000 | 2,591,290 | ||||||
27
Table of Contents
Schedule of investments
Delaware Limited-Term Diversified Income Fund
| Principal amount° | Value (U.S. $) | |||||||
| ||||||||
Non-Agency Asset-Backed Securities (continued) | ||||||||
| ||||||||
GE Dealer Floorplan Master Note Trust | ||||||||
Series 2012-2 A 0.915% 4/22/19 — | 24,865,000 | $ | 25,009,204 | |||||
Series 2013-1 A 0.565% 4/20/18 — | 15,090,000 | 15,070,142 | ||||||
Series 2014-2 A 0.615% 10/20/19 — | 8,575,000 | 8,578,481 | ||||||
GE Equipment Transportation | ||||||||
Series 2013-1 A3 0.69% 11/25/16 | 2,693,024 | 2,694,031 | ||||||
Series 2014-1 A3 0.97% 4/23/18 | 3,000,000 | 2,997,717 | ||||||
Golden Credit Card Trust | ||||||||
Series 2012-3A A 144A 0.611% 7/17/17 #— | 17,580,000 | 17,600,744 | ||||||
Series 2012-5A A 144A 0.79% 9/15/17 # | 1,050,000 | 1,050,970 | ||||||
Series 2013-2A A 144A 0.591% 9/15/18 #— | 6,500,000 | 6,514,586 | ||||||
Series 2014-2A A 144A 0.612% 3/15/21 #— | 535,000 | 533,651 | ||||||
GreatAmerica Leasing Receivables | ||||||||
Series 2014-1 A3 144A 0.89% 7/15/17 # | 2,985,000 | 2,983,612 | ||||||
Hertz Fleet Lease Funding | ||||||||
Series 2014-1 A 144A 0.562% 4/10/28 #— | 8,000,000 | 7,992,408 | ||||||
Hyundai Auto Lease Securitization Trust | ||||||||
Series 2014-A A4 144A 1.01% 9/15/17 # | 1,310,000 | 1,311,091 | ||||||
M&T Bank Auto Receivables Trust | ||||||||
Series 2013-1A A3 144A 1.06% 11/15/17 # | 8,000,000 | 8,024,936 | ||||||
Master Credit Card Trust II | ||||||||
Series 2012-2A A 144A 0.78% 4/21/17 # | 3,500,000 | 3,501,120 | ||||||
MASTR Specialized Loan Trust | ||||||||
Series 2005-2 A2 144A 5.006% 7/25/35 #— | 22,620 | 22,589 | ||||||
Motor | ||||||||
Series 2013-1A A1 144A 0.67% 2/25/21 #— | 2,590,000 | 2,591,691 | ||||||
Navistar Financial Dealer Note Master Owner Trust II | ||||||||
Series 2014-1 A 144A 0.92% 10/25/19 #�� | 9,000,000 | 9,002,961 | ||||||
Navistar Financial Dealer Note Master Trust | ||||||||
Series 2013-2 A 144A 0.85% 9/25/18 #• | 3,000,000 | 3,002,985 | ||||||
NextGear Floorplan Master Owner Trust | ||||||||
Series 2014-1A A 144A 1.92% 10/15/19 # | 2,540,000 | 2,534,346 | ||||||
Nissan Auto Receivables Owner Trust | ||||||||
Series 2013-C A3 0.67% 8/15/18 | 2,675,000 | 2,668,508 | ||||||
Nissan Master Owner Trust Receivables | ||||||||
Series 2012-A A 0.631% 5/15/17 — | 5,000,000 | 5,004,120 | ||||||
Series 2013-A A 0.461% 2/15/18 — | 7,420,000 | 7,411,541 | ||||||
PFS Financing | ||||||||
Series 2013-AA A 144A 0.711% 2/15/18 #— | 9,300,000 | 9,297,666 | ||||||
Series 2014-AA A 144A 0.761% 2/15/19 #— | 8,000,000 | 8,017,280 | ||||||
Synchrony Credit Card Master Note Trust | ||||||||
Series 2014-1 A 1.61% 11/15/20 | 1,010,000 | 1,006,314 | ||||||
Trade MAPS 1 | ||||||||
Series 2013-1A A 144A 0.862% 12/10/18 #— | 5,000,000 | 5,006,475 | ||||||
28
Table of Contents
| Principal amount° | Value (U.S. $) | |||||||
| ||||||||
Non-Agency Asset-Backed Securities (continued) | ||||||||
| ||||||||
Trafigura Securitisation Finance | ||||||||
Series 2012-1A A 144A 2.561% 10/15/15 #— | 3,700,000 | $ | 3,708,816 | |||||
Volkswagen Auto Lease Trust | ||||||||
Series 2014-A A2B 0.375% 10/20/16 — | 6,276,339 | 6,272,241 | ||||||
Wheels | ||||||||
Series 2014-1A A2 144A 0.84% 3/20/23 # | 2,795,000 | 2,795,257 | ||||||
|
| |||||||
Total Non-Agency Asset-Backed Securities (cost $437,816,930) | 438,394,414 | |||||||
|
| |||||||
| ||||||||
Non-Agency Collateralized Mortgage Obligations – 0.04% | ||||||||
| ||||||||
American Home Mortgage Investment Trust | ||||||||
Series 2005-2 5A1 5.064% 9/25/35 — | 58,305 | 57,577 | ||||||
Bank of America Alternative Loan Trust | ||||||||
Series 2005-3 2A1 5.50% 4/25/20 | 72,716 | 75,038 | ||||||
Series 2005-6 7A1 5.50% 7/25/20 | 61,814 | 62,346 | ||||||
Bank of America Mortgage Securities | ||||||||
Series 2002-K 2A1 2.477% 10/20/32 — | 3,375 | 3,379 | ||||||
GSMPS Mortgage Loan Trust | ||||||||
Series 1998-2 A 144A 7.587% 5/19/27 #— | 86,256 | 87,403 | ||||||
Wells Fargo Mortgage-Backed Securities Trust | ||||||||
Series 2004-EE 3A1 2.496% 12/25/34 — | 15,660 | 15,859 | ||||||
Series 2006-AR5 2A1 2.615% 4/25/36 — | 190,828 | 182,402 | ||||||
|
| |||||||
Total Non-Agency Collateralized Mortgage Obligations (cost $417,513) | 484,004 | |||||||
|
| |||||||
| ||||||||
Senior Secured Loans – 0.64%« | ||||||||
| ||||||||
Avast Software 1st Lien 5.00% 3/20/20 | 481,250 | 477,641 | ||||||
BJ’s Wholesale Club 2nd Lien 8.50% 3/31/20 | 500,000 | 493,333 | ||||||
Borgata Tranche B 1st Lien 6.75% 8/15/18 | 500,000 | 498,375 | ||||||
Caesars Growth Partners Tranche B 1st Lien | ||||||||
6.25% 5/8/21 | 499,248 | 463,469 | ||||||
Clear Channel Communications Tranche B 3.81% 1/29/16 | 997,219 | 986,935 | ||||||
Fieldwood Energy 8.375% 2/10/24 | 246,305 | 181,404 | ||||||
Hostess Brands 1st Lien 6.75% 3/20/20 | 993,747 | 1,013,622 | ||||||
KIK Custom Products 1st Lien 5.50% 4/29/19 | 494,984 | 488,178 | ||||||
LTS Buyer 2nd Lien 8.00% 4/1/21 | 316,250 | 311,770 | ||||||
Mauser Holdings 2nd Lien 8.25% 7/31/22 | 1,000,000 | 975,000 | ||||||
Otterbox Tranche B 5.75% 6/3/20 | 531,825 | 526,839 | ||||||
Republic of Angola (Unsecured) 6.57% 12/16/23 | 510,000 | 511,275 | ||||||
Rite Aid 2nd Lien 5.75% 8/21/20 | 750,000 | 754,219 | ||||||
|
| |||||||
Total Senior Secured Loans (cost $7,830,601) | 7,682,060 | |||||||
|
| |||||||
29
Table of Contents
Schedule of investments
Delaware Limited-Term Diversified Income Fund
| Principal amount° | Value (U.S. $) | |||||||
| ||||||||
Sovereign Bonds – 0.52%D | ||||||||
| ||||||||
Brazil – 0.04% | ||||||||
Banco Nacional De Desenvolvimento Economico E Social | ||||||||
144A 4.00% 4/14/19 # | 500,000 | $ | 493,750 | |||||
|
| |||||||
| 493,750 | ||||||||
|
| |||||||
China – 0.21% | ||||||||
Export-Import Bank of China 144A 2.50% 7/31/19 # | 2,500,000 | 2,501,890 | ||||||
|
| |||||||
| 2,501,890 | ||||||||
|
| |||||||
Gabon – 0.04% | ||||||||
Gabonese Republic 144A 8.20% 12/12/17 # | 450,000 | 488,340 | ||||||
|
| |||||||
| 488,340 | ||||||||
|
| |||||||
Indonesia – 0.05% | ||||||||
Perusahaan Penerbit Indonesia 144A 6.125% 3/15/19 # | 500,000 | 555,000 | ||||||
|
| |||||||
| 555,000 | ||||||||
|
| |||||||
Kenya – 0.04% | ||||||||
Kenya Government International Bond 144A | ||||||||
5.875% 6/24/19 # | 500,000 | 507,500 | ||||||
|
| |||||||
| 507,500 | ||||||||
|
| |||||||
Pakistan – 0.04% | ||||||||
Pakistan Government International Bond 144A | ||||||||
7.25% 4/15/19 # | 500,000 | 509,750 | ||||||
|
| |||||||
| 509,750 | ||||||||
|
| |||||||
Peru – 0.05% | ||||||||
Peruvian Government International Bond 7.125% 3/30/19 | 500,000 | 593,750 | ||||||
|
| |||||||
| 593,750 | ||||||||
|
| |||||||
Slovenia – 0.05% | ||||||||
Slovenia Government International Bond 144A | ||||||||
4.75% 5/10/18 # | 500,000 | 536,250 | ||||||
|
| |||||||
| 536,250 | ||||||||
|
| |||||||
Total Sovereign Bonds (cost $6,228,825) | 6,186,230 | |||||||
|
| |||||||
| ||||||||
Supranational Bank – 0.04% | ||||||||
| ||||||||
African Export-Import Bank 3.875% 6/4/18 | 500,000 | 488,750 | ||||||
|
| |||||||
Total Supranational Bank (cost $500,750) | 488,750 | |||||||
|
| |||||||
| ||||||||
U.S. Treasury Obligations – 0.29% | ||||||||
| ||||||||
U.S. Treasury Notes | ||||||||
1.50% 11/30/19 | 870,000 | 864,563 | ||||||
2.25% 11/15/24 | 1,540,000 | 1,550,587 | ||||||
30
Table of Contents
| Principal amount° | Value (U.S. $) | |||||||
| ||||||||
U.S. Treasury Obligations (continued) | ||||||||
| ||||||||
U.S. Treasury Notes | ||||||||
2.375% 8/15/24 | 1,010,000 | $ | 1,028,780 | |||||
|
| |||||||
Total U.S. Treasury Obligations (cost $3,437,858) | 3,443,930 | |||||||
|
| |||||||
Number of | ||||||||
| ||||||||
Preferred Stock – 0.09% | ||||||||
| ||||||||
Bank of America 8.125% • | 1,000,000 | 1,083,750 | ||||||
|
| |||||||
Total Preferred Stock (cost $1,115,000) | 1,083,750 | |||||||
|
| |||||||
Principal amount° | ||||||||
| ||||||||
Short-Term Investments – 1.96% | ||||||||
| ||||||||
Discount Notes – 1.28%≠ | ||||||||
Federal Home Loan Bank | ||||||||
0.065% 1/14/15 | 4,377,786 | 4,377,773 | ||||||
0.065% 1/21/15 | 2,673,094 | 2,673,081 | ||||||
0.065% 2/25/15 | 2,031,174 | 2,031,128 | ||||||
0.065% 3/5/15 | 141,654 | 141,649 | ||||||
0.067% 1/16/15 | 303,743 | 303,742 | ||||||
0.08% 2/20/15 | 2,278,862 | 2,278,816 | ||||||
0.08% 3/18/15 | 693,604 | 693,575 | ||||||
0.085% 3/27/15 | 2,777,947 | 2,777,816 | ||||||
|
| |||||||
| 15,277,580 | ||||||||
|
| |||||||
Repurchase Agreements – 0.68% | ||||||||
Bank of America Merrill Lynch | ||||||||
0.03%, dated 12/31/14, to be repurchased on 1/2/15, repurchase price $5,013,585 (collateralized by U.S. government obligations 0.875%–4.625% 10/15/17–2/15/40 market value $5,113,849) | 5,013,577 | 5,013,577 | ||||||
Bank of Montreal | ||||||||
0.06%, dated 12/31/14, to be repurchased on 1/2/15, repurchase price $1,671,198 (collateralized by U.S. government obligations 1.25%–3.875% 8/31/15–8/15/44 market value $1,704,616) | 1,671,192 | 1,671,192 | ||||||
BNP Paribas | ||||||||
0.05%, dated 12/31/14, to be repurchased on 1/2/15, repurchase price $1,390,235 (collateralized by U.S. government obligations 0.875%–1.75% 8/15/17–5/15/23 market value $1,418,036) | 1,390,231 | 1,390,231 | ||||||
|
| |||||||
| 8,075,000 | ||||||||
|
| |||||||
Total Short-Term Investments (cost $23,351,481) | 23,352,580 | |||||||
|
| |||||||
31
Table of Contents
Schedule of investments
Delaware Limited-Term Diversified Income Fund
Total Value of Securities – 99.51% | ||||
(cost $1,183,093,326) | $ | 1,188,275,550 | ||
|
|
| # | Security exempt from registration under Rule 144A of the Securities Act of 1933, as amended. At Dec. 31, 2014, the aggregate value of Rule 144A securities was $320,230,172, which represents 26.82% of the Fund’s net assets. See Note 11 in “Notes to financial statements.” |
| ¿ | Pass Through Agreement. Security represents the contractual right to receive a proportionate amount of underlying payments due to the counterparty pursuant to various agreements related to the rescheduling of obligations and the exchange of certain notes. |
| T | 100% of the income received was in the form of additional cash. |
| ≠ | The rate shown is the effective yield at the time of purchase. |
| ° | Principal amount shown is stated in U.S. dollars unless noted that the security is denominated in another currency. |
| — | Variable rate security. The rate shown is the rate as of Dec. 31, 2014. Interest rates reset periodically. |
| D | Securities have been classified by country of origin. |
| « | Senior secured loans generally pay interest at rates which are periodically redetermined by reference to a base lending rate plus a premium. These base lending rates are generally: (i) the prime rate offered by one or more United States banks, (ii) the lending rate offered by one or more European banks such as the London Inter-Bank Offered Rate (LIBOR), and (iii) the certificate of deposit rate. Senior secured loans may be subject to restrictions on resale. Stated rate in effect at Dec. 31, 2014. |
The following futures and swap contracts were outstanding at Dec. 31, 2014:1
Futures Contracts
| Contracts to Buy (Sell) | Notional Cost (Proceeds) | Notional Value | Expiration Date | Unrealized Appreciation (Depreciation) | ||||||||||||||||
| 721 | U.S. Treasury 10 yr Notes | $ | 90,925,717 | $ | 91,420,547 | 3/24/15 | $ | 494,830 | ||||||||||||
Swap Contracts
CDS Contracts2
| Counterparty | Swap Referenced Obligation | Notional Value | Annual Protection Payments | Termination Date | Unrealized Appreciation (Depreciation) | |||||||||||||
| Protection Purchased: | ||||||||||||||||||
| BNP | ICE-CDX.NA.HY.23 | 48,000,000 | 5.00 | % | 12/20/19 | $ | 95,337 | |||||||||||
The use of futures contracts and swap contracts involves elements of market risk and risks in excess of the amounts disclosed in the financial statements. The notional values presented above represent the Fund’s total exposure in such contracts, whereas only the net unrealized appreciation (depreciation) is reflected in the Fund’s net assets.
1See Note 8 in “Notes to financial statements.”
32
Table of Contents
2A CDS contract is a risk-transfer instrument through which one party (purchaser of protection) transfers to another party (seller of protection) the financial risk of a credit event (as defined in the CDS agreement), as it relates to a particular reference security or basket of securities (such as an index). Periodic payments (receipts) on such contracts are accrued daily and recorded as unrealized losses (gains) on swap contracts. Upon payment (receipt), such amounts are recorded as realized losses (gains) on swap contracts. Upfront payments made or received in connection with CDS contracts are amortized over the expected life of the CDS contracts as unrealized losses (gains) on swap contracts. The change in value of CDS contracts is recorded as unrealized appreciation or depreciation daily. A realized gain or loss is recorded upon a credit event (as defined in the CDS agreement) or the maturity or termination of the agreement.
Summary of abbreviations:
ARM – Adjustable Rate Mortgage
BNP – Banque Paribas
CDX.NA.HY – Credit Default Swap Index North American High-Yield
CLO – Collateralized Loan Obligation
FHAVA – Federal Housing Administration & Veterans Administration
GNMA – Government National Mortgage Association
GPM – Graduated Payment Mortgage
GSMPS – Goldman Sachs Reperforming Mortgage Securities
ICE – IntercontinentalExchange, Inc.
MASTR – Mortgage Asset Securitization Transactions, Inc.
PIK – Pay-in-kind bond
REIT – Real Estate Investment Trust
REMIC – Real Estate Mortgage Investment Conduit
S.F. – Single Family
yr – Year
See accompanying notes, which are an integral part of the financial statements.
33
Table of Contents
Statement of assets and liabilities
| Delaware Limited-Term Diversified Income Fund | December 31, 2014 |
Assets: | ||||
Investments, at value1 | $ | 1,164,922,970 | ||
Short-term investments, at value2 | 23,352,580 | |||
Cash | 2,588,202 | |||
Cash collateral due from brokers | 866,000 | |||
Dividends and interest receivable | 5,738,253 | |||
Receivables for fund shares sold | 2,961,257 | |||
Due from brokers | 2,942,496 | |||
Variation margin receivable on futures contracts | 157,719 | |||
Receivables for securities sold | 157,413 | |||
Unrealized gain on credit default swap contracts | 95,337 | |||
|
| |||
Total assets | 1,203,782,227 | |||
|
| |||
Liabilities: | ||||
Payable for fund shares redeemed | 3,487,375 | |||
Payable for securities purchased | 1,260,597 | |||
Income distribution payable | 474,646 | |||
Swap payments payable | 66,141 | |||
Other accrued expenses | 531,255 | |||
Investment management fees payable | 488,452 | |||
Distribution fees payable | 216,403 | |||
Other affiliates payable | 89,767 | |||
Trustees’ fees and expenses payable | 2,970 | |||
Upfront payments paid on credit default swap contracts | 3,076,362 | |||
|
| |||
Total liabilities | 9,693,968 | |||
|
| |||
Total Net Assets | $ | 1,194,088,259 | ||
|
| |||
Net Assets Consist of: | ||||
Paid-in capital | $ | 1,224,273,838 | ||
Distributions in excess of net investment income | (601,753 | ) | ||
Accumulated net realized loss on investments | (35,289,551 | ) | ||
Net unrealized appreciation of investments, foreign currencies, and derivatives | 5,705,725 | |||
|
| |||
Total Net Assets | $ | 1,194,088,259 | ||
|
| |||
34
Table of Contents
Net Asset Value | ||||
Class A: | ||||
Net assets | $ | 472,653,988 | ||
Shares of beneficial interest outstanding, unlimited authorization, no par | 55,469,342 | |||
Net asset value per share | $ | 8.52 | ||
Sales charge | 2.75 | % | ||
Offering price per share, equal to net asset value per share / (1 – sales charge) | $ | 8.76 | ||
Class C: | ||||
Net assets | $ | 176,904,232 | ||
Shares of beneficial interest outstanding, unlimited authorization, no par | 20,773,002 | |||
Net asset value per share | $ | 8.52 | ||
Class R: | ||||
Net assets | $ | 8,021,967 | ||
Shares of beneficial interest outstanding, unlimited authorization, no par | 941,139 | |||
Net asset value per share | $ | 8.52 | ||
Institutional Class: | ||||
Net assets | $ | 536,508,072 | ||
Shares of beneficial interest outstanding, unlimited authorization, no par | 62,970,714 | |||
Net asset value per share | $ | 8.52 | ||
| ||||
| 1Investments, at cost | $ | 1,159,741,845 | ||
| 2 Short-term investments, at cost | 23,351,481 | |||
See accompanying notes, which are an integral part of the financial statements.
35
Table of Contents
| Delaware Limited-Term Diversified Income Fund | Year ended December 31, 2014 |
Investment Income: | ||||
Interest | $ | 25,854,019 | ||
Dividends | 36,236 | |||
|
| |||
| 25,890,255 | ||||
|
| |||
Expenses: | ||||
Management fees | 6,319,119 | |||
Distribution expenses – Class A | 1,551,639 | |||
Distribution expenses – Class B | 1,663 | |||
Distribution expenses – Class C | 2,151,027 | |||
Distribution expenses – Class R | 44,117 | |||
Dividend disbursing and transfer agent fees and expenses | 1,577,362 | |||
Accounting and administration expenses | 439,652 | |||
Legal fees | 135,913 | |||
Registration fees | 129,142 | |||
Reports and statements to shareholders | 111,071 | |||
Custodian fees | 78,112 | |||
Trustee’s fees and expenses | 61,551 | |||
Audit and tax | 47,093 | |||
Other | 83,073 | |||
|
| |||
| 12,730,534 | ||||
Less waived distribution expenses – Class A | (620,655 | ) | ||
Less waived distribution expenses – Class B | (1,415 | ) | ||
Less expense paid indirectly | (792 | ) | ||
|
| |||
Total operating expenses | 12,107,672 | |||
|
| |||
Net Investment Income | 13,782,583 | |||
|
| |||
Net Realized and Unrealized Gain (Loss): | ||||
Net realized gain (loss) on: | ||||
Investments | 10,128,186 | |||
Foreign currencies | (19,017 | ) | ||
Foreign currency exchange contracts | 2,623 | |||
Futures contracts | (2,600,547 | ) | ||
Swap contracts | 619,933 | |||
|
| |||
Net realized gain | 8,131,178 | |||
|
| |||
Net change in unrealized appreciation (depreciation) of: | ||||
Investments | (3,567,774 | ) | ||
Foreign currencies | (742 | ) | ||
Futures contracts | (1,269,226 | ) | ||
Swap contracts | 28,671 | |||
|
| |||
Net change in unrealized appreciation (depreciation) | (4,809,071 | ) | ||
|
| |||
Net Realized and Unrealized Gain | 3,322,107 | |||
|
| |||
Net Increase in Net Assets Resulting from Operations | $ | 17,104,690 | ||
|
| |||
See accompanying notes, which are an integral part of the financial statements.
36
Table of Contents
This page intentionally left blank.
Table of Contents
Statements of changes in net assets
Delaware Limited-Term Diversified Income Fund
| Year ended | ||||||||
| 12/31/14 | 12/31/13 | |||||||
Increase (Decrease) in Net Assets from Operations: | ||||||||
Net investment income | $ | 13,782,583 | $ | 16,281,727 | ||||
Net realized gain (loss) | 8,131,178 | (47,096,474 | ) | |||||
Net change in unrealized appreciation (depreciation) | (4,809,071 | ) | (15,770,977 | ) | ||||
|
|
|
| |||||
Net increase (decrease) in net assets resulting from operations | 17,104,690 | (46,585,724 | ) | |||||
|
|
|
| |||||
Dividends and Distributions to Shareholders from: | ||||||||
Net investment income: | ||||||||
Class A | (9,874,288 | ) | — | |||||
Class B | (2,717 | ) | — | |||||
Class C | (1,601,223 | ) | — | |||||
Class R | (108,883 | ) | — | |||||
Institutional Class | (8,271,832 | ) | — | |||||
Return of capital: | ||||||||
Class A | (208,221 | ) | (17,963,149 | ) | ||||
Class B | — | (6,844 | ) | |||||
Class C | (77,978 | ) | (2,711,141 | ) | ||||
Class R | (3,533 | ) | (179,543 | ) | ||||
Institutional Class | (236,380 | ) | (10,091,546 | ) | ||||
|
|
|
| |||||
| (20,385,055 | ) | (30,952,223 | ) | |||||
|
|
|
| |||||
Capital Share Transactions: | ||||||||
Proceeds from shares sold: | ||||||||
Class A | 91,234,844 | 291,798,598 | ||||||
Class B | 25,345 | 24,140 | ||||||
Class C | 8,753,193 | 33,776,162 | ||||||
Class R | 2,465,212 | 4,121,669 | ||||||
Institutional Class | 297,984,195 | 254,708,224 | ||||||
38
Table of Contents
| Year ended | ||||||||
| 12/31/14 | 12/31/13 | |||||||
Capital Share Transactions (continued): | ||||||||
Net asset value of shares based upon reinvestment of dividends and distributions: | ||||||||
Class A | $ | 9,892,727 | $ | 17,621,959 | ||||
Class B | 2,651 | 6,328 | ||||||
Class C | 1,540,467 | 2,452,341 | ||||||
Class R | 112,722 | 180,058 | ||||||
Institutional Class | 6,985,018 | 8,643,009 | ||||||
|
|
|
| |||||
| 418,996,374 | 613,332,488 | |||||||
|
|
|
| |||||
Cost of shares redeemed: | ||||||||
Class A | (408,093,054 | ) | (824,723,032 | ) | ||||
Class B | (306,039 | ) | (414,148 | ) | ||||
Class C | (93,074,420 | ) | (215,368,876 | ) | ||||
Class R | (5,206,583 | ) | (10,316,641 | ) | ||||
Institutional Class | (204,019,355 | ) | (546,776,251 | ) | ||||
|
|
|
| |||||
| (710,699,451 | ) | (1,597,598,948 | ) | |||||
|
|
|
| |||||
Decrease in net assets derived from capital share transactions | (291,703,077 | ) | (984,266,460 | ) | ||||
|
|
|
| |||||
Net Decrease in Net Assets | (294,983,442 | ) | (1,061,804,407 | ) | ||||
Net Assets: | ||||||||
Beginning of year | 1,489,071,701 | 2,550,876,108 | ||||||
|
|
|
| |||||
End of year | $ | 1,194,088,259 | $ | 1,489,071,701 | ||||
|
|
|
| |||||
Distributions in excess of net investment income | $ | (601,753 | ) | $ | (686,541 | ) | ||
|
|
|
| |||||
See accompanying notes, which are an integral part of the financial statements.
39
Table of Contents
Delaware Limited-Term Diversified Income Fund Class A
Selected data for each share of the Fund outstanding throughout each period were as follows:
Net asset value, beginning of period |
Income (loss) from investment operations: |
Net investment income1 |
Net realized and unrealized gain (loss) |
Total from investment operations |
Less dividends and distributions from: |
Net investment income |
Return of capital |
Net realized gain |
Total dividends and distributions |
Net asset value, end of period |
Total return2 |
Ratios and supplemental data: |
Net assets, end of period (000 omitted) |
Ratio of expenses to average net assets |
Ratio of expenses to average net assets prior to fees waived |
Ratio of net investment income to average net assets |
Ratio of net investment income to average net assets prior to fees waived |
Portfolio turnover |
| 1 | The average shares outstanding method has been applied for per share information. |
| 2 | Total investment return is based on the change in net asset value of a share during the period and assumes reinvestment of dividends and distributions at net asset value and does not reflect the impact of a sales charge. Total investment return during all of the periods shown reflects a waiver by the distributor. Performance would have been lower had the waiver not been in effect. |
See accompanying notes, which are an integral part of the financial statements.
40
Table of Contents
| Year ended | ||||||||||||||||||
| 12/31/14 | 12/31/13 | 12/31/12 | 12/31/11 | 12/31/10 | ||||||||||||||
| $ 8.550 | $ | 8.850 | $ | 8.820 | $ | 8.920 | $ | 8.880 | ||||||||||
| 0.097 | 0.079 | 0.096 | 0.145 | 0.192 | ||||||||||||||
| 0.013 | (0.239 | ) | 0.123 | 0.100 | 0.134 | |||||||||||||
|
|
|
|
|
|
|
|
|
| |||||||||
| 0.110 | (0.160 | ) | 0.219 | 0.245 | 0.326 | |||||||||||||
|
|
|
|
|
|
|
|
|
| |||||||||
| (0.136 | ) | — | (0.174 | ) | (0.220 | ) | (0.143 | ) | ||||||||||
| (0.004 | ) | (0.140 | ) | (0.004 | ) | — | — | |||||||||||
| — | — | (0.011 | ) | (0.125 | ) | (0.143 | ) | |||||||||||
|
|
|
|
|
|
|
|
|
| |||||||||
| (0.140 | ) | (0.140 | ) | (0.189 | ) | (0.345 | ) | (0.286 | ) | |||||||||
|
|
|
|
|
|
|
|
|
| |||||||||
| $ 8.520 | $ | 8.550 | $ | 8.850 | $ | 8.820 | $ | 8.920 | ||||||||||
|
|
|
|
|
|
|
|
|
| |||||||||
| 1.28% | (1.81% | ) | 2.49% | 2.78% | 3.70% | |||||||||||||
| $472,654 | $ | 780,359 | $ | 1,337,983 | $ | 1,210,257 | $ | 1,217,992 | ||||||||||
| 0.83% | 0.82% | 0.81% | 0.82% | 0.83% | ||||||||||||||
| 0.93% | 0.96% | 0.96% | 0.97% | 0.98% | ||||||||||||||
| 1.13% | 0.91% | 1.07% | 1.62% | 2.14% | ||||||||||||||
| 1.03% | 0.77% | 0.92% | 1.47% | 1.99% | ||||||||||||||
| 80% | 236% | 262% | 333% | 411% | ||||||||||||||
41
Table of Contents
Financial highlights
Delaware Limited-Term Diversified Income Fund Class C
Selected data for each share of the Fund outstanding throughout each period were as follows:
Net asset value, beginning of period |
Income (loss) from investment operations: |
Net investment income1 |
Net realized and unrealized gain (loss) |
Total from investment operations |
Less dividends and distributions from: |
Net investment income |
Return of capital |
Net realized gain |
Total dividends and distributions |
Net asset value, end of period |
Total return2 |
Ratios and supplemental data: |
Net assets, end of period (000 omitted) |
Ratio of expenses to average net assets |
Ratio of net investment income to average net assets |
Portfolio turnover |
| 1 | The average shares outstanding method has been applied for per share information. |
| 2 | Total investment return is based on the change in net asset value of a share during the period and assumes reinvestment of dividends and distributions at net asset value and does not reflect the impact of a sales charge. |
See accompanying notes, which are an integral part of the financial statements.
42
Table of Contents
| Year ended | ||||||||||||||||||
| 12/31/14 | 12/31/13 | 12/31/12 | 12/31/11 | 12/31/10 | ||||||||||||||
| $ 8.540 | $ | 8.850 | $ | 8.820 | $ | 8.910 | $ | 8.870 | ||||||||||
| 0.024 | 0.005 | 0.020 | 0.069 | 0.116 | ||||||||||||||
| 0.023 | (0.248 | ) | 0.123 | 0.110 | 0.133 | |||||||||||||
|
|
|
|
|
|
|
|
|
| |||||||||
| 0.047 | (0.243 | ) | 0.143 | 0.179 | 0.249 | |||||||||||||
|
|
|
|
|
|
|
|
|
| |||||||||
| (0.063 | ) | — | (0.098 | ) | (0.144 | ) | (0.066 | ) | ||||||||||
| (0.004 | ) | (0.067 | ) | (0.004 | ) | — | — | |||||||||||
| — | — | (0.011 | ) | (0.125 | ) | (0.143 | ) | |||||||||||
|
|
|
|
|
|
|
|
|
| |||||||||
| (0.067 | ) | (0.067 | ) | (0.113 | ) | (0.269 | ) | (0.209 | ) | |||||||||
|
|
|
|
|
|
|
|
|
| |||||||||
| $ 8.520 | $ | 8.540 | $ | 8.850 | $ | 8.820 | $ | 8.910 | ||||||||||
|
|
|
|
|
|
|
|
|
| |||||||||
| 0.55% | (2.75% | ) | 1.62% | 2.03% | 2.82% | |||||||||||||
| $176,904 | $ | 260,073 | $ | 452,197 | $ | 500,237 | $ | 550,958 | ||||||||||
| 1.68% | 1.67% | 1.66% | 1.67% | 1.68% | ||||||||||||||
| 0.28% | 0.06% | 0.22% | 0.77% | 1.29% | ||||||||||||||
| 80% | 236% | 262% | 333% | 411% | ||||||||||||||
43
Table of Contents
Financial highlights
Delaware Limited-Term Diversified Income Fund Class R
Selected data for each share of the Fund outstanding throughout each period were as follows:
Net asset value, beginning of period |
Income (loss) from investment operations: |
Net investment income1 |
Net realized and unrealized gain (loss) |
Total from investment operations. |
Less dividends and distributions from: |
Net investment income |
Return of capital |
Net realized gain |
Total dividends and distributions |
Net asset value, end of period |
Total return2 |
Ratios and supplemental data: |
Net assets, end of period (000 omitted) |
Ratio of expenses to average net assets |
Ratio of expenses to average net assets prior to fees waived |
Ratio of net investment income to average net assets |
Ratio of net investment income to average net assets prior to fees waived |
Portfolio turnover |
| 1 | The average shares outstanding method has been applied for per share information. |
| 2 | Total investment return is based on the change in net asset value of a share during the period and assumes reinvestment of dividends and distributions at net asset value. Total investment return during some of the periods shown reflects a waiver by the distributor. Performance would have been lower had the waiver not been in effect. |
See accompanying notes, which are an integral part of the financial statements.
44
Table of Contents
| Year ended | ||||||||||||||||||||
| ||||||||||||||||||||
| 12/31/14 | 12/31/13 | 12/31/12 | 12/31/11 | 12/31/10 | ||||||||||||||||
| ||||||||||||||||||||
| $ | 8.550 | $ | 8.850 | $ | 8.820 | $ | 8.920 | $ | 8.880 | |||||||||||
| 0.067 | 0.048 | 0.065 | 0.114 | 0.161 | ||||||||||||||||
| 0.012 | (0.238 | ) | 0.123 | 0.100 | 0.133 | |||||||||||||||
|
|
|
|
|
|
|
|
|
| |||||||||||
| 0.079 | (0.190 | ) | 0.188 | 0.214 | 0.294 | |||||||||||||||
|
|
|
|
|
|
|
|
|
| |||||||||||
| (0.105 | ) | — | (0.143 | ) | (0.189 | ) | (0.111 | ) | ||||||||||||
| (0.004 | ) | (0.110 | ) | (0.004 | ) | — | — | |||||||||||||
| — | — | (0.011 | ) | (0.125 | ) | (0.143 | ) | |||||||||||||
|
|
|
|
|
|
|
|
|
| |||||||||||
| (0.109 | ) | (0.110 | ) | (0.158 | ) | (0.314 | ) | (0.254 | ) | |||||||||||
|
|
|
|
|
|
|
|
|
| |||||||||||
| $ | 8.520 | $ | 8.550 | $ | 8.850 | $ | 8.820 | $ | 8.920 | |||||||||||
|
|
|
|
|
|
|
|
|
| |||||||||||
| 0.93% | (2.16% | ) | 2.13% | 2.42% | 3.34% | |||||||||||||||
| $ | 8,022 | $ | 10,672 | $ | 17,243 | $ | 16,796 | $ | 16,639 | |||||||||||
| 1.18% | 1.17% | 1.16% | 1.17% | 1.18% | ||||||||||||||||
| 1.18% | 1.25% | 1.26% | 1.27% | 1.28% | ||||||||||||||||
| 0.78% | 0.56% | 0.72% | 1.27% | 1.79% | ||||||||||||||||
| 0.78% | 0.48% | 0.62% | 1.17% | 1.69% | ||||||||||||||||
| 80% | 236% | 262% | 333% | 411% | ||||||||||||||||
45
Table of Contents
Financial highlights
Delaware Limited-Term Diversified Income Fund Institutional Class
Selected data for each share of the Fund outstanding throughout each period were as follows:
Net asset value, beginning of period |
Income (loss) from investment operations: |
Net investment income1 |
Net realized and unrealized gain (loss) |
Total from investment operations |
Less dividends and distributions from: |
Net investment income |
Return of capital |
Net realized gain |
Total dividends and distributions |
Net asset value, end of period |
Total return2 |
Ratios and supplemental data: |
Net assets, end of period (000 omitted) |
Ratio of expenses to average net assets |
Ratio of net investment income to average net assets |
Portfolio turnover |
| 1 | The average shares outstanding method has been applied for per share information. |
| 2 | Total investment return is based on the change in net asset value of a share during the period and assumes reinvestment of dividends and distributions at net asset value. |
See accompanying notes, which are an integral part of the financial statements.
46
Table of Contents
| Year ended | ||||||||||||||||||||
| ||||||||||||||||||||
| 12/31/14 | 12/31/13 | 12/31/12 | 12/31/11 | 12/31/10 | ||||||||||||||||
| ||||||||||||||||||||
| $ | 8.550 | $ | 8.850 | $ | 8.820 | $ | 8.920 | $ | 8.870 | |||||||||||
| 0.110 | 0.092 | 0.109 | 0.159 | 0.206 | ||||||||||||||||
| 0.012 | (0.239 | ) | 0.123 | 0.100 | 0.143 | |||||||||||||||
|
|
|
|
|
|
|
|
|
| |||||||||||
| 0.122 | (0.147 | ) | 0.232 | 0.259 | 0.349 | |||||||||||||||
|
|
|
|
|
|
|
|
|
| |||||||||||
| (0.148 | ) | — | (0.187 | ) | (0.234 | ) | (0.156 | ) | ||||||||||||
| (0.004 | ) | (0.153 | ) | (0.004 | ) | — | — | |||||||||||||
| — | — | (0.011 | ) | (0.125 | ) | (0.143 | ) | |||||||||||||
|
|
|
|
|
|
|
|
|
| |||||||||||
| (0.152 | ) | (0.153 | ) | (0.202 | ) | (0.359 | ) | (0.299 | ) | |||||||||||
|
|
|
|
|
|
|
|
|
| |||||||||||
| $ | 8.520 | $ | 8.550 | $ | 8.850 | $ | 8.820 | $ | 8.920 | |||||||||||
|
|
|
|
|
|
|
|
|
| |||||||||||
| 1.43% | (1.66% | ) | 2.64% | 2.94% | 3.97% | |||||||||||||||
| $ | 536,508 | $ | 437,690 | $ | 742,773 | $ | 570,968 | $ | 390,769 | |||||||||||
| 0.68% | 0.67% | 0.66% | 0.67% | 0.68% | ||||||||||||||||
| 1.28% | 1.06% | 1.22% | 1.77% | 2.29% | ||||||||||||||||
| 80% | 236% | 262% | 333% | 411% | ||||||||||||||||
47
Table of Contents
| Delaware Limited-Term Diversified Income Fund | December 31, 2014 |
Delaware Group® Limited-Term Government Funds (Trust) is organized as a Delaware statutory trust and offers one series: Delaware Limited-Term Diversified Income Fund (Fund). The Trust is an open-end investment company. The Fund is considered diversified under the Investment Company Act of 1940, as amended, and offers Class A, Class C, Class R, and Institutional Class shares. Class A shares are sold with a maximum front-end sales charge of 2.75%. Class A share purchases of $1,000,000 or more will incur a limited contingent deferred sales charge (CDSC) of 0.75% if redeemed during the first year, provided that Delaware Distributors, L.P. (DDLP) paid a financial advisor a commission on the purchase of those shares. Effective Sept. 25, 2014, all remaining shares of Class B were converted to Class A shares. Between June 1, 2007 and Sept. 25, 2014, Class B shares could be purchased only through dividend reinvestment and certain permitted exchanges. Prior to June 1, 2007, Class B shares were sold with a CDSC that declined from 2.00% to zero depending upon the period of time the shares were held. Class B shares automatically converted to Class A shares on a quarterly basis approximately five years after purchase. Class C shares are sold with a CDSC of 1.00%, if redeemed during the first 12 months. Class R and Institutional Class shares are not subject to a sales charge and are offered for sale exclusively to certain eligible investors.
The investment objective of the Fund is to seek maximum total return, consistent with reasonable risk.
1. Significant Accounting Policies
The following accounting policies are in accordance with U.S. generally accepted accounting principles (U.S. GAAP) and are consistently followed by the Fund.
Security Valuation – Equity securities, except those traded on the Nasdaq Stock Market, Inc. (Nasdaq), are valued at the last quoted sales price as of the time of the regular close of the New York Stock Exchange on the valuation date. Securities traded on the Nasdaq are valued in accordance with the Nasdaq Official Closing Price, which may not be the last sales price. If, on a particular day, an equity security does not trade, then the mean between the bid and ask prices will be used, which approximates fair value. Securities listed on a foreign exchange are normally valued at the last quoted sales price on the valuation date. Debt securities and credit default swap (CDS) contracts are valued based upon valuations provided by an independent pricing service or broker/counterparty and reviewed by management. To the extent current market prices are not available, the pricing service may take into account developments related to the specific security, as well as transactions in comparable securities. U.S. government and agency securities are valued at the mean between the bid and ask prices, which approximates fair value. For asset-backed securities, collateralized mortgage obligations, commercial mortgage securities, and U.S. government agency mortgage securities, pricing vendors utilize matrix pricing which considers prepayment speed; attributes of the collateral; yield or price of bonds of comparable quality, coupon, maturity, and type as well as broker/dealer-supplied prices. Swap prices are derived using daily swap curves and models that incorporate a number of market data factors, such as discounted cash flows, trades, and values of the underlying reference instruments. Foreign currency exchange contracts and foreign cross currency exchange contracts are valued at the mean between the bid and ask prices, which approximates fair value. Interpolated values are derived when the settlement date of the contract is an interim date for which quotations are not available. Futures contracts and options on futures contracts are valued at the daily quoted settlement prices. Exchange-traded options are valued at the last reported sale price or, if no sales are reported, at the mean between the last
48
Table of Contents
reported bid and ask prices, which approximates fair value. Generally, other securities and assets for which market quotations are not readily available are valued at fair value as determined in good faith under the direction of the Fund’s Board of Trustees (Board). In determining whether market quotations are readily available or fair valuation will be used, various factors will be taken into consideration, such as market closures or suspension of trading in a security. The Fund may use fair value pricing more frequently for securities traded primarily in non-U.S. markets because, among other things, most foreign markets close well before the Fund values its securities, generally as of 4:00 p.m. Eastern time. The earlier close of these foreign markets gives rise to the possibility that significant events, including broad market moves, government actions or pronouncements, aftermarket trading, or news events may have occurred in the interim. Whenever such a significant event occurs, the Fund may value foreign securities using fair value prices based on third-party vendor modeling tools (international fair value pricing).
Federal and Foreign Income Taxes – No provision for federal income taxes has been made as the Fund intends to continue to qualify for federal income tax purposes as a regulated investment company under Subchapter M of the Internal Revenue Code of 1986, as amended, and make the requisite distributions to shareholders. The Fund evaluates tax positions taken or expected to be taken in the course of preparing the Fund’s tax returns to determine whether the tax positions are “more-likely-than-not” of being sustained by the applicable tax authority. Tax positions not deemed to meet the “more-likely-than-not” threshold are recorded as a tax benefit or expense in the current year. Management has analyzed the Fund’s tax positions taken for all open federal income tax years (Dec. 31, 2011–Dec. 31, 2014), and has concluded that no provision for federal income tax is required in the Fund’s financial statements. In regard to foreign taxes only, the Fund has open tax years in certain foreign countries in which it invests that may date back to the inception of the Fund.
Class Accounting – Investment income and common expenses are allocated to the various classes of the Fund on the basis of “settled shares” of each class in relation to the net assets of the Fund. Realized and unrealized gain (loss) on investments are allocated to the various classes of the Fund on the basis of daily net assets of each class. Distribution expenses relating to a specific class are charged directly to that class.
Repurchase Agreements – The Fund may purchase certain U.S. government securities subject to the counterparty’s agreement to repurchase them at an agreed upon date and price. The counterparty will be required on a daily basis to maintain the value of the collateral subject to the agreement at not less than the repurchase price (including accrued interest). The agreements are conditioned upon the collateral being deposited under the Federal Reserve book-entry system with the Fund’s custodian or a third party sub-custodian. In the event of default or bankruptcy by the other party to the agreement, retention of the collateral may be subject to legal proceedings. All open repurchase agreements as of the date of this report were entered into on Dec. 31, 2014.
To Be Announced Trades – The Fund may contract to purchase or sell securities for a fixed price at a transaction date beyond the customary settlement period (Examples: when issued, delayed delivery, forward commitment, or TBA transactions) consistent with the Fund’s ability to manage its investment portfolio and meet redemption requests. These transactions involve a commitment by the Fund to purchase or sell securities for a predetermined price or yield with payment and delivery taking place more than three days in the future, or after a period longer than the customary settlement period for that
49
Table of Contents
Notes to financial statements
Delaware Limited-Term Diversified Income Fund
1. Significant Accounting Policies (continued)
type of security. No interest will be earned by the Fund on such purchases until the securities are delivered or the transaction is completed; however the market value may change prior to delivery.
Foreign Currency Transactions – Transactions denominated in foreign currencies are recorded at the prevailing exchange rates on the valuation date in accordance with the Fund’s prospectus. The value of all assets and liabilities denominated in foreign currencies is translated daily into U.S. dollars at the exchange rate of such currencies against the U.S. dollar. Transaction gains or losses resulting from changes in exchange rates during the reporting period or upon settlement of the foreign currency transaction are reported in operations for the current period. The Fund generally bifurcates that portion of realized gains and losses on investments in debt securities which is due to changes in foreign exchange rates from that which is due to changes in market prices of debt securities. That portion of gains (losses) is included on the “Statement of operations” under “Net realized gain (loss) on foreign currencies.” The Fund reports certain foreign currency related transactions as components of realized gains (losses) for financial reporting purposes, whereas such components are treated as ordinary income (loss) for federal income tax purposes.
Use of Estimates – The Fund is an investment company in conformity with U.S. generally accepted accounting principles (“U.S. GAAP”). Therefore, the Fund follows the accounting and reporting guidelines for investment companies. The preparation of financial statements in conformity with U.S. GAAP requires management to make estimates and assumptions that affect the fair value of investments, the reported amounts of assets and liabilities and disclosure of contingent assets and liabilities at the date of the financial statements, and the reported amounts of revenues and expenses during the reporting period. Actual results could differ from those estimates and the differences could be material.
Other – Expenses directly attributable to the Fund are charged directly to the Fund. Other expenses common to various funds within the Delaware Investments® Family of Funds are generally allocated among such funds on the basis of average net assets. Management fees and some other expenses are paid monthly. Security transactions are recorded on the date the securities are purchased or sold (trade date) for financial reporting purposes. Costs used in calculating realized gains and losses on the sale of investment securities are those of the specific securities sold. Dividend income is recorded on the ex-dividend date and interest income is recorded on the accrual basis. Discounts and premiums on debt securities are amortized to interest income over the lives of the respective securities using the effective interest method. Realized gains (losses) on paydowns of asset- and mortgage-backed securities are classified as interest income. The Fund declares dividends daily from net investment income and pays the dividends monthly and declares and pays distributions from net realized gain on investments, if any, annually. The Fund may distribute more frequently, if necessary for tax purposes. Dividends and distributions, if any, are recorded on the ex-dividend date.
The Fund may receive earnings credits from its custodian when positive cash balances are maintained, which may be used to offset custody fees. There were no earnings credits for the year ended Dec. 31, 2014.
The Fund receives earnings credits from its transfer agent when positive cash balances are maintained, which may be used to offset transfer agent fees. If the amount earned is greater than one dollar, the expense paid under this arrangement is included on the “Statement of operations” under “Dividend
50
Table of Contents
disbursing and transfer agent fees and expenses” with the corresponding expense offset shown under “Less expense paid indirectly.” For the year ended Dec. 31, 2014, the Fund earned $792 under this agreement.
2. Investment Management, Administration Agreements and Other Transactions with Affiliates
In accordance with the terms of its investment management agreement, the Fund pays Delaware Management Company (DMC), a series of Delaware Management Business Trust and the investment manager, an annual fee which is calculated daily at the rate of 0.50% on the first $500 million of average daily net assets of the Fund, 0.475% on the next $500 million, 0.45% on the next $1.5 billion, and 0.425% on average daily net assets in excess of $2.5 billion.
Effective Nov. 1, 2014, Delaware Investments Fund Services Company (DIFSC), an affiliate of DMC, provides fund accounting and financial administration oversight services to the Fund. Prior to this time, Delaware Service Company, Inc. (DSC), an affiliate of DMC, provided fund accounting and financial administration oversight services to the Fund under a substantially identical agreement with an identical fee schedule. For these services, DIFSC’s fees are calculated based on the aggregate daily net assets of the Delaware Investments® Family of Funds at the following annual rate: 0.0050% of the first $30 billion; 0.0045% of the next $10 billion; 0.0040% of the next $10 billion; and 0.0025% of aggregate average daily net assets in excess of $50 billion. The fees payable to DIFSC under the service agreement described above are allocated among all funds in the Delaware Investments Family of Funds on a relative net asset value basis. For the year ended Dec. 31, 2014, the Fund was charged $63,267 for these services. This amount is included on the “Statement of operations” under “Accounting and administration expenses.”
Effective Nov. 1, 2014, DIFSC is the transfer agent and dividend disbursing agent of the Fund. Prior to this time, DSC was the transfer agent and dividend disbursing agent of the Fund under a substantially identical agreement with an identical fee schedule. For these services, DIFSC’s fees are calculated based on the aggregate daily net assets of the retail funds within the Delaware Investments Family of Funds at the following annual rate: 0.025% of the first $20 billion, 0.020% of the next $5 billion; 0.015% of the next $5 billion; and 0.013% on average daily net assets in excess of $30 billion. The fees payable to DIFSC under the service agreement described above are allocated among all retail Funds in the Delaware Investments Family of Funds on a relative net asset value basis. This amount is included on the “Statement of operations” under “Dividend disbursing and transfer agent fees and expenses.” For the year ended Dec. 31, 2014, the Fund was charged $284,665 for these services. Pursuant to a sub-transfer agency agreement between DIFSC and BNY Mellon Investment Servicing (US) Inc. (BNYMIS), BNYMIS provides certain sub-transfer agency services to the Fund. Sub-transfer agency fees are passed on to and paid by the Fund.
Pursuant to a distribution agreement and distribution plan, the Fund pays DDLP, the distributor and an affiliate of DMC, an annual distribution and service fee of 0.25%, 1.00%, and 0.50% of the average daily net assets of the Class A, Class C, and Class R shares, respectively. DDLP has contractually agreed to waive Class A shares’ 12b-1 fees to 0.15% of average daily net assets from Jan. 1, 2014 through Dec. 31, 2014.* The Fund’s Class B shares paid DDLP 1.00% of the average daily net assets for the period Jan. 1, 2014 through Sept. 25, 2014. DDLP had contractually agreed to waive Class B shares’
51
Table of Contents
Notes to financial statements
Delaware Limited-Term Diversified Income Fund
2. Investment Management, Administration Agreements and Other Transactions with Affiliates (continued)
12b-1 fees to 0.15% of average daily net assets from Jan. 1, 2014 through Sept. 25, 2014. Institutional Class shares pay no distribution and service fees.
As provided in the investment management agreement, the Fund bears a portion of the cost of certain resources shared with DMC, including the cost of internal personnel of DMC and/or its affiliates that provide legal, tax, and regulatory reporting services to the Fund. For the year ended Dec. 31, 2014, the Fund was charged $36,972 for internal legal, tax, and regulatory reporting services provided by DMC and/or its affiliates’ employees. This amount is included on the “Statement of operations” under “Legal fees.”
For the year ended Dec. 31, 2014, DDLP earned $6,137 for commissions on sales of the Fund’s Class A shares. For the year ended Dec. 31, 2014, DDLP received gross CDSC commissions of $269 and $825 on redemption of the Fund’s Class A and Class C shares, respectively, and these commissions were entirely used to offset upfront commissions previously paid by DDLP to broker/dealers on sales of those shares.
Trustees’ fees include expenses accrued by the Fund for each Trustee’s retainer and meeting fees. Certain officers of DMC, DIFSC, and DDLP are officers and/or Trustees of the Trust. These officers and Trustees are paid no compensation by the Fund.
* The contractual waiver period is April 30, 2013 through April 30, 2015.
3. Investments
For the year ended Dec. 31, 2014, the Fund made purchases and sales of investment securities other than short-term investments as follows:
Purchases other than U.S. government securities | $ | 936,186,928 | ||
Purchases of U.S. government securities | 97,976,306 | |||
Sales other than U.S. government securities | 1,229,865,597 | |||
Sales of U.S. government securities | 94,527,131 |
At Dec. 31, 2014, the cost of investments and unrealized appreciation (depreciation) for federal income tax purposes for the Fund were as follows:
Cost of investments | $ | 1,187,929,880 | ||
|
| |||
Aggregate unrealized appreciation | $ | 13,309,229 | ||
Aggregate unrealized depreciation | (12,963,559 | ) | ||
|
| |||
Net unrealized appreciation | $ | 345,670 | ||
|
|
U.S. GAAP defines fair value as the price that the Fund would receive to sell an asset or pay to transfer a liability in an orderly transaction between market participants at the measurement date under current market conditions. A three-level hierarchy for fair value measurements has been established based upon the transparency of inputs to the valuation of an asset or liability. Inputs may be observable or unobservable and refer broadly to the assumptions that market participants would use in pricing the
52
Table of Contents
asset or liability. Observable inputs reflect the assumptions market participants would use in pricing the asset or liability based on market data obtained from sources independent of the reporting entity. Unobservable inputs reflect the reporting entity’s own assumptions about the assumptions that market participants would use in pricing the asset or liability based on the best information available under the circumstances. The Fund’s investment in its entirety is assigned a level based upon the observability of the inputs which are significant to the overall valuation. The three-level hierarchy of inputs is summarized below.
| Level 1 – | Inputs are quoted prices in active markets for identical investments. (Examples: equity securities, open-end investment companies, futures contracts, exchange-traded options contracts) | |
| Level 2 – | Other observable inputs, including, but not limited to: quoted prices for similar assets or liabilities in markets that are active, quoted prices for identical or similar assets or liabilities in markets that are not active, inputs other than quoted prices that are observable for the assets or liabilities (such as interest rates, yield curves, volatilities, prepayment speeds, loss severities, credit risks, and default rates), or other market-corroborated inputs. (Examples: debt securities, government securities, swap contracts, foreign currency exchange contracts, foreign securities utilizing international fair value pricing, broker-quoted securities, fair valued securities) | |
| Level 3 – | Significant unobservable inputs, including the Fund’s own assumptions used to determine the fair value of investments. (Examples: broker-quoted securities, fair valued securities) | |
Level 3 investments are valued using significant unobservable inputs. The Fund may also use an income-based valuation approach in which the anticipated future cash flows of the investment are discounted to calculate fair value. Discounts may also be applied due to the nature or duration of any restrictions on the disposition of the investments. Valuations may also be based upon current market prices of securities that are comparable in coupon, rating, maturity, and industry. The derived value of a Level 3 investment may not represent the value which is received upon disposition and this could impact the results of operations.
53
Table of Contents
Notes to financial statements
Delaware Limited-Term Diversified Income Fund
3. Investments (continued)
The following table summarizes the valuation of the Fund’s investments by fair value hierarchy levels as of Dec. 31, 2014:
| Level 1 | Level 2 | Level 3 | Total | |||||||||||||
Agency, Asset- & Mortgage- Backed Securities1 | $ | — | $ | 520,843,360 | $ | 11,269,151 | $ | 532,112,511 | ||||||||
Corporate Debt | — | 603,471,065 | — | 603,471,065 | ||||||||||||
Foreign Debt | — | 6,674,980 | — | 6,674,980 | ||||||||||||
Senior Secured Loans1 | — | 7,170,785 | 511,275 | 7,682,060 | ||||||||||||
Municipal Bonds | — | 10,454,674 | — | 10,454,674 | ||||||||||||
Preferred Stock | — | 1,083,750 | — | 1,083,750 | ||||||||||||
Short-Term Investments | — | 23,352,580 | — | 23,352,580 | ||||||||||||
U.S. Treasury Obligations | — | 3,443,930 | — | 3,443,930 | ||||||||||||
|
|
|
|
|
|
|
| |||||||||
Total | $ | — | $ | 1,176,495,124 | $ | 11,780,426 | $ | 1,188,275,550 | ||||||||
|
|
|
|
|
|
|
| |||||||||
Futures Contracts | $ | 494,830 | $ | — | $ | — | $ | 494,830 | ||||||||
Swap Contracts | — | 95,337 | — | 95,337 | ||||||||||||
1Security type is valued across multiple levels. Level 2 investments represent investments with observable inputs, or matrix-price investments, and Level 3 investments represent investments without observable inputs. The amounts attributed to Level 2 investments and Level 3 investments represent the following percentages of the total market value of this security type:
| Level 2 | Level 3 | Total | ||||||||||||||
Agency, Asset- & Mortgage- Backed Securities | 97.88 | % | 2.12 | % | 100.00 | % | ||||||||||
Senior Secured Loans | 93.34 | % | 6.66 | % | 100.00 | % | ||||||||||
During the year ended Dec. 31, 2014, there were no transfers between Level 1 investments, Level 2 investments, or Level 3 investments that had a significant impact to the Fund. The Fund’s policy is to recognize transfers between levels at the beginning of the reporting period.
A reconciliation of Level 3 investments is presented when the Fund has a significant amount of Level 3 investments at the beginning, interim, or end of the period in relation to net assets. Management has determined not to provide additional disclosure on Level 3 inputs under ASU No. 2011-04 since the Level 3 investments are not considered significant to the Fund’s net assets at the end of the year.
54
Table of Contents
4. Dividends and Distribution Information
Income and long-term capital gain distributions are determined in accordance with federal income tax regulations, which may differ from U.S. GAAP. Additionally, distributions from net gains on foreign currency transactions and net short-term gains on sales of investment securities are treated as ordinary income for federal income tax purposes. The tax character of dividends and distributions paid during the years ended Dec. 31, 2014 and 2013 was as follows:
| Year ended | ||||||||
| 12/31/14 | 12/31/13 | |||||||
Ordinary income | $ | 19,858,945 | $ | — | ||||
Return of capital | 526,110 | 30,952,223 | ||||||
|
|
|
| |||||
Total | $ | 20,385,055 | $ | 30,952,223 | ||||
|
|
|
| |||||
5. Components of Net Assets on a Tax Basis
As of Dec. 31, 2014, the components of net assets on a tax basis were as follows:
Shares of beneficial interest | $ | 1,224,273,838 | ||
Other temporary differences | (6,072 | ) | ||
Capital loss carryforwards | (30,050,531 | ) | ||
Dividends payable | (474,646 | ) | ||
Unrealized appreciation | 345,670 | |||
|
| |||
Net assets | $ | 1,194,088,259 | ||
|
|
The differences between book basis and tax basis components of net assets are primarily attributable to tax deferral of losses on wash sales and straddles, mark-to-market of futures contracts, contingent payment debt instruments, tax treatment of market discount and premium on debt instruments, and CDS contracts.
For financial reporting purposes, capital accounts are adjusted to reflect the tax character of permanent book/tax differences. Reclassifications are primarily due to tax treatment of gain (loss) on foreign currency transactions, CDS contracts, contingent payment debt instruments, market discount and premium on certain debt instruments and paydowns of asset- and mortgage-backed securities. Results of operations and net assets were not affected by these reclassifications. For the year ended Dec. 31, 2014 the Fund recorded the following reclassifications:
Undistributed net investment income | $ | 6,161,150 | ||
Accumulated net realized loss | (6,161,150 | ) |
For federal income tax purposes, capital loss carryforwards may be carried forward and applied against future capital gains.
On Dec. 22, 2010, the Regulated Investment Company Modernization Act of 2010 (Act) was enacted, which changed various technical rules governing the tax treatment of regulated investment companies. The changes were generally effective for taxable years beginning after the date of enactment. Under the Act, the Fund is permitted to carry forward capital losses incurred in taxable years beginning after the date of enactment for an unlimited period. However, any losses incurred during those future taxable years will be required to be utilized prior to the losses incurred in pre-enactment taxable years, which carry an expiration date. As a result of this ordering rule, pre-enactment capital loss carryforwards may
55
Table of Contents
Notes to financial statements
Delaware Limited-Term Diversified Income Fund
5. Components of Net Assets on a Tax Basis (continued)
be more likely to expire unused. Additionally, post-enactment capital loss carryforwards will retain their character as either short-term or long-term capital losses rather than being considered all short-term as permitted under previous regulation.
Losses incurred that will be carried forward under the Act are as follows:
| Loss carryforward character | ||||||||||||
| Short-term | Long-term | |||||||||||
| $(21,370,047) | $ | (8,680,484 | ) | |||||||||
6. Capital Shares
Transactions in capital shares were as follows:
| Year ended | Year ended | |||||||
| 12/31/14 | 12/31/13 | |||||||
Shares sold: | ||||||||
Class A | 10,639,427 | 33,427,369 | ||||||
Class B | 2,957 | 2,830 | ||||||
Class C | 1,022,200 | 3,905,901 | ||||||
Class R | 287,356 | 474,813 | ||||||
Institutional Class | 34,768,065 | 29,323,141 | ||||||
Shares issued upon reinvestment of dividends and distributions: | ||||||||
Class A | 1,154,602 | 2,034,165 | ||||||
Class B | 309 | 732 | ||||||
Class C | 179,943 | 283,043 | ||||||
Class R | 13,153 | 20,773 | ||||||
Institutional Class | 815,574 | 997,684 | ||||||
|
|
|
| |||||
| 48,883,586 | 70,470,451 | |||||||
|
|
|
| |||||
Shares redeemed: | ||||||||
Class A | (47,590,323 | ) | (95,339,569 | ) | ||||
Class B | (35,748 | ) | (47,929 | ) | ||||
Class C | (10,865,349 | ) | (24,867,982 | ) | ||||
Class R | (607,216 | ) | (1,195,141 | ) | ||||
Institutional Class | (23,817,210 | ) | (63,051,078 | ) | ||||
|
|
|
| |||||
| (82,915,846 | ) | (184,501,699 | ) | |||||
|
|
|
| |||||
Net decrease | (34,032,260 | ) | (114,031,248 | ) | ||||
|
|
|
| |||||
For the years ended Dec. 31, 2014 and 2013, 15,321 Class B shares were converted to 15,327 Class A shares valued at $131,220, and 8,480 Class B shares were converted to 8,479 Class A shares valued at $73,359, respectively. The respective amounts are included in Class B redemptions and Class A subscriptions in the table above and on the “Statements of changes in net assets.”
56
Table of Contents
Certain shareholders may exchange shares of one class of shares for another class in the same Fund. For the year ended Dec. 31, 2014, exchange transactions were as follows:
| Exchange Redemptions | Exchange Subscriptions | |||||||||
Class A Shares | Class C Shares | Institutional Class Shares | Class A Shares | Institutional Class Shares | Value | |||||
8,846 | 37,468 | — | — | 46,293 | $397,363 | |||||
These exchange transactions are included as subscriptions and redemptions in the table above and on the “Statements of changes in net assets.”
7. Line of Credit
The Fund, along with certain other funds in the Delaware Investments® Family of Funds (Participants), was a participant in a $225,000,000 revolving line of credit intended to be used for temporary or emergency purposes as an additional source of liquidity to fund redemptions of investor shares. Under the agreement, the Participants were charged an annual commitment fee of 0.08%, which was allocated across the Participants on the basis of each Participant’s allocation of the entire facility. The Participants were permitted to borrow up to a maximum of one third of their net assets under the agreement. Each Participant was individually, and not jointly, liable for its particular advances, if any, under the line of credit. The line of credit under the agreement expired on Nov. 10, 2014.
On Nov. 10, 2014, the Fund, along with the other Participants, entered into an amendment to the agreement for a $275,000,000 revolving line of credit to be used as described above and to be operated in substantially the same manner as the original agreement. The line of credit under the agreement expires on Nov. 9, 2015.
The Fund had no amounts outstanding as of Dec. 31, 2014 or at any time during the year then ended.
8. Derivatives
U.S. GAAP requires disclosures that enable investors to understand: (1) how and why an entity uses derivatives, (2) how they are accounted for, and (3) how they affect an entity’s results of operations and financial position.
Foreign Currency Exchange Contracts – The Fund may enter into foreign currency exchange contracts and foreign cross currency exchange contracts as a way of managing foreign exchange rate risk. The Fund may enter into these contracts to fix the U.S. dollar value of a security that it has agreed to buy or sell for the period between the date the trade was entered into and the date the security is delivered and paid for. The Fund may also use these contracts to hedge the U.S. dollar value of securities it already owns that are denominated in foreign currencies. In addition, the Fund may enter into these contracts to facilitate or expedite the settlement of portfolio transactions. The change in value is recorded as an unrealized gain or loss. When the contract is closed, a realized gain or loss is recorded equal to the difference between the value of the contract at the time it was opened and the value at the time it was closed.
The use of foreign currency exchange contracts and foreign cross currency exchange contracts does not eliminate fluctuations in the underlying prices of the securities, but does establish a rate of exchange that
57
Table of Contents
Notes to financial statements
Delaware Limited-Term Diversified Income Fund
8. Derivatives (continued)
can be achieved in the future. Although foreign currency exchange contracts and foreign cross currency exchange contracts limit the risk of loss due to an unfavorable change in the value of the hedged currency, they also limit any potential gain that might result should the value of the currency change favorably. In addition, the Fund could be exposed to risks if the counterparties to the contracts are unable to meet the terms of their contracts. The Fund’s maximum risk of loss from counterparty credit risk is the value of its currency exchanged with the counterparty. The risk is generally mitigated by having a netting arrangement between the Fund and the counterparty and by the posting of collateral by the counterparty to the Fund to cover the Fund’s exposure to the counterparty. No foreign currency exchange contracts are outstanding at Dec. 31, 2014.
During the year ended Dec. 31, 2014, the Fund entered into foreign currency exchange contracts to hedge the U.S. dollar value of securities it already owns that are denominated in foreign currencies.
Futures Contracts – A futures contract is an agreement in which the writer (or seller) of the contract agrees to deliver to the buyer an amount of cash or securities equal to a specific dollar amount times the difference between the value of a specific security or index at the close of the last trading day of the contract and the price at which the agreement is made. The Fund may use futures in the normal course of pursuing its investment objective. The Fund may invest in futures contracts to hedge its existing portfolio securities against fluctuations in fair value caused by changes in interest rates or market conditions. Upon entering into a futures contract, the Fund deposits cash or pledges U.S. government securities to a broker, equal to the minimum “initial margin” requirements of the exchange on which the contract is traded. Subsequent payments are received from the broker or paid to the broker each day, based on the daily fluctuation in the market value of the contract. These receipts or payments are known as “variation margin” and are recorded daily by the Fund as unrealized gains or losses until the contracts are closed. When the contracts are closed, the Fund records a realized gain or loss equal to the difference between the value of the contract at the time it was opened and the value at the time it was closed. Risks of entering into futures contracts include potential imperfect correlation between the futures contracts and the underlying securities and the possibility of an illiquid secondary market for these instruments. When investing in futures, there is reduced counterparty credit risk to the Fund because futures are exchange-traded and the exchange’s clearinghouse, as counterparty to all exchange-traded futures, guarantees against default. The Fund posted $866,000 cash collateral for open futures contracts, which is presented as “Cash collateral due from brokers” on the “Statement of assets and liabilities.”
During the year ended Dec. 31, 2014, the Fund used futures contracts to hedge its existing portfolio securities against fluctuations in value caused by changes in interest rates or market conditions.
Swap Contracts – The Fund may enter into CDS contracts in the normal course of pursuing its investment objective. The Fund may enter into CDS contracts in order to hedge against credit events, to enhance total return, or to gain exposure to certain securities or markets. The Fund will not be permitted to enter into any swap transactions unless, at the time of entering into such transactions, the unsecured long-term debt of the actual counterparty, combined with any credit enhancements, is rated at least BBB- by Standard & Poor’s Financial Services LLC (S&P) or Baa3 by Moody’s Investors Service, Inc. (Moody’s) or is determined to be of equivalent credit quality by DMC.
58
Table of Contents
Credit Default Swaps. A CDS contract is a risk-transfer instrument through which one party (purchaser of protection) transfers to another party (seller of protection) the financial risk of a credit event (as defined in the CDS agreement), as it relates to a particular reference security or basket of securities (such as an index). In exchange for the protection offered by the seller of protection, the purchaser of protection agrees to pay the seller of protection a periodic amount at a stated rate that is applied to the notional amount of the CDS contract. In addition, an upfront payment may be made or received by the Fund in connection with an unwinding or assignment of a CDS contract. Upon the occurrence of a credit event, the seller of protection would pay the par (or other agreed-upon) value of the reference security (or basket of securities) to the counterparty. Credit events generally include, among others, bankruptcy, failure to pay, and obligation default.
During the year ended Dec. 31, 2014, the Fund entered into CDS contracts as a purchaser of protection. Periodic payments (receipts) on such contracts are accrued daily and recorded as unrealized losses (gains) on swap contracts. Upon payment (receipt), such amounts are recorded as realized losses (gains) on swap contracts. Upfront payments made or received in connection with CDS contracts are amortized over the expected life of the CDS contracts as unrealized losses (gains) on swap contracts. The change in value of CDS contracts is recorded daily as unrealized appreciation or depreciation. A realized gain or loss is recorded upon a credit event (as defined in the CDS agreement) or the maturity or termination of the agreement. For the year ended Dec. 31, 2014, the Fund did not enter into any CDS contracts as a seller of protection. Initial margin and variation margin are posted to central counterparties for CDS basket trades, as determined by the applicable central counterparty.
CDS contracts may involve greater risks than if the Fund had invested in the reference obligation directly. CDS contracts are subject to general market risk, liquidity risk, counterparty risk, and credit risk. The Fund’s maximum risk of loss from counterparty credit risk, either as the seller of protection or the buyer of protection, is the fair value of the contract. This risk is mitigated by (1) for bilateral swap contracts, having a netting arrangement between the Fund and the counterparty and by the posting of collateral by the counterparty to the Fund to cover the Fund’s exposure to the counterparty or (2) for cleared swaps, trading these instruments through a central counterparty.
During the year ended Dec. 31, 2014, the Fund used CDS contracts to hedge against credit events.
Swaps Generally. The value of open swaps may differ from that which would be realized in the event the Fund terminated its position in the contract on a given day. Risks of entering into these contracts include the potential inability of the counterparty to meet the terms of the contracts. This type of risk is generally limited to the amount of favorable movement in the value of the underlying security, instrument, or basket of instruments, if any, at the day of default. Risks also arise from potential losses from adverse market movements and such losses could exceed the unrealized amounts that would be shown on the “Schedule of investments.”
59
Table of Contents
Notes to financial statements
Delaware Limited-Term Diversified Income Fund
8. Derivatives (continued)
Fair value of derivative instruments as of Dec. 31, 2014 was as follows:
| Asset Derivatives | Liability Derivatives | |||||||||
| Statement of Assets and Liabilities Location | Fair Value | Statement of Assets and Liabilities Location | Fair Value | |||||||
Interest rate contracts | ||||||||||
(Futures contracts) | Variation margin receivable on futures contracts | 494,830 | * | Variation margin receivable on futures contracts | — | |||||
Credit contracts | ||||||||||
(Swap contracts) | Unrealized gain of | 95,337 | Unrealized loss of credit default swap contracts | — | ||||||
|
|
| ||||||||
Total | $ | 590,167 | $— | |||||||
|
|
| ||||||||
*Includes cumulative appreciation (depreciation) of futures contracts from the date the contracts are opened through Dec. 31, 2014. Only current day variation margin is reported on the “Statement of assets and liabilities.”
The effect of derivative instruments on the “Statement of operations” for the year ended Dec. 31, 2014 was as follows:
| Net Realized Gain (Loss) on: | ||||||||||||||||
| Foreign Currency Exchange Contracts | Futures Contracts | Swap Contracts | Total | |||||||||||||
Forward currency exchange contracts | $2,623 | $ | — | $ | — | $ | 2,623 | |||||||||
Interest rate contracts | — | (2,600,547 | ) | — | (2,600,547 | ) | ||||||||||
Credit contracts | — | — | 619,933 | 619,933 | ||||||||||||
|
|
|
|
|
|
|
| |||||||||
Total | $2,623 | $ | (2,600,547 | ) | $ | 619,933 | $ | (1,977,991 | ) | |||||||
|
|
|
|
|
|
|
| |||||||||
| Net Change in Unrealized Appreciation (Depreciation) of: | ||||||||||||
| Futures Contracts | Swap Contracts | Total | ||||||||||
Interest rate contracts | $ | (1,269,226 | ) | $ | — | $ | (1,269,226 | ) | ||||
Credit contracts | — | 28,671 | 28,671 | |||||||||
|
|
|
|
|
| |||||||
Total | $ | (1,269,226 | ) | $ | 28,671 | $ | (1,240,555 | ) | ||||
|
|
|
|
|
| |||||||
60
Table of Contents
Derivatives Generally. The table below summarizes the average balance of derivative holdings by the Fund during the year ended Dec. 31, 2014.
| Long Derivative Volume | Short Derivative Volume | |||||||
Foreign currency exchange contracts (average cost) | USD | 4,240 | USD | 33,720 | ||||
Futures contracts (average notional value) | 33,762,939 | 60,084,376 | ||||||
CDS contracts (average notional value)* | 20,864,941 | — | ||||||
*Long represents buying protection and short represents selling protection.
9. Offsetting
In December 2011, the Financial Accounting Standards Board (FASB) issued guidance that expands disclosure requirements on the offsetting of certain assets and liabilities. The disclosures are required for investments and derivative financial instruments subject to master netting or similar agreements which are eligible for offset on the “Statement of assets and liabilities” and requires an entity to disclose both gross and net information about such investments and transactions in the financial statements. In January 2013, the FASB issued guidance that clarifies which investments and transactions are subject to the offsetting disclosure requirements. The scope of the disclosure requirements for offsetting is limited to derivative instruments, repurchase agreements and reverse repurchase agreements, and securities borrowing. The guidance is effective for financial statements with fiscal years beginning on or after Jan. 1, 2013, and interim periods within those fiscal years.
In order to better define its contractual rights and to secure rights that will help the Fund mitigate its counterparty risk, the Fund entered into an International Swaps and Derivatives Association, Inc. Master Agreement (ISDA Master Agreement) or a similar agreement with each of its derivative contract counterparties. An ISDA Master Agreement is a bilateral agreement between the Fund and a counterparty that governs certain over-the-counter (OTC) derivatives and foreign exchange contracts and typically contains, among other things, collateral posting items and provisions in the event of a default and/or termination event. Under an ISDA Master Agreement, the Fund may, under certain circumstances, offset with the counterparty certain derivative financial instruments’ payables and/or receivables with collateral held and/or posted and create one single net payment. The provisions of the ISDA Master Agreement typically permit a single net payment in the event of default (close-out), including the bankruptcy or insolvency of the counterparty. However, bankruptcy or insolvency laws of a particular jurisdiction may impose restrictions on or prohibitions against the right of offset in bankruptcy, insolvency, or other events.
For financial reporting purposes, the Fund does not offset derivative assets and derivative liabilities that are subject to netting arrangements on the “Statement of assets and liabilities.”
61
Table of Contents
Notes to financial statements
Delaware Limited-Term Diversified Income Fund
9. Offsetting (continued)
At Dec. 31, 2014, the Fund had the following assets and liabilities subject to offsetting provisions:
Offsetting of Financial Assets and Liabilities and Derivative Assets and Liabilities
| Counterparty | Gross Value of Derivative Asset | Gross Value of Derivative Liability | Net Position | |||
BNP Paribas | $95,337 | $— | $95,337 |
| Counterparty | Net Position | Fair Value of Non-Cash Collateral Received | Cash Collateral Received | Fair Value of Non-Cash Collateral Pledged | Cash Collateral Pledged | Net Amount(a) | ||||||
BNP Paribas | $95,337 | $— | $— | $— | $— | $95,337 | ||||||
Master Repurchase Agreements
| ||||||||||||
| Counterparty | Repurchase Agreements | Fair Value of Non-Cash Collateral Received | Cash Collateral Received | Net Amount(a) | ||||||||
Bank of America | $5,013,577 | $(5,013,577) | $— | $— | ||||||||
Bank of Montreal | 1,671,192 | (1,671,192) | — | — | ||||||||
BNP Paribas | 1,390,231 | (1,390,231) | — | — | ||||||||
|
|
|
| |||||||||
Total | $8,075,000 | $(8,075,000) | $— | $— | ||||||||
|
|
|
| |||||||||
(a)Net amount represents the receivable/(payable) that would be due from/(to) the counterparty in the event of default.
10. Securities Lending
The Fund, along with other funds in the Delaware Investments® Family of Funds, may lend its securities pursuant to a security lending agreement (Lending Agreement) with The Bank of New York Mellon (BNY Mellon). At the time a security is loaned, the borrower must post collateral equal to the required percentage of the market value of the loaned security, including any accrued interest. The required percentage is: (1) 102% with respect to U.S. securities and foreign securities that are denominated and payable in U.S. dollars; and (2) 105% with respect to foreign securities. With respect to each loan, if on any business day the aggregate market value of securities collateral plus cash collateral held is less than the aggregate market value of the securities which are the subject of such loan, the borrower will be notified to provide additional collateral by the end of the following business day which, together with the collateral already held, will be not less than the applicable initial collateral requirements for such security loan. If the aggregate market value of securities collateral and cash collateral held with respect to a security loan exceeds the applicable initial collateral requirement, upon request of the borrower, BNY Mellon must return enough collateral to the borrower by the end of the following business day to reduce the value of the remaining collateral to the applicable initial collateral requirement for such security loan. As a result of the foregoing, the value of the collateral held with respect to a loaned security on any particular day may be more or less than the value of the security on loan.
Cash collateral received is generally invested in the Delaware Investments Collateral Fund No. 1 (Collective Trust) established by BNY Mellon for the purpose of investment on behalf of funds managed by DMC that participate in BNY Mellon’s securities lending program. The Collective Trust may invest in
62
Table of Contents
U.S. government securities and high-quality corporate debt, asset-backed and other money market securities, and in repurchase agreements collateralized by such securities, provided that the Collective Trust will generally have a dollar-weighted average portfolio maturity of 60 days or less. The Fund can also accept U.S. government securities and letters of credit (non-cash collateral) in connection with securities loans. In the event of default or bankruptcy by the lending agent, realization and/or retention of the collateral may be subject to legal proceedings. In the event the borrower fails to return loaned securities and the collateral received is insufficient to cover the value of the loaned securities and provided such collateral shortfall is not the result of investment losses, the lending agent has agreed to pay the amount of the shortfall to the Fund or, at the discretion of the lending agent, replace the loaned securities. The Fund continues to record dividends or interest, as applicable, on the securities loaned and is subject to changes in value of the securities loaned that may occur during the term of the loan. The Fund has the right under the Lending Agreement to recover the securities from the borrower on demand. With respect to security loans collateralized by non-cash collateral, the Fund receives loan premiums paid by the borrower. With respect to security loans collateralized by cash collateral, the earnings from the collateral investments are shared among the Fund, the security lending agent, and the borrower. The Fund records security lending income net of allocations to the security lending agent and the borrower.
The Collective Trust used for the investment of cash collateral received from borrowers of securities seeks to maintain a net asset value per unit of $1.00, but there can be no assurance that it will always be able to do so. The Fund may incur investment losses as a result of investing securities lending collateral in the Collective Trust. This could occur if an investment in the Collective Trust defaulted or if it were necessary to liquidate assets in the Collective Trust to meet returns on outstanding security loans at a time when the Collective Trust’s net asset value per unit was less than $1.00. Under those circumstances, the Fund may not receive an amount from the Collective Trust that is equal in amount to the collateral the Fund would be required to return to the borrower of the securities and the Fund would be required to make up for this shortfall.
During the year ended Dec. 31, 2014, the Fund had no securities out on loan.
11. Credit and Market Risk
Some countries in which the Fund may invest require governmental approval for the repatriation of investment income, capital, or the proceeds of sales of securities by foreign investors. In addition, if there is deterioration in a country’s balance of payments or for other reasons, a country may impose temporary restrictions on foreign capital remittances abroad.
The securities exchanges of certain foreign markets are substantially smaller, less liquid, and more volatile than the major securities markets in the United States. Consequently, acquisition and disposition of securities by the Fund may be inhibited. In addition, a significant portion of the aggregate market value of equity securities listed on the major securities exchanges in emerging markets is held by a smaller number of investors. This may limit the number of shares available for acquisition or disposition by the Fund.
The Fund invests a portion of its assets in high-yield fixed income securities, which are securities rated lower than BBB- by S&P and Baa3 by Moody’s, or similarly rated by another nationally recognized
63
Table of Contents
Notes to financial statements
Delaware Limited-Term Diversified Income Fund
11. Credit and Market Risk (continued)
statistical rating organization. Investments in these higher yielding securities are generally accompanied by a greater degree of credit risk than higher rated securities. Additionally, lower rated securities may be more susceptible to adverse economic and competitive industry conditions than investment-grade securities.
The Fund invests in fixed income securities whose value is derived from an underlying pool of mortgages or consumer loans. The value of these securities is sensitive to changes in economic conditions, including delinquencies and/or defaults, and may be adversely affected by shifts in the market’s perception of the issuers and changes in interest rates. Investors receive principal and interest payments as the underlying mortgages and consumer loans are paid back. Some of these securities are collateralized mortgage obligations (CMOs). CMOs are debt securities issued by U.S. government agencies or by financial institutions and other mortgage lenders, which are collateralized by a pool of mortgages held under an indenture. Prepayment of mortgages may shorten the stated maturity of the obligations and can result in a loss of premium, if any has been paid. Certain of these securities may be stripped (securities which provide only the principal or interest feature of the underlying security). The yield to maturity on an interest-only CMO is extremely sensitive not only to changes in prevailing interest rates, but also to the rate of principal payments (including prepayments) on the related underlying mortgage assets. A rapid rate of principal payments may have a material adverse effect on the Fund’s yield to maturity. If the underlying mortgage assets experience greater than anticipated prepayments of principal, the Fund may fail to fully recoup its initial investment in these securities even if the securities are rated in the highest rating categories.
The Fund invests in certain obligations that may have liquidity protection designed to ensure that the receipt of payments due on the underlying security is timely. Such protection may be provided through guarantees, insurance policies, or letters of credit obtained by the issuer or sponsor through third parties, through various means of structuring the transaction, or through a combination of such approaches. The Fund will not pay any additional fees for such credit support, although the existence of credit support may increase the price of the security.
The Fund invests in bank loans and other securities that may subject it to direct indebtedness risk, the risk that the Fund will not receive payment of principal, interest, and other amounts due in connection with these investments and will depend primarily on the financial condition of the borrower. Loans that are fully secured offer the Fund more protection than unsecured loans in the event of nonpayment of scheduled interest or principal, although there is no assurance that the liquidation of collateral from a secured loan would satisfy the corporate borrower’s obligation, or that the collateral can be liquidated. Some loans or claims may be in default at the time of purchase. Certain of the loans and the other direct indebtedness acquired by the Fund may involve revolving credit facilities or other standby financing commitments that obligate the Fund to pay additional cash on a certain date or on demand. These commitments may require the Fund to increase its investment in a company at a time when the Fund might not otherwise decide to do so (including at a time when the company’s financial condition makes it unlikely that such amounts will be repaid). To the extent that the Fund is committed to advance additional funds, it will at all times hold and maintain cash or other high grade debt obligations in an amount sufficient to meet such commitments. As the Fund may be required to rely upon another lending institution to collect and pass on to the Fund amounts payable with respect to the loan and to enforce
64
Table of Contents
the Fund’s rights under the loan and other direct indebtedness, an insolvency, bankruptcy, or reorganization of the lending institution may delay or prevent the Fund from receiving such amounts. The highly leveraged nature of many loans may make them especially vulnerable to adverse changes in economic or market conditions. Investments in such loans and other direct indebtedness may involve additional risk to the Fund.
The Fund may invest up to 15% of its net assets in illiquid securities, which may include securities with contractual restrictions on resale, securities exempt from registration under Rule 144A of the Securities Act of 1933, as amended, and other securities, which may not be readily marketable. The relative illiquidity of these securities may impair the Fund from disposing of them in a timely manner and at a fair price when it is necessary or desirable to do so. While maintaining oversight, the Fund’s Board has delegated to DMC the day-to-day functions of determining whether individual securities are liquid for purposes of the Fund’s limitation on investments in illiquid securities. Securities eligible for resale pursuant to Rule 144A, which are determined to be liquid, are not subject to the Fund’s 15% limit on investments in illiquid securities. As of Dec. 31, 2014, no securities held by the Fund have been determined to be illiquid under the Fund’s Liquidity Procedures. Rule 144A securities have been identified on the “Schedule of investments.”
12. Contractual Obligations
The Fund enters into contracts in the normal course of business that contain a variety of indemnifications. The Fund’s maximum exposure under these arrangements is unknown. However, the Fund has not had prior claims or losses pursuant to these contracts. Management has reviewed the Fund’s existing contracts and expects the risk of loss to be remote.
13. Recent Accounting Pronouncements
In June 2014, the Financial Accounting Standards Board issued guidance to improve the financial reporting of reverse repurchase agreements and other similar transactions. The guidance includes expanded disclosure requirements for entities that enter into reverse repurchase agreements and similar transactions accounted for as secured borrowings. The guidance is effective for financial statements with fiscal years beginning on or after Dec. 15, 2014 and interim periods within those fiscal years. Management is evaluating the impact, if any, of this guidance on the Fund’s financial statement disclosures.
14. Subsequent Events
Management has determined that no material events or transactions occurred subsequent to Dec. 31, 2014 that would require recognition or disclosure in the Fund’s financial statements.
65
Table of Contents
registered public accounting firm
To the Board of Trustees of Delaware Group® Limited-Term Government Funds
and Shareholders of Delaware Limited-Term Diversified Income Fund:
In our opinion, the accompanying statement of assets and liabilities, including the schedule of investments, and the related statements of operations and of changes in net assets and the financial highlights present fairly, in all material respects, the financial position of Delaware Limited-Term Diversified Income Fund (constituting Delaware Group Limited-Term Government Funds, hereafter referred to as the “Fund”) at December 31, 2014, the results of its operations for the year then ended, the changes in its net assets for each of the two years in the period then ended and the financial highlights for each of the five years in the period then ended, in conformity with accounting principles generally accepted in the United States of America. These financial statements and financial highlights (hereafter referred to as “financial statements”) are the responsibility of the Fund’s management. Our responsibility is to express an opinion on these financial statements based on our audits. We conducted our audits of these financial statements in accordance with the standards of the Public Company Accounting Oversight Board (United States). Those standards require that we plan and perform the audit to obtain reasonable assurance about whether the financial statements are free of material misstatement. An audit includes examining, on a test basis, evidence supporting the amounts and disclosures in the financial statements, assessing the accounting principles used and significant estimates made by management, and evaluating the overall financial statement presentation. We believe that our audits, which included confirmation of securities at December 31, 2014 by correspondence with the custodian and brokers, provide a reasonable basis for our opinion.
PricewaterhouseCoopers LLP
Philadelphia, Pennsylvania
February 13, 2015
66
Table of Contents
Other Fund information (Unaudited)
Delaware Limited-Term Diversified Income Fund
Board consideration of Delaware Limited-Term Diversified Income Fund’s investment management agreement
At a meeting held on Aug. 19–21, 2014 (the “Annual Meeting”), the Board of Trustees (the “Board”), including a majority of disinterested or independent Trustees, approved the renewal of the Investment Management Agreement for Delaware Limited-Term Diversified Income Fund (the “Fund”). In making its decision, the Board considered information furnished at regular quarterly Board meetings, including reports detailing Fund performance, investment strategies and expenses, as well as information prepared specifically in connection with the renewal of the investment advisory and sub-advisory contracts. Information furnished specifically in connection with the renewal of the Investment Management Agreement with Delaware Management Company (“DMC”) included materials provided by DMC and its affiliates (“Delaware Investments”) concerning, among other things, the nature, extent, and quality of services provided to the Fund; the costs of such services to the Fund; economies of scale; and the financial condition and profitability of Delaware Investments. In addition, in connection with the Annual Meeting, reports were provided to the Trustees in May 2014 and included reports provided by Lipper, Inc., an independent statistical compilation organization (“Lipper”). The Lipper reports compared the Fund’s investment performance and expenses with those of other comparable mutual funds. The Independent Trustees reviewed and discussed the Lipper reports with independent legal counsel to the Independent Trustees. The Board requested and received information regarding DMC’s policy with respect to advisory fee levels and its breakpoint philosophy; the structure of portfolio manager compensation; the investment manager’s profitability; comparative client fee information; and any constraints or limitations on the availability of securities for certain investment styles, which had in the past year inhibited, or which were likely in the future to inhibit, DMC’s ability to invest fully in accordance with Fund policies.
In considering information relating to the approval of the Fund’s management agreement, the Independent Trustees received assistance and advice from and met separately with independent legal counsel to the Independent Trustees. Although the Board gave attention to all information furnished, the following discussion identifies, under separate headings, the primary factors taken into account by the Board during its contract renewal considerations.
Nature, Extent and Quality of Service. The Board considered the services provided by Delaware Investments to the Fund and its shareholders. In reviewing the nature, extent, and quality of services, the Board considered reports furnished to it throughout the year, which covered matters such as the relative performance of the Fund; compliance of portfolio managers with the investment policies, strategies, and restrictions for the Fund; compliance by DMC and Delaware Distributors, L.P. (together, “Management”) personnel with the Code of Ethics adopted throughout the Delaware Investments® Family of Funds complex; and adherence to fair value pricing procedures as established by the Board. The Board was pleased with the current staffing of the Fund’s investment manager and the emphasis placed on research in the investment process. The Board recognized DMC’s receipt of several industry distinctions. The Board gave favorable consideration to DMC’s efforts to control expenditures while maintaining service levels committed to Fund matters. The Board noted that, in the third and fourth quarters of 2013, Management reduced the maximum 12b-1 fee for certain funds; and in November 2013, Management negotiated a substantial reduction in fees for fund accounting services provided to the Fund. The Board noted the benefits provided to Fund shareholders through each shareholder’s ability to exchange an investment in one Delaware Investments fund for the same class of shares in another Delaware Investments fund without a sales charge, to reinvest Fund dividends into additional shares of the Fund or into additional shares of other Delaware Investments funds and the privilege to combine holdings in other Delaware Investments funds to obtain a reduced sales charge. The Board was satisfied with the nature, extent and quality of the overall services provided by Delaware Investments.
67
Table of Contents
Other Fund information (Unaudited)
Delaware Limited-Term Diversified Income Fund
Board consideration of Delaware Limited-Term Diversified Income Fund’s investment management agreement (continued)
Investment Performance. The Board placed significant emphasis on the investment performance of the Fund in view of the importance of investment performance to shareholders. Although the Board gave appropriate consideration to performance reports and discussions with portfolio managers at Investment Committee meetings throughout the year, the Board gave particular weight to the Lipper reports furnished for the Annual Meeting. The Lipper reports prepared for the Fund showed the investment performance of its Class A shares in comparison to a group of similar funds as selected by Lipper (the “Performance Universe”). A fund with the best performance ranked first, and a fund with the poorest performance ranked last. The highest/best performing 25% of funds in the Performance Universe make up the first quartile; the next 25%, the second quartile; the next 25%, the third quartile; and the poorest/worst performing 25% of funds in the Performance Universe make up the fourth quartile. Comparative annualized performance for the Fund was shown for the past 1-, 3-, 5-, and 10-year periods, to the extent applicable, ended March 31, 2014. The Board’s objective is that the Fund’s performance for the periods considered be at or above the median of its Performance Universe. The following paragraph summarizes the performance results for the Fund and the Board’s view of such performance.
The Performance Universe for the Fund consisted of the Fund and all retail and institutional short-intermediate investment grade debt funds as selected by Lipper. The Lipper report comparison showed that the Fund’s total return for the 1- and 3-year periods was in the fourth quartile of its Performance Universe. The report further showed that the Fund’s total return for the 5- and 10-year periods was in the third quartile and second quartile, respectively, of its Performance Universe. The Board observed that the Fund’s performance results were not in line with the Board’s objective. In evaluating the Fund’s performance, the Board considered the numerous investment and performance reports delivered by Management personnel to the Board’s Investments Committee. The Board was satisfied that Management was taking action to improve Fund performance and to meet the Board’s performance objective.
Comparative Expenses. The Board considered expense comparison data for the Delaware Investments® Family of Funds. Management provided the Board with information on pricing levels and fee structures for the Fund as of its most recently completed fiscal year. The Board also focused on the comparative analysis of effective management fees and total expense ratios of the Fund versus effective management fees and expense ratios of a group of similar funds as selected by Lipper (the “Expense Group”). In reviewing comparative costs, the Fund’s contractual management fee and the actual management fee incurred by the Fund were compared with the contractual management fees (assuming all funds in the Expense Group were similar in size to the Fund) and actual management fees (as reported by each fund) within the Expense Group, taking into account any applicable breakpoints and fee waivers. The Fund’s total expenses were also compared with those of its Expense Group. The Lipper total expenses, for comparative consistency, were shown by Lipper for Class A shares and comparative total expenses including 12b-1 and non 12b-1 service fees. The Board considered fees paid to Delaware Investments for non-management services. The Board’s objective is to limit the Fund’s total expense ratio to be competitive with that of the Expense Group. The following paragraph summarizes the expense results for the Fund and the Board’s view of such expenses.
The expense comparisons for the Fund showed that its actual management fee was in the quartile with the second highest expenses of its Expense Group and its total expenses were in the quartile with the second lowest expenses of its Expense Group. The Board was satisfied with the total expenses of the Fund in comparison to those of its Expense Group as shown in the Lipper report.
Management Profitability. The Board considered the level of profits realized by Delaware Investments in connection with the operation of the Fund. In this respect, the Board reviewed the Investment Management Profitability Analysis that addressed the overall profitability of Delaware Investments’ business in providing management and other services to
68
Table of Contents
each of the individual funds and the Delaware Investments Family of Funds as a whole. Specific attention was given to the methodology followed in allocating costs for the purpose of determining profitability. Management stated that the level of profits of Delaware Investments, to a certain extent, reflects recent operational cost savings and efficiencies initiated by Delaware Investments. The Board considered Delaware Investments’ efforts to improve services provided to fund shareholders and to meet additional regulatory and compliance requirements resulting from recent industry-wide Securities and Exchange Commission initiatives. The Board also considered the extent to which Delaware Investments might derive ancillary benefits from fund operations, including the potential for procuring additional business as a result of the prestige and visibility associated with its role as service provider to the Delaware Investments® Family of Funds and the benefits from allocation of fund brokerage to improve trading efficiencies. The Board found that the management fees were reasonable in light of the services rendered and the level of profitability of Delaware Investments.
Economies of Scale. The Trustees considered whether economies of scale are realized by Delaware Investments as the Fund’s assets increase and the extent to which any economies of scale are reflected in the level of management fees charged. The Trustees reviewed the standardized advisory fee pricing and structure, approved by the Board and shareholders, which includes breakpoints. Breakpoints in the advisory fee occur when the advisory fee rate is reduced on assets in excess of specified levels. Breakpoints result in a lower advisory fee than would otherwise be the case on all assets when the asset levels specified are exceeded. The Board noted that the fee under the Fund’s management contract fell within the standard structure. The Board also noted that the Fund’s assets exceeded the second breakpoint level. The Board believed that, given the extent to which economies of scale might be realized by the advisor and its affiliates, the schedule of fees under the Investment Management Agreement provides a sharing of benefits with the Fund and its shareholders.
Tax Information.
All disclosures are based on financial information available as of the date of this annual report and, accordingly are subject to change. For any and all items requiring reporting, it is the intention of the Fund to report the maximum amount permitted under the Internal Revenue Code and the regulations thereunder.
For the year ended Dec. 31, 2014, the Fund reports distributions paid during the year as follows:
(A) Ordinary Income Distribution (Tax Basis) | 97.42 | % | ||
(B) Return of Capital (Tax-Basis) | 2.58 | % | ||
Total Distributions (Tax Basis) | 100.00 | % |
(A) and (B) are based on a percentage of the Fund’s total distributions.
For the year ended Dec. 31, 2014, certain interest income paid by the Fund, determined to be Qualified Interest Income may be subject to relief from U.S. withholding for foreign shareholders, as provided by the American Jobs Creation Act of 2004, and by the Tax Relief, Unemployment Insurance Reauthorization, and Job Creation Act of 2010 and as extended by the American Taxpayer Relief Act of 2012. For the fiscal year ended Dec. 31, 2014, the Fund has reported maximum distributions of Qualified Interest Income of $20,374,022.
69
Table of Contents
Board of trustees / directors and officers addendum
Delaware Investments® Family of Funds
A mutual fund is governed by a Board of Trustees/Directors (“Trustees”), which has oversight responsibility for the management of a fund’s business affairs. Trustees establish procedures and oversee and review the performance of the investment manager, the distributor, and others who perform services for the fund. The independent fund trustees, in particular, are advocates
Name, Address, and Birth Date | Position(s) Held with Fund(s) | Length of Time Served | ||
Interested Trustee
| ||||
Patrick P. Coyne1 2005 Market Street Philadelphia, PA 19103 April 1963 | Chairman, President, Chief Executive Officer, and Trustee | Chairman and Trustee since August 16, 2006 | ||
President and Chief Executive Officer since August 1, 2006
| ||||
Independent Trustees
| ||||
Thomas L. Bennett 2005 Market Street Philadelphia, PA 19103 October 1947
| Trustee | Since March 2005 | ||
Joseph W. Chow 2005 Market Street Philadelphia, PA 19103 January 1953
| Trustee | Since January 2013 | ||
John A. Fry 2005 Market Street Philadelphia, PA 19103 May 1960
| Trustee | Since January 2001 |
| 1 | Patrick P. Coyne is considered to be an “Interested Trustee“ because he is an executive officer of the Fund’s(s’) investment advisor. |
70
Table of Contents
for shareholder interests. Each trustee has served in that capacity since he or she was elected to or appointed to the Board of Trustees, and will continue to serve until his or her retirement or the election of a new trustee in his or her place. The following is a list of the Trustees and Officers with certain background and related information.
Principal Occupation(s) During the Past Five Years | Number of Portfolios in Fund Complex Overseen by Trustee or Officer | Other Directorships Held by Trustee or Officer | ||
Patrick P. Coyne has served in | 65 | Board of Governors Member Investment Company Institute (ICI) | ||
| Director and Audit Committee Member Kaydon Corp. (2007–2013) | ||||
Private Investor | 65 | Director
| ||
Executive Vice President
| 65 | Director and Audit Committee Member — Hercules Technology Growth Capital, Inc. (2004-2014) | ||
President
| 65 | Director — Hershey Trust Company | ||
President | Director, Audit Committee,
|
| 2 | Delaware Investments is the marketing name for Delaware Management Holdings, Inc. and its subsidiaries, including the Fund’s(s’) investment advisor, principal underwriter, and its transfer agent. |
71
Table of Contents
Board of trustees / directors and officers addendum
Delaware Investments® Family of Funds
Name, Address, and Birth Date | Position(s) Held with Fund(s) | Length of Time Served | ||
Independent Trustees (continued)
| ||||
Lucinda S. Landreth 2005 Market Street Philadelphia, PA 19103 June 1947
| Trustee | Since March 2005 | ||
Frances A. Sevilla-Sacasa 2005 Market Street Philadelphia, PA 19103 January 1956
| Trustee | Since September 2011 | ||
Thomas K. Whitford 2005 Market Street Philadelphia, PA 19103 March 1956
| Trustee | Since January 2013 | ||
72
Table of Contents
Principal Occupation(s) During the Past Five Years | Number of Portfolios in Fund Complex Overseen by Trustee or Officer | Other Directorships Held by Trustee or Officer | ||
Private Investor (2004–Present)
| 65 | None | ||
Chief Executive Officer — Banco Itaú International (April 2012–Present)
| 65 | Trust Manager and Audit Committee Member — Camden Property Trust | ||
Executive Advisor to Dean (August 2011–March 2012) and Interim Dean (January 2011–July 2011) — University of Miami School of Business Administration
| ||||
President — U.S. Trust, Bank of America Private Wealth Management (Private Banking) (July 2007–December 2008)
| ||||
Vice Chairman (2010–April 2013) Chief Administrative Officer (2008–2010) and Executive Vice President and Chief Administrative Officer (2007–2009) — PNC Financial Services Group
| 65 | Director — HSBC Finance Corporation and HSBC North America Holdings Inc. | ||
73
Table of Contents
Board of trustees / directors and officers addendum
Delaware Investments® Family of Funds
Name, Address, and Birth Date | Position(s) Held with Fund(s) | Length of Time Served | ||
Independent Trustees (continued)
| ||||
Janet L. Yeomans 2005 Market Street Philadelphia, PA 19103 July 1948
| Trustee | Since April 1999 | ||
J. Richard Zecher 2005 Market Street Philadelphia, PA 19103 July 1940
| Trustee | Since March 2005 | ||
74
Table of Contents
Principal Occupation(s) During the Past Five Years | Number of Portfolios in Fund Complex Overseen by Trustee or Officer | Other Directorships Held by Trustee or Officer | ||
| ||||
Vice President and Treasurer (January 2006–July 2012) Vice President — Mergers & Acquisitions (January 2003–January 2006), and Vice President and Treasurer (July 1995–January 2003) 3M Corporation | 65 | Director, Audit and Compliance Committee Chair, Investment Committee Member and Governance Committee Member Okabena Company
Chair — 3M Investment Management Company (2005–2012)
| ||
Founder Investor Analytics (Risk Management) (May 1999–Present)
Founder P/E Investments (Hedge Fund) (September 1996–Present) | 65 | Director and Compensation Committee Chairman
Director — P/E Investments | ||
75
Table of Contents
Board of trustees / directors and officers addendum
Delaware Investments® Family of Funds
Name, Address, and Birth Date | Position(s) Held with Fund(s) | Length of Time Served | ||
Officers
| ||||
David F. Connor | Senior Vice President, Deputy General Counsel, and Secretary | Senior Vice President,
| ||
Daniel V. Geatens
| Vice President and Treasurer | Treasurer since October 2007 | ||
David P. O’Connor | Executive Vice President, General Counsel and Chief Legal Officer | Executive Vice President
| ||
Richard Salus
| Senior Vice President and Chief Financial Officer | Chief Financial Officer since November 2006 |
The Statement of Additional Information for the Fund(s) includes additional information about the Trustees and Officers and is available, without charge, upon request by calling 800 523-1918.
76
Table of Contents
Principal Occupation(s) During the Past Five Years | Number of Portfolios in Fund Complex Overseen by Trustee or Officer | Other Directorships Held by Trustee or Officer | ||
David F. Connor has served as
| 65 | None3 | ||
Daniel V. Geatens has served
| 65 | None3 | ||
David P. O’Connor has served
| 65 | None3 | ||
Richard Salus has served in
| 65 | None3 |
| 3 | David F. Connor, Daniel V. Geatens, David P. O’Connor, and Richard Salus serve in similar capacities for the six portfolios of the Optimum Fund Trust, which have the same investment advisor, principal underwriter, and transfer agent as the registrant. |
77
Table of Contents
| Board of trustees | ||||||
| Patrick P. Coyne | Joseph W. Chow | Lucinda S. Landreth | Thomas K. Whitford | |||
| Chairman, President, and | Former Executive Vice | Former Chief Investment | Former Vice Chairman | |||
| Chief Executive Officer | President | Officer | PNC Financial Services Group | |||
| Delaware Investments® | State Street Corporation | Assurant, Inc. | Pittsburgh, PA | |||
| Family of Funds | Brookline, MA | Philadelphia, PA | ||||
| Philadelphia, PA | Janet L. Yeomans | |||||
| John A. Fry | Frances A. | Former Vice President | ||||
| Thomas L. Bennett | President | Sevilla-Sacasa | and Treasurer | |||
| Private Investor | Drexel University | Chief Executive Officer | 3M Corporation | |||
| Rosemont, PA | Philadelphia, PA | Banco Itaú | St. Paul, MN | |||
International Miami, FL |
J. Richard Zecher | |||||
| Founder | ||||||
| Investor Analytics | ||||||
| Scottsdale, AZ | ||||||
| Affiliated officers | ||||||
| David F. Connor | Daniel V. Geatens | David P. O’Connor | Richard Salus | |||
| Senior Vice President, | Vice President and | Executive Vice President, | Senior Vice President and | |||
| Deputy General Counsel, | Treasurer | General Counsel, | Chief Financial Officer | |||
| and Secretary | Delaware Investments | and Chief Legal Officer | Delaware Investments | |||
| Delaware Investments | Family of Funds | Delaware Investments | Family of Funds | |||
| Family of Funds | Philadelphia, PA | Family of Funds | Philadelphia, PA | |||
| Philadelphia, PA | Philadelphia, PA | |||||
This annual report is for the information of Delaware Limited-Term Diversified Income Fund shareholders, but it may be used with prospective investors when preceded or accompanied by the Delaware Investments Fund fact sheet for the most recently completed calendar quarter. These documents are available at delawareinvestments.com.
Delaware Investments is the marketing name of Delaware Management Holdings, Inc. and its subsidiaries.
The Fund files its complete schedule of portfolio holdings with the Securities and Exchange Commission (SEC) for the first and third quarters of each fiscal year on Form N-Q. The Fund’s Forms N-Q, as well as a description of the policies and procedures that the Fund uses to determine how to vote proxies (if any) relating to portfolio securities are available without charge (i) upon request, by calling 800 523-1918; and (ii) on the SEC’s website at sec.gov. In addition, a description of the policies and procedures that the Fund uses to determine how to vote proxies (if any) relating to portfolio securities and the Schedule of Investments included in the Fund’s most recent Form N-Q are available without charge on the Fund’s website at delawareinvestments.com. The Fund’s Forms N-Q may be reviewed and copied at the SEC’s Public Reference Room in Washington, D.C.; information on the operation of the Public Reference Room may be obtained by calling 800 SEC-0330.
Information (if any) regarding how the Fund voted proxies relating to portfolio securities during the most recently disclosed 12-month period ended June 30 is available without charge (i) through the Fund’s website at delawareinvestments.com; and (ii) on the SEC’s website at sec.gov.
78
Item 2. Code of Ethics
The registrant has adopted a code of ethics that applies to the registrant’s principal executive officer, principal financial officer, principal accounting officer or controller, or persons performing similar functions, regardless of whether these individuals are employed by the registrant or a third party. A copy of the registrant’s Code of Business Ethics has been posted on the Delaware Investments Internet Web site at www.delawareinvestments.com. Any amendments to the Code of Business Ethics, and information on any waiver from its provisions granted by the registrant, will also be posted on this Web site within five business days of such amendment or waiver and will remain on the Web site for at least 12 months.
Item 3. Audit Committee Financial Expert
The registrant’s Board of Trustees/Directors has determined that certain members of the registrant’s Audit Committee are audit committee financial experts, as defined below. For purposes of this item, an “audit committee financial expert” is a person who has the following attributes:
a. An understanding of generally accepted accounting principles and financial statements;
b. The ability to assess the general application of such principles in connection with the accounting for estimates, accruals, and reserves;
c. Experience preparing, auditing, analyzing, or evaluating financial statements that present a breadth and level of complexity of accounting issues that are generally comparable to the breadth and complexity of issues that can reasonably be expected to be raised by the registrant’s financial statements, or experience actively supervising one or more persons engaged in such activities;
d. An understanding of internal controls and procedures for financial reporting; and
e. An understanding of audit committee functions.
An “audit committee financial expert” shall have acquired such attributes through:
a. Education and experience as a principal financial officer, principal accounting officer, controller, public accountant, or auditor or experience in one or more positions that involve the performance of similar functions;
b. Experience actively supervising a principal financial officer, principal accounting officer, controller, public accountant, auditor, or person performing similar functions;
c. Experience overseeing or assessing the performance of companies or public accountants with respect to the preparation, auditing, or evaluation of financial statements; or
d. Other relevant experience.
The registrant’s Board of Trustees/Directors has also determined that each member of the registrant’s Audit Committee is independent. In order to be “independent” for purposes of this item, the Audit Committee member may not: (i) other than in his or her capacity as a member of the Board of Trustees/Directors or any committee thereof, accept directly or indirectly any consulting, advisory or other compensatory fee from the issuer; or (ii) be an “interested person” of the registrant as defined in Section 2(a)(19) of the Investment Company Act of 1940.
The names of the audit committee financial experts on the registrant’s Audit Committee are set forth below:
Joseph W. Chow
Lucinda S. Landreth1
Frances A. Sevilla-Sacasa
Janet L. Yeomans
Item 4. Principal Accountant Fees and Services
(a) Audit fees.
The aggregate fees billed for services provided to the registrant by its independent auditors for the audit of the registrant’s annual financial statements and for services normally provided by the independent auditors in connection with statutory and regulatory filings or engagements were $40,400 for the fiscal year ended December 31, 2014.
The aggregate fees billed for services provided to the registrant by its independent auditors for the audit of the registrant’s annual financial statements and for services normally provided by the independent auditors in connection with statutory and regulatory filings or engagements were $35,435 for the fiscal year ended December 31, 2013.
(b) Audit-related fees.
The aggregate fees billed by the registrant’s independent auditors for services relating to the performance of the audit of the registrant’s financial statements and not reported under paragraph (a) of this Item were $0 for the fiscal year ended December 31, 2014.
The aggregate fees billed by the registrant’s independent auditors for services relating to the performance of the audit of the financial statements of the registrant’s investment adviser and other service providers under common control with the adviser and that relate directly to the operations or financial reporting of the registrant were $618,000 for the registrant’s fiscal year ended December 31, 2014. The percentage of these fees relating to services approved by the registrant’s Audit Committee pursuant to the de minimis exception from the pre-approval requirement in Rule 2-01(c)(7)(i)(C) of Regulation S-X was 0%. These audit-related services were as follows: year-end audit procedures; group reporting and subsidiary statutory audits.
The aggregate fees billed by the registrant’s independent auditors for services relating to the performance of the audit of the registrant’s financial statements and not reported under paragraph (a) of this Item were $0 for the fiscal year ended December 31, 2013.
1 The instructions to Form N-CSR require disclosure on the relevant experience of persons who qualify as audit committee financial experts based on “other relevant experience.” The Board of Trustees/Directors has determined that Ms. Landreth qualifies as an audit committee financial expert by virtue of her experience as a financial analyst, her Chartered Financial Analyst (CFA) designation and her service as an audit committee chairperson for a non-profit organization.
The aggregate fees billed by the registrant’s independent auditors for services relating to the performance of the audit of the financial statements of the registrant’s investment adviser and other service providers under common control with the adviser and that relate directly to the operations or financial reporting of the registrant were $618,000 for the registrant’s fiscal year ended December 31, 2013. The percentage of these fees relating to services approved by the registrant’s Audit Committee pursuant to the de minimis exception from the pre-approval requirement in Rule 2-01(c)(7)(i)(C) of Regulation S-X was 0%. These audit-related services were as follows: year-end audit procedures; group reporting and subsidiary statutory audits.
(c) Tax fees.
The aggregate fees billed by the registrant’s independent auditors for tax-related services provided to the registrant were $4,996 for the fiscal year ended December 31, 2014. The percentage of these fees relating to services approved by the registrant’s Audit Committee pursuant to the de minimis exception from the pre-approval requirement in Rule 2-01(c)(7)(i)(C) of Regulation S-X was 0%. These tax-related services were as follows: review of income tax returns and review of annual excise distribution calculations.
The aggregate fees billed by the registrant’s independent auditors for tax-related services provided to the registrant’s investment adviser and other service providers under common control with the adviser and that relate directly to the operations or financial reporting of the registrant were $0 for the registrant’s fiscal year ended December 31, 2014.
The aggregate fees billed by the registrant’s independent auditors for tax-related services provided to the registrant were $4,850 for the fiscal year ended December 31, 2013. The percentage of these fees relating to services approved by the registrant’s Audit Committee pursuant to the de minimis exception from the pre-approval requirement in Rule 2-01(c)(7)(i)(C) of Regulation S-X was 0%. These tax-related services were as follows: review of income tax returns and review of annual excise distribution calculations.
The aggregate fees billed by the registrant’s independent auditors for tax-related services provided to the registrant’s investment adviser and other service providers under common control with the adviser and that relate directly to the operations or financial reporting of the registrant were $0 for the registrant’s fiscal year ended December 31, 2013.
(d) All other fees.
The aggregate fees billed for all services provided by the independent auditors to the registrant other than those set forth in paragraphs (a), (b) and (c) of this Item were $0 for the fiscal year ended December 31, 2014.
The aggregate fees billed for all services other than those set forth in paragraphs (b) and (c) of this Item provided by the registrant’s independent auditors to the registrant’s adviser and other service providers under common control with the adviser and that relate directly to the operations or financial reporting of the registrant were $0 for the registrant’s fiscal year ended December 31, 2014. The percentage of these fees relating to services approved by the registrant’s Audit Committee pursuant to the de minimis exception from the pre-approval requirement in Rule 2-01(c)(7)(i)(C) of Regulation S-X was 0%.
The aggregate fees billed for all services provided by the independent auditors to the registrant other than those set forth in paragraphs (a), (b) and (c) of this Item were $0 for the fiscal year ended December 31, 2013.
The aggregate fees billed for all services other than those set forth in paragraphs (b) and (c) of this Item provided by the registrant’s independent auditors to the registrant’s adviser and other service providers under common control with the adviser and that relate directly to the operations or financial reporting of the registrant were $0 for the registrant’s fiscal year ended December 31, 2013. The percentage of these fees relating to services approved by the registrant’s Audit Committee pursuant to the de minimis exception from the pre-approval requirement in Rule 2-01(c)(7)(i)(C) of Regulation S-X was 0%.
(e) The registrant’s Audit Committee has established pre-approval policies and procedures as permitted by Rule 2-01(c)(7)(i)(B) of Regulation S-X (the “Pre-Approval Policy”) with respect to services provided by the registrant’s independent auditors. Pursuant to the Pre-Approval Policy, the Audit Committee has pre-approved the services set forth in the table below with respect to the registrant up to the specified fee limits. Certain fee limits are based on aggregate fees to the registrant and other registrants within the Delaware Investments Family of Funds.
| Service | Range of Fees |
| Audit Services | |
| Statutory audits or financial audits for new Funds | up to $40,000 per Fund |
| Services associated with SEC registration statements (e.g., Form N-1A, Form N-14, etc.), periodic reports and other documents filed with the SEC or other documents issued in connection with securities offerings (e.g., comfort letters for closed-end Fund offerings, consents), and assistance in responding to SEC comment letters | up to $10,000 per Fund |
| Consultations by Fund management as to the accounting or disclosure treatment of transactions or events and/or the actual or potential impact of final or proposed rules, standards or interpretations by the SEC, FASB, or other regulatory or standard-setting bodies (Note: Under SEC rules, some consultations may be considered “audit-related services” rather than “audit services”) | up to $25,000 in the aggregate |
| Audit-Related Services | |
| Consultations by Fund management as to the accounting or disclosure treatment of transactions or events and/or the actual or potential impact of final or proposed rules, standards or interpretations by the SEC, FASB, or other regulatory or standard-setting bodies (Note: Under SEC rules, some consultations may be considered “audit services” rather than “audit-related services”) | up to $25,000 in the aggregate |
| Tax Services | |
| U.S. federal, state and local and international tax planning and advice (e.g., consulting on statutory, regulatory or administrative developments, evaluation of Funds’ tax compliance function, etc.) | up to $25,000 in the aggregate |
| U.S. federal, state and local tax compliance (e.g., excise distribution reviews, etc.) | up to $5,000 per Fund |
| Review of federal, state, local and international income, franchise and other tax returns | up to $5,000 per Fund |
Under the Pre-Approval Policy, the Audit Committee has also pre-approved the services set forth in the table below with respect to the registrant’s investment adviser and other entities controlling, controlled by or under common control with the investment adviser that provide ongoing services to the registrant (the “Control Affiliates”) up to the specified fee limit. This fee limit is based on aggregate fees to the investment adviser and its Control Affiliates.
| Service | Range of Fees |
| Non-Audit Services | |
| Services associated with periodic reports and other documents filed with the SEC and assistance in responding to SEC comment letters | up to $10,000 in the aggregate |
The Pre-Approval Policy requires the registrant’s independent auditors to report to the Audit Committee at each of its regular meetings regarding all services initiated since the last such report was rendered, including those services authorized by the Pre-Approval Policy.
(f) Not applicable.
(g) The aggregate non-audit fees billed by the registrant’s independent auditors for services rendered to the registrant and to its investment adviser and other service providers under common control with the adviser were $5,653,375 and $7,732,970 for the registrant’s fiscal years ended December 31, 2014 and December 31, 2013, respectively.
(h) In connection with its selection of the independent auditors, the registrant’s Audit Committee has considered the independent auditors’ provision of non-audit services to the registrant’s investment adviser and other service providers under common control with the adviser that were not required to be pre-approved pursuant to Rule 2-01(c)(7)(ii) of Regulation S-X. The Audit Committee has determined that the independent auditors’ provision of these services is compatible with maintaining the auditors’ independence.
Item 5. Audit Committee of Listed Registrants
Not applicable.
Item 6. Investments
(a) Included as part of report to shareholders filed under Item 1 of this Form N-CSR.
(b) Divestment of securities in accordance with Section 13(c) of the Investment Company Act of 1940.
Not applicable.
Item 7. Disclosure of Proxy Voting Policies and Procedures for Closed-End Management Investment Companies
Not applicable.
Item 8. Portfolio Managers of Closed-End Management Investment Companies
Not applicable.
Item 9. Purchases of Equity Securities by Closed-End Management Investment Company and Affiliated Purchasers
Not applicable.
Item 10. Submission of Matters to a Vote of Security Holders
Not applicable.
Item 11. Controls and Procedures
The registrant’s principal executive officer and principal financial officer have evaluated the registrant’s disclosure controls and procedures within 90 days of the filing of this report and have concluded that they are effective in providing reasonable assurance that the information required to be disclosed by the registrant in its reports or statements filed under the Securities Exchange Act of 1934 is recorded, processed, summarized and reported within the time periods specified in the rules and forms of the Securities and Exchange Commission.
There were no significant changes in the registrant’s internal control over financial reporting that occurred during the second fiscal quarter of the period covered by the report to stockholders included herein (i.e., the registrant’s fourth fiscal quarter) that have materially affected, or are reasonably likely to materially affect, the registrant’s internal control over financial reporting.
Item 12. Exhibits
(a) (1) Code of Ethics
Not applicable.
(2) Certifications of Principal Executive Officer and Principal Financial Officer pursuant to Rule 30a-2 under the Investment Company Act of 1940 are attached hereto as Exhibit 99.CERT.
(3) Written solicitations to purchase securities pursuant to Rule 23c-1 under the Securities Exchange Act of 1934.
Not applicable.
(b) Certifications pursuant to Section 906 of the Sarbanes-Oxley Act of 2002 are furnished herewith as Exhibit 99.906CERT.
SIGNATURES
Pursuant to the requirements of the Securities Exchange Act of 1934 and the Investment Company Act of 1940, the registrant has duly caused this report to be signed on its behalf, by the undersigned, thereunto duly authorized.
DELAWARE GROUP® LIMITED-TERM GOVERNMENT FUNDS
| /s/ PATRICK P. COYNE | |
| By: | Patrick P. Coyne |
| Title: | Chief Executive Officer |
| Date: | March 3, 2015 |
Pursuant to the requirements of the Securities Exchange Act of 1934 and the Investment Company Act of 1940, this report has been signed below by the following persons on behalf of the registrant and in the capacities and on the dates indicated.
| /s/ PATRICK P. COYNE | |
| By: | Patrick P. Coyne |
| Title: | Chief Executive Officer |
| Date: | March 3, 2015 |
| /s/ RICHARD SALUS | |
| By: | Richard Salus |
| Title: | Chief Financial Officer |
| Date: | March 3, 2015 |