UNITED STATES SECURITIES AND EXCHANGE COMMISSION
Washington, D.C. 20549
FORM N-CSR
CERTIFIED SHAREHOLDER REPORT OF REGISTERED MANAGEMENT
INVESTMENT COMPANIES
| Investment Company Act file number: | 811-03363 | |
| Exact name of registrant as specified in charter: | Delaware Group® Limited-Term | |
| Government Funds | ||
| Address of principal executive offices: | 2005 Market Street | |
| Philadelphia, PA 19103 | ||
| Name and address of agent for service: | David F. Connor, Esq. | |
| 2005 Market Street | ||
| Philadelphia, PA 19103 | ||
| Registrant’s telephone number, including area code: | (800) 523-1918 | |
| Date of fiscal year end: | December 31 | |
| Date of reporting period: | December 31, 2017 |
Item 1. Reports to Stockholders
Table of Contents
Fixed income mutual fund
Delaware Limited-Term Diversified Income Fund
December 31, 2017
Carefully consider the Fund’s investment objectives, risk factors, charges, and expenses before investing. This and other information can be found in the Fund’s prospectus and its summary prospectus, which may be obtained by visiting delawarefunds.com/literature or calling 800 523-1918. Investors should read the prospectus and the summary prospectus carefully before investing.
You can obtain shareholder reports and prospectuses online instead of in the mail. Visit delawarefunds.com/edelivery.
Table of Contents
Experience Delaware FundsSM by Macquarie
Macquarie Investment Management (MIM) is a global asset manager with offices throughout the United States, Europe, Asia, and Australia. We are active managers who prioritize autonomy and accountability at the investment team level in pursuit of opportunities that matter for our clients. Delaware Funds is one of the longest-standing mutual fund families, with more than 75 years in existence.
If you are interested in learning more about creating an investment plan, contact your financial advisor.
You can learn more about Delaware Funds by Macquarie or obtain a prospectus for Delaware Limited-Term Diversified Income Fund at delawarefunds.com/literature.
Manage your account online
| • | Check your account balance and transactions |
| • | View statements and tax forms |
| • | Make purchases and redemptions |
Visit delawarefunds.com/account-access.
Macquarie Investment Management (MIM) is the marketing name for the following registered investment advisers: Macquarie Investment Management Business Trust (MIMBT) (formerly, Delaware Management Business Trust), Macquarie Funds Management Hong Kong Limited, Macquarie Investment Management Austria Kapitalanlage AG, Macquarie Investment Management Global Limited, Macquarie Investment Management Europe Limited, and Macquarie Capital Investment Management, Inc.
The Fund is distributed by Delaware Distributors, L.P., an affiliate of MIMBT and Macquarie Group Limited. MIM, a member of Macquarie Group, refers to the companies comprising the asset management division of Macquarie Group Limited and its subsidiaries and affiliates worldwide.
Other than Macquarie Bank Limited (MBL), none of the entities noted are authorized deposit-taking institutions for the purposes of the Banking Act 1959 (Commonwealth of Australia). The obligations of these entities do not represent deposits or other liabilities of MBL. MBL does not guarantee or otherwise provide assurance in respect of the obligations of these entities, unless noted otherwise. The Fund is governed by US laws and regulations.
| 1 | ||||
| 4 | ||||
| 9 | ||||
| 11 | ||||
| 12 | ||||
| 42 | ||||
| 44 | ||||
| 46 | ||||
| 48 | ||||
| 57 | ||||
| 75 | ||||
| 76 | ||||
| 80 | ||||
| 86 | ||||
Unless otherwise noted, views expressed herein are current as of Dec. 31, 2017, and subject to change for events occurring after such date.
The Fund is not FDIC insured and is not guaranteed. It is possible to lose the principal amount invested.
Advisory services provided by Delaware Management Company, a series of MIMBT, a US registered investment advisor.
All third-party marks cited are the property of their respective owners.
© 2018 Macquarie Management Holdings, Inc. (formerly, Delaware Management Holdings, Inc.)
Table of Contents
Delaware Limited-Term Diversified Income Fund | January 9, 2018 |
Performance preview (for the year ended December 31, 2017) | ||||||
| Delaware Limited-Term Diversified Income Fund (Institutional Class shares) | 1-year return | +2.39% | ||||
| Delaware Limited-Term Diversified Income Fund (Class A shares) | 1-year return | +2.11% | ||||
| Bloomberg Barclays 1–3 Year US Government/Credit Index (benchmark) | 1-year return | +0.84% | ||||
Past performance does not guarantee future results.
For complete, annualized performance for Delaware Limited-Term Diversified Income Fund, please see the table on page 4.
Institutional Class shares are not subject to a sales charge and are offered for sale exclusively to certain eligible investors. In addition, Institutional Class shares pay no distribution and service fee.
The performance of Class A shares excludes the applicable sales charge. Both Institutional Class shares and Class A shares reflect the reinvestment of all distributions.
Please see page 7 for a description of the index. Index performance returns do not reflect any management fees, transaction costs, or expenses. Indices are unmanaged and one cannot invest directly in an index.
In 2017, low global economic growth and low interest rates continued, supported by central bank liquidity. The US Federal Reserve was the only major central bank withdrawing stimulus throughout the year. By contrast, the European Central Bank, Bank of Japan, and People’s Bank of China all cut rates. The yields on many of their 2-year and even some 5-year government bonds were negative, and many were 2 percentage points below that of same-maturity US Treasurys.
Those significantly lower yields sent investors to the United States in search of higher fixed income yields, which further compressed yields, particularly in bonds with yields higher than Treasurys (spread product). With little sign of inflation picking up, investors didn’t hesitate to move further out on the yield curve or to reach for yield in spread product, including investment grade and high yield corporate bonds and mortgage-backed securities (MBS).
Spread tightening continued throughout the year as market volatility declined. Risk levels were at historic lows in the equity market. The CBOE Volatility Index® (VIX®) spent 50 days below 10 in 2017 after only nine such days from 1990 to 2016. Also, the stock market rose in all 12 months for the first time in 45 years. With little fear of volatility rising, spread product drove fixed income markets, benefiting investors who embraced higher risk levels.
In US politics at the start of 2017, some of the “hope trade” that followed Trump’s election persisted given the anticipation of pro-growth policies. Despite the subsequent failure to repeal the Affordable Care Act and concern that the Republican-controlled Congress would be unable to enact much of its pro-growth agenda, investors maintained the expectation that tax cuts would be passed. That confidence left investors feeling comfortable while holding – and adding to – riskier assets during the fall, and was confirmed when the Tax Cuts and Jobs Act became law in December 2017.
Globally, investors shrugged off some issues – notably tensions with North Korea – that in other years might have led to a flight to quality, adding support for less risky assets such as US Treasurys.
Fund performance
For the fiscal year ended Dec. 31, 2017, Delaware Limited-Term Diversified Income Fund Institutional Class shares returned +2.39%. The Fund’s Class A shares returned +2.11% at asset value and -0.70% at maximum offer price. These figures reflect all distributions reinvested. For the same period, the Bloomberg Barclays 1-3 Year US Government/Credit Index returned +0.84%. Complete annualized performance for
1
Table of Contents
Portfolio management review
Delaware Limited-Term Diversified Income Fund
Delaware Limited-Term Diversified Income Fund is shown in the table on page 4.
We maintained significant exposure to high grade credit for its market value and contribution to duration. The Fund’s corporate bond holdings tended to be longer duration, at five to 10 years, than the benchmark’s two-year average duration. We did that for higher current income and the prospect of better returns if spreads narrow.
To balance overall duration, the Fund also owned a large portion of floating-rate asset-backed securities as an anchor on the short end of the curve. Overall, that barbell structure brought the portfolio to slightly longer than a two-year duration, fairly close to the benchmark, while generating significantly more yield. The portfolio’s barbell positioning benefited from the significant flattening of the yield curve as longer-duration bonds rallied with much lower rates while shorter rates rose. (A barbell strategy involves purchasing both short- and long-term bonds in an attempt to seek better risk-adjusted returns.)
The Fund benefited from spread product contributions. An average of just 3% of the portfolio was allocated to Treasurys through the fiscal year versus 66% in the benchmark. Instead of owning Treasurys, we sourced the Fund’s duration from high grade credit, high yield credit, some bank loans, and a small amount of emerging market debt. We also averaged an 18% weighting in agency MBS, which are not in the benchmark. Each of those components contributed to the Fund’s performance. The Fund’s high grade credit holdings, which earned 3.6% versus 1.66% in the benchmark, further aided its relative performance.
Within corporate bonds, we favored regulated industries, particularly banks within financials and utilities. Conversely, we avoided technology and some telecommunications securities because of idiosyncratic or unsystematic risk (risk that is not correlated to overall market risk), including event risk. Specifically, our concern was with companies
issuing debt to fund mergers and acquisitions, pay dividends, or for other shareholder-friendly activity. Regulated industries, such as banks, have less of that.
Little detracted from the Fund’s performance relative to the benchmark during the year. However, one drawback was our periodic hedge – through credit default swaps – against high yield exposure in order to reduce risk. That hedge detracted from performance as riskier assets rallied all year.
In assessing current market risks and opportunities, we believe corporate balance sheets and credit metrics are in solid shape. However, in our view, there are idiosyncratic risks, including valuations. Although we think corporate fundamentals remain strong along with market technical factors, such as supply-demand dynamics, partly driven by the relative attractiveness of higher US yields to global investors, the historically high level of valuations concerns us. We likely won’t see much more spread tightening, in our opinion, and in this environment, we believe it is critical to focus on individual bond selection. Accordingly, at fiscal year end, we’ve moved up in quality to avoid some valuation-related idiosyncratic risk.
The corporate tax cuts passed by Congress at fiscal year end will likely affect bond supply because the cost of funds will change. Corporations would be more likely to use equity than debt, and we think a reduction in issuance should be supportive to corporate spreads.
We remain unwilling to own bonds in the two-year part of the yield curve, where we believe potential Fed rate increases are likely to affect bonds the most. We’re still comfortable owning the short floating-rate bonds while maintaining the yield on the longer end of the curve, and we don’t plan to change our Fund positioning.
2
Table of Contents
During the year, the Fund owned some high yield credit default swaps, and we used Treasury futures at times. The Fund’s exposure to credit default swaps averaged about 3% to 4% of the portfolio and, combined with Treasury futures, its effect on the portfolio’s returns was less than 0.50 percentage points. At fiscal year end, the Fund’s exposure to derivatives totaled slightly more than 1%.
3
Table of Contents
Delaware Limited-Term Diversified Income Fund | December 31, 2017 |
The performance quoted represents past performance and does not guarantee future results. Investment return and principal value of an investment will fluctuate so that shares, when redeemed, may be worth more or less than their original cost. Current performance may be lower or higher than the performance quoted. Performance data current to the most recent month end may be obtained by calling 800 523-1918 or visiting delawarefunds.com/performance.
| Fund and benchmark performance1,2 | Average annual total returns through December 31, 2017 | |||||||
| 1 year | 5 years | 10 years | Lifetime | |||||
Class A (Est. Nov. 24, 1985) | ||||||||
Excluding sales charge | +2.11% | +0.91% | +2.81% | +4.82% | ||||
Including sales charge | -0.70% | +0.35% | +2.52% | +4.73% | ||||
Class C (Est. Nov. 28, 1995) | ||||||||
Excluding sales charge | +1.25% | +0.04% | +1.94% | +3.02% | ||||
Including sales charge | +0.26% | +0.04% | +1.94% | +3.02% | ||||
Class R (Est. June 2, 2003) | ||||||||
Excluding sales charge | +1.76% | +0.56% | +2.45% | +2.54% | ||||
Including sales charge | +1.76% | +0.56% | +2.45% | +2.54% | ||||
Institutional Class (Est. June 1, 1992) | ||||||||
Excluding sales charge | +2.39% | +1.06% | +2.96% | +4.12% | ||||
Including sales charge | +2.39% | +1.06% | +2.96% | +4.12% | ||||
Class R6 (Est. May 1, 2017) | ||||||||
Excluding sales charge | n/a | n/a | n/a | +1.10%* | ||||
Including sales charge | n/a | n/a | n/a | +1.10%* | ||||
Bloomberg Barclays 1–3 Year US Government/Credit Index | +0.84% | +0.84% | +1.86% | +3.92%** | ||||
*Returns are as of the Fund’s Class R6 inception date. Returns for less than one year are not annualized. The benchmark lifetime return was +0.27% and is as of the month-end prior to the Class R6 inception date.
**The benchmark lifetime return is for Institutional Class share comparison only and is calculated using the last business day in the month of the Fund’s Institutional Class inception date.
1 Returns reflect the reinvestment of all distributions and are presented both with and without the applicable sales charges described below. Returns do not reflect the deduction of taxes the shareholder would pay on Fund distributions or redemptions of Fund shares.
Expense limitations were in effect for certain classes during some or all of the periods shown in the “Fund and benchmark performance” table. Expenses for each class are listed on the “Fund expense ratios” table on page 6. Performance
would have been lower had expense limitations not been in effect.
Institutional Class shares are not subject to a sales charge and are offered for sale exclusively to certain eligible investors. In addition, Institutional Class shares pay no distribution and service fee.
Class A shares are sold with a maximum front-end sales charge of 2.75%, and have an annual distribution and service fee of 0.25% of average daily net assets. This fee was contractually limited to 0.15% of average daily net assets from Jan. 1, 2017 through Dec. 31, 2017.* Performance
4
Table of Contents
for Class A shares, excluding sales charges, assumes that no front-end sales charge applied.
Class C shares are sold with a contingent deferred sales charge of 1.00% if redeemed during the first 12 months. They are also subject to an annual distribution and service fee of 1.00% of average daily net assets. Performance for Class C shares, excluding sales charges, assumes either that contingent deferred sales charges did not apply or that the investment was not redeemed.
Class R shares are available only for certain retirement plan products. They are sold without a sales charge and have an annual distribution and service fee of 0.50% of average daily net assets.
Class R6 shares are available only to certain investors. In addition, Class R6 shares do not pay any service fees, sub-accounting fees, and/or sub-transfer agency fees to any brokers, dealers, or other financial intermediaries. Class R6 shares pay no distribution and service fee.
Fixed income securities and bond funds can lose value, and investors can lose principal, as interest rates rise. They also may be affected by economic conditions that hinder an issuer’s ability to make interest and principal payments on its debt.
The Fund may also be subject to prepayment risk, the risk that the principal of a bond that is held by a portfolio will be prepaid prior to maturity, at the time when interest rates are lower than what the bond was paying. A portfolio may then have to reinvest that money at a lower interest rate.
High yielding, non-investment-grade bonds (junk bonds) involve higher risk than investment grade bonds.
The high yield secondary market is particularly susceptible to liquidity problems when institutional investors, such as mutual funds and certain other financial institutions, temporarily stop buying bonds for regulatory, financial, or other reasons. In addition, a less liquid secondary market makes it more difficult for the Fund to obtain precise valuations of the high yield securities in its portfolio.
If and when the Fund invests in forward foreign currency contracts or uses other investments to hedge against currency risks, the Fund will be subject to special risks, including counterparty risk.
The Fund may invest in derivatives, which may involve additional expenses and are subject to risk, including the risk that an underlying security or securities index moves in the opposite direction from what the portfolio manager anticipated. A derivative transaction depends upon the counterparties’ ability to fulfill their contractual obligations.
International investments entail risks not ordinarily associated with US investments including fluctuation in currency values, differences in accounting principles, or economic or political instability in other nations. Investing in emerging markets can be riskier than investing in established foreign markets due to increased volatility and lower trading volume.
Diversification may not protect against market risk.
* The aggregate contractual waiver period covering this report is from April 29, 2016 through May 1, 2018.
5
Table of Contents
Performance summary
Delaware Limited-Term Diversified Income Fund
2 The Fund’s expense ratios, as described in the most recent prospectus, are disclosed in the following “Fund expense ratios” table. Delaware Management Company has agreed to reimburse certain expenses and/or waive certain fees in order to prevent total annual fund operating expenses (excluding any 12b-1 fees, acquired fund fees and expenses, taxes, interest, short sale dividend and interest expenses, brokerage fees, certain insurance costs, and nonroutine expenses or costs, including, but not limited to, those relating to reorganizations, litigation, conducting shareholder meetings, and liquidations (collectively, nonroutine expenses)) from exceeding 0.59% of the Fund’s average daily net assets for all shares classes other than Class R6 and 0.52% of the Class R6 shares’ average daily net assets from May 1, 2017 (Class R6 inception date) through Dec. 31, 2017.** Prior to May 1, 2017, the contractual waiver was 0.59% of average daily net assets of Class A, Class C, Class R, and Institutional Class shares. Please see the most recent prospectus and any applicable supplement(s) for additional information on these fee waivers and/or reimbursements. Please see the “Financial highlights” section in this report for the most recent expense ratios.
| Fund expense ratios | Class A | Class C | Class R | Institutional Class | Class R6 | |||||
Total annual operating expenses | 0.92% | 1.67% | 1.17% | 0.67% | 0.60% | |||||
(without fee waivers) | ||||||||||
Net expenses | 0.74% | 1.59% | 1.09% | 0.59% | 0.52% | |||||
(including fee waivers, if any) | ||||||||||
Type of waiver | Contractual | Contractual | Contractual | Contractual | Contractual |
** The aggregate contractual waiver period covering this report is from Oct. 5, 2016 through May 1, 2018.
6
Table of Contents
Performance of a $10,000 investment1
Average annual total returns from Dec. 31, 2007 through Dec. 31, 2017
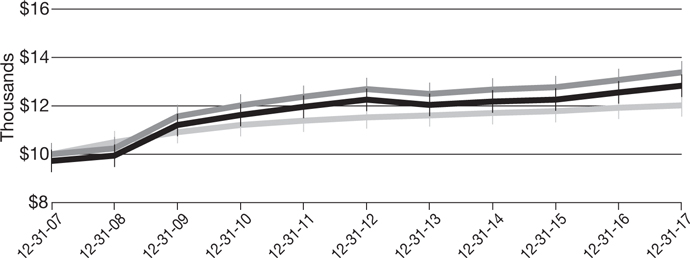
For the period beginning Dec. 31, 2007 through Dec. 31, 2017 | Starting value | Ending value | ||||||||
| Delaware Limited-Term Diversified Income | $10,000 | $13,389 | |||||||
Fund — Institutional Class shares | ||||||||||
Delaware Limited-Term Diversified Income | $9,725 | $12,821 | ||||||||
Fund — Class A shares | ||||||||||
Bloomberg Barclays 1–3 Year US Government/Credit Index | $10,000 | $12,019 | ||||||||

1 The “Performance of a $10,000 investment” graph assumes $10,000 invested in Institutional Class and Class A shares of the Fund on Dec. 31, 2007, and includes the effect of a 2.75% front-end sales charge (for Class A shares) and the reinvestment of all distributions. The graph does not reflect the deduction of taxes the shareholders would pay on Fund distributions or redemptions of Fund shares. Expense limitations were in effect for some or all of the periods shown. Performance would have been lower had expense limitations not been in effect. Expenses are listed in the “Fund expense ratios“ table above. Please note additional details on pages 4 through 8.
The graph also assumes $10,000 invested in the Bloomberg Barclays 1–3 Year US Government/Credit Index as of Dec. 31, 2007. The Bloomberg Barclays 1–3 Year US Government/Credit Index is a market value-weighted index of government fixed-rate
debt securities and investment grade US and foreign fixed-rate debt securities with average maturities of one to three years.
The CBOE Volatility Index, mentioned on page 1, is a key measure of market expectations of near-term volatility conveyed by S&P 500 stock index option prices.
Index performance returns do not reflect any management fees, transaction costs, or expenses. Indices are unmanaged and one cannot invest directly in an index. Past performance is not a guarantee of future results.
Performance of other Fund classes will vary due to different charges and expenses.
7
Table of Contents
Performance summary
Delaware Limited-Term Diversified Income Fund
| Nasdaq symbols | CUSIPs | |||||
Class A | DTRIX | 245912308 | ||||
Class C | DTICX | 245912704 | ||||
Class R | DLTRX | 245912803 | ||||
Institutional Class | DTINX | 245912506 | ||||
Class R6 | DLTZX | 245912886 |
8
Table of Contents
For the six-month period from July 1, 2017 to December 31, 2017
As a shareholder of the Fund, you incur two types of costs: (1) transaction costs, including sales charges (loads) on purchase payments, reinvested dividends, or other distributions; redemption fees; and exchange fees; and (2) ongoing costs, including management fees; distribution and/or service (12b-1) fees; and other Fund expenses. This example is intended to help you understand your ongoing costs (in dollars) of investing in the Fund and to compare these costs with the ongoing costs of investing in other mutual funds.
The example is based on an investment of $1,000 invested at the beginning of the period and held for the entire six-month period from July 1, 2017 to Dec. 31, 2017.
Actual expenses
The first section of the table shown, “Actual Fund return,” provides information about actual account values and actual expenses. You may use the information in this section of the table, together with the amount you invested, to estimate the expenses that you paid over the period. Simply divide your account value by $1,000 (for example, an $8,600 account value divided by $1,000 = 8.6), then multiply the result by the number in the first section under the heading entitled “Expenses Paid During Period” to estimate the expenses you paid on your account during this period.
Hypothetical example for comparison purposes
The second section of the table shown, “Hypothetical 5% return,” provides information about hypothetical account values and hypothetical expenses based on the Fund’s actual expense ratio and an assumed rate of return of 5% per year before expenses, which is not the Fund’s actual return. The hypothetical account values and expenses may not be used to estimate the actual ending account balance or expenses you paid for the period. You may use this information to compare the ongoing costs of investing in the Fund and other funds. To do so, compare this 5% hypothetical example with the 5% hypothetical examples that appear in the shareholder reports of the other funds.
Please note that the expenses shown in the table are meant to highlight your ongoing costs only and do not reflect any transactional costs, such as sales charges (loads), redemption fees, or exchange fees. Therefore, the second section of the table is useful in comparing ongoing costs only, and will not help you determine the relative total costs of owning different funds. In addition, if these transactional costs were included, your costs would have been higher. The Fund’s expenses shown in the table reflect fee waivers in effect. The expenses shown in the table assume reinvestment of all dividends and distributions.
9
Table of Contents
Disclosure of Fund expenses
For the six-month period from July 1, 2017 to December 31, 2017
Delaware Limited-Term Diversified Income Fund
Expense analysis of an investment of $1,000
| Beginning | Ending | Expenses | ||||||
| Account Value | Account Value | Annualized | Paid During Period | |||||
| 7/1/17 | 12/31/17 | Expense Ratio | 7/1/17 to 12/31/17* | |||||
Actual Fund return† | ||||||||
Class A | $1,000.00 | $1,006.40 | 0.74% | $3.74 | ||||
Class C | 1,000.00 | 1,000.90 | 1.59% | 8.02 | ||||
Class R | 1,000.00 | 1,004.60 | 1.09% | 5.51 | ||||
Institutional Class | 1,000.00 | 1,007.10 | 0.59% | 2.98 | ||||
Class R6** | 1,000.00 | 1,007.50 | 0.52% | 2.63 | ||||
Hypothetical 5% return (5% return before expenses) | ||||||||
Class A | $1,000.00 | $1,021.48 | 0.74% | $3.77 | ||||
Class C | 1,000.00 | 1,017.19 | 1.59% | 8.08 | ||||
Class R | 1,000.00 | 1,019.71 | 1.09% | 5.55 | ||||
Institutional Class | 1,000.00 | 1,022.23 | 0.59% | 3.01 | ||||
Class R6** | 1,000.00 | 1,022.58 | 0.52% | 2.65 | ||||
| * | “Expenses Paid During Period” are equal to the Fund’s annualized expense ratio, multiplied by the average account value over the period, multiplied by 184/365 (to reflect the one-half year period). |
| † | Because actual returns reflect only the most recent six-month period, the returns shown may differ significantly from fiscal year returns. |
10
Table of Contents
Security type / sector allocation
| Delaware Limited-Term Diversified Income Fund | As of December 31, 2017 (Unaudited) |
Sector designations may be different than the sector designations presented in other Fund materials. The sector designations may represent the investment manager’s internal sector classifications, which may result in the sector designations for one fund being different than another fund’s sector designations.
| Security type / sector | Percentage of net assets | |
Agency Asset-Backed Securities | 0.02% | |
Agency Collateralized Mortgage Obligations | 11.28% | |
Agency Commercial Mortgage-Backed Securities | 0.29% | |
Agency Mortgage-Backed Securities | 5.52% | |
Collateralized Debt Obligations | 2.96% | |
Corporate Bonds | 35.41% | |
Banking | 14.51% | |
Basic Industry | 2.32% | |
Brokerage | 0.55% | |
Capital Goods | 0.66% | |
Communications | 3.09% | |
Consumer Cyclical | 1.11% | |
Consumer Non-Cyclical | 1.77% | |
Electric | 4.93% | |
Energy | 2.48% | |
Finance Companies | 0.62% | |
Healthcare | 0.10% | |
Insurance | 0.79% | |
Natural Gas | 0.38% | |
Real Estate | 0.07% | |
REITs | 0.26% | |
Technology | 0.83% | |
Transportation | 0.94% | |
Loan Agreements | 3.27% | |
Municipal Bonds | 0.35% | |
Non-Agency Asset-Backed Securities | 25.86% | |
Non-Agency Collateralized Mortgage Obligations | 0.13% | |
Non-Agency Commercial Mortgage-Backed Security | 0.01% | |
Regional Bond | 0.05% | |
Sovereign Bonds | 0.56% | |
Supranational Bank | 0.07% | |
US Treasury Obligations | 12.70% | |
Preferred Stock | 0.37% | |
Short-Term Investments | 1.61% | |
Total Value of Securities | 100.46% | |
Liabilities Net of Receivables and Other Assets | (0.46%) | |
Total Net Assets | 100.00% |
11
Table of Contents
| Delaware Limited-Term Diversified Income Fund | December 31, 2017 |
| Principal amount° | Value (US $) | |||||||
| ||||||||
Agency Asset-Backed Securities – 0.02% | ||||||||
| ||||||||
Fannie Mae Grantor Trust | ||||||||
Series 2003-T4 2A5 4.747% 9/26/33 f | 153,090 | $ | 167,395 | |||||
Fannie Mae REMIC Trust | ||||||||
Series 2001-W2 AS5 6.473% 10/25/31 f | 119 | 119 | ||||||
Freddie Mac Structured Pass Through Securities | ||||||||
Series T-30 A5 6.658% 12/25/30 ◆f | 4,061 | 4,277 | ||||||
|
| |||||||
Total Agency Asset-Backed Securities (cost $156,229) | 171,791 | |||||||
|
| |||||||
| ||||||||
Agency Collateralized Mortgage Obligations – 11.28% | ||||||||
| ||||||||
Fannie Mae Grantor Trust | ||||||||
Series 2001-T5 A2 7.00% 6/19/41 • | 25,765 | 27,764 | ||||||
Series 2002-T1 A2 7.00% 11/25/31 | 149,736 | 174,749 | ||||||
Fannie Mae Interest Strip | ||||||||
Series 413 167 4.50% 7/25/42 ∑• | 1,205,483 | 305,774 | ||||||
Series 419 C3 3.00% 11/25/43 ∑ | 68,167 | 13,417 | ||||||
Fannie Mae REMIC Trust | ||||||||
Series 2002-W1 2A 7.50% 2/25/42 • | 114,889 | 127,924 | ||||||
Fannie Mae REMICs | ||||||||
Series 2003-78 B 5.00% 8/25/23 | 28,571 | 30,099 | ||||||
Series 2003-120 BL 3.50% 12/25/18 | 42,696 | 42,794 | ||||||
Series 2004-36 FA 1.952% (LIBOR01M + 0.40%) 5/25/34 • | 243,970 | 245,236 | ||||||
Series 2004-49 EB 5.00% 7/25/24 | 21,686 | 22,946 | ||||||
Series 2005-66 FD 1.852% (LIBOR01M + 0.30%) 7/25/35 • | 1,096,364 | 1,094,714 | ||||||
Series 2005-110 MB 5.50% 9/25/35 | 5,565 | 5,767 | ||||||
Series 2006-105 FB 1.972% (LIBOR01M + 0.42%) 11/25/36 • | 66,580 | 66,723 | ||||||
Series 2011-88 AB 2.50% 9/25/26 | 22,780 | 22,789 | ||||||
Series 2011-101 EI 3.50% 10/25/26 S | 101,408 | 9,702 | ||||||
Series 2011-105 FP 1.952% (LIBOR01M + 0.40%) 6/25/41 • | 1,860,139 | 1,868,320 | ||||||
Series 2011-113 MC 4.00% 12/25/40 | 107,244 | 109,130 | ||||||
Series 2012-51 SA 4.948% (6.50% minus LIBOR01M, | ||||||||
Cap 6.50%, Floor 0.00%) 5/25/42 S• | 57,881 | 13,689 | ||||||
Series 2012-67 GB 3.00% 7/25/42 | 390,000 | 383,018 | ||||||
Series 2012-93 LY 2.50% 9/25/42 | 433,000 | 393,308 | ||||||
Series 2012-98 KI 3.50% 7/25/27 S | 296,204 | 29,007 | ||||||
Series 2012-98 MI 3.00% 8/25/31 S | 23,176,983 | 2,605,607 | ||||||
Series 2012-99 AI 3.50% 5/25/39 S | 1,514,298 | 154,396 | ||||||
Series 2012-102 IB 3.50% 9/25/27 S | 7,869,600 | 887,460 | ||||||
Series 2012-118 AI 3.50% 11/25/37 S | 433,910 | 46,410 | ||||||
Series 2012-120 WI 3.00% 11/25/27 S | 121,338 | 11,805 | ||||||
Series 2012-121 ID 3.00% 11/25/27 S | 617,344 | 61,416 | ||||||
12
Table of Contents
| Principal amount° | Value (US $) | |||||||
| ||||||||
Agency Collateralized Mortgage Obligations (continued) | ||||||||
| ||||||||
Fannie Mae REMICs | ||||||||
Series 2012-122 SD 4.548% (6.10% minus LIBOR01M, | ||||||||
Cap 6.10%, Floor 0.00%) 11/25/42 S• | 2,947,055 | $ | 562,513 | |||||
Series 2012-125 MI 3.50% 11/25/42 S | 1,342,868 | 282,651 | ||||||
Series 2012-126 PI 3.50% 7/25/42 S | 335,658 | 43,617 | ||||||
Series 2012-128 NP 2.50% 11/25/42 | 474,979 | 451,843 | ||||||
Series 2012-132 AI 3.00% 12/25/27 S | 164,243 | 15,530 | ||||||
Series 2012-137 QI 3.00% 12/25/27 S | 1,394,031 | 143,652 | ||||||
Series 2012-137 WI 3.50% 12/25/32 S | 59,955 | 9,811 | ||||||
Series 2012-139 NS 5.148% (6.70% minus LIBOR01M, | ||||||||
Cap 6.70%, Floor 0.00%) 12/25/42 S• | 1,767,556 | 407,136 | ||||||
Series 2012-148 HE 2.50% 1/25/43 | 1,000,000 | 927,700 | ||||||
Series 2013-2 DA 2.00% 11/25/42 | 25,616 | 23,343 | ||||||
Series 2013-4 PL 2.00% 2/25/43 | 76,000 | 63,900 | ||||||
Series 2013-7 EI 3.00% 10/25/40 S | 1,445,473 | 193,912 | ||||||
Series 2013-7 GP 2.50% 2/25/43 | 65,000 | 60,171 | ||||||
Series 2013-20 IH 3.00% 3/25/33 S | 365,838 | 52,416 | ||||||
Series 2013-26 HI 3.00% 4/25/32 S | 196,423 | 16,129 | ||||||
Series 2013-26 ID 3.00% 4/25/33 S | 715,925 | 102,576 | ||||||
Series 2013-28 YB 3.00% 4/25/43 | 1,550,000 | 1,515,052 | ||||||
Series 2013-38 AI 3.00% 4/25/33 S | 544,195 | 77,439 | ||||||
Series 2013-43 IX 4.00% 5/25/43 S | 307,655 | 73,051 | ||||||
Series 2013-51 PI 3.00% 11/25/32 S | 689,822 | 82,507 | ||||||
Series 2013-52 ZA 3.00% 6/25/43 | 214,327 | 201,217 | ||||||
Series 2013-55 AI 3.00% 6/25/33 S | 15,168,734 | 2,200,239 | ||||||
Series 2013-59 PY 2.50% 6/25/43 | 547,142 | 505,952 | ||||||
Series 2013-62 PY 2.50% 6/25/43 | 61,000 | 55,929 | ||||||
Series 2013-67 KZ 2.50% 4/25/43 | 783,259 | 705,991 | ||||||
Series 2013-69 IJ 3.00% 7/25/33 S | 54,885 | 7,698 | ||||||
Series 2013-69 IO 3.00% 11/25/31 S | 96,103 | 9,382 | ||||||
Series 2013-71 ZA 3.50% 7/25/43 | 289,067 | 294,754 | ||||||
Series 2013-75 JI 3.00% 9/25/32 S | 716,940 | 92,020 | ||||||
Series 2013-92 SA 4.398% (5.95% minus LIBOR01M, | ||||||||
Cap 5.95%, Floor 0.00%) 9/25/43 S• | 227,223 | 44,679 | ||||||
Series 2013-129 KI 3.00% 8/25/28 S | 1,709,213 | 137,517 | ||||||
Series 2014-21 ID 3.50% 6/25/33 S | 353,239 | 48,397 | ||||||
Series 2014-25 DI 3.50% 8/25/32 S | 278,737 | 32,816 | ||||||
Series 2014-46 IK 3.00% 9/25/40 S | 291,726 | 34,597 | ||||||
Series 2014-63 KI 3.50% 11/25/33 S | 345,289 | 41,861 | ||||||
Series 2014-64 IT 3.50% 6/25/41 S | 43,131 | 4,827 | ||||||
Series 2014-68 BS 4.598% (6.15% minus LIBOR01M, | ||||||||
Cap 6.15%, Floor 0.00%) 11/25/44 S• | 245,066 | 46,192 | ||||||
Series 2014-85 IB 3.00% 12/25/44 S | 913,819 | 172,367 | ||||||
13
Table of Contents
Schedule of investments
Delaware Limited-Term Diversified Income Fund
| Principal amount° | Value (US $) | |||||||
| ||||||||
Agency Collateralized Mortgage Obligations (continued) | ||||||||
| ||||||||
Fannie Mae REMICs | ||||||||
Series 2014-90 SA 4.598% (6.15% minus LIBOR01M, | ||||||||
Cap 6.15%, Floor 0.00%) 1/25/45 S• | 288,744 | $ | 54,179 | |||||
Series 2014-94 AI 3.00% 10/25/32 S | 482,253 | 43,715 | ||||||
Series 2015-11 BI 3.00% 1/25/33 S | 503,316 | 53,944 | ||||||
Series 2015-27 SA 4.898% (6.45% minus LIBOR01M, | ||||||||
Cap 6.45%, Floor 0.00%) 5/25/45 S• | 64,631 | 13,673 | ||||||
Series 2015-31 ZD 3.00% 5/25/45 | 454,935 | 414,662 | ||||||
Series 2015-40 GZ 3.50% 5/25/45 | 109,449 | 107,538 | ||||||
Series 2015-43 PZ 3.50% 6/25/45 | 43,779 | 44,865 | ||||||
Series 2015-44 AI 3.50% 1/25/34 S | 720,518 | 107,080 | ||||||
Series 2015-45 AI 3.00% 1/25/33 S | 66,708 | 7,234 | ||||||
Series 2015-45 EI 3.00% 12/25/40 S | 1,301,064 | 144,806 | ||||||
Series 2015-66 ID 3.50% 5/25/42 S | 256,268 | 40,129 | ||||||
Series 2015-71 PI 4.00% 3/25/43 S | 501,323 | 82,002 | ||||||
Series 2015-82 AI 3.50% 6/25/34 S | 4,323,145 | 781,981 | ||||||
Series 2015-85 BI 4.50% 9/25/43 S | 643,391 | 123,904 | ||||||
Series 2015-87 TI 3.50% 11/25/35 S | 253,669 | 39,373 | ||||||
Series 2015-89 EZ 3.00% 12/25/45 | 652,484 | 642,932 | ||||||
Series 2015-95 SH 4.448% (6.00% minus LIBOR01M, | ||||||||
Cap 6.00%, Floor 0.00%) 1/25/46 S• | 128,065 | 28,039 | ||||||
Series 2016-2 HI 3.00% 12/25/41 S | 1,179,307 | 163,784 | ||||||
Series 2016-17 BI 4.00% 2/25/43 S | 1,143,843 | 192,205 | ||||||
Series 2016-24 LI 3.00% 6/25/42 S | 438,862 | 49,998 | ||||||
Series 2016-33 DI 3.50% 6/25/36 S | 230,017 | 34,020 | ||||||
Series 2016-33 EL 3.00% 6/25/46 | 1,119,000 | 1,058,801 | ||||||
Series 2016-40 ZC 3.00% 7/25/46 | 37,655 | 35,245 | ||||||
Series 2016-51 LI 3.00% 8/25/46 S | 290,356 | 43,797 | ||||||
Series 2016-54 PI 3.00% 2/25/44 S | 1,305,325 | 154,892 | ||||||
Series 2016-55 SK 4.448% (6.00% minus LIBOR01M, | ||||||||
Cap 6.00%, Floor 0.00%) 8/25/46 S• | 107,838 | 23,063 | ||||||
Series 2016-60 LI 3.00% 9/25/46 S | 131,646 | 20,049 | ||||||
Series 2016-61 ML 3.00% 9/25/46 | 55,000 | 53,363 | ||||||
Series 2016-62 IC 3.00% 3/25/43 S | 398,363 | 44,063 | ||||||
Series 2016-74 GS 4.448% (6.00% minus LIBOR01M, | ||||||||
Cap 6.00%, Floor 0.00%) 10/25/46 S• | 813,282 | 193,679 | ||||||
Series 2016-74 IH 3.50% 11/25/45 S | 118,822 | 21,619 | ||||||
Series 2016-79 JS 4.498% (6.05% minus LIBOR01M, | ||||||||
Cap 6.05%, Floor 0.00%) 11/25/46 S• | 177,015 | 37,025 | ||||||
Series 2016-80 JZ 3.00% 11/25/46 | 144,023 | 135,478 | ||||||
Series 2016-83 PI 3.50% 7/25/45 S | 88,676 | 14,786 | ||||||
Series 2016-90 CI 3.00% 2/25/45 S | 721,600 | 104,682 | ||||||
Series 2016-95 IO 3.00% 12/25/46 S | 2,902,728 | 505,734 | ||||||
Series 2016-99 DI 3.50% 1/25/46 S | 93,823 | 15,456 | ||||||
14
Table of Contents
| Principal amount° | Value (US $) | |||||||
| ||||||||
Agency Collateralized Mortgage Obligations (continued) | ||||||||
| ||||||||
Fannie Mae REMICs | ||||||||
Series 2016-99 TI 3.50% 3/25/36 S | 589,854 | $ | 84,142 | |||||
Series 2016-101 ZP 3.50% 1/25/47 | 94,237 | 91,723 | ||||||
Series 2016-105 SA 4.448% (6.00% minus LIBOR01M, | ||||||||
Cap 6.00%, Floor 0.00%) 1/25/47 S• | 302,391 | 65,667 | ||||||
Series 2017-6 NI 3.50% 3/25/46 S | 903,057 | 146,958 | ||||||
Series 2017-8 BZ 3.00% 2/25/47 | 12,334 | 11,430 | ||||||
Series 2017-8 SG 4.448% (6.00% minus LIBOR01M, | ||||||||
Cap 6.00%, Floor 0.00%) 2/25/47 S• | 98,573 | 20,881 | ||||||
Series 2017-14 AI 3.00% 9/25/42 S | 93,021 | 14,660 | ||||||
Series 2017-16 SM 4.498% (6.05% minus LIBOR01M, | ||||||||
Cap 6.05%, Floor 0.00%) 3/25/47 S• | 1,084,361 | 225,601 | ||||||
Series 2017-16 UW 3.00% 7/25/45 | 1,225,000 | 1,203,477 | ||||||
Series 2017-16 WI 3.00% 1/25/45 S | 92,906 | 12,748 | ||||||
Series 2017-16 YW 3.00% 3/25/47 | 875,000 | 843,364 | ||||||
Series 2017-17 CM 3.00% 11/25/41 | 228,150 | 226,379 | ||||||
Series 2017-17 LI 3.00% 4/25/37 S | 142,963 | 12,821 | ||||||
Series 2017-19 MD 3.00% 1/25/47 | 99,000 | 100,456 | ||||||
Series 2017-24 AI 3.00% 8/25/46 S | 1,010,687 | 156,018 | ||||||
Series 2017-25 GS 5.148% (6.70% minus LIBOR01M, | ||||||||
Cap 6.70%, Floor 0.00%) 4/25/47 S• | 230,045 | 35,823 | ||||||
Series 2017-26 VZ 3.00% 4/25/47 | 97,159 | 91,661 | ||||||
Series 2017-27 EM 3.00% 4/25/47 | 113,000 | 107,763 | ||||||
Series 2017-28 Z 3.50% 4/25/47 | 108,815 | 110,292 | ||||||
Series 2017-40 GZ 3.50% 5/25/47 | 36,849 | 37,479 | ||||||
Series 2017-40 IG 3.50% 3/25/43 S | 248,411 | 39,662 | ||||||
Series 2017-45 IJ 3.00% 11/25/46 S | 989,470 | 173,022 | ||||||
Series 2017-46 BI 3.00% 4/25/47 S | 363,690 | 54,412 | ||||||
Series 2017-46 JI 3.50% 1/25/43 S | 133,817 | 16,929 | ||||||
Series 2017-55 HY 3.00% 7/25/47 | 395,000 | 375,072 | ||||||
Series 2017-59 KI 3.00% 3/25/47 S | 1,066,987 | 144,515 | ||||||
Series 2017-61 SB 4.598% (6.15% minus LIBOR01M, | ||||||||
Cap 6.15%, Floor 0.00%) 8/25/47 S• | 587,767 | 128,927 | ||||||
Series 2017-61 TB 3.00% 8/25/44 | 30,000 | 28,872 | ||||||
Series 2017-66 IQ 3.00% 9/25/43 S | 96,050 | 14,088 | ||||||
Series 2017-66 QY 3.00% 9/25/43 | 87,000 | 86,198 | ||||||
Series 2017-67 BZ 3.00% 9/25/47 | 15,151 | 14,085 | ||||||
Series 2017-69 SG 4.598% (6.15% minus LIBOR01M, | ||||||||
Cap 6.15%, Floor 0.00%) 9/25/47 S• | 157,151 | 33,084 | ||||||
Series 2017-94 CZ 3.50% 11/25/47 | 32,187 | 32,038 | ||||||
Series 2017-96 EZ 3.50% 12/25/47 | 56,163 | 55,780 | ||||||
Freddie Mac REMICs | ||||||||
Series 3016 FL 1.867% (LIBOR01M + 0.39%) 8/15/35 • | 20,251 | 20,284 | ||||||
Series 3027 DE 5.00% 9/15/25 | 23,547 | 25,145 | ||||||
15
Table of Contents
Schedule of investments
Delaware Limited-Term Diversified Income Fund
| Principal amount° | Value (US $) | |||||||
| ||||||||
Agency Collateralized Mortgage Obligations (continued) | ||||||||
| ||||||||
Freddie Mac REMICs | ||||||||
Series 3067 FA 1.827% (LIBOR01M + 0.35%) 11/15/35 • | 2,236,981 | $ | 2,233,757 | |||||
Series 3232 KF 1.927% (LIBOR01M + 0.45%) 10/15/36 • | 51,250 | 51,490 | ||||||
Series 3241 FM 1.857% (LIBOR01M + 0.38%) 11/15/36 • | 18,084 | 18,125 | ||||||
Series 3297 BF 1.717% (LIBOR01M + 0.24%) 4/15/37 • | 747,033 | 744,191 | ||||||
Series 3316 FB 1.777% (LIBOR01M + 0.30%) 8/15/35 • | 95,252 | 95,109 | ||||||
Series 3578 EO 0.00% 5/15/37 W | 258,932 | 240,260 | ||||||
Series 3737 NA 3.50% 6/15/25 | 80,578 | 82,182 | ||||||
Series 3780 LF 1.877% (LIBOR01M + 0.40%) 3/15/29 • | 4,920 | 4,920 | ||||||
Series 3800 AF 1.977% (LIBOR01M + 0.50%) 2/15/41 • | 1,362,798 | 1,370,899 | ||||||
Series 3803 TF 1.877% (LIBOR01M + 0.40%) 11/15/28 • | 24,645 | 24,654 | ||||||
Series 3939 EI 3.00% 3/15/26 S | 1,299,767 | 85,419 | ||||||
Series 4050 EI 4.00% 2/15/39 S | 145,150 | 16,198 | ||||||
Series 4088 PI 3.00% 12/15/40 S | 457,219 | 52,227 | ||||||
Series 4092 AI 3.00% 9/15/31 S | 356,564 | 39,320 | ||||||
Series 4100 EI 3.00% 8/15/27 S | 9,601,493 | 936,905 | ||||||
Series 4105 YC 3.00% 8/15/42 | 197,000 | 193,691 | ||||||
Series 4109 AI 3.00% 7/15/31 S | 5,720,509 | 654,782 | ||||||
Series 4120 IK 3.00% 10/15/32 S | 79,087 | 10,814 | ||||||
Series 4146 IA 3.50% 12/15/32 S | 81,078 | 12,786 | ||||||
Series 4150 PQ 2.50% 1/15/43 | 44,279 | 41,910 | ||||||
Series 4150 UI 3.50% 8/15/32 S | 51,419 | 5,544 | ||||||
Series 4152 BW 2.50% 1/15/43 | 195,361 | 184,047 | ||||||
Series 4152 GW 2.50% 1/15/43 | 36,000 | 33,105 | ||||||
Series 4159 KS 4.673% (6.15% minus LIBOR01M, Cap 6.15%, Floor 0.00%) 1/15/43 S• | 74,471 | 16,167 | ||||||
Series 4161 IM 3.50% 2/15/43 S | 428,008 | 94,832 | ||||||
Series 4171 Z 3.00% 2/15/43 | 473,798 | 447,979 | ||||||
Series 4181 DI 2.50% 3/15/33 S | 57,710 | 7,218 | ||||||
Series 4185 LI 3.00% 3/15/33 S | 489,988 | 70,170 | ||||||
Series 4191 CI 3.00% 4/15/33 S | 59,026 | 8,484 | ||||||
Series 4197 LZ 4.00% 4/15/43 | 301,213 | 320,378 | ||||||
Series 4206 DZ 3.00% 5/15/33 | 326,811 | 326,854 | ||||||
Series 4210 Z 3.00% 5/15/43 | 640,349 | 596,855 | ||||||
Series 4216 KI 3.50% 6/15/28 S | 146,966 | 15,095 | ||||||
Series 4223 HI 3.00% 4/15/30 S | 2,675,631 | 217,769 | ||||||
Series 4342 CI 3.00% 11/15/33 S | 1,083,170 | 133,658 | ||||||
Series 4366 DI 3.50% 5/15/33 S | 1,508,558 | 203,228 | ||||||
Series 4408 BC 3.00% 11/15/44 | 270,000 | 261,430 | ||||||
Series 4408 ZG 2.00% 9/15/41 | 406,723 | 362,027 | ||||||
16
Table of Contents
| Principal amount° | Value (US $) | |||||||
| ||||||||
Agency Collateralized Mortgage Obligations (continued) | ||||||||
| ||||||||
Freddie Mac REMICs | ||||||||
Series 4419 DC 3.00% 12/15/44 | 152,000 | $ | 148,869 | |||||
Series 4433 DI 3.00% 8/15/32 S | 5,517,852 | 582,520 | ||||||
Series 4448 TS 1.931% 5/15/40 S• | 411,352 | 24,643 | ||||||
Series 4452 PZ 3.50% 3/15/45 | 4,635,073 | 4,584,936 | ||||||
Series 4453 DI 3.50% 11/15/33 S | 5,469,556 | 712,769 | ||||||
Series 4457 KZ 3.00% 4/15/45 | 3,441,334 | 3,280,729 | ||||||
Series 4464 DA 2.50% 1/15/43 | 19,359 | 18,342 | ||||||
Series 4476 GI 3.00% 6/15/41 S | 1,319,894 | 156,519 | ||||||
Series 4487 BI 3.00% 11/15/41 S | 982,385 | 111,634 | ||||||
Series 4493 HI 3.00% 6/15/41 S | 182,600 | 23,472 | ||||||
Series 4504 IO 3.50% 5/15/42 S | 57,574 | 6,377 | ||||||
Series 4518 CI 3.50% 6/15/42 S | 573,531 | 69,489 | ||||||
Series 4527 CI 3.50% 2/15/44 S | 228,568 | 38,827 | ||||||
Series 4531 PZ 3.50% 11/15/45 | 1,303,538 | 1,372,562 | ||||||
Series 4567 LI 4.00% 8/15/45 S | 499,927 | 94,515 | ||||||
Series 4574 AI 3.00% 4/15/31 S | 2,399,168 | 297,412 | ||||||
Series 4581 LI 3.00% 5/15/36 S | 77,114 | 10,788 | ||||||
Series 4594 SG 4.523% (6.00% minus LIBOR01M, Cap 6.00%, Floor 0.00%) 6/15/46 S• | 123,047 | 28,072 | ||||||
Series 4601 IN 3.50% 7/15/46 S | 380,464 | 74,972 | ||||||
Series 4610 IB 3.00% 6/15/41 S | 356,955 | 41,294 | ||||||
Series 4614 HB 2.50% 9/15/46 | 62,000 | 57,215 | ||||||
Series 4615 GW 2.50% 4/15/41 | 18,000 | 17,009 | ||||||
Series 4618 SA 4.523% (6.00% minus LIBOR01M, Cap 6.00%, Floor 0.00%) 9/15/46 S• | 392,343 | 90,712 | ||||||
Series 4622 HI 3.00% 11/15/43 S | 647,304 | 77,617 | ||||||
Series 4623 IY 4.00% 10/15/46 S | 191,107 | 41,786 | ||||||
Series 4623 LZ 2.50% 10/15/46 | 52,508 | 45,995 | ||||||
Series 4623 MW 2.50% 10/15/46 | 60,000 | 56,090 | ||||||
Series 4623 WI 4.00% 8/15/44 S | 1,174,859 | 224,680 | ||||||
Series 4623 YT 2.50% 3/15/46 | 1,442,246 | 1,339,868 | ||||||
Series 4625 BI 3.50% 6/15/46 S | 128,737 | 26,719 | ||||||
Series 4625 PZ 3.00% 6/15/46 | 30,032 | 28,490 | ||||||
Series 4631 GS 4.523% (6.00% minus LIBOR01M, Cap 6.00%, Floor 0.00%) 11/15/46 S• | 87,321 | 18,984 | ||||||
Series 4636 ET 3.00% 3/15/41 | 1,000,000 | 982,809 | ||||||
Series 4643 QI 3.50% 9/15/45 S | 2,007,051 | 353,054 | ||||||
Series 4648 SA 4.523% (6.00% minus LIBOR01M, Cap 6.00%, Floor 0.00%) 1/15/47 S• | 1,086,241 | 232,305 | ||||||
Series 4650 JE 3.00% 7/15/46 | 110,000 | 106,149 | ||||||
Series 4650 JG 3.00% 11/15/46 | 1,997,000 | 1,901,351 | ||||||
Series 4653 VB 3.00% 4/15/40 | 865,000 | 862,538 | ||||||
17
Table of Contents
Schedule of investments
Delaware Limited-Term Diversified Income Fund
| Principal amount° | Value (US $) | |||||||
| ||||||||
Agency Collateralized Mortgage Obligations (continued) | ||||||||
| ||||||||
Freddie Mac REMICs | ||||||||
Series 4654 G 3.00% 2/15/43 | 74,840 | $ | 74,264 | |||||
Series 4655 TI 3.00% 8/15/36 S | 91,751 | 8,750 | ||||||
Series 4655 WI 3.50% 8/15/43 S | 90,273 | 14,894 | ||||||
Series 4656 HI 3.50% 5/15/42 S | 624,331 | 84,380 | ||||||
Series 4657 PS 4.523% (6.00% minus LIBOR01M, Cap 6.00%, Floor 0.00%) 2/15/47 S• | 4,309,405 | 904,592 | ||||||
Series 4660 GI 3.00% 8/15/43 S | 746,116 | 121,520 | ||||||
Series 4663 AI 3.00% 3/15/42 S | 241,455 | 30,968 | ||||||
Series 4675 KS 4.523% (6.00% minus LIBOR01M, Cap 6.00%, Floor 0.00%) 4/15/47 S• | 140,191 | 30,551 | ||||||
Series 4681 WI 1.566% 8/15/33 S• | 603,775 | 40,445 | ||||||
Series 4690 WI 3.50% 12/15/43 S | 674,596 | 101,419 | ||||||
Series 4693 EI 3.50% 8/15/42 S | 94,201 | 12,698 | ||||||
Series 4695 OZ 3.00% 6/15/47 | 576,573 | 539,303 | ||||||
Series 4710 CI 3.50% 12/15/43 S | 201,551 | 29,568 | ||||||
Series 4721 HI 3.50% 9/15/42 | 317,019 | 48,252 | ||||||
Freddie Mac Strips | ||||||||
Series 267 S5 4.523% (6.00% minus LIBOR01M, Cap 6.00%, Floor 0.00%) 8/15/42 S• | 54,093 | 10,502 | ||||||
Series 284 S6 4.623% (6.10% minus LIBOR01M, Cap 6.10%, Floor 0.00%) 10/15/42 S• | 1,133,410 | 232,117 | ||||||
Series 290 IO 3.50% 11/15/32 S | 56,391 | 9,220 | ||||||
Series 299 S1 4.523% (6.00% minus LIBOR01M, Cap 6.00%, Floor 0.00%) 1/15/43 S• | 83,322 | 15,593 | ||||||
Series 303 151 4.30% 12/15/42 S• | 398,597 | 99,293 | ||||||
Series 303 185 3.489% 1/15/43 S• | 1,111,960 | 222,298 | ||||||
Series 319 S2 4.523% (6.00% minus LIBOR01M, Cap 6.00%, Floor 0.00%) 11/15/43 S• | 7,344,506 | 1,558,882 | ||||||
Series 326 S2 4.473% (5.95% minus LIBOR01M, Cap 5.95%, Floor 0.00%) 3/15/44 S• | 534,142 | 102,594 | ||||||
Series 350 S5 1.747% 9/15/40 S• | 210,792 | 10,752 | ||||||
Freddie Mac Structured Pass Through Certificates | ||||||||
Series T-42 A5 7.50% 2/25/42 ◆ | 30,773 | 35,374 | ||||||
Series T-54 2A 6.50% 2/25/43 ◆ | 760 | 883 | ||||||
Series T-58 2A 6.50% 9/25/43 ◆ | 525,532 | 599,827 | ||||||
GNMA | ||||||||
Series 2012-77 MU 2.50% 6/20/42 | 111,551 | 105,343 | ||||||
Series 2012-108 PB 2.75% 9/16/42 | 39,000 | 37,315 | ||||||
Series 2013-26 KD 2.50% 2/16/43 | 870,000 | 820,195 | ||||||
Series 2013-79 KE 3.00% 5/20/43 | 1,250,000 | 1,238,235 | ||||||
Series 2013-88 LZ 2.50% 6/16/43 | 459,885 | 414,255 | ||||||
Series 2013-113 AZ 3.00% 8/20/43 | 18,218 | 17,708 | ||||||
Series 2013-113 LY 3.00% 5/20/43 | 17,000 | 17,034 | ||||||
18
Table of Contents
| Principal amount° | Value (US $) | |||||||
| ||||||||
Agency Collateralized Mortgage Obligations (continued) | ||||||||
| ||||||||
GNMA | ||||||||
Series 2013-182 CZ 2.50% 12/20/43 | 37,572 | $ | 34,761 | |||||
Series 2014-12 ZA 3.00% 1/20/44 | 208,036 | 202,592 | ||||||
Series 2014-12 ZB 3.00% 1/16/44 | 55,101 | 53,552 | ||||||
Series 2014-62 Z 3.00% 4/20/44 | 177,464 | 173,889 | ||||||
Series 2015-36 PI 3.50% 8/16/41 S | 419,840 | 56,839 | ||||||
Series 2015-74 CI 3.00% 10/16/39 S | 290,326 | 37,911 | ||||||
Series 2015-76 MZ 3.00% 5/20/45 | 1,109,603 | 1,136,339 | ||||||
Series 2015-82 GI 3.50% 12/20/38 S | 907,104 | 84,681 | ||||||
Series 2015-142 AI 4.00% 2/20/44 S | 53,192 | 6,774 | ||||||
Series 2015-155 QZ 3.50% 10/20/45 | 1,589,950 | 1,627,415 | ||||||
Series 2015-185 PZ 3.00% 12/20/45 | 1,116,968 | 1,081,145 | ||||||
Series 2016-5 GL 3.00% 7/20/45 | 5,000 | 4,964 | ||||||
Series 2016-46 DZ 3.00% 4/20/46 | 113,530 | 107,055 | ||||||
Series 2016-49 PZ 3.00% 11/16/45 | 231,265 | 216,328 | ||||||
Series 2016-54 MZ 3.00% 4/20/46 | 762,124 | 713,723 | ||||||
Series 2016-74 PL 3.00% 5/20/46 | 610,000 | 588,790 | ||||||
Series 2016-80 JZ 3.00% 6/20/46 | 679,880 | 641,934 | ||||||
Series 2016-81 IM 4.00% 10/20/44 S | 251,034 | 44,098 | ||||||
Series 2016-83 MB 3.00% 10/20/45 | 36,000 | 36,278 | ||||||
Series 2016-89 QS 4.549% (6.05% minus LIBOR01M, Cap 6.05%, Floor 0.00%) 7/20/46 S• | 3,678,101 | 857,574 | ||||||
Series 2016-103 DY 2.50% 8/20/46 | 559,000 | 502,939 | ||||||
Series 2016-108 SK 4.549% (6.05% minus LIBOR01M, Cap 6.05%, Floor 0.00%) 8/20/46 S• | 175,947 | 38,024 | ||||||
Series 2016-115 SA 4.599% (6.10% minus LIBOR01M, Cap 6.10%, Floor 0.00%) 8/20/46 S• | 213,971 | 46,681 | ||||||
Series 2016-118 DI 3.50% 3/20/43 S | 302,079 | 46,425 | ||||||
Series 2016-120 NS 4.599% (6.10% minus LIBOR01M, Cap 6.10%, Floor 0.00%) 9/20/46 S• | 252,555 | 58,254 | ||||||
Series 2016-126 NS 4.599% (6.10% minus LIBOR01M, Cap 6.10%, Floor 0.00%) 9/20/46 S• | 130,165 | 30,418 | ||||||
Series 2016-134 MW 3.00% 10/20/46 | 10,000 | 10,182 | ||||||
Series 2016-135 Z 3.00% 10/20/46 | 50,743 | 47,769 | ||||||
Series 2016-146 KS 4.599% (6.10% minus LIBOR01M, Cap 6.10%, Floor 0.00%) 10/20/46 S• | 87,622 | 20,010 | ||||||
Series 2016-147 ST 4.549% (6.05% minus LIBOR01M, Cap 6.05%, Floor 0.00%) 10/20/46 S• | 124,871 | 27,698 | ||||||
Series 2016-149 GI 4.00% 11/20/46 S | 559,602 | 126,079 | ||||||
Series 2016-167 QM 3.00% 4/20/46 | 402,000 | 399,493 | ||||||
Series 2016-170 MZ 3.00% 12/20/46 | 752,204 | 703,852 | ||||||
Series 2016-171 IP 3.00% 3/20/46 S | 1,114,214 | 174,310 | ||||||
Series 2017-2 Z 2.65% 1/20/46 | 1,388,281 | 1,379,432 | ||||||
Series 2017-4 WI 4.00% 2/20/44 S | 89,375 | 17,561 | ||||||
19
Table of Contents
Schedule of investments
Delaware Limited-Term Diversified Income Fund
| Principal amount° | Value (US $) | |||||||
| ||||||||
Agency Collateralized Mortgage Obligations (continued) | ||||||||
| ||||||||
GNMA | ||||||||
Series 2017-10 IB 4.00% 1/20/47 S | 145,051 | $ | 30,534 | |||||
Series 2017-10 KZ 3.00% 1/20/47 | 15,418 | 14,444 | ||||||
Series 2017-14 EZ 3.00% 1/20/47 | 270,324 | 258,516 | ||||||
Series 2017-17 BV 3.00% 4/20/40 | 434,000 | 439,387 | ||||||
Series 2017-17 BZ 3.00% 2/20/47 | 1,783,993 | 1,864,075 | ||||||
Series 2017-18 QS 4.609% (6.10% minus LIBOR01M, Cap 6.10%, Floor 0.00%) 2/16/47 S• | 149,143 | 31,831 | ||||||
Series 2017-25 CZ 3.50% 2/20/47 | 49,419 | 50,298 | ||||||
Series 2017-26 SA 4.599% (6.10% minus LIBOR01M, Cap 6.10%, Floor 0.00%) 2/20/47 S• | 145,071 | 29,613 | ||||||
Series 2017-33 PZ 3.00% 2/20/47 | 1,373,879 | 1,347,329 | ||||||
Series 2017-34 DY 3.50% 3/20/47 | 230,000 | 228,001 | ||||||
Series 2017-36 ZB 3.00% 3/20/47 | 1,022,726 | 975,543 | ||||||
Series 2017-36 ZC 3.00% 3/20/47 | 178,977 | 167,911 | ||||||
Series 2017-52 LE 3.00% 1/16/47 | 474,000 | 459,580 | ||||||
Series 2017-56 GZ 3.50% 4/20/47 | 261,011 | 255,671 | ||||||
Series 2017-68 SB 4.649% (6.15% minus LIBOR01M, Cap 6.15%, Floor 0.00%) 5/20/47 S• | 100,444 | 18,246 | ||||||
Series 2017-80 AS 4.699% (6.20% minus LIBOR01M, Cap 6.20%, Floor 0.00%) 5/20/47 S• | 221,862 | 46,474 | ||||||
Series 2017-101 AI 4.00% 7/20/47 S | 98,056 | 18,779 | ||||||
Series 2017-101 HD 3.00% 1/20/47 | 89,000 | 86,583 | ||||||
Series 2017-101 KS 4.699% (6.20% minus LIBOR01M, Cap 6.20%, Floor 0.00%) 7/20/47 S• | 97,893 | 20,581 | ||||||
Series 2017-101 ND 3.00% 1/20/47 | 88,000 | 85,481 | ||||||
Series 2017-101 SK 4.699% (6.20% minus LIBOR01M, Cap 6.20%, Floor 0.00%) 7/20/47 S• | 254,412 | 52,693 | ||||||
Series 2017-101 TI 4.00% 3/20/44 S | 141,136 | 22,096 | ||||||
Series 2017-107 T 3.00% 1/20/47 | 65,000 | 65,106 | ||||||
Series 2017-116 ZL 3.00% 6/20/47 | 47,590 | 44,706 | ||||||
Series 2017-117 C 3.00% 8/20/47 | 131,000 | 124,510 | ||||||
Series 2017-117 GI 3.00% 3/20/47 S | 593,110 | 92,264 | ||||||
Series 2017-120 QS 4.699% (6.20% minus LIBOR01M, Cap 6.20%, Floor 0.00%) 8/20/47 S• | 212,202 | 48,273 | ||||||
Series 2017-121 CW 3.00% 8/20/47 | 55,000 | 52,719 | ||||||
Series 2017-121 IC 3.00% 12/20/45 S | 621,116 | 100,528 | ||||||
Series 2017-121 IL 3.00% 2/20/42 S | 911,164 | 117,453 | ||||||
Series 2017-132 JI 3.00% 6/20/45 S | 98,704 | 13,122 | ||||||
Series 2017-134 ES 4.699% (6.20% minus LIBOR01M, Cap 6.20%, Floor 0.00%) 9/20/47 S• | 242,550 | 49,551 | ||||||
Series 2017-134 SD 4.699% (6.20% minus LIBOR01M, Cap 6.20%, Floor 0.00%) 9/20/47 S• | 188,572 | 42,377 | ||||||
20
Table of Contents
| Principal amount° | Value (US $) | |||||||
| ||||||||
Agency Collateralized Mortgage Obligations (continued) | ||||||||
| ||||||||
GNMA | ||||||||
Series 2017-134 SK 4.699% (6.20% minus LIBOR01M, Cap 6.20%, Floor 0.00%) 9/20/47 S• | 154,036 | $ | 31,929 | |||||
Series 2017-137 CZ 3.00% 9/20/47 | 138,030 | 129,179 | ||||||
Series 2017-141 JS 4.699% (6.20% minus LIBOR01M, Cap 6.20%, Floor 0.00%) 9/20/47 S• | 238,187 | 53,526 | ||||||
Series 2017-144 MZ 2.50% 9/20/47 | 65,407 | 55,161 | ||||||
Series 2017-156 LP 2.50% 10/20/47 | 122,000 | 108,626 | ||||||
|
| |||||||
Total Agency Collateralized Mortgage Obligations (cost $81,840,395) | 83,882,679 | |||||||
|
| |||||||
| ||||||||
Agency Commercial Mortgage-Backed Securities – 0.29% | ||||||||
| ||||||||
FREMF Mortgage Trust | ||||||||
Series 2011-K15 B 144A 4.948% 8/25/44 #• | 95,000 | 101,134 | ||||||
Series 2012-K708 B 144A 3.75% 2/25/45 #• | 675,000 | 682,563 | ||||||
Series 2013-K712 B 144A 3.362% 5/25/45 #• | 345,000 | 348,022 | ||||||
NCUA Guaranteed Notes Trust | ||||||||
Series 2011-C1 2A 1.933% (LIBOR01M + 0.53%) 3/9/21 • | 1,049,624 | 1,047,420 | ||||||
|
| |||||||
Total Agency Commercial Mortgage-Backed Securities (cost $2,205,013) |
| 2,179,139 | ||||||
|
| |||||||
| ||||||||
Agency Mortgage-Backed Securities – 5.52% | ||||||||
| ||||||||
Fannie Mae ARM | ||||||||
3.213%(H15T1Y + 2.127%) 12/1/33 • | 68,581 | 72,662 | ||||||
3.284%(LIBOR12M + 1.518%) 8/1/34 • | 74,598 | 77,830 | ||||||
3.334%(LIBOR12M + 1.584%) 9/1/38 • | 1,165,856 | 1,214,654 | ||||||
3.378%(LIBOR12M + 1.591%) 8/1/36 • | 28,336 | 30,059 | ||||||
3.448%(LIBOR12M + 1.698%) 4/1/36 • | 24,871 | 26,179 | ||||||
3.455%(LIBOR12M + 1.705%) 11/1/39 • | 194,254 | 204,609 | ||||||
3.505%(LIBOR12M + 1.77%) 1/1/41 • | 122,208 | 125,942 | ||||||
3.506%(LIBOR12M + 1.731%) 6/1/36 • | 101,407 | 106,548 | ||||||
3.537%(LIBOR12M + 1.814%) 7/1/36 • | 83,701 | 88,029 | ||||||
3.58%(LIBOR12M + 1.83%) 8/1/35 • | 21,046 | 22,154 | ||||||
3.603%(LIBOR12M + 1.777%) 6/1/34 • | 32,435 | 34,419 | ||||||
3.609%(LIBOR12M + 1.859%) 7/1/36 • | 15,694 | 16,559 | ||||||
4.565%(LIBOR12M + 1.77%) 11/1/39 • | 594,778 | 627,718 | ||||||
Fannie Mae S.F. 30 yr | ||||||||
4.50% 8/1/40 | 97,429 | 104,846 | ||||||
5.00% 12/1/35 | 12,532 | 13,750 | ||||||
5.00% 1/1/40 | 65,999 | 72,457 | ||||||
5.00% 6/1/44 | 612,889 | 671,712 | ||||||
5.00% 7/1/47 | 400,200 | 433,563 | ||||||
5.50% 1/1/34 | 9,489 | 10,596 | ||||||
5.50% 4/1/34 | 87,817 | 97,230 | ||||||
21
Table of Contents
Schedule of investments
Delaware Limited-Term Diversified Income Fund
| Principal amount° | Value (US $) | |||||||
| ||||||||
Agency Mortgage-Backed Securities (continued) | ||||||||
| ||||||||
Fannie Mae S.F. 30 yr | ||||||||
5.50% 1/1/38 | 1,116,897 | $ | 1,239,479 | |||||
5.50% 9/1/41 | 398,965 | 446,941 | ||||||
5.50% 5/1/44 | 7,858,499 | 8,725,986 | ||||||
6.00% 6/1/36 | 95,974 | 110,062 | ||||||
6.00% 9/1/36 | 122,134 | 140,029 | ||||||
6.00% 12/1/37 | 145,463 | 163,752 | ||||||
6.00% 3/1/38 | 1,354,155 | 1,530,867 | ||||||
6.00% 5/1/38 | 95,283 | 107,522 | ||||||
6.00% 10/1/38 | 554,443 | 625,005 | ||||||
6.00% 9/1/39 | 108,014 | 123,999 | ||||||
6.00% 10/1/39 | 2,301,551 | 2,612,875 | ||||||
6.00% 7/1/41 | 7,086,064 | 8,005,439 | ||||||
6.50% 1/1/29 | 6,217 | 7,007 | ||||||
6.50% 5/1/40 | 157,968 | 176,238 | ||||||
7.50% 6/1/31 | 514 | 607 | ||||||
Fannie Mae S.F. 30 yr TBA | ||||||||
4.50% 2/1/48 | 5,934,000 | 6,305,765 | ||||||
Freddie Mac ARM | ||||||||
2.559%(LIBOR12M + 1.63%) 10/1/46 • | 384,244 | 384,097 | ||||||
2.924%(LIBOR12M + 1.612%) 11/1/44 • | 125,747 | 128,056 | ||||||
3.286%(H15T1Y + 2.14%) 10/1/36 • | 5,219 | 5,471 | ||||||
3.37%(H15T1Y + 2.37%) 6/1/37 • | 281,108 | 292,448 | ||||||
3.489%(LIBOR12M + 1.737%) 2/1/37 • | 3,332 | 3,491 | ||||||
3.525%(LIBOR12M + 1.775%) 10/1/37 • | 178,260 | 186,750 | ||||||
3.635%(LIBOR12M + 1.885%) 7/1/38 • | 839,253 | 883,260 | ||||||
4.999%(LIBOR12M + 1.93%) 8/1/38 • | 15,975 | 16,779 | ||||||
Freddie Mac S.F. 30 yr | ||||||||
4.50% 8/1/44 | 182,070 | 195,906 | ||||||
5.00% 12/1/41 | 43,269 | 47,364 | ||||||
5.50% 1/1/38 | 7,710 | 8,571 | ||||||
6.00% 5/1/35 | 7,925 | 8,949 | ||||||
6.00% 2/1/36 | 169,630 | 190,660 | ||||||
6.00% 3/1/36 | 205,287 | 231,311 | ||||||
6.00% 8/1/38 | 1,592,242 | 1,802,074 | ||||||
6.00% 5/1/39 | 43,211 | 48,944 | ||||||
6.00% 7/1/39 | 23,162 | 26,130 | ||||||
6.00% 11/1/39 | 26,738 | 30,134 | ||||||
6.00% 5/1/40 | 200,110 | 224,198 | ||||||
6.50% 12/1/31 | 16,882 | 18,934 | ||||||
7.50% 7/1/32 | 3,512 | 4,203 | ||||||
GNMA II S.F. 30 yr | ||||||||
5.50% 5/20/37 | 161,511 | 177,725 | ||||||
22
Table of Contents
| Principal amount° | Value (US $) | |||||||
| ||||||||
Agency Mortgage-Backed Securities (continued) | ||||||||
| ||||||||
GNMA II S.F. 30 yr | ||||||||
5.50% 4/20/40 | 122,187 | $ | 132,021 | |||||
5.50% 7/20/46 | 69,145 | 74,881 | ||||||
6.00% 2/20/39 | 150,059 | 165,843 | ||||||
6.00% 10/20/39 | 231,652 | 256,021 | ||||||
6.00% 2/20/40 | 578,855 | 642,409 | ||||||
6.00% 4/20/46 | 186,970 | 207,423 | ||||||
6.50% 10/20/39 | 225,568 | 250,582 | ||||||
|
| |||||||
Total Agency Mortgage-Backed Securities (cost $41,195,267) | 41,017,724 | |||||||
| ||||||||
Collateralized Debt Obligations – 2.96% | ||||||||
| ||||||||
AMMC CLO | ||||||||
Series 2015-16A XR 144A 2.409% (LIBOR03M + 1.05%) 4/14/29 #• | 5,700,000 | 5,699,686 | ||||||
Cathedral Lake CLO | ||||||||
Series 2015-2A AXR 144A 2.609% (LIBOR03M + 1.25%) 7/16/29 #• | 2,078,125 | 2,079,497 | ||||||
Dryden 36 Senior Loan Fund | ||||||||
Series 2014-36A X 144A 2.459% (LIBOR03M + 1.10%) 1/15/28 #• | 1,777,778 | 1,778,628 | ||||||
Harbourview CLO VII | ||||||||
Series 7A AXR 144A 2.436% (LIBOR03M + 1.00%) 11/18/26 #• | 1,666,667 | 1,669,175 | ||||||
Hempstead II CLO | ||||||||
Series 2017-2A X 144A 2.41% (LIBOR03M + 1.00%) 8/10/29 #• | 3,718,750 | 3,719,635 | ||||||
KKR CLO | ||||||||
Series 18 X 144A 2.354% (LIBOR03M + 1.00%) 7/18/30 #• | 1,750,000 | 1,749,116 | ||||||
Neuberger Berman CLO XVII | ||||||||
Series 2014-17A XR 144A 2.363% (LIBOR03M + 1.00%) 4/22/29 #• | 2,966,250 | 2,966,084 | ||||||
Telos CLO | ||||||||
Series 2013-3A X 144A 2.353% (LIBOR03M + 1.00%) 7/17/26 #• | 1,662,500 | 1,662,962 | ||||||
Tuolumne Grove CLO | ||||||||
Series 2014-1A AXR 144A 2.317% (LIBOR03M + 0.95%) 4/25/26 #• | 666,667 | 666,629 | ||||||
|
| |||||||
Total Collateralized Debt Obligations (cost $21,986,736) | 21,991,412 | |||||||
| ||||||||
Corporate Bonds – 35.41% | ||||||||
| ||||||||
Banking – 14.51% | ||||||||
ANZ New Zealand International 144A 2.60% 9/23/19 # | 3,900,000 | 3,914,440 | ||||||
Banco de Bogota 144A 5.375% 2/19/23 # | 500,000 | 525,625 | ||||||
23
Table of Contents
Schedule of investments
Delaware Limited-Term Diversified Income Fund
| Principal amount° | Value (US $) | |||||||
| ||||||||
Corporate Bonds (continued) | ||||||||
| ||||||||
Banking (continued) | ||||||||
Banco Nacional de Costa Rica 144A 5.875% 4/25/21 # | 450,000 | $ | 469,969 | |||||
Banco Santander 3.50% 4/11/22 | 1,600,000 | 1,632,851 | ||||||
Bank of America | ||||||||
144A 3.004% 12/20/23 #µ | 445,000 | 446,387 | ||||||
3.124% 1/20/23 µ | 2,050,000 | 2,080,466 | ||||||
144A 3.419% 12/20/28 #µ | 2,830,000 | 2,833,297 | ||||||
4.183% 11/25/27 | 905,000 | 946,558 | ||||||
Bank of New York Mellon 2.428% (LIBOR03M + 1.05%) | ||||||||
10/30/23 • | 3,700,000 | 3,803,983 | ||||||
Barclays | ||||||||
3.20% 8/10/21 | 780,000 | 785,158 | ||||||
8.25%µy | 200,000 | 210,075 | ||||||
BB&T 1.608% (LIBOR03M + 0.22%) 2/1/21 • | 3,750,000 | 3,734,014 | ||||||
BBVA Bancomer 144A 7.25% 4/22/20 # | 500,000 | 542,500 | ||||||
BGEO Group 144A 6.00% 7/26/23 # | 200,000 | 208,917 | ||||||
Branch Banking & Trust 2.85% 4/1/21 | 1,505,000 | 1,526,201 | ||||||
Citigroup 2.522% (LIBOR03M + 1.10%) 5/17/24 • | 3,555,000 | 3,612,382 | ||||||
Citizens Bank | ||||||||
2.45% 12/4/19 | 5,010,000 | 5,015,035 | ||||||
2.50% 3/14/19 | 2,890,000 | 2,897,432 | ||||||
Commonwealth Bank of Australia 2.40% 11/2/20 | 4,055,000 | 4,055,608 | ||||||
Compass Bank 2.875% 6/29/22 | 5,695,000 | 5,640,621 | ||||||
Credit Suisse 2.30% 5/28/19 | 4,890,000 | 4,895,308 | ||||||
Export Credit Bank of Turkey 144A 5.375% 2/8/21 # | 300,000 | 307,685 | ||||||
Goldman Sachs Group 6.00% 6/15/20 | 2,000,000 | 2,163,537 | ||||||
HBOS 144A 6.75% 5/21/18 # | 2,555,000 | 2,598,560 | ||||||
Huntington National Bank | ||||||||
2.375% 3/10/20 | 1,500,000 | 1,498,422 | ||||||
2.50% 8/7/22 | 480,000 | 473,888 | ||||||
JPMorgan Chase & Co. | ||||||||
2.55% 3/1/21 | 3,810,000 | 3,813,354 | ||||||
4.25% 10/1/27 | 1,010,000 | 1,075,314 | ||||||
KeyBank | 920,000 | 908,087 | ||||||
2.40% 6/9/22 | ||||||||
2.50% 11/22/21 | 1,890,000 | 1,880,897 | ||||||
3.18% 5/22/22 | 1,335,000 | 1,345,636 | ||||||
Manufacturers & Traders Trust | ||||||||
2.05% 8/17/20 | 2,500,000 | 2,482,419 | ||||||
2.50% 5/18/22 | 555,000 | 552,883 | ||||||
Morgan Stanley | ||||||||
3.625% 1/20/27 | 885,000 | 906,546 | ||||||
5.00% 11/24/25 | 1,850,000 | 2,027,184 | ||||||
24
Table of Contents
| Principal amount° | Value (US $) | |||||||
| ||||||||
Corporate Bonds (continued) | ||||||||
| ||||||||
Banking (continued) | ||||||||
PNC Bank | ||||||||
2.45% 11/5/20 | 4,275,000 | $ | 4,282,800 | |||||
3.10% 10/25/27 | 520,000 | 519,149 | ||||||
PNC Financial Services Group 5.00%µy | 1,160,000 | 1,229,600 | ||||||
Popular 7.00% 7/1/19 | 500,000 | 522,500 | ||||||
Regions Financial 2.75% 8/14/22 | 370,000 | 369,185 | ||||||
Royal Bank of Canada 2.75% 2/1/22 | 1,685,000 | 1,706,835 | ||||||
Royal Bank of Scotland Group | 1,470,000 | 1,496,573 | ||||||
3.875% 9/12/23 | ||||||||
8.625%µy | 910,000 | 1,027,163 | ||||||
Santander UK | 3,805,000 | 3,775,665 | ||||||
2.125% 11/3/20 | ||||||||
144A 5.00% 11/7/23 # | 820,000 | 878,222 | ||||||
Skandinaviska Enskilda Banken 144A 2.375% 3/25/19 # | 4,580,000 | 4,592,110 | ||||||
SunTrust Banks 2.70% 1/27/22 | 2,785,000 | 2,787,242 | ||||||
Swedbank 144A 2.375% 2/27/19 # | 2,000,000 | 2,005,196 | ||||||
Turkiye Garanti Bankasi 144A 6.25% 4/20/21 # | 230,000 | 243,599 | ||||||
UBS Group Funding Jersey | 640,000 | 633,286 | ||||||
144A 2.65% 2/1/22 # | ||||||||
144A 3.00% 4/15/21 # | 2,700,000 | 2,720,809 | ||||||
US Bancorp 2.35% 1/29/21 | 1,000,000 | 1,000,524 | ||||||
USB Capital IX 3.50% (LIBOR03M + 1.02%)y• | 6,960,000 | 6,307,498 | ||||||
|
| |||||||
| 107,909,195 | ||||||||
|
| |||||||
Basic Industry – 2.32% | ||||||||
Braskem Netherlands Finance 144A 3.50% 1/10/23 # | 500,000 | 492,250 | ||||||
Dow Chemical 8.55% 5/15/19 | 3,260,000 | 3,532,024 | ||||||
Equate Petrochemical 144A 3.00% 3/3/22 # | 265,000 | 261,584 | ||||||
First Quantum Minerals 144A 7.00% 2/15/21 # | 250,000 | 260,000 | ||||||
FMG Resources August 2006 144A 4.75% 5/15/22 # | 500,000 | 508,125 | ||||||
Georgia-Pacific | 1,000,000 | 1,003,757 | ||||||
144A 2.539% 11/15/19 # | ||||||||
144A 5.40% 11/1/20 # | 5,750,000 | 6,203,485 | ||||||
Hudbay Minerals 144A 7.25% 1/15/23 # | 750,000 | 798,750 | ||||||
Joseph T Ryerson & Son 144A 11.00% 5/15/22 # | 500,000 | 560,625 | ||||||
MMC Finance DAC 4.375% 4/30/18 | 500,000 | 503,446 | ||||||
NCI Building Systems 144A 8.25% 1/15/23 # | 335,000 | 355,519 | ||||||
Phosagro OAO via Phosagro Bond Funding DAC 144A | ||||||||
3.95% 11/3/21 # | 500,000 | 504,683 | ||||||
Sherwin-Williams 2.25% 5/15/20 | 1,900,000 | 1,894,606 | ||||||
Vale Overseas | 55,000 | 57,007 | ||||||
4.375% 1/11/22 | ||||||||
5.875% 6/10/21 | 115,000 | 125,523 | ||||||
25
Table of Contents
Schedule of investments
Delaware Limited-Term Diversified Income Fund
| Principal amount° | Value (US $) | |||||||
| ||||||||
Corporate Bonds (continued) | ||||||||
| ||||||||
Basic Industry (continued) | ||||||||
Vedanta Resources 144A 6.375% 7/30/22 # | 200,000 | $ | 209,260 | |||||
|
| |||||||
| 17,270,644 | ||||||||
|
| |||||||
Brokerage - 0.55% | ||||||||
E*TRADE Financial 5.30%µy | 1,575,000 | 1,586,813 | ||||||
Jefferies Group 5.125% 1/20/23 | 2,285,000 | 2,478,919 | ||||||
|
| |||||||
| 4,065,732 | ||||||||
|
| |||||||
Capital Goods - 0.66% | ||||||||
Ardagh Packaging Finance 144A 7.25% 5/15/24 # | 500,000 | 546,250 | ||||||
General Electric | ||||||||
1.771% (LIBOR03M + 0.38%) 5/5/26 • | 280,000 | 268,761 | ||||||
5.55% 5/4/20 | 2,175,000 | 2,328,986 | ||||||
6.00% 8/7/19 | 1,445,000 | 1,531,310 | ||||||
SAN Miguel Industrias Pet 144A 4.50% 9/18/22 # | 225,000 | 229,163 | ||||||
|
| |||||||
| 4,904,470 | ||||||||
|
| |||||||
Communications - 3.09% | ||||||||
American Tower | ||||||||
3.00% 6/15/23 | 2,140,000 | 2,136,735 | ||||||
3.40% 2/15/19 | 2,250,000 | 2,275,955 | ||||||
AT&T | ||||||||
2.85% 2/14/23 | 3,445,000 | 3,462,197 | ||||||
144A 4.10% 2/15/28 # | 770,000 | 773,875 | ||||||
Cablevision 144A 6.50% 6/15/21 # | 195,000 | 207,617 | ||||||
CC Holdings GS V 3.849% 4/15/23 | 1,165,000 | 1,203,173 | ||||||
CCO Holdings 5.75% 9/1/23 | 500,000 | 513,750 | ||||||
CenturyLink 5.625% 4/1/20 | 750,000 | 758,437 | ||||||
Crown Castle International | ||||||||
3.65% 9/1/27 | 75,000 | 74,945 | ||||||
5.25% 1/15/23 | 735,000 | 805,570 | ||||||
Crown Castle Towers 144A 3.663% 5/15/25 # | 635,000 | 645,852 | ||||||
CSC Holdings 6.75% 11/15/21 | 750,000 | 806,250 | ||||||
Digicel Group 144A 7.125% 4/1/22 # | 500,000 | 464,885 | ||||||
GTH Finance 144A 6.25% 4/26/20 # | 500,000 | 526,625 | ||||||
GTP Acquisition Partners I 144A 2.35% 6/15/20 # | 520,000 | 515,850 | ||||||
SBA Tower Trust 144A 2.24% 4/10/18 # | 1,995,000 | 1,995,395 | ||||||
Sirius XM Radio 144A 3.875% 8/1/22 # | 500,000 | 503,750 | ||||||
Sprint Communications 6.00% 11/15/22 | 750,000 | 751,875 | ||||||
Time Warner Entertainment 8.375% 3/15/23 | 3,295,000 | 4,004,369 | ||||||
VTR Finance 144A 6.875% 1/15/24 # | 500,000 | 528,750 | ||||||
|
| |||||||
| 22,955,855 | ||||||||
|
| |||||||
Consumer Cyclical - 1.11% | ||||||||
Alibaba Group Holding 2.80% 6/6/23 | 1,105,000 | 1,102,512 | ||||||
Atento Luxco 1 144A 6.125% 8/10/22 # | 180,000 | 189,000 | ||||||
26
Table of Contents
| Principal amount° | Value (US $) | |||||||
| ||||||||
Corporate Bonds (continued) | ||||||||
| ||||||||
Consumer Cyclical (continued) | ||||||||
Cencosud 144A 4.875% 1/20/23 # | 250,000 | $ | 262,825 | |||||
Ford Motor Credit 3.336% 3/18/21 | 1,575,000 | 1,600,689 | ||||||
JD.com 3.125% 4/29/21 | 400,000 | 398,983 | ||||||
MGM Resorts International 6.75% 10/1/20 | 375,000 | 405,937 | ||||||
NCL 144A 4.75% 12/15/21 # | 500,000 | 518,750 | ||||||
Prime Security Services Borrower 144A 9.25% 5/15/23 # | 750,000 | 834,375 | ||||||
Scientific Games International 10.00% 12/1/22 | 500,000 | 550,625 | ||||||
Starbucks 2.10% 2/4/21 | 2,110,000 | 2,097,197 | ||||||
Wyndham Worldwide 4.15% 4/1/24 | 310,000 | 311,804 | ||||||
|
| |||||||
| 8,272,697 | ||||||||
|
| |||||||
Consumer Non-Cyclical - 1.77% | ||||||||
BAT Capital 144A 2.297% 8/14/20 # | 2,600,000 | 2,587,151 | ||||||
CK Hutchison International 144A 2.875% 4/5/22 # | 275,000 | 274,189 | ||||||
ESAL 144A 6.25% 2/5/23 # | 200,000 | 191,000 | ||||||
Kernel Holding 144A 8.75% 1/31/22 # | 235,000 | 259,416 | ||||||
Marfrig Holdings Europe 144A 8.00% 6/8/23 # | 200,000 | 209,250 | ||||||
MHP 144A 8.25% 4/2/20 # | 500,000 | 544,138 | ||||||
Pernod Ricard 144A 4.45% 1/15/22 # | 1,795,000 | 1,908,247 | ||||||
Roche Holdings 144A 1.75% 1/28/22 # | 1,015,000 | 987,153 | ||||||
Shire Acquisitions Investments Ireland | ||||||||
1.90% 9/23/19 | 3,000,000 | 2,973,769 | ||||||
2.40% 9/23/21 | 1,090,000 | 1,073,676 | ||||||
Thermo Fisher Scientific 3.00% 4/15/23 | 2,130,000 | 2,145,351 | ||||||
|
| |||||||
| 13,153,340 | ||||||||
|
| |||||||
Electric - 4.93% | ||||||||
AEP Texas 144A 2.40% 10/1/22 # | 1,930,000 | 1,903,167 | ||||||
AES Gener 144A 5.25% 8/15/21 # | 203,000 | 212,764 | ||||||
Ameren 2.70% 11/15/20 | 3,665,000 | 3,679,277 | ||||||
Arizona Public Service 2.20% 1/15/20 | 4,195,000 | 4,183,659 | ||||||
Avangrid 3.15% 12/1/24 | 1,100,000 | 1,095,675 | ||||||
CMS Energy 6.25% 2/1/20 | 1,345,000 | 1,447,345 | ||||||
DTE Energy 2.40% 12/1/19 | 1,725,000 | 1,723,540 | ||||||
Duke Energy 1.80% 9/1/21 | 2,450,000 | 2,384,838 | ||||||
Dynegy 7.375% 11/1/22 | 500,000 | 528,750 | ||||||
Enel Finance International 144A 2.875% 5/25/22 # | 2,790,000 | 2,784,921 | ||||||
Entergy 4.00% 7/15/22 | 2,050,000 | 2,141,961 | ||||||
Entergy Louisiana 4.05% 9/1/23 | 1,125,000 | 1,193,154 | ||||||
Exelon 2.85% 6/15/20 | 2,000,000 | 2,019,034 | ||||||
Fortis 2.10% 10/4/21 | 2,895,000 | 2,828,095 | ||||||
IPALCO Enterprises 3.45% 7/15/20 | 710,000 | 720,650 | ||||||
ITC Holdings 144A 2.70% 11/15/22 # | 2,455,000 | 2,452,999 | ||||||
Majapahit Holding 144A 8.00% 8/7/19 # | 500,000 | 542,150 | ||||||
27
Table of Contents
Schedule of investments
Delaware Limited-Term Diversified Income Fund
| Principal amount° | Value (US $) | |||||||
| ||||||||
Corporate Bonds (continued) | ||||||||
| ||||||||
Electric (continued) | ||||||||
NV Energy 6.25% 11/15/20 | 2,460,000 | $ | 2,703,260 | |||||
WEC Energy Group 2.45% 6/15/20 | 2,075,000 | 2,080,071 | ||||||
|
| |||||||
| 36,625,310 | ||||||||
|
| |||||||
Energy – 2.48% | ||||||||
Dominion Energy Gas Holdings 2.50% 12/15/19 | 2,020,000 | 2,023,121 | ||||||
Energy Transfer Equity | ||||||||
4.25% 3/15/23 | 500,000 | 497,500 | ||||||
7.50% 10/15/20 | 500,000 | 551,250 | ||||||
Genesis Energy 6.75% 8/1/22 | 500,000 | 521,250 | ||||||
KazMunayGas National | ||||||||
144A 3.875% 4/19/22 # | 250,000 | 254,359 | ||||||
144A 6.375% 4/9/21 # | 250,000 | 273,337 | ||||||
Kinder Morgan Energy Partners 9.00% 2/1/19 | 850,000 | 907,638 | ||||||
Kunlun Energy 144A 2.875% 5/13/20 # | 400,000 | 400,976 | ||||||
Laredo Petroleum 5.625% 1/15/22 | 500,000 | 507,500 | ||||||
Murphy Oil USA 6.00% 8/15/23 | 500,000 | 523,750 | ||||||
Newfield Exploration 5.75% 1/30/22 | 500,000 | 536,250 | ||||||
Noble Holding International 5.75% 3/16/18 | 580,000 | 582,537 | ||||||
Oasis Petroleum 6.50% 11/1/21 | 500,000 | 511,875 | ||||||
ONEOK 7.50% 9/1/23 | 1,655,000 | 1,973,703 | ||||||
Pertamina Persero 144A 4.30% 5/20/23 # | 310,000 | 324,728 | ||||||
Petrobras Global Finance 4.375% 5/20/23 | 500,000 | 495,735 | ||||||
Plains All American Pipeline 2.85% 1/31/23 | 415,000 | 397,510 | ||||||
Precision Drilling 6.50% 12/15/21 | 338,000 | 346,027 | ||||||
Sabine Pass Liquefaction | ||||||||
5.75% 5/15/24 | 1,595,000 | 1,774,779 | ||||||
5.875% 6/30/26 | 1,455,000 | 1,636,900 | ||||||
Tecpetrol 144A 4.875% 12/12/22 # | 305,000 | 306,373 | ||||||
Woodside Finance 144A 8.75% 3/1/19 # | 2,235,000 | 2,392,991 | ||||||
WPX Energy 7.50% 8/1/20 | 335,000 | 364,313 | ||||||
YPF 144A 25.458% (BADLARPP + 4.00%) 7/7/20 #● | 325,000 | 318,467 | ||||||
|
| |||||||
| 18,422,869 | ||||||||
|
| |||||||
Finance Companies – 0.62% | ||||||||
Air Lease 3.00% 9/15/23 | 1,030,000 | 1,023,187 | ||||||
Aviation Capital Group 144A 2.875% 1/20/22 # | 605,000 | 605,007 | ||||||
BOC Aviation 144A 2.375% 9/15/21 # | 400,000 | 389,826 | ||||||
Development Bank of Japan 144A 2.625% 9/1/27 # | 790,000 | 777,583 | ||||||
GrupoSura Finance 144A 5.70% 5/18/21 # | 500,000 | 536,250 | ||||||
International Lease Finance 8.625% 1/15/22 | 1,080,000 | 1,301,675 | ||||||
|
| |||||||
| 4,633,528 | ||||||||
|
| |||||||
Healthcare – 0.10% | ||||||||
HCA Healthcare 6.25% 2/15/21 | 500,000 | 531,250 | ||||||
28
Table of Contents
| Principal amount° | Value (US $) | |||||||
| ||||||||
Corporate Bonds (continued) | ||||||||
| ||||||||
Healthcare (continued) | ||||||||
Mallinckrodt International Finance 144A 4.875% 4/15/20 # | 250,000 | $ | 241,250 | |||||
|
| |||||||
| 772,500 | ||||||||
|
| |||||||
Insurance – 0.79% | ||||||||
Hub Holdings 144A PIK 8.125% 7/15/19 #T | 500,000 | 501,250 | ||||||
Nuveen Finance 144A 2.95% 11/1/19 # | 1,500,000 | 1,514,839 | ||||||
Pricoa Global Funding I 144A 2.20% 5/16/19 # | 3,855,000 | 3,856,938 | ||||||
|
| |||||||
| 5,873,027 | ||||||||
|
| |||||||
Natural Gas – 0.38% | ||||||||
CenterPoint Energy Resources 4.50% 1/15/21 | 2,700,000 | 2,825,515 | ||||||
|
| |||||||
| 2,825,515 | ||||||||
|
| |||||||
Real Estate – 0.07% | ||||||||
Hazine Mustesarligi Varlik Kiralama 144A 4.251% 6/8/21 # | 500,000 | 505,309 | ||||||
|
| |||||||
| 505,309 | ||||||||
|
| |||||||
REITs – 0.26% | ||||||||
Alexandria Real Estate Equities 3.45% 4/30/25 | 335,000 | 334,341 | ||||||
GEO Group 5.875% 1/15/22 | 500,000 | 517,500 | ||||||
Iron Mountain 144A 4.375% 6/1/21 # | 500,000 | 508,690 | ||||||
Kilroy Realty 3.45% 12/15/24 | 590,000 | 589,074 | ||||||
|
| |||||||
| 1,949,605 | ||||||||
|
| |||||||
Technology – 0.83% | ||||||||
Apple 1.903% (LIBOR03M + 0.50%) 2/9/22 • | 3,750,000 | 3,803,852 | ||||||
First Data 144A 7.00% 12/1/23 # | 750,000 | 795,000 | ||||||
NXP 144A 4.125% 6/15/20 # | 1,500,000 | 1,539,795 | ||||||
|
| |||||||
| 6,138,647 | ||||||||
|
| |||||||
Transportation – 0.94% | ||||||||
Adani Abbot Point Terminal 144A 4.45% 12/15/22 # | 300,000 | 292,063 | ||||||
DAE Funding 144A 4.00% 8/1/20 # | 500,000 | 506,250 | ||||||
Penske Truck Leasing 144A 4.20% 4/1/27 # | 2,635,000 | 2,743,342 | ||||||
Transnet SOC 144A 4.00% 7/26/22 # | 200,000 | 196,290 | ||||||
United Airlines 2015-1 Class AA Pass-Through Trust 3.45% 12/1/27 ◆ | 333,890 | 339,115 | ||||||
United Continental Holdings 4.25% 10/1/22 | 500,000 | 501,875 | ||||||
United Parcel Service 5.125% 4/1/19 | 2,340,000 | 2,427,256 | ||||||
|
| |||||||
| 7,006,191 | ||||||||
|
| |||||||
Total Corporate Bonds (cost $262,329,264) | 263,284,434 | |||||||
|
| |||||||
| ||||||||
Loan Agreements – 3.27% | ||||||||
| ||||||||
Alpha 3 Tranche B1 1st Lien 4.00% (LIBOR03M + 3.00%) 1/31/24 • | 1,492,500 | 1,503,927 | ||||||
Blue Ribbon 1st Lien 5.00% (LIBOR03M + 4.00%) 11/13/21 • | 509,843 | 508,993 | ||||||
29
Table of Contents
Schedule of investments
Delaware Limited-Term Diversified Income Fund
| Principal amount° | Value (US $) | |||||||
| ||||||||
Loan Agreements (continued) | ||||||||
| ||||||||
Builders FirstSource 1st Lien 4.00% (LIBOR03M + 3.00%) 2/29/24 • | 1,477,500 | $ | 1,485,348 | |||||
Change Healthcare Holdings Tranche B 1st Lien 3.75% (LIBOR03M + 2.75%) 3/1/24 | 1,588,000 | 1,592,342 | ||||||
Chesapeake Energy 1st Lien 8.50% (LIBOR03M + 7.50%) 8/23/21 • | 250,000 | 266,719 | ||||||
First Data 1st Lien 3.80% (LIBOR03M + 2.25%) 4/26/24 | 429,698 | 430,466 | ||||||
First Eagle Holdings Tranche B 1st Lien 3.75% (LIBOR03M + 3.00%) 12/1/22 • | 1,481,250 | 1,496,063 | ||||||
Gardner Denver Tranche B 1st Lien 4.443% (LIBOR03M + 2.75%) 7/30/24 • | 452,130 | 453,968 | ||||||
JC Penney Tranche B 1st Lien 5.25% (LIBOR03M + 4.25%) 6/23/23 • | 72,496 | 67,965 | ||||||
Mission Broadcasting 1st Lien 2.50% (LIBOR03M + 2.50%) 1/17/24 • | 209,273 | 210,188 | ||||||
Mohegan Gaming & Entertainment Tranche B 1st Lien 5.00% (LIBOR03M + 4.00%) 10/13/23 • | 489,354 | 493,942 | ||||||
MPH Acquisition Holdings Tranche B 1st Lien 4.00% (LIBOR03M + 3.00%) 6/7/23 • | 220,101 | 220,806 | ||||||
Nexstar Broadcasting Tranche B 1st Lien 2.50% (LIBOR03M + 2.50%) 1/17/24 • | 1,661,892 | 1,669,163 | ||||||
ON Semiconductor Tranche B 1st Lien 3.35% (LIBOR03M + 2.00%) 3/31/23 • | 1,168,998 | 1,175,939 | ||||||
PQ Tranche B 1st Lien 4.63% (LIBOR03M + 3.25%) 11/4/22 • | 341,640 | 344,896 | ||||||
Republic of Angola 8.032% (LIBOR06M + 6.25%) 12/16/23 = | 382,500 | 355,247 | ||||||
Rite Aid 2nd Lien 5.75% (LIBOR03M + 4.75%) 8/21/20 • | 500,000 | 502,187 | ||||||
Russell Investments US Institutional Holdco Tranche B 1st Lien 5.25% (LIBOR03M + 4.25%) 6/1/23 • | 1,844,051 | 1,862,030 | ||||||
SFR Group Tranche B12 1st Lien 4.349% (LIBOR03M + 3.00%) 1/31/26 • | 2,378,750 | 2,300,449 | ||||||
Sinclair Television Group Tranche B 1st Lien 2.50% (LIBOR03M + 2.50%) 12/12/24 • | 750,000 | 750,229 | ||||||
Sprint Communications Tranche B 1st Lien 3.25% (LIBOR03M + 2.50%) 2/2/24 | 2,481,250 | 2,483,060 | ||||||
Staples 1st Lien 5.00% (LIBOR03M + 4.00%) 9/12/24 • | 125,000 | 122,547 | ||||||
Stars Group Holdings Tranche B 1st Lien 4.50% (LIBOR03M + 3.50%) 8/1/21 • | 492,424 | 495,779 | ||||||
Summit Midstream Partners Holdings Tranche B 1st Lien 7.00% (LIBOR03M + 6.00%) 5/21/22 • | 230,000 | 234,025 | ||||||
Univision Communications Tranche C 1st Lien 3.75% (LIBOR03M + 2.75%) 3/15/24 • | 1,435,814 | 1,433,211 | ||||||
WideOpenWest Finance Tranche B 1st Lien 4.25% (LIBOR03M + 3.25%) 8/19/23 • | 1,726,922 | 1,709,114 | ||||||
30
Table of Contents
| Principal amount° | Value (US $) | |||||||
| ||||||||
Loan Agreements (continued) | ||||||||
| ||||||||
Windstream Services Tranche B6 1st Lien 4.75% (LIBOR03M + 4.00%) 3/30/21 • | 152,954 | $ | 144,063 | |||||
|
| |||||||
Total Loan Agreements (cost $23,937,327) | 24,312,666 | |||||||
|
| |||||||
| ||||||||
Municipal Bonds – 0.35% | ||||||||
| ||||||||
Commonwealth of Massachusetts | ||||||||
Series C 5.00% 10/1/25 | 100,000 | 121,902 | ||||||
County of Baltimore, Maryland 5.00% 2/1/26 | 2,030,000 | 2,507,720 | ||||||
|
| |||||||
Total Municipal Bonds (cost $2,645,081) | 2,629,622 | |||||||
|
| |||||||
| ||||||||
Non-Agency Asset-Backed Securities – 25.86% | ||||||||
| ||||||||
Ally Master Owner Trust | ||||||||
Series 2015-2 A1 2.047% (LIBOR01M + 0.57%) 1/15/21 • | 7,500,000 | 7,529,155 | ||||||
American Express Credit Account Master Trust | ||||||||
Series 2013-1 A 1.897% (LIBOR01M + 0.42%) 2/16/21 • | 2,135,000 | 2,139,046 | ||||||
Series 2013-2 A 1.897% (LIBOR01M + 0.42%) 5/17/21 • | 2,474,000 | 2,480,611 | ||||||
Series 2014-1 A 1.847% (LIBOR01M + 0.37%) 12/15/21 • | 2,100,000 | 2,107,769 | ||||||
Series 2017-2 A 2.038% (LIBOR01M + 0.45%) 9/16/24 • | 270,000 | 272,093 | ||||||
Series 2017-5 A 1.857% (LIBOR01M + 0.38%) 2/18/25 • | 575,000 | 577,795 | ||||||
ARI Fleet Lease Trust | ||||||||
Series 2015-A A2 144A 1.11% 11/15/18 # | 8,284 | 8,281 | ||||||
Series 2017-A A1 144A 1.25% 6/15/18 # | 326,690 | 326,434 | ||||||
Avis Budget Rental Car Funding AESOP | ||||||||
Series 2013-2A A 144A 2.97% 2/20/20 # | 6,500,000 | 6,543,237 | ||||||
Bank of America Credit Card Trust | ||||||||
Series 2014-A1 A 1.857% (LIBOR01M + 0.38%) 6/15/21 • | 5,625,000 | 5,640,711 | ||||||
Series 2017-A1 A1 1.95% 8/15/22 | 3,000,000 | 2,986,084 | ||||||
Barclays Dryrock Issuance Trust | ||||||||
Series 2017-1 A 1.807% (LIBOR01M + 0.33%) 3/15/23 • | 1,410,000 | 1,413,940 | ||||||
BMW Vehicle Lease Trust | ||||||||
Series 2016-1 A3 1.34% 1/22/19 | 3,592,770 | 3,588,029 | ||||||
Series 2016-2 A3 1.43% 9/20/19 | 1,810,000 | 1,802,313 | ||||||
Cabela’s Credit Card Master Note Trust | ||||||||
Series 2014-2 A 1.927% (LIBOR01M + 0.45%) 7/15/22 • | 3,000,000 | 3,010,243 | ||||||
31
Table of Contents
Schedule of investments
Delaware Limited-Term Diversified Income Fund
| Principal amount° | Value (US $) | |||||||
| ||||||||
Non-Agency Asset-Backed Securities (continued) | ||||||||
| ||||||||
Cabela’s Credit Card Master Note Trust | ||||||||
Series 2015-1A A1 2.26% 3/15/23 | 500,000 | $ | 500,491 | |||||
Capital One Multi-Asset Execution Trust | ||||||||
Series 2014-A3 A3 1.857% (LIBOR01M + 0.38%) 1/18/22 • | 2,000,000 | 2,006,460 | ||||||
Series 2016-A1 A1 1.927% (LIBOR01M + 0.45%) 2/15/22 • | 4,000,000 | 4,018,943 | ||||||
Series 2017-A5 A5 2.057% (LIBOR01M + 0.58%) 7/15/27 • | 480,000 | 483,755 | ||||||
Chase Issuance Trust | ||||||||
Series 2013-A3 A3 1.757% (LIBOR01M + 0.28%) 4/15/20 • | 3,670,000 | 3,672,504 | ||||||
Series 2013-A6 A6 2.008% (LIBOR01M + 0.42%) 7/15/20 • | 4,000,000 | 4,007,237 | ||||||
Series 2013-A9 A 1.897% (LIBOR01M + 0.42%) 11/16/20 • | 8,900,000 | 8,924,161 | ||||||
Series 2014-A5 A5 1.847% (LIBOR01M + 0.37%) 4/15/21 • | 3,281,000 | 3,293,375 | ||||||
Series 2016-A1 A 1.887% (LIBOR01M + 0.41%) 5/17/21 • | 3,026,000 | 3,038,122 | ||||||
Series 2016-A3 A3 2.027% (LIBOR01M + 0.55%) 6/15/23 • | 7,350,000 | 7,433,267 | ||||||
Series 2017-A1 A 1.777% (LIBOR01M + 0.30%) 1/18/22 • | 4,935,000 | 4,952,565 | ||||||
Series 2017-A2 A 1.877% (LIBOR01M + 0.40%) 3/15/24 • | 1,300,000 | 1,307,491 | ||||||
Chesapeake Funding II | ||||||||
Series 2017-4A A2 144A 1.817% (LIBOR01M + 0.34%) 11/15/29 #• | 1,925,000 | 1,925,636 | ||||||
Citibank Credit Card Issuance Trust | ||||||||
Series 2013-A4 A4 1.972% (LIBOR01M + 0.42%) 7/24/20 • | 800,000 | 801,625 | ||||||
Series 2013-A7 A7 1.862% (LIBOR01M + 0.43%) 9/10/20 • | 8,100,000 | 8,120,091 | ||||||
Series 2016-A3 A3 1.893% (LIBOR01M + 0.49%) 12/7/23 • | 4,270,000 | 4,310,972 | ||||||
Series 2017-A1 A1 1.741% (LIBOR01M + 0.25%) 1/19/21 • | 2,650,000 | 2,654,199 | ||||||
Series 2017-A5 A5 2.155% (LIBOR01M + 0.62%) 4/22/26 • | 360,000 | 364,125 | ||||||
Series 2017-A7 A7 1.777% (LIBOR01M + 0.37%) 8/8/24 • | 11,900,000 | 11,948,199 | ||||||
CNH Equipment Trust | ||||||||
Series 2016-B A2B 1.877% (LIBOR01M + 0.40%) 10/15/19 • | 48,671 | 48,694 | ||||||
32
Table of Contents
| Principal amount° | Value (US $) | |||||||
| ||||||||
Non-Agency Asset-Backed Securities (continued) | ||||||||
| ||||||||
Discover Card Execution Note Trust | ||||||||
Series 2013-A6 A6 1.927% (LIBOR01M + 0.45%) 4/15/21 • | 2,405,000 | $ | 2,412,616 | |||||
Series 2014-A1 A1 1.907% (LIBOR01M + 0.43%) 7/15/21 • | 4,500,000 | 4,515,389 | ||||||
Series 2015-A1 A1 1.827% (LIBOR01M + 0.35%) 8/17/20 • | 325,000 | 325,152 | ||||||
Series 2016-A4 A4 1.39% 3/15/22 | 2,000,000 | 1,975,447 | ||||||
Series 2017-A1 A1 1.967% (LIBOR01M + 0.49%) 7/15/24 • | 13,995,000 | 14,102,161 | ||||||
Series 2017-A3 A3 1.707% (LIBOR01M + 0.23%) 10/17/22 • | 3,025,000 | 3,031,284 | ||||||
Series 2017-A5 A5 2.077% (LIBOR01M + 0.60%) 12/15/26 • | 4,045,000 | 4,089,731 | ||||||
Series 2017-A7 A7 1.837% (LIBOR01M + 0.36%) 4/15/25 • | 4,465,000 | 4,483,578 | ||||||
Ford Credit Auto Owner Trust | ||||||||
Series 2014-A C 1.90% 9/15/19 | 1,750,000 | 1,750,409 | ||||||
Series 2016-B A2B 1.787% (LIBOR01M + 0.31%) 3/15/19 • | 60,441 | 60,451 | ||||||
Series 2016-C A2B 1.617% (LIBOR01M + 0.14%) 9/15/19 • | 1,204,629 | 1,204,744 | ||||||
Ford Credit Floorplan Master Owner Trust A | ||||||||
Series 2014-2 A 1.977% (LIBOR01M + 0.50%) 2/15/21 • | 6,612,000 | 6,648,992 | ||||||
Series 2015-2 A2 2.047% (LIBOR01M + 0.57%) 1/15/22 • | 1,470,000 | 1,479,953 | ||||||
Series 2017-1 A2 1.897% (LIBOR01M + 0.42%) 5/15/22 • | 400,000 | 401,884 | ||||||
Series 2017-2 A2 1.827% (LIBOR01M + 0.35%) 9/15/22 • | 1,000,000 | 1,003,165 | ||||||
Golden Credit Card Trust | ||||||||
Series 2014-2A A 144A 1.927% (LIBOR01M + 0.45%) 3/15/21 #• | 535,000 | 537,064 | ||||||
GreatAmerica Leasing Receivables Funding | ||||||||
Series 2017-1 A2 144A 1.72% 4/22/19 # | 744,934 | 744,306 | ||||||
HOA Funding | ||||||||
Series 2014-1A A2 144A 4.846% 8/20/44 # | 247,775 | 241,033 | ||||||
Hyundai Auto Lease Securitization Trust | ||||||||
Series 2016-C A3 144A 1.49% 2/18/20 # | 6,650,000 | 6,628,704 | ||||||
Hyundai Auto Receivables Trust | ||||||||
Series 2016-A A2B 1.847% (LIBOR01M + 0.37%) 6/17/19 • | 545,861 | 546,094 | ||||||
33
Table of Contents
Schedule of investments
Delaware Limited-Term Diversified Income Fund
| Principal amount° | Value (US $) | |||||||
| ||||||||
Non-Agency Asset-Backed Securities (continued) | ||||||||
| ||||||||
Mercedes-Benz Master Owner Trust | ||||||||
Series 2015-BA A 144A 1.857% (LIBOR01M + 0.38%) 4/15/20 #• | 1,000,000 | $ | 1,000,836 | |||||
Series 2016-AA A 144A 2.057% (LIBOR01M + 0.58%) 5/15/20 #• | 1,970,000 | 1,973,537 | ||||||
Navistar Financial Dealer Note Master Owner Trust II | ||||||||
Series 2016-1 A 144A 2.902% (LIBOR01M + 1.35%) 9/27/21 #• | 390,000 | 392,294 | ||||||
Series 2017-1 A 144A 2.332% (LIBOR01M + 0.78%) 6/27/22 #• | 1,000,000 | 1,002,327 | ||||||
Nissan Auto Lease Trust | ||||||||
Series 2016-A A2B 1.857% (LIBOR01M + 0.38%) 8/15/18 • | 2,087 | 2,087 | ||||||
Series 2016-B A2B 1.757% (LIBOR01M + 0.28%) 12/17/18 • | 779,442 | 779,710 | ||||||
Series 2016-B A3 1.50% 7/15/19 | 755,000 | 752,795 | ||||||
Nissan Auto Receivables Owner Trust | ||||||||
Series 2016-B A2B 1.777% (LIBOR01M + 0.30%) 4/15/19 • | 499,913 | 500,087 | ||||||
Nissan Master Owner Trust Receivables | ||||||||
Series 2016-A A1 2.117% (LIBOR01M + 0.64%) 6/15/21 • | 3,040,000 | 3,059,841 | ||||||
Series 2017-C A 1.797% (LIBOR01M + 0.32%) 10/17/22 • | 850,000 | 851,688 | ||||||
PFS Financing | ||||||||
Series 2017-C A 144A 1.947% (LIBOR01M + 0.47%) 10/15/21 #• | 380,000 | 379,391 | ||||||
Towd Point Mortgage Trust | ||||||||
Series 2015-5 A1B 144A 2.75% 5/25/55 #• | 464,880 | 464,910 | ||||||
Series 2015-6 A1B 144A 2.75% 4/25/55 #• | 522,798 | 522,180 | ||||||
Toyota Auto Receivables Owner Trust | ||||||||
Series 2017-A A2B 1.547% (LIBOR01M + 0.07%) 9/16/19 • | 828,877 | 828,817 | ||||||
Trafigura Securitisation Finance | ||||||||
Series 2017-1A A1 144A 2.327% (LIBOR01M + 0.85%) 12/15/20 #• | 3,410,000 | 3,424,810 | ||||||
Verizon Owner Trust | ||||||||
Series 2017-3A A1B 144A 1.771% (LIBOR01M + 0.27%) 4/20/22 #• | 4,675,000 | 4,682,358 | ||||||
Volvo Financial Equipment | ||||||||
Series 2017-1A A2 144A 1.55% 10/15/19 # | 515,000 | 514,164 | ||||||
34
Table of Contents
| Principal amount° | Value (US $) | |||||||
| ||||||||
Non-Agency Asset-Backed Securities (continued) | ||||||||
| ||||||||
World Financial Network Credit Card Master Trust | ||||||||
Series 2015-A A 1.957% (LIBOR01M + 0.48%) 2/15/22 • | 685,000 | $ | 685,547 | |||||
|
| |||||||
Total Non-Agency Asset-Backed Securities | ||||||||
(cost $192,177,313) | 192,237,189 | |||||||
|
| |||||||
| ||||||||
Non-Agency Collateralized Mortgage Obligations – 0.13% | ||||||||
| ||||||||
Bank of America Alternative Loan Trust | ||||||||
Series 2005-6 7A1 5.50% 7/25/20 | 17,292 | 16,494 | ||||||
GSMPS Mortgage Loan Trust | ||||||||
Series 1998-2 A 144A 7.75% 5/19/27 #• | 40,932 | 41,672 | ||||||
JPMorgan Mortgage Trust | ||||||||
Series 2014-IVR6 2A4 144A 2.50% 7/25/44 #• | 455,000 | 455,121 | ||||||
Sequoia Mortgage Trust | ||||||||
Series 2014-2 A4 144A 3.50% 7/25/44 #• | 318,627 | 323,535 | ||||||
Wells Fargo Mortgage-Backed Securities Trust | ||||||||
Series 2006-AR5 2A1 3.325% 4/25/36 • | 100,622 | 95,055 | ||||||
|
| |||||||
Total Non-Agency Collateralized Mortgage Obligations (cost $892,638) | 931,877 | |||||||
|
| |||||||
| ||||||||
Non-Agency Commercial Mortgage-Backed Security – 0.01% | ||||||||
| ||||||||
DB-UBS Mortgage Trust | ||||||||
Series 2011-LC1A C 144A 5.698% 11/10/46 #• | 100,000 | 107,123 | ||||||
|
| |||||||
Total Non-Agency Commercial Mortgage-Backed Security (cost $110,844) | 107,123 | |||||||
|
| |||||||
| ||||||||
Regional Bond – 0.05%D | ||||||||
| ||||||||
Argentina – 0.05% | ||||||||
Provincia de Cordoba 144A 7.125% 6/10/21 # | 350,000 | 378,861 | ||||||
|
| |||||||
Total Regional Bond (cost $368,375) | 378,861 | |||||||
|
| |||||||
| ||||||||
Sovereign Bonds – 0.56%D | ||||||||
| ||||||||
Argentina – 0.07% | ||||||||
Argentine Republic Government International Bond 5.625% 1/26/22 | 500,000 | 528,750 | ||||||
|
| |||||||
| 528,750 | ||||||||
|
| |||||||
Costa Rica – 0.03% | ||||||||
Costa Rica Government International Bond 144A 4.25% 1/26/23 # | 250,000 | 244,375 | ||||||
|
| |||||||
| 244,375 | ||||||||
|
| |||||||
Croatia – 0.07% | ||||||||
Croatia Government International Bond 144A 5.50% 4/4/23 # | 500,000 | 552,314 | ||||||
|
| |||||||
| 552,314 | ||||||||
|
| |||||||
35
Table of Contents
Schedule of investments
Delaware Limited-Term Diversified Income Fund
| Principal amount° | Value (US $) | |||||||
| ||||||||
Sovereign BondsD (continued) | ||||||||
| ||||||||
Dominican Republic – 0.04% | ||||||||
Dominican Republic International Bond 144A 7.50% 5/6/21 # | 300,000 | $ | 328,125 | |||||
|
| |||||||
| 328,125 | ||||||||
|
| |||||||
Egypt – 0.07% | ||||||||
Egypt Government International Bond 144A 6.125% 1/31/22 # | 500,000 | 524,087 | ||||||
|
| |||||||
| 524,087 | ||||||||
|
| |||||||
Mongolia – 0.03% | ||||||||
Mongolia Government International Bond 144A 5.625% 5/1/23 # | 215,000 | 217,459 | ||||||
|
| |||||||
| 217,459 | ||||||||
|
| |||||||
Nigeria – 0.07% | ||||||||
Nigeria Government International Bond 5.625% 6/27/22 | 500,000 | 519,813 | ||||||
| �� | |||||||
| 519,813 | ||||||||
|
| |||||||
Saudi Arabia – 0.07% | ||||||||
Kingdom of Saudi Arabia Sukuk 144A 2.894% 4/20/22 # | 500,000 | 497,221 | ||||||
|
| |||||||
| 497,221 | ||||||||
|
| |||||||
Sri Lanka – 0.07% | ||||||||
Sri Lanka Government International Bond | ||||||||
144A 5.125% 4/11/19 # | 250,000 | 254,687 | ||||||
144A 5.75% 1/18/22 # | 250,000 | 261,761 | ||||||
|
| |||||||
| 516,448 | ||||||||
|
| |||||||
Ukraine – 0.04% | ||||||||
Ukraine Government International Bond 144A 7.75% 9/1/20 # | 250,000 | 265,465 | ||||||
|
| |||||||
| 265,465 | ||||||||
|
| |||||||
Total Sovereign Bonds (cost $4,098,023) | 4,194,057 | |||||||
|
| |||||||
| ||||||||
Supranational Bank – 0.07% | ||||||||
| ||||||||
Banque Ouest Africaine de Developpement 144A 5.50% 5/6/21 # | 500,000 | 532,695 | ||||||
|
| |||||||
Total Supranational Bank (cost $529,500) | 532,695 | |||||||
|
| |||||||
| ||||||||
US Treasury Obligations – 12.70% | ||||||||
| ||||||||
US Treasury Floating Rate Note 1.488% (USBMMY3M + 0.048%) 10/31/19 • | 17,135,000 | 17,140,360 | ||||||
US Treasury Notes | 13,755,000 | 13,635,293 | ||||||
2.00% 10/31/22 | ||||||||
2.00% 11/30/22 | 2,495,000 | 2,472,232 | ||||||
2.25% 8/15/27 | 49,360,000 | 48,658,224 | ||||||
36
Table of Contents
| Principal amount° | Value (US $) | |||||||
US Treasury Obligations (continued) | ||||||||
US Treasury Notes | 12,700,000 | $ | 12,518,847 | |||||
|
| |||||||
Total US Treasury Obligations (cost $94,727,748) | 94,424,956 | |||||||
|
| |||||||
| Number of Shares | ||||||||
Preferred Stock – 0.37% | ||||||||
General Electric 5.00% µy | 1,111,000 | 1,146,385 | ||||||
Morgan Stanley 5.55% µy | 1,180,000 | 1,227,200 | ||||||
USB Realty144A 2.506%(LIBOR03M + 1.147%) #y• | 400,000 | 361,500 | ||||||
|
| |||||||
Total Preferred Stock (cost $2,598,522) | 2,735,085 | |||||||
|
| |||||||
| Principal amount° | ||||||||
Short-Term Investments – 1.61% | ||||||||
Discount Notes – 0.48%≠ | ||||||||
Federal Home Loan Bank | 1,459,183 | 1,457,937 | ||||||
1.211% 2/5/18 | 1,158,082 | 1,156,649 | ||||||
1.235% 2/8/18 | 941,792 | 940,525 | ||||||
|
| |||||||
| 3,555,111 | ||||||||
|
| |||||||
Repurchase Agreements – 0.80% | ||||||||
Bank of America Merrill Lynch | 1,496,933 | 1,496,933 | ||||||
Bank of Montreal | 3,742,332 | 3,742,332 | ||||||
BNP Paribas | 709,755 | 709,755 | ||||||
|
| |||||||
| 5,949,020 | ||||||||
|
| |||||||
US Treasury Obligations – 0.33%≠ | ||||||||
US Cash Management Bill 0.333% 1/2/18 | 2,401,680 | 2,401,680 | ||||||
US Treasury Bill 0.884% 1/11/18 | 34,355 | 34,345 | ||||||
|
| |||||||
| 2,436,025 | ||||||||
|
| |||||||
Total Short-Term Investments (cost $11,940,014) | 11,940,156 | |||||||
|
| |||||||
Total Value of Securities – 100.46% | $ | 746,951,466 | ||||||
|
| |||||||
37
Table of Contents
Schedule of investments
Delaware Limited-Term Diversified Income Fund
| # | Security exempt from registration under Rule 144A of the Securities Act of 1933, as amended. At Dec. 31, 2017, the aggregate value of Rule 144A securities was $137,239,693 which represents 18.46% of the Fund’s net assets. See Note 9 in “Notes to financial statements.” |
| t | Pass Through Agreement. Security represents the contractual right to receive a proportionate amount of underlying payments due to the counterparty pursuant to various agreements related to the rescheduling of obligations and the exchange of certain notes. |
| T | PIK. 100% of the income received was in the form of cash. |
| = | The value of this security was determined using significant unobservable inputs and is reported as a Level 3 security in the disclosure table located in Note 3 in “Notes to financial statements.” |
| ≠ | The rate shown is the effective yield at the time of purchase. |
| ° | Principal amount shown is stated in US dollars unless noted that the security is denominated in another currency. |
| D | Securities have been classified by country of origin. |
| µ | Fixed to variable rate investment. The rate shown reflects the fixed rate in effect at Dec. 31, 2017. Rate will reset at a future date. |
| ∑ | Interest only security. An interest only security is the interest only portion of a fixed income security, which is separated and sold individually from the principal portion of the security. |
| y | No contractual maturity date. |
| W | Principal only security. A principal only security is the principal only portion of a fixed income security which is separated and sold individually from the interest portion of the security. |
| ● | Variable rate investment. Rates reset periodically. Rates shown reflect the rate in effect at Dec. 31, 2017. For securities based on a published reference rate and spread, the reference rate and spread are indicated in their description above. Certain variable rate securities are not based on a published reference rate and spread but are determined by the issuer or agent and are based on current market conditions. These securities do not indicate a reference rate and spread in their description above. |
| f | Step coupon bond. Coupon increases or decreases periodically based on a predetermined schedule. Stated rate in effect at Dec. 31, 2017. |
38
Table of Contents
The following futures and swap contracts were outstanding at Dec. 31, 2017:1
Futures Contracts
| Contracts to Buy (Sell) | Notional | Notional | Expiration | Value/ | Value/ | |||||||
| (26) | US Treasury Long Bonds | $ (3,978,000) | $ (3,984,426) | 3/21/18 | $ 6,426 | $ — | ||||||
| (387) | US Treasury 10 yr Notes | (48,006,141) | (48,174,889) | 3/21/18 | 168,748 | — | ||||||
| 318 | US Treasury 10 yr Notes | 39,446,907 | 39,745,925 | 3/21/18 | — | (299,018) | ||||||
|
|
| ||||||||||
Total Futures Contracts | $ (12,413,390) | $ 175,174 | $ (299,018) | |||||||||
|
|
| ||||||||||
Swap Contracts
CDS Contracts2
Reference Obligation/ Termination Date/ Payment Frequency | Notional Amount3 | Annual Protection Payments | Value | Upfront Payments Paid (Received) | Unrealized Depreciation4 | |||||||||||||||
Centrally Cleared/ Protection Purchased: | ||||||||||||||||||||
CDX.NA.HY.285 | 43,560,000 | 5.00 | % | $ | (3,798,172 | ) | $ | (2,859,243 | ) | $ | (938,929 | ) | ||||||||
CDX.NA.HY.295 | 38,000,000 | 5.00 | % | (3,147,242 | ) | (2,943,509 | ) | (203,733 | ) | |||||||||||
|
|
|
|
|
| |||||||||||||||
Total CDS Contracts | $ | (6,945,414 | ) | $ | (5,802,752 | ) | $ | (1,142,662 | ) | |||||||||||
|
|
|
|
|
| |||||||||||||||
The use of futures contracts and swap contracts involves elements of market risk and risks in excess of the amounts disclosed in these financial statements. The notional amounts presented above represent the Fund’s total exposure in such contracts, whereas only the net unrealized appreciation (depreciation) is reflected in the Fund’s net assets.
| 1 | See Note 8 in “Notes to financial statements.” |
| 2 | A CDS contract is a risk-transfer instrument through which one party (purchaser of protection) transfers to another party (seller of protection) the financial risk of a credit event (as defined in the CDS agreement), as it relates to a particular reference security or basket of securities (such as an index). Periodic payments (receipts) on such contracts are accrued daily and recorded as unrealized losses (gains) on swap contracts. Upon payment (receipt), such amounts are recorded as realized losses (gains) on swap contracts. Upfront payments made or received in connection with CDS contracts are amortized over the expected life of the CDS contracts as unrealized losses (gains) on swap contracts. The change in value of CDS contracts is recorded as unrealized appreciation or depreciation daily. A realized gain or loss is recorded upon a credit event (as defined in the CDS agreement) or the maturity or termination of the agreement. |
| 3 | Notional amount shown is stated in US Dollars unless noted that the swap is denominated in another currency. |
39
Table of Contents
Schedule of investments
Delaware Limited-Term Diversified Income Fund
4Unrealized appreciation (depreciation) does not include periodic interest payments on swap contracts accrued daily in the amount of $(88,855).
5Markit’s CDX.NA.HY Index, is composed of 100 of the most liquid North American entities with high yield credit ratings that trade in the CDS market.
Summary of abbreviations:
ARM – Adjustable Rate Mortgage
BADLARPP – Argentina Term Deposit Rate
CDS – Credit Default Swap
CDX.NA.HY – Credit Default Swap Index North American High-Yield
CLO – Collateralized Loan Obligation
DAC – Designated Activity Company
DB – Deutsche Bank
FREMF – Freddie Mac Multifamily
GNMA – Government National Mortgage Association
GSMPS – Goldman Sachs Reperforming Mortgage Securities
H15T1Y – US Treasury Yield Curve T Note Constant Maturity 1 Year
ICE – Intercontinental Exchange
LIBOR – London Interbank Offered Rate
LIBOR01M – ICE LIBOR USD 1 Month
LIBOR03M – ICE LIBOR USD 3 Month
LIBOR06M – ICE LIBOR USD 6 Month
LIBOR012M – ICE LIBOR USD 12 Month
NCUA – National Credit Union Administration
PIK – Pay-in-kind
REIT – Real Estate Investment Trust
REMIC – Real Estate Mortgage Investment Conduit
S.F. – Single Family
TBA – To be announced
USBMMY3M – US Treasury 3 Month Bill Money Market Yield
USD – US Dollar
yr – Year
See accompanying notes, which are an integral part of the financial statements.
40
Table of Contents
This page intentionally left blank.
Table of Contents
Statement of assets and liabilities
| Delaware Limited-Term Diversified Income Fund | Dcember 31, 2017 |
Assets: | ||||
Investments, at value1 | $ | 735,011,310 | ||
Short-term investments, at value2 | 11,940,156 | |||
Cash collateral due from brokers | 9,491,033 | |||
Receivable for securities sold | 34,127,830 | |||
Dividends and interest receivable | 4,051,392 | |||
Receivable for fund shares sold | 307,101 | |||
|
| |||
Total assets | 794,928,822 | |||
|
| |||
Liabilities: | ||||
Cash due to custodian | 754,671 | |||
Payable for securities purchased | 41,668,768 | |||
Upfront payments received on credit default swap contracts | 5,802,752 | |||
Payable for fund shares redeemed | 2,088,672 | |||
Other accrued expenses | 283,771 | |||
Investment management fees payable | 242,026 | |||
Distribution payable | 161,665 | |||
Swap payments payable | 135,407 | |||
Distribution fees payable to affiliates | 127,021 | |||
Variation margin due to broker on centrally cleared credit default swap contracts | 87,915 | |||
Variation margin due to broker on futures contracts | 21,328 | |||
Dividend disbursing and transfer agent fees and expenses payable to affiliates | 12,428 | |||
Accounting and administration expenses payable to affiliates | 2,749 | |||
Trustees’ fees and expenses payable | 1,896 | |||
Legal fees payable to affiliates | 1,119 | |||
Reports and statements to shareholders expenses payable to affiliates | 540 | |||
|
| |||
Total liabilities | 51,392,728 | |||
|
| |||
Total Net Assets | $ | 743,536,094 | ||
|
| |||
Net Assets Consist of: | ||||
Paid-in capital | $ | 772,629,280 | ||
Undistributed net investment income | 459,218 | |||
Accumulated net realized loss on investments | (31,410,220 | ) | ||
Net unrealized appreciation of investments | 3,213,177 | |||
Net unrealized appreciation of future contracts | (123,844 | ) | ||
Net unrealized depreciation of swap contracts | (1,231,517 | ) | ||
|
| |||
Total Net Assets | $ | 743,536,094 | ||
|
| |||
42
Table of Contents
Net Asset Value | ||||
Class A: | ||||
Net assets | $ | 382,353,486 | ||
Shares of beneficial interest outstanding, unlimited authorization, no par | 45,211,559 | |||
Net asset value per share | $ | 8.46 | ||
Sales charge | 2.75 | % | ||
Offering price per share, equal to net asset value per share / (1 – sales charge) | $ | 8.70 | ||
Class C: | ||||
Net assets | $ | 89,455,985 | ||
Shares of beneficial interest outstanding, unlimited authorization, no par | 10,584,448 | |||
Net asset value per share | $ | 8.45 | ||
Class R: | ||||
Net assets | $ | 3,819,281 | ||
Shares of beneficial interest outstanding, unlimited authorization, no par | 451,562 | |||
Net asset value per share | $ | 8.46 | ||
Institutional Class: | ||||
Net assets | $ | 266,273,630 | ||
Shares of beneficial interest outstanding, unlimited authorization, no par | 31,492,164 | |||
Net asset value per share | $ | 8.46 | ||
Class R6: | ||||
Net assets | $ | 1,633,712 | ||
Shares of beneficial interest outstanding, unlimited authorization, no par | 193,340 | |||
Net asset value per share | $ | 8.45 | ||
1Investments, at cost | $ | 731,798,275 | ||
2Short-term investments, at cost | 11,940,014 |
See accompanying notes, which are an integral part of the financial statements.
43
Table of Contents
Delaware Limited-Term Diversified Income Fund | Year ended December 31, 2017 |
Investment Income: | ||||
Interest | $ | 22,360,293 | ||
|
| |||
Expenses: | ||||
Management fees | 4,067,694 | |||
Distribution expenses — Class A | 1,016,005 | |||
Distribution expenses — Class C | 1,030,301 | |||
Distribution expenses — Class R | 21,712 | |||
Dividend disbursing and transfer agent fees and expenses | 895,988 | |||
Accounting and administration expenses | 221,361 | |||
Registration fees | 131,015 | |||
Legal fees | 88,289 | |||
Reports and statements to shareholders | 76,663 | |||
Custodian fees | 69,597 | |||
Audit and tax | 52,179 | |||
Trustees’ fees and expenses | 40,414 | |||
Other | 86,128 | |||
|
| |||
| 7,797,346 | ||||
Less waived distribution expenses — Class A | (406,402 | ) | ||
Less expenses waived | (818,349 | ) | ||
Less expenses paid indirectly | (7,137 | ) | ||
|
| |||
Total operating expenses | 6,565,458 | |||
|
| |||
Net Investment Income | 15,794,835 | |||
|
| |||
Net Realized and Unrealized Gain (Loss): | ||||
Net realized gain (loss) on: | ||||
Investments | 5,398,256 | |||
Foreign currencies | 12,165 | |||
Foreign currency exchange contracts | (703 | ) | ||
Futures contracts | 331,770 | |||
Swap contracts | (3,802,804 | ) | ||
|
| |||
Net realized gain | 1,938,684 | |||
|
| |||
Net change in unrealized appreciation (depreciation) of: | ||||
Investments | 521,391 | |||
Futures contracts | (416,686 | ) | ||
Swap contracts | (423 | ) | ||
|
| |||
Net change in unrealized appreciation (depreciation) | 104,282 | |||
|
| |||
Net Realized and Unrealized Gain | 2,042,966 | |||
|
| |||
Net Increase in Net Assets Resulting from Operations | $ | 17,837,801 | ||
|
| |||
See accompanying notes, which are an integral part of the financial statements.
44
Table of Contents
This page intentionally left blank.
Table of Contents
Statements of changes in net assets
Delaware Limited-Term Diversified Income Fund
| Year ended | ||||||||
| 12/31/17 | 12/31/16 | |||||||
Increase in Net Assets from Operations: | ||||||||
Net investment income | $ | 15,794,835 | $ | 13,106,646 | ||||
Net realized gain | 1,938,684 | 7,412,145 | ||||||
Net change in unrealized appreciation (depreciation) | 104,282 | 3,576,820 | ||||||
|
|
|
| |||||
Net increase in net assets resulting from operations | 17,837,801 | 24,095,611 | ||||||
|
|
|
| |||||
Dividends and Distributions to Shareholders from: | ||||||||
Net investment income: | ||||||||
Class A | (7,023,929 | ) | (7,258,655 | ) | ||||
Class C | (960,478 | ) | (1,080,963 | ) | ||||
Class R | (61,643 | ) | (77,048 | ) | ||||
Institutional Class | (6,200,139 | ) | (7,716,809 | ) | ||||
Class R6 | (9,395 | ) | — | |||||
Return of capital: | ||||||||
Class A | (2,468,043 | ) | (608,436 | ) | ||||
Class C | (577,792 | ) | (166,890 | ) | ||||
Class R | (24,650 | ) | (6,925 | ) | ||||
Institutional Class | (1,719,118 | ) | (524,864 | ) | ||||
Class R6 | (10,554 | ) | — | |||||
|
|
|
| |||||
| (19,055,741 | ) | (17,440,590 | ) | |||||
|
|
|
| |||||
Capital Share Transactions: | ||||||||
Proceeds from shares sold: | ||||||||
Class A | 15,565,146 | 93,552,583 | ||||||
Class C | 5,223,708 | 11,115,741 | ||||||
Class R | 1,162,492 | 1,684,314 | ||||||
Institutional Class | 86,469,266 | 137,699,714 | ||||||
Class R6 | 1,757,715 | — | ||||||
46
Table of Contents
| Year ended | ||||||||
| 12/31/17 | 12/31/16 | |||||||
Capital Share Transactions (continued): | ||||||||
Net asset value of shares issued upon reinvestment of dividends and distributions: | ||||||||
Class A | $ | 9,358,059 | $ | 7,607,393 | ||||
Class C | 1,439,507 | 1,138,578 | ||||||
Class R | 86,379 | 83,230 | ||||||
Institutional Class | 6,508,853 | 6,090,455 | ||||||
Class R6 | 19,385 | — | ||||||
|
|
|
| |||||
| 127,590,510 | 258,972,008 | |||||||
|
|
|
| |||||
Cost of shares redeemed: | ||||||||
Class A | (79,595,237 | ) | (105,173,090 | ) | ||||
Class C | (37,072,075 | ) | (34,970,751 | ) | ||||
Class R | (2,407,328 | ) | (3,128,378 | ) | ||||
Institutional Class | (204,019,609 | ) | (233,738,073 | ) | ||||
Class R6 | (135,029 | ) | — | |||||
|
|
|
| |||||
| (323,229,278 | ) | (377,010,292 | ) | |||||
|
|
|
| |||||
Decrease in net assets derived from capital share transactions | (195,638,768 | ) | (118,038,284 | ) | ||||
|
|
|
| |||||
Net Decrease in Net Assets | (196,856,708 | ) | (111,383,263 | ) | ||||
Net Assets: | ||||||||
Beginning of year | 940,392,802 | 1,051,776,065 | ||||||
|
|
|
| |||||
End of year | $ | 743,536,094 | $ | 940,392,802 | ||||
|
|
|
| |||||
Undistributed (distributions in excess of) net investment income | $ | 459,218 | $ | (973,747 | ) | |||
|
|
|
| |||||
See accompanying notes, which are an integral part of the financial statements.
47
Table of Contents
Delaware Limited-Term Diversified Income Fund Class A
Selected data for each share of the Fund outstanding throughout each period were as follows:
Net asset value, beginning of period |
Income (loss) from investment operations: |
Net investment income1 |
Net realized and unrealized gain (loss) |
Total from investment operations. |
Less dividends and distributions from: |
Net investment income |
Return of capital |
Total dividends and distributions |
Net asset value, end of period |
Total return3 |
Ratios and supplemental data: |
Net assets, end of period (000 omitted) |
Ratio of expenses to average net assets |
Ratio of expenses to average net assets prior to fees waived4 |
Ratio of net investment income to average net assets |
Ratio of net investment income to average net assets prior to fees waived4 |
Portfolio turnover |
| 1 | The average shares outstanding method has been applied for per share information. |
| 2 | For the year ended Dec. 31, 2014, return of capital distributions of $208,221 were made by the Fund’s Class A shares, which calculated to a de minimis amount of $(0.004) per share. |
| 3 | Total investment return is based on the change in net asset value of a share during the period and assumes reinvestment of dividends and distributions at net asset value and does not reflect the impact of a sales charge. Total investment return during all of the periods shown reflects waivers by the manager and/or distributor. Performance would have been lower had the waivers not been in effect. |
| 4 | Expenses paid indirectly were not material and had no impact on the ratios disclosed. Expenses paid indirectly for the year ended Dec. 31, 2017 are reflected on the “Statement of operations.” |
See accompanying notes, which are an integral part of the financial statements.
48
Table of Contents
| Year ended | ||||||||||||||||||||||||||||
| ||||||||||||||||||||||||||||
| 12/31/17 | 12/31/16 | 12/31/15 | 12/31/14 | 12/31/13 | ||||||||||||||||||||||||
| ||||||||||||||||||||||||||||
| $ | 8.48 | $ | 8.43 | $ | 8.52 | $ | 8.55 | $ | 8.85 | |||||||||||||||||||
| 0.16 | 0.12 | 0.11 | 0.10 | 0.08 | ||||||||||||||||||||||||
| 0.02 | 0.08 | (0.06 | ) | 0.01 | (0.24 | ) | ||||||||||||||||||||||
|
|
|
|
|
|
|
|
|
| |||||||||||||||||||
| 0.18 | 0.20 | 0.05 | 0.11 | (0.16 | ) | |||||||||||||||||||||||
|
|
|
|
|
|
|
|
|
| |||||||||||||||||||
| (0.15 | ) | (0.14 | ) | (0.13 | ) | (0.14 | ) | — | ||||||||||||||||||||
| (0.05 | ) | (0.01 | ) | (0.01 | ) | — | 2 | (0.14 | ) | |||||||||||||||||||
|
|
|
|
|
|
|
|
|
| |||||||||||||||||||
| (0.20 | ) | (0.15 | ) | (0.14 | ) | (0.14 | ) | (0.14 | ) | |||||||||||||||||||
|
|
|
|
|
|
|
|
|
| |||||||||||||||||||
| $ | 8.46 | $ | 8.48 | $ | 8.43 | $ | 8.52 | $ | 8.55 | |||||||||||||||||||
|
|
|
|
|
|
|
|
|
| |||||||||||||||||||
| 2.11% | 2.42% | 0.62% | 1.28% | (1.81% | ) | |||||||||||||||||||||||
| $ | 382,353 | $ | 437,803 | $ | 439,310 | $ | 472,654 | $ | 780,359 | |||||||||||||||||||
| 0.74% | 0.81% | 0.83% | 0.83% | 0.82% | ||||||||||||||||||||||||
| 0.94% | 0.92% | 0.93% | 0.93% | 0.96% | ||||||||||||||||||||||||
| 1.95% | 1.36% | 1.29% | 1.13% | 0.91% | ||||||||||||||||||||||||
| 1.75% | 1.25% | 1.19% | 1.03% | 0.77% | ||||||||||||||||||||||||
| 151% | 124% | 94% | 80% | 236% | ||||||||||||||||||||||||
49
Table of Contents
Financial highlights
Delaware Limited-Term Diversified Income Fund Class C
Selected data for each share of the Fund outstanding throughout each period were as follows:
Net asset value, beginning of period |
Income (loss) from investment operations: |
Net investment income1 |
Net realized and unrealized gain (loss) |
Total from investment operations. |
Less dividends and distributions from: |
Net investment income |
Return of capital |
Total dividends and distributions |
Net asset value, end of period |
Total return3 |
Ratios and supplemental data: |
Net assets, end of period (000 omitted) |
Ratio of expenses to average net assets |
Ratio of expenses to average net assets prior to fees waived4 |
Ratio of net investment income to average net assets |
Ratio of net investment income to average net assets prior to fees waived4 |
Portfolio turnover |
| 1 | The average shares outstanding method has been applied for per share information. |
| 2 | For the year ended Dec. 31, 2014, return of capital distributions of $77,978 were made by the Fund’s Class C shares, which calculated to a de minimis amount of $(0.004) per share. |
| 3 | Total investment return is based on the change in net asset value of a share during the period and assumes reinvestment of dividends and distributions at net asset value and does not reflect the impact of a sales charge. Total investment return during some of the periods shown reflects a waiver by the manager. Performance would have been lower had the waiver not been in effect. |
| 4 | Expenses paid indirectly were not material and had no impact on the ratios disclosed. Expenses paid indirectly for the year ended Dec. 31, 2017 are reflected on the “Statement of operations.” |
See accompanying notes, which are an integral part of the financial statements.
50
Table of Contents
| Year ended | ||||||||||||||||||||||||||||
| ||||||||||||||||||||||||||||
| 12/31/17 | 12/31/16 | 12/31/15 | 12/31/14 | 12/31/13 | ||||||||||||||||||||||||
| ||||||||||||||||||||||||||||
| $ | 8.47 | $ | 8.42 | $ | 8.52 | $ | 8.54 | $ | 8.85 | |||||||||||||||||||
| 0.09 | 0.04 | 0.04 | 0.02 | 0.01 | ||||||||||||||||||||||||
| 0.02 | 0.09 | (0.07 | ) | 0.02 | (0.25 | ) | ||||||||||||||||||||||
|
|
|
|
|
|
|
|
|
| |||||||||||||||||||
| 0.11 | 0.13 | (0.03 | ) | 0.04 | (0.24 | ) | ||||||||||||||||||||||
|
|
|
|
|
|
|
|
|
| |||||||||||||||||||
| (0.08 | ) | (0.07 | ) | (0.06 | ) | (0.06 | ) | — | ||||||||||||||||||||
| (0.05 | ) | (0.01 | ) | (0.01 | ) | — | 2 | (0.07 | ) | |||||||||||||||||||
|
|
|
|
|
|
|
|
|
| |||||||||||||||||||
| (0.13 | ) | (0.08 | ) | (0.07 | ) | (0.06 | ) | (0.07 | ) | |||||||||||||||||||
|
|
|
|
|
|
|
|
|
| |||||||||||||||||||
| $ | 8.45 | $ | 8.47 | $ | 8.42 | $ | 8.52 | $ | 8.54 | |||||||||||||||||||
|
|
|
|
|
|
|
|
|
| |||||||||||||||||||
| 1.25% | 1.55% | (0.35% | ) | 0.55% | (2.75% | ) | ||||||||||||||||||||||
| $ | 89,456 | $ | 120,011 | $ | 141,739 | $ | 176,904 | $ | 260,073 | |||||||||||||||||||
| 1.59% | 1.66% | 1.68% | 1.68% | 1.67% | ||||||||||||||||||||||||
| 1.69% | 1.67% | 1.68% | 1.68% | 1.67% | ||||||||||||||||||||||||
| 1.10% | 0.51% | 0.44% | 0.28% | 0.06% | ||||||||||||||||||||||||
| 1.00% | 0.50% | 0.44% | 0.28% | 0.06% | ||||||||||||||||||||||||
| 151% | 124% | 94% | 80% | 236% | ||||||||||||||||||||||||
51
Table of Contents
Financial highlights
Delaware Limited-Term Diversified Income Fund Class R
Selected data for each share of the Fund outstanding throughout each period were as follows:
Net asset value, beginning of period |
Income (loss) from investment operations: |
Net investment income1 |
Net realized and unrealized gain (loss) |
Total from investment operations. |
Less dividends and distributions from: |
Net investment income |
Return of capital |
Total dividends and distributions |
Net asset value, end of period |
Total return3 |
Ratios and supplemental data: |
Net assets, end of period (000 omitted) |
Ratio of expenses to average net assets |
Ratio of expenses to average net assets prior to fees waived4 |
Ratio of net investment income to average net assets |
Ratio of net investment income to average net assets prior to fees waived4 |
Portfolio turnover |
| 1 | The average shares outstanding method has been applied for per share information. |
| 2 | For the year ended Dec. 31, 2014, return of capital distributions of $3,533 were made by the Fund’s Class R shares, which calculated to a de minimis amount of $(0.004) per share. |
| 3 | Total investment return is based on the change in net asset value of a share during the period and assumes reinvestment of dividends and distributions at net asset value. Total investment return during some of the periods shown reflects waivers by the manager and/or distributor. Performance would have been lower had the waivers not been in effect. |
| 4 | Expenses paid indirectly were not material and had no impact on the ratios disclosed. Expenses paid indirectly for the year ended Dec. 31, 2017 are reflected on the “Statement of operations.” |
See accompanying notes, which are an integral part of the financial statements.
52
Table of Contents
| Year ended | ||||||||||||||||||||||||||||
| ||||||||||||||||||||||||||||
| 12/31/17 | 12/31/16 | 12/31/15 | 12/31/14 | 12/31/13 | ||||||||||||||||||||||||
| ||||||||||||||||||||||||||||
| $ | 8.48 | $ | 8.43 | $ | 8.52 | $ | 8.55 | $ | 8.85 | |||||||||||||||||||
| 0.14 | 0.09 | 0.08 | 0.07 | 0.05 | ||||||||||||||||||||||||
| 0.01 | 0.08 | (0.06 | ) | 0.01 | (0.24 | ) | ||||||||||||||||||||||
|
|
|
|
|
|
|
|
|
| |||||||||||||||||||
| 0.15 | 0.17 | 0.02 | 0.08 | (0.19 | ) | |||||||||||||||||||||||
|
|
|
|
|
|
|
|
|
| |||||||||||||||||||
| (0.12 | ) | (0.11 | ) | (0.10 | ) | (0.11 | ) | — | ||||||||||||||||||||
| (0.05 | ) | (0.01 | ) | (0.01 | ) | — | 2 | (0.11 | ) | |||||||||||||||||||
|
|
|
|
|
|
|
|
|
| |||||||||||||||||||
| (0.17 | ) | (0.12 | ) | (0.11 | ) | (0.11 | ) | (0.11 | ) | |||||||||||||||||||
|
|
|
|
|
|
|
|
|
| |||||||||||||||||||
| $ | 8.46 | $ | 8.48 | $ | 8.43 | $ | 8.52 | $ | 8.55 | |||||||||||||||||||
|
|
|
|
|
|
|
|
|
| |||||||||||||||||||
| 1.76% | 2.06% | 0.27% | 0.93% | (2.16% | ) | |||||||||||||||||||||||
| $ | 3,819 | $ | 4,984 | $ | 6,298 | $ | 8,022 | $ | 10,672 | |||||||||||||||||||
| 1.09% | 1.16% | 1.18% | 1.18% | 1.17% | ||||||||||||||||||||||||
| 1.19% | 1.17% | 1.18% | 1.18% | 1.25% | ||||||||||||||||||||||||
| 1.60% | 1.01% | 0.94% | 0.78% | 0.56% | ||||||||||||||||||||||||
| 1.50% | 1.00% | 0.94% | 0.78% | 0.48% | ||||||||||||||||||||||||
| 151% | 124% | 94% | 80% | 236% | ||||||||||||||||||||||||
53
Table of Contents
Financial highlights
Delaware Limited-Term Diversified Income Fund Institutional Class
Selected data for each share of the Fund outstanding throughout each period were as follows:
Net asset value, beginning of period |
Income (loss) from investment operations: |
Net investment income1 |
Net realized and unrealized gain (loss) |
Total from investment operations. |
Less dividends and distributions from: |
Net investment income |
Return of capital |
Total dividends and distributions |
Net asset value, end of period |
Total return3 |
Ratios and supplemental data: |
Net assets, end of period (000 omitted) |
Ratio of expenses to average net assets |
Ratio of expenses to average net assets prior to fees waived4 |
Ratio of net investment income to average net assets |
Ratio of net investment income to average net assets prior to fees waived4 |
Portfolio turnover |
| 1 | The average shares outstanding method has been applied for per share information. |
| 2 | For the year ended Dec. 31, 2014, return of capital distributions of $236,380 were made by the Fund’s Institutional Class shares, which calculated to a de minimis amount of $(0.004) per share. |
| 3 | Total investment return is based on the change in net asset value of a share during the period and assumes reinvestment of dividends and distributions at net asset value. Total investment return during some of the periods shown reflects a waiver by the manager. Performance would have been lower had the waiver not been in effect. |
| 4 | Expenses paid indirectly were not material and had no impact on the ratios disclosed. Expenses paid indirectly for the year ended Dec. 31, 2017 are reflected on the “Statement of operations.” |
See accompanying notes, which are an integral part of the financial statements.
54
Table of Contents
| Year ended | ||||||||||||||||||||||||||||
| ||||||||||||||||||||||||||||
| 12/31/17 | 12/31/16 | 12/31/15 | 12/31/14 | 12/31/13 | ||||||||||||||||||||||||
| ||||||||||||||||||||||||||||
| $ | 8.47 | $ | 8.43 | $ | 8.52 | $ | 8.55 | $ | 8.85 | |||||||||||||||||||
| 0.18 | 0.13 | 0.12 | 0.11 | 0.09 | ||||||||||||||||||||||||
| 0.02 | 0.07 | (0.06 | ) | 0.01 | (0.24 | ) | ||||||||||||||||||||||
|
|
|
|
|
|
|
|
|
| |||||||||||||||||||
| 0.20 | 0.20 | 0.06 | 0.12 | (0.15 | ) | |||||||||||||||||||||||
|
|
|
|
|
|
|
|
|
| |||||||||||||||||||
| (0.16 | ) | (0.15 | ) | (0.14 | ) | (0.15 | ) | — | ||||||||||||||||||||
| (0.05 | ) | (0.01 | ) | (0.01 | ) | — | 2 | (0.15 | ) | |||||||||||||||||||
|
|
|
|
|
|
|
|
|
| |||||||||||||||||||
| (0.21 | ) | (0.16 | ) | (0.15 | ) | (0.15 | ) | (0.15 | ) | |||||||||||||||||||
|
|
|
|
|
|
|
|
|
| |||||||||||||||||||
| $ | 8.46 | $ | 8.47 | $ | 8.43 | $ | 8.52 | $ | 8.55 | |||||||||||||||||||
|
|
|
|
|
|
|
|
|
| |||||||||||||||||||
| 2.39% | 2.45% | 0.77% | 1.43% | (1.66% | ) | |||||||||||||||||||||||
| $ | 266,274 | $ | 377,595 | $ | 464,429 | $ | 536,508 | $ | 437,690 | |||||||||||||||||||
| 0.59% | 0.66% | 0.68% | 0.68% | 0.67% | ||||||||||||||||||||||||
| 0.69% | 0.67% | 0.68% | 0.68% | 0.67% | ||||||||||||||||||||||||
| 2.10% | 1.51% | 1.44% | 1.28% | 1.06% | ||||||||||||||||||||||||
| 2.00% | 1.50% | 1.44% | 1.28% | 1.06% | ||||||||||||||||||||||||
| 151% | 124% | 94% | 80% | 236% | ||||||||||||||||||||||||
55
Table of Contents
Financial highlights
Delaware Limited-Term Diversified Income Fund Class R6
Selected data for each share of the Fund outstanding throughout each period were as follows:
| 5/1/171 to 12/31/17 | ||||
Net asset value, beginning of period | $ | 8.50 | ||
Income (loss) from investment operations: | ||||
Net investment income2 | 0.12 | |||
Net realized and unrealized loss. | (0.03 | ) | ||
|
| |||
Total from investment operations | 0.09 | |||
|
| |||
Less dividends and distributions from: | ||||
Net investment income | (0.09 | ) | ||
Return of capital | (0.05 | ) | ||
|
| |||
Total dividends and distributions | (0.14 | ) | ||
|
| |||
Net asset value, end of period. | $ | 8.45 | ||
|
| |||
Total return3 | 1.10% | |||
Ratios and supplemental data: | ||||
Net assets, end of period (000 omitted) | $ | 1,634 | ||
Ratio of expenses to average net assets | 0.52% | |||
Ratio of expenses to average net assets prior to fees waived4 | 0.61% | |||
Ratio of net investment income to average net assets | 2.11% | |||
Ratio of net investment income to average net assets prior to fees waived4 | 2.02% | |||
Portfolio turnover | 151% | 5 | ||
| 1 | Date of commencement of operations; ratios have been annualized and total return has not been annualized. |
| 2 | The average shares outstanding method has been applied for per share information. |
| 3 | Total investment return is based on the change in net asset value of a share during the period and assumes reinvestment of dividends and distributions at net asset value. Total investment return shown reflects a waiver by the manager. Performance would have been lower had the waiver not been in effect. |
| 4 | Expenses paid indirectly were not material and had no impact on the ratios disclosed. Expenses paid indirectly for the year ended Dec. 31, 2017 are reflected on the “Statement of operations.” |
| 5 | Portfolio turnover is representative of the Fund for the entire year. |
56
Table of Contents
| Notes to financial statements | ||
Delaware Limited-Term Diversified Income Fund | December 31, 2017 |
Delaware Group® Limited-Term Government Funds (Trust) is organized as a Delaware statutory trust and offers one series: Delaware Limited-Term Diversified Income Fund (Fund). The Trust is an open-end investment company. The Fund is considered diversified under the Investment Company Act of 1940, as amended (1940 Act), and offers Class A, Class C, Class R, Institutional Class, and Class R6 shares. Class A shares are sold with a maximum front-end sales charge of 2.75%. Class A share purchases of $1,000,000 or more will incur a limited contingent deferred sales charge (CDSC) instead of a front-end sales charge of 1.00% if redeemed during the first year, provided that Delaware Distributors, L.P. (DDLP) paid a financial advisor a commission on the purchase of those shares. Class C shares are sold with a CDSC of 1.00%, if redeemed during the first 12 months. Class R, Institutional Class, and Class R6 shares are not subject to a sales charge and are offered for sale exclusively to certain eligible investors. Class R6 shares do not pay any service fees, sub-accounting fees, and/or sub-transfer agency fees. Class R6 shares commenced operations on May 1, 2017.
The investment objective of the Fund is to seek maximum total return, consistent with reasonable risk.
1. Significant Accounting Policies
The following accounting policies are in accordance with US generally accepted accounting principles (US GAAP) and are consistently followed by the Fund.
Security Valuation – Equity securities, except those traded on the Nasdaq Stock Market LLC (Nasdaq), are valued at the last quoted sales price as of the time of the regular close of the New York Stock Exchange on the valuation date. Equity securities traded on the Nasdaq are valued in accordance with the Nasdaq Official Closing Price, which may not be the last sales price. If, on a particular day, an equity security does not trade, the mean between the bid and ask prices will be used, which approximates fair value. Securities listed on a foreign exchange are normally valued at the last quoted sales price on the valuation date. Debt securities and credit default swap (CDS) contracts are valued based upon valuations provided by an independent pricing service or broker/counterparty and reviewed by management. To the extent current market prices are not available, the pricing service may take into account developments related to the specific security, as well as transactions in comparable securities. US government and agency securities are valued at the mean between the bid and ask prices, which approximates fair value. For asset-backed securities, collateralized mortgage obligations, commercial mortgage securities, and US government agency mortgage securities, pricing vendors utilize matrix pricing which considers prepayment speed; attributes of the collateral; yield or price of bonds of comparable quality, coupon, maturity, and type as well as broker/dealer-supplied prices. Swap prices are derived using daily swap curves and models that incorporate a number of market data factors, such as discounted cash flows, trades, and values of the underlying reference instruments. Foreign currency exchange contracts and foreign cross currency exchange contracts are valued at the mean between the bid and ask prices, which approximates fair value. Interpolated values are derived when the settlement date of the contract is an interim date for which quotations are not available. Futures contracts and options on futures contracts are valued at the daily quoted settlement prices. Exchange-traded options are valued at the last reported sale price or, if no sales are reported, at the mean between the last reported bid and ask prices, which approximates fair value. Generally, other securities and assets for which market quotations are not readily available are valued at fair value as determined in good faith under the direction of the Trust’s Board of Trustees (Board). In determining whether market quotations
57
Table of Contents
Notes to financial statements
Delaware Limited-Term Diversified Income Fund
1. Significant Accounting Policies (continued)
are readily available or fair valuation will be used, various factors will be taken into consideration, such as market closures or suspension of trading in a security. The foregoing valuation policies apply to restricted and unrestricted securities.
Federal and Foreign Income Taxes – No provision for federal income taxes has been made as the Fund intends to continue to qualify for federal income tax purposes as a regulated investment company under Subchapter M of the Internal Revenue Code of 1986, as amended, and make the requisite distributions to shareholders. The Fund evaluates tax positions taken or expected to be taken in the course of preparing the Fund’s tax returns to determine whether the tax positions are “more-likely-than-not” of being sustained by the applicable tax authority. Tax positions not deemed to meet the “more-likely-than-not” threshold are recorded as a tax benefit or expense in the current year. Management has analyzed the Fund’s tax positions taken or to be taken on the Fund’s federal income tax returns through the year ended Dec. 31, 2017 and for all open tax years (years ended Dec. 31, 2014–Dec. 31, 2016), and has concluded that no provision for federal income tax is required in the Fund’s financial statements. In regard to foreign taxes only, the Fund has open tax years in certain foreign countries in which it invests that may date back to the inception of the Fund. If applicable, the Fund recognizes interest accrued on unrecognized tax benefits in interest expense and penalties in other expenses on the “Statement of operations.” During the year ended Dec. 31, 2017, the Fund did not incur any interest or tax penalties.
Class Accounting – Investment income and common expenses are allocated to the various classes of the Fund on the basis of “settled shares” of each class in relation to the net assets of the Fund. Realized and unrealized gain (loss) on investments are allocated to the various classes of the Fund on the basis of daily net assets of each class. Distribution expenses relating to a specific class are charged directly to that class.
Repurchase Agreements – The Fund may purchase certain US government securities subject to the counterparty’s agreement to repurchase them at an agreed upon date and price. The counterparty will be required on a daily basis to maintain the value of the collateral subject to the agreement at not less than the repurchase price (including accrued interest). The agreements are conditioned upon the collateral being deposited under the Federal Reserve book-entry system with the Fund’s custodian or a third party sub-custodian. In the event of default or bankruptcy by the other party to the agreement, retention of the collateral may be subject to legal proceedings. All open repurchase agreements as of the date of this report were entered into on Dec. 29, 2017 and matured on the next business day.
To Be Announced Trades – The Fund may contract to purchase or sell securities for a fixed price at a transaction date beyond the customary settlement period (examples: when issued, delayed delivery, forward commitment, or TBA transactions) consistent with the Fund’s ability to manage its investment portfolio and meet redemption requests. These transactions involve a commitment by the Fund to purchase or deliver securities for a predetermined price or yield with payment and delivery taking place more than three days in the future, or after a period longer than the customary settlement period for that type of security. No interest will be earned by the Fund on such purchases until the securities are delivered or the transaction is completed; however, the market value may change prior to delivery. The
58
Table of Contents
Fund posted $11,000 cash collateral for open TBA transactions, which is presented as “Cash collateral due from brokers” on the “Statement of assets and liabilities.”
Foreign Currency Transactions – Transactions denominated in foreign currencies are recorded at the prevailing exchange rates on the valuation date in accordance with the Fund’s prospectus. The value of all assets and liabilities denominated in foreign currencies is translated daily into US dollars at the exchange rate of such currencies against the US dollar. Transaction gains or losses resulting from changes in exchange rates during the reporting period or upon settlement of the foreign currency transaction are reported in operations for the current period. The Fund generally bifurcates that portion of realized gains and losses on investments in debt securities which is due to changes in foreign exchange rates from that which is due to changes in market prices of debt securities. That portion of gains (losses) attributable to changes in foreign exchange rates is included on the “Statement of operations” under “Net realized gain (loss) on foreign currencies.” The Fund reports certain foreign currency related transactions as components of realized gains (losses) for financial reporting purposes, whereas such components are treated as ordinary income (loss) for federal income tax purposes.
Use of Estimates – The Fund is an investment company, whose financial statements are prepared in conformity with US GAAP. Therefore, the Fund follows the accounting and reporting guidelines for investment companies. The preparation of financial statements in conformity with US GAAP requires management to make estimates and assumptions that affect the fair value of investments, the reported amounts of assets and liabilities and disclosure of contingent assets and liabilities at the date of the financial statements, and the reported amounts of revenues and expenses during the reporting period. Actual results could differ from those estimates and the differences could be material.
Other – Expenses directly attributable to the Fund are charged directly to the Fund. Other expenses common to various funds within the Delaware FundsSM by Macquarie (Delaware Funds) are generally allocated among such funds on the basis of average net assets. Management fees and certain other expenses are paid monthly. Security transactions are recorded on the date the securities are purchased or sold (trade date) for financial reporting purposes. Costs used in calculating realized gains and losses on the sale of investment securities are those of the specific securities sold. Dividend income is recorded on the ex-dividend date and interest income is recorded on the accrual basis. Discounts and premiums on debt securities are accreted or amortized to interest income, respectively, over the lives of the respective securities using the effective interest method. Realized gains (losses) on paydowns of asset- and mortgage-backed securities are classified as interest income. The Fund declares dividends daily from net investment income and pays the dividends monthly and declares and pays distributions from net realized gain on investments, if any, annually. The Fund may distribute more frequently, if necessary for tax purposes. Dividends and distributions, if any, are recorded on the ex-dividend date.
The Fund receives earnings credits from its custodian when positive cash balances are maintained, which may be used to offset custody fees. The expense paid under this arrangement is included on the “Statement of operations” under “Custodian fees” with the corresponding expense offset included under “Less expenses paid indirectly.” For the year ended Dec. 31, 2017, the Fund earned $6,850 under this agreement.
The Fund receives earnings credits from its transfer agent when positive cash balances are maintained, which may be used to offset transfer agent fees. If the amount earned is greater than $1, the expense
59
Table of Contents
Notes to financial statements
Delaware Limited-Term Diversified Income Fund
1. Significant Accounting Policies (continued)
paid under this arrangement is included on the “Statement of operations” under “Dividend disbursing and transfer agent fees and expenses” with the corresponding expense offset included under “Less expense paid indirectly.” For the year ended Dec. 31, 2017, the Fund earned $287 under this agreement.
2. Investment Management, Administration Agreements, and Other Transactions with Affiliates
In accordance with the terms of its investment management agreement, the Fund pays Delaware Management Company (DMC), a series of Macquarie Investment Management Business Trust (formerly, Delaware Management Business Trust) and the investment manager, an annual fee which is calculated daily and paid monthly at the rate of 0.50% on the first $500 million of average daily net assets of the Fund, 0.475% on the next $500 million, 0.45% on the next $1.5 billion, and 0.425% on average daily net assets in excess of $2.5 billion.
DMC has contractually agreed to waive that portion, if any, of its management fee and reimburse the Fund to the extent necessary to ensure that annual operating expenses (excluding any 12b-1 fees, acquired fund fees and expenses, taxes, interest, short sale dividend and interest expenses, brokerage fees, certain insurance costs, and nonroutine expenses or costs, including, but not limited to, those relating to reorganizations, litigation, conducting shareholder meetings, and liquidations), do not exceed 0.59% of average daily net assets of Class A, Class C, Class R, and Institutional Class shares and 0.52% of average daily net assets of Class R6 shares. The expense waiver was in effect from Jan. 1, 2017 through Dec. 31, 2017* for all share classes except for Class R6 shares whose waiver was in effect from May 1, 2017 (commencement of operations) through Dec. 31, 2017.** For purposes of these waivers and reimbursements, nonroutine expenses may also include such additional costs and expenses as may be agreed upon from time to time by the Fund’s Board and DMC. These expense waivers and reimbursements apply only to expenses paid directly by the Fund and may only be terminated by agreement of DMC and the Fund.
Delaware Investments Fund Services Company (DIFSC), an affiliate of DMC, provides fund accounting and financial administrative oversight services to the Fund. For these services, DIFSC’s fees are calculated daily and paid monthly based on the aggregate daily net assets of the Delaware Funds from Jan. 1, 2017 through Aug. 31, 2017 at the following annual rate: 0.0050% of the first $30 billion; 0.0045% of the next $10 billion; 0.0040% of the next $10 billion; and 0.0025% of aggregate average daily net assets in excess of $50 billion. The fees payable to DIFSC under the service agreement described above are allocated among all Funds in the Delaware Funds on a relative net asset value (NAV) basis. Effective Sept.1, 2017, the Fund as well as other Delaware Funds entered into an amendment to the DIFSC agreement. Under the amendment to the DIFSC agreement, DIFSC’s fees are calculated daily and paid monthly based on the aggregate daily net assets of the Delaware Funds at the following annual rate: 0.00475% of the first $35 billion; 0.0040% of the next $10 billion; and 0.0025% of aggregate average daily net assets in excess of $45 billion (Total Fee). Each Fund in the Delaware Funds pays a minimum of $4,000, which, in aggregate, is subtracted from the Total Fee. Each Fund in the Delaware Funds then pays its portion of the remainder of the Total Fee on a relative NAV basis. For the year ended Dec. 31, 2017, the Fund was charged $37,694 for these services. This amount is included on the “Statement of operations” under “Accounting and administration expenses.”
60
Table of Contents
DIFSC is also the transfer agent and dividend disbursing agent of the Fund. For these services, DIFSC’s fees are calculated daily and paid monthly based on the aggregate daily net assets of the retail funds within the Delaware Funds at the following annual rate: 0.025% of the first $20 billion; 0.020% of the next $5 billion; 0.015% of the next $5 billion; and 0.013% on average daily net assets in excess of $30 billion. The fees payable to DIFSC under the service agreement described above are allocated among all retail funds in the Delaware Funds on a relative NAV basis. This amount is included on the “Statement of operations” under “Dividend disbursing and transfer agent fees and expenses.” For the year ended Dec. 31, 2017, the Fund was charged $164,565 for these services. Pursuant to a sub-transfer agency agreement between DIFSC and BNY Mellon Investment Servicing (US) Inc. (BNYMIS), BNYMIS provides certain sub-transfer agency services to the Fund. Sub-transfer agency fees are paid by the Fund and are also included on the “Statement of operations” under “Dividend disbursing and transfer agent fees and expenses.”
Pursuant to a distribution agreement and distribution plan, the Fund pays DDLP, the distributor and an affiliate of DMC, annual distribution and service (12b-1) fees of 0.25%, 1.00%, and 0.50% of the average daily net assets of the Class A, Class C, and Class R shares, respectively. The fees are calculated daily and paid monthly. DDLP has contractually agreed to waive Class A shares’ 12b-1 fee to 0.15% of average daily net assets from Jan. 1, 2017 through Dec. 31, 2017.*** Institutional Class and Class R6 shares pay no 12b-1 fees.
As provided in the investment management agreement, the Fund bears a portion of the cost of certain resources shared with DMC, including the cost of internal personnel of DMC and/or its affiliates that provide legal, tax, and regulatory reporting services to the Fund. For the year ended Dec. 31, 2017, the Fund was charged $16,918 for internal legal, tax, and regulatory reporting services provided by DMC and/or its affiliates’ employees. This amount is included on the “Statement of operations” under “Legal fees.”
For the year ended Dec. 31, 2017, DDLP earned $3,440 for commissions on sales of the Fund’s Class A shares. For the year ended Dec. 31, 2017, DDLP received gross CDSC commissions of $12,121 and $2,875 on redemption of the Fund’s Class A and Class C shares, respectively, and these commissions were entirely used to offset upfront commissions previously paid by DDLP to broker/dealers on sales of those shares.
Trustees’ fees include expenses accrued by the Fund for each Trustee’s retainer and meeting fees. Certain officers of DMC, DIFSC, and DDLP are officers and/or Trustees of the Trust. These officers and Trustees are paid no compensation by the Fund.
Cross trades for the year ended Dec. 31, 2017, were executed by the Fund pursuant to procedures adopted by the Board designed to ensure compliance with Rule 17a-7 under the 1940 Act. Cross trading is the buying or selling of portfolio securities between funds of investment companies, or between a fund of an investment company and another entity, that are or could be considered affiliates by virtue of having a common investment advisor (or affiliated investment advisors), common directors/trustees and/or common officers. At its regularly scheduled meetings, the Board reviews such transactions for compliance with the procedures adopted by the Board. Pursuant to these procedures, for the year
61
Table of Contents
Notes to financial statements
Delaware Limited-Term Diversified Income Fund
2. Investment Management, Administration Agreements, and Other Transactions with Affiliates (continued)
ended Dec. 31, 2017, the Fund engaged in securities purchases of $5,765,604 and securities sales of $10,854,910, which resulted in net realized losses of $810.
*The aggregate contractual waiver period covering this report is from Oct. 5, 2016 through May 1, 2018.
**The aggregate contractual waiver period covering this report is from May 1, 2017 through May 1, 2018.
***The aggregate contractual waiver period covering this report is from April 29, 2016 through May 1, 2018.
3. Investments
For the year ended Dec. 31, 2017, the Fund made purchases and sales of investment securities other than short-term investments as follows:
Purchases other than US government securities | $ | 430,674,141 | ||
Purchases of US government securities | 827,471,850 | |||
Sales other than US government securities | 702,745,035 | |||
Sales of US government securities | 757,549,306 |
The tax cost of investments includes adjustments to net unrealized appreciation (depreciation) which may not necessarily be the final tax cost basis adjustments, but approximate the tax basis unrealized gains and losses that may be realized and distributed to shareholders. At Dec. 31, 2017, the cost and unrealized appreciation (depreciation) of investments and derivatives for federal income tax purposes for the Fund were as follows:
Cost of investments and derivatives | $ | 744,895,092 | ||
|
| |||
Aggregate unrealized appreciation of investments and derivatives | $ | 10,121,132 | ||
Aggregate unrealized depreciation of investments and derivatives | (9,331,264 | ) | ||
|
| |||
Net unrealized appreciation of investments and derivatives | $ | 789,868 | ||
|
|
US GAAP defines fair value as the price that the Fund would receive to sell an asset or pay to transfer a liability in an orderly transaction between market participants at the measurement date under current market conditions. A three-level hierarchy for fair value measurements has been established based upon the transparency of inputs to the valuation of an asset or liability. Inputs may be observable or unobservable and refer broadly to the assumptions that market participants would use in pricing the asset or liability. Observable inputs reflect the assumptions market participants would use in pricing the asset or liability based on market data obtained from sources independent of the reporting entity. Unobservable inputs reflect the reporting entity’s own assumptions about the assumptions that market participants would use in pricing the asset or liability based on the best information available under the circumstances. The Fund’s investment in its entirety is assigned a level based upon the
62
Table of Contents
observability of the inputs which are significant to the overall valuation. The three-level hierarchy of inputs is summarized below.
| Level 1 – | Inputs are quoted prices in active markets for identical investments. (Examples: equity securities, open-end investment companies, futures contracts, exchange-traded options contracts) | |
| Level 2 – | Other observable inputs, including, but not limited to: quoted prices for similar assets or liabilities in markets that are active, quoted prices for identical or similar assets or liabilities in markets that are not active, inputs other than quoted prices that are observable for the assets or liabilities (such as interest rates, yield curves, volatilities, prepayment speeds, loss severities, credit risks, and default rates), or other market-corroborated inputs. (Examples: debt securities, government securities, swap contracts, foreign currency exchange contracts, foreign securities utilizing international fair value pricing, broker-quoted securities, fair valued securities) | |
| Level 3 – | Significant unobservable inputs, including the Fund’s own assumptions used to determine the fair value of investments. (Examples: broker-quoted securities, fair valued securities) | |
Level 3 investments are valued using significant unobservable inputs. The Fund may also use an income-based valuation approach in which the anticipated future cash flows of the investment are discounted to calculate fair value. Discounts may also be applied due to the nature or duration of any restrictions on the disposition of the investments. Valuations may also be based upon current market prices of securities that are comparable in coupon, rating, maturity, and industry. The derived value of a Level 3 investment may not represent the value which is received upon disposition and this could impact the results of operations.
The following table summarizes the valuation of the Fund’s investments by fair value hierarchy levels as of Dec. 31, 2017:
Securities | Level 1 | Level 2 | Level 3 | Total | ||||||||||||
Assets: | ||||||||||||||||
Agency, Asset- & Mortgage- Backed Securities | $— | $342,518,934 | $ — | $342,518,934 | ||||||||||||
Corporate Debt | — | 263,284,434 | — | 263,284,434 | ||||||||||||
Foreign Debt | — | 5,105,613 | — | 5,105,613 | ||||||||||||
Loan Agreements1 | — | 23,957,419 | 355,247 | 24,312,666 | ||||||||||||
Municipal Bonds | — | 2,629,622 | — | 2,629,622 | ||||||||||||
Preferred Stock | — | 2,735,085 | — | 2,735,085 | ||||||||||||
Short-Term Investments | — | 11,940,156 | — | 11,940,156 | ||||||||||||
US Treasury Obligations | — | 94,424,956 | — | 94,424,956 | ||||||||||||
|
|
|
|
|
|
|
| |||||||||
Total Value of Securities | $— | $746,596,219 | $355,247 | $746,951,466 | ||||||||||||
|
|
|
|
|
|
|
| |||||||||
63
Table of Contents
Notes to financial statements
Delaware Limited-Term Diversified Income Fund
3. Investments (continued)
Level 1 | Level 2 | Level 3 | Total | |||||||||||||
Derivatives* | ||||||||||||||||
Assets: | ||||||||||||||||
Futures Contracts | $ | 175,174 | $ | — | $ | — | $ | 175,174 | ||||||||
Liabilities: | ||||||||||||||||
Futures Contracts | (299,018 | ) | — | — | (299,018 | ) | ||||||||||
Swap Contracts | — | (1,142,662 | ) | — | (1,142,662 | ) | ||||||||||
*Futures contracts and swap contracts are valued at the unrealized appreciation (depreciation) on the instrument at the year end.
1Security type is valued across multiple levels. Level 2 investments represent investments with observable inputs, or matrix-price investments, and Level 3 investments represent investments without observable inputs. The amounts attributed to Level 2 investments and Level 3 investments represent the following percentages of the total market value of this security type:
Level 2 | Level 3 | Total | ||||||||||
Loan Agreements | 98.54 | % | 1.46 | % | 100.00 | % | ||||||
During the year ended Dec. 31, 2017, there were no transfers between Level 1 investments, Level 2 investments, or Level 3 investments that had a significant impact to the Fund. The Fund’s policy is to recognize transfers between levels based on fair value at the beginning of the reporting period.
A reconciliation of Level 3 investments is presented when the Fund has a significant amount of Level 3 investments at the beginning, interim, or end of the period in relation to net assets. Management has determined not to provide a reconciliation of Level 3 investments as they are not considered significant to the Fund’s net assets at the beginning, interim, or end of the year. Management has determined not to provide additional disclosure on Level 3 inputs since the Level 3 investments are not considered significant to the Fund’s net assets at the end of the year.
4. Dividends and Distribution Information
Income and long-term capital gain distributions are determined in accordance with federal income tax regulations, which may differ from US GAAP. Additionally, distributions from net gains on foreign currency transactions and net short-term gains on sales of investment securities are treated as ordinary income for federal income tax purposes. The tax character of dividends and distributions paid during the years ended Dec. 31, 2017 and 2016 was as follows:
| Year ended | ||||||||
| 12/31/17 | 12/31/16 | |||||||
Ordinary income | $ | 14,255,584 | $ | 16,133,475 | ||||
Return of capital | 4,800,157 | 1,307,115 | ||||||
|
|
|
| |||||
Total | $ | 19,055,741 | $ | 17,440,590 | ||||
|
|
|
| |||||
64
Table of Contents
5. Components of Net Assets on a Tax Basis
As of Dec. 31, 2017, the components of net assets on a tax basis were as follows:
Shares of beneficial interest | $ | 772,629,280 | ||
Capital loss carryforwards | (29,110,755 | ) | ||
Distributions payable | (161,665 | ) | ||
Qualified late year loss deferrals | (610,634 | ) | ||
Unrealized appreciation of investments, foreign currencies, and derivatives | 789,868 | |||
|
| |||
Net assets | $ | 743,536,094 | ||
|
|
The differences between book basis and tax basis components of net assets are primarily attributable to tax deferral of losses on wash sales, mark-to-market of futures contracts, mark-to-market of swap contracts, tax treatment of market discount and premium on debt instruments, and CDS contracts.
Qualified late year losses represent losses realized on investment transactions from Nov. 1, 2017 through Dec. 31, 2017 that, in accordance with federal income tax regulations, the Fund has elected to defer and treat as having arisen in the following fiscal year.
For financial reporting purposes, capital accounts are adjusted to reflect the tax character of permanent book/tax differences. Reclassifications are primarily due to tax treatment of CDS contracts, gain (loss) on foreign currency transactions, deemed dividend income, market discount and premium on certain debt instruments and paydowns of asset- and mortgage-backed securities. Results of operations and net assets were not affected by these reclassifications. For the year ended Dec. 31, 2017 the Fund recorded the following reclassifications:
Undistributed net investment income | $ | (106,286 | ) | |
Accumulated net realized loss on investments | 106,286 |
In 2017, the Fund utilized $103,013 of capital loss carryforwards.
Under the Regulated Investment Company Modernization Act of 2010 (Act), net capital losses recognized for tax years beginning after Dec. 22, 2010 may be carried forward indefinitely, and their character is retained as short-term and/or long-term losses.
The Fund has capital loss carryforwards available to offset future realized capital gains as follows:
| Loss carryforward character | ||||
Short-term | Long-term | Total | ||
$19,292,237 | $9,818,518 | $29,110,755 | ||
65
Table of Contents
Notes to financial statements
Delaware Limited-Term Diversified Income Fund
6. Capital Shares
Transactions in capital shares were as follows:
| Year ended | ||||||||
| 12/31/17 | 12/31/16 | |||||||
Shares sold: | ||||||||
Class A | 1,833,797 | 10,972,164 | ||||||
Class C | 616,077 | 1,306,386 | ||||||
Class R | 136,853 | 197,626 | ||||||
Institutional Class | 10,187,339 | 16,158,550 | ||||||
Class R6 | 206,996 | — | ||||||
Shares issued upon reinvestment of dividends and distributions: | ||||||||
Class A | 1,101,960 | 892,174 | ||||||
Class C | 169,580 | 133,629 | ||||||
Class R | 10,168 | 9,760 | ||||||
Institutional Class | 766,556 | 714,443 | ||||||
Class R6 | 2,285 | — | ||||||
|
|
|
| |||||
| 15,031,611 | 30,384,732 | |||||||
|
|
|
| |||||
Shares redeemed: | ||||||||
Class A | (9,374,017 | ) | (12,350,885 | ) | ||||
Class C | (4,368,453 | ) | (4,104,280 | ) | ||||
Class R | (283,345 | ) | (366,643 | ) | ||||
Institutional Class | (24,017,191 | ) | (27,440,485 | ) | ||||
Class R6 | (15,941 | ) | — | |||||
|
|
|
| |||||
| (38,058,947 | ) | (44,262,293 | ) | |||||
|
|
|
| |||||
Net decrease | (23,027,336 | ) | (13,877,561 | ) | ||||
|
|
|
| |||||
Certain shareholders may exchange shares of one class for shares of another class in the same Fund.
For the year ended Dec. 31, 2017 exchange transactions were as follows:
| Exchange Redemptions | Exchange Subscriptions | |||||||||
| Institutional | ||||||||||
| Class A | Class C | Class A | Class | |||||||
Shares | Shares | Shares | Shares | Value | ||||||
629,840 | 46,009 | 5,106 | 671,620 | $5,739,302 | ||||||
For the year ended Dec. 31, 2016 exchange transactions were as follows:
| Exchange Redemptions | Exchange Subscriptions | |||||||
| Institutional | ||||||||
| Class A | Class C | Class | ||||||
Shares | Shares | Shares | Value | |||||
| 101,612 | 2,226 | 103,942 | $888,028 | |||||
66
Table of Contents
These exchange transactions are included as subscriptions and redemptions in the table on the previous page and on the “Statements of changes in net assets.”
7. Line of Credit
The Fund, along with certain other funds in the Delaware Funds (Participants), was a participant in a $155,000,000 revolving line of credit to be used for temporary or emergency purposes as an additional source of liquidity to fund redemptions of investor shares. Under the agreement, the Participants were charged an annual commitment fee of 0.15%, which was generally allocated across the Participants based on a weighted average of the respective net assets of each participant. The Participants were permitted to borrow up to a maximum of one-third of their net assets under the agreement. Each Participant was individually, and not jointly, liable for its particular advances, if any, under the line of credit. The line of credit available under the agreement expired on Nov. 6, 2017.
On Nov. 6, 2017, the Fund, along with the other Participants, entered into an amendment to the agreement for a $155,000,000 revolving line of credit. The line of credit is to be used as described above and operates in substantially the same manner as the original agreement. Under the amendment to the agreement, the Participants are charged an annual commitment fee of 0.15%, which is generally allocated across the Participants based on a weighted average of the respective net assets of each participant. The line of credit available under the agreement expires on Nov. 5, 2018.
The Fund had no amounts outstanding as of Dec. 31, 2017 or at any time during the year then ended.
8. Derivatives
US GAAP requires disclosures that enable investors to understand: (1) how and why an entity uses derivatives, (2) how they are accounted for, and (3) how they affect an entity’s results of operations and financial position.
Futures Contracts – A futures contract is an agreement in which the writer (or seller) of the contract agrees to deliver to the buyer an amount of cash or securities equal to a specific dollar amount times the difference between the value of a specific security or index at the close of the last trading day of the contract and the price at which the agreement is made. The Fund may use futures in the normal course of pursuing its investment objective. The Fund may invest in futures contracts to hedge its existing portfolio securities against fluctuations in fair value caused by changes in interest rates or market conditions. Upon entering into a futures contract, the Fund deposits cash or pledges US government securities to a broker, equal to the minimum “initial margin” requirements of the exchange on which the contract is traded. Subsequent payments are received from the broker or paid to the broker each day, based on the daily fluctuation in the market value of the contract. These receipts or payments are known as “variation margin” and are recorded daily by the Fund as unrealized gains or losses until the contracts are closed. When the contracts are closed, the Fund records a realized gain or loss equal to the difference between the value of the contract at the time it was opened and the value at the time it was closed. Risks of entering into futures contracts include potential imperfect correlation between the futures contracts and the underlying securities and the possibility of an illiquid secondary market for these instruments. When investing in futures, there is reduced counterparty credit risk to the Fund because futures are exchange-traded and the exchange’s clearinghouse, as counterparty to all exchange-traded futures, guarantees against default. At Dec. 31, 2017, the Fund posted $161,000 cash
67
Table of Contents
Notes to financial statements
Delaware Limited-Term Diversified Income Fund
8. Derivatives (continued)
collateral for open futures contracts, which is presented as “Cash collateral due from brokers” on the “Statement of assets and liabilities.”
During the year ended Dec. 31, 2017, the Fund used futures contracts to hedge its existing portfolio securities against fluctuations in value caused by changes in interest rates or market conditions.
Swap Contracts – The Fund may enter into CDS contracts in the normal course of pursuing its investment objective. The Fund may enter into CDS contracts in order to hedge against credit events, to enhance total return, or to gain exposure to certain securities or markets. The Fund will not be permitted to enter into any swap transactions unless, at the time of entering into such transactions, the unsecured long-term debt of the actual counterparty, combined with any credit enhancements, is rated at least BBB- by Standard & Poor’s Financial Services LLC (S&P) or Baa3 by Moody’s Investors Service, Inc. (Moody’s) or is determined to be of equivalent credit quality by DMC.
Credit Default Swaps. A CDS contract is a risk-transfer instrument through which one party (purchaser of protection) transfers to another party (seller of protection) the financial risk of a credit event (as defined in the CDS agreement), as it relates to a particular reference security or basket of securities (such as an index). In exchange for the protection offered by the seller of protection, the purchaser of protection agrees to pay the seller of protection a periodic amount at a stated rate that is applied to the notional amount of the CDS contract. In addition, an upfront payment may be made or received by the Fund in connection with an unwinding or assignment of a CDS contract. Upon the occurrence of a credit event, the seller of protection would pay the par (or other agreed-upon) value of the reference security (or basket of securities) to the counterparty. Credit events generally include, among others, bankruptcy, failure to pay, and obligation default.
During the year ended Dec. 31, 2017, the Fund entered into CDS contracts as a purchaser of protection. Periodic payments (receipts) on such contracts are accrued daily and recorded as unrealized losses (gains) on swap contracts. Upon payment (receipt), such amounts are recorded as realized losses (gains) on swap contracts. Upfront payments made or received in connection with CDS contracts are amortized over the expected life of the CDS contracts as unrealized losses (gains) on swap contracts. The change in value of CDS contracts is recorded daily as unrealized appreciation or depreciation. A realized gain or loss is recorded upon a credit event (as defined in the CDS agreement) or the maturity or termination of the agreement. For the year ended Dec. 31, 2017, the Fund did not enter into any CDS contracts as a seller of protection. Initial margin and variation margin are posted to central counterparties for CDS basket trades, as determined by the applicable central counterparty. At Dec. 31, 2017, the Fund posted $9,319,033 cash collateral for open centrally cleared credit default swap contracts, which is presented as “Cash collateral due from brokers” on the “Statement of assets and liabilities.”
CDS contracts may involve greater risks than if the Fund had invested in the reference obligation directly. CDS contracts are subject to general market risk, liquidity risk, counterparty risk, and credit risk. The Fund’s maximum risk of loss from counterparty credit risk, either as the seller of protection or the buyer of protection, is the fair value of the contract. This risk is mitigated by (1) for bilateral swap contracts, having a netting arrangement between the Fund and the counterparty and by the posting of collateral by the counterparty to the Fund to cover the Fund’s exposure to the counterparty or (2) for cleared swaps, trading these instruments through a central counterparty.
68
Table of Contents
During the year ended Dec. 31, 2017, the Fund used CDS contracts to hedge against credit events.
Swaps Generally. The value of open swaps may differ from that which would be realized in the event the Fund terminated its position in the contract on a given day. Risks of entering into these contracts include the potential inability of the counterparty to meet the terms of the contracts. This type of risk is generally limited to the amount of favorable movement in the value of the underlying security, instrument, or basket of instruments, if any, at the day of default. Risks also arise from potential losses from adverse market movements and such losses could exceed the unrealized amounts that would be shown on the “Schedule of investments.” For centrally cleared swaps, payments are received from the broker or paid to the broker each day, based on the daily fluctuation in the market value of the contract. These receipts or payments are known as “variation margin” and are recorded by the Fund as unrealized gains or losses until the contracts are closed. When the contracts are closed, the Fund records a realized gain or loss equal to the difference between the value of the contract at the time it was opened and the value at the time it was closed.
Fair value of derivative instruments as of Dec. 31, 2017 was as follows:
| Asset Derivatives | ||||||||
| Fair Value | ||||||||
Statement of Assets and Liabilities Location | Interest Contracts | Total | ||||||
Variation margin due to broker on futures contracts* | $175,174 | $175,174 | ||||||
|
|
|
| |||||
Liability Derivatives Fair Value | ||||||||||||
Statement of Assets and Liabilities Location | Interest Contracts | Credit Contracts | Total | |||||||||
Variation margin due to broker on futures contracts* | $ | 299,018 | $ | — | $ | 299,018 | ||||||
Upfront payments received on credit default swap contracts | — | 5,802,753 | 5,802,753 | |||||||||
Variation margin due to broker on centrally cleared credit default swap contracts** | — | 1,142,662 | 1,142,662 | |||||||||
|
|
|
|
|
| |||||||
Total | $ | 299,018 | $6,945,415 | $ | 7,244,433 | |||||||
|
|
|
|
|
| |||||||
*Includes cumulative appreciation (depreciation) of futures contracts from the date the contracts are opened through Dec. 31, 2017. Only current day variation margin is reported on the “Statement of assets and liabilities.”
**Includes cumulative appreciation (depreciation) of centrally cleared credit default swap contracts from the date the contracts were opened through Dec. 31, 2017. Only current day variation margin is reported on the “Statement of assets and liabilities.”
69
Table of Contents
Notes to financial statements
Delaware Limited-Term Diversified Income Fund
8. Derivatives (continued)
The effect of derivative instruments on the “Statement of operations” for the year ended Dec. 31, 2017 was as follows:
| Net Realized Gain (Loss) on: | ||||||||||||||||
| Foreign Currency Exchange Contracts | Futures Contracts | Swap Contracts | Total | |||||||||||||
Forward currency exchange contracts | $(703) | $ | — | $ | — | $ | (703 | ) | ||||||||
Interest rate contracts | — | 331,770 | — | 331,770 | ||||||||||||
Credit contracts | — | — | (3,802,804 | ) | (3,802,804 | ) | ||||||||||
|
|
|
|
|
|
|
| |||||||||
Total | $(703) | $ | 331,770 | $ | (3,802,804 | ) | $ | (3,471,737 | ) | |||||||
|
|
|
|
|
|
|
| |||||||||
| Net Change in Unrealized Appreciation (Depreciation) of: | ||||||||||||
| Futures Contracts | Swap Contracts | Total | ||||||||||
Interest rate contracts | $(416,686) | $ — | $(416,686) | |||||||||
Credit contracts | — | (423 | ) | (423) | ||||||||
|
|
|
|
|
| |||||||
Total | $(416,686) | $(423) | $(417,109) | |||||||||
|
|
|
|
|
| |||||||
Derivatives Generally. The table below summarizes the average balance of derivative holdings by the Fund during the year ended Dec. 31, 2017.
Long Derivatives Volume | Short Derivatives Volume | |||||||
Futures contracts (average notional value) | USD | 17,815,720 | USD | 73,988,478 | ||||
CDS contracts (average notional value)* | 68,625,817 | — | ||||||
*Long represents buying protection and short represents selling protection.
9. Offsetting
The Fund entered into an International Swaps and Derivatives Association, Inc. Master Agreement (ISDA Master Agreement) or a similar agreement with certain of its derivative contract counterparties in order to better define its contractual rights and to secure that will help the Fund mitigate its counterparty risk. An ISDA Master Agreement is a bilateral agreement between the Fund and a counterparty that governs over-the-counter (OTC) derivatives and foreign exchange contracts and typically contains, among other things, collateral posting items and provisions in the event of a default and/or termination event. Under an ISDA Master Agreement, the Fund may, under certain circumstances, offset with the counterparty certain derivative financial instruments’ payables and/or receivables with collateral held and/or posted and create one single net payment. The provisions of the ISDA Master Agreement typically permit a single net payment in the event of default (close-out), including the bankruptcy or insolvency of the counterparty. However, bankruptcy or insolvency laws of a particular jurisdiction may
70
Table of Contents
impose restrictions on or prohibitions against the right of offset in bankruptcy, insolvency, or other events.
For financial reporting purposes, the Fund does not offset derivative assets and derivative liabilities that are subject to netting arrangements on the “Statement of assets and liabilities.”
At Dec. 31, 2017, the Fund had the following assets and liabilities subject to offsetting provisions:
Offsetting of Financial Assets and Liabilities and Derivative Assets and Liabilities Master Repurchase Agreements
Counterparty | Repurchase Agreements | Fair Value of Non-Cash Collateral Received(a) | Cash Collateral Received | Net Collateral Received | Net Exposure(b) | |||||||||||
Bank of America Merrill Lynch | $1,496,933 | $(1,496,933) | $— | $(1,496,933) | $— | |||||||||||
Bank of Montreal | 3,742,332 | (3,742,332) | — | (3,742,332) | — | |||||||||||
BNP Paribas | 709,755 | (709,755) | — | (709,755) | — | |||||||||||
|
|
|
|
|
|
|
| |||||||||
Total | $5,949,020 | $(5,949,020) | $— | $(5,949,020) | $— | |||||||||||
|
|
|
|
|
|
|
| |||||||||
| (a) | The value of the related collateral received exceeded the value of the repurchase agreements as of Dec. 31, 2017. |
| (b) | Net exposure represents the receivable (payable) that would be due from (to) the counterparty in the event of default. |
10. Securities Lending
The Fund, along with other funds in the Delaware Funds, may lend its securities pursuant to a security lending agreement (Lending Agreement) with The Bank of New York Mellon (BNY Mellon). At the time a security is loaned, the borrower must post collateral equal to the required percentage of the market value of the loaned security, including any accrued interest. The required percentage is: (1) 102% with respect to US securities and foreign securities that are denominated and payable in US dollars; and (2) 105% with respect to foreign securities. With respect to each loan, if on any business day the aggregate market value of securities collateral plus cash collateral held is less than the aggregate market value of the securities that are the subject of such loan, the borrower will be notified to provide additional collateral by the end of the following business day, which, together with the collateral already held, will be not less than the applicable initial collateral requirements for such security loan. If the aggregate market value of securities collateral and cash collateral held with respect to a security loan exceeds the applicable initial collateral requirement, upon the request of the borrower, BNY Mellon must return enough collateral to the borrower by the end of the following business day to reduce the value of the remaining collateral to the applicable initial collateral requirement for such security loan. As a result of the foregoing, the value of the collateral held with respect to a loaned security on any particular day may be more or less than the value of the security on loan. The collateral percentage with respect to the market value of the loaned security is determined by the security lending agent.
Cash collateral received by each fund of the Trust is generally invested in a series of individual separate accounts, each corresponding to a fund. The investment guidelines permit each separate account to hold certain securities that would be considered eligible securities for a money market fund. Cash collateral received is generally invested in government securities; certain obligations issued by government sponsored enterprises; repurchase agreements collateralized by US Treasury securities; obligations issued by the central government of any Organization for Economic Cooperation and
71
Table of Contents
Notes to financial statements
Delaware Limited-Term Diversified Income Fund
10. Securities Lending (continued)
Development (OECD) country or its agencies, instrumentalities, or establishments; obligations of supranational organizations; commercial paper, notes, bonds, and other debt obligations; certificates of deposit, time deposits, and other bank obligations; and asset-backed securities. A fund can also accept US government securities and letters of credit (non-cash collateral) in connection with securities loans.
In the event of default or bankruptcy by the lending agent, realization and/or retention of the collateral may be subject to legal proceedings. In the event the borrower fails to return loaned securities and the collateral received is insufficient to cover the value of the loaned securities and provided such collateral shortfall is not the result of investment losses, the lending agent has agreed to pay the amount of the shortfall to the Fund or, at the discretion of the lending agent, replace the loaned securities. The Fund continues to record dividends or interest, as applicable, on the securities loaned and is subject to changes in value of the securities loaned that may occur during the term of the loan. The Fund has the right under the Lending Agreement to recover the securities from the borrower on demand. With respect to security loans collateralized by non-cash collateral, the Fund receives loan premiums paid by the borrower. With respect to security loans collateralized by cash collateral, the earnings from the collateral investments are shared among the Fund, the security lending agent, and the borrower. The Fund records security lending income net of allocations to the security lending agent and the borrower.
The Fund may incur investment losses as a result of investing securities lending collateral. This could occur if an investment in the collateral investment account defaulted or became impaired. Under those circumstances, the value of a Fund’s cash collateral account may be less than the amount the Fund would be required to return to the borrowers of the securities and the Fund would be required to make up for this shortfall.
During the year ended Dec. 31, 2017, the Fund had no securities out on loan.
11. Credit and Market Risk
Some countries in which the Fund may invest require governmental approval for the repatriation of investment income, capital, or the proceeds of sales of securities by foreign investors. In addition, if there is deterioration in a country’s balance of payments or for other reasons, a country may impose temporary restrictions on foreign capital remittances abroad.
The securities exchanges of certain foreign markets are substantially smaller, less liquid, and more volatile than the major securities markets in the US. Consequently, acquisition and disposition of securities by the Fund may be inhibited. In addition, a significant portion of the aggregate market value of equity securities listed on the major securities exchanges in emerging markets is held by a smaller number of investors. This may limit the number of shares available for acquisition or disposition by the Fund.
The Fund invests a portion of its assets in high-yield fixed income securities, which are securities rated lower than BBB- by S&P and Baa3 by Moody’s, or similarly rated by another nationally recognized statistical rating organization. Investments in these higher yielding securities are generally accompanied by a greater degree of credit risk than higher rated securities. Additionally, lower rated securities
72
Table of Contents
may be more susceptible to adverse economic and competitive industry conditions than investment grade securities.
The Fund invests in fixed income securities whose value is derived from an underlying pool of mortgages or consumer loans. The value of these securities is sensitive to changes in economic conditions, including delinquencies and/or defaults, and may be adversely affected by shifts in the market’s perception of the issuers and changes in interest rates. Investors receive principal and interest payments as the underlying mortgages and consumer loans are paid back. Some of these securities are collateralized mortgage obligations (CMOs). CMOs are debt securities issued by US government agencies or by financial institutions and other mortgage lenders, which are collateralized by a pool of mortgages held under an indenture. Prepayment of mortgages may shorten the stated maturity of the obligations and can result in a loss of premium, if any has been paid. Certain of these securities may be stripped (securities which provide only the principal or interest feature of the underlying security). The yield to maturity on an interest-only CMO is extremely sensitive not only to changes in prevailing interest rates, but also to the rate of principal payments (including prepayments) on the related underlying mortgage assets. A rapid rate of principal payments may have a material adverse effect on the Fund’s yield to maturity. If the underlying mortgage assets experience greater than anticipated prepayments of principal, the Fund may fail to fully recoup its initial investment in these securities even if the securities are rated in the highest rating categories.
The Fund invests in certain obligations that may have liquidity protection designed to ensure that the receipt of payments due on the underlying security is timely. Such protection may be provided through guarantees, insurance policies, or letters of credit obtained by the issuer or sponsor through third parties, through various means of structuring the transaction, or through a combination of such approaches. The Fund will not pay any additional fees for such credit support, although the existence of credit support may increase the price of the security.
The Fund invests in bank loans and other securities that may subject it to direct indebtedness risk, the risk that the Fund will not receive payment of principal, interest, and other amounts due in connection with these investments and will depend primarily on the financial condition of the borrower. Loans that are fully secured offer the Fund more protection than unsecured loans in the event of nonpayment of scheduled interest or principal, although there is no assurance that the liquidation of collateral from a secured loan would satisfy the corporate borrower’s obligation, or that the collateral can be liquidated. Some loans or claims may be in default at the time of purchase. Certain of the loans and the other direct indebtedness acquired by the Fund may involve revolving credit facilities or other standby financing commitments that obligate the Fund to pay additional cash on a certain date or on demand. These commitments may require the Fund to increase its investment in a company at a time when the Fund might not otherwise decide to do so (including at a time when the company’s financial condition makes it unlikely that such amounts will be repaid). To the extent that the Fund is committed to advance additional funds, it will at all times hold and maintain cash or other high-grade debt obligations in an amount sufficient to meet such commitments. When a loan agreement is purchased the Fund may pay an assignment fee. On an ongoing basis, the Fund may receive a commitment fee based on the undrawn portion of the underlying line of credit portion of a loan agreement. Prepayment penalty fees are received upon the prepayment of a loan agreement by the borrower. Prepayment penalty, facility, commitment, consent, and amendment fees are recorded to income as earned or paid.
73
Table of Contents
Notes to financial statements
Delaware Limited-Term Diversified Income Fund
11. Credit and Market Risk (continued)
As the Fund may be required to rely upon another lending institution to collect and pass on to the Fund amounts payable with respect to the loan and to enforce the Fund’s rights under the loan and other direct indebtedness, an insolvency, bankruptcy, or reorganization of the lending institution may delay or prevent the Fund from receiving such amounts. The highly leveraged nature of many loans may make them especially vulnerable to adverse changes in economic or market conditions. Investments in such loans and other direct indebtedness may involve additional risk to the Fund.
The Fund may invest up to 15% of its net assets in illiquid securities, which may include securities with contractual restrictions on resale, securities exempt from registration under Rule 144A promulgated under the Securities Act of 1933, as amended, and other securities which may not be readily marketable. The relative illiquidity of these securities may impair the Fund from disposing of them in a timely manner and at a fair price when it is necessary or desirable to do so. While maintaining oversight, the Fund’s Board has delegated to DMC the day-to-day functions of determining whether individual securities are liquid for purposes of the Fund’s limitation on investments in illiquid securities. Securities eligible for resale pursuant to Rule 144A, which are determined to be liquid, are not subject to the Fund’s 15% limit on investments in illiquid securities. Rule 144A securities have been identified on the “Schedule of investments.”
12. Contractual Obligations
The Fund enters into contracts in the normal course of business that contain a variety of indemnifications. The Fund’s maximum exposure under these arrangements is unknown. However, the Fund has not had prior claims or losses pursuant to these contracts. Management has reviewed the Fund’s existing contracts and expects the risk of loss to be remote.
13. Recent Accounting Pronouncements
In October 2016, the Securities and Exchange Commission released its Final Rule on Investment Company Reporting Modernization (Rule). The Rule contains amendments to Regulation S-X which impact financial statement presentation, particularly the presentation of derivative investments. The financial statements presented are in compliance with the most recent Regulation S-X amendments.
In March 2017, the Financial Accounting Standards Board issued an Accounting Standards Update, ASU 2017-08, Receivables — Nonrefundable Fees and Other Costs (Subtopic 310-20), Premium Amortization on Purchased Callable Debt Securities (ASU) which amends the amortization period for certain purchased callable debt securities held at a premium, shortening such period to the earliest call date. The ASU does not require any accounting change for debt securities held at a discount; the discount continues to be amortized to maturity. The ASU is effective for fiscal years, and interim periods within those fiscal years, beginning after Dec. 15, 2018. At this time, management is evaluating the implications of these changes on the financial statements.
14. Subsequent Events
Management has determined that no material events or transactions occurred subsequent to Dec. 31, 2017 that would require recognition or disclosure in the Fund’s financial statements.
74
Table of Contents
registered public accounting firm
To the Board of Trustees of Delaware Group® Limited-Term Government Funds
and Shareholders of Delaware Limited-Term Diversified Income Fund
Opinion on the Financial Statements
We have audited the accompanying statement of assets and liabilities, including the schedule of investments, of Delaware Limited-Term Diversified Income Fund (the “Fund”) as of December 31, 2017, the related statement of operations for the year ended December��31, 2017, the statements of changes in net assets for each of the two years in the period ended December 31, 2017, including the related notes, and the financial highlights for each of the periods indicated therein (collectively referred to as the “financial statements”). In our opinion, the financial statements present fairly, in all material respects, the financial position of the Fund as of December 31, 2017, the results of its operations for the year then ended, the changes in its net assets for each of the two years in the period ended December 31, 2017 and the financial highlights for each of the periods indicated therein in conformity with accounting principles generally accepted in the United States of America.
Basis for Opinion
These financial statements are the responsibility of the Fund’s management. Our responsibility is to express an opinion on the Fund’s financial statements based on our audits. We are a public accounting firm registered with the Public Company Accounting Oversight Board (United States) (“PCAOB”) and are required to be independent with respect to the Fund in accordance with the U.S. federal securities laws and the applicable rules and regulations of the Securities and Exchange Commission and the PCAOB.
We conducted our audits of these financial statements in accordance with the standards of the PCAOB. Those standards require that we plan and perform the audit to obtain reasonable assurance about whether the financial statements are free of material misstatement, whether due to error or fraud.
Our audits included performing procedures to assess the risks of material misstatement of the financial statements, whether due to error or fraud, and performing procedures that respond to those risks. Such procedures included examining, on a test basis, evidence regarding the amounts and disclosures in the financial statements. Our audits also included evaluating the accounting principles used and significant estimates made by management, as well as evaluating the overall presentation of the financial statements. Our procedures included confirmation of securities owned as of December 31, 2017 by correspondence with the custodian and brokers; when replies were not received from brokers, we performed other auditing procedures. We believe that our audits provide a reasonable basis for our opinion.
PricewaterhouseCoopers LLP
Philadelphia, Pennsylvania
February 15, 2018
We have served as the auditor of one or more investment companies in Delaware Funds by Macquarie since 2010.
75
Table of Contents
Other Fund information (Unaudited)
Delaware Limited-Term Diversified Income Fund
Tax Information
All disclosures are based on financial information available as of the date of this annual report and, accordingly are subject to change. For any and all items requiring reporting, it is the intention of the Fund to report the maximum amount permitted under the Internal Revenue Code and the regulations thereunder.
For the year ended Dec. 31, 2017, the Fund reports distributions paid during the year as follows:
(A) Ordinary Income Distribution (Tax Basis) | 74.81 | % | ||
(B) Return of Capital (Tax-Basis) | 25.19 | % | ||
Total Distributions (Tax Basis) | 100.00 | % |
(A) and (B) are based on a percentage of the Fund’s total distributions.
Board consideration of Delaware Limited-Term Diversified Income Fund investment advisory agreement
At a meeting held on Aug. 16-17, 2017 (the “Annual Meeting”), the Board of Trustees (the “Board”), including a majority of disinterested or independent Trustees, approved the renewal of the Investment Advisory Agreement for Delaware Limited-Term Diversified Income Fund (the “Fund”). In making its decision, the Board considered information furnished at regular quarterly Board meetings, including reports detailing Fund performance, investment strategies, and expenses, as well as information prepared specifically in connection with the renewal of the Investment Advisory Agreement. Information furnished specifically in connection with the renewal of the Investment Advisory Agreement with Delaware Management Company (“DMC”), a series of Macquarie Investment Management Business Trust (formerly, Delaware Management Business Trust), included materials provided by DMC and its affiliates concerning, among other things, the nature, extent, and quality of services provided to the Fund; the costs of such services to the Fund; economies of scale; and the investment manager’s financial condition and profitability. In addition, in connection with the Annual Meeting, reports were provided to the Trustees in May 2017 and included reports provided by Broadridge Financial Solutions (formerly Lipper) (“Broadridge” or “Lipper”). The Broadridge reports compared the Fund’s investment performance and expenses with those of other comparable mutual funds. The Independent Trustees reviewed and discussed the Broadridge reports with independent legal counsel to the Independent Trustees. In addition to the information noted above, the Board also requested and received information regarding DMC’s policy with respect to advisory fee levels and its breakpoint philosophy; the structure of portfolio manager compensation; comparative client fee information; and any constraints or limitations on the availability of securities for certain investment styles, which had in the past year inhibited, or which were likely in the future to inhibit, the investment manager’s ability to invest fully in accordance with Fund policies.
In considering information relating to the approval of the Fund’s Investment Advisory Agreement, the Independent Trustees received assistance and advice from and met separately with independent legal counsel to the Independent Trustees and also from an experienced and knowledgeable fund consultant, JDL Consultants, LLC (“JDL”). Although the Board gave attention to all information furnished, the
76
Table of Contents
following discussion identifies, under separate headings, the primary factors taken into account by the Board during its contract renewal considerations.
Nature, extent, and quality of service. The Board considered the services provided by DMC to the Fund and its shareholders. In reviewing the nature, extent, and quality of services, the Board considered reports furnished to it throughout the year, which covered matters such as the relative performance of the Fund; compliance of portfolio managers with the investment policies, strategies, and restrictions for the Fund; compliance by DMC and Delaware Distributors, L.P. (together, “Management”) personnel with the Code of Ethics adopted throughout the Delaware FundsSM by Macquarie (“Delaware Funds”); and adherence to fair value pricing procedures as established by the Board. The Board was pleased with the current staffing of the Fund’s investment advisor and the emphasis placed on research in the investment process. The Board recognized DMC’s receipt of certain industry distinctions during the past several years. The Board gave favorable consideration to DMC’s efforts to control expenditures while maintaining service levels committed to Fund matters. The Board also noted the benefits provided to Fund shareholders through each shareholder’s ability to exchange an investment in one Delaware Fund for the same class of shares in another Delaware Fund without a sales charge, to reinvest Fund dividends into additional shares of the Fund or into additional shares of other Delaware Funds, and the privilege to combine holdings in other Delaware Funds to obtain a reduced sales charge. The Board was satisfied with the nature, extent, and quality of the overall services provided by DMC.
Investment performance. The Board placed significant emphasis on the investment performance of the Fund in view of the importance of investment performance to shareholders. Although the Board considered performance reports and discussions with portfolio managers at Investment Committee meetings throughout the year, the Board gave particular weight to the Broadridge reports furnished for the Annual Meeting. The Broadridge reports prepared for the Fund showed the investment performance of its Class A shares in comparison to a group of similar funds as selected by Broadridge (the “Performance Universe”). A fund with the best performance ranked first, and a fund with the poorest performance ranked last. The highest/best performing 25% of funds in the Performance Universe make up the first quartile; the next 25%, the second quartile; the next 25%, the third quartile; and the poorest/worst performing 25% of funds in the Performance Universe make up the fourth quartile. Comparative annualized performance for the Fund was shown for the past 1-, 3-, 5-, and 10-year periods, to the extent applicable, ended Jan. 31, 2017. The Board’s objective is that the Fund’s performance for the 1-, 3-, and 5-year periods considered be at or above the median of its Performance Universe.
The Performance Universe for the Fund consisted of the Fund and all retail and institutional short-intermediate investment grade debt funds as selected by Broadridge. The Broadridge report comparison showed that the Fund’s total return for the 1- and 3-year periods was in the third quartile of its Performance Universe. The report further showed that the Fund’s total return for the 5-year period was in the fourth quartile of its Performance Universe. The Board noted that the Fund’s performance was not in line with the Board’s objective. In evaluating the Fund’s performance, the Board considered the performance attribution included in the Meeting materials, as well as the numerous investment and performance reports delivered by Management personnel to the Board’s Investments Committee. The Board was satisfied that Management was taking action to improve Fund performance and to meet the Board’s performance objective.
77
Table of Contents
Other Fund information (Unaudited)
Delaware Limited-Term Diversified Income Fund
Board consideration of Delaware Limited-Term Diversified Income Fund investment advisory agreement (continued)
Comparative expenses. The Board considered expense data for the Delaware Funds. Management provided the Board with information on pricing levels and fee structures for the Fund as of its most recently completed fiscal year. The Board also focused on the comparative analysis of effective management fees and total expense ratios of the Fund versus effective management fees and total expense ratios of a group of similar funds as selected by Broadridge (the “Expense Group”). In reviewing comparative costs, the Fund’s contractual management fee and the actual management fee incurred by the Fund were compared with the contractual management fees (assuming all funds in the Expense Group were similar in size to the Fund) and actual management fees (as reported by each fund) within the Expense Group, taking into account any applicable breakpoints and fee waivers. The Fund’s total expenses were also compared with those of its Expense Group. The Broadridge total expenses, for comparative consistency, were shown by Broadridge for Class A shares and comparative total expenses including 12b-1 and non-12b-1 service fees. The Board’s objective is to limit the Fund’s total expense ratio to be competitive with that of the Expense Group.
The expense comparisons for the Fund showed that its actual management fee was in the quartile with the highest expenses of its Expense Group and its total expenses were in the quartile with the second highest expenses of its Expense Group. The Board noted that the Fund’s management fee and total expenses were not in line with the Board’s objective. In evaluating total expenses, the Board considered fee waivers in place through May 1, 2018 and various initiatives implemented by Management, such as the negotiation of lower fees for fund accounting, fund accounting oversight, and custody services, which had created an opportunity for a further reduction in expenses. The Board was satisfied with Management’s efforts to improve the Fund’s total expense ratio and to bring it in line with the Board’s objective.
Management profitability. The Board considered the level of profits realized by DMC in connection with the operation of the Fund. In this respect, the Board reviewed the Investment Management Profitability Analysis that addressed the overall profitability of DMC’s business in providing management and other services to each of the individual funds and the Delaware Funds as a whole. Specific attention was given to the methodology used by DMC in allocating costs for the purpose of determining profitability. Management stated that the level of profits of DMC, to a certain extent, reflects recent operational cost savings and efficiencies initiated by DMC. The Board considered DMC’s efforts to improve services provided to fund shareholders and to meet additional regulatory and compliance requirements resulting from recent industry-wide Securities and Exchange Commission initiatives. The Board also considered the extent to which DMC might derive ancillary benefits from fund operations, including the potential for procuring additional business as a result of the prestige and visibility associated with its role as service provider to the Delaware Funds and the benefits from allocation of fund brokerage to improve trading efficiencies. Finally, the Board also reviewed a report prepared by JDL regarding DMC profitability in the context of sub-advised funds and met with JDL personnel to discuss DMC’s profitability in such context. The Board found that the management fees were reasonable in light of the services rendered and the level of profitability of DMC.
78
Table of Contents
Economies of scale. The Trustees considered whether economies of scale are realized by DMC as the Fund’s assets increase and the extent to which any economies of scale are reflected in the level of management fees charged. The Trustees reviewed the standardized advisory fee pricing and structure, approved by the Board and shareholders, which includes breakpoints, and which applies to most funds in the Delaware Funds complex. Breakpoints in the advisory fee occur when the advisory fee rate is reduced on assets in excess of specified levels. Breakpoints result in a lower advisory fee than would otherwise be the case in the absence of breakpoints, when the asset levels specified in the breakpoints are exceeded. The Board noted that the fee under the Fund’s management contract fell within the standardized fee pricing structure. The Board also noted that, as of Feb. 28, 2017, the Fund’s assets exceeded the first breakpoint level. The Board believed that, given the extent to which economies of scale might be realized by the adviser and its affiliates, the schedule of fees under the Investment Advisory Agreement provides a sharing of benefits with the Fund and its shareholders.
79
Table of Contents
Board of trustees / directors and officers addendum
Delaware FundsSM by Macquarie
A mutual fund is governed by a Board of Trustees/Directors (“Trustees”), which has oversight responsibility for the management of a fund’s business affairs. Trustees establish procedures and oversee and review the performance of the investment manager, the distributor, and others who perform services for the fund. The independent fund trustees, in particular, are advocates
| Name, Address, | Position(s) | Length of | ||
| and Birth Date | Held with Fund(s) | Time Served | ||
Interested Trustee
| ||||
| Shawn K. Lytle1, 2 | President, | Trustee since | ||
| 2005 Market Street | Chief Executive Officer, | September 2015 | ||
| Philadelphia, PA 19103 | and Trustee | |||
| February 1970 | President and | |||
| Chief Executive Officer | ||||
since August 2015
| ||||
Independent Trustees
| ||||
| Thomas L. Bennett | Chairman and Trustee | Trustee since | ||
| 2005 Market Street | March 2005 | |||
| Philadelphia, PA 19103 | ||||
| October 1947 | Chairman since | |||
| March 2015 | ||||
| Ann D. Borowiec | Trustee | Since March 2015 | ||
| 2005 Market Street | ||||
| Philadelphia, PA 19103 | ||||
November 1958
| ||||
| Joseph W. Chow | Trustee | Since January 2013 | ||
| 2005 Market Street | ||||
| Philadelphia, PA 19103 | ||||
January 1953
|
| 1 | Shawn K. Lytle is considered to be an “Interested Trustee” because he is an executive officer of the Fund’s(s’) investment advisor. |
| 2 | Shawn K. Lytle, David F. Connor, Daniel V. Geatens, and Richard Salus serve in similar capacities for the six portfolios of the Optimum Fund Trust, which have the same investment advisor, principal underwriter, and transfer agent as the registrant. Mr. Geatens also serves as the Chief Financial Officer and Treasurer for Macquarie Global Infrastructure Total Return Fund Inc., which shares an affiliated investment manager. |
80
Table of Contents
for shareholder interests. Each trustee has served in that capacity since he or she was elected to or appointed to the Board of Trustees, and will continue to serve until his or her retirement or the election of a new trustee in his or her place. The following is a list of the Trustees and Officers with certain background and related information.
| Number of Portfolios in | ||||
| Principal Occupation(s) | Fund Complex Overseen | Other Directorships | ||
| During the Past Five Years | by Trustee or Officer | Held by Trustee or Officer | ||
| Shawn K. Lytle has served as | 60 | Trustee — UBS | ||
| President of | Relationship Funds, | |||
| Macquarie Investment | SMA Relationship | |||
| Management3 | Trust, and UBS Funds | |||
| since June 2015 and was the | (May 2010–April 2015) | |||
| Regional Head of Americas for | ||||
| UBS Global Asset | ||||
Management from 2010 through 2015. | ||||
| Private Investor | 60 | None | ||
(March 2004–Present)
| ||||
| Chief Executive Officer, | 60 | Director — | ||
| Private Wealth Management | Banco Santander International | |||
| (2011–2013) and | ||||
| Market Manager, | Director — | |||
| New Jersey Private | Santander Bank, N.A. | |||
| Bank (2005–2011) — | ||||
| J.P. Morgan Chase & Co. | ||||
| Executive Vice President | 60 | Director and Audit Committee | ||
| (Emerging Economies | Member — Hercules | |||
| Strategies, Risks, and | Technology Growth | |||
| Corporate Administration) | Capital, Inc. | |||
| State Street Corporation | (2004–2014) | |||
| (July 2004–March 2011) | ||||
| 3 | Macquarie Investment Management (formerly known as Delaware Investments) is the marketing name for Macquarie Management Holdings, Inc. (formerly known as Delaware Management Holdings, Inc.) and its subsidiaries, including the Fund’s(s’) investment advisor, principal underwriter, and its transfer agent. |
81
Table of Contents
Board of trustees / directors and officers addendum
Delaware FundsSM by Macquarie
| Name, Address, | Position(s) | Length of | ||
| and Birth Date | Held with Fund(s) | Time Served | ||
Independent Trustees (continued)
| ||||
| John A. Fry | Trustee | Since January 2001 | ||
| 2005 Market Street | ||||
| Philadelphia, PA 19103 | ||||
May 1960
| ||||
| Lucinda S. Landreth | Trustee | Since March 2005 | ||
| 2005 Market Street | ||||
| Philadelphia, PA 19103 | ||||
| June 1947 | ||||
| Frances A. Sevilla-Sacasa | Trustee | Since September 2011 | ||
| 2005 Market Street | ||||
| Philadelphia, PA 19103 | ||||
January 1956
| ||||
82
Table of Contents
| Number of Portfolios in | ||||
| Principal Occupation(s) | Fund Complex Overseen | Other Directorships | ||
| During the Past Five Years | by Trustee or Officer | Held by Trustee or Officer | ||
| President — | 60 | Director, Audit Committee, | ||
| Drexel University | and Governance Committee | |||
| (August 2010–Present) | Member — Community | |||
| Health Systems | ||||
| President — | ||||
| Franklin & Marshall College | Director — Drexel | |||
| (July 2002–July 2010) | Morgan & Co. | |||
| Director, Audit Committee | ||||
| Member — vTv | ||||
| Therapeutics LLC | ||||
| Director — FS Credit Real | ||||
| Estate Income Trust, Inc. | ||||
| Private Investor | 60 | None | ||
(2004–Present)
| ||||
| Chief Executive Officer — | 60 | Trust Manager and | ||
| Banco Itaú | Audit Committee | |||
| International | Chair — Camden | |||
| (April 2012–December 2016) | Property Trust | |||
| Executive Advisor to Dean | ||||
(August 2011–March 2012) and Interim Dean | ||||
| (January 2011–July 2011) — | ||||
| University of Miami School of | ||||
| Business Administration | ||||
| President — U.S. Trust, | ||||
| Bank of America Private | ||||
| Wealth Management | ||||
| (Private Banking) | ||||
| (July 2007–December 2008) | ||||
83
Table of Contents
Board of trustees / directors and officers addendum
Delaware FundsSM by Macquarie
| Name, Address, | Position(s) | Length of | ||
| and Birth Date | Held with Fund(s) | Time Served | ||
Independent Trustees (continued)
| ||||
| Thomas K. Whitford | Trustee | Since January 2013 | ||
| 2005 Market Street | ||||
| Philadelphia, PA 19103 | ||||
March 1956
| ||||
| Janet L. Yeomans | Trustee | Since April 1999 | ||
| 2005 Market Street | ||||
| Philadelphia, PA 19103 | ||||
July 1948
| ||||
Officers
| ||||
| David F. Connor | Senior Vice President, | Senior Vice President | ||
| 2005 Market Street | General Counsel, | since May 2013; | ||
| Philadelphia, PA 19103 | and Secretary | General Counsel | ||
| December 1963 | since May 2015; | |||
| Secretary since | ||||
October 2005
| ||||
| Daniel V. Geatens | Vice President | Treasurer since October 2007 | ||
| 2005 Market Street | and Treasurer | |||
| Philadelphia, PA 19103 | ||||
October 1972
| ||||
| Richard Salus | Senior Vice President | Chief Financial Officer | ||
| 2005 Market Street | and Chief Financial Officer | since November 2006 | ||
| Philadelphia, PA 19103 | ||||
October 1963
| ||||
The Statement of Additional Information for the Fund(s) includes additional information about the Trustees and Officers and is available, without charge, upon request by calling 800 523-1918.
84
Table of Contents
| Number of Portfolios in | ||||
| Principal Occupation(s) | Fund Complex Overseen | Other Directorships | ||
| During the Past Five Years | by Trustee or Officer | Held by Trustee or Officer | ||
| Vice Chairman | 60 | Director — HSBC Finance | ||
| (2010–April 2013) — | Corporation and HSBC | |||
| PNC Financial | North America Holdings Inc. | |||
| Services Group | ||||
| Director — | ||||
HSBC USA Inc.
| ||||
| Vice President and Treasurer | 60 | Director (2009–2017); | ||
| (January 2006–July 2012), | Personnel and Compensation | |||
Vice President — Mergers & Acquisitions (January 2003–January 2006), and Vice President | Committee Chair; Member of Nominating, Investments, and Audit Committees for various periods throughout | |||
| and Treasurer | directorship — | |||
| (July 1995–January 2003) — | Okabena Company | |||
3M Company
| ||||
| David F. Connor has served | 60 | None2 | ||
in various capacities at different times at | ||||
| Macquarie Investment | ||||
Management.
| ||||
| Daniel V. Geatens has served | 60 | None2 | ||
in various capacities at different times at | ||||
| Macquarie Investment | ||||
Management.
| ||||
| Richard Salus has served | 60 | None2 | ||
in various executive capacities at different times at | ||||
| Macquarie Investment | ||||
Management.
| ||||
85
Table of Contents
Board of trustees | ||||||
Shawn K. Lytle President and Chief Executive Officer Delaware FundsSM by Macquarie Philadelphia, PA
Thomas L. Bennett Chairman of the Board Delaware Funds by Macquarie Private Investor Rosemont, PA | Ann D. Borowiec Former Chief Executive Officer Private Wealth Management J.P. Morgan Chase & Co. New York, NY
Joseph W. Chow Former Executive Vice President State Street Corporation Boston, MA | John A. Fry President Drexel University Philadelphia, PA
Lucinda S. Landreth Former Chief Investment Officer Assurant, Inc. New York, NY | Frances A. Sevilla-Sacasa Former Chief Executive Officer Banco Itaú International Miami, FL
Thomas K. Whitford Former Vice Chairman PNC Financial Services Group Pittsburgh, PA
Janet L. Yeomans Former Vice President and Treasurer 3M Company St. Paul, MN | |||
Affiliated officers | ||||||
| David F. Connor | Daniel V. Geatens | Richard Salus | ||||
| Senior Vice President, | Vice President and | Senior Vice President and | ||||
| General Counsel, | Treasurer | Chief Financial Officer | ||||
| and Secretary | Delaware Funds | Delaware Funds | ||||
| Delaware Funds | by Macquarie | by Macquarie | ||||
| by Macquarie | Philadelphia, PA | Philadelphia, PA | ||||
| Philadelphia, PA | ||||||
This annual report is for the information of Delaware Limited-Term Diversified Income Fund shareholders, but it may be used with prospective investors when preceded or accompanied by the Delaware Fund fact sheet for the most recently completed calendar quarter. These documents are available at delawarefunds.com/literature.
The Fund files its complete schedule of portfolio holdings with the Securities and Exchange Commission (SEC) for the first and third quarters of each fiscal year on Form N-Q. The Fund’s Forms N-Q, as well as a description of the policies and procedures that the Fund uses to determine how to vote proxies (if any) relating to portfolio securities are available without charge (i) upon request, by calling 800 523-1918; and (ii) on the SEC’s website at sec.gov. In addition, a description of the policies and procedures that the Fund uses to determine how to vote proxies (if any) relating to portfolio securities and the Schedule of Investments included in the Fund’s most recent Form N-Q are available without charge on the Fund’s website at delawarefunds.com/literature. The Fund’s Forms N-Q may be reviewed and copied at the SEC’s Public Reference Room in Washington, D.C.; information on the operation of the Public Reference Room may be obtained by calling 800 SEC-0330.
Information (if any) regarding how the Fund voted proxies relating to portfolio securities during the most recently disclosed 12-month period ended June 30 is available without charge (i) through the Fund’s website at delawarefunds.com/proxy; and (ii) on the SEC’s website at sec.gov.
86
Item 2. Code of Ethics
The registrant has adopted a code of ethics that applies to the registrant’s principal executive officer, principal financial officer, principal accounting officer or controller, or persons performing similar functions, regardless of whether these individuals are employed by the registrant or a third party. A copy of the registrant’s Code of Business Ethics has been posted on the Delaware FundsSM by Macquarie Internet Web site at www.delawarefunds.com. Any amendments to the Code of Business Ethics, and information on any waiver from its provisions granted by the registrant, will also be posted on this Web site within five business days of such amendment or waiver and will remain on the Web site for at least 12 months.
Item 3. Audit Committee Financial Expert
The registrant’s Board of Trustees has determined that certain members of the registrant’s Audit Committee are audit committee financial experts, as defined below. For purposes of this item, an “audit committee financial expert” is a person who has the following attributes:
a. An understanding of generally accepted accounting principles and financial statements;
b. The ability to assess the general application of such principles in connection with the accounting for estimates, accruals, and reserves;
c. Experience preparing, auditing, analyzing, or evaluating financial statements that present a breadth and level of complexity of accounting issues that are generally comparable to the breadth and complexity of issues that can reasonably be expected to be raised by the registrant’s financial statements, or experience actively supervising one or more persons engaged in such activities;
d. An understanding of internal controls and procedures for financial reporting; and
e. An understanding of audit committee functions.
An “audit committee financial expert” shall have acquired such attributes through:
a. Education and experience as a principal financial officer, principal accounting officer, controller, public accountant, or auditor or experience in one or more positions that involve the performance of similar functions;
b. Experience actively supervising a principal financial officer, principal accounting officer, controller, public accountant, auditor, or person performing similar functions;
c. Experience overseeing or assessing the performance of companies or public accountants with respect to the preparation, auditing, or evaluation of financial statements; or
d. Other relevant experience.
The registrant’s Board of Trustees/Directors has also determined that each member of the registrant’s Audit Committee is independent. In order to be “independent” for purposes of this item, the Audit Committee member may not: (i) other than in his or her capacity as a member of the Board of Trustees/Directors or any committee thereof, accept directly or indirectly any consulting, advisory or other compensatory fee from the issuer; or (ii) be an “interested person” of the registrant as defined in Section 2(a)(19) of the Investment Company Act of 1940.
The names of the audit committee financial experts on the registrant’s Audit Committee are set forth below:
Joseph W. Chow
John A. Fry
Lucinda S. Landreth
Thomas K. Whitford
Item 4. Principal Accountant Fees and Services
(a) Audit fees.
The aggregate fees billed for services provided to the registrant by its independent auditors for the audit of the registrant’s annual financial statements and for services normally provided by the independent auditors in connection with statutory and regulatory filings or engagements were $45,575 for the fiscal year ended December 31, 2017.
The aggregate fees billed for services provided to the registrant by its independent auditors for the audit of the registrant’s annual financial statements and for services normally provided by the independent auditors in connection with statutory and regulatory filings or engagements were $45,575 for the fiscal year ended December 31, 2016.
(b) Audit-related fees.
The aggregate fees billed by the registrant’s independent auditors for services relating to the performance of the audit of the registrant’s financial statements and not reported under paragraph (a) of this Item were $0 for the fiscal year ended December 31, 2017.
The aggregate fees billed by the registrant’s independent auditors for services relating to the performance of the audit of the financial statements of the registrant’s investment adviser and other service providers under common control with the adviser and that relate directly to the operations or financial reporting of the registrant were $640,000 for the registrant’s fiscal year ended December 31, 2017. The percentage of these fees relating to services approved by the registrant’s Audit Committee pursuant to the de minimis exception from the pre-approval requirement in Rule 2-01(c)(7)(i)(C) of Regulation S-X was 0%. These audit-related services were as follows: year-end audit procedures; group reporting and subsidiary statutory audits.
The aggregate fees billed by the registrant’s independent auditors for services relating to the performance of the audit of the registrant’s financial statements and not reported under paragraph (a) of this Item were $0 for the fiscal year ended December 31, 2016.
The aggregate fees billed by the registrant’s independent auditors for services relating to the performance of the audit of the financial statements of the registrant’s investment adviser and other service providers under common control with the adviser and that relate directly to the operations or financial reporting of the registrant were $667,000 for the registrant’s fiscal year ended December 31, 2016. The percentage of these fees relating to services approved by the registrant’s Audit Committee pursuant to the de minimis exception from the pre-approval requirement in Rule 2-01(c)(7)(i)(C) of Regulation S-X was 0%. These audit-related services were as follows: year-end audit procedures; group reporting and subsidiary statutory audits.
(c) Tax fees.
The aggregate fees billed by the registrant’s independent auditors for tax-related services provided to the registrant were $5,733 for the fiscal year ended December 31, 2017. The percentage of these fees relating to services approved by the registrant’s Audit Committee pursuant to the de minimis exception from the pre-approval requirement in Rule 2-01(c)(7)(i)(C) of Regulation S-X was 0%. These tax-related services were as follows: review of income tax returns and review of annual excise distribution calculations.
The aggregate fees billed by the registrant’s independent auditors for tax-related services provided to the registrant’s investment adviser and other service providers under common control with the adviser and that relate directly to the operations or financial reporting of the registrant were $0 for the registrant’s fiscal year ended December 31, 2017. The percentage of these fees relating to services approved by the registrant’s Audit Committee pursuant to the de minimis exception from the pre-approval requirement in Rule 2-01(c)(7)(i)(C) of Regulation S-X was 0%.
The aggregate fees billed by the registrant’s independent auditors for tax-related services provided to the registrant were $5,558 for the fiscal year ended December 31, 2016. The percentage of these fees relating to services approved by the registrant’s Audit Committee pursuant to the de minimis exception from the pre-approval requirement in Rule 2-01(c)(7)(i)(C) of Regulation S-X was 0%. These tax-related services were as follows: review of income tax returns and review of annual excise distribution calculations.
The aggregate fees billed by the registrant’s independent auditors for tax-related services provided to the registrant’s investment adviser and other service providers under common control with the adviser and that relate directly to the operations or financial reporting of the registrant were $0 for the registrant’s fiscal year ended December 31, 2016. The percentage of these fees relating to services approved by the registrant’s Audit Committee pursuant to the de minimis exception from the pre-approval requirement in Rule 2-01(c)(7)(i)(C) of Regulation S-X was 0%.
(d) All other fees.
The aggregate fees billed for all services provided by the independent auditors to the registrant other than those set forth in paragraphs (a), (b) and (c) of this Item were $0 for the fiscal year ended December 31, 2017.
The aggregate fees billed for all services other than those set forth in paragraphs (b) and (c) of this Item provided by the registrant’s independent auditors to the registrant’s adviser and other service providers under common control with the adviser and that relate directly to the operations or financial reporting of the registrant were $0 for the registrant’s fiscal year ended December 31, 2017. The percentage of these fees relating to services approved by the registrant’s Audit Committee pursuant to the de minimis exception from the pre-approval requirement in Rule 2-01(c)(7)(i)(C) of Regulation S-X was 0%.
The aggregate fees billed for all services provided by the independent auditors to the registrant other than those set forth in paragraphs (a), (b) and (c) of this Item were $0 for the fiscal year ended December 31, 2016.
The aggregate fees billed for all services other than those set forth in paragraphs (b) and (c) of this Item provided by the registrant’s independent auditors to the registrant’s adviser and other service providers under common control with the adviser and that relate directly to the operations or financial reporting of the registrant were $0 for the registrant’s fiscal year ended December 31, 2016. The percentage of these fees relating to services approved by the registrant’s Audit Committee pursuant to the de minimis exception from the pre-approval requirement in Rule 2-01(c)(7)(i)(C) of Regulation S-X was 0%.
(e) The registrant’s Audit Committee has established pre-approval policies and procedures as permitted by Rule 2-01(c)(7)(i)(B) of Regulation S-X (the “Pre-Approval Policy”) with respect to services provided by the registrant’s independent auditors. Pursuant to the Pre-Approval Policy, the Audit Committee has pre-approved the services set forth in the table below with respect to the registrant up to the specified fee limits. Certain fee limits are based on aggregate fees to the registrant and other registrants within the Delaware FundsSM by Macquarie.
| Service | Range of Fees |
| Audit Services | |
| Statutory audits or financial audits for new Funds | up to $40,000 per Fund |
| Services associated with SEC registration statements (e.g., Form N-1A, Form N-14, etc.), periodic reports and other documents filed with the SEC or other documents issued in connection with securities offerings (e.g., comfort letters for closed-end Fund offerings, consents), and assistance in responding to SEC comment letters | up to $10,000 per Fund |
| Consultations by Fund management as to the accounting or disclosure treatment of transactions or events and/or the actual or potential impact of final or proposed rules, standards or interpretations by the SEC, FASB, or other regulatory or standard-setting bodies (Note: Under SEC rules, some consultations may be considered “audit-related services” rather than “audit services”) | up to $25,000 in the aggregate |
| Audit-Related Services | |
| Consultations by Fund management as to the accounting or disclosure treatment of transactions or events and /or the actual or potential impact of final or proposed rules, standards or interpretations by the SEC, FASB, or other regulatory or standard-setting bodies (Note: Under SEC rules, some consultations may be considered “audit services” rather than “audit-related services”) | up to $25,000 in the aggregate |
| Tax Services | |
| U.S. federal, state and local and international tax planning and advice (e.g., consulting on statutory, regulatory or administrative developments, evaluation of Funds’ tax compliance function, etc.) | up to $25,000 in the aggregate |
| U.S. federal, state and local tax compliance (e.g., excise distribution reviews, etc.) | up to $5,000 per Fund |
| Review of federal, state, local and international income, franchise and other tax returns | up to $5,000 per Fund |
Under the Pre-Approval Policy, the Audit Committee has also pre-approved the services set forth in the table below with respect to the registrant’s investment adviser and other entities controlling, controlled by or under common control with the investment adviser that provide ongoing services to the registrant (the “Control Affiliates”) up to the specified fee limit. This fee limit is based on aggregate fees to the investment adviser and its Control Affiliates.
| Service | Range of Fees |
| Non-Audit Services | |
| Services associated with periodic reports and other documents filed with the SEC and assistance in responding to SEC comment letters | up to $10,000 in the aggregate |
The Pre-Approval Policy requires the registrant’s independent auditors to report to the Audit Committee at each of its regular meetings regarding all services initiated since the last such report was rendered, including those services authorized by the Pre-Approval Policy.
(f) Not applicable.
(g) The aggregate non-audit fees billed by the registrant’s independent auditors for services rendered to the registrant and to its investment adviser and other service providers under common control with the adviser were $11,180,000 and $8,665,000 for the registrant’s fiscal years ended December 31, 2017 and December 31, 2016, respectively.
(h) In connection with its selection of the independent auditors, the registrant’s Audit Committee has considered the independent auditors’ provision of non-audit services to the registrant’s investment adviser and other service providers under common control with the adviser that were not required to be pre-approved pursuant to Rule 2-01(c)(7)(ii) of Regulation S-X. The Audit Committee has determined that the independent auditors’ provision of these services is compatible with maintaining the auditors’ independence.
Item 5. Audit Committee of Listed Registrants
Not applicable.
Item 6. Investments
(a) Included as part of report to shareholders filed under Item 1 of this Form N-CSR.
(b) Divestment of securities in accordance with Section 13(c) of the Investment Company Act of 1940.
Not applicable.
Item 7. Disclosure of Proxy Voting Policies and Procedures for Closed-End Management Investment Companies
Not applicable.
Item 8. Portfolio Managers of Closed-End Management Investment Companies
Not applicable.
Item 9. Purchases of Equity Securities by Closed-End Management Investment Company and Affiliated Purchasers
Not applicable.
Item 10. Submission of Matters to a Vote of Security Holders
Not applicable.
Item 11. Controls and Procedures
The registrant’s principal executive officer and principal financial officer have evaluated the registrant’s disclosure controls and procedures within 90 days of the filing of this report and have concluded that they are effective in providing reasonable assurance that the information required to be disclosed by the registrant in its reports or statements filed under the Securities Exchange Act of 1934 is recorded, processed, summarized and reported within the time periods specified in the rules and forms of the Securities and Exchange Commission.
There were no significant changes in the registrant’s internal control over financial reporting that occurred during the second fiscal quarter of the period covered by the report to stockholders included herein (i.e., the registrant’s fourth fiscal quarter) that have materially affected, or are reasonably likely to materially affect, the registrant’s internal control over financial reporting.
Item 12. Exhibits
(a) (1) Code of Ethics
Not applicable.
(2) Certifications of Principal Executive Officer and Principal Financial Officer pursuant to Rule 30a-2 under the Investment Company Act of 1940 are attached hereto as Exhibit 99.CERT.
(3) Written solicitations to purchase securities pursuant to Rule 23c-1 under the Securities Exchange Act of 1934.
Not applicable.
(b) Certifications pursuant to Section 906 of the Sarbanes-Oxley Act of 2002 are furnished herewith as Exhibit 99.906CERT.
SIGNATURES
Pursuant to the requirements of the Securities Exchange Act of 1934 and the Investment Company Act of 1940, the registrant has duly caused this report to be signed on its behalf, by the undersigned, thereunto duly authorized.
DELAWARE GROUP® LIMITED-TERM GOVERNMENT FUNDS
| SHAWN K. LYTLE | |
| By: | Shawn K. Lytle |
| Title: | President and Chief Executive Officer |
| Date: | March 2, 2018 |
Pursuant to the requirements of the Securities Exchange Act of 1934 and the Investment Company Act of 1940, this report has been signed below by the following persons on behalf of the registrant and in the capacities and on the dates indicated.
| SHAWN K. LYTLE | |
| By: | Shawn K. Lytle |
| Title: | President and Chief Executive Officer |
| Date: | March 2, 2018 |
| RICHARD SALUS | |
| By: | Richard Salus |
| Title: | Chief Financial Officer |
| Date: | March 2, 2018 |