UNITED STATES
SECURITIES AND EXCHANGE COMMISSION
Washington, D.C. 20549
FORM N-CSR
CERTIFIED SHAREHOLDER REPORT
OF
REGISTERED MANAGEMENT INVESTMENT COMPANIES
Investment Company Act file number: 811-02652
Name of Registrant: Vanguard Index Funds
Address of Registrant:
P.O. Box 2600
Valley Forge, PA 19482
Name and address of agent for service:
Heidi Stam, Esquire
P.O. Box 876
Valley Forge, PA 19482
Registrant’s telephone number, including area code: (610) 669-1000
Date of fiscal year end: December 31
Date of reporting period: January 1, 2013 – December 31, 2013
Item 1: Reports to Shareholders
![]()
Annual Report | December 31, 2013
Vanguard 500 Index Fund

Vanguard’s Principles for Investing Success
We want to give you the best chance of investment success. These principles, grounded in Vanguard’s research and experience, can put you on the right path.
Goals. Create clear, appropriate investment goals.
Balance. Develop a suitable asset allocation using broadly diversified funds. Cost. Minimize cost.
Discipline. Maintain perspective and long-term discipline.
A single theme unites these principles: Focus on the things you can control.
We believe there is no wiser course for any investor.
| Contents | |
| Your Fund’s Total Returns. | 1 |
| Chairman’s Letter. | 2 |
| Fund Profile. | 9 |
| Performance Summary. | 11 |
| Financial Statements. | 14 |
| Your Fund’s After-Tax Returns. | 34 |
| About Your Fund’s Expenses. | 35 |
| Glossary. | 37 |
Please note: The opinions expressed in this report are just that—informed opinions. They should not be considered promises or advice.
Also, please keep in mind that the information and opinions cover the period through the date on the front of this report. Of course, the risks of investing in your fund are spelled out in the prospectus.
See the Glossary for definitions of investment terms used in this report.
About the cover: The ship’s wheel represents leadership and guidance, essential qualities in navigating difficult seas.
This one is a replica based on an 18th-century British vessel. The HMS Vanguard, another ship of that era, served as the flagship for British Admiral Horatio Nelson when he defeated a French fleet at the Battle of the Nile.
| Your Fund’s Total Returns | |
| Fiscal Year Ended December 31, 2013 | |
| Total | |
| Returns | |
| Vanguard 500 Index Fund | |
| Investor Shares | 32.18% |
| Admiral™ Shares | 32.33 |
| Signal® Shares | 32.33 |
| ETF Shares | |
| Market Price | 32.30 |
| Net Asset Value | 32.33 |
| S&P 500 Index | 32.39 |
| Large-Cap Core Funds Average | 31.42 |
| Large-Cap Core Funds Average: Derived from data provided by Lipper, a Thomson Reuters Company. | |
Admiral Shares carry lower expenses and are available to investors who meet certain account-balance requirements. Signal Shares are available to certain institutional shareholders who meet specific administrative, service, and account-size criteria. The Vanguard ETF® Shares shown are traded on the NYSE Arca exchange and are available only through brokers. The table provides ETF returns based on both the NYSE Arca market price and the net asset value for a share. U.S. Pat. Nos. 6,879,964; 7,337,138; 7,720,749; 7,925,573; 8,090,646; and 8,417,623.
For the ETF Shares, the market price is determined by the midpoint of the bid-offer spread as of the closing time of the New York Stock Exchange (generally 4 p.m., Eastern time). The net asset value is also determined as of the NYSE closing time. For more information about how the ETF Shares' market prices have compared with their net asset value, visit vanguard.com, select your ETF, and then select the Price and Performance tab. The ETF premium/discount analysis there shows the percentages of days on which the ETF Shares' market price was above or below the NAV.
| Your Fund’s Performance at a Glance | ||||
| December 31, 2012, Through December 31, 2013 | ||||
| Distributions Per Share | ||||
| Starting | Ending | |||
| Share | Share | Income | Capital | |
| Price | Price | Dividends | Gains | |
| Vanguard 500 Index Fund | ||||
| Investor Shares | $131.37 | $170.36 | $2.948 | $0.000 |
| Admiral Shares | 131.37 | 170.36 | 3.132 | 0.000 |
| Signal Shares | 108.52 | 140.72 | 2.587 | 0.000 |
| ETF Shares | 130.381 | 169.07 | 3.1081 | 0.000 |
| 1 Shares adjusted to reflect a 1-for-2 reverse share split as of the close of business on October 24, 2013. | ||||
1

Chairman’s Letter
Dear Shareholder,
U.S. stocks steamed forward over the past 12 months, pausing little despite meeting a variety of obstacles along the way. Vanguard 500 Index Fund returned about 32% for the period, its best fiscal-year result since 1997, and closely tracked its benchmark, the Standard & Poor’s 500 Index. The fund slightly exceeded the average return of its large-capitalization core fund peers.
Although the 500 Index Fund recorded notable returns for the year, it made no capital gains distributions—continuing a streak begun in 2000 and providing a potential benefit to shareholders in taxable accounts. If you hold shares of the fund in a taxable account, you may wish to review the section on after-tax returns that appears later in this report.
Please note that we’ve made several important announcements about the fund over the last few months:
• We’re phasing out Signal Shares to streamline our share-class offerings. Your fund’s Signal Shares will be converted to Admiral Shares by October 2014.
• Vanguard Tax-Managed Growth and Income Fund will be merged into the 500 Index Fund in the next few months, a step designed to simplify our fund lineup. The tax-managed fund also closely follows the S&P 500 Index.
2
• A 1-for-2 reverse share split of the 500 Index Fund’s ETF Shares occurred on October 24, 2013. No other share classes were affected. We expect the split to lower transaction costs for ETF shareholders.
Earnings, optimism, and stimulus made it a big year for U.S. stocks
For the 12 months ended December 31, the broad U.S. stock market surged about 34%, its best calendar-year finish since 1995. Corporations posted solid earnings and investors placed a higher premium on those earnings. The Federal
Reserve’s stimulative bond-buying program also supported stock markets; in fact, they slumped a bit in the summer when questions arose about the timing of the program’s unwinding. In December, the Fed ended the uncertainty by announcing that it would begin paring its bond purchases in January 2014.
International stocks, in aggregate, returned about 15%, with the developed markets of Europe and the Pacific region posting double-digit results and emerging-market stocks dipping into negative territory.
For 2014, Vanguard Chief Economist Joe Davis and his team are guarded in their outlook for global stock returns, and their forecast for the bond market remains muted. While Joe readily acknowledges that such forecasts are accompanied by uncertainty, he writes, “We believe a balanced and diversified, low-cost portfolio can remain a high-value proposition in the decade ahead.” (You can read more
| Market Barometer | |||
| Average Annual Total Returns | |||
| Periods Ended December 31, 2013 | |||
| One | Three | Five | |
| Year | Years | Years | |
| Stocks | |||
| Russell 1000 Index (Large-caps) | 33.11% | 16.30% | 18.59% |
| Russell 2000 Index (Small-caps) | 38.82 | 15.67 | 20.08 |
| Russell 3000 Index (Broad U.S. market) | 33.55 | 16.24 | 18.71 |
| MSCI All Country World Index ex USA (International) | 15.29 | 5.14 | 12.81 |
| Bonds | |||
| Barclays U.S. Aggregate Bond Index (Broad taxable market) | -2.02% | 3.26% | 4.44% |
| Barclays Municipal Bond Index (Broad tax-exempt market) | -2.55 | 4.83 | 5.89 |
| Citigroup Three-Month U.S. Treasury Bill Index | 0.05 | 0.06 | 0.09 |
| CPI | |||
| Consumer Price Index | 1.50% | 2.07% | 2.08% |
3
about our expectations for bond and stock returns in Vanguard’s Economic and Investment Outlook, available at vanguard.com/research.)
Bond returns faltered in 2013 as the Fed’s phaseout loomed
The broad U.S. taxable bond market returned –2.02%—its first negative calendar-year result since 1999 and its worst calendar-year performance since 1994. The Fed’s plans for phasing out its bond-buying program rattled investors, who sold bonds in anticipation of further price declines. Municipal bonds returned –2.55% in aggregate. The yield of the 10-year Treasury note closed at 2.97%, up from 1.76% at the close of December 2012. (Bond yields and prices move in opposite directions.)
International bond markets (as measured by the Barclays Global Aggregate Index ex USD) returned –3.08%. As for money market funds and savings accounts, returns remained tiny as the Fed held short-term interest rates between 0% and 0.25%.
A broad spectrum of sectors produced an impressive result
In 2013, the stock market overcame much more than the Fed’s plans to curtail its bond-buying program; investors also confronted the U.S. government shutdown, strife in the Middle East, the failure of Cyprus’s banking system, and the sluggish global economy. Still, as I mentioned earlier, corporate profits impressed, and investors displayed growing confidence in the market.
| Expense Ratios | |||||
| Your Fund Compared With Its Peer Group | |||||
| Investor | Admiral | Signal | ETF | Peer Group | |
| Shares | Shares | Shares | Shares | Average | |
| 500 Index Fund | 0.17% | 0.05% | 0.05% | 0.05% | 1.15% |
The fund expense ratios shown are from the prospectus dated April 12, 2013, and represent estimated costs for the current fiscal year. For the fiscal year ended December 31, 2013, the fund’s expense ratios were 0.17% for Investor Shares, 0.05% for Admiral Shares, 0.05% for Signal Shares, and 0.05% for ETF Shares. The peer-group expense ratio is derived from data provided by Lipper, a Thomson Reuters Company, and captures information through year-end 2012.
Peer group: Large-Cap Core Funds.
4
Stocks of every size, style, and sector participated in the rally. The S&P 500 Index consists of 500 of the largest U.S. companies and accounts for more than three-quarters of the U.S. stock market’s value. However, small- and mid-capitalization stocks led large-caps over the year. Smaller companies generate more of their revenues and profits within the United States than larger multinational firms do. Because of this, small- and mid-caps are at an advantage when U.S. stocks trump their international counterparts and the U.S. economy is generally growing faster than other economies around the world.
Each of the fund’s ten industry sectors recorded double-digit returns, but just five accounted for three-quarters of its return: financials, health care, information technology, consumer discretionary, and industrials. The fund’s two smallest sectors––utilities and telecommunication services––were the only ones with returns below 20%.
The financial sector, the fund’s second largest, returned nearly 36%. Notable gains came from diversified financial services giants, insurance firms, commercial banks, asset managers, and consumer finance companies.
| Total Returns | |
| Ten Years Ended December 31, 2013 | |
| Average | |
| Annual Return | |
| 500 Index Fund Investor Shares | 7.29% |
| S&P 500 Index | 7.41 |
| Large-Cap Core Funds Average | 6.12 |
| Large-Cap Core Funds Average: Derived from data provided by Lipper, a Thomson Reuters Company. |
The figures shown represent past performance, which is not a guarantee of future results. (Current performance may be lower or higher than the performance data cited. For performance data current to the most recent month-end, visit our website at vanguard.com/performance.) Note, too, that both investment returns and principal value can fluctuate widely, so an investor’s shares, when sold, could be worth more or less than their original cost.
5
Overall, the sector was helped by the strong investing environment, fewer insurance claims, firmer corporate balance sheets, better lending conditions, and improved housing and labor markets.
The health care, consumer discretionary, and industrial sectors each returned more than 40%. Major pharmaceutical and biotechnology companies shined as
Don’t let a trick of the calendar alter your course
When making investment decisions, it’s important to weigh past returns with caution. That’s because investment returns from any particular period are an unreliable anchor for gauging the future. They can be highly date-dependent.
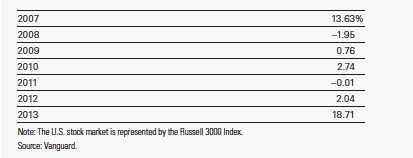
For example, take the five-year average annual return for the broad U.S. stock market. That average just made a startling bounce: from 2.04% for the period ended December 31, 2012, to 18.71% for the period ended December 31, 2013. True, the market returned a hearty 33.55% in the most recent 12 months, but that’s not enough to explain such a big leap in the average. Significantly, the 12 months ended December 31, 2008—when U.S. stocks returned –37.31% during the financial crisis—has now rolled off the five-year calculation.
The important thing to remember is that historical returns are just that: historical. Basing investment decisions on such date-dependent snapshots could easily lead you to alter course—possibly in the wrong direction. Instead, Vanguard believes, you should build your asset allocation strategy on long-term risk-and-return relationships, always recognizing that no level of return is guaranteed.
Which five-year average should you count on? (Answer: None of them!)
Average annual returns for U.S. stocks over five-year periods ended December 31
6
pipelines for new medicines expanded and favorable rulings from the Food and Drug Administration contributed to a more congenial business climate.
Within the consumer discretionary sector, media corporations and internet and specialty retailers reaped rewards from favorable customer and economic trends. Setting the pace in industrials were the aerospace and defense industries, where technological improvements and cost management have helped some companies offset cuts in government spending. Industrial conglomerates also did well.
Information technology, the fund’s largest sector, returned about 28% overall as software, internet, data processing services, and semiconductor stocks flourished. The consumer staples, energy, and materials sectors had returns of about 25%.
The fund sustained its lead over large-cap core peers
For the decade through December 2013, the 500 Index Fund recorded an average annual return of 7.29% for Investor Shares.
This result was in line that of the fund’s target benchmark, the S&P 500 Index, which has no transaction costs or operating expenses.
The close index tracking is all the more impressive when you remember that those ten years included the financial crisis and global recession of 2008–2009, which sent markets reeling. Vanguard Equity Investment Group, the fund’s advisor, deserves credit for its success in tracking the benchmark. The advisor was helped in this task by the fund’s low expenses, which are far below the average for its peer group.
Over the decade, the fund topped the 6.12% average annual result of its large-cap core fund peers. Those peers consist mostly of actively managed funds.
Rebalancing your portfolio keeps your target in focus
The surge in U.S. stocks in 2013 undoubtedly brought good cheer to investors at the end of the year. But while the rally has been welcome, we simply don’t know how long it will last. History teaches that it’s wise to anticipate a pullback in stocks after an extended winning streak.
At Vanguard, no matter what the current market conditions, we encourage you to maintain a diversified portfolio with a mix of stock, bond, and money market funds consistent with your long-term goals and risk tolerance.
7
Following such a robust year for stocks, you may find that your asset mix has drifted from your original target. If your allocation is off-target by about 5 percentage points or more, it may be time to rebalance. Specifically, the strong results for stocks and weak results for bonds in 2013 may mean directing assets from equities to fixed income.
I understand that it feels counterintuitive to move away from one asset class that’s done well recently and into another that’s underperformed. But, as a Vanguard research paper puts it, “bonds are likely to remain one of the best diversifiers of equity market risk and . . . will likely provide downside protection to balanced investors over the long term.” (You can read the paper, Risk of Loss: Should the Prospect of Rising Rates Push Investors from High-Quality Bonds?, at vanguard.com/research.)
Ultimately, rebalancing is about controlling risk by keeping your portfolio in line with your target asset allocation. The alternative is to allow market fluctuations to set your asset mix, potentially leaving you with a portfolio that’s more risky than you intended. As we’ve long counseled our clients, focusing on what you can control is one of the most prudent steps you can take as an investor.
Thank you for entrusting your assets to Vanguard.
Sincerely,

F. William McNabb III
Chairman and Chief Executive Officer
January 13, 2014
8
500 Index Fund
Fund Profile
As of December 31, 2013
| Share-Class Characteristics | ||||
| Investor | Admiral | Signal | ||
| Shares | Shares | Shares | ETF Shares | |
| Ticker Symbol | VFINX | VFIAX | VIFSX | VOO |
| Expense Ratio1 | 0.17% | 0.05% | 0.05% | 0.05% |
| 30-Day SEC Yield | 1.83% | 1.95% | 1.95% | 1.95% |
| Portfolio Characteristics | |||
| DJ | |||
| U.S. | |||
| Total | |||
| Stock | |||
| Market | |||
| S&P 500 | FA | ||
| Fund | Index | Index | |
| Number of Stocks | 502 | 500 | 3,653 |
| Median Market Cap | $70.5B | $70.5B | $43.0B |
| Price/Earnings Ratio | 19.2x | 19.2x | 20.7x |
| Price/Book Ratio | 2.7x | 2.7x | 2.7x |
| Return on Equity | 18.1% | 17.9% | 16.5% |
| Earnings Growth | |||
| Rate | 11.0% | 11.0% | 11.4% |
| Dividend Yield | 2.0% | 2.0% | 1.8% |
| Foreign Holdings | 0.0% | 0.0% | 0.0% |
| Turnover Rate | 3% | — | — |
| Short-Term Reserves | 0.2% | — | — |
| Volatility Measures | ||
| DJ | ||
| U.S. Total | ||
| S&P 500 | Stock Market | |
| Index | FA Index | |
| R-Squared | 1.00 | 1.00 |
| Beta | 1.00 | 0.95 |
| These measures show the degree and timing of the fund’s fluctuations compared with the indexes over 36 months. | ||
| Ten Largest Holdings (% of total net assets) | ||
| Apple Inc. | Computer Hardware | 3.0% |
| Exxon Mobil Corp. | Integrated Oil & Gas | 2.7 |
| Google Inc. | Internet Software & | |
| Services | 1.9 | |
| Microsoft Corp. | Systems Software | 1.7 |
| General Electric Co. | Industrial | |
| Conglomerates | 1.7 | |
| Johnson & Johnson | Pharmaceuticals | 1.6 |
| Chevron Corp. | Integrated Oil & Gas | 1.5 |
| Procter & Gamble Co. | Household Products | 1.3 |
| JPMorgan Chase & Co. | Diversified Financial | |
| Services | 1.3 | |
| Wells Fargo & Co. | Diversified Banks | 1.3 |
| Top Ten | 18.0% | |
| The holdings listed exclude any temporary cash investments and equity index products. | ||
1 The expense ratios shown are from the prospectus dated April 12, 2013, and represent estimated costs for the current fiscal year. For the fiscal year ended December 31, 2013, the expense ratios were 0.17% for Investor Shares, 0.05% for Admiral Shares, 0.05% for Signal Shares, and 0.05% for ETF Shares.
9
500 Index Fund
Investment Focus
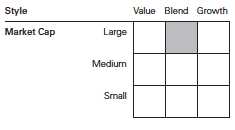
Sector Diversification (% of equity exposure)
| DJ | |||
| U.S. | |||
| Total | |||
| Stock | |||
| Market | |||
| S&P 500 | FA | ||
| Fund | Index | Index | |
| Consumer Discretionary | 12.5% | 12.5% | 13.3% |
| Consumer Staples | 9.8 | 9.8 | 8.5 |
| Energy | 10.3 | 10.3 | 9.4 |
| Financials | 16.2 | 16.2 | 17.3 |
| Health Care | 13.0 | 13.0 | 12.6 |
| Industrials | 10.9 | 10.9 | 11.8 |
| Information Technology | 18.6 | 18.6 | 18.1 |
| Materials | 3.5 | 3.5 | 3.9 |
| Telecommunication | |||
| Services | 2.3 | 2.3 | 2.1 |
| Utilities | 2.9 | 2.9 | 3.0 |
10
500 Index Fund
Performance Summary
All of the returns in this report represent past performance, which is not a guarantee of future results that may be achieved by the fund. (Current performance may be lower or higher than the performance data cited. For performance data current to the most recent month-end, visit our website at vanguard.com/performance.) Note, too, that both investment returns and principal value can fluctuate widely, so an investor’s shares, when sold, could be worth more or less than their original cost. The returns shown do not reflect taxes that a shareholder would pay on fund distributions or on the sale of fund shares.
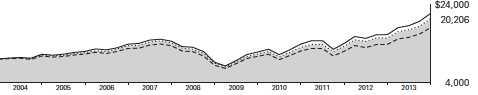
Cumulative Performance: December 31, 2003, Through December 31, 2013
Initial Investment of $10,000
| Average Annual Total Returns | |||||
| Periods Ended December 31, 2013 | |||||
| Final Value | |||||
| One | Five | Ten | of a $10,000 | ||
| Year | Years | Years | Investment | ||
| 500 Index Fund*Investor Shares | 32.18% | 17.81% | 7.29% | $20,206 | |
| •••••••• | S&P 500 Index | 32.39 | 17.94 | 7.41 | 20,430 |
| – – – – | Large-Cap Core Funds Average | 31.42 | 16.62 | 6.12 | 18,114 |
| Dow Jones U.S. Total Stock Market | |||||
| Float Adjusted Index | 33.47 | 18.86 | 8.09 | 21,777 | |
| Large-Cap Core Funds Average: Derived from data provided by Lipper, a Thomson Reuters Company. | |||||
| Final Value | |||||
| One | Five | Ten | of a $10,000 | ||
| Year | Years | Years | Investment | ||
| 500 Index Fund Admiral Shares | 32.33% | 17.94% | 7.39% | $20,409 | |
| S&P 500 Index | 32.39 | 17.94 | 7.41 | 20,430 | |
| Dow Jones U.S. Total Stock Market Float | |||||
| Adjusted Index | 33.47 | 18.86 | 8.09 | 21,777 | |
See Financial Highlights for dividend and capital gains information.
11
| 500 Index Fund | ||||
| Average Annual Total Returns | ||||
| Periods Ended December 31, 2013 | ||||
| Since | Final Value | |||
| One | Five | Inception | of a $10,000 | |
| Year | Years | (9/29/2006) | Investment | |
| 500 Index Fund Signal Shares | 32.33% | 17.94% | 6.86% | $16,184 |
| S&P 500 Index | 32.39 | 17.94 | 6.86 | 16,182 |
| Dow Jones U.S. Total Stock Market Float | ||||
| Adjusted Index | 33.47 | 18.86 | 7.46 | 16,856 |
"Since Inception" performance is calculated from the Signal Shares’ inception date for both the fund and its comparative standards.
| Since | Final Value | ||
| One | Inception | of a $10,000 | |
| Year | (9/7/2010) | Investment | |
| 500 Index Fund | |||
| ETF Shares Net Asset Value | 32.33% | 19.72% | $18,159 |
| S&P 500 Index | 32.39 | 19.75 | 18,177 |
| Dow Jones U.S. Total Stock Market Float | |||
| Adjusted Index | 33.47 | 20.23 | 18,417 |
| "Since Inception" performance is calculated from the ETF Shares’ inception date for both the fund and its comparative standards. | ||
| Cumulative Returns of ETF Shares: September 7, 2010, Through December 31, 2013 | ||
| Since | ||
| One | Inception | |
| Year | (9/7/2010) | |
| 500 Index Fund ETF Shares Market Price | 32.30% | 81.59% |
| 500 Index Fund ETF Shares Net Asset Value | 32.33 | 81.59 |
| S&P 500 Index | 32.39 | 81.77 |
"Since Inception" performance is calculated from the ETF Shares’ inception date for both the fund and its comparative standard.
12
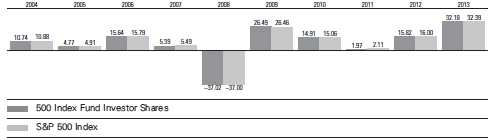
500 Index Fund
Fiscal-Year Total Returns (%): December 31, 2003, Through December 31, 2013
13
500 Index Fund
Financial Statements
Statement of Net Assets
As of December 31, 2013
The fund reports a complete list of its holdings in regulatory filings four times in each fiscal year, at the quarter-ends. For the second and fourth fiscal quarters, the lists appear in the fund’s semiannual and annual reports to shareholders. For the first and third fiscal quarters, the fund files the lists with the Securities and Exchange Commission on Form N-Q. Shareholders can look up the fund’s Forms N-Q on the SEC’s website at sec.gov. Forms N-Q may also be reviewed and copied at the SEC’s Public Reference Room (see the back cover of this report for further information).
| Market | |||
| Value | |||
| Shares | ($000) | ||
| Common Stocks (99.6%)1 | |||
| Consumer Discretionary (12.5%) | |||
| * | Amazon.com Inc. | 3,576,720 | 1,426,360 |
| Comcast Corp. Class A | 23,834,905 | 1,238,581 | |
| Walt Disney Co. | 15,765,695 | 1,204,499 | |
| Home Depot Inc. | 13,584,993 | 1,118,588 | |
| McDonald’s Corp. | 9,598,896 | 931,381 | |
| Twenty-First Century | |||
| Fox Inc. Class A | 18,930,648 | 665,980 | |
| Time Warner Inc. | 8,727,716 | 608,496 | |
| Ford Motor Co. | 38,051,589 | 587,136 | |
| * | priceline.com Inc. | 496,093 | 576,659 |
| Starbucks Corp. | 7,270,012 | 569,896 | |
| NIKE Inc. Class B | 7,208,322 | 566,862 | |
| Lowe’s Cos. Inc. | 10,088,956 | 499,908 | |
| * | General Motors Co. | 10,987,602 | 449,063 |
| TJX Cos. Inc. | 6,860,806 | 437,239 | |
| Target Corp. | 6,097,708 | 385,802 | |
| Time Warner Cable Inc. | 2,719,317 | 368,467 | |
| CBS Corp. Class B | 5,383,672 | 343,155 | |
| Viacom Inc. Class B | 3,915,075 | 341,943 | |
| Johnson Controls Inc. | 6,608,062 | 338,994 | |
| * | DIRECTV | 4,714,006 | 325,691 |
| Yum! Brands Inc. | 4,296,054 | 324,825 | |
| VF Corp. | 3,402,050 | 212,084 | |
| * | Netflix Inc. | 571,638 | 210,460 |
| * | Discovery | ||
| Communications Inc. | |||
| Class A | 2,176,959 | 196,841 | |
| Macy’s Inc. | 3,554,624 | 189,817 | |
| Omnicom Group Inc. | 2,482,643 | 184,634 | |
| * | Dollar General Corp. | 2,842,293 | 171,447 |
| Carnival Corp. | 4,225,507 | 169,739 | |
| * | Bed Bath & Beyond Inc. | 2,071,533 | 166,344 |
| Delphi Automotive plc | 2,701,345 | 162,432 | |
| * | Chipotle Mexican Grill Inc. | ||
| Class A | 298,518 | 159,044 | |
| * | AutoZone Inc. | 328,321 | 156,918 |
| Ross Stores Inc. | 2,090,200 | 156,619 | |
| Market | |||
| Value | |||
| Shares | ($000) | ||
| Mattel Inc. | 3,264,799 | 155,339 | |
| Coach Inc. | 2,705,538 | 151,862 | |
| Wynn Resorts Ltd. | 779,174 | 151,323 | |
| Harley-Davidson Inc. | 2,132,944 | 147,685 | |
| Starwood Hotels & | |||
| Resorts Worldwide Inc. | 1,847,432 | 146,778 | |
| L Brands Inc. | 2,352,203 | 145,484 | |
| * | Michael Kors Holdings | ||
| Ltd. | 1,730,635 | 140,510 | |
| * | O’Reilly Automotive Inc. | 1,035,270 | 133,250 |
| Genuine Parts Co. | 1,489,079 | 123,876 | |
| BorgWarner Inc. | 2,196,024 | 122,780 | |
| Whirlpool Corp. | 757,207 | 118,775 | |
| * | Dollar Tree Inc. | 2,007,376 | 113,256 |
| Kohl’s Corp. | 1,941,844 | 110,200 | |
| PVH Corp. | 786,885 | 107,032 | |
| Marriott International Inc. | 2,167,194 | 106,973 | |
| Best Buy Co. Inc. | 2,636,945 | 105,161 | |
| Ralph Lauren Corp. | |||
| Class A | 575,144 | 101,553 | |
| * | CarMax Inc. | 2,154,594 | 101,309 |
| Staples Inc. | 6,371,629 | 101,245 | |
| Gap Inc. | 2,555,350 | 99,863 | |
| Tiffany & Co. | 1,062,245 | 98,555 | |
| Wyndham Worldwide | |||
| Corp. | 1,257,034 | 92,631 | |
| Scripps Networks | |||
| Interactive Inc. Class A | 1,056,801 | 91,318 | |
| Newell Rubbermaid Inc. | 2,770,623 | 89,796 | |
| * | TripAdvisor Inc. | 1,068,888 | 88,536 |
| * | Mohawk Industries Inc. | 588,578 | 87,639 |
| * | News Corp. Class A | 4,802,311 | 86,538 |
| Nordstrom Inc. | 1,380,255 | 85,300 | |
| H&R Block Inc. | 2,636,105 | 76,552 | |
| PetSmart Inc. | 1,000,665 | 72,798 | |
| Interpublic Group of Cos. | |||
| Inc. | 4,015,434 | 71,073 | |
| Expedia Inc. | 993,384 | 69,199 | |
| Darden Restaurants Inc. | 1,259,532 | 68,481 | |
| PulteGroup Inc. | 3,325,702 | 67,745 |
14
| 500 Index Fund | |||
| Market | |||
| Value | |||
| Shares | ($000) | ||
| Comcast Corp. | 1,304,720 | 65,079 | |
| Gannett Co. Inc. | 2,198,370 | 65,028 | |
| Lennar Corp. Class A | 1,612,971 | 63,809 | |
| Hasbro Inc. | 1,114,043 | 61,284 | |
| * | DR Horton Inc. | 2,741,540 | 61,191 |
| Family Dollar Stores Inc. | 932,728 | 60,599 | |
| * | Fossil Group Inc. | 473,959 | 56,847 |
| Goodyear Tire & Rubber | |||
| Co. | 2,381,834 | 56,807 | |
| GameStop Corp. Class A | 1,127,658 | 55,548 | |
| ^ | Garmin Ltd. | 1,186,468 | 54,839 |
| Harman International | |||
| Industries Inc. | 651,614 | 53,335 | |
| International Game | |||
| Technology | 2,401,086 | 43,604 | |
| Leggett & Platt Inc. | 1,362,224 | 42,147 | |
| * | Urban Outfitters Inc. | 1,051,963 | 39,028 |
| Cablevision Systems | |||
| Corp. Class A | 2,065,236 | 37,030 | |
| * | AutoNation Inc. | 622,911 | 30,952 |
| * | Graham Holdings Co. | ||
| Class B | 42,017 | 27,871 | |
| 19,951,317 | |||
| Consumer Staples (9.7%) | |||
| Procter & Gamble Co. | 26,222,535 | 2,134,777 | |
| Coca-Cola Co. | 36,636,011 | 1,513,434 | |
| Philip Morris | |||
| International Inc. | 15,455,937 | 1,346,676 | |
| Wal-Mart Stores Inc. | 15,607,564 | 1,228,159 | |
| PepsiCo Inc. | 14,794,472 | 1,227,054 | |
| CVS Caremark Corp. | 11,482,168 | 821,779 | |
| Altria Group Inc. | 19,293,886 | 740,692 | |
| Mondelez | |||
| International Inc. | |||
| Class A | 16,918,621 | 597,227 | |
| Colgate-Palmolive Co. | 8,479,068 | 552,920 | |
| Costco Wholesale Corp. | 4,214,928 | 501,619 | |
| Walgreen Co. | 8,401,153 | 482,562 | |
| Kimberly-Clark Corp. | 3,681,589 | 384,579 | |
| Kraft Foods Group Inc. | 5,748,338 | 309,950 | |
| General Mills Inc. | 6,118,584 | 305,379 | |
| Archer-Daniels-Midland | |||
| Co. | 6,347,337 | 275,474 | |
| Whole Foods Market Inc. | 3,589,941 | 207,606 | |
| Sysco Corp. | 5,610,377 | 202,535 | |
| Kroger Co. | 5,020,484 | 198,460 | |
| Estee Lauder Cos. Inc. | |||
| Class A | 2,470,068 | 186,046 | |
| Lorillard Inc. | 3,553,518 | 180,092 | |
| Mead Johnson Nutrition | |||
| Co. | 1,948,519 | 163,208 | |
| Kellogg Co. | 2,480,798 | 151,502 | |
| Reynolds American Inc. | 3,023,887 | 151,164 | |
| Hershey Co. | 1,445,091 | 140,506 | |
| ConAgra Foods Inc. | 4,069,806 | 137,152 | |
| Market | |||
| Value | |||
| Shares | ($000) | ||
| Brown-Forman Corp. | |||
| Class B | 1,562,998 | 118,116 | |
| Clorox Co. | 1,244,808 | 115,468 | |
| * | Constellation Brands Inc. | ||
| Class A | 1,607,382 | 113,128 | |
| Beam Inc. | 1,573,141 | 107,068 | |
| JM Smucker Co. | 1,014,244 | 105,096 | |
| Coca-Cola Enterprises | |||
| Inc. | 2,329,372 | 102,795 | |
| Dr Pepper Snapple | |||
| Group Inc. | 1,935,505 | 94,298 | |
| * | Monster Beverage Corp. | 1,310,196 | 88,792 |
| McCormick & Co. Inc. | 1,273,859 | 87,794 | |
| Tyson Foods Inc. Class A | 2,620,240 | 87,673 | |
| Molson Coors Brewing | |||
| Co. Class B | 1,525,246 | 85,643 | |
| Safeway Inc. | 2,380,947 | 77,547 | |
| Campbell Soup Co. | 1,732,185 | 74,969 | |
| Avon Products Inc. | 4,184,465 | 72,056 | |
| Hormel Foods Corp. | 1,298,439 | 58,651 | |
| 15,529,646 | |||
| Energy (10.2%) | |||
| Exxon Mobil Corp. | 42,142,620 | 4,264,833 | |
| Chevron Corp. | 18,552,616 | 2,317,407 | |
| Schlumberger Ltd. | 12,704,517 | 1,144,804 | |
| ConocoPhillips | 11,818,379 | 834,969 | |
| Occidental Petroleum | |||
| Corp. | 7,775,895 | 739,488 | |
| Phillips 66 | 5,783,626 | 446,091 | |
| EOG Resources Inc. | 2,633,302 | 441,973 | |
| Halliburton Co. | 8,182,815 | 415,278 | |
| Anadarko Petroleum | |||
| Corp. | 4,854,907 | 385,091 | |
| Apache Corp. | 3,851,351 | 330,985 | |
| National Oilwell Varco | |||
| Inc. | 4,129,842 | 328,446 | |
| Marathon Petroleum | |||
| Corp. | 2,903,942 | 266,379 | |
| Valero Energy Corp. | 5,205,044 | 262,334 | |
| Williams Cos. Inc. | 6,592,919 | 254,289 | |
| Pioneer Natural | |||
| Resources Co. | 1,375,911 | 253,264 | |
| Marathon Oil Corp. | 6,720,306 | 237,227 | |
| Baker Hughes Inc. | 4,275,707 | 236,276 | |
| Noble Energy Inc. | 3,465,920 | 236,064 | |
| Kinder Morgan Inc. | 6,495,258 | 233,829 | |
| Spectra Energy Corp. | 6,463,798 | 230,241 | |
| Devon Energy Corp. | 3,681,607 | 227,781 | |
| Hess Corp. | 2,743,994 | 227,752 | |
| Transocean Ltd. | 3,269,819 | 161,594 | |
| Cabot Oil & Gas Corp. | 4,062,799 | 157,474 | |
| * | Cameron International | ||
| Corp. | 2,294,707 | 136,604 | |
| * | Southwestern | ||
| Energy Co. | 3,383,073 | 133,056 | |
15
| 500 Index Fund | |||
| Market | |||
| Value | |||
| Shares | ($000) | ||
| Range Resources Corp. | 1,576,498 | 132,915 | |
| Chesapeake Energy Corp. | 4,876,148 | 132,339 | |
| EQT Corp. | 1,453,957 | 130,536 | |
| Ensco plc Class A | 2,253,409 | 128,850 | |
| * | FMC Technologies Inc. | 2,282,330 | 119,160 |
| Murphy Oil Corp. | 1,695,517 | 110,005 | |
| Noble Corp. plc | 2,444,504 | 91,596 | |
| Helmerich & Payne Inc. | 1,033,638 | 86,908 | |
| CONSOL Energy Inc. | 2,208,528 | 84,012 | |
| Tesoro Corp. | 1,281,364 | 74,960 | |
| * | Denbury Resources Inc. | 3,537,324 | 58,118 |
| QEP Resources Inc. | 1,729,430 | 53,007 | |
| Peabody Energy Corp. | 2,602,959 | 50,836 | |
| Nabors Industries Ltd. | 2,505,707 | 42,572 | |
| * | Rowan Cos. plc Class A | 1,198,495 | 42,379 |
| * | WPX Energy Inc. | 1,937,108 | 39,478 |
| Diamond Offshore | |||
| Drilling Inc. | 670,556 | 38,168 | |
| * | Newfield Exploration Co. | 1,313,211 | 32,344 |
| 16,351,712 | |||
| Financials (16.1%) | |||
| JPMorgan Chase & Co. | 36,264,601 | 2,120,754 | |
| Wells Fargo & Co. | 46,242,588 | 2,099,413 | |
| * | Berkshire Hathaway Inc. | ||
| Class B | 15,836,187 | 1,877,538 | |
| Bank of America Corp. | 102,895,234 | 1,602,079 | |
| Citigroup Inc. | 29,259,046 | 1,524,689 | |
| American Express Co. | 8,887,579 | 806,370 | |
| American International | |||
| Group Inc. | 14,203,547 | 725,091 | |
| Goldman Sachs | |||
| Group Inc. | 4,066,314 | 720,795 | |
| US Bancorp | 17,618,198 | 711,775 | |
| MetLife Inc. | 10,814,661 | 583,127 | |
| Simon Property Group | |||
| Inc. | 2,993,603 | 455,507 | |
| Capital One Financial | |||
| Corp. | 5,561,976 | 426,103 | |
| Morgan Stanley | 13,363,139 | 419,068 | |
| Prudential Financial Inc. | 4,466,483 | 411,899 | |
| PNC Financial Services | |||
| Group Inc. | 5,133,143 | 398,229 | |
| BlackRock Inc. | 1,225,782 | 387,923 | |
| Bank of New York | |||
| Mellon Corp. | 11,079,695 | 387,125 | |
| ACE Ltd. | 3,280,523 | 339,633 | |
| Travelers Cos. Inc. | 3,512,051 | 317,981 | |
| State Street Corp. | 4,234,900 | 310,799 | |
| American Tower | |||
| Corporation | 3,806,998 | 303,875 | |
| Aflac Inc. | 4,496,283 | 300,352 | |
| Charles Schwab Corp. | 11,193,353 | 291,027 | |
| Discover Financial | |||
| Services | 4,620,818 | 258,535 | |
| Market | |||
| Value | |||
| Shares | ($000) | ||
| Marsh & McLennan Cos. | |||
| Inc. | 5,294,000 | 256,018 | |
| BB&T Corp. | 6,800,352 | 253,789 | |
| IntercontinentalExchange | |||
| Group Inc. | 1,109,735 | 249,602 | |
| Aon plc | 2,904,169 | 243,631 | |
| Allstate Corp. | 4,387,827 | 239,312 | |
| CME Group Inc. | 3,041,101 | 238,605 | |
| Chubb Corp. | 2,428,610 | 234,677 | |
| Franklin Resources Inc. | 3,894,729 | 224,843 | |
| Ameriprise Financial Inc. | 1,876,719 | 215,917 | |
| T. Rowe Price Group Inc. | 2,517,004 | 210,849 | |
| Public Storage | 1,394,302 | 209,870 | |
| McGraw Hill Financial Inc. | 2,612,298 | 204,282 | |
| SunTrust Banks Inc. | 5,163,696 | 190,076 | |
| * | Berkshire Hathaway Inc. | ||
| Class A | 1,019 | 181,280 | |
| Fifth Third Bancorp | 8,516,545 | 179,103 | |
| Prologis Inc. | 4,811,100 | 177,770 | |
| Weyerhaeuser Co. | 5,621,781 | 177,480 | |
| Equity Residential | 3,233,452 | 167,719 | |
| Ventas Inc. | 2,836,982 | 162,502 | |
| HCP Inc. | 4,401,629 | 159,867 | |
| Hartford Financial | |||
| Services Group Inc. | 4,312,894 | 156,256 | |
| Invesco Ltd. | 4,276,275 | 155,656 | |
| Health Care REIT Inc. | 2,784,817 | 149,183 | |
| Vornado Realty Trust | 1,678,150 | 149,003 | |
| Boston Properties Inc. | 1,474,889 | 148,035 | |
| M&T Bank Corp. | 1,256,246 | 146,252 | |
| Progressive Corp. | 5,324,997 | 145,213 | |
| Moody’s Corp. | 1,825,924 | 143,280 | |
| Loews Corp. | 2,950,536 | 142,334 | |
| Host Hotels & Resorts | |||
| Inc. | 7,295,842 | 141,831 | |
| AvalonBay Communities | |||
| Inc. | 1,173,445 | 138,736 | |
| Northern Trust Corp. | 2,167,151 | 134,125 | |
| Regions Financial Corp. | 13,289,138 | 131,430 | |
| Lincoln National Corp. | 2,530,751 | 130,637 | |
| Principal Financial Group | |||
| Inc. | 2,640,875 | 130,222 | |
| KeyCorp | 8,650,119 | 116,085 | |
| SLM Corp. | 4,208,568 | 110,601 | |
| General Growth | |||
| Properties Inc. | 5,186,105 | 104,085 | |
| Unum Group | 2,519,324 | 88,378 | |
| XL Group plc Class A | 2,728,221 | 86,867 | |
| Leucadia National Corp. | 3,024,254 | 85,707 | |
| Comerica Inc. | 1,764,439 | 83,881 | |
| Macerich Co. | 1,355,682 | 79,836 | |
| Plum Creek Timber Co. | |||
| Inc. | 1,706,675 | 79,377 | |
| Kimco Realty Corp. | 3,952,199 | 78,056 |
16
| 500 Index Fund | |||
| Market | |||
| Value | |||
| Shares | ($000) | ||
| Huntington Bancshares | |||
| Inc. | 8,011,947 | 77,315 | |
| Cincinnati Financial Corp. | 1,422,369 | 74,489 | |
| * | Genworth Financial Inc. | ||
| Class A | 4,768,063 | 74,048 | |
| * | CBRE Group Inc. Class A | 2,685,491 | 70,628 |
| Torchmark Corp. | 872,199 | 68,162 | |
| * | E*TRADE Financial Corp. | 2,770,549 | 54,414 |
| Zions Bancorporation | 1,780,892 | 53,356 | |
| Assurant Inc. | 701,453 | 46,555 | |
| People’s United Financial | |||
| Inc. | 3,065,690 | 46,353 | |
| Legg Mason Inc. | 1,023,963 | 44,522 | |
| NASDAQ OMX Group Inc. | 1,115,387 | 44,392 | |
| Hudson City Bancorp Inc. | 4,587,843 | 43,263 | |
| Apartment Investment & | |||
| Management Co. | |||
| Class A | 1,407,556 | 36,470 | |
| 25,745,912 | |||
| Health Care (12.9%) | |||
| Johnson & Johnson | 27,218,190 | 2,492,914 | |
| Pfizer Inc. | 62,522,239 | 1,915,056 | |
| Merck & Co. Inc. | 28,187,531 | 1,410,786 | |
| * | Gilead Sciences Inc. | 14,792,066 | 1,111,624 |
| Bristol-Myers Squibb Co. | 15,884,077 | 844,239 | |
| Amgen Inc. | 7,274,911 | 830,504 | |
| AbbVie Inc. | 15,346,912 | 810,470 | |
| UnitedHealth Group Inc. | 9,712,022 | 731,315 | |
| * | Celgene Corp. | 3,975,179 | 671,646 |
| * | Biogen Idec Inc. | 2,278,716 | 637,471 |
| Abbott Laboratories | 14,915,919 | 571,727 | |
| Medtronic Inc. | 9,630,994 | 552,723 | |
| * | Express Scripts Holding | ||
| Co. | 7,773,425 | 546,005 | |
| Eli Lilly & Co. | 9,564,442 | 487,787 | |
| Thermo Fisher Scientific | |||
| Inc. | 3,486,010 | 388,167 | |
| Baxter International Inc. | 5,235,316 | 364,116 | |
| McKesson Corp. | 2,216,078 | 357,675 | |
| Allergan Inc. | 2,866,669 | 318,430 | |
| Covidien plc | 4,437,534 | 302,196 | |
| * | Actavis plc | 1,679,084 | 282,086 |
| WellPoint Inc. | 2,849,792 | 263,292 | |
| * | Alexion Pharmaceuticals | ||
| Inc. | 1,891,571 | 251,693 | |
| Aetna Inc. | 3,545,241 | 243,168 | |
| Cigna Corp. | 2,666,485 | 233,264 | |
| Cardinal Health Inc. | 3,294,195 | 220,085 | |
| Stryker Corp. | 2,847,441 | 213,957 | |
| * | Regeneron | ||
| Pharmaceuticals Inc. | 757,667 | 208,540 | |
| Becton Dickinson and Co. | 1,872,387 | 206,880 | |
| * | Perrigo Co. plc | 1,283,684 | 196,994 |
| Agilent Technologies Inc. | 3,191,113 | 182,500 | |
| Market | |||
| Value | |||
| Shares | ($000) | ||
| St. Jude Medical Inc. | 2,815,210 | 174,402 | |
| * | Vertex Pharmaceuticals | ||
| Inc. | 2,255,071 | 167,552 | |
| * | Mylan Inc. | 3,693,488 | 160,297 |
| * | Cerner Corp. | 2,847,801 | 158,736 |
| Zoetis Inc. | 4,823,518 | 157,681 | |
| AmerisourceBergen | |||
| Corp. Class A | 2,219,011 | 156,019 | |
| Humana Inc. | 1,504,076 | 155,251 | |
| * | Boston Scientific Corp. | 12,880,716 | 154,826 |
| Zimmer Holdings Inc. | 1,649,512 | 153,718 | |
| * | Intuitive Surgical Inc. | 367,220 | 141,042 |
| * | Forest Laboratories Inc. | 2,287,165 | 137,299 |
| * | Life Technologies Corp. | 1,665,609 | 126,253 |
| * | DaVita HealthCare | ||
| Partners Inc. | 1,703,042 | 107,922 | |
| CR Bard Inc. | 751,389 | 100,641 | |
| * | Waters Corp. | 821,164 | 82,116 |
| * | CareFusion Corp. | 2,038,733 | 81,182 |
| * | Varian Medical Systems | ||
| Inc. | 1,019,836 | 79,231 | |
| * | Laboratory Corp. | ||
| of America Holdings | 843,069 | 77,031 | |
| Quest Diagnostics Inc. | 1,402,863 | 75,109 | |
| * | Edwards Lifesciences | ||
| Corp. | 1,055,426 | 69,405 | |
| DENTSPLY International | |||
| Inc. | 1,376,111 | 66,714 | |
| * | Hospira Inc. | 1,600,141 | 66,054 |
| PerkinElmer Inc. | 1,084,324 | 44,707 | |
| * | Tenet Healthcare Corp. | 957,210 | 40,318 |
| Patterson Cos. Inc. | 804,144 | 33,131 | |
| 20,613,947 | |||
| Industrials (10.9%) | |||
| General Electric Co. | 97,601,350 | 2,735,766 | |
| United Technologies | |||
| Corp. | 8,143,603 | 926,742 | |
| Boeing Co. | 6,669,258 | 910,287 | |
| 3M Co. | 6,170,234 | 865,375 | |
| Union Pacific Corp. | 4,443,068 | 746,435 | |
| United Parcel Service Inc. | |||
| Class B | 6,895,800 | 724,611 | |
| Honeywell | |||
| International Inc. | 7,569,667 | 691,641 | |
| Caterpillar Inc. | 6,138,852 | 557,469 | |
| Emerson Electric Co. | 6,790,980 | 476,591 | |
| Danaher Corp. | 5,784,203 | 446,540 | |
| FedEx Corp. | 2,871,324 | 412,810 | |
| Lockheed Martin Corp. | 2,595,506 | 385,848 | |
| Precision Castparts Corp. | 1,401,241 | 377,354 | |
| Eaton Corp. plc | 4,577,420 | 348,433 | |
| Deere & Co. | 3,693,217 | 337,302 | |
| Illinois Tool Works Inc. | 3,939,091 | 331,199 | |
| General Dynamics Corp. | 3,227,818 | 308,418 | |
17
| 500 Index Fund | |||
| Market | |||
| Value | |||
| Shares | ($000) | ||
| CSX Corp. | 9,778,809 | 281,336 | |
| Raytheon Co. | 3,081,854 | 279,524 | |
| Norfolk Southern Corp. | 2,979,976 | 276,631 | |
| Northrop Grumman Corp. | 2,141,441 | 245,431 | |
| Cummins Inc. | 1,680,979 | 236,968 | |
| Delta Air Lines Inc. | 8,253,324 | 226,719 | |
| PACCAR Inc. | 3,415,867 | 202,117 | |
| Waste Management Inc. | 4,209,362 | 188,874 | |
| Parker Hannifin Corp. | 1,439,588 | 185,189 | |
| Tyco International Ltd. | 4,488,816 | 184,221 | |
| Ingersoll-Rand plc | 2,584,627 | 159,213 | |
| Dover Corp. | 1,643,529 | 158,666 | |
| Rockwell Automation Inc. | 1,337,701 | 158,063 | |
| WW Grainger Inc. | 595,971 | 152,223 | |
| Pentair Ltd. | 1,922,924 | 149,354 | |
| Roper Industries Inc. | 957,984 | 132,853 | |
| Kansas City Southern | 1,063,108 | 131,645 | |
| Southwest Airlines Co. | 6,721,141 | 126,626 | |
| Fluor Corp. | 1,575,862 | 126,526 | |
| Fastenal Co. | 2,633,592 | 125,122 | |
| AMETEK Inc. | 2,361,117 | 124,360 | |
| Stanley Black & Decker | |||
| Inc. | 1,497,324 | 120,819 | |
| Nielsen Holdings NV | 2,441,137 | 112,024 | |
| Flowserve Corp. | 1,345,385 | 106,057 | |
| Textron Inc. | 2,712,278 | 99,703 | |
| Rockwell Collins Inc. | 1,303,426 | 96,349 | |
| * | Stericycle Inc. | 826,812 | 96,051 |
| L-3 Communications | |||
| Holdings Inc. | 854,946 | 91,360 | |
| Pall Corp. | 1,068,696 | 91,213 | |
| Expeditors International | |||
| of Washington Inc. | 1,983,195 | 87,756 | |
| Republic Services Inc. | |||
| Class A | 2,605,304 | 86,496 | |
| CH Robinson Worldwide | |||
| Inc. | 1,462,790 | 85,339 | |
| Equifax Inc. | 1,173,890 | 81,104 | |
| * | Jacobs Engineering | ||
| Group Inc. | 1,270,558 | 80,032 | |
| Masco Corp. | 3,443,704 | 78,413 | |
| ADT Corp. | 1,929,281 | 78,078 | |
| * | Quanta Services Inc. | 2,082,416 | 65,721 |
| Xylem Inc. | 1,779,679 | 61,577 | |
| Snap-on Inc. | 560,944 | 61,435 | |
| Joy Global Inc. | 1,025,203 | 59,964 | |
| Cintas Corp. | 971,458 | 57,889 | |
| Robert Half International | |||
| Inc. | 1,336,978 | 56,140 | |
| Iron Mountain Inc. | 1,641,695 | 49,825 | |
| Pitney Bowes Inc. | 1,948,580 | 45,402 | |
| Dun & Bradstreet Corp. | 368,074 | 45,181 | |
| * | Allegion plc | 861,462 | 38,068 |
| Ryder System Inc. | 507,443 | 37,439 | |
| 17,403,917 | |||
| Market | |||
| Value | |||
| Shares | ($000) | ||
| Information Technology (18.6%) | |||
| Apple Inc. | 8,679,674 | 4,870,252 | |
| * | Google Inc. Class A | 2,707,245 | 3,034,037 |
| Microsoft Corp. | 73,284,221 | 2,743,028 | |
| International Business | |||
| Machines Corp. | 9,846,612 | 1,846,929 | |
| Oracle Corp. | 33,853,378 | 1,295,230 | |
| Intel Corp. | 47,954,793 | 1,244,906 | |
| QUALCOMM Inc. | 16,297,773 | 1,210,110 | |
| Cisco Systems Inc. | 51,578,315 | 1,157,933 | |
| Visa Inc. Class A | 4,912,548 | 1,093,926 | |
| * | Facebook Inc. Class A | 15,867,457 | 867,315 |
| MasterCard Inc. Class A | 998,735 | 834,403 | |
| * | eBay Inc. | 11,239,942 | 616,960 |
| Hewlett-Packard Co. | 18,539,649 | 518,739 | |
| Accenture plc Class A | 6,132,841 | 504,242 | |
| EMC Corp. | 19,851,805 | 499,273 | |
| Texas Instruments Inc. | 10,559,079 | 463,649 | |
| Automatic Data | |||
| Processing Inc. | 4,644,208 | 375,298 | |
| * | Yahoo! Inc. | 9,101,134 | 368,050 |
| * | Salesforce.com Inc. | 5,351,807 | 295,366 |
| * | Cognizant Technology | ||
| Solutions Corp. Class A | 2,918,142 | 294,674 | |
| * | Adobe Systems Inc. | 4,484,775 | 268,548 |
| Corning Inc. | 13,961,011 | 248,785 | |
| * | Micron Technology Inc. | 10,147,180 | 220,803 |
| TE Connectivity Ltd. | 3,958,838 | 218,172 | |
| Intuit Inc. | 2,747,886 | 209,719 | |
| Applied Materials Inc. | 11,616,557 | 205,497 | |
| Seagate Technology plc | 3,146,372 | 176,700 | |
| Western Digital Corp. | 2,030,673 | 170,373 | |
| Symantec Corp. | 6,714,541 | 158,329 | |
| Broadcom Corp. Class A | 5,205,444 | 154,341 | |
| SanDisk Corp. | 2,179,115 | 153,715 | |
| Analog Devices Inc. | 3,000,623 | 152,822 | |
| Fidelity National | |||
| Information Services | |||
| Inc. | 2,808,529 | 150,762 | |
| Motorola Solutions Inc. | 2,221,188 | 149,930 | |
| * | Fiserv Inc. | 2,488,201 | 146,928 |
| Paychex Inc. | 3,135,476 | 142,758 | |
| Amphenol Corp. Class A | 1,526,955 | 136,174 | |
| Xerox Corp. | 11,163,778 | 135,863 | |
| NetApp Inc. | 3,287,822 | 135,261 | |
| * | Alliance Data Systems | ||
| Corp. | 469,942 | 123,562 | |
| Xilinx Inc. | 2,588,495 | 118,864 | |
| * | Citrix Systems Inc. | 1,798,116 | 113,731 |
| * | Juniper Networks Inc. | 4,871,621 | 109,953 |
| * | Autodesk Inc. | 2,176,439 | 109,540 |
| CA Inc. | 3,134,370 | 105,472 | |
| KLA-Tencor Corp. | 1,607,743 | 103,635 | |
| Linear Technology Corp. | 2,258,978 | 102,896 | |
| * | Red Hat Inc. | 1,828,026 | 102,443 |
18
| 500 Index Fund | |||
| Market | |||
| Value | |||
| Shares | ($000) | ||
| Altera Corp. | 3,097,938 | 100,776 | |
| Western Union Co. | 5,327,397 | 91,898 | |
| NVIDIA Corp. | 5,581,649 | 89,418 | |
| Microchip Technology | |||
| Inc. | 1,913,738 | 85,640 | |
| * | Lam Research Corp. | 1,566,610 | 85,302 |
| * | Akamai Technologies Inc. | 1,726,654 | 81,464 |
| Computer Sciences Corp. | 1,420,074 | 79,354 | |
| * | VeriSign Inc. | 1,242,714 | 74,289 |
| Harris Corp. | 1,030,998 | 71,974 | |
| * | Teradata Corp. | 1,576,307 | 71,706 |
| * | Electronic Arts Inc. | 2,982,127 | 68,410 |
| * | F5 Networks Inc. | 748,679 | 68,025 |
| LSI Corp. | 5,256,881 | 57,931 | |
| Total System Services | |||
| Inc. | 1,611,043 | 53,616 | |
| FLIR Systems Inc. | 1,366,450 | 41,130 | |
| * | First Solar Inc. | 681,100 | 37,215 |
| Jabil Circuit Inc. | 1,783,543 | 31,105 | |
| 29,649,149 | |||
| Materials (3.5%) | |||
| Monsanto Co. | 5,072,648 | 591,217 | |
| EI du Pont de Nemours | |||
| & Co. | 8,934,070 | 580,447 | |
| Dow Chemical Co. | 11,700,340 | 519,495 | |
| Freeport-McMoRan | |||
| Copper & Gold Inc. | 10,014,936 | 377,964 | |
| Praxair Inc. | 2,839,656 | 369,240 | |
| LyondellBasell Industries | |||
| NV Class A | 4,214,191 | 338,315 | |
| Ecolab Inc. | 2,615,829 | 272,753 | |
| PPG Industries Inc. | 1,369,985 | 259,831 | |
| Air Products | |||
| & Chemicals Inc. | 2,038,159 | 227,825 | |
| International Paper Co. | 4,279,545 | 209,826 | |
| Nucor Corp. | 3,069,718 | 163,862 | |
| Mosaic Co. | 3,287,465 | 155,398 | |
| Sherwin-Williams Co. | 830,817 | 152,455 | |
| CF Industries Holdings | |||
| Inc. | 552,915 | 128,851 | |
| Eastman Chemical Co. | 1,484,834 | 119,826 | |
| Newmont Mining Corp. | 4,802,928 | 110,611 | |
| Alcoa Inc. | 10,318,297 | 109,684 | |
| Sigma-Aldrich Corp. | 1,154,365 | 108,522 | |
| FMC Corp. | 1,285,573 | 97,009 | |
| Vulcan Materials Co. | 1,253,874 | 74,505 | |
| Ball Corp. | 1,395,232 | 72,078 | |
| Airgas Inc. | 640,368 | 71,625 | |
| International Flavors | |||
| & Fragrances Inc. | 786,336 | 67,609 | |
| Sealed Air Corp. | 1,892,429 | 64,437 | |
| MeadWestvaco Corp. | 1,716,000 | 63,372 | |
| * | Owens-Illinois Inc. | 1,591,686 | 56,951 |
| Avery Dennison Corp. | 932,050 | 46,780 | |
| United States Steel Corp. | 1,395,550 | 41,169 | |
| Bemis Co. Inc. | 992,976 | 40,672 | |
| Market | |||
| Value | |||
| Shares | ($000) | ||
| ^ | Cliffs Natural Resources | ||
| Inc. | 1,477,127 | 38,716 | |
| Allegheny Technologies | |||
| Inc. | 1,041,672 | 37,115 | |
| 5,568,160 | |||
| Telecommunication Services (2.3%) | |||
| AT&T Inc. | 50,819,862 | 1,786,826 | |
| Verizon | |||
| Communications Inc. | 27,607,004 | 1,356,608 | |
| * | Crown Castle | ||
| International Corp. | 3,222,780 | 236,649 | |
| CenturyLink Inc. | 5,701,902 | 181,606 | |
| ^ | Windstream Holdings Inc. | 5,750,296 | 45,887 |
| Frontier Communications | |||
| Corp. | 9,642,451 | 44,837 | |
| 3,652,413 | |||
| Utilities (2.9%) | |||
| Duke Energy Corp. | 6,810,635 | 470,002 | |
| Dominion Resources Inc. | 5,599,348 | 362,222 | |
| NextEra Energy Inc. | 4,154,825 | 355,736 | |
| Southern Co. | 8,506,168 | 349,689 | |
| Exelon Corp. | 8,266,412 | 226,417 | |
| American Electric Power | |||
| Co. Inc. | 4,700,841 | 219,717 | |
| Sempra Energy | 2,192,646 | 196,812 | |
| PPL Corp. | 6,079,934 | 182,945 | |
| PG&E Corp. | 4,334,384 | 174,589 | |
| Public Service Enterprise | |||
| Group Inc. | 4,879,921 | 156,353 | |
| Consolidated Edison Inc. | 2,825,363 | 156,186 | |
| Edison International | 3,143,039 | 145,523 | |
| Xcel Energy Inc. | 4,800,625 | 134,129 | |
| FirstEnergy Corp. | 4,034,556 | 133,060 | |
| Northeast Utilities | 3,039,658 | 128,851 | |
| ONEOK Inc. | 1,990,013 | 123,739 | |
| DTE Energy Co. | 1,705,603 | 113,235 | |
| Entergy Corp. | 1,720,244 | 108,840 | |
| NiSource Inc. | 3,022,283 | 99,373 | |
| CenterPoint Energy Inc. | 4,135,017 | 95,850 | |
| AES Corp. | 6,334,488 | 91,913 | |
| Wisconsin Energy Corp. | 2,185,117 | 90,333 | |
| NRG Energy Inc. | 3,119,897 | 89,603 | |
| Ameren Corp. | 2,340,606 | 84,636 | |
| CMS Energy Corp. | 2,565,969 | 68,691 | |
| SCANA Corp. | 1,355,886 | 63,632 | |
| Pinnacle West Capital | |||
| Corp. | 1,061,498 | 56,174 | |
| AGL Resources Inc. | 1,145,928 | 54,122 | |
| Pepco Holdings Inc. | 2,409,471 | 46,093 | |
| Integrys Energy Group | |||
| Inc. | 769,811 | 41,885 | |
| TECO Energy Inc. | 1,970,506 | 33,972 | |
| 4,654,322 | |||
| Total Common Stocks | |||
| (Cost $87,835,673) | 159,120,495 | ||
19
| 500 Index Fund | |||
| Market | |||
| Value | |||
| Shares | ($000) | ||
| Temporary Cash Investments (0.6%)1 | |||
| Money Market Fund (0.6%) | |||
| 2,3 | Vanguard Market Liquidity | ||
| Fund, 0.125% | 987,689,000 | 987,689 | |
| Face | |||
| Amount | |||
| ($000) | |||
| U.S. Government and Agency Obligations (0.0%) | |||
| 4,5 | Fannie Mae Discount | ||
| Notes, 0.050%, 1/22/14 | 17,000 | 16,998 | |
| 4,5 | Fannie Mae Discount | ||
| Notes, 0.065%, 2/3/14 | 3,000 | 3,000 | |
| 4,5 | Fannie Mae Discount | ||
| Notes, 0.095%, 4/9/14 | 2,700 | 2,698 | |
| 5,6 | Federal Home Loan Bank | ||
| Discount Notes, | |||
| 0.050%, 1/10/14 | 3,200 | 3,200 | |
| 5,6 | Federal Home Loan Bank | ||
| Discount Notes, | |||
| 0.100%, 1/15/14 | 2,000 | 2,000 | |
| 5,6 | Federal Home Loan Bank | ||
| Discount Notes, | |||
| 0.065%, 1/31/14 | 3,500 | 3,500 | |
| 5,6 | Federal Home Loan Bank | ||
| Discount Notes, | |||
| 0.070%, 2/5/14 | 10,400 | 10,398 | |
| 5,6 | Federal Home Loan Bank | ||
| Discount Notes, | |||
| 0.120%, 5/28/14 | 10,000 | 9,994 | |
| 51,788 | |||
| Total Temporary Cash Investments | |||
| (Cost $1,039,481) | 1,039,477 | ||
| Total Investments (100.2%) | |||
| (Cost $88,875,154) | 160,159,972 | ||
| Other Assets and Liabilities (-0.2%) | |||
| Other Assets | 1,122,690 | ||
| Liabilities3 | (1,465,325) | ||
| (342,635) | |||
| Net Assets (100%) | 159,817,337 | ||
| At December 31, 2013, net assets consisted of: | |
| Amount | |
| ($000) | |
| Paid-in Capital | 92,719,156 |
| Overdistributed Net Investment Income | (128,180) |
| Accumulated Net Realized Losses | (4,082,334) |
| Unrealized Appreciation (Depreciation) | |
| Investment Securities | 71,284,818 |
| Futures Contracts | 23,877 |
| Net Assets | 159,817,337 |
| Investor Shares—Net Assets | |
| Applicable to 162,934,311 outstanding | |
| $.001 par value shares of beneficial | |
| interest (unlimited authorization) | 27,758,019 |
| Net Asset Value Per Share— | |
| Investor Shares | $170.36 |
| Admiral Shares—Net Assets | |
| Applicable to 483,426,103 outstanding | |
| $.001 par value shares of beneficial | |
| interest (unlimited authorization) | 82,357,227 |
| Net Asset Value Per Share— | |
| Admiral Shares | $170.36 |
| Signal Shares—Net Assets | |
| Applicable to 246,338,279 outstanding | |
| $.001 par value shares of beneficial | |
| interest (unlimited authorization) | 34,665,577 |
| Net Asset Value Per Share— | |
| Signal Shares | $140.72 |
20
| 500 Index Fund | |
| Amount | |
| ($000) | |
| ETF Shares—Net Assets | |
| Applicable to 88,937,611 outstanding | |
| $.001 par value shares of beneficial | |
| interest (unlimited authorization) | 15,036,514 |
| Net Asset Value Per Share— | |
| ETF Shares | $169.07 |
See Note A in Notes to Financial Statements.
* Non-income-producing security.
^ Includes partial security positions on loan to broker-dealers. The total value of securities on loan is $34,018,000.
1 The fund invests a portion of its cash reserves in equity markets through the use of index futures contracts. After giving effect to futures investments, the fund’s effective common stock and temporary cash investment positions represent 100.0% and 0.2%, respectively, of net assets.
2 Affiliated money market fund available only to Vanguard funds and certain trusts and accounts managed by Vanguard. Rate shown is the 7-day yield.
3 Includes $36,625,000 of collateral received for securities on loan.
4 The issuer was placed under federal conservatorship in September 2008; since that time, its daily operations have been managed by the Federal Housing Finance Agency and it receives capital from the U.S. Treasury, as needed to maintain a positive net worth, in exchange for senior preferred stock.
5 Securities with a value of $46,489,000 have been segregated as initial margin for open futures contracts.
6 The issuer operates under a congressional charter; its securities are generally neither guaranteed by the U.S. Treasury nor backed by the full faith and credit of the U.S. government.
REIT—Real Estate Investment Trust.
See accompanying Notes, which are an integral part of the Financial Statements.
21
| 500 Index Fund | |
| Statement of Operations | |
| Year Ended | |
| December 31, 2013 | |
| ($000) | |
| Investment Income | |
| Income | |
| Dividends | 2,976,869 |
| Interest1 | 918 |
| Securities Lending | 3,306 |
| Total Income | 2,981,093 |
| Expenses | |
| The Vanguard Group—Note B | |
| Investment Advisory Services | 6,701 |
| Management and Administrative—Investor Shares | 38,282 |
| Management and Administrative—Admiral Shares | 21,299 |
| Management and Administrative—Signal Shares | 6,737 |
| Management and Administrative—ETF Shares | 2,297 |
| Marketing and Distribution—Investor Shares | 5,264 |
| Marketing and Distribution—Admiral Shares | 9,864 |
| Marketing and Distribution—Signal Shares | 7,554 |
| Marketing and Distribution—ETF Shares | 2,290 |
| Custodian Fees | 1,016 |
| Auditing Fees | 35 |
| Shareholders’ Reports—Investor Shares | 427 |
| Shareholders’ Reports—Admiral Shares | 273 |
| Shareholders’ Reports—Signal Shares | 115 |
| Shareholders’ Reports—ETF Shares | 108 |
| Trustees’ Fees and Expenses | 176 |
| Total Expenses | 102,438 |
| Net Investment Income | 2,878,655 |
| Realized Net Gain (Loss) | |
| Investment Securities Sold | 3,679,620 |
| Futures Contracts | 161,168 |
| Realized Net Gain (Loss) | 3,840,788 |
| Change in Unrealized Appreciation (Depreciation) | |
| Investment Securities | 32,083,783 |
| Futures Contracts | 23,248 |
| Change in Unrealized Appreciation (Depreciation) | 32,107,031 |
| Net Increase (Decrease) in Net Assets Resulting from Operations | 38,826,474 |
| 1 Interest income from an affiliated company of the fund was $883,000. | |
| See accompanying Notes, which are an integral part of the Financial Statements. | |
22
| 500 Index Fund | ||
| Statement of Changes in Net Assets | ||
| Year Ended December 31, | ||
| 2013 | 2012 | |
| ($000) | ($000) | |
| Increase (Decrease) in Net Assets | ||
| Operations | ||
| Net Investment Income | 2,878,655 | 2,512,384 |
| Realized Net Gain (Loss) | 3,840,788 | 2,485,148 |
| Change in Unrealized Appreciation (Depreciation) | 32,107,031 | 11,202,236 |
| Net Increase (Decrease) in Net Assets Resulting from Operations | 38,826,474 | 16,199,768 |
| Distributions | ||
| Net Investment Income | ||
| Investor Shares | (512,169) | (545,412) |
| Admiral Shares | (1,470,287) | (1,282,737) |
| Signal Shares | (665,590) | (564,477) |
| ETF Shares | (227,304) | (114,084) |
| Realized Capital Gain | ||
| Investor Shares | — | — |
| Admiral Shares | — | — |
| Signal Shares | — | — |
| ETF Shares | — | — |
| Total Distributions | (2,875,350) | (2,506,710) |
| Capital Share Transactions | ||
| Investor Shares | (4,012,845) | (4,504,796) |
| Admiral Shares | 4,436,942 | 863,165 |
| Signal Shares | (852,824) | 2,758,859 |
| ETF Shares | 5,791,555 | 3,843,275 |
| Net Increase (Decrease) from Capital Share Transactions | 5,362,828 | 2,960,503 |
| Total Increase (Decrease) | 41,313,952 | 16,653,561 |
| Net Assets | ||
| Beginning of Period | 118,503,385 | 101,849,824 |
| End of Period1 | 159,817,337 | 118,503,385 |
1 Net Assets—End of Period includes undistributed (overdistributed) net investment income of ($128,180,000) and ($131,485,000).
See accompanying Notes, which are an integral part of the Financial Statements.
23
| 500 Index Fund | |||||
| Financial Highlights | |||||
| Investor Shares | |||||
| For a Share Outstanding | Year Ended December 31, | ||||
| Throughout Each Period | 2013 | 2012 | 2011 | 2010 | 2009 |
| Net Asset Value, Beginning of Period | $131.37 | $115.80 | $115.82 | $102.67 | $83.09 |
| Investment Operations | |||||
| Net Investment Income | 2.956 | 2.709 | 2.246 | 2.020 | 2.131 |
| Net Realized and Unrealized Gain (Loss) | |||||
| on Investments | 38.982 | 15.560 | (.020) | 13.096 | 19.553 |
| Total from Investment Operations | 41.938 | 18.269 | 2.226 | 15.116 | 21.684 |
| Distributions | |||||
| Dividends from Net Investment Income | (2.948) | (2.699) | (2.246) | (1.966) | (2.104) |
| Distributions from Realized Capital Gains | — | — | — | — | — |
| Total Distributions | (2.948) | (2.699) | (2.246) | (1.966) | (2.104) |
| Net Asset Value, End of Period | $170.36 | $131.37 | $115.80 | $115.82 | $102.67 |
| Total Return1 | 32.18% | 15.82% | 1.97% | 14.91% | 26.49% |
| Ratios/Supplemental Data | |||||
| Net Assets, End of Period (Millions) | $27,758 | $24,821 | $25,967 | $31,904 | $48,313 |
| Ratio of Total Expenses to Average Net Assets | 0.17% | 0.17% | 0.17% | 0.17% | 0.18% |
| Ratio of Net Investment Income to | |||||
| Average Net Assets | 1.95% | 2.13% | 1.92% | 1.94% | 2.42% |
| Portfolio Turnover Rate2 | 3% | 3% | 4% | 5% | 12% |
1 Total returns do not include account service fees that may have applied in the periods shown. Fund prospectuses provide information about any applicable account service fees.
2 Excludes the value of portfolio securities received or delivered as a result of in-kind purchases or redemptions of the fund’s capital shares, including ETF Creation Units.
See accompanying Notes, which are an integral part of the Financial Statements.
24
| 500 Index Fund | |||||
| Financial Highlights | |||||
| Admiral Shares | |||||
| For a Share Outstanding | Year Ended December 31, | ||||
| Throughout Each Period | 2013 | 2012 | 2011 | 2010 | 2009 |
| Net Asset Value, Beginning of Period | $131.37 | $115.80 | $115.83 | $102.67 | $83.09 |
| Investment Operations | |||||
| Net Investment Income | 3.142 | 2.866 | 2.391 | 2.152 | 2.227 |
| Net Realized and Unrealized Gain (Loss) | |||||
| on Investments | 38.980 | 15.560 | (.031) | 13.092 | 19.556 |
| Total from Investment Operations | 42.122 | 18.426 | 2.360 | 15.244 | 21.783 |
| Distributions | |||||
| Dividends from Net Investment Income | (3.132) | (2.856) | (2.390) | (2.084) | (2.203) |
| Distributions from Realized Capital Gains | — | — | — | — | — |
| Total Distributions | (3.132) | (2.856) | (2.390) | (2.084) | (2.203) |
| Net Asset Value, End of Period | $170.36 | $131.37 | $115.80 | $115.83 | $102.67 |
| Total Return1 | 32.33% | 15.96% | 2.08% | 15.05% | 26.62% |
| Ratios/Supplemental Data | |||||
| Net Assets, End of Period (Millions) | 82,357 | $59,749 | $51,925 | $51,438 | $28,380 |
| Ratio of Total Expenses to Average Net Assets | 0.05% | 0.05% | 0.05% | 0.06% | 0.07% |
| Ratio of Net Investment Income to | |||||
| Average Net Assets | 2.07% | 2.25% | 2.04% | 2.05% | 2.53% |
| Portfolio Turnover Rate2 | 3% | 3% | 4% | 5% | 12% |
1 Total returns do not include account service fees that may have applied in the periods shown. Fund prospectuses provide information about any applicable account service fees.
2 Excludes the value of portfolio securities received or delivered as a result of in-kind purchases or redemptions of the fund’s capital shares, including ETF Creation Units.
See accompanying Notes, which are an integral part of the Financial Statements.
25
| 500 Index Fund | |||||
| Financial Highlights | |||||
| Signal Shares | |||||
| For a Share Outstanding | Year Ended December 31, | ||||
| Throughout Each Period | 2013 | 2012 | 2011 | 2010 | 2009 |
| Net Asset Value, Beginning of Period | $108.52 | $95.65 | $95.68 | $84.81 | $68.64 |
| Investment Operations | |||||
| Net Investment Income | 2.594 | 2.368 | 1.975 | 1.780 | 1.839 |
| Net Realized and Unrealized Gain (Loss) | |||||
| on Investments | 32.193 | 12.861 | (. 030) | 10.813 | 16.151 |
| Total from Investment Operations | 34.787 | 15.229 | 1.945 | 12.593 | 17.990 |
| Distributions | |||||
| Dividends from Net Investment Income | (2.587) | (2.359) | (1.975) | (1.723) | (1.820) |
| Distributions from Realized Capital Gains | — | — | — | — | — |
| Total Distributions | (2.587) | (2.359) | (1.975) | (1.723) | (1.820) |
| Net Asset Value, End of Period | $140.72 | $108.52 | $95.65 | $95.68 | $84.81 |
| Total Return | 32.33% | 15.97% | 2.08% | 15.05% | 26.61% |
| Ratios/Supplemental Data | |||||
| Net Assets, End of Period (Millions) | $34,666 | $27,304 | $21,592 | $18,977 | $16,590 |
| Ratio of Total Expenses to Average Net Assets | 0.05% | 0.05% | 0.05% | 0.06% | 0.07% |
| Ratio of Net Investment Income to | |||||
| Average Net Assets | 2.07% | 2.25% | 2.04% | 2.05% | 2.53% |
| Portfolio Turnover Rate1 | 3% | 3% | 4% | 5% | 12% |
1 Excludes the value of portfolio securities received or delivered as a result of in-kind purchases or redemptions of the fund’s capital shares, including ETF Creation Units.
See accompanying Notes, which are an integral part of the Financial Statements.
26
| 500 Index Fund | ||||
| Financial Highlights | ||||
| ETF Shares | ||||
| Sept. 7, | ||||
| 20102, to | ||||
| Year Ended December 31, | ||||
| For a Share Outstanding | Dec. 31, | |||
| Throughout Each Period1 | 2013 | 2012 | 2011 | 2010 |
| Net Asset Value, Beginning of Period | $130.38 | $114.92 | $114.94 | $100.16 |
| Investment Operations | ||||
| Net Investment Income | 3.117 | 2.846 | 2.372 | .726 |
| Net Realized and Unrealized Gain (Loss) | ||||
| on Investments | 38.681 | 15.450 | (.020) | 15.138 |
| Total from Investment Operations | 41.798 | 18.296 | 2.352 | 15.864 |
| Distributions | ||||
| Dividends from Net Investment Income | (3.108) | (2.836) | (2.372) | (1.084) |
| Distributions from Realized Capital Gains | — | — | — | — |
| Total Distributions | (3.108) | (2.836) | (2.372) | (1.084) |
| Net Asset Value, End of Period | $169.07 | $130.38 | $114.92 | $114.94 |
| Total Return | 32.33% | 15.98% | 2.09% | 15.89% |
| Ratios/Supplemental Data | ||||
| Net Assets, End of Period (Millions) | $15,037 | $6,628 | $2,366 | $261 |
| Ratio of Total Expenses to Average Net Assets | 0.05% | 0.05% | 0.05% | 0.06%3 |
| Ratio of Net Investment Income to Average Net Assets | 2.07% | 2.25% | 2.04% | 2.05%3 |
| Portfolio Turnover Rate 4 | 3% | 3% | 4% | 5% |
1 Adjusted to reflect a 1-for-2 reverse share split as of the close of business on October 24, 2013.
2 Inception.
3 Annualized.
4 Excludes the value of portfolio securities received or delivered as a result of in-kind purchases or redemptions of the fund’s capital shares, including ETF Creation Units.
See accompanying Notes, which are an integral part of the Financial Statements.
27
500 Index Fund
Notes to Financial Statements
Vanguard 500 Index Fund is registered under the Investment Company Act of 1940 as an open-end investment company, or mutual fund. The fund offers four classes of shares: Investor Shares, Admiral Shares, Signal Shares, and ETF Shares. Investor Shares are available to any investor who meets the fund’s minimum purchase requirements. Admiral Shares and Signal Shares are designed for investors who meet certain administrative, service, and account-size criteria. ETF Shares are listed for trading on NYSE Arca; they can be purchased and sold through a broker.
A. The following significant accounting policies conform to generally accepted accounting principles for U.S. mutual funds. The fund consistently follows such policies in preparing its financial statements.
1. Security Valuation: Securities are valued as of the close of trading on the New York Stock Exchange (generally 4 p.m., Eastern time) on the valuation date. Equity securities are valued at the latest quoted sales prices or official closing prices taken from the primary market in which each security trades; such securities not traded on the valuation date are valued at the mean of the latest quoted bid and asked prices. Securities for which market quotations are not readily available, or whose values have been materially affected by events occurring before the fund’s pricing time but after the close of the securities’ primary markets, are valued by methods deemed by the board of trustees to represent fair value. Investments in Vanguard Market Liquidity Fund are valued at that fund’s net asset value. Temporary cash investments acquired over 60 days to maturity are valued using the latest bid prices or using valuations based on a matrix system (which considers such factors as security prices, yields, maturities, and ratings), both as furnished by independent pricing services. Other temporary cash investments are valued at amortized cost, which approximates market value.
2. Futures Contracts: The fund may use index futures contracts to a limited extent, with the objectives of maintaining full exposure to the stock market, enhancing returns, maintaining liquidity, and minimizing transaction costs. The fund may purchase futures contracts to immediately invest incoming cash in the market, or sell futures in response to cash outflows, thereby simulating a fully invested position in the underlying index while maintaining a cash balance for liquidity. The fund may seek to enhance returns by using futures contracts instead of the underlying securities when futures are believed to be priced more attractively than the underlying securities. The primary risks associated with the use of futures contracts are imperfect correlation between changes in market values of stocks held by the fund and the prices of futures contracts, and the possibility of an illiquid market. Counterparty risk involving futures is mitigated because a regulated clearinghouse is the counterparty instead of the clearing broker. To further mitigate counterparty risk, the fund trades futures contracts on an exchange, monitors the financial strength of its clearing brokers and clearinghouse, and has entered into clearing agreements with its clearing brokers. The clearinghouse imposes initial margin requirements to secure the fund’s performance and requires daily settlement of variation margin representing changes in the market value of each contract.
Futures contracts are valued at their quoted daily settlement prices. The aggregate notional amounts of the contracts are not recorded in the Statement of Net Assets. Fluctuations in the value of the contracts are recorded in the Statement of Net Assets as an asset (liability) and in the Statement of Operations as unrealized appreciation (depreciation) until the contracts are closed, when they are recorded as realized futures gains (losses).
During the year ended December 31, 2013, the fund’s average investments in long and short futures contracts represented less than 1% and 0% of net assets, respectively, based on quarterly average aggregate settlement values.
28
500 Index Fund
3. Federal Income Taxes: The fund intends to continue to qualify as a regulated investment company and distribute all of its taxable income. Management has analyzed the fund’s tax positions taken for all open federal income tax years (December 31, 2010–2013), and has concluded that no provision for federal income tax is required in the fund’s financial statements.
4. Distributions: Distributions to shareholders are recorded on the ex-dividend date.
5. Securities Lending: To earn additional income, the fund may lend its securities to qualified institutional borrowers. Security loans are required to be secured at all times by collateral in an amount at least equal to the market value of securities loaned. Daily market fluctuations could cause the value of loaned securities to be more or less than the value of the collateral received. When this occurs, the collateral is adjusted and settled on the next business day. The fund further mitigates its counterparty risk by entering into securities lending transactions only with a diverse group of prequalified counter-parties, monitoring their financial strength, and entering into master securities lending agreements with its counterparties. The master securities lending agreements provide that, in the event of a counterparty’s default (including bankruptcy), the fund may terminate any loans with that borrower, determine the net amount owed, and sell or retain the collateral up to the net amount owed to the fund; however, such actions may be subject to legal proceedings. While collateral mitigates counter-party risk, in the absence of a default the fund may experience delays and costs in recovering the securities loaned. The fund invests cash collateral received in Vanguard Market Liquidity Fund, and records a liability for the return of the collateral, during the period the securities are on loan. Securities lending income represents fees charged to borrowers plus income earned on invested cash collateral, less expenses associated with the loan.
6. Other: Dividend income is recorded on the ex-dividend date. Interest income includes income distributions received from Vanguard Market Liquidity Fund and is accrued daily. Premiums and discounts on debt securities purchased are amortized and accreted, respectively, to interest income over the lives of the respective securities. Security transactions are accounted for on the date securities are bought or sold. Costs used to determine realized gains (losses) on the sale of investment securities are those of the specific securities sold.
Each class of shares has equal rights as to assets and earnings, except that each class separately bears certain class-specific expenses related to maintenance of shareholder accounts (included in Management and Administrative expenses) and shareholder reporting. Marketing and distribution expenses are allocated to each class of shares based on a method approved by the board of trustees. Income, other non-class-specific expenses, and gains and losses on investments are allocated to each class of shares based on its relative net assets.
B. The Vanguard Group furnishes at cost investment advisory, corporate management, administrative, marketing, and distribution services. The costs of such services are allocated to the fund under methods approved by the board of trustees. The fund has committed to provide up to 0.40% of its net assets in capital contributions to Vanguard. At December 31, 2013, the fund had contributed capital of $17,431,000 to Vanguard (included in Other Assets), representing 0.01% of the fund’s net assets and 6.97% of Vanguard’s capitalization. The fund’s trustees and officers are also directors and officers of Vanguard.
C. Various inputs may be used to determine the value of the fund’s investments. These inputs are summarized in three broad levels for financial statement purposes. The inputs or methodologies used to value securities are not necessarily an indication of the risk associated with investing in those securities.
29
500 Index Fund
Level 1—Quoted prices in active markets for identical securities.
Level 2—Other significant observable inputs (including quoted prices for similar securities, interest rates, prepayment speeds, credit risk, etc.).
Level 3—Significant unobservable inputs (including the fund’s own assumptions used to determine the fair value of investments).
The following table summarizes the market value of the fund’s investments as of December 31, 2013, based on the inputs used to value them:
| Level 1 | Level 2 | Level 3 | |
| Investments | ($000) | ($000) | ($000) |
| Common Stocks | 159,120,495 | — | — |
| Temporary Cash Investments | 987,689 | 51,788 | — |
| Futures Contracts—Assets1 | 4,826 | — | — |
| Futures Contracts—Liabilities1 | (1,076) | — | — |
| Total | 160,111,934 | 51,788 | — |
| 1 Represents variation margin on the last day of the reporting period. |
D. At December 31, 2013, the aggregate settlement value of open futures contracts and the related unrealized appreciation (depreciation) were:
| ($000) | ||||
| Aggregate | ||||
| Number of | Settlement | Unrealized | ||
| Long (Short) | Value | Appreciation | ||
| Futures Contracts | Expiration | Contracts | Long (Short) | (Depreciation) |
| S&P 500 Index | March 2014 | 1,388 | 638,862 | 23,610 |
| E-mini S&P 500 Index | March 2014 | 835 | 76,866 | 267 |
| 23,877 |
Unrealized appreciation (depreciation) on open futures contracts is required to be treated as realized gain (loss) for tax purposes.
E. Distributions are determined on a tax basis and may differ from net investment income and realized capital gains for financial reporting purposes. Differences may be permanent or temporary. Permanent differences are reclassified among capital accounts in the financial statements to reflect their tax character. Temporary differences arise when certain items of income, expense, gain, or loss are recognized in different periods for financial statement and tax purposes. These differences will reverse at some time in the future. Differences in classification may also result from the treatment of short-term gains as ordinary income for tax purposes.
During the year ended December 31, 2013, the fund realized $4,766,801,000 of net capital gains resulting from in-kind redemptions—in which shareholders exchanged fund shares for securities held by the fund rather than for cash. Because such gains are not taxable to the fund, and are not distributed to shareholders, they have been reclassified from accumulated net realized losses to paid-in capital.
For tax purposes, at December 31, 2013, the fund had $18,062,000 of ordinary income available for distribution. At December 31, 2013, the fund had available capital losses totaling $4,054,780,000 to offset future net capital gains. Of this amount, $2,057,911,000 is subject to expiration dates;
30
500 Index Fund
$293,941,000 may be used to offset future net capital gains through December 31, 2014, and $1,763,970,000 through December 31, 2016. Capital losses of $1,996,869,000 realized beginning in fiscal 2011 may be carried forward indefinitely under the Regulated Investment Company Modernization Act of 2010, but must be used before any expiring loss carryforwards.
At December 31, 2013, the cost of investment securities for tax purposes was $88,875,218,000. Net unrealized appreciation of investment securities for tax purposes was $71,284,754,000, consisting of unrealized gains of $75,003,464,000 on securities that had risen in value since their purchase and $3,718,710,000 in unrealized losses on securities that had fallen in value since their purchase.
F. During the year ended December 31, 2013, the fund purchased $17,102,010,000 of investment securities and sold $12,003,456,000 of investment securities, other than temporary cash investments. Purchases and sales include $8,499,161,000 and $7,253,589,000, respectively, in connection with in-kind purchases and redemptions of the fund’s capital shares.
G. During the year ended December 31, 2013, the fund’s ETF Shares underwent a 1-for-2 reverse share split. Each shareholder of record on October 24, 2013, received one share for every two ETF Shares held on that date. The split had no effect on net assets or total return.
H. Capital share transactions for each class of shares were:
| Year Ended December 31, | ||||
| 2013 | 2012 | |||
| Amount | Shares | Amount | Shares | |
| ($000) | (000) | ($000) | (000) | |
| Investor Shares | ||||
| Issued | 4,265,742 | 27,761 | 3,469,946 | 27,336 |
| Issued in Lieu of Cash Distributions | 491,640 | 3,197 | 524,604 | 4,049 |
| Redeemed | (8,770,227) | (56,959) | (8,499,346) | (66,693) |
| Net Increase (Decrease)—Investor Shares | (4,012,845) | (26,001) | (4,504,796) | (35,308) |
| Admiral Shares | ||||
| Issued | 9,329,798 | 61,049 | 5,809,353 | 45,236 |
| Issued in Lieu of Cash Distributions | 1,339,808 | 8,678 | 1,167,640 | 9,003 |
| Redeemed | (6,232,664) | (41,109) | (6,113,828) | (47,856) |
| Net Increase (Decrease) —Admiral Shares | 4,436,942 | 28,618 | 863,165 | 6,383 |
| Signal Shares | ||||
| Issued | 9,679,558 | 77,796 | 8,315,286 | 78,877 |
| Issued in Lieu of Cash Distributions | 594,241 | 4,673 | 507,129 | 4,731 |
| Redeemed | (11,126,623) | (87,744) | (6,063,556) | (57,737) |
| Net Increase (Decrease)—Signal Shares | (852,824) | (5,275) | 2,758,859 | 25,871 |
| ETF Shares1 | ||||
| Issued | 8,569,611 | 56,551 | 4,386,285 | 34,507 |
| Issued in Lieu of Cash Distributions | — | — | — | — |
| Redeemed | (2,778,056) | (18,454) | (543,010) | (4,250) |
| Net Increase (Decrease) —ETF Shares | 5,791,555 | 38,097 | 3,843,275 | 30,257 |
| 1 Shares adjusted to reflect a 1-for-2 reverse share split as of the close of business on October 24, 2013. | ||||
31
500 Index Fund
I. Management has determined that no material events or transactions occurred subsequent to December 31, 2013, that would require recognition in these financial statements.
In October 2013, Vanguard announced plans to merge Vanguard Tax-Managed Growth and Income Fund into Vanguard 500 Index Fund in the second quarter of 2014. Both funds seek to track the Standard & Poor’s 500 Index.
32
Report of Independent Registered Public Accounting Firm
To the Trustees of Vanguard Index Funds and the Shareholders of Vanguard 500 Index Fund:
In our opinion, the accompanying statement of net assets and the related statements of operations and of changes in net assets and the financial highlights present fairly, in all material respects, the financial position of Vanguard 500 Index Fund (constituting a separate portfolio of Vanguard Index Funds, hereafter referred to as the “Fund”) at December 31, 2013, the results of its operations for the year then ended, the changes in its net assets for each of the two years in the period then ended, and the financial highlights for each of the periods indicated, in conformity with accounting principles generally accepted in the United States of America. These financial statements and financial highlights (hereafter referred to as “financial statements”) are the responsibility of the Fund’s management; our responsibility is to express an opinion on these financial statements based on our audits. We conducted our audits of these financial statements in accordance with the standards of the Public Company Accounting Oversight Board (United States). Those standards require that we plan and perform the audit to obtain reasonable assurance about whether the financial statements are free of material misstatement. An audit includes examining, on a test basis, evidence supporting the amounts and disclosures in the financial statements, assessing the accounting principles used and significant estimates made by management, and evaluating the overall financial statement presentation. We believe that our audits, which included confirmation of securities at December 31, 2013 by correspondence with the custodian and broker and by agreement to the underlying ownership records of the transfer agent, provide a reasonable basis for our opinion.
PricewaterhouseCoopers LLP
Philadelphia, Pennsylvania
February 10, 2014
Special 2013 tax information (unaudited) for Vanguard 500 Index Fund
This information for the fiscal year ended December 31, 2013, is included pursuant to provisions of the Internal Revenue Code.
The fund distributed $2,875,350,000 of qualified dividend income to shareholders during the fiscal year.
For corporate shareholders, 98.4% of investment income (dividend income plus short-term gains, if any) qualifies for the dividends-received deduction.
33
Your Fund’s After-Tax Returns
This table presents returns for your fund both before and after taxes. The after-tax returns are shown in two ways: (1) assuming that an investor owned the fund during the entire period and paid taxes on the fund’s distributions, and (2) assuming that an investor paid taxes on the fund’s distributions and sold all shares at the end of each period.
Calculations are based on the highest individual federal income tax and capital gains tax rates in effect at the times of the distributions and the hypothetical sales. State and local taxes were not considered. After-tax returns reflect any qualified dividend income . (In the example, returns after the sale of fund shares may be higher than those assuming no sale. This occurs when the sale would have produced a capital loss. The calculation assumes that the investor received a tax deduction for the loss.)
The table shows returns for one share class only; returns for other share classes will differ. Please note that your actual after-tax returns will depend on your tax situation and may differ from those shown. Also note that if you own the fund in a tax-deferred account, such as an individual retirement account or a 401(k) plan, this information does not apply to you. Such accounts are not subject to current taxes.
Finally, keep in mind that a fund’s performance—whether before or after taxes—does not guarantee future results.
Average Annual Total Returns: 500 Index Fund Investor Shares
Periods Ended December 31, 2013
| One | Five | Ten | |
| Year | Years | Years | |
| Returns Before Taxes | 32.18% | 17.81% | 7.29% |
| Returns After Taxes on Distributions | 31.58 | 17.41 | 6.95 |
| Returns After Taxes on Distributions and Sale of Fund Shares | 18.62 | 14.49 | 5.93 |
34
About Your Fund’s Expenses
As a shareholder of the fund, you incur ongoing costs, which include costs for portfolio management, administrative services, and shareholder reports (like this one), among others. Operating expenses, which are deducted from a fund’s gross income, directly reduce the investment return of the fund.
A fund’s expenses are expressed as a percentage of its average net assets. This figure is known as the expense ratio. The following examples are intended to help you understand the ongoing costs (in dollars) of investing in your fund and to compare these costs with those of other mutual funds. The examples are based on an investment of $1,000 made at the beginning of the period shown and held for the entire period.
The accompanying table illustrates your fund’s costs in two ways:
• Based on actual fund return. This section helps you to estimate the actual expenses that you paid over the period. The ”Ending Account Value“ shown is derived from the fund‘s actual return, and the third column shows the dollar amount that would have been paid by an investor who started with $1,000 in the fund. You may use the information here, together with the amount you invested, to estimate the expenses that you paid over the period.
To do so, simply divide your account value by $1,000 (for example, an $8,600 account value divided by $1,000 = 8.6), then multiply the result by the number given for your fund under the heading ”Expenses Paid During Period.“
• Based on hypothetical 5% yearly return. This section is intended to help you compare your fund‘s costs with those of other mutual funds. It assumes that the fund had a yearly return of 5% before expenses, but that the expense ratio is unchanged. In this case—because the return used is not the fund’s actual return—the results do not apply to your investment. The example is useful in making comparisons because the Securities and Exchange Commission requires all mutual funds to calculate expenses based on a 5% return. You can assess your fund’s costs by comparing this hypothetical example with the hypothetical examples that appear in shareholder reports of other funds.
Note that the expenses shown in the table are meant to highlight and help you compare ongoing costs only and do not reflect transaction costs incurred by the fund for buying and selling securities. Further, the expenses do not include any purchase, redemption, or account service fees described in the fund prospectus. If such fees were applied to your account, your costs would be higher. Your fund does not carry a “sales load.”
The calculations assume no shares were bought or sold during the period. Your actual costs may have been higher or lower, depending on the amount of your investment and the timing of any purchases or redemptions.
You can find more information about the fund’s expenses, including annual expense ratios, in the Financial Statements section of this report. For additional information on operating expenses and other shareholder costs, please refer to your fund’s current prospectus.
35
| Six Months Ended December 31, 2013 | |||
| Beginning | Ending | Expenses | |
| Account Value | Account Value | Paid During | |
| 500 Index Fund | 6/30/2013 | 12/31/2013 | Period |
| Based on Actual Fund Return | |||
| Investor Shares | $1,000.00 | $1,162.03 | $0.93 |
| Admiral Shares | 1,000.00 | 1,162.80 | 0.27 |
| Signal Shares | 1,000.00 | 1,162.81 | 0.27 |
| ETF Shares | 1,000.00 | 1,162.88 | 0.27 |
| Based on Hypothetical 5% Yearly Return | |||
| Investor Shares | $1,000.00 | $1,024.35 | $0.87 |
| Admiral Shares | 1,000.00 | 1,024.95 | 0.26 |
| Signal Shares | 1,000.00 | 1,024.95 | 0.26 |
| ETF Shares | 1,000.00 | 1,024.95 | 0.26 |
The calculations are based on expenses incurred in the most recent six-month period. The fund’s annualized six-month expense ratios for that period are 0.17% for Investor Shares, 0.05% for Admiral Shares, 0.05% for Signal Shares, and 0.05% for ETF Shares. The dollar amounts shown as “Expenses Paid” are equal to the annualized expense ratio multiplied by the average account value over the period, multiplied by the number of days in the most recent six-month period, then divided by the number of days in the most recent 12-month period.
36
Glossary
30-Day SEC Yield. A fund’s 30-day SEC yield is derived using a formula specified by the U.S. Securities and Exchange Commission. Under the formula, data related to the fund’s security holdings in the previous 30 days are used to calculate the fund’s hypothetical net income for that period, which is then annualized and divided by the fund’s estimated average net assets over the calculation period. For the purposes of this calculation, a security’s income is based on its current market yield to maturity (for bonds), its actual income (for asset-backed securities), or its projected dividend yield (for stocks). Because the SEC yield represents hypothetical annualized income, it will differ—at times significantly—from the fund’s actual experience. As a result, the fund’s income distributions may be higher or lower than implied by the SEC yield.
Beta. A measure of the magnitude of a fund’s past share-price fluctuations in relation to the ups and downs of a given market index. The index is assigned a beta of 1.00. Compared with a given index, a fund with a beta of 1.20 typically would have seen its share price rise or fall by 12% when the index rose or fell by 10%. For this report, beta is based on returns over the past 36 months for both the fund and the index. Note that a fund’s beta should be reviewed in conjunction with its R-squared (see definition). The lower the R-squared, the less correlation there is between the fund and the index, and the less reliable beta is as an indicator of volatility.
Dividend Yield. Dividend income earned by stocks, expressed as a percentage of the aggregate market value (or of net asset value, for a fund). The yield is determined by dividing the amount of the annual dividends by the aggregate value (or net asset value) at the end of the period. For a fund, the dividend yield is based solely on stock holdings and does not include any income produced by other investments.
Earnings Growth Rate. The average annual rate of growth in earnings over the past five years for the stocks now in a fund.
Equity Exposure. A measure that reflects a fund’s investments in stocks and stock futures. Any holdings in short-term reserves are excluded.
Expense Ratio. A fund’s total annual operating expenses expressed as a percentage of the fund’s average net assets. The expense ratio includes management and administrative expenses, but does not include the transaction costs of buying and selling portfolio securities.
Foreign Holdings. The percentage of a fund represented by securities or depositary receipts of companies based outside the United States.
Inception Date. The date on which the assets of a fund (or one of its share classes) are first invested in accordance with the fund’s investment objective. For funds with a subscription period, the inception date is the day after that period ends. Investment performance is measured from the inception date.
Median Market Cap. An indicator of the size of companies in which a fund invests; the midpoint of market capitalization (market price x shares outstanding) of a fund’s stocks, weighted by the proportion of the fund’s assets invested in each stock. Stocks representing half of the fund’s assets have market capitalizations above the median, and the rest are below it.
Price/Book Ratio. The share price of a stock divided by its net worth, or book value, per share. For a fund, the weighted average price/book ratio of the stocks it holds.
37
Price/Earnings Ratio. The ratio of a stock’s current price to its per-share earnings over the past year. For a fund, the weighted average P/E of the stocks it holds. P/E is an indicator of market expectations about corporate prospects; the higher the P/E, the greater the expectations for a company’s future growth.
R-Squared. A measure of how much of a fund’s past returns can be explained by the returns from the market in general, as measured by a given index. If a fund’s total returns were precisely synchronized with an index’s returns, its R-squared would be 1.00. If the fund’s returns bore no relationship to the index’s returns, its R-squared would be 0. For this report, R-squared is based on returns over the past 36 months for both the fund and the index.
Return on Equity. The annual average rate of return generated by a company during the past five years for each dollar of shareholder’s equity (net income divided by shareholder’s equity). For a fund, the weighted average return on equity for the companies whose stocks it holds.
Short-Term Reserves. The percentage of a fund invested in highly liquid, short-term securities that can be readily converted to cash.
Turnover Rate. An indication of the fund’s trading activity. Funds with high turnover rates incur higher transaction costs and may be more likely to distribute capital gains (which may be taxable to investors). The turnover rate excludes in-kind transactions, which have minimal impact on costs.
38
This page intentionally left blank.
The People Who Govern Your Fund
The trustees of your mutual fund are there to see that the fund is operated and managed in your best interests since, as a shareholder, you are a part owner of the fund. Your fund’s trustees also serve on the board of directors of The Vanguard Group, Inc., which is owned by the Vanguard funds and provides services to them on an at-cost basis.
A majority of Vanguard’s board members are independent, meaning that they have no affiliation with Vanguard or the funds they oversee, apart from the sizable personal investments they have made as private individuals. The independent board members have distinguished backgrounds in business, academia, and public service. Each of the trustees and executive officers oversees 182 Vanguard funds.
The following table provides information for each trustee and executive officer of the fund. More information about the trustees is in the Statement of Additional Information, which can be obtained, without charge, by contacting Vanguard at 800-662-7447, or online at vanguard.com.
| InterestedTrustee1 | and Delphi Automotive LLP (automotive components); |
| Senior Advisor at New Mountain Capital; Trustee of | |
| F. William McNabb III | The Conference Board. |
| Born 1957. Trustee Since July 2009. Chairman of the | |
| Board. Principal Occupation(s) During the Past Five | Amy Gutmann |
| Years: Chairman of the Board of The Vanguard Group, | Born 1949. Trustee Since June 2006. Principal |
| Inc., and of each of the investment companies served | Occupation(s) During the Past Five Years: President |
| by The Vanguard Group, since January 2010; Director | of the University of Pennsylvania; Christopher H. |
| of The Vanguard Group since 2008; Chief Executive | Browne Distinguished Professor of Political Science |
| Officer and President of The Vanguard Group and of | in the School of Arts and Sciences with secondary |
| each of the investment companies served by The | appointments at the Annenberg School for |
| Vanguard Group since 2008; Director of Vanguard | Communication and the Graduate School of Education |
| Marketing Corporation; Managing Director of The | of the University of Pennsylvania; Member of the |
| Vanguard Group (1995–2008). | National Commission on the Humanities and Social |
| Sciences; Trustee of Carnegie Corporation of New | |
| York and of the National Constitution Center; Chair | |
| IndependentTrustees | of the U.S. Presidential Commission for the Study |
| of Bioethical Issues. | |
| Emerson U. Fullwood | |
| Born 1948. Trustee Since January 2008. Principal | JoAnn Heffernan Heisen |
| Occupation(s) During the Past Five Years: Executive | Born 1950. Trustee Since July 1998. Principal |
| Chief Staff and Marketing Officer for North America | Occupation(s) During the Past Five Years: Corporate |
| and Corporate Vice President (retired 2008) of Xerox | Vice President and Chief Global Diversity Officer |
| Corporation (document management products and | (retired 2008) and Member of the Executive |
| services); Executive in Residence and 2010 | Committee (1997–2008) of Johnson & Johnson |
| Distinguished Minett Professor at the Rochester | (pharmaceuticals/medical devices/consumer |
| Institute of Technology; Director of SPX Corporation | products); Director of Skytop Lodge Corporation |
| (multi-industry manufacturing), the United Way of | (hotels), the University Medical Center at Princeton, |
| Rochester, Amerigroup Corporation (managed health | the Robert Wood Johnson Foundation, and the Center |
| care), the University of Rochester Medical Center, | for Talent Innovation; Member of the Advisory Board |
| Monroe Community College Foundation, and North | of the Maxwell School of Citizenship and Public Affairs |
| Carolina A&T University. | at Syracuse University. |
| Rajiv L. Gupta | |
| Born 1945. Trustee Since December 2001.2 | F. Joseph Loughrey |
| Principal Occupation(s) During the Past Five Years: | Born 1949. Trustee Since October 2009. Principal |
| Chairman and Chief Executive Officer (retired 2009) | Occupation(s) During the Past Five Years: President |
| and President (2006–2008) of Rohm and Haas Co. | and Chief Operating Officer (retired 2009) of Cummins |
| (chemicals); Director of Tyco International, Ltd. | Inc. (industrial machinery); Chairman of the Board of |
| (diversified manufacturing and services), Hewlett- | Hillenbrand, Inc. (specialized consumer services) and |
| Packard Co. (electronic computer manufacturing), | of Oxfam America; Director of SKF AB (industrial |
| machinery), Hyster-Yale Materials Handling, Inc. | Executive Officers | |
| (forklift trucks), and the Lumina Foundation for | ||
| Education; Member of the Advisory Council for the | Glenn Booraem | |
| College of Arts and Letters and of the Advisory Board | Born 1967. Controller Since July 2010. Principal | |
| to the Kellogg Institute for International Studies, both | Occupation(s) During the Past Five Years: Principal | |
| at the University of Notre Dame. | of The Vanguard Group, Inc.; Controller of each of | |
| the investment companies served by The Vanguard | ||
| Mark Loughridge | Group; Assistant Controller of each of the investment | |
| Born 1953. Trustee Since March 2012. Principal | companies served by The Vanguard Group (2001–2010). | |
| Occupation(s) During the Past Five Years: Senior Vice | ||
| President and Chief Financial Officer at IBM (information | Thomas J. Higgins | |
| technology services); Fiduciary Member of IBM’s | Born 1957. Chief Financial Officer Since September | |
| Retirement Plan Committee. | 2008. Principal Occupation(s) During the Past Five | |
| Years: Principal of The Vanguard Group, Inc.; Chief | ||
| Scott C. Malpass | Financial Officer of each of the investment companies | |
| Born 1962. Trustee Since March 2012. Principal | served by The Vanguard Group; Treasurer of each of | |
| Occupation(s) During the Past Five Years: Chief | the investment companies served by The Vanguard | |
| Investment Officer and Vice President at the University | Group (1998–2008). | |
| of Notre Dame; Assistant Professor of Finance at the | ||
| Mendoza College of Business at Notre Dame; Member | Kathryn J. Hyatt | |
| of the Notre Dame 403(b) Investment Committee; | Born 1955. Treasurer Since November 2008. Principal | |
| Director of TIFF Advisory Services, Inc. (investment | Occupation(s) During the Past Five Years: Principal of | |
| advisor); Member of the Investment Advisory | The Vanguard Group, Inc.; Treasurer of each of the | |
| Committees of the Financial Industry Regulatory | investment companies served by The Vanguard | |
| Authority (FINRA) and of Major League Baseball. | Group; Assistant Treasurer of each of the investment | |
| companies served by The Vanguard Group (1988–2008). | ||
| André F. Perold | ||
| Born 1952. Trustee Since December 2004. Principal | Heidi Stam | |
| Occupation(s) During the Past Five Years: George | Born 1956. Secretary Since July 2005. Principal | |
| Gund Professor of Finance and Banking at the Harvard | Occupation(s) During the Past Five Years: Managing | |
| Business School (retired 2011); Chief Investment | Director of The Vanguard Group, Inc.; General Counsel | |
| Officer and Managing Partner of HighVista Strategies | of The Vanguard Group; Secretary of The Vanguard | |
| LLC (private investment firm); Director of Rand | Group and of each of the investment companies | |
| Merchant Bank; Overseer of the Museum of Fine | served by The Vanguard Group; Director and Senior | |
| Arts Boston. | Vice President of Vanguard Marketing Corporation. | |
| Alfred M. Rankin, Jr. | ||
| Vanguard Senior ManagementTeam | ||
| Born 1941. Trustee Since January 1993. Principal | ||
| Occupation(s) During the Past Five Years: Chairman, | Mortimer J. Buckley | Chris D. McIsaac |
| President, and Chief Executive Officer of NACCO | Kathleen C. Gubanich | Michael S. Miller |
| Industries, Inc. (housewares/lignite) and of Hyster-Yale | Paul A. Heller | James M. Norris |
| Materials Handling, Inc. (forklift trucks); Director of | Martha G. King | Glenn W. Reed |
| the National Association of Manufacturers; Chairman | John T. Marcante | |
| of the Board of University Hospitals of Cleveland; | ||
| Advisory Chairman of the Board of The Cleveland | Chairman Emeritus and Senior Advisor | |
| Museum of Art. | ||
| John J. Brennan | ||
| Peter F. Volanakis | Chairman, 1996–2009 | |
| Born 1955. Trustee Since July 2009. Principal | Chief Executive Officer and President, 1996–2008 | |
| Occupation(s) During the Past Five Years: President | ||
| and Chief Operating Officer (retired 2010) of Corning | ||
| Incorporated (communications equipment); Director | Founder | |
| of SPX Corporation (multi-industry manufacturing); | John C. Bogle | |
| Overseer of the Amos Tuck School of Business | Chairman and Chief Executive Officer, 1974–1996 | |
| Administration at Dartmouth College; Advisor to the | ||
| Norris Cotton Cancer Center. | ||
1 Mr. McNabb is considered an “interested person,” as defined in the Investment Company Act of 1940, because he is an officer of the Vanguard funds.
2 December 2002 for Vanguard Equity Income Fund, Vanguard Growth Equity Fund, the Vanguard Municipal Bond Funds, and the Vanguard State Tax-Exempt Funds.
 | |
| P.O. Box 2600 | |
| Valley Forge, PA 19482-2600 |
Connect with Vanguard® > vanguard.com
| Fund Information > 800-662-7447 | S&P® and S&P 500® are registered trademarks of |
| Direct Investor Account Services > 800-662-2739 | Standard & Poor’s Financial Services LLC (“S&P”) and |
| have been licensed for use by S&P Dow Jones Indices | |
| Institutional Investor Services > 800-523-1036 | LLC and its affiliates and sublicensed for certain |
| Text Telephone for People | purposes by Vanguard. The S&P 500 Index is a product |
| With Hearing Impairment > 800-749-7273 | of S&P Dow Jones Indices LLC and has been licensed |
| for use by Vanguard. The Vanguard funds are not | |
| This material may be used in conjunction | sponsored, endorsed, sold, or promoted by S&P Dow |
| with the offering of shares of any Vanguard | Jones Indices LLC, Dow Jones, S&P, or their respective |
| fund only if preceded or accompanied by | affiliates, and none of S&P Dow Jones Indices LLC, |
| Dow Jones, S&P, nor their respective affiliates makes | |
| the fund’s current prospectus. | any representation regarding the advisability of |
| All comparative mutual fund data are from Lipper, a | investing in such products. |
| Thomson Reuters Company, or Morningstar, Inc., unless | |
| otherwise noted. | |
| You can obtain a free copy of Vanguard’s proxy voting | |
| guidelines by visiting vanguard.com/proxyreporting or by | |
| calling Vanguard at 800-662-2739. The guidelines are | |
| also available from the SEC’s website, sec.gov. In | |
| addition, you may obtain a free report on how your fund | |
| voted the proxies for securities it owned during the 12 | |
| months ended June 30. To get the report, visit either | |
| vanguard.com/proxyreporting or sec.gov. | |
| You can review and copy information about your fund at | |
| the SEC’s Public Reference Room in Washington, D.C. To | |
| find out more about this public service, call the SEC at | |
| 202-551-8090. Information about your fund is also | |
| available on the SEC’s website, and you can receive | |
| copies of this information, for a fee, by sending a | |
| request in either of two ways: via e-mail addressed to | |
| publicinfo@sec.gov or via regular mail addressed to the | |
| Public Reference Section, Securities and Exchange | |
| Commission, Washington, DC 20549-1520. | |
| © 2014 The Vanguard Group, Inc. | |
| All rights reserved. | |
| Vanguard Marketing Corporation, Distributor. | |
| Q400 022014 | |
![]()
Annual Report | December 31, 2013
Vanguard U.S. Stock Index Funds Small-Capitalization Portfolios

Vanguard’s Principles for Investing Success
We want to give you the best chance of investment success. These principles, grounded in Vanguard’s research and experience, can put you on the right path.
Goals. Create clear, appropriate investment goals.
Balance. Develop a suitable asset allocation using broadly diversified funds. Cost. Minimize cost.
Discipline. Maintain perspective and long-term discipline.
A single theme unites these principles: Focus on the things you can control.
We believe there is no wiser course for any investor.
| Contents | |
| Your Fund’s Total Returns. | 1 |
| Chairman’s Letter. | 4 |
| Small-Cap Index Fund. | 10 |
| Small-Cap Growth Index Fund. | 32 |
| Small-Cap Value Index Fund. | 52 |
| Your Fund’s After-Tax Returns. | 74 |
| About Your Fund’s Expenses. | 75 |
| Glossary. | 78 |
Please note: The opinions expressed in this report are just that—informed opinions. They should not be considered promises or advice.
Also, please keep in mind that the information and opinions cover the period through the date on the front of this report. Of course, the risks of investing in your fund are spelled out in the prospectus.
See the Glossary for definitions of investment terms used in this report.
About the cover: The ship’s wheel represents leadership and guidance, essential qualities in navigating difficult seas.
This one is a replica based on an 18th-century British vessel. The HMS Vanguard, another ship of that era, served as the flagship for British Admiral Horatio Nelson when he defeated a French fleet at the Battle of the Nile.
| Your Fund’s Total Returns | |
| Fiscal Year Ended December 31, 2013 | |
| Total | |
| Returns | |
| Vanguard Small-Cap Index Fund | |
| Investor Shares | 37.62% |
| Admiral™ Shares | 37.81 |
| Signal® Shares | 37.79 |
| Institutional Shares | 37.80 |
| Institutional Plus Shares | 37.85 |
| ETF Shares | |
| Market Price | 37.75 |
| Net Asset Value | 37.80 |
| Spliced Small-Cap Index | 37.77 |
| Small-Cap Core Funds Average | 36.57 |
| For a benchmark description, see the Glossary. | |
| Small-Cap Core Funds Average: Derived from data provided by Lipper, a Thomson Reuters Company. | |
| Vanguard Small-Cap Growth Index Fund | |
| Investor Shares | 37.98% |
| Admiral Shares | 38.22 |
| Institutional Shares | 38.20 |
| ETF Shares | |
| Market Price | 38.14 |
| Net Asset Value | 38.18 |
| Spliced Small-Cap Growth Index | 37.91 |
| Small-Cap Growth Funds Average | 42.14 |
For a benchmark description, see the Glossary.
Small-Cap Growth Funds Average: Derived from data provided by Lipper, a Thomson Reuters Company.
Admiral Shares carry lower expenses and are available to investors who meet certain account-balance requirements. Signal Shares, Institutional Shares, and Institutional Plus Shares are available to certain institutional investors who meet specific administrative, service, and account-size criteria. The Vanguard ETF® Shares shown are traded on the NYSE Arca exchange and are available only through brokers.
The table provides ETF returns based on both the NYSE Arca market price and the net asset value for a share. U.S. Pat. Nos. 6,879,964; 7,337,138; 7,720,749; 7,925,573; 8,090,646; and 8,417,623.
1
| Your Fund’s Total Returns | |
| Fiscal Year Ended December 31, 2013 | |
| Total | |
| Returns | |
| Vanguard Small-Cap Value Index Fund | |
| Investor Shares | 36.41% |
| Admiral Shares | 36.58 |
| Institutional Shares | 36.55 |
| ETF Shares | |
| Market Price | 36.48 |
| Net Asset Value | 36.57 |
| Spliced Small-Cap Value Index | 36.67 |
| Small-Cap Value Funds Average | 36.66 |
For a benchmark description, see the Glossary.
Small-Cap Value Funds Average: Derived from data provided by Lipper, a Thomson Reuters Company.
Admiral Shares carry lower expenses and are available to investors who meet certain account-balance requirements. Signal Shares, Institutional Shares, and Institutional Plus Shares are available to certain institutional investors who meet specific administrative, service, and account-size criteria. The Vanguard ETF® Shares shown are traded on the NYSE Arca exchange and are available only through brokers. The table provides ETF returns based on both the NYSE Arca market price and the net asset value for a share. U.S. Pat. Nos. 6,879,964; 7,337,138; 7,720,749; 7,925,573; 8,090,646; and 8,417,623.
For the ETF Shares, the market price is determined by the midpoint of the bid-offer spread as of the closing time of the New York Stock Exchange (generally 4 p.m., Eastern time). The net asset value is also determined as of the NYSE closing time. For more information about how the ETF Shares' market prices have compared with their net asset value, visit vanguard.com, select your ETF, and then select the Price and Performance tab. The ETF premium/discount analysis there shows the percentages of days on which the ETF Shares' market price was above or below the NAV.
2
| Your Fund’s Performance at a Glance | ||||
| December 31, 2012, Through December 31, 2013 | ||||
| Distributions Per Share | ||||
| Starting | Ending | Income | Capital | |
| Share Price | Share Price | Dividends | Gains | |
| Vanguard Small-Cap Index Fund | ||||
| Investor Shares | $38.74 | $52.69 | $0.617 | $0.000 |
| Admiral Shares | 38.76 | 52.72 | 0.689 | 0.000 |
| Signal Shares | 34.92 | 47.49 | 0.621 | 0.000 |
| Institutional Shares | 38.76 | 52.71 | 0.693 | 0.000 |
| Institutional Plus Shares | 111.87 | 152.16 | 2.028 | 0.000 |
| ETF Shares | 80.89 | 110.02 | 1.439 | 0.000 |
| Vanguard Small-Cap Growth Index Fund | ||||
| Investor Shares | $25.03 | $34.37 | $0.164 | $0.000 |
| Admiral Shares | 31.30 | 42.98 | 0.280 | 0.000 |
| Institutional Shares | 25.07 | 34.42 | 0.225 | 0.000 |
| ETF Shares | 89.03 | 122.23 | 0.790 | 0.000 |
| Vanguard Small-Cap Value Index Fund | ||||
| Investor Shares | $17.40 | $23.33 | $0.400 | $0.000 |
| Admiral Shares | 31.20 | 41.82 | 0.782 | 0.000 |
| Institutional Shares | 17.44 | 23.37 | 0.439 | 0.000 |
| ETF Shares | 72.60 | 97.32 | 1.818 | 0.000 |
3

Chairman’s Letter
Dear Shareholder,
U.S. stocks produced strong results for the 12 months ended December 31, 2013, with stocks of smaller-capitalization companies outpacing their larger counterparts. In this investment environment, Vanguard’s three small-cap U.S. index funds delivered impressive gains, ranging from 36.41% for Vanguard Small-Cap Value Index Fund to 37.98% for Vanguard Small-Cap Growth Index Fund. Vanguard Small-Cap Index Fund fell between the two other funds, returning 37.62%. (All returns are for the funds’ Investor Shares.)
The performances of all three funds closely tracked those of their target indexes.
Please note that in October, we announced plans to streamline Vanguard’s share-class offerings by phasing out Signal Shares. Your Small-Cap Index Fund’s Signal Shares will be converted to Admiral Shares by October 2014.
If you hold any of these funds in a taxable account, you may wish to review the discussion of after-tax returns that appears later in this report.
Earnings, optimism, and stimulus made it a big year for U.S. stocks
For the 12 months ended December 31, U.S. stocks surged about 34%, their best calendar-year finish since 1995. Corporations posted solid earnings,
4
and investors placed a higher premium on those earnings. The Federal Reserve’s stimulative bond-buying program also supported stock markets; in fact, markets slumped a bit in the summer when questions arose about the timing of the program’s unwinding. In December, the Fed ended the uncertainty by announcing that it would begin paring its bond purchases in January 2014.
International stocks, in aggregate, returned about 15%, with the developed markets of Europe and the Pacific region posting double-digit results and emerging-market stocks dipping into negative territory.
For 2014, Vanguard Chief Economist Joe Davis and his team are guarded in their outlook for global stock returns, and their forecast for the bond market remains muted. Although Joe readily acknowledges that such forecasts are accompanied by uncertainty, he writes, “We believe. . . a balanced, diversified, low-cost portfolio can remain a high-value proposition in the decade ahead.” (You can read more about our expectations for bond and stock returns in Vanguard’s Economic and Investment Outlook, available at vanguard.com/research.)
Bond returns faltered as the Fed’s phaseout loomed
The broad U.S. taxable bond market returned –2.02%—its first negative calendar-year result since 1999 and its worst since 1994. The Fed’s plans for phasing out its bond-buying program rattled investors, who sold bonds in
| Market Barometer | |||
| Average Annual Total Returns | |||
| Periods Ended December 31, 2013 | |||
| One | Three | Five | |
| Year | Years | Years | |
| Stocks | |||
| Russell 1000 Index (Large-caps) | 33.11% | 16.30% | 18.59% |
| Russell 2000 Index (Small-caps) | 38.82 | 15.67 | 20.08 |
| Russell 3000 Index (Broad U.S. market) | 33.55 | 16.24 | 18.71 |
| MSCI All Country World Index ex USA (International) | 15.29 | 5.14 | 12.81 |
| Bonds | |||
| Barclays U.S. Aggregate Bond Index (Broad taxable market) | -2.02% | 3.26% | 4.44% |
| Barclays Municipal Bond Index (Broad tax-exempt market) | -2.55 | 4.83 | 5.89 |
| Citigroup Three-Month U.S. Treasury Bill Index | 0.05 | 0.06 | 0.09 |
| CPI | |||
| Consumer Price Index | 1.50% | 2.07% | 2.08% |
5
anticipation of further price declines. Municipal bonds returned –2.55% in aggregate. The yield of the 10-year Treasury note closed at 2.97%, up from 1.76% at the close of December 2012. (Bond yields and prices move in opposite directions.)
International bond markets (as measured by the Barclays Global Aggregate Index ex USD) returned –3.08%. Returns for money market funds and savings accounts remained tiny as the Fed held short-term interest rates between 0% and 0.25%.
Small-caps outperformed as investors pursued more risk
The most recent 12 months was, as I mentioned, a strong period for stocks of all sizes; small-caps, though, generally outperformed larger-company stocks. Shares of these smaller firms can outperform at times, such as during the past fiscal year, when investors seem more open to risk-taking. Keep in mind that prices of small-cap stocks often fluctuate more than those of large-company stocks.
During 2013, small-cap growth stocks were especially in favor. Such companies may have been attractive to investors because larger companies have faced challenges in recent years delivering more than just modest profit and sales growth. Although the Small-Cap Growth Index Fund led, each of the small-cap index funds posted positive results in all ten market sectors.
| Expense Ratios | |||||||
| Your Fund Compared With Its Peer Group | |||||||
| Peer | |||||||
| Investor | Admiral | Signal | Institutional | Institutional | ETF | Group | |
| Shares | Shares | Shares | Shares | Plus Shares | Shares | Average | |
| Small-Cap Index Fund | 0.24% | 0.10% | 0.10% | 0.08% | 0.06% | 0.10% | 1.34% |
| Small-Cap Growth Index Fund | 0.24 | 0.10 | — | 0.08 | — | 0.10 | 1.47 |
| Small-Cap Value Index Fund | 0.24 | 0.10 | — | 0.08 | — | 0.10 | 1.40 |
The fund expense ratios shown are from the prospectus dated August 12, 2013, and represent estimated costs for the current fiscal year. For the fiscal year ended December 31, 2013, the funds’ expense ratios were: for the Small-Cap Index Fund, 0.24% for Investor Shares, 0.09% for Admiral Shares, 0.09% for Signal Shares, 0.08% for Institutional Shares, 0.06% for Institutional Plus Shares, and 0.09% for ETF Shares; for the Small-Cap Growth Index Fund, 0.24% for Investor Shares, 0.09% for Admiral Shares, 0.08% for Institutional Shares, and 0.09% for ETF Shares; and for the Small-Cap Value Index Fund, 0.24% for Investor Shares, 0.09% for Admiral Shares, 0.08% for Institutional Shares, and 0.09% for ETF Shares. The peer-group expense ratios are derived from data provided by Lipper, a Thomson Reuters Company, and capture information through year-end 2012.
Peer groups: For the Small-Cap Index Fund, Small-Cap Core Funds; for the Small-Cap Growth Index Fund, Small-Cap Growth Funds; for the Small-Cap Value Index Fund, Small-Cap Value Funds.
6
Within the Small-Cap Growth Index Fund, industrial stocks contributed most to returns; various types of business-support companies and industrial engineering firms thrived as corporate budgets grew and business expansion accelerated. Holdings in health care also added significantly to performance, as the industry benefited from expanded pipelines for new medicines and favorable rulings from the Food and Drug Administration. The fund also posted sizable gains in consumer services and technology.
The Small-Cap Value Index Fund benefited most from its outsized allocation to financials, which added more than 10 percentage points to the
| Total Returns | |
| Ten Years Ended December 31, 2013 | |
| Average | |
| Annual Return | |
| Small-Cap Index Fund Investor Shares | 10.20% |
| Spliced Small-Cap Index | 10.27 |
| Small-Cap Core Funds Average | 8.46 |
| For a benchmark description, see the Glossary. | |
| Small-Cap Core Funds Average: Derived from data provided by Lipper, a Thomson Reuters Company. | |
| Small-Cap Growth Index Fund Investor Shares | 10.63% |
| Spliced Small-Cap Growth Index | 10.66 |
| Small-Cap Growth Funds Average | 8.03 |
| For a benchmark description, see the Glossary. | |
| Small-Cap Growth Funds Average: Derived from data provided by Lipper, a Thomson Reuters Company. | |
| Small-Cap Value Index Fund Investor Shares | 9.54% |
| Spliced Small-Cap Value Index | 9.67 |
| Small-Cap Value Funds Average | 8.79 |
| For a benchmark description, see the Glossary. | |
| Small-Cap Value Funds Average: Derived from data provided by Lipper, a Thomson Reuters Company. | |
The figures shown represent past performance, which is not a guarantee of future results. (Current performance may be lower or higher than the performance data cited. For performance data current to the most recent month-end, visit our website at vanguard.com/performance.) Note, too, that both investment returns and principal value can fluctuate widely, so an investor’s shares, when sold, could be worth more or less than their original cost.
7
fund’s return. Overall, the sector was helped by the strong investing environment, fewer insurance claims, firmer corporate balance sheets, better lending conditions, and the improved housing and labor markets. The fund’s holdings in industrials also boosted performance.
The Small-Cap Index Fund’s performance closely mirrored that of the Growth Fund, with industrial stocks contributing most to returns. Holdings in consumer services and health care boosted results as well. As in the Value Fund, financial stocks were strong performers.
| Don’t let a trick of the calendar alter your course |
| When making investment decisions, it’s important to weigh past returns with caution. That’s |
| because investment returns from any particular period are an unreliable anchor for gauging the |
| future. They can be highly date-dependent. |
| For example, take the five-year average annual return for the broad U.S. stock market. That |
| average just made a startling bounce: from 2.04% for the period ended December 31, 2012, |
| to 18.71% for the period ended December 31, 2013. True, the market returned a hearty 33.55% |
| in the most recent 12 months, but that’s not enough to explain such a big leap in the average. |
| Significantly, the 12 months ended December 31, 2008—when U.S. stocks returned –37.31% |
| during the financial crisis—has now rolled off the five-year calculation. |
| The important thing to remember is that historical returns are just that: historical. Basing |
| investment decisions on such date-dependent snapshots could easily lead you to alter |
| course—possibly in the wrong direction. Instead, Vanguard believes, you should build your |
| asset allocation strategy on long-term risk-and-return relationships, always recognizing that |
| no level of return is guaranteed. |
| Which five-year average should you count on? |
| (Answer: None of them!) |
| Average annual returns for U.S. stocks over five-year periods ended December 31 |
| 2007 | 13.63% |
| 2008 | –1.95 |
| 2009 | 0.76 |
| 2010 | 2.74 |
| 2011 | –0.01 |
| 2012 | 2.04 |
| 2013 | 18.71 |
| Note: The U.S. stock market is represented by the Russell 3000 Index. | |
| Source: Vanguard. |
8
Over ten years, all three funds posted competitive results
For the decade ended December 31, 2013, Vanguard’s three small-cap index funds recorded average annual returns ranging from 9.54% for the Small-Cap Value Index Fund to 10.63% for the Small-Cap Growth Index Fund. Each fund’s average annual return surpassed that of its peer group.
The three funds have met their objective of closely tracking their target index over the long term. This tracking success is a tribute to Vanguard Equity Investment Group, the funds’ advisor. The advisor is helped in this effort by the funds’ low expenses, which are far below the industry average for small-cap funds.
Rebalancing your portfolio keeps your target in focus
The surge in U.S. stocks in 2013 undoubtedly brought good cheer to investors at the end of the year. But although the rally has been welcome, we simply don’t know how long it will last. History teaches that it’s wise to anticipate a pullback in stocks after an extended winning streak.
At Vanguard, no matter what the current market conditions, we encourage you to maintain a diversified portfolio with a mix of stock, bond, and money market funds consistent with your long-term goals and risk tolerance.
Following such a robust year for stocks, you may find that your asset mix has drifted from your original target. If your allocation is off-target by about 5 percentage points or more, it may be time to rebalance. Specifically, the strong results for stocks and weak results for bonds in 2013 may mean directing assets from equities to fixed income. I understand that it feels counterintuitive to move away from one asset class that’s done well recently and into another that’s underperformed. But, as a Vanguard research paper puts it, “bonds are likely to remain one of the best diversifiers of equity market risk and . . . will likely provide downside protection to balanced investors over the long term.” (You can read the paper, Risk of Loss: Should the Prospect of Rising Rates Push Investors from High-Quality Bonds?, at vanguard.com/research.)
Ultimately, rebalancing is about controlling risk by keeping your portfolio in line with your target asset allocation. The alternative is to allow market fluctuations to set your asset mix, potentially leaving you with a riskier portfolio than you intended. As we’ve long counseled our clients, focusing on what you can control is one of the most prudent steps you can take as an investor.
Thank you for entrusting your assets to Vanguard.
Sincerely,
F. William McNabb III
Chairman and Chief Executive Officer
January 17, 2014
9
Small-Cap Index Fund
Fund Profile
As of December 31, 2013
| Share-Class Characteristics | ||||||
| Investor | Admiral | Signal | Institutional | Institutional | ||
| Shares | Shares | Shares | Shares | Plus Shares | ETF Shares | |
| Ticker Symbol | NAESX | VSMAX | VSISX | VSCIX | VSCPX | VB |
| Expense Ratio1 | 0.24% | 0.10% | 0.10% | 0.08% | 0.06% | 0.10% |
| 30-Day SEC Yield | 1.09% | 1.23% | 1.23% | 1.24% | 1.26% | 1.23% |
| Portfolio Characteristics | |||
| DJ | |||
| U.S. Total | |||
| CRSP US | Stock | ||
| Small Cap | Market | ||
| Fund | Index FA Index | ||
| Number of Stocks | 1,442 | 1,432 | 3,653 |
| Median Market Cap | $3.0B | $3.0B | $43.0B |
| Price/Earnings Ratio | 29.1x | 29.1x | 20.7x |
| Price/Book Ratio | 2.5x | 2.5x | 2.7x |
| Return on Equity | 9.9% | 9.9% | 16.5% |
| Earnings Growth | |||
| Rate | 10.7% | 10.7% | 11.4% |
| Dividend Yield | 1.3% | 1.3% | 1.8% |
| Foreign Holdings | 0.0% | 0.0% | 0.0% |
| Turnover Rate | 29% | — | — |
| Short-Term Reserves | 0.4% | — | — |
| Sector Diversification (% of equity exposure) | |||
| DJ | |||
| U.S. Total | |||
| CRSP US | Stock | ||
| Small Cap | Market | ||
| Fund | Index FA Index | ||
| Basic Materials | 4.4% | 4.4% | 3.1% |
| Consumer Goods | 7.9 | 7.9 | 10.2 |
| Consumer Services | 13.5 | 13.7 | 13.7 |
| Financials | 23.0 | 23.0 | 18.4 |
| Health Care | 9.8 | 9.8 | 11.8 |
| Industrials | 20.7 | 20.7 | 13.5 |
| Oil & Gas | 5.3 | 5.2 | 9.3 |
| Technology | 11.5 | 11.4 | 14.9 |
| Telecommunications | 0.7 | 0.7 | 2.1 |
| Utilities | 3.2 | 3.2 | 3.0 |
| Volatility Measures | ||
| DJ | ||
| Spliced | U.S. Total | |
| Small-Cap | Stock Market | |
| Index | FA Index | |
| R-Squared | 1.00 | 0.95 |
| Beta | 1.00 | 1.25 |
| These measures show the degree and timing of the fund’s fluctuations compared with the indexes over 36 months. | ||
| Ten Largest Holdings (% of total net assets) | ||
| Fortune Brands Home & Building Materials & | ||
| Security Inc. | Fixtures | 0.3% |
| United Rentals Inc. | Business Support | |
| Services | 0.3 | |
| Hanesbrands Inc. | Clothing & | |
| Accessories | 0.3 | |
| Wabtec Corp. | Commercial Vehicles | |
| & Trucks | 0.3 | |
| Gannett Co. Inc. | Publishing | 0.3 |
| Snap-on Inc. | Durable Household | |
| Products | 0.2 | |
| Jazz Pharmaceuticals plc Pharmaceuticals | 0.2 | |
| Omnicare Inc. | Drug Retailers | 0.2 |
| Arthur J Gallagher & Co. | Property & Casualty | |
| Insurance | 0.2 | |
| Packaging Corp. of | Containers & | |
| America | Packaging | 0.2 |
| Top Ten | 2.5% | |
| The holdings listed exclude any temporary cash investments and equity index products. | ||
1 The expense ratios shown are from the prospectus dated August 12, 2013, and represent estimated costs for the current fiscal year. For the fiscal year ended December 31, 2013, the expense ratios were 0.24% for Investor Shares, 0.09% for Admiral Shares, 0.09% for Signal Shares, 0.08% for Institutional Shares, 0.06% for Institutional Plus Shares, and 0.09% for ETF Shares.
10
Small-Cap Index Fund
Investment Focus
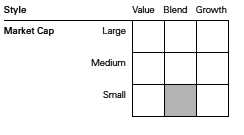
11
Small-Cap Index Fund
Performance Summary
All of the returns in this report represent past performance, which is not a guarantee of future results that may be achieved by the fund. (Current performance may be lower or higher than the performance data cited. For performance data current to the most recent month-end, visit our website at vanguard.com/performance.) Note, too, that both investment returns and principal value can fluctuate widely, so an investor’s shares, when sold, could be worth more or less than their original cost. The returns shown do not reflect taxes that a shareholder would pay on fund distributions or on the sale of fund shares.
Cumulative Performance: December 31, 2003, Through December 31, 2013
Initial Investment of $10,000
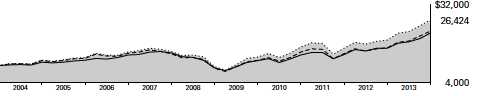
| Average Annual Total Returns | |||||
| Periods Ended December 31, 2013 | |||||
| Final Value | |||||
| One | Five | Ten | of a $10,000 | ||
| Year | Years | Years | Investment | ||
| Small-Cap Index Fund*Investor | |||||
| Shares | 37.62% | 22.38% | 10.20% | $26,424 | |
| •••••••• | Spliced Small-Cap Index | 37.77 | 22.48 | 10.27 | 26,571 |
| – – – – | Small-Cap Core Funds Average | 36.57 | 19.95 | 8.46 | 22,527 |
| Dow Jones U.S. Total Stock Market | |||||
| Float Adjusted Index | 33.47 | 18.86 | 8.09 | 21,777 | |
| For a benchmark description, see the Glossary. | |||||
| Small-Cap Core Funds Average: Derived from data provided by Lipper, a Thomson Reuters Company. | |||||
| Final Value | |||||
| One | Five | Ten | of a $10,000 | ||
| Year | Years | Years | Investment | ||
| Small-Cap Index Fund Admiral Shares | 37.81% | 22.55% | 10.34% | $26,752 | |
| Spliced Small-Cap Index | 37.77 | 22.48 | 10.27 | 26,571 | |
| Dow Jones U.S. Total Stock Market Float | |||||
| Adjusted Index | 33.47 | 18.86 | 8.09 | 21,777 | |
See Financial Highlights for dividend and capital gains information.
12
| Small-Cap Index Fund | ||||
| Average Annual Total Returns | ||||
| Periods Ended December 31, 2013 | ||||
| Since | Final Value | |||
| One | Five | Inception | of a $10,000 | |
| Year | Years | (12/15/2006) | Investment | |
| Small-Cap Index Fund Signal Shares | 37.79% | 22.55% | 8.50% | $17,766 |
| Spliced Small-Cap Index | 37.77 | 22.48 | 8.40 | 17,650 |
| Dow Jones U.S. Total Stock Market Float | ||||
| Adjusted Index | 33.47 | 18.86 | 6.54 | 15,627 |
"Since Inception" performance is calculated from the Signal Shares’ inception date for both the fund and its comparative standards.
| Final Value | ||||
| One | Five | Ten | of a $5,000,000 | |
| Year | Years | Years | Investment | |
| Small-Cap Index Fund Institutional Shares | 37.80% | 22.59% | 10.38% | $13,427,139 |
| Spliced Small-Cap Index | 37.77 | 22.48 | 10.27 | 13,285,297 |
| Dow Jones U.S. Total Stock Market Float | ||||
| Adjusted Index | 33.47 | 18.86 | 8.09 | 10,888,699 |
| Since | Final Value | |||
| One | Inception | of a $100,000,000 | ||
| Year | (12/17/2010) | Investment | ||
| Small-Cap Index Fund Institutional Plus Shares | 37.85% | 16.74% | $160,046,784 | |
| Spliced Small-Cap Index | 37.77 | 16.65 | 159,652,333 | |
| Dow Jones U.S. Total Stock Market Float | ||||
| Adjusted Index | 33.47 | 16.45 | 158,820,537 | |
"Since Inception" performance is calculated from the Institutional Plus Shares’ inception date for both the fund and its comparative standards.
| Since | Final Value | |||
| One | Five | Inception | of a $10,000 | |
| Year | Years | (1/26/2004) | Investment | |
| Small-Cap Index Fund | ||||
| ETF Shares Net Asset Value | 37.80% | 22.55% | 9.65% | $24,966 |
| Spliced Small-Cap Index | 37.77 | 22.48 | 9.57 | 24,787 |
| Dow Jones U.S. Total Stock Market Float | ||||
| Adjusted Index | 33.47 | 18.86 | 7.67 | 20,835 |
"Since Inception" performance is calculated from the ETF Shares’ inception date for both the fund and its comparative standards.
13
Small-Cap Index Fund
| Cumulative Returns of ETF Shares: January 26, 2004, Through December 31, 2013 | |||
| Since | |||
| One | Five | Inception | |
| Year | Years | (1/26/2004) | |
| Small-Cap Index Fund ETF Shares Market Price | 37.75% | 177.58% | 149.66% |
| Small-Cap Index Fund ETF Shares Net Asset Value | 37.80 | 176.42 | 149.66 |
| Spliced Small-Cap Index | 37.77 | 175.58 | 147.87 |
| "Since Inception" performance is calculated from the ETF Shares’ inception date for both the fund and its comparative standards. | |||
Fiscal-Year Total Returns (%): December 31, 2003, Through December 31, 2013
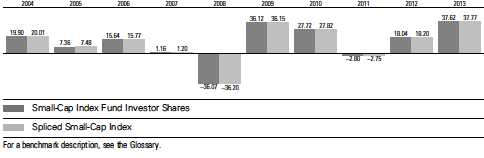
14
Small-Cap Index Fund
Financial Statements
Statement of Net Assets—Investments Summary
As of December 31, 2013
This Statement summarizes the fund’s holdings by asset type. Details are reported for each of the fund’s 50 largest individual holdings and for investments that, in total for any issuer, represent more than 1% of the fund’s net assets. The total value of smaller holdings is reported as a single amount within each category.
The fund reports a complete list of its holdings in regulatory filings four times in each fiscal year, at the quarter-ends. For the second and fourth fiscal quarters, the complete listing of the fund’s holdings is available electronically on vanguard.com and on the Securities and Exchange Commission’s website (sec.gov), or you can have it mailed to you without charge by calling 800-662-7447. For the first and third fiscal quarters, the fund files the lists with the SEC on Form N-Q. Shareholders can look up the fund’s Forms N-Q on the SEC’s website. Forms N-Q may also be reviewed and copied at the SEC’s Public Reference Room (see the back cover of this report for further information).
| Market | Percentage | ||
| Value | of Net | ||
| Shares | ($000) | Assets | |
| Common Stocks | |||
| Basic Materials | |||
| RPM International Inc. | 2,193,356 | 91,046 | 0.2% |
| Rockwood Holdings Inc. | 1,207,115 | 86,816 | 0.2% |
| Basic Materials—Other † | 1,765,505 | 4.0% | |
| 1,943,367 | 4.4% | ||
| Consumer Goods | |||
| Hanesbrands Inc. | 1,634,446 | 114,852 | 0.3% |
| Snap-on Inc. | 958,792 | 105,007 | 0.3% |
| Goodyear Tire & Rubber Co. | 4,071,432 | 97,104 | 0.2% |
| * Toll Brothers Inc. | 2,600,750 | 96,228 | 0.2% |
| Harman International Industries Inc. | 1,114,528 | 91,224 | 0.2% |
| Ingredion Inc. | 1,264,685 | 86,580 | 0.2% |
| Consumer Goods—Other † | 2,888,781 | 6.5% | |
| 3,479,776 | 7.9% | ||
| Consumer Services | |||
| Gannett Co. Inc. | 3,759,088 | 111,194 | 0.3% |
| Omnicare Inc. | 1,698,458 | 102,519 | 0.2% |
| Foot Locker Inc. | 2,449,394 | 101,503 | 0.2% |
| Dick’s Sporting Goods Inc. | 1,664,133 | 96,686 | 0.2% |
| GNC Holdings Inc. Class A | 1,566,978 | 91,590 | 0.2% |
| GameStop Corp. Class A | 1,832,646 | 90,276 | 0.2% |
| Dunkin’ Brands Group Inc. | 1,759,460 | 84,806 | 0.2% |
| Alaska Air Group Inc. | 1,147,244 | 84,173 | 0.2% |
| Consumer Services—Other † | 5,176,680 | 11.7% | |
| 5,939,427 | 13.4% |
15
| Small-Cap Index Fund | ||||
| Market | Percentage | |||
| Value | of Net | |||
| Shares | ($000) | Assets | ||
| Financials | ||||
| Arthur J Gallagher & Co. | 2,184,212 | 102,505 | 0.2% | |
| * | E*TRADE Financial Corp. | 4,735,879 | 93,013 | 0.2% |
| Starwood Property Trust Inc. | 3,220,177 | 89,199 | 0.2% | |
| Waddell & Reed Financial Inc. Class A | 1,338,742 | 87,179 | 0.2% | |
| Financials—Other † | 9,684,617 | 21.9% | ||
| 10,056,513 | 22.7% | |||
| Health Care | ||||
| * | Jazz Pharmaceuticals plc | 810,311 | 102,553 | 0.2% |
| Cooper Cos. Inc. | 807,267 | 99,972 | 0.2% | |
| * | Alkermes plc | 2,255,622 | 91,714 | 0.2% |
| * | Salix Pharmaceuticals Ltd. | 985,072 | 88,597 | 0.2% |
| * | MEDNAX Inc. | 1,658,579 | 88,535 | 0.2% |
| * | United Therapeutics Corp. | 745,547 | 84,306 | 0.2% |
| * | Cubist Pharmaceuticals Inc. | 1,221,104 | 84,097 | 0.2% |
| Health Care—Other † | 3,649,395 | 8.3% | ||
| 4,289,169 | 9.7% | |||
| Industrials | ||||
| Fortune Brands Home & Security Inc. | 2,742,618 | 125,338 | 0.3% | |
| * | United Rentals Inc. | 1,537,710 | 119,864 | 0.3% |
| Wabtec Corp. | 1,508,813 | 112,060 | 0.2% | |
| Packaging Corp. of America | 1,617,364 | 102,347 | 0.2% | |
| IDEX Corp. | 1,337,941 | 98,807 | 0.2% | |
| Lincoln Electric Holdings Inc. | 1,345,957 | 96,021 | 0.2% | |
| Total System Services Inc. | 2,817,372 | 93,762 | 0.2% | |
| Valspar Corp. | 1,286,721 | 91,730 | 0.2% | |
| * | Colfax Corp. | 1,428,353 | 90,972 | 0.2% |
| Waste Connections Inc. | 1,935,748 | 84,457 | 0.2% | |
| * | Kirby Corp. | 842,954 | 83,663 | 0.2% |
| Jack Henry & Associates Inc. | 1,410,964 | 83,543 | 0.2% | |
| Carlisle Cos. Inc. | 1,049,010 | 83,291 | 0.2% | |
| * | CoStar Group Inc. | 450,477 | 83,149 | 0.2% |
| * | Genesee & Wyoming Inc. Class A | 854,753 | 82,099 | 0.2% |
| Industrials—Other † | 7,648,325 | 17.3% | ||
| 9,079,428 | 20.5% | |||
| Oil & Gas | ||||
| * | Oil States International Inc. | 909,532 | 92,518 | 0.2% |
| * | Gulfport Energy Corp. | 1,387,316 | 87,609 | 0.2% |
| Oil & Gas—Other † | 2,119,354 | 4.8% | ||
| 2,299,481 | 5.2% | |||
| Technology | ||||
| * | NCR Corp. | 2,745,057 | 93,497 | 0.2% |
| IAC/InterActiveCorp | 1,278,676 | 87,832 | 0.2% | |
| * | athenahealth Inc. | 613,255 | 82,483 | 0.2% |
| Technology—Other † | 4,758,318 | 10.7% | ||
| 5,022,130 | 11.3% | |||
| Telecommunications | ||||
| * | Level 3 Communications Inc. | 2,766,072 | 91,751 | 0.2% |
| Telecommunications—Other † | 207,984 | 0.5% | ||
| 299,735 | 0.7% | |||
16
| Small-Cap Index Fund | ||||
| Market | Percentage | |||
| Value | of Net | |||
| Shares | ($000) | Assets | ||
| Utilities | ||||
| AGL Resources Inc. | 1,959,056 | 92,526 | 0.2% | |
| ITC Holdings Corp. | 865,265 | 82,910 | 0.2% | |
| Utilities—Other † | 1,228,491 | 2.8% | ||
| 1,403,927 | 3.2% | |||
| Total Common Stocks (Cost $31,187,639) | 43,812,953 | 99.0%1 | ||
| Coupon | ||||
| Temporary Cash Investments | ||||
| Money Market Fund | ||||
| 2,3 Vanguard Market Liquidity Fund | 0.125% | 1,060,404,291 | 1,060,404 | 2.4% |
| 4U.S. Government and Agency Obligations † | 19,692 | 0.1% | ||
| Total Temporary Cash Investments (Cost $1,080,099) | 1,080,096 | 2.5%1 | ||
| 5Total Investments (Cost $32,267,738) | 44,893,049 | 101.5% | ||
| Other Assets and Liabilities | ||||
| Other Assets | 207,705 | 0.5% | ||
| Liabilities3 | (857,657) | (2.0%) | ||
| (649,952) | (1.5%) | |||
| Net Assets | 44,243,097 | 100.0% | ||
| At December 31, 2013, net assets consisted of: | ||||
| Amount | ||||
| ($000) | ||||
| Paid-in Capital | 33,335,343 | |||
| Overdistributed Net Investment Income | (37,787) | |||
| Accumulated Net Realized Losses | (1,689,883) | |||
| Unrealized Appreciation (Depreciation) | ||||
| Investment Securities | 12,625,311 | |||
| Futures Contracts | 10,113 | |||
| Net Assets | 44,243,097 | |||
| Investor Shares—Net Assets | ||||
| Applicable to 95,678,323 outstanding $.001 par value shares of | ||||
| beneficial interest (unlimited authorization) | 5,040,982 | |||
| Net Asset Value Per Share—Investor Shares | $52.69 | |||
| Admiral Shares—Net Assets | ||||
| Applicable to 192,079,106 outstanding $.001 par value shares of | ||||
| beneficial interest (unlimited authorization) | 10,125,873 | |||
| Net Asset Value Per Share—Admiral Shares | $52.72 | |||
17
| Small-Cap Index Fund | |
| Amount | |
| ($000) | |
| Signal Shares—Net Assets | |
| Applicable to 154,781,483 outstanding $.001 par value shares of | |
| beneficial interest (unlimited authorization) | 7,351,107 |
| Net Asset Value Per Share—Signal Shares | $47.49 |
| Institutional Shares—Net Assets | |
| Applicable to 174,244,803 outstanding $.001 par value shares of | |
| beneficial interest (unlimited authorization) | 9,185,118 |
| Net Asset Value Per Share—Institutional Shares | $52.71 |
| Institutional Plus Shares—Net Assets | |
| Applicable to 28,408,055 outstanding $.001 par value shares of | |
| beneficial interest (unlimited authorization) | 4,322,531 |
| Net Asset Value Per Share—Institutional Plus Shares | $152.16 |
| ETF Shares—Net Assets | |
| Applicable to 74,691,296 outstanding $.001 par value shares of | |
| beneficial interest (unlimited authorization) | 8,217,486 |
| Net Asset Value Per Share—ETF Shares | $110.02 |
See Note A in Notes to Financial Statements.
* Non-income-producing security.
† Represents the aggregate value, by category, of securities that are not among the 50 largest holdings and, in total for any issuer, represent 1% or less of net assets.
1 The fund invests a portion of its cash reserves in equity markets through the use of index futures contracts. After giving effect to futures investments, the fund’s effective common stock and temporary cash investment positions represent 100.0% and 1.5%, respectively, of net assets.
2 Affiliated money market fund available only to Vanguard funds and certain trusts and accounts managed by Vanguard. Rate shown is the 7-day yield.
3 Includes $482,350,000 of collateral received for securities on loan.
4 Securities with a value of $18,892,000 have been segregated as initial margin for open futures contracts.
5 The total value of securities on loan is $458,686,000
See accompanying Notes, which are an integral part of the Financial Statements.
18
| Small-Cap Index Fund | |
| Statement of Operations | |
| Year Ended | |
| December 31, 2013 | |
| ($000) | |
| Investment Income | |
| Income | |
| Dividends | 565,017 |
| Interest1 | 457 |
| Securities Lending | 28,591 |
| Total Income | 594,065 |
| Expenses | |
| The Vanguard Group—Note B | |
| Investment Advisory Services | 1,769 |
| Management and Administrative—Investor Shares | 9,399 |
| Management and Administrative—Admiral Shares | 5,643 |
| Management and Administrative—Signal Shares | 3,481 |
| Management and Administrative—Institutional Shares | 3,613 |
| Management and Administrative—Institutional Plus Shares | 1,203 |
| Management and Administrative—ETF Shares | 3,876 |
| Marketing and Distribution—Investor Shares | 1,005 |
| Marketing and Distribution—Admiral Shares | 1,106 |
| Marketing and Distribution—Signal Shares | 1,410 |
| Marketing and Distribution—Institutional Shares | 1,754 |
| Marketing and Distribution—Institutional Plus Shares | 530 |
| Marketing and Distribution—ETF Shares | 1,447 |
| Custodian Fees | 971 |
| Auditing Fees | 37 |
| Shareholders’ Reports—Investor Shares | 114 |
| Shareholders’ Reports—Admiral Shares | 56 |
| Shareholders’ Reports—Signal Shares | 68 |
| Shareholders’ Reports—Institutional Shares | 89 |
| Shareholders’ Reports—Institutional Plus Shares | 20 |
| Shareholders’ Reports—ETF Shares | 212 |
| Trustees’ Fees and Expenses | 42 |
| Total Expenses | 37,845 |
| Net Investment Income | 556,220 |
| Realized Net Gain (Loss) | |
| Investment Securities Sold | 494,130 |
| Futures Contracts | 89,092 |
| Realized Net Gain (Loss) | 583,222 |
| Change in Unrealized Appreciation (Depreciation) | |
| Investment Securities | 10,267,790 |
| Futures Contracts | 9,626 |
| Change in Unrealized Appreciation (Depreciation) | 10,277,416 |
| Net Increase (Decrease) in Net Assets Resulting from Operations | 11,416,858 |
| 1 Interest income from an affiliated company of the fund was $433,000. | |
| See accompanying Notes, which are an integral part of the Financial Statements. | |
19
| Small-Cap Index Fund | ||
| Statement of Changes in Net Assets | ||
| Year Ended December 31, | ||
| 2013 | 2012 | |
| ($000) | ($000) | |
| Increase (Decrease) in Net Assets | ||
| Operations | ||
| Net Investment Income | 556,220 | 502,306 |
| Realized Net Gain (Loss) | 583,222 | 1,147,066 |
| Change in Unrealized Appreciation (Depreciation) | 10,277,416 | 2,559,591 |
| Net Increase (Decrease) in Net Assets Resulting from Operations | 11,416,858 | 4,208,963 |
| Distributions | ||
| Net Investment Income | ||
| Investor Shares | (59,108) | (65,627) |
| Admiral Shares | (130,303) | (119,456) |
| Signal Shares | (95,062) | (79,055) |
| Institutional Shares | (118,018) | (108,272) |
| Institutional Plus Shares | (56,696) | (45,220) |
| ETF Shares | (108,060) | (87,168) |
| Realized Capital Gain | ||
| Investor Shares | — | — |
| Admiral Shares | — | — |
| Signal Shares | — | — |
| Institutional Shares | — | — |
| Institutional Plus Shares | — | — |
| ETF Shares | — | — |
| Total Distributions | (567,247) | (504,798) |
| Capital Share Transactions | ||
| Investor Shares | (140,555) | (706,073) |
| Admiral Shares | 1,110,132 | 130,540 |
| Signal Shares | 1,241,430 | 730,889 |
| Institutional Shares | 948,902 | 272,583 |
| Institutional Plus Shares | 914,375 | 284,008 |
| ETF Shares | 1,555,179 | 406,197 |
| Net Increase (Decrease) from Capital Share Transactions | 5,629,463 | 1,118,144 |
| Total Increase (Decrease) | 16,479,074 | 4,822,309 |
| Net Assets | ||
| Beginning of Period | 27,764,023 | 22,941,714 |
| End of Period1 | 44,243,097 | 27,764,023 |
1 Net Assets—End of Period includes undistributed (overdistributed) net investment income of ($37,787,000) and ($28,016,000).
See accompanying Notes, which are an integral part of the Financial Statements.
20
| Small-Cap Index Fund | |||||
| Financial Highlights | |||||
| Investor Shares | |||||
| For a Share Outstanding | Year Ended December 31, | ||||
| Throughout Each Period | 2013 | 2012 | 2011 | 2010 | 2009 |
| Net Asset Value, Beginning of Period | $38.74 | $33.38 | $34.75 | $27.49 | $20.40 |
| Investment Operations | |||||
| Net Investment Income | .609 | .659 | .402 | .355 | .272 |
| Net Realized and Unrealized Gain (Loss) | |||||
| on Investments | 13.958 | 5.363 | (1.375) | 7.266 | 7.094 |
| Total from Investment Operations | 14.567 | 6.022 | (.973) | 7.621 | 7.366 |
| Distributions | |||||
| Dividends from Net Investment Income | (. 617) | (. 662) | (. 397) | (.361) | (.276) |
| Distributions from Realized Capital Gains | — | — | — | — | — |
| Total Distributions | (.617) | (.662) | (.397) | (.361) | (.276) |
| Net Asset Value, End of Period | $52.69 | $38.74 | $33.38 | $34.75 | $27.49 |
| Total Return1 | 37.62% | 18.04% | -2.80% | 27.72% | 36.12% |
| Ratios/Supplemental Data | |||||
| Net Assets, End of Period (Millions) | $5,041 | $3,813 | $3,925 | $5,270 | $5,913 |
| Ratio of Total Expenses to Average Net Assets | 0.24% | 0.24% | 0.24% | 0.26% | 0.28% |
| Ratio of Net Investment Income to | |||||
| Average Net Assets | 1.39% | 1.82% | 1.15% | 1.24% | 1.30% |
| Portfolio Turnover Rate2 | 29% | 14% | 17% | 12% | 14% |
1 Total returns do not include account service fees that may have applied in the periods shown. Fund prospectuses provide information about any applicable account service fees.
2 Excludes the value of portfolio securities received or delivered as a result of in-kind purchases or redemptions of the fund’s capital shares, including ETF Creation Units.
See accompanying Notes, which are an integral part of the Financial Statements.
21
| Small-Cap Index Fund | |||||
| Financial Highlights | |||||
| Admiral Shares | |||||
| For a Share Outstanding | Year Ended December 31 | ||||
| Throughout Each Period | 2013 | 2012 | 2011 | 2010 | 2009 |
| Net Asset Value, Beginning of Period | $38.76 | $33.39 | $34.78 | $27.50 | $20.40 |
| Investment Operations | |||||
| Net Investment Income | .681 | .717 | .461 | .384 | .303 |
| Net Realized and Unrealized Gain (Loss) | |||||
| on Investments | 13.968 | 5.372 | (1.395) | 7.286 | 7.105 |
| Total from Investment Operations | 14.649 | 6.089 | (.934) | 7.670 | 7.408 |
| Distributions | |||||
| Dividends from Net Investment Income | (.689) | (.719) | (.456) | (.390) | (.308) |
| Distributions from Realized Capital Gains | — | — | — | — | — |
| Total Distributions | (.689) | (.719) | (.456) | (.390) | (.308) |
| Net Asset Value, End of Period | $52.72 | $38.76 | $33.39 | $34.78 | $27.50 |
| Total Return1 | 37.81% | 18.24% | -2.69% | 27.89% | 36.33% |
| Ratios/Supplemental Data | |||||
| Net Assets, End of Period (Millions) | $10,126 | $6,541 | $5,525 | $5,554 | $1,992 |
| Ratio of Total Expenses to Average Net Assets | 0.09% | 0.10% | 0.10% | 0.12% | 0.14% |
| Ratio of Net Investment Income to | |||||
| Average Net Assets | 1.54% | 1.96% | 1.29% | 1.38% | 1.44% |
| Portfolio Turnover Rate2 | 29% | 14% | 17% | 12% | 14% |
1 Total returns do not include account service fees that may have applied in the periods shown. Fund prospectuses provide information about any applicable account service fees.
2 Excludes the value of portfolio securities received or delivered as a result of in-kind purchases or redemptions of the fund’s capital shares, including ETF Creation Units.
See accompanying Notes, which are an integral part of the Financial Statements.
22
| Small-Cap Index Fund | |||||
| Financial Highlights | |||||
| Signal Shares | |||||
| For a Share Outstanding | Year Ended December 31, | ||||
| Throughout Each Period | 2013 | 2012 | 2011 | 2010 | 2009 |
| Net Asset Value, Beginning of Period | $34.92 | $30.08 | $31.33 | $24.79 | $18.39 |
| Investment Operations | |||||
| Net Investment Income | .614 | .648 | .417 | .359 | .274 |
| Net Realized and Unrealized Gain (Loss) | |||||
| on Investments | 12.577 | 4.841 | (1.254) | 6.545 | 6.405 |
| Total from Investment Operations | 13.191 | 5.489 | (.837) | 6.904 | 6.679 |
| Distributions | |||||
| Dividends from Net Investment Income | (.621) | (.649) | (.413) | (.364) | (.279) |
| Distributions from Realized Capital Gains | — | — | — | — | — |
| Total Distributions | (.621) | (.649) | (.413) | (.364) | (.279) |
| Net Asset Value, End of Period | $47.49 | $34.92 | $30.08 | $31.33 | $24.79 |
| Total Return | 37.79% | 18.25% | -2.68% | 27.85% | 36.34% |
| Ratios/Supplemental Data | |||||
| Net Assets, End of Period (Millions) | $7,351 | $4,329 | $3,075 | $2,300 | $1,763 |
| Ratio of Total Expenses to Average Net Assets | 0.09% | 0.10% | 0.10% | 0.12% | 0.14% |
| Ratio of Net Investment Income to | |||||
| Average Net Assets | 1.54% | 1.96% | 1.29% | 1.38% | 1.44% |
| Portfolio Turnover Rate1 | 29% | 14% | 17% | 12% | 14% |
1 Excludes the value of portfolio securities received or delivered as a result of in-kind purchases or redemptions of the fund’s capital shares, including ETF Creation Units.
See accompanying Notes, which are an integral part of the Financial Statements.
23
| Small-Cap Index Fund | |||||
| Financial Highlights | |||||
| Institutional Shares | |||||
| For a Share Outstanding | Year Ended December 31, | ||||
| Throughout Each Period | 2013 | 2012 | 2011 | 2010 | 2009 |
| Net Asset Value, Beginning of Period | $38.76 | $33.39 | $34.77 | $27.50 | $20.40 |
| Investment Operations | |||||
| Net Investment Income | .686 | .724 | .467 | .410 | .316 |
| Net Realized and Unrealized Gain (Loss) | |||||
| on Investments | 13.957 | 5.372 | (1.385) | 7.276 | 7.106 |
| Total from Investment Operations | 14.643 | 6.096 | (.918) | 7.686 | 7.422 |
| Distributions | |||||
| Dividends from Net Investment Income | (.693) | (.726) | (.462) | (.416) | (.322) |
| Distributions from Realized Capital Gains | — | — | — | — | — |
| Total Distributions | (.693) | (.726) | (.462) | (.416) | (.322) |
| Net Asset Value, End of Period | $52.71 | $38.76 | $33.39 | $34.77 | $27.50 |
| Total Return | 37.80% | 18.26% | -2.65% | 27.95% | 36.40% |
| Ratios/Supplemental Data | |||||
| Net Assets, End of Period (Millions) | $9,185 | $5,955 | $4,894 | $5,711 | $4,162 |
| Ratio of Total Expenses to Average Net Assets | 0.08% | 0.08% | 0.08% | 0.08% | 0.08% |
| Ratio of Net Investment Income to | |||||
| Average Net Assets | 1.55% | 1.98% | 1.31% | 1.42% | 1.50% |
| Portfolio Turnover Rate1 | 29% | 14% | 17% | 12% | 14% |
1 Excludes the value of portfolio securities received or delivered as a result of in-kind purchases or redemptions of the fund’s capital shares, including ETF Creation Units.
See accompanying Notes, which are an integral part of the Financial Statements.
24
| Small-Cap Index Fund | ||||
| Financial Highlights | ||||
| Institutional Plus Shares | ||||
| Dec. 17, | ||||
| 20101 to | ||||
| Year Ended December 31, | Dec. 31, | |||
| For a Share Outstanding Throughout Each Period | 2013 | 2012 | 2011 | 2010 |
| Net Asset Value, Beginning of Period | $111.87 | $96.37 | $100.38 | $100.73 |
| Investment Operations | ||||
| Net Investment Income | 2.007 | 2.114 | 1.373 | .0642 |
| Net Realized and Unrealized Gain (Loss) on Investments | 40.311 | 15.506 | (4.023) | .767 |
| Total from Investment Operations | 42.318 | 17.620 | (2.650) | .831 |
| Distributions | ||||
| Dividends from Net Investment Income | (2.028) | (2.120) | (1.360) | (1.181) |
| Distributions from Realized Capital Gains | — | — | — | — |
| Total Distributions | (2.028) | (2.120) | (1.360) | (1.181) |
| Net Asset Value, End of Period | $152.16 | $111.87 | $96.37 | $100.38 |
| Total Return | 37.85% | 18.29% | -2.65% | 0.82% |
| Ratios/Supplemental Data | ||||
| Net Assets, End of Period (Millions) | $4,323 | $2,435 | $1,840 | $341 |
| Ratio of Total Expenses to Average Net Assets | 0.06% | 0.06% | 0.06% | 0.06%3 |
| Ratio of Net Investment Income to Average Net Assets | 1.57% | 2.00% | 1.33% | 1.44%3 |
| Portfolio Turnover Rate4 | 29% | 14% | 17% | 12% |
1 Inception.
2 Calculated based on average shares outstanding.
3 Annualized.
4 Excludes the value of portfolio securities received or delivered as a result of in-kind purchases or redemptions of the fund’s capital shares, including ETF Creation Units.
See accompanying Notes, which are an integral part of the Financial Statements.
25
| Small-Cap Index Fund | |||||
| Financial Highlights | |||||
| ETF Shares | |||||
| For a Share Outstanding | Year Ended December 31, | ||||
| Throughout Each Period | 2013 | 2012 | 2011 | 2010 | 2009 |
| Net Asset Value, Beginning of Period | $80.89 | $69.70 | $72.58 | $57.41 | $42.60 |
| Investment Operations | |||||
| Net Investment Income | 1.424 | 1.500 | .957 | .833 | .646 |
| Net Realized and Unrealized Gain (Loss) | |||||
| on Investments | 29.145 | 11.194 | (2.891) | 15.183 | 14.822 |
| Total from Investment Operations | 30.569 | 12.694 | (1.934) | 16.016 | 15.468 |
| Distributions | |||||
| Dividends from Net Investment Income | (1.439) | (1.504) | (.946) | (.846) | (.658) |
| Distributions from Realized Capital Gains | — | — | — | — | — |
| Total Distributions | (1.439) | (1.504) | (.946) | (.846) | (.658) |
| Net Asset Value, End of Period | $110.02 | $80.89 | $69.70 | $72.58 | $57.41 |
| Total Return | 37.80% | 18.22% | -2.68% | 27.89% | 36.31% |
| Ratios/Supplemental Data | |||||
| Net Assets, End of Period (Millions) | $8,217 | $4,691 | $3,683 | $4,843 | $3,460 |
| Ratio of Total Expenses to Average Net Assets | 0.09% | 0.10% | 0.10% | 0.12% | 0.14% |
| Ratio of Net Investment Income to | |||||
| Average Net Assets | 1.54% | 1.96% | 1.29% | 1.38% | 1.44% |
| Portfolio Turnover Rate1 | 29% | 14% | 17% | 12% | 14% |
1 Excludes the value of portfolio securities received or delivered as a result of in-kind purchases or redemptions of the fund’s capital shares, including ETF Creation Units.
See accompanying Notes, which are an integral part of the Financial Statements.
26
Small-Cap Index Fund
Notes to Financial Statements
Vanguard Small-Cap Index Fund is registered under the Investment Company Act of 1940 as an open-end investment company, or mutual fund. The fund offers six classes of shares: Investor Shares, Admiral Shares, Signal Shares, Institutional Shares, Institutional Plus Shares, and ETF Shares. Investor Shares are available to any investor who meets the fund’s minimum purchase requirements. Admiral Shares, Signal Shares, Institutional Shares, and Institutional Plus Shares are designed for investors who meet certain administrative, service, and account-size criteria. ETF Shares are listed for trading on NYSE Arca; they can be purchased and sold through a broker.
A. The following significant accounting policies conform to generally accepted accounting principles for U.S. mutual funds. The fund consistently follows such policies in preparing its financial statements.
1. Security Valuation: Securities are valued as of the close of trading on the New York Stock Exchange (generally 4 p.m., Eastern time) on the valuation date. Equity securities are valued at the latest quoted sales prices or official closing prices taken from the primary market in which each security trades; such securities not traded on the valuation date are valued at the mean of the latest quoted bid and asked prices. Securities for which market quotations are not readily available, or whose values have been materially affected by events occurring before the fund’s pricing time but after the close of the securities’ primary markets, are valued by methods deemed by the board of trustees to represent fair value. Investments in Vanguard Market Liquidity Fund are valued at that fund’s net asset value. Temporary cash investments acquired over 60 days to maturity are valued using the latest bid prices or using valuations based on a matrix system (which considers such factors as security prices, yields, maturities, and ratings), both as furnished by independent pricing services. Other temporary cash investments are valued at amortized cost, which approximates market value.
2. Futures Contracts: The fund may use index futures contracts to a limited extent, with the objectives of maintaining full exposure to the stock market, enhancing returns, maintaining liquidity, and minimizing transaction costs. The fund may purchase futures contracts to immediately invest incoming cash in the market, or sell futures in response to cash outflows, thereby simulating a fully invested position in the underlying index while maintaining a cash balance for liquidity. The fund may seek to enhance returns by using futures contracts instead of the underlying securities when futures are believed to be priced more attractively than the underlying securities. The primary risks associated with the use of futures contracts are imperfect correlation between changes in market values of stocks held by the fund and the prices of futures contracts, and the possibility of an illiquid market. Counterparty risk involving futures is mitigated because a regulated clearinghouse is the counterparty instead of the clearing broker. To further mitigate counterparty risk, the fund trades futures contracts on an exchange, monitors the financial strength of its clearing brokers and clearinghouse, and has entered into clearing agreements with its clearing brokers. The clearinghouse imposes initial margin requirements to secure the fund’s performance and requires daily settlement of variation margin representing changes in the market value of each contract.
Futures contracts are valued at their quoted daily settlement prices. The aggregate notional amounts of the contracts are not recorded in the Statement of Net Assets. Fluctuations in the value of the contracts are recorded in the Statement of Net Assets as an asset (liability) and in the Statement of Operations as unrealized appreciation (depreciation) until the contracts are closed, when they are recorded as realized futures gains (losses).
During the year ended December 31, 2013, the fund’s average investments in long and short futures contracts represented less than 1% and 0% of net assets, respectively, based on quarterly average aggregate settlement values.
27
Small-Cap Index Fund
3. Federal Income Taxes: The fund intends to continue to qualify as a regulated investment company and distribute all of its taxable income. Management has analyzed the fund’s tax positions taken for all open federal income tax years (December 31, 2010–2013), and has concluded that no provision for federal income tax is required in the fund’s financial statements.
4. Distributions: Distributions to shareholders are recorded on the ex-dividend date.
5. Securities Lending: To earn additional income, the fund may lend its securities to qualified institutional borrowers. Security loans are required to be secured at all times by collateral in an amount at least equal to the market value of securities loaned. Daily market fluctuations could cause the value of loaned securities to be more or less than the value of the collateral received. When this occurs, the collateral is adjusted and settled on the next business day. The fund further mitigates its counterparty risk by entering into securities lending transactions only with a diverse group of prequalified counterparties, monitoring their financial strength, and entering into master securities lending agreements with its counterparties. The master securities lending agreements provide that, in the event of a counterparty’s default (including bankruptcy), the fund may terminate any loans with that borrower, determine the net amount owed, and sell or retain the collateral up to the net amount owed to the fund; however, such actions may be subject to legal proceedings. While collateral mitigates counterparty risk, in the absence of a default the fund may experience delays and costs in recovering the securities loaned. The fund invests cash collateral received in Vanguard Market Liquidity Fund, and records a liability for the return of the collateral, during the period the securities are on loan. Securities lending income represents fees charged to borrowers plus income earned on invested cash collateral, less expenses associated with the loan.
6. Other: Dividend income is recorded on the ex-dividend date. Interest income includes income distributions received from Vanguard Market Liquidity Fund and is accrued daily. Premiums and discounts on debt securities purchased are amortized and accreted, respectively, to interest income over the lives of the respective securities. Security transactions are accounted for on the date securities are bought or sold. Costs used to determine realized gains (losses) on the sale of investment securities are those of the specific securities sold.
Each class of shares has equal rights as to assets and earnings, except that each class separately bears certain class-specific expenses related to maintenance of shareholder accounts (included in Management and Administrative expenses) and shareholder reporting. Marketing and distribution expenses are allocated to each class of shares based on a method approved by the board of trustees. Income, other non-class-specific expenses, and gains and losses on investments are allocated to each class of shares based on its relative net assets.
B. The Vanguard Group furnishes at cost investment advisory, corporate management, administrative, marketing, and distribution services. The costs of such services are allocated to the fund under methods approved by the board of trustees. The fund has committed to provide up to 0.40% of its net assets in capital contributions to Vanguard. At December 31, 2013, the fund had contributed capital of $4,828,000 to Vanguard (included in Other Assets), representing 0.01% of the fund’s net assets and 1.93% of Vanguard’s capitalization. The fund’s trustees and officers are also directors and officers of Vanguard.
C. Various inputs may be used to determine the value of the fund’s investments. These inputs are summarized in three broad levels for financial statement purposes. The inputs or methodologies used to value securities are not necessarily an indication of the risk associated with investing in those securities.
28
Small-Cap Index Fund
Level 1—Quoted prices in active markets for identical securities.
Level 2—Other significant observable inputs (including quoted prices for similar securities, interest rates, prepayment speeds, credit risk, etc.).
Level 3—Significant unobservable inputs (including the fund’s own assumptions used to determine the fair value of investments).
The following table summarizes the market value of the fund’s investments as of December 31, 2013, based on the inputs used to value them:
| Level 1 | Level 2 | Level 3 | |
| Investments | ($000) | ($000) | ($000) |
| Common Stocks | 43,812,953 | — | — |
| Temporary Cash Investments | 1,060,404 | 19,692 | — |
| Futures Contracts—Assets1 | 2,089 | — | — |
| Futures Contracts—Liabilities1 | (155) | — | — |
| Total | 44,875,291 | 19,692 | — |
| 1 Represents variation margin on the last day of the reporting period. |
D. At December 31, 2013, the aggregate settlement value of open futures contracts and the related unrealized appreciation (depreciation) were:
| ($000) | ||||
| Aggregate | ||||
| Number of | Settlement | Unrealized | ||
| Long (Short) | Value | Appreciation | ||
| Futures Contracts | Expiration | Contracts | Long (Short) | (Depreciation) |
| E-mini Russell 2000 Index | March 2014 | 3,331 | 386,862 | 9,016 |
| E-mini S&P MidCap 400 Index | March 2014 | 406 | 54,380 | 1,097 |
| 10,113 |
Unrealized appreciation (depreciation) on open futures contracts is required to be treated as realized gain (loss) for tax purposes.
E. Distributions are determined on a tax basis and may differ from net investment income and realized capital gains for financial reporting purposes. Differences may be permanent or temporary. Permanent differences are reclassified among capital accounts in the financial statements to reflect their tax character. Temporary differences arise when certain items of income, expense, gain, or loss are recognized in different periods for financial statement and tax purposes. These differences will reverse at some time in the future. Differences in classification may also result from the treatment of short-term gains as ordinary income for tax purposes.
Certain of the fund’s investments are in securities considered to be passive foreign investment companies, for which any unrealized appreciation and/or realized gains are required to be included in distributable net income for tax purposes. During the year ended December 31, 2013, the fund realized gains on the sale of passive foreign investment companies of $1,256,000, which have been included in current and prior periods’ taxable income; accordingly, such gains have been reclassified from accumulated net realized losses to overdistributed net investment income. Passive foreign investment companies held at December 31, 2013, had unrealized appreciation of $9,287,000, of which all has been distributed and is reflected in the balance of overdistributed net investment income.
29
Small-Cap Index Fund
During the year ended December 31, 2013, the fund realized $1,239,603,000 of net capital gains resulting from in-kind redemptions—in which shareholders exchanged fund shares for securities held by the fund rather than for cash. Because such gains are not taxable to the fund, and are not distributed to shareholders, they have been reclassified from accumulated net realized losses to paid-in capital.
For tax purposes, at December 31, 2013, the fund had $3,070,000 of ordinary income available for distribution. At December 31, 2013, the fund had available capital losses totaling $1,606,276,000 to offset future net capital gains. Of this amount, $946,157,000 is subject to expiration dates; $342,008,000 may be used to offset future net capital gains through December 31, 2017, and $604,149,000 through December 31, 2018. Capital losses of $660,119,000 realized beginning in fiscal 2011 may be carried forward indefinitely under the Regulated Investment Company Modernization Act of 2010, but must be used before any expiring loss carryforwards.
At December 31, 2013, the cost of investment securities for tax purposes was $32,350,490,000. Net unrealized appreciation of investment securities for tax purposes was $12,542,559,000, consisting of unrealized gains of $13,667,829,000 on securities that had risen in value since their purchase and $1,125,270,000 in unrealized losses on securities that had fallen in value since their purchase.
F. During the year ended December 31, 2013, the fund purchased $18,930,325,000 of investment securities and sold $13,403,788,000 of investment securities, other than temporary cash investments. Purchases and sales include $4,376,566,000 and $2,909,239,000, respectively, in connection with in-kind purchases and redemptions of the fund’s capital shares.
G. Capital share transactions for each class of shares were:
| Year Ended December 31, | ||||
| 2013 | 2012 | |||
| Amount | Shares | Amount | Shares | |
| ($000) | (000) | ($000) | (000) | |
| Investor Shares | ||||
| Issued | 1,042,480 | 22,850 | 696,904 | 18,945 |
| Issued in Lieu of Cash Distributions | 56,809 | 1,090 | 63,466 | 1,641 |
| Redeemed | (1,239,844) | (26,671) | (1,466,443) | (39,768) |
| Net Increase (Decrease)—Investor Shares | (140,555) | (2,731) | (706,073) | (19,182) |
| Admiral Shares | ||||
| Issued | 1,852,237 | 39,626 | 795,474 | 21,365 |
| Issued in Lieu of Cash Distributions | 117,877 | 2,260 | 108,574 | 2,806 |
| Redeemed | (859,982) | (18,566) | (773,508) | (20,883) |
| Net Increase (Decrease) —Admiral Shares | 1,110,132 | 23,320 | 130,540 | 3,288 |
| Signal Shares | ||||
| Issued | 2,803,375 | 67,822 | 1,645,642 | 49,338 |
| Issued in Lieu of Cash Distributions | 86,598 | 1,843 | 71,340 | 2,046 |
| Redeemed | (1,648,543) | (38,841) | (986,093) | (29,645) |
| Net Increase (Decrease)—Signal Shares | 1,241,430 | 30,824 | 730,889 | 21,739 |
30
Small-Cap Index Fund
| Year Ended December 31, | ||||
| 2013 | 2012 | |||
| Amount | Shares | Amount | Shares | |
| ($000) | (000) | ($000) | (000) | |
| Institutional Shares | ||||
| Issued | 2,730,652 | 59,376 | 1,670,109 | 45,178 |
| Issued in Lieu of Cash Distributions | 109,774 | 2,105 | 98,902 | 2,556 |
| Redeemed | (1,891,524) | (40,878) | (1,496,428) | (40,673) |
| Net Increase (Decrease)—Institutional Shares | 948,902 | 20,603 | 272,583 | 7,061 |
| Institutional Plus Shares | ||||
| Issued | 1,629,864 | 12,227 | 733,174 | 6,917 |
| Issued in Lieu of Cash Distributions | 56,601 | 376 | 45,220 | 405 |
| Redeemed | (772,090) | (5,966) | (494,386) | (4,639) |
| Net Increase (Decrease)—Institutional Plus Shares | 914,375 | 6,637 | 284,008 | 2,683 |
| ETF Shares | ||||
| Issued | 4,397,170 | 44,397 | 2,788,617 | 36,449 |
| Issued in Lieu of Cash Distributions | — | — | — | — |
| Redeemed | (2,841,991) | (27,700) | (2,382,420) | (31,300) |
| Net Increase (Decrease)—ETF Shares | 1,555,179 | 16,697 | 406,197 | 5,149 |
H. Management has determined that no material events or transactions occurred subsequent to December 31, 2013, that would require recognition or disclosure in these financial statements.
31
Small-Cap Growth Index Fund
Fund Profile
As of December 31, 2013
| Share-Class Characteristics | ||||
| Investor | Admiral | Institutional | ||
| Shares | Shares | Shares | ETF Shares | |
| Ticker Symbol | VISGX | VSGAX | VSGIX | VBK |
| Expense Ratio1 | 0.24% | 0.10% | 0.08% | 0.10% |
| 30-Day SEC Yield | 0.53% | 0.67% | 0.68% | 0.67% |
| Portfolio Characteristics | |||
| DJ | |||
| CRSP US | U.S. Total | ||
| Small Cap | Stock | ||
| Growth | Market | ||
| Fund | Index | FA Index | |
| Number of Stocks | 680 | 673 | 3,653 |
| Median Market Cap | $3.1B | $3.1B | $43.0B |
| Price/Earnings Ratio | 41.8x | 41.8x | 20.7x |
| Price/Book Ratio | 3.5x | 3.5x | 2.7x |
| Return on Equity | 11.1% | 11.1% | 16.5% |
| Earnings Growth | |||
| Rate | 15.8% | 15.8% | 11.4% |
| Dividend Yield | 0.8% | 0.8% | 1.8% |
| Foreign Holdings | 0.0% | 0.0% | 0.0% |
| Turnover Rate | 50% | — | — |
| Short-Term Reserves | 0.5% | — | — |
| Sector Diversification (% of equity exposure) | |||
| DJ | |||
| CRSP US | U.S. Total | ||
| Small Cap | Stock | ||
| Growth | Market | ||
| Fund | Index | FA Index | |
| Basic Materials | 2.5% | 2.5% | 3.1% |
| Consumer Goods | 8.6 | 8.6 | 10.2 |
| Consumer Services | 14.6 | 14.6 | 13.7 |
| Financials | 16.3 | 16.4 | 18.4 |
| Health Care | 14.7 | 14.6 | 11.8 |
| Industrials | 18.8 | 18.8 | 13.5 |
| Oil & Gas | 6.2 | 6.2 | 9.3 |
| Technology | 16.9 | 16.9 | 14.9 |
| Telecommunications | 0.9 | 0.9 | 2.1 |
| Utilities | 0.5 | 0.5 | 3.0 |
| Volatility Measures | |||
| DJ | |||
| Spliced | U.S. Total | ||
| Small-Cap | Stock Market | ||
| Growth Index | FA Index | ||
| R-Squared | 1.00 | 0.93 | |
| Beta | 1.00 | 1.29 | |
| These measures show the degree and timing of the fund’s fluctuations compared with the indexes over 36 months. | |||
| Ten Largest Holdings (% of total net assets) | |||
| Fortune Brands Home & Building Materials & | |||
| Security Inc. | Fixtures | 0.6% | |
| Wabtec Corp. | Commercial Vehicles | ||
| & Trucks | 0.6 | ||
| Jazz Pharmaceuticals plc Pharmaceuticals | 0.5 | ||
| Cooper Cos. Inc. | Medical Supplies | 0.5 | |
| Dick's Sporting Goods | |||
| Inc. | Specialty Retailers | 0.5 | |
| Toll Brothers Inc. | Home Construction | 0.5 | |
| Lincoln Electric Holdings | |||
| Inc. | Industrial Machinery | 0.5 | |
| Level 3 Communications Fixed Line | |||
| Inc. | Telecommunications | 0.5 | |
| Alkermes plc | Pharmaceuticals | 0.5 | |
| GNC Holdings Inc. | Food Retailers & | ||
| Wholesalers | 0.5 | ||
| Top Ten | 5.2% | ||
| The holdings listed exclude any temporary cash investments and equity index products. | |||
1 The expense ratios shown are from the prospectus dated August 12, 2013, and represent estimated costs for the current fiscal year. For the fiscal year ended December 31, 2013, the expense ratios were 0.24% for Investor Shares, 0.09% for Admiral Shares, 0.08% for Institutional Shares, and 0.09% for ETF Shares.
32
Small-Cap Growth Index Fund
Investment Focus
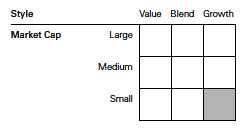
33
Small-Cap Growth Index Fund
Performance Summary
All of the returns in this report represent past performance, which is not a guarantee of future results that may be achieved by the fund. (Current performance may be lower or higher than the performance data cited. For performance data current to the most recent month-end, visit our website at vanguard.com/performance.) Note, too, that both investment returns and principal value can fluctuate widely, so an investor’s shares, when sold, could be worth more or less than their original cost. The returns shown do not reflect taxes that a shareholder would pay on fund distributions or on the sale of fund shares.
Cumulative Performance: December 31, 2003, Through December 31, 2013
Initial Investment of $10,000

| Average Annual Total Returns | |||||
| Periods Ended December 31, 2013 | |||||
| Final Value | |||||
| One | Five | Ten | of a $10,000 | ||
| Year | Years | Years | Investment | ||
| Small-Cap Growth Index | |||||
| Fund*Investor Shares | 37.98% | 24.23% | 10.63% | $27,467 | |
| •••••••• | Spliced Small-Cap Growth Index | 37.91 | 24.26 | 10.66 | 27,533 |
| – – – – | Small-Cap Growth Funds Average | 42.14 | 21.72 | 8.03 | 21,645 |
| Dow Jones U.S. Total Stock Market | |||||
| Float Adjusted Index | 33.47 | 18.86 | 8.09 | 21,777 | |
| For a benchmark description, see the Glossary. | |||||
| Small-Cap Growth Funds Average: Derived from data provided by Lipper, a Thomson Reuters Company. | |||||
| Since | Final Value | ||||
| One | Inception | of a $10,000 | |||
| Year | (9/27/2011) | Investment | |||
| Small-Cap Growth Index Fund Admiral Shares | 38.22% | 28.29% | $17,559 | ||
| Spliced Small-Cap Growth Index | 37.91 | 28.10 | 17,502 | ||
| Dow Jones U.S. Total Stock Market Float | |||||
| Adjusted Index | 33.47 | 25.52 | 16,717 | ||
| "Since Inception" performance is calculated from the Admiral Shares’ inception date for both the fund and its comparative standards. | |||||
See Financial Highlights for dividend and capital gains information.
34
| Small-Cap Growth Index Fund | ||||
| Average Annual Total Returns | ||||
| Periods Ended December 31, 2013 | ||||
| Final Value | ||||
| One | Five | Ten | of a $5,000,000 | |
| Year | Years | Years | Investment | |
| Small-Cap Growth Index Fund Institutional | ||||
| Shares | 38.20% | 24.45% | 10.82% | $13,963,077 |
| Spliced Small-Cap Growth Index | 37.91 | 24.26 | 10.66 | 13,766,409 |
| Dow Jones U.S. Total Stock Market Float | ||||
| Adjusted Index | 33.47 | 18.86 | 8.09 | 10,888,699 |
| Since | Final Value | |||
| One | Five | Inception | of a $10,000 | |
| Year | Years | (1/26/2004) | Investment | |
| Small-Cap Growth Index Fund | ||||
| ETF Shares Net Asset Value | 38.18% | 24.40% | 9.88% | $25,478 |
| Spliced Small-Cap Growth Index | 37.91 | 24.26 | 9.77 | 25,238 |
| Dow Jones U.S. Total Stock Market Float | ||||
| Adjusted Index | 33.47 | 18.86 | 7.67 | 20,835 |
"Since Inception" performance is calculated from the ETF Shares’ inception date for both the fund and its comparative standards.
| Cumulative Returns of ETF Shares: January 26, 2004, Through December 31, 2013 | |||
| Since | |||
| One | Five | Inception | |
| Year | Years | (1/26/2004) | |
| Small-Cap Growth Index Fund ETF Shares Market | |||
| Price | 38.14% | 198.78% | 154.75% |
| Small-Cap Growth Index Fund ETF Shares Net | |||
| Asset Value | 38.18 | 197.90 | 154.78 |
| Spliced Small-Cap Growth Index | 37.91 | 196.30 | 152.38 |
"Since Inception" performance is calculated from the ETF Shares’ inception date for both the fund and its comparative standards.
35
Small-Cap Growth Index Fund
Fiscal-Year Total Returns (%): December 31, 2003, Through December 31, 2013
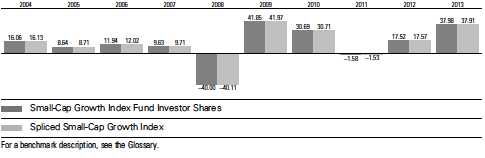
36
Small-Cap Growth Index Fund
Financial Statements
Statement of Net Assets—Investments Summary
As of December 31, 2013
This Statement summarizes the fund’s holdings by asset type. Details are reported for each of the fund’s 50 largest individual holdings and for investments that, in total for any issuer, represent more than 1% of the fund’s net assets. The total value of smaller holdings is reported as a single amount within each category.
The fund reports a complete list of its holdings in regulatory filings four times in each fiscal year, at the quarter-ends. For the second and fourth fiscal quarters, the complete listing of the fund’s holdings is available electronically on vanguard.com and on the Securities and Exchange Commission’s website (sec.gov), or you can have it mailed to you without charge by calling 800-662-7447. For the first and third fiscal quarters, the fund files the lists with the SEC on Form N-Q. Shareholders can look up the fund’s Forms N-Q on the SEC’s website. Forms N-Q may also be reviewed and copied at the SEC’s Public Reference Room (see the back cover of this report for further information).
| Market | Percentage | ||
| Value | of Net | ||
| Shares | ($000) | Assets | |
| Common Stocks | |||
| Basic Materials † | 377,074 | 2.5% | |
| Consumer Goods | |||
| * Toll Brothers Inc. | 1,989,839 | 73,624 | 0.5% |
| Harman International Industries Inc. | 852,857 | 69,806 | 0.4% |
| * Middleby Corp. | 241,399 | 57,929 | 0.4% |
| Gentex Corp. | 1,736,124 | 57,275 | 0.4% |
| Consumer Goods—Other † | 1,047,759 | 6.9% | |
| 1,306,393 | 8.6% | ||
| Consumer Services | |||
| Dick’s Sporting Goods Inc. | 1,273,557 | 73,994 | 0.5% |
| GNC Holdings Inc. Class A | 1,199,282 | 70,098 | 0.5% |
| Dunkin’ Brands Group Inc. | 1,346,812 | 64,916 | 0.4% |
| * Sally Beauty Holdings Inc. | 2,069,130 | 62,550 | 0.4% |
| * Panera Bread Co. Class A | 337,927 | 59,708 | 0.4% |
| Consumer Services—Other † | 1,876,199 | 12.3% | |
| 2,207,465 | 14.5% | ||
| Financials | |||
| Waddell & Reed Financial Inc. Class A | 1,024,491 | 66,715 | 0.4% |
| Duke Realty Corp. | 4,113,199 | 61,862 | 0.4% |
| * SVB Financial Group | 576,599 | 60,462 | 0.4% |
| * Signature Bank | 553,384 | 59,444 | 0.4% |
| Extra Space Storage Inc. | 1,388,413 | 58,494 | 0.4% |
| CBOE Holdings Inc. | 1,100,047 | 57,158 | 0.4% |
| DDR Corp. | 3,628,778 | 55,774 | 0.4% |
| Regency Centers Corp. | 1,164,738 | 53,927 | 0.4% |
| BRE Properties Inc. | 973,787 | 53,276 | 0.3% |
| Financials—Other † | 1,948,832 | 12.8% | |
| 2,475,944 | 16.3% | ||
37
| Small-Cap Growth Index Fund | ||||
| Market | Percentage | |||
| Value | of Net | |||
| Shares | ($000) | Assets | ||
| Health Care | ||||
| * | Jazz Pharmaceuticals plc | 620,116 | 78,482 | 0.5% |
| Cooper Cos. Inc. | 618,000 | 76,533 | 0.5% | |
| * | Alkermes plc | 1,726,513 | 70,200 | 0.5% |
| * | Salix Pharmaceuticals Ltd. | 754,420 | 67,853 | 0.5% |
| * | MEDNAX Inc. | 1,269,970 | 67,791 | 0.4% |
| * | United Therapeutics Corp. | 570,310 | 64,491 | 0.4% |
| * | Cubist Pharmaceuticals Inc. | 935,112 | 64,401 | 0.4% |
| * | Isis Pharmaceuticals Inc. | 1,465,547 | 58,387 | 0.4% |
| * | Medivation Inc. | 905,046 | 57,760 | 0.4% |
| Health Care—Other † | 1,617,563 | 10.6% | ||
| 2,223,461 | 14.6% | |||
| Industrials | ||||
| Fortune Brands Home & Security Inc. | 2,097,919 | 95,875 | 0.6% | |
| Wabtec Corp. | 1,154,892 | 85,774 | 0.6% | |
| Lincoln Electric Holdings Inc. | 1,030,346 | 73,505 | 0.5% | |
| * | Colfax Corp. | 1,093,516 | 69,646 | 0.5% |
| Waste Connections Inc. | 1,481,805 | 64,651 | 0.4% | |
| * | Kirby Corp. | 645,161 | 64,032 | 0.4% |
| Jack Henry & Associates Inc. | 1,080,571 | 63,981 | 0.4% | |
| * | CoStar Group Inc. | 344,696 | 63,624 | 0.4% |
| * | Genesee & Wyoming Inc. Class A | 654,695 | 62,883 | 0.4% |
| Graco Inc. | 772,508 | 60,348 | 0.4% | |
| Acuity Brands Inc. | 543,395 | 59,404 | 0.4% | |
| * | Hexcel Corp. | 1,256,053 | 56,133 | 0.4% |
| AO Smith Corp. | 983,988 | 53,076 | 0.4% | |
| Industrials—Other † | 1,982,442 | 13.0% | ||
| 2,855,374 | 18.8% | |||
| Oil & Gas | ||||
| * | Gulfport Energy Corp. | 1,061,649 | 67,043 | 0.4% |
| Oil & Gas—Other † | 877,869 | 5.8% | ||
| 944,912 | 6.2% | |||
| Technology | ||||
| IAC/InterActiveCorp | 978,485 | 67,212 | 0.4% | |
| * | athenahealth Inc. | 469,546 | 63,154 | 0.4% |
| Solera Holdings Inc. | 869,494 | 61,525 | 0.4% | |
| * | Concur Technologies Inc. | 565,764 | 58,376 | 0.4% |
| *,^ | 3D Systems Corp. | 615,921 | 57,238 | 0.4% |
| * | PTC Inc. | 1,507,420 | 53,348 | 0.4% |
| Technology—Other † | 2,202,796 | 14.5% | ||
| 2,563,649 | 16.9% | |||
| Telecommunications | ||||
| * | Level 3 Communications Inc. | 2,117,153 | 70,226 | 0.4% |
| * | tw telecom inc Class A | 1,819,112 | 55,429 | 0.4% |
| Telecommunications—Other † | 15,352 | 0.1% | ||
| 141,007 | 0.9% | |||
| Utilities | ||||
| ITC Holdings Corp. | 662,086 | 63,441 | 0.4% | |
| Utilities—Other † | 17,309 | 0.1% | ||
| 80,750 | 0.5% | |||
| Total Common Stocks (Cost $11,194,385) | 15,176,029 | 99.8%1 | ||
38
| Small-Cap Growth Index Fund | ||||
| Market | Percentage | |||
| Value | of Net | |||
| Coupon | Shares | ($000) | Assets | |
| Temporary Cash Investments | ||||
| Money Market Fund | ||||
| 2,3 Vanguard Market Liquidity Fund | 0.125% | 269,954,261 | 269,954 | 1.8% |
| 4U.S. Government and Agency Obligations † | 3,698 | 0.0% | ||
| Total Temporary Cash Investments (Cost $273,653) | 273,652 | 1.8%1 | ||
| Total Investments (Cost $11,468,038) | 15,449,681 | 101.6% | ||
| Other Assets and Liabilities | ||||
| Other Assets | 71,260 | 0.5% | ||
| Liabilities3 | (321,126) | (2.1%) | ||
| (249,866) | (1.6%) | |||
| Net Assets | 15,199,815 | 100.0% | ||
| At December 31, 2013, net assets consisted of: | ||||
| Amount | ||||
| ($000) | ||||
| Paid-in Capital | 11,761,531 | |||
| Overdistributed Net Investment Income | (7,700) | |||
| Accumulated Net Realized Losses | (536,342) | |||
| Unrealized Appreciation (Depreciation) | ||||
| Investment Securities | 3,981,643 | |||
| Futures Contracts | 683 | |||
| Net Assets | 15,199,815 | |||
| Investor Shares—Net Assets | ||||
| Applicable to 83,167,967 outstanding $.001 par value shares of | ||||
| beneficial interest (unlimited authorization) | 2,858,604 | |||
| Net Asset Value Per Share—Investor Shares | $34.37 | |||
| Admiral Shares—Net Assets | ||||
| Applicable to 113,564,699 outstanding $.001 par value shares of | ||||
| beneficial interest (unlimited authorization) | 4,880,666 | |||
| Net Asset Value Per Share—Admiral Shares | $42.98 | |||
| Institutional Shares—Net Assets | ||||
| Applicable to 111,084,306 outstanding $.001 par value shares of | ||||
| beneficial interest (unlimited authorization) | 3,823,249 | |||
| Net Asset Value Per Share—Institutional Shares | $34.42 | |||
39
| Small-Cap Growth Index Fund | |
| Amount | |
| ($000) | |
| ETF Shares—Net Assets | |
| Applicable to 29,758,082 outstanding $.001 par value shares of | |
| beneficial interest (unlimited authorization) | 3,637,296 |
| Net Asset Value Per Share—ETF Shares | $122.23 |
See Note A in Notes to Financial Statements.
* Non-income-producing security.
^ Includes partial security positions on loan to broker-dealers. The total value of securities on loan is $165,513,000.
† Represents the aggregate value, by category, of securities that are not among the 50 largest holdings and, in total for any issuer, represent 1% or less of net assets.
1 The fund invests a portion of its cash reserves in equity markets through the use of index futures contracts. After giving effect to futures investments, the fund’s effective common stock and temporary cash investment positions represent 100.0% and 1.6%, respectively, of net assets.
2 Affiliated money market fund available only to Vanguard funds and certain trusts and accounts managed by Vanguard. Rate shown is the 7-day yield.
3 Includes $174,719,000 of collateral received for securities on loan.
4 Securities with a value of $1,499,000 have been segregated as initial margin for open futures contracts.
See accompanying Notes, which are an integral part of the Financial Statements.
40
| Small-Cap Growth Index Fund | |
| Statement of Operations | |
| Year Ended | |
| December 31, 2013 | |
| ($000) | |
| Investment Income | |
| Income | |
| Dividends | 91,466 |
| Interest1 | 132 |
| Securities Lending | 17,567 |
| Total Income | 109,165 |
| Expenses | |
| The Vanguard Group—Note B | |
| Investment Advisory Services | 742 |
| Management and Administrative—Investor Shares | 6,163 |
| Management and Administrative—Admiral Shares | 2,275 |
| Management and Administrative—Institutional Shares | 1,387 |
| Management and Administrative—ETF Shares | 1,757 |
| Marketing and Distribution—Investor Shares | 766 |
| Marketing and Distribution—Admiral Shares | 581 |
| Marketing and Distribution—Institutional Shares | 674 |
| Marketing and Distribution—ETF Shares | 559 |
| Custodian Fees | 354 |
| Auditing Fees | 36 |
| Shareholders’ Reports—Investor Shares | 39 |
| Shareholders’ Reports—Admiral Shares | 20 |
| Shareholders’ Reports—Institutional Shares | 43 |
| Shareholders’ Reports—ETF Shares | 107 |
| Trustees’ Fees and Expenses | 15 |
| Total Expenses | 15,518 |
| Net Investment Income | 93,647 |
| Realized Net Gain (Loss) | |
| Investment Securities Sold | 913,325 |
| Futures Contracts | 388 |
| Realized Net Gain (Loss) | 913,713 |
| Change in Unrealized Appreciation (Depreciation) | |
| Investment Securities | 2,951,621 |
| Futures Contracts | 554 |
| Change in Unrealized Appreciation (Depreciation) | 2,952,175 |
| Net Increase (Decrease) in Net Assets Resulting from Operations | 3,959,535 |
| 1 Interest income from an affiliated company of the fund was $121,000. | |
| See accompanying Notes, which are an integral part of the Financial Statements. | |
41
| Small-Cap Growth Index Fund | ||
| Statement of Changes in Net Assets | ||
| Year Ended December 31, | ||
| 2013 | 2012 | |
| ($000) | ($000) | |
| Increase (Decrease) in Net Assets | ||
| Operations | ||
| Net Investment Income | 93,647 | 96,313 |
| Realized Net Gain (Loss) | 913,713 | 420,030 |
| Change in Unrealized Appreciation (Depreciation) | 2,952,175 | 889,417 |
| Net Increase (Decrease) in Net Assets Resulting from Operations | 3,959,535 | 1,405,760 |
| Distributions | ||
| Net Investment Income | ||
| Investor Shares | (13,753) | (23,644) |
| Admiral Shares | (31,388) | (26,176) |
| Institutional Shares | (24,532) | (24,191) |
| ETF Shares | (23,474) | (22,630) |
| Realized Capital Gain | ||
| Investor Shares | — | — |
| Admiral Shares | — | — |
| Institutional Shares | — | — |
| ETF Shares | — | — |
| Total Distributions | (93,147) | (96,641) |
| Capital Share Transactions | ||
| Investor Shares | (738,905) | (371,989) |
| Admiral Shares | 1,252,154 | 447,516 |
| Institutional Shares | 609,367 | 400,654 |
| ETF Shares | 510,887 | 41,161 |
| Net Increase (Decrease) from Capital Share Transactions | 1,633,503 | 517,342 |
| Total Increase (Decrease) | 5,499,891 | 1,826,461 |
| Net Assets | ||
| Beginning of Period | 9,699,924 | 7,873,463 |
| End of Period1 | 15,199,815 | 9,699,924 |
1 Net Assets—End of Period includes undistributed (overdistributed) net investment income of ($7,700,000) and ($8,202,000).
See accompanying Notes, which are an integral part of the Financial Statements.
42
| Small-Cap Growth Index Fund | |||||
| Financial Highlights | |||||
| Investor Shares | |||||
| For a Share Outstanding | Year Ended December 31, | ||||
| Throughout Each Period | 2013 | 2012 | 2011 | 2010 | 2009 |
| Net Asset Value, Beginning of Period | $25.03 | $21.49 | $21.92 | $16.83 | $11.90 |
| Investment Operations | |||||
| Net Investment Income | .168 | .223 | .086 | .075 | .046 |
| Net Realized and Unrealized Gain (Loss) | |||||
| on Investments | 9.336 | 3.541 | (.431) | 5.091 | 4.933 |
| Total from Investment Operations | 9.504 | 3.764 | (.345) | 5.166 | 4.979 |
| Distributions | |||||
| Dividends from Net Investment Income | (.164) | (.224) | (.085) | (.076) | (.049) |
| Distributions from Realized Capital Gains | — | — | — | — | — |
| Total Distributions | (.164) | (.224) | (.085) | (.076) | (.049) |
| Net Asset Value, End of Period | $34.37 | $25.03 | $21.49 | $21.92 | $16.83 |
| Total Return1 | 37.98% | 17.52% | -1.58% | 30.69% | 41.85% |
| Ratios/Supplemental Data | |||||
| Net Assets, End of Period (Millions) | $2,859 | $2,649 | $2,613 | $4,229 | $3,018 |
| Ratio of Total Expenses to Average Net Assets | 0.24% | 0.24% | 0.24% | 0.26% | 0.28% |
| Ratio of Net Investment Income to | |||||
| Average Net Assets | 0.63% | 0.97% | 0.37% | 0.43% | 0.33% |
| Portfolio Turnover Rate2 | 50% | 37% | 40% | 34% | 38% |
1 Total returns do not include account service fees that may have applied in the periods shown. Fund prospectuses provide information about any applicable account service fees.
2 Excludes the value of portfolio securities received or delivered as a result of in-kind purchases or redemptions of the fund’s capital shares, including ETF Creation Units.
See accompanying Notes, which are an integral part of the Financial Statements.
43
| Small-Cap Growth Index Fund | |||
| Financial Highlights | |||
| Admiral Shares | Sept. 27, | ||
| Year Ended | 20111 to | ||
| December 31, | Dec. 31, | ||
| For a Share Outstanding Throughout Each Period | 2013 | 2012 | 2011 |
| Net Asset Value, Beginning of Period | $31.30 | $26.88 | $25.00 |
| Investment Operations | |||
| Net Investment Income | .284 | .326 | .031 |
| Net Realized and Unrealized Gain (Loss) on Investments | 11.676 | 4.420 | 1.962 |
| Total from Investment Operations | 11.960 | 4.746 | 1.993 |
| Distributions | |||
| Dividends from Net Investment Income | (.280) | (.326) | (.113) |
| Distributions from Realized Capital Gains | — | — | — |
| Total Distributions | (.280) | (.326) | (.113) |
| Net Asset Value, End of Period | $42.98 | $31.30 | $26.88 |
| Total Return2 | 38.22% | 17.66% | 7.97% |
| Ratios/Supplemental Data | |||
| Net Assets, End of Period (Millions) | $4,881 | $2,539 | $1,781 |
| Ratio of Total Expenses to Average Net Assets | 0.09% | 0.10% | 0.10%3 |
| Ratio of Net Investment Income to Average Net Assets | 0.78% | 1.11% | 0.51%3 |
| Portfolio Turnover Rate4 | 50% | 37% | 40% |
1 Inception.
2 Total returns do not include account service fees that may have applied in the periods shown. Fund prospectuses provide information about any applicable account service fees.
3 Annualized.
4 Excludes the value of portfolio securities received or delivered as a result of in-kind purchases or redemptions of the fund’s capital shares, including ETF Creation Units.
See accompanying Notes, which are an integral part of the Financial Statements.
44
| Small-Cap Growth Index Fund | |||||
| Financial Highlights | |||||
| Institutional Shares | |||||
| For a Share Outstanding | Year Ended December 31, | ||||
| Throughout Each Period | 2013 | 2012 | 2011 | 2010 | 2009 |
| Net Asset Value, Beginning of Period | $25.07 | $21.53 | $21.96 | $16.85 | $11.91 |
| Investment Operations | |||||
| Net Investment Income | .229 | .265 | .125 | .107 | .072 |
| Net Realized and Unrealized Gain (Loss) | |||||
| on Investments | 9.346 | 3.540 | (.432) | 5.111 | 4.944 |
| Total from Investment Operations | 9.575 | 3.805 | (.307) | 5.218 | 5.016 |
| Distributions | |||||
| Dividends from Net Investment Income | (.225) | (.265) | (.123) | (.108) | (.076) |
| Distributions from Realized Capital Gains | — | — | — | — | — |
| Total Distributions | (.225) | (.265) | (.123) | (.108) | (.076) |
| Net Asset Value, End of Period | $34.42 | $25.07 | $21.53 | $21.96 | $16.85 |
| Total Return | 38.20% | 17.68% | -1.40% | 30.96% | 42.13% |
| Ratios/Supplemental Data | |||||
| Net Assets, End of Period (Millions) | $3,823 | $2,302 | $1,622 | $1,527 | $945 |
| Ratio of Total Expenses to Average Net Assets | 0.08% | 0.08% | 0.08% | 0.08% | 0.08% |
| Ratio of Net Investment Income to | |||||
| Average Net Assets | 0.79% | 1.13% | 0.53% | 0.61% | 0.53% |
| Portfolio Turnover Rate1 | 50% | 37% | 40% | 34% | 38% |
1 Excludes the value of portfolio securities received or delivered as a result of in-kind purchases or redemptions of the fund’s capital shares, including ETF Creation Units.
See accompanying Notes, which are an integral part of the Financial Statements.
45
| Small-Cap Growth Index Fund | |||||
| Financial Highlights | |||||
| ETF Shares | |||||
| For a Share Outstanding | Year Ended December 31, | ||||
| Throughout Each Period | 2013 | 2012 | 2011 | 2010 | 2009 |
| Net Asset Value, Beginning of Period | $89.03 | $76.45 | $77.98 | $59.86 | $42.32 |
| Investment Operations | |||||
| Net Investment Income | .802 | .925 | .424 | .360 | .225 |
| Net Realized and Unrealized Gain (Loss) | |||||
| on Investments | 33.188 | 12.578 | (1.535) | 18.121 | 17.555 |
| Total from Investment Operations | 33.990 | 13.503 | (1.111) | 18.481 | 17.780 |
| Distributions | |||||
| Dividends from Net Investment Income | (.790) | (.923) | (.419) | (.361) | (.240) |
| Distributions from Realized Capital Gains | — | — | — | — | — |
| Total Distributions | (.790) | (.923) | (.419) | (.361) | (.240) |
| Net Asset Value, End of Period | $122.23 | $89.03 | $76.45 | $77.98 | $59.86 |
| Total Return | 38.18% | 17.67% | -1.43% | 30.87% | 42.02% |
| Ratios/Supplemental Data | |||||
| Net Assets, End of Period (Millions) | $3,637 | $2,209 | $1,857 | $1,842 | $1,177 |
| Ratio of Total Expenses to Average Net Assets | 0.09% | 0.10% | 0.10% | 0.12% | 0.14% |
| Ratio of Net Investment Income to | |||||
| Average Net Assets | 0.78% | 1.11% | 0.51% | 0.57% | 0.47% |
| Portfolio Turnover Rate1 | 50% | 37% | 40% | 34% | 38% |
1 Excludes the value of portfolio securities received or delivered as a result of in-kind purchases or redemptions of the fund’s capital shares, including ETF Creation Units.
See accompanying Notes, which are an integral part of the Financial Statements.
46
Small-Cap Growth Index Fund
Notes to Financial Statements
Vanguard Small-Cap Growth Index Fund is registered under the Investment Company Act of 1940 as an open-end investment company, or mutual fund. The fund offers four classes of shares: Investor Shares, Admiral Shares, Institutional Shares, and ETF Shares. Investor Shares are available to any investor who meets the fund’s minimum purchase requirements. Admiral Shares and Institutional Shares are designed for investors who meet certain administrative, service, and account-size criteria. ETF Shares are listed for trading on NYSE Arca; they can be purchased and sold through a broker.
A. The following significant accounting policies conform to generally accepted accounting principles for U.S. mutual funds. The fund consistently follows such policies in preparing its financial statements.
1. Security Valuation: Securities are valued as of the close of trading on the New York Stock Exchange (generally 4 p.m., Eastern time) on the valuation date. Equity securities are valued at the latest quoted sales prices or official closing prices taken from the primary market in which each security trades; such securities not traded on the valuation date are valued at the mean of the latest quoted bid and asked prices. Securities for which market quotations are not readily available, or whose values have been materially affected by events occurring before the fund’s pricing time but after the close of the securities’ primary markets, are valued by methods deemed by the board of trustees to represent fair value. Investments in Vanguard Market Liquidity Fund are valued at that fund’s net asset value. Temporary cash investments acquired over 60 days to maturity are valued using the latest bid prices or using valuations based on a matrix system (which considers such factors as security prices, yields, maturities, and ratings), both as furnished by independent pricing services. Other temporary cash investments are valued at amortized cost, which approximates market value.
2. Futures Contracts: The fund may use index futures contracts to a limited extent, with the objectives of maintaining full exposure to the stock market, enhancing returns, maintaining liquidity, and minimizing transaction costs. The fund may purchase futures contracts to immediately invest incoming cash in the market, or sell futures in response to cash outflows, thereby simulating a fully invested position in the underlying index while maintaining a cash balance for liquidity. The fund may seek to enhance returns by using futures contracts instead of the underlying securities when futures are believed to be priced more attractively than the underlying securities. The primary risks associated with the use of futures contracts are imperfect correlation between changes in market values of stocks held by the fund and the prices of futures contracts, and the possibility of an illiquid market. Counterparty risk involving futures is mitigated because a regulated clearinghouse is the counterparty instead of the clearing broker. To further mitigate counterparty risk, the fund trades futures contracts on an exchange, monitors the financial strength of its clearing brokers and clearinghouse, and has entered into clearing agreements with its clearing brokers. The clearinghouse imposes initial margin requirements to secure the fund’s performance and requires daily settlement of variation margin representing changes in the market value of each contract.
Futures contracts are valued at their quoted daily settlement prices. The aggregate notional amounts of the contracts are not recorded in the Statement of Net Assets. Fluctuations in the value of the contracts are recorded in the Statement of Net Assets as an asset (liability) and in the Statement of Operations as unrealized appreciation (depreciation) until the contracts are closed, when they are recorded as realized futures gains (losses).
During the year ended December 31, 2013, the fund’s average investments in long and short futures contracts represented less than 1% and 0% of net assets, respectively, based on quarterly average aggregate settlement values.
47
Small-Cap Growth Index Fund
3. Federal Income Taxes: The fund intends to continue to qualify as a regulated investment company and distribute all of its taxable income. Management has analyzed the fund’s tax positions taken for all open federal income tax years (December 31, 2010–2013), and has concluded that no provision for federal income tax is required in the fund’s financial statements.
4. Distributions: Distributions to shareholders are recorded on the ex-dividend date.
5. Securities Lending: To earn additional income, the fund may lend its securities to qualified institutional borrowers. Security loans are required to be secured at all times by collateral in an amount at least equal to the market value of securities loaned. Daily market fluctuations could cause the value of loaned securities to be more or less than the value of the collateral received. When this occurs, the collateral is adjusted and settled on the next business day. The fund further mitigates its counterparty risk by entering into securities lending transactions only with a diverse group of prequalified counterparties, monitoring their financial strength, and entering into master securities lending agreements with its counterparties. The master securities lending agreements provide that, in the event of a counterparty’s default (including bankruptcy), the fund may terminate any loans with that borrower, determine the net amount owed, and sell or retain the collateral up to the net amount owed to the fund; however, such actions may be subject to legal proceedings. While collateral mitigates counterparty risk, in the absence of a default the fund may experience delays and costs in recovering the securities loaned. The fund invests cash collateral received in Vanguard Market Liquidity Fund, and records a liability for the return of the collateral, during the period the securities are on loan. Securities lending income represents fees charged to borrowers plus income earned on invested cash collateral, less expenses associated with the loan.
6. Other: Dividend income is recorded on the ex-dividend date. Interest income includes income distributions received from Vanguard Market Liquidity Fund and is accrued daily. Premiums and discounts on debt securities purchased are amortized and accreted, respectively, to interest income over the lives of the respective securities. Security transactions are accounted for on the date securities are bought or sold. Costs used to determine realized gains (losses) on the sale of investment securities are those of the specific securities sold.
Each class of shares has equal rights as to assets and earnings, except that each class separately bears certain class-specific expenses related to maintenance of shareholder accounts (included in Management and Administrative expenses) and shareholder reporting. Marketing and distribution expenses are allocated to each class of shares based on a method approved by the board of trustees. Income, other non-class-specific expenses, and gains and losses on investments are allocated to each class of shares based on its relative net assets.
B. The Vanguard Group furnishes at cost investment advisory, corporate management, administrative, marketing, and distribution services. The costs of such services are allocated to the fund under methods approved by the board of trustees. The fund has committed to provide up to 0.40% of its net assets in capital contributions to Vanguard. At December 31, 2013, the fund had contributed capital of $1,673,000 to Vanguard (included in Other Assets), representing 0.01% of the fund’s net assets and 0.67% of Vanguard’s capitalization. The fund’s trustees and officers are also directors and officers of Vanguard.
C. Various inputs may be used to determine the value of the fund’s investments. These inputs are summarized in three broad levels for financial statement purposes. The inputs or methodologies used to value securities are not necessarily an indication of the risk associated with investing in those securities.
48
Small-Cap Growth Index Fund
Level 1—Quoted prices in active markets for identical securities.
Level 2—Other significant observable inputs (including quoted prices for similar securities, interest rates, prepayment speeds, credit risk, etc.).
Level 3—Significant unobservable inputs (including the fund’s own assumptions used to determine the fair value of investments).
The following table summarizes the market value of the fund’s investments as of December 31, 2013, based on the inputs used to value them:
| Level 1 | Level 2 | Level 3 | |
| Investments | ($000) | ($000) | ($000) |
| Common Stocks | 15,176,029 | — | — |
| Temporary Cash Investments | 269,954 | 3,698 | — |
| Futures Contracts—Assets1 | 97 | — | — |
| Total | 15,446,080 | 3,698 | — |
| 1 Represents variation margin on the last day of the reporting period. |
D. At December 31, 2013, the aggregate settlement value of open futures contracts and the related unrealized appreciation (depreciation) were:
| ($000) | ||||
| Aggregate | ||||
| Number of | Settlement | Unrealized | ||
| Long (Short) | Value | Appreciation | ||
| Futures Contracts | Expiration | Contracts | Long (Short) | (Depreciation) |
| E-mini Russell 2000 Index | March 2014 | 202 | 23,460 | 683 |
Unrealized appreciation (depreciation) on open futures contracts is required to be treated as realized gain (loss) for tax purposes.
E. Distributions are determined on a tax basis and may differ from net investment income and realized capital gains for financial reporting purposes. Differences may be permanent or temporary. Permanent differences are reclassified among capital accounts in the financial statements to reflect their tax character. Temporary differences arise when certain items of income, expense, gain, or loss are recognized in different periods for financial statement and tax purposes. These differences will reverse at some time in the future. Differences in classification may also result from the treatment of short-term gains as ordinary income for tax purposes.
During the year ended December 31, 2013, the fund realized $574,446,000 of net capital gains resulting from in-kind redemptions—in which shareholders exchanged fund shares for securities held by the fund rather than for cash. Because such gains are not taxable to the fund, and are not distributed to shareholders, they have been reclassified from accumulated net realized losses to paid-in capital.
For tax purposes, at December 31, 2013, the fund had $1,509,000 of ordinary income available for distribution. The fund used capital loss carryforwards of $366,261,000 to offset taxable capital gains realized during the year ended December 31, 2013. At December 31, 2013, the fund had available capital losses totaling $509,185,000 to offset future net capital gains. Of this amount, $504,200,000 is subject to expiration dates; $243,082,000 through December 31, 2017, and $261,118,000 through
49
Small-Cap Growth Index Fund
December 31, 2018. Capital losses of $4,985,000 realized beginning in fiscal 2011 may be carried forward indefinitely under the Regulated Investment Company Modernization Act of 2010, but must be used before any expiring loss carryforwards.
At December 31, 2013, the cost of investment securities for tax purposes was $11,494,510,000. Net unrealized appreciation of investment securities for tax purposes was $3,955,171,000, consisting of unrealized gains of $4,362,037,000 on securities that had risen in value since their purchase and $406,866,000 in unrealized losses on securities that had fallen in value since their purchase.
F. During the year ended December 31, 2013, the fund purchased $9,189,591,000 of investment securities and sold $7,545,056,000 of investment securities, other than temporary cash investments. Purchases and sales include $1,871,110,000 and $1,357,256,000, respectively, in connection with in-kind purchases and redemptions of the fund’s capital shares.
G. Capital share transactions for each class of shares were:
| Year Ended December 31, | ||||
| 2013 | 2012 | |||
| Amount | Shares | Amount | Shares | |
| ($000) | (000) | ($000) | (000) | |
| Investor Shares | ||||
| Issued | 885,186 | 29,970 | 618,019 | 26,010 |
| Issued in Lieu of Cash Distributions | 12,789 | 375 | 22,152 | 888 |
| Redeemed | (1,636,880) | (53,015) | (1,012,160) | (42,656) |
| Net Increase (Decrease)—Investor Shares | (738,905) | (22,670) | (371,989) | (15,758) |
| Admiral Shares | ||||
| Issued | 1,872,580 | 48,848 | 830,232 | 27,774 |
| Issued in Lieu of Cash Distributions | 29,408 | 691 | 24,456 | 784 |
| Redeemed | (649,834) | (17,093) | (407,172) | (13,681) |
| Net Increase (Decrease)—Admiral Shares | 1,252,154 | 32,446 | 447,516 | 14,877 |
| Institutional Shares | ||||
| Issued | 1,119,510 | 36,742 | 700,138 | 29,131 |
| Issued in Lieu of Cash Distributions | 23,841 | 699 | 23,227 | 930 |
| Redeemed | (533,984) | (18,199) | (322,711) | (13,564) |
| Net Increase (Decrease) —Institutional Shares | 609,367 | 19,242 | 400,654 | 16,497 |
| ETF Shares | ||||
| Issued | 1,903,832 | 17,142 | 1,365,762 | 16,323 |
| Issued in Lieu of Cash Distributions | — | — | — | — |
| Redeemed | (1,392,945) | (12,200) | (1,324,601) | (15,800) |
| Net Increase (Decrease)—ETF Shares | 510,887 | 4,942 | 41,161 | 523 |
50
Small-Cap Growth Index Fund
H. Management has determined that no material events or transactions occurred subsequent to December 31, 2013, that would require recognition or disclosure in these financial statements.
51
| Small-Cap Value Index Fund | ||||
| Fund Profile | ||||
| As of December 31, 2013 | ||||
| Share-Class Characteristics | ||||
| Investor | Admiral | Institutional | ||
| Shares | Shares | Shares | ETF Shares | |
| Ticker Symbol | VISVX | VSIAX | VSIIX | VBR |
| Expense Ratio1 | 0.24% | 0.10% | 0.08% | 0.10% |
| 30-Day SEC Yield | 1.58% | 1.72% | 1.73% | 1.72% |
| Portfolio Characteristics | |||
| DJ | |||
| U.S. Total | |||
| CRSP US | Stock | ||
| Small Cap | Market | ||
| Fund | Value Index | FA Index | |
| Number of Stocks | 804 | 800 | 3,653 |
| Median Market Cap | $2.9B | $2.9B | $43.0B |
| Price/Earnings Ratio | 23.1x | 23.1x | 20.7x |
| Price/Book Ratio | 2.0x | 2.0x | 2.7x |
| Return on Equity | 9.1% | 9.1% | 16.5% |
| Earnings Growth | |||
| Rate | 7.2% | 7.2% | 11.4% |
| Dividend Yield | 1.8% | 1.8% | 1.8% |
| Foreign Holdings | 0.0% | 0.0% | 0.0% |
| Turnover Rate | 47% | — | — |
| Short-Term Reserves | 0.0% | — | — |
Sector Diversification (% of equity exposure)
| DJ | |||
| U.S. Total | |||
| CRSP US | Stock | ||
| Small Cap | Market | ||
| Fund | Value Index | FA Index | |
| Basic Materials | 6.0% | 6.0% | 3.1% |
| Consumer Goods | 7.4 | 7.4 | 10.2 |
| Consumer Services | 12.7 | 12.7 | 13.7 |
| Financials | 28.4 | 28.5 | 18.4 |
| Health Care | 5.8 | 5.8 | 11.8 |
| Industrials | 22.3 | 22.3 | 13.5 |
| Oil & Gas | 4.5 | 4.4 | 9.3 |
| Technology | 7.0 | 7.0 | 14.9 |
| Telecommunications | 0.5 | 0.5 | 2.1 |
| Utilities | 5.4 | 5.4 | 3.0 |
| Volatility Measures | ||
| DJ | ||
| Spliced | U.S. Total | |
| Small-Cap | Stock Market | |
| Value Index | FA Index | |
| R-Squared | 1.00 | 0.95 |
| Beta | 1.00 | 1.20 |
These measures show the degree and timing of the fund’s fluctuations compared with the indexes over 36 months.
Ten Largest Holdings (% of total net assets)
| United Rentals Inc. | Business Support | |
| Services | 0.5% | |
| Hanesbrands Inc. | Clothing & | |
| Accessories | 0.5 | |
| Gannett Co. Inc. | Publishing | 0.5 |
| Snap-on Inc. | Durable Household | |
| Products | 0.4 | |
| Omnicare Inc. | Drug Retailers | 0.4 |
| Arthur J Gallagher & Co. | Property & Casualty | |
| Insurance | 0.4 | |
| Packaging Corp. of | Containers & | |
| America | Packaging | 0.4 |
| Foot Locker Inc. | Apparel Retailers | 0.4 |
| IDEX Corp. | Industrial Machinery | 0.4 |
| Goodyear Tire & Rubber | ||
| Co. | Tires | 0.4 |
| Top Ten | 4.3% |
The holdings listed exclude any temporary cash investments and equity index products.
1 The expense ratios shown are from the prospectus dated August 12, 2013, and represent estimated costs for the current fiscal year. For the fiscal year ended December 31, 2013, the expense ratios were 0.24% for Investor Shares, 0.09% for Admiral Shares, 0.08% for Institutional Shares, and 0.09% for ETF Shares.
52
Small-Cap Value Index Fund
Investment Focus
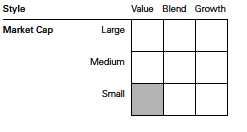
53
Small-Cap Value Index Fund
Performance Summary
All of the returns in this report represent past performance, which is not a guarantee of future results that may be achieved by the fund. (Current performance may be lower or higher than the performance data cited. For performance data current to the most recent month-end, visit our website at vanguard.com/performance.) Note, too, that both investment returns and principal value can fluctuate widely, so an investor’s shares, when sold, could be worth more or less than their original cost. The returns shown do not reflect taxes that a shareholder would pay on fund distributions or on the sale of fund shares.
Cumulative Performance: December 31, 2003, Through December 31, 2013
Initial Investment of $10,000
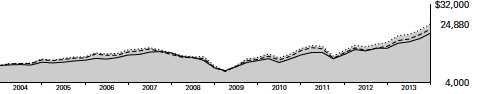
| Average Annual Total Returns | |||||
| Periods Ended December 31, 2013 | |||||
| Final Value | |||||
| One | Five | Ten | of a $10,000 | ||
| Year | Years | Years | Investment | ||
| Small-Cap Value Index Fund*Investor | |||||
| Shares | 36.41% | 20.32% | 9.54% | $24,880 | |
| •••••••• | Spliced Small-Cap Value Index | 36.67 | 20.47 | 9.67 | 25,178 |
| – – – – | Small-Cap Value Funds Average | 36.66 | 20.07 | 8.79 | 23,222 |
| Dow Jones U.S. Total Stock Market | |||||
| Float Adjusted Index | 33.47 | 18.86 | 8.09 | 21,777 | |
| For a benchmark description, see the Glossary. | |||||
| Small-Cap Value Funds Average: Derived from data provided by Lipper, a Thomson Reuters Company. | |||||
| Since | Final Value | ||||
| One | Inception | of a $10,000 | |||
| Year | (9/27/2011) | Investment | |||
| Small-Cap Value Index Fund Admiral Shares | 36.58% | 29.23% | $17,852 | ||
| Spliced Small-Cap Value Index | 36.67 | 29.28 | 17,869 | ||
| Dow Jones U.S. Total Stock Market Float | |||||
| Adjusted Index | 33.47 | 25.52 | 16,717 | ||
| "Since Inception" performance is calculated from the Admiral Shares’ inception date for both the fund and its comparative standards. | |||||
See Financial Highlights for dividend and capital gains information.
54
| Small-Cap Value Index Fund | ||||
| Average Annual Total Returns | ||||
| Periods Ended December 31, 2013 | ||||
| Final Value | ||||
| One | Five | Ten | of a $5,000,000 | |
| Year | Years | Years | Investment | |
| Small-Cap Value Index Fund Institutional | ||||
| Shares | 36.55% | 20.54% | 9.73% | $12,652,575 |
| Spliced Small-Cap Value Index | 36.67 | 20.47 | 9.67 | 12,589,067 |
| Dow Jones U.S. Total Stock Market Float | ||||
| Adjusted Index | 33.47 | 18.86 | 8.09 | 10,888,699 |
| Since | Final Value | |||
| One | Five | Inception | of a $10,000 | |
| Year | Years | (1/26/2004) | Investment | |
| Small-Cap Value Index Fund | ||||
| ETF Shares Net Asset Value | 36.57% | 20.48% | 9.17% | $23,902 |
| Spliced Small-Cap Value Index | 36.67 | 20.47 | 9.17 | 23,901 |
| Dow Jones U.S. Total Stock Market Float | ||||
| Adjusted Index | 33.47 | 18.86 | 7.67 | 20,835 |
"Since Inception" performance is calculated from the ETF Shares’ inception date for both the fund and its comparative standards.
| Cumulative Returns of ETF Shares: January 26, 2004, Through December 31, 2013 | |||
| Since | |||
| One | Five | Inception | |
| Year | Years | (1/26/2004) | |
| Small-Cap Value Index Fund ETF Shares Market | |||
| Price | 36.48% | 155.15% | 139.04% |
| Small-Cap Value Index Fund ETF Shares Net Asset | |||
| Value | 36.57 | 153.89 | 139.02 |
| Spliced Small-Cap Value Index | 36.67 | 153.75 | 139.01 |
"Since Inception" performance is calculated from the ETF Shares’ inception date for both the fund and its comparative standards.
55
Small-Cap Value Index Fund
Fiscal-Year Total Returns (%): December 31, 2003, Through December 31, 2013
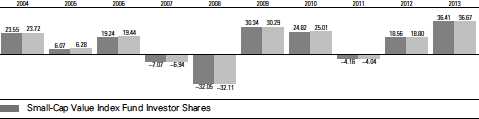
Spliced Small-Cap Value Index
For a benchmark description, see the Glossary.
56
Small-Cap Value Index Fund
Financial Statements
Statement of Net Assets—Investments Summary
As of December 31, 2013
This Statement summarizes the fund’s holdings by asset type. Details are reported for each of the fund’s 50 largest individual holdings and for investments that, in total for any issuer, represent more than 1% of the fund’s net assets. The total value of smaller holdings is reported as a single amount within each category.
The fund reports a complete list of its holdings in regulatory filings four times in each fiscal year, at the quarter-ends. For the second and fourth fiscal quarters, the complete listing of the fund’s holdings is available electronically on vanguard.com and on the Securities and Exchange Commission’s website (sec.gov), or you can have it mailed to you without charge by calling 800-662-7447. For the first and third fiscal quarters, the fund files the lists with the SEC on Form N-Q. Shareholders can look up the fund’s Forms N-Q on the SEC’s website. Forms N-Q may also be reviewed and copied at the SEC’s Public Reference Room (see the back cover of this report for further information).
| Market | Percentage | |||
| Value | of Net | |||
| Shares | ($000) | Assets | ||
| Common Stocks | ||||
| Basic Materials | ||||
| RPM International Inc. | 1,123,379 | 46,632 | 0.4% | |
| Rockwood Holdings Inc. | 618,366 | 44,473 | 0.3% | |
| United States Steel Corp. | 1,222,454 | 36,062 | 0.3% | |
| Basic Materials—Other † | 616,022 | 5.0% | ||
| 743,189 | 6.0% | |||
| Consumer Goods | ||||
| Hanesbrands Inc. | 837,417 | 58,845 | 0.5% | |
| Snap-on Inc. | 491,322 | 53,810 | 0.4% | |
| Goodyear Tire & Rubber Co. | 2,086,311 | 49,759 | 0.4% | |
| Ingredion Inc. | 647,919 | 44,357 | 0.3% | |
| Leggett & Platt Inc. | 1,193,240 | 36,919 | 0.3% | |
| Tupperware Brands Corp. | 385,292 | 36,422 | 0.3% | |
| Consumer Goods—Other † | 628,079 | 5.1% | ||
| 908,191 | 7.3% | |||
| Consumer Services | ||||
| Gannett Co. Inc. | 1,925,789 | 56,965 | 0.5% | |
| Omnicare Inc. | 870,182 | 52,524 | 0.4% | |
| Foot Locker Inc. | 1,254,861 | 52,001 | 0.4% | |
| GameStop Corp. Class A | 938,386 | 46,225 | 0.4% | |
| Alaska Air Group Inc. | 587,594 | 43,112 | 0.4% | |
| *,^ | American Airlines Group Inc. | 1,581,404 | 39,930 | 0.3% |
| * | Rite Aid Corp. | 7,741,984 | 39,174 | 0.3% |
| * | Avis Budget Group Inc. | 905,987 | 36,620 | 0.3% |
| Consumer Services—Other † | 1,197,193 | 9.7% | ||
| 1,563,744 | 12.7% | |||
| Financials | ||||
| Arthur J Gallagher & Co. | 1,119,151 | 52,522 | 0.4% | |
| Starwood Property Trust Inc. | 1,650,036 | 45,706 | 0.4% | |
| Liberty Property Trust | 1,238,813 | 41,959 | 0.4 | |
| Eaton Vance Corp. | 973,219 | 41,644 | 0.3% | |
57
| Small-Cap Value Index Fund | ||||
| Market | Percentage | |||
| Value | of Net | |||
| Shares | ($000) | Assets | ||
| East West Bancorp Inc. | 1,164,161 | 40,711 | 0.3% | |
| HCC Insurance Holdings Inc. | 846,702 | 39,067 | 0.3% | |
| Mid-America Apartment Communities Inc. | 631,880 | 38,380 | 0.3% | |
| American Financial Group Inc. | 641,860 | 37,048 | 0.3% | |
| Senior Housing Properties Trust | 1,590,104 | 35,348 | 0.3% | |
| Financials—Other † | 3,122,830 | 25.3% | ||
| 3,495,215 | 28.3% | |||
| Health Care | ||||
| * | Covance Inc. | 474,560 | 41,790 | 0.3% |
| Health Care—Other † | 667,376 | 5.4% | ||
| 709,166 | 5.7% | |||
| Industrials | ||||
| * | United Rentals Inc. | 787,862 | 61,414 | 0.5% |
| Packaging Corp. of America | 828,762 | 52,444 | 0.4% | |
| IDEX Corp. | 685,428 | 50,619 | 0.4% | |
| Total System Services Inc. | 1,443,289 | 48,033 | 0.4% | |
| Valspar Corp. | 659,175 | 46,993 | 0.4% | |
| Carlisle Cos. Inc. | 537,452 | 42,674 | 0.4% | |
| Global Payments Inc. | 615,958 | 40,031 | 0.3% | |
| * | Flextronics International Ltd. | 5,135,985 | 39,907 | 0.3% |
| Broadridge Financial Solutions Inc. | 1,007,116 | 39,801 | 0.3% | |
| PerkinElmer Inc. | 949,691 | 39,156 | 0.3% | |
| Towers Watson & Co. Class A | 299,795 | 38,257 | 0.3% | |
| Aptargroup Inc. | 556,435 | 37,732 | 0.3% | |
| Huntington Ingalls Industries Inc. | 417,175 | 37,550 | 0.3% | |
| Terex Corp. | 894,216 | 37,548 | 0.3% | |
| Oshkosh Corp. | 730,063 | 36,781 | 0.3% | |
| Trinity Industries Inc. | 659,907 | 35,978 | 0.3% | |
| Sonoco Products Co. | 861,526 | 35,943 | 0.3% | |
| Bemis Co. Inc. | 869,820 | 35,628 | 0.3% | |
| Industrials—Other † | 1,983,036 | 16.1% | ||
| 2,739,525 | 22.2% | |||
| Oil & Gas | ||||
| * | Superior Energy Services Inc. | 1,347,673 | 35,862 | 0.3% |
| Oil & Gas—Other † | 509,621 | 4.1% | ||
| 545,483 | 4.4% | |||
| Technology | ||||
| * | NCR Corp. | 1,406,088 | 47,891 | 0.4% |
| Pitney Bowes Inc. | 1,706,848 | 39,770 | 0.3% | |
| Technology—Other † | 769,345 | 6.2% | ||
| 857,006 | 6.9% | |||
| Telecommunications † | 59,244 | 0.5% | ||
| Utilities | ||||
| AGL Resources Inc. | 1,003,767 | 47,408 | 0.4% | |
| UGI Corp. | 964,081 | 39,971 | 0.3% | |
| Utilities—Other † | 577,940 | 4.7% | ||
| 665,319 | 5.4% | |||
| Total Common Stocks (Cost $9,377,593) | 12,286,082 | 99.4%1 | ||
58
| Small-Cap Value Index Fund | ||||
| Market | Percentage | |||
| Value | of Net | |||
| Coupon | Shares | ($000) | Assets | |
| Temporary Cash Investments | ||||
| Money Market Fund | ||||
| 2,3 Vanguard Market Liquidity Fund | 0.125% | 141,534,341 | 141,534 | 1.2% |
| 4U.S. Government and Agency Obligations † | 3,999 | 0.0% | ||
| Total Temporary Cash Investments (Cost $145,534) | 145,533 | 1.2%1 | ||
| Total Investments (Cost $9,523,127) | 12,431,615 | 100.6% | ||
| Other Assets and Liabilities | ||||
| Other Assets | 31,165 | 0.3% | ||
| Liabilities3 | (109,481) | (0.9%) | ||
| (78,316) | (0.6%) | |||
| Net Assets | 12,353,299 | 100.0% | ||
| At December 31, 2013, net assets consisted of: | ||||
| Amount | ||||
| ($000) | ||||
| Paid-in Capital | 10,393,415 | |||
| Overdistributed Net Investment Income | (13,207) | |||
| Accumulated Net Realized Losses | (936,398) | |||
| Unrealized Appreciation (Depreciation) | ||||
| Investment Securities | 2,908,488 | |||
| Futures Contracts | 1,001 | |||
| Net Assets | 12,353,299 | |||
| Investor Shares—Net Assets | ||||
| Applicable to 101,817,610 outstanding $.001 par value shares of | ||||
| beneficial interest (unlimited authorization) | 2,375,222 | |||
| Net Asset Value Per Share—Investor Shares | $23.33 | |||
| Admiral Shares—Net Assets | ||||
| Applicable to 104,517,456 outstanding $.001 par value shares of | ||||
| beneficial interest (unlimited authorization) | 4,370,623 | |||
| Net Asset Value Per Share—Admiral Shares | $41.82 | |||
| Institutional Shares—Net Assets | ||||
| Applicable to 72,705,678 outstanding $.001 par value shares of | ||||
| beneficial interest (unlimited authorization) | 1,699,263 | |||
| Net Asset Value Per Share—Institutional Shares | $23.37 | |||
59
| Small-Cap Value Index Fund | |
| Amount | |
| ($000) | |
| ETF Shares—Net Assets | |
| Applicable to 40,158,753 outstanding $.001 par value shares of | |
| beneficial interest (unlimited authorization) | 3,908,191 |
| Net Asset Value Per Share—ETF Shares | $97.32 |
See Note A in Notes to Financial Statements.
* Non-income-producing security.
^ Includes partial security positions on loan to broker-dealers. The total value of securities on loan is $72,629,000.
† Represents the aggregate value, by category, of securities that are not among the 50 largest holdings and, in total for any issuer, represent 1% or less of net assets.
1 The fund invests a portion of its cash reserves in equity markets through the use of index futures contracts. After giving effect to futures investments, the fund’s effective common stock and temporary cash investment positions represent 100.0% and 0.6%, respectively, of net assets.
2 Affiliated money market fund available only to Vanguard funds and certain trusts and accounts managed by Vanguard. Rate shown is the 7-day yield.
3 Includes $76,159,000 of collateral received for securities on loan.
4 Securities with a value of $3,199,000 have been segregated as initial margin for open futures contracts.
See accompanying Notes, which are an integral part of the Financial Statements.
60
| Small-Cap Value Index Fund | |
| Statement of Operations | |
| Year Ended | |
| December 31, 2013 | |
| ($000) | |
| Investment Income | |
| Income | |
| Dividends | 229,751 |
| Interest1 | 169 |
| Securities Lending | 2,303 |
| Total Income | 232,223 |
| Expenses | |
| The Vanguard Group—Note B | |
| Investment Advisory Services | 641 |
| Management and Administrative—Investor Shares | 4,720 |
| Management and Administrative—Admiral Shares | 2,238 |
| Management and Administrative—Institutional Shares | 620 |
| Management and Administrative—ETF Shares | 1,829 |
| Marketing and Distribution—Investor Shares | 558 |
| Marketing and Distribution—Admiral Shares | 501 |
| Marketing and Distribution—Institutional Shares | 284 |
| Marketing and Distribution—ETF Shares | 597 |
| Custodian Fees | 313 |
| Auditing Fees | 37 |
| Shareholders’ Reports—Investor Shares | 37 |
| Shareholders’ Reports—Admiral Shares | 19 |
| Shareholders’ Reports—Institutional Shares | 30 |
| Shareholders’ Reports—ETF Shares | 118 |
| Trustees’ Fees and Expenses | 13 |
| Total Expenses | 12,555 |
| Net Investment Income | 219,668 |
| Realized Net Gain (Loss) | |
| Investment Securities Sold | 430,894 |
| Futures Contracts | 18,516 |
| Realized Net Gain (Loss) | 449,410 |
| Change in Unrealized Appreciation (Depreciation) | |
| Investment Securities | 2,457,864 |
| Futures Contracts | 561 |
| Change in Unrealized Appreciation (Depreciation) | 2,458,425 |
| Net Increase (Decrease) in Net Assets Resulting from Operations | 3,127,503 |
| 1 Interest income from an affiliated company of the fund was $153,000. | |
| See accompanying Notes, which are an integral part of the Financial Statements. | |
61
| Small-Cap Value Index Fund | ||
| Statement of Changes in Net Assets | ||
| Year Ended December 31, | ||
| 2013 | 2012 | |
| ($000) | ($000) | |
| Increase (Decrease) in Net Assets | ||
| Operations | ||
| Net Investment Income | 219,668 | 198,040 |
| Realized Net Gain (Loss) | 449,410 | 288,607 |
| Change in Unrealized Appreciation (Depreciation) | 2,458,425 | 730,899 |
| Net Increase (Decrease) in Net Assets Resulting from Operations | 3,127,503 | 1,217,546 |
| Distributions | ||
| Net Investment Income | ||
| Investor Shares | (40,303) | (49,439) |
| Admiral Shares | (79,929) | (65,573) |
| Institutional Shares | (31,614) | (25,249) |
| ETF Shares | (72,359) | (59,329) |
| Realized Capital Gain | ||
| Investor Shares | — | — |
| Admiral Shares | — | — |
| Institutional Shares | — | — |
| ETF Shares | — | — |
| Total Distributions | (224,205) | (199,590) |
| Capital Share Transactions | ||
| Investor Shares | (290,808) | (274,112) |
| Admiral Shares | 836,372 | 305,708 |
| Institutional Shares | 344,441 | 136,875 |
| ETF Shares | 736,310 | 239,683 |
| Net Increase (Decrease) from Capital Share Transactions | 1,626,315 | 408,154 |
| Total Increase (Decrease) | 4,529,613 | 1,426,110 |
| Net Assets | ||
| Beginning of Period | 7,823,686 | 6,397,576 |
| End of Period1 | 12,353,299 | 7,823,686 |
1 Net Assets—End of Period includes undistributed (overdistributed) net investment income of ($13,207,000) and ($9,654,000).
See accompanying Notes, which are an integral part of the Financial Statements.
62
| Small-Cap Value Index Fund | |||||
| Financial Highlights | |||||
| Investor Shares | |||||
| For a Share Outstanding | Year Ended December 31, | ||||
| Throughout Each Period | 2013 | 2012 | 2011 | 2010 | 2009 |
| Net Asset Value, Beginning of Period | $17.40 | $15.04 | $16.01 | $13.06 | $10.21 |
| Investment Operations | |||||
| Net Investment Income | . 394 | .428 | .309 | .285 | .241 |
| Net Realized and Unrealized Gain (Loss) | |||||
| on Investments | 5.936 | 2.364 | (. 974) | 2.956 | 2.854 |
| Total from Investment Operations | 6.330 | 2.792 | (.665) | 3.241 | 3.095 |
| Distributions | |||||
| Dividends from Net Investment Income | (. 400) | (.432) | (. 305) | (.291) | (.245) |
| Distributions from Realized Capital Gains | — | — | — | — | — |
| Total Distributions | (.400) | (.432) | (. 305) | (.291) | (.245) |
| Net Asset Value, End of Period | $23.33 | $17.40 | $15.04 | $16.01 | $13.06 |
| Total Return1 | 36.41% | 18.56% | -4.16% | 24.82% | 30.34% |
| Ratios/Supplemental Data | |||||
| Net Assets, End of Period (Millions) | $2,375 | $2,001 | $1,980 | $4,316 | $3,279 |
| Ratio of Total Expenses to Average Net Assets | 0.24% | 0.24% | 0.24% | 0.26% | 0.28% |
| Ratio of Net Investment Income to | |||||
| Average Net Assets | 2.03% | 2.66% | 1.90% | 2.03% | 2.26% |
| Portfolio Turnover Rate 2 | 47% | 25% | 30% | 25% | 33% |
1 Total returns do not include account service fees that may have applied in the periods shown. Fund prospectuses provide information about any applicable account service fees.
2 Excludes the value of portfolio securities received or delivered as a result of in-kind purchases or redemptions of the fund’s capital shares, including ETF Creation Units.
See accompanying Notes, which are an integral part of the Financial Statements.
63
| Small-Cap Value Index Fund | |||
| Financial Highlights | |||
| Admiral Shares | |||
| Sept. 27, | |||
| Year Ended | 20111 to | ||
| December 31, | Dec. 31, | ||
| For a Share Outstanding Throughout Each Period | 2013 | 2012 | 2011 |
| Net Asset Value, Beginning of Period | $31.20 | $26.96 | $25.00 |
| Investment Operations | |||
| Net Investment Income | .773 | .814 | .196 |
| Net Realized and Unrealized Gain (Loss) on Investments | 10.629 | 4.245 | 2.320 |
| Total from Investment Operations | 11.402 | 5.059 | 2.516 |
| Distributions | |||
| Dividends from Net Investment Income | (.782) | (.819) | (.556) |
| Distributions from Realized Capital Gains | — | — | — |
| Total Distributions | (.782) | (.819) | (.556) |
| Net Asset Value, End of Period | $41.82 | $31.20 | $26.96 |
| Total Return2 | 36.58% | 18.77% | 10.05% |
| Ratios/Supplemental Data | |||
| Net Assets, End of Period (Millions) | $4,371 | $2,563 | $1,941 |
| Ratio of Total Expenses to Average Net Assets | 0.09% | 0.10% | 0.10%3 |
| Ratio of Net Investment Income to Average Net Assets | 2.18% | 2.80% | 2.04%3 |
| Portfolio Turnover Rate4 | 47% | 25% | 30% |
1 Inception.
2 Total returns do not include account service fees that may have applied in the periods shown. Fund prospectuses provide information about any applicable account service fees.
3 Annualized.
4 Excludes the value of portfolio securities received or delivered as a result of in-kind purchases or redemptions of the fund’s capital shares, including ETF Creation Units.
See accompanying Notes, which are an integral part of the Financial Statements.
64
| Small-Cap Value Index Fund | |||||
| Financial Highlights | |||||
| Institutional Shares | |||||
| For a Share Outstanding | Year Ended December 31, | ||||
| Throughout Each Period | 2013 | 2012 | 2011 | 2010 | 2009 |
| Net Asset Value, Beginning of Period | $17.44 | $15.07 | $16.04 | $13.09 | $10.22 |
| Investment Operations | |||||
| Net Investment Income | .434 | .459 | .338 | .311 | .262 |
| Net Realized and Unrealized Gain (Loss) | |||||
| on Investments | 5.935 | 2.371 | (.973) | 2.957 | 2.874 |
| Total from Investment Operations | 6.369 | 2.830 | (.635) | 3.268 | 3.136 |
| Distributions | |||||
| Dividends from Net Investment Income | (.439) | (.460) | (.335) | (.318) | (.266) |
| Distributions from Realized Capital Gains | — | — | — | — | — |
| Total Distributions | (.439) | (.460) | (.335) | (.318) | (.266) |
| Net Asset Value, End of Period | $23.37 | $17.44 | $15.07 | $16.04 | $13.09 |
| Total Return | 36.55% | 18.78% | -3.97% | 24.97% | 30.71% |
| Ratios/Supplemental Data | |||||
| Net Assets, End of Period (Millions) | $1,699 | $979 | $722 | $871 | $543 |
| Ratio of Total Expenses to Average Net Assets | 0.08% | 0.08% | 0.08% | 0.08% | 0.08% |
| Ratio of Net Investment Income to | |||||
| Average Net Assets | 2.19% | 2.82% | 2.06% | 2.21% | 2.46% |
| Portfolio Turnover Rate1 | 47% | 25% | 30% | 25% | 33% |
1 Excludes the value of portfolio securities received or delivered as a result of in-kind purchases or redemptions of the fund’s capital shares, including ETF Creation Units.
See accompanying Notes, which are an integral part of the Financial Statements.
65
| Small-Cap Value Index Fund | |||||
| Financial Highlights | |||||
| ETF Shares | |||||
| For a Share Outstanding | Year Ended December 31, | ||||
| Throughout Each Period | 2013 | 2012 | 2011 | 2010 | 2009 |
| Net Asset Value, Beginning of Period | $72.60 | $62.73 | $66.80 | $54.49 | $42.58 |
| Investment Operations | |||||
| Net Investment Income | 1.796 | 1.896 | 1.393 | 1.269 | 1.071 |
| Net Realized and Unrealized Gain (Loss) | |||||
| on Investments | 24.742 | 9.877 | (4.083) | 12.340 | 11.923 |
| Total from Investment Operations | 26.538 | 11.773 | (2.690) | 13.609 | 12.994 |
| Distributions | |||||
| Dividends from Net Investment Income | (1.818) | (1.903) | (1.380) | (1.299) | (1.084) |
| Distributions from Realized Capital Gains | — | — | — | — | — |
| Total Distributions | (1.818) | (1.903) | (1.380) | (1.299) | (1.084) |
| Net Asset Value, End of Period | $97.32 | $72.60 | $62.73 | $66.80 | $54.49 |
| Total Return | 36.57% | 18.78% | -4.05% | 24.97% | 30.52% |
| Ratios/Supplemental Data | |||||
| Net Assets, End of Period (Millions) | $3,908 | $2,281 | $1,755 | $1,851 | $1,310 |
| Ratio of Total Expenses to Average Net Assets | 0.09% | 0.10% | 0.10% | 0.12% | 0.14% |
| Ratio of Net Investment Income to | |||||
| Average Net Assets | 2.18% | 2.80% | 2.04% | 2.17% | 2.40% |
| Portfolio Turnover Rate1 | 47% | 25% | 30% | 25% | 33% |
1 Excludes the value of portfolio securities received or delivered as a result of in-kind purchases or redemptions of the fund’s capital shares, including ETF Creation Units.
See accompanying Notes, which are an integral part of the Financial Statements.
66
Small-Cap Value Index Fund
Notes to Financial Statements
Vanguard Small-Cap Value Index Fund is registered under the Investment Company Act of 1940 as an open-end investment company, or mutual fund. The fund offers four classes of shares: Investor Shares, Admiral Shares, Institutional Shares, and ETF Shares. Investor Shares are available to any investor who meets the fund’s minimum purchase requirements. Admiral Shares and Institutional Shares are designed for investors who meet certain administrative, service, and account-size criteria. ETF Shares are listed for trading on NYSE Arca; they can be purchased and sold through a broker.
A. The following significant accounting policies conform to generally accepted accounting principles for U.S. mutual funds. The fund consistently follows such policies in preparing its financial statements.
1. Security Valuation: Securities are valued as of the close of trading on the New York Stock Exchange (generally 4 p.m., Eastern time) on the valuation date. Equity securities are valued at the latest quoted sales prices or official closing prices taken from the primary market in which each security trades; such securities not traded on the valuation date are valued at the mean of the latest quoted bid and asked prices. Securities for which market quotations are not readily available, or whose values have been materially affected by events occurring before the fund’s pricing time but after the close of the securities’ primary markets, are valued by methods deemed by the board of trustees to represent fair value. Investments in Vanguard Market Liquidity Fund are valued at that fund’s net asset value. Temporary cash investments acquired over 60 days to maturity are valued using the latest bid prices or using valuations based on a matrix system (which considers such factors as security prices, yields, maturities, and ratings), both as furnished by independent pricing services. Other temporary cash investments are valued at amortized cost, which approximates market value.
2. Futures Contracts: The fund may use index futures contracts to a limited extent, with the objectives of maintaining full exposure to the stock market, enhancing returns, maintaining liquidity, and minimizing transaction costs. The fund may purchase futures contracts to immediately invest incoming cash in the market, or sell futures in response to cash outflows, thereby simulating a fully invested position in the underlying index while maintaining a cash balance for liquidity. The fund may seek to enhance returns by using futures contracts instead of the underlying securities when futures are believed to be priced more attractively than the underlying securities. The primary risks associated with the use of futures contracts are imperfect correlation between changes in market values of stocks held by the fund and the prices of futures contracts, and the possibility of an illiquid market. Counterparty risk involving futures is mitigated because a regulated clearinghouse is the counterparty instead of the clearing broker. To further mitigate counterparty risk, the fund trades futures contracts on an exchange, monitors the financial strength of its clearing brokers and clearinghouse, and has entered into clearing agreements with its clearing brokers. The clearinghouse imposes initial margin requirements to secure the fund’s performance and requires daily settlement of variation margin representing changes in the market value of each contract.
Futures contracts are valued at their quoted daily settlement prices. The aggregate notional amounts of the contracts are not recorded in the Statement of Net Assets. Fluctuations in the value of the contracts are recorded in the Statement of Net Assets as an asset (liability) and in the Statement of Operations as unrealized appreciation (depreciation) until the contracts are closed, when they are recorded as realized futures gains (losses).
During the year ended December 31, 2013, the fund’s average investments in long and short futures contracts represented 1% and 0% of net assets, respectively, based on quarterly average aggregate settlement values.
67
Small-Cap Value Index Fund
3. Federal Income Taxes: The fund intends to continue to qualify as a regulated investment company and distribute all of its taxable income. Management has analyzed the fund’s tax positions taken for all open federal income tax years (December 31, 2010–2013), and has concluded that no provision for federal income tax is required in the fund’s financial statements.
4. Distributions: Distributions to shareholders are recorded on the ex-dividend date.
5. Securities Lending: To earn additional income, the fund may lend its securities to qualified institutional borrowers. Security loans are required to be secured at all times by collateral in an amount at least equal to the market value of securities loaned. Daily market fluctuations could cause the value of loaned securities to be more or less than the value of the collateral received. When this occurs, the collateral is adjusted and settled on the next business day. The fund further mitigates its counterparty risk by entering into securities lending transactions only with a diverse group of prequalified counterparties, monitoring their financial strength, and entering into master securities lending agreements with its counterparties. The master securities lending agreements provide that, in the event of a counterparty’s default (including bankruptcy), the fund may terminate any loans with that borrower, determine the net amount owed, and sell or retain the collateral up to the net amount owed to the fund; however, such actions may be subject to legal proceedings. While collateral mitigates counterparty risk, in the absence of a default the fund may experience delays and costs in recovering the securities loaned. The fund invests cash collateral received in Vanguard Market Liquidity Fund, and records a liability for the return of the collateral, during the period the securities are on loan. Securities lending income represents fees charged to borrowers plus income earned on invested cash collateral, less expenses associated with the loan.
6. Other: Dividend income is recorded on the ex-dividend date. Interest income includes income distributions received from Vanguard Market Liquidity Fund and is accrued daily. Premiums and discounts on debt securities purchased are amortized and accreted, respectively, to interest income over the lives of the respective securities. Security transactions are accounted for on the date securities are bought or sold. Costs used to determine realized gains (losses) on the sale of investment securities are those of the specific securities sold.
Each class of shares has equal rights as to assets and earnings, except that each class separately bears certain class-specific expenses related to maintenance of shareholder accounts (included in Management and Administrative expenses) and shareholder reporting. Marketing and distribution expenses are allocated to each class of shares based on a method approved by the board of trustees. Income, other non-class-specific expenses, and gains and losses on investments are allocated to each class of shares based on its relative net assets.
B. The Vanguard Group furnishes at cost investment advisory, corporate management, administrative, marketing, and distribution services. The costs of such services are allocated to the fund under methods approved by the board of trustees. The fund has committed to provide up to 0.40% of its net assets in capital contributions to Vanguard. At December 31, 2013, the fund had contributed capital of $1,347,000 to Vanguard (included in Other Assets), representing 0.01% of the fund’s net assets and 0.54% of Vanguard’s capitalization. The fund’s trustees and officers are also directors and officers of Vanguard.
C. Various inputs may be used to determine the value of the fund’s investments. These inputs are summarized in three broad levels for financial statement purposes. The inputs or methodologies used to value securities are not necessarily an indication of the risk associated with investing in those securities.
68
Small-Cap Value Index Fund
Level 1—Quoted prices in active markets for identical securities.
Level 2—Other significant observable inputs (including quoted prices for similar securities, interest rates, prepayment speeds, credit risk, etc.).
Level 3—Significant unobservable inputs (including the fund’s own assumptions used to determine the fair value of investments).
The following table summarizes the market value of the fund’s investments as of December 31, 2013, based on the inputs used to value them:
| Level 1 | Level 2 | Level 3 | |
| Investments | ($000) | ($000) | ($000) |
| Common Stocks | 12,286,082 | — | — |
| Temporary Cash Investments | 141,534 | 3,999 | — |
| Futures Contracts—Assets1 | 269 | — | — |
| Total | 12,427,885 | 3,999 | — |
| 1 Represents variation margin on the last day of the reporting period. |
D. At December 31, 2013, the aggregate settlement value of open futures contracts and the related unrealized appreciation (depreciation) were:
| ($000) | ||||
| Aggregate | ||||
| Number of | Settlement | Unrealized | ||
| Long (Short) | Value | Appreciation | ||
| Futures Contracts | Expiration | Contracts | Long (Short) | (Depreciation) |
| E-mini Russell 2000 Index | March 2014 | 508 | 58,999 | 802 |
| E-mini S&P MidCap 400 Index | March 2014 | 71 | 9,510 | 199 |
| 1,001 |
Unrealized appreciation (depreciation) on open futures contracts is required to be treated as realized gain (loss) for tax purposes.
E. Distributions are determined on a tax basis and may differ from net investment income and realized capital gains for financial reporting purposes. Differences may be permanent or temporary. Permanent differences are reclassified among capital accounts in the financial statements to reflect their tax character. Temporary differences arise when certain items of income, expense, gain, or loss are recognized in different periods for financial statement and tax purposes. These differences will reverse at some time in the future. Differences in classification may also result from the treatment of short-term gains as ordinary income for tax purposes.
Certain of the fund’s investments are in securities considered to be passive foreign investment companies, for which any unrealized appreciation and/or realized gains are required to be included in distributable net income for tax purposes. During the year ended December 31, 2013, the fund realized gains on the sale of passive foreign investment companies of $984,000, which have been included in current and prior periods’ taxable income; accordingly, such gains have been reclassified from accumulated net realized losses to overdistributed net investment income. Passive foreign investment companies held at December 31, 2013, had unrealized appreciation of $5,438,000, of which all has been distributed and is reflected in the balance of overdistributed net investment income.
69
Small-Cap Value Index Fund
During the year ended December 31, 2013, the fund realized $186,435,000 of net capital gains resulting from in-kind redemptions—in which shareholders exchanged fund shares for securities held by the fund rather than for cash. Because such gains are not taxable to the fund, and are not distributed to shareholders, they have been reclassified from accumulated net realized losses to paid-in capital.
For tax purposes, at December 31, 2013, the fund had $2,845,000 of ordinary income available for distribution. The fund used capital loss carryforwards of $265,623,000 to offset taxable capital gains realized during the year ended December 31, 2013. At December 31, 2013, the fund had available capital losses totaling $931,261,000 to offset future net capital gains. Of this amount, $916,816,000 is subject to expiration dates; $528,042,000 may be used to offset future net capital gains through December 31, 2017, and $388,774,000 through December 31, 2018. Capital losses of $14,445,000 realized beginning in fiscal 2011 may be carried forward indefinitely under the Regulated Investment Company Modernization Act of 2010, but must be used before any expiring loss carryforwards.
At December 31, 2013, the cost of investment securities for tax purposes was $9,531,659,000.
Net unrealized appreciation of investment securities for tax purposes was $2,899,956,000, consisting of unrealized gains of $3,132,658,000 on securities that had risen in value since their purchase and $232,702,000 in unrealized losses on securities that had fallen in value since their purchase.
F. During the year ended December 31, 2013, the fund purchased $6,915,160,000 of investment securities and sold $5,319,417,000 of investment securities, other than temporary cash investments. Purchases and sales include $1,281,930,000 and $564,494,000, respectively, in connection with in-kind purchases and redemptions of the fund’s capital shares.
G. Capital share transactions for each class of shares were:
| Year Ended December 31, | ||||
| 2013 | 2012 | |||
| Amount | Shares | Amount | Shares | |
| ($000) | (000) | ($000) | (000) | |
| Investor Shares | ||||
| Issued | 623,704 | 30,686 | 417,447 | 25,184 |
| Issued in Lieu of Cash Distributions | 37,188 | 1,613 | 45,892 | 2,638 |
| Redeemed | (951,700) | (45,442) | (737,451) | (44,523) |
| Net Increase (Decrease)—Investor Shares | (290,808) | (13,143) | (274,112) | (16,701) |
| Admiral Shares | ||||
| Issued | 1,221,573 | 32,856 | 557,583 | 18,672 |
| Issued in Lieu of Cash Distributions | 72,142 | 1,746 | 59,631 | 1,912 |
| Redeemed | (457,343) | (12,259) | (311,506) | (10,410) |
| Net Increase (Decrease)—Admiral Shares | 836,372 | 22,343 | 305,708 | 10,174 |
| Institutional Shares | ||||
| Issued | 589,813 | 28,421 | 315,863 | 19,079 |
| Issued in Lieu of Cash Distributions | 29,371 | 1,271 | 22,904 | 1,313 |
| Redeemed | (274,743) | (13,130) | (201,892) | (12,141) |
| Net Increase (Decrease)—Institutional Shares | 344,441 | 16,562 | 136,875 | 8,251 |
70
Small-Cap Value Index Fund
| Year Ended December 31, | ||||
| 2013 | 2012 | |||
| Amount | Shares | Amount | Shares | |
| ($000) | (000) | ($000) | (000) | |
| ETF Shares | ||||
| Issued | 1,328,171 | 15,142 | 1,166,553 | 16,837 |
| Issued in Lieu of Cash Distributions | — | — | — | — |
| Redeemed | (591,861) | (6,400) | (926,870) | (13,400) |
| Net Increase (Decrease)—ETF Shares | 736,310 | 8,742 | 239,683 | 3,437 |
H. Management has determined that no material events or transactions occurred subsequent to December 31, 2013, that would require recognition or disclosure in these financial statements.
71
Report of Independent Registered Public Accounting Firm
To the Trustees of Vanguard Index Funds and the Shareholders of Vanguard Small-Cap Index Fund,Vanguard Small-Cap Growth Index Fund and Vanguard Small-Cap Value Index Fund:
In our opinion, the accompanying statements of net assets—investments summary and the related statements of operations and of changes in net assets and the financial highlights present fairly, in all material respects, the financial position of Vanguard Small-Cap Index Fund, Vanguard Small-Cap Growth Index Fund and Vanguard Small-Cap Value Index Fund (constituting separate portfolios of Vanguard Index Funds, hereafter referred to as the “Funds”) at December 31, 2013, the results of each of their operations for the year then ended, the changes in each of their net assets for each of the two years in the period then ended, and the financial highlights for each of the periods indicated, in conformity with accounting principles generally accepted in the United States of America. These financial statements and financial highlights (hereafter referred to as “financial statements”) are the responsibility of the Funds’ management; our responsibility is to express an opinion on these financial statements based on our audits. We conducted our audits of these financial statements in accordance with the standards of the Public Company Accounting Oversight Board (United States). Those standards require that we plan and perform the audit to obtain reasonable assurance about whether the financial statements are free of material misstatement. An audit includes examining, on a test basis, evidence supporting the amounts and disclosures in the financial statements, assessing the accounting principles used and significant estimates made by management, and evaluating the overall financial statement presentation. We believe that our audits, which included confirmation of securities at December 31, 2013 by correspondence with the custodians and broker and by agreement to the underlying ownership records of the transfer agent, provide a reasonable basis for our opinion.
PricewaterhouseCoopers LLP
Philadelphia, Pennsylvania
February 14, 2014
72
Special 2013 tax information (unaudited) for Vanguard U.S. Stock Index Funds (Small-Capitalization Portfolios)
This information for the fiscal year ended December 31, 2013, is included pursuant to provisions of the Internal Revenue Code.
The funds distributed qualified dividend income to shareholders during the fiscal year as follows:
| Fund | ($000) |
| Small-Cap Index Fund | 359,409 |
| Small-Cap Growth Index Fund | 49,889 |
| Small-Cap Value Index Fund | 147,258 |
For corporate shareholders, the percentage of investment income (dividend income plus short-term gains, if any) that qualifies for the dividends-received deduction is as follows:
| Fund | Percentage |
| Small-Cap Index Fund | 62.9% |
| Small-Cap Growth Index Fund | 52.5 |
| Small-Cap Value Index Fund | 63.4 |
73
Your Fund’s After-Tax Returns
This table presents returns for your fund both before and after taxes. The after-tax returns are shown in two ways: (1) assuming that an investor owned the fund during the entire period and paid taxes on the fund’s distributions, and (2) assuming that an investor paid taxes on the fund’s distributions and sold all shares at the end of each period.
Calculations are based on the highest individual federal income tax and capital gains tax rates in effect at the times of the distributions and the hypothetical sales. State and local taxes were not considered. After-tax returns reflect any qualified dividend income . (In the example, returns after the sale of fund shares may be higher than those assuming no sale. This occurs when the sale would have produced a capital loss. The calculation assumes that the investor received a tax deduction for the loss.)
The table shows returns for one share class only; returns for other share classes will differ. Please note that your actual after-tax returns will depend on your tax situation and may differ from those shown. Also note that if you own the fund in a tax-deferred account, such as an individual retirement account or a 401(k) plan, this information does not apply to you. Such accounts are not subject to current taxes.
Finally, keep in mind that a fund’s performance—whether before or after taxes—does not guarantee future results.
Average Annual Total Returns: U.S. Stock Index Funds Small-Capitalization Portfolios
Periods Ended December 31, 2013
| One | Five | Ten | |
| Year | Years | Years | |
| Small-Cap Index Fund Investor Shares | |||
| Returns Before Taxes | 37.62% | 22.38% | 10.20% |
| Returns After Taxes on Distributions | 37.12 | 22.05 | 9.91 |
| Returns After Taxes on Distributions and Sale of Fund Shares | 21.49 | 18.35 | 8.36 |
| One | Five | Ten | |
| Year | Years | Years | |
| Small-Cap Growth Index Fund Investor Shares | |||
| Returns Before Taxes | 37.98% | 24.23% | 10.63% |
| Returns After Taxes on Distributions | 37.76 | 24.10 | 10.53 |
| Returns After Taxes on Distributions and Sale of Fund Shares | 21.56 | 20.02 | 8.81 |
| One | Five | Ten | |
| Year | Years | Years | |
| Small-Cap Value Index Fund Investor Shares | |||
| Returns Before Taxes | 36.41% | 20.32% | 9.54% |
| Returns After Taxes on Distributions | 35.70 | 19.80 | 9.07 |
| Returns After Taxes on Distributions and Sale of Fund Shares | 20.90 | 16.53 | 7.74 |
74
About Your Fund’s Expenses
As a shareholder of the fund, you incur ongoing costs, which include costs for portfolio management, administrative services, and shareholder reports (like this one), among others. Operating expenses, which are deducted from a fund’s gross income, directly reduce the investment return of the fund.
A fund’s expenses are expressed as a percentage of its average net assets. This figure is known as the expense ratio. The following examples are intended to help you understand the ongoing costs (in dollars) of investing in your fund and to compare these costs with those of other mutual funds. The examples are based on an investment of $1,000 made at the beginning of the period shown and held for the entire period.
The accompanying table illustrates your fund’s costs in two ways:
• Based on actual fund return. This section helps you to estimate the actual expenses that you paid over the period. The ”Ending Account Value“ shown is derived from the fund‘s actual return, and the third column shows the dollar amount that would have been paid by an investor who started with $1,000 in the fund. You may use the information here, together with the amount you invested, to estimate the expenses that you paid over the period.
To do so, simply divide your account value by $1,000 (for example, an $8,600 account value divided by $1,000 = 8.6), then multiply the result by the number given for your fund under the heading ”Expenses Paid During Period.“
• Based on hypothetical 5% yearly return. This section is intended to help you compare your fund‘s costs with those of other mutual funds. It assumes that the fund had a yearly return of 5% before expenses, but that the expense ratio is unchanged. In this case—because the return used is not the fund’s actual return—the results do not apply to your investment. The example is useful in making comparisons because the Securities and Exchange Commission requires all mutual funds to calculate expenses based on a 5% return. You can assess your fund’s costs by comparing this hypothetical example with the hypothetical examples that appear in shareholder reports of other funds.
Note that the expenses shown in the table are meant to highlight and help you compare ongoing costs only and do not reflect transaction costs incurred by the fund for buying and selling securities. Further, the expenses do not include any purchase, redemption, or account service fees described in the fund prospectus. If such fees were applied to your account, your costs would be higher. Your fund does not carry a “sales load.”
The calculations assume no shares were bought or sold during the period. Your actual costs may have been higher or lower, depending on the amount of your investment and the timing of any purchases or redemptions.
You can find more information about the fund’s expenses, including annual expense ratios, in the Financial Statements section of this report. For additional information on operating expenses and other shareholder costs, please refer to your fund’s current prospectus.
75
| Six Months Ended December 31, 2013 | |||
| Beginning | Ending | Expenses | |
| Account Value | Account Value | Paid During | |
| 6/30/2013 | 12/31/2013 | Period | |
| Based on Actual Fund Return | |||
| Small-Cap Index Fund | |||
| Investor Shares | $1,000.00 | $1,187.49 | $1.32 |
| Admiral Shares | 1,000.00 | 1,188.40 | 0.50 |
| Signal Shares | 1,000.00 | 1,188.18 | 0.50 |
| Institutional Shares | 1,000.00 | 1,188.27 | 0.44 |
| Institutional Plus Shares | 1,000.00 | 1,188.48 | 0.33 |
| ETF Shares | 1,000.00 | 1,188.28 | 0.50 |
| Small-Cap Growth Index Fund | |||
| Investor Shares | $1,000.00 | $1,193.30 | $1.33 |
| Admiral Shares | 1,000.00 | 1,194.31 | 0.50 |
| Institutional Shares | 1,000.00 | 1,194.19 | 0.44 |
| ETF Shares | 1,000.00 | 1,194.17 | 0.50 |
| Small-Cap Value Index Fund | |||
| Investor Shares | $1,000.00 | $1,182.36 | $1.32 |
| Admiral Shares | 1,000.00 | 1,183.36 | 0.50 |
| Institutional Shares | 1,000.00 | 1,183.32 | 0.44 |
| ETF Shares | 1,000.00 | 1,183.17 | 0.50 |
76
| Six Months Ended December 31, 2013 | |||
| Beginning | Ending | Expenses | |
| Account Value | Account Value | Paid During | |
| 6/30/2013 | 12/31/2013 | Period | |
| Based on Hypothetical 5% Yearly Return | |||
| Small-Cap Index Fund | |||
| Investor Shares | $1,000.00 | $1,024.00 | $1.22 |
| Admiral Shares | 1,000.00 | 1,024.75 | 0.46 |
| Signal Shares | 1,000.00 | 1,024.75 | 0.46 |
| Institutional Shares | 1,000.00 | 1,024.80 | 0.41 |
| Institutional Plus Shares | 1,000.00 | 1,024.90 | 0.31 |
| ETF Shares | 1,000.00 | 1,024.75 | 0.46 |
| Small-Cap Growth Index Fund | |||
| Investor Shares | $1,000.00 | $1,024.00 | $1.22 |
| Admiral Shares | 1,000.00 | 1,024.75 | 0.46 |
| Institutional Shares | 1,000.00 | 1,024.80 | 0.41 |
| ETF Shares | 1,000.00 | 1,024.75 | 0.46 |
| Small-Cap Value Index Fund | |||
| Investor Shares | $1,000.00 | $1,024.00 | $1.22 |
| Admiral Shares | 1,000.00 | 1,024.75 | 0.46 |
| Institutional Shares | 1,000.00 | 1,024.80 | 0.41 |
| ETF Shares | 1,000.00 | 1,024.75 | 0.46 |
The calculations are based on expenses incurred in the most recent six-month period. The funds’ annualized six-month expense ratios for that period are: for the Small-Cap Index Fund, 0.24% for Investor Shares, 0.09% for Admiral Shares, 0.09% for Signal Shares, 0.08% for Institutional Shares, 0.06% for Institutional Plus Shares, and 0.09% for ETF Shares; for the Small-Cap Growth Index Fund, 0.24% for Investor Shares, 0.09% for Admiral Shares, 0.08% for Institutional Shares, and 0.09% for ETF Shares; and for the Small-Cap Value Index Fund, 0.24% for Investor Shares, 0.09% for Admiral Shares, 0.08% for Institutional Shares, and 0.09% for ETF Shares. The dollar amounts shown as “Expenses Paid” are equal to the annualized expense ratio multiplied by the average account value over the period, multiplied by the number of days in the most recent six-month period, then divided by the number of days in the most recent 12-month period.
77
Glossary
30-Day SEC Yield. A fund’s 30-day SEC yield is derived using a formula specified by the U.S. Securities and Exchange Commission. Under the formula, data related to the fund’s security holdings in the previous 30 days are used to calculate the fund’s hypothetical net income for that period, which is then annualized and divided by the fund’s estimated average net assets over the calculation period. For the purposes of this calculation, a security’s income is based on its current market yield to maturity (for bonds), its actual income (for asset-backed securities), or its projected dividend yield (for stocks). Because the SEC yield represents hypothetical annualized income, it will differ—at times significantly—from the fund’s actual experience. As a result, the fund’s income distributions may be higher or lower than implied by the SEC yield.
Beta. A measure of the magnitude of a fund’s past share-price fluctuations in relation to the ups and downs of a given market index. The index is assigned a beta of 1.00. Compared with a given index, a fund with a beta of 1.20 typically would have seen its share price rise or fall by 12% when the index rose or fell by 10%. For this report, beta is based on returns over the past 36 months for both the fund and the index. Note that a fund’s beta should be reviewed in conjunction with its R-squared (see definition). The lower the R-squared, the less correlation there is between the fund and the index, and the less reliable beta is as an indicator of volatility.
Dividend Yield. Dividend income earned by stocks, expressed as a percentage of the aggregate market value (or of net asset value, for a fund). The yield is determined by dividing the amount of the annual dividends by the aggregate value (or net asset value) at the end of the period. For a fund, the dividend yield is based solely on stock holdings and does not include any income produced by other investments.
Earnings Growth Rate. The average annual rate of growth in earnings over the past five years for the stocks now in a fund.
Equity Exposure. A measure that reflects a fund’s investments in stocks and stock futures. Any holdings in short-term reserves are excluded.
Expense Ratio. A fund’s total annual operating expenses expressed as a percentage of the fund’s average net assets. The expense ratio includes management and administrative expenses, but does not include the transaction costs of buying and selling portfolio securities.
Foreign Holdings. The percentage of a fund represented by securities or depositary receipts of companies based outside the United States.
Inception Date. The date on which the assets of a fund (or one of its share classes) are first invested in accordance with the fund’s investment objective. For funds with a subscription period, the inception date is the day after that period ends. Investment performance is measured from the inception date.
Median Market Cap. An indicator of the size of companies in which a fund invests; the midpoint of market capitalization (market price x shares outstanding) of a fund’s stocks, weighted by the proportion of the fund’s assets invested in each stock. Stocks representing half of the fund’s assets have market capitalizations above the median, and the rest are below it.
Price/Book Ratio. The share price of a stock divided by its net worth, or book value, per share. For a fund, the weighted average price/book ratio of the stocks it holds.
78
Price/Earnings Ratio. The ratio of a stock’s current price to its per-share earnings over the past year. For a fund, the weighted average P/E of the stocks it holds. P/E is an indicator of market expectations about corporate prospects; the higher the P/E, the greater the expectations for a company’s future growth.
R-Squared. A measure of how much of a fund’s past returns can be explained by the returns from the market in general, as measured by a given index. If a fund’s total returns were precisely synchronized with an index’s returns, its R-squared would be 1.00. If the fund’s returns bore no relationship to the index’s returns, its R-squared would be 0. For this report, R-squared is based on returns over the past 36 months for both the fund and the index.
Return on Equity. The annual average rate of return generated by a company during the past five years for each dollar of shareholder’s equity (net income divided by shareholder’s equity). For a fund, the weighted average return on equity for the companies whose stocks it holds.
Short-Term Reserves. The percentage of a fund invested in highly liquid, short-term securities that can be readily converted to cash.
Turnover Rate. An indication of the fund’s trading activity. Funds with high turnover rates incur higher transaction costs and may be more likely to distribute capital gains (which may be taxable to investors). The turnover rate excludes in-kind transactions, which have minimal impact on costs.
Benchmark Information
Spliced Small-Cap Growth Index: S&P SmallCap 600/Barra Growth Index through May 16, 2003; MSCI US Small Cap Growth Index through April 16, 2013; CRSP US Small Cap Growth Index thereafter.
Spliced Small-Cap Index: Russell 2000 Index through May 16, 2003; MSCI US Small Cap 1750 Index through January 30, 2013; CRSP US Small Cap Index thereafter.
Spliced Small-Cap Value Index: S&P SmallCap 600 Value Index (formerly known as the S&P SmallCap 600/Barra Value Index) through May 16, 2003; MSCI US Small Cap Value Index through April 16, 2013; CRSP US Small Cap Value Index thereafter.
79
The People Who Govern Your Fund
The trustees of your mutual fund are there to see that the fund is operated and managed in your best interests since, as a shareholder, you are a part owner of the fund. Your fund’s trustees also serve on the board of directors of The Vanguard Group, Inc., which is owned by the Vanguard funds and provides services to them on an at-cost basis.
A majority of Vanguard’s board members are independent, meaning that they have no affiliation with Vanguard or the funds they oversee, apart from the sizable personal investments they have made as private individuals. The independent board members have distinguished backgrounds in business, academia, and public service. Each of the trustees and executive officers oversees 182 Vanguard funds.
The following table provides information for each trustee and executive officer of the fund. More information about the trustees is in the Statement of Additional Information, which can be obtained, without charge, by contacting Vanguard at 800-662-7447, or online at vanguard.com.
| InterestedTrustee1 | and Delphi Automotive LLP (automotive components); |
| Senior Advisor at New Mountain Capital; Trustee of | |
| F. William McNabb III | The Conference Board. |
| Born 1957. Trustee Since July 2009. Chairman of the | |
| Board. Principal Occupation(s) During the Past Five | Amy Gutmann |
| Years: Chairman of the Board of The Vanguard Group, | Born 1949. Trustee Since June 2006. Principal |
| Inc., and of each of the investment companies served | Occupation(s) During the Past Five Years: President |
| by The Vanguard Group, since January 2010; Director | of the University of Pennsylvania; Christopher H. |
| of The Vanguard Group since 2008; Chief Executive | Browne Distinguished Professor of Political Science |
| Officer and President of The Vanguard Group and of | in the School of Arts and Sciences with secondary |
| each of the investment companies served by The | appointments at the Annenberg School for |
| Vanguard Group since 2008; Director of Vanguard | Communication and the Graduate School of Education |
| Marketing Corporation; Managing Director of The | of the University of Pennsylvania; Member of the |
| Vanguard Group (1995–2008). | National Commission on the Humanities and Social |
| Sciences; Trustee of Carnegie Corporation of New | |
| York and of the National Constitution Center; Chair | |
| IndependentTrustees | of the U.S. Presidential Commission for the Study |
| of Bioethical Issues. | |
| Emerson U. Fullwood | |
| Born 1948. Trustee Since January 2008. Principal | |
| Occupation(s) During the Past Five Years: Executive | JoAnn Heffernan Heisen |
| Chief Staff and Marketing Officer for North America | Born 1950. Trustee Since July 1998. Principal |
| and Corporate Vice President (retired 2008) of Xerox | Occupation(s) During the Past Five Years: Corporate |
| Corporation (document management products and | Vice President and Chief Global Diversity Officer |
| services); Executive in Residence and 2010 | (retired 2008) and Member of the Executive |
| Distinguished Minett Professor at the Rochester | Committee (1997–2008) of Johnson & Johnson |
| Institute of Technology; Director of SPX Corporation | (pharmaceuticals/medical devices/consumer |
| (multi-industry manufacturing), the United Way of | products); Director of Skytop Lodge Corporation |
| Rochester, Amerigroup Corporation (managed health | (hotels), the University Medical Center at Princeton, |
| care), the University of Rochester Medical Center, | the Robert Wood Johnson Foundation, and the Center |
| Monroe Community College Foundation, and North | for Talent Innovation; Member of the Advisory Board |
| Carolina A&T University. | of the Maxwell School of Citizenship and Public Affairs |
| at Syracuse University. | |
| Rajiv L. Gupta | |
| Born 1945. Trustee Since December 2001.2 | F. Joseph Loughrey |
| Principal Occupation(s) During the Past Five Years: | Born 1949. Trustee Since October 2009. Principal |
| Chairman and Chief Executive Officer (retired 2009) | Occupation(s) During the Past Five Years: President |
| and President (2006–2008) of Rohm and Haas Co. | and Chief Operating Officer (retired 2009) of Cummins |
| (chemicals); Director of Tyco International, Ltd. | Inc. (industrial machinery); Chairman of the Board of |
| (diversified manufacturing and services), Hewlett- | Hillenbrand, Inc. (specialized consumer services) and |
| Packard Co. (electronic computer manufacturing), | of Oxfam America; Director of SKF AB (industrial |
| machinery), Hyster-Yale Materials Handling, Inc. | Executive Officers | |
| (forklift trucks), and the Lumina Foundation for | ||
| Education; Member of the Advisory Council for the | Glenn Booraem | |
| College of Arts and Letters and of the Advisory Board | Born 1967. Controller Since July 2010. Principal | |
| to the Kellogg Institute for International Studies, both | Occupation(s) During the Past Five Years: Principal | |
| at the University of Notre Dame. | of The Vanguard Group, Inc.; Controller of each of | |
| the investment companies served by The Vanguard | ||
| Mark Loughridge | Group; Assistant Controller of each of the investment | |
| Born 1953. Trustee Since March 2012. Principal | companies served by The Vanguard Group (2001–2010). | |
| Occupation(s) During the Past Five Years: Senior Vice | ||
| President and Chief Financial Officer at IBM (information | Thomas J. Higgins | |
| technology services); Fiduciary Member of IBM’s | Born 1957. Chief Financial Officer Since September | |
| Retirement Plan Committee. | 2008. Principal Occupation(s) During the Past Five | |
| Years: Principal of The Vanguard Group, Inc.; Chief | ||
| Scott C. Malpass | Financial Officer of each of the investment companies | |
| Born 1962. Trustee Since March 2012. Principal | served by The Vanguard Group; Treasurer of each of | |
| Occupation(s) During the Past Five Years: Chief | the investment companies served by The Vanguard | |
| Investment Officer and Vice President at the University | Group (1998–2008). | |
| of Notre Dame; Assistant Professor of Finance at the | ||
| Mendoza College of Business at Notre Dame; Member | Kathryn J. Hyatt | |
| of the Notre Dame 403(b) Investment Committee; | Born 1955. Treasurer Since November 2008. Principal | |
| Director of TIFF Advisory Services, Inc. (investment | Occupation(s) During the Past Five Years: Principal of | |
| advisor); Member of the Investment Advisory | The Vanguard Group, Inc.; Treasurer of each of the | |
| Committees of the Financial Industry Regulatory | investment companies served by The Vanguard | |
| Authority (FINRA) and of Major League Baseball. | Group; Assistant Treasurer of each of the investment | |
| companies served by The Vanguard Group (1988–2008). | ||
| André F. Perold | ||
| Born 1952. Trustee Since December 2004. Principal | Heidi Stam | |
| Occupation(s) During the Past Five Years: George | Born 1956. Secretary Since July 2005. Principal | |
| Gund Professor of Finance and Banking at the Harvard | Occupation(s) During the Past Five Years: Managing | |
| Business School (retired 2011); Chief Investment | Director of The Vanguard Group, Inc.; General Counsel | |
| Officer and Managing Partner of HighVista Strategies | of The Vanguard Group; Secretary of The Vanguard | |
| LLC (private investment firm); Director of Rand | Group and of each of the investment companies | |
| Merchant Bank; Overseer of the Museum of Fine | served by The Vanguard Group; Director and Senior | |
| Arts Boston. | Vice President of Vanguard Marketing Corporation. | |
| Alfred M. Rankin, Jr. | ||
| Vanguard Senior ManagementTeam | ||
| Born 1941. Trustee Since January 1993. Principal | ||
| Occupation(s) During the Past Five Years: Chairman, | Mortimer J. Buckley | Chris D. McIsaac |
| President, and Chief Executive Officer of NACCO | Kathleen C. Gubanich | Michael S. Miller |
| Industries, Inc. (housewares/lignite) and of Hyster-Yale | Paul A. Heller | James M. Norris |
| Materials Handling, Inc. (forklift trucks); Director of | Martha G. King | Glenn W. Reed |
| the National Association of Manufacturers; Chairman | John T. Marcante | |
| of the Board of University Hospitals of Cleveland; | ||
| Advisory Chairman of the Board of The Cleveland | ||
| Museum of Art. | Chairman Emeritus and Senior Advisor | |
| John J. Brennan | ||
| Peter F. Volanakis | Chairman, 1996–2009 | |
| Born 1955. Trustee Since July 2009. Principal | Chief Executive Officer and President, 1996–2008 | |
| Occupation(s) During the Past Five Years: President | ||
| and Chief Operating Officer (retired 2010) of Corning | ||
| Incorporated (communications equipment); Director | Founder | |
| of SPX Corporation (multi-industry manufacturing); | John C. Bogle | |
| Overseer of the Amos Tuck School of Business | Chairman and Chief Executive Officer, 1974–1996 | |
| Administration at Dartmouth College; Advisor to the | ||
| Norris Cotton Cancer Center. | ||
1 Mr. McNabb is considered an “interested person,” as defined in the Investment Company Act of 1940, because he is an officer of the Vanguard funds.
2 December 2002 for Vanguard Equity Income Fund, Vanguard Growth Equity Fund, the Vanguard Municipal Bond Funds, and the Vanguard State Tax-Exempt Funds.
 | |
| P.O. Box 2600 | |
| Valley Forge, PA 19482-2600 |
Connect with Vanguard® > vanguard.com
| Fund Information > 800-662-7447 | |
| Direct Investor Account Services > 800-662-2739 | |
| Institutional Investor Services > 800-523-1036 | |
| Text Telephone for People | |
| With Hearing Impairment > 800-749-7273 | |
| This material may be used in conjunction | |
| with the offering of shares of any Vanguard | |
| fund only if preceded or accompanied by | |
| the fund’s current prospectus. | |
| All comparative mutual fund data are from Lipper, a | |
| Thomson Reuters Company, or Morningstar, Inc., unless | |
| otherwise noted. | |
| You can obtain a free copy of Vanguard’s proxy voting | |
| guidelines by visiting vanguard.com/proxyreporting or by | |
| calling Vanguard at 800-662-2739. The guidelines are | |
| also available from the SEC’s website, sec.gov. In | |
| addition, you may obtain a free report on how your fund | |
| voted the proxies for securities it owned during the 12 | |
| months ended June 30. To get the report, visit either | |
| vanguard.com/proxyreporting or sec.gov. | |
| You can review and copy information about your fund at | |
| the SEC’s Public Reference Room in Washington, D.C. To | |
| find out more about this public service, call the SEC at | |
| 202-551-8090. Information about your fund is also | |
| available on the SEC’s website, and you can receive | |
| copies of this information, for a fee, by sending a | |
| request in either of two ways: via e-mail addressed to | |
| publicinfo@sec.gov or via regular mail addressed to the | |
| Public Reference Section, Securities and Exchange | |
| Commission, Washington, DC 20549-1520. | |
| © 2014 The Vanguard Group, Inc. | |
| All rights reserved. | |
| Vanguard Marketing Corporation, Distributor. | |
| Q480 022014 | |
![]()
Annual Report | December 31, 2013
Vanguard U.S. Stock Index Funds Mid-Capitalization Portfolios

Vanguard’s Principles for Investing Success
We want to give you the best chance of investment success. These principles, grounded in Vanguard’s research and experience, can put you on the right path.
Goals. Create clear, appropriate investment goals.
Balance. Develop a suitable asset allocation using broadly diversified funds. Cost. Minimize cost.
Discipline. Maintain perspective and long-term discipline.
A single theme unites these principles: Focus on the things you can control.
We believe there is no wiser course for any investor.
| Contents | |
| Your Fund’s Total Returns. | 1 |
| Chairman’s Letter. | 4 |
| Extended Market Index Fund. | 11 |
| Mid-Cap Index Fund. | 33 |
| Mid-Cap Growth Index Fund. | 58 |
| Mid-Cap Value Index Fund. | 74 |
| Your Fund’s After-Tax Returns. | 92 |
| About Your Fund’s Expenses. | 94 |
| Glossary. | 97 |
Please note: The opinions expressed in this report are just that—informed opinions. They should not be considered promises or advice.
Also, please keep in mind that the information and opinions cover the period through the date on the front of this report. Of course, the risks of investing in your fund are spelled out in the prospectus.
See the Glossary for definitions of investment terms used in this report.
About the cover: The ship’s wheel represents leadership and guidance, essential qualities in navigating difficult seas.
This one is a replica based on an 18th-century British vessel. The HMS Vanguard, another ship of that era, served as the flagship for British Admiral Horatio Nelson when he defeated a French fleet at the Battle of the Nile.
| Your Fund’s Total Returns | |
| Fiscal Year Ended December 31, 2013 | |
| Total | |
| Returns | |
| Vanguard Extended Market Index Fund | |
| Investor Shares | 38.19% |
| Admiral™ Shares | 38.37 |
| Signal® Shares | 38.37 |
| Institutional Shares | 38.42 |
| Institutional Plus Shares | 38.43 |
| ETF Shares | |
| Market Price | 38.11 |
| Net Asset Value | 38.37 |
| S&P Completion Index | 38.24 |
| Mid-Cap Core Funds Average | 34.57 |
| Mid-Cap Core Funds Average: Derived from data provided by Lipper, a Thomson Reuters Company. | |
| Vanguard Mid-Cap Index Fund | |
| Investor Shares | 35.00% |
| Admiral Shares | 35.15 |
| Signal Shares | 35.15 |
| Institutional Shares | 35.17 |
| Institutional Plus Shares | 35.20 |
| ETF Shares | |
| Market Price | 35.14 |
| Net Asset Value | 35.15 |
| Spliced Mid-Cap Index | 35.21 |
| Mid-Cap Core Funds Average | 34.57 |
For a benchmark description, see the Glossary.
Mid-Cap Core Funds Average: Derived from data provided by Lipper, a Thomson Reuters Company.
Admiral Shares carry lower expenses and are available to investors who meet certain account-balance requirements. Signal Shares, Institutional Shares, and Institutional Plus Shares are available to certain institutional investors who meet specific administrative, service, and account-size criteria. The Vanguard ETF® Shares shown are traded on the NYSE Arca exchange and are available only through brokers.
The table provides ETF returns based on both the NYSE Arca market price and the net asset value for a share. U.S. Pat. Nos. 6,879,964; 7,337,138; 7,720,749; 7,925,573; 8,090,646; and 8,417,623.
1
| Your Fund’s Total Returns | |
| Fiscal Year Ended December 31, 2013 | |
| Total | |
| Returns | |
| Vanguard Mid-Cap Growth Index Fund | |
| Investor Shares | 32.02% |
| Admiral Shares | 32.22 |
| ETF Shares | |
| Market Price | 32.23 |
| Net Asset Value | 32.23 |
| Spliced Mid-Cap Growth Index | 32.07 |
| Mid-Cap Growth Funds Average | 35.31 |
| For a benchmark description, see the Glossary. | |
| Mid-Cap Growth Funds Average: Derived from data provided by Lipper, a Thomson Reuters Company. | |
| Vanguard Mid-Cap Value Index Fund | |
| Investor Shares | 37.42% |
| Admiral Shares | 37.66 |
| ETF Shares | |
| Market Price | 37.68 |
| Net Asset Value | 37.65 |
| Spliced Mid-Cap Value Index | 37.81 |
| Mid-Cap Value Funds Average | 35.83 |
For a benchmark description, see the Glossary.
Mid-Cap Value Funds Average: Derived from data provided by Lipper, a Thomson Reuters Company.
Admiral Shares carry lower expenses and are available to investors who meet certain account-balance requirements. Signal Shares, Institutional Shares, and Institutional Plus Shares are available to certain institutional investors who meet specific administrative, service, and account-size criteria. The Vanguard ETF® Shares shown are traded on the NYSE Arca exchange and are available only through brokers. The table provides ETF returns based on both the NYSE Arca market price and the net asset value for a share. U.S. Pat. Nos. 6,879,964; 7,337,138; 7,720,749; 7,925,573; 8,090,646; and 8,417,623.
For the ETF Shares, the market price is determined by the midpoint of the bid-offer spread as of the closing time of the New York Stock Exchange (generally 4 p.m., Eastern time). The net asset value is also determined as of the NYSE closing time. For more information about how the ETF Shares' market prices have compared with their net asset value, visit vanguard.com, select your ETF, and then select the Price and Performance tab. The ETF premium/discount analysis there shows the percentages of days on which the ETF Shares' market price was above or below the NAV.
2
| Your Fund’s Performance at a Glance | ||||
| December 31, 2012, Through December 31, 2013 | ||||
| Distributions Per Share | ||||
| Starting | Ending | Income | Capital | |
| Share Price | Share Price | Dividends | Gains | |
| Vanguard Extended Market Index Fund | ||||
| Investor Shares | $45.86 | $62.76 | $0.605 | $0.000 |
| Admiral Shares | 45.87 | 62.75 | 0.710 | 0.000 |
| Signal Shares | 39.41 | 53.92 | 0.604 | 0.000 |
| Institutional Shares | 45.86 | 62.75 | 0.720 | 0.000 |
| Institutional Plus Shares | 113.18 | 154.84 | 1.808 | 0.000 |
| ETF Shares | 60.46 | 82.71 | 0.940 | 0.000 |
| Vanguard Mid-Cap Index Fund | ||||
| Investor Shares | $22.47 | $30.02 | $0.309 | $0.000 |
| Admiral Shares | 101.97 | 136.19 | 1.599 | 0.000 |
| Signal Shares | 32.18 | 42.98 | 0.504 | 0.000 |
| Institutional Shares | 22.52 | 30.08 | 0.355 | 0.000 |
| Institutional Plus Shares | 111.08 | 148.37 | 1.779 | 0.000 |
| ETF Shares | 82.33 | 109.96 | 1.293 | 0.000 |
| Vanguard Mid-Cap Growth Index Fund | ||||
| Investor Shares | $26.99 | $35.46 | $0.169 | $0.000 |
| Admiral Shares | 29.55 | 38.83 | 0.238 | 0.000 |
| ETF Shares | 68.64 | 90.20 | 0.554 | 0.000 |
| Vanguard Mid-Cap Value Index Fund | ||||
| Investor Shares | $23.16 | $31.38 | $0.439 | $0.000 |
| Admiral Shares | 30.47 | 41.30 | 0.634 | 0.000 |
| ETF Shares | 58.82 | 79.73 | 1.223 | 0.000 |
3

Chairman’s Letter
Dear Shareholder,
U.S. stock markets enjoyed a mostly unbridled rise in 2013, and small- and mid-capitalization equities were the leaders of this procession. The results were impressive for the four Vanguard mid-cap stock index funds reviewed in this report.
In the fiscal year ended December 31, all four funds logged returns above 30% and—importantly—closely tracked their target indexes. All but the Mid-Cap Growth Index Fund exceeded the average returns of their peers.
If you hold any of these funds in a taxable account, you may wish to review the after-tax returns that appear later in this report.
Please note that we’re phasing out Signal Shares across the Vanguard funds in a move to streamline our share-class offerings. If you own Signal Shares, they will be converted to Admiral Shares by October 2014.
Earnings, optimism, and stimulus made it a big year for U.S. stocks
For the 12 months ended December 31, the broad U.S. stock market surged about 34%, its best calendar-year finish since 1995. Corporations posted solid earnings and investors placed a higher premium on those earnings. The Federal Reserve’s stimulative bond-buying program also supported stock markets; in fact, markets slumped a bit in the summer when questions arose about the timing of the program’s unwinding. In December, the
4
Fed ended the uncertainty by announcing that it would begin paring its bond purchases in January 2014.
International stocks, in aggregate, returned about 15%, with the developed markets of Europe and the Pacific region posting double-digit results and emerging-market stocks dipping into negative territory.
For 2014, Vanguard Chief Economist Joe Davis and his team are guarded in their outlook for global stock returns, and their forecast for the bond market remains muted. While Joe readily acknowledges that such forecasts are accompanied by uncertainty, he writes, “We believe a balanced and diversified, low-cost portfolio can remain a high-value proposition in the decade ahead.” (You can read more about our expectations for bond and stock returns in Vanguard’s Economic and Investment Outlook, available at vanguard.com/research.)
Bond returns faltered in 2013 as the Fed’s phaseout loomed
The broad U.S. taxable bond market returned –2.02%—its first negative calendar-year result since 1999 and its worst calendar-year performance since 1994. The Fed’s plans for phasing out its bond-buying program rattled investors, who sold bonds in anticipation of further price declines. Municipal bonds returned –2.55% in aggregate. The yield of the 10-year Treasury note closed at 2.97%, up from 1.76% at the close of December 2012. (Bond yields and prices move in opposite directions.)
| Market Barometer | |||
| Average Annual Total Returns | |||
| Periods Ended December 31, 2013 | |||
| One | Three | Five | |
| Year | Years | Years | |
| Stocks | |||
| Russell 1000 Index (Large-caps) | 33.11% | 16.30% | 18.59% |
| Russell 2000 Index (Small-caps) | 38.82 | 15.67 | 20.08 |
| Russell 3000 Index (Broad U.S. market) | 33.55 | 16.24 | 18.71 |
| MSCI All Country World Index ex USA (International) | 15.29 | 5.14 | 12.81 |
| Bonds | |||
| Barclays U.S. Aggregate Bond Index (Broad taxable market) | -2.02% | 3.26% | 4.44% |
| Barclays Municipal Bond Index (Broad tax-exempt market) | -2.55 | 4.83 | 5.89 |
| Citigroup Three-Month U.S. Treasury Bill Index | 0.05 | 0.06 | 0.09 |
| CPI | |||
| Consumer Price Index | 1.50% | 2.07% | 2.08% |
5
International bond markets (as measured by the Barclays Global Aggregate Index ex USD) returned –3.08%. As for money market funds and savings accounts, returns remained tiny as the Fed held short-term interest rates between 0% and 0.25%.
Smaller stocks set the pace as the U.S. market flourished
As I mentioned earlier, mid- and small-cap stocks were among the top performers as the broad U.S. market staged its best showing in 18 years. Smaller companies generate more of their revenues and profits within the United States than larger, multinational firms do. That means small-and mid-caps are at an advantage when U.S. stocks trump their international counterparts and the U.S. economy is generally growing faster than those in other parts of the world.
Although mid-cap stocks tend to be more volatile than large-caps and don’t always offer as much growth potential as small-caps, they can provide some of the advantages of each. Mid-cap companies may have more room for expansion and more ability to quickly adapt to changing markets than larger, more established companies. And compared with small-cap companies, mid-caps may have more established and experienced management, greater resources, and deeper market penetration.
| Expense Ratios | |||||||
| Your Fund Compared With Its Peer Group | |||||||
| Peer | |||||||
| Investor | Admiral | Signal | Institutional | Institutional | ETF | Group | |
| Shares | Shares | Shares | Shares | Plus Shares | Shares | Average | |
| Extended Market Index Fund | 0.28% | 0.14% | 0.14% | 0.12% | 0.10% | 0.14% | 1.23% |
| Mid-Cap Index Fund | 0.24 | 0.10 | 0.10 | 0.08 | 0.06 | 0.10 | 1.23 |
| Mid-Cap Growth Index Fund | 0.24 | 0.10 | — | — | — | 0.10 | 1.35 |
| Mid-Cap Value Index Fund | 0.24 | 0.10 | — | — | — | 0.10 | 1.31 |
The fund expense ratios shown are from the prospectus dated August 12, 2013, and represent estimated costs for the current fiscal year. For the fiscal year ended December 31, 2013, the funds’ expense ratios were: for the Extended Market Index Fund, 0.24% for Investor Shares, 0.10% for Admiral Shares, 0.10% for Signal Shares, 0.08% for Institutional Shares, 0.06% for Institutional Plus Shares, and 0.10% for ETF Shares; for the Mid-Cap Index Fund, 0.24% for Investor Shares, 0.09% for Admiral Shares, 0.09% for Signal Shares, 0.08% for Institutional Shares, 0.06% for Institutional Plus Shares, and 0.09% for ETF Shares; for the Mid-Cap Growth Index Fund, 0.24% for Investor Shares, 0.09% for Admiral Shares, and 0.09% for ETF Shares; and for the Mid-Cap Value Index Fund, 0.24% for Investor Shares, 0.09% for Admiral Shares, and 0.09% for ETF Shares. The peer-group expense ratios are derived from data provided by Lipper, a Thomson Reuters Company, and capture information through year-end 2012.
Peer groups: For the Extended Market and Mid-Cap Index Funds, Mid-Cap Core Funds; for the Mid-Cap Growth Index Fund, Mid-Cap Growth Funds; for the Mid-Cap Value Index Fund, Mid-Cap Value Funds.
6
In 2013, however, smaller was generally better. The Extended Market Index Fund, whose portfolio includes small-cap companies, returned more than 38%, the best performance of the four funds in this report. At the same time, value stocks outdid growth. The Mid-Cap Value Index Fund returned nearly 38%, the Mid-Cap Index Fund about 35%, and the Mid-Cap Growth Index Fund about 32%.
The consumer services sector supplied especially robust returns. An assortment of retailers and travel and leisure companies benefited as confident consumers spent more freely and media companies profited from an increase in advertising revenue. Consumer services stocks were a key driver of the performance of the Mid-Cap Growth Index Fund in particular.
| Total Returns | |
| Ten Years Ended December 31, 2013 | |
| Average | |
| Annual Return | |
| Extended Market Index Fund Investor Shares | 10.17% |
| Spliced Extended Market Index | 10.19 |
| Mid-Cap Core Funds Average | 8.78 |
| For a benchmark description, see the Glossary. | |
| Mid-Cap Core Funds Average: Derived from data provided by Lipper, a Thomson Reuters Company. | |
| Mid-Cap Index Fund Investor Shares | 9.97% |
| Spliced Mid-Cap Index | 10.13 |
| Mid-Cap Core Funds Average | 8.78 |
| For a benchmark description, see the Glossary. | |
| Mid-Cap Core Funds Average: Derived from data provided by Lipper, a Thomson Reuters Company. | |
| Mid-Cap Growth Index Fund Investor Shares (Returns since inception: 8/24/2006) | 8.59% |
| Spliced Mid-Cap Growth Index | 8.77 |
| Mid-Cap Growth Funds Average | 8.69 |
| For a benchmark description, see the Glossary. | |
| Mid-Cap Growth Funds Average: Derived from data provided by Lipper, a Thomson Reuters Company. | |
| Mid-Cap Value Index Fund Investor Shares (Returns since inception: 8/24/2006) | 8.38% |
| Spliced Mid-Cap Value Index | 8.58 |
| Mid-Cap Value Funds Average | 7.95 |
| For a benchmark description, see the Glossary. | |
| Mid-Cap Value Funds Average: Derived from data provided by Lipper, a Thomson Reuters Company. | |
The figures shown represent past performance, which is not a guarantee of future results. (Current performance may be lower or higher than the performance data cited. For performance data current to the most recent month-end, visit our website at vanguard.com/performance.) Note, too, that both investment returns and principal value can fluctuate widely, so an investor’s shares, when sold, could be worth more or less than their original cost.
7
Financial stocks also delivered strong results. Banks trimmed expenses and added capital, financial services firms received a boost from the improved investing climate, and insurance companies were helped by their rising
investment portfolios and a drop in claims. Financial stocks had the greatest effect on the Mid-Cap Value Index Fund, which has a heavy allocation to the sector; during the year, financials made up nearly 25% of its assets, on average.
Don’t let a trick of the calendar alter your course
When making investment decisions, it’s important to weigh past returns with caution. That’s because investment returns from any particular period are an unreliable anchor for gauging the future. They can be highly date-dependent.
For example, take the five-year average annual return for the broad U.S. stock market. That average just made a startling bounce: from 2.04% for the period ended December 31, 2012, to 18.71% for the period ended December 31, 2013. True, the market returned a hearty 33.55% in the most recent 12 months, but that’s not enough to explain such a big leap in the average. Significantly, the 12 months ended December 31, 2008—when U.S. stocks returned –37.31% during the financial crisis—has now rolled off the five-year calculation.
The important thing to remember is that historical returns are just that: historical. Basing investment decisions on such date-dependent snapshots could easily lead you to alter course—possibly in the wrong direction. Instead, Vanguard believes, you should build your asset allocation strategy on long-term risk-and-return relationships, always recognizing that no level of return is guaranteed.
Which five-year average should you count on? (Answer: None of them!)
Average annual returns for U.S. stocks over five-year periods ended December 31
| 2007 | 13.63% |
| 2008 | –1.95 |
| 2009 | 0.76 |
| 2010 | 2.74 |
| 2011 | –0.01 |
| 2012 | 2.04 |
| 2013 | 18.71 |
| Note: The U.S. stock market is represented by the Russell 3000 Index. | |
| Source: Vanguard. |
8
Industrial stocks also made major contributions. Various types of business-support companies, machinery and construction firms, and airlines thrived as corporate budgets grew and business expansion accelerated. Aerospace and defense companies also did well, despite the government’s temporary shutdown and the U.S. military’s ongoing withdrawal from Afghanistan.
Although strength was evident across every sector, one group in the materials sector had notably poor returns: companies that mine gold and other precious metals. The prices of these metals fell as global demand declined; in addition, some investors believed that the unwinding of the Fed’s bond-buying program could reduce potential inflationary pressures and thus erode gold’s value as a safe haven.
Measured over the longer term, the funds have had solid results
The four mid-cap index funds have provided commendable longer-term results, as you can see in the table on page 7. In average annual returns over the past decade, the Extended Market Index Fund has gained 10.17% a year and the Mid-Cap Index Fund 9.97% (both for Investor Shares). Since launching in 2006, the Mid-Cap Growth Index Fund has returned an average of 8.59% annually for Investor Shares and the Mid-Cap Value Index Fund 8.38%. For the two younger funds, the financial crisis and global recession of 2008–2009 weigh more heavily on the averages.
All four funds have closely tracked their indexes. This is a tribute to the expertise of the funds’ advisor, Vanguard Equity Investment Group, and its team of seasoned professionals. With its sophisticated and proven portfolio management strategies, the group has been able to produce benchmark-tracking returns over the years regardless of market conditions. The advisor is helped in this task by the funds’ low expenses, which are far below the average for their peer groups. Of the four funds, only the Mid-Cap Growth Index Fund trailed the average return of its peers in 2013.
Rebalancing your portfolio keeps your target in focus
The surge in U.S. stocks in 2013 undoubtedly brought good cheer to investors at the end of the year. But while the rally has been welcome, we simply don’t know how long it will last. History teaches that it’s wise to anticipate a pullback in stocks after an extended winning streak.
At Vanguard, no matter what the current market conditions, we encourage you to maintain a diversified portfolio with a mix of stock, bond, and money market funds consistent with your long-term goals and risk tolerance.
Following such a robust year for stocks, you may find that your asset mix has drifted from your original target. If your allocation is off-target by about 5 percentage points or more, it may be time to rebalance. Specifically, the strong results for stocks
9
and weak results for bonds in 2013 may mean directing assets from equities to fixed income.
I understand that it feels counterintuitive to move away from one asset class that’s done well recently and into another that’s underperformed. But, as a Vanguard research paper puts it, “bonds are likely to remain one of the best diversifiers of equity market risk and . . . will likely provide downside protection to balanced investors over the long term.” (You can read the paper, Risk of Loss: Should the Prospect of Rising Rates Push Investors from High-Quality Bonds?, at vanguard.com/research.)
Ultimately, rebalancing is about controlling risk by keeping your portfolio in line with your target asset allocation. The alternative is to allow market fluctuations to set your asset mix, potentially leaving you with a portfolio that’s more risky than you intended. As we’ve long counseled our clients, focusing on what you can control is one of the most prudent steps you can take as an investor.
Thank you for entrusting your assets to Vanguard.
Sincerely,

F. William McNabb III
Chairman and Chief Executive Officer
January 16, 2013
| A note on expense ratios |
| The Expense Ratios table in each shareholder report’s Chairman’s Letter displays fund expense |
| ratios from the most recent prospectus. These figures include the funds’ actual operating |
| expenses. For some funds, the figures also include “acquired fund fees and expenses,” which |
| result from the funds’ holdings in business development companies (BDCs). |
| Although the Securities and Exchange Commission requires that BDC costs be included in a |
| fund’s expense ratio, these fees are not incurred by the fund. They have no impact on a fund’s |
| total return or on its tracking error relative to an index. A footnote to the Expense Ratios table |
| reports the fund’s actual expenses for the fiscal year, a more relevant tally of the operating |
| costs incurred by shareholders. |
10
Extended Market Index Fund
Fund Profile
As of December 31, 2013
| Share-Class Characteristics | ||||||
| Investor | Admiral | Signal | Institutional | Institutional | ||
| Shares | Shares | Shares | Shares | Plus Shares | ETF Shares | |
| Ticker Symbol | VEXMX | VEXAX | VEMSX | VIEIX | VEMPX | VXF |
| Expense Ratio1 | 0.28% | 0.14% | 0.14% | 0.12% | 0.10% | 0.14% |
| 30-Day SEC Yield | 0.96% | 1.09% | 1.09% | 1.11% | 1.13% | 1.09% |
| Portfolio Characteristics | |||
| DJ | |||
| U.S. Total | |||
| S&P | Stock | ||
| Completion | Market | ||
| Fund | Index | FA Index | |
| Number of Stocks | 3,078 | 3,310 | 3,653 |
| Median Market Cap | $3.7B | $3.7B | $43.0B |
| Price/Earnings Ratio | 31.0x | 31.1x | 20.7x |
| Price/Book Ratio | 2.6x | 2.6x | 2.7x |
| Return on Equity | 10.1% | 10.1% | 16.5% |
| Earnings Growth | |||
| Rate | 13.8% | 13.9% | 11.4% |
| Dividend Yield | 1.2% | 1.2% | 1.8% |
| Foreign Holdings | 0.0% | 0.0% | 0.0% |
| Turnover Rate | 11% | — | — |
| Short-Term Reserves | 0.1% | — | — |
| Sector Diversification (% of equity exposure) | |||
| DJ | |||
| U.S. Total | |||
| S&P | Stock | ||
| Completion | Market | ||
| Fund | Index | FA Index | |
| Consumer Discretionary | 16.1% | 16.1% | 13.3% |
| Consumer Staples | 3.6 | 3.5 | 8.5 |
| Energy | 5.8 | 5.8 | 9.4 |
| Financials | 22.4 | 22.4 | 17.3 |
| Health Care | 11.1 | 11.2 | 12.6 |
| Industrials | 15.3 | 15.3 | 11.8 |
| Information Technology | 15.7 | 15.8 | 18.1 |
| Materials | 5.5 | 5.4 | 3.9 |
| Telecommunication | |||
| Services | 1.4 | 1.4 | 2.1 |
| Utilities | 3.1 | 3.1 | 3.0 |
| Volatility Measures | ||
| DJ | ||
| S&P | U.S. Total | |
| Completion | Stock Market | |
| Index | FA Index | |
| R-Squared | 1.00 | 0.95 |
| Beta | 1.00 | 1.22 |
| These measures show the degree and timing of the fund’s fluctuations compared with the indexes over 36 months. | ||
| Ten Largest Holdings (% of total net assets) | ||
| Liberty Global plc | Cable & Satellite | 0.8% |
| Las Vegas Sands Corp. | Casinos & Gaming | 0.8 |
| LinkedIn Corp. | Internet Software & | |
| Services | 0.5 | |
| Liberty Media Corp. | Broadcasting | 0.4 |
| HCA Holdings Inc. | Health Care Facilities 0.4 | |
| Illumina Inc. | Life Sciences Tools & | |
| Services | 0.3 | |
| United Continental | ||
| Holdings Inc. | Airlines | 0.3 |
| Avago Technologies Ltd. Semiconductors | 0.3 | |
| Hertz Global Holdings | ||
| Inc. | Trucking | 0.3 |
| Tesla Motors Inc. | Automobile | |
| Manufacturers | 0.3 | |
| Top Ten | 4.4% | |
| The holdings listed exclude any temporary cash investments and equity index products. | ||
1 The expense ratios shown are from the prospectus dated August 12, 2013, and represent estimated costs for the current fiscal year. For the fiscal year ended December 31, 2013, the expense ratios were 0.24% for Investor Shares, 0.10% for Admiral Shares, 0.10% for Signal Shares, 0.08% for Institutional Shares, 0.06% for Institutional Plus Shares, and 0.10% for ETF Shares.
11
Extended Market Index Fund
Investment Focus
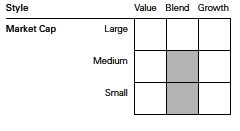
12
Extended Market Index Fund
Performance Summary
All of the returns in this report represent past performance, which is not a guarantee of future results that may be achieved by the fund. (Current performance may be lower or higher than the performance data cited. For performance data current to the most recent month-end, visit our website at vanguard.com/performance.) Note, too, that both investment returns and principal value can fluctuate widely, so an investor’s shares, when sold, could be worth more or less than their original cost. The returns shown do not reflect taxes that a shareholder would pay on fund distributions or on the sale of fund shares.
Cumulative Performance: December 31, 2003, Through December 31, 2013
Initial Investment of $10,000
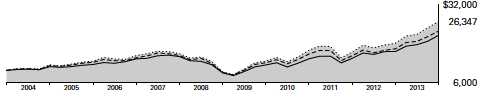
| Average Annual Total Returns | |||||
| Periods Ended December 31, 2013 | |||||
| Final Value | |||||
| One | Five | Ten | of a $10,000 | ||
| Year | Years | Years | Investment | ||
| Extended Market Index | |||||
| Fund*Investor Shares | 38.19% | 22.47% | 10.17% | $26,347 | |
| •••••••• | Spliced Extended Market Index | 38.24 | 22.57 | 10.19 | 26,395 |
| – – – – | Mid-Cap Core Funds Average | 34.57 | 20.26 | 8.78 | 23,195 |
| Dow Jones U.S. Total Stock Market | |||||
| Float Adjusted Index | 33.47 | 18.86 | 8.09 | 21,777 | |
| For a benchmark description, see the Glossary. | |||||
| Mid-Cap Core Funds Average: Derived from data provided by Lipper, a Thomson Reuters Company. | |||||
| Final Value | |||||
| One | Five | Ten | of a $10,000 | ||
| Year | Years | Years | Investment | ||
| Extended Market Index Fund Admiral Shares | 38.37% | 22.65% | 10.33% | $26,728 | |
| Spliced Extended Market Index | 38.24 | 22.57 | 10.19 | 26,395 | |
| Dow Jones U.S. Total Stock Market Float | |||||
| Adjusted Index | 33.47 | 18.86 | 8.09 | 21,777 | |
See Financial Highlights for dividend and capital gains information.
13
| Extended Market Index Fund | ||||
| Average Annual Total Returns | ||||
| Periods Ended December 31, 2013 | ||||
| Since | Final Value | |||
| One | Five | Inception | of a $10,000 | |
| Year | Years | (9/1/2006) | Investment | |
| Extended Market Index Fund Signal Shares | 38.37% | 22.64% | 9.50% | $19,451 |
| S&P Completion Index | 38.24 | 22.57 | 9.38 | 19,295 |
| Dow Jones U.S. Total Stock Market Float | ||||
| Adjusted Index | 33.47 | 18.86 | 7.63 | 17,139 |
"Since Inception" performance is calculated from the Signal Shares’ inception date for both the fund and its comparative standards.
| Final Value | ||||
| One | Five | Ten | of a $5,000,000 | |
| Year | Years | Years | Investment | |
| Extended Market Index Fund Institutional | ||||
| Shares | 38.42% | 22.68% | 10.37% | $13,412,240 |
| Spliced Extended Market Index | 38.24 | 22.57 | 10.19 | 13,197,652 |
| Dow Jones U.S. Total Stock Market Float | ||||
| Adjusted Index | 33.47 | 18.86 | 8.09 | 10,888,699 |
| Since | Final Value | |||
| One | Inception | of a $100,000,000 | ||
| Year | (1/14/2011) | Investment | ||
| Extended Market Index Fund Institutional Plus | ||||
| Shares | 38.43% | 15.53% | $153,334,198 | |
| S&P Completion Index | 38.24 | 15.38 | 144,686,588 | |
| Dow Jones U.S. Total Stock Market Float | ||||
| Adjusted Index | 33.47 | 15.31 | 152,477,649 | |
"Since Inception" performance is calculated from the Institutional Plus Shares’ inception date for both the fund and its comparative standards.
| Final Value | ||||
| One | Five | Ten | of a $10,000 | |
| Year | Years | Years | Investment | |
| Extended Market Index Fund | ||||
| ETF Shares Net Asset Value | 38.37% | 22.64% | 10.33% | $26,725 |
| Spliced Extended Market Index | 38.24 | 22.57 | 10.19 | 26,395 |
| Dow Jones U.S. Total Stock Market Float | ||||
| Adjusted Index | 33.47 | 18.86 | 8.09 | 21,777 |
14
Extended Market Index Fund
| Cumulative Returns of ETF Shares: December 31, 2003, Through December 31, 2013 | |||
| One | Five | Ten | |
| Year | Years | Years | |
| Extended Market Index Fund ETF Shares Market | |||
| Price | 38.11% | 178.14% | 166.34% |
| Extended Market Index Fund ETF Shares Net Asset | |||
| Value | 38.37 | 177.40 | 167.25 |
| Spliced Extended Market Index | 38.24 | 176.66 | 163.95 |
Fiscal-Year Total Returns (%): December 31, 2003, Through December 31, 2013
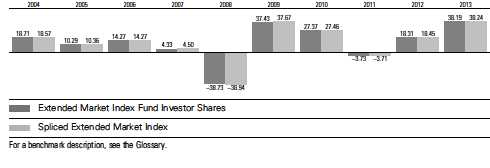
15
Extended Market Index Fund
Financial Statements
Statement of Net Assets—Investments Summary
As of December 31, 2013
This Statement summarizes the fund’s holdings by asset type. Details are reported for each of the fund’s 50 largest individual holdings and for investments that, in total for any issuer, represent more than 1% of the fund’s net assets. The total value of smaller holdings is reported as a single amount within each category.
The fund reports a complete list of its holdings in regulatory filings four times in each fiscal year, at the quarter-ends. For the second and fourth fiscal quarters, the complete listing of the fund’s holdings is available electronically on vanguard.com and on the Securities and Exchange Commission’s website (sec.gov), or you can have it mailed to you without charge by calling 800-662-7447. For the first and third fiscal quarters, the fund files the lists with the SEC on Form N-Q. Shareholders can look up the fund’s Forms N-Q on the SEC’s website. Forms N-Q may also be reviewed and copied at the SEC’s Public Reference Room (see the back cover of this report for further information).
| Market | Percentage | |||
| Value | of Net | |||
| Shares | ($000) | Assets | ||
| Common Stocks | ||||
| Consumer Discretionary | ||||
| Las Vegas Sands Corp. | 3,536,906 | 278,956 | 0.8% | |
| * | Liberty Global plc Class A | 1,808,572 | 160,945 | 0.4% |
| * | Liberty Media Corp. Class A | 918,137 | 134,461 | 0.4% |
| * | Liberty Global plc | 1,582,532 | 133,439 | 0.4% |
| *,^ | Tesla Motors Inc. | 750,159 | 112,809 | 0.3% |
| * | DISH Network Corp. Class A | 1,927,194 | 111,623 | 0.3% |
| Tractor Supply Co. | 1,280,029 | 99,305 | 0.3% | |
| * | Sirius XM Holdings Inc. | 27,454,522 | 95,816 | 0.3% |
| * | LKQ Corp. | 2,753,374 | 90,586 | 0.2% |
| Polaris Industries Inc. | 588,304 | 85,681 | 0.2% | |
| * | Charter Communications Inc. Class A | 618,599 | 84,600 | 0.2% |
| * | TRW Automotive Holdings Corp. | 1,053,428 | 78,364 | 0.2% |
| Advance Auto Parts Inc. | 668,299 | 73,967 | 0.2% | |
| Consumer Discretionary—Other † | 4,350,300 | 11.9% | ||
| 5,890,852 | 16.1% | |||
| Consumer Staples | ||||
| Bunge Ltd. | 1,350,936 | 110,925 | 0.3% | |
| *,^ | Green Mountain Coffee Roasters Inc. | 1,203,032 | 90,925 | 0.2% |
| Church & Dwight Co. Inc. | 1,271,392 | 84,268 | 0.2% | |
| Nu Skin Enterprises Inc. Class A | 543,222 | 75,084 | 0.2% | |
| Consumer Staples—Other † | 938,037 | 2.6% | ||
| 1,299,239 | 3.5% | |||
| Energy | ||||
| * | Concho Resources Inc. | 960,927 | 103,780 | 0.3% |
| HollyFrontier Corp. | 1,814,639 | 90,169 | 0.3% | |
| * | Cheniere Energy Inc. | 2,007,096 | 86,546 | 0.2% |
| Cimarex Energy Co. | 793,687 | 83,266 | 0.2% | |
| Core Laboratories NV | 414,292 | 79,109 | 0.2% | |
| Oceaneering International Inc. | 992,781 | 78,311 | 0.2% | |
| Energy—Other † | 1,595,263 | 4.4% | ||
| 2,116,444 | 5.8% | |||
16
| Extended Market Index Fund | ||||
| Market | Percentage | |||
| Value | of Net | |||
| Shares | ($000) | Assets | ||
| Financials | ||||
| * | Affiliated Managers Group Inc. | 485,007 | 105,188 | 0.3% |
| CIT Group Inc. | 1,827,958 | 95,291 | 0.3% | |
| SL Green Realty Corp. | 866,339 | 80,032 | 0.2% | |
| Fidelity National Financial Inc. Class A | 2,280,501 | 74,002 | 0.2% | |
| * | Markel Corp. | 127,444 | 73,962 | 0.2% |
| Financials—Other † | 7,756,521 | 21.2% | ||
| 8,184,996 | 22.4% | |||
| Health Care | ||||
| * | HCA Holdings Inc. | 2,793,023 | 133,255 | 0.4% |
| * | Illumina Inc. | 1,151,757 | 127,407 | 0.3% |
| * | BioMarin Pharmaceutical Inc. | 1,298,770 | 91,265 | 0.3% |
| * | Henry Schein Inc. | 784,038 | 89,584 | 0.2% |
| Health Care—Other † | 3,603,259 | 9.8% | ||
| 4,044,770 | 11.0% | |||
| Industrials | ||||
| * | United Continental Holdings Inc. | 3,304,681 | 125,016 | 0.3% |
| * | Hertz Global Holdings Inc. | 4,113,052 | 117,716 | 0.3% |
| * | Verisk Analytics Inc. Class A | 1,373,586 | 90,272 | 0.3% |
| Chicago Bridge & Iron Co. NV | 985,041 | 81,896 | 0.2% | |
| * | B/E Aerospace Inc. | 903,269 | 78,612 | 0.2% |
| Towers Watson & Co. Class A | 590,734 | 75,384 | 0.2% | |
| TransDigm Group Inc. | 453,037 | 72,948 | 0.2% | |
| Industrials—Other † | 4,961,836 | 13.6% | ||
| 5,603,680 | 15.3% | |||
| Information Technology | ||||
| * | LinkedIn Corp. Class A | 883,239 | 191,513 | 0.5% |
| Avago Technologies Ltd. Class A | 2,265,153 | 119,804 | 0.4% | |
| * | Trimble Navigation Ltd. | 2,355,370 | 81,731 | 0.2% |
| *,^ | 3D Systems Corp. | 872,919 | 81,120 | 0.2% |
| * | Equinix Inc. | 454,603 | 80,669 | 0.2% |
| * | FleetCor Technologies Inc. | 668,560 | 78,335 | 0.2% |
| * | ANSYS Inc. | 848,236 | 73,966 | 0.2% |
| Information Technology—Other † | 5,044,038 | 13.8% | ||
| 5,751,176 | 15.7% | |||
| Materials | ||||
| Celanese Corp. Class A | 1,439,873 | 79,639 | 0.2% | |
| Materials—Other † | 1,911,992 | 5.2% | ||
| 1,991,631 | 5.4% | |||
| Other † | 581 | 0.0% | ||
| Telecommunication Services | ||||
| * | SBA Communications Corp. Class A | 1,172,701 | 105,355 | 0.3% |
| * | Sprint Corp. | 7,928,766 | 85,234 | 0.2% |
| * | T-Mobile US Inc. | 2,342,156 | 78,790 | 0.2% |
| Telecommunication Services—Other † | 235,546 | 0.7% | ||
| 504,925 | 1.4% | |||
| Utilities † | 1,130,590 | 3.1% | ||
| Total Common Stocks (Cost $25,398,551) | 36,518,884 | 99.7%1 | ||
17
| Extended Market Index Fund | ||||
| Market | Percentage | |||
| Value | of Net | |||
| Coupon | Shares | ($000) | Assets | |
| Temporary Cash Investments | ||||
| Money Market Fund | ||||
| 2,3 Vanguard Market Liquidity Fund | 0.125% | 596,095,000 | 596,095 | 1.7% |
| 4U.S. Government and Agency Obligations † | 6,897 | 0.0% | ||
| Total Temporary Cash Investments (Cost $602,993) | 602,992 | 1.7%1 | ||
| Total Investments (Cost $26,001,544) | 37,121,876 | 101.4% | ||
| Other Assets and Liabilities | ||||
| Other Assets | 182,775 | 0.5% | ||
| Liabilities3 | (688,266) | (1.9%) | ||
| (505,491) | (1.4%) | |||
| Net Assets | 36,616,385 | 100.0% | ||
| At December 31, 2013, net assets consisted of: | ||||
| Amount | ||||
| ($000) | ||||
| Paid-in Capital | 25,784,775 | |||
| Overdistributed Net Investment Income | (24,091) | |||
| Accumulated Net Realized Losses | (267,394) | |||
| Unrealized Appreciation (Depreciation) | ||||
| Investment Securities | 11,120,332 | |||
| Futures Contracts | 2,763 | |||
| Net Assets | 36,616,385 | |||
| Investor Shares—Net Assets | ||||
| Applicable to 43,803,245 outstanding $.001 par value shares of | ||||
| beneficial interest (unlimited authorization) | 2,749,174 | |||
| Net Asset Value Per Share—Investor Shares | $62.76 | |||
| Admiral Shares—Net Assets | ||||
| Applicable to 141,253,738 outstanding $.001 par value shares of | ||||
| beneficial interest (unlimited authorization) | 8,863,678 | |||
| Net Asset Value Per Share—Admiral Shares | $62.75 | |||
| Signal Shares—Net Assets | ||||
| Applicable to 50,818,304 outstanding $.001 par value shares of | ||||
| beneficial interest (unlimited authorization) | 2,740,164 | |||
| Net Asset Value Per Share—Signal Shares | $53.92 | |||
| Institutional Shares—Net Assets | ||||
| Applicable to 124,506,196 outstanding $.001 par value shares of | ||||
| beneficial interest (unlimited authorization) | 7,812,151 | |||
| Net Asset Value Per Share—Institutional Shares | $62.75 | |||
18
| Extended Market Index Fund | |
| Amount | |
| ($000) | |
| Institutional Plus Shares—Net Assets | |
| Applicable to 73,278,836 outstanding $.001 par value shares of | |
| beneficial interest (unlimited authorization) | 11,346,591 |
| Net Asset Value Per Share—Institutional Plus Shares | $154.84 |
| ETF Shares—Net Assets | |
| Applicable to 37,536,737 outstanding $.001 par value shares of | |
| beneficial interest (unlimited authorization) | 3,104,627 |
| Net Asset Value Per Share—ETF Shares | $82.71 |
See Note A in Notes to Financial Statements.
* Non-income-producing security.
^ Includes partial security positions on loan to broker-dealers. The total value of securities on loan is $429,708,000.
† Represents the aggregate value, by category, of securities that are not among the 50 largest holdings and, in total for any issuer, represent % or less of net assets.
1 The fund invests a portion of its cash reserves in equity markets through the use of index futures contracts. After giving effect to futures investments, the fund’s effective common stock and temporary cash investment positions represent 100.0% and 1.4%, respectively, of net assets.
2 Affiliated money market fund available only to Vanguard funds and certain trusts and accounts managed by Vanguard. Rate shown is the 7-day yield.
3 Includes $455,531,000 of collateral received for securities on loan.
4 Securities with a value of $4,598,000 have been segregated as initial margin for open futures contracts.
See accompanying Notes, which are an integral part of the Financial Statements.
19
| Extended Market Index Fund | |
| Statement of Operations | |
| Year Ended | |
| December 31, 2013 | |
| ($000) | |
| Investment Income | |
| Income | |
| Dividends | 405,734 |
| Interest1 | 196 |
| Securities Lending | 28,291 |
| Total Income | 434,221 |
| Expenses | |
| The Vanguard Group—Note B | |
| Investment Advisory Services | 1,520 |
| Management and Administrative—Investor Shares | 6,299 |
| Management and Administrative—Admiral Shares | 5,832 |
| Management and Administrative—Signal Shares | 1,814 |
| Management and Administrative—Institutional Shares | 3,118 |
| Management and Administrative—Institutional Plus Shares | 2,361 |
| Management and Administrative—ETF Shares | 1,625 |
| Marketing and Distribution—Investor Shares | 654 |
| Marketing and Distribution—Admiral Shares | 983 |
| Marketing and Distribution—Signal Shares | 684 |
| Marketing and Distribution—Institutional Shares | 1,641 |
| Marketing and Distribution—Institutional Plus Shares | 1,825 |
| Marketing and Distribution—ETF Shares | 518 |
| Custodian Fees | 654 |
| Auditing Fees | 37 |
| Shareholders’ Reports—Investor Shares | 74 |
| Shareholders’ Reports—Admiral Shares | 59 |
| Shareholders’ Reports—Signal Shares | 34 |
| Shareholders’ Reports—Institutional Shares | 66 |
| Shareholders’ Reports—Institutional Plus Shares | 151 |
| Shareholders’ Reports—ETF Shares | 76 |
| Trustees’ Fees and Expenses | 36 |
| Total Expenses | 30,061 |
| Net Investment Income | 404,160 |
| Realized Net Gain (Loss) | |
| Investment Securities Sold | 963,193 |
| Futures Contracts | 32,040 |
| Realized Net Gain (Loss) | 995,233 |
| Change in Unrealized Appreciation (Depreciation) | |
| Investment Securities | 8,305,029 |
| Futures Contracts | 2,800 |
| Change in Unrealized Appreciation (Depreciation) | 8,307,829 |
| Net Increase (Decrease) in Net Assets Resulting from Operations | 9,707,222 |
| 1 Interest income from an affiliated company of the fund was $186,000. | |
| See accompanying Notes, which are an integral part of the Financial Statements. | |
20
| Extended Market Index Fund | ||
| Statement of Changes in Net Assets | ||
| Year Ended December 31, | ||
| 2013 | 2012 | |
| ($000) | ($000) | |
| Increase (Decrease) in Net Assets | ||
| Operations | ||
| Net Investment Income | 404,160 | 378,931 |
| Realized Net Gain (Loss) | 995,233 | 1,006,949 |
| Change in Unrealized Appreciation (Depreciation) | 8,307,829 | 2,133,156 |
| Net Increase (Decrease) in Net Assets Resulting from Operations | 9,707,222 | 3,519,036 |
| Distributions | ||
| Net Investment Income | ||
| Investor Shares | (27,116) | (42,238) |
| Admiral Shares | (98,912) | (96,338) |
| Signal Shares | (30,756) | (36,221) |
| Institutional Shares | (88,223) | (89,944) |
| Institutional Plus Shares | (129,861) | (89,978) |
| ETF Shares | (34,500) | (23,617) |
| Realized Capital Gain | ||
| Investor Shares | — | — |
| Admiral Shares | — | — |
| Signal Shares | — | — |
| Institutional Shares | — | — |
| Institutional Plus Shares | — | — |
| ETF Shares | — | — |
| Total Distributions | (409,368) | (378,336) |
| Capital Share Transactions | ||
| Investor Shares | (1,059,749) | (334,651) |
| Admiral Shares | 615,695 | 122,276 |
| Signal Shares | (321,297) | 130,865 |
| Institutional Shares | 257,765 | (1,240,690) |
| Institutional Plus Shares | 3,404,789 | 3,716,303 |
| ETF Shares | 902,373 | 132,781 |
| Net Increase (Decrease) from Capital Share Transactions | 3,799,576 | 2,526,884 |
| Total Increase (Decrease) | 13,097,430 | 5,667,584 |
| Net Assets | ||
| Beginning of Period | 23,518,955 | 17,851,371 |
| End of Period1 | 36,616,385 | 23,518,955 |
1 Net Assets—End of Period includes undistributed (overdistributed) net investment income of ($24,091,000) and ($20,146,000).
See accompanying Notes, which are an integral part of the Financial Statements.
21
| Extended Market Index Fund | |||||
| Financial Highlights | |||||
| Investor Shares | |||||
| For a Share Outstanding | Year Ended December 31, | ||||
| Throughout Each Period | 2013 | 2012 | 2011 | 2010 | 2009 |
| Net Asset Value, Beginning of Period | $45.86 | $39.34 | $41.26 | $32.67 | $24.01 |
| Investment Operations | |||||
| Net Investment Income | . 602 | . 688 | .385 | .360 | .316 |
| Net Realized and Unrealized Gain (Loss) | |||||
| on Investments | 16.903 | 6.515 | (1.923) | 8.581 | 8.670 |
| Total from Investment Operations | 17.505 | 7.203 | (1.538) | 8.941 | 8.986 |
| Distributions | |||||
| Dividends from Net Investment Income | (.605) | (.683) | (. 382) | (. 351) | (. 326) |
| Distributions from Realized Capital Gains | — | — | — | — | — |
| Total Distributions | (.605) | (.683) | (. 382) | (. 351) | (. 326) |
| Net Asset Value, End of Period | $62.76 | $45.86 | $39.34 | $41.26 | $32.67 |
| Total Return1 | 38.19% | 18.31% | -3.73% | 27.37% | 37.43% |
| Ratios/Supplemental Data | |||||
| Net Assets, End of Period (Millions) | $2,749 | $2,857 | $2,753 | $3,405 | $4,309 |
| Ratio of Total Expenses to | |||||
| Average Net Assets | 0.24% | 0.24% | 0.24% | 0.26% | 0.30% |
| Ratio of Net Investment Income to | |||||
| Average Net Assets | 1.19% | 1.62% | 0.93% | 1.07% | 1.16% |
| Portfolio Turnover Rate2 | 11% | 12% | 14% | 10% | 17% |
1 Total returns do not include account service fees that may have applied in the periods shown. Fund prospectuses provide information about any applicable account service fees.
2 Excludes the value of portfolio securities received or delivered as a result of in-kind purchases or redemptions of the fund’s capital shares, including ETF Creation Units.
See accompanying Notes, which are an integral part of the Financial Statements.
22
| Extended Market Index Fund | |||||
| Financial Highlights | |||||
| Admiral Shares | |||||
| For a Share Outstanding | Year Ended December 31, | ||||
| Throughout Each Period | 2013 | 2012 | 2011 | 2010 | 2009 |
| Net Asset Value, Beginning of Period | $45.87 | $39.35 | $41.28 | $32.67 | $24.01 |
| Investment Operations | |||||
| Net Investment Income | .706 | .758 | .450 | .399 | .362 |
| Net Realized and Unrealized Gain (Loss) | |||||
| on Investments | 16.884 | 6.513 | (1.932) | 8.606 | 8.673 |
| Total from Investment Operations | 17.590 | 7.271 | (1.482) | 9.005 | 9.035 |
| Distributions | |||||
| Dividends from Net Investment Income | (.710) | (.751) | (.448) | (. 395) | (. 375) |
| Distributions from Realized Capital Gains | — | — | — | — | — |
| Total Distributions | (.710) | (.751) | (.448) | (. 395) | (. 375) |
| Net Asset Value, End of Period | $62.75 | $45.87 | $39.35 | $41.28 | $32.67 |
| Total Return1 | 38.37% | 18.48% | -3.59% | 27.57% | 37.65% |
| Ratios/Supplemental Data | |||||
| Net Assets, End of Period (Millions) | $8,864 | $5,970 | $5,018 | $5,161 | $2,300 |
| Ratio of Total Expenses to | |||||
| Average Net Assets | 0.10% | 0.10% | 0.10% | 0.12% | 0.13% |
| Ratio of Net Investment Income to | |||||
| Average Net Assets | 1.33% | 1.76% | 1.07% | 1.21% | 1.33% |
| Portfolio Turnover Rate2 | 11% | 12% | 14% | 10% | 17% |
1 Total returns do not include account service fees that may have applied in the periods shown. Fund prospectuses provide information about any applicable account service fees.
2 Excludes the value of portfolio securities received or delivered as a result of in-kind purchases or redemptions of the fund’s capital shares, including ETF Creation Units.
See accompanying Notes, which are an integral part of the Financial Statements.
23
| Extended Market Index Fund | |||||
| Financial Highlights | |||||
| Signal Shares | |||||
| For a Share Outstanding | Year Ended December 31, | ||||
| Throughout Each Period | 2013 | 2012 | 2011 | 2010 | 2009 |
| Net Asset Value, Beginning of Period | $39.41 | $33.81 | $35.46 | $28.08 | $20.64 |
| Investment Operations | |||||
| Net Investment Income | . 601 | . 650 | . 384 | .355 | .310 |
| Net Realized and Unrealized Gain (Loss) | |||||
| on Investments | 14.513 | 5.595 | (1.652) | 7.376 | 7.451 |
| Total from Investment Operations | 15.114 | 6.245 | (1.268) | 7.731 | 7.761 |
| Distributions | |||||
| Dividends from Net Investment Income | (.604) | (.645) | (. 382) | (. 351) | (. 321) |
| Distributions from Realized Capital Gains | — | — | — | — | — |
| Total Distributions | (.604) | (.645) | (. 382) | (. 351) | (. 321) |
| Net Asset Value, End of Period | $53.92 | $39.41 | $33.81 | $35.46 | $28.08 |
| Total Return | 38.37% | 18.48% | -3.58% | 27.53% | 37.62% |
| Ratios/Supplemental Data | |||||
| Net Assets, End of Period (Millions) | $2,740 | $2,242 | $1,814 | $2,094 | $1,661 |
| Ratio of Total Expenses to | |||||
| Average Net Assets | 0.10% | 0.10% | 0.10% | 0.12% | 0.13% |
| Ratio of Net Investment Income to | |||||
| Average Net Assets | 1.33% | 1.76% | 1.07% | 1.21% | 1.33% |
| Portfolio Turnover Rate1 | 11% | 12% | 14% | 10% | 17% |
1 Excludes the value of portfolio securities received or delivered as a result of in-kind purchases or redemptions of the fund’s capital shares, including ETF Creation Units.
See accompanying Notes, which are an integral part of the Financial Statements.
24
| Extended Market Index Fund | |||||
| Financial Highlights | |||||
| Institutional Shares | |||||
| For a Share Outstanding | Year Ended December 31, | ||||
| Throughout Each Period | 2013 | 2012 | 2011 | 2010 | 2009 |
| Net Asset Value, Beginning of Period | $45.86 | $39.34 | $41.27 | $32.68 | $24.02 |
| Investment Operations | |||||
| Net Investment Income | .715 | .764 | .460 | .429 | . 374 |
| Net Realized and Unrealized Gain (Loss) | |||||
| on Investments | 16.895 | 6.514 | (1.933) | 8.586 | 8.674 |
| Total from Investment Operations | 17.610 | 7.278 | (1.473) | 9.015 | 9.048 |
| Distributions | |||||
| Dividends from Net Investment Income | (.720) | (.758) | (.457) | (.425) | (.388) |
| Distributions from Realized Capital Gains | — | — | — | — | — |
| Total Distributions | (.720) | (.758) | (.457) | (.425) | (.388) |
| Net Asset Value, End of Period | $62.75 | $45.86 | $39.34 | $41.27 | $32.68 |
| Total Return | 38.42% | 18.50% | -3.57% | 27.59% | 37.69% |
| Ratios/Supplemental Data | |||||
| Net Assets, End of Period (Millions) | $7,812 | $5,496 | $5,810 | $5,648 | $3,494 |
| Ratio of Total Expenses to | |||||
| Average Net Assets | 0.08% | 0.08% | 0.08% | 0.08% | 0.08% |
| Ratio of Net Investment Income to | |||||
| Average Net Assets | 1.35% | 1.78% | 1.09% | 1.25% | 1.38% |
| Portfolio Turnover Rate1 | 11% | 12% | 14% | 10% | 17% |
1 Excludes the value of portfolio securities received or delivered as a result of in-kind purchases or redemptions of the fund’s capital shares, including ETF Creation Units.
See accompanying Notes, which are an integral part of the Financial Statements.
25
| Extended Market Index Fund | |||
| Financial Highlights | |||
| Institutional Plus Shares | |||
| Jan. 14, | |||
| Year Ended | 20111 to | ||
| December 31, | Dec. 31, | ||
| For a Share Outstanding Throughout Each Period | 2013 | 2012 | 2011 |
| Net Asset Value, Beginning of Period | $113.18 | $97.10 | $105.13 |
| Investment Operations | |||
| Net Investment Income | 1.797 | 1.917 | 1.139 |
| Net Realized and Unrealized Gain (Loss) on Investments | 41.671 | 16.064 | (8.015) |
| Total from Investment Operations | 43.468 | 17.981 | (6.876) |
| Distributions | |||
| Dividends from Net Investment Income | (1.808) | (1.901) | (1.154) |
| Distributions from Realized Capital Gains | — | — | — |
| Total Distributions | (1.808) | (1.901) | (1.154) |
| Net Asset Value, End of Period | $154.84 | $113.18 | $97.10 |
| Total Return | 38.43% | 18.52% | -6.54% |
| Ratios/Supplemental Data | |||
| Net Assets, End of Period (Millions) | $11,347 | $5,477 | $1,307 |
| Ratio of Total Expenses to Average Net Assets | 0.06% | 0.06% | 0.06%2 |
| Ratio of Net Investment Income to Average Net Assets | 1.37% | 1.80% | 1.11%2 |
| Portfolio Turnover Rate 3 | 11% | 12% | 14% |
| 1 | Inception. |
| 2 | Annualized. |
| 3 | Excludes the value of portfolio securities received or delivered as a result of in-kind purchases or redemptions of the fund’s capital shares, including ETF Creation Units. |
See accompanying Notes, which are an integral part of the Financial Statements.
26
| Extended Market Index Fund | |||||
| Financial Highlights | |||||
| ETF Shares | |||||
| For a Share Outstanding | Year Ended December 31, | ||||
| Throughout Each Period | 2013 | 2012 | 2011 | 2010 | 2009 |
| Net Asset Value, Beginning of Period | $60.46 | $51.87 | $54.42 | $43.09 | $31.67 |
| Investment Operations | |||||
| Net Investment Income | . 934 | 1.000 | .593 | .547 | .476 |
| Net Realized and Unrealized Gain (Loss) | |||||
| on Investments | 22.256 | 8.582 | (2.553) | 11.324 | 11.438 |
| Total from Investment Operations | 23.190 | 9.582 | (1.960) | 11.871 | 11.914 |
| Distributions | |||||
| Dividends from Net Investment Income | (.940) | (. 992) | (. 590) | (. 541) | (.494) |
| Distributions from Realized Capital Gains | — | — | — | — | — |
| Total Distributions | (.940) | (. 992) | (. 590) | (. 541) | (.494) |
| Net Asset Value, End of Period | $82.71 | $60.46 | $51.87 | $54.42 | $43.09 |
| Total Return | 38.37% | 18.48% | -3.61% | 27.55% | 37.63% |
| Ratios/Supplemental Data | |||||
| Net Assets, End of Period (Millions) | $3,105 | $1,477 | $1,148 | $1,113 | $781 |
| Ratio of Total Expenses to | |||||
| Average Net Assets | 0.10% | 0.10% | 0.10% | 0.12% | 0.13% |
| Ratio of Net Investment Income to | |||||
| Average Net Assets | 1.33% | 1.76% | 1.07% | 1.21% | 1.33% |
| Portfolio Turnover Rate1 | 11% | 12% | 14% | 10% | 17% |
1 Excludes the value of portfolio securities received or delivered as a result of in-kind purchases or redemptions of the fund’s capital shares, including ETF Creation Units.
See accompanying Notes, which are an integral part of the Financial Statements.
27
Extended Market Index Fund
Notes to Financial Statements
Vanguard Extended Market Index Fund is registered under the Investment Company Act of 1940 as an open-end investment company, or mutual fund. The fund offers six classes of shares: Investor Shares, Admiral Shares, Signal Shares, Institutional Shares, Institutional Plus Shares, and ETF Shares. Investor Shares are available to any investor who meets the fund’s minimum purchase requirements. Admiral Shares, Signal Shares, Institutional Shares, and Institutional Plus Shares are designed for investors who meet certain administrative, service, and account-size criteria. ETF Shares are listed for trading on NYSE Arca; they can be purchased and sold through a broker.
A. The following significant accounting policies conform to generally accepted accounting principles for U.S. mutual funds. The fund consistently follows such policies in preparing its financial statements.
1. Security Valuation: Securities are valued as of the close of trading on the New York Stock Exchange (generally 4 p.m., Eastern time) on the valuation date. Equity securities are valued at the latest quoted sales prices or official closing prices taken from the primary market in which each security trades; such securities not traded on the valuation date are valued at the mean of the latest quoted bid and asked prices. Securities for which market quotations are not readily available, or whose values have been materially affected by events occurring before the fund’s pricing time but after the close of the securities’ primary markets, are valued by methods deemed by the board of trustees to represent fair value. Investments in Vanguard Market Liquidity Fund are valued at that fund’s net asset value. Temporary cash investments acquired over 60 days to maturity are valued using the latest bid prices or using valuations based on a matrix system (which considers such factors as security prices, yields, maturities, and ratings), both as furnished by independent pricing services. Other temporary cash investments are valued at amortized cost, which approximates market value.
2. Futures Contracts: The fund may use index futures contracts to a limited extent, with the objectives of maintaining full exposure to the stock market, enhancing returns, maintaining liquidity, and minimizing transaction costs. The fund may purchase futures contracts to immediately invest incoming cash in the market, or sell futures in response to cash outflows, thereby simulating a fully invested position in the underlying index while maintaining a cash balance for liquidity. The fund may seek to enhance returns by using futures contracts instead of the underlying securities when futures are believed to be priced more attractively than the underlying securities. The primary risks associated with the use of futures contracts are imperfect correlation between changes in market values of stocks held by the fund and the prices of futures contracts, and the possibility of an illiquid market. Counterparty risk involving futures is mitigated because a regulated clearinghouse is the counterparty instead of the clearing broker. To further mitigate counterparty risk, the fund trades futures contracts on an exchange, monitors the financial strength of its clearing brokers and clearinghouse, and has entered into clearing agreements with its clearing brokers. The clearinghouse imposes initial margin requirements to secure the fund’s performance and requires daily settlement of variation margin representing changes in the market value of each contract.
Futures contracts are valued at their quoted daily settlement prices. The aggregate notional amounts of the contracts are not recorded in the Statement of Net Assets. Fluctuations in the value of the contracts are recorded in the Statement of Net Assets as an asset (liability) and in the Statement of Operations as unrealized appreciation (depreciation) until the contracts are closed, when they are recorded as realized futures gains (losses).
28
Extended Market Index Fund
During the year ended December 31, 2013, the fund’s average investments in long and short futures contracts represented less than 1% and 0% of net assets, respectively, based on quarterly average aggregate settlement values.
3. Federal Income Taxes: The fund intends to continue to qualify as a regulated investment company and distribute all of its taxable income. Management has analyzed the fund’s tax positions taken for all open federal income tax years (December 31, 2010–2013), and has concluded that no provision for federal income tax is required in the fund’s financial statements.
4. Distributions: Distributions to shareholders are recorded on the ex-dividend date.
5. Securities Lending: To earn additional income, the fund may lend its securities to qualified institutional borrowers. Security loans are required to be secured at all times by collateral in an amount at least equal to the market value of securities loaned. Daily market fluctuations could cause the value of loaned securities to be more or less than the value of the collateral received. When this occurs, the collateral is adjusted and settled on the next business day. The fund further mitigates its counterparty risk by entering into securities lending transactions only with a diverse group of prequalified counterparties, monitoring their financial strength, and entering into master securities lending agreements with its counterparties. The master securities lending agreements provide that, in the event of a counterparty’s default (including bankruptcy), the fund may terminate any loans with that borrower, determine the net amount owed, and sell or retain the collateral up to the net amount owed to the fund; however, such actions may be subject to legal proceedings. While collateral mitigates counterparty risk, in the absence of a default the fund may experience delays and costs in recovering the securities loaned. The fund invests cash collateral received in Vanguard Market Liquidity Fund, and records a liability for the return of the collateral, during the period the securities are on loan. Securities lending income represents fees charged to borrowers plus income earned on invested cash collateral, less expenses associated with the loan.
6. Other: Dividend income is recorded on the ex-dividend date. Interest income includes income distributions received from Vanguard Market Liquidity Fund and is accrued daily. Premiums and discounts on debt securities purchased are amortized and accreted, respectively, to interest income over the lives of the respective securities. Security transactions are accounted for on the date securities are bought or sold. Costs used to determine realized gains (losses) on the sale of investment securities are those of the specific securities sold.
Each class of shares has equal rights as to assets and earnings, except that each class separately bears certain class-specific expenses related to maintenance of shareholder accounts (included in Management and Administrative expenses) and shareholder reporting. Marketing and distribution expenses are allocated to each class of shares based on a method approved by the board of trustees. Income, other non-class-specific expenses, and gains and losses on investments are allocated to each class of shares based on its relative net assets.
B. The Vanguard Group furnishes at cost investment advisory, corporate management, administrative, marketing, and distribution services. The costs of such services are allocated to the fund under methods approved by the board of trustees. The fund has committed to provide up to 0.40% of its net assets in capital contributions to Vanguard. At December 31, 2013, the fund had contributed
29
Extended Market Index Fund
capital of $3,985,000 to Vanguard (included in Other Assets), representing 0.01% of the fund’s net assets and 1.59% of Vanguard’s capitalization. The fund’s trustees and officers are also directors and officers of Vanguard.
C. Various inputs may be used to determine the value of the fund’s investments. These inputs are summarized in three broad levels for financial statement purposes. The inputs or methodologies used to value securities are not necessarily an indication of the risk associated with investing in those securities.
Level 1—Quoted prices in active markets for identical securities.
Level 2—Other significant observable inputs (including quoted prices for similar securities, interest rates, prepayment speeds, credit risk, etc.).
Level 3—Significant unobservable inputs (including the fund’s own assumptions used to determine the fair value of investments).
The following table summarizes the market value of the fund’s investments as of December 31, 2013, based on the inputs used to value them:
| Level 1 | Level 2 | Level 3 | |
| Investments | ($000) | ($000) | ($000) |
| Common Stocks | 36,518,304 | 207 | 373 |
| Temporary Cash Investments | 596,095 | 6,897 | — |
| Futures Contracts—Assets1 | 396 | — | — |
| Futures Contracts—Liabilities1 | (8) | — | — |
| Total | 37,114,787 | 7,104 | 373 |
| 1 Represents variation margin on the last day of the reporting period. |
D. At December 31, 2013, the aggregate settlement value of open futures contracts and the related unrealized appreciation (depreciation) were:
| ($000) | ||||
| Aggregate | ||||
| Number of | Settlement | Unrealized | ||
| Long (Short) | Value | Appreciation | ||
| Futures Contracts | Expiration | Contracts | Long (Short) | (Depreciation) |
| E-mini Russell 2000 Index | March 2014 | 565 | 65,619 | 1,891 |
| E-mini S&P MidCap 400 Index | March 2014 | 289 | 38,709 | 872 |
| 2,763 |
Unrealized appreciation (depreciation) on open futures contracts is required to be treated as realized gain (loss) for tax purposes.
E. Distributions are determined on a tax basis and may differ from net investment income and realized capital gains for financial reporting purposes. Differences may be permanent or temporary. Permanent differences are reclassified among capital accounts in the financial statements to reflect
30
Extended Market Index Fund
their tax character. Temporary differences arise when certain items of income, expense, gain, or loss are recognized in different periods for financial statement and tax purposes. These differences will reverse at some time in the future. Differences in classification may also result from the treatment of short-term gains as ordinary income for tax purposes.
Certain of the fund’s investments are in securities considered to be passive foreign investment companies, for which any unrealized appreciation and/or realized gains are required to be included in distributable net income for tax purposes. During the year ended December 31, 2013, the fund realized gains on the sale of passive foreign investment companies of $1,263,000, which have been included in current and prior periods’ taxable income; accordingly, such gains have been reclassified from accumulated net realized losses to overdistributed net investment income. Passive foreign investment companies held at December 31, 2013, had unrealized appreciation of $6,656,000.
During the year ended December 31, 2013, the fund realized $1,082,781,000 of net capital gains resulting from in-kind redemptions—in which shareholders exchanged fund shares for securities held by the fund rather than for cash. Because such gains are not taxable to the fund, and are not distributed to shareholders, they have been reclassified from accumulated net realized losses to paid-in capital.
For tax purposes, at December 31, 2013, the fund had $8,014,000 of ordinary income available for distribution. The fund used capital loss carryforwards of $85,322,000 to offset taxable capital gains realized during the year ended December 31, 2013. At December 31, 2013, the fund had available capital losses totaling $258,366,000 to offset future net capital gains. Of this amount, $74,162,000 is subject to expiration dates; $49,578,000 may be used to offset future net capital gains through December 31, 2017, and $24,584,000 through December 31, 2018. Capital losses of $184,204,000 realized beginning in fiscal 2011 may be carried forward indefinitely under the Regulated Investment Company Modernization Act of 2010, but must be used before any expiring loss carryforwards.
At December 31, 2013, the cost of investment securities for tax purposes was $26,013,276,000. Net unrealized appreciation of investment securities for tax purposes was $11,108,600,000, consisting of unrealized gains of $12,357,486,000 on securities that had risen in value since their purchase and $1,248,886,000 in unrealized losses on securities that had fallen in value since their purchase.
F. During the year ended December 31, 2013, the fund purchased $9,869,793,000 of investment securities and sold $6,014,870,000 of investment securities, other than temporary cash investments. Purchases and sales include $3,730,082,000 and $2,727,525,000, respectively, in connection with in-kind purchases and redemptions of the fund’s capital shares.
31
Extended Market Index Fund
G. Capital share transactions for each class of shares were:
| Year Ended December 31, | ||||
| 2013 | 2012 | |||
| Amount | Shares | Amount | Shares | |
| ($000) | (000) | ($000) | (000) | |
| Investor Shares | ||||
| Issued | 549,282 | 10,154 | 452,943 | 10,437 |
| Issued in Lieu of Cash Distributions | 26,565 | 431 | 41,611 | 909 |
| Redeemed | (1,635,596) | (29,081) | (829,205) | (19,032) |
| Net Increase (Decrease)—Investor Shares | (1,059,749) | (18,496) | (334,651) | (7,686) |
| Admiral Shares | ||||
| Issued | 1,261,504 | 23,061 | 688,463 | 15,624 |
| Issued in Lieu of Cash Distributions | 88,388 | 1,430 | 86,360 | 1,886 |
| Redeemed | (734,197) | (13,381) | (652,547) | (14,894) |
| Net Increase (Decrease)—Admiral Shares | 615,695 | 11,110 | 122,276 | 2,616 |
| Signal Shares | ||||
| Issued | 1,254,647 | 26,848 | 671,550 | 17,843 |
| Issued in Lieu of Cash Distributions | 27,016 | 509 | 33,949 | 863 |
| Redeemed | (1,602,960) | (33,432) | (574,634) | (15,475) |
| Net Increase (Decrease)—Signal Shares | (321,297) | (6,075) | 130,865 | 3,231 |
| Institutional Shares | ||||
| Issued | 2,647,825 | 48,729 | 1,636,658 | 38,018 |
| Issued in Lieu of Cash Distributions | 83,456 | 1,350 | 85,133 | 1,860 |
| Redeemed | (2,473,516) | (45,401) | (2,962,481) | (67,733) |
| Net Increase (Decrease) —Institutional Shares | 257,765 | 4,678 | (1,240,690) | (27,855) |
| Institutional Plus Shares | ||||
| Issued | 4,181,041 | 30,708 | 4,237,341 | 39,783 |
| Issued in Lieu of Cash Distributions | 128,172 | 839 | 88,482 | 783 |
| Redeemed | (904,424) | (6,656) | (609,520) | (5,635) |
| Net Increase (Decrease) —Institutional Plus Shares | 3,404,789 | 24,891 | 3,716,303 | 34,931 |
| ETF Shares | ||||
| Issued | 3,748,528 | 50,303 | 1,290,123 | 22,299 |
| Issued in Lieu of Cash Distributions | — | — | — | — |
| Redeemed | (2,846,155) | (37,200) | (1,157,342) | (20,000) |
| Net Increase (Decrease)—ETF Shares | 902,373 | 13,103 | 132,781 | 2,299 |
H. Management has determined that no material events or transactions occurred subsequent to December 31, 2013, that would require recognition or disclosure in these financial statements.
32
| Mid-Cap Index Fund | ||||||
| Fund Profile | ||||||
| As of December 31, 2013 | ||||||
| Share-Class Characteristics | ||||||
| Investor | Admiral | Signal | Institutional | Institutional | ||
| Shares | Shares | Shares | Shares | Plus Shares | ETF Shares | |
| Ticker Symbol | VIMSX | VIMAX | VMISX | VMCIX | VMCPX | VO |
| Expense Ratio1 | 0.24% | 0.10% | 0.10% | 0.08% | 0.06% | 0.10% |
| 30-Day SEC Yield | 1.11% | 1.25% | 1.25% | 1.26% | 1.28% | 1.25% |
| Portfolio Characteristics | |||
| DJ | |||
| U.S. Total | |||
| CRSP US | Stock | ||
| Mid Cap | Market | ||
| Fund | Index | FA Index | |
| Number of Stocks | 371 | 370 | 3,653 |
| Median Market Cap | $10.0B | $10.0B | $43.0B |
| Price/Earnings Ratio | 24.7x | 24.6x | 20.7x |
| Price/Book Ratio | 2.7x | 2.7x | 2.7x |
| Return on Equity | 14.1% | 14.1% | 16.5% |
| Earnings Growth | |||
| Rate | 11.9% | 11.9% | 11.4% |
| Dividend Yield | 1.3% | 1.3% | 1.8% |
| Foreign Holdings | 0.0% | 0.0% | 0.0% |
| Turnover Rate | 32% | — | — |
| Short-Term Reserves | 0.3% | — | — |
Sector Diversification (% of equity exposure)
| DJ | |||
| U.S. Total | |||
| CRSP US | Stock | ||
| Mid Cap | Market | ||
| Fund | Index | FA Index | |
| Basic Materials | 4.4% | 4.5% | 3.1% |
| Consumer Goods | 13.7 | 13.6 | 10.2 |
| Consumer Services | 15.4 | 15.4 | 13.7 |
| Financials | 16.9 | 17.0 | 18.4 |
| Health Care | 8.7 | 8.7 | 11.8 |
| Industrials | 16.9 | 16.9 | 13.5 |
| Oil & Gas | 6.8 | 6.7 | 9.3 |
| Technology | 11.4 | 11.4 | 14.9 |
| Telecommunications | 0.7 | 0.7 | 2.1 |
| Utilities | 5.1 | 5.1 | 3.0 |
| Volatility Measures | ||
| DJ | ||
| Spliced | U.S. Total | |
| Mid-Cap | Stock Market | |
| Index | FA Index | |
| R-Squared | 1.00 | 0.96 |
| Beta | 1.00 | 1.12 |
These measures show the degree and timing of the fund’s fluctuations compared with the indexes over 36 months.
Ten Largest Holdings (% of total net assets)
| Discovery | Broadcasting & | |
| Communications Inc. | Entertainment | 0.7% |
| Macy's Inc. | Broadline Retailers | 0.7 |
| Western Digital Corp. | Computer Hardware | 0.6 |
| Delphi Automotive plc | Auto Parts | 0.6 |
| Seagate Technology plc | Computer Hardware | 0.6 |
| Vertex Pharmaceuticals | ||
| Inc. | Biotechnology | 0.6 |
| Cerner Corp. | Software | 0.6 |
| Moody's Corp. | Specialty Finance | 0.6 |
| Mylan Inc. | Pharmaceuticals | 0.6 |
| Chipotle Mexican Grill | ||
| Inc. | Restaurants & Bars | 0.6 |
| Top Ten | 6.2% |
The holdings listed exclude any temporary cash investments and equity index products.
1 The expense ratios shown are from the prospectus dated August 12, 2013, and represent estimated costs for the current fiscal year. For the fiscal year ended December 31, 2013, the expense ratios were 0.24% for Investor Shares, 0.09% for Admiral Shares, 0.09% for Signal Shares, 0.08% for Institutional Shares, 0.06% for Institutional Plus Shares, and 0.09% for ETF Shares.
33
Mid-Cap Index Fund
Investment Focus
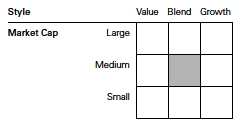
34
Mid-Cap Index Fund
Performance Summary
All of the returns in this report represent past performance, which is not a guarantee of future results that may be achieved by the fund. (Current performance may be lower or higher than the performance data cited. For performance data current to the most recent month-end, visit our website at vanguard.com/performance.) Note, too, that both investment returns and principal value can fluctuate widely, so an investor’s shares, when sold, could be worth more or less than their original cost. The returns shown do not reflect taxes that a shareholder would pay on fund distributions or on the sale of fund shares.
Cumulative Performance: December 31, 2003, Through December 31, 2013
Initial Investment of $10,000
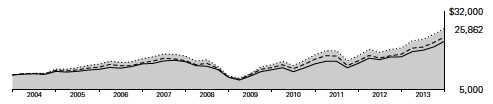
| Average Annual Total Returns | |||||
| Periods Ended December 31, 2013 | |||||
| Final Value | |||||
| One | Five | Ten | of a $10,000 | ||
| Year | Years | Years | Investment | ||
| Mid-Cap Index Fund*Investor Shares | 35.00% | 21.90% | 9.97% | $25,862 | |
| •••••••• | Spliced Mid-Cap Index | 35.21 | 22.13 | 10.13 | 26,234 |
| – – – – | Mid-Cap Core Funds Average | 34.57 | 20.26 | 8.78 | 23,195 |
| Dow Jones U.S. Total Stock Market | |||||
| Float Adjusted Index | 33.47 | 18.86 | 8.09 | 21,777 | |
| For a benchmark description, see the Glossary. | |||||
| Mid-Cap Core Funds Average: Derived from data provided by Lipper, a Thomson Reuters Company. | |||||
| Final Value | |||||
| One | Five | Ten | of a $10,000 | ||
| Year | Years | Years | Investment | ||
| Mid-Cap Index Fund Admiral Shares | 35.15% | 22.08% | 10.10% | $26,167 | |
| Spliced Mid-Cap Index | 35.21 | 22.13 | 10.13 | 26,234 | |
| Dow Jones U.S. Total Stock Market Float | |||||
| Adjusted Index | 33.47 | 18.86 | 8.09 | 21,777 | |
See Financial Highlights for dividend and capital gains information.
35
| Mid-Cap Index Fund | ||||
| Average Annual Total Returns | ||||
| Periods Ended December 31, 2013 | ||||
| Since | Final Value | |||
| One | Five | Inception | of a $10,000 | |
| Year | Years | (3/30/2007) | Investment | |
| Mid-Cap Index Fund Signal Shares | 35.15% | 22.07% | 7.23% | $16,021 |
| Spliced Mid-Cap Index | 35.21 | 22.13 | 7.26 | 16,055 |
| Dow Jones U.S. Total Stock Market Float | ||||
| Adjusted Index | 33.47 | 18.86 | 6.71 | 15,506 |
"Since Inception" performance is calculated from the Signal Shares’ inception date for both the fund and its comparative standards.
| Final Value | ||||
| One | Five | Ten | of a $5,000,000 | |
| Year | Years | Years | Investment | |
| Mid-Cap Index Fund Institutional Shares | 35.17% | 22.11% | 10.14% | $13,129,609 |
| Spliced Mid-Cap Index | 35.21 | 22.13 | 10.13 | 13,117,059 |
| Dow Jones U.S. Total Stock Market Float | ||||
| Adjusted Index | 33.47 | 18.86 | 8.09 | 10,888,699 |
| Since | Final Value | |||
| One | Inception | of a $100,000,000 | ||
| Year | (12/15/2010) | Investment | ||
| Mid-Cap Index Fund Institutional Plus Shares | 35.20% | 16.02% | $157,199,722 | |
| Spliced Mid-Cap Index | 35.21 | 16.03 | 153,014,749 | |
| Dow Jones U.S. Total Stock Market Float | ||||
| Adjusted Index | 33.47 | 16.74 | 160,185,632 | |
"Since Inception" performance is calculated from the Institutional Plus Shares’ inception date for both the fund and its comparative standards.
| Since | Final Value | |||
| One | Five | Inception | of a $10,000 | |
| Year | Years | (1/26/2004) | Investment | |
| Mid-Cap Index Fund | ||||
| ETF Shares Net Asset Value | 35.15% | 22.07% | 9.67% | $25,006 |
| Spliced Mid-Cap Index | 35.21 | 22.13 | 9.71 | 25,096 |
| Dow Jones U.S. Total Stock Market Float | ||||
| Adjusted Index | 33.47 | 18.86 | 7.67 | 20,835 |
"Since Inception" performance is calculated from the ETF Shares’ inception date for both the fund and its comparative standards.
36
Mid-Cap Index Fund
| Cumulative Returns of ETF Shares: January 26, 2004, Through December 31, 2013 | |||
| Since | |||
| One | Five | Inception | |
| Year | Years | (1/26/2004) | |
| Mid-Cap Index Fund ETF Shares Market Price | 35.14% | 171.33% | 150.12% |
| Mid-Cap Index Fund ETF Shares Net Asset Value | 35.15 | 171.09 | 150.06 |
| Spliced Mid-Cap Index | 35.21 | 171.76 | 150.96 |
"Since Inception" performance is calculated from the ETF Shares’ inception date for both the fund and its comparative standards.
Fiscal-Year Total Returns (%): December 31, 2003, Through December 31, 2013
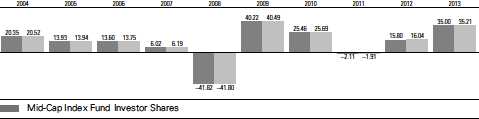
Spliced Mid-Cap Index
For a benchmark description, see the Glossary.
37
Mid-Cap Index Fund
Financial Statements
Statement of Net Assets
As of December 31, 2013
The fund reports a complete list of its holdings in regulatory filings four times in each fiscal year, at the quarter-ends. For the second and fourth fiscal quarters, the lists appear in the fund’s semiannual and annual reports to shareholders. For the first and third fiscal quarters, the fund files the lists with the Securities and Exchange Commission on Form N-Q. Shareholders can look up the fund’s Forms N-Q on the SEC’s website at sec.gov. Forms N-Q may also be reviewed and copied at the SEC’s Public Reference Room (see the back cover of this report for further information).
| Market | |||
| Value | |||
| Shares | ($000) | ||
| Common Stocks (99.7%)1 | |||
| Basic Materials (4.4%) | |||
| CF Industries Holdings Inc. | 893,780 | 208,286 | |
| Eastman Chemical Co. | 2,400,342 | 193,708 | |
| Alcoa Inc. | 16,680,159 | 177,310 | |
| Sigma-Aldrich Corp. | 1,866,151 | 175,437 | |
| FMC Corp. | 2,078,382 | 156,835 | |
| Celanese Corp. Class A | 2,458,855 | 135,999 | |
| CONSOL Energy Inc. | 3,570,238 | 135,812 | |
| Ashland Inc. | 1,208,758 | 117,298 | |
| Airgas Inc. | 1,035,126 | 115,779 | |
| * | WR Grace & Co. | 1,139,251 | 112,638 |
| International Flavors & | |||
| Fragrances Inc. | 1,271,239 | 109,301 | |
| Reliance Steel & | |||
| Aluminum Co. | 1,145,932 | 86,907 | |
| Peabody Energy Corp. | 4,208,077 | 82,184 | |
| Albemarle Corp. | 1,269,496 | 80,473 | |
| Avery Dennison Corp. | 1,506,762 | 75,624 | |
| Huntsman Corp. | 3,012,288 | 74,102 | |
| Westlake Chemical Corp. | 311,902 | 38,074 | |
| 2,075,767 | |||
| Consumer Goods (13.6%) | |||
| Delphi Automotive plc | 4,798,782 | 288,551 | |
| Mattel Inc. | 5,277,744 | 251,115 | |
| Harley-Davidson Inc. | 3,448,101 | 238,747 | |
| ConAgra Foods Inc. | 6,579,131 | 221,717 | |
| BorgWarner Inc. | 3,548,993 | 198,424 | |
| Whirlpool Corp. | 1,224,183 | 192,025 | |
| Genuine Parts Co. | 2,286,855 | 190,244 | |
| Clorox Co. | 2,012,471 | 186,677 | |
| Bunge Ltd. | 2,185,143 | 179,422 | |
| Beam Inc. | 2,543,051 | 173,080 | |
| PVH Corp. | 1,272,100 | 173,031 | |
| * | Constellation Brands Inc. | ||
| Class A | 2,457,475 | 172,957 | |
| Coca-Cola Enterprises Inc. | 3,846,596 | 169,750 | |
| Ralph Lauren Corp. | |||
| Class A | 942,848 | 166,479 | |
| Market | |||
| Value | |||
| Shares | ($000) | ||
| JM Smucker Co. | 1,557,694 | 161,408 | |
| * | Monster Beverage Corp. | 2,353,398 | 159,490 |
| Polaris Industries Inc. | 1,080,289 | 157,333 | |
| Dr Pepper Snapple | |||
| Group Inc. | 3,129,011 | 152,445 | |
| Newell Rubbermaid Inc. | 4,478,831 | 145,159 | |
| Church & Dwight Co. Inc. | 2,165,392 | 143,522 | |
| * | Mohawk Industries Inc. | 962,677 | 143,343 |
| Tyson Foods Inc. Class A | 4,269,999 | 142,874 | |
| *,^ | Green Mountain Coffee | ||
| Roasters Inc. | 1,859,304 | 140,526 | |
| * | LKQ Corp. | 4,219,338 | 138,816 |
| * | TRW Automotive | ||
| Holdings Corp. | 1,798,932 | 133,823 | |
| Molson Coors Brewing | |||
| Co. Class B | 2,236,153 | 125,560 | |
| McCormick & Co. Inc. | 1,775,645 | 122,378 | |
| Avon Products Inc. | 6,764,416 | 116,483 | |
| * | Under Armour Inc. | ||
| Class A | 1,268,684 | 110,756 | |
| PulteGroup Inc. | 5,376,321 | 109,516 | |
| Energizer Holdings Inc. | 976,705 | 105,719 | |
| * | Electronic Arts Inc. | 4,579,661 | 105,057 |
| Lear Corp. | 1,258,514 | 101,902 | |
| * | DR Horton Inc. | 4,532,544 | 101,166 |
| Hasbro Inc. | 1,821,199 | 100,184 | |
| Lennar Corp. Class A | 2,486,569 | 98,369 | |
| * | Lululemon Athletica Inc. | 1,614,198 | 95,286 |
| *,^ | Tesla Motors Inc. | 621,367 | 93,441 |
| Herbalife Ltd. | 1,184,473 | 93,218 | |
| Hormel Foods Corp. | 2,058,068 | 92,963 | |
| * | WABCO Holdings Inc. | 969,209 | 90,534 |
| * | Fossil Group Inc. | 688,813 | 82,616 |
| * | NVR Inc. | 63,837 | 65,497 |
| * | Jarden Corp. | 951,811 | 58,394 |
| Nu Skin Enterprises Inc. | |||
| Class A | 416,990 | 57,636 | |
| Coty Inc. Class A | 1,017,722 | 15,520 | |
| Lennar Corp. Class B | 76,352 | 2,575 | |
| 6,365,728 |
38
| Mid-Cap Index Fund | |||
| Market | |||
| Value | |||
| Shares | ($000) | ||
| Consumer Services (15.4%) | |||
| Macy’s Inc. | 5,740,396 | 306,537 | |
| * | Chipotle Mexican Grill Inc. | ||
| Class A | 482,559 | 257,098 | |
| AmerisourceBergen Corp. | |||
| Class A | 3,587,330 | 252,225 | |
| Ross Stores Inc. | 3,210,189 | 240,539 | |
| L Brands Inc. | 3,847,821 | 237,988 | |
| * | United Continental | ||
| Holdings Inc. | 5,643,269 | 213,485 | |
| * | Discovery | ||
| Communications Inc. | |||
| Class A | 2,284,968 | 206,607 | |
| Southwest Airlines Co. | 10,865,117 | 204,699 | |
| * | O’Reilly Automotive Inc. | 1,590,016 | 204,651 |
| * | Hertz Global Holdings Inc. | 7,001,743 | 200,390 |
| Delta Air Lines Inc. | 6,671,013 | 183,253 | |
| Nielsen Holdings NV | 3,828,402 | 175,685 | |
| * | Dollar Tree Inc. | 3,082,969 | 173,941 |
| Best Buy Co. Inc. | 4,260,661 | 169,915 | |
| Tractor Supply Co. | 2,176,844 | 168,880 | |
| * | CarMax Inc. | 3,483,087 | 163,775 |
| Staples Inc. | 10,193,890 | 161,981 | |
| * | Netflix Inc. | 438,950 | 161,608 |
| Tiffany & Co. | 1,697,389 | 157,484 | |
| * | Dollar General Corp. | 2,497,108 | 150,626 |
| Marriott International Inc. | |||
| Class A | 3,036,356 | 149,874 | |
| Wyndham Worldwide | |||
| Corp. | 2,032,112 | 149,746 | |
| * | Charter Communications | ||
| Inc. Class A | 1,055,574 | 144,360 | |
| * | TripAdvisor Inc. | 1,713,491 | 141,928 |
| Nordstrom Inc. | 2,261,594 | 139,766 | |
| * | News Corp. Class A | 7,490,068 | 134,971 |
| * | MGM Resorts | ||
| International | 5,731,770 | 134,811 | |
| Advance Auto Parts Inc. | 1,135,775 | 125,708 | |
| Safeway Inc. | 3,848,722 | 125,353 | |
| H&R Block Inc. | 4,261,476 | 123,753 | |
| PetSmart Inc. | 1,617,624 | 117,682 | |
| Interpublic Group of | |||
| Cos. Inc. | 6,491,166 | 114,894 | |
| Darden Restaurants Inc. | 2,036,155 | 110,706 | |
| Expedia Inc. | 1,558,267 | 108,549 | |
| * | IHS Inc. Class A | 890,602 | 106,605 |
| Scripps Networks | |||
| Interactive Inc. Class A | 1,219,986 | 105,419 | |
| * | Discovery | ||
| Communications Inc. | 1,251,708 | 104,968 | |
| Family Dollar Stores Inc. | 1,525,812 | 99,132 | |
| Signet Jewelers Ltd. | 1,250,990 | 98,453 | |
| Royal Caribbean | |||
| Cruises Ltd. | 2,058,028 | 97,592 | |
| Market | |||
| Value | |||
| Shares | ($000) | ||
| * | Ulta Salon Cosmetics & | ||
| Fragrance Inc. | 951,684 | 91,856 | |
| Williams-Sonoma Inc. | 1,268,664 | 73,938 | |
| Dun & Bradstreet Corp. | 595,122 | 73,051 | |
| International Game | |||
| Technology | 3,881,586 | 70,490 | |
| FactSet Research | |||
| Systems Inc. | 638,636 | 69,343 | |
| * | Urban Outfitters Inc. | 1,722,607 | 63,909 |
| * | AutoNation Inc. | 1,139,806 | 56,637 |
| * | Sprouts Farmers | ||
| Market Inc. | 1,140,364 | 43,824 | |
| * | Norwegian Cruise | ||
| Line Holdings Ltd. | 1,118,283 | 39,665 | |
| Burger King | |||
| Worldwide Inc. | 1,641,239 | 37,519 | |
| * | Groupon Inc. | 3,110,602 | 36,612 |
| *,^ | Sears Holdings Corp. | 746,157 | 36,591 |
| * | Hyatt Hotels Corp. Class A | 685,893 | 33,924 |
| * | Extended Stay America Inc. | 468,612 | 12,306 |
| * | ARAMARK Holdings Corp. | 454,370 | 11,914 |
| * | News Corp. Class B | 136,094 | 2,427 |
| 7,179,643 | |||
| Financials (16.8%) | |||
| Moody’s Corp. | 3,354,431 | 263,222 | |
| Hartford Financial | |||
| Services Group Inc. | 6,972,063 | 252,598 | |
| Health Care REIT Inc. | 4,501,759 | 241,159 | |
| AvalonBay | |||
| Communities Inc. | 1,917,269 | 226,679 | |
| Principal Financial | |||
| Group Inc. | 4,590,654 | 226,365 | |
| M&T Bank Corp. | 1,827,844 | 212,798 | |
| Regions Financial Corp. | 21,482,375 | 212,461 | |
| Lincoln National Corp. | 4,091,228 | 211,189 | |
| IntercontinentalExchange | |||
| Group Inc. | 896,976 | 201,748 | |
| KeyCorp | 13,983,344 | 187,656 | |
| * | Affiliated Managers | ||
| Group Inc. | 824,214 | 178,756 | |
| CIT Group Inc. | 3,121,546 | 162,726 | |
| Western Union Co. | 8,612,214 | 148,561 | |
| Unum Group | 4,072,831 | 142,875 | |
| XL Group plc Class A | 4,410,389 | 140,427 | |
| Leucadia National Corp. | 4,832,201 | 136,945 | |
| Comerica Inc. | 2,852,500 | 135,608 | |
| SL Green Realty Corp. | 1,438,807 | 132,917 | |
| Equifax Inc. | 1,897,662 | 131,109 | |
| Macerich Co. | 2,191,699 | 129,069 | |
| Plum Creek Timber | |||
| Co. Inc. | 2,758,844 | 128,314 | |
| Cincinnati Financial Corp. | 2,427,120 | 127,108 | |
| Huntington | |||
| Bancshares Inc. | 12,951,517 | 124,982 | |
| * | Markel Corp. | 206,945 | 120,101 |
39
| Mid-Cap Index Fund | |||
| Market | |||
| Value | |||
| Shares | ($000) | ||
| Kimco Realty Corp. | 6,069,492 | 119,872 | |
| * | Arch Capital Group Ltd. | 1,978,482 | 118,096 |
| American Capital | |||
| Agency Corp. | 5,993,218 | 115,609 | |
| * | CBRE Group Inc. Class A | 4,392,801 | 115,531 |
| Realty Income Corp. | 3,061,944 | 114,302 | |
| * | Realogy Holdings Corp. | 2,277,024 | 112,644 |
| Willis Group Holdings plc | 2,495,019 | 111,802 | |
| Torchmark Corp. | 1,410,099 | 110,199 | |
| New York Community | |||
| Bancorp Inc. | 6,531,418 | 110,054 | |
| First Republic Bank | 2,056,904 | 107,679 | |
| Federal Realty | |||
| Investment Trust | 1,014,347 | 102,865 | |
| Cole Real Estate | |||
| Investment Inc. | 7,319,554 | 102,767 | |
| Raymond James | |||
| Financial Inc. | 1,965,793 | 102,595 | |
| SLM Corp. | 3,903,407 | 102,582 | |
| * | Ocwen Financial Corp. | 1,800,384 | 99,831 |
| ^ | Digital Realty Trust Inc. | 2,002,949 | 98,385 |
| Everest Re Group Ltd. | 597,654 | 93,156 | |
| UDR Inc. | 3,910,288 | 91,305 | |
| Zions Bancorporation | 2,879,105 | 86,258 | |
| Reinsurance Group of | |||
| America Inc. Class A | 1,100,880 | 85,219 | |
| Essex Property Trust Inc. | 593,236 | 85,135 | |
| SEI Investments Co. | 2,394,639 | 83,166 | |
| PartnerRe Ltd. | 788,117 | 83,091 | |
| Rayonier Inc. | 1,969,057 | 82,897 | |
| Lazard Ltd. Class A | 1,811,465 | 82,096 | |
| * | MSCI Inc. Class A | 1,846,608 | 80,734 |
| Axis Capital Holdings Ltd. | 1,604,500 | 76,326 | |
| Camden Property Trust | 1,330,443 | 75,676 | |
| People’s United | |||
| Financial Inc. | 4,956,211 | 74,938 | |
| Annaly Capital | |||
| Management Inc. | 7,387,372 | 73,652 | |
| Legg Mason Inc. | 1,693,182 | 73,620 | |
| WR Berkley Corp. | 1,683,176 | 73,033 | |
| NASDAQ OMX Group Inc. | 1,829,385 | 72,810 | |
| Alexandria Real Estate | |||
| Equities Inc. | 1,115,860 | 70,991 | |
| Jones Lang LaSalle Inc. | 693,014 | 70,958 | |
| LPL Financial Holdings Inc. | 1,505,343 | 70,796 | |
| Hudson City Bancorp Inc. | 7,416,591 | 69,938 | |
| ING US Inc. | 1,828,343 | 64,266 | |
| Fidelity National | |||
| Financial Inc. Class A | 1,847,466 | 59,950 | |
| * | Genworth Financial Inc. | ||
| Class A | 3,848,928 | 59,774 | |
| * | Alleghany Corp. | 124,021 | 49,603 |
| Assurant Inc. | 566,283 | 37,584 | |
| * | Brixmor Property Group Inc. | 714,573 | 14,527 |
| 7,861,685 | |||
| Market | |||
| Value | |||
| Shares | ($000) | ||
| Health Care (8.7%) | |||
| * | Vertex | ||
| Pharmaceuticals Inc. | 3,645,375 | 270,851 | |
| * | Mylan Inc. | 5,970,562 | 259,122 |
| * | Boston Scientific Corp. | 20,822,192 | 250,283 |
| * | Forest Laboratories Inc. | 3,781,198 | 226,985 |
| * | Illumina Inc. | 1,971,177 | 218,052 |
| * | Perrigo Co. plc | 1,400,369 | 214,901 |
| * | Life Technologies Corp. | 2,695,235 | 204,299 |
| * | DaVita HealthCare | ||
| Partners Inc. | 3,151,177 | 199,690 | |
| CR Bard Inc. | 1,214,747 | 162,703 | |
| * | BioMarin | ||
| Pharmaceutical Inc. | 2,217,777 | 155,843 | |
| * | Henry Schein Inc. | 1,338,898 | 152,983 |
| * | CareFusion Corp. | 3,295,765 | 131,237 |
| * | Varian Medical | ||
| Systems Inc. | 1,648,738 | 128,090 | |
| * | Waters Corp. | 1,261,256 | 126,126 |
| * | Laboratory Corp. of | ||
| America Holdings | 1,362,982 | 124,536 | |
| Quest Diagnostics Inc. | 2,267,938 | 121,425 | |
| * | Endo Health Solutions Inc. | 1,790,918 | 120,815 |
| Universal Health | |||
| Services Inc. Class B | 1,418,811 | 115,293 | |
| * | Edwards | ||
| Lifesciences Corp. | 1,706,217 | 112,201 | |
| DENTSPLY | |||
| International Inc. | 2,224,665 | 107,852 | |
| * | Hospira Inc. | 2,586,836 | 106,785 |
| ^ | ResMed Inc. | 2,215,727 | 104,316 |
| * | Pharmacyclics Inc. | 919,682 | 97,284 |
| * | Hologic Inc. | 4,259,474 | 95,199 |
| * | IDEXX Laboratories Inc. | 809,365 | 86,092 |
| * | Incyte Corp. Ltd. | 1,129,267 | 57,175 |
| Patterson Cos. Inc. | 1,232,771 | 50,790 | |
| * | Quintiles Transnational | ||
| Holdings Inc. | 593,808 | 27,517 | |
| * | Envision Healthcare | ||
| Holdings Inc. | 702,045 | 24,937 | |
| 4,053,382 | |||
| Industrials (16.9%) | |||
| WW Grainger Inc. | 974,193 | 248,828 | |
| Sherwin-Williams Co. | 1,343,254 | 246,487 | |
| Pentair Ltd. | 3,108,598 | 241,445 | |
| * | Fiserv Inc. | 4,022,459 | 237,526 |
| Amphenol Corp. Class A | 2,468,381 | 220,130 | |
| Fidelity National | |||
| Information Services Inc. | 4,086,095 | 219,342 | |
| Roper Industries Inc. | 1,548,791 | 214,786 | |
| Kansas City Southern | 1,718,738 | 212,831 | |
| AMETEK Inc. | 3,816,915 | 201,037 | |
| Fastenal Co. | 4,164,815 | 197,870 | |
| * | Alliance Data | ||
| Systems Corp. | 721,673 | 189,750 | |
40
| Mid-Cap Index Fund | |||
| Market | |||
| Value | |||
| Shares | ($000) | ||
| Flowserve Corp. | 2,174,976 | 171,453 | |
| Textron Inc. | 4,384,518 | 161,175 | |
| Rockwell Collins Inc. | 2,107,196 | 155,764 | |
| * | Stericycle Inc. | 1,336,659 | 155,280 |
| * | Verisk Analytics Inc. | ||
| Class A | 2,361,203 | 155,178 | |
| Pall Corp. | 1,727,776 | 147,466 | |
| * | B/E Aerospace Inc. | 1,633,846 | 142,194 |
| Expeditors International | |||
| of Washington Inc. | 3,206,041 | 141,867 | |
| L-3 Communications | |||
| Holdings Inc. | 1,313,008 | 140,308 | |
| * | Trimble Navigation Ltd. | 4,020,994 | 139,529 |
| Chicago Bridge & | |||
| Iron Co. NV | 1,676,636 | 139,396 | |
| CH Robinson | |||
| Worldwide Inc. | 2,364,719 | 137,958 | |
| * | FleetCor | ||
| Technologies Inc. | 1,090,288 | 127,749 | |
| ADT Corp. | 3,146,442 | 127,337 | |
| Masco Corp. | 5,567,092 | 126,763 | |
| * | Jacobs Engineering | ||
| Group Inc. | 1,951,991 | 122,956 | |
| Vulcan Materials Co. | 2,027,068 | 120,448 | |
| TransDigm Group Inc. | 739,241 | 119,033 | |
| Rock Tenn Co. Class A | 1,123,405 | 117,969 | |
| Ball Corp. | 2,255,480 | 116,518 | |
| JB Hunt Transport | |||
| Services Inc. | 1,470,346 | 113,658 | |
| * | Mettler-Toledo | ||
| International Inc. | 462,941 | 112,305 | |
| Xerox Corp. | 9,119,405 | 110,983 | |
| Manpowergroup Inc. | 1,231,929 | 105,773 | |
| * | Quanta Services Inc. | 3,311,695 | 104,517 |
| Sealed Air Corp. | 3,059,279 | 104,168 | |
| MeadWestvaco Corp. | 2,774,096 | 102,447 | |
| Fluor Corp. | 1,273,780 | 102,272 | |
| Xylem Inc. | 2,877,057 | 99,546 | |
| Donaldson Co. Inc. | 2,280,564 | 99,113 | |
| Joy Global Inc. | 1,657,415 | 96,942 | |
| * | Crown Holdings Inc. | 2,153,073 | 95,963 |
| Avnet Inc. | 2,145,466 | 94,637 | |
| Cintas Corp. | 1,495,807 | 89,135 | |
| Hubbell Inc. Class B | 810,096 | 88,219 | |
| Robert Half | |||
| International Inc. | 2,053,404 | 86,222 | |
| MDU Resources | |||
| Group Inc. | 2,797,617 | 85,467 | |
| * | Arrow Electronics Inc. | 1,571,157 | 85,235 |
| Iron Mountain Inc. | 2,683,951 | 81,458 | |
| AGCO Corp. | 1,366,538 | 80,885 | |
| Timken Co. | 1,370,434 | 75,470 | |
| KBR Inc. | 2,310,164 | 73,671 | |
| * | Sensata Technologies | ||
| Holding NV | 1,877,900 | 72,806 | |
| Market | |||
| Value | |||
| Shares | ($000) | ||
| Martin Marietta | |||
| Materials Inc. | 721,239 | 72,081 | |
| Towers Watson & | |||
| Co. Class A | 553,073 | 70,578 | |
| * | Owens Corning | 1,652,287 | 67,281 |
| FLIR Systems Inc. | 2,209,178 | 66,496 | |
| SPX Corp. | 635,752 | 63,327 | |
| National Instruments Corp. | 1,559,441 | 49,933 | |
| Jabil Circuit Inc. | 2,847,803 | 49,666 | |
| * | Owens-Illinois Inc. | 1,284,898 | 45,974 |
| Allison Transmission | |||
| Holdings Inc. | 1,278,273 | 35,293 | |
| 7,877,894 | |||
| Oil & Gas (6.7%) | |||
| Cabot Oil & Gas Corp. | 6,580,311 | 255,053 | |
| Range Resources Corp. | 2,421,070 | 204,120 | |
| EQT Corp. | 2,115,370 | 189,918 | |
| Murphy Oil Corp. | 2,770,212 | 179,731 | |
| * | Concho Resources Inc. | 1,638,485 | 176,956 |
| HollyFrontier Corp. | 3,103,755 | 154,226 | |
| Noble Corp. plc | 3,951,870 | 148,077 | |
| * | Cheniere Energy Inc. | 3,352,980 | 144,581 |
| Core Laboratories NV | 707,479 | 135,093 | |
| Cimarex Energy Co. | 1,286,702 | 134,988 | |
| Helmerich & Payne Inc. | 1,587,340 | 133,464 | |
| Oceaneering | |||
| International Inc. | 1,687,301 | 133,094 | |
| Tesoro Corp. | 2,071,510 | 121,183 | |
| * | Whiting Petroleum Corp. | 1,850,369 | 114,482 |
| OGE Energy Corp. | 3,094,872 | 104,916 | |
| * | Denbury Resources Inc. | 5,718,584 | 93,956 |
| SM Energy Co. | 1,044,717 | 86,827 | |
| QEP Resources Inc. | 2,795,904 | 85,695 | |
| * | Weatherford | ||
| International Ltd. | 5,399,506 | 83,638 | |
| Energen Corp. | 1,133,550 | 80,199 | |
| Nabors Industries Ltd. | 4,373,033 | 74,298 | |
| * | Cobalt International | ||
| Energy Inc. | 4,489,934 | 73,859 | |
| * | Dresser-Rand Group Inc. | 1,189,767 | 70,946 |
| * | Rowan Cos. plc Class A | 1,935,330 | 68,433 |
| Diamond Offshore | |||
| Drilling Inc. | 1,084,201 | 61,713 | |
| * | Antero Resources Corp. | 612,125 | 38,833 |
| 3,148,279 | |||
| Technology (11.4%) | |||
| Western Digital Corp. | 3,501,069 | 293,740 | |
| Seagate Technology plc | 4,831,758 | 271,352 | |
| * | Cerner Corp. | 4,817,738 | 268,541 |
| SanDisk Corp. | 3,522,746 | 248,494 | |
| Xilinx Inc. | 4,184,260 | 192,141 | |
| * | Micron Technology Inc. | 8,201,676 | 178,468 |
| * | Autodesk Inc. | 3,518,236 | 177,073 |
41
| Mid-Cap Index Fund | |||
| Market | |||
| Value | |||
| Shares | ($000) | ||
| Avago Technologies Ltd. | |||
| Class A | 3,280,672 | 173,515 | |
| KLA-Tencor Corp. | 2,598,778 | 167,517 | |
| Linear Technology Corp. | 3,651,707 | 166,335 | |
| * | Red Hat Inc. | 2,955,209 | 165,610 |
| * | Catamaran Corp. | 3,217,239 | 152,754 |
| * | Lam Research Corp. | 2,532,553 | 137,898 |
| * | Equinix Inc. | 776,273 | 137,750 |
| NVIDIA Corp. | 8,422,699 | 134,932 | |
| Microchip Technology Inc. | 2,938,818 | 131,512 | |
| Computer Sciences Corp. | 2,295,770 | 128,288 | |
| * | VeriSign Inc. | 2,137,292 | 127,767 |
| * | ANSYS Inc. | 1,445,032 | 126,007 |
| * | Akamai Technologies Inc. | 2,651,565 | 125,101 |
| Maxim Integrated | |||
| Products Inc. | 4,406,702 | 122,991 | |
| * | Cree Inc. | 1,882,330 | 117,777 |
| Harris Corp. | 1,666,660 | 116,350 | |
| * | Teradata Corp. | 2,548,168 | 115,916 |
| * | F5 Networks Inc. | 1,210,297 | 109,968 |
| * | ServiceNow Inc. | 1,839,145 | 103,011 |
| * | Workday Inc. Class A | 1,221,074 | 101,545 |
| * | Synopsys Inc. | 2,404,300 | 97,542 |
| * | Gartner Inc. | 1,365,687 | 97,032 |
| LSI Corp. | 8,498,321 | 93,651 | |
| Marvell Technology | |||
| Group Ltd. | 6,137,064 | 88,251 | |
| * | Juniper Networks Inc. | 3,740,927 | 84,433 |
| Garmin Ltd. | 1,826,744 | 84,432 | |
| * | Skyworks Solutions Inc. | 2,938,344 | 83,919 |
| * | 3D Systems Corp. | 760,587 | 70,681 |
| * | Rackspace Hosting Inc. | 1,744,319 | 68,255 |
| * | Nuance | ||
| Communications Inc. | 3,923,282 | 59,634 | |
| * | TIBCO Software Inc. | 2,412,492 | 54,233 |
| * | Splunk Inc. | 576,502 | 39,588 |
| * | Informatica Corp. | 845,117 | 35,072 |
| * | MICROS Systems Inc. | 586,365 | 33,640 |
| * | NetSuite Inc. | 261,729 | 26,963 |
| * | Premier Inc. Class A | 482,388 | 17,733 |
| Leidos Holdings Inc. | 631 | 29 | |
| 5,327,441 | |||
| Telecommunications (0.7%) | |||
| * | SBA Communications | ||
| Corp. Class A | 2,002,253 | 179,882 | |
| ^ | Windstream Holdings Inc. | 9,295,919 | 74,182 |
| Frontier | |||
| Communications Corp. | 15,588,210 | 72,485 | |
| 326,549 | |||
| Utilities (5.1%) | |||
| Northeast Utilities | 4,913,770 | 208,295 | |
| ONEOK Inc. | 3,216,978 | 200,032 | |
| DTE Energy Co. | 2,757,146 | 183,047 | |
| NiSource Inc. | 4,885,818 | 160,646 | |
| Market | |||
| Value | |||
| Shares | ($000) | ||
| CenterPoint Energy Inc. | 6,684,523 | 154,947 | |
| Wisconsin Energy Corp. | 3,532,606 | 146,038 | |
| NRG Energy Inc. | 5,043,648 | 144,853 | |
| AES Corp. | 9,839,962 | 142,778 | |
| Ameren Corp. | 3,783,879 | 136,825 | |
| * | Calpine Corp. | 6,108,202 | 119,171 |
| American Water | |||
| Works Co. Inc. | 2,780,164 | 117,490 | |
| CMS Energy Corp. | 4,165,174 | 111,502 | |
| SCANA Corp. | 1,972,748 | 92,581 | |
| Pinnacle West | |||
| Capital Corp. | 1,716,200 | 90,821 | |
| Alliant Energy Corp. | 1,730,185 | 89,277 | |
| National Fuel Gas Co. | 1,239,979 | 88,534 | |
| Pepco Holdings Inc. | 3,895,017 | 74,512 | |
| Integrys Energy Group Inc. | 1,243,232 | 67,644 | |
| TECO Energy Inc. | 3,384,381 | 58,347 | |
| 2,387,340 | |||
| Total Common Stocks | |||
| (Cost $34,433,086) | 46,603,708 | ||
| Temporary Cash Investments (0.7%)1 | |||
| Money Market Fund (0.7%) | |||
| 2,3 | Vanguard Market Liquidity | ||
| Fund, 0.125% | 298,538,460 | 298,538 | |
| Face | |||
| Amount | |||
| ($000) | |||
| U.S. Government and Agency Obligations (0.0%) | |||
| 4 | Federal Home Loan | ||
| Bank Discount Notes, | |||
| 0.120%, 5/23/14 | 2,500 | 2,499 | |
| 5,6 | Freddie Mac | ||
| Discount Notes, | |||
| 0.063%, 3/17/14 | 7,500 | 7,497 | |
| 9,996 | |||
| Total Temporary Cash Investments | |||
| (Cost $308,536) | 308,534 | ||
| Total Investments (100.4%) | |||
| (Cost $34,741,622) | 46,912,242 | ||
| Other Assets and Liabilities (-0.4%) | |||
| Other Assets | 146,571 | ||
| Liabilities3 | (335,157) | ||
| (188,586) | |||
| Net Assets (100%) | 46,723,656 | ||
42
Mid-Cap Index Fund
| At December 31, 2013, net assets consisted of: | |
| Amount | |
| ($000) | |
| Paid-in Capital | 34,951,459 |
| Overdistributed Net Investment Income | (23,654) |
| Accumulated Net Realized Losses | (377,602) |
| Unrealized Appreciation (Depreciation) | |
| Investment Securities | 12,170,620 |
| Futures Contracts | 1,886 |
| Swap Contracts | 947 |
| Net Assets | 46,723,656 |
| Investor Shares—Net Assets | |
| Applicable to 159,817,032 outstanding | |
| $.001 par value shares of beneficial | |
| interest (unlimited authorization) | 4,797,227 |
| Net Asset Value Per Share— | |
| Investor Shares | $30.02 |
| Admiral Shares—Net Assets | |
| Applicable to 75,266,752 outstanding | |
| $.001 par value shares of beneficial | |
| interest (unlimited authorization) | 10,250,731 |
| Net Asset Value Per Share— | |
| Admiral Shares | $136.19 |
| Signal Shares—Net Assets | |
| Applicable to 165,499,727 outstanding | |
| $.001 par value shares of beneficial | |
| interest (unlimited authorization) | 7,112,513 |
| Net Asset Value Per Share— | |
| Signal Shares | $42.98 |
| Amount | |
| ($000) | |
| Institutional Shares—Net Assets | |
| Applicable to 311,403,848 outstanding | |
| $.001 par value shares of beneficial | |
| interest (unlimited authorization) | 9,367,910 |
| Net Asset Value Per Share— | |
| Institutional Shares | $30.08 |
| Institutional Plus Shares—Net Assets | |
| Applicable to 57,072,137 outstanding | |
| $.001 par value shares of beneficial | |
| interest (unlimited authorization) | 8,467,705 |
| Net Asset Value Per Share— | |
| Institutional Plus Shares | $148.37 |
| ETF Shares—Net Assets | |
| Applicable to 61,179,345 outstanding | |
| $.001 par value shares of beneficial | |
| interest (unlimited authorization) | 6,727,570 |
| Net Asset Value Per Share— | |
| ETF Shares | $109.96 |
See Note A in Notes to Financial Statements.
* Non-income-producing security.
^ Includes partial security positions on loan to broker-dealers. The total value of securities on loan is $90,722,000.
1 The fund invests a portion of its cash reserves in equity markets through the use of index futures contracts. After giving effect to futures investments, the fund’s effective common stock and temporary cash investment positions represent 99.9% and 0.5%, respectively, of net assets.
2 Affiliated money market fund available only to Vanguard funds and certain trusts and accounts managed by Vanguard. Rate shown is the 7-day yield.
3 Includes $93,987,000 of collateral received for securities on loan.
4 The issuer operates under a congressional charter; its securities are generally neither guaranteed by the U.S. Treasury nor backed by the full faith and credit of the U.S. government.
5 Securities with a value of $4,998,000 have been segregated as initial margin for open futures contracts.
6 The issuer was placed under federal conservatorship in September 2008; since that time, its daily operations have been managed by the Federal Housing Finance Agency and it receives capital from the U.S. Treasury, as needed to maintain a positive net worth, in exchange for senior preferred stock.
REIT—Real Estate Investment Trust.
See accompanying Notes, which are an integral part of the Financial Statements.
43
| Mid-Cap Index Fund | |
| Statement of Operations | |
| Year Ended | |
| December 31, 2013 | |
| ($000) | |
| Investment Income | |
| Income | |
| Dividends | 554,021 |
| Interest1 | 234 |
| Securities Lending | 6,289 |
| Total Income | 560,544 |
| Expenses | |
| The Vanguard Group—Note B | |
| Investment Advisory Services | 1,981 |
| Management and Administrative—Investor Shares | 9,253 |
| Management and Administrative—Admiral Shares | 5,919 |
| Management and Administrative—Signal Shares | 3,678 |
| Management and Administrative—Institutional Shares | 4,034 |
| Management and Administrative—Institutional Plus Shares | 2,296 |
| Management and Administrative—ETF Shares | 3,427 |
| Marketing and Distribution—Investor Shares | 1,003 |
| Marketing and Distribution—Admiral Shares | 1,144 |
| Marketing and Distribution—Signal Shares | 1,515 |
| Marketing and Distribution—Institutional Shares | 1,910 |
| Marketing and Distribution—Institutional Plus Shares | 1,487 |
| Marketing and Distribution—ETF Shares | 970 |
| Custodian Fees | 358 |
| Auditing Fees | 34 |
| Shareholders’ Reports—Investor Shares | 132 |
| Shareholders’ Reports—Admiral Shares | 75 |
| Shareholders’ Reports—Signal Shares | 87 |
| Shareholders’ Reports—Institutional Shares | 89 |
| Shareholders’ Reports—Institutional Plus Shares | 51 |
| Shareholders’ Reports—ETF Shares | 141 |
| Trustees’ Fees and Expenses | 46 |
| Total Expenses | 39,630 |
| Net Investment Income | 520,914 |
| Realized Net Gain (Loss) | |
| Investment Securities Sold | 3,514,504 |
| Futures Contracts | 19,075 |
| Swap Contracts | 21,283 |
| Realized Net Gain (Loss) | 3,554,862 |
| Change in Unrealized Appreciation (Depreciation) | |
| Investment Securities | 7,656,830 |
| Futures Contracts | 2,074 |
| Swap Contracts | 947 |
| Change in Unrealized Appreciation (Depreciation) | 7,659,851 |
| Net Increase (Decrease) in Net Assets Resulting from Operations | 11,735,627 |
| 1 Interest income from an affiliated company of the fund was $221,000. | |
| See accompanying Notes, which are an integral part of the Financial Statements. | |
44
| Mid-Cap Index Fund | ||
| Statement of Changes in Net Assets | ||
| Year Ended December 31, | ||
| 2013 | 2012 | |
| ($000) | ($000) | |
| Increase (Decrease) in Net Assets | ||
| Operations | ||
| Net Investment Income | 520,914 | 446,289 |
| Realized Net Gain (Loss) | 3,554,862 | 693,188 |
| Change in Unrealized Appreciation (Depreciation) | 7,659,851 | 3,103,944 |
| Net Increase (Decrease) in Net Assets Resulting from Operations | 11,735,627 | 4,243,421 |
| Distributions | ||
| Net Investment Income | ||
| Investor Shares | (49,295) | (49,025) |
| Admiral Shares | (118,331) | (96,184) |
| Signal Shares | (83,346) | (67,578) |
| Institutional Shares | (108,634) | (100,070) |
| Institutional Plus Shares | (100,095) | (76,806) |
| ETF Shares | (80,063) | (55,058) |
| Realized Capital Gain | ||
| Investor Shares | — | — |
| Admiral Shares | — | — |
| Signal Shares | — | — |
| Institutional Shares | — | — |
| Institutional Plus Shares | — | — |
| ETF Shares | — | — |
| Total Distributions | (539,764) | (444,721) |
| Capital Share Transactions | ||
| Investor Shares | (357,619) | (837,289) |
| Admiral Shares | 960,633 | 49,913 |
| Signal Shares | 532,100 | 695,819 |
| Institutional Shares | (13,444) | 641,250 |
| Institutional Plus Shares | 1,066,890 | 1,481,497 |
| ETF Shares | 1,311,208 | 206,782 |
| Net Increase (Decrease) from Capital Share Transactions | 3,499,768 | 2,237,972 |
| Total Increase (Decrease) | 14,695,631 | 6,036,672 |
| Net Assets | ||
| Beginning of Period | 32,028,025 | 25,991,353 |
| End of Period1 | 46,723,656 | 32,028,025 |
1 Net Assets—End of Period includes undistributed (overdistributed) net investment income of ($23,654,000) and ($26,087,000).
See accompanying Notes, which are an integral part of the Financial Statements.
45
| Mid-Cap Index Fund | |||||
| Financial Highlights | |||||
| Investor Shares | |||||
| For a Share Outstanding | Year Ended December 31, | ||||
| Throughout Each Period | 2013 | 2012 | 2011 | 2010 | 2009 |
| Net Asset Value, Beginning of Period | $22.47 | $19.65 | $20.31 | $16.36 | $11.80 |
| Investment Operations | |||||
| Net Investment Income | . 299 | . 286 | .233 | .214 | .171 |
| Net Realized and Unrealized Gain (Loss) | |||||
| on Investments | 7.560 | 2.818 | (. 661) | 3.951 | 4.571 |
| Total from Investment Operations | 7.859 | 3.104 | (. 428) | 4.165 | 4.742 |
| Distributions | |||||
| Dividends from Net Investment Income | (.309) | (.284) | (. 232) | (. 215) | (.182) |
| Distributions from Realized Capital Gains | — | — | — | — | — |
| Total Distributions | (.309) | (.284) | (. 232) | (. 215) | (.182) |
| Net Asset Value, End of Period | $30.02 | $22.47 | $19.65 | $20.31 | $16.36 |
| Total Return1 | 35.00% | 15.80% | -2.11% | 25.46% | 40.22% |
| Ratios/Supplemental Data | |||||
| Net Assets, End of Period (Millions) | $4,797 | $3,887 | $4,168 | $5,602 | $6,789 |
| Ratio of Total Expenses to | |||||
| Average Net Assets | 0.24% | 0.24% | 0.24% | 0.26% | 0.27% |
| Ratio of Net Investment Income to | |||||
| Average Net Assets | 1.16% | 1.36% | 1.15% | 1.25% | 1.32% |
| Portfolio Turnover Rate2 | 32% | 17% | 22% | 16% | 21% |
1 Total returns do not include account service fees that may have applied in the periods shown. Fund prospectuses provide information about any applicable account service fees.
2 Excludes the value of portfolio securities received or delivered as a result of in-kind purchases or redemptions of the fund’s capital shares, including ETF Creation Units.
See accompanying Notes, which are an integral part of the Financial Statements.
46
| Mid-Cap Index Fund | |||||
| Financial Highlights | |||||
| Admiral Shares | |||||
| For a Share Outstanding | Year Ended December 31, | ||||
| Throughout Each Period | 2013 | 2012 | 2011 | 2010 | 2009 |
| Net Asset Value, Beginning of Period | $101.97 | $89.15 | $92.17 | $74.23 | $53.49 |
| Investment Operations | |||||
| Net Investment Income | 1.550 | 1.450 | 1.212 | 1.049 | .855 |
| Net Realized and Unrealized Gain (Loss) | |||||
| on Investments | 34.269 | 12.808 | (3.023) | 17.946 | 20.782 |
| Total from Investment Operations | 35.819 | 14.258 | (1.811) | 18.995 | 21.637 |
| Distributions | |||||
| Dividends from Net Investment Income | (1.599) | (1.438) | (1.209) | (1.055) | (.897) |
| Distributions from Realized Capital Gains | — | — | — | — | — |
| Total Distributions | (1.599) | (1.438) | (1.209) | (1.055) | (.897) |
| Net Asset Value, End of Period | $136.19 | $101.97 | $89.15 | $92.17 | $74.23 |
| Total Return1 | 35.15% | 15.99% | -1.97% | 25.59% | 40.48% |
| Ratios/Supplemental Data | |||||
| Net Assets, End of Period (Millions) | $10,251 | $6,895 | $5,989 | $6,036 | $2,184 |
| Ratio of Total Expenses to | |||||
| Average Net Assets | 0.09% | 0.10% | 0.10% | 0.12% | 0.14% |
| Ratio of Net Investment Income to | |||||
| Average Net Assets | 1.31% | 1.50% | 1.29% | 1.39% | 1.45% |
| Portfolio Turnover Rate2 | 32% | 17% | 22% | 16% | 21% |
1 Total returns do not include account service fees that may have applied in the periods shown. Fund prospectuses provide information about any applicable account service fees.
2 Excludes the value of portfolio securities received or delivered as a result of in-kind purchases or redemptions of the fund’s capital shares, including ETF Creation Units.
See accompanying Notes, which are an integral part of the Financial Statements.
47
| Mid-Cap Index Fund | |||||
| Financial Highlights | |||||
| Signal Shares | |||||
| For a Share Outstanding | Year Ended December 31, | ||||
| Throughout Each Period | 2013 | 2012 | 2011 | 2010 | 2009 |
| Net Asset Value, Beginning of Period | $32.18 | $28.13 | $29.09 | $23.43 | $16.89 |
| Investment Operations | |||||
| Net Investment Income | . 489 | .459 | .382 | .341 | .271 |
| Net Realized and Unrealized Gain (Loss) | |||||
| on Investments | 10.815 | 4.047 | (.961) | 5.662 | 6.552 |
| Total from Investment Operations | 11.304 | 4.506 | (.579) | 6.003 | 6.823 |
| Distributions | |||||
| Dividends from Net Investment Income | (.504) | (.456) | (.381) | (.343) | (. 283) |
| Distributions from Realized Capital Gains | — | — | — | — | — |
| Total Distributions | (.504) | (.456) | (.381) | (.343) | (. 283) |
| Net Asset Value, End of Period | $42.98 | $32.18 | $28.13 | $29.09 | $23.43 |
| Total Return | 35.15% | 16.02% | -1.99% | 25.62% | 40.43% |
| Ratios/Supplemental Data | |||||
| Net Assets, End of Period (Millions) | $7,113 | $4,834 | $3,589 | $2,831 | $2,346 |
| Ratio of Total Expenses to | |||||
| Average Net Assets | 0.09% | 0.10% | 0.10% | 0.12% | 0.14% |
| Ratio of Net Investment Income to | |||||
| Average Net Assets | 1.31% | 1.50% | 1.29% | 1.39% | 1.45% |
| Portfolio Turnover Rate1 | 32% | 17% | 22% | 16% | 21% |
1 Excludes the value of portfolio securities received or delivered as a result of in-kind purchases or redemptions of the fund’s capital shares, including ETF Creation Units.
See accompanying Notes, which are an integral part of the Financial Statements.
48
| Mid-Cap Index Fund | |||||
| Financial Highlights | |||||
| Institutional Shares | |||||
| For a Share Outstanding | Year Ended December 31, | ||||
| Throughout Each Period | 2013 | 2012 | 2011 | 2010 | 2009 |
| Net Asset Value, Beginning of Period | $22.52 | $19.69 | $20.36 | $16.40 | $11.82 |
| Investment Operations | |||||
| Net Investment Income | . 344 | .325 | .271 | .247 | .197 |
| Net Realized and Unrealized Gain (Loss) | |||||
| on Investments | 7.571 | 2.827 | (. 669) | 3.962 | 4.588 |
| Total from Investment Operations | 7.915 | 3.152 | (.398) | 4.209 | 4.785 |
| Distributions | |||||
| Dividends from Net Investment Income | (. 355) | (. 322) | (. 272) | (. 249) | (. 205) |
| Distributions from Realized Capital Gains | — | — | — | — | — |
| Total Distributions | (. 355) | (. 322) | (. 272) | (. 249) | (. 205) |
| Net Asset Value, End of Period | $30.08 | $22.52 | $19.69 | $20.36 | $16.40 |
| Total Return | 35.17% | 16.01% | -1.96% | 25.67% | 40.51% |
| Ratios/Supplemental Data | |||||
| Net Assets, End of Period (Millions) | $9,368 | $7,057 | $5,611 | $7,795 | $5,960 |
| Ratio of Total Expenses to | |||||
| Average Net Assets | 0.08% | 0.08% | 0.08% | 0.08% | 0.08% |
| Ratio of Net Investment Income to | |||||
| Average Net Assets | 1.32% | 1.52% | 1.31% | 1.43% | 1.51% |
| Portfolio Turnover Rate1 | 32% | 17% | 22% | 16% | 21% |
1 Excludes the value of portfolio securities received or delivered as a result of in-kind purchases or redemptions of the fund’s capital shares, including ETF Creation Units.
See accompanying Notes, which are an integral part of the Financial Statements.
49
| Mid-Cap Index Fund | ||||
| Financial Highlights | ||||
| Institutional Plus Shares | ||||
| Dec. 15, | ||||
| 20101 to | ||||
| Year Ended December 31, | Dec. 31, | |||
| For a Share Outstanding Throughout Each Period | 2013 | 2012 | 2011 | 2010 |
| Net Asset Value, Beginning of Period | $111.08 | $97.12 | $100.40 | $99.45 |
| Investment Operations | ||||
| Net Investment Income | 1.726 | 1.624 | 1.358 | .079 2 |
| Net Realized and Unrealized Gain (Loss) on Investments | 37.343 | 13.945 | (3.280) | 2.078 |
| Total from Investment Operations | 39.069 | 15.569 | (1.922) | 2.157 |
| Distributions | ||||
| Dividends from Net Investment Income | (1.779) | (1.609) | (1.358) | (1.207) |
| Distributions from Realized Capital Gains | — | — | — | — |
| Total Distributions | (1.779) | (1.609) | (1.358) | (1.207) |
| Net Asset Value, End of Period | $148.37 | $111.08 | $97.12 | $100.40 |
| Total Return | 35.20% | 16.03% | -1.91% | 2.17% |
| Ratios/Supplemental Data | ||||
| Net Assets, End of Period (Millions) | $8,468 | $5,428 | $3,393 | $440 |
| Ratio of Total Expenses to Average Net Assets | 0.06% | 0.06% | 0.06% | 0.06%3 |
| Ratio of Net Investment Income to Average Net Assets | 1.34% | 1.54% | 1.33% | 1.45%3 |
| Portfolio Turnover Rate 4 | 32% | 17% | 22% | 16% |
1 Inception.
2 Calculated based on average shares outstanding.
3 Annualized.
4 Excludes the value of portfolio securities received or delivered as a result of in-kind purchases or redemptions of the fund’s capital shares, including ETF Creation Units.
See accompanying Notes, which are an integral part of the Financial Statements.
50
| Mid-Cap Index Fund | |||||
| Financial Highlights | |||||
| ETF Shares | |||||
| For a Share Outstanding | Year Ended December 31, | ||||
| Throughout Each Period | 2013 | 2012 | 2011 | 2010 | 2009 |
| Net Asset Value, Beginning of Period | $82.33 | $71.99 | $74.42 | $59.97 | $43.21 |
| Investment Operations | |||||
| Net Investment Income | 1.255 | 1.173 | .976 | .882 | .696 |
| Net Realized and Unrealized Gain (Loss) | |||||
| on Investments | 27.668 | 10.329 | (2.430) | 14.454 | 16.794 |
| Total from Investment Operations | 28.923 | 11.502 | (1.454) | 15.336 | 17.490 |
| Distributions | |||||
| Dividends from Net Investment Income | (1.293) | (1.162) | (.976) | (. 886) | (.730) |
| Distributions from Realized Capital Gains | — | — | — | — | — |
| Total Distributions | (1.293) | (1.162) | (.976) | (. 886) | (.730) |
| Net Asset Value, End of Period | $109.96 | $82.33 | $71.99 | $74.42 | $59.97 |
| Total Return | 35.15% | 15.98% | -1.96% | 25.57% | 40.49% |
| Ratios/Supplemental Data | |||||
| Net Assets, End of Period (Millions) | $6,728 | $3,926 | $3,241 | $3,356 | $2,207 |
| Ratio of Total Expenses to | |||||
| Average Net Assets | 0.09% | 0.10% | 0.10% | 0.12% | 0.14% |
| Ratio of Net Investment Income to | |||||
| Average Net Assets | 1.31% | 1.50% | 1.29% | 1.39% | 1.45% |
| Portfolio Turnover Rate1 | 32% | 17% | 22% | 16% | 21% |
1 Excludes the value of portfolio securities received or delivered as a result of in-kind purchases or redemptions of the fund’s capital shares, including ETF Creation Units.
See accompanying Notes, which are an integral part of the Financial Statements.
51
Mid-Cap Index Fund
Notes to Financial Statements
Vanguard Mid-Cap Index Fund is registered under the Investment Company Act of 1940 as an open-end investment company, or mutual fund. The fund offers six classes of shares: Investor Shares, Admiral Shares, Signal Shares, Institutional Shares, Institutional Plus Shares, and ETF Shares. Investor Shares are available to any investor who meets the fund’s minimum purchase requirements. Admiral Shares, Signal Shares, Institutional Shares, and Institutional Plus Shares are designed for investors who meet certain administrative, service, and account-size criteria. ETF Shares are listed for trading on NYSE Arca; they can be purchased and sold through a broker.
A. The following significant accounting policies conform to generally accepted accounting principles for U.S. mutual funds. The fund consistently follows such policies in preparing its financial statements.
1. Security Valuation: Securities are valued as of the close of trading on the New York Stock Exchange (generally 4 p.m., Eastern time) on the valuation date. Equity securities are valued at the latest quoted sales prices or official closing prices taken from the primary market in which each security trades; such securities not traded on the valuation date are valued at the mean of the latest quoted bid and asked prices. Securities for which market quotations are not readily available, or whose values have been materially affected by events occurring before the fund’s pricing time but after the close of the securities’ primary markets, are valued by methods deemed by the board of trustees to represent fair value. Investments in Vanguard Market Liquidity Fund are valued at that fund’s net asset value. Temporary cash investments acquired over 60 days to maturity are valued using the latest bid prices or using valuations based on a matrix system (which considers such factors as security prices, yields, maturities, and ratings), both as furnished by independent pricing services. Other temporary cash investments are valued at amortized cost, which approximates market value.
2. Futures Contracts: The fund may use index futures contracts to a limited extent, with the objectives of maintaining full exposure to the stock market, enhancing returns, maintaining liquidity, and minimizing transaction costs. The fund may purchase futures contracts to immediately invest incoming cash in the market, or sell futures in response to cash outflows, thereby simulating a fully invested position in the underlying index while maintaining a cash balance for liquidity. The fund may seek to enhance returns by using futures contracts instead of the underlying securities when futures are believed to be priced more attractively than the underlying securities. The primary risks associated with the use of futures contracts are imperfect correlation between changes in market values of stocks held by the fund and the prices of futures contracts, and the possibility of an illiquid market. Counterparty risk involving futures is mitigated because a regulated clearinghouse is the counterparty instead of the clearing broker. To further mitigate counterparty risk, the fund trades futures contracts on an exchange, monitors the financial strength of its clearing brokers and clearinghouse, and has entered into clearing agreements with its clearing brokers. The clearinghouse imposes initial margin requirements to secure the fund’s performance and requires daily settlement of variation margin representing changes in the market value of each contract.
Futures contracts are valued at their quoted daily settlement prices. The aggregate notional amounts of the contracts are not recorded in the Statement of Net Assets. Fluctuations in the value of the contracts are recorded in the Statement of Net Assets as an asset (liability) and in the Statement of Operations as unrealized appreciation (depreciation) until the contracts are closed, when they are recorded as realized futures gains (losses).
52
Mid-Cap Index Fund
During the year ended December 31, 2013, the fund’s average investments in long and short futures contracts represented less than 1% and 0% of net assets, respectively, based on quarterly average aggregate settlement values.
3. Swap Contracts: The fund has entered into an equity swap contract to earn the total return on a selected reference stock in the fund’s target index. Under the terms of the swap, the fund receives the total return on the referenced stock (i.e., receiving the increase or paying the decrease in value of the selected reference stock and receiving the equivalent of any dividends in respect of the selected referenced stock) over a specified period of time, applied to a notional amount that represents the value of a designated number of shares of the selected reference stock at the beginning of the equity swap contract. The fund also pays a floating rate that is based on short-term interest rates, applied to the notional amount. At the same time, the fund invests an amount approximating the notional amount of the swap in high-quality temporary cash investments.
The notional amounts of swap contracts are not recorded in the Statement of Net Assets. Swaps are valued daily based on market quotations received from independent pricing services or recognized dealers and the change in value is recorded as unrealized appreciation (depreciation) until termination of the swap, at which time realized gain (loss) is recorded. The primary risks associated with the swaps are that a counterparty will default on its obligation to pay net amounts due to the fund, or that the fund will incur fees in the event it terminates a swap prior to the scheduled termination date. The fund’s maximum risk of loss from counterparty credit risk is the amount of unrealized appreciation on the swap contract. The fund mitigates its counterparty risk by entering into swaps only with a diverse group of pre-qualified counterparties, monitoring their financial strength, entering into master netting arrangements with its counterparties, and requiring its counterparties to transfer collateral as security for their performance. In the event of a counterparty’s default (including bankruptcy), the fund may terminate any swap contracts with that counterparty, determine the net amount owed by either party in accordance with its master netting arrangements, and sell or retain any collateral held up to the net amount owed to the fund under the master netting arrangements. The swap contracts contain provisions whereby a counterparty may terminate open contracts if the fund’s net assets decline below a certain level, triggering a payment by the fund if the fund is in a net liability position at the time of the termination. The payment amount would be reduced by any collateral the fund has pledged. Any securities pledged as collateral for open contracts are noted in the Statement of Net Assets. The value of collateral received or pledged is compared daily to the value of the swap contracts exposure with each counterparty, and any difference, if in excess of a specified minimum transfer amount, is adjusted and settled within two business days.
During the year ended December 31, 2013, the fund’s average amounts of total return swaps represented less than 1% of net assets, based on quarterly average notional amounts.
4. Federal Income Taxes: The fund intends to continue to qualify as a regulated investment company and distribute all of its taxable income. Management has analyzed the fund’s tax positions taken for all open federal income tax years (December 31, 2010–2013), and has concluded that no provision for federal income tax is required in the fund’s financial statements.
5. Distributions: Distributions to shareholders are recorded on the ex-dividend date.
53
Mid-Cap Index Fund
6. Securities Lending: To earn additional income, the fund may lend its securities to qualified institutional borrowers. Security loans are required to be secured at all times by collateral in an amount at least equal to the market value of securities loaned. Daily market fluctuations could cause the value of loaned securities to be more or less than the value of the collateral received. When this occurs, the collateral is adjusted and settled on the next business day. The fund further mitigates its counterparty risk by entering into securities lending transactions only with a diverse group of prequalified counter-parties, monitoring their financial strength, and entering into master securities lending agreements with its counterparties. The master securities lending agreements provide that, in the event of a counterparty’s default (including bankruptcy), the fund may terminate any loans with that borrower, determine the net amount owed, and sell or retain the collateral up to the net amount owed to the fund; however, such actions may be subject to legal proceedings. While collateral mitigates counterparty risk, in the absence of a default the fund may experience delays and costs in recovering the securities loaned. The fund invests cash collateral received in Vanguard Market Liquidity Fund, and records a liability for the return of the collateral, during the period the securities are on loan. Securities lending income represents fees charged to borrowers plus income earned on invested cash collateral, less expenses associated with the loan.
7. Other: Dividend income is recorded on the ex-dividend date. Interest income includes income distributions received from Vanguard Market Liquidity Fund and is accrued daily. Premiums and discounts on debt securities purchased are amortized and accreted, respectively, to interest income over the lives of the respective securities. Security transactions are accounted for on the date securities are bought or sold. Costs used to determine realized gains (losses) on the sale of investment securities are those of the specific securities sold.
Each class of shares has equal rights as to assets and earnings, except that each class separately bears certain class-specific expenses related to maintenance of shareholder accounts (included in Management and Administrative expenses) and shareholder reporting. Marketing and distribution expenses are allocated to each class of shares based on a method approved by the board of trustees. Income, other non-class-specific expenses, and gains and losses on investments are allocated to each class of shares based on its relative net assets.
B. The Vanguard Group furnishes at cost investment advisory, corporate management, administrative, marketing, and distribution services. The costs of such services are allocated to the fund under methods approved by the board of trustees. The fund has committed to provide up to 0.40% of its net assets in capital contributions to Vanguard. At December 31, 2013, the fund had contributed capital of $5,079,000 to Vanguard (included in Other Assets), representing 0.01% of the fund’s net assets and 2.03% of Vanguard’s capitalization. The fund’s trustees and officers are also directors and officers of Vanguard.
C. Various inputs may be used to determine the value of the fund’s investments. These inputs are summarized in three broad levels for financial statement purposes. The inputs or methodologies used to value securities are not necessarily an indication of the risk associated with investing in those securities.
54
Mid-Cap Index Fund
Level 1—Quoted prices in active markets for identical securities.
Level 2—Other significant observable inputs (including quoted prices for similar securities, interest rates, prepayment speeds, credit risk, etc.).
Level 3—Significant unobservable inputs (including the fund’s own assumptions used to determine the fair value of investments).
The following table summarizes the market value of the fund’s investments as of December 31, 2013, based on the inputs used to value them:
| Level 1 | Level 2 | Level 3 | |
| Investments | ($000) | ($000) | ($000) |
| Common Stocks | 46,603,708 | — | — |
| Temporary Cash Investments | 298,538 | 9,996 | — |
| Futures Contracts—Assets1 | 585 | — | — |
| Futures Contracts—Liabilities1 | (148) | — | — |
| Swap Contracts—Assets | — | 947 | — |
| Total | 46,902,683 | 10,943 | — |
| 1 Represents variation margin on the last day of the reporting period. |
D. At December 31, 2013, the aggregate settlement value of open futures contracts and the related unrealized appreciation (depreciation) were:
| ($000) | ||||
| Aggregate | ||||
| Number of | Settlement | Unrealized | ||
| Long (Short) | Value | Appreciation | ||
| Futures Contracts | Expiration | Contracts | Long (Short) | (Depreciation) |
| E-mini S&P MidCap 400 Index | March 2014 | 332 | 44,468 | 1,001 |
| S&P 500 Index | March 2014 | 52 | 23,934 | 885 |
| 1,886 |
Unrealized appreciation (depreciation) on open futures contracts is required to be treated as realized gain (loss) for tax purposes.
| At December 31, 2013, the fund had the following open total return swap contracts: | |||||
| Floating | Unrealized | ||||
| Notional | Interest Rate | Appreciation | |||
| Termination | Amount | Received | (Depreciation) | ||
| Reference Entity | Date | Counterparty1 | ($000) | (Paid) | ($000) |
| SLM Corp. | 1/25/14 | GSI | 75,255 | (0.515%) | 947 |
| 1 GSI—Goldman Sachs International. | |||||
After December 31, 2013, the counterparty had deposited in segregated accounts cash with a value of $950,000 in connection with open swap contracts. In the event of default or bankruptcy by the counterparty, the fund may retain the cash, however such action may be subject to legal proceedings.
55
Mid-Cap Index Fund
E. Distributions are determined on a tax basis and may differ from net investment income and realized capital gains for financial reporting purposes. Differences may be permanent or temporary. Permanent differences are reclassified among capital accounts in the financial statements to reflect their tax character. Temporary differences arise when certain items of income, expense, gain, or loss are recognized in different periods for financial statement and tax purposes. These differences will reverse at some time in the future. Differences in classification may also result from the treatment of short-term gains as ordinary income for tax purposes.
Realized and unrealized gains (losses) on the fund’s swap contracts are treated as ordinary income (loss) for tax purposes. Realized gains of $21,283,000 on swap contracts have been reclassified from accumulated net realized losses to undistributed net investment income.
During the year ended December 31, 2013, the fund realized $1,316,151,000 of net capital gains resulting from in-kind redemptions—in which shareholders exchanged fund shares for securities held by the fund rather than for cash. Because such gains are not taxable to the fund, and are not distributed to shareholders, they have been reclassified from accumulated net realized losses to paid-in capital.
For tax purposes, at December 31, 2013, the fund had $8,882,000 of ordinary income available for distribution. The fund used capital loss carryforwards of $2,219,474,000 to offset taxable capital gains realized during the year ended December 31, 2013. At December 31, 2013, the fund had available capital losses totaling $374,408,000 to offset future net capital gains through December 31, 2018.
At December 31, 2013, the cost of investment securities for tax purposes was $34,741,734,000. Net unrealized appreciation of investment securities for tax purposes was $12,170,508,000, consisting of unrealized gains of $12,825,991,000 on securities that had risen in value since their purchase and $655,483,000 in unrealized losses on securities that had fallen in value since their purchase.
F. During the year ended December 31, 2013, the fund purchased $19,019,711,000 of investment securities and sold $15,517,710,000 of investment securities, other than temporary cash investments. Purchases and sales include $4,360,269,000 and $3,048,363,000, respectively, in connection with in-kind purchases and redemptions of the fund’s capital shares.
56
Mid-Cap Index Fund
G. Capital share transactions for each class of shares were:
| Year Ended December 31, | ||||
| 2013 | 2012 | |||
| Amount | Shares | Amount | Shares | |
| ($000) | (000) | ($000) | (000) | |
| Investor Shares | ||||
| Issued | 856,554 | 32,579 | 714,211 | 33,073 |
| Issued in Lieu of Cash Distributions | 46,436 | 1,569 | 46,399 | 2,063 |
| Redeemed | (1,260,609) | (47,275) | (1,597,899) | (74,317) |
| Net Increase (Decrease)—Investor Shares | (357,619) | (13,127) | (837,289) | (39,181) |
| Admiral Shares | ||||
| Issued | 1,714,308 | 13,967 | 831,355 | 8,435 |
| Issued in Lieu of Cash Distributions | 105,835 | 788 | 86,410 | 847 |
| Redeemed | (859,510) | (7,109) | (867,852) | (8,837) |
| Net Increase (Decrease) —Admiral Shares | 960,633 | 7,646 | 49,913 | 445 |
| Signal Shares | ||||
| Issued | 2,556,524 | 67,255 | 1,794,040 | 58,026 |
| Issued in Lieu of Cash Distributions | 75,284 | 1,778 | 59,736 | 1,856 |
| Redeemed | (2,099,708) | (53,776) | (1,157,957) | (37,196) |
| Net Increase (Decrease)—Signal Shares | 532,100 | 15,257 | 695,819 | 22,686 |
| Institutional Shares | ||||
| Issued | 2,418,607 | 90,613 | 2,043,658 | 94,208 |
| Issued in Lieu of Cash Distributions | 100,999 | 3,406 | 93,697 | 4,159 |
| Redeemed | (2,533,050) | (95,955) | (1,496,105) | (69,989) |
| Net Increase (Decrease) —Institutional Shares | (13,444) | (1,936) | 641,250 | 28,378 |
| Institutional Plus Shares | ||||
| Issued | 2,708,068 | 21,003 | 2,054,815 | 19,336 |
| Issued in Lieu of Cash Distributions | 93,992 | 643 | 69,076 | 622 |
| Redeemed | (1,735,170) | (13,443) | (642,394) | (6,029) |
| Net Increase (Decrease) —Institutional Plus Shares | 1,066,890 | 8,203 | 1,481,497 | 13,929 |
| ETF Shares | ||||
| Issued | 4,440,057 | 43,592 | 2,665,050 | 33,566 |
| Issued in Lieu of Cash Distributions | — | — | — | — |
| Redeemed | (3,128,849) | (30,100) | (2,458,268) | (30,900) |
| Net Increase (Decrease)—ETF Shares | 1,311,208 | 13,492 | 206,782 | 2,666 |
H. Management has determined that no material events or transactions occurred subsequent to December 31, 2013, that would require recognition or disclosure in these financial statements.
57
Mid-Cap Growth Index Fund
Fund Profile
As of December 31, 2013
| Share-Class Characteristics | |||
| Investor | Admiral | ETF | |
| Shares | Shares | Shares | |
| Ticker Symbol | VMGIX | VMGMX | VOT |
| Expense Ratio1 | 0.24% | 0.10% | 0.10% |
| 30-Day SEC Yield | 0.60% | 0.74% | 0.74% |
| Portfolio Characteristics | |||
| DJ | |||
| CRSP US | U.S. Total | ||
| Mid Cap | Stock | ||
| Growth | Market | ||
| Fund | Index | FA Index | |
| Number of Stocks | 178 | 178 | 3,653 |
| Median Market Cap | $10.7B | $10.7B | $43.0B |
| Price/Earnings Ratio | 31.2x | 31.2x | 20.7x |
| Price/Book Ratio | 4.4x | 4.4x | 2.7x |
| Return on Equity | 17.0% | 17.0% | 16.5% |
| Earnings Growth | |||
| Rate | 16.6% | 16.6% | 11.4% |
| Dividend Yield | 0.8% | 0.8% | 1.8% |
| Foreign Holdings | 0.0% | 0.0% | 0.0% |
| Turnover Rate | 64% | — | — |
| Short-Term Reserves | 0.2% | — | — |
Sector Diversification (% of equity exposure)
| DJ | |||
| CRSP US | U.S. Total | ||
| Mid Cap | Stock | ||
| Growth | Market | ||
| Fund | Index | FA Index | |
| Basic Materials | 2.7% | 2.7% | 3.1% |
| Consumer Goods | 11.8 | 11.8 | 10.2 |
| Consumer Services | 18.3 | 18.3 | 13.7 |
| Financials | 10.9 | 10.9 | 18.4 |
| Health Care | 9.6 | 9.7 | 11.8 |
| Industrials | 20.6 | 20.6 | 13.5 |
| Oil & Gas | 8.2 | 8.2 | 9.3 |
| Technology | 16.6 | 16.5 | 14.9 |
| Telecommunications | 0.8 | 0.8 | 2.1 |
| Utilities | 0.5 | 0.5 | 3.0 |
| Volatility Measures | ||
| DJ | ||
| Spliced | U.S. Total | |
| Mid-Cap | Stock Market | |
| Growth Index | FA Index | |
| R-Squared | 1.00 | 0.92 |
| Beta | 1.00 | 1.17 |
These measures show the degree and timing of the fund’s fluctuations compared with the indexes over 36 months.
Ten Largest Holdings (% of total net assets)
| Discovery | Broadcasting & | |
| Communications Inc. | Entertainment | 1.4% |
| Vertex Pharmaceuticals | ||
| Inc. | Biotechnology | 1.2 |
| Cerner Corp. | Software | 1.2 |
| Moody's Corp. | Specialty Finance | 1.2 |
| Chipotle Mexican Grill | ||
| Inc. | Restaurants & Bars | 1.1 |
| Cabot Oil & Gas Corp. | Exploration & | |
| Production | 1.1 | |
| WW Grainger Inc. | Industrial Suppliers | 1.1 |
| Sherwin-Williams Co. | Building Materials & | |
| Fixtures | 1.1 | |
| Pentair Ltd. | Industrial Machinery | 1.1 |
| Health Care REIT Inc. | Specialty REITs | 1.1 |
| Top Ten | 11.6% |
The holdings listed exclude any temporary cash investments and equity index products.
Investment Focus
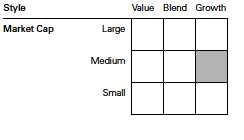
1 The expense ratios shown are from the prospectus dated August 12, 2013, and represent estimated costs for the current fiscal year. For the fiscal year ended December 31, 2013, the expense ratios were 0.24% for Investor Shares, 0.09% for Admiral Shares, and 0.09% for ETF Shares.
58
Mid-Cap Growth Index Fund
Performance Summary
All of the returns in this report represent past performance, which is not a guarantee of future results that may be achieved by the fund. (Current performance may be lower or higher than the performance data cited. For performance data current to the most recent month-end, visit our website at vanguard.com/performance.) Note, too, that both investment returns and principal value can fluctuate widely, so an investor’s shares, when sold, could be worth more or less than their original cost. The returns shown do not reflect taxes that a shareholder would pay on fund distributions or on the sale of fund shares.
Cumulative Performance: August 24, 2006, Through December 31, 2013
Initial Investment of $10,000
| Average Annual Total Returns | |||||
| Periods Ended December 31, 2013 | |||||
| Since | Final Value | ||||
| One | Five | Inception | of a $10,000 | ||
| Year | Years | (8/24/2006) | Investment | ||
| Mid-Cap Growth Index Fund*Investor | |||||
| Shares | 32.02% | 21.99% | 8.59% | $18,335 | |
| •••••••• | Spliced Mid-Cap Growth Index | 32.07 | 22.25 | 8.77 | 18,550 |
| – – – – | Mid-Cap Growth Funds Average | 35.31 | 21.02 | 8.69 | 18,455 |
| Dow Jones U.S. Total Stock Market | |||||
| Float Adjusted Index | 33.47 | 18.86 | 7.82 | 17,402 | |
For a benchmark description, see the Glossary.
Mid-Cap Growth Funds Average: Derived from data provided by Lipper, a Thomson Reuters Company.
"Since Inception" performance is calculated from the Investor Shares’ inception date for both the fund and its comparative standards.
| Since | Final Value | ||
| One | Inception | of a $10,000 | |
| Year | (9/27/2011) | Investment | |
| Mid-Cap Growth Index Fund Admiral Shares | 32.22% | 22.43% | $15,800 |
| Spliced Mid-Cap Growth Index | 32.07 | 22.43 | 15,800 |
| Dow Jones U.S. Total Stock Market Float | |||
| Adjusted Index | 33.47 | 25.52 | 16,717 |
"Since Inception" performance is calculated from the Admiral Shares’ inception date for both the fund and its comparative standards.
See Financial Highlights for dividend and capital gains information.
59
| Mid-Cap Growth Index Fund | ||||
| Average Annual Total Returns | ||||
| Periods Ended December 31, 2013 | ||||
| Since | Final Value | |||
| One | Five | Inception | of a $10,000 | |
| Year | Years | (8/17/2006) | Investment | |
| Mid-Cap Growth Index Fund | ||||
| ETF Shares Net Asset Value | 32.23% | 22.18% | 8.51% | $18,259 |
| Spliced Mid-Cap Growth Index | 32.07 | 22.25 | 8.53 | 18,287 |
| Dow Jones U.S. Total Stock Market Float | ||||
| Adjusted Index | 33.47 | 18.86 | 7.76 | 17,346 |
"Since Inception" performance is calculated from the ETF Shares’ inception date for both the fund and its comparative standards.
| Cumulative Returns of ETF Shares: August 17, 2006, Through December 31, 2013 | |||
| Since | |||
| One | Five | Inception | |
| Year | Years | (8/17/2006) | |
| Mid-Cap Growth Index Fund ETF Shares Market | |||
| Price | 32.23% | 172.74% | 82.65% |
| Mid-Cap Growth Index Fund ETF Shares Net Asset | |||
| Value | 32.23 | 172.27 | 82.59 |
| Spliced Mid-Cap Growth Index | 32.07 | 173.01 | 82.87 |
"Since Inception" performance is calculated from the ETF Shares’ inception date for both the fund and its comparative standards.
Fiscal-Year Total Returns (%): August 24, 2006, Through December 31, 2013
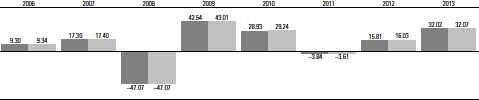
Mid-Cap Growth Index Fund Investor Shares
Spliced Mid-Cap Growth Index
For a benchmark description, see the Glossary.
60
Mid-Cap Growth Index Fund
Financial Statements
Statement of Net Assets
As of December 31, 2013
The fund reports a complete list of its holdings in regulatory filings four times in each fiscal year, at the quarter-ends. For the second and fourth fiscal quarters, the lists appear in the fund’s semiannual and annual reports to shareholders. For the first and third fiscal quarters, the fund files the lists with the Securities and Exchange Commission on Form N-Q. Shareholders can look up the fund’s Forms N-Q on the SEC’s website at sec.gov. Forms N-Q may also be reviewed and copied at the SEC’s Public Reference Room (see the back cover of this report for further information).
| Market | |||
| Value | |||
| Shares | ($000) | ||
| Common Stocks (100.0%)1 | |||
| Basic Materials (2.7%) | |||
| Eastman Chemical Co. | 432,629 | 34,913 | |
| FMC Corp. | 374,524 | 28,261 | |
| CONSOL Energy Inc. | 643,444 | 24,477 | |
| Airgas Inc. | 186,527 | 20,863 | |
| 108,514 | |||
| Consumer Goods (11.8%) | |||
| BorgWarner Inc. | 639,305 | 35,744 | |
| PVH Corp. | 229,286 | 31,187 | |
| Ralph Lauren Corp. Class A | 169,992 | 30,015 | |
| * | Monster Beverage Corp. | 424,085 | 28,740 |
| Polaris Industries Inc. | 194,732 | 28,361 | |
| Church & Dwight Co. Inc. | 390,241 | 25,865 | |
| * | Mohawk Industries Inc. | 173,563 | 25,844 |
| * | Green Mountain Coffee | ||
| Roasters Inc. | 335,115 | 25,328 | |
| * | LKQ Corp. | 760,400 | 25,017 |
| McCormick & Co. Inc. | 319,991 | 22,054 | |
| Harley-Davidson Inc. | 310,743 | 21,516 | |
| * | Under Armour Inc. Class A | 228,628 | 19,959 |
| * | Electronic Arts Inc. | 825,290 | 18,932 |
| * | Lululemon Athletica Inc. | 290,910 | 17,172 |
| *,^ | Tesla Motors Inc. | 111,990 | 16,841 |
| Herbalife Ltd. | 213,466 | 16,800 | |
| * | WABCO Holdings Inc. | 174,683 | 16,317 |
| * | Constellation Brands Inc. | ||
| Class A | 220,922 | 15,549 | |
| * | Fossil Group Inc. | 124,195 | 14,896 |
| * | NVR Inc. | 11,496 | 11,795 |
| * | Jarden Corp. | 171,357 | 10,513 |
| Nu Skin Enterprises Inc. | |||
| Class A | 75,077 | 10,377 | |
| PulteGroup Inc. | 482,845 | 9,836 | |
| Coty Inc. Class A | 91,728 | 1,399 | |
| 480,057 | |||
| Consumer Services (18.3%) | |||
| * | Chipotle Mexican Grill Inc. | ||
| Class A | 86,959 | 46,330 | |
| Ross Stores Inc. | 578,522 | 43,349 | |
| Market | |||
| Value | |||
| Shares | ($000) | ||
| L Brands Inc. | 693,429 | 42,889 | |
| * | Discovery Communications | ||
| Inc. Class A | 411,755 | 37,231 | |
| Southwest Airlines Co. | 1,957,909 | 36,887 | |
| * | O’Reilly Automotive Inc. | 286,578 | 36,886 |
| * | Dollar Tree Inc. | 555,604 | 31,347 |
| Tractor Supply Co. | 392,327 | 30,437 | |
| * | CarMax Inc. | 627,650 | 29,512 |
| * | Netflix Inc. | 79,105 | 29,124 |
| Tiffany & Co. | 305,954 | 28,386 | |
| * | Dollar General Corp. | 450,068 | 27,148 |
| Marriott International Inc. | |||
| Class A | 547,160 | 27,008 | |
| Wyndham Worldwide Corp. | 366,215 | 26,986 | |
| * | Charter Communications | ||
| Inc. Class A | 190,240 | 26,017 | |
| * | TripAdvisor Inc. | 308,819 | 25,580 |
| Nordstrom Inc. | 407,567 | 25,188 | |
| PetSmart Inc. | 291,525 | 21,208 | |
| * | IHS Inc. Class A | 160,562 | 19,219 |
| Scripps Networks | |||
| Interactive Inc. Class A | 219,849 | 18,997 | |
| * | Discovery Communications | ||
| Inc. | 225,641 | 18,922 | |
| Family Dollar Stores Inc. | 274,961 | 17,864 | |
| * | Ulta Salon Cosmetics & | ||
| Fragrance Inc. | 171,575 | 16,560 | |
| Williams-Sonoma Inc. | 228,659 | 13,326 | |
| FactSet Research | |||
| Systems Inc. | 115,102 | 12,498 | |
| * | Urban Outfitters Inc. | 310,163 | 11,507 |
| * | AutoNation Inc. | 205,267 | 10,200 |
| * | Sprouts Farmers | ||
| Market Inc. | 205,644 | 7,903 | |
| * | Norwegian Cruise Line | ||
| Holdings Ltd. | 201,622 | 7,152 | |
| * | Groupon Inc. | 560,946 | 6,602 |
| * | Hyatt Hotels Corp. Class A | 123,657 | 6,116 |
| * | Extended Stay America Inc. | 83,635 | 2,196 |
| 740,575 |
61
| Mid-Cap Growth Index Fund | |||
| Market | |||
| Value | |||
| Shares | ($000) | ||
| Financials (10.9%) | |||
| Moody’s Corp. | 604,522 | 47,437 | |
| Health Care REIT Inc. | 811,223 | 43,457 | |
| AvalonBay | |||
| Communities Inc. | 345,530 | 40,852 | |
| IntercontinentalExchange | |||
| Group Inc. | 161,633 | 36,354 | |
| * | Affiliated Managers | ||
| Group Inc. | 148,526 | 32,212 | |
| Leucadia National Corp. | 870,814 | 24,679 | |
| * | CBRE Group Inc. Class A | 791,655 | 20,821 |
| Federal Realty Investment | |||
| Trust | 182,796 | 18,537 | |
| Raymond James | |||
| Financial Inc. | 354,266 | 18,489 | |
| * | Ocwen Financial Corp. | 323,711 | 17,950 |
| Digital Realty Trust Inc. | 361,024 | 17,733 | |
| Essex Property Trust Inc. | 106,693 | 15,312 | |
| SEI Investments Co. | 431,582 | 14,989 | |
| Rayonier Inc. | 354,894 | 14,941 | |
| Lazard Ltd. Class A | 326,494 | 14,797 | |
| * | MSCI Inc. Class A | 332,782 | 14,549 |
| Alexandria Real Estate | |||
| Equities Inc. | 201,133 | 12,796 | |
| Macerich Co. | 197,329 | 11,621 | |
| * | Realogy Holdings Corp. | 205,019 | 10,142 |
| Cole Real Estate | |||
| Investment Inc. | 657,955 | 9,238 | |
| Camden Property Trust | 119,483 | 6,796 | |
| 443,702 | |||
| Health Care (9.6%) | |||
| * | Vertex Pharmaceuticals Inc. | 656,967 | 48,813 |
| * | Forest Laboratories Inc. | 681,456 | 40,908 |
| * | Illumina Inc. | 355,277 | 39,301 |
| * | Perrigo Co. plc | 251,807 | 38,642 |
| * | DaVita HealthCare | ||
| Partners Inc. | 567,901 | 35,988 | |
| * | BioMarin | ||
| Pharmaceutical Inc. | 399,659 | 28,084 | |
| * | Varian Medical | ||
| Systems Inc. | 297,108 | 23,082 | |
| * | Waters Corp. | 227,358 | 22,736 |
| * | Edwards Lifesciences Corp. | 307,486 | 20,220 |
| DENTSPLY International Inc. | 400,928 | 19,437 | |
| ^ | ResMed Inc. | 399,299 | 18,799 |
| * | Pharmacyclics Inc. | 165,804 | 17,539 |
| * | IDEXX Laboratories Inc. | 145,916 | 15,521 |
| * | Incyte Corp. Ltd. | 203,284 | 10,292 |
| * | Quintiles Transnational | ||
| Holdings Inc. | 107,563 | 4,985 | |
| * | Envision Healthcare | ||
| Holdings Inc. | 125,913 | 4,472 | |
| 388,819 | |||
| Market | |||
| Value | |||
| Shares | ($000) | ||
| Industrials (20.6%) | |||
| WW Grainger Inc. | 175,554 | 44,840 | |
| Sherwin-Williams Co. | 242,143 | 44,433 | |
| Pentair Ltd. | 560,166 | 43,508 | |
| Amphenol Corp. Class A | 444,809 | 39,668 | |
| Roper Industries Inc. | 279,132 | 38,710 | |
| Kansas City Southern | 309,763 | 38,358 | |
| AMETEK Inc. | 687,841 | 36,229 | |
| Fastenal Co. | 750,529 | 35,658 | |
| * | Alliance Data Systems Corp. | 130,053 | 34,195 |
| Flowserve Corp. | 392,005 | 30,902 | |
| * | Stericycle Inc. | 240,923 | 27,988 |
| * | Verisk Analytics Inc. | ||
| Class A | 425,490 | 27,963 | |
| Pall Corp. | 311,417 | 26,579 | |
| * | B/E Aerospace Inc. | 294,465 | 25,627 |
| Expeditors International | |||
| of Washington Inc. | 577,775 | 25,567 | |
| * | Trimble Navigation Ltd. | 724,646 | 25,145 |
| Chicago Bridge & | |||
| Iron Co. NV | 302,111 | 25,118 | |
| CH Robinson | |||
| Worldwide Inc. | 426,131 | 24,861 | |
| * | FleetCor Technologies Inc. | 196,503 | 23,024 |
| ADT Corp. | 567,058 | 22,949 | |
| Masco Corp. | 1,003,210 | 22,843 | |
| TransDigm Group Inc. | 133,227 | 21,452 | |
| Rock Tenn Co. Class A | 202,449 | 21,259 | |
| JB Hunt Transport | |||
| Services Inc. | 265,015 | 20,486 | |
| * | Mettler-Toledo | ||
| International Inc. | 83,425 | 20,238 | |
| * | Quanta Services Inc. | 596,803 | 18,835 |
| Donaldson Co. Inc. | 410,959 | 17,860 | |
| Robert Half | |||
| International Inc. | 370,012 | 15,537 | |
| * | Sensata Technologies | ||
| Holding NV | 338,468 | 13,122 | |
| Martin Marietta | |||
| Materials Inc. | 129,841 | 12,976 | |
| National Instruments Corp. | 281,233 | 9,005 | |
| 834,935 | |||
| Oil & Gas (8.2%) | |||
| Cabot Oil & Gas Corp. | 1,185,776 | 45,961 | |
| Range Resources Corp. | 436,345 | 36,788 | |
| EQT Corp. | 381,229 | 34,227 | |
| * | Concho Resources Inc. | 295,330 | 31,896 |
| * | Cheniere Energy Inc. | 604,236 | 26,055 |
| Core Laboratories NV | 127,581 | 24,361 | |
| Oceaneering | |||
| International Inc. | 304,058 | 23,984 | |
| * | Whiting Petroleum Corp. | 333,447 | 20,630 |
| SM Energy Co. | 188,311 | 15,650 | |
| QEP Resources Inc. | 503,863 | 15,443 | |
| Noble Corp. plc | 356,119 | 13,344 | |
62
| Mid-Cap Growth Index Fund | |||
| Market | |||
| Value | |||
| Shares | ($000) | ||
| * | Cobalt International | ||
| Energy Inc. | 809,157 | 13,311 | |
| * | Dresser-Rand Group Inc. | 214,234 | 12,775 |
| * | Rowan Cos. plc Class A | 348,916 | 12,338 |
| * | Antero Resources Corp. | 110,195 | 6,991 |
| 333,754 | |||
| Technology (16.6%) | |||
| * | Cerner Corp. | 868,154 | 48,391 |
| Xilinx Inc. | 754,061 | 34,626 | |
| * | Autodesk Inc. | 633,974 | 31,908 |
| Avago Technologies Ltd. | |||
| Class A | 591,249 | 31,271 | |
| KLA-Tencor Corp. | 468,374 | 30,191 | |
| Linear Technology Corp. | 658,106 | 29,977 | |
| * | Red Hat Inc. | 532,523 | 29,843 |
| * | Catamaran Corp. | 579,758 | 27,527 |
| * | Lam Research Corp. | 456,381 | 24,850 |
| * | Equinix Inc. | 139,895 | 24,824 |
| Microchip Technology Inc. | 529,621 | 23,701 | |
| * | VeriSign Inc. | 385,147 | 23,024 |
| * | ANSYS Inc. | 260,488 | 22,715 |
| * | Akamai Technologies Inc. | 477,826 | 22,544 |
| SanDisk Corp. | 317,441 | 22,392 | |
| Maxim Integrated | |||
| Products Inc. | 794,143 | 22,165 | |
| * | Cree Inc. | 339,218 | 21,225 |
| * | Teradata Corp. | 459,250 | 20,891 |
| * | F5 Networks Inc. | 218,110 | 19,817 |
| * | ServiceNow Inc. | 331,477 | 18,566 |
| * | Workday Inc. Class A | 219,720 | 18,272 |
| * | Gartner Inc. | 246,135 | 17,488 |
| * | Micron Technology Inc. | 739,059 | 16,082 |
| * | Skyworks Solutions Inc. | 529,531 | 15,123 |
| * | 3D Systems Corp. | 136,907 | 12,723 |
| * | Rackspace Hosting Inc. | 314,116 | 12,291 |
| NVIDIA Corp. | 756,461 | 12,119 | |
| * | TIBCO Software Inc. | 435,008 | 9,779 |
| * | Splunk Inc. | 103,813 | 7,129 |
| * | Informatica Corp. | 152,322 | 6,321 |
| * | MICROS Systems Inc. | 105,651 | 6,061 |
| * | NetSuite Inc. | 47,163 | 4,859 |
| * | Premier Inc. Class A | 86,419 | 3,177 |
| 671,872 | |||
| Telecommunications (0.8%) | |||
| * | SBA Communications | ||
| Corp. Class A | 360,884 | 32,422 | |
| Utilities (0.5%) | |||
| * | Calpine Corp. | 1,100,784 | 21,476 |
| Total Common Stocks | |||
| (Cost $3,384,485) | 4,056,126 | ||
| Market | ||
| Value | ||
| Shares | ($000) | |
| Temporary Cash Investments (0.6%)1 | ||
| Money Market Fund (0.6%) | ||
| 2,3 Vanguard Market Liquidity | ||
| Fund, 0.125% | 23,940,296 | 23,940 |
| Face |
| Amount |
| ($000) |
| U.S. Government and Agency Obligations (0.0%) |
| 4,5 | Fannie Mae Discount Notes, | ||
| 0.060%, 3/19/14 | 700 | 700 | |
| 4,6 | Federal Home Loan | ||
| Bank Discount Notes, | |||
| 0.065%, 3/21/14 | 500 | 500 | |
| 1,200 | |||
| Total Temporary Cash Investments | |||
| (Cost $25,140) | 25,140 | ||
| Total Investments (100.6%) | |||
| (Cost $3,409,625) | 4,081,266 | ||
| Other Assets and Liabilities (-0.6%) | |||
| Other Assets | 9,574 | ||
| Liabilities3 | (34,059) | ||
| (24,485) | |||
| Net Assets (100%) | 4,056,781 | ||
63
Mid-Cap Growth Index Fund
| At December 31, 2013, net assets consisted of: | |
| Amount | |
| ($000) | |
| Paid-in Capital | 3,460,044 |
| Overdistributed Net Investment Income | (1,667) |
| Accumulated Net Realized Losses | (73,250) |
| Unrealized Appreciation (Depreciation) | |
| Investment Securities | 671,641 |
| Futures Contracts | 13 |
| Net Assets | 4,056,781 |
| Investor Shares—Net Assets | |
| Applicable to 16,774,871 outstanding | |
| $.001 par value shares of beneficial | |
| interest (unlimited authorization) | 594,860 |
| Net Asset Value Per Share— | |
| Investor Shares | $35.46 |
| Admiral Shares—Net Assets | |
| Applicable to 40,332,151 outstanding | |
| $.001 par value shares of beneficial | |
| interest (unlimited authorization) | 1,566,079 |
| Net Asset Value Per Share— | |
| Admiral Shares | $38.83 |
| ETF Shares—Net Assets | |
| Applicable to 21,017,937 outstanding | |
| $.001 par value shares of beneficial | |
| interest (unlimited authorization) | 1,895,842 |
| Net Asset Value Per Share— | |
| ETF Shares | $90.20 |
See Note A in Notes to Financial Statements.
* Non-income-producing security.
^ Includes partial security positions on loan to broker-dealers. The total value of securities on loan is $12,207,000.
1 The fund invests a portion of its cash reserves in equity markets through the use of index futures contracts. After giving effect to futures investments, the fund’s effective common stock and temporary cash investment positions represent 100.1% and 0.5%, respectively, of net assets.
2 Affiliated money market fund available only to Vanguard funds and certain trusts and accounts managed by Vanguard. Rate shown is the 7-day yield.
3 Includes $12,678,000 of collateral received for securities on loan.
4 Securities with a value of $400,000 have been segregated as initial margin for open futures contracts.
5 The issuer was placed under federal conservatorship in September 2008; since that time, its daily operations have been managed by the Federal Housing Finance Agency and it receives capital from the U.S. Treasury, as needed to maintain a positive net worth, in exchange for senior preferred stock.
6 The issuer operates under a congressional charter; its securities are generally neither guaranteed by the U.S. Treasury nor backed by the full faith and credit of the U.S. government.
REIT—Real Estate Investment Trust.
See accompanying Notes, which are an integral part of the Financial Statements.
64
| Mid-Cap Growth Index Fund | |
| Statement of Operations | |
| Year Ended | |
| December 31, 2013 | |
| ($000) | |
| Investment Income | |
| Income | |
| Dividends | 27,243 |
| Interest1 | 11 |
| Securities Lending | 296 |
| Total Income | 27,550 |
| Expenses | |
| The Vanguard Group—Note B | |
| Investment Advisory Services | 291 |
| Management and Administrative—Investor Shares | 1,100 |
| Management and Administrative—Admiral Shares | 724 |
| Management and Administrative—ETF Shares | 871 |
| Marketing and Distribution—Investor Shares | 140 |
| Marketing and Distribution—Admiral Shares | 229 |
| Marketing and Distribution—ETF Shares | 336 |
| Custodian Fees | 64 |
| Auditing Fees | 31 |
| Shareholders’ Reports—Investor Shares | 16 |
| Shareholders’ Reports—Admiral Shares | 16 |
| Shareholders’ Reports—ETF Shares | 60 |
| Trustees’ Fees and Expenses | 4 |
| Total Expenses | 3,882 |
| Net Investment Income | 23,668 |
| Realized Net Gain (Loss) | |
| Investment Securities Sold | 490,697 |
| Futures Contracts | (1,638) |
| Realized Net Gain (Loss) | 489,059 |
| Change in Unrealized Appreciation (Depreciation) | |
| Investment Securities | 407,608 |
| Futures Contracts | 13 |
| Change in Unrealized Appreciation (Depreciation) | 407,621 |
| Net Increase (Decrease) in Net Assets Resulting from Operations | 920,348 |
| 1 Interest income from an affiliated company of the fund was $8,000. | |
See accompanying Notes, which are an integral part of the Financial Statements.
65
| Mid-Cap Growth Index Fund | ||
| Statement of Changes in Net Assets | ||
| Year Ended December 31, | ||
| 2013 | 2012 | |
| ($000) | ($000) | |
| Increase (Decrease) in Net Assets | ||
| Operations | ||
| Net Investment Income | 23,668 | 17,113 |
| Realized Net Gain (Loss) | 489,059 | 78,605 |
| Change in Unrealized Appreciation (Depreciation) | 407,621 | 236,438 |
| Net Increase (Decrease) in Net Assets Resulting from Operations | 920,348 | 332,156 |
| Distributions | ||
| Net Investment Income | ||
| Investor Shares | (2,863) | (2,603) |
| Admiral Shares | (9,414) | (6,255) |
| ETF Shares | (11,564) | (8,280) |
| Realized Capital Gain | ||
| Investor Shares | — | — |
| Admiral Shares | — | — |
| ETF Shares | — | — |
| Total Distributions | (23,841) | (17,138) |
| Capital Share Transactions | ||
| Investor Shares | (36,578) | (90,935) |
| Admiral Shares | 329,271 | 299,717 |
| ETF Shares | 272,035 | (51,292) |
| Net Increase (Decrease) from Capital Share Transactions | 564,728 | 157,490 |
| Total Increase (Decrease) | 1,461,235 | 472,508 |
| Net Assets | ||
| Beginning of Period | 2,595,546 | 2,123,038 |
| End of Period1 | 4,056,781 | 2,595,546 |
1 Net Assets—End of Period includes undistributed (overdistributed) net investment income of ($1,667,000) and ($1,494,000).
See accompanying Notes, which are an integral part of the Financial Statements.
66
| Mid-Cap Growth Index Fund | |||||
| Financial Highlights | |||||
| Investor Shares | |||||
| For a Share Outstanding | Year Ended December 31, | ||||
| Throughout Each Period | 2013 | 2012 | 2011 | 2010 | 2009 |
| Net Asset Value, Beginning of Period | $26.99 | $23.43 | $24.46 | $19.05 | $13.43 |
| Investment Operations | |||||
| Net Investment Income | .169 | .146 | .087 | .1041 | .084 |
| Net Realized and Unrealized Gain (Loss) | |||||
| on Investments | 8.470 | 3.559 | (1.027) | 5.408 | 5.629 |
| Total from Investment Operations | 8.639 | 3.705 | (.940) | 5.512 | 5.713 |
| Distributions | |||||
| Dividends from Net Investment Income | (.169) | (.145) | (. 090) | (.102) | (. 093) |
| Distributions from Realized Capital Gains | — | — | — | — | — |
| Total Distributions | (.169) | (.145) | (. 090) | (.102) | (. 093) |
| Net Asset Value, End of Period | $35.46 | $26.99 | $23.43 | $24.46 | $19.05 |
| Total Return2 | 32.02% | 15.81% | -3.84% | 28.93% | 42.54% |
| Ratios/Supplemental Data | |||||
| Net Assets, End of Period (Millions) | $595 | $483 | $503 | $958 | $546 |
| Ratio of Total Expenses to | |||||
| Average Net Assets | 0.24% | 0.24% | 0.24% | 0.26% | 0.30% |
| Ratio of Net Investment Income to | |||||
| Average Net Assets | 0.57% | 0.58% | 0.35% | 0.57%1 | 0.55% |
| Portfolio Turnover Rate 3 | 64% | 38% | 41% | 38% | 43% |
1 Net investment income per share and the ratio of net investment income to average net assets include $0.011 and 0.06%, respectively, resulting from a special dividend from VeriSign Inc. in December 2010.
2 Total returns do not include account service fees that may have applied in the periods shown. Fund prospectuses provide information about any applicable account service fees.
3 Excludes the value of portfolio securities received or delivered as a result of in-kind purchases or redemptions of the fund’s capital shares, including ETF Creation Units.
See accompanying Notes, which are an integral part of the Financial Statements.
67
| Mid-Cap Growth Index Fund | |||
| Financial Highlights | |||
| Admiral Shares | |||
| Sept. 27, | |||
| Year Ended | 20111 to | ||
| December 31, | Dec. 31, | ||
| For a Share Outstanding Throughout Each Period | 2013 | 2012 | 2011 |
| Net Asset Value, Beginning of Period | $29.55 | $25.66 | $25.00 |
| Investment Operations | |||
| Net Investment Income | . 239 | . 205 | . 027 |
| Net Realized and Unrealized Gain (Loss) on Investments | 9.279 | 3.889 | 0.736 |
| Total from Investment Operations | 9.518 | 4.094 | 0.763 |
| Distributions | |||
| Dividends from Net Investment Income | (.238) | (.204) | (.103) |
| Distributions from Realized Capital Gains | — | — | — |
| Total Distributions | (.238) | (.204) | (.103) |
| Net Asset Value, End of Period | $38.83 | $29.55 | $25.66 |
| Total Return2 | 32.22% | 15.96% | 3.05% |
| Ratios/Supplemental Data | |||
| Net Assets, End of Period (Millions) | $1,566 | $913 | $525 |
| Ratio of Total Expenses to Average Net Assets | 0.09% | 0.10% | 0.10%3 |
| Ratio of Net Investment Income to Average Net Assets | 0.72% | 0.72% | 0.49%3 |
| Portfolio Turnover Rate 4 | 64% | 38% | 41% |
1 Inception.
2 Total returns do not include account service fees that may have applied in the periods shown. Fund prospectuses provide information about any applicable account service fees.
3 Annualized.
4 Excludes the value of portfolio securities received or delivered as a result of in-kind purchases or redemptions of the fund’s capital shares, including ETF Creation Units.
See accompanying Notes, which are an integral part of the Financial Statements.
68
| Mid-Cap Growth Index Fund | |||||
| Financial Highlights | |||||
| ETF Shares | |||||
| For a Share Outstanding | Year Ended December 31, | ||||
| Throughout Each Period | 2013 | 2012 | 2011 | 2010 | 2009 |
| Net Asset Value, Beginning of Period | $68.64 | $59.61 | $62.23 | $48.45 | $34.12 |
| Investment Operations | |||||
| Net Investment Income | . 556 | . 474 | .316 | .3261 | .267 |
| Net Realized and Unrealized Gain (Loss) | |||||
| on Investments | 21.558 | 9.029 | (2.617) | 13.776 | 14.353 |
| Total from Investment Operations | 22.114 | 9.503 | (2.301) | 14.102 | 14.620 |
| Distributions | |||||
| Dividends from Net Investment Income | (.554) | (.473) | (. 319) | (. 322) | (. 290) |
| Distributions from Realized Capital Gains | — | — | — | — | — |
| Total Distributions | (.554) | (.473) | (. 319) | (. 322) | (. 290) |
| Net Asset Value, End of Period | $90.20 | $68.64 | $59.61 | $62.23 | $48.45 |
| Total Return | 32.23% | 15.94% | -3.70% | 29.11% | 42.85% |
| Ratios/Supplemental Data | |||||
| Net Assets, End of Period (Millions) | $1,896 | $1,200 | $1,095 | $1,030 | $646 |
| Ratio of Total Expenses to | |||||
| Average Net Assets | 0.09% | 0.10% | 0.10% | 0.12% | 0.14% |
| Ratio of Net Investment Income to | |||||
| Average Net Assets | 0.72% | 0.72% | 0.49% | 0.71%1 | 0.71% |
| Portfolio Turnover Rate2 | 64% | 38% | 41% | 38% | 43% |
1 Net investment income per share and the ratio of net investment income to average net assets include $0.028 and 0.06%, respectively, resulting from a special dividend from VeriSign Inc. in December 2010.
2 Excludes the value of portfolio securities received or delivered as a result of in-kind purchases or redemptions of the fund’s capital shares, including ETF Creation Units.
See accompanying Notes, which are an integral part of the Financial Statements.
69
Mid-Cap Growth Index Fund
Notes to Financial Statements
Vanguard Mid-Cap Growth Index Fund is registered under the Investment Company Act of 1940 as an open-end investment company, or mutual fund. The fund offers three classes of shares: Investor Shares, Admiral Shares, and ETF Shares. Investor Shares are available to any investor who meets the fund’s minimum purchase requirements. Admiral Shares are designed for investors who meet certain administrative, service, and account-size criteria. ETF Shares are listed for trading on NYSE Arca; they can be purchased and sold through a broker.
A. The following significant accounting policies conform to generally accepted accounting principles for U.S. mutual funds. The fund consistently follows such policies in preparing its financial statements.
1. Security Valuation: Securities are valued as of the close of trading on the New York Stock Exchange (generally 4 p.m., Eastern time) on the valuation date. Equity securities are valued at the latest quoted sales prices or official closing prices taken from the primary market in which each security trades; such securities not traded on the valuation date are valued at the mean of the latest quoted bid and asked prices. Securities for which market quotations are not readily available, or whose values have been materially affected by events occurring before the fund’s pricing time but after the close of the securities’ primary markets, are valued by methods deemed by the board of trustees to represent fair value. Investments in Vanguard Market Liquidity Fund are valued at that fund’s net asset value. Temporary cash investments acquired over 60 days to maturity are valued using the latest bid prices or using valuations based on a matrix system (which considers such factors as security prices, yields, maturities, and ratings), both as furnished by independent pricing services. Other temporary cash investments are valued at amortized cost, which approximates market value.
2. Futures Contracts: The fund may use index futures contracts to a limited extent, with the objectives of maintaining full exposure to the stock market, enhancing returns, maintaining liquidity, and minimizing transaction costs. The fund may purchase futures contracts to immediately invest incoming cash in the market, or sell futures in response to cash outflows, thereby simulating a fully invested position in the underlying index while maintaining a cash balance for liquidity. The fund may seek to enhance returns by using futures contracts instead of the underlying securities when futures are believed to be priced more attractively than the underlying securities. The primary risks associated with the use of futures contracts are imperfect correlation between changes in market values of stocks held by the fund and the prices of futures contracts, and the possibility of an illiquid market. Counterparty risk involving futures is mitigated because a regulated clearinghouse is the counterparty instead of the clearing broker. To further mitigate counterparty risk, the fund trades futures contracts on an exchange, monitors the financial strength of its clearing brokers and clearinghouse, and has entered into clearing agreements with its clearing brokers. The clearinghouse imposes initial margin requirements to secure the fund’s performance and requires daily settlement of variation margin representing changes in the market value of each contract.
Futures contracts are valued at their quoted daily settlement prices. The aggregate notional amounts of the contracts are not recorded in the Statement of Net Assets. Fluctuations in the value of the contracts are recorded in the Statement of Net Assets as an asset (liability) and in the Statement of Operations as unrealized appreciation (depreciation) until the contracts are closed, when they are recorded as realized futures gains (losses).
During the year ended December 31, 2013, the fund’s average investments in long and short futures contracts represented less than 1% and 0% of net assets, respectively, based on quarterly average aggregate settlement values
70
Mid-Cap Growth Index Fund
3. Federal Income Taxes: The fund intends to continue to qualify as a regulated investment company and distribute all of its taxable income. Management has analyzed the fund’s tax positions taken for all open federal income tax years (December 31, 2010–2013), and has concluded that no provision for federal income tax is required in the fund’s financial statements.
4. Distributions: Distributions to shareholders are recorded on the ex-dividend date.
5. Securities Lending: To earn additional income, the fund may lend its securities to qualified institutional borrowers. Security loans are required to be secured at all times by collateral in an amount at least equal to the market value of securities loaned. Daily market fluctuations could cause the value of loaned securities to be more or less than the value of the collateral received. When this occurs, the collateral is adjusted and settled on the next business day. The fund further mitigates its counterparty risk by entering into securities lending transactions only with a diverse group of prequalified counterparties, monitoring their financial strength, and entering into master securities lending agreements with its counterparties. The master securities lending agreements provide that, in the event of a counterparty’s default (including bankruptcy), the fund may terminate any loans with that borrower, determine the net amount owed, and sell or retain the collateral up to the net amount owed to the fund; however, such actions may be subject to legal proceedings. While collateral mitigates counterparty risk, in the absence of a default the fund may experience delays and costs in recovering the securities loaned. The fund invests cash collateral received in Vanguard Market Liquidity Fund, and records a liability for the return of the collateral, during the period the securities are on loan. Securities lending income represents fees charged to borrowers plus income earned on invested cash collateral, less expenses associated with the loan.
6. Other: Dividend income is recorded on the ex-dividend date. Interest income includes income distributions received from Vanguard Market Liquidity Fund and is accrued daily. Premiums and discounts on debt securities purchased are amortized and accreted, respectively, to interest income over the lives of the respective securities. Security transactions are accounted for on the date securities are bought or sold. Costs used to determine realized gains (losses) on the sale of investment securities are those of the specific securities sold.
Each class of shares has equal rights as to assets and earnings, except that each class separately bears certain class-specific expenses related to maintenance of shareholder accounts (included in Management and Administrative expenses) and shareholder reporting. Marketing and distribution expenses are allocated to each class of shares based on a method approved by the board of trustees. Income, other non-class-specific expenses, and gains and losses on investments are allocated to each class of shares based on its relative net assets.
B. The Vanguard Group furnishes at cost investment advisory, corporate management, administrative, marketing, and distribution services. The costs of such services are allocated to the fund under methods approved by the board of trustees. The fund has committed to provide up to 0.40% of its net assets in capital contributions to Vanguard. At December 31, 2013, the fund had contributed capital of $446,000 to Vanguard (included in Other Assets), representing 0.01% of the fund’s net assets and 0.18% of Vanguard’s capitalization. The fund’s trustees and officers are also directors and officers of Vanguard.
C. Various inputs may be used to determine the value of the fund’s investments. These inputs are summarized in three broad levels for financial statement purposes. The inputs or methodologies used to value securities are not necessarily an indication of the risk associated with investing in those securities.
71
Mid-Cap Growth Index Fund
Level 1—Quoted prices in active markets for identical securities.
Level 2—Other significant observable inputs (including quoted prices for similar securities, interest rates, prepayment speeds, credit risk, etc.).
Level 3—Significant unobservable inputs (including the fund’s own assumptions used to determine the fair value of investments).
The following table summarizes the market value of the fund’s investments as of December 31, 2013, based on the inputs used to value them:
| Level 1 | Level 2 | Level 3 | |
| Investments | ($000) | ($000) | ($000) |
| Common Stocks | 4,056,126 | — | — |
| Temporary Cash Investments | 23,940 | 1,200 | — |
| Futures Contracts—Assets1 | 6 | — | — |
| Futures Contracts—Liabilities1 | (3) | — | — |
| Total | 4,080,069 | 1,200 | — |
| 1 Represents variation margin on the last day of the reporting period. |
D. At December 31, 2013, the aggregate settlement value of open futures contracts and the related unrealized appreciation (depreciation) were:
| ($000) | ||||
| Aggregate | ||||
| Number of | Settlement | Unrealized | ||
| Long (Short) | Value | Appreciation | ||
| Futures Contracts | Expiration | Contracts | Long (Short) | (Depreciation) |
| E-mini S&P 500 Index | March 2014 | 30 | 2,761 | 1 |
| E-mini S&P MidCap 400 Index | March 2014 | 4 | 536 | 12 |
| 13 |
Unrealized appreciation (depreciation) on open futures contracts is required to be treated as realized gain (loss) for tax purposes.
E. Distributions are determined on a tax basis and may differ from net investment income and realized capital gains for financial reporting purposes. Differences may be permanent or temporary. Permanent differences are reclassified among capital accounts in the financial statements to reflect their tax character. Temporary differences arise when certain items of income, expense, gain, or loss are recognized in different periods for financial statement and tax purposes. These differences will reverse at some time in the future. Differences in classification may also result from the treatment of short-term gains as ordinary income for tax purposes.
During the year ended December 31, 2013, the fund realized $160,015,000 of net capital gains resulting from in-kind redemptions—in which shareholders exchanged fund shares for securities held by the fund rather than for cash. Because such gains are not taxable to the fund, and are not distributed to shareholders, they have been reclassified from accumulated net realized losses to paid-in capital.
72
Mid-Cap Growth Index Fund
For tax purposes, at December 31, 2013, the fund had $313,000 of ordinary income available for distribution. The fund used capital loss carryforwards of $329,040,000 to offset taxable capital gains realized during the year ended December 31, 2013. At December 31, 2013, the fund had available capital losses totaling $73,214,000 to offset future net capital gains through December 31, 2018.
At December 31, 2013, the cost of investment securities for tax purposes was $3,409,647,000. Net unrealized appreciation of investment securities for tax purposes was $671,619,000, consisting of unrealized gains of $749,167,000 on securities that had risen in value since their purchase and $77,548,000 in unrealized losses on securities that had fallen in value since their purchase.
F. During the year ended December 31, 2013, the fund purchased $3,122,821,000 of investment securities and sold $2,557,403,000 of investment securities, other than temporary cash investments. Purchases and sales include $697,113,000 and $413,941,000, respectively, in connection with in-kind purchases and redemptions of the fund’s capital shares.
G. Capital share transactions for each class of shares were:
| Year Ended December 31, | ||||
| 2013 | 2012 | |||
| Amount | Shares | Amount | Shares | |
| ($000) | (000) | ($000) | (000) | |
| Investor Shares | ||||
| Issued | 218,779 | 6,940 | 214,387 | 8,282 |
| Issued in Lieu of Cash Distributions | 2,662 | 76 | 2,430 | 90 |
| Redeemed | (258,019) | (8,134) | (307,752) | (11,934) |
| Net Increase (Decrease)—Investor Shares | (36,578) | (1,118) | (90,935) | (3,562) |
| Admiral Shares | ||||
| Issued | 627,290 | 18,048 | 514,031 | 17,978 |
| Issued in Lieu of Cash Distributions | 8,809 | 230 | 5,791 | 196 |
| Redeemed | (306,828) | (8,830) | (220,105) | (7,742) |
| Net Increase (Decrease) —Admiral Shares | 329,271 | 9,448 | 299,717 | 10,432 |
| ETF Shares | ||||
| Issued | 700,423 | 8,436 | 464,982 | 7,004 |
| Issued in Lieu of Cash Distributions | — | — | — | — |
| Redeemed | (428,388) | (4,900) | (516,274) | (7,900) |
| Net Increase (Decrease)—ETF Shares | 272,035 | 3,536 | (51,292) | (896) |
H. Management has determined that no material events or transactions occurred subsequent to December 31, 2013, that would require recognition or disclosure in these financial statements.
73
Mid-Cap Value Index Fund
Fund Profile
As of December 31, 2013
| Share-Class Characteristics | ||||
| Investor | Admiral | ETF | ||
| Shares | Shares | Shares | ||
| Ticker Symbol | VMVIX | VMVAX | VOE | |
| Expense Ratio1 | 0.24% | 0.10% | 0.10% | |
| 30-Day SEC Yield | 1.59% | 1.73% | 1.73% | |
| Portfolio Characteristics | ||||
| DJ | ||||
| CRSP US | U.S. Total | |||
| Mid Cap | Stock | |||
| Value | Market | |||
| Fund | Index | FA Index | ||
| Number of Stocks | 204 | 204 | 3,653 | |
| Median Market Cap | $9.4B | $9.4B | $43.0B | |
| Price/Earnings Ratio | 20.6x | 20.6x | 20.7x | |
| Price/Book Ratio | 2.0x | 2.0x | 2.7x | |
| Return on Equity | 11.6% | 11.6% | 16.5% | |
| Earnings Growth | ||||
| Rate | 6.3% | 6.3% | 11.4% | |
| Dividend Yield | 1.8% | 1.8% | 1.8% | |
| Foreign Holdings | 0.0% | 0.0% | 0.0% | |
| Turnover Rate | 46% | — | — | |
| Short-Term Reserves | 0.3% | — | — | |
| Sector Diversification (% of equity exposure) | ||||
| DJ | ||||
| CRSP US | U.S. Total | |||
| Mid Cap | Stock | |||
| Value | Market | |||
| Fund | Index | FA Index | ||
| Basic Materials | 6.1% | 6.1% | 3.1% | |
| Consumer Goods | 15.3 | 15.3 | 10.2 | |
| Consumer Services | 12.7 | 12.7 | 13.7 | |
| Financials | 22.7 | 22.7 | 18.4 | |
| Health Care | 7.8 | 7.8 | 11.8 | |
| Industrials | 13.4 | 13.4 | 13.5 | |
| Oil & Gas | 5.4 | 5.4 | 9.3 | |
| Technology | 6.6 | 6.6 | 14.9 | |
| Telecommunications | 0.6 | 0.6 | 2.1 | |
| Utilities | 9.4 | 9.4 | 3.0 | |
| Volatility Measures | ||
| DJ | ||
| Spliced | U.S. Total | |
| Mid-Cap | Stock Market | |
| Value Index | FA Index | |
| R-Squared | 1.00 | 0.97 |
| Beta | 1.00 | 1.07 |
| These measures show the degree and timing of the fund’s | ||
| fluctuations compared with the indexes over 36 months. | ||
| Ten Largest Holdings (% of total net assets) | ||
| Macy's Inc. | Broadline Retailers | 1.3% |
| Western Digital Corp. | Computer Hardware | 1.2 |
| Delphi Automotive plc | Auto Parts | 1.2 |
| Seagate Technology plc | Computer Hardware | 1.1 |
| Mylan Inc. | Pharmaceuticals | 1.1 |
| Hartford Financial | ||
| Services Group Inc. | Full Line Insurance | 1.0 |
| AmerisourceBergen | ||
| Corp. | Drug Retailers | 1.0 |
| Mattel Inc. | Toys | 1.0 |
| Boston Scientific Corp. | Medical Equipment | 1.0 |
| Fiserv Inc. | Financial | |
| Administration | 1.0 | |
| Top Ten | 10.9% | |
| The holdings listed exclude any temporary cash investments and equity index products. | ||
Investment Focus
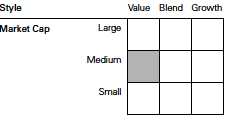
1 The expense ratios shown are from the prospectus dated August 12, 2013, and represent estimated costs for the current fiscal year. For the fiscal year ended December 31, 2013, the expense ratios were 0.24% for Investor Shares, 0.09% for Admiral Shares, and 0.09% for ETF Shares.
74
Mid-Cap Value Index Fund
Performance Summary
All of the returns in this report represent past performance, which is not a guarantee of future results that may be achieved by the fund. (Current performance may be lower or higher than the performance data cited. For performance data current to the most recent month-end, visit our website at vanguard.com/performance.) Note, too, that both investment returns and principal value can fluctuate widely, so an investor’s shares, when sold, could be worth more or less than their original cost. The returns shown do not reflect taxes that a shareholder would pay on fund distributions or on the sale of fund shares.
Cumulative Performance: August 24, 2006, Through December 31, 2013
Initial Investment of $10,000
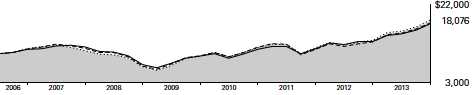
| Average Annual Total Returns | |||||
| Periods Ended December 31, 2013 | |||||
| Since | Final Value | ||||
| One | Five | Inception | of a $10,000 | ||
| Year | Years | (8/24/2006) | Investment | ||
| Mid-Cap Value Index Fund*Investor | |||||
| Shares | 37.42% | 21.56% | 8.38% | $18,076 | |
| •••••••• | Spliced Mid-Cap Value Index | 37.81 | 21.82 | 8.58 | 18,324 |
| – – – – | Mid-Cap Value Funds Average | 35.83 | 20.28 | 7.95 | 17,548 |
| Dow Jones U.S. Total Stock Market | |||||
| Float Adjusted Index | 33.47 | 18.86 | 7.82 | 17,402 | |
For a benchmark description, see the Glossary.
Mid-Cap Value Funds Average: Derived from data provided by Lipper, a Thomson Reuters Company.
"Since Inception" performance is calculated from the Investor Shares’ inception date for both the fund and its comparative standards.
| Since | Final Value | ||
| One | Inception | of a $10,000 | |
| Year | (9/27/2011) | Investment | |
| Mid-Cap Value Index Fund Admiral Shares | 37.66% | 27.95% | $17,455 |
| Spliced Mid-Cap Value Index | 37.81 | 28.05 | 17,486 |
| Dow Jones U.S. Total Stock Market Float | |||
| Adjusted Index | 33.47 | 25.52 | 16,717 |
"Since Inception" performance is calculated from the Admiral Shares’ inception date for both the fund and its comparative standards.
See Financial Highlights for dividend and capital gains information.
75
| Mid-Cap Value Index Fund | ||||
| Average Annual Total Returns | ||||
| Periods Ended December 31, 2013 | ||||
| Since | Final Value | |||
| One | Five | Inception | of a $10,000 | |
| Year | Years | (8/17/2006) | Investment | |
| Mid-Cap Value Index Fund | ||||
| ETF Shares Net Asset Value | 37.65% | 21.72% | 8.43% | $18,157 |
| Spliced Mid-Cap Value Index | 37.81 | 21.82 | 8.48 | 18,223 |
| Dow Jones U.S. Total Stock Market Float | ||||
| Adjusted Index | 33.47 | 18.86 | 7.76 | 17,346 |
"Since Inception" performance is calculated from the ETF Shares’ inception date for both the fund and its comparative standards.
| Cumulative Returns of ETF Shares: August 17, 2006, Through December 31, 2013 | |||
| Since | |||
| One | Five | Inception | |
| Year | Years | (8/17/2006) | |
| Mid-Cap Value Index Fund ETF Shares Market Price | 37.68% | 167.52% | 81.62% |
| Mid-Cap Value Index Fund ETF Shares Net Asset | |||
| Value | 37.65 | 167.20 | 81.57 |
| Spliced Mid-Cap Value Index | 37.81 | 168.30 | 82.23 |
"Since Inception" performance is calculated from the ETF Shares’ inception date for both the fund and its comparative standards.
Fiscal-Year Total Returns (%): August 24, 2006, Through December 31, 2013
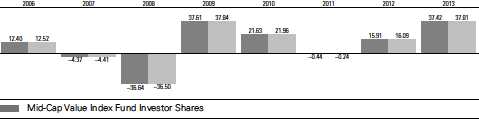
Spliced Mid-Cap Value Index
For a benchmark description, see the Glossary.
76
Mid-Cap Value Index Fund
Financial Statements
Statement of Net Assets
As of December 31, 2013
The fund reports a complete list of its holdings in regulatory filings four times in each fiscal year, at the quarter-ends. For the second and fourth fiscal quarters, the lists appear in the fund’s semiannual and annual reports to shareholders. For the first and third fiscal quarters, the fund files the lists with the Securities and Exchange Commission on Form N-Q. Shareholders can look up the fund’s Forms N-Q on the SEC’s website at sec.gov. Forms N-Q may also be reviewed and copied at the SEC’s Public Reference Room (see the back cover of this report for further information).
| Market | |||
| Value | |||
| Shares | ($000) | ||
| Common Stocks (99.9%)1 | |||
| Basic Materials (6.1%) | |||
| CF Industries | |||
| Holdings Inc. | 171,778 | 40,031 | |
| Alcoa Inc. | 3,205,834 | 34,078 | |
| Sigma-Aldrich Corp. | 358,716 | 33,723 | |
| Celanese Corp. Class A | 472,609 | 26,140 | |
| Ashland Inc. | 232,361 | 22,548 | |
| * | WR Grace & Co. | 218,996 | 21,652 |
| International Flavors & | |||
| Fragrances Inc. | 244,369 | 21,011 | |
| Reliance Steel & | |||
| Aluminum Co. | 219,996 | 16,685 | |
| Peabody Energy Corp. | 808,249 | 15,785 | |
| Albemarle Corp. | 243,905 | 15,461 | |
| Avery Dennison Corp. | 289,468 | 14,528 | |
| Huntsman Corp. | 578,556 | 14,233 | |
| Westlake Chemical Corp. | 59,859 | 7,307 | |
| 283,182 | |||
| Consumer Goods (15.3%) | |||
| Delphi Automotive plc | 922,287 | 55,457 | |
| Mattel Inc. | 1,014,349 | 48,263 | |
| ConAgra Foods Inc. | 1,264,457 | 42,612 | |
| Whirlpool Corp. | 235,279 | 36,906 | |
| Genuine Parts Co. | 439,551 | 36,566 | |
| Clorox Co. | 386,795 | 35,879 | |
| Bunge Ltd. | 419,995 | 34,486 | |
| Beam Inc. | 488,822 | 33,269 | |
| Coca-Cola Enterprises Inc. | 739,296 | 32,625 | |
| JM Smucker Co. | 299,396 | 31,023 | |
| Dr Pepper Snapple | |||
| Group Inc. | 601,465 | 29,303 | |
| Newell Rubbermaid Inc. | 860,881 | 27,901 | |
| Tyson Foods Inc. Class A | 820,689 | 27,460 | |
| * | TRW Automotive | ||
| Holdings Corp. | 345,779 | 25,723 | |
| Molson Coors Brewing Co. | |||
| Class B | 429,847 | 24,136 | |
| Harley-Davidson Inc. | 331,432 | 22,948 | |
| Market | |||
| Value | |||
| Shares | ($000) | ||
| Avon Products Inc. | 1,300,191 | 22,389 | |
| Energizer Holdings Inc. | 187,634 | 20,310 | |
| Lear Corp. | 241,603 | 19,563 | |
| * | DR Horton Inc. | 871,243 | 19,446 |
| Hasbro Inc. | 350,072 | 19,258 | |
| Lennar Corp. Class A | 464,536 | 18,377 | |
| Hormel Foods Corp. | 395,330 | 17,857 | |
| * | Constellation Brands Inc. | ||
| Class A | 236,059 | 16,614 | |
| PulteGroup Inc. | 516,321 | 10,517 | |
| Coty Inc. Class A | 98,071 | 1,496 | |
| Lennar Corp. Class B | 28,612 | 965 | |
| 711,349 | |||
| Consumer Services (12.7%) | |||
| Macy’s Inc. | 1,103,237 | 58,913 | |
| AmerisourceBergen Corp. | |||
| Class A | 689,427 | 48,473 | |
| * | United Continental | ||
| Holdings Inc. | 1,084,646 | 41,032 | |
| * | Hertz Global Holdings Inc. | 1,345,697 | 38,514 |
| Delta Air Lines Inc. | 1,282,134 | 35,220 | |
| Nielsen Holdings NV | 735,827 | 33,767 | |
| Best Buy Co. Inc. | 818,914 | 32,658 | |
| Staples Inc. | 1,959,265 | 31,133 | |
| * | MGM Resorts | ||
| International | 1,101,701 | 25,912 | |
| Advance Auto Parts Inc. | 218,356 | 24,168 | |
| Safeway Inc. | 739,759 | 24,094 | |
| H&R Block Inc. | 819,088 | 23,786 | |
| * | News Corp. Class A | 1,285,109 | 23,158 |
| Interpublic Group of | |||
| Cos. Inc. | 1,247,680 | 22,084 | |
| Darden Restaurants Inc. | 391,394 | 21,280 | |
| Expedia Inc. | 299,574 | 20,868 | |
| Signet Jewelers Ltd. | 240,456 | 18,924 | |
| Royal Caribbean | |||
| Cruises Ltd. | 395,590 | 18,759 | |
| Dun & Bradstreet Corp. | 114,311 | 14,032 | |
| International Game | |||
| Technology | 744,576 | 13,521 | |
77
| Mid-Cap Value Index Fund | |||
| Market | |||
| Value | |||
| Shares | ($000) | ||
| Burger King Worldwide Inc. | 315,173 | 7,205 | |
| * | Sears Holdings Corp. | 143,237 | 7,024 |
| * | News Corp. Class B | 180,690 | 3,222 |
| * | ARAMARK Holdings Corp. | 87,217 | 2,287 |
| 590,034 | |||
| Financials (22.6%) | |||
| Hartford Financial | |||
| Services Group Inc. | 1,339,975 | 48,547 | |
| Principal Financial | |||
| Group Inc. | 882,349 | 43,509 | |
| M&T Bank Corp. | 351,333 | 40,902 | |
| Regions Financial Corp. | 4,128,754 | 40,833 | |
| Lincoln National Corp. | 786,348 | 40,591 | |
| KeyCorp | 2,687,558 | 36,067 | |
| SLM Corp. | 1,307,618 | 34,364 | |
| CIT Group Inc. | 599,945 | 31,275 | |
| Western Union Co. | 1,655,257 | 28,553 | |
| Unum Group | 782,867 | 27,463 | |
| XL Group plc Class A | 847,729 | 26,992 | |
| Comerica Inc. | 548,250 | 26,064 | |
| SL Green Realty Corp. | 276,555 | 25,548 | |
| Equifax Inc. | 364,792 | 25,203 | |
| Plum Creek Timber Co. Inc. | 530,316 | 24,665 | |
| Cincinnati Financial Corp. | 466,522 | 24,432 | |
| Huntington | |||
| Bancshares Inc. | 2,489,422 | 24,023 | |
| * | Markel Corp. | 39,777 | 23,085 |
| Kimco Realty Corp. | 1,166,623 | 23,041 | |
| * | Arch Capital Group Ltd. | 379,798 | 22,670 |
| American Capital | |||
| Agency Corp. | 1,152,029 | 22,223 | |
| Realty Income Corp. | 587,760 | 21,941 | |
| Willis Group Holdings plc | 479,645 | 21,493 | |
| Torchmark Corp. | 271,060 | 21,183 | |
| New York Community | |||
| Bancorp Inc. | 1,255,440 | 21,154 | |
| First Republic Bank | 395,418 | 20,700 | |
| Everest Re Group Ltd. | 114,869 | 17,905 | |
| UDR Inc. | 751,634 | 17,551 | |
| Zions Bancorporation | 553,050 | 16,569 | |
| Reinsurance Group of | |||
| America Inc. Class A | 211,430 | 16,367 | |
| PartnerRe Ltd. | 151,319 | 15,954 | |
| Axis Capital Holdings Ltd. | 308,201 | 14,661 | |
| People’s United | |||
| Financial Inc. | 951,948 | 14,393 | |
| Annaly Capital | |||
| Management Inc. | 1,418,783 | 14,145 | |
| Legg Mason Inc. | 325,278 | 14,143 | |
| WR Berkley Corp. | 323,722 | 14,046 | |
| NASDAQ OMX Group Inc. | 351,399 | 13,986 | |
| Jones Lang LaSalle Inc. | 133,107 | 13,629 | |
| LPL Financial Holdings Inc. | 289,466 | 13,614 | |
| Hudson City Bancorp Inc. | 1,422,630 | 13,415 | |
| Macerich Co. | 210,198 | 12,379 | |
| Market | |||
| Value | |||
| Shares | ($000) | ||
| ING US Inc. | 351,053 | 12,340 | |
| Fidelity National Financial | |||
| Inc. Class A | 355,308 | 11,530 | |
| * | Genworth Financial Inc. | ||
| Class A | 740,210 | 11,495 | |
| * | Realogy Holdings Corp. | 218,348 | 10,802 |
| Cole Real Estate | |||
| Investment Inc. | 701,971 | 9,856 | |
| * | Alleghany Corp. | 23,815 | 9,525 |
| Camden Property Trust | 127,575 | 7,256 | |
| Assurant Inc. | 108,761 | 7,218 | |
| * | Brixmor Property Group Inc. | 137,924 | 2,804 |
| 1,052,104 | |||
| Health Care (7.8%) | |||
| * | Mylan Inc. | 1,147,481 | 49,801 |
| * | Boston Scientific Corp. | 4,001,801 | 48,102 |
| * | Life Technologies Corp. | 518,065 | 39,269 |
| CR Bard Inc. | 233,522 | 31,278 | |
| * | Henry Schein Inc. | 257,366 | 29,406 |
| * | CareFusion Corp. | 633,519 | 25,227 |
| * | Laboratory Corp. of | ||
| America Holdings | 262,036 | 23,942 | |
| Quest Diagnostics Inc. | 435,952 | 23,341 | |
| * | Endo Health Solutions Inc. | 343,816 | 23,194 |
| Universal Health Services | |||
| Inc. Class B | 272,369 | 22,133 | |
| * | Hospira Inc. | 497,262 | 20,527 |
| * | Hologic Inc. | 818,734 | 18,299 |
| Patterson Cos. Inc. | 236,754 | 9,754 | |
| 364,273 | |||
| Industrials (13.4%) | |||
| * | Fiserv Inc. | 773,109 | 45,652 |
| Fidelity National | |||
| Information Services Inc. | 785,364 | 42,158 | |
| Textron Inc. | 842,697 | 30,978 | |
| Rockwell Collins Inc. | 405,031 | 29,940 | |
| L-3 Communications | |||
| Holdings Inc. | 252,381 | 26,969 | |
| * | Jacobs Engineering | ||
| Group Inc. | 375,273 | 23,638 | |
| Vulcan Materials Co. | 389,663 | 23,154 | |
| Ball Corp. | 433,607 | 22,400 | |
| Xerox Corp. | 1,752,904 | 21,333 | |
| Manpowergroup Inc. | 236,789 | 20,331 | |
| Sealed Air Corp. | 588,090 | 20,025 | |
| MeadWestvaco Corp. | 533,248 | 19,693 | |
| Fluor Corp. | 244,864 | 19,660 | |
| Xylem Inc. | 553,071 | 19,136 | |
| Joy Global Inc. | 318,404 | 18,624 | |
| * | Crown Holdings Inc. | 413,849 | 18,445 |
| Avnet Inc. | 412,410 | 18,191 | |
| Cintas Corp. | 287,334 | 17,122 | |
| Hubbell Inc. Class B | 155,530 | 16,937 | |
| MDU Resources Group Inc. | 537,379 | 16,417 | |
78
| Mid-Cap Value Index Fund | |||
| Market | |||
| Value | |||
| Shares | ($000) | ||
| * | Arrow Electronics Inc. | 301,837 | 16,375 |
| Iron Mountain Inc. | 515,467 | 15,644 | |
| AGCO Corp. | 262,456 | 15,535 | |
| Timken Co. | 263,220 | 14,496 | |
| KBR Inc. | 443,792 | 14,153 | |
| Towers Watson & Co. | |||
| Class A | 106,212 | 13,554 | |
| * | Owens Corning | 316,954 | 12,906 |
| FLIR Systems Inc. | 424,487 | 12,777 | |
| SPX Corp. | 122,347 | 12,187 | |
| Jabil Circuit Inc. | 546,889 | 9,538 | |
| * | Owens-Illinois Inc. | 246,707 | 8,827 |
| Allison Transmission | |||
| Holdings Inc. | 245,462 | 6,777 | |
| 623,572 | |||
| Oil & Gas (5.4%) | |||
| Murphy Oil Corp. | 532,421 | 34,543 | |
| HollyFrontier Corp. | 596,564 | 29,643 | |
| Cimarex Energy Co. | 247,353 | 25,950 | |
| Helmerich & Payne Inc. | 305,097 | 25,653 | |
| Tesoro Corp. | 397,669 | 23,264 | |
| OGE Energy Corp. | 594,883 | 20,167 | |
| * | Denbury Resources Inc. | 1,099,198 | 18,060 |
| * | Weatherford | ||
| International Ltd. | 1,037,096 | 16,065 | |
| Energen Corp. | 217,784 | 15,408 | |
| Nabors Industries Ltd. | 839,973 | 14,271 | |
| Noble Corp. plc | 379,490 | 14,219 | |
| Diamond Offshore | |||
| Drilling Inc. | 208,283 | 11,855 | |
| 249,098 | |||
| Technology (6.6%) | |||
| Western Digital Corp. | 672,880 | 56,455 | |
| Seagate Technology plc | 928,679 | 52,155 | |
| Computer Sciences Corp. | 441,300 | 24,660 | |
| SanDisk Corp. | 338,582 | 23,883 | |
| Harris Corp. | 319,939 | 22,335 | |
| * | Synopsys Inc. | 462,199 | 18,751 |
| LSI Corp. | 1,633,553 | 18,002 | |
| * | Micron Technology Inc. | 787,672 | 17,140 |
| Marvell Technology | |||
| Group Ltd. | 1,178,680 | 16,949 | |
| * | Juniper Networks Inc. | 718,569 | 16,218 |
| Garmin Ltd. | 350,882 | 16,218 | |
| NVIDIA Corp. | 807,835 | 12,941 | |
| * | Nuance | ||
| Communications Inc. | 753,500 | 11,453 | |
| 307,160 | |||
| Telecommunications (0.6%) | |||
| ^ | Windstream Holdings Inc. | 1,785,449 | 14,248 |
| Frontier | |||
| Communications Corp. | 2,994,032 | 13,922 | |
| 28,170 | |||
| Market | |||
| Value | |||
| Shares | ($000) | ||
| Utilities (9.4%) | |||
| Northeast Utilities | 944,461 | 40,036 | |
| ONEOK Inc. | 618,315 | 38,447 | |
| DTE Energy Co. | 529,932 | 35,182 | |
| NiSource Inc. | 939,105 | 30,878 | |
| CenterPoint Energy Inc. | 1,284,770 | 29,781 | |
| Wisconsin Energy Corp. | 678,970 | 28,068 | |
| NRG Energy Inc. | 969,410 | 27,841 | |
| AES Corp. | 1,891,303 | 27,443 | |
| Ameren Corp. | 727,315 | 26,300 | |
| American Water | |||
| Works Co. Inc. | 534,401 | 22,584 | |
| CMS Energy Corp. | 800,625 | 21,433 | |
| SCANA Corp. | 379,205 | 17,796 | |
| Pinnacle West Capital Corp. | 329,686 | 17,447 | |
| Alliant Energy Corp. | 332,369 | 17,150 | |
| National Fuel Gas Co. | 238,232 | 17,010 | |
| Pepco Holdings Inc. | 748,115 | 14,311 | |
| Integrys Energy Group Inc. | 239,135 | 13,011 | |
| TECO Energy Inc. | 649,981 | 11,206 | |
| 435,924 | |||
| Total Common Stocks | |||
| (Cost $3,680,259) | 4,644,866 | ||
| Temporary Cash Investments (0.4%)1 | |||
| Money Market Fund (0.4%) | |||
| 2,3 | Vanguard Market Liquidity | ||
| Fund, 0.125% | 16,810,337 | 16,810 | |
| Face | |||
| Amount | |||
| ($000) | |||
| U.S. Government and Agency Obligations (0.0%) | |||
| 4,5 | Freddie Mac | ||
| Discount Notes, | |||
| 0.070%, 3/24/14 | 1,000 | 1,000 | |
| 4 | United States | ||
| Treasury Note/Bond, | |||
| 1.750%, 3/31/14 | 500 | 502 | |
| 1,502 | |||
| Total Temporary Cash Investments | |||
| (Cost $18,312) | 18,312 | ||
| Total Investments (100.3%) | |||
| (Cost $3,698,571) | 4,663,178 | ||
| Other Assets and Liabilities (-0.3%) | |||
| Other Assets | 18,503 | ||
| Liabilities3 | (32,279) | ||
| (13,776) | |||
| Net Assets (100%) | 4,649,402 | ||
79
Mid-Cap Value Index Fund
| At December 31, 2013, net assets consisted of: | |
| Amount | |
| ($000) | |
| Paid-in Capital | 3,722,554 |
| Overdistributed Net Investment Income | (699) |
| Accumulated Net Realized Losses | (37,150) |
| Unrealized Appreciation (Depreciation) | |
| Investment Securities | 964,607 |
| Futures Contracts | 90 |
| Net Assets | 4,649,402 |
| Investor Shares—Net Assets | |
| Applicable to 20,390,944 outstanding | |
| $.001 par value shares of beneficial | |
| interest (unlimited authorization) | 639,893 |
| Net Asset Value Per Share— | |
| Investor Shares | $31.38 |
| Admiral Shares—Net Assets | |
| Applicable to 42,454,687 outstanding | |
| $.001 par value shares of beneficial | |
| interest (unlimited authorization) | 1,753,249 |
| Net Asset Value Per Share— | |
| Admiral Shares | $41.30 |
| ETF Shares—Net Assets | |
| Applicable to 28,300,444 outstanding | |
| $.001 par value shares of beneficial | |
| interest (unlimited authorization) | 2,256,260 |
| Net Asset Value Per Share— | |
| ETF Shares | $79.73 |
See Note A in Notes to Financial Statements.
* Non-income-producing security.
^ Includes partial security positions on loan to broker-dealers. The total value of securities on loan is $2,155,000.
1 The fund invests a portion of its cash reserves in equity markets through the use of index futures contracts. After giving effect to futures investments, the fund’s effective common stock and temporary cash investment positions represent 100.0% and 0.3%, respectively, of net assets.
2 Affiliated money market fund available only to Vanguard funds and certain trusts and accounts managed by Vanguard. Rate shown is the 7-day yield.
3 Includes $2,430,000 of collateral received for securities on loan.
4 Securities with a value of $702,000 have been segregated as initial margin for open futures contracts.
5 The issuer was placed under federal conservatorship in September 2008; since that time, its daily operations have been managed by the Federal Housing Finance Agency and it receives capital from the U.S. Treasury, as needed to maintain a positive net worth, in exchange for senior preferred stock.
See accompanying Notes, which are an integral part of the Financial Statements.
80
| Mid-Cap Value Index Fund | |
| Statement of Operations | |
| Year Ended | |
| December 31, 2013 | |
| ($000) | |
| Investment Income | |
| Income | |
| Dividends | 72,793 |
| Interest1 | 14 |
| Securities Lending | 496 |
| Total Income | 73,303 |
| Expenses | |
| The Vanguard Group—Note B | |
| Investment Advisory Services | 277 |
| Management and Administrative—Investor Shares | 1,152 |
| Management and Administrative—Admiral Shares | 716 |
| Management and Administrative—ETF Shares | 890 |
| Marketing and Distribution—Investor Shares | 143 |
| Marketing and Distribution—Admiral Shares | 272 |
| Marketing and Distribution—ETF Shares | 391 |
| Custodian Fees | 105 |
| Auditing Fees | 33 |
| Shareholders’ Reports—Investor Shares | 15 |
| Shareholders’ Reports—Admiral Shares | 15 |
| Shareholders’ Reports—ETF Shares | 90 |
| Trustees’ Fees and Expenses | 4 |
| Total Expenses | 4,103 |
| Net Investment Income | 69,200 |
| Realized Net Gain (Loss) | |
| Investment Securities Sold | 245,519 |
| Futures Contracts | (47) |
| Realized Net Gain (Loss) | 245,472 |
| Change in Unrealized Appreciation (Depreciation) | |
| Investment Securities | 788,500 |
| Futures Contracts | 90 |
| Change in Unrealized Appreciation (Depreciation) | 788,590 |
| Net Increase (Decrease) in Net Assets Resulting from Operations | 1,103,262 |
| 1 Interest income from an affiliated company of the fund was $12,000. | |
See accompanying Notes, which are an integral part of the Financial Statements.
81
| Mid-Cap Value Index Fund | ||
| Statement of Changes in Net Assets | ||
| Year Ended December 31, | ||
| 2013 | 2012 | |
| ($000) | ($000) | |
| Increase (Decrease) in Net Assets | ||
| Operations | ||
| Net Investment Income | 69,200 | 44,513 |
| Realized Net Gain (Loss) | 245,472 | 51,474 |
| Change in Unrealized Appreciation (Depreciation) | 788,590 | 177,898 |
| Net Increase (Decrease) in Net Assets Resulting from Operations | 1,103,262 | 273,885 |
| Distributions | ||
| Net Investment Income | ||
| Investor Shares | (8,828) | (8,569) |
| Admiral Shares | (26,210) | (13,598) |
| ETF Shares | (34,036) | (22,017) |
| Realized Capital Gain | ||
| Investor Shares | — | — |
| Admiral Shares | — | — |
| ETF Shares | — | — |
| Total Distributions | (69,074) | (44,184) |
| Capital Share Transactions | ||
| Investor Shares | (17,703) | (27,139) |
| Admiral Shares | 672,082 | 405,667 |
| ETF Shares | 602,650 | 242,249 |
| Net Increase (Decrease) from Capital Share Transactions | 1,257,029 | 620,777 |
| Total Increase (Decrease) | 2,291,217 | 850,478 |
| Net Assets | ||
| Beginning of Period | 2,358,185 | 1,507,707 |
| End of Period1 | 4,649,402 | 2,358,185 |
1 Net Assets—End of Period includes undistributed (overdistributed) net investment income of ($699,000) and ($825,000).
See accompanying Notes, which are an integral part of the Financial Statements.
82
| Mid-Cap Value Index Fund | |||||
| Financial Highlights | |||||
| Investor Shares | |||||
| For a Share Outstanding | Year Ended December 31, | ||||
| Throughout Each Period | 2013 | 2012 | 2011 | 2010 | 2009 |
| Net Asset Value, Beginning of Period | $23.16 | $20.34 | $20.85 | $17.45 | $12.92 |
| Investment Operations | |||||
| Net Investment Income | . 441 | .423 | .417 | .371 | .300 |
| Net Realized and Unrealized Gain (Loss) | |||||
| on Investments | 8.218 | 2.813 | (.509) | 3.403 | 4.551 |
| Total from Investment Operations | 8.659 | 3.236 | (.092) | 3.774 | 4.851 |
| Distributions | |||||
| Dividends from Net Investment Income | (.439) | (.416) | (.418) | (.374) | (.321) |
| Distributions from Realized Capital Gains | — | — | — | — | — |
| Total Distributions | (.439) | (.416) | (.418) | (.374) | (.321) |
| Net Asset Value, End of Period | $31.38 | $23.16 | $20.34 | $20.85 | $17.45 |
| Total Return1 | 37.42% | 15.91% | -0.44% | 21.63% | 37.61% |
| Ratios/Supplemental Data | |||||
| Net Assets, End of Period (Millions) | $640 | $487 | $455 | $683 | $459 |
| Ratio of Total Expenses to | |||||
| Average Net Assets | 0.24% | 0.24% | 0.24% | 0.26% | 0.30% |
| Ratio of Net Investment Income to | |||||
| Average Net Assets | 1.80% | 2.21% | 1.97% | 1.99% | 2.14% |
| Portfolio Turnover Rate2 | 46% | 33% | 41% | 37% | 47% |
1 Total returns do not include account service fees that may have applied in the periods shown. Fund prospectuses provide information about any applicable account service fees.
2 Excludes the value of portfolio securities received or delivered as a result of in-kind purchases or redemptions of the fund’s capital shares, including ETF Creation Units.
See accompanying Notes, which are an integral part of the Financial Statements.
83
| Mid-Cap Value Index Fund | |||
| Financial Highlights | |||
| Admiral Shares | |||
| Sept. 27, | |||
| Year Ended | 20111 to | ||
| December 31, | Dec. 31, | ||
| For a Share Outstanding Throughout Each Period | 2013 | 2012 | 2011 |
| Net Asset Value, Beginning of Period | $30.47 | $26.77 | $25.00 |
| Investment Operations | |||
| Net Investment Income | . 638 | .598 | .157 |
| Net Realized and Unrealized Gain (Loss) on Investments | 10.826 | 3.692 | 2.165 |
| Total from Investment Operations | 11.464 | 4.290 | 2.322 |
| Distributions | |||
| Dividends from Net Investment Income | (.634) | (. 590) | (. 552) |
| Distributions from Realized Capital Gains | — | — | — |
| Total Distributions | (.634) | (. 590) | (. 552) |
| Net Asset Value, End of Period | $41.30 | $30.47 | $26.77 |
| Total Return2 | 37.66% | 16.02% | 9.29% |
| Ratios/Supplemental Data | |||
| Net Assets, End of Period (Millions) | $1,753 | $724 | $268 |
| Ratio of Total Expenses to Average Net Assets | 0.09% | 0.10% | 0.10%3 |
| Ratio of Net Investment Income to Average Net Assets | 1.95% | 2.35% | 2.11%3 |
| Portfolio Turnover Rate 4 | 46% | 33% | 41% |
1 Inception.
2 Total returns do not include account service fees that may have applied in the periods shown. Fund prospectuses provide information about any applicable account service fees.
3 Annualized.
4 Excludes the value of portfolio securities received or delivered as a result of in-kind purchases or redemptions of the fund’s capital shares, including ETF Creation Units.
See accompanying Notes, which are an integral part of the Financial Statements.
84
| Mid-Cap Value Index Fund | |||||
| Financial Highlights | |||||
| ETF Shares | |||||
| For a Share Outstanding | Year Ended December 31, | ||||
| Throughout Each Period | 2013 | 2012 | 2011 | 2010 | 2009 |
| Net Asset Value, Beginning of Period | $58.82 | $51.67 | $52.97 | $44.31 | $32.80 |
| Investment Operations | |||||
| Net Investment Income | 1.232 | 1.156 | 1.134 | 1.004 | .812 |
| Net Realized and Unrealized Gain (Loss) | |||||
| on Investments | 20.901 | 7.130 | (1.297) | 8.669 | 11.562 |
| Total from Investment Operations | 22.133 | 8.286 | (.163) | 9.673 | 12.374 |
| Distributions | |||||
| Dividends from Net Investment Income | (1.223) | (1.136) | (1.137) | (1.013) | (.864) |
| Distributions from Realized Capital Gains | — | — | — | — | — |
| Total Distributions | (1.223) | (1.136) | (1.137) | (1.013) | (.864) |
| Net Asset Value, End of Period | $79.73 | $58.82 | $51.67 | $52.97 | $44.31 |
| Total Return | 37.65% | 16.04% | -0.32% | 21.83% | 37.75% |
| Ratios/Supplemental Data | |||||
| Net Assets, End of Period (Millions) | $2,256 | $1,147 | $785 | $746 | $583 |
| Ratio of Total Expenses to | |||||
| Average Net Assets | 0.09% | 0.10% | 0.10% | 0.12% | 0.14% |
| Ratio of Net Investment Income to | |||||
| Average Net Assets | 1.95% | 2.35% | 2.11% | 2.13% | 2.30% |
| Portfolio Turnover Rate1 | 46% | 33% | 41% | 37% | 47% |
1 Excludes the value of portfolio securities received or delivered as a result of in-kind purchases or redemptions of the fund’s capital shares, including ETF Creation Units.
See accompanying Notes, which are an integral part of the Financial Statements.
85
Mid-Cap Value Index Fund
Notes to Financial Statements
Vanguard Mid-Cap Value Index Fund is registered under the Investment Company Act of 1940 as an open-end investment company, or mutual fund. The fund offers three classes of shares: Investor Shares, Admiral Shares, and ETF Shares. Investor Shares are available to any investor who meets the fund’s minimum purchase requirements. Admiral Shares are designed for investors who meet certain administrative, service, and account-size criteria. ETF Shares are listed for trading on NYSE Arca; they can be purchased and sold through a broker.
A. The following significant accounting policies conform to generally accepted accounting principles for U.S. mutual funds. The fund consistently follows such policies in preparing its financial statements.
1. Security Valuation: Securities are valued as of the close of trading on the New York Stock Exchange (generally 4 p.m., Eastern time) on the valuation date. Equity securities are valued at the latest quoted sales prices or official closing prices taken from the primary market in which each security trades; such securities not traded on the valuation date are valued at the mean of the latest quoted bid and asked prices. Securities for which market quotations are not readily available, or whose values have been materially affected by events occurring before the fund’s pricing time but after the close of the securities’ primary markets, are valued by methods deemed by the board of trustees to represent fair value. Investments in Vanguard Market Liquidity Fund are valued at that fund’s net asset value. Temporary cash investments acquired over 60 days to maturity are valued using the latest bid prices or using valuations based on a matrix system (which considers such factors as security prices, yields, maturities, and ratings), both as furnished by independent pricing services. Other temporary cash investments are valued at amortized cost, which approximates market value.
2. Futures Contracts: The fund may use index futures contracts to a limited extent, with the objectives of maintaining full exposure to the stock market, enhancing returns, maintaining liquidity, and minimizing transaction costs. The fund may purchase futures contracts to immediately invest incoming cash in the market, or sell futures in response to cash outflows, thereby simulating a fully invested position in the underlying index while maintaining a cash balance for liquidity. The fund may seek to enhance returns by using futures contracts instead of the underlying securities when futures are believed to be priced more attractively than the underlying securities. The primary risks associated with the use of futures contracts are imperfect correlation between changes in market values of stocks held by the fund and the prices of futures contracts, and the possibility of an illiquid market. Counterparty risk involving futures is mitigated because a regulated clearinghouse is the counterparty instead of the clearing broker. To further mitigate counterparty risk, the fund trades futures contracts on an exchange, monitors the financial strength of its clearing brokers and clearinghouse, and has entered into clearing agreements with its clearing brokers. The clearinghouse imposes initial margin requirements to secure the fund’s performance and requires daily settlement of variation margin representing changes in the market value of each contract.
Futures contracts are valued at their quoted daily settlement prices. The aggregate notional amounts of the contracts are not recorded in the Statement of Net Assets. Fluctuations in the value of the contracts are recorded in the Statement of Net Assets as an asset (liability) and in the Statement of Operations as unrealized appreciation (depreciation) until the contracts are closed, when they are recorded as realized futures gains (losses).
During the year ended December 31, 2013, the fund’s average investments in long and short futures contracts represented less than 1% and 0% of net assets, respectively, based on quarterly average aggregate settlement values.
86
Mid-Cap Value Index Fund
3. Federal Income Taxes: The fund intends to continue to qualify as a regulated investment company and distribute all of its taxable income. Management has analyzed the fund’s tax positions taken for all open federal income tax years (December 31, 2010–2013), and has concluded that no provision for federal income tax is required in the fund’s financial statements.
4. Distributions: Distributions to shareholders are recorded on the ex-dividend date.
5. Securities Lending: To earn additional income, the fund may lend its securities to qualified institutional borrowers. Security loans are required to be secured at all times by collateral in an amount at least equal to the market value of securities loaned. Daily market fluctuations could cause the value of loaned securities to be more or less than the value of the collateral received. When this occurs, the collateral is adjusted and settled on the next business day. The fund further mitigates its counterparty risk by entering into securities lending transactions only with a diverse group of prequalified counterparties, monitoring their financial strength, and entering into master securities lending agreements with its counterparties. The master securities lending agreements provide that, in the event of a counterparty’s default (including bankruptcy), the fund may terminate any loans with that borrower, determine the net amount owed, and sell or retain the collateral up to the net amount owed to the fund; however, such actions may be subject to legal proceedings. While collateral mitigates counterparty risk, in the absence of a default the fund may experience delays and costs in recovering the securities loaned. The fund invests cash collateral received in Vanguard Market Liquidity Fund, and records a liability for the return of the collateral, during the period the securities are on loan. Securities lending income represents fees charged to borrowers plus income earned on invested cash collateral, less expenses associated with the loan.
6. Other: Dividend income is recorded on the ex-dividend date. Interest income includes income distributions received from Vanguard Market Liquidity Fund and is accrued daily. Premiums and discounts on debt securities purchased are amortized and accreted, respectively, to interest income over the lives of the respective securities. Security transactions are accounted for on the date securities are bought or sold. Costs used to determine realized gains (losses) on the sale of investment securities are those of the specific securities sold.
Each class of shares has equal rights as to assets and earnings, except that each class separately bears certain class-specific expenses related to maintenance of shareholder accounts (included in Management and Administrative expenses) and shareholder reporting. Marketing and distribution expenses are allocated to each class of shares based on a method approved by the board of trustees. Income, other non-class-specific expenses, and gains and losses on investments are allocated to each class of shares based on its relative net assets.
B. The Vanguard Group furnishes at cost investment advisory, corporate management, administrative, marketing, and distribution services. The costs of such services are allocated to the fund under methods approved by the board of trustees. The fund has committed to provide up to 0.40% of its net assets in capital contributions to Vanguard. At December 31, 2013, the fund had contributed capital of $497,000 to Vanguard (included in Other Assets), representing 0.01% of the fund’s net assets and 0.20% of Vanguard’s capitalization. The fund’s trustees and officers are also directors and officers of Vanguard.
C. Various inputs may be used to determine the value of the fund’s investments. These inputs are summarized in three broad levels for financial statement purposes. The inputs or methodologies used to value securities are not necessarily an indication of the risk associated with investing in those securities.
87
Mid-Cap Value Index Fund
Level 1—Quoted prices in active markets for identical securities.
Level 2—Other significant observable inputs (including quoted prices for similar securities, interest rates, prepayment speeds, credit risk, etc.).
Level 3—Significant unobservable inputs (including the fund’s own assumptions used to determine the fair value of investments).
The following table summarizes the market value of the fund’s investments as of December 31, 2013, based on the inputs used to value them:
| Level 1 | Level 2 | Level 3 | |
| Investments | ($000) | ($000) | ($000) |
| Common Stocks | 4,644,866 | — | — |
| Temporary Cash Investments | 16,810 | 1,502 | — |
| Futures Contracts—Assets1 | 13 | — | — |
| Total | 4,661,689 | 1,502 | — |
| 1 Represents variation margin on the last day of the reporting period. |
D. At December 31, 2013, the aggregate settlement value of open futures contracts and the related unrealized appreciation (depreciation) were:
| ($000) | ||||
| Aggregate | ||||
| Number of | Settlement | Unrealized | ||
| Long (Short) | Value | Appreciation | ||
| Futures Contracts | Expiration | Contracts | Long (Short) | (Depreciation) |
| S&P 500 Index | March 2014 | 4 | 1,841 | 72 |
| E-mini S&P 500 Index | March 2014 | 15 | 1,381 | 6 |
| E-mini S&P MidCap 400 Index | March 2014 | 4 | 536 | 12 |
| 90 |
Unrealized appreciation (depreciation) on open futures contracts is required to be treated as realized gain (loss) for tax purposes.
E. Distributions are determined on a tax basis and may differ from net investment income and realized capital gains for financial reporting purposes. Differences may be permanent or temporary. Permanent differences are reclassified among capital accounts in the financial statements to reflect their tax character. Temporary differences arise when certain items of income, expense, gain, or loss are recognized in different periods for financial statement and tax purposes. These differences will reverse at some time in the future. Differences in classification may also result from the treatment of short-term gains as ordinary income for tax purposes.
During the year ended December 31, 2013, the fund realized $136,637,000 of net capital gains resulting from in-kind redemptions—in which shareholders exchanged fund shares for securities held by the fund rather than for cash. Because such gains are not taxable to the fund, and are not distributed to shareholders, they have been reclassified from accumulated net realized losses to paid-in capital.
88
Mid-Cap Value Index Fund
For tax purposes, at December 31, 2013, the fund had $936,000 of ordinary income available for distribution. The fund used capital loss carryforwards of $115,475,000 to offset taxable capital gains realized during the year ended December 31, 2013. At December 31, 2013, the fund had available capital losses totaling $30,495,000 to offset future net capital gains through December 31, 2018.
At December 31, 2013, the cost of investment securities for tax purposes was $3,705,136,000. Net unrealized appreciation of investment securities for tax purposes was $958,042,000, consisting of unrealized gains of $1,004,247,000 on securities that had risen in value since their purchase and $46,205,000 in unrealized losses on securities that had fallen in value since their purchase.
F. During the year ended December 31, 2013, the fund purchased $3,288,444,000 of investment securities and sold $2,030,791,000 of investment securities, other than temporary cash investments. Purchases and sales include $1,003,835,000 and $400,528,000, respectively, in connection with in-kind purchases and redemptions of the fund’s capital shares.
G. Capital share transactions for each class of shares were:
| Year Ended December 31, | ||||
| 2013 | 2012 | |||
| Amount | Shares | Amount | Shares | |
| ($000) | (000) | ($000) | (000) | |
| Investor Shares | ||||
| Issued | 270,155 | 9,766 | 213,885 | 9,661 |
| Issued in Lieu of Cash Distributions | 8,237 | 266 | 7,667 | 331 |
| Redeemed | (296,095) | (10,670) | (248,691) | (11,345) |
| Net Increase (Decrease)—Investor Shares | (17,703) | (638) | (27,139) | (1,353) |
| Admiral Shares | ||||
| Issued | 989,915 | 27,334 | 484,978 | 16,495 |
| Issued in Lieu of Cash Distributions | 23,713 | 583 | 12,287 | 403 |
| Redeemed | (341,546) | (9,240) | (91,598) | (3,125) |
| Net Increase (Decrease) —Admiral Shares | 672,082 | 18,677 | 405,667 | 13,773 |
| ETF Shares | ||||
| Issued | 1,012,726 | 14,405 | 465,481 | 8,210 |
| Issued in Lieu of Cash Distributions | — | — | — | — |
| Redeemed | (410,076) | (5,600) | (223,232) | (3,900) |
| Net Increase (Decrease)—ETF Shares | 602,650 | 8,805 | 242,249 | 4,310 |
H. Management has determined that no material events or transactions occurred subsequent to December 31, 2013, that would require recognition or disclosure in these financial statements.
89
Report of Independent Registered Public Accounting Firm
To the Trustees of Vanguard Index Funds and the Shareholders of Vanguard Extended Market Index Fund, Vanguard Mid-Cap Index Fund, Vanguard Mid-Cap Growth Index Fund and Vanguard Mid-Cap Value Index Fund:
In our opinion, the accompanying statement of net assets—investments summary and statements of net assets and the related statements of operations and of changes in net assets and the financial highlights present fairly, in all material respects, the financial position of Vanguard Extended Market Index Fund, Vanguard Mid-Cap Index Fund, Vanguard Mid-Cap Growth Index Fund and Vanguard Mid-Cap Value Index Fund (constituting separate portfolios of Vanguard Index Funds, hereafter referred to as the “Funds”) at December 31, 2013, the results of each of their operations for the year then ended, the changes in each of their net assets for each of the two years in the period then ended, and the financial highlights for each of the periods indicated, in conformity with accounting principles generally accepted in the United States of America. These financial statements and financial highlights (hereafter referred to as “financial statements”) are the responsibility of the Funds’ management; our responsibility is to express an opinion on these financial statements based on our audits. We conducted our audits of these financial statements in accordance with the standards of the Public Company Accounting Oversight Board (United States). Those standards require that we plan and perform the audit to obtain reasonable assurance about whether the financial statements are free of material misstatement. An audit includes examining, on a test basis, evidence supporting the amounts and disclosures in the financial statements, assessing the accounting principles used and significant estimates made by management, and evaluating the overall financial statement presentation. We believe that our audits, which included confirmation of securities at December 31, 2013 by correspondence with the custodians and brokers and by agreement to the underlying ownership records of the transfer agent, provide a reasonable basis for our opinion.
PricewaterhouseCoopers LLP
Philadelphia, Pennsylvania
February 14, 2014
90
Special 2013 tax information (unaudited) for Vanguard U.S. Stock Index Funds (Mid-Capitalization Portfolios)
This information for the fiscal year ended December 31, 2013, is included pursuant to provisions of the Internal Revenue Code.
The funds distributed qualified dividend income to shareholders during the fiscal year as follows:
| Fund | ($000) |
| Extended Market Index Fund | 271,329 |
| Mid-Cap Index Fund | 477,906 |
| Mid-Cap Growth Index Fund | 20,698 |
| Mid-Cap Value Index Fund | 64,370 |
For corporate shareholders, the percentage of investment income (dividend income plus short-term gains, if any) that qualifies for the dividends-received deduction is as follows:
| Fund | Percentage |
| Extended Market Index Fund | 62.1% |
| Mid-Cap Index Fund | 81.4 |
| Mid-Cap Growth Index Fund | 75.5 |
| Mid-Cap Value Index Fund | 85.6 |
91
Your Fund’s After-Tax Returns
This table presents returns for your fund both before and after taxes. The after-tax returns are shown in two ways: (1) assuming that an investor owned the fund during the entire period and paid taxes on the fund’s distributions, and (2) assuming that an investor paid taxes on the fund’s distributions and sold all shares at the end of each period.
Calculations are based on the highest individual federal income tax and capital gains tax rates in effect at the times of the distributions and the hypothetical sales. State and local taxes were not considered. After-tax returns reflect any qualified dividend income . (In the example, returns after the sale of fund shares may be higher than those assuming no sale. This occurs when the sale would have produced a capital loss. The calculation assumes that the investor received a tax deduction for the loss.)
The table shows returns for one share class only; returns for other share classes will differ. Please note that your actual after-tax returns will depend on your tax situation and may differ from those shown. Also note that if you own the fund in a tax-deferred account, such as an individual retirement account or a 401(k) plan, this information does not apply to you. Such accounts are not subject to current taxes.
Finally, keep in mind that a fund’s performance—whether before or after taxes—does not guarantee future results.
Average Annual Total Returns: U.S. Stock Index Funds Mid-Capitalization Portfolios
Periods Ended December 31, 2013
| One | Five | Ten | |
| Year | Years | Years | |
| Extended Market Index Fund Investor Shares | |||
| Returns Before Taxes | 38.19% | 22.47% | 10.17% |
| Returns After Taxes on Distributions | 37.78 | 22.20 | 9.92 |
| Returns After Taxes on Distributions and Sale of Fund Shares | 21.78 | 18.46 | 8.36 |
| One | Five | Ten | |
| Year | Years | Years | |
| Mid-Cap Index Fund Investor Shares | |||
| Returns Before Taxes | 35.00% | 21.90% | 9.97% |
| Returns After Taxes on Distributions | 34.63 | 21.66 | 9.73 |
| Returns After Taxes on Distributions and Sale of Fund Shares | 20.04 | 18.01 | 8.21 |
| Since | |||
| One | Five | Inception | |
| Year | Years | (8/24/2006) | |
| Mid-Cap Growth Index Fund Investor Shares | |||
| Returns Before Taxes | 32.02% | 21.99% | 8.59% |
| Returns After Taxes on Distributions | 31.85 | 21.90 | 8.51 |
| Returns After Taxes on Distributions and Sale of Fund Shares | 18.23 | 18.10 | 6.92 |
92
Average Annual Total Returns: U.S. Stock Index Funds Mid-Capitalization Portfolios
Periods Ended December 31, 2013
| Since | |||
| One | Five | Inception | |
| Year | Years | (8/24/2006) | |
| Mid-Cap Value Index Fund Investor Shares | |||
| Returns Before Taxes | 37.42% | 21.56% | 8.38% |
| Returns After Taxes on Distributions | 36.93 | 21.16 | 7.99 |
| Returns After Taxes on Distributions and Sale of Fund Shares | 21.52 | 17.69 | 6.67 |
93
About Your Fund’s Expenses
As a shareholder of the fund, you incur ongoing costs, which include costs for portfolio management, administrative services, and shareholder reports (like this one), among others. Operating expenses, which are deducted from a fund’s gross income, directly reduce the investment return of the fund.
A fund’s expenses are expressed as a percentage of its average net assets. This figure is known as the expense ratio. The following examples are intended to help you understand the ongoing costs (in dollars) of investing in your fund and to compare these costs with those of other mutual funds. The examples are based on an investment of $1,000 made at the beginning of the period shown and held for the entire period.
The accompanying table illustrates your fund’s costs in two ways:
• Based on actual fund return. This section helps you to estimate the actual expenses that you paid over the period. The ”Ending Account Value“ shown is derived from the fund‘s actual return, and the third column shows the dollar amount that would have been paid by an investor who started with $1,000 in the fund. You may use the information here, together with the amount you invested, to estimate the expenses that you paid over the period.
To do so, simply divide your account value by $1,000 (for example, an $8,600 account value divided by $1,000 = 8.6), then multiply the result by the number given for your fund under the heading ”Expenses Paid During Period.“
• Based on hypothetical 5% yearly return. This section is intended to help you compare your fund‘s costs with those of other mutual funds. It assumes that the fund had a yearly return of 5% before expenses, but that the expense ratio is unchanged. In this case—because the return used is not the fund’s actual return—the results do not apply to your investment. The example is useful in making comparisons because the Securities and Exchange Commission requires all mutual funds to calculate expenses based on a 5% return. You can assess your fund’s costs by comparing this hypothetical example with the hypothetical examples that appear in shareholder reports of other funds.
Note that the expenses shown in the table are meant to highlight and help you compare ongoing costs only and do not reflect transaction costs incurred by the fund for buying and selling securities. Further, the expenses do not include any purchase, redemption, or account service fees described in the fund prospectus. If such fees were applied to your account, your costs would be higher. Your fund does not carry a “sales load.”
The calculations assume no shares were bought or sold during the period. Your actual costs may have been higher or lower, depending on the amount of your investment and the timing of any purchases or redemptions.
You can find more information about the fund’s expenses, including annual expense ratios, in the Financial Statements section of this report. For additional information on operating expenses and other shareholder costs, please refer to your fund’s current prospectus.
94
| Six Months Ended December 31, 2013 | |||
| Beginning | Ending | Expenses | |
| Account Value | Account Value | Paid During | |
| 6/30/2013 | 12/31/2013 | Period | |
| Based on Actual Fund Return | |||
| Extended Market Index Fund | |||
| Investor Shares | $1,000.00 | $1,195.61 | $1.33 |
| Admiral Shares | 1,000.00 | 1,196.47 | 0.55 |
| Signal Shares | 1,000.00 | 1,196.28 | 0.55 |
| Institutional Shares | 1,000.00 | 1,196.66 | 0.44 |
| Institutional Plus Shares | 1,000.00 | 1,196.66 | 0.33 |
| ETF Shares | 1,000.00 | 1,196.44 | 0.55 |
| Mid-Cap Index Fund | |||
| Investor Shares | $1,000.00 | $1,168.73 | $1.31 |
| Admiral Shares | 1,000.00 | 1,169.54 | 0.49 |
| Signal Shares | 1,000.00 | 1,169.81 | 0.49 |
| Institutional Shares | 1,000.00 | 1,169.64 | 0.44 |
| Institutional Plus Shares | 1,000.00 | 1,169.70 | 0.33 |
| ETF Shares | 1,000.00 | 1,169.51 | 0.49 |
| Mid-Cap Growth Index Fund | |||
| Investor Shares | $1,000.00 | $1,159.76 | $1.31 |
| Admiral Shares | 1,000.00 | 1,160.94 | 0.49 |
| ETF Shares | 1,000.00 | 1,160.72 | 0.49 |
| Mid-Cap Value Index Fund | |||
| Investor Shares | $1,000.00 | $1,176.76 | $1.32 |
| Admiral Shares | 1,000.00 | 1,177.56 | 0.49 |
| ETF Shares | 1,000.00 | 1,177.55 | 0.49 |
95
| Six Months Ended December 31, 2013 | |||
| Beginning | Ending | Expenses | |
| Account Value | Account Value | Paid During | |
| 6/30/2013 | 12/31/2013 | Period | |
| Based on Hypothetical 5% Yearly Return | |||
| Extended Market Index Fund | |||
| Investor Shares | $1,000.00 | $1,024.00 | $1.22 |
| Admiral Shares | 1,000.00 | 1,024.70 | 0.51 |
| Signal Shares | 1,000.00 | 1,024.70 | 0.51 |
| Institutional Shares | 1,000.00 | 1,024.80 | 0.41 |
| Institutional Plus Shares | 1,000.00 | 1,024.90 | 0.31 |
| ETF Shares | 1,000.00 | 1,024.70 | 0.51 |
| Mid-Cap Index Fund | |||
| Investor Shares | $1,000.00 | $1,024.00 | $1.22 |
| Admiral Shares | 1,000.00 | 1,024.75 | 0.46 |
| Signal Shares | 1,000.00 | 1,024.75 | 0.46 |
| Institutional Shares | 1,000.00 | 1,024.80 | 0.41 |
| Institutional Plus Shares | 1,000.00 | 1,024.90 | 0.31 |
| ETF Shares | 1,000.00 | 1,024.75 | 0.46 |
| Mid-Cap Growth Index Fund | |||
| Investor Shares | $1,000.00 | $1,024.00 | $1.22 |
| Admiral Shares | 1,000.00 | 1,024.75 | 0.46 |
| ETF Shares | 1,000.00 | 1,024.75 | 0.46 |
| Mid-Cap Value Index Fund | |||
| Investor Shares | $1,000.00 | $1,024.00 | $1.22 |
| Admiral Shares | 1,000.00 | 1,024.75 | 0.46 |
| ETF Shares | 1,000.00 | 1,024.75 | 0.46 |
The calculations are based on expenses incurred in the most recent six-month period. The funds’ annualized six-month expense ratios for that period are: for the Extended Market Index Fund, 0.24% for Investor Shares, 0.10% for Admiral Shares, 0.10% for Signal Shares, 0.08% for Institutional Shares, 0.06% for Institutional Plus Shares, and 0.10% for ETF Shares; for the Mid-Cap Index Fund, 0.24% for Investor Shares, 0.09% for Admiral Shares, 0.09% for Signal Shares, 0.08% for Institutional Shares, 0.06% for Institutional Plus Shares, and 0.09% for ETF Shares; for the Mid-Cap Growth Index Fund, 0.24% for Investor Shares, 0.09% for Admiral Shares, and 0.09% for ETF Shares; and for the Mid-Cap Value Index Fund, 0.24% for Investor Shares, 0.09% for Admiral Shares, and 0.09% for ETF Shares. The dollar amounts shown as “Expenses Paid” are equal to the annualized expense ratio multiplied by the average account value over the period, multiplied by the number of days in the most recent six-month period, then divided by the number of days in the most recent 12-month period.
96
Glossary
30-Day SEC Yield. A fund’s 30-day SEC yield is derived using a formula specified by the U.S. Securities and Exchange Commission. Under the formula, data related to the fund’s security holdings in the previous 30 days are used to calculate the fund’s hypothetical net income for that period, which is then annualized and divided by the fund’s estimated average net assets over the calculation period. For the purposes of this calculation, a security’s income is based on its current market yield to maturity (for bonds), its actual income (for asset-backed securities), or its projected dividend yield (for stocks). Because the SEC yield represents hypothetical annualized income, it will differ—at times significantly—from the fund’s actual experience. As a result, the fund’s income distributions may be higher or lower than implied by the SEC yield.
Beta. A measure of the magnitude of a fund’s past share-price fluctuations in relation to the ups and downs of a given market index. The index is assigned a beta of 1.00. Compared with a given index, a fund with a beta of 1.20 typically would have seen its share price rise or fall by 12% when the index rose or fell by 10%. For this report, beta is based on returns over the past 36 months for both the fund and the index. Note that a fund’s beta should be reviewed in conjunction with its R-squared (see definition). The lower the R-squared, the less correlation there is between the fund and the index, and the less reliable beta is as an indicator of volatility.
Dividend Yield. Dividend income earned by stocks, expressed as a percentage of the aggregate market value (or of net asset value, for a fund). The yield is determined by dividing the amount of the annual dividends by the aggregate value (or net asset value) at the end of the period. For a fund, the dividend yield is based solely on stock holdings and does not include any income produced by other investments.
Earnings Growth Rate. The average annual rate of growth in earnings over the past five years for the stocks now in a fund.
Equity Exposure. A measure that reflects a fund’s investments in stocks and stock futures. Any holdings in short-term reserves are excluded.
Expense Ratio. A fund’s total annual operating expenses expressed as a percentage of the fund’s average net assets. The expense ratio includes management and administrative expenses, but does not include the transaction costs of buying and selling portfolio securities.
Foreign Holdings. The percentage of a fund represented by securities or depositary receipts of companies based outside the United States.
Inception Date. The date on which the assets of a fund (or one of its share classes) are first invested in accordance with the fund’s investment objective. For funds with a subscription period, the inception date is the day after that period ends. Investment performance is measured from the inception date.
Median Market Cap. An indicator of the size of companies in which a fund invests; the midpoint of market capitalization (market price x shares outstanding) of a fund’s stocks, weighted by the proportion of the fund’s assets invested in each stock. Stocks representing half of the fund’s assets have market capitalizations above the median, and the rest are below it.
Price/Book Ratio. The share price of a stock divided by its net worth, or book value, per share. For a fund, the weighted average price/book ratio of the stocks it holds.
97
Price/Earnings Ratio. The ratio of a stock’s current price to its per-share earnings over the past year. For a fund, the weighted average P/E of the stocks it holds. P/E is an indicator of market expectations about corporate prospects; the higher the P/E, the greater the expectations for a company’s future growth.
R-Squared. A measure of how much of a fund’s past returns can be explained by the returns from the market in general, as measured by a given index. If a fund’s total returns were precisely synchronized with an index’s returns, its R-squared would be 1.00. If the fund’s returns bore no relationship to the index’s returns, its R-squared would be 0. For this report, R-squared is based on returns over the past 36 months for both the fund and the index.
Return on Equity. The annual average rate of return generated by a company during the past five years for each dollar of shareholder’s equity (net income divided by shareholder’s equity). For a fund, the weighted average return on equity for the companies whose stocks it holds.
Short-Term Reserves. The percentage of a fund invested in highly liquid, short-term securities that can be readily converted to cash.
Turnover Rate. An indication of the fund’s trading activity. Funds with high turnover rates incur higher transaction costs and may be more likely to distribute capital gains (which may be taxable to investors). The turnover rate excludes in-kind transactions, which have minimal impact on costs.
Benchmark Information
Spliced Extended Market Index: Dow Jones Wilshire 4500 Index through June 17, 2005; S&P Transitional Completion Index through September 16, 2005; S&P Completion Index thereafter.
Spliced Mid-Cap Growth Index: MSCI US Mid Cap Growth Index through April 16, 2013; CRSP US Mid Cap Growth Index thereafter.
Spliced Mid-Cap Value Index: MSCI US Mid Cap Value Index through April 16, 2013; CRSP US Mid Cap Value Index thereafter.
Spliced Mid-Cap Index: S&P MidCap 400 Index through May 16, 2003; MSCI US Mid Cap 450 Index through January 30, 2013; CRSP US Mid Cap Index thereafter.
98
This page intentionally left blank.
The People Who Govern Your Fund
The trustees of your mutual fund are there to see that the fund is operated and managed in your best interests since, as a shareholder, you are a part owner of the fund. Your fund’s trustees also serve on the board of directors of The Vanguard Group, Inc., which is owned by the Vanguard funds and provides services to them on an at-cost basis.
A majority of Vanguard’s board members are independent, meaning that they have no affiliation with Vanguard or the funds they oversee, apart from the sizable personal investments they have made as private individuals. The independent board members have distinguished backgrounds in business, academia, and public service. Each of the trustees and executive officers oversees 182 Vanguard funds.
The following table provides information for each trustee and executive officer of the fund. More information about the trustees is in the Statement of Additional Information, which can be obtained, without charge, by contacting Vanguard at 800-662-7447, or online at vanguard.com.
| InterestedTrustee1 | and Delphi Automotive LLP (automotive components); |
| Senior Advisor at New Mountain Capital; Trustee of | |
| F. William McNabb III | The Conference Board. |
| Born 1957. Trustee Since July 2009. Chairman of the | |
| Board. Principal Occupation(s) During the Past Five | Amy Gutmann |
| Years: Chairman of the Board of The Vanguard Group, | Born 1949. Trustee Since June 2006. Principal |
| Inc., and of each of the investment companies served | Occupation(s) During the Past Five Years: President |
| by The Vanguard Group, since January 2010; Director | of the University of Pennsylvania; Christopher H. |
| of The Vanguard Group since 2008; Chief Executive | Browne Distinguished Professor of Political Science |
| Officer and President of The Vanguard Group and of | in the School of Arts and Sciences with secondary |
| each of the investment companies served by The | appointments at the Annenberg School for |
| Vanguard Group since 2008; Director of Vanguard | Communication and the Graduate School of Education |
| Marketing Corporation; Managing Director of The | of the University of Pennsylvania; Member of the |
| Vanguard Group (1995–2008). | National Commission on the Humanities and Social |
| Sciences; Trustee of Carnegie Corporation of New | |
| York and of the National Constitution Center; Chair | |
| IndependentTrustees | of the U.S. Presidential Commission for the Study |
| of Bioethical Issues. | |
| Emerson U. Fullwood | |
| Born 1948. Trustee Since January 2008. Principal | |
| Occupation(s) During the Past Five Years: Executive | JoAnn Heffernan Heisen |
| Chief Staff and Marketing Officer for North America | Born 1950. Trustee Since July 1998. Principal |
| and Corporate Vice President (retired 2008) of Xerox | Occupation(s) During the Past Five Years: Corporate |
| Corporation (document management products and | Vice President and Chief Global Diversity Officer |
| services); Executive in Residence and 2010 | (retired 2008) and Member of the Executive |
| Distinguished Minett Professor at the Rochester | Committee (1997–2008) of Johnson & Johnson |
| Institute of Technology; Director of SPX Corporation | (pharmaceuticals/medical devices/consumer |
| (multi-industry manufacturing), the United Way of | products); Director of Skytop Lodge Corporation |
| Rochester, Amerigroup Corporation (managed health | (hotels), the University Medical Center at Princeton, |
| care), the University of Rochester Medical Center, | the Robert Wood Johnson Foundation, and the Center |
| Monroe Community College Foundation, and North | for Talent Innovation; Member of the Advisory Board |
| Carolina A&T University. | of the Maxwell School of Citizenship and Public Affairs |
| at Syracuse University. | |
| Rajiv L. Gupta | |
| Born 1945. Trustee Since December 2001.2 | F. Joseph Loughrey |
| Principal Occupation(s) During the Past Five Years: | Born 1949. Trustee Since October 2009. Principal |
| Chairman and Chief Executive Officer (retired 2009) | Occupation(s) During the Past Five Years: President |
| and President (2006–2008) of Rohm and Haas Co. | and Chief Operating Officer (retired 2009) of Cummins |
| (chemicals); Director of Tyco International, Ltd. | Inc. (industrial machinery); Chairman of the Board of |
| (diversified manufacturing and services), Hewlett- | Hillenbrand, Inc. (specialized consumer services) and |
| Packard Co. (electronic computer manufacturing), | of Oxfam America; Director of SKF AB (industrial |
| machinery), Hyster-Yale Materials Handling, Inc. | Executive Officers | |
| (forklift trucks), and the Lumina Foundation for | ||
| Education; Member of the Advisory Council for the | Glenn Booraem | |
| College of Arts and Letters and of the Advisory Board | Born 1967. Controller Since July 2010. Principal | |
| to the Kellogg Institute for International Studies, both | Occupation(s) During the Past Five Years: Principal | |
| at the University of Notre Dame. | of The Vanguard Group, Inc.; Controller of each of | |
| the investment companies served by The Vanguard | ||
| Mark Loughridge | Group; Assistant Controller of each of the investment | |
| Born 1953. Trustee Since March 2012. Principal | companies served by The Vanguard Group (2001–2010). | |
| Occupation(s) During the Past Five Years: Senior Vice | ||
| President and Chief Financial Officer at IBM (information | Thomas J. Higgins | |
| technology services); Fiduciary Member of IBM’s | Born 1957. Chief Financial Officer Since September | |
| Retirement Plan Committee. | 2008. Principal Occupation(s) During the Past Five | |
| Years: Principal of The Vanguard Group, Inc.; Chief | ||
| Scott C. Malpass | Financial Officer of each of the investment companies | |
| Born 1962. Trustee Since March 2012. Principal | served by The Vanguard Group; Treasurer of each of | |
| Occupation(s) During the Past Five Years: Chief | the investment companies served by The Vanguard | |
| Investment Officer and Vice President at the University | Group (1998–2008). | |
| of Notre Dame; Assistant Professor of Finance at the | ||
| Mendoza College of Business at Notre Dame; Member | Kathryn J. Hyatt | |
| of the Notre Dame 403(b) Investment Committee; | Born 1955. Treasurer Since November 2008. Principal | |
| Director of TIFF Advisory Services, Inc. (investment | Occupation(s) During the Past Five Years: Principal of | |
| advisor); Member of the Investment Advisory | The Vanguard Group, Inc.; Treasurer of each of the | |
| Committees of the Financial Industry Regulatory | investment companies served by The Vanguard | |
| Authority (FINRA) and of Major League Baseball. | Group; Assistant Treasurer of each of the investment | |
| companies served by The Vanguard Group (1988–2008). | ||
| André F. Perold | ||
| Born 1952. Trustee Since December 2004. Principal | Heidi Stam | |
| Occupation(s) During the Past Five Years: George | Born 1956. Secretary Since July 2005. Principal | |
| Gund Professor of Finance and Banking at the Harvard | Occupation(s) During the Past Five Years: Managing | |
| Business School (retired 2011); Chief Investment | Director of The Vanguard Group, Inc.; General Counsel | |
| Officer and Managing Partner of HighVista Strategies | of The Vanguard Group; Secretary of The Vanguard | |
| LLC (private investment firm); Director of Rand | Group and of each of the investment companies | |
| Merchant Bank; Overseer of the Museum of Fine | served by The Vanguard Group; Director and Senior | |
| Arts Boston. | Vice President of Vanguard Marketing Corporation. | |
| Alfred M. Rankin, Jr. | ||
| Vanguard Senior ManagementTeam | ||
| Born 1941. Trustee Since January 1993. Principal | ||
| Occupation(s) During the Past Five Years: Chairman, | Mortimer J. Buckley | Chris D. McIsaac |
| President, and Chief Executive Officer of NACCO | Kathleen C. Gubanich | Michael S. Miller |
| Industries, Inc. (housewares/lignite) and of Hyster-Yale | Paul A. Heller | James M. Norris |
| Materials Handling, Inc. (forklift trucks); Director of | Martha G. King | Glenn W. Reed |
| the National Association of Manufacturers; Chairman | John T. Marcante | |
| of the Board of University Hospitals of Cleveland; | ||
| Advisory Chairman of the Board of The Cleveland | ||
| Museum of Art. | Chairman Emeritus and Senior Advisor | |
| John J. Brennan | ||
| Peter F. Volanakis | ||
| Born 1955. Trustee Since July 2009. Principal | Chairman, 1996–2009 | |
| Occupation(s) During the Past Five Years: President | Chief Executive Officer and President, 1996–2008 | |
| and Chief Operating Officer (retired 2010) of Corning | ||
| Incorporated (communications equipment); Director | Founder | |
| of SPX Corporation (multi-industry manufacturing); | ||
| Overseer of the Amos Tuck School of Business | John C. Bogle | |
| Administration at Dartmouth College; Advisor to the | Chairman and Chief Executive Officer, 1974–1996 | |
| Norris Cotton Cancer Center. | ||
1 Mr. McNabb is considered an “interested person,” as defined in the Investment Company Act of 1940, because he is an officer of the Vanguard funds.
2 December 2002 for Vanguard Equity Income Fund, Vanguard Growth Equity Fund, the Vanguard Municipal Bond Funds, and the Vanguard State Tax-Exempt Funds.
 | |
| P.O. Box 2600 | |
| Valley Forge, PA 19482-2600 |
Connect with Vanguard® > vanguard.com
| Fund Information > 800-662-7447 | S&P® and S&P 500® are registered trademarks of |
| Direct Investor Account Services > 800-662-2739 | Standard & Poor’s Financial Services LLC (“S&P”) and |
| have been licensed for use by S&P Dow Jones Indices | |
| Institutional Investor Services > 800-523-1036 | LLC and its affiliates and sublicensed for certain |
| Text Telephone for People | purposes by Vanguard. The S&P Index is a product of |
| With Hearing Impairment > 800-749-7273 | S&P Dow Jones Indices LLC and has been licensed for |
| use by Vanguard. The Vanguard funds are not | |
| This material may be used in conjunction | sponsored, endorsed, sold, or promoted by S&P Dow |
| with the offering of shares of any Vanguard | Jones Indices LLC, Dow Jones, S&P, or their respective |
| fund only if preceded or accompanied by | affiliates, and none of S&P Dow Jones Indices LLC, |
| Dow Jones, S&P, nor their respective affiliates makes | |
| the fund’s current prospectus. | any representation regarding the advisability of |
| All comparative mutual fund data are from Lipper, a | investing in such products. |
| Thomson Reuters Company, or Morningstar, Inc., unless | |
| otherwise noted. | |
| You can obtain a free copy of Vanguard’s proxy voting | |
| guidelines by visiting vanguard.com/proxyreporting or by | |
| calling Vanguard at 800-662-2739. The guidelines are | |
| also available from the SEC’s website, sec.gov. In | |
| addition, you may obtain a free report on how your fund | |
| voted the proxies for securities it owned during the 12 | |
| months ended June 30. To get the report, visit either | |
| vanguard.com/proxyreporting or sec.gov. | |
| You can review and copy information about your fund at | |
| the SEC’s Public Reference Room in Washington, D.C. To | |
| find out more about this public service, call the SEC at | |
| 202-551-8090. Information about your fund is also | |
| available on the SEC’s website, and you can receive | |
| copies of this information, for a fee, by sending a | |
| request in either of two ways: via e-mail addressed to | |
| publicinfo@sec.gov or via regular mail addressed to the | |
| Public Reference Section, Securities and Exchange | |
| Commission, Washington, DC 20549-1520. | |
| © 2014 The Vanguard Group, Inc. | |
| All rights reserved. | |
| Vanguard Marketing Corporation, Distributor. | |
| Q980 022014 | |
![]()
Annual Report | December 31, 2013
Vanguard U.S. Stock Index Funds Large-Capitalization Portfolios

Vanguard’s Principles for Investing Success
We want to give you the best chance of investment success. These principles, grounded in Vanguard’s research and experience, can put you on the right path.
Goals. Create clear, appropriate investment goals.
Balance. Develop a suitable asset allocation using broadly diversified funds. Cost. Minimize cost.
Discipline. Maintain perspective and long-term discipline.
A single theme unites these principles: Focus on the things you can control.
We believe there is no wiser course for any investor.
| Contents | |
| Your Fund’s Total Returns. | 1 |
| Chairman’s Letter. | 4 |
| Growth Index Fund. | 10 |
| Value Index Fund. | 32 |
| Large-Cap Index Fund. | 53 |
| Your Fund’s After-Tax Returns. | 80 |
| About Your Fund’s Expenses. | 81 |
| Glossary. | 84 |
Please note: The opinions expressed in this report are just that—informed opinions. They should not be considered promises or advice.
Also, please keep in mind that the information and opinions cover the period through the date on the front of this report. Of course, the risks of investing in your fund are spelled out in the prospectus.
See the Glossary for definitions of investment terms used in this report.
About the cover: The ship’s wheel represents leadership and guidance, essential qualities in navigating difficult seas.
This one is a replica based on an 18th-century British vessel. The HMS Vanguard, another ship of that era, served as the flagship for British Admiral Horatio Nelson when he defeated a French fleet at the Battle of the Nile.
| Your Fund’s Total Returns | |
| Fiscal Year Ended December 31, 2013 | |
| Total | |
| Returns | |
| Vanguard Growth Index Fund | |
| Investor Shares | 32.16% |
| Admiral™ Shares | 32.40 |
| Signal® Shares | 32.37 |
| Institutional Shares | 32.41 |
| ETF Shares | |
| Market Price | 32.40 |
| Net Asset Value | 32.38 |
| Spliced Growth Index | 32.47 |
| Large-Cap Growth Funds Average | 33.68 |
| For a benchmark description, see the Glossary. | |
| Large-Cap Growth Funds Average: Derived from data provided by Lipper, a Thomson Reuters Company. | |
| Vanguard Value Index Fund | |
| Investor Shares | 32.85% |
| Admiral Shares | 33.05 |
| Signal Shares | 33.06 |
| Institutional Shares | 33.07 |
| ETF Shares | |
| Market Price | 33.11 |
| Net Asset Value | 33.03 |
| Spliced Value Index | 33.15 |
| Large-Cap Value Funds Average | 32.39 |
For a benchmark description, see the Glossary.
Large-Cap Value Funds Average: Derived from data provided by Lipper, a Thomson Reuters Company.
Admiral Shares carry lower expenses and are available to investors who meet certain account-balance requirements. Signal Shares and Institutional Shares are available to certain institutional investors who meet specific administrative, service, and account-size criteria. The Vanguard ETF® Shares shown are traded on the NYSE Arca exchange and are available only through brokers. The table provides ETF returns based on both the NYSE Arca market price and the net asset value for a share. U.S. Pat. Nos. 6,879,964; 7,337,138; 7,720,749; 7,925,573; 8,090,646; and 8,417,623.
1
| Your Fund’s Total Returns | |
| Fiscal Year Ended December 31, 2013 | |
| Total | |
| Returns | |
| Vanguard Large-Cap Index Fund | |
| Investor Shares | 32.45% |
| Admiral Shares | 32.66 |
| Signal Shares | 32.65 |
| Institutional Shares | 32.65 |
| ETF Shares | |
| Market Price | 32.68 |
| Net Asset Value | 32.65 |
| Spliced Large Cap Index | 32.74 |
| Large-Cap Core Funds Average | 31.42 |
For a benchmark description, see the Glossary.
Large-Cap Core Funds Average: Derived from data provided by Lipper, a Thomson Reuters Company.
Admiral Shares carry lower expenses and are available to investors who meet certain account-balance requirements. Signal Shares and Institutional Shares are available to certain institutional investors who meet specific administrative, service, and account-size criteria. The Vanguard ETF® Shares shown are traded on the NYSE Arca exchange and are available only through brokers. The table provides ETF returns based on both the NYSE Arca market price and the net asset value for a share. U.S. Pat. Nos. 6,879,964; 7,337,138; 7,720,749; 7,925,573; 8,090,646; and 8,417,623.
For the ETF Shares, the market price is determined by the midpoint of the bid-offer spread as of the closing time of the New York Stock Exchange (generally 4 p.m., Eastern time). The net asset value is also determined as of the NYSE closing time. For more information about how the ETF Shares' market prices have compared with their net asset value, visit vanguard.com, select your ETF, and then select the Price and Performance tab. The ETF premium/discount analysis there shows the percentages of days on which the ETF Shares' market price was above or below the NAV.
2
| Your Fund’s Performance at a Glance | ||||
| December 31, 2012, Through December 31, 2013 | ||||
| Distributions Per Share | ||||
| Starting | Ending | Income | Capital | |
| Share Price | Share Price | Dividends | Gains | |
| Vanguard Growth Index Fund | ||||
| Investor Shares | $36.65 | $47.87 | $0.507 | $0.000 |
| Admiral Shares | 36.64 | 47.87 | 0.571 | 0.000 |
| Signal Shares | 33.93 | 44.32 | 0.529 | 0.000 |
| Institutional Shares | 36.64 | 47.87 | 0.575 | 0.000 |
| ETF Shares | 71.19 | 92.99 | 1.110 | 0.000 |
| Vanguard Value Index Fund | ||||
| Investor Shares | $22.93 | $29.78 | $0.618 | $0.000 |
| Admiral Shares | 22.93 | 29.78 | 0.658 | 0.000 |
| Signal Shares | 23.86 | 30.99 | 0.685 | 0.000 |
| Institutional Shares | 22.93 | 29.78 | 0.662 | 0.000 |
| ETF Shares | 58.79 | 76.34 | 1.688 | 0.000 |
| Vanguard Large-Cap Index Fund | ||||
| Investor Shares | $26.32 | $34.24 | $0.557 | $0.000 |
| Admiral Shares | 32.90 | 42.81 | 0.751 | 0.000 |
| Signal Shares | 28.70 | 37.34 | 0.657 | 0.000 |
| Institutional Shares | 135.42 | 176.18 | 3.106 | 0.000 |
| ETF Shares | 65.15 | 84.76 | 1.488 | 0.000 |
3

Chairman’s Letter
Dear Shareholder,
Vanguard’s three large-capitalization U.S. index funds delivered strong results for the 12 months ended December 31, 2013, posting returns ranging from 32.16% for Vanguard Growth Index Fund to 32.85% for Vanguard Value Index Fund. Vanguard Large-Cap Index Fund, which invests in both value and growth stocks, fell between the other two funds, returning 32.45%. (All returns are for the funds’ Investor Shares.)
The performances of all three funds closely tracked those of their respective target indexes.
Please note that in October, we announced plans to streamline Vanguard’s share-class offerings by phasing out Signal Shares. Your fund’s Signal Shares will be converted to Admiral Shares by October 2014.
If you hold any of these funds in a taxable account, you may wish to review the after-tax returns that appear later in this report.
Earnings, optimism, and stimulus made it a big year for U.S. stocks
For the 12 months ended December 31, U.S. stocks surged about 34%, their best calendar-year finish since 1995. Corporations posted solid earnings and investors placed a higher premium on those earnings. The Federal Reserve’s stimulative bond-buying program also supported stock markets; in fact, markets slumped a bit in the summer when
4
questions arose about the timing of the program’s unwinding. In December, the Fed ended the uncertainty by announcing that it would begin paring its bond purchases in January 2014.
International stocks, in aggregate, returned about 15%, with the developed markets of Europe and the Pacific region posting double-digit results and emerging-market stocks dipping into negative territory.
For 2014, Vanguard Chief Economist Joe Davis and his team are guarded in their outlook for global stock returns, and their forecast for the bond market remains muted. While Joe readily acknowledges that such forecasts are accompanied by uncertainty, he writes, “We believe a balanced and diversified, low-cost portfolio can remain a high-value proposition in the decade ahead.” (You can read more about our expectations for bond and stock returns in Vanguard’s Economic and Investment Outlook, available at vanguard.com/research.)
Bond returns slipped further as the Fed’s phaseout loomed
The broad U.S. taxable bond market returned –2.02%—its first negative calendar-year result since 1999 and its worst calendar-year performance since 1994. The Fed’s plans for phasing out its bond-buying program rattled investors, who sold bonds in anticipation of further price declines. Municipal bonds returned –2.55% in aggregate. The yield of the 10-year Treasury note closed at 2.97%, up
| Market Barometer | |||
| Average Annual Total Returns | |||
| Periods Ended December 31, 2013 | |||
| One | Three | Five | |
| Year | Years | Years | |
| Stocks | |||
| Russell 1000 Index (Large-caps) | 33.11% | 16.30% | 18.59% |
| Russell 2000 Index (Small-caps) | 38.82 | 15.67 | 20.08 |
| Russell 3000 Index (Broad U.S. market) | 33.55 | 16.24 | 18.71 |
| MSCI All Country World Index ex USA (International) | 15.29 | 5.14 | 12.81 |
| Bonds | |||
| Barclays U.S. Aggregate Bond Index (Broad taxable market) | -2.02% | 3.26% | 4.44% |
| Barclays Municipal Bond Index (Broad tax-exempt market) | -2.55 | 4.83 | 5.89 |
| Citigroup Three-Month U.S. Treasury Bill Index | 0.05 | 0.06 | 0.09 |
| CPI | |||
| Consumer Price Index | 1.50% | 2.07% | 2.08% |
5
from 1.76% at the close of December 2012. (Bond yields and prices move in opposite directions.)
International bond markets (as measured by the Barclays Global Aggregate Index ex USD) returned –3.08%. As for money market funds and savings accounts, returns remained tiny as the Fed held short-term interest rates between 0% and 0.25%.
Large-caps performed well across all market segments
Vanguard’s three large-cap index funds provide exposure to some of the United States’ biggest companies. Investors may choose to invest broadly in the large-cap segment of the market through the Large-Cap Index Fund or to focus specifically on its growth or value segment through the Growth or Value Index Fund.
It was, as I mentioned, a strong period for large-cap stocks, with all ten industry sectors posting positive results. However, large-cap stocks generally lagged small- and mid-cap stocks. Shares of these smaller firms can outperform at times, such as the past fiscal year, when investors seem more open to risk.
The Value Index Fund benefited most from its heavy allocation to financial stocks, which contributed roughly one-quarter of the fund’s return for the period. Notable gains came from banks, financial services companies, and insurance firms. Industrial stocks—especially diversified industrial
| Expense Ratios | ||||||
| Your Fund Compared With Its Peer Group | ||||||
| Peer | ||||||
| Investor | Admiral | Signal | Institutional | ETF | Group | |
| Shares | Shares | Shares | Shares | Shares | Average | |
| Growth Index Fund | 0.24% | 0.10% | 0.10% | 0.08% | 0.10% | 1.28% |
| Value Index Fund | 0.24 | 0.10 | 0.10 | 0.08 | 0.10 | 1.19 |
| Large-Cap Index Fund | 0.24 | 0.10 | 0.10 | 0.08 | 0.10 | 1.15 |
The fund expense ratios shown are from the prospectus dated August 12, 2013, and represent estimated costs for the current fiscal year. For the fiscal year ended December 31, 2013, the funds’ expense ratios were: for the Growth Index Fund, 0.24% for Investor Shares, 0.09% for Admiral Shares, 0.09% for Signal Shares, 0.08% for Institutional Shares, and 0.09% for ETF Shares; for the Value Index Fund, 0.24% for Investor Shares, 0.09% for Admiral Shares, 0.09% for Signal Shares, 0.08% for Institutional Shares, and 0.09% for ETF Shares; and for the Large-Cap Index Fund, 0.24% for Investor Shares, 0.09% for Admiral Shares, 0.09% for Signal Shares, 0.08% for Institutional Shares, and 0.09% for ETF Shares. The peer-group expense ratios are derived from data provided by Lipper, a Thomson Reuters Company, and capture information through year-end 2012.
Peer groups: For the Growth Index Fund, Large-Cap Growth Funds; for the Value Index Fund, Large-Cap Value Funds; and for the Large-Cap Index Fund, Large-Cap Core Funds.
6
companies and aerospace and defense firms—also added significantly to performance. In health care, pharmaceutical companies turned in impressive results.
Within the Growth Index Fund, stocks in the consumer services sector added most to returns, with retailers and media companies leading the way. Holdings in technology contributed as well, as stocks of internet, software, and semiconductor companies flourished. The fund also posted sizable gains in the industrial and health care sectors.
The LargeCap Index Fund’s performance closely mirrored that of the Value Index Fund. Stocks in the financial sector added most to returns, aided by holdings in health care and industrials. As in the Growth Index Fund, consumer services and technology firms also boosted results.
| Total Returns | |
| Ten Years Ended December 31, 2013 | |
| Average | |
| Annual Return | |
| Growth Index Fund Investor Shares | 7.88% |
| Spliced Growth Index | 8.09 |
| Large-Cap Growth Funds Average | 6.77 |
| For a benchmark description, see the Glossary. | |
| Large-Cap Growth Funds Average: Derived from data provided by Lipper, a Thomson Reuters Company. | |
| Value Index Fund Investor Shares | 7.38% |
| Spliced Value Index | 7.53 |
| Large-Cap Value Funds Average | 6.39 |
| For a benchmark description, see the Glossary. | |
| Large-Cap Value Funds Average: Derived from data provided by Lipper, a Thomson Reuters Company. | |
| Large-Cap Index Fund Investor Shares (Returns since inception: 1/30/2004) | 7.53% |
| Spliced Large Cap Index | 7.71 |
| Large-Cap Core Funds Average | 6.01 |
| For a benchmark description, see the Glossary. | |
| Large-Cap Core Funds Average: Derived from data provided by Lipper, a Thomson Reuters Company. | |
The figures shown represent past performance, which is not a guarantee of future results. (Current performance may be lower or higher than the performance data cited. For performance data current to the most recent month-end, visit our website at vanguard.com/performance.) Note, too, that both investment returns and principal value can fluctuate widely, so an investor’s shares, when sold, could be worth more or less than their original cost.
7
The funds continue to post competitive long-term results
For the decade ended December 31, 2013, the Growth and Value Index Funds recorded average annual returns of 7.88% and 7.38%, respectively. The Large-Cap Index Fund, which does not yet have a full decade of performance, has posted an average annual return of 7.53% since its inception in early 2004.
| Don’t let a trick of the calendar alter your course |
| When making investment decisions, it’s important to weigh past returns with caution. That’s |
| because investment returns from any particular period are an unreliable anchor for gauging the |
| future. They can be highly date-dependent. |
| For example, take the five-year average annual return for the broad U.S. stock market. That |
| average just made a startling bounce: from 2.04% for the period ended December 31, 2012, |
| to 18.71% for the period ended December 31, 2013. True, the market returned a hearty 33.55% |
| in the most recent 12 months, but that’s not enough to explain such a big leap in the average. |
| Significantly, the 12 months ended December 31, 2008—when U.S. stocks returned –37.31% |
| during the financial crisis—has now rolled off the five-year calculation. |
| The important thing to remember is that historical returns are just that: historical. Basing |
| investment decisions on such date-dependent snapshots could easily lead you to alter |
| course—possibly in the wrong direction. Instead, Vanguard believes, you should build your |
| asset allocation strategy on long-term risk-and-return relationships, always recognizing that |
| no level of return is guaranteed. |
| Which five-year average should you count on? |
| (Answer: None of them!) |
| Average annual returns for U.S. stocks over five-year periods ended December 31 |
| 2007 | 13.63% |
| 2008 | –1.95 |
| 2009 | 0.76 |
| 2010 | 2.74 |
| 2011 | –0.01 |
| 2012 | 2.04 |
| 2013 | 18.71 |
| Note: The U.S. stock market is represented by the Russell 3000 Index. | |
| Source: Vanguard. |
8
Each of the three funds has met its primary objective of closely tracking its target index over the long term. In addition, each fund’s average annual return has surpassed that of its respective peer group.
This success is a tribute to Vanguard Equity Investment Group, the funds’ advisor. The advisor is helped in this task by the funds’ low expenses, which are far below the industry average for large-cap funds.
Rebalancing your portfolio keeps your target in focus
The surge in U.S. stocks in 2013 undoubtedly brought good cheer to investors at the end of the year. Although the rally has been welcome, we simply don’t know how long it will last. History teaches that it’s wise to anticipate a pullback after an extended winning streak.
At Vanguard, no matter what the current market conditions, we encourage you to maintain a diversified portfolio with a mix of stock, bond, and money market funds consistent with your long-term goals and risk tolerance.
Following such a robust year for stocks, you may find that your asset mix has drifted from your original target. If your allocation is off-target by about 5 percentage points or more, it may be time to rebalance. Specifically, the strong results for stocks and weak results for bonds in 2013 may mean directing assets from equities to fixed income.
I understand that it feels counterintuitive to move away from one asset class that’s done well recently and into another that’s underperformed. But, as a Vanguard research paper puts it, “bonds are likely to remain one of the best diversifiers of equity market risk and . . . will likely provide downside protection to balanced investors over the long term.” (You can read Risk of Loss: Should the Prospect of Rising Rates Push Investors from High-Quality Bonds? at vanguard.com/research.)
Ultimately, rebalancing is about controlling risk by keeping your portfolio in line with your target asset allocation. The alternative is to allow market fluctuations to set your asset mix, potentially leaving you with a portfolio that’s riskier than you intended. As we’ve long counseled our clients, focusing on what you can control is one of the most prudent steps you can take as an investor.
Thank you for entrusting your assets to Vanguard.
Sincerely,
F. William McNabb III
Chairman and Chief Executive Officer
January 13, 2014
9
Growth Index Fund
Fund Profile
As of December 31, 2013
| Share-Class Characteristics | |||||
| Investor | Admiral | Signal | Institutional | ||
| Shares | Shares | Shares | Shares | ETF Shares | |
| Ticker Symbol | VIGRX | VIGAX | VIGSX | VIGIX | VUG |
| Expense Ratio1 | 0.24% | 0.10% | 0.10% | 0.08% | 0.10% |
| 30-Day SEC Yield | 1.16% | 1.30% | 1.30% | 1.31% | 1.30% |
| Portfolio Characteristics | |||
| DJ | |||
| U.S. | |||
| Total | |||
| CRSP US | Stock | ||
| Large Cap | Market | ||
| Growth | FA | ||
| Fund | Index | Index | |
| Number of Stocks | 356 | 356 | 3,653 |
| Median Market Cap | $56.1B | $56.1B | $43.0B |
| Price/Earnings Ratio | 24.7x | 24.7x | 20.7x |
| Price/Book Ratio | 4.6x | 4.6x | 2.7x |
| Return on Equity | 21.8% | 21.4% | 16.5% |
| Earnings Growth | |||
| Rate | 17.8% | 17.8% | 11.4% |
| Dividend Yield | 1.3% | 1.3% | 1.8% |
| Foreign Holdings | 0.0% | 0.0% | 0.0% |
| Turnover Rate | 32% | — | — |
| Short-Term Reserves | 0.0% | — | — |
| Sector Diversification (% of equity exposure) | |||
| DJ | |||
| CRSP US | U.S. Total | ||
| Large Cap | Stock | ||
| Growth | Market | ||
| Fund | Index | FA Index | |
| Basic Materials | 1.6% | 1.6% | 3.1% |
| Consumer Goods | 10.6 | 10.7 | 10.2 |
| Consumer Services | 20.3 | 20.3 | 13.7 |
| Financials | 11.9 | 11.8 | 18.4 |
| Health Care | 10.0 | 10.0 | 11.8 |
| Industrials | 12.1 | 12.1 | 13.5 |
| Oil & Gas | 7.1 | 7.1 | 9.3 |
| Technology | 25.6 | 25.6 | 14.9 |
| Telecommunications | 0.4 | 0.4 | 2.1 |
| Utilities | 0.4 | 0.4 | 3.0 |
| Volatility Measures | ||
| DJ | ||
| U.S. Total | ||
| Spliced | Stock Market | |
| Growth Index | FA Index | |
| R-Squared | 1.00 | 0.96 |
| Beta | 1.00 | 0.98 |
| These measures show the degree and timing of the fund’s fluctuations compared with the indexes over 36 months. | ||
| Ten Largest Holdings (% of total net assets) | ||
| Apple Inc. | Computer Hardware | 6.3% |
| Google Inc. | Internet | 3.9 |
| International Business | ||
| Machines Corp. | Computer Services | 2.5 |
| Coca-Cola Co. | Soft Drinks | 2.0 |
| Amazon.com Inc. | Broadline Retailers | 1.8 |
| Comcast Corp. | Broadcasting & | |
| Entertainment | 1.7 | |
| Philip Morris | ||
| International Inc. | Tobacco | 1.7 |
| Oracle Corp. | Software | 1.6 |
| QUALCOMM Inc. | Semiconductors | 1.6 |
| Walt Disney Co. | Broadcasting & | |
| Entertainment | 1.5 | |
| Top Ten | 24.6% | |
| The holdings listed exclude any temporary cash investments and equity index products. | ||
1 The expense ratios shown are from the prospectus dated August 12, 2013, and represent estimated costs for the current fiscal year. For the fiscal year ended December 31, 2013, the expense ratios were 0.24% for Investor Shares, 0.09% for Admiral Shares, 0.09% for Signal Shares, 0.08% for Institutional Shares, and 0.09% for ETF Shares.
10
Growth Index Fund
Investment Focus
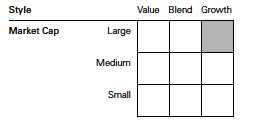
11
Growth Index Fund
Performance Summary
All of the returns in this report represent past performance, which is not a guarantee of future results that may be achieved by the fund. (Current performance may be lower or higher than the performance data cited. For performance data current to the most recent month-end, visit our website at vanguard.com/performance.) Note, too, that both investment returns and principal value can fluctuate widely, so an investor’s shares, when sold, could be worth more or less than their original cost. The returns shown do not reflect taxes that a shareholder would pay on fund distributions or on the sale of fund shares.
Cumulative Performance: December 31, 2003, Through December 31, 2013
Initial Investment of $10,000
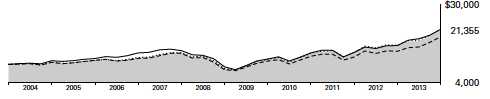
| Average Annual Total Returns | |||||
| Periods Ended December 31, 2013 | |||||
| Final Value | |||||
| One | Five | Ten | of a $10,000 | ||
| Year | Years | Years | Investment | ||
| Growth Index Fund*Investor Shares | 32.16% | 20.16% | 7.88% | $21,355 | |
| •••••••• | Spliced Growth Index | 32.47 | 20.42 | 8.09 | 21,762 |
| – – – – | Large-Cap Growth Funds Average | 33.68 | 18.58 | 6.77 | 19,247 |
| Dow Jones U.S. Total Stock Market | |||||
| Float Adjusted Index | 33.47 | 18.86 | 8.09 | 21,777 | |
For a benchmark description, see the Glossary.
Large-Cap Growth Funds Average: Derived from data provided by Lipper, a Thomson Reuters Company.
| Final Value | ||||
| One | Five | Ten | of a $10,000 | |
| Year | Years | Years | Investment | |
| Growth Index Fund Admiral Shares | 32.40% | 20.32% | 8.02% | $21,632 |
| Spliced Growth Index | 32.47 | 20.42 | 8.09 | 21,762 |
| Dow Jones U.S. Total Stock Market Float | ||||
| Adjusted Index | 33.47 | 18.86 | 8.09 | 21,777 |
See Financial Highlights for dividend and capital gains information.
12
| Growth Index Fund | ||||
| Average Annual Total Returns | ||||
| Periods Ended December 31, 2013 | ||||
| Since | Final Value | |||
| One | Five | Inception | of a $10,000 | |
| Year | Years | (6/4/2007) | Investment | |
| Growth Index Fund Signal Shares | 32.37% | 20.31% | 7.37% | $15,958 |
| Spliced Growth Index | 32.47 | 20.42 | 7.44 | 16,027 |
| Dow Jones U.S. Total Stock Market Float | ||||
| Adjusted Index | 33.47 | 18.86 | 5.58 | 14,290 |
"Since Inception" performance is calculated from the Signal Shares’ inception date for both the fund and its comparative standards.
| Final Value | ||||
| One | Five | Ten | of a $5,000,000 | |
| Year | Years | Years | Investment | |
| Growth Index Fund Institutional Shares | 32.41% | 20.36% | 8.06% | $10,850,191 |
| Spliced Growth Index | 32.47 | 20.42 | 8.09 | 10,880,838 |
| Dow Jones U.S. Total Stock Market Float | ||||
| Adjusted Index | 33.47 | 18.86 | 8.09 | 10,888,699 |
| Since | Final Value | |||
| One | Five | Inception | of a $10,000 | |
| Year | Years | (1/26/2004) | Investment | |
| Growth Index Fund | ||||
| ETF Shares Net Asset Value | 32.38% | 20.32% | 7.59% | $20,683 |
| Spliced Growth Index | 32.47 | 20.42 | 7.66 | 20,813 |
| Dow Jones U.S. Total Stock Market Float | ||||
| Adjusted Index | 33.47 | 18.86 | 7.67 | 20,835 |
"Since Inception" performance is calculated from the ETF Shares’ inception date for both the fund and its comparative standards.
| Cumulative Returns of ETF Shares: January 26, 2004, Through December 31, 2013 | |||
| Since | |||
| One | Five | Inception | |
| Year | Years | (1/26/2004) | |
| Growth Index Fund ETF Shares Market Price | 32.40% | 151.89% | 106.86% |
| Growth Index Fund ETF Shares Net Asset Value | 32.38 | 152.20 | 106.83 |
| Spliced Growth Index | 32.47 | 153.18 | 108.13 |
"Since Inception" performance is calculated from the ETF Shares’ inception date for both the fund and its comparative standard.
13
Growth Index Fund
Fiscal-Year Total Returns (%): December 31, 2003, Through December 31, 2013
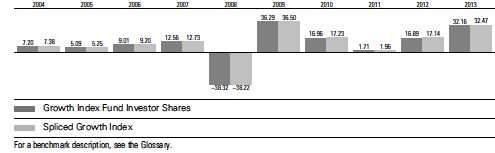
14
Growth Index Fund
Financial Statements
Statement of Net Assets
As of December 31, 2013
The fund reports a complete list of its holdings in regulatory filings four times in each fiscal year, at the quarter-ends. For the second and fourth fiscal quarters, the lists appear in the fund’s semiannual and annual reports to shareholders. For the first and third fiscal quarters, the fund files the lists with the Securities and Exchange Commission on Form N-Q. Shareholders can look up the fund’s Forms N-Q on the SEC’s website at sec.gov. Forms N-Q may also be reviewed and copied at the SEC’s Public Reference Room (see the back cover of this report for further information).
| Market | |||
| Value | |||
| Shares | ($000) | ||
| Common Stocks (99.9%)1 | |||
| Basic Materials (1.6%) | |||
| Praxair Inc. | 1,374,035 | 178,666 | |
| Ecolab Inc. | 1,265,742 | 131,979 | |
| Eastman Chemical Co. | 718,219 | 57,960 | |
| Sigma-Aldrich Corp. | 558,271 | 52,483 | |
| FMC Corp. | 621,814 | 46,922 | |
| CONSOL Energy Inc. | 1,067,491 | 40,607 | |
| Airgas Inc. | 309,830 | 34,655 | |
| * | WR Grace & Co. | 341,497 | 33,764 |
| Albemarle Corp. | 379,938 | 24,084 | |
| Westlake Chemical Corp. | 93,393 | 11,401 | |
| 612,521 | |||
| Consumer Goods (10.5%) | |||
| Coca-Cola Co. | 18,552,060 | 766,386 | |
| Philip Morris | |||
| International Inc. | 7,104,869 | 619,047 | |
| Monsanto Co. | 2,454,588 | 286,082 | |
| Colgate-Palmolive Co. | 4,318,850 | 281,632 | |
| NIKE Inc. Class B | 3,321,698 | 261,218 | |
| VF Corp. | 1,644,368 | 102,510 | |
| Lorillard Inc. | 1,719,663 | 87,153 | |
| Estee Lauder Cos. Inc. | |||
| Class A | 1,116,715 | 84,111 | |
| Mead Johnson | |||
| Nutrition Co. | 942,914 | 78,978 | |
| Mattel Inc. | 1,579,962 | 75,175 | |
| Coach Inc. | 1,309,257 | 73,489 | |
| Harley-Davidson Inc. | 1,032,216 | 71,471 | |
| * | Michael Kors | ||
| Holdings Ltd. | 856,711 | 69,556 | |
| Stanley Black | |||
| & Decker Inc. | 825,396 | 66,601 | |
| Hershey Co. | 684,565 | 66,560 | |
| BorgWarner Inc. | 1,062,699 | 59,415 | |
| *,^ | Tesla Motors Inc. | 372,111 | 55,958 |
| PVH Corp. | 380,770 | 51,792 | |
| * | Constellation Brands Inc. | ||
| Class A | 735,837 | 51,788 | |
| Market | |||
| Value | |||
| Shares | ($000) | ||
| Ralph Lauren Corp. | |||
| Class A | 282,034 | 49,799 | |
| JM Smucker Co. | 465,932 | 48,280 | |
| * | Monster Beverage Corp. | 703,884 | 47,702 |
| Polaris Industries Inc. | 323,535 | 47,120 | |
| * | Mohawk Industries Inc. | 288,490 | 42,956 |
| Church & Dwight Co. Inc. | 647,428 | 42,912 | |
| * | Green Mountain | ||
| Coffee Roasters Inc. | 556,111 | 42,031 | |
| * | LKQ Corp. | 1,262,411 | 41,533 |
| McCormick & Co. Inc. | 532,217 | 36,680 | |
| Brown-Forman Corp. | |||
| Class B | 481,423 | 36,381 | |
| * | Under Armour Inc. | ||
| Class A | 380,348 | 33,204 | |
| PulteGroup Inc. | 1,611,768 | 32,832 | |
| * | Electronic Arts Inc. | 1,371,892 | 31,471 |
| * | Lululemon Athletica Inc. | 483,814 | 28,560 |
| Herbalife Ltd. | 355,015 | 27,940 | |
| Hormel Foods Corp. | 616,889 | 27,865 | |
| * | WABCO Holdings Inc. | 290,459 | 27,132 |
| * | Fossil Group Inc. | 206,404 | 24,756 |
| * | NVR Inc. | 19,134 | 19,632 |
| * | Jarden Corp. | 285,399 | 17,509 |
| Nu Skin Enterprises Inc. | |||
| Class A | 125,088 | 17,290 | |
| * | DR Horton Inc. | 677,158 | 15,114 |
| Coty Inc. Class A | 305,056 | 4,652 | |
| 3,952,273 | |||
| Consumer Services (20.3%) | |||
| * | Amazon.com Inc. | 1,709,356 | 681,674 |
| Walt Disney Co. | 7,382,574 | 564,029 | |
| Comcast Corp. Class A | 10,485,272 | 544,867 | |
| Home Depot Inc. | 6,573,573 | 541,268 | |
| McDonald’s Corp. | 4,644,712 | 450,676 | |
| * | eBay Inc. | 5,438,816 | 298,537 |
| * | priceline.com Inc. | 240,058 | 279,043 |
| Starbucks Corp. | 3,341,849 | 261,967 | |
| Twenty-First Century | |||
| Fox Inc. Class A | 7,066,936 | 248,615 | |
| Costco Wholesale Corp. | 2,052,591 | 244,279 | |
15
| Growth Index Fund | |||
| Market | |||
| Value | |||
| Shares | ($000) | ||
| TJX Cos. Inc. | 3,153,837 | 200,994 | |
| Time Warner Cable Inc. | 1,315,825 | 178,294 | |
| CBS Corp. Class B | 2,652,172 | 169,049 | |
| Viacom Inc. Class B | 1,888,060 | 164,903 | |
| * | DIRECTV | 2,330,111 | 160,987 |
| Yum! Brands Inc. | 2,078,994 | 157,193 | |
| Las Vegas Sands Corp. | 1,721,683 | 135,789 | |
| Whole Foods Market Inc. | 1,737,248 | 100,465 | |
| * | Netflix Inc. | 262,802 | 96,756 |
| * | Dollar General Corp. | 1,495,088 | 90,184 |
| Comcast Corp. | 1,679,422 | 83,770 | |
| * | Chipotle Mexican | ||
| Grill Inc. Class A | 144,458 | 76,964 | |
| * | Bed Bath & Beyond Inc. | 952,367 | 76,475 |
| * | AutoZone Inc. | 158,953 | 75,970 |
| Wynn Resorts Ltd. | 377,693 | 73,352 | |
| Ross Stores Inc. | 960,993 | 72,007 | |
| L Brands Inc. | 1,151,734 | 71,235 | |
| Starwood Hotels & | |||
| Resorts Worldwide Inc. | 893,968 | 71,026 | |
| Twenty-First Century | |||
| Fox Inc. | 1,907,067 | 65,984 | |
| * | Liberty Interactive Corp. | ||
| Class A | 2,238,503 | 65,700 | |
| * | O’Reilly Automotive Inc. | 475,928 | 61,257 |
| * | Discovery | ||
| Communications Inc. | |||
| Class A | 654,201 | 59,153 | |
| * | DISH Network Corp. | ||
| Class A | 972,082 | 56,303 | |
| Nielsen Holdings NV | 1,146,022 | 52,591 | |
| * | Dollar Tree Inc. | 922,828 | 52,066 |
| Tractor Supply Co. | 651,138 | 50,515 | |
| Gap Inc. | 1,257,417 | 49,140 | |
| * | CarMax Inc. | 1,041,869 | 48,989 |
| Tiffany & Co. | 507,667 | 47,101 | |
| * | Sirius XM Holdings Inc. | 12,882,657 | 44,960 |
| Marriott International Inc. | |||
| Class A | 908,325 | 44,835 | |
| Wyndham | |||
| Worldwide Corp. | 607,890 | 44,795 | |
| * | Charter Communications | ||
| Inc. Class A | 315,698 | 43,175 | |
| * | TripAdvisor Inc. | 512,300 | 42,434 |
| Nordstrom Inc. | 676,185 | 41,788 | |
| * | MGM Resorts | ||
| International | 1,713,955 | 40,312 | |
| Advance Auto Parts Inc. | 339,473 | 37,573 | |
| PetSmart Inc. | 484,871 | 35,274 | |
| * | Discovery | ||
| Communications Inc. | 404,431 | 33,916 | |
| Expedia Inc. | 465,803 | 32,448 | |
| * | IHS Inc. Class A | 266,722 | 31,927 |
| Scripps Networks | |||
| Interactive Inc. Class A | 365,193 | 31,556 | |
| * | Hertz Global Holdings Inc. | 1,048,967 | 30,021 |
| Market | |||
| Value | |||
| Shares | ($000) | ||
| Family Dollar Stores Inc. | 456,690 | 29,671 | |
| Signet Jewelers Ltd. | 374,978 | 29,511 | |
| * | Ulta Salon Cosmetics | ||
| & Fragrance Inc. | 284,581 | 27,468 | |
| Williams-Sonoma Inc. | 380,263 | 22,162 | |
| FactSet Research | |||
| Systems Inc. | 191,398 | 20,782 | |
| * | Urban Outfitters Inc. | 515,633 | 19,130 |
| H&R Block Inc. | 638,745 | 18,549 | |
| * | AutoNation Inc. | 341,610 | 16,975 |
| * | Sprouts Farmers | ||
| Market Inc. | 341,522 | 13,125 | |
| * | News Corp. Class A | 664,851 | 11,981 |
| * | Norwegian Cruise Line | ||
| Holdings Ltd. | 334,296 | 11,857 | |
| Burger King Worldwide Inc. | 489,837 | 11,198 | |
| * | Groupon Inc. | 933,560 | 10,988 |
| * | Hilton Worldwide | ||
| Holdings Inc. | 460,031 | 10,236 | |
| * | Hyatt Hotels Corp. Class A | 205,090 | 10,144 |
| * | News Corp. Class B | 476,548 | 8,497 |
| * | Extended Stay America Inc. | 139,199 | 3,655 |
| Viacom Inc. Class A | 2,820 | 247 | |
| CBS Corp. Class A | 2,401 | 153 | |
| 7,590,510 | |||
| Financials (11.9%) | |||
| Visa Inc. Class A | 2,364,748 | 526,582 | |
| American Express Co. | 5,000,604 | 453,705 | |
| MasterCard Inc. Class A | 486,495 | 406,447 | |
| Simon Property Group Inc. | 1,448,549 | 220,411 | |
| BlackRock Inc. | 506,981 | 160,444 | |
| American Tower | |||
| Corporation | 1,842,082 | 147,035 | |
| Charles Schwab Corp. | 5,115,839 | 133,012 | |
| Marsh & McLennan | |||
| Cos. Inc. | 2,561,883 | 123,893 | |
| IntercontinentalExchange | |||
| Group Inc. | 537,143 | 120,814 | |
| Franklin Resources Inc. | 1,914,174 | 110,505 | |
| Public Storage | 682,719 | 102,763 | |
| McGraw Hill Financial Inc. | 1,264,179 | 98,859 | |
| T. Rowe Price Group Inc. | 1,157,032 | 96,925 | |
| Equity Residential | 1,682,506 | 87,272 | |
| Prologis Inc. | 2,328,242 | 86,029 | |
| Weyerhaeuser Co. | 2,720,550 | 85,888 | |
| Moody’s Corp. | 1,004,183 | 78,798 | |
| Ventas Inc. | 1,372,873 | 78,638 | |
| HCP Inc. | 2,129,994 | 77,361 | |
| Invesco Ltd. | 2,069,395 | 75,326 | |
| Health Care REIT Inc. | 1,347,962 | 72,210 | |
| Boston Properties Inc. | 713,621 | 71,626 | |
| Vornado Realty Trust | 785,759 | 69,768 | |
| Host Hotels | |||
| & Resorts Inc. | 3,528,437 | 68,593 | |
| AvalonBay | |||
| Communities Inc. | 573,763 | 67,836 | |
16
| Growth Index Fund | |||
| Market | |||
| Value | |||
| Shares | ($000) | ||
| * | Affiliated Managers | ||
| Group Inc. | 246,600 | 53,483 | |
| General Growth | |||
| Properties Inc. | 2,552,223 | 51,223 | |
| Leucadia National Corp. | 1,444,906 | 40,949 | |
| SL Green Realty Corp. | 430,628 | 39,781 | |
| Equifax Inc. | 568,025 | 39,245 | |
| Macerich Co. | 655,299 | 38,591 | |
| Plum Creek | |||
| Timber Co. Inc. | 826,173 | 38,425 | |
| Kimco Realty Corp. | 1,819,424 | 35,934 | |
| * | CBRE Group Inc. Class A | 1,316,845 | 34,633 |
| Realty Income Corp. | 917,806 | 34,262 | |
| * | Realogy Holdings Corp. | 682,541 | 33,765 |
| Federal Realty | |||
| Investment Trust | 304,031 | 30,832 | |
| Cole Real Estate | |||
| Investment Inc. | 2,194,223 | 30,807 | |
| Raymond James | |||
| Financial Inc. | 588,452 | 30,711 | |
| * | Ocwen Financial Corp. | 538,018 | 29,833 |
| ^ | Digital Realty Trust Inc. | 600,437 | 29,493 |
| UDR Inc. | 1,170,547 | 27,332 | |
| Essex Property Trust Inc. | 177,792 | 25,515 | |
| SEI Investments Co. | 717,865 | 24,931 | |
| Rayonier Inc. | 589,328 | 24,811 | |
| Lazard Ltd. Class A | 542,921 | 24,605 | |
| * | MSCI Inc. Class A | 553,570 | 24,202 |
| Camden Property Trust | 398,177 | 22,648 | |
| Alexandria Real Estate | |||
| Equities Inc. | 334,070 | 21,254 | |
| LPL Financial Holdings Inc. | 451,510 | 21,234 | |
| Jones Lang LaSalle Inc. | 207,352 | 21,231 | |
| TD Ameritrade | |||
| Holding Corp. | 578,438 | 17,723 | |
| 4,468,193 | |||
| Health Care (10.0%) | |||
| * | Gilead Sciences Inc. | 7,157,575 | 537,892 |
| Amgen Inc. | 3,520,236 | 401,870 | |
| AbbVie Inc. | 7,426,066 | 392,170 | |
| * | Celgene Corp. | 1,923,517 | 324,997 |
| * | Biogen Idec Inc. | 1,102,631 | 308,461 |
| * | Express Scripts | ||
| Holding Co. | 3,761,442 | 264,204 | |
| Allergan Inc. | 1,387,123 | 154,082 | |
| * | Actavis plc | 812,358 | 136,476 |
| * | Alexion | ||
| Pharmaceuticals Inc. | 915,322 | 121,793 | |
| * | Regeneron | ||
| Pharmaceuticals Inc. | 363,675 | 100,098 | |
| Stryker Corp. | 1,324,907 | 99,553 | |
| * | Vertex | ||
| Pharmaceuticals Inc. | 1,091,206 | 81,077 | |
| Zoetis Inc. | 2,334,245 | 76,306 | |
| * | Intuitive Surgical Inc. | 177,694 | 68,249 |
| * | Forest Laboratories Inc. | 1,131,699 | 67,936 |
| Market | |||
| Value | |||
| Shares | ($000) | ||
| * | Illumina Inc. | 590,269 | 65,296 |
| * | Perrigo Co. plc | 418,099 | 64,161 |
| * | DaVita HealthCare | ||
| Partners Inc. | 942,956 | 59,755 | |
| CR Bard Inc. | 363,440 | 48,679 | |
| * | BioMarin | ||
| Pharmaceutical Inc. | 664,129 | 46,668 | |
| * | Henry Schein Inc. | 400,458 | 45,756 |
| * | Varian Medical | ||
| Systems Inc. | 493,032 | 38,304 | |
| * | Waters Corp. | 378,029 | 37,803 |
| * | Laboratory Corp. of | ||
| America Holdings | 407,643 | 37,246 | |
| * | Edwards Lifesciences | ||
| Corp. | 510,002 | 33,538 | |
| DENTSPLY | |||
| International Inc. | 666,828 | 32,328 | |
| ^ | ResMed Inc. | 664,140 | 31,268 |
| * | Pharmacyclics Inc. | 274,863 | 29,075 |
| * | IDEXX Laboratories Inc. | 242,549 | 25,800 |
| * | Incyte Corp. Ltd. | 338,671 | 17,147 |
| * | Quintiles Transnational | ||
| Holdings Inc. | 177,336 | 8,218 | |
| * | Envision Healthcare | ||
| Holdings Inc. | 209,449 | 7,440 | |
| 3,763,646 | |||
| Industrials (12.0%) | |||
| 3M Co. | 3,142,720 | 440,766 | |
| Union Pacific Corp. | 2,149,888 | 361,181 | |
| United Parcel Service Inc. | |||
| Class B | 3,341,186 | 351,092 | |
| Accenture plc Class A | 2,967,496 | 243,987 | |
| Boeing Co. | 1,753,865 | 239,385 | |
| Danaher Corp. | 2,766,336 | 213,561 | |
| Precision Castparts Corp. | 678,048 | 182,598 | |
| Automatic Data | |||
| Processing Inc. | 2,247,287 | 181,603 | |
| Cummins Inc. | 874,664 | 123,301 | |
| * | LinkedIn Corp. Class A | 475,141 | 103,025 |
| PACCAR Inc. | 1,652,992 | 97,807 | |
| Agilent Technologies Inc. | 1,544,244 | 88,315 | |
| Rockwell Automation Inc. | 647,249 | 76,479 | |
| WW Grainger Inc. | 291,621 | 74,486 | |
| Sherwin-Williams Co. | 402,055 | 73,777 | |
| Pentair Ltd. | 930,433 | 72,267 | |
| * | Fiserv Inc. | 1,204,115 | 71,103 |
| Paychex Inc. | 1,534,237 | 69,854 | |
| Amphenol Corp. Class A | 738,875 | 65,893 | |
| Fidelity National | |||
| Information Services Inc. | 1,222,983 | 65,650 | |
| Roper Industries Inc. | 463,413 | 64,266 | |
| Kansas City Southern | 514,289 | 63,684 | |
| AMETEK Inc. | 1,142,169 | 60,158 | |
| Fastenal Co. | 1,246,253 | 59,209 | |
| * | Alliance Data | ||
| Systems Corp. | 215,944 | 56,778 | |
17
Growth Index Fund
| Market | |||
| Value | |||
| Shares | ($000) | ||
| Flowserve Corp. | 650,688 | 51,294 | |
| Textron Inc. | 1,311,469 | 48,210 | |
| * | Stericycle Inc. | 399,743 | 46,438 |
| * | Verisk Analytics Inc. | ||
| Class A | 706,215 | 46,412 | |
| Pall Corp. | 516,709 | 44,101 | |
| * | B/E Aerospace Inc. | 489,476 | 42,599 |
| Expeditors International | |||
| of Washington Inc. | 958,792 | 42,426 | |
| * | Trimble Navigation Ltd. | 1,203,177 | 41,750 |
| Chicago Bridge | |||
| & Iron Co. NV | 502,077 | 41,743 | |
| CH Robinson | |||
| Worldwide Inc. | 707,453 | 41,273 | |
| * | FleetCor Technologies Inc. | 325,935 | 38,190 |
| ADT Corp. | 942,133 | 38,128 | |
| Masco Corp. | 1,664,436 | 37,899 | |
| TransDigm Group Inc. | 221,281 | 35,631 | |
| Rock Tenn Co. Class A | 336,753 | 35,362 | |
| JB Hunt Transport | |||
| Services Inc. | 440,760 | 34,071 | |
| * | Mettler-Toledo | ||
| International Inc. | 138,784 | 33,668 | |
| * | Quanta Services Inc. | 991,621 | 31,296 |
| Sealed Air Corp. | 917,181 | 31,230 | |
| Donaldson Co. Inc. | 682,647 | 29,668 | |
| Cintas Corp. | 448,373 | 26,719 | |
| Hubbell Inc. Class B | 242,782 | 26,439 | |
| Robert Half | |||
| International Inc. | 615,523 | 25,846 | |
| Iron Mountain Inc. | 803,346 | 24,382 | |
| * | Sensata Technologies | ||
| Holding NV | 561,056 | 21,752 | |
| Martin Marietta | |||
| Materials Inc. | 215,868 | 21,574 | |
| Towers Watson | |||
| & Co. Class A | 165,663 | 21,140 | |
| FLIR Systems Inc. | 662,246 | 19,934 | |
| National Instruments Corp. | 468,662 | 15,007 | |
| Allison Transmission | |||
| Holdings Inc. | 382,493 | 10,561 | |
| * | Owens Corning | 247,705 | 10,087 |
| 4,515,055 | |||
| Oil & Gas (7.1%) | |||
| Schlumberger Ltd. | 6,147,468 | 553,948 | |
| EOG Resources Inc. | 1,274,181 | 213,859 | |
| Halliburton Co. | 3,761,505 | 190,896 | |
| Anadarko Petroleum Corp. | 2,349,220 | 186,340 | |
| National Oilwell Varco Inc. | 1,998,274 | 158,923 | |
| Williams Cos. Inc. | 3,190,502 | 123,058 | |
| Pioneer Natural | |||
| Resources Co. | 647,278 | 119,144 | |
| Noble Energy Inc. | 1,677,266 | 114,239 | |
| Kinder Morgan Inc. | 3,143,223 | 113,156 | |
| Cabot Oil & Gas Corp. | 1,969,868 | 76,352 | |
| Market | |||
| Value | |||
| Shares | ($000) | ||
| * | Cameron | ||
| International Corp. | 1,110,456 | 66,105 | |
| * | Southwestern Energy Co. | 1,641,724 | 64,569 |
| Ensco plc Class A | 1,089,805 | 62,315 | |
| Range Resources Corp. | 724,467 | 61,080 | |
| * | FMC Technologies Inc. | 1,103,961 | 57,638 |
| EQT Corp. | 632,858 | 56,818 | |
| * | Concho Resources Inc. | 490,142 | 52,935 |
| * | Weatherford | ||
| International Ltd. | 3,230,648 | 50,043 | |
| * | Cheniere Energy Inc. | 1,002,718 | 43,237 |
| Core Laboratories NV | 212,014 | 40,484 | |
| Oceaneering | |||
| International Inc. | 504,480 | 39,793 | |
| * | Whiting Petroleum Corp. | 554,640 | 34,316 |
| SM Energy Co. | 312,716 | 25,990 | |
| QEP Resources Inc. | 838,074 | 25,687 | |
| * | Continental Resources Inc. | 216,713 | 24,385 |
| Noble Corp. plc | 591,436 | 22,161 | |
| * | Cobalt International | ||
| Energy Inc. | 1,344,702 | 22,120 | |
| * | Dresser-Rand Group Inc. | 356,108 | 21,235 |
| * | Rowan Cos. plc Class A | 579,935 | 20,506 |
| * | Antero Resources Corp. | 183,386 | 11,634 |
| 2,652,966 | |||
| Technology (25.6%) | |||
| Apple Inc. | 4,199,961 | 2,356,640 | |
| * | Google Inc. Class A | 1,291,734 | 1,447,659 |
| International Business | |||
| Machines Corp. | 5,068,680 | 950,732 | |
| Oracle Corp. | 15,955,547 | 610,459 | |
| QUALCOMM Inc. | 7,886,205 | 585,551 | |
| * | Facebook Inc. Class A | 8,748,028 | 478,167 |
| Intel Corp. | 11,602,234 | 301,194 | |
| EMC Corp. | 9,605,961 | 241,590 | |
| Texas Instruments Inc. | 5,109,316 | 224,350 | |
| * | Yahoo! Inc. | 4,261,771 | 172,346 |
| * | Cognizant Technology | ||
| Solutions Corp. Class A | 1,412,136 | 142,598 | |
| * | Salesforce.com Inc. | 2,533,546 | 139,826 |
| * | Adobe Systems Inc. | 2,216,928 | 132,750 |
| * | Micron Technology Inc. | 4,910,522 | 106,853 |
| Intuit Inc. | 1,263,480 | 96,429 | |
| * | Cerner Corp. | 1,442,230 | 80,390 |
| SanDisk Corp. | 1,054,522 | 74,386 | |
| Analog Devices Inc. | 1,452,075 | 73,954 | |
| NetApp Inc. | 1,590,765 | 65,444 | |
| Xilinx Inc. | 1,253,282 | 57,551 | |
| * | Citrix Systems Inc. | 869,663 | 55,006 |
| * | Autodesk Inc. | 1,053,495 | 53,022 |
| Avago Technologies Ltd. | |||
| Class A | 981,531 | 51,913 | |
| * | Juniper Networks Inc. | 2,238,296 | 50,518 |
| KLA-Tencor Corp. | 778,519 | 50,183 | |
| Linear Technology Corp. | 1,093,170 | 49,794 | |
| Applied Materials Inc. | 2,808,844 | 49,689 | |
18
| Growth Index Fund | |||
| Market | |||
| Value | |||
| Shares | ($000) | ||
| * | Red Hat Inc. | 884,034 | 49,541 |
| Altera Corp. | 1,500,597 | 48,814 | |
| * | Catamaran Corp. | 962,257 | 45,688 |
| * | Lam Research Corp. | 757,261 | 41,233 |
| * | Equinix Inc. | 232,192 | 41,203 |
| NVIDIA Corp. | 2,519,511 | 40,363 | |
| Microchip Technology Inc. | 879,751 | 39,369 | |
| * | VeriSign Inc. | 639,320 | 38,219 |
| * | ANSYS Inc. | 432,573 | 37,720 |
| * | Akamai Technologies Inc. | 793,034 | 37,415 |
| Maxim Integrated | |||
| Products Inc. | 1,317,438 | 36,770 | |
| Motorola Solutions Inc. | 542,951 | 36,649 | |
| * | VMware Inc. Class A | 395,623 | 35,491 |
| * | Cree Inc. | 564,306 | 35,309 |
| * | Teradata Corp. | 762,820 | 34,701 |
| * | F5 Networks Inc. | 362,824 | 32,966 |
| * | ServiceNow Inc. | 550,747 | 30,847 |
| * | Workday Inc. Class A | 365,835 | 30,423 |
| * | Gartner Inc. | 409,319 | 29,082 |
| * | Skyworks Solutions Inc. | 877,801 | 25,070 |
| *,^ | Twitter Inc. | 381,970 | 24,312 |
| * | 3D Systems Corp. | 227,996 | 21,188 |
| * | Rackspace Hosting Inc. | 522,216 | 20,434 |
| * | TIBCO Software Inc. | 724,696 | 16,291 |
| * | Splunk Inc. | 173,449 | 11,911 |
| * | Informatica Corp. | 253,968 | 10,540 |
| * | MICROS Systems Inc. | 175,950 | 10,094 |
| * | Nuance | ||
| Communications Inc. | 587,594 | 8,932 | |
| * | NetSuite Inc. | 78,558 | 8,093 |
| * | Premier Inc. Class A | 143,893 | 5,290 |
| 9,582,952 | |||
| Telecommunications (0.5%) | |||
| * | Crown Castle | ||
| International Corp. | 1,559,493 | 114,513 | |
| * | SBA Communications | ||
| Corp. Class A | 599,329 | 53,844 | |
| 168,357 | |||
| Utilities (0.4%) | |||
| ONEOK Inc. | 962,595 | 59,854 | |
| NRG Energy Inc. | 1,508,426 | 43,322 | |
| * | Calpine Corp. | 1,825,931 | 35,624 |
| 138,800 | |||
| Total Common Stocks | |||
| (Cost $23,968,697) | 37,445,273 | ||
| Market | |||
| Value | |||
| Shares | ($000) | ||
| Temporary Cash Investments (0.3%)1 | |||
| Money Market Fund (0.3%) | |||
| 2,3 | Vanguard Market | ||
| Liquidity Fund, | |||
| 0.125% | 94,530,401 | 94,530 | |
| Face | |||
| Amount | |||
| ($000) | |||
| U.S. Government and Agency Obligations (0.0%) | |||
| 4,5 | Fannie Mae Discount | ||
| Notes, 0.060%, 3/19/14 | 500 | 500 | |
| 4,5 | Fannie Mae Discount | ||
| Notes, 0.095%, 4/9/14 | 600 | 599 | |
| 5,6 | Federal Home Loan | ||
| Bank Discount Notes, | |||
| 0.070%, 2/5/14 | 900 | 900 | |
| 5,6 | Federal Home Loan | ||
| Bank Discount Notes, | |||
| 0.090%, 3/7/14 | 500 | 500 | |
| 2,499 | |||
| Total Temporary Cash Investments | |||
| (Cost $97,030) | 97,029 | ||
| Total Investments (100.2%) | |||
| (Cost $24,065,727) | 37,542,302 | ||
| Other Assets and Liabilities (-0.2%) | |||
| Other Assets | 85,510 | ||
| Liabilities3 | (142,363) | ||
| (56,853) | |||
| Net Assets (100%) | 37,485,449 | ||
19
Growth Index Fund
| At December 31, 2013, net assets consisted of: | |
| Amount | |
| ($000) | |
| Paid-in Capital | 24,347,588 |
| Overdistributed Net Investment Income | (27,032) |
| Accumulated Net Realized Losses | (312,136) |
| Unrealized Appreciation (Depreciation) | |
| Investment Securities | 13,476,575 |
| Futures Contracts | 454 |
| Net Assets | 37,485,449 |
| Investor Shares—Net Assets | |
| Applicable to 75,837,336 outstanding | |
| $.001 par value shares of beneficial | |
| interest (unlimited authorization) | 3,630,480 |
| Net Asset Value Per Share— | |
| Investor Shares | $47.87 |
| Admiral Shares—Net Assets | |
| Applicable to 165,108,557 outstanding | |
| $.001 par value shares of beneficial | |
| interest (unlimited authorization) | 7,903,383 |
| Net Asset Value Per Share— | |
| Admiral Shares | $47.87 |
| Amount | |
| ($000) | |
| Signal Shares—Net Assets | |
| Applicable to 105,401,838 outstanding | |
| $.001 par value shares of beneficial | |
| interest (unlimited authorization) | 4,671,845 |
| Net Asset Value Per Share— | |
| Signal Shares | $44.32 |
| Institutional Shares—Net Assets | |
| Applicable to 167,444,140 outstanding | |
| $.001 par value shares of beneficial | |
| interest (unlimited authorization) | 8,014,872 |
| Net Asset Value Per Share— | |
| Institutional Shares | $47.87 |
| ETF Shares—Net Assets | |
| Applicable to 142,648,952 outstanding | |
| $.001 par value shares of beneficial | |
| interest (unlimited authorization) | 13,264,869 |
| Net Asset Value Per Share— | |
| ETF Shares | $92.99 |
See Note A in Notes to Financial Statements.
* Non-income-producing security.
^ Includes partial security positions on loan to broker-dealers. The total value of securities on loan is $46,326,000.
1 The fund invests a portion of its cash reserves in equity markets through the use of index futures contracts. After giving effect to futures investments, the fund’s effective common stock and temporary cash investment positions represent 100.0% and 0.2%, respectively, of net assets.
2 Affiliated money market fund available only to Vanguard funds and certain trusts and accounts managed by Vanguard. Rate shown is the 7-day yield.
3 Includes $46,795,000 of collateral received for securities on loan.
4 The issuer was placed under federal conservatorship in September 2008; since that time, its daily operations have been managed by the Federal Housing Finance Agency and it receives capital from the U.S. Treasury, as needed to maintain a positive net worth, in exchange for senior preferred stock.
5 Securities with a value of $2,399,000 have been segregated as initial margin for open futures contracts.
6 The issuer operates under a congressional charter; its securities are generally neither guaranteed by the U.S. Treasury nor backed by the full faith and credit of the U.S. government.
REIT—Real Estate Investment Trust.
See accompanying Notes, which are an integral part of the Financial Statements.
20
| Growth Index Fund | |
| Statement of Operations | |
| Year Ended | |
| December 31, 2013 | |
| ($000) | |
| Investment Income | |
| Income | |
| Dividends | 463,617 |
| Interest1 | 66 |
| Securities Lending | 1,405 |
| Total Income | 465,088 |
| Expenses | |
| The Vanguard Group—Note B | |
| Investment Advisory Services | 1,660 |
| Management and Administrative—Investor Shares | 7,097 |
| Management and Administrative—Admiral Shares | 4,575 |
| Management and Administrative—Signal Shares | 2,420 |
| Management and Administrative—Institutional Shares | 3,306 |
| Management and Administrative—ETF Shares | 6,439 |
| Marketing and Distribution—Investor Shares | 699 |
| Marketing and Distribution—Admiral Shares | 916 |
| Marketing and Distribution—Signal Shares | 1,049 |
| Marketing and Distribution—Institutional Shares | 1,639 |
| Marketing and Distribution—ETF Shares | 2,314 |
| Custodian Fees | 353 |
| Auditing Fees | 30 |
| Shareholders’ Reports—Investor Shares | 122 |
| Shareholders’ Reports—Admiral Shares | 69 |
| Shareholders’ Reports—Signal Shares | 42 |
| Shareholders’ Reports—Institutional Shares | 65 |
| Shareholders’ Reports—ETF Shares | 293 |
| Trustees’ Fees and Expenses | 38 |
| Total Expenses | 33,126 |
| Net Investment Income | 431,962 |
| Realized Net Gain (Loss) | |
| Investment Securities Sold | 1,657,984 |
| Futures Contracts | (4,772) |
| Realized Net Gain (Loss) | 1,653,212 |
| Change in Unrealized Appreciation (Depreciation) | |
| Investment Securities | 6,932,687 |
| Futures Contracts | 454 |
| Change in Unrealized Appreciation (Depreciation) | 6,933,141 |
| Net Increase (Decrease) in Net Assets Resulting from Operations | 9,018,315 |
| 1 Interest income from an affiliated company of the fund was $61,000. | |
| See accompanying Notes, which are an integral part of the Financial Statements. | |
21
| Growth Index Fund | ||
| Statement of Changes in Net Assets | ||
| Year Ended December 31, | ||
| 2013 | 2012 | |
| ($000) | ($000) | |
| Increase (Decrease) in Net Assets | ||
| Operations | ||
| Net Investment Income | 431,962 | 392,814 |
| Realized Net Gain (Loss) | 1,653,212 | 367,593 |
| Change in Unrealized Appreciation (Depreciation) | 6,933,141 | 2,908,364 |
| Net Increase (Decrease) in Net Assets Resulting from Operations | 9,018,315 | 3,668,771 |
| Distributions | ||
| Net Investment Income | ||
| Investor Shares | (40,362) | (43,607) |
| Admiral Shares | (91,897) | (85,446) |
| Signal Shares | (57,566) | (49,314) |
| Institutional Shares | (93,443) | (91,233) |
| ETF Shares | (149,475) | (121,121) |
| Realized Capital Gain | ||
| Investor Shares | — | — |
| Admiral Shares | — | — |
| Signal Shares | — | — |
| Institutional Shares | — | — |
| ETF Shares | — | — |
| Total Distributions | (432,743) | (390,721) |
| Capital Share Transactions | ||
| Investor Shares | (384,430) | (226,956) |
| Admiral Shares | 332,128 | 220,246 |
| Signal Shares | 6,446 | 749,005 |
| Institutional Shares | (25,279) | 715,804 |
| ETF Shares | 1,895,714 | 1,450,303 |
| Net Increase (Decrease) from Capital Share Transactions | 1,824,579 | 2,908,402 |
| Total Increase (Decrease) | 10,410,151 | 6,186,452 |
| Net Assets | ||
| Beginning of Period | 27,075,298 | 20,888,846 |
| End of Period1 | 37,485,449 | 27,075,298 |
1 Net Assets—End of Period includes undistributed (overdistributed) net investment income of ($27,032,000) and ($26,251,000).
See accompanying Notes, which are an integral part of the Financial Statements.
22
| Growth Index Fund | |||||
| Financial Highlights | |||||
| Investor Shares | |||||
| For a Share Outstanding | Year Ended December 31, | ||||
| Throughout Each Period | 2013 | 2012 | 2011 | 2010 | 2009 |
| Net Asset Value, Beginning of Period | $36.65 | $31.79 | $31.60 | $27.32 | $20.29 |
| Investment Operations | |||||
| Net Investment Income | .508 | .509 | .351 | .315 | .276 |
| Net Realized and Unrealized Gain (Loss) | |||||
| on Investments | 11.219 | 4.853 | .183 | 4.284 | 7.035 |
| Total from Investment Operations | 11.727 | 5.362 | .534 | 4.599 | 7.311 |
| Distributions | |||||
| Dividends from Net Investment Income | (.507) | (.502) | (.344) | (.319) | (.281) |
| Distributions from Realized Capital Gains | — | — | — | — | — |
| Total Distributions | (.507) | (.502) | (.344) | (.319) | (.281) |
| Net Asset Value, End of Period | $47.87 | $36.65 | $31.79 | $31.60 | $27.32 |
| Total Return1 | 32.16% | 16.89% | 1.71% | 16.96% | 36.29% |
| Ratios/Supplemental Data | |||||
| Net Assets, End of Period (Millions) | $3,630 | $3,105 | $2,897 | $3,843 | $5,770 |
| Ratio of Total Expenses to | |||||
| Average Net Assets | 0.24% | 0.24% | 0.24% | 0.26% | 0.28% |
| Ratio of Net Investment Income to | |||||
| Average Net Assets | 1.22% | 1.45% | 1.10% | 1.13% | 1.20% |
| Portfolio Turnover Rate2 | 32% | 21% | 23% | 26% | 29% |
1 Total returns do not include account service fees that may have applied in the periods shown. Fund prospectuses provide information about any applicable account service fees.
2 Excludes the value of portfolio securities received or delivered as a result of in-kind purchases or redemptions of the fund’s capital shares, including ETF Creation Units.
See accompanying Notes, which are an integral part of the Financial Statements.
23
| Growth Index Fund | |||||
| Financial Highlights | |||||
| Admiral Shares | |||||
| For a Share Outstanding | Year Ended December 31, | ||||
| Throughout Each Period | 2013 | 2012 | 2011 | 2010 | 2009 |
| Net Asset Value, Beginning of Period | $36.64 | $31.79 | $31.60 | $27.32 | $20.30 |
| Investment Operations | |||||
| Net Investment Income | .572 | .560 | .399 | .357 | .308 |
| Net Realized and Unrealized Gain (Loss) | |||||
| on Investments | 11.229 | 4.842 | .185 | 4.282 | 7.027 |
| Total from Investment Operations | 11.801 | 5.402 | .584 | 4.639 | 7.335 |
| Distributions | |||||
| Dividends from Net Investment Income | (.571) | (.552) | (.394) | (.359) | (.315) |
| Distributions from Realized Capital Gains | — | — | — | — | — |
| Total Distributions | (.571) | (.552) | (.394) | (.359) | (.315) |
| Net Asset Value, End of Period | $47.87 | $36.64 | $31.79 | $31.60 | $27.32 |
| Total Return1 | 32.40% | 17.01% | 1.87% | 17.12% | 36.42% |
| Ratios/Supplemental Data | |||||
| Net Assets, End of Period (Millions) | $7,903 | $5,774 | $4,819 | $4,712 | $1,641 |
| Ratio of Total Expenses to | |||||
| Average Net Assets | 0.09% | 0.10% | 0.10% | 0.12% | 0.14% |
| Ratio of Net Investment Income to | |||||
| Average Net Assets | 1.37% | 1.59% | 1.24% | 1.27% | 1.34% |
| Portfolio Turnover Rate2 | 32% | 21% | 23% | 26% | 29% |
1 Total returns do not include account service fees that may have applied in the periods shown. Fund prospectuses provide information about any applicable account service fees.
2 Excludes the value of portfolio securities received or delivered as a result of in-kind purchases or redemptions of the fund’s capital shares, including ETF Creation Units.
See accompanying Notes, which are an integral part of the Financial Statements.
24
| Growth Index Fund | |||||
| Financial Highlights | |||||
| Signal Shares | |||||
| For a Share Outstanding | Year Ended December 31, | ||||
| Throughout Each Period | 2013 | 2012 | 2011 | 2010 | 2009 |
| Net Asset Value, Beginning of Period | $33.93 | $29.44 | $29.26 | $25.30 | $18.80 |
| Investment Operations | |||||
| Net Investment Income | .530 | .519 | .369 | .331 | .286 |
| Net Realized and Unrealized Gain (Loss) | |||||
| on Investments | 10.389 | 4.483 | .175 | 3.963 | 6.507 |
| Total from Investment Operations | 10.919 | 5.002 | .544 | 4.294 | 6.793 |
| Distributions | |||||
| Dividends from Net Investment Income | (.529) | (.512) | (.364) | (.334) | (.293) |
| Distributions from Realized Capital Gains | — | — | — | — | — |
| Total Distributions | (.529) | (.512) | (.364) | (.334) | (.293) |
| Net Asset Value, End of Period | $44.32 | $33.93 | $29.44 | $29.26 | $25.30 |
| Total Return | 32.37% | 17.01% | 1.88% | 17.11% | 36.42% |
| Ratios/Supplemental Data | |||||
| Net Assets, End of Period (Millions) | $4,672 | $3,540 | $2,402 | $1,658 | $1,428 |
| Ratio of Total Expenses to | |||||
| Average Net Assets | 0.09% | 0.10% | 0.10% | 0.12% | 0.14% |
| Ratio of Net Investment Income to | |||||
| Average Net Assets | 1.37% | 1.59% | 1.24% | 1.27% | 1.34% |
| Portfolio Turnover Rate1 | 32% | 21% | 23% | 26% | 29% |
1 Excludes the value of portfolio securities received or delivered as a result of in-kind purchases or redemptions of the fund’s capital shares, including ETF Creation Units.
See accompanying Notes, which are an integral part of the Financial Statements.
25
| Growth Index Fund | |||||
| Financial Highlights | |||||
| Institutional Shares | |||||
| For a Share Outstanding | Year Ended December 31, | ||||
| Throughout Each Period | 2013 | 2012 | 2011 | 2010 | 2009 |
| Net Asset Value, Beginning of Period | $36.64 | $31.79 | $31.60 | $27.32 | $20.30 |
| Investment Operations | |||||
| Net Investment Income | .576 | .567 | .405 | .369 | .322 |
| Net Realized and Unrealized Gain (Loss) | |||||
| on Investments | 11.229 | 4.842 | .186 | 4.283 | 7.027 |
| Total from Investment Operations | 11.805 | 5.409 | .591 | 4.652 | 7.349 |
| Distributions | |||||
| Dividends from Net Investment Income | (.575) | (.559) | (.401) | (.372) | (.329) |
| Distributions from Realized Capital Gains | — | — | — | — | — |
| Total Distributions | (.575) | (.559) | (.401) | (.372) | (.329) |
| Net Asset Value, End of Period | $47.87 | $36.64 | $31.79 | $31.60 | $27.32 |
| Total Return | 32.41% | 17.04% | 1.89% | 17.17% | 36.50% |
| Ratios/Supplemental Data | |||||
| Net Assets, End of Period (Millions) | $8,015 | $6,189 | $4,726 | $3,934 | $2,913 |
| Ratio of Total Expenses to | |||||
| Average Net Assets | 0.08% | 0.08% | 0.08% | 0.08% | 0.08% |
| Ratio of Net Investment Income to | |||||
| Average Net Assets | 1.38% | 1.61% | 1.26% | 1.31% | 1.40% |
| Portfolio Turnover Rate1 | 32% | 21% | 23% | 26% | 29% |
1 Excludes the value of portfolio securities received or delivered as a result of in-kind purchases or redemptions of the fund’s capital shares, including ETF Creation Units.
See accompanying Notes, which are an integral part of the Financial Statements.
26
| Growth Index Fund | |||||
| Financial Highlights | |||||
| ETF Shares | |||||
| For a Share Outstanding | Year Ended December 31, | ||||
| Throughout Each Period | 2013 | 2012 | 2011 | 2010 | 2009 |
| Net Asset Value, Beginning of Period | $71.19 | $61.76 | $61.39 | $53.08 | $39.43 |
| Investment Operations | |||||
| Net Investment Income | 1.112 | 1.087 | .776 | .695 | .598 |
| Net Realized and Unrealized Gain (Loss) | |||||
| on Investments | 21.798 | 9.416 | .360 | 8.315 | 13.666 |
| Total from Investment Operations | 22.910 | 10.503 | 1.136 | 9.010 | 14.264 |
| Distributions | |||||
| Dividends from Net Investment Income | (1.110) | (1.073) | (.766) | (.700) | (.614) |
| Distributions from Realized Capital Gains | — | — | — | — | — |
| Total Distributions | (1.110) | (1.073) | (.766) | (.700) | (.614) |
| Net Asset Value, End of Period | $92.99 | $71.19 | $61.76 | $61.39 | $53.08 |
| Total Return | 32.38% | 17.03% | 1.87% | 17.11% | 36.46% |
| Ratios/Supplemental Data | |||||
| Net Assets, End of Period (Millions) | $13,265 | $8,467 | $6,046 | $5,099 | $3,917 |
| Ratio of Total Expenses to | |||||
| Average Net Assets | 0.09% | 0.10% | 0.10% | 0.12% | 0.14% |
| Ratio of Net Investment Income to | |||||
| Average Net Assets | 1.37% | 1.59% | 1.24% | 1.27% | 1.34% |
| Portfolio Turnover Rate1 | 32% | 21% | 23% | 26% | 29% |
1 Excludes the value of portfolio securities received or delivered as a result of in-kind purchases or redemptions of the fund’s capital shares, including ETF Creation Units.
See accompanying Notes, which are an integral part of the Financial Statements.
27
Growth Index Fund
Notes to Financial Statements
Vanguard Growth Index Fund is registered under the Investment Company Act of 1940 as an open-end investment company, or mutual fund. The fund offers five classes of shares: Investor Shares, Admiral Shares, Signal Shares, Institutional Shares, and ETF Shares. Investor Shares are available to any investor who meets the fund’s minimum purchase requirements. Admiral Shares, Signal Shares, and Institutional Shares are designed for investors who meet certain administrative, service, and account-size criteria. ETF Shares are listed for trading on NYSE Arca; they can be purchased and sold through a broker.
A. The following significant accounting policies conform to generally accepted accounting principles for U.S. mutual funds. The fund consistently follows such policies in preparing its financial statements.
1. Security Valuation: Securities are valued as of the close of trading on the New York Stock Exchange (generally 4 p.m., Eastern time) on the valuation date. Equity securities are valued at the latest quoted sales prices or official closing prices taken from the primary market in which each security trades; such securities not traded on the valuation date are valued at the mean of the latest quoted bid and asked prices. Securities for which market quotations are not readily available, or whose values have been materially affected by events occurring before the fund’s pricing time but after the close of the securities’ primary markets, are valued by methods deemed by the board of trustees to represent fair value. Investments in Vanguard Market Liquidity Fund are valued at that fund’s net asset value. Temporary cash investments acquired over 60 days to maturity are valued using the latest bid prices or using valuations based on a matrix system (which considers such factors as security prices, yields, maturities, and ratings), both as furnished by independent pricing services. Other temporary cash investments are valued at amortized cost, which approximates market value.
2. Futures Contracts: The fund may use index futures contracts to a limited extent, with the objectives of maintaining full exposure to the stock market, enhancing returns, maintaining liquidity, and minimizing transaction costs. The fund may purchase futures contracts to immediately invest incoming cash in the market, or sell futures in response to cash outflows, thereby simulating a fully invested position in the underlying index while maintaining a cash balance for liquidity. The fund may seek to enhance returns by using futures contracts instead of the underlying securities when futures are believed to be priced more attractively than the underlying securities. The primary risks associated with the use of futures contracts are imperfect correlation between changes in market values of stocks held by the fund and the prices of futures contracts, and the possibility of an illiquid market. Counterparty risk involving futures is mitigated because a regulated clearinghouse is the counterparty instead of the clearing broker. To further mitigate counterparty risk, the fund trades futures contracts on an exchange, monitors the financial strength of its clearing brokers and clearinghouse, and has entered into clearing agreements with its clearing brokers. The clearinghouse imposes initial margin requirements to secure the fund’s performance and requires daily settlement of variation margin representing changes in the market value of each contract.
Futures contracts are valued at their quoted daily settlement prices. The aggregate notional amounts of the contracts are not recorded in the Statement of Net Assets. Fluctuations in the value of the contracts are recorded in the Statement of Net Assets as an asset (liability) and in the Statement of Operations as unrealized appreciation (depreciation) until the contracts are closed, when they are recorded as realized futures gains (losses).
During the year ended December 31, 2013, the fund’s average investments in long and short futures contracts represented less than 1% and 0% of net assets, respectively, based on quarterly average aggregate settlement values.
28
Growth Index Fund
3. Federal Income Taxes: The fund intends to continue to qualify as a regulated investment company and distribute all of its taxable income. Management has analyzed the fund’s tax positions taken for all open federal income tax years (December 31, 2010–2013), and has concluded that no provision for federal income tax is required in the fund’s financial statements.
4. Distributions: Distributions to shareholders are recorded on the ex-dividend date.
5. Securities Lending: To earn additional income, the fund may lend its securities to qualified institutional borrowers. Security loans are required to be secured at all times by collateral in an amount at least equal to the market value of securities loaned. Daily market fluctuations could cause the value of loaned securities to be more or less than the value of the collateral received. When this occurs, the collateral is adjusted and settled on the next business day. The fund further mitigates its counterparty risk by entering into securities lending transactions only with a diverse group of prequalified counterparties, monitoring their financial strength, and entering into master securities lending agreements with its counterparties. The master securities lending agreements provide that, in the event of a counterparty’s default (including bankruptcy), the fund may terminate any loans with that borrower, determine the net amount owed, and sell or retain the collateral up to the net amount owed to the fund; however, such actions may be subject to legal proceedings. While collateral mitigates counterparty risk, in the absence of a default the fund may experience delays and costs in recovering the securities loaned. The fund invests cash collateral received in Vanguard Market Liquidity Fund, and records a liability for the return of the collateral, during the period the securities are on loan. Securities lending income represents fees charged to borrowers plus income earned on invested cash collateral, less expenses associated with the loan.
6. Other: Dividend income is recorded on the ex-dividend date. Interest income includes income distributions received from Vanguard Market Liquidity Fund and is accrued daily. Premiums and discounts on debt securities purchased are amortized and accreted, respectively, to interest income over the lives of the respective securities. Security transactions are accounted for on the date securities are bought or sold. Costs used to determine realized gains (losses) on the sale of investment securities are those of the specific securities sold.
Each class of shares has equal rights as to assets and earnings, except that each class separately bears certain class-specific expenses related to maintenance of shareholder accounts (included in Management and Administrative expenses) and shareholder reporting. Marketing and distribution expenses are allocated to each class of shares based on a method approved by the board of trustees. Income, other non-class-specific expenses, and gains and losses on investments are allocated to each class of shares based on its relative net assets.
B. The Vanguard Group furnishes at cost investment advisory, corporate management, administrative, marketing, and distribution services. The costs of such services are allocated to the fund under methods approved by the board of trustees. The fund has committed to provide up to 0.40% of its net assets in capital contributions to Vanguard. At December 31, 2013, the fund had contributed capital of $4,051,000 to Vanguard (included in Other Assets), representing 0.01% of the fund’s net assets and 1.62% of Vanguard’s capitalization. The fund’s trustees and officers are also directors and officers of Vanguard.
C. Various inputs may be used to determine the value of the fund’s investments. These inputs are summarized in three broad levels for financial statement purposes. The inputs or methodologies used to value securities are not necessarily an indication of the risk associated with investing in those securities.
29
Growth Index Fund
Level 1—Quoted prices in active markets for identical securities.
Level 2—Other significant observable inputs (including quoted prices for similar securities, interest rates, prepayment speeds, credit risk, etc.).
Level 3—Significant unobservable inputs (including the fund’s own assumptions used to determine the fair value of investments).
The following table summarizes the market value of the fund’s investments as of December 31, 2013, based on the inputs used to value them:
| Level 1 | Level 2 | Level 3 | |
| Investments | ($000) | ($000) | ($000) |
| Common Stocks | 37,445,273 | — | — |
| Temporary Cash Investments | 94,530 | 2,499 | — |
| Futures Contracts—Assets1 | 147 | — | — |
| Total | 37,539,950 | 2,499 | — |
| 1 Represents variation margin on the last day of the reporting period. |
D. At December 31, 2013, the aggregate settlement value of open futures contracts and the related unrealized appreciation (depreciation) were:
| ($000) | ||||
| Aggregate | ||||
| Number of | Settlement | Unrealized | ||
| Long (Short) | Value | Appreciation | ||
| Futures Contracts | Expiration | Contracts | Long (Short) | (Depreciation) |
| E-mini S&P 500 Index | March 2014 | 460 | 42,345 | 454 |
Unrealized appreciation (depreciation) on open futures contracts is required to be treated as realized gain (loss) for tax purposes.
E. Distributions are determined on a tax basis and may differ from net investment income and realized capital gains for financial reporting purposes. Differences may be permanent or temporary. Permanent differences are reclassified among capital accounts in the financial statements to reflect their tax character. Temporary differences arise when certain items of income, expense, gain, or loss are recognized in different periods for financial statement and tax purposes. These differences will reverse at some time in the future. Differences in classification may also result from the treatment of short-term gains as ordinary income for tax purposes.
During the year ended December 31, 2013, the fund realized $955,132,000 of net capital gains resulting from in-kind redemptions—in which shareholders exchanged fund shares for securities held by the fund rather than for cash. Because such gains are not taxable to the fund, and are not distributed to shareholders, they have been reclassified from accumulated net realized losses to paid-in capital.
For tax purposes, at December 31, 2013, the fund had $2,722,000 of ordinary income available for distribution. The fund used capital loss carryforwards of $706,861,000 to offset taxable capital gains realized during the year ended December 31, 2013. At December 31, 2013, the fund had available capital losses totaling $300,177,000 to offset future net capital gains through December 31, 2017.
30
Growth Index Fund
At December 31, 2013, the cost of investment securities for tax purposes was $24,074,729,000. Net unrealized appreciation of investment securities for tax purposes was $13,467,573,000, consisting of unrealized gains of $13,708,940,000 on securities that had risen in value since their purchase and $241,367,000 in unrealized losses on securities that had fallen in value since their purchase.
F. During the year ended December 31, 2013, the fund purchased $14,471,177,000 of investment securities and sold $12,694,625,000 of investment securities, other than temporary cash investments. Purchases and sales include $4,207,219,000 and $2,396,913,000, respectively, in connection with in-kind purchases and redemptions of the fund’s capital shares.
G. Capital share transactions for each class of shares were:
| Year Ended December 31, | ||||
| 2013 | 2012 | |||
| Amount | Shares | Amount | Shares | |
| ($000) | (000) | ($000) | (000) | |
| Investor Shares | ||||
| Issued | 431,291 | 10,400 | 602,050 | 16,845 |
| Issued in Lieu of Cash Distributions | 37,960 | 887 | 41,832 | 1,150 |
| Redeemed | (853,681) | (20,181) | (870,838) | (24,381) |
| Net Increase (Decrease)—Investor Shares | (384,430) | (8,894) | (226,956) | (6,386) |
| Admiral Shares | ||||
| Issued | 945,498 | 22,310 | 827,142 | 22,980 |
| Issued in Lieu of Cash Distributions | 85,033 | 1,981 | 78,877 | 2,167 |
| Redeemed | (698,403) | (16,754) | (685,773) | (19,175) |
| Net Increase (Decrease) —Admiral Shares | 332,128 | 7,537 | 220,246 | 5,972 |
| Signal Shares | ||||
| Issued | 1,478,192 | 38,454 | 1,479,198 | 44,790 |
| Issued in Lieu of Cash Distributions | 49,030 | 1,236 | 41,899 | 1,242 |
| Redeemed | (1,520,776) | (38,618) | (772,092) | (23,287) |
| Net Increase (Decrease)—Signal Shares | 6,446 | 1,072 | 749,005 | 22,745 |
| Institutional Shares | ||||
| Issued | 1,695,058 | 40,508 | 1,572,068 | 44,246 |
| Issued in Lieu of Cash Distributions | 86,390 | 2,012 | 80,278 | 2,205 |
| Redeemed | (1,806,727) | (43,962) | (936,542) | (26,228) |
| Net Increase (Decrease) —Institutional Shares | (25,279) | (1,442) | 715,804 | 20,223 |
| ETF Shares | ||||
| Issued | 4,351,346 | 53,707 | 2,733,537 | 39,551 |
| Issued in Lieu of Cash Distributions | — | — | — | — |
| Redeemed | (2,455,632) | (30,000) | (1,283,234) | (18,500) |
| Net Increase (Decrease) —ETF Shares | 1,895,714 | 23,707 | 1,450,303 | 21,051 |
H. Management has determined that no material events or transactions occurred subsequent to December 31, 2013, that would require recognition or disclosure in these financial statements.
31
Value Index Fund
Fund Profile
As of December 31, 2013
| Share-Class Characteristics | |||||
| Investor | Admiral | Signal | Institutional | ||
| Shares | Shares | Shares | Shares | ETF Shares | |
| Ticker Symbol | VIVAX | VVIAX | VVISX | VIVIX | VTV |
| Expense Ratio1 | 0.24% | 0.10% | 0.10% | 0.08% | 0.10% |
| 30-Day SEC Yield | 2.19% | 2.33% | 2.33% | 2.34% | 2.33% |
| Portfolio Characteristics | |||
| DJ | |||
| U.S. | |||
| Total | |||
| Stock | |||
| CRSP US | Market | ||
| Large Cap | FA | ||
| Fund | Value Index | Index | |
| Number of Stocks | 313 | 313 | 3,653 |
| Median Market Cap | $71.9B | $71.9B | $43.0B |
| Price/Earnings Ratio | 16.7x | 16.8x | 20.7x |
| Price/Book Ratio | 2.0x | 2.0x | 2.7x |
| Return on Equity | 14.8% | 14.8% | 16.5% |
| Earnings Growth | |||
| Rate | 6.0% | 5.8% | 11.4% |
| Dividend Yield | 2.4% | 2.4% | 1.8% |
| Foreign Holdings | 0.0% | 0.0% | 0.0% |
| Turnover Rate | 25% | — | — |
| Short-Term Reserves | 0.0% | — | — |
Sector Diversification (% of equity exposure)
| DJ | |||
| U.S. Total | |||
| CRSP US | Stock | ||
| Large Cap | Market | ||
| Fund | Value Index | FA Index | |
| Basic Materials | 3.9% | 3.9% | 3.1% |
| Consumer Goods | 10.4 | 10.5 | 10.2 |
| Consumer Services | 7.8 | 7.8 | 13.7 |
| Financials | 22.6 | 22.6 | 18.4 |
| Health Care | 13.7 | 13.7 | 11.8 |
| Industrials | 12.9 | 12.9 | 13.5 |
| Oil & Gas | 12.3 | 12.3 | 9.3 |
| Technology | 7.2 | 7.2 | 14.9 |
| Telecommunications | 3.9 | 3.9 | 2.1 |
| Utilities | 5.3 | 5.2 | 3.0 |
| Volatility Measures | ||
| DJ | ||
| U.S. Total | ||
| Spliced | Stock Market | |
| Value Index | FA Index | |
| R-Squared | 1.00 | 0.96 |
| Beta | 1.00 | 0.96 |
| These measures show the degree and timing of the fund’s | ||
| fluctuations compared with the indexes over 36 months. | ||
| Ten Largest Holdings (% of total net assets) | ||
| Exxon Mobil Corp. | Integrated Oil & Gas | 4.7% |
| General Electric Co. | Diversified Industrials | 3.0 |
| Microsoft Corp. | Software | 3.0 |
| Johnson & Johnson | Pharmaceuticals | 2.7 |
| Chevron Corp. | Integrated Oil & Gas | 2.5 |
| Wells Fargo & Co. | Banks | 2.5 |
| Procter & Gamble Co. | Nondurable | |
| Household Products | 2.3 | |
| JPMorgan Chase & Co. | Banks | 2.3 |
| Berkshire Hathaway Inc. Reinsurance | 2.2 | |
| Pfizer Inc. | Pharmaceuticals | 2.1 |
| Top Ten | 27.3% | |
| The holdings listed exclude any temporary cash investments and equity index products. | ||
1 The expense ratios shown are from the prospectus dated August 12, 2013, and represent estimated costs for the current fiscal year. For the fiscal year ended December 31, 2013, the expense ratios were 0.24% for Investor Shares, 0.09% for Admiral Shares, 0.09% for Signal Shares, 0.08% for Institutional Shares, and 0.09% for ETF Shares.
32
Value Index Fund
Investment Focus
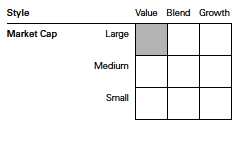
33
Value Index Fund
Performance Summary
All of the returns in this report represent past performance, which is not a guarantee of future results that may be achieved by the fund. (Current performance may be lower or higher than the performance data cited. For performance data current to the most recent month-end, visit our website at vanguard.com/performance.) Note, too, that both investment returns and principal value can fluctuate widely, so an investor’s shares, when sold, could be worth more or less than their original cost. The returns shown do not reflect taxes that a shareholder would pay on fund distributions or on the sale of fund shares.
Cumulative Performance: December 31, 2003, Through December 31, 2013
Initial Investment of $10,000
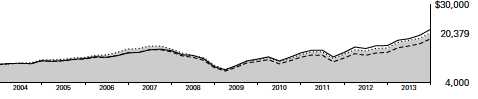
| Average Annual Total Returns | |||||
| Periods Ended December 31, 2013 | |||||
| Final Value | |||||
| One | Five | Ten | of a $10,000 | ||
| Year | Years | Years | Investment | ||
| Value Index Fund*Investor Shares | 32.85% | 16.09% | 7.38% | $20,379 | |
| •••••••• | Spliced Value Index | 33.15 | 16.29 | 7.53 | 20,667 |
| – – – – | Large-Cap Value Funds Average | 32.39 | 15.86 | 6.39 | 18,574 |
| Dow Jones U.S. Total Stock Market | |||||
| Float Adjusted Index | 33.47 | 18.86 | 8.09 | 21,777 | |
For a benchmark description, see the Glossary.
Large-Cap Value Funds Average: Derived from data provided by Lipper, a Thomson Reuters Company.
| Final Value | ||||
| One | Five | Ten | of a $10,000 | |
| Year | Years | Years | Investment | |
| Value Index Fund Admiral Shares | 33.05% | 16.26% | 7.51% | $20,625 |
| Spliced Value Index | 33.15 | 16.29 | 7.53 | 20,667 |
| Dow Jones U.S. Total Stock Market Float | ||||
| Adjusted Index | 33.47 | 18.86 | 8.09 | 21,777 |
See Financial Highlights for dividend and capital gains information.
34
| Value Index Fund | ||||
| Average Annual Total Returns | ||||
| Periods Ended December 31, 2013 | ||||
| Since | Final Value | |||
| One | Five | Inception | of a $10,000 | |
| Year | Years | (6/4/2007) | Investment | |
| Value Index Fund Signal Shares | 33.06% | 16.26% | 3.37% | $12,438 |
| Spliced Value Index | 33.15 | 16.29 | 3.37 | 12,439 |
| Dow Jones U.S. Total Stock Market Float | ||||
| Adjusted Index | 33.47 | 18.86 | 5.58 | 14,290 |
"Since Inception" performance is calculated from the Signal Shares’ inception date for both the fund and its comparative standards.
| Final Value | ||||
| One | Five | Ten | of a $5,000,000 | |
| Year | Years | Years | Investment | |
| Value Index Fund Institutional Shares | 33.07% | 16.29% | 7.54% | $10,345,578 |
| Spliced Value Index | 33.15 | 16.29 | 7.53 | 10,333,624 |
| Dow Jones U.S. Total Stock Market Float | ||||
| Adjusted Index | 33.47 | 18.86 | 8.09 | 10,888,699 |
| Since | Final Value | |||
| One | Five | Inception | of a $10,000 | |
| Year | Years | (1/26/2004) | Investment | |
| Value Index Fund | ||||
| ETF Shares Net Asset Value | 33.03% | 16.26% | 7.18% | $19,911 |
| Spliced Value Index | 33.15 | 16.29 | 7.21 | 19,956 |
| Dow Jones U.S. Total Stock Market Float | ||||
| Adjusted Index | 33.47 | 18.86 | 7.67 | 20,835 |
"Since Inception" performance is calculated from the ETF Shares’ inception date for both the fund and its comparative standards.
| Cumulative Returns of ETF Shares: January 26, 2004, Through December 31, 2013 | |||
| Since | |||
| One | Five | Inception | |
| Year | Years | (1/26/2004) | |
| Value Index Fund ETF Shares Market Price | 33.11% | 112.19% | 99.16% |
| Value Index Fund ETF Shares Net Asset Value | 33.03 | 112.41 | 99.11 |
| Spliced Value Index | 33.15 | 112.67 | 99.56 |
"Since Inception" performance is calculated from the ETF Shares’ inception date for both the fund and its comparative standard.
35
Value Index Fund
Fiscal-Year Total Returns (%): December 31, 2003, Through December 31, 2013
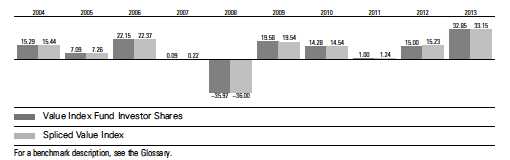
36
Value Index Fund
Financial Statements
Statement of Net Assets
As of December 31, 2013
The fund reports a complete list of its holdings in regulatory filings four times in each fiscal year, at the quarter-ends. For the second and fourth fiscal quarters, the lists appear in the fund’s semiannual and annual reports to shareholders. For the first and third fiscal quarters, the fund files the lists with the Securities and Exchange Commission on Form N-Q. Shareholders can look up the fund’s Forms N-Q on the SEC’s website at sec.gov. Forms N-Q may also be reviewed and copied at the SEC’s Public Reference Room (see the back cover of this report for further information).
| Market | |||
| Value | |||
| Shares | ($000) | ||
| Common Stocks (99.9%)1 | |||
| Basic Materials (3.9%) | |||
| EI du Pont de | |||
| Nemours & Co. | 2,782,754 | 180,796 | |
| Dow Chemical Co. | 3,647,712 | 161,958 | |
| Freeport-McMoRan | |||
| Copper & Gold Inc. | 3,121,368 | 117,800 | |
| LyondellBasell Industries | |||
| NV Class A | 1,414,899 | 113,588 | |
| PPG Industries Inc. | 405,922 | 76,987 | |
| Air Products & | |||
| Chemicals Inc. | 634,745 | 70,952 | |
| International Paper Co. | 1,329,393 | 65,180 | |
| Nucor Corp. | 957,971 | 51,136 | |
| CF Industries Holdings Inc. | 172,688 | 40,243 | |
| Mosaic Co. | 851,281 | 40,240 | |
| Newmont Mining Corp. | 1,486,143 | 34,226 | |
| Alcoa Inc. | 3,218,439 | 34,212 | |
| Celanese Corp. Class A | 480,353 | 26,568 | |
| Ashland Inc. | 233,157 | 22,626 | |
| International Flavors | |||
| & Fragrances Inc. | 246,288 | 21,176 | |
| Reliance Steel | |||
| & Aluminum Co. | 220,856 | 16,750 | |
| Peabody Energy Corp. | 814,990 | 15,917 | |
| Avery Dennison Corp. | 296,372 | 14,875 | |
| Huntsman Corp. | 583,132 | 14,345 | |
| 1,119,575 | |||
| Consumer Goods (10.4%) | |||
| Procter & Gamble Co. | 8,178,123 | 665,781 | |
| PepsiCo Inc. | 4,610,829 | 382,422 | |
| Altria Group Inc. | 6,017,331 | 231,005 | |
| Mondelez | |||
| International Inc. | |||
| Class A | 5,269,144 | 186,001 | |
| Ford Motor Co. | 11,637,980 | 179,574 | |
| * | General Motors Co. | 3,132,036 | 128,006 |
| Kimberly-Clark Corp. | 1,147,519 | 119,870 | |
| Johnson Controls Inc. | 2,062,076 | 105,784 | |
| Kraft Foods Group Inc. | 1,793,853 | 96,725 | |
| Market | |||
| Value | |||
| Shares | ($000) | ||
| General Mills Inc. | 1,907,812 | 95,219 | |
| Archer-Daniels-Midland Co. | 1,979,092 | 85,893 | |
| Delphi Automotive plc | 922,153 | 55,449 | |
| Kellogg Co. | 874,414 | 53,400 | |
| Reynolds American Inc. | 982,780 | 49,129 | |
| ConAgra Foods Inc. | 1,272,049 | 42,868 | |
| Genuine Parts Co. | 443,832 | 36,922 | |
| Whirlpool Corp. | 235,148 | 36,885 | |
| Clorox Co. | 386,728 | 35,873 | |
| Bunge Ltd. | 420,815 | 34,553 | |
| Beam Inc. | 488,578 | 33,253 | |
| Coca-Cola Enterprises Inc. | 739,197 | 32,621 | |
| Dr Pepper Snapple | |||
| Group Inc. | 612,659 | 29,849 | |
| Newell Rubbermaid Inc. | 867,172 | 28,105 | |
| Tyson Foods Inc. Class A | 820,524 | 27,455 | |
| * | TRW Automotive | ||
| Holdings Corp. | 352,865 | 26,250 | |
| Campbell Soup Co. | 565,991 | 24,496 | |
| Molson Coors | |||
| Brewing Co. Class B | 430,722 | 24,185 | |
| Activision Blizzard Inc. | 1,348,865 | 24,050 | |
| Avon Products Inc. | 1,306,026 | 22,490 | |
| Energizer Holdings Inc. | 187,823 | 20,330 | |
| Lear Corp. | 243,166 | 19,689 | |
| Lennar Corp. Class A | 490,395 | 19,400 | |
| Hasbro Inc. | 352,319 | 19,381 | |
| * | DR Horton Inc. | 435,786 | 9,727 |
| Lennar Corp. Class B | 1,431 | 48 | |
| 2,982,688 | |||
| Consumer Services (7.8%) | |||
| Wal-Mart Stores Inc. | 4,864,222 | 382,766 | |
| CVS Caremark Corp. | 3,580,127 | 256,230 | |
| Time Warner Inc. | 2,582,337 | 180,040 | |
| Lowe’s Cos. Inc. | 3,144,383 | 155,804 | |
| Walgreen Co. | 2,569,792 | 147,609 | |
| Target Corp. | 1,902,099 | 120,346 | |
| McKesson Corp. | 690,968 | 111,522 | |
| Delta Air Lines Inc. | 2,563,909 | 70,431 | |
| Cardinal Health Inc. | 1,027,141 | 68,623 | |
| Sysco Corp. | 1,742,837 | 62,916 | |
37
| Value Index Fund | |||
| Market | |||
| Value | |||
| Shares | ($000) | ||
| Macy’s Inc. | 1,103,099 | 58,905 | |
| Kroger Co. | 1,460,457 | 57,732 | |
| Omnicom Group Inc. | 771,268 | 57,359 | |
| Carnival Corp. | 1,424,690 | 57,230 | |
| AmerisourceBergen Corp. | |||
| Class A | 695,363 | 48,891 | |
| * | Liberty Media Corp. | ||
| Class A | 281,543 | 41,232 | |
| * | United Continental | ||
| Holdings Inc. | 1,087,343 | 41,134 | |
| Southwest Airlines Co. | 2,087,955 | 39,337 | |
| Kohl’s Corp. | 577,567 | 32,777 | |
| Best Buy Co. Inc. | 817,987 | 32,621 | |
| Staples Inc. | 1,987,343 | 31,579 | |
| Safeway Inc. | 741,605 | 24,154 | |
| Interpublic Group | |||
| of Cos. Inc. | 1,271,969 | 22,514 | |
| Darden Restaurants Inc. | 392,667 | 21,349 | |
| * | Hertz Global Holdings Inc. | 672,829 | 19,256 |
| Royal Caribbean | |||
| Cruises Ltd. | 397,824 | 18,865 | |
| Dun & Bradstreet Corp. | 116,445 | 14,294 | |
| International Game | |||
| Technology | 745,873 | 13,545 | |
| * | News Corp. Class A | 720,123 | 12,977 |
| H&R Block Inc. | 410,734 | 11,928 | |
| * | Sears Holdings Corp. | 143,577 | 7,041 |
| * | ARAMARK Holdings Corp. | 87,453 | 2,293 |
| * | News Corp. Class B | 12,440 | 222 |
| 2,223,522 | |||
| Financials (22.5%) | |||
| Wells Fargo & Co. | 15,843,730 | 719,305 | |
| JPMorgan Chase & Co. | 11,309,974 | 661,407 | |
| * | Berkshire Hathaway Inc. | ||
| Class B | 5,290,402 | 627,230 | |
| Bank of America Corp. | 32,090,322 | 499,646 | |
| Citigroup Inc. | 8,668,955 | 451,739 | |
| American International | |||
| Group Inc. | 4,429,825 | 226,143 | |
| US Bancorp | 5,494,777 | 221,989 | |
| Goldman Sachs Group Inc. | 1,227,342 | 217,559 | |
| MetLife Inc. | 2,865,013 | 154,481 | |
| Capital One Financial Corp. | 1,733,520 | 132,805 | |
| Morgan Stanley | 4,106,810 | 128,790 | |
| Prudential Financial Inc. | 1,386,061 | 127,823 | |
| PNC Financial Services | |||
| Group Inc. | 1,601,041 | 124,209 | |
| Bank of New York | |||
| Mellon Corp. | 3,453,173 | 120,654 | |
| Travelers Cos. Inc. | 1,095,080 | 99,149 | |
| ACE Ltd. | 922,272 | 95,483 | |
| Aflac Inc. | 1,401,263 | 93,604 | |
| State Street Corp. | 1,254,432 | 92,063 | |
| Discover Financial | |||
| Services | 1,434,340 | 80,251 | |
| BB&T Corp. | 2,119,962 | 79,117 | |
| Aon plc | 905,839 | 75,991 | |
| Market | |||
| Value | |||
| Shares | ($000) | ||
| CME Group Inc. | 956,512 | 75,048 | |
| Allstate Corp. | 1,368,541 | 74,640 | |
| Chubb Corp. | 757,531 | 73,200 | |
| Ameriprise Financial Inc. | 582,980 | 67,072 | |
| SunTrust Banks Inc. | 1,620,846 | 59,663 | |
| Fifth Third Bancorp | 2,645,830 | 55,642 | |
| Hartford Financial | |||
| Services Group Inc. | 1,339,807 | 48,541 | |
| Loews Corp. | 933,404 | 45,027 | |
| Progressive Corp. | 1,629,650 | 44,441 | |
| Principal Financial | |||
| Group Inc. | 886,827 | 43,729 | |
| M&T Bank Corp. | 352,857 | 41,080 | |
| Regions Financial Corp. | 4,128,312 | 40,829 | |
| Lincoln National Corp. | 786,218 | 40,585 | |
| Northern Trust Corp. | 651,814 | 40,341 | |
| KeyCorp | 2,687,199 | 36,062 | |
| SLM Corp. | 1,315,971 | 34,584 | |
| CIT Group Inc. | 605,185 | 31,548 | |
| Western Union Co. | 1,661,271 | 28,657 | |
| Annaly Capital | |||
| Management Inc. | 2,850,692 | 28,421 | |
| Unum Group | 793,608 | 27,840 | |
| XL Group plc Class A | 861,510 | 27,430 | |
| Comerica Inc. | 556,906 | 26,475 | |
| Cincinnati Financial Corp. | 468,226 | 24,521 | |
| Huntington | |||
| Bancshares Inc. | 2,499,239 | 24,118 | |
| * | Markel Corp. | 40,079 | 23,260 |
| * | Arch Capital Group Ltd. | 381,762 | 22,787 |
| American Capital | |||
| Agency Corp. | 1,151,665 | 22,216 | |
| Torchmark Corp. | 276,030 | 21,572 | |
| Willis Group Holdings plc | 477,868 | 21,413 | |
| New York Community | |||
| Bancorp Inc. | 1,262,033 | 21,265 | |
| First Republic Bank | 394,901 | 20,673 | |
| Everest Re Group Ltd. | 117,352 | 18,292 | |
| Zions Bancorporation | 556,997 | 16,688 | |
| Reinsurance Group | |||
| of America Inc. Class A | 214,396 | 16,596 | |
| PartnerRe Ltd. | 155,200 | 16,363 | |
| Axis Capital Holdings Ltd. | 310,685 | 14,779 | |
| People’s United | |||
| Financial Inc. | 969,952 | 14,666 | |
| Legg Mason Inc. | 335,343 | 14,581 | |
| WR Berkley Corp. | 327,146 | 14,195 | |
| NASDAQ OMX Group Inc. | 353,605 | 14,073 | |
| Hudson City Bancorp Inc. | 1,437,479 | 13,555 | |
| ING US Inc. | 351,764 | 12,365 | |
| Fidelity National | |||
| Financial Inc. Class A | 355,387 | 11,532 | |
| * | Genworth Financial Inc. | ||
| Class A | 740,418 | 11,499 | |
| TD Ameritrade | |||
| Holding Corp. | 371,228 | 11,374 | |
| * | Alleghany Corp. | 23,887 | 9,554 |
38
| Value Index Fund | |||
| Market | |||
| Value | |||
| Shares | ($000) | ||
| Assurant Inc. | 112,178 | 7,445 | |
| * | Brixmor Property Group Inc. | 131,918 | 2,682 |
| * | Berkshire Hathaway Inc. | ||
| Class A | 14 | 2,491 | |
| 6,444,848 | |||
| Health Care (13.7%) | |||
| Johnson & Johnson | 8,486,222 | 777,253 | |
| Pfizer Inc. | 19,499,088 | 597,257 | |
| Merck & Co. Inc. | 8,791,017 | 439,991 | |
| Bristol-Myers Squibb Co. | 4,952,456 | 263,223 | |
| UnitedHealth Group Inc. | 3,028,970 | 228,082 | |
| Abbott Laboratories | 4,645,477 | 178,061 | |
| Medtronic Inc. | 2,999,493 | 172,141 | |
| Eli Lilly & Co. | 3,048,615 | 155,479 | |
| Thermo Fisher | |||
| Scientific Inc. | 1,086,448 | 120,976 | |
| Baxter International Inc. | 1,631,749 | 113,488 | |
| Covidien plc | 1,360,827 | 92,672 | |
| WellPoint Inc. | 888,620 | 82,100 | |
| Aetna Inc. | 1,105,701 | 75,840 | |
| Cigna Corp. | 830,649 | 72,665 | |
| Becton Dickinson and Co. | 585,373 | 64,678 | |
| St. Jude Medical Inc. | 874,612 | 54,182 | |
| * | Mylan Inc. | 1,149,511 | 49,889 |
| Humana Inc. | 471,373 | 48,655 | |
| * | Boston Scientific Corp. | 4,043,318 | 48,601 |
| Zimmer Holdings Inc. | 514,306 | 47,928 | |
| * | HCA Holdings Inc. | 943,115 | 44,996 |
| * | Life Technologies Corp. | 520,678 | 39,467 |
| * | CareFusion Corp. | 645,606 | 25,708 |
| Quest Diagnostics Inc. | 435,737 | 23,329 | |
| * | Endo Health Solutions Inc. | 344,180 | 23,218 |
| Universal Health | |||
| Services Inc. Class B | 274,121 | 22,275 | |
| * | Hospira Inc. | 499,307 | 20,612 |
| * | Hologic Inc. | 815,606 | 18,229 |
| Patterson Cos. Inc. | 236,932 | 9,762 | |
| 3,910,757 | |||
| Industrials (12.9%) | |||
| General Electric Co. | 30,430,711 | 852,973 | |
| United Technologies | |||
| Corp. | 2,759,984 | 314,086 | |
| Honeywell | |||
| International Inc. | 2,360,800 | 215,706 | |
| Caterpillar Inc. | 1,911,899 | 173,620 | |
| Boeing Co. | 1,129,647 | 154,186 | |
| Emerson Electric Co. | 2,116,558 | 148,540 | |
| Lockheed Martin Corp. | 963,077 | 143,171 | |
| FedEx Corp. | 904,755 | 130,077 | |
| Eaton Corp. plc | 1,428,449 | 108,734 | |
| Illinois Tool Works Inc. | 1,268,265 | 106,636 | |
| Deere & Co. | 1,127,978 | 103,018 | |
| General Dynamics Corp. | 1,006,026 | 96,126 | |
| CSX Corp. | 3,049,022 | 87,720 | |
| Raytheon Co. | 961,011 | 87,164 | |
| Norfolk Southern Corp. | 929,238 | 86,261 | |
| Market | |||
| Value | |||
| Shares | ($000) | ||
| Northrop Grumman Corp. | 667,982 | 76,557 | |
| TE Connectivity Ltd. | 1,229,832 | 67,776 | |
| Waste Management Inc. | 1,342,077 | 60,219 | |
| Parker Hannifin Corp. | 449,105 | 57,773 | |
| Tyco International Ltd. | 1,394,221 | 57,219 | |
| Ingersoll-Rand plc | 824,244 | 50,773 | |
| Dover Corp. | 514,087 | 49,630 | |
| Xerox Corp. | 3,529,321 | 42,952 | |
| Fluor Corp. | 491,706 | 39,479 | |
| Rockwell Collins Inc. | 406,303 | 30,034 | |
| L-3 Communications | |||
| Holdings Inc. | 256,282 | 27,386 | |
| Republic Services Inc. | |||
| Class A | 817,222 | 27,132 | |
| * | Jacobs Engineering | ||
| Group Inc. | 376,304 | 23,703 | |
| Vulcan Materials Co. | 391,643 | 23,271 | |
| Ball Corp. | 437,313 | 22,592 | |
| Manpowergroup Inc. | 236,178 | 20,278 | |
| MeadWestvaco Corp. | 535,321 | 19,769 | |
| Xylem Inc. | 558,666 | 19,330 | |
| * | Crown Holdings Inc. | 424,608 | 18,925 |
| Joy Global Inc. | 320,714 | 18,759 | |
| Avnet Inc. | 413,947 | 18,259 | |
| MDU Resources Group Inc. | 541,444 | 16,541 | |
| * | Arrow Electronics Inc. | 302,500 | 16,411 |
| AGCO Corp. | 262,528 | 15,539 | |
| Timken Co. | 264,450 | 14,563 | |
| KBR Inc. | 446,425 | 14,236 | |
| SPX Corp. | 122,458 | 12,198 | |
| Jabil Circuit Inc. | 547,142 | 9,542 | |
| * | Owens-Illinois Inc. | 246,613 | 8,824 |
| * | Owens Corning | 168,927 | 6,879 |
| 3,694,567 | |||
| Oil & Gas (12.3%) | |||
| Exxon Mobil Corp. | 13,143,133 | 1,330,085 | |
| Chevron Corp. | 5,784,481 | 722,540 | |
| ConocoPhillips | 3,684,844 | 260,334 | |
| Occidental Petroleum | |||
| Corp. | 2,425,214 | 230,638 | |
| Phillips 66 | 1,802,588 | 139,034 | |
| Apache Corp. | 1,200,928 | 103,208 | |
| Marathon Petroleum Corp. | 905,504 | 83,062 | |
| Valero Energy Corp. | 1,623,020 | 81,800 | |
| Marathon Oil Corp. | 2,096,053 | 73,991 | |
| Baker Hughes Inc. | 1,334,373 | 73,737 | |
| Devon Energy Corp. | 1,161,839 | 71,883 | |
| Hess Corp. | 859,869 | 71,369 | |
| Chesapeake Energy Corp. | 1,803,751 | 48,954 | |
| Murphy Oil Corp. | 535,649 | 34,753 | |
| HollyFrontier Corp. | 601,648 | 29,896 | |
| Cimarex Energy Co. | 247,662 | 25,982 | |
| Helmerich & Payne Inc. | 304,762 | 25,624 | |
| Tesoro Corp. | 406,909 | 23,804 | |
| OGE Energy Corp. | 597,910 | 20,269 | |
| * | Denbury Resources Inc. | 1,124,241 | 18,471 |
39
| Value Index Fund | |||
| Market | |||
| Value | |||
| Shares | ($000) | ||
| Energen Corp. | 218,299 | 15,445 | |
| Nabors Industries Ltd. | 845,856 | 14,371 | |
| Noble Corp. plc | 379,610 | 14,224 | |
| Diamond Offshore | |||
| Drilling Inc. | 210,279 | 11,969 | |
| 3,525,443 | |||
| Technology (7.2%) | |||
| Microsoft Corp. | 22,597,852 | 845,838 | |
| Cisco Systems Inc. | 16,081,488 | 361,029 | |
| Intel Corp. | 7,467,543 | 193,858 | |
| Hewlett-Packard Co. | 5,778,062 | 161,670 | |
| Corning Inc. | 4,353,052 | 77,571 | |
| Western Digital Corp. | 675,989 | 56,716 | |
| Seagate Technology plc | 928,612 | 52,151 | |
| Symantec Corp. | 2,105,857 | 49,656 | |
| Broadcom Corp. Class A | 1,552,213 | 46,023 | |
| CA Inc. | 959,650 | 32,292 | |
| Applied Materials Inc. | 1,809,451 | 32,009 | |
| Computer Sciences Corp. | 444,961 | 24,865 | |
| Motorola Solutions Inc. | 348,842 | 23,547 | |
| Harris Corp. | 322,261 | 22,497 | |
| * | Synopsys Inc. | 465,916 | 18,902 |
| LSI Corp. | 1,653,486 | 18,221 | |
| Marvell Technology | |||
| Group Ltd. | 1,189,313 | 17,102 | |
| Garmin Ltd. | 353,852 | 16,355 | |
| * | Nuance | ||
| Communications Inc. | 377,363 | 5,736 | |
| 2,056,038 | |||
| Telecommunications (3.9%) | |||
| AT&T Inc. | 15,849,391 | 557,265 | |
| Verizon | |||
| Communications Inc. | 8,604,683 | 422,834 | |
| CenturyLink Inc. | 1,771,363 | 56,418 | |
| * | Sprint Corp. | 2,367,349 | 25,449 |
| * | T-Mobile US Inc. | 718,775 | 24,180 |
| ^ | Windstream Holdings Inc. | 1,790,542 | 14,288 |
| Frontier Communications | |||
| Corp. | 3,019,851 | 14,042 | |
| 1,114,476 | |||
| Utilities (5.3%) | |||
| Duke Energy Corp. | 2,122,693 | 146,487 | |
| Dominion Resources Inc. | 1,744,867 | 112,875 | |
| NextEra Energy Inc. | 1,308,980 | 112,075 | |
| Southern Co. | 2,648,332 | 108,873 | |
| Spectra Energy Corp. | 2,016,694 | 71,835 | |
| Exelon Corp. | 2,580,094 | 70,669 | |
| American Electric | |||
| Power Co. Inc. | 1,466,589 | 68,548 | |
| Sempra Energy | 699,610 | 62,797 | |
| PPL Corp. | 1,904,996 | 57,321 | |
| PG&E Corp. | 1,351,483 | 54,438 | |
| Public Service Enterprise | |||
| Group Inc. | 1,522,858 | 48,792 | |
| Consolidated Edison Inc. | 881,858 | 48,749 | |
| Edison International | 981,206 | 45,430 | |
| Market | ||
| Value | ||
| Shares | ($000) | |
| Xcel Energy Inc. | 1,499,107 | 41,885 |
| FirstEnergy Corp. | 1,260,105 | 41,558 |
| Northeast Utilities | 948,837 | 40,221 |
| DTE Energy Co. | 527,837 | 35,043 |
| Entergy Corp. | 537,997 | 34,039 |
| NiSource Inc. | 940,627 | 30,928 |
| CenterPoint Energy Inc. | 1,289,585 | 29,893 |
| Wisconsin Energy Corp. | 685,207 | 28,326 |
| AES Corp. | 1,897,339 | 27,530 |
| Ameren Corp. | 730,499 | 26,415 |
| American Water | ||
| Works Co. Inc. | 536,086 | 22,655 |
| CMS Energy Corp. | 804,539 | 21,537 |
| SCANA Corp. | 380,072 | 17,837 |
| Pinnacle West Capital Corp. | 331,728 | 17,555 |
| Alliant Energy Corp. | 334,758 | 17,274 |
| National Fuel Gas Co. | 239,533 | 17,103 |
| Pepco Holdings Inc. | 751,680 | 14,380 |
| Integrys Energy Group Inc. | 240,713 | 13,097 |
| TECO Energy Inc. | 651,728 | 11,236 |
| 1,497,401 | ||
| Total Common Stocks | ||
| (Cost $23,401,938) | 28,569,315 | |
| Temporary Cash Investments (0.2%)1 | ||
| Money Market Fund (0.2%) | ||
| 2,3 Vanguard Market | ||
| Liquidity Fund, | ||
| 0.125% | 44,641,850 | 44,642 |
| Face |
| Amount |
| ($000) |
| U.S. Government and Agency Obligations (0.0%) |
| 4,5 | Fannie Mae Discount | ||
| Notes, 0.060%, 3/19/14 | 500 | 500 | |
| 5,6 | Federal Home Loan | ||
| Bank Discount Notes, | |||
| 0.070%, 2/5/14 | 1,000 | 1,000 | |
| 4,5 | Freddie Mac Discount | ||
| Notes, 0.063%, 3/17/14 | 1,000 | 999 | |
| 2,499 | |||
| Total Temporary Cash Investments | |||
| (Cost $47,142) | 47,141 | ||
| Total Investments (100.1%) | |||
| (Cost $23,449,080) | 28,616,456 | ||
| Other Assets and Liabilities (-0.1%) | |||
| Other Assets | 77,643 | ||
| Liabilities3 | (95,020) | ||
| (17,377) | |||
| Net Assets (100%) | 28,599,079 | ||
40
Value Index Fund
| At December 31, 2013, net assets consisted of: | |
| Amount | |
| ($000) | |
| Paid-in Capital | 23,793,709 |
| Overdistributed Net Investment Income | (15,536) |
| Accumulated Net Realized Losses | (347,547) |
| Unrealized Appreciation (Depreciation) | |
| Investment Securities | 5,167,376 |
| Futures Contracts | 1,077 |
| Net Assets | 28,599,079 |
| Investor Shares—Net Assets | |
| Applicable to 58,111,295 outstanding | |
| $.001 par value shares of beneficial | |
| interest (unlimited authorization) | 1,730,683 |
| Net Asset Value Per Share— | |
| Investor Shares | $29.78 |
| Admiral Shares—Net Assets | |
| Applicable to 169,705,893 outstanding | |
| $.001 par value shares of beneficial | |
| interest (unlimited authorization) | 5,053,707 |
| Net Asset Value Per Share— | |
| Admiral Shares | $29.78 |
| Amount | |
| ($000) | |
| Signal Shares—Net Assets | |
| Applicable to 94,330,079 outstanding | |
| $.001 par value shares of beneficial | |
| interest (unlimited authorization) | 2,922,933 |
| Net Asset Value Per Share— | |
| Signal Shares | $30.99 |
| Institutional Shares—Net Assets | |
| Applicable to 215,964,046 outstanding | |
| $.001 par value shares of beneficial | |
| interest (unlimited authorization) | 6,430,874 |
| Net Asset Value Per Share— | |
| Institutional Shares | $29.78 |
| ETF Shares—Net Assets | |
| Applicable to 163,229,771 outstanding | |
| $.001 par value shares of beneficial | |
| interest (unlimited authorization) | 12,460,882 |
| Net Asset Value Per Share— | |
| ETF Shares | $76.34 |
See Note A in Notes to Financial Statements.
* Non-income-producing security.
^ Includes partial security positions on loan to broker-dealers. The total value of securities on loan is $780,000.
1 The fund invests a portion of its cash reserves in equity markets through the use of index futures contracts. After giving effect to futures investments, the fund’s effective common stock and temporary cash investment positions represent 100.0% and 0.1%, respectively, of net assets.
2 Affiliated money market fund available only to Vanguard funds and certain trusts and accounts managed by Vanguard. Rate shown is the 7-day yield.
3 Includes $880,000 of collateral received for securities on loan.
4 The issuer was placed under federal conservatorship in September 2008; since that time, its daily operations have been managed by the Federal Housing Finance Agency and it receives capital from the U.S. Treasury, as needed to maintain a positive net worth, in exchange for senior preferred stock.
5 Securities with a value of $1,999,000 have been segregated as initial margin for open futures contracts.
6 The issuer operates under a congressional charter; its securities are generally neither guaranteed by the U.S. Treasury nor backed by the full faith and credit of the U.S. government.
See accompanying Notes, which are an integral part of the Financial Statements.
41
| Value Index Fund | |
| Statement of Operations | |
| Year Ended | |
| December 31, 2013 | |
| ($000) | |
| Investment Income | |
| Income | |
| Dividends | 629,088 |
| Interest1 | 39 |
| Securities Lending | 1,166 |
| Total Income | 630,293 |
| Expenses | |
| The Vanguard Group—Note B | |
| Investment Advisory Services | 1,250 |
| Management and Administrative—Investor Shares | 3,444 |
| Management and Administrative—Admiral Shares | 2,985 |
| Management and Administrative—Signal Shares | 1,480 |
| Management and Administrative—Institutional Shares | 2,838 |
| Management and Administrative—ETF Shares | 6,047 |
| Marketing and Distribution—Investor Shares | 351 |
| Marketing and Distribution—Admiral Shares | 575 |
| Marketing and Distribution—Signal Shares | 616 |
| Marketing and Distribution—Institutional Shares | 1,104 |
| Marketing and Distribution—ETF Shares | 2,349 |
| Custodian Fees | 343 |
| Auditing Fees | 30 |
| Shareholders’ Reports—Investor Shares | 47 |
| Shareholders’ Reports—Admiral Shares | 35 |
| Shareholders’ Reports—Signal Shares | 21 |
| Shareholders’ Reports—Institutional Shares | 70 |
| Shareholders’ Reports—ETF Shares | 236 |
| Trustees’ Fees and Expenses | 27 |
| Total Expenses | 23,848 |
| Net Investment Income | 606,445 |
| Realized Net Gain (Loss) | |
| Investment Securities Sold | 1,528,376 |
| Futures Contracts | 5,855 |
| Realized Net Gain (Loss) | 1,534,231 |
| Change in Unrealized Appreciation (Depreciation) | |
| Investment Securities | 4,556,240 |
| Futures Contracts | 1,077 |
| Change in Unrealized Appreciation (Depreciation) | 4,557,317 |
| Net Increase (Decrease) in Net Assets Resulting from Operations | 6,697,993 |
| 1 Interest income from an affiliated company of the fund was $36,000. | |
| See accompanying Notes, which are an integral part of the Financial Statements. | |
42
| Value Index Fund | ||
| Statement of Changes in Net Assets | ||
| Year Ended December 31, | ||
| 2013 | 2012 | |
| ($000) | ($000) | |
| Increase (Decrease) in Net Assets | ||
| Operations | ||
| Net Investment Income | 606,445 | 482,329 |
| Realized Net Gain (Loss) | 1,534,231 | 583,872 |
| Change in Unrealized Appreciation (Depreciation) | 4,557,317 | 1,269,213 |
| Net Increase (Decrease) in Net Assets Resulting from Operations | 6,697,993 | 2,335,414 |
| Distributions | ||
| Net Investment Income | ||
| Investor Shares | (37,540) | (40,486) |
| Admiral Shares | (107,291) | (95,460) |
| Signal Shares | (62,855) | (50,325) |
| Institutional Shares | (137,123) | (120,114) |
| ETF Shares | (260,653) | (176,096) |
| Realized Capital Gain | ||
| Investor Shares | — | — |
| Admiral Shares | — | — |
| Signal Shares | — | — |
| Institutional Shares | — | — |
| ETF Shares | — | — |
| Total Distributions | (605,462) | (482,481) |
| Capital Share Transactions | ||
| Investor Shares | (177,905) | (538,521) |
| Admiral Shares | 416,232 | 49,830 |
| Signal Shares | 271,378 | 357,771 |
| Institutional Shares | 674,349 | 484,020 |
| ETF Shares | 2,894,352 | 1,327,951 |
| Net Increase (Decrease) from Capital Share Transactions | 4,078,406 | 1,681,051 |
| Total Increase (Decrease) | 10,170,937 | 3,533,984 |
| Net Assets | ||
| Beginning of Period | 18,428,142 | 14,894,158 |
| End of Period1 | 28,599,079 | 18,428,142 |
1 Net Assets—End of Period includes undistributed (overdistributed) net investment income of ($15,536,000) and ($16,519,000).
See accompanying Notes, which are an integral part of the Financial Statements.
43
| Value Index Fund | |||||
| Financial Highlights | |||||
| Investor Shares | |||||
| For a Share Outstanding | Year Ended December 31, | ||||
| Throughout Each Period | 2013 | 2012 | 2011 | 2010 | 2009 |
| Net Asset Value, Beginning of Period | $22.93 | $20.47 | $20.79 | $18.63 | $16.08 |
| Investment Operations | |||||
| Net Investment Income | .621 | .595 | .521 | .459 | .498 |
| Net Realized and Unrealized Gain (Loss) | |||||
| on Investments | 6.847 | 2.458 | (.325) | 2.163 | 2.561 |
| Total from Investment Operations | 7.468 | 3.053 | .196 | 2.622 | 3.059 |
| Distributions | |||||
| Dividends from Net Investment Income | (.618) | (.593) | (.516) | (.462) | (.509) |
| Distributions from Realized Capital Gains | — | — | — | — | — |
| Total Distributions | (.618) | (.593) | (.516) | (.462) | (.509) |
| Net Asset Value, End of Period | $29.78 | $22.93 | $20.47 | $20.79 | $18.63 |
| Total Return1 | 32.85% | 15.00% | 1.00% | 14.28% | 19.58% |
| Ratios/Supplemental Data | |||||
| Net Assets, End of Period (Millions) | $1,731 | $1,482 | $1,814 | $2,317 | $3,357 |
| Ratio of Total Expenses to | |||||
| Average Net Assets | 0.24% | 0.24% | 0.24% | 0.26% | 0.26% |
| Ratio of Net Investment Income to | |||||
| Average Net Assets | 2.35% | 2.71% | 2.52% | 2.43% | 3.09% |
| Portfolio Turnover Rate2 | 25% | 22% | 23% | 27% | 31% |
1 Total returns do not include account service fees that may have applied in the periods shown. Fund prospectuses provide information about any applicable account service fees.
2 Excludes the value of portfolio securities received or delivered as a result of in-kind purchases or redemptions of the fund’s capital shares, including ETF Creation Units.
See accompanying Notes, which are an integral part of the Financial Statements.
44
| Value Index Fund | |||||
| Financial Highlights | |||||
| Admiral Shares | |||||
| For a Share Outstanding | Year Ended December 31, | ||||
| Throughout Each Period | 2013 | 2012 | 2011 | 2010 | 2009 |
| Net Asset Value, Beginning of Period | $22.93 | $20.47 | $20.79 | $18.63 | $16.08 |
| Investment Operations | |||||
| Net Investment Income | .663 | .629 | .551 | .488 | .517 |
| Net Realized and Unrealized Gain (Loss) | |||||
| on Investments | 6.845 | 2.458 | (.325) | 2.162 | 2.562 |
| Total from Investment Operations | 7.508 | 3.087 | .226 | 2.650 | 3.079 |
| Distributions | |||||
| Dividends from Net Investment Income | (.658) | (.627) | (.546) | (.490) | (.529) |
| Distributions from Realized Capital Gains | — | — | — | — | — |
| Total Distributions | (.658) | (.627) | (.546) | (.490) | (.529) |
| Net Asset Value, End of Period | $29.78 | $22.93 | $20.47 | $20.79 | $18.63 |
| Total Return1 | 33.05% | 15.18% | 1.14% | 14.45% | 19.72% |
| Ratios/Supplemental Data | |||||
| Net Assets, End of Period (Millions) | $5,054 | $3,539 | $3,116 | $3,082 | $1,421 |
| Ratio of Total Expenses to | |||||
| Average Net Assets | 0.09% | 0.10% | 0.10% | 0.12% | 0.14% |
| Ratio of Net Investment Income to | |||||
| Average Net Assets | 2.50% | 2.85% | 2.66% | 2.57% | 3.21% |
| Portfolio Turnover Rate2 | 25% | 22% | 23% | 27% | 31% |
1 Total returns do not include account service fees that may have applied in the periods shown. Fund prospectuses provide information about any applicable account service fees.
2 Excludes the value of portfolio securities received or delivered as a result of in-kind purchases or redemptions of the fund’s capital shares, including ETF Creation Units.
See accompanying Notes, which are an integral part of the Financial Statements.
45
| Value Index Fund | |||||
| Financial Highlights | |||||
| Signal Shares | |||||
| For a Share Outstanding | Year Ended December 31, | ||||
| Throughout Each Period | 2013 | 2012 | 2011 | 2010 | 2009 |
| Net Asset Value, Beginning of Period | $23.86 | $21.30 | $21.63 | $19.38 | $16.73 |
| Investment Operations | |||||
| Net Investment Income | .689 | .654 | .574 | .508 | .538 |
| Net Realized and Unrealized Gain (Loss) | |||||
| on Investments | 7.126 | 2.558 | (.335) | 2.252 | 2.663 |
| Total from Investment Operations | 7.815 | 3.212 | .239 | 2.760 | 3.201 |
| Distributions | |||||
| Dividends from Net Investment Income | (.685) | (.652) | (.569) | (.510) | (.551) |
| Distributions from Realized Capital Gains | — | — | — | — | — |
| Total Distributions | (.685) | (.652) | (.569) | (.510) | (.551) |
| Net Asset Value, End of Period | $30.99 | $23.86 | $21.30 | $21.63 | $19.38 |
| Total Return | 33.06% | 15.18% | 1.16% | 14.46% | 19.70% |
| Ratios/Supplemental Data | |||||
| Net Assets, End of Period (Millions) | $2,923 | $2,011 | $1,467 | $1,018 | $907 |
| Ratio of Total Expenses to | |||||
| Average Net Assets | 0.09% | 0.10% | 0.10% | 0.12% | 0.14% |
| Ratio of Net Investment Income to | |||||
| Average Net Assets | 2.50% | 2.85% | 2.66% | 2.57% | 3.21% |
| Portfolio Turnover Rate1 | 25% | 22% | 23% | 27% | 31% |
1 Excludes the value of portfolio securities received or delivered as a result of in-kind purchases or redemptions of the fund’s capital shares, including ETF Creation Units.
See accompanying Notes, which are an integral part of the Financial Statements.
46
| Value Index Fund | |||||
| Financial Highlights | |||||
| Institutional Shares | |||||
| For a Share Outstanding | Year Ended December 31, | ||||
| Throughout Each Period | 2013 | 2012 | 2011 | 2010 | 2009 |
| Net Asset Value, Beginning of Period | $22.93 | $20.47 | $20.79 | $18.63 | $16.08 |
| Investment Operations | |||||
| Net Investment Income | .666 | .633 | .556 | .496 | .527 |
| Net Realized and Unrealized Gain (Loss) | |||||
| on Investments | 6.846 | 2.458 | (.325) | 2.162 | 2.562 |
| Total from Investment Operations | 7.512 | 3.091 | .231 | 2.658 | 3.089 |
| Distributions | |||||
| Dividends from Net Investment Income | (.662) | (.631) | (.551) | (.498) | (.539) |
| Distributions from Realized Capital Gains | — | — | — | — | — |
| Total Distributions | (.662) | (.631) | (.551) | (.498) | (.539) |
| Net Asset Value, End of Period | $29.78 | $22.93 | $20.47 | $20.79 | $18.63 |
| Total Return | 33.07% | 15.20% | 1.17% | 14.49% | 19.79% |
| Ratios/Supplemental Data | |||||
| Net Assets, End of Period (Millions) | $6,431 | $4,369 | $3,449 | $3,450 | $2,812 |
| Ratio of Total Expenses to | |||||
| Average Net Assets | 0.08% | 0.08% | 0.08% | 0.08% | 0.08% |
| Ratio of Net Investment Income to | |||||
| Average Net Assets | 2.51% | 2.87% | 2.68% | 2.61% | 3.27% |
| Portfolio Turnover Rate1 | 25% | 22% | 23% | 27% | 31% |
1 Excludes the value of portfolio securities received or delivered as a result of in-kind purchases or redemptions of the fund’s capital shares, including ETF Creation Units.
See accompanying Notes, which are an integral part of the Financial Statements.
47
| Value Index Fund | |||||
| Financial Highlights | |||||
| ETF Shares | |||||
| For a Share Outstanding | Year Ended December 31, | ||||
| Throughout Each Period | 2013 | 2012 | 2011 | 2010 | 2009 |
| Net Asset Value, Beginning of Period | $58.79 | $52.48 | $53.29 | $47.75 | $41.21 |
| Investment Operations | |||||
| Net Investment Income | 1.700 | 1.613 | 1.414 | 1.252 | 1.324 |
| Net Realized and Unrealized Gain (Loss) | |||||
| on Investments | 17.538 | 6.305 | (.821) | 5.545 | 6.573 |
| Total from Investment Operations | 19.238 | 7.918 | .593 | 6.797 | 7.897 |
| Distributions | |||||
| Dividends from Net Investment Income | (1.688) | (1.608) | (1.403) | (1.257) | (1.357) |
| Distributions from Realized Capital Gains | — | — | — | — | — |
| Total Distributions | (1.688) | (1.608) | (1.403) | (1.257) | (1.357) |
| Net Asset Value, End of Period | $76.34 | $58.79 | $52.48 | $53.29 | $47.75 |
| Total Return | 33.03% | 15.19% | 1.16% | 14.45% | 19.72% |
| Ratios/Supplemental Data | |||||
| Net Assets, End of Period (Millions) | $12,461 | $7,027 | $5,049 | $4,330 | $3,145 |
| Ratio of Total Expenses to | |||||
| Average Net Assets | 0.09% | 0.10% | 0.10% | 0.12% | 0.14% |
| Ratio of Net Investment Income to | |||||
| Average Net Assets | 2.50% | 2.85% | 2.66% | 2.57% | 3.21% |
| Portfolio Turnover Rate1 | 25% | 22% | 23% | 27% | 31% |
1 Excludes the value of portfolio securities received or delivered as a result of in-kind purchases or redemptions of the fund’s capital shares, including ETF Creation Units.
See accompanying Notes, which are an integral part of the Financial Statements.
48
Value Index Fund
Notes to Financial Statements
Vanguard Value Index Fund is registered under the Investment Company Act of 1940 as an open-end investment company, or mutual fund. The fund offers five classes of shares: Investor Shares, Admiral Shares, Signal Shares, Institutional Shares, and ETF Shares. Investor Shares are available to any investor who meets the fund’s minimum purchase requirements. Admiral Shares, Signal Shares, and Institutional Shares are designed for investors who meet certain administrative, service, and account-size criteria. ETF Shares are listed for trading on NYSE Arca; they can be purchased and sold through a broker.
A. The following significant accounting policies conform to generally accepted accounting principles for U.S. mutual funds. The fund consistently follows such policies in preparing its financial statements.
1. Security Valuation: Securities are valued as of the close of trading on the New York Stock Exchange (generally 4 p.m., Eastern time) on the valuation date. Equity securities are valued at the latest quoted sales prices or official closing prices taken from the primary market in which each security trades; such securities not traded on the valuation date are valued at the mean of the latest quoted bid and asked prices. Securities for which market quotations are not readily available, or whose values have been materially affected by events occurring before the fund’s pricing time but after the close of the securities’ primary markets, are valued by methods deemed by the board of trustees to represent fair value. Investments in Vanguard Market Liquidity Fund are valued at that fund’s net asset value. Temporary cash investments acquired over 60 days to maturity are valued using the latest bid prices or using valuations based on a matrix system (which considers such factors as security prices, yields, maturities, and ratings), both as furnished by independent pricing services. Other temporary cash investments are valued at amortized cost, which approximates market value.
2. Futures Contracts: The fund may use index futures contracts to a limited extent, with the objectives of maintaining full exposure to the stock market, enhancing returns, maintaining liquidity, and minimizing transaction costs. The fund may purchase futures contracts to immediately invest incoming cash in the market, or sell futures in response to cash outflows, thereby simulating a fully invested position in the underlying index while maintaining a cash balance for liquidity. The fund may seek to enhance returns by using futures contracts instead of the underlying securities when futures are believed to be priced more attractively than the underlying securities. The primary risks associated with the use of futures contracts are imperfect correlation between changes in market values of stocks held by the fund and the prices of futures contracts, and the possibility of an illiquid market. Counterparty risk involving futures is mitigated because a regulated clearinghouse is the counterparty instead of the clearing broker. To further mitigate counterparty risk, the fund trades futures contracts on an exchange, monitors the financial strength of its clearing brokers and clearinghouse, and has entered into clearing agreements with its clearing brokers. The clearinghouse imposes initial margin requirements to secure the fund’s performance and requires daily settlement of variation margin representing changes in the market value of each contract.
Futures contracts are valued at their quoted daily settlement prices. The aggregate notional amounts of the contracts are not recorded in the Statement of Net Assets. Fluctuations in the value of the contracts are recorded in the Statement of Net Assets as an asset (liability) and in the Statement of Operations as unrealized appreciation (depreciation) until the contracts are closed, when they are recorded as realized futures gains (losses).
During the year ended December 31, 2013, the fund’s average investments in long and short futures contracts represented less than 1% and 0% of net assets, respectively, based on quarterly average aggregate settlement values.
49
Value Index Fund
3. Federal Income Taxes: The fund intends to continue to qualify as a regulated investment company and distribute all of its taxable income. Management has analyzed the fund’s tax positions taken for all open federal income tax years (December 31, 2010–2013), and has concluded that no provision for federal income tax is required in the fund’s financial statements.
4. Distributions: Distributions to shareholders are recorded on the ex-dividend date.
5. Securities Lending: To earn additional income, the fund may lend its securities to qualified institutional borrowers. Security loans are required to be secured at all times by collateral in an amount at least equal to the market value of securities loaned. Daily market fluctuations could cause the value of loaned securities to be more or less than the value of the collateral received. When this occurs, the collateral is adjusted and settled on the next business day. The fund further mitigates its counterparty risk by entering into securities lending transactions only with a diverse group of prequalified counterparties, monitoring their financial strength, and entering into master securities lending agreements with its counterparties. The master securities lending agreements provide that, in the event of a counterparty’s default (including bankruptcy), the fund may terminate any loans with that borrower, determine the net amount owed, and sell or retain the collateral up to the net amount owed to the fund; however, such actions may be subject to legal proceedings. While collateral mitigates counterparty risk, in the absence of a default the fund may experience delays and costs in recovering the securities loaned. The fund invests cash collateral received in Vanguard Market Liquidity Fund, and records a liability for the return of the collateral, during the period the securities are on loan. Securities lending income represents fees charged to borrowers plus income earned on invested cash collateral, less expenses associated with the loan.
6. Other: Dividend income is recorded on the ex-dividend date. Interest income includes income distributions received from Vanguard Market Liquidity Fund and is accrued daily. Premiums and discounts on debt securities purchased are amortized and accreted, respectively, to interest income over the lives of the respective securities. Security transactions are accounted for on the date securities are bought or sold. Costs used to determine realized gains (losses) on the sale of investment securities are those of the specific securities sold.
Each class of shares has equal rights as to assets and earnings, except that each class separately bears certain class-specific expenses related to maintenance of shareholder accounts (included in Management and Administrative expenses) and shareholder reporting. Marketing and distribution expenses are allocated to each class of shares based on a method approved by the board of trustees. Income, other non-class-specific expenses, and gains and losses on investments are allocated to each class of shares based on its relative net assets.
B. The Vanguard Group furnishes at cost investment advisory, corporate management, administrative, marketing, and distribution services. The costs of such services are allocated to the fund under methods approved by the board of trustees. The fund has committed to provide up to 0.40% of its net assets in capital contributions to Vanguard. At December 31, 2013, the fund had contributed capital of $3,144,000 to Vanguard (included in Other Assets), representing 0.01% of the fund’s net assets and 1.26% of Vanguard’s capitalization. The fund’s trustees and officers are also directors and officers of Vanguard.
C. Various inputs may be used to determine the value of the fund’s investments. These inputs are summarized in three broad levels for financial statement purposes. The inputs or methodologies used to value securities are not necessarily an indication of the risk associated with investing in those securities.
50
Value Index Fund
Level 1—Quoted prices in active markets for identical securities.
Level 2—Other significant observable inputs (including quoted prices for similar securities, interest rates, prepayment speeds, credit risk, etc.).
Level 3—Significant unobservable inputs (including the fund’s own assumptions used to determine the fair value of investments).
The following table summarizes the market value of the fund’s investments as of December 31, 2013, based on the inputs used to value them:
| Level 1 | Level 2 | Level 3 | |
| Investments | ($000) | ($000) | ($000) |
| Common Stocks | 28,569,315 | — | — |
| Temporary Cash Investments | 44,642 | 2,499 | — |
| Futures Contracts—Assets1 | 126 | — | — |
| Total | 28,614,083 | 2,499 | — |
| 1 Represents variation margin on the last day of the reporting period. |
D. At December 31, 2013, the aggregate settlement value of open futures contracts and the related unrealized appreciation (depreciation) were:
| ($000) | ||||
| Aggregate | ||||
| Number of | Settlement | Unrealized | ||
| Long (Short) | Value | Appreciation | ||
| Futures Contracts | Expiration | Contracts | Long (Short) | (Depreciation) |
| E-mini S&P 500 Index | March 2014 | 393 | 36,178 | 1,077 |
Unrealized appreciation (depreciation) on open futures contracts is required to be treated as realized gain (loss) for tax purposes.
E. Distributions are determined on a tax basis and may differ from net investment income and realized capital gains for financial reporting purposes. Differences may be permanent or temporary. Permanent differences are reclassified among capital accounts in the financial statements to reflect their tax character. Temporary differences arise when certain items of income, expense, gain, or loss are recognized in different periods for financial statement and tax purposes. These differences will reverse at some time in the future. Differences in classification may also result from the treatment of short-term gains as ordinary income for tax purposes.
During the year ended December 31, 2013, the fund realized $355,766,000 of net capital gains resulting from in-kind redemptions—in which shareholders exchanged fund shares for securities held by the fund rather than for cash. Because such gains are not taxable to the fund, and are not distributed to shareholders, they have been reclassified from accumulated net realized losses to paid-in capital.
For tax purposes, at December 31, 2013, the fund had $5,224,000 of ordinary income available for distribution. The fund used capital loss carryforwards of $1,179,424,000 to offset taxable capital gains realized during the year ended December 31, 2013. At December 31, 2013, the fund had available capital losses totaling $346,212,000 to offset future net capital gains through December 31, 2017.
51
Value Index Fund
At December 31, 2013, the cost of investment securities for tax purposes was $23,449,339,000. Net unrealized appreciation of investment securities for tax purposes was $5,167,117,000, consisting of unrealized gains of $5,677,434,000 on securities that had risen in value since their purchase and $510,317,000 in unrealized losses on securities that had fallen in value since their purchase.
F. During the year ended December 31, 2013, the fund purchased $11,248,631,000 of investment securities and sold $7,184,303,000 of investment securities, other than temporary cash investments. Purchases and sales include $3,979,973,000 and $1,190,650,000, respectively, in connection with in-kind purchases and redemptions of the fund’s capital shares.
G. Capital share transactions for each class of shares were:
| Year Ended December 31, | ||||
| 2013 | 2012 | |||
| Amount | Shares | Amount | Shares | |
| ($000) | (000) | ($000) | (000) | |
| Investor Shares | ||||
| Issued | 263,619 | 9,878 | 263,810 | 11,888 |
| Issued in Lieu of Cash Distributions | 34,188 | 1,260 | 38,404 | 1,711 |
| Redeemed | (475,712) | (17,640) | (840,735) | (37,593) |
| Net Increase (Decrease)—Investor Shares | (177,905) | (6,502) | (538,521) | (23,994) |
| Admiral Shares | ||||
| Issued | 771,134 | 28,590 | 398,762 | 17,922 |
| Issued in Lieu of Cash Distributions | 95,406 | 3,504 | 84,832 | 3,775 |
| Redeemed | (450,308) | (16,740) | (433,764) | (19,522) |
| Net Increase (Decrease) —Admiral Shares | 416,232 | 15,354 | 49,830 | 2,175 |
| Signal Shares | ||||
| Issued | 887,826 | 31,864 | 740,791 | 32,096 |
| Issued in Lieu of Cash Distributions | 52,620 | 1,857 | 41,738 | 1,783 |
| Redeemed | (669,068) | (23,672) | (424,758) | (18,449) |
| Net Increase (Decrease)—Signal Shares | 271,378 | 10,049 | 357,771 | 15,430 |
| Institutional Shares | ||||
| Issued | 1,337,495 | 50,315 | 1,186,579 | 53,648 |
| Issued in Lieu of Cash Distributions | 132,013 | 4,850 | 114,935 | 5,113 |
| Redeemed | (795,159) | (29,718) | (817,494) | (36,688) |
| Net Increase (Decrease) —Institutional Shares | 674,349 | 25,447 | 484,020 | 22,073 |
| ETF Shares | ||||
| Issued | 4,102,875 | 61,095 | 3,242,989 | 57,134 |
| Issued in Lieu of Cash Distributions | — | — | — | — |
| Redeemed | (1,208,523) | (17,400) | (1,915,038) | (33,800) |
| Net Increase (Decrease) —ETF Shares | 2,894,352 | 43,695 | 1,327,951 | 23,334 |
H. Management has determined that no material events or transactions occurred subsequent to December 31, 2013, that would require recognition or disclosure in these financial statements.
52
Large-Cap Index Fund
Fund Profile
As of December 31, 2013
| Share-Class Characteristics | |||||
| Investor | Admiral | Signal | Institutional | ||
| Shares | Shares | Shares | Shares | ETF Shares | |
| Ticker Symbol | VLACX | VLCAX | VLCSX | VLISX | VV |
| Expense Ratio1 | 0.24% | 0.10% | 0.10% | 0.08% | 0.10% |
| 30-Day SEC Yield | 1.72% | 1.86% | 1.86% | 1.87% | 1.86% |
| Portfolio Characteristics | |||
| DJ | |||
| U.S. | |||
| Total | |||
| Stock | |||
| CRSP US | Market | ||
| Large Cap | FA | ||
| Fund | Index | Index | |
| Number of Stocks | 656 | 656 | 3,653 |
| Median Market Cap | $60.7B | $60.7B | $43.0B |
| Price/Earnings Ratio | 19.6x | 19.7x | 20.7x |
| Price/Book Ratio | 2.7x | 2.7x | 2.7x |
| Return on Equity | 17.9% | 17.7% | 16.5% |
| Earnings Growth | |||
| Rate | 11.4% | 11.3% | 11.4% |
| Dividend Yield | 1.9% | 1.9% | 1.8% |
| Foreign Holdings | 0.0% | 0.0% | 0.0% |
| Turnover Rate | 9% | — | — |
| Short-Term Reserves | 0.2% | — | — |
| Sector Diversification (% of equity exposure) | |||
| DJ | |||
| U.S. Total | |||
| CRSP US | Stock | ||
| Large Cap | Market | ||
| Fund | Index | FA Index | |
| Basic Materials | 2.9% | 2.9% | 3.1% |
| Consumer Goods | 10.5 | 10.6 | 10.2 |
| Consumer Services | 13.5 | 13.5 | 13.7 |
| Financials | 17.7 | 17.7 | 18.4 |
| Health Care | 12.0 | 12.0 | 11.8 |
| Industrials | 12.5 | 12.5 | 13.5 |
| Oil & Gas | 10.0 | 9.9 | 9.3 |
| Technology | 15.6 | 15.6 | 14.9 |
| Telecommunications | 2.3 | 2.3 | 2.1 |
| Utilities | 3.0 | 3.0 | 3.0 |
| Volatility Measures | ||
| DJ | ||
| Spliced | U.S. Total | |
| Large Cap | Stock Market | |
| Index | FA Index | |
| R-Squared | 1.00 | 1.00 |
| Beta | 1.00 | 0.97 |
| These measures show the degree and timing of the fund’s | ||
| fluctuations compared with the indexes over 36 months. | ||
| Ten Largest Holdings (% of total net assets) | ||
| Apple Inc. | Computer Hardware | 2.9% |
| Exxon Mobil Corp. | Integrated Oil & Gas | 2.5 |
| Google Inc. | Internet | 1.8 |
| General Electric Co. | Diversified Industrials | 1.6 |
| Microsoft Corp. | Software | 1.6 |
| Johnson & Johnson | Pharmaceuticals | 1.5 |
| Chevron Corp. | Integrated Oil & Gas | 1.4 |
| Wells Fargo & Co. | Banks | 1.4 |
| Procter & Gamble Co. | Nondurable | |
| Household Products | 1.3 | |
| JPMorgan Chase & Co. | Banks | 1.3 |
| Top Ten | 17.3% | |
| The holdings listed exclude any temporary cash investments and equity index products. | ||
1 The expense ratios shown are from the prospectus dated August 12, 2013, and represent estimated costs for the current fiscal year. For the fiscal year ended December 31, 2013, the expense ratios were 0.24% for Investor Shares, 0.09% for Admiral Shares, 0.09% for Signal Shares, 0.08% for Institutional Shares, and 0.09% for ETF Shares.
53
Large-Cap Index Fund
Investment Focus
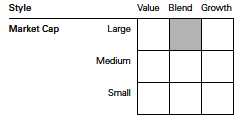
54
Large-Cap Index Fund
Performance Summary
All of the returns in this report represent past performance, which is not a guarantee of future results that may be achieved by the fund. (Current performance may be lower or higher than the performance data cited. For performance data current to the most recent month-end, visit our website at vanguard.com/performance.) Note, too, that both investment returns and principal value can fluctuate widely, so an investor’s shares, when sold, could be worth more or less than their original cost. The returns shown do not reflect taxes that a shareholder would pay on fund distributions or on the sale of fund shares.
Cumulative Performance: January 30, 2004, Through December 31, 2013
Initial Investment of $10,000
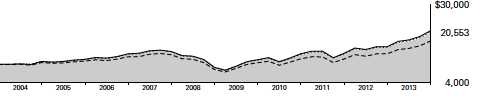
| Average Annual Total Returns | |||||
| Periods Ended December 31, 2013 | |||||
| Since | Final Value | ||||
| One | Five | Inception | of a $10,000 | ||
| Year | Years | (1/30/2004) | Investment | ||
| Large-Cap Index Fund*Investor | |||||
| Shares | 32.45% | 18.11% | 7.53% | $20,553 | |
| •••••••• | Spliced Large Cap Index | 32.74 | 18.36 | 7.71 | 20,894 |
| – – – – | Large-Cap Core Funds Average | 31.42 | 16.62 | 6.01 | 17,836 |
| Dow Jones U.S. Total Stock Market | |||||
| Float Adjusted Index | 33.47 | 18.86 | 7.92 | 21,304 | |
For a benchmark description, see the Glossary.
Large-Cap Core Funds Average: Derived from data provided by Lipper, a Thomson Reuters Company.
"Since Inception" performance is calculated from the Investor Shares’ inception date for both the fund and its comparative standards.
| Since | Final Value | |||
| One | Five | Inception | of a $10,000 | |
| Year | Years | (2/2/2004) | Investment | |
| Large-Cap Index Fund Admiral Shares | 32.66% | 18.28% | 7.63% | $20,728 |
| Spliced Large Cap Index | 32.74 | 18.36 | 7.68 | 20,824 |
| Dow Jones U.S. Total Stock Market Float | ||||
| Adjusted Index | 33.47 | 18.86 | 7.90 | 21,242 |
"Since Inception" performance is calculated from the Admiral Shares’ inception date for both the fund and its comparative standards.
See Financial Highlights for dividend and capital gains information.
55
| Large-Cap Index Fund | ||||
| Average Annual Total Returns | ||||
| Periods Ended December 31, 2013 | ||||
| Since | Final Value | |||
| One | Five | Inception | of a $10,000 | |
| Year | Years | (8/30/2007) | Investment | |
| Large-Cap Index Fund Signal Shares | 32.65% | 18.28% | 6.44% | $14,850 |
| Spliced Large Cap Index | 32.74 | 18.36 | 6.48 | 14,885 |
| Dow Jones U.S. Total Stock Market Float | ||||
| Adjusted Index | 33.47 | 18.86 | 6.72 | 15,099 |
"Since Inception" performance is calculated from the Signal Shares’ inception date for both the fund and its comparative standards.
| Since | Final Value | |||
| One | Five | Inception | of a $5,000,000 | |
| Year | Years | (6/30/2005) | Investment | |
| Large-Cap Index Fund Institutional Shares | 32.65% | 18.31% | 7.90% | $9,545,454 |
| Spliced Large Cap Index | 32.74 | 18.36 | 7.92 | 9,559,796 |
| Dow Jones U.S. Total Stock Market Float | ||||
| Adjusted Index | 33.47 | 18.86 | 8.07 | 9,677,550 |
"Since Inception" performance is calculated from the Institutional Shares’ inception date for both the fund and its comparative standards.
| Since | Final Value | |||
| One | Five | Inception | of a $10,000 | |
| Year | Years | (1/27/2004) | Investment | |
| Large-Cap Index Fund | ||||
| ETF Shares Net Asset Value | 32.65% | 18.28% | 7.55% | $20,592 |
| Spliced Large Cap Index | 32.74 | 18.36 | 7.59 | 20,663 |
| Dow Jones U.S. Total Stock Market Float | ||||
| Adjusted Index | 33.47 | 18.86 | 7.78 | 21,031 |
"Since Inception" performance is calculated from the ETF Shares’ inception date for both the fund and its comparative standards.
| Cumulative Returns of ETF Shares: January 27, 2004, Through December 31, 2013 | |||
| Since | |||
| One | Five | Inception | |
| Year | Years | (1/27/2004) | |
| Large-Cap Index Fund ETF Shares Market Price | 32.68% | 131.28% | 105.91% |
| Large-Cap Index Fund ETF Shares Net Asset Value | 32.65 | 131.52 | 105.92 |
| Spliced Large Cap Index | 32.74 | 132.24 | 106.63 |
"Since Inception" performance is calculated from the ETF Shares’ inception date for both the fund and its comparative standard.
56
Large-Cap Index Fund
Fiscal-Year Total Returns (%): January 30, 2004, Through December 31, 2013
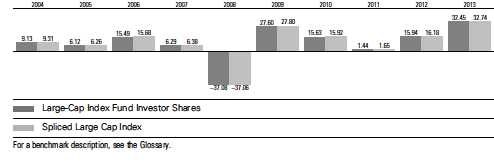
57
Large-Cap Index Fund
Financial Statements
Statement of Net Assets
As of December 31, 2013
The fund reports a complete list of its holdings in regulatory filings four times in each fiscal year, at the quarter-ends. For the second and fourth fiscal quarters, the lists appear in the fund’s semiannual and annual reports to shareholders. For the first and third fiscal quarters, the fund files the lists with the Securities and Exchange Commission on Form N-Q. Shareholders can look up the fund’s Forms N-Q on the SEC’s website at sec.gov. Forms N-Q may also be reviewed and copied at the SEC’s Public Reference Room (see the back cover of this report for further information).
| Market | |||
| Value | |||
| Shares | ($000) | ||
| Common Stocks (99.7%)1 | |||
| Basic Materials (2.9%) | |||
| EI du Pont de | |||
| Nemours & Co. | 432,687 | 28,112 | |
| Dow Chemical Co. | 567,208 | 25,184 | |
| Freeport-McMoRan | |||
| Copper & Gold Inc. | 485,021 | 18,305 | |
| Praxair Inc. | 137,551 | 17,886 | |
| LyondellBasell Industries | |||
| NV Class A | 219,874 | 17,651 | |
| Ecolab Inc. | 126,715 | 13,213 | |
| PPG Industries Inc. | 63,117 | 11,971 | |
| Air Products & | |||
| Chemicals Inc. | 98,865 | 11,051 | |
| International Paper Co. | 207,109 | 10,155 | |
| Nucor Corp. | 148,647 | 7,935 | |
| CF Industries Holdings Inc. | 26,806 | 6,247 | |
| Mosaic Co. | 132,131 | 6,246 | |
| Eastman Chemical Co. | 71,922 | 5,804 | |
| Newmont Mining Corp. | 230,630 | 5,311 | |
| Alcoa Inc. | 499,170 | 5,306 | |
| Sigma-Aldrich Corp. | 55,846 | 5,250 | |
| FMC Corp. | 62,506 | 4,717 | |
| Celanese Corp. Class A | 73,803 | 4,082 | |
| CONSOL Energy Inc. | 106,930 | 4,068 | |
| Ashland Inc. | 36,337 | 3,526 | |
| Airgas Inc. | 31,194 | 3,489 | |
| * | WR Grace & Co. | 34,241 | 3,385 |
| International Flavors | |||
| & Fragrances Inc. | 38,096 | 3,275 | |
| Reliance Steel & | |||
| Aluminum Co. | 34,619 | 2,625 | |
| Peabody Energy Corp. | 126,208 | 2,465 | |
| Albemarle Corp. | 37,941 | 2,405 | |
| Avery Dennison Corp. | 45,602 | 2,289 | |
| Huntsman Corp. | 90,346 | 2,222 | |
| Westlake Chemical Corp. | 9,353 | 1,142 | |
| 235,317 | |||
| Market | ||||
| Value | ||||
| Shares | ($000) | |||
| Consumer Goods (10.4%) | ||||
| Procter & Gamble Co. | 1,270,637 | 103,443 | ||
| Coca-Cola Co. | 1,857,963 | 76,752 | ||
| Philip Morris | ||||
| International Inc. | 711,532 | 61,996 | ||
| PepsiCo Inc. | 716,914 | 59,461 | ||
| Altria Group Inc. | 934,998 | 35,895 | ||
| Mondelez International Inc. | ||||
| Class A | 820,096 | 28,949 | ||
| Monsanto Co. | 245,968 | 28,668 | ||
| Colgate-Palmolive Co. | 432,268 | 28,188 | ||
| Ford Motor Co. | 1,811,287 | 27,948 | ||
| NIKE Inc. Class B | 332,478 | 26,146 | ||
| * | General Motors Co. | 486,728 | 19,893 | |
| Kimberly-Clark Corp. | 178,366 | 18,632 | ||
| Johnson Controls Inc. | 320,082 | 16,420 | ||
| Kraft Foods Group Inc. | 278,362 | 15,009 | ||
| General Mills Inc. | 296,404 | 14,794 | ||
| Archer-Daniels-Midland Co. | 307,624 | 13,351 | ||
| VF Corp. | 164,812 | 10,274 | ||
| Lorillard Inc. | 172,266 | 8,730 | ||
| Delphi Automotive plc | 143,726 | 8,642 | ||
| Estee Lauder Cos. Inc. | ||||
| Class A | 111,776 | 8,419 | ||
| Kellogg Co. | 135,383 | 8,268 | ||
| Mead Johnson Nutrition Co. | 94,558 | 7,920 | ||
| Reynolds American Inc. | 151,510 | 7,574 | ||
| Mattel Inc. | 158,371 | 7,535 | ||
| Coach Inc. | 130,930 | 7,349 | ||
| Harley-Davidson Inc. | 103,250 | 7,149 | ||
| * | Michael Kors Holdings Ltd. | 85,288 | 6,925 | |
| Stanley Black & Decker Inc. | 82,574 | 6,663 | ||
| Hershey Co. | 68,424 | 6,653 | ||
| ConAgra Foods Inc. | 196,918 | 6,636 | ||
| BorgWarner Inc. | 106,234 | 5,940 | ||
| Whirlpool Corp. | 36,673 | 5,753 | ||
| Genuine Parts Co. | 68,621 | 5,709 | ||
| * | Tesla Motors Inc. | 37,249 | 5,602 | |
| Clorox Co. | 60,325 | 5,596 | ||
| Bunge Ltd. | 65,570 | 5,384 | ||
58
| Large-Cap Index Fund | |||
| Market | |||
| Value | |||
| Shares | ($000) | ||
| Beam Inc. | 76,238 | 5,189 | |
| PVH Corp. | 38,114 | 5,184 | |
| * | Constellation Brands Inc. | ||
| Class A | 73,658 | 5,184 | |
| Coca-Cola Enterprises Inc. | 115,009 | 5,075 | |
| Ralph Lauren Corp. Class A | 28,277 | 4,993 | |
| JM Smucker Co. | 46,578 | 4,826 | |
| * | Monster Beverage Corp. | 70,460 | 4,775 |
| Polaris Industries Inc. | 32,318 | 4,707 | |
| Dr Pepper Snapple | |||
| Group Inc. | 93,892 | 4,574 | |
| Newell Rubbermaid Inc. | 134,526 | 4,360 | |
| Church & Dwight Co. Inc. | 65,017 | 4,309 | |
| * | Mohawk Industries Inc. | 28,920 | 4,306 |
| Tyson Foods Inc. Class A | 127,676 | 4,272 | |
| * | Green Mountain | ||
| Coffee Roasters Inc. | 55,662 | 4,207 | |
| * | LKQ Corp. | 126,196 | 4,152 |
| * | TRW Automotive | ||
| Holdings Corp. | 54,011 | 4,018 | |
| Campbell Soup Co. | 88,475 | 3,829 | |
| Activision Blizzard Inc. | 211,268 | 3,767 | |
| Molson Coors Brewing Co. | |||
| Class B | 66,865 | 3,754 | |
| McCormick & Co. Inc. | 53,057 | 3,657 | |
| Brown-Forman Corp. | |||
| Class B | 48,308 | 3,651 | |
| Avon Products Inc. | 202,529 | 3,488 | |
| * | Under Armour Inc. | ||
| Class A | 37,959 | 3,314 | |
| PulteGroup Inc. | 161,232 | 3,284 | |
| Energizer Holdings Inc. | 29,182 | 3,159 | |
| * | Electronic Arts Inc. | 137,226 | 3,148 |
| Lear Corp. | 37,545 | 3,040 | |
| * | DR Horton Inc. | 135,713 | 3,029 |
| Hasbro Inc. | 54,550 | 3,001 | |
| Lennar Corp. Class A | 75,848 | 3,001 | |
| * | Lululemon Athletica Inc. | 48,427 | 2,859 |
| Herbalife Ltd. | 35,558 | 2,798 | |
| Hormel Foods Corp. | 61,913 | 2,797 | |
| * | WABCO Holdings Inc. | 29,123 | 2,720 |
| * | Fossil Group Inc. | 20,663 | 2,478 |
| * | NVR Inc. | 1,903 | 1,952 |
| * | Jarden Corp. | 28,378 | 1,741 |
| Nu Skin Enterprises Inc. | |||
| Class A | 12,432 | 1,718 | |
| Coty Inc. Class A | 30,590 | 466 | |
| Lennar Corp. Class B | 985 | 33 | |
| 859,081 | |||
| Consumer Services (13.5%) | |||
| * | Amazon.com Inc. | 171,180 | 68,265 |
| Wal-Mart Stores Inc. | 756,312 | 59,514 | |
| Walt Disney Co. | 739,372 | 56,488 | |
| Home Depot Inc. | 658,322 | 54,206 | |
| Comcast Corp. Class A | 926,786 | 48,160 | |
| Market | |||
| Value | |||
| Shares | ($000) | ||
| McDonald’s Corp. | 465,164 | 45,135 | |
| CVS Caremark Corp. | 556,428 | 39,824 | |
| Twenty-First Century | |||
| Fox Inc. Class A | 850,795 | 29,931 | |
| * | eBay Inc. | 544,784 | 29,903 |
| Time Warner Inc. | 401,565 | 27,997 | |
| * | priceline.com Inc. | 24,031 | 27,934 |
| Starbucks Corp. | 334,474 | 26,219 | |
| Costco Wholesale Corp. | 205,486 | 24,455 | |
| Lowe’s Cos. Inc. | 488,612 | 24,211 | |
| Walgreen Co. | 399,298 | 22,936 | |
| TJX Cos. Inc. | 315,639 | 20,116 | |
| Target Corp. | 295,347 | 18,687 | |
| Time Warner Cable Inc. | 131,693 | 17,844 | |
| McKesson Corp. | 107,402 | 17,335 | |
| CBS Corp. Class B | 262,265 | 16,717 | |
| Viacom Inc. Class B | 188,323 | 16,448 | |
| * | DIRECTV | 233,276 | 16,117 |
| Yum! Brands Inc. | 208,076 | 15,733 | |
| Comcast Corp. | 291,422 | 14,536 | |
| Las Vegas Sands Corp. | 172,535 | 13,608 | |
| Delta Air Lines Inc. | 400,316 | 10,997 | |
| Cardinal Health Inc. | 159,622 | 10,664 | |
| Whole Foods Market Inc. | 173,919 | 10,058 | |
| Sysco Corp. | 271,890 | 9,815 | |
| * | Netflix Inc. | 26,302 | 9,684 |
| Macy’s Inc. | 172,155 | 9,193 | |
| * | Dollar General Corp. | 149,787 | 9,035 |
| Kroger Co. | 227,920 | 9,010 | |
| Omnicom Group Inc. | 120,439 | 8,957 | |
| Carnival Corp. | 221,055 | 8,880 | |
| * | Chipotle Mexican Grill Inc. | ||
| Class A | 14,472 | 7,710 | |
| * | Bed Bath & Beyond Inc. | 95,461 | 7,666 |
| * | AutoZone Inc. | 15,906 | 7,602 |
| AmerisourceBergen Corp. | |||
| Class A | 107,394 | 7,551 | |
| Wynn Resorts Ltd. | 37,917 | 7,364 | |
| Ross Stores Inc. | 96,202 | 7,208 | |
| Starwood Hotels & Resorts | |||
| Worldwide Inc. | 89,706 | 7,127 | |
| L Brands Inc. | 115,121 | 7,120 | |
| * | Liberty Interactive Corp. | ||
| Class A | 224,520 | 6,590 | |
| * | Liberty Media Corp. | ||
| Class A | 43,893 | 6,428 | |
| * | United Continental | ||
| Holdings Inc. | 168,842 | 6,387 | |
| * | Discovery | ||
| Communications Inc. | |||
| Class A | 68,375 | 6,182 | |
| Southwest Airlines Co. | 326,309 | 6,148 | |
| * | O’Reilly Automotive Inc. | 47,727 | 6,143 |
| * | Hertz Global Holdings Inc. | 209,334 | 5,991 |
| * | DISH Network Corp. Class A | 97,409 | 5,642 |
59
| Large-Cap Index Fund | |||
| Market | |||
| Value | |||
| Shares | ($000) | ||
| Nielsen Holdings NV | 114,512 | 5,255 | |
| * | Dollar Tree Inc. | 92,205 | 5,202 |
| Kohl’s Corp. | 90,143 | 5,116 | |
| Best Buy Co. Inc. | 127,731 | 5,094 | |
| Tractor Supply Co. | 65,080 | 5,049 | |
| Gap Inc. | 125,578 | 4,908 | |
| * | CarMax Inc. | 104,358 | 4,907 |
| Staples Inc. | 305,457 | 4,854 | |
| Tiffany & Co. | 50,743 | 4,708 | |
| * | Sirius XM Holdings Inc. | 1,290,890 | 4,505 |
| Wyndham | |||
| Worldwide Corp. | 61,107 | 4,503 | |
| Marriott International Inc. | |||
| Class A | 91,050 | 4,494 | |
| * | Charter | ||
| Communications Inc. | |||
| Class A | 31,629 | 4,326 | |
| * | TripAdvisor Inc. | 51,276 | 4,247 |
| Nordstrom Inc. | 67,722 | 4,185 | |
| * | MGM Resorts International | 171,282 | 4,029 |
| * | News Corp. Class A | 215,966 | 3,892 |
| Advance Auto Parts Inc. | 33,981 | 3,761 | |
| Safeway Inc. | 115,406 | 3,759 | |
| H&R Block Inc. | 127,911 | 3,715 | |
| PetSmart Inc. | 48,589 | 3,535 | |
| Interpublic Group | |||
| of Cos. Inc. | 194,768 | 3,447 | |
| Darden Restaurants Inc. | 61,188 | 3,327 | |
| Expedia Inc. | 46,543 | 3,242 | |
| * | IHS Inc. Class A | 26,771 | 3,204 |
| Scripps Networks | |||
| Interactive Inc. Class A | 36,586 | 3,161 | |
| * | Discovery | ||
| Communications Inc. | 37,414 | 3,138 | |
| Family Dollar Stores Inc. | 45,685 | 2,968 | |
| Signet Jewelers Ltd. | 37,515 | 2,952 | |
| Royal Caribbean Cruises Ltd. | 61,703 | 2,926 | |
| * | Ulta Salon Cosmetics | ||
| & Fragrance Inc. | 28,573 | 2,758 | |
| Williams-Sonoma Inc. | 38,254 | 2,229 | |
| Dun & Bradstreet Corp. | 17,787 | 2,183 | |
| International Game | |||
| Technology | 117,454 | 2,133 | |
| FactSet Research | |||
| Systems Inc. | 19,176 | 2,082 | |
| * | Urban Outfitters Inc. | 51,708 | 1,918 |
| * | AutoNation Inc. | 34,112 | 1,695 |
| Twenty-First Century | |||
| Fox Inc. | 48,091 | 1,664 | |
| * | Sprouts Farmers Market Inc. | 34,208 | 1,315 |
| * | Norwegian Cruise Line | ||
| Holdings Ltd. | 33,629 | 1,193 | |
| Burger King Worldwide Inc. | 49,642 | 1,135 | |
| * | Groupon Inc. | 93,947 | 1,106 |
| * | Sears Holdings Corp. | 22,461 | 1,101 |
| Market | |||
| Value | |||
| Shares | ($000) | ||
| * | Hyatt Hotels Corp. Class A | 20,856 | 1,032 |
| * | Hilton Worldwide |
| Holdings Inc. | 46,033 | 1,024 | |
| * | Extended Stay America Inc. | 13,954 | 366 |
| * | ARAMARK Holdings Corp. | 13,626 | 357 |
| * | News Corp. Class B | 12,020 | 214 |
| CBS Corp. Class A | 3,364 | 214 | |
| Viacom Inc. Class A | 985 | 86 | |
| 1,105,685 | |||
| Financials (17.6%) | |||
| Wells Fargo & Co. | 2,462,367 | 111,791 | |
| JPMorgan Chase & Co. | 1,757,288 | 102,766 | |
| * | Berkshire Hathaway Inc. |
| Class B | 816,291 | 96,779 |
| Bank of America Corp. | 4,985,921 | 77,631 |
| Citigroup Inc. | 1,346,969 | 70,191 |
| Visa Inc. Class A | 236,807 | 52,732 |
| American Express Co. | 500,812 | 45,439 |
| MasterCard Inc. Class A | 48,732 | 40,714 |
| American International | ||
| Group Inc. | 688,346 | 35,140 |
| US Bancorp | 853,843 | 34,495 |
| Goldman Sachs Group Inc. | 190,623 | 33,790 |
| MetLife Inc. | 445,649 | 24,029 |
| Simon Property Group Inc. | 144,987 | 22,061 |
| Capital One Financial Corp. | 269,391 | 20,638 |
| Morgan Stanley | 638,187 | 20,014 |
| Prudential Financial Inc. | 215,367 | 19,861 |
| PNC Financial Services | ||
| Group Inc. | 248,725 | 19,296 |
| Bank of New York | ||
| Mellon Corp. | 536,674 | 18,751 |
| BlackRock Inc. | 50,746 | 16,060 |
| Travelers Cos. Inc. | 170,169 | 15,407 |
| ACE Ltd. | 143,069 | 14,812 |
| American Tower | ||
| Corporation | 184,475 | 14,725 |
| Aflac Inc. | 217,823 | 14,551 |
| State Street Corp. | 194,894 | 14,303 |
| Charles Schwab Corp. | 512,002 | 13,312 |
| Discover Financial | ||
| Services | 222,891 | 12,471 |
| Marsh & McLennan | ||
| Cos. Inc. | 256,743 | 12,416 |
| BB&T Corp. | 329,330 | 12,291 |
| IntercontinentalExchange | ||
| Group Inc. | 53,745 | 12,088 |
| Aon plc | 140,730 | 11,806 |
| CME Group Inc. | 148,851 | 11,679 |
| Allstate Corp. | 212,631 | 11,597 |
| Chubb Corp. | 117,653 | 11,369 |
| Franklin Resources Inc. | 191,442 | 11,052 |
| Ameriprise Financial Inc. | 90,962 | 10,465 |
| Public Storage | 68,357 | 10,289 |
| McGraw Hill Financial Inc. | 126,701 | 9,908 |
60
| Large-Cap Index Fund | |||
| Market | |||
| Value | |||
| Shares | ($000) | ||
| T. Rowe Price Group Inc. | 115,818 | 9,702 | |
| SunTrust Banks Inc. | 250,830 | 9,233 | |
| Equity Residential | 168,304 | 8,730 | |
| Fifth Third Bancorp | 412,935 | 8,684 | |
| Weyerhaeuser Co. | 272,733 | 8,610 | |
| Prologis Inc. | 232,922 | 8,606 | |
| Moody’s Corp. | 100,668 | 7,899 | |
| Ventas Inc. | 137,653 | 7,885 | |
| HCP Inc. | 212,985 | 7,736 | |
| Hartford Financial | |||
| Services Group Inc. | 209,146 | 7,577 | |
| Invesco Ltd. | 206,948 | 7,533 | |
| Health Care REIT Inc. | 134,928 | 7,228 | |
| Boston Properties Inc. | 71,343 | 7,161 | |
| Loews Corp. | 144,848 | 6,987 | |
| Vornado Realty Trust | 78,657 | 6,984 | |
| Host Hotels & Resorts Inc. | 353,371 | 6,870 | |
| Progressive Corp. | 251,897 | 6,869 | |
| AvalonBay | |||
| Communities Inc. | 57,582 | 6,808 | |
| Principal Financial | |||
| Group Inc. | 137,494 | 6,780 | |
| M&T Bank Corp. | 54,874 | 6,388 | |
| Regions Financial Corp. | 644,658 | 6,376 | |
| Lincoln National Corp. | 122,646 | 6,331 | |
| Northern Trust Corp. | 100,382 | 6,213 | |
| KeyCorp | 419,614 | 5,631 | |
| SLM Corp. | 204,376 | 5,371 | |
| * | Affiliated Managers | ||
| Group Inc. | 24,654 | 5,347 | |
| General Growth | |||
| Properties Inc. | 255,027 | 5,118 | |
| CIT Group Inc. | 93,768 | 4,888 | |
| Western Union Co. | 257,480 | 4,441 | |
| Annaly Capital | |||
| Management Inc. | 442,048 | 4,407 | |
| Unum Group | 122,053 | 4,282 | |
| XL Group plc Class A | 132,296 | 4,212 | |
| Leucadia National Corp. | 144,725 | 4,101 | |
| Comerica Inc. | 85,451 | 4,062 | |
| SL Green Realty Corp. | 43,209 | 3,992 | |
| Equifax Inc. | 56,716 | 3,918 | |
| Macerich Co. | 65,511 | 3,858 | |
| Plum Creek Timber Co. Inc. | 82,745 | 3,848 | |
| Cincinnati Financial Corp. | 72,554 | 3,800 | |
| Huntington Bancshares Inc. | 387,896 | 3,743 | |
| * | Markel Corp. | 6,199 | 3,598 |
| Kimco Realty Corp. | 181,623 | 3,587 | |
| * | Arch Capital Group Ltd. | 59,345 | 3,542 |
| TD Ameritrade | |||
| Holding Corp. | 115,462 | 3,538 | |
| * | CBRE Group Inc. Class A | 131,660 | 3,463 |
| American Capital | |||
| Agency Corp. | 179,267 | 3,458 | |
| Realty Income Corp. | 91,460 | 3,414 | |
| Market | |||
| Value | |||
| Shares | ($000) | ||
| * | Realogy Holdings Corp. | 68,271 | 3,377 |
| Willis Group Holdings plc | 74,773 | 3,351 | |
| Torchmark Corp. | 42,315 | 3,307 | |
| New York Community | |||
| Bancorp Inc. | 196,012 | 3,303 | |
| First Republic Bank | 61,912 | 3,241 | |
| Cole Real Estate | |||
| Investment Inc. | 219,373 | 3,080 | |
| Federal Realty | |||
| Investment Trust | 30,330 | 3,076 | |
| Raymond James | |||
| Financial Inc. | 58,854 | 3,072 | |
| * | Ocwen Financial Corp. | 53,757 | 2,981 |
| Digital Realty Trust Inc. | 59,977 | 2,946 | |
| Everest Re Group Ltd. | 17,862 | 2,784 | |
| UDR Inc. | 116,945 | 2,731 | |
| Zions Bancorporation | 86,243 | 2,584 | |
| Reinsurance Group | |||
| of America Inc. Class A | 33,052 | 2,559 | |
| Essex Property Trust Inc. | 17,724 | 2,544 | |
| SEI Investments Co. | 72,006 | 2,501 | |
| PartnerRe Ltd. | 23,575 | 2,485 | |
| Rayonier Inc. | 58,970 | 2,483 | |
| Lazard Ltd. Class A | 54,408 | 2,466 | |
| * | MSCI Inc. Class A | 55,695 | 2,435 |
| Axis Capital Holdings Ltd. | 48,527 | 2,308 | |
| People’s United | |||
| Financial Inc. | 149,975 | 2,268 | |
| Camden Property Trust | 39,786 | 2,263 | |
| Legg Mason Inc. | 50,920 | 2,214 | |
| WR Berkley Corp. | 50,623 | 2,196 | |
| NASDAQ OMX Group Inc. | 54,552 | 2,171 | |
| Alexandria Real Estate | |||
| Equities Inc. | 33,819 | 2,152 | |
| Jones Lang LaSalle Inc. | 20,778 | 2,127 | |
| LPL Financial Holdings Inc. | 45,112 | 2,122 | |
| Hudson City Bancorp Inc. | 222,958 | 2,102 | |
| ING US Inc. | 54,736 | 1,924 | |
| Fidelity National | |||
| Financial Inc. Class A | 55,093 | 1,788 | |
| * | Genworth Financial Inc. | ||
| Class A | 114,782 | 1,783 | |
| * | Alleghany Corp. | 3,771 | 1,508 |
| Assurant Inc. | 17,248 | 1,145 | |
| * | Berkshire Hathaway Inc. | ||
| Class A | 6 | 1,067 | |
| * | Brixmor Property Group Inc. | 21,968 | 447 |
| 1,448,419 | |||
| Health Care (12.0%) | |||
| Johnson & Johnson | 1,318,897 | 120,798 | |
| Pfizer Inc. | 3,029,607 | 92,797 | |
| Merck & Co. Inc. | 1,365,910 | 68,364 | |
| * | Gilead Sciences Inc. | 716,779 | 53,866 |
| Bristol-Myers Squibb Co. | 769,692 | 40,909 | |
| Amgen Inc. | 352,667 | 40,260 | |
61
| Large-Cap Index Fund | |||
| Market | |||
| Value | |||
| Shares | ($000) | ||
| AbbVie Inc. | 743,742 | 39,277 | |
| UnitedHealth Group Inc. | 470,766 | 35,449 | |
| * | Celgene Corp. | 192,697 | 32,558 |
| * | Biogen Idec Inc. | 110,437 | 30,895 |
| Abbott Laboratories | 722,378 | 27,689 | |
| Medtronic Inc. | 466,459 | 26,770 | |
| * | Express Scripts Holding Co. | 376,478 | 26,444 |
| Eli Lilly & Co. | 473,704 | 24,159 | |
| Thermo Fisher Scientific Inc. | 168,849 | 18,801 | |
| Baxter International Inc. | 253,615 | 17,639 | |
| Allergan Inc. | 138,881 | 15,427 | |
| Covidien plc | 211,365 | 14,394 | |
| * | Actavis plc | 81,374 | 13,671 |
| WellPoint Inc. | 138,055 | 12,755 | |
| * | Alexion Pharmaceuticals Inc. | 91,638 | 12,193 |
| Aetna Inc. | 171,800 | 11,784 | |
| Cigna Corp. | 129,144 | 11,297 | |
| Becton Dickinson and Co. | 90,757 | 10,028 | |
| * | Regeneron | ||
| Pharmaceuticals Inc. | 36,400 | 10,019 | |
| Stryker Corp. | 132,864 | 9,983 | |
| St. Jude Medical Inc. | 136,649 | 8,465 | |
| * | Vertex Pharmaceuticals Inc. | 109,262 | 8,118 |
| * | Mylan Inc. | 179,030 | 7,770 |
| Zoetis Inc. | 233,643 | 7,638 | |
| Humana Inc. | 72,999 | 7,535 | |
| * | Boston Scientific Corp. | 623,422 | 7,493 |
| Zimmer Holdings Inc. | 79,926 | 7,448 | |
| * | HCA Holdings Inc. | 146,735 | 7,001 |
| * | Intuitive Surgical Inc. | 17,819 | 6,844 |
| * | Forest Laboratories Inc. | 113,564 | 6,817 |
| * | Illumina Inc. | 59,093 | 6,537 |
| * | Perrigo Co. plc | 42,036 | 6,451 |
| * | Life Technologies Corp. | 80,831 | 6,127 |
| * | DaVita HealthCare | ||
| Partners Inc. | 94,602 | 5,995 | |
| CR Bard Inc. | 36,417 | 4,878 | |
| * | BioMarin Pharmaceutical Inc. | 66,512 | 4,674 |
| * | Henry Schein Inc. | 40,080 | 4,580 |
| * | CareFusion Corp. | 98,790 | 3,934 |
| * | Varian Medical Systems Inc. | 49,402 | 3,838 |
| * | Waters Corp. | 37,852 | 3,785 |
| * | Laboratory Corp. of | ||
| America Holdings | 40,699 | 3,719 | |
| Quest Diagnostics Inc. | 67,783 | 3,629 | |
| * | Endo Health Solutions Inc. | 53,541 | 3,612 |
| Universal Health | |||
| Services Inc. Class B | 42,529 | 3,456 | |
| * | Edwards Lifesciences Corp. | 51,361 | 3,377 |
| DENTSPLY International Inc. | 66,645 | 3,231 | |
| * | Hospira Inc. | 77,387 | 3,194 |
| ResMed Inc. | 66,249 | 3,119 | |
| * | Pharmacyclics Inc. | 27,476 | 2,906 |
| * | Hologic Inc. | 127,666 | 2,853 |
| * | IDEXX Laboratories Inc. | 24,450 | 2,601 |
| Market | |||
| Value | |||
| Shares | ($000) | ||
| * | Incyte Corp. Ltd. | 33,675 | 1,705 |
| Patterson Cos. Inc. | 36,887 | 1,520 | |
| * | Quintiles Transnational | ||
| Holdings Inc. | 17,823 | 826 | |
| * | Envision Healthcare | ||
| Holdings Inc. | 20,691 | 735 | |
| 984,637 | |||
| Industrials (12.5%) | |||
| General Electric Co. | 4,729,346 | 132,564 | |
| United Technologies Corp. | 428,958 | 48,815 | |
| Boeing Co. | 351,351 | 47,956 | |
| 3M Co. | 314,728 | 44,141 | |
| Union Pacific Corp. | 215,381 | 36,184 | |
| United Parcel Service Inc. | |||
| Class B | 334,702 | 35,171 | |
| Honeywell International Inc. | 366,870 | 33,521 | |
| Caterpillar Inc. | 297,305 | 26,998 | |
| Accenture plc Class A | 297,003 | 24,420 | |
| Emerson Electric Co. | 328,938 | 23,085 | |
| Lockheed Martin Corp. | 149,651 | 22,247 | |
| Danaher Corp. | 276,917 | 21,378 | |
| FedEx Corp. | 140,561 | 20,208 | |
| Precision Castparts Corp. | 67,865 | 18,276 | |
| Automatic Data | |||
| Processing Inc. | 224,963 | 18,179 | |
| Eaton Corp. plc | 221,822 | 16,885 | |
| Illinois Tool Works Inc. | 196,986 | 16,563 | |
| Deere & Co. | 175,210 | 16,002 | |
| General Dynamics Corp. | 156,394 | 14,943 | |
| CSX Corp. | 473,353 | 13,618 | |
| Raytheon Co. | 149,320 | 13,543 | |
| Norfolk Southern Corp. | 144,342 | 13,399 | |
| Cummins Inc. | 87,607 | 12,350 | |
| Northrop Grumman Corp. | 103,771 | 11,893 | |
| TE Connectivity Ltd. | 191,648 | 10,562 | |
| * | LinkedIn Corp. Class A | 47,590 | 10,319 |
| PACCAR Inc. | 165,383 | 9,786 | |
| Waste Management Inc. | 208,498 | 9,355 | |
| Parker Hannifin Corp. | 69,809 | 8,980 | |
| Tyco International Ltd. | 217,377 | 8,921 | |
| Agilent Technologies Inc. | 154,678 | 8,846 | |
| Ingersoll-Rand plc | 127,730 | 7,868 | |
| Dover Corp. | 79,784 | 7,702 | |
| Rockwell Automation Inc. | 64,932 | 7,672 | |
| WW Grainger Inc. | 29,208 | 7,460 | |
| Sherwin-Williams Co. | 40,290 | 7,393 | |
| Pentair Ltd. | 93,169 | 7,236 | |
| * | Fiserv Inc. | 120,436 | 7,112 |
| Paychex Inc. | 153,922 | 7,008 | |
| Xerox Corp. | 545,937 | 6,644 | |
| Amphenol Corp. Class A | 73,875 | 6,588 | |
| Fidelity National Information | |||
| Services Inc. | 122,382 | 6,569 | |
| Roper Industries Inc. | 46,419 | 6,437 | |
| Kansas City Southern | 51,407 | 6,366 | |
62
| Large-Cap Index Fund | |||
| Market | |||
| Value | |||
| Shares | ($000) | ||
| Fluor Corp. | 76,400 | 6,134 | |
| AMETEK Inc. | 114,429 | 6,027 | |
| Fastenal Co. | 125,075 | 5,942 | |
| * | Alliance Data Systems Corp. | 21,602 | 5,680 |
| Flowserve Corp. | 65,183 | 5,138 | |
| Textron Inc. | 131,478 | 4,833 | |
| Rockwell Collins Inc. | 63,325 | 4,681 | |
| * | Stericycle Inc. | 40,137 | 4,663 |
| * | Verisk Analytics Inc. | ||
| Class A | 70,834 | 4,655 | |
| Pall Corp. | 51,712 | 4,414 | |
| Expeditors International | |||
| of Washington Inc. | 96,441 | 4,268 | |
| * | B/E Aerospace Inc. | 48,843 | 4,251 |
| Republic Services Inc. | |||
| Class A | 126,683 | 4,206 | |
| L-3 Communications | |||
| Holdings Inc. | 39,265 | 4,196 | |
| * | Trimble Navigation Ltd. | 120,511 | 4,182 |
| Chicago Bridge | |||
| & Iron Co. NV | 50,016 | 4,158 | |
| CH Robinson Worldwide Inc. | 70,700 | 4,125 | |
| * | FleetCor Technologies Inc. | 32,679 | 3,829 |
| ADT Corp. | 94,273 | 3,815 | |
| Masco Corp. | 167,278 | 3,809 | |
| * | Jacobs Engineering | ||
| Group Inc. | 58,547 | 3,688 | |
| Vulcan Materials Co. | 60,746 | 3,610 | |
| TransDigm Group Inc. | 22,190 | 3,573 | |
| Rock Tenn Co. Class A | 33,787 | 3,548 | |
| Ball Corp. | 67,633 | 3,494 | |
| JB Hunt Transport | |||
| Services Inc. | 43,981 | 3,400 | |
| * | Mettler-Toledo | ||
| International Inc. | 13,831 | 3,355 | |
| Manpowergroup Inc. | 37,042 | 3,180 | |
| * | Quanta Services Inc. | 99,290 | 3,134 |
| Sealed Air Corp. | 91,507 | 3,116 | |
| MeadWestvaco Corp. | 82,947 | 3,063 | |
| Xylem Inc. | 86,753 | 3,002 | |
| Donaldson Co. Inc. | 68,354 | 2,971 | |
| Joy Global Inc. | 49,692 | 2,907 | |
| * | Crown Holdings Inc. | 64,869 | 2,891 |
| Avnet Inc. | 64,365 | 2,839 | |
| Cintas Corp. | 44,848 | 2,673 | |
| Hubbell Inc. Class B | 24,249 | 2,641 | |
| Robert Half International Inc. | 61,353 | 2,576 | |
| MDU Resources Group Inc. | 83,986 | 2,566 | |
| * | Arrow Electronics Inc. | 47,229 | 2,562 |
| Iron Mountain Inc. | 80,425 | 2,441 | |
| AGCO Corp. | 40,821 | 2,416 | |
| Timken Co. | 41,127 | 2,265 | |
| KBR Inc. | 69,280 | 2,209 | |
| * | Sensata Technologies | ||
| Holding NV | 56,191 | 2,179 | |
| Market | |||
| Value | |||
| Shares | ($000) | ||
| Martin Marietta | |||
| Materials Inc. | 21,557 | 2,154 | |
| Towers Watson & Co. | |||
| Class A | 16,470 | 2,102 | |
| * | Owens Corning | 49,375 | 2,011 |
| FLIR Systems Inc. | 66,654 | 2,006 | |
| SPX Corp. | 19,258 | 1,918 | |
| National Instruments Corp. | 47,038 | 1,506 | |
| Jabil Circuit Inc. | 85,953 | 1,499 | |
| * | Owens-Illinois Inc. | 38,207 | 1,367 |
| Allison Transmission | |||
| Holdings Inc. | 38,381 | 1,060 | |
| 1,026,091 | |||
| Oil & Gas (9.9%) | |||
| Exxon Mobil Corp. | 2,042,037 | 206,654 | |
| Chevron Corp. | 899,023 | 112,297 | |
| Schlumberger Ltd. | 615,685 | 55,479 | |
| ConocoPhillips | 572,753 | 40,465 | |
| Occidental Petroleum Corp. | 376,885 | 35,842 | |
| Phillips 66 | 280,142 | 21,607 | |
| EOG Resources Inc. | 127,575 | 21,412 | |
| Halliburton Co. | 376,438 | 19,104 | |
| Anadarko Petroleum Corp. | 235,251 | 18,660 | |
| Apache Corp. | 186,602 | 16,037 | |
| National Oilwell Varco Inc. | 200,232 | 15,924 | |
| Marathon Petroleum Corp. | 140,631 | 12,900 | |
| Valero Energy Corp. | 252,466 | 12,724 | |
| Williams Cos. Inc. | 319,344 | 12,317 | |
| Pioneer Natural | |||
| Resources Co. | 64,849 | 11,937 | |
| Marathon Oil Corp. | 325,695 | 11,497 | |
| Baker Hughes Inc. | 207,247 | 11,453 | |
| Noble Energy Inc. | 167,952 | 11,439 | |
| Kinder Morgan Inc. | 314,932 | 11,338 | |
| Devon Energy Corp. | 180,539 | 11,170 | |
| Hess Corp. | 134,148 | 11,134 | |
| Cabot Oil & Gas Corp. | 196,962 | 7,634 | |
| Chesapeake Energy Corp. | 279,772 | 7,593 | |
| * | Cameron International Corp. | 110,960 | 6,605 |
| * | Southwestern Energy Co. | 164,502 | 6,470 |
| Ensco plc Class A | 109,403 | 6,256 | |
| Range Resources Corp. | 72,680 | 6,128 | |
| * | FMC Technologies Inc. | 110,469 | 5,768 |
| EQT Corp. | 63,462 | 5,698 | |
| Murphy Oil Corp. | 82,871 | 5,377 | |
| * | Concho Resources Inc. | 49,273 | 5,322 |
| * | Weatherford | ||
| International Ltd. | 323,900 | 5,017 | |
| HollyFrontier Corp. | 93,185 | 4,630 | |
| Noble Corp. plc | 118,254 | 4,431 | |
| * | Cheniere Energy Inc. | 100,286 | 4,324 |
| Core Laboratories NV | 21,304 | 4,068 | |
| Cimarex Energy Co. | 38,646 | 4,054 | |
| Helmerich & Payne Inc. | 47,673 | 4,008 | |
63
| Large-Cap Index Fund | |||
| Market | |||
| Value | |||
| Shares | ($000) | ||
| Oceaneering | |||
| International Inc. | 50,395 | 3,975 | |
| Tesoro Corp. | 62,264 | 3,642 | |
| * | Whiting Petroleum Corp. | 55,291 | 3,421 |
| OGE Energy Corp. | 92,822 | 3,147 | |
| * | Denbury Resources Inc. | 171,662 | 2,820 |
| SM Energy Co. | 31,291 | 2,601 | |
| QEP Resources Inc. | 83,808 | 2,569 | |
| * | Continental Resources Inc. | 21,701 | 2,442 |
| Energen Corp. | 34,274 | 2,425 | |
| Nabors Industries Ltd. | 131,147 | 2,228 | |
| * | Cobalt International | ||
| Energy Inc. | 134,217 | 2,208 | |
| * | Dresser-Rand Group Inc. | 35,628 | 2,125 |
| * | Rowan Cos. plc Class A | 58,261 | 2,060 |
| Diamond Offshore | |||
| Drilling Inc. | 32,733 | 1,863 | |
| * | Antero Resources Corp. | 18,402 | 1,167 |
| 813,466 | |||
| Technology (15.6%) | |||
| Apple Inc. | 420,582 | 235,993 | |
| * | Google Inc. Class A | 129,354 | 144,968 |
| Microsoft Corp. | 3,511,988 | 131,454 | |
| International Business | |||
| Machines Corp. | 507,671 | 95,224 | |
| Oracle Corp. | 1,597,863 | 61,134 | |
| Intel Corp. | 2,323,763 | 60,325 | |
| QUALCOMM Inc. | 789,816 | 58,644 | |
| Cisco Systems Inc. | 2,499,263 | 56,108 | |
| * | Facebook Inc. Class A | 876,052 | 47,885 |
| Hewlett-Packard Co. | 898,711 | 25,146 | |
| EMC Corp. | 962,318 | 24,202 | |
| Texas Instruments Inc. | 511,372 | 22,454 | |
| * | Yahoo! Inc. | 426,605 | 17,252 |
| * | Cognizant Technology | ||
| Solutions Corp. Class A | 141,366 | 14,275 | |
| * | Salesforce.com Inc. | 253,692 | 14,001 |
| * | Adobe Systems Inc. | 221,782 | 13,280 |
| Corning Inc. | 676,498 | 12,055 | |
| * | Micron Technology Inc. | 491,820 | 10,702 |
| Applied Materials Inc. | 563,093 | 9,961 | |
| Intuit Inc. | 126,573 | 9,660 | |
| Western Digital Corp. | 104,888 | 8,800 | |
| Seagate Technology plc | 145,054 | 8,146 | |
| * | Cerner Corp. | 144,266 | 8,041 |
| Symantec Corp. | 325,004 | 7,664 | |
| SanDisk Corp. | 105,695 | 7,456 | |
| Analog Devices Inc. | 145,413 | 7,406 | |
| Motorola Solutions Inc. | 108,965 | 7,355 | |
| Broadcom Corp. Class A | 242,486 | 7,190 | |
| NetApp Inc. | 159,191 | 6,549 | |
| Xilinx Inc. | 125,417 | 5,759 | |
| * | Citrix Systems Inc. | 87,283 | 5,521 |
| * | Autodesk Inc. | 105,422 | 5,306 |
| Market | |||
| Value | |||
| Shares | ($000) | ||
| Avago Technologies Ltd. | |||
| Class A | 98,473 | 5,208 | |
| * | Juniper Networks Inc. | 224,537 | 5,068 |
| KLA-Tencor Corp. | 77,880 | 5,020 | |
| Linear Technology Corp. | 109,437 | 4,985 | |
| CA Inc. | 147,530 | 4,964 | |
| * | Red Hat Inc. | 88,399 | 4,954 |
| Altera Corp. | 150,090 | 4,882 | |
| * | Catamaran Corp. | 96,204 | 4,568 |
| * | Lam Research Corp. | 76,032 | 4,140 |
| * | Equinix Inc. | 23,315 | 4,137 |
| NVIDIA Corp. | 252,859 | 4,051 | |
| Microchip Technology Inc. | 88,107 | 3,943 | |
| Computer Sciences Corp. | 68,998 | 3,856 | |
| * | VeriSign Inc. | 63,878 | 3,819 |
| * | ANSYS Inc. | 43,402 | 3,785 |
| * | Akamai Technologies Inc. | 79,625 | 3,757 |
| Maxim Integrated | |||
| Products Inc. | 131,955 | 3,683 | |
| * | VMware Inc. Class A | 39,675 | 3,559 |
| * | Cree Inc. | 56,536 | 3,537 |
| Harris Corp. | 50,089 | 3,497 | |
| * | Teradata Corp. | 76,236 | 3,468 |
| * | F5 Networks Inc. | 36,191 | 3,288 |
| * | ServiceNow Inc. | 55,013 | 3,081 |
| * | Workday Inc. Class A | 36,517 | 3,037 |
| * | Synopsys Inc. | 71,955 | 2,919 |
| * | Gartner Inc. | 40,823 | 2,900 |
| LSI Corp. | 254,219 | 2,802 | |
| Marvell Technology | |||
| Group Ltd. | 184,119 | 2,648 | |
| Garmin Ltd. | 54,870 | 2,536 | |
| * | Skyworks Solutions Inc. | 88,642 | 2,532 |
| *,^ | Twitter Inc. | 38,164 | 2,429 |
| * | 3D Systems Corp. | 22,676 | 2,107 |
| * | Rackspace Hosting Inc. | 52,471 | 2,053 |
| * | Nuance | ||
| Communications Inc. | 117,569 | 1,787 | |
| * | TIBCO Software Inc. | 72,806 | 1,637 |
| * | Splunk Inc. | 17,199 | 1,181 |
| * | Informatica Corp. | 25,541 | 1,060 |
| * | MICROS Systems Inc. | 17,580 | 1,009 |
| * | NetSuite Inc. | 7,909 | 815 |
| * | Premier Inc. Class A | 14,393 | 529 |
| 1,279,147 | |||
| Telecommunications (2.3%) | |||
| AT&T Inc. | 2,462,582 | 86,584 | |
| Verizon | |||
| Communications Inc. | 1,336,936 | 65,697 | |
| * | Crown Castle | ||
| International Corp. | 156,265 | 11,475 | |
| CenturyLink Inc. | 276,406 | 8,803 | |
| * | SBA Communications | ||
| Corp. Class A | 60,059 | 5,396 | |
| * | Sprint Corp. | 367,496 | 3,951 |
64
| Large-Cap Index Fund | |||
| Market | |||
| Value | |||
| Shares | ($000) | ||
| * | T-Mobile US Inc. | 111,308 | 3,744 |
| Windstream Holdings Inc. | 277,115 | 2,211 | |
| Frontier Communications | |||
| Corp. | 467,053 | 2,172 | |
| 190,033 | |||
| Utilities (3.0%) | |||
| Duke Energy Corp. | 329,864 | 22,764 | |
| Dominion Resources Inc. | 271,212 | 17,545 | |
| NextEra Energy Inc. | 203,316 | 17,408 | |
| Southern Co. | 411,967 | 16,936 | |
| Spectra Energy Corp. | 312,914 | 11,146 | |
| Exelon Corp. | 400,596 | 10,972 | |
| American Electric Power | |||
| Co. Inc. | 227,634 | 10,640 | |
| Sempra Energy | 108,423 | 9,732 | |
| PPL Corp. | 294,912 | 8,874 | |
| PG&E Corp. | 209,971 | 8,458 | |
| Public Service Enterprise | |||
| Group Inc. | 236,222 | 7,569 | |
| Consolidated Edison Inc. | 136,804 | 7,562 | |
| Edison International | 152,208 | 7,047 | |
| Xcel Energy Inc. | 232,683 | 6,501 | |
| FirstEnergy Corp. | 195,400 | 6,444 | |
| Northeast Utilities | 147,382 | 6,247 | |
| ONEOK Inc. | 96,651 | 6,010 | |
| DTE Energy Co. | 82,606 | 5,484 | |
| Entergy Corp. | 83,472 | 5,281 | |
| NiSource Inc. | 146,495 | 4,817 | |
| CenterPoint Energy Inc. | 199,902 | 4,634 | |
| Wisconsin Energy Corp. | 105,734 | 4,371 | |
| NRG Energy Inc. | 151,530 | 4,352 | |
| AES Corp. | 294,343 | 4,271 | |
| Ameren Corp. | 113,188 | 4,093 | |
| * | Calpine Corp. | 182,889 | 3,568 |
| American Water Works | |||
| Co. Inc. | 83,010 | 3,508 | |
| CMS Energy Corp. | 124,683 | 3,338 | |
| SCANA Corp. | 59,402 | 2,788 | |
| Pinnacle West Capital Corp. | 51,443 | 2,722 | |
| Alliant Energy Corp. | 51,867 | 2,676 | |
| National Fuel Gas Co. | 37,194 | 2,656 | |
| Pepco Holdings Inc. | 116,457 | 2,228 | |
| Integrys Energy Group Inc. | 37,208 | 2,024 | |
| TECO Energy Inc. | 101,678 | 1,753 | |
| 246,419 | |||
| Total Common Stocks | |||
| (Cost $5,594,341) | 8,188,295 | ||
| Market | |||
| Value | |||
| Shares | ($000) | ||
| Temporary Cash Investments (0.5%)1 | |||
| Money Market Fund (0.5%) | |||
| 2,3 | Vanguard Market Liquidity | ||
| Fund, 0.125% | 36,551,000 | 36,551 | |
| Face | |||
| Amount | |||
| ($000) | |||
| U.S. Government and Agency Obligations (0.0%) | |||
| 4,5 | Federal Home Loan | ||
| Bank Discount Notes, | |||
| 0.080%, 2/28/14 | 1,000 | 1,000 | |
| 4,5 | Federal Home Loan | ||
| Bank Discount Notes, | |||
| 0.125%, 5/30/14 | 200 | 200 | |
| 5,6 | Freddie Mac Discount | ||
| Notes, 0.100%, 1/27/14 | 400 | 400 | |
| 1,600 | |||
| Total Temporary Cash Investments | |||
| (Cost $38,151) | 38,151 | ||
| Total Investments (100.2%) | |||
| (Cost $5,632,492) | 8,226,446 | ||
| Other Assets and Liabilities (-0.2%) | |||
| Other Assets | 18,206 | ||
| Liabilities3 | (34,028) | ||
| (15,822) | |||
| Net Assets (100%) | 8,210,624 | ||
65
Large-Cap Index Fund
At December 31, 2013, net assets consisted of:
Amount ($000)
| Paid-in Capital | 5,659,498 |
| Overdistributed Net Investment Income | (3,857) |
| Accumulated Net Realized Losses | (39,769) |
| Unrealized Appreciation (Depreciation) | |
| Investment Securities | 2,593,954 |
| Futures Contracts | 798 |
| Net Assets | 8,210,624 |
| Investor Shares—Net Assets | |
| Applicable to 11,408,781 outstanding | |
| $.001 par value shares of beneficial | |
| interest (unlimited authorization) | 390,613 |
| Net Asset Value Per Share— | |
| Investor Shares | $34.24 |
| Admiral Shares—Net Assets | |
| Applicable to 33,591,241 outstanding | |
| $.001 par value shares of beneficial | |
| interest (unlimited authorization) | 1,437,984 |
| Net Asset Value Per Share— | |
| Admiral Shares | $42.81 |
| Amount | |
| ($000) | |
| Signal Shares—Net Assets | |
| Applicable to 24,787,956 outstanding | |
| $.001 par value shares of beneficial | |
| interest (unlimited authorization) | 925,488 |
| Net Asset Value Per Share— | |
| Signal Shares | $37.34 |
| Institutional Shares—Net Assets | |
| Applicable to 4,255,695 outstanding | |
| $.001 par value shares of beneficial | |
| interest (unlimited authorization) | 749,783 |
| Net Asset Value Per Share— | |
| Institutional Shares | $176.18 |
| ETF Shares—Net Assets | |
| Applicable to 55,529,607 outstanding | |
| $.001 par value shares of beneficial | |
| interest (unlimited authorization) | 4,706,756 |
| Net Asset Value Per Share— | |
| ETF Shares | $84.76 |
See Note A in Notes to Financial Statements.
* Non-income-producing security.
^ Includes partial security positions on loan to broker-dealers. The total value of securities on loan is $1,324,000.
1 The fund invests a portion of its cash reserves in equity markets through the use of index futures contracts. After giving effect to futures investments, the fund’s effective common stock and temporary cash investment positions represent 100.0% and 0.2%, respectively, of net assets.
2 Affiliated money market fund available only to Vanguard funds and certain trusts and accounts managed by Vanguard. Rate shown is the 7-day yield.
3 Includes $1,290,000 of collateral received for securities on loan. The fund received additional collateral of $62,000 on the next business day.
4 The issuer operates under a congressional charter; its securities are generally neither guaranteed by the U.S. Treasury nor backed by the full faith and credit of the U.S. government.
5 Securities with a value of $1,500,000 have been segregated as initial margin for open futures contracts.
6 The issuer was placed under federal conservatorship in September 2008; since that time, its daily operations have been managed by the Federal Housing Finance Agency and it receives capital from the U.S. Treasury, as needed to maintain a positive net worth, in exchange for senior preferred stock.
REIT—Real Estate Investment Trust.
See accompanying Notes, which are an integral part of the Financial Statements.
66
| Large-Cap Index Fund | |
| Statement of Operations | |
| Year Ended | |
| December 31, 2013 | |
| ($000) | |
| Investment Income | |
| Income | |
| Dividends | 150,092 |
| Interest1 | 19 |
| Securities Lending | 146 |
| Total Income | 150,257 |
| Expenses | |
| The Vanguard Group—Note B | |
| Investment Advisory Services | 539 |
| Management and Administrative—Investor Shares | 690 |
| Management and Administrative—Admiral Shares | 774 |
| Management and Administrative—Signal Shares | 418 |
| Management and Administrative—Institutional Shares | 368 |
| Management and Administrative—ETF Shares | 2,593 |
| Marketing and Distribution—Investor Shares | 84 |
| Marketing and Distribution—Admiral Shares | 172 |
| Marketing and Distribution—Signal Shares | 191 |
| Marketing and Distribution—Institutional Shares | 223 |
| Marketing and Distribution—ETF Shares | 632 |
| Custodian Fees | 157 |
| Auditing Fees | 32 |
| Shareholders’ Reports—Investor Shares | 9 |
| Shareholders’ Reports—Admiral Shares | 9 |
| Shareholders’ Reports—Signal Shares | 6 |
| Shareholders’ Reports—Institutional Shares | 1 |
| Shareholders’ Reports—ETF Shares | 52 |
| Trustees’ Fees and Expenses | 8 |
| Total Expenses | 6,958 |
| Net Investment Income | 143,299 |
| Realized Net Gain (Loss) | |
| Investment Securities Sold | 388,346 |
| Futures Contracts | 3,551 |
| Realized Net Gain (Loss) | 391,897 |
| Change in Unrealized Appreciation (Depreciation) | |
| Investment Securities | 1,502,195 |
| Futures Contracts | 762 |
| Change in Unrealized Appreciation (Depreciation) | 1,502,957 |
| Net Increase (Decrease) in Net Assets Resulting from Operations | 2,038,153 |
| 1 Interest income from an affiliated company of the fund was $17,000. | |
| See accompanying Notes, which are an integral part of the Financial Statements. | |
67
| Large-Cap Index Fund | ||
| Statement of Changes in Net Assets | ||
| Year Ended December 31, | ||
| 2013 | 2012 | |
| ($000) | ($000) | |
| Increase (Decrease) in Net Assets | ||
| Operations | ||
| Net Investment Income | 143,299 | 128,613 |
| Realized Net Gain (Loss) | 391,897 | 53,042 |
| Change in Unrealized Appreciation (Depreciation) | 1,502,957 | 654,927 |
| Net Increase (Decrease) in Net Assets Resulting from Operations | 2,038,153 | 836,582 |
| Distributions | ||
| Net Investment Income | ||
| Investor Shares | (6,224) | (5,943) |
| Admiral Shares | (23,807) | (19,955) |
| Signal Shares | (15,483) | (13,062) |
| Institutional Shares | (16,340) | (15,026) |
| ETF Shares | (81,511) | (74,625) |
| Realized Capital Gain | ||
| Investor Shares | — | — |
| Admiral Shares | — | — |
| Signal Shares | — | — |
| Institutional Shares | — | — |
| ETF Shares | — | — |
| Total Distributions | (143,365) | (128,611) |
| Capital Share Transactions | ||
| Investor Shares | 11,281 | (40,296) |
| Admiral Shares | 146,933 | 76,148 |
| Signal Shares | 87,247 | 44,049 |
| Institutional Shares | (222,932) | 174,593 |
| ETF Shares | 55,403 | 141,131 |
| Net Increase (Decrease) from Capital Share Transactions | 77,9 32 | 395,625 |
| Total Increase (Decrease) | 1,972,720 | 1,103,596 |
| Net Assets | ||
| Beginning of Period | 6,237,904 | 5,134,308 |
| End of Period1 | 8,210,624 | 6,237,904 |
1 Net Assets—End of Period includes undistributed (overdistributed) net investment income of ($3,857,000) and ($3,791,000).
See accompanying Notes, which are an integral part of the Financial Statements.
68
| Large-Cap Index Fund | |||||
| Financial Highlights | |||||
| Investor Shares | |||||
| For a Share Outstanding | Year Ended December 31, | ||||
| Throughout Each Period | 2013 | 2012 | 2011 | 2010 | 2009 |
| Net Asset Value, Beginning of Period | $26.32 | $23.16 | $23.25 | $20.47 | $16.41 |
| Investment Operations | |||||
| Net Investment Income | . 556 | . 521 | . 421 | .372 | .387 |
| Net Realized and Unrealized Gain (Loss) | |||||
| on Investments | 7.921 | 3.159 | (.095) | 2.791 | 4.075 |
| Total from Investment Operations | 8.477 | 3.680 | .326 | 3.163 | 4.462 |
| Distributions | |||||
| Dividends from Net Investment Income | (.557) | (. 520) | (. 416) | (.383) | (. 402) |
| Distributions from Realized Capital Gains | — | — | — | — | — |
| Total Distributions | (.557) | (. 520) | (. 416) | (.383) | (. 402) |
| Net Asset Value, End of Period | $34.24 | $26.32 | $23.16 | $23.25 | $20.47 |
| Total Return1 | 32.45% | 15.94% | 1.44% | 15.63% | 27.60% |
| Ratios/Supplemental Data | |||||
| Net Assets, End of Period (Millions) | $391 | $290 | $293 | $307 | $448 |
| Ratio of Total Expenses to | |||||
| Average Net Assets | 0.24% | 0.24% | 0.24% | 0.26% | 0.26% |
| Ratio of Net Investment Income to | |||||
| Average Net Assets | 1.82% | 2.08% | 1.81% | 1.78% | 2.24% |
| Portfolio Turnover Rate2 | 9% | 8% | 7% | 8% | 8% |
1 Total returns do not include account service fees that may have applied in the periods shown. Fund prospectuses provide information about any applicable account service fees.
2 Excludes the value of portfolio securities received or delivered as a result of in-kind purchases or redemptions of the fund’s capital shares, including ETF Creation Units.
See accompanying Notes, which are an integral part of the Financial Statements.
69
| Large-Cap Index Fund | |||||
| Financial Highlights | |||||
| Admiral Shares | |||||
| For a Share Outstanding | Year Ended December 31, | ||||
| Throughout Each Period | 2013 | 2012 | 2011 | 2010 | 2009 |
| Net Asset Value, Beginning of Period | $32.90 | $28.96 | $29.07 | $25.59 | $20.51 |
| Investment Operations | |||||
| Net Investment Income | .752 | .698 | .569 | .503 | .516 |
| Net Realized and Unrealized Gain (Loss) | |||||
| on Investments | 9.909 | 3.939 | (.116) | 3.495 | 5.097 |
| Total from Investment Operations | 10.661 | 4.637 | .453 | 3.998 | 5.613 |
| Distributions | |||||
| Dividends from Net Investment Income | (.751) | (.697) | (. 563) | (. 518) | (.533) |
| Distributions from Realized Capital Gains | — | — | — | — | — |
| Total Distributions | (.751) | (.697) | (. 563) | (. 518) | (.533) |
| Net Asset Value, End of Period | $42.81 | $32.90 | $28.96 | $29.07 | $25.59 |
| Total Return1 | 32.66% | 16.06% | 1.60% | 15.81% | 27.80% |
| Ratios/Supplemental Data | |||||
| Net Assets, End of Period (Millions) | $1,438 | $981 | $796 | $698 | $328 |
| Ratio of Total Expenses to | |||||
| Average Net Assets | 0.09% | 0.10% | 0.10% | 0.12% | 0.12% |
| Ratio of Net Investment Income to | |||||
| Average Net Assets | 1.97% | 2.22% | 1.95% | 1.92% | 2.38% |
| Portfolio Turnover Rate2 | 9% | 8% | 7% | 8% | 8% |
1 Total returns do not include account service fees that may have applied in the periods shown. Fund prospectuses provide information about any applicable account service fees.
2 Excludes the value of portfolio securities received or delivered as a result of in-kind purchases or redemptions of the fund’s capital shares, including ETF Creation Units.
See accompanying Notes, which are an integral part of the Financial Statements.
70
| Large-Cap Index Fund | |||||
| Financial Highlights | |||||
| Signal Shares | |||||
| For a Share Outstanding | Year Ended December 31, | ||||
| Throughout Each Period | 2013 | 2012 | 2011 | 2010 | 2009 |
| Net Asset Value, Beginning of Period | $28.70 | $25.26 | $25.36 | $22.32 | $17.89 |
| Investment Operations | |||||
| Net Investment Income | . 656 | . 609 | . 495 | .440 | .451 |
| Net Realized and Unrealized Gain (Loss) | |||||
| on Investments | 8.641 | 3.438 | (.105) | 3.052 | 4.446 |
| Total from Investment Operations | 9.297 | 4.047 | .390 | 3.492 | 4.897 |
| Distributions | |||||
| Dividends from Net Investment Income | (.657) | (.607) | (.490) | (.452) | (. 467) |
| Distributions from Realized Capital Gains | — | — | — | — | — |
| Total Distributions | (.657) | (.607) | (.490) | (.452) | (. 467) |
| Net Asset Value, End of Period | $37.34 | $28.70 | $25.26 | $25.36 | $22.32 |
| Total Return | 32.65% | 16.07% | 1.58% | 15.83% | 27.81% |
| Ratios/Supplemental Data | |||||
| Net Assets, End of Period (Millions) | $925 | $637 | $520 | $381 | $247 |
| Ratio of Total Expenses to | |||||
| Average Net Assets | 0.09% | 0.10% | 0.10% | 0.12% | 0.12% |
| Ratio of Net Investment Income to | |||||
| Average Net Assets | 1.97% | 2.22% | 1.95% | 1.92% | 2.38% |
| Portfolio Turnover Rate1 | 9% | 8% | 7% | 8% | 8% |
1 Excludes the value of portfolio securities received or delivered as a result of in-kind purchases or redemptions of the fund’s capital shares, including ETF Creation Units.
See accompanying Notes, which are an integral part of the Financial Statements.
71
| Large-Cap Index Fund | |||||
| Financial Highlights | |||||
| Institutional Shares | |||||
| For a Share Outstanding | Year Ended December 31, | ||||
| Throughout Each Period | 2013 | 2012 | 2011 | 2010 | 2009 |
| Net Asset Value, Beginning of Period | $135.42 | $119.18 | $119.65 | $105.33 | $84.43 |
| Investment Operations | |||||
| Net Investment Income | 3.105 | 2.903 | 2.366 | 2.111 | 2.160 |
| Net Realized and Unrealized Gain (Loss) | |||||
| on Investments | 40.761 | 16.234 | (. 499) | 14.383 | 20.973 |
| Total from Investment Operations | 43.866 | 19.137 | 1.867 | 16.494 | 23.133 |
| Distributions | |||||
| Dividends from Net Investment Income | (3.106) | (2.897) | (2.337) | (2.174) | (2.233) |
| Distributions from Realized Capital Gains | — | — | — | — | — |
| Total Distributions | (3.106) | (2.897) | (2.337) | (2.174) | (2.233) |
| Net Asset Value, End of Period | $176.18 | $135.42 | $119.18 | $119.65 | $105.33 |
| Total Return | 32.65% | 16.11% | 1.60% | 15.85% | 27.84% |
| Ratios/Supplemental Data | |||||
| Net Assets, End of Period (Millions) | $750 | $752 | $504 | $276 | $306 |
| Ratio of Total Expenses to | |||||
| Average Net Assets | 0.08% | 0.08% | 0.08% | 0.08% | 0.08% |
| Ratio of Net Investment Income to | |||||
| Average Net Assets | 1.98% | 2.24% | 1.97% | 1.96% | 2.42% |
| Portfolio Turnover Rate1 | 9% | 8% | 7% | 8% | 8% |
1 Excludes the value of portfolio securities received or delivered as a result of in-kind purchases or redemptions of the fund’s capital shares, including ETF Creation Units.
See accompanying Notes, which are an integral part of the Financial Statements.
72
| Large-Cap Index Fund | |||||
| Financial Highlights | |||||
| ETF Shares | |||||
| For a Share Outstanding | Year Ended December 31, | ||||
| Throughout Each Period | 2013 | 2012 | 2011 | 2010 | 2009 |
| Net Asset Value, Beginning of Period | $65.15 | $57.34 | $57.56 | $50.67 | $40.61 |
| Investment Operations | |||||
| Net Investment Income | 1.488 | 1.383 | 1.126 | .996 | 1.022 |
| Net Realized and Unrealized Gain (Loss) | |||||
| on Investments | 19.610 | 7.807 | (. 234) | 6.920 | 10.095 |
| Total from Investment Operations | 21.098 | 9.190 | .892 | 7.916 | 11.117 |
| Distributions | |||||
| Dividends from Net Investment Income | (1.488) | (1.380) | (1.112) | (1.026) | (1.057) |
| Distributions from Realized Capital Gains | — | — | — | — | — |
| Total Distributions | (1.488) | (1.380) | (1.112) | (1.026) | (1.057) |
| Net Asset Value, End of Period | $84.76 | $65.15 | $57.34 | $57.56 | $50.67 |
| Total Return | 32.65% | 16.09% | 1.58% | 15.81% | 27.80% |
| Ratios/Supplemental Data | |||||
| Net Assets, End of Period (Millions) | $4,707 | $3,577 | $3,021 | $2,858 | $2,489 |
| Ratio of Total Expenses to | |||||
| Average Net Assets | 0.09% | 0.10% | 0.10% | 0.12% | 0.12% |
| Ratio of Net Investment Income to | |||||
| Average Net Assets | 1.97% | 2.22% | 1.95% | 1.92% | 2.38% |
| Portfolio Turnover Rate1 | 9% | 8% | 7% | 8% | 8% |
1 Excludes the value of portfolio securities received or delivered as a result of in-kind purchases or redemptions of the fund’s capital shares, including ETF Creation Units.
See accompanying Notes, which are an integral part of the Financial Statements.
73
Large-Cap Index Fund
Notes to Financial Statements
Vanguard Large-Cap Index Fund is registered under the Investment Company Act of 1940 as an open-end investment company, or mutual fund. The fund offers five classes of shares: Investor Shares, Admiral Shares, Signal Shares, Institutional Shares, and ETF Shares. Investor Shares are available to any investor who meets the fund’s minimum purchase requirements. Admiral Shares, Signal Shares, and Institutional Shares are designed for investors who meet certain administrative, service, and account-size criteria. ETF Shares are listed for trading on NYSE Arca; they can be purchased and sold through a broker.
A. The following significant accounting policies conform to generally accepted accounting principles for U.S. mutual funds. The fund consistently follows such policies in preparing its financial statements.
1. Security Valuation: Securities are valued as of the close of trading on the New York Stock Exchange (generally 4 p.m., Eastern time) on the valuation date. Equity securities are valued at the latest quoted sales prices or official closing prices taken from the primary market in which each security trades; such securities not traded on the valuation date are valued at the mean of the latest quoted bid and asked prices. Securities for which market quotations are not readily available, or whose values have been materially affected by events occurring before the fund’s pricing time but after the close of the securities’ primary markets, are valued by methods deemed by the board of trustees to represent fair value. Investments in Vanguard Market Liquidity Fund are valued at that fund’s net asset value. Temporary cash investments acquired over 60 days to maturity are valued using the latest bid prices or using valuations based on a matrix system (which considers such factors as security prices, yields, maturities, and ratings), both as furnished by independent pricing services. Other temporary cash investments are valued at amortized cost, which approximates market value.
2. Futures Contracts: The fund may use index futures contracts to a limited extent, with the objectives of maintaining full exposure to the stock market, enhancing returns, maintaining liquidity, and minimizing transaction costs. The fund may purchase futures contracts to immediately invest incoming cash in the market, or sell futures in response to cash outflows, thereby simulating a fully invested position in the underlying index while maintaining a cash balance for liquidity. The fund may seek to enhance returns by using futures contracts instead of the underlying securities when futures are believed to be priced more attractively than the underlying securities. The primary risks associated with the use of futures contracts are imperfect correlation between changes in market values of stocks held by the fund and the prices of futures contracts, and the possibility of an illiquid market. Counterparty risk involving futures is mitigated because a regulated clearinghouse is the counterparty instead of the clearing broker. To further mitigate counterparty risk, the fund trades futures contracts on an exchange, monitors the financial strength of its clearing brokers and clearinghouse, and has entered into clearing agreements with its clearing brokers. The clearinghouse imposes initial margin requirements to secure the fund’s performance and requires daily settlement of variation margin representing changes in the market value of each contract.
Futures contracts are valued at their quoted daily settlement prices. The aggregate notional amounts of the contracts are not recorded in the Statement of Net Assets. Fluctuations in the value of the contracts are recorded in the Statement of Net Assets as an asset (liability) and in the Statement of Operations as unrealized appreciation (depreciation) until the contracts are closed, when they are recorded as realized futures gains (losses).
During the year ended December 31, 2013, the fund’s average investments in long and short futures contracts represented less than 1% and 0% of net assets, respectively, based on quarterly average aggregate settlement values.
74
Large-Cap Index Fund
3. Federal Income Taxes: The fund intends to continue to qualify as a regulated investment company and distribute all of its taxable income. Management has analyzed the fund’s tax positions taken for all open federal income tax years (December 31, 2010–2013), and has concluded that no provision for federal income tax is required in the fund’s financial statements.
4. Distributions: Distributions to shareholders are recorded on the ex-dividend date.
5. Securities Lending: To earn additional income, the fund may lend its securities to qualified institutional borrowers. Security loans are required to be secured at all times by collateral in an amount at least equal to the market value of securities loaned. Daily market fluctuations could cause the value of loaned securities to be more or less than the value of the collateral received. When this occurs, the collateral is adjusted and settled on the next business day. The fund further mitigates its counterparty risk by entering into securities lending transactions only with a diverse group of prequalified counterparties, monitoring their financial strength, and entering into master securities lending agreements with its counterparties. The master securities lending agreements provide that, in the event of a counterparty’s default (including bankruptcy), the fund may terminate any loans with that borrower, determine the net amount owed, and sell or retain the collateral up to the net amount owed to the fund; however, such actions may be subject to legal proceedings. While collateral mitigates counterparty risk, in the absence of a default the fund may experience delays and costs in recovering the securities loaned. The fund invests cash collateral received in Vanguard Market Liquidity Fund, and records a liability for the return of the collateral, during the period the securities are on loan. Securities lending income represents fees charged to borrowers plus income earned on invested cash collateral, less expenses associated with the loan.
6. Other: Dividend income is recorded on the ex-dividend date. Interest income includes income distributions received from Vanguard Market Liquidity Fund and is accrued daily. Premiums and discounts on debt securities purchased are amortized and accreted, respectively, to interest income over the lives of the respective securities. Security transactions are accounted for on the date securities are bought or sold. Costs used to determine realized gains (losses) on the sale of investment securities are those of the specific securities sold.
Each class of shares has equal rights as to assets and earnings, except that each class separately bears certain class-specific expenses related to maintenance of shareholder accounts (included in Management and Administrative expenses) and shareholder reporting. Marketing and distribution expenses are allocated to each class of shares based on a method approved by the board of trustees. Income, other non-class-specific expenses, and gains and losses on investments are allocated to each class of shares based on its relative net assets.
B. The Vanguard Group furnishes at cost investment advisory, corporate management, administrative, marketing, and distribution services. The costs of such services are allocated to the fund under methods approved by the board of trustees. The fund has committed to provide up to 0.40% of its net assets in capital contributions to Vanguard. At December 31, 2013, the fund had contributed capital of $890,000 to Vanguard (included in Other Assets), representing 0.01% of the fund’s net assets and 0.36% of Vanguard’s capitalization. The fund’s trustees and officers are also directors and officers of Vanguard.
C. Various inputs may be used to determine the value of the fund’s investments. These inputs are summarized in three broad levels for financial statement purposes. The inputs or methodologies used to value securities are not necessarily an indication of the risk associated with investing in those securities.
75
Large-Cap Index Fund
Level 1—Quoted prices in active markets for identical securities.
Level 2—Other significant observable inputs (including quoted prices for similar securities, interest rates, prepayment speeds, credit risk, etc.).
Level 3—Significant unobservable inputs (including the fund’s own assumptions used to determine the fair value of investments).
The following table summarizes the market value of the fund’s investments as of December 31, 2013, based on the inputs used to value them:
| Level 1 | Level 2 | Level 3 | |
| Investments | ($000) | ($000) | ($000) |
| Common Stocks | 8,188,295 | — | — |
| Temporary Cash Investments | 36,551 | 1,600 | — |
| Futures Contracts—Assets1 | 77 | — | — |
| Total | 8,224,923 | 1,600 | — |
| 1 Represents variation margin on the last day of the reporting period. |
D. At December 31, 2013, the aggregate settlement value of open futures contracts and the related unrealized appreciation (depreciation) were:
| ($000) | ||||
| Aggregate | ||||
| Number of | Settlement | Unrealized | ||
| Long (Short) | Value | Appreciation | ||
| Futures Contracts | Expiration | Contracts | Long (Short) | (Depreciation) |
| S&P 500 Index | March 2014 | 46 | 21,172 | 782 |
| E-mini S&P 500 Index | March 2014 | 12 | 1,105 | 16 |
| 798 |
Unrealized appreciation (depreciation) on open futures contracts is required to be treated as realized gain (loss) for tax purposes.
E. Distributions are determined on a tax basis and may differ from net investment income and realized capital gains for financial reporting purposes. Differences may be permanent or temporary. Permanent differences are reclassified among capital accounts in the financial statements to reflect their tax character. Temporary differences arise when certain items of income, expense, gain, or loss are recognized in different periods for financial statement and tax purposes. These differences will reverse at some time in the future. Differences in classification may also result from the treatment of short-term gains as ordinary income for tax purposes.
During the year ended December 31, 2013, the fund realized $218,563,000 of net capital gains resulting from in-kind redemptions—in which shareholders exchanged fund shares for securities held by the fund rather than for cash. Because such gains are not taxable to the fund, and are not distributed to shareholders, they have been reclassified from accumulated net realized losses to paid-in capital.
For tax purposes, at December 31, 2013, the fund had $1,345,000 of ordinary income available for distribution. The fund used capital loss carryforwards of $174,024,000 to offset taxable capital gains realized during the year ended December 31, 2013. At December 31, 2013, the fund had available capital losses totaling $38,914,000 to offset future net capital gains of $5,147,000 through December 31, 2017 and $33,767,000 through December 31, 2018.
76
Large-Cap Index Fund
At December 31, 2013, the cost of investment securities for tax purposes was $5,632,548,000. Net unrealized appreciation of investment securities for tax purposes was $2,593,898,000, consisting of unrealized gains of $2,714,923,000 on securities that had risen in value since their purchase and $121,025,000 in unrealized losses on securities that had fallen in value since their purchase.
F. During the year ended December 31, 2013, the fund purchased $1,146,693,000 of investment securities and sold $1,069,336,000 of investment securities, other than temporary cash investments. Purchases and sales include $273,315,000 and $430,841,000, respectively, in connection with in-kind purchases and redemptions of the fund’s capital shares.
| G. Capital share transactions for each class of shares were: | ||||
| Year Ended December 31, | ||||
| 2013 | 2012 | |||
| Amount | Shares | Amount | Shares | |
| ($000) | (000) | ($000) | (000) | |
| Investor Shares | ||||
| Issued | 113,753 | 3,731 | 81,153 | 3,195 |
| Issued in Lieu of Cash Distributions | 5,997 | 193 | 5,693 | 219 |
| Redeemed | (108,469) | (3,553) | (127,142) | (5,016) |
| Net Increase (Decrease)—Investor Shares | 11,281 | 371 | (40,296) | (1,602) |
| Admiral Shares | ||||
| Issued | 355,538 | 9,316 | 244,045 | 7,613 |
| Issued in Lieu of Cash Distributions | 20,643 | 532 | 17,079 | 526 |
| Redeemed | (229,248) | (6,081) | (184,976) | (5,805) |
| Net Increase (Decrease) —Admiral Shares | 146,933 | 3,767 | 76,148 | 2,334 |
| Signal Shares | ||||
| Issued | 254,147 | 7,619 | 231,248 | 8,308 |
| Issued in Lieu of Cash Distributions | 11,355 | 335 | 9,726 | 343 |
| Redeemed | (178,255) | (5,379) | (196,925) | (7,032) |
| Net Increase (Decrease)—Signal Shares | 87,247 | 2,575 | 44,049 | 1,619 |
| Institutional Shares | ||||
| Issued | 111,550 | 733 | 347,377 | 2,618 |
| Issued in Lieu of Cash Distributions | 14,858 | 94 | 13,704 | 102 |
| Redeemed | (349,340) | (2,125) | (186,488) | (1,400) |
| Net Increase (Decrease)—Institutional Shares | (222,932) | (1,298) | 174,593 | 1,320 |
| ETF Shares | ||||
| Issued | 316,306 | 4,133 | 183,358 | 2,911 |
| Issued in Lieu of Cash Distributions | — | — | — | — |
| Redeemed | (260,903) | (3,500) | (42,227) | (700) |
| Net Increase (Decrease)—ETF Shares | 55,403 | 633 | 141,131 | 2,211 |
H. Management has determined that no material events or transactions occurred subsequent to December 31, 2013, that would require recognition or disclosure in these financial statements.
77
Report of Independent Registered Public Accounting Firm
To the Trustees of Vanguard Index Funds and the Shareholders of Vanguard Growth Index Fund, Vanguard Value Index Fund and Vanguard Large-Cap Index Fund:
In our opinion, the accompanying statements of net assets and the related statements of operations and of changes in net assets and the financial highlights present fairly, in all material respects, the financial position of Vanguard Growth Index Fund, Vanguard Value Index Fund and Vanguard Large-Cap Index Fund (constituting separate portfolios of Vanguard Index Funds, hereafter referred to as the “Funds”) at December 31, 2013, the results of each of their operations for the year then ended, the changes in each of their net assets for each of the two years in the period then ended, and the financial highlights for each of the five years in the period then ended, in conformity with accounting principles generally accepted in the United States of America. These financial statements and financial highlights (hereafter referred to as “financial statements”) are the responsibility of the Funds’ management; our responsibility is to express an opinion on these financial statements based on our audits. We conducted our audits of these financial statements in accordance with the standards of the Public Company Accounting Oversight Board (United States). Those standards require that we plan and perform the audit to obtain reasonable assurance about whether the financial statements are free of material misstatement. An audit includes examining, on a test basis, evidence supporting the amounts and disclosures in the financial statements, assessing the accounting principles used and significant estimates made by management, and evaluating the overall financial statement presentation. We believe that our audits, which included confirmation of securities at December 31, 2013 by correspondence with the custodians and broker and by agreement to the underlying ownership records of the transfer agent, provide a reasonable basis for our opinion.
/s/PricewaterhouseCoopers LLP
Philadelphia, Pennsylvania
February 10, 2014
78
| Special 2013 tax information (unaudited) for Vanguard U.S. Stock Index Funds(Large-Capitalization Portfolios) |
| This information for the fiscal year ended December 31, 2013, is included pursuant to provisions of |
| the Internal Revenue Code. |
| The funds distributed qualified dividend income to shareholders during the fiscal year as follows: |
| Fund | ($000) |
| Growth Index Fund | 432,743 |
| Value Index Fund | 605,462 |
| Large-Cap Index Fund | 143,365 |
For corporate shareholders, the percentage of investment income (dividend income plus short-term gains, if any) that qualifies for the dividends-received deduction is as follows:
| Fund | Percentage |
| Growth Index Fund | 94.1% |
| Value Index Fund | 100.0 |
| Large-Cap Index Fund | 98.0 |
Shareholders will receive more detailed information with their FORM 1099-DIV in January 2014 to determine the calendar-year amounts to be included on their 2013 tax returns.
79
Your Fund’s After-Tax Returns
This table presents returns for your fund both before and after taxes. The after-tax returns are shown in two ways: (1) assuming that an investor owned the fund during the entire period and paid taxes on the fund’s distributions, and (2) assuming that an investor paid taxes on the fund’s distributions and sold all shares at the end of each period.
Calculations are based on the highest individual federal income tax and capital gains tax rates in effect at the times of the distributions and the hypothetical sales. State and local taxes were not considered. After-tax returns reflect any qualified dividend income . (In the example, returns after the sale of fund shares may be higher than those assuming no sale. This occurs when the sale would have produced a capital loss. The calculation assumes that the investor received a tax deduction for the loss.)
The table shows returns for one share class only; returns for other share classes will differ. Please note that your actual after-tax returns will depend on your tax situation and may differ from those shown. Also note that if you own the fund in a tax-deferred account, such as an individual retirement account or a 401(k) plan, this information does not apply to you. Such accounts are not subject to current taxes.
Finally, keep in mind that a fund’s performance—whether before or after taxes—does not guarantee future results.
Average Annual Total Returns: U.S. Stock Index Funds Large-Capitalization Portfolios
Periods Ended December 31, 2013
| One | Five | Ten | |
| Year | Years | Years | |
| Growth Index Fund Investor Shares | |||
| Returns Before Taxes | 32.16% | 20.16% | 7.88% |
| Returns After Taxes on Distributions | 31.79 | 19.92 | 7.70 |
| Returns After Taxes on Distributions and Sale of Fund Shares | 18.45 | 16.51 | 6.43 |
| One | Five | Ten | |
| Year | Years | Years | |
| Value Index Fund Investor Shares | |||
| Returns Before Taxes | 32.85% | 16.09% | 7.38% |
| Returns After Taxes on Distributions | 32.14 | 15.60 | 6.94 |
| Returns After Taxes on Distributions and Sale of Fund Shares | 19.09 | 13.03 | 6.02 |
| Since | |||
| One | Five | Inception | |
| Year | Years | (1/30/2004) | |
| Large-Cap Index Fund Investor Shares | |||
| Returns Before Taxes | 32.45% | 18.11% | 7.53% |
| Returns After Taxes on Distributions | 31.88 | 17.73 | 7.22 |
| Returns After Taxes on Distributions and Sale of Fund Shares | 18.75 | 14.75 | 6.13 |
80
About Your Fund’s Expenses
As a shareholder of the fund, you incur ongoing costs, which include costs for portfolio management, administrative services, and shareholder reports (like this one), among others. Operating expenses, which are deducted from a fund’s gross income, directly reduce the investment return of the fund.
A fund’s expenses are expressed as a percentage of its average net assets. This figure is known as the expense ratio. The following examples are intended to help you understand the ongoing costs (in dollars) of investing in your fund and to compare these costs with those of other mutual funds. The examples are based on an investment of $1,000 made at the beginning of the period shown and held for the entire period.
The accompanying table illustrates your fund’s costs in two ways:
• Based on actual fund return. This section helps you to estimate the actual expenses that you paid over the period. The ”Ending Account Value“ shown is derived from the fund‘s actual return, and the third column shows the dollar amount that would have been paid by an investor who started with $1,000 in the fund. You may use the information here, together with the amount you invested, to estimate the expenses that you paid over the period.
To do so, simply divide your account value by $1,000 (for example, an $8,600 account value divided by $1,000 = 8.6), then multiply the result by the number given for your fund under the heading ”Expenses Paid During Period.“
• Based on hypothetical 5% yearly return. This section is intended to help you compare your fund‘s costs with those of other mutual funds. It assumes that the fund had a yearly return of 5% before expenses, but that the expense ratio is unchanged. In this case—because the return used is not the fund’s actual return—the results do not apply to your investment. The example is useful in making comparisons because the Securities and Exchange Commission requires all mutual funds to calculate expenses based on a 5% return. You can assess your fund’s costs by comparing this hypothetical example with the hypothetical examples that appear in shareholder reports of other funds.
Note that the expenses shown in the table are meant to highlight and help you compare ongoing costs only and do not reflect transaction costs incurred by the fund for buying and selling securities. Further, the expenses do not include any purchase, redemption, or account service fees described in the fund prospectus. If such fees were applied to your account, your costs would be higher. Your fund does not carry a “sales load.”
The calculations assume no shares were bought or sold during the period. Your actual costs may have been higher or lower, depending on the amount of your investment and the timing of any purchases or redemptions.
You can find more information about the fund’s expenses, including annual expense ratios, in the Financial Statements section of this report. For additional information on operating expenses and other shareholder costs, please refer to your fund’s current prospectus.
81
| Six Months Ended December 31, 2013 | |||
| Beginning | Ending | Expenses | |
| Account Value | Account Value | Paid During | |
| 6/30/2013 | 12/31/2013 | Period | |
| Based on Actual Fund Return | |||
| Growth Index Fund | |||
| Investor Shares | $1,000.00 | $1,195.88 | $1.33 |
| Admiral Shares | 1,000.00 | 1,196.80 | 0.44 |
| Signal Shares | 1,000.00 | 1,196.89 | 0.44 |
| Institutional Shares | 1,000.00 | 1,197.12 | 0.44 |
| ETF Shares | 1,000.00 | 1,196.89 | 0.50 |
| Value Index Fund | |||
| Investor Shares | $1,000.00 | $1,140.33 | $1.29 |
| Admiral Shares | 1,000.00 | 1,141.20 | 0.49 |
| Signal Shares | 1,000.00 | 1,141.37 | 0.49 |
| Institutional Shares | 1,000.00 | 1,141.68 | 0.43 |
| ETF Shares | 1,000.00 | 1,141.48 | 0.49 |
| Large-Cap Index Fund | |||
| Investor Shares | $1,000.00 | $1,164.85 | $1.31 |
| Admiral Shares | 1,000.00 | 1,165.89 | 0.49 |
| Signal Shares | 1,000.00 | 1,165.95 | 0.44 |
| Institutional Shares | 1,000.00 | 1,165.89 | 0.44 |
| ETF Shares | 1,000.00 | 1,165.81 | 0.44 |
82
| Six Months Ended December 31, 2013 | |||
| Beginning | Ending | Expenses | |
| Account Value | Account Value | Paid During | |
| 6/30/2013 | 12/31/2013 | Period | |
| Based on Hypothetical 5% Yearly Return | |||
| Growth Index Fund | |||
| Investor Shares | $1,000.00 | $1,024.00 | $1.22 |
| Admiral Shares | 1,000.00 | 1,024.80 | 0.41 |
| Signal Shares | 1,000.00 | 1,024.80 | 0.41 |
| Institutional Shares | 1,000.00 | 1,024.80 | 0.41 |
| ETF Shares | 1,000.00 | 1,024.75 | 0.46 |
| Value Index Fund | |||
| Investor Shares | $1,000.00 | $1,024.00 | $1.22 |
| Admiral Shares | 1,000.00 | 1,024.75 | 0.46 |
| Signal Shares | 1,000.00 | 1,024.75 | 0.46 |
| Institutional Shares | 1,000.00 | 1,024.80 | 0.41 |
| ETF Shares | 1,000.00 | 1,024.75 | 0.46 |
| Large-Cap Index Fund | |||
| Investor Shares | $1,000.00 | $1,024.00 | $1.22 |
| Admiral Shares | 1,000.00 | 1,024.75 | 0.46 |
| Signal Shares | 1,000.00 | 1,024.80 | 0.41 |
| Institutional Shares | 1,000.00 | 1,024.80 | 0.41 |
| ETF Shares | 1,000.00 | 1,024.80 | 0.41 |
The calculations are based on expenses incurred in the most recent six-month period. The funds’ annualized six-month expense ratios for that period are: for the Growth Index Fund, 0.24% for Investor Shares, 0.08% for Admiral Shares, 0.08% for Signal Shares, 0.08% for Institutional Shares, and 0.09% for ETF Shares; for the Value Index Fund, 0.24% for Investor Shares, 0.09% for Admiral Shares, 0.09% for Signal Shares, 0.08% for Institutional Shares, and 0.09% for ETF Shares; and for the Large-Cap Index Fund, 0.24% for Investor Shares, 0.09% for Admiral Shares, 0.08% for Signal Shares, 0.08% for Institutional Shares, and 0.08% for ETF Shares. The dollar amounts shown as “Expenses Paid” are equal to the annualized expense ratio multiplied by the average account value over the period, multiplied by the number of days in the most recent six-month period, then divided by the number of days in the most recent 12-month period.
83
Glossary
30-Day SEC Yield. A fund’s 30-day SEC yield is derived using a formula specified by the U.S. Securities and Exchange Commission. Under the formula, data related to the fund’s security holdings in the previous 30 days are used to calculate the fund’s hypothetical net income for that period, which is then annualized and divided by the fund’s estimated average net assets over the calculation period. For the purposes of this calculation, a security’s income is based on its current market yield to maturity (for bonds), its actual income (for asset-backed securities), or its projected dividend yield (for stocks). Because the SEC yield represents hypothetical annualized income, it will differ—at times significantly—from the fund’s actual experience. As a result, the fund’s income distributions may be higher or lower than implied by the SEC yield.
Beta. A measure of the magnitude of a fund’s past share-price fluctuations in relation to the ups and downs of a given market index. The index is assigned a beta of 1.00. Compared with a given index, a fund with a beta of 1.20 typically would have seen its share price rise or fall by 12% when the index rose or fell by 10%. For this report, beta is based on returns over the past 36 months for both the fund and the index. Note that a fund’s beta should be reviewed in conjunction with its R-squared (see definition). The lower the R-squared, the less correlation there is between the fund and the index, and the less reliable beta is as an indicator of volatility.
Dividend Yield. Dividend income earned by stocks, expressed as a percentage of the aggregate market value (or of net asset value, for a fund). The yield is determined by dividing the amount of the annual dividends by the aggregate value (or net asset value) at the end of the period. For a fund, the dividend yield is based solely on stock holdings and does not include any income produced by other investments.
Earnings Growth Rate. The average annual rate of growth in earnings over the past five years for the stocks now in a fund.
Equity Exposure. A measure that reflects a fund’s investments in stocks and stock futures. Any holdings in short-term reserves are excluded.
Expense Ratio. A fund’s total annual operating expenses expressed as a percentage of the fund’s average net assets. The expense ratio includes management and administrative expenses, but does not include the transaction costs of buying and selling portfolio securities.
Foreign Holdings. The percentage of a fund represented by securities or depositary receipts of companies based outside the United States.
Inception Date. The date on which the assets of a fund (or one of its share classes) are first invested in accordance with the fund’s investment objective. For funds with a subscription period, the inception date is the day after that period ends. Investment performance is measured from the inception date.
Median Market Cap. An indicator of the size of companies in which a fund invests; the midpoint of market capitalization (market price x shares outstanding) of a fund’s stocks, weighted by the proportion of the fund’s assets invested in each stock. Stocks representing half of the fund’s assets have market capitalizations above the median, and the rest are below it.
Price/Book Ratio. The share price of a stock divided by its net worth, or book value, per share. For a fund, the weighted average price/book ratio of the stocks it holds.
84
Price/Earnings Ratio. The ratio of a stock’s current price to its per-share earnings over the past year. For a fund, the weighted average P/E of the stocks it holds. P/E is an indicator of market expectations about corporate prospects; the higher the P/E, the greater the expectations for a company’s future growth.
R-Squared. A measure of how much of a fund’s past returns can be explained by the returns from the market in general, as measured by a given index. If a fund’s total returns were precisely synchronized with an index’s returns, its R-squared would be 1.00. If the fund’s returns bore no relationship to the index’s returns, its R-squared would be 0. For this report, R-squared is based on returns over the past 36 months for both the fund and the index.
Return on Equity. The annual average rate of return generated by a company during the past five years for each dollar of shareholder’s equity (net income divided by shareholder’s equity). For a fund, the weighted average return on equity for the companies whose stocks it holds.
Short-Term Reserves. The percentage of a fund invested in highly liquid, short-term securities that can be readily converted to cash.
Turnover Rate. An indication of the fund’s trading activity. Funds with high turnover rates incur higher transaction costs and may be more likely to distribute capital gains (which may be taxable to investors). The turnover rate excludes in-kind transactions, which have minimal impact on costs.
Benchmark Information
Spliced Growth Index: S&P 500 Growth Index (formerly known as the S&P 500/Barra Growth Index) through May 16, 2003; MSCI US Prime Market Growth Index through April 16, 2013; CRSP US Large Cap Growth Index thereafter.
Spliced Value Index: S&P 500 Value Index (formerly known as the S&P 500/Barra Value Index) through May 16, 2003; MSCI US Prime Market Value Index through April 16, 2013; CRSP US Large Cap Value Index thereafter.
Spliced Large Cap Index: MSCI US Prime Market 750 Index through January 30, 2013; CRSP US
Large Cap Index thereafter.
85
This page intentionally left blank.
This page intentionally left blank.
The People Who Govern Your Fund
The trustees of your mutual fund are there to see that the fund is operated and managed in your best interests since, as a shareholder, you are a part owner of the fund. Your fund’s trustees also serve on the board of directors of The Vanguard Group, Inc., which is owned by the Vanguard funds and provides services to them on an at-cost basis.
A majority of Vanguard’s board members are independent, meaning that they have no affiliation with Vanguard or the funds they oversee, apart from the sizable personal investments they have made as private individuals. The independent board members have distinguished backgrounds in business, academia, and public service. Each of the trustees and executive officers oversees 182 Vanguard funds.
The following table provides information for each trustee and executive officer of the fund. More information about the trustees is in the Statement of Additional Information, which can be obtained, without charge, by contacting Vanguard at 800-662-7447, or online at vanguard.com.
| InterestedTrustee1 | and Delphi Automotive LLP (automotive components); |
| Senior Advisor at New Mountain Capital; Trustee of | |
| F. William McNabb III | The Conference Board. |
| Born 1957. Trustee Since July 2009. Chairman of the | |
| Board. Principal Occupation(s) During the Past Five | Amy Gutmann |
| Years: Chairman of the Board of The Vanguard Group, | Born 1949. Trustee Since June 2006. Principal |
| Inc., and of each of the investment companies served | Occupation(s) During the Past Five Years: President |
| by The Vanguard Group, since January 2010; Director | of the University of Pennsylvania; Christopher H. |
| of The Vanguard Group since 2008; Chief Executive | Browne Distinguished Professor of Political Science |
| Officer and President of The Vanguard Group and of | in the School of Arts and Sciences with secondary |
| each of the investment companies served by The | appointments at the Annenberg School for |
| Vanguard Group since 2008; Director of Vanguard | Communication and the Graduate School of Education |
| Marketing Corporation; Managing Director of The | of the University of Pennsylvania; Member of the |
| Vanguard Group (1995–2008). | National Commission on the Humanities and Social |
| Sciences; Trustee of Carnegie Corporation of New | |
| IndependentTrustees | York and of the National Constitution Center; Chair |
| of the U.S. Presidential Commission for the Study | |
| Emerson U. Fullwood | of Bioethical Issues. |
| Born 1948. Trustee Since January 2008. Principal | |
| Occupation(s) During the Past Five Years: Executive | JoAnn Heffernan Heisen |
| Chief Staff and Marketing Officer for North America | Born 1950. Trustee Since July 1998. Principal |
| and Corporate Vice President (retired 2008) of Xerox | Occupation(s) During the Past Five Years: Corporate |
| Corporation (document management products and | Vice President and Chief Global Diversity Officer |
| services); Executive in Residence and 2010 | (retired 2008) and Member of the Executive |
| Distinguished Minett Professor at the Rochester | Committee (1997–2008) of Johnson & Johnson |
| Institute of Technology; Director of SPX Corporation | (pharmaceuticals/medical devices/consumer |
| (multi-industry manufacturing), the United Way of | products); Director of Skytop Lodge Corporation |
| Rochester, Amerigroup Corporation (managed health | (hotels), the University Medical Center at Princeton, |
| care), the University of Rochester Medical Center, | the Robert Wood Johnson Foundation, and the Center |
| Monroe Community College Foundation, and North | for Talent Innovation; Member of the Advisory Board |
| Carolina A&T University. | of the Maxwell School of Citizenship and Public Affairs |
| at Syracuse University. | |
| Rajiv L. Gupta | |
| Born 1945. Trustee Since December 2001.2 | F. Joseph Loughrey |
| Principal Occupation(s) During the Past Five Years: | Born 1949. Trustee Since October 2009. Principal |
| Chairman and Chief Executive Officer (retired 2009) | Occupation(s) During the Past Five Years: President |
| and President (2006–2008) of Rohm and Haas Co. | and Chief Operating Officer (retired 2009) of Cummins |
| (chemicals); Director of Tyco International, Ltd. | Inc. (industrial machinery); Chairman of the Board of |
| (diversified manufacturing and services), Hewlett- | Hillenbrand, Inc. (specialized consumer services) and |
| Packard Co. (electronic computer manufacturing), | of Oxfam America; Director of SKF AB (industrial |
| machinery), Hyster-Yale Materials Handling, Inc. | Executive Officers | |
| (forklift trucks), and the Lumina Foundation for | ||
| Education; Member of the Advisory Council for the | Glenn Booraem | |
| College of Arts and Letters and of the Advisory Board | Born 1967. Controller Since July 2010. Principal | |
| to the Kellogg Institute for International Studies, both | Occupation(s) During the Past Five Years: Principal | |
| at the University of Notre Dame. | of The Vanguard Group, Inc.; Controller of each of | |
| the investment companies served by The Vanguard | ||
| Mark Loughridge | Group; Assistant Controller of each of the investment | |
| Born 1953. Trustee Since March 2012. Principal | companies served by The Vanguard Group (2001–2010). | |
| Occupation(s) During the Past Five Years: Senior Vice | ||
| President and Chief Financial Officer at IBM (information | Thomas J. Higgins | |
| technology services); Fiduciary Member of IBM’s | Born 1957. Chief Financial Officer Since September | |
| Retirement Plan Committee. | 2008. Principal Occupation(s) During the Past Five | |
| Years: Principal of The Vanguard Group, Inc.; Chief | ||
| Scott C. Malpass | Financial Officer of each of the investment companies | |
| Born 1962. Trustee Since March 2012. Principal | served by The Vanguard Group; Treasurer of each of | |
| Occupation(s) During the Past Five Years: Chief | the investment companies served by The Vanguard | |
| Investment Officer and Vice President at the University | Group (1998–2008). | |
| of Notre Dame; Assistant Professor of Finance at the | ||
| Mendoza College of Business at Notre Dame; Member | Kathryn J. Hyatt | |
| of the Notre Dame 403(b) Investment Committee; | Born 1955. Treasurer Since November 2008. Principal | |
| Director of TIFF Advisory Services, Inc. (investment | Occupation(s) During the Past Five Years: Principal of | |
| advisor); Member of the Investment Advisory | The Vanguard Group, Inc.; Treasurer of each of the | |
| Committees of the Financial Industry Regulatory | investment companies served by The Vanguard | |
| Authority (FINRA) and of Major League Baseball. | Group; Assistant Treasurer of each of the investment | |
| companies served by The Vanguard Group (1988–2008). | ||
| André F. Perold | ||
| Born 1952. Trustee Since December 2004. Principal | Heidi Stam | |
| Occupation(s) During the Past Five Years: George | Born 1956. Secretary Since July 2005. Principal | |
| Gund Professor of Finance and Banking at the Harvard | Occupation(s) During the Past Five Years: Managing | |
| Business School (retired 2011); Chief Investment | Director of The Vanguard Group, Inc.; General Counsel | |
| Officer and Managing Partner of HighVista Strategies | of The Vanguard Group; Secretary of The Vanguard | |
| LLC (private investment firm); Director of Rand | Group and of each of the investment companies | |
| Merchant Bank; Overseer of the Museum of Fine | served by The Vanguard Group; Director and Senior | |
| Arts Boston. | Vice President of Vanguard Marketing Corporation. | |
| Alfred M. Rankin, Jr. | ||
| Vanguard Senior ManagementTeam | ||
| Born 1941. Trustee Since January 1993. Principal | ||
| Occupation(s) During the Past Five Years: Chairman, | Mortimer J. Buckley | Chris D. McIsaac |
| President, and Chief Executive Officer of NACCO | Kathleen C. Gubanich | Michael S. Miller |
| Industries, Inc. (housewares/lignite) and of Hyster-Yale | Paul A. Heller | James M. Norris |
| Materials Handling, Inc. (forklift trucks); Director of | Martha G. King | Glenn W. Reed |
| the National Association of Manufacturers; Chairman | John T. Marcante | |
| of the Board of University Hospitals of Cleveland; | ||
| Advisory Chairman of the Board of The Cleveland | ||
| Chairman Emeritus and Senior Advisor | ||
| Museum of Art. | ||
| John J. Brennan | ||
| Peter F. Volanakis | Chairman, 1996–2009 | |
| Born 1955. Trustee Since July 2009. Principal | Chief Executive Officer and President, 1996–2008 | |
| Occupation(s) During the Past Five Years: President | ||
| and Chief Operating Officer (retired 2010) of Corning | ||
| Incorporated (communications equipment); Director | Founder | |
| of SPX Corporation (multi-industry manufacturing); | John C. Bogle | |
| Overseer of the Amos Tuck School of Business | Chairman and Chief Executive Officer, 1974–1996 | |
| Administration at Dartmouth College; Advisor to the | ||
| Norris Cotton Cancer Center. | ||
1 Mr. McNabb is considered an “interested person,” as defined in the Investment Company Act of 1940, because he is an officer of the Vanguard funds.
2 December 2002 for Vanguard Equity Income Fund, Vanguard Growth Equity Fund, the Vanguard Municipal Bond Funds, and the Vanguard State Tax-Exempt Funds.
 | |
| P.O. Box 2600 | |
| Valley Forge, PA 19482-2600 |
Connect with Vanguard® > vanguard.com
| Fund Information > 800-662-7447 | The funds or securities referred to herein are not |
| Direct Investor Account Services > 800-662-2739 | sponsored, endorsed, or promoted by MSCI, and MSCI |
| bears no liability with respect to any such funds or | |
| Institutional Investor Services > 800-523-1036 | securities. The prospectus or the Statement of |
| Text Telephone for People | Additional Information contains a more detailed |
| With Hearing Impairment > 800-749-7273 | description of the limited relationship MSCI has with |
| Vanguard and any related funds. | |
| This material may be used in conjunction | |
| with the offering of shares of any Vanguard | |
| fund only if preceded or accompanied by | |
| the fund’s current prospectus. | |
| All comparative mutual fund data are from Lipper, a | |
| Thomson Reuters Company, or Morningstar, Inc., unless | |
| otherwise noted. | |
| You can obtain a free copy of Vanguard’s proxy voting | |
| guidelines by visiting vanguard.com/proxyreporting or by | |
| calling Vanguard at 800-662-2739. The guidelines are | |
| also available from the SEC’s website, sec.gov. In | |
| addition, you may obtain a free report on how your fund | |
| voted the proxies for securities it owned during the 12 | |
| months ended June 30. To get the report, visit either | |
| vanguard.com/proxyreporting or sec.gov. | |
| You can review and copy information about your fund at | |
| the SEC’s Public Reference Room in Washington, D.C. To | |
| find out more about this public service, call the SEC at | |
| 202-551-8090. Information about your fund is also | |
| available on the SEC’s website, and you can receive | |
| copies of this information, for a fee, by sending a | |
| request in either of two ways: via e-mail addressed to | |
| publicinfo@sec.gov or via regular mail addressed to the | |
| Public Reference Section, Securities and Exchange | |
| Commission, Washington, DC 20549-1520. | |
| © 2014 The Vanguard Group, Inc. | |
| All rights reserved. | |
| Vanguard Marketing Corporation, Distributor. | |
| Q03070 022014 | |
![]()
Annual Report | December 31, 2013
Vanguard Total Stock Market Index Fund

Vanguard’s Principles for Investing Success
We want to give you the best chance of investment success. These principles, grounded in Vanguard’s research and experience, can put you on the right path.
Goals. Create clear, appropriate investment goals.
Balance. Develop a suitable asset allocation using broadly diversified funds. Cost. Minimize cost.
Discipline. Maintain perspective and long-term discipline.
A single theme unites these principles: Focus on the things you can control.
We believe there is no wiser course for any investor.
| Contents | |
| Your Fund’s Total Returns. | 1 |
| Chairman’s Letter. | 2 |
| Fund Profile. | 8 |
| Performance Summary. | 9 |
| Financial Statements. | 12 |
| Your Fund’s After-Tax Returns. | 30 |
| About Your Fund’s Expenses. | 31 |
| Glossary. | 33 |
Please note: The opinions expressed in this report are just that—informed opinions. They should not be considered promises or advice. Also, please keep in mind that the information and opinions cover the period through the date on the front of this report. Of course, the risks of investing in your fund are spelled out in the prospectus.
See the Glossary for definitions of investment terms used in this report.
About the cover: The ship’s wheel represents leadership and guidance, essential qualities in navigating difficult seas. This one is a replica based on an 18th-century British vessel. The HMSVanguard, another ship of that era, served as the flagship for British Admiral Horatio Nelson when he defeated a French fleet at the Battle of the Nile.
| Your Fund’s Total Returns | |
| Fiscal Year Ended December 31, 2013 | |
| Total | |
| Returns | |
| Vanguard Total Stock Market Index Fund | |
| Investor Shares | 33.35% |
| Admiral™ Shares | 33.52 |
| Signal® Shares | 33.51 |
| Institutional Shares | 33.49 |
| ETF Shares | |
| Market Price | 33.48 |
| Net Asset Value | 33.51 |
| Spliced Total Stock Market Index | 33.51 |
| Multi-Cap Core Funds Average | 32.12 |
For a benchmark description, see the Glossary.
Multi-Cap Core Funds Average: Derived from data provided by Lipper, a Thomson Reuters Company.
Admiral Shares carry lower expenses and are available to investors who meet certain account-balance requirements. Signal Shares and Institutional Shares are available to certain institutional investors who meet specific administrative, service, and account-size criteria. The Vanguard ETF® Shares shown are traded on the NYSE Arca exchange and are available only through brokers. The table provides ETF returns based on both the NYSE Arca market price and the net asset value for a share. U.S. Pat. Nos. 6,879,964; 7,337,138; 7,720,749; 7,925,573; 8,090,646; and 8,417,623.
For the ETF Shares, the market price is determined by the midpoint of the bid-offer spread as of the closing time of the New York Stock Exchange (generally 4 p.m., Eastern time). The net asset value is also determined as of the NYSE closing time. For more information about how the ETF Shares' market prices have compared with their net asset value, visit vanguard.com, select your ETF, and then select the Price and Performance tab. The ETF premium/discount analysis there shows the percentages of days on which the ETF Shares' market price was above or below the NAV.
| Your Fund’s Performance at a Glance | ||||
| December 31, 2012, Through December 31, 2013 | ||||
| Distributions Per Share | ||||
| Starting | Ending | |||
| Share | Share | Income | Capital | |
| Price | Price | Dividends | Gains | |
| Vanguard Total Stock Market Index Fund | ||||
| Investor Shares | $35.64 | $46.67 | $0.765 | $0.000 |
| Admiral Shares | 35.65 | 46.69 | 0.814 | 0.000 |
| Signal Shares | 34.41 | 45.06 | 0.786 | 0.000 |
| Institutional Shares | 35.66 | 46.69 | 0.816 | 0.000 |
| ETF Shares | 73.24 | 95.91 | 1.673 | 0.000 |
1

Chairman’s Letter
Dear Shareholder,
U.S. stocks led global markets in 2013 as investor confidence trumped political wrangling in Washington, a mixed economic picture, and fiscal policy uncertainty.
For the 12 months ended December 31, 2013, Vanguard Total Stock Market Index Fund closely tracked its benchmark, the Spliced Total Stock Market Index, which returned about 34%, and surpassed the average return of its peer group. It was the fund’s best calendar-year result since 1995.
Please note that in October, we announced plans to streamline Vanguard’s share-class offerings by phasing out Signal Shares. Your fund’s Signal Shares will be converted to Admiral Shares by October 2014.
If you own the fund in a taxable account, you may wish to review the information on after-tax returns presented later in this report.
Earnings, optimism, and stimulus made it a big year for U.S. stocks
For the year ended December 31, U.S. corporations posted solid earnings, and investors placed a higher premium on those earnings. The Federal Reserve’s stimulative bond-buying program also supported stock markets; in fact, markets slumped a bit in the summer when questions arose about the timing of the program’s unwinding. In December, the Fed ended the uncertainty by announcing that it would begin paring its bond purchases in January 2014.
2
International stocks, in aggregate, returned about 15% as the developed markets of Europe and the Pacific region posted double-digit results and emerging-market stocks dipped into negative territory.
For 2014, Vanguard Chief Economist Joe Davis and his team are guarded in their outlook for global stock returns, and their forecast for the bond market remains muted. Although Joe readily acknowledges that such forecasts are accompanied by uncertainty, he writes, “We believe a balanced and diversified, low-cost portfolio can remain a high-value proposition in the decade ahead.” (You can read more about our expectations for bond and stock returns in Vanguard’s Economic and Investment Outlook, available at vanguard.com/research.)
Bond returns faltered as the Fed’s phaseout loomed
The broad U.S. taxable bond market returned –2.02%—its first negative calendar-year result since 1999 and its worst since 1994. The Fed’s plan for phasing out its bond-buying program rattled investors, who sold bonds in anticipation of further price declines. Municipal bonds returned –2.55% in aggregate. The yield of the 10-year Treasury note closed at 2.97%, up from 1.76% at the close of December 2012. (Bond yields and prices move in opposite directions.)
International bond markets (as measured by the Barclays Global Aggregate Index ex USD) returned –3.08%. Returns for
| Market Barometer | |||
| Average Annual Total Returns | |||
| Periods Ended December 31, 2013 | |||
| One | Three | Five | |
| Year | Years | Years | |
| Stocks | |||
| Russell 1000 Index (Large-caps) | 33.11% | 16.30% | 18.59% |
| Russell 2000 Index (Small-caps) | 38.82 | 15.67 | 20.08 |
| Russell 3000 Index (Broad U.S. market) | 33.55 | 16.24 | 18.71 |
| MSCI All Country World Index ex USA (International) | 15.29 | 5.14 | 12.81 |
| Bonds | |||
| Barclays U.S. Aggregate Bond Index (Broad taxable market) | -2.02% | 3.26% | 4.44% |
| Barclays Municipal Bond Index (Broad tax-exempt market) | -2.55 | 4.83 | 5.89 |
| Citigroup Three-Month U.S. Treasury Bill Index | 0.05 | 0.06 | 0.09 |
| CPI | |||
| Consumer Price Index | 1.50% | 2.07% | 2.08% |
3
money market funds and savings accounts remained tiny as the Fed held short-term interest rates between 0% and 0.25%.
Financial, consumer services, and industrial stocks stood out Vanguard Total Stock Market Index Fund benefited from widespread gains across all market segments. The stocks of small and midsized U.S. companies performed best, but stocks of all sizes rode the rising tide of investor confidence. Each of the fund’s ten sectors posted double-digit returns.
The financial, consumer services, and industrial sectors, which together constituted more than 40% of the fund’s assets, contributed most to its overall result. Financial stocks soared, thanks partly to improvements in the U.S. economic outlook and increased investment activity. Credit-card processors, investment service providers, banks, and insurance companies recorded impressive returns.
Consumer services stocks also benefited from rising consumer confidence. Large retailers, media companies, and leisure and hospitality providers did well. With the labor market improving, inflation low, and home values rising, consumers were willing to spend more money on shopping, eating out, and entertainment.
Industrial stocks stood out largely because of the strength of major conglomerates, including some in the aerospace and defense industry, where technological
| Expense Ratios | ||||||
| Your Fund Compared With Its Peer Group | ||||||
| Peer | ||||||
| Investor | Admiral | Signal | Institutional | ETF | Group | |
| Shares | Shares | Shares | Shares | Shares | Average | |
| Total Stock Market Index Fund | 0.17% | 0.05% | 0.05% | 0.04% | 0.05% | 1.20% |
The fund expense ratios shown are from the prospectus dated August 12, 2013, and represent estimated costs for the current fiscal year. For the fiscal year ended December 31, 2013, the fund’s expense ratios were: 0.17% for Investor Shares, 0.05% for Admiral Shares, 0.05% for Signal Shares, 0.04% for Institutional Shares, and 0.05% for ETF Shares. The peer-group expense ratio is derived from data provided by Lipper, a Thomson Reuters Company, and captures information through year-end 2012.
Peer group: Multi-Cap Core Funds.
4
improvements and cost management have helped counteract cuts in government spending.
Telecommunication and utilities, which made up a relatively small proportion of the fund’s holdings, had the smallest gains.
The fund has a strong record of tracking its benchmark index
For the decade ended December 31, 2013, Vanguard Total Stock Market Index Fund’s Investor Shares posted an annual average return of 7.99%, in line with its broad-market benchmark and ahead of the average return of its peers.
The fund successfully tracked its benchmark’s return over a volatile ten years, which included the 2008–2009 financial crisis. Credit goes to the fund’s advisor, Vanguard Equity Investment Group, whose experience and sophisticated portfolio tracking techniques enabled the fund to capture the returns of its benchmark while keeping costs low.
| Total Returns | |
| Ten Years Ended December 31, 2013 | |
| Average | |
| Annual Return | |
| Total Stock Market Index Fund Investor Shares | 7.99% |
| Spliced Total Stock Market Index | 8.11 |
| Multi-Cap Core Funds Average | 6.88 |
For a benchmark description, see the Glossary.
Multi-Cap Core Funds Average: Derived from data provided by Lipper, a Thomson Reuters Company.
The figures shown represent past performance, which is not a guarantee of future results. (Current performance may be lower or higher than the performance data cited. For performance data current to the most recent month-end, visit our website at vanguard.com/performance.) Note, too, that both investment returns and principal value can fluctuate widely, so an investor’s shares, when sold, could be worth more or less than their original cost.
5
Don’t let a trick of the calendar alter your course
When making investment decisions, it’s important to weigh past returns with caution. That’s because investment returns from any particular period are an unreliable anchor for gauging the future. They can be highly date-dependent.
For example, take the five-year average annual return for the broad U.S. stock market. That average just made a startling bounce: from 2.04% for the period ended December 31, 2012, to 18.71% for the period ended December 31, 2013. True, the market returned a hearty 33.55% in the most recent 12 months, but that’s not enough to explain such a big leap in the average. Significantly, the 12 months ended December 31, 2008—when U.S. stocks returned –37.31% during the financial crisis—has now rolled off the five-year calculation.
The important thing to remember is that historical returns are just that: historical. Basing investment decisions on such date-dependent snapshots could easily lead you to alter course—possibly in the wrong direction. Instead, Vanguard believes, you should build your asset allocation strategy on long-term risk-and-return relationships, always recognizing that no level of return is guaranteed.
Which five-year average should you count on? (Answer: None of them!)
Average annual returns for U.S. stocks over five-year periods ended December 31
| 2007 | 13.63% |
| 2008 | –1.95 |
| 2009 | 0.76 |
| 2010 | 2.74 |
| 2011 | –0.01 |
| 2012 | 2.04 |
| 2013 | 18.71 |
| Note: The U.S. stock market is represented by the Russell 3000 Index. | |
| Source: Vanguard. |
6
Rebalancing your portfolio keeps your target in focus
The surge in U.S. stocks in 2013 undoubtedly brought good cheer to investors at the end of the year. Although the rally has been welcome, we simply don’t know how long it will last. History teaches that it’s wise to anticipate a pullback after an extended winning streak.
At Vanguard, no matter what the current market conditions, we encourage you to maintain a diversified portfolio with a mix of stock, bond, and money market funds consistent with your long-term goals and risk tolerance.
Following such a robust year for stocks, you may find that your asset mix has drifted from your original target. If your allocation is off-target by about 5 percentage points or more, it may be time to rebalance. Specifically, the strong results for stocks and weak results for bonds in 2013 may mean directing assets from equities to fixed income.
I understand that it feels counterintuitive to move away from one asset class that has done well recently and into another that has underperformed. But, as a Vanguard research paper puts it, “bonds are likely to remain one of the best diversifiers of equity market risk and . . . will likely provide downside protection to balanced investors over the long term.” (You can read the paper, Risk of Loss: Should the Prospect of Rising Rates Push Investors from High-Quality Bonds?, at vanguard.com/research.)
Ultimately, rebalancing is about controlling risk by keeping your portfolio in line with your target asset allocation. The alternative is to allow market fluctuations to set your asset mix, potentially leaving you with a riskier portfolio than you intended. As we’ve long counseled our clients, focusing on what you can control is one of the most prudent steps an investor can take.
Thank you for entrusting your assets to Vanguard.
Sincerely,

F. William McNabb III
Chairman and Chief Executive Officer
January 13, 2014
7
Total Stock Market Index Fund
Fund Profile
As of December 31, 2013
| Share-Class Characteristics | |||||
| Investor | Admiral | Signal | Institutional | ||
| Shares | Shares | Shares | Shares | ETF Shares | |
| Ticker Symbol | VTSMX | VTSAX | VTSSX | VITSX | VTI |
| Expense Ratio1 | 0.17% | 0.05% | 0.05% | 0.04% | 0.05% |
| 30-Day SEC Yield | 1.68% | 1.80% | 1.80% | 1.80% | 1.80% |
| Portfolio Characteristics | ||
| CRSP US | ||
| Total Market | ||
| Fund | Index | |
| Number of Stocks | 3,657 | 3,626 |
| Median Market Cap | $45.6B | $45.6B |
| Price/Earnings Ratio | 20.6x | 20.7x |
| Price/Book Ratio | 2.7x | 2.7x |
| Return on Equity | 16.8% | 16.6% |
| Earnings Growth | ||
| Rate | 11.4% | 11.3% |
| Dividend Yield | 1.8% | 1.8% |
| Foreign Holdings | 0.0% | 0.0% |
| Turnover Rate | 4% | — |
| Short-Term Reserves | 0.0% | — |
| Sector Diversification (% of equity exposure) | ||
| CRSP US | ||
| Total Market | ||
| Fund | Index | |
| Basic Materials | 3.1% | 3.1% |
| Consumer Goods | 10.1 | 10.1 |
| Consumer Services | 13.5 | 13.5 |
| Financials | 18.5 | 18.5 |
| Health Care | 11.8 | 11.8 |
| Industrials | 13.7 | 13.7 |
| Oil & Gas | 9.2 | 9.2 |
| Technology | 15.0 | 15.0 |
| Telecommunications | 2.1 | 2.1 |
| Utilities | 3.0 | 3.0 |
| Volatility Measures | ||
| Spliced Total | ||
| Stock Market | ||
| Index | ||
| R-Squared | 1.00 | |
| Beta | 1.00 | |
| These measures show the degree and timing of the fund’s fluctuations compared with the index over 36 months. | ||
| Ten Largest Holdings (% of total net assets) | ||
| Apple Inc. | Computer Hardware | 2.5% |
| Exxon Mobil Corp. | Integrated Oil & Gas | 2.2 |
| Google Inc. | Internet | 1.5 |
| General Electric Co. | Diversified Industrials | 1.4 |
| Microsoft Corp. | Software | 1.4 |
| Johnson & Johnson | Pharmaceuticals | 1.3 |
| Chevron Corp. | Integrated Oil & Gas | 1.2 |
| Wells Fargo & Co. | Banks | 1.2 |
| Procter & Gamble Co. | Nondurable | |
| Household Products | 1.1 | |
| JPMorgan Chase & Co. | Banks | 1.1 |
| Top Ten | 14.9% | |
| The holdings listed exclude any temporary cash investments and equity index products. | ||
Investment Focus
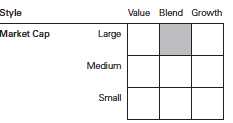
1 The expense ratios shown are from the prospectus dated August 12, 2013, and represent estimated costs for the current fiscal year. For the fiscal year ended December 31, 2013, the expense ratios were 0.17% for Investor Shares, 0.05% for Admiral Shares, 0.05% for Signal Shares, 0.04% for Institutional Shares, and 0.05% for ETF Shares.
8
Total Stock Market Index Fund
Performance Summary
All of the returns in this report represent past performance, which is not a guarantee of future results that may be achieved by the fund. (Current performance may be lower or higher than the performance data cited. For performance data current to the most recent month-end, visit our website at vanguard.com/performance.) Note, too, that both investment returns and principal value can fluctuate widely, so an investor’s shares, when sold, could be worth more or less than their original cost. The returns shown do not reflect taxes that a shareholder would pay on fund distributions or on the sale of fund shares.
Cumulative Performance: December 31, 2003, Through December 31, 2013
Initial Investment of $10,000
| Average Annual Total Returns | |||||
| Periods Ended December 31, 2013 | |||||
| Final Value | |||||
| One | Five | Ten | of a $10,000 | ||
| Year | Years | Years | Investment | ||
| Total Stock Market Index | |||||
| Fund*Investor Shares | 33.35% | 18.72% | 7.99% | $21,578 | |
| •••••••• | Spliced Total Stock Market Index | 33.51 | 18.87 | 8.11 | 21,810 |
| – – – – | Multi-Cap Core Funds Average | 32.12 | 17.45 | 6.88 | 19,459 |
| For a benchmark description, see the Glossary. | |||||
| Multi-Cap Core Funds Average: Derived from data provided by Lipper, a Thomson Reuters Company. | |||||
| Final Value | |||||
| One | Five | Ten | of a $10,000 | ||
| Year | Years | Years | Investment | ||
| Total Stock Market Index Fund Admiral | |||||
| Shares | 33.52% | 18.86% | 8.11% | $21,803 | |
| Spliced Total Stock Market Index | 33.51 | 18.87 | 8.11 | 21,810 | |
See Financial Highlights for dividend and capital gains information.
9
| Total Stock Market Index Fund | ||||
| Average Annual Total Returns | ||||
| Periods Ended December 31, 2013 | ||||
| Since | Final Value | |||
| One | Five | Inception | of a $10,000 | |
| Year | Years | (9/1/2006) | Investment | |
| Total Stock Market Index Fund Signal Shares | 33.51% | 18.86% | 7.67% | $17,193 |
| Spliced Total Stock Market Index | 33.51 | 18.87 | 7.67 | 17,193 |
"Since Inception" performance is calculated from the Signal Shares’ inception date for both the fund and its comparative standard.
| Final Value | ||||
| One | Five | Ten | of a $5,000,000 | |
| Year | Years | Years | Investment | |
| Total Stock Market Index Fund Institutional | ||||
| Shares | 33.49% | 18.86% | 8.12% | $10,916,516 |
| Spliced Total Stock Market Index | 33.51 | 18.87 | 8.11 | 10,905,000 |
| Final Value | ||||
| One | Five | Ten | of a $10,000 | |
| Year | Years | Years | Investment | |
| Total Stock Market Index Fund | ||||
| ETF Shares Net Asset Value | 33.51% | 18.86% | 8.11% | $21,804 |
| Spliced Total Stock Market Index | 33.51 | 18.87 | 8.11 | 21,810 |
| Cumulative Returns of ETF Shares: December 31, 2003, Through December 31, 2013 | ||||
| One | Five | Ten | ||
| Year | Years | Years | ||
| Total Stock Market Index Fund ETF Shares Market | ||||
| Price | 33.48% | 137.01% | 118.47% | |
| Total Stock Market Index Fund ETF Shares Net | ||||
| Asset Value | 33.51 | 137.25 | 118.04 | |
| Spliced Total Stock Market Index | 33.51 | 137.31 | 118.10 | |
10
Total Stock Market Index Fund
Fiscal-Year Total Returns (%): December 31, 2003, Through December 31, 2013
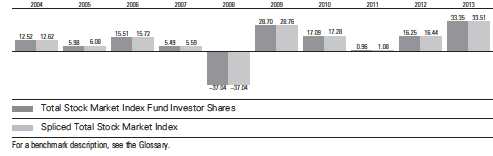
11
Total Stock Market Index Fund
Financial Statements
Statement of Net Assets—Investments Summary
As of December 31, 2013
This Statement summarizes the fund’s holdings by asset type. Details are reported for each of the fund’s 50 largest individual holdings and for investments that, in total for any issuer, represent more than 1% of the fund’s net assets. The total value of smaller holdings is reported as a single amount within each category.
The fund reports a complete list of its holdings in regulatory filings four times in each fiscal year, at the quarter-ends. For the second and fourth fiscal quarters, the complete listing of the fund’s holdings is available electronically on vanguard.com and on the Securities and Exchange Commission’s website (sec.gov), or you can have it mailed to you without charge by calling 800-662-7447. For the first and third fiscal quarters, the fund files the lists with the SEC on Form N-Q. Shareholders can look up the fund’s Forms N-Q on the SEC’s website. Forms N-Q may also be reviewed and copied at the SEC’s Public Reference Room (see the back cover of this report for further information).
| Market | Percentage | ||
| Value | of Net | ||
| Shares | ($000) | Assets | |
| Common Stocks | |||
| Basic Materials † | 9,399,466 | 3.1% | |
| Consumer Goods | |||
| Procter & Gamble Co. | 40,641,359 | 3,308,613 | 1.1% |
| Coca-Cola Co. | 59,421,978 | 2,454,722 | 0.8% |
| Philip Morris International Inc. | 22,756,955 | 1,982,813 | 0.6% |
| PepsiCo Inc. | 22,929,633 | 1,901,784 | 0.6% |
| Altria Group Inc. | 29,910,707 | 1,148,272 | 0.4% |
| Consumer Goods—Other † | 20,132,989 | 6.6% | |
| 30,929,193 | 10.1% | ||
| Consumer Services | |||
| * Amazon.com Inc. | 5,475,019 | 2,183,383 | 0.7% |
| Wal-Mart Stores Inc. | 24,189,821 | 1,903,497 | 0.6% |
| Walt Disney Co. | 23,646,469 | 1,806,590 | 0.6% |
| Comcast Corp. Class A | 34,167,767 | 1,775,528 | 0.6% |
| Home Depot Inc. | 21,055,044 | 1,733,672 | 0.5% |
| McDonald’s Corp. | 14,877,163 | 1,443,531 | 0.5% |
| CVS Caremark Corp. | 17,796,307 | 1,273,682 | 0.4% |
| Consumer Services—Other † | 29,209,024 | 9.5% | |
| 41,328,907 | 13.4% | ||
| Financials | |||
| Wells Fargo & Co. | 78,758,148 | 3,575,620 | 1.2% |
| JPMorgan Chase & Co. | 56,205,292 | 3,286,885 | 1.1% |
| * Berkshire Hathaway Inc. Class B | 25,008,837 | 2,965,048 | 1.0% |
| Bank of America Corp. | 159,473,913 | 2,483,009 | 0.8% |
| Citigroup Inc. | 43,080,409 | 2,244,920 | 0.7% |
| Visa Inc. Class A | 7,574,401 | 1,686,668 | 0.5% |
| American Express Co. | 16,017,064 | 1,453,228 | 0.5% |
| MasterCard Inc. Class A | 1,558,703 | 1,302,234 | 0.4% |
| * Berkshire Hathaway Inc. Class A | 863 | 153,528 | 0.0% |
| Financials—Other † | 37,262,746 | 12.1% | |
| 56,413,886 | 18.3% | ||
12
| Total Stock Market Index Fund | ||||
| Market | Percentage | |||
| Value | of Net | |||
| Shares | ($000) | Assets | ||
| Health Care | ||||
| Johnson & Johnson | 42,184,572 | 3,863,685 | 1.3% | |
| Pfizer Inc. | 96,901,359 | 2,968,089 | 1.0% | |
| Merck & Co. Inc. | 43,687,086 | 2,186,539 | 0.7% | |
| * | Gilead Sciences Inc. | 22,925,819 | 1,722,875 | 0.6% |
| Bristol-Myers Squibb Co. | 24,617,645 | 1,308,428 | 0.4% | |
| Amgen Inc. | 11,275,272 | 1,287,185 | 0.4% | |
| AbbVie Inc. | 23,785,705 | 1,256,123 | 0.4% | |
| UnitedHealth Group Inc. | 15,052,517 | 1,133,455 | 0.4% | |
| Health Care—Other † | 20,444,324 | 6.6% | ||
| 36,170,703 | 11.8% | |||
| Industrials | ||||
| General Electric Co. | 151,269,232 | 4,240,077 | 1.4% | |
| United Technologies Corp. | 13,718,897 | 1,561,210 | 0.5% | |
| Boeing Co. | 11,235,254 | 1,533,500 | 0.5% | |
| 3M Co. | 10,066,420 | 1,411,815 | 0.4% | |
| Union Pacific Corp. | 6,886,216 | 1,156,884 | 0.4% | |
| United Parcel Service Inc. Class B | 10,701,874 | 1,124,553 | 0.4% | |
| Industrials—Other † | 30,767,450 | 10.0% | ||
| 41,795,489 | 13.6% | |||
| Oil & Gas | ||||
| Exxon Mobil Corp. | 65,315,614 | 6,609,940 | 2.1% | |
| Chevron Corp. | 28,754,174 | 3,591,684 | 1.2% | |
| Schlumberger Ltd. | 19,690,385 | 1,774,301 | 0.6% | |
| ConocoPhillips | 18,317,018 | 1,294,097 | 0.4% | |
| Occidental Petroleum Corp. | 12,051,209 | 1,146,070 | 0.4% | |
| Oil & Gas—Other † | 13,818,086 | 4.5% | ||
| 28,234,178 | 9.2% | |||
| Other † | 491 | 0.0% | ||
| Technology | ||||
| Apple Inc. | 13,452,375 | 7,548,262 | 2.4% | |
| * | Google Inc. Class A | 4,137,406 | 4,636,832 | 1.5% |
| Microsoft Corp. | 112,332,767 | 4,204,615 | 1.4% | |
| International Business Machines Corp. | 16,235,143 | 3,045,226 | 1.0% | |
| Oracle Corp. | 51,105,408 | 1,955,293 | 0.6% | |
| Intel Corp. | 74,323,592 | 1,929,440 | 0.6% | |
| QUALCOMM Inc. | 25,259,525 | 1,875,520 | 0.6% | |
| Cisco Systems Inc. | 79,939,775 | 1,794,648 | 0.6% | |
| * | Facebook Inc. Class A | 28,018,403 | 1,531,486 | 0.5% |
| Technology—Other † | 17,437,080 | 5.7% | ||
| 45,958,402 | 14.9% | |||
| Telecommunications | ||||
| AT&T Inc. | 78,764,177 | 2,769,348 | 0.9% | |
| Verizon Communications Inc. | 42,764,103 | 2,101,428 | 0.7% | |
| Telecommunications—Other † | 1,552,739 | 0.5% | ||
| 6,423,515 | 2.1% | |||
| Utilities † | 9,198,729 | 3.0% | ||
| Total Common Stocks (Cost $204,351,223) | 305,852,959 | 99.5%1 | ||
13
| Total Stock Market Index Fund | ||||
| Market | Percentage | |||
| Value | of Net | |||
| Coupon | Shares | ($000) | Assets | |
| Temporary Cash Investments | ||||
| Money Market Fund | ||||
| 2,3 Vanguard Market Liquidity Fund | 0.125% | 2,263,406,146 | 2,263,406 | 0.8% |
| 4U.S. Government and Agency Obligations † | 75,595 | 0.0% | ||
| Total Temporary Cash Investments (Cost $2,339,008) | 2,339,001 | 0.8%1 | ||
| 5Total Investments (Cost $206,690,231) | 308,191,960 | 100.3% | ||
| Other Assets and Liabilities | ||||
| Other Assets | 1,845,573 | 0.6% | ||
| Liabilities3 | (2,705,412) | (0.9%) | ||
| (859,839) | (0.3%) | |||
| Net Assets | 307,332,121 | 100.0% | ||
| At December 31, 2013, net assets consisted of: | ||||
| Amount | ||||
| ($000) | ||||
| Paid-in Capital | 209,566,446 | |||
| Overdistributed Net Investment Income | (119,086) | |||
| Accumulated Net Realized Losses | (3,653,864) | |||
| Unrealized Appreciation (Depreciation) | ||||
| Investment Securities | 101,501,729 | |||
| Futures Contracts | 34,929 | |||
| Swap Contracts | 1,967 | |||
| Net Assets | 307,332,121 | |||
| Investor Shares—Net Assets | ||||
| Applicable to 2,249,870,593 outstanding $.001 par value shares of | ||||
| beneficial interest (unlimited authorization) | 105,008,333 | |||
| Net Asset Value Per Share—Investor Shares | $46.67 | |||
| Admiral Shares—Net Assets | ||||
| Applicable to 1,853,634,021 outstanding $.001 par value shares of | ||||
| beneficial interest (unlimited authorization) | 86,541,305 | |||
| Net Asset Value Per Share—Admiral Shares | $46.69 | |||
14
| Total Stock Market Index Fund | |
| Amount | |
| ($000) | |
| Signal Shares—Net Assets | |
| Applicable to 241,446,876 outstanding $.001 par value shares of | |
| beneficial interest (unlimited authorization) | 10,879,125 |
| Net Asset Value Per Share—Signal Shares | $45.06 |
| Institutional Shares—Net Assets | |
| Applicable to 1,407,852,869 outstanding $.001 par value shares of | |
| beneficial interest (unlimited authorization) | 65,738,416 |
| Net Asset Value Per Share—Institutional Shares | $46.69 |
| ETF Shares—Net Assets | |
| Applicable to 408,344,918 outstanding $.001 par value shares of | |
| beneficial interest (unlimited authorization) | 39,164,942 |
| Net Asset Value Per Share—ETF Shares | $95.91 |
See Note A in Notes to Financial Statements.
Non-income-producing security.
Represents the aggregate value, by category, of securities that are not among the 50 largest holdings and, in total for any issuer, represent 1% or less of net assets.
1 The fund invests a portion of its cash reserves in equity markets through the use of index futures contracts. After giving effect to futures investments, the fund's effective common stock and temporary cash investment positions represent 100.0% and 0.3%, respectively, of net assets.
2 Affiliated money market fund available only to Vanguard funds and certain trusts and accounts managed by Vanguard. Rate shown is the 7-day yield.
3 Includes $901,050,000 of collateral received for securities on loan.
4 Securities with a value of $59,095,000 have been segregated as inital margin for open futures contracts.
5 The total value of securities on loan is $854,514,000.
See accompanying Notes, which are an integral part of the Financial Statements.
15
| Total Stock Market Index Fund | |
| Statement of Operations | |
| Year Ended | |
| December 31, 2013 | |
| ($000) | |
| Investment Income | |
| Income | |
| Dividends | 5,168,693 |
| Interest1 | 1,434 |
| Securities Lending | 49,826 |
| Total Income | 5,219,953 |
| Expenses | |
| The Vanguard Group—Note B | |
| Investment Advisory Services | 11,764 |
| Management and Administrative—Investor Shares | 135,533 |
| Management and Administrative—Admiral Shares | 22,211 |
| Management and Administrative—Signal Shares | 2,018 |
| Management and Administrative—Institutional Shares | 8,962 |
| Management and Administrative—ETF Shares | 7,001 |
| Marketing and Distribution—Investor Shares | 17,700 |
| Marketing and Distribution—Admiral Shares | 10,156 |
| Marketing and Distribution—Signal Shares | 2,356 |
| Marketing and Distribution—Institutional Shares | 11,317 |
| Marketing and Distribution—ETF Shares | 6,790 |
| Custodian Fees | 2,409 |
| Auditing Fees | 35 |
| Shareholders’ Reports—Investor Shares | 147 |
| Shareholders’ Reports—Admiral Shares | 148 |
| Shareholders’ Reports—Signal Shares | 29 |
| Shareholders’ Reports—Institutional Shares | 22 |
| Shareholders’ Reports—ETF Shares | 458 |
| Trustees’ Fees and Expenses | 301 |
| Total Expenses | 239,357 |
| Net Investment Income | 4,980,596 |
| Realized Net Gain (Loss) | |
| Investment Securities Sold | 1,535,135 |
| Futures Contracts | 211,339 |
| Swap Contracts | 72,047 |
| Realized Net Gain (Loss) | 1,818,521 |
| Change in Unrealized Appreciation (Depreciation) | |
| Investment Securities | 67,247,666 |
| Futures Contracts | 31,993 |
| Swap Contracts | (2,595) |
| Change in Unrealized Appreciation (Depreciation) | 67,277,064 |
| Net Increase (Decrease) in Net Assets Resulting from Operations | 74,076,181 |
| 1 Interest income from an affiliated company of the fund was $1,368,000. | |
| See accompanying Notes, which are an integral part of the Financial Statements. | |
16
| Total Stock Market Index Fund | ||
| Statement of Changes in Net Assets | ||
| Year Ended December 31, | ||
| 2013 | 2012 | |
| ($000) | ($000) | |
| Increase (Decrease) in Net Assets | ||
| Operations | ||
| Net Investment Income | 4,980,596 | 4,201,141 |
| Realized Net Gain (Loss) | 1,818,521 | 3,590,512 |
| Change in Unrealized Appreciation (Depreciation) | 67,277,064 | 20,295,286 |
| Net Increase (Decrease) in Net Assets Resulting from Operations | 74,076,181 | 28,086,939 |
| Distributions | ||
| Net Investment Income | ||
| Investor Shares | (1,729,931) | (1,512,860) |
| Admiral Shares | (1,453,044) | (1,242,985) |
| Signal Shares | (196,060) | (162,769) |
| Institutional Shares | (1,027,734) | (803,059) |
| ETF Shares | (639,967) | (489,484) |
| Realized Capital Gain | ||
| Investor Shares | — | — |
| Admiral Shares | — | — |
| Signal Shares | — | — |
| Institutional Shares | — | — |
| ETF Shares | — | — |
| Total Distributions | (5,046,736) | (4,211,157) |
| Capital Share Transactions | ||
| Investor Shares | 1,154,267 | 7,341,080 |
| Admiral Shares | 7,305,262 | 3,306,885 |
| Signal Shares | 242,207 | 1,009,438 |
| Institutional Shares | 12,750,062 | 5,518,094 |
| ETF Shares | 6,481,221 | 2,033,357 |
| Net Increase (Decrease) from Capital Share Transactions | 27,933,019 | 19,208,854 |
| Total Increase (Decrease) | 96,962,464 | 43,084,636 |
| Net Assets | ||
| Beginning of Period | 210,369,657 | 167,285,021 |
| End of Period1 | 307,332,121 | 210,369,657 |
1 Net Assets—End of Period includes undistributed (overdistributed) net investment income of ($119,086,000) and ($126,046,000).
See accompanying Notes, which are an integral part of the Financial Statements.
17
| Total Stock Market Index Fund | |||||
| Financial Highlights | |||||
| Investor Shares | |||||
| For a Share Outstanding | Year Ended December 31, | ||||
| Throughout Each Period | 2013 | 2012 | 2011 | 2010 | 2009 |
| Net Asset Value, Beginning of Period | $35.64 | $31.29 | $31.56 | $27.45 | $21.80 |
| Investment Operations | |||||
| Net Investment Income | .757 | .720 | .565 | .523 | .514 |
| Net Realized and Unrealized Gain (Loss) | |||||
| on Investments | 11.038 | 4.350 | (.273) | 4.117 | 5.651 |
| Total from Investment Operations | 11.795 | 5.070 | .292 | 4.640 | 6.165 |
| Distributions | |||||
| Dividends from Net Investment Income | (.765) | (.720) | (. 562) | (. 530) | (. 515) |
| Distributions from Realized Capital Gains | — | — | — | — | — |
| Total Distributions | (.765) | (.720) | (. 562) | (. 530) | (. 515) |
| Net Asset Value, End of Period | $46.67 | $35.64 | $31.29 | $31.56 | $27.45 |
| Total Return1 | 33.35% | 16.25% | 0.96% | 17.09% | 28.70% |
| Ratios/Supplemental Data | |||||
| Net Assets, End of Period (Millions) | $105,008 | $78,936 | $62,668 | $56,063 | $58,004 |
| Ratio of Total Expenses to | |||||
| Average Net Assets | 0.17% | 0.17% | 0.17% | 0.17% | 0.18% |
| Ratio of Net Investment Income to | |||||
| Average Net Assets | 1.84% | 2.11% | 1.79% | 1.85% | 2.22% |
| Portfolio Turnover Rate2 | 4% | 3% | 5% | 5% | 5% |
1 Total returns do not include account service fees that may have applied in the periods shown. Fund prospectuses provide information about any applicable account service fees.
2 Excludes the value of portfolio securities received or delivered as a result of in-kind purchases or redemptions of the fund’s capital shares, including ETF Creation Units.
See accompanying Notes, which are an integral part of the Financial Statements.
18
| Total Stock Market Index Fund | |||||
| Financial Highlights | |||||
| Admiral Shares | |||||
| For a Share Outstanding | Year Ended December 31, | ||||
| Throughout Each Period | 2013 | 2012 | 2011 | 2010 | 2009 |
| Net Asset Value, Beginning of Period | $35.65 | $31.30 | $31.57 | $27.45 | $21.80 |
| Investment Operations | |||||
| Net Investment Income | . 807 | .761 | . 602 | . 554 | .539 |
| Net Realized and Unrealized Gain (Loss) | |||||
| on Investments | 11.047 | 4.350 | (.273) | 4.127 | 5.650 |
| Total from Investment Operations | 11.854 | 5.111 | .329 | 4.681 | 6.189 |
| Distributions | |||||
| Dividends from Net Investment Income | (.814) | (.761) | (. 599) | (. 561) | (. 539) |
| Distributions from Realized Capital Gains | — | — | — | — | — |
| Total Distributions | (.814) | (.761) | (. 599) | (. 561) | (. 539) |
| Net Asset Value, End of Period | $46.69 | $35.65 | $31.30 | $31.57 | $27.45 |
| Total Return1 | 33.52% | 16.38% | 1.08% | 17.26% | 28.83% |
| Ratios/Supplemental Data | |||||
| Net Assets, End of Period (Millions) | $86,541 | $59,771 | $49,496 | $47,190 | $27,762 |
| Ratio of Total Expenses to | |||||
| Average Net Assets | 0.05% | 0.05% | 0.05% | 0.06% | 0.07% |
| Ratio of Net Investment Income to | |||||
| Average Net Assets | 1.96% | 2.23% | 1.91% | 1.96% | 2.33% |
| Portfolio Turnover Rate2 | 4% | 3% | 5% | 5% | 5% |
1 Total returns do not include account service fees that may have applied in the periods shown. Fund prospectuses provide information about any applicable account service fees.
2 Excludes the value of portfolio securities received or delivered as a result of in-kind purchases or redemptions of the fund’s capital shares, including ETF Creation Units.
See accompanying Notes, which are an integral part of the Financial Statements.
19
| Total Stock Market Index Fund | |||||
| Financial Highlights | |||||
| Signal Shares | |||||
| For a Share Outstanding | Year Ended December 31, | ||||
| Throughout Each Period | 2013 | 2012 | 2011 | 2010 | 2009 |
| Net Asset Value, Beginning of Period | $34.41 | $30.21 | $30.47 | $26.50 | $21.04 |
| Investment Operations | |||||
| Net Investment Income | .778 | .735 | .581 | .535 | .520 |
| Net Realized and Unrealized Gain (Loss) | |||||
| on Investments | 10.658 | 4.200 | (.262) | 3.977 | 5.459 |
| Total from Investment Operations | 11.436 | 4.935 | . 319 | 4.512 | 5.979 |
| Distributions | |||||
| Dividends from Net Investment Income | (.786) | (.735) | (.579) | (.542) | (. 519) |
| Distributions from Realized Capital Gains | — | — | — | — | — |
| Total Distributions | (.786) | (.735) | (.579) | (.542) | (. 519) |
| Net Asset Value, End of Period | $45.06 | $34.41 | $30.21 | $30.47 | $26.50 |
| Total Return | 33.51% | 16.39% | 1.09% | 17.23% | 28.85% |
| Ratios/Supplemental Data | |||||
| Net Assets, End of Period (Millions) | $10,879 | $8,025 | $6,133 | $5,471 | $4,757 |
| Ratio of Total Expenses to | |||||
| Average Net Assets | 0.05% | 0.05% | 0.05% | 0.06% | 0.07% |
| Ratio of Net Investment Income to | |||||
| Average Net Assets | 1.96% | 2.23% | 1.91% | 1.96% | 2.33% |
| Portfolio Turnover Rate1 | 4% | 3% | 5% | 5% | 5% |
1 Excludes the value of portfolio securities received or delivered as a result of in-kind purchases or redemptions of the fund’s capital shares, including ETF Creation Units.
See accompanying Notes, which are an integral part of the Financial Statements.
20
| Total Stock Market Index Fund | |||||
| Financial Highlights | |||||
| Institutional Shares | |||||
| For a Share Outstanding | Year Ended December 31, | ||||
| Throughout Each Period | 2013 | 2012 | 2011 | 2010 | 2009 |
| Net Asset Value, Beginning of Period | $35.66 | $31.30 | $31.57 | $27.46 | $21.81 |
| Investment Operations | |||||
| Net Investment Income | . 808 | .763 | .603 | .558 | .541 |
| Net Realized and Unrealized Gain (Loss) | |||||
| on Investments | 11.038 | 4.359 | (.272) | 4.117 | 5.650 |
| Total from Investment Operations | 11.846 | 5.122 | .331 | 4.675 | 6.191 |
| Distributions | |||||
| Dividends from Net Investment Income | (.816) | (.762) | (. 601) | (. 565) | (. 541) |
| Distributions from Realized Capital Gains | — | — | — | — | — |
| Total Distributions | (.816) | (.762) | (. 601) | (. 565) | (. 541) |
| Net Asset Value, End of Period | $46.69 | $35.66 | $31.30 | $31.57 | $27.46 |
| Total Return | 33.49% | 16.42% | 1.09% | 17.23% | 28.83% |
| Ratios/Supplemental Data | |||||
| Net Assets, End of Period (Millions) | $65,738 | $39,367 | $29,467 | $23,785 | $16,047 |
| Ratio of Total Expenses to | |||||
| Average Net Assets | 0.04% | 0.04% | 0.04% | 0.05% | 0.06% |
| Ratio of Net Investment Income to | |||||
| Average Net Assets | 1.97% | 2.24% | 1.92% | 1.97% | 2.34% |
| Portfolio Turnover Rate1 | 4% | 3% | 5% | 5% | 5% |
1 Excludes the value of portfolio securities received or delivered as a result of in-kind purchases or redemptions of the fund’s capital shares, including ETF Creation Units.
See accompanying Notes, which are an integral part of the Financial Statements.
21
| Total Stock Market Index Fund | |||||
| Financial Highlights | |||||
| ETF Shares | |||||
| For a Share Outstanding | Year Ended December 31, | ||||
| Throughout Each Period | 2013 | 2012 | 2011 | 2010 | 2009 |
| Net Asset Value, Beginning of Period | $73.24 | $64.29 | $64.86 | $56.39 | $44.78 |
| Investment Operations | |||||
| Net Investment Income | 1.657 | 1.564 | 1.238 | 1.133 | 1.106 |
| Net Realized and Unrealized Gain (Loss) | |||||
| on Investments | 22.686 | 8.949 | (.575) | 8.485 | 11.611 |
| Total from Investment Operations | 24.343 | 10.513 | .663 | 9.618 | 12.717 |
| Distributions | |||||
| Dividends from Net Investment Income | (1.673) | (1.563) | (1.233) | (1.148) | (1.107) |
| Distributions from Realized Capital Gains | — | — | — | — | — |
| Total Distributions | (1.673) | (1.563) | (1.233) | (1.148) | (1.107) |
| Net Asset Value, End of Period | $95.91 | $73.24 | $64.29 | $64.86 | $56.39 |
| Total Return | 33.51% | 16.41% | 1.06% | 17.26% | 28.82% |
| Ratios/Supplemental Data | |||||
| Net Assets, End of Period (Millions) | $39,165 | $24,270 | $19,521 | $17,930 | $13,443 |
| Ratio of Total Expenses to | |||||
| Average Net Assets | 0.05% | 0.05% | 0.05% | 0.06% | 0.07% |
| Ratio of Net Investment Income to | |||||
| Average Net Assets | 1.96% | 2.23% | 1.91% | 1.96% | 2.33% |
| Portfolio Turnover Rate1 | 4% | 3% | 5% | 5% | 5% |
1 Excludes the value of portfolio securities received or delivered as a result of in-kind purchases or redemptions of the fund’s capital shares, including ETF Creation Units.
See accompanying Notes, which are an integral part of the Financial Statements.
22
Total Stock Market Index Fund
Notes to Financial Statements
Vanguard Total Stock Market Index Fund is registered under the Investment Company Act of 1940 as an open-end investment company, or mutual fund. The fund offers five classes of shares: Investor Shares, Admiral Shares, Signal Shares, Institutional Shares, and ETF Shares. Investor Shares are available to any investor who meets the fund’s minimum purchase requirements. Admiral Shares, Signal Shares, and Institutional Shares are designed for investors who meet certain administrative, service, and account-size criteria. ETF Shares are listed for trading on NYSE Arca; they can be purchased and sold through a broker.
A. The following significant accounting policies conform to generally accepted accounting principles for U.S. mutual funds. The fund consistently follows such policies in preparing its financial statements.
1. Security Valuation: Securities are valued as of the close of trading on the New York Stock Exchange (generally 4 p.m., Eastern time) on the valuation date. Equity securities are valued at the latest quoted sales prices or official closing prices taken from the primary market in which each security trades; such securities not traded on the valuation date are valued at the mean of the latest quoted bid and asked prices. Securities for which market quotations are not readily available, or whose values have been materially affected by events occurring before the fund’s pricing time but after the close of the securities’ primary markets, are valued by methods deemed by the board of trustees to represent fair value. Investments in Vanguard Market Liquidity Fund are valued at that fund’s net asset value. Temporary cash investments acquired over 60 days to maturity are valued using the latest bid prices or using valuations based on a matrix system (which considers such factors as security prices, yields, maturities, and ratings), both as furnished by independent pricing services. Other temporary cash investments are valued at amortized cost, which approximates market value.
2. Futures Contracts: The fund may use index futures contracts to a limited extent, with the objectives of maintaining full exposure to the stock market, enhancing returns, maintaining liquidity, and minimizing transaction costs. The fund may purchase futures contracts to immediately invest incoming cash in the market, or sell futures in response to cash outflows, thereby simulating a fully invested position in the underlying index while maintaining a cash balance for liquidity. The fund may seek to enhance returns by using futures contracts instead of the underlying securities when futures are believed to be priced more attractively than the underlying securities. The primary risks associated with the use of futures contracts are imperfect correlation between changes in market values of stocks held by the fund and the prices of futures contracts, and the possibility of an illiquid market. Counterparty risk involving futures is mitigated because a regulated clearinghouse is the counterparty instead of the clearing broker. To further mitigate counterparty risk, the fund trades futures contracts on an exchange, monitors the financial strength of its clearing brokers and clearinghouse, and has entered into clearing agreements with its clearing brokers. The clearinghouse imposes initial margin requirements to secure the fund’s performance and requires daily settlement of variation margin representing changes in the market value of each contract.
Futures contracts are valued at their quoted daily settlement prices. The aggregate notional amounts of the contracts are not recorded in the Statement of Net Assets. Fluctuations in the value of the contracts are recorded in the Statement of Net Assets as an asset (liability) and in the Statement of Operations as unrealized appreciation (depreciation) until the contracts are closed, when they are recorded as realized futures gains (losses).
During the year ended December 31, 2013, the fund’s average investments in long and short futures contracts represented less than 1% and 0% of net assets, respectively, based on quarterly average aggregate settlement values.
23
Total Stock Market Index Fund
3. Swap Contracts: The fund has entered into an equity swap contract to earn the total return on a selected reference stock in the fund’s target index. Under the terms of the swap, the fund receives the total return on the referenced stock (i.e., receiving the increase or paying the decrease in value of the selected reference stock and receiving the equivalent of any dividends in respect of the selected referenced stock) over a specified period of time, applied to a notional amount that represents the value of a designated number of shares of the selected reference stock at the beginning of the equity swap contract. The fund also pays a floating rate that is based on short-term interest rates, applied to the notional amount. At the same time, the fund invests an amount approximating the notional amount of the swap in high-quality temporary cash investments.
The notional amounts of swap contracts are not recorded in the Statement of Net Assets. Swaps are valued daily based on market quotations received from independent pricing services or recognized dealers and the change in value is recorded as unrealized appreciation (depreciation) until termination of the swap, at which time realized gain (loss) is recorded. The primary risks associated with the swaps are that a counterparty will default on its obligation to pay net amounts due to the fund, or that the fund will incur fees in the event it terminates a swap prior to the scheduled termination date. The fund’s maximum risk of loss from counterparty credit risk is the amount of unrealized appreciation on the swap contract. The fund mitigates its counterparty risk by entering into swaps only with a diverse group of prequalified counterparties, monitoring their financial strength, entering into master netting arrangements with its counterparties, and requiring its counterparties to transfer collateral as security for their performance. In the event of a counterparty’s default (including bankruptcy), the fund may terminate any swap contracts with that counterparty, determine the net amount owed by either party in accordance with its master netting arrangements, and sell or retain any collateral held up to the net amount owed to the fund under the master netting arrangements. The swap contracts contain provisions whereby a counterparty may terminate open contracts if the fund’s net assets decline below a certain level, triggering a payment by the fund if the fund is in a net liability position at the time of the termination. The payment amount would be reduced by any collateral the fund has pledged. Any securities pledged as collateral for open contracts are noted in the Statement of Net Assets. The value of collateral received or pledged is compared daily to the value of the swap contracts exposure with each counterparty, and any difference, if in excess of a specified minimum transfer amount, is adjusted and settled within two business days.
During the year ended December 31, 2013, the fund’s average amounts of total return swaps represented less than 1% of net assets, based on quarterly average notional amounts.
4. Federal Income Taxes: The fund intends to continue to qualify as a regulated investment company and distribute all of its taxable income. Management has analyzed the fund’s tax positions taken for all open federal income tax years (December 31, 2010–2013), and has concluded that no provision for federal income tax is required in the fund’s financial statements.
5. Distributions: Distributions to shareholders are recorded on the ex-dividend date.
6. Securities Lending: To earn additional income, the fund may lend its securities to qualified institutional borrowers. Security loans are required to be secured at all times by collateral in an amount at least equal to the market value of securities loaned. Daily market fluctuations could cause the value of loaned securities to be more or less than the value of the collateral received. When this occurs, the collateral is adjusted and settled on the next business day. The fund further mitigates its counterparty risk by entering into securities lending transactions only with a diverse group of prequalified counterparties, monitoring their financial strength, and entering into master securities lending agreements with its counterparties. The master securities lending agreements provide that, in the
24
Total Stock Market Index Fund
event of a counterparty’s default (including bankruptcy), the fund may terminate any loans with that borrower, determine the net amount owed, and sell or retain the collateral up to the net amount owed to the fund; however, such actions may be subject to legal proceedings. While collateral mitigates counterparty risk, in the absence of a default the fund may experience delays and costs in recovering the securities loaned. The fund invests cash collateral received in Vanguard Market Liquidity Fund, and records a liability for the return of the collateral, during the period the securities are on loan. Securities lending income represents fees charged to borrowers plus income earned on invested cash collateral, less expenses associated with the loan.
7. Other: Dividend income is recorded on the ex-dividend date. Interest income includes income distributions received from Vanguard Market Liquidity Fund and is accrued daily. Premiums and discounts on debt securities purchased are amortized and accreted, respectively, to interest income over the lives of the respective securities. Security transactions are accounted for on the date securities are bought or sold. Costs used to determine realized gains (losses) on the sale of investment securities are those of the specific securities sold.
Each class of shares has equal rights as to assets and earnings, except that each class separately bears certain class-specific expenses related to maintenance of shareholder accounts (included in Management and Administrative expenses) and shareholder reporting. Marketing and distribution expenses are allocated to each class of shares based on a method approved by the board of trustees. Income, other non-class-specific expenses, and gains and losses on investments are allocated to each class of shares based on its relative net assets.
B. The Vanguard Group furnishes at cost investment advisory, corporate management, administrative, marketing, and distribution services. The costs of such services are allocated to the fund under methods approved by the board of trustees. The fund has committed to provide up to 0.40% of its net assets in capital contributions to Vanguard. At December 31, 2013, the fund had contributed capital of $33,327,000 to Vanguard (included in Other Assets), representing 0.01% of the fund’s net assets and 13.33% of Vanguard’s capitalization. The fund’s trustees and officers are also directors and officers of Vanguard.
C. Various inputs may be used to determine the value of the fund’s investments. These inputs are summarized in three broad levels for financial statement purposes. The inputs or methodologies used to value securities are not necessarily an indication of the risk associated with investing in those securities.
Level 1—Quoted prices in active markets for identical securities.
Level 2—Other significant observable inputs (including quoted prices for similar securities, interest rates, prepayment speeds, credit risk, etc.).
Level 3—Significant unobservable inputs (including the fund’s own assumptions used to determine the fair value of investments).
25
Total Stock Market Index Fund
The following table summarizes the market value of the fund’s investments as of December 31, 2013, based on the inputs used to value them:
| Level 1 | Level 2 | Level 3 | |
| Investments | ($000) | ($000) | ($000) |
| Common Stocks | 305,852,333 | 128 | 498 |
| Temporary Cash Investments | 2,263,406 | 75,595 | — |
| Futures Contracts—Assets1 | 4,649 | — | — |
| Swap Contracts—Assets | — | 1,967 | — |
| Total | 308,120,388 | 77,690 | 498 |
| 1 Represents variation margin on the last day of the reporting period. |
D. At December 31, 2013, the aggregate settlement value of open futures contracts and the related unrealized appreciation (depreciation) were:
| ($000) | ||||
| Aggregate | ||||
| Number of | Settlement | Unrealized | ||
| Long (Short) | Value | Appreciation | ||
| Futures Contracts | Expiration | Contracts | Long (Short) | (Depreciation) |
| E-mini S&P 500 Index | March 2014 | 6,551 | 603,052 | 7,377 |
| S&P 500 Index | March 2014 | 1,256 | 578,105 | 22,478 |
| E-mini Russell 2000 Index | March 2014 | 957 | 111,146 | 4,349 |
| S&P MidCap 400 Index | March 2014 | 240 | 32,146 | 725 |
| 34,929 |
Unrealized appreciation (depreciation) on open futures contracts is required to be treated as realized gain (loss) for tax purposes.
| At December 31, 2013, the fund had the following open total return swap contracts: | |||||
| Floating | Unrealized | ||||
| Notional | Interest Rate | Appreciation | |||
| Termination | Amount | Received | (Depreciation) | ||
| Reference Entity | Date | Counterparty1 | ($000) | (Paid) | ($000) |
| SLM Corp | 1/25/14 | GSI | 156,297 | (0.515%) | 1,967 |
| 1 GSI—Goldman Sachs International. | |||||
After December 31, 2013, the counterparty deposited in segregated accounts cash with a value of $1,270,000 in connection with open swap contracts. In the event of default or bankruptcy by the counterparty, the fund may retain the cash; however, such action may be subject to legal proceedings.
E. Distributions are determined on a tax basis and may differ from net investment income and realized capital gains for financial reporting purposes. Differences may be permanent or temporary. Permanent differences are reclassified among capital accounts in the financial statements to reflect their tax character. Temporary differences arise when certain items of income, expense, gain, or loss are recognized in different periods for financial statement and tax purposes. These differences will reverse at some time in the future. Differences in classification may also result from the treatment of short-term gains as ordinary income for tax purposes.
26
Total Stock Market Index Fund
Certain of the fund’s investments are in securities considered to be passive foreign investment companies, for which any unrealized appreciation and/or realized gains are required to be included in distributable net income for tax purposes. During the year ended December 31, 2013, the fund realized gains on the sale of passive foreign investment companies of $1,053,000, which have been included in current and prior periods’ taxable income; accordingly, such gains have been reclassified from accumulated net realized losses to overdistributed net investment income. Passive foreign investment companies held at December 31, 2013, had unrealized appreciation of $9,915,000, of which all has been distributed and is reflected in the balance of overdistributed net investment income.
During the year ended December 31, 2013, the fund realized $2,401,164,000 of net capital gains resulting from in-kind redemptions—in which shareholders exchanged fund shares for securities held by the fund rather than for cash. Because such gains are not taxable to the fund, and are not distributed to shareholders, they have been reclassified from accumulated net realized losses to paid-in capital.
Realized and unrealized gains (losses) on the fund’s swap contracts are treated as ordinary income (loss) for tax purposes. Realized gains of $72,047,000 on swap contracts have been reclassified from accumulated net realized losses to overdistributed net investment income.
For tax purposes, at December 31, 2013, the fund had $66,886,000 of ordinary income available for distribution. The fund used capital loss carryforwards of $101,605,000 to offset taxable capital gains realized during the year ended December 31, 2013. At December 31, 2013, the fund had available capital losses totaling $2,889,792,000 to offset future net capital gains. Of this amount, $2,283,002,000 is subject to expiration dates; $19,516,000 may be used to offset future net capital gains through December 31, 2015, and $2,263,486,000 through December 31, 2016. Capital losses of $606,790,000 realized beginning in fiscal 2011 may be carried forward indefinitely under the Regulated Investment Company Modernization Act of 2010, but must be used before any expiring loss carryforwards. Capital loss carryforwards of $209,043,000 expired on December 31, 2013; accordingly, such losses have been reclassified from accumulated net realized losses to paid-in capital.
At December 31, 2013, the cost of investment securities for tax purposes was $207,425,571,000. Net unrealized appreciation of investment securities for tax purposes was $100,766,389,000, consisting of unrealized gains of $107,463,541,000 on securities that had risen in value since their purchase and $6,697,152,000 in unrealized losses on securities that had fallen in value since their purchase.
F. During the year ended December 31, 2013, the fund purchased $42,438,725,000 of investment securities and sold $15,002,309,000 of investment securities, other than temporary cash investments. Purchases and sales include $9,847,648,000 and $4,058,852,000, respectively, in connection with in-kind purchases and redemptions of the fund’s capital shares.
27
Total Stock Market Index Fund
G. Capital share transactions for each class of shares were:
| Year Ended December 31, | ||||
| 2013 | 2012 | |||
| Amount | Shares | Amount | Shares | |
| ($000) | (000) | ($000) | (000) | |
| Investor Shares | ||||
| Issued | 12,266,763 | 300,373 | 12,856,470 | 373,964 |
| Issued in Lieu of Cash Distributions | 1,721,975 | 41,022 | 1,505,142 | 42,800 |
| Redeemed | (12,834,471) | (306,111) | (7,020,532) | (204,981) |
| Net Increase (Decrease)—Investor Shares | 1,154,267 | 35,284 | 7,341,080 | 211,783 |
| Admiral Shares | ||||
| Issued | 13,336,091 | 322,900 | 8,578,164 | 247,996 |
| Issued in Lieu of Cash Distributions | 1,287,181 | 30,594 | 1,101,786 | 31,338 |
| Redeemed | (7,318,010) | (176,330) | (6,373,065) | (184,355) |
| Net Increase (Decrease) —Admiral Shares | 7,305,262 | 177,164 | 3,306,885 | 94,979 |
| Signal Shares | ||||
| Issued | 3,462,726 | 87,006 | 2,907,524 | 87,545 |
| Issued in Lieu of Cash Distributions | 172,682 | 4,261 | 146,081 | 4,303 |
| Redeemed | (3,393,201) | (83,052) | (2,044,167) | (61,646) |
| Net Increase (Decrease)—Signal Shares | 242,207 | 8,215 | 1,009,438 | 30,202 |
| Institutional Shares | ||||
| Issued | 16,902,913 | 404,366 | 10,170,383 | 297,546 |
| Issued in Lieu of Cash Distributions | 965,838 | 22,878 | 749,004 | 21,306 |
| Redeemed | (5,118,689) | (123,389) | (5,401,293) | (156,276) |
| Net Increase (Decrease) —Institutional Shares | 12,750,062 | 303,855 | 5,518,094 | 162,576 |
| ETF Shares | ||||
| Issued | 9,888,388 | 115,881 | 4,671,146 | 65,833 |
| Issued in Lieu of Cash Distributions | — | — | — | — |
| Redeemed | (3,407,167) | (38,900) | (2,637,789) | (38,100) |
| Net Increase (Decrease) —ETF Shares | 6,481,221 | 76,981 | 2,033,357 | 27,733 |
H. Management has determined that no material events or transactions occurred subsequent to December 31, 2013, that would require recognition or disclosure in these financial statements.
28
Report of Independent Registered Public Accounting Firm
To the Trustees of Vanguard Index Funds and the Shareholders of Vanguard Total Stock Market Index Fund:
In our opinion, the statement of net assets—investments summary and the related statements of operations and of changes in net assets and the financial highlights present fairly, in all material respects, the financial position of Vanguard Total Stock Market Index Fund (constituting a separate portfolio of Vanguard Index Funds, hereafter referred to as the “Fund”) at December 31, 2013, the results of its operations for the year then ended, the changes in its net assets for each of the two years in the period then ended, and the financial highlights for each of the five years in the period then ended, in conformity with accounting principles generally accepted in the United States of America. These financial statements and financial highlights (hereafter referred to as “financial statements”) are the responsibility of the Fund’s management; our responsibility is to express an opinion on these financial statements based on our audits. We conducted our audits of these financial statements in accordance with the standards of the Public Company Accounting Oversight Board (United States). Those standards require that we plan and perform the audit to obtain reasonable assurance about whether the financial statements are free of material misstatement. An audit includes examining, on a test basis, evidence supporting the amounts and disclosures in the financial statements, assessing the accounting principles used and significant estimates made by management, and evaluating the overall financial statement presentation. We believe that our audits, which included confirmation of securities at December 31, 2013 by correspondence with the custodian and brokers and by agreement to the underlying ownership records of the transfer agent, provide a reasonable basis for our opinion.
PricewaterhouseCoopers LLP
Philadelphia, Pennsylvania
February 10, 2014
Special 2013 tax information (unaudited) for Vanguard Total Stock Market Index Fund
This information for the fiscal year ended December 31, 2013, is included pursuant to provisions of the Internal Revenue Code.
The fund distributed $4,761,594,000 of qualified dividend income to shareholders during the fiscal year.
For corporate shareholders, 91.7% of investment income (dividend income plus short-term gains, if any) qualifies for the dividends-received deduction.
29
Your Fund’s After-Tax Returns
This table presents returns for your fund both before and after taxes. The after-tax returns are shown in two ways: (1) assuming that an investor owned the fund during the entire period and paid taxes on the fund’s distributions, and (2) assuming that an investor paid taxes on the fund’s distributions and sold all shares at the end of each period.
Calculations are based on the highest individual federal income tax and capital gains tax rates in effect at the times of the distributions and the hypothetical sales. State and local taxes were not considered. After-tax returns reflect any qualified dividend income . (In the example, returns after the sale of fund shares may be higher than those assuming no sale. This occurs when the sale would have produced a capital loss. The calculation assumes that the investor received a tax deduction for the loss.)
The table shows returns for one share class only; returns for other share classes will differ. Please note that your actual after-tax returns will depend on your tax situation and may differ from those shown. Also note that if you own the fund in a tax-deferred account, such as an individual retirement account or a 401(k) plan, this information does not apply to you. Such accounts are not subject to current taxes.
Finally, keep in mind that a fund’s performance—whether before or after taxes—does not guarantee future results.
| Average Annual Total Returns: Total Stock Market Index Fund Investor Shares | |||
| Periods Ended December 31, 2013 | |||
| One | Five | Ten | |
| Year | Years | Years | |
| Returns Before Taxes | 33.35% | 18.72% | 7.99% |
| Returns After Taxes on Distributions | 32.75 | 18.34 | 7.68 |
| Returns After Taxes on Distributions and Sale of Fund Shares | 19.24 | 15.27 | 6.53 |
30
About Your Fund’s Expenses
As a shareholder of the fund, you incur ongoing costs, which include costs for portfolio management, administrative services, and shareholder reports (like this one), among others. Operating expenses, which are deducted from a fund’s gross income, directly reduce the investment return of the fund.
A fund’s expenses are expressed as a percentage of its average net assets. This figure is known as the expense ratio. The following examples are intended to help you understand the ongoing costs (in dollars) of investing in your fund and to compare these costs with those of other mutual funds. The examples are based on an investment of $1,000 made at the beginning of the period shown and held for the entire period.
The accompanying table illustrates your fund’s costs in two ways:
• Based on actual fund return. This section helps you to estimate the actual expenses that you paid over the period. The ”Ending Account Value“ shown is derived from the fund‘s actual return, and the third column shows the dollar amount that would have been paid by an investor who started with $1,000 in the fund. You may use the information here, together with the amount you invested, to estimate the expenses that you paid over the period.
To do so, simply divide your account value by $1,000 (for example, an $8,600 account value divided by $1,000 = 8.6), then multiply the result by the number given for your fund under the heading ”Expenses Paid During Period.“
• Based on hypothetical 5% yearly return. This section is intended to help you compare your fund‘s costs with those of other mutual funds. It assumes that the fund had a yearly return of 5% before expenses, but that the expense ratio is unchanged. In this case—because the return used is not the fund’s actual return—the results do not apply to your investment. The example is useful in making comparisons because the Securities and Exchange Commission requires all mutual funds to calculate expenses based on a 5% return. You can assess your fund’s costs by comparing this hypothetical example with the hypothetical examples that appear in shareholder reports of other funds.
Note that the expenses shown in the table are meant to highlight and help you compare ongoing costs only and do not reflect transaction costs incurred by the fund for buying and selling securities. Further, the expenses do not include any purchase, redemption, or account service fees described in the fund prospectus. If such fees were applied to your account, your costs would be higher. Your fund does not carry a “sales load.”
The calculations assume no shares were bought or sold during the period. Your actual costs may have been higher or lower, depending on the amount of your investment and the timing of any purchases or redemptions.
You can find more information about the fund’s expenses, including annual expense ratios, in the Financial Statements section of this report. For additional information on operating expenses and other shareholder costs, please refer to your fund’s current prospectus.
31
| Six Months Ended December 31, 2013 | |||
| Beginning | Ending | Expenses | |
| Account Value | Account Value | Paid During | |
| Total Stock Market Index Fund | 6/30/2013 | 12/31/2013 | Period |
| Based on Actual Fund Return | |||
| Investor Shares | $1,000.00 | $1,169.40 | $0.93 |
| Admiral Shares | 1,000.00 | 1,170.00 | 0.27 |
| Signal Shares | 1,000.00 | 1,170.10 | 0.27 |
| Institutional Shares | 1,000.00 | 1,170.00 | 0.22 |
| ETF Shares | 1,000.00 | 1,170.06 | 0.27 |
| Based on Hypothetical 5% Yearly Return | |||
| Investor Shares | $1,000.00 | $1,024.35 | $0.87 |
| Admiral Shares | 1,000.00 | 1,024.95 | 0.26 |
| Signal Shares | 1,000.00 | 1,024.95 | 0.26 |
| Institutional Shares | 1,000.00 | 1,025.00 | 0.20 |
| ETF Shares | 1,000.00 | 1,024.95 | 0.26 |
The calculations are based on expenses incurred in the most recent six-month period. The fund’s annualized six-month expense ratios for that period are: 0.17% for Investor Shares, 0.05% for Admiral Shares, 0.05% for Signal Shares, 0.04% for Institutional Shares, and 0.05% for ETF Shares. The dollar amounts shown as “Expenses Paid” are equal to the annualized expense ratio multiplied by the average account value over the period, multiplied by the number of days in the most recent six-month period, then divided by the number of days in the most recent 12-month period.
32
Glossary
30-Day SEC Yield. A fund’s 30-day SEC yield is derived using a formula specified by the U.S. Securities and Exchange Commission. Under the formula, data related to the fund’s security holdings in the previous 30 days are used to calculate the fund’s hypothetical net income for that period, which is then annualized and divided by the fund’s estimated average net assets over the calculation period. For the purposes of this calculation, a security’s income is based on its current market yield to maturity (for bonds), its actual income (for asset-backed securities), or its projected dividend yield (for stocks). Because the SEC yield represents hypothetical annualized income, it will differ—at times significantly—from the fund’s actual experience. As a result, the fund’s income distributions may be higher or lower than implied by the SEC yield.
Beta. A measure of the magnitude of a fund’s past share-price fluctuations in relation to the ups and downs of a given market index. The index is assigned a beta of 1.00. Compared with a given index, a fund with a beta of 1.20 typically would have seen its share price rise or fall by 12% when the index rose or fell by 10%. For this report, beta is based on returns over the past 36 months for both the fund and the index. Note that a fund’s beta should be reviewed in conjunction with its R-squared (see definition). The lower the R-squared, the less correlation there is between the fund and the index, and the less reliable beta is as an indicator of volatility.
Dividend Yield. Dividend income earned by stocks, expressed as a percentage of the aggregate market value (or of net asset value, for a fund). The yield is determined by dividing the amount of the annual dividends by the aggregate value (or net asset value) at the end of the period. For a fund, the dividend yield is based solely on stock holdings and does not include any income produced by other investments.
Earnings Growth Rate. The average annual rate of growth in earnings over the past five years for the stocks now in a fund.
Equity Exposure. A measure that reflects a fund’s investments in stocks and stock futures. Any holdings in short-term reserves are excluded.
Expense Ratio. A fund’s total annual operating expenses expressed as a percentage of the fund’s average net assets. The expense ratio includes management and administrative expenses, but does not include the transaction costs of buying and selling portfolio securities.
Foreign Holdings. The percentage of a fund represented by securities or depositary receipts of companies based outside the United States.
Inception Date. The date on which the assets of a fund (or one of its share classes) are first invested in accordance with the fund’s investment objective. For funds with a subscription period, the inception date is the day after that period ends. Investment performance is measured from the inception date.
Median Market Cap. An indicator of the size of companies in which a fund invests; the midpoint of market capitalization (market price x shares outstanding) of a fund’s stocks, weighted by the proportion of the fund’s assets invested in each stock. Stocks representing half of the fund’s assets have market capitalizations above the median, and the rest are below it.
Price/Book Ratio. The share price of a stock divided by its net worth, or book value, per share. For a fund, the weighted average price/book ratio of the stocks it holds.
33
Price/Earnings Ratio. The ratio of a stock’s current price to its per-share earnings over the past year. For a fund, the weighted average P/E of the stocks it holds. P/E is an indicator of market expectations about corporate prospects; the higher the P/E, the greater the expectations for a company’s future growth.
R-Squared. A measure of how much of a fund’s past returns can be explained by the returns from the market in general, as measured by a given index. If a fund’s total returns were precisely synchronized with an index’s returns, its R-squared would be 1.00. If the fund’s returns bore no relationship to the index’s returns, its R-squared would be 0. For this report, R-squared is based on returns over the past 36 months for both the fund and the index.
Return on Equity. The annual average rate of return generated by a company during the past five years for each dollar of shareholder’s equity (net income divided by shareholder’s equity). For a fund, the weighted average return on equity for the companies whose stocks it holds.
Short-Term Reserves. The percentage of a fund invested in highly liquid, short-term securities that can be readily converted to cash.
Turnover Rate. An indication of the fund’s trading activity. Funds with high turnover rates incur higher transaction costs and may be more likely to distribute capital gains (which may be taxable to investors). The turnover rate excludes in-kind transactions, which have minimal impact on costs.
Benchmark Information
Spliced Total Stock Market Index: Dow Jones U.S. Total Stock Market Index (formerly known as the Dow Jones Wilshire 5000 Index) through April 22, 2005; MSCI US Broad Market Index through June 2, 2013; and CRSP US Total Market Index thereafter.
34
This page intentionally left blank.
The People Who Govern Your Fund
The trustees of your mutual fund are there to see that the fund is operated and managed in your best interests since, as a shareholder, you are a part owner of the fund. Your fund’s trustees also serve on the board of directors of The Vanguard Group, Inc., which is owned by the Vanguard funds and provides services to them on an at-cost basis.
A majority of Vanguard’s board members are independent, meaning that they have no affiliation with Vanguard or the funds they oversee, apart from the sizable personal investments they have made as private individuals. The independent board members have distinguished backgrounds in business, academia, and public service. Each of the trustees and executive officers oversees 182 Vanguard funds.
The following table provides information for each trustee and executive officer of the fund. More information about the trustees is in the Statement of Additional Information, which can be obtained, without charge, by contacting Vanguard at 800-662-7447, or online at vanguard.com.
| InterestedTrustee1 | and Delphi Automotive LLP (automotive components); |
| Senior Advisor at New Mountain Capital; Trustee of | |
| F. William McNabb III | The Conference Board. |
| Born 1957. Trustee Since July 2009. Chairman of the | |
| Board. Principal Occupation(s) During the Past Five | Amy Gutmann |
| Years: Chairman of the Board of The Vanguard Group, | Born 1949. Trustee Since June 2006. Principal |
| Inc., and of each of the investment companies served | Occupation(s) During the Past Five Years: President |
| by The Vanguard Group, since January 2010; Director | of the University of Pennsylvania; Christopher H. |
| of The Vanguard Group since 2008; Chief Executive | Browne Distinguished Professor of Political Science |
| Officer and President of The Vanguard Group and of | in the School of Arts and Sciences with secondary |
| each of the investment companies served by The | appointments at the Annenberg School for |
| Vanguard Group since 2008; Director of Vanguard | Communication and the Graduate School of Education |
| Marketing Corporation; Managing Director of The | of the University of Pennsylvania; Member of the |
| Vanguard Group (1995–2008). | National Commission on the Humanities and Social |
| Sciences; Trustee of Carnegie Corporation of New | |
| York and of the National Constitution Center; Chair | |
| IndependentTrustees | of the U.S. Presidential Commission for the Study |
| of Bioethical Issues. | |
| Emerson U. Fullwood | |
| Born 1948. Trustee Since January 2008. Principal | |
| Occupation(s) During the Past Five Years: Executive | JoAnn Heffernan Heisen |
| Chief Staff and Marketing Officer for North America | Born 1950. Trustee Since July 1998. Principal |
| and Corporate Vice President (retired 2008) of Xerox | Occupation(s) During the Past Five Years: Corporate |
| Corporation (document management products and | Vice President and Chief Global Diversity Officer |
| services); Executive in Residence and 2010 | (retired 2008) and Member of the Executive |
| Distinguished Minett Professor at the Rochester | Committee (1997–2008) of Johnson & Johnson |
| Institute of Technology; Director of SPX Corporation | (pharmaceuticals/medical devices/consumer |
| (multi-industry manufacturing), the United Way of | products); Director of Skytop Lodge Corporation |
| Rochester, Amerigroup Corporation (managed health | (hotels), the University Medical Center at Princeton, |
| care), the University of Rochester Medical Center, | the Robert Wood Johnson Foundation, and the Center |
| Monroe Community College Foundation, and North | for Talent Innovation; Member of the Advisory Board |
| Carolina A&T University. | of the Maxwell School of Citizenship and Public Affairs |
| at Syracuse University. | |
| Rajiv L. Gupta | |
| Born 1945. Trustee Since December 2001.2 | F. Joseph Loughrey |
| Principal Occupation(s) During the Past Five Years: | Born 1949. Trustee Since October 2009. Principal |
| Chairman and Chief Executive Officer (retired 2009) | Occupation(s) During the Past Five Years: President |
| and President (2006–2008) of Rohm and Haas Co. | and Chief Operating Officer (retired 2009) of Cummins |
| (chemicals); Director of Tyco International, Ltd. | Inc. (industrial machinery); Chairman of the Board of |
| (diversified manufacturing and services), Hewlett- | Hillenbrand, Inc. (specialized consumer services) and |
| Packard Co. (electronic computer manufacturing), | of Oxfam America; Director of SKF AB (industrial |
| machinery), Hyster-Yale Materials Handling, Inc. | Executive Officers | |
| (forklift trucks), and the Lumina Foundation for | ||
| Education; Member of the Advisory Council for the | Glenn Booraem | |
| College of Arts and Letters and of the Advisory Board | Born 1967. Controller Since July 2010. Principal | |
| to the Kellogg Institute for International Studies, both | Occupation(s) During the Past Five Years: Principal | |
| at the University of Notre Dame. | of The Vanguard Group, Inc.; Controller of each of | |
| the investment companies served by The Vanguard | ||
| Mark Loughridge | Group; Assistant Controller of each of the investment | |
| Born 1953. Trustee Since March 2012. Principal | companies served by The Vanguard Group (2001–2010). | |
| Occupation(s) During the Past Five Years: Senior Vice | ||
| President and Chief Financial Officer at IBM (information | Thomas J. Higgins | |
| technology services); Fiduciary Member of IBM’s | Born 1957. Chief Financial Officer Since September | |
| Retirement Plan Committee. | 2008. Principal Occupation(s) During the Past Five | |
| Years: Principal of The Vanguard Group, Inc.; Chief | ||
| Scott C. Malpass | Financial Officer of each of the investment companies | |
| Born 1962. Trustee Since March 2012. Principal | served by The Vanguard Group; Treasurer of each of | |
| Occupation(s) During the Past Five Years: Chief | the investment companies served by The Vanguard | |
| Investment Officer and Vice President at the University | Group (1998–2008). | |
| of Notre Dame; Assistant Professor of Finance at the | ||
| Mendoza College of Business at Notre Dame; Member | Kathryn J. Hyatt | |
| of the Notre Dame 403(b) Investment Committee; | Born 1955. Treasurer Since November 2008. Principal | |
| Director of TIFF Advisory Services, Inc. (investment | Occupation(s) During the Past Five Years: Principal of | |
| advisor); Member of the Investment Advisory | The Vanguard Group, Inc.; Treasurer of each of the | |
| Committees of the Financial Industry Regulatory | investment companies served by The Vanguard | |
| Authority (FINRA) and of Major League Baseball. | Group; Assistant Treasurer of each of the investment | |
| companies served by The Vanguard Group (1988–2008). | ||
| André F. Perold | ||
| Born 1952. Trustee Since December 2004. Principal | Heidi Stam | |
| Occupation(s) During the Past Five Years: George | Born 1956. Secretary Since July 2005. Principal | |
| Gund Professor of Finance and Banking at the Harvard | Occupation(s) During the Past Five Years: Managing | |
| Business School (retired 2011); Chief Investment | Director of The Vanguard Group, Inc.; General Counsel | |
| Officer and Managing Partner of HighVista Strategies | of The Vanguard Group; Secretary of The Vanguard | |
| LLC (private investment firm); Director of Rand | Group and of each of the investment companies | |
| Merchant Bank; Overseer of the Museum of Fine | served by The Vanguard Group; Director and Senior | |
| Arts Boston. | Vice President of Vanguard Marketing Corporation. | |
| Alfred M. Rankin, Jr. | ||
| Vanguard Senior ManagementTeam | ||
| Born 1941. Trustee Since January 1993. Principal | ||
| Occupation(s) During the Past Five Years: Chairman, | Mortimer J. Buckley | Chris D. McIsaac |
| President, and Chief Executive Officer of NACCO | Kathleen C. Gubanich | Michael S. Miller |
| Industries, Inc. (housewares/lignite) and of Hyster-Yale | Paul A. Heller | James M. Norris |
| Materials Handling, Inc. (forklift trucks); Director of | Martha G. King | Glenn W. Reed |
| the National Association of Manufacturers; Chairman | John T. Marcante | |
| of the Board of University Hospitals of Cleveland; | ||
| Advisory Chairman of the Board of The Cleveland | ||
| Museum of Art. | Chairman Emeritus and Senior Advisor | |
| John J. Brennan | ||
| Peter F. Volanakis | ||
| Born 1955. Trustee Since July 2009. Principal | Chairman, 1996–2009 | |
| Occupation(s) During the Past Five Years: President | Chief Executive Officer and President, 1996–2008 | |
| and Chief Operating Officer (retired 2010) of Corning | ||
| Incorporated (communications equipment); Director | Founder | |
| of SPX Corporation (multi-industry manufacturing); | ||
| Overseer of the Amos Tuck School of Business | John C. Bogle | |
| Administration at Dartmouth College; Advisor to the | Chairman and Chief Executive Officer, 1974–1996 | |
| Norris Cotton Cancer Center. | ||
1 Mr. McNabb is considered an “interested person,” as defined in the Investment Company Act of 1940, because he is an officer of the Vanguard funds.
2 December 2002 for Vanguard Equity Income Fund, Vanguard Growth Equity Fund, the Vanguard Municipal Bond Funds, and the Vanguard State Tax-Exempt Funds.
 | |
| P.O. Box 2600 | |
| Valley Forge, PA 19482-2600 |
Connect with Vanguard® > vanguard.com
| Fund Information > 800-662-7447 | |
| Direct Investor Account Services > 800-662-2739 | |
| Institutional Investor Services > 800-523-1036 | |
| Text Telephone for People | |
| With Hearing Impairment > 800-749-7273 | |
| This material may be used in conjunction | |
| with the offering of shares of any Vanguard | |
| fund only if preceded or accompanied by | |
| the fund’s current prospectus. | |
| All comparative mutual fund data are from Lipper, a | |
| Thomson Reuters Company, or Morningstar, Inc., unless | |
| otherwise noted. | |
| You can obtain a free copy of Vanguard’s proxy voting | |
| guidelines by visiting vanguard.com/proxyreporting or by | |
| calling Vanguard at 800-662-2739. The guidelines are | |
| also available from the SEC’s website, sec.gov. In | |
| addition, you may obtain a free report on how your fund | |
| voted the proxies for securities it owned during the 12 | |
| months ended June 30. To get the report, visit either | |
| vanguard.com/proxyreporting or sec.gov. | |
| You can review and copy information about your fund at | |
| the SEC’s Public Reference Room in Washington, D.C. To | |
| find out more about this public service, call the SEC at | |
| 202-551-8090. Information about your fund is also | |
| available on the SEC’s website, and you can receive | |
| copies of this information, for a fee, by sending a | |
| request in either of two ways: via e-mail addressed to | |
| publicinfo@sec.gov or via regular mail addressed to the | |
| Public Reference Section, Securities and Exchange | |
| Commission, Washington, DC 20549-1520. | |
| © 2014 The Vanguard Group, Inc. | |
| All rights reserved. | |
| Vanguard Marketing Corporation, Distributor. | |
| Q850 022014 | |
Item 2: Code of Ethics. The Registrant has adopted a code of ethics that applies to the Registrant’s principal executive officer, principal financial officer, principal accounting officer or controller or persons performing similar functions. The Code of Ethics was amended during the reporting period covered by this report to make certain technical, non-material changes.
Item 3: Audit Committee Financial Expert. The following members of the Audit Committee have been determined by the Registrant’s Board of Trustees to be Audit Committee Financial Experts serving on its Audit Committee, and to be independent: Rajiv L. Gupta, Amy Gutmann, JoAnn Heffernan Heisen, F. Joseph Loughrey, Mark Loughridge, Scott C. Malpass, André F. Perold, and Alfred M. Rankin, Jr.
Item 4: Principal Accountant Fees and Services.
(a) Audit Fees.
Audit Fees of the Registrant
Fiscal Year Ended December 31, 2013: $407,000
Fiscal Year Ended December 31, 2012: $403,000
Aggregate Audit Fees of Registered Investment Companies in the Vanguard Group.
Fiscal Year Ended December 31, 2013: $5,714,113
Fiscal Year Ended December 31, 2012: $4,809,780
Includes fees billed in connection with audits of the Registrant and other registered investment companies in the Vanguard complex. Also includes fees billed in connection with audits of The Vanguard Group, Inc. and Vanguard Marketing Corporation for Fiscal Year Ended December 31, 2013.
(b) Audit-Related Fees.
Fiscal Year Ended December 31, 2013: $1,552,950
Fiscal Year Ended December 31, 2012: $1,812,565
Includes fees billed in connection with assurance and related services provided to the Registrant, other registered investment companies in the Vanguard complex, The Vanguard Group, Inc., and Vanguard Marketing Corporation.
(c) Tax Fees.
Fiscal Year Ended December 31, 2013: $110,000
Fiscal Year Ended December 31, 2012: $490,518
Includes fees billed in connection with tax compliance, planning, and advice services provided to the Registrant, other registered investment companies in the Vanguard complex, The Vanguard Group, Inc., and Vanguard Marketing Corporation. Also includes fees billed in connection with certain tax services related to audits of the Registrant and other registered investment companies in the Vanguard complex for Fiscal Year Ended December 31, 2012.
(d) All Other Fees.
Fiscal Year Ended December 31, 2013: $132,000
Fiscal Year Ended December 31, 2012: $16,000
Includes fees billed for services related to tax reported information provided to the Registrant, other registered investment companies in the Vanguard complex, The Vanguard Group, Inc., and Vanguard Marketing Corporation.
(e) (1) Pre-Approval Policies. The policy of the Registrant’s Audit Committee is to consider and, if appropriate, approve before the principal accountant is engaged for such services, all specific audit and non-audit services provided to: the Registrant, other registered investment companies in the Vanguard complex, The Vanguard Group, Inc., and entities controlled by The Vanguard Group, Inc. that provide ongoing services to the Registrant. In making a determination, the Audit Committee considers whether the services are consistent with maintaining the principal accountant’s independence.
In the event of a contingency situation in which the principal accountant is needed to provide services in between scheduled Audit Committee meetings, the Chairman of the Audit Committee would be called on to consider and, if appropriate, pre-approve audit or permitted non-audit services in an amount sufficient to complete services through the next Audit Committee meeting, and to determine if such services would be consistent with maintaining the accountant’s independence. At the next scheduled Audit Committee meeting, services and fees would be presented to the Audit Committee for formal consideration, and, if appropriate, approval by the entire Audit Committee. The Audit Committee would again consider whether such services and fees are consistent with maintaining the principal accountant’s independence.
The Registrant’s Audit Committee is informed at least annually of all audit and non-audit services provided by the principal accountant to the Vanguard complex, whether such services are provided to: the Registrant, other registered investment companies in the Vanguard complex, The Vanguard Group, Inc., or other entities controlled by The Vanguard Group, Inc. that provide ongoing services to the Registrant.
(2) No percentage of the principal accountant’s fees or services were approved pursuant to the waiver provision of paragraph (c)(7)(i)(C) of Rule 2-01 of Regulation S-X.
(f) For the most recent fiscal year, over 50% of the hours worked under the principal accountant’s engagement were not performed by persons other than full-time, permanent employees of the principal accountant.
(g) Aggregate Non-Audit Fees.
Fiscal Year Ended December 31, 2013: $242,000
Fiscal Year Ended December 31, 2012: $506,518
Includes fees billed for non-audit services provided to the Registrant, other registered investment companies in the Vanguard complex, The Vanguard Group, Inc., and Vanguard Marketing Corporation.
(h) For the most recent fiscal year, the Audit Committee has determined that the provision of all non-audit services was consistent with maintaining the principal accountant’s independence.
Item 5: Audit Committee of Listed Registrants.
The Registrant is a listed issuer as defined in rule 10A-3 under the Securities Exchange Act of 1934 (“Exchange Act”). The Registrant has a separately-designated standing audit committee established in accordance with Section 3(a)(58)(A) of the Exchange Act. The Registrant’s audit committee members are: Emerson U. Fullwood, Rajiv L. Gupta, Amy Gutmann, JoAnn Heffernan Heisen, F. Joseph Loughrey, Mark Loughridge, Scott C. Malpass, André F. Perold, Alfred M. Rankin, Jr., and Peter F. Volanakis.
Item 6: Investments.
| Vanguard® Small-Cap Index Fund | |||
| Schedule of Investments | |||
| December 31, 2013 | |||
| Market | |||
| Value | |||
| Shares | ($000) | ||
| Common Stocks (99.0%)1 | |||
| Basic Materials (4.4%) | |||
| RPM International Inc. | 2,193,356 | 91,046 | |
| Rockwood Holdings Inc. | 1,207,115 | 86,816 | |
| United States Steel Corp. | 2,387,323 | 70,426 | |
| Steel Dynamics Inc. | 3,477,924 | 67,959 | |
| ^ | Cliffs Natural Resources Inc. | 2,525,656 | 66,197 |
| Allegheny Technologies Inc. | 1,692,093 | 60,289 | |
| NewMarket Corp. | 175,099 | 58,509 | |
| PolyOne Corp. | 1,586,934 | 56,098 | |
| Axiall Corp. | 1,153,120 | 54,704 | |
| Cytec Industries Inc. | 585,071 | 54,505 | |
| Carpenter Technology Corp. | 829,900 | 51,620 | |
| Domtar Corp. | 524,796 | 49,509 | |
| Cabot Corp. | 950,910 | 48,877 | |
| Royal Gold Inc. | 1,009,325 | 46,500 | |
| * | Chemtura Corp. | 1,590,820 | 44,416 |
| Compass Minerals International Inc. | 552,147 | 44,199 | |
| HB Fuller Co. | 828,762 | 43,129 | |
| Sensient Technologies Corp. | 825,315 | 40,044 | |
| Commercial Metals Co. | 1,929,198 | 39,221 | |
| Olin Corp. | 1,312,387 | 37,862 | |
| * | KapStone Paper and Packaging Corp. | 669,618 | 37,405 |
| Worthington Industries Inc. | 873,593 | 36,761 | |
| Minerals Technologies Inc. | 568,048 | 34,123 | |
| Balchem Corp. | 496,954 | 29,171 | |
| ^,* | Polypore International Inc. | 740,267 | 28,796 |
| US Silica Holdings Inc. | 833,328 | 28,425 | |
| * | Alpha Natural Resources Inc. | 3,645,191 | 26,027 |
| * | SunCoke Energy Inc. | 1,090,138 | 24,866 |
| * | Stillwater Mining Co. | 1,967,633 | 24,281 |
| Tronox Ltd. Class A | 975,832 | 22,512 | |
| Kaiser Aluminum Corp. | 293,979 | 20,649 | |
| Stepan Co. | 312,943 | 20,538 | |
| PH Glatfelter Co. | 713,436 | 19,719 | |
| * | OM Group Inc. | 527,313 | 19,199 |
| Globe Specialty Metals Inc. | 1,056,101 | 19,020 | |
| * | Calgon Carbon Corp. | 900,516 | 18,524 |
| * | Ferro Corp. | 1,427,933 | 18,320 |
| * | Cloud Peak Energy Inc. | 1,003,948 | 18,071 |
| * | Coeur Mining Inc. | 1,657,959 | 17,989 |
| Innophos Holdings Inc. | 362,407 | 17,613 | |
| ^,* | AK Steel Holding Corp. | 2,136,447 | 17,519 |
| * | Resolute Forest Products Inc. | 1,091,158 | 17,480 |
| Hecla Mining Co. | 5,647,645 | 17,395 | |
| * | Clearwater Paper Corp. | 329,826 | 17,316 |
| * | RTI International Metals Inc. | 504,385 | 17,255 |
| Innospec Inc. | 372,155 | 17,201 | |
| ^ | Walter Energy Inc. | 1,032,922 | 17,178 |
| A Schulman Inc. | 456,265 | 16,088 | |
| Quaker Chemical Corp. | 206,763 | 15,935 | |
| ^ | Arch Coal Inc. | 3,501,933 | 15,584 |
| ^,* | Intrepid Potash Inc. | 937,028 | 14,843 |
| Koppers Holdings Inc. | 318,625 | 14,577 | |
| ^,* | Molycorp Inc. | 2,574,273 | 14,467 |
| AMCOL International Corp. | 401,136 | 13,631 | |
| * | Horsehead Holding Corp. | 831,783 | 13,483 |
| * | LSB Industries Inc. | 315,973 | 12,961 |
| Deltic Timber Corp. | 188,088 | 12,779 | |
| * | Kraton Performance Polymers Inc. | 536,029 | 12,356 |
| Tredegar Corp. | 425,536 | 12,260 | |
| Haynes International Inc. | 203,241 | 11,227 | |
| American Vanguard Corp. | 401,073 | 9,742 | |
1
| Vanguard® Small-Cap Index Fund | |||
| Schedule of Investments | |||
| December 31, 2013 | |||
| Market | |||
| Value | |||
| Shares | ($000) | ||
| * | Century Aluminum Co. | 803,743 | 8,407 |
| ^ | Kronos Worldwide Inc. | 381,686 | 7,271 |
| * | Rentech Inc. | 3,543,398 | 6,201 |
| FutureFuel Corp. | 356,052 | 5,626 | |
| ^,* | Allied Nevada Gold Corp. | 1,536,997 | 5,456 |
| Gold Resource Corp. | 751,107 | 3,403 | |
| NL Industries Inc. | 119,874 | 1,340 | |
| ^,* | Paramount Gold and Silver Corp. | 484,265 | 451 |
| 1,943,367 | |||
| Consumer Goods (7.9%) | |||
| Hanesbrands Inc. | 1,634,446 | 114,852 | |
| Snap-on Inc. | 958,792 | 105,007 | |
| Goodyear Tire & Rubber Co. | 4,071,432 | 97,104 | |
| * | Toll Brothers Inc. | 2,600,750 | 96,228 |
| Harman International Industries Inc. | 1,114,528 | 91,224 | |
| Ingredion Inc. | 1,264,685 | 86,580 | |
| * | Middleby Corp. | 315,555 | 75,724 |
| Gentex Corp. | 2,268,062 | 74,823 | |
| Leggett & Platt Inc. | 2,328,761 | 72,052 | |
| Tupperware Brands Corp. | 752,010 | 71,087 | |
| Brunswick Corp. | 1,500,338 | 69,106 | |
| * | Hain Celestial Group Inc. | 748,544 | 67,953 |
| Hillshire Brands Co. | 2,029,276 | 67,859 | |
| Flowers Foods Inc. | 3,095,561 | 66,462 | |
| * | Visteon Corp. | 802,266 | 65,698 |
| * | WhiteWave Foods Co. Class A | 2,860,700 | 65,624 |
| * | Fifth & Pacific Cos. Inc. | 2,024,853 | 64,937 |
| * | Jarden Corp. | 1,008,280 | 61,858 |
| Carter's Inc. | 854,270 | 61,328 | |
| Nu Skin Enterprises Inc. Class A | 441,692 | 61,051 | |
| * | Tenneco Inc. | 1,003,820 | 56,786 |
| * | Darling International Inc. | 2,608,804 | 54,472 |
| * | Tempur Sealy International Inc. | 997,396 | 53,819 |
| Wolverine World Wide Inc. | 1,576,148 | 53,526 | |
| Scotts Miracle-Gro Co. Class A | 766,647 | 47,701 | |
| Dana Holding Corp. | 2,423,461 | 47,548 | |
| * | Deckers Outdoor Corp. | 541,326 | 45,720 |
| Pool Corp. | 719,485 | 41,831 | |
| Thor Industries Inc. | 747,236 | 41,270 | |
| * | TreeHouse Foods Inc. | 570,537 | 39,321 |
| * | Zynga Inc. Class A | 10,335,303 | 39,274 |
| * | Steven Madden Ltd. | 1,005,907 | 36,806 |
| * | Boston Beer Co. Inc. Class A | 145,466 | 35,172 |
| Ryland Group Inc. | 762,199 | 33,087 | |
| * | Iconix Brand Group Inc. | 808,059 | 32,080 |
| B&G Foods Inc. | 881,114 | 29,879 | |
| Lancaster Colony Corp. | 337,577 | 29,757 | |
| HNI Corp. | 746,039 | 28,969 | |
| * | Dorman Products Inc. | 511,524 | 28,681 |
| KB Home | 1,555,315 | 28,431 | |
| Herman Miller Inc. | 923,867 | 27,273 | |
| La-Z-Boy Inc. | 866,160 | 26,851 | |
| Schweitzer-Mauduit International Inc. | 518,060 | 26,665 | |
| * | Take-Two Interactive Software Inc. | 1,521,117 | 26,422 |
| Andersons Inc. | 293,097 | 26,135 | |
| * | Meritage Homes Corp. | 538,051 | 25,821 |
| Dean Foods Co. | 1,479,041 | 25,425 | |
| * | Post Holdings Inc. | 512,492 | 25,250 |
| * | TiVo Inc. | 1,911,026 | 25,073 |
| * | Helen of Troy Ltd. | 501,878 | 24,848 |
| Snyders-Lance Inc. | 863,763 | 24,807 | |
| Sanderson Farms Inc. | 341,820 | 24,724 | |
| Cooper Tire & Rubber Co. | 1,022,813 | 24,588 | |
| Spectrum Brands Holdings Inc. | 345,965 | 24,408 | |
2
| Vanguard® Small-Cap Index Fund | |||
| Schedule of Investments | |||
| December 31, 2013 | |||
| Market | |||
| Value | |||
| Shares | ($000) | ||
| Pinnacle Foods Inc. | 869,452 | 23,875 | |
| * | American Axle & Manufacturing Holdings Inc. | 1,122,235 | 22,950 |
| Interface Inc. Class A | 1,038,140 | 22,798 | |
| * | Standard Pacific Corp. | 2,514,075 | 22,752 |
| * | Crocs Inc. | 1,385,685 | 22,060 |
| J&J Snack Foods Corp. | 246,434 | 21,832 | |
| * | Skechers U.S.A. Inc. Class A | 652,872 | 21,630 |
| Steelcase Inc. Class A | 1,335,949 | 21,188 | |
| Universal Corp. | 383,199 | 20,923 | |
| * | MDC Holdings Inc. | 645,248 | 20,803 |
| * | G-III Apparel Group Ltd. | 269,545 | 19,890 |
| Jones Group Inc. | 1,248,316 | 18,675 | |
| Drew Industries Inc. | 364,254 | 18,650 | |
| Oxford Industries Inc. | 229,953 | 18,550 | |
| Fresh Del Monte Produce Inc. | 647,630 | 18,328 | |
| * | Select Comfort Corp. | 865,509 | 18,254 |
| Columbia Sportswear Co. | 227,672 | 17,929 | |
| Vector Group Ltd. | 1,090,959 | 17,859 | |
| WD-40 Co. | 239,094 | 17,855 | |
| * | Tumi Holdings Inc. | 783,449 | 17,667 |
| * | Quiksilver Inc. | 1,943,684 | 17,046 |
| Briggs & Stratton Corp. | 743,292 | 16,174 | |
| ^,* | Eastman Kodak Co. | 465,386 | 16,154 |
| Titan International Inc. | 838,676 | 15,079 | |
| * | iRobot Corp. | 428,756 | 14,908 |
| * | Boulder Brands Inc. | 939,043 | 14,893 |
| * | Elizabeth Arden Inc. | 414,731 | 14,702 |
| Cal-Maine Foods Inc. | 232,598 | 14,009 | |
| * | Pilgrim's Pride Corp. | 854,310 | 13,882 |
| Knoll Inc. | 756,092 | 13,844 | |
| * | Seaboard Corp. | 4,896 | 13,684 |
| Ethan Allen Interiors Inc. | 429,206 | 13,056 | |
| Movado Group Inc. | 293,972 | 12,938 | |
| * | ACCO Brands Corp. | 1,872,752 | 12,585 |
| ^,* | Hovnanian Enterprises Inc. Class A | 1,845,196 | 12,215 |
| * | Taylor Morrison Home Corp. Class A | 541,424 | 12,155 |
| * | Annie's Inc. | 278,573 | 11,990 |
| * | Blount International Inc. | 813,395 | 11,770 |
| * | Modine Manufacturing Co. | 782,829 | 10,036 |
| Tootsie Roll Industries Inc. | 307,596 | 10,009 | |
| Inter Parfums Inc. | 278,923 | 9,988 | |
| * | Federal-Mogul Corp. | 494,204 | 9,726 |
| ^,* | Diamond Foods Inc. | 351,738 | 9,089 |
| * | USANA Health Sciences Inc. | 114,208 | 8,632 |
| * | Chiquita Brands International Inc. | 732,890 | 8,575 |
| Superior Industries International Inc. | 407,526 | 8,407 | |
| ^,* | Vera Bradley Inc. | 334,475 | 8,041 |
| * | LeapFrog Enterprises Inc. | 956,251 | 7,593 |
| * | National Presto Industries Inc. | 85,162 | 6,856 |
| * | DTS Inc. | 281,325 | 6,746 |
| * | RealD Inc. | 697,104 | 5,953 |
| * | Revlon Inc. Class A | 172,061 | 4,295 |
| * | National Beverage Corp. | 190,203 | 3,834 |
| * | Central Garden and Pet Co. Class A | 522,119 | 3,524 |
| * | Fuel Systems Solutions Inc. | 214,539 | 2,976 |
| * | Central Garden and Pet Co. | 140,835 | 967 |
| 3,479,776 | |||
| Consumer Services (13.4%) | |||
| Gannett Co. Inc. | 3,759,088 | 111,194 | |
| Omnicare Inc. | 1,698,458 | 102,519 | |
| Foot Locker Inc. | 2,449,394 | 101,503 | |
| Dick's Sporting Goods Inc. | 1,664,133 | 96,686 | |
| GNC Holdings Inc. Class A | 1,566,978 | 91,590 | |
| GameStop Corp. Class A | 1,832,646 | 90,276 | |
3
| Vanguard® Small-Cap Index Fund | |||
| Schedule of Investments | |||
| December 31, 2013 | |||
| Market | |||
| Value | |||
| Shares | ($000) | ||
| Dunkin' Brands Group Inc. | 1,759,460 | 84,806 | |
| Alaska Air Group Inc. | 1,147,244 | 84,173 | |
| * | Sally Beauty Holdings Inc. | 2,704,328 | 81,752 |
| * | Panera Bread Co. Class A | 441,872 | 78,074 |
| ^,* | American Airlines Group Inc. | 3,086,466 | 77,933 |
| * | Rite Aid Corp. | 15,103,872 | 76,426 |
| * | Avis Budget Group Inc. | 1,769,068 | 71,506 |
| * | Lamar Advertising Co. Class A | 1,319,932 | 68,966 |
| * | Copart Inc. | 1,863,891 | 68,312 |
| * | Pandora Media Inc. | 2,564,240 | 68,209 |
| * | AMC Networks Inc. Class A | 952,214 | 64,855 |
| KAR Auction Services Inc. | 2,174,729 | 64,263 | |
| Domino's Pizza Inc. | 918,860 | 63,999 | |
| * | Yelp Inc. Class A | 898,082 | 61,923 |
| Sotheby's | 1,133,504 | 60,302 | |
| Service Corp. International | 3,319,382 | 60,180 | |
| Cablevision Systems Corp. Class A | 3,345,088 | 59,977 | |
| * | United Natural Foods Inc. | 777,126 | 58,588 |
| DSW Inc. Class A | 1,369,162 | 58,504 | |
| * | Madison Square Garden Co. Class A | 991,166 | 57,071 |
| Cinemark Holdings Inc. | 1,711,670 | 57,050 | |
| * | Spirit Airlines Inc. | 1,198,356 | 54,417 |
| Brinker International Inc. | 1,105,363 | 51,222 | |
| * | Cabela's Inc. | 757,016 | 50,463 |
| * | Bally Technologies Inc. | 642,697 | 50,420 |
| * | Graham Holdings Co. Class B | 71,844 | 47,656 |
| Chico's FAS Inc. | 2,488,938 | 46,892 | |
| * | Acxiom Corp. | 1,239,205 | 45,826 |
| * | Apollo Education Group Inc. | 1,676,469 | 45,801 |
| * | Buffalo Wild Wings Inc. | 310,259 | 45,670 |
| * | Live Nation Entertainment Inc. | 2,300,893 | 45,466 |
| * | Ascena Retail Group Inc. | 2,123,855 | 44,941 |
| * | Starz | 1,532,201 | 44,802 |
| Vail Resorts Inc. | 595,188 | 44,776 | |
| * | Lumber Liquidators Holdings Inc. | 432,632 | 44,513 |
| Casey's General Stores Inc. | 633,452 | 44,500 | |
| Sinclair Broadcast Group Inc. Class A | 1,219,172 | 43,561 | |
| CST Brands Inc. | 1,184,709 | 43,502 | |
| Cracker Barrel Old Country Store Inc. | 392,805 | 43,236 | |
| * | HomeAway Inc. | 1,054,397 | 43,104 |
| * | Office Depot Inc. | 7,866,315 | 41,613 |
| Dillard's Inc. Class A | 427,904 | 41,597 | |
| Abercrombie & Fitch Co. | 1,260,524 | 41,484 | |
| ^,* | JC Penney Co. Inc. | 4,522,241 | 41,378 |
| * | VCA Antech Inc. | 1,317,297 | 41,310 |
| American Eagle Outfitters Inc. | 2,860,482 | 41,191 | |
| Harris Teeter Supermarkets Inc. | 815,824 | 40,261 | |
| John Wiley & Sons Inc. Class A | 729,311 | 40,258 | |
| Wendy's Co. | 4,520,243 | 39,416 | |
| * | Groupon Inc. | 3,294,314 | 38,774 |
| Men's Wearhouse Inc. | 749,189 | 38,269 | |
| * | DreamWorks Animation SKG Inc. Class A | 1,065,204 | 37,815 |
| Six Flags Entertainment Corp. | 1,020,144 | 37,562 | |
| Cheesecake Factory Inc. | 776,216 | 37,468 | |
| Lions Gate Entertainment Corp. | 1,137,879 | 36,025 | |
| Pier 1 Imports Inc. | 1,540,521 | 35,555 | |
| * | Jack in the Box Inc. | 702,488 | 35,138 |
| Aaron's Inc. | 1,194,605 | 35,121 | |
| PriceSmart Inc. | 299,200 | 34,570 | |
| * | JetBlue Airways Corp. | 3,958,256 | 33,843 |
| New York Times Co. Class A | 2,088,050 | 33,137 | |
| Rollins Inc. | 1,082,768 | 32,797 | |
| * | Conn's Inc. | 415,890 | 32,768 |
| HSN Inc. | 523,440 | 32,610 | |
4
| Vanguard® Small-Cap Index Fund | |||
| Schedule of Investments | |||
| December 31, 2013 | |||
| Market | |||
| Value | |||
| Shares | ($000) | ||
| * | Beacon Roofing Supply Inc. | 808,042 | 32,548 |
| * | Restoration Hardware Holdings Inc. | 481,554 | 32,409 |
| * | Grand Canyon Education Inc. | 741,945 | 32,349 |
| Penske Automotive Group Inc. | 669,335 | 31,566 | |
| * | Five Below Inc. | 713,179 | 30,809 |
| ^,* | SolarCity Corp. | 538,961 | 30,624 |
| Guess? Inc. | 980,173 | 30,454 | |
| * | Murphy USA Inc. | 732,249 | 30,432 |
| * | Shutterfly Inc. | 596,242 | 30,367 |
| * | Dolby Laboratories Inc. Class A | 779,613 | 30,062 |
| * | Life Time Fitness Inc. | 632,948 | 29,749 |
| DeVry Education Group Inc. | 834,406 | 29,621 | |
| Meredith Corp. | 570,023 | 29,527 | |
| * | Big Lots Inc. | 913,211 | 29,488 |
| Texas Roadhouse Inc. Class A | 1,047,455 | 29,119 | |
| Hillenbrand Inc. | 987,889 | 29,064 | |
| ^,* | Hibbett Sports Inc. | 428,753 | 28,816 |
| Rent-A-Center Inc. | 838,480 | 27,955 | |
| Monro Muffler Brake Inc. | 492,300 | 27,746 | |
| * | Asbury Automotive Group Inc. | 510,666 | 27,443 |
| * | OpenTable Inc. | 345,739 | 27,441 |
| * | Genesco Inc. | 373,812 | 27,311 |
| Morningstar Inc. | 340,972 | 26,626 | |
| * | ANN Inc. | 719,690 | 26,312 |
| Choice Hotels International Inc. | 531,468 | 26,100 | |
| * | Fresh Market Inc. | 638,685 | 25,867 |
| Allegiant Travel Co. Class A | 245,317 | 25,866 | |
| Group 1 Automotive Inc. | 362,072 | 25,714 | |
| Regal Entertainment Group Class A | 1,307,475 | 25,430 | |
| Lithia Motors Inc. Class A | 365,705 | 25,387 | |
| * | Jos A Bank Clothiers Inc. | 462,167 | 25,294 |
| ^ | Buckle Inc. | 478,258 | 25,137 |
| * | Vitamin Shoppe Inc. | 477,034 | 24,811 |
| * | Marriott Vacations Worldwide Corp. | 467,468 | 24,664 |
| * | Express Inc. | 1,315,244 | 24,556 |
| * | ValueClick Inc. | 1,046,294 | 24,452 |
| SeaWorld Entertainment Inc. | 846,142 | 24,343 | |
| Papa John's International Inc. | 533,176 | 24,206 | |
| * | Pinnacle Entertainment Inc. | 927,308 | 24,101 |
| * | SUPERVALU Inc. | 3,208,220 | 23,388 |
| * | AMERCO | 97,081 | 23,090 |
| Finish Line Inc. Class A | 810,221 | 22,824 | |
| DineEquity Inc. | 266,812 | 22,292 | |
| * | Orient-Express Hotels Ltd. Class A | 1,449,367 | 21,900 |
| ^ | Chemed Corp. | 276,644 | 21,196 |
| * | WebMD Health Corp. | 534,515 | 21,113 |
| Bob Evans Farms Inc. | 414,930 | 20,991 | |
| * | Krispy Kreme Doughnuts Inc. | 1,085,484 | 20,939 |
| ^ | Valassis Communications Inc. | 603,272 | 20,662 |
| Churchill Downs Inc. | 222,348 | 19,933 | |
| * | Children's Place Retail Stores Inc. | 349,415 | 19,906 |
| National CineMedia Inc. | 994,001 | 19,840 | |
| * | Bloomin' Brands Inc. | 820,859 | 19,709 |
| Brown Shoe Co. Inc. | 676,851 | 19,047 | |
| Interval Leisure Group Inc. | 614,775 | 18,997 | |
| * | Susser Holdings Corp. | 283,104 | 18,540 |
| * | Ascent Capital Group Inc. Class A | 214,032 | 18,313 |
| Matthews International Corp. Class A | 427,260 | 18,206 | |
| * | Sonic Corp. | 882,123 | 17,810 |
| ^,* | Caesars Entertainment Corp. | 790,011 | 17,017 |
| * | Penn National Gaming Inc. | 1,148,656 | 16,460 |
| * | comScore Inc. | 559,258 | 16,000 |
| International Speedway Corp. Class A | 437,223 | 15,517 | |
| ^ | Weight Watchers International Inc. | 465,597 | 15,332 |
5
| Vanguard® Small-Cap Index Fund | |||
| Schedule of Investments | |||
| December 31, 2013 | |||
| Market | |||
| Value | |||
| Shares | ($000) | ||
| * | AFC Enterprises Inc. | 392,985 | 15,130 |
| * | Constant Contact Inc. | 480,373 | 14,925 |
| Cato Corp. Class A | 453,891 | 14,434 | |
| Scholastic Corp. | 423,780 | 14,413 | |
| * | Rush Enterprises Inc. Class A | 481,547 | 14,278 |
| ^,* | Clean Energy Fuels Corp. | 1,106,121 | 14,247 |
| * | Boyd Gaming Corp. | 1,244,847 | 14,017 |
| Sonic Automotive Inc. Class A | 570,006 | 13,954 | |
| * | Bright Horizons Family Solutions Inc. | 375,828 | 13,808 |
| Nexstar Broadcasting Group Inc. Class A | 238,050 | 13,267 | |
| * | Scientific Games Corp. Class A | 772,848 | 13,084 |
| ^,* | ITT Educational Services Inc. | 385,836 | 12,956 |
| * | BJ's Restaurants Inc. | 395,409 | 12,281 |
| * | Francesca's Holdings Corp. | 662,234 | 12,192 |
| CEC Entertainment Inc. | 274,738 | 12,165 | |
| * | Biglari Holdings Inc. | 23,909 | 12,113 |
| * | Bankrate Inc. | 668,848 | 11,999 |
| * | American Public Education Inc. | 274,271 | 11,923 |
| SkyWest Inc. | 801,932 | 11,893 | |
| * | K12 Inc. | 542,404 | 11,797 |
| Capella Education Co. | 173,639 | 11,537 | |
| Stage Stores Inc. | 497,231 | 11,048 | |
| Regis Corp. | 745,738 | 10,821 | |
| * | Mattress Firm Holding Corp. | 251,352 | 10,818 |
| * | Steiner Leisure Ltd. | 217,251 | 10,687 |
| Fred's Inc. Class A | 574,397 | 10,638 | |
| ^,* | Aeropostale Inc. | 1,164,435 | 10,585 |
| ^,* | Angie's List Inc. | 674,208 | 10,214 |
| * | Pep Boys-Manny Moe & Jack | 830,425 | 10,081 |
| * | FTD Cos. Inc. | 305,932 | 9,967 |
| * | Blue Nile Inc. | 210,893 | 9,931 |
| * | Zumiez Inc. | 374,138 | 9,728 |
| ^,* | Liquidity Services Inc. | 423,366 | 9,593 |
| Weis Markets Inc. | 177,015 | 9,304 | |
| ^,* | Noodles & Co. Class A | 249,557 | 8,964 |
| ^,* | Container Store Group Inc. | 189,694 | 8,842 |
| * | RetailMeNot Inc. | 305,931 | 8,808 |
| * | Barnes & Noble Inc. | 541,035 | 8,088 |
| ^,* | Tile Shop Holdings Inc. | 421,351 | 7,614 |
| Clear Channel Outdoor Holdings Inc. Class A | 681,085 | 6,906 | |
| * | Cumulus Media Inc. Class A | 892,702 | 6,901 |
| Harte-Hanks Inc. | 875,613 | 6,847 | |
| * | Ruby Tuesday Inc. | 908,275 | 6,294 |
| ^,* | Media General Inc. | 277,723 | 6,277 |
| * | Strayer Education Inc. | 169,033 | 5,827 |
| * | Burlington Stores Inc. | 176,066 | 5,634 |
| ClubCorp Holdings Inc. | 314,591 | 5,581 | |
| * | Bridgepoint Education Inc. | 312,403 | 5,533 |
| ^,* | Fairway Group Holdings Corp. | 277,386 | 5,026 |
| * | Sears Hometown and Outlet Stores Inc. | 190,439 | 4,856 |
| * | SFX Entertainment Inc. | 361,696 | 4,340 |
| * | Demand Media Inc. | 739,964 | 4,270 |
| ^,* | RadioShack Corp. | 1,562,933 | 4,064 |
| Speedway Motorsports Inc. | 203,923 | 4,048 | |
| * | QuinStreet Inc. | 463,410 | 4,027 |
| * | Rush Enterprises Inc. Class B | 141,883 | 3,618 |
| * | Diamond Resorts International Inc. | 185,949 | 3,433 |
| * | hhgregg Inc. | 225,053 | 3,144 |
| * | Education Management Corp. | 308,873 | 3,117 |
| ^,* | Potbelly Corp. | 119,445 | 2,900 |
| * | RealNetworks Inc. | 381,572 | 2,881 |
| * | Travelzoo Inc. | 126,159 | 2,690 |
| * | Avid Technology Inc. | 255,752 | 2,084 |
| * | ReachLocal Inc. | 159,688 | 2,030 |
6
| Vanguard® Small-Cap Index Fund | ||
| Schedule of Investments | ||
| December 31, 2013 | ||
| Market | ||
| Value | ||
| Shares | ($000) | |
| * Vitacost.com Inc. | 138,470 | 802 |
| 5,939,427 | ||
| Financials (22.7%) | ||
| Arthur J Gallagher & Co. | 2,184,212 | 102,505 |
| * E*TRADE Financial Corp. | 4,735,879 | 93,013 |
| Starwood Property Trust Inc. | 3,220,177 | 89,199 |
| Waddell & Reed Financial Inc. Class A | 1,338,742 | 87,179 |
| Liberty Property Trust | 2,418,052 | 81,899 |
| Eaton Vance Corp. | 1,900,351 | 81,316 |
| Duke Realty Corp. | 5,373,206 | 80,813 |
| East West Bancorp Inc. | 2,271,746 | 79,443 |
| * SVB Financial Group | 752,922 | 78,951 |
| * Signature Bank | 723,163 | 77,682 |
| Extra Space Storage Inc. | 1,814,477 | 76,444 |
| HCC Insurance Holdings Inc. | 1,651,792 | 76,214 |
| Mid-America Apartment Communities Inc. | 1,233,414 | 74,918 |
| CBOE Holdings Inc. | 1,438,408 | 74,740 |
| DDR Corp. | 4,740,296 | 72,858 |
| American Financial Group Inc. | 1,252,457 | 72,292 |
| Regency Centers Corp. | 1,522,777 | 70,505 |
| BRE Properties Inc. | 1,272,971 | 69,644 |
| Senior Housing Properties Trust | 3,104,229 | 69,007 |
| Kilroy Realty Corp. | 1,354,656 | 67,977 |
| * Liberty Ventures Class A | 554,056 | 67,922 |
| RenaissanceRe Holdings Ltd. | 695,921 | 67,741 |
| Cullen/Frost Bankers Inc. | 897,570 | 66,806 |
| * Howard Hughes Corp. | 554,849 | 66,637 |
| Old Republic International Corp. | 3,858,126 | 66,630 |
| Hospitality Properties Trust | 2,447,032 | 66,143 |
| Protective Life Corp. | 1,295,879 | 65,649 |
| Prosperity Bancshares Inc. | 1,024,520 | 64,944 |
| CNO Financial Group Inc. | 3,659,704 | 64,740 |
| NorthStar Realty Finance Corp. | 4,778,665 | 64,273 |
| Brown & Brown Inc. | 2,038,548 | 63,990 |
| Assured Guaranty Ltd. | 2,701,973 | 63,740 |
| Taubman Centers Inc. | 995,601 | 63,639 |
| Fidelity National Financial Inc. Class A | 1,956,309 | 63,482 |
| * Genworth Financial Inc. Class A | 4,077,278 | 63,320 |
| Validus Holdings Ltd. | 1,556,990 | 62,731 |
| Apartment Investment & Management Co. Class A | 2,407,176 | 62,370 |
| First Niagara Financial Group Inc. | 5,836,109 | 61,980 |
| Corrections Corp. of America | 1,911,161 | 61,291 |
| National Retail Properties Inc. | 2,009,931 | 60,961 |
| FirstMerit Corp. | 2,722,906 | 60,530 |
| City National Corp. | 762,333 | 60,392 |
| Commerce Bancshares Inc. | 1,343,749 | 60,348 |
| Omega Healthcare Investors Inc. | 2,021,425 | 60,238 |
| Allied World Assurance Co. Holdings AG | 528,958 | 59,672 |
| * Gaming and Leisure Properties Inc. | 1,174,054 | 59,654 |
| WP Carey Inc. | 956,763 | 58,697 |
| Financial Engines Inc. | 830,960 | 57,735 |
| BioMed Realty Trust Inc. | 3,168,459 | 57,413 |
| Spirit Realty Capital Inc. | 5,801,664 | 57,030 |
| Two Harbors Investment Corp. | 6,006,504 | 55,740 |
| American Campus Communities Inc. | 1,728,179 | 55,665 |
| Synovus Financial Corp. | 15,224,090 | 54,807 |
| * Forest City Enterprises Inc. Class A | 2,815,651 | 53,779 |
| Highwoods Properties Inc. | 1,482,974 | 53,639 |
| * Alleghany Corp. | 131,340 | 52,531 |
| Chimera Investment Corp. | 16,924,045 | 52,465 |
| Weingarten Realty Investors | 1,911,237 | 52,406 |
| LaSalle Hotel Properties | 1,698,118 | 52,404 |
| Douglas Emmett Inc. | 2,235,209 | 52,058 |
| Home Properties Inc. | 938,149 | 50,304 |
7
| Vanguard® Small-Cap Index Fund | |||
| Schedule of Investments | |||
| December 31, 2013 | |||
| Market | |||
| Value | |||
| Shares | ($000) | ||
| Tanger Factory Outlet Centers | 1,558,259 | 49,895 | |
| Hancock Holding Co. | 1,354,290 | 49,675 | |
| Retail Properties of America Inc. | 3,896,968 | 49,569 | |
| StanCorp Financial Group Inc. | 725,476 | 48,063 | |
| CBL & Associates Properties Inc. | 2,662,601 | 47,820 | |
| * | Stifel Financial Corp. | 995,875 | 47,722 |
| Equity Lifestyle Properties Inc. | 1,305,229 | 47,288 | |
| * | MGIC Investment Corp. | 5,570,933 | 47,019 |
| ProAssurance Corp. | 966,052 | 46,834 | |
| ^ | Columbia Property Trust Inc. | 1,872,331 | 46,808 |
| RLJ Lodging Trust | 1,922,842 | 46,764 | |
| First American Financial Corp. | 1,656,258 | 46,707 | |
| Associated Banc-Corp | 2,679,742 | 46,628 | |
| * | Popular Inc. | 1,618,669 | 46,504 |
| Webster Financial Corp. | 1,489,726 | 46,450 | |
| CommonWealth REIT | 1,952,817 | 45,520 | |
| First Horizon National Corp. | 3,897,398 | 45,405 | |
| Aspen Insurance Holdings Ltd. | 1,082,644 | 44,724 | |
| Federated Investors Inc. Class B | 1,552,847 | 44,722 | |
| CapitalSource Inc. | 3,084,499 | 44,324 | |
| Piedmont Office Realty Trust Inc. Class A | 2,657,951 | 43,909 | |
| Bank of Hawaii Corp. | 734,031 | 43,411 | |
| * | Portfolio Recovery Associates Inc. | 820,443 | 43,352 |
| Hanover Insurance Group Inc. | 723,293 | 43,188 | |
| UMB Financial Corp. | 669,931 | 43,063 | |
| ^ | MFA Financial Inc. | 6,038,500 | 42,632 |
| * | Altisource Portfolio Solutions SA | 264,070 | 41,889 |
| Fulton Financial Corp. | 3,172,968 | 41,502 | |
| EPR Properties | 836,927 | 41,143 | |
| Endurance Specialty Holdings Ltd. | 694,637 | 40,754 | |
| Post Properties Inc. | 893,803 | 40,427 | |
| Sunstone Hotel Investors Inc. | 3,015,972 | 40,414 | |
| Radian Group Inc. | 2,854,673 | 40,308 | |
| * | Texas Capital Bancshares Inc. | 642,227 | 39,947 |
| White Mountains Insurance Group Ltd. | 66,226 | 39,940 | |
| Assurant Inc. | 600,124 | 39,830 | |
| TCF Financial Corp. | 2,447,069 | 39,765 | |
| Susquehanna Bancshares Inc. | 3,087,115 | 39,639 | |
| MarketAxess Holdings Inc. | 589,146 | 39,396 | |
| American Realty Capital Properties Inc. | 3,057,318 | 39,317 | |
| Washington Federal Inc. | 1,677,900 | 39,078 | |
| Primerica Inc. | 904,132 | 38,796 | |
| BankUnited Inc. | 1,164,982 | 38,351 | |
| Geo Group Inc. | 1,188,872 | 38,305 | |
| American National Insurance Co. | 332,464 | 38,080 | |
| DCT Industrial Trust Inc. | 5,227,498 | 37,272 | |
| DiamondRock Hospitality Co. | 3,224,122 | 37,239 | |
| Brandywine Realty Trust | 2,584,670 | 36,418 | |
| BancorpSouth Inc. | 1,413,813 | 35,939 | |
| ^,* | Zillow Inc. Class A | 433,009 | 35,390 |
| Umpqua Holdings Corp. | 1,846,132 | 35,335 | |
| Glacier Bancorp Inc. | 1,164,481 | 34,690 | |
| Sovran Self Storage Inc. | 528,177 | 34,421 | |
| Corporate Office Properties Trust | 1,441,483 | 34,149 | |
| Home BancShares Inc. | 911,461 | 34,043 | |
| Healthcare Realty Trust Inc. | 1,581,188 | 33,695 | |
| ^ | First Financial Bankshares Inc. | 500,956 | 33,223 |
| FNB Corp. | 2,618,912 | 33,051 | |
| CubeSmart | 2,064,663 | 32,911 | |
| Invesco Mortgage Capital Inc. | 2,230,405 | 32,742 | |
| PrivateBancorp Inc. | 1,129,843 | 32,686 | |
| Newcastle Investment Corp. | 5,669,541 | 32,543 | |
| Pebblebrook Hotel Trust | 1,051,637 | 32,348 | |
| Valley National Bancorp | 3,127,748 | 31,653 | |
8
| Vanguard® Small-Cap Index Fund | ||
| Schedule of Investments | ||
| December 31, 2013 | ||
| Market | ||
| Value | ||
| Shares | ($000) | |
| Cathay General Bancorp | 1,179,761 | 31,535 |
| RLI Corp. | 318,453 | 31,011 |
| Medical Properties Trust Inc. | 2,531,656 | 30,937 |
| Janus Capital Group Inc. | 2,495,672 | 30,871 |
| Erie Indemnity Co. Class A | 422,178 | 30,870 |
| Bank of the Ozarks Inc. | 544,798 | 30,830 |
| ^ Lexington Realty Trust | 3,012,098 | 30,754 |
| Cousins Properties Inc. | 2,970,698 | 30,598 |
| Wintrust Financial Corp. | 658,459 | 30,368 |
| * WisdomTree Investments Inc. | 1,707,296 | 30,236 |
| * Virtus Investment Partners Inc. | 150,361 | 30,080 |
| First Industrial Realty Trust Inc. | 1,723,012 | 30,067 |
| Chambers Street Properties | 3,900,398 | 29,838 |
| Alexander & Baldwin Inc. | 710,668 | 29,656 |
| Ryman Hospitality Properties Inc. | 708,075 | 29,583 |
| Symetra Financial Corp. | 1,554,482 | 29,473 |
| Iberiabank Corp. | 466,592 | 29,325 |
| * Western Alliance Bancorp | 1,222,259 | 29,163 |
| Healthcare Trust of America Inc. Class A | 2,961,954 | 29,146 |
| * Strategic Hotels & Resorts Inc. | 3,049,820 | 28,821 |
| American Equity Investment Life Holding Co. | 1,082,541 | 28,557 |
| * MBIA Inc. | 2,377,566 | 28,388 |
| Trustmark Corp. | 1,053,605 | 28,279 |
| Platinum Underwriters Holdings Ltd. | 460,259 | 28,205 |
| Kemper Corp. | 688,464 | 28,144 |
| Mack-Cali Realty Corp. | 1,307,037 | 28,075 |
| * First Cash Financial Services Inc. | 452,851 | 28,004 |
| Potlatch Corp. | 668,162 | 27,889 |
| New Residential Investment Corp. | 4,174,079 | 27,883 |
| EastGroup Properties Inc. | 479,821 | 27,796 |
| MB Financial Inc. | 860,995 | 27,629 |
| Home Loan Servicing Solutions Ltd. | 1,171,153 | 26,901 |
| CVB Financial Corp. | 1,562,337 | 26,669 |
| Capitol Federal Financial Inc. | 2,194,045 | 26,570 |
| Hatteras Financial Corp. | 1,614,560 | 26,382 |
| DuPont Fabros Technology Inc. | 1,067,501 | 26,378 |
| Redwood Trust Inc. | 1,359,167 | 26,327 |
| PacWest Bancorp | 621,434 | 26,237 |
| EverBank Financial Corp. | 1,414,988 | 25,951 |
| Evercore Partners Inc. Class A | 433,263 | 25,900 |
| Washington REIT | 1,097,248 | 25,632 |
| Colony Financial Inc. | 1,261,452 | 25,595 |
| Old National Bancorp | 1,660,129 | 25,516 |
| PennyMac Mortgage Investment Trust | 1,103,755 | 25,342 |
| Greenhill & Co. Inc. | 435,099 | 25,210 |
| First Financial Holdings Inc. | 377,158 | 25,085 |
| Community Bank System Inc. | 631,961 | 25,076 |
| * Hilltop Holdings Inc. | 1,074,125 | 24,845 |
| ARMOUR Residential REIT Inc. | 6,113,908 | 24,517 |
| Equity One Inc. | 1,083,500 | 24,314 |
| Sun Communities Inc. | 566,259 | 24,145 |
| National Health Investors Inc. | 427,370 | 23,975 |
| Selective Insurance Group Inc. | 873,545 | 23,638 |
| Westamerica Bancorporation | 417,184 | 23,554 |
| ^ United Bankshares Inc. | 748,152 | 23,529 |
| International Bancshares Corp. | 886,203 | 23,387 |
| Columbia Banking System Inc. | 845,352 | 23,256 |
| Acadia Realty Trust | 916,019 | 22,745 |
| PS Business Parks Inc. | 296,563 | 22,663 |
| BOK Financial Corp. | 340,204 | 22,562 |
| Kennedy-Wilson Holdings Inc. | 1,013,760 | 22,556 |
| Mercury General Corp. | 453,344 | 22,536 |
| Government Properties Income Trust | 902,274 | 22,422 |
| Glimcher Realty Trust | 2,391,785 | 22,387 |
9
| Vanguard® Small-Cap Index Fund | |||
| Schedule of Investments | |||
| December 31, 2013 | |||
| Market | |||
| Value | |||
| Shares | ($000) | ||
| ^,* | St. Joe Co. | 1,141,610 | 21,908 |
| National Penn Bancshares Inc. | 1,922,376 | 21,781 | |
| Horace Mann Educators Corp. | 665,056 | 20,976 | |
| Chesapeake Lodging Trust | 818,031 | 20,688 | |
| Northwest Bancshares Inc. | 1,398,254 | 20,666 | |
| First Midwest Bancorp Inc. | 1,176,584 | 20,626 | |
| BBCN Bancorp Inc. | 1,242,180 | 20,608 | |
| * | Walter Investment Management Corp. | 580,331 | 20,521 |
| Investors Bancorp Inc. | 798,911 | 20,436 | |
| Argo Group International Holdings Ltd. | 439,257 | 20,421 | |
| CYS Investments Inc. | 2,752,135 | 20,393 | |
| LTC Properties Inc. | 573,349 | 20,291 | |
| Pennsylvania REIT | 1,068,758 | 20,285 | |
| Artisan Partners Asset Management Inc. Class A | 310,572 | 20,246 | |
| Montpelier Re Holdings Ltd. | 693,391 | 20,178 | |
| * | Encore Capital Group Inc. | 398,425 | 20,025 |
| Interactive Brokers Group Inc. | 811,172 | 19,744 | |
| Sterling Financial Corp. | 565,455 | 19,271 | |
| Astoria Financial Corp. | 1,386,159 | 19,171 | |
| Capstead Mortgage Corp. | 1,578,825 | 19,072 | |
| Empire State Realty Trust Inc. | 1,246,326 | 19,069 | |
| First Citizens BancShares Inc. Class A | 85,000 | 18,924 | |
| * | iStar Financial Inc. | 1,267,498 | 18,087 |
| Pinnacle Financial Partners Inc. | 550,680 | 17,914 | |
| Parkway Properties Inc. | 927,769 | 17,897 | |
| American Assets Trust Inc. | 567,117 | 17,825 | |
| Franklin Street Properties Corp. | 1,486,442 | 17,763 | |
| Cash America International Inc. | 463,528 | 17,753 | |
| Hersha Hospitality Trust Class A | 3,174,025 | 17,679 | |
| NBT Bancorp Inc. | 678,279 | 17,567 | |
| * | Altisource Asset Management Corp. | 18,686 | 17,378 |
| Ramco-Gershenson Properties Trust | 1,096,321 | 17,256 | |
| Provident Financial Services Inc. | 888,999 | 17,175 | |
| Education Realty Trust Inc. | 1,893,149 | 16,698 | |
| BGC Partners Inc. Class A | 2,754,620 | 16,693 | |
| Retail Opportunity Investments Corp. | 1,129,351 | 16,624 | |
| Sabra Health Care REIT Inc. | 624,764 | 16,331 | |
| Employers Holdings Inc. | 514,879 | 16,296 | |
| ViewPoint Financial Group Inc. | 592,932 | 16,276 | |
| Park National Corp. | 190,806 | 16,232 | |
| * | Greenlight Capital Re Ltd. Class A | 479,796 | 16,174 |
| ^ | Amtrust Financial Services Inc. | 492,570 | 16,102 |
| * | Enstar Group Ltd. | 114,636 | 15,924 |
| Boston Private Financial Holdings Inc. | 1,250,396 | 15,780 | |
| First Financial Bancorp | 903,340 | 15,745 | |
| Chemical Financial Corp. | 491,015 | 15,550 | |
| Hudson Pacific Properties Inc. | 701,522 | 15,342 | |
| * | TFS Financial Corp. | 1,266,206 | 15,340 |
| American Capital Mortgage Investment Corp. | 872,317 | 15,231 | |
| * | FelCor Lodging Trust Inc. | 1,842,586 | 15,036 |
| NRG Yield Inc. Class A | 371,299 | 14,856 | |
| * | HFF Inc. Class A | 552,921 | 14,846 |
| STAG Industrial Inc. | 728,053 | 14,845 | |
| American Homes 4 Rent Class A | 914,534 | 14,815 | |
| Investors Real Estate Trust | 1,722,567 | 14,780 | |
| WesBanco Inc. | 459,600 | 14,707 | |
| Inland Real Estate Corp. | 1,397,931 | 14,706 | |
| Independent Bank Corp. | 372,808 | 14,610 | |
| Nelnet Inc. Class A | 344,938 | 14,536 | |
| National Bank Holdings Corp. Class A | 663,232 | 14,193 | |
| First Commonwealth Financial Corp. | 1,570,532 | 13,852 | |
| Banner Corp. | 306,015 | 13,716 | |
| Associated Estates Realty Corp. | 853,432 | 13,698 | |
| OFG Bancorp | 752,974 | 13,057 | |
10
| Vanguard® Small-Cap Index Fund | |||
| Schedule of Investments | |||
| December 31, 2013 | |||
| Market | |||
| Value | |||
| Shares | ($000) | ||
| Infinity Property & Casualty Corp. | 179,857 | 12,905 | |
| Safety Insurance Group Inc. | 228,508 | 12,865 | |
| * | World Acceptance Corp. | 141,977 | 12,427 |
| * | Credit Acceptance Corp. | 94,614 | 12,299 |
| Select Income REIT | 451,647 | 12,077 | |
| Resource Capital Corp. | 1,999,757 | 11,859 | |
| S&T Bancorp Inc. | 465,559 | 11,783 | |
| ^ | Cohen & Steers Inc. | 291,674 | 11,684 |
| * | Investment Technology Group Inc. | 568,098 | 11,680 |
| * | Green Dot Corp. Class A | 461,447 | 11,605 |
| * | Forestar Group Inc. | 543,331 | 11,557 |
| City Holding Co. | 246,284 | 11,410 | |
| * | KCG Holdings Inc. Class A | 937,192 | 11,209 |
| Alexander's Inc. | 33,740 | 11,134 | |
| Brookline Bancorp Inc. | 1,154,772 | 11,051 | |
| * | Navigators Group Inc. | 174,884 | 11,046 |
| ^,* | Nationstar Mortgage Holdings Inc. | 297,978 | 11,013 |
| First Potomac Realty Trust | 917,848 | 10,675 | |
| Berkshire Hills Bancorp Inc. | 391,423 | 10,674 | |
| * | First BanCorp | 1,704,576 | 10,551 |
| Ashford Hospitality Trust Inc. | 1,260,721 | 10,439 | |
| Central Pacific Financial Corp. | 519,567 | 10,433 | |
| Oritani Financial Corp. | 638,979 | 10,256 | |
| FXCM Inc. Class A | 573,266 | 10,227 | |
| Rouse Properties Inc. | 449,477 | 9,974 | |
| * | Piper Jaffray Cos. | 248,756 | 9,838 |
| Anworth Mortgage Asset Corp. | 2,319,441 | 9,765 | |
| * | Tejon Ranch Co. | 265,242 | 9,750 |
| * | Capital Bank Financial Corp. | 427,125 | 9,717 |
| Silver Bay Realty Trust Corp. | 607,565 | 9,715 | |
| * | Ezcorp Inc. Class A | 802,847 | 9,385 |
| Tompkins Financial Corp. | 181,628 | 9,334 | |
| * | Trulia Inc. | 261,575 | 9,226 |
| Maiden Holdings Ltd. | 836,754 | 9,146 | |
| State Bank Financial Corp. | 501,574 | 9,124 | |
| * | Ambac Financial Group Inc. | 370,374 | 9,096 |
| Saul Centers Inc. | 185,549 | 8,856 | |
| * | PICO Holdings Inc. | 374,571 | 8,656 |
| United Fire Group Inc. | 292,703 | 8,389 | |
| National Western Life Insurance Co. Class A | 36,763 | 8,218 | |
| Dime Community Bancshares Inc. | 481,824 | 8,152 | |
| Getty Realty Corp. | 412,295 | 7,574 | |
| Universal Health Realty Income Trust | 188,113 | 7,536 | |
| FBL Financial Group Inc. Class A | 162,704 | 7,288 | |
| * | DFC Global Corp. | 607,574 | 6,957 |
| AG Mortgage Investment Trust Inc. | 443,866 | 6,942 | |
| * | MoneyGram International Inc. | 333,895 | 6,938 |
| GAMCO Investors Inc. | 75,854 | 6,597 | |
| * | NewStar Financial Inc. | 360,432 | 6,405 |
| * | Flagstar Bancorp Inc. | 323,434 | 6,346 |
| Urstadt Biddle Properties Inc. Class A | 326,790 | 6,029 | |
| Aviv REIT Inc. | 247,727 | 5,871 | |
| OneBeacon Insurance Group Ltd. Class A | 369,668 | 5,848 | |
| Bancfirst Corp. | 100,570 | 5,638 | |
| * | Beneficial Mutual Bancorp Inc. | 512,657 | 5,598 |
| * | PennyMac Financial Services Inc. Class A | 310,302 | 5,446 |
| Meadowbrook Insurance Group Inc. | 778,647 | 5,419 | |
| * | Blackhawk Network Holdings Inc. | 198,171 | 5,006 |
| State Auto Financial Corp. | 233,748 | 4,965 | |
| GFI Group Inc. | 1,212,884 | 4,742 | |
| Ashford Hospitality Prime Inc. | 251,475 | 4,577 | |
| Northfield Bancorp Inc. | 333,095 | 4,397 | |
| * | Springleaf Holdings Inc. | 170,149 | 4,301 |
| * | Walker & Dunlop Inc. | 257,859 | 4,170 |
11
| Vanguard® Small-Cap Index Fund | ||
| Schedule of Investments | ||
| December 31, 2013 | ||
| Market | ||
| Value | ||
| Shares | ($000) | |
| * TESARO Inc. | 134,457 | 3,797 |
| * Kearny Financial Corp. | 217,616 | 2,531 |
| Tower Group International Ltd. | 449,178 | 1,518 |
| Urstadt Biddle Properties Inc. | 60,433 | 958 |
| * Tejon Ranch Co. Warrants Exp. 08/31/2016 | 37,571 | 201 |
| 10,056,513 | ||
| Health Care (9.7%) | ||
| * Jazz Pharmaceuticals plc | 810,311 | 102,553 |
| Cooper Cos. Inc. | 807,267 | 99,972 |
| * Alkermes plc | 2,255,622 | 91,714 |
| * Salix Pharmaceuticals Ltd. | 985,072 | 88,597 |
| * MEDNAX Inc. | 1,658,579 | 88,535 |
| * United Therapeutics Corp. | 745,547 | 84,306 |
| * Cubist Pharmaceuticals Inc. | 1,221,104 | 84,097 |
| * Covance Inc. | 926,360 | 81,575 |
| * Isis Pharmaceuticals Inc. | 1,914,816 | 76,286 |
| * Medivation Inc. | 1,182,227 | 75,450 |
| * Tenet Healthcare Corp. | 1,636,913 | 68,947 |
| * Seattle Genetics Inc. | 1,717,048 | 68,493 |
| * Align Technology Inc. | 1,126,269 | 64,366 |
| Teleflex Inc. | 678,431 | 63,678 |
| * Sirona Dental Systems Inc. | 907,067 | 63,676 |
| * Incyte Corp. Ltd. | 1,195,712 | 60,539 |
| * Community Health Systems Inc. | 1,488,519 | 58,454 |
| Techne Corp. | 607,745 | 57,535 |
| * Alnylam Pharmaceuticals Inc. | 889,276 | 57,207 |
| * Health Management Associates Inc. Class A | 4,142,111 | 54,262 |
| * ViroPharma Inc. | 1,087,463 | 54,210 |
| West Pharmaceutical Services Inc. | 1,094,526 | 53,697 |
| * Team Health Holdings Inc. | 1,151,914 | 52,470 |
| * Cepheid Inc. | 1,118,552 | 52,259 |
| ^ Questcor Pharmaceuticals Inc. | 952,048 | 51,839 |
| * WellCare Health Plans Inc. | 721,069 | 50,778 |
| * Centene Corp. | 858,146 | 50,588 |
| * Mallinckrodt plc | 951,420 | 49,721 |
| STERIS Corp. | 970,464 | 46,631 |
| * Alere Inc. | 1,282,848 | 46,439 |
| * NPS Pharmaceuticals Inc. | 1,515,850 | 46,021 |
| HealthSouth Corp. | 1,370,307 | 45,659 |
| * Theravance Inc. | 1,276,486 | 45,507 |
| * Brookdale Senior Living Inc. Class A | 1,640,182 | 44,580 |
| * Charles River Laboratories International Inc. | 793,733 | 42,100 |
| * Puma Biotechnology Inc. | 402,103 | 41,630 |
| * Bio-Rad Laboratories Inc. Class A | 330,786 | 40,888 |
| * Medicines Co. | 1,054,303 | 40,717 |
| * PAREXEL International Corp. | 885,284 | 39,997 |
| * DexCom Inc. | 1,124,563 | 39,821 |
| Hill-Rom Holdings Inc. | 962,190 | 39,777 |
| * LifePoint Hospitals Inc. | 736,846 | 38,935 |
| Owens & Minor Inc. | 1,041,361 | 38,072 |
| * Health Net Inc. | 1,246,267 | 36,977 |
| * Haemonetics Corp. | 849,579 | 35,793 |
| * Celldex Therapeutics Inc. | 1,453,923 | 35,199 |
| * Thoratec Corp. | 939,601 | 34,389 |
| * Air Methods Corp. | 579,328 | 33,792 |
| * Insulet Corp. | 899,536 | 33,373 |
| * HMS Holdings Corp. | 1,455,644 | 33,087 |
| * Bruker Corp. | 1,657,552 | 32,770 |
| * Santarus Inc. | 996,436 | 31,846 |
| Healthcare Services Group Inc. | 1,093,896 | 31,034 |
| * Aegerion Pharmaceuticals Inc. | 434,532 | 30,834 |
| * Prestige Brands Holdings Inc. | 852,925 | 30,535 |
| * ACADIA Pharmaceuticals Inc. | 1,198,992 | 29,963 |
| * Akorn Inc. | 1,192,267 | 29,366 |
12
| Vanguard® Small-Cap Index Fund | |||
| Schedule of Investments | |||
| December 31, 2013 | |||
| Market | |||
| Value | |||
| Shares | ($000) | ||
| * | Pacira Pharmaceuticals Inc. | 494,193 | 28,411 |
| ^,* | Opko Health Inc. | 3,364,376 | 28,395 |
| * | Cyberonics Inc. | 423,108 | 27,718 |
| * | Acadia Healthcare Co. Inc. | 583,377 | 27,611 |
| * | Impax Laboratories Inc. | 1,090,175 | 27,407 |
| * | Magellan Health Services Inc. | 446,512 | 26,751 |
| * | Neogen Corp. | 571,014 | 26,095 |
| ^,* | Myriad Genetics Inc. | 1,232,965 | 25,868 |
| * | HeartWare International Inc. | 261,611 | 24,581 |
| * | Masimo Corp. | 838,947 | 24,522 |
| * | Wright Medical Group Inc. | 776,753 | 23,854 |
| * | NuVasive Inc. | 735,595 | 23,782 |
| * | Amsurg Corp. Class A | 504,742 | 23,178 |
| * | Clovis Oncology Inc. | 363,562 | 21,912 |
| * | Nektar Therapeutics | 1,915,280 | 21,738 |
| * | InterMune Inc. | 1,460,406 | 21,512 |
| * | Hanger Inc. | 544,792 | 21,432 |
| * | Halozyme Therapeutics Inc. | 1,411,246 | 21,155 |
| ^,* | Arena Pharmaceuticals Inc. | 3,605,856 | 21,094 |
| * | Globus Medical Inc. | 1,025,052 | 20,686 |
| * | ImmunoGen Inc. | 1,408,625 | 20,664 |
| * | Acorda Therapeutics Inc. | 680,521 | 19,871 |
| ^,* | Ariad Pharmaceuticals Inc. | 2,908,994 | 19,839 |
| * | Volcano Corp. | 904,974 | 19,774 |
| ^ | PDL BioPharma Inc. | 2,308,920 | 19,487 |
| CONMED Corp. | 455,595 | 19,363 | |
| * | Integra LifeSciences Holdings Corp. | 390,897 | 18,650 |
| Cantel Medical Corp. | 544,877 | 18,477 | |
| Analogic Corp. | 205,121 | 18,165 | |
| * | Synageva BioPharma Corp. | 279,061 | 18,061 |
| * | ArthroCare Corp. | 444,809 | 17,899 |
| * | Ironwood Pharmaceuticals Inc. Class A | 1,527,750 | 17,737 |
| * | Endologix Inc. | 995,279 | 17,358 |
| Meridian Bioscience Inc. | 650,163 | 17,249 | |
| * | Molina Healthcare Inc. | 490,636 | 17,050 |
| * | Auxilium Pharmaceuticals Inc. | 817,647 | 16,958 |
| ^,* | MannKind Corp. | 3,239,579 | 16,878 |
| ^,* | Exelixis Inc. | 2,734,188 | 16,761 |
| Kindred Healthcare Inc. | 848,923 | 16,758 | |
| * | IPC The Hospitalist Co. Inc. | 279,152 | 16,579 |
| * | ABIOMED Inc. | 553,291 | 14,795 |
| * | Quidel Corp. | 476,085 | 14,706 |
| Select Medical Holdings Corp. | 1,266,026 | 14,699 | |
| * | Emeritus Corp. | 669,195 | 14,475 |
| * | Abaxis Inc. | 348,816 | 13,960 |
| * | ICU Medical Inc. | 218,865 | 13,944 |
| * | Momenta Pharmaceuticals Inc. | 776,052 | 13,721 |
| * | Exact Sciences Corp. | 1,170,612 | 13,684 |
| Ensign Group Inc. | 308,337 | 13,650 | |
| ^,* | Vivus Inc. | 1,426,010 | 12,948 |
| * | Luminex Corp. | 620,330 | 12,034 |
| ^,* | Sarepta Therapeutics Inc. | 589,003 | 11,998 |
| Invacare Corp. | 483,426 | 11,220 | |
| * | HealthStream Inc. | 336,616 | 11,031 |
| * | Emergent Biosolutions Inc. | 479,423 | 11,022 |
| * | Accuray Inc. | 1,233,217 | 10,741 |
| * | Merit Medical Systems Inc. | 668,414 | 10,521 |
| ^,* | Bio-Reference Labs Inc. | 410,357 | 10,480 |
| * | Infinity Pharmaceuticals Inc. | 752,987 | 10,399 |
| * | Portola Pharmaceuticals Inc. | 402,139 | 10,355 |
| ^,* | Idenix Pharmaceuticals Inc. | 1,655,115 | 9,898 |
| * | NxStage Medical Inc. | 952,851 | 9,528 |
| * | Tornier NV | 478,736 | 8,995 |
| * | Cadence Pharmaceuticals Inc. | 992,487 | 8,982 |
13
| Vanguard® Small-Cap Index Fund | |||
| Schedule of Investments | |||
| December 31, 2013 | |||
| Market | |||
| Value | |||
| Shares | ($000) | ||
| * | Corvel Corp. | 189,490 | 8,849 |
| * | Sagent Pharmaceuticals Inc. | 339,939 | 8,628 |
| * | Healthways Inc. | 548,539 | 8,420 |
| ^,* | Spectrum Pharmaceuticals Inc. | 946,740 | 8,379 |
| ^,* | Merrimack Pharmaceuticals Inc. | 1,517,204 | 8,102 |
| * | BioScrip Inc. | 1,065,228 | 7,883 |
| * | Synergy Pharmaceuticals Inc. | 1,336,550 | 7,525 |
| National Healthcare Corp. | 138,760 | 7,481 | |
| * | Amedisys Inc. | 507,897 | 7,430 |
| ^,* | Dendreon Corp. | 2,465,543 | 7,372 |
| * | Accretive Health Inc. | 800,557 | 7,333 |
| * | Orthofix International NV | 304,374 | 6,946 |
| * | Lexicon Pharmaceuticals Inc. | 3,802,997 | 6,845 |
| * | Genomic Health Inc. | 227,448 | 6,657 |
| * | Surgical Care Affiliates Inc. | 188,690 | 6,574 |
| * | Gentiva Health Services Inc. | 507,289 | 6,295 |
| * | LHC Group Inc. | 202,414 | 4,866 |
| * | Achillion Pharmaceuticals Inc. | 1,429,443 | 4,746 |
| Universal American Corp. | 632,410 | 4,617 | |
| ^,* | Sequenom Inc. | 1,901,271 | 4,449 |
| * | Ophthotech Corp. | 84,218 | 2,724 |
| * | Rigel Pharmaceuticals Inc. | 719,813 | 2,051 |
| ^,* | Epizyme Inc. | 93,375 | 1,942 |
| ^,* | Agios Pharmaceuticals Inc. | 76,841 | 1,840 |
| * | Cubist Pharmaceutic-CVR | 453,893 | 613 |
| 4,289,169 | |||
| Industrials (20.5%) | |||
| Fortune Brands Home & Security Inc. | 2,742,618 | 125,338 | |
| * | United Rentals Inc. | 1,537,710 | 119,864 |
| Wabtec Corp. | 1,508,813 | 112,060 | |
| Packaging Corp. of America | 1,617,364 | 102,347 | |
| IDEX Corp. | 1,337,941 | 98,807 | |
| Lincoln Electric Holdings Inc. | 1,345,957 | 96,021 | |
| Total System Services Inc. | 2,817,372 | 93,762 | |
| Valspar Corp. | 1,286,721 | 91,730 | |
| * | Colfax Corp. | 1,428,353 | 90,972 |
| Waste Connections Inc. | 1,935,748 | 84,457 | |
| * | Kirby Corp. | 842,954 | 83,663 |
| Jack Henry & Associates Inc. | 1,410,964 | 83,543 | |
| Carlisle Cos. Inc. | 1,049,010 | 83,291 | |
| * | CoStar Group Inc. | 450,477 | 83,149 |
| * | Genesee & Wyoming Inc. Class A | 854,753 | 82,099 |
| Graco Inc. | 1,009,473 | 78,860 | |
| Global Payments Inc. | 1,202,337 | 78,140 | |
| * | Flextronics International Ltd. | 10,020,078 | 77,856 |
| Broadridge Financial Solutions Inc. | 1,966,049 | 77,698 | |
| Acuity Brands Inc. | 709,895 | 77,606 | |
| PerkinElmer Inc. | 1,854,571 | 76,464 | |
| Towers Watson & Co. Class A | 584,914 | 74,641 | |
| Aptargroup Inc. | 1,085,748 | 73,625 | |
| * | Hexcel Corp. | 1,641,676 | 73,367 |
| Terex Corp. | 1,746,338 | 73,329 | |
| Huntington Ingalls Industries Inc. | 814,033 | 73,271 | |
| Oshkosh Corp. | 1,424,905 | 71,787 | |
| Trinity Industries Inc. | 1,288,167 | 70,231 | |
| Sonoco Products Co. | 1,680,843 | 70,125 | |
| Bemis Co. Inc. | 1,697,819 | 69,543 | |
| AO Smith Corp. | 1,286,693 | 69,404 | |
| * | Spirit Aerosystems Holdings Inc. Class A | 1,991,239 | 67,861 |
| Kennametal Inc. | 1,293,441 | 67,349 | |
| Nordson Corp. | 899,889 | 66,862 | |
| * | Allegion plc | 1,504,010 | 66,462 |
| * | Vantiv Inc. Class A | 2,036,657 | 66,415 |
| * | WESCO International Inc. | 728,934 | 66,384 |
14
| Vanguard® Small-Cap Index Fund | |||
| Schedule of Investments | |||
| December 31, 2013 | |||
| Market | |||
| Value | |||
| Shares | ($000) | ||
| MSC Industrial Direct Co. Inc. Class A | 812,629 | 65,717 | |
| URS Corp. | 1,234,879 | 65,436 | |
| Triumph Group Inc. | 858,436 | 65,301 | |
| ITT Corp. | 1,495,904 | 64,952 | |
| Generac Holdings Inc. | 1,130,871 | 64,053 | |
| Ryder System Inc. | 867,327 | 63,991 | |
| Alliant Techsystems Inc. | 525,115 | 63,896 | |
| * | WEX Inc. | 640,947 | 63,473 |
| Valmont Industries Inc. | 419,871 | 62,611 | |
| Lennox International Inc. | 735,030 | 62,522 | |
| Babcock & Wilcox Co. | 1,827,952 | 62,498 | |
| FEI Co. | 688,420 | 61,517 | |
| RR Donnelley & Sons Co. | 2,997,689 | 60,793 | |
| Toro Co. | 942,197 | 59,924 | |
| Exelis Inc. | 3,116,026 | 59,391 | |
| * | Old Dominion Freight Line Inc. | 1,065,626 | 56,499 |
| EnerSys Inc. | 781,657 | 54,786 | |
| Eagle Materials Inc. | 700,052 | 54,205 | |
| * | Teledyne Technologies Inc. | 587,636 | 53,980 |
| * | Foster Wheeler AG | 1,622,870 | 53,587 |
| CLARCOR Inc. | 825,628 | 53,129 | |
| Lender Processing Services Inc. | 1,409,305 | 52,680 | |
| * | Cognex Corp. | 1,367,934 | 52,228 |
| * | CoreLogic Inc. | 1,468,398 | 52,172 |
| Regal-Beloit Corp. | 706,115 | 52,055 | |
| Crane Co. | 767,398 | 51,608 | |
| * | NeuStar Inc. Class A | 1,032,692 | 51,490 |
| Manitowoc Co. Inc. | 2,204,924 | 51,419 | |
| * | DigitalGlobe Inc. | 1,241,086 | 51,071 |
| * | Clean Harbors Inc. | 850,332 | 50,986 |
| Belden Inc. | 716,751 | 50,495 | |
| World Fuel Services Corp. | 1,131,732 | 48,846 | |
| * | Genpact Ltd. | 2,657,878 | 48,825 |
| * | Owens-Illinois Inc. | 1,361,213 | 48,704 |
| * | Esterline Technologies Corp. | 466,046 | 47,518 |
| MAXIMUS Inc. | 1,074,233 | 47,256 | |
| * | Moog Inc. Class A | 686,197 | 46,620 |
| Woodward Inc. | 1,010,335 | 46,081 | |
| * | AECOM Technology Corp. | 1,538,392 | 45,275 |
| * | Zebra Technologies Corp. | 828,876 | 44,826 |
| EMCOR Group Inc. | 1,052,142 | 44,653 | |
| Air Lease Corp. Class A | 1,426,323 | 44,330 | |
| Curtiss-Wright Corp. | 702,891 | 43,741 | |
| Deluxe Corp. | 832,862 | 43,467 | |
| Landstar System Inc. | 754,114 | 43,324 | |
| * | USG Corp. | 1,524,036 | 43,252 |
| * | Louisiana-Pacific Corp. | 2,328,088 | 43,093 |
| ^,* | IPG Photonics Corp. | 553,889 | 42,987 |
| Corporate Executive Board Co. | 554,361 | 42,924 | |
| Actuant Corp. Class A | 1,144,692 | 41,942 | |
| Anixter International Inc. | 456,098 | 40,976 | |
| Watsco Inc. | 421,528 | 40,492 | |
| GATX Corp. | 761,830 | 39,745 | |
| * | Armstrong World Industries Inc. | 670,080 | 38,603 |
| * | Graphic Packaging Holding Co. | 4,017,562 | 38,569 |
| * | Advisory Board Co. | 594,441 | 37,848 |
| * | Euronet Worldwide Inc. | 787,419 | 37,678 |
| Harsco Corp. | 1,330,484 | 37,293 | |
| Con-way Inc. | 938,160 | 37,254 | |
| Silgan Holdings Inc. | 731,896 | 35,146 | |
| * | MWI Veterinary Supply Inc. | 201,757 | 34,418 |
| Littelfuse Inc. | 369,314 | 34,320 | |
| * | MasTec Inc. | 1,018,950 | 33,340 |
| ^,* | Navistar International Corp. | 862,223 | 32,928 |
15
| Vanguard® Small-Cap Index Fund | |||
| Schedule of Investments | |||
| December 31, 2013 | |||
| Market | |||
| Value | |||
| Shares | ($000) | ||
| Covanta Holding Corp. | 1,829,620 | 32,476 | |
| * | Cardtronics Inc. | 742,408 | 32,258 |
| TAL International Group Inc. | 558,517 | 32,031 | |
| Convergys Corp. | 1,509,417 | 31,773 | |
| ^,* | Outerwall Inc. | 457,136 | 30,752 |
| Applied Industrial Technologies Inc. | 625,991 | 30,730 | |
| * | WageWorks Inc. | 513,742 | 30,537 |
| * | Coherent Inc. | 409,191 | 30,440 |
| United Stationers Inc. | 658,053 | 30,198 | |
| * | Mobile Mini Inc. | 724,511 | 29,835 |
| Franklin Electric Co. Inc. | 667,898 | 29,815 | |
| * | Tetra Tech Inc. | 1,057,859 | 29,599 |
| * | Vishay Intertechnology Inc. | 2,229,579 | 29,564 |
| * | Berry Plastics Group Inc. | 1,235,986 | 29,404 |
| Heartland Payment Systems Inc. | 578,155 | 28,815 | |
| Barnes Group Inc. | 739,541 | 28,332 | |
| * | Trimas Corp. | 704,505 | 28,103 |
| Watts Water Technologies Inc. Class A | 451,380 | 27,927 | |
| * | VistaPrint NV | 491,017 | 27,914 |
| Mueller Industries Inc. | 442,952 | 27,910 | |
| * | On Assignment Inc. | 798,971 | 27,900 |
| * | FTI Consulting Inc. | 663,705 | 27,305 |
| Brink's Co. | 795,919 | 27,173 | |
| * | RBC Bearings Inc. | 380,676 | 26,933 |
| Mine Safety Appliances Co. | 521,332 | 26,697 | |
| HEICO Corp. | 455,418 | 26,391 | |
| UTi Worldwide Inc. | 1,468,658 | 25,790 | |
| EVERTEC Inc. | 1,036,874 | 25,569 | |
| UniFirst Corp. | 237,698 | 25,434 | |
| * | Itron Inc. | 613,544 | 25,419 |
| Simpson Manufacturing Co. Inc. | 678,390 | 24,917 | |
| Raven Industries Inc. | 600,077 | 24,687 | |
| Mueller Water Products Inc. Class A | 2,611,885 | 24,473 | |
| * | Texas Industries Inc. | 353,980 | 24,347 |
| ^,* | Swift Transportation Co. | 1,090,686 | 24,224 |
| * | Huron Consulting Group Inc. | 386,166 | 24,220 |
| * | Plexus Corp. | 557,195 | 24,121 |
| * | Masonite International Corp. | 401,917 | 24,115 |
| * | Proto Labs Inc. | 335,987 | 23,916 |
| Brady Corp. Class A | 761,501 | 23,553 | |
| CIRCOR International Inc. | 290,092 | 23,434 | |
| ABM Industries Inc. | 818,232 | 23,393 | |
| ^ | Sturm Ruger & Co. Inc. | 319,325 | 23,339 |
| * | Orbital Sciences Corp. | 997,311 | 23,237 |
| * | Hub Group Inc. Class A | 579,332 | 23,104 |
| * | Sanmina Corp. | 1,379,209 | 23,033 |
| * | PHH Corp. | 944,186 | 22,991 |
| General Cable Corp. | 779,610 | 22,928 | |
| * | HD Supply Holdings Inc. | 950,526 | 22,822 |
| * | Universal Display Corp. | 648,567 | 22,285 |
| Forward Air Corp. | 504,822 | 22,167 | |
| * | Korn/Ferry International | 815,301 | 21,296 |
| * | GrafTech International Ltd. | 1,895,260 | 21,284 |
| * | Trex Co. Inc. | 261,583 | 20,804 |
| Tennant Co. | 304,601 | 20,655 | |
| * | Benchmark Electronics Inc. | 890,488 | 20,552 |
| Aircastle Ltd. | 1,065,426 | 20,414 | |
| * | Veeco Instruments Inc. | 615,091 | 20,243 |
| Granite Construction Inc. | 577,161 | 20,189 | |
| * | EnPro Industries Inc. | 345,504 | 19,918 |
| AZZ Inc. | 399,933 | 19,541 | |
| HEICO Corp. Class A | 463,450 | 19,521 | |
| G&K Services Inc. Class A | 310,504 | 19,323 | |
| * | Wesco Aircraft Holdings Inc. | 854,030 | 18,720 |
16
| Vanguard® Small-Cap Index Fund | |||
| Schedule of Investments | |||
| December 31, 2013 | |||
| Market | |||
| Value | |||
| Shares | ($000) | ||
| Primoris Services Corp. | 595,391 | 18,535 | |
| Matson Inc. | 706,251 | 18,440 | |
| Knight Transportation Inc. | 990,259 | 18,161 | |
| MTS Systems Corp. | 253,234 | 18,043 | |
| * | Rogers Corp. | 292,397 | 17,982 |
| Kaman Corp. | 447,186 | 17,767 | |
| Werner Enterprises Inc. | 717,561 | 17,745 | |
| * | Greatbatch Inc. | 398,296 | 17,621 |
| * | DXP Enterprises Inc. | 152,580 | 17,577 |
| Otter Tail Corp. | 598,183 | 17,509 | |
| * | TrueBlue Inc. | 677,447 | 17,465 |
| * | Rexnord Corp. | 644,694 | 17,413 |
| AAR Corp. | 620,636 | 17,384 | |
| Greif Inc. Class A | 328,053 | 17,190 | |
| * | Atlas Air Worldwide Holdings Inc. | 413,041 | 16,997 |
| Albany International Corp. | 469,876 | 16,883 | |
| * | Meritor Inc. | 1,607,121 | 16,762 |
| ^ | Lindsay Corp. | 201,908 | 16,708 |
| * | OSI Systems Inc. | 314,443 | 16,700 |
| * | Tutor Perini Corp. | 634,576 | 16,689 |
| Encore Wire Corp. | 307,164 | 16,648 | |
| * | FARO Technologies Inc. | 282,638 | 16,478 |
| Heartland Express Inc. | 839,220 | 16,466 | |
| * | II-VI Inc. | 928,138 | 16,335 |
| Cubic Corp. | 309,198 | 16,282 | |
| Universal Forest Products Inc. | 311,730 | 16,254 | |
| Apogee Enterprises Inc. | 451,465 | 16,212 | |
| McGrath RentCorp | 402,321 | 16,012 | |
| * | LifeLock Inc. | 969,068 | 15,902 |
| Exponent Inc. | 205,239 | 15,894 | |
| * | Imperva Inc. | 329,805 | 15,874 |
| Booz Allen Hamilton Holding Corp. Class A | 821,304 | 15,728 | |
| * | Navigant Consulting Inc. | 815,628 | 15,660 |
| * | Boise Cascade Co. | 519,323 | 15,310 |
| * | ExamWorks Group Inc. | 510,420 | 15,246 |
| * | Measurement Specialties Inc. | 248,625 | 15,089 |
| Sun Hydraulics Corp. | 369,317 | 15,079 | |
| ^ | Textainer Group Holdings Ltd. | 372,145 | 14,968 |
| * | H&E Equipment Services Inc. | 493,530 | 14,623 |
| AAON Inc. | 454,621 | 14,525 | |
| Altra Industrial Motion Corp. | 422,464 | 14,457 | |
| * | ExlService Holdings Inc. | 516,111 | 14,255 |
| * | Sykes Enterprises Inc. | 652,601 | 14,233 |
| ESCO Technologies Inc. | 414,835 | 14,212 | |
| * | Wabash National Corp. | 1,129,800 | 13,953 |
| ^,* | Smith & Wesson Holding Corp. | 1,032,920 | 13,934 |
| * | Aegion Corp. Class A | 632,866 | 13,853 |
| Insperity Inc. | 379,370 | 13,707 | |
| * | Greenbrier Cos. Inc. | 416,820 | 13,688 |
| * | Team Inc. | 323,070 | 13,679 |
| Arkansas Best Corp. | 403,375 | 13,586 | |
| * | Thermon Group Holdings Inc. | 494,810 | 13,523 |
| Schnitzer Steel Industries Inc. | 409,782 | 13,388 | |
| John Bean Technologies Corp. | 453,761 | 13,309 | |
| Standex International Corp. | 210,542 | 13,239 | |
| Hyster-Yale Materials Handling Inc. | 135,964 | 12,666 | |
| * | Rofin-Sinar Technologies Inc. | 463,718 | 12,530 |
| * | Roadrunner Transportation Systems Inc. | 463,443 | 12,490 |
| * | RPX Corp. | 735,470 | 12,429 |
| Badger Meter Inc. | 225,345 | 12,281 | |
| Quanex Building Products Corp. | 610,724 | 12,166 | |
| ManTech International Corp. Class A | 395,070 | 11,824 | |
| * | Monster Worldwide Inc. | 1,641,396 | 11,703 |
| Astec Industries Inc. | 300,777 | 11,619 | |
17
| Vanguard® Small-Cap Index Fund | |||
| Schedule of Investments | |||
| December 31, 2013 | |||
| Market | |||
| Value | |||
| Shares | ($000) | ||
| AVX Corp. | 832,958 | 11,603 | |
| Quad/Graphics Inc. | 417,883 | 11,379 | |
| ^ | Acacia Research Corp. | 781,150 | 11,358 |
| Comfort Systems USA Inc. | 584,789 | 11,339 | |
| Kelly Services Inc. Class A | 446,446 | 11,134 | |
| * | Newport Corp. | 612,219 | 11,063 |
| * | Checkpoint Systems Inc. | 682,022 | 10,755 |
| Materion Corp. | 339,395 | 10,470 | |
| * | Nortek Inc. | 139,573 | 10,412 |
| Gorman-Rupp Co. | 302,376 | 10,108 | |
| Griffon Corp. | 728,837 | 9,628 | |
| Park Electrochemical Corp. | 325,942 | 9,361 | |
| American Science & Engineering Inc. | 129,359 | 9,302 | |
| * | Consolidated Graphics Inc. | 136,049 | 9,175 |
| Kforce Inc. | 444,282 | 9,090 | |
| Resources Connection Inc. | 621,520 | 8,906 | |
| * | Taminco Corp. | 437,210 | 8,836 |
| * | Aerovironment Inc. | 299,375 | 8,721 |
| Landauer Inc. | 156,647 | 8,241 | |
| Black Box Corp. | 261,595 | 7,796 | |
| * | TTM Technologies Inc. | 884,412 | 7,588 |
| ^ | American Railcar Industries Inc. | 158,294 | 7,242 |
| * | TeleTech Holdings Inc. | 290,780 | 6,961 |
| * | Bazaarvoice Inc. | 874,574 | 6,927 |
| * | CAI International Inc. | 292,664 | 6,898 |
| * | Air Transport Services Group Inc. | 851,302 | 6,887 |
| * | Ply Gem Holdings Inc. | 331,166 | 5,971 |
| Greif Inc. Class B | 91,711 | 5,390 | |
| * | Mistras Group Inc. | 256,375 | 5,353 |
| * | Layne Christensen Co. | 309,294 | 5,283 |
| * | InnerWorkings Inc. | 673,767 | 5,249 |
| * | Higher One Holdings Inc. | 502,188 | 4,901 |
| * | Dice Holdings Inc. | 647,853 | 4,697 |
| Electro Scientific Industries Inc. | 419,144 | 4,384 | |
| ^,* | Nuverra Environmental Solutions Inc. | 256,174 | 4,301 |
| * | M/A-COM Technology Solutions Holdings Inc. | 191,572 | 3,255 |
| * | Multi-Fineline Electronix Inc. | 138,492 | 1,924 |
| * | Aeroflex Holding Corp. | 279,052 | 1,814 |
| * | Viasystems Group Inc. | 68,290 | 934 |
| 9,079,428 | |||
| Oil & Gas (5.2%) | |||
| * | Oil States International Inc. | 909,532 | 92,518 |
| * | Gulfport Energy Corp. | 1,387,316 | 87,609 |
| * | Superior Energy Services Inc. | 2,630,336 | 69,993 |
| * | WPX Energy Inc. | 3,311,668 | 67,492 |
| * | First Solar Inc. | 1,230,667 | 67,244 |
| * | Dril-Quip Inc. | 603,915 | 66,388 |
| * | Oasis Petroleum Inc. | 1,411,958 | 66,320 |
| Patterson-UTI Energy Inc. | 2,260,206 | 57,228 | |
| Targa Resources Corp. | 628,144 | 55,383 | |
| * | Newfield Exploration Co. | 2,245,794 | 55,314 |
| * | Atwood Oceanics Inc. | 1,003,443 | 53,574 |
| ^,* | Ultra Petroleum Corp. | 2,397,601 | 51,908 |
| * | MRC Global Inc. | 1,594,296 | 51,432 |
| * | Kodiak Oil & Gas Corp. | 4,388,684 | 49,197 |
| * | Rosetta Resources Inc. | 1,010,184 | 48,529 |
| Tidewater Inc. | 817,660 | 48,463 | |
| * | Chart Industries Inc. | 501,225 | 47,937 |
| ^,* | SandRidge Energy Inc. | 7,680,869 | 46,623 |
| SemGroup Corp. Class A | 700,164 | 45,672 | |
| Bristow Group Inc. | 603,787 | 45,320 | |
| * | Unit Corp. | 809,716 | 41,798 |
| * | Helix Energy Solutions Group Inc. | 1,657,741 | 38,426 |
| CARBO Ceramics Inc. | 323,945 | 37,749 | |
18
| Vanguard® Small-Cap Index Fund | |||
| Schedule of Investments | |||
| December 31, 2013 | |||
| Market | |||
| Value | |||
| Shares | ($000) | ||
| Western Refining Inc. | 854,713 | 36,248 | |
| * | McDermott International Inc. | 3,901,902 | 35,741 |
| * | Exterran Holdings Inc. | 977,681 | 33,437 |
| Energy XXI Bermuda Ltd. | 1,188,319 | 32,156 | |
| * | PDC Energy Inc. | 588,239 | 31,306 |
| * | Laredo Petroleum Holdings Inc. | 1,123,522 | 31,110 |
| * | Carrizo Oil & Gas Inc. | 674,374 | 30,192 |
| * | SEACOR Holdings Inc. | 318,925 | 29,086 |
| * | Stone Energy Corp. | 783,586 | 27,104 |
| * | Hornbeck Offshore Services Inc. | 535,587 | 26,367 |
| * | Diamondback Energy Inc. | 466,349 | 24,651 |
| Crosstex Energy Inc. | 669,497 | 24,209 | |
| * | Forum Energy Technologies Inc. | 840,211 | 23,744 |
| Delek US Holdings Inc. | 645,086 | 22,197 | |
| * | Bonanza Creek Energy Inc. | 498,515 | 21,670 |
| ^,* | SunPower Corp. Class A | 700,729 | 20,889 |
| * | Bill Barrett Corp. | 767,704 | 20,559 |
| ^ | PBF Energy Inc. Class A | 652,958 | 20,542 |
| * | Magnum Hunter Resources Corp. | 2,680,180 | 19,592 |
| RPC Inc. | 1,083,859 | 19,347 | |
| * | Geospace Technologies Corp. | 202,927 | 19,244 |
| Gulfmark Offshore Inc. | 403,314 | 19,008 | |
| * | GT Advanced Technologies Inc. | 2,076,179 | 18,104 |
| * | EPL Oil & Gas Inc. | 612,523 | 17,457 |
| * | Matador Resources Co. | 919,937 | 17,148 |
| * | Key Energy Services Inc. | 2,135,140 | 16,868 |
| * | Newpark Resources Inc. | 1,369,336 | 16,829 |
| * | C&J Energy Services Inc. | 719,850 | 16,629 |
| * | Hercules Offshore Inc. | 2,502,523 | 16,341 |
| ^,* | Sanchez Energy Corp. | 649,936 | 15,930 |
| * | Rex Energy Corp. | 796,064 | 15,690 |
| * | Flotek Industries Inc. | 766,599 | 15,386 |
| * | Parker Drilling Co. | 1,883,725 | 15,315 |
| * | TETRA Technologies Inc. | 1,235,830 | 15,275 |
| * | Northern Oil and Gas Inc. | 968,295 | 14,592 |
| ^,* | Halcon Resources Corp. | 3,759,969 | 14,513 |
| Comstock Resources Inc. | 707,713 | 12,944 | |
| CVR Energy Inc. | 286,525 | 12,444 | |
| * | Approach Resources Inc. | 578,393 | 11,157 |
| * | Tesco Corp. | 547,143 | 10,823 |
| * | Basic Energy Services Inc. | 660,811 | 10,428 |
| * | Resolute Energy Corp. | 1,138,370 | 10,279 |
| * | Penn Virginia Corp. | 1,076,389 | 10,150 |
| * | Goodrich Petroleum Corp. | 575,244 | 9,791 |
| * | Swift Energy Co. | 679,590 | 9,174 |
| W&T Offshore Inc. | 557,759 | 8,924 | |
| * | Contango Oil & Gas Co. | 187,699 | 8,871 |
| Pattern Energy Group Inc. | 292,582 | 8,868 | |
| * | Pioneer Energy Services Corp. | 1,028,152 | 8,236 |
| * | Clayton Williams Energy Inc. | 100,119 | 8,205 |
| * | Athlon Energy Inc. | 270,609 | 8,186 |
| ^,* | Solazyme Inc. | 729,910 | 7,949 |
| ^ | EXCO Resources Inc. | 1,482,900 | 7,874 |
| * | Forest Oil Corp. | 1,970,905 | 7,115 |
| * | ION Geophysical Corp. | 2,013,537 | 6,645 |
| ^,* | Quicksilver Resources Inc. | 2,042,171 | 6,269 |
| * | Willbros Group Inc. | 655,433 | 6,174 |
| Alon USA Energy Inc. | 338,396 | 5,597 | |
| ^,* | Vantage Drilling Co. | 2,993,342 | 5,508 |
| * | PetroQuest Energy Inc. | 794,852 | 3,434 |
| ^,* | Midstates Petroleum Co. Inc. | 505,748 | 3,348 |
| * | Jones Energy Inc. | 185,194 | 2,682 |
| ^,* | BPZ Resources Inc. | 822,309 | 1,497 |
19
| Vanguard® Small-Cap Index Fund | |||
| Schedule of Investments | |||
| December 31, 2013 | |||
| Market | |||
| Value | |||
| Shares | ($000) | ||
| ^,* | EXCO Resources Inc. Rights Exp. 01/09/2014 | 1,975,051 | 316 |
| 2,299,481 | |||
| Technology (11.3%) | |||
| * | NCR Corp. | 2,745,057 | 93,497 |
| IAC/InterActiveCorp | 1,278,676 | 87,832 | |
| * | athenahealth Inc. | 613,255 | 82,483 |
| Solera Holdings Inc. | 1,135,146 | 80,323 | |
| Pitney Bowes Inc. | 3,332,787 | 77,654 | |
| * | Concur Technologies Inc. | 739,406 | 76,292 |
| ^,* | 3D Systems Corp. | 805,176 | 74,825 |
| * | PTC Inc. | 1,970,896 | 69,750 |
| * | Ultimate Software Group Inc. | 437,531 | 67,038 |
| * | Cadence Design Systems Inc. | 4,744,813 | 66,522 |
| ^ | Leidos Holdings Inc. | 1,412,701 | 65,676 |
| * | Brocade Communications Systems Inc. | 7,342,070 | 65,124 |
| * | Aspen Technology Inc. | 1,533,680 | 64,108 |
| * | ON Semiconductor Corp. | 7,321,037 | 60,325 |
| * | Ingram Micro Inc. | 2,541,434 | 59,622 |
| * | AOL Inc. | 1,205,375 | 56,195 |
| * | Teradyne Inc. | 3,160,847 | 55,694 |
| * | CommVault Systems Inc. | 740,783 | 55,470 |
| * | SunEdison Inc. | 4,176,128 | 54,498 |
| * | Atmel Corp. | 6,671,778 | 52,240 |
| * | Tyler Technologies Inc. | 505,312 | 51,608 |
| * | Guidewire Software Inc. | 1,049,058 | 51,477 |
| * | SS&C Technologies Holdings Inc. | 1,152,309 | 51,001 |
| * | Medidata Solutions Inc. | 838,164 | 50,768 |
| * | JDS Uniphase Corp. | 3,783,926 | 49,115 |
| * | VeriFone Systems Inc. | 1,802,430 | 48,341 |
| * | Palo Alto Networks Inc. | 836,567 | 48,077 |
| * | Riverbed Technology Inc. | 2,537,593 | 45,880 |
| Mentor Graphics Corp. | 1,890,479 | 45,504 | |
| * | ARRIS Group Inc. | 1,824,658 | 44,458 |
| DST Systems Inc. | 487,149 | 44,204 | |
| * | Fortinet Inc. | 2,291,900 | 43,844 |
| * | Allscripts Healthcare Solutions Inc. | 2,795,103 | 43,212 |
| * | ViaSat Inc. | 676,514 | 42,384 |
| * | Splunk Inc. | 610,918 | 41,952 |
| * | ACI Worldwide Inc. | 635,882 | 41,332 |
| * | Ciena Corp. | 1,701,157 | 40,709 |
| * | SolarWinds Inc. | 1,054,349 | 39,886 |
| ^,* | Advanced Micro Devices Inc. | 10,140,842 | 39,245 |
| * | Microsemi Corp. | 1,549,400 | 38,658 |
| Compuware Corp. | 3,393,345 | 38,039 | |
| * | Finisar Corp. | 1,585,240 | 37,919 |
| * | Verint Systems Inc. | 881,298 | 37,843 |
| * | Manhattan Associates Inc. | 317,146 | 37,258 |
| * | Informatica Corp. | 894,868 | 37,137 |
| * | Qlik Technologies Inc. | 1,389,902 | 37,013 |
| j2 Global Inc. | 729,068 | 36,461 | |
| Lexmark International Inc. Class A | 1,024,122 | 36,377 | |
| Fair Isaac Corp. | 570,183 | 35,830 | |
| * | MICROS Systems Inc. | 620,980 | 35,626 |
| * | Dealertrack Technologies Inc. | 724,076 | 34,814 |
| * | EchoStar Corp. Class A | 700,005 | 34,804 |
| * | Cornerstone OnDemand Inc. | 643,759 | 34,338 |
| * | Sapient Corp. | 1,965,774 | 34,126 |
| Plantronics Inc. | 721,535 | 33,515 | |
| * | Rovi Corp. | 1,684,580 | 33,169 |
| Diebold Inc. | 997,871 | 32,940 | |
20
| Vanguard® Small-Cap Index Fund | |||
| Schedule of Investments | |||
| December 31, 2013 | |||
| Market | |||
| Value | |||
| Shares | ($000) | ||
| * | Polycom Inc. | 2,810,593 | 31,563 |
| * | Aruba Networks Inc. | 1,710,370 | 30,616 |
| * | International Rectifier Corp. | 1,172,373 | 30,564 |
| * | Tech Data Corp. | 591,440 | 30,518 |
| * | Electronics For Imaging Inc. | 775,696 | 30,043 |
| * | Demandware Inc. | 456,602 | 29,277 |
| * | SYNNEX Corp. | 434,290 | 29,271 |
| * | Semtech Corp. | 1,132,512 | 28,630 |
| * | NetSuite Inc. | 277,593 | 28,598 |
| Blackbaud Inc. | 754,749 | 28,416 | |
| Cogent Communications Group Inc. | 702,747 | 28,398 | |
| * | CACI International Inc. Class A | 386,637 | 28,310 |
| * | Synaptics Inc. | 546,028 | 28,290 |
| * | Cavium Inc. | 814,190 | 28,098 |
| * | Fairchild Semiconductor International Inc. Class A | 2,093,992 | 27,955 |
| * | Silicon Laboratories Inc. | 640,244 | 27,729 |
| * | Hittite Microwave Corp. | 441,863 | 27,276 |
| * | Entegris Inc. | 2,285,232 | 26,509 |
| MKS Instruments Inc. | 877,277 | 26,266 | |
| Power Integrations Inc. | 468,785 | 26,168 | |
| * | Infoblox Inc. | 786,158 | 25,959 |
| * | FleetMatics Group plc | 577,484 | 24,976 |
| ADTRAN Inc. | 903,371 | 24,400 | |
| * | Unisys Corp. | 724,385 | 24,318 |
| Intersil Corp. Class A | 2,105,664 | 24,152 | |
| * | Web.com Group Inc. | 756,561 | 24,051 |
| NIC Inc. | 964,606 | 23,990 | |
| Advent Software Inc. | 673,441 | 23,564 | |
| Cypress Semiconductor Corp. | 2,242,265 | 23,544 | |
| * | Ubiquiti Networks Inc. | 506,157 | 23,263 |
| * | Integrated Device Technology Inc. | 2,247,815 | 22,905 |
| * | RF Micro Devices Inc. | 4,421,705 | 22,816 |
| Science Applications International Corp. | 686,913 | 22,716 | |
| * | TriQuint Semiconductor Inc. | 2,648,676 | 22,090 |
| * | Syntel Inc. | 241,108 | 21,929 |
| * | Bottomline Technologies de Inc. | 604,540 | 21,860 |
| * | Cirrus Logic Inc. | 1,047,713 | 21,405 |
| * | iGATE Corp. | 529,079 | 21,248 |
| * | NETGEAR Inc. | 639,383 | 21,061 |
| * | Progress Software Corp. | 813,491 | 21,012 |
| ^,* | InvenSense Inc. | 1,009,687 | 20,981 |
| Monotype Imaging Holdings Inc. | 643,458 | 20,501 | |
| InterDigital Inc. | 679,617 | 20,042 | |
| * | Responsys Inc. | 720,433 | 19,747 |
| * | ScanSource Inc. | 463,931 | 19,685 |
| * | Monolithic Power Systems Inc. | 567,125 | 19,657 |
| * | Tableau Software Inc. Class A | 282,872 | 19,498 |
| * | RealPage Inc. | 832,561 | 19,465 |
| * | MedAssets Inc. | 969,163 | 19,218 |
| * | MicroStrategy Inc. Class A | 149,781 | 18,609 |
| * | Infinera Corp. | 1,872,826 | 18,316 |
| * | PMC - Sierra Inc. | 2,848,483 | 18,316 |
| * | Interactive Intelligence Group Inc. | 266,810 | 17,972 |
| * | Blucora Inc. | 611,669 | 17,836 |
| * | EPAM Systems Inc. | 498,611 | 17,421 |
| * | Netscout Systems Inc. | 582,188 | 17,227 |
| * | Loral Space & Communications Inc. | 211,895 | 17,159 |
| * | Freescale Semiconductor Ltd. | 1,063,385 | 17,067 |
| * | QLogic Corp. | 1,430,153 | 16,919 |
| * | Shutterstock Inc. | 202,180 | 16,908 |
| * | Cabot Microelectronics Corp. | 369,420 | 16,882 |
| * | Rambus Inc. | 1,765,957 | 16,724 |
| * | Kulicke & Soffa Industries Inc. | 1,252,625 | 16,660 |
| CDW Corp. | 708,826 | 16,558 | |
21
| Vanguard® Small-Cap Index Fund | |||
| Schedule of Investments | |||
| December 31, 2013 | |||
| Market | |||
| Value | |||
| Shares | ($000) | ||
| * | Applied Micro Circuits Corp. | 1,218,067 | 16,298 |
| Tessera Technologies Inc. | 806,360 | 15,893 | |
| * | OmniVision Technologies Inc. | 922,728 | 15,871 |
| * | Insight Enterprises Inc. | 698,175 | 15,856 |
| Quality Systems Inc. | 743,513 | 15,658 | |
| CSG Systems International Inc. | 530,218 | 15,588 | |
| * | Synchronoss Technologies Inc. | 501,551 | 15,583 |
| * | ATMI Inc. | 499,104 | 15,078 |
| * | Dycom Industries Inc. | 528,805 | 14,695 |
| * | Advanced Energy Industries Inc. | 626,405 | 14,320 |
| * | Comverse Inc. | 366,881 | 14,235 |
| * | Ixia | 1,067,216 | 14,205 |
| * | Sonus Networks Inc. | 4,509,083 | 14,204 |
| Pegasystems Inc. | 281,774 | 13,858 | |
| * | Diodes Inc. | 577,288 | 13,601 |
| * | Amkor Technology Inc. | 2,154,914 | 13,210 |
| ^,* | Fusion-io Inc. | 1,478,719 | 13,175 |
| ^,* | VirnetX Holding Corp. | 675,617 | 13,114 |
| * | LogMeIn Inc. | 379,375 | 12,728 |
| * | Ultratech Inc. | 435,648 | 12,634 |
| West Corp. | 482,540 | 12,406 | |
| * | Harmonic Inc. | 1,661,117 | 12,259 |
| * | CommScope Holding Co. Inc. | 642,474 | 12,156 |
| * | Spansion Inc. Class A | 873,004 | 12,126 |
| * | BroadSoft Inc. | 441,740 | 12,077 |
| * | Ruckus Wireless Inc. | 845,594 | 12,007 |
| * | LivePerson Inc. | 802,805 | 11,898 |
| * | Ellie Mae Inc. | 430,491 | 11,567 |
| * | ICG Group Inc. | 591,784 | 11,025 |
| Brooks Automation Inc. | 1,041,585 | 10,926 | |
| Computer Programs & Systems Inc. | 174,725 | 10,800 | |
| * | Lattice Semiconductor Corp. | 1,914,395 | 10,548 |
| * | Tangoe Inc. | 566,553 | 10,204 |
| * | FireEye Inc. | 229,468 | 10,007 |
| * | Digital River Inc. | 522,883 | 9,673 |
| * | IntraLinks Holdings Inc. | 782,759 | 9,479 |
| * | ChannelAdvisor Corp. | 224,396 | 9,360 |
| * | Marketo Inc. | 250,206 | 9,275 |
| * | Super Micro Computer Inc. | 528,111 | 9,062 |
| * | Emulex Corp. | 1,258,164 | 9,008 |
| * | Textura Corp. | 284,210 | 8,509 |
| * | Cvent Inc. | 231,574 | 8,427 |
| Comtech Telecommunications Corp. | 257,574 | 8,119 | |
| ^ | Ebix Inc. | 536,240 | 7,893 |
| * | Silicon Image Inc. | 1,273,517 | 7,832 |
| * | Silicon Graphics International Corp. | 564,067 | 7,564 |
| Forrester Research Inc. | 195,047 | 7,462 | |
| Epiq Systems Inc. | 457,719 | 7,420 | |
| Micrel Inc. | 750,848 | 7,411 | |
| ^,* | Veeva Systems Inc. Class A | 215,029 | 6,902 |
| ^,* | Millennial Media Inc. | 932,111 | 6,776 |
| * | Entropic Communications Inc. | 1,427,520 | 6,724 |
| * | Jive Software Inc. | 569,377 | 6,405 |
| * | Calix Inc. | 614,951 | 5,928 |
| * | Benefitfocus Inc. | 100,758 | 5,818 |
| * | Gigamon Inc. | 204,258 | 5,736 |
| * | Mercury Systems Inc. | 519,517 | 5,689 |
| * | Ceva Inc. | 361,204 | 5,498 |
| * | Vocera Communications Inc. | 347,666 | 5,427 |
| * | FormFactor Inc. | 896,547 | 5,397 |
| * | Pendrell Corp. | 2,442,712 | 4,910 |
| * | Inphi Corp. | 371,443 | 4,792 |
| ^,* | Rocket Fuel Inc. | 77,663 | 4,775 |
| * | Endurance International Group Holdings Inc. | 312,394 | 4,430 |
22
| Vanguard® Small-Cap Index Fund | |||
| Schedule of Investments | |||
| December 31, 2013 | |||
| Market | |||
| Value | |||
| Shares | ($000) | ||
| * | Quantum Corp. | 3,465,049 | 4,158 |
| ^,* | Gogo Inc. | 138,154 | 3,428 |
| ^,* | RingCentral Inc. Class A | 141,471 | 2,599 |
| * | Systemax Inc. | 211,088 | 2,375 |
| * | Nimble Storage Inc. | 19,989 | 905 |
| * | Piksel Inc. | 241 | — |
| 5,022,130 | |||
| Telecommunications (0.7%) | |||
| * | Level 3 Communications Inc. | 2,766,072 | 91,751 |
| * | tw telecom inc Class A | 2,376,848 | 72,423 |
| Telephone & Data Systems Inc. | 1,504,032 | 38,774 | |
| * | Leap Wireless International Inc. | 915,897 | 15,937 |
| Consolidated Communications Holdings Inc. | 628,425 | 12,336 | |
| * | Cincinnati Bell Inc. | 3,428,078 | 12,204 |
| * | Vonage Holdings Corp. | 2,714,245 | 9,038 |
| Atlantic Tele-Network Inc. | 155,644 | 8,805 | |
| United States Cellular Corp. | 210,353 | 8,797 | |
| EarthLink Inc. | 1,677,587 | 8,505 | |
| * | Intelsat SA | 347,296 | 7,828 |
| ^,* | NII Holdings Inc. | 2,696,365 | 7,415 |
| * | Iridium Communications Inc. | 946,048 | 5,922 |
| 299,735 | |||
| Utilities (3.2%) | |||
| AGL Resources Inc. | 1,959,056 | 92,526 | |
| ITC Holdings Corp. | 865,265 | 82,910 | |
| UGI Corp. | 1,881,544 | 78,009 | |
| Aqua America Inc. | 2,915,227 | 68,770 | |
| Atmos Energy Corp. | 1,498,779 | 68,074 | |
| Westar Energy Inc. Class A | 2,096,663 | 67,450 | |
| Questar Corp. | 2,887,519 | 66,384 | |
| Great Plains Energy Inc. | 2,536,916 | 61,495 | |
| Vectren Corp. | 1,357,853 | 48,204 | |
| Cleco Corp. | 996,671 | 46,465 | |
| IDACORP Inc. | 828,404 | 42,944 | |
| Hawaiian Electric Industries Inc. | 1,642,047 | 42,792 | |
| Southwest Gas Corp. | 764,025 | 42,717 | |
| Piedmont Natural Gas Co. Inc. | 1,252,208 | 41,523 | |
| UNS Energy Corp. | 650,813 | 38,951 | |
| Portland General Electric Co. | 1,287,575 | 38,885 | |
| Black Hills Corp. | 733,621 | 38,522 | |
| UIL Holdings Corp. | 930,837 | 36,070 | |
| WGL Holdings Inc. | 854,070 | 34,214 | |
| ALLETE Inc. | 671,720 | 33,505 | |
| New Jersey Resources Corp. | 693,013 | 32,045 | |
| PNM Resources Inc. | 1,314,174 | 31,698 | |
| * | Dynegy Inc. Class A | 1,402,816 | 30,189 |
| South Jersey Industries Inc. | 530,981 | 29,714 | |
| Avista Corp. | 989,820 | 27,903 | |
| NorthWestern Corp. | 634,378 | 27,481 | |
| Laclede Group Inc. | 512,360 | 23,333 | |
| El Paso Electric Co. | 663,999 | 23,313 | |
| MGE Energy Inc. | 381,099 | 22,066 | |
| Northwest Natural Gas Co. | 445,336 | 19,069 | |
| American States Water Co. | 638,803 | 18,353 | |
| California Water Service Group | 747,847 | 17,253 | |
| Empire District Electric Co. | 708,598 | 16,078 | |
| Ormat Technologies Inc. | 299,348 | 8,145 | |
| Atlantic Power Corp. | 1,976,292 | 6,877 | |
| 1,403,927 | |||
| Total Common Stocks (Cost $31,187,639) | 43,812,953 | ||
23
| Vanguard® Small-Cap Index Fund | |||||
| Schedule of Investments | |||||
| December 31, 2013 | |||||
| Market | |||||
| Value | |||||
| Coupon | Shares | ($000) | |||
| Temporary Cash Investments (2.5%)1 | |||||
| Money Market Fund (2.4%) | |||||
| 2,3 | Vanguard Market Liquidity Fund | 0.125% | 1,060,404,291 | 1,060,404 | |
| Face | |||||
| Maturity | Amount | ||||
| Date | ($000) | ||||
| U.S. Government and Agency Obligations (0.1%) | |||||
| 4,5 | Fannie Mae Discount Notes | 0.095% | 4/9/14 | 700 | 700 |
| 5,6 | Federal Home Loan Bank Discount Notes | 0.120%-0.130% | 5/23/14 | 1,200 | 1,199 |
| 5,6 | Federal Home Loan Bank Discount Notes | 0.120% | 5/28/14 | 3,200 | 3,198 |
| 5,6 | Federal Home Loan Bank Discount Notes | 0.125% | 5/30/14 | 2,400 | 2,399 |
| 4,5 | Freddie Mac Discount Notes | 0.090% | 2/24/14 | 4,700 | 4,699 |
| 4,5 | Freddie Mac Discount Notes | 0.085% | 3/3/14 | 7,500 | 7,497 |
| 19,692 | |||||
| Total Temporary Cash Investments (Cost $1,080,099) | 1,080,096 | ||||
| Total Investments (101.5%) (Cost $32,267,738) | 44,893,049 | ||||
| Other Assets and Liabilities—Net (-1.5%)3 | (649,952) | ||||
| Net Assets (100%) | 44,243,097 | ||||
^ Includes partial security positions on loan to broker-dealers. The total value of securities on loan is $458,686,000.
* Non-income-producing security.
1 The fund invests a portion of its cash reserves in equity markets through the use of index futures contracts. After giving effect to futures investments, the fund's effective common stock and temporary cash investment positions represent 100.0% and 1.5%, respectively, of net assets.
2 Affiliated money market fund available only to Vanguard funds and certain trusts and accounts managed by Vanguard. Rate shown is the 7-day yield.
3 Includes $482,350,000 of collateral received for securities on loan.
4 The issuer was placed under federal conservatorship in September 2008; since that time, its daily operations have been managed by the Federal Housing Finance Agency and it receives capital from the U.S. Treasury, as needed to maintain a positive net worth, in exchange for senior preferred stock.
5 Securities with a value of $18,892,000 have been segregated as initial margin for open futures contracts.
6 The issuer operates under a congressional charter; its securities are generally neither guaranteed by the U.S. Treasury nor backed by the full faith and credit of the U.S. government.
REIT—Real Estate Investment Trust.
24
| Vanguard® Small-Cap Growth Index Fund | |||
| Schedule of Investments | |||
| December 31, 2013 | |||
| Market | |||
| Value | |||
| Shares | ($000) | ||
| Common Stocks (99.8%)1 | |||
| Basic Materials (2.5%) | |||
| NewMarket Corp. | 133,825 | 44,718 | |
| Carpenter Technology Corp. | 634,844 | 39,487 | |
| Royal Gold Inc. | 772,361 | 35,583 | |
| * | KapStone Paper and Packaging Corp. | 512,007 | 28,601 |
| Balchem Corp. | 380,357 | 22,327 | |
| *,^ | Polypore International Inc. | 566,623 | 22,042 |
| US Silica Holdings Inc. | 637,640 | 21,750 | |
| * | Stillwater Mining Co. | 1,506,519 | 18,590 |
| Globe Specialty Metals Inc. | 808,938 | 14,569 | |
| * | Calgon Carbon Corp. | 690,096 | 14,195 |
| * | Coeur Mining Inc. | 1,270,575 | 13,786 |
| * | RTI International Metals Inc. | 386,290 | 13,215 |
| *,^ | Molycorp Inc. | 1,974,383 | 11,096 |
| * | Horsehead Holding Corp. | 637,581 | 10,335 |
| Deltic Timber Corp. | 143,989 | 9,783 | |
| Haynes International Inc. | 156,084 | 8,622 | |
| American Vanguard Corp. | 306,447 | 7,444 | |
| * | Ferro Corp. | 545,632 | 7,000 |
| *,^ | AK Steel Holding Corp. | 814,687 | 6,680 |
| Hecla Mining Co. | 2,168,675 | 6,679 | |
| ^ | Walter Energy Inc. | 393,536 | 6,544 |
| * | Rentech Inc. | 2,710,841 | 4,744 |
| *,^ | Allied Nevada Gold Corp. | 1,176,905 | 4,178 |
| Gold Resource Corp. | 574,994 | 2,605 | |
| FutureFuel Corp. | 136,021 | 2,149 | |
| *,^ | Paramount Gold and Silver Corp. | 377,609 | 352 |
| 377,074 | |||
| Consumer Goods (8.6%) | |||
| * | Toll Brothers Inc. | 1,989,839 | 73,624 |
| Harman International Industries Inc. | 852,857 | 69,806 | |
| * | Middleby Corp. | 241,399 | 57,929 |
| Gentex Corp. | 1,736,124 | 57,275 | |
| Brunswick Corp. | 1,147,294 | 52,844 | |
| * | Hain Celestial Group Inc. | 572,746 | 51,994 |
| Flowers Foods Inc. | 2,367,499 | 50,830 | |
| * | WhiteWave Foods Co. Class A | 2,187,800 | 50,188 |
| * | Fifth & Pacific Cos. Inc. | 1,548,478 | 49,660 |
| Carter's Inc. | 653,483 | 46,914 | |
| Nu Skin Enterprises Inc. Class A | 337,736 | 46,682 | |
| * | Darling International Inc. | 1,995,945 | 41,675 |
| * | Tempur Sealy International Inc. | 763,070 | 41,175 |
| Wolverine World Wide Inc. | 1,205,429 | 40,936 | |
| * | Deckers Outdoor Corp. | 413,964 | 34,963 |
| Pool Corp. | 550,518 | 32,007 | |
| * | Zynga Inc. Class A | 7,905,878 | 30,042 |
| * | Steven Madden Ltd. | 769,517 | 28,157 |
| * | Boston Beer Co. Inc. Class A | 111,286 | 26,908 |
| Ryland Group Inc. | 582,964 | 25,307 | |
| B&G Foods Inc. | 674,279 | 22,865 | |
| Lancaster Colony Corp. | 258,165 | 22,757 | |
| * | Dorman Products Inc. | 391,474 | 21,950 |
| * | Meritage Homes Corp. | 411,836 | 19,764 |
| * | TiVo Inc. | 1,462,563 | 19,189 |
| Snyders-Lance Inc. | 661,733 | 19,005 | |
| Interface Inc. Class A | 795,347 | 17,466 | |
| * | Standard Pacific Corp. | 1,924,967 | 17,421 |
| J&J Snack Foods Corp. | 188,773 | 16,723 | |
| * | MDC Holdings Inc. | 493,945 | 15,925 |
| * | G-III Apparel Group Ltd. | 205,906 | 15,194 |
| Drew Industries Inc. | 279,049 | 14,287 | |
| Oxford Industries Inc. | 176,038 | 14,201 | |
25
| Vanguard® Small-Cap Growth Index Fund | |||
| Schedule of Investments | |||
| December 31, 2013 | |||
| Market | |||
| Value | |||
| Shares | ($000) | ||
| * | Select Comfort Corp. | 663,187 | 13,987 |
| WD-40 Co. | 183,279 | 13,687 | |
| Vector Group Ltd. | 835,929 | 13,684 | |
| * | Tumi Holdings Inc. | 600,376 | 13,539 |
| * | iRobot Corp. | 328,256 | 11,413 |
| * | Boulder Brands Inc. | 719,483 | 11,411 |
| Ethan Allen Interiors Inc. | 328,990 | 10,008 | |
| * | Taylor Morrison Home Corp. Class A | 415,638 | 9,331 |
| * | Annie's Inc. | 213,901 | 9,206 |
| * | Blount International Inc. | 624,402 | 9,035 |
| * | Crocs Inc. | 531,358 | 8,459 |
| * | USANA Health Sciences Inc. | 87,881 | 6,642 |
| *,^ | Vera Bradley Inc. | 255,415 | 6,140 |
| * | LeapFrog Enterprises Inc. | 730,592 | 5,801 |
| * | DTS Inc. | 214,935 | 5,154 |
| * | RealD Inc. | 532,731 | 4,550 |
| * | Diamond Foods Inc. | 134,207 | 3,468 |
| * | National Beverage Corp. | 145,661 | 2,937 |
| * | Fuel Systems Solutions Inc. | 164,221 | 2,278 |
| 1,306,393 | |||
| Consumer Services (14.5%) | |||
| Dick's Sporting Goods Inc. | 1,273,557 | 73,994 | |
| GNC Holdings Inc. Class A | 1,199,282 | 70,098 | |
| Dunkin' Brands Group Inc. | 1,346,812 | 64,916 | |
| * | Sally Beauty Holdings Inc. | 2,069,130 | 62,550 |
| * | Panera Bread Co. Class A | 337,927 | 59,708 |
| * | Lamar Advertising Co. Class A | 1,010,545 | 52,801 |
| * | Copart Inc. | 1,425,388 | 52,240 |
| * | Pandora Media Inc. | 1,960,408 | 52,147 |
| * | AMC Networks Inc. Class A | 728,646 | 49,628 |
| Domino's Pizza Inc. | 702,970 | 48,962 | |
| * | Yelp Inc. Class A | 686,963 | 47,366 |
| Sotheby's | 866,803 | 46,114 | |
| * | United Natural Foods Inc. | 594,537 | 44,822 |
| DSW Inc. Class A | 1,046,998 | 44,738 | |
| * | Madison Square Garden Co. Class A | 758,321 | 43,664 |
| * | Spirit Airlines Inc. | 916,521 | 41,619 |
| * | Cabela's Inc. | 578,929 | 38,591 |
| * | Bally Technologies Inc. | 491,678 | 38,572 |
| Chico's FAS Inc. | 1,903,081 | 35,854 | |
| * | Buffalo Wild Wings Inc. | 236,980 | 34,883 |
| * | Live Nation Entertainment Inc. | 1,759,851 | 34,775 |
| * | Ascena Retail Group Inc. | 1,624,208 | 34,368 |
| Vail Resorts Inc. | 455,387 | 34,259 | |
| * | Lumber Liquidators Holdings Inc. | 330,789 | 34,035 |
| * | HomeAway Inc. | 806,530 | 32,971 |
| * | Groupon Inc. | 2,519,506 | 29,655 |
| * | DreamWorks Animation SKG Inc. Class A | 814,497 | 28,915 |
| Six Flags Entertainment Corp. | 780,137 | 28,725 | |
| Cheesecake Factory Inc. | 593,878 | 28,666 | |
| Lions Gate Entertainment Corp. | 869,978 | 27,543 | |
| Pier 1 Imports Inc. | 1,178,076 | 27,190 | |
| PriceSmart Inc. | 228,839 | 26,440 | |
| Rollins Inc. | 828,139 | 25,084 | |
| * | Conn's Inc. | 317,901 | 25,047 |
| HSN Inc. | 400,344 | 24,941 | |
| * | Restoration Hardware Holdings Inc. | 368,234 | 24,782 |
| * | Grand Canyon Education Inc. | 567,517 | 24,744 |
| * | Five Below Inc. | 545,437 | 23,563 |
| * | SolarCity Corp. | 412,231 | 23,423 |
| * | Shutterfly Inc. | 455,904 | 23,219 |
| * | Life Time Fitness Inc. | 484,349 | 22,764 |
| Texas Roadhouse Inc. Class A | 800,918 | 22,266 | |
| *,^ | Hibbett Sports Inc. | 327,875 | 22,036 |
26
| Vanguard® Small-Cap Growth Index Fund | |||
| Schedule of Investments | |||
| December 31, 2013 | |||
| Market | |||
| Value | |||
| Shares | ($000) | ||
| Monro Muffler Brake Inc. | 376,382 | 21,213 | |
| * | OpenTable Inc. | 264,276 | 20,976 |
| * | Genesco Inc. | 286,088 | 20,902 |
| Morningstar Inc. | 260,877 | 20,372 | |
| * | ANN Inc. | 550,730 | 20,135 |
| * | Fresh Market Inc. | 488,723 | 19,793 |
| Allegiant Travel Co. Class A | 187,531 | 19,773 | |
| * | Jos A Bank Clothiers Inc. | 353,429 | 19,343 |
| * | Vitamin Shoppe Inc. | 364,758 | 18,971 |
| * | Marriott Vacations Worldwide Corp. | 357,854 | 18,880 |
| Papa John's International Inc. | 408,218 | 18,533 | |
| Finish Line Inc. Class A | 620,331 | 17,475 | |
| * | Orient-Express Hotels Ltd. Class A | 1,110,113 | 16,774 |
| * | WebMD Health Corp. | 408,823 | 16,149 |
| * | Krispy Kreme Doughnuts Inc. | 831,150 | 16,033 |
| Churchill Downs Inc. | 170,402 | 15,277 | |
| * | Bloomin' Brands Inc. | 629,134 | 15,105 |
| Interval Leisure Group Inc. | 471,132 | 14,558 | |
| * | Ascent Capital Group Inc. Class A | 163,615 | 13,999 |
| * | comScore Inc. | 428,775 | 12,267 |
| * | AFC Enterprises Inc. | 301,016 | 11,589 |
| * | Constant Contact Inc. | 367,952 | 11,432 |
| *,^ | Clean Energy Fuels Corp. | 846,894 | 10,908 |
| * | Boyd Gaming Corp. | 950,387 | 10,701 |
| * | Bright Horizons Family Solutions Inc. | 288,121 | 10,586 |
| Nexstar Broadcasting Group Inc. Class A | 182,287 | 10,159 | |
| * | Scientific Games Corp. Class A | 592,484 | 10,031 |
| * | BJ's Restaurants Inc. | 303,538 | 9,428 |
| * | Francesca's Holdings Corp. | 508,325 | 9,358 |
| * | Bankrate Inc. | 513,415 | 9,211 |
| * | American Public Education Inc. | 210,516 | 9,151 |
| * | K12 Inc. | 416,564 | 9,060 |
| * | Mattress Firm Holding Corp. | 193,023 | 8,308 |
| * | Angie's List Inc. | 514,453 | 7,794 |
| * | Blue Nile Inc. | 161,175 | 7,590 |
| * | Zumiez Inc. | 287,535 | 7,476 |
| *,^ | Liquidity Services Inc. | 323,283 | 7,326 |
| *,^ | Noodles & Co. Class A | 190,425 | 6,840 |
| * | Container Store Group Inc. | 145,117 | 6,764 |
| * | RetailMeNot Inc. | 233,711 | 6,729 |
| * | Tile Shop Holdings Inc. | 321,946 | 5,818 |
| * | Cumulus Media Inc. Class A | 682,676 | 5,277 |
| * | Burlington Stores Inc. | 134,195 | 4,294 |
| * | Fairway Group Holdings Corp. | 212,418 | 3,849 |
| * | SFX Entertainment Inc. | 278,105 | 3,337 |
| * | Diamond Resorts International Inc. | 142,317 | 2,627 |
| *,^ | Media General Inc. | 105,751 | 2,390 |
| * | Potbelly Corp. | 91,789 | 2,229 |
| ClubCorp Holdings Inc. | 120,647 | 2,140 | |
| * | Travelzoo Inc. | 96,614 | 2,060 |
| * | Demand Media Inc. | 282,757 | 1,632 |
| * | ReachLocal Inc. | 122,248 | 1,554 |
| * | Vitacost.com Inc. | 105,582 | 611 |
| 2,207,465 | |||
| Financials (16.3%) | |||
| Waddell & Reed Financial Inc. Class A | 1,024,491 | 66,715 | |
| Duke Realty Corp. | 4,113,199 | 61,862 | |
| * | SVB Financial Group | 576,599 | 60,462 |
| * | Signature Bank | 553,384 | 59,444 |
| Extra Space Storage Inc. | 1,388,413 | 58,494 | |
| CBOE Holdings Inc. | 1,100,047 | 57,158 | |
| DDR Corp. | 3,628,778 | 55,774 | |
| Regency Centers Corp. | 1,164,738 | 53,927 | |
| BRE Properties Inc. | 973,787 | 53,276 | |
27
| Vanguard® Small-Cap Growth Index Fund | ||
| Schedule of Investments | ||
| December 31, 2013 | ||
| Market | ||
| Value | ||
| Shares | ($000) | |
| Kilroy Realty Corp. | 1,035,918 | 51,982 |
| * Howard Hughes Corp. | 424,383 | 50,968 |
| Taubman Centers Inc. | 761,700 | 48,688 |
| WP Carey Inc. | 731,912 | 44,903 |
| Financial Engines Inc. | 635,930 | 44,184 |
| BioMed Realty Trust Inc. | 2,423,464 | 43,913 |
| American Campus Communities Inc. | 1,321,861 | 42,577 |
| LaSalle Hotel Properties | 1,298,814 | 40,081 |
| Weingarten Realty Investors | 1,461,387 | 40,071 |
| Douglas Emmett Inc. | 1,709,020 | 39,803 |
| Home Properties Inc. | 717,716 | 38,484 |
| Tanger Factory Outlet Centers | 1,191,874 | 38,164 |
| * Stifel Financial Corp. | 761,923 | 36,511 |
| Equity Lifestyle Properties Inc. | 998,663 | 36,182 |
| RLJ Lodging Trust | 1,470,320 | 35,758 |
| * E*TRADE Financial Corp. | 1,811,566 | 35,579 |
| * Portfolio Recovery Associates Inc. | 627,645 | 33,165 |
| * Altisource Portfolio Solutions SA | 201,883 | 32,025 |
| Post Properties Inc. | 683,740 | 30,926 |
| Sunstone Hotel Investors Inc. | 2,306,932 | 30,913 |
| * Texas Capital Bancshares Inc. | 491,151 | 30,550 |
| MarketAxess Holdings Inc. | 450,924 | 30,153 |
| American Realty Capital Properties Inc. | 2,339,507 | 30,086 |
| * Zillow Inc. Class A | 330,953 | 27,049 |
| Sovran Self Storage Inc. | 403,881 | 26,321 |
| Home BancShares Inc. | 697,493 | 26,051 |
| Healthcare Realty Trust Inc. | 1,209,469 | 25,774 |
| CubeSmart | 1,579,640 | 25,179 |
| Pebblebrook Hotel Trust | 804,240 | 24,738 |
| Medical Properties Trust Inc. | 1,936,424 | 23,663 |
| ^ Lexington Realty Trust | 2,304,636 | 23,530 |
| * WisdomTree Investments Inc. | 1,305,908 | 23,128 |
| * Virtus Investment Partners Inc. | 114,815 | 22,969 |
| Chambers Street Properties | 2,983,041 | 22,820 |
| Alexander & Baldwin Inc. | 543,864 | 22,695 |
| Ryman Hospitality Properties Inc. | 541,559 | 22,626 |
| * Western Alliance Bancorp | 935,362 | 22,318 |
| Healthcare Trust of America Inc. Class A | 2,266,232 | 22,300 |
| * Strategic Hotels & Resorts Inc. | 2,335,106 | 22,067 |
| Spirit Realty Capital Inc. | 2,219,275 | 21,815 |
| * First Cash Financial Services Inc. | 346,485 | 21,427 |
| DuPont Fabros Technology Inc. | 817,102 | 20,191 |
| Chimera Investment Corp. | 6,485,138 | 20,104 |
| Evercore Partners Inc. Class A | 331,502 | 19,817 |
| Washington REIT | 839,809 | 19,618 |
| Colony Financial Inc. | 965,634 | 19,593 |
| Greenhill & Co. Inc. | 333,065 | 19,298 |
| * Hilltop Holdings Inc. | 821,863 | 19,010 |
| Equity One Inc. | 829,155 | 18,606 |
| Sun Communities Inc. | 433,538 | 18,486 |
| PS Business Parks Inc. | 227,274 | 17,368 |
| Kennedy-Wilson Holdings Inc. | 776,339 | 17,274 |
| Glimcher Realty Trust | 1,831,895 | 17,147 |
| Chesapeake Lodging Trust | 626,585 | 15,846 |
| * Walter Investment Management Corp. | 444,249 | 15,709 |
| Investors Bancorp Inc. | 612,162 | 15,659 |
| Artisan Partners Asset Management Inc. Class A | 237,744 | 15,499 |
| * Encore Capital Group Inc. | 305,229 | 15,341 |
| DCT Industrial Trust Inc. | 1,997,716 | 14,244 |
| Hersha Hospitality Trust Class A | 2,433,417 | 13,554 |
| Ramco-Gershenson Properties Trust | 840,266 | 13,226 |
| Education Realty Trust Inc. | 1,451,467 | 12,802 |
| Retail Opportunity Investments Corp. | 865,477 | 12,740 |
| Sabra Health Care REIT Inc. | 479,048 | 12,522 |
28
| Vanguard® Small-Cap Growth Index Fund | |||
| Schedule of Investments | |||
| December 31, 2013 | |||
| Market | |||
| Value | |||
| Shares | ($000) | ||
| ViewPoint Financial Group Inc. | 454,667 | 12,481 | |
| * | TFS Financial Corp. | 971,151 | 11,765 |
| Hudson Pacific Properties Inc. | 537,238 | 11,749 | |
| * | FelCor Lodging Trust Inc. | 1,411,464 | 11,518 |
| STAG Industrial Inc. | 558,543 | 11,389 | |
| NRG Yield Inc. Class A | 284,428 | 11,380 | |
| * | HFF Inc. Class A | 423,540 | 11,372 |
| Investors Real Estate Trust | 1,321,090 | 11,335 | |
| National Bank Holdings Corp. Class A | 508,112 | 10,874 | |
| * | Credit Acceptance Corp. | 72,582 | 9,435 |
| Selective Insurance Group Inc. | 335,182 | 9,070 | |
| ^ | Cohen & Steers Inc. | 223,917 | 8,970 |
| Alexander's Inc. | 25,844 | 8,529 | |
| *,^ | Nationstar Mortgage Holdings Inc. | 228,611 | 8,449 |
| * | St. Joe Co. | 436,715 | 8,381 |
| * | Tejon Ranch Co. | 204,038 | 7,500 |
| * | Capital Bank Financial Corp. | 328,524 | 7,474 |
| Silver Bay Realty Trust Corp. | 463,793 | 7,416 | |
| *,^ | Trulia Inc. | 199,518 | 7,037 |
| * | Altisource Asset Management Corp. | 7,146 | 6,646 |
| * | PICO Holdings Inc. | 286,127 | 6,612 |
| Employers Holdings Inc. | 196,258 | 6,212 | |
| Universal Health Realty Income Trust | 143,750 | 5,759 | |
| * | MoneyGram International Inc. | 255,134 | 5,302 |
| GAMCO Investors Inc. | 58,049 | 5,049 | |
| * | NewStar Financial Inc. | 275,502 | 4,896 |
| Aviv REIT Inc. | 189,089 | 4,481 | |
| * | Forestar Group Inc. | 207,622 | 4,416 |
| * | PennyMac Financial Services Inc. Class A | 237,836 | 4,174 |
| * | Blackhawk Network Holdings Inc. | 151,791 | 3,834 |
| Northfield Bancorp Inc. | 255,033 | 3,366 | |
| * | Springleaf Holdings Inc. | 130,056 | 3,288 |
| Urstadt Biddle Properties Inc. Class A | 147,975 | 2,730 | |
| * | Tejon Ranch Co. Warrants Exp. 08/31/2016 | 28,628 | 153 |
| 2,475,944 | |||
| Health Care (14.6%) | |||
| * | Jazz Pharmaceuticals plc | 620,116 | 78,482 |
| Cooper Cos. Inc. | 618,000 | 76,533 | |
| * | Alkermes plc | 1,726,513 | 70,200 |
| * | Salix Pharmaceuticals Ltd. | 754,420 | 67,853 |
| * | MEDNAX Inc. | 1,269,970 | 67,791 |
| * | United Therapeutics Corp. | 570,310 | 64,491 |
| * | Cubist Pharmaceuticals Inc. | 935,112 | 64,401 |
| * | Isis Pharmaceuticals Inc. | 1,465,547 | 58,387 |
| * | Medivation Inc. | 905,046 | 57,760 |
| * | Seattle Genetics Inc. | 1,313,321 | 52,388 |
| * | Align Technology Inc. | 861,278 | 49,222 |
| * | Sirona Dental Systems Inc. | 693,919 | 48,713 |
| * | Incyte Corp. Ltd. | 914,631 | 46,308 |
| Techne Corp. | 465,146 | 44,035 | |
| * | ViroPharma Inc. | 832,186 | 41,484 |
| West Pharmaceutical Services Inc. | 836,967 | 41,062 | |
| * | Cepheid Inc. | 855,775 | 39,982 |
| Questcor Pharmaceuticals Inc. | 728,304 | 39,656 | |
| * | Centene Corp. | 656,367 | 38,693 |
| * | NPS Pharmaceuticals Inc. | 1,159,243 | 35,195 |
| * | Theravance Inc. | 976,284 | 34,805 |
| * | Brookdale Senior Living Inc. Class A | 1,254,326 | 34,093 |
| * | Medicines Co. | 806,397 | 31,143 |
| * | PAREXEL International Corp. | 677,186 | 30,595 |
| * | DexCom Inc. | 860,343 | 30,465 |
| * | Haemonetics Corp. | 650,099 | 27,389 |
| * | Thoratec Corp. | 718,746 | 26,306 |
| * | Air Methods Corp. | 443,314 | 25,859 |
29
| Vanguard® Small-Cap Growth Index Fund | |||
| Schedule of Investments | |||
| December 31, 2013 | |||
| Market | |||
| Value | |||
| Shares | ($000) | ||
| * | Insulet Corp. | 688,054 | 25,527 |
| * | HMS Holdings Corp. | 1,113,602 | 25,312 |
| * | Bruker Corp. | 1,268,196 | 25,072 |
| * | Santarus Inc. | 762,289 | 24,363 |
| Healthcare Services Group Inc. | 836,582 | 23,734 | |
| * | ACADIA Pharmaceuticals Inc. | 917,114 | 22,919 |
| * | Akorn Inc. | 911,677 | 22,455 |
| * | Pacira Pharmaceuticals Inc. | 378,139 | 21,739 |
| *,^ | Opko Health Inc. | 2,573,437 | 21,720 |
| * | Cyberonics Inc. | 323,387 | 21,185 |
| * | Acadia Healthcare Co. Inc. | 446,406 | 21,128 |
| * | Impax Laboratories Inc. | 834,001 | 20,967 |
| * | Neogen Corp. | 437,096 | 19,975 |
| *,^ | Myriad Genetics Inc. | 943,315 | 19,791 |
| * | HeartWare International Inc. | 200,305 | 18,821 |
| * | Masimo Corp. | 642,480 | 18,780 |
| * | NuVasive Inc. | 563,487 | 18,218 |
| * | Nektar Therapeutics | 1,466,463 | 16,644 |
| * | Halozyme Therapeutics Inc. | 1,080,200 | 16,192 |
| *,^ | Arena Pharmaceuticals Inc. | 2,760,566 | 16,149 |
| * | Puma Biotechnology Inc. | 153,634 | 15,906 |
| * | Globus Medical Inc. | 785,420 | 15,850 |
| * | ImmunoGen Inc. | 1,078,621 | 15,823 |
| * | Acorda Therapeutics Inc. | 521,572 | 15,230 |
| *,^ | Ariad Pharmaceuticals Inc. | 2,225,113 | 15,175 |
| * | Volcano Corp. | 693,474 | 15,152 |
| Cantel Medical Corp. | 417,600 | 14,161 | |
| Analogic Corp. | 156,942 | 13,899 | |
| * | ArthroCare Corp. | 340,826 | 13,715 |
| * | Ironwood Pharmaceuticals Inc. Class A | 1,170,318 | 13,587 |
| * | Endologix Inc. | 762,978 | 13,306 |
| Meridian Bioscience Inc. | 498,622 | 13,228 | |
| * | Auxilium Pharmaceuticals Inc. | 626,839 | 13,001 |
| *,^ | MannKind Corp. | 2,484,003 | 12,942 |
| *,^ | Exelixis Inc. | 2,095,978 | 12,848 |
| * | IPC The Hospitalist Co. Inc. | 214,028 | 12,711 |
| * | Aegerion Pharmaceuticals Inc. | 165,832 | 11,767 |
| * | ABIOMED Inc. | 422,345 | 11,294 |
| * | Quidel Corp. | 364,823 | 11,269 |
| * | Emeritus Corp. | 512,794 | 11,092 |
| * | Abaxis Inc. | 267,417 | 10,702 |
| * | ICU Medical Inc. | 167,586 | 10,677 |
| * | Momenta Pharmaceuticals Inc. | 594,887 | 10,518 |
| Ensign Group Inc. | 236,495 | 10,470 | |
| * | Exact Sciences Corp. | 893,001 | 10,439 |
| *,^ | Vivus Inc. | 1,092,955 | 9,924 |
| * | Luminex Corp. | 476,645 | 9,247 |
| *,^ | Sarepta Therapeutics Inc. | 451,623 | 9,200 |
| * | HealthStream Inc. | 258,735 | 8,479 |
| * | Emergent Biosolutions Inc. | 368,175 | 8,464 |
| *,^ | Accuray Inc. | 942,137 | 8,206 |
| * | Merit Medical Systems Inc. | 514,122 | 8,092 |
| *,^ | Bio-Reference Labs Inc. | 315,244 | 8,051 |
| *,^ | Idenix Pharmaceuticals Inc. | 1,264,328 | 7,561 |
| * | NxStage Medical Inc. | 728,189 | 7,282 |
| * | Tornier NV | 365,947 | 6,876 |
| * | Cadence Pharmaceuticals Inc. | 758,095 | 6,861 |
| * | Corvel Corp. | 145,856 | 6,811 |
| * | Sagent Pharmaceuticals Inc. | 259,868 | 6,595 |
| * | Spectrum Pharmaceuticals Inc. | 723,217 | 6,400 |
| *,^ | Merrimack Pharmaceuticals Inc. | 1,158,856 | 6,188 |
| *,^ | Dendreon Corp. | 1,882,196 | 5,628 |
| * | Accretive Health Inc. | 611,793 | 5,604 |
| * | Genomic Health Inc. | 174,015 | 5,093 |
30
| Vanguard® Small-Cap Growth Index Fund | |||
| Schedule of Investments | |||
| December 31, 2013 | |||
| Market | |||
| Value | |||
| Shares | ($000) | ||
| *,^ | Sequenom Inc. | 1,455,808 | 3,407 |
| * | Healthways Inc. | 209,418 | 3,215 |
| * | BioScrip Inc. | 406,256 | 3,006 |
| * | Surgical Care Affiliates Inc. | 72,167 | 2,514 |
| *,^ | Epizyme Inc. | 71,595 | 1,489 |
| * | Cubist Pharmaceutic-CVR | 349,042 | 471 |
| * | Wright Medical Group Inc. CVR | 165,303 | 53 |
| 2,223,461 | |||
| Industrials (18.8%) | |||
| Fortune Brands Home & Security Inc. | 2,097,919 | 95,875 | |
| Wabtec Corp. | 1,154,892 | 85,774 | |
| Lincoln Electric Holdings Inc. | 1,030,346 | 73,505 | |
| * | Colfax Corp. | 1,093,516 | 69,646 |
| Waste Connections Inc. | 1,481,805 | 64,651 | |
| * | Kirby Corp. | 645,161 | 64,032 |
| Jack Henry & Associates Inc. | 1,080,571 | 63,981 | |
| * | CoStar Group Inc. | 344,696 | 63,624 |
| * | Genesee & Wyoming Inc. Class A | 654,695 | 62,883 |
| Graco Inc. | 772,508 | 60,348 | |
| Acuity Brands Inc. | 543,395 | 59,404 | |
| * | Hexcel Corp. | 1,256,053 | 56,133 |
| AO Smith Corp. | 983,988 | 53,076 | |
| Nordson Corp. | 688,642 | 51,166 | |
| * | Vantiv Inc. Class A | 1,557,745 | 50,798 |
| MSC Industrial Direct Co. Inc. Class A | 621,609 | 50,270 | |
| Triumph Group Inc. | 656,672 | 49,953 | |
| * | WEX Inc. | 490,421 | 48,566 |
| Valmont Industries Inc. | 321,040 | 47,873 | |
| FEI Co. | 526,789 | 47,074 | |
| Toro Co. | 721,062 | 45,860 | |
| * | Old Dominion Freight Line Inc. | 815,265 | 43,225 |
| Eagle Materials Inc. | 535,391 | 41,455 | |
| CLARCOR Inc. | 631,817 | 40,657 | |
| * | Cognex Corp. | 1,045,971 | 39,935 |
| * | NeuStar Inc. Class A | 789,945 | 39,387 |
| * | DigitalGlobe Inc. | 948,982 | 39,051 |
| * | Clean Harbors Inc. | 650,446 | 39,001 |
| * | Genpact Ltd. | 2,032,608 | 37,339 |
| MAXIMUS Inc. | 821,460 | 36,136 | |
| Woodward Inc. | 773,118 | 35,262 | |
| * | Zebra Technologies Corp. | 634,206 | 34,298 |
| Air Lease Corp. Class A | 1,091,088 | 33,911 | |
| Landstar System Inc. | 576,747 | 33,134 | |
| *,^ | IPG Photonics Corp. | 423,802 | 32,891 |
| Corporate Executive Board Co. | 424,067 | 32,836 | |
| Watsco Inc. | 322,084 | 30,939 | |
| * | Advisory Board Co. | 454,776 | 28,956 |
| * | MWI Veterinary Supply Inc. | 154,018 | 26,274 |
| * | MasTec Inc. | 779,605 | 25,509 |
| *,^ | Navistar International Corp. | 659,524 | 25,187 |
| * | Cardtronics Inc. | 567,839 | 24,673 |
| *,^ | Outerwall Inc. | 349,632 | 23,520 |
| * | WageWorks Inc. | 392,826 | 23,350 |
| * | Coherent Inc. | 313,075 | 23,290 |
| Franklin Electric Co. Inc. | 510,904 | 22,807 | |
| Heartland Payment Systems Inc. | 441,996 | 22,029 | |
| * | Trimas Corp. | 539,367 | 21,515 |
| Mueller Industries Inc. | 339,060 | 21,364 | |
| * | On Assignment Inc. | 611,669 | 21,359 |
| *,^ | VistaPrint NV | 375,574 | 21,351 |
| * | RBC Bearings Inc. | 291,569 | 20,629 |
| EVERTEC Inc. | 793,899 | 19,578 | |
| HEICO Corp. | 329,879 | 19,117 | |
| Simpson Manufacturing Co. Inc. | 519,330 | 19,075 | |
31
| Vanguard® Small-Cap Growth Index Fund | |||
| Schedule of Investments | |||
| December 31, 2013 | |||
| Market | |||
| Value | |||
| Shares | ($000) | ||
| Raven Industries Inc. | 459,678 | 18,911 | |
| * | Huron Consulting Group Inc. | 295,443 | 18,530 |
| * | Proto Labs Inc. | 257,275 | 18,313 |
| Sturm Ruger & Co. Inc. | 244,402 | 17,863 | |
| * | Hub Group Inc. Class A | 443,682 | 17,694 |
| * | HD Supply Holdings Inc. | 727,654 | 17,471 |
| * | Universal Display Corp. | 496,860 | 17,072 |
| Forward Air Corp. | 386,779 | 16,983 | |
| * | Louisiana-Pacific Corp. | 891,171 | 16,496 |
| * | Trex Co. Inc. | 199,975 | 15,904 |
| Tennant Co. | 233,422 | 15,828 | |
| HEICO Corp. Class A | 372,921 | 15,707 | |
| * | Veeco Instruments Inc. | 471,130 | 15,505 |
| AZZ Inc. | 306,176 | 14,960 | |
| Primoris Services Corp. | 456,336 | 14,206 | |
| * | Rogers Corp. | 224,024 | 13,777 |
| * | DXP Enterprises Inc. | 116,710 | 13,445 |
| ^ | Lindsay Corp. | 154,464 | 12,782 |
| * | OSI Systems Inc. | 240,603 | 12,778 |
| * | FARO Technologies Inc. | 215,582 | 12,568 |
| * | II-VI Inc. | 711,848 | 12,529 |
| * | LifeLock Inc. | 743,382 | 12,199 |
| Exponent Inc. | 157,250 | 12,177 | |
| * | Imperva Inc. | 251,537 | 12,106 |
| * | ExamWorks Group Inc. | 389,817 | 11,644 |
| * | Measurement Specialties Inc. | 190,461 | 11,559 |
| Sun Hydraulics Corp. | 282,957 | 11,553 | |
| AAON Inc. | 347,766 | 11,111 | |
| * | ExlService Holdings Inc. | 395,437 | 10,922 |
| * | Wabash National Corp. | 865,957 | 10,695 |
| *,^ | Smith & Wesson Holding Corp. | 791,834 | 10,682 |
| * | Team Inc. | 247,622 | 10,484 |
| * | Thermon Group Holdings Inc. | 379,352 | 10,368 |
| * | Roadrunner Transportation Systems Inc. | 355,780 | 9,588 |
| * | RPX Corp. | 561,713 | 9,493 |
| Badger Meter Inc. | 172,766 | 9,416 | |
| Mueller Water Products Inc. Class A | 1,001,570 | 9,385 | |
| Quanex Building Products Corp. | 468,812 | 9,339 | |
| Gorman-Rupp Co. | 231,174 | 7,728 | |
| Griffon Corp. | 556,833 | 7,356 | |
| * | Aerovironment Inc. | 228,466 | 6,655 |
| Landauer Inc. | 119,796 | 6,302 | |
| Apogee Enterprises Inc. | 172,309 | 6,188 | |
| American Railcar Industries Inc. | 120,781 | 5,526 | |
| * | Aegion Corp. Class A | 243,243 | 5,325 |
| * | Bazaarvoice Inc. | 667,824 | 5,289 |
| Acacia Research Corp. | 297,788 | 4,330 | |
| * | Mistras Group Inc. | 196,332 | 4,099 |
| * | InnerWorkings Inc. | 515,895 | 4,019 |
| * | Higher One Holdings Inc. | 384,500 | 3,753 |
| Electro Scientific Industries Inc. | 320,945 | 3,357 | |
| *,^ | Nuverra Environmental Solutions Inc. | 196,202 | 3,294 |
| * | M/A-COM Technology Solutions Holdings Inc. | 146,660 | 2,492 |
| * | Ply Gem Holdings Inc. | 126,945 | 2,289 |
| * | Dice Holdings Inc. | 247,918 | 1,797 |
| 2,855,374 | |||
| Oil & Gas (6.2%) | |||
| * | Gulfport Energy Corp. | 1,061,649 | 67,043 |
| * | Dril-Quip Inc. | 462,028 | 50,791 |
| * | Oasis Petroleum Inc. | 1,079,769 | 50,717 |
| * | Atwood Oceanics Inc. | 767,771 | 40,991 |
| * | Kodiak Oil & Gas Corp. | 3,355,956 | 37,620 |
| * | Rosetta Resources Inc. | 772,942 | 37,132 |
| Tidewater Inc. | 625,588 | 37,079 | |
32
| Vanguard® Small-Cap Growth Index Fund | |||
| Schedule of Investments | |||
| December 31, 2013 | |||
| Market | |||
| Value | |||
| Shares | ($000) | ||
| * | Chart Industries Inc. | 383,284 | 36,657 |
| *,^ | SandRidge Energy Inc. | 5,876,220 | 35,669 |
| * | Oil States International Inc. | 347,902 | 35,389 |
| SemGroup Corp. Class A | 535,491 | 34,930 | |
| CARBO Ceramics Inc. | 247,498 | 28,841 | |
| Energy XXI Bermuda Ltd. | 908,496 | 24,584 | |
| * | PDC Energy Inc. | 449,777 | 23,937 |
| * | Laredo Petroleum Holdings Inc. | 862,971 | 23,896 |
| * | Carrizo Oil & Gas Inc. | 515,736 | 23,089 |
| * | Hornbeck Offshore Services Inc. | 409,724 | 20,171 |
| * | Diamondback Energy Inc. | 356,619 | 18,851 |
| * | Forum Energy Technologies Inc. | 643,324 | 18,180 |
| * | Bonanza Creek Energy Inc. | 381,654 | 16,590 |
| *,^ | SunPower Corp. Class A | 536,740 | 16,000 |
| * | Bill Barrett Corp. | 587,763 | 15,740 |
| * | Magnum Hunter Resources Corp. | 2,052,865 | 15,006 |
| RPC Inc. | 830,204 | 14,819 | |
| * | Geospace Technologies Corp. | 155,326 | 14,730 |
| Gulfmark Offshore Inc. | 308,929 | 14,560 | |
| * | McDermott International Inc. | 1,495,269 | 13,697 |
| * | EPL Oil & Gas Inc. | 469,356 | 13,377 |
| * | Matador Resources Co. | 705,162 | 13,144 |
| * | C&J Energy Services Inc. | 551,916 | 12,749 |
| * | Sanchez Energy Corp. | 498,307 | 12,214 |
| * | Rex Energy Corp. | 609,538 | 12,014 |
| * | Flotek Industries Inc. | 585,357 | 11,748 |
| * | Northern Oil and Gas Inc. | 739,377 | 11,142 |
| *,^ | Halcon Resources Corp. | 2,884,280 | 11,133 |
| Comstock Resources Inc. | 542,538 | 9,923 | |
| * | Approach Resources Inc. | 444,523 | 8,575 |
| * | Resolute Energy Corp. | 869,282 | 7,850 |
| * | Goodrich Petroleum Corp. | 439,497 | 7,480 |
| Pattern Energy Group Inc. | 224,192 | 6,795 | |
| * | Athlon Energy Inc. | 206,567 | 6,249 |
| *,^ | Solazyme Inc. | 557,545 | 6,072 |
| * | ION Geophysical Corp. | 1,541,087 | 5,086 |
| * | Quicksilver Resources Inc. | 1,559,706 | 4,788 |
| * | Penn Virginia Corp. | 410,854 | 3,874 |
| *,^ | Swift Energy Co. | 258,895 | 3,495 |
| * | PetroQuest Energy Inc. | 608,236 | 2,628 |
| * | Midstates Petroleum Co. Inc. | 387,213 | 2,563 |
| * | Vantage Drilling Co. | 1,145,944 | 2,109 |
| * | Jones Energy Inc. | 141,786 | 2,053 |
| * | BPZ Resources Inc. | 627,438 | 1,142 |
| 944,912 | |||
| Technology (16.9%) | |||
| IAC/InterActiveCorp | 978,485 | 67,212 | |
| * | athenahealth Inc. | 469,546 | 63,154 |
| Solera Holdings Inc. | 869,494 | 61,525 | |
| * | Concur Technologies Inc. | 565,764 | 58,376 |
| *,^ | 3D Systems Corp. | 615,921 | 57,238 |
| * | PTC Inc. | 1,507,420 | 53,348 |
| * | Ultimate Software Group Inc. | 334,727 | 51,287 |
| * | Cadence Design Systems Inc. | 3,629,878 | 50,891 |
| * | Aspen Technology Inc. | 1,173,245 | 49,042 |
| * | CommVault Systems Inc. | 566,712 | 42,435 |
| * | SunEdison Inc. | 3,195,073 | 41,696 |
| * | Atmel Corp. | 5,103,683 | 39,962 |
| * | Tyler Technologies Inc. | 386,496 | 39,473 |
| * | Guidewire Software Inc. | 802,755 | 39,391 |
| * | SS&C Technologies Holdings Inc. | 881,746 | 39,026 |
| * | Medidata Solutions Inc. | 641,400 | 38,850 |
| * | JDS Uniphase Corp. | 2,894,965 | 37,577 |
| * | Palo Alto Networks Inc. | 640,161 | 36,790 |
33
| Vanguard® Small-Cap Growth Index Fund | |||
| Schedule of Investments | |||
| December 31, 2013 | |||
| Market | |||
| Value | |||
| Shares | ($000) | ||
| * | Riverbed Technology Inc. | 1,940,484 | 35,084 |
| Mentor Graphics Corp. | 1,445,853 | 34,802 | |
| * | Fortinet Inc. | 1,752,738 | 33,530 |
| * | Allscripts Healthcare Solutions Inc. | 2,138,674 | 33,064 |
| * | ViaSat Inc. | 517,616 | 32,429 |
| * | Splunk Inc. | 467,163 | 32,080 |
| * | ACI Worldwide Inc. | 486,301 | 31,610 |
| * | Ciena Corp. | 1,301,227 | 31,138 |
| * | SolarWinds Inc. | 805,893 | 30,487 |
| * | Finisar Corp. | 1,212,718 | 29,008 |
| * | Manhattan Associates Inc. | 242,345 | 28,471 |
| * | Informatica Corp. | 684,459 | 28,405 |
| * | Qlik Technologies Inc. | 1,063,731 | 28,327 |
| Fair Isaac Corp. | 436,152 | 27,408 | |
| * | MICROS Systems Inc. | 474,870 | 27,243 |
| * | Dealertrack Technologies Inc. | 553,762 | 26,625 |
| * | Cornerstone OnDemand Inc. | 492,335 | 26,261 |
| * | Sapient Corp. | 1,503,302 | 26,097 |
| Plantronics Inc. | 552,306 | 25,655 | |
| * | Aruba Networks Inc. | 1,308,371 | 23,420 |
| * | International Rectifier Corp. | 897,037 | 23,386 |
| * | Electronics For Imaging Inc. | 593,436 | 22,984 |
| * | Demandware Inc. | 349,275 | 22,395 |
| * | Semtech Corp. | 866,302 | 21,900 |
| * | NetSuite Inc. | 212,210 | 21,862 |
| Blackbaud Inc. | 577,903 | 21,758 | |
| Cogent Communications Group Inc. | 537,771 | 21,731 | |
| * | Cavium Inc. | 623,149 | 21,505 |
| * | Silicon Laboratories Inc. | 489,870 | 21,216 |
| * | Hittite Microwave Corp. | 338,279 | 20,882 |
| * | Entegris Inc. | 1,749,582 | 20,295 |
| MKS Instruments Inc. | 671,984 | 20,119 | |
| Power Integrations Inc. | 358,997 | 20,039 | |
| * | Infoblox Inc. | 601,939 | 19,876 |
| * | FleetMatics Group plc | 442,106 | 19,121 |
| * | Web.com Group Inc. | 579,250 | 18,414 |
| NIC Inc. | 738,583 | 18,369 | |
| Advent Software Inc. | 515,617 | 18,041 | |
| * | Ubiquiti Networks Inc. | 387,419 | 17,806 |
| * | Integrated Device Technology Inc. | 1,722,213 | 17,549 |
| * | TriQuint Semiconductor Inc. | 2,028,431 | 16,917 |
| * | Syntel Inc. | 184,457 | 16,776 |
| * | Bottomline Technologies de Inc. | 463,129 | 16,747 |
| * | Cirrus Logic Inc. | 802,072 | 16,386 |
| * | iGATE Corp. | 405,186 | 16,272 |
| *,^ | InvenSense Inc. | 773,386 | 16,071 |
| Monotype Imaging Holdings Inc. | 492,980 | 15,706 | |
| InterDigital Inc. | 520,371 | 15,346 | |
| * | Responsys Inc. | 551,205 | 15,109 |
| * | Monolithic Power Systems Inc. | 434,515 | 15,060 |
| * | RealPage Inc. | 638,033 | 14,917 |
| * | Tableau Software Inc. Class A | 216,225 | 14,904 |
| * | MedAssets Inc. | 742,663 | 14,727 |
| * | MicroStrategy Inc. Class A | 114,578 | 14,235 |
| * | Infinera Corp. | 1,435,450 | 14,039 |
| * | Interactive Intelligence Group Inc. | 204,266 | 13,759 |
| * | Blucora Inc. | 468,665 | 13,666 |
| * | EPAM Systems Inc. | 382,180 | 13,353 |
| * | Netscout Systems Inc. | 446,286 | 13,206 |
| * | Freescale Semiconductor Ltd. | 814,997 | 13,081 |
| * | Shutterstock Inc. | 155,006 | 12,963 |
| * | Rambus Inc. | 1,353,477 | 12,817 |
| * | Applied Micro Circuits Corp. | 933,947 | 12,496 |
| Tessera Technologies Inc. | 618,405 | 12,189 | |
34
| Vanguard® Small-Cap Growth Index Fund | |||
| Schedule of Investments | |||
| December 31, 2013 | |||
| Market | |||
| Value | |||
| Shares | ($000) | ||
| * | OmniVision Technologies Inc. | 707,619 | 12,171 |
| Quality Systems Inc. | 570,270 | 12,010 | |
| * | Synchronoss Technologies Inc. | 383,996 | 11,931 |
| * | ATMI Inc. | 382,195 | 11,546 |
| * | Advanced Energy Industries Inc. | 480,045 | 10,974 |
| * | Comverse Inc. | 281,001 | 10,903 |
| * | Ixia | 815,121 | 10,849 |
| * | Sonus Networks Inc. | 3,443,851 | 10,848 |
| Pegasystems Inc. | 215,168 | 10,582 | |
| * | Diodes Inc. | 442,444 | 10,424 |
| * | Fusion-io Inc. | 1,129,015 | 10,059 |
| *,^ | VirnetX Holding Corp. | 517,736 | 10,049 |
| * | LogMeIn Inc. | 290,976 | 9,762 |
| * | Ultratech Inc. | 334,375 | 9,697 |
| * | BroadSoft Inc. | 339,492 | 9,282 |
| * | Ruckus Wireless Inc. | 649,338 | 9,221 |
| * | LivePerson Inc. | 616,415 | 9,135 |
| * | Ellie Mae Inc. | 330,437 | 8,879 |
| * | ICG Group Inc. | 455,297 | 8,482 |
| Brooks Automation Inc. | 800,432 | 8,397 | |
| Computer Programs & Systems Inc. | 134,215 | 8,296 | |
| * | Lattice Semiconductor Corp. | 1,467,892 | 8,088 |
| * | Tangoe Inc. | 433,020 | 7,799 |
| * | FireEye Inc. | 175,245 | 7,642 |
| * | ChannelAdvisor Corp. | 171,364 | 7,148 |
| * | Marketo Inc. | 191,228 | 7,089 |
| * | Super Micro Computer Inc. | 403,476 | 6,924 |
| * | Textura Corp. | 217,537 | 6,513 |
| * | Cvent Inc. | 177,108 | 6,445 |
| * | Silicon Image Inc. | 973,249 | 5,985 |
| * | Silicon Graphics International Corp. | 430,954 | 5,779 |
| Forrester Research Inc. | 149,086 | 5,704 | |
| * | Veeva Systems Inc. Class A | 164,347 | 5,276 |
| *,^ | Millennial Media Inc. | 712,880 | 5,183 |
| * | Entropic Communications Inc. | 1,090,659 | 5,137 |
| * | Jive Software Inc. | 435,475 | 4,899 |
| * | Calix Inc. | 469,593 | 4,527 |
| * | Gigamon Inc. | 156,372 | 4,391 |
| * | Ceva Inc. | 276,554 | 4,209 |
| * | Vocera Communications Inc. | 266,228 | 4,156 |
| * | Inphi Corp. | 284,587 | 3,671 |
| *,^ | Rocket Fuel Inc. | 59,625 | 3,666 |
| * | Quantum Corp. | 2,653,214 | 3,184 |
| ^ | Ebix Inc. | 204,545 | 3,011 |
| * | Gogo Inc. | 105,698 | 2,622 |
| * | RingCentral Inc. Class A | 108,704 | 1,997 |
| * | Nimble Storage Inc. | 15,462 | 700 |
| 2,563,649 | |||
| Telecommunications (0.9%) | |||
| * | Level 3 Communications Inc. | 2,117,153 | 70,226 |
| * | tw telecom inc Class A | 1,819,112 | 55,429 |
| * | Cincinnati Bell Inc. | 2,631,754 | 9,369 |
| * | Intelsat SA | 265,446 | 5,983 |
| 141,007 | |||
| Utilities (0.5%) | |||
| ITC Holdings Corp. | 662,086 | 63,441 | |
| * | Dynegy Inc. Class A | 537,454 | 11,566 |
| Ormat Technologies Inc. | 114,264 | 3,109 | |
| Atlantic Power Corp. | 756,885 | 2,634 | |
| 80,750 | |||
| Total Common Stocks (Cost $11,194,385) | 15,176,029 | ||
35
| Vanguard® Small-Cap Growth Index Fund | |||||
| Schedule of Investments | |||||
| December 31, 2013 | |||||
| Market | |||||
| Value | |||||
| Coupon | Shares | ($000) | |||
| Temporary Cash Investments (1.8%)1 | |||||
| Money Market Fund (1.8%) | |||||
| 2,3 | Vanguard Market Liquidity Fund | 0.125% | 269,954,261 | 269,954 | |
| Face | |||||
| Maturity | Amount | ||||
| Date | ($000) | ||||
| U.S. Government and Agency Obligations (0.0%) | |||||
| 4,5 | Federal Home Loan Bank Discount Notes | 0.120% | 5/28/14 | 1,500 | 1,499 |
| 5 | Federal Home Loan Bank Discount Notes | 0.125% | 5/30/14 | 1,200 | 1,199 |
| 6 | Freddie Mac Discount Notes | 0.070% | 3/24/14 | 1,000 | 1,000 |
| 3,698 | |||||
| Total Temporary Cash Investments (Cost $273,653) | 273,652 | ||||
| Total Investments (101.6%) (Cost $11,468,038) | 15,449,681 | ||||
| Other Assets and Liabilities—Net (-1.6%)3 | (249,866) | ||||
| Net Assets (100%) | 15,199,815 | ||||
* Non-income-producing security.
^ Includes partial security positions on loan to broker-dealers. The total value of securities on loan is $165,513,000.
1 The fund invests a portion of its cash reserves in equity markets through the use of index futures contracts. After giving effect to futures investments, the fund's effective common stock and temporary cash investment positions represent 100.0% and 1.6%, respectively, of net assets.
2 Affiliated money market fund available only to Vanguard funds and certain trusts and accounts managed by Vanguard. Rate shown is the 7-day yield.
3 Includes $174,719,000 of collateral received for securities on loan.
4 Securities with a value of $1,499,000 have been segregated as initial margin for open futures contracts.
5 The issuer operates under a congressional charter; its securities are generally neither guaranteed by the U.S. Treasury nor backed by the full faith and credit of the U.S. government.
6 The issuer was placed under federal conservatorship in September 2008; since that time, its daily operations have been managed by the Federal Housing Finance Agency and it receives capital from the U.S. Treasury, as needed to maintain a positive net worth, in exchange for senior preferred stock.
REIT—Real Estate Investment Trust.
36
| Vanguard® Small-Cap Value Index Fund | |||
| Schedule of Investments | |||
| December 31, 2013 | |||
| Market | |||
| Value | |||
| Shares | ($000) | ||
| Common Stocks (99.4%)1 | |||
| Basic Materials (6.0%) | |||
| RPM International Inc. | 1,123,379 | 46,632 | |
| Rockwood Holdings Inc. | 618,366 | 44,473 | |
| United States Steel Corp. | 1,222,454 | 36,062 | |
| Steel Dynamics Inc. | 1,781,991 | 34,820 | |
| Cliffs Natural Resources Inc. | 1,293,891 | 33,913 | |
| Allegheny Technologies Inc. | 866,879 | 30,887 | |
| PolyOne Corp. | 813,341 | 28,752 | |
| Axiall Corp. | 590,467 | 28,012 | |
| Cytec Industries Inc. | 299,661 | 27,916 | |
| Domtar Corp. | 268,801 | 25,359 | |
| Cabot Corp. | 487,447 | 25,055 | |
| * | Chemtura Corp. | 815,184 | 22,760 |
| Compass Minerals International Inc. | 282,839 | 22,641 | |
| HB Fuller Co. | 424,761 | 22,105 | |
| Sensient Technologies Corp. | 422,989 | 20,523 | |
| Commercial Metals Co. | 988,848 | 20,103 | |
| Olin Corp. | 672,315 | 19,396 | |
| Worthington Industries Inc. | 447,585 | 18,834 | |
| Minerals Technologies Inc. | 290,933 | 17,476 | |
| * | Alpha Natural Resources Inc. | 1,867,141 | 13,331 |
| * | SunCoke Energy Inc. | 558,533 | 12,740 |
| Tronox Ltd. Class A | 500,151 | 11,539 | |
| Kaiser Aluminum Corp. | 150,521 | 10,573 | |
| Stepan Co. | 160,310 | 10,521 | |
| PH Glatfelter Co. | 365,642 | 10,106 | |
| * | OM Group Inc. | 270,248 | 9,840 |
| * | Cloud Peak Energy Inc. | 514,522 | 9,261 |
| Innophos Holdings Inc. | 185,745 | 9,027 | |
| * | Resolute Forest Products Inc. | 558,830 | 8,953 |
| * | Clearwater Paper Corp. | 169,022 | 8,874 |
| Innospec Inc. | 190,694 | 8,814 | |
| A Schulman Inc. | 233,683 | 8,240 | |
| Quaker Chemical Corp. | 105,778 | 8,152 | |
| Arch Coal Inc. | 1,793,772 | 7,982 | |
| * | Intrepid Potash Inc. | 480,061 | 7,604 |
| Koppers Holdings Inc. | 163,131 | 7,463 | |
| AMCOL International Corp. | 205,538 | 6,984 | |
| * | LSB Industries Inc. | 161,719 | 6,634 |
| * | Kraton Performance Polymers Inc. | 274,776 | 6,334 |
| Tredegar Corp. | 218,176 | 6,286 | |
| * | Ferro Corp. | 366,194 | 4,698 |
| *,^ | AK Steel Holding Corp. | 547,181 | 4,487 |
| Hecla Mining Co. | 1,446,572 | 4,455 | |
| Walter Energy Inc. | 264,369 | 4,396 | |
| * | Century Aluminum Co. | 412,158 | 4,311 |
| Kronos Worldwide Inc. | 195,776 | 3,730 | |
| FutureFuel Corp. | 91,488 | 1,446 | |
| NL Industries Inc. | 61,659 | 689 | |
| 743,189 | |||
| Consumer Goods (7.3%) | |||
| Hanesbrands Inc. | 837,417 | 58,845 | |
| Snap-on Inc. | 491,322 | 53,810 | |
| Goodyear Tire & Rubber Co. | 2,086,311 | 49,759 | |
| Ingredion Inc. | 647,919 | 44,357 | |
| Leggett & Platt Inc. | 1,193,240 | 36,919 | |
| Tupperware Brands Corp. | 385,292 | 36,422 | |
| Hillshire Brands Co. | 1,039,458 | 34,759 | |
| * | Visteon Corp. | 411,051 | 33,661 |
| * | Jarden Corp. | 516,637 | 31,696 |
| * | Tenneco Inc. | 514,066 | 29,081 |
| Scotts Miracle-Gro Co. Class A | 392,773 | 24,438 | |
37
| Vanguard® Small-Cap Value Index Fund | |||
| Schedule of Investments | |||
| December 31, 2013 | |||
| Market | |||
| Value | |||
| Shares | ($000) | ||
| Dana Holding Corp. | 1,241,380 | 24,356 | |
| Thor Industries Inc. | 382,768 | 21,140 | |
| * | TreeHouse Foods Inc. | 292,303 | 20,146 |
| * | Iconix Brand Group Inc. | 414,013 | 16,436 |
| HNI Corp. | 382,383 | 14,848 | |
| KB Home | 796,667 | 14,563 | |
| Herman Miller Inc. | 473,428 | 13,976 | |
| La-Z-Boy Inc. | 443,883 | 13,760 | |
| Schweitzer-Mauduit International Inc. | 265,361 | 13,658 | |
| * | Take-Two Interactive Software Inc. | 779,405 | 13,538 |
| Andersons Inc. | 150,049 | 13,380 | |
| Dean Foods Co. | 757,851 | 13,027 | |
| * | Post Holdings Inc. | 262,408 | 12,929 |
| * | Helen of Troy Ltd. | 257,167 | 12,732 |
| Sanderson Farms Inc. | 174,952 | 12,654 | |
| Cooper Tire & Rubber Co. | 523,976 | 12,596 | |
| Spectrum Brands Holdings Inc. | 177,163 | 12,499 | |
| Pinnacle Foods Inc. | 445,619 | 12,237 | |
| * | American Axle & Manufacturing Holdings Inc. | 574,693 | 11,752 |
| * | Skechers U.S.A. Inc. Class A | 334,391 | 11,078 |
| Steelcase Inc. Class A | 684,395 | 10,854 | |
| Universal Corp. | 196,254 | 10,715 | |
| Jones Group Inc. | 639,973 | 9,574 | |
| Fresh Del Monte Produce Inc. | 331,955 | 9,394 | |
| Columbia Sportswear Co. | 116,570 | 9,180 | |
| * | Quiksilver Inc. | 995,859 | 8,734 |
| Briggs & Stratton Corp. | 380,872 | 8,288 | |
| *,^ | Eastman Kodak Co. | 238,502 | 8,278 |
| Titan International Inc. | 429,796 | 7,728 | |
| * | Elizabeth Arden Inc. | 212,400 | 7,530 |
| Cal-Maine Foods Inc. | 119,185 | 7,178 | |
| * | Pilgrim's Pride Corp. | 437,723 | 7,113 |
| Knoll Inc. | 387,455 | 7,094 | |
| * | Seaboard Corp. | 2,505 | 7,001 |
| Movado Group Inc. | 150,637 | 6,630 | |
| * | ACCO Brands Corp. | 960,348 | 6,454 |
| * | Hovnanian Enterprises Inc. Class A | 947,147 | 6,270 |
| * | Crocs Inc. | 354,696 | 5,647 |
| * | Modine Manufacturing Co. | 401,936 | 5,153 |
| Tootsie Roll Industries Inc. | 157,874 | 5,137 | |
| Inter Parfums Inc. | 143,063 | 5,123 | |
| * | Federal-Mogul Corp. | 253,488 | 4,989 |
| * | Chiquita Brands International Inc. | 375,920 | 4,398 |
| Superior Industries International Inc. | 209,106 | 4,314 | |
| * | National Presto Industries Inc. | 43,649 | 3,514 |
| * | Diamond Foods Inc. | 90,171 | 2,330 |
| * | Revlon Inc. Class A | 88,462 | 2,208 |
| * | Central Garden and Pet Co. Class A | 268,549 | 1,813 |
| * | Central Garden and Pet Co. | 72,440 | 498 |
| 908,191 | |||
| Consumer Services (12.7%) | |||
| Gannett Co. Inc. | 1,925,789 | 56,965 | |
| Omnicare Inc. | 870,182 | 52,524 | |
| Foot Locker Inc. | 1,254,861 | 52,001 | |
| GameStop Corp. Class A | 938,386 | 46,225 | |
| Alaska Air Group Inc. | 587,594 | 43,112 | |
| *,^ | American Airlines Group Inc. | 1,581,404 | 39,930 |
| * | Rite Aid Corp. | 7,741,984 | 39,174 |
| * | Avis Budget Group Inc. | 905,987 | 36,620 |
| KAR Auction Services Inc. | 1,114,558 | 32,935 | |
| Service Corp. International | 1,701,562 | 30,849 | |
| Cablevision Systems Corp. Class A | 1,713,624 | 30,725 | |
| Cinemark Holdings Inc. | 877,173 | 29,236 | |
| Brinker International Inc. | 566,291 | 26,242 | |
38
| Vanguard® Small-Cap Value Index Fund | |||
| Schedule of Investments | |||
| December 31, 2013 | |||
| Market | |||
| Value | |||
| Shares | ($000) | ||
| * | Graham Holdings Co. Class B | 36,754 | 24,380 |
| * | Acxiom Corp. | 634,705 | 23,471 |
| * | Apollo Education Group Inc. | 859,094 | 23,470 |
| * | Starz | 784,839 | 22,949 |
| Casey's General Stores Inc. | 324,560 | 22,800 | |
| Sinclair Broadcast Group Inc. Class A | 624,534 | 22,315 | |
| CST Brands Inc. | 606,815 | 22,282 | |
| Cracker Barrel Old Country Store Inc. | 201,207 | 22,147 | |
| * | Office Depot Inc. | 4,031,101 | 21,325 |
| Dillard's Inc. Class A | 219,216 | 21,310 | |
| Abercrombie & Fitch Co. | 645,389 | 21,240 | |
| *,^ | JC Penney Co. Inc. | 2,315,924 | 21,191 |
| * | VCA Antech Inc. | 674,944 | 21,166 |
| American Eagle Outfitters Inc. | 1,465,794 | 21,107 | |
| Harris Teeter Supermarkets Inc. | 418,236 | 20,640 | |
| John Wiley & Sons Inc. Class A | 373,789 | 20,633 | |
| Wendy's Co. | 2,316,850 | 20,203 | |
| Men's Wearhouse Inc. | 383,692 | 19,599 | |
| * | Jack in the Box Inc. | 360,040 | 18,009 |
| Aaron's Inc. | 612,281 | 18,001 | |
| * | JetBlue Airways Corp. | 2,027,936 | 17,339 |
| New York Times Co. Class A | 1,069,755 | 16,977 | |
| * | Beacon Roofing Supply Inc. | 414,009 | 16,676 |
| Penske Automotive Group Inc. | 342,916 | 16,172 | |
| Guess? Inc. | 502,097 | 15,600 | |
| * | Murphy USA Inc. | 375,220 | 15,594 |
| *,^ | Dolby Laboratories Inc. Class A | 399,566 | 15,407 |
| DeVry Education Group Inc. | 427,626 | 15,181 | |
| Meredith Corp. | 292,041 | 15,128 | |
| * | Big Lots Inc. | 467,897 | 15,108 |
| Hillenbrand Inc. | 506,244 | 14,894 | |
| Rent-A-Center Inc. | 429,610 | 14,323 | |
| * | Asbury Automotive Group Inc. | 261,610 | 14,059 |
| Choice Hotels International Inc. | 272,153 | 13,365 | |
| Group 1 Automotive Inc. | 185,279 | 13,159 | |
| Regal Entertainment Group Class A | 669,851 | 13,029 | |
| Lithia Motors Inc. Class A | 187,225 | 12,997 | |
| Buckle Inc. | 245,038 | 12,879 | |
| * | Express Inc. | 673,903 | 12,582 |
| * | ValueClick Inc. | 535,878 | 12,523 |
| SeaWorld Entertainment Inc. | 433,462 | 12,471 | |
| * | Pinnacle Entertainment Inc. | 475,232 | 12,351 |
| * | SUPERVALU Inc. | 1,644,430 | 11,988 |
| * | AMERCO | 49,698 | 11,820 |
| DineEquity Inc. | 136,632 | 11,416 | |
| ^ | Chemed Corp. | 141,534 | 10,844 |
| Bob Evans Farms Inc. | 212,437 | 10,747 | |
| Valassis Communications Inc. | 309,025 | 10,584 | |
| * | Children's Place Retail Stores Inc. | 178,719 | 10,182 |
| National CineMedia Inc. | 509,543 | 10,171 | |
| Brown Shoe Co. Inc. | 346,670 | 9,755 | |
| * | Susser Holdings Corp. | 144,784 | 9,482 |
| Matthews International Corp. Class A | 218,985 | 9,331 | |
| * | Sonic Corp. | 452,084 | 9,128 |
| * | Caesars Entertainment Corp. | 404,795 | 8,719 |
| * | Penn National Gaming Inc. | 588,287 | 8,430 |
| International Speedway Corp. Class A | 223,972 | 7,949 | |
| ^ | Weight Watchers International Inc. | 238,268 | 7,846 |
| Cato Corp. Class A | 232,481 | 7,393 | |
| Scholastic Corp. | 217,075 | 7,383 | |
| * | Rush Enterprises Inc. Class A | 243,834 | 7,230 |
| Sonic Automotive Inc. Class A | 291,981 | 7,148 | |
| * | ITT Educational Services Inc. | 197,395 | 6,629 |
| CEC Entertainment Inc. | 140,883 | 6,238 | |
39
| Vanguard® Small-Cap Value Index Fund | |||
| Schedule of Investments | |||
| December 31, 2013 | |||
| Market | |||
| Value | |||
| Shares | ($000) | ||
| SkyWest Inc. | 411,205 | 6,098 | |
| Capella Education Co. | 88,978 | 5,912 | |
| Stage Stores Inc. | 255,067 | 5,668 | |
| Regis Corp. | 382,921 | 5,556 | |
| * | Steiner Leisure Ltd. | 111,460 | 5,483 |
| Fred's Inc. Class A | 294,838 | 5,460 | |
| * | Aeropostale Inc. | 596,916 | 5,426 |
| * | Biglari Holdings Inc. | 10,290 | 5,213 |
| * | Pep Boys-Manny Moe & Jack | 426,234 | 5,175 |
| * | FTD Cos. Inc. | 157,009 | 5,115 |
| Weis Markets Inc. | 90,918 | 4,779 | |
| * | Barnes & Noble Inc. | 277,619 | 4,150 |
| Clear Channel Outdoor Holdings Inc. Class A | 349,240 | 3,541 | |
| Harte-Hanks Inc. | 449,202 | 3,513 | |
| * | Ruby Tuesday Inc. | 466,775 | 3,235 |
| * | Strayer Education Inc. | 86,812 | 2,992 |
| * | Bridgepoint Education Inc. | 160,700 | 2,846 |
| * | Sears Hometown and Outlet Stores Inc. | 97,887 | 2,496 |
| *,^ | RadioShack Corp. | 804,057 | 2,091 |
| Speedway Motorsports Inc. | 104,846 | 2,081 | |
| * | QuinStreet Inc. | 238,295 | 2,071 |
| * | Rush Enterprises Inc. Class B | 75,666 | 1,930 |
| * | hhgregg Inc. | 115,784 | 1,618 |
| *,^ | Media General Inc. | 71,029 | 1,605 |
| * | Education Management Corp. | 158,853 | 1,603 |
| * | RealNetworks Inc. | 196,170 | 1,481 |
| ClubCorp Holdings Inc. | 80,850 | 1,434 | |
| * | Demand Media Inc. | 190,143 | 1,097 |
| * | Avid Technology Inc. | 131,541 | 1,072 |
| 1,563,744 | |||
| Financials (28.3%) | |||
| Arthur J Gallagher & Co. | 1,119,151 | 52,522 | |
| Starwood Property Trust Inc. | 1,650,036 | 45,706 | |
| Liberty Property Trust | 1,238,813 | 41,959 | |
| Eaton Vance Corp. | 973,219 | 41,644 | |
| East West Bancorp Inc. | 1,164,161 | 40,711 | |
| HCC Insurance Holdings Inc. | 846,702 | 39,067 | |
| Mid-America Apartment Communities Inc. | 631,880 | 38,380 | |
| American Financial Group Inc. | 641,860 | 37,048 | |
| Senior Housing Properties Trust | 1,590,104 | 35,348 | |
| * | Liberty Ventures Class A | 283,687 | 34,777 |
| RenaissanceRe Holdings Ltd. | 356,464 | 34,698 | |
| Cullen/Frost Bankers Inc. | 460,090 | 34,244 | |
| Old Republic International Corp. | 1,977,378 | 34,149 | |
| Hospitality Properties Trust | 1,253,432 | 33,880 | |
| Protective Life Corp. | 663,855 | 33,631 | |
| Prosperity Bancshares Inc. | 525,557 | 33,315 | |
| CNO Financial Group Inc. | 1,876,107 | 33,188 | |
| NorthStar Realty Finance Corp. | 2,448,409 | 32,931 | |
| Brown & Brown Inc. | 1,044,606 | 32,790 | |
| Assured Guaranty Ltd. | 1,383,928 | 32,647 | |
| Fidelity National Financial Inc. Class A | 1,003,104 | 32,551 | |
| * | Genworth Financial Inc. Class A | 2,089,976 | 32,457 |
| Validus Holdings Ltd. | 798,064 | 32,154 | |
| Apartment Investment & Management Co. Class A | 1,232,966 | 31,946 | |
| First Niagara Financial Group Inc. | 2,991,199 | 31,767 | |
| Corrections Corp. of America | 978,873 | 31,392 | |
| National Retail Properties Inc. | 1,029,702 | 31,231 | |
| FirstMerit Corp. | 1,394,744 | 31,005 | |
| City National Corp. | 390,705 | 30,952 | |
| Commerce Bancshares Inc. | 688,524 | 30,922 | |
| Omega Healthcare Investors Inc. | 1,035,425 | 30,856 | |
| * | Gaming and Leisure Properties Inc. | 601,842 | 30,580 |
| Allied World Assurance Co. Holdings AG | 270,964 | 30,567 | |
40
| Vanguard® Small-Cap Value Index Fund | ||
| Schedule of Investments | ||
| December 31, 2013 | ||
| Market | ||
| Value | ||
| Shares | ($000) | |
| Two Harbors Investment Corp. | 3,079,118 | 28,574 |
| Synovus Financial Corp. | 7,805,185 | 28,099 |
| * Forest City Enterprises Inc. Class A | 1,442,495 | 27,552 |
| Highwoods Properties Inc. | 759,769 | 27,481 |
| * Alleghany Corp. | 67,282 | 26,910 |
| Hancock Holding Co. | 693,772 | 25,448 |
| Retail Properties of America Inc. | 1,996,598 | 25,397 |
| StanCorp Financial Group Inc. | 371,724 | 24,627 |
| CBL & Associates Properties Inc. | 1,363,923 | 24,496 |
| * MGIC Investment Corp. | 2,854,191 | 24,089 |
| ProAssurance Corp. | 495,100 | 24,002 |
| Columbia Property Trust Inc. | 959,285 | 23,982 |
| First American Financial Corp. | 848,494 | 23,928 |
| Associated Banc-Corp | 1,373,414 | 23,897 |
| * Popular Inc. | 829,618 | 23,835 |
| * E*TRADE Financial Corp. | 1,213,433 | 23,832 |
| Webster Financial Corp. | 763,360 | 23,802 |
| CommonWealth REIT | 1,000,397 | 23,319 |
| First Horizon National Corp. | 1,997,011 | 23,265 |
| Federated Investors Inc. Class B | 795,354 | 22,906 |
| Aspen Insurance Holdings Ltd. | 554,491 | 22,906 |
| CapitalSource Inc. | 1,580,828 | 22,716 |
| Piedmont Office Realty Trust Inc. Class A | 1,361,478 | 22,492 |
| Bank of Hawaii Corp. | 376,210 | 22,249 |
| Hanover Insurance Group Inc. | 370,581 | 22,127 |
| UMB Financial Corp. | 343,345 | 22,070 |
| ^ MFA Financial Inc. | 3,094,587 | 21,848 |
| Fulton Financial Corp. | 1,626,218 | 21,271 |
| EPR Properties | 428,954 | 21,087 |
| Endurance Specialty Holdings Ltd. | 355,912 | 20,881 |
| Radian Group Inc. | 1,462,724 | 20,654 |
| White Mountains Insurance Group Ltd. | 33,935 | 20,466 |
| Assurant Inc. | 307,224 | 20,390 |
| TCF Financial Corp. | 1,253,807 | 20,374 |
| Susquehanna Bancshares Inc. | 1,582,191 | 20,315 |
| Washington Federal Inc. | 860,081 | 20,031 |
| Primerica Inc. | 463,285 | 19,880 |
| BankUnited Inc. | 596,985 | 19,653 |
| Geo Group Inc. | 608,810 | 19,616 |
| American National Insurance Co. | 170,432 | 19,521 |
| DiamondRock Hospitality Co. | 1,651,761 | 19,078 |
| Brandywine Realty Trust | 1,324,206 | 18,658 |
| BancorpSouth Inc. | 724,121 | 18,407 |
| Umpqua Holdings Corp. | 945,810 | 18,103 |
| Glacier Bancorp Inc. | 596,608 | 17,773 |
| Corporate Office Properties Trust | 738,402 | 17,493 |
| First Financial Bankshares Inc. | 256,641 | 17,020 |
| FNB Corp. | 1,342,506 | 16,942 |
| Invesco Mortgage Capital Inc. | 1,142,705 | 16,775 |
| PrivateBancorp Inc. | 578,772 | 16,744 |
| Newcastle Investment Corp. | 2,906,360 | 16,682 |
| Valley National Bancorp | 1,602,537 | 16,218 |
| Cathay General Bancorp | 604,552 | 16,160 |
| RLI Corp. | 163,046 | 15,877 |
| Erie Indemnity Co. Class A | 216,384 | 15,822 |
| Janus Capital Group Inc. | 1,278,419 | 15,814 |
| Bank of the Ozarks Inc. | 279,098 | 15,794 |
| Cousins Properties Inc. | 1,522,621 | 15,683 |
| Wintrust Financial Corp. | 337,440 | 15,563 |
| First Industrial Realty Trust Inc. | 882,874 | 15,406 |
| Symetra Financial Corp. | 796,278 | 15,097 |
| Iberiabank Corp. | 238,947 | 15,018 |
| Spirit Realty Capital Inc. | 1,487,633 | 14,623 |
| American Equity Investment Life Holding Co. | 554,329 | 14,623 |
41
| Vanguard® Small-Cap Value Index Fund | ||
| Schedule of Investments | ||
| December 31, 2013 | ||
| Market | ||
| Value | ||
| Shares | ($000) | |
| * MBIA Inc. | 1,218,379 | 14,547 |
| Trustmark Corp. | 539,311 | 14,475 |
| Platinum Underwriters Holdings Ltd. | 235,767 | 14,448 |
| Kemper Corp. | 352,868 | 14,425 |
| Mack-Cali Realty Corp. | 669,421 | 14,379 |
| Potlatch Corp. | 342,420 | 14,293 |
| New Residential Investment Corp. | 2,139,491 | 14,292 |
| EastGroup Properties Inc. | 245,759 | 14,237 |
| MB Financial Inc. | 441,189 | 14,158 |
| Home Loan Servicing Solutions Ltd. | 600,070 | 13,784 |
| CVB Financial Corp. | 800,381 | 13,662 |
| Capitol Federal Financial Inc. | 1,124,510 | 13,618 |
| Hatteras Financial Corp. | 827,324 | 13,518 |
| Redwood Trust Inc. | 696,252 | 13,486 |
| Chimera Investment Corp. | 4,341,454 | 13,458 |
| PacWest Bancorp | 318,241 | 13,436 |
| EverBank Financial Corp. | 724,932 | 13,295 |
| Old National Bancorp | 850,822 | 13,077 |
| PennyMac Mortgage Investment Trust | 565,514 | 12,984 |
| Community Bank System Inc. | 323,958 | 12,855 |
| First Financial Holdings Inc. | 193,202 | 12,850 |
| ARMOUR Residential REIT Inc. | 3,134,267 | 12,568 |
| National Health Investors Inc. | 218,826 | 12,276 |
| Westamerica Bancorporation | 213,709 | 12,066 |
| United Bankshares Inc. | 383,420 | 12,059 |
| International Bancshares Corp. | 454,280 | 11,988 |
| Columbia Banking System Inc. | 433,246 | 11,919 |
| Acadia Realty Trust | 469,409 | 11,655 |
| BOK Financial Corp. | 174,356 | 11,563 |
| Mercury General Corp. | 232,210 | 11,543 |
| Government Properties Income Trust | 462,379 | 11,490 |
| National Penn Bancshares Inc. | 985,244 | 11,163 |
| Horace Mann Educators Corp. | 340,766 | 10,748 |
| Northwest Bancshares Inc. | 716,280 | 10,587 |
| First Midwest Bancorp Inc. | 602,581 | 10,563 |
| BBCN Bancorp Inc. | 636,315 | 10,556 |
| Argo Group International Holdings Ltd. | 224,933 | 10,457 |
| CYS Investments Inc. | 1,410,346 | 10,451 |
| LTC Properties Inc. | 293,614 | 10,391 |
| Pennsylvania REIT | 547,430 | 10,390 |
| Montpelier Re Holdings Ltd. | 355,127 | 10,334 |
| Interactive Brokers Group Inc. | 415,711 | 10,118 |
| Sterling Financial Corp. | 289,522 | 9,867 |
| Astoria Financial Corp. | 710,117 | 9,821 |
| Capstead Mortgage Corp. | 809,218 | 9,775 |
| Empire State Realty Trust Inc. | 638,375 | 9,767 |
| First Citizens BancShares Inc. Class A | 43,519 | 9,689 |
| DCT Industrial Trust Inc. | 1,340,633 | 9,559 |
| * iStar Financial Inc. | 649,450 | 9,268 |
| Pinnacle Financial Partners Inc. | 282,118 | 9,177 |
| Parkway Properties Inc. | 475,481 | 9,172 |
| American Assets Trust Inc. | 290,496 | 9,130 |
| Franklin Street Properties Corp. | 761,948 | 9,105 |
| Cash America International Inc. | 237,463 | 9,095 |
| NBT Bancorp Inc. | 347,705 | 9,006 |
| Provident Financial Services Inc. | 455,502 | 8,800 |
| BGC Partners Inc. Class A | 1,413,010 | 8,563 |
| Park National Corp. | 97,699 | 8,311 |
| * Greenlight Capital Re Ltd. Class A | 245,821 | 8,287 |
| Amtrust Financial Services Inc. | 252,301 | 8,248 |
| * Enstar Group Ltd. | 58,793 | 8,167 |
| Boston Private Financial Holdings Inc. | 640,802 | 8,087 |
| First Financial Bancorp | 462,818 | 8,067 |
| Chemical Financial Corp. | 251,582 | 7,968 |
42
| Vanguard® Small-Cap Value Index Fund | ||
| Schedule of Investments | ||
| December 31, 2013 | ||
| Market | ||
| Value | ||
| Shares | ($000) | |
| American Capital Mortgage Investment Corp. | 447,045 | 7,805 |
| American Homes 4 Rent Class A | 468,603 | 7,591 |
| WesBanco Inc. | 235,548 | 7,538 |
| Inland Real Estate Corp. | 716,000 | 7,532 |
| Independent Bank Corp. | 190,909 | 7,482 |
| Nelnet Inc. Class A | 176,788 | 7,450 |
| First Commonwealth Financial Corp. | 804,831 | 7,099 |
| Banner Corp. | 156,797 | 7,028 |
| Associated Estates Realty Corp. | 437,373 | 7,020 |
| OFG Bancorp | 385,757 | 6,689 |
| Infinity Property & Casualty Corp. | 92,108 | 6,609 |
| Safety Insurance Group Inc. | 117,008 | 6,588 |
| * World Acceptance Corp. | 72,762 | 6,369 |
| Select Income REIT | 231,562 | 6,192 |
| Resource Capital Corp. | 1,025,473 | 6,081 |
| Selective Insurance Group Inc. | 223,782 | 6,056 |
| S&T Bancorp Inc. | 238,717 | 6,042 |
| * Investment Technology Group Inc. | 291,255 | 5,988 |
| * Green Dot Corp. Class A | 236,669 | 5,952 |
| City Holding Co. | 126,187 | 5,846 |
| * KCG Holdings Inc. Class A | 480,644 | 5,748 |
| Brookline Bancorp Inc. | 592,867 | 5,674 |
| * Navigators Group Inc. | 89,609 | 5,660 |
| * St. Joe Co. | 292,690 | 5,617 |
| First Potomac Realty Trust | 471,186 | 5,480 |
| Berkshire Hills Bancorp Inc. | 200,911 | 5,479 |
| * First BanCorp | 875,024 | 5,416 |
| Central Pacific Financial Corp. | 266,679 | 5,355 |
| Ashford Hospitality Trust Inc. | 646,690 | 5,355 |
| Oritani Financial Corp. | 328,067 | 5,265 |
| FXCM Inc. Class A | 294,101 | 5,247 |
| Rouse Properties Inc. | 230,760 | 5,121 |
| * Piper Jaffray Cos. | 127,613 | 5,047 |
| Anworth Mortgage Asset Corp. | 1,191,048 | 5,014 |
| * Ezcorp Inc. Class A | 412,089 | 4,817 |
| Tompkins Financial Corp. | 93,219 | 4,791 |
| Maiden Holdings Ltd. | 429,459 | 4,694 |
| State Bank Financial Corp. | 257,439 | 4,683 |
| * Ambac Financial Group Inc. | 190,141 | 4,670 |
| Saul Centers Inc. | 95,183 | 4,543 |
| * Altisource Asset Management Corp. | 4,789 | 4,454 |
| United Fire Group Inc. | 150,173 | 4,304 |
| National Western Life Insurance Co. Class A | 18,855 | 4,215 |
| Dime Community Bancshares Inc. | 247,390 | 4,186 |
| Employers Holdings Inc. | 131,782 | 4,171 |
| Getty Realty Corp. | 211,623 | 3,887 |
| FBL Financial Group Inc. Class A | 83,439 | 3,737 |
| * DFC Global Corp. | 311,671 | 3,569 |
| AG Mortgage Investment Trust Inc. | 227,811 | 3,563 |
| * Flagstar Bancorp Inc. | 165,984 | 3,257 |
| OneBeacon Insurance Group Ltd. Class A | 189,756 | 3,002 |
| * Forestar Group Inc. | 139,454 | 2,966 |
| Bancfirst Corp. | 51,655 | 2,896 |
| * Beneficial Mutual Bancorp Inc. | 263,660 | 2,879 |
| Meadowbrook Insurance Group Inc. | 400,399 | 2,787 |
| State Auto Financial Corp. | 120,229 | 2,554 |
| GFI Group Inc. | 622,979 | 2,436 |
| Ashford Hospitality Prime Inc. | 129,264 | 2,353 |
| * Walker & Dunlop Inc. | 132,597 | 2,144 |
| * TESARO Inc. | 69,082 | 1,951 |
| * Kearny Financial Corp. | 111,881 | 1,301 |
| Urstadt Biddle Properties Inc. Class A | 56,994 | 1,052 |
| Tower Group International Ltd. | 230,692 | 780 |
43
| Vanguard® Small-Cap Value Index Fund | ||
| Schedule of Investments | ||
| December 31, 2013 | ||
| Market | ||
| Value | ||
| Shares | ($000) | |
| Urstadt Biddle Properties Inc. | 42,332 | 671 |
| 3,495,215 | ||
| Health Care (5.7%) | ||
| * Covance Inc. | 474,560 | 41,790 |
| * Tenet Healthcare Corp. | 838,509 | 35,318 |
| Teleflex Inc. | 347,610 | 32,627 |
| * Community Health Systems Inc. | 762,357 | 29,938 |
| * Alnylam Pharmaceuticals Inc. | 455,530 | 29,304 |
| * Health Management Associates Inc. Class A | 2,123,315 | 27,815 |
| * Team Health Holdings Inc. | 590,277 | 26,887 |
| * WellCare Health Plans Inc. | 369,305 | 26,007 |
| * Mallinckrodt plc | 487,564 | 25,480 |
| STERIS Corp. | 497,457 | 23,903 |
| * Alere Inc. | 657,326 | 23,795 |
| HealthSouth Corp. | 701,828 | 23,385 |
| * Charles River Laboratories International Inc. | 406,591 | 21,566 |
| * Bio-Rad Laboratories Inc. Class A | 169,473 | 20,949 |
| Hill-Rom Holdings Inc. | 493,158 | 20,387 |
| * LifePoint Hospitals Inc. | 377,354 | 19,939 |
| Owens & Minor Inc. | 533,372 | 19,500 |
| * Health Net Inc. | 638,271 | 18,938 |
| * Celldex Therapeutics Inc. | 744,337 | 18,020 |
| * Prestige Brands Holdings Inc. | 436,941 | 15,643 |
| * Magellan Health Services Inc. | 228,646 | 13,698 |
| * Wright Medical Group Inc. | 397,961 | 12,221 |
| * Amsurg Corp. Class A | 258,669 | 11,878 |
| * Clovis Oncology Inc. | 186,145 | 11,219 |
| * InterMune Inc. | 748,069 | 11,019 |
| * Hanger Inc. | 279,096 | 10,980 |
| * Puma Biotechnology Inc. | 103,100 | 10,674 |
| ^ PDL BioPharma Inc. | 1,183,395 | 9,988 |
| CONMED Corp. | 233,317 | 9,916 |
| * Integra LifeSciences Holdings Corp. | 200,323 | 9,557 |
| * Synageva BioPharma Corp. | 142,818 | 9,243 |
| * Molina Healthcare Inc. | 251,309 | 8,733 |
| Kindred Healthcare Inc. | 434,939 | 8,586 |
| * Aegerion Pharmaceuticals Inc. | 111,201 | 7,891 |
| Select Medical Holdings Corp. | 648,534 | 7,530 |
| Invacare Corp. | 248,143 | 5,759 |
| * Infinity Pharmaceuticals Inc. | 385,978 | 5,330 |
| * Portola Pharmaceuticals Inc. | 206,398 | 5,315 |
| * Synergy Pharmaceuticals Inc. | 685,848 | 3,861 |
| National Healthcare Corp. | 71,226 | 3,840 |
| * Amedisys Inc. | 260,546 | 3,812 |
| * Orthofix International NV | 156,143 | 3,563 |
| * Lexicon Pharmaceuticals Inc. | 1,952,696 | 3,515 |
| * Gentiva Health Services Inc. | 260,542 | 3,233 |
| * LHC Group Inc. | 104,088 | 2,502 |
| * Achillion Pharmaceuticals Inc. | 735,243 | 2,441 |
| Universal American Corp. | 325,194 | 2,374 |
| * Healthways Inc. | 140,772 | 2,161 |
| * BioScrip Inc. | 273,163 | 2,021 |
| * Surgical Care Affiliates Inc. | 48,384 | 1,686 |
| * Ophthotech Corp. | 43,474 | 1,406 |
| * Rigel Pharmaceuticals Inc. | 369,668 | 1,054 |
| * Agios Pharmaceuticals Inc. | 39,515 | 946 |
| * Wright Medical Group Inc. CVR | 71,097 | 23 |
| 709,166 | ||
| Industrials (22.2%) | ||
| * United Rentals Inc. | 787,862 | 61,414 |
| Packaging Corp. of America | 828,762 | 52,444 |
| IDEX Corp. | 685,428 | 50,619 |
| Total System Services Inc. | 1,443,289 | 48,033 |
| Valspar Corp. | 659,175 | 46,993 |
44
| Vanguard® Small-Cap Value Index Fund | ||
| Schedule of Investments | ||
| December 31, 2013 | ||
| Market | ||
| Value | ||
| Shares | ($000) | |
| Carlisle Cos. Inc. | 537,452 | 42,674 |
| Global Payments Inc. | 615,958 | 40,031 |
| * Flextronics International Ltd. | 5,135,985 | 39,907 |
| Broadridge Financial Solutions Inc. | 1,007,116 | 39,801 |
| PerkinElmer Inc. | 949,691 | 39,156 |
| Towers Watson & Co. Class A | 299,795 | 38,257 |
| Aptargroup Inc. | 556,435 | 37,732 |
| Huntington Ingalls Industries Inc. | 417,175 | 37,550 |
| Terex Corp. | 894,216 | 37,548 |
| Oshkosh Corp. | 730,063 | 36,781 |
| Trinity Industries Inc. | 659,907 | 35,978 |
| Sonoco Products Co. | 861,526 | 35,943 |
| Bemis Co. Inc. | 869,820 | 35,628 |
| * Spirit Aerosystems Holdings Inc. Class A | 1,020,068 | 34,764 |
| Kennametal Inc. | 662,629 | 34,503 |
| * Allegion plc | 770,617 | 34,054 |
| * WESCO International Inc. | 373,434 | 34,009 |
| URS Corp. | 632,802 | 33,532 |
| ITT Corp. | 766,428 | 33,278 |
| Generac Holdings Inc. | 579,319 | 32,813 |
| Ryder System Inc. | 444,380 | 32,786 |
| Alliant Techsystems Inc. | 269,021 | 32,735 |
| Lennox International Inc. | 376,473 | 32,023 |
| Babcock & Wilcox Co. | 936,220 | 32,009 |
| RR Donnelley & Sons Co. | 1,535,358 | 31,137 |
| Exelis Inc. | 1,595,730 | 30,415 |
| EnerSys Inc. | 400,551 | 28,075 |
| * Teledyne Technologies Inc. | 301,157 | 27,664 |
| * Foster Wheeler AG | 831,437 | 27,454 |
| Lender Processing Services Inc. | 721,868 | 26,983 |
| * CoreLogic Inc. | 752,357 | 26,731 |
| Regal-Beloit Corp. | 361,764 | 26,669 |
| Crane Co. | 393,044 | 26,432 |
| Manitowoc Co. Inc. | 1,129,215 | 26,333 |
| Belden Inc. | 367,138 | 25,865 |
| World Fuel Services Corp. | 580,015 | 25,033 |
| * Owens-Illinois Inc. | 697,107 | 24,943 |
| * Esterline Technologies Corp. | 238,563 | 24,324 |
| * Moog Inc. Class A | 351,689 | 23,894 |
| * AECOM Technology Corp. | 788,235 | 23,198 |
| EMCOR Group Inc. | 538,883 | 22,870 |
| Curtiss-Wright Corp. | 360,155 | 22,412 |
| Deluxe Corp. | 426,666 | 22,268 |
| * USG Corp. | 780,696 | 22,156 |
| Actuant Corp. Class A | 586,278 | 21,481 |
| Anixter International Inc. | 233,720 | 20,997 |
| GATX Corp. | 390,383 | 20,366 |
| * Armstrong World Industries Inc. | 343,127 | 19,768 |
| * Graphic Packaging Holding Co. | 2,058,134 | 19,758 |
| * Euronet Worldwide Inc. | 403,499 | 19,307 |
| Harsco Corp. | 681,644 | 19,107 |
| Con-way Inc. | 480,655 | 19,087 |
| Silgan Holdings Inc. | 375,107 | 18,013 |
| Littelfuse Inc. | 189,279 | 17,590 |
| Covanta Holding Corp. | 937,345 | 16,638 |
| TAL International Group Inc. | 286,000 | 16,402 |
| Convergys Corp. | 773,514 | 16,282 |
| Applied Industrial Technologies Inc. | 320,637 | 15,740 |
| United Stationers Inc. | 337,356 | 15,481 |
| * Mobile Mini Inc. | 371,605 | 15,303 |
| * Tetra Tech Inc. | 542,147 | 15,169 |
| * Vishay Intertechnology Inc. | 1,142,064 | 15,144 |
| * Berry Plastics Group Inc. | 633,290 | 15,066 |
| Barnes Group Inc. | 378,903 | 14,516 |
45
| Vanguard® Small-Cap Value Index Fund | |||
| Schedule of Investments | |||
| December 31, 2013 | |||
| Market | |||
| Value | |||
| Shares | ($000) | ||
| Watts Water Technologies Inc. Class A | 231,250 | 14,307 | |
| * | FTI Consulting Inc. | 339,911 | 13,984 |
| Brink's Co. | 407,857 | 13,924 | |
| Mine Safety Appliances Co. | 267,101 | 13,678 | |
| UTi Worldwide Inc. | 752,364 | 13,212 | |
| UniFirst Corp. | 121,683 | 13,020 | |
| * | Itron Inc. | 314,257 | 13,020 |
| * | Texas Industries Inc. | 181,315 | 12,471 |
| *,^ | Swift Transportation Co. | 558,827 | 12,412 |
| * | Plexus Corp. | 285,592 | 12,363 |
| * | Masonite International Corp. | 205,882 | 12,353 |
| Brady Corp. Class A | 390,149 | 12,067 | |
| CIRCOR International Inc. | 148,626 | 12,006 | |
| ABM Industries Inc. | 419,372 | 11,990 | |
| * | Orbital Sciences Corp. | 510,833 | 11,902 |
| * | Sanmina Corp. | 706,684 | 11,802 |
| * | PHH Corp. | 483,797 | 11,780 |
| General Cable Corp. | 399,431 | 11,747 | |
| Greif Inc. Class A | 215,047 | 11,268 | |
| * | Louisiana-Pacific Corp. | 596,188 | 11,035 |
| * | Korn/Ferry International | 417,736 | 10,911 |
| * | GrafTech International Ltd. | 971,032 | 10,905 |
| * | Benchmark Electronics Inc. | 456,338 | 10,532 |
| Aircastle Ltd. | 546,039 | 10,462 | |
| Granite Construction Inc. | 295,653 | 10,342 | |
| * | EnPro Industries Inc. | 176,980 | 10,203 |
| G&K Services Inc. Class A | 158,967 | 9,893 | |
| * | Wesco Aircraft Holdings Inc. | 437,717 | 9,595 |
| Matson Inc. | 361,937 | 9,450 | |
| Knight Transportation Inc. | 507,465 | 9,307 | |
| MTS Systems Corp. | 129,694 | 9,241 | |
| Kaman Corp. | 229,128 | 9,103 | |
| Werner Enterprises Inc. | 367,641 | 9,092 | |
| * | Greatbatch Inc. | 203,874 | 9,019 |
| Otter Tail Corp. | 306,415 | 8,969 | |
| * | TrueBlue Inc. | 346,833 | 8,941 |
| * | Rexnord Corp. | 330,404 | 8,924 |
| AAR Corp. | 317,725 | 8,900 | |
| * | Atlas Air Worldwide Holdings Inc. | 211,529 | 8,704 |
| Albany International Corp. | 240,813 | 8,652 | |
| * | Meritor Inc. | 823,394 | 8,588 |
| * | Tutor Perini Corp. | 325,182 | 8,552 |
| Encore Wire Corp. | 157,342 | 8,528 | |
| Heartland Express Inc. | 430,117 | 8,439 | |
| Cubic Corp. | 158,338 | 8,338 | |
| Universal Forest Products Inc. | 159,702 | 8,327 | |
| McGrath RentCorp | 206,125 | 8,204 | |
| Booz Allen Hamilton Holding Corp. Class A | 420,856 | 8,059 | |
| * | Navigant Consulting Inc. | 417,975 | 8,025 |
| * | Boise Cascade Co. | 266,098 | 7,845 |
| Textainer Group Holdings Ltd. | 190,405 | 7,658 | |
| * | H&E Equipment Services Inc. | 252,828 | 7,491 |
| Altra Industrial Motion Corp. | 216,477 | 7,408 | |
| * | Sykes Enterprises Inc. | 334,398 | 7,293 |
| ESCO Technologies Inc. | 212,609 | 7,284 | |
| Insperity Inc. | 194,422 | 7,024 | |
| * | Greenbrier Cos. Inc. | 213,485 | 7,011 |
| Arkansas Best Corp. | 206,552 | 6,957 | |
| Schnitzer Steel Industries Inc. | 210,192 | 6,867 | |
| John Bean Technologies Corp. | 232,433 | 6,817 | |
| Standex International Corp. | 107,836 | 6,781 | |
| Hyster-Yale Materials Handling Inc. | 69,630 | 6,487 | |
| * | Rofin-Sinar Technologies Inc. | 237,730 | 6,423 |
| Mueller Water Products Inc. Class A | 669,042 | 6,269 | |
46
| Vanguard® Small-Cap Value Index Fund | |||
| Schedule of Investments | |||
| December 31, 2013 | |||
| Market | |||
| Value | |||
| Shares | ($000) | ||
| ManTech International Corp. Class A | 202,571 | 6,063 | |
| * | Monster Worldwide Inc. | 841,868 | 6,003 |
| Astec Industries Inc. | 154,414 | 5,965 | |
| AVX Corp. | 427,080 | 5,949 | |
| Quad/Graphics Inc. | 214,445 | 5,839 | |
| Comfort Systems USA Inc. | 299,843 | 5,814 | |
| Kelly Services Inc. Class A | 229,173 | 5,716 | |
| * | Newport Corp. | 314,243 | 5,678 |
| * | Checkpoint Systems Inc. | 350,119 | 5,521 |
| Materion Corp. | 174,223 | 5,375 | |
| * | Nortek Inc. | 71,568 | 5,339 |
| Park Electrochemical Corp. | 167,415 | 4,808 | |
| American Science & Engineering Inc. | 66,285 | 4,767 | |
| * | Consolidated Graphics Inc. | 69,498 | 4,687 |
| Kforce Inc. | 227,919 | 4,663 | |
| Resources Connection Inc. | 318,871 | 4,569 | |
| * | Taminco Corp. | 224,423 | 4,536 |
| Apogee Enterprises Inc. | 115,578 | 4,150 | |
| Black Box Corp. | 134,285 | 4,002 | |
| * | TTM Technologies Inc. | 453,879 | 3,894 |
| * | TeleTech Holdings Inc. | 149,062 | 3,569 |
| * | Aegion Corp. Class A | 162,009 | 3,546 |
| * | CAI International Inc. | 150,252 | 3,541 |
| * | Air Transport Services Group Inc. | 437,135 | 3,536 |
| Acacia Research Corp. | 200,242 | 2,912 | |
| * | Layne Christensen Co. | 159,021 | 2,716 |
| * | Ply Gem Holdings Inc. | 85,084 | 1,534 |
| * | Dice Holdings Inc. | 166,606 | 1,208 |
| * | Multi-Fineline Electronix Inc. | 71,129 | 988 |
| * | Aeroflex Holding Corp. | 143,514 | 933 |
| * | Viasystems Group Inc. | 34,871 | 477 |
| 2,739,525 | |||
| Oil & Gas (4.4%) | |||
| * | Superior Energy Services Inc. | 1,347,673 | 35,862 |
| * | WPX Energy Inc. | 1,696,856 | 34,582 |
| * | First Solar Inc. | 630,289 | 34,439 |
| Patterson-UTI Energy Inc. | 1,157,878 | 29,317 | |
| Targa Resources Corp. | 321,938 | 28,385 | |
| * | Newfield Exploration Co. | 1,150,295 | 28,332 |
| *,^ | Ultra Petroleum Corp. | 1,228,017 | 26,587 |
| * | MRC Global Inc. | 816,850 | 26,352 |
| * | Oil States International Inc. | 232,852 | 23,686 |
| Bristow Group Inc. | 309,555 | 23,235 | |
| * | Unit Corp. | 414,875 | 21,416 |
| * | Helix Energy Solutions Group Inc. | 849,319 | 19,687 |
| Western Refining Inc. | 437,835 | 18,569 | |
| * | Exterran Holdings Inc. | 500,937 | 17,132 |
| * | SEACOR Holdings Inc. | 163,167 | 14,881 |
| * | Stone Energy Corp. | 401,304 | 13,881 |
| Crosstex Energy Inc. | 342,982 | 12,402 | |
| Delek US Holdings Inc. | 330,276 | 11,365 | |
| PBF Energy Inc. Class A | 334,445 | 10,522 | |
| * | GT Advanced Technologies Inc. | 1,063,471 | 9,273 |
| * | McDermott International Inc. | 999,554 | 9,156 |
| * | Key Energy Services Inc. | 1,094,092 | 8,643 |
| * | Newpark Resources Inc. | 701,360 | 8,620 |
| * | Hercules Offshore Inc. | 1,282,320 | 8,373 |
| * | Parker Drilling Co. | 964,798 | 7,844 |
| * | TETRA Technologies Inc. | 632,873 | 7,822 |
| CVR Energy Inc. | 146,932 | 6,381 | |
| * | Tesco Corp. | 280,978 | 5,558 |
| * | Basic Energy Services Inc. | 338,694 | 5,345 |
| W&T Offshore Inc. | 286,211 | 4,579 | |
| * | Contango Oil & Gas Co. | 96,266 | 4,549 |
47
| Vanguard® Small-Cap Value Index Fund | |||
| Schedule of Investments | |||
| December 31, 2013 | |||
| Market | |||
| Value | |||
| Shares | ($000) | ||
| * | Pioneer Energy Services Corp. | 527,783 | 4,227 |
| * | Clayton Williams Energy Inc. | 51,307 | 4,205 |
| ^ | EXCO Resources Inc. | 761,647 | 4,044 |
| * | Forest Oil Corp. | 1,011,132 | 3,650 |
| * | Willbros Group Inc. | 336,471 | 3,170 |
| Alon USA Energy Inc. | 173,982 | 2,878 | |
| * | Penn Virginia Corp. | 275,852 | 2,601 |
| *,^ | Swift Energy Co. | 174,052 | 2,350 |
| * | Vantage Drilling Co. | 772,210 | 1,421 |
| *,^ | EXCO Resources Inc. Rights Exp. 01/09/2014 | 1,012,319 | 162 |
| 545,483 | |||
| Technology (6.9%) | |||
| * | NCR Corp. | 1,406,088 | 47,891 |
| Pitney Bowes Inc. | 1,706,848 | 39,770 | |
| Leidos Holdings Inc. | 724,009 | 33,659 | |
| * | Brocade Communications Systems Inc. | 3,762,789 | 33,376 |
| * | ON Semiconductor Corp. | 3,754,198 | 30,935 |
| * | Ingram Micro Inc. | 1,302,489 | 30,556 |
| * | AOL Inc. | 617,534 | 28,789 |
| * | Teradyne Inc. | 1,618,607 | 28,520 |
| * | VeriFone Systems Inc. | 923,085 | 24,757 |
| * | ARRIS Group Inc. | 934,937 | 22,780 |
| DST Systems Inc. | 249,372 | 22,628 | |
| *,^ | Advanced Micro Devices Inc. | 5,198,052 | 20,116 |
| * | Microsemi Corp. | 794,051 | 19,812 |
| Compuware Corp. | 1,738,661 | 19,490 | |
| * | Verint Systems Inc. | 451,710 | 19,396 |
| j2 Global Inc. | 373,604 | 18,684 | |
| Lexmark International Inc. Class A | 524,754 | 18,639 | |
| * | EchoStar Corp. Class A | 358,730 | 17,836 |
| * | Rovi Corp. | 863,482 | 17,002 |
| Diebold Inc. | 511,864 | 16,897 | |
| * | Polycom Inc. | 1,440,075 | 16,172 |
| * | Tech Data Corp. | 303,098 | 15,640 |
| * | SYNNEX Corp. | 222,428 | 14,992 |
| * | CACI International Inc. Class A | 197,888 | 14,489 |
| * | Synaptics Inc. | 279,557 | 14,484 |
| * | Fairchild Semiconductor International Inc. Class A | 1,073,175 | 14,327 |
| ADTRAN Inc. | 463,091 | 12,508 | |
| * | Unisys Corp. | 370,984 | 12,454 |
| Intersil Corp. Class A | 1,078,921 | 12,375 | |
| Cypress Semiconductor Corp. | 1,149,107 | 12,066 | |
| * | RF Micro Devices Inc. | 2,265,760 | 11,691 |
| Science Applications International Corp. | 352,120 | 11,645 | |
| * | NETGEAR Inc. | 327,512 | 10,788 |
| * | Progress Software Corp. | 416,711 | 10,764 |
| * | ScanSource Inc. | 237,719 | 10,086 |
| * | PMC - Sierra Inc. | 1,460,253 | 9,389 |
| * | Loral Space & Communications Inc. | 108,617 | 8,796 |
| * | QLogic Corp. | 733,005 | 8,671 |
| * | Cabot Microelectronics Corp. | 189,288 | 8,651 |
| * | Kulicke & Soffa Industries Inc. | 641,767 | 8,536 |
| CDW Corp. | 363,255 | 8,486 | |
| * | Insight Enterprises Inc. | 357,697 | 8,123 |
| CSG Systems International Inc. | 271,638 | 7,986 | |
| * | Dycom Industries Inc. | 270,937 | 7,529 |
| * | Amkor Technology Inc. | 1,104,493 | 6,771 |
| West Corp. | 247,213 | 6,356 | |
| * | Harmonic Inc. | 851,828 | 6,287 |
| * | CommScope Holding Co. Inc. | 329,326 | 6,231 |
| * | Spansion Inc. Class A | 447,678 | 6,218 |
| * | Digital River Inc. | 268,389 | 4,965 |
| * | IntraLinks Holdings Inc. | 401,823 | 4,866 |
| * | Emulex Corp. | 645,888 | 4,625 |
48
| Vanguard® Small-Cap Value Index Fund | |||
| Schedule of Investments | |||
| December 31, 2013 | |||
| Market | |||
| Value | |||
| Shares | ($000) | ||
| Comtech Telecommunications Corp. | 132,165 | 4,166 | |
| Epiq Systems Inc. | 234,922 | 3,808 | |
| Micrel Inc. | 385,420 | 3,804 | |
| * | Benefitfocus Inc. | 51,532 | 2,975 |
| * | Mercury Systems Inc. | 267,205 | 2,926 |
| * | FormFactor Inc. | 461,096 | 2,776 |
| * | Pendrell Corp. | 1,256,304 | 2,525 |
| * | Endurance International Group Holdings Inc. | 160,801 | 2,280 |
| ^ | Ebix Inc. | 137,567 | 2,025 |
| * | Systemax Inc. | 108,520 | 1,221 |
| 857,006 | |||
| Telecommunications (0.5%) | |||
| Telephone & Data Systems Inc. | 770,632 | 19,867 | |
| * | Leap Wireless International Inc. | 469,451 | 8,168 |
| Consolidated Communications Holdings Inc. | 321,983 | 6,320 | |
| * | Vonage Holdings Corp. | 1,393,986 | 4,642 |
| Atlantic Tele-Network Inc. | 79,894 | 4,520 | |
| United States Cellular Corp. | 107,910 | 4,513 | |
| EarthLink Inc. | 861,174 | 4,366 | |
| *,^ | NII Holdings Inc. | 1,384,328 | 3,807 |
| * | Iridium Communications Inc. | 485,786 | 3,041 |
| 59,244 | |||
| Utilities (5.4%) | |||
| AGL Resources Inc. | 1,003,767 | 47,408 | |
| UGI Corp. | 964,081 | 39,971 | |
| Aqua America Inc. | 1,493,185 | 35,224 | |
| Atmos Energy Corp. | 768,205 | 34,892 | |
| Westar Energy Inc. Class A | 1,074,457 | 34,565 | |
| Questar Corp. | 1,479,387 | 34,011 | |
| Great Plains Energy Inc. | 1,299,814 | 31,507 | |
| Vectren Corp. | 695,956 | 24,706 | |
| Cleco Corp. | 510,806 | 23,814 | |
| IDACORP Inc. | 424,440 | 22,003 | |
| Hawaiian Electric Industries Inc. | 841,695 | 21,935 | |
| Southwest Gas Corp. | 391,667 | 21,898 | |
| Piedmont Natural Gas Co. Inc. | 641,624 | 21,276 | |
| UNS Energy Corp. | 333,442 | 19,956 | |
| Portland General Electric Co. | 659,617 | 19,920 | |
| Black Hills Corp. | 375,899 | 19,738 | |
| UIL Holdings Corp. | 477,101 | 18,488 | |
| WGL Holdings Inc. | 437,737 | 17,536 | |
| ALLETE Inc. | 344,163 | 17,167 | |
| New Jersey Resources Corp. | 355,126 | 16,421 | |
| PNM Resources Inc. | 673,040 | 16,234 | |
| South Jersey Industries Inc. | 272,157 | 15,230 | |
| Avista Corp. | 507,264 | 14,300 | |
| NorthWestern Corp. | 324,956 | 14,077 | |
| Laclede Group Inc. | 262,541 | 11,956 | |
| El Paso Electric Co. | 340,164 | 11,943 | |
| MGE Energy Inc. | 195,316 | 11,309 | |
| Northwest Natural Gas Co. | 228,139 | 9,769 | |
| American States Water Co. | 327,150 | 9,399 | |
| California Water Service Group | 383,151 | 8,839 | |
| Empire District Electric Co. | 363,013 | 8,237 | |
| * | Dynegy Inc. Class A | 359,514 | 7,737 |
| Ormat Technologies Inc. | 76,720 | 2,088 | |
| Atlantic Power Corp. | 507,155 | 1,765 | |
| 665,319 | |||
| Total Common Stocks (Cost $9,377,593) | 12,286,082 | ||
49
| Vanguard® Small-Cap Value Index Fund | ||||
| Schedule of Investments | ||||
| December 31, 2013 | ||||
| Market | ||||
| Value | ||||
| Coupon | Shares | ($000) | ||
| Temporary Cash Investments (1.2%)1 | ||||
| Money Market Fund (1.2%) | ||||
| 2,3 Vanguard Market Liquidity Fund | 0.125% | 141,534,341 | 141,534 | |
| Face | ||||
| Maturity | Amount | |||
| Date | ($000) | |||
| U.S. Government and Agency Obligations (0.0%) | ||||
| 4,5 Freddie Mac Discount Notes | 0.063% | 3/17/14 | 4,000 | 3,999 |
| Total Temporary Cash Investments (Cost $145,534) | 145,533 | |||
| Total Investments (100.6%) (Cost $9,523,127) | 12,431,615 | |||
| Other Assets and Liabilities—Net (-0.6%)3 | (78,316) | |||
| Net Assets (100%) | 12,353,299 | |||
* Non-income-producing security.
^ Includes partial security positions on loan to broker-dealers. The total value of securities on loan is $72,629,000.
1 The fund invests a portion of its cash reserves in equity markets through the use of index futures contracts. After giving effect to futures investments, the fund's effective common stock and temporary cash investment positions represent 100.0% and 0.6%, respectively, of net assets.
2 Affiliated money market fund available only to Vanguard funds and certain trusts and accounts managed by Vanguard. Rate shown is the 7-day yield.
3 Includes $76,159,000 of collateral received for securities on loan.
4 Securities with a value of $3,199,000 have been segregated as initial margin for open futures contracts.
5 The issuer was placed under federal conservatorship in September 2008; since that time, its daily operations have been managed by the Federal Housing Finance Agency and it receives capital from the U.S. Treasury, as needed to maintain a positive net worth, in exchange for senior preferred stock.
REIT—Real Estate Investment Trust.
50
This page intentionally left blank.
© 2014 The Vanguard Group, Inc. All rights reserved.
Vanguard Marketing Corporation, Distributor.
SNA480_022014
| Vanguard® Extended Market Index Fund | |||
| Schedule of Investments | |||
| December 31, 2013 | |||
| Market | |||
| Value | |||
| Shares | ($000) | ||
| Common Stocks (99.7%)1 | |||
| Consumer Discretionary (16.1%) | |||
| Las Vegas Sands Corp. | 3,536,906 | 278,956 | |
| * | Liberty Global plc Class A | 1,808,572 | 160,945 |
| * | Liberty Media Corp. Class A | 918,137 | 134,461 |
| * | Liberty Global plc | 1,582,532 | 133,439 |
| *,^ | Tesla Motors Inc. | 750,159 | 112,809 |
| * | DISH Network Corp. Class A | 1,927,194 | 111,623 |
| Tractor Supply Co. | 1,280,029 | 99,305 | |
| * | Sirius XM Holdings Inc. | 27,454,522 | 95,816 |
| * | LKQ Corp. | 2,753,374 | 90,586 |
| Polaris Industries Inc. | 588,304 | 85,681 | |
| * | Charter Communications Inc. Class A | 618,599 | 84,600 |
| * | TRW Automotive Holdings Corp. | 1,053,428 | 78,364 |
| Advance Auto Parts Inc. | 668,299 | 73,967 | |
| * | MGM Resorts International | 3,055,116 | 71,856 |
| Royal Caribbean Cruises Ltd. | 1,491,359 | 70,720 | |
| * | Jarden Corp. | 1,092,414 | 67,020 |
| * | Under Armour Inc. Class A | 735,777 | 64,233 |
| Hanesbrands Inc. | 908,533 | 63,843 | |
| Lear Corp. | 739,599 | 59,885 | |
| Signet Jewelers Ltd. | 738,177 | 58,095 | |
| * | Lululemon Athletica Inc. | 980,182 | 57,860 |
| Foot Locker Inc. | 1,362,822 | 56,475 | |
| * | Ulta Salon Cosmetics & Fragrance Inc. | 584,662 | 56,432 |
| Dick's Sporting Goods Inc. | 933,444 | 54,233 | |
| * | Toll Brothers Inc. | 1,451,424 | 53,703 |
| GNC Holdings Inc. Class A | 867,595 | 50,711 | |
| Williams-Sonoma Inc. | 817,449 | 47,641 | |
| Dunkin' Brands Group Inc. | 976,146 | 47,050 | |
| Gentex Corp. | 1,326,200 | 43,751 | |
| Tupperware Brands Corp. | 462,685 | 43,738 | |
| * | Panera Bread Co. Class A | 244,430 | 43,188 |
| * | Groupon Inc. | 3,417,675 | 40,226 |
| * | NVR Inc. | 38,211 | 39,205 |
| * | Sally Beauty Holdings Inc. | 1,272,177 | 38,458 |
| Brunswick Corp. | 830,785 | 38,266 | |
| * | Visteon Corp. | 460,095 | 37,677 |
| * | AMC Networks Inc. Class A | 544,407 | 37,080 |
| * | Fifth & Pacific Cos. Inc. | 1,127,034 | 36,144 |
| Carter's Inc. | 501,645 | 36,013 | |
| Domino's Pizza Inc. | 510,497 | 35,556 | |
| Service Corp. International | 1,943,680 | 35,239 | |
| Sotheby's | 628,373 | 33,429 | |
| Six Flags Entertainment Corp. | 879,219 | 32,373 | |
| * | Madison Square Garden Co. Class A | 561,603 | 32,337 |
| Cinemark Holdings Inc. | 953,871 | 31,793 | |
| * | Tenneco Inc. | 560,927 | 31,732 |
| Wolverine World Wide Inc. | 923,652 | 31,367 | |
| * | Lamar Advertising Co. Class A | 597,977 | 31,244 |
| * | Tempur Sealy International Inc. | 556,484 | 30,028 |
| DSW Inc. Class A | 668,718 | 28,574 | |
| * | Cabela's Inc. | 428,017 | 28,532 |
| Brinker International Inc. | 612,143 | 28,367 | |
| * | Bally Technologies Inc. | 357,840 | 28,073 |
| Chico's FAS Inc. | 1,475,144 | 27,792 | |
| * | Deckers Outdoor Corp. | 317,347 | 26,803 |
| Dana Holding Corp. | 1,346,773 | 26,424 | |
| * | Hyatt Hotels Corp. Class A | 532,686 | 26,347 |
| * | Lumber Liquidators Holdings Inc. | 252,533 | 25,983 |
| *,^ | JC Penney Co. Inc. | 2,791,458 | 25,542 |
| * | Live Nation Entertainment Inc. | 1,292,273 | 25,535 |
| CST Brands Inc. | 693,736 | 25,474 | |
1
| Vanguard® Extended Market Index Fund | |||
| Schedule of Investments | |||
| December 31, 2013 | |||
| Market | |||
| Value | |||
| Shares | ($000) | ||
| * | Buffalo Wild Wings Inc. | 172,774 | 25,432 |
| * | Apollo Education Group Inc. | 914,261 | 24,978 |
| * | Ascena Retail Group Inc. | 1,175,807 | 24,880 |
| Vail Resorts Inc. | 330,301 | 24,849 | |
| * | Starz | 847,003 | 24,766 |
| Pool Corp. | 419,653 | 24,399 | |
| Cracker Barrel Old Country Store Inc. | 218,736 | 24,076 | |
| Sinclair Broadcast Group Inc. Class A | 668,978 | 23,903 | |
| John Wiley & Sons Inc. Class A | 426,199 | 23,526 | |
| * | Norwegian Cruise Line Holdings Ltd. | 655,545 | 23,252 |
| * | HomeAway Inc. | 568,234 | 23,229 |
| * | DreamWorks Animation SKG Inc. Class A | 653,119 | 23,186 |
| * | Office Depot Inc. | 4,367,302 | 23,103 |
| Abercrombie & Fitch Co. | 697,658 | 22,960 | |
| Wendy's Co. | 2,607,974 | 22,742 | |
| Thor Industries Inc. | 409,938 | 22,641 | |
| American Eagle Outfitters Inc. | 1,555,225 | 22,395 | |
| Pier 1 Imports Inc. | 962,222 | 22,208 | |
| Allison Transmission Holdings Inc. | 780,745 | 21,556 | |
| Dillard's Inc. Class A | 221,178 | 21,501 | |
| Men's Wearhouse Inc. | 416,628 | 21,281 | |
| Cheesecake Factory Inc. | 440,389 | 21,258 | |
| Aaron's Inc. | 697,993 | 20,521 | |
| * | Steven Madden Ltd. | 546,512 | 19,997 |
| * | Jack in the Box Inc. | 395,172 | 19,766 |
| *,^ | Sears Holdings Corp. | 400,341 | 19,633 |
| HSN Inc. | 308,811 | 19,239 | |
| * | Iconix Brand Group Inc. | 471,025 | 18,700 |
| * | Five Below Inc. | 431,285 | 18,631 |
| New York Times Co. Class A | 1,169,097 | 18,554 | |
| DeVry Education Group Inc. | 521,408 | 18,510 | |
| Ryland Group Inc. | 425,385 | 18,466 | |
| Penske Automotive Group Inc. | 389,440 | 18,366 | |
| * | Grand Canyon Education Inc. | 411,294 | 17,932 |
| * | Conn's Inc. | 226,612 | 17,855 |
| Meredith Corp. | 344,536 | 17,847 | |
| * | Shutterfly Inc. | 347,403 | 17,693 |
| *,^ | Outerwall Inc. | 258,538 | 17,392 |
| * | Big Lots Inc. | 535,552 | 17,293 |
| * | Life Time Fitness Inc. | 362,844 | 17,054 |
| * | Restoration Hardware Holdings Inc. | 252,968 | 17,025 |
| Hillenbrand Inc. | 578,261 | 17,012 | |
| * | Murphy USA Inc. | 407,779 | 16,947 |
| Guess? Inc. | 544,941 | 16,931 | |
| Rent-A-Center Inc. | 491,589 | 16,390 | |
| * | Genesco Inc. | 220,853 | 16,136 |
| *,^ | Hibbett Sports Inc. | 239,632 | 16,106 |
| * | Dorman Products Inc. | 279,178 | 15,653 |
| Monro Muffler Brake Inc. | 274,886 | 15,493 | |
| * | Asbury Automotive Group Inc. | 287,189 | 15,434 |
| Texas Roadhouse Inc. Class A | 554,177 | 15,406 | |
| * | ANN Inc. | 420,652 | 15,379 |
| Morningstar Inc. | 195,966 | 15,303 | |
| * | Meritage Homes Corp. | 313,158 | 15,028 |
| La-Z-Boy Inc. | 483,858 | 15,000 | |
| * | Marriott Vacations Worldwide Corp. | 280,139 | 14,780 |
| Nexstar Broadcasting Group Inc. Class A | 263,822 | 14,703 | |
| * | Vitamin Shoppe Inc. | 279,460 | 14,535 |
| Lithia Motors Inc. Class A | 206,783 | 14,355 | |
| * | Express Inc. | 765,885 | 14,299 |
| Choice Hotels International Inc. | 289,902 | 14,237 | |
| Regal Entertainment Group Class A | 725,858 | 14,118 | |
| * | Jos A Bank Clothiers Inc. | 257,825 | 14,111 |
| * | Pinnacle Entertainment Inc. | 540,867 | 14,057 |
2
| Vanguard® Extended Market Index Fund | |||
| Schedule of Investments | |||
| December 31, 2013 | |||
| Market | |||
| Value | |||
| Shares | ($000) | ||
| KB Home | 762,759 | 13,943 | |
| Buckle Inc. | 263,429 | 13,846 | |
| Group 1 Automotive Inc. | 194,802 | 13,835 | |
| * | Helen of Troy Ltd. | 277,542 | 13,741 |
| Cooper Tire & Rubber Co. | 559,217 | 13,444 | |
| Papa John's International Inc. | 295,404 | 13,411 | |
| ^ | Sturm Ruger & Co. Inc. | 177,680 | 12,987 |
| * | Crocs Inc. | 815,509 | 12,983 |
| Finish Line Inc. Class A | 460,220 | 12,964 | |
| * | American Axle & Manufacturing Holdings Inc. | 623,005 | 12,740 |
| Bob Evans Farms Inc. | 250,473 | 12,671 | |
| * | Standard Pacific Corp. | 1,392,689 | 12,604 |
| Burger King Worldwide Inc. | 550,457 | 12,583 | |
| DineEquity Inc. | 149,855 | 12,520 | |
| * | Orient-Express Hotels Ltd. Class A | 819,890 | 12,389 |
| * | Skechers U.S.A. Inc. Class A | 366,658 | 12,147 |
| Valassis Communications Inc. | 351,580 | 12,042 | |
| * | Children's Place Retail Stores Inc. | 206,225 | 11,749 |
| Interval Leisure Group Inc. | 377,417 | 11,662 | |
| * | Krispy Kreme Doughnuts Inc. | 602,487 | 11,622 |
| * | MDC Holdings Inc. | 360,212 | 11,613 |
| * | Fiesta Restaurant Group Inc. | 221,961 | 11,595 |
| * | G-III Apparel Group Ltd. | 151,476 | 11,177 |
| National CineMedia Inc. | 553,474 | 11,047 | |
| Matthews International Corp. Class A | 258,812 | 11,028 | |
| Oxford Industries Inc. | 136,128 | 10,981 | |
| * | Select Comfort Corp. | 512,514 | 10,809 |
| Brown Shoe Co. Inc. | 379,958 | 10,692 | |
| Jones Group Inc. | 712,422 | 10,658 | |
| * | Quiksilver Inc. | 1,199,820 | 10,522 |
| Churchill Downs Inc. | 115,721 | 10,374 | |
| Drew Industries Inc. | 200,898 | 10,286 | |
| * | Bloomin' Brands Inc. | 422,502 | 10,144 |
| * | Tumi Holdings Inc. | 448,928 | 10,123 |
| SeaWorld Entertainment Inc. | 351,350 | 10,108 | |
| * | LifeLock Inc. | 611,339 | 10,032 |
| * | Loral Space & Communications Inc. | 122,147 | 9,891 |
| * | Ascent Capital Group Inc. Class A | 115,019 | 9,841 |
| * | Sonic Corp. | 478,449 | 9,660 |
| Columbia Sportswear Co. | 118,026 | 9,295 | |
| * | iRobot Corp. | 263,797 | 9,172 |
| International Speedway Corp. Class A | 257,409 | 9,135 | |
| * | Red Robin Gourmet Burgers Inc. | 123,874 | 9,110 |
| * | Penn National Gaming Inc. | 630,163 | 9,030 |
| * | Multimedia Games Holding Co. Inc. | 276,214 | 8,662 |
| * | AFC Enterprises Inc. | 221,203 | 8,516 |
| * | Gentherm Inc. | 316,904 | 8,496 |
| ^ | Weight Watchers International Inc. | 255,493 | 8,413 |
| *,^ | Smith & Wesson Holding Corp. | 610,633 | 8,237 |
| * | Biglari Holdings Inc. | 16,243 | 8,229 |
| Core-Mark Holding Co. Inc. | 107,639 | 8,173 | |
| Cato Corp. Class A | 256,212 | 8,148 | |
| Capella Education Co. | 121,658 | 8,083 | |
| Scholastic Corp. | 235,388 | 8,006 | |
| * | Boyd Gaming Corp. | 693,863 | 7,813 |
| * | Scientific Games Corp. Class A | 460,461 | 7,796 |
| Sonic Automotive Inc. Class A | 316,214 | 7,741 | |
| * | Francesca's Holdings Corp. | 419,959 | 7,731 |
| Ethan Allen Interiors Inc. | 251,618 | 7,654 | |
| Movado Group Inc. | 172,767 | 7,603 | |
| Arctic Cat Inc. | 131,246 | 7,478 | |
| * | American Public Education Inc. | 170,476 | 7,411 |
| * | BJ's Restaurants Inc. | 238,352 | 7,403 |
| * | Winnebago Industries Inc. | 263,959 | 7,246 |
3
| Vanguard® Extended Market Index Fund | |||
| Schedule of Investments | |||
| December 31, 2013 | |||
| Market | |||
| Value | |||
| Shares | ($000) | ||
| CEC Entertainment Inc. | 162,572 | 7,199 | |
| Regis Corp. | 489,314 | 7,100 | |
| * | Caesars Entertainment Corp. | 326,011 | 7,022 |
| Fred's Inc. Class A | 376,867 | 6,980 | |
| * | Beazer Homes USA Inc. | 285,043 | 6,961 |
| Stage Stores Inc. | 312,929 | 6,953 | |
| Standard Motor Products Inc. | 187,129 | 6,886 | |
| * | EW Scripps Co. Class A | 314,573 | 6,833 |
| * | Denny's Corp. | 949,909 | 6,830 |
| *,^ | Aeropostale Inc. | 720,103 | 6,546 |
| * | Federal-Mogul Corp. | 330,282 | 6,500 |
| * | Steiner Leisure Ltd. | 131,104 | 6,449 |
| * | Pep Boys-Manny Moe & Jack | 509,534 | 6,186 |
| * | Blue Nile Inc. | 127,802 | 6,018 |
| Haverty Furniture Cos. Inc. | 191,788 | 6,003 | |
| * | Hovnanian Enterprises Inc. Class A | 882,020 | 5,839 |
| * | FTD Cos. Inc. | 176,581 | 5,753 |
| * | Overstock.com Inc. | 185,117 | 5,700 |
| * | Modine Manufacturing Co. | 440,148 | 5,643 |
| * | Taylor Morrison Home Corp. Class A | 249,183 | 5,594 |
| * | Universal Electronics Inc. | 145,733 | 5,554 |
| * | Zumiez Inc. | 213,192 | 5,543 |
| World Wrestling Entertainment Inc. Class A | 331,207 | 5,491 | |
| * | Barnes & Noble Inc. | 366,065 | 5,473 |
| * | K12 Inc. | 246,827 | 5,368 |
| Ruth's Hospitality Group Inc. | 375,716 | 5,339 | |
| * | Cumulus Media Inc. Class A | 688,870 | 5,325 |
| * | M/I Homes Inc. | 208,015 | 5,294 |
| * | Bright Horizons Family Solutions Inc. | 142,917 | 5,251 |
| * | Rentrak Corp. | 136,325 | 5,165 |
| * | Tuesday Morning Corp. | 319,140 | 5,093 |
| * | Unifi Inc. | 185,331 | 5,048 |
| * | ITT Educational Services Inc. | 150,333 | 5,048 |
| * | Vera Bradley Inc. | 209,801 | 5,044 |
| Nutrisystem Inc. | 304,778 | 5,011 | |
| Callaway Golf Co. | 580,248 | 4,891 | |
| * | Gray Television Inc. | 326,046 | 4,852 |
| Superior Industries International Inc. | 223,949 | 4,620 | |
| * | Mattress Firm Holding Corp. | 103,280 | 4,445 |
| *,^ | Tile Shop Holdings Inc. | 244,107 | 4,411 |
| * | Carmike Cinemas Inc. | 157,983 | 4,398 |
| PetMed Express Inc. | 263,092 | 4,375 | |
| Big 5 Sporting Goods Corp. | 217,844 | 4,318 | |
| * | Libbey Inc. | 201,159 | 4,224 |
| Destination Maternity Corp. | 139,390 | 4,165 | |
| * | VOXX International Corp. Class A | 247,722 | 4,137 |
| * | Ruby Tuesday Inc. | 589,452 | 4,085 |
| Clear Channel Outdoor Holdings Inc. Class A | 399,274 | 4,049 | |
| * | Chuy's Holdings Inc. | 109,228 | 3,934 |
| * | Strayer Education Inc. | 114,028 | 3,931 |
| NACCO Industries Inc. Class A | 62,221 | 3,870 | |
| Harte-Hanks Inc. | 474,513 | 3,711 | |
| * | Kirkland's Inc. | 155,873 | 3,690 |
| * | Cavco Industries Inc. | 53,448 | 3,672 |
| * | Container Store Group Inc. | 78,584 | 3,663 |
| * | Cooper-Standard Holding Inc. | 73,900 | 3,629 |
| * | Journal Communications Inc. Class A | 389,223 | 3,624 |
| * | Del Frisco's Restaurant Group Inc. | 150,238 | 3,541 |
| Entravision Communications Corp. Class A | 581,230 | 3,540 | |
| Speedway Motorsports Inc. | 173,752 | 3,449 | |
| *,^ | Media General Inc. | 152,491 | 3,446 |
| Stein Mart Inc. | 254,147 | 3,418 | |
| Shoe Carnival Inc. | 115,366 | 3,347 | |
| * | Zale Corp. | 211,566 | 3,336 |
4
| Vanguard® Extended Market Index Fund | |||
| Schedule of Investments | |||
| December 31, 2013 | |||
| Market | |||
| Value | |||
| Shares | ($000) | ||
| * | Digital Generation Inc. | 259,221 | 3,305 |
| * | LeapFrog Enterprises Inc. | 413,524 | 3,283 |
| * | Career Education Corp. | 575,637 | 3,281 |
| * | MarineMax Inc. | 202,834 | 3,262 |
| * | Hilton Worldwide Holdings Inc. | 146,560 | 3,261 |
| * | Costa Inc. | 141,814 | 3,082 |
| * | America's Car-Mart Inc. | 71,056 | 3,001 |
| * | Stoneridge Inc. | 231,241 | 2,948 |
| Universal Technical Institute Inc. | 203,486 | 2,830 | |
| Saga Communications Inc. Class A | 55,516 | 2,792 | |
| *,^ | Noodles & Co. Class A | 76,350 | 2,742 |
| * | Christopher & Banks Corp. | 309,051 | 2,639 |
| * | Wet Seal Inc. Class A | 958,824 | 2,618 |
| * | Morgans Hotel Group Co. | 316,079 | 2,570 |
| Marcus Corp. | 189,802 | 2,551 | |
| * | Bridgepoint Education Inc. | 141,997 | 2,515 |
| Spartan Motors Inc. | 369,681 | 2,477 | |
| Town Sports International Holdings Inc. | 166,320 | 2,455 | |
| Marine Products Corp. | 242,928 | 2,441 | |
| *,^ | RadioShack Corp. | 922,324 | 2,398 |
| * | Fuel Systems Solutions Inc. | 167,606 | 2,325 |
| * | Citi Trends Inc. | 135,508 | 2,304 |
| Strattec Security Corp. | 50,676 | 2,264 | |
| * | hhgregg Inc. | 159,657 | 2,230 |
| * | Nautilus Inc. | 262,423 | 2,212 |
| * | Jamba Inc. | 176,103 | 2,189 |
| * | RetailMeNot Inc. | 75,757 | 2,181 |
| * | Motorcar Parts of America Inc. | 112,871 | 2,178 |
| * | William Lyon Homes Class A | 97,700 | 2,163 |
| * | Tower International Inc. | 100,597 | 2,153 |
| Collectors Universe Inc. | 124,595 | 2,137 | |
| Carriage Services Inc. Class A | 108,155 | 2,112 | |
| AH Belo Corp. Class A | 266,351 | 1,990 | |
| * | Famous Dave's Of America Inc. | 106,560 | 1,950 |
| * | Education Management Corp. | 190,783 | 1,925 |
| * | TRI Pointe Homes Inc. | 94,965 | 1,893 |
| * | McClatchy Co. Class A | 544,895 | 1,853 |
| * | Burlington Stores Inc. | 57,784 | 1,849 |
| * | Sears Hometown and Outlet Stores Inc. | 72,497 | 1,849 |
| Flexsteel Industries Inc. | 59,327 | 1,823 | |
| * | Bravo Brio Restaurant Group Inc. | 108,524 | 1,766 |
| * | Dixie Group Inc. | 132,074 | 1,743 |
| * | Tandy Leather Factory Inc. | 173,075 | 1,689 |
| Mac-Gray Corp. | 78,557 | 1,668 | |
| Culp Inc. | 81,545 | 1,668 | |
| CSS Industries Inc. | 58,002 | 1,663 | |
| Lifetime Brands Inc. | 104,887 | 1,650 | |
| bebe stores inc | 305,509 | 1,625 | |
| * | Destination XL Group Inc. | 246,387 | 1,619 |
| Bassett Furniture Industries Inc. | 103,360 | 1,579 | |
| JAKKS Pacific Inc. | 223,879 | 1,507 | |
| Cherokee Inc. | 108,760 | 1,501 | |
| Weyco Group Inc. | 50,898 | 1,498 | |
| Remy International Inc. | 63,829 | 1,488 | |
| * | Corinthian Colleges Inc. | 816,785 | 1,454 |
| RG Barry Corp. | 75,240 | 1,452 | |
| * | Orbitz Worldwide Inc. | 197,059 | 1,415 |
| * | Entercom Communications Corp. Class A | 134,221 | 1,411 |
| * | ValueVision Media Inc. Class A | 199,419 | 1,394 |
| * | Monarch Casino & Resort Inc. | 69,320 | 1,392 |
| Bon-Ton Stores Inc. | 85,107 | 1,386 | |
| * | West Marine Inc. | 96,752 | 1,377 |
| ClubCorp Holdings Inc. | 77,421 | 1,373 | |
| * | MTR Gaming Group Inc. | 265,154 | 1,368 |
5
| Vanguard® Extended Market Index Fund | |||
| Schedule of Investments | |||
| December 31, 2013 | |||
| Market | |||
| Value | |||
| Shares | ($000) | ||
| Winmark Corp. | 14,711 | 1,363 | |
| * | Isle of Capri Casinos Inc. | 151,237 | 1,361 |
| * | Perry Ellis International Inc. | 85,527 | 1,350 |
| Hooker Furniture Corp. | 80,015 | 1,335 | |
| * | Central European Media Enterprises Ltd. Class A | 345,300 | 1,326 |
| * | Gaiam Inc. Class A | 198,738 | 1,316 |
| Rocky Brands Inc. | 89,284 | 1,301 | |
| * | Black Diamond Inc. | 97,561 | 1,300 |
| ^ | Blyth Inc. | 117,343 | 1,277 |
| Ambassadors Group Inc. | 269,686 | 1,254 | |
| * | Luby's Inc. | 161,582 | 1,247 |
| Escalade Inc. | 105,152 | 1,238 | |
| * | 1-800-Flowers.com Inc. Class A | 225,149 | 1,218 |
| * | Nathan's Famous Inc. | 23,665 | 1,193 |
| * | Crown Media Holdings Inc. Class A | 335,758 | 1,185 |
| * | Diamond Resorts International Inc. | 63,737 | 1,177 |
| * | Shiloh Industries Inc. | 59,757 | 1,165 |
| Beasley Broadcasting Group Inc. Class A | 131,564 | 1,149 | |
| * | Rick's Cabaret International Inc. | 93,202 | 1,079 |
| Ark Restaurants Corp. | 46,300 | 1,026 | |
| * | Zagg Inc. | 227,679 | 990 |
| * | Carrols Restaurant Group Inc. | 145,551 | 962 |
| * | Kona Grill Inc. | 51,767 | 959 |
| * | Charles & Colvard Ltd. | 179,886 | 908 |
| * | Emmis Communications Corp. Class A | 334,355 | 899 |
| * | Trans World Entertainment Corp. | 195,751 | 865 |
| * | Systemax Inc. | 76,163 | 857 |
| Lincoln Educational Services Corp. | 171,957 | 856 | |
| Frisch's Restaurants Inc. | 32,765 | 840 | |
| * | Ballantyne Strong Inc. | 180,582 | 836 |
| * | Cache Inc. | 152,892 | 830 |
| * | Delta Apparel Inc. | 48,659 | 826 |
| * | Insignia Systems Inc. | 291,212 | 795 |
| *,^ | SFX Entertainment Inc. | 62,847 | 754 |
| * | Red Lion Hotels Corp. | 123,596 | 748 |
| * | Vince Holding Corp. | 23,598 | 724 |
| * | Geeknet Inc. | 39,271 | 710 |
| * | Tilly's Inc. Class A | 61,551 | 705 |
| * | Century Casinos Inc. | 130,616 | 680 |
| * | Joe's Jeans Inc. | 612,767 | 674 |
| * | UQM Technologies Inc. | 314,513 | 673 |
| Einstein Noah Restaurant Group Inc. | 45,320 | 657 | |
| * | Extended Stay America Inc. | 24,890 | 654 |
| * | Full House Resorts Inc. | 222,501 | 623 |
| Dover Motorsports Inc. | 244,223 | 613 | |
| * | Gaming Partners International Corp. | 74,766 | 612 |
| * | Lakes Entertainment Inc. | 128,112 | 506 |
| Johnson Outdoors Inc. Class A | 17,636 | 475 | |
| * | Emerson Radio Corp. | 246,030 | 467 |
| * | ReachLocal Inc. | 34,250 | 435 |
| * | Reading International Inc. Class A | 55,497 | 416 |
| * | Perfumania Holdings Inc. | 64,749 | 411 |
| * | Harris Interactive Inc. | 204,712 | 409 |
| * | Vitacost.com Inc. | 66,827 | 387 |
| * | Dover Downs Gaming & Entertainment Inc. | 247,196 | 366 |
| * | Radio One Inc. | 94,133 | 357 |
| * | Potbelly Corp. | 13,681 | 332 |
| * | Hollywood Media Corp. | 237,174 | 331 |
| * | Martha Stewart Living Omnimedia Inc. Class A | 78,537 | 330 |
| * | Learning Tree International Inc. | 100,833 | 316 |
| * | Lee Enterprises Inc. | 87,498 | 304 |
| Gordmans Stores Inc. | 39,332 | 302 | |
| * | Skyline Corp. | 56,914 | 293 |
| * | Stanley Furniture Co. Inc. | 76,192 | 293 |
6
| Vanguard® Extended Market Index Fund | |||
| Schedule of Investments | |||
| December 31, 2013 | |||
| Market | |||
| Value | |||
| Shares | ($000) | ||
| * | Forward Industries Inc. | 190,865 | 292 |
| Superior Uniform Group Inc. | 18,311 | 283 | |
| *,^ | dELiA*s Inc. | 291,585 | 256 |
| * | New York & Co. Inc. | 58,103 | 254 |
| * | Spanish Broadcasting System Inc. | 73,134 | 245 |
| * | Books-A-Million Inc. | 101,558 | 235 |
| *,^ | Comstock Holding Cos. Inc. Class A | 112,628 | 225 |
| * | Summer Infant Inc. | 115,095 | 208 |
| * | Premier Exhibitions Inc. | 178,455 | 207 |
| * | Cambium Learning Group Inc. | 117,787 | 196 |
| * | Cobra Electronics Corp. | 62,713 | 187 |
| * | NTN Buzztime Inc. | 287,989 | 181 |
| * | CafePress Inc. | 18,473 | 117 |
| * | Coldwater Creek Inc. | 136,879 | 102 |
| * | Lakeland Industries Inc. | 17,187 | 91 |
| * | Cosi Inc. | 48,560 | 82 |
| *,^ | Dex Media Inc. | 11,940 | 81 |
| * | American Apparel Inc. | 63,304 | 78 |
| * | US Auto Parts Network Inc. | 29,615 | 73 |
| * | Appliance Recycling Centers of America Inc. | 24,098 | 70 |
| * | SPAR Group Inc. | 33,227 | 64 |
| * | Wells-Gardner Electronics Corp. | 29,185 | 53 |
| * | Pacific Sunwear of California Inc. | 13,375 | 45 |
| * | Kid Brands Inc. | 43,645 | 45 |
| * | Nevada Gold & Casinos Inc. | 30,913 | 42 |
| * | Sport Chalet Inc. Class A | 27,740 | 30 |
| * | UCP Inc. | 2,028 | 30 |
| * | Entertainment Gaming Asia Inc. | 22,710 | 27 |
| * | Hallwood Group Inc. | 1,737 | 17 |
| * | Skullcandy Inc. | 1,498 | 11 |
| * | Digital Cinema Destinations Corp. Class A | 400 | 2 |
| * | Hastings Entertainment Inc. | 603 | 1 |
| * | Here Media Inc. | 12,670 | — |
| 5,890,852 | |||
| Consumer Staples (3.5%) | |||
| Bunge Ltd. | 1,350,936 | 110,925 | |
| *,^ | Green Mountain Coffee Roasters Inc. | 1,203,032 | 90,925 |
| Church & Dwight Co. Inc. | 1,271,392 | 84,268 | |
| Nu Skin Enterprises Inc. Class A | 543,222 | 75,084 | |
| Energizer Holdings Inc. | 571,451 | 61,854 | |
| ^ | Herbalife Ltd. | 758,370 | 59,684 |
| Ingredion Inc. | 698,936 | 47,849 | |
| * | Hain Celestial Group Inc. | 438,091 | 39,770 |
| * | Rite Aid Corp. | 7,697,607 | 38,950 |
| Hillshire Brands Co. | 1,131,364 | 37,833 | |
| * | WhiteWave Foods Co. Class A | 1,591,220 | 36,503 |
| Flowers Foods Inc. | 1,607,281 | 34,508 | |
| * | United Natural Foods Inc. | 453,296 | 34,174 |
| * | Darling International Inc. | 1,448,356 | 30,242 |
| Casey's General Stores Inc. | 353,043 | 24,801 | |
| * | TreeHouse Foods Inc. | 334,935 | 23,084 |
| Harris Teeter Supermarkets Inc. | 455,359 | 22,472 | |
| * | Boston Beer Co. Inc. Class A | 80,334 | 19,424 |
| PriceSmart Inc. | 158,666 | 18,332 | |
| B&G Foods Inc. | 488,101 | 16,551 | |
| Lancaster Colony Corp. | 178,498 | 15,735 | |
| * | Fresh Market Inc. | 368,935 | 14,942 |
| Dean Foods Co. | 862,581 | 14,828 | |
| * | Post Holdings Inc. | 300,823 | 14,822 |
| Andersons Inc. | 161,722 | 14,421 | |
| * | Sprouts Farmers Market Inc. | 365,771 | 14,057 |
| Spectrum Brands Holdings Inc. | 197,626 | 13,942 | |
| Sanderson Farms Inc. | 186,629 | 13,499 | |
| * | SUPERVALU Inc. | 1,812,056 | 13,210 |
7
| Vanguard® Extended Market Index Fund | |||
| Schedule of Investments | |||
| December 31, 2013 | |||
| Market | |||
| Value | |||
| Shares | ($000) | ||
| Snyders-Lance Inc. | 454,615 | 13,056 | |
| J&J Snack Foods Corp. | 135,082 | 11,967 | |
| Universal Corp. | 213,585 | 11,662 | |
| *,^ | Susser Holdings Corp. | 165,901 | 10,865 |
| Pinnacle Foods Inc. | 383,810 | 10,539 | |
| WD-40 Co. | 133,394 | 9,962 | |
| Fresh Del Monte Produce Inc. | 345,046 | 9,765 | |
| Vector Group Ltd. | 558,326 | 9,140 | |
| * | Pilgrim's Pride Corp. | 549,138 | 8,923 |
| * | Elizabeth Arden Inc. | 239,646 | 8,495 |
| * | Boulder Brands Inc. | 523,721 | 8,306 |
| Cal-Maine Foods Inc. | 136,508 | 8,222 | |
| Spartan Stores Inc. | 334,898 | 8,131 | |
| Coty Inc. Class A | 527,065 | 8,038 | |
| * | Seaboard Corp. | 2,801 | 7,829 |
| Tootsie Roll Industries Inc. | 209,210 | 6,808 | |
| * | Annie's Inc. | 154,970 | 6,670 |
| Weis Markets Inc. | 110,232 | 5,794 | |
| * | Diamond Foods Inc. | 218,076 | 5,635 |
| Inter Parfums Inc. | 145,550 | 5,212 | |
| * | Chiquita Brands International Inc. | 417,276 | 4,882 |
| * | USANA Health Sciences Inc. | 58,804 | 4,444 |
| * | Medifast Inc. | 159,573 | 4,170 |
| Calavo Growers Inc. | 123,536 | 3,738 | |
| * | Revlon Inc. Class A | 145,302 | 3,627 |
| * | Pantry Inc. | 210,101 | 3,525 |
| * | National Beverage Corp. | 174,342 | 3,515 |
| Coca-Cola Bottling Co. Consolidated | 45,533 | 3,333 | |
| Ingles Markets Inc. Class A | 122,276 | 3,314 | |
| * | Chefs' Warehouse Inc. | 112,463 | 3,279 |
| * | Central Garden and Pet Co. Class A | 476,734 | 3,218 |
| * | Natural Grocers by Vitamin Cottage Inc. | 64,174 | 2,724 |
| Roundy's Inc. | 263,772 | 2,601 | |
| * | Alliance One International Inc. | 842,156 | 2,569 |
| * | Nutraceutical International Corp. | 87,560 | 2,345 |
| John B Sanfilippo & Son Inc. | 92,466 | 2,282 | |
| * | Seneca Foods Corp. Class A | 65,786 | 2,098 |
| * | Harbinger Group Inc. | 175,406 | 2,079 |
| Oil-Dri Corp. of America | 52,194 | 1,975 | |
| * | Farmer Bros Co. | 79,219 | 1,843 |
| * | Fairway Group Holdings Corp. | 93,892 | 1,701 |
| Limoneira Co. | 63,790 | 1,696 | |
| * | Omega Protein Corp. | 133,951 | 1,646 |
| United-Guardian Inc. | 56,614 | 1,592 | |
| Village Super Market Inc. Class A | 47,108 | 1,461 | |
| *,^ | Star Scientific Inc. | 1,238,271 | 1,436 |
| Alico Inc. | 36,449 | 1,417 | |
| Lifeway Foods Inc. | 86,865 | 1,388 | |
| Female Health Co. | 157,245 | 1,337 | |
| Rocky Mountain Chocolate Factory Inc. | 111,705 | 1,297 | |
| Orchids Paper Products Co. | 37,259 | 1,224 | |
| * | Inventure Foods Inc. | 85,092 | 1,128 |
| * | Craft Brew Alliance Inc. | 67,364 | 1,106 |
| *,^ | S&W Seed Co. | 155,550 | 1,081 |
| Arden Group Inc. | 8,037 | 1,017 | |
| * | Lifevantage Corp. | 570,454 | 941 |
| Nature's Sunshine Products Inc. | 49,551 | 858 | |
| * | Synutra International Inc. | 93,740 | 832 |
| MGP Ingredients Inc. | 153,708 | 798 | |
| * | Natural Alternatives International Inc. | 112,367 | 627 |
| *,^ | Pizza Inn Holdings Inc. | 56,876 | 461 |
| * | IGI Laboratories Inc. | 88,519 | 270 |
| * | Primo Water Corp. | 58,242 | 153 |
| * | Mannatech Inc. | 7,432 | 126 |
8
| Vanguard® Extended Market Index Fund | |||
| Schedule of Investments | |||
| December 31, 2013 | |||
| Market | |||
| Value | |||
| Shares | ($000) | ||
| Reliv International Inc. | 44,259 | 124 | |
| * | Reed's Inc. | 14,906 | 119 |
| * | Crumbs Bake Shop Inc. | 97,703 | 79 |
| * | Crystal Rock Holdings Inc. | 42,584 | 40 |
| * | Castle Brands Inc. | 20,100 | 15 |
| 1,299,239 | |||
| Energy (5.8%) | |||
| * | Concho Resources Inc. | 960,927 | 103,780 |
| HollyFrontier Corp. | 1,814,639 | 90,169 | |
| * | Cheniere Energy Inc. | 2,007,096 | 86,546 |
| Cimarex Energy Co. | 793,687 | 83,266 | |
| Core Laboratories NV | 414,292 | 79,109 | |
| Oceaneering International Inc. | 992,781 | 78,311 | |
| * | Whiting Petroleum Corp. | 1,083,615 | 67,043 |
| * | Oil States International Inc. | 505,875 | 51,458 |
| SM Energy Co. | 613,931 | 51,024 | |
| * | Gulfport Energy Corp. | 771,006 | 48,689 |
| Energen Corp. | 663,144 | 46,917 | |
| * | Cobalt International Energy Inc. | 2,716,518 | 44,687 |
| * | Continental Resources Inc. | 391,886 | 44,095 |
| * | Dresser-Rand Group Inc. | 699,843 | 41,732 |
| * | Oasis Petroleum Inc. | 872,817 | 40,996 |
| * | Dril-Quip Inc. | 372,297 | 40,927 |
| * | Superior Energy Services Inc. | 1,463,284 | 38,938 |
| Patterson-UTI Energy Inc. | 1,311,081 | 33,197 | |
| * | Ultra Petroleum Corp. | 1,405,520 | 30,429 |
| World Fuel Services Corp. | 669,104 | 28,879 | |
| * | Atwood Oceanics Inc. | 529,191 | 28,253 |
| * | Kodiak Oil & Gas Corp. | 2,439,276 | 27,344 |
| * | Rosetta Resources Inc. | 561,671 | 26,983 |
| Tidewater Inc. | 453,984 | 26,908 | |
| SemGroup Corp. Class A | 390,698 | 25,485 | |
| Bristow Group Inc. | 334,496 | 25,107 | |
| Targa Resources Corp. | 265,891 | 23,444 | |
| * | Antero Resources Corp. | 334,762 | 21,237 |
| CARBO Ceramics Inc. | 182,136 | 21,224 | |
| Western Refining Inc. | 496,577 | 21,060 | |
| * | Helix Energy Solutions Group Inc. | 904,385 | 20,964 |
| * | Unit Corp. | 402,244 | 20,764 |
| *,^ | SandRidge Energy Inc. | 3,322,403 | 20,167 |
| * | McDermott International Inc. | 2,175,739 | 19,930 |
| * | Diamondback Energy Inc. | 366,678 | 19,383 |
| Energy XXI Bermuda Ltd. | 695,454 | 18,819 | |
| * | Exterran Holdings Inc. | 537,736 | 18,391 |
| * | PDC Energy Inc. | 330,360 | 17,582 |
| * | Carrizo Oil & Gas Inc. | 380,106 | 17,017 |
| * | Stone Energy Corp. | 461,524 | 15,964 |
| * | SEACOR Holdings Inc. | 172,650 | 15,746 |
| * | Laredo Petroleum Holdings Inc. | 538,519 | 14,912 |
| * | Hornbeck Offshore Services Inc. | 297,779 | 14,660 |
| * | Alpha Natural Resources Inc. | 2,034,852 | 14,529 |
| Crosstex Energy Inc. | 398,913 | 14,425 | |
| * | Forum Energy Technologies Inc. | 483,287 | 13,658 |
| * | Bill Barrett Corp. | 450,352 | 12,060 |
| Delek US Holdings Inc. | 343,129 | 11,807 | |
| PBF Energy Inc. Class A | 365,539 | 11,500 | |
| * | Bonanza Creek Energy Inc. | 262,849 | 11,426 |
| * | Geospace Technologies Corp. | 119,149 | 11,299 |
| * | Magnum Hunter Resources Corp. | 1,490,703 | 10,897 |
| Gulfmark Offshore Inc. | 226,914 | 10,694 | |
| * | Kosmos Energy Ltd. | 929,137 | 10,388 |
| * | Newpark Resources Inc. | 830,625 | 10,208 |
| * | Cloud Peak Energy Inc. | 559,770 | 10,076 |
| RPC Inc. | 549,758 | 9,813 | |
9
| Vanguard® Extended Market Index Fund | |||
| Schedule of Investments | |||
| December 31, 2013 | |||
| Market | |||
| Value | |||
| Shares | ($000) | ||
| * | Hercules Offshore Inc. | 1,472,437 | 9,615 |
| * | C&J Energy Services Inc. | 415,501 | 9,598 |
| * | Key Energy Services Inc. | 1,199,874 | 9,479 |
| * | Parker Drilling Co. | 1,136,440 | 9,239 |
| * | Matador Resources Co. | 491,476 | 9,161 |
| *,^ | Halcon Resources Corp. | 2,368,556 | 9,143 |
| * | TETRA Technologies Inc. | 732,899 | 9,059 |
| * | EPL Oil & Gas Inc. | 313,696 | 8,940 |
| * | Sanchez Energy Corp. | 363,481 | 8,909 |
| ^ | Arch Coal Inc. | 1,992,230 | 8,865 |
| * | Northern Oil and Gas Inc. | 542,355 | 8,173 |
| *,^ | Clean Energy Fuels Corp. | 632,028 | 8,140 |
| Comstock Resources Inc. | 432,435 | 7,909 | |
| * | Rex Energy Corp. | 399,984 | 7,884 |
| * | Matrix Service Co. | 302,483 | 7,402 |
| * | Contango Oil & Gas Co. | 141,427 | 6,684 |
| ^ | EXCO Resources Inc. | 1,239,305 | 6,581 |
| * | Approach Resources Inc. | 322,140 | 6,214 |
| CVR Energy Inc. | 142,327 | 6,181 | |
| Frank's International NV | 225,771 | 6,096 | |
| * | Swift Energy Co. | 416,639 | 5,625 |
| W&T Offshore Inc. | 335,947 | 5,375 | |
| * | Era Group Inc. | 168,484 | 5,199 |
| * | Goodrich Petroleum Corp. | 305,324 | 5,197 |
| *,^ | Quicksilver Resources Inc. | 1,627,526 | 4,996 |
| * | Clayton Williams Energy Inc. | 60,700 | 4,974 |
| * | Pioneer Energy Services Corp. | 601,464 | 4,818 |
| * | Tesco Corp. | 242,682 | 4,800 |
| * | Willbros Group Inc. | 507,921 | 4,785 |
| Green Plains Renewable Energy Inc. | 233,469 | 4,527 | |
| * | Triangle Petroleum Corp. | 542,803 | 4,516 |
| * | Basic Energy Services Inc. | 276,554 | 4,364 |
| * | Penn Virginia Corp. | 457,739 | 4,316 |
| * | Forest Oil Corp. | 1,138,483 | 4,110 |
| * | Resolute Energy Corp. | 435,368 | 3,931 |
| * | ION Geophysical Corp. | 1,161,707 | 3,834 |
| * | Synergy Resources Corp. | 408,474 | 3,782 |
| * | Rentech Inc. | 2,155,045 | 3,771 |
| * | Vaalco Energy Inc. | 543,465 | 3,744 |
| * | Abraxas Petroleum Corp. | 1,133,887 | 3,719 |
| Gulf Island Fabrication Inc. | 153,264 | 3,559 | |
| *,^ | Solazyme Inc. | 304,484 | 3,316 |
| * | Vantage Drilling Co. | 1,706,062 | 3,139 |
| * | PHI Inc. | 75,566 | 3,002 |
| * | RigNet Inc. | 61,992 | 2,971 |
| * | Athlon Energy Inc. | 96,658 | 2,924 |
| *,^ | Miller Energy Resources Inc. | 407,403 | 2,868 |
| * | Endeavour International Corp. | 514,383 | 2,700 |
| * | Dawson Geophysical Co. | 75,223 | 2,544 |
| Alon USA Energy Inc. | 147,924 | 2,447 | |
| * | Emerald Oil Inc. | 317,171 | 2,430 |
| * | Mitcham Industries Inc. | 135,431 | 2,398 |
| * | BPZ Resources Inc. | 1,312,314 | 2,388 |
| * | Natural Gas Services Group Inc. | 85,183 | 2,348 |
| * | PetroQuest Energy Inc. | 539,416 | 2,330 |
| * | Westmoreland Coal Co. | 119,899 | 2,313 |
| *,^ | Nuverra Environmental Solutions Inc. | 133,004 | 2,233 |
| * | REX American Resources Corp. | 49,305 | 2,204 |
| * | Gastar Exploration Inc. | 310,741 | 2,150 |
| * | Callon Petroleum Co. | 327,873 | 2,141 |
| *,^ | Cal Dive International Inc. | 1,052,053 | 2,115 |
| * | Warren Resources Inc. | 671,284 | 2,108 |
| Bolt Technology Corp. | 93,804 | 2,065 | |
| Evolution Petroleum Corp. | 161,934 | 1,998 | |
10
| Vanguard® Extended Market Index Fund | |||
| Schedule of Investments | |||
| December 31, 2013 | |||
| Market | |||
| Value | |||
| Shares | ($000) | ||
| * | Harvest Natural Resources Inc. | 394,405 | 1,783 |
| * | FX Energy Inc. | 459,948 | 1,683 |
| *,^ | Hyperdynamics Corp. | 367,636 | 1,496 |
| Panhandle Oil and Gas Inc. Class A | 44,536 | 1,488 | |
| *,^ | James River Coal Co. | 929,664 | 1,255 |
| *,^ | Uranium Energy Corp. | 621,983 | 1,244 |
| * | Apco Oil and Gas International Inc. | 78,686 | 1,227 |
| *,^ | ZaZa Energy Corp. | 1,262,213 | 1,206 |
| * | Midstates Petroleum Co. Inc. | 177,883 | 1,178 |
| Adams Resources & Energy Inc. | 16,653 | 1,141 | |
| * | PHI Inc. | 25,732 | 1,117 |
| * | Renewable Energy Group Inc. | 93,538 | 1,072 |
| * | US Energy Corp. Wyoming | 269,858 | 1,015 |
| *,^ | CAMAC Energy Inc. | 678,289 | 1,004 |
| * | Isramco Inc. | 6,745 | 857 |
| *,^ | Amyris Inc. | 145,572 | 770 |
| *,^ | Royale Energy Inc. | 291,305 | 752 |
| * | TGC Industries Inc. | 88,827 | 648 |
| * | Saratoga Resources Inc. | 501,406 | 572 |
| *,^ | Gevo Inc. | 393,202 | 562 |
| Hallador Energy Co. | 64,228 | 518 | |
| *,^ | Uranium Resources Inc. | 161,500 | 489 |
| * | Forbes Energy Services Ltd. | 130,816 | 428 |
| * | Jones Energy Inc. | 28,271 | 409 |
| * | Magellan Petroleum Corp. | 330,749 | 344 |
| *,^ | Zion Oil & Gas Inc. | 234,790 | 331 |
| * | Syntroleum Corp. | 91,723 | 310 |
| * | Pyramid Oil Co. | 56,343 | 285 |
| * | Global Geophysical Services Inc. | 174,798 | 281 |
| *,^ | Uranerz Energy Corp. | 215,880 | 276 |
| * | Double Eagle Petroleum Co. | 116,717 | 272 |
| *,^ | Lucas Energy Inc. | 233,203 | 225 |
| * | Tengasco Inc. | 558,194 | 218 |
| *,^ | EXCO Resources Inc. Rights | 1,239,305 | 198 |
| *,^ | GreenHunter Resources Inc. | 142,231 | 165 |
| *,^ | Ceres Inc. | 114,694 | 158 |
| * | FieldPoint Petroleum Corp. | 35,776 | 147 |
| * | Barnwell Industries Inc. | 46,909 | 141 |
| * | PrimeEnergy Corp. | 2,726 | 128 |
| ^ | USEC Inc. | 18,106 | 120 |
| * | Lilis Energy Inc. | 44,772 | 103 |
| *,^ | BioFuel Energy Corp. | 50,981 | 88 |
| * | PostRock Energy Corp. | 45,606 | 53 |
| * | FieldPoint Petroleum Corp. Warrants Exp 03/23/2017 | 33,558 | 19 |
| * | Pacific Ethanol Inc. | 1,145 | 6 |
| 2,116,444 | |||
| Financials (22.4%) | |||
| * | Affiliated Managers Group Inc. | 485,007 | 105,188 |
| CIT Group Inc. | 1,827,958 | 95,291 | |
| SL Green Realty Corp. | 866,339 | 80,032 | |
| Fidelity National Financial Inc. Class A | 2,280,501 | 74,002 | |
| * | Markel Corp. | 127,444 | 73,962 |
| Willis Group Holdings plc | 1,623,422 | 72,746 | |
| Realty Income Corp. | 1,882,383 | 70,269 | |
| Everest Re Group Ltd. | 437,545 | 68,200 | |
| New York Community Bancorp Inc. | 4,045,288 | 68,163 | |
| TD Ameritrade Holding Corp. | 2,171,170 | 66,525 | |
| * | Realogy Holdings Corp. | 1,340,003 | 66,290 |
| * | Alleghany Corp. | 152,989 | 61,189 |
| Federal Realty Investment Trust | 594,020 | 60,240 | |
| First Republic Bank | 1,137,806 | 59,564 | |
| * | Ocwen Financial Corp. | 1,071,450 | 59,412 |
| Raymond James Financial Inc. | 1,129,271 | 58,937 | |
| ^ | Digital Realty Trust Inc. | 1,178,589 | 57,892 |
11
| Vanguard® Extended Market Index Fund | ||
| Schedule of Investments | ||
| December 31, 2013 | ||
| Market | ||
| Value | ||
| Shares | ($000) | |
| Arthur J Gallagher & Co. | 1,201,266 | 56,375 |
| Cole Real Estate Investment Inc. | 3,833,780 | 53,826 |
| UDR Inc. | 2,301,175 | 53,732 |
| Waddell & Reed Financial Inc. Class A | 785,999 | 51,184 |
| Lazard Ltd. Class A | 1,119,151 | 50,720 |
| Reinsurance Group of America Inc. Class A | 647,496 | 50,123 |
| Essex Property Trust Inc. | 348,882 | 50,068 |
| Starwood Property Trust Inc. | 1,783,198 | 49,395 |
| Rayonier Inc. | 1,157,535 | 48,732 |
| Eaton Vance Corp. | 1,113,600 | 47,651 |
| * MSCI Inc. Class A | 1,081,351 | 47,277 |
| * Signature Bank | 434,534 | 46,678 |
| SEI Investments Co. | 1,308,628 | 45,449 |
| Liberty Property Trust | 1,338,713 | 45,342 |
| Ares Capital Corp. | 2,536,796 | 45,079 |
| Duke Realty Corp. | 2,984,995 | 44,894 |
| Camden Property Trust | 782,917 | 44,532 |
| East West Bancorp Inc. | 1,264,710 | 44,227 |
| * SVB Financial Group | 418,507 | 43,885 |
| WR Berkley Corp. | 1,007,146 | 43,700 |
| HCC Insurance Holdings Inc. | 919,787 | 42,439 |
| Extra Space Storage Inc. | 1,004,318 | 42,312 |
| Jones Lang LaSalle Inc. | 408,321 | 41,808 |
| CBOE Holdings Inc. | 804,357 | 41,794 |
| Alexandria Real Estate Equities Inc. | 656,024 | 41,736 |
| Mid-America Apartment Communities Inc. | 685,312 | 41,626 |
| DDR Corp. | 2,668,420 | 41,014 |
| * American Capital Ltd. | 2,579,804 | 40,348 |
| RenaissanceRe Holdings Ltd. | 409,844 | 39,894 |
| Regency Centers Corp. | 848,011 | 39,263 |
| BRE Properties Inc. | 709,511 | 38,817 |
| Senior Housing Properties Trust | 1,726,259 | 38,375 |
| Old Republic International Corp. | 2,216,264 | 38,275 |
| American Financial Group Inc. | 653,260 | 37,706 |
| Kilroy Realty Corp. | 749,492 | 37,610 |
| Taubman Centers Inc. | 586,446 | 37,486 |
| Hospitality Properties Trust | 1,359,905 | 36,758 |
| Validus Holdings Ltd. | 907,797 | 36,575 |
| Protective Life Corp. | 720,508 | 36,501 |
| CNO Financial Group Inc. | 2,043,176 | 36,144 |
| Cullen/Frost Bankers Inc. | 480,912 | 35,794 |
| ING US Inc. | 1,004,594 | 35,311 |
| LPL Financial Holdings Inc. | 742,713 | 34,930 |
| Assured Guaranty Ltd. | 1,479,053 | 34,891 |
| Allied World Assurance Co. Holdings AG | 308,404 | 34,791 |
| First Niagara Financial Group Inc. | 3,254,270 | 34,560 |
| * Howard Hughes Corp. | 287,038 | 34,473 |
| City National Corp. | 434,775 | 34,443 |
| Brown & Brown Inc. | 1,091,113 | 34,250 |
| Corrections Corp. of America | 1,062,945 | 34,089 |
| National Retail Properties Inc. | 1,113,199 | 33,763 |
| FirstMerit Corp. | 1,517,315 | 33,730 |
| Commerce Bancshares Inc. | 744,290 | 33,426 |
| Omega Healthcare Investors Inc. | 1,118,970 | 33,345 |
| * Gaming and Leisure Properties Inc. | 653,700 | 33,215 |
| Prosperity Bancshares Inc. | 520,319 | 32,983 |
| Synovus Financial Corp. | 8,993,173 | 32,375 |
| Financial Engines Inc. | 460,406 | 31,989 |
| BioMed Realty Trust Inc. | 1,763,335 | 31,952 |
| Spirit Realty Capital Inc. | 3,235,076 | 31,801 |
| WP Carey Inc. | 513,679 | 31,514 |
| Two Harbors Investment Corp. | 3,359,344 | 31,175 |
| American Campus Communities Inc. | 962,898 | 31,015 |
| NorthStar Realty Finance Corp. | 2,282,481 | 30,699 |
12
| Vanguard® Extended Market Index Fund | ||
| Schedule of Investments | ||
| December 31, 2013 | ||
| Market | ||
| Value | ||
| Shares | ($000) | |
| White Mountains Insurance Group Ltd. | 50,770 | 30,618 |
| Highwoods Properties Inc. | 825,978 | 29,876 |
| LaSalle Hotel Properties | 949,524 | 29,302 |
| Chimera Investment Corp. | 9,444,602 | 29,278 |
| Prospect Capital Corp. | 2,606,188 | 29,241 |
| Weingarten Realty Investors | 1,031,410 | 28,281 |
| CBL & Associates Properties Inc. | 1,559,318 | 28,005 |
| Home Properties Inc. | 521,876 | 27,983 |
| Tanger Factory Outlet Centers | 868,010 | 27,794 |
| Douglas Emmett Inc. | 1,193,100 | 27,787 |
| * Forest City Enterprises Inc. Class A | 1,449,625 | 27,688 |
| Hancock Holding Co. | 752,793 | 27,612 |
| ProAssurance Corp. | 569,066 | 27,588 |
| RLJ Lodging Trust | 1,128,584 | 27,447 |
| * Popular Inc. | 950,872 | 27,319 |
| First American Financial Corp. | 965,520 | 27,228 |
| StanCorp Financial Group Inc. | 408,485 | 27,062 |
| Equity Lifestyle Properties Inc. | 727,350 | 26,352 |
| * MGIC Investment Corp. | 3,107,433 | 26,227 |
| * Stifel Financial Corp. | 544,018 | 26,069 |
| CapitalSource Inc. | 1,811,374 | 26,029 |
| Webster Financial Corp. | 829,764 | 25,872 |
| Associated Banc-Corp | 1,486,045 | 25,857 |
| Piedmont Office Realty Trust Inc. Class A | 1,541,908 | 25,472 |
| First Horizon National Corp. | 2,186,335 | 25,471 |
| * Altisource Portfolio Solutions SA | 157,380 | 24,965 |
| Federated Investors Inc. Class B | 865,565 | 24,928 |
| Aspen Insurance Holdings Ltd. | 600,404 | 24,803 |
| TCF Financial Corp. | 1,512,378 | 24,576 |
| * Portfolio Recovery Associates Inc. | 461,871 | 24,405 |
| Bank of Hawaii Corp. | 410,597 | 24,283 |
| Hanover Insurance Group Inc. | 403,172 | 24,073 |
| Columbia Property Trust Inc. | 962,566 | 24,064 |
| Endurance Specialty Holdings Ltd. | 409,716 | 24,038 |
| CommonWealth REIT | 1,020,109 | 23,779 |
| ^ MFA Financial Inc. | 3,344,425 | 23,612 |
| * Texas Capital Bancshares Inc. | 376,246 | 23,403 |
| Fulton Financial Corp. | 1,778,076 | 23,257 |
| EPR Properties | 471,828 | 23,195 |
| MarketAxess Holdings Inc. | 345,179 | 23,082 |
| Post Properties Inc. | 501,800 | 22,696 |
| Sunstone Hotel Investors Inc. | 1,678,171 | 22,487 |
| BankUnited Inc. | 683,036 | 22,486 |
| Radian Group Inc. | 1,591,115 | 22,467 |
| Susquehanna Bancshares Inc. | 1,722,509 | 22,117 |
| Washington Federal Inc. | 949,133 | 22,105 |
| UMB Financial Corp. | 342,322 | 22,004 |
| American Realty Capital Properties Inc. | 1,700,634 | 21,870 |
| Retail Properties of America Inc. | 1,704,900 | 21,686 |
| Primerica Inc. | 501,545 | 21,521 |
| Geo Group Inc. | 661,394 | 21,310 |
| DiamondRock Hospitality Co. | 1,798,009 | 20,767 |
| DCT Industrial Trust Inc. | 2,895,673 | 20,646 |
| Glacier Bancorp Inc. | 686,153 | 20,441 |
| Brandywine Realty Trust | 1,438,319 | 20,266 |
| Umpqua Holdings Corp. | 1,030,683 | 19,727 |
| Kemper Corp. | 481,613 | 19,688 |
| BancorpSouth Inc. | 770,491 | 19,586 |
| Ryman Hospitality Properties Inc. | 462,051 | 19,304 |
| Sovran Self Storage Inc. | 292,436 | 19,058 |
| ^ Lexington Realty Trust | 1,863,352 | 19,025 |
| Corporate Office Properties Trust | 801,974 | 18,999 |
| CubeSmart | 1,181,598 | 18,835 |
| Healthcare Realty Trust Inc. | 881,302 | 18,781 |
13
| Vanguard® Extended Market Index Fund | ||
| Schedule of Investments | ||
| December 31, 2013 | ||
| Market | ||
| Value | ||
| Shares | ($000) | |
| First Financial Bankshares Inc. | 280,197 | 18,583 |
| Valley National Bancorp | 1,835,822 | 18,579 |
| FNB Corp. | 1,451,423 | 18,317 |
| Invesco Mortgage Capital Inc. | 1,242,772 | 18,244 |
| Cathay General Bancorp | 676,903 | 18,094 |
| Medical Properties Trust Inc. | 1,475,670 | 18,033 |
| Evercore Partners Inc. Class A | 299,688 | 17,915 |
| Apollo Investment Corp. | 2,065,931 | 17,519 |
| Pebblebrook Hotel Trust | 566,690 | 17,431 |
| Mack-Cali Realty Corp. | 809,802 | 17,395 |
| PrivateBancorp Inc. | 599,222 | 17,335 |
| Iberiabank Corp. | 273,001 | 17,158 |
| Janus Capital Group Inc. | 1,376,179 | 17,023 |
| * Western Alliance Bancorp | 709,905 | 16,938 |
| Wintrust Financial Corp. | 365,913 | 16,876 |
| Symetra Financial Corp. | 885,388 | 16,787 |
| American Equity Investment Life Holding Co. | 634,311 | 16,733 |
| Cousins Properties Inc. | 1,621,156 | 16,698 |
| Bank of the Ozarks Inc. | 295,006 | 16,694 |
| Erie Indemnity Co. Class A | 227,586 | 16,641 |
| Trustmark Corp. | 618,296 | 16,595 |
| Mercury General Corp. | 333,828 | 16,595 |
| Chambers Street Properties | 2,160,418 | 16,527 |
| * First Cash Financial Services Inc. | 266,478 | 16,479 |
| Home BancShares Inc. | 440,292 | 16,445 |
| Alexander & Baldwin Inc. | 393,025 | 16,401 |
| Platinum Underwriters Holdings Ltd. | 265,914 | 16,295 |
| * St. Joe Co. | 848,924 | 16,291 |
| First Industrial Realty Trust Inc. | 928,688 | 16,206 |
| EastGroup Properties Inc. | 279,713 | 16,204 |
| MB Financial Inc. | 504,754 | 16,198 |
| * WisdomTree Investments Inc. | 913,472 | 16,178 |
| * Strategic Hotels & Resorts Inc. | 1,694,863 | 16,016 |
| Healthcare Trust of America Inc. Class A | 1,590,145 | 15,647 |
| Potlatch Corp. | 372,903 | 15,565 |
| * MBIA Inc. | 1,299,303 | 15,514 |
| RLI Corp. | 157,189 | 15,307 |
| Capitol Federal Financial Inc. | 1,263,916 | 15,306 |
| First Citizens BancShares Inc. Class A | 66,804 | 14,873 |
| PacWest Bancorp | 352,174 | 14,869 |
| PennyMac Mortgage Investment Trust | 647,375 | 14,864 |
| Hatteras Financial Corp. | 908,952 | 14,852 |
| Community Bank System Inc. | 371,220 | 14,730 |
| DuPont Fabros Technology Inc. | 594,953 | 14,701 |
| First Financial Holdings Inc. | 220,868 | 14,690 |
| ^ Redwood Trust Inc. | 757,936 | 14,681 |
| CVB Financial Corp. | 858,846 | 14,661 |
| National Health Investors Inc. | 260,880 | 14,635 |
| Washington REIT | 612,704 | 14,313 |
| Old National Bancorp | 928,866 | 14,277 |
| Colony Financial Inc. | 701,783 | 14,239 |
| EverBank Financial Corp. | 776,099 | 14,234 |
| Selective Insurance Group Inc. | 522,778 | 14,146 |
| PS Business Parks Inc. | 183,424 | 14,017 |
| Greenhill & Co. Inc. | 240,977 | 13,962 |
| * Hilltop Holdings Inc. | 603,315 | 13,955 |
| Westamerica Bancorporation | 246,986 | 13,945 |
| International Bancshares Corp. | 523,969 | 13,828 |
| ARMOUR Residential REIT Inc. | 3,438,412 | 13,788 |
| Home Loan Servicing Solutions Ltd. | 596,106 | 13,693 |
| Investors Bancorp Inc. | 531,439 | 13,594 |
| Sun Communities Inc. | 314,115 | 13,394 |
| Equity One Inc. | 591,875 | 13,282 |
| United Bankshares Inc. | 421,784 | 13,265 |
14
| Vanguard® Extended Market Index Fund | ||
| Schedule of Investments | ||
| December 31, 2013 | ||
| Market | ||
| Value | ||
| Shares | ($000) | |
| Columbia Banking System Inc. | 471,384 | 12,968 |
| Northwest Bancshares Inc. | 867,237 | 12,818 |
| * Virtus Investment Partners Inc. | 64,014 | 12,806 |
| Acadia Realty Trust | 510,340 | 12,672 |
| BOK Financial Corp. | 189,467 | 12,565 |
| Government Properties Income Trust | 502,506 | 12,487 |
| Glimcher Realty Trust | 1,334,042 | 12,487 |
| Kennedy-Wilson Holdings Inc. | 553,998 | 12,326 |
| National Penn Bancshares Inc. | 1,076,520 | 12,197 |
| First Midwest Bancorp Inc. | 691,989 | 12,131 |
| BBCN Bancorp Inc. | 730,704 | 12,122 |
| * PHH Corp. | 496,972 | 12,101 |
| * Walter Investment Management Corp. | 339,214 | 11,995 |
| Pennsylvania REIT | 625,365 | 11,869 |
| Montpelier Re Holdings Ltd. | 406,722 | 11,836 |
| Argo Group International Holdings Ltd. | 252,980 | 11,761 |
| Fifth Street Finance Corp. | 1,271,290 | 11,759 |
| Horace Mann Educators Corp. | 371,140 | 11,706 |
| CYS Investments Inc. | 1,564,674 | 11,594 |
| Chesapeake Lodging Trust | 456,796 | 11,552 |
| LTC Properties Inc. | 326,015 | 11,538 |
| * Enstar Group Ltd. | 81,854 | 11,370 |
| * Credit Acceptance Corp. | 87,364 | 11,356 |
| Interactive Brokers Group Inc. | 459,590 | 11,186 |
| Empire State Realty Trust Inc. | 729,326 | 11,159 |
| Astoria Financial Corp. | 788,188 | 10,901 |
| ^ Main Street Capital Corp. | 330,271 | 10,797 |
| * Encore Capital Group Inc. | 214,397 | 10,776 |
| CNA Financial Corp. | 250,653 | 10,751 |
| Parkway Properties Inc. | 553,247 | 10,672 |
| Capstead Mortgage Corp. | 882,214 | 10,657 |
| Altisource Residential Corp. | 353,874 | 10,655 |
| NBT Bancorp Inc. | 410,774 | 10,639 |
| Artisan Partners Asset Management Inc. Class A | 160,865 | 10,487 |
| * KCG Holdings Inc. Class A | 872,132 | 10,431 |
| Park National Corp. | 122,276 | 10,402 |
| * iStar Financial Inc. | 725,562 | 10,354 |
| * Capital Bank Financial Corp. | 454,985 | 10,351 |
| * Ambac Financial Group Inc. | 415,524 | 10,205 |
| American Assets Trust Inc. | 323,070 | 10,154 |
| Pinnacle Financial Partners Inc. | 312,127 | 10,153 |
| Cash America International Inc. | 259,216 | 9,928 |
| Hersha Hospitality Trust Class A | 1,767,692 | 9,846 |
| Franklin Street Properties Corp. | 813,683 | 9,724 |
| Provident Financial Services Inc. | 499,828 | 9,657 |
| * Sterling Bancorp | 721,139 | 9,642 |
| Education Realty Trust Inc. | 1,087,320 | 9,590 |
| Ramco-Gershenson Properties Trust | 608,013 | 9,570 |
| First Financial Bancorp | 545,926 | 9,515 |
| Boston Private Financial Holdings Inc. | 749,902 | 9,464 |
| Renasant Corp. | 296,925 | 9,341 |
| ^ Amtrust Financial Services Inc. | 285,709 | 9,340 |
| Hercules Technology Growth Capital Inc. | 569,016 | 9,332 |
| * eHealth Inc. | 200,592 | 9,326 |
| BGC Partners Inc. Class A | 1,531,122 | 9,279 |
| * Greenlight Capital Re Ltd. Class A | 272,237 | 9,177 |
| * TFS Financial Corp. | 755,540 | 9,153 |
| ViewPoint Financial Group Inc. | 333,188 | 9,146 |
| Employers Holdings Inc. | 288,650 | 9,136 |
| Sabra Health Care REIT Inc. | 346,177 | 9,049 |
| Hudson Pacific Properties Inc. | 410,717 | 8,982 |
| * World Acceptance Corp. | 101,573 | 8,891 |
| National Bank Holdings Corp. Class A | 405,311 | 8,674 |
| * BofI Holding Inc. | 110,166 | 8,640 |
15
| Vanguard® Extended Market Index Fund | |||
| Schedule of Investments | |||
| December 31, 2013 | |||
| Market | |||
| Value | |||
| Shares | ($000) | ||
| WesBanco Inc. | 269,472 | 8,623 | |
| Chemical Financial Corp. | 271,943 | 8,612 | |
| Independent Bank Corp. | 218,532 | 8,564 | |
| American Capital Mortgage Investment Corp. | 489,260 | 8,542 | |
| Retail Opportunity Investments Corp. | 577,226 | 8,497 | |
| * | FelCor Lodging Trust Inc. | 1,040,394 | 8,490 |
| Associated Estates Realty Corp. | 528,900 | 8,489 | |
| Nelnet Inc. Class A | 198,665 | 8,372 | |
| * | HFF Inc. Class A | 307,679 | 8,261 |
| STAG Industrial Inc. | 404,127 | 8,240 | |
| Investors Real Estate Trust | 958,940 | 8,228 | |
| First Commonwealth Financial Corp. | 928,328 | 8,188 | |
| Infinity Property & Casualty Corp. | 113,172 | 8,120 | |
| Inland Real Estate Corp. | 769,631 | 8,097 | |
| Solar Capital Ltd. | 358,748 | 8,090 | |
| Sterling Financial Corp. | 235,366 | 8,021 | |
| Banner Corp. | 178,280 | 7,991 | |
| Wilshire Bancorp Inc. | 730,201 | 7,981 | |
| * | Investment Technology Group Inc. | 384,445 | 7,904 |
| * | Eagle Bancorp Inc. | 250,514 | 7,673 |
| Hanmi Financial Corp. | 348,702 | 7,633 | |
| City Holding Co. | 163,945 | 7,596 | |
| AMERISAFE Inc. | 179,790 | 7,594 | |
| OFG Bancorp | 437,770 | 7,591 | |
| PennantPark Investment Corp. | 635,272 | 7,369 | |
| Alexander's Inc. | 22,158 | 7,312 | |
| ^ | Triangle Capital Corp. | 264,308 | 7,308 |
| S&T Bancorp Inc. | 286,135 | 7,242 | |
| Resource Capital Corp. | 1,214,454 | 7,202 | |
| * | Forestar Group Inc. | 335,239 | 7,131 |
| * | ICG Group Inc. | 382,324 | 7,123 |
| Safety Insurance Group Inc. | 126,140 | 7,102 | |
| *,^ | Nationstar Mortgage Holdings Inc. | 190,711 | 7,049 |
| Select Income REIT | 262,717 | 7,025 | |
| Blackstone Mortgage Trust Inc. Class A | 257,406 | 6,983 | |
| Kite Realty Group Trust | 1,062,697 | 6,982 | |
| Cohen & Steers Inc. | 171,409 | 6,867 | |
| Community Trust Bancorp Inc. | 151,997 | 6,864 | |
| * | Bancorp Inc. | 378,547 | 6,780 |
| Summit Hotel Properties Inc. | 737,819 | 6,640 | |
| * | United Community Banks Inc. | 374,002 | 6,639 |
| CoreSite Realty Corp. | 205,813 | 6,625 | |
| TrustCo Bank Corp. NY | 912,196 | 6,550 | |
| Berkshire Hills Bancorp Inc. | 239,001 | 6,518 | |
| * | Navigators Group Inc. | 102,942 | 6,502 |
| Flushing Financial Corp. | 313,251 | 6,484 | |
| Brookline Bancorp Inc. | 672,742 | 6,438 | |
| Saul Centers Inc. | 133,229 | 6,359 | |
| First Potomac Realty Trust | 545,671 | 6,346 | |
| Simmons First National Corp. Class A | 169,261 | 6,288 | |
| First Merchants Corp. | 276,207 | 6,286 | |
| American National Insurance Co. | 54,229 | 6,211 | |
| * | Piper Jaffray Cos. | 156,479 | 6,189 |
| United Fire Group Inc. | 215,417 | 6,174 | |
| Oritani Financial Corp. | 384,392 | 6,169 | |
| Sandy Spring Bancorp Inc. | 215,858 | 6,085 | |
| * | Ameris Bancorp | 286,395 | 6,046 |
| * | Brixmor Property Group Inc. | 294,604 | 5,989 |
| Stewart Information Services Corp. | 182,092 | 5,876 | |
| Campus Crest Communities Inc. | 617,674 | 5,812 | |
| * | Ezcorp Inc. Class A | 496,617 | 5,805 |
| Maiden Holdings Ltd. | 531,005 | 5,804 | |
| Anworth Mortgage Asset Corp. | 1,372,811 | 5,780 | |
| Lakeland Financial Corp. | 146,943 | 5,731 | |
16
| Vanguard® Extended Market Index Fund | ||
| Schedule of Investments | ||
| December 31, 2013 | ||
| Market | ||
| Value | ||
| Shares | ($000) | |
| TICC Capital Corp. | 548,249 | 5,669 |
| State Bank Financial Corp. | 310,770 | 5,653 |
| FBL Financial Group Inc. Class A | 125,263 | 5,611 |
| BlackRock Kelso Capital Corp. | 599,032 | 5,589 |
| * Customers Bancorp Inc. | 271,216 | 5,549 |
| Northfield Bancorp Inc. | 416,131 | 5,493 |
| American Homes 4 Rent Class A | 333,183 | 5,398 |
| Ashford Hospitality Trust Inc. | 647,094 | 5,358 |
| Southside Bancshares Inc. | 193,171 | 5,281 |
| Getty Realty Corp. | 285,955 | 5,253 |
| * Green Dot Corp. Class A | 207,999 | 5,231 |
| Apollo Residential Mortgage Inc. | 351,032 | 5,188 |
| ^ Golub Capital BDC Inc. | 268,829 | 5,137 |
| * PICO Holdings Inc. | 218,665 | 5,053 |
| Excel Trust Inc. | 442,224 | 5,037 |
| Central Pacific Financial Corp. | 249,689 | 5,014 |
| * Safeguard Scientifics Inc. | 248,766 | 4,998 |
| Tompkins Financial Corp. | 97,228 | 4,997 |
| Universal Health Realty Income Trust | 123,903 | 4,964 |
| Dime Community Bancshares Inc. | 291,815 | 4,938 |
| New Mountain Finance Corp. | 328,022 | 4,933 |
| WSFS Financial Corp. | 63,260 | 4,905 |
| * Tejon Ranch Co. | 133,412 | 4,904 |
| National Western Life Insurance Co. Class A | 21,640 | 4,838 |
| THL Credit Inc. | 292,181 | 4,818 |
| * Phoenix Cos. Inc. | 78,287 | 4,807 |
| Union First Market Bankshares Corp. | 193,080 | 4,790 |
| * Taylor Capital Group Inc. | 180,176 | 4,789 |
| Washington Trust Bancorp Inc. | 127,037 | 4,728 |
| * DFC Global Corp. | 411,810 | 4,715 |
| StellarOne Corp. | 194,199 | 4,674 |
| Cardinal Financial Corp. | 254,617 | 4,583 |
| * Virginia Commerce Bancorp Inc. | 269,456 | 4,578 |
| Urstadt Biddle Properties Inc. Class A | 246,137 | 4,541 |
| First Interstate Bancsystem Inc. | 158,942 | 4,509 |
| Apollo Commercial Real Estate Finance Inc. | 272,842 | 4,434 |
| HCI Group Inc. | 82,536 | 4,416 |
| Bancfirst Corp. | 78,648 | 4,409 |
| GAMCO Investors Inc. | 50,631 | 4,403 |
| * NewStar Financial Inc. | 247,306 | 4,395 |
| FXCM Inc. Class A | 244,891 | 4,369 |
| * First BanCorp | 698,498 | 4,324 |
| RAIT Financial Trust | 480,200 | 4,307 |
| Silver Bay Realty Trust Corp. | 267,136 | 4,272 |
| Rouse Properties Inc. | 191,481 | 4,249 |
| AG Mortgage Investment Trust Inc. | 271,332 | 4,244 |
| * Southwest Bancorp Inc. | 255,605 | 4,069 |
| Great Southern Bancorp Inc. | 132,923 | 4,042 |
| First Financial Corp. | 110,554 | 4,042 |
| * Ladenburg Thalmann Financial Services Inc. | 1,285,249 | 4,023 |
| SY Bancorp Inc. | 121,916 | 3,892 |
| Agree Realty Corp. | 131,086 | 3,804 |
| MCG Capital Corp. | 857,785 | 3,774 |
| Park Sterling Corp. | 524,279 | 3,743 |
| * Metro Bancorp Inc. | 172,234 | 3,710 |
| * Suffolk Bancorp | 176,183 | 3,665 |
| MainSource Financial Group Inc. | 202,631 | 3,653 |
| German American Bancorp Inc. | 127,429 | 3,632 |
| * Beneficial Mutual Bancorp Inc. | 331,261 | 3,617 |
| Univest Corp. of Pennsylvania | 174,753 | 3,614 |
| Bank Mutual Corp. | 503,802 | 3,532 |
| TowneBank | 229,013 | 3,525 |
| Arlington Asset Investment Corp. Class A | 131,939 | 3,482 |
| Medley Capital Corp. | 250,867 | 3,475 |
17
| Vanguard® Extended Market Index Fund | ||
| Schedule of Investments | ||
| December 31, 2013 | ||
| Market | ||
| Value | ||
| Shares | ($000) | |
| Chatham Lodging Trust | 169,412 | 3,464 |
| Rockville Financial Inc. | 239,655 | 3,406 |
| Arrow Financial Corp. | 128,163 | 3,404 |
| Meadowbrook Insurance Group Inc. | 487,807 | 3,395 |
| Capital Southwest Corp. | 97,168 | 3,388 |
| MetroCorp Bancshares Inc. | 224,297 | 3,380 |
| National Interstate Corp. | 146,685 | 3,374 |
| Monmouth Real Estate Investment Corp. Class A | 369,955 | 3,363 |
| Guaranty Bancorp | 237,168 | 3,332 |
| Federal Agricultural Mortgage Corp. | 95,774 | 3,280 |
| * Citizens Inc. Class A | 374,084 | 3,273 |
| Yadkin Financial Corp. | 190,337 | 3,243 |
| OneBeacon Insurance Group Ltd. Class A | 203,411 | 3,218 |
| Winthrop Realty Trust | 285,804 | 3,158 |
| CoBiz Financial Inc. | 263,682 | 3,154 |
| * Tree.com Inc. | 95,674 | 3,142 |
| New York Mortgage Trust Inc. | 448,616 | 3,136 |
| First Bancorp | 187,946 | 3,124 |
| Financial Institutions Inc. | 125,806 | 3,109 |
| * Kearny Financial Corp. | 267,072 | 3,106 |
| Bryn Mawr Bank Corp. | 102,866 | 3,104 |
| ^ Western Asset Mortgage Capital Corp. | 208,250 | 3,099 |
| West Bancorporation Inc. | 195,869 | 3,099 |
| * Flagstar Bancorp Inc. | 156,217 | 3,065 |
| Westwood Holdings Group Inc. | 49,298 | 3,052 |
| Republic Bancorp Inc. Class A | 123,969 | 3,042 |
| First Busey Corp. | 521,371 | 3,024 |
| Fidelity Southern Corp. | 181,993 | 3,023 |
| Heartland Financial USA Inc. | 104,409 | 3,006 |
| 1st Source Corp. | 94,009 | 3,003 |
| Seacoast Banking Corp. of Florida | 244,748 | 2,986 |
| State Auto Financial Corp. | 140,212 | 2,978 |
| * Preferred Bank | 148,506 | 2,978 |
| OceanFirst Financial Corp. | 172,944 | 2,963 |
| * OmniAmerican Bancorp Inc. | 137,974 | 2,950 |
| First Connecticut Bancorp Inc. | 180,900 | 2,916 |
| * Essent Group Ltd. | 120,760 | 2,905 |
| Oppenheimer Holdings Inc. Class A | 116,792 | 2,894 |
| * GSV Capital Corp. | 237,316 | 2,869 |
| MVC Capital Inc. | 208,431 | 2,814 |
| * CommunityOne Bancorp | 216,763 | 2,764 |
| Cedar Realty Trust Inc. | 439,916 | 2,754 |
| Camden National Corp. | 65,094 | 2,748 |
| 1st United Bancorp Inc. | 360,144 | 2,741 |
| Heritage Commerce Corp. | 332,144 | 2,737 |
| Baldwin & Lyons Inc. | 98,962 | 2,704 |
| Diamond Hill Investment Group Inc. | 22,741 | 2,691 |
| * Franklin Financial Corp. | 136,050 | 2,691 |
| TCP Capital Corp. | 154,971 | 2,600 |
| One Liberty Properties Inc. | 128,896 | 2,595 |
| * HomeTrust Bancshares Inc. | 161,606 | 2,584 |
| Washington Banking Co. | 143,957 | 2,552 |
| ^ Fidus Investment Corp. | 117,333 | 2,551 |
| United Financial Bancorp Inc. | 134,997 | 2,550 |
| CyrusOne Inc. | 113,399 | 2,532 |
| Hudson Valley Holding Corp. | 123,489 | 2,513 |
| Universal Insurance Holdings Inc. | 172,895 | 2,504 |
| * Sun Bancorp Inc. | 709,295 | 2,497 |
| * Gramercy Property Trust Inc. | 434,160 | 2,496 |
| * Walker & Dunlop Inc. | 154,241 | 2,494 |
| Lakeland Bancorp Inc. | 200,256 | 2,477 |
| First Financial Northwest Inc. | 238,343 | 2,472 |
| Pzena Investment Management Inc. Class A | 209,705 | 2,466 |
| * Intervest Bancshares Corp. Class A | 326,973 | 2,456 |
18
| Vanguard® Extended Market Index Fund | ||
| Schedule of Investments | ||
| December 31, 2013 | ||
| Market | ||
| Value | ||
| Shares | ($000) | |
| Gladstone Commercial Corp. | 136,011 | 2,444 |
| * Heritage Oaks Bancorp | 325,667 | 2,443 |
| * Global Indemnity plc | 96,279 | 2,436 |
| * INTL. FCStone Inc. | 130,906 | 2,427 |
| Trico Bancshares | 85,160 | 2,416 |
| Gladstone Capital Corp. | 249,408 | 2,394 |
| Terreno Realty Corp. | 134,772 | 2,385 |
| * Cowen Group Inc. Class A | 607,573 | 2,376 |
| Mercantile Bank Corp. | 109,930 | 2,372 |
| * Third Point Reinsurance Ltd. | 127,600 | 2,364 |
| * NewBridge Bancorp | 314,987 | 2,362 |
| Medallion Financial Corp. | 164,114 | 2,355 |
| Calamos Asset Management Inc. Class A | 196,154 | 2,322 |
| * Orrstown Financial Services Inc. | 140,635 | 2,299 |
| ^ JAVELIN Mortgage Investment Corp. | 164,246 | 2,288 |
| Ashford Hospitality Prime Inc. | 124,153 | 2,260 |
| GFI Group Inc. | 568,987 | 2,225 |
| ^ KCAP Financial Inc. | 274,651 | 2,216 |
| * Meridian Interstate Bancorp Inc. | 97,926 | 2,211 |
| * BBX Capital Corp. | 140,798 | 2,196 |
| BNC Bancorp | 127,873 | 2,192 |
| Marlin Business Services Corp. | 86,388 | 2,177 |
| Westfield Financial Inc. | 289,228 | 2,158 |
| National Bankshares Inc. | 58,026 | 2,141 |
| * Pacific Premier Bancorp Inc. | 135,123 | 2,127 |
| * North Valley Bancorp | 112,470 | 2,127 |
| First of Long Island Corp. | 49,511 | 2,123 |
| Territorial Bancorp Inc. | 90,498 | 2,100 |
| Hannon Armstrong Sustainable Infrastructure Capital Inc. | 149,431 | 2,086 |
| * Bridge Capital Holdings | 101,348 | 2,082 |
| Eastern Insurance Holdings Inc. | 84,757 | 2,076 |
| * Macatawa Bank Corp. | 413,825 | 2,069 |
| Crawford & Co. Class B | 221,436 | 2,046 |
| * Harris & Harris Group Inc. | 681,043 | 2,030 |
| * FBR & Co. | 76,910 | 2,029 |
| Citizens & Northern Corp. | 98,102 | 2,024 |
| Whitestone REIT | 150,347 | 2,010 |
| Federated National Holding Co. | 137,066 | 2,005 |
| Peoples Bancorp Inc. | 88,925 | 2,002 |
| * Hampton Roads Bankshares Inc. | 1,143,522 | 2,001 |
| Northrim BanCorp Inc. | 74,373 | 1,952 |
| Aviv REIT Inc. | 81,570 | 1,933 |
| EMC Insurance Group Inc. | 61,953 | 1,897 |
| HomeStreet Inc. | 94,557 | 1,891 |
| * Pacific Mercantile Bancorp | 303,388 | 1,887 |
| Heritage Financial Corp. | 109,976 | 1,882 |
| * RE/MAX Holdings Inc. | 57,928 | 1,858 |
| Enterprise Financial Services Corp. | 90,345 | 1,845 |
| Tower Financial Corp. | 73,761 | 1,838 |
| Kansas City Life Insurance Co. | 38,258 | 1,826 |
| Ares Commercial Real Estate Corp. | 138,700 | 1,817 |
| First Community Bancshares Inc. | 108,646 | 1,814 |
| * BSB Bancorp Inc. | 119,629 | 1,805 |
| Center Bancorp Inc. | 96,047 | 1,802 |
| CorEnergy Infrastructure Trust Inc. | 249,649 | 1,778 |
| * Waterstone Financial Inc. | 158,662 | 1,761 |
| Consolidated-Tomoka Land Co. | 48,195 | 1,749 |
| * Capital City Bank Group Inc. | 146,097 | 1,720 |
| American National Bankshares Inc. | 65,352 | 1,715 |
| Centerstate Banks Inc. | 168,828 | 1,714 |
| Doral Financial Corp. | 108,348 | 1,697 |
| Penns Woods Bancorp Inc. | 33,069 | 1,687 |
| Meta Financial Group Inc. | 41,585 | 1,677 |
| Simplicity Bancorp Inc. | 102,702 | 1,660 |
19
| Vanguard® Extended Market Index Fund | ||
| Schedule of Investments | ||
| December 31, 2013 | ||
| Market | ||
| Value | ||
| Shares | ($000) | |
| CNB Financial Corp. | 87,321 | 1,659 |
| First Bancorp Inc. | 95,020 | 1,655 |
| BankFinancial Corp. | 179,909 | 1,648 |
| * ZipRealty Inc. | 293,133 | 1,642 |
| Merchants Bancshares Inc. | 47,177 | 1,580 |
| * MBT Financial Corp. | 367,905 | 1,567 |
| * United Community Financial Corp. | 438,253 | 1,565 |
| * Regional Management Corp. | 45,700 | 1,551 |
| Cape Bancorp Inc. | 150,272 | 1,527 |
| Home Federal Bancorp Inc. | 101,725 | 1,516 |
| * First South Bancorp Inc. | 192,141 | 1,499 |
| Donegal Group Inc. Class B | 63,194 | 1,495 |
| * AV Homes Inc. | 80,575 | 1,464 |
| * Riverview Bancorp Inc. | 504,565 | 1,463 |
| QTS Realty Trust Inc. Class A | 58,900 | 1,460 |
| NGP Capital Resources Co. | 191,198 | 1,428 |
| MicroFinancial Inc. | 166,298 | 1,422 |
| Century Bancorp Inc. Class A | 42,568 | 1,415 |
| Pulaski Financial Corp. | 125,562 | 1,414 |
| Gladstone Investment Corp. | 174,317 | 1,405 |
| MutualFirst Financial Inc. | 80,909 | 1,386 |
| AmREIT Inc. | 82,139 | 1,380 |
| Manning & Napier Inc. | 77,797 | 1,373 |
| * Springleaf Holdings Inc. | 54,072 | 1,367 |
| ESB Financial Corp. | 95,560 | 1,357 |
| Unity Bancorp Inc. | 174,680 | 1,338 |
| Timberland Bancorp Inc. | 138,776 | 1,335 |
| * Imperial Holdings Inc. | 203,613 | 1,332 |
| JMP Group Inc. | 179,790 | 1,330 |
| Arbor Realty Trust Inc. | 198,834 | 1,324 |
| * SWS Group Inc. | 217,585 | 1,323 |
| Peoples Federal Bancshares Inc. | 74,276 | 1,318 |
| Stellus Capital Investment Corp. | 87,195 | 1,304 |
| * Asta Funding Inc. | 153,816 | 1,295 |
| Tower Group International Ltd. | 380,123 | 1,285 |
| ESSA Bancorp Inc. | 111,135 | 1,285 |
| * Farmers Capital Bank Corp. | 58,359 | 1,269 |
| Clifton Savings Bancorp Inc. | 99,139 | 1,269 |
| * Heritage Financial Group Inc. | 63,161 | 1,216 |
| Garrison Capital Inc. | 86,071 | 1,195 |
| Nicholas Financial Inc. | 75,110 | 1,182 |
| AmeriServ Financial Inc. | 380,876 | 1,154 |
| UMH Properties Inc. | 122,011 | 1,149 |
| Pacific Continental Corp. | 72,017 | 1,148 |
| Peapack Gladstone Financial Corp. | 60,066 | 1,147 |
| Donegal Group Inc. Class A | 72,062 | 1,146 |
| PennantPark Floating Rate Capital Ltd. | 83,342 | 1,144 |
| Provident Financial Holdings Inc. | 75,794 | 1,137 |
| * Republic First Bancorp Inc. | 380,930 | 1,135 |
| Gain Capital Holdings Inc. | 150,633 | 1,131 |
| Fox Chase Bancorp Inc. | 64,911 | 1,128 |
| * Security National Financial Corp. Class A | 232,213 | 1,119 |
| * Consumer Portfolio Services Inc. | 117,078 | 1,099 |
| Bank of Commerce Holdings | 192,071 | 1,097 |
| Chicopee Bancorp Inc. | 61,671 | 1,074 |
| * Independent Bank Corp. | 88,750 | 1,065 |
| NASB Financial Inc. | 34,883 | 1,053 |
| * Camco Financial Corp. | 157,311 | 1,051 |
| First Defiance Financial Corp. | 39,632 | 1,029 |
| New Hampshire Thrift Bancshares Inc. | 67,166 | 1,024 |
| * First United Corp. | 132,833 | 1,015 |
| * Southcoast Financial Corp. | 167,773 | 998 |
| Bridge Bancorp Inc. | 37,769 | 982 |
| Peoples Bancorp of North Carolina Inc. | 68,148 | 966 |
20
| Vanguard® Extended Market Index Fund | ||
| Schedule of Investments | ||
| December 31, 2013 | ||
| Market | ||
| Value | ||
| Shares | ($000) | |
| Old Line Bancshares Inc. | 65,743 | 953 |
| * United Security Bancshares | 183,830 | 927 |
| Physicians Realty Trust | 70,500 | 898 |
| * Carolina Bank Holdings Inc. | 86,992 | 896 |
| Firstbank Corp. | 46,094 | 891 |
| * Community Bankers Trust Corp. | 236,942 | 891 |
| TF Financial Corp. | 31,291 | 870 |
| Bank of Marin Bancorp | 19,763 | 858 |
| * American Residential Properties Inc. | 46,100 | 791 |
| Ohio Valley Banc Corp. | 34,561 | 783 |
| BCB Bancorp Inc. | 57,260 | 770 |
| * BCSB Bancorp Inc. | 28,790 | 751 |
| Ames National Corp. | 33,397 | 748 |
| Independence Holding Co. | 55,094 | 743 |
| Sierra Bancorp | 46,020 | 740 |
| * PennyMac Financial Services Inc. Class A | 41,100 | 721 |
| PMC Commercial Trust | 81,171 | 698 |
| * American River Bankshares | 72,581 | 686 |
| * Summit Financial Group Inc. | 68,467 | 680 |
| C&F Financial Corp. | 14,795 | 676 |
| Ocean Shore Holding Co. | 49,411 | 675 |
| Hawthorn Bancshares Inc. | 52,943 | 656 |
| Bank of Kentucky Financial Corp. | 17,658 | 652 |
| Middleburg Financial Corp. | 35,897 | 648 |
| * VantageSouth Bancshares Inc. | 122,099 | 643 |
| Solar Senior Capital Ltd. | 35,280 | 643 |
| * Maui Land & Pineapple Co. Inc. | 104,528 | 637 |
| Investors Title Co. | 7,827 | 634 |
| * Home Bancorp Inc. | 33,321 | 628 |
| * Louisiana Bancorp Inc. | 34,271 | 623 |
| Citizens Community Bancorp Inc. | 83,110 | 618 |
| Urstadt Biddle Properties Inc. | 38,700 | 613 |
| Rexford Industrial Realty Inc. | 44,343 | 585 |
| * Shore Bancshares Inc. | 61,223 | 564 |
| * Oak Valley Bancorp | 66,347 | 547 |
| US Global Investors Inc. Class A | 207,104 | 526 |
| Banc of California Inc. | 38,075 | 511 |
| * ASB Bancorp Inc. | 29,456 | 508 |
| * Eastern Virginia Bankshares Inc. | 71,522 | 501 |
| * Jefferson Bancshares Inc. | 78,123 | 492 |
| * HMN Financial Inc. | 46,647 | 490 |
| * Colony Bankcorp Inc. | 80,138 | 489 |
| Teche Holding Co. | 9,765 | 487 |
| * Hallmark Financial Services Inc. | 54,686 | 486 |
| Firsthand Technology Value Fund Inc. | 20,600 | 477 |
| * Stratus Properties Inc. | 27,859 | 477 |
| * 1st Constitution Bancorp | 43,079 | 470 |
| Norwood Financial Corp. | 16,139 | 434 |
| Prudential Bancorp Inc. | 40,039 | 432 |
| * OBA Financial Services Inc. | 23,817 | 431 |
| Bar Harbor Bankshares | 10,605 | 424 |
| Citizens Holding Co. | 22,634 | 417 |
| MidWestOne Financial Group Inc. | 15,228 | 414 |
| * Old Second Bancorp Inc. | 88,795 | 409 |
| Sotherly Hotels Inc. | 67,221 | 399 |
| * Guaranty Federal Bancshares Inc. | 36,149 | 391 |
| Preferred Apartment Communities Inc. Class A | 47,686 | 383 |
| * Parke Bancorp Inc. | 42,387 | 381 |
| Southern National Bancorp of Virginia Inc. | 36,675 | 367 |
| Federal Agricultural Mortgage Corp. Class A | 12,788 | 352 |
| Hampden Bancorp Inc. | 21,407 | 351 |
| HF Financial Corp. | 26,106 | 338 |
| * Investors Capital Holdings Ltd. | 46,740 | 336 |
| * First Acceptance Corp. | 147,808 | 336 |
21
| Vanguard® Extended Market Index Fund | ||
| Schedule of Investments | ||
| December 31, 2013 | ||
| Market | ||
| Value | ||
| Shares | ($000) | |
| Central Valley Community Bancorp | 29,772 | 335 |
| * Cascade Bancorp | 62,684 | 328 |
| * Atlanticus Holdings Corp. | 91,683 | 325 |
| * First Federal Bancshares of Arkansas Inc. | 36,314 | 316 |
| Monarch Financial Holdings Inc. | 24,717 | 304 |
| FedFirst Financial Corp. | 15,141 | 301 |
| * CU Bancorp | 16,930 | 296 |
| Premier Financial Bancorp Inc. | 20,738 | 293 |
| QC Holdings Inc. | 158,879 | 283 |
| * BRT Realty Trust | 39,982 | 283 |
| Armada Hoffler Properties Inc. | 30,100 | 279 |
| First Marblehead Corp. | 36,988 | 273 |
| Codorus Valley Bancorp Inc. | 13,006 | 259 |
| CIFC Corp. | 32,062 | 249 |
| SB Financial Group Inc. | 31,319 | 247 |
| First Bancshares Inc. | 16,469 | 239 |
| * Xenith Bankshares Inc. | 40,283 | 237 |
| Horizon Bancorp | 9,268 | 235 |
| First Savings Financial Group Inc. | 9,746 | 219 |
| First Clover Leaf Financial Corp. | 21,799 | 207 |
| Union Bankshares Inc. | 8,739 | 201 |
| * Anchor Bancorp Inc. | 10,700 | 196 |
| NB&T Financial Group Inc. | 9,807 | 193 |
| Georgetown Bancorp Inc. | 12,400 | 191 |
| Two River Bancorp | 26,479 | 191 |
| First Citizens Banc Corp. | 29,098 | 190 |
| SI Financial Group Inc. | 15,247 | 184 |
| Cheviot Financial Corp. | 17,498 | 182 |
| MidSouth Bancorp Inc. | 9,974 | 178 |
| Gleacher & Co. Inc. | 16,187 | 168 |
| United Bancshares Inc. | 11,489 | 165 |
| Old Point Financial Corp. | 12,862 | 165 |
| Farmers National Banc Corp. | 23,917 | 157 |
| Valley Financial Corp. | 13,798 | 154 |
| * New Century Bancorp Inc. | 21,884 | 151 |
| * Southern First Bancshares Inc. | 10,419 | 139 |
| Saratoga Investment Corp. | 8,113 | 127 |
| IF Bancorp Inc. | 7,557 | 126 |
| Wolverine Bancorp Inc. | 5,954 | 126 |
| Enterprise Bancorp Inc. | 5,747 | 122 |
| * InterGroup Corp. | 6,300 | 116 |
| Resource America Inc. Class A | 12,100 | 113 |
| * First Financial Service Corp. | 22,276 | 111 |
| Glen Burnie Bancorp | 9,147 | 110 |
| IMPAC Mortgage Holdings Inc. | 17,001 | 102 |
| * Tejon Ranch Co. Warrants Exp. 08/31/2016 | 17,984 | 96 |
| * Hamilton Bancorp Inc. | 6,700 | 94 |
| Laporte Bancorp Inc. | 8,278 | 92 |
| FS Bancorp Inc. | 5,340 | 91 |
| * Severn Bancorp Inc. | 19,055 | 90 |
| Greene County Bancorp Inc. | 3,483 | 89 |
| United Community Bancorp | 7,174 | 82 |
| * Peoples Financial Corp. | 6,186 | 81 |
| * Magyar Bancorp Inc. | 10,365 | 77 |
| United Bancorp Inc. | 9,360 | 75 |
| Life Partners Holdings Inc. | 40,287 | 72 |
| * Naugatuck Valley Financial Corp. | 10,037 | 71 |
| Bank of South Carolina Corp. | 4,282 | 68 |
| * Atlantic Coast Financial Corp. | 15,224 | 66 |
| * Sussex Bancorp | 8,387 | 65 |
| Supertel Hospitality Inc. | 26,365 | 64 |
| Southwest Georgia Financial Corp. | 5,535 | 63 |
| Kentucky First Federal Bancorp | 7,514 | 61 |
| Eagle Bancorp Montana Inc. | 5,462 | 60 |
22
| Vanguard® Extended Market Index Fund | ||
| Schedule of Investments | ||
| December 31, 2013 | ||
| Market | ||
| Value | ||
| Shares | ($000) | |
| Northeast Community Bancorp Inc. | 8,054 | 58 |
| * 1st Century Bancshares Inc. | 8,013 | 57 |
| * First Security Group Inc. | 24,656 | 57 |
| * Royal Bancshares of Pennsylvania Inc. | 40,173 | 55 |
| Oconee Federal Financial Corp. | 2,383 | 42 |
| Madison County Financial Inc. | 2,107 | 37 |
| * First Capital Bancorp Inc. | 8,224 | 36 |
| Salisbury Bancorp Inc. | 1,341 | 36 |
| * Malvern Bancorp Inc. | 3,103 | 34 |
| * Jacksonville Bancorp Inc. | 2,692 | 34 |
| * Community West Bancshares | 4,500 | 30 |
| * Porter Bancorp Inc. | 26,941 | 27 |
| Fauquier Bankshares Inc. | 1,931 | 26 |
| Mackinac Financial Corp. | 2,200 | 22 |
| Horizon Technology Finance Corp. | 1,465 | 21 |
| Full Circle Capital Corp. | 2,818 | 20 |
| Mid Penn Bancorp Inc. | 1,384 | 20 |
| QCR Holdings Inc. | 1,100 | 19 |
| * Rand Capital Corp. | 6,050 | 19 |
| River Valley Bancorp/ | 669 | 17 |
| ACNB Corp. | 948 | 17 |
| * State Investors Bancorp Inc. | 1,013 | 16 |
| First West Virginia Bancorp | 916 | 15 |
| * Presidential Realty Corp. Class B | 46,000 | 14 |
| First Business Financial Services Inc. | 332 | 12 |
| * Polonia Bancorp Inc. | 1,200 | 12 |
| Elmira Savings Bank | 431 | 11 |
| First Capital Inc. | 511 | 11 |
| Auburn National Bancorporation Inc. | 359 | 9 |
| * Central Federal Corp. | 6,416 | 9 |
| CKX Lands Inc. | 399 | 6 |
| * SP Bancorp Inc. | 300 | 6 |
| Summit State Bank | 400 | 4 |
| * Transcontinental Realty Investors Inc. | 400 | 4 |
| * Village Bank and Trust Financial Corp. | 2,400 | 3 |
| First Internet Bancorp | 150 | 3 |
| * Patriot National Bancorp Inc. | 3,120 | 3 |
| * Siebert Financial Corp. | 1,836 | 3 |
| Oneida Financial Corp. | 194 | 2 |
| Stewardship Financial Corp. | 400 | 2 |
| WhiteHorse Finance Inc. | 100 | 2 |
| Ellington Residential Mortgage REIT | 12 | — |
| * American Spectrum Realty Inc. | 100 | — |
| WashingtonFirst Bankshare Inc. | — | |
| 8,184,996 | ||
| Health Care (11.0%) | ||
| * HCA Holdings Inc. | 2,793,023 | 133,255 |
| * Illumina Inc. | 1,151,757 | 127,407 |
| * BioMarin Pharmaceutical Inc. | 1,298,770 | 91,265 |
| * Henry Schein Inc. | 784,038 | 89,584 |
| * Endo Health Solutions Inc. | 1,048,820 | 70,753 |
| * Incyte Corp. Ltd. | 1,330,084 | 67,342 |
| Universal Health Services Inc. Class B | 820,015 | 66,634 |
| * Mettler-Toledo International Inc. | 271,103 | 65,767 |
| * Pharmacyclics Inc. | 612,579 | 64,799 |
| ^ ResMed Inc. | 1,303,528 | 61,370 |
| * Jazz Pharmaceuticals plc | 480,329 | 60,790 |
| Omnicare Inc. | 947,751 | 57,206 |
| * Hologic Inc. | 2,494,346 | 55,749 |
| Cooper Cos. Inc. | 448,978 | 55,601 |
| * Salix Pharmaceuticals Ltd. | 574,438 | 51,665 |
| * Alkermes plc | 1,250,394 | 50,841 |
| * IDEXX Laboratories Inc. | 471,812 | 50,187 |
| * MEDNAX Inc. | 922,872 | 49,263 |
23
| Vanguard® Extended Market Index Fund | |||
| Schedule of Investments | |||
| December 31, 2013 | |||
| Market | |||
| Value | |||
| Shares | ($000) | ||
| * | United Therapeutics Corp. | 421,944 | 47,713 |
| * | Cubist Pharmaceuticals Inc. | 679,317 | 46,785 |
| * | athenahealth Inc. | 339,620 | 45,679 |
| * | Covance Inc. | 513,045 | 45,179 |
| * | Medivation Inc. | 691,050 | 44,103 |
| * | Isis Pharmaceuticals Inc. | 1,060,043 | 42,232 |
| * | Seattle Genetics Inc. | 1,017,904 | 40,604 |
| * | Align Technology Inc. | 645,526 | 36,892 |
| Teleflex Inc. | 378,115 | 35,490 | |
| * | Sirona Dental Systems Inc. | 502,384 | 35,267 |
| * | Community Health Systems Inc. | 870,822 | 34,197 |
| * | Health Management Associates Inc. Class A | 2,415,544 | 31,644 |
| West Pharmaceutical Services Inc. | 642,040 | 31,498 | |
| * | Alnylam Pharmaceuticals Inc. | 486,634 | 31,305 |
| * | ViroPharma Inc. | 600,972 | 29,958 |
| * | Centene Corp. | 502,232 | 29,607 |
| * | Team Health Holdings Inc. | 639,972 | 29,151 |
| * | Cepheid Inc. | 619,768 | 28,956 |
| Techne Corp. | 305,254 | 28,898 | |
| * | WellCare Health Plans Inc. | 400,567 | 28,208 |
| * | Medidata Solutions Inc. | 460,121 | 27,870 |
| ^ | Questcor Pharmaceuticals Inc. | 510,652 | 27,805 |
| * | Mallinckrodt plc | 530,977 | 27,749 |
| HealthSouth Corp. | 800,756 | 26,681 | |
| STERIS Corp. | 543,189 | 26,100 | |
| * | NPS Pharmaceuticals Inc. | 857,878 | 26,045 |
| * | VCA Antech Inc. | 814,702 | 25,549 |
| * | Alere Inc. | 704,719 | 25,511 |
| * | Theravance Inc. | 709,790 | 25,304 |
| * | Brookdale Senior Living Inc. Class A | 924,515 | 25,128 |
| * | PAREXEL International Corp. | 517,151 | 23,365 |
| * | Charles River Laboratories International Inc. | 439,920 | 23,333 |
| * | LifePoint Hospitals Inc. | 436,038 | 23,040 |
| * | Bio-Rad Laboratories Inc. Class A | 183,951 | 22,738 |
| * | Medicines Co. | 583,845 | 22,548 |
| * | Allscripts Healthcare Solutions Inc. | 1,453,566 | 22,472 |
| Hill-Rom Holdings Inc. | 538,561 | 22,264 | |
| * | Health Net Inc. | 728,275 | 21,608 |
| * | DexCom Inc. | 609,121 | 21,569 |
| Owens & Minor Inc. | 582,989 | 21,314 | |
| * | MWI Veterinary Supply Inc. | 117,801 | 20,096 |
| * | Haemonetics Corp. | 472,385 | 19,902 |
| * | Bruker Corp. | 997,063 | 19,712 |
| * | Celldex Therapeutics Inc. | 804,785 | 19,484 |
| * | Thoratec Corp. | 530,321 | 19,410 |
| * | Air Methods Corp. | 322,124 | 18,789 |
| * | Insulet Corp. | 499,841 | 18,544 |
| * | HMS Holdings Corp. | 807,117 | 18,346 |
| * | Puma Biotechnology Inc. | 175,980 | 18,219 |
| * | ACADIA Pharmaceuticals Inc. | 705,680 | 17,635 |
| * | Pacira Pharmaceuticals Inc. | 306,395 | 17,615 |
| * | Prestige Brands Holdings Inc. | 472,298 | 16,908 |
| *,^ | Opko Health Inc. | 1,974,778 | 16,667 |
| * | Akorn Inc. | 654,575 | 16,122 |
| * | Aegerion Pharmaceuticals Inc. | 224,414 | 15,924 |
| * | Clovis Oncology Inc. | 263,157 | 15,860 |
| * | Neogen Corp. | 332,899 | 15,213 |
| * | Acadia Healthcare Co. Inc. | 320,702 | 15,179 |
| * | Cyberonics Inc. | 227,606 | 14,910 |
| * | Impax Laboratories Inc. | 591,841 | 14,879 |
| * | Magellan Health Services Inc. | 247,702 | 14,840 |
| *,^ | Myriad Genetics Inc. | 688,526 | 14,445 |
| * | Envision Healthcare Holdings Inc. | 395,622 | 14,053 |
| * | Masimo Corp. | 471,883 | 13,793 |
24
| Vanguard® Extended Market Index Fund | |||
| Schedule of Investments | |||
| December 31, 2013 | |||
| Market | |||
| Value | |||
| Shares | ($000) | ||
| * | Amsurg Corp. Class A | 298,415 | 13,703 |
| * | NuVasive Inc. | 410,458 | 13,270 |
| * | Wright Medical Group Inc. | 430,502 | 13,221 |
| * | Halozyme Therapeutics Inc. | 854,553 | 12,810 |
| * | HeartWare International Inc. | 135,209 | 12,704 |
| * | Hanger Inc. | 320,453 | 12,607 |
| ^ | Chemed Corp. | 163,015 | 12,490 |
| * | Nektar Therapeutics | 1,066,414 | 12,104 |
| * | InterMune Inc. | 813,464 | 11,982 |
| *,^ | Arena Pharmaceuticals Inc. | 2,027,470 | 11,861 |
| *,^ | Ariad Pharmaceuticals Inc. | 1,702,631 | 11,612 |
| * | ImmunoGen Inc. | 779,926 | 11,442 |
| * | Ironwood Pharmaceuticals Inc. Class A | 977,451 | 11,348 |
| * | Synageva BioPharma Corp. | 174,134 | 11,270 |
| * | MedAssets Inc. | 565,015 | 11,204 |
| * | Acorda Therapeutics Inc. | 377,037 | 11,009 |
| * | Volcano Corp. | 502,814 | 10,986 |
| CONMED Corp. | 254,973 | 10,836 | |
| Cantel Medical Corp. | 312,895 | 10,610 | |
| * | ArthroCare Corp. | 261,161 | 10,509 |
| Analogic Corp. | 116,899 | 10,353 | |
| Meridian Bioscience Inc. | 389,733 | 10,340 | |
| * | Integra LifeSciences Holdings Corp. | 214,288 | 10,224 |
| Kindred Healthcare Inc. | 516,512 | 10,196 | |
| * | Globus Medical Inc. | 502,874 | 10,148 |
| * | Endologix Inc. | 581,534 | 10,142 |
| * | Ligand Pharmaceuticals Inc. Class B | 191,639 | 10,080 |
| * | Quintiles Transnational Holdings Inc. | 213,363 | 9,887 |
| * | Greatbatch Inc. | 223,035 | 9,867 |
| * | Keryx Biopharmaceuticals Inc. | 755,325 | 9,781 |
| * | Spectranetics Corp. | 390,151 | 9,754 |
| *,^ | MannKind Corp. | 1,867,287 | 9,729 |
| *,^ | Exelixis Inc. | 1,571,260 | 9,632 |
| * | Premier Inc. Class A | 254,238 | 9,346 |
| * | IPC The Hospitalist Co. Inc. | 156,310 | 9,283 |
| * | Molina Healthcare Inc. | 261,931 | 9,102 |
| * | Auxilium Pharmaceuticals Inc. | 428,120 | 8,879 |
| * | Novavax Inc. | 1,713,951 | 8,775 |
| * | ExamWorks Group Inc. | 293,116 | 8,755 |
| * | Quidel Corp. | 279,909 | 8,646 |
| * | ABIOMED Inc. | 322,118 | 8,613 |
| * | Sangamo Biosciences Inc. | 611,111 | 8,488 |
| Quality Systems Inc. | 400,922 | 8,443 | |
| *,^ | Vivus Inc. | 929,667 | 8,441 |
| * | Fluidigm Corp. | 219,042 | 8,394 |
| * | Omnicell Inc. | 327,015 | 8,349 |
| * | Dyax Corp. | 1,105,502 | 8,324 |
| * | Emeritus Corp. | 374,838 | 8,108 |
| Ensign Group Inc. | 182,913 | 8,098 | |
| * | Abaxis Inc. | 201,252 | 8,054 |
| * | Cardiovascular Systems Inc. | 229,930 | 7,884 |
| * | ICU Medical Inc. | 122,884 | 7,829 |
| * | Exact Sciences Corp. | 664,812 | 7,772 |
| * | Momenta Pharmaceuticals Inc. | 435,931 | 7,707 |
| * | Raptor Pharmaceutical Corp. | 568,983 | 7,408 |
| * | Lannett Co. Inc. | 214,040 | 7,085 |
| * | Luminex Corp. | 365,012 | 7,081 |
| * | Affymetrix Inc. | 824,840 | 7,069 |
| * | Geron Corp. | 1,461,759 | 6,929 |
| Invacare Corp. | 298,178 | 6,921 | |
| *,^ | Idenix Pharmaceuticals Inc. | 1,156,157 | 6,914 |
| * | Depomed Inc. | 653,085 | 6,910 |
| * | Natus Medical Inc. | 304,817 | 6,858 |
| Computer Programs & Systems Inc. | 107,272 | 6,630 | |
25
| Vanguard® Extended Market Index Fund | |||
| Schedule of Investments | |||
| December 31, 2013 | |||
| Market | |||
| Value | |||
| Shares | ($000) | ||
| * | AMN Healthcare Services Inc. | 436,867 | 6,422 |
| * | HealthStream Inc. | 191,702 | 6,282 |
| * | Corvel Corp. | 133,320 | 6,226 |
| * | Capital Senior Living Corp. | 258,095 | 6,192 |
| * | Merit Medical Systems Inc. | 390,519 | 6,147 |
| * | Accuray Inc. | 672,061 | 5,854 |
| *,^ | Sarepta Therapeutics Inc. | 286,073 | 5,827 |
| *,^ | Bio-Reference Labs Inc. | 227,106 | 5,800 |
| * | PharMerica Corp. | 267,771 | 5,757 |
| * | Infinity Pharmaceuticals Inc. | 416,327 | 5,749 |
| * | Array BioPharma Inc. | 1,136,036 | 5,692 |
| *,^ | Antares Pharma Inc. | 1,234,942 | 5,533 |
| Select Medical Holdings Corp. | 471,275 | 5,472 | |
| * | AngioDynamics Inc. | 316,951 | 5,448 |
| * | Neurocrine Biosciences Inc. | 580,317 | 5,420 |
| * | AVANIR Pharmaceuticals Inc. | 1,602,405 | 5,384 |
| * | Orexigen Therapeutics Inc. | 954,061 | 5,371 |
| US Physical Therapy Inc. | 151,245 | 5,333 | |
| * | Staar Surgical Co. | 327,901 | 5,309 |
| * | Genomic Health Inc. | 180,217 | 5,275 |
| * | BioCryst Pharmaceuticals Inc. | 693,882 | 5,274 |
| * | XOMA Corp. | 779,575 | 5,247 |
| National Healthcare Corp. | 95,543 | 5,151 | |
| * | NxStage Medical Inc. | 509,199 | 5,092 |
| * | AMAG Pharmaceuticals Inc. | 202,954 | 4,926 |
| * | Lexicon Pharmaceuticals Inc. | 2,736,065 | 4,925 |
| * | Emergent Biosolutions Inc. | 211,200 | 4,855 |
| * | Cambrex Corp. | 271,850 | 4,847 |
| Landauer Inc. | 91,018 | 4,788 | |
| * | Healthways Inc. | 310,389 | 4,764 |
| *,^ | MiMedx Group Inc. | 543,905 | 4,754 |
| * | Insmed Inc. | 278,125 | 4,731 |
| * | Accretive Health Inc. | 512,937 | 4,699 |
| * | Intercept Pharmaceuticals Inc. | 67,500 | 4,609 |
| * | Cerus Corp. | 702,851 | 4,533 |
| * | Dynavax Technologies Corp. | 2,305,857 | 4,519 |
| *,^ | Dendreon Corp. | 1,492,355 | 4,462 |
| * | Spectrum Pharmaceuticals Inc. | 499,004 | 4,416 |
| * | Chelsea Therapeutics International Ltd. | 996,021 | 4,412 |
| * | BioScrip Inc. | 587,816 | 4,350 |
| * | Immunomedics Inc. | 939,599 | 4,322 |
| * | Vanda Pharmaceuticals Inc. | 347,509 | 4,313 |
| *,^ | Organovo Holdings Inc. | 383,782 | 4,248 |
| * | Orthofix International NV | 185,682 | 4,237 |
| *,^ | Galena Biopharma Inc. | 850,675 | 4,219 |
| *,^ | ZIOPHARM Oncology Inc. | 964,754 | 4,187 |
| * | Anika Therapeutics Inc. | 109,617 | 4,183 |
| * | Cadence Pharmaceuticals Inc. | 459,131 | 4,155 |
| * | Repligen Corp. | 293,921 | 4,009 |
| * | Amedisys Inc. | 271,198 | 3,968 |
| * | Furiex Pharmaceuticals Inc. | 94,443 | 3,968 |
| * | Hi-Tech Pharmacal Co. Inc. | 89,340 | 3,876 |
| * | LHC Group Inc. | 159,617 | 3,837 |
| * | Cynosure Inc. Class A | 141,374 | 3,772 |
| * | Osiris Therapeutics Inc. | 233,834 | 3,760 |
| * | OraSure Technologies Inc. | 592,593 | 3,727 |
| * | Synergy Pharmaceuticals Inc. | 648,895 | 3,653 |
| CryoLife Inc. | 327,310 | 3,630 | |
| * | Endocyte Inc. | 334,059 | 3,571 |
| * | Symmetry Medical Inc. | 346,310 | 3,491 |
| *,^ | Inovio Pharmaceuticals Inc. | 1,201,756 | 3,485 |
| * | Sagent Pharmaceuticals Inc. | 136,874 | 3,474 |
| * | Zogenix Inc. | 998,895 | 3,436 |
| * | Gentiva Health Services Inc. | 274,190 | 3,403 |
26
| Vanguard® Extended Market Index Fund | |||
| Schedule of Investments | |||
| December 31, 2013 | |||
| Market | |||
| Value | |||
| Shares | ($000) | ||
| * | Anacor Pharmaceuticals Inc. | 201,594 | 3,383 |
| * | Repros Therapeutics Inc. | 176,509 | 3,230 |
| * | SurModics Inc. | 131,054 | 3,196 |
| * | Prothena Corp. plc | 120,117 | 3,186 |
| Atrion Corp. | 10,747 | 3,184 | |
| * | AtriCure Inc. | 169,128 | 3,159 |
| * | Tornier NV | 166,753 | 3,133 |
| * | Triple-S Management Corp. Class B | 160,656 | 3,123 |
| *,^ | Unilife Corp. | 703,914 | 3,097 |
| *,^ | Navidea Biopharmaceuticals Inc. | 1,484,608 | 3,073 |
| * | Providence Service Corp. | 119,198 | 3,066 |
| * | GenMark Diagnostics Inc. | 229,315 | 3,052 |
| *,^ | Neuralstem Inc. | 1,046,388 | 3,045 |
| * | TESARO Inc. | 106,696 | 3,013 |
| *,^ | Omeros Corp. | 265,817 | 3,001 |
| * | Vascular Solutions Inc. | 128,899 | 2,984 |
| * | Rigel Pharmaceuticals Inc. | 1,046,991 | 2,984 |
| * | KYTHERA Biopharmaceuticals Inc. | 78,813 | 2,936 |
| * | TearLab Corp. | 310,004 | 2,895 |
| Universal American Corp. | 394,059 | 2,877 | |
| * | Merrimack Pharmaceuticals Inc. | 528,327 | 2,821 |
| * | Sucampo Pharmaceuticals Inc. Class A | 292,680 | 2,751 |
| * | TherapeuticsMD Inc. | 517,215 | 2,695 |
| *,^ | Cytori Therapeutics Inc. | 1,047,509 | 2,692 |
| * | Albany Molecular Research Inc. | 266,756 | 2,689 |
| * | Curis Inc. | 948,967 | 2,676 |
| * | Almost Family Inc. | 82,058 | 2,653 |
| * | Progenics Pharmaceuticals Inc. | 488,585 | 2,604 |
| * | NewLink Genetics Corp. | 118,102 | 2,599 |
| * | Veeva Systems Inc. Class A | 80,840 | 2,595 |
| *,^ | Synta Pharmaceuticals Corp. | 485,953 | 2,546 |
| * | XenoPort Inc. | 441,676 | 2,540 |
| * | Santarus Inc. | 79,423 | 2,538 |
| *,^ | Ampio Pharmaceuticals Inc. | 353,851 | 2,523 |
| * | Alliance HealthCare Services Inc. | 101,861 | 2,520 |
| *,^ | Sequenom Inc. | 1,069,823 | 2,503 |
| * | Zeltiq Aesthetics Inc. | 126,962 | 2,401 |
| * | Corcept Therapeutics Inc. | 734,258 | 2,364 |
| * | Cytokinetics Inc. | 352,878 | 2,294 |
| * | Peregrine Pharmaceuticals Inc. | 1,602,393 | 2,227 |
| * | Achillion Pharmaceuticals Inc. | 666,298 | 2,212 |
| *,^ | Rockwell Medical Inc. | 209,103 | 2,183 |
| * | Sciclone Pharmaceuticals Inc. | 431,449 | 2,175 |
| * | Durect Corp. | 1,192,598 | 2,063 |
| * | Threshold Pharmaceuticals Inc. | 441,248 | 2,061 |
| * | BioDelivery Sciences International Inc. | 344,033 | 2,026 |
| * | Pain Therapeutics Inc. | 416,675 | 2,025 |
| * | Cross Country Healthcare Inc. | 201,774 | 2,014 |
| *,^ | Horizon Pharma Inc. | 261,619 | 1,994 |
| * | Arqule Inc. | 904,439 | 1,945 |
| *,^ | AcelRx Pharmaceuticals Inc. | 171,429 | 1,939 |
| * | Chindex International Inc. | 109,390 | 1,907 |
| * | Harvard Bioscience Inc. | 400,748 | 1,884 |
| * | Five Star Quality Care Inc. | 334,338 | 1,836 |
| * | Fonar Corp. | 84,467 | 1,784 |
| * | Surgical Care Affiliates Inc. | 48,838 | 1,702 |
| Psychemedics Corp. | 115,494 | 1,697 | |
| * | Cutera Inc. | 160,876 | 1,638 |
| * | Vocera Communications Inc. | 104,495 | 1,631 |
| * | Sunesis Pharmaceuticals Inc. | 342,049 | 1,621 |
| Pozen Inc. | 195,732 | 1,574 | |
| * | MEI Pharma Inc. | 194,664 | 1,559 |
| *,^ | Accelerate Diagnostics Inc. | 126,569 | 1,544 |
| * | Targacept Inc. | 351,681 | 1,459 |
27
| Vanguard® Extended Market Index Fund | |||
| Schedule of Investments | |||
| December 31, 2013 | |||
| Market | |||
| Value | |||
| Shares | ($000) | ||
| Simulations Plus Inc. | 275,993 | 1,394 | |
| * | TG Therapeutics Inc. | 355,770 | 1,388 |
| * | Alphatec Holdings Inc. | 684,988 | 1,377 |
| * | Amicus Therapeutics Inc. | 580,796 | 1,365 |
| Digirad Corp. | 362,665 | 1,342 | |
| * | National Research Corp. Class A | 70,149 | 1,320 |
| *,^ | Biolase Inc. | 463,892 | 1,313 |
| * | RTI Surgical Inc. | 366,590 | 1,298 |
| * | Icad Inc. | 110,160 | 1,284 |
| * | Iridex Corp. | 124,615 | 1,267 |
| * | Durata Therapeutics Inc. | 96,842 | 1,239 |
| * | SIGA Technologies Inc. | 364,520 | 1,192 |
| *,^ | NeoStem Inc. | 171,188 | 1,168 |
| * | Solta Medical Inc. | 395,596 | 1,167 |
| *,^ | Cyclacel Pharmaceuticals Inc. | 283,983 | 1,142 |
| *,^ | Catalyst Pharmaceutical Partners Inc. | 562,073 | 1,096 |
| *,^ | Galectin Therapeutics Inc. | 131,261 | 1,061 |
| LeMaitre Vascular Inc. | 132,140 | 1,058 | |
| Utah Medical Products Inc. | 18,407 | 1,052 | |
| *,^ | Celsion Corp. | 269,349 | 1,048 |
| * | Nanosphere Inc. | 444,833 | 1,019 |
| * | Discovery Laboratories Inc. | 446,833 | 1,005 |
| *,^ | Supernus Pharmaceuticals Inc. | 132,308 | 998 |
| * | Oncothyreon Inc. | 562,634 | 990 |
| * | Cempra Inc. | 79,476 | 985 |
| * | Exactech Inc. | 40,053 | 952 |
| * | Biotime Inc. | 261,836 | 943 |
| * | Pacific Biosciences of California Inc. | 175,411 | 917 |
| * | PharmAthene Inc. | 491,354 | 914 |
| * | Idera Pharmaceuticals Inc. | 190,397 | 882 |
| * | Hyperion Therapeutics Inc. | 43,300 | 876 |
| * | Cleveland Biolabs Inc. | 735,255 | 860 |
| * | Esperion Therapeutics Inc. | 62,300 | 856 |
| *,^ | Apricus Biosciences Inc. | 314,675 | 834 |
| * | BioTelemetry Inc. | 104,715 | 831 |
| * | Enzo Biochem Inc. | 278,535 | 813 |
| * | Portola Pharmaceuticals Inc. | 31,429 | 809 |
| * | Stemline Therapeutics Inc. | 41,187 | 807 |
| * | Sunshine Heart Inc. | 82,977 | 806 |
| * | Merge Healthcare Inc. | 341,358 | 792 |
| * | Synergetics USA Inc. | 213,690 | 774 |
| * | BioSpecifics Technologies Corp. | 35,296 | 765 |
| * | Heska Corp. | 82,386 | 720 |
| * | Medical Action Industries Inc. | 83,183 | 712 |
| * | Intrexon Corp. | 29,700 | 707 |
| * | Ophthotech Corp. | 21,065 | 681 |
| *,^ | PhotoMedex Inc. | 51,423 | 666 |
| *,^ | Cell Therapeutics Inc. | 346,735 | 666 |
| * | Mirati Therapeutics Inc. | 39,811 | 662 |
| *,^ | ImmunoCellular Therapeutics Ltd. | 697,039 | 645 |
| Columbia Laboratories Inc. | 97,047 | 641 | |
| *,^ | Palatin Technologies Inc. | 865,720 | 635 |
| * | RadNet Inc. | 373,069 | 623 |
| *,^ | CytRx Corp. | 98,554 | 618 |
| Enzon Pharmaceuticals Inc. | 527,481 | 612 | |
| * | Derma Sciences Inc. | 55,415 | 600 |
| *,^ | Acura Pharmaceuticals Inc. | 356,334 | 595 |
| * | AdCare Health Systems Inc. | 135,530 | 583 |
| * | Synthetic Biologics Inc. | 379,634 | 581 |
| * | Tandem Diabetes Care Inc. | 22,015 | 567 |
| * | Chimerix Inc. | 37,347 | 564 |
| * | Medgenics Inc. | 94,203 | 564 |
| * | Hansen Medical Inc. | 302,763 | 524 |
| * | Cardica Inc. | 526,562 | 513 |
28
| Vanguard® Extended Market Index Fund | |||
| Schedule of Investments | |||
| December 31, 2013 | |||
| Market | |||
| Value | |||
| Shares | ($000) | ||
| * | pSivida Corp. | 127,464 | 506 |
| * | Karyopharm Therapeutics Inc. | 21,969 | 504 |
| *,^ | Bluebird Bio Inc. | 23,800 | 499 |
| *,^ | TrovaGene Inc. | 85,716 | 492 |
| * | Cellular Dynamics International Inc. | 29,750 | 491 |
| * | Verastem Inc. | 42,860 | 489 |
| * | Harvard Apparatus Regenerative Technology Inc. | 100,168 | 476 |
| *,^ | ChemoCentryx Inc. | 79,505 | 460 |
| * | PDI Inc. | 94,976 | 457 |
| * | Acceleron Pharma Inc. | 11,465 | 454 |
| * | Hemispherx Biopharma Inc. | 1,675,052 | 444 |
| * | MacroGenics Inc. | 16,100 | 442 |
| * | Transcept Pharmaceuticals Inc. | 129,739 | 436 |
| * | EnteroMedics Inc. | 212,170 | 433 |
| *,^ | Stereotaxis Inc. | 119,439 | 432 |
| * | Uroplasty Inc. | 157,785 | 431 |
| *,^ | Rexahn Pharmaceuticals Inc. | 779,754 | 398 |
| * | Cancer Genetics Inc. | 28,856 | 398 |
| * | Agios Pharmaceuticals Inc. | 16,160 | 387 |
| * | Cumberland Pharmaceuticals Inc. | 73,721 | 377 |
| *,^ | Opexa Therapeutics Inc. | 206,165 | 375 |
| * | LCA-Vision Inc. | 95,864 | 374 |
| MGC Diagnostics Corp. | 29,309 | 371 | |
| * | Athersys Inc. | 146,347 | 366 |
| * | Cubist Pharmaceutic-CVR | 270,942 | 366 |
| * | Authentidate Holding Corp. | 264,899 | 355 |
| * | Tetraphase Pharmaceuticals Inc. | 26,074 | 353 |
| * | NanoViricides Inc. | 73,278 | 352 |
| * | Agenus Inc. | 132,280 | 349 |
| *,^ | BSD Medical Corp. | 293,101 | 349 |
| * | Receptos Inc. | 11,861 | 344 |
| * | Vical Inc. | 284,142 | 335 |
| * | Mast Therapeutics Inc. | 716,278 | 331 |
| *,^ | Northwest Biotherapeutics Inc. | 84,302 | 318 |
| * | Arrowhead Research Corp. | 28,201 | 306 |
| * | Retractable Technologies Inc. | 97,255 | 300 |
| * | Pernix Therapeutics Holdings | 118,747 | 299 |
| * | Sharps Compliance Corp. | 63,085 | 298 |
| *,^ | Novabay Pharmaceuticals Inc. | 235,841 | 290 |
| * | ERBA Diagnostics Inc. | 100,949 | 283 |
| * | Ventrus Biosciences Inc. | 73,128 | 279 |
| * | Bovie Medical Corp. | 128,896 | 273 |
| *,^ | Foundation Medicine Inc. | 11,416 | 272 |
| * | Cornerstone Therapeutics Inc. | 28,390 | 269 |
| * | Codexis Inc. | 186,711 | 261 |
| * | Vision Sciences Inc. | 254,570 | 255 |
| *,^ | Bacterin International Holdings Inc. | 506,800 | 253 |
| *,^ | OncoMed Pharmaceuticals Inc. | 8,579 | 253 |
| *,^ | Oculus Innovative Sciences Inc. | 72,361 | 252 |
| * | Hooper Holmes Inc. | 466,668 | 247 |
| * | Skilled Healthcare Group Inc. | 50,496 | 243 |
| * | Bioanalytical Systems Inc. | 86,496 | 233 |
| * | Coronado Biosciences Inc. | 86,710 | 228 |
| * | Anthera Pharmaceuticals Inc. Class A | 73,835 | 227 |
| * | Epizyme Inc. | 10,444 | 217 |
| * | Alexza Pharmaceuticals Inc. | 45,712 | 216 |
| * | NeoGenomics Inc. | 58,177 | 211 |
| * | Ambit Biosciences Corp. | 21,761 | 210 |
| * | Alimera Sciences Inc. | 43,663 | 206 |
| * | EntreMed Inc. | 119,606 | 205 |
| * | IsoRay Inc. | 406,044 | 203 |
| *,^ | BG Medicine Inc. | 185,274 | 193 |
| * | BIND Therapeutics Inc. | 12,730 | 192 |
| * | ANI Pharmaceuticals Inc. | 9,548 | 192 |
29
| Vanguard® Extended Market Index Fund | |||
| Schedule of Investments | |||
| December 31, 2013 | |||
| Market | |||
| Value | |||
| Shares | ($000) | ||
| * | PTC Therapeutics Inc. | 9,536 | 162 |
| * | Veracyte Inc. | 10,958 | 159 |
| * | MediciNova Inc. | 71,942 | 154 |
| * | iBio Inc. | 459,496 | 154 |
| * | GTx Inc. | 83,499 | 138 |
| * | Biota Pharmaceuticals Inc. | 32,627 | 137 |
| * | Biodel Inc. | 58,911 | 136 |
| *,^ | Baxano Surgical Inc. | 127,801 | 129 |
| * | AVEO Pharmaceuticals Inc. | 69,104 | 127 |
| * | Escalon Medical Corp. | 59,011 | 120 |
| * | StemCells Inc. | 96,504 | 119 |
| * | Ocera Therapeutics Inc. | 9,085 | 118 |
| * | Cel-Sci Corp. | 194,755 | 115 |
| * | CAS Medical Systems Inc. | 66,116 | 112 |
| * | Vermillion Inc. | 43,524 | 103 |
| * | Delcath Systems Inc. | 366,347 | 93 |
| * | Onconova Therapeutics Inc. | 8,083 | 93 |
| * | Insys Therapeutics Inc. | 2,300 | 89 |
| * | Misonix Inc. | 15,828 | 89 |
| * | ProPhase Labs Inc. | 52,286 | 86 |
| * | American Caresource Holdings Inc. | 51,566 | 85 |
| * | Addus HomeCare Corp. | 3,355 | 75 |
| * | Regulus Therapeutics Inc. | 9,982 | 74 |
| *,^ | Venaxis Inc. | 34,036 | 73 |
| * | NuPathe Inc. | 21,502 | 70 |
| * | Aastrom Biosciences Inc. | 20,875 | 67 |
| * | Lpath Inc. Class A | 14,808 | 63 |
| * | Chembio Diagnostics Inc. | 17,355 | 58 |
| * | NanoString Technologies Inc. | 3,365 | 58 |
| * | VirtualScopics Inc. | 16,180 | 56 |
| * | SunLink Health Systems Inc. | 59,900 | 52 |
| * | Ligand Pharmaceuticals Inc. Rights | 395,811 | 48 |
| * | Aratana Therapeutics Inc. | 1,705 | 33 |
| * | Urologix Inc. | 160,918 | 29 |
| * | Metabolix Inc. | 20,961 | 26 |
| * | Allied Healthcare Products Inc. | 10,415 | 24 |
| Ligand Pharmaceuticals Inc. Rights | 395,811 | 24 | |
| * | CombiMatrix Corp. | 9,624 | 22 |
| * | Telik Inc. | 14,700 | 18 |
| * | ARCA Biopharma Inc. | 10,322 | 17 |
| *,^ | Wright Medical Group Inc. CVR Exp. 12/31/2049 | 52,493 | 17 |
| * | OncoGenex Pharmaceutical Inc. | 1,752 | 15 |
| Cardium Therapeutics Inc. | 15,324 | 13 | |
| *,^ | Oxygen Biotherapeutics Inc. | 2,210 | 10 |
| * | Sorrento Therapeutics Inc. | 1,200 | 10 |
| * | Enanta Pharmaceuticals Inc. | 300 | 8 |
| * | Response Genetics Inc. | 5,975 | 7 |
| *,^ | NeuroMetrix Inc. | 1,751 | 5 |
| * | Ligand Pharmaceuticals Inc. Rights | 395,811 | 3 |
| * | DARA Biosciences Inc. | 5,069 | 3 |
| * | Ligand Pharmaceuticals Inc. Rights | 395,811 | 2 |
| * | GenVec Inc. | 800 | 2 |
| * | Zalicus Inc. | 1,671 | 2 |
| * | MELA Sciences Inc. | 40 | — |
| Maxygen Inc. | 143 | — | |
| 4,044,770 | |||
| Industrials (15.3%) | |||
| * | United Continental Holdings Inc. | 3,304,681 | 125,016 |
| * | Hertz Global Holdings Inc. | 4,113,052 | 117,716 |
| * | Verisk Analytics Inc. Class A | 1,373,586 | 90,272 |
| Chicago Bridge & Iron Co. NV | 985,041 | 81,896 | |
| * | B/E Aerospace Inc. | 903,269 | 78,612 |
| Towers Watson & Co. Class A | 590,734 | 75,384 | |
| TransDigm Group Inc. | 453,037 | 72,948 | |
30
| Vanguard® Extended Market Index Fund | |||
| Schedule of Investments | |||
| December 31, 2013 | |||
| Market | |||
| Value | |||
| Shares | ($000) | ||
| Fortune Brands Home & Security Inc. | 1,523,454 | 69,622 | |
| * | IHS Inc. Class A | 566,244 | 67,779 |
| * | United Rentals Inc. | 856,063 | 66,730 |
| Wabtec Corp. | 883,423 | 65,612 | |
| JB Hunt Transport Services Inc. | 839,601 | 64,901 | |
| Manpowergroup Inc. | 721,450 | 61,944 | |
| IDEX Corp. | 744,968 | 55,016 | |
| Hubbell Inc. Class B | 494,863 | 53,891 | |
| Lincoln Electric Holdings Inc. | 749,177 | 53,446 | |
| Donaldson Co. Inc. | 1,227,764 | 53,359 | |
| * | WABCO Holdings Inc. | 567,256 | 52,987 |
| * | Sensata Technologies Holding NV | 1,345,631 | 52,170 |
| * | Colfax Corp. | 812,598 | 51,754 |
| * | Kirby Corp. | 521,046 | 51,714 |
| Waste Connections Inc. | 1,133,243 | 49,443 | |
| AGCO Corp. | 830,737 | 49,171 | |
| Alaska Air Group Inc. | 640,610 | 47,002 | |
| Carlisle Cos. Inc. | 585,231 | 46,467 | |
| * | Genesee & Wyoming Inc. Class A | 465,312 | 44,693 |
| *,^ | American Airlines Group Inc. | 1,765,128 | 44,569 |
| Graco Inc. | 563,878 | 44,050 | |
| KBR Inc. | 1,358,231 | 43,314 | |
| Acuity Brands Inc. | 392,868 | 42,948 | |
| Terex Corp. | 1,021,550 | 42,895 | |
| * | Middleby Corp. | 175,323 | 42,072 |
| SPX Corp. | 415,783 | 41,416 | |
| * | Owens Corning | 1,014,274 | 41,301 |
| Nordson Corp. | 553,037 | 41,091 | |
| Huntington Ingalls Industries Inc. | 455,932 | 41,038 | |
| * | Hexcel Corp. | 914,548 | 40,871 |
| Timken Co. | 731,872 | 40,304 | |
| * | Avis Budget Group Inc. | 992,976 | 40,136 |
| Oshkosh Corp. | 788,693 | 39,734 | |
| Trinity Industries Inc. | 720,988 | 39,308 | |
| AO Smith Corp. | 699,966 | 37,756 | |
| * | Copart Inc. | 1,024,235 | 37,538 |
| KAR Auction Services Inc. | 1,267,902 | 37,467 | |
| Kennametal Inc. | 716,189 | 37,292 | |
| * | WESCO International Inc. | 406,148 | 36,988 |
| Valmont Industries Inc. | 245,726 | 36,643 | |
| URS Corp. | 686,801 | 36,394 | |
| Triumph Group Inc. | 478,059 | 36,366 | |
| ITT Corp. | 828,807 | 35,987 | |
| Lennox International Inc. | 421,559 | 35,858 | |
| Alliant Techsystems Inc. | 294,095 | 35,785 | |
| MSC Industrial Direct Co. Inc. Class A | 442,245 | 35,764 | |
| Generac Holdings Inc. | 629,343 | 35,646 | |
| Babcock & Wilcox Co. | 1,020,293 | 34,884 | |
| * | Old Dominion Freight Line Inc. | 640,745 | 33,972 |
| RR Donnelley & Sons Co. | 1,669,241 | 33,852 | |
| Toro Co. | 525,754 | 33,438 | |
| Exelis Inc. | 1,730,192 | 32,977 | |
| * | Spirit Aerosystems Holdings Inc. Class A | 928,771 | 31,653 |
| * | Teledyne Technologies Inc. | 343,969 | 31,597 |
| EnerSys Inc. | 438,066 | 30,704 | |
| Regal-Beloit Corp. | 414,014 | 30,521 | |
| * | Clean Harbors Inc. | 506,835 | 30,390 |
| * | Spirit Airlines Inc. | 667,990 | 30,333 |
| * | MRC Global Inc. | 935,371 | 30,175 |
| * | Foster Wheeler AG | 913,151 | 30,152 |
| Crane Co. | 447,414 | 30,089 | |
| CLARCOR Inc. | 459,185 | 29,549 | |
| * | Esterline Technologies Corp. | 288,721 | 29,438 |
| Manitowoc Co. Inc. | 1,229,013 | 28,661 | |
31
| Vanguard® Extended Market Index Fund | |||
| Schedule of Investments | |||
| December 31, 2013 | |||
| Market | |||
| Value | |||
| Shares | ($000) | ||
| * | Moog Inc. Class A | 416,101 | 28,270 |
| Curtiss-Wright Corp. | 433,426 | 26,972 | |
| * | Chart Industries Inc. | 279,092 | 26,692 |
| * | AECOM Technology Corp. | 897,978 | 26,428 |
| EMCOR Group Inc. | 615,353 | 26,116 | |
| * | DigitalGlobe Inc. | 625,574 | 25,742 |
| Woodward Inc. | 557,457 | 25,426 | |
| Air Lease Corp. Class A | 811,971 | 25,236 | |
| Actuant Corp. Class A | 673,571 | 24,680 | |
| Deluxe Corp. | 464,253 | 24,229 | |
| HEICO Corp. | 417,325 | 24,184 | |
| Landstar System Inc. | 419,217 | 24,084 | |
| * | USG Corp. | 848,498 | 24,080 |
| Corporate Executive Board Co. | 308,815 | 23,912 | |
| Watsco Inc. | 247,350 | 23,760 | |
| * | Navistar International Corp. | 617,350 | 23,577 |
| * | Swift Transportation Co. | 1,002,982 | 22,276 |
| GATX Corp. | 424,950 | 22,170 | |
| Covanta Holding Corp. | 1,197,626 | 21,258 | |
| * | Advisory Board Co. | 333,103 | 21,209 |
| Harsco Corp. | 742,861 | 20,822 | |
| Con-way Inc. | 519,632 | 20,635 | |
| * | Armstrong World Industries Inc. | 357,283 | 20,583 |
| Applied Industrial Technologies Inc. | 388,457 | 19,069 | |
| Healthcare Services Group Inc. | 643,356 | 18,252 | |
| * | MasTec Inc. | 554,631 | 18,148 |
| * | Beacon Roofing Supply Inc. | 450,390 | 18,142 |
| Rollins Inc. | 591,885 | 17,928 | |
| TAL International Group Inc. | 311,959 | 17,891 | |
| *,^ | SolarCity Corp. | 309,471 | 17,584 |
| * | JetBlue Airways Corp. | 2,004,324 | 17,137 |
| United Stationers Inc. | 368,254 | 16,899 | |
| *,^ | Polypore International Inc. | 428,823 | 16,681 |
| * | Tetra Tech Inc. | 593,429 | 16,604 |
| Watts Water Technologies Inc. Class A | 263,280 | 16,289 | |
| Mueller Industries Inc. | 258,395 | 16,281 | |
| HNI Corp. | 417,685 | 16,219 | |
| * | WageWorks Inc. | 271,774 | 16,154 |
| Barnes Group Inc. | 420,125 | 16,095 | |
| Franklin Electric Co. Inc. | 359,066 | 16,029 | |
| Herman Miller Inc. | 540,158 | 15,945 | |
| * | Mobile Mini Inc. | 374,455 | 15,420 |
| * | Trimas Corp. | 386,217 | 15,406 |
| * | FTI Consulting Inc. | 373,928 | 15,383 |
| Brink's Co. | 447,936 | 15,293 | |
| UniFirst Corp. | 140,156 | 14,997 | |
| * | RBC Bearings Inc. | 211,408 | 14,957 |
| Mine Safety Appliances Co. | 290,613 | 14,882 | |
| * | On Assignment Inc. | 424,574 | 14,826 |
| UTi Worldwide Inc. | 839,043 | 14,734 | |
| Allegiant Travel Co. Class A | 137,121 | 14,458 | |
| Raven Industries Inc. | 342,845 | 14,105 | |
| Simpson Manufacturing Co. Inc. | 376,423 | 13,826 | |
| Mueller Water Products Inc. Class A | 1,461,123 | 13,691 | |
| * | Huron Consulting Group Inc. | 216,293 | 13,566 |
| ABM Industries Inc. | 474,009 | 13,552 | |
| General Cable Corp. | 457,765 | 13,463 | |
| Brady Corp. Class A | 429,066 | 13,271 | |
| * | Proto Labs Inc. | 186,072 | 13,245 |
| CIRCOR International Inc. | 162,954 | 13,163 | |
| * | Orbital Sciences Corp. | 555,646 | 12,947 |
| * | Hub Group Inc. Class A | 323,205 | 12,889 |
| * | AMERCO | 54,018 | 12,848 |
| Forward Air Corp. | 287,229 | 12,612 | |
32
| Vanguard® Extended Market Index Fund | |||
| Schedule of Investments | |||
| December 31, 2013 | |||
| Market | |||
| Value | |||
| Shares | ($000) | ||
| * | HD Supply Holdings Inc. | 508,342 | 12,205 |
| * | GrafTech International Ltd. | 1,086,080 | 12,197 |
| * | Korn/Ferry International | 464,599 | 12,135 |
| Granite Construction Inc. | 341,811 | 11,957 | |
| Interface Inc. Class A | 537,660 | 11,807 | |
| AZZ Inc. | 239,685 | 11,711 | |
| Tennant Co. | 169,968 | 11,526 | |
| Aircastle Ltd. | 595,389 | 11,408 | |
| * | Trex Co. Inc. | 142,773 | 11,355 |
| G&K Services Inc. Class A | 182,393 | 11,350 | |
| * | Nortek Inc. | 150,350 | 11,216 |
| * | EnPro Industries Inc. | 192,816 | 11,116 |
| * | DXP Enterprises Inc. | 95,231 | 10,971 |
| Werner Enterprises Inc. | 428,607 | 10,599 | |
| Knight Transportation Inc. | 567,918 | 10,416 | |
| Matson Inc. | 394,372 | 10,297 | |
| AAR Corp. | 361,594 | 10,128 | |
| *,^ | GenCorp Inc. | 560,414 | 10,099 |
| Cubic Corp. | 191,568 | 10,088 | |
| Primoris Services Corp. | 322,693 | 10,045 | |
| ^ | Lindsay Corp. | 120,985 | 10,012 |
| Kaman Corp. | 250,877 | 9,967 | |
| * | TrueBlue Inc. | 378,337 | 9,754 |
| Hyster-Yale Materials Handling Inc. | 104,459 | 9,731 | |
| * | Meritor Inc. | 927,273 | 9,671 |
| * | Rexnord Corp. | 357,837 | 9,665 |
| * | Rush Enterprises Inc. Class A | 325,683 | 9,657 |
| Universal Forest Products Inc. | 184,548 | 9,622 | |
| Briggs & Stratton Corp. | 441,580 | 9,609 | |
| * | Atlas Air Worldwide Holdings Inc. | 232,859 | 9,582 |
| Encore Wire Corp. | 176,434 | 9,563 | |
| Exponent Inc. | 123,159 | 9,537 | |
| Apogee Enterprises Inc. | 265,122 | 9,521 | |
| Sun Hydraulics Corp. | 230,585 | 9,415 | |
| Albany International Corp. | 258,871 | 9,301 | |
| Titan International Inc. | 511,610 | 9,199 | |
| * | Navigant Consulting Inc. | 477,963 | 9,177 |
| * | Tutor Perini Corp. | 348,203 | 9,158 |
| * | II-VI Inc. | 518,204 | 9,120 |
| Steelcase Inc. Class A | 569,266 | 9,029 | |
| * | Masonite International Corp. | 149,191 | 8,951 |
| Heartland Express Inc. | 456,150 | 8,950 | |
| McGrath RentCorp | 224,648 | 8,941 | |
| Altra Industrial Motion Corp. | 260,121 | 8,901 | |
| Arkansas Best Corp. | 262,166 | 8,830 | |
| John Bean Technologies Corp. | 297,176 | 8,716 | |
| * | Wesco Aircraft Holdings Inc. | 391,335 | 8,578 |
| * | Dycom Industries Inc. | 308,328 | 8,568 |
| * | Federal Signal Corp. | 577,240 | 8,457 |
| ESCO Technologies Inc. | 245,474 | 8,410 | |
| Knoll Inc. | 454,968 | 8,330 | |
| * | H&E Equipment Services Inc. | 279,787 | 8,290 |
| AAON Inc. | 255,102 | 8,151 | |
| * | Wabash National Corp. | 655,040 | 8,090 |
| * | Aegion Corp. Class A | 367,865 | 8,053 |
| Comfort Systems USA Inc. | 413,196 | 8,012 | |
| * | Team Inc. | 185,839 | 7,868 |
| Astec Industries Inc. | 203,145 | 7,847 | |
| Standex International Corp. | 124,319 | 7,817 | |
| * | Greenbrier Cos. Inc. | 237,373 | 7,795 |
| Insperity Inc. | 210,163 | 7,593 | |
| * | Taser International Inc. | 475,945 | 7,558 |
| * | Saia Inc. | 228,630 | 7,328 |
| * | ACCO Brands Corp. | 1,090,149 | 7,326 |
33
| Vanguard® Extended Market Index Fund | |||
| Schedule of Investments | |||
| December 31, 2013 | |||
| Market | |||
| Value | |||
| Shares | ($000) | ||
| * | Thermon Group Holdings Inc. | 260,995 | 7,133 |
| SkyWest Inc. | 480,359 | 7,124 | |
| Quanex Building Products Corp. | 357,602 | 7,123 | |
| Barrett Business Services Inc. | 75,880 | 7,037 | |
| Acacia Research Corp. | 468,800 | 6,816 | |
| * | Blount International Inc. | 470,183 | 6,804 |
| US Ecology Inc. | 182,056 | 6,771 | |
| Aceto Corp. | 260,105 | 6,505 | |
| Resources Connection Inc. | 453,716 | 6,502 | |
| Kelly Services Inc. Class A | 258,225 | 6,440 | |
| Quad/Graphics Inc. | 235,969 | 6,425 | |
| American Science & Engineering Inc. | 89,218 | 6,416 | |
| * | Consolidated Graphics Inc. | 94,750 | 6,390 |
| Gorman-Rupp Co. | 188,402 | 6,298 | |
| Griffon Corp. | 471,089 | 6,223 | |
| * | ICF International Inc. | 177,262 | 6,153 |
| Kforce Inc. | 295,884 | 6,054 | |
| *,^ | XPO Logistics Inc. | 223,349 | 5,872 |
| Viad Corp. | 207,742 | 5,771 | |
| * | Columbus McKinnon Corp. | 202,213 | 5,488 |
| Kadant Inc. | 134,087 | 5,433 | |
| Powell Industries Inc. | 78,818 | 5,280 | |
| * | MYR Group Inc. | 205,342 | 5,150 |
| * | Gibraltar Industries Inc. | 276,691 | 5,144 |
| Marten Transport Ltd. | 250,746 | 5,063 | |
| * | American Woodmark Corp. | 123,573 | 4,885 |
| * | Great Lakes Dredge & Dock Corp. | 522,708 | 4,809 |
| * | Aerovironment Inc. | 164,020 | 4,778 |
| * | Roadrunner Transportation Systems Inc. | 175,142 | 4,720 |
| Alamo Group Inc. | 77,278 | 4,690 | |
| Celadon Group Inc. | 240,586 | 4,687 | |
| * | Park-Ohio Holdings Corp. | 86,852 | 4,551 |
| * | CBIZ Inc. | 489,724 | 4,466 |
| Multi-Color Corp. | 114,249 | 4,312 | |
| *,^ | Hawaiian Holdings Inc. | 445,257 | 4,288 |
| * | National Presto Industries Inc. | 53,254 | 4,287 |
| LB Foster Co. Class A | 90,543 | 4,282 | |
| * | Kratos Defense & Security Solutions Inc. | 556,128 | 4,271 |
| * | RPX Corp. | 252,551 | 4,268 |
| HEICO Corp. Class A | 101,171 | 4,261 | |
| Ennis Inc. | 237,028 | 4,195 | |
| *,^ | ExOne Co. | 68,000 | 4,111 |
| * | Astronics Corp. | 79,567 | 4,058 |
| Heidrick & Struggles International Inc. | 201,271 | 4,054 | |
| * | SP Plus Corp. | 155,574 | 4,051 |
| * | Air Transport Services Group Inc. | 498,671 | 4,034 |
| * | Northwest Pipe Co. | 106,213 | 4,011 |
| * | Engility Holdings Inc. | 116,357 | 3,886 |
| * | Lydall Inc. | 220,384 | 3,883 |
| American Railcar Industries Inc. | 84,624 | 3,872 | |
| * | GP Strategies Corp. | 129,417 | 3,855 |
| * | Republic Airways Holdings Inc. | 360,353 | 3,852 |
| *,^ | Capstone Turbine Corp. | 2,950,341 | 3,806 |
| Ceco Environmental Corp. | 230,440 | 3,726 | |
| Kimball International Inc. Class B | 247,663 | 3,722 | |
| West Corp. | 142,093 | 3,653 | |
| * | EnerNOC Inc. | 211,481 | 3,640 |
| FreightCar America Inc. | 129,703 | 3,453 | |
| Insteel Industries Inc. | 149,567 | 3,400 | |
| * | Ducommun Inc. | 112,690 | 3,359 |
| NN Inc. | 164,562 | 3,323 | |
| * | Vicor Corp. | 244,584 | 3,282 |
| Douglas Dynamics Inc. | 193,517 | 3,255 | |
| Coleman Cable Inc. | 119,303 | 3,128 | |
34
| Vanguard® Extended Market Index Fund | |||
| Schedule of Investments | |||
| December 31, 2013 | |||
| Market | |||
| Value | |||
| Shares | ($000) | ||
| Global Power Equipment Group Inc. | 158,459 | 3,101 | |
| * | Orion Marine Group Inc. | 257,692 | 3,100 |
| * | Furmanite Corp. | 287,605 | 3,054 |
| CDI Corp. | 162,978 | 3,020 | |
| * | Pacer International Inc. | 360,936 | 2,981 |
| Graham Corp. | 81,273 | 2,949 | |
| * | Layne Christensen Co. | 172,054 | 2,939 |
| *,^ | Titan Machinery Inc. | 164,699 | 2,935 |
| * | Mistras Group Inc. | 134,805 | 2,815 |
| Dynamic Materials Corp. | 122,439 | 2,662 | |
| Houston Wire & Cable Co. | 198,813 | 2,660 | |
| * | NCI Building Systems Inc. | 148,034 | 2,597 |
| * | ARC Document Solutions Inc. | 312,993 | 2,573 |
| VSE Corp. | 53,516 | 2,569 | |
| * | Builders FirstSource Inc. | 346,714 | 2,476 |
| * | PowerSecure International Inc. | 142,888 | 2,453 |
| * | CAI International Inc. | 103,898 | 2,449 |
| * | Pendrell Corp. | 1,202,471 | 2,417 |
| * | Xerium Technologies Inc. | 141,272 | 2,330 |
| * | Echo Global Logistics Inc. | 107,312 | 2,305 |
| * | InnerWorkings Inc. | 292,769 | 2,281 |
| * | Franklin Covey Co. | 114,259 | 2,271 |
| Argan Inc. | 82,358 | 2,270 | |
| *,^ | YRC Worldwide Inc. | 128,473 | 2,232 |
| * | Accuride Corp. | 588,176 | 2,194 |
| * | KEYW Holding Corp. | 160,450 | 2,156 |
| * | Cenveo Inc. | 577,065 | 1,985 |
| * | Energy Recovery Inc. | 352,703 | 1,961 |
| * | Power Solutions International Inc. | 25,764 | 1,935 |
| * | USA Truck Inc. | 142,489 | 1,907 |
| Ampco-Pittsburgh Corp. | 97,646 | 1,899 | |
| * | PAM Transportation Services Inc. | 91,576 | 1,897 |
| * | Pike Corp. | 176,366 | 1,864 |
| * | Astronics Corp. Class B | 36,702 | 1,863 |
| * | CRA International Inc. | 92,773 | 1,837 |
| *,^ | FuelCell Energy Inc. | 1,279,651 | 1,804 |
| Twin Disc Inc. | 69,364 | 1,796 | |
| * | Quality Distribution Inc. | 136,724 | 1,754 |
| Universal Truckload Services Inc. | 57,202 | 1,745 | |
| * | Commercial Vehicle Group Inc. | 238,845 | 1,736 |
| * | Sterling Construction Co. Inc. | 146,931 | 1,724 |
| Schawk Inc. Class A | 114,357 | 1,700 | |
| LSI Industries Inc. | 194,288 | 1,684 | |
| International Shipholding Corp. | 56,822 | 1,676 | |
| Intersections Inc. | 215,104 | 1,676 | |
| * | Patrick Industries Inc. | 57,833 | 1,673 |
| Preformed Line Products Co. | 22,204 | 1,624 | |
| Allied Motion Technologies Inc. | 128,498 | 1,600 | |
| Miller Industries Inc. | 85,479 | 1,592 | |
| *,^ | Odyssey Marine Exploration Inc. | 781,641 | 1,579 |
| NL Industries Inc. | 137,008 | 1,532 | |
| Courier Corp. | 81,319 | 1,471 | |
| * | PGT Inc. | 144,618 | 1,464 |
| * | Performant Financial Corp. | 141,992 | 1,463 |
| * | CPI Aerostructures Inc. | 96,915 | 1,458 |
| * | Patriot Transportation Holding Inc. | 34,975 | 1,452 |
| Baltic Trading Ltd. | 210,827 | 1,358 | |
| *,^ | Real Goods Solar Inc. Class A | 438,860 | 1,325 |
| * | LMI Aerospace Inc. | 89,195 | 1,315 |
| SIFCO Industries Inc. | 46,392 | 1,302 | |
| * | Flow International Corp. | 315,236 | 1,274 |
| * | Willis Lease Finance Corp. | 70,407 | 1,222 |
| * | Magnetek Inc. | 50,100 | 1,198 |
| * | Ply Gem Holdings Inc. | 66,403 | 1,197 |
35
| Vanguard® Extended Market Index Fund | |||
| Schedule of Investments | |||
| December 31, 2013 | |||
| Market | |||
| Value | |||
| Shares | ($000) | ||
| * | Ameresco Inc. Class A | 121,222 | 1,171 |
| * | Active Power Inc. | 344,211 | 1,160 |
| * | Rand Logistics Inc. | 193,713 | 1,118 |
| Hurco Cos. Inc. | 40,210 | 1,006 | |
| * | API Technologies Corp. | 293,596 | 1,001 |
| * | PMFG Inc. | 107,380 | 972 |
| Hardinge Inc. | 66,364 | 960 | |
| * | TRC Cos. Inc. | 133,600 | 954 |
| * | BlueLinx Holdings Inc. | 455,425 | 888 |
| * | Mfri Inc. | 61,557 | 883 |
| *,^ | Astrotech Corp. | 304,120 | 861 |
| * | Innovative Solutions & Support Inc. | 115,439 | 842 |
| * | Lawson Products Inc. | 67,897 | 832 |
| * | Manitex International Inc. | 51,159 | 812 |
| * | Supreme Industries Inc. Class A | 137,574 | 802 |
| * | Hudson Technologies Inc. | 212,882 | 788 |
| *,^ | American Superconductor Corp. | 473,397 | 776 |
| * | Fuel Tech Inc. | 100,300 | 711 |
| * | Hill International Inc. | 179,068 | 707 |
| * | Orion Energy Systems Inc. | 101,795 | 692 |
| *,^ | Revolution Lighting Technologies Inc. | 201,900 | 692 |
| * | Sparton Corp. | 24,010 | 671 |
| * | Swisher Hygiene Inc. | 1,276,797 | 656 |
| Providence and Worcester Railroad Co. | 31,838 | 623 | |
| * | Tecumseh Products Co. Class A | 68,413 | 619 |
| *,^ | Eagle Bulk Shipping Inc. | 134,748 | 619 |
| * | Innotrac Corp. | 74,779 | 613 |
| Global Brass & Copper Holdings Inc. | 37,048 | 613 | |
| * | Arotech Corp. | 169,743 | 592 |
| * | Hudson Global Inc. | 144,078 | 579 |
| Omega Flex Inc. | 28,118 | 575 | |
| * | Key Technology Inc. | 38,521 | 552 |
| * | Casella Waste Systems Inc. Class A | 92,753 | 538 |
| LS Starrett Co. Class A | 36,454 | 531 | |
| Eastern Co. | 31,545 | 502 | |
| Ecology and Environment Inc. | 45,100 | 502 | |
| * | Heritage-Crystal Clean Inc. | 23,754 | 487 |
| Acorn Energy Inc. | 110,249 | 449 | |
| * | Virco Manufacturing Corp. | 188,287 | 439 |
| * | Gencor Industries Inc. | 41,010 | 391 |
| * | Adept Technology Inc. | 23,162 | 391 |
| * | American Electric Technologies Inc. | 37,160 | 371 |
| * | Ultralife Corp. | 98,312 | 349 |
| Mastech Holdings Inc. | 24,267 | 340 | |
| * | RCM Technologies Inc. | 47,961 | 335 |
| * | Covenant Transportation Group Inc. Class A | 39,032 | 320 |
| *,^ | Genco Shipping & Trading Ltd. | 108,151 | 270 |
| * | Metalico Inc. | 127,383 | 264 |
| * | Jewett-Cameron Trading Co. Ltd. | 23,964 | 250 |
| * | Integrated Electrical Services Inc. | 45,122 | 243 |
| Sypris Solutions Inc. | 79,234 | 242 | |
| * | Taylor Devices Inc. | 27,295 | 222 |
| * | Versar Inc. | 42,809 | 207 |
| * | Transcat Inc. | 25,670 | 205 |
| * | Lightbridge Corp. | 138,689 | 201 |
| * | Perma-Fix Environmental Services | 61,035 | 198 |
| *,^ | Ascent Solar Technologies Inc. | 281,332 | 198 |
| *,^ | Enphase Energy Inc. | 29,613 | 188 |
| *,^ | Plug Power Inc. | 116,900 | 181 |
| * | Dolan Co. | 254,398 | 178 |
| Servotronics Inc. | 19,902 | 163 | |
| * | UniTek Global Services Inc. | 94,665 | 157 |
| * | AMREP Corp. | 21,268 | 148 |
| * | Breeze-Eastern Corp. | 15,615 | 144 |
36
| Vanguard® Extended Market Index Fund | |||
| Schedule of Investments | |||
| December 31, 2013 | |||
| Market | |||
| Value | |||
| Shares | ($000) | ||
| * | Rush Enterprises Inc. Class B | 5,550 | 142 |
| * | Luna Innovations Inc. | 86,079 | 121 |
| * | Erickson Air-Crane Inc. | 5,100 | 106 |
| * | Tecumseh Products Co. Class B | 11,900 | 103 |
| * | Essex Rental Corp. | 30,245 | 99 |
| * | Altair Nanotechnologies Inc. | 12,362 | 50 |
| Hubbell Inc. Class A | 500 | 49 | |
| * | ZBB Energy Corp. | 54,312 | 48 |
| * | Industrial Services of America Inc. | 13,228 | 42 |
| * | Lime Energy Co. | 12,704 | 37 |
| * | DLH Holdings Corp. | 17,157 | 26 |
| * | CTPartners Executive Search Inc. | 2,973 | 17 |
| *,^ | Spherix Inc. | 1,456 | 12 |
| * | General Finance Corp. | 1,811 | 11 |
| * | Broadwind Energy Inc. | 263 | 2 |
| * | Innovaro Inc. | 36,380 | 2 |
| 5,603,680 | |||
| Information Technology (15.7%) | |||
| * | LinkedIn Corp. Class A | 883,239 | 191,513 |
| Avago Technologies Ltd. Class A | 2,265,153 | 119,804 | |
| * | Trimble Navigation Ltd. | 2,355,370 | 81,731 |
| *,^ | 3D Systems Corp. | 872,919 | 81,120 |
| * | Equinix Inc. | 454,603 | 80,669 |
| * | FleetCor Technologies Inc. | 668,560 | 78,335 |
| * | ANSYS Inc. | 848,236 | 73,966 |
| Maxim Integrated Products Inc. | 2,580,607 | 72,025 | |
| * | VMware Inc. Class A | 788,333 | 70,721 |
| Activision Blizzard Inc. | 3,937,540 | 70,206 | |
| * | Cree Inc. | 1,102,588 | 68,989 |
| * | Gartner Inc. | 841,823 | 59,812 |
| * | Synopsys Inc. | 1,417,032 | 57,489 |
| Avnet Inc. | 1,258,813 | 55,526 | |
| * | NCR Corp. | 1,523,405 | 51,887 |
| * | ServiceNow Inc. | 924,697 | 51,792 |
| * | Splunk Inc. | 744,035 | 51,093 |
| * | Arrow Electronics Inc. | 920,105 | 49,916 |
| * | Skyworks Solutions Inc. | 1,722,826 | 49,204 |
| * | CoStar Group Inc. | 262,662 | 48,482 |
| IAC/InterActiveCorp | 700,601 | 48,124 | |
| Jack Henry & Associates Inc. | 781,953 | 46,299 | |
| Solera Holdings Inc. | 631,532 | 44,687 | |
| * | Concur Technologies Inc. | 431,674 | 44,540 |
| Global Payments Inc. | 665,651 | 43,261 | |
| Broadridge Financial Solutions Inc. | 1,092,768 | 43,186 | |
| * | Informatica Corp. | 994,774 | 41,283 |
| * | Rackspace Hosting Inc. | 1,047,024 | 40,970 |
| FactSet Research Systems Inc. | 369,866 | 40,160 | |
| * | Pandora Media Inc. | 1,490,194 | 39,639 |
| * | MICROS Systems Inc. | 687,526 | 39,443 |
| * | Ultimate Software Group Inc. | 254,293 | 38,963 |
| * | PTC Inc. | 1,099,308 | 38,905 |
| * | Cadence Design Systems Inc. | 2,627,725 | 36,841 |
| * | Vantiv Inc. Class A | 1,121,294 | 36,565 |
| * | Brocade Communications Systems Inc. | 4,102,337 | 36,388 |
| * | Yelp Inc. Class A | 524,146 | 36,140 |
| * | Aspen Technology Inc. | 857,426 | 35,840 |
| * | Nuance Communications Inc. | 2,352,245 | 35,754 |
| * | WEX Inc. | 356,835 | 35,337 |
| FEI Co. | 383,457 | 34,266 | |
| * | ON Semiconductor Corp. | 4,144,332 | 34,149 |
| * | AOL Inc. | 716,695 | 33,412 |
| * | Ingram Micro Inc. | 1,407,772 | 33,026 |
| * | TIBCO Software Inc. | 1,400,980 | 31,494 |
| Leidos Holdings Inc. | 667,846 | 31,048 | |
37
| Vanguard® Extended Market Index Fund | |||
| Schedule of Investments | |||
| December 31, 2013 | |||
| Market | |||
| Value | |||
| Shares | ($000) | ||
| * | Teradyne Inc. | 1,749,900 | 30,833 |
| * | Atmel Corp. | 3,921,560 | 30,706 |
| * | CoreLogic Inc. | 856,561 | 30,434 |
| * | CommVault Systems Inc. | 405,928 | 30,396 |
| * | Guidewire Software Inc. | 602,425 | 29,561 |
| Lender Processing Services Inc. | 784,946 | 29,341 | |
| * | SunEdison Inc. | 2,239,966 | 29,232 |
| * | Cognex Corp. | 760,766 | 29,046 |
| * | NetSuite Inc. | 279,734 | 28,818 |
| National Instruments Corp. | 894,125 | 28,630 | |
| * | NeuStar Inc. Class A | 571,870 | 28,513 |
| Belden Inc. | 399,911 | 28,174 | |
| MAXIMUS Inc. | 626,930 | 27,579 | |
| * | JDS Uniphase Corp. | 2,112,304 | 27,418 |
| * | VeriFone Systems Inc. | 1,004,287 | 26,935 |
| * | Riverbed Technology Inc. | 1,479,351 | 26,747 |
| * | Tyler Technologies Inc. | 259,210 | 26,473 |
| * | ARRIS Group Inc. | 1,054,817 | 25,701 |
| * | Acxiom Corp. | 686,074 | 25,371 |
| * | SS&C Technologies Holdings Inc. | 570,751 | 25,261 |
| * | Zebra Technologies Corp. | 467,080 | 25,260 |
| *,^ | IPG Photonics Corp. | 317,007 | 24,603 |
| DST Systems Inc. | 269,798 | 24,481 | |
| * | ViaSat Inc. | 383,554 | 24,030 |
| * | Fortinet Inc. | 1,255,534 | 24,018 |
| * | Palo Alto Networks Inc. | 416,679 | 23,947 |
| * | Workday Inc. Class A | 286,116 | 23,793 |
| * | ACI Worldwide Inc. | 352,627 | 22,921 |
| * | SolarWinds Inc. | 602,196 | 22,781 |
| * | Ciena Corp. | 946,900 | 22,659 |
| Compuware Corp. | 1,978,695 | 22,181 | |
| Anixter International Inc. | 245,713 | 22,075 | |
| * | Cornerstone OnDemand Inc. | 413,476 | 22,055 |
| * | Zynga Inc. Class A | 5,752,947 | 21,861 |
| *,^ | Advanced Micro Devices Inc. | 5,619,791 | 21,749 |
| * | Qlik Technologies Inc. | 810,601 | 21,586 |
| Mentor Graphics Corp. | 889,697 | 21,415 | |
| * | Microsemi Corp. | 857,271 | 21,389 |
| * | Finisar Corp. | 875,385 | 20,939 |
| * | Verint Systems Inc. | 486,991 | 20,911 |
| * | Manhattan Associates Inc. | 177,091 | 20,805 |
| * | Euronet Worldwide Inc. | 432,325 | 20,687 |
| Lexmark International Inc. Class A | 575,670 | 20,448 | |
| j2 Global Inc. | 400,307 | 20,019 | |
| Fair Isaac Corp. | 315,984 | 19,856 | |
| Convergys Corp. | 930,043 | 19,577 | |
| * | Dealertrack Technologies Inc. | 402,813 | 19,367 |
| Diebold Inc. | 586,346 | 19,355 | |
| Littelfuse Inc. | 205,980 | 19,142 | |
| Plantronics Inc. | 403,597 | 18,747 | |
| * | EchoStar Corp. Class A | 371,274 | 18,460 |
| * | Rovi Corp. | 935,147 | 18,413 |
| * | Aruba Networks Inc. | 1,008,112 | 18,045 |
| * | Tech Data Corp. | 348,039 | 17,959 |
| * | Cardtronics Inc. | 413,167 | 17,952 |
| * | Hittite Microwave Corp. | 289,789 | 17,889 |
| *,^ | Zillow Inc. Class A | 216,521 | 17,696 |
| * | Sapient Corp. | 1,018,938 | 17,689 |
| * | Dolby Laboratories Inc. Class A | 450,005 | 17,352 |
| * | International Rectifier Corp. | 660,641 | 17,223 |
| * | OpenTable Inc. | 212,581 | 16,873 |
| * | Coherent Inc. | 226,674 | 16,862 |
| Heartland Payment Systems Inc. | 337,811 | 16,837 | |
| * | Electronics For Imaging Inc. | 429,698 | 16,642 |
38
| Vanguard® Extended Market Index Fund | |||
| Schedule of Investments | |||
| December 31, 2013 | |||
| Market | |||
| Value | |||
| Shares | ($000) | ||
| * | Vishay Intertechnology Inc. | 1,237,644 | 16,411 |
| * | Cavium Inc. | 474,641 | 16,380 |
| * | SYNNEX Corp. | 242,259 | 16,328 |
| * | Synaptics Inc. | 309,861 | 16,054 |
| * | Demandware Inc. | 247,665 | 15,880 |
| * | Semtech Corp. | 627,068 | 15,852 |
| Blackbaud Inc. | 420,470 | 15,831 | |
| * | CACI International Inc. Class A | 214,618 | 15,714 |
| * | Silicon Laboratories Inc. | 362,551 | 15,702 |
| * | Fairchild Semiconductor International Inc. Class A | 1,174,846 | 15,684 |
| Power Integrations Inc. | 275,557 | 15,382 | |
| * | Itron Inc. | 360,946 | 14,954 |
| * | Entegris Inc. | 1,281,916 | 14,870 |
| * | Polycom Inc. | 1,306,966 | 14,677 |
| * | TiVo Inc. | 1,117,068 | 14,656 |
| MKS Instruments Inc. | 489,451 | 14,654 | |
| * | Take-Two Interactive Software Inc. | 842,968 | 14,642 |
| ADTRAN Inc. | 534,452 | 14,436 | |
| * | Infoblox Inc. | 437,160 | 14,435 |
| * | WebMD Health Corp. | 358,878 | 14,176 |
| NIC Inc. | 548,920 | 13,652 | |
| * | Unisys Corp. | 406,459 | 13,645 |
| EVERTEC Inc. | 552,802 | 13,632 | |
| Cypress Semiconductor Corp. | 1,297,440 | 13,623 | |
| * | ValueClick Inc. | 580,187 | 13,559 |
| * | Plexus Corp. | 311,045 | 13,465 |
| Intersil Corp. Class A | 1,173,674 | 13,462 | |
| * | RF Micro Devices Inc. | 2,592,407 | 13,377 |
| Advent Software Inc. | 380,963 | 13,330 | |
| * | Universal Display Corp. | 382,264 | 13,135 |
| * | Web.com Group Inc. | 410,053 | 13,036 |
| * | Syntel Inc. | 143,135 | 13,018 |
| * | Sanmina Corp. | 770,383 | 12,865 |
| * | Integrated Device Technology Inc. | 1,261,249 | 12,852 |
| * | Progress Software Corp. | 493,203 | 12,739 |
| Science Applications International Corp. | 382,112 | 12,636 | |
| * | TriQuint Semiconductor Inc. | 1,466,939 | 12,234 |
| * | PMC - Sierra Inc. | 1,895,928 | 12,191 |
| * | Bottomline Technologies de Inc. | 336,098 | 12,153 |
| * | Cirrus Logic Inc. | 584,730 | 11,946 |
| * | Veeco Instruments Inc. | 360,092 | 11,851 |
| * | NETGEAR Inc. | 355,316 | 11,704 |
| Monotype Imaging Holdings Inc. | 365,449 | 11,643 | |
| * | Benchmark Electronics Inc. | 504,394 | 11,641 |
| * | Blucora Inc. | 386,698 | 11,276 |
| InterDigital Inc. | 379,301 | 11,186 | |
| Methode Electronics Inc. | 324,713 | 11,102 | |
| * | Trulia Inc. | 313,197 | 11,046 |
| * | Monolithic Power Systems Inc. | 317,601 | 11,008 |
| *,^ | SunPower Corp. Class A | 367,963 | 10,969 |
| * | ScanSource Inc. | 258,313 | 10,960 |
| * | Infinera Corp. | 1,108,723 | 10,843 |
| * | iGATE Corp. | 267,264 | 10,733 |
| * | RealPage Inc. | 458,358 | 10,716 |
| * | Envestnet Inc. | 262,498 | 10,579 |
| * | GT Advanced Technologies Inc. | 1,212,825 | 10,576 |
| MTS Systems Corp. | 147,821 | 10,532 | |
| * | MicroStrategy Inc. Class A | 83,455 | 10,368 |
| * | Netscout Systems Inc. | 342,747 | 10,142 |
| * | Cray Inc. | 368,928 | 10,131 |
| * | Rambus Inc. | 1,065,777 | 10,093 |
| * | Rogers Corp. | 162,477 | 9,992 |
| *,^ | InvenSense Inc. | 475,521 | 9,881 |
| * | Interactive Intelligence Group Inc. | 146,224 | 9,850 |
39
| Vanguard® Extended Market Index Fund | |||
| Schedule of Investments | |||
| December 31, 2013 | |||
| Market | |||
| Value | |||
| Shares | ($000) | ||
| * | Cabot Microelectronics Corp. | 215,428 | 9,845 |
| * | Tableau Software Inc. Class A | 141,210 | 9,734 |
| * | SPS Commerce Inc. | 147,028 | 9,601 |
| * | QLogic Corp. | 810,955 | 9,594 |
| * | Responsys Inc. | 342,533 | 9,389 |
| * | Applied Micro Circuits Corp. | 695,902 | 9,311 |
| CSG Systems International Inc. | 314,823 | 9,256 | |
| * | Kulicke & Soffa Industries Inc. | 694,820 | 9,241 |
| * | OSI Systems Inc. | 173,439 | 9,211 |
| * | FARO Technologies Inc. | 157,430 | 9,178 |
| * | PROS Holdings Inc. | 226,695 | 9,045 |
| * | Imperva Inc. | 186,476 | 8,975 |
| * | comScore Inc. | 313,640 | 8,973 |
| * | OmniVision Technologies Inc. | 518,327 | 8,915 |
| * | Insight Enterprises Inc. | 390,846 | 8,876 |
| Tessera Technologies Inc. | 449,377 | 8,857 | |
| * | Measurement Specialties Inc. | 145,452 | 8,827 |
| * | ATMI Inc. | 290,848 | 8,787 |
| * | Constant Contact Inc. | 281,416 | 8,744 |
| Booz Allen Hamilton Holding Corp. Class A | 454,945 | 8,712 | |
| * | Sonus Networks Inc. | 2,747,358 | 8,654 |
| * | Synchronoss Technologies Inc. | 277,794 | 8,631 |
| * | CalAmp Corp. | 303,561 | 8,491 |
| * | Sykes Enterprises Inc. | 374,254 | 8,162 |
| * | Comverse Inc. | 209,627 | 8,134 |
| * | Diodes Inc. | 344,943 | 8,127 |
| * | Monster Worldwide Inc. | 1,131,072 | 8,065 |
| CDW Corp. | 345,218 | 8,064 | |
| * | Freescale Semiconductor Ltd. | 495,022 | 7,945 |
| Pegasystems Inc. | 160,588 | 7,898 | |
| * | Fusion-io Inc. | 873,927 | 7,787 |
| * | Advanced Energy Industries Inc. | 340,435 | 7,782 |
| * | ExlService Holdings Inc. | 281,412 | 7,773 |
| *,^ | VirnetX Holding Corp. | 398,813 | 7,741 |
| * | Virtusa Corp. | 202,806 | 7,725 |
| * | Ultratech Inc. | 265,254 | 7,692 |
| * | EPAM Systems Inc. | 220,064 | 7,689 |
| Badger Meter Inc. | 138,214 | 7,533 | |
| * | Rofin-Sinar Technologies Inc. | 270,631 | 7,312 |
| * | BroadSoft Inc. | 267,063 | 7,302 |
| CTS Corp. | 365,367 | 7,274 | |
| * | Harmonic Inc. | 976,070 | 7,203 |
| * | Move Inc. | 448,688 | 7,175 |
| * | LogMeIn Inc. | 213,457 | 7,162 |
| * | LivePerson Inc. | 482,435 | 7,150 |
| * | Perficient Inc. | 304,332 | 7,127 |
| ManTech International Corp. Class A | 230,925 | 6,912 | |
| * | Ixia | 517,626 | 6,890 |
| * | Stamps.com Inc. | 162,845 | 6,856 |
| * | Checkpoint Systems Inc. | 430,025 | 6,782 |
| Brooks Automation Inc. | 640,162 | 6,715 | |
| * | Ruckus Wireless Inc. | 472,610 | 6,711 |
| * | Shutterstock Inc. | 80,052 | 6,695 |
| * | Newport Corp. | 369,733 | 6,681 |
| * | Bankrate Inc. | 372,015 | 6,674 |
| AVX Corp. | 476,920 | 6,644 | |
| * | Spansion Inc. Class A | 464,662 | 6,454 |
| * | Digital River Inc. | 340,076 | 6,291 |
| * | Emulex Corp. | 870,610 | 6,234 |
| * | Global Cash Access Holdings Inc. | 622,909 | 6,223 |
| * | Exar Corp. | 527,733 | 6,222 |
| * | Callidus Software Inc. | 451,039 | 6,193 |
| * | Lattice Semiconductor Corp. | 1,116,701 | 6,153 |
| Daktronics Inc. | 387,292 | 6,073 | |
40
| Vanguard® Extended Market Index Fund | |||
| Schedule of Investments | |||
| December 31, 2013 | |||
| Market | |||
| Value | |||
| Shares | ($000) | ||
| Cass Information Systems Inc. | 88,407 | 5,954 | |
| * | Amkor Technology Inc. | 953,231 | 5,843 |
| Park Electrochemical Corp. | 203,270 | 5,838 | |
| Comtech Telecommunications Corp. | 183,838 | 5,795 | |
| Epiq Systems Inc. | 351,467 | 5,697 | |
| * | Angie's List Inc. | 369,131 | 5,592 |
| * | TeleTech Holdings Inc. | 233,238 | 5,584 |
| * | Silicon Image Inc. | 889,335 | 5,469 |
| *,^ | Liquidity Services Inc. | 236,503 | 5,359 |
| * | Extreme Networks Inc. | 760,633 | 5,324 |
| * | Tangoe Inc. | 292,993 | 5,277 |
| Micrel Inc. | 523,818 | 5,170 | |
| *,^ | Ubiquiti Networks Inc. | 111,940 | 5,145 |
| * | Proofpoint Inc. | 152,927 | 5,073 |
| EarthLink Inc. | 1,000,385 | 5,072 | |
| Forrester Research Inc. | 130,569 | 4,996 | |
| * | Accelrys Inc. | 519,018 | 4,951 |
| * | SciQuest Inc. | 172,269 | 4,906 |
| Black Box Corp. | 164,088 | 4,890 | |
| * | PDF Solutions Inc. | 188,380 | 4,826 |
| * | XO Group Inc. | 323,305 | 4,804 |
| * | Ellie Mae Inc. | 175,773 | 4,723 |
| ^ | Ebix Inc. | 318,077 | 4,682 |
| * | Super Micro Computer Inc. | 269,918 | 4,632 |
| * | Global Eagle Entertainment Inc. | 305,473 | 4,542 |
| * | Marketo Inc. | 122,531 | 4,542 |
| * | Anaren Inc. | 159,036 | 4,451 |
| * | DTS Inc. | 182,058 | 4,366 |
| IXYS Corp. | 335,439 | 4,351 | |
| * | TTM Technologies Inc. | 501,539 | 4,303 |
| * | Silicon Graphics International Corp. | 320,116 | 4,293 |
| * | ShoreTel Inc. | 453,533 | 4,209 |
| * | Photronics Inc. | 462,504 | 4,176 |
| * | CommScope Holding Co. Inc. | 220,300 | 4,168 |
| * | Internap Network Services Corp. | 534,670 | 4,021 |
| * | Entropic Communications Inc. | 852,307 | 4,014 |
| * | Actuate Corp. | 507,390 | 3,912 |
| * | Dice Holdings Inc. | 530,548 | 3,846 |
| *,^ | Textura Corp. | 127,410 | 3,815 |
| * | Procera Networks Inc. | 253,755 | 3,811 |
| * | Rudolph Technologies Inc. | 323,024 | 3,792 |
| *,^ | Parkervision Inc. | 824,431 | 3,751 |
| * | LTX-Credence Corp. | 460,474 | 3,679 |
| * | FireEye Inc. | 83,393 | 3,637 |
| * | Oplink Communications Inc. | 193,951 | 3,608 |
| * | Ceva Inc. | 231,246 | 3,520 |
| * | RealD Inc. | 404,079 | 3,451 |
| * | Fabrinet | 166,011 | 3,413 |
| * | Nanometrics Inc. | 178,154 | 3,394 |
| * | ServiceSource International Inc. | 403,913 | 3,385 |
| * | FormFactor Inc. | 551,816 | 3,322 |
| * | Agilysys Inc. | 233,782 | 3,254 |
| Electro Scientific Industries Inc. | 305,826 | 3,199 | |
| * | ModusLink Global Solutions Inc. | 557,771 | 3,196 |
| * | Seachange International Inc. | 261,264 | 3,177 |
| Electro Rent Corp. | 168,968 | 3,129 | |
| * | Supertex Inc. | 123,393 | 3,091 |
| * | Mercury Systems Inc. | 281,486 | 3,082 |
| * | Lionbridge Technologies Inc. | 497,644 | 2,966 |
| * | Higher One Holdings Inc. | 302,943 | 2,957 |
| *,^ | Oclaro Inc. | 1,185,971 | 2,953 |
| * | MoneyGram International Inc. | 137,477 | 2,857 |
| * | DSP Group Inc. | 291,888 | 2,834 |
| * | Calix Inc. | 293,980 | 2,834 |
41
| Vanguard® Extended Market Index Fund | |||
| Schedule of Investments | |||
| December 31, 2013 | |||
| Market | |||
| Value | |||
| Shares | ($000) | ||
| * | ChannelAdvisor Corp. | 67,483 | 2,815 |
| * | IntraLinks Holdings Inc. | 232,296 | 2,813 |
| * | Digi International Inc. | 231,587 | 2,807 |
| * | Integrated Silicon Solution Inc. | 231,036 | 2,793 |
| Computer Task Group Inc. | 142,649 | 2,696 | |
| *,^ | Glu Mobile Inc. | 683,701 | 2,660 |
| * | Quantum Corp. | 2,190,176 | 2,628 |
| * | Brightcove Inc. | 184,083 | 2,603 |
| PC Connection Inc. | 104,063 | 2,586 | |
| * | Jive Software Inc. | 229,598 | 2,583 |
| * | Immersion Corp. | 247,355 | 2,568 |
| * | Zix Corp. | 559,817 | 2,553 |
| * | Kopin Corp. | 601,751 | 2,539 |
| * | NVE Corp. | 43,518 | 2,536 |
| Cohu Inc. | 241,167 | 2,532 | |
| * | QuinStreet Inc. | 283,719 | 2,466 |
| * | VASCO Data Security International Inc. | 315,800 | 2,441 |
| * | Avid Technology Inc. | 295,640 | 2,409 |
| * | PLX Technology Inc. | 360,134 | 2,370 |
| * | CIBER Inc. | 568,219 | 2,352 |
| * | Kemet Corp. | 412,878 | 2,329 |
| * | Xoom Corp. | 84,140 | 2,303 |
| * | Pericom Semiconductor Corp. | 259,686 | 2,301 |
| *,^ | Neonode Inc. | 362,094 | 2,288 |
| * | support.com Inc. | 598,100 | 2,267 |
| * | Vocus Inc. | 190,107 | 2,165 |
| * | MoSys Inc. | 385,424 | 2,128 |
| American Software Inc. Class A | 215,386 | 2,126 | |
| * | Bazaarvoice Inc. | 260,788 | 2,065 |
| * | Maxwell Technologies Inc. | 264,704 | 2,057 |
| * | Datawatch Corp. | 60,329 | 2,052 |
| * | PRGX Global Inc. | 303,702 | 2,041 |
| * | Zygo Corp. | 135,204 | 1,998 |
| * | Marchex Inc. Class B | 225,315 | 1,949 |
| * | Gogo Inc. | 77,917 | 1,933 |
| * | NAPCO Security Technologies Inc. | 305,202 | 1,917 |
| * | Datalink Corp. | 175,505 | 1,913 |
| *,^ | Rubicon Technology Inc. | 192,243 | 1,913 |
| *,^ | Mitek Systems Inc. | 319,044 | 1,895 |
| Tessco Technologies Inc. | 46,556 | 1,877 | |
| * | Dot Hill Systems Corp. | 552,939 | 1,863 |
| * | GSI Group Inc. | 163,316 | 1,836 |
| * | Vishay Precision Group Inc. | 121,145 | 1,804 |
| * | Qualys Inc. | 76,901 | 1,777 |
| * | Gigamon Inc. | 62,835 | 1,764 |
| * | Autobytel Inc. | 116,348 | 1,760 |
| * | Dynamics Research Corp. | 153,169 | 1,758 |
| * | Unwired Planet Inc. | 1,273,611 | 1,758 |
| United Online Inc. | 126,108 | 1,735 | |
| * | KVH Industries Inc. | 133,168 | 1,735 |
| * | Guidance Software Inc. | 167,934 | 1,696 |
| * | Reis Inc. | 86,411 | 1,662 |
| * | Twitter Inc. | 26,010 | 1,656 |
| Mesa Laboratories Inc. | 20,970 | 1,648 | |
| * | Axcelis Technologies Inc. | 673,767 | 1,644 |
| Transact Technologies Inc. | 130,847 | 1,640 | |
| * | Aviat Networks Inc. | 724,464 | 1,637 |
| * | Key Tronic Corp. | 147,774 | 1,628 |
| * | Intevac Inc. | 219,131 | 1,628 |
| * | Carbonite Inc. | 137,527 | 1,627 |
| * | Multi-Fineline Electronix Inc. | 116,929 | 1,624 |
| * | Inphi Corp. | 125,850 | 1,623 |
| * | Travelzoo Inc. | 75,875 | 1,618 |
| * | Ultra Clean Holdings Inc. | 152,882 | 1,533 |
42
| Vanguard® Extended Market Index Fund | |||
| Schedule of Investments | |||
| December 31, 2013 | |||
| Market | |||
| Value | |||
| Shares | ($000) | ||
| * | RealNetworks Inc. | 201,813 | 1,524 |
| * | Limelight Networks Inc. | 749,981 | 1,485 |
| * | Sigma Designs Inc. | 310,720 | 1,467 |
| * | ANADIGICS Inc. | 792,054 | 1,457 |
| Bel Fuse Inc. Class B | 67,431 | 1,437 | |
| * | Aeroflex Holding Corp. | 219,690 | 1,428 |
| * | Pfsweb Inc. | 155,162 | 1,407 |
| * | Blackhawk Network Holdings Inc. | 55,466 | 1,401 |
| *,^ | Research Frontiers Inc. | 237,493 | 1,373 |
| * | Endurance International Group Holdings Inc. | 94,500 | 1,340 |
| * | Aware Inc. | 217,576 | 1,329 |
| * | PCM Inc. | 128,872 | 1,324 |
| * | QuickLogic Corp. | 328,053 | 1,296 |
| * | Westell Technologies Inc. Class A | 319,195 | 1,293 |
| * | Demand Media Inc. | 220,692 | 1,273 |
| * | Zhone Technologies Inc. | 232,450 | 1,241 |
| QAD Inc. Class A | 69,282 | 1,224 | |
| Hackett Group Inc. | 196,636 | 1,221 | |
| Richardson Electronics Ltd. | 107,140 | 1,217 | |
| MOCON Inc. | 75,913 | 1,199 | |
| * | E2open Inc. | 50,141 | 1,199 |
| * | Rally Software Development Corp. | 60,739 | 1,181 |
| * | Benefitfocus Inc. | 20,108 | 1,161 |
| * | iPass Inc. | 725,632 | 1,139 |
| * | eGain Corp. | 108,610 | 1,112 |
| * | Speed Commerce Inc. | 231,423 | 1,081 |
| * | TeleCommunication Systems Inc. Class A | 465,327 | 1,080 |
| PC-Tel Inc. | 111,619 | 1,068 | |
| Evolving Systems Inc. | 108,562 | 1,057 | |
| * | Numerex Corp. Class A | 81,082 | 1,050 |
| * | ePlus Inc. | 18,444 | 1,048 |
| Communications Systems Inc. | 94,052 | 1,048 | |
| * | Qumu Corp. | 81,635 | 1,045 |
| * | AXT Inc. | 395,721 | 1,033 |
| * | MaxLinear Inc. | 96,536 | 1,007 |
| * | Frequency Electronics Inc. | 86,235 | 1,006 |
| * | Mattson Technology Inc. | 360,332 | 987 |
| * | Cinedigm Corp. Class A | 468,904 | 947 |
| * | Park City Group Inc. | 92,338 | 938 |
| * | Peregrine Semiconductor Corp. | 125,700 | 931 |
| *,^ | Uni-Pixel Inc. | 89,398 | 895 |
| *,^ | CVD Equipment Corp. | 61,399 | 892 |
| Astro-Med Inc. | 65,498 | 884 | |
| * | Information Services Group Inc. | 206,647 | 876 |
| * | Rosetta Stone Inc. | 71,504 | 874 |
| Alliance Fiber Optic Products Inc. | 55,590 | 837 | |
| *,^ | Millennial Media Inc. | 102,975 | 749 |
| * | Amtech Systems Inc. | 106,689 | 743 |
| * | M/A-COM Technology Solutions Holdings Inc. | 43,591 | 741 |
| * | Telenav Inc. | 111,994 | 738 |
| Digimarc Corp. | 37,954 | 731 | |
| * | Meru Networks Inc. | 167,979 | 724 |
| * | Pixelworks Inc. | 148,862 | 718 |
| * | Clearfield Inc. | 34,622 | 701 |
| * | ID Systems Inc. | 120,324 | 697 |
| * | Bsquare Corp. | 190,233 | 681 |
| *,^ | Rocket Fuel Inc. | 10,901 | 670 |
| * | Echelon Corp. | 309,664 | 666 |
| * | Emcore Corp. | 129,740 | 664 |
| *,^ | Document Security Systems Inc. | 318,494 | 659 |
| * | Ikanos Communications Inc. | 546,808 | 656 |
| * | Performance Technologies Inc. | 174,654 | 652 |
| * | FalconStor Software Inc. | 471,141 | 636 |
| *,^ | Vringo Inc. | 211,895 | 627 |
43
| Vanguard® Extended Market Index Fund | |||
| Schedule of Investments | |||
| December 31, 2013 | |||
| Market | |||
| Value | |||
| Shares | ($000) | ||
| * | Innodata Inc. | 241,360 | 591 |
| *,^ | Parametric Sound Corp. | 42,074 | 583 |
| * | PAR Technology Corp. | 106,779 | 582 |
| * | GSI Technology Inc. | 86,863 | 577 |
| *,^ | Local Corp. | 361,731 | 572 |
| * | Radisys Corp. | 244,876 | 561 |
| * | Onvia Inc. | 108,483 | 533 |
| *,^ | ClearSign Combustion Corp. | 45,907 | 526 |
| * | LRAD Corp. | 275,461 | 518 |
| * | Mattersight Corp. | 107,638 | 516 |
| *,^ | MeetMe Inc. | 281,417 | 515 |
| CSP Inc. | 63,018 | 509 | |
| * | Nimble Storage Inc. | 10,873 | 493 |
| * | Wireless Telecom Group Inc. | 231,111 | 490 |
| * | STR Holdings Inc. | 308,585 | 484 |
| * | Data I/O Corp. | 180,066 | 463 |
| * | Cvent Inc. | 12,500 | 455 |
| * | CyberOptics Corp. | 69,636 | 443 |
| * | TheStreet Inc. | 193,979 | 438 |
| * | Cascade Microtech Inc. | 46,248 | 431 |
| Optical Cable Corp. | 112,873 | 421 | |
| * | LoJack Corp. | 116,077 | 419 |
| * | Crossroads Systems Inc. | 165,788 | 400 |
| * | WidePoint Corp. | 239,634 | 393 |
| * | IEC Electronics Corp. | 91,854 | 384 |
| * | Tremor Video Inc. | 65,789 | 382 |
| * | Edgewater Technology Inc. | 52,896 | 370 |
| * | BroadVision Inc. | 36,717 | 356 |
| * | Newtek Business Services Inc. | 111,103 | 349 |
| * | BTU International Inc. | 113,437 | 331 |
| * | ClearOne Inc. | 37,181 | 326 |
| * | GSE Systems Inc. | 200,594 | 321 |
| * | Model N Inc. | 26,708 | 315 |
| * | Internet Patents Corp. | 100,800 | 315 |
| Concurrent Computer Corp. | 38,068 | 311 | |
| * | StarTek Inc. | 46,382 | 301 |
| * | Novatel Wireless Inc. | 124,184 | 294 |
| * | Sonic Foundry Inc. | 29,544 | 290 |
| * | Infosonics Corp. | 187,832 | 287 |
| * | Hutchinson Technology Inc. | 86,422 | 277 |
| * | USA Technologies Inc. | 151,298 | 274 |
| * | NCI Inc. Class A | 40,978 | 271 |
| * | NeoPhotonics Corp. | 37,316 | 263 |
| * | LGL Group Inc. | 47,780 | 259 |
| * | Video Display Corp. | 71,008 | 251 |
| * | Envivio Inc. | 71,426 | 243 |
| * | Netlist Inc. | 327,952 | 243 |
| * | Planar Systems Inc. | 90,447 | 230 |
| QAD Inc. Class B | 14,091 | 226 | |
| * | eMagin Corp. | 78,635 | 223 |
| * | Spark Networks Inc. | 36,047 | 222 |
| Globalscape Inc. | 92,232 | 215 | |
| * | Lantronix Inc. | 134,602 | 211 |
| * | Viasystems Group Inc. | 14,776 | 202 |
| * | NetSol Technologies Inc. | 34,512 | 201 |
| * | Crexendo Inc. | 65,793 | 199 |
| * | Imation Corp. | 42,322 | 198 |
| *,^ | Wave Systems Corp. Class A | 212,740 | 194 |
| * | Marin Software Inc. | 17,916 | 183 |
| *,^ | Digital Ally Inc. | 18,621 | 171 |
| * | Selectica Inc. | 25,943 | 166 |
| * | Majesco Entertainment Co. | 276,585 | 163 |
| * | Inuvo Inc. | 118,627 | 154 |
| * | Vitesse Semiconductor Corp. | 51,816 | 151 |
44
| Vanguard® Extended Market Index Fund | |||
| Schedule of Investments | |||
| December 31, 2013 | |||
| Market | |||
| Value | |||
| Shares | ($000) | ||
| * | Asure Software Inc. | 27,280 | 150 |
| *,^ | Aetrium Inc. | 21,572 | 145 |
| * | Looksmart Ltd. | 69,526 | 143 |
| * | Interphase Corp. | 34,145 | 132 |
| * | Intermolecular Inc. | 24,999 | 123 |
| * | Ambient Corp. | 43,817 | 117 |
| Bel Fuse Inc. Class A | 5,719 | 111 | |
| * | Violin Memory Inc. | 27,981 | 111 |
| * | Intellicheck Mobilisa Inc. | 210,101 | 105 |
| * | Remark Media Inc. | 22,453 | 105 |
| * | Bridgeline Digital Inc. | 96,477 | 103 |
| * | Microvision Inc. | 76,209 | 101 |
| * | Overland Storage Inc. | 99,822 | 97 |
| * | Relm Wireless Corp. | 27,322 | 92 |
| * | TSR Inc. | 27,043 | 91 |
| * | Mediabistro Inc. | 27,418 | 87 |
| * | Lightpath Technologies Inc. Class A | 63,678 | 86 |
| * | World Energy Solutions Inc. | 19,534 | 84 |
| * | Advanced Photonix Inc. Class A | 99,780 | 70 |
| * | TigerLogic Corp. | 31,880 | 59 |
| *,^ | Net Element Inc. | 12,508 | 55 |
| * | Exa Corp. | 3,923 | 52 |
| * | Smith Micro Software Inc. | 33,227 | 49 |
| *,^ | Daegis Inc. | 31,670 | 38 |
| * | Superconductor Technologies Inc. | 14,507 | 31 |
| * | Identive Group Inc. | 51,148 | 29 |
| * | GigOptix Inc. | 15,789 | 24 |
| * | Sutron Corp. | 3,900 | 20 |
| * | LGL Group, Inc. Warrants Exp. 06/8/2018 | 238,900 | 19 |
| * | Cover-All Technologies Inc. | 9,331 | 13 |
| * | Synacor Inc. | 5,300 | 13 |
| * | Qualstar Corp. | 9,220 | 10 |
| * | Sevcon Inc. | 500 | 3 |
| * | IntriCon Corp. | 400 | 2 |
| * | MAM Software Group Inc. | 200 | 1 |
| * | Saba Software Inc. | 74 | 1 |
| 5,751,176 | |||
| Materials (5.4%) | |||
| Celanese Corp. Class A | 1,439,873 | 79,639 | |
| * | WR Grace & Co. | 702,916 | 69,497 |
| Rock Tenn Co. Class A | 660,473 | 69,356 | |
| Ashland Inc. | 660,207 | 64,066 | |
| Packaging Corp. of America | 902,019 | 57,080 | |
| * | Crown Holdings Inc. | 1,260,805 | 56,194 |
| Reliance Steel & Aluminum Co. | 706,574 | 53,587 | |
| Valspar Corp. | 739,790 | 52,740 | |
| RPM International Inc. | 1,219,247 | 50,611 | |
| Rockwood Holdings Inc. | 682,203 | 49,064 | |
| Albemarle Corp. | 746,913 | 47,347 | |
| Huntsman Corp. | 1,796,739 | 44,200 | |
| Martin Marietta Materials Inc. | 425,032 | 42,478 | |
| Aptargroup Inc. | 607,839 | 41,218 | |
| Steel Dynamics Inc. | 2,029,482 | 39,656 | |
| Sonoco Products Co. | 931,059 | 38,844 | |
| Eagle Materials Inc. | 456,090 | 35,315 | |
| NewMarket Corp. | 105,230 | 35,163 | |
| PolyOne Corp. | 891,603 | 31,518 | |
| Axiall Corp. | 641,795 | 30,447 | |
| Cytec Industries Inc. | 323,912 | 30,176 | |
| Carpenter Technology Corp. | 485,027 | 30,169 | |
| Domtar Corp. | 299,613 | 28,265 | |
| Cabot Corp. | 544,834 | 28,004 | |
| Royal Gold Inc. | 597,620 | 27,532 | |
| Scotts Miracle-Gro Co. Class A | 403,538 | 25,108 | |
45
| Vanguard® Extended Market Index Fund | |||
| Schedule of Investments | |||
| December 31, 2013 | |||
| Market | |||
| Value | |||
| Shares | ($000) | ||
| * | Chemtura Corp. | 896,020 | 25,017 |
| Compass Minerals International Inc. | 307,615 | 24,625 | |
| HB Fuller Co. | 461,559 | 24,019 | |
| * | Louisiana-Pacific Corp. | 1,291,693 | 23,909 |
| Westlake Chemical Corp. | 184,789 | 22,557 | |
| Sensient Technologies Corp. | 460,436 | 22,340 | |
| Commercial Metals Co. | 1,075,920 | 21,873 | |
| Olin Corp. | 739,039 | 21,321 | |
| * | KapStone Paper and Packaging Corp. | 372,502 | 20,808 |
| * | Graphic Packaging Holding Co. | 2,139,589 | 20,540 |
| Worthington Industries Inc. | 486,358 | 20,466 | |
| Silgan Holdings Inc. | 403,167 | 19,360 | |
| Minerals Technologies Inc. | 319,480 | 19,191 | |
| * | Berry Plastics Group Inc. | 711,857 | 16,935 |
| US Silica Holdings Inc. | 487,711 | 16,636 | |
| Balchem Corp. | 275,503 | 16,172 | |
| Schweitzer-Mauduit International Inc. | 289,631 | 14,907 | |
| Greif Inc. Class A | 281,154 | 14,732 | |
| * | SunCoke Energy Inc. | 645,140 | 14,716 |
| * | Resolute Forest Products Inc. | 887,596 | 14,219 |
| * | Texas Industries Inc. | 200,669 | 13,802 |
| * | Stillwater Mining Co. | 1,095,918 | 13,524 |
| Tronox Ltd. Class A | 561,799 | 12,961 | |
| Kaiser Aluminum Corp. | 172,018 | 12,083 | |
| Stepan Co. | 174,242 | 11,435 | |
| PH Glatfelter Co. | 399,211 | 11,034 | |
| Globe Specialty Metals Inc. | 610,263 | 10,991 | |
| * | OM Group Inc. | 297,338 | 10,826 |
| *,^ | AK Steel Holding Corp. | 1,287,807 | 10,560 |
| * | Clearwater Paper Corp. | 198,096 | 10,400 |
| * | Calgon Carbon Corp. | 502,464 | 10,336 |
| * | Ferro Corp. | 797,516 | 10,232 |
| * | Coeur Mining Inc. | 934,603 | 10,140 |
| Innospec Inc. | 217,013 | 10,030 | |
| Hecla Mining Co. | 3,208,172 | 9,881 | |
| Innophos Holdings Inc. | 202,689 | 9,851 | |
| A Schulman Inc. | 277,401 | 9,781 | |
| Quaker Chemical Corp. | 125,274 | 9,655 | |
| * | RTI International Metals Inc. | 281,517 | 9,631 |
| ^ | Walter Energy Inc. | 576,541 | 9,588 |
| *,^ | Molycorp Inc. | 1,673,257 | 9,404 |
| Koppers Holdings Inc. | 191,295 | 8,752 | |
| * | Boise Cascade Co. | 287,638 | 8,480 |
| * | Flotek Industries Inc. | 420,910 | 8,448 |
| AMCOL International Corp. | 244,155 | 8,296 | |
| *,^ | Intrepid Potash Inc. | 512,514 | 8,118 |
| Schnitzer Steel Industries Inc. | 235,127 | 7,682 | |
| * | LSB Industries Inc. | 182,412 | 7,483 |
| Neenah Paper Inc. | 167,290 | 7,155 | |
| * | Kraton Performance Polymers Inc. | 309,773 | 7,140 |
| Deltic Timber Corp. | 104,198 | 7,079 | |
| * | Headwaters Inc. | 698,774 | 6,841 |
| Materion Corp. | 220,095 | 6,790 | |
| Tredegar Corp. | 229,576 | 6,614 | |
| Myers Industries Inc. | 313,159 | 6,614 | |
| Haynes International Inc. | 119,077 | 6,578 | |
| * | Horsehead Holding Corp. | 389,676 | 6,317 |
| Wausau Paper Corp. | 495,264 | 6,280 | |
| * | Advanced Emissions Solutions Inc. | 105,324 | 5,712 |
| American Vanguard Corp. | 232,946 | 5,658 | |
| * | Century Aluminum Co. | 517,862 | 5,417 |
| *,^ | McEwen Mining Inc. | 2,538,228 | 4,975 |
| Zep Inc. | 247,933 | 4,502 | |
| Kronos Worldwide Inc. | 223,375 | 4,255 | |
46
| Vanguard® Extended Market Index Fund | |||
| Schedule of Investments | |||
| December 31, 2013 | |||
| Market | |||
| Value | |||
| Shares | ($000) | ||
| * | OMNOVA Solutions Inc. | 462,382 | 4,212 |
| * | Zoltek Cos. Inc. | 236,165 | 3,956 |
| Olympic Steel Inc. | 130,423 | 3,780 | |
| Hawkins Inc. | 88,904 | 3,306 | |
| *,^ | Allied Nevada Gold Corp. | 897,921 | 3,188 |
| * | Senomyx Inc. | 621,721 | 3,146 |
| * | Taminco Corp. | 140,113 | 2,832 |
| * | Mercer International Inc. | 263,494 | 2,627 |
| FutureFuel Corp. | 157,841 | 2,494 | |
| * | American Pacific Corp. | 63,561 | 2,368 |
| * | AEP Industries Inc. | 43,386 | 2,292 |
| * | Landec Corp. | 185,612 | 2,250 |
| * | AM Castle & Co. | 150,343 | 2,221 |
| Noranda Aluminum Holding Corp. | 654,265 | 2,153 | |
| * | Universal Stainless & Alloy Products Inc. | 58,452 | 2,108 |
| * | US Concrete Inc. | 79,100 | 1,790 |
| * | Handy & Harman Ltd. | 67,082 | 1,624 |
| Synalloy Corp. | 79,419 | 1,220 | |
| Chase Corp. | 32,598 | 1,151 | |
| * | Penford Corp. | 89,440 | 1,149 |
| * | United States Lime & Minerals Inc. | 18,000 | 1,101 |
| * | General Moly Inc. | 683,263 | 916 |
| * | Core Molding Technologies Inc. | 56,974 | 781 |
| KMG Chemicals Inc. | 42,173 | 712 | |
| *,^ | Paramount Gold and Silver Corp. | 753,749 | 702 |
| Gold Resource Corp. | 139,548 | 632 | |
| * | Arabian American Development Co. | 49,424 | 620 |
| * | TOR Minerals International Inc. | 56,356 | 558 |
| * | Comstock Mining Inc. | 314,323 | 550 |
| * | UFP Technologies Inc. | 14,447 | 364 |
| * | Material Sciences Corp. | 30,525 | 360 |
| * | US Antimony Corp. | 181,971 | 358 |
| * | Midway Gold Corp. | 413,844 | 335 |
| * | Solitario Exploration & Royalty Corp. | 381,460 | 324 |
| *,^ | Silver Bull Resources Inc. | 463,119 | 157 |
| * | Mines Management Inc. | 194,673 | 117 |
| *,^ | Clean Diesel Technologies Inc. | 51,075 | 77 |
| * | Timberline Resources Corp. | 366,815 | 64 |
| * | GSE Holding Inc. | 24,914 | 52 |
| * | Verso Paper Corp. | 37,309 | 24 |
| * | Continental Materials Corp. | 600 | 12 |
| * | Prospect Global Resources Inc. | 92 | — |
| 1,991,631 | |||
| Other (0.0%) | |||
| * | Adolor Corp. Rights Exp. 07/01/2019 | 596,841 | 310 |
| * | Camco Financial Corp. Warrants Exp.11/06/2017 | 45,300 | 208 |
| * | Southern Community Financial Corp | 182,721 | 40 |
| * | Cubist Pharmaceuticals, Inc. CVR | 178,549 | 23 |
| 581 | |||
| Telecommunication Services (1.4%) | |||
| * | SBA Communications Corp. Class A | 1,172,701 | 105,355 |
| * | Sprint Corp. | 7,928,766 | 85,234 |
| * | T-Mobile US Inc. | 2,342,156 | 78,790 |
| * | Level 3 Communications Inc. | 1,471,177 | 48,799 |
| * | tw telecom inc Class A | 1,315,596 | 40,086 |
| Telephone & Data Systems Inc. | 906,414 | 23,367 | |
| Cogent Communications Group Inc. | 401,697 | 16,233 | |
| * | Leap Wireless International Inc. | 521,335 | 9,071 |
| * | 8x8 Inc. | 691,463 | 7,025 |
| Consolidated Communications Holdings Inc. | 357,191 | 7,012 | |
| * | Cincinnati Bell Inc. | 1,950,761 | 6,945 |
| * | Premiere Global Services Inc. | 523,625 | 6,069 |
| United States Cellular Corp. | 139,440 | 5,831 | |
| Shenandoah Telecommunications Co. | 219,669 | 5,639 | |
47
| Vanguard® Extended Market Index Fund | |||
| Schedule of Investments | |||
| December 31, 2013 | |||
| Market | |||
| Value | |||
| Shares | ($000) | ||
| Atlantic Tele-Network Inc. | 88,837 | 5,025 | |
| *,^ | NII Holdings Inc. | 1,639,492 | 4,509 |
| * | General Communication Inc. Class A | 388,944 | 4,337 |
| * | Vonage Holdings Corp. | 1,196,260 | 3,983 |
| Lumos Networks Corp. | 179,668 | 3,773 | |
| USA Mobility Inc. | 257,350 | 3,675 | |
| Inteliquent Inc. | 317,483 | 3,626 | |
| * | Iridium Communications Inc. | 561,198 | 3,513 |
| *,^ | Fairpoint Communications Inc. | 296,262 | 3,351 |
| * | Intelsat SA | 147,500 | 3,325 |
| IDT Corp. Class B | 172,527 | 3,083 | |
| NTELOS Holdings Corp. | 138,353 | 2,799 | |
| * | inContact Inc. | 322,008 | 2,515 |
| * | ORBCOMM Inc. | 386,562 | 2,451 |
| * | Cbeyond Inc. | 306,801 | 2,117 |
| HickoryTech Corp. | 136,657 | 1,753 | |
| * | Hawaiian Telcom Holdco Inc. | 48,209 | 1,416 |
| * | Towerstream Corp. | 376,671 | 1,115 |
| * | Alaska Communications Systems Group Inc. | 366,406 | 777 |
| * | Straight Path Communications Inc. Class B | 82,483 | 675 |
| *,^ | Elephant Talk Communications Corp. | 442,889 | 545 |
| Alteva | 64,581 | 528 | |
| * | Boingo Wireless Inc. | 37,447 | 240 |
| * | RingCentral Inc. Class A | 13,030 | 239 |
| * | NTS Inc. | 48,081 | 95 |
| * | xG Technology Inc. | 2,700 | 4 |
| 504,925 | |||
| Utilities (3.1%) | |||
| American Water Works Co. Inc. | 1,632,844 | 69,004 | |
| * | Calpine Corp. | 3,179,456 | 62,031 |
| OGE Energy Corp. | 1,820,069 | 61,700 | |
| National Fuel Gas Co. | 767,411 | 54,793 | |
| MDU Resources Group Inc. | 1,732,946 | 52,941 | |
| Alliant Energy Corp. | 1,018,192 | 52,539 | |
| ITC Holdings Corp. | 481,159 | 46,105 | |
| UGI Corp. | 1,046,402 | 43,384 | |
| Aqua America Inc. | 1,621,084 | 38,241 | |
| Atmos Energy Corp. | 832,810 | 37,826 | |
| Westar Energy Inc. Class A | 1,164,978 | 37,477 | |
| Questar Corp. | 1,608,614 | 36,982 | |
| Great Plains Energy Inc. | 1,413,533 | 34,264 | |
| Vectren Corp. | 757,157 | 26,879 | |
| Cleco Corp. | 556,503 | 25,944 | |
| IDACORP Inc. | 462,380 | 23,970 | |
| Southwest Gas Corp. | 426,656 | 23,854 | |
| Hawaiian Electric Industries Inc. | 910,465 | 23,727 | |
| Piedmont Natural Gas Co. Inc. | 698,421 | 23,160 | |
| UNS Energy Corp. | 381,886 | 22,856 | |
| Portland General Electric Co. | 713,027 | 21,533 | |
| Black Hills Corp. | 409,099 | 21,482 | |
| UIL Holdings Corp. | 515,708 | 19,984 | |
| * | Dynegy Inc. Class A | 904,049 | 19,455 |
| WGL Holdings Inc. | 476,333 | 19,082 | |
| New Jersey Resources Corp. | 383,862 | 17,750 | |
| PNM Resources Inc. | 732,903 | 17,677 | |
| ALLETE Inc. | 338,572 | 16,888 | |
| South Jersey Industries Inc. | 295,815 | 16,554 | |
| Avista Corp. | 551,325 | 15,542 | |
| NorthWestern Corp. | 356,832 | 15,458 | |
| El Paso Electric Co. | 376,052 | 13,203 | |
| Laclede Group Inc. | 280,010 | 12,752 | |
| MGE Energy Inc. | 212,654 | 12,313 | |
| Northwest Natural Gas Co. | 249,121 | 10,667 | |
| American States Water Co. | 362,538 | 10,416 | |
48
| Vanguard® Extended Market Index Fund | |||||
| Schedule of Investments | |||||
| December 31, 2013 | |||||
| Market | |||||
| Value | |||||
| Shares | ($000) | ||||
| California Water Service Group | 441,824 | 10,193 | |||
| Otter Tail Corp. | 343,420 | 10,052 | |||
| Empire District Electric Co. | 406,833 | 9,231 | |||
| Chesapeake Utilities Corp. | 99,816 | 5,991 | |||
| NRG Yield Inc. Class A | 141,427 | 5,658 | |||
| Ormat Technologies Inc. | 205,437 | 5,590 | |||
| SJW Corp. | 132,183 | 3,938 | |||
| Unitil Corp. | 115,767 | 3,530 | |||
| Middlesex Water Co. | 159,694 | 3,344 | |||
| Pattern Energy Group Inc. | 93,734 | 2,841 | |||
| Connecticut Water Service Inc. | 79,521 | 2,824 | |||
| York Water Co. | 100,663 | 2,107 | |||
| Artesian Resources Corp. Class A | 78,642 | 1,805 | |||
| Delta Natural Gas Co. Inc. | 74,312 | 1,663 | |||
| * | Genie Energy Ltd. Class B | 147,785 | 1,509 | ||
| * | Pure Cycle Corp. | 141,048 | 893 | ||
| *,^ | Cadiz Inc. | 88,858 | 618 | ||
| * | US Geothermal Inc. | 514,441 | 195 | ||
| * | Synthesis Energy Systems Inc. | 145,152 | 87 | ||
| * | American DG Energy Inc. | 49,512 | 84 | ||
| * | EuroSite Power Inc. | 4,951 | 4 | ||
| 1,130,590 | |||||
| Total Common Stocks (Cost $25,398,551) | 36,518,884 | ||||
| Coupon | |||||
| Temporary Cash Investments (1.7%)1 | |||||
| Money Market Fund (1.7%) | |||||
| 2,3 | Vanguard Market Liquidity Fund | 0.125% | 596,095,000 | 596,095 | |
| Face | |||||
| Maturity | Amount | ||||
| Date | ($000) | ||||
| U.S. Government and Agency Obligations (0.0%) | |||||
| 4 | Federal Home Loan Bank Discount Notes | 0.100% | 1/15/14 | 1,000 | 1,000 |
| 4,5 | Federal Home Loan Bank Discount Notes | 0.130% | 5/23/14 | 400 | 400 |
| 6 | Freddie Mac Discount Notes | 0.085% | 3/3/14 | 1,000 | 999 |
| 5,6 | Freddie Mac Discount Notes | 0.070% | 3/31/14 | 4,500 | 4,498 |
| 6,897 | |||||
| Total Temporary Cash Investments (Cost $602,993) | 602,992 | ||||
| Total Investments (101.4%) (Cost $26,001,544) | 37,121,876 | ||||
| Other Assets and Liabilities—Net (-1.4%)3 | (505,491) | ||||
| Net Assets (100%) | 36,616,385 | ||||
* Non-income-producing security.
^ Includes partial security positions on loan to broker-dealers. The total value of securities on loan is $429,708,000.
1 The fund invests a portion of its cash reserves in equity markets through the use of index futures contracts. After giving effect to futures investments, the fund's effective common stock and temporary cash investment positions represent 100.0% and 1.4%, respectively, of net assets.
2 Affiliated money market fund available only to Vanguard funds and certain trusts and accounts managed by Vanguard. Rate shown is the 7-day yield.
3 Includes $455,531,000 of collateral received for securities on loan.
4 The issuer operates under a congressional charter; its securities are generally neither guaranteed by the U.S. Treasury nor backed by the full faith and credit of the U.S. government.
5 Securities with a value of $4,598,000 have been segregated as initial margin for open futures contracts.
49
Vanguard® Extended Market Index Fund
Schedule of Investments
December 31, 2013
6 The issuer was placed under federal conservatorship in September 2008; since that time, its daily operations have been managed by the Federal Housing Finance Agency and it receives capital from the U.S. Treasury, as needed to maintain a positive net worth, in exchange for senior preferred stock.
REIT—Real Estate Investment Trust.
50
This page intentionally left blank.
© 2014 The Vanguard Group, Inc. All rights reserved.
Vanguard Marketing Corporation, Distributor.
SNA980_022014
| Vanguard® Total Stock Market Index Fund | |||
| Schedule of Investments | |||
| December 31, 2013 | |||
| Market | |||
| Value | |||
| Shares | ($000) | ||
| Common Stocks (99.5%)1 | |||
| Basic Materials (3.1%) | |||
| EI du Pont de Nemours & Co. | 13,845,651 | 899,552 | |
| Dow Chemical Co. | 18,132,666 | 805,090 | |
| Freeport-McMoRan Copper & Gold Inc. | 15,521,345 | 585,776 | |
| Praxair Inc. | 4,402,099 | 572,405 | |
| LyondellBasell Industries NV Class A | 7,035,184 | 564,785 | |
| Ecolab Inc. | 4,054,540 | 422,767 | |
| PPG Industries Inc. | 2,020,388 | 383,187 | |
| Air Products & Chemicals Inc. | 3,161,847 | 353,431 | |
| International Paper Co. | 6,636,547 | 325,390 | |
| Nucor Corp. | 4,757,788 | 253,971 | |
| CF Industries Holdings Inc. | 856,809 | 199,671 | |
| Mosaic Co. | 4,221,626 | 199,556 | |
| Eastman Chemical Co. | 2,301,834 | 185,758 | |
| Alcoa Inc. | 15,991,597 | 169,991 | |
| Newmont Mining Corp. | 7,371,331 | 169,762 | |
| Sigma-Aldrich Corp. | 1,789,166 | 168,200 | |
| FMC Corp. | 2,029,033 | 153,111 | |
| Celanese Corp. Class A | 2,372,639 | 131,231 | |
| CONSOL Energy Inc. | 3,422,486 | 130,191 | |
| Ashland Inc. | 1,158,881 | 112,458 | |
| Airgas Inc. | 991,941 | 110,949 | |
| * | WR Grace & Co. | 1,091,689 | 107,935 |
| International Flavors & Fragrances Inc. | 1,219,077 | 104,816 | |
| Reliance Steel & Aluminum Co. | 1,098,043 | 83,276 | |
| RPM International Inc. | 1,987,298 | 82,493 | |
| Rockwood Holdings Inc. | 1,113,720 | 80,099 | |
| Peabody Energy Corp. | 4,034,128 | 78,787 | |
| Albemarle Corp. | 1,216,992 | 77,145 | |
| Avery Dennison Corp. | 1,457,839 | 73,169 | |
| Huntsman Corp. | 2,887,176 | 71,025 | |
| United States Steel Corp. | 2,162,793 | 63,802 | |
| Steel Dynamics Inc. | 3,150,314 | 61,557 | |
| ^ | Cliffs Natural Resources Inc. | 2,289,203 | 60,000 |
| Allegheny Technologies Inc. | 1,604,475 | 57,167 | |
| ^ | NewMarket Corp. | 158,342 | 52,910 |
| Cytec Industries Inc. | 542,780 | 50,565 | |
| PolyOne Corp. | 1,396,065 | 49,351 | |
| Axiall Corp. | 1,038,546 | 49,269 | |
| Carpenter Technology Corp. | 752,072 | 46,779 | |
| Domtar Corp. | 481,904 | 45,463 | |
| Cabot Corp. | 858,983 | 44,152 | |
| Royal Gold Inc. | 914,701 | 42,140 | |
| * | Chemtura Corp. | 1,465,477 | 40,916 |
| Compass Minerals International Inc. | 500,266 | 40,046 | |
| HB Fuller Co. | 743,351 | 38,684 | |
| Westlake Chemical Corp. | 297,789 | 36,351 | |
| Sensient Technologies Corp. | 741,605 | 35,983 | |
| Commercial Metals Co. | 1,748,451 | 35,546 | |
| Olin Corp. | 1,192,871 | 34,414 | |
| * | KapStone Paper and Packaging Corp. | 606,295 | 33,868 |
| Worthington Industries Inc. | 791,329 | 33,299 | |
| Minerals Technologies Inc. | 513,335 | 30,836 | |
| *,^ | Polypore International Inc. | 680,358 | 26,466 |
| Balchem Corp. | 443,062 | 26,008 | |
| US Silica Holdings Inc. | 749,537 | 25,567 | |
| * | Alpha Natural Resources Inc. | 3,267,840 | 23,332 |
| * | SunCoke Energy Inc. | 981,651 | 22,391 |
| * | Stillwater Mining Co. | 1,771,829 | 21,864 |
| Tronox Ltd. Class A | 921,277 | 21,254 | |
| Kaiser Aluminum Corp. | 261,441 | 18,364 | |
| Stepan Co. | 274,962 | 18,046 | |
1
| Vanguard® Total Stock Market Index Fund | |||
| Schedule of Investments | |||
| December 31, 2013 | |||
| Market | |||
| Value | |||
| Shares | ($000) | ||
| PH Glatfelter Co. | 634,566 | 17,539 | |
| * | OM Group Inc. | 471,643 | 17,173 |
| Globe Specialty Metals Inc. | 946,158 | 17,040 | |
| * | Clearwater Paper Corp. | 322,694 | 16,941 |
| * | Calgon Carbon Corp. | 800,240 | 16,461 |
| * | Ferro Corp. | 1,273,917 | 16,344 |
| * | Coeur Mining Inc. | 1,500,579 | 16,281 |
| * | Cloud Peak Energy Inc. | 896,873 | 16,144 |
| * | RTI International Metals Inc. | 464,660 | 15,896 |
| Innophos Holdings Inc. | 324,719 | 15,781 | |
| * | Resolute Forest Products Inc. | 983,418 | 15,754 |
| *,^ | AK Steel Holding Corp. | 1,918,786 | 15,734 |
| Hecla Mining Co. | 5,094,858 | 15,692 | |
| Walter Energy Inc. | 930,467 | 15,474 | |
| Innospec Inc. | 328,252 | 15,172 | |
| *,^ | Molycorp Inc. | 2,569,582 | 14,441 |
| A Schulman Inc. | 407,484 | 14,368 | |
| Quaker Chemical Corp. | 182,637 | 14,076 | |
| ^ | Arch Coal Inc. | 3,138,088 | 13,965 |
| Koppers Holdings Inc. | 287,525 | 13,154 | |
| *,^ | Intrepid Potash Inc. | 811,358 | 12,852 |
| AMCOL International Corp. | 353,235 | 12,003 | |
| * | Horsehead Holding Corp. | 731,802 | 11,863 |
| Deltic Timber Corp. | 167,539 | 11,383 | |
| * | LSB Industries Inc. | 276,078 | 11,325 |
| * | Kraton Performance Polymers Inc. | 478,581 | 11,031 |
| Tredegar Corp. | 381,700 | 10,997 | |
| Haynes International Inc. | 182,521 | 10,083 | |
| Neenah Paper Inc. | 234,936 | 10,048 | |
| Aceto Corp. | 388,015 | 9,704 | |
| Wausau Paper Corp. | 678,007 | 8,597 | |
| American Vanguard Corp. | 353,530 | 8,587 | |
| * | Century Aluminum Co. | 779,963 | 8,158 |
| * | Cambrex Corp. | 413,728 | 7,377 |
| * | Zoltek Cos. Inc. | 401,492 | 6,725 |
| Kronos Worldwide Inc. | 338,233 | 6,443 | |
| * | OMNOVA Solutions Inc. | 640,520 | 5,835 |
| Zep Inc. | 316,336 | 5,745 | |
| * | Rentech Inc. | 3,058,846 | 5,353 |
| Hawkins Inc. | 133,224 | 4,955 | |
| FutureFuel Corp. | 307,797 | 4,863 | |
| *,^ | Allied Nevada Gold Corp. | 1,351,604 | 4,798 |
| * | American Pacific Corp. | 125,666 | 4,682 |
| Olympic Steel Inc. | 137,084 | 3,973 | |
| * | Westmoreland Coal Co. | 190,519 | 3,675 |
| * | Universal Stainless & Alloy Products Inc. | 95,871 | 3,457 |
| Chase Corp. | 93,154 | 3,288 | |
| Gold Resource Corp. | 697,258 | 3,159 | |
| * | Senomyx Inc. | 548,455 | 2,775 |
| Ampco-Pittsburgh Corp. | 123,047 | 2,393 | |
| KMG Chemicals Inc. | 115,254 | 1,947 | |
| * | Penford Corp. | 139,711 | 1,795 |
| * | Handy & Harman Ltd. | 71,880 | 1,740 |
| *,^ | Paramount Gold and Silver Corp. | 1,706,012 | 1,590 |
| *,^ | Uni-Pixel Inc. | 156,672 | 1,568 |
| *,^ | Comstock Mining Inc. | 876,575 | 1,534 |
| Noranda Aluminum Holding Corp. | 460,823 | 1,516 | |
| *,^ | Marrone Bio Innovations Inc. | 80,638 | 1,434 |
| Hallador Energy Co. | 170,638 | 1,375 | |
| Synalloy Corp. | 86,723 | 1,332 | |
| * | General Moly Inc. | 918,905 | 1,231 |
| * | Material Sciences Corp. | 103,918 | 1,227 |
| *,^ | Uranerz Energy Corp. | 887,221 | 1,136 |
| * | Midway Gold Corp. | 1,361,986 | 1,103 |
2
| Vanguard® Total Stock Market Index Fund | |||
| Schedule of Investments | |||
| December 31, 2013 | |||
| Market | |||
| Value | |||
| Shares | ($000) | ||
| * | Northern Technologies International Corp. | 55,404 | 1,028 |
| NL Industries Inc. | 81,693 | 913 | |
| * | US Antimony Corp. | 345,732 | 681 |
| *,^ | James River Coal Co. | 499,937 | 675 |
| Friedman Industries Inc. | 75,387 | 641 | |
| *,^ | Uranium Resources Inc. | 177,955 | 539 |
| * | Metabolix Inc. | 386,346 | 487 |
| ^ | USEC Inc. | 70,275 | 465 |
| * | Codexis Inc. | 253,050 | 354 |
| * | Solitario Exploration & Royalty Corp. | 368,557 | 313 |
| United-Guardian Inc. | 10,523 | 296 | |
| *,^ | Golden Minerals Co. | 490,029 | 231 |
| * | Dynasil Corp. of America | 134,449 | 153 |
| * | Verso Paper Corp. | 183,061 | 116 |
| Empire Resources Inc. | 24,767 | 86 | |
| * | TOR Minerals International Inc. | 2,580 | 26 |
| * | Mines Management Inc. | 10,759 | 6 |
| * | Ikonics Corp. | 300 | 4 |
| 9,399,466 | |||
| Consumer Goods (10.1%) | |||
| Procter & Gamble Co. | 40,641,359 | 3,308,613 | |
| Coca-Cola Co. | 59,421,978 | 2,454,722 | |
| Philip Morris International Inc. | 22,756,955 | 1,982,813 | |
| PepsiCo Inc. | 22,929,633 | 1,901,784 | |
| Altria Group Inc. | 29,910,707 | 1,148,272 | |
| Mondelez International Inc. Class A | 26,221,422 | 925,616 | |
| Monsanto Co. | 7,861,988 | 916,315 | |
| Colgate-Palmolive Co. | 13,837,552 | 902,347 | |
| Ford Motor Co. | 57,915,300 | 893,633 | |
| NIKE Inc. Class B | 10,640,877 | 836,799 | |
| * | General Motors Co. | 15,573,777 | 636,500 |
| Kimberly-Clark Corp. | 5,708,581 | 596,318 | |
| Johnson Controls Inc. | 10,244,121 | 525,523 | |
| Kraft Foods Group Inc. | 8,908,533 | 480,348 | |
| General Mills Inc. | 9,482,002 | 473,247 | |
| Archer-Daniels-Midland Co. | 9,839,765 | 427,046 | |
| VF Corp. | 5,265,728 | 328,265 | |
| Lorillard Inc. | 5,507,008 | 279,095 | |
| Delphi Automotive plc | 4,616,468 | 277,588 | |
| Estee Lauder Cos. Inc. Class A | 3,576,658 | 269,394 | |
| Kellogg Co. | 4,332,699 | 264,598 | |
| Mead Johnson Nutrition Co. | 3,020,710 | 253,015 | |
| Reynolds American Inc. | 4,858,031 | 242,853 | |
| Mattel Inc. | 5,059,517 | 240,732 | |
| Coach Inc. | 4,194,868 | 235,458 | |
| Harley-Davidson Inc. | 3,319,099 | 229,814 | |
| * | Michael Kors Holdings Ltd. | 2,743,085 | 222,711 |
| Stanley Black & Decker Inc. | 2,644,668 | 213,398 | |
| Hershey Co. | 2,192,251 | 213,153 | |
| ConAgra Foods Inc. | 6,307,779 | 212,572 | |
| BorgWarner Inc. | 3,406,708 | 190,469 | |
| Whirlpool Corp. | 1,179,445 | 185,008 | |
| Genuine Parts Co. | 2,193,285 | 182,459 | |
| Clorox Co. | 1,940,737 | 180,023 | |
| *,^ | Tesla Motors Inc. | 1,191,408 | 179,164 |
| Bunge Ltd. | 2,094,583 | 171,986 | |
| Beam Inc. | 2,437,390 | 165,889 | |
| PVH Corp. | 1,219,409 | 165,864 | |
| * | Constellation Brands Inc. Class A | 2,356,080 | 165,821 |
| Coca-Cola Enterprises Inc. | 3,687,601 | 162,734 | |
| Ralph Lauren Corp. Class A | 904,159 | 159,647 | |
| JM Smucker Co. | 1,493,236 | 154,729 | |
| * | Monster Beverage Corp. | 2,255,579 | 152,861 |
| Polaris Industries Inc. | 1,035,533 | 150,815 | |
3
| Vanguard® Total Stock Market Index Fund | |||
| Schedule of Investments | |||
| December 31, 2013 | |||
| Market | |||
| Value | |||
| Shares | ($000) | ||
| Dr Pepper Snapple Group Inc. | 3,028,993 | 147,573 | |
| Newell Rubbermaid Inc. | 4,295,042 | 139,202 | |
| Church & Dwight Co. Inc. | 2,073,202 | 137,412 | |
| * | Mohawk Industries Inc. | 922,846 | 137,412 |
| Tyson Foods Inc. Class A | 4,093,407 | 136,965 | |
| *,^ | Green Mountain Coffee Roasters Inc. | 1,793,178 | 135,528 |
| * | LKQ Corp. | 4,044,878 | 133,076 |
| * | TRW Automotive Holdings Corp. | 1,743,635 | 129,709 |
| Campbell Soup Co. | 2,825,878 | 122,304 | |
| Activision Blizzard Inc. | 6,755,743 | 120,455 | |
| Molson Coors Brewing Co. Class B | 2,142,975 | 120,328 | |
| McCormick & Co. Inc. | 1,701,934 | 117,297 | |
| Brown-Forman Corp. Class B | 1,538,143 | 116,237 | |
| * | Jarden Corp. | 1,826,883 | 112,079 |
| Avon Products Inc. | 6,484,421 | 111,662 | |
| Nu Skin Enterprises Inc. Class A | 800,460 | 110,640 | |
| * | Under Armour Inc. Class A | 1,216,279 | 106,181 |
| PulteGroup Inc. | 5,195,470 | 105,832 | |
| Hanesbrands Inc. | 1,481,456 | 104,102 | |
| Energizer Holdings Inc. | 935,658 | 101,276 | |
| * | Electronic Arts Inc. | 4,390,513 | 100,718 |
| Lear Corp. | 1,206,334 | 97,677 | |
| * | DR Horton Inc. | 4,345,238 | 96,986 |
| Hasbro Inc. | 1,745,806 | 96,037 | |
| Snap-on Inc. | 869,466 | 95,224 | |
| * | Lululemon Athletica Inc. | 1,547,336 | 91,339 |
| Herbalife Ltd. | 1,149,156 | 90,439 | |
| Hormel Foods Corp. | 1,972,939 | 89,118 | |
| Goodyear Tire & Rubber Co. | 3,689,623 | 87,998 | |
| * | Toll Brothers Inc. | 2,356,568 | 87,193 |
| * | WABCO Holdings Inc. | 931,217 | 86,985 |
| Lennar Corp. Class A | 2,186,837 | 86,511 | |
| Harman International Industries Inc. | 1,011,980 | 82,831 | |
| * | Fossil Group Inc. | 671,383 | 80,526 |
| Ingredion Inc. | 1,153,386 | 78,961 | |
| * | Middleby Corp. | 285,773 | 68,577 |
| Gentex Corp. | 2,054,558 | 67,780 | |
| Tupperware Brands Corp. | 696,806 | 65,869 | |
| Leggett & Platt Inc. | 2,111,486 | 65,329 | |
| * | NVR Inc. | 62,050 | 63,664 |
| Brunswick Corp. | 1,358,813 | 62,587 | |
| * | Hain Celestial Group Inc. | 678,633 | 61,606 |
| Hillshire Brands Co. | 1,839,147 | 61,501 | |
| * | Visteon Corp. | 743,994 | 60,926 |
| Flowers Foods Inc. | 2,791,558 | 59,935 | |
| * | WhiteWave Foods Co. Class A | 2,592,219 | 59,466 |
| * | Fifth & Pacific Cos. Inc. | 1,834,870 | 58,844 |
| Carter's Inc. | 770,170 | 55,291 | |
| * | Tenneco Inc. | 908,248 | 51,380 |
| * | Darling International Inc. | 2,351,761 | 49,105 |
| Wolverine World Wide Inc. | 1,428,222 | 48,502 | |
| * | Tempur Sealy International Inc. | 898,588 | 48,488 |
| Dana Holding Corp. | 2,195,064 | 43,067 | |
| Scotts Miracle-Gro Co. Class A | 690,299 | 42,950 | |
| * | Deckers Outdoor Corp. | 490,261 | 41,407 |
| Pool Corp. | 667,769 | 38,824 | |
| Thor Industries Inc. | 676,744 | 37,377 | |
| * | TreeHouse Foods Inc. | 515,349 | 35,518 |
| * | Zynga Inc. Class A | 9,322,428 | 35,425 |
| * | Steven Madden Ltd. | 920,447 | 33,679 |
| * | Boston Beer Co. Inc. Class A | 131,124 | 31,704 |
| * | Iconix Brand Group Inc. | 790,764 | 31,393 |
| Ryland Group Inc. | 690,229 | 29,963 | |
| Lancaster Colony Corp. | 302,030 | 26,624 | |
4
| Vanguard® Total Stock Market Index Fund | |||
| Schedule of Investments | |||
| December 31, 2013 | |||
| Market | |||
| Value | |||
| Shares | ($000) | ||
| B&G Foods Inc. | 783,891 | 26,582 | |
| HNI Corp. | 670,452 | 26,034 | |
| * | Dorman Products Inc. | 458,882 | 25,730 |
| ^ | KB Home | 1,401,731 | 25,624 |
| Herman Miller Inc. | 832,094 | 24,563 | |
| La-Z-Boy Inc. | 784,314 | 24,314 | |
| * | Take-Two Interactive Software Inc. | 1,370,561 | 23,807 |
| Andersons Inc. | 262,220 | 23,382 | |
| * | Meritage Homes Corp. | 482,691 | 23,164 |
| * | TiVo Inc. | 1,761,391 | 23,109 |
| Schweitzer-Mauduit International Inc. | 443,530 | 22,828 | |
| Dean Foods Co. | 1,322,511 | 22,734 | |
| Spectrum Brands Holdings Inc. | 322,037 | 22,720 | |
| * | Post Holdings Inc. | 459,477 | 22,638 |
| * | Helen of Troy Ltd. | 448,226 | 22,192 |
| Cooper Tire & Rubber Co. | 917,144 | 22,048 | |
| Sanderson Farms Inc. | 304,768 | 22,044 | |
| Snyders-Lance Inc. | 767,342 | 22,038 | |
| Pinnacle Foods Inc. | 783,389 | 21,512 | |
| * | American Axle & Manufacturing Holdings Inc. | 1,015,207 | 20,761 |
| * | Crocs Inc. | 1,297,354 | 20,654 |
| Interface Inc. Class A | 925,378 | 20,321 | |
| * | Standard Pacific Corp. | 2,242,644 | 20,296 |
| J&J Snack Foods Corp. | 219,992 | 19,489 | |
| * | Skechers U.S.A. Inc. Class A | 583,246 | 19,323 |
| Steelcase Inc. Class A | 1,211,693 | 19,217 | |
| * | MDC Holdings Inc. | 588,905 | 18,986 |
| Universal Corp. | 334,294 | 18,252 | |
| * | G-III Apparel Group Ltd. | 240,591 | 17,753 |
| Jones Group Inc. | 1,155,073 | 17,280 | |
| Drew Industries Inc. | 326,533 | 16,718 | |
| * | Select Comfort Corp. | 780,257 | 16,456 |
| Oxford Industries Inc. | 203,722 | 16,434 | |
| Fresh Del Monte Produce Inc. | 579,493 | 16,400 | |
| Columbia Sportswear Co. | 203,564 | 16,031 | |
| Vector Group Ltd. | 977,117 | 15,995 | |
| WD-40 Co. | 213,591 | 15,951 | |
| * | Tumi Holdings Inc. | 698,184 | 15,744 |
| * | Quiksilver Inc. | 1,733,203 | 15,200 |
| Briggs & Stratton Corp. | 682,832 | 14,858 | |
| *,^ | Eastman Kodak Co. | 419,449 | 14,559 |
| * | Seaboard Corp. | 4,828 | 13,494 |
| Titan International Inc. | 749,495 | 13,476 | |
| Coty Inc. Class A | 882,514 | 13,458 | |
| * | Elizabeth Arden Inc. | 377,299 | 13,375 |
| * | iRobot Corp. | 381,566 | 13,267 |
| * | Boulder Brands Inc. | 834,777 | 13,240 |
| * | Gentherm Inc. | 474,751 | 12,728 |
| * | Pilgrim's Pride Corp. | 775,406 | 12,600 |
| Cal-Maine Foods Inc. | 207,147 | 12,476 | |
| Knoll Inc. | 667,022 | 12,213 | |
| Movado Group Inc. | 265,002 | 11,663 | |
| Ethan Allen Interiors Inc. | 381,572 | 11,607 | |
| * | Winnebago Industries Inc. | 410,679 | 11,273 |
| Arctic Cat Inc. | 197,395 | 11,248 | |
| * | ACCO Brands Corp. | 1,644,908 | 11,054 |
| * | Taylor Morrison Home Corp. Class A | 486,884 | 10,931 |
| *,^ | Hovnanian Enterprises Inc. Class A | 1,644,691 | 10,888 |
| * | Annie's Inc. | 250,015 | 10,761 |
| Standard Motor Products Inc. | 284,094 | 10,455 | |
| * | Blount International Inc. | 720,245 | 10,422 |
| * | Federal-Mogul Corp. | 498,226 | 9,805 |
| Lennar Corp. Class B | 270,198 | 9,111 | |
| * | Beazer Homes USA Inc. | 370,608 | 9,050 |
5
| Vanguard® Total Stock Market Index Fund | |||
| Schedule of Investments | |||
| December 31, 2013 | |||
| Market | |||
| Value | |||
| Shares | ($000) | ||
| Inter Parfums Inc. | 250,148 | 8,958 | |
| Tootsie Roll Industries Inc. | 274,438 | 8,930 | |
| * | Modine Manufacturing Co. | 696,304 | 8,927 |
| Callaway Golf Co. | 1,055,158 | 8,895 | |
| * | M/I Homes Inc. | 332,932 | 8,473 |
| * | Cavco Industries Inc. | 122,122 | 8,390 |
| * | Universal Electronics Inc. | 212,032 | 8,081 |
| *,^ | Diamond Foods Inc. | 308,772 | 7,979 |
| * | USANA Health Sciences Inc. | 100,933 | 7,629 |
| * | Chiquita Brands International Inc. | 639,235 | 7,479 |
| Superior Industries International Inc. | 357,351 | 7,372 | |
| * | Vera Bradley Inc. | 301,570 | 7,250 |
| * | LeapFrog Enterprises Inc. | 851,498 | 6,761 |
| Nutrisystem Inc. | 405,255 | 6,662 | |
| * | Unifi Inc. | 240,184 | 6,543 |
| * | DTS Inc. | 257,292 | 6,170 |
| * | Libbey Inc. | 289,422 | 6,078 |
| * | National Presto Industries Inc. | 73,554 | 5,921 |
| * | Tower International Inc. | 271,653 | 5,813 |
| Coca-Cola Bottling Co. Consolidated | 79,368 | 5,809 | |
| Remy International Inc. | 246,038 | 5,738 | |
| Calavo Growers Inc. | 183,347 | 5,548 | |
| * | RealD Inc. | 607,221 | 5,186 |
| * | Medifast Inc. | 185,335 | 4,843 |
| * | Revlon Inc. Class A | 190,018 | 4,743 |
| * | Stoneridge Inc. | 361,858 | 4,614 |
| * | TRI Pointe Homes Inc. | 231,015 | 4,604 |
| * | Black Diamond Inc. | 312,627 | 4,167 |
| * | Nutraceutical International Corp. | 147,820 | 3,959 |
| * | Motorcar Parts of America Inc. | 203,175 | 3,921 |
| Limoneira Co. | 141,975 | 3,775 | |
| * | WCI Communities Inc. | 196,410 | 3,749 |
| John B Sanfilippo & Son Inc. | 149,908 | 3,700 | |
| * | Inventure Foods Inc. | 272,619 | 3,615 |
| * | Omega Protein Corp. | 289,825 | 3,562 |
| Oil-Dri Corp. of America | 93,252 | 3,529 | |
| *,^ | Glu Mobile Inc. | 893,124 | 3,474 |
| * | Alliance One International Inc. | 1,127,662 | 3,439 |
| * | Nautilus Inc. | 406,459 | 3,426 |
| * | William Lyon Homes Class A | 153,633 | 3,401 |
| * | National Beverage Corp. | 160,715 | 3,240 |
| * | Seneca Foods Corp. Class A | 99,386 | 3,169 |
| Hooker Furniture Corp. | 178,152 | 2,972 | |
| * | Central Garden and Pet Co. Class A | 438,583 | 2,960 |
| * | Fuel Systems Solutions Inc. | 208,187 | 2,888 |
| Orchids Paper Products Co. | 87,785 | 2,883 | |
| * | Jamba Inc. | 225,532 | 2,803 |
| Weyco Group Inc. | 95,177 | 2,801 | |
| Nature's Sunshine Products Inc. | 160,581 | 2,781 | |
| * | Costa Inc. | 127,038 | 2,761 |
| * | Perry Ellis International Inc. | 172,145 | 2,718 |
| Female Health Co. | 292,186 | 2,484 | |
| *,^ | Star Scientific Inc. | 2,082,567 | 2,416 |
| Flexsteel Industries Inc. | 77,185 | 2,372 | |
| RG Barry Corp. | 122,617 | 2,367 | |
| * | Fox Factory Holding Corp. | 132,006 | 2,326 |
| * | LGI Homes Inc. | 129,775 | 2,309 |
| Bassett Furniture Industries Inc. | 148,869 | 2,275 | |
| Culp Inc. | 108,916 | 2,227 | |
| * | Farmer Bros Co. | 92,919 | 2,161 |
| * | Shiloh Industries Inc. | 110,312 | 2,151 |
| *,^ | Lifevantage Corp. | 1,296,678 | 2,140 |
| * | Craft Brew Alliance Inc. | 125,409 | 2,059 |
| Strattec Security Corp. | 45,185 | 2,018 | |
6
| Vanguard® Total Stock Market Index Fund | |||
| Schedule of Investments | |||
| December 31, 2013 | |||
| Market | |||
| Value | |||
| Shares | ($000) | ||
| Cherokee Inc. | 145,928 | 2,014 | |
| JAKKS Pacific Inc. | 297,222 | 2,000 | |
| Lifetime Brands Inc. | 120,582 | 1,897 | |
| Johnson Outdoors Inc. Class A | 69,364 | 1,869 | |
| Alico Inc. | 46,638 | 1,813 | |
| Griffin Land & Nurseries Inc. | 53,560 | 1,788 | |
| * | Dixie Group Inc. | 128,274 | 1,693 |
| Marine Products Corp. | 166,467 | 1,673 | |
| *,^ | Quantum Fuel Systems Technologies Worldwide Inc. | 202,890 | 1,583 |
| * | Central Garden and Pet Co. | 223,966 | 1,539 |
| ^ | Blyth Inc. | 141,026 | 1,534 |
| Lifeway Foods Inc. | 95,840 | 1,532 | |
| * | Zagg Inc. | 346,599 | 1,508 |
| * | Delta Apparel Inc. | 84,602 | 1,437 |
| Escalade Inc. | 121,721 | 1,433 | |
| Rocky Brands Inc. | 95,177 | 1,387 | |
| * | Skullcandy Inc. | 191,257 | 1,379 |
| * | Vince Holding Corp. | 38,914 | 1,194 |
| * | Charles & Colvard Ltd. | 221,308 | 1,118 |
| * | LoJack Corp. | 276,852 | 999 |
| * | Joe's Jeans Inc. | 832,167 | 915 |
| * | Core Molding Technologies Inc. | 64,062 | 878 |
| *,^ | American Apparel Inc. | 710,946 | 874 |
| * | Stanley Furniture Co. Inc. | 227,672 | 874 |
| LS Starrett Co. Class A | 58,996 | 860 | |
| * | Reed's Inc. | 95,419 | 761 |
| Crown Crafts Inc. | 92,415 | 718 | |
| * | S&W Seed Co. | 89,979 | 625 |
| MGP Ingredients Inc. | 115,565 | 600 | |
| * | Primo Water Corp. | 222,131 | 584 |
| Rocky Mountain Chocolate Factory Inc. | 50,079 | 581 | |
| Reliv International Inc. | 132,578 | 371 | |
| * | Mannatech Inc. | 21,837 | 370 |
| * | Skyline Corp. | 69,891 | 360 |
| * | US Auto Parts Network Inc. | 144,542 | 358 |
| * | Emerson Radio Corp. | 169,085 | 321 |
| * | Kid Brands Inc. | 294,706 | 301 |
| Kewaunee Scientific Corp. | 13,832 | 216 | |
| *,^ | Coffee Holding Co. Inc. | 37,730 | 192 |
| *,^ | Ceres Inc. | 131,157 | 181 |
| * | Summer Infant Inc. | 89,573 | 162 |
| * | Hovnanian Enterprises Inc. Class B | 19,300 | 128 |
| * | Tofutti Brands Inc. | 33,900 | 121 |
| * | Majesco Entertainment Co. | 195,453 | 115 |
| *,^ | Comstock Holding Cos. Inc. Class A | 53,875 | 108 |
| Acme United Corp. | 6,623 | 99 | |
| *,^ | Clean Diesel Technologies Inc. | 64,160 | 96 |
| * | Hallwood Group Inc. | 7,919 | 77 |
| * | DS Healthcare Group Inc. | 32,023 | 76 |
| * | Castle Brands Inc. | 76,500 | 58 |
| * | Universal Security Instruments Inc. | 12,777 | 56 |
| CCA Industries Inc. | 17,873 | 53 | |
| * | Truett-Hurst Inc. | 11,700 | 49 |
| * | Forward Industries Inc. | 31,564 | 48 |
| * | CTI Industries Corp. | 7,424 | 43 |
| * | Willamette Valley Vineyards Inc. | 6,384 | 41 |
| * | Lakeland Industries Inc. | 6,701 | 36 |
| Compx International Inc. | 2,430 | 34 | |
| * | Natural Alternatives International Inc. | 6,000 | 33 |
| * | Crystal Rock Holdings Inc. | 32,920 | 31 |
| * | P&F Industries Inc. Class A | 3,745 | 27 |
| Koss Corp. | 3,972 | 20 | |
| * | Ocean Bio-Chem Inc. | 3,142 | 8 |
| Golden Enterprises Inc. | 1,240 | 5 | |
7
| Vanguard® Total Stock Market Index Fund | ||
| Schedule of Investments | ||
| December 31, 2013 | ||
| Market | ||
| Value | ||
| Shares | ($000) | |
| * Cyanotech Corp. | 900 | 4 |
| 30,929,193 | ||
| Consumer Services (13.4%) | ||
| * Amazon.com Inc. | 5,475,019 | 2,183,383 |
| Wal-Mart Stores Inc. | 24,189,821 | 1,903,497 |
| Walt Disney Co. | 23,646,469 | 1,806,590 |
| Comcast Corp. Class A | 34,167,767 | 1,775,528 |
| Home Depot Inc. | 21,055,044 | 1,733,672 |
| McDonald's Corp. | 14,877,163 | 1,443,531 |
| CVS Caremark Corp. | 17,796,307 | 1,273,682 |
| Twenty-First Century Fox Inc. Class A | 28,184,565 | 991,533 |
| * eBay Inc. | 17,420,234 | 956,197 |
| Time Warner Inc. | 12,850,551 | 895,940 |
| * priceline.com Inc. | 769,049 | 893,943 |
| Starbucks Corp. | 10,703,223 | 839,026 |
| Costco Wholesale Corp. | 6,574,518 | 782,433 |
| Lowe's Cos. Inc. | 15,636,653 | 774,796 |
| Walgreen Co. | 12,778,281 | 733,984 |
| TJX Cos. Inc. | 10,100,527 | 643,707 |
| Target Corp. | 9,450,552 | 597,936 |
| Time Warner Cable Inc. | 4,214,273 | 571,034 |
| McKesson Corp. | 3,434,262 | 554,290 |
| CBS Corp. Class B | 8,501,719 | 541,900 |
| Viacom Inc. Class B | 6,055,953 | 528,927 |
| * DIRECTV | 7,462,533 | 515,586 |
| Yum! Brands Inc. | 6,659,949 | 503,559 |
| Las Vegas Sands Corp. | 5,518,640 | 435,255 |
| Delta Air Lines Inc. | 12,795,856 | 351,502 |
| Cardinal Health Inc. | 5,105,199 | 341,078 |
| Whole Foods Market Inc. | 5,564,672 | 321,805 |
| Sysco Corp. | 8,694,392 | 313,868 |
| * Netflix Inc. | 841,629 | 309,863 |
| Macy's Inc. | 5,503,008 | 293,861 |
| * Dollar General Corp. | 4,815,258 | 290,456 |
| Kroger Co. | 7,326,566 | 289,619 |
| Omnicom Group Inc. | 3,883,636 | 288,826 |
| Carnival Corp. | 7,079,411 | 284,380 |
| * Bed Bath & Beyond Inc. | 3,078,313 | 247,189 |
| * Chipotle Mexican Grill Inc. Class A | 462,513 | 246,418 |
| * AutoZone Inc. | 508,788 | 243,170 |
| AmerisourceBergen Corp. Class A | 3,436,448 | 241,617 |
| Comcast Corp. | 4,795,423 | 239,196 |
| Wynn Resorts Ltd. | 1,209,869 | 234,969 |
| Ross Stores Inc. | 3,090,885 | 231,600 |
| L Brands Inc. | 3,688,462 | 228,131 |
| Starwood Hotels & Resorts Worldwide Inc. | 2,863,167 | 227,479 |
| * Liberty Interactive Corp. Class A | 7,168,490 | 210,395 |
| * Liberty Media Corp. Class A | 1,404,294 | 205,659 |
| * United Continental Holdings Inc. | 5,410,159 | 204,666 |
| * Discovery Communications Inc. Class A | 2,190,574 | 198,072 |
| Southwest Airlines Co. | 10,509,283 | 197,995 |
| * O'Reilly Automotive Inc. | 1,533,883 | 197,426 |
| * Hertz Global Holdings Inc. | 6,712,189 | 192,103 |
| * DISH Network Corp. Class A | 3,115,776 | 180,466 |
| Nielsen Holdings NV | 3,668,198 | 168,334 |
| * Dollar Tree Inc. | 2,955,507 | 166,750 |
| Kohl's Corp. | 2,906,441 | 164,941 |
| Best Buy Co. Inc. | 4,084,743 | 162,900 |
| Tractor Supply Co. | 2,087,060 | 161,914 |
| Gap Inc. | 4,027,541 | 157,396 |
| * CarMax Inc. | 3,339,706 | 157,033 |
| Staples Inc. | 9,827,752 | 156,163 |
| Tiffany & Co. | 1,627,124 | 150,965 |
| Wyndham Worldwide Corp. | 1,978,338 | 145,784 |
8
| Vanguard® Total Stock Market Index Fund | |||
| Schedule of Investments | |||
| December 31, 2013 | |||
| Market | |||
| Value | |||
| Shares | ($000) | ||
| * | Sirius XM Holdings Inc. | 41,579,241 | 145,112 |
| Marriott International Inc. Class A | 2,929,953 | 144,622 | |
| * | Charter Communications Inc. Class A | 1,011,959 | 138,396 |
| * | TripAdvisor Inc. | 1,646,453 | 136,376 |
| Nordstrom Inc. | 2,173,610 | 134,329 | |
| * | News Corp. Class A | 7,175,544 | 129,303 |
| * | MGM Resorts International | 5,494,255 | 129,225 |
| Advance Auto Parts Inc. | 1,088,767 | 120,505 | |
| Safeway Inc. | 3,689,710 | 120,174 | |
| H&R Block Inc. | 4,086,281 | 118,666 | |
| PetSmart Inc. | 1,550,937 | 112,831 | |
| Interpublic Group of Cos. Inc. | 6,276,800 | 111,099 | |
| Darden Restaurants Inc. | 1,951,500 | 106,103 | |
| Expedia Inc. | 1,493,792 | 104,058 | |
| * | IHS Inc. Class A | 853,724 | 102,191 |
| Scripps Networks Interactive Inc. Class A | 1,169,339 | 101,043 | |
| Gannett Co. Inc. | 3,408,220 | 100,815 | |
| * | Discovery Communications Inc. | 1,199,919 | 100,625 |
| Family Dollar Stores Inc. | 1,462,485 | 95,018 | |
| Signet Jewelers Ltd. | 1,197,792 | 94,266 | |
| Royal Caribbean Cruises Ltd. | 1,972,596 | 93,540 | |
| Foot Locker Inc. | 2,242,679 | 92,937 | |
| Omnicare Inc. | 1,539,225 | 92,908 | |
| * | Ulta Salon Cosmetics & Fragrance Inc. | 911,464 | 87,975 |
| Dick's Sporting Goods Inc. | 1,507,904 | 87,609 | |
| GNC Holdings Inc. Class A | 1,420,172 | 83,009 | |
| GameStop Corp. Class A | 1,660,319 | 81,787 | |
| Dunkin' Brands Group Inc. | 1,594,302 | 76,845 | |
| Alaska Air Group Inc. | 1,039,231 | 76,248 | |
| * | Sally Beauty Holdings Inc. | 2,492,313 | 75,343 |
| * | Panera Bread Co. Class A | 418,288 | 73,907 |
| Williams-Sonoma Inc. | 1,228,917 | 71,621 | |
| Dun & Bradstreet Corp. | 577,912 | 70,939 | |
| *,^ | American Airlines Group Inc. | 2,797,684 | 70,642 |
| International Game Technology | 3,878,690 | 70,437 | |
| * | Groupon Inc. | 5,968,419 | 70,248 |
| * | Rite Aid Corp. | 13,684,969 | 69,246 |
| ^ | FactSet Research Systems Inc. | 612,416 | 66,496 |
| * | Avis Budget Group Inc. | 1,606,819 | 64,948 |
| * | Lamar Advertising Co. Class A | 1,195,868 | 62,484 |
| * | Copart Inc. | 1,688,911 | 61,899 |
| * | Pandora Media Inc. | 2,311,470 | 61,485 |
| * | Urban Outfitters Inc. | 1,650,951 | 61,250 |
| * | AMC Networks Inc. Class A | 858,680 | 58,485 |
| KAR Auction Services Inc. | 1,971,635 | 58,262 | |
| Domino's Pizza Inc. | 832,622 | 57,992 | |
| * | Yelp Inc. Class A | 813,944 | 56,121 |
| Sotheby's | 1,026,475 | 54,608 | |
| Cablevision Systems Corp. Class A | 3,031,505 | 54,355 | |
| Service Corp. International | 2,994,436 | 54,289 | |
| * | AutoNation Inc. | 1,086,842 | 54,005 |
| * | United Natural Foods Inc. | 702,929 | 52,994 |
| DSW Inc. Class A | 1,234,033 | 52,730 | |
| Cinemark Holdings Inc. | 1,543,527 | 51,446 | |
| * | Madison Square Garden Co. Class A | 892,902 | 51,413 |
| * | Spirit Airlines Inc. | 1,079,596 | 49,024 |
| Brinker International Inc. | 1,021,689 | 47,345 | |
| * | Cabela's Inc. | 685,633 | 45,704 |
| * | Bally Technologies Inc. | 569,002 | 44,638 |
| Chico's FAS Inc. | 2,329,913 | 43,896 | |
| * | Starz | 1,481,136 | 43,308 |
| * | Graham Holdings Co. Class B | 64,970 | 43,096 |
| * | Sprouts Farmers Market Inc. | 1,094,091 | 42,046 |
| * | Apollo Education Group Inc. | 1,512,667 | 41,326 |
9
| Vanguard® Total Stock Market Index Fund | |||
| Schedule of Investments | |||
| December 31, 2013 | |||
| Market | |||
| Value | |||
| Shares | ($000) | ||
| * | Office Depot Inc. | 7,779,418 | 41,153 |
| * | Buffalo Wild Wings Inc. | 279,164 | 41,093 |
| * | Acxiom Corp. | 1,104,825 | 40,856 |
| * | Ascena Retail Group Inc. | 1,921,265 | 40,654 |
| * | Live Nation Entertainment Inc. | 2,050,195 | 40,512 |
| Vail Resorts Inc. | 536,941 | 40,394 | |
| * | Lumber Liquidators Holdings Inc. | 391,611 | 40,293 |
| Casey's General Stores Inc. | 569,659 | 40,019 | |
| Sinclair Broadcast Group Inc. Class A | 1,103,809 | 39,439 | |
| CST Brands Inc. | 1,073,180 | 39,407 | |
| Dillard's Inc. Class A | 404,094 | 39,282 | |
| *,^ | JC Penney Co. Inc. | 4,286,029 | 39,217 |
| Cracker Barrel Old Country Store Inc. | 353,520 | 38,912 | |
| * | HomeAway Inc. | 950,550 | 38,858 |
| Abercrombie & Fitch Co. | 1,162,314 | 38,252 | |
| John Wiley & Sons Inc. Class A | 684,311 | 37,774 | |
| * | Norwegian Cruise Line Holdings Ltd. | 1,064,881 | 37,771 |
| * | VCA Antech Inc. | 1,194,078 | 37,446 |
| American Eagle Outfitters Inc. | 2,580,825 | 37,164 | |
| Cheesecake Factory Inc. | 757,794 | 36,579 | |
| Harris Teeter Supermarkets Inc. | 739,750 | 36,507 | |
| Burger King Worldwide Inc. | 1,574,538 | 35,994 | |
| Men's Wearhouse Inc. | 704,377 | 35,980 | |
| Wendy's Co. | 4,110,050 | 35,840 | |
| *,^ | Sears Holdings Corp. | 712,613 | 34,947 |
| * | DreamWorks Animation SKG Inc. Class A | 968,321 | 34,375 |
| Six Flags Entertainment Corp. | 923,853 | 34,016 | |
| * | Hyatt Hotels Corp. Class A | 668,604 | 33,069 |
| Pier 1 Imports Inc. | 1,422,057 | 32,821 | |
| Lions Gate Entertainment Corp. | 1,029,653 | 32,599 | |
| * | Hilton Worldwide Holdings Inc. | 1,463,695 | 32,567 |
| PriceSmart Inc. | 279,561 | 32,300 | |
| * | Jack in the Box Inc. | 645,089 | 32,267 |
| Aaron's Inc. | 1,078,447 | 31,706 | |
| * | JetBlue Airways Corp. | 3,565,074 | 30,481 |
| New York Times Co. Class A | 1,897,580 | 30,115 | |
| * | Grand Canyon Education Inc. | 680,468 | 29,668 |
| * | Conn's Inc. | 376,392 | 29,656 |
| HSN Inc. | 474,723 | 29,575 | |
| Rollins Inc. | 971,655 | 29,431 | |
| * | Restoration Hardware Holdings Inc. | 434,018 | 29,209 |
| * | Beacon Roofing Supply Inc. | 724,392 | 29,179 |
| Penske Automotive Group Inc. | 599,696 | 28,282 | |
| * | Life Time Fitness Inc. | 593,262 | 27,883 |
| * | Five Below Inc. | 639,957 | 27,646 |
| *,^ | SolarCity Corp. | 485,877 | 27,608 |
| * | Shutterfly Inc. | 539,433 | 27,473 |
| Rent-A-Center Inc. | 822,987 | 27,438 | |
| * | Murphy USA Inc. | 659,401 | 27,405 |
| Guess? Inc. | 879,721 | 27,333 | |
| * | Big Lots Inc. | 843,808 | 27,247 |
| *,^ | Dolby Laboratories Inc. Class A | 696,519 | 26,858 |
| Meredith Corp. | 514,485 | 26,650 | |
| DeVry Education Group Inc. | 745,422 | 26,462 | |
| Texas Roadhouse Inc. Class A | 948,143 | 26,358 | |
| Hillenbrand Inc. | 891,238 | 26,220 | |
| *,^ | Hibbett Sports Inc. | 385,121 | 25,884 |
| * | Genesco Inc. | 348,192 | 25,439 |
| Monro Muffler Brake Inc. | 441,814 | 24,901 | |
| * | Asbury Automotive Group Inc. | 461,962 | 24,826 |
| * | OpenTable Inc. | 311,109 | 24,693 |
| * | ANN Inc. | 672,866 | 24,600 |
| * | ValueClick Inc. | 1,049,339 | 24,523 |
| Morningstar Inc. | 311,295 | 24,309 | |
10
| Vanguard® Total Stock Market Index Fund | |||
| Schedule of Investments | |||
| December 31, 2013 | |||
| Market | |||
| Value | |||
| Shares | ($000) | ||
| Nexstar Broadcasting Group Inc. Class A | 431,033 | 24,021 | |
| ^ | Regal Entertainment Group Class A | 1,232,607 | 23,974 |
| Papa John's International Inc. | 524,480 | 23,811 | |
| Allegiant Travel Co. Class A | 222,848 | 23,497 | |
| Choice Hotels International Inc. | 474,531 | 23,304 | |
| * | Fresh Market Inc. | 571,572 | 23,149 |
| Group 1 Automotive Inc. | 324,317 | 23,033 | |
| Lithia Motors Inc. Class A | 330,877 | 22,969 | |
| * | Jos A Bank Clothiers Inc. | 414,605 | 22,691 |
| Buckle Inc. | 428,887 | 22,542 | |
| * | Vitamin Shoppe Inc. | 426,813 | 22,199 |
| * | Express Inc. | 1,187,414 | 22,169 |
| * | Pinnacle Entertainment Inc. | 851,685 | 22,135 |
| * | Marriott Vacations Worldwide Corp. | 418,744 | 22,093 |
| SeaWorld Entertainment Inc. | 762,098 | 21,926 | |
| * | SUPERVALU Inc. | 2,970,141 | 21,652 |
| ^ | Chemed Corp. | 279,298 | 21,400 |
| * | Orient-Express Hotels Ltd. Class A | 1,398,525 | 21,132 |
| * | AMERCO | 86,292 | 20,524 |
| Finish Line Inc. Class A | 723,109 | 20,370 | |
| Bob Evans Farms Inc. | 401,704 | 20,322 | |
| DineEquity Inc. | 241,453 | 20,173 | |
| Twenty-First Century Fox Inc. | 559,078 | 19,344 | |
| * | Fiesta Restaurant Group Inc. | 369,993 | 19,328 |
| * | Children's Place Retail Stores Inc. | 337,276 | 19,215 |
| Valassis Communications Inc. | 556,969 | 19,076 | |
| * | WebMD Health Corp. | 482,142 | 19,045 |
| * | Krispy Kreme Doughnuts Inc. | 966,084 | 18,636 |
| Churchill Downs Inc. | 197,167 | 17,676 | |
| * | Bloomin' Brands Inc. | 733,165 | 17,603 |
| National CineMedia Inc. | 881,651 | 17,598 | |
| Interval Leisure Group Inc. | 555,323 | 17,159 | |
| Brown Shoe Co. Inc. | 606,217 | 17,059 | |
| * | Susser Holdings Corp. | 253,564 | 16,606 |
| * | Rush Enterprises Inc. Class A | 556,562 | 16,502 |
| Matthews International Corp. Class A | 381,213 | 16,243 | |
| * | Sonic Corp. | 800,444 | 16,161 |
| * | Ascent Capital Group Inc. Class A | 186,610 | 15,966 |
| *,^ | Caesars Entertainment Corp. | 702,926 | 15,141 |
| * | Penn National Gaming Inc. | 1,035,560 | 14,840 |
| *,^ | Media General Inc. | 653,959 | 14,779 |
| * | Red Robin Gourmet Burgers Inc. | 190,410 | 14,003 |
| International Speedway Corp. Class A | 388,960 | 13,804 | |
| ^ | Weight Watchers International Inc. | 412,948 | 13,598 |
| * | comScore Inc. | 473,403 | 13,544 |
| Sonic Automotive Inc. Class A | 553,072 | 13,539 | |
| * | AFC Enterprises Inc. | 350,017 | 13,476 |
| * | Constant Contact Inc. | 430,194 | 13,366 |
| Scholastic Corp. | 388,387 | 13,209 | |
| * | Multimedia Games Holding Co. Inc. | 418,488 | 13,124 |
| MDC Partners Inc. Class A | 509,106 | 12,987 | |
| Cato Corp. Class A | 402,104 | 12,787 | |
| *,^ | Clean Energy Fuels Corp. | 991,183 | 12,766 |
| * | Boyd Gaming Corp. | 1,109,737 | 12,496 |
| Spartan Stores Inc. | 507,057 | 12,311 | |
| Capella Education Co. | 183,639 | 12,201 | |
| * | Biglari Holdings Inc. | 24,046 | 12,183 |
| Core-Mark Holding Co. Inc. | 160,399 | 12,179 | |
| * | Bright Horizons Family Solutions Inc. | 330,264 | 12,134 |
| CEC Entertainment Inc. | 273,834 | 12,125 | |
| * | Scientific Games Corp. Class A | 704,594 | 11,929 |
| * | Extended Stay America Inc. | 445,480 | 11,698 |
| *,^ | ITT Educational Services Inc. | 343,077 | 11,521 |
| * | Cumulus Media Inc. Class A | 1,477,981 | 11,425 |
11
| Vanguard® Total Stock Market Index Fund | |||
| Schedule of Investments | |||
| December 31, 2013 | |||
| Market | |||
| Value | |||
| Shares | ($000) | ||
| * | Francesca's Holdings Corp. | 617,167 | 11,362 |
| * | ARAMARK Holdings Corp. | 432,612 | 11,343 |
| Regis Corp. | 758,365 | 11,004 | |
| * | American Public Education Inc. | 251,612 | 10,938 |
| * | BJ's Restaurants Inc. | 351,279 | 10,911 |
| * | Bankrate Inc. | 602,101 | 10,802 |
| SkyWest Inc. | 725,743 | 10,763 | |
| *,^ | Aeropostale Inc. | 1,169,593 | 10,632 |
| * | Gray Television Inc. | 690,557 | 10,275 |
| Stage Stores Inc. | 456,866 | 10,152 | |
| * | EW Scripps Co. Class A | 458,287 | 9,954 |
| * | K12 Inc. | 451,604 | 9,822 |
| * | Mattress Firm Holding Corp. | 221,581 | 9,537 |
| * | Denny's Corp. | 1,324,597 | 9,524 |
| Fred's Inc. Class A | 508,224 | 9,412 | |
| * | Steiner Leisure Ltd. | 191,263 | 9,408 |
| * | Tuesday Morning Corp. | 582,242 | 9,293 |
| Weis Markets Inc. | 176,119 | 9,257 | |
| * | Pep Boys-Manny Moe & Jack | 744,467 | 9,038 |
| * | Angie's List Inc. | 590,302 | 8,943 |
| * | FTD Cos. Inc. | 270,563 | 8,815 |
| * | Blue Nile Inc. | 183,979 | 8,664 |
| * | Stamps.com Inc. | 204,806 | 8,622 |
| * | Carmike Cinemas Inc. | 309,350 | 8,612 |
| * | Zumiez Inc. | 328,654 | 8,545 |
| *,^ | Liquidity Services Inc. | 371,472 | 8,418 |
| Haverty Furniture Cos. Inc. | 262,806 | 8,226 | |
| *,^ | Noodles & Co. Class A | 224,384 | 8,060 |
| * | Container Store Group Inc. | 171,092 | 7,975 |
| * | RetailMeNot Inc. | 276,100 | 7,949 |
| * | Del Frisco's Restaurant Group Inc. | 333,808 | 7,868 |
| * | Chuy's Holdings Inc. | 216,021 | 7,781 |
| * | Republic Airways Holdings Inc. | 721,705 | 7,715 |
| * | Zale Corp. | 481,012 | 7,586 |
| * | Barnes & Noble Inc. | 501,721 | 7,501 |
| * | Chefs' Warehouse Inc. | 255,332 | 7,445 |
| *,^ | Hawaiian Holdings Inc. | 728,588 | 7,016 |
| *,^ | Tile Shop Holdings Inc. | 385,467 | 6,965 |
| Ruth's Hospitality Group Inc. | 485,304 | 6,896 | |
| World Wrestling Entertainment Inc. Class A | 414,690 | 6,876 | |
| * | Overstock.com Inc. | 222,850 | 6,862 |
| Shoe Carnival Inc. | 210,430 | 6,105 | |
| Harte-Hanks Inc. | 763,799 | 5,973 | |
| Carriage Services Inc. Class A | 304,499 | 5,947 | |
| * | Journal Communications Inc. Class A | 638,319 | 5,943 |
| Clear Channel Outdoor Holdings Inc. Class A | 582,203 | 5,904 | |
| * | SP Plus Corp. | 225,763 | 5,879 |
| * | Orbitz Worldwide Inc. | 801,783 | 5,757 |
| * | Strayer Education Inc. | 165,373 | 5,700 |
| * | XO Group Inc. | 382,264 | 5,680 |
| Stein Mart Inc. | 422,020 | 5,676 | |
| * | Natural Grocers by Vitamin Cottage Inc. | 132,929 | 5,643 |
| * | Ruby Tuesday Inc. | 803,160 | 5,566 |
| * | MarineMax Inc. | 336,567 | 5,412 |
| * | Pantry Inc. | 320,787 | 5,383 |
| Big 5 Sporting Goods Corp. | 267,074 | 5,293 | |
| Destination Maternity Corp. | 174,026 | 5,200 | |
| * | America's Car-Mart Inc. | 122,497 | 5,173 |
| Ingles Markets Inc. Class A | 189,638 | 5,139 | |
| PetMed Express Inc. | 306,044 | 5,090 | |
| * | Burlington Stores Inc. | 158,589 | 5,075 |
| * | Career Education Corp. | 888,436 | 5,064 |
| * | Kirkland's Inc. | 209,164 | 4,951 |
| Entravision Communications Corp. Class A | 811,328 | 4,941 | |
12
| Vanguard® Total Stock Market Index Fund | |||
| Schedule of Investments | |||
| December 31, 2013 | |||
| Market | |||
| Value | |||
| Shares | ($000) | ||
| *,^ | Bridgepoint Education Inc. | 275,492 | 4,879 |
| * | Providence Service Corp. | 178,512 | 4,591 |
| Town Sports International Holdings Inc. | 305,528 | 4,510 | |
| ClubCorp Holdings Inc. | 252,821 | 4,485 | |
| *,^ | Titan Machinery Inc. | 243,976 | 4,348 |
| * | Sears Hometown and Outlet Stores Inc. | 168,644 | 4,300 |
| * | Digital Generation Inc. | 335,458 | 4,277 |
| * | Christopher & Banks Corp. | 499,398 | 4,265 |
| * | Destination XL Group Inc. | 639,086 | 4,199 |
| * | Bravo Brio Restaurant Group Inc. | 255,515 | 4,157 |
| * | Fairway Group Holdings Corp. | 220,835 | 4,002 |
| Speedway Motorsports Inc. | 195,066 | 3,872 | |
| * | ValueVision Media Inc. Class A | 553,760 | 3,871 |
| Roundy's Inc. | 392,507 | 3,870 | |
| * | Wet Seal Inc. Class A | 1,379,266 | 3,765 |
| * | Avid Technology Inc. | 459,684 | 3,746 |
| Marcus Corp. | 276,351 | 3,714 | |
| * | Demand Media Inc. | 632,539 | 3,650 |
| CSS Industries Inc. | 125,949 | 3,612 | |
| *,^ | RadioShack Corp. | 1,356,205 | 3,526 |
| * | QuinStreet Inc. | 400,608 | 3,481 |
| * | Citi Trends Inc. | 204,553 | 3,477 |
| * | West Marine Inc. | 244,285 | 3,476 |
| * | hhgregg Inc. | 244,405 | 3,414 |
| Saga Communications Inc. Class A | 67,482 | 3,394 | |
| Mac-Gray Corp. | 152,549 | 3,239 | |
| Bon-Ton Stores Inc. | 198,551 | 3,232 | |
| * | Famous Dave's Of America Inc. | 172,228 | 3,152 |
| Schawk Inc. Class A | 209,335 | 3,113 | |
| * | Monarch Casino & Resort Inc. | 153,221 | 3,077 |
| * | Diamond Resorts International Inc. | 165,671 | 3,058 |
| Winmark Corp. | 32,883 | 3,046 | |
| * | Entercom Communications Corp. Class A | 288,724 | 3,034 |
| * | Morgans Hotel Group Co. | 372,086 | 3,025 |
| * | Speed Commerce Inc. | 634,267 | 2,962 |
| * | Marchex Inc. Class B | 322,393 | 2,789 |
| * | McClatchy Co. Class A | 819,544 | 2,786 |
| *,^ | Education Management Corp. | 275,560 | 2,780 |
| Courier Corp. | 151,484 | 2,740 | |
| * | Daily Journal Corp. | 14,695 | 2,718 |
| bebe stores inc | 494,890 | 2,633 | |
| * | Isle of Capri Casinos Inc. | 292,282 | 2,631 |
| * | RealNetworks Inc. | 320,582 | 2,420 |
| * | News Corp. Class B | 135,089 | 2,409 |
| Village Super Market Inc. Class A | 77,161 | 2,393 | |
| * | Travelzoo Inc. | 111,504 | 2,377 |
| * | Lee Enterprises Inc. | 638,345 | 2,215 |
| Arden Group Inc. | 17,307 | 2,190 | |
| * | Nathan's Famous Inc. | 42,147 | 2,125 |
| AH Belo Corp. Class A | 282,580 | 2,111 | |
| Einstein Noah Restaurant Group Inc. | 143,807 | 2,085 | |
| * | Luby's Inc. | 269,231 | 2,078 |
| * | Spark Networks Inc. | 335,985 | 2,070 |
| * | Radio One Inc. | 538,531 | 2,041 |
| * | Pacific Sunwear of California Inc. | 603,033 | 2,014 |
| * | Corinthian Colleges Inc. | 1,104,920 | 1,967 |
| * | Carrols Restaurant Group Inc. | 284,831 | 1,883 |
| * | Autobytel Inc. | 121,653 | 1,841 |
| * | PCM Inc. | 177,713 | 1,825 |
| * | Geeknet Inc. | 100,443 | 1,817 |
| * | Vitacost.com Inc. | 313,533 | 1,815 |
| * | Reading International Inc. Class A | 237,170 | 1,776 |
| * | 1-800-Flowers.com Inc. Class A | 322,024 | 1,742 |
| * | Gaiam Inc. Class A | 252,728 | 1,673 |
13
| Vanguard® Total Stock Market Index Fund | |||
| Schedule of Investments | |||
| December 31, 2013 | |||
| Market | |||
| Value | |||
| Shares | ($000) | ||
| * | New York & Co. Inc. | 381,523 | 1,667 |
| * | JTH Holding Inc. Class A | 68,036 | 1,653 |
| * | Martha Stewart Living Omnimedia Inc. Class A | 390,644 | 1,641 |
| * | ReachLocal Inc. | 126,766 | 1,611 |
| * | Tilly's Inc. Class A | 138,635 | 1,587 |
| *,^ | Dex Media Inc. | 223,903 | 1,518 |
| * | MTR Gaming Group Inc. | 284,544 | 1,468 |
| * | Red Lion Hotels Corp. | 228,513 | 1,382 |
| * | Ignite Restaurant Group Inc. | 108,138 | 1,352 |
| * | Cache Inc. | 245,468 | 1,333 |
| * | Century Casinos Inc. | 253,622 | 1,321 |
| ^ | Collectors Universe Inc. | 76,351 | 1,309 |
| * | Kona Grill Inc. | 70,179 | 1,300 |
| * | Build-A-Bear Workshop Inc. | 168,197 | 1,270 |
| * | Rick's Cabaret International Inc. | 107,071 | 1,240 |
| Salem Communications Corp. Class A | 133,714 | 1,163 | |
| Frisch's Restaurants Inc. | 41,790 | 1,071 | |
| * | Lakes Entertainment Inc. | 268,877 | 1,062 |
| * | Emmis Communications Corp. Class A | 389,056 | 1,047 |
| * | Trans World Entertainment Corp. | 219,546 | 970 |
| Ambassadors Group Inc. | 195,913 | 911 | |
| * | TheStreet Inc. | 395,735 | 894 |
| Gordmans Stores Inc. | 116,460 | 893 | |
| * | PDI Inc. | 177,317 | 853 |
| * | Body Central Corp. | 209,867 | 827 |
| *,^ | SFX Entertainment Inc. | 59,670 | 716 |
| * | Diversified Restaurant Holdings Inc. | 147,300 | 703 |
| *,^ | Empire Resorts Inc. | 130,292 | 631 |
| * | Mandalay Digital Group Inc. | 238,655 | 625 |
| National American University Holdings Inc. | 175,287 | 613 | |
| * | Envivio Inc. | 179,194 | 609 |
| Dover Motorsports Inc. | 236,518 | 594 | |
| * | YuMe Inc. | 69,704 | 519 |
| Beasley Broadcasting Group Inc. Class A | 59,000 | 515 | |
| * | Dover Downs Gaming & Entertainment Inc. | 339,612 | 503 |
| *,^ | dELiA*s Inc. | 567,740 | 499 |
| * | Digital Cinema Destinations Corp. Class A | 79,100 | 460 |
| * | Learning Tree International Inc. | 136,059 | 426 |
| * | Premier Exhibitions Inc. | 363,244 | 421 |
| * | Full House Resorts Inc. | 147,684 | 414 |
| * | Perfumania Holdings Inc. | 64,655 | 411 |
| * | CafePress Inc. | 63,441 | 402 |
| *,^ | Pizza Inn Holdings Inc. | 46,505 | 377 |
| * | Gaming Partners International Corp. | 41,577 | 341 |
| *,^ | Local Corp. | 205,258 | 324 |
| * | ALCO Stores Inc. | 33,827 | 315 |
| * | Cosi Inc. | 179,823 | 302 |
| * | Cambium Learning Group Inc. | 157,716 | 262 |
| * | TechTarget Inc. | 37,564 | 258 |
| Wayside Technology Group Inc. | 18,728 | 253 | |
| * | Books-A-Million Inc. | 105,377 | 243 |
| * | Hollywood Media Corp. | 174,057 | 243 |
| * | Insignia Systems Inc. | 73,979 | 202 |
| * | Hastings Entertainment Inc. | 105,219 | 199 |
| *,^ | Coldwater Creek Inc. | 256,305 | 191 |
| * | Potbelly Corp. | 7,858 | 191 |
| * | RLJ Entertainment Inc. | 36,487 | 174 |
| Ark Restaurants Corp. | 7,542 | 167 | |
| * | Spanish Broadcasting System Inc. | 48,500 | 162 |
| * | DGSE Cos. Inc. | 61,321 | 137 |
| * | You On Demand Holdings Inc. | 55,625 | 125 |
| *,^ | Good Times Restaurants Inc. | 42,965 | 111 |
| * | Sport Chalet Inc. Class A | 65,485 | 71 |
| * | Crumbs Bake Shop Inc. | 64,830 | 53 |
14
| Vanguard® Total Stock Market Index Fund | ||
| Schedule of Investments | ||
| December 31, 2013 | ||
| Market | ||
| Value | ||
| Shares | ($000) | |
| * Flanigan's Enterprises Inc. | 4,012 | 52 |
| Value Line Inc. | 3,601 | 42 |
| * NTN Buzztime Inc. | 66,042 | 42 |
| Educational Development Corp. | 11,647 | 36 |
| * Dover Saddlery Inc. | 6,230 | 34 |
| * SPAR Group Inc. | 16,145 | 31 |
| * PokerTek Inc. | 31,769 | 30 |
| * Bacterin International Holdings Inc. | 48,600 | 24 |
| * Nevada Gold & Casinos Inc. | 17,500 | 24 |
| * Haverty Furniture Cos. Inc. Class A | 300 | 9 |
| * Universal Travel Group | 42,843 | 7 |
| * Sport Chalet Inc. Class B | 2,690 | 3 |
| 41,328,907 | ||
| Financials (18.3%) | ||
| Wells Fargo & Co. | 78,758,148 | 3,575,620 |
| JPMorgan Chase & Co. | 56,205,292 | 3,286,885 |
| * Berkshire Hathaway Inc. Class B | 25,008,837 | 2,965,048 |
| Bank of America Corp. | 159,473,913 | 2,483,009 |
| Citigroup Inc. | 43,080,409 | 2,244,920 |
| Visa Inc. Class A | 7,574,401 | 1,686,668 |
| American Express Co. | 16,017,064 | 1,453,228 |
| MasterCard Inc. Class A | 1,558,703 | 1,302,234 |
| American International Group Inc. | 22,013,613 | 1,123,795 |
| US Bancorp | 27,305,902 | 1,103,158 |
| Goldman Sachs Group Inc. | 6,098,880 | 1,081,087 |
| MetLife Inc. | 14,247,176 | 768,208 |
| Simon Property Group Inc. | 4,639,943 | 706,014 |
| Capital One Financial Corp. | 8,619,263 | 660,322 |
| Morgan Stanley | 20,431,346 | 640,727 |
| Prudential Financial Inc. | 6,896,216 | 635,969 |
| PNC Financial Services Group Inc. | 7,955,739 | 617,206 |
| Bank of New York Mellon Corp. | 17,175,460 | 600,111 |
| BlackRock Inc. | 1,626,119 | 514,618 |
| Travelers Cos. Inc. | 5,442,662 | 492,779 |
| ACE Ltd. | 4,576,140 | 473,768 |
| American Tower Corporation | 5,901,052 | 471,022 |
| Aflac Inc. | 6,968,685 | 465,508 |
| State Street Corp. | 6,234,857 | 457,576 |
| Charles Schwab Corp. | 16,381,772 | 425,926 |
| Discover Financial Services | 7,128,683 | 398,850 |
| Marsh & McLennan Cos. Inc. | 8,206,496 | 396,866 |
| BB&T Corp. | 10,537,799 | 393,271 |
| IntercontinentalExchange Group Inc. | 1,719,861 | 386,831 |
| Aon plc | 4,500,593 | 377,555 |
| CME Group Inc. | 4,762,623 | 373,675 |
| Allstate Corp. | 6,799,790 | 370,861 |
| Chubb Corp. | 3,763,772 | 363,693 |
| Franklin Resources Inc. | 6,144,293 | 354,710 |
| Ameriprise Financial Inc. | 2,908,296 | 334,599 |
| Public Storage | 2,186,666 | 329,137 |
| McGraw Hill Financial Inc. | 4,048,358 | 316,582 |
| T. Rowe Price Group Inc. | 3,705,833 | 310,438 |
| SunTrust Banks Inc. | 8,017,729 | 295,133 |
| Equity Residential | 5,388,457 | 279,499 |
| Fifth Third Bancorp | 13,198,189 | 277,558 |
| Prologis Inc. | 7,456,481 | 275,517 |
| Weyerhaeuser Co. | 8,712,286 | 275,047 |
| Moody's Corp. | 3,215,705 | 252,336 |
| Ventas Inc. | 4,396,934 | 251,856 |
| HCP Inc. | 6,821,055 | 247,741 |
| Hartford Financial Services Group Inc. | 6,683,819 | 242,155 |
| Invesco Ltd. | 6,626,661 | 241,210 |
| Health Care REIT Inc. | 4,315,724 | 231,193 |
| Boston Properties Inc. | 2,285,787 | 229,424 |
15
| Vanguard® Total Stock Market Index Fund | ||
| Schedule of Investments | ||
| December 31, 2013 | ||
| Market | ||
| Value | ||
| Shares | ($000) | |
| Vornado Realty Trust | 2,516,850 | 223,471 |
| Loews Corp. | 4,631,089 | 223,404 |
| Progressive Corp. | 8,075,440 | 220,217 |
| Host Hotels & Resorts Inc. | 11,306,625 | 219,801 |
| AvalonBay Communities Inc. | 1,838,117 | 217,321 |
| Principal Financial Group Inc. | 4,401,183 | 217,022 |
| Regions Financial Corp. | 20,769,658 | 205,412 |
| M&T Bank Corp. | 1,752,123 | 203,982 |
| Lincoln National Corp. | 3,935,674 | 203,159 |
| Northern Trust Corp. | 3,215,847 | 199,029 |
| KeyCorp | 13,560,444 | 181,981 |
| * Affiliated Managers Group Inc. | 790,147 | 171,367 |
| General Growth Properties Inc. | 8,173,248 | 164,037 |
| CIT Group Inc. | 2,991,897 | 155,968 |
| * Berkshire Hathaway Inc. Class A | 863 | 153,528 |
| Western Union Co. | 8,255,643 | 142,410 |
| Annaly Capital Management Inc. | 14,164,510 | 141,220 |
| Unum Group | 3,922,452 | 137,600 |
| XL Group plc Class A | 4,258,246 | 135,583 |
| Leucadia National Corp. | 4,632,097 | 131,274 |
| Comerica Inc. | 2,750,086 | 130,739 |
| SL Green Realty Corp. | 1,378,820 | 127,375 |
| Equifax Inc. | 1,818,489 | 125,639 |
| Macerich Co. | 2,101,012 | 123,729 |
| Plum Creek Timber Co. Inc. | 2,644,856 | 123,012 |
| Cincinnati Financial Corp. | 2,326,454 | 121,836 |
| Huntington Bancshares Inc. | 12,415,732 | 119,812 |
| * Markel Corp. | 198,488 | 115,193 |
| Fidelity National Financial Inc. Class A | 3,546,772 | 115,093 |
| Kimco Realty Corp. | 5,818,417 | 114,914 |
| * Genworth Financial Inc. Class A | 7,388,139 | 114,738 |
| American Capital Agency Corp. | 5,890,659 | 113,631 |
| TD Ameritrade Holding Corp. | 3,703,169 | 113,465 |
| * Arch Capital Group Ltd. | 1,887,445 | 112,662 |
| * CBRE Group Inc. Class A | 4,211,291 | 110,757 |
| Realty Income Corp. | 2,934,778 | 109,555 |
| * Realogy Holdings Corp. | 2,182,822 | 107,984 |
| Torchmark Corp. | 1,361,652 | 106,413 |
| Willis Group Holdings plc | 2,371,067 | 106,248 |
| New York Community Bancorp Inc. | 6,261,354 | 105,504 |
| First Republic Bank | 1,971,976 | 103,233 |
| Federal Realty Investment Trust | 976,730 | 99,050 |
| Cole Real Estate Investment Inc. | 7,017,001 | 98,519 |
| Raymond James Financial Inc. | 1,884,228 | 98,338 |
| * Ocwen Financial Corp. | 1,725,752 | 95,693 |
| * Alleghany Corp. | 238,105 | 95,232 |
| ^ Digital Realty Trust Inc. | 1,920,224 | 94,321 |
| Arthur J Gallagher & Co. | 1,950,693 | 91,546 |
| Everest Re Group Ltd. | 578,151 | 90,116 |
| UDR Inc. | 3,748,617 | 87,530 |
| * E*TRADE Financial Corp. | 4,293,416 | 84,323 |
| Zions Bancorporation | 2,759,710 | 82,681 |
| Reinsurance Group of America Inc. Class A | 1,057,252 | 81,842 |
| Essex Property Trust Inc. | 568,744 | 81,620 |
| PartnerRe Ltd. | 767,401 | 80,907 |
| Starwood Property Trust Inc. | 2,919,276 | 80,864 |
| SEI Investments Co. | 2,308,032 | 80,158 |
| Rayonier Inc. | 1,887,487 | 79,463 |
| Waddell & Reed Financial Inc. Class A | 1,209,677 | 78,774 |
| Lazard Ltd. Class A | 1,736,261 | 78,687 |
| * MSCI Inc. Class A | 1,799,359 | 78,668 |
| Assurant Inc. | 1,124,826 | 74,655 |
| Liberty Property Trust | 2,191,665 | 74,232 |
| Axis Capital Holdings Ltd. | 1,556,779 | 74,056 |
16
| Vanguard® Total Stock Market Index Fund | ||
| Schedule of Investments | ||
| December 31, 2013 | ||
| Market | ||
| Value | ||
| Shares | ($000) | |
| Eaton Vance Corp. | 1,721,301 | 73,654 |
| Duke Realty Corp. | 4,868,965 | 73,229 |
| Camden Property Trust | 1,275,253 | 72,536 |
| People's United Financial Inc. | 4,767,493 | 72,085 |
| East West Bancorp Inc. | 2,059,690 | 72,027 |
| Legg Mason Inc. | 1,650,601 | 71,768 |
| * SVB Financial Group | 682,529 | 71,570 |
| * Signature Bank | 655,753 | 70,441 |
| WR Berkley Corp. | 1,610,179 | 69,866 |
| NASDAQ OMX Group Inc. | 1,753,501 | 69,789 |
| HCC Insurance Holdings Inc. | 1,497,730 | 69,105 |
| Alexandria Real Estate Equities Inc. | 1,070,458 | 68,103 |
| Jones Lang LaSalle Inc. | 664,385 | 68,026 |
| LPL Financial Holdings Inc. | 1,444,762 | 67,947 |
| CBOE Holdings Inc. | 1,304,175 | 67,765 |
| Extra Space Storage Inc. | 1,604,939 | 67,616 |
| Hudson City Bancorp Inc. | 7,107,840 | 67,027 |
| Mid-America Apartment Communities Inc. | 1,093,524 | 66,421 |
| DDR Corp. | 4,296,519 | 66,038 |
| American Financial Group Inc. | 1,124,653 | 64,915 |
| Regency Centers Corp. | 1,380,090 | 63,898 |
| BRE Properties Inc. | 1,153,646 | 63,116 |
| Senior Housing Properties Trust | 2,812,879 | 62,530 |
| ING US Inc. | 1,754,650 | 61,676 |
| Kilroy Realty Corp. | 1,226,030 | 61,522 |
| * Liberty Ventures Class A | 500,848 | 61,399 |
| RenaissanceRe Holdings Ltd. | 629,702 | 61,295 |
| Old Republic International Corp. | 3,536,281 | 61,072 |
| * Howard Hughes Corp. | 502,922 | 60,401 |
| Cullen/Frost Bankers Inc. | 806,429 | 60,023 |
| Hospitality Properties Trust | 2,217,511 | 59,939 |
| Protective Life Corp. | 1,174,556 | 59,503 |
| Prosperity Bancshares Inc. | 923,189 | 58,521 |
| CNO Financial Group Inc. | 3,302,635 | 58,424 |
| NorthStar Realty Finance Corp. | 4,331,476 | 58,258 |
| Assured Guaranty Ltd. | 2,455,903 | 57,935 |
| Taubman Centers Inc. | 900,908 | 57,586 |
| Apartment Investment & Management Co. Class A | 2,180,908 | 56,507 |
| Brown & Brown Inc. | 1,796,858 | 56,403 |
| First Niagara Financial Group Inc. | 5,291,383 | 56,194 |
| Corrections Corp. of America | 1,731,714 | 55,536 |
| National Retail Properties Inc. | 1,820,660 | 55,221 |
| Validus Holdings Ltd. | 1,370,016 | 55,198 |
| City National Corp. | 691,296 | 54,764 |
| FirstMerit Corp. | 2,454,584 | 54,565 |
| Omega Healthcare Investors Inc. | 1,829,609 | 54,522 |
| Allied World Assurance Co. Holdings AG | 481,076 | 54,270 |
| Commerce Bancshares Inc. | 1,207,146 | 54,213 |
| WP Carey Inc. | 862,350 | 52,905 |
| * Gaming and Leisure Properties Inc. | 1,034,092 | 52,542 |
| Financial Engines Inc. | 749,473 | 52,073 |
| BioMed Realty Trust Inc. | 2,856,645 | 51,762 |
| Two Harbors Investment Corp. | 5,437,833 | 50,463 |
| American Campus Communities Inc. | 1,558,208 | 50,190 |
| Synovus Financial Corp. | 13,807,126 | 49,706 |
| Spirit Realty Capital Inc. | 5,051,443 | 49,656 |
| Highwoods Properties Inc. | 1,343,094 | 48,580 |
| * Forest City Enterprises Inc. Class A | 2,537,789 | 48,472 |
| Chimera Investment Corp. | 15,356,171 | 47,604 |
| LaSalle Hotel Properties | 1,538,548 | 47,480 |
| Weingarten Realty Investors | 1,721,956 | 47,216 |
| Douglas Emmett Inc. | 2,014,867 | 46,926 |
| Home Properties Inc. | 845,309 | 45,325 |
| Hancock Holding Co. | 1,231,435 | 45,169 |
17
| Vanguard® Total Stock Market Index Fund | |||
| Schedule of Investments | |||
| December 31, 2013 | |||
| Market | |||
| Value | |||
| Shares | ($000) | ||
| Tanger Factory Outlet Centers | 1,403,406 | 44,937 | |
| Retail Properties of America Inc. | 3,513,077 | 44,686 | |
| StanCorp Financial Group Inc. | 660,333 | 43,747 | |
| CBL & Associates Properties Inc. | 2,399,414 | 43,093 | |
| * | Stifel Financial Corp. | 898,329 | 43,048 |
| Associated Banc-Corp | 2,467,220 | 42,930 | |
| * | MGIC Investment Corp. | 5,046,643 | 42,594 |
| Equity Lifestyle Properties Inc. | 1,174,559 | 42,554 | |
| First American Financial Corp. | 1,504,067 | 42,415 | |
| RLJ Lodging Trust | 1,741,824 | 42,361 | |
| ProAssurance Corp. | 873,437 | 42,344 | |
| ^ | Columbia Property Trust Inc. | 1,689,523 | 42,238 |
| * | Popular Inc. | 1,465,529 | 42,105 |
| Webster Financial Corp. | 1,341,627 | 41,832 | |
| First Horizon National Corp. | 3,568,245 | 41,570 | |
| Aspen Insurance Holdings Ltd. | 999,692 | 41,297 | |
| CapitalSource Inc. | 2,870,805 | 41,253 | |
| CommonWealth REIT | 1,769,119 | 41,238 | |
| Piedmont Office Realty Trust Inc. Class A | 2,474,567 | 40,880 | |
| ^ | Federated Investors Inc. Class B | 1,395,359 | 40,186 |
| * | Portfolio Recovery Associates Inc. | 751,044 | 39,685 |
| Bank of Hawaii Corp. | 660,556 | 39,065 | |
| Hanover Insurance Group Inc. | 652,225 | 38,944 | |
| ^ | MFA Financial Inc. | 5,465,600 | 38,587 |
| UMB Financial Corp. | 596,731 | 38,358 | |
| * | Altisource Portfolio Solutions SA | 238,224 | 37,789 |
| Fulton Financial Corp. | 2,872,210 | 37,569 | |
| EPR Properties | 754,715 | 37,102 | |
| BankUnited Inc. | 1,124,031 | 37,003 | |
| Endurance Specialty Holdings Ltd. | 627,528 | 36,817 | |
| Post Properties Inc. | 808,503 | 36,569 | |
| Radian Group Inc. | 2,586,353 | 36,519 | |
| Sunstone Hotel Investors Inc. | 2,718,384 | 36,426 | |
| TCF Financial Corp. | 2,218,163 | 36,045 | |
| Susquehanna Bancshares Inc. | 2,797,409 | 35,919 | |
| * | Texas Capital Bancshares Inc. | 576,849 | 35,880 |
| Washington Federal Inc. | 1,529,154 | 35,614 | |
| MarketAxess Holdings Inc. | 532,074 | 35,580 | |
| American Realty Capital Properties Inc. | 2,749,450 | 35,358 | |
| White Mountains Insurance Group Ltd. | 58,262 | 35,137 | |
| Primerica Inc. | 817,820 | 35,093 | |
| Geo Group Inc. | 1,069,882 | 34,472 | |
| American National Insurance Co. | 297,737 | 34,103 | |
| DCT Industrial Trust Inc. | 4,733,415 | 33,749 | |
| DiamondRock Hospitality Co. | 2,893,545 | 33,420 | |
| Brandywine Realty Trust | 2,329,735 | 32,826 | |
| BancorpSouth Inc. | 1,280,263 | 32,544 | |
| *,^ | Zillow Inc. Class A | 390,142 | 31,886 |
| Umpqua Holdings Corp. | 1,664,240 | 31,854 | |
| Glacier Bancorp Inc. | 1,037,034 | 30,893 | |
| Home BancShares Inc. | 822,593 | 30,724 | |
| Corporate Office Properties Trust | 1,294,594 | 30,669 | |
| Sovran Self Storage Inc. | 469,331 | 30,586 | |
| Healthcare Realty Trust Inc. | 1,421,867 | 30,300 | |
| ^ | First Financial Bankshares Inc. | 447,501 | 29,678 |
| Invesco Mortgage Capital Inc. | 2,010,019 | 29,507 | |
| PrivateBancorp Inc. | 1,012,911 | 29,304 | |
| Newcastle Investment Corp. | 5,093,735 | 29,238 | |
| CubeSmart | 1,808,878 | 28,834 | |
| Erie Indemnity Co. Class A | 393,609 | 28,781 | |
| FNB Corp. | 2,259,355 | 28,513 | |
| Cathay General Bancorp | 1,066,344 | 28,503 | |
| Valley National Bancorp | 2,808,934 | 28,426 | |
| Kemper Corp. | 695,221 | 28,421 | |
18
| Vanguard® Total Stock Market Index Fund | ||
| Schedule of Investments | ||
| December 31, 2013 | ||
| Market | ||
| Value | ||
| Shares | ($000) | |
| Platinum Underwriters Holdings Ltd. | 462,893 | 28,366 |
| Pebblebrook Hotel Trust | 915,387 | 28,157 |
| RLI Corp. | 286,445 | 27,894 |
| Janus Capital Group Inc. | 2,253,161 | 27,872 |
| ^ Lexington Realty Trust | 2,728,368 | 27,857 |
| Medical Properties Trust Inc. | 2,272,604 | 27,771 |
| Bank of the Ozarks Inc. | 489,824 | 27,719 |
| Symetra Financial Corp. | 1,461,246 | 27,705 |
| Wintrust Financial Corp. | 596,300 | 27,501 |
| * WisdomTree Investments Inc. | 1,539,426 | 27,263 |
| First Industrial Realty Trust Inc. | 1,543,586 | 26,936 |
| * Virtus Investment Partners Inc. | 134,369 | 26,881 |
| Cousins Properties Inc. | 2,608,874 | 26,871 |
| Ryman Hospitality Properties Inc. | 641,931 | 26,820 |
| Chambers Street Properties | 3,494,476 | 26,733 |
| Alexander & Baldwin Inc. | 636,787 | 26,573 |
| Iberiabank Corp. | 418,631 | 26,311 |
| * Western Alliance Bancorp | 1,096,090 | 26,153 |
| * Strategic Hotels & Resorts Inc. | 2,752,097 | 26,007 |
| * MBIA Inc. | 2,138,218 | 25,530 |
| Healthcare Trust of America Inc. Class A | 2,583,746 | 25,424 |
| Trustmark Corp. | 942,454 | 25,295 |
| * First Cash Financial Services Inc. | 407,946 | 25,227 |
| Mack-Cali Realty Corp. | 1,169,836 | 25,128 |
| American Equity Investment Life Holding Co. | 949,307 | 25,043 |
| New Residential Investment Corp. | 3,740,708 | 24,988 |
| Potlatch Corp. | 598,575 | 24,985 |
| EastGroup Properties Inc. | 429,008 | 24,852 |
| MB Financial Inc. | 771,823 | 24,768 |
| Capitol Federal Financial Inc. | 2,043,034 | 24,741 |
| Home Loan Servicing Solutions Ltd. | 1,054,718 | 24,227 |
| Hatteras Financial Corp. | 1,459,539 | 23,849 |
| CVB Financial Corp. | 1,395,269 | 23,817 |
| PacWest Bancorp | 562,508 | 23,749 |
| Evercore Partners Inc. Class A | 395,583 | 23,648 |
| Redwood Trust Inc. | 1,219,801 | 23,628 |
| DuPont Fabros Technology Inc. | 955,022 | 23,599 |
| EverBank Financial Corp. | 1,275,197 | 23,387 |
| Old National Bancorp | 1,499,950 | 23,054 |
| Colony Financial Inc. | 1,132,691 | 22,982 |
| Washington REIT | 980,628 | 22,907 |
| PennyMac Mortgage Investment Trust | 994,124 | 22,825 |
| PS Business Parks Inc. | 296,389 | 22,650 |
| First Financial Holdings Inc. | 338,716 | 22,528 |
| Greenhill & Co. Inc. | 387,458 | 22,449 |
| ^ United Bankshares Inc. | 710,790 | 22,354 |
| Community Bank System Inc. | 562,109 | 22,304 |
| Westamerica Bancorporation | 391,235 | 22,089 |
| ARMOUR Residential REIT Inc. | 5,473,022 | 21,947 |
| Equity One Inc. | 975,134 | 21,882 |
| Sun Communities Inc. | 505,892 | 21,571 |
| National Health Investors Inc. | 383,629 | 21,522 |
| * Hilltop Holdings Inc. | 929,346 | 21,496 |
| Selective Insurance Group Inc. | 783,672 | 21,206 |
| International Bancshares Corp. | 796,835 | 21,028 |
| Montpelier Re Holdings Ltd. | 720,586 | 20,969 |
| Columbia Banking System Inc. | 756,896 | 20,822 |
| National Penn Bancshares Inc. | 1,805,573 | 20,457 |
| Acadia Realty Trust | 823,360 | 20,444 |
| Mercury General Corp. | 405,599 | 20,162 |
| BOK Financial Corp. | 303,149 | 20,105 |
| Glimcher Realty Trust | 2,143,384 | 20,062 |
| Government Properties Income Trust | 805,977 | 20,029 |
| * St. Joe Co. | 1,025,348 | 19,676 |
19
| Vanguard® Total Stock Market Index Fund | ||
| Schedule of Investments | ||
| December 31, 2013 | ||
| Market | ||
| Value | ||
| Shares | ($000) | |
| CYS Investments Inc. | 2,548,003 | 18,881 |
| Northwest Bancshares Inc. | 1,272,563 | 18,808 |
| Kennedy-Wilson Holdings Inc. | 835,059 | 18,580 |
| Argo Group International Holdings Ltd. | 399,010 | 18,550 |
| Horace Mann Educators Corp. | 586,824 | 18,508 |
| * Walter Investment Management Corp. | 521,956 | 18,456 |
| First Midwest Bancorp Inc. | 1,047,943 | 18,370 |
| Investors Bancorp Inc. | 718,078 | 18,368 |
| BBCN Bancorp Inc. | 1,106,623 | 18,359 |
| Chesapeake Lodging Trust | 718,055 | 18,160 |
| LTC Properties Inc. | 513,043 | 18,157 |
| Pennsylvania REIT | 951,222 | 18,054 |
| * Encore Capital Group Inc. | 354,622 | 17,823 |
| Sterling Financial Corp. | 520,738 | 17,747 |
| Astoria Financial Corp. | 1,269,028 | 17,551 |
| Artisan Partners Asset Management Inc. Class A | 267,486 | 17,437 |
| Interactive Brokers Group Inc. | 709,443 | 17,268 |
| Empire State Realty Trust Inc. | 1,123,102 | 17,183 |
| Capstead Mortgage Corp. | 1,419,359 | 17,146 |
| Altisource Residential Corp. | 566,872 | 17,069 |
| First Citizens BancShares Inc. Class A | 76,352 | 16,998 |
| * Trulia Inc. | 469,460 | 16,558 |
| * Ambac Financial Group Inc. | 666,798 | 16,377 |
| * iStar Financial Inc. | 1,141,317 | 16,287 |
| American Assets Trust Inc. | 508,625 | 15,986 |
| Cash America International Inc. | 416,095 | 15,936 |
| Pinnacle Financial Partners Inc. | 488,959 | 15,906 |
| Franklin Street Properties Corp. | 1,321,286 | 15,789 |
| Parkway Properties Inc. | 816,143 | 15,743 |
| NBT Bancorp Inc. | 605,928 | 15,694 |
| Hersha Hospitality Trust Class A | 2,816,079 | 15,686 |
| * Altisource Asset Management Corp. | 16,821 | 15,644 |
| Ramco-Gershenson Properties Trust | 981,758 | 15,453 |
| Provident Financial Services Inc. | 791,772 | 15,297 |
| * TFS Financial Corp. | 1,249,863 | 15,142 |
| BGC Partners Inc. Class A | 2,479,659 | 15,027 |
| ^ Amtrust Financial Services Inc. | 459,314 | 15,015 |
| American Capital Mortgage Investment Corp. | 857,147 | 14,966 |
| Education Realty Trust Inc. | 1,689,196 | 14,899 |
| Retail Opportunity Investments Corp. | 1,003,679 | 14,774 |
| * Sterling Bancorp | 1,097,424 | 14,673 |
| Park National Corp. | 172,265 | 14,655 |
| ViewPoint Financial Group Inc. | 529,735 | 14,541 |
| Sabra Health Care REIT Inc. | 553,747 | 14,475 |
| Employers Holdings Inc. | 452,876 | 14,334 |
| * Greenlight Capital Re Ltd. Class A | 424,791 | 14,320 |
| First Financial Bancorp | 816,812 | 14,237 |
| * Enstar Group Ltd. | 101,514 | 14,101 |
| Boston Private Financial Holdings Inc. | 1,117,112 | 14,098 |
| Chemical Financial Corp. | 437,411 | 13,853 |
| * First BanCorp | 2,237,005 | 13,847 |
| Renasant Corp. | 434,647 | 13,674 |
| National Bank Holdings Corp. Class A | 638,185 | 13,657 |
| * BofI Holding Inc. | 174,050 | 13,651 |
| Hudson Pacific Properties Inc. | 620,875 | 13,579 |
| * FelCor Lodging Trust Inc. | 1,642,758 | 13,405 |
| * Brixmor Property Group Inc. | 657,147 | 13,360 |
| * HFF Inc. Class A | 495,809 | 13,312 |
| NRG Yield Inc. Class A | 331,591 | 13,267 |
| SLM Corp. | 499,093 | 13,116 |
| Inland Real Estate Corp. | 1,246,271 | 13,111 |
| Independent Bank Corp. | 333,347 | 13,064 |
| Banner Corp. | 291,466 | 13,064 |
| Investors Real Estate Trust | 1,520,559 | 13,046 |
20
| Vanguard® Total Stock Market Index Fund | |||
| Schedule of Investments | |||
| December 31, 2013 | |||
| Market | |||
| Value | |||
| Shares | ($000) | ||
| Nelnet Inc. Class A | 309,516 | 13,043 | |
| WesBanco Inc. | 407,192 | 13,030 | |
| STAG Industrial Inc. | 631,351 | 12,873 | |
| First Commonwealth Financial Corp. | 1,439,740 | 12,699 | |
| American Homes 4 Rent Class A | 771,430 | 12,497 | |
| * | eHealth Inc. | 268,424 | 12,479 |
| *,^ | Nationstar Mortgage Holdings Inc. | 333,663 | 12,332 |
| Kite Realty Group Trust | 1,858,217 | 12,208 | |
| Central Pacific Financial Corp. | 589,664 | 11,840 | |
| Associated Estates Realty Corp. | 735,558 | 11,806 | |
| First Merchants Corp. | 510,370 | 11,616 | |
| OFG Bancorp | 668,086 | 11,585 | |
| Infinity Property & Casualty Corp. | 161,298 | 11,573 | |
| * | KCG Holdings Inc. Class A | 966,790 | 11,563 |
| * | United Community Banks Inc. | 647,757 | 11,498 |
| AMERISAFE Inc. | 271,939 | 11,487 | |
| * | World Acceptance Corp. | 131,023 | 11,468 |
| Safety Insurance Group Inc. | 201,277 | 11,332 | |
| * | Credit Acceptance Corp. | 86,481 | 11,242 |
| * | Investment Technology Group Inc. | 539,018 | 11,082 |
| ^ | Cohen & Steers Inc. | 274,225 | 10,985 |
| Select Income REIT | 402,937 | 10,775 | |
| S&T Bancorp Inc. | 416,063 | 10,531 | |
| * | Navigators Group Inc. | 165,497 | 10,453 |
| Blackstone Mortgage Trust Inc. Class A | 383,404 | 10,402 | |
| Resource Capital Corp. | 1,752,972 | 10,395 | |
| Summit Hotel Properties Inc. | 1,139,210 | 10,253 | |
| * | Forestar Group Inc. | 480,038 | 10,210 |
| CoreSite Realty Corp. | 316,664 | 10,193 | |
| City Holding Co. | 218,295 | 10,114 | |
| Brookline Bancorp Inc. | 1,038,001 | 9,934 | |
| * | Eagle Bancorp Inc. | 321,392 | 9,844 |
| Alexander's Inc. | 29,679 | 9,794 | |
| Wilshire Bancorp Inc. | 892,357 | 9,753 | |
| Sandy Spring Bancorp Inc. | 345,470 | 9,739 | |
| Stewart Information Services Corp. | 300,089 | 9,684 | |
| Hanmi Financial Corp. | 437,979 | 9,587 | |
| First Potomac Realty Trust | 818,495 | 9,519 | |
| Berkshire Hills Bancorp Inc. | 343,297 | 9,362 | |
| RAIT Financial Trust | 1,040,844 | 9,336 | |
| TrustCo Bank Corp. NY | 1,297,412 | 9,315 | |
| Ashford Hospitality Trust Inc. | 1,114,050 | 9,224 | |
| * | Piper Jaffray Cos. | 231,740 | 9,165 |
| WSFS Financial Corp. | 116,921 | 9,065 | |
| * | Move Inc. | 565,286 | 9,039 |
| Oritani Financial Corp. | 561,186 | 9,007 | |
| Community Trust Bancorp Inc. | 198,588 | 8,968 | |
| Campus Crest Communities Inc. | 947,334 | 8,914 | |
| Apollo Commercial Real Estate Finance Inc. | 544,575 | 8,849 | |
| * | Bancorp Inc. | 493,826 | 8,844 |
| Lakeland Financial Corp. | 226,586 | 8,837 | |
| * | Capital Bank Financial Corp. | 386,698 | 8,797 |
| Anworth Mortgage Asset Corp. | 2,067,168 | 8,703 | |
| Silver Bay Realty Trust Corp. | 542,059 | 8,668 | |
| Flushing Financial Corp. | 418,606 | 8,665 | |
| United Fire Group Inc. | 302,281 | 8,663 | |
| * | Tejon Ranch Co. | 231,804 | 8,521 |
| * | Ezcorp Inc. Class A | 717,462 | 8,387 |
| * | Green Dot Corp. Class A | 332,995 | 8,375 |
| Maiden Holdings Ltd. | 761,423 | 8,322 | |
| * | American Residential Properties Inc. | 474,287 | 8,139 |
| * | Xoom Corp. | 294,871 | 8,071 |
| Tompkins Financial Corp. | 156,634 | 8,049 | |
| Union First Market Bankshares Corp. | 323,658 | 8,030 | |
21
| Vanguard® Total Stock Market Index Fund | ||
| Schedule of Investments | ||
| December 31, 2013 | ||
| Market | ||
| Value | ||
| Shares | ($000) | |
| State Bank Financial Corp. | 439,457 | 7,994 |
| Saul Centers Inc. | 166,986 | 7,970 |
| Simmons First National Corp. Class A | 210,170 | 7,808 |
| First Interstate Bancsystem Inc. | 273,523 | 7,760 |
| * PICO Holdings Inc. | 330,105 | 7,629 |
| Cardinal Financial Corp. | 422,158 | 7,599 |
| StellarOne Corp. | 311,636 | 7,501 |
| Washington Trust Bancorp Inc. | 201,340 | 7,494 |
| FXCM Inc. Class A | 418,447 | 7,465 |
| ^ HCI Group Inc. | 137,731 | 7,369 |
| Rouse Properties Inc. | 330,973 | 7,344 |
| Excel Trust Inc. | 643,404 | 7,328 |
| Chatham Lodging Trust | 357,060 | 7,302 |
| National Western Life Insurance Co. Class A | 32,515 | 7,269 |
| * Ameris Bancorp | 337,450 | 7,124 |
| FBL Financial Group Inc. Class A | 159,008 | 7,122 |
| Dime Community Bancshares Inc. | 417,954 | 7,072 |
| * Synergy Resources Corp. | 756,315 | 7,003 |
| Apollo Residential Mortgage Inc. | 473,285 | 6,995 |
| * TESARO Inc. | 241,594 | 6,823 |
| Getty Realty Corp. | 366,481 | 6,732 |
| Universal Health Realty Income Trust | 165,997 | 6,650 |
| * Virginia Commerce Bancorp Inc. | 386,408 | 6,565 |
| AG Mortgage Investment Trust Inc. | 416,048 | 6,507 |
| * DFC Global Corp. | 562,292 | 6,438 |
| First Busey Corp. | 1,109,669 | 6,436 |
| Southside Bancshares Inc. | 235,285 | 6,433 |
| ^ New York Mortgage Trust Inc. | 919,539 | 6,428 |
| * First NBC Bank Holding Co. | 197,544 | 6,381 |
| Arlington Asset Investment Corp. Class A | 237,551 | 6,269 |
| 1st Source Corp. | 196,223 | 6,267 |
| CoBiz Financial Inc. | 516,316 | 6,175 |
| Heartland Financial USA Inc. | 214,486 | 6,175 |
| * Beneficial Mutual Bancorp Inc. | 563,656 | 6,155 |
| Universal Insurance Holdings Inc. | 424,448 | 6,146 |
| Dynex Capital Inc. | 759,496 | 6,076 |
| Agree Realty Corp. | 209,273 | 6,073 |
| * MoneyGram International Inc. | 291,373 | 6,055 |
| * Flagstar Bancorp Inc. | 308,365 | 6,050 |
| * Safeguard Scientifics Inc. | 300,501 | 6,037 |
| CyrusOne Inc. | 268,233 | 5,990 |
| Terreno Realty Corp. | 338,146 | 5,985 |
| SY Bancorp Inc. | 185,877 | 5,933 |
| * NewStar Financial Inc. | 332,115 | 5,902 |
| Cedar Realty Trust Inc. | 930,227 | 5,823 |
| TowneBank | 378,034 | 5,818 |
| * Regional Management Corp. | 168,167 | 5,706 |
| Lakeland Bancorp Inc. | 459,140 | 5,680 |
| Urstadt Biddle Properties Inc. Class A | 304,147 | 5,612 |
| * Customers Bancorp Inc. | 273,756 | 5,601 |
| * Taylor Capital Group Inc. | 209,812 | 5,577 |
| Westwood Holdings Group Inc. | 89,510 | 5,542 |
| Rockville Financial Inc. | 387,970 | 5,513 |
| First Financial Corp. | 150,739 | 5,511 |
| * Cowen Group Inc. Class A | 1,375,297 | 5,377 |
| Winthrop Realty Trust | 477,013 | 5,271 |
| GAMCO Investors Inc. | 60,553 | 5,266 |
| Bryn Mawr Bank Corp. | 173,437 | 5,234 |
| Trico Bancshares | 183,486 | 5,206 |
| Ares Commercial Real Estate Corp. | 386,800 | 5,067 |
| * Phoenix Cos. Inc. | 82,305 | 5,054 |
| * Tree.com Inc. | 153,670 | 5,047 |
| Monmouth Real Estate Investment Corp. Class A | 553,402 | 5,030 |
| Aviv REIT Inc. | 212,085 | 5,026 |
22
| Vanguard® Total Stock Market Index Fund | |||
| Schedule of Investments | |||
| December 31, 2013 | |||
| Market | |||
| Value | |||
| Shares | ($000) | ||
| OneBeacon Insurance Group Ltd. Class A | 317,477 | 5,022 | |
| ^ | Western Asset Mortgage Capital Corp. | 336,450 | 5,006 |
| * | Citizens Inc. Class A | 559,416 | 4,895 |
| United Financial Bancorp Inc. | 257,769 | 4,869 | |
| Bancfirst Corp. | 86,586 | 4,854 | |
| * | PennyMac Financial Services Inc. Class A | 274,706 | 4,821 |
| First of Long Island Corp. | 112,452 | 4,821 | |
| Arrow Financial Corp. | 180,576 | 4,796 | |
| Enterprise Financial Services Corp. | 234,148 | 4,781 | |
| Meadowbrook Insurance Group Inc. | 681,292 | 4,742 | |
| Diamond Hill Investment Group Inc. | 39,642 | 4,691 | |
| MainSource Financial Group Inc. | 257,329 | 4,640 | |
| State Auto Financial Corp. | 218,275 | 4,636 | |
| Univest Corp. of Pennsylvania | 223,135 | 4,614 | |
| *,^ | Arrowhead Research Corp. | 424,897 | 4,610 |
| * | Walker & Dunlop Inc. | 284,399 | 4,599 |
| * | FBR & Co. | 174,247 | 4,597 |
| AmREIT Inc. | 273,446 | 4,594 | |
| German American Bancorp Inc. | 160,744 | 4,581 | |
| Camden National Corp. | 107,679 | 4,546 | |
| * | Southwest Bancorp Inc. | 284,445 | 4,528 |
| * | Ladenburg Thalmann Financial Services Inc. | 1,434,112 | 4,489 |
| Great Southern Bancorp Inc. | 146,647 | 4,460 | |
| Bank Mutual Corp. | 625,218 | 4,383 | |
| Federal Agricultural Mortgage Corp. | 127,490 | 4,367 | |
| Hudson Valley Holding Corp. | 214,031 | 4,356 | |
| Financial Institutions Inc. | 174,421 | 4,310 | |
| * | Performant Financial Corp. | 413,724 | 4,261 |
| First Bancorp | 254,662 | 4,232 | |
| Park Sterling Corp. | 592,213 | 4,228 | |
| * | HomeTrust Bancshares Inc. | 263,725 | 4,217 |
| * | Blackhawk Network Holdings Inc. | 165,100 | 4,170 |
| Whitestone REIT | 309,040 | 4,132 | |
| West Bancorporation Inc. | 259,826 | 4,110 | |
| Centerstate Banks Inc. | 403,262 | 4,093 | |
| Bridge Bancorp Inc. | 157,073 | 4,084 | |
| First Community Bancshares Inc. | 242,916 | 4,057 | |
| Ashford Hospitality Prime Inc. | 222,810 | 4,055 | |
| * | INTL. FCStone Inc. | 215,594 | 3,997 |
| GFI Group Inc. | 1,016,891 | 3,976 | |
| Seacoast Banking Corp. of Florida | 325,760 | 3,974 | |
| Gladstone Commercial Corp. | 219,589 | 3,946 | |
| * | Gramercy Property Trust Inc. | 685,801 | 3,943 |
| * | Metro Bancorp Inc. | 183,047 | 3,943 |
| Center Bancorp Inc. | 210,050 | 3,941 | |
| First Connecticut Bancorp Inc. | 240,249 | 3,873 | |
| * | Springleaf Holdings Inc. | 153,101 | 3,870 |
| Physicians Realty Trust | 300,863 | 3,833 | |
| Northfield Bancorp Inc. | 289,672 | 3,824 | |
| Arbor Realty Trust Inc. | 572,423 | 3,812 | |
| Heritage Financial Corp. | 221,510 | 3,790 | |
| Pacific Continental Corp. | 236,014 | 3,762 | |
| Washington Banking Co. | 206,387 | 3,659 | |
| Fidelity Southern Corp. | 219,789 | 3,651 | |
| Oppenheimer Holdings Inc. Class A | 145,542 | 3,607 | |
| * | Preferred Bank | 173,163 | 3,472 |
| Manning & Napier Inc. | 196,473 | 3,468 | |
| Rexford Industrial Realty Inc. | 261,581 | 3,453 | |
| * | Pacific Premier Bancorp Inc. | 219,197 | 3,450 |
| * | Independent Bank Corp. | 287,202 | 3,446 |
| Charter Financial Corp. | 318,192 | 3,427 | |
| OceanFirst Financial Corp. | 198,894 | 3,407 | |
| Republic Bancorp Inc. Class A | 138,450 | 3,398 | |
| Marlin Business Services Corp. | 133,805 | 3,372 | |
23
| Vanguard® Total Stock Market Index Fund | ||
| Schedule of Investments | ||
| December 31, 2013 | ||
| Market | ||
| Value | ||
| Shares | ($000) | |
| National Bankshares Inc. | 91,093 | 3,360 |
| CNB Financial Corp. | 176,386 | 3,351 |
| * Suffolk Bancorp | 160,926 | 3,347 |
| Citizens & Northern Corp. | 161,906 | 3,340 |
| Calamos Asset Management Inc. Class A | 281,874 | 3,337 |
| 1st United Bancorp Inc. | 438,276 | 3,335 |
| First Defiance Financial Corp. | 128,201 | 3,329 |
| One Liberty Properties Inc. | 162,375 | 3,269 |
| HomeStreet Inc. | 162,550 | 3,251 |
| Baldwin & Lyons Inc. | 117,958 | 3,223 |
| Yadkin Financial Corp. | 187,811 | 3,200 |
| Bank of Marin Bancorp | 71,357 | 3,096 |
| * Global Indemnity plc | 121,107 | 3,064 |
| * Franklin Financial Corp. | 154,702 | 3,060 |
| Donegal Group Inc. Class A | 191,748 | 3,049 |
| * OmniAmerican Bancorp Inc. | 141,005 | 3,015 |
| Peoples Bancorp Inc. | 133,001 | 2,994 |
| Territorial Bancorp Inc. | 128,669 | 2,985 |
| Hannon Armstrong Sustainable Infrastructure Capital Inc. | 211,261 | 2,949 |
| * BBX Capital Corp. | 186,856 | 2,915 |
| Penns Woods Bancorp Inc. | 56,924 | 2,903 |
| MetroCorp Bancshares Inc. | 192,044 | 2,894 |
| Kansas City Life Insurance Co. | 59,723 | 2,851 |
| Consolidated-Tomoka Land Co. | 78,165 | 2,837 |
| Heritage Commerce Corp. | 343,871 | 2,834 |
| Guaranty Bancorp | 201,524 | 2,831 |
| * Tristate Capital Holdings Inc. | 236,994 | 2,811 |
| * CommunityOne Bancorp | 219,784 | 2,802 |
| Horizon Bancorp | 108,982 | 2,761 |
| * Meridian Interstate Bancorp Inc. | 120,811 | 2,728 |
| American National Bankshares Inc. | 103,500 | 2,717 |
| Tower Group International Ltd. | 798,233 | 2,698 |
| Banc of California Inc. | 200,626 | 2,690 |
| Home Federal Bancorp Inc. | 179,058 | 2,668 |
| ^ JAVELIN Mortgage Investment Corp. | 190,681 | 2,656 |
| Bank of Kentucky Financial Corp. | 71,405 | 2,635 |
| EMC Insurance Group Inc. | 85,344 | 2,613 |
| * Bridge Capital Holdings | 127,159 | 2,612 |
| QTS Realty Trust Inc. Class A | 104,900 | 2,599 |
| Independent Bank Group Inc. | 51,533 | 2,559 |
| Meta Financial Group Inc. | 62,177 | 2,508 |
| Ames National Corp. | 111,888 | 2,505 |
| ESSA Bancorp Inc. | 216,456 | 2,502 |
| Sierra Bancorp | 154,304 | 2,483 |
| * ConnectOne Bancorp Inc. | 62,047 | 2,459 |
| MidWestOne Financial Group Inc. | 90,150 | 2,452 |
| Armada Hoffler Properties Inc. | 262,370 | 2,435 |
| National Interstate Corp. | 104,658 | 2,407 |
| Peapack Gladstone Financial Corp. | 124,922 | 2,386 |
| * Macatawa Bank Corp. | 476,968 | 2,385 |
| * SWS Group Inc. | 389,620 | 2,369 |
| Westfield Financial Inc. | 317,429 | 2,368 |
| ESB Financial Corp. | 164,941 | 2,342 |
| Mercantile Bank Corp. | 108,070 | 2,332 |
| United Insurance Holdings Corp. | 164,899 | 2,322 |
| Fox Chase Bancorp Inc. | 133,131 | 2,314 |
| First Bancorp Inc. | 131,912 | 2,298 |
| * NewBridge Bancorp | 306,244 | 2,297 |
| BankFinancial Corp. | 249,542 | 2,286 |
| Merchants Bancshares Inc. | 68,100 | 2,281 |
| UMH Properties Inc. | 237,290 | 2,235 |
| * Reis Inc. | 116,004 | 2,231 |
| Northrim BanCorp Inc. | 82,417 | 2,163 |
| * Heritage Oaks Bancorp | 288,131 | 2,161 |
24
| Vanguard® Total Stock Market Index Fund | |||
| Schedule of Investments | |||
| December 31, 2013 | |||
| Market | |||
| Value | |||
| Shares | ($000) | ||
| Resource America Inc. Class A | 230,302 | 2,156 | |
| *,^ | JGWPT Holdings Inc. Class A | 123,208 | 2,143 |
| Firstbank Corp. | 110,168 | 2,131 | |
| Eastern Insurance Holdings Inc. | 86,759 | 2,125 | |
| * | Consumer Portfolio Services Inc. | 226,136 | 2,123 |
| * | CU Bancorp | 121,228 | 2,119 |
| * | Sun Bancorp Inc. | 584,815 | 2,059 |
| * | United Community Financial Corp. | 575,151 | 2,053 |
| * | AV Homes Inc. | 111,892 | 2,033 |
| * | Kearny Financial Corp. | 174,240 | 2,026 |
| * | Farmers Capital Bank Corp. | 92,938 | 2,021 |
| * | Intervest Bancshares Corp. Class A | 265,354 | 1,993 |
| First Financial Northwest Inc. | 187,439 | 1,944 | |
| * | Waterstone Financial Inc. | 171,738 | 1,906 |
| C&F Financial Corp. | 41,452 | 1,893 | |
| * | Heritage Financial Group Inc. | 95,993 | 1,848 |
| * | Hemisphere Media Group Inc. | 153,914 | 1,827 |
| * | Orrstown Financial Services Inc. | 110,799 | 1,812 |
| * | Capital City Bank Group Inc. | 153,843 | 1,811 |
| Bar Harbor Bankshares | 45,272 | 1,810 | |
| First Business Financial Services Inc. | 48,098 | 1,810 | |
| Simplicity Bancorp Inc. | 111,966 | 1,809 | |
| * | BSB Bancorp Inc. | 119,133 | 1,798 |
| Preferred Apartment Communities Inc. Class A | 220,496 | 1,773 | |
| Federated National Holding Co. | 120,037 | 1,756 | |
| * | North Valley Bancorp | 92,806 | 1,755 |
| * | First Security Group Inc. | 754,772 | 1,736 |
| Pzena Investment Management Inc. Class A | 147,246 | 1,732 | |
| * | RE/MAX Holdings Inc. | 53,965 | 1,731 |
| Enterprise Bancorp Inc. | 81,368 | 1,723 | |
| * | Hampton Roads Bankshares Inc. | 966,450 | 1,691 |
| MidSouth Bancorp Inc. | 94,283 | 1,684 | |
| * | Blue Capital Reinsurance Holdings Ltd. | 90,999 | 1,672 |
| * | UCP Inc. | 112,780 | 1,651 |
| SI Financial Group Inc. | 135,597 | 1,634 | |
| Chemung Financial Corp. | 47,432 | 1,621 | |
| * | Marcus & Millichap Inc. | 108,753 | 1,620 |
| * | Hallmark Financial Services Inc. | 181,402 | 1,612 |
| Provident Financial Holdings Inc. | 106,579 | 1,599 | |
| *,^ | Stonegate Mortgage Corp. | 94,099 | 1,555 |
| * | Imperial Holdings Inc. | 237,523 | 1,553 |
| Clifton Savings Bancorp Inc. | 119,741 | 1,533 | |
| * | Pacific Mercantile Bancorp | 242,517 | 1,508 |
| Investors Title Co. | 18,455 | 1,494 | |
| JMP Group Inc. | 198,055 | 1,466 | |
| * | Home Bancorp Inc. | 75,867 | 1,430 |
| Century Bancorp Inc. Class A | 42,768 | 1,422 | |
| Doral Financial Corp. | 87,182 | 1,365 | |
| Independence Holding Co. | 98,921 | 1,334 | |
| Fifth Street Senior Floating Rate Corp. | 96,944 | 1,284 | |
| Ellington Residential Mortgage REIT | 82,550 | 1,270 | |
| NASB Financial Inc. | 41,451 | 1,252 | |
| MutualFirst Financial Inc. | 72,206 | 1,237 | |
| Cape Bancorp Inc. | 120,787 | 1,227 | |
| Pulaski Financial Corp. | 108,562 | 1,222 | |
| Middleburg Financial Corp. | 67,282 | 1,214 | |
| Codorus Valley Bancorp Inc. | 60,391 | 1,202 | |
| Hingham Institution for Savings | 15,243 | 1,196 | |
| First Internet Bancorp | 52,699 | 1,186 | |
| Monarch Financial Holdings Inc. | 95,642 | 1,177 | |
| Gain Capital Holdings Inc. | 154,415 | 1,160 | |
| Access National Corp. | 76,649 | 1,146 | |
| * | Atlas Financial Holdings Inc. | 77,351 | 1,139 |
| * | Maui Land & Pineapple Co. Inc. | 183,834 | 1,120 |
25
| Vanguard® Total Stock Market Index Fund | ||
| Schedule of Investments | ||
| December 31, 2013 | ||
| Market | ||
| Value | ||
| Shares | ($000) | |
| ZAIS Financial Corp. | 68,998 | 1,106 |
| * Asta Funding Inc. | 129,928 | 1,094 |
| Silvercrest Asset Management Group Inc. Class A | 63,551 | 1,084 |
| Federal Agricultural Mortgage Corp. Class A | 38,986 | 1,073 |
| Intersections Inc. | 135,760 | 1,058 |
| Old Line Bancshares Inc. | 70,651 | 1,024 |
| Urstadt Biddle Properties Inc. | 63,312 | 1,004 |
| PMC Commercial Trust | 115,492 | 993 |
| Farmers National Banc Corp. | 148,659 | 974 |
| * Westbury Bancorp Inc. | 68,678 | 955 |
| Northeast Bancorp | 99,071 | 949 |
| * ZipRealty Inc. | 169,360 | 948 |
| HopFed Bancorp Inc. | 82,791 | 943 |
| Ameriana Bancorp | 67,980 | 937 |
| * Camco Financial Corp. | 139,923 | 935 |
| * Community Bankers Trust Corp. | 245,057 | 921 |
| * Republic First Bancorp Inc. | 308,077 | 918 |
| Alliance Bancorp Inc. of Pennsylvania | 58,843 | 896 |
| QCR Holdings Inc. | 50,885 | 887 |
| BNC Bancorp | 51,055 | 875 |
| * First Acceptance Corp. | 371,196 | 843 |
| MicroFinancial Inc. | 98,493 | 842 |
| Cheviot Financial Corp. | 78,989 | 821 |
| Peoples Federal Bancshares Inc. | 45,951 | 815 |
| * Eastern Virginia Bankshares Inc. | 115,124 | 806 |
| Premier Financial Bancorp Inc. | 56,157 | 795 |
| * Shore Bancshares Inc. | 85,271 | 786 |
| First Marblehead Corp. | 106,361 | 786 |
| * Old Second Bancorp Inc. | 166,779 | 769 |
| Gladstone Land Corp. | 46,867 | 759 |
| * Fortegra Financial Corp. | 91,069 | 753 |
| Bank of Commerce Holdings | 129,758 | 741 |
| * Riverview Bancorp Inc. | 249,239 | 723 |
| * Atlantic Coast Financial Corp. | 161,939 | 701 |
| FS Bancorp Inc. | 40,502 | 693 |
| Teche Holding Co. | 13,723 | 685 |
| Tower Financial Corp. | 26,602 | 663 |
| * Naugatuck Valley Financial Corp. | 91,875 | 654 |
| * Malvern Bancorp Inc. | 58,990 | 647 |
| Gleacher & Co. Inc. | 60,772 | 631 |
| US Global Investors Inc. Class A | 227,235 | 577 |
| * Health Insurance Innovations Inc. Class A | 56,654 | 573 |
| * Hamilton Bancorp Inc. | 39,671 | 557 |
| Owens Realty Mortgage Inc. | 45,034 | 546 |
| * American River Bankshares | 57,046 | 539 |
| * ASB Bancorp Inc. | 31,058 | 536 |
| * Ohr Pharmaceutical Inc. | 67,086 | 529 |
| LSB Financial Corp. | 15,863 | 449 |
| * Polonia Bancorp Inc. | 41,525 | 421 |
| * World Energy Solutions Inc. | 98,000 | 421 |
| Bancorp of New Jersey Inc. | 30,855 | 421 |
| Five Oaks Investment Corp. | 39,725 | 414 |
| California First National Bancorp | 27,285 | 412 |
| First Bancshares Inc. | 28,281 | 411 |
| RCS Capital Corp. | 22,321 | 410 |
| Life Partners Holdings Inc. | 230,077 | 408 |
| Cherry Hill Mortgage Investment Corp. | 21,664 | 386 |
| Wheeler REIT Inc. | 87,100 | 375 |
| Timberland Bancorp Inc. | 38,133 | 367 |
| Old Point Financial Corp. | 28,200 | 362 |
| CIFC Corp. | 45,872 | 357 |
| * Security National Financial Corp. Class A | 73,635 | 355 |
| * Jefferson Bancshares Inc. | 55,872 | 352 |
| Hampden Bancorp Inc. | 20,740 | 340 |
26
| Vanguard® Total Stock Market Index Fund | ||
| Schedule of Investments | ||
| December 31, 2013 | ||
| Market | ||
| Value | ||
| Shares | ($000) | |
| ^ Orchid Island Capital Inc. | 25,845 | 333 |
| Trade Street Residential Inc. | 50,397 | 319 |
| * Atlanticus Holdings Corp. | 81,773 | 290 |
| * OBA Financial Services Inc. | 15,891 | 288 |
| Salisbury Bancorp Inc. | 10,606 | 284 |
| Eagle Bancorp Montana Inc. | 24,838 | 273 |
| United Bancorp Inc. | 33,210 | 267 |
| United Community Bancorp | 22,954 | 262 |
| * First Federal Bancshares of Arkansas Inc. | 29,977 | 261 |
| * Community West Bancshares | 38,834 | 255 |
| SB Financial Group Inc. | 31,820 | 251 |
| Institutional Financial Markets Inc. | 122,156 | 244 |
| * Wellesley Bank | 12,062 | 236 |
| Bank of South Carolina Corp. | 14,579 | 230 |
| * American Independence Corp. | 17,673 | 212 |
| IF Bancorp Inc. | 12,247 | 205 |
| Sotherly Hotels Inc. | 34,231 | 203 |
| FedFirst Financial Corp. | 9,872 | 196 |
| * CMS Bancorp Inc. | 20,755 | 193 |
| * Tejon Ranch Co. Warrants Exp. 08/31/2016 | 33,339 | 178 |
| Sound Financial Bancorp Inc. | 10,290 | 174 |
| First Savings Financial Group Inc. | 7,188 | 162 |
| First Clover Leaf Financial Corp. | 16,915 | 161 |
| QC Holdings Inc. | 77,554 | 138 |
| Madison County Financial Inc. | 7,441 | 132 |
| * Carolina Bank Holdings Inc. | 12,613 | 130 |
| Donegal Group Inc. Class B | 5,255 | 124 |
| * Vestin Realty Mortgage II Inc. | 74,073 | 123 |
| * Southern First Bancshares Inc. | 9,189 | 123 |
| Hawthorn Bancshares Inc. | 9,408 | 117 |
| WVS Financial Corp. | 9,511 | 116 |
| Summit State Bank | 9,843 | 104 |
| * Transcontinental Realty Investors Inc. | 10,999 | 103 |
| HF Financial Corp. | 7,469 | 97 |
| * Carolina Trust Bank | 27,055 | 94 |
| * Colonial Financial Services Inc. | 6,936 | 90 |
| LNB Bancorp Inc. | 8,899 | 89 |
| * Royal Bancshares of Pennsylvania Inc. | 64,104 | 88 |
| NB&T Financial Group Inc. | 4,302 | 85 |
| * Guaranty Federal Bancshares Inc. | 7,623 | 82 |
| Citizens Community Bancorp Inc. | 10,966 | 82 |
| * Sorrento Therapeutics Inc. | 9,840 | 80 |
| Unity Bancorp Inc. | 8,345 | 64 |
| * Income Opportunity Realty Investors Inc. | 12,450 | 62 |
| * Patriot National Bancorp Inc. | 56,201 | 58 |
| Laporte Bancorp Inc. | 4,700 | 52 |
| IMPAC Mortgage Holdings Inc. | 8,160 | 49 |
| * Parke Bancorp Inc. | 5,325 | 48 |
| * Atlantic American Corp. | 11,680 | 48 |
| * Carver Bancorp Inc. | 6,784 | 47 |
| Ocean Shore Holding Co. | 3,096 | 42 |
| * Investors Capital Holdings Ltd. | 5,492 | 39 |
| * Southcoast Financial Corp. | 6,297 | 37 |
| Community Financial Corp. | 1,700 | 35 |
| * MBT Financial Corp. | 7,727 | 33 |
| Supertel Hospitality Inc. | 13,192 | 32 |
| * SP Bancorp Inc. | 1,600 | 31 |
| * Citizens First Corp. | 3,099 | 29 |
| * Power REIT | 3,136 | 28 |
| * Internet Patents Corp. | 8,400 | 26 |
| Athens Bancshares Corp. | 1,100 | 26 |
| * Jacksonville Bancorp Inc. | 1,914 | 24 |
| * Cordia Bancorp Inc. | 5,680 | 24 |
| Northeast Community Bancorp Inc. | 3,100 | 22 |
27
| Vanguard® Total Stock Market Index Fund | ||
| Schedule of Investments | ||
| December 31, 2013 | ||
| Market | ||
| Value | ||
| Shares | ($000) | |
| Kingstone Cos. Inc. | 2,985 | 22 |
| * First Capital Bancorp Inc. | 4,300 | 19 |
| * Porter Bancorp Inc. | 16,831 | 17 |
| * Vestin Realty Mortgage I Inc. | 8,700 | 16 |
| * Trade Street Residential Rights Exp. 01/10/2014 | 49,597 | 15 |
| Independence Realty Trust Inc. | 1,740 | 15 |
| Home Federal Bancorp Inc. | 780 | 14 |
| HMG Courtland Properties | 600 | 11 |
| * ForceField Energy Inc. | 1,300 | 8 |
| Oconee Federal Financial Corp. | 300 | 5 |
| * American Realty Investors Inc. | 800 | 4 |
| * InterGroup Corp. | 200 | 4 |
| River Valley Bancorp | 100 | 3 |
| * HMN Financial Inc. | 200 | 2 |
| * Valley National Bancorp Warrants Exp. 06/30/2015 | 6,511 | 2 |
| * Prospect Global Resources Inc. | 1 | — |
| 56,413,886 | ||
| Health Care (11.8%) | ||
| Johnson & Johnson | 42,184,572 | 3,863,685 |
| Pfizer Inc. | 96,901,359 | 2,968,089 |
| Merck & Co. Inc. | 43,687,086 | 2,186,539 |
| * Gilead Sciences Inc. | 22,925,819 | 1,722,875 |
| Bristol-Myers Squibb Co. | 24,617,645 | 1,308,428 |
| Amgen Inc. | 11,275,272 | 1,287,185 |
| AbbVie Inc. | 23,785,705 | 1,256,123 |
| UnitedHealth Group Inc. | 15,052,517 | 1,133,455 |
| * Celgene Corp. | 6,161,037 | 1,040,969 |
| * Biogen Idec Inc. | 3,531,712 | 987,996 |
| Abbott Laboratories | 23,117,673 | 886,100 |
| Medtronic Inc. | 14,926,775 | 856,648 |
| * Express Scripts Holding Co. | 12,047,972 | 846,250 |
| Eli Lilly & Co. | 15,160,471 | 773,184 |
| Thermo Fisher Scientific Inc. | 5,402,354 | 601,552 |
| Baxter International Inc. | 8,114,386 | 564,356 |
| Allergan Inc. | 4,442,433 | 493,465 |
| Covidien plc | 6,763,226 | 460,576 |
| * Actavis plc | 2,602,034 | 437,142 |
| WellPoint Inc. | 4,416,504 | 408,041 |
| * Alexion Pharmaceuticals Inc. | 2,931,622 | 390,082 |
| Aetna Inc. | 5,494,027 | 376,835 |
| Cigna Corp. | 4,132,327 | 361,496 |
| Becton Dickinson and Co. | 2,902,234 | 320,668 |
| * Regeneron Pharmaceuticals Inc. | 1,164,811 | 320,603 |
| Stryker Corp. | 4,242,995 | 318,819 |
| St. Jude Medical Inc. | 4,362,830 | 270,277 |
| * Vertex Pharmaceuticals Inc. | 3,494,392 | 259,633 |
| * Mylan Inc. | 5,722,454 | 248,355 |
| Zoetis Inc. | 7,475,580 | 244,377 |
| Humana Inc. | 2,332,129 | 240,722 |
| * Boston Scientific Corp. | 19,980,814 | 240,169 |
| Zimmer Holdings Inc. | 2,556,240 | 238,216 |
| * HCA Holdings Inc. | 4,686,241 | 223,581 |
| * Intuitive Surgical Inc. | 569,052 | 218,561 |
| * Forest Laboratories Inc. | 3,625,282 | 217,626 |
| * Illumina Inc. | 1,889,682 | 209,037 |
| * Perrigo Co. plc | 1,339,678 | 205,587 |
| * Life Technologies Corp. | 2,583,704 | 195,845 |
| * DaVita HealthCare Partners Inc. | 3,020,826 | 191,430 |
| CR Bard Inc. | 1,176,913 | 157,636 |
| * BioMarin Pharmaceutical Inc. | 2,126,151 | 149,405 |
| * Henry Schein Inc. | 1,286,023 | 146,941 |
| * CareFusion Corp. | 3,189,348 | 127,000 |
| * Varian Medical Systems Inc. | 1,600,660 | 124,355 |
| * Laboratory Corp. of America Holdings | 1,340,449 | 122,477 |
28
| Vanguard® Total Stock Market Index Fund | ||
| Schedule of Investments | ||
| December 31, 2013 | ||
| Market | ||
| Value | ||
| Shares | ($000) | |
| * Waters Corp. | 1,209,319 | 120,932 |
| Quest Diagnostics Inc. | 2,174,116 | 116,402 |
| * Endo Health Solutions Inc. | 1,716,981 | 115,828 |
| Universal Health Services Inc. Class B | 1,360,084 | 110,520 |
| * Edwards Lifesciences Corp. | 1,669,277 | 109,772 |
| * Incyte Corp. Ltd. | 2,167,889 | 109,760 |
| DENTSPLY International Inc. | 2,132,009 | 103,360 |
| * Hospira Inc. | 2,479,409 | 102,350 |
| ^ ResMed Inc. | 2,123,967 | 99,996 |
| * Pharmacyclics Inc. | 881,626 | 93,258 |
| * Jazz Pharmaceuticals plc | 735,368 | 93,068 |
| * Hologic Inc. | 4,081,923 | 91,231 |
| Cooper Cos. Inc. | 731,810 | 90,627 |
| * Alkermes plc | 2,044,723 | 83,138 |
| * IDEXX Laboratories Inc. | 781,361 | 83,113 |
| * MEDNAX Inc. | 1,506,164 | 80,399 |
| * Salix Pharmaceuticals Ltd. | 893,419 | 80,354 |
| * United Therapeutics Corp. | 675,330 | 76,366 |
| * Cubist Pharmaceuticals Inc. | 1,107,234 | 76,255 |
| * Covance Inc. | 839,201 | 73,900 |
| * Isis Pharmaceuticals Inc. | 1,733,584 | 69,066 |
| * Medivation Inc. | 1,071,280 | 68,369 |
| * Tenet Healthcare Corp. | 1,515,051 | 63,814 |
| * Seattle Genetics Inc. | 1,554,995 | 62,029 |
| * Sirona Dental Systems Inc. | 818,296 | 57,444 |
| Teleflex Inc. | 611,779 | 57,422 |
| * Align Technology Inc. | 979,083 | 55,955 |
| * Community Health Systems Inc. | 1,348,337 | 52,949 |
| * Alnylam Pharmaceuticals Inc. | 805,057 | 51,789 |
| Techne Corp. | 524,042 | 49,611 |
| * ViroPharma Inc. | 985,204 | 49,112 |
| * Health Management Associates Inc. Class A | 3,734,955 | 48,928 |
| Patterson Cos. Inc. | 1,182,540 | 48,721 |
| West Pharmaceutical Services Inc. | 985,551 | 48,351 |
| * Team Health Holdings Inc. | 1,043,928 | 47,551 |
| * Cepheid Inc. | 1,013,454 | 47,349 |
| ^ Questcor Pharmaceuticals Inc. | 858,695 | 46,756 |
| * WellCare Health Plans Inc. | 652,785 | 45,969 |
| * Centene Corp. | 777,380 | 45,827 |
| * NPS Pharmaceuticals Inc. | 1,501,157 | 45,575 |
| * Mallinckrodt plc | 856,100 | 44,740 |
| * Alere Inc. | 1,162,168 | 42,070 |
| STERIS Corp. | 874,021 | 41,997 |
| HealthSouth Corp. | 1,241,384 | 41,363 |
| * Theravance Inc. | 1,155,359 | 41,189 |
| * Brookdale Senior Living Inc. Class A | 1,476,246 | 40,124 |
| * Charles River Laboratories International Inc. | 726,977 | 38,559 |
| * PAREXEL International Corp. | 835,569 | 37,751 |
| * Puma Biotechnology Inc. | 362,013 | 37,479 |
| * Bio-Rad Laboratories Inc. Class A | 297,551 | 36,780 |
| Hill-Rom Holdings Inc. | 879,361 | 36,353 |
| * DexCom Inc. | 1,018,336 | 36,059 |
| * Medicines Co. | 929,681 | 35,904 |
| * LifePoint Hospitals Inc. | 667,835 | 35,288 |
| Owens & Minor Inc. | 937,465 | 34,274 |
| * Health Net Inc. | 1,121,630 | 33,279 |
| * Haemonetics Corp. | 769,765 | 32,430 |
| * Celldex Therapeutics Inc. | 1,307,214 | 31,648 |
| * Thoratec Corp. | 850,288 | 31,121 |
| * Air Methods Corp. | 524,795 | 30,611 |
| * HMS Holdings Corp. | 1,318,123 | 29,961 |
| * Bruker Corp. | 1,489,981 | 29,457 |
| * Insulet Corp. | 784,937 | 29,121 |
| * Santarus Inc. | 898,616 | 28,720 |
29
| Vanguard® Total Stock Market Index Fund | |||
| Schedule of Investments | |||
| December 31, 2013 | |||
| Market | |||
| Value | |||
| Shares | ($000) | ||
| * | Aegerion Pharmaceuticals Inc. | 392,796 | 27,873 |
| Healthcare Services Group Inc. | 981,859 | 27,855 | |
| * | Prestige Brands Holdings Inc. | 762,013 | 27,280 |
| * | ACADIA Pharmaceuticals Inc. | 1,079,079 | 26,966 |
| * | Akorn Inc. | 1,079,183 | 26,580 |
| * | Quintiles Transnational Holdings Inc. | 564,607 | 26,164 |
| * | Pacira Pharmaceuticals Inc. | 450,413 | 25,894 |
| * | Cyberonics Inc. | 392,231 | 25,695 |
| *,^ | Opko Health Inc. | 3,041,925 | 25,674 |
| *,^ | Myriad Genetics Inc. | 1,188,675 | 24,938 |
| * | Acadia Healthcare Co. Inc. | 523,185 | 24,762 |
| * | Impax Laboratories Inc. | 972,523 | 24,449 |
| * | Envision Healthcare Holdings Inc. | 670,028 | 23,799 |
| * | Magellan Health Services Inc. | 396,548 | 23,757 |
| * | Neogen Corp. | 508,938 | 23,258 |
| * | Masimo Corp. | 781,406 | 22,841 |
| * | Wright Medical Group Inc. | 694,516 | 21,329 |
| * | NuVasive Inc. | 657,950 | 21,272 |
| * | Amsurg Corp. Class A | 450,686 | 20,696 |
| * | HeartWare International Inc. | 219,036 | 20,581 |
| * | Halozyme Therapeutics Inc. | 1,335,856 | 20,024 |
| * | Clovis Oncology Inc. | 326,270 | 19,664 |
| * | Nektar Therapeutics | 1,712,337 | 19,435 |
| * | Hanger Inc. | 490,474 | 19,295 |
| * | InterMune Inc. | 1,307,036 | 19,253 |
| *,^ | Arena Pharmaceuticals Inc. | 3,235,499 | 18,928 |
| * | ImmunoGen Inc. | 1,266,649 | 18,582 |
| * | Acorda Therapeutics Inc. | 607,372 | 17,735 |
| * | Volcano Corp. | 811,608 | 17,734 |
| *,^ | Ariad Pharmaceuticals Inc. | 2,596,952 | 17,711 |
| ^ | PDL BioPharma Inc. | 2,065,509 | 17,433 |
| CONMED Corp. | 404,928 | 17,209 | |
| * | Integra LifeSciences Holdings Corp. | 351,598 | 16,775 |
| * | Globus Medical Inc. | 828,174 | 16,713 |
| * | Ironwood Pharmaceuticals Inc. Class A | 1,413,885 | 16,415 |
| Cantel Medical Corp. | 479,113 | 16,247 | |
| * | ArthroCare Corp. | 399,007 | 16,056 |
| * | Synageva BioPharma Corp. | 246,711 | 15,967 |
| Analogic Corp. | 179,634 | 15,908 | |
| *,^ | Exelixis Inc. | 2,561,285 | 15,701 |
| * | Keryx Biopharmaceuticals Inc. | 1,206,671 | 15,626 |
| Meridian Bioscience Inc. | 586,665 | 15,564 | |
| * | Endologix Inc. | 890,812 | 15,536 |
| * | Molina Healthcare Inc. | 436,159 | 15,157 |
| * | Auxilium Pharmaceuticals Inc. | 726,425 | 15,066 |
| Kindred Healthcare Inc. | 762,313 | 15,048 | |
| * | IPC The Hospitalist Co. Inc. | 247,113 | 14,676 |
| * | Spectranetics Corp. | 578,870 | 14,472 |
| * | Ligand Pharmaceuticals Inc. Class B | 271,879 | 14,301 |
| * | Novavax Inc. | 2,765,886 | 14,161 |
| *,^ | MannKind Corp. | 2,685,924 | 13,994 |
| *,^ | Vivus Inc. | 1,463,482 | 13,288 |
| * | ABIOMED Inc. | 492,958 | 13,182 |
| * | Fluidigm Corp. | 340,977 | 13,066 |
| * | Quidel Corp. | 421,124 | 13,009 |
| * | Emeritus Corp. | 596,835 | 12,910 |
| * | Cardiovascular Systems Inc. | 376,071 | 12,895 |
| * | Dyax Corp. | 1,691,339 | 12,736 |
| * | Abaxis Inc. | 313,669 | 12,553 |
| * | Omnicell Inc. | 486,274 | 12,415 |
| * | ICU Medical Inc. | 193,517 | 12,329 |
| Select Medical Holdings Corp. | 1,055,958 | 12,260 | |
| Ensign Group Inc. | 274,902 | 12,170 | |
| * | Momenta Pharmaceuticals Inc. | 687,135 | 12,149 |
30
| Vanguard® Total Stock Market Index Fund | |||
| Schedule of Investments | |||
| December 31, 2013 | |||
| Market | |||
| Value | |||
| Shares | ($000) | ||
| * | Exact Sciences Corp. | 1,033,142 | 12,077 |
| *,^ | Sangamo Biosciences Inc. | 850,470 | 11,813 |
| * | Lannett Co. Inc. | 354,032 | 11,718 |
| * | Raptor Pharmaceutical Corp. | 843,502 | 10,982 |
| *,^ | Sarepta Therapeutics Inc. | 530,265 | 10,802 |
| *,^ | MiMedx Group Inc. | 1,229,475 | 10,746 |
| * | Intercept Pharmaceuticals Inc. | 155,030 | 10,585 |
| * | Luminex Corp. | 542,284 | 10,520 |
| *,^ | Organovo Holdings Inc. | 912,789 | 10,105 |
| Invacare Corp. | 427,587 | 9,924 | |
| * | HealthStream Inc. | 296,976 | 9,732 |
| * | Emergent Biosolutions Inc. | 423,062 | 9,726 |
| * | Capital Senior Living Corp. | 404,588 | 9,706 |
| * | Corvel Corp. | 207,000 | 9,667 |
| * | Natus Medical Inc. | 426,272 | 9,591 |
| * | Infinity Pharmaceuticals Inc. | 678,377 | 9,368 |
| *,^ | Bio-Reference Labs Inc. | 365,314 | 9,330 |
| * | Merit Medical Systems Inc. | 587,168 | 9,242 |
| * | Array BioPharma Inc. | 1,839,826 | 9,218 |
| * | Geron Corp. | 1,912,430 | 9,065 |
| * | Affymetrix Inc. | 1,052,472 | 9,020 |
| * | PharMerica Corp. | 417,647 | 8,979 |
| * | Depomed Inc. | 842,289 | 8,911 |
| *,^ | Idenix Pharmaceuticals Inc. | 1,452,364 | 8,685 |
| * | Accuray Inc. | 990,965 | 8,631 |
| * | Neurocrine Biosciences Inc. | 923,971 | 8,630 |
| * | NxStage Medical Inc. | 847,301 | 8,473 |
| * | Anika Therapeutics Inc. | 218,291 | 8,330 |
| * | Staar Surgical Co. | 508,206 | 8,228 |
| * | Cadence Pharmaceuticals Inc. | 890,883 | 8,062 |
| * | XOMA Corp. | 1,180,263 | 7,943 |
| * | Tornier NV | 418,064 | 7,855 |
| * | Insmed Inc. | 461,736 | 7,854 |
| * | Cynosure Inc. Class A | 291,905 | 7,788 |
| *,^ | Galena Biopharma Inc. | 1,562,768 | 7,751 |
| * | Orexigen Therapeutics Inc. | 1,356,325 | 7,636 |
| * | Dynavax Technologies Corp. | 3,862,856 | 7,571 |
| * | AMAG Pharmaceuticals Inc. | 311,713 | 7,565 |
| * | Healthways Inc. | 483,335 | 7,419 |
| *,^ | Antares Pharma Inc. | 1,647,754 | 7,382 |
| * | Hi-Tech Pharmacal Co. Inc. | 169,017 | 7,334 |
| *,^ | Merrimack Pharmaceuticals Inc. | 1,362,905 | 7,278 |
| * | Spectrum Pharmaceuticals Inc. | 821,481 | 7,270 |
| *,^ | Inovio Pharmaceuticals Inc. | 2,480,967 | 7,195 |
| * | KYTHERA Biopharmaceuticals Inc. | 190,761 | 7,106 |
| * | GenMark Diagnostics Inc. | 526,448 | 7,007 |
| * | Sagent Pharmaceuticals Inc. | 275,900 | 7,002 |
| * | Portola Pharmaceuticals Inc. | 271,463 | 6,990 |
| * | BioScrip Inc. | 925,344 | 6,848 |
| * | Triple-S Management Corp. Class B | 350,041 | 6,805 |
| National Healthcare Corp. | 124,968 | 6,737 | |
| Atrion Corp. | 22,733 | 6,735 | |
| *,^ | Dendreon Corp. | 2,225,165 | 6,653 |
| * | Amedisys Inc. | 446,673 | 6,535 |
| * | Orthofix International NV | 285,716 | 6,520 |
| * | Synergy Pharmaceuticals Inc. | 1,156,328 | 6,510 |
| * | Cerus Corp. | 1,003,774 | 6,474 |
| * | Accretive Health Inc. | 704,238 | 6,451 |
| * | Anacor Pharmaceuticals Inc. | 380,795 | 6,390 |
| US Physical Therapy Inc. | 174,627 | 6,157 | |
| * | Zeltiq Aesthetics Inc. | 324,118 | 6,129 |
| * | Lexicon Pharmaceuticals Inc. | 3,374,924 | 6,075 |
| * | Repligen Corp. | 442,684 | 6,038 |
| * | AngioDynamics Inc. | 350,952 | 6,033 |
31
| Vanguard® Total Stock Market Index Fund | |||
| Schedule of Investments | |||
| December 31, 2013 | |||
| Market | |||
| Value | |||
| Shares | ($000) | ||
| * | Vanda Pharmaceuticals Inc. | 485,689 | 6,027 |
| * | AVANIR Pharmaceuticals Inc. | 1,784,302 | 5,995 |
| * | Surgical Care Affiliates Inc. | 170,034 | 5,924 |
| * | Genomic Health Inc. | 200,566 | 5,871 |
| * | Repros Therapeutics Inc. | 315,047 | 5,765 |
| * | NewLink Genetics Corp. | 258,902 | 5,698 |
| *,^ | Rockwell Medical Inc. | 520,347 | 5,432 |
| * | BioCryst Pharmaceuticals Inc. | 701,320 | 5,330 |
| * | Gentiva Health Services Inc. | 427,893 | 5,310 |
| * | Chelsea Therapeutics International Ltd. | 1,180,948 | 5,232 |
| * | Immunomedics Inc. | 1,136,337 | 5,227 |
| *,^ | Unilife Corp. | 1,172,464 | 5,159 |
| * | Zogenix Inc. | 1,493,786 | 5,139 |
| * | Symmetry Medical Inc. | 504,224 | 5,083 |
| * | SurModics Inc. | 207,734 | 5,067 |
| * | LHC Group Inc. | 210,025 | 5,049 |
| *,^ | ZIOPHARM Oncology Inc. | 1,157,692 | 5,024 |
| * | Vascular Solutions Inc. | 213,357 | 4,939 |
| CryoLife Inc. | 443,435 | 4,918 | |
| * | Furiex Pharmaceuticals Inc. | 116,191 | 4,881 |
| * | AtriCure Inc. | 252,233 | 4,712 |
| * | OraSure Technologies Inc. | 747,474 | 4,702 |
| *,^ | Horizon Pharma Inc. | 597,846 | 4,556 |
| * | Progenics Pharmaceuticals Inc. | 826,209 | 4,404 |
| * | Acceleron Pharma Inc. | 110,636 | 4,381 |
| *,^ | Omeros Corp. | 378,139 | 4,269 |
| * | Idera Pharmaceuticals Inc. | 880,602 | 4,077 |
| Universal American Corp. | 540,126 | 3,943 | |
| * | Achillion Pharmaceuticals Inc. | 1,185,291 | 3,935 |
| * | Endocyte Inc. | 364,766 | 3,899 |
| *,^ | Synta Pharmaceuticals Corp. | 737,383 | 3,864 |
| * | Almost Family Inc. | 118,193 | 3,821 |
| *,^ | TearLab Corp. | 409,068 | 3,821 |
| *,^ | Sequenom Inc. | 1,625,783 | 3,804 |
| *,^ | Navidea Biopharmaceuticals Inc. | 1,826,618 | 3,781 |
| * | Pacific Biosciences of California Inc. | 719,261 | 3,762 |
| * | Hyperion Therapeutics Inc. | 180,491 | 3,650 |
| * | Chindex International Inc. | 208,861 | 3,640 |
| *,^ | AcelRx Pharmaceuticals Inc. | 321,820 | 3,640 |
| * | Osiris Therapeutics Inc. | 221,766 | 3,566 |
| * | BioTelemetry Inc. | 442,809 | 3,516 |
| * | Rigel Pharmaceuticals Inc. | 1,221,119 | 3,480 |
| * | Alliance HealthCare Services Inc. | 140,174 | 3,468 |
| * | Cempra Inc. | 278,359 | 3,449 |
| * | Albany Molecular Research Inc. | 341,357 | 3,441 |
| * | XenoPort Inc. | 593,846 | 3,415 |
| * | Five Star Quality Care Inc. | 609,543 | 3,346 |
| * | Curis Inc. | 1,161,830 | 3,276 |
| *,^ | Accelerate Diagnostics Inc. | 268,082 | 3,271 |
| * | Tetraphase Pharmaceuticals Inc. | 241,700 | 3,268 |
| * | Sciclone Pharmaceuticals Inc. | 636,372 | 3,207 |
| * | Chimerix Inc. | 209,762 | 3,170 |
| *,^ | Ampio Pharmaceuticals Inc. | 442,084 | 3,152 |
| *,^ | Cell Therapeutics Inc. | 1,613,187 | 3,097 |
| *,^ | CytRx Corp. | 493,936 | 3,097 |
| * | Exactech Inc. | 130,147 | 3,092 |
| Pozen Inc. | 380,548 | 3,060 | |
| * | Threshold Pharmaceuticals Inc. | 652,492 | 3,047 |
| * | Sunesis Pharmaceuticals Inc. | 631,384 | 2,993 |
| * | Insys Therapeutics Inc. | 75,933 | 2,939 |
| * | Corcept Therapeutics Inc. | 907,898 | 2,923 |
| Utah Medical Products Inc. | 49,349 | 2,821 | |
| * | RTI Surgical Inc. | 787,887 | 2,789 |
| *,^ | Peregrine Pharmaceuticals Inc. | 2,003,137 | 2,784 |
32
| Vanguard® Total Stock Market Index Fund | |||
| Schedule of Investments | |||
| December 31, 2013 | |||
| Market | |||
| Value | |||
| Shares | ($000) | ||
| * | Pain Therapeutics Inc. | 572,446 | 2,782 |
| *,^ | Neuralstem Inc. | 921,529 | 2,682 |
| * | Discovery Laboratories Inc. | 1,176,099 | 2,646 |
| *,^ | MacroGenics Inc. | 93,000 | 2,551 |
| * | Stemline Therapeutics Inc. | 129,314 | 2,535 |
| * | Durect Corp. | 1,451,440 | 2,511 |
| * | Solta Medical Inc. | 840,335 | 2,479 |
| * | BioDelivery Sciences International Inc. | 408,677 | 2,407 |
| *,^ | OncoMed Pharmaceuticals Inc. | 80,929 | 2,389 |
| *,^ | PhotoMedex Inc. | 184,098 | 2,384 |
| * | Mirati Therapeutics Inc. | 137,870 | 2,293 |
| * | Verastem Inc. | 200,105 | 2,281 |
| * | Receptos Inc. | 77,031 | 2,233 |
| *,^ | Northwest Biotherapeutics Inc. | 577,558 | 2,177 |
| * | Derma Sciences Inc. | 200,547 | 2,170 |
| * | Agios Pharmaceuticals Inc. | 90,433 | 2,166 |
| *,^ | NeoStem Inc. | 316,170 | 2,156 |
| * | Cytokinetics Inc. | 325,740 | 2,117 |
| *,^ | Cytori Therapeutics Inc. | 799,439 | 2,055 |
| * | Alphatec Holdings Inc. | 989,644 | 1,989 |
| * | Sunshine Heart Inc. | 200,376 | 1,946 |
| * | Nanosphere Inc. | 846,721 | 1,939 |
| * | Targacept Inc. | 467,121 | 1,939 |
| * | Ocera Therapeutics Inc. | 147,733 | 1,919 |
| *,^ | MEI Pharma Inc. | 237,167 | 1,900 |
| * | NeoGenomics Inc. | 521,601 | 1,888 |
| * | Addus HomeCare Corp. | 83,898 | 1,884 |
| *,^ | ChemoCentryx Inc. | 323,942 | 1,876 |
| * | Cutera Inc. | 183,939 | 1,873 |
| * | PTC Therapeutics Inc. | 110,007 | 1,867 |
| * | Aratana Therapeutics Inc. | 97,644 | 1,865 |
| * | Arqule Inc. | 849,160 | 1,826 |
| * | Fonar Corp. | 85,991 | 1,816 |
| * | Durata Therapeutics Inc. | 140,000 | 1,791 |
| * | Medical Action Industries Inc. | 208,424 | 1,784 |
| *,^ | Biotime Inc. | 492,077 | 1,771 |
| *,^ | Supernus Pharmaceuticals Inc. | 230,274 | 1,736 |
| *,^ | SIGA Technologies Inc. | 525,800 | 1,719 |
| * | Harvard Bioscience Inc. | 360,542 | 1,695 |
| * | LDR Holding Corp. | 69,605 | 1,643 |
| Psychemedics Corp. | 111,607 | 1,640 | |
| * | Athersys Inc. | 655,055 | 1,638 |
| * | Sucampo Pharmaceuticals Inc. Class A | 160,494 | 1,509 |
| * | Regulus Therapeutics Inc. | 202,260 | 1,495 |
| * | Cancer Genetics Inc. | 107,545 | 1,482 |
| *,^ | Bluebird Bio Inc. | 70,377 | 1,477 |
| * | OncoGenex Pharmaceutical Inc. | 176,975 | 1,476 |
| * | Fibrocell Science Inc. | 362,698 | 1,473 |
| * | Aerie Pharmaceuticals Inc. | 79,731 | 1,432 |
| *,^ | Galectin Therapeutics Inc. | 176,143 | 1,423 |
| * | Skilled Healthcare Group Inc. | 289,646 | 1,393 |
| * | Enzo Biochem Inc. | 471,186 | 1,376 |
| *,^ | Biolase Inc. | 475,650 | 1,346 |
| Digirad Corp. | 362,321 | 1,341 | |
| * | Vical Inc. | 1,101,106 | 1,299 |
| * | Epizyme Inc. | 61,969 | 1,289 |
| *,^ | Oncothyreon Inc. | 726,614 | 1,279 |
| *,^ | ANI Pharmaceuticals Inc. | 62,848 | 1,262 |
| *,^ | TrovaGene Inc. | 215,768 | 1,239 |
| *,^ | Apricus Biosciences Inc. | 462,817 | 1,226 |
| * | KaloBios Pharmaceuticals Inc. | 271,152 | 1,198 |
| * | EnteroMedics Inc. | 584,526 | 1,192 |
| *,^ | pSivida Corp. | 297,200 | 1,180 |
| * | AVEO Pharmaceuticals Inc. | 640,556 | 1,179 |
33
| Vanguard® Total Stock Market Index Fund | |||
| Schedule of Investments | |||
| December 31, 2013 | |||
| Market | |||
| Value | |||
| Shares | ($000) | ||
| * | Amicus Therapeutics Inc. | 495,781 | 1,165 |
| * | BioSpecifics Technologies Corp. | 53,486 | 1,159 |
| * | TG Therapeutics Inc. | 293,481 | 1,145 |
| *,^ | PharmAthene Inc. | 615,272 | 1,144 |
| * | Cornerstone Therapeutics Inc. | 119,809 | 1,137 |
| * | NanoString Technologies Inc. | 63,743 | 1,099 |
| *,^ | Medgenics Inc. | 181,202 | 1,085 |
| *,^ | Hansen Medical Inc. | 627,239 | 1,085 |
| *,^ | Alexza Pharmaceuticals Inc. | 228,182 | 1,079 |
| LeMaitre Vascular Inc. | 133,720 | 1,071 | |
| * | Synergetics USA Inc. | 289,440 | 1,048 |
| * | OvaScience Inc. | 110,903 | 1,014 |
| *,^ | Catalyst Pharmaceutical Partners Inc. | 518,903 | 1,012 |
| *,^ | Cyclacel Pharmaceuticals Inc. | 247,785 | 996 |
| *,^ | Coronado Biosciences Inc. | 364,292 | 958 |
| * | Iridex Corp. | 94,200 | 958 |
| *,^ | Foundation Medicine Inc. | 39,743 | 947 |
| * | Tandem Diabetes Care Inc. | 36,680 | 945 |
| * | Cellular Dynamics International Inc. | 57,200 | 944 |
| * | Agenus Inc. | 355,443 | 938 |
| * | Enanta Pharmaceuticals Inc. | 34,180 | 932 |
| * | Esperion Therapeutics Inc. | 66,985 | 920 |
| * | LCA-Vision Inc. | 221,694 | 865 |
| * | Karyopharm Therapeutics Inc. | 36,761 | 843 |
| * | Ventrus Biosciences Inc. | 203,827 | 779 |
| * | Cumberland Pharmaceuticals Inc. | 152,070 | 777 |
| *,^ | StemCells Inc. | 625,659 | 770 |
| * | Uroplasty Inc. | 280,598 | 766 |
| * | Onconova Therapeutics Inc. | 62,230 | 714 |
| *,^ | Stereotaxis Inc. | 197,094 | 713 |
| *,^ | ImmunoCellular Therapeutics Ltd. | 768,029 | 710 |
| Columbia Laboratories Inc. | 103,477 | 684 | |
| *,^ | GTx Inc. | 412,329 | 680 |
| * | NuPathe Inc. | 196,651 | 643 |
| *,^ | Venaxis Inc. | 296,400 | 634 |
| *,^ | Cleveland Biolabs Inc. | 535,493 | 627 |
| * | Oragenics Inc. | 219,275 | 618 |
| * | RadNet Inc. | 367,613 | 614 |
| *,^ | Rexahn Pharmaceuticals Inc. | 1,197,220 | 611 |
| Enzon Pharmaceuticals Inc. | 517,601 | 600 | |
| * | Pernix Therapeutics Holdings | 234,810 | 592 |
| *,^ | Celsion Corp. | 151,287 | 589 |
| * | Synthetic Biologics Inc. | 381,227 | 583 |
| * | BIND Therapeutics Inc. | 38,556 | 582 |
| *,^ | Novabay Pharmaceuticals Inc. | 469,822 | 578 |
| * | Cardica Inc. | 567,438 | 553 |
| * | Biodel Inc. | 238,888 | 549 |
| * | Cubist Pharmaceutic-CVR | 401,195 | 542 |
| * | Advaxis Inc. | 127,163 | 539 |
| * | Response Genetics Inc. | 460,766 | 534 |
| * | AdCare Health Systems Inc. | 121,964 | 524 |
| * | Alimera Sciences Inc. | 109,535 | 516 |
| * | Five Prime Therapeutics Inc. | 30,600 | 514 |
| * | Ophthotech Corp. | 15,648 | 506 |
| *,^ | Acura Pharmaceuticals Inc. | 290,232 | 485 |
| * | Transcept Pharmaceuticals Inc. | 141,462 | 475 |
| * | Anthera Pharmaceuticals Inc. Class A | 153,003 | 470 |
| * | IGI Laboratories Inc. | 151,369 | 462 |
| * | Mast Therapeutics Inc. | 971,733 | 449 |
| * | LipoScience Inc. | 105,347 | 448 |
| * | Hemispherx Biopharma Inc. | 1,666,987 | 442 |
| * | Conatus Pharmaceuticals Inc. | 67,930 | 438 |
| * | Vermillion Inc. | 181,825 | 429 |
| * | Harvard Apparatus Regenerative Technology Inc. | 90,135 | 428 |
34
| Vanguard® Total Stock Market Index Fund | |||
| Schedule of Investments | |||
| December 31, 2013 | |||
| Market | |||
| Value | |||
| Shares | ($000) | ||
| *,^ | Echo Therapeutics Inc. | 135,621 | 426 |
| * | AxoGen Inc. | 93,968 | 422 |
| * | Lpath Inc. Class A | 98,212 | 418 |
| * | Chembio Diagnostics Inc. | 120,789 | 407 |
| *,^ | Ambit Biosciences Corp. | 42,081 | 406 |
| *,^ | Tonix Pharmaceuticals Holding Corp. | 37,190 | 384 |
| * | Heska Corp. | 43,828 | 383 |
| *,^ | Palatin Technologies Inc. | 504,697 | 370 |
| * | MediciNova Inc. | 170,820 | 366 |
| * | InfuSystems Holdings Inc. | 168,213 | 360 |
| *,^ | Oculus Innovative Sciences Inc. | 101,250 | 352 |
| * | Zalicus Inc. | 314,264 | 349 |
| * | Bovie Medical Corp. | 162,513 | 345 |
| *,^ | MELA Sciences Inc. | 517,162 | 331 |
| * | EntreMed Inc. | 191,112 | 327 |
| * | Hooper Holmes Inc. | 591,641 | 314 |
| Span-America Medical Systems Inc. | 14,982 | 312 | |
| *,^ | BSD Medical Corp. | 257,082 | 306 |
| * | Vision Sciences Inc. | 273,044 | 273 |
| MGC Diagnostics Corp. | 21,475 | 272 | |
| * | Evoke Pharma Inc. | 36,221 | 270 |
| * | Veracyte Inc. | 18,420 | 267 |
| Daxor Corp. | 37,740 | 262 | |
| *,^ | Delcath Systems Inc. | 1,025,257 | 261 |
| *,^ | ARCA Biopharma Inc. | 151,257 | 254 |
| *,^ | Cel-Sci Corp. | 410,009 | 242 |
| * | Imprimis Pharmaceuticals Inc. | 63,100 | 211 |
| * | Escalon Medical Corp. | 103,945 | 211 |
| * | Baxano Surgical Inc. | 200,063 | 202 |
| * | Misonix Inc. | 32,584 | 183 |
| *,^ | NanoViricides Inc. | 37,599 | 180 |
| * | Aastrom Biosciences Inc. | 53,565 | 173 |
| * | ERBA Diagnostics Inc. | 61,375 | 172 |
| * | CAS Medical Systems Inc. | 97,251 | 165 |
| * | ThermoGenesis Corp. | 123,286 | 123 |
| * | Fate Therapeutics Inc. | 18,526 | 116 |
| * | Dynatronics Corp. | 26,415 | 113 |
| *,^ | CombiMatrix Corp. | 45,819 | 105 |
| * | Bioanalytical Systems Inc. | 34,869 | 94 |
| * | Wright Medical Group Inc. CVR | 288,011 | 93 |
| * | Kips Bay Medical Inc. | 107,300 | 77 |
| * | USMD Holdings Inc. | 3,500 | 70 |
| * | BG Medicine Inc. | 65,950 | 69 |
| * | Heat Biologics Inc. | 9,400 | 67 |
| * | Regado Biosciences Inc. | 11,200 | 53 |
| * | ProPhase Labs Inc. | 31,802 | 52 |
| * | iBio Inc. | 100,750 | 34 |
| Birner Dental Management Services Inc. | 1,710 | 30 | |
| * | IsoRay Inc. | 46,600 | 23 |
| * | DARA Biosciences Inc. | 14,200 | 8 |
| * | ImmuCell Corp. | 1,700 | 7 |
| Myrexis Inc. | 34,818 | 6 | |
| * | Cormedix Inc. | 4,900 | 6 |
| Diversicare Healthcare Services Inc. | 1,100 | 5 | |
| 36,170,703 | |||
| Industrials (13.6%) | |||
| General Electric Co. | 151,269,232 | 4,240,077 | |
| United Technologies Corp. | 13,718,897 | 1,561,210 | |
| Boeing Co. | 11,235,254 | 1,533,500 | |
| 3M Co. | 10,066,420 | 1,411,815 | |
| Union Pacific Corp. | 6,886,216 | 1,156,884 | |
| United Parcel Service Inc. Class B | 10,701,874 | 1,124,553 | |
| Honeywell International Inc. | 11,732,285 | 1,071,979 | |
| Caterpillar Inc. | 9,514,506 | 864,012 | |
35
| Vanguard® Total Stock Market Index Fund | ||
| Schedule of Investments | ||
| December 31, 2013 | ||
| Market | ||
| Value | ||
| Shares | ($000) | |
| Accenture plc Class A | 9,505,103 | 781,510 |
| Emerson Electric Co. | 10,525,266 | 738,663 |
| Lockheed Martin Corp. | 4,790,227 | 712,115 |
| Danaher Corp. | 8,860,155 | 684,004 |
| FedEx Corp. | 4,497,491 | 646,604 |
| Precision Castparts Corp. | 2,172,332 | 585,009 |
| Automatic Data Processing Inc. | 7,200,553 | 581,877 |
| Eaton Corp. plc | 7,094,446 | 540,029 |
| Illinois Tool Works Inc. | 6,303,550 | 530,002 |
| Deere & Co. | 5,606,117 | 512,007 |
| General Dynamics Corp. | 5,002,131 | 477,954 |
| CSX Corp. | 15,162,557 | 436,227 |
| Raytheon Co. | 4,775,980 | 433,181 |
| Norfolk Southern Corp. | 4,618,143 | 428,702 |
| Cummins Inc. | 2,801,139 | 394,877 |
| Northrop Grumman Corp. | 3,318,826 | 380,371 |
| TE Connectivity Ltd. | 6,154,474 | 339,173 |
| * LinkedIn Corp. Class A | 1,521,569 | 329,922 |
| PACCAR Inc. | 5,293,966 | 313,244 |
| Waste Management Inc. | 6,663,621 | 298,997 |
| Parker Hannifin Corp. | 2,231,246 | 287,028 |
| Tyco International Ltd. | 6,956,361 | 285,489 |
| Agilent Technologies Inc. | 4,945,925 | 282,857 |
| Ingersoll-Rand plc | 4,091,812 | 252,056 |
| Dover Corp. | 2,547,735 | 245,958 |
| Rockwell Automation Inc. | 2,073,244 | 244,975 |
| WW Grainger Inc. | 934,141 | 238,598 |
| Sherwin-Williams Co. | 1,298,756 | 238,322 |
| Pentair Ltd. | 2,979,964 | 231,454 |
| * Fiserv Inc. | 3,872,258 | 228,657 |
| Paychex Inc. | 4,914,592 | 223,761 |
| Xerox Corp. | 17,488,616 | 212,836 |
| Amphenol Corp. Class A | 2,368,244 | 211,200 |
| Fidelity National Information Services Inc. | 3,919,028 | 210,373 |
| Roper Industries Inc. | 1,484,544 | 205,877 |
| Kansas City Southern | 1,647,726 | 204,038 |
| Fluor Corp. | 2,441,746 | 196,048 |
| AMETEK Inc. | 3,658,368 | 192,686 |
| Fastenal Co. | 3,993,200 | 189,717 |
| * Alliance Data Systems Corp. | 691,908 | 181,923 |
| Flowserve Corp. | 2,092,059 | 164,917 |
| Textron Inc. | 4,202,257 | 154,475 |
| Rockwell Collins Inc. | 2,019,911 | 149,312 |
| * Stericycle Inc. | 1,281,825 | 148,910 |
| * Verisk Analytics Inc. Class A | 2,263,247 | 148,741 |
| Pall Corp. | 1,658,937 | 141,590 |
| * B/E Aerospace Inc. | 1,566,451 | 136,328 |
| Expeditors International of Washington Inc. | 3,071,050 | 135,894 |
| Towers Watson & Co. Class A | 1,060,282 | 135,303 |
| L-3 Communications Holdings Inc. | 1,265,484 | 135,230 |
| Republic Services Inc. Class A | 4,037,522 | 134,046 |
| Chicago Bridge & Iron Co. NV | 1,607,297 | 133,631 |
| * Trimble Navigation Ltd. | 3,835,625 | 133,096 |
| CH Robinson Worldwide Inc. | 2,266,983 | 132,256 |
| * FleetCor Technologies Inc. | 1,045,184 | 122,464 |
| ADT Corp. | 3,016,643 | 122,084 |
| Masco Corp. | 5,336,776 | 121,518 |
| * Jacobs Engineering Group Inc. | 1,870,585 | 117,828 |
| Vulcan Materials Co. | 1,943,328 | 115,473 |
| TransDigm Group Inc. | 708,550 | 114,091 |
| Fortune Brands Home & Security Inc. | 2,484,585 | 113,546 |
| Rock Tenn Co. Class A | 1,076,791 | 113,074 |
| Ball Corp. | 2,157,548 | 111,459 |
| JB Hunt Transport Services Inc. | 1,409,582 | 108,961 |
36
| Vanguard® Total Stock Market Index Fund | ||
| Schedule of Investments | ||
| December 31, 2013 | ||
| Market | ||
| Value | ||
| Shares | ($000) | |
| * United Rentals Inc. | 1,394,051 | 108,666 |
| * Mettler-Toledo International Inc. | 445,184 | 107,997 |
| Wabtec Corp. | 1,367,846 | 101,590 |
| Manpowergroup Inc. | 1,181,036 | 101,404 |
| * Quanta Services Inc. | 3,173,825 | 100,166 |
| Sealed Air Corp. | 2,932,255 | 99,843 |
| MeadWestvaco Corp. | 2,658,557 | 98,181 |
| Xylem Inc. | 2,756,205 | 95,365 |
| Donaldson Co. Inc. | 2,185,985 | 95,003 |
| * Crown Holdings Inc. | 2,096,022 | 93,420 |
| Joy Global Inc. | 1,588,919 | 92,936 |
| Packaging Corp. of America | 1,466,414 | 92,795 |
| Avnet Inc. | 2,056,050 | 90,692 |
| IDEX Corp. | 1,215,532 | 89,767 |
| * Owens-Illinois Inc. | 2,465,729 | 88,224 |
| Lincoln Electric Holdings Inc. | 1,222,634 | 87,223 |
| Cintas Corp. | 1,433,911 | 85,447 |
| Total System Services Inc. | 2,552,693 | 84,954 |
| Hubbell Inc. Class B | 768,051 | 83,641 |
| Valspar Corp. | 1,166,026 | 83,126 |
| * Colfax Corp. | 1,294,711 | 82,460 |
| Robert Half International Inc. | 1,961,829 | 82,377 |
| * Arrow Electronics Inc. | 1,515,674 | 82,225 |
| MDU Resources Group Inc. | 2,669,981 | 81,568 |
| Iron Mountain Inc. | 2,572,568 | 78,077 |
| AGCO Corp. | 1,310,031 | 77,541 |
| Waste Connections Inc. | 1,754,510 | 76,549 |
| * Kirby Corp. | 764,403 | 75,867 |
| Carlisle Cos. Inc. | 950,798 | 75,493 |
| * CoStar Group Inc. | 404,158 | 74,599 |
| * Genesee & Wyoming Inc. Class A | 775,154 | 74,454 |
| Global Payments Inc. | 1,123,913 | 73,043 |
| Jack Henry & Associates Inc. | 1,228,947 | 72,766 |
| Timken Co. | 1,313,759 | 72,349 |
| Graco Inc. | 911,778 | 71,228 |
| * Flextronics International Ltd. | 9,139,770 | 71,016 |
| KBR Inc. | 2,214,286 | 70,614 |
| Acuity Brands Inc. | 642,976 | 70,290 |
| Broadridge Financial Solutions Inc. | 1,774,597 | 70,132 |
| * Sensata Technologies Holding NV | 1,800,308 | 69,798 |
| PerkinElmer Inc. | 1,679,527 | 69,247 |
| Martin Marietta Materials Inc. | 691,487 | 69,107 |
| Aptargroup Inc. | 985,762 | 66,845 |
| Huntington Ingalls Industries Inc. | 739,927 | 66,601 |
| * Hexcel Corp. | 1,488,334 | 66,514 |
| Terex Corp. | 1,582,059 | 66,431 |
| Oshkosh Corp. | 1,292,985 | 65,141 |
| * Owens Corning | 1,583,971 | 64,499 |
| Trinity Industries Inc. | 1,167,901 | 63,674 |
| FLIR Systems Inc. | 2,113,319 | 63,611 |
| AO Smith Corp. | 1,178,732 | 63,581 |
| Bemis Co. Inc. | 1,538,799 | 63,029 |
| Sonoco Products Co. | 1,492,744 | 62,277 |
| * Spirit Aerosystems Holdings Inc. Class A | 1,804,607 | 61,501 |
| Kennametal Inc. | 1,171,293 | 60,989 |
| SPX Corp. | 610,281 | 60,790 |
| Nordson Corp. | 811,993 | 60,331 |
| * Allegion plc | 1,363,326 | 60,245 |
| * Vantiv Inc. Class A | 1,845,867 | 60,194 |
| * WESCO International Inc. | 660,727 | 60,172 |
| MSC Industrial Direct Co. Inc. Class A | 736,341 | 59,548 |
| URS Corp. | 1,119,331 | 59,313 |
| Triumph Group Inc. | 777,948 | 59,179 |
| ITT Corp. | 1,355,144 | 58,840 |
37
| Vanguard® Total Stock Market Index Fund | |||
| Schedule of Investments | |||
| December 31, 2013 | |||
| Market | |||
| Value | |||
| Shares | ($000) | ||
| Generac Holdings Inc. | 1,024,785 | 58,044 | |
| Ryder System Inc. | 785,799 | 57,976 | |
| Alliant Techsystems Inc. | 476,328 | 57,960 | |
| * | WEX Inc. | 581,179 | 57,554 |
| Lennox International Inc. | 668,170 | 56,835 | |
| Valmont Industries Inc. | 380,435 | 56,730 | |
| Babcock & Wilcox Co. | 1,650,349 | 56,425 | |
| FEI Co. | 620,662 | 55,462 | |
| RR Donnelley & Sons Co. | 2,715,654 | 55,073 | |
| Exelis Inc. | 2,822,280 | 53,793 | |
| Toro Co. | 845,636 | 53,782 | |
| * | Old Dominion Freight Line Inc. | 960,992 | 50,952 |
| EnerSys Inc. | 725,462 | 50,848 | |
| Eagle Materials Inc. | 634,058 | 49,095 | |
| * | Foster Wheeler AG | 1,468,632 | 48,494 |
| * | Teledyne Technologies Inc. | 527,784 | 48,482 |
| * | CoreLogic Inc. | 1,345,930 | 47,821 |
| * | Clean Harbors Inc. | 796,508 | 47,759 |
| CLARCOR Inc. | 741,462 | 47,713 | |
| Jabil Circuit Inc. | 2,732,031 | 47,647 | |
| National Instruments Corp. | 1,485,862 | 47,577 | |
| Lender Processing Services Inc. | 1,270,655 | 47,497 | |
| * | Cognex Corp. | 1,239,131 | 47,310 |
| Regal-Beloit Corp. | 636,423 | 46,917 | |
| Crane Co. | 694,842 | 46,728 | |
| Manitowoc Co. Inc. | 1,996,828 | 46,566 | |
| * | DigitalGlobe Inc. | 1,118,816 | 46,039 |
| * | NeuStar Inc. Class A | 920,928 | 45,917 |
| Belden Inc. | 645,804 | 45,497 | |
| World Fuel Services Corp. | 1,029,926 | 44,452 | |
| * | Genpact Ltd. | 2,406,962 | 44,216 |
| * | Esterline Technologies Corp. | 418,821 | 42,703 |
| MAXIMUS Inc. | 967,834 | 42,575 | |
| * | AECOM Technology Corp. | 1,429,600 | 42,073 |
| * | Moog Inc. Class A | 617,938 | 41,983 |
| Woodward Inc. | 915,693 | 41,765 | |
| * | Zebra Technologies Corp. | 753,400 | 40,744 |
| EMCOR Group Inc. | 946,348 | 40,163 | |
| Air Lease Corp. Class A | 1,282,168 | 39,850 | |
| Curtiss-Wright Corp. | 636,913 | 39,635 | |
| Deluxe Corp. | 754,515 | 39,378 | |
| * | Louisiana-Pacific Corp. | 2,108,116 | 39,021 |
| * | USG Corp. | 1,372,662 | 38,956 |
| Landstar System Inc. | 677,990 | 38,951 | |
| *,^ | IPG Photonics Corp. | 501,781 | 38,943 |
| Corporate Executive Board Co. | 498,281 | 38,582 | |
| Actuant Corp. Class A | 1,034,784 | 37,915 | |
| Anixter International Inc. | 410,179 | 36,850 | |
| Watsco Inc. | 382,256 | 36,720 | |
| GATX Corp. | 684,692 | 35,720 | |
| * | Armstrong World Industries Inc. | 601,462 | 34,650 |
| * | Advisory Board Co. | 531,282 | 33,827 |
| * | Graphic Packaging Holding Co. | 3,521,528 | 33,807 |
| * | Euronet Worldwide Inc. | 706,374 | 33,800 |
| Con-way Inc. | 849,308 | 33,726 | |
| Allison Transmission Holdings Inc. | 1,219,432 | 33,669 | |
| Harsco Corp. | 1,198,724 | 33,600 | |
| Silgan Holdings Inc. | 659,532 | 31,671 | |
| Littelfuse Inc. | 338,586 | 31,465 | |
| * | MWI Veterinary Supply Inc. | 181,152 | 30,903 |
| Covanta Holding Corp. | 1,686,187 | 29,930 | |
| * | MasTec Inc. | 914,080 | 29,909 |
| *,^ | Navistar International Corp. | 778,643 | 29,736 |
| * | Cardtronics Inc. | 672,165 | 29,206 |
38
| Vanguard® Total Stock Market Index Fund | |||
| Schedule of Investments | |||
| December 31, 2013 | |||
| Market | |||
| Value | |||
| Shares | ($000) | ||
| Convergys Corp. | 1,376,947 | 28,985 | |
| HEICO Corp. Class A | 684,702 | 28,840 | |
| TAL International Group Inc. | 501,508 | 28,761 | |
| *,^ | Outerwall Inc. | 419,798 | 28,240 |
| Applied Industrial Technologies Inc. | 564,550 | 27,714 | |
| * | WageWorks Inc. | 458,053 | 27,227 |
| * | Tetra Tech Inc. | 954,471 | 26,706 |
| * | Berry Plastics Group Inc. | 1,108,066 | 26,361 |
| UTi Worldwide Inc. | 1,497,260 | 26,292 | |
| Heartland Payment Systems Inc. | 523,111 | 26,072 | |
| * | Vishay Intertechnology Inc. | 1,959,390 | 25,982 |
| United Stationers Inc. | 565,801 | 25,965 | |
| * | Mobile Mini Inc. | 630,063 | 25,946 |
| Barnes Group Inc. | 671,369 | 25,720 | |
| * | Coherent Inc. | 345,298 | 25,687 |
| Mueller Industries Inc. | 406,058 | 25,586 | |
| Franklin Electric Co. Inc. | 572,940 | 25,576 | |
| *,^ | VistaPrint NV | 442,350 | 25,148 |
| Watts Water Technologies Inc. Class A | 403,559 | 24,968 | |
| * | On Assignment Inc. | 710,548 | 24,812 |
| * | Trimas Corp. | 615,999 | 24,572 |
| * | FTI Consulting Inc. | 593,223 | 24,405 |
| Brink's Co. | 714,491 | 24,393 | |
| * | RBC Bearings Inc. | 338,709 | 23,964 |
| Mine Safety Appliances Co. | 467,145 | 23,923 | |
| * | Itron Inc. | 556,893 | 23,072 |
| EVERTEC Inc. | 932,761 | 23,002 | |
| UniFirst Corp. | 212,268 | 22,713 | |
| Simpson Manufacturing Co. Inc. | 608,477 | 22,349 | |
| Raven Industries Inc. | 538,991 | 22,174 | |
| Mueller Water Products Inc. Class A | 2,333,651 | 21,866 | |
| * | Texas Industries Inc. | 317,831 | 21,860 |
| *,^ | Swift Transportation Co. | 983,507 | 21,844 |
| * | Huron Consulting Group Inc. | 347,238 | 21,779 |
| * | Masonite International Corp. | 362,226 | 21,734 |
| * | Plexus Corp. | 498,566 | 21,583 |
| * | Proto Labs Inc. | 302,578 | 21,538 |
| Brady Corp. Class A | 688,961 | 21,310 | |
| General Cable Corp. | 717,776 | 21,110 | |
| * | Hub Group Inc. Class A | 527,156 | 21,023 |
| CIRCOR International Inc. | 259,101 | 20,930 | |
| ^ | Sturm Ruger & Co. Inc. | 285,535 | 20,870 |
| * | Sanmina Corp. | 1,242,098 | 20,743 |
| * | Orbital Sciences Corp. | 889,677 | 20,729 |
| ABM Industries Inc. | 722,248 | 20,649 | |
| * | PHH Corp. | 843,445 | 20,538 |
| * | Universal Display Corp. | 597,480 | 20,529 |
| Greif Inc. Class A | 378,463 | 19,831 | |
| * | HD Supply Holdings Inc. | 824,594 | 19,799 |
| Forward Air Corp. | 448,645 | 19,700 | |
| * | Trex Co. Inc. | 241,295 | 19,190 |
| * | Korn/Ferry International | 731,489 | 19,107 |
| * | GrafTech International Ltd. | 1,693,696 | 19,020 |
| Aircastle Ltd. | 973,647 | 18,655 | |
| * | Veeco Instruments Inc. | 562,288 | 18,505 |
| * | Benchmark Electronics Inc. | 799,282 | 18,447 |
| Tennant Co. | 270,945 | 18,373 | |
| Granite Construction Inc. | 522,436 | 18,275 | |
| * | EnPro Industries Inc. | 309,691 | 17,854 |
| Methode Electronics Inc. | 520,786 | 17,806 | |
| AZZ Inc. | 358,408 | 17,512 | |
| G&K Services Inc. Class A | 274,547 | 17,085 | |
| * | Wesco Aircraft Holdings Inc. | 760,162 | 16,663 |
| Matson Inc. | 633,567 | 16,542 | |
39
| Vanguard® Total Stock Market Index Fund | |||
| Schedule of Investments | |||
| December 31, 2013 | |||
| Market | |||
| Value | |||
| Shares | ($000) | ||
| Primoris Services Corp. | 531,170 | 16,535 | |
| Knight Transportation Inc. | 893,033 | 16,378 | |
| MTS Systems Corp. | 228,045 | 16,248 | |
| Booz Allen Hamilton Holding Corp. Class A | 841,559 | 16,116 | |
| Werner Enterprises Inc. | 643,115 | 15,904 | |
| Kaman Corp. | 396,464 | 15,752 | |
| * | Rogers Corp. | 256,094 | 15,750 |
| * | DXP Enterprises Inc. | 136,621 | 15,739 |
| Otter Tail Corp. | 536,541 | 15,705 | |
| * | Greatbatch Inc. | 353,598 | 15,643 |
| * | Atlas Air Worldwide Holdings Inc. | 379,834 | 15,630 |
| Cubic Corp. | 295,504 | 15,561 | |
| * | TrueBlue Inc. | 600,358 | 15,477 |
| AAR Corp. | 551,825 | 15,457 | |
| * | Rexnord Corp. | 571,372 | 15,433 |
| Albany International Corp. | 422,983 | 15,198 | |
| * | Meritor Inc. | 1,441,120 | 15,031 |
| ^ | Lindsay Corp. | 181,531 | 15,022 |
| * | Tutor Perini Corp. | 567,409 | 14,923 |
| * | OSI Systems Inc. | 279,057 | 14,821 |
| Encore Wire Corp. | 271,612 | 14,721 | |
| * | FARO Technologies Inc. | 252,275 | 14,708 |
| Heartland Express Inc. | 746,051 | 14,638 | |
| Universal Forest Products Inc. | 280,481 | 14,624 | |
| * | II-VI Inc. | 829,470 | 14,599 |
| Apogee Enterprises Inc. | 402,626 | 14,458 | |
| * | LifeLock Inc. | 876,756 | 14,388 |
| McGrath RentCorp | 356,019 | 14,170 | |
| Exponent Inc. | 182,609 | 14,141 | |
| * | Navigant Consulting Inc. | 729,148 | 14,000 |
| *,^ | GenCorp Inc. | 763,940 | 13,766 |
| * | Boise Cascade Co. | 465,212 | 13,714 |
| ^ | Textainer Group Holdings Ltd. | 333,100 | 13,397 |
| * | Measurement Specialties Inc. | 219,802 | 13,340 |
| Sun Hydraulics Corp. | 325,773 | 13,301 | |
| * | H&E Equipment Services Inc. | 437,098 | 12,951 |
| * | ExamWorks Group Inc. | 431,967 | 12,903 |
| Altra Industrial Motion Corp. | 376,872 | 12,897 | |
| AAON Inc. | 401,639 | 12,832 | |
| ESCO Technologies Inc. | 373,299 | 12,789 | |
| * | Federal Signal Corp. | 869,268 | 12,735 |
| * | Sykes Enterprises Inc. | 583,269 | 12,721 |
| * | ExlService Holdings Inc. | 459,922 | 12,703 |
| * | Imperva Inc. | 263,774 | 12,695 |
| *,^ | Smith & Wesson Holding Corp. | 930,560 | 12,553 |
| * | Wabash National Corp. | 1,014,806 | 12,533 |
| * | Aegion Corp. Class A | 571,869 | 12,518 |
| Insperity Inc. | 340,117 | 12,288 | |
| Arkansas Best Corp. | 362,227 | 12,200 | |
| * | Team Inc. | 287,844 | 12,187 |
| * | Greenbrier Cos. Inc. | 367,884 | 12,081 |
| * | Thermon Group Holdings Inc. | 436,239 | 11,922 |
| Standex International Corp. | 188,443 | 11,849 | |
| John Bean Technologies Corp. | 403,151 | 11,824 | |
| * | Monster Worldwide Inc. | 1,612,266 | 11,495 |
| * | Saia Inc. | 355,885 | 11,406 |
| Schnitzer Steel Industries Inc. | 348,671 | 11,391 | |
| * | Taser International Inc. | 715,376 | 11,360 |
| *,^ | XPO Logistics Inc. | 431,350 | 11,340 |
| Kelly Services Inc. Class A | 452,910 | 11,296 | |
| Hyster-Yale Materials Handling Inc. | 120,099 | 11,188 | |
| * | Rofin-Sinar Technologies Inc. | 410,111 | 11,081 |
| US Ecology Inc. | 297,369 | 11,059 | |
| Badger Meter Inc. | 201,576 | 10,986 | |
40
| Vanguard® Total Stock Market Index Fund | |||
| Schedule of Investments | |||
| December 31, 2013 | |||
| Market | |||
| Value | |||
| Shares | ($000) | ||
| Quanex Building Products Corp. | 545,283 | 10,862 | |
| * | Roadrunner Transportation Systems Inc. | 390,897 | 10,535 |
| AVX Corp. | 749,367 | 10,439 | |
| ManTech International Corp. Class A | 347,231 | 10,393 | |
| Acacia Research Corp. | 709,937 | 10,322 | |
| Astec Industries Inc. | 266,024 | 10,277 | |
| Comfort Systems USA Inc. | 521,736 | 10,116 | |
| Quad/Graphics Inc. | 371,377 | 10,113 | |
| * | Headwaters Inc. | 1,017,366 | 9,960 |
| * | Newport Corp. | 548,633 | 9,914 |
| * | AMN Healthcare Services Inc. | 670,942 | 9,863 |
| Myers Industries Inc. | 464,463 | 9,809 | |
| * | Fabrinet | 476,581 | 9,799 |
| Barrett Business Services Inc. | 104,726 | 9,712 | |
| * | RPX Corp. | 571,519 | 9,659 |
| * | ICF International Inc. | 276,300 | 9,590 |
| Gorman-Rupp Co. | 285,696 | 9,551 | |
| * | Checkpoint Systems Inc. | 601,671 | 9,488 |
| * | Global Cash Access Holdings Inc. | 944,372 | 9,434 |
| CTS Corp. | 471,766 | 9,393 | |
| Materion Corp. | 304,445 | 9,392 | |
| Griffon Corp. | 710,552 | 9,386 | |
| * | Nortek Inc. | 124,145 | 9,261 |
| Cass Information Systems Inc. | 136,587 | 9,199 | |
| *,^ | ExOne Co. | 146,050 | 8,830 |
| * | Era Group Inc. | 282,141 | 8,707 |
| Powell Industries Inc. | 129,653 | 8,685 | |
| Resources Connection Inc. | 605,330 | 8,674 | |
| * | TeleTech Holdings Inc. | 360,142 | 8,622 |
| Kforce Inc. | 414,472 | 8,480 | |
| Daktronics Inc. | 534,121 | 8,375 | |
| * | Engility Holdings Inc. | 250,578 | 8,369 |
| American Science & Engineering Inc. | 115,773 | 8,325 | |
| * | Consolidated Graphics Inc. | 121,503 | 8,194 |
| Park Electrochemical Corp. | 285,065 | 8,187 | |
| * | Advanced Emissions Solutions Inc. | 148,521 | 8,054 |
| * | Taminco Corp. | 394,641 | 7,976 |
| HEICO Corp. | 137,436 | 7,964 | |
| * | Aerovironment Inc. | 269,094 | 7,839 |
| * | Gibraltar Industries Inc. | 420,470 | 7,817 |
| Viad Corp. | 279,269 | 7,758 | |
| * | GP Strategies Corp. | 259,362 | 7,726 |
| * | Great Lakes Dredge & Dock Corp. | 817,472 | 7,521 |
| * | ServiceSource International Inc. | 884,579 | 7,413 |
| * | Columbus McKinnon Corp. | 268,980 | 7,300 |
| * | MYR Group Inc. | 290,396 | 7,283 |
| Landauer Inc. | 136,812 | 7,198 | |
| Black Box Corp. | 230,841 | 6,879 | |
| LB Foster Co. Class A | 144,310 | 6,824 | |
| Marten Transport Ltd. | 337,337 | 6,811 | |
| Alamo Group Inc. | 109,655 | 6,655 | |
| Multi-Color Corp. | 175,944 | 6,640 | |
| * | TTM Technologies Inc. | 773,217 | 6,634 |
| Kadant Inc. | 163,255 | 6,615 | |
| * | American Woodmark Corp. | 166,995 | 6,601 |
| * | Park-Ohio Holdings Corp. | 123,789 | 6,487 |
| Celadon Group Inc. | 331,540 | 6,458 | |
| * | Rentrak Corp. | 170,345 | 6,454 |
| Ennis Inc. | 361,889 | 6,405 | |
| * | Astronics Corp. | 124,777 | 6,364 |
| American Railcar Industries Inc. | 139,084 | 6,363 | |
| * | Builders FirstSource Inc. | 862,284 | 6,157 |
| Kimball International Inc. Class B | 409,068 | 6,148 | |
| NN Inc. | 300,722 | 6,072 | |
41
| Vanguard® Total Stock Market Index Fund | |||
| Schedule of Investments | |||
| December 31, 2013 | |||
| Market | |||
| Value | |||
| Shares | ($000) | ||
| * | Bazaarvoice Inc. | 761,682 | 6,033 |
| * | EnerNOC Inc. | 349,422 | 6,014 |
| * | Air Transport Services Group Inc. | 741,184 | 5,996 |
| * | CAI International Inc. | 252,536 | 5,952 |
| Insteel Industries Inc. | 251,874 | 5,725 | |
| *,^ | Capstone Turbine Corp. | 4,365,271 | 5,631 |
| * | Furmanite Corp. | 510,945 | 5,426 |
| * | CBIZ Inc. | 577,994 | 5,271 |
| * | Kratos Defense & Security Solutions Inc. | 680,260 | 5,224 |
| * | Echo Global Logistics Inc. | 240,611 | 5,168 |
| * | PowerSecure International Inc. | 295,318 | 5,071 |
| Douglas Dynamics Inc. | 298,848 | 5,027 | |
| * | Lionbridge Technologies Inc. | 827,322 | 4,931 |
| Graham Corp. | 134,795 | 4,892 | |
| * | Anaren Inc. | 172,654 | 4,833 |
| * | Northwest Pipe Co. | 126,869 | 4,791 |
| * | Mistras Group Inc. | 228,940 | 4,780 |
| * | GSI Group Inc. | 422,627 | 4,750 |
| * | Orion Marine Group Inc. | 393,009 | 4,728 |
| Heidrick & Struggles International Inc. | 231,994 | 4,672 | |
| * | Quality Distribution Inc. | 362,770 | 4,654 |
| * | NCI Building Systems Inc. | 265,099 | 4,650 |
| * | Layne Christensen Co. | 269,178 | 4,598 |
| * | Dice Holdings Inc. | 633,039 | 4,590 |
| * | ARC Document Solutions Inc. | 556,358 | 4,573 |
| * | Power Solutions International Inc. | 60,631 | 4,553 |
| Global Power Equipment Group Inc. | 232,101 | 4,542 | |
| * | Ply Gem Holdings Inc. | 250,700 | 4,520 |
| Electro Rent Corp. | 243,969 | 4,518 | |
| FreightCar America Inc. | 168,931 | 4,497 | |
| * | InnerWorkings Inc. | 576,865 | 4,494 |
| * | Higher One Holdings Inc. | 451,206 | 4,404 |
| * | PGT Inc. | 434,121 | 4,393 |
| * | AM Castle & Co. | 294,331 | 4,347 |
| NACCO Industries Inc. Class A | 69,499 | 4,322 | |
| * | Lydall Inc. | 244,829 | 4,314 |
| * | Ducommun Inc. | 143,962 | 4,292 |
| Ceco Environmental Corp. | 265,352 | 4,291 | |
| * | Landec Corp. | 353,169 | 4,280 |
| * | US Concrete Inc. | 188,504 | 4,266 |
| Universal Technical Institute Inc. | 303,492 | 4,222 | |
| * | Pike Corp. | 396,542 | 4,191 |
| Electro Scientific Industries Inc. | 395,598 | 4,138 | |
| * | Pacer International Inc. | 499,903 | 4,129 |
| * | Astronics Corp. Class B | 78,998 | 4,009 |
| Dynamic Materials Corp. | 184,043 | 4,001 | |
| * | NVE Corp. | 68,053 | 3,966 |
| *,^ | Nuverra Environmental Solutions Inc. | 228,111 | 3,830 |
| CDI Corp. | 203,692 | 3,774 | |
| * | Flow International Corp. | 933,714 | 3,772 |
| Argan Inc. | 134,646 | 3,711 | |
| * | Franklin Covey Co. | 185,385 | 3,685 |
| * | Patriot Transportation Holding Inc. | 87,619 | 3,637 |
| * | Cross Country Healthcare Inc. | 364,289 | 3,636 |
| Twin Disc Inc. | 135,502 | 3,508 | |
| * | ModusLink Global Solutions Inc. | 610,788 | 3,500 |
| * | AEP Industries Inc. | 65,019 | 3,435 |
| * | Kemet Corp. | 605,993 | 3,418 |
| Universal Truckload Services Inc. | 111,489 | 3,402 | |
| Houston Wire & Cable Co. | 245,121 | 3,280 | |
| * | Zygo Corp. | 221,856 | 3,279 |
| * | Vicor Corp. | 243,584 | 3,269 |
| * | Casella Waste Systems Inc. Class A | 544,417 | 3,158 |
| * | Sparton Corp. | 110,773 | 3,096 |
42
| Vanguard® Total Stock Market Index Fund | |||
| Schedule of Investments | |||
| December 31, 2013 | |||
| Market | |||
| Value | |||
| Shares | ($000) | ||
| Global Brass & Copper Holdings Inc. | 184,500 | 3,053 | |
| * | Maxwell Technologies Inc. | 388,058 | 3,015 |
| Bel Fuse Inc. Class B | 139,941 | 2,982 | |
| Mesa Laboratories Inc. | 37,848 | 2,974 | |
| * | Energy Recovery Inc. | 530,664 | 2,951 |
| * | Heritage-Crystal Clean Inc. | 142,796 | 2,926 |
| Coleman Cable Inc. | 110,680 | 2,902 | |
| * | Xerium Technologies Inc. | 171,754 | 2,832 |
| Spartan Motors Inc. | 422,257 | 2,829 | |
| Miller Industries Inc. | 149,815 | 2,791 | |
| * | CRA International Inc. | 139,348 | 2,759 |
| * | Cenveo Inc. | 792,194 | 2,725 |
| * | M/A-COM Technology Solutions Holdings Inc. | 155,611 | 2,644 |
| * | PRGX Global Inc. | 389,487 | 2,617 |
| VSE Corp. | 53,466 | 2,567 | |
| * | Commercial Vehicle Group Inc. | 346,972 | 2,523 |
| * | Vishay Precision Group Inc. | 169,091 | 2,518 |
| *,^ | YRC Worldwide Inc. | 144,638 | 2,512 |
| * | Sterling Construction Co. Inc. | 211,232 | 2,478 |
| LSI Industries Inc. | 282,092 | 2,446 | |
| *,^ | Rubicon Technology Inc. | 244,953 | 2,437 |
| * | Orion Energy Systems Inc. | 355,225 | 2,416 |
| International Shipholding Corp. | 81,256 | 2,397 | |
| * | Manitex International Inc. | 150,229 | 2,386 |
| * | Intevac Inc. | 318,610 | 2,367 |
| * | Adept Technology Inc. | 139,858 | 2,362 |
| * | Ameresco Inc. Class A | 235,147 | 2,272 |
| * | Patrick Industries Inc. | 77,752 | 2,249 |
| Hardinge Inc. | 152,003 | 2,199 | |
| *,^ | Odyssey Marine Exploration Inc. | 1,088,852 | 2,199 |
| Richardson Electronics Ltd. | 193,571 | 2,199 | |
| * | Accuride Corp. | 581,553 | 2,169 |
| * | LMI Aerospace Inc. | 146,716 | 2,163 |
| * | Stock Building Supply Holdings Inc. | 115,325 | 2,101 |
| * | Multi-Fineline Electronix Inc. | 147,819 | 2,053 |
| * | PMFG Inc. | 225,410 | 2,040 |
| * | National Research Corp. Class A | 108,016 | 2,033 |
| Crawford & Co. Class B | 219,434 | 2,028 | |
| Hurco Cos. Inc. | 80,717 | 2,019 | |
| * | UFP Technologies Inc. | 75,839 | 1,913 |
| * | Norcraft Cos. Inc. | 97,164 | 1,906 |
| * | United States Lime & Minerals Inc. | 30,170 | 1,846 |
| * | Willis Lease Finance Corp. | 105,689 | 1,835 |
| * | Hudson Global Inc. | 453,090 | 1,821 |
| * | Broadwind Energy Inc. | 188,956 | 1,784 |
| * | Innovative Solutions & Support Inc. | 238,921 | 1,742 |
| * | USA Truck Inc. | 128,180 | 1,715 |
| * | Fuel Tech Inc. | 236,561 | 1,677 |
| * | Aeroflex Holding Corp. | 254,629 | 1,655 |
| Crawford & Co. Class A | 214,622 | 1,650 | |
| * | CPI Aerostructures Inc. | 109,472 | 1,646 |
| * | Tecumseh Products Co. Class A | 176,582 | 1,598 |
| Perceptron Inc. | 113,982 | 1,581 | |
| * | TRC Cos. Inc. | 217,977 | 1,556 |
| * | Covenant Transportation Group Inc. Class A | 183,964 | 1,510 |
| * | CUI Global Inc. | 236,735 | 1,496 |
| * | Hill International Inc. | 363,287 | 1,435 |
| Lincoln Educational Services Corp. | 278,106 | 1,385 | |
| *,^ | Revolution Lighting Technologies Inc. | 403,623 | 1,382 |
| *,^ | Research Frontiers Inc. | 238,598 | 1,379 |
| * | Metalico Inc. | 651,835 | 1,349 |
| * | Information Services Group Inc. | 317,385 | 1,346 |
| *,^ | Control4 Corp. | 74,220 | 1,314 |
| * | API Technologies Corp. | 378,101 | 1,289 |
43
| Vanguard® Total Stock Market Index Fund | |||
| Schedule of Investments | |||
| December 31, 2013 | |||
| Market | |||
| Value | |||
| Shares | ($000) | ||
| * | PAM Transportation Services Inc. | 61,693 | 1,278 |
| * | Pfsweb Inc. | 137,332 | 1,246 |
| * | Newtek Business Services Inc. | 391,173 | 1,228 |
| * | Magnetek Inc. | 49,099 | 1,174 |
| * | BlueLinx Holdings Inc. | 597,002 | 1,164 |
| *,^ | Document Security Systems Inc. | 552,894 | 1,145 |
| * | StarTek Inc. | 174,800 | 1,134 |
| *,^ | Erickson Air-Crane Inc. | 54,224 | 1,127 |
| * | Planet Payment Inc. | 386,712 | 1,075 |
| Eastern Co. | 67,410 | 1,073 | |
| *,^ | Genco Shipping & Trading Ltd. | 427,689 | 1,069 |
| * | Mfri Inc. | 72,759 | 1,044 |
| * | NAPCO Security Technologies Inc. | 159,758 | 1,003 |
| * | Harris Interactive Inc. | 497,732 | 995 |
| *,^ | American Superconductor Corp. | 602,395 | 988 |
| * | SL Industries Inc. | 35,428 | 960 |
| * | Echelon Corp. | 445,959 | 959 |
| * | Frequency Electronics Inc. | 79,528 | 928 |
| * | Key Technology Inc. | 64,325 | 922 |
| Omega Flex Inc. | 44,518 | 911 | |
| * | Supreme Industries Inc. Class A | 153,623 | 896 |
| *,^ | Eagle Bulk Shipping Inc. | 193,463 | 888 |
| * | Lawson Products Inc. | 71,807 | 880 |
| * | Essex Rental Corp. | 267,152 | 874 |
| *,^ | UQM Technologies Inc. | 401,083 | 858 |
| * | Viasystems Group Inc. | 61,452 | 841 |
| * | Hudson Technologies Inc. | 219,888 | 814 |
| * | Rand Logistics Inc. | 139,458 | 805 |
| * | Swisher Hygiene Inc. | 1,539,917 | 792 |
| Espey Manufacturing & Electronics Corp. | 24,066 | 786 | |
| *,^ | ClearSign Combustion Corp. | 66,004 | 756 |
| Hubbell Inc. Class A | 7,600 | 744 | |
| * | Sharps Compliance Corp. | 156,325 | 739 |
| * | Ballantyne Strong Inc. | 154,532 | 715 |
| RF Industries Ltd. | 77,348 | 711 | |
| *,^ | Parametric Sound Corp. | 49,286 | 683 |
| * | Active Power Inc. | 200,570 | 676 |
| * | Iteris Inc. | 313,907 | 659 |
| * | American Electric Technologies Inc. | 65,150 | 650 |
| * | CyberOptics Corp. | 100,886 | 642 |
| * | Innotrac Corp. | 73,831 | 605 |
| * | Arotech Corp. | 171,526 | 599 |
| * | Goldfield Corp. | 304,041 | 593 |
| * | Mattersight Corp. | 115,122 | 551 |
| *,^ | National Research Corp. Class B | 15,832 | 550 |
| * | Planar Systems Inc. | 202,835 | 515 |
| * | Ultralife Corp. | 126,101 | 448 |
| * | Perma-Fix Environmental Services | 133,397 | 434 |
| * | Microvision Inc. | 314,342 | 415 |
| Allied Motion Technologies Inc. | 31,419 | 391 | |
| * | eMagin Corp. | 135,353 | 383 |
| Sypris Solutions Inc. | 124,211 | 380 | |
| * | Transcat Inc. | 46,994 | 375 |
| Standard Register Co. | 52,428 | 361 | |
| *,^ | American DG Energy Inc. | 211,784 | 360 |
| * | Breeze-Eastern Corp. | 36,916 | 341 |
| * | Radiant Logistics Inc. | 117,694 | 315 |
| * | Astrotech Corp. | 109,953 | 311 |
| * | Wireless Telecom Group Inc. | 141,368 | 300 |
| * | Lightbridge Corp. | 199,245 | 289 |
| * | AMREP Corp. | 41,386 | 288 |
| * | Dolan Co. | 390,244 | 273 |
| * | Synthesis Energy Systems Inc. | 441,809 | 265 |
| * | GSE Holding Inc. | 124,264 | 257 |
44
| Vanguard® Total Stock Market Index Fund | |||
| Schedule of Investments | |||
| December 31, 2013 | |||
| Market | |||
| Value | |||
| Shares | ($000) | ||
| * | Gencor Industries Inc. | 26,846 | 256 |
| * | IEC Electronics Corp. | 57,711 | 241 |
| * | Elecsys Corp. | 17,962 | 235 |
| Bel Fuse Inc. Class A | 10,580 | 205 | |
| * | Vertex Energy Inc. | 58,625 | 196 |
| *,^ | Altair Nanotechnologies Inc. | 45,918 | 184 |
| Chicago Rivet & Machine Co. | 5,444 | 180 | |
| SIFCO Industries Inc. | 6,335 | 178 | |
| * | Onvia Inc. | 35,938 | 176 |
| * | Video Display Corp. | 48,546 | 171 |
| * | Versar Inc. | 35,189 | 170 |
| * | Continental Materials Corp. | 7,139 | 141 |
| Pulse Electronics Corp. | 43,372 | 125 | |
| EnviroStar Inc. | 41,800 | 123 | |
| * | CTPartners Executive Search Inc. | 20,503 | 115 |
| * | Professional Diversity Network | 23,996 | 111 |
| * | Asure Software Inc. | 19,976 | 110 |
| AMCON Distributing Co. | 1,380 | 109 | |
| * | Pioneer Power Solutions Inc. | 10,511 | 109 |
| * | Lightpath Technologies Inc. Class A | 75,800 | 102 |
| * | Micronet Enertec Technologies Inc. | 19,850 | 101 |
| *,^ | Spherix Inc. | 12,243 | 99 |
| * | Nortech Systems Inc. | 17,942 | 99 |
| SmartPros Ltd. | 36,726 | 90 | |
| Ecology and Environment Inc. | 7,800 | 87 | |
| * | ENGlobal Corp. | 59,639 | 83 |
| * | Management Network Group Inc. | 29,028 | 80 |
| * | BTU International Inc. | 26,703 | 78 |
| * | Coast Distribution System Inc. | 22,532 | 73 |
| * | Vicon Industries Inc. | 22,460 | 69 |
| * | Advanced Photonix Inc. Class A | 94,400 | 66 |
| *,^ | Liquid Holdings Group Inc. | 8,835 | 61 |
| * | Integrated Electrical Services Inc. | 10,915 | 59 |
| * | Willdan Group Inc. | 10,900 | 59 |
| * | Image Sensing Systems Inc. | 11,600 | 57 |
| *,^ | Lime Energy Co. | 16,821 | 49 |
| * | Taylor Devices Inc. | 5,915 | 48 |
| Air T Inc. | 3,402 | 41 | |
| * | AeroCentury Corp. | 2,172 | 37 |
| * | Sigmatron International Inc. | 3,300 | 29 |
| * | Food Technology Service Inc. | 4,100 | 29 |
| WSI Industries Inc. | 3,999 | 24 | |
| * | Wells-Gardner Electronics Corp. | 13,100 | 24 |
| * | DLH Holdings Corp. | 14,000 | 21 |
| * | Industrial Services of America Inc. | 5,905 | 19 |
| * | General Finance Corp. | 2,701 | 16 |
| MOCON Inc. | 800 | 13 | |
| * | Sevcon Inc. | 1,400 | 9 |
| * | Sutron Corp. | 1,402 | 7 |
| * | Luna Innovations Inc. | 5,000 | 7 |
| * | Electro-Sensors Inc. | 1,100 | 4 |
| Art's-Way Manufacturing Co. Inc. | 600 | 4 | |
| * | LGL Group Inc. | 600 | 3 |
| * | Orbit International Corp. | 900 | 3 |
| * | Command Security Corp. | 1,300 | 3 |
| Servotronics Inc. | 200 | 2 | |
| * | LGL GROUP INC WARRANTS EXP 06/08/2018 | 3,000 | — |
| 41,795,489 | |||
| Oil & Gas (9.2%) | |||
| Exxon Mobil Corp. | 65,315,614 | 6,609,940 | |
| Chevron Corp. | 28,754,174 | 3,591,684 | |
| Schlumberger Ltd. | 19,690,385 | 1,774,301 | |
| ConocoPhillips | 18,317,018 | 1,294,097 | |
| Occidental Petroleum Corp. | 12,051,209 | 1,146,070 | |
45
| Vanguard® Total Stock Market Index Fund | |||
| Schedule of Investments | |||
| December 31, 2013 | |||
| Market | |||
| Value | |||
| Shares | ($000) | ||
| Phillips 66 | 8,962,900 | 691,308 | |
| EOG Resources Inc. | 4,080,936 | 684,944 | |
| Halliburton Co. | 12,046,553 | 611,363 | |
| Anadarko Petroleum Corp. | 7,523,494 | 596,764 | |
| Apache Corp. | 5,968,463 | 512,930 | |
| National Oilwell Varco Inc. | 6,400,763 | 509,053 | |
| Marathon Petroleum Corp. | 4,500,220 | 412,805 | |
| Valero Energy Corp. | 8,068,300 | 406,642 | |
| Williams Cos. Inc. | 10,217,755 | 394,099 | |
| Pioneer Natural Resources Co. | 2,073,020 | 381,581 | |
| Marathon Oil Corp. | 10,414,494 | 367,632 | |
| Baker Hughes Inc. | 6,626,570 | 366,184 | |
| Noble Energy Inc. | 5,371,193 | 365,832 | |
| Kinder Morgan Inc. | 10,066,750 | 362,403 | |
| Devon Energy Corp. | 5,766,616 | 356,781 | |
| Hess Corp. | 4,289,675 | 356,043 | |
| Cabot Oil & Gas Corp. | 6,307,883 | 244,494 | |
| Chesapeake Energy Corp. | 8,950,498 | 242,916 | |
| * | Cameron International Corp. | 3,556,154 | 211,698 |
| * | Southwestern Energy Co. | 5,258,627 | 206,822 |
| Ensco plc Class A | 3,491,641 | 199,652 | |
| Range Resources Corp. | 2,321,254 | 195,705 | |
| * | FMC Technologies Inc. | 3,537,811 | 184,709 |
| EQT Corp. | 2,027,933 | 182,068 | |
| Murphy Oil Corp. | 2,655,692 | 172,301 | |
| * | Concho Resources Inc. | 1,570,655 | 169,631 |
| * | Weatherford International Ltd. | 10,350,421 | 160,328 |
| HollyFrontier Corp. | 2,973,569 | 147,757 | |
| Noble Corp. plc | 3,788,671 | 141,961 | |
| * | Cheniere Energy Inc. | 3,212,513 | 138,524 |
| Core Laboratories NV | 678,652 | 129,589 | |
| Cimarex Energy Co. | 1,232,863 | 129,340 | |
| Helmerich & Payne Inc. | 1,521,723 | 127,946 | |
| Oceaneering International Inc. | 1,617,558 | 127,593 | |
| Tesoro Corp. | 2,008,226 | 117,481 | |
| * | Whiting Petroleum Corp. | 1,773,929 | 109,753 |
| OGE Energy Corp. | 2,966,352 | 100,559 | |
| * | Denbury Resources Inc. | 5,547,057 | 91,138 |
| * | Oil States International Inc. | 824,515 | 83,870 |
| SM Energy Co. | 1,001,328 | 83,220 | |
| QEP Resources Inc. | 2,680,433 | 82,155 | |
| * | Gulfport Energy Corp. | 1,257,127 | 79,388 |
| *,^ | Continental Resources Inc. | 694,172 | 78,108 |
| Energen Corp. | 1,085,796 | 76,820 | |
| Nabors Industries Ltd. | 4,191,850 | 71,220 | |
| * | Cobalt International Energy Inc. | 4,304,226 | 70,804 |
| * | Dresser-Rand Group Inc. | 1,140,478 | 68,007 |
| * | Rowan Cos. plc Class A | 1,857,112 | 65,667 |
| * | Superior Energy Services Inc. | 2,373,284 | 63,153 |
| * | WPX Energy Inc. | 3,001,699 | 61,175 |
| * | First Solar Inc. | 1,114,994 | 60,923 |
| * | Dril-Quip Inc. | 547,477 | 60,184 |
| * | Oasis Petroleum Inc. | 1,279,280 | 60,088 |
| Diamond Offshore Drilling Inc. | 1,039,238 | 59,153 | |
| Patterson-UTI Energy Inc. | 2,080,874 | 52,688 | |
| * | Newfield Exploration Co. | 2,034,205 | 50,102 |
| Targa Resources Corp. | 566,441 | 49,943 | |
| * | Atwood Oceanics Inc. | 909,660 | 48,567 |
| *,^ | Ultra Petroleum Corp. | 2,160,004 | 46,764 |
| * | MRC Global Inc. | 1,436,689 | 46,348 |
| * | Kodiak Oil & Gas Corp. | 3,949,816 | 44,277 |
| * | Rosetta Resources Inc. | 915,482 | 43,980 |
| Tidewater Inc. | 740,867 | 43,911 | |
| * | Chart Industries Inc. | 453,925 | 43,413 |
46
| Vanguard® Total Stock Market Index Fund | |||
| Schedule of Investments | |||
| December 31, 2013 | |||
| Market | |||
| Value | |||
| Shares | ($000) | ||
| *,^ | SandRidge Energy Inc. | 6,961,199 | 42,254 |
| SemGroup Corp. Class A | 634,321 | 41,377 | |
| Bristow Group Inc. | 526,054 | 39,486 | |
| * | Unit Corp. | 728,322 | 37,596 |
| * | Antero Resources Corp. | 584,904 | 37,106 |
| * | Helix Energy Solutions Group Inc. | 1,487,986 | 34,491 |
| CARBO Ceramics Inc. | 295,569 | 34,443 | |
| ^ | Western Refining Inc. | 783,002 | 33,207 |
| * | McDermott International Inc. | 3,514,108 | 32,189 |
| * | Exterran Holdings Inc. | 885,561 | 30,286 |
| Energy XXI Bermuda Ltd. | 1,094,573 | 29,619 | |
| * | PDC Energy Inc. | 529,572 | 28,184 |
| * | Laredo Petroleum Holdings Inc. | 1,010,197 | 27,972 |
| * | Carrizo Oil & Gas Inc. | 605,147 | 27,092 |
| * | SEACOR Holdings Inc. | 285,646 | 26,051 |
| * | Stone Energy Corp. | 703,889 | 24,347 |
| * | Hornbeck Offshore Services Inc. | 480,129 | 23,637 |
| * | Diamondback Energy Inc. | 416,996 | 22,042 |
| Crosstex Energy Inc. | 601,014 | 21,733 | |
| * | Forum Energy Technologies Inc. | 752,511 | 21,266 |
| Delek US Holdings Inc. | 577,755 | 19,881 | |
| * | Bonanza Creek Energy Inc. | 444,469 | 19,321 |
| *,^ | SunPower Corp. Class A | 630,311 | 18,790 |
| * | Bill Barrett Corp. | 694,544 | 18,600 |
| PBF Energy Inc. Class A | 583,545 | 18,358 | |
| * | Geospace Technologies Corp. | 190,881 | 18,101 |
| RPC Inc. | 972,973 | 17,368 | |
| Gulfmark Offshore Inc. | 360,999 | 17,014 | |
| * | Magnum Hunter Resources Corp. | 2,286,814 | 16,717 |
| * | GT Advanced Technologies Inc. | 1,863,813 | 16,252 |
| * | Key Energy Services Inc. | 1,984,706 | 15,679 |
| * | EPL Oil & Gas Inc. | 546,169 | 15,566 |
| * | C&J Energy Services Inc. | 666,337 | 15,392 |
| * | Newpark Resources Inc. | 1,226,990 | 15,080 |
| * | Matador Resources Co. | 762,251 | 14,208 |
| * | Rex Energy Corp. | 710,949 | 14,013 |
| * | Sanchez Energy Corp. | 562,911 | 13,797 |
| * | TETRA Technologies Inc. | 1,106,789 | 13,680 |
| * | Flotek Industries Inc. | 681,077 | 13,669 |
| * | Parker Drilling Co. | 1,672,040 | 13,594 |
| * | Northern Oil and Gas Inc. | 872,775 | 13,153 |
| *,^ | Halcon Resources Corp. | 3,333,581 | 12,868 |
| * | Hercules Offshore Inc. | 1,969,237 | 12,859 |
| Comstock Resources Inc. | 637,142 | 11,653 | |
| CVR Energy Inc. | 267,236 | 11,606 | |
| * | Contango Oil & Gas Co. | 228,793 | 10,813 |
| * | Approach Resources Inc. | 513,573 | 9,907 |
| * | Resolute Energy Corp. | 1,022,873 | 9,237 |
| * | Tesco Corp. | 464,770 | 9,193 |
| * | Basic Energy Services Inc. | 581,306 | 9,173 |
| * | Penn Virginia Corp. | 969,742 | 9,145 |
| * | Matrix Service Co. | 358,307 | 8,768 |
| * | Goodrich Petroleum Corp. | 502,311 | 8,549 |
| W&T Offshore Inc. | 519,687 | 8,315 | |
| *,^ | Swift Energy Co. | 595,031 | 8,033 |
| Pattern Energy Group Inc. | 263,926 | 8,000 | |
| * | Triangle Petroleum Corp. | 935,222 | 7,781 |
| * | PHI Inc. –Non-Voting | 171,216 | 7,431 |
| ^ | EXCO Resources Inc. | 1,395,201 | 7,408 |
| * | Clayton Williams Energy Inc. | 89,396 | 7,326 |
| * | Pioneer Energy Services Corp. | 912,257 | 7,307 |
| * | Athlon Energy Inc. | 238,840 | 7,225 |
| Green Plains Renewable Energy Inc. | 372,454 | 7,222 | |
| * | TherapeuticsMD Inc. | 1,290,726 | 6,725 |
47
| Vanguard® Total Stock Market Index Fund | |||
| Schedule of Investments | |||
| December 31, 2013 | |||
| Market | |||
| Value | |||
| Shares | ($000) | ||
| * | Forest Oil Corp. | 1,762,939 | 6,364 |
| *,^ | Solazyme Inc. | 543,947 | 5,924 |
| * | Gastar Exploration Inc. | 840,340 | 5,815 |
| * | ION Geophysical Corp. | 1,737,024 | 5,732 |
| *,^ | Quicksilver Resources Inc. | 1,817,190 | 5,579 |
| * | Willbros Group Inc. | 586,112 | 5,521 |
| * | Emerald Oil Inc. | 717,331 | 5,495 |
| Alon USA Energy Inc. | 328,070 | 5,426 | |
| * | Vaalco Energy Inc. | 768,970 | 5,298 |
| * | REX American Resources Corp. | 107,907 | 4,824 |
| * | Vantage Drilling Co. | 2,551,541 | 4,695 |
| * | Natural Gas Services Group Inc. | 167,249 | 4,611 |
| * | Renewable Energy Group Inc. | 391,957 | 4,492 |
| Gulf Island Fabrication Inc. | 187,539 | 4,355 | |
| * | Abraxas Petroleum Corp. | 1,247,423 | 4,092 |
| * | Callon Petroleum Co. | 586,084 | 3,827 |
| * | Dawson Geophysical Co. | 109,392 | 3,700 |
| Bolt Technology Corp. | 159,407 | 3,509 | |
| Panhandle Oil and Gas Inc. Class A | 103,237 | 3,449 | |
| * | PetroQuest Energy Inc. | 786,176 | 3,396 |
| * | Arabian American Development Co. | 253,398 | 3,180 |
| * | Warren Resources Inc. | 978,379 | 3,072 |
| * | Mitcham Industries Inc. | 170,436 | 3,018 |
| *,^ | FuelCell Energy Inc. | 2,132,747 | 3,007 |
| *,^ | Midstates Petroleum Co. Inc. | 446,852 | 2,958 |
| * | Endeavour International Corp. | 561,914 | 2,950 |
| *,^ | Miller Energy Resources Inc. | 418,130 | 2,944 |
| *,^ | Amyris Inc. | 523,198 | 2,768 |
| *,^ | Cal Dive International Inc. | 1,289,316 | 2,591 |
| * | FX Energy Inc. | 698,652 | 2,557 |
| * | Ring Energy Inc. | 204,166 | 2,491 |
| Evolution Petroleum Corp. | 199,069 | 2,456 | |
| * | Harvest Natural Resources Inc. | 542,099 | 2,450 |
| * | Jones Energy Inc. | 163,612 | 2,369 |
| * | BPZ Resources Inc. | 1,292,236 | 2,352 |
| Adams Resources & Energy Inc. | 26,200 | 1,795 | |
| * | Isramco Inc. | 12,720 | 1,616 |
| * | TGC Industries Inc. | 208,907 | 1,525 |
| *,^ | CAMAC Energy Inc. | 1,014,640 | 1,502 |
| *,^ | Enphase Energy Inc. | 201,702 | 1,279 |
| * | US Energy Corp. Wyoming | 321,367 | 1,208 |
| *,^ | Hyperdynamics Corp. | 290,900 | 1,184 |
| *,^ | Real Goods Solar Inc. Class A | 376,123 | 1,136 |
| *,^ | Gevo Inc. | 713,425 | 1,020 |
| * | Pacific Ethanol Inc. | 152,265 | 775 |
| *,^ | KiOR Inc. | 404,308 | 679 |
| * | STR Holdings Inc. | 375,064 | 589 |
| * | Forbes Energy Services Ltd. | 167,990 | 549 |
| * | Double Eagle Petroleum Co. | 215,701 | 503 |
| *,^ | ZaZa Energy Corp. | 496,916 | 475 |
| * | Global Geophysical Services Inc. | 292,618 | 471 |
| * | Syntroleum Corp. | 125,828 | 425 |
| *,^ | Zion Oil & Gas Inc. | 262,097 | 370 |
| *,^ | EXCO Resources Inc. Rights Exp. 01/09/2014 | 1,855,564 | 297 |
| * | Magellan Petroleum Corp. | 222,449 | 231 |
| * | Saratoga Resources Inc. | 201,263 | 229 |
| *,^ | Ascent Solar Technologies Inc. | 320,367 | 226 |
| *,^ | Royale Energy Inc. | 79,998 | 206 |
| * | PrimeEnergy Corp. | 3,540 | 166 |
| * | Ocean Power Technologies Inc. | 79,149 | 152 |
| * | Earthstone Energy Inc. | 6,637 | 122 |
| * | PostRock Energy Corp. | 96,588 | 112 |
| * | GreenHunter Resources Inc. | 89,492 | 104 |
| * | FieldPoint Petroleum Corp. | 22,892 | 94 |
48
| Vanguard® Total Stock Market Index Fund | |||
| Schedule of Investments | |||
| December 31, 2013 | |||
| Market | |||
| Value | |||
| Shares | ($000) | ||
| *,^ | Lucas Energy Inc. | 75,875 | 73 |
| * | PHI Inc. -Voting | 1,400 | 56 |
| * | SAExploration Holdings Inc. | 6,200 | 55 |
| * | Houston American Energy Corp. | 221,330 | 55 |
| * | Lilis Energy Inc. | 19,200 | 44 |
| *,^ | Pedevco Corp. | 20,446 | 44 |
| * | Barnwell Industries Inc. | 5,973 | 18 |
| * | MagneGas Corp. | 18,100 | 8 |
| * | BioFuel Energy Corp. | 3,000 | 5 |
| * | Mexco Energy Corp. | 600 | 4 |
| * | Pyramid Oil Co. | 600 | 3 |
| * | Tengasco Inc. | 4,100 | 2 |
| 28,234,178 | |||
| Other (0.0%) | |||
| * | Adolor Corp. Rights Exp. 07/01/2019 | 592,629 | 308 |
| * | Omthera Pharmaceuticals Inc. CVR | 121,311 | 73 |
| *,^ | Cubist Pharmaceuticals, Inc. CVR | 511,822 | 67 |
| * | Southern Community Financial Corp | 197,337 | 43 |
| 491 | |||
| Technology (14.9%) | |||
| Apple Inc. | 13,452,375 | 7,548,262 | |
| * | Google Inc. Class A | 4,137,406 | 4,636,832 |
| Microsoft Corp. | 112,332,767 | 4,204,615 | |
| International Business Machines Corp. | 16,235,143 | 3,045,226 | |
| Oracle Corp. | 51,105,408 | 1,955,293 | |
| Intel Corp. | 74,323,592 | 1,929,440 | |
| QUALCOMM Inc. | 25,259,525 | 1,875,520 | |
| Cisco Systems Inc. | 79,939,775 | 1,794,648 | |
| * | Facebook Inc. Class A | 28,018,403 | 1,531,486 |
| Hewlett-Packard Co. | 28,745,915 | 804,311 | |
| EMC Corp. | 30,767,784 | 773,810 | |
| Texas Instruments Inc. | 16,365,347 | 718,602 | |
| * | Yahoo! Inc. | 13,665,642 | 552,639 |
| * | Cognizant Technology Solutions Corp. Class A | 4,522,423 | 456,674 |
| * | Salesforce.com Inc. | 8,113,140 | 447,764 |
| * | Adobe Systems Inc. | 7,100,672 | 425,188 |
| Corning Inc. | 21,733,289 | 387,287 | |
| * | Micron Technology Inc. | 15,725,018 | 342,176 |
| Applied Materials Inc. | 18,001,801 | 318,452 | |
| Intuit Inc. | 4,046,341 | 308,817 | |
| Western Digital Corp. | 3,356,701 | 281,627 | |
| Seagate Technology plc | 4,632,002 | 260,133 | |
| * | Cerner Corp. | 4,618,785 | 257,451 |
| Symantec Corp. | 10,406,037 | 245,374 | |
| SanDisk Corp. | 3,377,074 | 238,219 | |
| Analog Devices Inc. | 4,649,852 | 236,817 | |
| Motorola Solutions Inc. | 3,480,991 | 234,967 | |
| Broadcom Corp. Class A | 7,743,978 | 229,609 | |
| NetApp Inc. | 5,094,427 | 209,585 | |
| Xilinx Inc. | 4,011,452 | 184,206 | |
| * | Citrix Systems Inc. | 2,788,024 | 176,343 |
| * | Autodesk Inc. | 3,372,841 | 169,755 |
| Avago Technologies Ltd. Class A | 3,144,180 | 166,296 | |
| * | Juniper Networks Inc. | 7,164,455 | 161,702 |
| KLA-Tencor Corp. | 2,491,579 | 160,607 | |
| CA Inc. | 4,745,480 | 159,685 | |
| Linear Technology Corp. | 3,499,347 | 159,395 | |
| * | Red Hat Inc. | 2,832,658 | 158,742 |
| Altera Corp. | 4,801,142 | 156,181 | |
49
| Vanguard® Total Stock Market Index Fund | |||
| Schedule of Investments | |||
| December 31, 2013 | |||
| Market | |||
| Value | |||
| Shares | ($000) | ||
| * | Catamaran Corp. | 3,084,121 | 146,434 |
| *,^ | 3D Systems Corp. | 1,459,834 | 135,662 |
| * | Lam Research Corp. | 2,425,610 | 132,074 |
| * | Equinix Inc. | 744,043 | 132,030 |
| NVIDIA Corp. | 8,172,756 | 130,928 | |
| Microchip Technology Inc. | 2,817,495 | 126,083 | |
| Computer Sciences Corp. | 2,196,447 | 122,737 | |
| * | VeriSign Inc. | 2,049,019 | 122,490 |
| * | ANSYS Inc. | 1,377,897 | 120,153 |
| * | Akamai Technologies Inc. | 2,540,502 | 119,861 |
| Maxim Integrated Products Inc. | 4,252,092 | 118,676 | |
| * | VMware Inc. Class A | 1,267,009 | 113,663 |
| * | Cree Inc. | 1,803,508 | 112,845 |
| Harris Corp. | 1,597,793 | 111,542 | |
| * | Teradata Corp. | 2,442,254 | 111,098 |
| * | F5 Networks Inc. | 1,164,150 | 105,775 |
| * | ServiceNow Inc. | 1,763,062 | 98,749 |
| * | Workday Inc. Class A | 1,170,724 | 97,357 |
| * | Gartner Inc. | 1,316,522 | 93,539 |
| * | Synopsys Inc. | 2,305,413 | 93,531 |
| LSI Corp. | 8,134,582 | 89,643 | |
| * | NCR Corp. | 2,487,067 | 84,710 |
| Marvell Technology Group Ltd. | 5,883,899 | 84,610 | |
| ^ | Garmin Ltd. | 1,751,306 | 80,945 |
| * | Skyworks Solutions Inc. | 2,815,675 | 80,416 |
| IAC/InterActiveCorp | 1,158,175 | 79,555 | |
| *,^ | Twitter Inc. | 1,221,370 | 77,740 |
| * | Splunk Inc. | 1,107,294 | 76,038 |
| * | athenahealth Inc. | 556,034 | 74,787 |
| Solera Holdings Inc. | 1,029,411 | 72,841 | |
| Pitney Bowes Inc. | 3,019,401 | 70,352 | |
| * | Concur Technologies Inc. | 670,321 | 69,164 |
| * | Informatica Corp. | 1,621,731 | 67,302 |
| * | MICROS Systems Inc. | 1,145,523 | 65,719 |
| * | Rackspace Hosting Inc. | 1,670,816 | 65,379 |
| * | PTC Inc. | 1,785,532 | 63,190 |
| * | Ultimate Software Group Inc. | 396,569 | 60,762 |
| * | Cadence Design Systems Inc. | 4,301,657 | 60,309 |
| ^ | Leidos Holdings Inc. | 1,276,039 | 59,323 |
| * | Brocade Communications Systems Inc. | 6,651,001 | 58,994 |
| * | Aspen Technology Inc. | 1,387,165 | 57,983 |
| * | Nuance Communications Inc. | 3,745,499 | 56,932 |
| * | ON Semiconductor Corp. | 6,688,735 | 55,115 |
| * | Ingram Micro Inc. | 2,270,648 | 53,269 |
| * | TIBCO Software Inc. | 2,314,787 | 52,036 |
| * | NetSuite Inc. | 499,782 | 51,488 |
| * | AOL Inc. | 1,091,991 | 50,909 |
| * | Teradyne Inc. | 2,863,160 | 50,449 |
| * | CommVault Systems Inc. | 670,612 | 50,215 |
| * | SunEdison Inc. | 3,766,347 | 49,151 |
| * | Atmel Corp. | 6,017,089 | 47,114 |
| * | Tyler Technologies Inc. | 452,020 | 46,165 |
| * | Medidata Solutions Inc. | 759,482 | 46,002 |
| * | JDS Uniphase Corp. | 3,530,491 | 45,826 |
| * | SS&C Technologies Holdings Inc. | 1,031,198 | 45,641 |
| * | Guidewire Software Inc. | 899,436 | 44,135 |
| * | VeriFone Systems Inc. | 1,632,443 | 43,782 |
| * | Palo Alto Networks Inc. | 754,803 | 43,379 |
| DST Systems Inc. | 466,531 | 42,333 | |
| * | Riverbed Technology Inc. | 2,309,766 | 41,761 |
| Mentor Graphics Corp. | 1,683,419 | 40,520 | |
| * | ARRIS Group Inc. | 1,653,557 | 40,289 |
| * | Fortinet Inc. | 2,066,231 | 39,527 |
| * | Allscripts Healthcare Solutions Inc. | 2,532,714 | 39,156 |
50
| Vanguard® Total Stock Market Index Fund | |||
| Schedule of Investments | |||
| December 31, 2013 | |||
| Market | |||
| Value | |||
| Shares | ($000) | ||
| * | ACI Worldwide Inc. | 586,309 | 38,110 |
| * | ViaSat Inc. | 606,269 | 37,983 |
| * | Ciena Corp. | 1,528,228 | 36,570 |
| * | SolarWinds Inc. | 947,620 | 35,848 |
| *,^ | Advanced Micro Devices Inc. | 9,185,080 | 35,546 |
| * | Microsemi Corp. | 1,380,776 | 34,450 |
| * | Verint Systems Inc. | 798,677 | 34,295 |
| * | Finisar Corp. | 1,430,060 | 34,207 |
| Lexmark International Inc. Class A | 962,167 | 34,176 | |
| Compuware Corp. | 3,047,541 | 34,163 | |
| * | Manhattan Associates Inc. | 285,993 | 33,598 |
| Fair Isaac Corp. | 520,419 | 32,703 | |
| j2 Global Inc. | 650,648 | 32,539 | |
| * | Dealertrack Technologies Inc. | 655,621 | 31,522 |
| * | EchoStar Corp. Class A | 625,929 | 31,121 |
| * | Cornerstone OnDemand Inc. | 582,266 | 31,058 |
| * | Qlik Technologies Inc. | 1,160,577 | 30,906 |
| Plantronics Inc. | 651,927 | 30,282 | |
| * | Rovi Corp. | 1,534,403 | 30,212 |
| * | Sapient Corp. | 1,714,171 | 29,758 |
| Diebold Inc. | 897,513 | 29,627 | |
| * | Aruba Networks Inc. | 1,624,999 | 29,087 |
| * | Polycom Inc. | 2,545,340 | 28,584 |
| * | Tech Data Corp. | 550,181 | 28,389 |
| * | International Rectifier Corp. | 1,049,586 | 27,363 |
| * | Electronics For Imaging Inc. | 688,575 | 26,669 |
| * | Demandware Inc. | 413,515 | 26,515 |
| * | SYNNEX Corp. | 388,427 | 26,180 |
| * | Semtech Corp. | 1,025,126 | 25,915 |
| * | Synaptics Inc. | 496,998 | 25,749 |
| * | CACI International Inc. Class A | 349,717 | 25,606 |
| Cogent Communications Group Inc. | 631,433 | 25,516 | |
| Blackbaud Inc. | 675,641 | 25,438 | |
| * | Cavium Inc. | 737,068 | 25,436 |
| * | Fairchild Semiconductor International Inc. Class A | 1,897,851 | 25,336 |
| * | Hittite Microwave Corp. | 407,085 | 25,129 |
| * | Silicon Laboratories Inc. | 571,487 | 24,751 |
| Science Applications International Corp. | 723,129 | 23,914 | |
| * | Entegris Inc. | 2,045,608 | 23,729 |
| Advent Software Inc. | 676,801 | 23,681 | |
| MKS Instruments Inc. | 784,069 | 23,475 | |
| * | Infoblox Inc. | 708,303 | 23,388 |
| Power Integrations Inc. | 415,723 | 23,206 | |
| ADTRAN Inc. | 849,786 | 22,953 | |
| * | Unisys Corp. | 655,211 | 21,995 |
| Intersil Corp. Class A | 1,910,323 | 21,911 | |
| * | Syntel Inc. | 240,336 | 21,859 |
| * | Web.com Group Inc. | 684,618 | 21,764 |
| * | FleetMatics Group plc | 500,367 | 21,641 |
| Cypress Semiconductor Corp. | 2,029,683 | 21,312 | |
| NIC Inc. | 856,847 | 21,310 | |
| * | Integrated Device Technology Inc. | 2,058,633 | 20,977 |
| * | Ubiquiti Networks Inc. | 455,714 | 20,945 |
| * | RF Micro Devices Inc. | 3,985,950 | 20,568 |
| * | Progress Software Corp. | 761,021 | 19,657 |
| * | TriQuint Semiconductor Inc. | 2,343,723 | 19,547 |
| * | Bottomline Technologies de Inc. | 538,589 | 19,475 |
| * | Cirrus Logic Inc. | 940,459 | 19,214 |
| * | iGATE Corp. | 472,579 | 18,979 |
| *,^ | InvenSense Inc. | 913,279 | 18,978 |
| * | NETGEAR Inc. | 573,662 | 18,896 |
| * | PMC - Sierra Inc. | 2,927,984 | 18,827 |
| InterDigital Inc. | 608,387 | 17,941 | |
| * | Responsys Inc. | 648,856 | 17,785 |
51
| Vanguard® Total Stock Market Index Fund | |||
| Schedule of Investments | |||
| December 31, 2013 | |||
| Market | |||
| Value | |||
| Shares | ($000) | ||
| * | ScanSource Inc. | 412,155 | 17,488 |
| * | Tableau Software Inc. Class A | 253,063 | 17,444 |
| * | Monolithic Power Systems Inc. | 501,002 | 17,365 |
| Monotype Imaging Holdings Inc. | 543,040 | 17,301 | |
| * | RealPage Inc. | 733,891 | 17,158 |
| * | MedAssets Inc. | 861,313 | 17,080 |
| * | Premier Inc. Class A | 462,086 | 16,986 |
| * | MicroStrategy Inc. Class A | 134,172 | 16,670 |
| * | Envestnet Inc. | 404,049 | 16,283 |
| * | Infinera Corp. | 1,661,479 | 16,249 |
| * | Blucora Inc. | 547,832 | 15,975 |
| * | SPS Commerce Inc. | 244,243 | 15,949 |
| * | Interactive Intelligence Group Inc. | 236,021 | 15,898 |
| * | Cray Inc. | 566,670 | 15,561 |
| * | Netscout Systems Inc. | 517,349 | 15,308 |
| * | QLogic Corp. | 1,292,241 | 15,287 |
| * | Freescale Semiconductor Ltd. | 951,666 | 15,274 |
| * | Insight Enterprises Inc. | 664,186 | 15,084 |
| * | Cabot Microelectronics Corp. | 328,906 | 15,031 |
| * | Rambus Inc. | 1,582,597 | 14,987 |
| CDW Corp. | 635,809 | 14,853 | |
| Tessera Technologies Inc. | 750,120 | 14,785 | |
| * | Loral Space & Communications Inc. | 182,537 | 14,782 |
| * | Kulicke & Soffa Industries Inc. | 1,109,760 | 14,760 |
| * | Applied Micro Circuits Corp. | 1,069,325 | 14,308 |
| Quality Systems Inc. | 674,675 | 14,209 | |
| * | EPAM Systems Inc. | 406,227 | 14,194 |
| * | OmniVision Technologies Inc. | 824,341 | 14,179 |
| * | Synchronoss Technologies Inc. | 453,063 | 14,077 |
| * | PROS Holdings Inc. | 351,133 | 14,010 |
| CSG Systems International Inc. | 470,242 | 13,825 | |
| * | Virtusa Corp. | 351,568 | 13,391 |
| * | ATMI Inc. | 441,649 | 13,342 |
| * | CalAmp Corp. | 475,848 | 13,309 |
| * | Shutterstock Inc. | 158,922 | 13,291 |
| * | Dycom Industries Inc. | 470,710 | 13,081 |
| * | Sonus Networks Inc. | 4,138,595 | 13,037 |
| * | Advanced Energy Industries Inc. | 554,937 | 12,686 |
| * | Comverse Inc. | 326,058 | 12,651 |
| Pegasystems Inc. | 251,667 | 12,377 | |
| * | Diodes Inc. | 511,031 | 12,040 |
| * | Ixia | 904,217 | 12,035 |
| * | Harmonic Inc. | 1,599,675 | 11,806 |
| *,^ | VirnetX Holding Corp. | 605,670 | 11,756 |
| * | Amkor Technology Inc. | 1,900,731 | 11,651 |
| * | Spansion Inc. Class A | 835,759 | 11,609 |
| * | LogMeIn Inc. | 341,102 | 11,444 |
| *,^ | Fusion-io Inc. | 1,275,041 | 11,361 |
| * | Proofpoint Inc. | 341,984 | 11,344 |
| * | Ultratech Inc. | 387,105 | 11,226 |
| * | CommScope Holding Co. Inc. | 579,031 | 10,955 |
| * | Perficient Inc. | 465,639 | 10,905 |
| * | RigNet Inc. | 221,638 | 10,623 |
| * | Ruckus Wireless Inc. | 746,987 | 10,607 |
| * | Ellie Mae Inc. | 390,820 | 10,501 |
| * | LivePerson Inc. | 705,825 | 10,460 |
| * | BroadSoft Inc. | 379,100 | 10,365 |
| * | ICG Group Inc. | 518,869 | 9,667 |
| West Corp. | 375,736 | 9,660 | |
| Brooks Automation Inc. | 920,519 | 9,656 | |
| Computer Programs & Systems Inc. | 152,662 | 9,436 | |
| * | Lattice Semiconductor Corp. | 1,703,237 | 9,385 |
| * | IntraLinks Holdings Inc. | 773,757 | 9,370 |
| * | Emulex Corp. | 1,276,706 | 9,141 |
52
| Vanguard® Total Stock Market Index Fund | |||
| Schedule of Investments | |||
| December 31, 2013 | |||
| Market | |||
| Value | |||
| Shares | ($000) | ||
| * | Tangoe Inc. | 503,708 | 9,072 |
| * | Digital River Inc. | 486,572 | 9,002 |
| * | FireEye Inc. | 206,405 | 9,001 |
| * | PDF Solutions Inc. | 336,256 | 8,615 |
| * | Extreme Networks Inc. | 1,229,104 | 8,604 |
| * | Exar Corp. | 696,477 | 8,211 |
| * | Photronics Inc. | 900,075 | 8,128 |
| * | Super Micro Computer Inc. | 469,821 | 8,062 |
| Comtech Telecommunications Corp. | 255,720 | 8,060 | |
| * | SciQuest Inc. | 273,863 | 7,800 |
| Forrester Research Inc. | 203,731 | 7,795 | |
| ^ | Ebix Inc. | 528,548 | 7,780 |
| *,^ | Textura Corp. | 256,225 | 7,671 |
| * | Accelrys Inc. | 803,834 | 7,669 |
| * | Premiere Global Services Inc. | 642,567 | 7,447 |
| * | Callidus Software Inc. | 531,426 | 7,296 |
| Epiq Systems Inc. | 447,877 | 7,260 | |
| * | ShoreTel Inc. | 765,171 | 7,101 |
| * | ChannelAdvisor Corp. | 167,518 | 6,987 |
| * | Silicon Image Inc. | 1,130,651 | 6,954 |
| Micrel Inc. | 682,886 | 6,740 | |
| * | Silicon Graphics International Corp. | 495,627 | 6,646 |
| *,^ | Veeva Systems Inc. Class A | 193,813 | 6,221 |
| PC Connection Inc. | 249,217 | 6,193 | |
| * | Marketo Inc. | 167,061 | 6,193 |
| * | Nanometrics Inc. | 325,084 | 6,193 |
| * | Cvent Inc. | 168,689 | 6,139 |
| * | Entropic Communications Inc. | 1,265,358 | 5,960 |
| *,^ | Parkervision Inc. | 1,292,237 | 5,880 |
| * | Jive Software Inc. | 500,217 | 5,627 |
| * | Brightcove Inc. | 395,918 | 5,598 |
| * | Seachange International Inc. | 457,753 | 5,566 |
| * | Qualys Inc. | 236,235 | 5,459 |
| * | Internap Network Services Corp. | 725,433 | 5,455 |
| * | LTX-Credence Corp. | 679,163 | 5,427 |
| * | Benefitfocus Inc. | 90,663 | 5,235 |
| * | Rudolph Technologies Inc. | 443,908 | 5,211 |
| * | Calix Inc. | 530,617 | 5,115 |
| * | Mercury Systems Inc. | 465,251 | 5,095 |
| * | Gigamon Inc. | 181,090 | 5,085 |
| * | Actuate Corp. | 657,654 | 5,071 |
| Inteliquent Inc. | 440,916 | 5,035 | |
| * | E2open Inc. | 208,585 | 4,987 |
| * | Oplink Communications Inc. | 267,522 | 4,976 |
| * | KEYW Holding Corp. | 368,642 | 4,955 |
| * | Integrated Silicon Solution Inc. | 409,751 | 4,954 |
| * | Ceva Inc. | 318,529 | 4,848 |
| * | FormFactor Inc. | 776,504 | 4,675 |
| * | VOXX International Corp. Class A | 278,841 | 4,657 |
| IXYS Corp. | 351,465 | 4,559 | |
| * | Vocera Communications Inc. | 287,538 | 4,488 |
| * | Digi International Inc. | 364,717 | 4,420 |
| * | Procera Networks Inc. | 281,744 | 4,232 |
| * | Pendrell Corp. | 2,088,310 | 4,198 |
| * | Endurance International Group Holdings Inc. | 282,934 | 4,012 |
| * | Agilysys Inc. | 287,756 | 4,006 |
| * | PLX Technology Inc. | 605,811 | 3,986 |
| * | ePlus Inc. | 69,755 | 3,965 |
| * | Immersion Corp. | 381,266 | 3,958 |
| * | Quantum Corp. | 3,277,332 | 3,933 |
| * | CIBER Inc. | 945,460 | 3,914 |
| * | Supertex Inc. | 153,227 | 3,838 |
| Computer Task Group Inc. | 202,289 | 3,823 | |
| * | Kopin Corp. | 901,309 | 3,804 |
53
| Vanguard® Total Stock Market Index Fund | |||
| Schedule of Investments | |||
| December 31, 2013 | |||
| Market | |||
| Value | |||
| Shares | ($000) | ||
| * | Rally Software Development Corp. | 194,721 | 3,787 |
| * | Axcelis Technologies Inc. | 1,541,173 | 3,760 |
| * | Zix Corp. | 822,192 | 3,749 |
| * | Ultra Clean Holdings Inc. | 371,529 | 3,726 |
| * | MaxLinear Inc. | 338,695 | 3,533 |
| *,^ | Millennial Media Inc. | 476,735 | 3,466 |
| American Software Inc. Class A | 349,984 | 3,454 | |
| Cohu Inc. | 327,756 | 3,441 | |
| * | Inphi Corp. | 263,862 | 3,404 |
| * | support.com Inc. | 881,047 | 3,339 |
| * | VASCO Data Security International Inc. | 425,707 | 3,291 |
| *,^ | Vringo Inc. | 1,073,836 | 3,179 |
| Tessco Technologies Inc. | 78,385 | 3,160 | |
| * | Datalink Corp. | 286,145 | 3,119 |
| * | MoSys Inc. | 564,406 | 3,116 |
| * | Vocus Inc. | 273,272 | 3,113 |
| * | KVH Industries Inc. | 238,592 | 3,109 |
| *,^ | QuickLogic Corp. | 774,435 | 3,059 |
| * | DSP Group Inc. | 312,429 | 3,034 |
| * | Gogo Inc. | 122,265 | 3,033 |
| *,^ | Mitel Networks Corp. | 297,757 | 3,004 |
| Preformed Line Products Co. | 40,937 | 2,995 | |
| * | Oclaro Inc. | 1,154,350 | 2,874 |
| * | Rosetta Stone Inc. | 223,882 | 2,736 |
| Alliance Fiber Optic Products Inc. | 179,236 | 2,698 | |
| * | Pericom Semiconductor Corp. | 303,719 | 2,691 |
| * | Westell Technologies Inc. Class A | 654,403 | 2,650 |
| * | Dot Hill Systems Corp. | 786,021 | 2,649 |
| * | Clearfield Inc. | 130,365 | 2,639 |
| United Online Inc. | 190,124 | 2,616 | |
| * | Guidance Software Inc. | 254,765 | 2,573 |
| * | Imation Corp. | 520,133 | 2,434 |
| Transact Technologies Inc. | 187,361 | 2,348 | |
| Hackett Group Inc. | 371,640 | 2,308 | |
| PC-Tel Inc. | 235,047 | 2,249 | |
| * | Numerex Corp. Class A | 169,515 | 2,195 |
| * | Peregrine Semiconductor Corp. | 295,740 | 2,191 |
| * | Mattson Technology Inc. | 793,379 | 2,174 |
| * | Merge Healthcare Inc. | 927,832 | 2,153 |
| *,^ | Mitek Systems Inc. | 360,504 | 2,141 |
| * | Vitesse Semiconductor Corp. | 726,720 | 2,122 |
| * | Systemax Inc. | 188,321 | 2,119 |
| * | Sigma Designs Inc. | 448,113 | 2,115 |
| * | Alpha & Omega Semiconductor Ltd. | 273,834 | 2,111 |
| * | Carbonite Inc. | 178,438 | 2,111 |
| * | Telenav Inc. | 317,182 | 2,090 |
| * | ANADIGICS Inc. | 1,131,469 | 2,082 |
| * | Boingo Wireless Inc. | 309,860 | 1,986 |
| * | Qumu Corp. | 152,829 | 1,956 |
| * | Exa Corp. | 145,798 | 1,933 |
| * | Zhone Technologies Inc. | 355,289 | 1,897 |
| * | Aviat Networks Inc. | 834,379 | 1,886 |
| * | Icad Inc. | 161,155 | 1,879 |
| Digimarc Corp. | 92,587 | 1,783 | |
| * | Unwired Planet Inc. | 1,278,235 | 1,764 |
| * | Emcore Corp. | 342,104 | 1,752 |
| * | Limelight Networks Inc. | 869,610 | 1,722 |
| * | NeoPhotonics Corp. | 239,829 | 1,693 |
| * | GSI Technology Inc. | 248,745 | 1,652 |
| * | Datawatch Corp. | 46,941 | 1,596 |
| * | Dynamics Research Corp. | 138,332 | 1,588 |
| * | Key Tronic Corp. | 142,810 | 1,574 |
| * | TeleCommunication Systems Inc. Class A | 675,338 | 1,567 |
| * | Model N Inc. | 130,447 | 1,538 |
54
| Vanguard® Total Stock Market Index Fund | |||
| Schedule of Investments | |||
| December 31, 2013 | |||
| Market | |||
| Value | |||
| Shares | ($000) | ||
| * | Audience Inc. | 128,940 | 1,501 |
| * | eGain Corp. | 142,838 | 1,463 |
| * | Park City Group Inc. | 143,049 | 1,453 |
| Concurrent Computer Corp. | 175,155 | 1,431 | |
| * | Aware Inc. | 224,568 | 1,372 |
| * | InterCloud Systems Inc. | 71,388 | 1,318 |
| * | Ikanos Communications Inc. | 1,072,149 | 1,287 |
| QAD Inc. Class A | 72,664 | 1,283 | |
| * | iPass Inc. | 799,631 | 1,255 |
| Evolving Systems Inc. | 127,521 | 1,242 | |
| * | Streamline Health Solutions Inc. | 175,220 | 1,223 |
| * | ID Systems Inc. | 199,990 | 1,158 |
| * | Meru Networks Inc. | 265,902 | 1,146 |
| * | Marin Software Inc. | 110,500 | 1,132 |
| * | AXT Inc. | 429,847 | 1,122 |
| * | Edgewater Technology Inc. | 156,976 | 1,097 |
| * | Intermolecular Inc. | 220,689 | 1,086 |
| * | Pixelworks Inc. | 216,041 | 1,041 |
| ^ | Acorn Energy Inc. | 251,197 | 1,022 |
| * | Hutchinson Technology Inc. | 312,192 | 999 |
| * | Novatel Wireless Inc. | 410,532 | 973 |
| * | PAR Technology Corp. | 170,216 | 928 |
| * | Cascade Microtech Inc. | 95,431 | 889 |
| *,^ | CVD Equipment Corp. | 60,365 | 877 |
| * | Applied Optoelectronics Inc. | 56,278 | 845 |
| * | Bsquare Corp. | 230,553 | 825 |
| * | Nimble Storage Inc. | 18,138 | 822 |
| *,^ | FAB Universal Corp. | 259,532 | 797 |
| * | Mavenir Systems Inc. | 69,144 | 772 |
| * | Amtech Systems Inc. | 107,331 | 747 |
| * | Innodata Inc. | 294,376 | 721 |
| * | Radisys Corp. | 310,738 | 712 |
| Communications Systems Inc. | 61,654 | 687 | |
| * | NCI Inc. Class A | 101,589 | 673 |
| * | Smith Micro Software Inc. | 441,823 | 654 |
| * | Tremor Video Inc. | 108,045 | 627 |
| * | FalconStor Software Inc. | 454,255 | 613 |
| * | LRAD Corp. | 319,915 | 601 |
| * | ClearOne Inc. | 63,498 | 557 |
| *,^ | Cyan Inc. | 103,914 | 550 |
| * | NetSol Technologies Inc. | 86,477 | 504 |
| * | GigOptix Inc. | 327,467 | 501 |
| * | WidePoint Corp. | 294,971 | 484 |
| * | USA Technologies Inc. | 263,232 | 476 |
| * | Crexendo Inc. | 151,996 | 461 |
| * | Covisint Corp. | 35,301 | 443 |
| * | GSE Systems Inc. | 274,629 | 439 |
| * | Authentidate Holding Corp. | 310,273 | 416 |
| * | RingCentral Inc. Class A | 22,596 | 415 |
| * | Identive Group Inc. | 626,086 | 360 |
| * | Inuvo Inc. | 273,937 | 356 |
| * | Synacor Inc. | 142,428 | 349 |
| *,^ | Superconductor Technologies Inc. | 162,129 | 349 |
| *,^ | MeetMe Inc. | 180,436 | 330 |
| *,^ | Rocket Fuel Inc. | 4,631 | 285 |
| *,^ | Wave Systems Corp. Class A | 307,162 | 280 |
| * | Relm Wireless Corp. | 81,195 | 274 |
| QAD Inc. Class B | 16,312 | 261 | |
| * | RCM Technologies Inc. | 36,276 | 253 |
| * | Lantronix Inc. | 138,633 | 218 |
| *,^ | Violin Memory Inc. | 48,584 | 192 |
| * | BroadVision Inc. | 17,283 | 168 |
| Astro-Med Inc. | 10,500 | 142 | |
| * | Interphase Corp. | 33,224 | 129 |
55
| Vanguard® Total Stock Market Index Fund | |||
| Schedule of Investments | |||
| December 31, 2013 | |||
| Market | |||
| Value | |||
| Shares | ($000) | ||
| * | inTEST Corp. | 33,500 | 127 |
| Globalscape Inc. | 50,973 | 119 | |
| * | Crossroads Systems Inc. | 45,094 | 109 |
| * | Selectica Inc. | 16,769 | 107 |
| Mastech Holdings Inc. | 7,570 | 106 | |
| * | ChyronHego Corp. | 46,550 | 99 |
| * | Sonic Foundry Inc. | 8,740 | 86 |
| * | Xplore Technologies Corp. | 13,550 | 85 |
| * | Overland Storage Inc. | 85,970 | 83 |
| CSP Inc. | 8,002 | 65 | |
| * | Voltari Corp. | 17,579 | 60 |
| * | xG Technology Inc. | 37,235 | 59 |
| * | Intellicheck Mobilisa Inc. | 98,702 | 49 |
| * | Cinedigm Corp. Class A | 24,244 | 49 |
| * | Netlist Inc. | 58,760 | 43 |
| Optical Cable Corp. | 11,226 | 42 | |
| * | Data I/O Corp. | 16,047 | 41 |
| * | Cobra Electronics Corp. | 13,809 | 41 |
| * | Helios and Matheson Analytics Inc. | 5,186 | 29 |
| * | Bridgeline Digital Inc. | 25,101 | 27 |
| * | Trio Tech International | 7,920 | 26 |
| * | Cover-All Technologies Inc. | 17,202 | 24 |
| * | Qualstar Corp. | 21,008 | 24 |
| *,^ | Daegis Inc. | 13,994 | 17 |
| Simulations Plus Inc. | 2,300 | 12 | |
| * | ADDvantage Technologies Group Inc. | 3,015 | 8 |
| * | UniTek Global Services Inc. | 3,400 | 6 |
| * | Looksmart Ltd. | 2,260 | 5 |
| * | Peerless Systems Corp. | 1,200 | 4 |
| 45,958,402 | |||
| Telecommunications (2.1%) | |||
| AT&T Inc. | 78,764,177 | 2,769,348 | |
| Verizon Communications Inc. | 42,764,103 | 2,101,428 | |
| * | Crown Castle International Corp. | 4,994,258 | 366,728 |
| CenturyLink Inc. | 8,836,339 | 281,437 | |
| * | SBA Communications Corp. Class A | 1,919,567 | 172,454 |
| * | Sprint Corp. | 11,754,863 | 126,365 |
| * | T-Mobile US Inc. | 3,564,425 | 119,907 |
| * | Level 3 Communications Inc. | 2,506,045 | 83,126 |
| ^ | Windstream Holdings Inc. | 8,905,415 | 71,065 |
| Frontier Communications Corp. | 14,941,772 | 69,479 | |
| * | tw telecom inc Class A | 2,194,484 | 66,866 |
| Telephone & Data Systems Inc. | 1,362,581 | 35,127 | |
| * | Leap Wireless International Inc. | 814,385 | 14,170 |
| * | 8x8 Inc. | 1,188,286 | 12,073 |
| Consolidated Communications Holdings Inc. | 559,693 | 10,987 | |
| * | Cincinnati Bell Inc. | 3,081,996 | 10,972 |
| Shenandoah Telecommunications Co. | 329,633 | 8,462 | |
| * | Vonage Holdings Corp. | 2,423,986 | 8,072 |
| Atlantic Tele-Network Inc. | 139,774 | 7,907 | |
| United States Cellular Corp. | 183,397 | 7,670 | |
| EarthLink Inc. | 1,501,514 | 7,613 | |
| * | Intelsat SA | 306,590 | 6,911 |
| *,^ | NII Holdings Inc. | 2,431,987 | 6,688 |
| Lumos Networks Corp. | 290,264 | 6,096 | |
| * | inContact Inc. | 753,388 | 5,884 |
| * | Iridium Communications Inc. | 817,303 | 5,116 |
| NTELOS Holdings Corp. | 228,576 | 4,624 | |
| IDT Corp. Class B | 244,449 | 4,368 | |
| * | General Communication Inc. Class A | 385,747 | 4,301 |
| USA Mobility Inc. | 297,765 | 4,252 | |
| *,^ | Fairpoint Communications Inc. | 348,903 | 3,946 |
| HickoryTech Corp. | 285,822 | 3,667 | |
| * | ORBCOMM Inc. | 485,978 | 3,081 |
56
| Vanguard® Total Stock Market Index Fund | |||
| Schedule of Investments | |||
| December 31, 2013 | |||
| Market | |||
| Value | |||
| Shares | ($000) | ||
| * | Hawaiian Telcom Holdco Inc. | 102,830 | 3,020 |
| * | Cbeyond Inc. | 417,103 | 2,878 |
| *,^ | Towerstream Corp. | 830,577 | 2,459 |
| * | Alaska Communications Systems Group Inc. | 641,232 | 1,359 |
| * | Straight Path Communications Inc. Class B | 130,783 | 1,071 |
| *,^ | Elephant Talk Communications Corp. | 771,629 | 949 |
| Alteva | 91,123 | 745 | |
| * | Global Telecom & Technology Inc. | 61,908 | 452 |
| * | NTS Inc. | 193,450 | 381 |
| * | Otelco Inc. Class A | 1,921 | 11 |
| 6,423,515 | |||
| Utilities (3.0%) | |||
| Duke Energy Corp. | 10,555,494 | 728,435 | |
| Dominion Resources Inc. | 8,677,258 | 561,332 | |
| NextEra Energy Inc. | 6,505,869 | 557,033 | |
| Southern Co. | 13,181,688 | 541,899 | |
| Spectra Energy Corp. | 10,016,777 | 356,798 | |
| Exelon Corp. | 12,811,235 | 350,900 | |
| American Electric Power Co. Inc. | 7,284,791 | 340,491 | |
| Sempra Energy | 3,471,272 | 311,581 | |
| PPL Corp. | 9,425,668 | 283,618 | |
| PG&E Corp. | 6,717,216 | 270,569 | |
| Public Service Enterprise Group Inc. | 7,563,435 | 242,332 | |
| Consolidated Edison Inc. | 4,379,093 | 242,076 | |
| Edison International | 4,871,203 | 225,537 | |
| Xcel Energy Inc. | 7,440,028 | 207,874 | |
| FirstEnergy Corp. | 6,252,961 | 206,223 | |
| Northeast Utilities | 4,710,335 | 199,671 | |
| ONEOK Inc. | 3,084,063 | 191,767 | |
| DTE Energy Co. | 2,643,206 | 175,482 | |
| Entergy Corp. | 2,666,011 | 168,679 | |
| NiSource Inc. | 4,682,814 | 153,971 | |
| CenterPoint Energy Inc. | 6,408,590 | 148,551 | |
| Wisconsin Energy Corp. | 3,387,459 | 140,038 | |
| NRG Energy Inc. | 4,834,639 | 138,851 | |
| AES Corp. | 9,431,490 | 136,851 | |
| Ameren Corp. | 3,627,416 | 131,167 | |
| * | Calpine Corp. | 5,947,115 | 116,028 |
| American Water Works Co. Inc. | 2,664,424 | 112,599 | |
| CMS Energy Corp. | 3,992,683 | 106,884 | |
| SCANA Corp. | 1,890,222 | 88,708 | |
| Pinnacle West Capital Corp. | 1,645,227 | 87,065 | |
| Alliant Energy Corp. | 1,658,645 | 85,586 | |
| National Fuel Gas Co. | 1,188,539 | 84,862 | |
| AGL Resources Inc. | 1,775,527 | 83,858 | |
| ITC Holdings Corp. | 784,413 | 75,162 | |
| Pepco Holdings Inc. | 3,732,578 | 71,404 | |
| UGI Corp. | 1,705,873 | 70,725 | |
| Integrys Energy Group Inc. | 1,192,589 | 64,889 | |
| Aqua America Inc. | 2,641,100 | 62,304 | |
| Atmos Energy Corp. | 1,346,219 | 61,145 | |
| Westar Energy Inc. Class A | 1,900,233 | 61,130 | |
| Questar Corp. | 2,617,067 | 60,166 | |
| Great Plains Energy Inc. | 2,299,406 | 55,738 | |
| TECO Energy Inc. | 3,231,432 | 55,710 | |
| Vectren Corp. | 1,222,059 | 43,383 | |
| Cleco Corp. | 898,831 | 41,903 | |
| Hawaiian Electric Industries Inc. | 1,490,232 | 38,835 | |
| IDACORP Inc. | 746,964 | 38,723 | |
| Southwest Gas Corp. | 689,073 | 38,526 | |
| Piedmont Natural Gas Co. Inc. | 1,128,939 | 37,436 | |
| UNS Energy Corp. | 592,706 | 35,473 | |
| Portland General Electric Co. | 1,165,424 | 35,196 | |
| Black Hills Corp. | 661,665 | 34,744 | |
57
| Vanguard® Total Stock Market Index Fund | |||||
| Schedule of Investments | |||||
| December 31, 2013 | |||||
| Market | |||||
| Value | |||||
| Shares | ($000) | ||||
| UIL Holdings Corp. | 827,070 | 32,049 | |||
| WGL Holdings Inc. | 766,950 | 30,724 | |||
| *,^ | Dynegy Inc. Class A | 1,411,738 | 30,381 | ||
| ALLETE Inc. | 594,049 | 29,631 | |||
| PNM Resources Inc. | 1,184,418 | 28,568 | |||
| New Jersey Resources Corp. | 609,355 | 28,177 | |||
| South Jersey Industries Inc. | 473,465 | 26,495 | |||
| Avista Corp. | 887,780 | 25,027 | |||
| NorthWestern Corp. | 568,071 | 24,609 | |||
| Laclede Group Inc. | 458,313 | 20,872 | |||
| El Paso Electric Co. | 593,412 | 20,835 | |||
| MGE Energy Inc. | 340,370 | 19,707 | |||
| Northwest Natural Gas Co. | 397,876 | 17,037 | |||
| American States Water Co. | 571,530 | 16,420 | |||
| California Water Service Group | 675,067 | 15,574 | |||
| Empire District Electric Co. | 626,850 | 14,223 | |||
| Chesapeake Utilities Corp. | 131,638 | 7,901 | |||
| SJW Corp. | 240,009 | 7,150 | |||
| Ormat Technologies Inc. | 260,551 | 7,090 | |||
| Atlantic Power Corp. | 1,771,799 | 6,166 | |||
| Unitil Corp. | 189,524 | 5,779 | |||
| Connecticut Water Service Inc. | 158,049 | 5,612 | |||
| Middlesex Water Co. | 236,947 | 4,962 | |||
| York Water Co. | 179,377 | 3,754 | |||
| Artesian Resources Corp. Class A | 102,984 | 2,363 | |||
| * | Genie Energy Ltd. Class B | 218,180 | 2,228 | ||
| Delta Natural Gas Co. Inc. | 75,677 | 1,694 | |||
| *,^ | Cadiz Inc. | 179,752 | 1,251 | ||
| * | Pure Cycle Corp. | 177,069 | 1,121 | ||
| Gas Natural Inc. | 135,261 | 1,086 | |||
| * | US Geothermal Inc. | 853,724 | 324 | ||
| *,^ | EuroSite Power Inc. | 15,009 | 11 | ||
| 9,198,729 | |||||
| Total Common Stocks (Cost $204,351,223) | 305,852,959 | ||||
| Coupon | |||||
| Temporary Cash Investments (0.8%)1 | |||||
| Money Market Fund (0.8%) | |||||
| 2,3 | Vanguard Market Liquidity Fund | 0.125% | 2,263,406,146 | 2,263,406 | |
| Face | |||||
| Maturity | Amount | ||||
| Date | ($000) | ||||
| U.S. Government and Agency Obligations (0.0%) | |||||
| 4 | Fannie Mae Discount Notes | 0.060% | 3/19/14 | 2,000 | 1,999 |
| 5,6 | Federal Home Loan Bank Discount Notes | 0.070% | 2/5/14 | 24,800 | 24,796 |
| 5,6 | Federal Home Loan Bank Discount Notes | 0.070% | 3/12/14 | 14,800 | 14,795 |
| 4,6 | Freddie Mac Discount Notes | 0.080% | 2/10/14 | 10,000 | 9,998 |
| 4,6 | Freddie Mac Discount Notes | 0.085% | 3/3/14 | 2,000 | 1,999 |
| 6 | United States Treasury Bill | 0.072% | 2/13/14 | 20,000 | 20,000 |
| 6 | United States Treasury Note/Bond | 1.750% | 3/31/14 | 2,000 | 2,008 |
| 75,595 | |||||
| Total Temporary Cash Investments (Cost $2,339,008) | 2,339,001 | ||||
| Total Investments (100.3%) (Cost $206,690,231) | 308,191,960 | ||||
| Other Assets and Liabilities—Net (-0.3%)3 | (859,839) | ||||
| Net Assets (100%) | 307,332,121 | ||||
| * | Non-income-producing security. | ||||
58
Vanguard® Total Stock Market Index Fund
Schedule of Investments
December 31, 2013
^ Includes partial security positions on loan to broker-dealers. The total value of securities on loan is $854,514,000.
1 The fund invests a portion of its cash reserves in equity markets through the use of index futures contracts. After giving effect to futures investments, the fund's effective common stock and temporary cash investment positions represent 100.0% and 0.3%, respectively, of net assets.
2 Affiliated money market fund available only to Vanguard funds and certain trusts and accounts managed by Vanguard. Rate shown is the 7-day yield.
3 Includes $901,050,000 of collateral received for securities on loan.
4 The issuer was placed under federal conservatorship in September 2008; since that time, its daily operations have been managed by the Federal Housing Finance Agency and it receives capital from the U.S. Treasury, as needed to maintain a positive net worth, in exchange for senior preferred stock.
5 The issuer operates under a congressional charter; its securities are generally neither guaranteed by the U.S. Treasury nor backed by the full faith and credit of the U.S. government.
6 Securities with a value of $59,095,000 have been segregated as initial margin for open futures contracts.
REIT—Real Estate Investment Trust.
59
© 2014 The Vanguard Group, Inc. All rights reserved.
Vanguard Marketing Corporation, Distributor.
SNA850_022014
Item 7: Disclosure of Proxy Voting Policies and Procedures for Closed-End Management Investment Companies.
Not Applicable.
Item 8: Portfolio Managers of Closed-End Management Investment Companies.
Not Applicable.
Item 9: Purchase of Equity Securities by Closed-End Management Investment Company and Affiliated Purchasers.
Not Applicable.
Item 10: Submission of Matters to a Vote of Security Holders.
Not Applicable.
Item 11: Controls and Procedures.
(a) Disclosure Controls and Procedures. The Principal Executive and Financial Officers concluded that the Registrant’s Disclosure Controls and Procedures are effective based on their evaluation of the Disclosure Controls and Procedures as of a date within 90 days of the filing date of this report.
(b) Internal Control Over Financial Reporting. There were no significant changes in Registrant’s Internal Control Over Financial Reporting or in other factors that could significantly affect this control subsequent to the date of the evaluation, including any corrective actions with regard to significant deficiencies and material weaknesses.
Item 12: Exhibits.
(a) Code of Ethics.
(b) Certifications.
Pursuant to the requirements of the Securities Exchange Act of 1934 and the Investment Company Act of 1940, the registrant has duly caused this report to be signed on its behalf by the undersigned, thereunto duly authorized.
| VANGUARD INDEX FUNDS | |
| By: | /s/ F. WILLIAM MCNABB III* |
| F. WILLIAM MCNABB III | |
| CHIEF EXECUTIVE OFFICER | |
| Date: February 20, 2014 | |
Pursuant to the requirements of the Securities Exchange Act of 1934 and the Investment Company Act of 1940, this report has been signed below by the following persons on behalf of the registrant and in the capacities and on the dates indicated.
| VANGUARD INDEX FUNDS | |
| By: | /s/ F. WILLIAM MCNABB III* |
| F. WILLIAM MCNABB III | |
| CHIEF EXECUTIVE OFFICER | |
| Date: February 20, 2014 | |
| VANGUARD INDEX FUNDS | |
| By: | /s/ THOMAS J. HIGGINS* |
| THOMAS J. HIGGINS | |
| CHIEF FINANCIAL OFFICER | |
| Date: February 20, 2014 | |
* By: /s/ Heidi Stam
Heidi Stam, pursuant to a Power of Attorney filed on March 27, 2012 see file Number 2-11444, Incorporated by Reference.