SECURITIES AND EXCHANGE COMMISSION
WASHINGTON, D.C. 20549
FORM 10-Q
(Mark One)
 QUARTERLY REPORT PURSUANT TO SECTION 13 OR 15(d) OF THE SECURITIES EXCHANGE ACT OF 1934
For the quarterly period ended September 30, 2001
OR
 TRANSITION REPORT PURSUANT TO SECTION 13 OR 15(d) OF THE SECURITIES EXCHANGE ACT OF 1934
For the transition period from to
Commission file numbers 1-6368
FORD MOTOR CREDIT COMPANY
(Exact name of registrant as specified in its charter)| | | |
| Delaware | | 38-1612444 |
| |
|
| (State of Incorporation) | | (I.R.S. employer identification no.) |
| | | | | |
| One American Road, Dearborn, Michigan | | 48126 |
| |
|
| (Address of principal executive offices) | | (Zip code) |
Registrant’s telephone number, including area code (313) 322-3000
Indicate by check mark whether the registrant (1) has filed all reports required to be filed by Section 13 or 15(d) of the Securities Exchange Act of 1934 during the preceding 12 months (or for such shorter period that the registrant was required to file such reports), and (2) has been subject to such filing requirements for the past 90 days. Yes No
APPLICABLE ONLY TO CORPORATE ISSUERS: Indicate the number of shares outstanding of each of the registrant’s classes of common stock, as of the latest practicable date: 250,000 shares of common stock as of September 30, 2001.
The registrant meets the conditions set forth in General Instruction H(1)(a) and (b) of Form 10-Q and is therefore filing this Form in reduced disclosure format.
PAGE 1 OF 33
EXHIBIT INDEX APPEARS AT PAGE 30
TABLE OF CONTENTS
FORD MOTOR CREDIT COMPANY AND SUBSIDIARIES
PART I. FINANCIAL INFORMATION
Item 1. Financial Statements — The interim financial data presented herein are unaudited, but in the opinion of management reflect those adjustments necessary for a fair presentation. Results for interim periods should not be considered indicative of results for a full year. Reference should be made to the financial statements contained in the registrant’s Annual Report on Form 10-K for the year ended December 31, 2000 (the “10-K Report”). Information relating to earnings per share is not presented because the registrant, Ford Motor Credit Company (“Ford Credit”), is an indirect wholly owned subsidiary of Ford Motor Company (“Ford” or the “Company”).
FORD MOTOR CREDIT COMPANY AND SUBSIDIARIES
Consolidated Statement of Income
and of Earnings Retained for Use in the Business
For the Periods Ended September 30, 2001 and 2000
(in millions)
| | | | | | | | | | | | | | | | | | | | |
| | | | | | Third Quarter | | | Nine Months | |
| | | | | |
| | |
| |
| | | | | | 2001 | | | 2000 | | | 2001 | | | 2000 | |
| | | | | |
| | |
| | |
| | |
| |
| | | | | | (Unaudited) | | | (Unaudited) | |
| Financing revenue | | | | | | | | | | | | | | | | |
| | Operating leases | | $ | 3,077.9 | | | $ | 2,820.7 | | | $ | 8,960.2 | | | $ | 8,042.6 | |
| | Retail | | | 2,167.6 | | | | 2,129.7 | | | | 6,459.6 | | | | 6,119.3 | |
| | Wholesale | | | 401.2 | | | | 594.7 | | | | 1,784.1 | | | | 1,723.0 | |
| | Other | | | 115.6 | | | | 133.1 | | | | 363.2 | | | | 400.8 | |
| | |
| | |
| | |
| | |
| |
| | | | Total financing revenue | | | 5,762.3 | | | | 5,678.2 | | | | 17,567.1 | | | | 16,285.7 | |
| Depreciation on operating leases | | | (2,219.4 | ) | | | (1,982.5 | ) | | | (6,590.8 | ) | | | (5,859.0 | ) |
| Interest expense | | | (2,146.9 | ) | | | (2,300.4 | ) | | | (6,920.6 | ) | | | (6,565.3 | ) |
| | |
| | |
| | |
| | |
| |
| | | Net financing margin | | | 1,396.0 | | | | 1,395.3 | | | | 4,055.7 | | | | 3,861.4 | |
| Other revenue | | | | | | | | | | | | | | | | |
| | Insurance premiums earned | | | 53.4 | | | | 49.5 | | | | 173.2 | | | | 169.8 | |
| | Investment and other income | | | 612.3 | | | | 263.0 | | | | 1,531.7 | | | | 884.0 | |
| | |
| | |
| | |
| | |
| |
| | | | Total financing margin and revenue | | | 2,061.7 | | | | 1,707.8 | | | | 5,760.6 | | | | 4,915.2 | |
| Expenses | | | | | | | | | | | | | | | | |
| | Operating expenses | | | 616.0 | | | | 619.7 | | | | 1,882.8 | | | | 1,799.0 | |
| | Provision for credit losses | | | 801.9 | | | | 409.7 | | | | 1,905.2 | | | | 1,097.6 | |
| | Other insurance expenses | | | 45.5 | | | | 44.1 | | | | 164.3 | | | | 175.1 | |
| | |
| | |
| | |
| | |
| |
| | | Total expenses | | | 1,463.4 | | | | 1,073.5 | | | | 3,952.3 | | | | 3,071.7 | |
| | |
| | |
| | |
| | |
| |
| | Income before income taxes and minority interests | | | 598.3 | | | | 634.3 | | | | 1,808.3 | | | | 1,843.5 | |
| Provision for income taxes | | | 222.0 | | | | 235.3 | | | | 670.9 | | | | 683.9 | |
| | |
| | |
| | |
| | |
| |
| | Income before minority interests | | | 376.3 | | | | 399.0 | | | | 1,137.4 | | | | 1,159.6 | |
| Minority interests in net income of subsidiaries | | | 0.7 | | | | 13.5 | | | | 1.6 | | | | 33.3 | |
| | |
| | |
| | |
| | |
| |
| | | Net income | | | 375.6 | | | | 385.5 | | | | 1,135.8 | | | | 1,126.3 | |
| Earnings retained for use in the business | | | | | | | | | | | | | | | | |
| | Beginning of period | | | 8,782.5 | | | | 7,590.9 | | | | 8,272.3 | | | | 6,855.5 | |
| | Dividends | | | (150.0 | ) | | | (0.2 | ) | | | (400.0 | ) | | | (5.6 | ) |
| | |
| | |
| | |
| | |
| |
| | | | End of period | | $ | 9,008.1 | | | $ | 7,976.2 | | | $ | 9,008.1 | | | $ | 7,976.2 | |
| | |
| | |
| | |
| | |
| |
The accompanying notes are an integral part of the financial statements.
2
FORD MOTOR CREDIT COMPANY AND SUBSIDIARIES
Consolidated Balance Sheet
(in millions)
| | | | | | | | | | | | | | | | | |
| | | | | | | September 30, | | | December 31, | | | September 30, | |
| | | | | | | 2001 | | | 2000 | | | 2000 | |
| | | | | | |
| | |
| | |
| |
| | | | | | | (Unaudited) | | | | | | | (Unaudited) | |
| Assets | | | | | | | | | | | | |
| | | | Cash and cash equivalents | | $ | 4,052.8 | | | $ | 1,123.4 | | | $ | 1,959.7 | |
| | | | Investments in securities | | | 502.8 | | | | 547.4 | | | | 530.0 | |
| | | | Finance receivables, net | | | 109,754.0 | | | | 122,738.4 | | | | 118,929.1 | |
| | | | Net investment, operating leases | | | 40,273.6 | | | | 38,457.0 | | | | 38,442.4 | |
| | | | Retained interest in securitized assets | | | 12,177.7 | | | | 3,686.6 | | | | 3,188.8 | |
| | | | Notes and accounts receivable from affiliated companies | | | 2,207.1 | | | | 2,489.1 | | | | 2,766.2 | |
| | | | Other assets | | | 5,349.6 | | | | 5,215.9 | | | | 4,078.1 | |
| | |
| | |
| | |
| |
| | | | | Total assets | | $ | 174,317.6 | | | $ | 174,257.8 | | | $ | 169,894.3 | |
| | |
| | |
| | |
| |
| Liabilities and Stockholder’s Equity | | | | | | | | | | | | |
| Liabilities | | | | | | | | | | | | |
| | Accounts payable |
| | | | | Trade, customer deposits, and dealer reserves | | $ | 4,087.7 | | | $ | 4,758.1 | | | $ | 4,027.0 | |
| | | | | Affiliated companies | | | 1,040.7 | | | | 1,036.9 | | | | 1,855.0 | |
| | |
| | |
| | |
| |
| | | Total accounts payable | | | 5,128.4 | | | | 5,795.0 | | | | 5,882.0 | |
| | Debt | | | 146,354.3 | | | | 146,294.7 | | | | 141,895.6 | |
| | Deferred income taxes | | | 4,765.6 | | | | 4,495.4 | | | | 4,338.4 | |
| | Other liabilities and deferred income | | | 5,706.0 | | | | 5,468.8 | | | | 5,393.1 | |
| | |
| | |
| | |
| |
| | | | | Total liabilities | | | 161,954.3 | | | | 162,053.9 | | | | 157,509.1 | |
| | Minority interests in net assets of subsidiaries | | | 17.1 | | | | 17.3 | | | | 401.1 | |
| Stockholder’s Equity | | | | | | | | | | | | |
| | Capital stock, par value $100 a share, 250,000 shares authorized, issued and outstanding | | | 25.0 | | | | 25.0 | | | | 25.0 | |
| | Paid-in surplus (contributions by stockholder) | | | 4,447.0 | | | | 4,273.0 | | | | 4,551.5 | |
| | Accumulated other comprehensive loss | | | (1,133.9 | ) | | | (383.7 | ) | | | (568.6 | ) |
| | Retained earnings | | | 9,008.1 | | | | 8,272.3 | | | | 7,976.2 | |
| | |
| | |
| | |
| |
| | | | | Total stockholder’s equity | | | 12,346.2 | | | | 12,186.6 | | | | 11,984.1 | |
| | |
| | |
| | |
| |
| | | | | Total liabilities and stockholder’s equity | | $ | 174,317.6 | | | $ | 174,257.8 | | | $ | 169,894.3 | |
| | |
| | |
| | |
| |
The accompanying notes are an integral part of the financial statements.
3
FORD MOTOR CREDIT COMPANY AND SUBSIDIARIES
Consolidated Statement of Cash Flows
For the Periods Ended September 30, 2001 and 2000
(in millions)
| | | | | | | | | | | | | |
| | | | | | | Nine Months | |
| | | | | | |
| |
| | | | | | | 2001 | | | 2000 | |
| | | | | | |
| | |
| |
| | | | | | | (Unaudited) | |
| Cash flows from operating activities | | | | | | | | |
| | Net income | | $ | 1,135.8 | | | $ | 1,126.3 | |
| | | | Adjustments to reconcile net income to net cash provided by operating activities |
| | | Provision for credit losses | | | 1,905.2 | | | | 1,097.6 | |
| | | Depreciation and amortization | | | 6,964.5 | | | | 6,229.6 | |
| | | Gain on sales of finance receivables | | | (469.6 | ) | | | (0.1 | ) |
| | | Increase in deferred income taxes | | | 603.9 | | | | 619.3 | |
| | | Decrease in other assets | | | 221.1 | | | | 128.3 | |
| | | (Decrease)/increase in other liabilities | | | (639.8 | ) | | | 1,322.8 | |
| | | All other operating activities | | | 39.9 | | | | 320.7 | |
| | |
| | |
| |
| | | | | Net cash provided by operating activities | | | 9,761.0 | | | | 10,844.5 | |
| | |
| | |
| |
| Cash flows from investing activities | | | | | | | | |
| | | | Purchase of finance receivables (other than wholesale) | | | (47,948.2 | ) | | | (47,636.7 | ) |
| | | | Collection of finance receivables (other than wholesale) | | | 22,016.1 | | | | 25,372.8 | |
| | | Purchase of operating lease vehicles | | | (21,796.4 | ) | | | (21,379.4 | ) |
| | | Liquidation of operating lease vehicles | | | 13,009.6 | | | | 12,072.4 | |
| | | Decrease/(increase) in wholesale receivables | | | 1,421.1 | | | | (1,292.8 | ) |
| | | Decrease in notes receivable with affiliates | | | 947.5 | | | | 3,645.0 | |
| | | Proceeds from sale of receivables | | | 29,449.1 | | | | 12,499.7 | |
| | | Purchase of investment securities | | | (559.4 | ) | | | (412.3 | ) |
| | | Proceeds from sale/maturity of investment securities | | | 604.0 | | | | 406.7 | |
| | | All other investing activities | | | (174.3 | ) | | | (258.2 | ) |
| | |
| | |
| |
| | | | | Net cash used in investing activities | | | (3,030.9 | ) | | | (16,982.8 | ) |
| | |
| | |
| |
| Cash flows from financing activities | | | | | | | | |
| | | Proceeds from issuance of long-term debt | | | 28,133.4 | | | | 30,736.5 | |
| | | Principal payments on long-term debt | | | (10,756.3 | ) | | | (13,885.0 | ) |
| | | Decrease in short-term debt | | | (21,070.3 | ) | | | (9,270.5 | ) |
| | | Cash dividends paid | | | (400.0 | ) | | | (150.0 | ) |
| | | All other financing activities | | | 295.4 | | | | (4.7 | ) |
| | |
| | |
| |
| | | | | Net cash (used)/provided by financing activities | | | (3,797.8 | ) | | | 7,426.3 | |
| | |
| | |
| |
| | | | | Effect of exchange rate changes on cash and cash equivalents | | | (2.9 | ) | | | (270.5 | ) |
| | | Net change in cash and cash equivalents | | | 2,929.4 | | | | 1,017.5 | |
| Cash and cash equivalents, beginning of period | | | 1,123.4 | | | | 942.2 | |
| | |
| | |
| |
| Cash and cash equivalents, end of period | | $ | 4,052.8 | | | $ | 1,959.7 | |
| | |
| | |
| |
| Supplementary cash flow information | | | | | | | | |
| | | Interest paid | | $ | 6,601.2 | | | $ | 4,207.5 | |
| | | Taxes paid | | | 154.0 | | | | 105.0 | |
The accompanying notes are an integral part of the financial statements.
4
FORD MOTOR CREDIT COMPANY AND SUBSIDIARIES
Notes To Financial Statements
Note 1. Finance Receivables, Net (in millions)
| | | | | | | | | | | | | | | | | |
| | | | | | | September 30, | | | December 31, | | | September 30, | |
| | | | | | | 2001 | | | 2000 | | | 2000 | |
| | | | | | |
| | |
| | |
| |
| | | | | | | (Unaudited) | | | | | | | (Unaudited) | |
| Retail | | $ | 83,611.7 | | | $ | 80,797.2 | | | $ | 82,940.7 | |
| Wholesale | | | 16,021.2 | | | | 34,122.0 | | | | 28,342.2 | |
| Other | | | 11,735.4 | | | | 9,129.9 | | | | 8,837.3 | |
| | |
| | |
| | |
| |
| | | Total finance receivables, net of unearned income | | | 111,368.3 | | | | 124,049.1 | | | | 120,120.2 | |
| Less: Allowance for credit losses | | | (1,614.3 | ) | | | (1,310.7 | ) | | | (1,191.1 | ) |
| | |
| | |
| | |
| |
| | Finance receivables, net | | $ | 109,754.0 | | | $ | 122,738.4 | | | $ | 118,929.1 | |
| | |
| | |
| | |
| |
Note 2. Debt (in millions)
| | | | | | | | | | | | | | | | | |
| | | | | | | September 30, | | | December 31, | | | September 30, | |
| | | | | | | 2001 | | | 2000 | | | 2000 | |
| | | | | | |
| | |
| | |
| |
| | | | | | | (Unaudited) | | | | | | | (Unaudited) | |
| Payable Within One Year: | | | | | | | | | | | | |
| | Commercial paper | | $ | 21,576.0 | | | $ | 42,254.8 | | | $ | 34,622.8 | |
| | Other short-term debt (a) | | | 7,389.6 | | | | 7,875.1 | | | | 7,020.0 | |
| | |
| | |
| | |
| |
| | | Total short-term debt | | | 28,965.6 | | | | 50,129.9 | | | | 41,642.8 | |
| | Long-term indebtedness payable within one year (b) | | | 21,104.4 | | | | 12,856.6 | | | | 18,177.2 | |
| | |
| | |
| | |
| |
| | | | | Total payable within one year | | | 50,070.0 | | | | 62,986.5 | | | | 59,820.0 | |
| Payable After One Year: | | | | | | | | | | | | |
| | Unsecured senior indebtedness Notes (c) (d) | | | 96,309.1 | | | | 83,402.6 | | | | 82,097.4 | |
| | | Unamortized discount | | | (24.8 | ) | | | (94.4 | ) | | | (104.5 | ) |
| | |
| | |
| | |
| |
| | | | Total unsecured senior indebtedness | | | 96,284.3 | | | | 83,308.2 | | | | 81,992.9 | |
| | Unsecured long-term subordinated notes | | | — | | | | — | | | | 82.7 | |
| | |
| | |
| | |
| |
| | | Total payable after one year | | | 96,284.3 | | | | 83,308.2 | | | | 82,075.6 | |
| | |
| | |
| | |
| |
| | | | | Total debt (e) | | $ | 146,354.3 | | | $ | 146,294.7 | | | $ | 141,895.6 | |
| | |
| | |
| | |
| |
| (a) | | Includes $340.2 million, $571.0 million, and $565.3 million with affiliated companies at September 30, 2001, December 31, 2000, and September 30, 2000, respectively. |
| |
| (b) | | Includes $627.2 million, $912.6 million, and $1,282.5 million with affiliated companies at September 30, 2001, December 31, 2000, and September 30, 2000, respectively. |
| |
| (c) | | Includes $1,063.9 million, $1,663.8 million, and $1,855.8 million with affiliated companies at September 30, 2001, December 31, 2000, and September 30, 2000, respectively. |
| |
| (d) | | Unsecured senior notes mature at various dates through 2078. |
| |
| (e) | | The weighted average interest rate, including the effects of interest rate swap agreements, for total debt at September 30, 2001 is 5.91%. |
5
FORD MOTOR CREDIT COMPANY AND SUBSIDIARIES
Notes To Financial Statements-Continued
Note 3. SFAS 133 “Accounting for Derivative Instruments and Hedging Activities” (in millions)
Non-cash adjustments to income (not material to total Company results) and to stockholder’s equity for the third quarter and nine months ended September 30, 2001, including the January 1, 2001 transition adjustment, were (in millions):
| | | | | | | | | |
| | | Third Quarter | | | Nine Months | |
| | | 2001 | | | 2001 | |
| | |
| | |
| |
| | | (Unaudited) | | (Unaudited) |
| Pre-tax income/(loss)* | | $ | (20.3 | ) | | $ | (91.4 | ) |
| Net income/(loss) | | | (12.9 | ) | | | (57.5 | ) |
| Stockholder’s equity** | | | (105.8 | ) | | | (557.9 | ) |
| * | | Recorded in investment and other income |
| |
| ** | | Recorded in accumulated other comprehensive income/(loss) |
Note 4. Comprehensive Income (in millions)
| | | | | | | | | | | | | | | | | | |
| | | | Third Quarter | | | Nine Months | |
| | | |
| | |
| |
| | | | 2001 | | | 2000 | | | 2001 | | | 2000 | |
| | | |
| | |
| | |
| | |
| |
| | | | (Unaudited) | | | (Unaudited) | |
| Net income | | $ | 375.6 | | | $ | 385.5 | | | $ | 1,135.8 | | | $ | 1,126.3 | |
| Other comprehensive loss | | | (42.1 | ) | | | (126.2 | ) | | | (750.2 | ) | | | (270.6 | ) |
| | |
| | |
| | |
| | |
| |
| | Total comprehensive income | | $ | 333.5 | | | $ | 259.3 | | | $ | 385.6 | | | $ | 855.7 | |
| | |
| | |
| | |
| | |
| |
Other comprehensive loss includes foreign currency translation adjustments, net unrealized gains and losses on investments in securities, unrealized gains and losses on derivative instruments, and unrealized gains and losses on retained interests in securitized assets.
6
FORD MOTOR CREDIT COMPANY AND SUBSIDIARIES
Notes to Financial Statements-Continued
Note 5. Segment Information (in millions)
Ford Credit manages its operations through two segments, Ford Credit North America and Ford Credit International.
| | | | | | | | | | | | | | | | | | | | | | |
| | | | Ford Credit | | | | | | | | | | | Ford Credit | | | | | |
| | | | North | | | Ford Credit | | | Eliminations/ | | | Financial | | | | | |
| | | | America | | | International | | | Reclassifications * | | | Statements | | | | | |
| | | |
| | |
| | |
| | |
| | | | | |
| | | | | | | | (Unaudited) | | | | | | | | | |
| Third Quarter | | | | | | | | | | | | | | | | | | | | |
| | | | | | | | | | | | | | | | | | | | |
| 2001 | | | | | | | | | | | | | | | | |
| Revenue | | $ | 6,114.0 | | | $ | 927.8 | | | $ | (613.8 | ) | | $ | 6,428.0 | |
| Income | | | | | | | | | | | | | | | | |
| | Income before income taxes | | | 520.0 | | | | 110.9 | | | | (32.6 | ) | | | 598.3 | |
| | Provision for income taxes | | | 195.2 | | | | 38.9 | | | | (12.1 | ) | | | 222.0 | |
| | Net income | | | 324.8 | | | | 72.0 | | | | (21.2 | ) | | | 375.6 | |
| Other disclosures |
| | Depreciation on operating leases | | | 1,993.5 | | | | 127.5 | | | | 98.4 | | | | 2,219.4 | |
| | Interest expense | | | 2,193.2 | | | | 362.3 | | | | (408.6 | ) | | | 2,146.9 | |
| 2000 | | | | | | | | | | | | | | | | |
| Revenue | | $ | 5,456.9 | | | $ | 946.8 | | | $ | (413.0 | ) | | $ | 5,990.7 | |
| Income | | | | | | | | | | | | | | | | |
| | Income before income taxes | | | 539.5 | | | | 100.5 | | | | (5.7 | ) | | | 634.3 | |
| | Provision for income taxes | | | 203.5 | | | | 35.5 | | | | (3.7 | ) | | | 235.3 | |
| | Net income | | | 336.0 | | | | 65.0 | | | | (15.5 | ) | | | 385.5 | |
| Other disclosures |
| | Depreciation on operating leases | | | 1,761.2 | | | | 212.1 | | | | 9.2 | | | | 1,982.5 | |
| | Interest expense | | | 2,235.1 | | | | 404.3 | | | | (339.0 | ) | | | 2,300.4 | |
| Nine Months | | | | | | | | | | | | | | | | |
| 2001 | | | | | | | | | | | | | | | | |
| Revenue | | $ | 18,382.1 | | | $ | 2,700.3 | | | $ | (1,810.4 | ) | | $ | 19,272.0 | |
| Income | | | | | | | | | | | | | | | | |
| | Income before income taxes | | | 1,616.8 | | | | 294.0 | | | | (102.5 | ) | | | 1,808.3 | |
| | Provision for income taxes | | | 605.5 | | | | 103.0 | | | | (37.6 | ) | | | 670.9 | |
| | Net income | | | 1,011.3 | | | | 191.0 | | | | (66.5 | ) | | | 1,135.8 | |
| Other disclosures |
| | Depreciation on operating leases | | | 5,940.8 | | | | 359.0 | | | | 291.0 | | | | 6,590.8 | |
| | Interest expense | | | 6,902.9 | | | | 1,234.6 | | | | (1,216.9 | ) | | | 6,920.6 | |
| | Finance receivables (including net investment operating leases) | | | 167,572.9 | | | | 30,668.4 | | | | (48,213.7 | ) | | | 150,027.6 | |
| | Total Assets | | $ | 174,038.3 | | | $ | 33,384.7 | | | $ | (33,105.4 | ) | | $ | 174,317.6 | |
| 2000 | | | | | | | | | | | | | | | | |
| Revenue | | $ | 15,559.9 | | | $ | 2,777.5 | | | $ | (997.9 | ) | | $ | 17,339.5 | |
| Income | | | | | | | | | | | | | | | | |
| | Income before income taxes | | | 1,514.4 | | | | 333.9 | | | | (4.8 | ) | | | 1,843.5 | |
| | Provision for income taxes | | | 566.3 | | | | 115.6 | | | | 2.0 | | | | 683.9 | |
| | Net income | | | 948.1 | | | | 218.3 | | | | (40.1 | ) | | | 1,126.3 | |
| Other disclosures |
| | Depreciation on operating leases | | | 5,241.4 | | | | 612.7 | | | | 4.9 | | | | 5,859.0 | |
| | Interest expense | | | 6,286.0 | | | | 1,178.2 | | | | (898.9 | ) | | | 6,565.3 | |
| | Finance receivables (including net investment operating leases) | | | 153,449.2 | | | | 27,523.0 | | | | (23,600.7 | ) | | | 157,371.5 | |
| | Total Assets | | | 159,516.8 | | | | 31,878.9 | | | | (21,501.4 | ) | | | 169,894.3 | |
| * | | Includes the impact of SFAS No. 133, “Accounting for Derivative Instruments and Hedging Activities”. |
7
FORD MOTOR CREDIT COMPANY AND SUBSIDIARIES
Item 2. Management’s Discussion and Analysis of Financial Condition and Results of Operations
Our 2001 financial results include the effects of Financial Accounting Standards Board Statement of Financial Accounting Standards Number 133 (SFAS No. 133) “Accounting for Derivative Instruments and Hedging Activities”. We adopted SFAS No. 133, as amended by SFAS No. 137 and SFAS No. 138, on January 1, 2001. For further information on SFAS No. 133 and its impact on us, see Note 3 of the Notes to Consolidated Financial Statements.
THIRD QUARTER 2001 RESULTS OF OPERATIONS
Our consolidated net income for the third quarter of 2001 was $376 million, down $10 million or 3% from the third quarter of 2000.
Excluding the effects of SFAS No. 133, net income for the third quarter of 2001 was $389 million, up $3 million or 1% from a year ago. Higher volume and margin and improvements in investment and other income (primarily the result of gains on the sale of receivables and higher interest income on retained assets related to securitization transactions) were offset largely by higher credit losses.
Credit losses as a percent of average owned net finance receivables including net investment in operating leases was 1.36% in the third quarter of 2001 compared with 0.95% in the second quarter of 2001 and 0.87% a year ago. The increase from a year ago was primarily due to higher losses associated with deteriorating economic conditions and a decrease in wholesale receivables as a result of securitization. (Wholesale receivables, historically, have experienced lower default rates. The sale of these assets therefore results in a higher overall credit loss ratio.)
We manage our operations through two segments, Ford Credit North America and Ford Credit International. Results of our operations by business segment for the third quarter of 2001 and 2000 are shown below (in millions):
| | | | | | | | | | | | | | |
| | | | Third Quarter Net Income | |
| | | |
| |
| | | | | | | | | | | | 2001 | |
| | | | | | | | | | | | O/(U) | |
| | | | 2001 | | | 2000 | | | 2000 | |
| | | |
| | |
| | |
| |
| Ford Credit North America | | $ | 325 | | | $ | 336 | | | $ | (11 | ) |
| Ford Credit International | | | 72 | | | | 65 | | | | 7 | |
| Eliminations / Reclassifications | | | (21 | ) | | | (15 | ) | | | (6 | ) |
| | |
| | |
| | |
| |
| | Net Income | | $ | 376 | | | $ | 386 | | | $ | (10 | ) |
| | |
| | |
| | |
| |
Net income in the North America segment for the third quarter of 2001 was $325 million, down $11 million or 3% from a year ago. Higher volume and margin and improvements in investment and other income (primarily the result of gains on the sale of receivables and higher interest income on retained assets related to securitization transactions) were more than offset by higher credit losses. Net income in the International segment for the third quarter of 2001 was $72 million, up $7 million or 11% from a year ago primarily related to higher contract volume in Europe. The Eliminations / Reclassifications category reflects primarily minority interest in 2000 and effects of SFAS No. 133 in 2001. See Note 5 of Notes to Financial Statements for additional segment information.
FIRST NINE MONTHS RESULTS OF OPERATIONS
For the first nine months of 2001, our consolidated net income was $1,136 million, up $10 million or 1% from the first nine months of 2000.
Excluding the effects of SFAS No. 133, net income for the first nine months of 2001 was $1,194 million, up $67 million or 6% from a year ago. Higher volume and improvements in investment and other income (primarily the result of gains on the sale of receivables related to securitization transactions) were offset largely by higher credit losses. Compared to the prior year, higher gains on the sale of receivables resulted from increased use of securitization as a cost-effective source of funds, as discussed below in Financial Condition and Liquidity.
8
Results of our operations by business segment for the first nine months of 2001 and 2000 are shown below (in millions):
| | | | | | | | | | | | | | |
| | | | Nine Months Net Income |
| | | |
| |
| | | | | | | | | | | | 2001 | |
| | | | | | | | | | | | O/(U) | |
| | | | 2001 | | | 2000 | | | 2000 | |
| | | |
| | |
| | |
| |
| Ford Credit North America | | $ | 1,011 | | | $ | 948 | | | $ | 63 | |
| Ford Credit International | | | 191 | | | | 218 | | | | (27 | ) |
| Eliminations/Reclassifications | | | (66 | ) | | | (40 | ) | | | (26 | ) |
| | |
| | |
| | |
| |
| | Net Income | | $ | 1,136 | | | $ | 1,126 | | | $ | 10 | |
| | |
| | |
| | |
| |
Net income in the North America segment for the first nine months of 2001 was $1,011 million, up $63 million or 7% from a year ago, primarily a result of higher volume and improvements in investment and other income (primarily the result of gains on the sale of receivables related to securitization transactions) offset largely by higher credit losses. Net income in the International segment for the first nine months of 2001 was $191 million, down $27 million or 12% from a year ago primarily related to continued weak conditions in South America and margin pressure in Europe. We are continuing to monitor our business operations in South America, especially in light of currency and other issues in Argentina and Brazil. See Note 5 of Notes to Financial Statements for additional segment information.
FINANCING VOLUME AND SHARE
The table below summarizes our financing share of all new cars and trucks sold by Ford, Lincoln, and Mercury dealers in the United States and Ford dealers in Europe as well as our wholesale financing of Ford, Lincoln, and Mercury factory sales in the United States and of Ford factory sales in Europe. Total retail financing for new and used vehicles in the United States and Europe is also shown below:
| | | | | | | | | | | | | | | | | | | |
| | | | | Third Quarter | | | First Nine Months | |
| | | | |
| | |
| |
| | | | | 2001 | | | 2000 | | | 2001 | | | 2000 | |
| | | | |
| | |
| | |
| | |
| |
| United States | | | | | | | | | | | | | | | | |
| | Financing Share | | | | | | | | | | | | | | | | |
| | | Retail | | | 52 | % | | | 56 | % | | | 47 | % | | | 52 | % |
| | | Wholesale | | | 85 | % | | | 81 | % | | | 86 | % | | | 83 | % |
| | New/Used Retail Volume (in thousands) | | | 983 | | | | 952 | | | | 2,781 | | | | 2,779 | |
| Europe | | | | | | | | | | | | | | | | |
| | Financing Share | | | | | | | | | | | | | | | | |
| | | Retail | | | 39 | % | | | 32 | % | | | 35 | % | | | 32 | % |
| | | Wholesale | | | 97 | % | | | 99 | % | | | 95 | % | | | 96 | % |
| | New/Used Retail Volume (in thousands) | | | 251 | | | | 206 | | | | 741 | | | | 618 | |
9
FINANCIAL CONDITION AND LIQUIDITY
Ford Credit’s managed net finance receivables include owned receivables and receivables that have been transferred to other entities in securitization transactions. Total managed net finance receivables and net investment in operating leases at September 30, 2001 were $201 billion, up $10 billion or 5% from June 30, 2001 and up $22 billion or 12% from a year ago. On an owned basis, net finance receivables at September 30, 2001 were $110 billion, down $16 billion or 13% from June 30, 2001 and down $9 billion or 8% from a year ago. Net investment in operating leases at September 30, 2001 was $40 billion, about equal to June 30, 2001 and up $2 billion or 5% from a year ago. The increase in managed receivables and net investment in operating leases from a year ago resulted primarily from a higher volume of retail receivables. The decrease in owned net finance receivables from a year ago reflects primarily higher sales of retail and wholesale receivables in securitization transactions. Our managed and owned net finance receivables are shown below (in billions):
| | | | | | | | | | | | | | | |
| Owned Finance Receivables & Net | | Sept 30, | | | June 30, | | | Sept 30, | |
| Investment in Operating Leases | | 2001 | | | 2001 | | | 2000 | |
| |
| | |
| | |
| |
| Retail | | $ | 83.6 | | | $ | 80.5 | | | $ | 82.9 | |
| Wholesale | | | 16.0 | | | | 36.5 | | | | 28.3 | |
| Other | | | 11.8 | | | | 10.0 | | | | 8.9 | |
| | |
| | |
| | |
| |
| | Total finance receivables | | $ | 111.4 | | | $ | 127.0 | | | $ | 120.1 | |
| Less: Allowance for credit losses | | | (1.6 | ) | | | (1.3 | ) | | | (1.2 | ) |
| | |
| | |
| | |
| |
| | | Finance receivables, net | | $ | 109.8 | | | $ | 125.7 | | | $ | 118.9 | |
| | |
| | |
| | |
| |
| Net investment in operating leases | | $ | 40.3 | | | $ | 39.5 | | | $ | 38.4 | |
| Memo: | | | | | | | | | | | | |
| Managed net finance receivables & net investment in operating leases | | $ | 201.3 | | | $ | 191.4 | | | $ | 179.6 | |
As a result of the credit rating downgrades discussed below, Ford Credit's commercial paper generally is no longer eligible for purchase by money market mutual funds subject to the Investment Company Act of 1940. In partial response to this, and to ensure liquidity throughout the business cycle, Ford Credit has reduced its reliance on commercial paper funding by reducing outstanding commercial paper from $42 billion at the end of 2000 to $21.6 billion at September 30, 2001. During 2001, Ford Credit has relied more heavily on other sources of funding, including long-term unsecured debt (such as the $7.9 billion of debt securities issued on October 25, 2001, described below) and public and private sales of receivables.
In addition, Ford Credit and its subsidiaries have available $15 billion under contractually committed global credit agreements with various banks, the majority of which is available through June 30, 2006. Substantially all of these bank facilities were unused at October 31, 2001. Also, banks provide $10 billion of liquidity facilities to support the asset-backed commercial paper program of a Ford Credit-sponsored special purpose entity. Furthermore, Ford Credit has entered into agreements with several bank-sponsored, commercial paper issuers ("conduits") under which such conduits are contractually committed to purchase receivables from Ford Credit, at Ford Credit's option. These agreements generally are revolving 364-day commitments. As of October 31, 2001, available capacity under these agreements was $8.1 billion, of which $1.5 billion expires in December 2001 and the balance expires between June and October 2002.
On October 18, 2001, Moody’s Investors Service (“Moody’s”) affirmed Ford Credit’s long- and short-term debt ratings at A2 and Prime-1, respectively, and lowered Ford’s long-term debt rating from A2 to A3. Moody’s stated that the outlook for the ratings is negative. On October 15, 2001, Standard & Poors lowered Ford’s and Ford Credit’s long-term debt rating from A to BBB+, stable outlook, and lowered short-term debt ratings from A-1 to A-2. On September 26, 2001, Fitch, Inc. announced that it had downgraded the long-term credit ratings of Ford, Ford Credit and certain affiliates from A+ to A- and lowered short-term debt ratings from F1 to F2.
Because of market conditions and in anticipation of these potential downgrades by the rating agencies, we significantly increased securitization activity in 2001 as a source of funding. For the first nine months 2001 and 2000, our proceeds from sale of finance receivables are shown below (in billions):
| | | | | | | | | | |
| | | | Nine Months | |
| | | |
| |
| | | | 2001 | | | 2000 | |
| | | |
| | |
| |
| Retail | | $ | 21.0 | | | $ | 12.5 | |
| Wholesale | | | 8.5 | | | | 0.0 | |
| | |
| | |
| |
| | Total | | $ | 29.5 | | | $ | 12.5 | |
| | |
| | |
| |
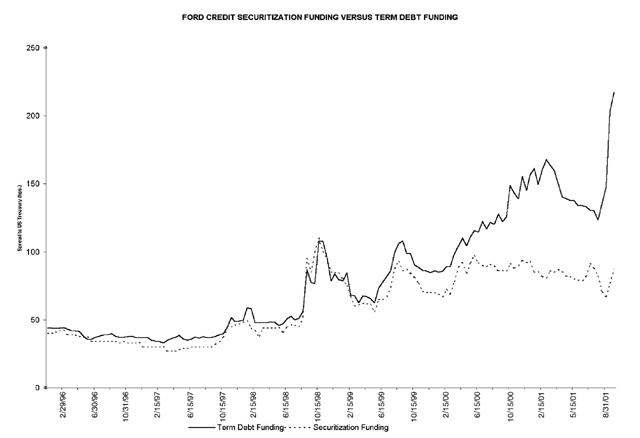
Securitization offers stable access to capital markets and provides us with a reliable and cost effective source of funds in unstable markets. Over the last year, we increased our use of securitization, including new securitization programs, as they proved to be a more cost effective source of funds than unsecured financing sources; coupled with the falling interest rate environment, the impact has been higher gains on sold receivables compared with prior periods. The attached graph reflects the relative spread volatility since
10
January 1997, and shows that securitization funding has maintained a relatively more stable trend than term debt funding.
In addition to the increased securitization activity, on October 25, 2001, we issued approximately $7.9 billion of debt securities, with maturities ranging from two to ten years. We will use the proceeds from this issuance to purchase receivables, make loans and retire existing debt.
11
NEW ACCOUNTING STANDARD
On January 1, 2002, we will adopt SFAS No. 142 “Goodwill and Other Intangible Assets”. SFAS No. 142 changes the method of accounting for goodwill and intangible assets. Goodwill and indefinite-lived intangible assets will no longer be amortized, but will become subject to an annual impairment test. As of September 30, 2001, net goodwill and intangible assets, having various amortization periods, was $0.2 billion. Adoption of this standard is not expected to have a material effect on our financial statements.
OTHER FINANCIAL INFORMATION
PricewaterhouseCoopers LLP, our independent accountants, performed a limited review of the financial data presented on pages 2 through 7 inclusive. The review was performed in accordance with standards for such reviews established by the American Institute of Certified Public Accountants. The review did not constitute an audit; accordingly, PricewaterhouseCoopers LLP did not express an opinion on the aforementioned data.
Ford Credit Liquidity and Capital Resources
Ford Credit’s outstanding debt at September 30, 2001 and at the end of each of the last four years was as follows (in millions):
| | | | | | | | | | | | | | | | | | | | | | |
| | | | | | | December 31 | |
| | | | September 30, | | |
| |
| | | | 2001 | | | 2000 | | | 1999 | | | 1998 | | | 1997 | |
| | | |
| | |
| | |
| | |
| | |
| |
| | | | (Unaudited) | | | | | | | | | | | | | | | | | |
| Commercial paper & STBAs (a) | | $ | 22,817 | | | $ | 43,627 | | | $ | 43,078 | | | $ | 48,636 | | | $ | 42,311 | |
| Other short-term debt (b) | | | 6,148 | | | | 6,503 | | | | 6,770 | | | | 4,997 | | | | 3,897 | |
| Long term debt (including current portion) (c) | | | 117,389 | | | | 96,165 | | | | 83,226 | | | | 61,334 | | | | 54,517 | |
| | |
| | |
| | |
| | |
| | |
| |
| | Total debt | | $ | 146,354 | | | $ | 146,295 | | | $ | 133,074 | | | $ | 114,967 | | | $ | 100,725 | |
| | |
| | |
| | |
| | |
| | |
| |
| United States | | $ | 113,215 | | | $ | 116,427 | | | $ | 104,186 | | | $ | 85,394 | | | $ | 78,443 | |
| Europe | | | 16,445 | | | | 14,866 | | | | 14,510 | | | | 16,653 | | | | 12,491 | |
| Other international | | | 16,694 | | | | 15,002 | | | | 14,378 | | | | 12,920 | | | | 9,791 | |
| | |
| | |
| | |
| | |
| | |
| |
| | Total debt | | $ | 146,354 | | | $ | 146,295 | | | $ | 133,074 | | | $ | 114,967 | | | $ | 100,725 | |
| | |
| | |
| | |
| | |
| | |
| |
| a) | | Short-term borrowing agreements with bank trust departments. Includes $1,031.0 million with an affiliated company at December 31, 1999. There were no outstanding balances with affiliates at September 30, 2001, December 31, 2000, December 31, 1998 or December 31, 1997. |
| |
| b) | | Includes $340 million, $571 million, $718 million, $989 million and $831 million with an affiliated company at September 30, 2001, December 31, 2000, December 31, 1999, December 31, 1998 and December 31, 1997, respectively. |
| |
| c) | | Includes $1,691 million, $2,576 million, $3,457 million, $2,878 million, and $3,547 million with affiliated companies at September 30, 2001, December 31, 2000, December 31, 1999, December 31, 1998, and December 31, 1997, respectively. |
Support facilities represent additional sources of funds, if required. At September 30, 2001, Ford Credit had approximately $10.8 billion of contractually committed facilities. In addition, approximately $7.4 billion of Ford lines of credit may be used by Ford Credit at Ford’s option. These credit lines have various maturity dates through June 30, 2006 and may be used, at Ford Credit’s option, by any of its direct or indirect majority-owned subsidiaries. Any such borrowings will be guaranteed by Ford Credit. Banks also provide $10.0 billion of contractually committed liquidity facilities to support Ford Credit’s asset-backed commercial paper program.
Additionally, at September 30, 2001, there were approximately $4.5 billion of contractually committed facilities available for FCE Bank plc’s (“FCE Bank”) use. In addition, $598 million of Ford lines of credit may be used by FCE Bank at Ford’s option. The lines have various maturity dates through June 30, 2006 and may be used, at FCE Bank’s option, by any of its direct or indirect majority-owned subsidiaries. Any such borrowings will be guaranteed by FCE Bank.
12
Part II. OTHER INFORMATION
Item 1. Legal Proceedings
| |
| | For a discussion of purported class actions and other proceedings affecting Ford Credit, see Item 5, “Other Information —
Information Concerning Ford — Class Actions — Ford Credit Debt Collection Class Actions — Late Charges Class Actions —
Reverse Discrimination Class Action”. |
Item 2. Changes in Securities
Item 3. Defaults Under Senior Securities
Item 4. Submission of Matters to a Vote of Security Holders
13
ITEM 5. Other Information
INFORMATION CONCERNING FORD
Ford Motor Company and Subsidiaries
CONSOLIDATED STATEMENT OF INCOME
For the Periods Ended September 30, 2001 and 2000
(in millions)
| | | | | | | | | | | | | | | | | | | |
| | | | | Third Quarter | | | Nine Months | |
| | | | |
| | |
| |
| | | | | 2001 | | | 2000 | | | 2001 | | | 2000 | |
| | | | |
| | |
| | |
| | |
| |
| | | | | (unaudited) | | | (unaudited) | |
| | | | |
| | |
| |
| AUTOMOTIVE Sales | | $ | 28,554 | | | $ | 32,582 | | | $ | 97,756 | | | $ | 106,123 | |
| Costs and expenses (Note 2) |
| Cost of sales (Note 3) | | | 27,296 | | | | 29,670 | | | | 91,759 | | | | 94,753 | |
| Selling, administrative and other expenses | | | 2,342 | | | | 2,338 | | | | 7,184 | | | | 7,061 | |
| | |
| | |
| | |
| | |
| |
| | Total costs and expenses | | | 29,638 | | | | 32,008 | | | | 98,943 | | | | 101,814 | |
| Operating income (loss) | | | (1,084 | ) | | | 574 | | | | (1,187 | ) | | | 4,309 | |
| Interest income | | | 144 | | | | 382 | | | | 617 | | | | 1,139 | |
| Interest expense | | | 308 | | | | 367 | | | | 1,005 | | | | 1,012 | |
| | |
| | |
| | |
| | |
| |
| | Net interest income (expense) | | | (164 | ) | | | 15 | | | | (388 | ) | | | 127 | |
| Equity in net loss of affiliated companies | | | (346 | ) | | | (61 | ) | | | (686 | ) | | | (64 | ) |
| | |
| | |
| | |
| | |
| |
| Income (loss) before income taxes — Automotive | | | (1,594 | ) | | | 528 | | | | (2,261 | ) | | | 4,372 | |
| FINANCIAL SERVICES |
| Revenues | | | 7,948 | | | | 7,473 | | | | 23,506 | | | | 21,335 | |
| Costs and expenses |
| Interest expense | | | 2,287 | | | | 2,451 | | | | 7,331 | | | | 6,975 | |
| Depreciation | | | 2,680 | | | | 2,427 | | | | 7,873 | | | | 7,033 | |
| Operating and other expenses (Note 3) | | | 1,476 | | | | 1,257 | | | | 4,255 | | | | 3,717 | |
| Provision for credit and insurance losses | | | 879 | | | | 482 | | | | 2,137 | | | | 1,347 | |
| | |
| | |
| | |
| | |
| |
| | Total costs and expenses | | | 7,322 | | | | 6,617 | | | | 21,596 | | | | 19,072 | |
| | |
| | |
| | |
| | |
| |
| Income before income taxes — Financial Services | | | 626 | | | | 856 | | | | 1,910 | | | | 2,263 | |
| | |
| | |
| | |
| | |
| |
| TOTAL COMPANY |
| Income (loss) before income taxes | | | (968 | ) | | | 1,384 | | | | (351 | ) | | | 6,635 | |
| Provision for income taxes | | | (285 | ) | | | 449 | | | | 2 | | | | 2,199 | |
| | |
| | |
| | |
| | |
| |
| Income (loss) before minority interests | | | (683 | ) | | | 935 | | | | (353 | ) | | | 4,436 | |
| Minority interests in net income of subsidiaries | | | 9 | | | | 47 | | | | 32 | | | | 103 | |
| | |
| | |
| | |
| | |
| |
| Income (loss) from continuing operations | | | (692 | ) | | | 888 | | | | (385 | ) | | | 4,333 | |
| Income from discontinued operation (Note 4) | | | — | | | | — | | | | — | | | | 309 | |
| Loss on spin-off of discontinued operation (Note 4) | | | — | | | | — | | | | — | | | | (2,252 | ) |
| | |
| | |
| | |
| | |
| |
| Net income (loss) | | $ | (692 | ) | | $ | 888 | | | $ | (385 | ) | | $ | 2,390 | |
| | |
| | |
| | |
| | |
| |
| Income (loss) attributable to Common and Class B Stock after preferred stock dividends | | $ | (696 | ) | | $ | 884 | | | $ | (396 | ) | | $ | 2,379 | |
| Average number of shares of Common and Class B Stock outstanding | | | 1,812 | | | | 1,649 | | | | 1,823 | | | | 1,354 | |
| AMOUNTS PER SHARE OF COMMON AND CLASS B STOCK (Notes 5 and 6) |
| Basic Income |
| Income (loss) from continuing operations | | $ | (0.39 | ) | | $ | 0.54 | | | $ | (0.22 | ) | | $ | 3.21 | |
| | | Income from discontinued operation | | | — | | | | — | | | | — | | | | 0.23 | |
| | | Loss on spin-off of discontinued operation | | | — | | | | — | | | | — | | | | (1.67 | ) |
| | |
| | |
| | |
| | |
| |
| | | Net income (loss) | | $ | (0.39 | ) | | $ | 0.54 | | | $ | (0.22 | ) | | $ | 1.77 | |
| Diluted Income |
| | | Income (loss) from continuing operations | | $ | (0.38 | ) | | $ | 0.53 | | | $ | (0.21 | ) | | $ | 3.14 | |
| | | Income from discontinued operation | | | — | | | | — | | | | — | | | | 0.23 | |
| | | Loss on spin-off of discontinued operation | | | — | | | | — | | | | — | | | | (1.64 | ) |
| | |
| | |
| | |
| | |
| |
| | | Net income (loss) | | $ | (0.38 | ) | | $ | 0.53 | | | $ | (0.21 | ) | | $ | 1.73 | |
| Cash dividends | | $ | 0.30 | | | $ | 0.50 | | | $ | 0.90 | | | $ | 1.50 | |
The accompanying notes are part of the financial statements.
14
Ford Motor Company and Subsidiaries
CONSOLIDATED BALANCE SHEET
(in millions)
| | | | | | | | | | | |
| | | | | September 30, | | | December 31, | |
| | | | | 2001 | | | 2000 | |
| | | | |
| | |
| |
| | | | | (unaudited) | | | | | |
| ASSETS | | | | | | | | |
| Automotive | | | | | | | | |
| Cash and cash equivalents | | $ | 6,127 | | | $ | 3,374 | |
| Marketable securities | | | 6,875 | | | | 13,116 | |
| | |
| | |
| |
| | | Total cash and marketable securities | | | 13,002 | | | | 16,490 | |
| Receivables | | | 2,747 | | | | 4,685 | |
| Inventories (Note 7) | | | 7,110 | | | | 7,514 | |
| Deferred income taxes | | | 2,692 | | | | 2,239 | |
| Other current assets | | | 5,427 | | | | 5,318 | |
| Current receivable from Financial Services | | | 1,815 | | | | 1,587 | |
| | |
| | |
| |
| | | Total current assets | | | 32,793 | | | | 37,833 | |
| Equity in net assets of affiliated companies | | | 2,662 | | | | 2,949 | |
| Net property | | | 35,825 | | | | 37,508 | |
| Deferred income taxes | | | 3,503 | | | | 3,342 | |
| Other assets | | | 12,847 | | | | 12,680 | |
| | |
| | |
| |
| | | Total Automotive assets | | | 87,630 | | | | 94,312 | |
| Financial Services Cash and cash equivalents | | | 4,511 | | | | 1,477 | |
| Investments in securities | | | 416 | | | | 817 | |
| Finance receivables, net | | | 112,728 | | | | 125,164 | |
| Net investment in operating leases | | | 49,112 | | | | 46,593 | |
| Other assets | | | 20,937 | | | | 12,390 | |
| Receivable from Automotive | | | 2,193 | | | | 2,637 | |
| | |
| | |
| |
| | | Total Financial Services assets | | | 189,897 | | | | 189,078 | |
| | |
| | |
| |
| | | Total assets | | $ | 277,527 | | | $ | 283,390 | |
| | |
| | |
| |
| LIABILITIES AND STOCKHOLDERS’ EQUITY | | | | | | | | |
| Automotive | | | | | | | | |
| Trade payables | | $ | 15,258 | | | $ | 15,075 | |
| Other payables | | | 3,802 | | | | 4,011 | |
| Accrued liabilities | | | 22,591 | | | | 23,369 | |
| Income taxes payable | | | 26 | | | | 449 | |
| Debt payable within one year | | | 283 | | | | 277 | |
| | |
| | |
| |
| | | Total current liabilities | | | 41,960 | | | | 43,181 | |
| Long-term debt | | | 11,804 | | | | 11,769 | |
| Other liabilities | | | 31,032 | | | | 29,610 | |
| Deferred income taxes | | | 296 | | | | 353 | |
| Payable to Financial Services | | | 2,193 | | | | 2,637 | |
| | |
| | |
| |
| | | Total Automotive liabilities | | | 87,285 | | | | 87,550 | |
| Financial Services Payables | | | 4,706 | | | | 5,297 | |
| Debt | | | 154,285 | | | | 153,510 | |
| Deferred income taxes | | | 8,448 | | | | 8,677 | |
| Other liabilities and deferred income | | | 6,951 | | | | 7,486 | |
| Payable to Automotive | | | 1,815 | | | | 1,587 | |
| | |
| | |
| |
| | | Total Financial Services liabilities | | | 176,205 | | | | 176,557 | |
| Company-obligated mandatorily redeemable preferred securities of a subsidiary Trust holding solely junior subordinated debentures of the Company (Note 8) | | | 672 | | | | 673 | |
| Stockholders’ equity | | | | | | | | |
| Capital stock | | | | | | | | |
| Preferred Stock, par value $1.00 per share (aggregate liquidation preference of $177 million) | | | * | | | | * | |
| | Common Stock (par value $0.01 per share (1,837 million shares issued) | | | 18 | | | | 18 | |
| | Class B Stock, par value $0.01 per share (71 million shares issued) | | | 1 | | | | 1 | |
| Capital in excess of par value of stock | | | 5,970 | | | | 6,174 | |
| Accumulated other comprehensive income (Notes 3 and 9) | | | (5,575 | ) | | | (3,432 | ) |
| ESOP loan and treasury stock | | | (2,894 | ) | | | (2,035 | ) |
| Earnings retained for use in business | | | 15,845 | | | | 17,884 | |
| | |
| | |
| |
| | | Total stockholders’ equity | | | 13,365 | | | | 18,610 | |
| | |
| | |
| |
| | | Total liabilities and stockholders’ equity | | $ | 277,527 | | | $ | 283,390 | |
| | |
| | |
| |
*Less than $1 million
The accompanying notes are part of the financial statements.
15
Ford Motor Company and Subsidiaries
CONDENSED CONSOLIDATED STATEMENT OF CASH FLOWS
For the Periods Ended September 30, 2001 and 2000
(in millions)
| | | | | | | | | | | | | | | | | | | |
| | | | | Nine Months 2001 | | | Nine Months 2000 | |
| | | | |
| | |
| |
| | | | | | | | | Financial | | | | | | | Financial | |
| | | | | Automotive | | | Services | | | Automotive | | | Services | |
| | | | |
| | |
| | |
| | |
| |
| | | | | (unaudited) | | | (unaudited) | |
| | | | | | | | | |
| Cash and cash equivalents at January 1 | | $ | 3,374 | | | $ | 1,477 | | | $ | 2,793 | | | $ | 1,588 | |
| Cash flows from operating activities before securities trading | | | 5,059 | | | | 11,123 | | | | 10,891 | | | | 13,089 | |
| Net sales of trading securities | | | 6,443 | | | | 109 | | | | 4,041 | | | | 151 | |
| | |
| | |
| | |
| | |
| |
| | | Net cash flows from operating activities | | | 11,502 | | | | 11,232 | | | | 14,932 | | | | 13,240 | |
Cash flows from investing activities
Capital expenditures | | | (3,994 | ) | | | (428 | ) | | | (4,884 | ) | | | (565 | ) |
| | Acquisitions of receivables and lease investments | | | — | | | | (68,498 | ) | | | — | | | | (69,257 | ) |
| | Collections of receivables and lease investments | | | — | | | | 36,053 | | | | — | | | | 39,834 | |
| | Net acquisitions of daily rental vehicles | | | — | | | | (1,864 | ) | | | — | | | | (2,482 | ) |
| | Purchases of securities | | | (11,228 | ) | | | (566 | ) | | | (374 | ) | | | (415 | ) |
| | Sales and maturities of securities | | | 11,026 | | | | 615 | | | | 29 | | | | 412 | |
| | Proceeds from sales of receivables and lease investments | | | — | | | | 29,515 | | | | — | | | | 12,502 | |
| | Net investing activity with Financial Services | | | 116 | | | | — | | | | 92 | | | | — | |
| | Cash paid for acquisitions (Note 10) | | | (1,935 | ) | | | (743 | ) | | | (2,487 | ) | | | (87 | ) |
| | Other | | | 375 | | | | (111 | ) | | | 0 | | | | 226 | |
| | |
| | |
| | |
| | |
| |
| | | Net cash used in investing activities | | | (5,640 | ) | | | (6,027 | ) | | | (7,624 | ) | | | (19,832 | ) |
Cash flows from financing activities
Cash dividends | | | (1,654 | ) | | | — | | | | (2,185 | ) | | | — | |
| | Value Enhancement Plan payments | | | — | | | | — | | | | (5,440 | ) | | | — | |
| | Net purchases of Common Stock | | | (1,347 | ) | | | — | | | | (185 | ) | | | — | |
| | Changes in short-term debt | | | (2 | ) | | | (12,506 | ) | | | (841 | ) | | | (8,140 | ) |
| | Proceeds from issuance of other debt | | | 189 | | | | 31,123 | | | | 1,917 | | | | 31,397 | |
| | Principal payments on other debt | | | (146 | ) | | | (20,675 | ) | | | (823 | ) | | | (14,896 | ) |
| | Net debt repayments from discontinued operations | | | — | | | | — | | | | 650 | | | | — | |
| | Net cash distribution to discontinued operations | | | — | | | | — | | | | (85 | ) | | | — | |
| | Net financing activity with Automotive | | | — | | | | (116 | ) | | | — | | | | (92 | ) |
| | Other | | | 174 | | | | (212 | ) | | | 14 | | | | (409 | ) |
| | |
| | |
| | |
| | |
| |
| | | Net cash (used in)/provided by financing activities | | | (2,786 | ) | | | (2,386 | ) | | | (6,978 | ) | | | 7,860 | |
| Effect of exchange rate changes on cash | | | (95 | ) | | | (13 | ) | | | (23 | ) | | | (294 | ) |
| Net transactions with Automotive/Financial Services | | | (228 | ) | | | 228 | | | | 252 | | | | (252 | ) |
| | |
| | |
| | |
| | |
| |
| | | Net increase in cash and cash equivalents | | | 2,753 | | | | 3,034 | | | | 559 | | | | 722 | |
| | |
| | |
| | |
| | |
| |
| Cash and cash equivalents at September 30 | | $ | 6,127 | | | $ | 4,511 | | | $ | 3,352 | | | $ | 2,310 | |
| | |
| | |
| | |
| | |
| |
The accompanying notes are part of the financial statements.
16
Ford Motor Company and Subsidiaries
NOTES TO FINANCIAL STATEMENTS
(unaudited)
| | 1. | | Financial Statements — The financial data presented herein are unaudited, but in the opinion of management reflect those adjustments necessary for a fair statement of such information. Results for interim periods should not be considered indicative of results for a full year. Reference should be made to the financial statements contained in Ford’s Annual Report on Form 10-K for the year ended December 31, 2000. For purposes of Notes to Financial Statements, “Ford” or the “Company” means Ford Motor Company and its majority owned subsidiaries unless the context requires otherwise. Certain amounts previously disclosed in Ford’s press release and Current Report on Form 8-K dated October 18, 2001 have been reclassified, and certain amounts for prior periods were reclassified to conform with present period presentation. |
| |
| | 2. | | Selected Automotive Costs and Expenses are summarized as follows (in millions): |
| | | | | | | | | | | | | | | | | |
| | | Third Quarter | | | Nine Months | |
| | |
| | |
| |
| | | 2001 | | | 2000 | | | 2001 | | | 2000 | |
| | |
| | |
| | |
| | |
| |
| Depreciation | | $ | 632 | | | $ | 734 | | | $ | 1,989 | | | $ | 2,146 | |
| Amortization | | | 482 | | | | 574 | | | | 1,832 | | | | 1,776 | |
| Pension expense (benefit) | | | (108 | ) | | | 74 | | | | (269 | ) | | | 87 | |
| | 3. | | SFAS 133 (“Accounting for Derivative Instruments and Hedges”) — Ford adopted SFAS 133 on January 1, 2001. For further discussion on SFAS 133 refer to Note 3 in Form 10-Q for the quarterly period ended March 31, 2001. Non-cash adjustments to income and to stockholders’ equity for the third quarter and nine months of 2001 were (in millions): |
| | | | | | | | | | | | | | | | | | | | | | | | | |
| | | Automotive | | | Financial Services | | | Total Company | |
| | |
| | |
| | |
| |
| | | Third | | | Nine | | | Third | | | Nine | | | Third | | | Nine | |
| | | Quarter | | | Months | | | Quarter | | | Months | | | Quarter | | | Months | |
| | |
| | |
| | |
| | |
| | |
| | |
| |
| Income before income taxes a/ | | $ | 33 | | | $ | (134 | ) | | $ | (20 | ) | | $ | (91 | ) | | $ | 13 | | | $ | (225 | ) |
| Net income | | | 22 | | | | (92 | ) | | | (13 | ) | | | (58 | ) | | | 9 | | | | (150 | ) |
| Stockholders’ equity b/ | | | | | | | | | | | | | | | | | | | 201 | | | | (1,127 | ) |
a/ Automotive recorded in cost of sales; Financial Services recorded in operating and other expenses
b/ Recorded in accumulated other comprehensive income
| | 4. | | Discontinued Operation — On June 28, 2000, Ford distributed 130 million shares of Visteon Corporation (“Visteon”), which represented its 100% ownership interest, by means of a tax-free spin-off in the form of a dividend on Ford Common and Class B Stock. Ford’s financial statements reflect Visteon as a “discontinued operation”. |
| |
| | 5. | | Value Enhancement Plan — On August 7, 2000, the Company announced the final results of its recapitalization, known as the Value Enhancement Plan (“VEP”). Under the VEP, Ford shareholders exchanged each of their old Ford Common or Class B shares for one new Ford Common or Class B share, as the case may be, plus, at their election, either $20 in cash, 0.748 additional new Ford Common shares, or a combination of $5.17 in cash and 0.555 additional new Ford Common shares. As a result of the elections made by shareholders under the VEP, the total cash elected was $5.7 billion and the total number of new Ford Common and Class B shares that became issued and outstanding was 1.893 billion. As a result of the VEP, approximately $1.2 billion was transferred from capital stock to capital in excess of par value of stock. |
| |
| | | | In accordance with generally accepted accounting principles, prior period shares and earnings per share amounts were not adjusted. |
| |
| | 6. | | Income Per Share of Common and Class B Stock — The calculation of diluted income per share of Common and Class B Stock takes into account the effect of obligations, such as stock options, considered to be potentially dilutive. Basic and diluted income per share were calculated using the following (in millions): |
| | | | | | | | | | | | | | | | | | |
| | | | Third Quarter | | | Nine Months | |
| | | |
| | |
| |
| | | | 2001 | | | 2000 | | | 2001 | | | 2000 | |
| | | |
| | |
| | |
| | |
| |
| Average shares outstanding | | | 1,812 | | | | 1,649 | | | | 1,823 | | | | 1,354 | |
| Issuable and uncommitted ESOP shares | | | (5 | ) | | | (6 | ) | | | (8 | ) | | | (7 | ) |
| | |
| | |
| | |
| | |
| |
| | Basic shares | | | 1,807 | | | | 1,643 | | | | 1,815 | | | | 1,347 | |
| Net dilutive effect of options | | | 26 | | | | 35 | | | | 34 | | | | 28 | |
| | |
| | |
| | |
| | |
| |
| | Diluted shares | | | 1,833 | | | | 1,678 | | | | 1,849 | | | | 1,375 | |
| | |
| | |
| | |
| | |
| |
17
Ford Motor Company and Subsidiaries
NOTES TO FINANCIAL STATEMENTS
(unaudited)
| | 7. | | Automotive Inventories are summarized as follows (in millions): |
| | | | | | | | | | |
| | | | September 30, | | | December 31, | |
| | | | 2001 | | | 2000 | |
| | | |
| | |
| |
| Raw materials, work in process and supplies | | $ | 2,626 | | | $ | 2,798 | |
| Finished products | | | 4,484 | | | | 4,716 | |
| | |
| | |
| |
| | Total inventories | | $ | 7,110 | | | $ | 7,514 | |
| | |
| | |
| |
| | 8. | | Company-Obligated Mandatorily Redeemable Preferred Securities of a Subsidiary Trust — The sole asset of Ford Motor Company Capital Trust I (the “Trust”), which is the obligor on the Preferred Securities of such Trust, is $632 million principal amount of 9% Junior Subordinated Debentures due 2025 of Ford Motor Company. |
| |
| | 9. | | Comprehensive Income — Other comprehensive income primarily reflects foreign currency translation adjustments and adjustments related to SFAS 133 (Note 3). Total comprehensive income is summarized as follows (in millions): |
| | | | | | | | | | | | | | | | | | |
| | | | Third Quarter | | | Nine Months | |
| | | |
| | |
| |
| | | | 2001 | | | 2000 | | | 2001 | | | 2000 | |
| | | |
| | |
| | |
| | |
| |
| Net income (loss) | | $ | (692 | ) | | $ | 888 | | | $ | (385 | ) | | $ | 2,390 | |
| Other comprehensive income (loss) | | | 775 | | | | (979 | ) | | | (2,143 | ) | | | (2,057 | ) |
| | |
| | |
| | |
| | |
| |
| | Total comprehensive income (loss) | | $ | 83 | | | $ | (91 | ) | | $ | (2,528 | ) | | $ | 333 | |
| | |
| | |
| | |
| | |
| |
| | 10. | | Acquisitions and Restructurings |
| |
| | | | Hertz Purchase — In March 2001, through a tender offer and a merger transaction, Ford acquired (for a total price of $735 million) the common stock of Hertz that it did not own, which represented about 18% of the economic interest in Hertz. |
| |
| | | | Purchase of Land Rover Business — On June 30, 2000, Ford purchased the Land Rover business from the BMW Group for approximately three billion euros. Approximately two-thirds of the purchase price (equivalent of $1.9 billion at June 30, 2000) was paid at time of closing; the remainder will be paid in 2005. The acquisition involves the entire Land Rover line of products and related assembly and engineering facilities. It does not include Rover’s passenger car business or financial services business. |
| |
| | | | European Charges — Following an extensive business review of the Ford Brand operations in Europe, the Company recorded a pre-tax charge in Automotive cost of sales of $1,568 million in the second quarter of 2000. This charge included $1.1 billion for asset impairments and $468 million for restructuring costs. The effect on after-tax earnings was $1,019 million. |
18
Ford Motor Company and Subsidiaries
NOTES TO FINANCIAL STATEMENTS
(unaudited)
| | 11. | | Segment Information — Ford’s business is divided into two business sectors - - Automotive and Financial Services (including Ford Credit and Hertz); detail is summarized as follows (in millions): |
| | | | | | | | | | | | | | | | | | | | | | | | | | | |
| | | | | | | | | Financial Services Sector | | | | | | | | | |
| | | | | | | | |
| | | | | | | | | |
| | | | | Auto | | | Ford | | | | | | | Other | | | Elims/ | | | | | |
| Third Quarter | | Sector | | | Credit | | | Hertz | | | Fin Svcs | | | Other | | | Total | |
| |
| | |
| | |
| | |
| | |
| | |
| |
| 2001 | | | | | | | | | | | | | | | | | | | | | | | | |
| | | | | | | | | | | | | | | | | | | | | | | | |
Revenues
External customer | | $ | 28,554 | | | $ | 6,334 | | | $ | 1,364 | | | $ | 245 | | | $ | 5 | | | $ | 36,502 | |
| | Intersegment | | | 388 | | | | 94 | | | | 7 | | | | 32 | | | | (521 | ) | | | — | |
| | |
| | |
| | |
| | |
| | |
| | |
| |
| | | Total Revenues | | $ | 28,942 | | | $ | 6,428 | | | $ | 1,371 | | | $ | 277 | | | $ | (516 | ) | | $ | 36,502 | |
| | |
| | |
| | |
| | |
| | |
| | |
| |
| Net income (loss) | | $ | (1,054 | ) | | $ | 376 | | | $ | 26 | | | $ | (44 | ) | | $ | 4 | | | $ | (692 | ) |
| | | | | | | | | | | | | | | | | | | | | | | | | | | |
| 2000 | | | | | | | | | | | | | | | | | | | | | | | | |
| | | | | | | | | | | | | | | | | | | | | | | | |
Revenues
External customer | | $ | 32,582 | | | $ | 5,948 | | | $ | 1,424 | | | $ | 94 | | | $ | 7 | | | $ | 40,055 | |
| | Intersegment | | | 760 | | | | 43 | | | | 8 | | | | 11 | | | | (822 | ) | | | — | |
| | |
| | |
| | |
| | |
| | |
| | |
| |
| | | Total Revenues | | $ | 33,342 | | | $ | 5,991 | | | $ | 1,432 | | | $ | 105 | | | $ | (815 | ) | | $ | 40,055 | |
| | |
| | |
| | |
| | |
| | |
| | |
| |
| Net income (loss) | | $ | 391 | | | $ | 386 | | | $ | 143 | | | $ | (29 | ) | | $ | (3 | ) | | $ | 888 | |
| | | | | | | | | | | | | | | | | | | | | | | | | | | |
| | | | | | | | | Financial Services Sector | | | | | | | | | |
| | | | | | | | |
| | | | | | | | | |
| | | | | Auto | | | Ford | | | | | | | Other | | | Elims/ | | | | | |
| Nine Months | | Sector | | | Credit | | | Hertz | | | Fin Svcs | | | Other | | | Total | |
| |
| | |
| | |
| | |
| | |
| | |
| |
| 2001 | | | | | | | | | | | | | | | | | | | | | | | | |
| | | | | | | | | | | | | | | | | | | | | | | | |
Revenues
External customer | | $ | 97,756 | | | $ | 18,938 | | | $ | 3,821 | | | $ | 728 | | | $ | 19 | | | $ | 121,262 | |
| | Intersegment | | | 2,932 | | | | 334 | | | | 21 | | | | 104 | | | | (3,391 | ) | | | — | |
| | |
| | |
| | |
| | |
| | |
| | |
| |
| | | Total Revenues | | $ | 100,688 | | | $ | 19,272 | | | $ | 3,842 | | | $ | 832 | | | $ | (3,372 | ) | | $ | 121,262 | |
| | |
| | |
| | |
| | |
| | |
| | |
| |
| Income (loss) from continuing operations | | $ | (1,559 | ) | | $ | 1,136 | | | $ | 81 | | | $ | (45 | ) | | $ | 2 | | | $ | (385 | ) |
| Total assets at September 30 | | $ | 87,630 | | | $ | 174,318 | | | $ | 11,811 | | | $ | 3,768 | | | $ | — | | | $ | 277,527 | |
| | | | | | | | | | | | | | | | | | | | | | | | | | | |
| 2000 | | | | | | | | | | | | | | | | | | | | | | | | |
| | | | | | | | | | | | | | | | | | | | | | | | |
Revenues
External customer | | $ | 106,123 | | | $ | 17,217 | | | $ | 3,826 | | | $ | 266 | | | $ | 26 | | | $ | 127,458 | |
| | Intersegment | | | 3,256 | | | | 123 | | | | 23 | | | | 115 | | | | (3,517 | ) | | | — | |
| | |
| | |
| | |
| | |
| | |
| | |
| |
| | | Total Revenues | | $ | 109,379 | | | $ | 17,340 | | | $ | 3,849 | | | $ | 381 | | | $ | (3,491 | ) | | $ | 127,458 | |
| | |
| | |
| | |
| | |
| | |
| | |
| |
| Income (loss) from continuing operations | | $ | 2,995 | | | $ | 1,126 | | | $ | 303 | | | $ | (26 | ) | | $ | (65 | ) | | $ | 4,333 | |
| Total assets at September 30 | | $ | 96,210 | | | $ | 169,894 | | | $ | 11,191 | | | $ | 4,990 | | | $ | — | | | $ | 282,285 | |
| | | |
“Other Financial Services” data is an aggregation of miscellaneous smaller Financial Services Sector business components, including Ford Motor Land Development Corporation, Ford Leasing Development Company, Ford Leasing Corporation and Granite Management Corporation. |
| |
| | | | “Elims/Other” data includes intersegment eliminations and minority interests. Interest income for the operating segments in the Financial Services Sector is reported as “Revenues”. |
19
Management’s Discussion and Analysis of Financial Condition and Results of Operations — Ford
THIRD QUARTER RESULTS OF OPERATIONS
Worldwide losses in the third quarter of 2001 were $692 million, compared with earnings of $888 million in the third quarter of 2000.
Sales and revenues were $36.5 billion in the third quarter of 2001, down $3.6 billion from a year ago. Vehicle unit sales were 1,513,000, down 163,000 units.
Results by business sector for the third quarter of 2001 and 2000 are shown below (in millions).
| | | | | | | | | | | | | | |
| | | | Third Quarter Net Income/(Loss) | |
| | | |
| |
| | | | | | | | | | | | 2001 | |
| | | | | | | | | | | | O/(U) | |
| | | | 2001 | | | 2000 | | | 2000 | |
| | | |
| | |
| | |
| |
| Automotive sector | | $ | (1,054 | ) | | $ | 391 | | | $ | (1,445 | ) |
| Financial Services sector | | | 362 | | | | 497 | | | | (135 | ) |
| | |
| | |
| | |
| |
| | Total Company | | $ | (692 | ) | | $ | 888 | | | $ | (1,580 | ) |
| | |
| | |
| | |
| |
Automotive Sector
Automotive sector losses were $1,054 million in the third quarter of 2001, on sales of $28.6 billion. These losses include a non-cash charge of $199 million for the write-down of certain investments and a credit of $9 million related to the new accounting standard (SFAS No. 133) on hedging and derivatives. Earnings in the third quarter of 2000 were $391 million, on sales of $32.6 billion (including a non-cash profit reduction of $106 million related to the acquisition of Land Rover).
Details of third quarter Automotive sector earnings are shown below (in millions).
| | | | | | | | | | | | | | |
| | | | Third Quarter Net Income/(Loss) | |
| | | |
| |
| | | | | | | | | | | | 2001 | |
| | | | | | | | | | | | O/(U) | |
| | | | 2001 | | | 2000 | | | 2000 | |
| | | |
| | |
| | |
| |
| North American Automotive | | $ | (1,026 | ) | | $ | 769 | | | $ | (1,795 | ) |
| Automotive outside North America |
| - Europe | | | (24 | ) | | | (297 | ) | | | 273 | |
| - South America | | | (56 | ) | | | (64 | ) | | | 8 | |
| - Rest of World | | | 52 | | | | (17 | ) | | | 69 | |
| | |
| | |
| | |
| |
| | Total Automotive outside North America | | | (28 | ) | | | (378 | ) | | | 350 | |
| | |
| | |
| | |
| |
| | Total Automotive sector | | $ | (1,054 | ) | | $ | 391 | | | $ | (1,445 | ) |
| | |
| | |
| | |
| |
Automotive sector losses in North America were $1,026 million in the third quarter of 2001, on sales of $19.8 billion. In the third quarter of 2000, earnings were $769 million, on sales of $23.4 billion. The reduction in earnings reflected primarily lower unit sales volume, significantly higher marketing costs, and warranty and other costs associated with customer satisfaction initiatives on various vehicles built several years ago.
In the third quarter of 2001, 4.2 million new cars and trucks were sold in the United States, down from 4.6 million units a year ago. Ford’s market share this year was 22.2%, down 0.6 percentage points from a year ago, due primarily to increased competition from Japanese and Korean manufacturers. Marketing costs increased to 16.0% of sales, up from 11.1% a year ago, reflecting increased competitive spending, including the introduction of 0.0% financing in mid-September.
In Europe, losses were $24 million in the third quarter of 2001, compared with losses of $297 million a year ago, reflecting improved results at Ford-brand operations from successful new products and the effects of last year’s restructuring actions.
In the third quarter of 2001, 4.1 million new cars and trucks were sold in Ford's 19 primary European markets, about equal to last year. Ford’s share was 11.0%, up 0.3 percentage points.
20
Management’s Discussion and Analysis of Financial Condition and Results of Operations — Ford (Continued)
In South America, losses were $56 million, compared with a loss of $64 million a year ago. About 380,000 new cars and trucks were sold in Brazil, compared with 390,000 a year ago. Ford’s share of those unit sales was 7.3%, down 1.9 percentage points, reflecting increased competition.
Earnings outside North America, Europe, and South America (“Rest of World”) were $52 million in the third quarter of 2001, $69 million better than a year ago, primarily reflecting favorable exchange and other factors that are not indicative of ongoing performance.
Financial Services Sector
Details of third quarter Financial Services sector earnings are shown below (in millions).
| | | | | | | | | | | | | | |
| | | | Third Quarter Net Income/(Loss) | |
| | | |
| |
| | | | | | | | | | | | 2001 | |
| | | | | | | | | | | | O/(U) | |
| | | | 2001 | | | 2000 | | | 2000 | |
| | | |
| | |
| | |
| |
| Ford Credit | | $ | 376 | | | $ | 386 | | | $ | (10 | ) |
| Hertz | | | 26 | | | | 143 | | | | (117 | ) |
| Minority interests and other | | | (40 | ) | | | (32 | ) | | | (8 | ) |
| | |
| | |
| | |
| |
| | Total Financial Services sector | | $ | 362 | | | $ | 497 | | | $ | (135 | ) |
| | |
| | |
| | |
| |
| Memo: Ford’s share of earnings in Hertz | | $ | 26 | | | $ | 116 | | | $ | (90 | ) |
Ford Credit’s net income in the third quarter of 2001 was $376 million, down $10 million from a year ago. Excluding the effects of SFAS No. 133, net income for the third quarter of 2001 was $389 million, up $3 million or 1% from a year ago. Higher volume and margin and improvements in investment and other income (primarily the result of gains on sale of receivables and higher interest income on retained assets related to securitization transactions) were offset largely by higher credit losses.
Hertz earned $26 million in the quarter, down $117 million from a year ago, reflecting lower rental volume due to the slowing U.S. economy and the September 11th terrorist attacks with resulting declines in both business and leisure travel. (Effective March 2001, Ford increased its ownership of Hertz to 100%, compared with about 81% a year ago.)
FIRST NINE MONTHS RESULTS OF OPERATIONS — Ford
Worldwide losses for the first nine months of 2001 were $385 million, compared with earnings from continuing operations of $4,333 million in the first nine months of 2000.
Sales and revenues were $121.3 billion in the first nine months of 2001, down $6.2 billion from a year ago. Vehicle unit sales were 5,183,000, down 402,000 units.
Results by major business sector for the first nine months of 2001 and 2000 are shown below (in millions).
| | | | | | | | | | | | | | |
| | | | First Nine Months | |
| | | | Net Income/(Loss) | |
| | | |
| |
| | | | | | | | | | | | 2001 | |
| | | | | | | | | | | | O/(U) | |
| | | | 2001 | | | 2000 | | | 2000 | |
| | | |
| | |
| | |
| |
| Automotive sector | | $ | (1,559 | ) | | $ | 2,995 | | | $ | (4,554 | ) |
| Financial Services sector | | | 1,174 | | | | 1,338 | | | | (164 | ) |
| | |
| | |
| | |
| |
| | Total continuing operations | | $ | (385 | ) | | $ | 4,333 | | | $ | (4,718 | ) |
| Net income from discontinued operation | | | — | | | | 309 | | | | (309 | ) |
| Loss on spin-off of discontinued operation | | | — | | | | (2,252 | ) | | | 2,252 | |
| | |
| | |
| | |
| |
| | Total Company | | $ | (385 | ) | | $ | 2,390 | | | $ | (2,775 | ) |
| | |
| | |
| | |
| |
21
Management’s Discussion and Analysis of Financial Condition and Results of Operations — Ford (Continued)
Automotive Sector
Losses for Ford’s Automotive sector were $1,559 million in the first nine months of 2001, on sales of $97.8 billion. Earnings in the first nine months of 2000 were $2,995 million, on sales of $106.1 billion. Adjusted for constant volume and mix, total automotive costs (excluding costs related to the Firestone tire replacement action) were up $200 million from the first nine months of 2000, reflecting higher precious metal and launch-related costs.
Automotive sector earnings in the first nine months of 2001 and 2000 are shown below (in millions).
| | | | | | | | | | | | | | |
| | | | First Nine Months | |
| | | | Net Income/(Loss) | |
| | | |
| |
| | | | | | | | | | | | 2001 | |
| | | | | | | | | | | | O/(U) |
| | | | 2001 | | | 2000 | | | 2000 | |
| | | |
| | |
| | |
| |
| North American Automotive | | $ | (1,529 | ) | | $ | 4,279 | | | $ | (5,808 | ) |
| Automotive outside North America | | | | | | | | | | | | |
| - Europe | | | 205 | | | | (1,163 | ) | | | 1,368 | |
| - South America | | | (179 | ) | | | (209 | ) | | | 30 | |
| - Rest of World | | | (56 | ) | | | 88 | | | | (144 | ) |
| | |
| | |
| | |
| |
| | Total Automotive outside North America | | | (30 | ) | | | (1,284 | ) | | | 1,254 | |
| | |
| | |
| | |
| |
| | Total Automotive sector | | $ | (1,559 | ) | | $ | 2,995 | | | $ | (4,554 | ) |
| | |
| | |
| | |
| |
In North America, losses were $1,529 million in the first nine months of 2001, down $5,808 million from the first nine months of 2000. The decrease reflected primarily lower unit sales volume, higher marketing costs, costs related to the Firestone tire replacement action, and higher costs for other customer satisfaction initiatives.
In the first nine months of 2001, 13.0 million new cars and trucks were sold in the United States, down from a record 13.9 million units a year ago. Ford’s share this year was 22.7%, down 1.3 percentage points reflecting primarily increased competition from Japanese and Korean manufacturers.
In Europe, first nine months earnings were $205 million, compared with losses of $1,163 million in the first nine months of 2000. The improvement reflected primarily stronger vehicle unit sales and the non-recurrence of charges last year for asset impairment and restructuring costs.
In the first nine months of 2001, 13.7 million new cars and trucks were sold in Ford’s 19 primary European markets, down 300,000 units from a year ago. Ford’s share this year was 10.9%, up 0.9 percentage points, reflecting increased sales of new Transit and Mondeo models.
In South America, losses were $179 million in the first nine months of 2001, compared with a loss of $209 million a year ago. In Brazil, 1,220,000 new cars and trucks were sold, compared with 1,046,000 a year ago. Ford’s share this year was 7.8%, down 1.5 percentage points.
In Rest of World, losses were $56 million in the first nine months of 2001, compared with earnings of $88 million in the first nine months of 2000. The decline reflected primarily restructuring costs and poorer operating results at Mazda.
22
Management’s Discussion and Analysis of Financial Condition and Results of Operations — Ford (Continued)
Financial Services Sector —
In the first nine months of 2001, earnings for the Financial Services sector declined $164 million from last year, more than explained by lower profits at Hertz, reflecting effects of the slowdown in the U.S. economy. Details of Financial Services sector earnings in the first nine months of 2001 and 2000 are shown below (in millions).
| | | | | | | | | | | | | | |
| | | | First Nine Months Net Income/(Loss) | |
| | | |
| |
| | | | | | | | | | | | 2001 | |
| | | | | | | | | | | | O/(U) | |
| | | | 2001 | | | 2000 | | | 2000 | |
| | | |
| | |
| | |
| |
| Ford Credit | | $ | 1,136 | | | $ | 1,126 | | | $ | 10 | |
| Hertz | | | 81 | | | | 303 | | | | (222 | ) |
| Minority interests and Other | | | (43 | ) | | | (91 | ) | | | 48 | |
| | |
| | |
| | |
| |
| | Total Financial Services sector | | $ | 1,174 | | | $ | 1,338 | | | $ | (164 | ) |
| | |
| | |
| | |
| |
| Memo: Ford’s share of earnings in Hertz | | $ | 85 | | | $ | 246 | | | $ | (161 | ) |
LIQUIDITY AND CAPITAL RESOURCES
Automotive Sector
At September 30, 2001, the Automotive sector had $13.0 billion of cash and marketable securities, down $3.5 billion from December 31, 2000. The decline was more than explained by cash outlays for the final payment for Volvo Car ($1.6 billion), share repurchase program ($1.1 billion), dividends to shareholders ($1.7 billion), and Ford’s acquisition of the minority interest in Hertz ($735 million), offset partially by positive operating cash flow. Automotive gross cash was $15.2 billion at September 30, 2001, including $2.2 billion of prefunding of certain employee health benefit obligations through a Voluntary Employee Beneficiary Association trust.
At September 30, 2001, the Automotive sector had total debt of $12.1 billion, about equal to December 31, 2000.
Financial Services Sector
At September 30, 2001, the Financial Services sector had cash and cash equivalents of $4.5 billion, up $3.0 billion from December 31, 2000. The increase in cash and cash equivalents is due to sales of receivables that occurred near the end of September 2001 in excess of commercial paper maturities. Finance receivables and net investments in operating leases were $161.8 billion at September 30, 2001, down from $171.8 billion at December 31, 2000.
Total debt was $154.3 billion at September 30, 2001, up $0.8 billion from December 31, 2000. This includes outstanding commercial paper at September 30, 2001 of $21.6 billion at Ford Credit, and $1.1 billion at Hertz, with an average remaining maturity of 45 days and 16 days, respectively.
As a result of the credit rating downgrades discussed below, Ford Credit’s commercial paper generally is no longer eligible for purchase by money market mutual funds subject to the Investment Company Act of 1940. In partial response to this, and to ensure liquidity throughout the business cycle, Ford Credit has reduced its reliance on commercial paper funding by reducing outstanding commercial paper from $42 billion at the end of 2000 to $21.6 billion at September 30, 2001. During 2001, Ford Credit has relied more heavily on other sources of funding, including long-term unsecured debt (such as the $7.9 billion of debt securities issued on October 25, 2001, described below) and public and private sales of receivables.
In addition, Ford Credit and its subsidiaries have available $15 billion under contractually committed global credit agreements with various banks, the majority of which is available through June 30, 2006. Substantially all of these bank facilities were unused at October 31, 2001. Also, banks provide $10 billion of
23
Management’s Discussion and Analysis of Financial Condition and Results of Operations — Ford (Continued)
liquidity facilities to support the asset-backed commercial paper program of a Ford Credit-sponsored special purpose entity. Furthermore, Ford Credit has entered into agreements with several bank-sponsored, commercial paper issuers (“conduits”) under which such conduits are contractually committed to purchase receivables from Ford Credit, at Ford Credit’s option. These agreements generally are revolving 364-day commitments. As of October 31, 2001, available capacity under these agreements was $8.1 billion, of which $1.5 billion expires in December 2001 and the balance expires between June and October of 2002.
On October 10, 2001, Ford’s Board of Directors declared a dividend of 15 cents a share on its common and Class B stock for the fourth quarter of 2001, which represents a 50% decrease from the 30 cents per share paid in the last several quarters. This will reduce cash outlays by about $1 billion on an annual basis.
On October 18, 2001, Moody’s Investors Service (“Moody’s”) affirmed Ford Credit’s long- and short-term debt ratings at A2 and Prime-1, respectively, and lowered Ford’s long-term debt rating from A2 to A3. Moody’s stated that the outlook for the ratings is negative. On October 15, 2001, Standard & Poors lowered Ford’s and Ford Credit’s long-term debt rating from A to BBB+, stable outlook, and lowered short-term debt ratings from A-1 to A-2. On September 26, 2001, Fitch, Inc. announced that it had downgraded the long-term credit ratings of Ford, Ford Credit and certain of their affiliates from A+ to A- and lowered short-term debt ratings from F1 to F2.
On October 25, 2001, Ford and Ford Credit issued approximately $9.4 billion of debt securities. Of this amount, $1.5 billion of debt securities due July 16, 2031 was issued by Ford, and the balance, with maturities ranging from two to ten years, was issued by Ford Credit. The proceeds from these issuances will be used by Ford for general corporate purposes and by Ford Credit to purchase receivables, make loans, and retire existing debt. Neither Ford nor Ford Credit guarantees the debt securities of the other.
OUTLOOK — FORD
Ford expects business conditions in the fourth quarter of 2001 to continue to be volatile and uncertain. Ford’s planned vehicle production in North America is 965,000 units, up from 813,000 units in the third quarter of 2001, but down 8% from a year ago. Excluding charges for restructuring actions described below, Ford expects fourth quarter 2001 results to improve from the third quarter, but it will be difficult to earn a profit.
In addition to the previously announced separation program for an estimated 4,000 to 5,000 salaried employees, the costs for which will be incurred in the fourth quarter, further restructuring actions are being considered.
NEW ACCOUNTING STANDARD — FORD
On January 1, 2002, Ford will adopt SFAS No. 142, “Goodwill and Other Intangible Assets”. Goodwill and certain intangible assets will no longer be amortized, but will be subject to an annual impairment test. As of September 30, 2001, net goodwill and intangible assets, having various amortization periods, was $8.6 billion. Ford is currently assessing the impact of this standard on its financial statements.
OTHER FINANCIAL INFORMATION — FORD
PricewaterhouseCoopers LLP, Ford’s independent accountants, performed a limited review of the financial data presented on pages 14 through 19 inclusive. The review was performed in accordance with standards for such reviews established by the American Institute of Certified Public Accountants. The review did not constitute an audit; accordingly, PricewaterhouseCoopers LLP did not express an opinion on the aforementioned data.
24
Legal Proceedings — Ford
Firestone Matters. (Previously discussed beginning on page 20 of the 10-K Report, on page 19 of Ford Credit’s Quarterly Report on Form 10-Q for the quarter ended March 31, 2001 (the “First Quarter 10-Q Report”) and on page 21 of Ford Credit’s Quarterly Report on Form 10-Q for the quarter ended June 30, 2001 (the “Second Quarter 10-Q Report”).) As previously reported, NHTSA has been investigating the circumstances leading up to Firestone’s tire recall and Ford’s tire replacement program, as well as the root cause of the tire failures and related accidents. On October 4, 2001, NHTSA issued its determination that 3.5 million of the older tires subject to Ford’s replacement program are defective, and said that Firestone had agreed to recall those tires. About 2.5 million of the defective tires are estimated to have been in service as of May 2001 (when Ford’s replacement program was announced), and consist of 15 and 16-inch Wilderness AT tires manufactured prior to May 1998 and supplied to Ford as original equipment or sold as replacement equipment.
In its October 4th announcement, NHTSA said that the plant-by-plant failure trends for the defective tires are similar to those of the ATX tires recalled by Firestone in August 2000. The agency also said that the failure rate for these tires is significantly higher than that of competitors’ tires used on SUVs, especially Goodyear tires used as original equipment on the Ford Explorer. As to Wilderness AT tires built after May 1998, NHTSA said that those tires are relatively new and, therefore, it is unable to determine at this time whether their field performance ultimately would be significantly better than the older tires. NHTSA therefore said that it would continue to monitor the newer tires. However, NHTSA has encouraged owners of those newer Wilderness AT tires to take advantage of Ford’s replacement program.
As a result of Firestone’s August 2000 recall and Ford’s May 2001 replacement program, Ford continues to deal with major litigation and other matters involving Firestone ATX and Wilderness AT tires on Ford vehicles. Ford is continuing its efforts to resolve the personal injury lawsuits and have settled more than one third of the total of such cases that have been filed to date. As previously reported, most of the class action lawsuits relating to Ford’s use of Firestone tires are consolidated in federal court in Indianapolis. That court has ruled that, under federal law, NHTSA has the exclusive authority to order and supervise automotive recalls. Accordingly, the court dismissed those portions of the class action complaints that sought recall of additional tires or court supervision of the recall and the tire replacement program. The court also dismissed some of the claims for damages. The court declined to dismiss the plaintiffs’ warranty claims for the alleged diminution in value of the Explorer. A hearing on plaintiffs’ motion to certify a class is scheduled for November 16, 2001. The estimated costs of these personal injury and class action lawsuits have been accrued and are reflected in Ford’s financial statements.
Environmental Matters
MFA Grand Jury Matter. (Previously discussed on page 22 of the 10-K Report and on page 22 of the Second Quarter 10-Q Report.) By letter dated October 16, 2001, the U.S. Department of Justice informed Ford that the government does not intend to pursue a criminal case against Ford. The U.S. Department of Justice has also assured Ford that the government does not intend to prosecute any individuals in connection with this matter.
Waste Disposal. (Previously discussed on page 22 of the 10-K Report.) The U.S. Attorney’s Office informed Ford on October 11, 2001, that it has terminated its investigation of the shipment of waste materials from Ford Venezuela for disposal in Texas and that it does not intend to prosecute any individual or business entity in connection with this matter. Discussions with U.S. EPA on the related civil enforcement matter are continuing.
25
Legal Proceedings — Ford
(Continued)
Class Actions
Paint Class Actions. (Previously discussed on page 22 of the 10-K Report.) The Illinois trial court denied Ford’s motion to dismiss and the parties are engaged in discovery. The Texas trial court granted Plaintiffs’ latest motion for class certification and certified two classes consisting of original owners of class vehicles who experienced peeling paint and all original owners who paid Ford or a Ford dealer to repaint their vehicles. Ford is preparing an appeal to the Texas Court of Appeals.
TFI Module Class Action. (Previously discussed beginning on page 23 of the 10-K Report, on page 19 of the First Quarter 10-Q Report and on page 22 of the Second Quarter 10-Q Report.) In July 2001, the parties reached an agreement in principle to settle the lead case in California and the similar cases in Maryland, Alabama, Tennessee, Washington and one in Illinois. The settlement agreement provides that Ford will extend the warranties applicable to distributor-mounted TFI modules, reimburse class members who previously paid to replace Motorcraft® distributor-mounted TFI modules prior to 100,000 miles of vehicle use, make donations to colleges and universities for research in the field of automotive safety, and pay plaintiffs’ counsel reasonable fees and expenses. On October 25, 2001, the California trial court gave preliminary approval to the settlement substantially as was agreed in July. Ford expects to receive final approval of the settlement in the first half of 2002.
Ford/Citibank Visa Class Actions. (Previously discussed on page 23 of the 10-K Report.) The U.S. Court of Appeals for the Ninth Circuit affirmed the dismissal of the coordinated proceedings. Ford has moved for rehearing en banc.
Ford Credit Debt Collection Class Actions. (Previously discussed on page 25 of the 10-K Report, on page 19 of the First Quarter 10-Q Report and on page 22 of the Second Quarter 10-Q Report.) On October 19, 2001, the United States Court of Appeals for the Eighth Circuit heard oral arguments in the Dubois case. Ford Credit anticipates the court will issue its decision during the first quarter 2002. In Davidson, plaintiff’s counsel agreed to the entry of a Stipulation and Order of Dismissal with the understanding that counsel has sixty days from the date of the order to substitute a new class representative.
Late Charges Class Actions. (Previously discussed on page 25 of the 10-K Report and on page 22 of the Second Quarter 10-Q Report.) In the Cumberland case, the California Supreme Court declined to review the trial court’s class certification order, and trial is scheduled to commence in January 2002. Recently, a second purported class action, Simpkins v. Ford Credit, was filed in Maryland state court with the same allegations.
Performance Management Process Class Action. (Previously discussed on page 26 of the 10-K Report, on page 20 of the First Quarter 10-Q Report and on page 22 of the Second Quarter 10-Q Report.) On July 31, 2001, the court denied Ford’s motion to dismiss the “disparate impact” claims of the putative class, and Ford is seeking to appeal that ruling.
Reverse Discrimination Class Action. (Previously discussed on page 26 of the 10-K Report, on page 20 of the First Quarter 10-Q Report and on page 22 of the Second Quarter 10-Q Report.) On July 31, 2001, the court denied Ford’s motion to dismiss the “disparate impact” claims of the putative class, and Ford is seeking to appeal that ruling.
F-150 Radiators Class Actions. (Previously discussed on page 20 of the First Quarter 10-Q Report.) The complaint in New York has been dismissed, but Ford expects plaintiffs to file an amended complaint.
26
ITEM 6. Exhibits and Reports on Form 8-K
| |
| | Please refer to Exhibit Index |
| |
| | (b) Reports on Form 8-K during the quarter ended September 30, 2001: |
| | | | | | | | | |
| | | | | | | FINANCIAL | |
| DATE OF REPORT | | ITEM | | | STATEMENTS FILED | |
| |
| | |
| |
| July 3, 2001 | | Item 5 — Other Events | | None |
| July 18, 2001 | | Item 5 — Other Events | | News Release dated |
| | | | | | | July 18, 2001 of |
| | | | | | | Ford Motor Credit Company |
| | | | | | | and subsidiaries for the |
| | | | | | | quarter ended June 30, 2001 |
| | | | | | | and news release dated |
| | | | | | | July 18, 2001 of |
| | | | | | | Ford Motor Company and |
| | | | | | | subsidiaries for the quarter |
| | | | | | | ended June 30, 2001 |
| | | | | | | with attachments. |
| August 1, 2001 | | Item 5 — Other Events | | None |
| August 17, 2001 | | Item 5 — Other Events | | None |
| September 4, 2001 | | Item 5 — Other Events | | None |
| September 14, 2001 | | Item 5 — Other Events | | None |
27
SIGNATURE
Pursuant to the requirements of the Securities Exchange Act of 1934, the registrant has duly caused this report to be signed on its behalf by the undersigned thereunto duly authorized.
| | | |
| | | FORD MOTOR CREDIT COMPANY
(Registrant) |
| |
| November 14, 2001 | | /s/ B. Boerio
B. Boerio
Executive Vice President,
Chief Financial Officer
and Treasurer |
28
Report of Independent Accountants
To the Board of Directors and Stockholder of
Ford Motor Credit Company:
We have reviewed the accompanying condensed consolidated balance sheets of Ford Motor Credit Company and Subsidiaries as of September 30, 2001 and 2000, and the related condensed consolidated statements of income and of earnings retained for use in the business for each of the three-month and nine-month periods ended September 30, 2001 and 2000 and the condensed consolidated statements of cash flows for the nine-month periods ended September 30, 2001 and 2000. These financial statements are the responsibility of the Company’s management.
We conducted our review in accordance with standards established by the American Institute of Certified Public Accountants. A review of interim financial information consists principally of applying analytical procedures to financial data and making inquiries of persons responsible for financial and accounting matters. It is substantially less in scope than an audit conducted in accordance with generally accepted auditing standards, the objective of which is the expression of an opinion regarding the financial statements taken as a whole. Accordingly, we do not express such an opinion.
Based on our review, we are not aware of any material modifications that should be made to the accompanying condensed consolidated interim financial statements for them to be in conformity with accounting principles generally accepted in the United States of America.
We previously audited in accordance with auditing standards generally accepted in the United States of America, the consolidated balance sheet as of December 31, 2000, and the related consolidated statements of income, stockholder’s equity, and of cash flows for the year then ended (not presented herein), and in our report dated January 18, 2001, we expressed an unqualified opinion on those consolidated financial statements. In our opinion, the information set forth in the accompanying condensed consolidated balance sheet as of December 31, 2000 is fairly stated in all material respects in relation to the consolidated balance sheet from which it has been derived.
/s/ PricewaterhouseCoopers LLP
Detroit, Michigan
October 15, 2001
29
FORD MOTOR CREDIT COMPANY AND SUBSIDIARIES
EXHIBIT INDEX
| | | | | | | | | |
| Sequential | | | | | | | | |
| Designation | | Description | | | Method of Filing | |
| |
| | |
| |
| 12-A | | Calculation of ratio of | | Filed with this |
| | | earnings to fixed charges | | Report. |
| | | of Ford Credit | | | | |
| 12-B | | Calculation of ratio of | | Filed with this |
| | | earnings to fixed charges | | Report. |
| | | of Ford. | | | | |
| 15 | | Letter from | | Filed with this |
| | | PricewaterhouseCoopers LLP | | Report. |
| | | dated October 15, 2001, | | | | |
| | | regarding unaudited | | | | |
| | | interim financial | | | | |
| | | information. | | | | |
30