Table of Contents
SECURITIES AND EXCHANGE COMMISSION
Washington, D. C. 20549
FORM 8-K
CURRENT REPORT
Pursuant to Section 13 or 15(d) of the
Securities Exchange Act of 1934
Date of Report April 21, 2004
(Date of earliest event reported)
FORD MOTOR COMPANY
(Exact name of registrant as specified in its charter)
| Delaware (State or other jurisdiction of incorporation) |
| 1-3950 | 38-0549190 | |
| (Commission File Number) | (IRS Employer Identification No.) | |
| One American Road, Dearborn, Michigan | 48126 | |
| (Address of principal executive offices) | (Zip Code) |
Registrant’s telephone number, including area code 313-322-3000
TABLE OF CONTENTS
Table of Contents
-2-
Item 7. Financial Statements, Pro Forma Financial Information and Exhibits.
EXHIBITS
| Designation | Description | Method of Filing | ||
| Exhibit 99.1 | News Release dated April 21, 2004 | Filed with this Report | ||
| Exhibit 99.2 | Sector Statement of Income | Filed with this Report | ||
| Exhibit 99.3 | Consolidated Statement of Income | Filed with this Report | ||
| Exhibit 99.4 | Sector Balance Sheet | Filed with this Report | ||
| Exhibit 99.5 | Consolidated Balance Sheet | Filed with this Report | ||
| Exhibit 99.6 | Condensed Sector Statement of Cash Flows | Filed with this Report | ||
| Exhibit 99.7 | Condensed Consolidated Statement of Cash Flows | Filed with this Report | ||
| Exhibit 99.8 | Investment Community Presentation | Filed with this Report | ||
| Exhibit 99.9 | Fixed Income Presentation | Filed with this Report |
Item 12. Results of Operations and Financial Condition.
Our news release dated April 21, 2004 and supplemental financial information, concerning first quarter 2004 financial results, filed as Exhibits 99.1 through 99.9, respectively, to this report, are incorporated by reference herein.
Ford Motor Company will conduct two conference calls on April 21, 2004 to review first quarter 2004 results.
Don Leclair, Ford’s Group Vice President and Chief Financial Officer, will host a conference call with the investment community and the news media that will begin at 9:00 a.m. to review our first quarter 2004 results. Investors can access this conference call by dialing 800-299-7635 (617-786-2901 for international dial-in) or on the Internet atwww.shareholder.ford.com. The passcode for both numbers is a verbal response of “Ford Earnings Call”.
Malcolm Macdonald, Ford’s Vice President and Treasurer, Jim Gouin, Ford’s Vice President and Controller, and David Cosper, Ford Motor Credit Company’s Executive Vice President, Chief Financial Officer and Treasurer will host a second conference call with fixed income investors beginning at 11:00 a.m. Investors can access this conference call by dialing 800-299-7635 (617-786-2901 for international dial-in). The passcode for both numbers is a verbal response of “Ford Fixed Income”.
Table of Contents
-3-
Investors can access replays of these calls by visiting one of the following web sites:www.shareholder.ford.comorwww.streetevents.comor by dialing 888-286-8010 (617-801-6888 for international dial-in), passcode 44456529 for the 9:00 a.m. call and passcode 33675945 for the 11:00 a.m. call. The times referenced above are Eastern Time.
Exhibits 99.1, 99.8 and 99.9 to this report contain certain “non-GAAP financial measures” as defined in Item 10 of Regulation S-K of the Securities Exchange Act of 1934, as amended. The non-GAAP financial measures include financial results excluding special items, net pricing and operating-related cash flows in respect of our Automotive sector, and managed leverage and credit loss ratios in respect of our subsidiary, Ford Motor Credit Company (“Ford Credit”). Each of these non-GAAP financial measures is discussed below, including the most directly comparable financial measure calculated and presented in accordance with Generally Accepted Accounting Principles in the United States (“GAAP”) and the reasons why we believe the presentation of the non-GAAP financial measure provides useful information to our investors.
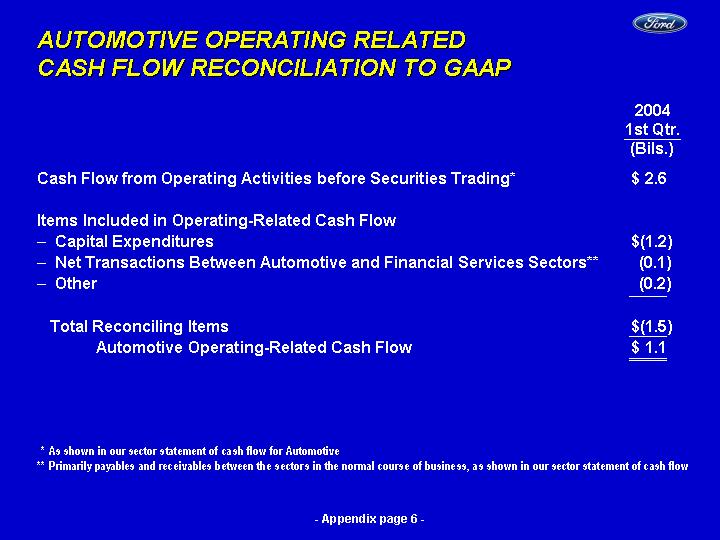
Operating-Related Cash Flows.The exhibits discuss our operating-related cash flows before contributions to trusts to fund pension and health care obligations and before tax refunds for the first quarter of 2004 and our milestone for operating-related cash flow for 2004. The exhibits indicate that we had positive operating cash flow before contributions and tax refunds of $2.3 billion for the first quarter of 2004. The most directly comparable financial measure calculated and presented in accordance with GAAP to this cash flow measure is Cash Flows from Operating Activities Before Securities Trading. Slide 17 of Exhibit 99.8 and the appendix (pages 12 and 13 of 13) to Exhibit 99.8 combine to provide a reconciliation of our non-GAAP operating cash flow measure and Cash Flows from Operating Activities Before Securities Trading. Cash Flows from Operating Activities Before Securities Trading was $2.6 billion for the first quarter of 2004. We believe the non-GAAP operating cash flow before contributions and tax refunds measure is useful to investors because it includes cash flow elements not included in Cash Flows from Operating Activities Before Securities Trading that we consider to be related to our operating activities (for example, capital spending). As a result, our operating cash flow measure provides investors with a more relevant measure of the cash generated by our operations.
Net Pricing.The exhibits indicate a change in net pricing in North America for the first quarter of 2004 was a positive 1.2%. The most directly comparable financial measure calculated and presented in accordance with GAAP to this net pricing measure is the period-over-period change in Automotive Sales. The period-over-period change in Automotive Sales is affected by changes in unit sales volume, product mix, foreign exchange rates, wholesale prices for vehicles sold and marketing incentives. The net pricing measure (which measures the combined effect of changes in wholesale prices and marketing incentives, while excluding the effects of changes in unit sales volumes, product mix, and foreign exchange rates) is useful to investors because it provides an indication of the underlying direction of changes in revenue in one performance measure. The change in Automotive Sales on a per unit basis for the first quarter of 2004 compared with for the first quarter of 2003 was an increase of 5.9% for North America. The appendix (page 7 of 13) to Exhibit 99.8 contains a reconciliation of the change in net pricing for the first quarter of 2004 compared with the first quarter of 2003 to the change in Automotive Sales for the same periods.
Table of Contents
-4-
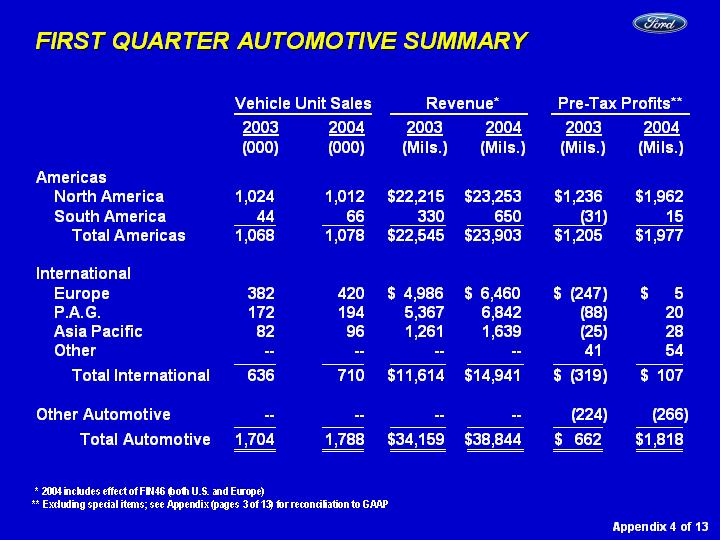
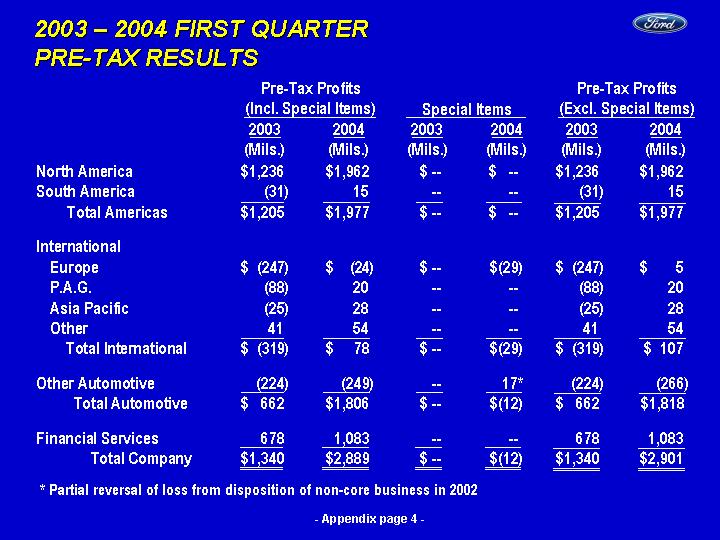
Financial Results Excluding Special Items.The exhibits discuss first quarter 2004 pre-tax profits excluding special items for our Automotive Sector and each of our primary operating segments and business units within the Automotive sector. The most directly comparable financial measure calculated and presented in accordance with GAAP to this measure is pre-tax profits including the special items. We believe that pre-tax profits excluding special items is useful to investors because it excludes elements that we do not consider to be indicative of earnings from our on-going operating activities. As a result, pre-tax profits excluding special items provides investors with a more relevant measure of the results generated by our operations. The appendix (page 2 of 13) to Exhibit 99.8 includes a list of the special items and their impact on our first quarter 2004 results. The table below sets forth the pre-tax profits for our Automotive sector, each of the operating segments and business units within our Automotive sector, and our Financial Services sector, both including and excluding the special items for the first quarter of 2004.
| 2003 - 2004 FIRST QUARTER PRE-TAX RESULTS | ||||||||||||||||||||||||
| Pre-Tax Profits | Pre-Tax Profits | |||||||||||||||||||||||
| (Incl. Special Items) | Special Items | (Excl. Special Items) | ||||||||||||||||||||||
| 2003 | 2004 | 2003 | 2004 | 2003 | 2004 | |||||||||||||||||||
| (Mils.) | (Mils.) | (Mils.) | (Mils.) | (Mils.) | (Mils.) | |||||||||||||||||||
| North America | $ | 1,236 | $ | 1,962 | $ | — | $ | — | $ | 1,236 | $ | 1,962 | ||||||||||||
| South America | (31 | ) | 15 | — | — | (31 | ) | 15 | ||||||||||||||||
| Total Americas | $ | 1,205 | $ | 1,977 | $ | — | $ | — | $ | 1,205 | $ | 1,977 | ||||||||||||
| International | ||||||||||||||||||||||||
| Europe | $ | (247 | ) | $ | (24 | ) | $ | — | $ | (29 | ) | $ | (247 | ) | $ | 5 | ||||||||
| P.A.G. | (88 | ) | 20 | — | — | (88 | ) | 20 | ||||||||||||||||
| Asia Pacific | (25 | ) | 28 | — | — | (25 | ) | 28 | ||||||||||||||||
| Other | 41 | 54 | — | — | 41 | 54 | ||||||||||||||||||
| Total International | $ | (319 | ) | $ | 78 | $ | — | $ | (29 | ) | $ | (319 | ) | $ | 107 | |||||||||
| Other Automotive | (224 | ) | (249 | ) | — | 17* | (224 | ) | (266 | ) | ||||||||||||||
| Total Automotive | $ | 662 | $ | 1,806 | $ | — | $ | (12 | ) | $ | 662 | $ | 1,818 | |||||||||||
| Financial Services | 678 | 1,083 | — | — | 678 | 1,083 | ||||||||||||||||||
| Total Company | $ | 1,340 | $ | 2,889 | $ | — | $ | (12 | ) | $ | 1,340 | $ | 2,901 | |||||||||||
| * Partial reversal of loss from disposition of non–core business in 2002. | ||||||||||||||||||||||||
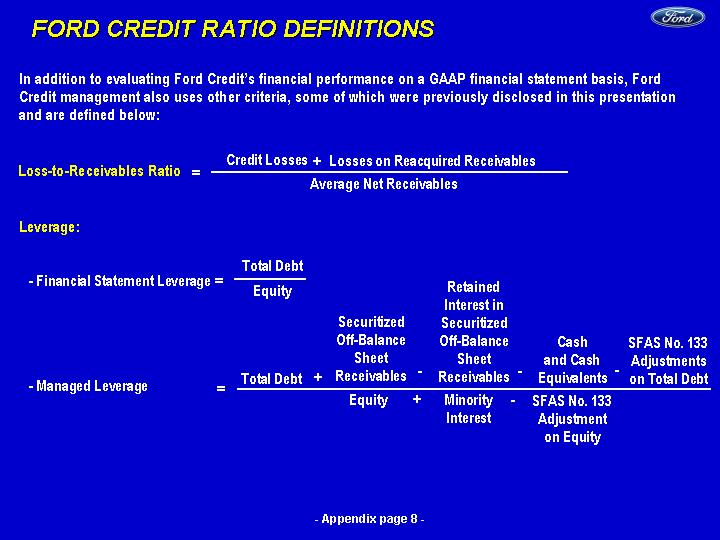
Managed Leverage.The exhibits discuss Ford Credit’s leverage (i.e., debt-to-equity ratio) on both a financial statement and managed basis. Financial statement leverage is the most directly comparable financial measure calculated and presented in accordance with GAAP to our non-GAAP managed leverage financial measure. The appendices to the exhibits contain a reconciliation of Ford Credit’s non-GAAP managed leverage measure to its financial statement leverage. The exhibits indicate that Ford Credit’s financial statement and managed leverage at March 31, 2004 were 11.6 and 12.8 to 1, respectively. We believe that the use of the non-GAAP managed leverage measure, which is the result of several adjustments to Ford Credit’s financial statement leverage, is useful to investors because it reflects the way Ford Credit manages its business. Ford Credit retains interests in receivables sold in off-balance sheet securitization transactions, and, with respect to subordinated retained interests, has credit risk. Accordingly, it considers securitization as an alternative source of funding and evaluates
Table of Contents
-5-
credit losses, receivables and leverage on a managed as well as on a financial statement basis. As a result, the managed leverage measure provides our investors with meaningful information regarding management’s decision-making processes.
In calculating its managed leverage ratio, Ford Credit adds the total amount of receivables sold in off-balance sheet securitizations, net of retained interests, to its debt. It also deducts cash and cash equivalents because these generally correspond to excess debt beyond the amount required to support Ford Credit’s financing operations. It adds minority interests to equity because all of the debt of such consolidated entities is included in total debt. It excludes the impact of Statement of Financial Accounting Standards No. 133 in both the numerator and the denominator in order to exclude the interim effects of changes in market rates because Ford Credit generally repays its debt funding obligations as they mature.
Loss-to-Receivables Ratio. The exhibits discuss Ford Credit’s loss to receivables ratios on an “on-balance sheet” and a managed basis. The exhibits indicate that Ford Credit’s total on-balance sheet credit loss ratio was 1.11% (including credit losses on reacquired receivables) and was 1.03% (excluding credit losses on reacquired receivables) for the first quarter of 2004. The exhibits further indicate that Ford Credit’s on-balance sheet credit loss ratio for its U.S. retail and lease business was 1.49% (including credit losses on reacquired receivables) and was 1.34% (excluding credit losses on reacquired receivables) for the first quarter of 2004. A loss-to-receivables ratio equals net credit losses divided by the average amount of net receivables outstanding for the period. The receivables that were reacquired in the second quarter of 2003 are those of FCAR Owner Trust (“FCAR”), an entity integral to a Ford Credit asset-backed commercial paper program. FCAR was consolidated for financial statement purposes with Ford Credit in the second quarter of 2003. The financial measure that is most directly comparable to these loss-to-receivables ratios and that is calculated and presented in accordance with GAAP is the on-balance sheet credit loss ratio excluding losses on the reacquired FCAR receivables. We believe that the use of the non-GAAP on-balance sheet credit loss ratio is useful to investors because it provides a more complete representation of our actual on-balance sheet credit loss experience.
SIGNATURE
Pursuant to the requirements of the Securities Exchange Act of 1934, the registrant has duly caused this report to be signed on its behalf by the undersigned thereunto duly authorized on the date indicated.
| FORD MOTOR COMPANY (Registrant) | ||||
| Date: April 21, 2004 | By: | /s/ Kathryn S. Lamping | ||
| Kathryn S. Lamping | ||||
| Assistant Secretary | ||||
Table of Contents
-6-
EXHIBIT INDEX
| Designation | Description | |
| Exhibit 99.1 | News Release dated April 21, 2004 | |
| Exhibit 99.2 | Sector Statement of Income | |
| Exhibit 99.3 | Consolidated Statement of Income | |
| Exhibit 99.4 | Sector Balance Sheet | |
| Exhibit 99.5 | Consolidated Balance Sheet | |
| Exhibit 99.6 | Condensed Sector Statement of Cash Flows | |
| Exhibit 99.7 | Condensed Consolidated Statement of Cash Flows | |
| Exhibit 99.8 | Investment Community Presentation | |
| Exhibit 99.9 | Fixed Income Presentation |
Table of Contents
EXHIBIT 99.1a
NEWS

Contact: | Media: | Investment Community: | Shareholder Inquiries: | Media Information Center: | ||||
| Becky Bach | Raj Modi | 1.800.555.5259 or | 1.800.665.1515 or | |||||
| 1.313.594.4410 | 1.313.323.8221 | 1.313.845.8540 | 1.313.621.0504 | |||||
| bbach1@ford.com | fordir@ford.com | stockinfo@ford.com | media@ford.com |
IMMEDIATE RELEASE
FORD ANNOUNCES FIRST QUARTER FINANCIAL RESULTS
| • | Net income of 94 cents per share, or $2 billion. | |||
| • | Earnings from continuing operations of 96 cents per share, excluding special items. | |||
| • | Automotive sector pre-tax profit of $1.8 billion. Financial Services sector pre-tax profit of $1.1 billion. | |||
| • | Full-year earnings guidance increased to a range of $1.50 to $1.60 per share from continuing operations, excluding special items. | |||
DEARBORN, Mich., April 21 — Ford Motor Company [NYSE: F] today reported net income of 94 cents per share, or $1,952 million, for the first quarter of 2004. This compares with net income of 45 cents per share, or $896 million, in the first quarter of 2003.
Ford’s first-quarter earnings from continuing operations excluding special items were 96 cents per share, or $1,983 million. This result exceeds the First Call consensus estimate of analysts of 44 cents per share.
Ford’s total sales and revenue in the first quarter rose to $44.7 billion from $40.8 billion in the year-ago period.
Go to http://media.ford.com for news releases and high-resolution photographs.
Table of Contents
2
“This is the best quarter we have achieved since we began our back-to-basics efforts more than two years ago, and it clearly demonstrates our plan is working and building momentum,” said Bill Ford, chairman and chief executive officer. “As we showed at the New York Auto Show, our product lineup continues to strengthen with new vehicles such as the Ford Escape Hybrid, Ford Mustang and Land Rover LR3/Discovery.”
AUTOMOTIVE SECTOR
On a pre-tax basis, Ford’s worldwide automotive sector reported a profit of $1,806 million during the first quarter of 2004. Excluding special items of $12 million, worldwide automotive profits in the first quarter were $1,818 million, a $1,156 million improvement over the same period a year ago. The special items included $29 million for restructuring in Ford Europe and a $17 million gain related to a prior divestiture.
Worldwide automotive sales for the first quarter rose more than 13 percent, or $4.6 billion, to $38.8 billion. Worldwide vehicle-unit sales in the quarter were 1,788,000, up from 1,704,000 a year ago.
Automotive cash, marketable securities, loaned securities and short-term Voluntary Employee Beneficiary Association (VEBA) assets on March 31, 2004 were $26.5 billion, up from $25.9 billion on December 31, 2003.
THE AMERICAS
For the first quarter, the Americas reported a pre-tax profit of $1,977 million, up $772 million from the same period a year ago.
North America:Ford’s North America automotive pre-tax profit for the first quarter was $1,962 million, up from $1,236 million a year ago. The increase primarily reflected favorable cost performance, improved vehicle mix and favorable net pricing. Sales increased to $23.3 billion from $22.2 billion in the same period a year ago.
Go to http://media.ford.com for news releases and high-resolution photographs.
Table of Contents
3
South America:Ford’s South America operations reported a first-quarter pre-tax profit of $15 million, a $46 million improvement from the 2003 first quarter. The improvement primarily reflected improved pricing, favorable mix and higher vehicle volumes. Sales were $650 million, up $320 million from the same period a year ago.
INTERNATIONAL
The 2004 first-quarter pre-tax profit for International was $107 million, excluding special items, compared with a loss of $319 million for the year-ago period, a year-over-year improvement of $426 million.
Ford Europe:Ford Europe’s first-quarter pre-tax profit was $5 million, excluding special items, compared with a pre-tax loss of $247 million during the 2003 period. The improvement primarily reflected favorable cost performance; stronger industry sales, particularly in Turkey; and favorable net pricing, partially offset by unfavorable exchange rates. Ford Europe’s sales in the first quarter were $6.5 billion, compared with $5 billion during the first quarter of 2003.
Premier Automotive Group (PAG):PAG reported a pre-tax profit of $20 million for the first quarter, compared with a pre-tax loss of $88 million for the first quarter of 2003. The improvement primarily reflected lower costs, higher volume and positive net pricing, partially offset by unfavorable exchange rates. First-quarter sales for PAG were $6.8 billion, compared with $5.4 billion a year ago.
Ford Asia-Pacific:During the first quarter of 2004, Ford Asia-Pacific reported a pre-tax profit of $28 million, compared with a pre-tax loss of $25 million in the same period a year ago. The improvement primarily reflected favorable exchange rates and cost reductions. Sales rose to $1.6 billion, compared with $1.3 billion during the first quarter of 2003.
Go to http://media.ford.com for news releases and high-resolution photographs.
Table of Contents
4
FORD CREDIT
Ford Motor Credit Company reported net income of $688 million in the first quarter of 2004, up $246 million from earnings of $442 million a year earlier. On a pre-tax basis from continuing operations, Ford Credit earned $1.1 billion in the first quarter, compared with $727 million in the previous year. The increase in earnings primarily reflected improved credit loss performance, higher used vehicle prices and the favorable impact of the present low interest rate environment.
HERTZ
Hertz reported a pre-tax loss of $7 million in the first quarter, compared with a $59 million loss during the same period a year ago. The improvement is primarily due to improved rental car demand, offset partly by unfavorable pricing.
OUTLOOK
“We are very pleased with our first-quarter results across all our automotive and financial services operations,” said Don Leclair, chief financial officer. “Our efforts to improve our quality and our business structure are continuing to pay off, and our strong pipeline of new products gives us continued confidence that we are on the right track.”
For these reasons, Ford is raising its full-year earnings guidance from a range of $1.20 to $1.30 per share to a range of $1.50 to $1.60 per share from continuing operations, excluding special items, which are presently estimated to reduce earnings by about 7 cents per share.
For the second quarter of 2004, Ford expects to earn 30 to 35 cents per share from continuing operations, excluding special items.
Investors and media can hear a review of first quarter results by Don Leclair via conference call at 800-299-7635 (617-786-2901 for international dial-in) or on the Internet athttp://www.shareholder.ford.com. Supporting presentation material will be available at the same Internet address. The presentation will begin at 9:00 a.m. EDT, April 21.
Go to http://media.ford.com for news releases and high-resolution photographs.
Table of Contents
5
Ford Motor Company, a global automotive industry leader based in Dearborn, Mich., manufactures and distributes automobiles in 200 markets across six continents. With more than 327,000 employees worldwide, the company’s core and affiliated automotive brands include Aston Martin, Ford, Jaguar, Land Rover, Lincoln, Mazda, Mercury and Volvo. Its automotive-related services include Ford Credit, Quality Care and Hertz. Ford Motor Company celebrated its 100th anniversary on June 16, 2003.
- # # # -
Statements included herein may constitute “forward looking statements” within the meaning of the Private Securities Litigation Reform Act of 1995. These statements involve a number of risks, uncertainties, and other factors that could cause actual results to differ materially from those stated, including, without limitation:
| • | greater price competition resulting from currency fluctuations, industry overcapacity or other factors; | |||
| • | a significant decline in industry sales, particularly in the U.S. or Europe, resulting from slowing economic growth, geo-political events or other factors; | |||
| • | lower-than-anticipated market acceptance of new or existing products; | |||
| • | work stoppages at key Ford or supplier facilities or other interruptions of supplies; | |||
| • | the discovery of defects in vehicles resulting in delays in new model launches, recall campaigns or increased warranty costs; | |||
| • | increased safety, emissions, fuel economy or other regulation resulting in higher costs and/or sales restrictions; | |||
| • | unusual or significant litigation or governmental investigations arising out of alleged defects in our products or otherwise; | |||
| • | worse-than-assumed economic and demographic experience for our post-retirement benefit plans (e.g., investment returns, interest rates, health care cost trends, benefit improvements); | |||
| • | currency or commodity price fluctuations; | |||
| • | a market shift from truck sales in the U.S.; | |||
| • | economic difficulties in any significant market; | |||
| • | reduced availability of or higher prices for fuel; | |||
| • | labor or other constraints on our ability to restructure our business; | |||
| • | a change in our requirements under long-term supply arrangements under which we are obligated to purchase minimum quantities or pay minimum amounts; | |||
| • | credit rating downgrades; | |||
| • | inability to access debt or securitization markets around the world at competitive rates or in sufficient amounts; | |||
| • | higher-than-expected credit losses; | |||
| • | lower-than-anticipated residual values for leased vehicles; | |||
| • | increased price competition in the rental car industry and/or a general decline in business or leisure travel due to terrorist attacks, acts of war, epidemic diseases or measures taken by governments in response thereto that negatively affect the travel industry; and | |||
| • | our inability to implement the Revitalization Plan. | |||
Go to http://media.ford.com for news releases and high-resolution photographs.
Table of Contents
Exhibit 99.2
Ford Motor Company and Subsidiaries
SECTOR STATEMENT OF INCOME
For the Periods Ended March 31, 2004 and 2003
(in millions, except per share amounts)
| First Quarter | ||||||||
| 2004 | 2003 | |||||||
| (unaudited) | ||||||||
AUTOMOTIVE | ||||||||
Sales | $ | 38,844 | $ | 34,159 | ||||
Costs and expenses | ||||||||
| Cost of sales | 34,071 | 31,055 | ||||||
| Selling, administrative and other expenses | 2,748 | 2,298 | ||||||
| Total costs and expenses | 36,819 | 33,353 | ||||||
Operating income/(loss) | 2,025 | 806 | ||||||
| Interest income | 117 | 148 | ||||||
| Interest expense | 392 | 313 | ||||||
| Net interest income/(expense) | (275 | ) | (165 | ) | ||||
| Equity in net income/(loss) of affiliated companies | 56 | 21 | ||||||
Income/(loss) before income taxes — Automotive | 1,806 | 662 | ||||||
FINANCIAL SERVICES | ||||||||
Revenues | 5,847 | 6,656 | ||||||
Costs and expenses | ||||||||
| Interest expense | 1,450 | 1,644 | ||||||
| Depreciation | 1,731 | 2,553 | ||||||
| Operating and other expenses | 1,212 | 1,188 | ||||||
| Provision for credit and insurance losses | 371 | 593 | ||||||
| Total costs and expenses | 4,764 | 5,978 | ||||||
Income/(loss) before income taxes — Financial Services | 1,083 | 678 | ||||||
TOTAL COMPANY | ||||||||
Income/(loss) before income taxes | 2,889 | 1,340 | ||||||
| Provision for/(benefit from) income taxes | 829 | 337 | ||||||
Income/(loss) before minority interests | 2,060 | 1,003 | ||||||
| Minority interests in net income/(loss) of subsidiaries | 85 | 102 | ||||||
Income/(loss) from continuing operations | 1,975 | 901 | ||||||
| Income/(loss) from discontinued/held-for-sale operations | (23 | ) | (5 | ) | ||||
Net income/(loss) | $ | 1,952 | $ | 896 | ||||
| Income/(loss) attributable to Common and Class B Stock | ||||||||
| after Preferred Stock dividends | $ | 1,952 | $ | 896 | ||||
| Average number of shares of Common and Class B | ||||||||
| Stock outstanding | 1,832 | 1,832 | ||||||
AMOUNTS PER SHARE OF COMMON AND CLASS B STOCK | ||||||||
Basic income/(loss) | ||||||||
| Income/(loss) from continuing operations | $ | 1.08 | $ | 0.49 | ||||
| Income/(loss) from discontinued/held-for-sale operations | (0.01 | ) | — | |||||
| Net income/(loss) | $ | 1.07 | $ | 0.49 | ||||
Diluted income/(loss) | ||||||||
| Income/(loss) from continuing operations | $ | 0.95 | $ | 0.45 | ||||
| Income/(loss) from discontinued/held-for-sale operations | (0.01 | ) | — | |||||
| Net income/(loss) | $ | 0.94 | $ | 0.45 | ||||
Cash dividends | $ | 0.10 | $ | 0.10 | ||||
Table of Contents
Exhibit 99.3
Ford Motor Company and Subsidiaries
CONSOLIDATED STATEMENT OF INCOME
For the Periods Ended March 31, 2004 and 2003
(in millions, except per share amounts)
| First Quarter | ||||||||
| 2004 | 2003 | |||||||
| (unaudited) | ||||||||
Sales and revenues | ||||||||
| Automotive sales | $ | 38,844 | $ | 34,159 | ||||
| Financial Services revenue | 5,847 | 6,656 | ||||||
| Total sales and revenues | 44,691 | 40,815 | ||||||
| Automotive interest income | 117 | 148 | ||||||
Costs and expenses | ||||||||
| Cost of sales | 34,071 | 31,055 | ||||||
| Selling, administrative and other expenses | 5,691 | 6,039 | ||||||
| Interest expense | 1,842 | 1,957 | ||||||
| Provision for credit and insurance losses | 371 | 593 | ||||||
| Total costs and expenses | 41,975 | 39,644 | ||||||
| Automotive equity in net income/(loss) of affiliated companies | 56 | 21 | ||||||
Income/(loss) before income taxes | 2,889 | 1,340 | ||||||
| Provision for/(benefit from) income taxes | 829 | 337 | ||||||
Income/(loss) before minority interests | 2,060 | 1,003 | ||||||
| Minority interests in net income/(loss) of subsidiaries | 85 | 102 | ||||||
Income/(loss) from continuing operations | 1,975 | 901 | ||||||
| Income/(loss) from discontinued/held-for-sale operations | (23 | ) | (5 | ) | ||||
Net income/(loss) | $ | 1,952 | $ | 896 | ||||
| Income/(loss) attributable to Common and Class B Stock after Preferred Stock dividends | $ | 1,952 | $ | 896 | ||||
| Average number of shares of Common and Class B Stock outstanding | 1,832 | 1,832 | ||||||
AMOUNTS PER SHARE OF COMMON AND CLASS B STOCK | ||||||||
Basic income/(loss) | ||||||||
| Income/(loss) from continuing operations | $ | 1.08 | $ | 0.49 | ||||
| Income/(loss) from discontinued/held-for-sale operations | (0.01 | ) | — | |||||
| Net income/(loss) | $ | 1.07 | $ | 0.49 | ||||
Diluted income/(loss) | ||||||||
| Income/(loss) from continuing operations | $ | 0.95 | $ | 0.45 | ||||
| Income/(loss) from discontinued/held-for-sale operations | (0.01 | ) | — | |||||
| Net income/(loss) | $ | 0.94 | $ | 0.45 | ||||
Cash dividends | $ | 0.10 | $ | 0.10 | ||||
Table of Contents
Exhibit 99.4
Ford Motor Company and Subsidiaries
SECTOR BALANCE SHEET
(in millions)
| March 31, | December 31, | |||||||
| 2004 | 2003 | |||||||
ASSETS | (unaudited) | |||||||
Automotive | ||||||||
| Cash and cash equivalents | $ | 4,664 | $ | 5,427 | ||||
| Marketable securities | 8,405 | 10,749 | ||||||
| Loaned securities | 9,344 | 5,667 | ||||||
| Total cash, marketable and loaned securities | 22,413 | 21,843 | ||||||
| Receivables, net | 3,020 | 2,721 | ||||||
| Inventories | 10,193 | 9,181 | ||||||
| Deferred income taxes | 3,269 | 3,225 | ||||||
| Other current assets | 10,806 | 6,839 | ||||||
| Total current assets | 49,701 | 43,809 | ||||||
| Equity in net assets of affiliated companies | 1,990 | 1,930 | ||||||
| Net property | 41,168 | 41,993 | ||||||
| Deferred income taxes | 10,918 | 12,092 | ||||||
| Goodwill and other intangible assets | 6,170 | 6,254 | ||||||
| Assets of discontinued/held-for-sale operations | 71 | 68 | ||||||
| Other assets | 15,261 | 14,495 | ||||||
| Total Automotive assets | 125,279 | 120,641 | ||||||
Financial Services | ||||||||
| Cash and cash equivalents | 13,526 | 16,343 | ||||||
| Investments in securities | 938 | 1,123 | ||||||
| Finance receivables, net | 109,867 | 110,893 | ||||||
| Net investment in operating leases | 31,293 | 31,859 | ||||||
| Retained interest in sold receivables | 13,369 | 13,017 | ||||||
| Goodwill and other intangible assets | 1,003 | 1,008 | ||||||
| Assets of discontinued/held-for-sale operations | 377 | 388 | ||||||
| Other assets | 14,437 | 17,292 | ||||||
| Receivable from Automotive | 2,820 | 3,356 | ||||||
| Total Financial Services assets | 187,630 | 195,279 | ||||||
Total assets | $ | 312,909 | $ | 315,920 | ||||
LIABILITIES AND STOCKHOLDERS’ EQUITY | ||||||||
Automotive | ||||||||
| Trade payables | $ | 16,980 | $ | 15,289 | ||||
| Other payables | 7,196 | 2,942 | ||||||
| Accrued liabilities | 32,877 | 32,171 | ||||||
| Debt payable within one year | 879 | 1,806 | ||||||
| Current payable to Financial Services | 29 | 124 | ||||||
| Total current liabilities | 57,961 | 52,332 | ||||||
| Senior debt | 13,346 | �� | 13,832 | |||||
| Subordinated debt | 5,155 | 5,155 | ||||||
| Total long-term debt | 18,501 | 18,987 | ||||||
| Other liabilities | 44,103 | 45,104 | ||||||
| Deferred income taxes | 1,903 | 2,352 | ||||||
| Liabilities of discontinued/held-for-sale operations | 109 | 94 | ||||||
| Payable to Financial Services | 2,791 | 3,232 | ||||||
| Total Automotive liabilities | 125,368 | 122,101 | ||||||
Financial Services | ||||||||
| Payables | 2,369 | 2,189 | ||||||
| Debt | 152,066 | 159,011 | ||||||
| Deferred income taxes | 11,039 | 11,061 | ||||||
| Other liabilities and deferred income | 8,409 | 9,211 | ||||||
| Liabilities of discontinued/held-for-sale operations | 36 | 37 | ||||||
| Total Financial Services liabilities | 173,919 | 181,509 | ||||||
| Minority interests | 740 | 659 | ||||||
Stockholders’ equity | ||||||||
| Capital stock | ||||||||
| Common Stock, par value $0.01 per share (1,837 million shares issued) | 18 | 18 | ||||||
| Class B Stock, par value $0.01 per share (71 million shares issued) | 1 | 1 | ||||||
| Capital in excess of par value of stock | 5,373 | 5,374 | ||||||
| Accumulated other comprehensive income/(loss) | (913 | ) | (414 | ) | ||||
| Treasury stock | (1,787 | ) | (1,749 | ) | ||||
| Earnings retained for use in business | 10,190 | 8,421 | ||||||
| Total stockholders’ equity | 12,882 | 11,651 | ||||||
Total liabilities and stockholders’ equity | $ | 312,909 | $ | 315,920 | ||||
Table of Contents
Exhibit 99.5
Ford Motor Company and Subsidiaries
CONSOLIDATED BALANCE SHEET
(in millions)
| March 31, | December 31, | |||||||
| 2004 | 2003 | |||||||
| (unaudited) | ||||||||
ASSETS | ||||||||
| Cash and cash equivalents | $ | 18,190 | $ | 21,770 | ||||
| Marketable securities | 9,343 | 11,872 | ||||||
| Loaned securities | 9,344 | 5,667 | ||||||
| Receivables, net | 3,020 | 2,721 | ||||||
| Finance receivables, net | 109,867 | 110,893 | ||||||
| Net investment in operating leases | 31,293 | 31,859 | ||||||
| Retained interest in sold receivables | 13,369 | 13,017 | ||||||
| Inventories | 10,193 | 9,181 | ||||||
| Equity in net assets of affiliated companies | 2,971 | 2,959 | ||||||
| Net property | 42,799 | 43,598 | ||||||
| Deferred income taxes | 4,162 | 7,389 | ||||||
| Goodwill and other intangible assets | 7,173 | 7,262 | ||||||
| Assets of discontinued/held-for-sale operations | 448 | 456 | ||||||
| Other assets | 37,907 | 35,950 | ||||||
Total assets | $ | 300,079 | $ | 304,594 | ||||
LIABILITIES AND STOCKHOLDERS’ EQUITY | ||||||||
| Payables | $ | 26,545 | $ | 20,420 | ||||
| Accrued liabilities | 29,781 | 29,591 | ||||||
| Debt | 171,446 | 179,804 | ||||||
| Other liabilities and deferred income | 52,655 | 53,899 | ||||||
| Deferred income taxes | 5,885 | 8,439 | ||||||
| Liabilities of discontinued/held-for-sale operations | 145 | 131 | ||||||
| Total liabilities | 286,457 | 292,284 | ||||||
| Minority interests | 740 | 659 | ||||||
Stockholders’ equity | ||||||||
| Capital stock | ||||||||
| Common Stock, par value $0.01 per share (1,837 million shares issued) | 18 | 18 | ||||||
| Class B Stock, par value $0.01 per share (71 million shares issued) | 1 | 1 | ||||||
| Capital in excess of par value of stock | 5,373 | 5,374 | ||||||
| Accumulated other comprehensive income/(loss) | (913 | ) | (414 | ) | ||||
| Treasury stock | (1,787 | ) | (1,749 | ) | ||||
| Earnings retained for use in business | 10,190 | 8,421 | ||||||
| Total stockholders’ equity | 12,882 | 11,651 | ||||||
Total liabilities and stockholders’ equity | $ | 300,079 | $ | 304,594 | ||||
Table of Contents
Exhibit 99.6
Ford Motor Company and Subsidiaries
CONDENSED SECTOR STATEMENT OF CASH FLOWS
For the Periods Ended March 31, 2004 and 2003
(in millions)
| First Quarter 2004 | First Quarter 2003 | |||||||||||||||
| Financial | Financial | |||||||||||||||
| Automotive | Services | Automotive | Services | |||||||||||||
| (unaudited) | (unaudited) | |||||||||||||||
Cash and cash equivalents at January 1 | $ | 5,427 | $ | 16,343 | $ | 5,157 | $ | 7,064 | ||||||||
| Cash flows from operating activities before securities trading | 2,564 | 5,853 | 2,942 | 4,643 | ||||||||||||
| Net sales/(purchases) of trading securities | (1,371 | ) | (8 | ) | 230 | (40 | ) | |||||||||
| Net cash flows from operating activities | 1,193 | 5,845 | 3,172 | 4,603 | ||||||||||||
| Cash flows from investing activities | ||||||||||||||||
| Capital expenditures | (1,204 | ) | (76 | ) | (1,416 | ) | (80 | ) | ||||||||
| Acquisitions of receivables and lease investments | — | (15,432 | ) | — | (17,584 | ) | ||||||||||
| Collections of receivables and lease investments | — | 11,464 | — | 10,749 | ||||||||||||
| Net acquisitions of daily rental vehicles | — | (1,041 | ) | — | (385 | ) | ||||||||||
| Purchases of securities | (1,342 | ) | (2 | ) | (566 | ) | (149 | ) | ||||||||
| Sales and maturities of securities | 1,380 | 196 | 474 | 207 | ||||||||||||
| Proceeds from sales of receivables and lease investments | — | 3,290 | — | 10,966 | ||||||||||||
| Proceeds from sale of businesses | 100 | — | — | 157 | ||||||||||||
| Repayment of debt from discontinued operations | — | — | — | 1,421 | ||||||||||||
| Net investing activity with Financial Services | 851 | — | 970 | — | ||||||||||||
| Cash paid for acquisitions | — | — | (8 | ) | — | |||||||||||
| Other | 4 | 11 | — | 47 | ||||||||||||
| Net cash (used in)/provided by investing activities | (211 | ) | (1,590 | ) | (546 | ) | 5,349 | |||||||||
| Cash flows from financing activities | ||||||||||||||||
| Cash dividends | (183 | ) | — | (183 | ) | — | ||||||||||
| Net sales/(purchases) of Common Stock | (60 | ) | — | (22 | ) | — | ||||||||||
| Changes in short-term debt | (156 | ) | 4,881 | (227 | ) | 2,424 | ||||||||||
| Proceeds from issuance of other debt | 148 | 4,343 | 90 | 3,862 | ||||||||||||
| Principal payments on other debt | (1,377 | ) | (15,491 | ) | (78 | ) | (10,640 | ) | ||||||||
| Net financing activity with Automotive | — | (851 | ) | — | (970 | ) | ||||||||||
| Other | (10 | ) | 12 | (3 | ) | 20 | ||||||||||
| Net cash (used in)/provided by financing activities | (1,638 | ) | (7,106 | ) | (423 | ) | (5,304 | ) | ||||||||
| Effect of exchange rate changes on cash | (12 | ) | (61 | ) | 55 | 78 | ||||||||||
| Net transactions with Automotive/Financial Services | (95 | ) | 95 | (304 | ) | 304 | ||||||||||
| Net increase/(decrease) in cash and cash equivalents | (763 | ) | (2,817 | ) | 1,954 | 5,030 | ||||||||||
Cash and cash equivalents at March 31 | $ | 4,664 | $ | 13,526 | $ | 7,111 | $ | 12,094 | ||||||||
Table of Contents
Exhibit 99.7
Ford Motor Company and Subsidiaries
CONDENSED CONSOLIDATED STATEMENT OF CASH FLOWS
For the Periods Ended March 31, 2004 and 2003
(in millions)
| First Quarter | ||||||||
| 2004 | 2003 | |||||||
| (unaudited) | ||||||||
Cash and cash equivalents at January 1 | $ | 21,770 | $ | 12,221 | ||||
| Cash flows from operating activities before securities trading | 8,417 | 7,585 | ||||||
| Net sales/(purchases) of trading securities | (1,379 | ) | 190 | |||||
| Net cash flows from operating activities | 7,038 | 7,775 | ||||||
| Cash flows from investing activities | ||||||||
| Capital expenditures | (1,280 | ) | (1,496 | ) | ||||
| Acquisitions of receivables and lease investments | (15,432 | ) | (17,584 | ) | ||||
| Collections of receivables and lease investments | 11,464 | 10,749 | ||||||
| Net acquisitions of daily rental vehicles | (1,041 | ) | (385 | ) | ||||
| Purchases of securities | (1,344 | ) | (715 | ) | ||||
| Sales and maturities of securities | 1,576 | 681 | ||||||
| Proceeds from sales of receivables and lease investments | 3,290 | 10,966 | ||||||
| Proceeds from sale of businesses | 100 | 157 | ||||||
| Repayment of debt from discontinued operations | — | 1,421 | ||||||
| Cash paid for acquisitions | — | (8 | ) | |||||
| Other | 15 | 47 | ||||||
| Net cash (used in)/provided by investing activities | (2,652 | ) | 3,833 | |||||
| Cash flows from financing activities | ||||||||
| Cash dividends | (183 | ) | (183 | ) | ||||
| Net sales/(purchases) of Common Stock | (60 | ) | (22 | ) | ||||
| Changes in short-term debt | 4,725 | 2,197 | ||||||
| Proceeds from issuance of other debt | 4,491 | 3,952 | ||||||
| Principal payments on other debt | (16,868 | ) | (10,718 | ) | ||||
| Other | 2 | 17 | ||||||
| Net cash (used in)/provided by financing activities | (7,893 | ) | (4,757 | ) | ||||
| Effect of exchange rate changes on cash | (73 | ) | 133 | |||||
| Net increase/(decrease) in cash and cash equivalents | (3,580 | ) | 6,984 | |||||
Cash and cash equivalents at March 31 | $ | 18,190 | $ | 19,205 | ||||
Table of Contents
Table of Contents
Table of Contents
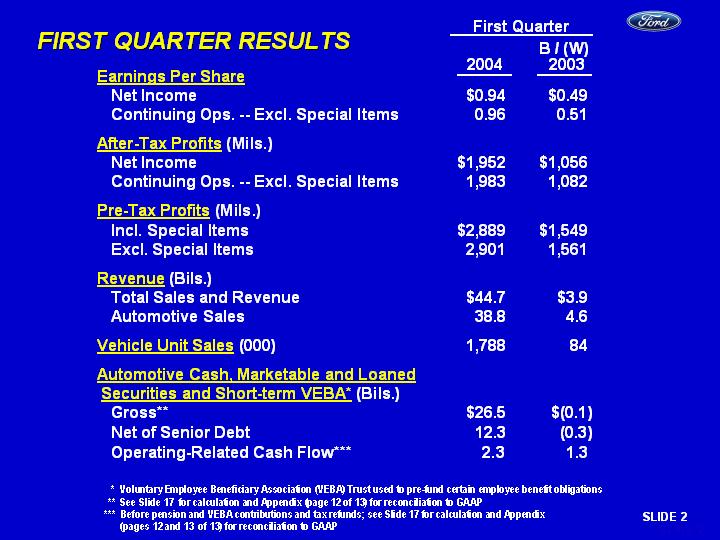
Table of Contents
Table of Contents
Table of Contents
Table of Contents

Table of Contents
Table of Contents
Table of Contents

Table of Contents
Table of Contents
Table of Contents
Table of Contents
Table of Contents
Table of Contents

Table of Contents
Table of Contents
Table of Contents
Table of Contents

| 2004 FIRST QUARTER AUTOMOTIVE CASH* First Quarter (Bils.) Cash, Marketable and Loaned Securities, Short-Term VEBA Assets March 31, 2004 $26.5 December 31, 2003 25.9 Change in Gross Cash $0.6 Operating-Related Cash Flow Automotive Pre-Tax Profits $ 1.8 Capital Spending (1.2 ) Depreciation and Amortization 1.6 Changes in Receivables, Inventory, and Trade Payables 0.4 Other -- Prim. Taxes and Expense and Payment Timing Differences (0.3 ) Total Auto. Op.-Related Cash Flow (Excl. Contrib. and Tax Refunds) $ 2.3 Pension Contributions (1.2 ) Tax Refunds 0 Total Automotive Operating-Related Cash Flow $ 1.1 Other Cash Flow Capital Transactions w / Financial Services Sector 0.9 Divestitures 0.2 Dividend to Shareholders (0.2 ) All Other -- Primarily Change in Automotive Debt (1.4 ) Total Change in Gross Cash $ 0.6 * See Appendix (pages 12 and 13 of 13) for reconciliation to GAAP |
Table of Contents
Table of Contents
Table of Contents
Table of Contents
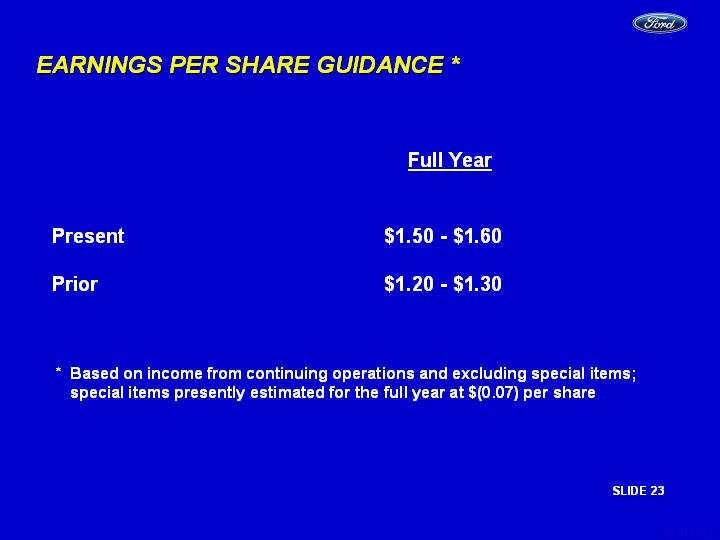
Table of Contents

Table of Contents

Table of Contents
Table of Contents
Table of Contents

Table of Contents
| 2003 - 2004 FIRST QUARTER PRE-TAX RESULTS North America $1,236 $1,962 $ -- $ -- $1,236 $1,962 South America (31 ) 15 -- -- (31 ) 15 Total Americas $1,205 $1,977 $ -- $ -- $1,205 $1,977 International Europe $ (247 ) $ (24 ) $ -- $(29 ) $ (247 ) $ 5 P.A.G. (88 ) 20 -- -- (88 ) 20 Asia Pacific (25 ) 28 -- -- (25 ) 28 Other 41 54 -- -- 41 54 Total International $ (319 ) $ 78 $ -- $(29 ) $ (319 ) $ 107 Other Automotive (224 ) (249 ) -- 17 * (224 ) (266 ) Total Automotive $ 662 $1,806 $ -- $(12 ) $ 662 $1,818 Financial Services 678 1,083 -- -- 678 1,083 Total Company $1,340 $2,889 $ -- $(12 ) $1,340 $2,901 * Partial reversal of loss from disposition of non-core business in 2002 2003 (Mils.) 2004 (Mils.) Pre-Tax Profits (Incl. Special Items) Special Items Pre-Tax Profits (Excl. Special Items) 2003 (Mils.) 2004 (Mils.) 2003 (Mils.) 2004 (Mils.) Appendix 3 of 13 |
Table of Contents
Table of Contents
Table of Contents
Table of Contents
Table of Contents

Table of Contents
Table of Contents
Table of Contents
Table of Contents
Table of Contents

Table of Contents
| FIRST QUARTER 2004 FIXED INCOME PRESENTATION April 21, 2004 EXHIBIT 99.9 |
Table of Contents
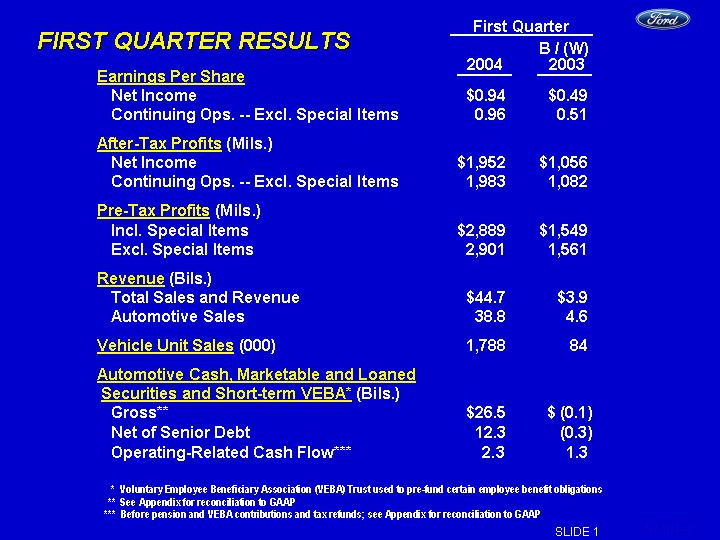
| Earnings Per Share Net Income $0.94 $0.49 Continuing Ops. -- Excl. Special Items 0.96 0.51 After-Tax Profits (Mils.) Net Income $1,952 $1,056 Continuing Ops. -- Excl. Special Items 1,983 1,082 Pre-Tax Profits (Mils.) Incl. Special Items $2,889 $1,549 Excl. Special Items 2,901 1,561 Revenue (Bils.) Total Sales and Revenue $44.7 $3.9 Automotive Sales 38.8 4.6 Vehicle Unit Sales (000) 1,788 84 Automotive Cash, Marketable and Loaned Securities and Short-term VEBA* (Bils.) Gross** $26.5 $ (0.1 ) Net of Senior Debt 12.3 (0.3 ) Operating-Related Cash Flow*** 2.3 1.3 FIRST QUARTER RESULTS 2004 B / (W) 2003 First Quarter * Voluntary Employee Beneficiary Association (VEBA) Trust used to pre-fund certain employee benefit obligations ** See Appendix for reconciliation to GAAP *** Before pension and VEBA contributions and tax refunds; see Appendix for reconciliation to GAAP SLIDE 1 |
Table of Contents

| 2004 PLANNING ASSUMPTIONS AND OPERATIONAL METRICS Planning Assumptions Industry Volume (SAAR) -- U.S. 17.0 million units 16.8 17.0 -- Europe 16.9 million units 17.1 17.0 Operational Metrics Quality Improve in all regions On track On track Market Share Flat or improve in all regions Mixed Mixed Automotive Cost Performance* Improve by at least $0.5 billion $0.6 billion Better Capital Spending $7 billion $1.2 billion On track Operating-Related Cash Flow** $1.2 billion positive $2.3 billion On track * At constant volume, mix, and exchange; excluding special items ** Before pension and VEBA contributions and tax refunds; see Appendix for reconciliation to GAAP Full Year Outlook Base 2004 Milestone First Quarter SLIDE 2 |
Table of Contents
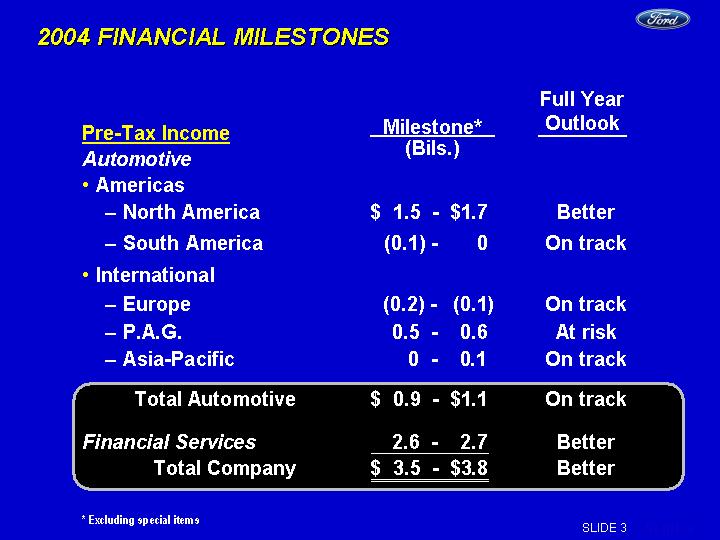
| 2004 FINANCIAL MILESTONES Pre-Tax Income Automotive Americas North America $ 1.5 - $1.7 Better South America (0.1) - 0 On track International Europe (0.2) - (0.1 ) On track P.A.G. 0.5 - 0.6 At risk Asia-Pacific 0 - 0.1 On track Total Automotive $ 0.9 - $1.1 On track Financial Services 2.6 - 2.7 Better Total Company $ 3.5 - $3.8 Better * Excluding special items Milestone* (Bils.) Full Year Outlook SLIDE 3 |
Table of Contents
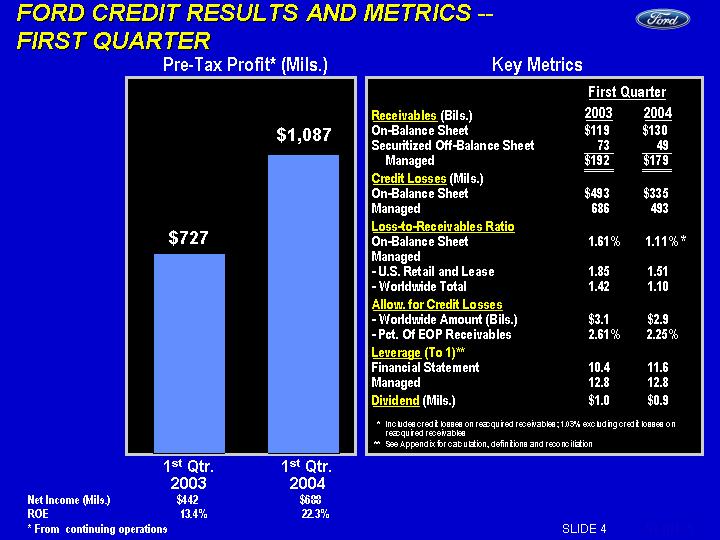
| FORD CREDIT RESULTS AND METRICS -- FIRST QUARTER Receivables (Bils.) On-Balance Sheet $119 $130 Securitized Off-Balance Sheet 73 49 Managed $192 $179 Credit Losses (Mils.) On-Balance Sheet $493 $335 Managed 686 493 Loss-to-Receivables Ratio On-Balance Sheet 1.61 % 1.11 % Managed - U.S. Retail and Lease 1.85 1.51 - Worldwide Total 1.42 1.10 Allow. for Credit Losses - Worldwide Amount (Bils.) $3.1 $2.9 - Pct. Of EOP Receivables 2.61 % 2.25 % Leverage (To 1)** Financial Statement 10.4 11.6 Managed 12.8 12.8 Dividend (Mils.) $1.0 $0.9 2003 2004 Key Metrics Net Income (Mils.) $442 $688 ROE 13.4 % 22.3 % * From continuing operations 2003 2004 East 727 1087 4Q 594 839 Pre-Tax Profit* (Mils.) 1st Qtr. 2003 1st Qtr. 2004 * $727 $1,087 First Quarter * Includes credit losses on reacquired receivables; 1.03% excluding credit losses on reacquired receivables ** See Appendix for calculation, definitions and reconciliation SLIDE 4 |
Table of Contents
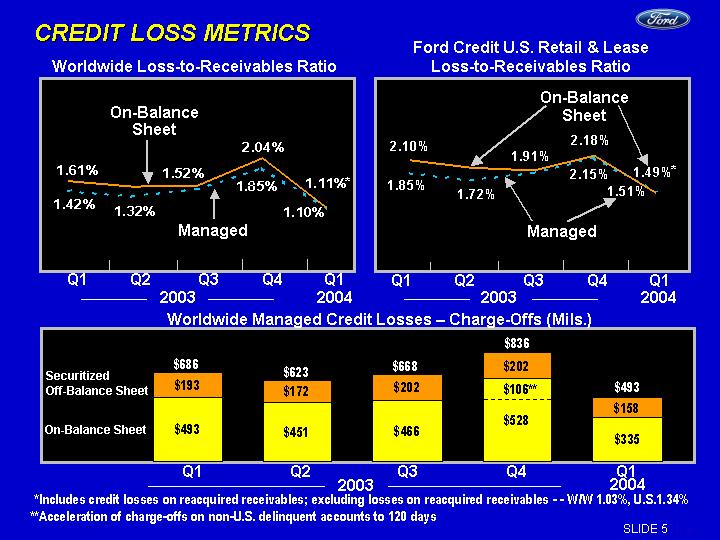
| Q4 Q1 Q2 Q3 Q4 Q104 Worldwide Managed 0.0156 0.0142 0.0132 0.0145 0.0185 0.011 Worldwide Owned 0.0192 0.0161 0.015 0.0152 0.0204 0.0111 Managed Reserves as Pct. Of EOP Receivables 0.019 0.0195 Q4 Q1 Q2 Q3 Q4 Q104 Ford Credit U.S. Managed LTR 0.0187 0.0185 0.0172 0.0186 0.0215 0.0151 Ford Credit U.S. Owned 0.0235 0.021 0.0196 0.0191 0.0218 0.0149 Managed Reserves as Pct. Of EOP Receivables 0.019 0.0195 CREDIT LOSS METRICS Managed Q4 Q1 Q2 Q3 Q4 Q104 Owned 639 493 451 466 634 335 Securitized 152 193 172 202 202 158 Worldwide Managed Credit Losses - Charge-Offs (Mils.) On-Balance Sheet Securitized Off-Balance Sheet $686 $623 Q1 Q2 Q3 Q4 2004 Q1 Q1 Q2 Q3 Q4 2004 Ford Credit U.S. Retail & Lease Loss-to-Receivables Ratio On-Balance Sheet Managed Worldwide Loss-to-Receivables Ratio On-Balance Sheet Q1 2003 2003 $668 * Includes credit losses on reacquired receivables; excluding losses on reacquired receivables - - W/W 1.03%, U.S.1.34% **Acceleration of charge-offs on non-U.S. delinquent accounts to 120 days Q1 Q2 Q3 Q4 2004 Q1 $836 2003 * * $493 ** $106 SLIDE 5 |
Table of Contents
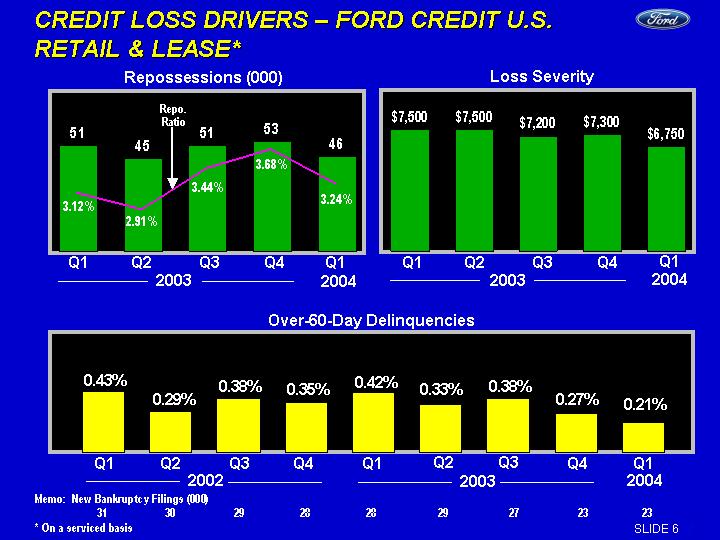
| Q4 Q1 Q2 Q3 Q4 Q104 Worldwide Owned 53 51 45 51 53 46 CREDIT LOSS DRIVERS - FORD CREDIT U.S. RETAIL & LEASE* Q4 Q1 Q2 Q3 Q4 Q1 Q2 Q3 Q4 1Q04 NON-BANKRUPT 0.0048 0.0043 0.0029 0.0038 0.0035 0.0042 0.0033 0.0038 0.0027 0.0021 Over-60-Day Delinquencies Repossessions (000) Q4 Q1 Q2 Q3 Q4 Q104 Worldwide Owned 7500 7500 7500 7200 7300 6750 Q1 Q2 Q3 Q4 Loss Severity Q1 Q4 Q1 Q2 Q3 Q4 Q1 Q2 Q3 2004 2002 Q1 3.12% 2.91% 3.44% 3.68% 3.24% 2004 2003 Memo: New Bankruptcy Filings (000) 31 30 29 28 28 29 27 23 23 * On a serviced basis Q4 Q1 Q2 Q3 Q4 Q104 Worldwide Owned 3.09 3.12 2.91 3.44 3.68 3.24 2004 2003 Q1 Q2 Q3 Q4 Q1 2003 Repo. Ratio SLIDE 6 |
Table of Contents
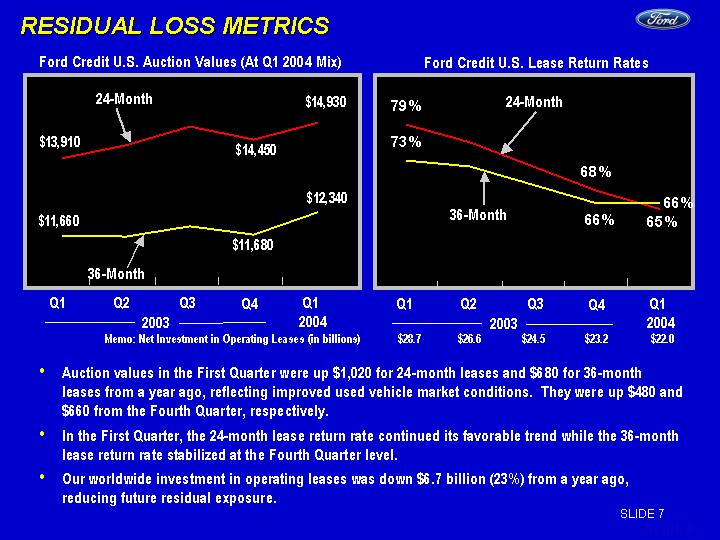
| Q4 2002 Q1 2003 Q2 2003 Q3 2003 Q4 2003 Q1 2004 RR 24-Month 0.75 0.79 0.76 0.72 0.68 0.65 RR 36-Month 0.64 0.73 0.72 0.69 0.66 0.66 RESIDUAL LOSS METRICS Auction values in the First Quarter were up $1,020 for 24-month leases and $680 for 36-month leases from a year ago, reflecting improved used vehicle market conditions. They were up $480 and $660 from the Fourth Quarter, respectively. In the First Quarter, the 24-month lease return rate continued its favorable trend while the 36-month lease return rate stabilized at the Fourth Quarter level. Our worldwide investment in operating leases was down $6.7 billion (23%) from a year ago, reducing future residual exposure. Q4 2002 Q1 2003 Q2 2003 Q3 2003 Q4 2003 Q1 2004 AV 24-Month 13680 13910 14280 14840 14450 14930 AV 36-Month 12010 11660 11630 11930 11680 12340 Ford Credit U.S. Auction Values (At Q1 2004 Mix) Ford Credit U.S. Lease Return Rates 36-Month 24-Month Q4 Q1 Q1 Q2 Q3 2004 2003 36-Month 24-Month Memo: Net Investment in Operating Leases (in billions) $28.7 $26.6 $24.5 $23.2 $22.0 Q4 Q1 Q1 Q2 Q3 2004 2003 SLIDE 7 |
Table of Contents
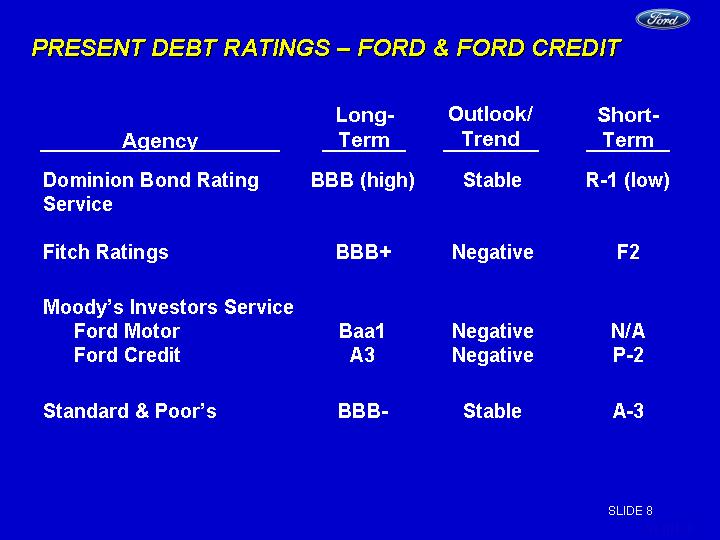
| PRESENT DEBT RATINGS - FORD & FORD CREDIT Agency Long- Term Outlook/ Trend Short- Term Dominion Bond Rating BBB (high) Stable R-1 (low) Service Fitch Ratings BBB+ Negative F2 Moody's Investors Service Ford Motor Baa1 Negative N/A Ford Credit A3 Negative P-2 Standard & Poor's BBB- Stable A-3 SLIDE 8 |
Table of Contents
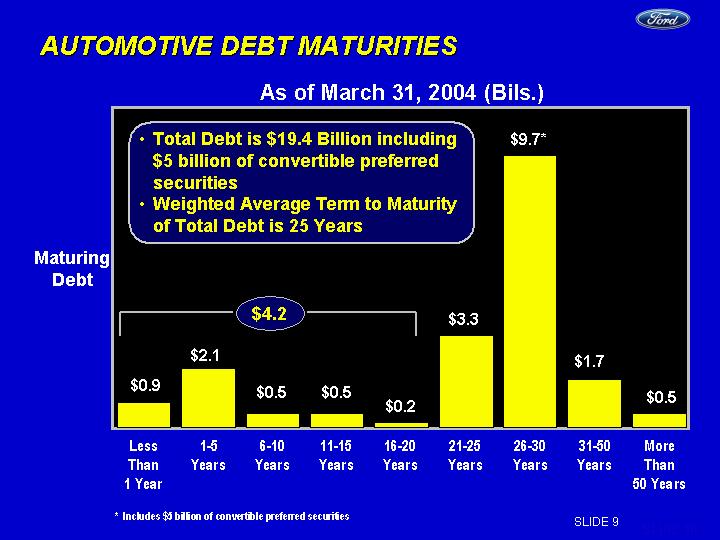
| AUTOMOTIVE DEBT MATURITIES 1 Yr. 1-5 Yrs. 6-10 Yrs. 11-15 Yrs. 16-20 Yrs. 21-25 Yrs. 26-30 Yrs. 31-50 Yrs. 50+ Yrs. Senior Debt $15 Billion 0.9 2.1 0.5 0.5 0.2 3.3 9.7 1.7 0.5 Subordinated Debt $5.8 Billion 0 0 Maturing Debt More Than 50 Years As of March 31, 2004 (Bils.) Less Than 1 Year 1-5 Years 11-15 Years 16-20 Years 31-50 Years Total Debt is $19.4 Billion including $5 billion of convertible preferred securities Weighted Average Term to Maturity of Total Debt is 25 Years 6-10 Years 21-25 Years 26-30 Years $0.9 $0.5 $0.2 $3.3 $9.7* $1.7 $0.5 $2.1 $0.5 $4.2 * Includes $5 billion of convertible preferred securities SLIDE 9 |
Table of Contents
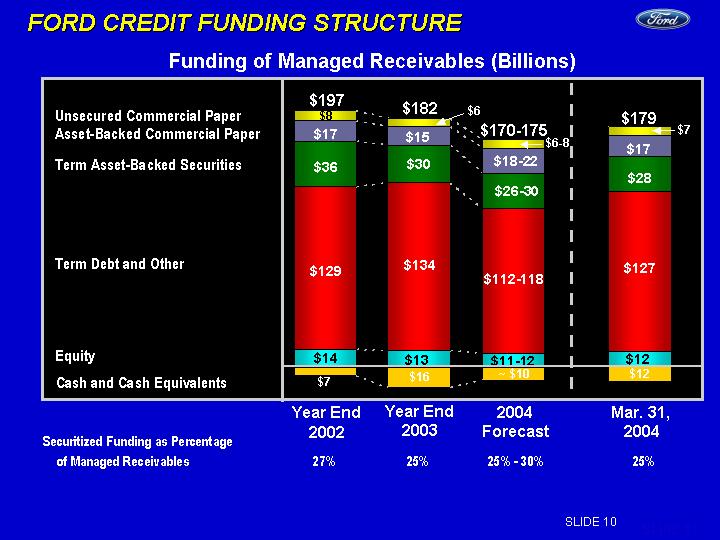
| 2004 Equity 12 Term Debt/Other 127 Securitization 28 ABS CP 17 Commercial Paper 7 Overborr -12 FORD CREDIT FUNDING STRUCTURE 2001 2002 2003 2004 Equity 13 14 12.7 11 Term Debt/Other 132 129 134 115 Securitization 34 36 30 28 ABS CP 12 17 15 20 Commercial Paper 16 8 6 7 Overborrow -3 -7 -16 -10 Equity Unsecured Commercial Paper Asset-Backed Commercial Paper $197 $170-175 $26-30 $129 $112-118 $14 $11-12 Year End 2002 Year End 2003 2004 Forecast $17 $36 Funding of Managed Receivables (Billions) Securitized Funding as Percentage of Managed Receivables 27% 25% 25% - 30% 25% Mar. 31, 2004 $6-8 $15 $30 $134 $13 Term Asset-Backed Securities Term Debt and Other $16 Cash and Cash Equivalents ~ $10 $8 $6 $7 $18-22 $182 $179 $28 $127 $12 $7 $12 $17 SLIDE 10 |
Table of Contents
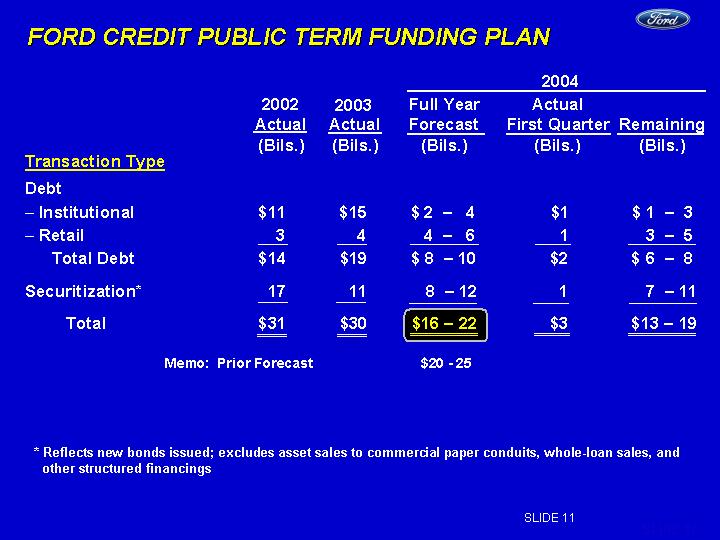
| Debt Institutional $ 11 $ 15 $ 2 - 4 $1 $ 1 - 3 Retail 3 4 4 - 6 1 3 - 5 Total Debt $ 14 $ 19 $ 8 - 10 $2 $ 6 - 8 Securitization* 17 11 8 - 12 1 7 - 11 Total $ 31 $ 30 $ 16 - 22 $3 $ 13 - 19 FORD CREDIT PUBLIC TERM FUNDING PLAN 2002 Actual (Bils.) Transaction Type * Reflects new bonds issued; excludes asset sales to commercial paper conduits, whole-loan sales, and other structured financings Actual (Bils.) 2003 Actual First Quarter (Bils.) Full Year Forecast (Bils.) Remaining (Bils.) 2004 Memo: Prior Forecast $20 - 25 SLIDE 11 |
Table of Contents
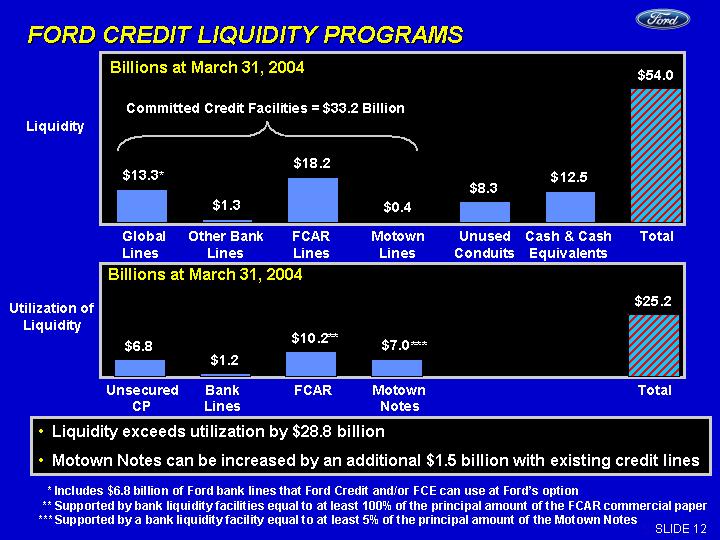
| Unsecured CP Bank Lines FCAR Motown Conduits Total Back-up liquidity 6.8 1.2 10.2 7 25.2 Global Bank Lines Other FCAR Motown Unused Conduits Cash Total Back-up liquidity 13.3 1.3 18.2 0.4 8.3 12.5 54 FORD CREDIT LIQUIDITY PROGRAMS Liquidity Global Other Bank FCAR Motown Unused Cash & Cash Total Lines Lines Lines Lines Conduits Equivalents Utilization of Liquidity Unsecured Bank FCAR Motown Total CP Lines Notes Liquidity exceeds utilization by $28.8 billion Motown Notes can be increased by an additional $1.5 billion with existing credit lines Billions at March 31, 2004 Billions at March 31, 2004 Committed Credit Facilities = $33.2 Billion * * Includes $6.8 billion of Ford bank lines that Ford Credit and/or FCE can use at Ford's option ** Supported by bank liquidity facilities equal to at least 100% of the principal amount of the FCAR commercial paper *** Supported by a bank liquidity facility equal to at least 5% of the principal amount of the Motown Notes $54.0 *** ** SLIDE 12 |
Table of Contents
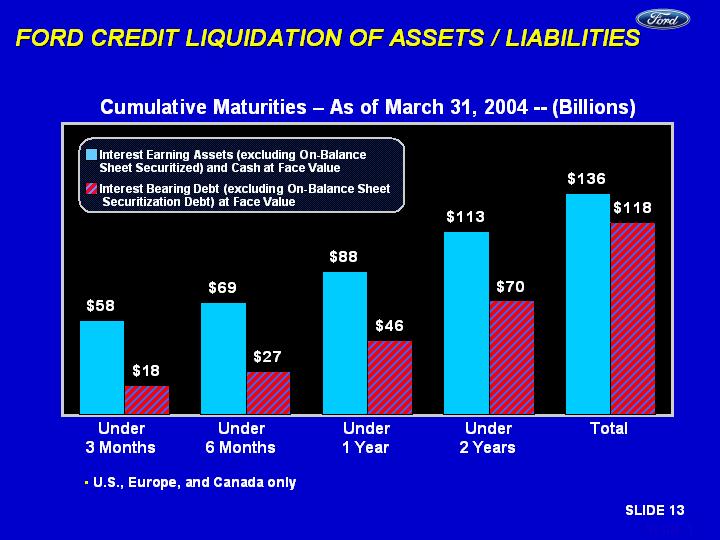
| Under 3 Months Under 6 Months Under 1 Year Under 2 Years Total Assets 58 69 88 113 136 Liabilities 18 27 46 70 118 FORD CREDIT LIQUIDATION OF ASSETS / LIABILITIES Cumulative Maturities - As of March 31, 2004 -- (Billions) U.S., Europe, and Canada only Under 3 Months Under 6 Months Under 1 Year Under 2 Years Total Interest Earning Assets (excluding On-Balance Sheet Securitized) and Cash at Face Value Interest Bearing Debt (excluding On-Balance Sheet Securitization Debt) at Face Value SLIDE 13 |
Table of Contents

| FIRST QUARTER 2004 SUMMARY Ford Earnings per share of $0.96 from continuing operations, excluding special items, and net income of $0.94 per share Strong profit improvement in North America Best-ever quality Record unit revenue and positive net pricing Strong F-Series and SUV sales South America profitable International profitable in total and in each operation Strong cost performance across all areas Continued strong automotive liquidity Increased Full Year EPS guidance to $1.50 - $1.60, up from $1.20 - $1.30 Ford Credit Ford Credit had record earnings Credit losses are down Managed leverage is 12.8 to 1, continue to target 13-14 to 1 range Liquidity is strong, with ample access to unsecured and asset-backed funding sources SLIDE 14 |
Table of Contents

| SAFE HARBOR Greater price competition resulting from currency fluctuations, industry overcapacity or other factors; A significant decline in industry sales, particularly in the U.S. or Europe, resulting from slowing economic growth, geo- political events or other factors; Lower-than-anticipated market acceptance of new or existing products; Work stoppages at key Ford or supplier facilities or other interruptions of supplies; The discovery of defects in vehicles resulting in delays in new model launches, recall campaigns or increased warranty costs; Increased safety, emissions, fuel economy or other regulation resulting in higher costs and/or sales restrictions; Unusual or significant litigation or governmental investigations arising out of alleged defects in our products or otherwise; Worse-than-assumed economic and demographic experience for our post-retirement benefit plans (e.g., investment returns, interest rates, health care cost trends, benefit improvements); Currency or commodity price fluctuations; A market shift from truck sales in the U.S.; Economic difficulties in any significant market; Reduced availability of or higher prices for fuel; Labor or other constraints on our ability to restructure our business; A change in our requirements under long-term supply arrangements under which we are obligated to purchase minimum quantities or pay minimum amounts; Credit rating downgrades; Inability to access debt or securitization markets around the world at competitive rates or in sufficient amounts; Higher-than-expected credit losses; Lower-than-anticipated residual values for leased vehicles; Increased price competition in the rental car industry and/or a general decline in business or leisure travel due to terrorist attacks, acts of war, epidemic diseases or measures taken by governments in response thereto that negatively affect the travel industry; and Our inability to implement the Revitalization Plan. Statements included herein may constitute "forward looking statements" within the meaning of the Private Securities Litigation Reform Act of 1995. These statements involve a number of risks, uncertainties, and other factors that could cause actual results to differ materially from those stated, including, without limitation: SLIDE 15 |
Table of Contents

| APPENDIX |
Table of Contents

| CALCULATION OF DILUTED EARNINGS PER SHARE Net Income (Mils.) Numerator After-Tax Profit $1,952 $1,983 Impact on Income from assumed conversion 49 49 of convertible preferred securities Income for diluted EPS $2,001 $2,032 Denominator Average shares outstanding 1,832 Net issuable / (returnable) shares, primarily stock options 10 Convertible preferred securities 282 Average shares for diluted EPS 2,124 Diluted EPS $0.94 $0.96 Memo: Diluted EPS from continuing operations - incl. special items $0.95 Cont. Ops. -- Excl. Special Items (Mils.) First Quarter 2004 - - Appendix page 1 - |
Table of Contents

| INCOME FROM CONTINUING OPERATIONS EXCLUDING SPECIAL ITEMS COMPARED WITH NET INCOME After-Tax Profit (Mils.) First Quarter 2004 Earnings Per Share* * Earnings per share from continuing operations is calculated on a basis that includes pre-tax profit, provision for taxes, and minority interest. See Appendix for calculation Income from Continuing Operations Excluding Special Items $ 0.96 $1,983 $2,901 $1,340 Special Items - European Restructuring $ (19 ) (29 ) - - Non-Core Business 11 17 - Income from Continuing Operations $ 0.95 $1,975 $2,889 $1,340 Discontinued Operations (0.01 ) (23 ) Net Income $ 0.94 $1,952 Pre-Tax Profit (Mils.) Memo: 1st Qtr. 2003 Pre-Tax Profits (Mils.) $(0.01) - - Appendix page 2 - |
Table of Contents

| 2004 FIRST QUARTER AUTOMOTIVE CASH* First Quarter (Bils.) Cash, Marketable and Loaned Securities, Short-Term VEBA Assets March 31, 2004 $26.5 December 31, 2003 25.9 Change in Gross Cash $0.6 Operating-Related Cash Flow Automotive Pre-Tax Profits $ 1.8 Capital Spending (1.2 ) Depreciation and Amortization 1.6 Changes in Receivables, Inventory, and Trade Payables 0.4 Other -- Prim. Taxes and Expense and Payment Timing Differences (0.3 ) Total Auto. Op.-Related Cash Flow (Excl. Contrib. and Tax Refunds) $ 2.3 Pension Contributions (1.2 ) Tax Refunds 0 Total Automotive Operating-Related Cash Flow $ 1.1 Other Cash Flow Capital Transactions w / Financial Services Sector 0.9 Divestitures 0.2 Dividend to Shareholders (0.2 ) All Other -- Primarily Change in Automotive Debt (1.4 ) Total Change in Gross Cash $ 0.6 * See Appendix for reconciliation to GAAP - - Appendix page 3 - |
Table of Contents
| 2003 - 2004 FIRST QUARTER PRE-TAX RESULTS North America $1,236 $1,962 $ -- $ -- $1,236 $1,962 South America (31 ) 15 -- -- (31 ) 15 Total Americas $1,205 $1,977 $ -- $ -- $1,205 $1,977 International Europe $ (247 ) $ (24 ) $ -- $(29 ) $ (247 ) $ 5 P.A.G. (88 ) 20 -- -- (88 ) 20 Asia Pacific (25 ) 28 -- -- (25 ) 28 Other 41 54 -- -- 41 54 Total International $ (319 ) $ 78 $ -- $(29 ) $ (319 ) $ 107 Other Automotive (224 ) (249 ) -- 17 * (224 ) (266 ) Total Automotive $ 662 $1,806 $ -- $(12 ) $ 662 $1,818 Financial Services 678 1,083 -- -- 678 1,083 Total Company $1,340 $2,889 $ -- $(12 ) $1,340 $2,901 * Partial reversal of loss from disposition of non-core business in 2002 2003 (Mils.) 2004 (Mils.) Pre-Tax Profits (Incl. Special Items) Special Items Pre-Tax Profits (Excl. Special Items) 2003 (Mils.) 2004 (Mils.) 2003 (Mils.) 2004 (Mils.) - - Appendix page 4 - |
Table of Contents

| AUTOMOTIVE GROSS CASH RECONCILIATION TO GAAP Cash and Cash Equivalents $ 5.4 $ 4.7 $ (0.7 ) $7.1 Marketable Securities 10.8 8.4 (2.4 ) 17.3 Loaned Securities 5.7 9.3 3.6 - Total Cash / Market. Sec. $21.9 $22.4 $0.5 $24.4 Short-Term VEBA 4.0 4.1 0.1 2.2 Gross Cash $25.9 $26.5 $ 0.6 $26.6 Mar. 31 2004 B / (W) Dec. 31 2003 (Bils.) Mar. 31 2004 (Bils.) Dec. 31 2003 (Bils.) Memo: Mar. 31 2003 (Bils.) - - Appendix page 5 - |
Table of Contents
| AUTOMOTIVE OPERATING RELATED CASH FLOW RECONCILIATION TO GAAP Cash Flow from Operating Activities before Securities Trading* $ 2.6 Items Included in Operating-Related Cash Flow Capital Expenditures $ (1.2 ) Net Transactions Between Automotive and Financial Services Sectors** (0.1 ) Other (0.2 ) Total Reconciling Items $ (1.5 ) Automotive Operating-Related Cash Flow $ 1.1 2004 1st Qtr. (Bils.) * As shown in our sector statement of cash flow for Automotive ** Primarily payables and receivables between the sectors in the normal course of business, as shown in our sector statement of cash flow - - Appendix page 6 - |
Table of Contents
| FORD CREDIT KEY METRIC DEFINITIONS In addition to evaluating Ford Credit's financial performance on a GAAP financial statement basis, Ford Credit management also uses other criteria, some of which were previously disclosed in this presentation and are defined below. Information about the impact of on-balance sheet securitization is also included below : Managed Receivables -- receivables reported on Ford Credit's balance sheet and receivables Ford Credit sold in off-balance-sheet securitizations and continues to service Serviced Receivables -- includes managed receivables and receivables Ford Credit sold in whole-loan sale transactions (i.e., receivables for which Ford Credit has no continuing exposure or risk of loss) Managed Credit Losses -- credit losses associated with receivables reported on Ford Credit's balance sheet plus credit losses associated with receivables Ford Credit sold in off-balance sheet securitizations and continues to service Impact of On-Balance Sheet Securitization -- retail installment receivables reported on Ford Credit's balance sheet include receivables sold in securitizations. These receivables have been legally sold to Ford Credit sponsored special purpose entities and are available only to pay securitization investors and other participants and are not available to pay the obligations of Ford Credit or the claims of Ford Credit's creditors. Debt reported on Ford Credit's balance sheet includes debt issued to securitization investors which is payable solely out of collections on the receivables supporting the securitization and is not the legal obligation of Ford Credit. - - Appendix page 7 - |
Table of Contents
| FORD CREDIT RATIO DEFINITIONS In addition to evaluating Ford Credit's financial performance on a GAAP financial statement basis, Ford Credit management also uses other criteria, some of which were previously disclosed in this presentation and are defined below: Leverage: Total Debt - - Financial Statement Leverage = Equity Total Debt Securitized Off-Balance Sheet Receivables Cash and Cash Equivalents SFAS No. 133 Adjustments on Total Debt Equity Minority Interest SFAS No. 133 Adjustment on Equity - - Managed Leverage + - - - - - - = + - - Retained Interest in Securitized Off-Balance Sheet Receivables Credit Losses = + Losses on Reacquired Receivables Average Net Receivables Loss-to-Receivables Ratio - - Appendix page 8 - |
Table of Contents
| PRE-TAX INCOME EFFECT OF RECEIVABLES SALES ACTIVITY 2004 (Mils.) First Quarter 2003 (Mils.) Net Gain on Sales of Receivables $ 233 $ 61 Servicing Fees 197 119 Interest Income from Retained Securities 210 139 Excess Spread and Other 251 230 Investment and Other Income Related to Sales of Receivables $ 891 $ 549 Less: Whole-loan Income (61 ) (24 ) Income Related to Off-Balance Sheet Securitizations $ 830 $ 525 Retail Revenue $ 1,079 $ 702 Wholesale Revenue 292 267 Total Financing Revenue $ 1,371 $ 969 Borrowing Cost (482 ) (269 ) Net Financing Margin $ 889 $ 700 Credit Losses (193 ) (133 ) Income Before Income Taxes $ 696 $ 567 Recalendarization Impact of Off-Balance Sheet Securitizations $ 134 $ (42) Investment and Other Income Related to Off- Balance Sheet Securitizations Memo: Earnings Impact if Reported on Balance Sheet - - Appendix page 9 - |
Table of Contents
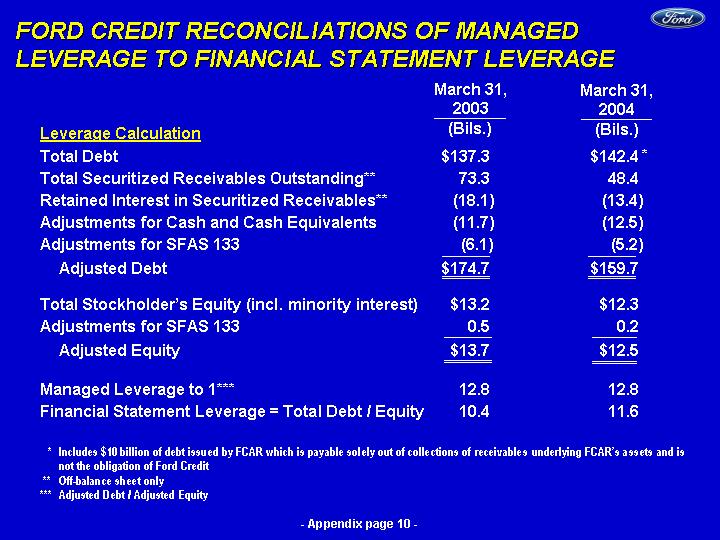
| FORD CREDIT RECONCILIATIONS OF MANAGED LEVERAGE TO FINANCIAL STATEMENT LEVERAGE Total Debt $137.3 $142.4 Total Securitized Receivables Outstanding** 73.3 48.4 Retained Interest in Securitized Receivables** (18.1 ) (13.4 ) Adjustments for Cash and Cash Equivalents (11.7 ) (12.5 ) Adjustments for SFAS 133 (6.1 ) (5.2 ) Adjusted Debt $174.7 $159.7 Total Stockholder's Equity (incl. minority interest) $13.2 $12.3 Adjustments for SFAS 133 0.5 0.2 Adjusted Equity $13.7 $12.5 Managed Leverage to 1*** 12.8 12.8 Financial Statement Leverage = Total Debt / Equity 10.4 11.6 * Includes $10 billion of debt issued by FCAR which is payable solely out of collections of receivables underlying FCAR's assets and is not the obligation of Ford Credit ** Off-balance sheet only *** Adjusted Debt / Adjusted Equity March 31, 2003 (Bils.) March 31, 2004 (Bils.) Leverage Calculation * - - Appendix page 10 - |