Table of Contents
UNITED STATES
SECURITIES AND EXCHANGE COMMISSION
WASHINGTON, DC 20549
FORM 8-K
CURRENT REPORT
Pursuant to Section 13 or 15(d) of the
Securities Exchange Act of 1934
Securities Exchange Act of 1934
Date of Report (Date of earliest event reported)April 20, 2005
FORD MOTOR COMPANY
(Exact Name of Registrant as Specified in Its Charter)
Delaware
(State or Other Jurisdiction of Incorporation)
| 1-3950 | 38-0549190 | |
| (Commission File Number) | (IRS Employer Identification No.) |
One American Road, Dearborn, Michigan 48126
(Address of Principal Executive Offices) (Zip Code)
(313) 322-3000
(Registrant’s Telephone Number, Including Area Code
Check the appropriate box below if the Form 8-K filing is intended to simultaneously satisfy the filing obligation of the registrant under any of the following provisions:
| o | Written communications pursuant to Rule 425 under the Securities Act (17 CFR 230.425) |
| o | Soliciting material pursuant to Rule 14a-12 under the Exchange Act (17 CFR 240.14a-12) |
| o | Pre-commencement communications pursuant to Rule 14d-2(b) under the Exchange Act (17 CFR 240.14d-2(b)) |
| o | Pre-commencement communications pursuant to Rule 13e-4(c) under the Exchange Act (17 CFR 240.13e-4(c)) |
TABLE OF CONTENTS
| Item 2.02 Results of Operations and Financial Condition. | ||||||||
| TOTAL COMPANY 2004 — 2005 FIRST QUARTER PRE-TAX RESULTS* | ||||||||
| Item 9.01 Financial Statements and Exhibits. | ||||||||
| SIGNATURE | ||||||||
| EXHIBIT INDEX | ||||||||
Table of Contents
- 2 -
Item 2.02 Results of Operations and Financial Condition.
Ford Motor Company (“Ford”) hereby incorporates by reference its news release dated April 20, 2005 and supplemental financial information concerning first quarter 2005 financial results, furnished as Exhibits 99.1, 99.2 and 99.3, respectively.
Ford will conduct two conference calls on April 20, 2005 to review first quarter 2005 financial results. Don Leclair, Ford’s Executive Vice President and Chief Financial Officer, hosts a conference call with the investment community and the news media beginning at 9:00 a.m. to review first quarter 2005 financial results. Investors may access this conference call by dialing
800-599-9795 (or 1-617-786-2905 if dialing from outside the United States). The passcode for either telephone number is a verbal response of “Ford Earnings Call”.
Ford’s Vice President and Treasurer, Ann Marie Petach, Ford Motor Credit Company’s (“Ford Credit’s”) Vice Chairman and Chief Financial Officer, David Cosper, and Ford’s Vice President and Controller, Jim Gouin, will host a second conference call with fixed income analysts and investors beginning at 11:00 a.m. Investors may access this conference call by dialing
800-599-9795 (or 1-617-786-2905 if dialing from outside the United States). The passcode for either telephone number is a verbal response of “Ford Fixed Income”.
A listen-only webcast, and supporting presentation materials for each call, will be available on the Internet atwww.shareholder.ford.com. Investors may also access replays of the calls by visitingwww.shareholder.ford.com, or by dialing 888-286-8010 (1-617-801-6888 if dialing from outside the United States) through April 27, 2005. The passcode for replays of the 9:00 a.m. call is 29481628; the passcode for replays of the 11:00 a.m. call is 55865600. All times referenced above are in Eastern Time.
Please note that the exhibits to this report contain certain “non-GAAP financial measures” as defined in Item 10 of Regulation S-K of the Securities Exchange Act of 1934, as amended. These non-GAAP financial measures include the following: operating-related cash flow for Ford’s Automotive sector; financial results that exclude special items; and managed leverage ratios for our subsidiary, Ford Credit. Each of these non-GAAP financial measures is discussed below, along with the most directly comparable financial measure calculated and presented in accordance with Generally Accepted Accounting Principles in the United States (“GAAP”) and the reason we believe the presentation of each non-GAAP financial measure provides useful information to investors.
Operating-Related Cash Flow.The exhibits hereto discuss operating-related cash flow before contributions to trusts (which fund pension and health care obligations) and before tax refunds for the first quarter of 2005. The exhibits also include a milestone for operating-related cash flow for 2005. These exhibits indicate that our Automotive sector had operating-related cash flow before contributions and tax refunds for the first quarter of 2005 of $800 million. The most directly comparable financial measure calculated and presented in accordance with GAAP is Cash Flow from Operating Activities before Securities Trading for our Automotive sector. Slide 14 and the Appendix (pages 14 and 15) of Exhibit 99.2 combine to provide a reconciliation of non-GAAP operating-related cash flow to Cash Flow from Operating Activities before Securities Trading. Cash Flow from Operating Activities before Securities Trading for our Automotive sector was $2.4 billion for the first quarter of 2005.
Table of Contents
- 3 -
We believe that the non-GAAP measure of operating-related cash flow before contributions and tax refunds is useful to investors because it includes cash flow elements not included in the GAAP measure of Cash Flow from Operating Activities before Securities Trading for our Automotive sector which we consider to be related to operating activities (for example, capital spending). Consequently, operating-related cash flow provides investors with a more relevant measure of the cash generated by Ford’s Automotive operations than the GAAP measure of Cash Flow from Operating Activities before Securities Trading.
Financial Results Excluding Special Items.The exhibits hereto also discuss pre-tax profits excluding special items for Ford’s Automotive sector and the primary operating segments and business units within the Automotive sector. The most directly comparable financial measure calculated and presented in accordance with GAAP is pre-tax profits including special items. Ford believes that pre-tax profits excluding special items is a useful measure to provide investors, because it excludes those items that Ford does not consider to be indicative of earnings from ongoing operating activities. As a result, pre-tax profits excluding special items provides investors with a more relevant measure of the results generated by our operations. Slide 3 and Appendix (page 3) of Exhibit 99.2 list the special items and their impact on first quarter 2005 results. Additionally, the table set forth below shows the pre-tax profits for each of the operating segments and business units within our Automotive sector, and for our Financial Services sector (both including and excluding special items), for the first quarter of 2005.
TOTAL COMPANY
2004 — 2005 FIRST QUARTER PRE-TAX RESULTS*
| Pre-Tax Profits | Pre-Tax Profits | |||||||||||||||||||||||
| (Incl. Special Items) | Special Items | (Excl. Special Items) | ||||||||||||||||||||||
| 2004 | 2005 | 2004 | 2005 | 2004 | 2005 | |||||||||||||||||||
| (Mils.) | (Mils.) | (Mils.) | (Mils.) | (Mils.) | (Mils.) | |||||||||||||||||||
North America | $ | 1,963 | $ | 557 | $ | 0 | $ | (106 | ) | $ | 1,963 | $ | 663 | |||||||||||
South America | 15 | 77 | 0 | 0 | 15 | 77 | ||||||||||||||||||
Total Americas | $ | 1,978 | $ | 634 | $ | 0 | $ | (106 | ) | $ | 1,978 | $ | 740 | |||||||||||
Europe | $ | (24 | ) | $ | 59 | $ | (29 | )** | $ | 0 | $ | 5 | $ | 59 | ||||||||||
P.A.G. | 33 | (55 | ) | 0 | 0 | 33 | (55 | ) | ||||||||||||||||
Total Europe / P.A.G. | $ | 9 | $ | 4 | $ | (29 | ) | $ | 0 | $ | 38 | $ | 4 | |||||||||||
Asia Pacific and Africa | $ | 28 | $ | 43 | $ | 0 | $ | 0 | $ | 28 | $ | 43 | ||||||||||||
Mazda & Assoc. Operations | 54 | 54 | 0 | 0 | 54 | 54 | ||||||||||||||||||
Total AP and Africa / Mazda | $ | 82 | $ | 97 | $ | 0 | $ | 0 | $ | 82 | $ | 97 | ||||||||||||
Other Automotive | (249 | ) | (262 | ) | 17 | *** | 0 | (266 | ) | (262 | ) | |||||||||||||
Total Automotive | $ | 1,820 | $ | 473 | $ | (12 | ) | $ | (106 | ) | $ | 1,832 | $ | 579 | ||||||||||
Financial Services | 1,043 | 1,076 | 0 | 0 | 1,043 | 1,076 | ||||||||||||||||||
Total Company | $ | 2,863 | $ | 1,549 | $ | (12 | ) | $ | (106 | ) | $ | 2,875 | $ | 1,655 | ||||||||||
* | From continuing operations | |
** | Ford Europe Improvement Plan | |
*** | Related to prior divestiture of non-core business |
Table of Contents
- 4 -
Managed Leverage. The exhibits hereto also discuss Ford Credit’s leverage (i.e., debt-to-equity ratio) on both a financial statement and managed basis. Financial statement leverage is the most directly comparable financial measure calculated and presented in accordance with GAAP to the non-GAAP managed leverage financial measure. The appendices to the exhibits hereto contain a reconciliation of Ford Credit’s non-GAAP managed leverage measure to its financial statement leverage. The appendices indicate that Ford Credit’s financial statement and managed leverage at March 31, 2005 were 11.4 and 13.0 to 1, respectively. We believe that the use of the non-GAAP managed leverage measure, which is the result of several adjustments to Ford Credit’s financial statement leverage, is useful to investors because it reflects the way Ford Credit manages its business. Ford Credit retains interests in receivables sold in off-balance sheet securitization transactions, and, with respect to subordinated retained interests, has credit risk. Accordingly, Ford Credit considers securitization as an alternative source of funding and evaluates credit losses, receivables and leverage on a managed as well as on a financial statement basis. As a result, the managed leverage measure provides investors with meaningful information regarding management’s decision-making processes.
In calculating its managed leverage ratio, Ford Credit adds the total amount of receivables sold in off-balance sheet securitizations (including securitized funding from discontinued operations), net of retained interests (including retained interest in securitized receivables from discontinued operations), to its debt. It also deducts cash and cash equivalents because these generally correspond to excess debt beyond the amount required to support Ford Credit’s financing operations. It adds minority interests to equity because all of the debt of such consolidated entities is included in total debt. It excludes the impact of Statement of Financial Accounting Standards No. 133 in both the numerator and the denominator in order to exclude the interim effects of changes in market rates, because Ford Credit generally repays its debt funding obligations as they mature.
Table of Contents
- 5 -
Item 9.01 Financial Statements and Exhibits.
EXHIBITS
| Designation | Description | Method of Furnishing | ||
| Exhibit 99.1 | News Release dated April 20, 2005 | Furnished with this Report | ||
| Exhibit 99.2 | Investment Community Presentation | Furnished with this Report | ||
| Exhibit 99.3 | Fixed Income Presentation | Furnished with this Report |
SIGNATURE
Pursuant to the requirements of the Securities Exchange Act of 1934, the registrant has duly caused this report to be signed on its behalf by the undersigned hereunto duly authorized.
| FORD MOTOR COMPANY (Registrant) |
| Date: April 20, 2005 | By: | /s/ Peter J. Sherry, Jr. | ||
| Peter J. Sherry, Jr. Secretary |
Table of Contents
- 6 -
EXHIBIT INDEX
| Designation | Description | |
| Exhibit 99.1 | News Release dated April 20, 2005 | |
| Exhibit 99.2 | Investment Community Presentation | |
| Exhibit 99.3 | Fixed Income Presentation |
Table of Contents
Exhibit 99.1
| NEWS |  |
Contact: | Media: | Investment Community: | Shareholder Inquiries: | Media | ||||||||||||
| Glenn Ray | Equity:Raj Modi | 800.555.5259 or | Information | |||||||||||||
| 313.594.4410 | 313.323.8221 | 313.845.8540 | Center: | |||||||||||||
| gray2@ford.com | Fixed Income: | stockinf@ford.com | 800.665.1515 or | |||||||||||||
| Rob Moeller | 313.621.0504 | |||||||||||||||
| 313.621.0881 | media@ford.com | |||||||||||||||
| fordir@ford.com | ||||||||||||||||
IMMEDIATE RELEASE
FORD ANNOUNCES FIRST-QUARTER FINANCIAL RESULTS
| • | Net income of 60 cents per share, or $1.21 billion. | |||
| • | Earnings from continuing operations of 62 cents per share, or $1.26 billion, excluding special items.* | |||
| • | Worldwide automotive pre-tax profits of $579 million, down $1.25 billion from the same period a year ago, excluding special items. | |||
| • | Financial Services sector pre-tax profit of $1.1 billion, up $33 million from a year ago. | |||
| • | Second-quarter earnings guidance is a range of a loss of 15 cents per share to breakeven, excluding special items. | |||
| • | Full-year earnings guidance of $1.25 to $1.50 per share from continuing operations, excluding special items, unchanged from April 8. | |||
DEARBORN, Mich., April 20 — Ford Motor Company [NYSE: F] today reported net income of 60 cents per share, or $1.21 billion, for the first quarter of 2005. This compares with net income of 94 cents per share, or $1.95 billion, in the first quarter of 2004.
Ford’s first-quarter earnings from continuing operations, excluding special items, were 62 cents per share, or $1.26 billion.*
Ford’s total sales and revenue in the first quarter rose to $45.1 billion from $44.7 billion in the year-ago period.
* Earnings per share from continuing operations is calculated on a basis that includes pre-tax profit (excluding special items), provision for taxes and minority interest. See attachment for reconciliation to GAAP.
Table of Contents
2
“The plan that we launched in 2002 has led to profits and positive cash flow,” said Bill Ford, chairman and chief executive officer. “Going forward, we will continue to focus on improving our quality, lowering our costs, and delivering exciting new products, as well as taking actions that strengthen our finances, optimize our global footprint and lead to the faster development of new products.”
The following discussion of the results of our automotive sector and business units is on a basis that excludes special items. See attachment for the nature and amount of these special items and a reconciliation to pre-tax results on a GAAP basis.
AUTOMOTIVE SECTOR
On a pre-tax basis, excluding special items of $106 million, worldwide automotive profits in the first quarter were $579 million, down by $1.25 billion from the same period a year ago.
Worldwide automotive sales for the first quarter rose to $39.3 billion from $38.8 billion in the same period last year. Worldwide vehicle-unit sales in the quarter were 1,716,000, down from 1,788,000 a year ago.
Operating-related cash flow was $800 million positive for the quarter. Automotive cash, marketable securities, loaned securities and short-term Voluntary Employee Beneficiary Association (VEBA) assets on March 31, 2005 were $22.9 billion, down from $23.6 billion at the end of the fourth-quarter.
THE AMERICAS
For the first quarter, the Americas reported a pre-tax profit of $740 million, excluding special items, down $1.24 billion from a $1.98 billion pre-tax profit in the same period a year ago.
North America:In the first quarter, Ford’s North American automotive operations reported pre-tax profit of $663 million, excluding special items, down $1.3 billion from a year ago. Lower volumes, higher costs, unfavorable currency exchange, and unfavorable net pricing contributed to the decline. Sales were $21.1 billion, down from $23.2 billion in the same period a year ago.
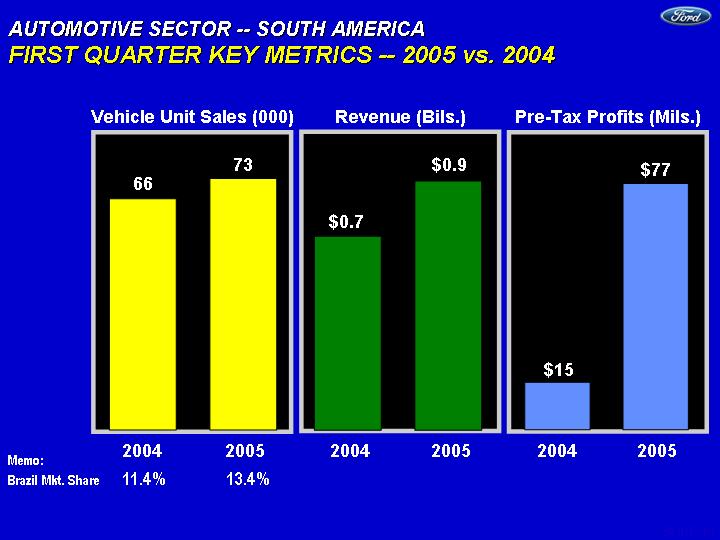
South America:Ford’s South American automotive operations reported a first-quarter pre-tax profit of $77 million, an increase of $62 million from first quarter 2004. The improvement reflected primarily higher volumes, favorable currency exchange, and higher pricing partially offset by higher commodity costs. Revenue for the first quarter increased to $866 million from $650 million in 2004.
Go tohttp://media.ford.com for news releases and high-resolution photographs.
Table of Contents
3
FORD EUROPE AND PREMIER AUTOMOTIVE GROUP (PAG)
The 2005 first-quarter combined pre-tax profit for Ford Europe and PAG automotive operations was $4 million, compared with a profit of $38 million for the year-ago period, excluding special items, a year-over-year deterioration of $34 million.
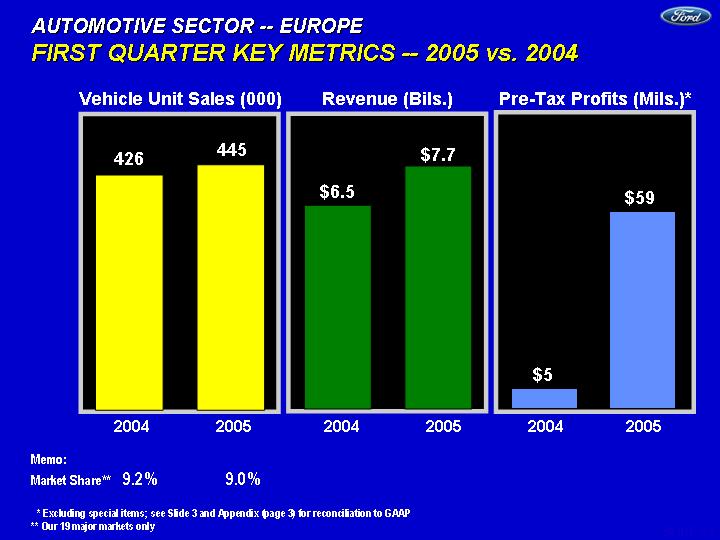
Ford Europe:Ford Europe’s first-quarter pre-tax profit was $59 million, compared with a pre-tax profit of $5 million, excluding special items, during the 2004 period. The improvement of $54 million primarily reflected higher volume and ongoing cost reductions. Ford Europe’s sales in the first quarter increased to $7.7 billion, compared with $6.5 billion during the first quarter of 2004.
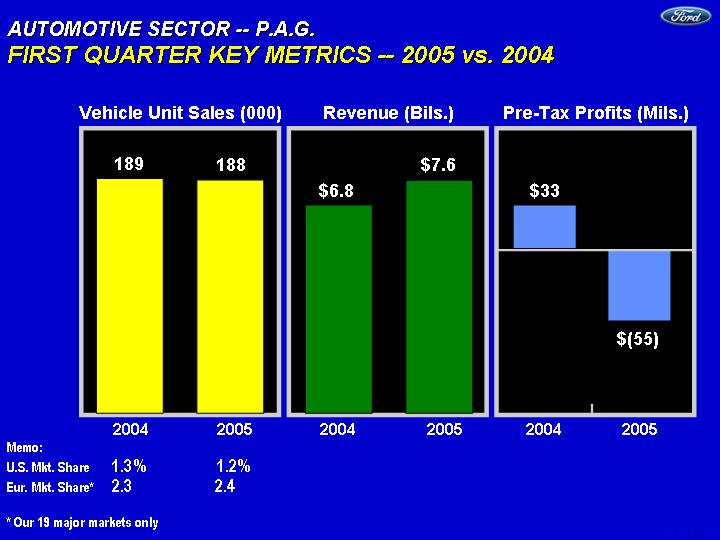
Premier Automotive Group:PAG reported a pre-tax loss of $55 million for the first quarter, compared with a pre-tax profit of $33 million for the first quarter of 2004. The decline in results primarily reflected unfavorable currency exchange, offset partially by lower costs. First-quarter sales for PAG were $7.6 billion, compared with $6.8 billion a year ago.
FORD ASIA-PACIFIC and AFRICA/MAZDA
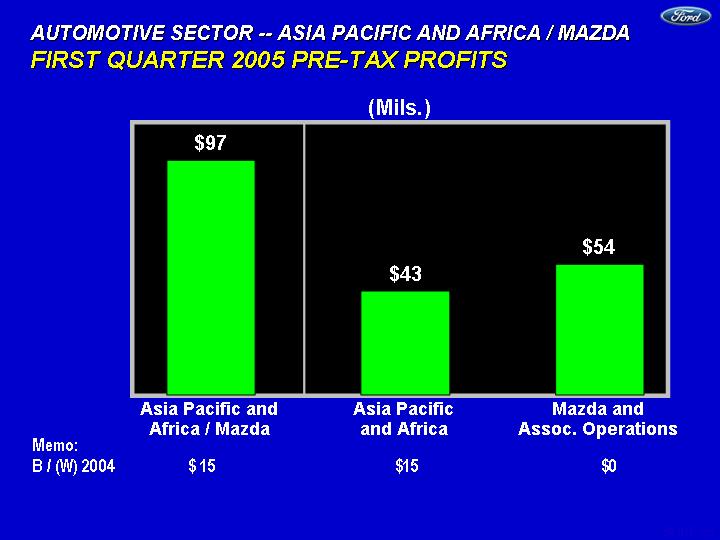
The 2005 first-quarter combined pre-tax profit for Ford Asia-Pacific and Africa/Mazda was $97 million, compared with $82 million for the year-ago period, a year-over-year improvement of $15 million.
Ford Asia-Pacific and Africa:For the first quarter of 2005, Ford Asia-Pacific and Africa reported a pre-tax profit of $43 million, an improvement of $15 million from the same period a year ago. The improvement primarily reflected higher volumes and a gain on the sale of Ford’s interest in Mahindra and Mahindra in India. Sales rose to $2 billion, compared with $1.6 billion during the first quarter of 2004.
Mazda:During the first quarter of 2005, Ford’s share of the pre-tax profit of Mazda and associated operations was $54 million, unchanged from the same period a year ago.
FORD MOTOR CREDIT COMPANY
Ford Motor Credit reported net income of $710 million in the first quarter of 2005, up $22 million from earnings of $688 million a year earlier. On a pre-tax basis, Ford Motor Credit earned $1.1 billion in the first quarter, unchanged from the previous year. The results primarily reflected improved credit loss performance, offset partially by the impact of a decline in volume and higher borrowing costs.
Go tohttp://media.ford.com for news releases and high-resolution photographs.
Table of Contents
4
HERTZ
Hertz reported a first-quarter pre-tax profit of $33 million, a $40 million improvement from the $7 million pre-tax loss from the same period in 2004. The improvement reflected higher car and equipment rental volumes and higher proceeds from the disposal of used vehicles, partially offset by a highly competitive pricing environment in car rental markets.
OUTLOOK
“As we previously announced, we have reduced our full-year earnings guidance for 2005 to a range of $1.25 to $1.50 per share, excluding special items. This outlook is based on our expectation of a tougher operating environment for the remainder of the year,” said Executive Vice President and Chief Financial Officer Don Leclair. “Consistent with this, we expect our second-quarter earnings per share, excluding special items, to range from a loss of 15 cents per share to breakeven.”
Full-year and second-quarter 2005 earnings-per-share guidance excludes the effect of special items, which are presently estimated to include charges related to the following items:
| 2ndQuarter | Full Year | |||||||
| Premier Automotive Group Improvement Plan | $ | (0.02 | ) | $ | (0.03 | ) | ||
| Investments in Fuel Cell Technologies | (0.04 | ) | (0.05 | ) | ||||
| Sale of a Non-Core Business | 0 | (0.02 | ) | |||||
| Visteon | (0.03 | ) | tbd* | |||||
| Salaried Reductions | (0.03 | ) | (0.03 | ) | ||||
| TOTAL | $ | (0.12 | ) | $ | (0.13 | ) | ||
* Ford expects to incur a charge to earnings associated with concluding a final agreement with Visteon, but at this time we are not able to provide any estimate.
FIRST-QUARTER RESULTS CONFERENCE CALL — APRIL 20
Chairman and Chief Executive Officer Bill Ford, and Executive Vice President and Chief Financial Officer Don Leclair, will host a conference call beginning at 9:00 a.m. ET to discuss first-quarter financial results.
Following the earnings call, at 11:00 a.m. ET, Ford Vice President and Treasurer Ann Marie Petach, Ford Credit Vice Chairman and Chief Financial Officer David Cosper, and Ford Vice President and Controller Jim Gouin, will host a conference call for fixed income analysts and investors.
The presentations (listen-only) and supporting materials also will be available on the Internet atwww.shareholder.ford.com. Representatives of the news media and the investment community participating by teleconference will have the opportunity to ask questions following the presentations.
Go tohttp://media.ford.com for news releases and high-resolution photographs.
Table of Contents
5
Conference Call Access Information
April 20
www.shareholder.ford.com
| Toll Free: | 800-599-9795 | |
| International: | 617-786-2905 | |
Earnings: | 9:00 a.m. ET | |
| Earnings Passcode: | “Ford Earnings Call” | |
Fixed Income: | 11:00 a.m. ET | |
| Fixed Income Passcode: | “Ford Fixed Income Call” |
Replays
Available through April 27
www.shareholder.ford.com
| Toll Free: | 888-286-8010 | |||
| International: | 617-801-6888 | |||
| Earnings Passcode: | 29481628 | |||
| Fixed Income Passcode: | 55865600 |
Ford Motor Company, a global automotive industry leader based in Dearborn, Michigan, manufactures and distributes automobiles in 200 markets across six continents. With more than 324,000 employees worldwide, the Company’s core and affiliated automotive brands include Aston Martin, Ford, Jaguar, Land Rover, Lincoln, Mazda, Mercury and Volvo. Its automotive-related services include Ford Motor Credit Company and The Hertz Corporation.
- # # # -
Go tohttp://media.ford.com for news releases and high-resolution photographs.
Table of Contents
6
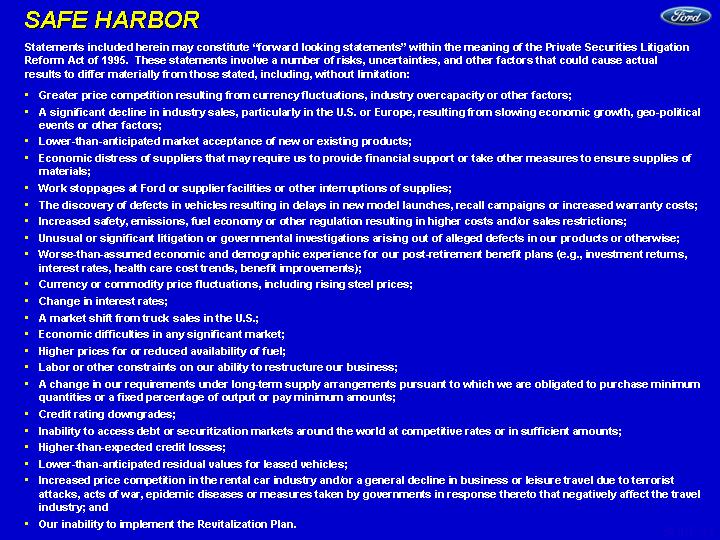
SAFE HARBOR
Statements included herein may constitute “forward-looking statements” within the meaning of the Private Securities Litigation Reform Act of 1995. These statements involve a number of risks, uncertainties, and other factors that could cause actual results to differ materially from those stated, including, without limitation:
* greater price competition resulting from currency fluctuations, industry overcapacity or other factors;
* a significant decline in industry sales, particularly in the U.S. or Europe, resulting from slowing economic growth, geo-political events or other factors;
* lower-than-anticipated market acceptance of new or existing products;
* economic distress of suppliers that may require us to provide financial support or take other measures to ensure supplies of materials;
* work stoppages at Ford or supplier facilities or other interruptions of supplies;
* the discovery of defects in vehicles resulting in delays in new model launches, recall campaigns or increased warranty costs;
* increased safety, emissions, fuel economy or other regulation resulting in higher costs and/or sales restrictions;
* unusual or significant litigation or governmental investigations arising out of alleged defects in our products or otherwise;
* worse-than-assumed economic and demographic experience for our post- retirement benefit plans (e.g., investment returns, interest rates, healthcare cost trends, benefit improvements);
* currency or commodity price fluctuations, including rising steel prices;
* changes in interest rates;
* a market shift from truck sales in the U.S.;
* economic difficulties in any significant market;
* higher prices for, or reduced availability of, fuel;
* labor or other constraints on our ability to restructure our business;
* a change in our requirements or obligations under long-term supply arrangements pursuant to which we are obligated to purchase minimum quantities or a fixed percentage or pay minimum amounts;
* credit rating downgrades;
* inability to access debt or securitization markets around the world at competitive rates or in sufficient amounts;
* higher-than-expected credit losses;
* lower-than-anticipated residual values for leased vehicles;
* increased price competition in the rental car industry and/or a general decline in business or leisure travel due to terrorist attacks, acts of war, epidemic diseases or measures taken by governments in response thereto that negatively affect the travel industry; and
* our inability to implement the Revitalization Plan.
***
Go tohttp://media.ford.com for news releases and high-resolution photographs.
Table of Contents
7
ATTACHMENT
TOTAL COMPANY
2005 FIRST QUARTER INCOME FROM CONTINUING OPERATIONS
COMPARED WITH NET INCOME
| First Quarter | ||||||||||||
| Earnings | Memo: | |||||||||||
| Per | After-Tax | Pre-Tax | ||||||||||
| Share* | Profit | Profit | ||||||||||
| (Mils.) | (Mils.) | |||||||||||
| Income from Continuing Operations | ||||||||||||
| Excluding Special Items | $ | 0.62 | $ | 1,260 | $ | 1,655 | ||||||
| Special Items | ||||||||||||
| - Fuel Cell Technology Charges | (0.02 | ) | (39 | ) | (39 | ) | ||||||
| - Non-Core Business Held for Sale | (0.02 | ) | (38 | ) | (58 | ) | ||||||
| - Visteon Charges | * | * | (6 | ) | (9 | ) | ||||||
| Total Special Items | $ | (0.04 | ) | $ | (83 | ) | $ | (106 | ) | |||
| Income from Continuing | ||||||||||||
| Operations | $ | 0.58 | $ | 1,177 | $ | 1,549 | ||||||
| Discontinued Operations | 0.02 | 35 | ||||||||||
| Net Income | $ | 0.60 | $ | 1,212 | ||||||||
| * | Earnings per share from continuing operations is calculated on a basis that includes pre-tax profit, provision for taxes, and minority interest |
| ** | Less than $0.01 |
Go tohttp://media.ford.com for news releases and high-resolution photographs.
Table of Contents
8
FORD MOTOR COMPANY AND SUBSIDIARIES
SECTOR STATEMENT OF INCOME
For the Periods Ended March 31, 2005 and 2004
(in millions, except per share amounts)
| First Quarter | ||||||||
| 2005 | 2004 | |||||||
| (unaudited) | ||||||||
AUTOMOTIVE | ||||||||
Sales | $ | 39,332 | $ | 38,800 | ||||
Costs and expenses | ||||||||
| Cost of sales | 35,553 | 34,054 | ||||||
| Selling, administrative and other expenses | 3,114 | 2,742 | ||||||
| Total costs and expenses | 38,667 | 36,796 | ||||||
Operating income/(loss) | 665 | 2,004 | ||||||
| Interest expense | 402 | 385 | ||||||
| Interest income and other non-operating income/(expense), net | 153 | 145 | ||||||
| Equity in net income/(loss) of affiliated companies | 57 | 56 | ||||||
Income/(loss) before income taxes — Automotive | 473 | 1,820 | ||||||
FINANCIAL SERVICES | ||||||||
Revenues | 5,804 | 5,923 | ||||||
Costs and expenses | ||||||||
| Interest expense | 1,562 | 1,450 | ||||||
| Depreciation | 1,514 | 1,729 | ||||||
| Operating and other expenses | 1,467 | 1,348 | ||||||
| Provision for credit and insurance losses | 185 | 353 | ||||||
| Total costs and expenses | 4,728 | 4,880 | ||||||
Income/(loss) before income taxes — Financial Services | 1,076 | 1,043 | ||||||
TOTAL COMPANY | ||||||||
Income/(loss) before income taxes | 1,549 | 2,863 | ||||||
| Provision for/(benefit from) income taxes | 314 | 819 | ||||||
Income/(loss) before minority interests | 1,235 | 2,044 | ||||||
| Minority interests in net income/(loss) of subsidiaries | 58 | 85 | ||||||
Income/(loss) from continuing operations | 1,177 | 1,959 | ||||||
| Income/(loss) from discontinued operations | 35 | (7 | ) | |||||
Net income/(loss) | $ | 1,212 | $ | 1,952 | ||||
AMOUNTS PER SHARE OF COMMON AND CLASS B STOCK | ||||||||
Basic income/(loss) | ||||||||
| Income/(loss) from continuing operations | $ | 0.64 | $ | 1.07 | ||||
| Income/(loss) from discontinued operations | 0.02 | — | ||||||
| Net income/(loss) | $ | 0.66 | $ | 1.07 | ||||
Diluted income/(loss) | ||||||||
| Income/(loss) from continuing operations | $ | 0.58 | $ | 0.95 | ||||
| Income/(loss) from discontinued operations | 0.02 | (0.01 | ) | |||||
| Net income/(loss) | $ | 0.60 | $ | 0.94 | ||||
Cash dividends | $ | 0.10 | $ | 0.10 | ||||
Certain amounts in prior year’s financial statements have been reclassified to conform with current year presentation.
Table of Contents
9
FORD MOTOR COMPANY AND SUBSIDIARIES
CONSOLIDATED STATEMENT OF INCOME
For the Periods Ended March 31, 2005 and 2004
(in millions, except per share amounts)
| First Quarter | ||||||||
| 2005 | 2004 | |||||||
| (unaudited) | ||||||||
Sales and revenues | ||||||||
| Automotive sales | $ | 39,332 | $ | 38,800 | ||||
| Financial Services revenues | 5,804 | 5,923 | ||||||
| Total sales and revenues | 45,136 | 44,723 | ||||||
Costs and expenses | ||||||||
| Cost of sales | 35,553 | 34,054 | ||||||
| Selling, administrative and other expenses | 6,095 | 5,819 | ||||||
| Interest expense | 1,964 | 1,835 | ||||||
| Provision for credit and insurance losses | 185 | 353 | ||||||
| Total costs and expenses | 43,797 | 42,061 | ||||||
| Automotive interest income and other non-operating income/(expense), net | 153 | 145 | ||||||
| Automotive equity in net income/(loss) of affiliated companies | 57 | 56 | ||||||
Income/(loss) before income taxes | 1,549 | 2,863 | ||||||
| Provision for/(benefit from) income taxes | 314 | 819 | ||||||
Income/(loss) before minority interests | 1,235 | 2,044 | ||||||
| Minority interests in net income/(loss) of subsidiaries | 58 | 85 | ||||||
Income/(loss) from continuing operations | 1,177 | 1,959 | ||||||
| Income/(loss) from discontinued operations | 35 | (7 | ) | |||||
Net income/(loss) | $ | 1,212 | $ | 1,952 | ||||
AMOUNTS PER SHARE OF COMMON AND CLASS B STOCK | ||||||||
Basic income/(loss) | ||||||||
| Income/(loss) from continuing operations | $ | 0.64 | $ | 1.07 | ||||
| Income/(loss) from discontinued operations | 0.02 | — | ||||||
| Net income/(loss) | $ | 0.66 | $ | 1.07 | ||||
Diluted income/(loss) | ||||||||
| Income/(loss) from continuing operations | $ | 0.58 | $ | 0.95 | ||||
| Income/(loss) from discontinued operations | 0.02 | (0.01 | ) | |||||
| Net income/(loss) | $ | 0.60 | $ | 0.94 | ||||
Cash dividends | $ | 0.10 | $ | 0.10 | ||||
Certain amounts in prior year’s financial statements have been reclassified to conform with current year presentation.
Table of Contents
10
FORD MOTOR COMPANY AND SUBSIDIARIES
SECTOR BALANCE SHEET
(in millions)
| March 31, | December 31, | |||||||
| 2005 | 2004 | |||||||
| (unaudited) | ||||||||
ASSETS | ||||||||
Automotive | �� | |||||||
| Cash and cash equivalents | $ | 9,532 | $ | 10,142 | ||||
| Marketable securities | 9,210 | 8,291 | ||||||
| Loaned securities | 839 | 1,058 | ||||||
| Total cash, marketable and loaned securities | 19,581 | 19,491 | ||||||
| Receivables, net | 3,034 | 2,894 | ||||||
| Inventories | 11,482 | 10,766 | ||||||
| Deferred income taxes | 3,734 | 3,837 | ||||||
| Other current assets | 8,229 | 8,916 | ||||||
| Total current assets | 46,060 | 45,904 | ||||||
| Equity in net assets of affiliated companies | 1,962 | 1,907 | ||||||
| Net property | 41,759 | 42,904 | ||||||
| Deferred income taxes | 10,095 | 10,894 | ||||||
| Goodwill and other intangible assets | 6,111 | 6,374 | ||||||
| Assets of discontinued/held-for-sale operations | 159 | 188 | ||||||
| Other assets | 9,837 | 9,455 | ||||||
| Total Automotive assets | 115,983 | 117,626 | ||||||
Financial Services | ||||||||
| Cash and cash equivalents | 13,813 | 13,368 | ||||||
| Investments in securities | 929 | 1,216 | ||||||
| Finance receivables, net | 106,048 | 113,824 | ||||||
| Net investment in operating leases | 32,475 | 31,763 | ||||||
| Retained interest in sold receivables | 8,028 | 9,166 | ||||||
| Goodwill and other intangible assets | 900 | 897 | ||||||
| Assets of discontinued/held-for-sale operations | 2,456 | 2,186 | ||||||
| Other assets | 10,963 | 13,746 | ||||||
| Receivable from Automotive | 1,633 | 2,753 | ||||||
| Total Financial Services assets | 177,245 | 188,919 | ||||||
Total assets | $ | 293,228 | $ | 306,545 | ||||
LIABILITIES AND STOCKHOLDERS’ EQUITY | ||||||||
Automotive | ||||||||
| Trade payables | $ | 17,389 | $ | 16,026 | ||||
| Other payables | 4,182 | 4,269 | ||||||
| Accrued liabilities | 33,729 | 33,573 | ||||||
| Debt payable within one year | 947 | 977 | ||||||
| Current payable to Financial Services | 672 | 1,382 | ||||||
| Total current liabilities | 56,919 | 56,227 | ||||||
| Long-term debt | 17,101 | 17,458 | ||||||
| Other liabilities | 35,807 | 35,699 | ||||||
| Deferred income taxes | 1,897 | 3,042 | ||||||
| Liabilities of discontinued/held-for-sale operations | 47 | 46 | ||||||
| Payable to Financial Services | 961 | 1,371 | ||||||
| Total Automotive liabilities | 112,732 | 113,843 | ||||||
Financial Services | ||||||||
| Payables | 2,598 | 2,394 | ||||||
| Debt | 143,214 | 154,538 | ||||||
| Deferred income taxes | 10,496 | 10,549 | ||||||
| Other liabilities and deferred income | 7,560 | 8,206 | ||||||
| Liabilities of discontinued/held-for-sale operations | 112 | 93 | ||||||
| Total Financial Services liabilities | 163,980 | 175,780 | ||||||
| Minority interests | 846 | 877 | ||||||
Stockholders’ equity | ||||||||
| Capital stock | ||||||||
| Common Stock, par value $0.01 per share (1,837 million shares issued) | 18 | 18 | ||||||
| Class B Stock, par value $0.01 per share (71 million shares issued) | 1 | 1 | ||||||
| Capital in excess of par value of stock | 5,224 | 5,321 | ||||||
| Accumulated other comprehensive income/(loss) | (150 | ) | 1,258 | |||||
| Treasury stock | (1,628 | ) | (1,728 | ) | ||||
| Earnings retained for use in business | 12,205 | 11,175 | ||||||
| Total stockholders’ equity | 15,670 | 16,045 | ||||||
Total liabilities and stockholders’ equity | $ | 293,228 | $ | 306,545 | ||||
Certain amounts in prior year’s financial statements have been reclassified to conform with current year presentation.
Table of Contents
11
FORD MOTOR COMPANY AND SUBSIDIARIES
CONSOLIDATED BALANCE SHEET
(in millions)
| March 31, | December 31, | |||||||
| 2005 | 2004 | |||||||
| (unaudited) | ||||||||
ASSETS | ||||||||
| Cash and cash equivalents | $ | 23,345 | $ | 23,510 | ||||
| Marketable securities | 10,139 | 9,507 | ||||||
| Loaned securities | 839 | 1,058 | ||||||
| Finance receivables, net | 102,552 | 110,749 | ||||||
| Other receivables, net | 6,530 | 5,969 | ||||||
| Net investment in operating leases | 32,475 | 31,763 | ||||||
| Retained interest in sold receivables | 8,028 | 9,166 | ||||||
| Inventories | 11,482 | 10,766 | ||||||
| Equity in net assets of affiliated companies | 2,872 | 2,835 | ||||||
| Net property | 43,395 | 44,549 | ||||||
| Deferred income taxes | 2,926 | 4,830 | ||||||
| Goodwill and other intangible assets | 7,011 | 7,271 | ||||||
| Assets of discontinued/held-for-sale operations | 2,615 | 2,374 | ||||||
| Other assets | 26,379 | 29,511 | ||||||
Total assets | $ | 280,588 | $ | 293,858 | ||||
LIABILITIES AND STOCKHOLDERS’ EQUITY | ||||||||
| Payables | $ | 24,169 | $ | 22,689 | ||||
| Accrued liabilities | 31,392 | 31,187 | ||||||
| Debt | 161,262 | 172,973 | ||||||
| Other liabilities and deferred income | 43,226 | 43,777 | ||||||
| Deferred income taxes | 3,864 | 6,171 | ||||||
| Liabilities of discontinued/held-for-sale operations | 159 | 139 | ||||||
| Total liabilities | 264,072 | 276,936 | ||||||
| Minority interests | 846 | 877 | ||||||
Stockholders’ equity | ||||||||
| Capital stock | ||||||||
| Common Stock, par value $0.01 per share (1,837 million shares issued) | 18 | 18 | ||||||
| Class B Stock, par value $0.01 per share (71 million shares issued) | 1 | 1 | ||||||
| Capital in excess of par value of stock | 5,224 | 5,321 | ||||||
| Accumulated other comprehensive income/(loss) | (150 | ) | 1,258 | |||||
| Treasury stock | (1,628 | ) | (1,728 | ) | ||||
| Earnings retained for use in business | 12,205 | 11,175 | ||||||
| Total stockholders’ equity | 15,670 | 16,045 | ||||||
Total liabilities and stockholders’ equity | $ | 280,588 | $ | 293,858 | ||||
Certain amounts in prior year’s financial statements have been reclassified to conform with current year presentation.
Table of Contents
12
FORD MOTOR COMPANY AND SUBSIDIARIES
CONDENSED SECTOR STATEMENT OF CASH FLOWS
For the Periods Ended March 31, 2005 and 2004
(in millions)
| First Quarter 2005 | First Quarter 2004 | |||||||||||||||
| Financial | Financial | |||||||||||||||
| Automotive | Services | Automotive | Services | |||||||||||||
| (unaudited) | (unaudited) | |||||||||||||||
Cash and cash equivalents at January 1 | $ | 10,142 | $ | 13,368 | $ | 6,856 | $ | 16,352 | ||||||||
| Cash flows from operating activities before securities trading | 2,449 | 3,453 | 2,556 | 5,569 | ||||||||||||
| Net sales/(purchases) of trading securities | (599 | ) | 8 | (2,267 | ) | (8 | ) | |||||||||
| Net cash flows from operating activities | 1,850 | 3,461 | 289 | 5,561 | ||||||||||||
Cash flows from investing activities | ||||||||||||||||
| Capital expenditures | (1,436 | ) | (125 | ) | (1,199 | ) | (76 | ) | ||||||||
| Acquisitions of retail and other finance receivables and operating leases | — | (14,035 | ) | — | (13,586 | ) | ||||||||||
| Collections of retail and other finance receivables and operating leases | — | 12,762 | — | 12,191 | ||||||||||||
| Net (acquisitions)/collections of wholesale receivables | — | (1,463 | ) | — | (1,920 | ) | ||||||||||
| Net acquisitions of daily rental vehicles | — | (1,283 | ) | — | (1,041 | ) | ||||||||||
| Purchases of securities | (1,808 | ) | (114 | ) | (1,342 | ) | (2 | ) | ||||||||
| Sales and maturities of securities | 1,540 | 391 | 1,380 | 196 | ||||||||||||
| Proceeds from sales of retail and other finance receivables and operating leases | — | 8,373 | — | 1,680 | ||||||||||||
| Proceeds from sales of wholesale receivables | — | 1,443 | — | 964 | ||||||||||||
| Proceeds from sale of businesses | 39 | — | 100 | — | ||||||||||||
| Net investing activity with Financial Services | 415 | — | 851 | — | ||||||||||||
| Other | (42 | ) | (153 | ) | 4 | 299 | ||||||||||
| Net cash (used in)/provided by investing activities | (1,292 | ) | 5,796 | (206 | ) | (1,295 | ) | |||||||||
Cash flows from financing activities | ||||||||||||||||
| Cash dividends | (183 | ) | — | (183 | ) | — | ||||||||||
| Net sales/(purchases) of Common Stock | (14 | ) | — | (60 | ) | — | ||||||||||
| Changes in short-term debt | (17 | ) | (403 | ) | (156 | ) | 4,881 | |||||||||
| Proceeds from issuance of other debt | 76 | 5,446 | 148 | 4,343 | ||||||||||||
| Principal payments on other debt | (373 | ) | (13,939 | ) | (1,377 | ) | (15,491 | ) | ||||||||
| Net financing activity with Automotive | — | (415 | ) | — | (851 | ) | ||||||||||
| Other | (3 | ) | (18 | ) | (10 | ) | (2 | ) | ||||||||
| Net cash (used in)/provided by financing activities | (514 | ) | (9,329 | ) | (1,638 | ) | (7,120 | ) | ||||||||
| Effect of exchange rate changes on cash | 56 | (193 | ) | (12 | ) | (61 | ) | |||||||||
| Net transactions with Automotive/Financial Services | (710 | ) | 710 | (95 | ) | 95 | ||||||||||
Net increase/(decrease) in cash and cash equivalents | (610 | ) | 445 | (1,662 | ) | (2,820 | ) | |||||||||
Cash and cash equivalents at March 31 | $ | 9,532 | $ | 13,813 | $ | 5,194 | $ | 13,532 | ||||||||
Certain amounts in prior year’s financial statements have been reclassified to conform with current year presentation.
Table of Contents
13
FORD MOTOR COMPANY AND SUBSIDIARIES
CONDENSED CONSOLIDATED STATEMENT OF CASH FLOWS
For the Periods Ended March 31, 2005 and 2004
(in millions)
| First Quarter | ||||||||
| 2005 | 2004 | |||||||
| (unaudited) | ||||||||
Cash and cash equivalents at January 1 | $ | 23,510 | $ | 23,208 | ||||
| Cash flows from operating activities before securities trading | 5,767 | 7,143 | ||||||
| Net sales/(purchases) of trading securities | (591 | ) | (2,275 | ) | ||||
| Net cash flows from operating activities | 5,176 | 4,868 | ||||||
Cash flows from investing activities | ||||||||
| Capital expenditures | (1,561 | ) | (1,275 | ) | ||||
| Acquisitions of retail and other finance receivables and operating leases | (14,035 | ) | (13,586 | ) | ||||
| Collections of retail and other finance receivables and operating leases | 12,877 | 12,217 | ||||||
| Net acquisitions of daily rental vehicles | (1,283 | ) | (1,041 | ) | ||||
| Purchases of securities | (1,922 | ) | (1,344 | ) | ||||
| Sales and maturities of securities | 1,931 | 1,576 | ||||||
| Proceeds from sales of retail and other finance receivables and operating leases | 8,373 | 1,680 | ||||||
| Proceeds from sale of businesses | 39 | 100 | ||||||
| Other | (195 | ) | 303 | |||||
| Net cash (used in)/provided by investing activities | 4,224 | (1,370 | ) | |||||
Cash flows from financing activities | ||||||||
| Cash dividends | (183 | ) | (183 | ) | ||||
| Net sales/(purchases) of Common Stock | (14 | ) | (60 | ) | ||||
| Changes in short-term debt | (420 | ) | 4,725 | |||||
| Proceeds from issuance of other debt | 5,522 | 4,491 | ||||||
| Principal payments on other debt | (14,312 | ) | (16,868 | ) | ||||
| Other | (21 | ) | (12 | ) | ||||
| Net cash (used in)/provided by financing activities | (9,428 | ) | (7,907 | ) | ||||
| Effect of exchange rate changes on cash | (137 | ) | (73 | ) | ||||
Net increase/(decrease) in cash and cash equivalents | (165 | ) | (4,482 | ) | ||||
Cash and cash equivalents at March 31 | $ | 23,345 | $ | 18,726 | ||||
Certain amounts in prior year’s financial statements have been reclassified to conform with current year presentation.
Table of Contents
Exhibit 99.2

| FIRST QUARTER 2005 EARNINGS REVIEW APRIL 20, 2005 |
Table of Contents
SLIDE 1
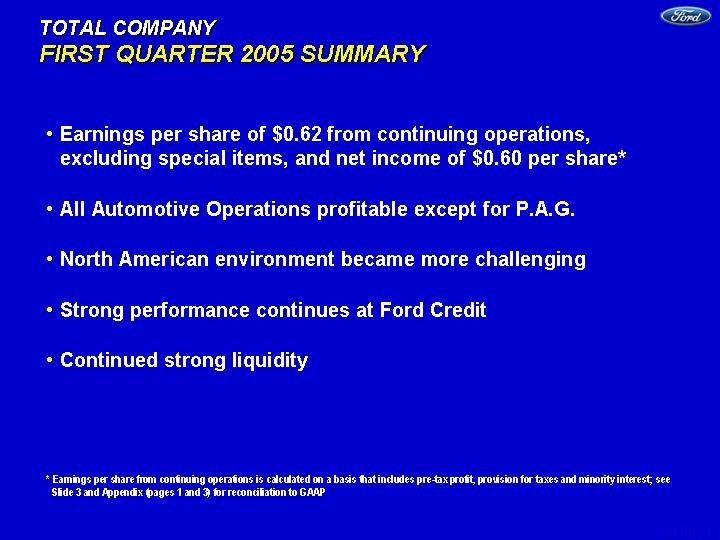
| TOTAL COMPANY FIRST QUARTER 2005 SUMMARY Earnings per share of $0.62 from continuing operations, excluding special items, and net income of $0.60 per share* All Automotive Operations profitable except for P.A.G. North American environment became more challenging Strong performance continues at Ford Credit Continued strong liquidity * Earnings per share from continuing operations is calculated on a basis that includes pre-tax profit, provision for taxes and minority interest; see Slide 3 and Appendix (pages 1 and 3) for reconciliation to GAAP |
Table of Contents
SLIDE 2
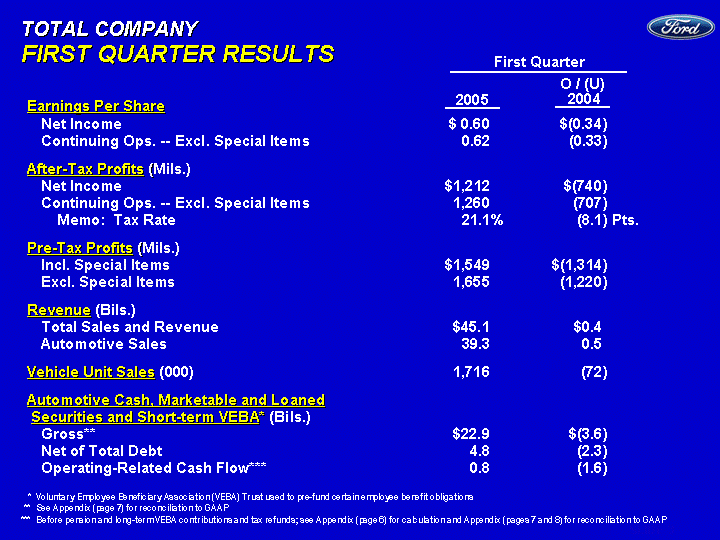
| Earnings Per Share Net Income $ 0.60 $(0.34 ) Continuing Ops. -- Excl. Special Items 0.62 (0.33 ) After-Tax Profits (Mils.) Net Income $1,212 $(740 ) Continuing Ops. -- Excl. Special Items 1,260 (707 ) Memo: Tax Rate 21.1 % (8.1 ) Pts. Pre-Tax Profits (Mils.) Incl. Special Items $1,549 $(1,314 ) Excl. Special Items 1,655 (1,220 ) Revenue (Bils.) Total Sales and Revenue $45.1 $0.4 Automotive Sales 39.3 0.5 Vehicle Unit Sales (000) 1,716 (72 ) Automotive Cash, Marketable and Loaned Securities and Short-term VEBA* (Bils.) Gross** $22.9 $(3.6 ) Net of Total Debt 4.9 (2.3 ) Operating-Related Cash Flow*** 0.8 (1.6 ) TOTAL COMPANY FIRST QUARTER RESULTS 2005 O / (U) 2004 First Quarter * Voluntary Employee Beneficiary Association (VEBA) Trust used to pre-fund certain employee benefit obligations ** See Appendix (page 14) for reconciliation to GAAP *** Before pension and long-term VEBA contributions and tax refunds; see Slide 14 for calculation and Appendix (pages 14 and 15) for reconciliation to GAAP SLIDE 2 |
Table of Contents
SLIDE 3
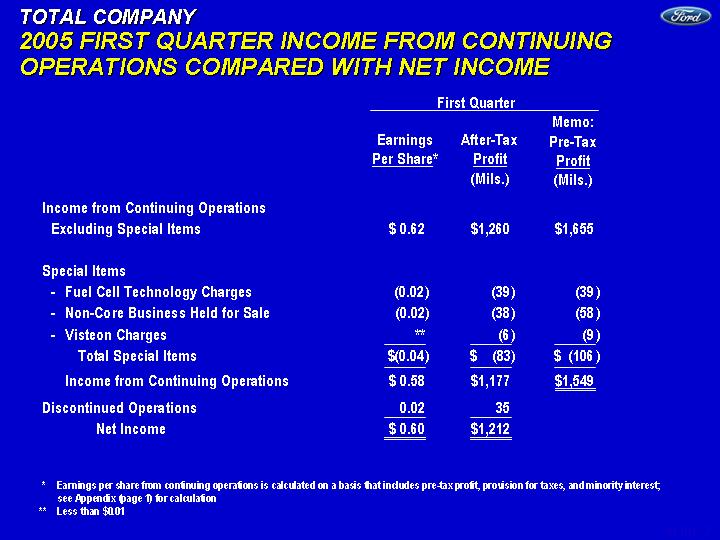
| TOTAL COMPANY 2005 FIRST QUARTER INCOME FROM CONTINUING OPERATIONS COMPARED WITH NET INCOME Memo: Pre-Tax Profit (Mils.) First Quarter Earnings Per Share* Income from Continuing Operations Excluding Special Items $ 0.62 $1,260 $1,655 Special Items - Fuel Cell Technology Charges (0.02 ) (39 ) (39 ) - Non-Core Business Held for Sale (0.02 ) (38 ) (58 ) - Visteon Charges ** (6 ) (9 ) Total Special Items $(0.04 ) $ (83 ) $ (106 ) Income from Continuing Operations $ 0.58 $1,177 $1,549 Discontinued Operations 0.02 35 Net Income $ 0.60 $1,212 After-Tax Profit (Mils.) * Earnings per share from continuing operations is calculated on a basis that includes pre-tax profit, provision for taxes, and minority interest; see Appendix (page 1) for calculation ** Less than $0.01 |
Table of Contents
SLIDE 4
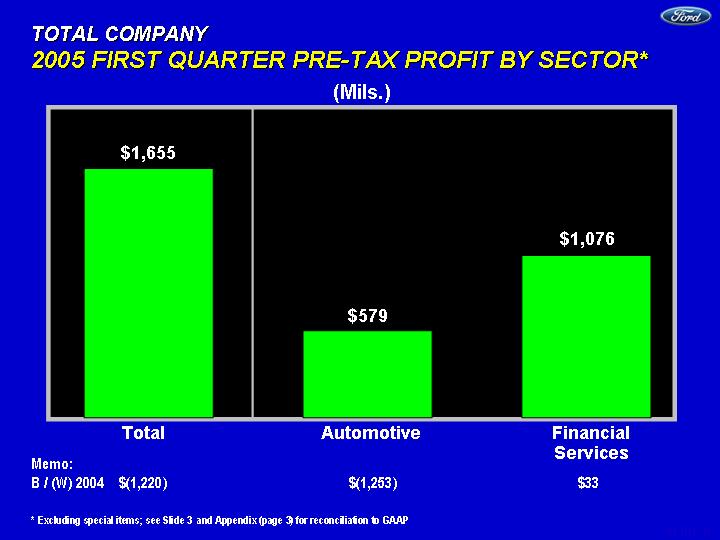
| TOTAL COMPANY 2005 FIRST QUARTER PRE-TAX PROFIT BY SECTOR* * Excluding special items; see Slide 3 and Appendix (page 3) for reconciliation to GAAP Financial Services Automotive Memo: B / (W) 2004 $(1,220) $(1,253) $33 (Mils.) Total Total Auto Fin Svcs 2Q 1655 579 1076 $1,655 $1,076 $579 |
Table of Contents
SLIDE 5
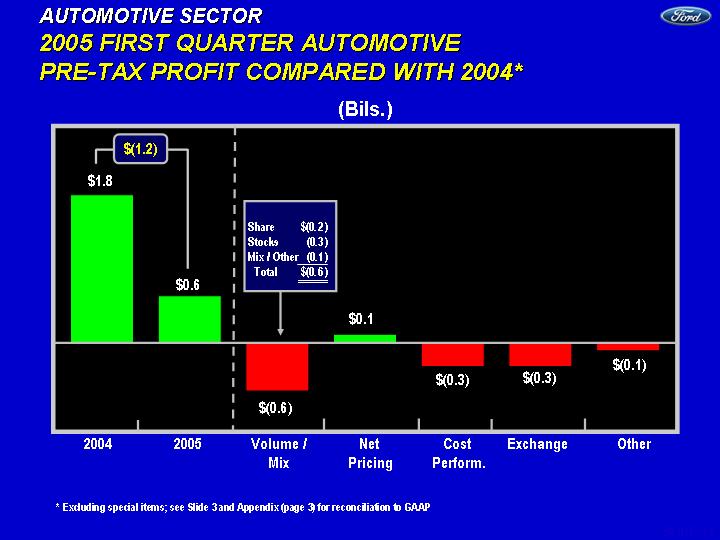
| * Excluding special items; see Slide 3 and Appendix (page 3) for reconciliation to GAAP AUTOMOTIVE SECTOR 2005 FIRST QUARTER AUTOMOTIVE PRE-TAX PROFIT COMPARED WITH 2004* (Bils.) 2204 2005 Volume Revenue Cost Exchange Other 1.831 0.579 -0.6 0.1 -0.3 -0.3 -0.1 $0.1 $(0.6) Net Pricing Cost Perform. $(0.3) Volume / Mix 2005 $0.6 Other 2004 $1.8 $(0.3) Exchange $(0.1) $(1.2) Share $(0.2 ) Stocks (0.3 ) Mix / Other (0.1 ) Total $(0.6 ) |
Table of Contents
SLIDE 6
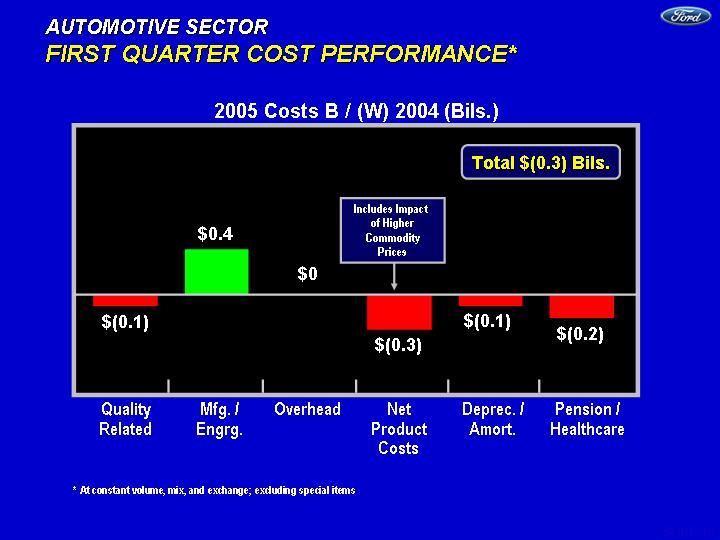
| AUTOMOTIVE SECTOR FIRST QUARTER COST PERFORMANCE* Quality Mfg. Eng Overhead Net Product D&A Pension -0.1 0.4 0 -0.3 -0.1 -0.2 2005 Costs B / (W) 2004 (Bils.) Net Product Costs Quality Related Pension / Healthcare Deprec. / Amort. Mfg. / Engrg. Overhead * At constant volume, mix, and exchange; excluding special items Total $(0.3) Bils. $(0.1) $0 $(0.3) $(0.2) $(0.1) $0.4 Includes Impact of Higher Commodity Prices |
Table of Contents
SLIDE 7
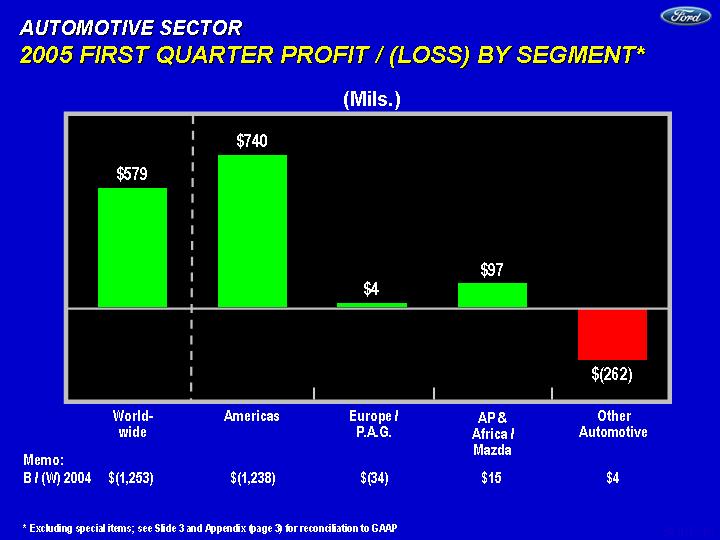
| AUTOMOTIVE SECTOR 2005 FIRST QUARTER PROFIT / (LOSS) BY SEGMENT* Memo: B / (W) 2004 $(1,253) $(1,238) $(34) $15 $4 * Excluding special items; see Slide 3 and Appendix (page 3) for reconciliation to GAAP World- wide Other Automotive WW Americas Europe/PAG AP/Africa Other 2Q 579 740 20 120 -262 Americas $579 $(262) $740 $4 Europe / P.A.G. AP & Africa / Mazda $97 (Mils.) |
Table of Contents
SLIDE 8
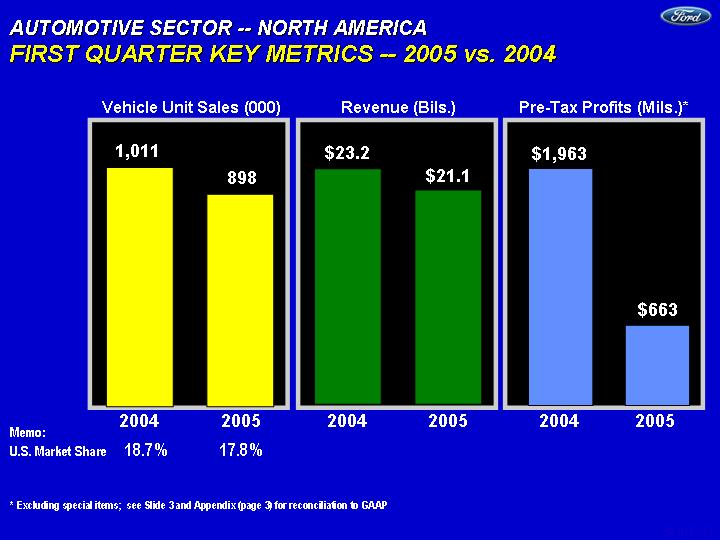
| AUTOMOTIVE SECTOR -- NORTH AMERICA FIRST QUARTER KEY METRICS -- 2005 vs. 2004 2003 2004 Revenue 23.2 21.1 $21.1 $23.2 Revenue (Bils.) 2003 2004 Vehicle Unit Sales 1011 898 898 1,011 Vehicle Unit Sales (000) 2003 2004 PBT 1962 663 $1,963 Pre-Tax Profits (Mils.)* Memo: U.S. Market Share 18.7 % 17.8 % * Excluding special items; see Slide 3 and Appendix (page 3) for reconciliation to GAAP $663 2005 2004 2005 2004 2005 2004 |
Table of Contents
SLIDE 9
| AUTOMOTIVE SECTOR -- SOUTH AMERICA FIRST QUARTER KEY METRICS -- 2005 vs. 2004 2004 2005 0.7 0.9 $0.9 $0.7 Revenue (Bils.) 2004 2005 Vehicle Unit Sales 66 72 73 66 Vehicle Unit Sales (000) 2004 2005 PBT 15 71 Pre-Tax Profits (Mils.) Memo: Brazil Mkt. Share 11.4 % 13.4 % 2005 2004 2005 2004 2005 2004 2004 2005 0.7 0.9 2003 2004 East 15 77 $15 $77 |
Table of Contents
SLIDE 10
| AUTOMOTIVE SECTOR -- EUROPE FIRST QUARTER KEY METRICS -- 2005 vs. 2004 1st Qtr 2nd Qtr East 6.459 7.7 2005 2004 $7.7 $6.5 Revenue (Bils.) 2003 2004 426 445 2005 2004 445 426 Vehicle Unit Sales (000) 2003 2004 East 6 59 $5 2005 2004 Pre-Tax Profits (Mils.)* Memo: Market Share** 9.2 % 9.0 % * Excluding special items; see Slide 3 and Appendix (page 3) for reconciliation to GAAP ** Our 19 major markets only $59 |
Table of Contents
SLIDE 11
| AUTOMOTIVE SECTOR -- P.A.G. FIRST QUARTER KEY METRICS -- 2005 vs. 2004 1st Qtr 1st Qtr East 6.8 7.6 2005 2004 $7.6 $6.8 Revenue (Bils.) 2003 2004 189 188 2005 2004 188 189 Vehicle Unit Sales (000) 2003 2004 East 33 -55 $33 2005 2004 Pre-Tax Profits (Mils.) $(55) Memo: U.S. Mkt. Share 1.3 % 1.2% Eur. Mkt. Share* 2.3 2.4 * Our 19 major markets only |
Table of Contents
SLIDE 12
| AUTOMOTIVE SECTOR -- ASIA PACIFIC AND AFRICA / MAZDA FIRST QUARTER 2005 PRE-TAX PROFITS Memo: B / (W) 2004 $ 15 $15 $0 (Mils.) Asia Pacific and Africa / Mazda Asia Pacific and Africa Mazda and Assoc. Operations AP and A/M AP & Af Mazda & 1Q 97 43 54 $97 $54 $43 |
Table of Contents
SLIDE 13
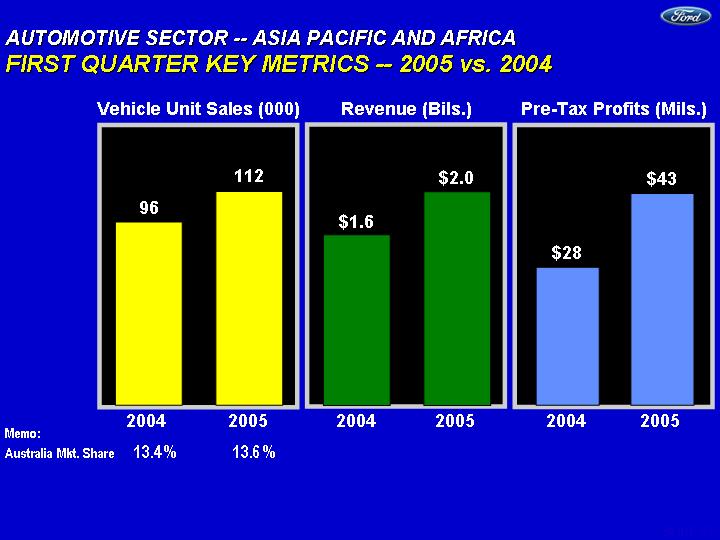
| AUTOMOTIVE SECTOR -- ASIA PACIFIC AND AFRICA FIRST QUARTER KEY METRICS -- 2005 vs. 2004 2003 2004 Revenue 1.6 2 2005 2004 $2.0 $1.6 Revenue (Bils.) 2003 2004 Vehicle Unit Sales 96 112 2005 2004 112 96 Vehicle Unit Sales (000) 2002 2003 PBT 3 25 2005 2004 Pre-Tax Profits (Mils.) 1st Qtr 2nd Qtr East 28 43 $43 $28 Memo: Australia Mkt. Share 13.4 % 13.6 % |
Table of Contents
SLIDE 14
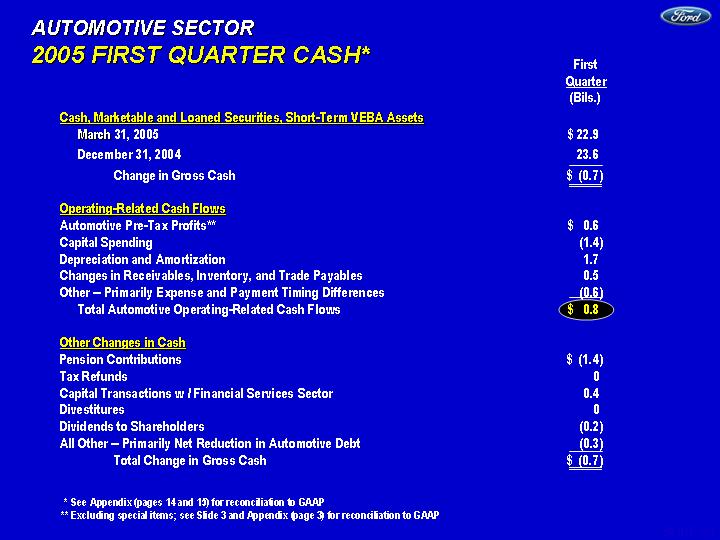
| AUTOMOTIVE SECTOR 2005 FIRST QUARTER CASH* First Quarter (Bils.) Cash, Marketable and Loaned Securities, Short-Term VEBA Assets March 31, 2005 $ 22.9 December 31, 2004 23.6 Change in Gross Cash $ (0.7 ) Operating-Related Cash Flows Automotive Pre-Tax Profits** $ 0.6 Capital Spending (1.4 ) Depreciation and Amortization 1.7 Changes in Receivables, Inventory, and Trade Payables 0.5 Other -- Primarily Expense and Payment Timing Differences (0.6 ) Total Automotive Operating-Related Cash Flows $ 0.8 Other Changes in Cash Pension Contributions $ (1.4 ) Tax Refunds 0 Capital Transactions w / Financial Services Sector 0.4 Divestitures 0 Dividends to Shareholders (0.2 ) All Other -- Primarily Net Reduction in Automotive Debt (0.3 ) Total Change in Gross Cash $ (0.7 ) * See Appendix (pages 14 and 15) for reconciliation to GAAP ** Excluding special items; see Slide 3 and Appendix (page 3) for reconciliation to GAAP |
Table of Contents
SLIDE 15
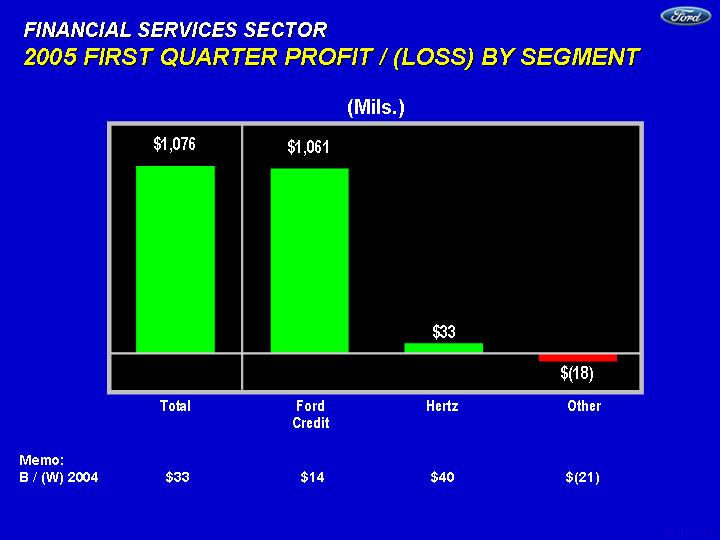
| FINANCIAL SERVICES SECTOR 2005 FIRST QUARTER PROFIT / (LOSS) BY SEGMENT Memo: B / (W) 2004 $33 $14 $40 $(21) Total Credit Hertz Other 1076 1061 63 -48 (Mils.) $1,076 Total Hertz Ford Credit Other $1,061 $33 $(18) |
Table of Contents
SLIDE 16
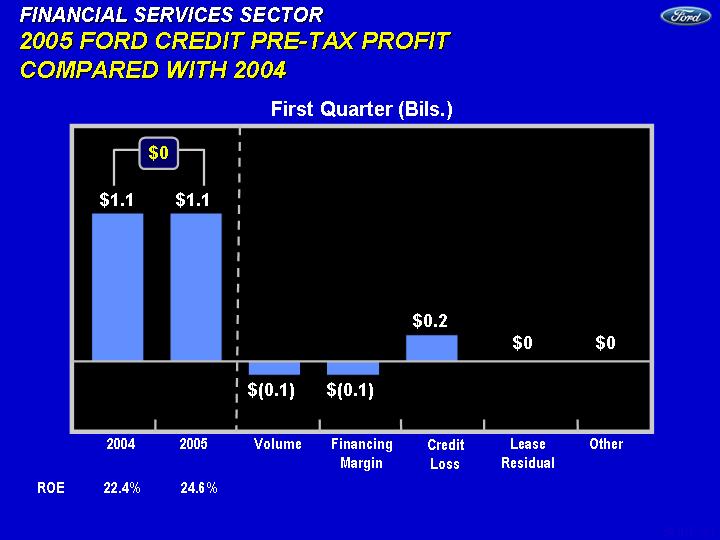
| FINANCIAL SERVICES SECTOR 2005 FORD CREDIT PRE-TAX PROFIT COMPARED WITH 2004 Credit Loss First Quarter (Bils.) Financing Margin Lease Residual Volume 2005 Other 2004 2004 2005 Volume Financing Credit Lease Other East 1.1 1.1 -0.1 -0.1 0.2 0 0 $1.1 $1.1 $0 $(0.1) $(0.1) $0 $0 $0.2 ROE 22.4% 24.6% |
Table of Contents
SLIDE 17
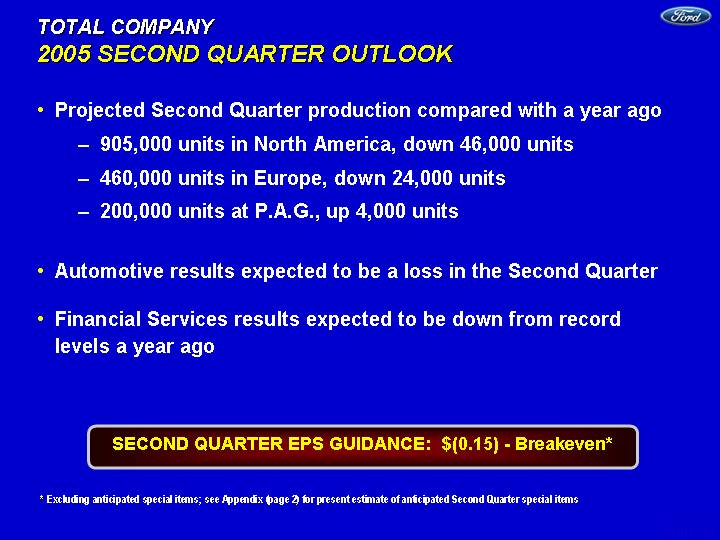
| TOTAL COMPANY 2005 SECOND QUARTER OUTLOOK Projected Second Quarter production compared with a year ago 905,000 units in North America, down 46,000 units 460,000 units in Europe, down 24,000 units 200,000 units at P.A.G., up 4,000 units Automotive results expected to be a loss in the Second Quarter Financial Services results expected to be down from record levels a year ago SECOND QUARTER EPS GUIDANCE: $(0.15) - Breakeven* * Excluding anticipated special items; see Appendix (page 2) for present estimate of anticipated Second Quarter special items |
Table of Contents
SLIDE 18
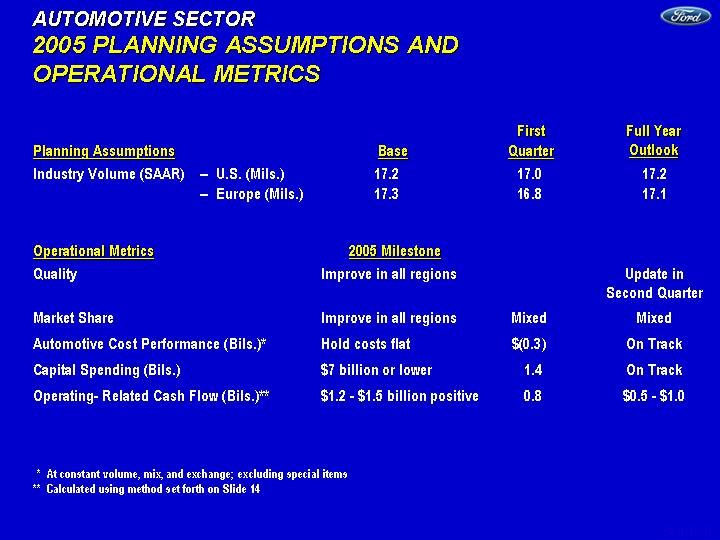
| AUTOMOTIVE SECTOR 2005 PLANNING ASSUMPTIONS AND OPERATIONAL METRICS Planning Assumptions Industry Volume (SAAR) -- U.S. (Mils.) 17.2 17.0 17.2 -- Europe (Mils.) 17.3 16.8 17.1 Operational Metrics Quality Improve in all regions Update in Second Quarter Market Share Improve in all regions Mixed Mixed Automotive Cost Performance (Bils.)* Hold costs flat $(0.3 ) On Track Capital Spending (Bils.) $7 billion or lower 1.4 On Track Operating- Related Cash Flow (Bils.)** $1.2 - $1.5 billion positive 0.8 $0.5 - $1.0 * At constant volume, mix, and exchange; excluding special items ** Calculated using method set forth on Slide 14 Base First Quarter Full Year Outlook 2005 Milestone |
Table of Contents

SLIDE 19
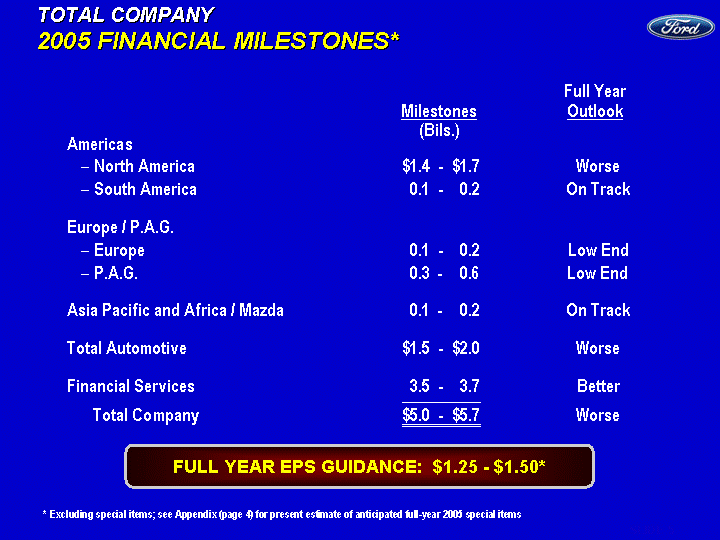
| TOTAL COMPANY 2005 FINANCIAL MILESTONES* Americas North America $1.4 - $1.7 Worse South America 0.1 - 0.2 On Track Europe / P.A.G. Europe 0.1 - 0.2 Low End P.A.G. 0.3 - 0.6 Low End Asia Pacific and Africa / Mazda 0.1 - 0.2 On Track Total Automotive $1.5 - $2.0 Worse Financial Services 3.5 - 3.7 Better Total Company $5.0 - $5.7 Worse Milestones (Bils.) Full Year Outlook FULL YEAR EPS GUIDANCE: $1.25 - $1.50* * Excluding special items; see Appendix (page 2) for present estimate of anticipated full-year 2005 special items SLIDE 39 |
Table of Contents
SLIDE 20
| SAFE HARBOR Greater price competition resulting from currency fluctuations, industry overcapacity or other factors; A significant decline in industry sales, particularly in the U.S. or Europe, resulting from slowing economic growth, geo-political events or other factors; Lower-than-anticipated market acceptance of new or existing products; Economic distress of suppliers that may require us to provide financial support or take other measures to ensure supplies of materials; Work stoppages at Ford or supplier facilities or other interruptions of supplies; The discovery of defects in vehicles resulting in delays in new model launches, recall campaigns or increased warranty costs; Increased safety, emissions, fuel economy or other regulation resulting in higher costs and/or sales restrictions; Unusual or significant litigation or governmental investigations arising out of alleged defects in our products or otherwise; Worse-than-assumed economic and demographic experience for our post-retirement benefit plans (e.g., investment returns, interest rates, health care cost trends, benefit improvements); Currency or commodity price fluctuations, including rising steel prices; Change in interest rates; A market shift from truck sales in the U.S.; Economic difficulties in any significant market; Higher prices for or reduced availability of fuel; Labor or other constraints on our ability to restructure our business; A change in our requirements under long-term supply arrangements pursuant to which we are obligated to purchase minimum quantities or a fixed percentage of output or pay minimum amounts; Credit rating downgrades; Inability to access debt or securitization markets around the world at competitive rates or in sufficient amounts; Higher-than-expected credit losses; Lower-than-anticipated residual values for leased vehicles; Increased price competition in the rental car industry and/or a general decline in business or leisure travel due to terrorist attacks, acts of war, epidemic diseases or measures taken by governments in response thereto that negatively affect the travel industry; and Our inability to implement the Revitalization Plan. Statements included herein may constitute "forward looking statements" within the meaning of the Private Securities Litigation Reform Act of 1995. These statements involve a number of risks, uncertainties, and other factors that could cause actual results to differ materially from those stated, including, without limitation: |
Table of Contents

| APPENDIX |
Table of Contents
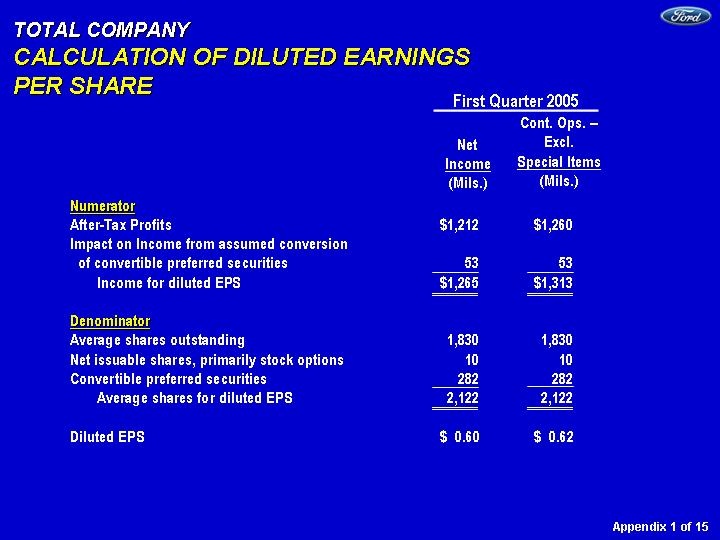
| TOTAL COMPANY CALCULATION OF DILUTED EARNINGS PER SHARE Net Income (Mils.) Numerator After-Tax Profits $1,212 $1,260 Impact on Income from assumed conversion of convertible preferred securities 53 53 Income for diluted EPS $1,265 $1,313 Denominator Average shares outstanding 1,830 1,830 Net issuable shares, primarily stock options 10 10 Convertible preferred securities 282 282 Average shares for diluted EPS 2,122 2,122 Diluted EPS $ 0.60 $ 0.62 Appendix 1 of 15 Cont. Ops. -- Excl. Special Items (Mils.) First Quarter 2005 |
Table of Contents
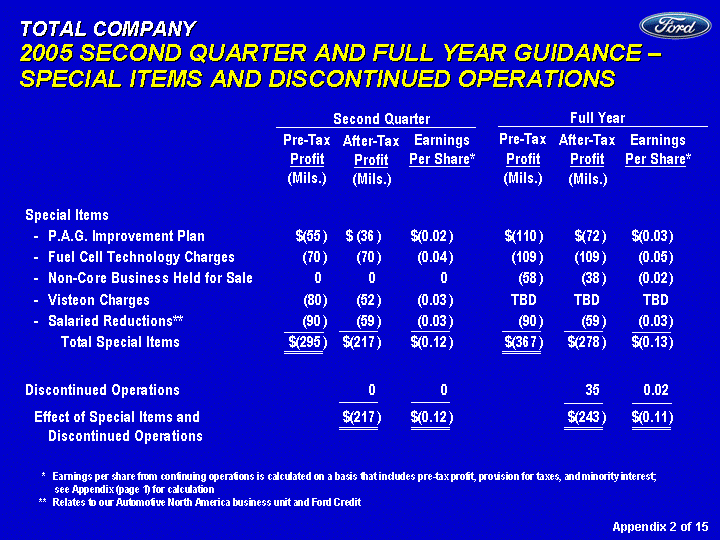
| TOTAL COMPANY 2005 SECOND QUARTER AND FULL YEAR GUIDANCE - SPECIAL ITEMS AND DISCONTINUED OPERATIONS Pre-Tax Profit (Mils.) Second Quarter Earnings Per Share* Special Items - P.A.G. Improvement Plan $(55 ) $ (36 ) $(0.02 ) $(110 ) $(72 ) $(0.03 ) - Fuel Cell Technology Charges (70 ) (70 ) (0.04 ) (109 ) (109 ) (0.05 ) - Non-Core Business Held for Sale 0 0 0 (58 ) (38 ) (0.02 ) - Visteon Charges (80 ) (52 ) (0.03 ) TBD TBD TBD - Salaried Reductions** (90 ) (59 ) (0.03 ) (90 ) (59 ) (0.03 ) Total Special Items $(295 ) $(217 ) $(0.12 ) $(367 ) $(278 ) $(0.13 ) Discontinued Operations 0 0 35 0.02 Effect of Special Items and $(217 ) $(0.12 ) $(243 ) $(0.11 ) Discontinued Operations After-Tax Profit (Mils.) * Earnings per share from continuing operations is calculated on a basis that includes pre-tax profit, provision for taxes, and minority interest; see Appendix (page 1) for calculation ** Relates to our Automotive North America business unit and Ford Credit Appendix 2 of 15 Pre-Tax Profit (Mils.) Full Year Earnings Per Share* After-Tax Profit (Mils.) |
Table of Contents

| TOTAL COMPANY 2004 - 2005 FIRST QUARTER PRE-TAX RESULTS* North America $1,963 $ 557 $ 0 $(106 ) $1,963 $ 663 South America 15 77 0 0 15 77 Total Americas $1,978 $ 634 $ 0 $(106 ) $1,978 $ 740 Europe $ (24 ) $ 59 $ (29 )** $ 0 $ 5 $ 59 P.A.G. 33 (55 ) 0 0 33 (55 ) Total Europe / P.A.G. $ 9 $ 4 $ (29 ) $ 0 $ 38 $ 4 Asia Pacific and Africa $ 28 $ 43 $ 0 $ 0 $ 28 $ 43 Mazda & Assoc. Operations 54 54 0 0 54 54 Total AP and Africa / Mazda $ 82 $ 97 $ 0 $ 0 $ 82 $ 97 Other Automotive (249 ) (262 ) 17 *** 0 (266 ) (262 ) Total Automotive $1,820 $ 473 $ (12 ) $(106 ) $1,832 $ 579 Financial Services 1,043 1,076 0 0 1,043 1,076 Total Company $2,863 $1,549 $ (12 ) $(106 ) $2,875 $1,655 * From continuing operations ** Ford Europe Improvement Plan *** Related to prior divestiture of non-core business 2004 (Mils.) 2005 (Mils.) Pre-Tax Profits (Incl. Special Items) Special Items Pre-Tax Profits (Excl. Special Items) 2004 (Mils.) 2005 (Mils.) 2004 (Mils.) 2005 (Mils.) Appendix 3 of 15 |
Table of Contents
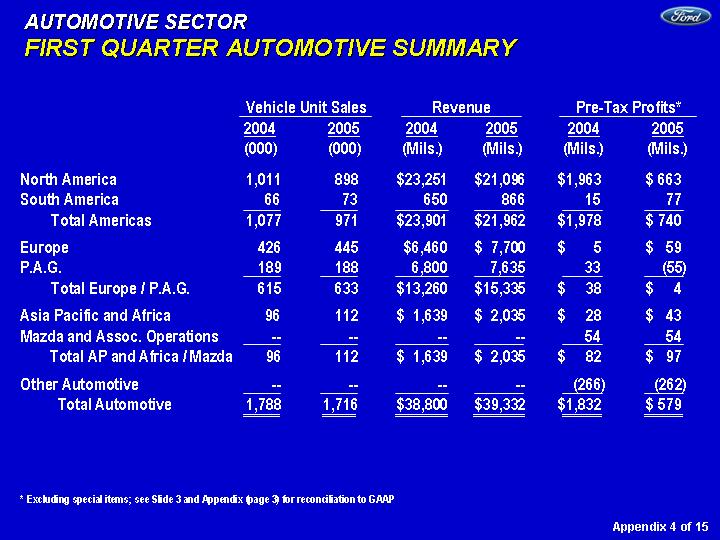
| AUTOMOTIVE SECTOR FIRST QUARTER AUTOMOTIVE SUMMARY Appendix 4 of 15 * Excluding special items; see Slide 3 and Appendix (page 3) for reconciliation to GAAP North America 1,011 898 $23,251 $21,096 $1,963 $ 663 South America 66 73 650 866 15 77 Total Americas 1,077 971 $23,901 $21,962 $1,978 $ 740 Europe 426 445 $6,460 $ 7,700 $ 5 $ 59 P.A.G. 189 188 6,800 7,635 33 (55 ) Total Europe / P.A.G. 615 633 $13,260 $15,335 $ 38 $ 4 Asia Pacific and Africa 96 112 $ 1,639 $ 2,035 $ 28 $ 43 Mazda and Assoc. Operations -- -- -- -- 54 54 Total AP and Africa / Mazda 96 112 $ 1,639 $ 2,035 $ 82 $ 97 Other Automotive -- -- -- -- (266 ) (262 ) Total Automotive 1,788 1,716 $38,800 $39,332 $1,832 $ 579 2004 (000) 2005 (000) Vehicle Unit Sales Revenue Pre-Tax Profits* 2004 (Mils.) 2005 (Mils.) 2004 (Mils.) 2005 (Mils.) |
Table of Contents
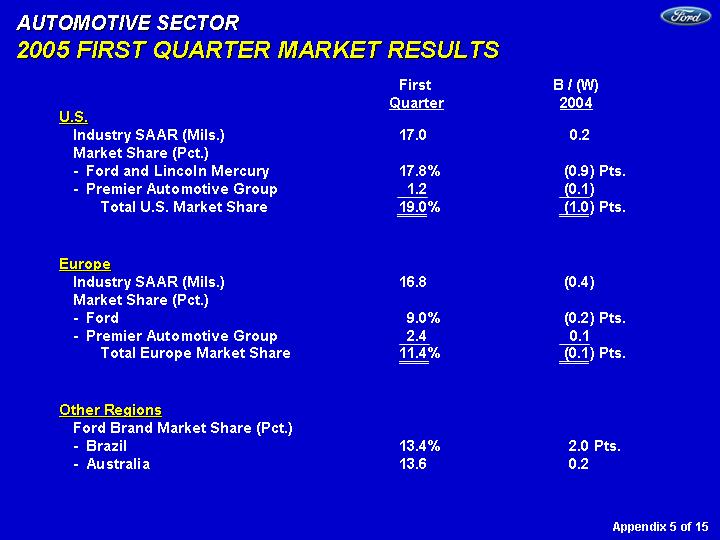
| AUTOMOTIVE SECTOR 2005 FIRST QUARTER MARKET RESULTS U.S. Industry SAAR (Mils.) 17.0 0.2 Market Share (Pct.) - Ford and Lincoln Mercury 17.8 % (0.9 ) Pts. - Premier Automotive Group 1.2 (0.1 ) Total U.S. Market Share 19.0 % (1.0 ) Pts. Europe Industry SAAR (Mils.) 16.8 (0.4 ) Market Share (Pct.) - Ford 9.0 % (0.2 ) Pts. - Premier Automotive Group 2.4 0.1 Total Europe Market Share 11.4 % (0.1 ) Pts. Other Regions Ford Brand Market Share (Pct.) - Brazil 13.4 % 2.0 Pts. - Australia 13.6 0.2 First Quarter B / (W) 2004 Appendix 5 of 15 |
Table of Contents
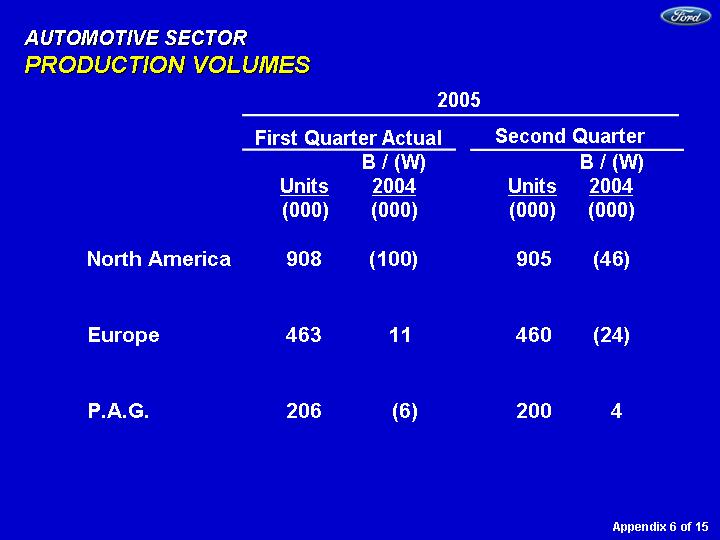
| AUTOMOTIVE SECTOR PRODUCTION VOLUMES Appendix 6 of 15 North America 908 (100 ) 905 (46 ) Europe 463 11 460 (24 ) P.A.G. 206 (6 ) 200 4 Units (000) B / (W) 2004 (000) First Quarter Actual 2005 Units (000) B / (W) 2004 (000) Second Quarter |
Table of Contents
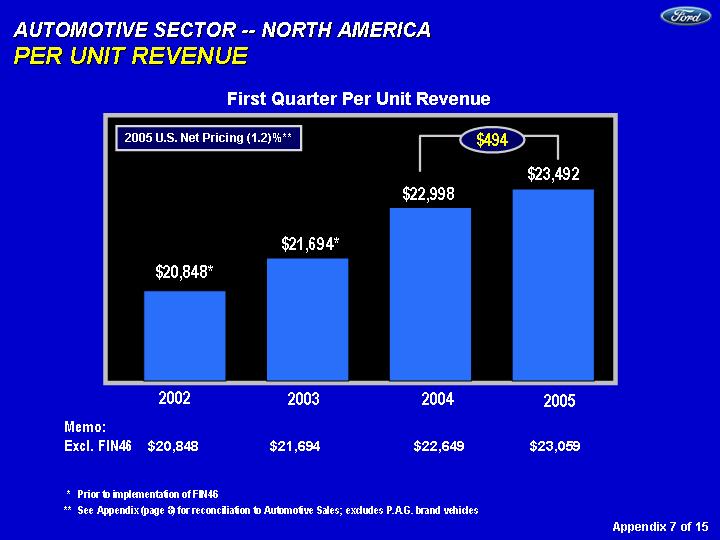
| * Prior to implementation of FIN46 ** See Appendix (page 8) for reconciliation to Automotive Sales; excludes P.A.G. brand vehicles 2002 2003 2004 2005 Net Rev 20848 21694 22998 23492 2002 2003 2004 $21,694* $20,848* First Quarter Per Unit Revenue $22,998 Memo: Excl. FIN46 $20,848 $21,694 $22,649 $23,059 2005 U.S. Net Pricing (1.2)%** AUTOMOTIVE SECTOR -- NORTH AMERICA PER UNIT REVENUE $23,492 2005 $494 Appendix 7 of 15 |
Table of Contents
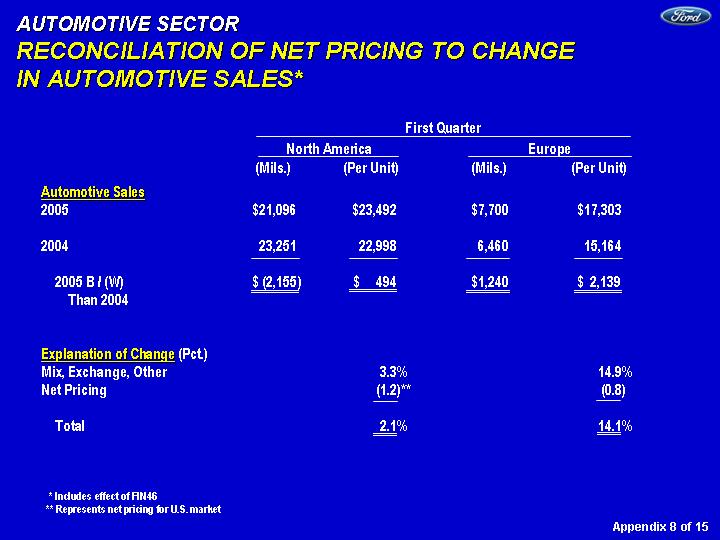
| AUTOMOTIVE SECTOR RECONCILIATION OF NET PRICING TO CHANGE IN AUTOMOTIVE SALES* Automotive Sales 2005 $21,096 $23,492 $7,700 $17,303 2004 23,251 22,998 6,460 15,164 2005 B / (W) $ (2,155 ) $ 494 $1,240 $ 2,139 Than 2004 Explanation of Change (Pct.) Mix, Exchange, Other 3.3 % 14.9 % Net Pricing (1.2 )** (0.8 ) Total 2.1 % 14.1 % North America (Mils.) (Per Unit) First Quarter Europe (Per Unit) (Mils.) Appendix 8 of 15 * Includes effect of FIN46 ** Represents net pricing for U.S. market |
Table of Contents
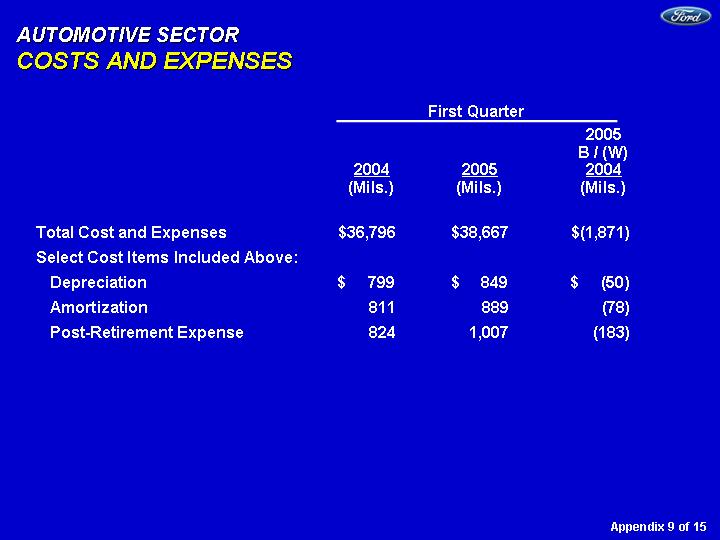
| AUTOMOTIVE SECTOR COSTS AND EXPENSES Total Cost and Expenses $36,796 $38,667 $(1,871 ) Select Cost Items Included Above: Depreciation $ 799 $ 849 $ (50 ) Amortization 811 889 (78 ) Post-Retirement Expense 824 1,007 (183 ) 2004 (Mils.) 2005 (Mils.) 2005 B / (W) 2004 (Mils.) First Quarter Appendix 9 of 15 |
Table of Contents
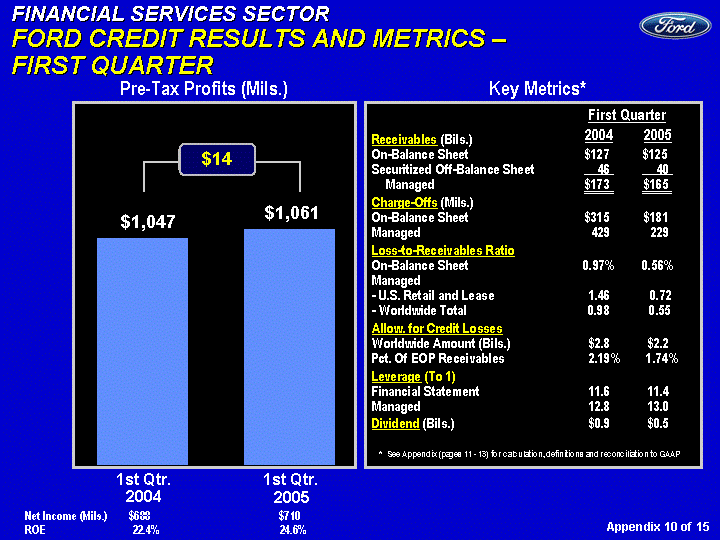
| FINANCIAL SERVICES SECTOR FORD CREDIT RESULTS AND METRICS - FIRST QUARTER Receivables (Bils.) On-Balance Sheet $127 $125 Securitized Off-Balance Sheet 46 40 Managed $173 $165 Charge-Offs (Mils.) On-Balance Sheet $315 $181 Managed 429 229 Loss-to-Receivables Ratio On-Balance Sheet 0.97% 0.56% Managed - U.S. Retail and Lease 1.46 0.72 - Worldwide Total 0.98 0.55 Allow. for Credit Losses Worldwide Amount (Bils.) $2.8 $2.2 Pct. Of EOP Receivables 2.19 % 1.74% Leverage (To 1) Financial Statement 11.6 11.4 Managed 12.8 13.0 Dividend (Bils.) $0.9 $0.5 2004 2005 Key Metrics* Net Income (Mils.) $688 $710 ROE 22.4 % 24.6% 2003 2004 East 1047 1061 4Q 594 839 Pre-Tax Profits (Mils.) 1st Qtr. 2004 1st Qtr. 2005 $1,047 $1,061 First Quarter * See Appendix (pages 11 - 13) for calculation, definitions and reconciliation to GAAP $14 Appendix 10 of 15 |
Table of Contents
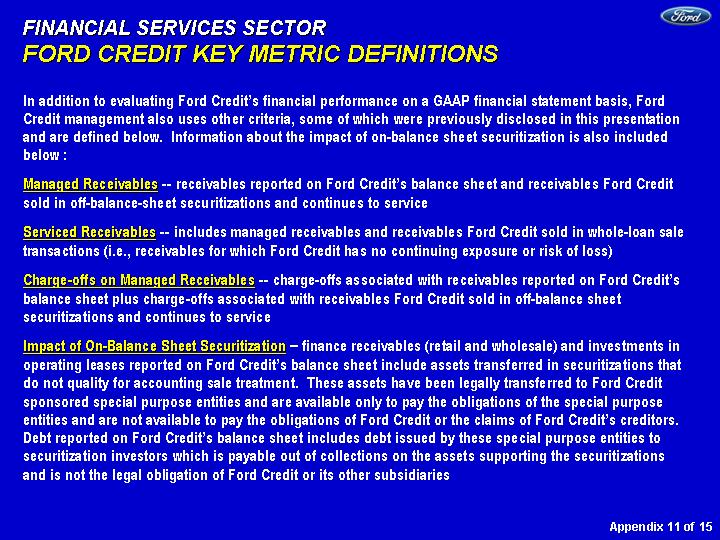
| FINANCIAL SERVICES SECTOR FORD CREDIT KEY METRIC DEFINITIONS In addition to evaluating Ford Credit's financial performance on a GAAP financial statement basis, Ford Credit management also uses other criteria, some of which were previously disclosed in this presentation and are defined below. Information about the impact of on-balance sheet securitization is also included below : Managed Receivables -- receivables reported on Ford Credit's balance sheet and receivables Ford Credit sold in off-balance-sheet securitizations and continues to service Serviced Receivables -- includes managed receivables and receivables Ford Credit sold in whole-loan sale transactions (i.e., receivables for which Ford Credit has no continuing exposure or risk of loss) Charge-offs on Managed Receivables -- charge-offs associated with receivables reported on Ford Credit's balance sheet plus charge-offs associated with receivables Ford Credit sold in off-balance sheet securitizations and continues to service Impact of On-Balance Sheet Securitization - finance receivables (retail and wholesale) and investments in operating leases reported on Ford Credit's balance sheet include assets transferred in securitizations that do not quality for accounting sale treatment. These assets have been legally transferred to Ford Credit sponsored special purpose entities and are available only to pay the obligations of the special purpose entities and are not available to pay the obligations of Ford Credit or the claims of Ford Credit's creditors. Debt reported on Ford Credit's balance sheet includes debt issued by these special purpose entities to securitization investors which is payable out of collections on the assets supporting the securitizations and is not the legal obligation of Ford Credit or its other subsidiaries Appendix 11 of 15 |
Table of Contents
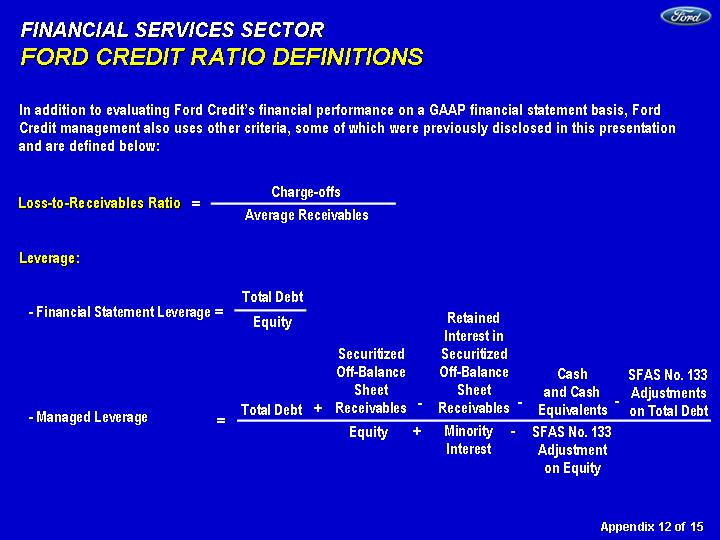
| FINANCIAL SERVICES SECTOR FORD CREDIT RATIO DEFINITIONS In addition to evaluating Ford Credit's financial performance on a GAAP financial statement basis, Ford Credit management also uses other criteria, some of which were previously disclosed in this presentation and are defined below: Leverage: Total Debt - - Financial Statement Leverage = Equity Total Debt Securitized Off-Balance Sheet Receivables Cash and Cash Equivalents SFAS No. 133 Adjustments on Total Debt Equity Minority Interest SFAS No. 133 Adjustment on Equity - - Managed Leverage + - - - - - - = + - - Retained Interest in Securitized Off-Balance Sheet Receivables Charge-offs = Average Receivables Loss-to-Receivables Ratio Appendix 12 of 15 |
Table of Contents
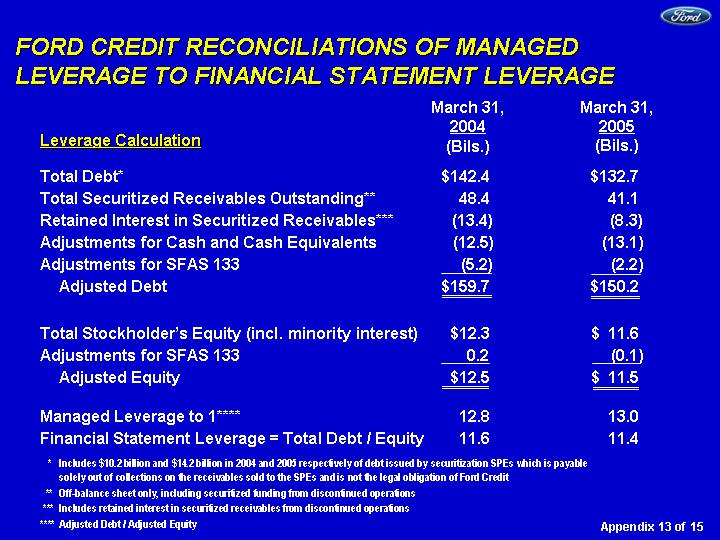
| FORD CREDIT RECONCILIATIONS OF MANAGED LEVERAGE TO FINANCIAL STATEMENT LEVERAGE Total Debt* $142.4 $132.7 Total Securitized Receivables Outstanding** 48.4 41.1 Retained Interest in Securitized Receivables*** (13.4) (8.3) Adjustments for Cash and Cash Equivalents (12.5) (13.1 ) Adjustments for SFAS 133 (5.2) (2.2 ) Adjusted Debt $159.7 $150.2 Total Stockholder's Equity (incl. minority interest) $12.3 $ 11.6 Adjustments for SFAS 133 0.2 (0.1 ) Adjusted Equity $12.5 $ 11.5 Managed Leverage to 1**** 12.8 13.0 Financial Statement Leverage = Total Debt / Equity 11.6 11.4 * Includes $10.2 billion and $14.2 billion in 2004 and 2005 respectively of debt issued by securitization SPEs which is payable solely out of collections on the receivables sold to the SPEs and is not the legal obligation of Ford Credit ** Off-balance sheet only, including securitized funding from discontinued operations *** Includes retained interest in securitized receivables from discontinued operations **** Adjusted Debt / Adjusted Equity March 31, 2005 (Bils.) Leverage Calculation Appendix 13 of 15 March 31, 2004 (Bils.) |
Table of Contents
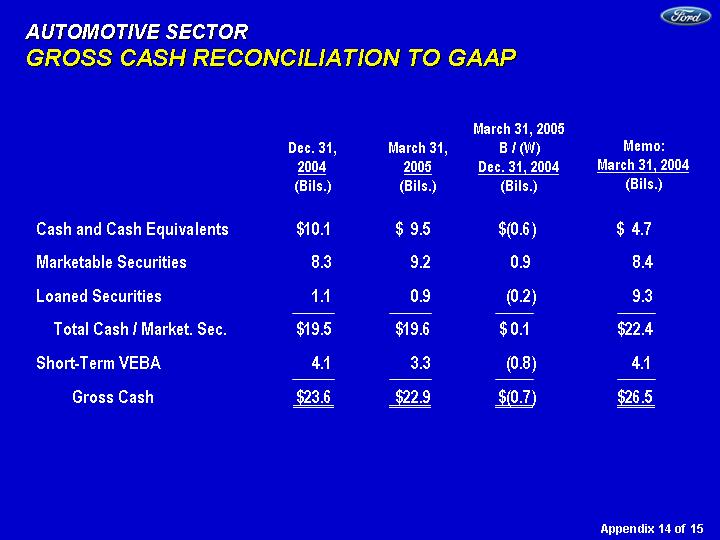
| AUTOMOTIVE SECTOR GROSS CASH RECONCILIATION TO GAAP Cash and Cash Equivalents $10.1 $ 9.5 $(0.6 ) $ 4.7 Marketable Securities 8.3 9.2 0.9 8.4 Loaned Securities 1.1 0.9 (0.2 ) 9.3 Total Cash / Market. Sec. $19.5 $19.6 $ 0.1 $22.4 Short-Term VEBA 4.1 3.3 (0.8 ) 4.1 Gross Cash $23.6 $22.9 $(0.7 ) $26.5 March 31, 2005 B / (W) Dec. 31, 2004 (Bils.) March 31, 2005 (Bils.) Dec. 31, 2004 (Bils.) Appendix 14 of 15 Memo: March 31, 2004 (Bils.) |
Table of Contents

| AUTOMOTIVE SECTOR GAAP RECONCILIATION OF OPERATING-RELATED CASH FLOWS Cash Flows from Operating Activities before Securities Trading $ 2.4 $(0.2 ) Items Included in Operating-Related Cash Flows Capital Expenditures $(1.4 ) $(0.2 ) Net Transactions Between Automotive and Financial Services Sectors (0.7 ) (0.6 ) Exclusion of ST VEBA Cash Flows - Net (Drawdown) / Top-Up (0.8 ) (0.8 ) Other (0.1 ) 0 Total Reconciling Items $(3.0 ) $(1.6 ) Total Automotive Operating-Related Cash Flows $(0.6 ) $(1.8 ) Pension Contributions 1.4 0.2 Tax Refunds 0 0 Total Auto. Op.-Related Cash Flows $ 0.8 $(1.6 ) (Excl. Contrib. and Tax Refunds) * Net transactions with Automotive / Financial Services line from Sector Cash Flows statement First Qtr. (Bils.) 2005 B / (W) Than 2004 (Bils.) Appendix 15 of 15 |
Table of Contents

Table of Contents
Exhibit 99.3

| FIRST QUARTER FIXED INCOME PRESENTATION APRIL 20, 2005 |
Table of Contents

| Earnings Per Share Net Income $ 0.60 $(0.34 ) Continuing Ops. -- Excl. Special Items 0.62 (0.33 ) After-Tax Profits (Mils.) Net Income $1,212 $(740 ) Continuing Ops. -- Excl. Special Items 1,260 (707 ) Memo: Tax Rate 21.1 % (8.1 ) Pts. Pre-Tax Profits (Mils.) Incl. Special Items $1,549 $(1,314 ) Excl. Special Items 1,655 (1,220 ) Revenue (Bils.) Total Sales and Revenue $45.1 $0.4 Automotive Sales 39.3 0.5 Vehicle Unit Sales (000) 1,716 (72 ) Automotive Cash, Marketable and Loaned Securities and Short-term VEBA* (Bils.) Gross** $22.9 $(3.6 ) Net of Total Debt 4.8 (2.3 ) Operating-Related Cash Flow*** 0.8 (1.6 ) TOTAL COMPANY FIRST QUARTER RESULTS 2005 O / (U) 2004 First Quarter * Voluntary Employee Beneficiary Association (VEBA) Trust used to pre-fund certain employee benefit obligations ** See Appendix (page 7) for reconciliation to GAAP *** Before pension and long-term VEBA contributions and tax refunds; see Appendix (page 6) for calculation and Appendix (pages 7 and 8) for reconciliation to GAAP |
Slide 1
Table of Contents
| TOTAL COMPANY 2005 FINANCIAL MILESTONES* Americas North America $1.4 - $1.7 Worse South America 0.1 - 0.2 On Track Europe / P.A.G. Europe 0.1 - 0.2 Low End P.A.G. 0.3 - 0.6 Low End Asia Pacific and Africa / Mazda 0.1 - 0.2 On Track Total Automotive $1.5 - $2.0 Worse Financial Services 3.5 - 3.7 Better Total Company $5.0 - $5.7 Worse Milestones (Bils.) Full Year Outlook FULL YEAR EPS GUIDANCE: $1.25 - $1.50* * Excluding special items; see Appendix (page 4) for present estimate of anticipated full-year 2005 special items |
Slide 2
Table of Contents
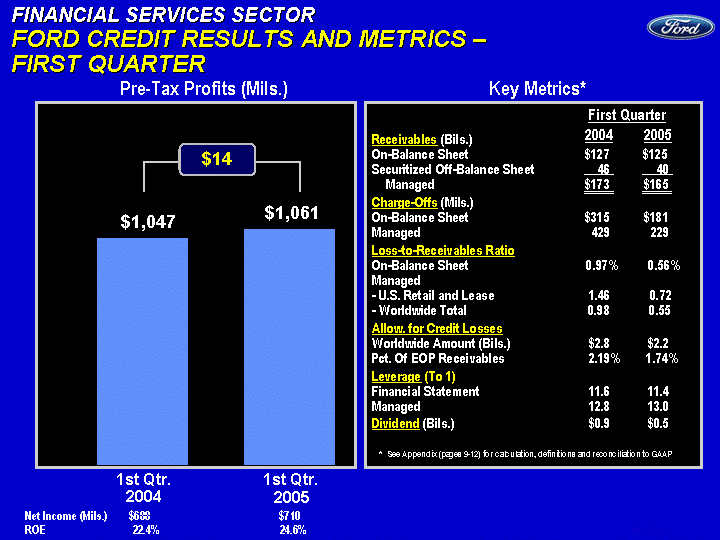
| FINANCIAL SERVICES SECTOR FORD CREDIT RESULTS AND METRICS - FIRST QUARTER Receivables (Bils.) On-Balance Sheet $127 $125 Securitized Off-Balance Sheet 46 40 Managed $173 $165 Charge-Offs (Mils.) On-Balance Sheet $315 $181 Managed 429 229 Loss-to-Receivables Ratio On-Balance Sheet 0.97% 0.56 % Managed - U.S. Retail and Lease 1.46 0.72 - Worldwide Total 0.98 0.55 Allow. for Credit Losses Worldwide Amount (Bils.) $2.8 $2.2 Pct. Of EOP Receivables 2.19 % 1.74% Leverage (To 1) Financial Statement 11.6 11.4 Managed 12.8 13.0 Dividend (Bils.) $0.9 $0.5 2004 2005 Key Metrics* Net Income (Mils.) $688 $710 ROE 22.4 % 24.6% 2003 2004 East 1047 1061 4Q 594 839 Pre-Tax Profits (Mils.) 1st Qtr. 2004 1st Qtr. 2005 $1,047 $1,061 First Quarter * See Appendix (pages 9-12) for calculation, definitions and reconciliation to GAAP $14 |
Slide 3
Table of Contents
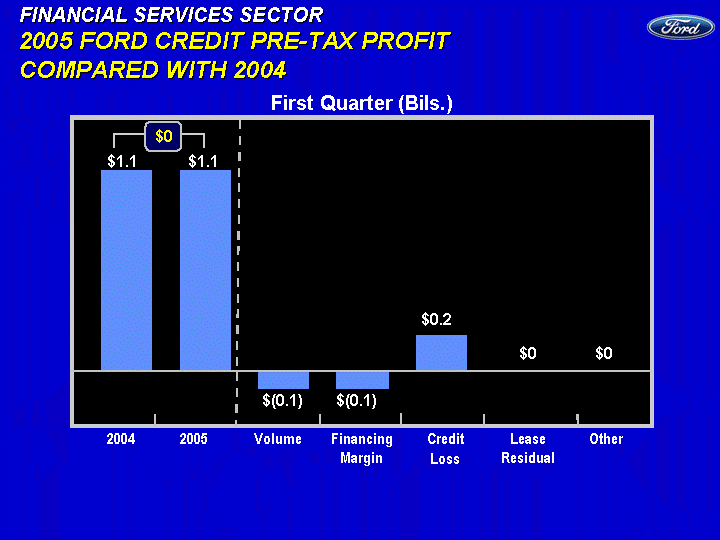
| FINANCIAL SERVICES SECTOR 2005 FORD CREDIT PRE-TAX PROFIT COMPARED WITH 2004 First Quarter (Bils.) Financing Margin Lease Residual Volume 2005 Other 2004 Credit Loss 2004 2005 Volume Financing Credit Lease Other East 1.1 1.1 -0.1 -0.1 0.2 0 0 $1.1 $1.1 $0 $0 $0 $0.2 $(0.1) $(0.1) |
Slide 4
Table of Contents
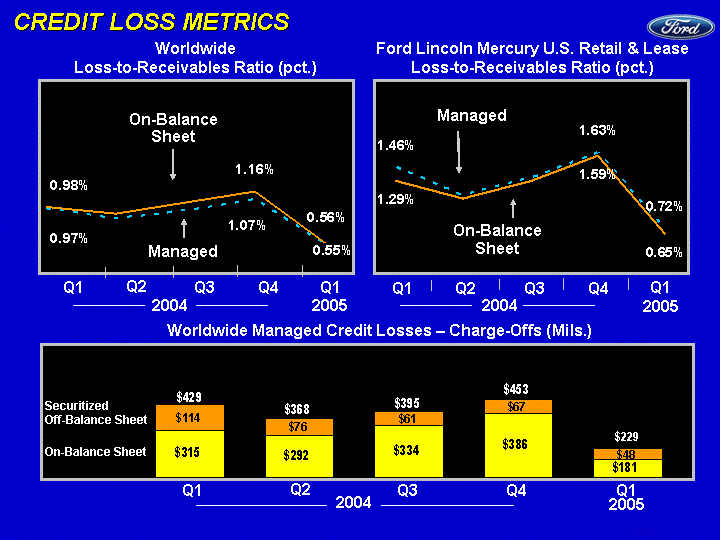
| Q104 Q204 Q304 Q404 Q105 Worldwide Managed 0.0097 0.0085 0.0094 0.0107 0.0055 Worldwide Owned 0.0098 0.0091 0.0104 0.0116 0.0056 Managed Reserves as Pct. Of EOP Receivables Q104 Q204 Q304 Q404 Q105 Ford Credit U.S. Managed LTR 0.0146 0.0112 0.0132 0.0163 0.0072 Ford Credit U.S. Owned 0.0129 0.0108 0.0129 0.0159 0.0065 Managed Reserves as Pct. Of EOP Receivables CREDIT LOSS METRICS Managed Q104 Q204 Q304 Q404 Q105 Owned 315 292 334 386 181 Securitized 114 76 61 67 48 Worldwide Managed Credit Losses - Charge-Offs (Mils.) On-Balance Sheet Securitized Off-Balance Sheet Q1 Q2 Q3 Q4 2004 Q1 Q1 Q2 Q3 Q4 2004 Ford Lincoln Mercury U.S. Retail & Lease Loss-to-Receivables Ratio (pct.) On-Balance Sheet Managed Worldwide Loss-to-Receivables Ratio (pct.) On-Balance Sheet Q1 $429 Q1 Q2 Q3 Q4 Q1 2005 $395 2004 $229 $453 2005 2005 $368 |
Slide 5
Table of Contents
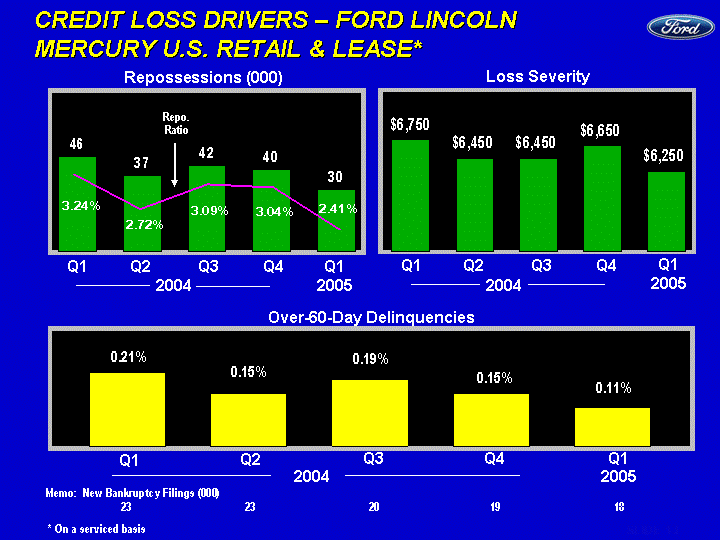
| Q104 Q204 Q304 Q404 Q105 Worldwide Owned 46 37 42 40 30 Q104 Q204 Q304 Q404 Q105 Worldwide Owned 3.24 2.72 3.09 3.04 2.41 CREDIT LOSS DRIVERS - FORD LINCOLN MERCURY U.S. RETAIL & LEASE* Over-60-Day Delinquencies Repossessions (000) Q104 Q204 Q304 Q404 Q105 Worldwide Owned 6750 6450 6450 6650 6250 Q1 Q2 Q3 Q4 Loss Severity Q1 2005 Q4 Q1 Q2 Q3 2004 Q1 * On a serviced basis Q1 Q2 Q3 Q4 Q1 Repo. Ratio 2004 2004 2005 2005 Memo: New Bankruptcy Filings (000) 23 23 20 19 18 1Q04 2Q04 3Q04 4Q04 1Q05 NON-BANKRUPT 0.0021 0.0015 0.0019 0.0015 0.0011 |
Slide 6
Table of Contents
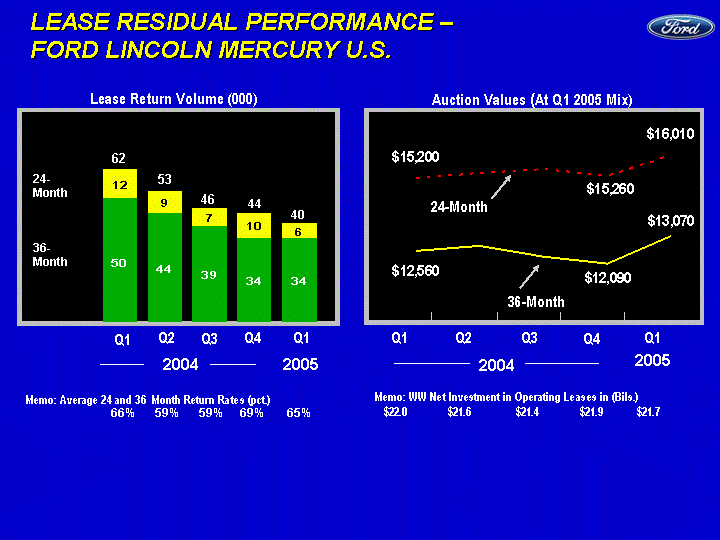
| Q1 2004 Q2 2004 Q3 2004 Q4 2004 Q1 2005 RR 24-Month 12 9 7 10 6 RR 36-Month 50 44 39 34 34 LEASE RESIDUAL PERFORMANCE - FORD LINCOLN MERCURY U.S. Lease Return Volume (000) Q4 Q1 Q1 Q2 Q3 2004 2005 Q1 Q2 Q3 Q4 Q1 36-Month 50 44 39 34 34 24-Month 12 9 7 10 6 62 53 46 44 40 Memo: Average 24 and 36 Month Return Rates (pct.) 66% 59% 59% 69% 65% 24- Month 36- Month Q1 2004 Q2 2004 Q3 2004 Q4 2004 Q1 2005 AV 24-Month 15200 15380 15530 15260 16010 AV 36-Month 12560 12740 12340 12090 13070 Auction Values (At Q1 2005 Mix) 36-Month 24-Month Q4 Q1 Q1 Q2 Q3 Memo: WW Net Investment in Operating Leases in (Bils.) $22.0 $21.6 $21.4 $21.9 $21.7 2004 2005 |
Slide 7
Table of Contents
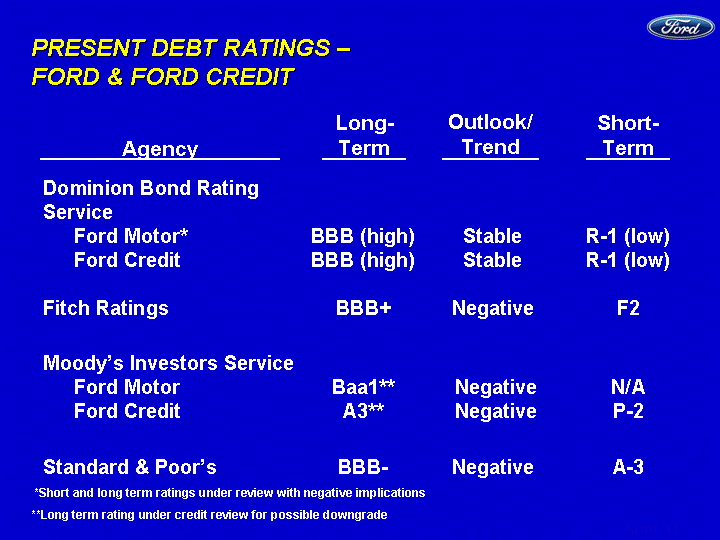
| PRESENT DEBT RATINGS - FORD & FORD CREDIT Agency Long- Term Outlook/ Trend Short- Term Dominion Bond Rating Service Ford Motor* BBB (high) Stable R-1 (low) Ford Credit BBB (high) Stable R-1 (low) Fitch Ratings BBB+ Negative F2 Moody's Investors Service Ford Motor Baa1** Negative N/A Ford Credit A3** Negative P-2 Standard & Poor's BBB- Negative A-3 *Short and long term ratings under review with negative implications **Long term rating under credit review for possible downgrade |
Slide 8
Table of Contents
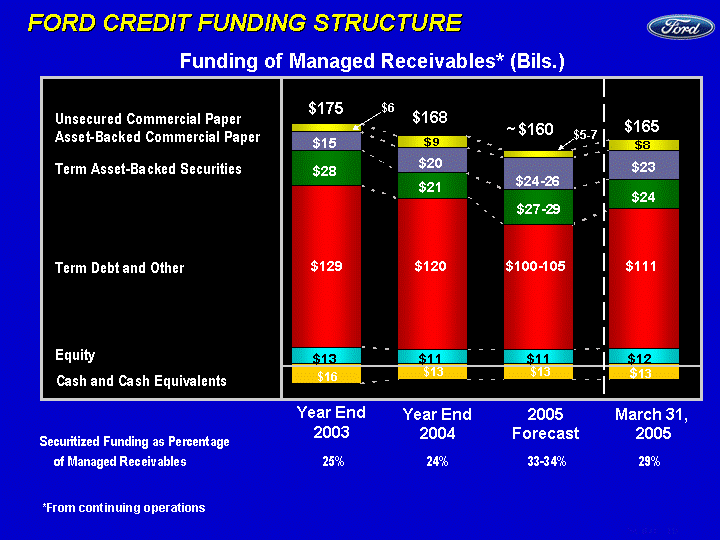
| FORD CREDIT FUNDING STRUCTURE 2001 2003 2004 2005 33105 Equity 13 12.7 11 11 12 Term Debt/Other 132 129 120 100 111 Securitization 34 28 21 28 24 ABS CP 12 15 20 25 23 Commercial Paper 16 6 9 6 8 Overborrow -3 -16 -12.7 -13 -13 Equity Unsecured Commercial Paper Asset-Backed Commercial Paper $175 $160 $27-29 $129 $13 $11 Year End 2003 Year End 2004 March 31, 2005 $15 $28 Funding of Managed Receivables* (Bils.) Securitized Funding as Percentage of Managed Receivables 25% 24% 33-34% 29% 2005 Forecast $20 $120 $11 Term Asset-Backed Securities Term Debt and Other $13 Cash and Cash Equivalents $13 $6 $16 $24-26 $168 $165 $24 $111 $12 $13 *From continuing operations $100-105 $5-7 $21 $23 ~ |
Slide 9
Table of Contents
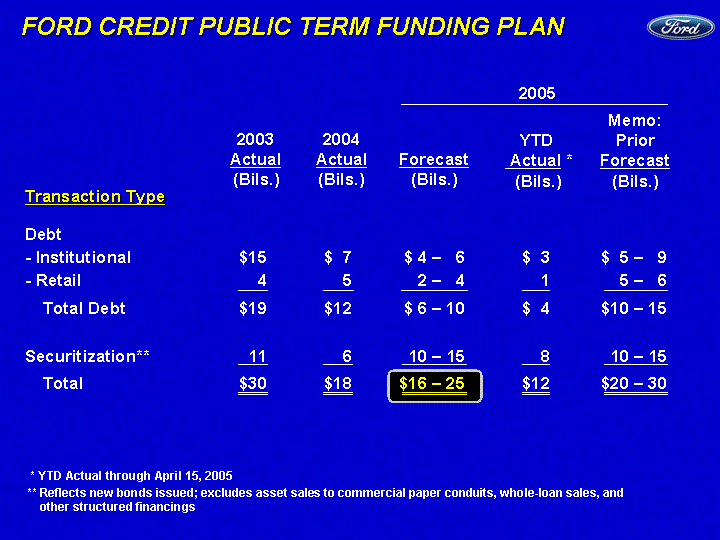
| FORD CREDIT PUBLIC TERM FUNDING PLAN 2003 Actual (Bils.) 2004 Actual (Bils.) Transaction Type Forecast (Bils.) * YTD Actual through April 15, 2005 ** Reflects new bonds issued; excludes asset sales to commercial paper conduits, whole-loan sales, and other structured financings YTD Actual * (Bils.) Memo: Prior Forecast (Bils.) Debt - - Institutional $15 $ 7 $ 4 - 6 $ 3 $ 5 - 9 - - Retail 4 5 2 - 4 1 5 - 6 Total Debt $19 $12 $ 6 - 10 $ 4 $10 - 15 Securitization** 11 6 10 - 15 8 10 - 15 Total $30 $18 $16 - 25 $12 $20 - 30 2005 |
Slide 10
Table of Contents
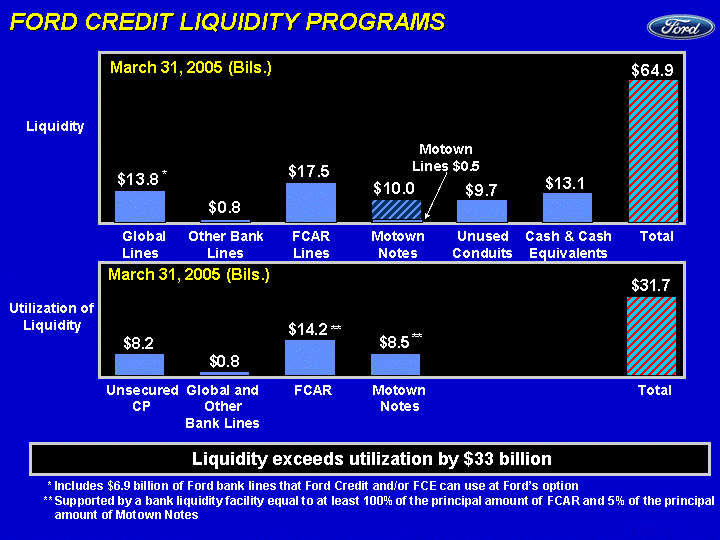
| Unsecured CP Bank Lines FCAR Motown Conduits Total Back-up liquidity 8.2 0.8 14.2 8.5 31.7 Global Bank Lines Other FCAR Motown Unused Conduits Cash Total Back-up liquidity 13.8 0.8 17.5 10 9.7 13.1 64.9 FORD CREDIT LIQUIDITY PROGRAMS Liquidity Global Other Bank FCAR Motown Unused Cash & Cash Total Lines Lines Lines Notes Conduits Equivalents Utilization of Liquidity Unsecured Global and FCAR Motown Total CP Other Notes Bank Lines Liquidity exceeds utilization by $33 billion March 31, 2005 (Bils.) March 31, 2005 (Bils.) * * Includes $6.9 billion of Ford bank lines that Ford Credit and/or FCE can use at Ford's option ** Supported by a bank liquidity facility equal to at least 100% of the principal amount of FCAR and 5% of the principal amount of Motown Notes ** ** Motown Lines $0.5 |
Slide 11
Table of Contents
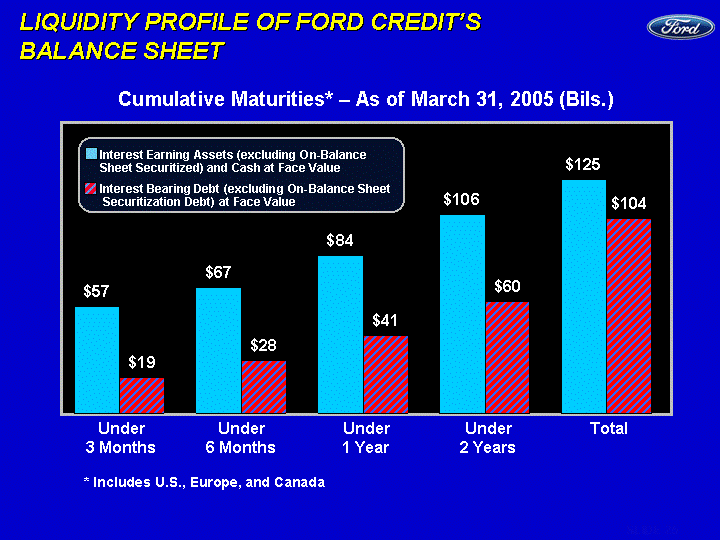
| Under 3 Months Under 6 Months Under 1 Year Under 2 Years Total Assets 57 67 84 106 125 Liabilities 19 28 41 60 104 LIQUIDITY PROFILE OF FORD CREDIT'S BALANCE SHEET Cumulative Maturities* - As of March 31, 2005 (Bils.) * Includes U.S., Europe, and Canada Under 3 Months Under 6 Months Under 1 Year Under 2 Years Total Interest Earning Assets (excluding On-Balance Sheet Securitized) and Cash at Face Value Interest Bearing Debt (excluding On-Balance Sheet Securitization Debt) at Face Value |
Slide 12
Table of Contents
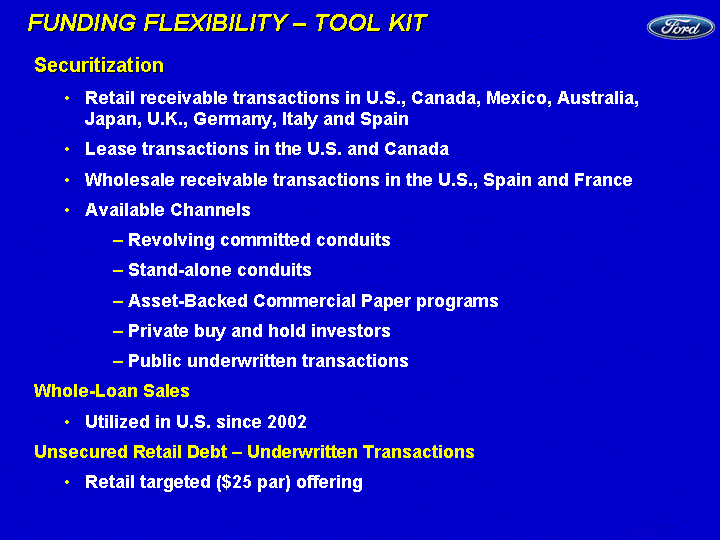
| FUNDING FLEXIBILITY - TOOL KIT Securitization Retail receivable transactions in U.S., Canada, Mexico, Australia, Japan, U.K., Germany, Italy and Spain Lease transactions in the U.S. and Canada Wholesale receivable transactions in the U.S., Spain and France Available Channels Revolving committed conduits Stand-alone conduits Asset-Backed Commercial Paper programs Private buy and hold investors Public underwritten transactions Whole-Loan Sales Utilized in U.S. since 2002 Unsecured Retail Debt - Underwritten Transactions Retail targeted ($25 par) offering |
Slide 13
Table of Contents
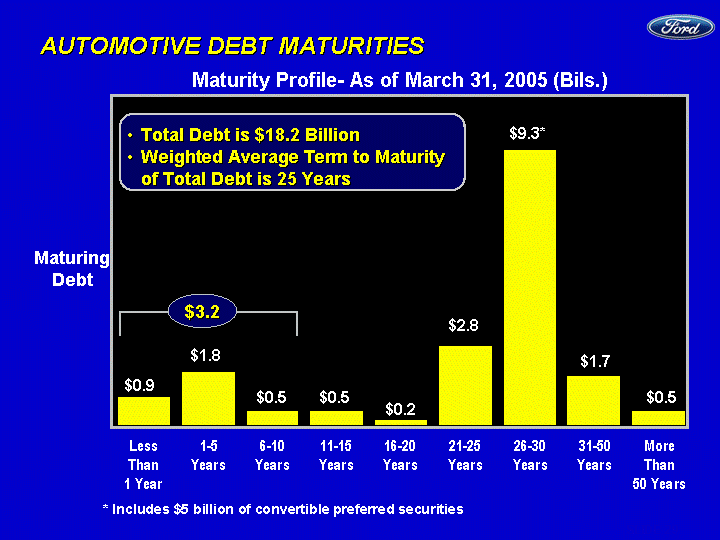
| AUTOMOTIVE DEBT MATURITIES 1 Yr. 1-5 Yrs. 6-10 Yrs. 11-15 Yrs. 16-20 Yrs. 21-25 Yrs. 26-30 Yrs. 31-50 Yrs. 50+ Yrs. 0.9765 1.8 0.5 0.5 0.2 2.7 9.3 1.668 0.5 Maturing Debt More Than 50 Years Maturity Profile- As of March 31, 2005 (Bils.) Less Than 1 Year 1-5 Years 11-15 Years 16-20 Years 31-50 Years Total Debt is $18.2 Billion Weighted Average Term to Maturity of Total Debt is 25 Years 6-10 Years 21-25 Years 26-30 Years $0.9 $0.5 $0.2 $2.8 $9.3* $1.7 $0.5 $1.8 $0.5 $3.2 * Includes $5 billion of convertible preferred securities |
Slide 14
Table of Contents
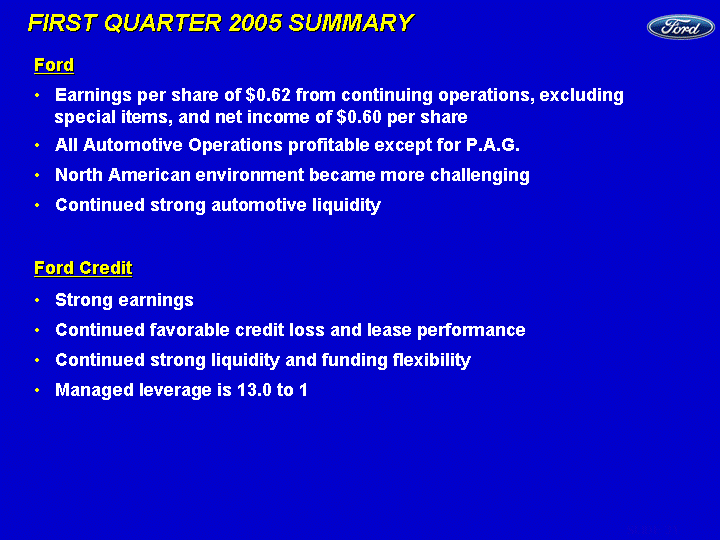
| FIRST QUARTER 2005 SUMMARY Ford Earnings per share of $0.62 from continuing operations, excluding special items, and net income of $0.60 per share All Automotive Operations profitable except for P.A.G. North American environment became more challenging Continued strong automotive liquidity Ford Credit Strong earnings Continued favorable credit loss and lease performance Continued strong liquidity and funding flexibility Managed leverage is 13.0 to 1 |
Slide 15
Table of Contents
| SAFE HARBOR Statements included herein may constitute "forward looking statements" within the meaning of the Private Securities Litigation Reform Act of 1995. These statements involve a number of risks, uncertainties, and other factors that could cause actual results to differ materially from those stated, including, without limitation: Greater price competition resulting from currency fluctuations, industry overcapacity or other factors; A significant decline in industry sales, particularly in the U.S. or Europe, resulting from slowing economic growth, geo-political events or other factors; Lower-than-anticipated market acceptance of new or existing products; Economic distress of suppliers that may require us to provide financial support or take other measures to ensure supplies of materials; Work stoppages at Ford or supplier facilities or other interruptions of supplies; The discovery of defects in vehicles resulting in delays in new model launches, recall campaigns or increased warranty costs; Increased safety, emissions, fuel economy or other regulation resulting in higher costs and/or sales restrictions; Unusual or significant litigation or governmental investigations arising out of alleged defects in our products or otherwise; Worse-than-assumed economic and demographic experience for our post-retirement benefit plans (e.g., investment returns, interest rates, health care cost trends, benefit improvements); Currency or commodity price fluctuations, including rising steel prices; Change in interest rates; A market shift from truck sales in the U.S.; Economic difficulties in any significant market; Higher prices for or reduced availability of fuel; Labor or other constraints on our ability to restructure our business; A change in our requirements or obligations under long-term supply arrangements pursuant to which we are obligated to purchase minimum quantities or a fixed percentage of output or pay minimum amounts; Credit rating downgrades; Inability to access debt or securitization markets around the world at competitive rates or in sufficient amounts; Higher-than-expected credit losses; Lower-than-anticipated residual values for leased vehicles; Increased price competition in the rental car industry and/or a general decline in business or leisure travel due to terrorist attacks, acts of war, epidemic diseases or measures taken by governments in response thereto that negatively affect the travel industry; and Our inability to implement the Revitalization Plan. |
Slide 16
Table of Contents

| APPENDIX |
Table of Contents
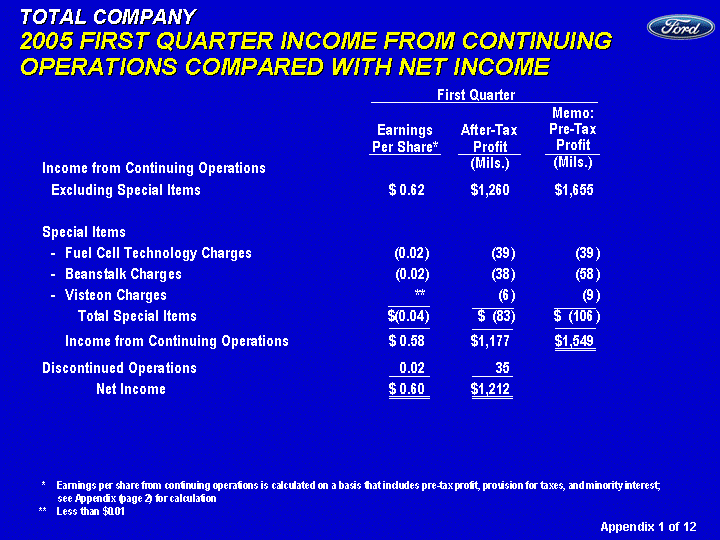
| TOTAL COMPANY 2005 FIRST QUARTER INCOME FROM CONTINUING OPERATIONS COMPARED WITH NET INCOME Memo: Pre-Tax Profit (Mils.) First Quarter Earnings Per Share* Income from Continuing Operations Excluding Special Items $ 0.62 $1,260 $1,655 Special Items - Fuel Cell Technology Charges (0.02 ) (39 ) (39 ) - Beanstalk Charges (0.02 ) (38 ) (58 ) - Visteon Charges ** (6 ) (9 ) Total Special Items $(0.04 ) $ (83 ) $ (106 ) Income from Continuing Operations $ 0.58 $1,177 $1,549 Discontinued Operations 0.02 35 Net Income $ 0.60 $1,212 After-Tax Profit (Mils.) * Earnings per share from continuing operations is calculated on a basis that includes pre-tax profit, provision for taxes, and minority interest; see Appendix (page 2) for calculation ** Less than $0.01 Appendix 1 of 12 |
Table of Contents
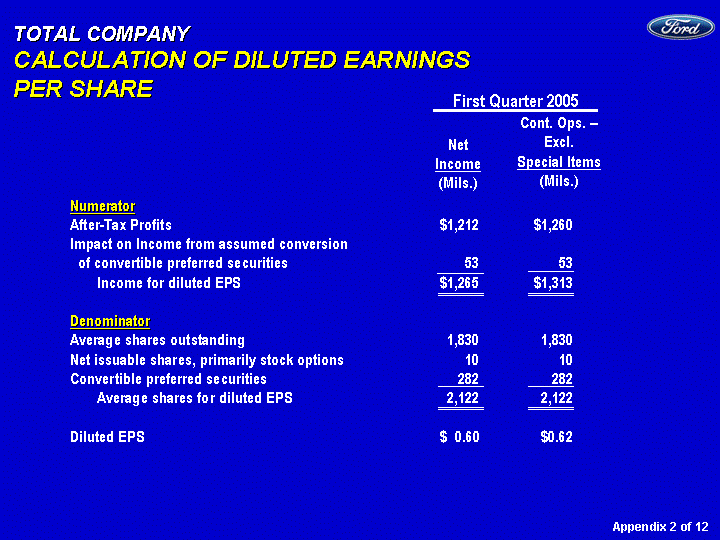
| TOTAL COMPANY CALCULATION OF DILUTED EARNINGS PER SHARE Net Income (Mils.) Numerator After-Tax Profits $1,212 $1,260 Impact on Income from assumed conversion of convertible preferred securities 53 53 Income for diluted EPS $1,265 $1,313 Denominator Average shares outstanding 1,830 1,830 Net issuable shares, primarily stock options 10 10 Convertible preferred securities 282 282 Average shares for diluted EPS 2,122 2,122 Diluted EPS $ 0.60 $0.62 Appendix 2 of 12 Cont. Ops. -- Excl. Special Items (Mils.) First Quarter 2005 |
Table of Contents
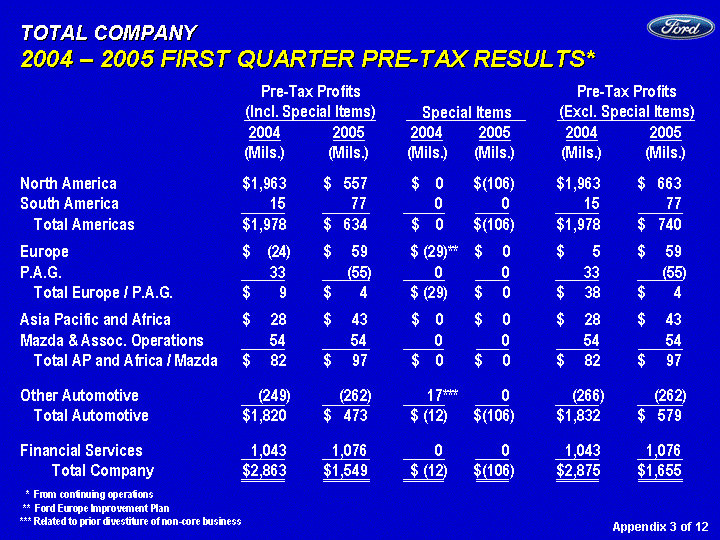
| TOTAL COMPANY 2004 - 2005 FIRST QUARTER PRE-TAX RESULTS* North America $1,963 $ 557 $ 0 $(106 ) $1,963 $ 663 South America 15 77 0 0 15 77 Total Americas $1,978 $ 634 $ 0 $(106 ) $1,978 $ 740 Europe $ (24 ) $ 59 $ (29 )** $ 0 $ 5 $ 59 P.A.G. 33 (55 ) 0 0 33 (55 ) Total Europe / P.A.G. $ 9 $ 4 $ (29 ) $ 0 $ 38 $ 4 Asia Pacific and Africa $ 28 $ 43 $ 0 $ 0 $ 28 $ 43 Mazda & Assoc. Operations 54 54 0 0 54 54 Total AP and Africa / Mazda $ 82 $ 97 $ 0 $ 0 $ 82 $ 97 Other Automotive (249 ) (262 ) 17 *** 0 (266 ) (262 ) Total Automotive $1,820 $ 473 $ (12 ) $(106 ) $1,832 $ 579 Financial Services 1,043 1,076 0 0 1,043 1,076 Total Company $2,863 $1,549 $ (12 ) $(106 ) $2,875 $1,655 * From continuing operations ** Ford Europe Improvement Plan *** Related to prior divestiture of non-core business 2004 (Mils.) 2005 (Mils.) Pre-Tax Profits (Incl. Special Items) Special Items Pre-Tax Profits (Excl. Special Items) 2004 (Mils.) 2005 (Mils.) 2004 (Mils.) 2005 (Mils.) Appendix 3 of 12 |
Table of Contents

| TOTAL COMPANY 2005 SECOND QUARTER AND FULL YEAR GUIDANCE - SPECIAL ITEMS AND DISCONTINUED OPERATIONS Pre-Tax Profit (Mils.) Second Quarter Earnings Per Share* Special Items - P.A.G. Improvement Plan $(55 ) $ (36 ) $(0.02 ) $(110 ) $(72 ) $(0.03 ) - Fuel Cell Technology Charges (70 ) (70 ) (0.04 ) (109 ) (109 ) (0.05 ) - Non-Core Business Held for Sale 0 0 0 (58 ) (38 ) (0.02 ) - Visteon Charges (80 ) (52 ) (0.03 ) TBD TBD TBD - Salaried Reductions** (90 ) (59 ) (0.03 ) (90 ) (59 ) (0.03 ) Total Special Items $(295 ) $(217 ) $(0.12 ) $(367 ) $(278 ) $(0.13 ) Discontinued Operations 0 0 35 0.02 Effect of Special Items and $(217 ) $(0.12 ) $(243 ) $(0.11 ) Discontinued Operations After-Tax Profit (Mils.) * Earnings per share from continuing operations is calculated on a basis that includes pre-tax profit, provision for taxes, and minority interest; see Appendix (page 2) for calculation ** Relates to our Automotive North America business unit and Ford Credit Appendix 4 of 12 Pre-Tax Profit (Mils.) Full Year Earnings Per Share* After-Tax Profit (Mils.) |
Table of Contents
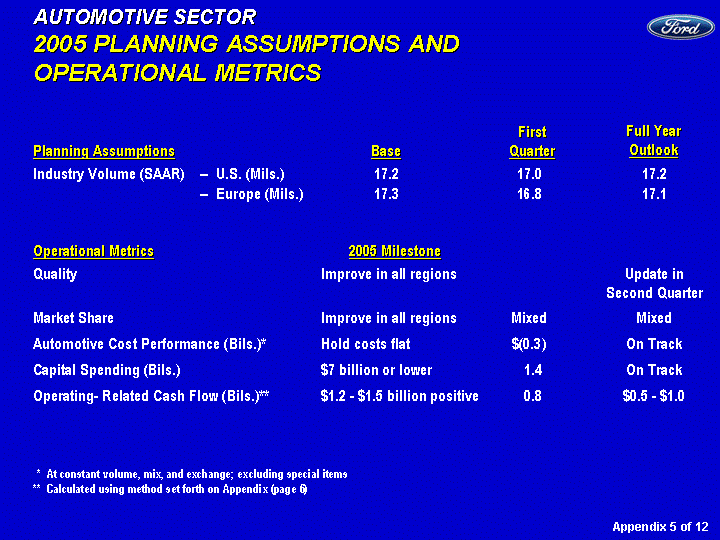
| AUTOMOTIVE SECTOR 2005 PLANNING ASSUMPTIONS AND OPERATIONAL METRICS Planning Assumptions Industry Volume (SAAR) -- U.S. (Mils.) 17.2 17.0 17.2 -- Europe (Mils.) 17.3 16.8 17.1 Operational Metrics Quality Improve in all regions Update in Second Quarter Market Share Improve in all regions Mixed Mixed Automotive Cost Performance (Bils.)* Hold costs flat $(0.3 ) On Track Capital Spending (Bils.) $7 billion or lower 1.4 On Track Operating- Related Cash Flow (Bils.)** $1.2 - $1.5 billion positive 0.8 $0.5 - $1.0 * At constant volume, mix, and exchange; excluding special items ** Calculated using method set forth on Appendix (page 6) Base First Quarter Full Year Outlook 2005 Milestone Appendix 5 of 12 |
Table of Contents
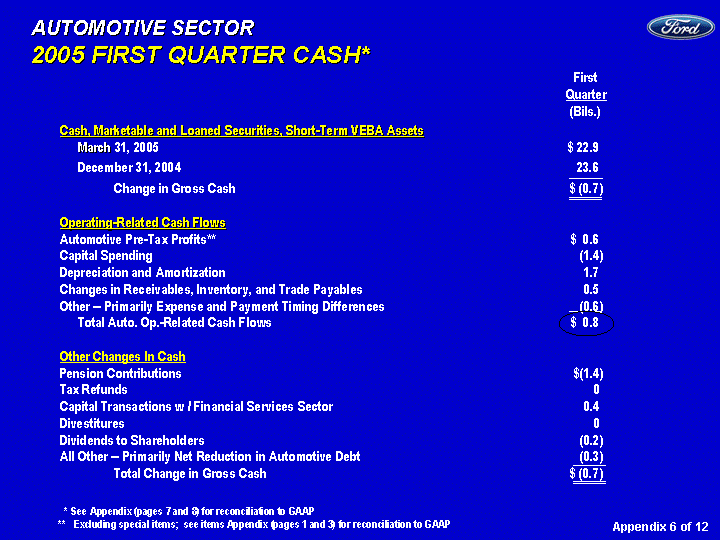
| AUTOMOTIVE SECTOR 2005 FIRST QUARTER CASH* First Quarter (Bils.) Cash, Marketable and Loaned Securities, Short-Term VEBA Assets March 31, 2005 $ 22.9 December 31, 2004 23.6 Change in Gross Cash $ (0.7 ) Operating-Related Cash Flows Automotive Pre-Tax Profits** $ 0.6 Capital Spending (1.4 ) Depreciation and Amortization 1.7 Changes in Receivables, Inventory, and Trade Payables 0.5 Other -- Primarily Expense and Payment Timing Differences (0.6 ) Total Auto. Op.-Related Cash Flows $ 0.8 Other Changes In Cash Pension Contributions $(1.4 ) Tax Refunds 0 Capital Transactions w / Financial Services Sector 0.4 Divestitures 0 Dividends to Shareholders (0.2 ) All Other -- Primarily Net Reduction in Automotive Debt (0.3 ) Total Change in Gross Cash $ (0.7 ) * See Appendix (pages 7 and 8) for reconciliation to GAAP ** Excluding special items; see items Appendix (pages 1 and 3) for reconciliation to GAAP Appendix 6 of 12 |
Table of Contents
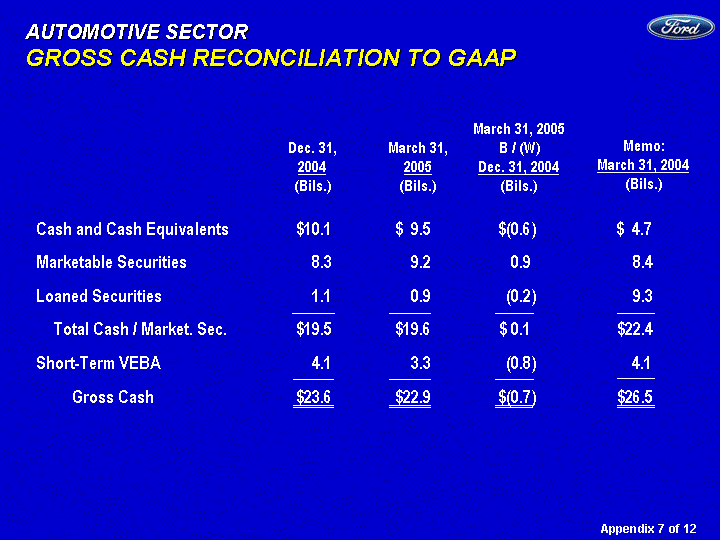
| AUTOMOTIVE SECTOR GROSS CASH RECONCILIATION TO GAAP Cash and Cash Equivalents $10.1 $ 9.5 $(0.6 ) $ 4.7 Marketable Securities 8.3 9.2 0.9 8.4 Loaned Securities 1.1 0.9 (0.2 ) 9.3 Total Cash / Market. Sec. $19.5 $19.6 $ 0.1 $22.4 Short-Term VEBA 4.1 3.3 (0.8 ) 4.1 Gross Cash $23.6 $22.9 $(0.7 ) $26.5 March 31, 2005 B / (W) Dec. 31, 2004 (Bils.) March 31, 2005 (Bils.) Dec. 31, 2004 (Bils.) Appendix 7 of 12 Memo: March 31, 2004 (Bils.) |
Table of Contents
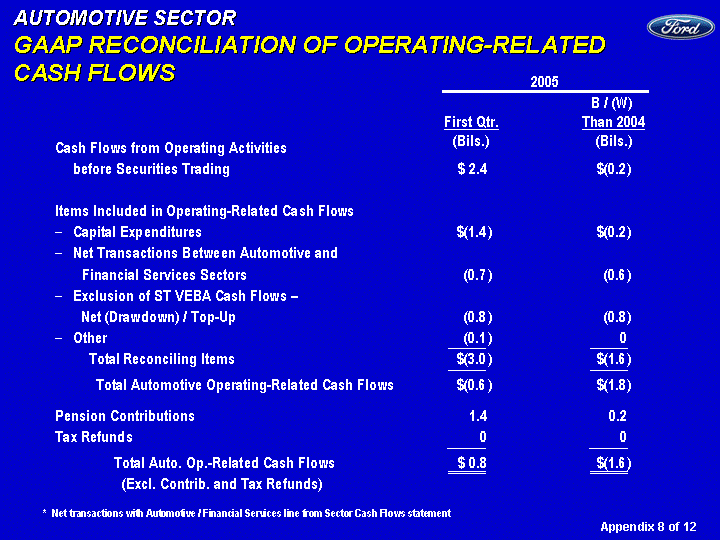
| AUTOMOTIVE SECTOR GAAP RECONCILIATION OF OPERATING-RELATED CASH FLOWS Cash Flows from Operating Activities before Securities Trading $ 2.4 $(0.2 ) Items Included in Operating-Related Cash Flows Capital Expenditures $(1.4 ) $(0.2 ) Net Transactions Between Automotive and Financial Services Sectors (0.7 ) (0.6 ) Exclusion of ST VEBA Cash Flows - Net (Drawdown) / Top-Up (0.8 ) (0.8 ) Other (0.1 ) 0 Total Reconciling Items $(3.0 ) $(1.6 ) Total Automotive Operating-Related Cash Flows $(0.6 ) $(1.8 ) Pension Contributions 1.4 0.2 Tax Refunds 0 0 Total Auto. Op.-Related Cash Flows $ 0.8 $(1.6 ) (Excl. Contrib. and Tax Refunds) * Net transactions with Automotive / Financial Services line from Sector Cash Flows statement First Qtr. (Bils.) 2005 B / (W) Than 2004 (Bils.) Appendix 8 of 12 |
Table of Contents

| FINANCIAL SERVICES SECTOR FORD CREDIT KEY METRIC DEFINITIONS In addition to evaluating Ford Credit's financial performance on a GAAP financial statement basis, Ford Credit management also uses other criteria, some of which were previously disclosed in this presentation and are defined below. Information about the impact of on-balance sheet securitization is also included below : Managed Receivables -- receivables reported on Ford Credit's balance sheet and receivables Ford Credit sold in off-balance-sheet securitizations and continues to service Serviced Receivables -- includes managed receivables and receivables Ford Credit sold in whole-loan sale transactions (i.e., receivables for which Ford Credit has no continuing exposure or risk of loss) Charge-offs on Managed Receivables -- charge-offs associated with receivables reported on Ford Credit's balance sheet plus charge-offs associated with receivables Ford Credit sold in off-balance sheet securitizations and continues to service Impact of On-Balance Sheet Securitization - finance receivables (retail and wholesale) and investments in operating leases reported on Ford Credit's balance sheet include assets transferred in securitizations that do not qualify for accounting sale treatment. These assets have been legally transferred to Ford Credit sponsored special purpose entities and are available only to pay the obligations of the special purpose entities and are not available to pay the obligations of Ford Credit or the claims of Ford Credit's creditors. Debt reported on Ford Credit's balance sheet includes debt issued by these special purpose entities to securitization investors which is payable out of collections on the assets supporting the securitizations and is not the legal obligation of Ford Credit or its other subsidiaries. Appendix 9 of 12 |
Table of Contents
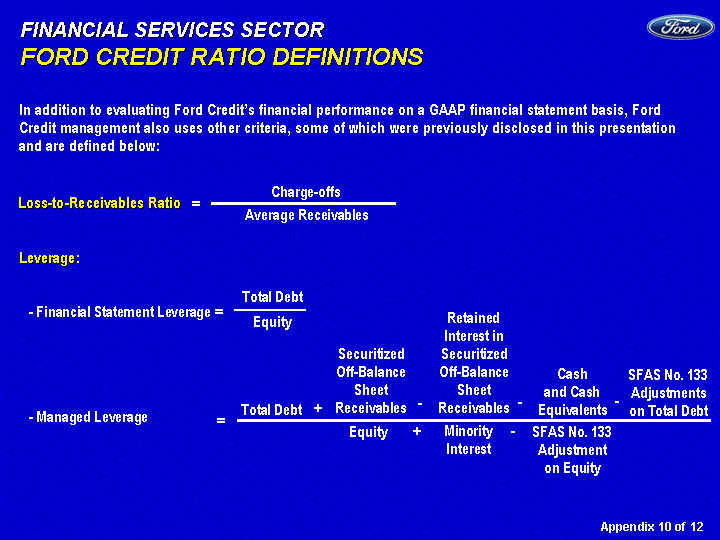
| FINANCIAL SERVICES SECTOR FORD CREDIT RATIO DEFINITIONS In addition to evaluating Ford Credit's financial performance on a GAAP financial statement basis, Ford Credit management also uses other criteria, some of which were previously disclosed in this presentation and are defined below: Leverage: Total Debt - - Financial Statement Leverage = Equity Total Debt Securitized Off-Balance Sheet Receivables Cash and Cash Equivalents SFAS No. 133 Adjustments on Total Debt Equity Minority Interest SFAS No. 133 Adjustment on Equity - - Managed Leverage + - - - - - - = + - - Retained Interest in Securitized Off-Balance Sheet Receivables Charge-offs = Average Receivables Loss-to-Receivables Ratio Appendix 10 of 12 |
Table of Contents
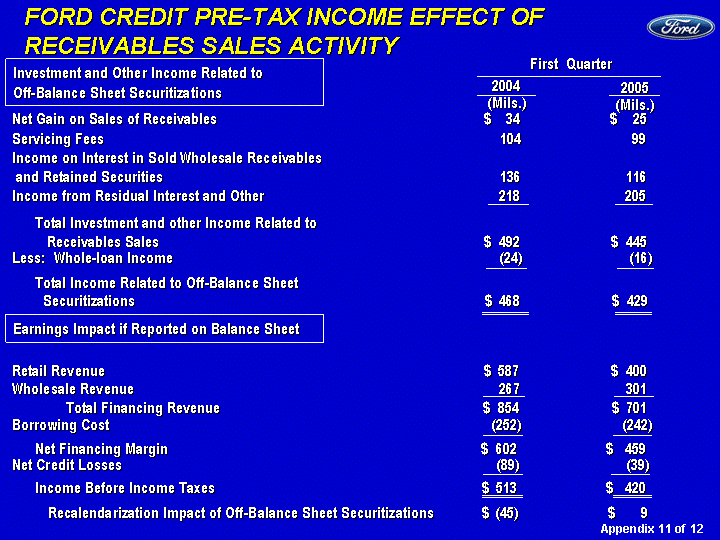
| FORD CREDIT PRE-TAX INCOME EFFECT OF RECEIVABLES SALES ACTIVITY 2005 (Mils.) First Quarter 2004 (Mils.) Investment and Other Income Related to Off-Balance Sheet Securitizations Earnings Impact if Reported on Balance Sheet Net Gain on Sales of Receivables $ 34 $ 25 Servicing Fees 104 99 Income on Interest in Sold Wholesale Receivables and Retained Securities 136 116 Income from Residual Interest and Other 218 205 Total Investment and other Income Related to Receivables Sales $ 492 $ 445 Less: Whole-loan Income (24) (16) Total Income Related to Off-Balance Sheet Securitizations $ 468 $ 429 Retail Revenue $ 587 $ 400 Wholesale Revenue 267 301 Total Financing Revenue $ 854 $ 701 Borrowing Cost (252) (242) Net Financing Margin $ 602 $ 459 Net Credit Losses (89) (39) Income Before Income Taxes $ 513 $ 420 Recalendarization Impact of Off-Balance Sheet Securitizations $ (45) $ 9 Appendix 11 of 12 |
Table of Contents
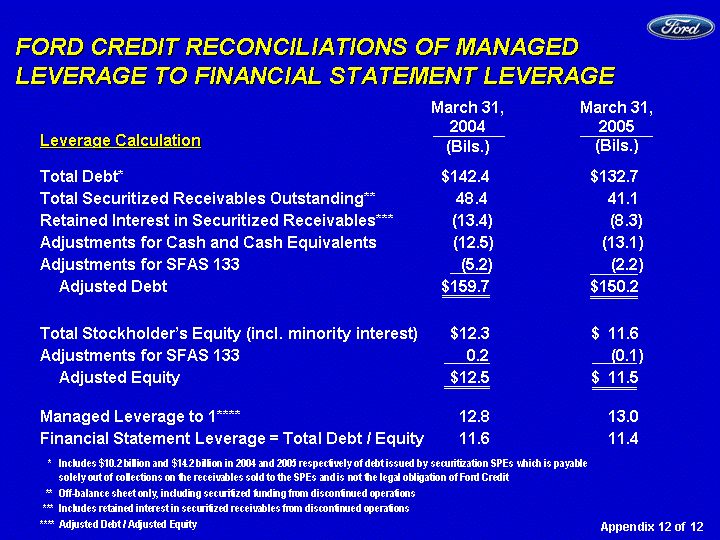
| FORD CREDIT RECONCILIATIONS OF MANAGED LEVERAGE TO FINANCIAL STATEMENT LEVERAGE Total Debt* $142.4 $132.7 Total Securitized Receivables Outstanding** 48.4 41.1 Retained Interest in Securitized Receivables*** (13.4) (8.3) Adjustments for Cash and Cash Equivalents (12.5) (13.1 ) Adjustments for SFAS 133 (5.2) (2.2 ) Adjusted Debt $159.7 $150.2 Total Stockholder's Equity (incl. minority interest) $12.3 $ 11.6 Adjustments for SFAS 133 0.2 (0.1 ) Adjusted Equity $12.5 $ 11.5 Managed Leverage to 1**** 12.8 13.0 Financial Statement Leverage = Total Debt / Equity 11.6 11.4 * Includes $10.2 billion and $14.2 billion in 2004 and 2005 respectively of debt issued by securitization SPEs which is payable solely out of collections on the receivables sold to the SPEs and is not the legal obligation of Ford Credit ** Off-balance sheet only, including securitized funding from discontinued operations *** Includes retained interest in securitized receivables from discontinued operations **** Adjusted Debt / Adjusted Equity March 31, 2005 (Bils.) Leverage Calculation Appendix 12 of 12 March 31, 2004 (Bils.) |
Table of Contents